EMU fiscal indicators: a misleading compass
25
Abstract The effectiveness of any device for fiscal discipline crucially depends on the indicators it refers to. This paper assesses the indicators adopted for fiscal rules in the European Economic and Monetary Union (EMU) with respect to their rele- vance for EMU’s objective of fiscal soundness and to the adequacy of the underlying statistical framework in providing conditions for enforcement. The paper argues that EMU’s deficit and debt indicators present several shortcomings with respect to both sustainability analysis and monitoring requirements. The debt indicator allows the achievement of targets via operations that do not improve fiscal sustainability and tends to underestimate overall outstanding liabilities. The deficit indicator cannot be monitored in a timely manner, allows too much room for discretion, and is subject to significant revisions. While acknowledging that any single indicator can be distorted when used as a policy target, the paper argues that the weaknesses of EMU’s indicators would be much reduced if consistency cross-checks played a larger role than they currently do. Keywords EMU Fiscal rules Fiscal indicators JEL Classification H60 H62 H63 The opinions expressed are those of the authors and do not necessarily represent those of the IMF or the Banca d’Italia. The authors wish to thank Claudia Braz, Carlo Cottarelli, Jorge Cunha, Mark De Broek, Albert Jaeger, Mohan Kumar, Joao Nogueira, Ethan Wiseman and the anonymous referees for helpful comments. F. Balassone (&) D. Franco S. Zotteri Banca d’Italia, Via Nazionale 91, 00184 Rome, Italy e-mail: [email protected] 123 Empirica (2006) 33:63–87 DOI 10.1007/s10663-006-9008-x ORIGINAL PAPER EMU fiscal indicators: a misleading compass? Fabrizio Balassone Daniele Franco Stefania Zotteri Published online: 12 September 2006 Ó Springer Science+Business Media B.V. 2006
-
Upload
independent -
Category
Documents
-
view
4 -
download
0
Transcript of EMU fiscal indicators: a misleading compass

Abstract The effectiveness of any device for fiscal discipline crucially depends onthe indicators it refers to. This paper assesses the indicators adopted for fiscal rules inthe European Economic and Monetary Union (EMU) with respect to their rele-vance for EMU’s objective of fiscal soundness and to the adequacy of the underlyingstatistical framework in providing conditions for enforcement. The paper argues thatEMU’s deficit and debt indicators present several shortcomings with respect to bothsustainability analysis and monitoring requirements. The debt indicator allows theachievement of targets via operations that do not improve fiscal sustainability andtends to underestimate overall outstanding liabilities. The deficit indicator cannot bemonitored in a timely manner, allows too much room for discretion, and is subject tosignificant revisions. While acknowledging that any single indicator can be distortedwhen used as a policy target, the paper argues that the weaknesses of EMU’sindicators would be much reduced if consistency cross-checks played a larger rolethan they currently do.
Keywords EMU Æ Fiscal rules Æ Fiscal indicators
JEL Classification H60 Æ H62 Æ H63
The opinions expressed are those of the authors and do not necessarily represent those ofthe IMF or the Banca d’Italia.
The authors wish to thank Claudia Braz, Carlo Cottarelli, Jorge Cunha, Mark De Broek,Albert Jaeger, Mohan Kumar, Joao Nogueira, Ethan Wiseman and the anonymous referees forhelpful comments.
F. Balassone (&) Æ D. Franco Æ S. ZotteriBanca d’Italia, Via Nazionale 91, 00184 Rome, Italye-mail: [email protected]
123
Empirica (2006) 33:63–87DOI 10.1007/s10663-006-9008-x
ORI GI N A L P A PE R
EMU fiscal indicators: a misleading compass?
Fabrizio Balassone Æ Daniele Franco Æ Stefania Zotteri
Published online: 12 September 2006� Springer Science+Business Media B.V. 2006

‘‘In general, countries characterized by a relatively high degree of fiscaltransparency have exhibited greater fiscal discipline and, in many instances,have been able to achieve a more robust economic performance ...’’ (Kopitsand Craig 1998, p. 2).
1 Introduction
The pros and cons of fiscal rules have long been debated (Kopits and Symansky1998; Kopits 2001; Banca d’Italia 2001). On the one hand, incentive-compatible fiscalrules are seen as a preventive device against opportunistic behavior by policy makersand sharp discontinuities in public policies. On the other hand, rules are seen as asource of unnecessary rigidity.
In the European context, fiscal rules have been adopted mainly to ensure soundand sustainable public finances. Discipline-inducing market mechanisms were nottrusted to be sufficient. The rules introduced to accompany EMU were effective inensuring fiscal consolidation up to 1997 but have been extensively criticized in recentyears. Moreover, their enforcement has encountered several problems: the 3% ofGDP deficit threshold has been violated and the implementation of monitoring andsanctioning procedures has come under pressure.
Proposals to reform the rules abound. Some have suggested the outright abolitionof the rules and reliance on market discipline only. Others have proposedstrengthening national fiscal institutions, even envisaging some delegation of fiscalpolicy to independent agencies (e.g. Wyplosz 2002). Less radical proposals includereplacing deficit targets with expenditure targets, introducing the golden rule, settingtargets for the euro area as a whole, moving to indicators of long-run sustainability ofpublic finances, and setting country-specific rules (Buti et al. 2003; HM Treasury2004). The European Commission (2004) has itself advanced a number of sugges-tions for improving the effectiveness of EMU’s fiscal framework. After a difficultdebate, an agreement was reached at the ECOFIN Council of March 2005. Theguidelines of the reform were set out in a report on ‘‘Improving the implementationof the Stability and Growth Pact’’, which envisaged changes to both the preventiveand corrective arms of the Pact (European Commission 2005).
Whether the Maastricht Treaty and the Stability and Growth Pact (SGP) willremain the cornerstone of fiscal discipline in EMU or whether market mechanismswill serve as the only constraint to budgetary imbalances, the quality of availabledeficit and debt measures remains crucial.
This paper contributes to the debate on European fiscal rules by assessing theindicators adopted in EMU with respect to their relevance for the objective of fiscalsoundness and to the adequacy of the underlying statistical framework in providingnecessary conditions for enforcement.
Concerning fiscal soundness, EMU’s fiscal rules rely on yearly targets set in termsof traditional indicators of deficit and debt. Continued compliance with these targetsis expected to ensure long-term fiscal sustainability. Arguably, reference to for-ward-looking indicators would have been more appropriate. However, theseindicators rely on strong assumptions, require complex computations, and do not
64 Empirica (2006) 33:63–87
123

lend themselves to be adopted for the enforcement of formal rules, especially in amultinational context where moral hazard issues gain prominence.
Beyond this general issue, the paper notes that EMU’s debt indicator (generalgovernment gross consolidated financial debt at face value) allows targets to beachieved via operations that do not improve fiscal sustainability, and tends tounderestimate outstanding liabilities. Evidence suggests that these measures havebeen used (and to a significant extent) in EMU member states in recent years (Koenand van den Noord 2005; Milesi-Ferretti 2003; Milesi-Ferretti and Moryiama 2004;Von Hagen and Wolff 2004).
Concerning enforcement, the paper argues that EMU’s deficit indicator (generalgovernment net borrowing as defined in ESA95)1 cannot be monitored in a timelymanner, allows too much room for discretion, and is subject to significant revisions.Its shortcomings are confirmed by the analysis of some recent episodes, wherebylarge deviations from policy targets were detected with significant delay, after deficitfigures underwent large upward revisions.
Continuous within-year monitoring is necessary from the point of view of both themember state trying to comply with the rules and the agency (the European Com-mission—EC) trying to detect early evidence of deviations from targets. Highmargins for discretion and frequent and sizeable revisions negatively affect both theviability of control of short-term developments and the reliability of the indicators asthe basis for long-term analysis.
The shortcomings of EMU’s indicators concern the use to which they are put inthe context of monitoring compliance with EMU’s fiscal rules and do not imply anyweaknesses of ESA95 in providing information suitable to economic analysis.
The paper acknowledges that all fiscal indicators can be distorted when used aspolicy targets and recognizes that simply replacing current indicators with new oneswould not solve the problem. Rather, it argues that the weaknesses of EMU’s deficitindicator would be much reduced if more weight were given to consistency cross-checks with EMU’s debt indicator than is currently the case.2 This would reduce therisk of large revisions and safeguard the integrity of ESA95 data as a support foreconomic analysis. The proposals put forward in the paper have the advantage of notrequiring any formal amendment of the current fiscal framework.3
The argument is supported by evidence from three case studies of abrupt andsignificant deficit revisions—Portugal and Italy, concerning fiscal data for 2001, andGreece, concerning fiscal data for 2003. In all three cases early signals of unusualdevelopments in public finances could have been detected by looking at the con-sistency between deficit and debt figures.
Finally, the paper stresses that for policy guidance—as opposed to rulesenforcement—the analysis of deficit and debt should take place within an integratedstatistical framework relying on a wider range of indicators.
1 ESA95 is the most recent version of the European System of Integrated Economic Accounts(Eurostat 1979, 1995).2 The possibility to cross-check flows and stocks, as well as accrual and cash data, is a prominentfeature of the Government Finance Statistics framework developed by the International MonetaryFund (IMF 2001a). On fiscal transparency, see also IMF (2001b).3 This paper does not consider the role of cyclically adjusted figures and macroeconomic projectionsin the implementation of fiscal rules. These issues are examined in European Commission (2002,2004) and Strauch et al. (2004), respectively.
Empirica (2006) 33:63–87 65
123

The paper is structured as follows. Section 2 briefly reviews EMU’s deficit anddebt indicators. Sections 3 and 4 assess the indicators with respect to the objectivesof sustainability of public finances and enforcement of the rules, respectively. Sec-tion 5 argues that monitoring of deficit developments would be more effective ifsupported by the analysis of debt dynamics and examines the three case studiesproviding evidence in support of this view. Section 6 suggests that, rules design aside,the analysis of EMU’s fiscal indicators would be more relevant for fiscal sustain-ability if it were carried out within a multifaceted statistical framework. Section 7concludes.
2 EMU fiscal indicators
The fiscal framework of EMU was developed gradually. The 1992 Treaty of Ma-astricht set the fiscal criteria to be met for joining the Monetary Union. The primaryobjective of the Treaty was to keep a sound fiscal stance in order to preserve stablemonetary and financial conditions within the Union. The SGP, adopted by theEuropean Council in Amsterdam in June 1997, complemented the Treaty with aview to reconciling permanent restraint of deficit and debt levels with margins forfiscal stabilization policies. The SGP also strengthened the monitoring proceduresaccompanying the quantitative rules (Buti and Sapir 1998; Brunila et al. 2002).
The design of EMU’s rules met with a number of practical problems. Sustain-ability analysis has a forward-looking nature and should not be based on annualoutturns, which depict only the current budgetary situation. The assessment of futuredevelopments can refer either to explicit medium- and long-term projections oftraditional deficit and debt measures (Franco and Marino 2004) or to summaryindicators of these projections, such as the change in net worth or the imbalance inthe fiscal treatment of different generations.4 However, both solutions rely on strongassumptions and can lead to results whose robustness can be questioned. Moreover,summary indicators are difficult to interpret and do not immediately translate intopolicy prescriptions.5 Negative net worth, for instance, signals that the present valuebudget constraint is not satisfied, but it gives no indication concerning the appro-priate timing for the needed correction. By contrast, positive net worth signals thatthe constraint is satisfied, but says nothing about the timing of future developmentsin public finances, and therefore cannot be taken as indication that current policiesare sustainable.6
4 Some authors have prescribed resorting to either ‘‘economic deficit’’ (Kotlikoff 1984) or to‘‘government net worth’’ (Buiter 1983). These solutions would require, inter alia, the inclusion ofpensions in the fiscal accounts when obligations are incurred rather than when the actual expenditureis made. For a survey, see Towe (1991) and Blejer and Cheasty (1991); for a critique see Mackenzie(1989). Both Buiter (1985) and Blanchard et al. (1990) suggest summary indicators of the outcomesof long-term projections. Summary indicators of the fiscal burden that current generations areplacing on future generations are provided by generational accounts (Auerbach et al. 1991). See alsoH.M. Treasury (2003).5 This problem is especially relevant for generational accounting. For a critical assessment see, e.g.,Buiter (1995), Haveman (1994) and IMF (1996).6 A positive net worth may be the net result of a sharp and significant increase in deficit and debtexpected to occur shortly and a compensating improvement expected to occur at a later stage.However, if the initial increase in debt triggers a financial crisis, it will then become impossible tocompensate for it.
66 Empirica (2006) 33:63–87
123

In the context of EMU it was difficult to consider the adoption of sophisticatedsustainability indicators for formal rules. The asymmetry between the monetaryregime, with the single currency and a single monetary authority, and the fiscalframework, lacking the authority of federal rank, gave prominence to moral hazardissues. Against this background, European policy makers took a cautious approachand selected relatively simple numerical rules and indicators.
Article 104 of the Treaty and the annexed Protocol on excessive deficits lay outthe criteria for assessing budgetary positions: (i) the general government deficit mustnot exceed 3% of GDP (save for exceptional circumstances, for a limited period andfor a limited amount);7 and (ii) the general government debt must not exceed 60% ofGDP or, if above this limit, must be decreasing and approaching the limit at asatisfactory pace.
As practical reasons forced the adoption of traditional indicators, tighter ceilingsthan otherwise necessary were chosen for yearly outcomes (Balassone and Franco2000a, 2001). While the ceiling to the deficit ratio is consistent with Domar’s (1944)requirement for sustainability, the debt ceiling aims at avoiding convergence to highlevels of debt. The arbitrariness sometimes attributed to the choice of the actualthresholds appears to reflect ambiguities in the theory of fiscal sustainability ratherthan poor design of the rules.8 The choice of a gross debt measure also appears toreflect the reasonable degree of prudence that is to be used in assessing solvency,given the unavoidable large degree of judgment involved in the valuation of financialassets.
A common reference accounting framework for the two indicators was adopted(Eurostat 2000). The deficit is defined as the ESA95 general government net bor-rowing, while the debt is defined as gross financial liabilities at face value consoli-dated between and within the sectors of general government. Although this is notthe debt definition provided by ESA, the relevant financial instruments and thereference sectors are those specified within that framework.9 The European Statis-tical Office (Eurostat) oversees the correct implementation of definitions and thecomputational criteria adopted by national statistical institutes. It also releasesexplanatory notes concerning controversial issues.
The choice of ESA as the relevant accounting framework for budgetary surveil-lance was due both to the appropriateness of national accounts for economic analysisand to the lack of any viable alternative. It was deemed unrealistic to define a newaccounting framework to monitor public finances. The risk that a new frameworkwould have been more permeable to politically motivated interpretations than ESAwas probably also perceived.
7 The SGP introduced a medium-term target of a budgetary position of close to balance or in surplusand indicated how to interpret the Treaty’s provisions allowing the annual deficit ratio to exceed the3% limit under exceptional recessions and other circumstances that are not under governmentcontrol and significantly impact on public finances. In March 2005, the Ecofin Council decided thatan excess over the reference value may be considered exceptional if it results from a negative growthrate or from an accumulated loss of output during a protracted period of very low growth relative topotential growth. The Council also decided that medium-term targets are to be defined in cyclicallyadjusted terms, net of one-off and other temporary measures (European Commission 2005).8 The target was set close to the European average at the time of the Treaty. In the absence of a fullyspecified ‘‘consensus’’ model of the economy, it is not possible to estimate a maximum sustainablelevel of the debt (see, for example, Balassone and Franco 2000a).9 On the measurement of public debt in EMU, see Mink and Rodriguez-Vives (2004).
Empirica (2006) 33:63–87 67
123

While continuous compliance with short-term prudent targets for the deficitindicator was taken as a means to ensure sustainability, the need for a forward-looking assessment of the budgetary situation was acknowledged by requiring thesubmission of multiyear programs including medium- and long-term projections.The internal consistency of the programs, their underlying assumption and, ulti-mately, attainability are also subject to scrutiny.10 Long-term projections arebecoming increasingly important in the monitoring of budgetary trends.11
3 Soundness of public finances
Fiscal soundness is the main objective of EMU’s rules. While the rationale is clear(a sound policy avoids insolvency), the analytical and operational definition ofsoundness is not straightforward: how can the balance between unnecessary restraintand irresponsible excess be defined? This difficulty is mirrored in the lengthy debateon the definition of fiscal sustainability (Balassone and Franco 2000a; Banca d’Italia2000).
In the literature, reference is often made to the present value budget constraintaccording to which financial liabilities (FL) must be equal to or smaller than the sumof: (i) assets (A); (ii) the difference between the stock of accrued revenue yet to becashed in and the stock of accrued expenditure yet to be paid (net other accounts,NOA); (iii) the present value of the difference between future revenue (T, excludingrevenue from the sale of assets) and expenditure (G, excluding expenditure for theacquisition of assets);12 and (iv) the present value of the difference between futurechanges in the value of assets and those in the value of liabilities (DV):
FLt 6At þNOAt þ ½Rtþ1;1Tið1þ rÞt�i � Rtþ1;1Gið1þ rÞt�i� þ Rtþ1;1DVið1þ rÞt�i
ð1Þ
Using Eq. 1 as a reference, EMU’s deficit and debt indicators can be examinedwith respect to two sets of issues: (i) comprehensiveness (i.e., issues related to terms inEq. 1 which are overlooked); and (ii) measurement (i.e., issues related to the con-sistency of actual measures with their ‘‘theoretical’’ counterparts featuring in Eq. 1).
3.1 Comprehensiveness issues
EMU’s fiscal indicators are measures of FLt, for the debt, and of (Tt �Gt), for thedeficit. Therefore, EMU’s fiscal rules do not take into account: (i) government assets(At); (ii) the stock of net other accounts (NOAt, net assets/liabilities already accrued
10 European Union (EU) member states must submit their medium-term budgetary targets to theEuropean Commission in a standardized format (Stability Programs and Convergence Programs forEMU and non-EMU countries, respectively). They must indicate the fiscal targets, the measures toallow their achievement, and the underlying assumptions. The relevance of the latter is emphasizedby the examination of the track-record of budgetary forecasts in the programs (Strauch et al. 2004).11 See the Opinion of the Economic and Financial Committee, 27 June 2001, as endorsed by theCouncil. See also Economic Policy Committee (2001, 2003).12 Future revenue and expenditure are valued in accrual terms so that there is no need to considerexplicitly future other accounts receivable and payable.
68 Empirica (2006) 33:63–87
123

but not yet incorporated into financial instruments); (iii) future revenue andexpenditure flows; and (iv) future changes in valuations of assets and liabilities (DV).
By taking into account government assets, one would be estimating net debt(FLt �At). While this indicator would represent a better benchmark for assessingfiscal sustainability, its measurement faces some difficulties. First, the degree ofliquidity of government assets should be taken into account. Second, data on assetsare often subject to significant uncertainty, especially those on non-interest-bearingassets. Third, there is an open issue concerning the proper valuation criterion: whileusing book values may lead to underestimating the assets, reference to market valueswould induce excessive volatility in the debt measure.
Sales of financial assets that leave the government’s net position unaffected can beused to reduce gross liabilities without improving the underlying sustainabilityconditions. In Italy a large privatization program undertaken during the 1990scontributed to the reduction of gross financial liabilities by almost 5 percentagepoints of GDP. More recently, gross debt was kept in check also thanks to sales ofreal estate (almost 1% of GDP in 2002) and reductions in the balances held by thetreasury in its bank accounts (about 0.6% of GDP in 2003).
For the EU15, it can be estimated that privatization proceeds amounted to over0.5% of GDP per year between 1994 and 2002. They were close to 1% of GDPbetween 1997 and 1999. In Belgium privatizations significantly contributed to debtreduction until 1998. In Germany privatization proceeds averaged at around 1% ofGDP at the end of the 1990s. In Finland sales of shares in public corporations in thetelecommunication sector amounted to 3% of GDP in 1999, 1.5% in 2000 and 1.9%in 2002. In Ireland privatization proceeds reached 5.5% of GDP in 1999. A largeprivatization program was started in Greece just before the turn of the century;revenue amounted to 3.3% of GDP in 1999. Government asset sales programs werealso undertaken in Austria, France, and Portugal.
A more comprehensive picture of government net liabilities would be achieved byconsidering the stock of net other accounts (NOAt). However, this would raiseproblems in terms of data availability. In particular, one would need estimates ofcommercial debts and tax credits.
Outstanding liabilities may be underestimated whenever net accrued liabilitiesare not yet incorporated in financial instruments. This may abruptly affect EMU’sdebt indicator. In Italy, the stock of tax credits reached significant levels in the firsthalf of the 1990s (almost 4% of GDP). They are currently estimated at less than halfthat level. Settlement of past debts, mostly commercial debts of public institutionsproviding health care, have been significant throughout the 1990s and in most recentyears, falling just short of 1/2% of GDP per year.
Overall a first-best solution is not available. However, useful indications may berecovered from: (i) a measure of debt net of most liquid assets (e.g., bank deposits)and of other assets whose valuation is less problematic (e.g., performing loans); (ii) ameasure of debt including the stock of most relevant and easily measurable accruedliabilities (e.g., tax credits); and (iii) a measure of changes in net debt (valuationproblems do not affect asset flows as much as stocks).
Concerning future revenue and expenditure (Rtþ1;1Tið1þ rÞt�i � Rtþ1;1Gið1þ rÞt�i), as mentioned in Section 2, there are practical reasons for excluding theuse of forward-looking indicators. Nevertheless, there is a need to monitor policymeasures that improve the debt and deficit today at the expense of deficit increases
Empirica (2006) 33:63–87 69
123

tomorrow so as to avoid misleading interpretations of current budgetary outcomes.Recourse to such measures has not been uncommon among EU member states. Atypical example is interest swap operations. During 1998–2003 interest swapssignificantly reduced the overall deficit in Austria (0.8 percentage points of GDP),Denmark (0.6 p.p.), Italy (0.6 p.p.), and Sweden (0.6 p.p.). Swap operations, aver-aging 0.2 percentage points of GDP, were also carried out in Belgium, Finland,Greece, and Spain.13
In 2002 the Italian Treasury undertook a major swap operation with the bondsgiven to the Banca d’Italia in 1993 to extinguish the overdraft on the current accountheld by the treasury with the bank. The treasury bought back € 39.4 billion of long-term bonds with an annual coupon of 1% and gave the Banca d’Italia € 15.4 billionof long-term bonds with annual coupons ranging between 5% and 6 1
2%. In this way,general government debt was reduced by € 23.9 billion. However, future governmentaccounts were burdened by higher interest expenditure (about € 0.5 billion per year),lower tax revenue due to the reduction of the Banca d’Italia’s taxable profits, andlower dividends paid by the bank to the treasury.
Securitizations of future revenue, securitizations backed by a state guarantee,sales and lease back of assets and transfers of pension liabilities from a company tothe government in exchange for an upfront payment by the company have becomeincreasingly popular among member states.14 However, some recent Eurostatdecisions have ruled out the viability of some of these measures as a means to reducecurrent deficits (these transactions must now be treated as a loan).
Future changes in valuations of assets and liabilities (DV) are mainly due toexchange rate fluctuations and capital gains and losses. While in general the effectsfrom each of these factors can be expected to cancel each other out in the long run,there can be circumstances in which they display a drift (e.g., if the domestic cur-rency consistently tends to depreciate). In this case, by disregarding them, the trueextent of liabilities is underestimated.
3.2 Measurement issues
These refer to the valuation criteria followed when computing the debt indicator(FLt) and to the definition of general government.
Concerning the valuation criteria, while the present value budget constraint isdefined in terms of the liabilities’ redemption value, (i.e., is based on the price to bepaid when the liabilities fall due), the debt indicator chosen for EMU’s fiscal rules isconsidered at face value. Most often the two criteria coincide. However, this isnot always the case. One example is the valuation of Italian Post Office Deposit
13 Note that two different definitions of the deficit are currently used in Europe: the first one, whichis used for the purposes of EMU’s fiscal rules, is affected by swap operations; the second one, whichis the proper ESA95 definition, is not.14 Securitizations of future revenue were carried out by Italy and Greece. Sale and lease-backoperations were sizeable in Austria. France reduced its deficits (by 0.5% of GDP) through com-pensation for the take over of pension liabilities (those of France Telecom) in 1997. Portugal made asimilar operation in 2003 with the Postal Service Pension Fund: the deficit reduction amounted toabout 1% of GDP.
70 Empirica (2006) 33:63–87
123
Certificates, whose nominal (face) value does not include accrued interest to be paidat withdrawal of funds. At the end of 2003, the difference between the two valuationcriteria amounted to almost 5% of GDP. Bonds with this feature are also issued inPortugal.
Market valuation of liabilities would not represent a satisfactory solution forsustainability analysis: it refers to the amount the government would be asked to payif it were to buy back its debt before it falls due, but the government has no obli-gation to do so. Furthermore, reference to market values could make the debtmeasure extremely volatile.
Concerning the definition of general government, the present value budget con-straint holds for the activities of all public bodies whose financial behavior may in theend have an impact on the revenue needed to satisfy the budget constraint. InESA95, general government units are identified as those units whose principalfunction is the production of non-market services or the redistribution of resources.This criterion is implemented by excluding from the general government sectorthose publicly-owned or controlled units dealing with commercial operations (suchas public enterprises) provided that they cover most of their costs out of their ownrevenues.15 As a result, general government debt can be subject to sudden increaseswhen the financial situation of these enterprises deteriorates to the point that thegovernment is called to bail them out.
Over the past decade, debt assumptions have occurred in several EMU memberstates. In 1997, Italy’s government assumed the outstanding liabilities of the NationalRailways Company (almost 2 1
2% of GDP). In 2001, Belgium included in governmentdebt the liabilities of the former Central Office of Mortgage Credit (in that year thisoperation and other ad-hoc factors increased the debt-to-GDP ratio by 1.9percentage points); similar operations were carried out in 2002. Moreover, theBelgian government has agreed to assume in 2005 the debt of the national railwaycompany (2.5% of GDP). In Austria, in the past few years the government issuedbonds amounting to about 5.2% of GDP to finance public enterprises (Rechtstra-gerfinanzierung). Significant debt assumptions were also carried out in France,Germany, Greece, and Portugal.
4 Enforcing the rules
In the context defined by EMU’s fiscal rules, continuous within-year monitoring isnecessary from the point of view of both the member state trying to comply with therules and the agency (the EC) trying to assess the consistency of within-yeardevelopments with yearly targets. From this perspective the focus of the analysis is
15 There can be borderline cases, especially when revenue of public enterprises comes from thegeneral government, which implies the need to ascertain whether these flows are truly revenue ratherthan transfers. Classification of units producing the same goods may therefore not be homogeneousacross countries. The case of public enterprises involved in public investment or in the sale of publicassets has recently come to the fore with reforms in Austria and Italy. Blejer and Cheasty (1991)discuss different approaches to defining the public sector.
Empirica (2006) 33:63–87 71
123

on flow variables. Therefore, it is crucial that the chosen deficit indicator is availableon a timely basis, that its computation does not involve too many elements ofjudgment, and that it is not subject to significant revisions.
From a fiscal monitoring point of view, the ESA deficit presents some problemsthat are mostly linked to its reliance on accrual accounting, a feature that washeightened by the switch from the 1979 to the 1995 version of ESA (effective as of2000). While accrual-based accounts are indispensable for gauging the macroeco-nomic repercussions of fiscal policy, cash accounting has some advantages for short-term budgetary control and analysis.16
First, accrual data are essentially estimates based on cash data. Therefore theirproduction is more time-consuming than that of cash data. This implies that theESA95 deficit is not available on a timely basis.17 Indeed, most short-term budgetaryindicators at the national level are based on cash data. There is a need to make theseindicators consistent with the ESA95 budget balance, but this can be problematic ifthe relationship between the cash deficit and the ESA95 deficit is not stable.18
Second, while economically more relevant than cash data, accrual data embodymore elements of judgment. Awareness of the potential problems linked with fullreliance on accrual data is apparent in Eurostat’s decision to specify that revenuecomputed in accrual terms should include only those items that are likely to be actuallycashed in, and that in the medium-term accrual and cash data should converge.19
Third, accrual data are also more likely to be revised: as better information becomesavailable over time, the assumptions underlying their estimation are subject to changes.
Further issues may arise with respect to the treatment of transactions in financialassets, which do not affect the ESA95 deficit. The distinction between financial andnonfinancial assets is somewhat arbitrary: the sale of nonfinancial assets (real estate,but also UMTS licenses) is not intrinsically different from a privatization; also, ingeneral, direct government investment is not intrinsically different from capitalinjections. Whether a transaction is a capital injection (which does not affect thedeficit) or a capital transfer (which does) may depend on the profitability of thebeneficiary enterprise, a concept that may not lend itself to unequivocal assessment.
The different accounting of investment spending and capital injections, on the onehand, and of sales of capital goods and privatizations, on the other hand, can inducedistortions in the budgeting process—as witnessed by the recent popularity of
16 The point is made, for instance, by Kopits and Craig (1998). Similarly, the Australian Treasurynotes that: ‘‘The main advantage of accrual measures (as opposed to cash) is that they provide amore comprehensive indication of the total activity of Government and the long-term effects ofcurrent policy. Cash measures, do, however, have some advantages for tracking expenditures in afiscal year and helping to identify the short-term effects of fiscal policy on the economy.’’ (Com-monwealth of Australia 1999, p. 2).17 To improve the timeliness of ESA95 data, EU countries agreed to begin to publish quarterly datafor the general government deficit in 2005.18 For instance, this has been the case of Italy in recent years.19 See Eurostat (2000) and EU Regulations 2516/2000 and 995/2001. Testimony to the relevance ofthis issue is the revision of the 2001 Portuguese deficit by almost 2 percentage points of GDP, partlymotivated by the expiration of the derogation allowing Portugal to provide accrual data withoutensuring consistency with cash data (the revision was significant also for the years from 1995 to 2000).
72 Empirica (2006) 33:63–87
123

investment outsourcing. It can also result in the use of one-off transactions, such assales of real estate, to fine-tune deficit figures.20
Table 1 presents deficit-to-GDP ratios for the years 1997–2004 as initially re-ported by Euro-area member states and as reported in the most recent notificationsavailable concerning each year considered. Revisions systematically result in worsebudgetary balances. The annual revision for the area averages about 0.2% of GDP,but changes are more significant at the national level. Upward revisions were par-ticularly large in Greece (2000–2003), Italy (2001–2003), Portugal (1998–2001) andSpain (1997, 1998, 2000). Significant upward revisions also took place in the Neth-erlands (2002) and Austria (2000). On the contrary, significant downward revisionstook place in Belgium (1998, 1999) and Luxembourg (1997–2001).
Table 2 presents general government debt-to-GDP ratios for the years 1997–2004for Euro-area countries as initially reported and as reported in the most recentnotification available. Revisions result in both increases and decreases in initial debtfigures. The overall revision averages about 0.4% of GDP per year. Upward revi-sions have been equal or larger than 1% percent of GDP in Belgium (1997–1998),France (1997–1998), Ireland (1998), Greece (2000–2003), Italy (2000–2002) andAustria (1999–2001). Relevant downward revisions have been as frequent as upwardones and mainly concerned Portugal, the Netherlands, Spain, and Ireland.
Changes in gross debt, an approximation of a cash deficit measure (see alsoSection 5), are, however, more stable. This can be seen from Table 3, which presentsthe ratio to GDP of the change in debt for the years 1997–2004 as initially reportedand as reported in the most recent notification available concerning each yearconsidered. Revisions are almost negligible. Revisions affecting the change in debtare less widespread across countries than those concerning ESA95 deficits and resultin both increases and decreases to previously released data. Revisions were signifi-cant in Austria in 1997, 2000, 2001, and in 2002 (+1.8, +1.6%, +2.0, and –0.6% ofGDP, respectively) and in Greece in 2000 and in 2001 (+2.3 and +5.1%, respec-tively).
Before the large revisions implemented in 2004 and 2005 to fiscal data for Greeceand Italy, the European Commission (2003) reported on the reliability of EMU’sfiscal indicators over the 2000–2003 period (i.e., since ESA95 came into force),noting that ‘‘the average absolute revision in the deficit ratios of Member States hasbeen 0.15% of GDP after six months, 0.22% after one year, and 0.26% after18 months’’ (p. 66). While arguing that these figures are small compared with theaverage size of expenditure and revenue to GDP ratios (around 47%), the EC (2003)also noted that ‘‘in some cases, the revisions in the government deficit ratios wereunacceptably high’’.
20 Indeed, the deficit consistent with equation (1) should not be affected by any transaction in assets,whether financial or not (i.e., it should be computed excluding any type of transaction in assets). Inprinciple, this means that equation (1) is also compatible with using deficit financing for purchasingproductive physical assets (i.e., with the so-called golden rule). However, in practice, the golden rulemay increase margins for opportunistic accounting (the evaluation of amortization is but oneexample). Moreover, the golden rule would only partly remove the bias against nonfinancial outlaysembodied in present rules, while introducing new biases (e.g., against investment in human capital).Interestingly, Article 104 of the Treaty includes gross investment among the elements to take intoaccount when assessing governments’ fiscal positions but does not make explicit reference to thegolden rule. For a discussion of the golden rule and the feasibility of its implementation in thecontext of EMU’s fiscal rules, see Balassone and Franco (2000b).
Empirica (2006) 33:63–87 73
123

Tab
le1
Net
bo
rro
win
g/l
en
din
g1
99
7–
200
4:
init
ial
an
dfi
na
le
stim
ate
so
fS
pri
ng
no
tifi
cati
on
sa
As
ap
erc
en
tag
eo
fG
DP
19
97
19
98
19
99
20
00
b2
00
12
00
22
00
32
00
4
Sp
rin
g1
99
8S
pri
ng
20
02
Sp
rin
g1
99
9S
pri
ng
20
03
Sp
rin
g2
00
0S
pri
ng
20
04
Sp
rin
g2
00
1S
pri
ng
20
04
Sp
rin
g2
00
2S
pri
ng
20
05
Sp
rin
g2
00
3S
pri
ng
20
05
Sp
rin
g2
00
4S
pri
ng
20
05
Sp
rin
g2
00
5
Be
lgiu
m–
2.1
–2
.0–
1.3
–0
.7–
0.9
–0
.40
.00
.20
.20
.60
.10
.10
.20
.40
.1G
erm
an
y–
2.7
–2
.7–
2.1
–2
.2–
1.1
–1
.51
.51
.3–
2.7
–2
.8–
3.6
–3
.7–
3.9
–3
.8–
3.7
Gre
ece
c–
4.0
–4
.7–
2.4
–2
.5–
1.6
–1
.8–
0.9
–2
.00
.1–
3.6
–1
.2–
4.1
–1
.7–
5.2
–6
.1S
pa
in–
2.6
–3
.2–
1.8
–3
.0–
1.1
–1
.2–
0.3
–0
.90
.0–
0.5
–0
.1–
0.3
0.3
0.3
–0
.3F
ran
ce–
3.0
–3
.0–
2.9
–2
.7–
1.8
–1
.8–
1.3
–1
.4–
1.4
–1
.5–
3.1
–3
.2–
4.1
–4
.2–
3.7
Ire
lan
d0
.91
.22
.32
.32
.02
.44
.54
.41
.70
.9–
0.1
–0
.40
.20
.21
.3It
aly
d–
2.7
–2
.7–
2.7
–2
.8–
1.9
–1
.7–
0.3
–0
.6–
1.4
–3
.2–
2.3
–2
.7–
2.4
–3
.2–
3.2
Lu
xe
mb
ou
rg1
.72
.82
.13
.02
.43
.75
.36
.35
.06
.22
.62
.3–
0.1
0.5
–1
.1N
eth
erl
an
ds
–1
.4–
1.1
–0
.9–
0.8
0.5
0.7
2.0
2.2
0.2
–0
.1–
1.1
–1
.9–
3.2
–3
.2–
2.5
Au
stri
a–
2.5
–2
.0–
2.1
–2
.5–
2.0
–2
.3–
1.1
–1
.50
.10
.3–
0.6
–0
.2–
1.1
–1
.1–
1.3
Po
rtu
gal
–2
.5–
2.6
–2
.3–
3.2
–2
.0–
2.8
–1
.4–
2.8
–2
.7–
4.4
–2
.7–
2.7
–2
.8–
2.9
–2
.9F
inla
nd
–0
.9–
1.5
1.0
1.5
2.3
2.2
6.7
7.1
4.9
5.2
4.7
4.3
2.3
2.5
2.1
Eu
roa
rea
–2
.5–
2.6
–2
.1–
2.3
–1
.2–
1.3
0.4
0.1
–1
.3–
1.7
–2
.2–
2.4
–2
.7–
2.8
–2
.8
aA
ne
ga
tiv
esi
gnin
dic
ate
sa
de
fici
t;a
po
siti
ve
sign
ind
ica
tes
asu
rplu
sb
Incl
ud
ing
UM
TS
pro
cee
ds
cT
he
da
tafo
rth
ey
ea
rs1
99
7–2
00
0w
ere
rev
ise
da
tth
ee
nd
of
20
04
to6
.6,
4.3
,3
.4a
nd
4.1
%o
fG
DP
,re
spe
ctiv
ely
dT
he
colu
mn
lab
ele
dS
pri
ng
20
05
refe
rsto
the
Ma
y2
00
5N
oti
fica
tio
n
74 Empirica (2006) 33:63–87
123

Ta
ble
2G
ross
de
bt,
19
97
–2
004
:in
itia
la
nd
fin
al
est
ima
tes
of
Sp
rin
gn
oti
fica
tio
ns
As
ap
erc
en
tag
eo
fG
DP
19
97
19
98
19
99
20
00
20
01
20
02
20
03
20
04
Sp
rin
g1
99
8S
pri
ng
20
02
Sp
rin
g1
99
9S
pri
ng
20
03
Sp
rin
g2
00
0S
pri
ng
20
04
Sp
rin
g2
00
1S
pri
ng
20
04
Sp
rin
g2
00
2S
pri
ng
20
05
Sp
rin
g2
00
3S
pri
ng
20
05
Sp
rin
g2
00
4S
pri
ng
20
05
Sp
rin
g2
00
5
Be
lgiu
m1
22
.21
24
.71
17
.31
19
.61
14
.41
14
.81
10
.91
09
.11
07
.51
08
.01
05
.31
05
.41
00
.51
00
.09
5.6
Ge
rman
y6
1.3
61
.06
1.0
60
.96
1.0
61
.26
0.2
60
.25
9.8
59
.46
0.8
60
.96
4.2
64
.26
6.0
Gre
ece
a1
08
.71
08
.21
06
.51
05
.81
04
.41
05
.21
03
.91
06
.29
9.7
11
4.8
10
4.9
11
2.2
10
3.0
10
9.3
11
0.5
Sp
ain
68
.86
6.6
65
.66
4.6
63
.56
3.1
60
.66
1.2
57
.25
7.8
54
.05
5.0
50
.85
1.4
48
.9F
ran
ce5
8.0
59
.35
8.5
59
.55
8.6
58
.55
8.0
57
.25
7.2
57
.05
9.1
59
.06
3.0
63
.96
5.6
Ire
lan
d6
6.3
65
.15
2.1
54
.95
2.4
48
.63
9.1
38
.43
6.3
35
.83
3.3
32
.63
2.0
32
.02
9.9
Ita
lyb
12
1.6
12
0.2
11
8.7
11
6.3
11
4.9
11
5.5
11
0.2
11
1.2
10
9.4
11
0.9
10
6.7
10
8.3
10
6.2
10
6.8
10
6.6
Lu
xe
mb
ou
rg6
.76
.06
.76
.36
.26
.05
.35
.55
.57
.25
.37
.54
.97
.17
.5N
eth
erl
an
ds
72
.16
9.9
67
.76
6.8
63
.96
3.1
56
.35
5.9
52
.95
2.9
52
.65
2.6
54
.85
4.3
55
.7A
ust
ria
66
.16
4.7
63
.16
3.7
64
.56
7.5
62
.86
7.0
61
.86
7.1
68
.76
6.7
65
.06
5.4
65
.2P
ort
ug
al6
2.0
58
.95
7.8
55
.05
6.7
54
.35
3.8
53
.35
5.4
55
.95
8.1
58
.55
9.4
60
.16
1.9
Fin
lan
d5
5.8
54
.14
9.6
48
.64
7.1
47
.04
4.0
44
.64
3.6
43
.84
2.7
42
.54
5.3
45
.34
5.1
Eu
roa
rea
75
.27
5.3
73
.47
3.7
72
.37
2.8
69
.77
0.4
69
.16
9.6
69
.26
9.5
70
.47
0.9
74
.1
aT
he
da
tafo
rth
ey
ea
rs1
99
7–
200
0w
ere
rev
ise
da
tth
ee
nd
of
20
04
to1
14
.0,
11
2.4
,1
12
.3a
nd
11
4.0
%o
fG
DP
resp
ect
ive
lyb
Th
eco
lum
nla
be
led
Sp
rin
g2
00
5re
fers
toth
eM
ay
20
05
No
tifi
cati
on
Empirica (2006) 33:63–87 75
123

Ta
ble
3C
ha
ng
ein
de
bt,
19
97
–2
004
:in
itia
la
nd
fin
al
est
ima
tes
of
Sp
rin
gn
oti
fica
tio
ns
As
ap
erc
en
tag
eo
fG
DP
19
97
19
98
19
99
20
00
20
01
20
02
20
03
20
04
Sp
rin
g1
99
8S
pri
ng
20
02
Sp
rin
g1
99
9S
pri
ng
20
03
Sp
rin
g2
00
0S
pri
ng
20
04
Sp
rin
g2
00
1S
pri
ng
20
04
Sp
rin
g2
00
2S
pri
ng
20
05
Sp
rin
g2
00
3S
pri
ng
20
05
Sp
rin
g2
00
4S
pri
ng
20
05
Sp
rin
g2
00
5
Be
lgiu
m0
.60
.7–
0.4
–0
.60
.90
.30
.30
.22
.01
.6–
0.1
0.3
–2
.1–
2.1
0.5
Ge
rman
y2
.52
.41
.71
.71
.81
.80
.80
.60
.50
.52
.42
.43
.93
.93
.3G
ree
ce7
.77
.65
.75
.65
.45
.46
.48
.74
.08
.35
.75
.85
.95
.89
.1S
pa
in2
.52
.52
.12
.22
.92
.81
.82
.00
.70
.40
.50
.8–
0.3
–0
.21
.0F
ran
ce4
.23
.92
.62
.71
.11
.11
.41
.41
.81
.83
.84
.05
.56
.04
.3Ir
ela
nd
0.3
0.8
–1
.5–
1.7
2.1
1.9
–3
.8–
3.6
1.6
1.7
0.5
0.3
1.1
1.0
0.4
Ita
lya
2.6
2.7
1.4
1.4
1.9
2.1
1.5
1.5
3.5
4.2
0.5
1.1
1.6
1.9
3.8
Lu
xe
mb
ou
rg0
.60
.50
.70
.80
.50
.00
.10
.20
.00
.20
.20
.5–
0.6
0.0
0.9
Ne
the
rla
nd
s–
1.1
–0
.90
.20
.8–
0.1
–0
.2–
2.7
–2
.90
.20
.51
.61
.63
.32
.72
.7A
ust
ria
–0
.8–
2.6
1.6
1.7
3.2
3.1
1.0
2.6
0.0
2.0
1.8
1.2
0.1
0.4
2.0
Po
rtu
ga
l0
.60
.80
.40
.53
.43
.02
.22
.55
.55
.55
.25
.22
.52
.53
.8F
inla
nd
2.0
1.5
–1
.4–
1.1
0.2
–0
.20
.91
.20
.91
.10
.20
.23
.73
.81
.7E
uro
are
a2
.52
.41
.71
.71
.71
.70
.91
.01
.61
.82
.12
.22
.93
.13
.3
aT
he
colu
mn
lab
ele
dS
pri
ng
20
05
refe
rsto
the
Ma
y2
00
5N
oti
fica
tio
n
76 Empirica (2006) 33:63–87
123

In the end, while EMU’s deficit indicator allows comparability among MemberStates, it is not the most appropriate indicator for short-term monitoring. In severalcases the deficit has turned out to be significantly higher than first estimated. Esti-mates of changes in debt seem to be less volatile.
5 Case studies
The discussion in the previous sections shows how both the deficit and debt indi-cators can be manipulated easily. However, it also suggests that since the ESA95deficit is not the flow concept corresponding to changes in the stock of gross financialliabilities, generally a given budgetary measure affects the two indicators differently.This can be seen most easily if we compare ESA95 deficit with the change in debt.The former is given by
DEFt � Gt � Tt ð2Þ
while the latter is given by
DFLt � Gt � Tt þNAFAt þ DVLt þ CAt ð3Þ
where NAFA is net acquisition of financial assets, CA is the difference between cashand accrual valuations (the former used to compute the change in debt, the latter tocompute the deficit; in the medium term the difference should tend to zero) andDVL is valuation changes in liabilities.
The discrepancy between the change in the debt and the deficit measure chosenfor EMU’s rules was by no means negligible over the 1990s. The yearly average forEU15 countries between 1992 and 2001 was almost 1% of GDP. While at presentthis inconsistency is mainly seen as an unnecessary complication to the assessment ofthe Stability Programs, it also suggests the potential for unexploited synergies fromthe joint assessment of the two indicators.
From Eq. 3 one can obtain an estimate of the deficit in cash terms:
DEFCt ¼ DFLt �NAFAt � DVLt ð4Þ
The comparison of accrual and cash deficit provides indications concerning theconsistency of accrual deficit estimates. Monitoring the extent of gross asset acqui-sition allows an evaluation of the degree of prudence exercised when deciding on theclassification of transactions. At the same time, by considering privatizations andoperations determining changes in the valuation of liabilities, one can assess theextent to which debt dynamics is dependent on ad hoc non-recurrent factors thatleave the government’s net asset position unaffected (if not worsened).21
EU countries are already required to provide the information needed for thesecross checks in the context of the twice-a-year Notification of public finance data.However, these data are not made publicly available, thereby limiting the possibility
21 Ideally one would also want to control the extent of one-off measures directly affecting G and T inequations (2) and (3). See Section 6.
Empirica (2006) 33:63–87 77
123

of independent assessment.22 Moreover, present arrangements do not provide for anexplicit estimation of the cash deficit.
Evidence supporting the usefulness of cross-checking fiscal data is provided bythree case studies of abrupt and significant deficit data revisions. These revisionsoccurred in Italy and Portugal in 2002, and in Greece in 2004.
5.1 Italy 2001
According to the March 2002 release by the Italian Statistical Office (Istat), netborrowing in 2001 was 1.4% of GDP (as against 1.7% in 2000, excluding UMTSproceeds). The outcome was very close to the range of forecasts by internationalorganizations.23
In June 2002, Istat raised the figure for the 2001 deficit to 1.6% of GDP, primarilyon account of the revision of the data on the health sector.24 In July 2002, Eurostatannounced its decision on the accounting treatment for the purposes of the excessivedeficit procedure of securitizations carried out by governmental authorities. Thisimplied an upward revision of Italy’s deficit to 2.2% of GDP.25 In March 2003, Istatagain revised the 2001 figure upwards, to 2.6% of GDP. This revision was due to theavailability of more complete information on the accounts of different governmenttiers.26 In March 2005, Istat revised the deficit for the period from 2001 to 2003upwards. The deficit for 2001 reached 3.0% of GDP. This change largely reflected arevision in the classification of capital injections to the state-owned railway company.In May 2005, the deficit was further revised to 3.2%.27
Overall, the initial estimate of the 2001 deficit was revised upwards by 1.8 per-centage points of GDP, from 1.4% in March 2002 to 3.2% in March 2005. Less thanone third of the revision was due to non-ordinary factors (i.e., Eurostat’s decisionconcerning securitizations).28
22 The European Central Bank publishes a deficit-debt adjustment table for the Euro area as awhole.23 1.3% of GDP according to the IMF in October 2001; 1.1% according to the EC in November2001; and 1.4% according to the OECD in December 2001.24 A similar revision, again due to health sector data, had already been made in March 2002, withreference to the 2000 outturn (from 1.5% to 1.7%).25 According to Eurostat’s decision, securitizations are considered loans to general government if:(i) they concern future income unrelated to previously existing assets; and (ii) they do not involve anadequate transfer of risk to the assignee (Eurostat established that the risk is transferred only if thegovernment does not guarantee the securitized asset and if it is paid at least 85% of the market valueof the securitized assets). The operation carried out in Italy in 2001 concerned real estate and futurelotteries’ receipts. They were both considered loans as, in the first case, the government received lessthan 85% of the market value of the securitized buildings and, in the second case, the future incomeflows were not related to previously existing assets.26 In particular, the revisions concerned health and interest expenditure, tax revenues and expen-diture on intermediate consumption, compensation of employees, subsidies and interests.27 Following indications provided by Eurostat, in May 2005 some payments that the government hadreceived from tax collectors in 2003 and 2004 were recorded as loans rather than as revenues.Moreover, the debt issued in 2004 by Infrastrutture S.p.A. in the context of the financing of the high-speed railway operation was to be recorded as government debt.28 Istat stressed that previously, up to the March 2002 Notification to the EC, ordinary revisions (i.e.,excluding, for example, those related to Eurostat decisions) of deficit figures from one year to thefollowing had been small, normally not exceeding ±0.1% of GDP. See Istat press release (February2003, p. 7).
78 Empirica (2006) 33:63–87
123
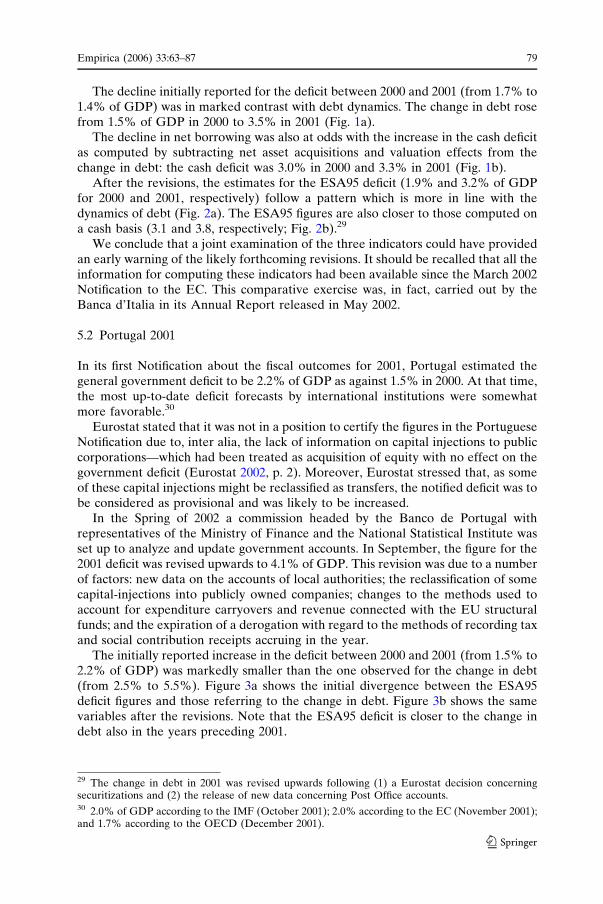
The decline initially reported for the deficit between 2000 and 2001 (from 1.7% to1.4% of GDP) was in marked contrast with debt dynamics. The change in debt rosefrom 1.5% of GDP in 2000 to 3.5% in 2001 (Fig. 1a).
The decline in net borrowing was also at odds with the increase in the cash deficitas computed by subtracting net asset acquisitions and valuation effects from thechange in debt: the cash deficit was 3.0% in 2000 and 3.3% in 2001 (Fig. 1b).
After the revisions, the estimates for the ESA95 deficit (1.9% and 3.2% of GDPfor 2000 and 2001, respectively) follow a pattern which is more in line with thedynamics of debt (Fig. 2a). The ESA95 figures are also closer to those computed ona cash basis (3.1 and 3.8, respectively; Fig. 2b).29
We conclude that a joint examination of the three indicators could have providedan early warning of the likely forthcoming revisions. It should be recalled that all theinformation for computing these indicators had been available since the March 2002Notification to the EC. This comparative exercise was, in fact, carried out by theBanca d’Italia in its Annual Report released in May 2002.
5.2 Portugal 2001
In its first Notification about the fiscal outcomes for 2001, Portugal estimated thegeneral government deficit to be 2.2% of GDP as against 1.5% in 2000. At that time,the most up-to-date deficit forecasts by international institutions were somewhatmore favorable.30
Eurostat stated that it was not in a position to certify the figures in the PortugueseNotification due to, inter alia, the lack of information on capital injections to publiccorporations—which had been treated as acquisition of equity with no effect on thegovernment deficit (Eurostat 2002, p. 2). Moreover, Eurostat stressed that, as someof these capital injections might be reclassified as transfers, the notified deficit was tobe considered as provisional and was likely to be increased.
In the Spring of 2002 a commission headed by the Banco de Portugal withrepresentatives of the Ministry of Finance and the National Statistical Institute wasset up to analyze and update government accounts. In September, the figure for the2001 deficit was revised upwards to 4.1% of GDP. This revision was due to a numberof factors: new data on the accounts of local authorities; the reclassification of somecapital-injections into publicly owned companies; changes to the methods used toaccount for expenditure carryovers and revenue connected with the EU structuralfunds; and the expiration of a derogation with regard to the methods of recording taxand social contribution receipts accruing in the year.
The initially reported increase in the deficit between 2000 and 2001 (from 1.5% to2.2% of GDP) was markedly smaller than the one observed for the change in debt(from 2.5% to 5.5%). Figure 3a shows the initial divergence between the ESA95deficit figures and those referring to the change in debt. Figure 3b shows the samevariables after the revisions. Note that the ESA95 deficit is closer to the change indebt also in the years preceding 2001.
29 The change in debt in 2001 was revised upwards following (1) a Eurostat decision concerningsecuritizations and (2) the release of new data concerning Post Office accounts.30 2.0% of GDP according to the IMF (October 2001); 2.0% according to the EC (November 2001);and 1.7% according to the OECD (December 2001).
Empirica (2006) 33:63–87 79
123

5.3 Greece 2003
At the beginning of March 2004, in its first Notification about the 2003 fiscal out-come, Greece estimated the general government deficit at 1.7% of GDP, as against
0
10.000
20.000
30.000
40.000
50.000
60.000
0
10.000
20.000
30.000
40.000
50.000
1998 1999 2000 2001
Net borrowing Change in debt
1998 1999 2000 2001
Net borrowing Cash deficit
a b
Fig. 2 a. Italy: net borrowing and change in gross debt as available in May 2005 (in billions of euro).b. Italy: net borrowing and cash deficit as available in May 2005 (in billions of euro)
-
10.000
20.000
30.000
40.000
50.000
60.000
1998 1999 2000 2001
Net borrowing Change in debt
-
10.000
20.000
30.000
40.000
50.000
1998 1999 2000 2001
Net borrowing Cash deficit
a b
Fig. 1 a. Italy: net borrowing and change in gross debt as available in March 2002 (in billions ofeuro). b. Italy: net borrowing and cash deficit as available in March 2002 (in billions of euro)
-
2.000
4.000
6.000
8.000
1998 1999 2000 2001
Net borrowing Change in debt
-
2.000
4.000
6.000
8.000
1998 1999 2000 2001
Net borrowing Change in debt
a b
Fig. 3 a. Portugal: net borrowing and change in gross debt as available in March 2002 (in billions ofeuro). b. Portugal: net borrowing and change in gross debt as available in March 2003 (in billions ofeuro)
80 Empirica (2006) 33:63–87
123

1.4% in 2003. At that time, the most up-to-date forecasts by international institutionswere broadly in line with the data notified by Greece.31
Later in March, Greece sent updated data to the EC, revising the 2003 deficitupwards to 3.0% of GDP. In April, when publishing the Spring Forecasts, the ECtook into account this Notification and stressed that ‘‘the data for 2003 are not yetvalidated by Eurostat and do not therefore provide a reliable basis for assessing thebudgetary situation at this stage’’ and ‘‘[a] fact-finding mission is being prepared forthe end of April in order to have more information about the budgetary situation inthis country and decide on steps to be taken’’. In May, following an additionalNotification, Eurostat verified that in 2003 the general government deficit was 3.2%of GDP. In the September Notification, deficit and debt figures for the years 2000–2003 were significantly revised. In particular, the 2003 deficit was revised to 4.6% ofGDP and the 2003 debt was revised to 109.9% of GDP.
The deficit revisions occurred between March and September and were essen-tially due to (i) lower tax revenue (mainly VAT); (ii) lower payments from EUinstitutions in the context of structural funds programs; (iii) the reclassification, as afinancial transaction, of a payment from the Saving Postal Bank to the government;(iv) upward revisions of military expenditure and interest payments; and (v) lowerthan expected surpluses of social security funds.32
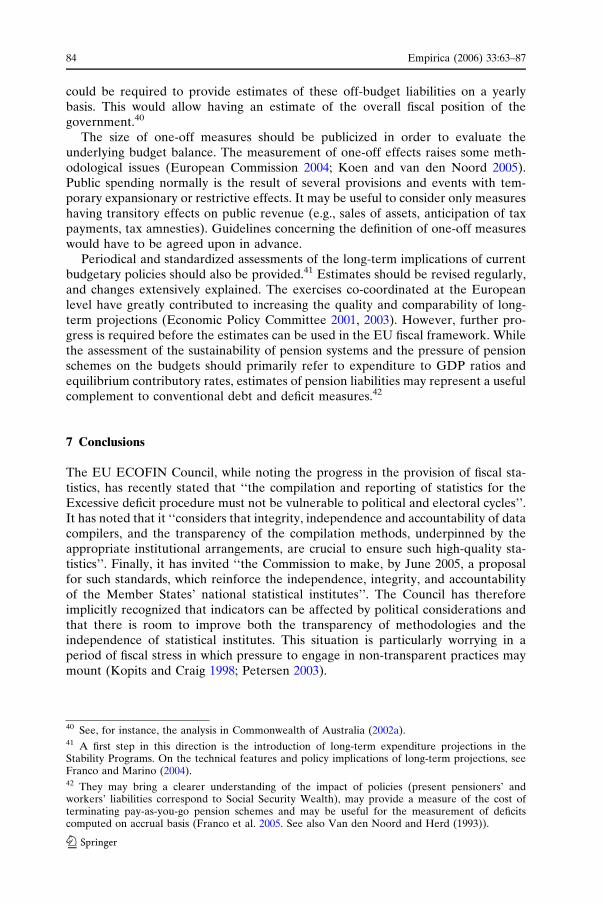
The initially reported increase in deficit between 2002 and 2003 (from 1.4% to1.7% of GDP) was in line with that observed for the change in debt, the latter risingfrom 5.6% of GDP in 2002 to 5.9% in 2003. However, the level of the two indicatorswas markedly different (Fig. 4a).33 Figure 4b shows how revisions began to reducethe discrepancy.
6 Toward an integrated framework of analysis
The ESA95 deficit is the main indicator for evaluating fiscal policy developments inEMU. It is the cornerstone of fiscal programs, fiscal monitoring, and ex-postassessment of budgetary policy. This extensive use contrasts with the concerns thatarise with respect to its use for monitoring purposes. It also contrasts with theconclusions of the economic literature concerning fiscal indicators, stressing that theevaluation of all the various aspects of fiscal policy (e.g., macroeconomic effects, sizeof discretionary policy measures, impact on national savings, fiscal sustainability)cannot be based on a single indicator.34 The analysis of each aspect of fiscal policy isbest conducted with reference to a specific indicator.35
In considering possible remedies, one should keep in mind that, as the literatureof monetary policy has also suggested, any single policy indicator is likely to be
31 1.4% of GDP according to the IMF (September 2003); 1.7% according to the EC (October 2003);and 1.7% according to the OECD (December 2003).32 The revisions concerning debt figures were due to underestimation of bonds with capitalizedinterest and to overestimation of consolidating assets of social security.33 Note that the level of net borrowing as reported in March was also significantly lower than that ofthe general government net borrowing requirement (see Bank of Greece 2003, 2004).34 ‘‘... too much concentration on a single indicator of policy ‘success’ over-simplifies the technicalissues concerning the running of the economy and diverts attention away from the more fundamentalproblems affecting its state of health’’ (Peacock and Shaw 1981, p. 5).35 See, for example, Blanchard (1990), Blanchard et al. (1990), and Blejer and Cheasty (1991, 1993).
Empirica (2006) 33:63–87 81
123

distorted (Goodhard 1984). This consideration warns against simply replacing theESA95 deficit with another indicator. Any alternative indicator would also be proneto distortions and not capture all the aspects of fiscal policy. This Section furtherconsiders how cross checking of current EMU deficit and debt indicators can bebetter exploited to ensure effective enforcement of EMU’s fiscal rules and how theseindicators can usefully be integrated with additional information to provide sounderpolicy guidance without any change in the Treaty.
6.1 Exploiting synergies
The three cases examined in Section 5 share two common features: (a) the initialdeficit figure was consistent with forecasts by all international organizations; and (b)the change in gross general government debt was much larger than the initial esti-mate of the ESA95 deficit and usually was not significantly modified upward.36
This suggests that: (a) by looking at the ESA95 deficit in isolation all parties involvedcan get a distorted view of fiscal trends over significant periods of time; and (b) thechange in debt and the cash deficit underlying it can be used to check the ESA95 deficitand that there are unexploited synergies between the two EMU indicators.
The European Commission recently made a similar point: ‘‘large and persistentstock-flow adjustment should give cause for concern, as they may be the result ofinappropriate recording of budgetary operations and can lead to large ex post up-ward revisions of deficit levels’’ (European Commission 2003, p. 59). The Com-mission also argued that ‘‘it is important that a link is established between the ESAgovernment deficit and the cash-based public accounts deficits. This is importantbecause the cash-based balances are easier to compile and to monitor as they aredirectly observable’’. Moreover, while ‘‘all countries transmit to the Commissiondata on the link between the cash-basis figures and the ESA government deficit [...],for several countries this information is relatively confusing or not complete or thereare important statistical discrepancies’’ (p. 67).
Greater reliance on cash and debt figures would have additional benefits in termsof timeliness and transparency. As for the former, data on financial liabilities are
-
2.000
4.000
6.000
8.000
10.000
12.000
2000 2001 2002 2003
Net borrowing Change in debt
-
2.000
4.000
6.000
8.000
10.000
12.000
14.000
2000 2001 2002 2003
Net borrowing Change in debt
a b
Fig. 4 a. Greece: net borrowing and change in gross debt as available in March 2004 (in billions ofeuro). b. Greece: net borrowing and change in gross debt as available in September 2004 (in billionsof euro)
36 In the case of Greece, the change in gross debt was significantly revised upwards for 2000 and2001.
82 Empirica (2006) 33:63–87
123

available more rapidly than those on real transactions and on transactions infinancial assets (the information set for the general government is usually completedwithin a month after the end of the reference period); as for the latter, data areusually publicly available from market sources.37
The ESA95 deficit should be systematically reconciled with the change in grossdebt and with the underlying cash deficit.38 The Stability and Convergence pro-grams, which set targets both for the budget balance and the debt, should provideinformation reconciling the two indicators. The reconciliation currently included inthe twice-a-year Notifications should be made available to the public and beextensively explained. Moreover, full details should be provided concerning thetransactions in financial assets, the difference between cash and accrual figures, thedifference between the nominal value of bonds and their price at issuance, the effectsof exchange rate movements on foreign currency denominated government bonds,and the other factors that may result in a wedge between the deficit and the changeof gross debt. This would allow in-depth investigation of unusual developments inany such items (such as persistently significant net acquisition of financial assets anddifferences between cash and accrual figures).
6.2 A broader network of indicators
While a more transparent and publicized reconciliation of deficit and debt figureswould surely help with rules enforcement, further complementing these indicatorscan prove beneficial from the point of view of sustainability analysis and policyguidance.
The gross debt definition overlooks the fact that government assets can be sold torepay the debt. Relying on both a gross and a net debt definition is preferable (H.M.Treasury 2003). The former is more precise, available on a more timely basis, andmore relevant over the short term; the latter is more complete and more relevantfrom a longer time perspective. As pointed out in Section 3, an adequate measure ofnet debt may not be available. However, it may be useful to complement gross debtwith (i) a measure of the most liquid assets (e.g., bank deposits) and of those otherassets whose valuation is less problematic (e.g., performing loans); and (ii) a measureof changes in net debt (valuation problems do not affect assets flows as much asstocks).
Moreover, liabilities excluded from EMU’s debt definition should be monitored.First, there are contingent liabilities that can emerge from the government’sinvolvement in the economy (e.g., guaranteeing the debt of public enterprises orproviding deposit insurance).39 Second, there are non-financial liabilities (such ascommercial debt and the credits of taxpayers) that need to be considered (Kopitsand Craig 1998). On the basis of an agreed and transparent framework, governments
37 Or, at worst, they are available not only from government sources but also from the counterpartsof the underlying financial transactions. While cash data are obviously not immune from window-dressing (e.g., by delaying payments to providers or employees), it is also true that in these cir-cumstances somebody is likely to voice objections to such practices, which is not the case foropportunistic accrual accounting.38 In the Australian accounting framework, which is based on accrual criteria, accrual and cashfigures are reconciled. See Commonwealth of Australia (1999) and Robinson (2002).39 A contingent liability can be defined as a public sector action that determines an expenditure onlyif and when a certain event takes place.
Empirica (2006) 33:63–87 83
123
could be required to provide estimates of these off-budget liabilities on a yearlybasis. This would allow having an estimate of the overall fiscal position of thegovernment.40
The size of one-off measures should be publicized in order to evaluate theunderlying budget balance. The measurement of one-off effects raises some meth-odological issues (European Commission 2004; Koen and van den Noord 2005).Public spending normally is the result of several provisions and events with tem-porary expansionary or restrictive effects. It may be useful to consider only measureshaving transitory effects on public revenue (e.g., sales of assets, anticipation of taxpayments, tax amnesties). Guidelines concerning the definition of one-off measureswould have to be agreed upon in advance.
Periodical and standardized assessments of the long-term implications of currentbudgetary policies should also be provided.41 Estimates should be revised regularly,and changes extensively explained. The exercises co-coordinated at the Europeanlevel have greatly contributed to increasing the quality and comparability of long-term projections (Economic Policy Committee 2001, 2003). However, further pro-gress is required before the estimates can be used in the EU fiscal framework. Whilethe assessment of the sustainability of pension systems and the pressure of pensionschemes on the budgets should primarily refer to expenditure to GDP ratios andequilibrium contributory rates, estimates of pension liabilities may represent a usefulcomplement to conventional debt and deficit measures.42
7 Conclusions
The EU ECOFIN Council, while noting the progress in the provision of fiscal sta-tistics, has recently stated that ‘‘the compilation and reporting of statistics for theExcessive deficit procedure must not be vulnerable to political and electoral cycles’’.It has noted that it ‘‘considers that integrity, independence and accountability of datacompilers, and the transparency of the compilation methods, underpinned by theappropriate institutional arrangements, are crucial to ensure such high-quality sta-tistics’’. Finally, it has invited ‘‘the Commission to make, by June 2005, a proposalfor such standards, which reinforce the independence, integrity, and accountabilityof the Member States’ national statistical institutes’’. The Council has thereforeimplicitly recognized that indicators can be affected by political considerations andthat there is room to improve both the transparency of methodologies and theindependence of statistical institutes. This situation is particularly worrying in aperiod of fiscal stress in which pressure to engage in non-transparent practices maymount (Kopits and Craig 1998; Petersen 2003).
40 See, for instance, the analysis in Commonwealth of Australia (2002a).41 A first step in this direction is the introduction of long-term expenditure projections in theStability Programs. On the technical features and policy implications of long-term projections, seeFranco and Marino (2004).42 They may bring a clearer understanding of the impact of policies (present pensioners’ andworkers’ liabilities correspond to Social Security Wealth), may provide a measure of the cost ofterminating pay-as-you-go pension schemes and may be useful for the measurement of deficitscomputed on accrual basis (Franco et al. 2005. See also Van den Noord and Herd (1993)).
84 Empirica (2006) 33:63–87
123

The paper has stressed that whatever the indicators adopted, it is important to beaware of the unavoidable pressures for opportunistic interpretations of accountingrules. While highlighting the problematic aspects of EMU’s deficit and debt indi-cators, we noted that any other indicator would suffer the same pressures, andsuggested that the effectiveness of short-term monitoring would greatly benefit fromthe full exploitation of the consistency cross-checks made possible by the availabilityof two indicators. At the same time, we argued that a battery of indicators should bedeveloped in order to increase the relevance of fiscal monitoring for fiscal sustain-ability and policy guidance.
By complementing indicators currently in use with cash deficit and net debt esti-mates, the mismatch of tools and targets implicit in the implementation of EMU’s ruleswould also be redressed. At present, the framework relies on accrual figures for short-term monitoring and on cash-consistent figures for the evaluation of long-term sus-tainability. However, accrual accounting is better suited for medium- and long-termsustainability analysis and cash figures are best used for short-term monitoring.43
The proposals formulated in Section 6 do not require any change to the Maas-tricht Treaty or to the Stability and Growth Pact. They are in line with the reformsintroduced in recent years in some countries to improve the analysis of fiscaldevelopments.44
In the context of a reform of budgetary targets, New Zealand has introducedmeasures aimed at increasing fiscal transparency and signaling a commitment tosound fiscal policies (New Zealand Treasury 1995; Cangiano 1996). Public accountsare reported for a broad public sector, which also includes non-financial enterprisesand public financial institutions. While the accounting statements are accrual-based,cash accounts are also published. Estimates of measurable commitments and con-tingent liabilities are provided.
The Australian budget presents a detailed analysis of financial and non-financialassets (Commonwealth of Australia 2002a). The latter include land, buildings, plant,equipment, infrastructure, and inventories. The budget also examines financial andnon-financial liabilities. The latter include public employees’ pension liabilities andother entitlements, subsidies and grants payable and payables to suppliers. Both thenet worth (total assets minus total liabilities) and the net debt (gross financial lia-bilities minus financial assets) are reported. Figures are provided for the generalgovernment (central and state/local), for public non-financial corporations and forthe consolidated public sector. The budget balance is presented both in accrual andcash terms. The Australian government also releases a report examining budgetaryprospects over a 40-year period (Commonwealth of Australia 2002b). Inter alia, thereport evaluates the effects of demographic changes on the main spending programs.
These and other examples provide evidence that ‘‘transparency is conducive tosuccessful fiscal policy whether in the context of rules-based or of discretionary
43 Accordingly, in the United States the Budget reports past and expected flows of cash into and outof the treasury and the federal government’s Financial Statement reports assets and liabilities on anaccrual basis of accounting (United States CBO 2004; United States Department of the Treasury2004). The budget deficit determines the change in the debt held by the public and contributes,together with changes in other liabilities (e.g., pension benefits earned by federal employees) andother items (e.g., the estimate of depreciation) to determine the change in the government’s netposition. In 2003, the deficit and the debt increase amounted to about 3.5% of GDP, the net positionworsened by 6.1% of GDP.44 For the developments in the U.S., see United States CBO (2004).
Empirica (2006) 33:63–87 85
123

policymaking’’ (Kopits 2001, p. 74) since ‘‘prudent expenditure, productive andequitable taxation, and due equilibrium between income and outlay will only befound where responsibility is enforced by the public opinion of an active andenlightened community’’ (Bastable 1927, p. 761).
References
Auerbach AJ, Gokhale J, Kotlikoff LJ (1991) Generational Accounts: A Meaningful Alternative toDeficit Accounting. In: Bradford D (ed) Tax policy and the economy, vol 5. National Bureau ofEconomic Research and MIT Press, Cambridge Massachusetts, pp 55–110
Balassone F, Franco D (2000a) Assessing fiscal sustainability: a review of methods with a view toEMU. In: Banca d’Italia (ed) Fiscal sustainability. Rome
Balassone F, Franco D (2000b) Public investment, the stability pact, and the golden rule. Fiscal Stud21(2):207–229
Balassone F, Franco D (2001) EMU fiscal rules: a new answer to an old question? In: Banca d’Italia(ed) Fiscal rules. Rome
Banca d’Italia (ed) (2000) Fiscal sustainability. RomeBanca d’Italia (ed) (2001) Fiscal rules. RomeBanca d’Italia (2002) Annual report. RomeBank of Greece (2003) Annual report 2002. AthensBank of Greece (2004) Summary of the annual report for 2003. AthensBastable CF (1927) Public finance. Macmillan, LondonBlanchard, OJ (1990) Suggestions for a new set of fiscal indicators, OECD Working Paper No. 79,
ParisBlanchard OJ, Chouraqui JC, Hagemann RP, Sartor N (1990) The sustainability of fiscal policy: new
answers to old questions. OECD Economic Study No. 15. ParisBlejer MI, Cheasty A (1991) The measurement of fiscal deficits: analytical and methodological
issues. J Econ Lit 29(4)Blejer MI, Cheasty A (eds) (1993) How to measure the fiscal deficit: analytical and methodological
issues. International Monetary Fund, WashingtonBoskin MJ (1982) Federal government deficit: some myths and realities. Am Econ Rev 72(2):296–
303Brunila A, Buti M, Franco D (eds) (2002) The stability and growth pact—the fiscal architecture of
EMU. Palgrave, BasingstokeBuiter WH (1983) Measurement of the public sector deficit and its implications for policy evaluation
and design. Staff Papers, IMF 30 (June) pp 307–349Buiter WH (1985) A guide to public sector debt and deficits. Econ Policy, n. 1Buiter WH (1995) What do generational accounts tell us about the effects of the budget on inter-
generational distribution and saving behaviour? In: Conference paper, S. 111, Centre for Eco-nomic Performance, Seminar. Cambridge
Buti M, Eijffinger S, Franco D (2003) Revisiting the stability and growth pact: grand design orinternal adjustment? CEPR Working Paper, No 3692
Buti M, Sapir A (eds) (1998) Economic policy in EMU. Oxford University Press, OxfordCangiano, M (1996) Accountability and transparency in the public sector: The New Zealand
Experience. IMF Working Paper 96/122. WashingtonCommonwealth of Australia (1999) Fiscal policy under accrual budgeting—information paper.
Australian Government Publishing Service, CanberraCommonwealth of Australia (2002a) Budget strategy and outlook 2002–03. Australian Government
Publishing Service, CanberraCommonwealth of Australia (2002b) Intergenerational report 2002–03. Australian Government
Publishing Service, CanberraDomar ED (1944) The burden of the debt and the national income. American Economic Review
(December)Economic Policy Committee (2001) Budgetary challenges posed by ageing populations: the impact
on public spending on pensions, health and long-term care for the elderly and possible indicatorsof the long-term sustainability of public finances. Brussels
Economic Policy Committee (2003) The impact of ageing populations on public finances: overviewof analysis carried out at EU level and proposals for a future work programme. Brussels
86 Empirica (2006) 33:63–87
123

Eisner R (1984) Which budget deficit? Some issues of measurement and their implications. Am EconRev 74(2):138–143
European Commission (2002) Public finances in EMU, 2002, European Economy, No. 3. BrusselsEuropean Commission (2003) Public finances in EMU, 2003, European Economy, No. 3. BrusselsEuropean Commission (2004) Public finances in EMU, 2004, European Economy, No. 3. BrusselsEuropean Commission (2005) Public finances in EMU, 2004, European Economy, No. 3. BrusselsEurostat (1979) European System of Accounts. LuxembourgEurostat (1995) European System of Accounts. LuxembourgEurostat (2000) ESA manual on deficit and debt. LuxembourgEurostat (2002) Euro-zone in 2001, News Release, 21st MarchFranco D, Marino MR (2004) The role of long-term fiscal projections. Workshop on long-term fiscal
projections, February 12–13, 2004, Seville, SpainFranco D, Marino MR, Zotteri S (2005) Pension expenditure projections, pension liabilities and
European union fiscal rules, Les finances publiques: defis a moyen et long termes, 16emeCongres des Economistes belges de Langue francaise, pp 287–342
Goodhart CAE (1984) Monetary theory and practice: the U.K. Experience. MacMillan, LondonHaveman R (1994) Should generational accounts replace public budgets and deficits? J Econ
Perspect 8(1):95–111International Monetary Fund (1996) World economic outlook, May 1996. WashingtonInternational Monetary Fund (2001a) Government finance statistics Manua. WashingtonInternational Monetary Fund (2001b) Manual on fiscal transparency. WashingtonKoen V, van den Noord P (2005) Fiscal gimmickry in Europe; one-off measures and creative
accounting. OECD Working Paper No. 417. ParisKopits G (2001) Fiscal rules: useful policy framework or unnecessary ornament? In Banca d’Italia.
(ed) Fiscal Rules, RomeKopits G, Craig J (1998) Transparency in government operations, IMF Occasional Paper No. 158.
IMF, WashingtonKopits G, Symansky S (1998) Fiscal policy rules, IMF Occasional Paper N. 162. IMF, WashingtonKotlikoff LJ (1984) Economic impact of deficit financing. Staff Papers, IMF 33Mackenzie GA (1989) Are all summary indicators of the stance of fiscal policy misleading? Staff
Papers, IMF 36(4)Milesi-Ferretti GM (2003) Good, bad or ugly, on the effects of fiscal rules with creative accounting.
J Public Econ 88:377–394Milesi-Ferretti GM, Moryiama K (2004) Fiscal adjustment in EU countries: a balance sheet
approach. In: Banca d’Italia (ed) Public Debt. RomeMink R, Rodriguez-Vives, M (2004) The measurement of government debt in the Economic and
Monetary Union. In: Banca d’Italia (ed) Public Debt. RomeNew Zealand Treasury (1995) Fiscal Responsibility Act 1994: an explanation. WellingtonPeacock A, Shaw GK (1981) The public sector borrowing requirement. Newnorth Artwork Ltd,
BedfordPetersen JE (2003) Changing red to black: deficit closing alchemy. National Tax J LVI(3)Robinson M (2002) Accrual accounting and Australian fiscal policy. Fiscal Stud 23(2):287–300Strauch R, Hallerberg M, von Hagen J (2004) Budgetary forecasts in Europe—the track record of
stability and convergence programmes, ECB Working Paper, No. 307. FrankfurtTowe CM (1991) The budgetary control and fiscal impact of government contingent liabilities. Staff
Papers, International Monetary Fund 38(1). WashingtonHM Treasury (2003) Long-term public finance report: fiscal sustainability with an ageing popula-
tions. HMSO, LondonHM Treasury (2004) The stability and growth pact: a discussion paper. HMSO, LondonUnited States Congressional Budget Office (2004) Measures of the U.S. government’s fiscal position
under current law. A CBO Paper (August). WashingtonUnited States Department of the Treasury (2004) Financial report of the United States Government.
Government Printing Office, Washingtonvan den Noord P, Herd R (1993) Pension liabilities in the seven major economies. OECD Working
Paper 142. Parisvon Hagen J, Wolff GB (2004) What do deficits tell us about debt? Empirical evidence on creative
accounting with fiscal rules in the EU. Discussion Paper, No. 38. Deutsche BundesbankWyplosz C (2002) Fiscal policy: institutions vs. rules. HEI working paper, no. 3
Empirica (2006) 33:63–87 87
123