R. D. Koch and R. L. Elliott 345 Middlefield Road Menlo Park ...
70
UNITED STATES DEPARTMENT OF INTERIOR GEOLOGICAL SURVEY TRACE-ELEMENT DATA FOR STREAM-SEDIMENT HEAVY-MINERAL CONCENTRATE SAMPLES FROM THE BRADFIELD CANAL QUADRANGLE, SOUTHEASTERN ALASKA by R. D. Koch and R. L. Elliott 345 Middlefield Road Menlo Park, California 94025 and R. M. O'Leary and D. A. Risoli 5946 Mclntyre Street Golden, Colorado 80401 Open-File Report 80-910C This report is preliminary and has not been reviewed for conformity with Geological Survey standards and stratigrpahic nomenclature 1980
-
Upload
khangminh22 -
Category
Documents
-
view
0 -
download
0
Transcript of R. D. Koch and R. L. Elliott 345 Middlefield Road Menlo Park ...
UNITED STATESDEPARTMENT OF INTERIOR
GEOLOGICAL SURVEY
TRACE-ELEMENT DATA FOR STREAM-SEDIMENT HEAVY-MINERAL CONCENTRATE SAMPLES
FROM THE BRADFIELD CANAL QUADRANGLE, SOUTHEASTERN ALASKA
by
R. D. Koch and R. L. Elliott345 Middlefield Road
Menlo Park, California 94025
and
R. M. O'Leary and D. A. Risoli5946 Mclntyre Street
Golden, Colorado 80401
Open-File Report 80-910C
This report is preliminary andhas not been reviewed for conformity
with Geological Survey standardsand stratigrpahic nomenclature
1980
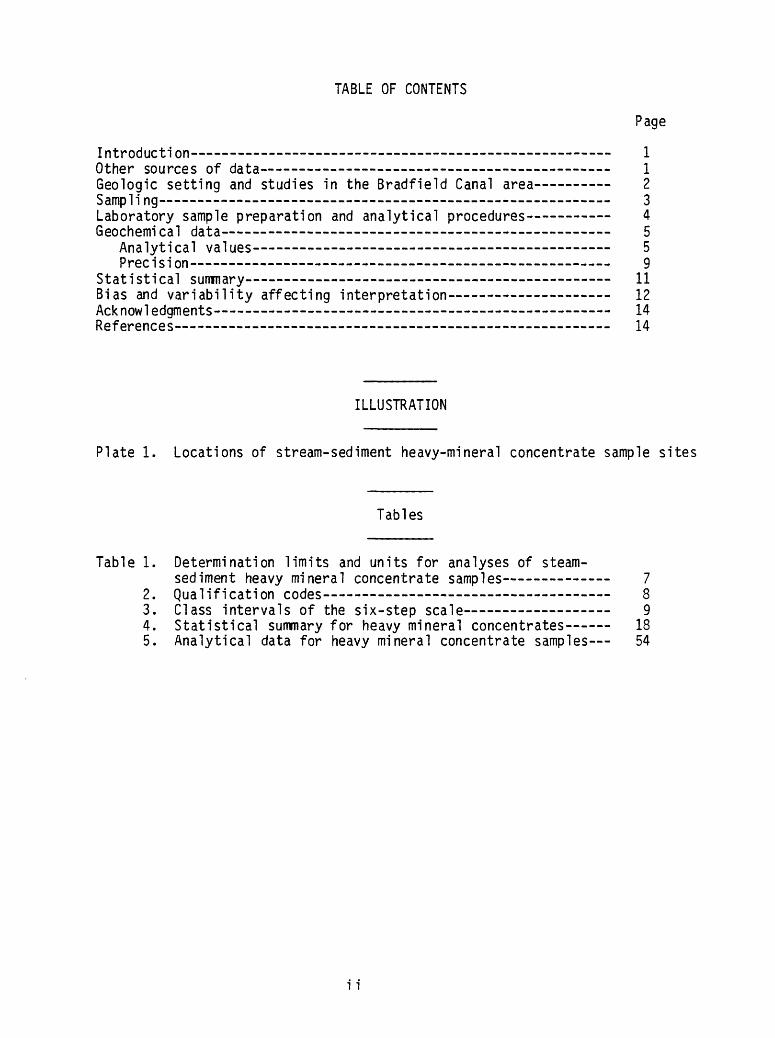
TABLE OF CONTENTS
Introduction—————————————————————————————• Other sources of data——————————————————————- Geologic setting and studies in the Bradfield Canal area- Sampling——————————————————————————————- Laboratory sample preparation and analytical procedures-- Geochemi cal data————————————————————————-
Analytical values——————————————————————• Precision———————————————————————————-
Statistical summary———————————————————————• Bias and variability affecting interpretation——————- Acknowledgments———————————————————————————• References—————————————————————————————-
Page
11234559
11121414
ILLUSTRATION
Plate 1. Locations of stream-sediment heavy-mineral concentrate sample sites
Tables
Table 1. Determination limits and units for analyses of steam- sediment heavy mineral concentrate samples——————•
2. Qualification codes—————————————————————•3. Class intervals of the six-step scale——————————•4. Statistical summary for heavy mineral concentrates—•5. Analytical data for heavy mineral concentrate samples-
91854
11
TRACE-ELEMENT DATA OF STREAM-SEDIMENT HEAVY-MINERAL CONCENTRATE SAMPLES FROM
BRADFIELD CANAL QUADRANGLE, SOUTHEASTERN ALASKA
by
R. D. Koch, R. L. Elliott, R. M. O'Leary, and D. A. Risoli
INTRODUCTION
A reconnaissance geochemical sampling program was conducted during 1978
and 1979 in the Bradfield Canal 1:250,000-scale quadrangle, southeastern
Alaska. The sampling was done to assist with evaluation of mineral resources
in the area as part of the Alaska Mineral Resource Assessment Program
(AMRAP). This report contains the analytical data for 219 stream-sediment
heavy mineral concentrate samples collected in the Bradfield Canal quadrangle
during the summer of 1979. These samples comprise all of the heavy mineral
concentrate geochemical samples known to have been collected by the U.S.
Geological Survey within the Bradfield Canal quadrangle through 1979. A brief
statistical summary of these analytical data is included in this report.
OTHER SOURCES OF DATA
Analytical data from rock and unconcentrated stream-sediment geochemical
samples collected within the Bradfield Canal quadrangle are contained in two
companion reports (Koch and others, 1980a, b). Geochemical data from rock
samples collected by U.S. Bureau of Mines engineers at selected prospects in
the Bradfield Canal quadrangle are reported in Koch and others, (1976).
Analytical data from rock and stream-sediment samples collected in the
Ketchikan and Prince Rupert quadrangles, south of the Bradfield Canal
quadrangle, are contained in several earlier reports (Koch and Elliott 1978a,
b, c). Data from all of the normal U.S. Geological Survey rock and stream-

sediment geochemical samples collected in the Ketchikan and Prince Rupert
quadrangles and from the rock, stream-sediment, and heavy-mineral concentrate
samples from the Bradfield Canal quadrangle are available on magnetic computer
tapes (Koch, Van Trump, and McDanal, 1978; Koch, O'Leary, and Risoli, 1980).
GEOLOGIC SETTING AND STUDIES IN THE BRADFIELD CANAL AREA
The United States portion of the Bradfield Canal quadrangle area is
dominated by amphibolite-facies schists and gneisses and Cretaceous to Miocene
granitic plutons of the Coast Range batholithic complex. A segment of the
Coast Range megalineament (Brew and Ford, 1978), a major structural and
topographic feature more than 500 km long, runs diagonally across the
southwestern portion of the map area from Nelson Glacier through the areas
near Eagle Bay and Eagle Lake. East of this zone, isolated roof pendants of
paragneiss and schist lie amid nearly continuous orthogneisses, spectacular
migmatites, and granitic plutons with compositions ranging from diorite and
quartz diorite to quartz monzonite (adamellite) and alkalai-feldspar
granite. Farther east, along the Canadian boundary, are roof pendants of
lower grade metasedimentary, metavolcanic, and carbonate rocks. West of the
megalineament, granitic rocks occur as discontinuous bodies within schist and
paragneiss.
The earliest comprehensive discussions of the geology of the Bradfield
Canal area are contained in reports by Wright and Wright (1908) and Buddington
and Chapin (1929). Buddington (1929) also described the Hyder mining district
located near the Canadian border 120 km northeast of the town of Ketchikan.
Recent geologic investigations by the U.S. Geological Survey in the Bradfield
Canal quadrangle began in 1968 with mapping in the Hyder area (Smith, 1977).
A mineral resource evaluation of the Granite Fiords Wilderness Study area,
which included a large portion of the eastern part of the Bradfield Canal
quadrangle, was conducted in 1972 and 1973 (Berg and others, 1977). Field
studies continued as part of the AMRAP program in 1978 and 1979. Other
discussions of Coast Range geology include reports by Hutchison (1970),
Roddick and Hutchison (1974), Brew and others, (1976), and Brew and others
(1977).
SAMPLING
Most of this recently glaciated study area is steep and rugged with
elevations ranging from sea level to 2300 meters. Rain- and snowfall are
heavy and precipitation continues year-round. Sediment in the resulting swift
streams is essentially all detrital material derived from mechanical erosion
of bedrock and, to a lesser extent, reworking of locally-derived glacial
deposits. The bulk of most sediment collected ranges in size from very fine
sand to pebbles. Samples from near the toe of a glacier may consist entirely
of very fine sand and rock flour. Otherwise, samples with a large percentage
of silt- and clay-size material are rare.
Standard procedures were followed in collection, preparation, and
analysis of the stream-sediment heavy-mineral concentrate samples. Those
collected from shoreline sites were obtained above highest high tide level
whenever possible, to eliminate contamination by sediment introduced by salt
water currents. Samples generally consisted of 7 to 10 kg of the finest, most
organic-free sediment in the active stream channel. If the sediment was
relatively coarse, it was passed through an 8-mesh (approx. 2 mm) stainless
steel screen before being put into cloth bags. In camp, where a smoothly-
flowing river was available, the samples were rough-panned in standard "gold
pans" to remove organic and clay-sized material, and to concentrate the heavy

minerals. Samples were then air-dried or oven-dried at low temperatures and
shipped to the lab for further preparation.
LABORATORY SAMPLE PREPARATION AND ANALYTICAL PROCEDURES
Laboratory preparation and analysis was performed by members of the
Branch of Exploration Research (BOER) of the U.S. Geological Survey. Samples
were dry-sieved and the -20 mesh fraction was settled through undiluted
bromoform (specific gravity 2.86). The light fraction was discarded.
Magnetic minerals, primarily magnetite and ilmenite, were removed from the
heavy fraction in the following manner. The sample was spread out over a flat
tray and passed under a powerful electromagnet. The magnet of a Frantz
Isodynamic separator, set at 1.8 amps, was shielded with a mylar sheet and
used for this purpose. The sheet could be removed for cleaning between
samples. The samples were not passed through the track of the Frantz
separator in the standard manner.
After the magnetic treatment, samples were ground with a mortar and
pestle. A split of this material was analyzed for copper, lead, and zinc by
standard atomic absorption spectrophotometry procedures (Ward and others,
1969). The samples were also analyzed for 31 elements by a rapid six-step
semiquantiative emission spectrographic method. The technique used for
spectrographic analysis is similar to that described by Myers and others
(1961) and Grimes and Marranzino (1968), with the following exception. To
limit spectral interference caused by high iron concentrations, 5 mg of ground
sample (half the normal amount) was added to 25 mg of a 4:1 mixture of
•'•Any use of trade names and tradmarks in this publication is for descriptive purposes only and does not constitute endorsement by the U.S Geological Survey

graphite and ground pure Arkansas quartz, to comprise a normal 30 mg
analytical load. Spectral lines were recorded on film and visually compared
to standards which are based on 10 mg samples. The resulting values were
doubled to produce the data reported here. Doubled values occurring between
six-step reporting values were "rounded up" to the higher reporting value
(example: 2 ppm X 2 = 4 ppm and is reported as 5 ppm). This procedure raises
the limits of analitical determination and may affect the analytical precision
as discussed below. The semiquantitative spectrographic analyses were
performed by D. A. Risoli and the atomic-absorption analyses by
R. M. O'Leary. Sample preparators were N. G. Courtright and G. G. VanGaalen.
GEOCHEMICAL DATA
Locations of sample sites are identified by 7 character station numbers
on plate 1. The analytical data for the samples are given in table 5 and are
identified by a sample number which consists of the station number, with the
letter "P" appended to it. Analyses are also identified in table 5 by a 6
character laboratory number; often called the "Tag Number". Locations are
indicated in table 5 by latitude and longitude coordinates as degrees,
minutes, and seconds.
Analytical Values
Analytical results are reported as percent of the sample (for
spectrographic analyses of Fe, Mg, Ca, and Ti) and as parts per million (ppm)
for all other analyses. The distribution of values for some of the
determinations is truncated at one or.both ends by the limits of
determinability for that analytical procedure. The limits of determination
and the units used for each analysis are listed in table 1 (page 7). Because
only half as much sample material is analyzed for heavy-mineral concentrates
as is used for spectrographic analyses of other materials (for example of rock
or unconcentrated stream-sediment samples), the determination limits are twice
the normal limit values; rounded up to the next six-step reporting value when
doubling produced a value not on the six-step scale.
A single-letter symbol is used by BOER analysts to indicate that no
analysis was performed for an element or that the analytical result is outside
the limits of determinability. These symbols (commonly called "qualification
codes") are used in the statistical summary but some are represented
differently in the data table. An explanation of both forms is listed in
table 2. The qualifier T does not appear in these data.
Because the original computer printout is used in tables 4 and 5, element
symbols are in capital letters; for example, the symbol for iron, Fe, is shown
as FE, magnesium, Mg, is shown as MG, and so on. In the tables, the prefix S
stands for spectrographic analysis, and AA for atomic absorption.
Results from semiquantitative emission spectrographic analyses (also
referred to as six-step spectrographic analyses) are reported as the
approximate midpoints of class intervals with 6 intervals per order of
magnitude. These class intervals are not evenly spaced when plotted on an
arithmetic scale. The values of interval boundaries and the widths (sizes) of
successive class intervals increase geometrically, with each succeeding
interval boundary and interval width being greater than the last by a factor
of the 6th root of 10 (about 1.4678). These class intervals have a constant
width when the data and interval boundary values are transformed to logarithms
(Miesch, 1967, p. B3-B4).
Use of geometrically-scaled class intervals is appropriate because of
characteristics of both the analytical techniques and of the normal

Table
1.--Determination
limits an
d un
its
for
analyses of st
eam-
sedi
ment
he
avy
mine
ral
concentrate
samp
les
[S,
indicates
spec
trog
raph
ic analysis,
AA,
indicates
atomic absorption anal
ysis
. Th
e un
its
used
to
repo
rt va
lues
for
each
anal
ytical procedure
are
list
ed after
the
upper
dete
rmin
atio
n li
mit.
]
Anal
ysis
S-Fe
S-Mg
S-Ca
S-Ti
S-Mn
S-Ag
S-As
S-Au
S-B
S-Ba
S-Be
S-Bi
L
Lower
0.1 .05
.1 .005
20 1
500 20 20 50 2 20
imit
s Upper
50 pe
rce
nt20 per
cent
50 pe
rce
nt2
per
cent
10,0
00 pp
m
10,000 pp
m
20,000 pp
m
1,000
ppm
5,00
0 pp
m
10,000 ppm
2,000
ppm
2,00
0 ppm
Anal
ysis
S-Cd
S-Co
S-Cr
S-Cu
S-La
S-Mo
S-Nb
S-Ni
S-Pb
S-Sb
S-Sc
S-Sn
Lower
50 10 20 10 50 10 50 10 20 200 10 20
Limi
ts Upper
1,000
ppm
5,00
0 pp
m
10,000 pp
m
50,000 ppm
2,00
0 pp
m
5,000
ppm
5,00
0 pp
m
10,0
00 pp
m
50,000 pp
m
20,0
00 pp
m
200
ppm
2,000
ppm
Analysis
S-Sr
S-Th
S-V
S-W
S-Y
S-Zn
S-Zr
AA-C
u
AA-Pb
AA-Zn
Lower
200
200 20 100 20 500 20 5 5 5
Limi
ts Upper
10,0
00 ppm
5,000
ppm
20,0
00 pp
m
20,0
00 pp
m
5,000
ppm
20,000 pp
m
2,00
0 ppm
ppm
—
ppm
—
ppm

Table 2.—Qualification codes
Qualification code
B
N
L
Form in table 5
N
<
Explanation
No analytical data for this analysis.
Nothing detected by analysis.
Element detected but below listed value (lower
(value = 0).
limit of determinability).
Element detected in amount greater than listed value (upper limit of determinability).
Interference - no valid data.
Trace
distribution of elements in geologic materials. Analytical variance tends to
be proportional to the amount of a contituent present; and tends to be
constant for the logarithms of the analytical data (Miesch, 1976, p. 58).
Variability at sample localities is similar, with the amount of variance at a
locality often being proportional to the mean of sample values for that site
and variance tending to be constant when the logarithms of the values are used
(Miesch, 1976, p. 58).
The spectrographic reporting values and the associated class interval
limits and widths are listed in table 3. Element concentrations are reported
as integral powers of 10 times one of the listed six-step reporting values.
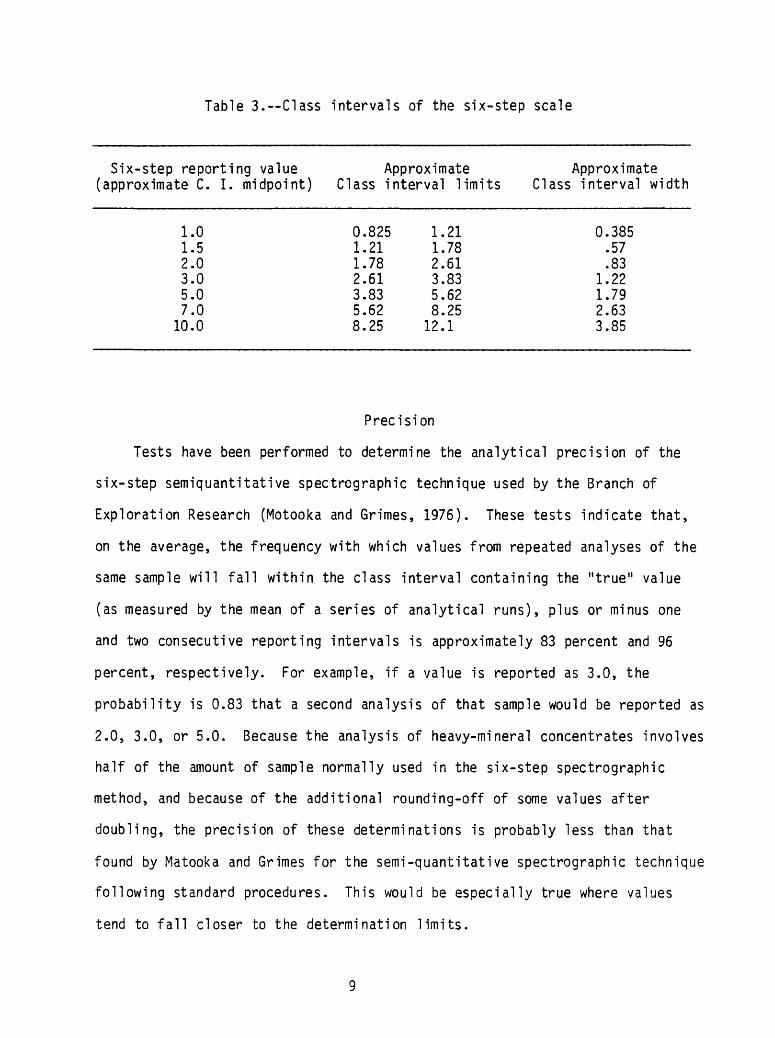
Table 3.—Class intervals of the six-step scale
Six-step reporting value Approximate (approximate C. I. midpoint) Class interval limits
1.01.52.03.05.07.0
10.0
0.8251.211.782.613.835.628.25
1.211.782.613.835.628.25
12.1
Approximate Class interval width
0.385.57.83
1.221.792.633.85
Precision
Tests have been performed to determine the analytical precision of the
six-step semiquantitative spectrographic technique used by the Branch of
Exploration Research (Motooka and Grimes, 1976). These tests indicate that,
on the average, the frequency with which values from repeated analyses of the
same sample will fall within the class interval containing the "true" value
(as measured by the mean of a series of analytical runs), plus or minus one
and two consecutive reporting intervals is approximately 83 percent and 96
percent, respectively. For example, if a value is reported as 3.0, the
probability is 0.83 that a second analysis of that sample would be reported as
2.0, 3.0, or 5.0. Because the analysis of heavy-mineral concentrates involves
half of the amount of sample normally used in the six-step spectrographic
method, and because of the additional rounding-off of some values after
doubling, the precision of these determinations is probably less than that
found by Matooka and Grimes for the semi-quantitative spectrographic technique
following standard procedures. This would be especially true where values
tend to fall closer to the determination limits.

The Motooka and Grimes study found analytical variance (reported as a
number of steps of the six-step scale), to be consistent for a variety of
geologic materials and to show no appreciable difference among most elements
or concentration ranges; except near the limits of determinability where
"precision of the analysis is greatly diminished" (Motooka and Grimes, 1976,
p. 2).
An experiment with unconcentrated stream-sediment samples was conducted
by Johnson and others (1980) in similar terrane within the Coast Range, 180 km
north of Bradfield Canal. They determined the amount of variability
attributable to analytical procedures and to variation in sample spacing. For
spectrographic data from that area, which does not contain detected mineral
enrichment, analytical variance ranged from 22 percent (Ni) to 88 percent (Ti,
Mn, V) of the total variance. At the 95 percent confidence level, only four
spectrographically determined elements had analytical variance greater than
the two step average variation determined by Motooka and Grimes; Ti (3 steps),
Cu (3 steps), La (3.5 steps), and Zr (2.5 steps). This study suggests that
for data with a narrow range of values (approaching the level of analytical
variance for that element), the analytical component of total variance will be
responsible for a significant portion of the observed fluctuations but that
for data with a relatively broad range of values, analytical variability
should have only minor effect.
Data from analyses by the atomic absorption methods are not reported on
the six-step scale. They are more sensitive and considered more precise than
spectrographic analyses. Johnson and others determined analytical variance
for atomic absorbtion analyses of Cu, Pb, and Zn to be equivalent to
approximately 1.0, 1.5, and 0.5 steps of the six-step scale respectively, at
the 95 percent confidence level (Johnson and others, 1980, table 3, last
column).
10

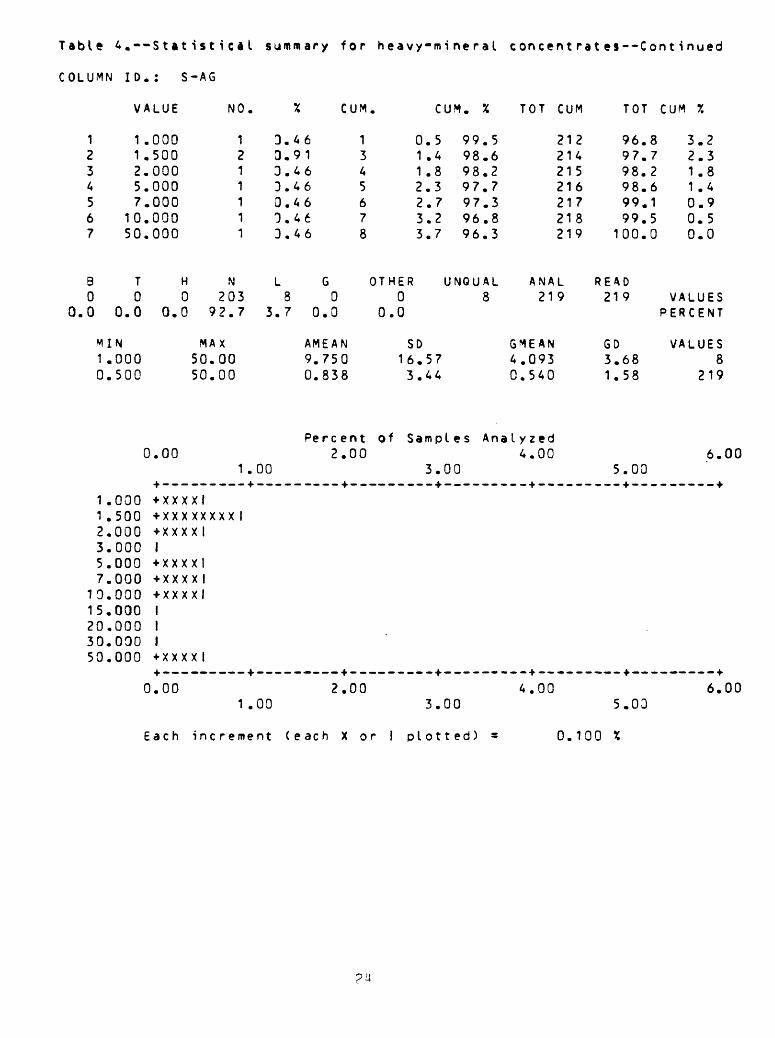
STATISTICAL SUMMARY
The analytical data were processed using a computer to produce the
statistical summary presented in table 4. All distributions are treated in
terms of the six-step class intervals described above and thus the atomic
absorption data are regrouped into these intervals for the summary. The
program output consists of: a frequency distribution table, histogram,
summary of qualified values, range of values, arithmetic and geometric means
and deviations for each element. Table 4 entries are identified in an
explanation at the beginning of that table.
The histograms have a quasi-logarithmic analytical value scale because
they use the class intervals of the six-step semi quantitative scale. All
values qualified with N, L, G, or H were omitted from the histograms. The
resulting statistics are biased and the histograms incomplete.
The summary at the end of table 4 presents estimates of geometric means
and geometric deviations recomputed using a method devised by A. J. Cohen
(Cohen, 1959, 1961; Miesch, 1967) for treating singly censored
distributions. If an element has no qualified data values, the geometric mean
and geometric deviation will be the same in both this summary and on the page
within the table for the particular element. Cohen 1 s method is applicable to
distributions truncated on either the high or low end but, because low end
truncations (left-censored distributions) are much more common in geochemical
problems, the computer program used here was designed only to handle them. If
some values are coded "G", the estimates by Cohen's method where not made for
that element. The estimates of geometric mean and geometric deviation are
unbiased in a strict sense only where the data are derived from a log-normal
parent population, but it has been shown that the method gives satisfactory results
whenever the data are symmetrical about a single mode (Miesch, 1967, p. 85).
11

The geometric mean of N values is the Nth root of their product and can
be computed as the antilogarithm of the arithmetic mean of the logarithms of
the analyses. It is not an estimate of geochemical abundance but of "central
tendency" (or characteristic value) for a frequency distribution which follows
the exponential or "natural growth" law and is thus symmetrical on a
logarithmic scale. The geometric mean has a more stable value than the
arithmetic mean because it is not influenced as strongly by data at the
extremes of the distribution. The geometric deviation can be computed as the
antilogarithm of the standard deviation of the logarithms of the data
values. The geometric mean and geometric deviation are useful for
characterizing many geochemical distributions, which are often more nearly
log-normally than normally distributed. Histograms of the data contained in
this report are more nearly symmetrical on a logarithmic scale than when
plotted with a linear scale. Cumulative frequency plots of the data values
and of their logarithms also demonstrate that these data are distributed in an
exponential fashion. While the geometric mean is the best estimate or
predictor of values for individuals within a log-normal population, it is not
an estimate of geochemical abundance. It can not be used to predict the
amounts of elements present as the arithmetic mean can (Miesch, 1963, 1967).
For further discussion of geometric mean and geometric deviation see Kenny,
(1952) and Miesch, (1963, 1967, and 1976).
BIAS AND VARIABILITY AFFECTING INTERPRETATION
In reviewing the data in table 5 and the statistical summary in table 4,
several sources of bias and variability in the data must be considered.
Factors including time limitations, weather, snow and vegetative cover, type
and amount of sediment accessable, and availability of helicopter landing
12
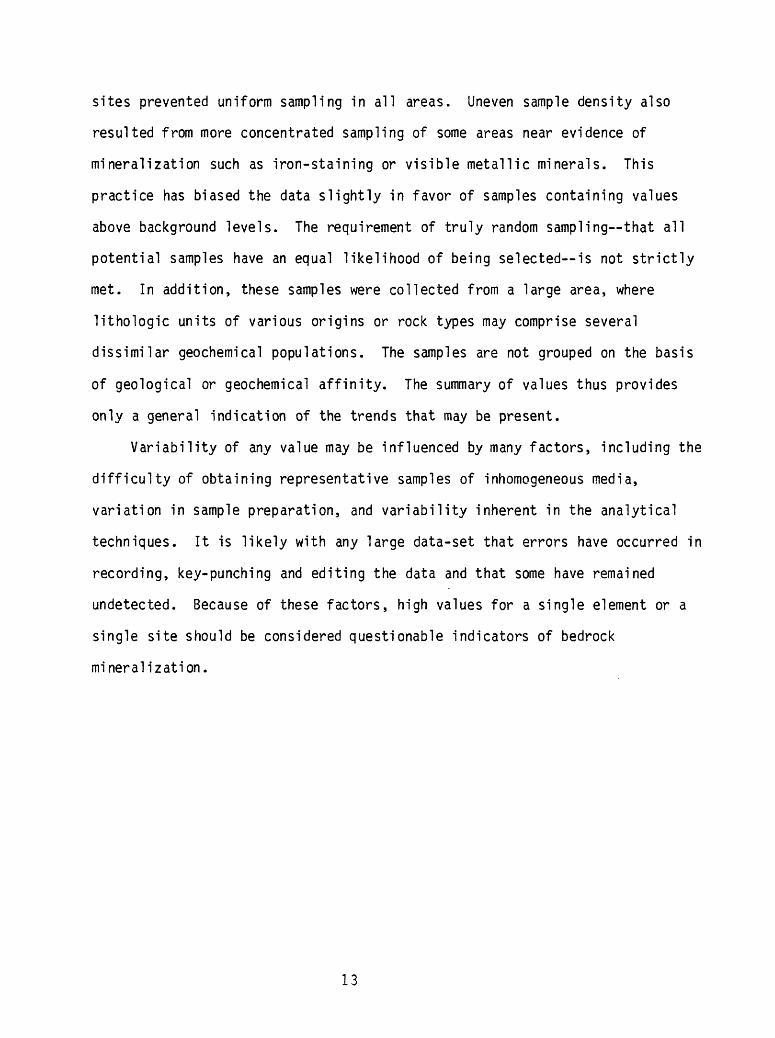
sites prevented uniform sampling in all areas. Uneven sample density also
resulted from more concentrated sampling of some areas near evidence of
mineralization such as iron-staining or visible metallic minerals. This
practice has biased the data slightly in favor of samples containing values
above background levels. The requirement of truly random sampling—that all
potential samples have an equal likelihood of being selected—is not strictly
met. In addition, these samples were collected from a large area, where
lithologic units of various origins or rock types may comprise several
dissimilar geochemical populations. The samples are not grouped on the basis
of geological or geochemical affinity. The summary of values thus provides
only a general indication of the trends that may be present.
Variability of any value may be influenced by many factors, including the
difficulty of obtaining representative samples of inhomogeneous media,
variation in sample preparation, and variability inherent in the analytical
techniques. It is likely with any large data-set that errors have occurred in
recording, key-punching and editing the data and that some have remained
undetected. Because of these factors, high values for a single element or a
single site should be considered questionable indicators of bedrock
mineralization.
13

ACKNOWLEDGMENTS
We wish to thank several U.S. Geological Survey colleagues for their
considerable cooperation and assistance. George Van Trump, Jr., provided
invaluable aid by resolving computer-programming problems. Steven K. McDanal
and Christine M. McDougal of the Branch of Exploration Research managed entry
of the data into computer data-files. Samples were collected by a number of
geologists including: J. E. Decker, M. F. Diggles, J. D. Gallinatti,
S. M. Karl, R. D. Koch, and M. L. Miller-Hoare. We also wish to thank
Kenneth Eicher of TEMSCO Helicopters, Ketchikan, who was most generous with
his time and advice; and volunteered logistical assistance which greatly aided
our field efforts. The skillful flying of helicopter pilots Richard Rossiter
and Ed Svec allowed us to sample this particularly rugged and inaccessible
terrain and helped maintain some of our peace of mind.
REFERENCES
Berg, H. C., Elliott, R. L., Smith, J. G., Pitman, T. L., and Kimball, A. L.,
1977, Mineral resources of the Granite Fiords Wilderness Study Area,
Alaska: U.S. Geological Survey Bulletin 1403, 151 p.
Brew, D. A., and Ford, A. B., 1978, Megalineament in southeastern Alaska marks
southwest edge of Coast Range batholithic complex: Canadian Journal of
Earth Sciences, v. 15, no. 11, p. 1763-1772.
Brew, H. C., Ford, A. B., Grybeck, Donald, Johnson, B. R., and Nutt, C. J.,
1976, Key foliated quartz diorite sill along southwest side of Coast
Range complex, northern southeastern Alaska, J_n_ Cobb, E. H., ed., The
United States Geological Survey in Alaska: Accomplishments during
1975: U.S. Geological Survey Circular 733, p. 60.
14

Brew, D. A., Grybeck, Donald, Johnson, B. R., Jachens, R. C., Nutt, C. J.,
Barnes, D. F., Kimball, A. L., Still, J. C., and Rataj, J. L., 1977,
Mineral resources of the Tracy Arm-Fords Terror Wilderness study area and
vicinity, Alaska: U.S. Geological Survey Open-File Report 77-649, 282 p.
Buddington, A. F., 1929, Geology of Hyder and vicinity, southeastern Alaska:
U.S. Geological Survey Bulletin 807, 124 p.
Buddington, A. F., and Chapin, T., 1929, Geology and mineral deposits of
southeastern Alaska: U.S. Geological Survey Bulletin 800, 398 p.
Cohen, A. C., 1959, Simplified estimators for the normal distribution when
samples are singly censored or truncated: Technometrics, v. 1, no. 3,
p. 217-237.
———, 1961, Tables for maximum likelihood estimates; singly truncated and
singly censored samples: Technometrics, v. 3, no. 4, p. 535-541.
Grimes, D. J., and Marranzino, A. P., 1968, Direct-current arc and
alternating-current spark emission spectrographic field methods for the
semiquantitative analysis of geologic materials: U.S. Geological Survey
Circular 591, 6 p.
Hutchison, W. W., 1970, Metamorphic framework and plutonic styles in the
Prince Rupert region of the Central Coast Mountains, British Columbia:
Canadian Journal of Earth Science, v. 7, p. 376-405.
Johnson, B. R., Forn, C. L., Hoffman, J. D., Brew, D. A., and Nutt, C. J.,
1980, Efficient stream-sediment sampling design: An experiment at Tracy
Arm, Alaska: U.S. Geological Survey Professional Paper 1129,
p. E1-E9.
Kenny, J. F., 1952, Mathamatics of Statistics Part I (2nd ed.): New York,
D. Van Nostrand Company, p. 52-55.
15

Koch, R. D., and Elliott, R. L., 1978a, Analyses of rock samples from the
Ketchikan quadrangle, southeastern Alaska: U.S. Geological Survey Open-
File Report 78-156A, 163 p.
———, 1978b, Analyses of rock and stream sediment samples from the Prince
Rupert quadrangle, southeastern Alaska: U.S. Geological Survey Open-File
Report 78-156B, 98 p.
———, 1978c, Analyses of stream-sediment samples from the Ketchikan
quadrangle, southeastern Alaska: U.S. Geological Survey Open-File
Report 78-156C, 214 p.
Koch, R. D., Elliott, R. L., Berg, H. C., and Smith, J. G., 1976, Analyses of
rock and stream-sediment samples from the Bradfield Canal quadrangle,
southeastern Alaska: U.S. Geological Survey Open-File Report 76-486,
136 p.
Koch, R. D., Elliott, R. L., O'Leary, R. M., and Risoli, D. A., 1980a,
Trace element data for rock samples from the Bradfield Canal quadrangle,
southeastern Alaska: U.S. Geological Survey Open-File Report 80-910A ,
———, 19805, Trace element data for stream-sediment samples from the
Bradfield Canal quadrangle, southeastern Alaska: U.S. Geological Survey
Open-File Report 80- 910B.
Koch, R. D., O'Leary, R. M., and Risoli, D. A., 1980, Magnetic tape containing
trace element data for rock, stream-sediment, and heavy-mineral
concentrate samples from the Bradfield Canal quadrangle, southeastern
Alaska: Menlo Park, Calif., U.S. Geological Survey Report, 23 p.,
computer tape Available from the U.S. Department of Comnerce, National
Technical Information Service, Springfield, VA. 22151, as report USGS-GD-
80-004.
16
Koch, R. D., Van Trump, George, Jr., and McDanal, S. K., 1978, Magnetic tape
containing analytical data for rock and stream-sediment samples from
Ketchikan and Prince Rupert quadrangles, southeastern Alaska: Menlo
Park, Calif., U.S. Geological Survey Report, 8 p., computer tape
available from the U.S. Department of Commerce, National Technical
Information Service, Springfield, VA 22151, as report NTIS PB-276-777.
Motooka, J. M., and Grimes, D. J., 1976, Analytical precision of one-sixth
order semiquantitative spectrographic analysis: U.S. Geological Survey
Circular 738, 25 p.
Miesch, A. T., 1963, Distribution of elements in Colorado Plateau uranium
deposits—a preliminary report: U.S. Geological Survey Bulletin 1147-E,
57 p.
———, 1967, Methods of computation for estimating geochemical abundance:
U.S. Geological Survey Professional Paper 574-B, 15 p.
———, 1976, Sampling designs for geochemical surveys—syllabus for a short
coarse: U.S. Geological Survey Open-File Report 76-772, 140 p.
Myers, A. T., Havens, R. G., and Dunton, P. J., 1961, A spectrochemical
method for the semiquantitative analysis of rocks, minerals, and ores:
U.S. Geological Survey Bulletin 1084-1, p. 207-229.
Roddick, 0. A., and Hutchinson, W. W., 1974, Setting of the Coast Plutonic
Complex, British Columbia: Pacific Geology, v. 8, p. 91-108.
Smith, J. G., 1977, Geology of the Ketchikan D-l and Bradfield Canal A-l
quadrangles, Alaska: U.S. Geological Survey Bulletin 1425, 49 p.
Ward, F. N., Nakagawa, H. M., Harms, T. F., and Van Sickle, G. H., 1969,
Atomic-absorption methods of analysis useful in geochemical
exploration: U.S. Geological Survey Bulletin 1289, 45 p.
Wright, F. E., and Wright, C. W., 1908, The Ketchikan and Wrangell mining
districts, Alaska: U.S. Geological Survey Bulletin 347, 210 p.
17
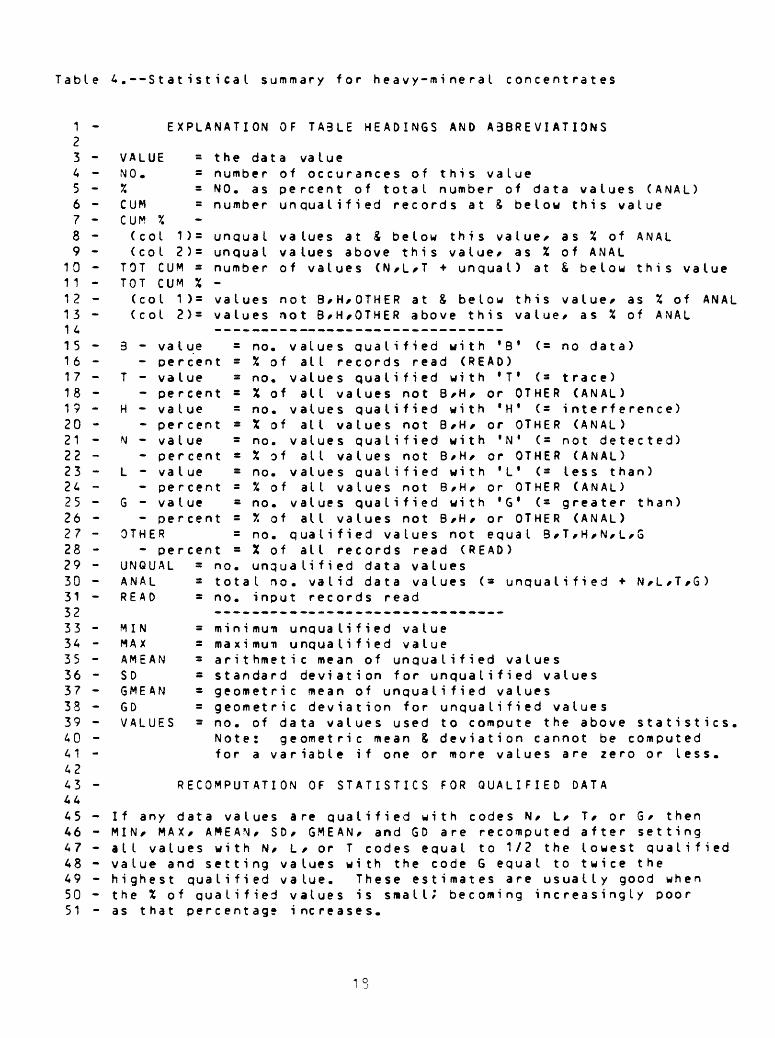
Table 4.--StatisticaI summary for heavy-mineral concentrates
1 - EXPLANATION OF TA3LE HEADINGS AND A3BREV I AT I ONS23 - VALUE = the data value4 - NO. - number of occurances of this value5 - X * NO. as percent of total number of data values (ANAL)6 - CUM = number unqualified records at & below this value7 - CUM %8 - (col 1)= unqual values at & below this value* as X of ANAL9 - (col 2) = unqual values above this value/ as % of ANAL
10 - TOT CUM s number of values (N*L*T + unqual) at & below this value11 - TOT CUM X -12 - (col 1)= values not 9,H,OTHER at & below this value* as X of ANAL13 - (col 2)= values not B/H,OTHER above this value/ as X of ANAL1 4 — — —— - —————— ————— —————————15 - 3 - value = no. values qualified with '3* (= no data)16 - - percent = X of all records read (READ)17 - T - value = no. values qualified with 'T 1 (= trace)18 - - percent = X of all values not B*H, or OTHER (ANAL)19 - H - value = no. values qualified with 'H* (= interference)20 - - percent = X of all values not B*H, or OTHER (ANAL)21 - N - value = no. values qualified with 'N 1 (= not detected)22 - - percent = X of all values not B/H, or OTHER (ANAL)23 - L - value = no. values qualified with 'L* ( = less than)24 - - percent = X of all values not B/H, or OTHER (ANAL)25 - G - value = no. values qualified with *G* (= greater than)26 - - percent = X of all values not B*H, or OTHER (ANAL)27 - OTHER = no. qualified values not equal 3*T/H*N/L/G28 - - percent - X of all records read (READ)29 - UNQUAL = no. unqualified data values30 - ANAL = total no. valid data values (= unqualified * N*L/T*G)31 - READ = no. input records read32 ——— ———— ————— —— ———————————33 - MIN = minimu-n unqualified value34 - MAX = maximum unqualified value35 - AMEAN = arithmetic mean of unqualified values36 - SO = standard deviation for unqualified values37 - GMEAN * geometric mean of unqualified values38 - GD = geometric deviation for unqualified values39 - VALUES = no. of data values used to compute the above statistics.40 - Note: geometric mean & deviation cannot be computed41 - for a variable if one or more values are zero or less.4243 - RECOMPUTATION OF STATISTICS FOR QUALIFIED DATA4445 - If any data values are qualified with codes N/ L* T* or G/ then46 - MIN* MAX/ AMEAN/ SD/ GMEAN/ and GD are recomputed after setting47 - all values with N/ L* or T codes equal to 1/2 the lowest qualified48 - value and setting values with the code G equal to twice the49 - highest qualified value. These estimates are usually good when50 - the X of qualified values is small; becoming increasingly poor51 - as that percentage increases.
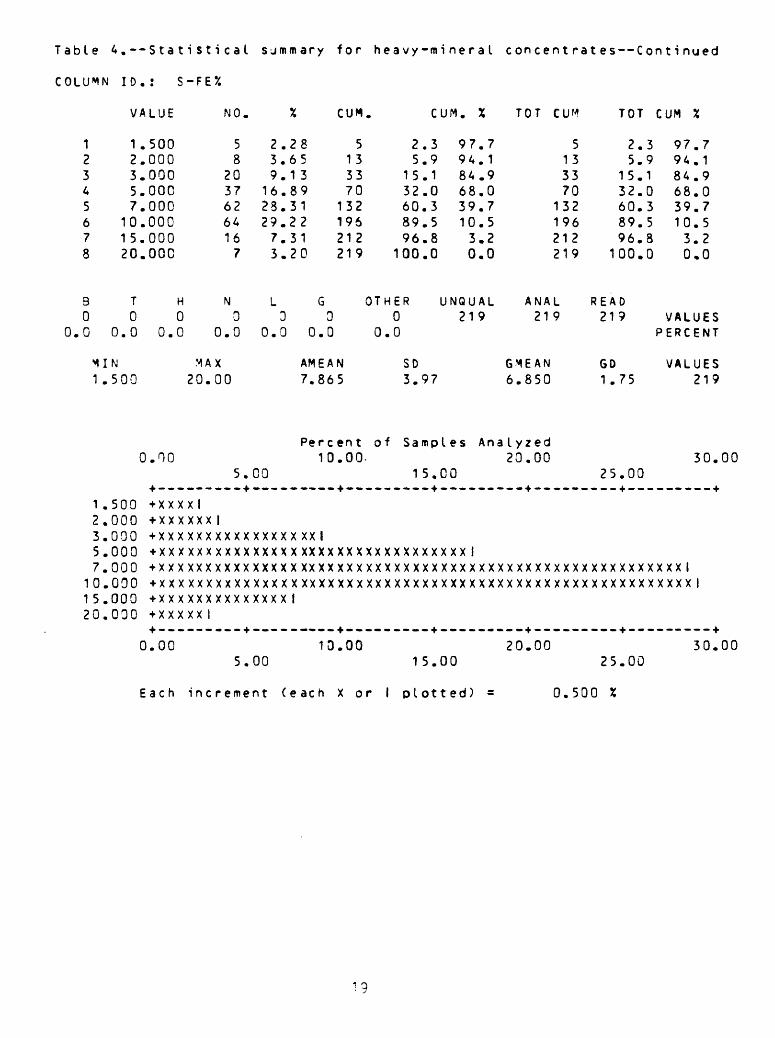
Table 4.--Statistica I summary for heavy-mineral con cent rates--Continued
COLUMN ID.: S-FEX
VALUE NO CU* CUM. X TOT CUM TOT CUM X
12345678
30
0.0
s.
1
12357
101 520
12357
101520
T0
0.0
IN.500
.500
.000
.000
.000
.000
.000
.000
.000
.500
.000
.000
.000
.000
.000
.000
.000
H0
0.0
58
20376264167
N0
0.0
239
16232973
L
0.
.28
.65
.1 3
.89
.31
.22
.31
.20
G3 00 0.0
5133370
132196212219
OTH
0.
,^AX AMEAN
o.no
+ XXX+ xxx+ XXX+ XX X+ XXX+ XXX+ XXX+ XXX+ ---
0.00
Each
20.00
5.
XIXXX IxxxxxxxxxxxxxxxxxxxxxxxxxxxxxxxxxxxXX I
5.
00
XXXXXXXXXXXXXXX
00
increment
7.86
Perc10
XX XXIXXXXXXxxxxxxxxxxxxX I
10
( e ach
5
ent of.00-
XXXXXXXXXXXXxxxxxx
.00
X or I
2.35.9
15.132.060.389.596.8
100.0
ER00
SD3.97
97948468391030
.7
.1
.9
.0
.7
.5
.2
.0
UNQUAL21
Sampl es
15.
xxxxxxxxxxxxxxx
15.
plot
CO
XXXIxxxxxxxx
00
ted)
9
Ana
XXXXXX
s
5 2.13 5.33 15.70 32.
132 60.196 89.212 96.219 100.
ANAL READ219 219
GMEAN GO6.850 1.75
I yzed20.00
25.00
xxxxxxxxxxxxxxxxxxxxxxxxxxxxxx
20.0025.00
0.500 X
3 97.79 94.11 84.90 68.03 39.75 10.58 3.20 0,0
VALUESPERCENT
VALUES219
30.00
XX XX IXXXXX I
30.00
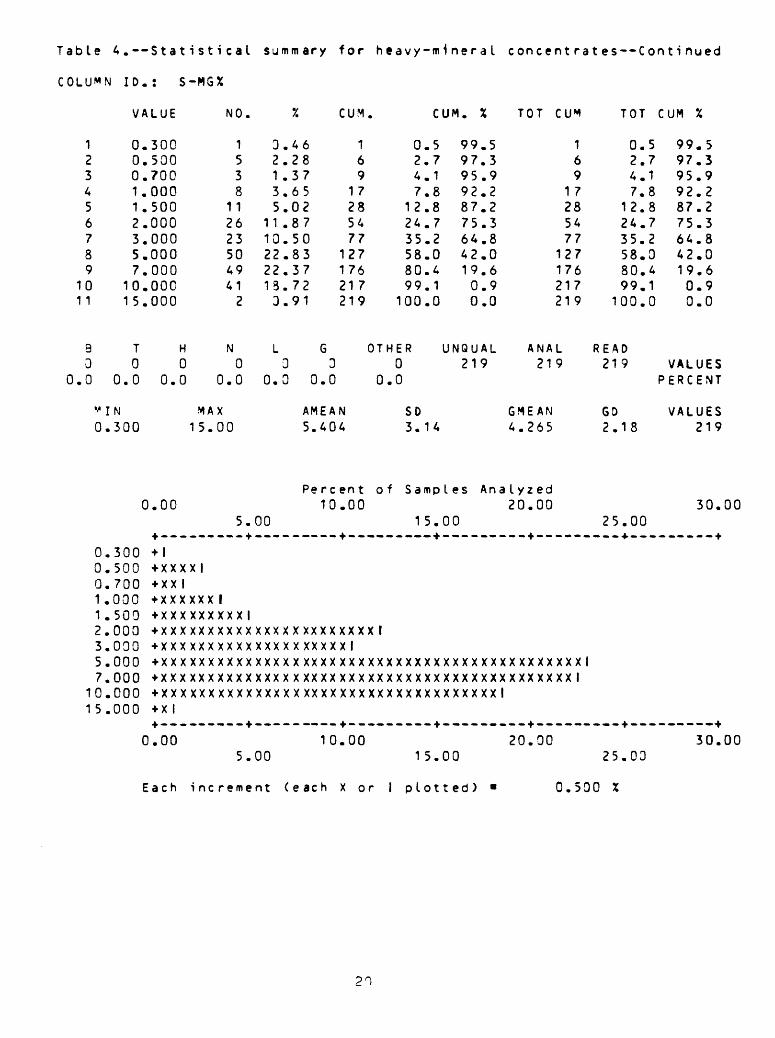
Table A.--Statistica I summary for heavy-mineral concent rates--Continued
COLUMN ID.: S-MGX
VALUE NO. CUM. CUM. TOT CUM TOT CUM %
123456789
101 1
33
0.0
M
0
000112357
1015
000112357
1015
T0
0.0
IN.300
.300
.500
.700
.000
.500
.000
.000
.000
.000
.000
.000
.300
.500
.700
.000
.500
.000
.000
.000
.000
.000
.000
H0
0.0
0.00
+ l+ XXX+ XX I+ XXX+ XXX+ XXX+ XXX+ XXX+ XXX+ XXX+ X I
0.00
Each
1538
1126235049412
N0
0.0
MAX15.00
5
XI
XXX 1xxxxxxxxxxxxxxxxxxxxxxxxxxxxxxxxxxxx
5
3.42.21 .33.65.0
11 .810.522.822.313.73.9
L3
0.0
68752703721
G3
0.0
AMEA
169
17285477
127176217219
OTH
0.
N5.404
.00
IXXXXX XxxxxxxxxxxxxXXXX X Xxxxxxx
.00
increment (e
Perc10
XXXXXXXXXXXXXXXXXXXX
10
ach
en t of.00
XXXX IXIxxxxxxxxxxxxxxxxxx
.00
X or I
0.52.74.17.8
12.824.735.258.080.499.1100.0
ER00
SD3.14
Samp
15.
XXXXXXXXXXXXXXX
1 5.
plot
99979592877564421900
.5
.3
.9
.2
.2
.3
.8
.0
.6
.9
.0
UNQUAL ANA21
les
00
XXXXXXXXXXXX
00
ted)
9 21
GMEAN4.265
Ana lyzed20.00
xxxxxxxxxxxxxxxxXX I
20.00
•
1 0.56 2.79 4.1
17 7.828 12.854 24.777 35.2
127 58.0176 80.4217 99.1219 100.0
L READ9 219
P
GD2.18
25.00
xxxiXX 1
25.03
0.500 X
99.597.395.992.287.275.364.842.019.60.90.0
VALUESERCENT
VALUES219
30.00
30.00

Table 4.--Statistica I summary for heavy-mineral concentrates--Continued
COLUMN 10.: S-CAX
VALUE
1234567
2.0003.0005.0007.00010.00015.00020.000
NO CUM CUM
12
46678317
3
0.463.91
21 .0033.5937.907.761.37
13
49116199216219
0.51.4
22.453.090.998.6
100.0
99.598.677.647.0
9.11.40.0
TOT CUM TOT CUM X
13
49116199216219
0.51.4
22.453.090.998.6
100.0
99.598.677.647.0
9.11.40.0
Ti 0 I 0.0
MIN 2.000
N0
0.0
MAX20.00
L0
0.0
G0
0.0
AMEAN 8.457
OTHER0
0.0
UNQUAL 219
SO 3.12
ANAL 219
GMEAN 7.929
READ 219
GO 1 .44
VALUES PERCENT
VALUES 219
00Percent 20.00
10.00
of Sampl es
30.00
Ana I y zed 40.00 60
50.00
2.0003.0005.0007.000
10.00015.00020.000
I
+XXXXXXXXXXXXXXXXXXXXI+XXXXXXXXXXXXXXXXXXXXXXXXXXXXXXI+XXXXXXXXXXXXXXXXXXXXXXXXXXXXXXXXXXXXXI+ XXXXXX X I•H
0
P
.00
ach
10.
i nc r erne
00
nt
23
( e ach
.00
X or i
30.
I plot
40.0000 50.00
ted) = 1.000 %
60.00

Table 4 .--$tatisticaI summary for heavy-mineral concentrates--Continued
COLUMN ID.: S-TIX
VALUE NO CUM CUM, TOT CUM TOT CUM %
123456
80
0.0
M00
000112
T0
0.0
IN.300.300
.300
.500
.700
.000
.500
.000
H0
0.0
0.00
51215324442
N0
0.0
MAX2.004.00
5
2.25.46.8
14.623.019.1
L0
0.0
.00
8 58 1 75 321 649 1088 150
G69
31.5
AMEAN1.3332.174
Percent10.00
27
14294968
OTHER0
0.0
SD0.1.
.3
.8
.6
.2
.3
.5
97.792.285.470.850.731.5
UNQUAL
5432
of Sample
1 5.00
150
s Ana
5173264108150
ANAL219
GMEAN1.1991 .753
I y zed20.00
2.37.8
14.629.249.368.5
READ219
P
GD1 .652.01
25.00
97.792.285.470.850.731.5
VALUESERCENT
VALUES150219
30.
0.300 +xxxxI0.500 +XXXXXXXXXX I0. 700 +XXXX.XXXXXXXXX I1.000 +XXXXXXXXXXXXXXXXXXXXXXXXXXXXI1.500 +XXXXXXXXXXXXXXXXXXXXXXXXXXXXXXXXXXXXXXXI2.000 +XXXXXXXXXXXXXXXXXXXXXXXXXXXXXXXXXXXXXI
+ ---— -..-« + - — -. — ._ + --..._... + -..-....._ + ...,0.00 13.00 20.00
5.00 15.0030.00
25.00
Each increment (each X or I plotted) s 0.500 %

Table 4.--Statistica I summary for heavy-mineral concentrates--Continued
COLUMN ID.: S-MN
VALUE
123456
B0
0.0
M1000
100015002000300050007000
1000.1500.2000.3000.5000.7000.
T0
0.0
IN.000
0
.000
.000
.000
.000
.000
.000
0
e
000000000000000000
H0
0.0
MA7000.
.00
+XXXXI+XXXXXX+XXXXXX+XXXXXX+ XXX XXXI+ --_ — -.00
ac h i nc
NO.
14
11
864 436
N
0.
X00
1
XXXXXXXX
1
1
00
0
XXXX
0
513392016D
L
0.
2
.00+ ---
xxxxxxxxxxxxxxxx
•f ---
.00
reme nt
X
.0
.7
.2
.0
.4
.4
00
57
XXXXXXXX
(e
227946
G0
0.0
AMEA3.05
Perc20
XXX Ixxxxxxxx1
20
ac h
CUM
1 152
138182218219
N9
ent.00
+ --
XXXI
.00
.
5.23.63.83.99.
100.
OTHER0
0.0
SD1253.1
CUM. X
0 95.07 76.30 37.01 16.95 0.50 0.0
UNQUAL219
3 232
of Sampl es Ana
30
XXXXXXX
30
.00+_..___.
xxxxxxxx
+ — .-.--_
.00
X or I plotted) =
TOT CUM TOT CUM X
11 5.0 95.052 23.7 76.3
138 63.0 37.0182 83.1 16.9218 99.5 0.5219 100.0 0.0
ANAL READ219 219 VALUES
PERCENT
GMEAN GO VALUES1.655 1.56 219
lyzed40.00 60.00
50.00 -._ + __------- + ._-_ — --- +
X I
--+-- — — --_+-__- — ---+ 40.00 60.00
50.03
1.000 X
OLUMN ID.:
VALUE
1 1.0002 1.5003 2.0004 5.0005 7.0006 10.0007 50.000
B T0 0
0.0 0.0 0.
MIN1 .0000.500
0.00
+ -- 1.000 +XX1.500 +XX2.000 +XX3.000 I5.000 +XX7.000 +XX
10.000 +XX15.000 I20.000 I30.000 I50.000 +XX
+ — 0.00
Each
S-AG
NO. % CUM. CUM. %
1 3.46 1 0.5 99.52 3.91 3 1.4 98.61 3.46 4 1.8 98.21 3.46 5 2.3 97.71 0.46 6 2.7 97.31 3.46 7 3.2 96.81 3.46 8 3.7 96.3
H N L G OTHER UNQUAL0 203 8 0 0 80 92.7 3.7 0.0 0.0
MAX AMEAN SD50.00 9.750 16.5750.00 0.838 3.44
Percent of Samples Ana2.00
1.00 3.00_ — ___.. + --...._ — -- + -_ — .- — - + _ — ---. XXIXXXXXX IXX I
XXIXX IXXI
XX I
2.001.00 3.00
increment (each X or I plotted) =
concent rates—Continued
TOT CUM TOT CUM X
212 96.8 3.2214 97.7 2.3215 98.2 1.8216 98.6 1.4217 99.1 0.9218 99.5 0.5219 100.0 0.0
ANAL READ219 219 VALUES
PERCENT
GMEAN GD VALUES4.093 3.68 80.540 1.58 219
I y zed4.00 6.00
5.00--+---------+---- —— --.-4-
_-+---_-- ——— 4. —— - —— .- —— _ +
4.00 6.005.03
0.100 X

Taole 4,--StatisticaI summary for heavy-mintra I concentrates — Continued
COLUMN ID.: S-AS
NO UNQUALIFIED VALUES FOUND
3 T H N L G OTHER UNQUAL ANAL READ000 219 000 0 219 219 VALUES
0.0 0.0 0.0 100.0 0.0 0.3 0.0 PERCENT
25

Table 4.--stat1st leal suwmary for heavy-mineral concentrates —Continued
COLUMN ID.: S-AU
VALUE NO. X CUM. CUM. % TOT CUM TOT CUM %
1 70.000 1 3.46 1 0.5 99.5 219 100.0 0.0
B T H N L G OTHER UNQUAL ANAL READ000 218 030 1 219 219 VALUES
0.0 0.0 0.0 99.5 0.0 0.0 0.0 PERCENT
MIN MAX AMEAN SO GMEAN GO VALUES70.000 70.00 70.030 0.00 70.000 ******** 110.000 70.00 10.274 4.05 10.089 1.14 219
Percent of Samples Analyzed0.00 2.00 4.00 6.00
1.00 3.00 5.00
70.000 +XXXXI
0.00 2.00 4.00 6.001.00 3.00 5.00
Each increment (each X or I plotted) = 0.100 X
2*5

Tablt 4.--Statistica I summary for heavy-mineral concentrates—Continued
COLUMN ID.: S-B
VALUE NO CUM CUM. % TOT CUM TOT CUM X
1234567
20.00030.00050.00070.000
100.000150.000200.000
55482421
25.1 11 .833.653.911 .830.913.46
55596769737576
25.126.930.631 .533.334.234.7
74.973.169.468.566.765.865.3
198202210212216218219
90.492.295.996.898.699.5
100.0
9.67.84.13.21.40.50.0
0
B 0
.0
M2010
T 0
0.0
IN .000.000
H0
0.0
MA 200. 200.
N 3
1.4
X00 00
L 140
63.9
31
G 0
0.3
AMEAN 5.000 8.676
OTHER 0
0.0
SD 34. 23.
UNQUAL 76
ANAL 219
GMEAN 12 27.509 30 14.207
READ 219
GD 1.81 1.81
VALUESPERCENT
VALUES 76
219
0.00Percent of Samples Analyzed
10.00 20.005.00 15.00
30.0025.03
20.000 +XXXXXXXXXXXXXXXXXXXXXXXXXXXXXXXXXXXXXXXXXXXXXXXXXI30.000 +XXXI50.000 +xxxxxxl70.000 +XI
100.000 +xxxl150.000 +XI200.000 -H
+ —— — -• — -4.----- ----4.------ — _ + ____-_._- + .>.>.>_. — —— 4.-... — — - +
0.00 10.00 20.00 • 30.00 5.00 15.00 25.03
Each increment (each X or I plotted) = 0.500 X
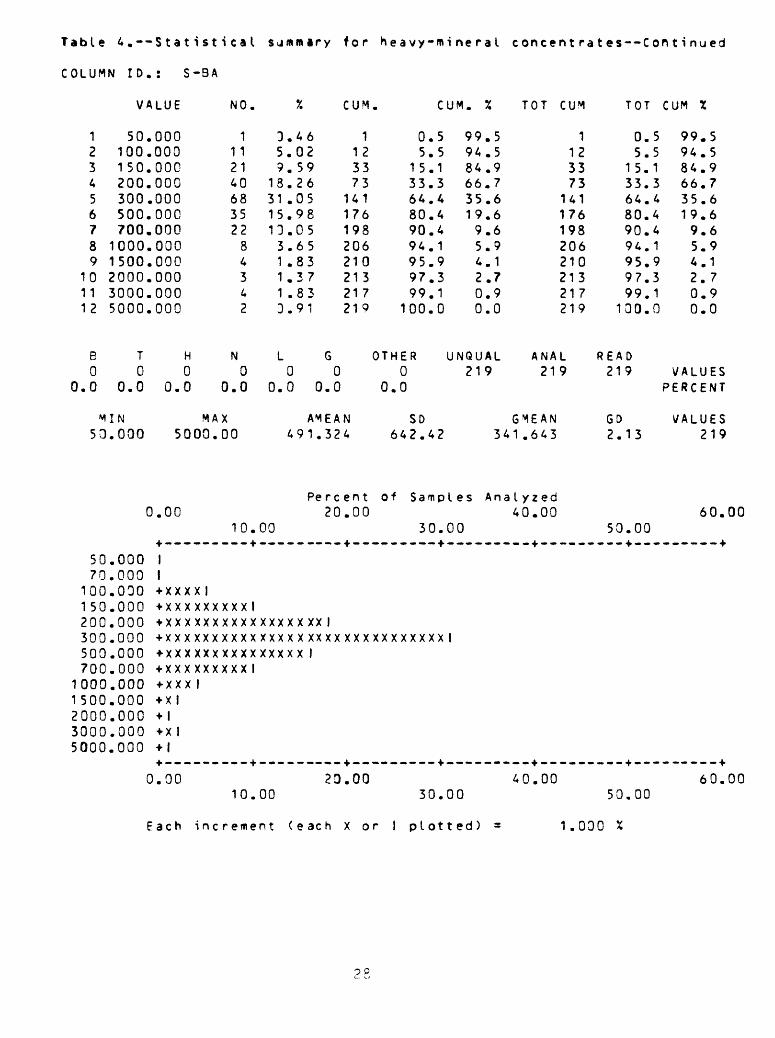
Table 4.--Stat 1st 1cal sjmmiry for heavy-mineral concentrates — Continued
COLUMN ID.: S-BA
VALUE NO. CUM. CUM TOT CUM TOT CUM
123456789
101112
B0
0.0
M50
5070
100150200300500700
10001500200030005000
5010015020030050070010001500200030005000
T0
0.0
IN.000
.000
.000
.030
.000
.000
.000
.000
.000
.000
.000
.000
.000
.000
.000
.000
.000
.000
.000
.000
.000
.000
.000
.000
.000
.000
H0
0.0
MA5000.
0.00
4-------
II+ XXXX I+XXXXXX•••XXX XXX+XXXXXX+XXXXXX4-XXX XXX+ XXX I+ xl+ I+ X I•H+_..._.
0.00
111214068352284342
N0
0.0
X00
10. --- +
XXX IxxxxxxxxxxxxXXX I
-__ +
10.
359
1831151331113
L
0.
.46
.02
.59
.26
.05
.98
.05
.65
.83
.37
.83
.91
G0 00 0.0
1123373
141176198206210213217219
AMEAN
00
XXXXXXXXX
00
491.32
Perc20
XX XX IX X XXXXXX I
2D
4
ent.00
+ --
XXX
.00
0.55.5
15.133.364.480.490.494.195.997.399.1
100.0
OTHER0
0.0
SO642.42
999484663519954200
.5 1
.5 12
.9 33
.7 73
.6 141
.6 176
.6 198
.9 206
.1 210
.7 213
.9 217
.0 219
UNQUAL ANAL21
Of Samples
30. — .....+
xxxxxxxx
— ..___+
30.
00
I
00
9 219
GMEAN341 .643
Analyzed40.00
----- + ......
40.00
0.55.5
15.133.364.480.490.494.195.997.399.1
130.0
READ219
GD2.13
50.00
50.00
99.594.584.966.735.619.69.65.94.12.70.90.0
VALUESPERCENT
VALUES219
60.00
60.00
Each increment (each X or I plotted) = 1.000 X
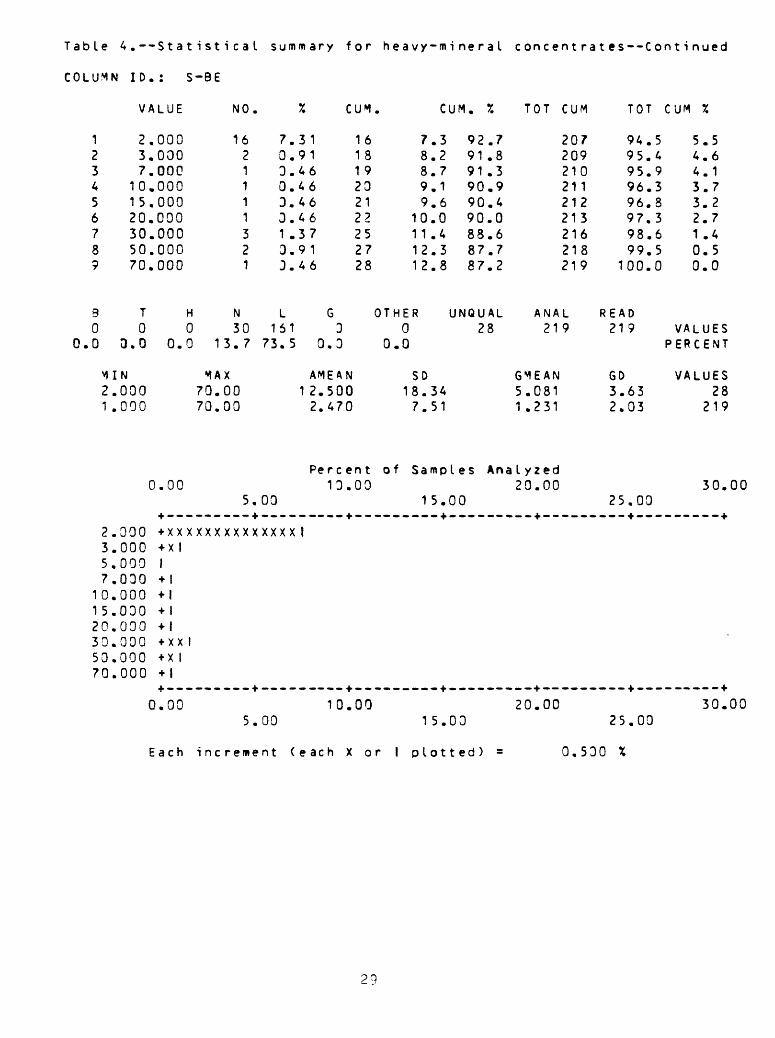
Table 4.--Statistica I summary for heavy-mineral concentratCS--Continued
COLUMN ID.: S-BE
VALUE NO CUM CUM. % TOT CUM TOT CUM %
123456789
B0
0.0
M21
237
101520305070
T0
0.0
IN
.000
.000
.000
.000
.000,000.000.000.000.000.000
H
00.0
1621111321
N30
13.7
MAX70.0070.00
700030133
L16
73.
.31
.91
.46
.46
.46
.46
.37
.91
.46
G1 35 0.3
AMEAN1 2.500
2.470
16181 9232122252728
Perc en t0.00
5. 0013. 00
7.38.28.79.19.6
10.011.412.312.8
OTHER0
0.0
SD18.347.51
92.791 .891.390.990.490.088.687.787.2
UNQUAL28
of Samples Ana
15. 00
207209210211212213216218219
ANAL219
GMEAN
5.0811 .231
I yzed20.00
94.595.495.996.396.897.398.699.5
100.0
READ219
P
GD3.632.03
25.00
5.54.64.13.73.22.71.40.50.0
VALUESERCENT
VALUES28
219
30.
2.000 +XXXXXXXXXXXXXXI3.000 +XI5.000 I7.000 +l
10.000 +l15.000 -H20.000 +l30.000 + X X I50.000 +XI70.000 -H
+___---___+——---——--+--.--,_,-,»- + ----..—---+---------4.--.
0.00 10.00 20.005.00 15.00 25.00
30.00
Each increment (each X or I plotted) = 0.500 X
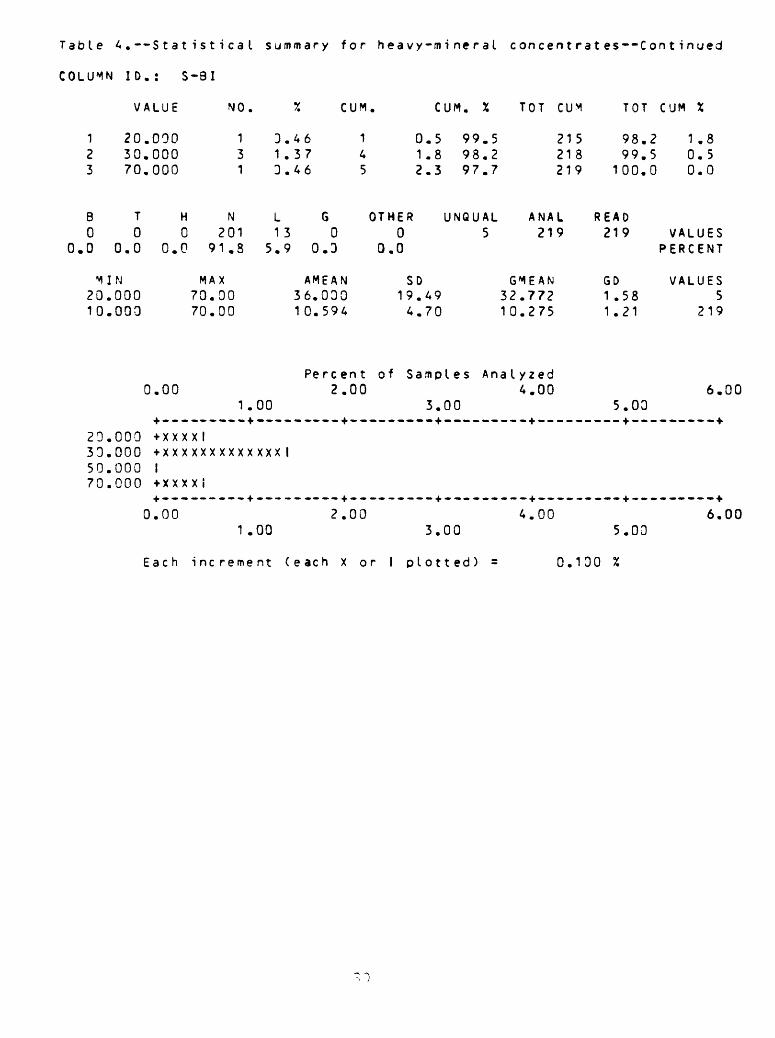
Table 4.--Statistica I summary for heavy-mineral concent rates--Continued
COLUMN ID.: S-8I
VALUE NO. X CUM. CUM.% TOT CUM TOT CUM X
123
B0
0.0
M2010
203070
T0
0.0
IN.000.000
.000
.000
.000
H0
0.0
131
N201
91. S
MAX70.0070.00
31D
L1
5.
.46
.37
.46
63 09 0.3
AMEAN36.03010.594
1 04 15 2
OTHER0
0.0
SD19.4.
.5
.8
.3
4970
99.598.297.7
UNQUAL5
215218219
ANAL219
GMEAN32.77210.275
98.99.
100.
READ219
GD1 .581.21
2 1 .85 0.50 0.0
VALUESPERCENT
VALUES5
219
Percent of Samples Analyzed 0.00 2.00 4.00 6.00
1.00 3.00 5.03 + ---— - — -.+—— -- — -. + - —— . — -- + - — - — ---. + ___.--_-_ + _-_- — --- +
20.000 +xxxxl33.000 +xxxxxxxxxxxxxI50.000 I70.000 + X X X X i
+ ---—— -„-_ + „_--_„__..+„„_„-. _-_ + _ -...-.-. + _ --•-«••«4> -»».--«- - +
0.00 2.00 4.00 6.001.00 3.00 5.03
Each increment (each x or I plotted) = 0.130 %
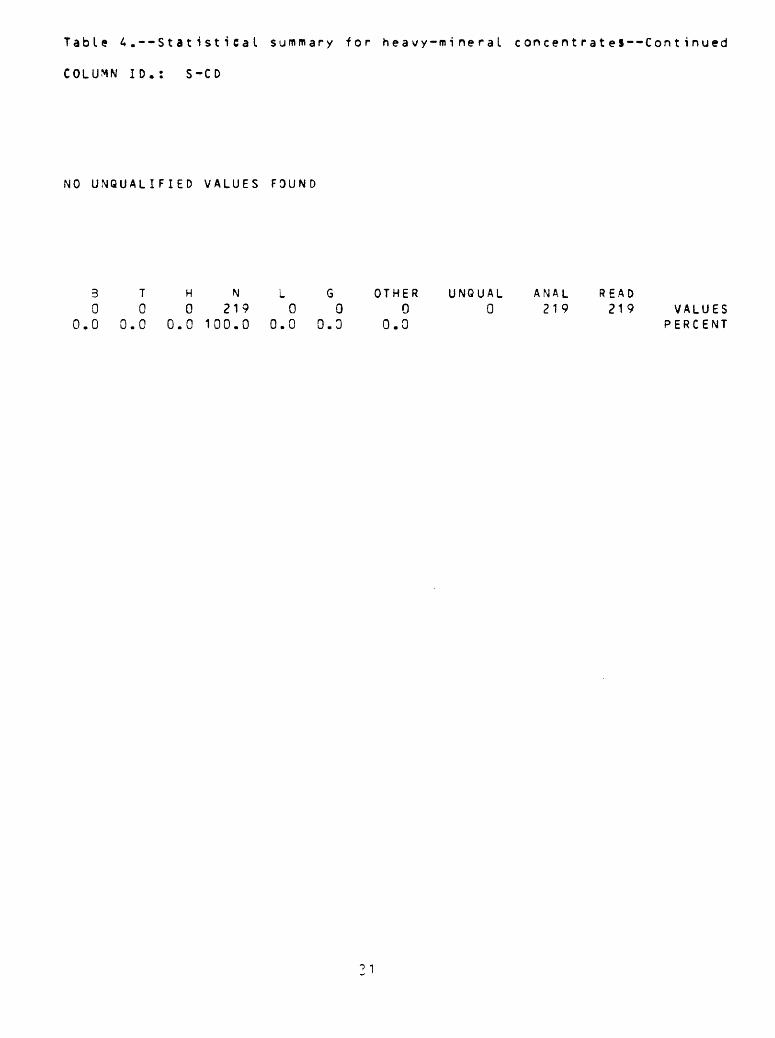
Table 4 .--Stat1stiCaI summary for heavy-mineral con centrateS--Continued
COLUMN ID.: S-CD
NO UNQUALIFIED VALUES FOUND
3 T H N L G OTHER UNQUAL ANAL READ000 219 000 0 219 219 VALUES
0.0 0.0 0.0 100.0 0.0 O.D 0.0 PERCENT

Table A.--Statistical summary for heavy-mineral concentrates'—Continued
COLUMN ID.: S-CO
VALUE NO CUM CUM. % TOT CUM TOT CUM
1234567
80
0.0
M135
101520305070
100
101520305070
100
T0
0.0
IN.000.000
.000
.000
.000
.000
.000
.000
.000
.000
.000
.000
.000
.000
.000
.000
H0
0.0
11
0.00
+ XXX•fXXX
+ XXX•fXXX+ XXX+ XX X•f XXX•f---
0.00
Each
1 2 59 4
26 115 3 2470 3135 151
N
0.
MAX00.0000.00
1
XIIxxxxxxxxxx
0 4
L00 1.
.4
. 1
.8
.2
.9
.9
.5
43
8170687
G3
0.0
11
1221470070
2052 1 5
AMEAN
0.00
XXXIxxxxx
xxxxxxxxxxxxxxxXI
1
XX XXX
_ + _--
0.00
inc rement
44
XXXXXX
Ce
3.32 6
5.9.
21.45.77.93.98.
OTHER0
0.0
SO
5 94.5 16 7.36 90.4 25 11.45 78.5 51 23.37 54.3 104 47.56 22.4 174 79.56 6.4 209 95.42 1.8 219 100.0
UNQUAL ANAL READ215 219 219
GMEAN GD22.07 37.415 1.78
2.626
Perc20
XXXXxxxx1
20
ach
en t•
*
X
00
XXXXX
X
00
0
22.46 36.065 1.88
92.788.676.752.520.54.60.0
VALUESPERCENT
VALUES215219
of Samples Analyzed
30
XIxxxxxxx
30
r 1 plo
40.00.00 50.00
XX I
40.00.00 50.00
tted) = 1.000 X
60.00
- — „...«.
60.00

Table 4.--Statistica I summary for heavy-mineral concentrates--Continued
COLUMN ID.: S-CR
VALUE NO. CUM. CUM. TOT CUM TOT CUM X
12 34 5 6 78 9
10 1 1 12
30
0.0
M2010
20. 30. 50. 70.
100. 150. 200. 300. 500. 700.
1000. 1500.
T
00.0
IN
.000
.000
000 000 000 000 000 000 000 000 000 000 000 000
0.
H00
4 6
14 14 21 32 29 44 31 13
6 2
N
MA11
500.5 00 .
0
X
•00
12 6 6 9
14 13 2D14
5 2 0
L
1.
.83
.74
.39
.39
.59
.61
.24
.09
.16
.94
.74
.91
G34 0.
4 1.8 98.2 7 3.2 96.8 10 4.6 95.4 13 5.9 94.1 24 11.0 89.0 27 12.3 87.7 38 17.4 82.6 41 18.7 81.3 59 26.9 73.1 62 28.3 71.7 91 41.6 58.4 94 42.9 57.1
120 54.8 45.2 123 56.2 43.8 164 74.9 25.1 167 76.3 23.7 195 89.0 11.0 198 90.4 9.6 208 95.0 5.0 211 96.3 3.7 214 97.7 2.3 217 99.1 0.9 216 98.6 1.4 219 100.0 0.0
OTHER UNQUAL ANAL READ0 0 216 219 219 VALUES0 0.0 PERCENT
AMEAN SO GMEAN GO VALUES0000
284.444 248.76 197.934 2.47 216280.685 249.10 190.003 2.62 219
Percent of Samples Analyzed
20305070
1001 50200300500700
10001500
0
.000
.000
.000
.000
.000
.000
.000
.000
.000
.000
.000
.000
0
E
.00
•••XX
+ XX+ XX
+ XX•••XX•••XX
+ XX+ XX•••XX
+ XX•••XX•••X I+ --
.00
ac h
XXXXXXXXXXX
IXIXXXXXXXXXXXXXXXXXI
X
X
XX
XX
X
X
inc
5.
xxxxXX
XX
XXXXXXX
r
XXXXXXXX
XXXXX
XXXX
5.
00
XXIXX 1XXXXXXXXXXXXXXXXI
00
ement
1
XX XXX
0.00 20.00 30.0015.00 25.00
IXX XXXXXXXXXXXXX IXX XXXXXXXXXX 1xxxxxxxxxxxxxxxxxxxxxxxxxxlxxxxx
1
( e ach
XXXXXXXXX I
3.00 20.00 30.0015.00 25.00
X or 1 plotted) « 0.500 %
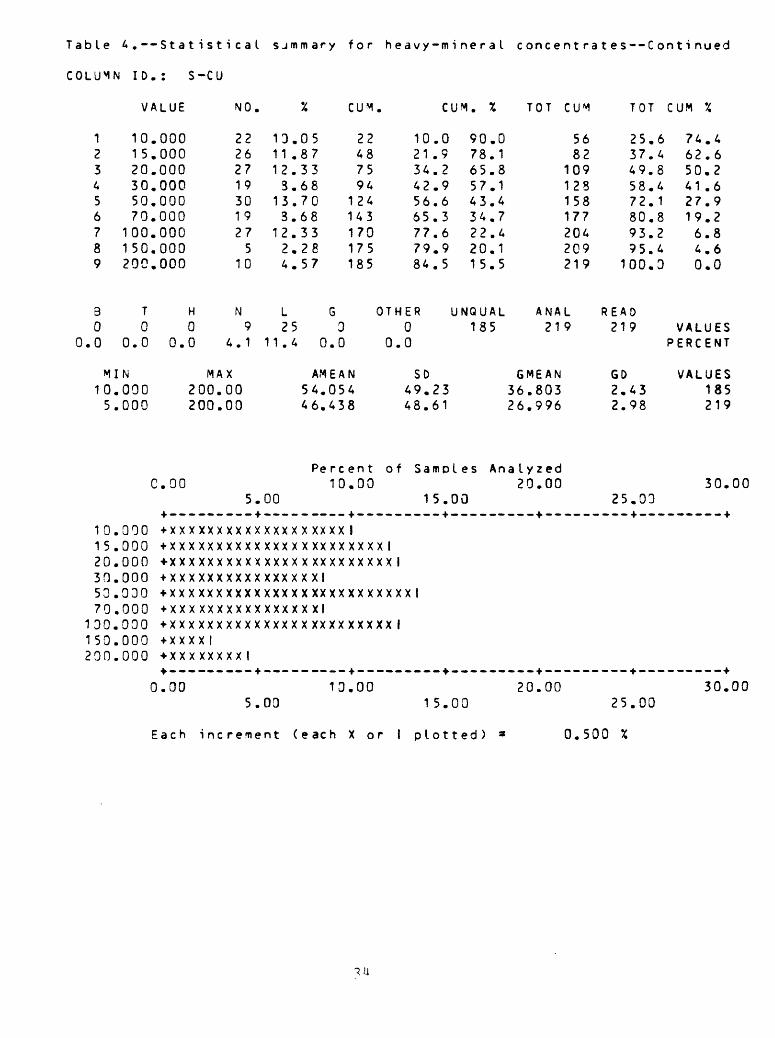
Table 4.--StatisticaL sjmmary for heavy-mineral coneentrates--Continued
COLUMN ID.: S-CU
VALUE
123456789
101 520305070
100150200
.000
.000
.000
.000
.000
.000
.000
.000
.000
NO. CUM CUM. %
222627193019275
10
13.0511.8712.333.6813.703.6812.332.284.57
22487594
124143170175185
10.021.934.242.956.665.377.679.984.5
90.078.165.857.143.434.722.420.115.5
TOT CUM TOT CUM %
5682
109128158177204209219
25.637.449.858.472.180.893.295.4
100.3
74.462.650.241 .627.919.26.84.60.0
30
0.0
T0
0.0
MIN 10.0005.000
H0
0.0
MAX200.00 200.00
L25
11.4
G3
0.0
AMEAN 54.054 46.438
OTHER0
0.0
UNQUAL 185
SO49.23 48.61
ANAL 219
GMEAN 36.803 26.996
READ 219
GD2.432.98
VALUES PERCENT
VALUES 185 219
c.ooPe re ent
10.005.00
of Samples
15.00
Analyzed 20.00
10.000 +XXXXXXXXXXXXXXXXXXXI15.000 +XXXXXXXXXXXXXXXXXXXXXXXI20.000 +XXXXXXXXXXXXXXXXXXXXXXXXI30.000 +XXXXXXXXXXXXXXXXI53.030 +XXXXXXXXXXXXXXXXXXXXXXXXXXI70.000 +XXXXXXXXXXXXXXXXI
130.000 +XXXXXXXXXXXXXXX XXXXXXXXX I1 50.000 +XXXXI200.000 +XXXXXXXXI
0.00 13.00 20.005.03 15.00
30.0025.03
30.00
Each increment (each X or I plotted)
25.00
0.500 %

Table 4.--Statistica I summary for heavy-mineral concentrates--Continued
COLUMN ID.: S-LA
VALUE NO. CUM CUM. TOT CUM TOT CUM %
1 70.000 3 1.3 2 100.000 4 1.8 3 150. OOC 17 7.7 4 200.000 16 7.3 5 300.000 37 16.8 6 500.030 52 23.7 7 700.000 48 21.9 8 1000.000 23 13.5 9 1500.000 12 5.4
10 2000.000 7 3.2
B T H N I000 00
0.0 0.0 0.0 3.0 0.0
MIN MAX70.000 2000.00 60
O.OC5.00
+___-_____+_____ 70.030 +XX I
100.000 +XXX1150.033 +XXXXXXXXXXXXXXX200.030 +XXXXXXXXXXXXXX I300.000 +XXXXXXXXXXXXXXX500.000 +XXXXXXXXXXXXXXX700.000 +XXXXXXXXXXXXXXX
1000.000 +XXXXXXXXXXXXXX X1500.000 +XXXXXXXXXX I2000.000 +XXXXXI
^.---_-_-.- + - — --0.00
5.00
Each i nc rement ( e
7 3 1.4 98.6 3 1.4 98.6 3 7 3.2 96.8 7 3.2 96.8 6 24 11.0 89.0 24 11.0 89.0 1 40 18.3 81.7 40 18.3 81.7 9 77 35.2 64.8 77 35.2 64.8 4 129 58.9 41.1 129 58.9 41.1 2 177 80.8 19.2 177 80.8 19.2 0 200 91.3 8.7 200 91.3 8.7 8 212 96.8 3.2 212 96.8 3.2 C 219 100.0 0.0 219 100.0 0.0
G OTHER UNQUAL ANAL READ0 0 219 219 219 VALUES
0.0 0.0 PERCENT
AMEAN SD GMEAN GO VALUES3.014 424.55 474.672 2.06 219
Percent of Samples Analyzed10.00 20.00 30.00
15.00 25.33— __ + -_ — ___._ + ____ — ___ + -______.._.». — __ — _-- +
I
XXXXXXXXXXXXXXXXXX IXXXXXXXXXXXXXXXXXXXXXXXXXXXXXXXIXXXXXXXXXXXXXXXXXXXXXXXXXXXXIXXXXX I
---- + . -------- + _ __.._-__-+_-___---_ + - .-_--__- + 10.00 20.00 30.00
15.00 25.00
ach X or 1 plotted) = 0.530 X
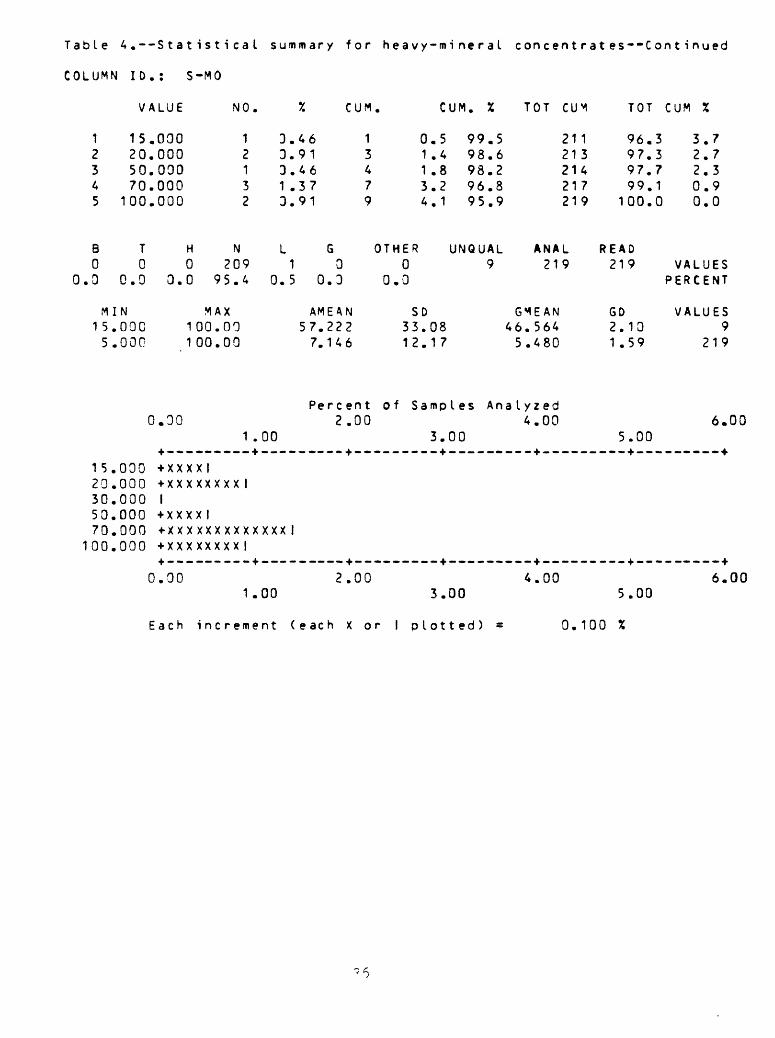
Table 4 .--Statistica I summary for heavy-mineral concentrates-"Continued
COLUMN ID.: S-MO
VALUE
15205070
,000000000000
100.000
NO
12132
3.463.913.461 .373.91
CUM
13479
CUM. X TOT CUM
0.5 1 .4 1 .8 3.2
99.598.698.296.8
TOT CUM X
4.1 95.9
21 121 3214217219
96.397.397.799.1
100.0
3.72.72.30.90.0
B0
0.3
T0
0.0
MI N15.00C 5.000
H0
0.0
N209
95.4
MAX100.00 100.00
L1
0.5
G0
0.3
AMEAN57.2227.146
OTHER0
0.0
UNQUAL 9
SD33.08 12.17
ANAL219
GMEAN 46.5645.480
READ219
GD2.101.59
VALUES PERCENT
VALUES9
219
0.30Percent of Samples Analyzed
2.00 4,001.00 3.00
1 5.000 +XXXXI 20.000 +XXXXXXXX ! 30.000 I 50.000 +XXXXI 70.000 +XXXXXXXXXXXXX I
100.000 +XXXXXXXXI
0.00 2.00 4.001.00 3.00
Each increment (each X or I plotted) =
6.005.00
6.005.00
0.100
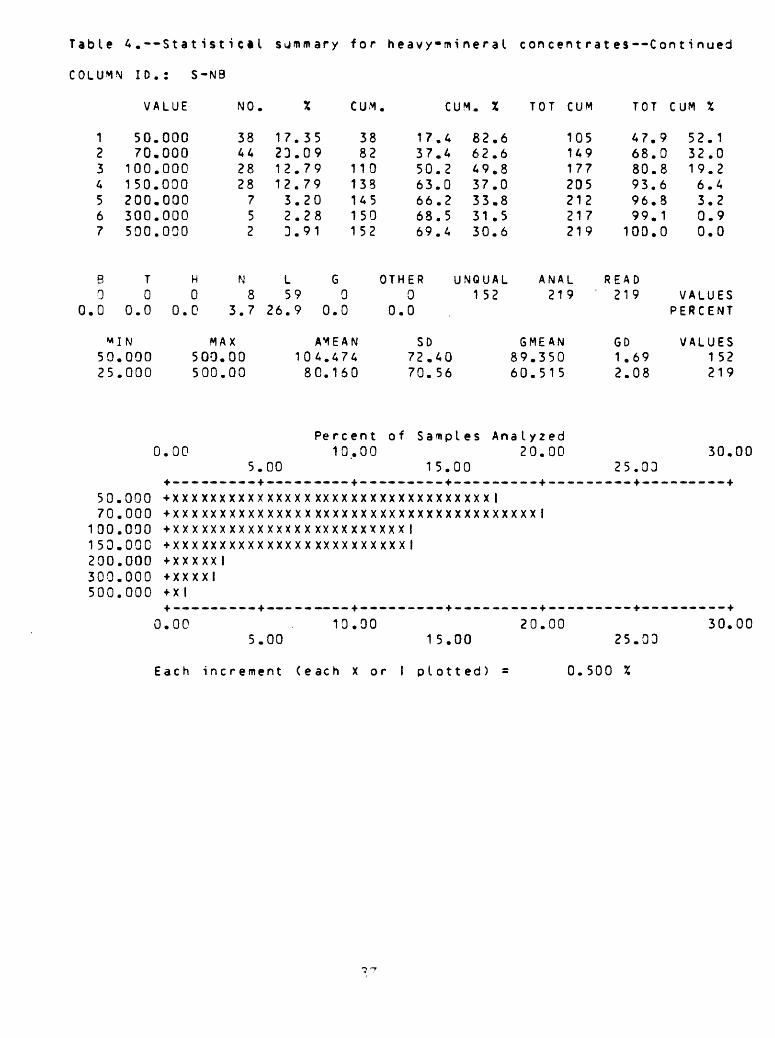
Table 4.--StatisticiI summary for heavy-mineral concentrates—Continued
COLUMN ID.: S-N9
VALUE NO. CUM CUM, TOT CUM TOT CUM %
1234567
B0
0.0
52
5070
100150200300500
T0
0.0
*I N0.0005.000
.000
.000
.000
.000
.000
.000
.000
H0
0.0
MA500.500.
38442828752
N8
3.7
X0000
17231212323
L5
26.
.35
.09
.79
.79
.20
.28
.91
G99 0.
3882
110138145150152
00
AMEAN104.480.1
7460
Percent0.00
5 .001 0.00
17.437.450.263.066.268.569.4
OTHER0
0.0
SO72.4070.56
82.662.649.837.033.831.530.6
UNQUAL1 52
105149177205212217219
ANAL219
GMEAN89.35060.515
47.968.080.893.696.899.1100.0
READ219
GO1.692.08
52.132.019.26.43.20.90.0
VALUESPERCENT
VALUES152219
of Sampl es Ana ly zed
1 5. 0020.00
25.0330.00
50.000 +XXXXXXXXXXXXXXXXXXXXXXXXXXXXXXXXXXI70.000 +XXXXXXXXXXXXXXXXXXXXXXXXXXXXXXXXXXXXXXXI
100.000 +XXXXXXXXXXXXXXXXXXXXXXXXXI150.000 +XXXXXXXXXXXXXXXXXXXXXXXXXI200.000 +xxxxxl300.000 +XXXXI500.000 +XI
00
ch
5.00
inc r ement
10.00
< e ac h X or I
1 5.00
I plotted)
20.0025.03
= 0.500 %
30.00

Table 4.—Statistical sjminary for heavy-mineral concentrates — Continued
COLUMN ID.: S-N1
VALUE NO. CUM CUM. % TOT CUM TOT CUM
1 10 2 15 3 20 4 30 5 50 6 70 7 100 8 150 9 200
10 300
9 T0 0
0.0 0.0
MIN10.0005.000
10.00015.00020.00030.00050.00070.000
100.0001 50.000200.000300.000
.000 21 9.
.000 14 6.
.000 9 4.
.000 19 3.
.000 28 12.
.000 35 15.
.000 22 13.
.000 17 7.
.000 3 1.
.000 2 3.
H N L0 247
0.0 0.9 21.5
MAX300.00300.00
0.005.00
+ --- — .-..4.--..+ X X X X X X X X X X X X X X+XXXXXXXXXXXX I4-XXXXXXX I4- X X X X X X X X X X X X X X+• X X X X X X X X X X X X X X+• X X X X X X X X X X X X X X+XXXXXXXXXX XXXX* X X X X X X X X X X X X X X+ XX I+ X I4..-- — - — - + - — . -
0.00
59 21 9.6 90.4 70 32.0 68.0 39 35 16.0 84.0 84 38.4 61.6 11 44 20.1 79.9 93 42.5 57.5 68 63 28.8 71.2 112 51.1 48.9 79 91 41.6 58.4 140 63.9 36.1 98 126 57.5 42.5 175 79.9 20.1 05 148 67.6 32.4 197 90.0 10.0 76 165 75.3 24.7 214 97.7 2.3 37 168 76.7 23.3 217 99.1 0.9 91 170 77.6 22.4 219 100.0 0.0
G OTHER UNQUAL ANAL READ3 0 170 219 219 VALUES
0.0 0.0 - PERCENT
AMEAN SD GMEAN GD VALUES64.529 52.29 45.734 2.43 17051.210 52.32 27.871 3.36 219
Percent of Samples Analyzed10.00 20.00 30.00
15.00 25.03- —— --4.---------4.- —— - —— ---4.---- —— ---4.---- —— ---4-
XXXX 1
X XIX XXXX XXXXXX 1XXXXXXXXXXXXXXXXX 1X XXXX 1X 1
13.00 20.00 30.005.00 15.00 25.00
Each increment (each X or I plotted) 0.500

Table 4.--Statistica I summary for heavy-mineral concentrates--Continued
COLUMN ID.: S-PB
VALUE NO. X CUM. CUM. X TOT CUM TOT CUM X
1 20.000 57 26.03 57 26.0 74.0 159 72.6 27.42 30.000 14 6.39 71 32.4 67.6 173 79.0 21.03 50.000 12 5.48 83 37.9 62.1 185 84.5 15.54 70.000 18 8.22 101 46.1 53.9 203 92.7 7.35 100,000 9 4.11 110 50.2 49.8 212 96.8 3.26 200.000 1 0.46 111 50.7 49.3 213 97.3 2.77 300.000 4 1.33 115 52.5 47.5 217 99.1 0.98 500.000 1 0.46 116 53.0 47.0 218 99.5 0.59 700.000 1 0.46 117 53.4 46.6 219 100.0 0.0
B T H N L G OTHER UNQUAL ANAL READ0 0 0 10 92 0 0 117 219 219 VALUES
0.0 0.0 0.0 4.6 42.0 0.0 0.0 PERCENT
MIN MAX AMEAN SD GMEAN GD VALUES20.000 700.00 59.145 91.65 37.522 2.24 11710.000 700.00 36.256 71.23 20.268 2.42 219
Percent of Samples Analyzed0.00 10.00 20.00 30.00
5.00 15.00 25.00
20.000 +XXXXXXXXXXXXXXXXXXXXXXXXXXXXXXXXXXXXXXXXXXXXXXXXXXXI30.000 +XXXXXXXXXXXXI50.000 +XXXXXXXXXX I70.000 +XXXXXXXXXXXXXXXI
100.000 +XXXXXXX1 150.000 I 200.000 +l 300.000 +XXXI 500.000 +1 700.000 +1
0.00 10.00 20.00 30.005.00 15.00 25.00
Each increment (each X or I plotted) a 0.500 X

Table 4.--Stat 1stica I summary for heavy-mineral concentrates--Continued
COLUMN ID.: S-SB
NO UNQUALIFIED VALUES FOUND
8 T H N L G OTHER UNQUAL ANAL READ000 219 030 0 219 219 VALUES
0.0 0.0 0.0 100.0 0.9 0.0 0.0 PERCENT
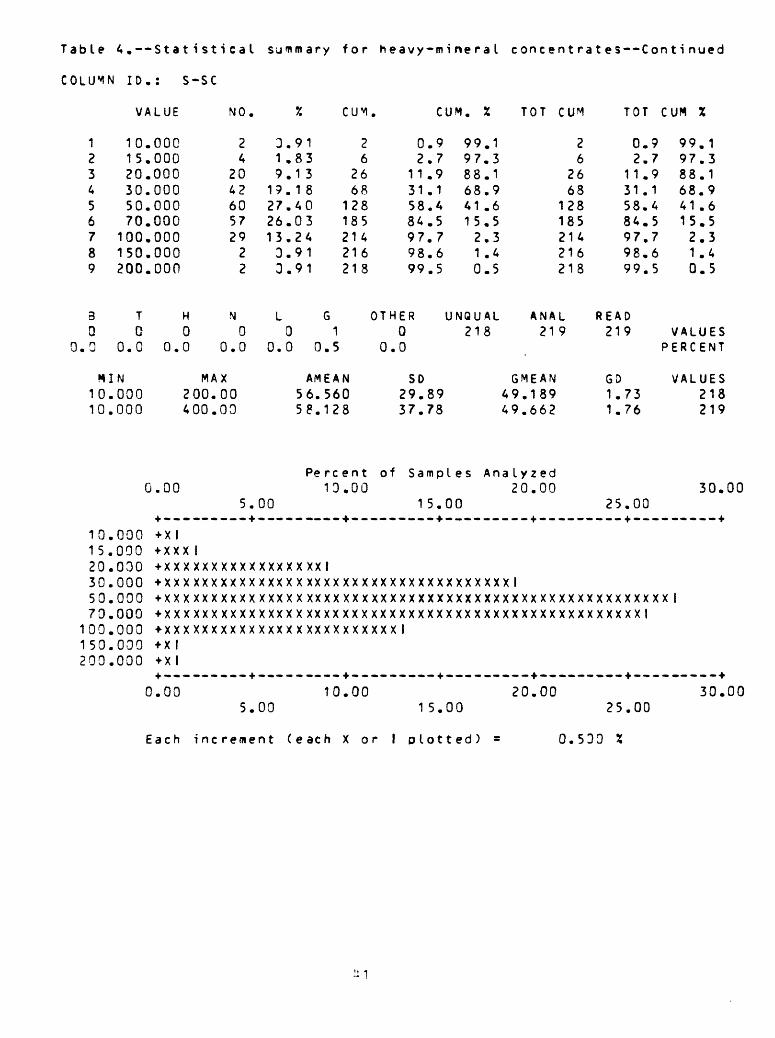
Table 4.--StatisticaI summary for heavy-mineral concentrates--Continued
COLUMN ID.: S-SC
VALUE
123456789
101520305070
100150200
.000
.000
.000
.000
.000
.000
.000
.000
.000
CUM
24
2042605729
22
3.911 .839.13
19. 1 827.4026.0313.243.913.91
26
2668
128185214216218
CUM. X
0.92.7
1 1.931.158.484.597.798.699.5
99.197.388.168.941 .615.52.31 .40.5
TOT CUM TOT CUM X
26
2668
128185214216218
0.92.7
11.931.158.484.597.798.699.5
99.197.388.168.941 .615.52.31.40.5
3 D
0.0
T0
0.0
PUN10.000 10.000
H0
0.0
N0
0.0
MAX200.00 400.00
L0
0.0
G1
0.5
AMEAN 56.560 58.128
OTHER0
0.0
UNQUAL 218
SO29.89 37.78
ANAL 219
GMEAN 49.189 49.662
READ 219
GD1.731.76
VALUESPERCENT
VALUES218219
101520305070
100
000000030000000000000
150.000200.000
00Percent of Samples Analyzed
13.00 20.00 30.005.00 15.00 25.00
+ XI+ XXX I+ XXXXXXXXXXXXXXX XX I+XXXXXXXXXXXXXXXXXXXXXXXXXXXXXXXXXXXXXI+XXXXXXXXXXXXXXXXXXXXXXXXXXXXXXXXXXXXXXXXXXXXXXXXXXXXXX+ XXXXXXXXXXXXXXX XXXX XXXXXXXXXXXXXXXXXXXXXXXXXXXXXXXXI+XXXXXXXXXXXXXXXXXXXXXXXXXI+ X I+ XI+ ---— .__- + . — -- — --+-_.— ---„_ + „ — ___._- + ....-_—._ + _.-.
0.00 10.00 20.005.00 15.00 25.00
30.00
Each increment (each X or I plotted) = 0.533

Table 4.--StatisticaI summary for heavy-mineral concent rates--Continued
COLUMN ID.: S-SN
VALUE NO CUM CUM. X TOT TOT CUM X
12345678
30
0.0
M2010
20305070
100150200300
20305070
100150200300
T0
0.0
IN.000.000
.000
.000
.000
.000
.000
.000
.000
.000
.000
.000
.000
.000
.000
.000
.000
.000
0.
0.00
+ XX+ XX+ XX+ XX+• X X+ X 1+ 1
*•--o.oc
Each
341924185211
H N0 980 44.7
MAX300.00300.00
5
xxxxxxxX XXXXXXxxxxxxxxxxxxxxXXI
5
15S
1382303
L1
7.
.00
xxxxxxxxxxxxxxxx
.00
inc rement
.53
.68
.96
.22
.28
.91
.46
.46
78 0
AM4£.28.
Pe
XX XXXXXI
34537795
100102103104
G OTH0
.3 0.
EAN173128
re en t of10.00
xxxxxxxx
1524354345464747
ER00
SD39.33.
.5
.2
.2
.4
.7
.6
.0
.5
7333
84.5 14975.8 16864.8 19256.6 21054.3 21553.4 21753.0 21852.5 219
UNQUAL ANAL R104 219
G M E A N38.95419.074
68.076.787.795.998.299.199.5
100.0
EAD219
GD1.852.23
32.023.312.34.11.80.90.50.0
VALUESPERCENT
VALUES104219
Samples Ana ly zed
1
XXX
5.
XX
20.0000
1
25.03' 30.00
xxxxxxxx IXX I
( eac
10.00
h X or I
1 5.
plot
20.0000
ted) = 0.530
25.00
X
30.00
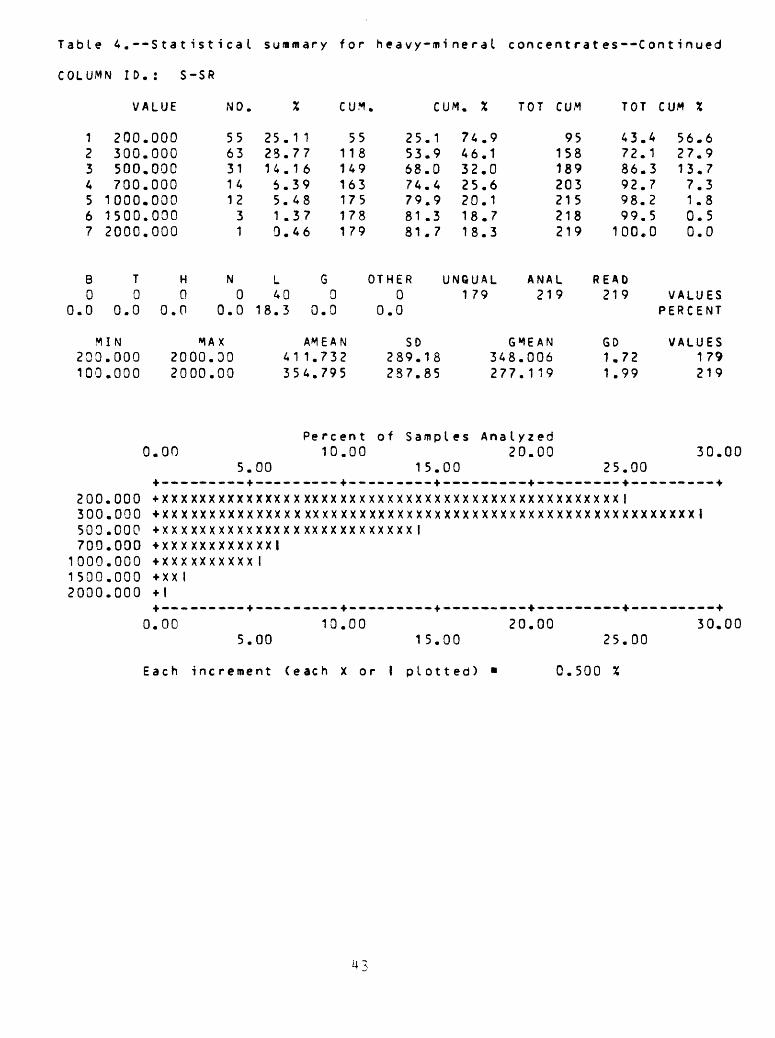
Table 4.--Statistica I summary for heavy-mineral concent rates--Continued
COLUMN ID.: S-SR
VALUE
1 2 3 4 5 6 7
200. 300. 500. 700.
1000. 1500. 2000.
000 000 000 000000 000 000
NO CUM CUM. % TOT CUM
5563311412
31
25.1 123.7714.166.395.481 .370.46
55118149163175178179
25.153.968.074.479.981 .381.7
74.946.132.025.620.118.718.3
TOT CUM %
95158189203215218219
43.472.186.392.798.299.5
100.0
56.627.913.77.31.80.50.0
B0
0.0
T0
0.0
WIN200.000100.000
H0
0.0
N0
0.0
MAX2000.002000.00
L40
18.3
G0
0.0
AMEAN 41 1.732 354.795
OTHER0
0.0
UNGUAL 1 79
SO289.18 287.85
ANAL 219
GMEAN 348.006 277.1 19
READ 219
GO 1.721 .99
VALUES PERCENT
VALUES 179 219
onPe re
105.00
ent.00
of Sampl es
15.00
Ana I2y0z.ed00 30
25.00
200.000 +XXXXXXXXXXXXXXXXXXXXXXXXXXXXXXXXXXXXXXXXXXXXXXXXXI300.000 +XXXXXXXXXXXXXXXXXXXXXXXXXXXXXXXXXXXXXXXXXXXXXXXXXXXXXXXXX1500.000 +XXXXXXXXXXXXXXXXXXXXXXXXXXXI700.000 +XXXXXXXXXXXXI1000.000 +XXXXXXXXXX I1500.000 +XXI2000.000 +l
0.00 10.00 20.00 30.005.00 15.00
Each increment (each x or I plotted)
25.00
0.500
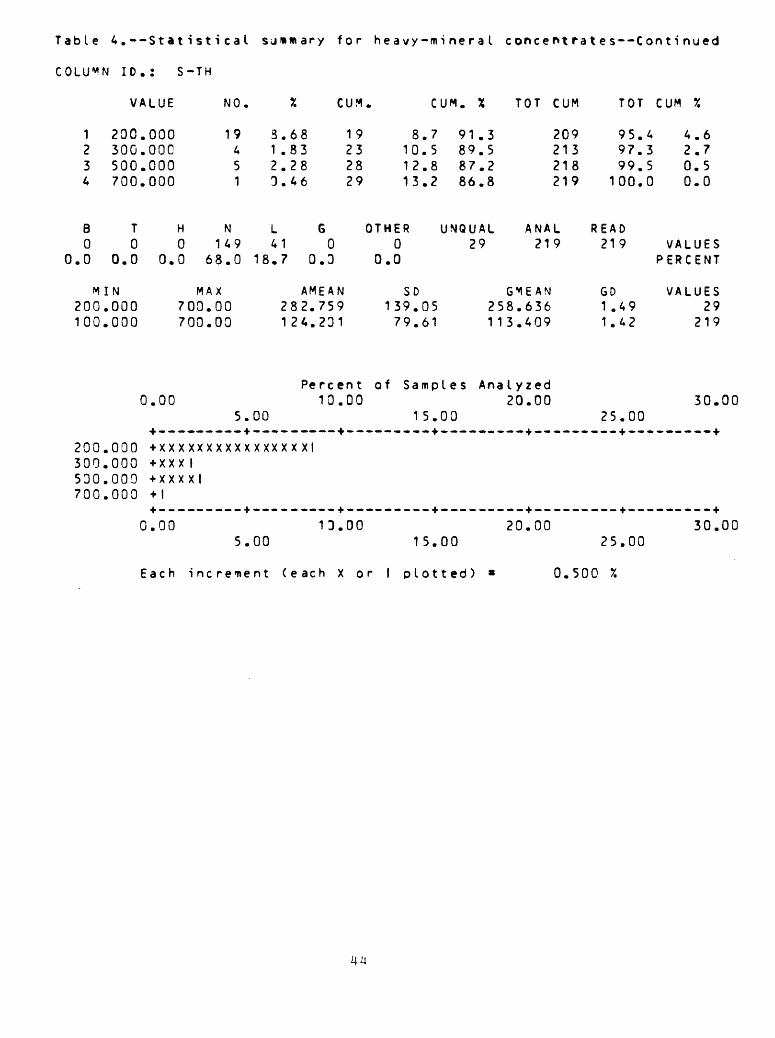
Table 4.--Statistical sjmmary for heavy-mineral coneentrates--Continued
COLUMN ID.: S-TH
VALUE NO. X CUM. CUM. X TOT CUM TOT CUM %
1234
B0
0.0
MI200.100.
200.300.500.700.
T0
0.0
N000000
000000000000
H0
0.0
19451
N149
68.0
MAX700700
.00
.00
3.68 191.83 232.28 283.46 29
L 641 0
18.7 0.3
AMEAN282.759124.231
8101213
OTHER0
0.0
SD139.79.
.7
.5
.8
.2
91.89.87.86.
3528
UNQUAL
0561
29
GM258.113.
209213218219
ANAL219
EAN636409
95.97.99.
100.
READ219
GO1.491.42
4 4.63 2.75 0.50 0.0
VALUESPERCENT
VALUES29
219
Percent of Samples Analyzed0.00 10.00 20.00 30.00
5.00 15.00 25.00
200.000 +XXXXXXXXXXXXXXXXI300.000 +XXXI530.000 +xxxxi700.000 +l
0.00 13.00 20.00 30.005.00 15.00 25.00
Each increment (each X or I plotted) « 0.500 %

Table 4.--Statistica I summary for heavy-mineral concentrates--Continued
COLUMN ID.: S-V
VALUE NO CUM CUM. x
1234567
150.000300.000300.000500.000700.000
1000.0002000.000
929
1055616
31
4.1 113.2447.9525.577.311.373.46
938
14319921521821 9
4.117.465.390.998.299.5
100.0
95.982.634.7
9.11.80.50.0
TOT CUM TOT CUM
938
143199215218219
4.117.465.390.998.299.5
100.0
95.982.634.7
9.11 .80.50.0
90
0.0
T0
0.0
150.000
H0
0.0
N 0
0.0
MAX 2000.00
L3
0.0
G 3
0.3
AMEAN 378.31 1
OTHER0
0.0
UNQUAL 219
SD 195.24
ANAL 219
GHEAN 343.534
READ 219
GD 1.53
VALUES PERCENT
VALUES 219
00Perc ent of20.00
10.00
Samples
30.00
Ana I yz ed40.00 60
50.00
1 50.000 + xxx I200.000 +XXXXXXXXXXXXI330.000 +XXXXXXXXXXXXXXXXXXXXXXXXXXXXXXXXXXXXXXXXXXXXXXXI500.000 +XXXXXXXXXXXXXXX XXXX XXXXXX I700.000 +XXXXXXI
1000.000 +l 1503.000 I 2000.000 I
0.00 20.00 40.00 60.0010.00 30.00
Each increment (each X or I plotted)
53.00
1.000 X

Table 4.--Statistical sjmmtry for heavy-mineral concentrates--Continued
COLUMN ID.: S-W
VALUE NO. % CUI. CUM. X TOT CU-M TOT CUM X
123
B0
0.0
M10050
100150200
T0
0.0
IN.000.000
.000
.000
.000
H0
0.0
22
421
N206
94.1
MAX00.0000.00
1 .833.913.46
L G6 3
2.7 0.0
AMEAN1 28.57152.51 1
4 16 27 3
OTHER0
0.0
SD39.15.
.8
.7
.2
3431
98.297.396.8
UNQUAL7
1
ANA21
GME AN23.97051.472
216218219
L9
98.99.
100.
READ219
GD1.331.18
6 1.45 0.53 0.0
VALUESPERCENT
VALUES7
219
Percent of Samples Analyzed0.00 2.00 4.00 6.00
1.00 3.00 5.03
130.000 +XXXXXXXXXXXXXXXXX I 1 50.000 +XXX XXXXXI200.000 +xxxxl
0.00 2.00 4.00 6.001.00 3.00 5.00
Each increment (each X or I plotted) = 0.100 %

Table 4.--Stit 1st 1ca I summary for heavy-mineral concent rates--Continued
COLUMN ID.: S-Y
VALUE
123456789
1011
50.00070.000
100.000150.000200.000300.000500.000700.000
1000.0001500.0002000.000
NO. CUM CUM. X TOT CUM
11 1334349312815
341
0.465.02
15.0719.6322.3714.1612.796.851.371 .833.46
1124588
137168196211214218219
0.55.5
20.540.262.676.789.596.397.799.5
100.0
99.594.579.559.837.423.310.53.72.30.50.0
TOT CUM X
1124588
137168196211214218219
0.55.5
20.540.262.676.789.596.397.799.5
100.0
99.594.579.559. 337.423.310.53.72.30.50.0
B0
0.0
T0
0.0
MIN 50.000
H 0
0.0
N0
0.0
MAX2000.00
L3
0.0
G 3
0.0
AMEAN 297.580
OTHER0
0.0
UNQUAL 219
SD 279.75
ANAL 219
GMEAN 223.193
READ 219
GD2.05
VALUES PERCENT
VALUES 219
11
5070
100150200300500700000500
2000
0
.000
.000
.000
.000
.000
.000
.000
.000
.000
.000
.000
0
E
.00
•H+ XX+ XX+ XX+ XX+ XX+ XX+ XX+ XX+ XX+ 1.00
ac h
XXXXXXX1X
XXXXXX
5.00
XXX 1xxxxxxx
xxxxxxxxxxXXXXXXXXXXXX
1
inc
xxxxxxxxxxxxxxxxxxxxxxxxxxxx
5.00
rement
XXXXXXXXXX1
<e
Pe re 10
XXXXXXXXxxxxxxxxxxxx
13
ach
ent.00
XXXXXXXXXX
•f- .0
X
XXXXX
0
o
of Samples Analyzed 20.00 30.00
15.00 25.00-.-----+- — - — _-_+-_ — -.... + — .. — --_+
XXXXXXX IXXXXXXXXXXXXXXXX IxxxxxxxxxxxxxxxxxxxxxxlXXXXX IXXX I
20.03 30.0015.00 25.00
r I plotted) « 0.500 X

Table 4.--Statistica I summary for heavy-mineral concentrates--Continued
COLUMN ID.: S-ZN
VALUE NO. X CUM. CUM. % TOT CUM TOT CUM %
1 700.000 1 3.46 1 0.5 99.5 219 100.0 0.0
B T H N L G OTHER UNQUAL ANAL READ0 0 0 215 3 0 0 1 219 219 VALUES
0.0 0.0 0.0 98.2 1.4 0.0 0.0 PERCENT
WIN MAX700.000 700.00 250.000 700.00
0.00 1.00
700.090 +XXXXI
0.00 1.00
Each increment
AMEAN700.000 252.355
Percent2.00
2.00
(each X o
SO0.00
30.41
of Sampl es
3.00
3.00
r I plotted
GMEAN GO700.000 ******** 251.178 1.07
Ana I y zed 4.00
5.03
- — ___+_-__-__ — + — -4.00
5.00
) = 0.100 %
VALUES1
219
6.00
6.00

Table 4.--StatisticaI summary for heavy-mineral con cent rates--Continued
COLUMN ID.: S-ZR
VALUE
12 345 6 7 8 9
100. 150.200. 300. 500. 700.
1000. 1500. 2000.
000 000000 000 000 000 000 000 000
NO. CUM. CUM. X
14579
22221733
3.461 .832.283.204.1 1
13.0513.057.7615.07
15
101726487087120
0.52.34.67.811.921.932.039.754.8
99.597.795.492.288.178.168.060.345.2
TOT CUM TOT CUM %
15
101726487087
120
0.52.34.67.8
11.921.932.039.754.8
99.597.795.492.288.178.168.060.345.2
30
0.0
T0
0.0
MIN 100.000100.000
H0
3.0
N0
0.0
MAX2000.00 4000.00
L3
0.0
G99
45.2
AMEAN 1143.3332434.703
OTHER0
0.0
SD643.94
1502.33
UNQUAL 120
ANAL 219
GMEAN914.811
1782.280
READ 219
GD2.132.52
VALUES PERCENT
VALUES 120 219
I30
5.00
Dercent of Samples Analyzed13.00 20.00 30
15.00 25.00
100.030 +l150.000 +XXXI230.000 +XXXXI300.000 +XXXXXI503.030 +XXXXXXXI700.030 +XXXXXXXXXXXXXXXXXXXI
1000.000 +XXXXXXXXXXXXXXXXXXXI1500.000 +XXXXXXXXXXXXXXXI2000.000 +XXXXXXXXXXXXXXXXXXXXXXXXXXXXXI
+ --- — - — - + — ___ — __+_„— ____- + __,
0.00 10.005.00 15.00
20.00.— 4- —•
25.0030.00
Each increment (each X or plotted) = 0.500

Table 4.—Statistical summary for heavy-min*ral concentrates—Continued
COLUMN ID.: AA-CU-P
VALUE
123456789
10
5.00010.00015.00020.00030.00050.00070.000
100.000150.000200.000
NO. CUM
82232402129211496
3.6510.0514.6113.269.5913.249.596.394.112.74
83062
102123152173187196202
CUM. X
3.713.728.346.656.269.479.085.489.592.2
96.386.371,753.443.830.621.014.610.5
7.8
TOT CUM TOT CUM %
244678
118139168189203212218
11.021.035.653.963.576.786.392.796.899.5
89.079.064.446.136.523.313.77.33.20.5
30
0.0
T 0
0.0
MIN5.0002.500
H 0
0.0
M 0
0.0
MAX200.00200.00
L16
7.3
G1
0.5
AMEAN 44.752 41.537
OTHER0
0.0
UNQUAL 202
SO44.49 44.17
ANAL 219
G M E A N 29.767 24.716
READ 219
602.452.94
VALUES PERCENT
VALUES 202 219
0.00Percent
10.005.00
of Samples
15.00
Ana Iyzed20.00
0.00 13.00 20.005.00 15.00
Each incre»ent (each X or I plotted) a
30.0025.00
57
101 520305070
100150200
.
.
.
.
.
.
.
.
.••
000000000000000000000000000000000
+ XXI+ XX+ XX+ XX+ XX+ XX+ xx+ XX+ XX+ XX
X
XXXXXXXXX
XX
XXXXXXXXXXXXXXXXX!
X
XXXXXXXX
I
xxxxxxxxxxxxxxxxxxxxxxxxxxxxxxxXI
XXXXXXXXXXXXXXXXXI
XXXXXX
XXXXXX
XXXX IXXXXXXXXXXXXX IxxxxxxxxxxxxxxxxxxxxxlXXX IXXXXXXXXXXIXXX I
30.0025.00
0.500 X
50

Table 4.--Statistica I sjmmary for heavy-mineral concentrates--Continued
COLUMN ID.: AA-PB-P
VALUE
123456789
10
5.00010.00015.00020.00030.00050.00070.000
100.000200.000300.000
NO. CUM CUM.
2177593010
93124
9.5935.1 626.9413.704.574.111.373.463.911 .83
2198
157187197206209210212216
9.644.771.785.490.094.195.495.996.898.6
90.455.328.314.610.05.94.64.13.21 .4
TOT CUM TOT CUM
24101160190200209212213215219
11.046.173.186.891.395.496.897.398.2
100.0
89.053.926.913.28.74.63.22.71 .80.0
90
0.3
T0
0.0
MIN5.0002.50C
H0
0.0
N0
0.0
MAX300.00 300.00
L3
1. 4
G3
0.3
AMEAN 23.241 22.957
OTHER0
0.0
UNQUAL 216
SO43.83 43.59
ANAL219
GMEAN 14.710 14.357
READ 219
GD2.102.15
VALUES PERCENT
VALUES 216219
Percent of Samples Analyzed0.00 29.00 40.00
10.00 30.00 50.00+ --- — _-_- + _ — -- — -- + -- — --- — + - — - — --- + ------_-.. + .._...-.
5.000 +XXXXXXXXX I7.000 I10.000 +XXXXXXXXXXXXXXXXXXXXXXXXXXXXXXXXXXI15. 000 +XXXXXXXXXXXXXXXXXXXXXXXXXXI20.000 +XXXXXXXXXXXXX I30.000 +XXXXI50.000 +XXXI70.000 +1
100.000 I150.000 I200.000 +l300.000 +XI
+ --- — - — - + —— --. — -- + _- — - — -- + - — - — --- + -- ——— ... + _.....0.00 20.00 40.00
10.00 30.00 50.00
Each increment (each X or I plotted) = 1.000 %
60.00
... — +
— --- +60.00
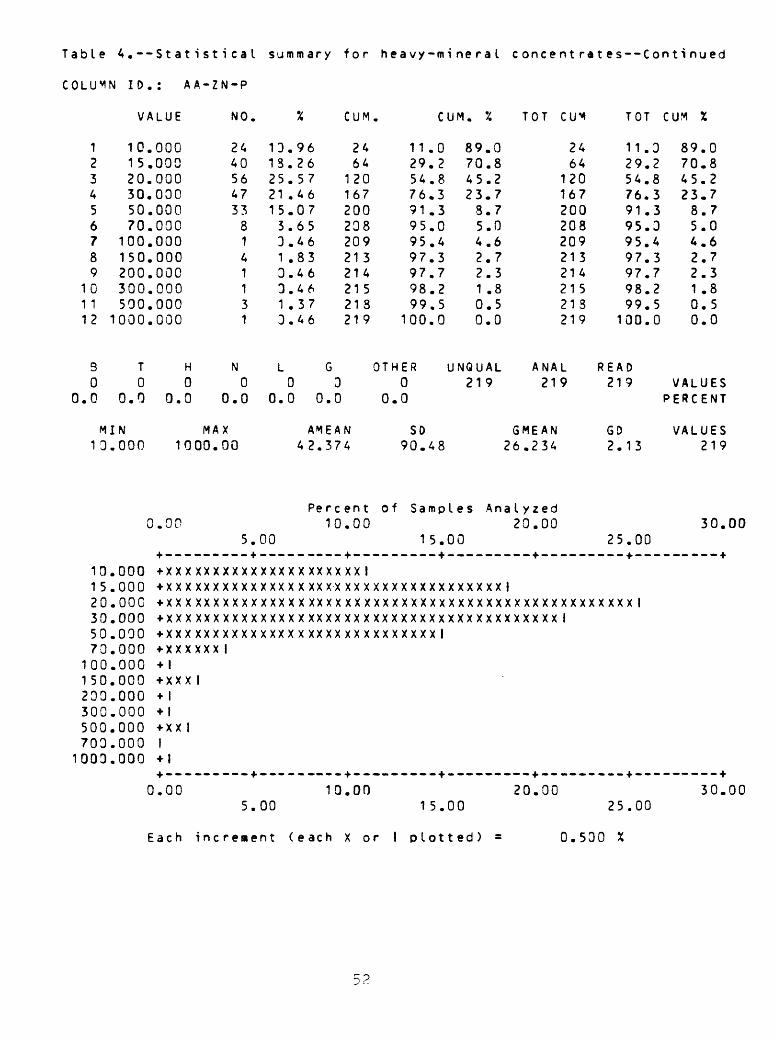
Table 4.--Statistica I summary for heavy-mineral concentrates--Confinued
COLUMN 10.: AA-ZN-P
VALUE NO. CUM CUM. % TOT CUM TOT CUM X
123456789
101 112
30
0.0
101520305070
100150200300500
1000
T0
0.0
MIN13
101520305070
100150230300500703
1003
.000
.000
.000
.000
.000
.030
.000
.000
.000
.000
.000
.000
.000
.000
.000
.000
.000
.000
.000
.000
.000
.000
.000
.000
.000
.000
H
00.0
MA1000.
0.00
+_____-
+XXXXXX+XXXXXX4-XXX XXX4-XXX XXX4-XXXXXX4-XXXXXX+ I+ XXX I-t- I•H
+ XX II+ l
0.00
Each inc
2440564733
8141131
N0
0.0
X00
5.--- + xxxxxxxxxxxxxxxxxxxxI
5.
13.9613.2625.5721 .4615.073.653.461 .833.463.461 .373.46
L G0 3
0.0 0.0
AMEA
2464
120167200238209213214215218219
N42.374
Perc10
00
xxxxxxxxxXXX X X XXXXxxxxx xxxxxxxxxxxxxxxxxxxxxx
1000
r enent ( e ach
ent.00
+ --
XX 1XXX
XXX
XXX
XXX
.00
X 0
11.029.254.876.391.395.095,497.397.798.299.5
100.0
OTHER0
0.0
SO90.48
89704523
35422100
.0 24
.8 64
.2 120
.7 167
.7 200
.0 208
.6 209
.7 213
.3 214
.8 215
.5 213
.0 219
UNQUAL ANAL R21
of Samples
15........4
xxxxxxxxxxxxxxxxxxxxxxxxXXXXXXX I
1 5.
r I plot
00
XXXXxxxxxxxx
00
ted)
9 219
GMEAN26.234
Analyzed20.00
— .-.+._..--.
XX IxxxxxxxxxxxxxXXXXXXXX I
20.00
= 0.530
11.329.254.876.391.395.395.497.397.798.299.5
100.0
EAO219
GD2.13
25.00..+...
XXX I
25.00
%
89704523
85422100
.0
.8
.2
.7
.7
.0
.6
.7
.3
.8
.5
.0
VALUESPERC ENT
VALUES219
30.00
-- +
30.00

Table 4.--Statistical summary fo
r heavy-mineral concentrates--Continued
[Estimates recomputed by the
method of
Cohen]
en CO
EL
EM
EN
T
S-F
EX
S-M
GX
S-C
AX
S-T
IXS
-MN
S-A
6S
-BS
-BA
S-B
ES
-BI
s-co
S-C
Rs-
cuS
-LA
S-M
OS
-NB
S-N
IS
-PB
s-sc
S-S
NS
-SR
S-T
HS
-VS
-WS
-YC
_ 7 D
d
& n
AA
-CU
-PA
A-P
B-P
AA
-ZN
-P
GE
OM
ET
RIC
ME
AN
6.8
54
.27
7.9
3
23
21
.0
.00
07
01
11
.93
*1.
5.
OB
0.7
46
36
.31
91
.2
6.7
47
5.
0.0
096S
59
.32
6.6
17
.6********
16
.62
87
.2
59
.3
44
.1
3.0
22
3.
********
********
14
.42
7.0
GE
OM
ET
RIC
DE
VIA
TIO
N
1.7
52
. 18
1.4
4******
1.5
65
1.8
22
.33
2.1
33.6
34
.90
1.8
52
.59
3.0
92
.06
49
.47
2.2
03.7
13.0
1******
2.7
81
.91
1.4
91
.53
2.7
22
.05
******
2.1
32
.09
RE
MA
RK
S
219
S219
S2
19
S
A. O
r
6V
G
21
9
S2
11
N
143
N219
S1
91
N
21
4
N4
N3
N34
N
219
S210
N67
N4
9
N1
02
N
1 G
115
N40
N190
N219
S212
N219
S99
G 1
G3
N219
SSAMPLES AND
219 ANALYTICAL VALUES.
SAMPLES AND
219 ANALYTICAL VALUES.
SAMPLES AND
219 ANALYTICAL VALUES.
GREATER THAN VALUES. NO COMPUTATIONS.
SAMPLES AND
219 ANALYTICAL VALUES.
DETECTED, LESS THAN, OR TRACE VALUES.
NOT DETECTED, LESS THAN, OR TRACE VALUES.
SAMPLES AND
219 ANALYTICAL VALUES.
NOT DETECTED, LESS THAN, OR TRACE VALUES.
NOT DETECTED, LESS THAN, OR TRACE VALUES.
NOT DETECTED, LESS THAN, OR TRACE VALUES.
NOT DETECTED, LESS THAN, OR TRACE VALUES.
NOT DETECTED, LESS THAN, OR TRACE VALUES.
SAMPLES AND
219 ANALYTICAL VALUES.
NOT DETECTED, LESS THAN, OR TRACE VALUES.
DETECTED, LESS THAN, OR TRACE VALUES.
NOT DETECTED, LESS THAN, OR TRACE VALUES.
NOT DETECTED, LESS THAN, OR TRACE VALUES.
GREATER THAN VALUE.
NO COMPUTATIONS.
DETECTED, LESS THAN, OR TRACE VALUES.
NOT DETECTED, LESS THAN, OR TRACE VALUES.
NOT DETECTED, LESS THAN, OR TRACE VALUES.
SAMPLES AND
219 ANALYTICAL VALUES.
NOT DETECTED, LESS THAN, OR TRACE VALUES.
SAMPLES AND
219 ANALYTICAL VALUES.
GREATER THAN VALUES. NO COMPUTATIONS.
GREATER THAN VALUE.
NO COMPUTATIONS.
DETECTED, LESS THAN, OR TRACE VALUES.
SAMPLES AND
219 ANALYTICAL VALUES.
8 REPORTED VALUES.
76 REPORTED VALUES.
28 REPORTED VALUES.
5 REPORTED VALUES.
215 REPORTED VALUES.
216 REPORTED VALUES.
185 REPORTED VALUES.
9 REPORTED VALUES.
152 REPORTED VALUES.
170 REPORTED VALUES.
117 REPORTED VALUES.
104 REPORTED VALUES.
179 REPORTED VALUES.
29 REPORTED VALUES.
7 REPORTED VALUES.
216 REPORTED VALUES.
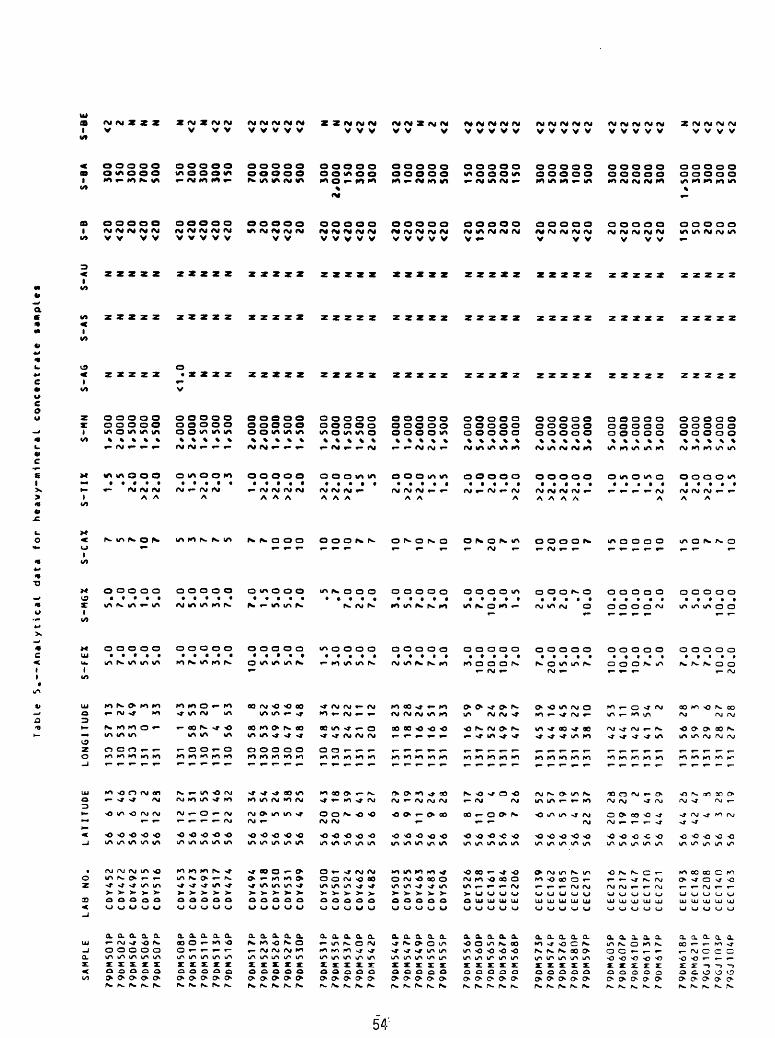
Table
5.--Anal
ytical
data
fo
r heavy-mineral conctntrate samples
SAMPLE
LAB NO.
LATITUDE
LONGITUDE
S-FEX
S-MGX
S-CAX
S-TIX
S-HN
S-AG
S-AS
S-AU
S-B
S-8A
S-BE
79DM501P
790M502P
79DM504P
790M506P
790M507P
790M508P
79DM510P
79DM51 1P
790M513P
790MS16P
790M517P
79DM523P
79DM526P
79DM527P
79DM530P
79DM531P
790M535P
790M537P
790M5AOP
79DM542P
790M544P
79DM547P
79DM549P
790M550P
79DM555P
790M556P
790M560P
79DM565P
79DM567P
79DM568P
79DM573P
79DM574P
79DM576P
79DM580P
790M597P
790M605P
79DM607P
790M610P
790M61 3P
790M617P
79DM61 8P
79DM621P
79GJ101P
79GJ105P
79GJ 10AP
CDY452
CDY472
CDY492
CDY515
CDY516
CDV453
COY473
CDY493
CDY517
CDY474
CDY494
CDY518
CDY530
CDY531
CDY499
CDY500
CDY501
CDY524
CDY462
CDY482
COY503
CDY525
CDY463
CDY483
CDY504
CDY526
CEC138
CEC161
CEC184
CEC206
CEC139
CEC162
CEC185
CEC207
CEC215
CEC216
CEC217
CEC1 A7
CEC170
CEC221
CEC193
CEC1 A8
CEC208
CECUO
C6C163
56 56 56 56 56 56 56 56 56 56 56 56 56 56 56 56 56 56 56 56 56 56 56 56 56 56 56 56 56 56 56 56 56 56 56 56 56 56 56 56 56 56 56 56 56
6 5 6 12 12 12 11 10 11 22 22 195 5 4
20 207 6 6 6 9
11 9 8 8 11 10 9 7 6 5 5 422 20 19 13 16 AA AA 42A 3 2
13 46 432
23 27 31 55 46 32 34 54 24 38 25 43 18 39 41 27 29 19 23 24 23 17 264 0
26 52 57 19 15 37 28 232
41 29 25 473 28 19
133
130
133
131
131
131
130
130
131
130
130
130
130
130
130
130
133
131
131
131
131
131
131
131
131
131
131
131
131
131
131
131
131
131
131
131
131
131
131
131
131
1 31
131
131
1 51
57 53 53 0 1 158 57 456 58 53 49 47 48 48 45 24 21 20 18 18 16 16 16 16 47 52 49 47 45 44 48 54 38 42 44 42 41 57 56 59 29 28 27
13 27 493
33 43 53 201
53 852 56 16 48 34 12 22 11 12 23 28 24 51 33 599
24 29 47 39 16 45 22 10 53 1 1
30 542
283 6
27 28
5.0
7.0
5.0
5.0
5.0
3.0
7.0
5.0
3.0
7.0
10.0 5.0
5.0
5.0
7,0
1.5
3.0
5.0
5.0
7.0
2.0
5.0
7.0
7.0
3.0
3.0
10.0
20.0
10.0 7.0
7.0
20.0
15.0 5.0
7.0
10.0
10.0
10.0 7.0
5.0
7.0
7.0
7.0
10.0
20.0
5.0
7.0
5.0
1.0
5.0
2.0
5.0
5.0
3.0
7.0
7.0
1.5
5.0
5.0
7.0 .5 ,7
7.0
2.0
7.0
3.0
5.0
7.0
7.0
3.0
5.0
7.0
10.0 3.0
1.5
2.0
5.0
2.0 .7
10.0
10.0
10.0
10.0
10.0 2.0
5.0
5.0
5.0
10.0
10.0
7 5 7107 5 3 7 7 5 7 7
10 10 10 10 10 107 7
107
107
10 107
207
15 10 20 10 107
15 10 10 10 10 15 107 7
10
1.S .5
2.0
>2.0
>2.0 2.0
1.5
>2.0 2.0 .3
1.0
>2.0
>2.0
>2.0 2.0
>2.0
>2.0
>2.0 1.5 .5
2.0
>2.0
>2.0 1.5
1.5
2.0
1.0
2.0
1.0
>2.0
>2.0
>2.0
>2.0
>2.0 1.0
1.0
1.5
1.0
1.5
>2.0
>2.0 2.0
>2.0 1.0
1.5
1*500
2*000
1*500
1*500
1*500
2*000
2*000
1*500
1*50
01*500
2*000
2*000
1*500
1,500
1*500
1*500
2*000
1*500
1*500
2*000
1*000
1*000
2*000
2*000
1*500
2*000
5*000
5*000
5*000
3*000
2*000
5*000
2*000
2*000
3*000
5*000
3*000
5*000
5*000
3*000
2*000
3*000
3*000
5*000
5*000
N N N N N
<1.0 N N N N N N N N N N N N N N N N N N N N N N N N N N N N N N N N N N N N N N N
N N N N N N N N N N N N N N N N N N N N N N N N N N N N N N N N N N N N H H N N N N N N N
N N N N N N N N N N N N N N N N N N N N N N N N N N N N N N N N N N N N N N N N N N N N N
<20
<20 20
<20
<20
<20
<20
<20
<20
<20 SO 20
<20
<20 20
<20
<20
<20
<20
<20
<20
<20
<20
<20
<20
<20
ISO 20 20 20
<2Q 20 20
<20
<20 20
<20 20
<20
<20
150 50 20 20 SO
300
ISO
300
700
SOO
ISO
200
300
300
ISO
700
SOO
SOO
200
SOO
300
2*000
ISO
300
300
300
100
200
300
SOO
ISO
200
SOO
200
ISO
300
SOO
300
100
SOO
300
200
200
200
300
1*500
300
300
300
500
<22 N N N N
<2N
<2 <2 <2 <2 <2 <2 <2
N N<2 <2 <2 <2 <2N 2
<2 <2 <2 <2 <2 <2 <2 <2 <2 <2 <2 <2 <2 <2 <2 <2
N<2 <2 <2 <2

T«bte
5.--AnalyticaI data for
heavy-mineral concentrate samples—Continued
SAMPLE
S-BI
S-CD
S-CO
S-CR
S-CU
S-LA
S-MO
S-NB
S-NI
S-PB
S-SB
S-SC
S-SN
S-SR
S-TH
s-w
790M501P
79DM502P
79DM504P
79DM506P
79DM507P
790MS08P
790M510P
790M511P
79DM51 3P
790M516P
79DM517P
790M523P
79DM526P
79DM527P
790M530P
790M531P
79DM535P
790M537P
79DM540P
79DM542P
en'
Uli
790M5AAP
790M547P
790M549P
79DM550P
790M555P
79DM556P
790M560P
79DM565P
790M567P
790M568P
790M573P
79DM574P
790M576P
79DM580P
790M597P
79DM605P
790M607P
790M610P
790M61 3P
790M61 7P
790M618P
790M621P
79GJ101P
79GJ103P
79GJ 104P
N N N N N N N N N N N<2
0 N N N N N N N N N<20 N N N- N N N N N N N N N N N N
<20 N N N N N N N
N N N N N N N N N N N N N N N N N N N N N N N N N N N N N N N N N N N N N N N N N N N N N
30 53 20 70 33 20 53 33 50 53 73 20 33 50 33
<10 50 23 53 30 20 70 50 33 30 30 33 70 20 10 15 33 20 <10 73 70 53 73 70 23 73 50 23 53 53
300
300
150
150
100
200 70
200
300
200
150 30
700
700
500 20 50
500
100
300
100
500
500
150
100
200
300
1,500
100
200
150
300
150
100
500
300
500
700
500
200
300
200
300
300
500
20 15<10
200
100 30 50 10 50 50
200
<10 70 30 100
00 10 50
100 20 70
100 20 30 50
100 15
<10
<1 0 N N
<10 N N
100 50 70 50 15 15
200 50N
<1 0 10
300
200
300
500
500
700
1,000
500
500
100
200
1,00
070
0700
500
700
700
500
700
300
500
500
500
150
500
200
200
1,500
700
700
1,50
01,
000
700
500
1,000
1,000
300
300
300
1,00
0
700
700
700
300
300
N N N70 N N N N N N N N N N N N N N N N N N N N N N N N N N N N15 N N N N N N N N N N N N
70 50 70100 70 100 50
100 70
<50 50
150 50 150 70
300
300 70
<50
<50 50 70 50
<50 50 50N
50 70 100
150 70
150
150
<50
<50 70 50 50
150
100 70
100 N
<50
100
150 20
<1 0 10 50 20 50 70 70
100
<1 0
100
100 70
<10
<1 0 70 50
100
<10
100
150 70 30
<10 20 50 10 10 10 10
<10
<1 0
150 70
100
100
100 15 50 30
<10 10 20
<20
<20 20 30 20
<20 20 20
<20
<20 20 20
<20 20 20 20 70N
20<20
<20
<20
<20
<20
<20
<20 20 70 20 70 30 70 50 50
<20
<20
<20
<20
<20
<20
<20
<20
<20 20 20
N N N N N N N N N N N N N N N N N N N N N N N N N N N N N N N N N N N N N N N N N N N N N
50 50 30 30 30 SO 50 50 30 70 50 30 50 30 50 20 20 50 30 70 20 50 50 30 30 30100
>200 70 50 50
200 50 50 70
100 70 70
100 30 50 50 70
100
100
N N20 70 SO 30 20 20 20N N
SO so so 70 ISO
100
<20 N N
<20 20 30N N
20N
<20 N30 30 20 30 50N N N N N
20
<20 N N N N
300
200
300
300
300
SOO
200
SOO
SOO
<200
200
300
SOO
300
300
200
200
300
SOO
<200
SOO
<200
300
300
SOO
<200
300
1,000
700
1,000
1,500
1,500
1,000
1,000
200
200
200
<200
<200
200
SOO
300
300
200
300
N N N200
<200 N
<200 N
<200 N N
<200 N
200
<200
200
SOO N
<200 N
<200
SOO
<200 N
<200
<200 N N N N N N N N
<200 N N N N
200 N N N N N
300
300
300
300
300
300
200
300
300
300
SOO
300
300
SOO
700
200
200
300
200
200
1SO
300
SOO
200
200
300
700
1,000
300
300
300
1,000
SOO
SOO
300
SOO
SOO
SOO
SOO
700
SOO
300
500
700
700

Tabl
e 5.—Analytical da
ta for
heavy-mineral concentrate sa»ples--Continutd
SAMPLE
S-U
S-Y
S-ZN
S-ZR
AA-CU-P
AA-PB-P
79DM501P
79DM502P
790M504P
79DM506P
790M507P
79DM508P
790M510P
79DM51 IP
79DM513P
79Df»516P
790M517P
79DM523P
79DM526P
79DM527P
79DM530P
79DM531P
79DM535P
79DM537P
790M540P
79DM542P
790M544P
790M547P
79DM549P
79DM550P
79DM555P
790M556P
79DM560P
79DM565P
79DM567P
790M568P
79DM573P
79DM574P
79DM576P
79DM580P
790M597P
79DM605P
790M607P
790M610P
79DM61 3P
79DM617P
790M618P
79DM621P
79GJ101P
79GJ103P
79GJ 104P
N N000 N N N N N N N
100 N N N N N
<100 N N N N N N N N N N N N N N N N N N N N N N N N N N N N
150
150
200
700
300
300
200
200
200 70
150
500
300
700
300
700
700
500
150
100
200
500
300
100
300
200
100
200
150
300
200
300
200
500
200
200
150
150
150
500
500
200
200
150
100
N N N N N N N N N N N N N N N N N N N N N N N N N N<500 N N N N N N N N N N N N N N N N N
<500
>2/000
500
2/000
>2/000
>2/000
700
>2/000
1/500
>2/000
500
2/000
>2/000
>2/000
>2/000
>2/000
>2/000
>2/000
>2/000
>2/000
500
>2/000
>2/000
2/000
1/000
>2/000
>2/000
200
200
700
1,500
500
300
500
>2/000
>2/000
>2/000
2/000
1,000
>2/000
>2/000
2/000
1/000
>2,000
1/000
700
15 15 10160 90 15 50 20 50 45 200 25 40 40 60 10 20 45 25 25 50 75 20 45 30 80 15 <5 <5 <5 <5 <5 <5 <5 75 50 45 25 25 25 160 50 <5 <5 10
20 15 15 30 20 10 15 15 20 10 15 20 20 20 10 20 40 10 10 15 25 20 15 15 20 15 10 10 10 10 10 35 10 10 10 15 10 10 10 10 10 105 5
10
AA-ZN-P
15 15 15 35 10 10 15 15 15 15 25 10 25 15 30 15 30 10 10 30 10 15 15 10 25 25 40 35 45 15 45 35 25 15 25 50 35 30 25 20
, 10 30 35 35 45

Table 5.--An*lyticaI data for
he*vy-niner*I concentrate sanplts--Continued
SAMPLE
LAB NO.
LATITUDE
LONGITUDE
S-FEX
S-MGX
S-CAX
S-TIX
S-NN
S-A6
S-AS
S-AU
S-8
S-BA
S-8E
79GJ108P
79GJ501P
79GJ505P
79GJ506P
79GJ512P
79GJ516P
79GJ521P
79GJ523P
79GJ525P
79GJ527P
79GJ530P
79GJ546P
79GJ556P
79GJ557P
79GJ558P
79GJ567P
79GJ568P
79GJ574P
79GJ584P
79GJ596P
79GJ597P
79GJ599P
79JD830P
79JD900P
79MH501P
79MH505P
79MH507P
79MH508P
79MH510P
79MH51 1P
79MH515P
79MH516P
79MH51 7P
79MH518P
79MH528P
79MH530P
79MH532P
79MH534P
79MH535P
79MH538P
79MH539P
79MH542P
79MH546P
79MH550P
79MH552P
CEC186
CDY513
CDY451
CDY471
CDY455
CDY479
CDY521
CDY460
CDY480
CDY498
CDY522
CDY523
CECU2
CEC165
CEC188
CEC152
CEC174
CEC199
CEC222
CEC153
CEC175
CEC200
CDY454
CDYS08
CDY448
CDY449
CDY468
CDY488
CDY510
CDY469
CDY489
CDY497
CDY533
CDY459
CDY461
CDY481
CDY502
CEC209
CEC141
CEC164
CEC187
CEC210
CEC211
CECU4
CECU3
565656
5656
56
5656
56 56 56 56 56 56 56 56 56 56 56 56 56 56 56 56 56 56 56 56 56 56 56 56 56 56 56 56 56 56 56 56 56 56 56 56 56
3109 9
22
9 1 2 1 1 2 8 17 18 17
4 4 0 2 8 7 9 2 7 9 8 8 8 7 7 6 10 13 14 13 155 18 18 16 16 17 17 18 17
33 43 35 39 18
735 32 24 16 193
432
56
4 0177 0
32 589 18 53 33 21 18 53 38 330 37 52 58
423 333
54 17 24 49 333
131
130
130
130
130
130
131
130
130
130
130
130
131
131
131
131
131
131
131
131
131
131
131
130
131
131
131
131
131
131
131
130
130
130
130
130
131
131
131
131
131
131
131
131
131
28 46 50
50
52 531
59 56 53 55 48 35 35 35 54 54 46
43 29 32 365
51 11 11 11 1 1 8 7 7
53 53 52 45 45 530 29 30 29 27 48 52 51
039 20 10 39 52 37 14 31 49 34 59 13 17 26
40 50 513
11 15 10 51 45 21 151
13 30 20 17 41 44 3414
37
42 555 5
28 38 25 34 59
7.0
3.0
5.0
7.0
2.0
10.0
5.0
5.0
10.0
3.0
7.0
5.0
10.0
7.0
5.0
10.0
7.0
5.0
5.0
15.0
7.0
7.0
3.0
3.0
1.5
2.0
7.0
10.0
7.0
10.0
7.0
5.0
3.0
1.5
7.0
7.0
5.0
3.0
7.0
10.0
10.0
10.0
10.0
10.0
5.0
5.0
1.5
3.0
5.0 .5
7.0
5.0
5.0
5.0
5.0
10.0
5.0
10.0
7.0
10.0
2.0
2.0
1.0
2.0
10.0
3.0
10.0
7.0
1.5
2.0
2.0
7.0
10.0
10.0
10.0
3.0
5.0
3.0
1.0
7.0
2.0
7.0
2.0
5.0
7.0
10.0
10.0
10.0
3.0
3.0
107 5 5
10
7105 5
10
710
10 15 10
10 15 157
15 10 107 7 2 7 7 7
107 5 7
105 7 5
107 7
10
710 10 10 10
1.5
>2.0 1.0
1.5
>2.0
>2.0
>2.0
2.0
1.0 .7 1.5
>2.0 .71.0 .5
2.0
>2.0
>2.0 1.0
1.0
2.0
1.0 .7
2.0 .7
2.0
1.5
1.0
2.0
2.0
2.0
>2.0
>2.0
>2.0 2.0
>2.0 1.5
1.0 .7
1.0 .7
1.0
1.0
>2.0
>2.0
2,000
1,500
2/000
2,000
2,000
2,000
1,500
2,000
2,000
2,000
2/000
1/000
5/000
5/000
2/000
3/000
2/000
2/000
3/000
5/000
2/000
2/000
2/000
1/500
1/000
1/500
1/500
2/000
3/000
5/000
1/500
1/500
1/000
1/500
2/000
1/500
1/500
1/500
3/000
3/000
2/000
5/000
3/000
5/000
3/000
N N N N N N N N N N N N N N10.0
N N N N N N N N N N N N N N N N N N<1.0
N
<1.0 N N N N N N N N N
N N N N N N N N N N N N N N N N N N N N N N N N N N N N N N N N N N N N N N N N N N N N N
N N N N N N N N N N N N N N N N N N N N N N N N N N N N N N N N N N N N N N N N
. N N N N N
<20 20
<20 20 20 20
<20
<20
<20
<20
<20
<20 20
<20
<20 20
<20
<20
<20 20 20 20
<20 N N
20<20
<20
<20
<20
<20 20 20
<20
<20
<20
<20 20
<20 20
<20
<20
100 20
<20
150
1/000
200
300
200
300
300
300
200
SOO
200
300
200
300
SOO
300
ISO
100
700
1/000
700
ISO
100
SOO SO
300
300
200
300
300
300
300
700
200
3/000
3/000
1,500
1/000
300
SOO
ISO
300
300
SOO
200
<2N
<22
<2 <2 <2 <22
<2 <2 <2 <22
<2 <2N
<22
<2 <2 <2 <2N
<2 <2 <2 <2 <2 <2 <2 <2 <2N
<2 <2 <2 <2 <2 <2 <22 2
<2 <2
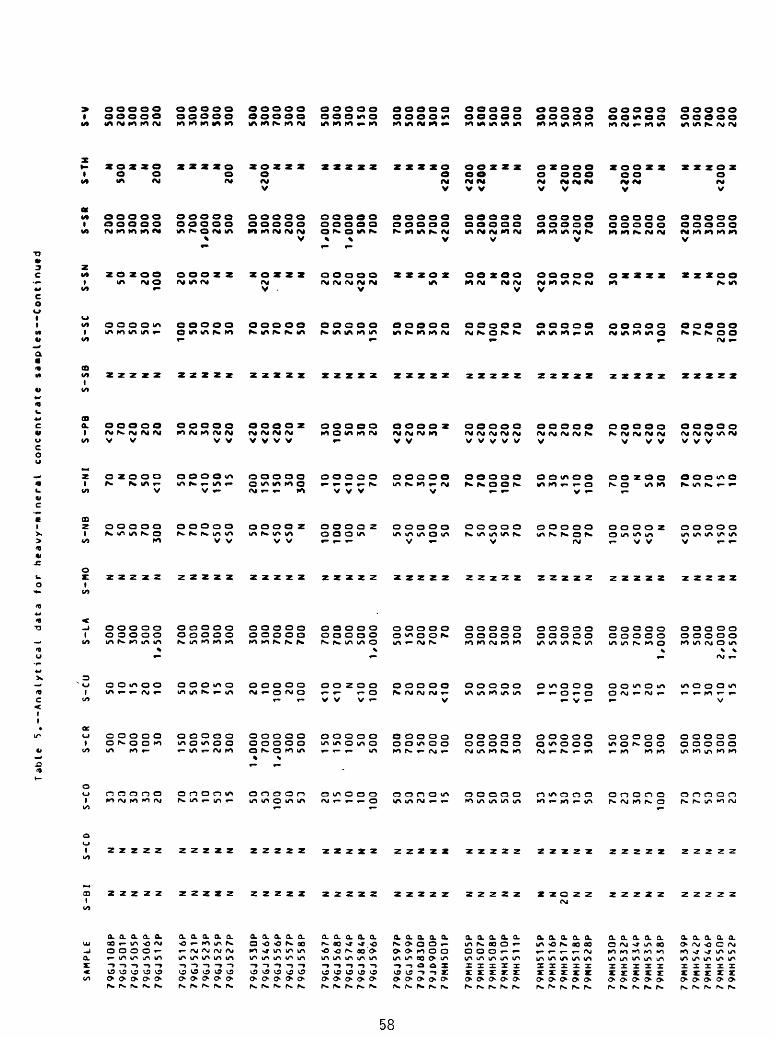
Ta
ble
5
.—A
na
lyti
ca
l d
ata
fo
r h
eavy-m
inera
l co
ncen
trate
s
am
ple
s—
Co
nti
nu
ed
SA
MP
LE
S-B
IS
-CO
S-C
OS
-CR
S-C
US
-LA
S-M
OS
-NB
S-N
IS
-P8
S-S
8S
-SC
S-S
NS
-SR
S
-TH
S-V
796J108P
796J501P
79GJ505P
796J506P
79GJ512P
79GJ516P
79GJ521P
79GJ523P
79GJ525P
79GJ527P
79GJ530P
79GJ546P
79GJ556P
79GJ557P
79GJ558P
79GJ567P
79GJ568P
79GJ574P
79GJ584P
79GJ596P
79GJ597P
79GJ599P
79JD830P
79JD900P
79MM501P
79MH505P
79MH507P
79MH508P
79MH510P
79MH51 IP
79MH515P
79MH516P
79MH517P
79MH518P
79NHS28P
79MH530P
79MH532P
79MH53AP
79MH535P
79MH538P
79MH539P
79MH5A2P
79MH5A6P
79MH550P
79MH552P
N N N N N N N N N N N N N N N N N N N N N N N N N N N N N N N N20N N N N N N N N N N N N
N N N N N N N N N N N N N N N N N N N N N N N N N N N N N N N N N N N N N N N N N N N N N
33 20 30 33 20 70 53 10 53 15 50 53100 50 53 20 15 10 10 100 50 50 23 10 15 30 50 50 53 50 33 15 30 13 50 70 23 30 73 100 70 73 53 30 23
500 70
300
100 30
150
500
150
200
300
1,000
700
1/000
300
500
150
150
100 50
500
300
700
150
200
100
200
500
300
700
300
200
150
700
100
300
150
300 70
300
300
500
300
500
300
300
50 10 15 20 10 50 50 70 15 50 20 10
100 20
100
<10
<10 N
<10
100 70 20 20 20
<10 50 50 30 50 50 10 15
100
<10
100
100 20 15 20 15 15 10 30
<10 15
500
700
300
500
1,500
700
500
300
300
300
300
300
700
700
700
700
700
500
500
1/000
.
500
150
200
700 70
300
300
200
300
300
500
500
500
700
500
500
500
700
300
1/000
300
500
200
2/000
1/500
N N N N N N N N N N N N N N N N N N N N N N N N N N N N N N N N N N N N N N N N N N N N N
70 50 50 7030
0 70 70 70
<50
<50 50 70
<50
<50 N
100
100
100 50N
50<50 50
100 50 70 50
<50 50 70 50 70
70200 70
100 50
<50
<50 N
<50 50 50
150
150
70N
70SO
<10 50 70
00
ISO 15
200
150
1SO 30
300 10
<10
<10
<10 70 50 70 30
<10 20 70 70
100
100 70 SO
30 15<10
100 70
100 NSO
30 70
50 70 15 10
<20 70
<20 20 20 30 20 30
<20
<20
<20
<20
<20
<20 N
30100 SO 30 20
<20
<20 20 30N
<20
<20
<20
<20
<20
<20 20 20
20 70 70
<20 20
<20
<20
<20
<20
<20 SO 20
N N N N N N N N N N N N N N N N N N N N N N N N N N N N N N N N N N N N N N N N N N N N N
SO 30 SO SO 15
100 SO SO 70 30 70 SO 70 70
SO 70 SO SO 30
ISO SO
70 30 30 20 2070
100 70 70 SO SO
30 10 SO
20 SO 30 SO
100 70 70 70
200
100
N SON
20 100 20 SO 20 N N N
<20 N N N
20 20
20<20 20 N N NSO N
SO
20 N 20 <20
<20 30 SO 70 20 30 N N N N N N N70 SO
200
300
300
300
200
SOO
700
1/000
200
SOO
300
300
200
200
<200
1/000
700
1/000
SOO
700
700
300
SOO
700
<200 SOO
200
<200 300
200
SOO
300
SOO
<200 700
SOO
SOO
700
200
200
<200 300
SOO
300
SOO
NSOO N N
200 N N N N
200 N
<200 N N N N N N N N N N N N
<200
<200
<200 N N N
<200 N
<200 200
200 N
<200 200 N N N N N
<200 N
SOO
200
300
300
200
300
300
300
SOO
SOO
SOO
SOO
700
300
200
SOO
SOO
300
ISO
300
300
SOO
200
SOO
ISO
300
$00
SOO
SOO
SOO
SOO
300
SOO
300
300
300
200
ISO
300
SOO
SOO
SOO
700
200
200

Table
5. — Analytical data for
heavy-mineral concentrate samples—'Continued
SAMPLE
S-W
S-Y
S-ZN
S-ZR
AA-CU-P
AA-PB-P
AA-ZN-P
79GJ108P
79GJ501P
79GJ505P
79GJ506P
79GJ512P
79GJ516P
79GJ521P
79GJ523P
79GJ525P
79GJ527P
79GJ530P
79GJ546P
79GJ556P
79GJ557P
79GJ558P
79GJ567P
79GJ568P
79GJ574P
79GJ584P
79GJ596P
79GJ597P
79GJ599P
79JD830P
79JD900P
79MH501P
79MH505P
79MH507P
79MH508P
79MH510P
79MH511P
79MH515P
79MH516P
79MH51 7P
79MH518P
79MH528P
79MH530P
79MH532P
79MH534P
79MH535P
79MH538P
79MH539P
79MH5A2P
79MH5A6P
79MH550P
79MH552P
N150 N N N N N N N N N N N N N N N N N N N N N N N N N N N N N
100
<100
100 N
<100 N N N N N N N N N
200
700
100
200
500
200
500
150
100
200
150
200
150
150
150
200
500
300
150
300
200
100
150
300 70
200
150
150
200
150
200
300
500
500
300
300
150
300
150
200
150
200
150
300
200
N N N N N N N N N N N N N N N N N N N N N N N N N N N N N N N N N N N N N N N N N N N N N
>2,000
>2,000
2,000
2,000
>2,000
2,000
2,000
2,000
700
>2,000
2,000
>2,000
1,500
>2,000
>2,000
700
1,500
2,000
150
>2,000
>2,000
1,500
2,000
>2,000
500
>2,000
>2,000
2,000
>2,000
1,000
1 ,500
2,000
>2,000
1,000
2,000
1 ,500
2,000
>2,000
>2,000
>2,000
2,000
>2,000
1,000
>2,000
>2,000
25 15 15 20 40 15 40200 15 40 30 20 75 20
140 5
<5 <5 10 50 70 30 20 15 15 45 20 35 30 15 10 15 80 15 35 75 25 <5 15 10 20 10 20 10 15
535 15 15 10 20 20 30 15 15 15 20 15 10 10 10 15 10 10 10 155
55 10 15 15 15 15 15 10 10 15 20 20 15 45 15 155
10
5 510 15 10
25 10 15 25 30 20 30 30 20 20 20 10 25 25 45 40 25 1513
0 45 40 20 15 10 15 10 15 20 15 15 20 15 10 20 10 50 30 15 30 25 25 35 35150 50

Table 5.—Analytical data for heavy-Mineral concentrate $a«pl«$--Continued
SAMPLE
LAB NO.
LATITUDE
LOMGITUDE
S-FEX
S-MGX
S-CAX
S-TIX
S-MN
S-AG
S-AS
S-AU
S-B
S-BA
S-BE
79MH554P
79MH559P
79MH560P
79MH570P
79MH576P
79MH577P
79MH586P
79MH588P
79MH593P
79MH594P
79MH597P
79MH606P
79MH608P
79MH614P
79MH615P
79MH623P
79MH624P
79MH635P
79MH639P
79MH643P
79MH645P
79MH651P
79MH656P
79MH659P
79MH663P
79MH670P
79MH671P
79MH682P
79MH690P
79MH692P
79MH699P
79MH700P
79MH701P
79MH705P
79MH709P
79MH713P
79MH71 7P
79MH718P
79MH720P
79MH727P
79MH730P
79MH733P
79MH737P
79MH739P
79MH743P
CEC166
CEC189
CEC212
CEC167
C EC 190
CEC213
CECU5
CEC168
CEC191
CEC214
CEC146
CEC169
CEC192
CEC196
CEC219
CEC150
CEC172
CEC197
CEC220
CEC151
CEC173
CEC198
CEC230
CEC241
CEC252
CEC262
CEC231
CEC242
CEC253
CEC263
CEC232
CEC243
CEC254
CEC264
CEC233
CEC244
CEC255
CEC265
CEC234
CEC245
CEC256
CEC266
CEC235
CEC246
CEC257
56 56 56 56 56 56 56 56 56 56 56 56 56 56 56 56 56 56 56 56 56 56 56 56 56 56 56 56 56 56 56 56 56 56 56 56 56 56 56 56 56 56 56 56 56
17 16 16 25 23 22 22 20 21 21 48 47 47 11 12
910 17 14 8 8 528 28 26 26 26 27 24 25 30 30 30 29 33 32 34 34 36 36 35 27 29 30 28
0 3334
34 51 39 44 43 25 47 52 18 49 49 29 31 26 14 36
2 458 35 55 33 29 33 43 44 363
13 40 49 52 19 10 30 23 15 314 5 35
131
131
131
131
131
131
131
131
131
131
131
131
131
131
131
131
131
131
131
131
131
131
131
131
131
131
131
131
131
131
131
131
131
131
131
131
131
131
131
131
131
131
131
131
131
50 50 51 33 36 36 43 42 48
47 58 58 59 23 22 25 27 45 41 42 40
33 39 40 38 42 42 49 48 50 57 57 54 56 53 50 52 51 52 59 57 14 17 20 23
55 43 18 24 29 591
20 17 44 18 11 29 2
32 31 24 311
27 34 45 10 10 44 25 30 37 40 0
509
35 48
29 290
40 40 15 324
18 15 42
10.0
7.0
7.0
7.0
7.0
10.0
7.0
7.0
10.0
20.0
2.0
3.0
3.0
7.0
7.0
10.0
7.0
10.0
5.0
10.0
7.0
5.0
10.0
10.0
7.0
20.0
15.0
10.0
7.0
7.0
10.0
10.0
15.0
10.0
10.0
10.0
15.0
15.0
15.0
10.0
15.0
7.0
10.0
15.0
10.0
5.0
5.0
1.5
5.0
7.0
10.0
10.0
10.0
7.0
15.0
1.0
2.0
1.0
5.0
7.0
10.0
3.0
10.0
5.0
10.0
10.0
5.0
7.0
7.0
7.0
10.0
7.0
7.0
7.0
10.0
5.0
7.0
10.0
10.0
7.0
7.0
7.0
10.0
7.0
7.0
5.0
2.0
3.0
7.0
5.0
10 710
10 10 10 10 15 10 10
710 15 15 10 10 10 10 15 15 15 105 7 5 7 5 5 5
10
5 5 7 5 5 7 7 5 7 5 3 7 7 7 5
2.0 .5
>2.0
1.5
2.0
2.0 .5
1.0
1.0
1.5
>2.0
>2.0
>2.0
>2.0
>2.0
1.5
1.5 .7
>2.0
1.5
1.0
2.0
2.0
2.0
2.0
2.0 .7
1.0 .5 .3
1.0 .7
1.0
1.5 .7
1.0
1.0
1.5
1.5
1.0 .5
>2.0
2.0
1.5
2.0
5/000
3,000
5,000
5,000
2,000
3/000
2/000
3/000
3/000
5,000
1/500
2/000
2/000
2,000
5/000
5,000
3/000
3/000
5/000
5,000
5/000
1/500
5/000
3/000
2/000
3/000
2/000
3/000
2/000
2/000
2/000
2/000
2/000
2/000
2/000
3/000
2/000
2/000
5/000
3/000
2/000
3/000
3/000
3/000
2/000
N N N N N N N N N N N<1.0 N N N N N N N
1.5
N N N N N N N N N N N N N N N N N N N N N N50.0 N N
N N N N N N N N N N N N N N N N N N N N N N N N N N N N N N N N N N N N N N N N N N N N N
N N N N N N N N N N N N N N N N N N N N N N N N N N N N N N N N N N N N N N N N •N N70 N N
20 20<20
<20
<20
<20 20 20
<20
<20
<20 20 20
<20
<20
<20
<20 50 100 70 20
<20
<20
<20
<20
<20
<20
<20 20
<20
<20
<20
<20
<20
<20
<20
<20
<20
<20
<20
<20
<20
<20 SO
<20
200
200
100
700
SOO
700
300
300
300
300
ISO
200
300
SOO
300
300
700
700
200
300
200
700
300
300
200
700
1,000
200
200
1SO
SOO
700
SOO
100
300
300
700
700
200
300
SOO
300
700
300
SOO
2 2<2 <2 <2 <2 <2 <2 <2 <2
N <2 N N N
<2 <2 <2N
<2 <2 <2 <2 <2 <2 <2
<2 <2 <2 <2 <2 <2 <2 <2 <2
2<2 <2 <2 <2 <2N
<2 <2 <2
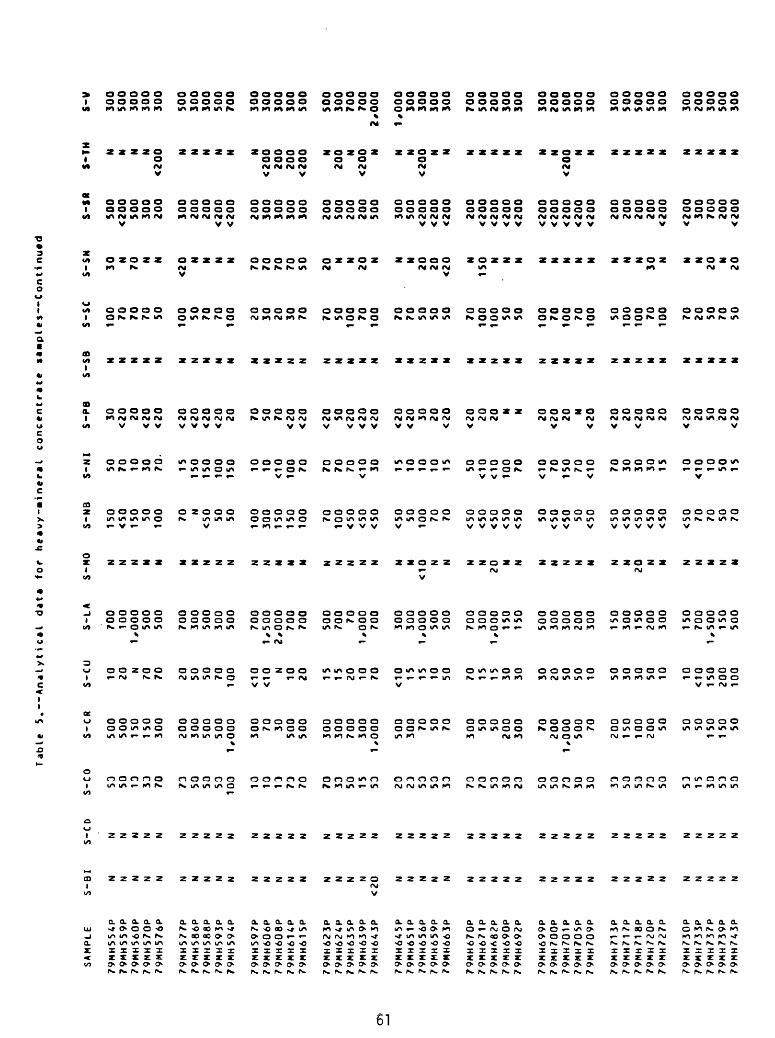
Table 5.--Analytical data for
heavy-mineral concentrate samples—Continued
SAMPLE
S-BI
S-CO
S-CO
S-CR
S-CU
S-LA
S-HO
S-NB
S-NI
S-PB
S-SB
S-SC
S-SN
s-$«
$-TM
S-V
79MH55AP
79MH559P
79MH560P
79MH570P
79MH576P
79MH577P
79MH586P
79MH588P
79MH593P
79MH59AP
79MH597P
79MH606P
79MH608P
79MH6KP
79MH615P
79MH623P
79MH62AP
79MH635P
79MH639P
79MH643P
79MH645P
79MH651P
79MH656P
79MH659P
79HH663P
79MH670P
79MH671P
79MHA82P
79MH690P
79MH692P
79MH699P
79MH700P
79MH701P
79MH705P
79MH709P
79MH713P
79MH717P
79MH718P
79MH720P
79MH727P
79MH730P
79MH733P
79MH737P
79MH739P
79MH743P
N N N N N N N N N N N N N N N N N N N<2
0 N N N N N N N N N N N N N N N N N N N N N N N N N
N N N N N N N N N N N N N N N N N N N N N N N N N N N N N N N N N N N N N N N N N N N N N
53 50 13 33 70 73 50 50 53 100 10 10 13 73 70 70 33 50 15 53 20 23 50 50 33 73 70 53 30 23 50 50 73 30 30 33 50 50 73 50 53 15 30 53 50
500
500
150
150
300
200
300
500
500
1/00
0
300 70 30
500
500
300
300
700
300
1/00
0
500
300 70 50 70
300 50 50
200
300 70
200
1/000
500 70
200
150
100
200 50 50 50
150
150 50
10 20N
70 70 20 50 50 70100
<10
<1 0 N10 20 15 15 20 10 70
<10 15 15 10 50 70 15 15 30 30 30 20 50 50 10 50 30 30 50 10 10
<10
150
200
100
700
100
1/00
0500
500
700
300
500
300
500
700
1/500
2/000
700
700
500
700 70
1/000
700
300
300
1/000
500
500
700
300
1/00
015
015
0
500
300
300
200
300
150
300
150
200
300
150
700
1/500
150
500
N N N N N N N N N N N N N N N N N N N N N N<10 N N N N
20 N N N N N N N N N20N N N N N N N
150
<50
150 50
100 70 N
<50 50 50
100
300
150
150
100 70
100
<50
<50
<50
<50 50 100 70 70
<50
<50
<50
<50
<50 50
<50
<50 50
<50
<50
<50
<50
<50
<50
<50 70 70 50 70
50 70 10 30 70-
15150
150
100
ISO 10 10
<1 0
100 70 70 70 70 <10 30 15 10 10 10 15 50
<1 0
< 1 0
100 70
<10 70
150
70 <10 70 30 30 30 15 10
00 10 50 15
30<20 20
<20
<20
<20
<20
<20
<20 20 70 50 70
<20
<20
<20 50
<20
<20
<20
<20
<20 30 20
<20
<20 20 20N N
20
<20 20 N
<20
<20 20
<20 20 20
<20 20 50 20
<20
N N N N N N N N N N N N N N N N N N N N N N N N N N N N N N N N N N N N N N N N N N N N N
100 70 70 70 50
100 50 70 70
100 20 30 20 30 70 70 50
100 70
100 70 70 50 50 50 70
100
100 50 50
100 70
100 70 100 50
100
100 70
100 70 20 50 70 50
30N
70N N
<20 N N N N
70
70 70 70 50 20N N
20N N N
20 20
<20 N
150 N N N N N N N N N N N30N N N
20 N
20
SOO
<200
SOO
300
200
300
200
200
<200
<200
200
300
300
300
300
200
SOO
200
200
SOO
300
SOO
<200
<200
<200
200
<200
<200
<200
<200
<200
<200
<200
<200
<200
200
200
200
200
<200
<200
300
700
200
<200
N N N N<200 N N N N N N
<200
200
200
<200 N
200 N
<200 N N N
<200 N N N N N N N N N
<200 N N N N N N N N N N N N
300
SOO
300
300
300
500
300
300
SOO
700
300
300
300
300
SOO
SOO
300
700
700
2/000
1/000
300
300
300
300
700
SOO
200
300
300
300
200
SOO
300
300
300
SOO
SOO
SOO
300
300
200
300
SOO
300

Tabl
e 5.—Analytical da
ta fo
r heavy-Mineral concentrate saaples--Continued
SAMPLE
S-U
S-Y
S-ZN
S-ZR
AA-CU-P
AA-P8-P
79MH554P
79MH559P
79MH560P
79MH570P
79MH576P
79MHS77P
79MMS86P
79MH588P
79MH593P
79MHS94P
79MH597P
79MH606P
79MH608P
79MH614P
79MH61 5P
79MH623P
79MH624P
79MH635P
79MH639P
79MH643P
79MM645P
79MH651P
79MH656P
79NH659P
79MH663P
79MH670P
79MH671P
79MH682P
79MH690P
79MH692P
79MH699P
79MH700P
79MH701P
79MH705P
79MH709P
79MH71 3P
79MH717P
79MH718P
79MH720P
79MH727P
79MH730P
79MH733P
79MH737P
79MH739P
79MH743P
N N N N N N N N N N N N N N N N N N N N N N N N N N N N N N N N N N N N N N N N N N N N N
200 70
700
150
200
200
100
150
150
200
700
700
700
700
500
200
200
150
500
200
150
200
200
300
200
200
100
150 70
100
150 70
100
100
150 70
100
100
100
100 70
300
300
100
200
N N N N N N N N N N N N N N N N N N N N N N N N N N N N N N N N N N N N N N N N N N N N N
>2*000
150
700
2,000
>2,000
>2*000
1,000
>2*000
3,000
1,500
700
300
2,000
>2*000
>2,000
700
>2*000
300
>2*000
700
>2*000
>2,000
700
300
1,000
1,500
>2,000
>2,000
200
700
>2,000
1 ,0
002,000
>2,o
no>2,000
300
1,000
1 ,000
1,500
1 ,5
00 300
2,000
1 ,0
00 300
1 ,000
10 20 <5 60 50 10 45 45 >5 35 <55
<5 30 25 15 15 35 20 25
510 15 10 30 30 10 15 30 25 35 30 25 25 10 30 30 25 205
10 1011
016
0 95
105
10 10 20 15 10 15 10 10
515 20 15 10 10 10 10 15 10 10 10 10 10 10 10 15 105 10 15 105 5
10 10 105
10 <5 10 15 20 15 10
AA-ZN-P
35
30
30
2Q
20 55 35 30 75 40 10 60 15 35 30 30 20 45 20 90 35 35 40 25 20 40 70 20 25 15 30 50 20 15 30 40 25 45 15 20 30 45 35 30 45
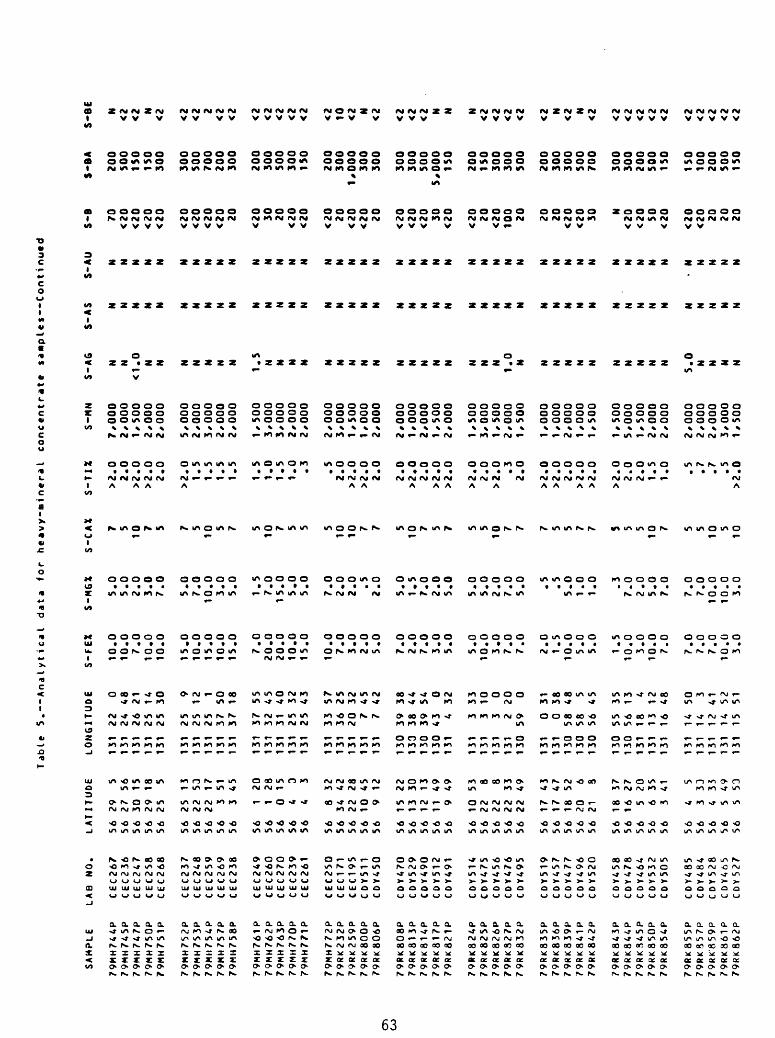
Tabl
e S.
— Analytical da
ta fo
r heavy-mineral concentrate sa«ples--Continued
SAMP
LELAB NO.
LATITUDE
LONGITUDE
S-FEX
S-MGX
S-CAX
S-TIX
S-MN
S-AG
S-AS
S-AU
S-8
S-BA
S-BE
79MH744P
79MH745P
79MH747P
79MH750P
79MH751P
79MH752P
79MH753P
79MH754P
79MH757P
79MH758P
79MH761P
79MH762P
79MH763P
79MH770P
79MH771P
79MH772P
79RK232P
79RK259P
79RK800P
79RK806P
79RK808P
79RK813P
79RK814P
79RK817P
79RK821P
79RK824P
79RK825P
79RK826P
79RK827P
79RK832P
79RK835P
79RK836P
79RK839P
79RK841P
79RK842P
79RK843P
79RK844P
79RK345P
79RK850P
79RK854P
79RK855P
79RK857P
79RK859P
79RK861P
79RK862P
CEC267
CEC236
CEC247
CEC258
CEC268
CEC237
CEC248
CEC259
CEC269
CEC238
CEC249
CEC260
CEC270
CEC239
CEC261
CEC250
CEC171
CEC195
CDY511
CDY450
CDY470
CDY529
CDY490
CDY512
CDY491
CDY514
CDY475
CDY456
CDY476
CDY495
CDY519
CDY457
CDY477
CDY496
CDY520
CDY458
CDY478
CDY464
CDY532
CDY505
CDY485
CDY484
CDY528
CDY465
CDY527
56
56
56 56 56 56 56 56 56 56 56 56 56 56 56 56 56 56 56 56 56 56 56 56 56 56 56 56 56 56 56 56 56 56 56 56 56 56 56 56 56 56 56 56 56
29 27 30 29 25 25 22 223 3 1 1 0 4 4 8 34 22 109
15 13 12 11 9 10 22 22 22 22 17 17 18 20 21 18 165 6 3 4 3 4 5 5
556 15 18 5 13 53 17 51 45 20 28 153 3
32 42 28 45 12 22 30 13 49 49 53 8 8 33 49 43 47 52 6 3
37 27 20 35 41
533 33 49 53
131
131
131
131
131
131
131
131
131
131
131
131
131
131
131
131
131
131
131
131
130
133
130
130
131
131
131
131
131
130
131
131
130
130
130
130
130
131
131
131
131
131
131
131
131
22 24 26 25 25 25 25 25 37 37 37 32 31 25 25 33 36 207 7
39 38 39 434 3 3 3 2
59
0 058 58 56 55 56 18 13 16 14 14 12 14 15
048 21 14 30
912
1SO 18 55 45 40 32 43 57 25 32 45 42 38 44 540
32 33 10 0200 31 38 485
45 35 134
12 48 503
41 52 51
10.0
10.0 7.0
10.0
10.0
15.0
10.0
1S.O
10.0
15. 0
7.0
20.0
20.0
10.0
15.0
10.0
7.0
3.0
2.0
5.0
7.0
2.0
7.0
3.0
5.0
5.0
10.0 3.0
7.0
7.0
2.0
1.5
10.0 5.0
5.0
1.5
10.0 3.0
10.0 7.0
7.0
7.0
7.0
10.0 3.0
5.0
5.0
2.0
3.0
7.0
5.0
7.0
10.0 3.0
5.0
1.5
7.0
15.0 s.o
5.0
7.0
2.0
2.0 .5
2.0
5.0
1.5
7.0
2.0
5.0
5.0
S.O
2.0
7.0
5.0 .5 .5
5.0
1.0
1.0 .3
7.0
2.0
5.0
7.0
7.0
7.0
10.0
10.0 3.0
7 5107 5 7 5
105 7 5
107 5 5 5
10 107 7 5
107 5 7 5 5
107 7 7 5 5 7 7 S 5 5
107 5 5
105
10
>2.0 2.0
>2.0
>2.0
2.0
>2.0
1.5
1.5
1.5
1.5
1.5
1.0
1.5
1.0 .3 .5
2.0
>2.0
>2.0 2.0
2.0
>2*0
2.0
>2.0
>2.0
>2.0
2.0
>2.0 .3
2.0
>2.0
>2.0 2.0
>2.0
>2.0
>2.0
2.0
2.0
1.5
1.0 .5 .7 .7 .5
>2.0
7,000
2,000
1,500
2,000
2,000
5,000
2,000
3,000
2,000
2,000
1,500
3,000
3,000
2,000
2,000
2,000
3,000
1,500
1,000
2,000
2/000
1/000
2/000
1/500
2/000
1,500
3/000
1,500
2/000
1/500
1/000
1/000
2/000
1/000
I/ 500
1/500
5/000
1/500
2/000
2/000
2/000
2/000
2/000
3/000
1/500
N N<1 .0 N N N N N N N
1.5
N N N N N N N N N N N N N N N N N1.0 N N N N N N N N N N N
5.0
N N N N
N N N N N N N N N N N N N N N N N N N N N N N N N N N N N N N N N N N N N N N N N N N N N
N N N N N N N N N N N N N N N N N N N N N N N N N N N N N N N N N N N N N N N N
• N N N N N
70<20
<20
<20
<20
<20
<20
<20
<20 20
<20 30 20
<20
<20
<20 20
<20
<20 20
<20
<20
<20 30
<20
<20 20
<20
100 20 20 20
<20
<20 30 N
<20
<20 50
<20
<20
<20 20 20 20
200
SOO
ISO
ISO
300
300
SOO
700
200
300
200
300
SOO
300
ISO
200
300
1,000
300
300
300
300
SOO
5,000
ISO
200
ISO
300
300
SOO
200
300
300
SOO
700
300
300
200
SOO
ISO
150
100
200
SOO
ISO
N<2 <2N
<2 <2 <22
<2 <2 <2 <2 <2 <2 <2 <2 10 <2N
<2 <2 <2 <2N N N
<2 <2 <2 <2 <2N
<2N
<2 <2 <2 <2 <2 <2 <2 <2 <2 <2 <2

Tabl
e 5.--Analytical da
ta for
heavy-Mineral concentrate taaplei--Continued
SAMPLE
S-8I
S-CD
s-co
S-CR
S-CU
S-LA
S-S8
S-SC
S-SM
s-sa
S-
THs-v
79MH744P
79MH745P
79MH747P
79HH750P
79MH751P
79MH752P
79MH753P
79MH754P
79MH757P
79HH758P
79MH761P
79MH762P
79HH763P
79MH770P
79HH771P
79MH772P
79RK232P
79RK259P
79RK800P
79RK806P
79RK808P
79RK813P
79RK814P
79RK81 7P
79RK821P
79RK824P
79RK825P
79RK826P
79RK827P
79RK832P
79RK835P
79RK836P
79RK839P
79RK841P
79RK842P
79RK843P
79RK844P
79RK845P
79RK850P
79RK854P
79RK855P
79RK857P
79RK859P
79RK861P
79RK862P
N N N N N N N N N N N N N N N N N N N N N N<20 N N N N N N N N N N N70 N N N N N N N N N N
N N N N N N N N N N
* N N N N N N N N N N N N N N N N N N N N N N N N N N N N N N N N N N N
70 33 23 70 53 50 70 73 20 23 15 30 33 33 30 53 20 20<1
0 30 30 15 50 33 33 30 53 50 30 53 10 13 50 50 53
<13 53 33 30 33 33 50 53 53 30
150 30 70 70
100
100
200
300
150
150
150
300
200
200
200
150
100
150 50
150
150
300
150
100
200
200
150
200 50
300 20 20
<20
100 50
<20 20
150
300
200
200
300
1*500
700
300
200 70 50
150 70 15 30 20 10
<10 15 10 10 15 30 15
100 20N
50 50<1
0200
100
<10
100 70
150
200
100 15 30 10
200
100
<1 0
< 1 0 30
<1 0 70 15 20 20 20 70
700
700
1*500
1/000
300
1/00
030
030
020
020
0
500
150
150
150
100
500
700
700
500
500
1*000
1/00
050
0500
700
300
500
1,50
0 70700
1*000
700
500
1*000
1*500
1*00
0300
1*00
02*000
150
150
200
700
500
2*000
N N N N N N N N N N N N N N N N70 N N
70 N N N N N N N N N N N N N N N N N N N N N N N N N
100
100
150
150 70
100 50
<50
<50
<50 70
<50
<50
<50 N
<50
500
150
150
150
100 70 70
100
100
150 70 70
<50 70
150 70 70 150
100 70 70 70
<50 50
<50
<50
<50
<50 50
50<1 0 10 15 20 IS 70 50 10
<1 0
<1 0 10 20 50 50 30
<10 20
<10 50 30 50 50 15 30 70 50 30 15 70
<1 0
<1 0
<1 0
<1 0
<10
<10
<1 0 50
<1 0
150
100
150
300
200 50
30 20 30<20
<20 20
<20
<20
<20 20 30
<20
<20
<20 N
<20
700 20 20
<20 30 20 20 70
<20 20
<20 50
<20 30 20 20 20 20 50 20 20
<20 70 N
<20
<20
<20 20
<20
N N N N N N N N N N N N N N N N N N N N N N N N N N N N N N N N N N N N N N N N N N N N N
30
SO
30 30 SO 30 70 70 SO 70 50 100 70 50 50
100 50 20 15 30 30 20 50 20 30 30 70 30 50 SO 15 IS 70 20 30 10
100 30
150 70 70 70 70
100 30
30<2
0 50 30 20 20 N N N N
<20 N N N N N20 N70 30 SO SO 20 70 30 SO
<20 70N
30 70 50 20 100 30 SO
<20
<20 20 N N N N
<20 30
300
200
300
<200
<200
300
200
200
300
300
700
200
200
<200
<200
200
1/000
700
300
300
200
200
200
SOO
300
200
<200
SOO
300
300
200
300
300
200
500
300
200
SOO
1/000
200
<200
<200
200
200
200
<200 N N N N N N N N N N N N N N N
200 N N
300
<200 N N
<200N
<200
<200
<200 N
<200
200 N
<200
200
300
<200
<200 200
<200 N N N
<200N
<200
300
300
SOO
300
300
300
SOO
SOO
300
300
300
SOO
700
200
300
SOO
300
300
SOO
SOO
200
200
300
200
SOO
300
300
300
SOO
300
SOO
300
300
300
300
300
300
200
500
200
300
300
300
300
200
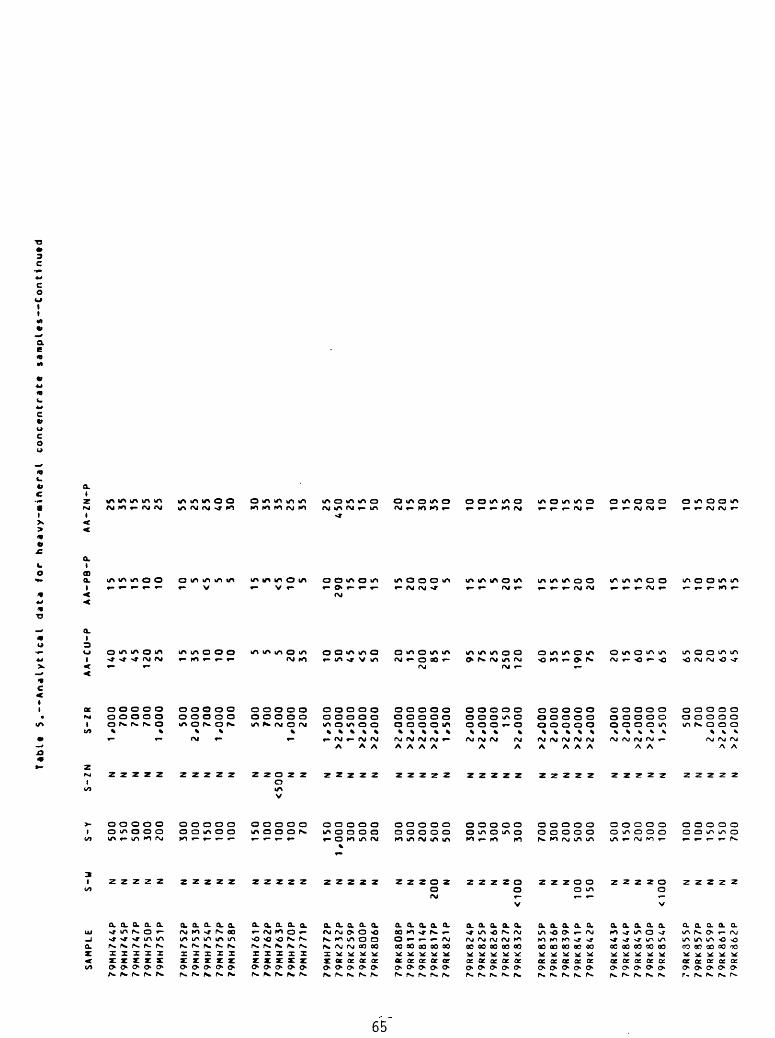
T*blt
5.--
Analyticat data for
heav
y-mi
nera
l concentrate
samples—Continutd
SAMPLE
S-U
S-Y
S-ZN
S-ZR
AA-CU-P
AA-PB-P
AA-ZN-P
79MH744P
79MH745P
79MH747P
79MH750P
79MH751P
79MH752P
79MH753P
79MH754P
79MH757P
79MH758P
79MH761P
79MH762P
79MH763P
79MH770P
79MH771P
79MH772P
79RK232P
79RK259P
79RK800P
79RK806P
79RK808P
79RK813P
79RK814P
79RK817P
79RK821P
79RK824P
79RK825P
79RK826P
79RK827P
79RK832P
79RK835P
79RK836P
79RK839P
79RK841P
79RK842P
79RK843P
79RK844P
79RK845P
79RK850P
79RK854P
79RK355P
79RK857P
79RK859P
79RK861P
79RK862P
N N N N N N N N N N N N N N N N N N N N N N N200 N N N N N
<100
N N N100
150 N N N N
<100 N N N N N
500
150
500
300
200
300
100
150
100
100
150
100
100
100 70
150
1,000
300
500
200
300
500
200
500
500
300
150
300 50
300
700
300
200
500
500
500
150
200
300
100
100
100
150
150
700
N N N N N N N N N N N N<5
00N N N N N N N N N N M N N N N N N N M N N N N N M N N N N N N N
1,000
700
700
700
1,000
500
2*000
700
1,000
700
500
700
200
1,000
200
1,500
>2,000
1,500
>2,000
>2,000
>2,000
>2*000
>2,000
>2,000
1,500
2,000
>2,000
2,000
150
>2,000
>2,000
2,000
>2,000
>2,000
>2,000
2,000
2,000
>2,000
>2,000
1 /.
500
500
700
2,000
>2,000
>2,000
UO 45 45
120 25 15 35 10 10 10
5 5 520 35 10 50 45 <5 50 20 15
200 85 15 95 75 25
250
120 60 35 15
190 75 20 15 60 15 65 65 20 20 65 45
15 15 15 10 10 105
<55 5
155
<5 10 5 1029
0 15 10 15 15 20 20 405
15 15 520 15 15 15 15 20 20 15 15 15 20 10 15 10 10 35 15
25 35 15 25 25 55 25 25 40 30 30 35 35 25 35 25450 25 15 50 20 15 30 35 10 10 10 15 35 20 15 10 15 25 10 10 15 20 20 10 10 15 20 20 15

Table 5.--AnalyticaI data for
heavy-Mineral concentrate sa«ples--Continued
SAMPLE
LAB NO.
LATITUDE
LONGITUDE
S-FEX
S-HGX
S-CAX
S-TlX
S-MN
S-AG
S-AS
S-AU
s-e
S-BA
S-BE
79RK864P
79RK865P
79RK867P
79RK868P
79RK870P
79RK871P
79RK872P
79RKS77P
79RK878P
79RK880P
79RK881P
79RK883P
79RK884P
79RK885P
79RK886P
79RK888P
79RK889P
79RK890P
79RK891P
79RK892P
79RK894P
79RK896P
79RK897P
79RK898P
79RK899P
79RK900P
79RK902P
79RK903P
79RK905P
79RK906P
79RK909P
79RK910P
79RK912P
79RK913P
79SK502P
79SK503P
79SK504P
79SK505P
79SK506P
CDY506
COY486
CDY466
cor507
CDY487
CDY467
COY509
CEC155
CEC176
CEC201
CEC224
CEC156
CEC229
CEC177
CEC202
CEC225
CEC157
CEC178
CEC203
CEC179
CEC204
CEC180
CEC226
CEC158
CEC181
CEC182
CEC227
CEC159
CEC183
CEC205
CEC228
CEC160
CEC251
CEC240
CEC194
CEC218
CECU9
CEC223
CEC154
56 56
56
56
56 56
565656
56
5656
56 56
56
5656
56
56 56
56 56
56
5656
5656 56
56
56 56
56 55 55 56 56 56 56 56
3 2 1 0 1 316 31 31 32 31 32 33 33 34 34 34 35 35 34 35 36 29 31 31 31 34 34 33 34 36 36 59 59 34 39 21 12 12
228 11 18 57 15 242 3 15 56 54 40 43 43 493
20 15 2
19 22 55 16 11 38 34 48 53 42 30 26 53 57 36 48 41 29 42
131
131
131
131
131
131
130
131
131
131
131
131
131
131
131
131
131
131
131
131
131
131
131
131
131
131
131
131
131
131
131
131
131
131
131
131
131
131
131
20 19 20 18 12 12 56 32 32 31 29 31 30 30 32 34 36 36 37 40 41 40 44 48
48
4646
45
4448
4348
17
16 32 59 18 33 33
20 29 24 52 48 25 10 27 17 48 111
42 47 36 48 42 32 13 14 0 27 19 42 36 22 12 561 4 3
48 55 48 14
812 53 43
7.0
7.0
7.0
3.0
10.0 7.0
2.0
5.0
10.0 5.0
5.0
7.0
10.0 5.0
3.0
10.0
15.0
10.0 7.0
10.0
10.0
10.0 7.0
10.0
15.0
10.0 5.0
7.0
7,0
5.0
10.0
15.0
10.0
10.0 7.0
5.0
10.0
10.0
10.0
10.0
10.0
7.0
7.0
10.0 7.0 .7
1.5
3.0
1.5
2.0
7.0
3.0
1.0
1.5
3.0
3.0
3.0
2.0
3.0
2.0
2.0
3.0
5.0
10.0
5.0
2.0
5.0
3.0
5.0
7.0
10.0
7.0
7.0
1.5
5.0
10.0
5.0
10.0
7 5 5 7 7 5 7 720 10 10 10 155
10 157
10 10 10 107
10 10 15 10 10 10 710 15 107 7
10 10 10 10 10
.5 .31.
51.5
1.0 .7
2.0
2.0
>2.0
>2.0
>2.0 .5
>2.0
>2.0
>2.0 1.5
2.0 .7
2.0
1.5
1.5
1.5
>2.0 .7
1.5
1.5
>2.0 1.5
1.5
>2.0
>2.0
>2.0
1.5
1.0
>2.0 1.5
1.5
1.5
1.5
2/000
2/000
1,500
2/000
2/000
2/000
1/000
2/000
5/000
1/500
2/000
2/000
3,000
3/000
1/500
5/000
3/000
2/000
2/000
3/000
2/000
3/000
3,000
5/000
5/000
3/000
3,000
2/000
3/000
3/000
3/000
5/000
2/000
2/000
2/000
2/000
5/000
5/000
5/000
N7.
0 N N N N N N N N N N N N N
2.0
0.0
0.0 N N N N N N N N N N N N N N N
0.0 N N N N N
N N N N N N N N N N N N N N N N N N N N N N N N N N N N N N N N N N N N N N N
N N N N N N N N N N N N N N N N N N N N N N N N N N N N N N N N N N N N N N N
<20
<20
<20
<20
<20
<20
<20
<20
<20
<20
<20
<20
<20
<20
<20 30 SO
200
<20 20 SO 20
<20
<20
<20
<20
<20 20 20
<20
<20 20
<20 20 20
<20
100 20 20
700
100
100
100
100
150
1/000
1,500
3,000
2/000
SOO
200
5,000
1/000
2/000
700
SOO
700
300
SOO
SOO
SOO
500
700
SOO
700
200
100
200
200
I/ SOO
200
200
200
3/000
SOO
SOO
1/000
300
<2 <2 <2 <22
<2N
<2N N
<27
<2 <2 <2 30 20 <2 30 IS SO so <22 3 2
<2 30 70 2
<23
<2 <2 <2 <2 <2 <2 <2
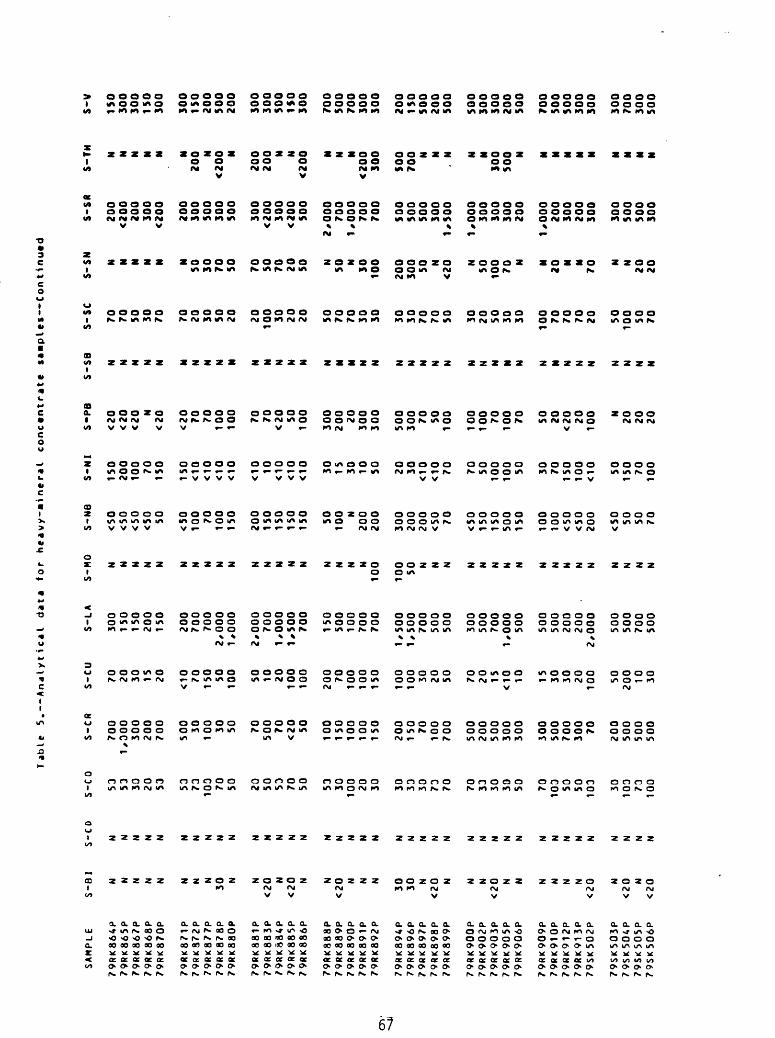
Ta
ble
5
.--A
na
lytica
l d
ata
fo
r h
ea
vy-M
ine
ral
co
nce
ntr
ate
sa
mp
les—
Co
ntin
utd
SA
MP
LE
S-B
IS
-CO
S-C
OS
-CR
S-C
US
-LA
S-M
OS
-NB
S-N
IS
-PB
S-S
BS
-SC
S-S
NS
-SR
S
-TH
S-W
79RK864P
79RK865P
79RK867P
79RK868P
79RK870P
79RK871P
79RK872P
79RK877P
79RK878P
79RK880P
79RK881P
79RK883P
79RK88AP
79RK885P
79RK886P
79RK888P
79RK889P
79RK890P
79RK891P
79RK892P
79RK894P
79RK896P
79RK897P
79RK898P
79RK899P
79RK900P
79RK902P
79RK903P
79RK905P
79RK906P
79RK909P
79RK910P
79RK912P
79RK913P
79SK502P
79SK503P
79SK504P
79SK505P
79SK506P
N N N N N N N N30N N
<20 N
<20 N N
<20 N N N
30 30 N<20 N N N
<20 N N N N N N
<20 N
<20 N
<20
N N N N N N N N N N N N N N N N N N N N N N N N N N N N N N N N N N N N N N N
53 53 30 20 S3 53 73 103 70 SO 20 SO 53 70 50 53 30
100 20 30 30 33 30 73 70 70 33 30 30 SO 70
103 50 SO 103 30 103 73
100
700
1/300
300
200
700
500 30
100 30 50 70
500 70
<20 SO
100
150
100
100
150
200
150 70
100
700
500
200
500
300
300
300
500
700
300 70
200
500
500
500
70 20 30 15 20
<10 70
150 SO
100 50 10 20
100
100
200 70
100
100
ISO
100
100 30 20 50 70 20 15
<10 10 15 30 30 20
100 50
200 10 30
300
150
150
200
150
200
700
700
2/000
1,000
2/000
700
1/000
1/500
700
150
500
100
700
700
1/500
1/500
700
500
500
300
500
700
1/000
500
500
500
200
200
.2/000
500
500
700
500
N N N N N N N N N N N N N N N N N N N100
10050 N N N N N N N N N N N N N N N N N
<50
<50
<50
<50 50
<50
100 70
100
150
200
150
150
150
150 50
100 N
200
200
300
200
200
<50 70
<SO
150
150
500
150
100
100
<50
<50
200
<50 50 50 70
150
200
100 70
150
150
00
<10
<10
<10
<10 10
<10
<10
<10 30 15 30 10 50 20 30
<10
<10
70 70
50100
100 50 30 70
ISO
100
<10 50
ISO 70
100
<20
<20
<20 N
<20
<20 70 70
100
100 70 70
<20 50
100
300
200 20
300
300
500
300 70 50
100
100
100 70
100 70 SO 20
<20 20
100 N20 20 20
N N N N N N N N N N N N N N N N N N N N N N N N N N N N N N N N N N N N N N N
7070
50 30
70 70 20 30 SO 20 20
100
30 20
20 50 70 70
30 30
30 30
70 70 50 30 20 50 30 30
100 70 70 70 20 50
100 SO 70
N N N N N N50 3070 50
70 SO 70 20
SO N SO N30 100
200
300 SON
<20 N
SO 100
70 N N20 N N
70 N N20 20
200
<200 200
300
<200 200
300
SOO
300
SOO
300
<200 300
<200 SOO
2/000
700
1/000
700
700
SOO
SOO
SOO
300
1/500
1/000
300
300
300
200
1/000
200
300
200
300
300
SOO
SOO
300
M N N N N N200 N
<200N
200
200 M M
<200
N M N<200
SOO
SOO
700 M N
, M N N
100
SOO N N N N N N N N N N
1SO
300
300
1SO
300
300
1SO
200
SOO
200
300
300
SOO
1SO
300
700
SOO
700
300
300
200
ISO
SOO
200
SOO
SOO
300
300
200
SOO
700
SOO
SOO
300
300
300
700
300
SOO

Tab
le
5.-
-An
aly
ticaI
da
ta
for
heavy-m
inera
l co
ncen
trate
sa«p
les--
Co
nti
nu
ed
SA
MP
LE
s-u
S-Y
S-Z
NS
-ZR
AA
-CU
-P
AA
-PB
-PA
A-Z
N-P
79RK864P
79RK865P
79RK867P
79RK868P
79RK870P
79RK871P
79RK872P
79RK877P
79RK878P
79RK880P
79RK881P
79RK883P
79RK884P
79RK885P
79RK886P
79RK888P
79RK889P
79RK890P
79RK891P
79RK892P
79RK894P
79RK896P
79RK897P
79RK898P
79RK899P
79RK900P
79RK902P
79RK903P
79RK905P
79RK906P
79RK909P
79RK910P
79RK912P
79RK913P
79SK502P
79SK503P
79SK504P
79SK505P
79SK506P
N N N N N N N N N N N N N N N N N N N N N N N N N N N N N N N N N N N N N N N
70 70
100
100
100
100
300
200
1,000
500
500
1,000
700
300
500
100
300 70
700
1,500
1,500
2,000
500
100
200
150
500
1,500
1,500
500
200
200
150
100
700
150
150
200
200
N N N N N N N N N N N N N N N
700 N N N N N N N N N N N N N N N N N N N N N N N
700
150
1,000
700
1,000
>2,000
>2,000
>2,000
>2,000
>2,000
>2,000
>2,000
>2,000
>2,000
>2,000
700
2,000
100
>2,000
>2,000
>2,000
>2,000
>2,000
>2,000
2,000
2,000
>2,000
>2,000
>2,000
>2,000
1,500
1 ,000
1,500
700
>2,000
>2,000
1,000
>2,000
>2,000
65 2511
0 15 IS
580
120 80
120 35 10 15
130
100
230 40
7017
0150
120
110 45 40 20 40 30 20 20 20 15 15 15 20
110 60
170 10 15
10 10 15 20 10 10 60 45 45 35 15 35 10 35 45
230 95 10
280
200
270
3QO 25 25 30
4060
35 45 25 20 10 10 5
60 15 10 20 15
25 15 15 15 10 15 35 30 45 30 25 60 15 25 25
520
130 45
1,200
380
400
250 45 65 65 170 60 50 60 45 40 40 25 25 35 25 40 40 35