Locally Adaptive DCT Filtering for Signal-Dependent Noise Removal
Upload
independentCategory
view
0download
0
H. Badioze Zaman et al. (Eds.): IVIC 2009, LNCS 5857, pp. 136–147, 2009. © Springer-Verlag Berlin Heidelberg 2009
Quasi-Gaussian DCT Filter for Speckle Reduction of Ultrasound Images
Slamet Riyadi1, Mohd. Marzuki Mustafa1, Aini Hussain1, Oteh Maskon2, and Ika Faizura Mohd. Noh2
1 Department of Electrical, Electronic and Systems Engineering Faculty of Engineering and Built Environment, Universiti Kebangsaan Malaysia, Bangi
43600 {riyadi,marzuki,aini}@eng.ukm.my 2 Universiti Kebangsaan Malaysia Medical Center, Kuala Lumpur 56000 Malaysia
[email protected], [email protected]
Abstract. In recent time, ultrasound imaging is a popular modality for various medical applications. The presence of speckle noise affects difficulties on fea-tures extraction and quantitative measurement of ultrasound images. This paper proposes a new method to suppress the speckle noise while attempting to pre-serve the image content using combination of Gaussian filter and discrete co-sine transform (DCT) approach. The proposed method, called quasi-Gaussian DCT (QGDCT) filter, is a quasi Gaussian filter in which its coefficients are de-rived from a selected 2-dimensional cosine basis function. The Gaussian ap-proach is used to suppress speckle noise whereas the selected DCT approach is intended to preserve the image content. The filter will be implemented on the synthetic speckle images and the clinical echocardiograph ultrasound images. To evaluate the effectiveness of the filter, several quantitative measurements such as mean square error, peak signal to noise ration, speckle suppression in-dex and speckle statistical analysis, are computed and analyzed. In comparison with established filters, results obtained confirmed the effectiveness of QGDCT filter in suppressing speckle noise and preserving the image content.
Keywords: Gaussian, DCT, speckle, ultrasound image, echocardiography.
1 Introduction
Ultrasound imaging is an essential tool and has been proven effective for many medi-cal applications mainly because of its portability, non-invasiveness and radiation free attributes. Additionally, it affords a real-time imaging at low cost imaging modality. Over the years, this imaging method has been an active research area in which ultra-sound data acquisition, processing and interpretation are amongst the topics studied. A major constraint with the ultrasound method is the issue of speckle noise. The presence of speckle noise further adds difficulties to the tasks of features extraction and quantitative measurement of ultrasound image. Consequently, it makes harder for physician to analyze and interpret images as well as for the computer assisted diagno-sis system.
Generally speaking, speckle reduction can be performed during ultrasound data ac-quisition stage and image processing stage. In the image processing stage, a number

Quasi-Gaussian DCT Filter for Speckle Reduction of Ultrasound Images 137
of speckle reduction methods have been proposed and developed. Lee defined and verified a statistical noise model and then introduced a multiplicative noise-smoothing algorithm for speckle appearing in synthetic aperture radar [1]. Frost et al proposed a multiplicative noise model that leads to an adaptive digital filtering technique [2]. This method used locally estimated parameter to provide minimum mean of square error inside a homogeneous area of an image. Meanwhile other filter methods are not derived from speckle noise model. They can be spatial domain such as mean, median, geometric and morphological filter [3]. Transformation based filters were proposed using wavelet decomposition method [4]. In this technique, the image is decomposed into wavelet coefficients and then an optimum threshold value is applied to suppress the speckle. The end result image is obtained by using inverse wavelet transform. Even though, each technique has reported its own successful filter model, the issue still remains and has opened a wide range of filter development due to the complexity of speckle phenomenon.
In this paper, we propose a new method to suppress speckle noise while preserving the image objects using the combination approach of Gaussian filter and discrete cosine transform (DCT). On its own, these two techniques are very popular low pass filtering technique and video compression method, respectively. The proposed method, which we called quasi-Gaussian DCT (QGDCT) filter, is a quasi Gaussian filter. Its coefficients are derived from a selected 2-dimensional cosine basis function and the Gaussian approach is used to suppress the speckle noise whilst the selected DCT approach is use to preserve the image object. The paper is outlined as such. Section 2 describes the speckle ultrasound image model followed by Section 3 that describes the methodology for filter development. Results are presented and discussed in Section 4 and conclusion is given in Section 5.
2 Speckle Ultrasound Image Model
Although, ultrasound imaging research is not a new area, an accurate modeling of speckle noise is still an active investigation subject as it involves complex analytical model. The acquisition of ultrasound image introduces a special noise as known as speckle. The speckle noise has a logarithmic compressed Rayleigh distribution [5]. The observed ultrasound image, uO, can be modeled as an original image, u, with signal-dependent noise as equation [6]
unuu +=0 (1)
where n is a zero-mean Gaussian variable with standard deviation nσ .
3 Methodology
3.1 Gaussian Filter
Gaussian filter is a filter that gives no overshoot to a step function input while mini-mizing the rise and fall time of the bell function as shown in Fig. 1(a). The character-istic of the kernel follows the Gaussian function
138 S. Riyadi et al.
2
2
2
)(
)( c
bx
aexf−−
= (2)
where a is the height of the curve peak, b is the position of the centre of the peak and c controls the width of the bell.
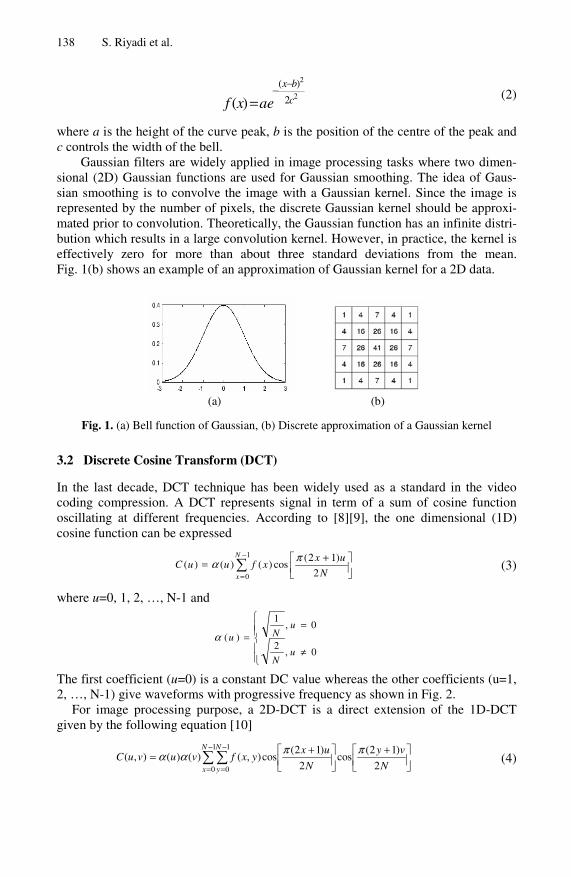
Gaussian filters are widely applied in image processing tasks where two dimen-sional (2D) Gaussian functions are used for Gaussian smoothing. The idea of Gaus-sian smoothing is to convolve the image with a Gaussian kernel. Since the image is represented by the number of pixels, the discrete Gaussian kernel should be approxi-mated prior to convolution. Theoretically, the Gaussian function has an infinite distri-bution which results in a large convolution kernel. However, in practice, the kernel is effectively zero for more than about three standard deviations from the mean. Fig. 1(b) shows an example of an approximation of Gaussian kernel for a 2D data.
(a) (b)
Fig. 1. (a) Bell function of Gaussian, (b) Discrete approximation of a Gaussian kernel
3.2 Discrete Cosine Transform (DCT)
In the last decade, DCT technique has been widely used as a standard in the video coding compression. A DCT represents signal in term of a sum of cosine function oscillating at different frequencies. According to [8][9], the one dimensional (1D) cosine function can be expressed
∑−
=⎥⎦⎤
⎢⎣⎡ +=
1
0 2
)12(cos)()()(
N
x N
uxxfuuC
πα (3)
where u=0, 1, 2, …, N-1 and
⎪⎪⎩
⎪⎪⎨
⎧
≠
==
0,2
0,1
)(
uN
uNuα
The first coefficient (u=0) is a constant DC value whereas the other coefficients (u=1, 2, …, N-1) give waveforms with progressive frequency as shown in Fig. 2.
For image processing purpose, a 2D-DCT is a direct extension of the 1D-DCT given by the following equation [10]
⎥⎦⎤
⎢⎣⎡ +
⎥⎦⎤
⎢⎣⎡ += ∑∑
−
=
−
= N
vy
N
uxyxfvuvuC
N
x
N
y 2
)12(cos
2
)12(cos),()()(),(
1
0
1
0
ππαα (4)

Quasi-Gaussian DCT Filter for Speckle Reduction of Ultrasound Images 139
Fig. 2. 1D cosine basis function with N=8
The 2D basis function is obtained by multiplying the horizontal and vertical set of 1D basis of the same function. Fig. 3 shows the 2D basis function with N=8. Similarly with 1D basis, the top left function is the constant basis and the others increase the function progressively in the both horizontal and vertical direction.
Fig. 3. 2D cosine basis function (N=8)
3.3 Quasi-Gaussian DCT Based Filter
The estimation of optical flow field using global regularization technique is quite simple and straight forward. Assumptions are taken to simplify the computation and often do not agree with the real movement. Due to its limitation, the computed optical flow vectors have errors both in direction and magnitude. Instead of the improvement

140 S. Riyadi et al.
in the optical flow estimation itself, in this paper we introduce a filter to smoothen optical flow vector computed before.
The main drawback of Gaussian filtering is uniform blurring on the image region caused by the natural kernel of Gaussian. On the other hand, the DCT function was proven as a standard image coding technique which means that the DCT has a power-ful function to represent an image. Our basic idea is to use the DCT function to create a new Gaussian kernel, called quasi-Gaussian DCT based filter (QGDCT).
Using the 2D cosine basis function (N=8) as shown in Fig. 3, only 36 selected top-left functions are usually used for JPEG compression. To use these functions to create the QGDCT kernel are inappropriate since it requires large computing time. According to our previous observation, the down-right function, indicated by the red circle in Fig. 3, is more suitable since it represents the high frequency function.
In order to understand how to create the QGDCT kernel, it is easier if one con-siders the 1D basis function (N=8) with u=7 as shown in Fig. 4(a). This function con-sists of positive and negative coefficients. A quasi-Gaussian model is created by re-moving the negative coefficients from the function as show in Fig. 4(b). It can be seen that the model is similar to the natural discrete Gaussian kernel without even term coefficients. Likewise, the 2D QGDCT kernel can be obtained using similar steps applied on the down-right function of 2D DCT basis.
(a)
(b)
Fig. 4. (a) Selected 1D DCT function, (b) a quasi-Gaussian model
3.4 Filter Performance Evaluation
In general, there are two types of filter evaluation, that are, 1) via visual interpretation of the filtered images and 2) via evaluating quantitative performances. The former, involving visual evaluation, investigates both the filter capability to suppress speckle noise and to preserve the image details. It is an easy and efficient way and probably, provides the best assessment method for filter performance [7]. The latter which involves some quantitative performances evaluation has its drawbacks [11][12].

Quasi-Gaussian DCT Filter for Speckle Reduction of Ultrasound Images 141
Depending on the performances measure, the filter has limited capability to perform both speckle suppression and preserve the image details, simultaneously. For instance, using a specific performance measure a filter may be able to reduce speckle noise but may not be able to preserve the image details effectively, and vice versa.
1. Mean Square Error (MSE) Mean square error (MSE) parameter evaluates the pixel-by-pixel difference between the noisy (X) and filtered image using equation
[ ]MN
jiPjiXMSE
Mi
Nj∑ ∑= = −
= 1 12),(),(
(5)
where M and N are the width and height of the image. This parameter shows the smoothing capability of filter. The lower MSE value indicates a better performance of filter to reduce the speckle.
2. Peak Signal to Noise Ratio (PSNR) Peak signal to noise ratio (PSNR) also measures the capability of filter to reduce the speckle noise. The definition of PSNR is given by
⎥⎥⎦
⎤
⎢⎢⎣
⎡=
MSEPSNR
255log10 (6)
The filtered image tends to have a higher PSNR that indicates a better performance of speckle noise reduction.
3. Speckle Suppression Index (SSI) Speckle strength is commonly measured by the coefficient of variance. Speckle sup-pression index (SSI) is defined as the ratio of the coefficient of variance of the filtered image and the noisy image, which is formulated as
[ ][ ]∑ ∑
∑ ∑= =
= =
−
−=
Mi
Nj P
Mi
Nj X
ujiP
ujiXSSI
1 12
1 12
),(
),( (7)
where xμ and pμ are mean of noisy and filtered image respectively. A filtered im-
age should have less variance or smaller SSI value because the speckle noise is sup-pressed [12].
4. Speckle Image Statistical Analysis As the ultrasound image is multiplicative in nature, the amplitude of speckle can be represented by the ratio of noisy to filtered image [12]. It is defined as
∑ ∑∑ ∑
= =
= ==Mi
Nj
Mi
Nj
jiP
jiXSp
1 1
1 1
),(
),( (8)
where Sp is speckle image. For ideal filter, the speckle image has normal distribution with a mean value 1.0. This is the reason why the mean of speckle image is suitable to

142 S. Riyadi et al.
be used in assessing the ability of filter to retain the original image content. In other words, for best performance, the mean of speckle image must be retained closed to 1.0.
4 Result and Discussion
4.1 Application to Synthetic Speckle Images
The proposed QG-DCT filter technique has been applied on a grayscale image eight.tif of size (242x208) that has been contaminated with synthetically generated speckle noise of 0.04 noise variance. The filter performance is evaluated at different filter size of (3x3), (5x5) and (7x7) as shown in Fig. 5. Evaluating via visual ap-pearances, we found that the proposed filter was able to suppress the speckle noise using any filter size. The filter also succeeded to improve the PSNR from 62.422 dB to 83.204 dB when filter of size (3x3) is used. Analyzing in term of the filter size, filter size (3x3) performed the best noise reduction which is indicated by the higher PSNR value.
Fig. 6 (a), (b), (c) and (d) depict the end results of filter implementation using Mean, Median, Frost and QGDCT, respectively. The QGDCT filtered image as shown in Fig. 6 (d) outperforms the other three with its most suppressed background. In term of PSNR, the QGDCT filter improves the ratio to 83.204 dB whereas mean filter 77.753 dB, median filter 68.077 dB and Frost filter 71.978 dB. Consequently, through visual evaluation, it can be confirmed that the QGDCT filter outperforms the other filters and can effectively suppress speckle noise.
Eventhough visual evaluation is an easy and efficient assessment method, its results can be biased and vary depending on the expert who performs the assessment. Therefore, four quantitative criteria, including mean square error (MSE), peak signal to noise ratio (PSNR), speckle suppression index (SSI) and speckle image statistical analysis (SISA), are computed for the analysis of each filtered image. Various window size are also tested to study the effect of filter size on the performance.
Fig. 7 and Fig. 8 depict the quantitative measurement of MSE and PSNR of the filtered images. The QGDCT filter performed significant improvement of noise reduction as compared to others since the MSE value of the QGDCT filter is the lowest and the PSNR is the highest. As aforementioned, the best filter shall have the lowest MSE and highest PSNR. Variation of filter size does not affect the performance of the proposed filter. The ability of filter to reduce speckle noise is also evaluated by SSI measurement as shown in Fig. 9. This figure agrees with the previous fact that the QGDCT filter suppresses speckle noise better than others since the SSI value is the lowest at every filter size. The ability of filter to preserve the image content is evaluated by the SISA measurement as shown in Fig. 10.
Eventhough the SISA values for the other filters are closer to 1.0 compared to QGDCT, the SISA of QGDCT filter is still within the acceptable range and this means that the QGDCT filter is still able to retain the image content.

Quasi-Gaussian DCT Filter for Speckle Reduction of Ultrasound Images 143
(a) PSNR = 62.422 dB (b) PSNR = 83.204 dB
(c) PSNR = 82.923 dB (d) PSNR = 83.045 dB
Fig. 5. (a) Speckle noisy image at noise variance 0.04, (b), (c) and (d) Filtered image by the QGDCT filter at different filter size
(a) PSNR = 77.753 dB (b) PSNR = 68.077 dB
(c) PSNR = 71.978 dB (d) PSNR = 83.204 dB
Fig. 6. Filtered image by using (a) mean, (b) median, (c) Frost and (d) QGDCT filter

144 S. Riyadi et al.
(3x3) (5x5) (6x6)0
10
20
30
40
50
60
70
80
Filter Size
MS
E
MeanMedianFrostQGDCT
Fig. 7. Mean square error (MSE) for filtered images by different filter
(3x3) (5x5) (7x7)60
65
70
75
80
85
90
Filter Size
PS
NR
MeanMedianFrostQGDCT
Fig. 8. Peak signal to noise ratio (PSNR) for filtered images by different filter

Quasi-Gaussian DCT Filter for Speckle Reduction of Ultrasound Images 145
(3x3) (5x5) (6x6)0
0.1
0.2
0.3
0.4
0.5
0.6
0.7
0.8
0.9
1
Filter Size
SS
I
MeanMedianFrostQGDCT
Fig. 9. Speckle suppression index (SSI) for filtered images by different filter
(3x3) (5x5) (7x7)0.6
0.8
1
1.2
1.4
Filter Size
SIS
A
MeanMedianFrostQGDCT
Fig. 10. Speckle image statistical analysis (SISA) for filtered image by different filter

146 S. Riyadi et al.
4.2 Application to Clinical Ultrasound Images
The proposed filter technique was also implemented on real clinical ultrasound data. A sample of the clinical ultrasound data consisting of the original echocardiograph image is shown in Fig. 11(a). Fig. 11(b), (c), (d) and (e) represent the filtered images of the Mean, Median, Frost and QGDCT, respectively. Visually, it can be concluded that the filtered image of QGDCT yields the best speckle suppression result when compared to the Mean, Median and Frost filters. This is indicated in Table 1 since QGDCT has the lowest MSE, the highest PSNR and the lowest SSI values. In addi-tion, as shown in Fig. 11, the proposed QGDCT filter is also effective in preserving the image content since the SISA value is closed to 1.0.
(a) (b) PSNR = 76.494 dB (c) PSNR = 80.162 dB
(d) PSNR = 77.402 dB (e) PSNR = 85.926 dB
Fig. 11. (a) Original echocardiography image, (b) to (e) filtered image window size (3x3) for Mean, Median, Frost and QGDCT filter
Table 1. Quantitative measurement of echocardiography filtered image
Filter MSE PSNR SSI SISA Mean 30.9727 76.494 0.8674 1.0113 Median 21.4629 80.162 0.9064 1.0338 Frost 28.2850 77.402 0.9054 0.9946 QGDCT 12.0604 85.926 0.7698 0.9802
5 Conclusion
This paper has afforded a new filtering method to suppress speckle noise and at the same time, preserve the image content of ultrasound images. From the results, the so-called QGDCT filter has been proven effective basing on the qualitative assessment

Quasi-Gaussian DCT Filter for Speckle Reduction of Ultrasound Images 147
through visualization of the filtered image and quantitative measures of the MSE, PSNR, SSI and SISA. In conclusion, a new filter that can suppress speckle noise and simultaneously preserve the image content has been successfully developed and tested using image data that has been synthetically corrupted with speckle noise and real field data comprising the clinical echocardiograph ultrasound images.
Acknowledgement
The authors would like to acknowledge Universiti Kebangsaan Malaysia (Project code UKM-GUP-TKP-08-24-080) for the financial support awarded for this research.
References
1. Lee, J.-S.: Speckle Suppression and Analysis for Synthetic Aperture Radar Images. Optical Engineering 25(5), 636–643 (1986)
2. Frost, V.S., Stiles, J.A., Shanmugan, K.S., Holtzman, J.C.: A Model for Radar Images and Its Application to Adaptive Digital Filtering of Multiplicative Noise. IEEE Transactions on Pattern Analysis and Machine Intelligence 4(2), 157–166 (1982)
3. Grimmins, T.R.: Geometric Filter for Reducing Speckle. Opt. Eng. 25(4), 652–654 (1986) 4. Donoho, D.L.: De-noising by Soft-thresholding. IEEE Trans. Inform Theory 41, 613–627
(1995) 5. Dutt, V., Greenleaf, J.: Adaptive Speckle Reduction Filter for Log Compressed B-scan Im-
ages. IEEE Trans. Med. Imaging 15(6), 802–813 (1996) 6. Krissian, K., Vosburgh, K., Kikinis, R., Westin, C.F.: Anisotropic Diffusion of Ultrasound
Constrained by Speckle Noise Model. Tech. report. Harvard Med. School (2004) 7. Raouf, A., Lichtenegger, J.: Integrated Use of SAR and Optical Data for Coastal Zone
Management. In: ERS Satellite Radar Imagery: Proceedings of the Third ERS Symposium, ESA SP-1204 (1997)
8. Petland, A., Horowitz, B.: Recovery of Non-rigid Motion and Structure. IEEE Transaction on Pattern Analysis and Machine Intelligent 13, 730–742 (1991)
9. Khayam, S.A.: The Discrete Cosine Transform: A Theory and Application.Tutorial of the Dept. of Electric & Computer Engineering, Michigan State University (2003)
10. Richardson, I.E.G.: H.264 and MPEG-4 Video Compression: Video Coding for Next-generation Multimedia. John Willey & Sons, West Sussex (2003)
11. Lee, J.S., Jurkevich, I., Dewaele, P., Wambacq, P., Oosterlinck, A.: Speckle Filtering of Synthetic Aperture Radar Images: A Review. Remote Sensing Review 8, 313–340 (1994)
12. Qiu, F., Berglund, J., Jensen, J.R., Thakkar, P., Ren, D.: Speckle noise reduction in SAR imagery using a local adaptive median filter. GIScience and Remote Sensing 41(3), 244–266 (2004)
Copyright © 2022 FDOKUMEN