QUANTITATIVE RESISTANCE TO PEANUT BUD NECROSIS ...
114
QUANTITATIVE RESISTANCE TO PEANUT BUD NECROSIS TOSPOVIRUS IN GROUNDNUT
-
Upload
khangminh22 -
Category
Documents
-
view
0 -
download
0
Transcript of QUANTITATIVE RESISTANCE TO PEANUT BUD NECROSIS ...

QUANTITATIVE RESISTANCE TO PEANUT BUD
NECROSIS TOSPOVIRUS IN GROUNDNUT

Promotor: dr ir J.E. Parlevliet
Emeritus Hoogleraar in de Plantenveredeling
Co-promotor: dr ir D. Peters
Universitair Hoofddocent, Vakgroep Virologie

QUANTITATIVE RESISTANCE TO
PEANUT BUD NECROSIS TOSPOVIRUS
IN GROUNDNUT
A.A.M. BuiEL
Proefschrift ter verkrijging van de graad van doctor
op gezag van de rector magnificus van de Landbouwuniversiteit Wageningen
dr C.M. Karssen, in het openbaar te verdedigen op maandag 2 december 1996
des namiddags te vier uur in de Aula
3 O V?
,—cAr\ U , o

The research described in this thesis was carried out at the Crop Protection Division,
International Crops Research Institute for the Semi-Arid Tropics Asia Center (ICRISAT-
IAC), India. The research was a collaborative project between Wageningen Agricultural
University and ICRISAT-IAC, as part of the Durable Resistance Program funded by the
Directorate General for International Cooperation of the Dutch Ministry of Foreign
Affairs.
BIBL.IOTKIu;X LANDSouwuNnv;:"o:Tsrr
CIP-DATA KONINKLIJKE BIBLIOTHEEK, DEN HAAG
Buiel, A.A.M.
Quantitative resistance to peanut bud necrosis tospovirus in groundnut /
A.A.M. Buiel. - [S.I.:s.n.]
Thesis Wageningen - With ref. - With summary in Hindi and Dutch
ISBN 90-5485-602-5
Subject headings: peanut bud necrosis tospovirus; Tospovirus; resistance; groundnut

A J f J u c " ^ , C
STELLINGEN
1. De kwantitatieve vorm van resistentie in de aardnoot tegen het 'peanut bud necrosis virus' kan als model dienen voor de resistentie tegen andere tospovirussen.
2. In India komen geen differentiërende vormen van het 'peanut bud necrosis virus' voor. Dit proefschrift.
3. Kwantitatieve virusresistentie kan gemaskeerd worden wanneer monsters voor de analyse samengevoegd worden.
4. Veel virussen houden zich niet aan de mandaatgewassen van de diverse internationale instituten, de laatsten zouden de regels voor het toegepast onderzoek dan ook moeten versoepelen.
5. De Nederlandse term 'aardnootknopnecrosevirus' voor het 'peanut bud necrosis virus' heeft een hoog hottentottententententoonstelling-gehalte, en is bovendien volledig overbodig. Gewasbescherming 26: Supplement 1, 1995.
6. Gelukkig is vloeken aangeleerd.
7. Tospovirussen zijn de vegetariërs binnen de niet-vegetarische familie Bunyaviridae.
8. De slogan 'Let's make things better' waarmee Philips zijn producten tracht te verkopen suggereert dat er thuis ook nog aan deze producten gesleuteld moet worden.
9. Het aantal passagiers per 2-wielig voertuig in India, is gemiddeld hoger dan het aantal passagiers per 4-wielig voertuig in Nederland.
10. De stappen die in 1994 genomen werden om de verspreiding van de pest {Yersinia pestis) in India in te dammen, stonden in geen enkele relatie tot de epidemie van deze ziekte. ne Lancet 1994, 344 (8933): 1033-1035.
11. Het gewicht van dit proefschrift dat bij verschijnen 0,260 kg was, zal toenemen.
Stellingen behorende bij het proefschrift van A.A.M. Buiel, getiteld 'Quantitative resistance to peanut bud necrosis tospovirus in groundnut', te verdedigen op 2 december 1996 in de Aula van de Landbouwuniversiteit te Wageningen.

ABSTRACT
Quantitative resistance to peanut bud necrosis virus (PBNV) is expressed as a reduced
disease incidence (percentage of infected plants) in the groundnut crop. An increased plant
density reduced this incidence, but the number of infected plants per unit area increased,
maintaining high levels of PBNV.
No significant inter-plot interference was observed. It appeared that the quantitative
resistance, assessed in small plots of the plant breeder, is representative of the farmers'
situation.
The PBNV infection was higher in the center of the field as compared to the border zones
of the field. This effect was probably caused by the dispersal pattern of the vector.
Selection for resistance to the virus was most effective in environments with average or
high levels of natural infection. However, selection in environments with low levels of
infection yielded similar results when the data of several years were combined.
At least three resistance factors were found in seven groundnut genotypes. Two different
factors were present in the resistant ICGV genotypes, while another factor was present in
groundnut cultivar TMV 2. The latter has a slight resistance compared to the most
susceptible check, but it has been effective for several decades and can be considered
durable.
In addition, mature plant and tissue resistance caused a reduction in incidence and increased
the incubation period. This effect was shown to occur in the field, and caused a slowing
down and a termination of the epidemic in the course of the growing season.
Virus resistance can be explained by an inhibition of virus multiplication and/or virus
movement. These mechanisms result in a reduction of the disease incidence in resistant
genotypes.

ACKNOWLEDGEMENTS
This thesis is the result of a DGIS funded project on 'Resistance to Peanut Bud Necrosis
Virus in Groundnut'. The five year project was a collaboration between Wageningen
Agriculture University and the International Crops Research Institute for the Semi-Arid
Tropics (ICRISAT), and included a cooperation with three national institutes in India and
the Khon Kaen University in Thailand.
For the successful cooperation with national institutes, I thank Drs. M.S. Basu (project
coordinator for groundnut in India), M.V.R. Prasad (former Director of the Directorate of
Oilseed Research, Rajendranagar, Andhra Pradesh), A.B. Singh (Groundnut Breeder of the
Groundnut Research Station, Mainpuri, Uttar Pradesh), S.A. Patil and P.S. Dharmaraj
(Associate Director and Breeder, Regional Research Station, Raichur, Karnataka), and
Sopone Wongkaew (Head, Department of Plant Pathology, Khon Kaen University,
Thailand).
I thank Drs. D. McDonald (former Director of Crop Protection Division), J.M. Lenné
(Director of Crop Protection Division), S.N. Nigam (Head of Groundnut Breeding), S.L.
Dwivedi (Groundnut Breeder), J. A. Wightman (Head of Entomology), and G. V. Ranga Rao
(Entomologist), from ICRISAT, for extending their support to the project.
The major part of the research was carried out at the Virology Unit of ICRISAT, between
July 1990 and March 1995. I would like to thank the staff of the Unit for the pleasant
interaction. S. Prabhakar Reddy (field assistant) was continuously affiliated with the project,
and for the last two years this was on a full time basis. With a good eye for virus
symptoms, his assistance was extremely helpful. I could always rely on Sham Sunder Rao
for assisting me in inoculating plants with the virus. In the last year Lakhe joined the
project as a research associate and proved himself very useful. Thanks also to Sudarshan
Reddy (research associate), for answering my many questions related to various aspects of
peanut bud necrosis virus, the groundnut crop, and field experiments. He also formed the
link with the regular work force of ICRISAT of whom I would like to thank Sujata,
Swaroopa, Lingamma and the late Iramma. Thanks are also due to Kotaiah, Nagendram,
Aseervadamma, and Babu Rao, who extended their assistance in different ways to the
project.
The monoclonal antibodies used in this study were developed and provided by François
Poul and Ratna. François helped me a great deal through our discussions and his excellent
knowledge of virological techniques.
I would also like to thank the three students, Guus Paardekooper, Gertjan Feitsma and

Aletta Karsies, who worked under the umbrella of this project for part of their MSc degree,
and added valuable contributions to this research. I wish to thank A.K. Murthy and S.K.
Manohar (Electron Microscope Unit) who assisted the students in their study on the
histology of the groundnut leaf.
The research on thrips would not have been possible without the help of Vijayalakshmi,
Mohan Kendre, and Uma, of the Entomology Unit. They collected an immense number of
samples and were very skilful in performing the tedious job of thrips identification.
I am very grateful to Dr Ramanna from the Department of Plant Breeding, and Dr Rai from
CEBECO Breeding Company for translating the summary into Hindi, and to Bob
Eaglesfield from ICRISAT for typing it.
None of this work would have been possible without the tremendous back up from Dr
D.V.R. Reddy, Head of the Virology Unit. D.V.R., thanks for your cheerful and lively view
on research and life in India. Perhaps your enthusiasm can be demonstrated by the fact that
you and your wife Ira went out of your way to get the highly appreciated Indian pickle for
me. You gave me such a large amount, it will probably last for the rest of my life!
Special thanks to my promoter Prof. Jan Parlevliet and co-promotor Dick Peters. Jan, your
positive support was of enormous help. My view on the research was invariably refreshed
after your visits to ICRISAT. You always provided constructive views and offered
productive discussions. Dick, even though you were officially not involved at the start of
the project, you have always showed great enthusiasm and interest in the research. Your
useful criticism drilled me into creative thinking, and to aim for perfection.
Besides a working place, Hyderabad turned out to be a great 'Hash' city. Many Sunday
afternoons were lightened up by the perfect mix of exercise and socializing. Digit, Diamond
Lil, Big Bird, Madame Tall, Snookers, and Cleopatra are only a few (Hash) names of this
active mob.
Going to India was a major change, not only for me but also for my family, especially my
parents. I thank them for the unconditional backing they gave me.
Martin, as husband and best friend, you are the last on this list of thanks. I find it
impossible to express my deepest gratitude here with mere words, when you have given me
your whole-hearted support from the beginning to the end. Five years of a mainly long
distance relationship was worth it in the end, as I finish this thesis. During these years India
has taken a special place in our hearts, not in the least because our daughter, Imke Tara,
began her earliest life in India, and she turned out to be of 'export quality'.

CONTENTS
GENERAL INTRODUCTION 1
CHAPTER 1 FACTORS AFFECTING THE INCIDENCE OF PEANUT BUD NECROSIS
VIRUS IN GROUNDNUT FIELDS I. PLANT DENSITY 5
CHAPTER 2 FACTORS AFFECTING THE INCIDENCE OF PEANUT BUD NECROSIS
VIRUS IN GROUNDNUT FIELDS II. INTER-ROW INTERFERENCE 15
CHAPTER 3 DISTRIBUTION OF PEANUT BUD NECROSIS DISEASE IN
GROUNDNUT FIELDS 23
CHAPTER 4 EPIDEMIOLOGY OF PEANUT BUD NECROSIS DISEASE IN
GROUNDNUT 29
CHAPTER 5 MULTI-ENVIRONMENT TESTING FOR REDUCED INCIDENCE OF
PEANUT BUD NECROSIS DISEASE 37
CHAPTER 6 INHERITANCE OF QUANTITATIVE RESISTANCE IN GROUNDNUT
TO PEANUT BUD NECROSIS VIRUS 47
CHAPTER 7 MATURE PLANT AND TISSUE RESISTANCE IN THE GROUNDNUT -
PEANUT BUD NECROSIS VIRUS SYSTEM 63
CHAPTER 8 MECHANISMS OF RESISTANCE IN GROUNDNUT TO PEANUT BUD
NECROSIS VIRUS 73
CHAPTER 9 VECTOR RESISTANCE 87
GENERAL DISCUSSION 93
SUMMARY 99
SUMMARY IN HINDI 101
SAMENVATTING 103
REFERENCES 105
LIST OF PUBLICATIONS 111
CURRICULUM VITAE 113

GENERAL INTRODUCTION
Peanut bud necrosis tospovirus (PBNV) causes bud necrosis disease, and is one of the most
devastating viruses of groundnut (Arachis hypogaea L.). The disease has been reported from
China, India, Nepal, Sri Lanka, and Thailand, and seems to be restricted to South Asia
(Reddy et al., 1991, 1995). Besides groundnut, PBNV infects chili, potato, tomato, tobacco,
mung bean and urd bean (Reddy et al., 1995), and probably many other crops. Knowledge
of the occurrence of PBNV is limited because virus detection in the South Asian countries
where PBNV presumably occurs is often hampered by a lack of equipment, skills etc. The
occurrence of PBNV, based only on symptoms, has been reported from Bangladesh (Khatun
et al., 1996), Indonesia (Baliadi and Saleh, 1996), Pakistan (Bashir et al., 1996), and
Vietnam (Thuan and Trung, 1996). Extensive studies in India and Thailand have shown that
PBNV occurs recurrently on groundnut in these countries. Sites with more than 50%
infection are not uncommon (Reddy et al, 1983; Wongkaew, 1995). The International
Crops Research Center for the Semi-Arid Tropics (ICRISAT) estimated the losses caused
by this virus at more than 89 million US dollars per year (Anonymous, 1992).
PBNV is currently classified as a species within the genus Tospovirus of the Bunyaviridae
(Reddy et al., 1992; Adam et al., 1993; Satyanarayana et al., 1995). Tomato spotted wilt
virus (TSWV), the type member of the genus, has a host range of more than 700 different
plant species, including many weeds and economically important crops (Best, 1968;
Goldbach and Peters, 1994; Peters, personal communication). PBNV also appears to have
a wide host range (Reddy et al., 1995).
Tospoviruses are transmitted by thrips (Thysanoptera: Tripidae), and PBNV has been shown
to be transmitted by Thrips palmi Karny (Vijaya Lakshmi et al., 1995). The virus is not
seed-transmitted (Reddy et al., 1983).
CAUSAL VIRUS
Reddy et al. (1968) first reported bud necrosis symptoms on groundnut, but the causal virus
was not yet known. Ghanekar et al. (1979) concluded that the disease was caused by
TSWV, as positive results were obtained in a haemagglutination test with TSWV-antiserum
from South Africa and the USA. Sreenivasulu et al. (1991) described that the isolate
causing peanut bud necrosis from India failed to react with antisera developed to TSWV
1

G E N E R A L I N T R O D U C T I O N
isolates from Texas (USA), Australia, Greece and The Netherlands. The antiserum
developed to the Indian isolate only reacted with the isolates from India. These results
strongly indicated that the Indian isolates were serologically distinct from TSWV.
Using serological techniques, Reddy et al. (1992) showed that the virus was indeed distinct
from TSWV and it was named peanut bud necrosis virus. The name groundnut bud necrosis
virus is preferred by several other authors as the disease was earlier described as 'groundnut
bud necrosis' (Reddy et al., 1983), or as 'bud necrosis of groundnut' (Ghanekar et al.,
1979). Recently, data on the nucleotide sequence of the nucleocapsid protein gene
confirmed that PBNV should be considered as a distinct species in serogroup IV of the
Tospoviruses of the Bunyaviridae (Heinze et al., 1995; Satyanarayana et al., 1995). TSWV,
a serogroup I virus, causes a similar disease on groundnut in the USA. Groundnut ringspot
virus, one of the two viruses forming serogroup II, has been found on groundnut in South
Africa. Impatiens necrotic spot virus is the only species forming serogroup III and has not
been found on any Leguminosae (De Âvila et al., 1993a, b). Serogroup IV contains, apart
from PBNV, watermelon silver mottle virus (WSMV) and PBNV-To, an isolate similar to
PBNV collected from tomato in Taiwan (Yeh and Chang, 1995; Yeh et al, 1992; Heinze
et al., 1995). The N protein of PBNV showed a 85% sequence identity to WSMV and
PBNV-To but 30-34% identity with the members of other serogroups, indicating that PBNV
is closely related to WSMV and PBNV-To (Satyanarayana et al., 1995).
VECTOR
Initially, Ghanekar et al. (1979) produced some evidence that the virus causing bud necrosis
disease was transmitted by Scirtothrips dorsalis Hood. Subsequently, it was shown that
Frankliniella schultzei Trybom could also transmit this virus, and that it transmitted the
virus more efficiently than S. dorsalis (Amin et al., 1981). However, Palmer et al. (1990)
showed that the thrips, earlier identified as F. schultzei, were in fact Thrips palmi Karny.
In subsequent laboratory studies it was shown that 38% of T. palmi individuals transmitted
PBNV, while a rate of 2% was found for F. schultzei, and S. dorsalis failed to transmit
PBNV. Only T. palmi adults, collected from infected plants in the field, were able to infect
healthy groundnut test seedlings at a rate of 60%. Other thrips species failed to transmit,

G E N E R A L I N T R O D U C T I O N
indicating that T. palmi is the major vector of PBNV (Vijaya Lakshmi et al., 1995).
Interestingly, T. palmi also transmits WSMV in Taiwan (Yeh et al., 1992). PBNV is
acquired only by larval stages of T. palmi, while transmission is exclusively due to adult
thrips (Vijaya Lakshmi, 1994). F. occidentalis Pergande, the main vector of TSWV and the
only vector of INSV, was able to transmit in the second larval stage as well as in the adult
stage (Wijkamp an Peters, 1993; Wijkamp et al., 1995). Some sources of vector resistance
have been reported (Amin et al., 1985).
SYMPTOMS
The first symptoms usually appear on the newly formed leaves as chlorotic spots that may
develop into chlorotic and necrotic rings (Reddy et al., 1991). These leaflets become flaccid
and droop, resulting in the typical necrosis of the terminal bud. The virus spreads
systemically and induces in most cases necrosis of all buds. Stunting and proliferation of
axillary shoots are common symptoms of PBNV after systemic spread. These symptoms
usually occur on early infected plants, i.e. less than one month old, giving them a stunted
and bushy appearance. However, early infected plants often die, and it becomes impossible
to determine visually or serologically, whether these plants were infected by PBNV.
Because of the large variation in the type of symptoms, produced on differnt groundnut
plants of the same cultivar, the disease has previously been described as groundnut mosaic,
groundnut rosette, bunchy top, chlorosis, ring mottle, bud blight, and ring mosaic (Reddy,
1988a).
RESISTANCE
Complete resistance (immunity), i.e. absence of systemic infections on genotype level, has
not been found among cultivated groundnut (Reddy et al., 1991). However, several
groundnut genotypes with resistance to PBNV (Amin, 1985; Dwivedi et al., 1993, 1995),
and with resistance to TSWV (Culbreath et al, 1992b, 1993, 1994), have been identified.
This resistance is of a quantitative nature and reduced the disease incidence in the crop. The
disease incidence is determined as the percentage of plants showing systemic symptoms.
Symptom expression and virus detection were always associated with the presence of

G E N E R A L I N T R O D U C T I O N
PBNV in the plants (Buiel, unpublished), and of TSWV (Prasada Rao et al., 1993). In rare
cases, virus could be detected in some TSWV-infected plants without symptoms (Culbreath
et al., 1992a). The symptoms caused by PBNV are highly variable, but they are not
genotype specific (Reddy, 1988a).
SCOPE OF INVESTIGATION
Information on the quantitative resistance to PBNV was limited. The purpose of this thesis
was to develop methods to assess resistance, to determine the inheritance, and to study the
mechanisms of resistance. The effect of plant density and inter-plot interference on the
disease incidence was reported in Chapter 1 and 2. Chapter 3 describes the distribution of
PBNV in groundnut fields. In Chapter 4 the epidemiology of PBNV is studied in field-
resistant and -susceptible groundnut genotypes. PBNV resistance was tested in multi-
environments to determine whether resistance operates across environments, to define the
optimal location for selection, and to investigate the occurrence of pathogenetic differences
between PBNV populations (Chapter 5). Five resistant genotypes were crossed with two
susceptible genotypes to study the inheritance of the quantitative resistance (Chapter 6). The
occurrence of a mature plant and tissue resistance is presented in Chapter 7. Chapter 8
describes the mechanisms that cause the quantitative resistance in resistant groundnut
genotypes. Findings on virus- and vector resistance are compared in Chapter 9. The results
presented here are collectively addressed in the general discussion.

CHAPTER 1
FACTORS AFFECTING THE INCIDENCE OF
PEANUT BUD NECROSIS VIRUS IN GROUNDNUT FIELDS
I. PLANT DENSITY
SUMMARY
The effect of plant density on the disease incidence of peanut bud necrosis
virus (PBNV) in groundnut was investigated using nine plant density
levels ranging from 6.7 to 33.5 plant/m2. The disease incidence
(percentage of infected plants) was reduced in high density plots of both a
susceptible and a resistant genotype. However, when expressed as the
number of infected plants per unit area, disease levels increased with plant
density. Thus, eventhough an increased plant density appeared to reduce
the disease incidence, it actually caused higher levels of the disease.
The use of a resistant genotype reduced the disease incidence to a much
larger extent than the effect of an increased plant density. The cultivation
of a resistant genotype would be recommended as a cultural practice to
control the disease.

CHAPTER 1
INTRODUCTION
Peanut bud necrosis tospovirus (PBNV) is of great economic importance to the
groundnut growing countries of South Asia. Losses due to PBNV were estimated at over
89 million US $ per year (Anonymous, 1992). Several cultural practices have been
recommended to reduce the incidence of the disease caused by PBNV, e.g. increasing
plant density, sowing at early dates to prevent vector invasion in the crop, and using
resistant cultivars (Reddy et al., 1983, 1991). Insecticide application to control the vector
failed to control the disease (Reddy et al, 1983).
Several groundnut genotypes with resistance to PBNV or to tomato spotted wilt
tospovirus (TSWV) causing a similar disease on groundnut in the USA, have been found
(Amin, 1985; Culbreath et al., 1992b, 1993, 1994; Dwivedi et al., 1993, 1995). The
resistance present in these genotypes did not change the severity of symptoms in the
plants but reduced the disease incidence levels in the crop.
In Asia, the resistance has hardly been combined with other desirable characteristics
such as higher yield, seed size and seed shape. As a result, most of the cultivars grown
by farmers in Asia are still highly susceptible to PBNV. Therefore, it is important to
determine if other practices such as an increased plant density can indeed reduce the
PBNV infection, and to what extent. Information on the relation between plant density
and the disease infection could lead to specific recommendations to farmers. The aim of
this study was to determine the effect of plant density on the disease incidence, using
nine plant density levels.
MATERIALS AND METHODS
The effect of plant density was tested in two field experiments at ICRISAT Asia Center,
in the rainy seasons of 1993 and 1994, each comprising 3 replicates. Three levels of
inter-row distance (R) of 30, 60, and 75 cm, and three levels of inter-plant distance (P)
of 10, 15, and 20 cm were used. The nine treatments (R*P) were randomized over nine

PLANT DENSITY
blocks within each replicate. Each block was divided into four plots each with two 4-m
rows with JL 24 (susceptible), or ICGV 86031 (resistant) plants.
The percentage of infected plants (disease incidence) was determined visually per row,
every two or three weeks during the growing season, until 63 days after sowing in the
1993 experiment, and 90 days after sowing in the 1994 experiment. The disease
incidence at the start of the epidemic and the final disease incidence were used in the
computations. The data were transformed to arcsine values and analyzed using Statistical
Analysis Systems (SAS, 1989).
RESULTS
The effect of plant density was fairly significant (P=0.06, Table 1). Plant density could
be divided in three components: the plant distance within the row, the row distance, and
the interaction between plant distance and row distance. The disease incidence was
clearly affected by the plant distance (P=0.03), while row distance had a smaller effect
(P=0.07), hence, the effect of plant distance was apparently more important than row
distance. The interaction between plant and row distance was of no importance (P=0.45).
The effect of environment and genotype were both highly significant. The environment
effect accounted for 10% of the total sum of squares, and the genotype effect for 64%,
compared to 1.7% for the plant density effect. The effect of plant density was small
compared to the effect of environment and genotype, yet is was quite substantial with an
important plant distance component. The interaction between environment and plant
density was not significant, nor was an interaction found between genotype and row
distance, genotype and plant distance, or the composite interaction.
The average disease incidence was about 12 times lower in plots with ICGV 86031,
than in plots with JL 24 (Table 2A). It increased from 2.8% in plots with ICGV 86031
(highest plant density) to 5.1% (lowest plant density), and from 41.7% to 58.2% in plots
with JL 24. These results show, conclusively, that by increasing plant and row distance,
the disease incidence in both genotypes was reduced.

CHAPTER 1
Table 1. Analysis of variance of the arcsine transformed disease incidence tested in two environments (years), using three replicates within environments, three levels of plant distance (within the row), three levels of row distance, and two genotypes JL 24 (susceptible) and ICGV 86031 (resistant).
Source of variation DF
Environment (E) 1 Replication within environment
(Rep(E)) 4 Plant density (D) 8
Row distance (R) 2 Plant distance (P) 2 R* P 4
E *D 8 D * Rep(E) 32
Genotype (G) 1 R * G 2 P * G 2 R * P * G 4 Error 369
Sum of squares
18400.5
6180.3 3067.6 1027.0 1365.3 675.3
2541.2 5735.3
114813.4 51.3
168.0 250.5
27945.9
Mean squares
18400.5
1545.1 383.5 513.5 682.7 168.8 317.7 179.2
114813.4 25.6 84.0 62.6 75.7
F value
102.67
8.62 2.14 2.87 3.81 0.94 1.77
1516.01 0.34 1.11 0.83
P r > F
0.0001
0.0001 0.0607 0.0717 0.0328 0.4524 0.1197
0.0001 0.7131 0.3310 0.5086
The disease incidence (Table 2A) was transformed to the mean number of infected
plants/m2 using the plant density levels (Table 2B). This transformation resulted in a
reversal of the effect of plant density on the number of infected plants for both
genotypes, hence, the number of infected plants/m2 increased with the plant density.
Only 0.3 plants/m2 were infected in plots with the lowest density of ICGV 86031 plants,
and 0.9 plants/m2 in plots with the highest plant density. A more substantial effect was
observed in plots with JL 24, in which 3.9 plants/m2 were infected at the lowest plant
density, and 13.9 plants/m2 at the highest plant density. A linear relationship
(Y=1.3+0.4X) was found between the infected plants and the total number of plants per
m2 (Figure 1).
The natural infection pressure was considerably higher in 1994 than in 1993 (Table 3).
In the 1993 experiment four infected JL 24 plants and no infected ICGV 86031 plants

PLANT DENSITY
Table 2. The mean PBNV infection in ICGV 86031 and JL 24 for nine levels of plant density, using the final scoring date of two experiments. A. Percentage of infected plants/total plants. B. Number of infected plants per m2.
A.
ICGV 86031 (mean=4.0) JL 24 (mean=48.6)
Plant distance (cm)
10
15
20
Row distance (cm)
30
2.8
2.9
3.4
60
2.9
3.3
6.8
75
3.6
6.7
5.1
30
41.7
44.1
46.7
low distance
60
46.7
48.8
54.0
(cm)
75
40.6
57.0
58.2
Plant distance (cm)
10
15
20
ICGV 86031
Row distance (cm)
30
0.9
0.6
0.6
60
0.5
0.4
0.6
75
0.5
0.6
0.3
JL24
Row distance
30
13.9
9.8
7.8
60
7.8
5.4
4.5
(cm)
75
5.4
5.1
3.9

CHAPTER 1
Table 3. The number of infected plants in JL 24 and ICGV 86031 plots, 34 and 47 days after sowing (DAS) in 1993, and 28 and 49 DAS in 1994.
Genotype
JL24
ICGV 86031
Sum
Days 34
4
0
4
1993 after sowing
47
158
0
158
Days 28
23
3
26
1994 after sowing
49
1602
125
1727
Table 4. The mean PBNV infection in JL 24 for nine levels of plant density, 49 DAS, in the 1994 experiment. A. Percentage of infected plants/total plants. B. Number of infected plants per
A. Percentage of infected plants/total plants
Row distance (cm) Plant distance 30 60 75
B. Number of infected plants/m2
Row distance (cm)
30 60 75
10
15
20
29.7
30.5
25.5
33.4
23.8
28.4
19.2
30.8
27.6
9.9
6.8
4.3
5.6
2.6
2.4
2.6
2.7
1.8
were found 34 days after sowing (DAS). The number of infected plants increased to 158
JL 24 plants, 47 DAS. In the 1994 experiment, 26 infected plants were observed 28
DAS, of which three were ICGV 86031 plants. Three weeks later (49 DAS), this
number had increased to 1727 infected plants, and most of the infected plants were
JL 24 plants. These data were used to determine the effect of plant density at the start of
the epidemic.
10

PLANT DENSITY
At the start of the epidemic, the disease incidence in plots of ICGV 86031 varied
between 0 and 1.4% (data not shown). In JL 24 plots, it ranged between 19.2 and
33.4%, and did not differ significantly between different plant density levels (Table 4A).
Forty-nine days after sowing 1.8 plants/m2 were infected at the lowest plant density
level, whereas 9.9 plants/m2 were infected at the highest plant density level for JL 24
(Table 4B). The relation between the infected JL 24 plants and the total number of
plants per m2 was also linear 49 DAS in the 1994 experiment (Figure 1).
15 r^
a c
-O
O
io -
Y=1.3+0.4X
r=0.993
25 30 35
Plants/m2
Figure 1. The relation between plant density and the number of PBNV infected plants per m2 for JL 24 (A) and ICGV 86031 (+) on the final scoring date (mean of two experiments). The same relation is also shown for JL 24 (o), 49 days after sowing in 1994.
11

CHAPTER 1
DISCUSSION
The perception that increasing plant density reduces the disease incidence (Reddy et al.,
1983; Culbreath et al., 1994) was confirmed here. Plant distance within the row was of
more importance to the disease incidence than row distance.
Increasing the plant density resulted at the same time in an increased number of infected
plants per unit area. The number of infected plants/m2 in the resistant genotype increased
with a factor 3, when increasing the plant density with a factor 5. In the susceptible
genotype, the number of infected plants/m2 increased with a factor 3.6 when increasing
the plant density with a factor 5. Thus, increasing the plant density resulted in a larger
increase of infected plants per unit area in the susceptible genotype than in the resistant
genotype. The linear regression of the data of JL 24 showed that raising the plant
density with ten plants/m2 resulted in an average increase of four infected plants/m2.
Increasing the plant density leads (to a certain extent) to an increase in yield (Reddy et
al., 1983). Firstly, this is due to the increased plant stand, and secondly, to the increased
percentage of healthy plants. Therefore, an increased plant density would be an
advantage to farmers. On the other hand, the larger number of infected plants per unit
area would maintain a higher number of PBNV reservoirs. Consequently, the number of
viruliferous thrips would increase, and enlarge the number of infected plants, and thus
also the virus sources in the field. However, thrips may prefer diseased plants over
healthy plants (Bautista et al., 1995). Thus, if few thrips on the diseased plants would
migrate to other (healthy) plants because of their preference, the number of infected
plants would probably not increase much.
In early and advanced phases of the epidemic a similar linear relationship was shown
between the number of infected plants and the plant density (Figure 1). In the early
phase of the epidemics the majority of infections are expected to originate from primary
infections, i.e. from viruliferous thrips coming from external sources. Here, differences
in disease incidence due to plant density are probably related to the number of
immigrating vectors. Thrips are possibly more attracted by high plant densities than by
low densities, or alternatively, thrips landing between plants in a low plant density plot,
12

PLANT DENSITY
failed to reach a host plant. In advanced phases of the epidemic both primary infections
and secondary infections (spread within the field) could play a role. Similar factors
related to vector preferences are probably involved because a comparable relationship in
early and advanced phases of the epidemic was observed. However, little is known on
the movement and settling of thrips. Lewis (1973) suggested that thrips have minimal
control of the track during flight, but they may have some control over landing and
settling. Other authors suggested that several climatic factors would influence the
dispersal of the vector (Reddy and Wightman, 1988).
The plant density varied in this study between 6.7 and 33.5 plants/m2. Reddy et al.
(1983) varied the plant density in a similar experiment from 4.4 to 53.3 plants/m2, and
observed a decrease in disease incidence from 40% to 10% when increasing the plant
density. Re-evaluating their data with respect to the number of infected plants per unit
area, an increase from 1.9 infected plants/m2 (low plant density) to 5.3 infected plants/m2
(high plant density) was detected (data of field experiments from 1978/79). These data
confirm our results.
The application of a high plant density has been recommended earlier (Reddy et al.,
1983) to suppress PBNV infection. Eventhough a high plant density may lead to a
decrease in disease incidence, considerable levels of PBNV infection are being
maintained in this way, possibly leading to increasing numbers of viruliferous thrips.
Rather than increasing the plant density, a larger impact would be achieved to reduce
PBNV infections when highly susceptible genotypes such as JL 24 would be replaced by
resistant cultivars. The resistant genotype ICGV 86031 (Dwivedi et al., 1993) used in
this study, proved to be an excellent candidate.
13
CHAPTER 2
FACTORS AFFECTING THE INCIDENCE OF
PEANUT BUD NECROSIS VIRUS IN GROUNDNUT FIELDS
II. INTER-ROW INTERFERENCE
SUMMARY
The presence of an inter-row interference, possibly affecting the
evaluation of peanut bud necrosis virus (PBNV) resistance in groundnut,
was analyzed in this chapter. The disease incidence was determined in a
series of rows, comprising rows with plants of a susceptible genotype, and
rows with plants of a resistant genotype. Inter-row interference could not
be discovered in these experiments. The experiments were fairly
representative of PBNV selection fields, thus, inter-row interference was
not expected to be of importance in the breeder's situation. The absence
of inter-plot interference leads us to believe that either secondary spread
was not important, or the dispersal of thrips affected both primary and
secondary infections.
15

CHAPTER 2
INTRODUCTION
Peanut bud necrosis disease affects groundnut crops in most parts of Asia (Reddy et al.,
1991). The disease is caused by peanut bud necrosis virus (PBNV), a distinct member of
the Tospovirus genus of the Bunyaviridae (De Haan et al., 1989; Reddy et al., 1992;
Murphy et al., 1995). Tomato spotted wilt virus (TSWV) causes a similar disease on
groundnut in the USA (Reddy et al., 1991). The natural disease incidence varied,
depending on the location and season (Buiel et al., 1995; Chapter 5). PBNV is
transmitted by Thrips palmi Karny (Vijaya Lakshmi et al., 1995). Initially, viruliferous
thrips carry virus from external sources to the crop (primary infection). The primary
infected plants will probably serve as virus sources for secondary infection within the
crop (Reddy et al., 1983).
Breeding for resistance is one of the most promising solutions to prevent yield losses
caused by peanut bud necrosis disease. Field resistance to PBNV is usually assessed in
small plots and entries are often placed adjacent to each other. Van der Plank (1963)
suggested that errors due to inter-plot interference would arise when assessing resistance
in small plots. Resistant entries would receive many more infectious units from their
susceptible neighbours, whereas susceptible entries would receive fewer units from their
resistant neighbours. The level of (partial) resistance would be underestimated for
resistant entries, but would be overestimated for susceptible entries. Inter-plot
interference could also affect the ranking order of the resistance of the entries in small
plots (Parlevliet and Danial, 1992).
A similar inter-plot interference could also occur for insect transmitted viruses such as
PBNV, when the disease spreads over short distances in the case of secondary
infections. A susceptible (JL 24) and a field resistant groundnut genotype (ICGV 86598)
were chosen to study the effect of inter-plot interference on the disease incidence.
Mechanical inoculation of JL 24 and ICGV 86598 with the virus (Chapters 8 and 9)
showed that ICGV 86598 was susceptible to the virus. Therefore, it was assumed that
the field resistance of this genotype was caused by thrips resistance, whereas JL 24 was
highly susceptible to virus and vector.
16

INTER-ROW INTERFERENCE
MATERIALS AND METHODS
FIELD
Two field trials were conducted at ICRISAT, Hyderabad, India, and one at the
Directorate of Oilseeds Research, Rajendranagar, India. Tetramethyl thiuram disulphide-
treated seed (3 g/kg) was sown in 1993 on July 21 (July trial) and December 9
(December trial) at ICRISAT, and on August 6 at Rajendranagar. Row distance was 60
cm at ICRISAT and 45 cm at Rajendranagar. Plant distance within the row was 20 cm
at both locations.
Each trial comprised six blocks with 4-m rows. Each block contained 100 rows in the
July trial, 70 rows in the December trial, and 62 rows at Rajendranagar. The blocks
comprised a number of sub-blocks with rows of JL 24 (S), and ICGV 86598 (R). Each
sub-block contained two central rows of R plants, flanked at both sides with four rows
of S plants. These were again flanked by ten rows of R plants in the ICRISAT trials,
and with eight rows of R plants in the Rajendranagar trial. Two sub-blocks were present
in each block of the July trial, and one sub-block in each block of the December trial
and the trial at Rajendranagar. These sub-block(s) were flanked by a set of rows at the
beginning and end of each block. This set consisted of: ten rows with R plants flanking
the sub-block (eight rows at Rajendranagar), followed by four rows with S plants, then
two rows of R plants, and finally four rows of S plants at the beginning or end of the
block.
DISEASE ASSESSMENT
The percentage of infected plants (disease incidence) was determined visually per row,
every two or three weeks during the growing season, until 82 days after sowing (DAS)
for the July trial, 126 DAS for the December trial, and 81 DAS at Rajendranagar. The
final disease incidence was arcsine transformed.
THRIPS
To determine the number of Thrips palmi adults, leaf terminals were collected regularly
17

CHAPTER 2
from R and S plants in one block of each experiment, and stored in 30% ethanol. Ten
terminals were collected from each two center rows of R plants, twenty terminals from
each of the four flanking rows with S plants, ten terminals from the two rows with R
plants flanking the rows with S plants, and ten terminals were taken from the last row of
R plants of each sub-block. The July trial was sampled on three dates, eight dates in the
December trial, and on six dates at Rajendranagar. The thrips counts were cumulated
over sampling dates and standardized to the average thrips numbers per ten terminals.
RESULTS
The natural disease incidence varied considerably between the trials (Figure 1A).
Highest disease incidence was observed in the trial at Rajendranagar, where an average
of 95% (nontransformed) of S plants were infected. Lowest disease incidence was found
in the July trial (15%, nontransformed). The disease incidence of JL 24 was significantly
higher than ICGV 86598, irrespective of the location. The disease incidence in the rows
with R plants did not differ significantly with their position, indicating that the disease
incidence was independent of the row position of the resistant genotype in relation to the
row position of the susceptible genotype.
The highest cumulative number of Thrips palmi were found in the December trial,
whereas the lowest number of thrips were observed in the July trial (Figure IB). The
cumulative number of thrips at Rajendranagar was intermediate between the other two
trials. The number of thrips was cumulated over collection dates, and although
dependent on, not correlated with the number of collection dates. The number of thrips
was usually high in the Irst part of the growing season but was considerably lower later
in the season (Table 1). Consistently fewer thrips were found on R plants than on S
plants. The highest level of disease incidence was not necessarily correlated with the
highest cumulative number of thrips and vice versa (Figure 1A and B).
18

INTER-ROW INTERFERENCE
Incidence (arcsine)
Cumulative thrips / 10 terminals
r s s s s r r r r r r r r r r
IH ICRISAT December trial
^ ICRISAT July trial
f/3 Rajendranagar trial
Figure 1. The mean disease incidence (arcsine transformed) (A), and the mean number of Thrips palmi on 10 terminals cumulated over sampling dates (B), on JL 24 (S) and ICGV 86598 (R) in half a sub-block at Rajendranagar and ICRISAT. Vertical bars indicate the standard deviation of the means.
19

CHAPTER 2
Table 1. The cumulative number of adult Trips palmi collected from leaf terminals of JL 24 (susceptible) and ICGV 86598 (resistant), during the course of the season (days after sowing) in the December trial at ICRISAT.
Genotype Location Days after sowing 29 40 55 67 77 92 104 116
ICGV 86598
JL24
ICGV 86598
ICGV 86598
two center rows flanking the center rows flanking JL24 separated by 8 resistant rows from JL 24
8.0 12.7 19.4 25.7 26.4 26.7 27.0 27.3
13.3 25.4 36.1 42.6 43.9 44.4 47.2 48.3
14.3 18.6 28.4 34.2 36.2 36.2 36.2 36.2
8.0 10.3 15.1 20.1 21.6 21.6 21.6 21.6
DISCUSSION
The disease incidence of the R genotype was independent of the row position in relation
to the row position of the S genotype. Similarly, the disease incidence of S plants was
consistent and independent of their position. These results show that no inter-row
interference effect, as was clearly demonstrated in the case of leaf rust on barley
(Parlevliet and van Ommeren, 1984) could be discovered in these experiments, using
ICGV 86598 and JL 24. Similar results were also observed in small plots and large area
studies on the TSWV infection of both a resistant and a susceptible cultivar (Culbreath
et al., 1992b). The plot size of 4-m single rows is fairly representative of the breeder's
situation in early generation selections, thus inter-row interference is not expected to be
of importance in breeders' plots.
The absence of a correlation between the number of thrips and the disease incidence
indicates that the proportion of viruliferous thrips must have been different for the
different locations and seasons. These field observations clearly show that the proportion
of viruliferous thrips is highly variable. Cho et al. (1987) compared tomato spotted wilt
disease incidence and thrips numbers in lettuce crops at four farms in Hawaii and also
20

INTER-ROW INTERFERENCE
observed no association between these parameters.
The results in this chapter indicate the absence of an inter-row interference effect. An
inter-row interference effect is expected when the spread of the disease within a field
occurs over short distances (secondary spread). Thus, a plausible explanation for the
absence of an inter-row effect could be that the majority of virus infections were the
result of primary virus infections, i.e. from external sources. Alternatively, the secondary
virus infections between rows over a short distance was of little importance. Also, a
preference of the thrips for JL 24 during both primary and secondary infection could
have overruled any inter-row interference. Experiments using a virus resistant, but thrips
susceptible genotype in stead of ICGV 86598, could elucidate these points. In such
experiments the vector activity would not be restricted in any way. However, genotypes
with virus resistance but lacking thrips resistance have not been found yet (Buiel and
Kendre, unpublished).
21
CHAPTER 3
DISTRIBUTION OF PEANUT BUD NECROSIS DISEASE
IN GROUNDNUT FIELDS
SUMMARY
The distribution of diseased plants, infected by peanut bud necrosis virus
(PBNV) was monitored in three groundnut fields. A lower disease
incidence was found in the border areas than in the central area of these
fields. This border effect appeared early and could be distinguished during
the entire season. In one field, a lower disease incidence was observed in
a border area next to fallow land, but not in the other border areas
adjacent to early sown groundnut crops. The incorporation of an extra
border zone around PBNV-selection fields, promotes a homogeneously
distributed infection. Possible explanations for the occurrence of a border
effect are discussed in relation to the spread by the vector.
23

CHAPTER 3
INTRODUCTION
Peanut bud necrosis disease (PBND) is a major virus disease of groundnut in South Asia
(Reddy et al., 1991). The disease is caused by peanut bud necrosis tospovirus
(PBNV)(Reddy et al., 1992), which is transmitted by Thrips palmi Karny (Vijaya
Lakshmi et al., 1995). The infection is quantified as the percentage of plants with PBNV
symptoms (disease incidence). Natural infection of PBNV varied considerably between
environments and cultivars (Buiel et al., 1995). An average disease incidence of 60%
across four locations was shown for a susceptible cultivar (Buiel et al., 1995, Chapter 5).
Analysis of the results from earlier experiments showed that PBNV infected plants
occurred in a scattered pattern in the field. However, some areas in the field were more
affected than others. A non-uniform dispersal pattern was also suggested for tomato
spotted wilt virus (TSWV), causing a similar disease on groundnut in the USA
(Culbreath et al., 1990). Presumably, these deviations from a uniform distribution are
related to the vector. The aim of this study was to analyze the distribution of PBND in
the field.
MATERIALS AND METHODS
Three field trials were performed in the rainy season of 1992. One trial was sown on 15
July at ICRISAT Asia Center, the second on 16 July at Rajendranagar (located
approximately 25 km South-East of ICRISAT), and the third trial at Raichur, Karnataka
State (approximately 250 km South of ICRISAT) on 5 August. Each trial comprised 81
groundnut entries in plots of two 4-m rows, in a 9x9 lattice design with four replicates.
Each two plots were separated by one 4-m row of the susceptible control JL 24. The
row distance was 60 cm, plant distance 20 cm, and the total size of each trial was
approximately 50 x 60 m.
The plants were visually scored for PBNV symptoms, every two or three weeks until 91
days after sowing (DAS) at ICRISAT, 99 DAS at Rajendranagar, and 96 DAS at
24

D I S T R I B U T I O N I N F I E L D S
Raichur. Infected plants were labelled to facilitate recurrent scoring. The disease
incidence was calculated as the percentage of infected plants (showing symptoms)/total
number of plants per row. Only the data of JL 24 were used in the analysis of the
spatial distribution of infected plants. The arcsine transformed data were used in SAS
analyses (SAS, 1989).
RESULTS
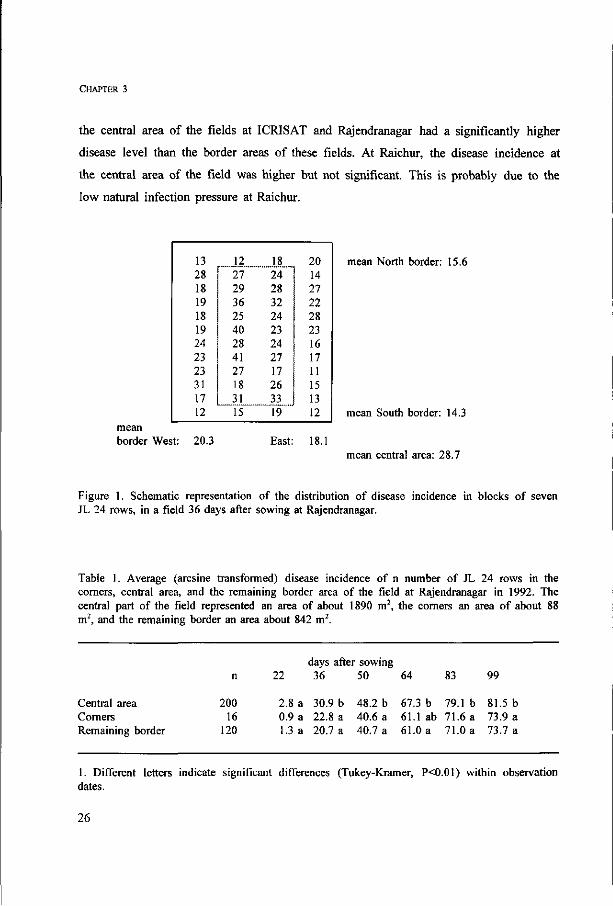
In the three trials the disease incidence appeared to be lower in the border areas than in
the central area of the field. Figure 1 shows the disease distribution in the field at
Rajendranagar, 36 DAS, averaged per block of seven adjacent JL 24 rows. The average
incidence varied between 11 and 41%. The average incidence was lower in the blocks of
the border areas (15.6, 14.3, 20.3, and 18.1%) than in the central area (28.7%).
The field was imaginary divided into nine parts: a central area of 38 x 50 m, four
corners each of 4 x 5.4 m, and the remaining border area (consisting of two parts of 5.4
x 50 m, and two parts of 4 x 37 m). The average disease incidence of the central area
was higher than the disease incidence in the four corner areas and the remaining border
areas, during the season at Rajendranagar (Table 1). No significant border effect was
found 22 DAS, when the level of infection was less than 3%. Two weeks later the level
of infection had increased to about 30%, and a border effect was significant. This
difference persisted during the entire season.
The disease incidence at ICRISAT developed similarly but it increased towards the
South side of the field (Table 2). The incidence in the northern part of the field (29%),
was significantly lower than in the middle part (44%), and lower than the southern part
of the field (50%). The North side of the field was bordered by fallow land, whereas the
other sides of the field were bordered by early sown groundnut. No significant
differences were found between East-West orientated parts of the field. A significant
higher disease was observed in the central area of the field (46.7%), despite the high
disease incidence at the South side of the field.
The disease incidence on the final scoring dates of the three trials (Table 3) shows that
25
CHAPTER 3
the central area of the fields at ICRISAT and Rajendranagar had a significantly higher
disease level than the border areas of these fields. At Raichur, the disease incidence at
the central area of the field was higher but not significant. This is probably due to the
low natural infection pressure at Raichur.
mean North border: 15.6
mean border Wes
13 28 18 19 18 19 24 23 23 31 17 12
t: 20.3
12 r 27
29 36 25 40 28 41 27 18 31 15
18 24 28 32 24 23 24 27 17 26 33 j 19
East:
20 14 27 22 28 23 16 17 11 15 13 12
18.1
mean South border: 14.3
mean central area: 28.7
Figure 1. Schematic representation of the distribution of disease incidence in blocks of seven JL 24 rows, in a field 36 days after sowing at Rajendranagar.
Table 1. Average (arcsine transformed) disease incidence of n number of JL 24 rows in the corners, central area, and the remaining border area of the field at Rajendranagar in 1992. The central part of the field represented an area of about 1890 m2, the corners an area of about 88 m , and the remaining border an area about 842 m
Central area Corners Remaining border
n
200 16
120
days after sowing 22 36
2.8 a 30.9 b 0.9 a 22.8 a 1.3 a 20.7 a
50 64
48.2 b 67.3 b 40.6 a 61.1 ab 40.7 a 61.0 a
83
79.1 b 71.6 a 71.0 a
99
81.5 b 73.9 a 73.7 a
1. Different letters indicate significant differences (Tukey-Kramer, P<0.01) within observation dates.
26

D I S T R I B U T I O N I N F I E L D S
Table 2. Disease incidence (arcsine transformed) of JL 24 in different parts of the ICRJSAT field, 91 days after sowing.
West middle East mean
North 25.6' 36.12 25.2' 29.0 a5
middle 44.03 46.74 41.T AAA b
South 46.9' 48.82 54.3' 50.0 c
mean 38.8 A5 43.9 A 40.4 A
1. Mean disease incidence of 4 rows in the corner areas of the field. 2. Mean disease incidence of 40 rows in the North or South border area. 3. Mean disease incidence of 20 rows in the East or West border area. 4. Mean disease incidence of 200 rows in the central area. 5. Different letters indicate significant differences (Tukey-Kramer, P<0.01) between North-
South direction means (lowercase), or between East-West means (uppercase).
Table 3. Average (arcsine transformed) disease incidence of n number of JL 24 rows on the final scoring date in the central area, the corners, and the remaining border areas of the fields at Raichur, ICRISAT (ICR), and Rajendranagar (RN) in 1992. The central part of the field represented an area of about 1890 m2, the corners an area of about 88 m2, and the remaining border an area about 842 m2.
Location Raichur ICR RN
Central area Corners Remaining border areas
200 16
120
21.6 a1
19.3 a 19.5 a
46.7 b 38.0 a 42.6 a
81.5 b 73.9 a 73.7 a
1. Different letters indicate significant differences (Tukey-Kramer, P<0.01) within locations.
27

CHAPTER 3
DISCUSSION
The border areas of these groundnut field analyzed, clearly had a lower disease
incidence compared to the central area of the field. This border effect was significant at
ICRISAT and Rajendranagar where the level of infection was high (about 40% and 80%
respectively). At Raichur the effect could not be distinguished, probably because the
infection level was low (20%).
This non-uniform distribution was presumably a result of a preference of the vector for
the central area of the field. The border effect was observed throughout the epidemic,
and implies that either one source of infection was involved (only primary infections
from external sources), or both primary and secondary sources (within the field) were
involved, but with similar patterns of virus spread (Chapters 1 and 2). Reddy et al.
(1983) suggested that primary infection is probably more important than secondary
infection. Secondary spread of TSWV in groundnut in the USA has been supposed
(Culbreath et al., 1990), based on clustered patterns of infected plants. However,
Camann et al. (1995) concluded that their data were consistent with the hypothesis that
most infections arise as a result of primary transmissions.
A lower disease incidence was observed in the border area of the ICRISAT field
adjacent to fallow land. Apparently, less thrips had moved into this part of the field.
Either thrips had entered the trial from adjacent early-sown groundnut fields, or thrips
immigrating from external sources did not favour the area of the field adjacent to the
fallow land. The adjacent fields at Rajendranagar and Raichur included non-host crops
or weeds, and no such effect as at ICRISAT was observed here.
The occurrence of a border effect on the distribution of PBND had not been shown
before. For PBNV-selection fields, a homogeneous distribution of the infection is
required. The border effect as described here, causes a non-uniform distribution in the
field, and interferes with the selection of resistant material. Therefore, it is advisable to
surround PBNV-selection fields with an extra border with groundnut plants that are
excluded from the selection. Alternatively, susceptible checks could be included
frequently to correct for environmental differences within the field.
28

CHAPTER 4
EPIDEMIOLOGY OF PEANUT BUD NECROSIS DISEASE
IN GROUNDNUT
SUMMARY
Peanut bud necrosis disease is caused by peanut bud necrosis virus (PBNV)
and is transmitted by Thrips palmi (Karny). The rate of epidemic
development of this disease was strongly affected by the resistance level of
the host genotype and by the conduciveness of the environment for the
disease (disease pressure). In all the environments, in which these tests were
done, epidemic development reached a plateau before the crop became fully
mature. This termination of the epidemic development appeared independent
of disease pressure, phase of the epidemic, rate of the epidemic development,
and resistance level of the host genotype. The most probable factor causing
terminations of epidemic development is mature plant resistance of the
groundnut to PBNV.
This chapter has been published in a slightly modified version as: A.A.M. Buiel and J.E. Parlevliet (1995). Epidemiology of peanut bud necrosis disease in groundnut in India. Pages 41-46 in: A.A.M. Buiel, J.E. Parlevliet & J.M. Lenné (Eds). Recent studies on peanut bud necrosis disease: Proceedings of a Meeting, 20 March 1995, ICRISAT Asia Center, India. 80 pp.
29

CHAPTER 4
INTRODUCTION
Peanut bud necrosis disease (PBND) is the most important virus disease of groundnut
(Arachis hypogaea L.) in South Asia, where it causes severe yield losses every year. PBND
is caused by peanut bud necrosis virus (PBNV), a member of the genus Tospovirus. The
virus is well characterized, and many of its properties have been described (Reddy et al.,
1992).
PBNV is transmitted by Thrips palmi Karny in a persistent manner (Palmer et al., 1990;
Wightman and Ranga Rao, 1994; Ranga Rao and Vijaya Lakshmi, 1993). Under laboratory
conditions, larvae acquired the virus but were not able to transmit it. After a larval period
of 5 days and after pupating for 3 days, about 60% of the adults transmitted the virus
throughout most of their life period of approximately 20 days. From thrips collected from
groundnut terminals it was found that Thrips palmi is present throughout the year in
Hyderabad, India. Yet, thrips populations declined in some periods because of unfavourable
weather conditions such as low night temperatures, high day temperatures, and heavy rains
(Reddy et al., 1983).
The aim of this study was to investigate the epidemiology of PBND under field conditions
in India, in field-resistant and -susceptible genotypes. Understanding of the epidemiology
of PBND will provide information on the plant-virus interaction, the role of thrips, and the
effect of plant resistance.
MATERIALS AND METHODS
Forty-two groundnut genotypes were grown in ten environments (location x year
combinations), each comprising four replicates. Plots consisted of two 4-meter rows, with
20 cm plant-to-plant distance, and 50 or 60 cm inter-row distance. Data used in this study
were from seven of these environments: ICRISAT Asia Center (Andhra Pradesh),
Rajendranagar (Andhra Pradesh), and Raichur (Karnataka), in 1991 and 1992, and from
Narkoda (Andhra Pradesh) in 1993. The trials were sown in the third or fourth week of
30

EPIDEMIOLOGY
July, except the trial at Raichur in 1992, which was sown in the first week of August.
PBND occurred in the field as a result of natural infection. The incidence (the number of
plants showing disease symptoms) was recorded every 2 weeks, from approximately 2
weeks after emergence until 3 weeks before harvest, except the trial at Raichur, where the
PBND incidence was recorded monthly. For this study, we chose two susceptible genotypes
(S), two moderately resistant (M), and two resistant (R) genotypes. The time to maturity
varied among the genotypes, the range being approximately 2 weeks.
RESULTS
Plants with PBND symptoms were observed as early as 13 days after emergence (DAE) at
ICRISAT Asia Center in 1991 (data not shown). The final PBND incidence of the
susceptible cultivar JL 24 was high at Rajendranagar and Narkoda (more than 85%),
moderate at ICRISAT (around 55%), and low at Raichur (around 25%).
The effect of resistance on the rate of epidemic development was large (Tables 1 and 3).
The effect of the environment was equally large (Table 3).
At all locations and over all years (all environments), the disease incidence reached an
apparent plateau. The onset of this plateau phase of the epidemic was estimated as the
number of days between emergence and the moment the increase in incidence became
almost zero. For instance, the epidemic at Rajendranagar in 1992 showed an initiation of
the plateau phase just before or at 76 DAE (Table 1). The onset of the plateau phase for
seven environments ranges approximately between 60 and 75 days (Table 2), and occurs
thus 35-50 days before harvest, suggesting that factors other than crop maturity caused the
decline of the disease progress.
Table 2 further presents the increase in incidence after the plateau has been reached per
genotype group (S, M, R) for each environment. The mean increase of incidence was low,
between 1.5 for the R group, 2.0 for the M group, and 2.8 for the S group. The onset of
the plateau phase occurred for all groups, independent of the level of resistance and
earliness of maturation at about the same time in a given environment.
31
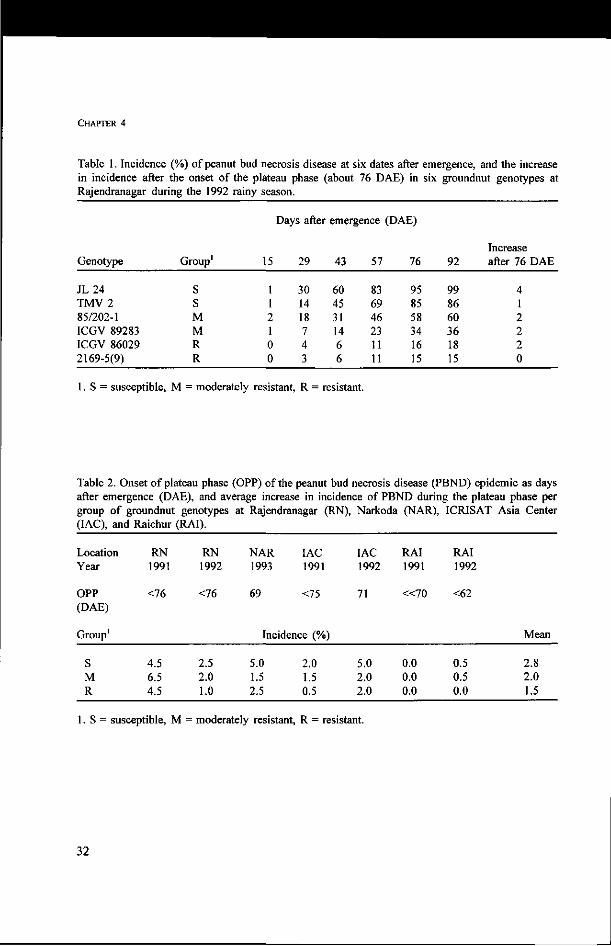
CHAPTER 4
Table 1. Incidence (%) of peanut bud necrosis disease at six dates after emergence, and the increase in incidence after the onset of the plateau phase (about 76 DAE) in six groundnut genotypes at Rajendranagar during the 1992 rainy season.
Genotype
JL24 TMV2 85/202-1 ICGV 89283 ICGV 86029 2169-5(9)
Group1
S S M M R R
15
1 1 2 1 0 0
Days after
29
30 14 18 7 4 3
emergence
43
60 45 31 14 6 6
57
83 69 46 23 11 11
DAE)
76
95 85 58 34 16 15
92
99 86 60 36 18 15
Increase after 76 DAE
4 1 2 2 2 0
1. S = susceptible, M = moderately resistant, R = resistant.
Table 2. Onset of plateau phase (OPP) of the peanut bud necrosis disease (PBND) epidemic as days after emergence (DAE), and average increase in incidence of PBND during the plateau phase per group of groundnut genotypes at Rajendranagar (RN), Narkoda (NAR), ICRISAT Asia Center (IAC), and Raichur (RAI).
Location Year
OPP (DAE)
Group1
S M R
RN 1991
<76
4.5 6.5 4.5
RN 1992
<76
2.5 2.0 1.0
NAR 1993
69
IAC 1991
<75
Incidence (%)
5.0 1.5 2.5
2.0 1.5 0.5
IAC 1992
71
5.0 2.0 2.0
RAI 1991
« 7 0
0.0 0.0 0.0
RAI 1992
<62
0.5 0.5 0.0
Mean
2.8 2.0 1.5
S = susceptible, M = moderately resistant, R = resistant.
32

EPIDEMIOLOGY
Table 3. Incidence (%) of peanut bud necrosis disease in six groundnut genotypes at the onset of the plateau phase of the epidemic in seven environments at four locations - Rajendranagar (RN), Narkoda (NAR), ICRISAT Asia Center (IAC), and Raichur (RAI), 1991-93.
Genotype
JL24 TMV 2 85/202-1 ICGV 89283 ICGV 86029 2169-5(9)
RN 1991
95 86 71 54 23 14
RN 1992
95 85 58 34 16 15
NAR 1993
81 71 59 36 18 20
Environment
IAC 1991
55 24 19 3 5 5
IAC 1992
49 30 36 6 4 2
RAI 1991
29 25 9 1 2 1
RAI 1992
19 4 6 1 1 0
Mean
60.4 46.4 36.9 19.3 9.9 8.1
Table 4. Number of days after emergence to 50% of the maximum disease level of six groundnut genotypes in three conducive environments at two locations, Rajendranagar (RN) and Narkoda (NAR), 1991-93.
Genotype
JL24 TMV 2 85/202-1 ICGV 89283 ICGV 86029 2169-5(9)
1. S = susceptible,
Group'
S S M M R R
M = moderately
RN 1991
33 38 51 53 66 54
resistant, R =
Environment
RN 1992
38 42 42 49 51 47
= resistant.
NAR 1993
52 52 50 56 62 59
Mean
41.0 44.0 47.7 52.7 59.7 53.3
Table 3 shows the disease incidence at the onset of the plateau phase for seven
environments. The incidence at this onset ranges from 19% at the location with the lowest
infection, to 95% at the location with highest infection for JL 24. The epidemics in these
environments apparently varied widely in dimensions; yet all epidemics reached a plateau
at about the same time per environment and independently of the infection level. The fact
that the plateau phase was reached at the same time for all genotypes in each environment
33

CHAPTER 4
indicates that the termination of the epidemic was independent of the rate of epidemic
development and of the earliness of crop maturation.
To compare the rate of disease development for the six genotypes, the time to reach 50%
of the maximum disease level was determined. Table 4 presents the results of the three
environments with the highest infection. The more susceptible the genotype, the earlier this
50% point was reached. This is expected in the case of a logistic development of the
epidemic. The higher the disease level, the greater the chance that viruliferous thrips visit
already-infected plants. The rate of epidemic development, therefore, is reduced more at
higher disease levels. This in turn, results in a slightly earlier 50% point for the more
susceptible genotypes.
DISCUSSION
As expected, the rate of epidemic development depended strongly on both the resistance
level of the host genotype and on the conduciveness of the environment for disease (disease
pressure). In all environments, the epidemic build-up ended independently of the disease
pressure, phase of the epidemic, rate of the epidemic development, time of maturation, and
degree of resistance. This termination of epidemic development could be caused by changes
in weather conditions, thrips numbers, amount of mature tissue, and plant resistance, or a
combination of these factors.
Weather data of 3 years at ICRISAT Asia Center, showed no major variation between years
in minimum and maximum temperatures, wind speed, and relative humidity during each
growing season. Therefore, weather does not seem an important factor in reaching the
plateau phase. Thrips numbers declined after reaching a maximum early in the crop-growing
period (Ranga Rao and Vijaya Lakshmi, 1993), but this decline (data not shown) could not
be related to the termination of the epidemic. Since weather conditions did not change
drastically, it is also unlikely that thrips behaviour was affected.
Consequently, we assume that it is the mature plant resistance which causes the decline in
disease progress. Mature plants and mature plant tissue are highly resistant to the virus.
34

EPIDEMIOLOGY
Only the young tissues of the relatively young plants are highly susceptible to PBNV (Buiel
and Parlevliet, 1996; Chapter 7). Mature (or adult) plant resistance to viruses has been
repeatedly reported for potato (Beemster, 1987; Venekamp and Beemster, 1980; Wislocka,
1984; Sigvald, 1985; Gibson, 1991). Mature plant and/or mature tissue resistance has been
reported from other host-pathogen combinations also, such as the rice-blast pathosystem
(Roumen, 1992). It occurs particularly often in perennial crops (Smit and Parlevliet, 1990).
We, therefore, consider mature plant resistance to be the cause for the low PBND incidence
when groundnut is sown early (June) in South India. In June, the thrips population is just
building up after the hot season in March-May. The thrips population (and number of
viruliferous thrips) is small during the first 60-75 days after emergence, when the crop is
still susceptible, thus escaping most of the infection. When the thrips population has become
large, the crop has acquired mature plant resistance.
In North India, late sowing (July, August) results in low infection levels whereas high
infection levels are found when the crop is sown early. This situation is different from that
in South India because many vegetable crops (e.g., cucumber, watermelon, and sweet
melon), which are known hosts of PBNV and Thrips palmi (Reddy and Wightman, 1990),
are cultivated from April to June. Early sowing exposes the young, susceptible, groundnut
crop to PBNV infection, carried over from these alternative hosts. By sowing late the
groundnut crop escapes high infection pressure.
This study also showed that resistant genotypes reduce the rate of epidemic development
and considerably reduce the incidence of PBND. Similar results were found for spotted wilt
disease, caused by tomato spotted wilt virus, on groundnut in the USA (Culbreath et al.,
1993). Using resistant cultivars and timely sowing is of great importance in the control of
peanut bud necrosis disease.
35

CHAPTER 5
MULTI-ENVIRONMENT TESTING FOR REDUCED INCIDENCE
OF PEANUT BUD NECROSIS DISEASE
SUMMARY
Forty groundnut genotypes were tested for field resistance (reduced
incidence) to peanut bud necrosis disease during 3 years at four locations in
India. The 40 genotypes were grouped into seven clusters using the average
linkage cluster analysis. Clusters 1 and 2 contained highly susceptible
genotypes (JL 24 and TMV 2). Susceptible to moderately susceptible
genotypes formed clusters 3, 4, and 5. Cluster 6 represented 29 fairly
resistant genotypes, and cluster 7 had the most resistant genotypes [ICGV
86430, 2192-8(50), and 2169-5(9)]. Genotype x environment interaction
variance was significant but small. The field resistance of the genotypes
studied was equally effective in all environments. Selection in any of these
environments is possible, but is more effective in environments which are
favourable for disease development.
This chapter has been published in a slightly modified version as: A.A.M. Buiel, S.L. Dwivedi, M.V.R. Prasad, A.B. Singh, P.S. Dharmaraj, and J.E. Parlevliet (1995). Multi-environment testing for reduced incidence of peanut bud necrosis disease in India. Pages 47-54 in: A.A.M. Buiel, J.E. Parlevliet & J.M. Lenné (Eds). Recent studies on peanut bud necrosis disease: Proceedings of a Meeting, 20 March 1995, ICRISAT Asia Center, India. 80 pp.
37

CHAPTER 5
INTRODUCTION
Groundnut (Arachis hypogaea L.) genotypes show a remarkable variation in peanut bud
necrosis disease (PBND) incidence. Reduced incidence (field resistance) is the collective
result of resistance to peanut bud necrosis virus (PBNV) and of resistance to the vector,
Thrips palmi (Karny). Amin (1985) reported considerable field resistance in cultivar
Robut 33-1, and Dwivedi et al. (1993) reported resistance in the ICRISAT germplasm line
ICGV 86031. In earlier field studies, in which approximately 900 groundnut genotypes were
tested, a wide range of PBND incidence was observed. These differences in disease
incidence indicated various degrees of resistance. Therefore, it seemed possible to select
among genotypes in a crossing program to improve the level of field resistance. Natural
PBND incidence varied between locations. This could result from differences in resistance
to the virus and/or the vector, as well as from differences in resistance of the genotypes
grown at different locations.
The performance of a genotype depends on both its resistance and the environmental
factors. To select efficiently for field resistance, we need to know whether environment and
genotype are independent factors or to what extent genotype x environment (G x E)
interactions are present. At the initiation of this study, no information was available on the
extent of G x E interaction. Similarly, we did not have information on whether selection
would yield corresponding results across environments. Substantial G x E interaction or
dissimilar results across environments are not only important in determining selection
methods in a breeding program, but they may also reveal the occurrence of different virus
strains.
The objectives of this multi-environment study were to determine:
• if field resistance operates across environments,
• the optimal location(s) for selection, and
• whether the field resistance is equally effective to the various virus populations
to which it is exposed.
The results will lead to the development of effective selection methods for field
resistance.
38

MULTI-ENVIRONMENT TESTING
MATERIALS AND METHODS
FIELD TRIALS
Forty groundnut genotypes were grown in 12 environments (4 locations x 3 year
combinations, Table 1). A large proportion of these 40 genotypes were chosen for their
putative field resistance. Seven genotypes, ranging from a low incidence to a high incidence
are shown in Table 2. The four locations were spread over three states in India - Uttar
Pradesh, Karnataka, and Andhra Pradesh - and trials were carried out in the 1991-1993
rainy seasons. Each trial comprised four replicates in a randomized complete block design.
Plots consisted of two 4-m rows, with 20-cm interplant distance and 50- or 60-cm inter-row
distance.
PBND occurred in the field as a result of natural infection. The incidence (the percentage
of plants showing symptoms) was recorded, and infected plants were labelled every 2
weeks, from approximately 2 weeks after emergence until 3 weeks before harvest. At
Mainpuri and Raichur, the PBND incidence was recorded monthly. Scoring and labelling
of infected plants was done regularly because often infected plants die, and the PBND
symptoms can no longer be identified on these dead plants.
Table 1. Mean peanut bud necrosis disease incidence across 40 groundnut genotypes at 10 environments in India.
Location
Raichur Raichur Raichur ICRISAT Asia Center ICRISAT Asia Center Mainpuri Narkoda (Rajendranagar) Mainpuri Rajendranagar Rajendranagar
Year
1992 1991 1993 1991 1992 1991 1993 1993 1992 1991
State
Karnataka Karnataka Karnataka Andhra Pradesh Andhra Pradesh Uttar Pradesh Andhra Pradesh Uttar Pradesh Andhra Pradesh Andhra Pradesh
Incidence (%)
2.5 4.4 4.5 9.4
11.5 15.7 36.5 36.7 41.1 51.8
39

CHAPTER 5
DATA ANALYSIS
Analysis of the response of 40 genotypes in 10 environments was done by clustering the
genotypes. The final data of incidence were arcsine transformed and standardized (to mean
= 0 and SD = 1) per environment for clustering. Standardization of the data set was done
because we were interested in the interaction effects. Clustering was performed using the
average linkage cluster analysis in SAS (SAS, 1989). The average incidence per cluster was
used to examine correlations between environments.
The analysis of variance (ANOVA) with environments (E), genotypes (G), and genotype
clusters as main effects, and G x E interaction was performed on the arcsine transformed
data in GENSTAT (GENSTAT, 1994).
RESULTS
Germination was very poor in two environments, Mainpuri in 1992 and ICRISAT Asia
Center in 1993. These environments were therefore omitted from the analysis.
The mean nontransformed incidence of the 40 genotypes across 10 environments ranged
from 8% [2192-8(50)] to 60% (JL 24) (Table 2). Most of the genotypes had an average
incidence between 10% and 25%.
Table 2. Peanut bud necrosis disease incidence (%) at four locations, mean incidence over 10 locations, and the classification in the cluster analysis of seven groundnut genotypes tested in 10 environments in India, rainy seasons 1991-93.
Entry
JL24 TMV 2 89310 86522 89268 86031 2192-8(50)
Raichur 1993
22 11 13 1 0 3 0
ICRISAT Asia Center
1991
59 24 12 15 11 5 0
Mainpuri 1993
75 59 56 50 51 46 13
Rajendra-nagar 1992
99 89 75 64 48 23 11
Mean
60 46 36 31 25 17 8
Cluster
1 2 3 4 5 6 7
40

MULTI-ENVIRONMENT TESTING
The average incidence of environments ranged from 2.5% at Raichur in 1992 to 51.8% at
Rajendranagar in 1991 (Table 1). Raichur had a low level of PBND in all 3 years, with an
average incidence below 5%. At ICRISAT Asia Center, the average incidence was around
10%. At Mainpuri, the average incidence was 16% in 1991, and 37% in 1993. The average
incidence at Rajendranagar was 41% in 1991 and 52% in 1992. At Narkoda, which is
located near Rajendranagar, the average incidence was 37%.
Results of the cluster analysis of genotypes are shown in Figure 1. Genotype clustering was
truncated, resulting in seven clusters, explaining 87% of the genotype sum of squares (SS).
Clusters 1 and 2 contained highly susceptible genotypes (JL 24 and TMV 2). Susceptible
to moderately susceptible genotypes form clusters 3, 4, and 5. Cluster 6 represented the
largest group of 29 resistant genotypes, whereas the three most resistant genotypes [ICGV
86430, 2192-8(50), and 2169-5(9)] were grouped in cluster 7. The number of genotypes
was not equally distributed over the clusters, as cluster 6 contained almost 75% of the
genotypes. This was not surprising since we were interested in resistance, and had chosen
many promising genotypes for this study. The unequal distribution emphasizes the need for
clustering, because a large group of genotypes with a similar incidence will interfere with
the comparison of incidence across environments.
Main effects (environment, genotype, and genotype clusters) were highly significant in the
ANOVA of the arcsine transformed incidence (Table 3). The G x E interaction was
significant but small (Table 3) because the variance of the interaction (age=14.40) was small
compared with the variance of the smallest main effect (genotype, crg=62.69).
Figure 2 shows the arcsine transformed incidence for different environments. The
differences in incidence among clusters increased with increasing infection level and is
shown in as the lines of the clusters diverge (Figure 2). It implies that the small G x E
interaction was primarily caused by this divergence in incidence between environments.
Interactions caused by a reversed order (shown as crossover of lines in Figure 2) did occur
but these were of minor importance.
In Figure 3, the interactions are shown in more detail. The clusters were ranked according
to the average transformed incidence per environment. Figure 3 shows two main findings.
Firstly, most of the interaction resulted from clusters 3, 4, and 5. Clusters 1, 2, 6, and 7
41

CHAPTER 5
2.6 ~
2.4
8 1-« C CO
I 1.2 -
1 1.0 -S § 0 . 8 E
g 0.6 H ir
0.4
0.2
S
JA nïïi ne "Tl rra. Genotype
f l J51
6 5 7 4 3 2 1
Figure 1. Dendrogram of cluster analysis of 40 groundnut genotypes tested for peanut bud necrosis disease incidence in 10 environments in India.
100—1
O C CD
• g
'o c
• a CD
£
c to
Cluster 1 Cluster 2 Cluster 3 Cluster 4 Cluster 5 Cluster 6 Cluster 7
i 1 r 4 6 8
Environment
Figure 2. Peanut bud necrosis disease incidence of seven genotypes clusters in 10 environments.
42

MULTI-ENVIRONMENT TESTING
Table 3. Analysis of variance for arcsine transformed peanut bud necrosis disease incidence of 40 groundnut genotypes across 10 environments in India.
Source of variation df SS MS
Replicates Environments (E) Residual
Genotypes (G) Among clusters Within clusters
G x E
Residual
Total
3 9
27
39 6
33
351
1162
1591
369.68 326497.53
4576.85
102415.56 89048.95 13366.61
41575.35
70701.59
546136.56
123.23 36277.50
169.51
2626.04 14841.49
405.05
118.45
60.84
343.27
214.01 ***
43.16 *** 243.92 ***
6.66 ***
1.95 ***
*** P<0.001.
Table 4. Correlation matrix (Spearman's rs) of 10 environments with low (L), average (A), and high (H) peanut bud necrosis disease incidence based on ranking of average incidence of seven genotype clusters.
L L L A A A H H H H
1 2 3 4 5 6 7 8 9 10
L 1 -
0.43 0.54
0.46 0.57 0.39
0.79 0.57 0.64 0.46
L 2
-0.61 0.96 0.82 0.89
0.86 0.96 0.89 0.96
L 3
-0.75 0.93 0.86
0.75 0.54 0.82 0.75
A 4
-0.93 0.96 0.89 0.89 0.96 1.00
A 5
-0.96
0.89 0.75 0.96 0.93
A 6
-0.82 0.79 0.93 0.96
H 7
-0.89 0.96 0.89
H 8
-0.86 0.89
H 9
-0.96
H 10
-
Mean 0.54 0.82 0.73 0.87 0.86 0.84 0.86 0.79 0.89 0.87
Mean correlation among: L environments 0.52 (n=3) A environments 0.95 (n=3) H environments 0.91 (n=6)
P <0.05 if r s> 0.750. P<0.01 ifr > 0.893.
43

CHAPTER 5
3 a cd
Raichur '92
.iJllI 1 2 3 4 5 6 7
3 Ö ca
PS
1 2 3 4 5 6 7
a «et
OS
1 2 3 4 5 6 7
1 2 3 4 5 6 7
1 2 3 4 5 6 7 1 2 3 4 5 6 7
1 2 3 4 5 6 7
1 2 3 4 5 6 7
Genotype cluster
Rajeadraoagar '93
A 1 2 3 4 5 6 7
1 2 3 4 5 6 7
Genotype cluster
Figure 3. Ranking order of the mean peanut bud necrosis disease incidence of seven genotype clusters in 10 environments.
44
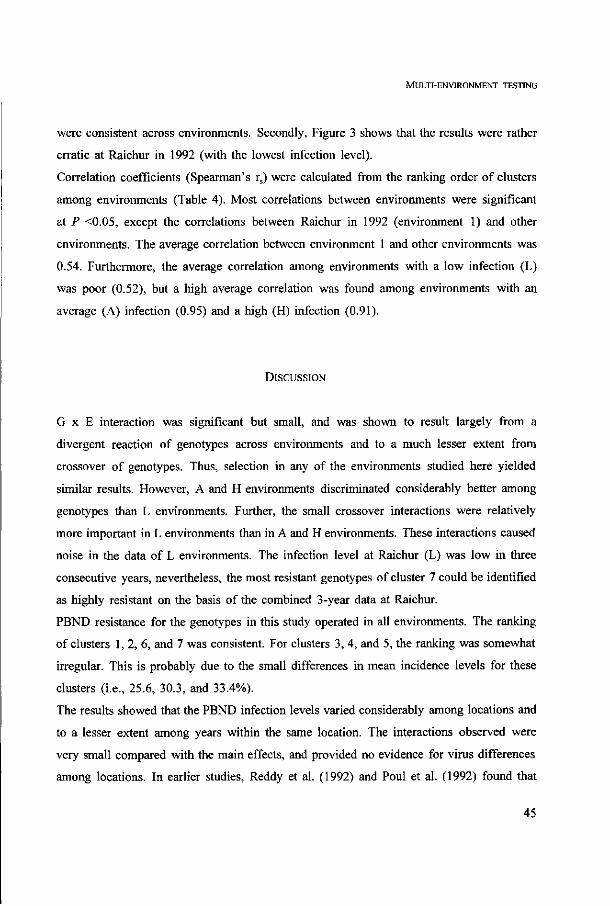
MULTI-ENVIRONMENT TESTING
were consistent across environments. Secondly, Figure 3 shows that the results were rather
erratic at Raichur in 1992 (with the lowest infection level).
Correlation coefficients (Spearman's rs) were calculated from the ranking order of clusters
among environments (Table 4). Most correlations between environments were significant
at P <0.05, except the correlations between Raichur in 1992 (environment 1) and other
environments. The average correlation between environment 1 and other environments was
0.54. Furthermore, the average correlation among environments with a low infection (L)
was poor (0.52), but a high average correlation was found among environments with an
average (A) infection (0.95) and a high (H) infection (0.91).
DISCUSSION
G x E interaction was significant but small, and was shown to result largely from a
divergent reaction of genotypes across environments and to a much lesser extent from
crossover of genotypes. Thus, selection in any of the environments studied here yielded
similar results. However, A and H environments discriminated considerably better among
genotypes than L environments. Further, the small crossover interactions were relatively
more important in L environments than in A and H environments. These interactions caused
noise in the data of L environments. The infection level at Raichur (L) was low in three
consecutive years, nevertheless, the most resistant genotypes of cluster 7 could be identified
as highly resistant on the basis of the combined 3-year data at Raichur.
PBND resistance for the genotypes in this study operated in all environments. The ranking
of clusters 1, 2, 6, and 7 was consistent. For clusters 3, 4, and 5, the ranking was somewhat
irregular. This is probably due to the small differences in mean incidence levels for these
clusters (i.e., 25.6, 30.3, and 33.4%).
The results showed that the PBND infection levels varied considerably among locations and
to a lesser extent among years within the same location. The interactions observed were
very small compared with the main effects, and provided no evidence for virus differences
among locations. In earlier studies, Reddy et al. (1992) and Poul et al. (1992) found that
45

CHAPTER 5
peanut bud necrosis virus (PBNV) isolates from different locations in India (including those
used in this study) reacted with PBNV polyclonal antiserum and with 10 monoclonal
antibodies directed against the nucleocapsid protein. This finding, and the results presented
here based on genotype reaction under field conditions, indicate that it is unlikely that the
prevailing virus populations in these environments were pathogenically different.
The results presented here allow us to draw some general conclusions which will help in
establishing a selection program for field resistance to PBND. Highly resistant and highly
susceptible genotypes can easily be identified at locations with high or low disease levels.
Results obtained at one location are also valuable to predict resistance at other locations.
In locations with a low disease pressure, differences between genotypes are relatively small,
and as a result, the data are noisier. This makes it more difficult to distinguish between
moderately resistant genotypes, but the selection of highly resistant genotypes is not
seriously impeded in these environments. We recommend selection at locations with an
average or high disease pressure because selection in these discriminating environments
yields more reliable results. Nevertheless, when the disease pressure is low (and it may be
impossible to predict this beforehand), the combined data of repeated experiments can be
used for selection.
46

CHAPTER 6
INHERITANCE OF QUANTITATIVE RESISTANCE
IN GROUNDNUT
TO PEANUT BUD NECROSIS VIRUS
SUMMARY
Five groundnut genotypes with quantitative resistance to peanut bud necrosis
tospovirus (PBNV), were crossed with two susceptible cultivars in a half
diallel to study the inheritance of the quantitative inheritance. This type of
resistance is expressed as a reduced percentage of infected plants (disease
incidence). Four levels of resistance were identified, which can be explained
by at least three resistance factors. The mean disease incidence of the F, to
F6 progenies were consistently close to the mid-parent values. Dominance
and epistatic factors seemed to be absent, and the resistance factors are
probably additively inherited. The susceptible groundnut cultivar TMV 2 had
a consistently lower disease incidence as compared to the susceptible cultivar
JL 24. TMV 2 has been grown for several decades in India, hence, this slight
resistance level of TMV 2 appears to be durable. Two distinct levels of
resistance were found in the five resistance genotypes, reducing the average
disease incidence with a factor 5 tot 10, compared to JL 24. This fair level
of quantitative resistance was stable across environments.
47

CHAPTER 6
INTRODUCTION
The resistance to peanut bud necrosis tospovirus (PBNV) in groundnut {Arachis hypogaea
L.) is quantitatively expressed as the percentage of infected plants (disease incidence).
Because of the large variation in the type of symptoms, the disease has previously been
described as groundnut mosaic, groundnut rosette, bunchy top, chlorosis, ring mottle, bud
blight, and ring mosaic (Reddy, 1988a). Mechanical inoculations with the virus revealed
that groundnut plants of the same cultivar can produce different symptoms (Reddy et al.,
1991). As the severity of symptoms is not genotype specific, it can not be used as an
appropriate assessment for resistance. However, disease incidence could be used
successfully to determine resistance levels. Initial studies with over 900 genotypes
demonstrated a large variation in disease incidence. Part of this variation was explained by
environmental variation, yet a substantial part could be contributed to genetic variation
(Buiel et al., 1995; Chapter 5).
The use of disease incidence to assess incomplete or quantitative resistance, implies that the
resistance cannot be determined from individual plants, but from a population of plants.
Preferably, the population is genetically homogeneous with respect to PBNV resistance.
Consequently, heterogenic populations, e.g. the F2, would yield only an average incidence
(infected F2 plants/total F2 plants), and thus genetic analysis of the resistance is not possible
within the F2. From the F3 onwards, the level of heterozygosity decreases and thus the
accuracy to determine the disease incidence of a line increases.
The inheritance of PBNV resistance in groundnut has not been studied earlier. In tomato,
the inheritance of resistance to tomato spotted wilt virus (TSWV, related to PBNV and
causing a similar disease on groundnut in the USA) was based on a single dominant gene,
which was not isolate-specific (Stevens et al., 1992). In another study, Kumar and Irulappan
(1992) reported the presence of a few recessive genes controlling the resistance of
Lycopersicon germ plasm to TSWV in India.
The present study was carried out to gain information on the genetic basis of the resistance
to PBNV. Seven groundnut genotypes with different levels of resistance were crossed in
a half-diallel (no reciprocal crosses) to study the inheritance of PBNV resistance. A single
48
INHERITANCE
seed descent (SSD) approach was used to study the inheritance up to the F6. The resistance
to PBNV was used here as a general term for the complex of virus and vector resistance
that may exists in the field. Virus resistance was studied specifically through mechanical
inoculation of plants.
MATERIALS AND METHODS
PLANTS
Seven groundnut genotypes were crossed in a half-diallel at ICRISAT Asia Center,
Hyderabad, India. Twenty-one crosses were made in a glasshouse between December 1991
and March 1992. Two parents were highly susceptible to PBNV (JL 24 and TMV 2), and
five parents were partially resistant (ICRISAT groundnut variety (ICGV) numbers 86029,
86031, 86363, 86388, and 86430). The cultivars JL 24 and TMV 2 are grown in India for
several decennia (Reddy, 1988b). The ICGV numbers are selected lines from crosses and
were at least 10 generations selfed.
Plants of the parents used in the crossing block, and the consecutive F,'s were grown in 30
cm diameter round pots in the glasshouse. The F,'s were also grown in the field in the rainy
season of 1994. From the F, onwards each generation was advanced to the next generation
through SSD. The F2 and subsequent generations were grown in the field.
The 200 to 600 F2 plants per cross were planted in the field in the post rainy season of
1992-93. Five seeds from 100-200 F2 plants were planted as F3 SSD lines in the next rainy
season. From each F3 SSD line, one plant was randomly selected and advanced to the F4.
Twenty-one F4 plants of each line were grown in the post-rainy season of 1993-94. One
plant was randomly taken from each F4 SSD line and 21 seeds were planted in the rainy
season of 1994, to produce the F5 SSD lines. From the six crosses with JL 24, the
remainder of the F4 SSD lines was harvested in bulk per F4 SSD line, and planted in three
replicates (F5 bulked lines). Thus, the F5 SSD lines were derived from single F4 plants,
whereas the 'F5 bulked lines' were derived from the bulked F4 SSD line, and thus derived
from single F3 plants. From six other crosses the F5 SSD lines were harvested in bulk per
49

CHAPTER 6
F5 SSD line to produce F6 lines, and 25 seeds of 60 F6 lines were mechanically inoculated
in the glasshouse. The inoculation procedure is described elsewhere (Buiel et al., 1996,
Chapter 7 and 8).
As four crosses yielded too few F, seed, their parents were crossed again between June and
September of 1992. The F, up to F4 of these crosses were planted in the field and although
they were one season behind that of the other 17 crosses, they were otherwise treated
similarly.
FIELD
At ICRISAT inter-row distance was 60 cm and plant spacing was 15 cm. Seeds were
treated with tetramethyl thiuram disulphide (3 g/kg). Calcium was applied at the pegging
phase (400 kg/ha). In a few cases the plants were sprayed with monocrotophos (1.5 ml/1)
to suppress the leafminer Aproaerema modicella Deventer.
Each season, the 21 crosses were randomized in the field, and lines were randomized within
the cross. Plots of the parents were included frequently in each generation. With each cross
two, four, twelve, and ten plots of the two parents were included in the F2, F3, F4, and F5
generation respectively.
The Fj bulked lines were planted in 3 rows x 3 m plots in a randomized complete block
design. Two replicates were located at ICRISAT and a third replication was located at
Rajendranagar, approximately 25 km from ICRISAT, with recurrent high natural PBNV
infections. The inter-row distance at Rajendranagar was 50 cm.
DISEASE ASSESSMENT
In each generation, plants were visually scored for PBNV symptoms every 2-3 weeks.
Often, early PBNV inf cted plants died, and it proved to be impossible to determine
visually or serologically, whether these plants had been infected by PBNV. Therefore,
infected plants were labelled to facilitate the recurrent scoring. The disease incidence was
determined as the percentage of infected plants.
Randomly chosen plants were harvested and progressed to the next generation. The seeds
were differently labelled depending on the fact whether the parental plant was healthy or
50

INHERITANCE
infected. In some cases when the randomly chosen plant was infected and had no seed, a
subsequent plant was chosen. However, when this plant was healthy, the seed was labelled
as selected indirectly. Here, infected plants without seeds would fail to pass on their genes
to the next generation. If susceptible plants are lost more frequently than resistant plants,
we defined this as a 'selection by substitution'. This selection by substitution would
probably cause a small shift towards to a higher level of resistance.
DATA ANALYSIS
The data of the percentage of infected plants (inf) were arcsine transformed, using
arcsin^inf/lOO)), to minimize variance differences related to the magnitude of incidence.
The data of the parents were analyzed using generalized linear models (GLM) in SAS
(SAS, 1995). Because of the considerable differences in infection pressure in which these
progenies were grown, a transformation was applied using the disease incidence of the
parents. Therefore, the arcsine transformed data of the progenies, and the parents, were
adjusted using the ratio of the average mid-parent value (from field data) and the mid-
parent values per generation for each cross. A mean incidence of zero was converted to 1.0,
to avoid large scaling differences.
RESULTS
PARENTS
Natural PBNV infection differed greatly among the years and seasons between 1992 and
1994, as seen from the parental data (Table 1). The season mean incidence was highest in
the rainy season of 1994 (38%), and lowest in the rainy season of 1993 (3%).
In most environments the two susceptible parents (JL 24 and TMV 2) had a significantly
higher PBNV incidence than the resistant parents. Only in the post-rainy season of 1992-93,
the incidence of TMV 2 was not significantly higher than the resistant parent. In general,
the incidence in TMV 2 appeared to be approximately 25% lower than JL 24, showing that
the former is less susceptible. Within the group of resistant parents, ICGV 86388 with the
51

CHAPTER 6
Table 1. Mean incidence and overall means of seven groundnut genotypes that were used as parents in a half-diallel and tested in four environments.
Genotype
ICGV 86388 ICGV 86031 ICGV 86029 ICGV 86363 ICGV 86430 TMV2 JL24
Overall Mean
Post-Rainy 1992-93
5.4' ab2
4.1 a 5.7 ab 4.5 a
11.1 ab 28.4 bc 50.5 c
13.1 C2
Environment
Rainy 1993
0.0 a 1.7 a 0.6 a 1.9 a 1.0 a
16.2 b 19.4 b
3.4 A
Post-Rainy 1993-94
2.3 a 2.8 a 2.4 a 3.3 a 4.5 a
21.6 b 28.9 b
7.3 B
Rainy 1994
18.1 a 16.5 a 20.0 ab 24.7 ab 33.7 b 73.2 c 84.7 c
38.1 D
Overall Mean
4.1 A2
5.2 AB 5.4 AB 6.8 AB 9.8 B
33.9 C 46.0 D
1. Back transformed mean incidence of the arcsine transformed incidence. The number of plots per parent, per cross was 2, 4, 12 and 10 in the seasons of 1992-93, 1993, 1993-94, and 1994 respectively.
2. Different characters indicate significant differences (Tukey-Kramer, P<0.05) between parents within one season (lowercase), or significant differences (Tukey-Kramer, PO.01) between parental means, or season means (uppercase).
Table 2. Analysis of variance of the arcsine transformed disease incidence of seven groundnut genotypes used as parents in a half-diallel (21 crosses) and tested in four environments. A block contained the parents of one cross.
Source of variation
Environment (E) Block (B) B*E
Genotype (G) G*E Error Total
df
3 20 60
6 18
1051 1158
sum of squares
148408.2 117280.6 28016.9
89082.3 7951.1
92388.8 483127.9
mean squares
49469.4 5864.0 466.9
14847.0 441.7
87.9
F value
105.94 12.56
168.90 5.03
P r > F
0.0001 0.0001
0.0001 0.0001
52

INHERITANCE
lowest incidence, could be distinguished from ICGV 86430 with the highest incidence,
based on the overall means. No significant differences between resistant parents were
observed within season, when the level of the disease was low (e.g. rainy season 1993 and
post-rainy 1993-94).
The disease incidence of the parents was used in an analysis of variance (Table 2) to test
the effect of environment, block (containing the parents of one cross), and genotype. A
significant environment effect (E) was observed for the incidence in the four growing
seasons tested. Apparently the disease levels varied considerably between years and seasons,
even though all trials were performed at ICRISAT. The block effect (B) was significant but
of a smaller size when compared to the environment effect. The effect of genotype (G) was
highly significant as was expected. The interaction G*E was significant but much smaller
than the effect of genotype of the parent. The G*E for disease incidence accounted for less
than 2% of the total sum of squares. Thus, even under these variable conditions, the
genotype x environment interactions were not very important. The G*B and G*E*B
interactions were not significant and were therefore included in the error term.
PROGENIES
The environments of Table 1 correspond with the environments in which the F2, F3, F4 and
Fj/F, generations were tested. The progeny and parental means were grouped on the basis
of the type of cross: susceptible x susceptible (S x S), resistant x susceptible (R x S), and
resistant x resistant (R x R), and discussed per group (Table 3). The data presented in Table
3 are adjusted using the average mid-parent value, whereas the data in Table 1 were
calculated based on GLM, resulting in a discrepancy between the incidence values presented
in these Tables.
CROSS BETWEEN SUSCEPTIBLE PARENTS
The F, of the cross between JL 24 and TMV 2 was close to the mid-parent value. The
mean generation disease incidence for the F2 and F3 appeared to be higher than the mid-
parent value, and would indicate a recessive inheritance. This was not confirmed in the F4
and F5.
53

cfl
o c cj
•n .e c M
bn B
3
CA
, 3
X ) c es
"O <L>
g S3
e o -o c e o
3 "O S " l
o ^
O S P
CL.
8 I g 2 2 13 *- G h. O Q U
_ 60 C
O C g
• o 2 » § 00.2 5 >
" * «3 c
fe J S3 tU - ° T3
vi O <-* S 'S
-*° g o- 's « « 3
^ tS t s
w p - ' CS
S 2 <?• C *3 -O
3 o E c c <" •S.2 3» 2 13 Ö
£gÉ3
S. I | S S o r n ' 5 . 2 "3 o H E £
2 8 .S c — -S eu o o
S S '
o •o a>
E g
S t u
moo in «S NO VÛ
i n r - NO »ri
I ^ O ; V O N Oi f i ~ ^ OO ON (N m m cN CN
•*t —. —, m o
(N • * t-- vq —; ON r«-i od r- ö (N m (N (N m
•^- ON NO i n »n
(N ~ - — i n ~ *
(N i n ON (N •*
(NI t-~ (N I> OO c i NO NO —; ^ f
ON O (N
oo T t OC ON ~-! <N
NO C--
Ö Ö
O CN) i n (N NO
NO O ON NO NO
(N T t ON NO OO
t ^ 6 o q t N ! m CN' ~ - od r- c i c i c i <N CN ^î-
00 (N oo ^ t
en
^ r-
o \ t^ r j oo oô NO c i in OI (N (N (N
—; (N rr NO Ö ON in' r-
(N O 00 NO Ö (N
ON r-; t~ O
m oo
^ d
m ^ m m m
T t vq ^ —- ON
r n t ^ ^ f ' - * r n
m o
r d
* 0 v i (N ONÏ
O t-i
<4-O
C/ï —
£ C U
ed o CL. C
c/3
X
(N
> S H X
• < * tN
„
t/3
ai
^ - ^J - ^ i - ^J- ^J-( N ( N ( N (N (N
J J J J J X X X X X
ON O m oo - H
o "3- m m o ^O 'Ô ^o \ o vo 00 oo oo oo oo
m i n x — i -
o Ë "S
l »
oo
CN (N (N (N (N
> > > > >
h h h h h X X X X XI
ON O C I 00 --^ (N m NO oo r*i o ^ t m m o NO NO NO NO NO OO 00 OO oo oo
— NO
O ON
a» T3
54

Q> U
•a
r/l 3
T ) ca
"O T5
El T3 efl
§g 0> C a.'S
I'S S3 <u M S3
I S § 8 .S c <u « 2 o o 'S.S
J3 C CJ u
2 2
o 01
c—
c <D
t C/l
C/l
2
o
»4—1
o ca 'ctt
Q r/i CD
o s u OU
r/3
p O
i -
a B O
H
<Ni -g oo <** c ir;
u . c ^ eu
„ ? S3
. - ru C
- S S * OH O T3
°" "*-! „>
E c >
o -a ^ ^ e *-• C? =a e w f e S3 8 a> <?-
ra's E
y <u .S e oo
o C3 2 ' 5 «3 u JS >
W 3 «
S 8 Ja 8-s f c ca ça o . c o o u
-o Ö .Ë .ca t t ; « H S 3
Tl
3 .s s d j
s ÜT
en ty-j ON e i
»n rn NO 00
•T-; CS es od
es ~* O es O ^ en in ^ ' od K *o ON t^
c s o r ^ r ~ - r ^ 0 f ^ r - i > 4 o v £ )
^ r j ^ t - t t ^ a o o o o i > n
. - ^csr -^cnodcs in- - i «ri o
o m in 1 in' es es
NO es o ~
O ^ q v - j O N O O T t c S - ^ r n ^ Ö ^ o c s ' ^ o o d ^ r ^ i n r n
moovocSNOcsoNo^o-—
N O ^ - ^ i n c s t - ^ o o r ^ N O i n N o c s c n c s ^ t - ^ o - ' ^ - r n ' ^ '
O N O ^ o O N O m O N O m o o c s c s m c s c o N o c s m N O o o N O N O ^ O ^ N O N O N Ü N O N O N O o o c o o o o o o o o o o o o o o o o o ?N ?% rs ?% rS ?S ?S rS r% r^
o m m o o o o o o ^ - — — — m N O N O o o o o o o m e i m t - * " ) ^ - m m m c n c n o o o o
Q^OOOOOOOOOOOOOOOOOOOO
ON *f) CS ^
o in r ö
O NO CS ^
ON ON O
NO ON od --
55

CHAPTER 6
CROSSES BETWEEN A RESISTANT AND SUSCEPTIBLE PARENT
JL 24 had a consistently higher incidence than TMV 2 (Table 1, 3). The progenies of R x
JL 24 also had a higher incidence compared to the progenies of R x TMV 2, except for the
incidence in the F2. Clearly, the moderate resistance of TMV 2 is heritable. No consistent
differences between crosses with different resistant parents were observed. The disease
incidence in the F, to F5 was close to the mid-parent value of 30.6% for the R x JL 24
crosses, and 26.0% for the R x TMV 2 crosses. The F6 of three crosses with JL 24 was
tested by mechanical inoculation, and the mean incidence values of the F6 were also close
to the mid-parent values. The reaction of the parents was similar to the incidence in the
field, indicating that the resistant parents had virus resistance (they may also have vector
resistance).
CROSSES BETWEEN RESISTANT PARENTS
The mean parental values (P,, P2) ranged from 7.7 to 20.6 (Table 3). Individual F, values
ranged from 5.0 to 25.4 and could indicate different dominance factors (low values) or
different recessive factors (high values), but these are not confirmed in the subsequent
generations. These F, values are probably extreme values of a population with a mean
around that of the mid-parent, like the other crosses. The same applied to some of the
extreme values in the other generations. The mechanically inoculated F6 of three crosses
was close to the mid-parent value, and consistent with the field data.
The mid-parent values and the generation means of the 21 crosses were ranked and the
correlations were determined using Spearman's ranking correlation (Table 4). Almost all
correlations were significant and suggests that the disease incidence of the progeny is
closely related to the disease incidence of the mid-parent. The F4 and F5 values were close
to the mid-parent values in all crosses. This is confirmed by the strong positive correlation
in the F4 (0.934) and the F5 (0.942) between the disease incidence of the mid-parent and
the generation means, indicating that epistatic factors are probably of little or no
importance. The significant correlation between the F, and the mid-parent value was 0.816,
suggesting that additive factors rather than dominance factors play a role in the resistance.
56

INHERITANCE
Table 4. Correlation coefficients (Spearman) between the mid-parent values, from field (MPfldd) or from mechanical inoculation (MPinoc), and the generation means (F, to F6) of the disease incidence based on n number of crosses between seven groundnut genotypes in a half diallel.
F, F2 F3 F4 Fs F6 MP„eld
MPfieId 0.816** 0.709** 0.882** 0.934** 0.942** 0.899* MPinoc 0.829 0.986* n 17 21 21 21 17 6 6
** Significant at P < 0.01 * Significant at P < 0.05
F5 BULK
Figure 1 shows the cumulative frequency distribution of the F5 bulked lines of each of the
six crosses with JL 24. The average LSD was 12.8. The mean incidence of a number of F5
bulked lines was lower than the resistant parents (transgression) but all except one were not
significantly different from the incidence of the resistant parent. Similarly, a few
transgressing lines were found with a higher disease incidence compared to JL 24. One line
of the cross JL 24 x TMV 2 had a significant lower disease incidence compared to TMV
2 and JL 24. This could indicate that JL 24 and TMV 2 both had resistance factors (with
very small effects), and that these factors were not identical. However, the significance of
the disease incidence from these lines are ambiguous, due to the relatively large
experimental error.
SELECTION BY SUBSTITUTION
F2 plants without seed could not be advanced to the next generation. Selection by
substitution in the F2 would be absent if the percentage of infected F2 plants was reflected
in the percentage of F3 lines from infected F2 plants. Table 5 shows that for most crosses
the percentage of F3 lines from infected F2 plants was lower than the percentage of infected
plants in the F2. Thus some selection by substitution occurred in the F2 of almost all
crosses.
57

CHAPTER 6
Cummulative frequency distribution
100
Disease incidence (arcsine)
JL 24 x T M V 2 86363 x JL 24
86029 x JL 24
86430 xJL 24
86388 xJL 24
86031 xJL 24
Figure 1. The cumulative frequency distribution of the disease incidence (arcsine transformed) of F5 bulked lines of six crosses between the susceptible parent JL 24 (0), and six other genotypes (•).
The level of selection by substitution in the F3 and F4 was calculated directly from the
number of harvested plants labelled as substituted, divided by the total number of harvested
plants. In the F3 a selection by substitution occurred between 0 and 12.7% (Table 5), but
was generally less than 7%. The average selection by substitution level in the F4 was 9.2%
58

INHERITANCE
and ranged from 0-19.8%. The number of lines in which repeated selection by substitution
occurred was very low. In only 7 lines of 4 different crosses a healthy plant of both the F3
and the F4 line was advanced to the next generation, when the randomly chosen plant was
infected and had no seed. On average no apparent shift towards susceptibility was found
in the F5 obtained from infected F4 plants.
Table 5. The level of selection by substitution in the F2 deducted from difference between the % infected F2 plants (first column) and the percentage F3 lines from infected F2 plants (second column) (A), in the F3 (B), and in the F4 (C).
Cross
1 JL 24 x TMV 2 2 86029 x TMV 2 3 86029 x JL 24 4 86430 x TMV 2 5 86430 x JL 24 6 86430 x 86029 7 86363 x TMV 2 8 86363 x JL 24 9 86363 x 86029 10 86363 x 86430 11 86388 x TMV 2 12 86388 x JL 24 13 86388 x 86029 14 86388 x 86430 15 86388 x 86363 16 86031 xTMV2 17 86031 x JL24 18 86031 x 86029 19 86031 x 86430 20 86031 x 86363 21 86031x86388
A. % infected plants in theF2
52.2 22.7 31.5 23.4 31.8 5.8
20.0 25.1 6.9 7.5
15.5 23.7 4.2
12.8 8.8
24.8 18.6 6.6
11.6 7.5 7.5
% F3 lines from infected F2 plants
45.5 16.2 26.2 13.0 26.1 3.2
12.9 18.1 1.9 3.5
12.5 16.9 4.2 9.4 5.2
23.2 9.7 2.7
10.8 3.6 3.8
B. F3
12.7 8.1 3.7 9.3 6.3 0.0 4.4 6.3 1.0 5.9 0.9 5.7 1.0 3.9 0.0 5.7
12.2 0.0 1.1
11.5 4.4
C. F4
19.1 9.9 5.5
12.1 11.5 0.0
11.0 15.6 7.0 -7.8
19.8 4.0 4.9 4.0
17.1 -4.8 2.2 --
59

CHAPTER 6
DISCUSSION
The parents chosen for this study clearly differed in field resistance to PBNV. The
susceptible genotypes JL 24 and TMV 2 were significantly different from each other.
TMV 2 has one or more resistance factors decreasing the level of infection by a quarter
compared to JL 24. In another study (Buiel et al., 1995; Chapter 5), TMV 2 had a
consistently lower disease incidence compared to JL 24 across 10 environments. The
groundnut cultivar TMV 2 was first released in 1940 and has been grown on a large scale
in India. Therefore, it can be assumed that the quantitative resistance of TMV 2 is a durable
form of resistance.
The five resistant genotypes have been developed by ICRISAT in 1986. The resistance was
stable across environments (this Chapter; Buiel & Parlevliet, 1995; Buiel et al., 1995;
Chapter 4 and 5). However, a judgement on the durability of this resistance can not be
made because of the relatively short life span and small-scale usage of these genotypes.
The mean disease incidence of the progenies of the 21 crosses were quite consistently close
to the mid-parent value. This is confirmed by the strong correlation between the F4's, F5's
and the mid-parent values. These observations indicate the absence of epistatic inheritance.
The F, values were close to the mid-parent values and indicate that dominance factors are
probably not present. The resistance factors are likely to inherit additively.
With a quantitative trait such as the resistance to PBNV it is difficult to estimate the
number of genes because of the large variation of the trait. Furthermore, the resistance
could only be determined on a population level. For example, the F2 yielded only single
values of the disease incidence without a variance . Therefore, the approaches being used
to study the inheritance of quantitative traits (Mather and Jinks, 1971), based on the
distributions in the progenies cannot be applied here.
Other approaches, such as developed by Jinks and Towey (1976), are based on the
proportion of segregating lines (families). However, measuring disease incidence will yield
only one value of incidence per line and the level of segregation cannot be determined. In
our study, one way to determine the segregation within a line would be to evaluate the
variation between the F5 bulked plots (within lines), which were planted in three replicates.
60

INHERITANCE
However, the variation of disease incidence is rather large. As a result, these methods to
estimate the number of genes cannot be applied here.
Four significantly different levels of resistance could be identified here, thus at least three
resistance factors were present in the seven groundnut genotypes used here. The slight level
of resistance of TMV 2 is caused by at least one resistance factor. The level of resistance
of the ICGV genotypes was significantly higher than the resistance of TMV 2, and must
be caused by at least one resistance factor other than the TMV 2 resistance factor. Within
the ICGV numbers two levels of resistance were distinguished, ICGV 86388 was
significantly more resistant than ICGV 86430. This can be explained by at least two
resistant factors in the ICGV group of genotypes. Therefore, this study revealed that a
minimum of three resistance factors causing quantitative resistance to PBNV were present
in the groundnut genotypes tested here.
In the past, other authors have reported on the inheritance of virus resistance when the
resistance was expressed as a reduced disease incidence. Two to three genes with additive
gene action were postulated for the quantitative resistance in maize to maize chlorotic dwarf
virus, which is expressed as the percentage of diseased plants (Rosenkranz and Scott, 1987).
In perennial ryegrass, the resistance to ryegrass mosaic virus was reported to be
polygenically inherited (Salehuzzaman and Wilkins, 1984; Wilkins, 1987). Yet, these
authors applied conventional approaches using semi-arbitrair classes to investigate the
resistance.
Stevens et al. (1992) concluded from the segregation in the F2, BC,, and BC2, that the
resistance to TSWV in tomato was based on a single dominant gene. In this case however,
the reactions of the parental populations were either 100% healthy or 100% infected. In
field studies, Kumar and Irulappan (1992) also studied crosses between a 100% infected
susceptible parent vs. a 100% healthy resistant parent. However, some of this material was
also tested in studies using mechanical inoculation and thrips transmission (Krishna Kumar
et al., 1993). A clear quantitative reaction was shown in these tests.
In the present study, it was assumed that cross pollination between plants in the field was
negligible. Reddy (1993) reported a natural outcrossing between 0 and 5.4% in India when
the ratio between acceptor and donor was 1:4. Though some outcrossing may have
61

CHAPTER 6
occurred, it is not expected to have a significant contribution to the error.
To some extent selection by substitution occurred in the F2 to F4 generations of all crosses.
Selection by substitution was more important in crosses with one or two susceptible parents.
Thus, some highly susceptible genotypes may have been lost. Therefore, selection by
substitution imposes an extra complication on the genetical analysis of the resistance to
PBNV.
62

CHAPTER 7
MATURE PLANT AND TISSUE RESISTANCE IN THE
GROUNDNUT - PEANUT BUD NECROSIS VIRUS SYSTEM
SUMMARY
Leaves and plants of different ages of a susceptible and two resistant
groundnut genotypes were mechanically inoculated with peanut bud
necrosis virus, and the percentage of plants with systemic symptoms
(incidence) and the incubation period were determined. The incidence
decreased sharply in all three genotypes with the age of the inoculated
leaves and plants. The incubation period increased with the age of leaves
and plants. Apparently, only young tissue of young plants is susceptible,
while mature tissue and plants are highly resistant. This mature tissue and
plant resistance occurs irrespective of the susceptibility level of the
genotype to peanut bud necrosis virus, however, it develops earlier in the
resistant than in the susceptible genotypes.
This chapter will be published in a slightly modified version as: A.A.M. Buiel and J.E. Parlevliet (1996). Mature plant and tissue resistance in the groundnut - peanut bud necrosis virus system. Euphytica 91: 213-217.
63

CHAPTER 7
INTRODUCTION
Peanut bud necrosis virus (PBNV) causes a serious disease in groundnut (Arachis
hypogaea L.) in Asia. The virus is presumably a distinct member in the genus
Tospovirus of the Bunyaviridae (Reddy et al., 1992). Plants infected with PBNV have a
strongly reduced yield, or do not yield at all. Natural infection can be very high, e.g. in
India an average of 46% in seven environments was reported for TMV 2 (Buiel &
Parlevliet, 1995; Chapter 4), the predominantly grown groundnut cultivar in India.
Resistance is therefore extremely important to reduce yield losses caused by PBNV.
Complete resistance (immunity) has not been found in the cultivated groundnut (Reddy
et al., 1991). However, resistance of a quantitative nature is present in groundnut and is
expressed as a reduced percentage of systemically infected plants. This quantitative
resistance is characterized by a wide variation (Buiel et al., 1995; Chapter 5), and occurs
both when naturally infected by thrips in the field, and when mechanically inoculated.
In addition to complete resistance and quantitative resistance, a third type described as
mature plant resistance, has been reported from many other host-pathogen systems, such
as bean-tobacco mosaic virus (Schein, 1965), Nicotiana glutinosa-lettuce necrotic
yellows virus (Crowley, 1967), potato-potato virus X (Venekamp and Beemster, 1980;
Wislocka, 1984), potato-potato virus Y° (Sigvald, 1985), potato-potato leaf roll virus and
potato-potato virus Y (Beemster, 1987), barley-barley leaf rust (Smit & Parlevliet,
1990), potato-potato virus Y° and potato-potato virus YN (Gibson, 1991), and rice-rice
blast (Roumen, 1992; Roumen et al., 1992). Mature plant resistance is generally
genotype independent, i.e. it occurs in all genotypes, even in the most susceptible ones
(Smit & Parlevliet, 1990). It has not been described for groundnut-PBNV.
Bald (1937) studied inter alia the mature plant resistance of tomato to tomato spotted
wilt virus (TSWV, the type member of the genus Tospovirus) in Australia. He observed
a delay in the incubation period in mature plants compared to young plants. No further
studies on mature plant resistance in the tomato-TSWV system were reported after
Bald's publication, nor on any other host-Tospovirus system. Yet on groundnut, Savary
(1987) described a clear effect of plant development and leaf age on the resistance to
64

M A T U R E P L A N T A N D T I S S U E R E S I S T A N C E
rust {Puccinia arachidis).
In this study, the occurrence of mature plant resistance in the groundnut-PBNV system
was investigated. Three groundnut genotypes and one PBNV isolate were used to
determine the effect of leaf and plant age on the percentage of plants with systemic
symptoms (incidence) and the incubation period.
MATERIALS AND METHODS
MECHANICAL INOCULATION
The PBNV isolate used was originally collected at ICPJSAT, Asia Center, India. The
virus was not more than six times mechanically transmitted to plants of the susceptible
genotype TMV 2, to minimize the risk of generating defective interfering RNA mutants,
as was shown to occur in TSWV (Resende et al., 1991). Inoculum was prepared by
grinding systemically infected leaves of TMV 2 plants with clear chlorotic ring spots in
0.05 M phosphate buffer, pH 7.0 containing 0.01 M NajSOj (1:10, w/v). This extract
was kept chilled during the inoculation of the test plants. The plants were grown in a
greenhouse with minimum/maximum temperatures of 15-20°C/25-35°C.
The incidence of systemically infected plants was recorded daily. The incubation period
(IP50) was determined as the interval between inoculation and the appearance of the first
systemic symptoms on 50% of the ultimately infected plants. In the absence of any
systemically infected plants, it was assumed that the IP50 was at least longer than the last
observation date (x). Here, x+1 was used in the computations.
LEAF AGE
The effect of leaf age was tested on three groundnut genotypes, JL 24 (susceptible),
ICGV 86031 (resistant), and ICGV 86388 (resistant). To inoculate leaves of different
ages at the same time, pre-germinated seeds were sown in 15 cm diameter pots at two-
day intervals. The third leaf (numbered in order of appearance) of each plant was
inoculated on 10, 12, and 14 days after sowing. The third leaves were unfolded (leaf age
65

CHAPTER 7
1), expanded (leaf age 2), and expanded and matured (leaf age 3).
The experiments were repeated three times (series 1 to 3) and consisted of two or three
replicates. Each treatment comprised five pots with five plants each. Plants were
removed before inoculation when the third leaf did not develop uniformly with the
others within the same treatment. The three series were mechanically sap-inoculated on
9 January 1991, 5 August 1994, and 4 October 1994.
PLANT AGE
To test the effect of plant age, leaves at different positions, but with identical age were
inoculated. Pre-germinated seeds of JL 24, ICGV 86031, and ICGV 86388 were sown in
15 cm diameter pots at regular intervals to inoculate leaves at different positions at the
same time. Leaves were numbered in order of their appearance: the first two
quadrifoliate leaves, leaf 1 and 2 appear simultaneously (2-leaf stage), followed by leaf
3, (3-leaf stage), leaf 4 (4-leaf stage) etc. From plants in the 2- to 5-leaf stage, one
unfolded quadrifoliate leaf was inoculated per plant.
Three tests (series 4 to 6) were performed, each comprising three or four replicates.
Every treatment comprised five pots with five plants each. Plants were discarded before
inoculation when the newly formed leaf layer was still folded or already expanded.
Mechanical sap-inoculation of these three series was performed on 12 March 1991, 24
February 1993, and 10 January 1995.
RESULTS
INCIDENCE IN RELATION TO LEAF AGE
The percentage of systemically infected plants (incidence) was monitored up to 23 days
after inoculation (DAI) for series 1, 21 DAI for series 2, and 20 DAI for series 3. The
average incidence of infected plants of JL 24 for leaf age 1 (unfolded) was 100.0% in
series 1, 91.4% in series 2, and 98.0% in series 3.
The genotype and treatment means of the incidence and the standard deviation of the
66

MATURE PLANT AND TISSUE RESISTANCE
means over series 1 to 3 were calculated, and shown in Table 1. In all three genotypes a
strong and significant reduction in the incidence of infected plants was observed when
leaves with a higher age were inoculated. In JL 24 the incidence reduced from 96% for
leaf age 1 (unfolded) to 67% for leaf age 2 (expanded). A further raise in maturity to
leaf age 3 (expanded and matured) reduced the incidence to 12%. The incidence of
infected plants decreased in ICGV 86031 from 67% (leaf age 1) to 27% (leaf age 2) and
to 9% for leaf age 3. Similarly, the values of ICGV 86388 reduced from 52% to 2 1 %
(leaf age 2) and to 5% (leaf age 3).
The greatest reduction in incidence for JL 24 (55%) was found when plants with leaf
age 2 and leaf age 3 were compared. On the other hand, the greatest reduction for the
two resistant genotypes (36% on average) was found when the leaf age increased from
leaf age 1 to leaf age 2, thus at an earlier stage than in JL 24.
Table 1. Mean incidence (%), standard deviation of the mean, and overall mean after inoculation of the third leaf at different leaf ages, of three groundnut genotypes.
Leaf age
1 (unfolded)
2(expanded)
3 (expanded and matured)
mean s.d.2
mean s.d.
mean s.d.
JL24
96.0 2.2
66.7 10.0
11.9 3.1
Genotype ICGV 86031
67.3 7.8
27.5 10.6
9.1 3.9
ICGV 86388
52.4 6.8
21.0 6.3
5.2 3.4
Overall mean
71.9 a3
38.4 b
8.7 c
1. Mean incidence (%). 2. Standard deviation of the mean incidence. 3. Different characters indicate significant differences (Tukey, P<0.001).
67

CHAPTER 7
INCIDENCE IN RELATION TO PLANT AGE
The incidence was monitored up to 20 DAI for series 4, 16 DAI for series 5, and 10
DAI for series 6. JL 24, in the 3-leaf stage, had an average incidence of 86.9% in series
4, 97.1% in series 5, and 98.8% in series 6.
The genotype and treatment means of the incidence, and the standard deviation of the
means over series 4 to 6 were calculated, and presented in Table 2. The incidence of
infected plants in the three genotypes tested, decreased strongly and significantly with
the plant age. In JL 24 the incidence of the 2-leaf stage (89%) and the 3-leaf stage
(94%) did not differ significantly. Raising the plant age from the 3-leaf stage to the 4-
leaf stage reduced the incidence to 71%. Increasing the plant age to the 5-leaf stage
dropped the incidence subsequently to 20% (Table 2). In the resistant genotypes, the
incidence of infected plants of the 3-leaf stage was significantly lower than the
incidence of the 2-leaf stage. The values decreased further when plant age was
increased to the 4- and 5-leaf stage.
Table 2. Mean incidence (%), standard deviation of the mean, and overall mean after inoculation of the unfolded leaf from plants at different plant ages, of three groundnut genotypes.
Plant age
2-leaf stage
3-leaf stage
4-leaf stage
5-leaf stage
mean s.d.2
mean s.d.
mean s.d.
mean s.d.
JL24
89.0 6.7
94.4 2.2
71.2 7.5
20.0 7.8
Genotype ICGV 86031
57.1 12.0
37.6 7.6
4.9 1.8
3.3 3.3
ICGV 86388
46.9 10.5
27.0 6.1
4.5 1.7
12.0 1.5
Overall mean
64.3 a3
53.0 b
26.9 c
11.8 c
1. Mean incidence (%). 2. Standard deviation of the mean incidence. 3. Different characters indicate significant differences (Tukey, P<0.001).
68

M A T U R E P L A N T A N D T I S S U E R E S I S T A N C E
The major reduction in incidence was observed between the 4- and 5-leaf stage in JL
24 (51%), whereas for the resistant genotypes this was observed between the 3- and 4-
leaf stage (28% on average). The 3-leaf stage" had a lower incidence than the 2-leaf
stage in the resistant genotypes, but not in the susceptible genotype.
INCUBATION PERIOD
The incubation period (IP50) clearly increased with leaf age (Table 3). The overall
treatment means of IP50 increased with about 2.5 days between leaf age 1 (unfolded)
and leaf age 2 (expanded). A further increase in IP50 of 4 days was observed when the
leaf age was raised from leaf age 2 (expanded) to leaf age 3 (expanded and matured).
The IP50 also increased with plant age, except in young plants, i.e. younger than the 3-
leaf stage (Table 4). The overall treatment means of IP50 were not significantly different
between these plants. The IP50 raised with 3.5 days from plants in the 3-leaf stage to
the 4-leaf stage. Increasing the plant age to the 5-leaf stage raised the IP50 with another
3.3 days.
The IPjo's found for the genotypes used here did not differ much. The IP50 was
generally short in JL 24, and longer in ICGV 86031 and ICGV 86388 (Tables 3 and 4).
Table 3. Mean incubation period (IP50), standard deviation of the mean, and overall mean after inoculation of the third leaf at different leaf ages, of three groundnut genotypes.
Leaf age
1 (unfolded)
2 (expanded)
3 (expanded and matured)
mean s.d.2
mean s.d.
mean s.d.
JL24
8.0 0.57
9.6 0.48
13.2 2.87
Genotype ICGV 86031
9.0 0.65
12.5 1.71
15.2 3.12
ICGV 86388
9.4 0.96
12.0 1.64
17.8 3.47
Overall mean
8.8 a3
11.4 b
15.4 c
1. Mean IP50 (days). 2. Standard deviation of the mean IP50. 3. Different characters indicate significant differences (Tukey, P<0.05).
69

CHAPTER 7
Table 4. Mean incubation period (IP50), standard deviation of the mean, and overall mean after inoculation of the unfolded leaf from plants at different plant ages, of three groundnut genotypes.
Plant age
2-leaf stage
3-leaf stage
4-leaf stage
5-leaf stage
mean s.d.2
mean s.d.
mean s.d.
mean s.d.
JL24
8.6 0.43
8.9 0.39
10.3 0.47
14.3 1.33
Genotype ICGV 86031
10.0 1.89
9.0 0.56
14.1 1.27
19.7 1.33
ICGV 86388
9.9 1.96
10.2 0.44
14.2 1.47
14.7 0.66
Overall mean
9.5 a3
9.4 a
12.9 b
16.2 c
1. Mean IP50 (days). 2. Standard deviation of the mean IP50. 3. Different characters indicate significant differences (Tukey, P<0.01).
DISCUSSION
The occurrence of mature plant resistance in groundnut to PBNV is shown here. Both
increased leaf and plant age reduced the incidence strongly and increased the incubation
period. This effect (a decreased incidence and an increased incubation period) can be
explained by a decreased rate of virus multiplication at the entry site, and/or a
decreased rate of virus transport from the entry site to other plant parts. In another
study we found that older, systemically infected tissue, diminished virus multiplication
(data not shown). The effect of mature leaves and mature plants on the incubation
period of resistant genotypes is almost certainly underestimated. The incidence in
resistant genotypes was low and therefore the assumption IP50=x+l was applied, while
the actual incubation period could have been considerably higher.
It seems that only young tissue of young plants is susceptible. An increase in leaf or
70

M A T U R E P L A N T A N D T I S S U E R E S I S T A N C E
plant age of a few days induces a mature plant resistance resulting in a longer
incubation period and fewer infected plants. This mature plant resistance occurs
irrespective of the level of susceptibility of the groundnut genotype.
The observations on mature plant resistance of groundnut to PBNV are in agreement
with the results of Bald (1937) of TSWV on tomato, and with the results of Savary
(1987) of rust on groundnut. Mature plant and tissue resistance in the groundnut -
PBNV system is an effective and highly important feature in the epidemiology of
PBNV. Under field conditions the groundnut crop is expected to become more resistant
during the growing period as a result of mature plant resistance. Buiel & Parlevliet
(1995; Chapter 4) showed that this effect did indeed occur in the field, in a study on
six genotypes ranging from susceptible to resistant.
In this study it was shown that mature plant resistance occurred in susceptible as well
as resistant genotypes. But, mature plant resistance developed earlier in resistant
genotypes, and had a much larger effect on incidence than in the susceptible genotype.
Furthermore, the IP50 was longer in the resistant genotypes than in the susceptible
genotype and this directly and indirectly affects the development of the disease. Firstly,
a longer IP50 directly slows down the rate of infection in a resistant crop. Secondly, it
indirectly decreases the spread of the virus by thrips as fewer virus sources occur. The
effect of mature plant resistance is altogether much larger in resistant genotypes, and
the use of resistant genotypes can therefore be recommended to keep peanut bud
necrosis disease at a low level.
71

CHAPTER 8
MECHANISMS OF RESISTANCE IN GROUNDNUT TO
PEANUT BUD NECROSIS VIRUS
ABSTRACT
The mechanisms that cause a reduced incidence of peanut bud necrosis
virus (PBNV) infected plants in resistant groundnut genotypes, were
studied. The development of symptoms and of virus concentrations were
analyzed in mechanically inoculated and systemically infected leaves. The
rate of systemic virus spread, and the incidence of systemically infected
plants were studied after removing the inoculated leaf at different
intervals. The results indicate that virus multiplication was inhibited at the
site of infection in resistant genotypes but not in systemically infected
leaves of resistant genotypes. The rate of systemic spread was lower in the
resistant genotypes than in the susceptible genotypes. The virus
concentration in systemically infected leaves was positively correlated
with the leaf area showing symptoms, but was genotype independent. The
viral antigen concentration decreased with the age of the systemically
infected leaves. The mechanisms resulting in the reduced incidence of
PBNV in resistant groundnut are discussed.
73

CHAPTER 8
. INTRODUCTION
Bud necrosis disease is one of the most serious virus diseases of groundnut Arachis
hypogaea L. in South Asia. Groundnut production is severely affected by this disease,
particularly when infection occurs early in the growing season (Reddy et al., 1991). The
disease is caused by peanut bud necrosis tospovirus (PBNV), which is transmitted by
Thrips palmi Karny (Palmer et al., 1990; Vijaya Lakshmi et al., 1995). PBNV has been
shown to be a distinct member of the Tospoviruses in the Bunyaviridae (De Haan et al.,
1989; Murphy et al., 1995; Reddy et al., 1992; Satyanarayana et al., 1996). Tomato
spotted wilt virus (TSWV, type member of the genus) is the cause of a similar disease
of groundnut in the USA (Reddy et al., 1991).
Efforts to control the virus are mainly geared towards breeding resistant genotypes.
Control of the vector with insecticide sprays resulted in an increased spread of the
disease (Wightman and Amin, 1988). Several groundnut genotypes with resistance to
PBNV (Amin, 1985; Dwivedi et al., 1993; Buiel et al., 1995; Chapter 5), and resistance
to TSWV (Black and Smith, 1987; Culbreath et al., 1994; Demski et al., 1991) have
been identified. The type of resistance reported is in all cases a quantitative resistance,
and expressed as a reduced incidence of infected plants, compared to that of susceptible
genotypes.
The virus moves from the infection sites in the inoculated leaves to newly formed leaves
and produces chlorotic spots that may develop into chlorotic and necrotic rings (Reddy
et al., 1991). Older leaves which are full-grown and mature at the time of infection, do
not become systemically infected, and virus can not be detected in these leaves. On the
young newly formed leaves, symptoms usually appear within 6-10 days after systemic
spread in the plants. Virus in these leaves can readily be detected by ELISA.
Systemically infected plants of resistant and susceptible genotypes show similar
symptoms, and the only visible difference between the genotypes is the contrast in
disease incidence of infected plants. Complete resistance or immunity, i.e. absence of
systemic infection on genotype level, has so far not been found in cultivated groundnut.
The mechanisms underlying the quantitative resistance observed in groundnut were not
74

MECHANISMS OF RESISTANCE
known. Therefore this study was undertaken to investigate the development of infection
in inoculated and systemically infected leaves of resistant and susceptible genotypes.
The symptoms and viral antigen concentrations were examined in individual leaves.
Virus movement in the plant was studied by removing the inoculated leaves at different
intervals following inoculation.
MATERIALS AND METHODS
VIRUS
A PBNV isolate, collected at ICRISAT Asia Center, India, was maintained on the
groundnut cultivar TMV 2 by mechanical sap inoculation. After six serial transfers the
virus was thrips transmitted, to avoid the possible occurrence of defective interfering
RNA mutants, reported to occur due to repeated mechanical transmissions (Resende et
al., 1991). Inoculum was prepared by collecting systemically infected tissue from
TMV 2 plants, and grinding it in 0.05 M phosphate buffer, pH 7.0, containing 0.01 M
Na^C^ (1:10, w/v). Leaves, to be inoculated, were dusted with carborundum powder
and rubbed with a pestle dipped in inoculum, that was kept chilled during inoculation.
PLANTS
Seeds were treated with tetramethyl thiuram disulphide (3 g/kg), and pre-germinated in
Petri dishes on moistened filter paper to promote uniform germination. Germinated seeds
were planted after 2 days in pots (15 cm diameter, 5 plants per pot), and were placed in
a randomized complete block design in a greenhouse with minimum/maximum
temperatures of 15-20°C/25-35°C. In the experiments described below, the plants were in
the 3-leaf stage and only the third leaf (in order of appearance) was inoculated when
unfolded. This was done to avoid differences in resistance related to the age of the leaf
(Buiel and Parlevliet, 1996; Chapter 7).
75

CHAPTER 8
ELISA
A triple antibody sandwich (TAS) ELISA was used to determine the PBNV antigen
concentration in individual groundnut leaves. ELISA plates were coated with a 1:2000
diluted PBNV polyclonal IgG (2 mg/ml) solution in 0.01 M carbonate buffer (pH 9.6),
incubated for 2 h at 37°C and washed with PBS-Tween (the incubation time,
temperature, and the washing conditions were the same throughout the whole ELISA
procedure unless described otherwise). Individual leaves (four leaflets without the
petiole) were weighed and ground in antigen buffer (PBS-Tween containing 2%
polyvinyl pyrrolidone and 0.01 M diethyldithiocarbamate) in a 1:10 (w/v) dilution. Plant
extracts were transferred into Eppendorf tubes and centrifuged for 5 min at 2000 rpm.
The supernatant of each sample was added in duplicate to the wells of the coated ELISA
plates. Plates were washed and a monoclonal antibody developed to the nucleocapsid
protein of PBNV (Poul et al., 1992), diluted 1/10000 in PBS-tween, was added. After
incubating overnight at 4°C, the plates were washed and goat anti-mouse alkaline
phosphatase conjugate (Sigma), diluted 1:2000 in antibody buffer (PBS-Tween
containing 2% polyvinyl pyrrolidone and 0.2% ovalbumin), was added. After incubation,
p-nitrophenyl phosphate (Sigma) substrate (1 mg/ml) in 10% diethanolamine buffer (pH
9.8) was added to the wells, and the plates were left at room temperature for the
development of the reaction. Absorption readings (405 nm) were taken up to 30 min.
The ELISA values were considered positive when they were greater than three times the
absorption values of the healthy controls.
ANALYSIS OF THE INFECTION IN INOCULATED LEAVES
Experiment 1 was a non- replicated experiment, whereas experiments 2 and 4 comprised
three replicates, and experiment 3 two replicates. Each replication consisted of 15 to 25
plants per treatment. The genotypes ICGV 86598 (susceptible to PBNV), and
ICGV 86388, ICGV 86031, and ICGV 86029 (resistant to PBNV) were used in these
experiments. JL 24 was included as a susceptible control. The inoculated leaves were
removed 1, 2, 3, 4, 6 or 8 days after inoculation (DAI). The inoculated leaves were not
removed from the control plants, so that the infection could develop in an undisturbed
76
MECHANISMS OF RESISTANCE
way. The viras content was determined by TAS-ELISA in seven or eight detached
leaves of the plants of one replicate in each treatment. These leaves were also scored
visually for the presence of symptoms. The incidence of systemically infected plants was
recorded daily, and continued after the removal of the inoculated leaves, until 20 DAI.
ANALYSIS OF THE INFECTION IN SYSTEMICALLY INFECTED LEAVES
Plants were inoculated in January 1993 (experiment 5), August 1994 (experiment 6), and
January 1995 (experiment 7). The genotypes JL 24 (susceptible to PBNV), and ICGV
86031 and ICGV 86388 (resistant), were used in these experiments. Systemically
infected leaves were labeled when first symptoms appeared. These leaves were collected
within 3 days after the appearance of symptoms, and the viral antigen concentration of
each individual leaf was determined by TAS ELISA. When collecting the leaves, the
number of leaves on the plant (plant age), leaf age, and the percentage of the area of
each leaf with symptoms were recorded. The age of the systemically infected leaf was
classified into four groups: leaf folded, unfolded, expanded, and expanded and full-
grown. The relationships between these traits and the viral antigen concentration of
systemically infected leaves were determined.
RESULTS
DEVELOPMENT OF THE INFECTION IN INOCULATED LEAVES
The first symptoms on the inoculated leaves became visible 3 DAI. The rate of
symptom development is shown in Table 1. A significantly lower percentage of
inoculated leaves of the resistant genotypes showed symptoms (3-10%), than the
susceptible genotypes JL 24 and ICGV 86598 (23-36%) 3 DAI. All inoculated leaves of
both susceptible and resistant genotypes showed symptoms 8 DAI. All three resistant
genotypes had a delayed symptom development compared to the susceptible genotypes,
ICGV 86029 being the most resistant genotype.
77

CHAPTER 8
Table 1. The development of the symptoms on inoculated leaves (percentage) in five groundnut genotypes.
Date (DAI1)
1 2 3 4 6 8
JL24
0.0 0.0
23.3 95.7
100.0 100.0
ICGV 86598
0.0 36.4 86.7 86.4
100.0
Genotype ICGV 86388
0.0 0.0 3.4
72.7 85.2
100.0
ICGV 86031
0.0 0.0 4.5
100.0 77.3
100.0
ICGV 86029
0.0 0.0 9.5
53.3 72.7 90.9
1. Inoculated leaves were collected 1, 2, 3, 4, 6 and 8 days after inoculation (DAI).
The viral antigen concentration in the inoculated leaves with symptoms is given in
Figure 1. The ELISA values of JL 24 increased from 0.058 (antigen below the detection
level) 1 DAI, to 0.218 (2 DAI) although no symptoms were visible on these leaves. The
ELISA value further increased from 0.861, 3 DAI, to 1.207, 8 DAI. A maximum was
found 6 DAI (1.303). The ELISA values of the susceptible genotype ICGV 86598
increased in a similar way. In the inoculated leaves of the resistant genotypes the virus
concentration developed at a slower rate and reached a relatively lower level (around
60% of JL 24).
1.50
1.25-
1.00-
0.75-
0.50-
0.25-
0.00 2 3 4
Days after inoculation
Figure 1. The development of the virus concentration in mechanically inoculated leaves with symptoms of susceptible genotypes JL 24 (+), ICGV 86598 ( T ) , and resistant genotypes ICGV 86388 ( A ) , ICGV 86031 (o), and ICGV 86029 (•). Vertical bars indicate the standard deviation. The detection level ( • ) was set at three times the absorption value of the healthy control. Note: None of the leaves had symptoms one and two days after infection.
78

MECHANISMS OF RESISTANCE
The percentage of inoculated leaves positive in ELISA, regardless of the presence of
symptoms, is shown in Table 2. PBNV antigen could not be detected in any of the
leaves, 1 DAI. Although none of the leaves showed symptoms 2 DAI, viral antigen
could be detected in several inoculated leaves of all genotypes. However, the percentage
of ELISA-positive leaves of the resistant genotypes was initially lower than that of the
two susceptible genotypes. Six DAI, PBNV antigen could be detected in (nearly) all
leaves. The number of ELISA-positive leaves was generally higher than the number of
leaves with symptoms.
Table 2. The development of the infection in inoculated leaves (percentage of ELISA-positive leaves) in five groundnut genotypes.
Date (DAI1)
1 2 3 4 6 8
JL24
0.0 69.6 90.0 95.7
100.0 100.0
ICGV 86598
53.3 72.7
100.0 100.0 100.0
Genotype ICGV 86388
0.0 40.9 55.2 77.3 85.2
100.0
ICGV 86031
0.0 26.7 50.0
100.0 90.9 90.0
ICGV 86029
0.0 46.7 66.7 86.7 90.9 90.9
1. Inoculated leaves were collected 1, 2, 3, 4, 6 and 8 days after inoculation (DAI).
The PBNV antigen increase in the ELISA-positive leaves in the first eight days after
inoculation is shown in Figure 2. The ELISA values of JL 24 increased from 0.058
(1 DAI) to 0.299 (2 DAI). The antigen concentration in ELISA-positive leaves of
resistant genotypes was much lower than that of susceptible genotypes. In most cases,
the virus concentration of leaves with detectable levels of viral antigen, regardless of
symptoms, was lower than that of leaves with symptoms (Figure 1). Thus, leaves with
symptoms usually had higher levels of viral antigen.
DEVELOPMENT OF SYSTEMIC INFECTION AFTER REMOVAL OF THE INOCULATED LEAF
The percentage of systemically infected plants (incidence) was recorded daily up to 21
DAI. The mean disease incidence was calculated for each genotype (Table 3). The
79

CHAPTER 8
1.50
1.25-
c 1.00-
5 0.75-
2 0.50-<
0.25
0.00
/ Y^L Ï / Y
— \ — i — i — i — i — i — i — i -
0 1 2 3 4 5 6 7 8 9
Days after inoculation
Figure 2. The development of the virus concentration in mechanically inoculated, ELISA-positive leaves of susceptible genotypes JL 24 (+), ICGV 86598 ( T ) , and resistant genotypes ICGV 86388 ( A ) , ICGV 86031 (o), and ICGV 86029 (•). Vertical bars indicate the standard deviation. The detection level ( • ) was set at three times the absorption value of the healthy control. Note: PBNV could not be detected one day after infection.
incidence was lower in the resistant genotypes than in the susceptible genotypes, except
for ICGV 86388 when the inoculated leaves were removed 1 DAI. More plants of this
genotype became infected than of the susceptible genotype ICGV 86598. In resistant
genotypes ICGV 86031 and ICGV 86029, the incidence was reduced to 0% when the
inoculated leaves were removed 1 DAI. Twenty-seven percent of the JL 24 plants
(susceptible check) became systemically infected when the inoculated leaf was removed
one day after inoculation. The incidence increased to 78% in JL 24 (when removing the
leaf 6 DAI), whereafter no significant difference was observed with the control (81%).
The results show that the rate of infection was lower in resistant genotypes than in
susceptible genotypes. The incidence of systemically infected plants was greatly reduced
for all genotypes when the inoculated leaves were removed within 4 days after
inoculation. Removing the inoculated leaves beyond 4 DAI had no effect on the
incidence.
DEVELOPMENT OF THE INFECTION IN SYSTEMICALLY INFECTED LEAVES
The first symptoms on the systemically infected leaves were visible 6 DAI. The leaves
which developed symptoms between 6 and 14 DAI were collected and tested by ELISA.
80

MECHANISMS OF RESISTANCE
Table 3. The incidence (%) of systemically infected plants after removal of the inoculated leaf of five groundnut genotypes. The incidence shown in this table is the mean of three experiments and was recorded about 20 DAI.
Date of removal (DAI1) JL 24
1 27.4 2 25.7 3 44.9 4 57.1 6 78.0 8 79.7 Control2 80.8
ICGV 86598
15.8 18.8 42.2 66.2 86.6 75.6 80.5
Genotype ICGV 86388
19.5 10.4 29.6 31.6 38.8 42.1 39.5
ICGV 86031
1.1 9.1
20.6 36.5 39.2 43.6 41.1
ICGV 86029
0.0 3.8 8.1
14.8 22.4 17.9 22.1
1. Inoculated leaves were removed 1, 2, 3, 4, 6 and 8 days after inoculation (DAI). 2. Inoculated leaves were not removed from the control plants.
The relationship between the ELISA values and the leaf area with symptoms, was
determined for the genotypes tested. A significant, positive correlation was found for all
genotypes (Figure 3 A, B and C). Tests (Snedecor and Cochran, 1967) for homology of
the regression and correlation coefficients (between symptoms and ELISA values) of the
three genotypes showed that the right tailed significance levels were far greater than 5%,
implying absence of differences between the regression and correlation coefficients. The
computed common correlation coefficient between the leaf area with symptoms and the
viral antigen concentration, was 0.856. Apparently, the viral antigen concentration was
genotype independent but was linearly related with the leaf area with symptoms.
The mean ELISA values were calculated for the date of sampling and the date of
appearance of symptoms on the systemically infected leaves (Table 4). A clear
relationship was neither observed between the virus concentration and the sampling date,
nor between the virus concentration and the date of appearance of symptoms. Obviously,
independently both traits had no effect on the virus concentration in systemically
infected leaves.
The mean ELISA values were calculated as a function of the time between the
appearance of symptoms and sampling of the systemically infected leaves (Table 5). A
mean ELISA value of 0.822 was found when the leaves were collected and analyzed by
81

CHAPTER 8
a Ö o
Ö o
o
<
2.00
1.75
1.50
1.25
1.00-
0.75-
0.50-
0.25-
0.00
(A) JL 24
+ +
Y=0.312+ + r - 0 . 615
+
+
t
+ .
^ • *
+ *
+ •
0.011X
+ • •
t* + +
+
• :
+ +
t * * • * ^^:
* * * * +
t t +
+
T I
0 10 20 30 40 50 60 70 80 90 100
(B) ICGV 86031
"\ B C <o o •sr N ^ 1
Ö
o -*-» o, l-l
o 03 XI
<
2.00
1.75
1.50
1.25
1.00
0.75
0.50
0.25
0.00
Y=0.306+0.010X
r=0.737
• ++ * Ï t i ^ t * I
- 4
* > I i 1 1 1 1 1 1 r-
0 10 20 30 40 50 60 70 80 90 100
Area of the leaf with symptoms (%)
(C) ICGV 86388
Y=0.269+0.010X
r -0 .688
- l 1 1 1 1 1 1 1 r-0 10 20 30 40 50 60 70 80 90 100
Area of the leaf with symptoms (%)
Figure 3. The relation between the percentage of the systemically infected leaf area with symptoms, and the ELISA values of these leaves from JL 24 (A), ICGV 86031 (B), and ICGV 86388 (C). The linear relationship and the correlation coefficient (r) is given for each genotype.
82

MECHANISMS OF RESISTANCE
Table 4. The mean ELISA values (bold) and standard deviation (in parentheses below) of systemically infected leaves at six sampling days (days after inoculation, DAI), and eight dates on which symptoms appeared (DAI).
Appearance of symptoms (DAI)
6
7
8
9
10
11
13
14
mean
7
1.026 (0.060)
8
0.871 (0.202) 0.765
(0.029)
0.769 (0.029)
Sampling 9
1.382 (0.267) 1.158
(0.204) 0.777
(0.103) 0.760
(0.110)
0.850 (0.081)
date (DAI) 10
0.816 (0.057) 0.739
(0.092)
0.752 (0.078)
11
1.079 (0.072) 0.881
(0.069) 0.762
(0.056) 0.865
(0.079)
0.890 (0.035)
14
1.520 (0.176) 1.842
(0.044) 0.783
(0.364) 1.437
(0.150)
ELISA on the day of appearance of symptoms. When leaves were collected and assayed
three days after the appearance of symptoms, the mean ELISA value was 1.181. Thus,
the viral antigen concentration in the systemically infected leaves increased between 0 to
3 days after the appearance of symptoms. Furthermore, the mean ELISA values in these
experiments were calculated as a function of the maturity of the systemically infected
leaf, and the age of the plant at the time of systemic infection (Table 6). The ELISA
values clearly declined with increasing leaf maturity. The mean ELISA value of the
folded leaf was 1.280, and reduced to 0.742 for the expanded and full-grown leaf. The
ELISA values did not differ significantly when leaves of plants in the 5-, and 6-leaf
stage were compared within leaf age group, nor for the overall means. Hence, it can be
concluded that an increased leaf maturity, but not plant maturity, had a decreasing effect
on the viral antigen concentration in the systemically infected leaf.
83

CHAPTER 8
Table 5. The mean ELISA values of systemically infected leaves for the interval between the appearance of the symptoms and ELISA.
Interval (days)
0 1 2 3
mean
0.822 0.831 0.906 1.181
standard deviation
0.025 0.054 0.067 0.072
number of samples
295 77 44 55
Table 6. The mean ELISA values of systemically infected leaves at different levels of leaf maturity and plant age at the time of collection.
Plant age
4-leaf stage 5-leaf stage 6-leaf stage
overall mean sd
folded
1.353 1.207
1.280 0.073
Leaf unfolded
1.129 1.092
1.111 0.019
maturity expanded
0.833 1.089
0.961 0.128
expanded & full-grown
0.827 0.550 0.850
0.742 0.167
overall mean
0.966 1.060
sd
0.175 0.075
DISCUSSION
This study shows that the PBNV concentration increased rapidly in the inoculated leaves
of susceptible genotypes. The virus could be detected 2 DAI, whereas the first
symptoms were visible 3 DAI. The virus concentration increased slower in resistant
genotypes, and attained only levels of about 60% of that in the susceptible genotypes.
These observations suggest that the inhibition of virus replication is one of the
mechanisms causing resistance in groundnut.
The virus movement from the inoculated leaf to other parts of the plant was measured
indirectly by recording the incidence after removal of the inoculated leaf. By removing
the inoculated leaf at different intervals we were able to show that the rate of systemic
84

MECHANISMS OF RESISTANCE
infection was reduced in resistant genotypes (Table 3). The reduction could be solely
caused by the inhibition of virus replication, or it may be due to restriction of virus
movement. This is possibly a second mechanism of resistance.
No difference in the percentage of systemically infected plants was observed when the
inoculated leaves were removed 6 or 8 DAI, or when they were not removed.
Presumably, virus movement occurred mainly within 4-5 days after inoculation. In the
systemically infected leaves, viral antigen levels reached the same levels in the resistar.
genotypes as those of the susceptible genotype. Evidently, the resistance was operating
in inoculated leaves but not in systemically infected leaves of the resistant genotypes.
This agrees with the observation that systemically infected leaves of resistant and
susceptible genotypes show similar symptoms. Furthermore, a clear and positive
association was found between viral antigen levels and symptoms of the systemically
infected leaves of all three genotypes.
The delay from inoculation to systemic infection varied between plants and ranged from
6 to 14 days. Consequently, plants differed in age when systemic infection developed.
Still, this difference in plant age did not affect the amount of viral antigen in the
systemically infected leaves. However, differences in plant age in these experiments are
expected to be too small to cause differences in the viral antigen concentration.
Similarly, systemically infected leaves varied in maturity when infection developed.
Fully expanded leaves did not support as much virus multiplication as young folded
leaves (Table 6). Apparently, the age of the leaf influenced the virus multiplication in
the leaf. This mature plant and tissue resistance has also been described elsewhere (Buiel
and Parlevliet, 1996; Chapter 7).
Other investigations seem to confirm our results, e.g. Tu and Ford (1970) observed a
reduced incidence of maize dwarf mosaic virus in resistant maize genotypes. The virus
concentration in inoculated leaves of a resistant corn variety was lower than that of a
susceptible variety. Later, Jones and Tolin (1972) described that the resistance of a corn
hybrid they used in their studies was based on a decreased rate of virus multiplication or
a limited virus spread. Barker and Harrison (1985) presented a possible explanation for
the reduced incidence of systemically infected plants in resistant genotypes. They
85

CHAPTER 8
showed that translocation of potato leaf roll virus (PLRV) from the infected tubers to the
shoots was prevented in resistant potato lines. Therefore, it is apparent that the
restriction of virus movement from the site of infection could lead to resistance to
systemic invasion of the virus. Although PLRV is a phloem restricted virus, our findings
illustrate that similar resistance mechanisms to PBNV exist in groundnut.
In the inoculated leaves of the resistant genotypes, virus movement was possibly also
restricted. Inhibition of virus multiplication, and the restriction of virus movement, are
the mechanisms presumably responsible for the reduction of incidence in resistant
genotypes.
A third, passive mechanism identified as mature plant and tissue resistance (Buiel and
Parlevliet, 1996; Chapter 7) may also be involved. This mechanism may have stronger
effects in resistant genotypes than in susceptible genotypes. The virus replication is
inhibited at the infection site in resistant genotypes and thus results in a delay between
initial infection and systemic infection as compared to the susceptible genotypes. The
leaves mature during this delay, and therefore do not permit systemic infection. This
conclusion is supported by the data presented in Table 6 which show a decrease in virus
concentration. The chances of a successful systemic infection in resistant genotypes are
probably furthermore diminished because of mature plant resistance. Mature plant
resistance may therefore enhance the genotypic resistance. Together, the mechanisms
discussed presumably cause the reduced incidence of infected plants in resistant
genotypes.
The practical implications of our results on the mechanisms of resistance to PBNV in
groundnut are three-fold. Firstly, field selection for resistance should be done on the
basis of incidence of systemically infected plants. Secondly, field selection for a reduced
extent of the leaf area with systemic symptoms does not result in an increased resistance
level, because this trait is genotype independent. Thirdly, serological tests of
symptomatic plants are not required for field selection, but may still be necessary for the
diagnosis of PBNV.

CHAPTER 9
VECTOR RESISTANCE
SUMMARY
Trips palmi Karny is the vector of peanut bud necrosis tospovirus (PBNV),
which infects groundnuts in many parts of South Asia. Vector and virus
resistance levels were evaluated in ten groundnut genotypes. Three groups
with distinct resistance levels could be distinguished. The first group
contained two cultivars JL 24 and TMV 2, highly susceptible to both vector
and virus, and showing high disease incidence levels in the field. The second
group was formed by three genotypes (ICGV 86985, ICGV 86030, and
2129-8 [50]). These genotypes lacked virus resistance, and were colonized by
fewer T. palmi. It is expected that the field resistance of the genotypes in this
group was caused by vector resistance. The third group was represented by
five field resistant genotypes, which had both virus and vector resistance.
None of the groundnut genotypes studied here had field resistance which was
entirely due to virus resistance, they all had some vector resistance.
87

CHAPTER 9
INTRODUCTION
T. palmi Karny (Thysanoptera; Thripidae) is the vector of peanut bud necrosis tospovirus
(PBNV), and it transmits PBNV in a persistent manner (Vijaya Lakshmi et al., 1995).
PBNV is acquired only by larval stages of T. palmi, while transmission is exclusively due
to adult thrips (Vijaya Lakshmi et al., 1995). Other thrips vectors of tospoviruses, e.g. F.
occidentalis Pergande, the main vector of tomato spotted wilt virus and the only vector of
impatiens necrotic spot virus, was able to transmit in the second larval stage as well as in
the adult stage (Wijkamp and Peters, 1993; Wijkamp et al., 1995).
Independent or combined resistance to virus and vector are important tools to control PBNV
infection. Resistance to the vector of PBNV has been reported (Amin et al., 1985).
Furthermore, several sources of PBNV resistant groundnut were observed (Amin, 1985;
Buiel et al., 1995; Chapter 5, Dwivedi et al., 1993, 1995). This resistance is quantitative and
assessed using the percentage of infected plants.
The aim of this study was to determine levels of vector- and virus resistance. Therefore,
vector counts were compared with data from virus resistance, and with data from field
infection, which is the combined result of vector and virus resistance.
MATERIALS AND METHODS
A field trial at Narkoda, Andhra Pradesh, India, comprised ten groundnut genotypes in a
randomized block design with four replicates. Each genotype was planted in a plot of two
4-m rows. A 4-m row of the susceptible cultivar JL 24 was included between all plots. The
row distance was 60 cm, plant distance 20 cm. The disease incidence was determined
regularly until the end of the season, as described earlier (Chapter 1). In the same trial, the
number of Thrips palmi Karny were determined in 25 leaf terminals collected from each
plot, as described in Chapter 2.
The groundnut genotypes were mechanically inoculated in several experiments using a
standard mechanical inoculation procedure (Chapter 8). The number of systemically infected

V E C T O R R E S I S T A N C E
plants were determined until approximately 25 days after inoculation.
RESULTS AND DISCUSSION
The T. palmi were collected on seven dates (Table 1). The number of T. palmi varied at
each collection date. JL 24 had the highest mean number of 3.5 thrips per 25 terminals,
whereas TMV 2 had 2.0 thrips. The other eight genotypes had lower mean number of
thrips, ranging from 0.4 to 1.1.
Table 1. T. palmi population on 25 terminals (mean of 4 replicates), of ten groundnut genotypes during the growing season, at Narkoda.
Genotype
JL24 TMV 2 86031 86598 86030 86363 86029 86388 86430 2192-8(50)
31
1.0 0.3 0.0 0.3 0.0 0.0 0.5 0.0 0.5 0.0
41
5.8 3.5 0.8 1.0 1.8 0.0 0.8 1.5 1.3 0.3
Collection date
48
5.3 2.5 1.8 1.8 1.3 1.0 0.5 0.8 1.0 0.8
58
1.3 0.3 0.5 0.8 0.3 0.3 0.3 0.3 0.3 0.5
days after
69
5.8 3.3 2.5 0.5 0.0 1.8 0.5 0.8 0.3 1.5
sowing)
76
4.8 3.5 2.0 1.0 0.8 1.0 0.5 0.0 0.3 0.0
89
0.8 0.5 0.0 0.0 0.0 0.0 0.3 0.3 0.0 0.0
mean
3.5 2.0 1.1 0.8 0.6 0.6 0.5 0.5 0.5 0.4
The results of the final disease incidence in the field, are combined with T. palmi numbers
occurring on the plants in the same trial, and with the results of mechanical inoculation
from other experiments (Table 2). The ten genotypes tested were arranged into three groups.
The first group (Table 2) contained groundnut cultivars JL 24 and TMV 2, with a high
disease incidence in the field. TMV 2 had a lower incidence compared to JL 24, and this
was consistent with the results found in other experiments (Buiel and Parlevliet, 1995; Buiel
89

CHAPTER 9
Table 2. Peanut bud necrosis virus incidence (%) from field infection and mechanical inoculation (mean of several experiments), and T. paltni numbers (mean over seven scoring dates).
Genotype Field infection
85 77
29 24 23
24 21 20 16 13
(%) Mechanical
inoculation (%)
79 69
73 61 68
28 20 26 16 9
T.palmi
JL24 TMV2
ICGV 86598 2129-8(50) ICGV 86030
ICGV 86031 ICGV 86029 ICGV 86388 ICGV 86363 ICGV 86430
3.5 2.0
0.8 0.4 0.6
1.1 0.5 0.5 0.6 0.5
et al., 1995; Chapter 4 and 5). In Chapter 6 it was shown that this slight resistance level in
TMV 2 was heritable. Fewer TMV 2 plants were infected when mechanically inoculated,
as compared to JL 24. Additionally, TMV 2 was colonized by fewer T. palmi, suggesting
vector resistance. Therefore, the small field resistance level of TMV 2 could be the result
of some resistance to virus and vector.
The second group represented ICGV 86598, 2129-8(50), and ICGV 86030 (Table 2), which
are fairly resistant in the field (23-29% infection). However, mechanical inoculation of
plants of these genotypes showed that the level of disease incidence was as high as in JL 24
or TMV 2. Thus, these genotypes lack virus resistance, or the effects are very small (as in
TMV 2). Other results (Chapter 8) confirmed that ICGV 86598 did not have virus
resistance. T. palmi numbers were lower in these genotypes, suggesting that the field
resistance was caused by vector resistance.
The third group of genotypes (Table 2) comprised five genotypes with fair or good levels
of field resistance (13-24% infection). These genotypes had virus resistance, as mechanical
inoculations yielded low disease incidence levels. Furthermore, these genotypes all had low
T. palmi numbers, suggesting that both virus and vector resistance were present.
None of these genotypes had similar thrips numbers as JL 24. The genotypes tested here,
90

V E C T O R R E S I S T A N C E
with fair or good levels of field resistance, are representative of a larger set of genotypes
that have been tested. In none of these genotypes the thrips counts were as low as in JL 24.
T. palmi numbers were generally low throughout the season (Table 1), even in JL 24. It is
remarkable that the disease attained such prominent levels in this cultivar. These results
suggest that many thrips are viruliferous and that T. palmi is a very efficient vector. Vijaya
Lakshmi et al. (1995) showed that 60% of the T. palmi, collected from PBNV infected
plants in the field, were able to transmit the virus, hence, they must have been viruliferous.
91

GENERAL DISCUSSION
Resistance to peanut bud necrosis tospovirus (PBNV) and other tospoviruses has become
increasingly important with the rapid spread of these viruses in many parts of the world
(Best, 1968; de Âvila et al, 1990). In South Asia, PBNV is a serious problem to groundnut
production. Breeding for resistance to the virus and to the vector is considered to be one
of the most promising solution to prevent the occurrence of this virus. The results described
in this thesis have elucidated several aspects of PBNV resistance. Information obtained on
the assessment of resistance, the epidemiology, and the durability of the resistance, is
discussed here.
ASSESSMENT OF RESISTANCE
I. NATURAL FIELD INFECTION
Quantitative resistance to PBNV is determined from the level of disease incidence, i.e. the
percentage of plants with symptoms. To develop appropriate selection methods, the
influence of several factors on the disease assessment was examined.
In this study an inter-row interference was not detected in plots in which rows with plants
of a susceptible genotype were flanked with plants of a resistant genotype. The absence of
any inter-row interference makes it highly likely that the resistance level of a groundnut
genotype determined in small plots in breeders' selection trials is fairly representative for
the resistance level when the genotype is grown on a large scale (Chapter 2). Other studies
have shown that an inter-plot interference is clearly present in some pathosystems, whereas
it is small or absent in others (Parlevliet and Danial, 1992).
The distribution of PBNV infected plants in the field was not uniform. A higher number
of infected plants was observed in the central part of the field, as compared to the border
area of the field (Chapter 3). This implies that to assess resistance, PBNV selection fields
should be surrounded by a border zone of groundnut plants to avoid differences due to the
location within the field.
The resistance to PBNV was consistent in ten environments (Buiel et al., 1995; Chapter 5).
This indicated also that the prevailing virus populations in these environments did not differ
93

G E N E R A L I N T R O D U C T I O N
in virulence and pathogenicity. The results were supported by the finding that PBNV
isolates from different locations in India reacted with a polyclonal antiserum (Reddy et al.,
1992), and with 10 monoclonal antibodies developed against the nucleocapsid protein (Poul
et al., 1992). Hence, it was concluded that selection for PBNV resistance can be performed
at any location. However, discrimination between resistance levels was more effective in
environments with a high level of PBNV infection (Buiel et al., 1995; Chapter 5).
II. MECHANICAL INOCULATION
Mechanical inoculation of plants with PBNV revealed virus resistance exclusively (Chapters
7, 8 and 9). Vector resistance explained field resistance in three genotypes, which lacked
virus resistance (Chapter 9).
A distinct mature plant and tissue resistance was found (Buiel and Parlevliet, 1996; Chapter
7). This type of resistance was also detected in the field (Buiel and Parlevliet, 1995;
Chapter 4). The percentage of infected plants decreased sharply with increasing age,
whereas the incubation period increased. Therefore, differences in plant and leaf age have
to be taken into consideration, when assessing virus resistance.
Studies on symptom development and virus concentration after mechanical inoculation
provided insight in the mechanisms of virus resistance. Virus multiplication was inhibited
at the site of infection in resistant genotypes, whereas in systemically infected leaves virus
multiplication was not inhibited. The rate of systemic infection was also lower in resistant
genotypes (Chapter 8). Likewise, the resistance to potato leaf roll luteovirus (PLRV) in
potato is quantitative and expressed as a reduced incidence of infected plants. In potato this
type of resistance is referred to as 'resistance to infection'. Virus multiplication and
distribution was restricted in plants of resistant potato clones (Barker and Harrison, 1985,
1986). The expression of resistance in potato plants transformed with the PLRV coat
protein, resembled the resistance found in some non-transgenic resistant potato clones. In
both cases, virus multiplication (Barker et al., 1991) and virus distribution (Derrick and
Barker, 1992) was restricted, resembling the results of this study (Chapter 8). Thus, the type
of quantitative resistance of groundnut to PBNV, as well as the underlying mechanisms are
similar to that of potato to PLRV.
94

G E N E R A L I N T R O D U C T I O N
EPIDEMIOLOGY OF PBNV INFECTION
Natural PBNV infections will develop after viruliferous thrips transmit the virus from
external sources to healthy plants of groundnut crops (primary infection). Subsequently,
further spread of the virus may occur from the infected plants by thrips to healthy plants
in the same crop. This type of infection is referred to as secondary infection (Reddy et al.,
1983). The magnitude of the two types involved in the spread of the epidemic are not
known. The occurrence of tomato spotted wilt tospovirus (TSWV) in tomato crops has
mainly been attributed to primary infections (Bald, 1937; Lavina et al., 1993). Analyzing
the spatial and temporal pattern of TSWV disease in groundnut in the USA, Camann et al.
(1995) observed that the data were consistent with the hypothesis that most infections arise
from primary infections. A similar conclusion was drawn earlier in India, where it was
observed that the majority of infections occurred shortly after the invasion of the vector in
the crop (Reddy et al., 1983).
The data collected in this study either supported the hypothesis that the infection is chiefly
caused by primary infections, or that both primary and secondary infections occur but that
secondary infection is not restricted to plants in the immediate vicinity.
The experiments in which the effect of plant density on the spread of the disease was
studied revealed that in both early and advanced phases of the epidemic a similar relation
existed between the disease incidence and the plant density (Chapter 1). This observation
suggests that the nature of the spread did not change during the epidemic. The absence of
an inter-row interference effect (Chapter 2) is also indicative for a spread which results
exclusively from primary infections. In Chapter 3, the non-uniform distribution in the field
throughout the course of the epidemic was described. This non-uniform distribution was not
a result from focal epidemics, but from a presumed preference of the vector for the central
area of the field. The same effect was observed throughout the epidemic, implying that
either one source of infection was involved (only external sources), or from both external
and internal sources but with similar spreading patterns.
The level of the infection pressure varied considerably between locations (Chapter 5), and
has to be explained by a difference in the number of viruliferous thrips and by the
95

G E N E R A L I N T R O D U C T I O N
occurrence of certain climatic conditions (Reddy and Wightman, 1988). Consistent
differences between certain locations with comparable climatic conditions (e.g. ICRISAT
and Rajendranagar) suggest that the extent of introduction of infections from external
sources determined the disease level. At ICRISAT, the groundnut trials were surrounded
by large areas of non-host crops (i.e. chickpea, pigeonpea, sorghum, and pearl millet), while
at Rajendranagar the trials were located within a largely vegetable growing area, with many
(suspected or identified) hosts of PBNV.
If PBNV infections primarily originated from external sources, one could also argue that
the termination of the epidemic (Buiel and Parlevliet, 1995; Chapter 4), resulted from an
abrupt cessation of the introduction of viruliferous thrips from the external PBNV sources.
For example, when certain vegetable crops are the main external source of PBNV, the
harvest of these crops would cease the migration of viruliferous vectors. However, weeds
could also be sources of PBNV infection (Reddy et al., 1991), and their presence would not
cease abruptly. Also, mature plant resistance to the virus was shown to exist (Buiel and
Parlevliet, 1996; Chapter 7), and confirms the hypothesis that mature plant resistance plays
a role in field infections. Furthermore, infected groundnut plants could also act as a
secondary source.
DURABILITY OF PBNV RESISTANCE
The resistance to PBNV in groundnut appeared to be quantitative. At least three resistance
factors could be distinguished in seven groundnut genotypes (Chapter 6). The durability of
resistance of these groundnut genotypes can only be analyzed in retrospective, i.e. when
grown for many years on a large scale. Cultivar TMV 2 has been grown all over India for
more than 50 years, and has a factor resulting in a slight level of resistance. Thus it can be
concluded that the quantitative resistance of TMV 2 is durable.
The multi-environment tests (Buiel et al., 1995; Chapter 5) showed that 42 groundnut
genotypes could be divided into seven groups depending on their level of resistance. One
group represented the highly susceptible cultivar, lacking resistance, and the other six
96

G E N E R A L I N T R O D U C T I O N
groups represented variable levels of resistance. These levels are probably due to different
genetic factors, and can be directed towards virus- or vector resistance, or both. At least
three factors, explaining the distinct virus resistance levels, were shown to be present in
seven genotypes (Chapter 6).
97

SUMMARY
Tospoviruses cause world-wide economic losses in many agricultural, horticultural, and
ornamental crops. In South Asia, peanut bud necrosis tospovirus (PBNV) is one of the most
destructive viruses of groundnut (Arachis hypogaea L.). The development of resistant
groundnut cultivars is an extremely important measure to reduce yield losses caused by this
virus. Complete resistance (immunity) is absent in A. hypogaea, but quantitative resistant
genotypes which reduced the percentage of infected plants (incidence) considerably, have
been found. This type of resistance has been investigated in this thesis with an emphasis
on the development of methods to assess resistance, and to analyze the inheritance and
mechanisms of resistance.
Several factors influencing PBNV epidemics were analyzed to determine the optimal
assessment of resistance. Increasing plant density reduced the disease incidence in a
resistant and in a susceptible groundnut genotype. However, the number of infected plants
per unit area increased, and caused higher levels of the disease. Therefore, an increased
plant density is not recommended to reduce PBNV infection. The assessment of resistance
in small plots was representative of the farmers situation, as no significant inter-plot
interference was observed. The PBNV incidence appeared to be higher in the center of
experimental trials, and was probably caused by vector preference.
A study of the quantitative resistance in field trials in ten environments in India, showed
that selection in any of these environments yielded similar results. Environments with an
average or high natural infection discriminated better among genotypes than environments
with a low infection. At locations with a low PBNV infection, selection can be achieved
based on the combined data of two or more years.
Five resistant and two susceptible groundnut genotypes were crossed in a half-diallel to
study the inheritance of quantitative resistance to PBNV. Four different levels of resistance
were identified and could be explained by at least three resistance factors. Epistatic
interactions were absent and the resistance factors were likely to inherit additively. The
disease incidence in the resistant genotypes was about five times reduced compared to that
of JL 24 (susceptible check). From the two susceptible genotypes (JL 24 and TMV 2),
TMV 2 had a consistently lower disease incidence than JL 24. This slight level of
quantitative resistance in TMV 2 was effective for more than 50 years and appeared to be
99

durable.
A clear mature plant and tissue resistance was observed when groundnut plants were
mechanically inoculated with a PBNV isolate. This type of resistance increased the
incubation period and reduced the disease incidence drastically. The mature plant resistance
also caused the termination of the PBNV epidemic in the field, and was independent of
disease pressure, phase of the epidemic, rate of the epidemic growth, and resistance level
of the host genotype.
A standard inoculation method was developed to study the mechanisms of resistance. The
field resistant genotypes were resistant to the virus, except three genotypes, which were as
susceptible to the virus as the susceptible control. It was shown that these field resistant
genotypes were colonized by fewer thrips vectors, hence, the field resistance was caused
by vector resistance.
Using the standard inoculation method, two different mechanisms of virus resistance could
be distinguished. Firstly, virus multiplication was inhibited at the site of infection in
resistant genotypes. In systemically infected leaves of the same genotypes, virus
multiplication was not inhibited. Secondly, in resistant genotypes the rate of systemic
infection was clearly lower. Thus, inhibition of virus multiplication, and restriction of virus
movement, are the mechanisms presumably responsible for the reduction in disease
incidence in resistant genotypes.
100

zrcqt c||ij<y (Tospoviruses) $ fà , vJïZlH ^ ' P Î ^ ' ïFt^ *ïïWf cffT ^ f^cf 3 STlfsfo SïfcT
TfrfTçft I I ^ M tf$Vl\ % ^ %afff^T ZTFtt <4\HW ^\. eft. T&. eft. (bud necrosis tospovirus
P B N V) * i J l * ^ (Arachis hypogaea L.) 3st ^ -3Tr^ ÇTfcF ï&Rcïï cTFJ T I I 3*T "ftïï $ ?fà
=TT# \id-IKH stfcT, cRÏÏ cR% %" M , iJTTO t elft "ftïï STcRtsft (disease resistant) ^ifr l i j l =fïï viM4Vl,
Êflrf ^t Wccnjüf | | ï jrrcf^ ö t ^ jp f 7t*T Tfèïï (immune) ü l l f M ^ # Rl=bRld 3>t *ï4t f ^ R
^ Miilriiiî ftra3ft mm 3 TRT ïrf&r ' M $i m&n (ïrfcr?RT) *7p =E*I s w s r f i I H ÏJCJ>R %
'JuiirHcbTfr 3T=Rtïff (quantitativeresistance) fcpsrif q^ 3T3^?IR f*T § f ï « ï ^ (thesis) % f ^ i ï W
I I fèrcrö "d^TïrfrRfïI (resistance) % I Ï Ï ^ T ëft fcrf T, f^% STJctfèTcjft (inheritance) sftr fè^iï fcrf T
<ft. êft. tjïï. êft. Hi?IHI^ (epidemics) cfft ïf*n%ïï =R% c # ë|p- $ cfjRTjft êfiT f % # W f^qT W I
fèrsrö yciïdH ïïfrRtïT feïï W * # 1 ^ i * H feïï üïï tfe|) H l ï ï ff q M fà» # ^ ï ï (ïrfcT lëR^
üpftïï) êl^Ft $ ftïï ïrirRtsra? tTg ^TT jrf^T (susceptible) < M ÎTcR-R ëft i ^m,^ f^Fff 3 Ttïï c&
ôfiïft (incident) qpïft ^Fft, PjR ^ ^W ïrf&ï ' M 3ft *R3TT ( ï fà ?cf^ spfa) ff Slfèc^T I*ft
fèrcrâ ffïï srfcT afft 3rfèfcp sr|t I f ï ï fè^ 'ft. sft. rçïï. =ft. ^ Ï Ï 3ft S&ÏÏ cjrrô % fè$ -a r te spft
'Etf«? 3ÏÏHT y^lé<*)K*H^' I I SÏcft y4)Rl* <W|R4i 3 ^T ïrfrRta fà^iï cfïï *i^icbH f*yn"l %
à^ff 3 5*raft ferfrr êur *rét yfdPiRi TRT ^WT W H ^ arm# <wiRiîl % «îrcf fcrêta ëfTïn
(interference) ^ f ^T^t l 4 t I 'ft. # . ^ . =u". "dïï y<JlR|cb =WlR41 % ^ 5 ^ sfàiïï TFÏÏ ^Fiï
5^JT cfîRW ^ ra ï ï : ^TOT ^JFPÏ Ï cb^cll^ f|RT (vectorthrips) c|ft î i ï ï f f ^ ^ «ft I
J iuHrH* (quantitative) "ft^j >3TcRÏïT 3ïï Wïfà c||d|e|<U| (^THÎ) ^ y41 R i * #cft ^ 3TKRR c ^ ^
^ïïT ^5T I f^TW nlcRÏîî W WW FT c||d|c|<u| ff r ^ ^pM qRu||H t^ïï I ï ï 3ÏÏ ^TF?f ÏÏ7
* i J i ^ %^îrfri4t 3 arfesatrR TWT TFÏÏ ^ T ftïï #^?r ^ÏÏ #BcT r a r f ^ srr, i ^ in f ^ t
ïï^HT ff JVff "dïï cFT 8TT I f RT « H TT 'ft. $\. ^ . ^ t . Ttïï W\ WM %, Milfd4î cfïï ïRR
(selection) ^t ?ïï 3 r f ^ cpsjf % of t^î 3T*t % 3ÏÏ?TR TT f^TT Jïï ^RïïT I I
101

'ft. êft. t?ïï. eft. % Jjuilt cb <>| ïrfrRttr fs IT W 3ftZl*FT êfr t % fè^ W Ttïï ïrfcRfaêf) SfT $
fP\ ïrffcïï (susceptible) ^ l^fô êft STu^ft êft 3Ttf SwRw (half diallel) STTOR ÏÏ7 «*Rd (cross)
f^ïï W # * ï[R fclftsr MT ê}ft ïricRfa fà^ïï êft MgrlH êft *Fft fà^ëft ôîfRaïï 3 ^ ^ | f% ^
iP\ êft STgêtfèlêfft ïFT % W1 # T ïricRfaëfiüftïï (gene) T* £PR I I
ft*T ïrfcRfa ^fcRT: i fèïèlei üffa (additive gene) ÏÏ7 arraiRrT I , cRÜfeb m§ i ^ f t ^cb^H
^<4cHHH (epistatic interaction) ^ $ ÏÏFÏÏ W , îrfrRtsr=f> llrliîf 3 Ttïï feKEJZ T (incidence) ftïï
ïffàcT f%FT (JL 24 Susceptible check) fefcfpRT 3 W3 ^pi «FT «ft I êft "ftn ïrflcT (susceptible)
iRUÎÏ êft MUMR* ^ R T ^ T ^ ïï7'WT^5Tf^TMV2^ 7W *R^T J L 2 4 ^ Ï Ï ^ *«JFft ^ %
êfJÏÏ «ft I «ÏTfT üuHcHcb (quantitative) ïrfcRta TMV 2 3 ?ft %ê&RUT ^ ^ f%FT, i fRT W % ft
^rfefj^raflT era cbi4yiïTcf5 " # # 7 ßcbivi ^ I C T §4t I
*iJl45^ % 3tsft eft 'ft. êft. r^T. eft. eft ^ itc(JT cjiRcf)^ <3ÎR STëRfa (mature plant and
tissue resistance) êfiT FPS? dTc^cFT fêfcïï W | 5H cTTF % STcRtSR (resistance) % cf TOT eft
gg^TTcR«ïï (incubation) W WT êj r # T ^ HR ïï (incidence) 3 STc cf êRïft | 4 t | c|i|*cb 1Ü4
aicRtîT (mature plant resistance) % êfiRUT 'ft. êft. ^ . eft. ïft HéWld #cT 3 f T O FÎcft ÏÏFÎf *Fft
ft f% 7W c TeT, H IHlft % fetfrT, ÏFTfrT eft êR cTSTT ^m êft ïrfcRHft «TO <R ^ f M ? «ft I
ïrfrRtîT fifcn ëfîT -3THTÎR êFRïf % fèîf TTcfj iTHcfi (standard) W ^ t (inoculation) fcffèr êfîT fc|cbl<H
fe&JTT TRÏÏ I ïféfö 3TcRtïft (fieldresistant) *JJN5# êft JïïfcTqf %^ft c||i|<y cj>f sricRfa fcRTT W
f%7 ft | ^ # T ^lîrlijï ^ft «ft # "ftWffcft (susceptible) ^lîrl41 êft ^R? JJ rrfefcT «ft I SÏÇfa
STCRM (field resistant) Mllîr)4l' 3 ^tïï ëJTfêfr-flTO (vector-thrips) ê ^ £ , 3îïï: ïf&fa TêRtSpT
(field resistance) 7W cn?cf) f RT êft êpft % cfiRüT qj |
ïïReïïfW yebHUI (inoculation) ferfèr % êft ?RÇ % cffiR^ gf^tg f ^ eft qfïjR êft fT êfjrft I I
ïfïlïï - 3ÎrR>£IeT5 snfàeff ^ eFRH êRT ê IcT (infection) *«TR ÏÏT t #f t ï ï TFT I # f ^ 3 # ^rirT %
' M ^ f raêft qfrrat SFT§T: jmrfercT (systemically infected) «ft OT3 eTllRH % ^ e T cR ^ êftf
WëJZ ^ # 3TPft I c RT - êTFRÏÏ StM^êR ^ricRÎ ^ ëïlîRtf c lêT ê f t c R ^ ^ q ^ ^ ^ ê f R î f t I
•3W: ïiFRS c[ Tci êRT 3îcRt£PT 3fR WFÏÏ # ï [ ï ï ïRR (movement) ÏÏTO: cft îri [ feßirr^ f üft
ïlfMsjêfjvjllïcliJÏ ^ Ttïï êCT êfR% % virlWIift f |
102

SAMENVATTING
Tospovirussen veroorzaken wereldwijd grote economische verliezen in veel landbouw-,
tuinbouw-, en siergewassen. In Zuid Azië is peanut bud necrosis tospovirus (PBNV) één
van de schadelijkste virussen van de aardnoot (Arachis hypogaea L.). De ontwikkeling van
resistente aardnootrassen is van groot belang om de opbrengstverliezen die PBNV
veroorzaakt, terug te dringen. Volledige resistentie (immuniteit) is niet waargenomen in het
genus Arachis. Wel zijn er genotypen gevonden met kwantitatieve vormen van resistentie,
die tot uiting komt in een verlaagd percentage geïnfecteerde planten (incidentie). Deze
kwantitatieve resistentie werd in dit proefschrift bestudeerd: er werden methoden ontwikkeld
om deze resistentie te evalueren, de overerving werd bestudeerd, en de mechanismen van
resistentie werden onderzocht.
Het verhogen van de plantdichtheid resulteerde in een verlaging van de incidentie in een
resistent en in een vatbaar aardnootgenotype, maar het aantal zieke planten per oppervlakte
eenheid nam toe. Een verhoging van de plantdichtheid kan derhalve niet aangeraden worden
om de infectie met PBNV te verminderen. De evaluatie van resistentie in kleine veldjes was
representatief voor de praktijksituatie, aangezien er geen significante inter-plot interferentie
werd gevonden. Er werd wel een verhoogde PBNV infectie gevonden in het midden van
het proefveld, en werd vermoedelijk veroorzaakt door een sterke voorkeur van de vector.
De kwantitatieve resistentie werd in tien milieu's in India getest. De volgorde van de rassen
met betrekking tot de resistentie was ongeveer dezelfde in alle milieu's. Selectie in elk van
deze milieu's zou hetzelfde resultaat opgeleverd hebben. Milieu's met een gemiddeld of
hoog niveau van natuurlijke infectie onderscheiden de genotypen beter dan milieu's met een
laag niveau van infectie. Op plaatsen met een lage PBNV infectie kan toch geselekteerd
worden door de gegevens van twee of meerdere jaren te combineren.
Vijf resistente en twee vatbare aardnootgenotypen werden gekruist in een half-diallel om
de overerving van de kwantitatieve resistentie tegen PBNV te kunnen bestuderen. Er konden
vier resistentieniveau's onderscheiden worden die verklaard kunnen worden met minimaal
drie resistentiefaktoren. Epistatische interacties waren niet aanwezig, en de
resistentiefactoren erfden vermoedelijk additief over. Kwantitatieve resistentie verlaagde de
incidentie in vijf resistente genotypen met ongeveer een factor vijf, vergeleken met JL 24
(vatbare controle). Van de twee vatbare rassen (JL 24 en TMV 2) had TMV 2 steeds een
103

lagere incidentie. Dit geringe niveau van kwantitatieve resistentie was effectief voor meer
dan 50 jaar, en lijkt dus duurzaam te zijn.
Bij het mechanisch inoculeren van planten met een PBNV isolaat werd een duidelijke
ouderdomsresistentie van de plant gevonden. Deze vorm van resistentie verlengde de
incubatietijd en verlaagde de incidentie zeer sterk. De ouderdomsresistentie remde ook de
PBNV epidemie in het veld af, en trad op onafhankelijk van de ziektedruk, stadium van de
epidemie, snelheid van de epidemie, en het resistentieniveau van het waardplant genotype.
Er werd een standaard inoculatie methode ontwikkeld, die gebruikt werd om de
achterliggende mechanismen van resistentie te onderzoeken. De genotypen met
veldresistentie waren allemaal resistent tegen het virus, behalve drie genotypen die net zo
vatbaar waren als de vatbare controle. Er werd aangetoond dat deze veldresistente
genotypen door minder thripsen gekolonialiseerd werden, dus kon aangenomen worden dat
de veldresistentie van deze genotypen veroorzaakt werd door vectorresistentie.
Met behulp van deze methode kon worden aangetoond dat twee verschillende mechanismen
een rol speelden bij de virusresistentie. Allereerst werd de virusvermeerdering geremd op
de plaats van infectie in resistente genotypen. De virusvermeerdering werd niet geremd in
systemisch geïnfecteerde bladeren van dezelfde genotypen. Tevens was de snelheid van
systemische infectie lager in resistente genotypen. Hieruit volgt dat vermoedelijk
virusvermeerdering en virusverspreiding de oorzaak zijn van de verlaagde ziekteincidentie
in resistente genotypen.
104

REFERENCES
Adam, G., S.D. Yeh, D.V.R. Reddy, and S.K. Green. 1993. Serological comparison of tospovirus isolates from Taiwan and India with impatiens necrotic spot virus and different tomato spotted wilt virus isolates. Arch. Virol. 130: 237-250.
Amin, P.W. 1985. Apparent resistance of groundnut cultivar Robut 33-1 to bud necrosis disease. Plant Dis. 69: 718-719.
Amin, P.W., K.N. Singh, S.L. Dwivedi, and V.R. Rao. 1985. Sources of resistance to the jassid {Empoasca kerri Pruthi), thrips (Frankliniella schultzei (Trybom)) and termites (Odontotermes sp.) in groundnut (Arachis hypogaea L.). Peanut Science 12: 58-60.
Amin, P.W., D.V.R. Reddy, and A.M. Ghanekar. 1981. Transmission of tomato spotted wilt virus, the causal agent of bud necrosis of peanut, by Scirtothrips dorsalis and Frankliniella schultzei. Plant Dis. 65: 663-665.
Anonymous, 1992. Medium Term Plan. 1994-1998. International Crops Research Institute for the Semi-Arid Tropics, Patancheru 502 324, Andhra Pradesh, India. (Limited distribution).
Bald, J.G., 1937. Investigations on spotted wilt of tomatoes. Ill Infection in field plots. Bull. Council Sei. Ind. Res. Australia Nr 106, 32 pp.
Baliadi, Y., and N. Saleh. 1996. Virus diseases of groundnut in Indonesia with special reference to peanut stripe virus. Pages 35-36 in: D.V.R. Reddy and C.L.L. Gowda (Eds). Groundnut virus diseases in the Asia-Pacific region: summary and recommendations of the fourth meeting of the international working group, 12-14 March 1995, Khon Kaen University, Thailand. Patancheru 502 324, Andhra Pradesh, India: ICRISAT. 44 pp.
Barker, H., and B.D. Harrison. 1985. Restricted multiplication of potato leafroll virus in resistant potato genotypes. Ann. Appl. Biol. 107: 205-212.
Bashir, M., N. Ali, and S.N. Malik. 1996. Requirements for the integrated management of virus diseases of groundnut in Pakistan. Pages 30-31 in: D.V.R. Reddy and C.L.L. Gowda (Eds). Groundnut virus diseases in the Asia-Pacific region: summary and recommendations of the fourth meeting of the international working group, 12-14 March 1995, Khon Kaen University, Thailand. Patancheru 502 324, Andhra Pradesh, India: ICRISAT. 44 pp.
Bautista, R.C., R.F.L. Mau, J.J. Cho, and D.M. Custer. 1995. Potential of tomato spotted wilt tospovirus plant hosts in Hawaii as virus reservoirs for transmission by Franklinniella occidentalis (Thysanoptera: Thripidae). Phytopathology 85: 953-958
Beemster, A.B.R. 1987. Virus translocation and mature plant resistance in potato plants. Pages 116-125 in: Viruses of potatoes and seed-potato production (de Bokx, J.A., and van der Want, J.P.H. eds.). 2nd edn. Wageningen, The Netherlands: PUDOC.
Best, R.J. 1968. Tomato spotted wilt virus. Adv. Virus Res. 13: 65-146. Black, M.C., and D.H. Smith. 1987. Spotted wilt and rust reactions in south Texas among selected peanut genotypes. Proc. Am. Peanut Res. Educ. Soc. 19: 31.
Buiel, A.A.M. and J.E. Parlevliet, 1995. Epidemiology of peanut bud necrosis disease in groundnut in India. Pages 41-46 in: A.A.M. Buiel, J.E. Parlevliet & J.M. Lenné (Eds). Recent studies on peanut bud necrosis disease: Proceedings of a Meeting, 20 March 1995, ICRISAT Asia Center, India. 80 pp.
Buiel, A.A.M., S.L. Dwivedi, M.V.R. Prasad, A.B. Singh, P.S. Dharmaraj, and J.E. Parlevliet. 1995. Multi environment testing for reduced incidence of peanut bud necrosis disease in India. Pages: 47-54 in: A.A.M. Buiel, J.E. Parlevliet & J.M. Lenné (Eds). Recent studies on peanut bud necrosis disease: Proceedings of a Meeting, 20 March 1995, ICRISAT Asia Center, India. 80 pp.
Buiel, A.A.M. and J.E. Parlevliet. 1996. Mature plant and tissue resistance in the groundnut - peanut bud necrosis virus system. Euphytica 91: 213-217.
Camann, M.A., Culbreath A.K., J. Pickering, J.W. Todd, and J.W. Demski. 1995. Spatial and
105

Q U A N T I T A T I V E R E S I S T A N C E T O P E A N U T B U D N E C R O S I S T O S P O V I R U S
temporal patterns of tomato spotted wilt epidemics in peanut. Phytopathology 85: 879-885. Cho, J.J., W.C. Mitchell, R.F.L. Mau, and K. Sakimura. 1987. Epidemiology of tomato spotted wilt
virus disease on crisphead lettuce in Hawaii. Plant Dis. 71:505-508. Crowley, N.C., 1967. Factors affecting the local lesion response of Nicotiana glutinosa to lettuce
necrotic yellows virus. Virology 31: 107-113. Culbreath, A.K., J.W. Demski, and J.W. Todd. 1990. Characterization of tomato spotted wilt virus
epidemics in peanut. Phytopathology 80: 988 (Abstr). Culbreath, A.K., J.W. Todd, and J.W. Demski. 1992a. Comparison of hidden and apparent spotted
wilt epidemics in peanut. Proc. Am. Peanut Res. Educ. Soc. 24: 39. Culbreath, A.K., J.W. Todd, J.W. Demski, and J.R. Chamberlin. 1992b. Disease progress of spotted
wilt in peanut cultivars Florunner and Southern Runner. Phytopathology 82: 766-771. Culbreath, A.K., J.W. Todd, D.W. Gorbet, and J.W. Demski. 1993. Spotted wilt apparent disease
progress in the component lines of Southern Runner cultivar. Peanut Science 20: 81-84. Culbreath, A.K., J.W. Todd, W.D. Branch, S.L. Brown, J.W. Demski, and J.P. Beasley. 1994. Effect
of new peanut cultivar Georgia Browne on epidemics of spotted wilt. Plant Dis. 78: 1185-1189.
De Âvila, A.C., P. De Haan, R. Kormelink, R. de O. Resende, R.W. Goldbach, and D. Peters. 1993a. Classification of tospoviruses based on phylogeny of nucleoprotein gene sequences. J. Gen. Virol. 74: 153-159.
De Âvila, A.C., P. De Haan, M.L.L. Smeets, R. de O. Resende, R. Kormelink, E.W. Kitajima, R.W. Goldbach, and D. Peters. 1993b Distinct levels of relationships between tospovirus isolates. Arch. Virol. 128: 211-227.
De Haan, P., L. Wagemakers, R. Goldbach, and D. Peters. 1989. Tomato spotted wilt virus, a new member of the Bunyaviridae? Pages 287-290 in: Genetics and Pathogenicity of Negative Strand Viruses. D. Kolakofsky and B.W.J. Mahy, eds. Amsterdam, Elsevier.
Demski, J.W., R. Pittman, J. Todd, and A. Culbreath. 1991. Identification of field resistance to tomato spotted wilt virus in groundnuts. Int. Arachis Newsletter 10: 23-24.
Dwivedi, S.L., D.V.R. Reddy, S.N. Nigam, G.V. Ranga Rao, J.A. Wightman, P.W. Amin, G.S.V. Nagabhushanam, A.S. Reddy, E. Scholberg, and V.M. Ramraj. 1993. Registration of ICGV 86031 peanut germplasm. Crop Science 33: 220.
Dwivedi, S.L., S.N. Nigam, D.V.R. Reddy, A.S. Reddy, and G.V. Ranga Rao. 1995. Progress in breeding groundnut varieties resistant to peanut bud necrosis virus and its vector. Pages 35-40 in: A.A.M. Buiel, J.E. Parlevliet & J.M. Lenné (Eds). Recent studies on peanut bud necrosis disease: Proceedings of a Meeting, 20 March 1995, ICRISAT Asia Center, India. 80 pp.
GENSTAT 1994. GENSTAT 5, Release 3, Reference Manual. Oxford, UK: Clarendon Press. 796 pp.
Ghanekar, A.M., D.V.R. Reddy, N. Iizuka, P.W. Amin, and R.W. Gibbons. 1979. Bud necrosis of groundnut (Arachis hypogaed) in India caused by tomato spotted wilt virus. Ann. Appl. Biol. 93: 173-179.
Gibson, R.W. 1991. The development of mature plant resistance against aphid-inoculated potato virus Y(O) and Y(N) in four potato cultivars. Potato Res. 34: 205-210.
Goldbach, R., and D. Peters. 1994. Possible causes of the emergence of tospovirus diseases. Sem. Virol. 5: 113-120.
Heinze, C , E. Maiss, G. Adam, and R. Caspar. 1995. The complete nucleotide sequence of the S RNA of anew Tospovirus species, representing serogroup IV. Phytopathology 85: 683-690.
Jinks, J.L., and P. Towey. 1976. Estimating the number of genes in a polygenic system by genotype assay. Heredity 37: 69-81.
106

REFERENCES
Jones, R.K., and S.A. Tolin. 1972. Concentration of maize dwarf mosaic virus in susceptible and resistant corn hybrids. Phytopathology 62: 640-644.
Khatun, F., F.U. Mian, and H.U. Ahmed. 1996. Integrated management of groundnut viruses in Bangladesh. Page 37 in: D.V.R. Reddy and C.L.L. Gowda (Eds). Groundnut virus diseases in the Asia-Pacific region: summary and recommendations of the fourth meeting of the international working group, 12-14 March 1995, Khon Kaen University, Thailand. Patancheru 502 324, Andhra Pradesh, India: ICRISAT. 44 pp.
Krishna Kumar, N.K., D.E. Ullman, and J.J. Cho. 1993. Evaluation of Lycopersicon germ plasm for tomato spotted wilt tospovirus resistance by mechanical and thrips transmission. Plant Dis. 77: 938-941.
Kumar, N., and I. Irulappan. 1992. Inheritance of resistance to tomato spotted wilt virus in tomato (Lycopersicon esculentum Mill.). J. Genet. & Breed. 46: 113-118.
Mather K., and J.L. Jinks, 1971. Biometrical Genetics, 2nd edition. Chapman and Hall, London. 382 pp.
Murphy, F.A., CM. Fauquet, D.H.L. Bishop, A.W. Jarvis, C.P. Martelli, M.A. Mayo, and M.D. Summers. 1995. Virus taxonomy: Sixth Report of the International Committee of Taxonomy of Viruses. Arch. Virology, Supplement 10. 586 pp.
Palmer, J.M., D.V.R. Reddy, J.A. Wightman, and G.V. Ranga Rao. 1990. New information on the thrips vectors of tomato spotted wilt virus in groundnut crops in India. Int. Arachis Newsletter 7: 24-25.
Parlevliet, J.E. and A. van Ommeren. 1984. Interpiot interference and the assessment of barley cultivars for partial resistance to leaf rust, Puccinia hordei. Euphytica 33: 685-697.
Parlevliet, J.E. and D.L. Danial. 1992. How does interpiot interference affect the field assessment for resistance in cereals to rusts and powdery mildew? Vort. Pflanzenzüchtg. 24: 289-291.
Poul, F.X., A.S Ratna, and D.V.R. Reddy. 1992. Production of monoclonal antibodies to bud necrosis virus. Int. Arachis Newsletter 12: 12-14.
Prasada Rao, R.D.V.J., G.P. Ribeiro, R. Pittman, D.V.R. Reddy, and J.W. Demski. 1993. Reaction of Arachis germplasm to peanut stripe, peanut mottle, and tomato spottet wilt viruses. Peanut Science 20: 115-118.
Ranga Rao, G.V., and Vijaya Lakshmi, K. 1993. Thrips and bud necrosis disease in groundnut. Pages 12-20 in: Collaborative research in India on breeding groundnuts for resistance to bud necrosis disease: Proceedings of a Meeting, 28 Sep 1992, ICRISAT Center, India. Patancheru, 502 324, Andhra Pradesh, India: International Crops Research Institute for the Semi-Arid Tropics.
Reddy, D.V.R., P.W. Amin, D. McDonald, and A.M. Ghanekar. 1983. Epidemiology and control of groundnut bud necrosis and other diseases of legume crops in India caused by tomato spotted wilt virus. Pages 93-102 in: R.T. Plomb and J.M. Thresh (Eds). Plant virus epidemiology. Blackwell Scientific Publications, Oxford, UK.
Reddy, D.V.R. 1988a. Virus diseases. Pages 508-525 in: P.S. Reddy (Ed.). Groundnut. Indian Council of Research, New Delhi, India. 583 pp.
Reddy, D.V.R. and J.A. Wightman. 1988. Tomato spotted wilt virus: thrips transmission and control. Adv. Virus Res. 5: 203-220
Reddy, D.V.R., J.A. Wightman, R.J. Beshear, B. Highland, M. Black, P. Sreenivasulu, S.L. Dwivedi, J.W. Demski, D. McDonald, Jr J.W. Smith, and D.H. Smith. 1991. Bud necrosis: a disease of groundnut caused by tomato spotted wilt virus. Information Bulletin no. 31. Patancheru A.P. 502 324, India: ICRISAT, 20 pp.
Reddy, D.V.R., A.S. Ratna, M.R. Sudarshana, F. Poul, and I. Kiran Kumar. 1992. Serological relationships and purification of bud necrosis virus, a tospovirus occurring in peanut
107

Q U A N T I T A T I V E R E S I S T A N C E T O P E A N U T B U D N E C R O S I S T O S P O V I R U S
(Arachis hypogaea L.) in India. Ann. Appl. Biol. 120: 279-286. Reddy, D.V.R., A.A.M. Buiel, T. Satyanarayana, S.L. Dwivedi, A.S. Reddy, A.S. Reddy, A.S.
Ratna, K. Vijaya Lakshmi, G.V. Ranga Rao, R.A. Naidu, and J.A. Wightman. 1995. Peanut bud necrosis disease: an overview. Pages 3-7 in: A.A.M. Buiel, J.E. Parlevliet & J.M. Lenn é (Eds). Recent studies on peanut bud necrosis disease: Proceedings of a Meeting, 20 March 1995, ICRISAT Asia Center, India. 80 pp.
Reddy, L.J., S.N. Nigam, and A.G.S. Reddy. 1993. Natural outcrossing in groundnut and its implications in groundnut breeding. J. Oilseeds Res. 10: 99-104.
Reddy, M.S., D.V.R. Reddy, and A. Appa Rao. 1968. A new record of virus disease on peanut. Plant Dis. Rep. 52: 494-495.
Reddy, P.S. 1988b. Genetics, breeding and varieties. Pages: 200-317 in: P.S. Reddy (Ed.). Groundnut. Indian Council of Agricultural Research, New Delhi, India. 583 pp.
Resende, R. de O., P. de Haan, A.C. de Avila, E.W. Kitajima, R. Kormelink, R. Goldbach & D. Peters, 1991. Generation of envelope and defective interfering RNA mutants of tomato spotted wilt virus by mechanical passage. J. Gen. Virol. 72: 2375-2383.
Rosenkranz, E. and G.E. Scott. 1987. Type of gene action in the resistance to maize chlorotic dwarf virus in corn. Phytopathology 77: 1293-1296.
Roumen, E.C., 1992. Effect of leaf age on components of partial resistance in rice to leaf blast. Euphytica 63: 271-279.
Roumen, E.C., J.M. Bonman & J.E. Parlevliet, 1992. Leaf age related partial resistance to Pyricularia oryzae in tropical lowland rice cultivars as measured by the number of sporulating lesions. Phytopathology 82: 1414-1417.
Salehuzzaman, M., and P.W. Wilkins. 1984. Components of resistance to ryegrass mosaic virus in a clone of Lolium perenne and their strain-specificity. Euphytica 33: 411-417.
SAS 1989. SAS/STAT User's Guide, Version 6, Fourth Edition, Volume 2, Cary, NC: SAS Institute Inc. 846 pp.
Satyanarayana, T., S.E. Mittchell, D.V.R. Reddy, S. Brown, S. Kresovich, R. Jarret, R.A. Naidu, and J.W. Demski. 1996. Peanut bud necrosis tospovirus S RNA: complete nucleotide sequence, genome organization and homology to other tospoviruses. Arch. Virol. 141: 85-98.
Savary, S., 1987. Decrease by plant development and leafage of susceptibility of groundnut to rust (Puccinia arachidis) in a susceptible cultivar. Neth. J. Plant Path. 93: 25-31.
Schein, R.D., 1965. Age-correlated changes in susceptibility of bean leaves to Uromyces phaseoli and tobacco mosaic virus. Phytopathology 55: 454-457.
Sigvald, R. 1985. Mature-plant resistance of potato plants against potato virus Y° (PVYO). Potato Research 28(2): 135-143.
Smit, G., and J.E. Parlevliet. 1990. Mature plant resistance of barley to barley leaf rust, another type of resistance. Euphytica 50: 159-162.
Snedecor, G.W. and W.G. Cochran. 1967. Pages 186-187, 432-435 in: Statistical methods. Sixth Edition, Iowa, USA. 593 pp.
Sreenivasulu, P., J.W. Demski, D.V.R. Reddy, R.A. Naidu, and A.S. Ratna. 1991. Purification and some serological relationships of tomato spotted wilt virus isolates occurring on peanut (Arachis hypogaea) in the USA. Plant Path. 40: 503-507.
Stevens, M.R., S.J. Scott, and R.C. Gergerich. 1992. Inheritance of a gene for resistance to tomato spotted wilt virus (TSWV) from Lycopersicon peruvianum Mill. Euphytica 59: 9-17.
Thuan, T.T., and H.M. Trung. 1996. Research on legume virus diseases in Vietnam. Page 34 in: D.V.R. Reddy and C.L.L. Gowda (Eds). Groundnut virus diseases in the Asia-Pacific region: summary and recommendations of the fourth meeting of the international working group, 12-14 March 1995, Khon Kaen University, Thailand. Patancheru 502 324, Andhra Pradesh,
108

REFERENCES
India: ICRISAT. 44 pp. Tu J.C., and R.E. Ford. 1970. Maize dwarf mosaic virus infection in susceptible and resistant corn:
virus multiplication, free amino acid concentrations, and symptom severity. Phytopathology 60: 1605-1608.
Van der Plank, J.E. 1963. Plant diseases: Epidemics and control. Pages 285-310. Academic Press. New York-London.
Venekamp, J.H., and A.B.R. Beemster. 1980. Mature plant resistance of potato against some virus diseases. I. Concurrence of development of mature plant resistance against potato virus X, and decrease of ribosome and RNA content. Neth. J. Plant Path. 86: 1-10.
Vijaya Lakshmi, K. 1994. Transmission and ecology of Thrips palmy Karny, the vector of peanut bud necrosis virus. PhD Thesis, Andhra Pradesh Agricultural University, Hyderabad, 99 pp.
Vijaya Lakshmi, K., J.A. Wightman, D.V.R. Reddy, G.V. Ranga Rao, A.A.M. Buiel, and D.D.R. Reddy. 1995. Transmission of peanut bud necrosis virus by Thrips palmi in India. Pages: 179-184 in B.L. Parker, M. Skinner, and T. Lewis (Eds). Thrips Biology and management. NATO ASI Series, Life Sciences Vol.276. Plenum Press, New York and London, 636 pp.
Wightman, J.A., and P.W. Amin. 1988. Groundnut pests and their control in the semi-arid tropics. Tropical Pest Management 34:218-226.
Wightman, J.A., and G.V. Ranga Rao. 1994. Groundnut pests. Pages 395-479 in The groundnut crop: a scientific basis for improvement (Smartt, J. ed.). London, UK: Chapman & Hall.
Wijkamp, I., N. Almarza, R. Goldbach, and D. Peters. 1995. Distinct levels of specificity in thrips transmission of tospoviruses. Phytopathology 85: 1069-1074.
Wijkamp, I, and D. Peters. 1993. Determination of the median latent period of two tospoviruses in Frankliniella occidentalis using a novel leaf disk assay. Phytopathology 83: 986-991.
Wjlkins, P.W. 1987. Transfer of polygenic resistance to ryegrass mosaic virus from perennial to Italian ryegrass by backcrossing. Ann. Appl. Biol. I l l : 409-413.
Wislocka, M. 1984. Influence of weather factors on the increase of mature plant resistance to PVY. The Potato (1983-1984): 105-116.
Wongkaew, S. 1995. Peanut bud necrosis disease in Thailand. Pages 55-59 in: A.A.M. Buiel, J.E. Parlevliet & J.M. Lenné (Eds). Recent studies on peanut bud necrosis disease in India: Proceedings of a Meeting, 20 March 1995, ICRISAT Asia Center, India. 80 pp.
Yeh, S.D., Y.C. Lin, Y.H. Cheng, C.L. Jih, M.J. Chen, and C.C. Chen. 1992. Identification of tomato spotted wilt-like virus on watermelon in Taiwan. Plant Dis. 76: 835-840.
Yeh, S.D., and T.F. Chang. 1995. Nucleotide sequence of the N gene of watermelon silver mottle virus, a proposed new member of the genus tospovirus. Phytopathology 85: 58-64.
109

LIST OF PUBLICATIONS
Buiel, A.A.M. and Parlevliet, J.E. 1996. Mature plant and tissue resistance in the groundnut - peanut bud necrosis virus system. Euphytica 91: 213-217.
Buiel, A.A.M., D.V.R. Reddy, D. Peters, J.E. Parlevliet. 1996. Components of resistance to peanut bud necrosis virus. Page 19 in: D.V.R. Reddy and C.L.L. Gowda (Eds). Groundnut virus diseases in the Asia-Pacific Region: summary and recommendations of the Fourth Meeting of the International Working Group, 12-14 March 1995, Khon Kaen University, Thailand. ICRISAT Asia Center, India. 44 pp.
Buiel, A.A.M., J.E. Parlevliet, and J.M. Lenné (Eds). 1995. Recent studies on peanut bud necrosis disease in India: Proceedings of a meeting, 20 March 1995, ICRISAT Asia Center, India. 80 pp.
Buiel, A.A.M. & J.E. Parlevliet, 1995. Epidemiology of peanut bud necrosis disease in groundnut in India. Pages 41-46 in: A.A.M. Buiel, J.E. Parlevliet & J.M. Lenné (Eds). Recent studies on peanut bud necrosis disease in India: Proceedings of a Meeting, 20 March 1995, ICRISAT Asia Center, India. 80 pp.
Buiel, A.A.M., S.L. Dwivedi, M.V.R. Prasad, A.B. Singh, P.S. Dharmaraj & J.E. Parlevliet, 1995. Multi-environment testing for reduced incidence of peanut bud necrosis disease in India. Pages 47-54 in: A.A.M. Buiel, J.E. Parlevliet & J.M. Lenné (Eds). Recent studies on peanut bud necrosis disease in India: Proceedings of a Meeting, 20 March 1995, ICRISAT Asia Center, India. 80 pp.
Buiel, A.A.M., D. Peters, and J.E. Parlevliet. 1994. Resistance mechanisms of groundnut to PBNV. International Conference on Virology from 8-13 August 1993 at Glasgow. (Abstract).
Buiel, A.A.M. 1993. Resistance in groundnut to peanut bud necrosis virus. Pages 207-210 in: Th. Jacobs, and J.E. Parlevliet (Eds). Durability of disease resistance. Proceedings of a Symposium held Feb 24-28, 1992, Wageningen, The Netherlands Dordrecht, The Netherlands: Kluwer Academic Publishers. 375 pp.
Buiel, A.A.M., M.A. Verhaar, F. van den Bosch, W. Hoogkamer, and J.C. Zadoks. 1989. Effect of cultivar mixtures on the wave velocity of expanding yellow stripe rust foci in winter wheat. Neth. J. Agr. Science 37: 75-78.
Van den Bosch, F., M.A. Verhaar, A.A.M. Buiel, W. Hoogkamer, and J.C. Zadoks. 1990. Focus expansion in plant disease. IV: Expansion rates in mixtures of resistant and susceptible hosts. Phytopathology 80: 598-602.
Metz, P.L.J., A.van Norel, A.A.M. Buiel, and J.P.F.G. Helsper. 1992. Inheritance of seedling colour in faba bean (Vicia faba L.). Euphytica 59: 231-234.
Metz, P.L.J., A.A.M. Buiel, A. van Norel, and J.P.F.G. Helsper. 1993. Rate and inheritance of cross-fertilization in faba bean (Vicia faba L.). Euphytica 66: 127-133.
Metz, P.L.J., A.A.M. Buiel, A. van Norel, and J.P.F.G. Helsper. 1994. Genetic factors controlling outcrossing in faba bean (Vicia faba): effects of pollen donor and receptor genotypes and estimates of inter-receptor cross-fertilization. J. Agr. Science, Cambridge 122: 249-254.
Link, W., W. Ederer, P. Metz, H. Buiel, and A.E. Melchinger. 1994. Genotype and environmental variation for degree of cross-fertilization in faba bean. Crop Science 34: 960-964.
I l l

C U R R I C U L U M V I T A E
Hanneke (Anne Aloysia Maria) Buiel was born on the first day of 1963, in 's Gravenhage,
The Netherlands. Between 1975 and 1981, she went to the Erasmus College, Zoetermeer,
to obtain her VWO degree. She began her study on Plant Breeding at Wageningen
Agricultural University in 1981. During this study she completed an 8-months research at
the International Rice Research Institute, Los Banos, The Philippines, in 1986. After she
received her 'ingenieur' degree in March 1988, she was employed by the 'Nederlands
Graan Centrum' and stationed at the Institute of Plant Protection (IPO), Wageningen, for
research on resistance in wheat to yellow stripe rust. In 1989 and 1990, she worked for
another project of the 'Nederlands Graan Centrum', at the Center for Plant Breeding and
Reproduction Research (CPRO) in Wageningen, on cross pollination of faba bean. From
June 1990 to June 1995, she was employed by the Wageningen Agricultural University, for
DGIS funded research on resistance to peanut bud necrosis virus in groundnut. The
research, which resulted in this thesis, was carried out at the International Crops Research
Institute for the Semi-Arid Tropics (ICRISAT) Asia Center at Hyderabad, India.
113