processes to enhance trans-resveratrol in peanut kernels
445
PROCESSES TO ENHANCE TRANS-RESVERATROL IN PEANUT KERNELS AND THEIR OPTIMIZATION by JOCELYN D. MASIGLAT-SALES (Under the Direction of Anna V. A. Resurreccion and Louise Wicker) ABSTRACT Abiotic stresses including wounding through size reduction, UV, ultrasound (US), and combined US-UV were applied to peanut kernels to enhance trans-resveratrol biosynthesis. Slicing produced the highest trans-resveratrol followed by chopping, whereas whole peanuts had the least, suggesting that only mild damage to cells was needed for maximum biosynthesis. UV, US and US-UV treatments of sliced peanuts further increased trans-resveratrol from 0.37 to 3.29, 6.35 and 7.14 μg/g, respectively, corresponding to >100% that found in red wines, a known major food source. Resveratrol-enhanced peanuts (REP) had less roasted peanutty flavor and more bitter, astringent, cardboard, oxidized and fishy off-flavors resulting in lower acceptance rating (OA) ≥ 5.0 or neither like nor dislike compared to untreated controls of 7.4 or like moderately. Trans-resveratrol was positively correlated to astringent, bitter and painty flavors of REP. Optimization using response surface methodology showed that optimum US-UV produced REP with highest trans-resveratrol of 4.8 μg/g followed by US and UV with 3.8 and 2.1μg/g, respectively, with maximum consumer acceptance ≤5 or neither like nor dislike. Furthermore,
-
Upload
khangminh22 -
Category
Documents
-
view
5 -
download
0
Transcript of processes to enhance trans-resveratrol in peanut kernels

PROCESSES TO ENHANCE TRANS-RESVERATROL IN PEANUT KERNELS
AND THEIR OPTIMIZATION
by
JOCELYN D. MASIGLAT-SALES
(Under the Direction of Anna V. A. Resurreccion and Louise Wicker)
ABSTRACT
Abiotic stresses including wounding through size reduction, UV, ultrasound (US), and
combined US-UV were applied to peanut kernels to enhance trans-resveratrol biosynthesis.
Slicing produced the highest trans-resveratrol followed by chopping, whereas whole peanuts had
the least, suggesting that only mild damage to cells was needed for maximum biosynthesis. UV,
US and US-UV treatments of sliced peanuts further increased trans-resveratrol from 0.37 to
3.29, 6.35 and 7.14 µg/g, respectively, corresponding to >100% that found in red wines, a known
major food source. Resveratrol-enhanced peanuts (REP) had less roasted peanutty flavor and
more bitter, astringent, cardboard, oxidized and fishy off-flavors resulting in lower acceptance
rating (OA) ≥ 5.0 or neither like nor dislike compared to untreated controls of 7.4 or like
moderately. Trans-resveratrol was positively correlated to astringent, bitter and painty flavors of
REP.
Optimization using response surface methodology showed that optimum US-UV produced
REP with highest trans-resveratrol of 4.8 µg/g followed by US and UV with 3.8 and 2.1µg/g,
respectively, with maximum consumer acceptance ≤5 or neither like nor dislike. Furthermore,

US-UV had maximum 170 µg/g p-coumaric acid and 150 µM TE/g ORAC corresponding to
>100% that found in red wines.
The shelf life of roasted REP was 52 days at 25oC, shorter than 90 days in regular roasted
peanuts due to weaker peanutty flavor and more intense off-flavors, with a Q10 value of 2.2 for
lipid oxidation. REP application in peanut bars increased shelf life at 25oC to 146 days probably
due to sugar’s protective effect which slowed down lipid oxidation or masked the effect on off-
flavors. On a per serving basis, about 3 ½ REP bars containing 30 g peanuts/bar would provide
equal resveratrol in 140 mL serving of red wine. REP will provide increased value and
profitability for the food industry and health benefits to consumers.
INDEX WORDS: peanuts, UV, ultrasound, abiotic stress, trans-resveratrol, phenolic
compounds, antioxidants, total phenolics, bioactive compounds, shelf life

PROCESSES TO ENHANCE TRANS-RESVERATROL IN PEANUT KERNELS
AND THEIR OPTIMIZATION
by
JOCELYN M. SALES
B.S., University of Philippines at the Los Baños, Philippines, 1983
M.S., University of the Philippines at the Los Baños, Philippines, 1999
A Dissertation Submitted to the Graduate Faculty of The University of Georgia in Partial
Fulfillment of the Requirements for the Degree
DOCTOR OF PHILOSOPHY
ATHENS, GEORGIA
2010

© 2010
Jocelyn D. Masiglat-Sales
All Rights Reserved

PROCESSES TO ENHANCE TRANS-RESVERATROL IN PEANUT KERNELS
AND THEIR OPTIMIZATION
by
JOCELYN D. MASIGLAT-SALES
Major Professors: Anna V. A. Resurreccion Louise Wicker Committee: Casimir C. Akoh Manjeet S. Chinnan Ronald R. Eitenmiller Electronic Version Approved: Maureen Grasso Dean of the Graduate School The University of Georgia December 2010
iv
DEDICATION
My dissertation is dedicated to God Almightly who makes everything possible;
To my daughter, Adelou Jane who is my greatest source of strength and inspiration;
and
To my family and loved ones for their prayers, constant support and encouragements,
and unconditional love.
Thank you all for allowing me to achieve another milestone in my career.

v
ACKNOWLEDGEMENTS
My immense gratitude to my major adviser, Dr. Anna V. A. Resurreccion. Dr. Anna, I
can’t thank you enough for your guidance, direction, patience, and financial support throughout
my Ph.D. program. I will forever be grateful for your constant motivation, invaluable advice,
and for believing in me throughout this endeavor.
To my co-major adviser, Dr. Louise Wicker, my sincere appreciation for your
encouraging technical and personal advice and kind concern of my academic status and well-
being; and my committee members, Dr. Manjeet S. Chinnan, Dr. Casimir C. Akoh, and Dr.
Ronald R. Eitenmiller, thank you for your ideas, constructive advice, and contribution to my
dissertation.
My heartfelt appreciation and thanks to the members of Consumer Insights and Sensory
Laboratory and the technicians of the Department of Food Science and Technology without
whose assistance, this milestone in my life could not have been accomplished including Paula
Scott, Rosemarie Quick, Trina Lapis, Nathan Wright, Deborah Ancel, Sue Ellen McCoullough,
Glenn Farrel, Lary Hitchcock, Mary Cooper, Sandra Young, and Sandra Walker. Thank you too
for your friendship and care.
I am greatly indebted to the management and employees of the Food Development
Center and the National Food Authority of the Philippines, especially to Dr. Alicia O. Lustre, our
former director, without her support and encouragement, my Ph. D. program here at UGA would
have not been possible.
Thank you to all consumers and descriptive test panelists who participated in my studies.

vi
I would like to thank my friends who enriched my life in one way or another, thanks for
being part of my graduate student life, for the camaraderie, and for making my burdens lighter
and my days brighter: my housemates at the Visitors House –Kranti, Lulu, Ali, Nunta, Daitaro,
Jakarat, and most especially my roommate Yeon Ju who always makes herself available in times
of need; my Filipino friends in Athens – Cesar, Marco, Mattie, Lotis, Owen, and Alvin; my
family friends in Griffin, Margie & Joel Paz and Mercy & Larry Guerra.
Thank you Adeng for your patience; and my family for your continual prayers and
encouragements.
And above all, thank you Lord God.

vii
TABLE OF CONTENTS
Page
ACKNOWLEDGEMENTS.............................................................................................................v
LIST OF TABLES......................................................................................................................... ix
LIST OF FIGURES ..................................................................................................................... xvi
SECTION
1. INTRODUCTION........................................................................................................1
2. REVIEW OF LITERATURE .....................................................................................5
I. Introduction ..........................................................................................................5
II. Trans-Resveratrol and Related Stilbenes ............................................................9
III. Biovailability and Health Effects of Resveratrol and Other Stilbenes...........31
IV. Processes to Enhance Biosynthesis of Resveratrol and Other Bioactive
Compounds in Peanuts and Plant Materials ...................................................44
V. Functional Peanuts and Products .....................................................................80
VI. Analysis of Resveratrol and Other Stilbenes in Peanuts ................................86
VII. Conclusions ......................................................................................................100
3. MATERIALS AND METHODS ............................................................................106
I. Study 1 –Ultraviolet Light (UV) Process Optimization to
Enhance Trans-Resveratrol Biosynthesis in Peanuts ....................................106
II. Study 2 - Ultrasound Process Optimization to Enhance
Trans-Resveratrol Biosynthesis in Peanuts ....................................................151

viii
III. Study 3 - Combined Ultrasound-UV Process Optimization
to Enhance Trans-Resveratrol Biosynthesis in Peanuts ................................156
IV. Study 4 - Applications of Resveratrol-Enhanced Peanuts
Selected Products and Their Shelf Life...........................................................173
V. Study 5 – Profiling of Phenolic Compounds and Sensory
Attributes of UV, Ultrasound, and Combined Ultrasound-UV
Treated Peanuts .................................................................................................194
4. RESULTS AND DISCUSSION ..............................................................................196
I. Study 1 - Ultraviolet (UV) Process Optimization to Enhance
Trans-Resveratrol Biosynthesis in Peanuts ....................................................196
II. Study 2 - Ultrasound Process Optimization to Enhance
Trans-Resveratrol Biosynthesis in Peanuts ....................................................227
III. Study 3 - Combined Ultrasound-UV Process Optimization
to Enhance Trans-Resveratrol Biosynthesis in Peanuts ................................275
IV. Study 4 - Applications of Resveratrol-Enhanced Peanuts
Selected Products and Their Shelf Life...........................................................297
V. Study 5 – Profiling of Phenolic Compounds and Sensory
Attributes of UV, Ultrasound, and Combined Ultrasound-UV
Treated Peanuts ................................................................................................356
5. SUMMARY AND CONCLUSIONS ......................................................................403
6. REFERENCES.........................................................................................................406

ix
LIST OF TABLES
Page
Table 2.1: Bioactive compounds in peanut plant materials and products.......................................6
Table 2.2: Concentrations of trans-resveratrol and other stilbenes found in peanuts and in edible and inedible peanut plant materials........................................................19 Table 2.3: Concentrations of resveratrol and other related compounds in peanut and grape plant materials stressed by microbial invasion and/or inoculation .............46
Table 2.4: Concentrations of trans-resveratrol and other stilbenes in peanut kernels stressed by post-harvest abiotic treatment of wounding through slicing,
chopping and grinding……………………………………….………………............52 Table 2.5: UV light stress treatments used to enhance trans-resveratrol and other bioactive compounds in peanuts and grapes................................................................................57
Table 2.6: Ultrasound stress treatments used to enhance trans-resveratrol and other bioactive compounds in peanuts and various food plants ...........................................................70
Table 2.7: Comparison of published methods of high performance liquid chromotagraphy
(HPLC) analysis for trans-resveratrol and other related phytoalexins in peanuts and grapes and their related products and standard solutions....................................101 Table 3.1: Treatment variables and levels for UV processes......................................................107 Table 3.2: Experimental design for the three-level, three-factor response surface analysis
for UV-treated peanuts...............................................................................................108 Table 3.3: Preparation of trolox working and calibration curve standard solutions for
TEAC assay ...............................................................................................................121 Table 3.4: Terms, definitions, standard references, and respective intensity ratings
used in the descriptive tests for roasted peanuts. .......................................................137 Table 3.5: Treatment variables and their levels for ultrasound processes ..................................153 Table 3.6: Experimental design for the three-level, three-factor response surface analysis for ultrasound-treated chopped, sliced and whole peanut kernels .............................154

x
Table 3.7: Treatment variables and their levels for combined ultrasound-UV processes ..........158 Table 3.8: Experimental design for the three-level, two factor response surface analysis for
combined ultrasound-UV treated peanuts..................................................................159 Table 3.9: Volumes of individual stock solution required for preparation of the standard mixture solution for phenolic profiling......................................................................165 Table 3.10: Volumes of standard mixture solution required for calibration standard curve for phenolic profiling ...............................................................................................166 Table 3.11: Chromatographic conditions for the determination of phenolic compounds in extracts of peanut kernels.........................................................................................168 Table 3.12: Sampling scheme for roasted resveratrol-enhanced peanuts stored at accelerated
temperatures of 30, 35 and 40oC based on target shelf life of 90 days at 25oC using Q10 of 1.75 for lipid oxidation and verified at 25oC.........................................176 Table 3.13: Sampling scheme for resveratrol-enhanced peanut bars stored at 25 and 40oC .......177 Table 3.14: Formulation for resveratrol-enhanced peanut bars ...................................................180 Table 3.15: Volumes of hexanal and 4-heptanone stock standard solutions used to prepare the five calibration curve standard solutions ...........................................................183 Table 4.1: Concentrations (mean ± standard deviation, dry basis) of trans-resveratrol,
trans-piceid, and total stilbenes of roasted UV-treated peanuts and controls............197 Table 4.2: Significant treatment effects on the concentrations of stilbenes, total phenolics,
antioxidant capacities, and overall acceptance of sliced UV-treated peanuts ...........200 Table 4.3: Concentrations (mean ± standard deviation, dry basis) of total phenolics, trolox
equivalent antioxidant capacity (TEAC), and oxygen radical absorbance capacity (ORAC) total antioxidant capacity (TAC) of roasted UV-treated peanuts and
controls.......................................................................................................................203 Table 4.4: Consumers’ overall acceptance rating (mean ± standard deviation) of roasted UV-treated peanuts and controls ...................................................................215 Table 4.5: Regression coefficients, R2, and P-values for the significant prediction models
of response variables in UV-treated peanuts .............................................................217 Table 4.6: Observed and predicted values of stilbenes concentrations and antioxidant capacity values of UV-treated peanuts for verification of prediction models ...........226

xi
Table 4.7: Concentrations (mean ± standard deviation, dry basis) of trans-resveratrol, trans-piceid, and total stilbenes of roasted sliced ultrasound-treated peanuts and
controls.......................................................................................................................228 Table 4.8: Significant treatment effects on the concentrations of stilbenes, total phenolics,
antioxidant capacities, and overall acceptance of sliced, chopped, and whole ultrasound-treated peanuts. ............................................................................231
Table 4.9: Concentrations (mean ± standard deviation, dry basis) of total phenolics, trolox
equivalent antioxidant capacity (TEAC), and oxygen radical absorbance capacity (ORAC) total antioxidant capacity (TAC) of roasted sliced ultrasound-treated peanuts and controls...................................................................................................234
Table 4.10: Concentrations (mean ± standard deviation, dry basis) of stilbenes of roasted
chopped ultrasound-treated peanuts and controls. ..................................................240 Table 4.11: Concentrations (mean ± standard deviation, dry basis) of total phenolics, trolox
equivalent antioxidant capacity (TEAC), and oxygen radical absorbance capacity (ORAC) total antioxidant capacity (TAC) of roasted chopped ultrasound-treated peanuts and controls...................................................................................................243
Table 4.12: Concentrations (mean ± standard deviation, dry basis) of stilbenes of roasted
whole ultrasound-treated peanuts and controls. ......................................................249 Table 4.13: Concentrations (mean ± standard deviation, dry basis) of total phenolics, trolox
equivalent antioxidant capacity (TEAC), and oxygen radical absorbance capacity (ORAC) total antioxidant capacity (TAC) of roasted whole ultrasound-treated peanuts and controls...................................................................................................253
Table 4.14: Maximum concentrations (mean ± standard deviation, dry basis) of stilbenes, total phenolics, and antioxidants in chopped, sliced, and whole ultrasound-
treated peanuts .........................................................................................................259 Table 4.15: Consumers’ overall acceptance rating (mean ± standard deviation) of roasted
ultrasound -treated sliced, chopped, and whole peanuts..........................................261 Table 4.16: Regression coefficients for the significant prediction models for trans-
resveratrol, total stilbenes, antioxidant capacities, total phenolics and overall acceptance of sliced ultrasound-treated peanuts ......................................................263
Table 4.17: Observed and predicted values of stilbenes concentrations, total phenolics, and
antioxidant capacities of ultrasound-treated peanuts for verification of prediction models ......................................................................................................................272

xii
Table 4.18: Concentrations (mean ± standard deviation, dry basis) of phenolic compounds, total phenolics, and antioxidant capacities, and overall acceptance ratings of roasted ultrasound (US)-UV treated peanuts and controls ......................................276
Table 4.19: Regression coefficients for the significant models of the combined ultrasound -UV treated peanuts ...............................................................................288 Table 4.20: Observed and predicted values of phenolic compounds concentrations, total
phenolics, and antioxidant capacities of combined ultrasound-UV treated peanuts for verification of prediction models ..........................................................294
Table 4.21: Mean hexanal concentrations (mean ± standard deviation) of roasted
resveratrol-enhanced peanuts stored for varying times at accelerated temperatures of 30, 35, and 40oC, and verified at 25oC...........................................300 Table 4.22: Mean hedonic ratings ± standard deviation of consumer panel on roasted
resveratrol-enhanced peanuts stored for varying times at 25, 30, 35, and 40oC......305 Table 4.23: Consumer panel ratings (mean ± standard deviation) for just-about-right
and intensity of sensory attributes of roasted resveratrol-enhanced peanuts stored for varying times at 25, 30, 35, and 40oC ........................................310 Table 4.24: Changes in the intensity ratings (mean±standard deviation) for the brown color,
roasted peanutty and raw beany aromatics of roasted resveratrol-enhanced peanuts stored for varying times at accelerated temperatures of 30, 35, and
40oC and verified at 25oC ........................................................................................315 Table 4.25: Changes in the intensity ratings (mean±standard deviation) for the basic tastes of
roasted resveratrol-enhanced peanuts stored for varying times at accelerated temperatures of 30, 35 and 40oC and verified at 25oC.............................................320 Table 4.26: Changes in the intensity ratings (mean±standard deviation) for the woody/hulls/skin,
and burnt flavors and astringency of roasted resveratrol-enhanced peanuts stored for varying times at accelerated temperatures of 30, 35, and 40oC, and verified
at 25oC......................................................................................................................323 Table 4.27: Changes in the intensity ratings (mean±standard deviation) for the cardboard, fishy,
oxidized, and painty aromatics of roasted resveratrol-enhanced peanuts stored for varying times at accelerated temperatures of 30, 35, and 40oC and verified
at 25 oC .....................................................................................................................326 Table 4.28: Changes in the intensity ratings (mean±standard deviation) for the texture
attributes, and toothpack of roasted resveratrol-enhanced peanuts stored for varying times at accelerated temperatures of 30, 35, and 40oC, and verified at 25 oC .....................................................................................................................329

xiii
Table 4.29: Changes in concentrations (mean ± standard deviation) of hexanal, trans- resveratrol, total phenolics, and TEAC values of resveratrol-enhanced
peanut bars stored at varying times at 25and 40oC ..................................................339 Table 4.30: Consumer hedonic ratings (mean ± standard deviation) for the sensory attributes of resveratrol-enhanced peanut bars stored for varying times
at 25 and 40oC..........................................................................................................342 Table 4.31: Just-about-right (JAR) and intensity ratings (mean ± standard deviation) of
consumer panel on resveratrol-enhanced peanut bars stored for varying times at 25 and 40oC .........................................................................................................345 Table 4.32: Changes in the intensity ratings (mean ± standard deviation) for color, caramel
and roasted peanutty aromatics of resveratrol-enhanced peanut bars by a descriptive panel during storage at 25 and 40oC......................................................352
Table 4.33: Changes in the intensity ratings (mean ± standard deviation) for the basic
tastes of resveratrol-enhanced peanut bars by a descriptive panel during storage at 25 and 40oC .............................................................................................353
Table 4.34: Changes in the intensity ratings (mean ± standard deviation) for the off-flavors
of resveratrol-enhanced peanut bars by a descriptive panel during storage at 25 and 40oC..........................................................................................................354
Table 4.35: Changes in the intensity ratings (mean ± standard deviation) for the texture
attributes and feeling factors of resveratrol-enhanced peanut bars by a descriptive panel during storage at 25 and 40oC......................................................355
Table 4.36: Sixteen phenolic compounds assayed in peanut kernels assayed using liquid chromatography-mass spectrometry (LC-MS) ........................................................357 Table 4.37: Profile of phenolic compounds (mean ± standard deviation, µg/g, dry basis )
in UV-treated peanuts .............................................................................................363 Table 4.38: Profile of phenolic compounds (mean ± standard deviation, µg/g, dry basis) in
ultrasound-treated peanuts ......................................................................................365 Table 4.39: Comparison of phenolic compound mean concentrations, expressed as
difference from control, in resveratrol-enhanced peanuts treated with UV, ultrasound, and combined ultrasound-UV. ..............................................................367
Table 4.40: Intensity ratings (mean±standard deviation) for the brown color, roasted peanutty
and raw/beany aromatics of roasted UV-treated peanuts by a descriptive panel. ...369 Table 4.41: Intensity ratings (mean±standard deviation) for the basic tastes of roasted sliced
UV-treated peanuts by a descriptive panel. .............................................................371

xiv
Table 4.42: Intensity ratings (mean±standard deviation) for woody/hulls/skins, burnt,
astringent, and tongue sting of roasted sliced UV-treated peanuts by a descriptive panel. .....................................................................................................374
Table 4.43: Intensity ratings (mean±standard deviation) for the oxidation-related off-flavors
of roasted sliced UV-treated peanuts by a descriptive panel. ..................................376 Table 4.44: Intensity ratings (mean±standard deviation) for the texture attributes and
toothpack of roasted sliced UV-treated peanuts by a descriptive panel. .................378 Table 4.45: Intensity ratings (mean±standard deviation) for the brown color, roasted peanutty
and raw/beany aromatics of roasted sliced ultrasound-treated peanuts by a descriptive panel. .....................................................................................................380
Table 4.46: Intensity ratings (mean±standard deviation) for the basic tastes of roasted sliced
ultrasound -treated peanuts by a descriptive panel. .................................................382 Table 4.47: Intensity ratings (mean±standard deviation) for woody/hulls/skins, burnt,
astringent, and tongue sting of roasted sliced ultrasound-treated peanuts by a descriptive panel. .....................................................................................................384
Table 4.48: Intensity ratings (mean±standard deviation) for the oxidation related off-flavors
of roasted ultrasound -treated peanuts by a descriptive panel. ................................386 Table 4.49: Intensity ratings (mean±standard deviation) for the texture attributes and
toothpack of roasted ultrasound -treated peanuts by a descriptive panel.................388 Table 4.50: Intensity ratings (mean±standard deviation) for the brown color, roasted peanutty
and raw/beany aromatics of roasted sliced ultrasound-UV treated peanuts by a descriptive panel. .....................................................................................................390
Table 4.51: Intensity ratings (mean±standard deviation) for the basic tastes of roasted
sliced ultrasound-UV treated peanuts by a descriptive panel. .................................392 Table 4.52: Intensity ratings (mean±standard deviation) for woody/hulls/skins, burnt,
astringent and toothpack of roasted sliced ultrasound –UV treated peanuts by a descriptive panel. .....................................................................................................394
Table 4.53: Intensity ratings (mean±standard deviation) for the oxidation related off-flavors
of roasted ultrasound -treated peanuts by a descriptive panel. ...............................396 Table 4.54: Intensity ratings (mean±standard deviation) for the texture attributes and
toothpack of roasted ultrasound -treated peanuts by a descriptive panel................397

xv
Table 4.55: Comparison of the intensity ratings (difference from controls) for the different sensory attributes of resveratrol-enhanced peanuts treated with UV, ultrasound, and combined ultrasound-UV by a descriptive panel. .............................................399
Table 4.56: Regression models for the response variables, adjusted R2, and Pearson correlation coefficient (r)for the significant correlation of profiles of phenolic
compounds and sensory properties of UV, ultrasound, and combined ultrasound-UV treated peanuts…...………………………………………………..403

xvi
LIST OF FIGURES
Page
Figure 2.1: Structures of trans- and cis-resveratrol and piceid.....................................................10
Figure 2.2: Structures of resveratrol derivatives found in peanuts ...............................................14
Figure 2.3: Biosynthesis of trans-resveratrol from one molecule of 4-coumaroyl CoA and three molecules of malonyl CoA.........................................................................16 Figure 3.1: Layout of the 96-well microplate used in the hydrophilic and lipophilic oxygen radical absorbance capacity assay................................................................125
Figure 3.2: The ballot used in descriptive sensory analysis test for roasted peanuts..................141
Figure 3.3: Computer ballot used in rating roasted peanuts during consumer test. Panelists used 9-point hedonic scale to rate acceptance ..........................................147
Figure 3.4: The ballot used in rating rating roasted peanuts during consumer test ....................148
Figure 3.5: Two-stage experimental design for combined ultrasound and UV treatments of peanut kernels ......................................................................................................157
Figure 3.6: The ballot used for the descriptive test of roasted combined ultrasound-UV treated peanuts .........................................................................................................170
Figure 3.7: The ballot used for the descriptive test of resveratrol-enhanced peanut bars ..........186 Figure 3.8: Plots of quality (A) against time (t) for zero order reaction and ln A against
time for the first order reaction ................................................................................190 Figure 3.9: Arrhenius plot of reaction rate constants (ln k) against inverse absolute
temperature (1/K).....................................................................................................192 Figure 3.10: Shelf life plot showing the relation of ln shelf life and storage temperature
(oC)...........................................................................................................................193 Figure 4.1: Mean trans-resveratrol, trans-piceid, and total stilbenes of sliced peanuts
exposed to varying doses of UV ..............................................................................198

xvii
Figure 4.2: Mean concentrations for total phenolics (mg GAE/g) of sliced peanuts exposed to varying doses of UV (A) and ultrasound (B).........................................205
Figure 4.3: Mean trolox equivalent antioxidant capacities (TEAC, µM Trolox
Equivalents/g of sliced peanuts exposed to varying doses of UV (A) and ultrasound (B)....................................................................................................208
Figure 4.4: Mean total antioxidant capacities (TAC-ORAC, µM Trolox Equivalents/g)
of sliced peanuts exposed to varying doses of UV (A) and ultrasound (B).............210 Figure 4.5: Mean hydrophilic ORAC (H-ORAC, µM Trolox Equivalents/g) of sliced
peanuts exposed to varying doses of UV (A) and ultrasound (B) ...........................211 Figure 4.6: Mean lipophilic ORAC (L-ORAC, µM Trolox Equivalents/g) of sliced
peanuts exposed to varying doses of UV (A) and ultrasound (B) ...........................214 Figure 4.7: Contour plots for the significant prediction models for trans-resveratrol (µg/g),
trans-piceid (µg/g), and total stilbenes (µg/g) of UV- treated peanuts as affected by distance from UV light and UV exposure times at specified incubation time (IC) at 25oC. Contours plots are shaded to cover the areas that meet the regions of interest, or the maximum concentrations achieved. ............................................219
Figure 4.8: Contour plots for the significant prediction models for H-ORAC (hydrophilic
ORAC, µM TE/g), L-ORAC (lipophilic ORAC, µM TE/g), TAC (total antioxidant capacity, µM TE/g), and overall acceptance (9-point hedonic rating) of UV-treated peanuts as affected by distance from UV light and UV exposure times at specified incubation time (IC) at 25oC. Contour plots are shaded to cover the areas that meet the regions of interest, or the maximum concentrations or OA ratings achieved. ...................................................................223
Figure 4.9: Superimposed contour plots for the significant (P<0.05) prediction models of
trans-resveratrol (RES, µg/g), trans-piceid (PIC), total antioxidant capacity based on ORAC assay (TAC, µM TE/g), and overall acceptance (OA) based on 9-point hedonic rating where 1=dislike extremely, 5=neither like nor dislike, and 9=like extremely. The regions of overlap (OL) represent the optimum UV processes at the specified incubation time. Arrows indicate direction of
increasing concentrations or acceptance ratings ......................................................224 Figure 4.10: Mean trans-resveratrol, trans-piceid, and total stilbenes of sliced peanuts peanuts exposed to varying doses of ultrasound ......................................................229 Figure 4.11: Contour plots for the significant prediction models for trans-resveratrol (µg/g),
and total stilbenes (µg/g) of ultrasound-treated peanuts as affected by ultrasound power density and exposure times at specified incubation time (IC) at 25oC.
Contour plots are shaded to cover the areas that meet regions of interest or the maximum concentrations achieved ..........................................................................265

xviii
Figure 4.12: Contour plots for the significant prediction models for hydrophilic (H-ORAC),
lipophilic ORAC (L-ORAC), total antioxidant capacity (TAC), total phenolics, TEAC, and sensory overall acceptance of ultrasound-treated peanuts as affected by ultrasound power density and exposure times at specified
incubation times (IC) at 25oC ..................................................................................267 Figure 4.13: Superimposed contour plots for the significant (P<0.05) prediction models
of trans-resveratrol (RES, µg/g), total stilbenes (TS, µg/g), ORAC total antioxidant capacity (µM trolox equivalents (TE)/g), TEAC (µM TE/g), total
phenolics (TP, mg gallic acid equivalents/g), and overall acceptance (OA) based on 9-point hedonic rating where 1=dislike extremely, 5=neither like nor
dislike and 9-like extremely. The regions of overlap (OL) represent the optimum ultrasound and UV processes at the specified incubation times. Arrows indicate directions of increasing concentrations or acceptance ratings. .....270
Figure 4.14: Trans-resveratrol concentrations (µg/g) in viable and non-viable peanuts to verify trans-resveratrol biosynthesis ...................................................................274 Figure 4.15: Contour plots for the significant prediction models of trans-resveratrol,
trans-piceid, ρ-coumaric-, caffeic-, and ferulic-cids, total phenolics, ORAC and overall acceptance (OA). The superimposed contour plots show regions of overlap (shaded areas) for the combined ultrasound-UV processes of peanut kernels. Arrows indicate direction of increasing concentrations or
acceptance ratings. ...................................................................................................289 Figure 4.16: Increments of trans-resveratrol in peanuts due to effects of abiotic stresses of wounding through size reduction and treatments with UV, ultrasound, and combined ultrasound-UV.........................................................................................296 Figure 4.17: Changes in hexanal and trans-resveratrol concentrations of roasted resveratrol-
enhanced peanuts during storage at accelerated temperatures of 30, 35 and 40oC and verified at 25oC..................................................................................299 Figure 4.18: Changes in the intensity ratings of the different sensory attributes of roasted
resveratrol-enhanced peanuts during storage at varying times and temperatures, by a descriptive panel. Horizontal lines indicate untreated controls ......................317 Figure 4.19: Plots of hexanal (A) and ln hexanal (B) concentrations against storage times
used in the determination of reaction order for roasted resveratrol-enhanced peanuts stored at varying times and temperatures ...................................................332

xix
Figure 4.20: Arrhenius plot showing ln k (rate of increase in hexanal concentration) against reciprocal of absolute accelerated storage temperatures in Kelvin at 30, 35, and 40oC used in the determination of activation energy for the lipid oxidation in roasted resveratrol-enhanced peanuts. The dot shows the predicted
ln k at 25oC...............................................................................................................333 Figure 4.21: Shelf life plot of roasted resveratrol-enhanced peanuts showing the end of shelf life at different accelerated storage temperatures at 30, 35, and 40oC based on consumer overall acceptance ≥5 or neither like nor dislike and hexanal concentration. The predicted shelf life at 25oC of 61days is represented by the dot ..............................................................................................335 Figure 4.22: Changes in hexanal and trans-resveratrol concentrations of roasted resveratrol- enhanced peanut bars during storage at 25 and 40oC ..............................................338 Figure 4.23: Changes in the mean intensity ratings scale for the different sensory attributes
of roasted resveratrol-enhanced peanut bars during storage at 25 and 40oC, by a descriptive panel using a 150 mm line. Horizontal lines indicate the mean
intensity ratings of controls......................................................................................347

SECTION 1
INTRODUCTION
Interest in functional foods has been increasing in recent years due to their beneficial health
effects in preventing the risk of cardiovascular disease, cancer and other diseases. Functional
foods appear similar to a conventional food that is consumed as part of usual diet, but contains
biologically active compounds that possess desirable physiological benefits and/or reduce the
risk of chronic diseases beyond basic nutritional functions. Trans-resveratrol is a functional
compound naturally occurring and synthesized in plants like grapes, peanuts and pines in
response to biotic and abiotic stresses. It has powerful antioxidant properties which protect the
tissue from oxidative damage. Many researchers devoted their research on trans-resveratrol as a
result of several epidemiological studies showing inverse relationship between moderate
consumption of red wines and incidence of coronary heart diseases, commonly known as the
“French Paradox” (Stanley and Mazier, 1999) which was attributed to the trans-resveratrol
contents of red wines.
Peanut has potential for developing into functional food as it contains not only trans-
resveratrol but other health beneficial functional compounds such as piceid - the glucoside of
trans-resveratrol, flavonoids, and other polyphenolic compounds. The USDA 2009 peanut crop
production forecast was estimated at 3.52 billion lbs, with the Southeastern states, including
Alabama, Florida, Georgia, Mississippi and South Carolina totaling 2.64 billion lbs (USDA,
2008). Increasing the value of peanuts provides economic benefits to farmers and the peanut
processing industries and health benefits to consumers.

2
Biotic stresses used to elicit resveratrol in peanuts and grape plant and plant materials include
invasion and/or inoculation of fungi, yeasts, and bacteria. Abiotic stresses include physical
challenges such as wounding, exposure to ultraviolet light, ultrasound and ozone, and treatment
with chemicals such as aluminum chloride, aluminum sulfate, cupric chloride, salicylic acid,
jasmonic acid, and ethylene.
In peanuts, biotic elicitations of resveratrol and other functional compounds through
microbial inoculation or invasion led to microbiological contamination that render peanuts and
plant materials inedible and/or unsafe for human consumption due to production of fungal
metabolites such as the carcinogenic aflatoxins produced by Aspergillus sp. (Wotton and
Strange, 1985). The use of abiotic elicitors is a safe alternative for the generation of bioactive
compounds to produce functional peanuts for food use and was effective in increasing
concentrations of trans-resveratrol in peanuts. The study from the University of Georgia (UGA)
showed that treatment of fully imbibed sliced (2 mm) peanuts with a single dose of UV (254 nm,
40 cm distance from UV light for 10 min) or ultrasound (39.2 mW/cm3 power density for 4 min)
followed by incubation at 25oC increased trans-resveratrol to 3.42 and 3.96 µg/g or up to 7- and
8-fold increase, respectively, compared to untreated controls with 0.48 µg/g (Rudolf and
Resurreccion, 2005). A Korean group of researchers found that UV exposure alone decreased
trans-resveratrol in raw peanuts, but soaking in water before UV light exposure had synergistic
effect increasing trans-resveratrol concentrations between 45 and 65 times (Seo et al., 2005).
UGA’s optimum ultrasound process which exposed 7 mm sliced peanuts to ultrasound power
density of 39.2 mW/cm3 for 4 min followed by incubation at 25oC for 44 h increased trans-
resveratrol to 6.80 to 7.15 µg/g in treated peanuts with and without skins, respectively,
corresponding to 15- and 16-fold increases compared to 0.45 µg/g in controls (Rudolf, 2003) and
3
were higher than those found in red wines containing 0.99 to 5.51 µg/g (McMurtrey et al., 1994).
However, peanut butter made from resveratrol-enhanced peanuts (REP) had low mean overall
consumer acceptance of like dislikely due lower intensities of roasted peanutty flavor and higher
off-flavors intensities such oxidized, painty, fishy and cardboard compared to untreated control
(Rudolf, 2003).
Previous studies used single doses of either UV or ultrasound in enhancing resveratrol
biosynthesis in peanuts (Rudolf and Resurreccion, 2005). The effects of varying doses of UV,
ultrasound (US), and their combination, US-UV on the concentrations of trans-resveratrol, total
phenolics, and antioxidant capacities, and sensory quality and acceptance in treated peanuts have
not been investigated. Questions remaining are whether increasing exposure to UV or ultrasound
or their combined treatments would result in increased biosynthesis of trans-resveratrol and other
bioactive compounds, increased generation of off-flavors and decrease consumer acceptance of
REP.
The goal of this research was to optimize the enhanced biosynthesis of trans-resveratrol and
other bioactive compounds and antioxidants, through application of UV, ultrasound, and
combined US-UV processing treatments, thereby producing resveratrol-enhanced peanuts with
high antioxidant capacities and consumer acceptance, for use as ingredient in the manufacture of
peanut and other food products, and deliver health benefits to consumers. The specific
objectives of this research were to: (1) investigate the effects of varying doses of UV, US, and
combined US-UV on the biosynthesis of trans-resveratrol and other phenolic compounds and
antioxidant capacities, and consumer acceptance of peanut kernels; (2) optimize UV, US, and
US-UV processes for enhanced biosynthesis of trans-resveratrol and other bioactive phenolics
and antioxidants in peanuts while maintaining acceptable REP; (3) determine the stability of

4
selected REP products; and (4) identify the phenolic compounds in REP, assess and correlate the
phenolic and sensory profiles of REP.

SECTION 2
REVIEW OF LITERATURE
I. INTRODUCTION
Peanuts, Arachis hypogaea, are an important food crop in the United States. In 2006, total
consumption was 6.5 pounds per capita (USDA/ERS, 2008) with over half consumed as peanut
butter. Peanut butter had a highest per capita consumption of 3.3 pounds followed by 1.4 pounds
in snack peanuts, 1.2 pounds in peanut containing candies, and 0.5 pounds in cleaned-in-shelled
peanuts (USDA/ERS, 2008). Stocks of shelled peanuts in commercial storage totaled 411
million pounds on August 31, 2008, of which 374 million pounds were edible grades and 37.3
million pounds were oil stocks (USDA/NAS, 2008). In August 2008 alone, commercial
processors utilized 96.9 million pounds as peanut butter, 30.1 million pounds as peanut candy,
33.7 million pounds as snack peanuts and 26.3 million pounds as oil (USDA/NAS, 2008).
Peanuts contain bioactive compounds with health benefits, such as stilbenes, flavonoids,
phenolic acids, and phytosterols (Table 2.1). These bioactive compounds may exert their effects
by functioning as antioxidants, activating liver detoxification enzymes, blocking activity of
bacterial or viral toxins, inhibiting cholesterol absorption, decreasing platelet aggregation, or
destroying gastrointestinal bacteria (Pennington, 2002).
The stilbene, resveratrol is a widely studied bioactive compound that has received much
interest over the last ten years due to its benefits to human health. It was first identified in 1940
in the roots of white hellebore, Veratrum grandiflorum O. Loes (Aggarwal et al., 2004) and later
in 1963 as a component of Polyganum cuspidatum roots used in Japanese and Chinese folk

6
Table 2.1 Bioactive compounds in peanut plant materials and products.
Compound Peanut Plant Materials and Products
Reference
Stilbenes: Trans-resveratrol Peanut kernels, raw
and roasted Sobolev and Cole, 1999; Sanders et al., 2000; Rudolf and Resurreccion, 2005; Sales and Resurreccion, 2009; Potrebko and Resurreccion, 2009
Peanut skins Nepote et al., 2004; Francisco and Resurreccion, 2009b
Peanut leaves Subba Rao et al., 1996; Chung et al., 2003 Peanut roots Chen et al., 2002 Peanut sprouts Wang et al., 2005 Peanut callus Ku et al., 2005 Peanut hairy roots Medina-Bolivar et al., 2007 Peanut butter Ibern-Gomez et al., 2000 Trans-piceid Peanut kernels,
roasted and raw Sales and Resurreccion, 2009; Potrebko and Resurreccion, 2009
Peanut butter Ibern-Gomez et al., 2000 Piceatannol Peanut callus Ku et al., 2005 Pterostilbene Peanut hairy roots
culture Medina-Bolivar et al., 2007
Phenolic acids: ρ-Coumaric acid Peanut kernels Talcott et al., 2005a; 2005b Peanut skins Yu et al., 2005; Francisco and Resurreccion,
2009b Hydroxybenzoic acid ester Peanut kernels Talcott et al., 2005a Ethyl protecatechuate Peanut skins Huang et al., 2003 Protocatechuic acid Peanut skins Francisco and Resurreccion, 2009b Chlorogenic acid Peanut skins Yu et al., 2005 Caffeic acid
Peanut skins Yu et al., 2005; Francisco and Resurreccion, 2009b
Ferulic acid Peanut skins Yu et al., 2005 ; Francisco and Resurreccion, 2009b
Flavonoids: Dihydroquercetin Peanut kernels Pratt and Miller, 1984 Biochanin Peanut kernels Chukwumah et al., 2005 Genistein Peanut kernels Chukwumah et al., 2005 Quercetin Peanut skins Francisco and Resurreccion, 2009b

7
Table 2.1 continued… Compound Peanut Plant
Materials and Products
Reference
Procyanidins (monomers, dimmers, trimers, tetramers, pentamers, hexamers, heptamers, octamers)
Peanut skins Lazarus et al., 1999
Epicatechin-(2β O 7,4β 6)-[epicatechin-(4β 8)- catechin Epicatechin-(2β O 7,4β 8)-[epicatechin-(4α 8)- catechin Procyanidin B2 Procyanidin B3 Procyanidin B4
Peanut skins Lou et al., 2004
Epigallocatechin Epicatechin Catechin gallate Epicatechin gallate
Peanut skins Yu et al., 2005;
Procyanidin dimer A1 [epicatechin-4β-8,2β-O7)-catechin] Procyanidin trimer A
Peanut skins Verstatraeten et al., 2005
Procyanidin monomers A-type procyanidin dimers B-type procyanidin dimers A-type procyanidin trimers B-type procyanidin dimers A-type procyanidin
tetramers B-type procyanidin
tetramers
Peanut skins Yu et al., 2006
Luteolin Peanut hulls, mature Daigle et al., 1988; Duh and Yen, 1995 Eriodictyol Peanut hulls,
immature Daigle et al., 1988
Formononetin Deidzen Medicarpin
Peanut leaves Subba Rao et al., 1996
Phytosterols: Beta-sitosterol Campesterol Stigmasterol
Peanut kernels Peanut oil
Awad et al., 2000

8
medicine (Soleas et al., 1997) for treatment of supporative dermatitis, gonorrhea favus, athlete’s
foot, and hyperlipemia (Aggarwal et al., 2004). In 1976, resveratrol was synthesized in
grapevine leaves after fungal infection and UV light exposure (Langcake and Pryce, 1976).
However, increased interest in resveratrol by researchers, from the perspective of mammalian
biochemistry or clinical science began in 1992 (Soleas et al., 1997) after Siemman and Creasy
(1992) found resveratrol in red wines.
The primary food and beverage sources of resveratrol in the human diet are peanuts, peanut
butters, grapes and red wines (King et al., 2006). Red wine, regularly present in the French diet,
is associated with “French paradox”, a phenomenon where the French had strikingly lower
mortality from coronary diseases, only one third of the average, despite large intake of high
saturated fat diet, similar to that in developed countries such as in the US (Stanley and Mazier,
1999). Resveratrol and other polyphenolic compounds in red wines were believed to be
associated with this paradox (Frankel et al., 1993).
There is evidence that resveratrol may protect against cardiovascular diseases (Pace-Asciak
et al., 1995). Resveratrol has also shown to inhibit initiation, promotion, and progression of
cancer (Jang et al., 1997). More recently, resveratrol was found to have therapeutic potential
against Alzheimer’s disease (Marambaud et al., 2005; Reviere et al., 2007) and in delaying aging
(de la Lastra and Villegas, 2005; Baur et al., 2006).
Resveratrol is a phytoalexin, a group of low molecular weight secondary metabolites
produced by a wide variety of plants (Aggarwal et al., 2004) in response to biotic and abiotic
stresses which enhance their synthesis (Boue, et al., 2009). Biotic stresses result from natural
infection or inoculation of the plant material with microorganisms such as fungi (Keen and
Ingham, 1976) and yeast (Chung et al., 2003), whereas, abiotic stresses include physical methods

9
like wounding through slicing (Aguamah et al., 1981), chopping or grinding (Rudolf and
Resurreccion, 2005), exposure to UV (Langcake and Pryce, 1977; Rudolf and Resurreccion,
2005), ultrasound (Lin et al., 2001; Rudolf and Resurreccion, 2005), ozone (Grimmig et al.,
1997), heat or far-infrared radiation (Lee et al., 2006), and treatment with chemicals such as
cupric acid (Hanawa et al., 1992), aluminum chloride (Adrian et al., 1996), salicylic acid (Subba
Rao et al., 1996), jasmonic acid (Chung et al., 2003) and ethylene (Chung et al., 2003).
This section reviewed trans- resveratrol and related stilbenes from peanuts - their chemical
structures, mechanisms for their biosynthesis, and concentrations in comparison with other major
food sources. This review also discussed trans- resveratrol’s major health benefits, absorption
and metabolism, processes to enhance their biosynthesis in peanuts and their potential food
applications, and methods used for its extraction and analysis.
II. TRANS-RESVERATROL AND RELATED STILBENES
A. Chemical Structure
The trans-resveratrol molecule consists of two phenolic rings linked by a styrene double
bond to generate 3, 5, 4′-trihydroxystilbene (Figure 2.1). The double bond facilitates trans and
cis isomeric forms of resveratrol (Aggarwal et al., 2004) with the trans isomer as stearically the
more stable form (Trela and Waterhouse, 1996) and therefore occurs predominantly in nature;
and more biologically active (King et al., 2006). Trans- resveratrol is commercially available as
an off-white powder, when extracted using methanol, with a molecular weight of 228 and a
melting point of 253-255oC (Aggarwal et al., 2004).
Trela and Waterhouse (1996) investigated the isomeric molar absorptivities and stability of
trans-resveratrol. They found that standard solutions of trans-resveratrol in 100% ethanol, in

10
cis-resveratrol trans-resveratrol
cis-3,5,4′-trihydroxystilbene trans-3,5,4′-trihydroxystilbene
trans-piceid cis-piceid trans-5,4′-trihydroxystilbene-3-O-β-
glycopyronoside cis-5,4′-trihydroxystilbene-3-O-β-
glycopyronoside
Figure 2.1 Structures of trans- and cis- resveratrol and piceid.

11
sealed, light-proof containers were stable for three months when stored at -5oC and protected
from light, except in high-pH buffers. Trela and Waterhouse (1996) reported that the trans form
was converted to a maximum of 90.6% cis isomer after exposure to UV irradiation at 366 nm for
100 min, and only up to ≤63% cis-resveratrol at lower wavelength of 254 nm even after 10 h.
When exposed to fluorescent light, trans-resveratrol standard solutions were isomerized to about
80% cis form over 30 days. Cis-resveratrol was extremely light-sensitive which made it difficult
to purify, remains stable in the dark only near neutral pH, and isomerized to trans form at low
pH (Trela and Waterhouse, 1996).
Trans-resveratrol is a better free radical scavenger compared to Vitamins E or C, but has
similar activity as the flavonoids, epicatechin and quercetin (Stojanovic et al., 2001). Their
antioxidant activities are believed to be due to their amphiphatic character with both hydrophilic
and hydrophobic sites, which allow more effective oxidative protection for cellular and
subcellular membrane components from oxidation compared to vitamin E (Sun et al., 1997).
The 4′-hydroxyl group of resveratrol was more reactive than the 3- and 5-hydroxyl groups
(Figure 2.1) because of resonance effects (Aggarwal et al., 2004). In terms of its antioxidant
activity, the 4′-hydroxyl group is the most important functional group in resveratrol as it is most
reactive in scavenging free radicals compared to the 3′-hydroxyl group (Regev-Shoshani et al.,
2003).
B. Synthetic Preparations of Resveratrol
Six analogues of resveratrol were synthetically prepared by Matsuoka et al., (2002). Those
containing 4′-hydroxyl group were found genotoxic, based on their positive reactions to three
genotoxicity tests including chromosomal aberration, micronucleus, and sister chromatid
exchange tests in a Chinese hamster cell line, and are therefore considered “unbeneficial” to

12
humans (Matsuoka et al., 2002). Among the six analogues of synthetic resveratrol, both 3, 4′-
dihydroxy-trans-stilbene and 4′-hydroxy-trans-stilbene showed clear positive genotoxicity
responses in a concentration-dependent manner in all three tests but the 4′-hydroxyl analogue
was the most genotoxic. The other four analogues without 4′-hydroxy group were not genotoxic.
These findings may suggest that naturally produced resveratrol is safer and beneficial to humans
than some synthetic forms which may be toxic.
C. Derivatives of Resveratrol
Resveratrol is the parent compound of a family of molecules, including glucosides and
polymers existing in cis and trans configurations in a narrow range of spermatophytes or seed
bearing plants (Soleas et al., 1997). A few naturally occurring derivatives of trans-resveratrol
such as piceid and piceatannol, have been identified, in which one or more of the hydroxyl
groups are substituted with sugars, methyl, methoxy or other residues (Soleas et al., 1997) with
antioxidant and biological activities as well as water solubility and bioavailability different from
the parent aglycon (Regev-Shoshani et al. 2003).
Piceid or 5, 4′-dihydroxystilbene-3-O-β-D-glucopyranoside (Rogev-Shoshani et al., 2003) is
the bound glucoside of resveratrol in cis and trans configuration (Figure 2.1), found in peanuts
(Ibern-Gomez et al., 2000), grapes, and wines (Lamuela-Raventos et al., 1995; Abert-Vian et al.,
2005). In piceid, a glucose moiety replaces the hydrogen of the OH-group at the meta position
of resveratrol. Piceid has received as much attention as resveratrol because its concentration is
usually significantly higher than resveratrol in grape products (Waterhouse and Lamuella-
Raventos, 1994). The relative distribution between piceid and resveratrol in wines is dependent
on a number of factors such as fermentation and ecological conditions such as region of growth
(Moreno-Labanda et al., 2004).

13
Piceatannol, 3,4,3′,5′-tetrahydroxy-trans-stilbene, is a resveratrol derivative obtained in
peanut roots, stems and leaves (Lin et al., 2007) and in high amounts in UV-irradiated peanut
callus (Ku et al., 2005; Lin et al., 2007). Piceatannol differs from resveratrol by having an
additional hydroxy group in one of the aromatic rings (Figure 2.2).
Peanuts that were imbibed, sliced, and then allowed for natural microflora or inoculated
microorganisms to grow produced several resveratrol derivatives. Keen and Ingham (1976)
identified cis- and trans-isomers of 3, 5, 4′-trihydroxy-4-isopentenylstilbene, which was later
named as Arachidin II (Arora and Strange, 1991), from the germinating American peanut seeds
challenged with native microflora. In sliced fully imbibed peanut kernels where natural
microflora were allowed to grow, Aguamah et al. (1981) isolated three resveratrol derivatives,
namely: a) Arachidin I or trans- 4-(3-methyl-but-1-enyl)-3,5,3′,4′-tetrahydroxy-stilbene; b) 4-(3-
methyl-but-1-enyl)-3,5,4′-trihydroxy stilbene (4-isopentenylresveratrol); and c) 4-(3-methyl-1-
butenyl)-3,5,4′-trihydroxy stilbene. Arachidin I, Arachidin II, and Arachidin III were also
isolated from fully imbibed and sliced peanut kernels incubated for 0 to 144 h at 25 and 37oC
(Wotton and Strange, 1985). The cis and trans isomers of 3, 5, 4′-trihydroxy-4-isopentylstilbene
were identified by Keen and Ingham (1976) from germinating American peanut seeds challenged
with native microflora which later named as Arachidin II by Arora and Strange (1991). Cooksey
et al. (1988) quantified 3-isopentadienyl-4, 3′, 5′-trihydroxystilbene, which was later named as
Arachidin IV by Arora and Strange (1991), from fully imbibed and sliced peanut kernels
incubated for 24 and 48 h at 25oC. Resveratrol derivatives, trans-3-isopentadienyl-4,3,5′-
trihydroxystilbene and trans-4-(3-methyl-butyl-enyl)-3,5′,4′-trihydroxystilbene (trans-arachidin-
III) were isolated from fully imbibed and sliced peanut kernels inoculated with Aspergillus flavus
and Aspergillus parasiticus (Sobolev et al., 1995).

14
Figure 2.2 Structures of resveratrol derivatives found in peanuts.

15
D. Biosynthesis of Resveratrol
Resveratrol is produced as a defense response to biotic and abiotic stresses. It is synthesized
by plants from the condensation of one molecule of ρ-coumaroyl CoA and three molecules of
malonyl CoA by the action of the enzyme, stilbene synthase (Figure 2.3; Soleas et al., 1997).
The ρ-coumaroyl CoA is derived from phenylalanine, an amino acid synthesized in plants from
sugars via the shikimate pathway while malonyl CoA is derived from the elongation of acetyl
CoA. Phenylalanine is converted to cinnamic acid by losing its amino group through oxidative
deamination, catalyzed by enzyme phenylalanine ammonia lyase. Cinnamic acid is then
enzymatically hydroxylated to ρ-coumaric acid by cinnamate-4-hydroxylase generating ρ-
coumaroyl CoA from the free co-enzyme by CoA ligase. For each molecule of trans-resveratrol
synthesized, four molecules of CO2 are released.
Biosynthesis of resveratrol specifically requires stilbene synthase (Aggarwal et al., 2004).
Resveratrol synthase is normally unexpressed and inducible only by a range of biotic, such as
infection, and abiotic stresses which include UV irradiation (Soleas et al., 1997). Soleas et al.
(1997) reported that after exposure of cultured peanut cells to sterilized insoluble fungal cell
walls, increase in stilbene synthase was detected after 40 min, and was 30-fold above the
baseline after 2h. The first increase in translatable mRNA for stilbene synthase occurred within
20 min after application of the fungal cells. A stilbene synthase purified from peanut cell
cultures was at least 10 times more active in producing resveratrol than other stilbenes (Soleas et
al., 1997).
When the gene from peanuts that codes for stilbene synthase was transferred to tobacco plant
together with a chimeric kanamycin-resistant gene, rapid expression of stilbene synthase with the
accumulation of trans-resveratrol in tobacco cells occurred on exposure to UV (Hain et al, 1990).

16
Figure 2.3 Biosynthesis of trans-resveratrol from one molecule of 4-coumaryl CoA and
three molecules of malonyl (Soleas et al., 1997).

17
Stilbene synthase mRNA was detected 10 min after UV irradiation reaching a maximum
between 2 and 8 h, and ceasing after 24 h (Hain et al, 1990).
Chung et al. (2003) investigated the regulation of resveratrol synthesis in peanut plants
grown in the glasshouse and in the field. They reported that resveratrol and resveratrol synthase
(RS) mRNA were relatively abundant in roots and shells of peanut plants grown up to mid-
maturity (40 days after flowering) compared to seed coats and seeds, indicating tissue-specific
regulation of resveratrol synthesis. The levels of resveratrol in leaves, pods, and roots were 2.05,
1.34, and 1.19 µg/g fresh weight, respectively. In the pod, resveratrol concentrations were 2.60,
0.06 and 0.05 µg/g fresh weight in the shell, developing seed, and seed coat, respectively.
Mature peanut seeds had lower trans-resveratrol concentrations of 0.03-0.14 µg/g seed. A
correlation existed between resveratrol and resveratrol synthase mRNA accumulation, indicating
that resveratrol synthesis was regulated through the transcriptional control of resveratrol synthase
genes. Chung et al. (2003) concluded that resveratrol was accumulated by elicitors and abiotic
stresses such as wounding and UV light through the expression of resveratrol synthase genes in
peanut leaves and roots. Peanut shells contain conjugated resveratrol at about half the amount of
the free form mostly present in other peanut tissues. Resveratrol synthesis by the expression of
resveratrol synthase in peanut tissues provides resistance to pathogen infection through direct
antifungal effect of resveratrol, and the reinforcement of shells by the synthesis of cell wall
materials, with resveratrol as an intermediate.
The biosynthesis of trans-resveratrol was observed in sliced peanuts after UV exposure,
increasing by 6-fold to 3.42 μg/g from 0.48 μg/g in untreated controls (Rudolf and Resurreccion,
2005). Similarly, trans-resveratrol synthesis occurred in table grapes irradiated with 510W UV
lamp for 30 s at a distance of 40 cm followed by 3 days of incubation which resulted in 11-fold

18
increase (Cantos et al., 2001). In peanut leaves, a 200-fold trans-resveratrol increase was
observed after exposure to UV light at 1.35 μE (m2/s) for 2 h which was much higher than 20-
fold increase in response to paraquat and 2-9 fold increase due to wounding (Chung et al., 2003).
Arora and Strange (1991) investigated the phytoalexins synthesis in peanuts during pod
development from stage 1 (youngest developing pods) to stage 8 (mature), and reported that the
capacity of peanuts to synthesize was reduced as they develop from stage 1 to 4 but increased
thereafter from stage 5 (cotyledons are clearly seen) to stage 8. When mature peanuts at stages 6
and 8 were divided into pod, testa, and cotyledons, Arora and Strange (1991) found that mature
pods and testas lost their abilities to synthesize phytoalexins whereas mature cotyledons
increased synthesis.
E. Concentrations in Peanuts
Resveratrol, piceid, and other stilbenes are naturally present in edible and inedible parts of
peanut plant (Table 2.2). Being a source of these bioactive compounds, attention had been
focused on the role of peanuts as phytochemicals with human health benefits and led to
investigations on methods that will efficiently extract and quantify them in peanuts and peanut
plant materials. This also led researchers to develop processes utilizing various parts of the
peanut plant to elevate concentrations of resveratrol and its derivatives.
1. Edible peanuts
1.1 Raw peanut kernels
Phytoalexin concentrations in peanuts were influenced by cultivar, length of storage, and
viability of peanuts (Arora and Strange, 1991), therefore variability in the amounts of trans-
resveratrol in peanuts are expected as shown in Table 2.2. Earlier reports by Sanders et al. (2000)
indicated that trans-resveratrol concentrations in raw peanuts ranged from 0.02 to 0.31µg/g in 14 of

19
Table 2.2 Concentrations of trans-resveratrol and other stilbenes found in peanuts and in edible and inedible peanut plant materials.
Compound Source
Name Concentration (µg/g)
Reference
A. Edible Peanuts
1. Raw Peanut Kernels
Runners, 6 cultivars, cold stored for ~3 years
Trans-resveratrol 0.022 - 0.069 Sanders et al., 2000
Spanish, 5 cultivars, cold stored for ~3 years
Trans-resveratrol 0.023 - 1.792 Sanders et al., 2000
Virginia, 4 cultivars, cold stored for ~3 years
Trans-resveratrol 0.048 - 0.306 Sanders et al., 2000
Spanish, 7 cultivars
Trans-resveratrol 0.09 - 0.30
Lee et al., 2004
Virginia, 8 cultivars
Trans-resveratrol 0.1 - 0.25
Lee et al., 2004
6 varieties and 4 market samples
Trans-resveratrol 0.03 - 1.92 Tokusoglu et al., 2005
Runners, Georgia Green
Trans-piceid 0.03 Sales and Resurreccion, 2009
Runners, Georgia Green
Trans-piceid 0.07 Sales and Resurreccion, 2009
2. Peanut Products
2.1 Roasted Peanut Kernels
Commercial brands (n=8)
Trans-resveratrol
0.18 - 0.80 Sobolev and Cole, 1999
Commercial brands in Korea
Trans-resveratrol
trace amounts to 0.13 Lee et al., 2004

20
Table 2.2 continued…
Compound Source
Name Concentration (µg/g)
Reference
2.2 Peanut Butter
Commercial brands (n=15)
Trans-resveratrol
0.148 – 0.504 Sobolev and Cole, 1999
Commercial brands (n=6)
Trans-resveratrol 0.27 - 0.70 Lee et al., 2004
Commercial brands, blended (n=7)
Trans-resveratrol
0.265 - 0.671 Ibern-Gomez et al., 2000
Commercial brands 100% natural (n=7)
Trans-resveratrol
0.534 - 0.753
Ibern-Gomez et al., 2000
Commercial brands, blended (n=7)
Trans-piceid 0.067 - 0.187
Ibern-Gomez et al., 2000
Commercial brands 100% natural (n=7)
Trans-piceid 0.073 - 0.225
Ibern-Gomez et al., 2000
2.3 Boiled Peanuts
Boiled peanuts Trans-resveratrol 0.02 - 1.79 Vayndorf, 2005
Boiled peanuts, canned, commercial brands Kernels Hulls Liquid
Trans-resveratrol 1.779 - 7.092 2.415 - 7.873 0.048 - 0.064
Sobolev and Cole, 1999
B. Inedible Peanut Materials
1. Peanut skins (seed coats)
Runner variety Trans-resveratrol 0.51
Sanders et al., 2000

21
Table 2.2 continued…
Compound Source
Name Concentration (µg/g)
Reference
Trans-resveratrol Runner variety 4.30 Francisco and Resurreccion, 2009b
Virginia variety Trans-resveratrol 3.66 Francisco and Resurreccion, 2009b
Virginia variety Trans-resveratrol 0.78
Sanders et al., 2000
Spanish variety Trans-resveratrol 15.04 Francisco and Resurreccion, 2009b
Jinpoong variety (South Korea)
Trans-resveratrol 0.05 (fresh weight)
Chung et al., 2003
Florunner variety Trans-resveratrol 9.07 Nepote, et al., 2004
Florunner, in ethanolic extract
Trans-resveratrol 91.4
Nepote, et al., 2004
Variety not specified
Trans-resveratrol
Not reported Yu et al., 2005
2. Peanut leaves
Jinpoong variety (South Korea)
Trans-resveratrol 2.05 (fresh weight)
Chung et al., 2003
3. Peanut roots
Jinpoong variety (South Korea)
Trans-resveratrol 1.19 (fresh weight)
Chung et al., 2003
Tainan variety (Taiwan)
Trans-resveratrol 39 to 1330 Chen et al., 2002
4. Peanut hulls
Peanut hulls (in boiled peanuts)
Trans-resveratrol 2.415-7.873 Sobolev and Cole, 1999
Peanut hulls (shells)
Trans-resveratrol 2.60 (fresh weight)
Chung et al., 2003

22 15 cultivars of three market types of raw peanuts. The trans-resveratrol content of 1.79 µg/g was
way above range and reported for only one, a small white Spanish cultivar sample (Sanders et al.,
2000) and therefore excluded from the range above. Later as equipment and procedures for
extraction and analysis of these stilbenes became more sophisticated, a higher range of 0.09 to 0.30
µg/g trans-resveratrol was obtained in raw peanuts (Lee et al., 2004). Even higher concentrations
were later reported from the analyses of six varieties and four market samples of raw peanuts
ranging from 0.03-1.92 µg/g, with an average of 0.84 µg/g (Tokusoglu et al., 2005). Peanut
cultivars PI 337394F and J11 reported to have resistance to seed colonization by A. flavus and
aflatoxin contamination, accumulated more than three times as much Arachidin IV as the susceptible
cultivars Gangapuri and TMV2 (Arora and Strange, 1991).
The observed differences in trans-resveratrol and phytoalexins concentrations may also be
attributed to the maturity and quality of the peanuts. Sobolev and Cole (1999) found that small seeds
which were associated with immature peanuts have greater capacity for phytoalexin production than
larger or mature peanuts. In terms of quality, discolored yellow inedible split peanuts contain higher
amounts of trans-resveratrol up to 7.09 µg/g compared to 0.23 µg/g in non-discolored splits (Sobolev
and Cole, 1999).
Conflicting effects of storage on the concentrations of trans-resveratrol in peanuts were
reported in the literature. Peanuts from 15 cultivars and three market types, which had been cold
stored for up to 3 years had higher trans-resveratrol of 0.02 – 1.79 µg/g compared to raw
unstored peanuts containing 0.03 to 0.15 µg/g (Sanders et al., 2000). This finding contradicts the
earlier report that peanuts stored at 15°C for 9 months drastically reduced their ability to
synthesize phytoalexins (Arora and Strange, 1991). Similarly, Potrebko and Resurreccion (2009)

23 found that peanuts stored for 13 months and then roasted, had lower trans-resveratrol
concentration of 0.016 μg/g compared to 0.03 μg/g in peanuts stored for only 6 months.
In terms of viability of peanut seeds, viable sliced peanuts accumulated higher total
phytoalexins of as much as 5.29 μM/g compared to non-viable sliced seeds with 0.716 μM/g
(Arora and Strange, 1991). Their results indicated that peanuts seeds should be viable for the
maximum biosynthesis of phytoalexins in peanuts.
1.2 Roasted peanuts
Trace amounts to 0.13 µg/g trans-resveratrol were found in roasted peanuts (Lee et al. 2004)
which were within the values of 0.10 to 0.80 µg/g earlier reported by Sobolev and Cole (1999).
The concentrations of trans-resveratrol in roasted compared to raw Virginia and Spanish peanuts
decreased by about half indicating that roasting decreased the concentrations of trans-resveratrol
in peanut (Sanders et al., 2000). This contradicts the findings of Rudolf (2003) who reported that
roasting significantly increased trans-resveratrol in ultrasound stressed peanuts from 2.73 to 6.8
µg/g trans-resveratrol before and after drying and roasting, respectively. Roasting considerably
increased the concentrations of coumaric acid, a phenolic acid, from 28.3 and 23.2 µg/g in raw
normal and high oleic peanuts to 78.5 and 62.7 µg/g in roasted samples, respectively (Talcott et
al., 2005b).
1.3 Peanut butter
Trans-resveratrol contents in commercial peanut butters ranged from 0.265 to 0.671 µg/g in
blended type (stabilizer added ), 0.577 to 0.753 µg/g in 100% natural peanut butter (Ibern-
Gomez et al., 2000), and in Korean commercial peanut butters, from 0.27 to 0.70 µg/g (Lee et al.
2004). Earlier, slightly lower range of trans-resveratrol concentrations of 0.148 to 0.504 µg/g
from commercial peanut butter samples were reported (Sobolev and Cole, 1999). Differences in

24 the values obtained by these investigators may be due to the efficiency of the methods of
extraction, the analytical methods used for analysis, and the quality of raw materials used in the
preparation of the peanut products.
Trans-piceid in peanuts was first reported by Ibern-Gomez and co-workers (2000). Natural
peanut butters contained 0.073- 0.225 µg/g trans- piceid which were higher than the 0.067-0.187
µg/g in blended peanut butters (Ibern-Gomez et al. 2000). These levels of trans-piceid are about
one third lower than that of trans-resveratrol found in the same samples of peanut butter.
Recently, slightly higher trans-piceid concentrations of 0.36 or 0.46 µg/g, were reported in
peanuts treated by UV and ultrasound, respectively (Potrebko and Resurreccion, 2009). Even
higher amounts of trans-piceid were observed in peanuts stressed by 27 treatments of UV and
ultrasound with concentration ranges of 0.35-1.05 and 0.16-6.39 µg/g, respectively (Sales and
Resurreccion, 2009).
1.4 Boiled peanuts
Among commercial peanut surveyed, Sobolev and Cole (1999) found the highest trans-
resveratrol concentrations of 1.779 to 7.092 µg/g in canned boiled peanuts. These authors
attributed this to the presence of low quality kernels, such as small, immature, and mechanically
damaged pods in boiled peanuts which were normally sorted out when manufacturing roasted
peanuts and peanut butter. In the same study, resveratrol concentrations in raw shelled peanuts
generally increased with decreasing seed size which usually associated with more immature
peanuts; and highest concentrations were found in discolored seeds (Sobolev and Cole, 1999).
1.5 Peanut sprouts
Peanut sprout is a novel product from peanuts being developed as a functional vegetable and
found to have trans-resveratrol up to as much as 11.7 to 25.7 µg/g in experimental samples of

25 three cultivars peanut seeds germinated for a maximum of 9 days in the dark compared to initial
concentrations of 2.3 to 4.5 µg/g (Wang et al., 2005). Among the sprout components, trans-
resveratrol was found highest in the cotyledons with 12.0-47.1 µg/g, slightly lower in roots with
7.9 to 18.6 µg/g, and none in the stems (Wang et al., 2005).
2. Inedible parts of peanut plant
Inedible peanut plant materials like leaves (Chung et al., 2003), roots (Chung et al., 2003;
Chen et al., 2002), hulls (Sobolev and Cole, 1999; Chung et al., 2003) and skins (Francisco and
Resurreccion, 2009a; Nepote et al. 2004) contain beneficial phenolic compounds (Table 2.2).
Recently, research studies on methods to enhance the concentrations of bioactive components in
inedible plant materials are increasing due to their potential as natural inexpensive sources of
dietary functional compounds for use as ingredient for dietary supplements and food product
formulations. Peanut skins, the by-product in the manufacture of peanut butter and other peanut
products are used as animal feed of low economic value (Nepote et al., 2004) or discarded as
waste.
2.1 Peanut skins
Peanut skins are a good source of polyphenolic compounds containing 90-125 mg total
phenolics/g (Yu et al., 2005). Polyphenols found by Yu et al. (2005) include the stilbene trans-
resveratrol; phenolic acids-chlorogenic, caffeic, coumaric, and ferulic acids; and the flavonoids -
epigallocatechin, epicatechin, catechin gallate, and epicatechin gallate. Francisco and
Resurreccion (2009b) identified and quantified trans-resveratrol, three phenolic acids, and five
flavonoids in skins of three U. S. peanut varieties using a reversed phase HPLC which they
developed for the simultaneous analysis of 16 phenolic compounds. They found that trans-
resveratrol was higher in Spanish skins (15.04 µg/g) followed by Runners (4.3 µg/g) and

26 Virginia (3.66 µg/g). The highest protocatechuic acid was obtained from Virginia (34.04 µg/g),
followed by Spanish (15.45 µg/g) and lowest in Runner skins (7.62 µg/g). Caffeic acid (3.49
µg/g) was detected only in Spanish peanut skins. p-Coumaric acid was highest in Runners (32.34
µg/g), followed by Spanish (12.31 µg/g) then Virginia (4.98 µg/g). Epigallocatechin and
catechin contents were higher in Virginia (1276 and 535 µg/g, respectively) and Spanish (1275
and 448 µg/g, respectively) compared to Runner skins (440 and 74 µg/g, respectively).
Procyanidin B2, epicatechin and quercetin were highest in Spanish skins with 107, 239 and 28
µg/g, respectively compared to those in Virginia and Runners.
Skins from Argentinian peanuts had 9.07 µg/g trans-resveratrol (Nepote et al., 2004). Lower
concentrations of trans-resveratrol of 0.65 µg/g peanut skin equivalent to <0.04 µg/seed was
found by Sanders et al. (2000). Much smaller amounts of 0.05 µg/g trans-resveratrol were
reported from skins of developing seeds grown in the field (Chung et al., 2003).
Peanut skins also contain the flavonoid ethyl protocatechuate or 3, 4-dihydroxybenzoic acid
ethyl ester (Huang et al., 2003). Among the 17 fractions of compounds separated from the crude
ethanol extracts of peanut skins, fraction 17 identified as ethyl protocatechuate, had the highest
yield and the fourth highest antioxidant activity (Huang et al., 2003).
2.2 Peanut hulls
Peanut hulls contain substantial amounts of trans-resveratrol in the range of 2.4 to 7.9 µg/g
(Sobolev and Cole, 1999). Hulls from the developing seeds had relatively higher trans-
resveratrol of 2.6 µg/g fresh weight compared with those in developing seeds and seed coats of
field grown peanuts (Chung et al., 2003). Hulls from mature peanuts were found to contain the
flavonoids, luteolin at 6.0 mg/g and eriodictyol at 3.8 mg/g; and flavonoid decomposition
product, 5, 7-dihydroxychromone, at 1.49 mg/g (Daigle et al, 1988). However, a lower

27 concentration of 1.74 mg/g luteolin in peanut hulls was reported by Duh and Yen (1995). Peanut
hulls had total phenolics content of 72.9 µM/L tannic acid equivalents which increased to 90.3
µM after roasting at 150oC for 60 min (Lee et al., 2006).
2.3 Peanut roots, leaves and stems
Peanut roots contained 1.19 µg/g trans-resveratrol whereas leaves had higher amounts of
2.05 µg/g fresh weight (Chung et al., 2003). Higher resveratrol concentrations of 6.34 µg/g in
peanut roots but lower in leaves with 0.02 µg/g fresh weight was reported by Lin et al. (2007).
Peanut roots and leaves also contain piceatannol of 2.955 and 0.06 µg/g fresh weight,
respectively (Lin et al., 2007).
In UV-irradiated peanut callus, Ku et al. (2005) did not detect trans-resveratrol and
piceatannol immediately after irradiation using static cultivation, but concentrations increased up
to 11.97 µg/g and 5.31 µg/g, respectively, after 18 h of incubation. Using suspension cultures,
trans-resveratrol but not piceatannol increased up to 6.93 µg/g after 4 h from UV treatment; and
did not increase thereafter from 8 to 80 h as calluses may have received shorter UV irradiation
while constantly moving in the suspension cultures (Ku et al., 2005).
3. Other major sources of resveratrol
3.1 Grapes and wines
Resveratrol is synthesized particularly in the skins of grape berries and none to trace amounts
are present in the fruit flesh (Creasy and Coffee, 1988; Becker et al., 2003). Compared to raw,
roasted and boiled peanuts with trans-resveratrol in the range of 0.02 to 7.09 (Table 2.2), grape
skins had higher concentration up to 24.06 µg/g and contain trans- and cis piceid of 42.1992.33
µg/g, respectively, but no detectable amounts of cis-resveratrol based on 13 samples of 7
varieties of grapes analyzed (Romero-Perez et al., 2001). Grape skins are also a major food
28 source of other stilbenes including viniferins, astringin, and piceatannol or astringinin
(Bavaresco, 2003).
Stilbene synthesis in grapes depends on grape variety, environment and viticultural practices
(Bavaresco, 2003). Red grapes have higher stilbene levels than white grapes. Red varieties of
Merlot and Cabernet Sauvignon grapes contain mainly trans-piceid in the range of 1.5-7.3 µg/g
fresh weight whereas trans-resveratrol ranged from non-detectable to 0.5 µg/g fresh weight
(Burns et al., 2002). Resveratrol in Concord grape products ranged from 0.002 – 1.042 µmol/g
(1.56 – 1042 nmol/g) and 0.002 µmol/g (1.56 nmol/g) in grape juice (Wang et al. 2002). A
positive correlation existed between vineyard elevation and grape stilbene concentrations
(Bavaresco, 2003). Quality-oriented cultural practices produce grapes with higher levels of
stilbenes (Bavaresco, 2003).
Due to its presence in grape skins, resveratrol is expected in wines due to skin contact during
fermentation (Becker et al., 2003). Red wines have higher trans- resveratrol concentrations of
0.352 - 1.99 µg/mL compared with white varieties with 0.005 - 0.57 µg /mL (Gerogiannaki-
Christopoulou et al., 2006). Italian red wines contained 8.63 to 24.84 µmol/L (Wang et al.
2002). When wine is made from grapes, resveratrol is released from the skins and maceration
increased the extraction of resveratrol by 9 and 13-fold in red and white wines, respectively,
compared to nonmacerated wines (Jeandet et al., 1995). Paradoxically, lower concentrations of
resveratrol were observed in wines made from grapes highly infected with Botrytis than in those
vinted from healthy and moderately infected grapes (Jeandet et al., 1995). Wines from various
red and white grapes ranged 0.2 - 7.7 µg/mL (Aggarwal et al., 2004). In comparison, these
values were higher than in raw and roasted peanuts but comparable with that in boiled peanuts
(Table 2.2).

29
Lamuela-Raventos et al. (1995) found that cis and trans forms of resveratrol and piceid were
present in 18 varieties of Spanish red wines with resveratrol concentrations higher than piceid in
all samples. These authors postulated that the presence of cis isomers of resveratrol and piceid
in wines resulted from light exposure of must or wine during wine-making process and possibly
from light exposure of wine bottles during storage. Pinot noir wines had the highest mean trans-
resveratrol of 5.13 µg/mL compared to 3.99, 2.43, 1.42 and 1.33 µg/mL in Merlot, Grenache,
Cabernet Sauvignon, and Tempralino, respectively. The trans- piceid concentrations of 2.98
mg/L in Merlot wines was highest compared to 2.63, 2.46, 1.13, and 1.07 mg/L in Grenache,
Pinot noir, Tempranillo, and Cabarnet Souvignon wines, respectively. The ratios of trans to cis
of both resveratrol and piceid in Spanish wines were always greater than 1 and highest at 20
(Lamuela-Raventos et al., 1995).
Similarly, Burns et al. (2002) found higher amounts of trans-resveratrol compared to trans-
piceid in four red wine samples. Trans-piceid was only detected in Cabernet Sauvignon
(Bulgaria) with 1.89 µg/mL trans-piceid while the other three samples had none. The total
resveratrol or the sum of trans- and cis-resveratrol and trans-piceid in Cabernet Sauvignon, 1996
(Bulgaria) was 1.380 µg/mL. The three wines without trans-piceid were Pinot noir, 1994
(California), with the highest trans-resveratrol of 1.057 µg/mL and cis-resveratrol of 0.746
µg/mL contributing to total resveratrol of 1.803 µg/mL; Merlot, 1994 (Chile) and Cabernet
Sauvignon, 1995 (California) with 0.20 and 0.098 µg/mL total resveratrol, respectively.
3.2 Vaccinum spp. including blueberries, bilberries, and cranberries
Trans- but not cis-resveratrol was found in both fresh blueberry and bilberry samples (Lyons
et al., 2003). These researchers found considerable regional variation in the concentrations of
trans-resveratrol, with highbush blueberries from Michigan at 140.0 ± 29.9 pmol/g (or 0.00014 ±
30 0.00003 µmol/g), fresh bilberries from Poland at 71.0 ± 15.0 pmol/g (or 0.000071 ± 0.000015
µmol/g), whereas none was detected in highbush blueberries from British Columbia. The trans-
resveratrol concentrations of blueberry and bilberries are much lower compared to raw, roasted,
and boiled peanuts (Table 2). Heating by baking decreased resveratrol concentrations in
blueberries between 17 and 46% after 18 min at 190°C, and were expected to be lower compared
to fresh fruits (Lyons et al., 2003). The level of resveratrol in fresh blueberries and bilberries was
less than 10% that reported for grapes (Lyons et al., 2003).
3.3 Japanese knotweed
Resveratrol was found in the dried roots of the Japanese knotweed, Polyganum cuspidatum,
also known as Ko-jo-kon or the Itadori plant, a traditional Chinese and Japanese medicine to
treat suppurative dermatitis, gonorrhea favus, athlete’s foot, and hyperlipedemia (Aggarwal et
al., 2004). The powder of P. cuspidatum has been used in China and Japan as a treatment for
atherosclerosis, cough, asthma, hypertension, cancer and for other therapeutic purposes (Vastano
et al., 2000). However, the major stilbene found in P. cuspidatum is piceid or trans-resveratrol
glucoside (Lamuela-Raventos et al., 1995; Burns et al., 2002). Commercial Itadori root
contained 1,653 µg/g trans-piceid and 523 µg/g trans-resveratrol (Burns et al., 2002) which are
much higher than those found in raw and roasted peanuts (Table 2). Itadori tea prepared by
infusing 1 g of the commercial root preparation with 100 mL of boiling water for 5 min
contained 0.905 µg/mL trans-piceid and 0.68 µg/mL trans-resveratrol (Burns et al., 2002).
Piceid standard extracted from P. cuspidatum was used to establish the evidence for the presence
of piceid in red wines (Lamuela-Raventos et al., 1995; Brandolini et al., 2002) and peanut butter
(Ibern-Gomez et al., 2000).

31 3.4 Pistachio nuts
Pistachio nuts are also a food source of trans-resveratrol with concentrations ranging from
0.09-1.67 µg/g (mean = 1.15 µg/g) in five varieties from Turkey (Tokusoglo et al., 2005) which
were higher compared to raw and roasted peanuts, but lower than boiled peanuts (Table 2.2).
Turkish pistachios contain higher trans-resveratrol compared to 0.08-0.18 µg/g (mean = 0.12
µg/g) in 12 Sicilian varieties (Grippi et al., 2008). The difference in resveratrol concentrations
could be attributed to differences in variety, quality of nuts, and analytical methods for extraction
and analysis. The Sicilian pistachios also contained trans-piceid of 6.2 – 8.15 µg/g (mean = 6.97
µg/g) which were markedly higher than trans-resveratrol in all 12 samples examined, a result
similar to that obtained generally in red grapes where the concentration of trans-piceid is more
than its aglycon, trans-resveratrol (Grippi et al., 2008).
III. BIOAVAILABILITY AND HEALTH EFFECTS OF RESVERATROL AND OTHER
STILBENES
A. Absorption and Bioavailability
The potential health benefits of resveratrol depend, in part, upon its absorption,
bioavailability and metabolism which were characterized in several in vitro and in vivo models
(King et al., 2006). Resveratrol is absorbed and metabolized and around 75% is excreted via
feces and urine (Wenzel and Somoza, 2005). Resveratrol had lower oral bioavailability of
almost zero due to rapid and extensive metabolism and the consequent formation of various
metabolites as resveratrol glucoronide and resveratrol sulfates (Wenzel and Somoza, 2005).
Absorption and metabolism studies using an isolated rat small intestine showed that the majority
of trans-resveratrol was most likely to be absorbed in the form of resveratrol glucuronide after
crossing the small intestine (Kuhnle et al., 2000; Andluer et al., 2000). Resveratrol biovailabity

32 was 38% and its exposure was approximately 7- and 46-fold lower than resveratrol glucuronide
after intravenous and oral administration, respectively (Marier et al., 2002).
Certain studies show that absorption of some phenols is enhanced by conjugation with
glucose, so that it could be possible that trans-piceid, would be more efficiently absorbed by the
intestinal gut than its aglycon, trans-resveratrol (Ibern-Gomez et al., 2000). The human
digestive tract is known to have glucosidase activity, so it could be possible that piceid could
release resveratrol, on ingestion (Lamuela-Raventos et al., 1995; Chen et al., 2001). Henry-
Vitrac et al. (2006) found that the transepithelial transport of trans-piceid in the small intestine
and liver occurred at a high rate and the compound was deglycosylated to its aglycon in two
possible ways. The first is cleavage by the cytosolic-β-glucosidase, after passing the brush-
border membrane by SGLT1 (sodium/glucose cotransporter 1). The second is deglycosylation on
the luminal side of the epithelium by the membrane bound enzyme, lactase phlorizin hydrolase,
followed by passive diffusion of the released resveratrol which was further metabolized into two
glucuronoconjugates – trans-resveratrol-3-β-glucuronide, the major glucuronide and trans-
resveratrol-4′-O-β-glucuronide, the minor one.
The study on the cellular uptake and efflux of trans-resveratrol and trans-piceid on the apical
membrane of the human intestinal caco-2 cells showed that trans-resveratrol had a higher rate of
cellular accumulation compared to trans-piceid (Henry et al., 2005). Trans-resveratrol used
passive transport to cross the apical membrane of the cells, whereas, transport of trans-piceid
was likely active. The involvement of the active transporter SGLT1 in the absorption of trans-
piceid was deduced using various inhibitors directly or indirectly exploiting the activity of this
transporter.
33
Piceatannol, a known anticancer (Lin et al., 2007) and antileukemic agent was confirmed to
be the main metabolite in in vitro metabolism of resveratrol in rat liver microsomal incubation
(Zhu at al., 2003). This result was consistent with the findings of Potter et al. (2002) that
piceatannol was formed during in vitro metabolism of resveratrol by recombinant human
cytochrome P450 enzyme CYP1B1 (cytochrome P450 family 1, subfamily B, polypeptide 1). In
a wide variety of human tumors, the enzyme CYP1B1 is overexpressed and catalyzes aromatic
hydroxylation reactions, so in the presence of resveratrol, this enzyme catalyzes the
hydroxylation of resveratrol to form piceatannol (Potter et al., 2002).
B. Health Effects
1. Antioxidative effect
Much evidence suggests that resveratrol exerts antioxidant activity. It is a potent inhibitor of
the production of reactive oxygen species (ROS) and this inhibitory action might be the major
biochemical mechanism related to its anti-inflammatory and anti-carcinogenic activities
(Aggarwal et al., 2004). Antioxidants are substances which when present at low concentrations
compared with those oxidizable substrates, such as lipid containing polyunsaturated fatty acids,
proteins, carbohydrates or DNA, significantly delay or prevent oxidation of the substrates
(Aruoma, 2003) by inhibiting the initiation or propagation of oxidizing chain reactions (Zheng
and Wang, 2001). An imbalance between antioxidants and ROS results in oxidative stress,
leading to cellular damage (Buhler and Miranda, 2003). Oxidative stress has been linked to
cancer, atherosclerosis, ischemic injury, inflammation, and neurodegenerative diseases such as
Parkinson's and Alzheimer's, and aging, (Buhler and Miranda, 2003). Emerging literature,
pointing to the low intestinal absorbance of polyphenols, suggests that the ability of polyphenols

34 and their metabolites in vivo to interact with cell-signaling cascades, such as apoptosis and
redox-sensitive cell-signaling pathways, may be a major mechanism of action (Jang et al., 1997).
2. Cardiovascular protective effect
Cardiovascular disease (CVD) including heart disease and stroke account for 34.3% of all
deaths in the U.S., with heart disease as the first and stroke as the third leading causes of death
(CDC, 2010b). The economic burden of CVD has a profound impact on the U. S. health care
system and the cost including health expenditures and loss of productivity resulting from death
and disability was estimated to be more than $503 billion in 2010 (CDC, 2010b).
Atherosclerosis is the major cause of the coronary damages, particularly ischemic vascular
disease, resulting from the disruption of normal reactions between blood (plasmatic proteins,
lipoproteins, growth factors, lymphocytes, platelets) and normal cellular elements of the arterial
wall (Delmas et al., 2005). Resveratrol protects against atherosclerosis by reducing peroxidative
degradation of low density lipoproteins (LDL) mainly due to its capacity to chelate copper and
scavenge free radicals in vitro (Belguendouz et al., 1998; Frankel et al., 1993b). The para-
hydroxyl group appeared to show a greater radical scavenging activity than the meta-hydroxyl
groups and the spatial position of hydroxyl groups was likely more favorable to the chelation of
the trans- than in the cis-isomer (Delmas et al., 2005). Due to its hydroxylated structure,
resveratrol can form a radical derivative stabilized by the delocalization of two electrons between
the two aromatic cycles and the methylene bridge joining these two cycles (Delmas et al., 2005).
Belguendouz et al. (1998) observed that when resveratrol was added to plasma prior to
fractionation, it was more associated with lipoproteins than with lipoprotein-free proteins
revealing its lipophilic character. For a given concentration of resveratrol added to the plasma,
the amounts of resveratrol per mg lipoprotein protein increases in concentration as lipoprotein

35 density decreases; lowest with high density lipoproteins (HDL) intermediate with LDL, and
highest with very low density lipoprotein (VLDL). To test the ability of resveratrol in protecting
phospholipid polyunsaturated fatty acid (PUFA) from oxidation, phospholipid unilamellar
liposomes supplemented with resveratrol were oxidized with a water-soluble radical generator, 2,
2′-azobis (2-amidinopropane) dihydrochloride (AAPH) then thiobarbituric acid reactive
substances (TBARS) were measured. Belguendouz et al. (1998) found that resveratrol inhibited
the formation of TBARS in a linear dose-response curve when resveratrol was added up to 30
μM in the final preparation, and up to 200 μM when it was added before preparation of
liposomes, suggesting that the soluble fraction of resveratrol scavenged free radicals in the
aqueous phase before attacking PUFA within membranes. These researchers concluded that all
these results support the hypothesis that resveratrol may be efficient at different sites in the cell,
in the protein and lipid moieties of LDL and in their aqueous environment.
The stimulation of the expression and activity of endothelial nitric oxide synthase (eNOS)
contributes to the cardiovascular disease protection from LDL oxidation (Wallerath et al., 2002).
In their study, Wallerath et al. (2002) found that after incubation of human umbilical vein
endothelial cells with resveratrol, increase in eNOS mRNA expression up to 2.8 fold in a time-
and concentration-dependent manner was observed. eNOS protein expression and eNOS-
derived nitric oxide production were also increased after long term incubation with resveratrol.
Resveratrol also stabilized mRNA. These results indicate the cardiovascular protective effect of
resveratrol.
Myocardial preconditioning is the exposure of myocardial tissue to brief, repeated periods of
vascular occlusion in order to render the myocardium resistant to the deleterious effects of
prolonged episodes of ischemia or reperfusion (Kalikiri and Sachan, 2004). The period of pre-

36 exposure and the number of times the tissue is exposed to ischemia and reperfusion vary, the
average being 3 to 5 minutes (Kalikiri and Sachan, 2004). Resveratrol protects the heart by pre-
conditioning it through the activation of adenosine A1 and A3 but not A2a receptors (Das et al.,
2004). Adenosine A1 transmits a survival signal through phosphatidylinositol (PI)3-kinase-Akt-
Bcl-2 signaling pathway whereas Adenosine A3 protects the heart through a cAMP response
element binding protein (CREB)-dependent Bcl-2 pathway in addition to an Akt-Bcl-2 pathway
(Das et al., 2004).
Squalene monooxygenase is a flavin adenine dinucleotide (FAD) - containing microsomal
enzyme that catalyzes the second step in the committed pathway for cholesterol biosynthesis
(Laden and Porter, 2001). Resveratrol prevents the action of human squalene monooxygenase in
a noncompetitive manner with respect to both squalene, Ki=35 micromolar and FAD, Ki=69
micromolar.
3. Cancer prevention and therapy
Cancer is the second leading cause of death in the United States (CDC, 2010a). According to
the United States Cancer Statistics: 2006 Incidence and Mortality, which tracks cancer incidence
for about 96% of U.S. population and mortality for the entire country, more than 559,000
Americans died of cancer and more than 1.37 million had a diagnosis of cancer in 2006 (CDC,
2010a). The financial cost of cancer was estimated at $228 billion in 2008 (CDC, 2010a).
In 1997, Jang et al. published a paper describing the ability of resveratrol to inhibit diverse
cellular events associated with the three major stages of carcinogenesis – initiation, promotion,
and progression which undoubtedly fired the imagination of the cancer chemoprevention
research community (Escher and Steward, 2003). Agawam et al. (2004) conducted a
comprehensive review of the role of resveratrol in prevention and therapy of a wide variety of

37 cancers including lymphoid, myeloid, multiple myeloma, breast, prostate, and stomach, colon,
pancreas, thyroid, melanoma, head and squalors cell carcinoma, ovarian and cervical carcinoma.
In their review, Agawam et al. (2004) reported that resveratrol induces apoptosis or initiation of
cell death from inside of the cells, primarily from mitochondria, through a variety of pathways.
Resveratrol suppresses the activation of transcription factors, nuclear factor kappa B (NF-κB)
that regulates the expression of various genes involved in inflammation, cytoprotection and
carcinogenesis (Holmes-McNary and Baldwin, 2000); activator protein-1 (AP-1), a transcription
factor transactivated by many tumor-promoting agents such as phorbol ester, UV radiation,
asbestos and crystalline silica (Manna et al., 2000; Eferl and Wagner, 2003); and early growth
response-1 (Egr-1) gene, a transcription factor belonging to a family of immediate early response
genes that regulates a number of pathophysiologically relevant genes that are involved in growth,
differentiation, immune response, wound healing and blood clotting (Regione et al., 2003).
Resveratrol inhibits the activities of mitogen-activated protein kinases (MAPK) including
extracellular receptor kinase (ERK 1/2) implicated in the proliferation of cells (Miloso et al.,
1999), c-Jun N-terminal kinase (JNK), and p38 MAPK which are responsible for the activation
of AP-1 (She et al., 2001); protein kinases which play a major role in tumorigenesis (Garcia-
Garcia et al., 1999; Stewart et al., 1999); growth factor and associated tyrosine kinases that
mediate various growth factors for a variety of tumor cells (Kaneuchi et al., 2003);
cyclooxygenase-2 (COX-2) and lipoxygenase (LOX) which play important roles in inflammation
of cells (Subbaramiah et al., 1998); and cell cycle proteins that inhibit cell proliferation (Wolter
et al., 2001; Yu et al., 2003).
Resveratrol suppresses the activities of cell surface adhesion molecules, including
intracellular adhesion molecule (ICAM)-1, vascular cell adhesion molecule (VCAM)-1, and

38 endothelial-leukocyte adhesion molecule (ELAM)-1 which play essential role in adhesion of
tumor cells to endothelial cells (Ferrero et al., 1998; Pendurhi et al., 2002); androgen receptors
that play a role in prostate cancer etiology (Mitchell et al., 1999); and prostate specific gene
(PSA) (Hsieh et al., 2000). It also prevents expression of inflammatory cytokine (Wang et al.,
2001).
Resveratrol suppresses angiogenesis, a process of formation of blood vessel that is mediated
through modulation of proliferation and gene expression by endothelial cells (Szende et al.,
2000; Igera et al., 2001) which plays an important role in tumor growth, other diseases and
wound healing (Aggarwal et al., 2004). It also prevents inflammation, by activating NF-κB,
suppressing proinflammatory cytokines such as tumor necrosis factor (TNF) and interleukin (IL)
-6 (Aggarwal et al., 2004; Wang et al., 2001), and suppressing the expression of proteins such as
iNOS, COX-2, and 5-LOX that mediate inflammation (Kimura et al., 1995; Kimura et al., 1983).
Resveratrol modulates the expression of nitric oxide (NO) and nitric oxide synthase (NOS).
NO mediates antiproliferative effects in various cell types and has proinflammatory effects.
Resveratrol both enhances and suppresses production of NO (Kageura et al., 2001; Hsieh et al.,
1999).
Piceatannol, a resveratrol derivative extracted from UV-induced peanut calluses was found to
be a more efficient inducer of apoptosis in an ex- vivo assay of primary lymphoblasts than
resveratrol (Ku et al., 2005). It has been demonstrated that resveratrol can be converted into
piceatannol by cytochrome P450 enzyme CYP1B1 (Ku et al., 2005). Piceatannol is a potent
inhibitor of the activity of protein tyrosine kinases which are positive regulators of cell
proliferation (Geahlen and McLaughlin, 1989). Both resveratrol and piceatannol induce

39 apoptosis in many cancer cell lines although there are reports that piceatannol is a more efficient
inducer of apoptosis (Lin et al., 2007).
4. Phytoestrogen activity
Resveratrol is categorized as a phytoestrogen with structure similar to a synthetic estrogen,
diethylstilberol, and exhibited variable degrees of estrogen receptor agonism in different test
systems (Gehm et al., 1997). In their study using human breast cancer cells, Gehm et al (1997)
found that resveratrol inhibited the binding of labeled estradiol to the estrogen receptor and it
activated transcription of estrogen-responsive reporter genes transfected into the cancer cells.
Resveratrol functioned as a superagonist producing a greater maximal transcriptional response
than estradiol in some cell types (e.g., MCF-7 cells), whereas, in others, it produced activation
equal to or less than that of estradiol. Gehm et al. (1997) found that resveratrol increased the
expression of native estrogen-regulated genes and stimulated proliferation of estrogen-dependent
T47D human breast cancer cells, which contradicted Jang et al (1997) who observed the
anticarcinogenic effect of resveratrol in mouse mammary cultures. Ghem et al. (1997) explained
this apparent contradiction that although many human breast cancer cells were mitogenically
stimulated by estrogen, most mouse mammary cancers are estrogen insensitive.
Lu and Serrero (1999) observed that resveratrol inhibits the growth of estrogen-receptor (ER)
positive MCF-7 cells in a dose dependent fashion. Resveratrol antagonized the growth
promoting effect of 17-β-estradiol (E2) in a dose dependent manner at both cellular (cell growth)
and the molecular (gene activation) levels. At the cellular level, the antiestrogenic effect of
resveratrol that abolished the growth-stimulatory effect mediated by E2, was observed at
concentrations ≥ 10-6 M. At the molecular level, resveratrol antagonized the stimulation by E2 of
progesterone receptor gene expression in MCF-7 cells. Furthermore, resveratrol inhibited the
40 expression of transforming growth factor-α and insulin-forming growth factor I receptor mRNA
while significantly elevating the expression of transforming growth factor β2 mRNA. These
results showed that resveratrol is a partial estrogen receptor itself, acting as an estrogen receptor
antagonist in the presence of estrogen leading to inhibition of human breast cells (Lu and
Serrero, 1999).
5. Treatment of Alzheimer’s disease
Alzheimer’s disease (AD) is a progressive neurodegenerative disorder leading to the most
common form of dementia (Marambaud et al., 2005). Beta-amyloid peptide is considered to be
responsible for the formation of senile plaques that accumulate in the brains of patients with AD
(Jang and Surh, 2003). There has been compelling evidence supporting the idea that beta-
amyloid-induced cytotoxicity is mediated through the generation of reactive oxygen
intermediates, ROIs (Jang and Suhr, 2003).
Considerable attention was focused on identifying phytochemicals that are able to scavenge
excess ROIs, thereby protecting against oxidative stress and cell death. Jang and Suhr (2003)
found that cultured rat pheochromocytoma (PC12) cells treated with beta-amyloid exhibited
increased accumulation of intracellular ROI and underwent apoptotic death as determined by
characteristic morphological alterations and positive in situ terminal end-labeling. The beta-
amyloid treatment also led to the decreased mitochondrial membrane potential, cleavage of poly
(ADP-ribose) polymerase, an increase in the Bax/Bcl-XL ratio, and activation of JNK.
Resveratrol attenuated beta-amyloid-induced cytotoxicity, apoptotic features, and intracellular
ROI accumulation. Beta-amyloid transiently induced activation of NF-қB in PC12 cells, which
was suppressed by resveratrol pretreatment.

41
Marambaud et al. (2005) showed that resveratrol has potent anti-amyloidogenic activity by
reducing levels of intracellular beta amyloid peptide. Resveratrol promotes the intracellular
degradation of beta amyloid peptide by a mechanism that implicates the proteosome. Evidence
is compelling that a decrease in proteasome activity occurs in brains of individuals with AD. It
has been proposed that beta amyloid itself may lead to proteosome inhibition suggesting that
high levels of beta amyloid in AD brains may create a vicious cycle by inhibiting the proteosome
and blocking the degradation of critical regulators of its own clearance.
6. Anti-aging property
Caloric restriction, a drastic, 30-40% reduction in daily caloric intake to a level that provides
all nutrients sufficient for a healthy life, has been implicated in extending the lifespan. Delmas et
al. (2005) reported that under caloric restriction, the altered oxygen consumption modifies the
NAD+/NADH ratio and leads to an NAD+-dependent activation of sirtuin, an evolutionary
conserved enzyme family which chemically modifies proteins, especially p53, the tumor
suppressor involved in longevity. Resveratrol and related compounds were recently shown to
mimic caloric restriction by lowering the Michaelis constant of sirtuin for both the NAD+ and
the acetylated substrates leading to a sirtuin-dependent deacetylation of p53 both in yeast and in
human cell cultures (Delmas et al., 2005). Resveratrol also increased the DNA stability as shown
by a strong decrease in the rDNA frequency.
Resveratrol increased the lifespan of brewer’s yeast, Saccharomyces cerevisiae by 70%;
roundworm, Caernorhabditis elegans by 14%, and fruit fly, Drosophila melanogaster by 29%
(Delmas et al., 2005) implicating its potential as an anti-aging agent in treating age-related
human diseases through the stimulation of Sirtuin (Sir) 2 activity (De la Lastra and Villegas,

42 2005). The lifespan extension in these organisms was dependent on Sir2, a conserved
deacetylase proposed to underlie the beneficial effects of caloric restriction (Baur et al., 2006).
In a more recent study, Baur et al., (2006) reported that resveratrol shifts the physiology of
middle aged mice on a high-calorie diet towards that of mice on a standard diet which
significantly increase their survival. Resveratrol produced changes associated with extended
lifespan of mice including increased insulin sensitivity, reduced insulin-like growth factors-1
(IGF-1), increased activities of AMPK and PGC-1 alpha (peroxisome proliferators-activated
receptor-gamma coactivator 1 aplha), increased mitochondrial number, and improved motor
function.
7. Other health effects
7.1 Analgesic effect or anti-pain property
Trans-resveratrol’s analgesic effect was reported to be mediated via an opioidergic
mechanism (where opiods attenuate or weaken the affective component of pain) and produces
tolerance to its analgesic effect similar to morphine (Gupta et al., 2004). The effect of graded
doses of trans-resveratrol using a hot plate analgesiometer in rats showed that trans-resveratrol
at graded doses of 5, 10, 20 and 40 mg/kg intraperitoneal (i.p.) produced dose-dependent
analgesia. Pretreatment for 20 min with naloxone (1 mg/kg i.p.) blocked the analgesic effect. A
potentiation effect was observed when the submaximal dose of trans-resveratrol (5 mg/kg i.p.)
was combined with a submaximal dose of morphine (2 mg/kg i.p.). Potentiation effect indicates
a synergistic action in which the effect of two drugs given simultaneously is greater than the sum
of the effects of each drug given separately.
Gupta et al. (2004) studied the effect of trans-resveratrol (20 mg/kg i.p.) on morphine
tolerance of rats in three different treatments administered continuously for 7 days including

43 treatment 1, morphine at 10 mg/kg i.p.; treatment 2, trans-resveratrol at 5 mg/kg i.p.
administered 10 min before morphine at 2 mg/kg i.p.; and treatment 3, trans-resveratrol at 20
mg/kg i.p. The occurrence of tolerance was estimated by comparing the antinociceptive
(reducing sensitivity to painful stimuli) effect of morphine with trans-resveratrol on day 1 and
day 8. Both morphine and trans-resveratrol produced tolerance. However, in the group that
received the combination of submaximal doses of trans-resveratrol and morphine, tolerance was
not significant.
The group of Kim (2005) investigated the effects of resveratrol on tetrodotoxin-sensitive
(TTX-S) and tetrodotoxin-resistant (TTX-R) Na+ currents in rat dorsal root ganglion (DRG)
neurons. According to these authors, resveratrol previously exhibited analgesic effects
suggesting that cyclooxygenase inhibition and K+ channel opening were the underlying
mechanisms. Kim et al (2005) reported that resveratrol caused a hyperpolarizing shift of the
steady-state inactivation voltage and slowed the recovery from inactivation of both Na+ currents.
However, no frequency-dependent inhibition of resveratrol on either type of Na+ current was
observed. The suppression and the unfavorable effects on the kinetics of Na+ currents in terms of
the excitability of dorsal root ganglion (DRG) neurons may make a great contribution to the
analgesia by resveratrol.
7.2. Protective effect on hyperglycemia
Hyperglycemia, a symptom of diabetes mellitus, induced hyperosmotic responses including
apoptosis in vascular endothelial cells and leukocytes in mammals (Chan, 2005). The apoptotic
biochemical changes such as caspase-3 activation and DNA fragmentation, were blocked by
antioxidant pretreatment during hyperosmotic shock-induced cell death. Chan (2005) found that
resveratrol blocks oxidative stress in high glucose-induced apoptosis and alterations in

44 attachment ability by virtue of its antioxidant property. Resveratrol attenuated high glucose-
induced apoptotic changes, including JNK and caspase-3 activation in human leukemia K562
cells. Experiments with the cell permeable dye, 20,70-dichlorofluorescein diacetate (DCF-DA),
an indicator of reactive oxygen species (ROS) generation, revealed that high glucose treatment
directly increased intracellular oxidative stress, which was attenuated by resveratrol. In addition,
high glucose-treated K562 cells displayed a lower degree of attachment to collagen, the major
component of vessel wall subendothelium whereas cells pretreated with resveratrol followed by
high glucose treatment exhibited higher affinity for collagen. These results collectively imply
the involvement of oxidative stress in high glucose-induced apoptosis and alterations in
attachment ability which was blocked by resveratrol by virtue of its antioxidant property.
IV. PROCESSES TO ENHANCE BIOSYNTHESIS OF RESVERATROL AND OTHER
BIOACTIVE COMPOUNDS IN PEANUTS AND PLANT MATERIALS
Resveratrol and other stilbenes accumulate in plants in response to two types of stresses,
biotic and abiotic, that activate stilbene synthase, the enzyme critical for resveratrol synthesis.
Biotic stresses result from microbiological invasion and/or inoculation of biological agents such
as molds and yeasts whereas abiotic stresses involve use of physical, mechanical or chemical
agents such as wounding, exposure to UV light or ultrasound, and treatment with metallic salts,
salicylic acid, or ozone.
Biotic stresses not only increase phytoalexin production but may also lead to degradation of
the plant material and production of toxic fungal metabolites such as aflatoxins produced by
Aspergillus flavus in groundnuts which renders the food unsafe for consumption. Problems
associated with microbial infections could be eliminated using abiotic elicitors by subjecting the
plant and/or plant materials to physical, mechanical or chemical stresses.

45
A. Biotic Stresses
Microbial invasion and/or inoculation of microorganisms in plant and plant materials had
been shown (Ingham, 1976) to increase the concentration of phytoalexins. Peanuts are known to
synthesize many phytoalexins in response to microbial stress as shown in Table 2.3 wherein
synthesis of resveratrol and other resveratrol-related phytoalexins were enhanced after the
proliferation or inoculation of various microorganisms in peanut kernels, leaves and roots.
1. Microbial invasion and/or inoculation of molds
Ingham (1976) found that peanut hypocotyls accumulated a mixture of 38-55 µg/mL cis- and
trans-resveratrol after inoculation with 10µl of a conidial suspension containing approximately 5
x104 spores/mL of a non-pathogenic fungus, Helminthosporium carborum, and incubation at
22oC for 24 h. These compounds were not detected in extracts from control non-inoculated
peanut hypocotyls (Ingham, 1976) suggesting that fungal infection initiated resveratrol
biosynthesis.
In peanut kernels, as high as 3,690 μg/g of a resveratrol derivative, 4-(3-methyl-but-1-enyl)-
3,5,4′-trihydroxystilbene, was accumulated when imbibed peanuts were sliced and incubated in
the dark at 25oC for 48h allowing natural microflora to grow (Aguamah et al., 1981). Other
resveratrol derivatives produced in the same sample were 950 μg/g of 4-(3-methyl-but-1-enyl)-
3,5,3′4′-tetrahydroxystilbene and 1,160 μg/g of 4-(3-methyl-but-2-enyl)-3,5,4′,-
trihydroxystilbene (4-isopentenylresveratrol).
Recently, Sobolev et al. (2009) isolated four new stilbenoids, arahypin-1, arahypin-3,
arahypin-4, and arahypin-5 from 3-6 mm sliced imbibed viable peanut seeds challenged by an
unspecified concentration of Aspergillus caelatus spores, along with two known stilbenoids that
have not been previously reported in peanuts, chiricanine A and arahypin-2, and six other

46 Table 2.3 Concentrations of resveratrol and other related compounds in peanut and grape plant materials stressed by microbial invasion and/or inoculation1
Post-harvest Stress Treatment Condition Compound
Incubation Concentration Plant material Microorganism Concen-
tration (spores/mL)
Time Temp. Name
Control Stressed
Reference
Peanut leaf hypocotyls, 2-4 cm
Helminthosporium carbonum Ullstrup
5 x 10⁴ 24 h 22oC, ca 400 lux
cis and trans-resveratrol
0 µg/g dry
weight(wt.)
38-55 µg/g dry wt.
Ingham, 1976
4-(3-methyl-but-1-enyl)-3,5,3′4′-tetrahydroxy stilbene
0 µg/g fresh wt
950 µg/g fresh wt.
4- (3-methyl-but-2-enyl)-3,5,4′-trihydroxystilbene (4-isopentenylresveratrol)
0 µg/g fresh wt
1,160µg/g fresh wt.
Peanut kernels
Natural microflora, wounding by slicing 1-2 mm
NR 48 h 25oC in the dark
4-(3-methyl-but-l-enyl)-3,5,4′-trihydroxystilbene
0 µg/g fresh wt
3,690µg/g fresh wt.
Aguamah et al., 1981
Peanut kernels
Aspergillus flavus
trans-resveratrol NR 30 µg/g dry wt.
Aspergilus parasiticus
NR 5 d 23-26oC, 100% RH trans-3-isopentadienyl-
4,3′5′-trihydroxystilbene
NR 10 µg/g dry wt.
Sobolev et al., 1995
trans-4-(3-methyl-but-1-enyl)-3,5,4′-trihydroxystilbene (trans-arachidin-3)
NR 95 µg/g dry wt.

47
Table 2.3 continued…
Post-harvest Stress Treatment Condition Compound Incubation Concentration
Plant material Microorganism Concen-
tration (spores/mL)
Time Temp. Name
Control Stressed
Reference
Peanut leaves
Cercospora arachidocola
104 Severe
infection
4 weeks
NR Total phytoalexins 2.96 nmoles/g fresh wt.
1,830.21 nmoles/g fresh wt.
Subba Rao et al., 1996
Peanut leaves
Cercospora arachidocola
103 Mild
infection
4 weeks
NR Total phytoalexins 2.96 nmoles/g fresh wt.
745.17 nmoles/g fresh wt.
Subba Rao et al., 1996
Peanut leaves
Puccinia arachidis 104
Severe infection
4 weeks
NR Total phytoalexins 2.96 nmoles/g fresh wt.
161.59 nmoles/g fresh wt.
Subba Rao et al., 1996
Phaeoisariopsis personata
Peanut leaves
104
Severe infection
4 weeks
NR Total phytoalexins 2.96 nmoles/g fresh wt.
663.57 nmoles/g fresh wt.
Subba Rao et al., 1996
Peanut leaves and roots
Yeast 25mg/mL yeast extract
6h in the dark
NR Trans-resveratrol -in leaves -in roots
0.15µg/g 1.2 µg/g 2.8 µg/g
Chung et al., 2003
Grape leaf discs
Plasmopora viticola
NR NR NR Trans-resveratrol ε-viniferin α-viniferin
NR NR Langcake and Pryce, 1977
1NR means no data reported

48 known stilbenes in peanuts, trans-resveratrol, trans-arachidin-1, trans-arachidin-2, trans-
arachidin-5, trans -3′-isopentadienyl-3,5,4′-trihydroxystilbene, and SB-1. All stilbenoids were
identified by nuclear magnetic resonance (NMR), mass spectrophotometry (MS) and UV spectra.
These authors found that non-viable peanuts prepared by boiling imbibed and sliced 3-6 mm
seeds in distilled water for 90 s were completely colonized by the fungus, whereas, only few
colonies were counted in viable peanuts suggesting that viable peanuts effectively suppress
fungal growth compared to non-viable samples. Viable sliced peanuts that were inoculated
produced an array of stilbenoids was produced at significant concentrations. In contrast, no
stilbenoids were detected in uninoculated sliced non-viable and viable control samples indicating
that slicing alone did not serve as elicitor (Sobolev et al., 2009), which is contrary to Aguamah et
al. (1981) who found that uninoculated sliced peanuts after incubation for 48 h to allow natural
microflora to proliferate induced accumulation of stilbene phytoalexins .
Subba Rao et al. (1996) found that extracts from peanut leaves that had been severely
infected by Cercospora arachidicola at 104 spores/mL contained the greatest phytoalexins
concentration of 1830 nmol/g fresh weight compared to uninoculated controls with 2.96 nmol/g
fresh weight. Leaves severely infected with 104 spores/mL of Puccina arachidis had the least
amount of phytoalexins with 162 nmol/g fresh weight, and those infected with 104 spores/mL of
Phaeoisariopsis personata or mildly infected with C. arachidicola at103 spores/mL were
intermediates at 664 and 745 nmol/g, respectively.
In leaves of transgenic tomato plants, a rapid accumulation of resveratrol occurred during the
first 6 h after inoculation of Phytoptera infestans and reached a maximum of 258 µg/g fresh
weight after about 44 h; afterwards resveratrol accumulation declined (Thomzik et al., 1997).
Inoculation of transgenic tomatoes with Botrytis cinerea and Alternaria solani also followed a

49 similar trend and afterwards, resveratrol accumulation slowly declined. After fungi treatment of
immature tomato fruits, resveratrol content of 51.6 µg/g fresh weight was lower than that
detected in sliced ripe fruit at 99 µg/g fresh weight. In whole tomatoes, inoculated with P.
infestans, resveratrol increased from 1.7 to 6.9µg/g fresh weight after 24 to 96 h, respectively,
which were lower than those detected in inoculated leaves and fruit slices which Thomzik et al.
(1997) attributed to probable dilution with the non-infected tissue of the fruit pulp.
In peanut leaves that were infected with early leaf spot fungus, Cercoscopora arachicola,
Edwards and Strange (1991) extracted and quantified seven phytoalexins. The four major
phytoalexins include dimethylmedicarpin, formononetin, 7, 4′-dimethoxy-2′-
hydroxyisoflavonone, and medicarpin whereas two minor components are 7, 2′-dihydroxy-4′-
methoxyisoflavonone and daidzen. Except for the low concentrations of medicarpin, all other
phytoalexins were essentially absent from the uninfected leaves indicating that fungal infection
elicited biosynthesis of these compounds.
Phytoalexins were also produced in rice leaves three days after 1-mm press-injured spots on
leaves were infected with 25 µL of suspension containing 4 x 10⁵ spores/mL Pyricularia oryzae,
a rice blast fungus (Kato et al., 1993). Based on their experiment, phytoalexins were not
produced in uninfected leaves whereas infected leaves produced 37.7 ng/spot momilactone A,
11.4 ng/spot oryzalexin D, and 12.3 ng/spot oryzalexin E.
Citrus lemon seedlings inoculated with conidia from Alternaria alternaria or treated with
fungal elicitors increase phenylpropanoid metabolism and synthesize umbelliferone and
scoparone as part of the developed hypersensitive response (Castañeda and Perez, 1996). Fungal
elicitation resulting in the transduction of the initial signal produced by oligomers of galacturonic
acid containing 19 sugar residues caused fungal elicitation otherwise unknown to this species.

50 2. Microbial invasion and/or inoculation of yeasts
Chung et al. (2003) incubated the roots of sterile intact peanut plants grown in vitro for 4
weeks then placed in the dark conditions for 48h, in half strength Murashige and Skoog medium
containing 25 mg/mL yeast extract to enhance the levels of resveratrol. After incubation in the
dark for 6h, resveratrol accumulated in peanut leaves and roots up to 1.2 and 2.8 µg/g fresh
weight, respectively, corresponding to 8- and 19-fold increases relative to untreated control
tissues. The levels of resveratrol synthase and mRNA increased in the treated leaves and roots
and increases were correlated with the increase in resveratrol contents in the tissues. Chung et al.
(2003) indicated that yeast extract induces resveratrol accumulation via transcription of
resveratrol synthase mRNA in peanut plants.
3. Microbial invasion and/or inoculation of bacteria
In peanut leaves, Azpilicueta et al. (2004) found that the levels of total phenolic was
enhanced 0 d after planting peanut hypocotyls inoculated with 1 mL cell suspension containing 1
x 107 cells/mL of Bradyrhizobium spp. (Arachis) strain. The plants were placed in a growth
chamber at 28/22oC under 16/8 h light/dark regime and watered every other day with either N-
free for inoculated plants or standard Hoagland solution for uninoculated plants. Total
phenolics in leaves of inoculated plants ranged from 14.6 to 20.03 µg ρ-coumaric acid/mL of
crude extract which were higher compared to 5.71 to 9.82 µg/mL in uninoculated plants, and
correspond to 2.6 - 3.5 fold increase.
B. Abiotic Stresses
1. Soaking or imbibing in water
Soaking raw peanuts in water for about 20 h and then drying for 66 h increased the
resveratrol content between 45 and 65 times after treatment (Seo et al., 2005). Similarly,

51
increases in resveratrol concentrations from 0.48 in controls to 0.96 and 1.46µ/g were observed
when raw peanuts were imbibed in water for 16 h and then incubated at 25oC for 24 and 36 h,
respectively (Rudolf and Resurreccion, 2005). Kernels from drought stressed peanuts cultivars
accumulated less phytoalexins of 17-65% than kernels from non-stressed (wet-treated) peanuts
(Wotton and Strange, 1987).
2. Wounding
Wounding by slicing has been shown to elicit synthesis of resveratrol and other phytoalexins
in peanuts (Arora and Strange, 1991; Rudolf and Resurreccion, 2005). Table 2.4 shows the
concentrations of resveratrol and phytoalexins in response to wounding through slicing,
chopping and grinding of peanut and peanut plant materials.
Wotton and Strange (1985) observed that phytoalexin concentrations of ten peanut cultivars
previously imbibed in water, sliced and incubated at 25oC for 24 h ranged from 28 to 935 µg/g
fresh weight and vary depending on cultivar conditions, duration of incubation after slicing, and
crop history. These authors found that phytoalexins accumulated within 24 h from wounding
peanut kernels and reached its maximum concentrations in 96 to 120 h afterwhich they begun to
decline (Wotton and Strange, 1985). Reduced phytoalexin yields were obtained when sliced
peanut kernels of one cultivar studied, TMV2, were incubated in water at 37oC; abolished
phytoalexin accumulation when peanut slices were incubated under nitrogen gas; and prevented
phytoalexin accumulation after alternate freezing and thawing before aerobic incubation (Wotton
and Strange, 1985).
Arora and Strange (1991) observed that when imbibed cotyledons of peanuts were wounded
by slicing 1-2 mm, and incubated for 48 h at 25oC in the dark, phytoalexins accumulated of up to
0.59 µM/g resveratrol, 0.02 - 0.98 µM/g arachidin III, and 1.11 - 4.38 µM/g arachidin IV

52 Table 2.4 Concentrations of trans-resveratrol and other stilbenes in peanut kernels stressed by post-harvest abiotic treatment of wounding through slicing, chopping and grinding1
Post-harvest Stress Treatment Condition Compound
Incubation Concentration (µg/g, dry basis)Wounding Treatment Time (h) Temperature
(oC)
Name Control Stressed
Reference
24 25 Trans-resveratrol NR 4.3-23.8 Slicing 2 mm 3-isopentadienyl-
4,3′,5′-trihydroxystilbene
NR 38.6 – 105.8
Cooksey et al., 1988
48 25 Trans-resveratrol
NR 21.2-42.2 Slicing 2 mm
3-isopentadienyl-4,3′,5′-trihydroxystilbene
NR 89.5 – 157.5
Cooksey et al., 1988
Slicing 1-2 mm 48 25 Trans-resveratrol
<22.82 (wet basis)
134.64 (wet basis)
Arora and Strange, 1991
Slicing 2 mm 0-144 25 and 37 Arachidin I, II, III 0 (wet basis)
>4000 (wet basis)
Wotton and Strange, 1985
24 25 Trans-resveratrol 0.22 1.43 36 1.06
Slicing 2 mm
48
2.15
Rudolf and Resureccion, 2005
24 25 Trans-resveratrol 0.18 0.65 36 0.76
Grinding 1-2 mm
48 0.49
Rudolf and Resureccion, 2005

53
Table 2.4 continued…
Post-harvest Stress Treatment Condition Compound Incubation Concentration (ug/g, dry basis)Wounding
Treatment Time (h) Temperature (oC)
Name Control* Stressed
Reference
24 25 Trans-resveratrol 0.25 1.47 36 0.89
Chopping 5mm
48
0.74
Rudolf and Resureccion, 2006
24 25 Trans-resveratrol 0.20 0.96 36 1.46
Whole peanut
48
1.44
Rudolf and Resureccion, 2006
1 NR means no data reported

54 depending on cultivar, maturity, and viability of seeds. Peanut cultivars resistant to seed
colonization by Aspergillus flavus and aflatoxin contamination such as PI 337394F and J11,
accumulated more than 3 times as much Arachidin IV compared to susceptible cultivars,
Gangapuri and TMV2. All parts of the developing peanut pod synthesized phytoalexins with
diminishing capacity from immature stages of 1 to 4, but increased thereafter up to mature stage
of 8. When more mature pods at stages 6 and 8 where divided in to pod, testa, and cotyledon,
mature pods and testa lost their ability to synthesize phytoalexins in contrast with mature
cotyledon (Arora and Strange, 1991). Peanut seeds which had been stored at 15oC for 9 months,
then sliced drastically reduced their ability for the cotyledon to synthesize phytoalexins as
evidenced by lower phytoalexins concentrations compared to fresh ones. Peanuts stored for 6
months then sliced produced lower trans-resveratrol compared to unstored controls. When non-
viable peanut seeds, ascertained by viability test were sliced, lower total phytoalexin
concentration of 0.716 µM/g was accumulated compared to 5.29 µM/g in sliced viable peanuts
(Arora and Strange, 1991).
After slicing germinated peanut seeds followed by incubation at 23-25oC with artificial
aeration, Chang et al. (2006) found a tremendous increase in the concentrations of trans-
resveratrol from trace to 147.3 μg/g after 20 h incubation. In the same samples, the biosynthesis
of three resveratrol derivatives was elicited, resulting in 495.7 μg/g trans-arachidin I, 2414.8
μg/g trans-arachidin III and 4474.4 μg/g trans-isopentadienylresveratrol (IPD) corresponding to
16, 24, and 28 h incubation, respectively, from initially non-detectable concentrations .
Grinding of fully imbibed raw peanuts then incubating for 48 h at 45oC increased
resveratrol to 0.85 µg/g compared to controls with 0.14 µg/g (Rudolf et al., 2002). In a
subsequent study Rudolf et al. (2005) compared the concentrations of peanuts wounded by

55 grinding 1-2 mm, chopping 5 mm, and slicing 2 mm and whole peanuts. Ground peanuts
initially had 0.18 µg/g resveratrol which increased significantly to 0.65 µg/g after 24 h
incubation but did not significantly change after incubating for 36 and 48 h with 0.76 and 0.49
µg/g, respectively. Chopped peanuts had an initial resveratrol concentration of 0.25 µg/g which
increased significantly to 1.47 µg/g after 24 h incubation, and then decreased to 0.89 and 0.74
µg/g after 36 and 48 h. Sliced peanuts had 0.22 µg/g resveratrol at 0 h which significantly
increased to 1.43 µg/g after 24 h incubation, did not change significantly after 36 h at 1.06 µg/g,
and then increased significantly to 2.15 µg/g after 48 h, a concentration which was not
significantly different from that incubated for 24 h. Whole peanuts had an initial resveratrol
concentration of 0.20 µg/g which increased significantly to 0.96 µg/g after 24 h incubation, and
further increased to 1.46 µg/g after 36h which did not differ from 1.44 µg/g after 48 h. Sliced
peanuts incubated for 48 h produced the highest resveratrol of 2.15 µg/g followed by chopped
peanuts incubated for 24 h and whole peanuts incubated for 36 h with 1.47 and 1.46 µg/g,
respectively, and the least was ground peanuts incubated for 36 h with 0.76 µg/g compared to
raw untreated control peanuts with 0.48 µg/g. These results showed that wounding by slicing
produced maximum concentrations of resveratrol in incubated peanut kernels, whereas chopping
and grinding resulted in moderate and lowest concentrations, respectively, suggesting that as the
severity of mechanical stress increased with size reduction, resveratrol production decreased
(Sales and Resurreccion, 2009). Whole kernels without wounding will result in moderate
resveratrol concentrations.
Wounding trifoliate peanut leaves by punching with fine pins followed by floating on the
sterile water, then kept for 12 h in the light with intensity of about 100 µE (m2/s) and then 12 h in
the dark at 25oC, increased resveratrol content up to 2-fold (Chung et al., 2003).

56
Wounding the germinating seeds of peanuts (previously soaked in water for about 24 h) by
slicing 1-3 mm, combined with abiotic stress by allowing natural microflora to proliferate during
a 3-5 day incubation period produced two antifungal compounds as determined by thin layer
chromatography (Keen, 1975). Later, Keen and Ingham (1976) identified these compounds as
the cis and trans isomers of 3,5,4′-trihydroxy-4-isopentenylstilbene which were not previously
found in nature.
3. Exposure to ultraviolet (UV) light
Exposure to UV light radiation was shown to elicit biosynthesis of phytoalexins such as
resveratrol in plant and plant materials (Langcake and Pryce, 1997; Cantos et al., 2000) and other
phenolics (Cantos et al., 2000). UV induces the increase in enzymes such as stilbene synthase
(Fritzemeier et al., 1983) responsible for biosynthesis of secondary metabolites such as
resveratrol and flavonoids, which act as screens to prevent UV-induced damage to genetic
material of plant cells (Cantos et al., 2000). The efficiency of the biosynthetic pathway and the
form and maxima of enzyme profiles depended on the duration of UV exposure (Fritzemeier et
al., 1983). Table 2.5 lists UV irradiation stress treatments applied by various researchers in
peanuts and grapes to enhance synthesis of resveratrol and other bioactive compounds.
Earlier research on the role of UV irradiation on resveratrol biosynthesis and other bioactive
compounds was conducted on grapes and grape plant materials, and are therefore discussed in
this section. In grape leaves, Langcake and Pryce (1997) found that the maximum concentration
of resveratrol was produced at 260-270 nm. At wavelengths above 300-310 nm or below 230
nm, little or no resveratrol production occurred. Natural sunlight is deficient in radiation
wavelengths below 300 nm and this may explain why resveratrol biosynthesis is not induced in
field grown plants (Langcake and Pryce, 1977). Sunlight does not act as an inducer under

57 Table 2.5 UV light stress treatments used to enhance resveratrol and other bioactive compounds in peanuts and grapes
UV Treatment and Conditions Substrate UV light parameters
UV light exposure time
Incubation time and temperature
Compound/ Concentration
Remarks Reference
Peanut kernels,
254 nm;
10 min
0 to 48 h at
Trans-resvaratrol content in ground peanuts, 0.17-0.86 µg/g; chopped peanuts 0.30-1.64 µg/g ; sliced peanuts, 0.33-3.42µg/g; whole peanuts, 0.20-1.76µg/g
Highest resveratrol content of 3.42 µg/g was found in sliced peanut kernels exposed to UV light for 10 min and incubated for 48 h at 25
Rudolf and Resureccion, 2005 Runner,
ground, chopped, sliced, whole
30W; 40 cm distance from the lamp; peanuts arranged 1 cm depth on plastic tray
25oC in the dark
oC.
Peanut hulls, Spanish
UV 110 V, 60 Hz, 110 mm from UV light
0 to 6 d 25oC Flavonoid: luteolin At 0 d: 1.74 mg/g After 3 d: 1.73 mg/g After 6 d: 1.21 mg/g
Duh and Yen, 1995

58 Table 2.5 continued…
UV Treatment and Conditions Substrate UV light parameters
UV light exposure time
Incubation time and temperature
Compound/ Concentration
Remarks Reference
Peanut hulls, Spanish
UV 110 V, 60 Hz, 110 mm from UV light
0 to 6 d 25oC Total Phenolics At 0 d: 7.8 mg/g (catechin equivalents) After 3 d: 7.53 mg/g After 6 d: 7.05 mg/g
Duh and Yen, 1995
Peanut leaf 254 nm, 180 µW/cm2 energy, 20 cm distance from lamp
48 h 25oC for 96h at high humidity
Phytoalexin - abaxial (lower) surface 393 nmols/g (fresh weight) - adaxial (upper) surface 115 nmols/g (fresh weight)
Trans-resveratrol in the adaxial surface was not significantly different from control samples with 115 nmols/g phytoalexin (fresh weight)
Subba Rao et al., 1996
Peanut leaves, sterile
1.35 µE (m
2 hrs
0, 3, 12 h in the dark
Resveratrol increased up to 225 fold after UV treatment and incubation for 12 h
Free resveratrol contents of control, leaves, pods, and roots of healthy plants grown in the fields up to 40 days from flowering were 2.05, 1.34, and 1.19 µg/g fresh weight respectively.
Chung et al., 2003 2/s) UV
lamps

59 Table 2.5 continued…
UV Treatment and Conditions Substrate UV light parameters
UV light exposure time
Incubation time and temperature
Compound/ Concentration
Remarks Reference
Peanut callus (stem)
UV-C light, 254 nm, 55 cm distance from the lamp
20 min
Static condition:
Static condition:
Static condition: Trans-resveratrol increased from 0.25 to 11.97 µg/g after 6 to 18 h of incubation then decreased to 1.42 after 24 h of incubation. Piceatannol increased from 2.17 to 5.31 µg/g after 12 to 18 h of incubation and then decreased to µg/g after 24 h of incubation.
Ku et al., 2005
0 to 24 h at 25oC in the dark Suspension condition: 0 to 80 h at 25oC in the dark
Resveratrol: 0.25 to 11.97 µg/g Piceatannol: 2.17- 5.31µg/g Suspension condition: Resveratrol: 3.14 to 6.93 µg/g Piceatannol: 0.32- 0.52µg/g
Suspension condition: Highest trans-resveratrol content of 6.93 µg/g was obtained after 4 hours of incubation of calluses in suspension. Initial piceatannol content of 0.52 µg/g was maintained from 0 to 8 h of incubation then decreased when incubation time was further increased

60 Table 2.5 continued…
UV Treatment and Conditions Substrate UV light parameters
UV light exposure time
Incubation time and temperature
Compound/ Concentration
Remarks Reference
Grape berries, immature
254 nm, 17 cm distance from lamp
10 min 18 h at 26oC in the dark
Resveratrol U-14C-phenylalanine =0.139 µmol U-14C-tyrosine = 0.009 µmol 2-14C-malonate = 0.014 µmol 2-14C-acetate = 0.124 µmol
Grape berries were cut longitudinally and radioactive substance was applied to cut surfaces. Amounts of trans-resveratrol formed in berries were generally lower than in leaves.
Langcake and Pryce, 1977
Grape berries, mature
254 nm
30 min 10 d at 0oC followed by 5d at 5oC
Resveratrol 100 µg/g
Trans-resvaratrol production increased by two-fold after 30 min exposure to UVC light with peak output at 254 nm
Cantos et al., 2000
Grape berries, mature
340 nm 30 min 10 d at 0oC followed by 5d at 5oC
Resveratrol 65 µg/g
Trans-resvaratrol production increased by to three-fold after 30 min exposure to UVB light with peak output at 340 nm.
Cantos et al., 2000
Grape berries, immature
254 nm
30 min 10d at 0oC followed by 5d at 5oC
Resveratrol 65 µg/g
Cantos et al., 2000

61 Table 2.5 continued…
UV Treatment and Conditions Substrate UV light parameters
UV light exposure time
Incubation time and temperature
Compound/ Concentration
Remarks Reference
Grape berries, immature
340 nm 30 min 10d at 0oC followed by 5d at 5oC
Resveratrol 45 µg/g
Cantos et al., 2000
Grapes, Napoleon red
510 W irradiation power, 40 cm distance from lamp
30 sec 3 days storage Resveratrol maximum 115µg/g of skin
A serving of UV-irradiated grapes could supply 7.5mg/200g serving trans-resveratrol equivalent to 3 glasses of red wine. Untreated grape contained 10µg/g of skin.
Cantos et al., 2001
Grape berries
254 nm 10 min 24 h at 24oC 48 h at 24oC
Phytoalexin 50 to 233.38 µg/g 150 to 400.08 µg/g
Creasy and Coffee, 1988
Grape berry skin
254 nm, 2.5 W/m2 energy
10 min 4 h at 24oC 48 h at 24oC
Phytoalexin 0.8-0.12µg/cm2 21µg/cm2
Creasy and Coffee, 1988
Grapevine leaves (Vitaceae)
254 nm, 3.7 W/m2 energy
10 min 23 h at 25oC in the dark
Resveratrol 50 -100 µg/g
Infection of leaves by Botrytis cinerea produced greater trans-resveratrol content of 50 to 400 µg/g
Langcake and Pryce, 1976

62
Table 2.5 continued..
UV Treatment and Conditions Substrate UV light parameters
UV light exposure time
Incubation time and temperature
Compound/ Concentration
Remarks Reference
Grape leaves
260-270 nm
equivalent to 10 min at 250 nm
20h at 26oC in the dark in moist filter paper
Resveratrol 1.4-1.5 µg/14 mm diameter disc
UV spectrum above 300 nm and below 230 nm produced little or no trans-rresveratrol
Langcake and Pryce, 1977
Grape leaves
254 nm, 12 cm distance from lamp
15 min 20 h Resveratrol U-14C-phenylalanine =0.14 µmol U-14C-tyrosine = 0.11 µmol 2-14C-malonate = 0.21 µmol 2-14C-acetate = 0.23 µmol
Trans-resveratrol was produced very rapidly rising to a maximum at 18 hours and decreasing thereafter. By incorporating radiolabelled precursors, 2-14C-acetate, 2-14C-malonate, U-14C-phenylalanine, and U-14C-tyrosine, into resveratrol prior to UV light exposure, it was confirmed that resveratrol is biosynthesized by the phenylalanine-polymalonate pathway.
Langcake and Pryce, 1977

63 natural conditions (Soleas et al., 1997) suggesting that DNA itself is the actual photoreceptor for
the UV irradiation induced response (Langcake and Pryce, 1997; Soleas et al., 1997).
Resveratrol was produced very rapidly following UV irradiation, rising to a maximum at 18 h
and decreasing thereafter (Langcake and Price, 1977). Resveratrol biosynthesis was confirmed
to follow the phenylalanine-polymalonate pathway after incorporating radiolabeled precursors,
2-14C-acetate, 2-14C-malonate, U-14C- phenylalanine, and U-14C-tyrosine into resveratrol prior to
UV-irradiation of both leaves and immature grape berries (Langcake and Pryce, 1977).
Although all four precursors confirmed their roles in resveratrol biosynthesis, more resveratrol
were isolated from leaves compared with those from immature fruits despite higher amounts of
precursors fed (Langcake and Pryce, 1977)
A number of studies on the UV irradiation of grapes were reported by Cantos and co-
workers. In their first report, Cantos et al. (2000) found that refrigerated storage and UV
irradiation of table grapes increased concentrations of potentially health-promoting phenolics,
which include the anthocyanins, malvidin 3-glucoside and its acetyl and p-coumaroyl
derivatives, cyanidin 3-glucoside, peonidin 3-glucoside, cyanidin 3-glucoside, petunidin 3-
glucoside, and delphinidin 3-glucoside. In addition, quercetin 3-glucoside and 3-glucuronide,
caffeoyltartaric, piceid, and resveratrol were also detected. While concentrations of most
phenolics remained constant during postharvest refrigerated storage of 10 days at 0 degrees C,
resveratrol derivatives increased 2-fold. Even larger increases in resveratrol derivatives of 3- and
2-fold were induced during postharvest treatments of Napoleon grapes with UVC and UVB light,
respectively (Cantos, 2000). These authors suggested that a 200 g serving of mature non-
irradiated Napoleon grapes provides approximately 1 mg of resveratrol, which is in the range of

64 the amount supplied by a 140 mL (5 oz) glass of red wine and can be increased to 2 or 3 mg per
serving if grapes are UVB or UVC irradiated, respectively.
In another study, Cantos et al. (2001) optimized the UV irradiation of grapes and concluded
that exposure of grapes for 60 s under a 510 W UV lamp at a distance of 40 cm was optimum for
maximum resveratrol concentration. This optimum process resulted in 11-fold increase in
resveratrol concentration compared to untreated grapes. The distance of 40 cm from UV light
was the optimum, achieving the highest resveratrol content in UV-treated grapes compared to 20
and 60 cm distance. The lower resveratrol synthesized at 20 cm may have been due to too close
a distance resulting in “too strong” irradiation causing damage to the “biosynthetic system” of
resveratrol whereas at 60 cm, the distance was too far causing delayed induction of resveratrol
biosynthesis (Cantos et al., 2001).
Later, Cantos et al. (2002) applied the optimum UV process for grapes (Cantos et al., 2001)
was to irradiate seven grape varieties - red table grape varieties of Flame, Red Globe, Crimson,
and Napoleon, and white varieties of Superior, Dominga, and Moscatel Italica to determine
elicitation of stilbenes in grapes. These authors reported that the most inducible stilbenes
included trans-resveratrol, trans-piceatannol, and viniferins. The total resveratrol content on a
fresh weight basis ranged from 0.69 mg/100 g in Dominga variety to 2.3 mg/100 g in Red Globe.
The net resveratrol induction ranged from 3.4-fold (2.27 µg/g) in Flame variety to 2315-fold
(2.31 µg/g) in Red Globe. The Flame variety had the highest viniferins content of 0.73 mg/100 g
although the Red Globe variety presented the highest viniferins induction of 175-fold (0.18
µg/g). The highest piceatannol content of 0.17 mg/100 g and induction of 173-fold were
observed in the Flame variety. They (Cantos et al., 2002) stressed that taking into account the
health-beneficial effects claimed for stilbenes, UV-C irradiated table grapes can be considered as

65 new “functional fruits” that can supply about 4.6 mg resveratrol to a 200 g serving of unpeeled
table grapes depending on the variety, equivalent to more than seven glasses of red wine
(approximately 1.5 L).
Furthermore, Cantos et al. (2003) found that UV-C irradiation using the optimum process
(Cantos et al., 2001) of "Monastrell" grapes increased resveratrol and piceatannol in the resulting
red wines while the stilbene glucosides such as piceid were not significantly induced. These
authors tracked the concentration of both compounds was followed through the different steps of
an "analytical" traditional maceration wine-making process which involved close contact
between skins and must. The maximum resveratrol and piceatannol contents in the must (before
pressing) were detected after 5 days at 1,170 and 655 µg/L, respectively, compared to 471 and
346 µg/L, respectively, in controls. After 10 days, resveratrol decreased to about 220 µg/L while
piceatannol to about 420 µg/L. The final wine made from UV-C-irradiated grapes was enriched
by about 2-fold (190.7 µg/L) resveratrol and 1.5-fold (311.0 µg/L) piceatannol compared to the
control wine. No difference was detected regarding the standard enological parameters (color,
acidity, density and alcoholic grade). These researchers suggested that the use of more
susceptible wine grapes to induce bioactive stilbenes upon UV-C-irradiation can produce a much
higher stilbene-enriched wine (Cantos et al., 2003).
Preliminary experiments of Bais et al., (2000) revealed that resveratrol was induced only in
berries that had been irradiated with UV-C (<280 nm) but not in control berries. These authors
studied the effects of UV-C-irradiation on the resveratrol biosynthesis in skins at various berry
development of four grape cultivars, red Shiraz and Cabernet Sauvignon, and white Semillon and
Chardonnay. The developing grape berries on an orbital 50 rpm shaker were irradiated for 10
min at 10 cm below UV-C light (254 nm), and then incubated in the dark at 25oC for 72h. Bais

66 et al. (2000) found that all four cultivars displayed similar patterns of UV-inducible resveratrol
accumulation throughout berry development and there were no major differences between the
responses of white- and red-skinned cultivars. A marked increase in the ability of the UV-
irradiated berry skins to synthesize resveratrol was observed 1-5 weeks post-flowering with
concentrations ranging from 150-330 µg/g fresh weight at week 1, to 810 to 1075 µg/g fresh
weight at week 5. The capacity of berry skin to synthesize resveratrol after week 5 progressively
declined such that in week 16, resveratrol concentrations were only ~11 µg/g fresh weight or
100-fold decline in concentrations of Semillon and ~113 µg/g fresh weight or 10-fold decline in
Chardonnay, Shiraz and Cabernet Sauvignon.
When Subba-Rao et al. (1996) exposed the abaxial (lower) or adaxial (upper) surfaces of
peanut leaves, 20 cm below the shortwave UV lamp (254 nm; 180 µW/cm2) for 48 h and then
incubated for 96 h at 25oC in the dark, phytoalexins in abaxial leaves increased to 393 nmol/g
fresh weight which was more than three times higher than that in adaxial leaf with only 115
nmol/g fresh weight and not significantly different from untreated controls with 104 nmol/g fresh
weight. Similarly, Chung et al. (2003) reported accumulation of resveratrol in peanut leaves in
response to UV light treatment using UV lamps at 1.35 microEinstein, µE (m2/s) for 2h which
increased up to 225-fold (56.43 µg/g fresh weight) after 12 h incubation in the dark.
To our knowledge, the earliest work on UV irradiation of peanut kernels for resveratrol
elicitation was conducted by Resurreccion and co-workers. Rudolf and Resurreccion (2005)
exposed fully imbibed peanuts that were sliced (2 mm), ground (1-2 mm), chopped (0.5 cm) and
whole at 40 cm below a UV germicidal lamp (254 nm, 30 W) for 10 min followed by incubation
in the dark at 25oC for 24, 36 and 48 h. Exposure to UV light of all peanut samples, regardless of
size, resulted in significant increases in trans-resveratrol concentration from 0.17 to 1.76 µg/g as

67 incubation period increased from 0 to 36 h. From 36 to 48 h incubation, the level of resveratrol
increased in sliced peanuts from 1.70 to 3.42 µg/g, but decreased in whole peanuts from 1.76 to
0.99 µg/g, and did not change in ground (from 0.86 to 0.67 µg/g) and chopped (from 1.52 to
1.64 µg/g) peanuts. The highest trans-resveratrol concentration of 3.42 µg/g was obtained in UV
treated sliced peanuts incubated for 48 h at 25oC. A similar maximum resveratrol concentration
of 3.30 µg/g was obtained after peanuts were UV irradiated for 30 min at 40 cm distance from
UV light and incubated for 36 h at 25oC (Sales and Resurreccion, 2009). A lower concentration
of 2.36 µg/g resveratrol, was achieved when peanuts were exposed to UV for 20 min at 40 cm
distance from UV light and incubated for 44 h at 25oC (Potrebko and Resurreccion, 2009).
Tokusoglo et al. (2005) found that after exposing peanuts and pistachios in UV light for 1
min, trans-resveratrol concentrations ranged from 0.02 - 1.47 and 0.07 - 1.24µg/g, respectively;
and cis-resveratrol from 0.008 - 0.32 and 0 - 0.44 µg/g, respectively. They found that cis-
resveratrol in pistachios was higher than in peanuts. Trans and cis -resveratrol in the samples
were confirmed using total ion chromatograms of the bis[trimethylsilyl]trifluoroacetamide
derivatives of resveratrol isomers, and by comparison of the mass spectral fragmentation data
with those of a resveratrol standard.
When peanut callus were UV irradiated by Ku et al. (2005), not only resveratrol but also
piceatannol which was not present in untreated samples, were synthesized. Peanut callus
exposed to UV at 254 nm for 20 min at 55 cm from UV light, and then incubated at 25oC for 0-
18 h produced 2.17-5.31 µg/g piceatannol after 12-18 h incubation and 0.25-11.97 µg/g
resveratrol after 6-18 h incubation under static cultivation, reaching their maximum
concentrations after 18 h. In contrast, the concentrations of resveratrol and piceatannol in
suspension cultures were lower at 3.93-6.93 and 0.30-0.52 µg/g, respectively, and did not
68 increase after 4 – 80 h incubation for resveratrol and throughout 0 – 80 h incubation for
piceatannol. Kuh et al (2005) explained that because calluses were constantly moving in
suspension, they may have received shorter UV irradiation than those in static cultures and
produced less resveratrol and piceid. These researchers claimed that piceatannol produced by
calluses in their study was much higher than the values reported in the literature, whereas the
resveratrol produced was comparable to reported values.
UV light exposure treatment alone decreased the amount of resveratrol in raw peanuts (Seo et
al., 2005). However, the synergistic effect of UV light exposure and soaking treatment induced
resveratrol production increasing between 45 and 65 times after a soaking treatment compared to
untreated raw peanuts (Seo et al., 2005).
In rice leaves, UV irradiation (15W) of detached leaves for 20 min at 20 cm from UV light
and incubation at 30oC in a moist box at high humidity, resulted in the accumulation of
oryzalexins A, B, C, and D, and momilactones A and B, an unknown antifugal substance
accompanied by the appearance of brown spots on the leaf surface (Kodama et al., 1988).
Momilactone A was detected in abundance and among the oryzalexins, oryzalexin D was a
major substance. The maximum accumulation of these phytoalexins, except for oryzalexins C
and D, was found 3 days after UV irradiation. Maximum accumulations of Oryzalexin D were
observed after 2 days whereas oryzalexin C, was after 4 days. Kato et al. (1993) later isolated
the novel diterpene phytoalexin, oryzalexin E in rice leaves using the same irradiation treatment
of Kodama et al. (1988) except for incubating the leaves at 27oC at high humidity under dark
conditions for 12 h, followed by light conditions for 2 days.

69
4. Ultrasound processing
Ultrasound technology using high frequency sound waves, above the threshold of human
hearing or >16 kHz (Soria and Villamiel, 2010) is a powerful technique with application in food
quality and safety such as materials extraction and food technology (Mason, 2003).
Ultrasonication produces cavitation phenomena when acoustic power inputs are sufficiently high
to allow multiple production of microbubbles that collapse violently and create shock waves that
cause cells to disintegrate into very fine cell debris particles (Chukwumah et al., 2005).
Ultrasound is an emerging novel technology in the food processing industry used in
emulsification of mayonnaise, reduction of fat globule size in milk, milk homogenization before
cheese making, increasing or improving viscosity of tomato puree and yoghurt, and improving
extractions of food bioactives (Soria and Villamiel, 2010). Lin et al. (2001) proposed that
ultrasound treatment at low intensities of ginseng cell cultures, a non-food material, stimulates
growth and biosynthesis of secondary metabolites through mechanical stress and microstreaming
induced by acoustic cavitation which disrupts the cell wall. Ultrasound caused rapid increase in
levels of enzymes, phenylammonia lyase, polyphenol oxidase and peroxidase in Panax ginseng
cell cultures (Wu and Lin, 2002b). Among these enzymes, phenylammonia lyase, the key
enzyme of the phenylpropanoid pathway responsible for stilbenes biosynthesis in Panax ginsenf
cell cultures was enhanced most dramatically by ultrasound with 5-fold higher at power level 4
after 4 days incubation compared to controls (Wu and Lin, 2002b).
There are a very limited number of researchers who utilized ultrasound for the synthesis of
bioactive compounds in food (Table 2.6). To our knowledge, major research on the application
of ultrasound treatment in peanuts was conducted by Resurreccion and co-workers. Rudolf and
Resurreccion (2005) investigated the effects of ultrasound treatment on increasing resveratrol
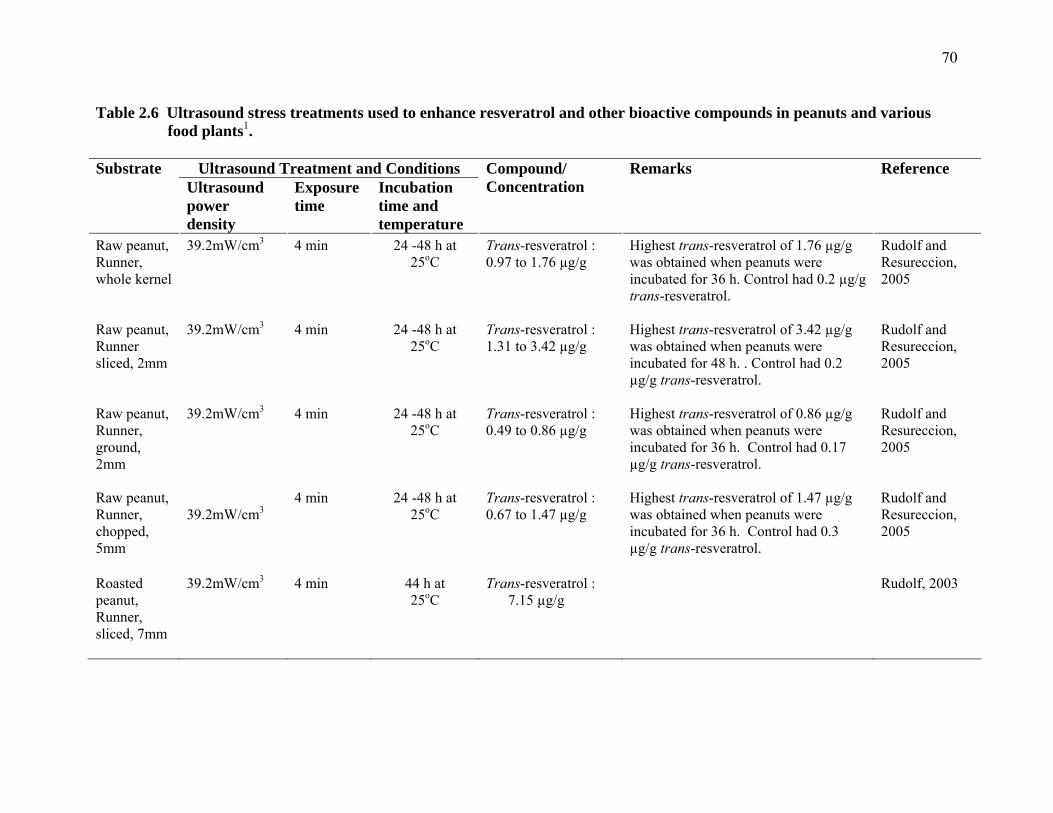
70 Table 2.6 Ultrasound stress treatments used to enhance resveratrol and other bioactive compounds in peanuts and various
food plants1.
Ultrasound Treatment and Conditions Substrate Ultrasound power density
Exposure time
Incubation time and temperature
Compound/ Concentration
Remarks Reference
Raw peanut, Runner, whole kernel
39.2mW/cm3 4 min 24 -48 h at 25oC
Trans-resveratrol : 0.97 to 1.76 µg/g
Highest trans-resveratrol of 1.76 µg/g was obtained when peanuts were incubated for 36 h. Control had 0.2 µg/g trans-resveratrol.
Rudolf and Resureccion, 2005
Raw peanut, Runner sliced, 2mm
39.2mW/cm3 4 min 24 -48 h at 25oC
Trans-resveratrol : 1.31 to 3.42 µg/g
Highest trans-resveratrol of 3.42 µg/g was obtained when peanuts were incubated for 48 h. . Control had 0.2 µg/g trans-resveratrol.
Rudolf and Resureccion, 2005
Raw peanut, Runner, ground, 2mm
39.2mW/cm3 4 min 24 -48 h at 25oC
Trans-resveratrol : 0.49 to 0.86 µg/g
Highest trans-resveratrol of 0.86 µg/g was obtained when peanuts were incubated for 36 h. Control had 0.17 µg/g trans-resveratrol.
Rudolf and Resureccion, 2005
Raw peanut, Runner, chopped, 5mm
39.2mW/cm3
4 min 24 -48 h at 25oC
Trans-resveratrol : 0.67 to 1.47 µg/g
Highest trans-resveratrol of 1.47 µg/g was obtained when peanuts were incubated for 36 h. Control had 0.3 µg/g trans-resveratrol.
Rudolf and Resureccion, 2005
Roasted peanut, Runner, sliced, 7mm
39.2mW/cm3 4 min 44 h at 25oC
Trans-resveratrol : 7.15 µg/g
Rudolf, 2003

71 Table 2.6 continued…
Ultrasound Treatment and Conditions Substrate Ultrasound power density
Exposure time
Incubation time and temperature
Compound/ Concentration
Remarks Reference
Raw peanut, Runner, sliced, 10mm
39.2mW/cm
4 min
Trans-resveratrol :
Rudolf, 2003
3 44 h at 25oC 0.57 µg/g
Roasted peanut, Runner sliced, 10mm
39.2mW/cm3 4 min 44 h at 25oC
Trans-resveratrol : 2.57 µg/g
Rudolf, 2003
Raw peanut High frequency ultrasonication (combined frequency of 25 kHz, 60 kHz, 80 kHz)
30, 60, 90, 120, 150, and 180 min
NR Trans-resveratrol: 0.11+0.05 to 0.27+0.01mg/100g Biochanin: 0.22+0.01 to 0.32+0.01g/100g Geneistein: 0.01+0.00 to 0.6+0.02 mg/100g
Chukwumah et al., 2005
Ginseng roots
82 mW/cm3 1-4 min NR Ginsenoside saponins Increased total saponin content up to 75% over that of controls
Lin et al., 2001

72
Table 2.6 continued…
Ultrasound Treatment and Conditions Substrate Ultrasound power density
Exposure time
Incubation time and temperature
Compound/ Concentration
Remarks Reference
1 h 25oC Ginsenoside saponins: Yield is 2.0-4.10% by weight
Indirect sonication in water bath 38.5 kHz, 810W
2 h 25oC Ginsenoside saponins: Yield is 2.11-4.3% by weight
1 h 25oC Ginsenoside saponins: Yield is 2.1-4.32% by weight
Ginseng roots2
Direct sonication with probe horn connected to 600W ultrasound microprocessor, 20 kHz, no pulse, 22% amplitude
2 h 25oC Ginsenoside saponins: Yield is 2.20- 4.75% by weight
Control using conventional thermal extraction (soxhlet method) yielded 1.15-2.10 % by weight after 1 h and 1.45 – 2.95% after 2 h Ultrasound-assisted extraction is three times faster than conventional thermal method and can be carried out at lower temperature. No significant difference in the recovery of saponins between indirect and direct sonication
Wu et al., 2001
1 h NR Glucose esters: At 120W, 70% yield
Alkaline protease from Bacillus subtilis
20 kHz at 40W, 100W, 120W using continual and interval treatment
2 h NR 94% yield
50% and 75% yield after 1 and 2h, respectively, under interval ultrasound (10 min ultrasound then 20 min shaking) High power and continual operation gave better acceleration on the yields.
Xiao et al., 2005
1NR means no data reported 2Indirect and direct ultrasound extraction used three solvents: pure methanol, water-saturated n-butanol, and water with 10% methanol.

73 concentrations in peanuts by sonicating whole and size-reduced (sliced 2 mm, ground 1-2 mm,
and chopped 0.5 cm) fully imbibed peanut kernels in a ultrasonic bath cleaner with a power
density of 39.2 mW/cm3 for 4 min at 25oC, and incubating at 25oC in the dark for 24, 36 and 48
h. Significant increases in trans- resveratrol concentrations after 24 h incubation were observed
in all peanut sizes, from 0.10-0.26 at 0 h to 0.75-2.54 µg/g after 24 h with the largest increase to
2.54 µg/g in sliced peanuts. From 24 to 36 h incubation, the concentrations of trans-resveratrol
significantly decreased in chopped peanuts from 1.3 to 0.93 µg/g; increased in sliced and whole
peanuts from 2.54 to 3.96 and 0.76 to 1.47 µg/g, respectively; but did not change significantly
in ground kernels from 0.75 to 0.69 µg/g. No significant change in trans-resveratrol
concentrations of all samples was observed from 36 to 48 h of incubation. The highest trans-
resveratrol concentration of 3.96 µg/g was obtained in sliced peanuts incubated after 36 h. In
more recent studies, the highest maximum trans-resveratrol concentration of 6.39 µg/g was
achieved when peanuts were treated with ultrasound power density of 75 mW/cm3 for 2 min
followed by incubation at 25oC for 48 h, among 27 ultrasound treatments (Sales and
Resurreccion, 2009). In a separate study, using different parameters, sliced peanuts exposed to
ultrasound power density of 40 mW/cm3 for 4 min then incubated for 44 h at 25oC produced 4.29
µg/g trans-resveratrol (Potrebko and Resurreccion, 2009). Ultrasound caused rapid increase in
the concentrations of phenylammonia lyase, polyphenol oxidase, and peroxidase in ginseng
cultures with phenylammonia lyase enhanced most dramatically (Wu and Lin, 2002b).
Phenylammonia lyase is responsible for the deamination of phenylalanine, the initial step in the
biosynthesis of coumaryl CoA, one of the precursors for resveratrol synthesis (Soleas et al.,
1997). We believe that the release of phenylammonia lyase after ultrasound treatment could be
responsible for increased concentrations of resveratrol in ultrasound treated peanuts.

74
Chukwumah et al. (2005) used ultrasound at combined frequency of 25, 60, and 80 kHz for
30, 60, 90, 120, 150, and 180 minutes to extract selected phytochemicals from raw peanuts with
80% ethanol. Improvement in extraction efficiency of ultrasound, a non-thermal procedure
could be attributed to the enhancement of cell disruption, solvent penetration, and mass transfer
(Chukwumah et al., 2009). The concentrations of resveratrol ranged from 0.11 + 0.05 to 0.27 +
0.01 mg/100g; biochanin, 0.22 + 0.01 to 0.32 + 0.01 mg/100g; and geneistein, 0.01 + 0.00 to 0.6
+ 0.02 mg/100 (Chukwumah et al., 2005). The highest amounts of resveratrol and biochanin
were obtained after 150 min ultrasound-assisted extraction, after 180 min for genistein while
daidzein was not detected (Chukwumah et al., 2005). Later, (Chukwumah et al., 2009) reported
that ultrasound-assisted extraction using sample to solvent ratio of 1:6 and a 30-min sonication at
25 kHz was sufficient to obtain significantly higher resveratrol.
Ultrasound technology was also used in the extraction of bioactive compounds in other
substrates (Wu et al., 2001; Xiao et al., 2005). Wu et al. (2001) reported that the ultrasound-
assisted extraction was simple and more effective alternative, about three times faster than the
conventional extraction methods for the isolation of ginsenosides (tripentene saponins) from
various types of ginseng roots. Direct sonication using the probe horn provided much higher
ultrasound energy (8.2 W) to the samples but did not show a clear advantage over the indirect
sonication using a cleaning bath (3.5W) for the extraction of saponins. The extraction rate with
the cleaning bath was slightly higher than that of the probe horn which is partially attributed to
the agitation and higher temperature (38-39oC) in the sample tubes in the sonic bath compared to
that of the sonicator probe horn (25-27oC) (Wu et al., 2001). These researchers concluded that
an ultrasound cleaning bath may be more convenient and efficient for the extraction of large
number of small volume samples for the following reasons: (a) the bath can process many

75 samples at one time while probe horn only allows for one at a time; (b) sonication with the
cleaning bath is non-intrusive to the sample which will eliminate the possible contamination and
loss of the extract; and (c) cleaning bath is usually much quieter than the probe horn during
operation.
Xiao et al. (2005) used ultrasound for the enzymatic synthesis of glucose esters, from the
alkaline protease of Bacillus subtilis in eight different solvents, using three different powers of
50, 100, and 120 W at 20 kHz operating at continuous ultrasound or interval ultrasound (10 min
ultrasound/20 min shaking without ultrasound). These researchers concluded that higher
ultrasound power and continuous operation gave better acceleration on the yields of glucose
esters without changing the character and selectivity of the enzyme in the transesterification.
Ultrasound showed a remarkable acceleration of the transesterification, and the yields under
continual or interval ultrasound treatments were higher than that of merely shaking over the same
reaction time. For example, the yields of glucose esters using continuous ultrasound at 120W
were 70% and 94% after 1 and 2 h, respectively, whereas the yields using interval ultrasound
were only 50% and 75%, respectively. Xiao et al. (2005) found that 120, 100, and 50 W
ultrasound powers had higher transesterification of glucose compared to shaking. A 98%
transesterification of glucose could be obtained after 2 h in 120 W in an ultrasound bath, whereas
only 48% was observed in shaking under the same conditions.
Ultrasound at 35 kHz and 37oC, effectively shortened the long enzymatic hydrolysis time to
30 min from 6h involved using conventional thermostatic devices for the heavy metals analysis
of edible seaweeds (Pena-Farfal et al., 2005). The ionic strength, a variable inherent to the
enzymatic activity, appears to the most important factor controlling the enzymatic hydrolysis for
both conventional and ultrasound assisted enzymatic hydrolysis which indicate that the metal

76 released are attributed to the enzymatic action and not to leaching procedures (Pena-Farfal et al.,
2005).
5. Treatment with metallic salts
Treatment of plants with metallic salts to induce stilbene production was earlier reported by
Hanawa et al. (1992) when they isolated from the leaves of Veratrum grandiflorum treated with
cupric chloride, two antifungal stilbenoids, resveratrol and oxyresveratrol, and their glucosides,
piceid, and oxyresveratrol-3-O-glucoside. The last compound was isolated for the first time
from a natural source. In addition, three glucosides of flavonoid apigenin-7-O-glucoside,
luteolin-7-O-glucoside, and chrysoeriol-7-O-glucoside were also found in the leaves.
Adrian et al. (1996) found that the metallic salt, aluminum chloride (AlCl3) can act as a
potent elicitor of resveratrol synthesis in grapevine leaves. They found out that all
concentrations of AlCl3 from 7 to 90 mM were capable of inducing a high resveratrol production
in the leaves of Vitis rupestris while greater concentrations of AlCl3 from 22 to 90 mM were
required to obtain a similar response in the leaves of Vitis vinifera cv. Pinot noir suggesting that
Vitis rupestris generally produces greater amounts resveratrol than Pinot noir. Aluminum sulfate
used at the same concentrations as AlCl3 had similar effects as those of AlCl3 on phytoalexin
induction, suggesting that aluminum was responsible for the enhanced elicitation of phytoalexins
(Adrian et al., 1996).
6. Treatment with other chemicals
Signal molecules such as salicylic acid, jasmonic acid, and ethylene play critical roles in
plant responses to various biotic and abiotic stresses (Chung et al., 2003). Salicylic acid is
responsible for the induction of genes involved in the systemic acquired resistance response

77 while jasmonic acid and ethylene activate certain genes involved in the salicylic acid-
independent response (Chung et al., 2003).
Subba Rao et al. (1996) found that 0.01M salicylic acid when applied as a foliar spray to
abraded leaves of peanuts is an effective elicitor of phytoalexins. A total of concentration of
1,270 nmol/g fresh weight of phytoalexins was obtained when salicylic acid was applied as a
foliar spray which was higher than when it was used as a root drench giving only 590 nmol
phytoalexin/g fresh weight.
Chung et al. (2003) investigated the accumulation of resveratrol and resveratrol synthase
(RS) gene expression in response to hormone stresses in peanut plant tissues. They immersed
peanut leaves with petioles in the sterile salicylic acid, jasmonic acid, and ethyphon for 0, 3, 12,
and 24 h. Results showed that resveratrol was accumulated up to 3-, 2-, and 8- fold in response to
salicylic acid, jasmonic acid and ethylene, respectively, in a time-dependent manner up to 24 h
but none in response to abscissic acid. RS mRNA increased in response to salicylic acid,
jasmonic acid and ethylene at least 12 h after treatment, and also increased in a time-dependent
manner in response to salicylic acid and ethylene which reached its maximum 24 h after
treatment. In contrast, RS mRNA was not induced by abscissic acid. The levels of RS mRNA
increased in response to the hormones correlated with the amounts of resveratrol accumulated,
indicating transcriptional control of RS gene expression (Chung et al., 2003).
Medina-Bolivar and his co-workers (2007) found that sodium acetate (10.2 mM ) was the
most appropriate elicitor for stilbene induction in the hairy root cultures of peanuts, compared to
laminarin, copper sulfate, cellulose and chitosan. The hairy root cultures treated with sodium
acetate accumulated 50 to 98 μg/mg dry weight (50,339 – 97,992 ng/mg) trans-resveratrol,
approximately 60-fold above the levels detected in untreated control culture media with 0.69-

78 0.81 µg/mg dry weight (692 to 1813 ng/mg). In treated cultures, cis-resveratrol concentrations
of 0.047-0.399 μg/mg (47 to 399 ng/mg) were relatively low compared to trans-resveratrol, but
higher than those in controls with 8-31 ng/mg. In control cultures, trans-resveratrol
concentrations were 80-fold higher compared to cis isomers with 0.008-0.031 μg/mg (8-31
ng/mg). In treated hairy root tissues, trans-resveratrol ranged from 253-1134 ng/mg whereas
untreated control root tissues had 0.210-0.587 μg/mg (210-587 ng/mg). Cis-resveratrol
concentrations were not detected or very low at 10 ng/g in treated hairy root tissues and 3 ng/g in
controls. Trans-pterostilbene in the treated hairy root cultures varied from 0.06 - 0.27 μg/mg
(61-267 ng/mg) reflecting approximately a 2-fold increase over untreated controls with 0.02-
0.14 μg/mg (22 – 140 ng/mg). The cis isomers of pterostilbene were not detected in both treated
and control cultures. Only trans-pterostilbene ranging from 44 to 136 ng/mg was found in the
treated root tissues while none was detected in the control root tissue. Cis-pterostilbene was not
detected in both treated and control hairy root cultures and root tissues. Higher resveratrol and
pterostilbene were observed in the cultures compared to root tissues of peanut hairy roots.
Peanut hairy root cultures offer a novel and sustainable bioproduction system for resveratrol and
associated derivatives (Medina-Bolivar et al., 2007).
7. Exposure to ozone
Ozone is a ubiquitous component of the terrestrial atmosphere and in the stratosphere, it
provides a crucial barrier to incoming UV radiation (Samuel et al., 2000). Among its numerous
phytoxic effects on plants, ozone is known to induce events usually elicited by various pathogens
(Biolley et al., 1998). Ozone stimulated elicitation of phytoalexins in bean leaves (Biolley et al.,
1988), and resveratrol and pterostilbene in grapes (Sarig et al., 1996). Sarig et al. (1996) found
out that exposure of ripe grape berries to a stream of air (airflow of 500 mL/min) containing
79 ozone at a rate of 8 mg/min, elicited resveratrol and pterostilbene, with the resveratrol
accumulating larger amounts. Production of these phytoalexins generally reached a maximum
level 24 h after 5-10 min exposure, depending on cultivar, to ozone and was enhanced by
inoculation with Rhizopus stolonifer isolated from diseased berries, either before or after ozone
treatments. Ethanol treatment, on the other hand, reduced elicitation potential of ozone for both
phytoalexins.
Grimmig et al. (1997) incorporated grapevine resveratrol synthase (Vst1) promoter combined
with the β-glucoronidase (GUS) reporter gene into a tobacco plant to identify the regions that
control ozone-regulated gene expression. They reported that sequences located within -430 to -
280 bp of the Vst1 promoter were required for ozone-regulation. Grimmig et al. (1997) found out
that in transgenic tobacco, a chimeric gene construct, containing the Vst1 promoter combined
with GUS reporter gene, is rapidly induced by ozone at 0.1 µl/L for 12 h. The same construct
was also strongly induced by ethylene at 20 µL/L for 12 h.
7. Far-infrared (FIR) and heat treatments
Generally, the outer layers of plants such as peel, shell, and hull contain large amount of
polyphenolic compounds to protect inner materials and a number of phenolic acids are linked to
various cell components (Lee et al., 2006). Far-infrared radiation and heat treatment may have
capability to cleave covalent bonds and to liberate antioxidants such as flavonoids, carotene or
polyphenols from repeating polymers (Lee et al., 2006). Far-infrared radiation for 5 to 60 min of
finely ground peanut hulls increased the total phenolic contents of water extracts in a time-
dependent manner from 79.3 to 141.6 micromole/L (µM) tannic acid equivalents compared to
untreated samples containing 72.9 µM tannic acid equivalents (Lee et al., 2006). Similarly
when peanut hulls were heat-treated by roasting at 150oC, total phenolics contents increased

80 from 79.8 to 90.3 µM tannic acid equivalents as heating increased from 5 to 60 min. Results
showed that FIR was more efficient than simple heating in increasing total phenolics contents of
water extracts of peanut hulls (Lee et al., 2006).
V. FUNCTIONAL PEANUTS AND PRODUCTS
A. Potential Product Usage for Functional Peanuts
Slicing of peanuts is necessary to produce peanuts with enhanced levels of bioactive
compounds such as trans-resveratrol (Arora and Strange, 1994; Rudolf and Resurreccion, 2005).
Therefore, for food applications, the sliced resveratrol-enhanced peanuts for use as ingredient
should either be chopped, ground or kept as sliced before it can be used in the product. Potential
products for functional peanuts that had been sliced include peanut butters, peanut bars, peanut
confections such are candies, and granola bars.
1. Peanut butter and spreads
Peanut butters and spreads which comprised more than 50% of all peanut products
consumed in the U.S. (USDA/NASS, 2008), are potential food product application for
resveratrol-enhanced peanuts (REP) that delivers additional health benefits to consumers.
Rudolf and Resurreccion (2007) prepared peanut butters from REPs processed by ultrasound at
39.2 mW/cm3 power density for min at 25oC to optimize parameters for the size of peanut slices
and incubation time. Their results showed that trans-resveratrol increased to 1.38 µg/g in
peanuts sliced to 0.6 cm and incubated for 48 h compared to 0.29 µg/g in untreated peanuts. All
natural peanut butters prepared from REP had slightly lower intensity ratings for roasted
peanutty aroma (22.5-30.2) and flavor (36.6-53.5), peanut butter aroma (10.5-16.7) and flavor
(27.9-35.0), and sweet aromatic aroma (8.2-10.5) compared to controls with 33, 78, 38, 51, and
12. REP had higher intensity ratings, although the magnitudes were low, for oxidized (3.2-8.4),

81 and fishy (4.4-8.2) flavors; painty (0-8.4) off-flavors compared to peanut butters prepared from
untreated peanuts with 0 ratings for these off-flavor attributes. Reformulations of REP butters are
therefore needed to mask the off-flavors inherently produced in the resveratrol-enhanced
peanuts. Inclusion of fruit jams and chocolate in the REP butters or mixing REP with regular
roasted peanuts may help in masking these off-flavors.
2. Peanut confections
The high protein content of peanuts makes them ideal for high energy snacks. Four of the
top ten candy bars sold in the U.S. contain peanuts and/or peanut butter (National Peanut Board,
2010) suggesting that resveratrol-enhanced peanuts have high potential in confectionery
industry. REPs have inherent off-flavors developed in the process of enhancing trans-
resveratrol resulting in its lower acceptance by consumers (Sales and Resurreccion, 2009; 2010).
Roasted peanuts from REPs treated by UV, ultrasound, and combined ultrasound-UV with
resveratrol concentrations received lower overall consumer acceptance ratings of 5.0-6.3 (mean
= 5.7), 4.2-6.0 (mean=5.1), and 4.4-5.6 (mean=4.9), respectively, compared to untreated controls
rated 7.4-7.7 or like moderately (Sales and Resurreccion, 2009; 2010). Addition of sugar and
flavoring improved the perceived bitter flavor of peanut skins infusions and consumers
significant gave higher acceptance ratings in sweetened compared to unsweetened infusions
(Francisco, 2009) which suggest that adding sugar to REP may mask the off-flavors and improve
the acceptance of REP products.
There are a seemingly infinite number of varieties of candy products wherein REPs can be
made available to the consumers. A large variety of candy bars combine peanuts as chopped or
as peanut butter, with other ingredients such as chocolate, nougat, marshmallow, caramel, and

82 dried fruit and peanut brittles and chocolate-covered peanuts are always popular (The Good
Earth Peanut Company, 2010).
3. Peanut flour
Spadaro (1979) described the uses of defatted and partially defatted peanut flours in a variety
of food products suggesting that peanut flour from resveratrol-enhanced peanuts may have the
same potential applications. Peanut flour was acceptable as a protein supplement and functional
ingredient in macaroni, bread dough and frankfurters at levels of 12, 11, and 10%, respectively;
however, doughs prepared with the flour tended to be sticky which may be overcome by changes
in processing (Spadaro, 1979). This author reported that the applications of peanut flour in
cakes, cookies, soups, gruels, puddings spreads, gravies, meat loaf, ice cream, snack items and
breakfast cereals have been evaluated. Peanut flour had been used satisfactorily to replace one-
fourth to one half of the milk solids in ice cream (Spadaro, 1979). Peanut milks were prepared
by adding one part of peanut flour to nine parts of water to produce skim milk. Incorporation of
defatted peanut flour in gruel type blended food formulations, including general purpose and
high calorie weaning blends containing either corn or wheat and peanut flour, whey protein
concentrate and lysine hydrochloride was also evaluated (Spadaro, 1979).
4. Roasted peanuts/snack peanuts/other peanut products
The application of resveratrol-enhanced peanuts in snacks may be limited to products that
will use them as ground, chopped or sliced, and butter. The National Peanut Board (2010)
recently published in their website, new peanut products commercially available in the market
for which REP may have applications which included peanut butter granola bar thins, peanut
butter honey and peanut butter dark chocolate bars, peanut butter chunky cookies, peanut butter
& caramel and peanut butter & raspberry duets, silky smooth milk chocolate peanut butter,
83 honey roasted peanut crunch, peanut butter & jelly and peanut butter cookie bar, gourmet peanut
brittle, curry peanut and peanut soup, pure power and peanut bar with blueberry or tart cherries,
chocolate peanut butter, and PB2, a powdered peanut butter with 85% less calories than regular
peanuts.
5. Peanut sprouts as functional vegetable
Functional peanut sprouts is a novel product developed by Wang et al. (2005) and Chang et
al.(2006) was found to contain high concentrations of trans-resveratrol. This product would
avail the consumers of a healthful vegetables enhanced with stilbenes beneficial to health.
Wang et al. (2005) found that when the rehydrated peanut kernels were germinated at 25oC and
95% relative humidity in the dark for 9 days, resveratrol contents increased significantly from
initial concentrations of 2.3-4.5 µg/g to a range of 11.7-25.7 µg/g depending on peanut cultivar.
Resveratrol was highest in the cotyledons (12.0-47.1 µg/g), slightly lower in roots (7.9-18.3
µg/g) and not detected in the stems of peanut sprouts. When sprouts were heated in boiling
water for 2 min, resveratrol contents were mostly unchanged indicating that resveratrol was
fairly stable against heating or cooking (Wang et al., 2006).
Chang et al. (2006) detected four major fractions of stilbenoids in germinated and sliced
peanuts as discussed previously which exhibited potent antioxidant and anti-inflammatory
activities. Resveratrol showed equivalently potent 2, 2-diphenyl-1-picrylhydrazyl (DPPH)
scavenging activity as butylated hydroxytoluene (BHT), and both had significantly higher
activity than trans-arachidin-1, trans-archidin-3, and trans- isopentadienylresveratrol. In pork oil
system, storage at 60oC of all supplemented antioxidants at 100 µM showed inhibitory effects
against formation of conjugated diene hydroperoxides.

84 6. Hairy root cultures of peanuts
Many stilbenes recovered as an extract from a selected number of plants were not suitable for
many applications in the food/pharmaceutical sectors due to high levels of impurities and overall
low concentration of resveratrol and its derivatives in the extract (Medina-Bolivar et al., 2007).
Medina-Bolivar et al. (2007) established and tested hairy root cultures of peanut as a
bioproduction system for resveratrol and associated derivatives. Their results showed that a
single 24 h sodium acetate elicitation resulted in a 60-fold induction and secretion of trans-
resveratrol into the medium of peanut hairy root cultures. Trans-resveratrol accumulated to 98
µg/mg of the dried extract from the medium representing 99% of the total resveratrol produced.
Trans-pterostilbene, were also detected in the medium at 0.24 µg/mg, a 2-fold increase compared
to non-elicited cultures. Their results demonstrated the capacity of hairy root cultures as an
effective bioprocessing system for valued nutraceuticals like resveratrol and resveratrol
derivatives. Hairy roots may offer a scalable and continuous product recovery platform for
naturally-derived, high quality, enriched nutraceuticals as these effectively induced and
recovered high levels of resveratrol and associated derivatives from the media fraction (Medina-
Bolivar et al., 2007).
B. Optimization of Processes for Enhanced Levels of Bioactive Compounds
Optimization studies are conducted to optimize parameters that would lead to optimal
product with the highest consumer acceptance. Sensory affective tests are performed to evaluate
the acceptance of a product using consumers – the ultimate users of the product. Response
surface methodology (RSM) is a statistical method used in optimization studies. RSM uses
quantitative data from appropriate experimental design to determine and simultaneously solve
multivariate equations which can be graphically represented as response surface, and can be used

85 in three ways: (1) to describe how test variables affect the response; (2) to determine the
interrelationships among the test variables; and (3) to describe the combined effect of all test
variables on the response (Giovanni, 1983).
Rudolf and Resurreccion (2007) optimized slicing and incubation times using response
surface methodology for maximum enhancement of trans-resveratrol in peanuts treated with one
level of ultrasound using a power density of 39.2 mW/cm3 for 4 min in an ultrasonic bath while
producing an acceptable resveratrol-enhanced peanut butters. The optimum processes included
all treatments combinations within a triangle bound by three points, representing peanut size and
incubation time combinations of 0.89 cm and 48 h; 0.72 cm and 41.5 h; and 0.64 cm, and 48 h,
respectively. This optimum processes were predicted to produce REP butters with a trans-
resveratrol ≥1.0 μg/g; and sensory intensity ratings for roasted peanutty aroma ≥24, and roasted
peaunutty flavor ≥ 43, peanut butter aroma ≥ 14, peanut butter flavor ≥ 31, oxidized flavor ≤ 6,
painty flavor ≤ 0.5, fishy≤ 6, and cardboard flavor ≤ 4 using a 150 mm unstructured line scale.
Optimization studies using varying doses of UV, ultrasound, and combined ultrasound and
UV were conducted by Sales and Resurreccion (2009; 2010) resulting in maximum levels of
trans-resveratrol in sliced (~7 mm) REP with the highest consumer acceptance ratings ≥ 5 or
neither like nor dislike. The optimum UV processes which produced REP with maximum trans-
resveratrol of 2.1 µg/g, included all process combinations within the area of a triangle bound by
three points, representing a combination of distance from UV light and UV exposure time of 47
cm and 20 min, 41 cm and 26.5 min, and 33 cm and 30 min, followed by incubation at 25oC for
36 h; (Sales and Resurreccion, 2009). Ultrasound process optimization achieved a maximum
4.4 µg/g trans-resveratrol and the optimum processes included all process combinations within a
pentagon bound by 5 points, representing combination of ultrasound power density and exposure

86 times of 75 mW/cm3 for 5.2 min, 75 mW/cm3 for 8 min, 72 mW/cm3 for 8 min, 67 mW/cm3 for
7.1 min, and 66 mW/cm3 for 5.5 min, followed by incubation at 25oC for 36 h (Sales and
Resurreccion, 2009). The optimum combined ultrasound-UV processes which produced a
maximum of 4.8 µg/g trans-resveratrol included all process combinations within a hexagon
bound by 6 points representing the combination of ultrasound power densities and exposure time
of 74 mW/cm3 for 8.3 min, 70 mW/cm3 for 10.9 min, 62 mW/cm3 for 11.2 min, 42 mW/cm3
for 10.4 min, 48 mW/cm3 for 8.3 min, and 58 mW/cm3 for 9.1 min, followed by 50 min
exposure at 40 cm distance from UV light and 36 h incubation at 25oC (Sales and Resurreccion,
2010).
VI. ANALYSIS OF RESVERATROL AND OTHER STILBENES IN PEANUTS
A. Extraction Methods
Extraction of resveratrol and other bioactive compounds is a critical step in its quantitative
analysis. Analytical methods have been developed that extract as much of the compounds from
the sample and prevent their degradation and/or alteration up to the time that they are
quantitatively analyzed. The following are important considerations during extraction of trans-
resveratrol and other bioactive compounds.
1. Protection from light
During extraction of samples for resveratrol analysis, it is important that extraction procedure
should be protected from light as the trans isomer converts to cis form upon exposure to UV or
fluorescent light (Trela and Waterhouse, 1996). The stability of resveratrol standards in ethanol
at various conditions in the laboratory was studied by Trela and Waterhouse (1996) and their
findings are summarized as follows: (1) Standards of trans-resveratrol in 100% ethanol can be
stored for 3 months at -5oC in the dark and protected from stray light in a sealed light-proof

87 containers, thus limiting the need for re-calibration after 3 months. (2) Trans-resveratrol
standards in 50% ethanol and kept unrefrigerated in light-proof, paraffin sealed containers
appeared stable although solvent evaporation was noticeable over 3 months. (3) Trans-
resveratrol standard solutions left unprotected from light and exposed to laboratory fluorescent
lighting over 30 days isomerized to about 80% cis-resveratrol. (4) Cis-resveratrol was extremely
light sensitive. When stored in 50% ethanol in the dark at ambient temperatures, cis-resveratrol
remained stable for at least 35 days over the range of 5.3 to 52.8 μmol/L.
Wang et al. (2001) investigated the stability of 0.5 µM resveratrol in 100% methanol and
found that the standard solution was stable for 5 days at -20oC and 3 days at 4oC in the dark but
not stable at room temperature. Resveratrol concentration decreased to ~85% after 4 days at 4oC
based on the reference standard stored at -80oC which was assumed to be stable. At room
temperature in the dark, reduction in resveratrol concentration was observed even only after 2 h,
reduced slowly to ~75% after 8 h, and maintained at this level for 96 h. When exposed to light at
room temperature, only ~70% of resveratrol remained after 4h and the concentration decreased
to 30% after 48 h. Wang et al. (2002) recommended that a) resveratrol should be protected from
light during extraction, storage, and analysis; b) standard solutions and extracts in methanol
should be stored at ≤20oC and analyzed within 5 days; c) fresh standard solutions should be
prepared at least weekly; d) automatic injectors maintained at ≤ 4oC; and e) samples should be
analyzed within 2 days.
The cis-resveratrol is extremely light-sensitive which made it difficult to purify (Trela and
Waterhouse, 1996) and therefore not commercially available. It can remain stable in the dark
only near neutral pH, and isomerized to trans form at low pH (Trela and Waterhouse, 1996).

88 2. Extraction solvents used
Ethanol/water, v/v of varying concentrations has been used by a majority researchers for the
extraction of resveratrol from different samples of peanuts and peanut plant materials including
95:5 (Aguamah et al., 1981; Arora and Strange, 1991); 8:2 in the extraction of peanut kernels
(Sanders et al., 2000; Rudolf et al., 2005; Chukwumah et al., 2005) and peanut butter (Ibern-
Gomez et al., 2000); and 1:1 in peanut leaves and roots (Azpilicueta et al., 2004).
Other organic solvents used in the extraction of stilbenes were (1) methanol/water, 8:2, v/v
in peanut roots (Chen et al., 2002) and in peanut kernels, leaves and roots (Chung et al., 2003);
(2) acetone/water, 8:2, v/v in peanut kernels (Arora and Strange, 1991); (3) acetonitrile, 100% in
peanut kernels (Arora and Strange, 1991); and acetonitrile/water, 9:1 v/v in roasted peanuts,
peanut butter, and boiled peanuts (Sobolev and Cole, 1999; Lee et al., 2004) .
3. Preliminary size reduction of sample
Peanuts and other solid samples were reduced to fine particles by grinding to facilitate the
extraction of bioactive compounds. Equipment for grinding used by researchers included
blender (Sobolev and Cole, 1999); coffee mill (Sanders et al., 2000; Rudolf et al., 2005;
Tokosoglu et al., 2005); SMP Process Homogenizer at 15,000 rpm for 1 min (Lee et al., 2004).
Skins of grapes were ground to a fine powder in a liquid nitrogen using a pre-chilled mortar
and pestle (Bais et al., 2003) to extract resveratrol. Resveratrol from grapevine leaves was
extracted by grinding in a mortar with sand and methanol/water 8:2, v/v (Adrian et al., 1996).
4. Homogenizing, centrifugation, and agitation
Samples reduced to smaller particle sizes are mixed with the extraction solvent and
homogenized, centrifuged, or agitated. Agitation with the solvent usually takes longer extraction
time compared to homogenization alone or in combination with centrifugation.

89
Resveratrol was commonly extracted from peanut kernels by homogenizing the ground
sample with the organic solvents followed by centrifugation. Sobolev and Cole (1999), Sanders
et al. (2000), and Rudolf et al. (2005) homogenized ground peanuts with ethanol/water (80:20,
v/v) using PowerGen 700 homogenizer set at approximately 27,000 rpm for 2 min in ice bath,
and then centrifuged for 5 min at 1380g. Lee et al (2004) recovered resveratrol from peanuts and
peanut butters by mixing the samples with acetonitrile/water (9:1, v/v), followed by
homogenizing the mixture for 2 min using a Polytron, rinsing the Polytron with 5 mL extraction
solvent, and then filtration through a Whatman No.2. Ibern-Gomez et al. (2000) extracted
resveratrol and piceid from peanut butters with ethanol/water 8:2, v/v at room temperature for 30
min followed by centrifugation for 5 min at 3000 rpm.
In dried peanut roots, Chen and co-workers (2002) recovered resveratrol by mixing the
powdered roots with methanol/water, 8:2 v/v and homogenizing the mixture at 15,000 rpm for 1
min using a Polytron with an aggregate probe. The probe was washed with 80% methanol adding
the washings to the homogenate, and the mixture was heated in a water bath at 70oC with
occasional shaking for 30 min. The heated mixture was centrifuged at 8000g at 20oC for 15 min,
the supernatant was collected, membrane-filtered, and diluted with water to adjust to 2:8, v/v
methanol/water, and then the aliquot was loaded onto solid phase extraction.
Resveratrol from frozen leaf peanut tissue powder was extracted by Chung et al. (2003) by
agitating in methanol for 16 h at room temperature. Nepote et al. (2004) prepared the ethanolic
extracts from peanut skins previously defatted in hexane, by macerating the defatted skins with
ethanol for 24 h in the dark at room temperature. The crude ethanolic extracts were purified by
partition with a solution of dichloromethane, ethyl acetate and water (90:300:55 v/v/v). The
90 ethyl acetate fraction was evaporated in a rotary evaporator and separated with methanol (100%)
in a minicolumn packed with Sephadex.
Adrian et al. (1996) extracted resveratrol from grapevine leaves by grounding in a mortar
with sand and methanol/water 8:2, v/v, followed by centrifugation at 10,000g for 15min. The
supernatant was pre-purified on a Sep-Pak C18 cartridge through elution with methanol/water
8:2, v/v and the eluate was evaporated to dryness at <40oC.
In powdered berry skins, Bais et al. (2003) mixed methanol (100%) to the sample and the
mixture was shaken in the dark at room temperature for 1 hr. Extracted tissue was then pelleted
via centrifugation at 7700 g for 30 min at 4oC and supernatant was taken for HPLC analysis.
5. Use of clean-up columns
Crude extracts from high-fat containing samples such as peanuts and peanut products
were cleaned-up to remove the lipid and protein components that may interfere in the analysis by
passing the extracts through clean-up columns (Sanders et al., 2000). The clean-up column is
made up of a 1:1 mixture of aluminum oxide (Al2O3) and silica gel 60 R18 packed in a
borosilicate glass disposable Pasteur pipette with cotton plug at the bottom ( Sobolev et al., 1995;
Sanders et al., 2000), or packed in a Teflon tube (Rudolf et al., 2005) or 3 mL disposable plastic
syringe (Potrebko and Resurreccion, 2009) fitted with AP25 Millipore prefilter at the bottom.
Commercially prepared clean-up columns are also available such as the Econo-column (Poly-
Prep chromatography column) packed with 1.0 – 1.2 mL of mixture of Al2O3 and AccuBOND11
SPE ODS C18 (Lee et al., 2004).
6. Facilitated diffusion technique
Azpilicueta et al. (2004) extracted phytoalexins in peanut leaves and roots using facilitated
diffusion technique. The plant tissues were vacuum infiltrated with ethanol/water 1:1, v/v and

91 agitated overnight in a rotary shaker at 100 rpm and 20oC. The plant tissues were removed by
gravitational filtration and the filtrates were vacuum concentrated to approximately one-half
volume at 45oC. The concentrated solutions were extracted twice with ethyl acetate using
separatory funnel, and organic fractions were pooled, dehydrated with anhydrous sodium
sulphate and taken to dryness. Residues were redissolved in methanol at 0.2 mL/g of fresh tissue
and kept at -20oC until analyzed.
5. Vacuum infiltration and solid phase extraction
Phytoalexins were also extracted from peanut kernels by vacuum infiltration with acetonitrile
in the dark for 48 h at 25oC and partially purified by solid phase extraction (SPE; Arora and
Strange, 1991). Chen and co-researchers (2002) purified the aliquots of supernatant from
dehydrated peanut root extracts by loading onto SPE columns and eluted for cleanup with 28%
methanol through an extraction unit. The absorbed resveratrol was eluted with 47.5% methanol
and eluates were repeatedly injected into a semipreparative HPLC column at 2.4 mL injection
volume, then separated with a gradient solvent system initiated with 20% to 80% methanol in 16
min and held for an additional 2 min using a flow rate of 3 mL/min. The active fractions were
collected, pooled, and subjected to further separation for purification according to the same semi-
HPLC procedure and the collected solutions were evaporated to dry white powder.
6. Drying of sample extracts
After extraction, peanut extracts are evaporated to dryness under a stream of nitrogen or
under vacuum or reduced pressure at a specified temperature to stabilize the samples while
awaiting quantitative analysis. Sanders and co-workers (2000) dried their extracts under
nitrogen at 60oC on a heating block; Rudolf et al. (2005) followed similar procedure but using a
water bath. Eluates containing resveratrol extracted from various peanut and peanut products

92 were evaporated to dryness under nitrogen stream at 40oC in an evaporating unit (Sobolev and
Cole, 1999) and Lee et al. (2004) adopted similar procedure at 50oC. Ibern-Gomez and her
group (2000) concentrated the supernatant extracts collected from peanut butter samples to
dryness under vacuum at temperatures below 40oC. The dried extracts were stable and can be
kept at -20oC until quantitatively analyzed (Rudolf et al., 2005).
B. Quantitative Analysis of Resvertrol and Other Stilbenes in Peanuts
1. Standards used
Currently, trans but not cis forms resveratrol, piceid, and piceatannol standards were
commercially available and used by various authors as reference standards. In earlier studies,
when trans-piceid standard was not commercially available, the standard was commonly
prepared by extracting the roots of Polygonum cuspidatum, the known major source (Waterhouse
and Lamuela-Raventos, 1994; Ibern-Gomez et al., 2000). The cis forms of the resveratrol and
other stilbenes were prepared by exposing the trans forms to UV (Trela and Waterhouse, 1994)
or white light (Bais et al., 2000). Cis-resveratrol was extremely light sensitive, and the
preparation of standards, while executed in near total darkness, allowed enough light to cause
slight isomerization to trans (Trela and Waterhouse, 1996). Trela and Waterhouse (1996)
investigated the UV-induced isomerization of trans-resveratrol and found that pure trans-
resveratrol at 418 μmol/L when subjected to UV light at 366 nm at an intensity of 180 μW/cm2
for 3 h converted to a maximum of 90.6% cis form. In contrast, at lower UV wavelength of 254
nm at an intensity of 750 μW/cm2, the same concentration of trans-resveratrol (4.18 μmol/L)
converted to only about 20% cis form after 3 h; and extending UV irradiation time to as long as
10 h resulted in only <63% conversion. Using higher concentration of 8.94 mmol/L trans-
resveratrol, UV irradiation at 366 nm for 3 h resulted in >80% conversion to cis-resveratrol.
93
Dominguez et al. (2001) prepared cis-resveratrol standard by exposing 100 mg/L stock
solution of trans-resveratrol for 15 min in a climatic chamber equipped with solar radiation panel
by xenon (1500 W) at controlled temperature of 28oC and 92 % humidity. The concentration of
cis-resveratrol was determined by based on the reduction in UV absorption and mass spectra of
trans-resveratrol after its irradiation.
The standards of cis isomers of resveratrol and piceid were prepared by Burns and her co-
workers (2002) by exposing the trans isomers in methanol solution for 12 h in high white light.
Lamuela-Raventos et al. (1995) isomerized trans-resveratrol and trans-piceid to cis forms by
exposing to sunlight but did not report the exposure time used.
2. Use of internal standard
Internal standards are used in the analysis of resveratrol in peanuts to efficiently quantify this
compound in the samples. For HPLC samples requiring significant pre-treatment or preparation
before HPLC analysis, the use of a stable internal standard which is not present in the sample
being analyzed is recommended (Francisco and Resurreccion, 2009b). Fixed and known amount
of an internal standard is added at the beginning of sample extraction. Phenolphthalein was used
an internal standard in the analysis of stilbenes in peanut samples by normal phase HPLC
(Sobolev et al., 1995) and reverse phase (Rudolf et al., 2005; Potrebko and Resurreccion, 2009)
due to its stability and suitable retention time relative to the stilbenes analyzed and therefore
helped to quantitative analysis (Sobolev et al., 1995). Other internal standards such as 3, 4, 5-
trimethoxycinnamic acid (Dominguez et al., 2001) and 2,5-dihydroxybenzaldehyde (Malovana et
al., 2001) were used in the reverse-phase HPLC analysis of trans-resveratrol in wines as these
were not known to be present in wines (Dominguez et al., 2001). β-resorcylic acid was used as

94 an internal standard for the simultaneous determination of 15 phenolic compounds in peanut
skins (Francisco and Resurreccion, 2009b).
3. Preparation of dried extracts prior to quantitative analysis
Prior to quantitative analysis of the stilbenes, the dried residue was re-dissolved in organic
solvents such as ethanol/water at low concentrations of 1:9 to 1.5: 8.5, v/v (Sanders et al., 2000;
Rudolf et al., 2005; Potrebko and Resurreccion, 2009), methanol/water, 1.5:8.5, v/v (Francisco
and Resurreccion, 2009b), or using HPLC mobile phase (Sobolev and Cole, 1999; Ibern-Gomez
et al., 2000; Lee et al., 2004; Waterhouse and Lamuela-Raventos, 1994; Adrian et al., 1996).
The reconstituted extracts were subjected to high frequency ultrasonification (Rudolf et al., 2005;
Chukwumah et al., 2005) to facilitate dissolution. Finally, the re-constituted residues were
filtered through inorganic membrane filter (0.45 μm) prior to injection for quantitative analysis
(Rudolf and Resurreccion, 2005; Potrebko and Resurreccion, 2009).
4. Methods for quantitative analysis of resveratrol and other stilbenes
A number of analytical methods have been developed to measure resveratrol, piceid, and
other stilbenes in peanuts, wines and grapes. These include high performance liquid
chromatography (HPLC), gas chromatography (GC, Luan et al. 2000); gas chromatography mass
spectrophotometry (GC-MS, Soleas et al., 1995; Medina-Bolivar et al., 2007); liquid
chromatography-tandem mass spectrometry (LC/MS/MS; Lyons et al., 2003) and capillary
electrophoresis (Gu et al., 2000; Gao et al., 2002). Among these methods, HPLC is regarded as
a prime separation method and most widely used method even though it has some shortcomings
including long analysis time, low resolution, and short lifetime of columns (Gao et al., 2002).

95 4.1 High Performance Liquid Chromatography (HPLC)
HPLC methods developed by various researches for the analysis of resveratrol and other
stilbenes in peanuts and peanut plant materials are listed in Table 2.7. HPLC separation modes
were conducted as normal-phase or reverse-phase. In normal phase HPLC, the stationary phase
(column) is made of polar packing medium such as silica, while the mobile phase is of non-polar
or low polarity solvents such as hexane, dichloromethane, chloroform, ethyl ether, and isopropyl
alcohol. In reverse-phase HPLC, a non-polar stationary phase such and a polar mobile phase are
used. The commonly used stationary phase packing material in the reverse-phase systems are
chemically bonded phases of silica surface silanols with an organochlorosilane.
The resveratrol and other stilbenes in peanuts analyzed using HPLC commonly using
gradient elution rather than isocratic methods (Rudolf et al., 2005). Isocratic elutions were used
for the determination of stilbene phytoalexins in peanuts using acetonitrile in a reverse phase
column (Aguamah et al., 1981), and n-Heptane/2-propanol/water/acetonitrile/acetic acid
(1050/270/17/5/1, v/v) in normal phase column (Sobolev et al., 1995; Sobolev and Cole, 1999).
Phytoalexins were detected and quantified by gradient elution in reverse-phase HPLC using
multichannel detector at 310 nm (Cooksey et al., 1988) and diode array detector (DAD) at 338
nm (Arora and Strange, 1991). Resveratrol and its isomers were detected using DAD in the
range of 306-308 nm for trans form and 285 nm for cis form; UV detectors over the
wavelengths of 254-320 nm; and fluorescence detector at 330 nm excitation and 374 emission
(Table 2.7). The use of photodiode array detector in combination with a UV-transparent mobile
phase (from 215 nm) helped to increase reliability of the method in the cases of low
concentrations analyzed in the samples (Sobolev and Cole, 1999).

96
Simultaneous determinations of resveratrol and piceid were detected and quantified in
peanuts and peanut butters using DAD at 285 and 306 nm for trans- and cis-resveratrol and
piceid (Ibern-Gomez et al., 2000), respectively and at 307 nm for both trans isomers of
resveratrol and piceid (Potrebko and Resurreccion, 2009). Resveratrol and piceatannol were
simultaneously detected in peanut callus using fluorescence detector at 343 excitation and 395
emission (Ku et al., 2005). The 16 phenolic compounds including an internal standard were
quantified in peanut skins using DAD detector set at 250, 280, 306, 320 and 370 nm (Francisco
and Resurreccion, 2009b).
In grapevine berries of three Vitis vinifera varieties, an HPLC analysis was used to quantify
the levels of resveratrol and its derivatives, piceid, pterostilbene and epsilon-viniferin, (Adrian et
al. 2000). The concentrations of these compounds were evaluated in healthy and Botrytis cinerea
infected grape clusters, both in natural vineyard conditions and in response to UV elicitation.
Vastano et al. (2000) analyzed the roots of two varieties of Polygonum cuspidatum, Hu
Zhang and Mexican Bamboo, for resveratrol and analogues. The powdered roots were extracted
with methanol and ethyl acetate, and the ethyl acetate fraction was subjected to fractionation and
purification using silica gel column chromatography and semipreparative HPLC. In addition to
resveratrol, three stilbene glucosides were identified as piceatannol glucoside (3, 5, 3′, 4′-
tetrahydroxystilbene 4'-O-beta-D-glucopyranoside), resveratroloside (3, 5, 4′-trihydroxystilbene
4′-O-beta-D-glucopyranoside), and piceid. The levels of the piceatannol glucoside and piceid
were twice as high in Mexican Bamboo as compared to Hu Zhang variety.
4.2 Liquid Chromatography-Mass Spectrometry (LC/MS)
Wang et al. (2002) developed a liquid chromatography-mass spectrometry method which
simultaneously detected and quantified concentrations of resveratrol and piceid in fruit juices
97 and wines, in a very wide range as low as 1.07 nmol/g in cranberry juice to as high as 24.84
µmol/L in Italian red wines. Samples were extracted using methanol, enzymatically hydrolyzed,
and analyzed using reversed phase HPLC with positive ion atmospheric pressure chemical
ionization (APCI) mass spectrometric detection. Following APCI, the abundance of protonated
molecules was recorded using selected ion monitoring (SIM) of m/z 229. The LC-MS
calibration curve showed a linear range over more than three orders of magnitude, from 0.52 to
2260 pmol of trans-resveratrol with a correlation coefficient 0.9999. The coefficient of variance
(COV) of the response factor over the same concentration range was 5.8%, and the intra-assay
COV was 4.2% (n = 7). The limit of quantitation, defined as signal-to-noise 10:1, was 0.31
pmol injected on-column. The extraction efficiency of the method was 92%. Resveratrol was
stable for 5 days at -20oC and 3 days at 4oC in the dark but not at room temperature without
protection from light indicating that resveratrol should be protected from light during extraction,
storage, and analysis (Wang et al., 2001).
4.3 High-performance Liquid Chromatography-Tandem Mass Spectrometry (LC-MS/MS)
Lyons et al. (2003) developed a new assay based on HPLC-tandem mass spectrometry (LC-
MS/MS) to measure resveratrol in bilberry Vaccinium myrtillus L., lowbush "wild" blueberry,
Vaccinium angustifolium Aiton, rabbiteye blueberry (Vaccinium ashei Reade), and the highbush
blueberry, Vaccinium corymbosum L. The LC-MS/MS assay provided lower limits of detection
than previous methods for resveratrol measurement, 90 fmol of trans-resveratrol injected on-
column, and a linear standard curve spanning >3 orders of magnitude. The recoveries of
resveratrol from blueberries spiked with 1.8, 3.6, or 36 ng/g were 91.5 ± 4.5, 95.6 ± 6.5, and 88.0
± 3.6%, respectively.
98 4.4 Gas Chromatography-Mass Spectrometry (GC-MS)
A GC-MS system was used to selectively target the detection of resveratrol and its
derivative, pterostilbene in the medium and root tissue of 12-day control (non-elicited) and
sodium acetate-treated (elicited) peanut hairy root cultures (Medina-Bolivar et al., 2007).
Discrimination between cis and trans isomers of the compounds was achieved by comparison of
the retention time and mass spectra of authentic standards. Although GC-MS analysis provides
excellent sensitivity and specificity, derivatization of resveratrol is required prior to analysis in
order to increase its thermal stability and volatility (Wang et al., 2002). Furthermore, the high
temperature of 250-300oC used at the injector, column, and ion source might cause partial
isomerization or degradation of the sample resulting in inaccurate quantitation (Wang et al.,
2002).
4.5 HPLC-Diode Array Detector (DAD)/Gas Chromatography-Mass Spectrometry (GC-MS).
Tokusoglu et al. (2005) analyzed trans and cis resveratrol in six edible peanut varieties, and
five pistachio (Pistacia vera L) varieties grown in Turkey and four market samples by HPLC
diode array and gas chromatography-mass spectrometric detection. Resveratrol was confirmed
by total ion chromatograms of bis[trimethylsilyl] trifluoroacetamide derivatives of resveratrol
isomers and comparison of the mass spectral fragmentation data with those of a resveratrol
standard.
4.6 Capillary Electrophoresis
Capillary electrophoresis (CE) is becoming increasingly recognized as an important
analytical separation technique for its speed, efficiency, reproducibility, ultra-small sample
volume, and little consumption of solvent (Gao et al., 2002; Brandolini et al., 2002) and
inexpensive capillary instead of expensive HPLC or GC columns (Brandolini et al., 2002). In
99 addition, with electrochemical detection (ED), CE–ED offers high sensitivity and good
selectivity for electroactive analytes. The group of Gao (2002) used CE-ED as an alternative
method for trans-resveratrol determination in samples of wines, medicinal herb, and health food,
which was proven to be simple, convenient, sensitive and selective.
Brandolini and co-workers (2002) developed an analytical method using CE with diode array
detection for the separation, identification, and quantification of trans and cis isomers of
resveratrol and their corresponding glucosides, piceid, from synthetic and natural sources. The
group optimized the process and they were able to obtain good separations of mixtures of trans-
resveratrol, cis-resveratrol, trans-piceid and cis-piceid. The effect of UV-irradiation time on the
isomerization of trans-piceid and trans-piceid showed that 50% isomerization was obtained after
5 min, and the equilibrium was achieved after 20 min of exposure, with 90% final conversion. In
view of the limited availability of piceid, Brandolini et al. (2002) also developed a synthetic
route using a simple and direct one-step glycosylation to synthesize adequate amount of trans-
piceid. The synthesis was performed on trans-resveratrol monosodium salt by the addition of α-
bromotetra-O-acetyl-D-glucose. The reaction proceeded with the concomitant deprotection of the
hydroxyl functions of the sugar moiety to provide the expected 3-O-glycosylated derivative in a
satisfactory yield. Results showed that the electrograms of both synthetic and natural trans-
piceid showed the same migration time, the same corresponding peaks, and the same absorption
spectra.
6. HPLC, UV spectrophotometry, electrospray mass spectrometry (HPLC-ESI-MS)
An HPLC method with electrochemical detection was used to determine the occurrence of
trans-resveratrol and cis-resveratrol in various vegetables and fruits (Kolouchova-Hanzlikova et
al., 2004). HPLC, UV spectrophotometry, electrospray ionization mass spectrometry (HPLC-
100
ESI-MS) and enzymatic hydrolysis were used to detect and identify two new transgenic plant
compounds, trans- and cis-isomers of resveratrol-3-glucoside (piceid) in poplar (Giorcelli et al.,
2004).
VII. CONCLUSIONS
Trans-resveratrol, trans-piceid and other stilbenes are potent antioxidants naturally present in
peanuts and can be enhanced in peanuts and peanut plant materials using biotic and abiotic
stresses. The knowledge of the presence of these health beneficial bioactive compounds in
peanuts led the researchers to investigate various processes that will further increase their
biosynthesis not only in the edible parts of the plant but also in its inedible portions with the
objective of obtaining cheaper sources for dietary supplements. Researchers developed
analytical methods for the effective extraction and quantitative analyses of these bioactive
compounds from the samples.

101
Table 2.7 Comparison of published methods of high performance liquid chromatography (HPLC) analysis for resveratrol and resveratrol derivatives in peanuts and peanut plant materials.
Mobile phase solvents Sample Separation
Mode1Column Column
Temperature(°C) A B
Elution Flow Rate (mL/min)
Detector
Peanut kernels2,3
Reverse-phase Hypersil Octadecylsilyl (ODS) (250 mm L20 x 4.6 mm i.d20.; 5 µm particle size)
NR22 acetonitrile/ water (1:1, v/v)
NA21 Isocratic 4 Pye-Unicam LC-UV 335 nm for stilbene phytoalexins
Peanut kernel4
Reverse-phase Spherisorb 10 ODS (250 mm L x 4.6 mm i.d.; 5 µm particle size)
NR water/ acetic acid (99:1, v/v)
acetonitrile Gradient: Time (min),%B; 1, 40; 7, 45; 12, 45; 20, 65
1.5 Mulitchannel detector 310 nm and 0.04 A for phytoalexins
Peanut kernels5
Reverse-phase Spherisorb 10 ODS (250 mm L x 4.6 mm i.d.; 5 µm particle size)
NR water/ acetic acid (99:1, v/v)
acetonitrile Gradient: Time (min),%B; 1, 30; 3, 30; 6, 35; 9, 35; 12, 40; 15, 40; 18, 50; 20, 50; 21, 30; 31, 30
1.5 Diode array detector (DAD) UV mode, 338 nm for phytoalexins
Peanut kernels6
Normal-phase Ultrasphere-SI (250 mm L x 4.6 mm i.d.; 5 µm particle size)
NR n-heptane/ 2-propanol/ water/ acetonitrile/ acetic acid (1050:270: 17:5:1, v/v/v/v/v)
NA Isocratic 1.5 Programmable multiwavelength 300 nm or 290-345 nm range (12 fixed wavelengths; 5 nm increments) in 0.005-0.005 AUFS range, for trans-resveratrol

102 Table 2.7 continued…
Mobile phase solvents Sample Separation Mode1
Column Column Temperature
(°C) A B
Elution Flow Rate (mL/min)
Detector
Roasted and boiled peanuts and peanut butter7
Normal-phase Zorbax-RX-SIL (250 mm L x 4.6 mm i.d.; 5 µm particle size)
ambient n-hexane/ 2-propanol/ water/ acetonitrile/ acetic acid (1050:270: 17:5:1, v/v/v/v/v)
NA Isocratic 1.5 DAD 307 nm for trans-resveratrol of fresh and roasted peanuts; 320 nm for peanut butter
Peanut kernels8
Reverse-phase Vydac C18 (150 mm L x 4.5 mm i.d.; 5 µm particle size)
NR water/TFA (9.9:0.1, v/v)
acetonitrile Gradient Time (min),%B; 1, 0; 3, 15; 23, 27; 28, 100; 29, 0; 39, 0
- UV 308 nm for resveratrol
Peanut Butter9
Reverse-phase Nucleosil 120 C18 (250 mm L x 4 mm i.d.; 5 µm particle size)
40 acetic acid/ water (52.6:900, v/v)
solvent A/ acetonitrile (2:8, v/v)
Gradient Time (min),%B; 0, 16.5; 13, 18; 15, 18; 17, 23; 21, 25; 27, 31.5; 30, 0
1.5 DAD 285 nm for trans forms of resveratrol and piceid; 306 nm for cis forms
Peanut roots10
Reverse-phase Thermal Hypersil ODS (250 mm L x 4 mm i.d.; 5 µm particle size)
NR water methanol Gradient Time (min),%B; 1, 20; 16, 80; 18, 80
1.0 UV 254 nm for resveratrol
Peanut leaves, pods and roots11
Reverse-phase µBondapak C18 column (3.9 mm x 300 mm)
NR water acetonitrile Gradient (elution time and composition were not reported)
1.0 Fluorescence detector 330 nm excitation and 374 mm emission, for resveratrol

103 Table 2.7 continued…
Mobile phase solvents Sample Separation Mode1
Column Column Temperature
(°C) A B
Elution Flow Rate (mL/min)
Detector
Peanut kernels and peanut butter12
Reverse Phase Nucleosil 100-5 C18 (250 mm L x 4.0 mm i.d.; 5 µm particle size) Pre-column packed with Nucleosil 5 C18 (4 mm x 4 mm)
NR acetonitrile/ water (40:60, v/v)
NA Isocratic 0.3 UV detector 306 nm for trans-resveratrol
Peanut skins13
Normal-phase Nucleosil 120-5-C-18 column
NR methanol/ water (1:1, v/v)
NA Isocratic 1.5 UV detector 320 nm for trans-resveratrol
Peanut sprouts14
Reverse phase Thermal Hypersil ODS (250 mm L x 4.6 mm i.d.; 5 µm particle size)
NR water methanol Gradient Time (min),%B; 0, 30; 16, 90; 2, 90
1.0 UV detector 307 nm for resveratrol
Peanut kernels15
Reverse phase Hypersil-ODS (250 mm L x 4.6 mm i.d.; 5 µm particle size)
30 acetonitrile/ bidistilled water (40:60, v/v) plus 0.1N trifluoro-acetic acid, v/v
NA Isocratic 1.0 DAD UV detector 308 nm for trans- and cis- resveratrol
Peanut callus16
Reverse phase Mightsil RP C-18 column (250 mm L x 4.6 mm i.d.
NR water adjusted to pH 2.1 with formic acid
acetonitrile adjusted to pH 2.1 with formic acid
Gradient: Time (min),%B; 0, 20; 20, 32; 30, 90; 35, 90
- Fluorescence detector 343 nm excitation and 395 nm emission for resveratrol and piceatannol

104 Table 2.7 continued…
Mobile phase solvents Sample Separation Mode1
Column Column Temperature
(°C) A B
Elution Flow Rate (mL/min)
Detector
Peanut kernels17
Reverse phase C18 column (250 mm L x 4.6 mm i.d.; 5 µm particle size) proceeded by a C18 guard column, 7.5 mm L x 4.6 mm i.d.; 5 µm particle size)
NR water/acetic acid (9.999:0.001, v/v)
acetonitrile Gradient: Time (min),%B; 0, 5; 7, 22; 13, 23; 26, 63; 28, 80; 29, 5; 34, 5
1.5 DAD 307 nm for trans-resveratrol; 280 nm for internal standard, phenolpthalein
Peanut kernels18
Reverse phase C18 column (250 mm L x 4.6 mm i.d.; 5 µm particle size) proceeded by a C18 guard column, 7.5 mm L x 4.6 mm i.d.; 5 µm particle size)
NR water acetonitrile Gradient: Time (min),%B; 0, 5; 23, 41.8; 28, 77; 29, 5; 34, 5
1.5 DAD 307 nm for trans-resveratrol and trans-piceid; 280 nm for internal standard, phenolpthalein
Peanut skins19
Reverse phase C18 column (250 mm L x 4.6 mm i.d.; 5 µm particle size) proceeded by a C18 guard column, 7.5 mm L x 4.6 mm i.d.; 5 µm particle size)
NR water/formic acid (9.999:0.001, v/v)
acetonitrile/ formic acid (9.999:0.001,
v/v)
Gradient: Time (min),%B; 0, 5; 7, 7; 75, 17; 110, 45; 117, 100; 124, 100
1.5 DAD 250 nm for benzoic acid derivatives and internal standard, β-resorcylic acid; 280 nm for flavanols; 320 for cinnamic acid derivatives; 306 nm for stilbenes, trans-resveratrol and trans-piceid; 370 nm for flavonol, quercetin

105
1Separation modes were conducted as normal or reverse-phase. Normal-phase HPLC utilizes a polar adsorbent as the stationary phase (column), such as silica or silica to which non-ionic functional groups have been chemically attached, and nonpolar mobile phase. Reverse-phase utilizes a nonpolar stationary phase and polar mobile phase. The stationary phase in reverse-phase systems are chemically bonded phases of silica surface silanols with an organochlorosilane. Usually the R3 group is a octadecyl (C18 chain) as in octadecylsilyl (ODS) bonded phases. 2Aguamah et al. (1981) 3Three phytoalexins, 4-(3-methyl-but-1-enyl)-3,5,3',4'-tetrahydroxy-stilbene, 4-(3-methyl-but-2-enyl)-3,5,4'-trihydroxystilbene (4-isopentenylresveratrol) and 4-(3-methyl-but-1-enyl)-3,5,4'-trihydroxystilbene, closely related to resveratrol were isolated from peanuts. 4Cooksey et al. (1988) 5Arora and Strange (1991) 6Sobolev et al. (1995) 7Sobolev and Cole (1999) 8Sanders et al. (2000) 9Ibern-Gomez et al. (2000) simultaneous determination of cis and trans resveratrol and piceid 10Chen et al. (2002) 11Chung et al. (2003) 12Lee et al. (2004) 13Nepote et al. (2004) 14Wang et al. (2005) 15Tokusoglu et al. (2005) 16Ku et al. (2005); simultaneous determination of resveratrol and piceatannol. 17Rudolf et al. (2005) 18Potrebko and Resurreccion (2009); simultaneous determination of trans-resveratrol and trans-piceid. 19Francisco and Resurreccion (2009b); simultaneous analysis of 16 phenolic compounds: benzoic acid derivatives- gallic acid, protocatechuic acid, and internal standard, β-resorcylic acid; flavanols – epigallocatechin, (+)-catechin, porcyanidin B2, (-)-epicatechin, (-)-epigallocatechin gallate, (-)-epicatechin gallate, (-)-catechin gallate; stilbenes- trans-piceid and trans-resveratrol; phenolic acids – caffeic-, coumaric- and ferulic acids; and flavonol, quercetin 20L means length; i.d. means internal diameter 21NA means not applicable 22NR means no data reported

SECTION 3
MATERIALS AND METHODS
The goal of this research was to enhance biosynthesis of trans-resveratrol and other bioactive
phenolics, through application of UV, ultrasound (US), and combined US-UV processing
treatments, thereby producing resveratrol-enhanced peanuts (REP) with high antioxidant
capacities and consumer acceptance. The intended use of REP for this study is that of an
ingredient for preparing resveratrol-enhanced roasted peanuts and peanut bars to deliver health
benefits to consumers.
I. STUDY 1 – ULTRAVIOLET LIGHT (UV) PROCESS OPTIMIZATION TO
ENHANCE TRANS-RESVERATROL BIOSYNTHESIS IN PEANUTS
A. Experimental Design
The UV treatments for peanut kernels included a 3 x 3 x 3 full factorial design (Table 3.1).
Parameters were distances from UV light of 20, 40 and 60 cm, UV exposure times of 10, 20 and
30 min, and incubation times at 25oC for 24, 36 and 48h. The levels chosen for the three UV
parameters were based on the work of Rudolf and Resurreccion (2005) who used one dose of UV
at 40 cm distance from UV light for 10 min and incubation times of 24, 36 and 48 h to enhance
elicitation of trans-resveratrol in peanuts; and Cantos et al. (2001) who used the range of 20 to
60 cm distances from UV light and exposure times of 5 s to 30 min to model postharvest
induction of trans-resveratrol in grapes. Two replications of the 27 UV treatments and a control
of untreated raw whole peanuts were prepared for a total of 56 samples (Table 3.2). Each sample
was analyzed in duplicate for trans-resveratrol, trans-piceid, total phenolics, antioxidant capacity
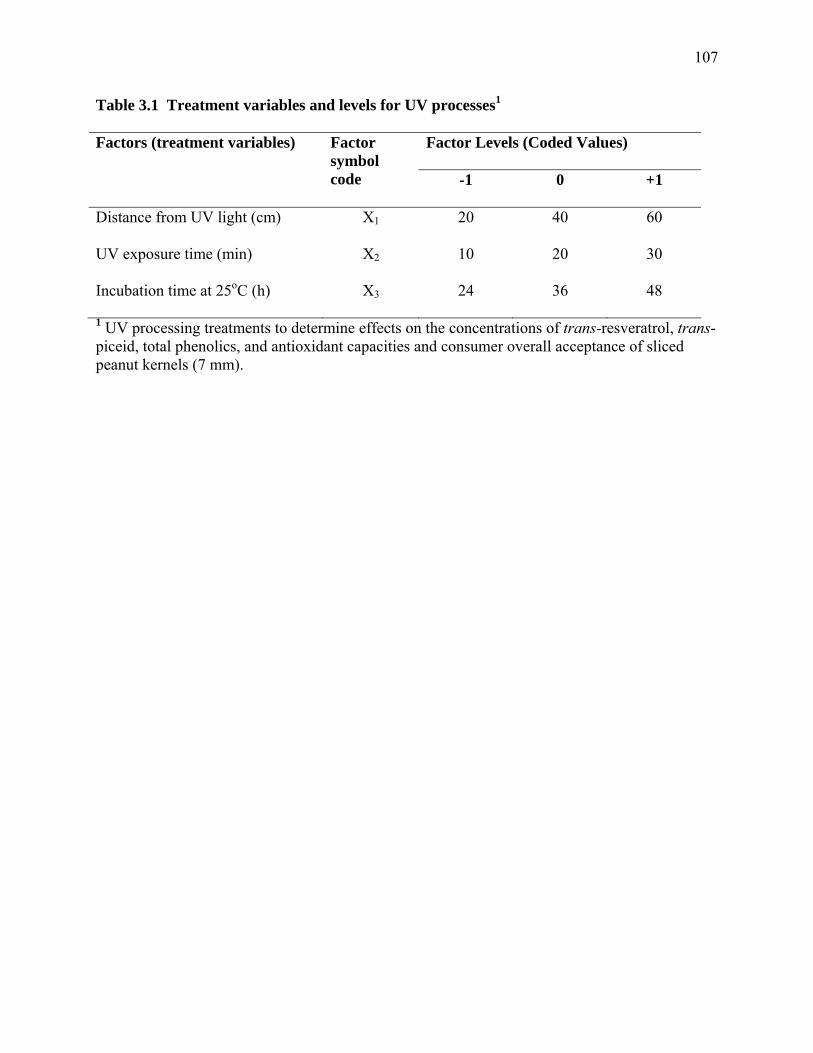
107
Table 3.1 Treatment variables and levels for UV processes1
Factor Levels (Coded Values)
Factors (treatment variables) Factor symbol code -1 0 +1
Distance from UV light (cm) X1 20 40 60
UV exposure time (min) X2 10 20 30
Incubation time at 25oC (h) X3 24 36 48
1 UV processing treatments to determine effects on the concentrations of trans-resveratrol, trans-piceid, total phenolics, and antioxidant capacities and consumer overall acceptance of sliced peanut kernels (7 mm).

108
Table 3.2 Experimental design for the three-level, three-factor response surface analysis for UV-treated peanuts.
Coded values Uncoded values Treatment X1 UV
irradiation distance
(cm)
X2 UV
exposure time (min)
X3 Incubation
time at 25oC (h)
X1 UV
irradiation distance
(cm)
X2 UV
exposure time (min)
X3 Incubation
time at 25oC(h)
1 -1 -1 -1 20 10 24 2 -1 -1 0 20 10 36 3 -1 -1 +1 20 10 48 4 -1 0 -1 20 20 24 5 -1 0 0 20 20 36 6 -1 0 +1 20 20 48 7 -1 +1 -1 20 30 24 8 -1 +1 0 20 30 36 9 -1 +1 +1 20 30 48 10 0 -1 -1 40 10 24 11 0 -1 0 40 10 36 12 0 -1 +1 40 10 48 13 0 0 -1 40 20 24 14 0 0 0 40 20 36 15 0 0 +1 40 20 48 16 0 +1 -1 40 30 24 17 0 +1 0 40 30 36 18 0 +1 +1 40 30 48 19 +1 -1 -1 60 10 24 20 +1 -1 0 60 10 36 21 +1 -1 +1 60 10 48 22 +1 0 -1 60 20 24 23 +1 0 0 60 20 36 24 +1 0 +1 60 20 48 25 +1 +1 -1 60 30 24 26 +1 +1 0 60 30 36 27 +1 +1 +1 60 30 48

109
By two methods: trolox antioxidant capacity (TEAC) and oxygen radical absorbance capacity
(ORAC) using hydrophilic (H-ORAC) and lipophilic (L-ORAC) assays, and profile of phenolic
compounds. When large coefficient of variation (COV) >35% occurred between two duplicates,
a triplicate analysis was conducted to decrease COV to <35%. However when COV remained
>35%, outlying results were dropped.
The 56 samples were analyzed using affective tests with 50 consumers, 25 panelists
evaluated replication 1, while the other half evaluated replication 2 in two 1-hour tests, with one
hour break in-between tests. During each test, panelists evaluated 4-5 samples in three sessions,
each separated by 5 min compulsory breaks. Descriptive sensory analysis of the 56 samples was
conducted using 10 trained panelists in two 2-hour tests, 28 samples/test, with 4-5 samples
evaluated in six sessions, each separated by 5 min compulsory breaks.
B. Sample Preparation
Raw peanuts, Arachis hypogaea cv Georgia green medium runners, harvested in 2005
(Golden Peanut Co., Alpharetta, GA, USA) and stored for two months at 4oC were used. All
processing implements and surfaces were washed and sanitized with 200 ppm chlorine solution
prior to use. About 1.8 kg peanuts were washed twice in 4 kg tap water, drained, surface
sanitized in 2 kg of 150 ppm chlorine solution for 15 min, and rinsed with sterilized deionized
water, prepared by passing through a 0.2 µm nylon filter (Millipore Corp., Bedford, MA, USA).
Peanuts were fully imbibed in 2 kg sterilized water for 16 h, drained, and manually sliced to
about 7 mm. Sliced peanuts, 3 batches of about 900 g each, were spread a single layer, about 1
cm deep on a plastic tray (56L x 30.5W x 60H cm, HDPE, Gage Industries Inc., Lake Oswego,
OR, USA). Three trays were positioned side by side along their length, a total of 91.5 cm, to
allow equal exposure to 122 cm UV light (UPV XX-40S, 40W, 254 nm, UltraViolet Products,
110
Upland, CA, USA) at the specified distances from UV light, and trays were removed after
specified time according to the experimental design. Peanuts within a tray were mixed after half
of exposure time for equal exposure of surfaces to UV.
UV-treated peanuts were packed in half gallon glass mason jars (Ball Corp., Muncie, IN,
USA), covered and wrapped with foil and incubated at 25oC (Environmental Growth Chamber,
Chagrin Falls, OH, USA) for 24, 36, and 48 h. Incubated samples were accumulated in a walk-in
freezer at -18oC, and then thawed in a walk-in cooler, 5oC for 24 h. Approximately 1 kg of
peanuts was poured into aluminum trays (40.6 L x 38.1 W x 1.2 H, cm; 0.4 cm i.d. perforations) to
one layer depth, and dried in a convection oven (645 Freas, Precision Scientific, Winchester, VA,
USA) at 40oC for 24 h to about 10% moisture by difference in weight before and after drying.
Peanuts were roasted (Lincoln Impingement Oven Model 1452, Fort Wayne, IN, USA) at 158oC
for 4.5 min to an L value of 50+1 (Chroma meter, Model CR-200, Minolta, Japan), cooled using an
industrial fan (Air Circulator, Model 9K961, Dayton Manufacturing Co., Niles, IL, USA). Skins
were manually removed then blown away by the fan. Roasted peanuts were packaged (10.16 x
45.72 cm vacuum plastic bags, Koch Packaging, Kansas, MO), flushed with nitrogen gas (medical
grade, South Air Gas, Griffin, GA, USA), and vacuum sealed (Ultravac, Koch Packaging, Kansas,
MO, USA). The entire process was conducted under yellow light to avoid isomerization or
degradation of stilbene compounds (Trela and Waterhouse, 1996). Samples were stored at -18oC
for 1 week prior to total phenolics and TEAC analyses, for 1 year prior to trans-resveratrol, trans-
picied and ORAC analyses, and for 2 years prior to profiling of phenolic compounds.
C. Chemical Analysis
Chemical analyses were conducted on the samples to determine the concentrations of
stilbenes - trans-resveratrol, trans-piceid, total phenolics, antioxidant capacities by trolox

111
equivalent antioxidant capacity (TEAC) and oxygen radical absorbance capacity (ORAC) and
profiled for 15 phenolic compounds.
1. Trans-resveratrol and trans-piceid
1.1 Extraction of trans-resveratrol and trans-piceid from samples
Only trans isomers of resveratrol and piceid were measured using the reverse HPLC method
of Potrebko and Resurreccion (2009) as trans isomers are more abundant in nature and more
stable than cis isomers (Trela and Waterhouse, 1996). About 30 g sample was ground using
coffee mill (Model K9M2-4, BrAun, Mexico) for 1 min, then 10 g were weighed into a 250mL
centrifuge bottle and 30 mL of 80% ethanol and 2 mL of 60 µg/mL freshly prepared
phenolphthalein (Aldrich Chemical Company, Milwaukee, WI, USA) solution as internal
standard were added. Contents were homogenized using PowerGen 700 (Fisher Scientific,
Pittsburg, PA, USA) for 2 min on ice then centrifuged (Model J2-21M, Beckman, Palo Alto, CA,
USA) for 5 min at 1380G at 25oC. A 2 mL supernatant was drained by gravity, about 20 min, into
a 5 mL tube through a clean-up column, to remove interfering compounds that co-eluted with
resveratrol and piceid (Sanders et al., 2000). The clean-up column was a 3 mL disposable syringe
fitted with about 5 mm diameter pre-filter (AP25, Millipore, Bedford, MA, USA) to prevent loss
of packing, consisting of 1g mixture of aluminum oxide (neutral activity 1, particle size of 0.063-
0.200 mm, EM Science, Gibbstown, NJ, USA) and silica gel 60 C18 (EM Science, Gibbstown, NJ,
USA), 1/1, w/w. The column was washed with 0.5 mL ethanol and filtrate was collected in the
same tube. Contents of 6 tubes placed parallel in a heating block (Thermolyne, Dubuque, IO,
USA) set at #5 to maintain 60oC, were dried for about 1h by blowing nitrogen directly over the
samples through a hollow six-pin blowdown manifold, then tubes were capped, wrapped with foil
and stored at -20oC until analyzed. All extractions were conducted under yellow light.

112
1.2 Preparation of standard solutions
Stock solutions, 200 ppm each of standards of trans-resveratrol (Aldrich Chemical Co.,
Milwaukee, WI, USA), trans-piceid (Ningbo J & S International Trade Company Ltd., Ningbo,
China) and phenolphthalein (Aldrich Chemical Company, Milwaukee, WI, USA) were prepared
separately by weighing out 0.01g of powder of each standard and diluting to 50 mL with 100%
ethanol in volumetric flasks. Prior to storage at -15oC of the standard stock solutions, the flasks
were flushed with nitrogen gas to remove oxygen and were wrapped with aluminum foil to
reduce light-induced isomerization.
A working stock solution which was a mixture of the three standards prepared for every
continuous run of approximately 1 week. The stock solution contain 10 ppm each of trans-
resveratrol and trans-piceid, and 20 ppm of phenolphthalein by transferring of 1mL each of 200
ppm stock solutions of trans-resveratrol and trans-piceid, and 2 mL of 200 ppm of
phenolphthalein stock solution in a 30 mL vial. To the mixture was added 16 mL of 15% ethanol
for a total volume of 20 mL.
Calculations: C1V1 = C2V2
where C1 = Concentration of stock solution, 200 ppm
V1= Volume (mL) stock solution
C2 = Concentration (ppm) of working stock solution
V2 = Volume (mL) of working stock solution
V1 = (10 ppm) (20 mL)/ 200ppm = 1 mL each of 200 ppm trans-resveratrol and trans-piceid V1 = (20 ppm) (20 mL)/ 200ppm = 2 mL of 200 ppm phenolphthalein
113
Standard solutions for calibration curve with concentrations of 10, 5, 3, 1, and 0.5 ppm for
trans-resveratrol and trans-piceid, and 20, 10, 6, 2, and 1 ppm for phenolphthalein for
generating standard curves were prepared by diluting appropriate amounts of the working stock
solution to 10 mL with 15% ethanol. An example of a calculation is as follows:
Calculation: To prepare 5 ppm trans-resveratrol and trans-piceid, and 10 ppm phenolphthalein:
C2V2 (5 ppm) (10 mL) V1 = C1
= 10 ppm = 5 mL of 10 ppm working stock solution
Where: V1= volume (mL) of working stock solution
V2= total volume of standard solution for calibration curve
C1= concentration of working stock solution required
C2= concentration of standard solution for calibration curve
All solutions were filtered by pouring into a glass syringe (Fisher Scientific, Fair Lawn, NJ,
USA) and filtered through an inorganic membrane filter (Anotop 10, 0.2 µm, Whatman
International Ltd., Maidstone, England) in 2 ml HPLC amber vial (National Scientific Co.,
Lawrenceville, GA, USA). The vial was sealed with a screw cap that was fitted with
Teflon/silicone septum (National Scientific Co., Lawrenceville, GA, USA). All standard
solutions were prepared under yellow light.
1.3 HPLC analysis of trans-resveratrol and trans-piceid
Before HPLC analysis, 0.40 mL ethanol (15%) was added to dried peanut extract, and mixed
in a vortex mixer (Model VM 3000, VWR, Thorofare, NJ, USA) at setting #6.5 for 30 s. Six
tubes at a time were immersed into water in a round plastic container (13 cm i.d. x 6 cm depth)
for 2 min indirect sonication at 50% amplitude using ultrasonic processor (750W, 115 VAC,

114
50/60 Hz, Cole Parmer, Vernon Hills, IL, USA). Sample was poured into a 3 mL glass syringe
with attached inorganic membrane filter (Anotop 10, 0.2µm, Whatman International Ltd.,
Maidstone, England), filtered into a 300 µL polypropylene insert placed in a 2 mL HPLC amber
vial and sealed with a screw cap fitted with a teflon/silicon septum (National Scientific Co.,
Lawrenceville, GA, USA). HPLC analysis used a Varian ProStar HPLC system consisting of
ProStar410 auto sampler, solvent delivery module 210, and ProStar 335 Diode Array Detector
(DAD) to set UV spectrum from 240 to 400 nm, and controlled by LC Module Add-In Star
version 6 and Star WS version 5.X, 6.41 software system (Varian Inc., Palo Alto, CA, USA).
The Eclipse Plus C18 reverse column, 250 x 4.6 mm, 5µm particle size, preceded by an Eclipse
Plus C18 guard column, 7.5 x 4.6 mm, 5µm particle size (Agilent Technologies, Deerfield, IL,
USA) was maintained at ambient temperature, 25oC. A 1.5 mL/min flow rate was used for
solvent A, 100% double deionized water vacuum filtered through a 0.2µm nylon filter and
solvent B, 100% acetonitrile (HPLC Grade, Aldrich, Milwaukee, WI, USA). Gradient elution
included: 0 min, 5% B; 7 min, 22% B; 13 min, 23% B; 26 min, 63% B; 28 min, 80% B; then
finally returned to 5% B in 1 min, and held at 5% B for an additional 5 min. Samples and
standards were injected at 40 µL volumes.
Peak areas of trans-resveratrol and piceid, were quantified at 307 nm and of phenolopthalein,
at 280 nm (Rudolf et al., 2005) and concentrations were calculated as follows:
µg of i in standard PA of i in standard x PA of i in sample
µg of i in sample = µg of IS in standard
PA of IS in standard x PA of IS in sample x µg of IS in sample
where i=trans-resveratrol or trans-piceid, IS (internal standard) =phenolphthalein, and PA=peak
area. Five levels of standards, 10, 5, 3, 1, and 0.5 µg/mL for trans-resveratrol and piceid, and 20,
10, 6, 2 and 1 µg/mL for phenolphthalein were analyzed at the beginning of each HPLC sample

115
set. Trans-resveratrol and piceid were reported as µg/g peanut, dry weight basis, and their sum, as
total stilbenes.
2. Total phenolics
Total phenolics contents of peanut extract samples were analyzed using Folin-Ciocalteu
assay of Singleton et al. (1999). The Folin Ciocalteu assay is used as it is one of the three assays
proposed for consideration as a standard antioxidant analytical procedure for measuring total
phenolics to assess antioxidant capacity of foods and neutraceuticals, during the First
International Congress on Antioxidants convened in Orlando, Florida in June 2004 (Prior et al.,
2005). The modified Folin Ciocalteau assay of Singleton et al. (1999) is simple, speedy,
economical, robust and does not require specialized equipment (Prior et al., 2005). This assay
specifically reduces phenols and imposes mandatory steps and conditions to minimize variability
and eliminate erratic results, such as addition of adequate reagent to react completely and rapidly
with the oxidizable substances in the samples, use of sufficient mixing time of the samples,
adding Folin Ciocalteau reagent solution before the alkali solution, and adequate time and
temperature of holding conditions for color development. The modified Folin Ciocalteau assay
of Singleton et al., (1999) was used in this study because it requires only 20 mL of reagents
instead of the 100 mL used by Singleton and Rossi (1965).
2.1 Extraction of total phenolics from samples
Peanut extracts for total phenolics analysis were prepared (Talcott et al., 2005) by grinding
about 20 g deskinned peanuts in a coffee mill (Model K9M2-4, Braun, Mexico) for 30 s. Ten grams
were weighed into a 250 mL centrifuge bottle (Fisher Scientific, Fair Lawn, N, USA J) and 20 mL
of 80% methanol (Fisher Scientific, Fair Lawn, NJ, USA) was added. The mixture was
homogenized (PowerGen 700, Fisher Scientific, Pittsburg, PA, USA) for 1 min and the centrifuge

116
bottles were capped, wrapped with foil, and held for 24 h at ambient temperature, approximately
23oC. After the holding period, the bottles were centrifuged (Model J2-21M, Beckman, Palo Alto,
CA, USA) at 2500g for 5 min at 18oC. Supernatant was filtered through Whatman No. 42 filter
paper (Maidstone, U.K; Rudolf and Resurreccion, 2005) and collected in a 35 mL screw capped
glass vial (Fisher Scientific, Fair Lawn, NJ, USA). The vials were capped, wrapped with foil, and
stored in a freezer at -18oC until analyzed.
2.2 Preparation of reagents and gallic acid standard solutions
The Folin-Ciocalteu’s phenol reagent, 1:10, was prepared by mixing 100 mL of Folin
Ciocalteau’s phenol reagent, 2N (Sigma-Aldrich, St. Louis, MO, USA) and 1 L of deionized
water. Sodium carbonate solution, 75g/1000 mL, was prepared by weighing 75 grams of sodium
carbonate powder (Sigma-Aldrich, St. Louis, MO, USA), followed by dissolving and diluting to
1L volume with deionized water. Methanol, 80% solution, was prepared by mixing 800 mL of
99.99% methanol (Sigma-Aldrich, St. Louis, MO, USA) with 200 mL of deionized water.
A stock solution of gallic acid, 1 mg/mL, was prepared by accurately weighing 0.0100 g
gallic acid powder (Sigma-Aldrich, St. Louis, MO, USA) in an empty 10 mL beaker. The
powder was dissolved in small amount of 80% methanol and quantitatively transferred into a 10
mL volumetric flask. The volume was brought to 10 mL with 80% methanol. Calculations are as
follows:
0.01 g Gallic Acid 1000 mg 10 ml of 80% methanol = 0.001 g gallic acid/mL solution x g = 1 mg/mL
Gallic acid calibaration standard solutions were prepared at concentrations of 5, 15, 30, 45
and 60 ppm for the generation of the standard curve. The formula, C1V1 = C2V2 was used to
calculate the amounts of gallic acid stock solution to prepare the desired concentrations.

117
Where: C1 = Concentration of gallic acid stock solution, 1 mg/mL
V1= Volume (ml) gallic stock solution
C2 = Concentration of working standards
V2 = Volume of working solution
An example of a calculation used for the working standards is as follows: For 30 µg/mL = 0.03 mg/mL
0.03 mg/mL x 20 mL mL gallic acid stock solution = 1 mg/mL = 0.6 mL
2.3 Total phenolics analysis
In a 30 mL test tube, 2 mL of diluted sample or gallic acid calibration standard solution were
mixed with 10 mL of 1:10 Folin Ciocalteau reagent. After 1 min but not exceeding 8 min, 8 mL
of the 75g/1000 mL sodium carbonate was added for a total volume of 20 mL. The mixture was
mixed in a vortex mixer, held for 2 h at ambient temperature at approximately 25oC for the blue
color complex generation. Absorbance was read at 760 nm (UV-Vis Diode Array
Spectrophotometer, Model 8451A, Hewlett Packard, Palo Alto, CA, USA). Total phenolics
concentration, expressed as mg gallic acid equivalents (GAE)/g, was calculated based on
regression equation of gallic acid standard curve:
Total phenolic (TP) concentration (mg GAE/g) = [Abs/b] * Dilution Factor Where: Abs = Absorbance at 760 nm
b= slope of the standard curve
Dilution Factor (DF) = amount of dilutions made on the analytical sample
20 mL of 80% methanol 2 mL diluted sample g sample wet weight DF= g sample wet weight x mL of sample extract x g sample dry weight

118
3. Trolox equivalent antioxidant capacity (TEAC)
TEAC is one in a set of three assays recommended as an antioxidant standard test for
antioxidant capacity (Prior et al., 2005); the two other tests in the set are ORAC and total
phenolics. TEAC represents the electron transfer based method that measures antioxidant
capacity and represents a reaction different from ORAC. TEAC of peanut kernels was
determined using the 2,2′-azinobis (3-ethylbenzothiaziline-6-sulfonate) (ABTS) anion
scavenging activity assay of Kim and Lee (2004). This procedure was modified by Kim and Lee
(2004) from the TEAC procedure of van den Berg et al. (1999) by: (a) using 2,2′-azobis-2-
amidinopropane dihydrochloride (AAPH), a thermolabile water-soluble radical initiator, rather
than 2,2′-azobis-2-amidopropane hydrochloride (ABAP) as radical initiator of ABTS, and b)
reducing the sample volume and reagents by half thus making the procedure more economical.
The antioxidant capacity is expressed as Trolox Equivalent Antioxidant Capacity (TEAC). The
higher the TEAC value of sample, the greater the antioxidant capacity
3.1 Extraction of antioxidants for TEAC analysis from samples
Samples for TEAC analysis were extracted along with total phenolics described previously in
Section 3.C.2.1 above. Extracts were diluted appropriately as needed prior to analysis.
3.2 Preparation of reagents and trolox standard solutions
ABTS radical solution was prepared fresh on the day of analysis by mixing 2.5 mM ABTS
(Sigma-Aldrich, St. Louis, MO, USA) and 1.0 mM AAPH (Sigma-Aldrich, St. Louis, MO, USA)
in phosphate buffered saline (PBS) solution (pH 7.4; 100 mM potassium phosphate buffer
containing 150 mM NaCl (Sigma-Aldrich, St. Louis, MO, USA). Details on preparing the
reagents are discussed below. The mixture was heated in a water bath (Buchi 461 Water Bath,
Switzerland) at 68oC internal temperature for 13 min to produce a blue green ABTS- radical

119
solution. The concentration of the ABTS- radical solution was adjusted with fresh PBS to an
absorbance of 0.650 + 0.020 at 734 nm (Spectrophotometer Model 8451A, Diode Array
Spectrophotometer, Hewlett Packard, Palo Alto, CA, USA) at 37oC. The adjusted freshly
prepared ABTS radical solution was stored at 37oC until needed for analysis. This ABTS radical
solution was used to react with trolox standards and sample extracts using the ABTS anion
scavenging activity assay.
PBS solution, 100 mL (pH 7.4, 100 mM with 150 mM NaCl) was prepared by mixing 1.3090
g KH2PO4 powder ( MW=136.09; Sigma-Aldrich, St. Louis, MO, USA) with 0.8766 g of NaCl
crystals (MW=58.44; Sigma-Aldrich, St. Louis, MO, USA), then dissolving and diluting to 100
mL with filtered deionized water. The pH of PBS was adjusted to 7.4 using 2M sodium
hydroxide (Sigma-Aldrich, St. Louis, MO, USA) solution prepared by dissolving 8.000 g of
NaOH pellets in 100 mL deionized water. In two separate 10 mL beakers, 0.1372 g of ABTS
powder (Sigma-Aldrich, St. Louis, MO, USA) and 0.0271 g of AAPH powder (Sigma-Aldrich,
St. Louis, MO, USA) were weighed, each was dissolved in about 5 mL of the prepared PBS, and
both were added to the remaining PBS resulting in 2.5 mM ABTS and 1 mM AAPH in the final
100 mL mixture. Formula used in the calculation of weights of powdered or solid reagents to
prepare ABTS radical solution is shown below.
mM x MW W = 1000 Where: W = weight of reagent needed, g/L
mM = millimolar = millimoles / L = concentration of reagent needed
MW = molecular weight of reagent, g/mole
1000 = conversion factor = 1000 millimoles/mole
For example, to prepare 1 L of 100 mM KH2PO4,

120
(100 mmoles/L x 136.09 g/mole) Weight of KH2PO4(g/L) = 1000 mmoles/mole = 13.609 g/L
Twenty five mL of 5 mM trolox stock solution was prepared by dissolving 0.0313 g of
Trolox powder (MW = 250.29 g/mole, Sigma-Aldrich, St. Louis, MO, USA) with 99.99%
methanol to a final volume of 25 mL. The weight of trolox powder needed to prepare 25 mL of
stock solution was calculated as follows:
(5 mmoles/L x 250.29 g/mole) Weight of Trolox (g/L) = 1000 mmoles/mole = 1.25145 g/L
= 0.0313g/25 mL
The 5 mM or 5000 µM trolox stock solution was used to prepare 5 mL each of the working
standard solutions with concentrations of 150, 300, 450, 600, and 750 µM to give the final
calibration curve standard solution concentrations of 3, 6, 9, 12, and 15 µM, respectively, in the
ABTS assay reaction tubes. For example 150 µM or 0.15 mM trolox standard was prepared by
mixing 0.15 mL of 5 mM stock solution with 4.85 mL of 80% methanol for a total volume of 5
mL, then 0.02 mL of 150 µM was transferred to a 5 mL ABTS assay reaction test tube and added
with 0.98 mL ABTS radical solution for a total volume of 1 mL and resulting to a final
concentration of 3 µM trolox calibration curve standard solution. The volumes of 5 mM Trolox
stock standard solution and 80% methanol used to prepare the different concentrations of trolox
working standard solutions and the resulting calibration curve standard solutions after mixing
0.02 mL each of the working standards with 0.98 mL of ABTS radical solutions are shown
below.

121
Table 3.3 Preparation of trolox working and calibration curve standard solutions for TEAC assay.
Preparation of trolox working standard solutions
Preparation of trolox calibration standard solutions in the reaction tube
Volume of 5 mM trolox stock solution required (mL)
Volume of 80% methanol added (mL)
Resulting concentration of trolox working standard solution (µM)
Volume of trolox working standard solution (mL)
Volume of ABTS radical solution added (mL)
Resulting concentration of trolox calibration curve standard solution (µM)
0.15 4.85 150 0.02 0.98 3 0.30 4.70 300 0.02 0.98 6 0.45 4.55 450 0.02 0.98 9 0.60 4.40 600 0.02 0.98 12 0.75 4.25 750 0.02 0.98 15

122
3.3 TEAC analysis
Peanut extract, standard, or a control consisting of 50% methanol in deionized water (v/v;
Kim et al., 2002), 20 µL each, was transferred to a 5 mL test tube. Then, 980 µL of ABTS radical
solution was added to each tube and mixed manually for 5 s. A set of 12 test tubes containing the
mixture, per run, was incubated in a water bath at 37oC for 10 min under yellow light. Absorbance
at 734 nm was measured after 10 min. Reduction in absorbance of the standards and the samples
was calculated by subtracting the absorbance of control from those of standards or samples.
ABTS radical scavenging activity of samples was expressed as TEAC in µM trolox equivalents
(TE)/g using the formula below.
TEAC (µM TE/g) = [(∆Abs – a)/b] x DF,
where: a = y intercept of the absorbance reduction curve of trolox standards
b = slope of the absorbance reduction curve of trolox standards
∆Abs = the difference in absorbance at 734 nm of control and sample
DF = dilution factor.
20 mL of 80% methanol
1 mL diluted sample
g sample wet weight DF = g sample wet
weight
x 0.02 mL of sample extract
x g sample dry weight
4. Oxygen Radical Absorbance Capacity (ORAC)
Food antioxidants have hydrophilic or lipophilic fractions. Most methods available for
analyzing antioxidant capacity in food measure only the hydrophilic fraction. In food containing
appreciable amounts of fat, like peanuts, it is necessary to measure not only the hydrophilic but
also the lipophilic antioxidants to measure their total antioxidant capacity. The ORAC assay of
Prior et al. (2003) and Wu et al. (2004) measures both lipophilic (L-ORAC) and hydrophilic (H-
ORAC) antioxidants and was used in this study. ORAC is the first of the set of three assays

123
recommended in the antioxidant standard tests for antioxidant capacity that include total
phenolics and TEAC. It represents a hydrogen atom transfer reaction mechanism, which is most
relevant to human biology (Prior et al., 2005). The ORAC analysis was carried out using a
fluorescence microplate reader (FLUOstar Optima, BMG Labtechnologies, Duraham, NC,
USA), fluorescence filters with an excitation wavelength of 485 nm and an emission wavelength
of 520 nm, and 96 well Costar black microplates (Corning Incorporated, Corning, NY, USA).
4.1 Microplate assay
A stock fluorescein (FL) solution, Stock #1 was prepared by dissolving 0.0225g of
fuorescein, Na salt (Fisher Scientific Co., Fairlawn, NJ, USA) in 50 mL of 0.075M phosphate
buffer (pH 7.0). A second FL stock solution, Stock #2 was prepared by diluting 50 (L of Stock
#1 in 10 mL 0.075M phosphate buffer. A 320 µL portion of Stock #2 was added to 20 mL of
0.075M phosphate buffer, of which 200 µL was added to each well. This provided 7.5 nmoles of
fluorescein per well, or a final concentration of 14 µM.
In the standard L-ORAC or H-ORAC assays, 20 µL each of Trolox standard solutions (30,
60, 90, 120 µM) in 7% Randomly Methylated Cyclodextrin (RMCD), for the lipophilic assay or
0.075 M phosphate buffer (pH 7.0) for the hydrophilic assay, were pipetted into appropriate
wells in triplicate based upon a set layout where samples were strategically positioned by
placing the samples, blanks, and standards in a “forward-then-reverse” order to avoid possible
positional errors (Wu, 2005) as shown in Figure 3.1. It is highly recommended to leave the edge
well empty or with phosphate buffer to reduce the impact of “edge effect” on samples and
standards (Wu, 2005).
The plate reader is equipped with an incubator and two injection pumps. The temperature of
the incubator was set to 37oC. The rate of peroxyl radical production from AAPH is temperature

124
sensitive, so timing and handling of the AAPH solution is critical (Wu et al., 2004). Therefore, a
new AAPH solution was prepared for each run. Old fluorescein and AAPH solutions were
flushed from the syringes and the syringes were primed with fresh fluorescein and AAPH before
starting each run. In addition, to optimize the signal amplification to give maximum sensitivity,
a gain adjustment was performed by manually pipetting 200 µL of fluorescein into a designated
well, A1 (Figure 3.1) before starting the program.
The major parameters of ORAC assay for the FLUOstar Optima were: 35 cycle number; 693 s
(11.55 min) cycle time for L-ORAC assay or 210 s (3.5 min) for H-ORAC assay; 8 s orbital
shaking with 4 mm shake width before each cycle; 0.3 s position delay; 420 µL/s injection speed
for both pumps 1 and 2. During each cycle, the instrument read the fluorescence in each well. In
cycle 2, fluorescein at 200 µL volume was injected from pump #1 into the respective wells, to
give a final fluorescein concentration of 14 µM in each well, followed by reading the
fluorescence. During cycle 4, pump #2 was programmed to inject 150 µL of AAPH into the
respective wells to give a final AAPH concentration of 4.8 mM per well, followed by reading the
fluorescence.
The H-ORAC and L-ORAC values in µmolar Trolox Equivalents/L (µM TE), generated by
Optima Software for FLOUstar (BMG LABTECH Inc., Durham, NC, U.S.A), were
automatically calculated using a regression equation (Y= a + bX, linear; or Y= a +bX + cX2,
quadratic) between Trolox concentration (µM = X) and the net area under the fluorescein decay
curve (net AUC=Y). Linear regression was used in the range of 30-120 µM Trolox Equivalents.
The area under curve (AUC) was calculated by the software as:
AUC = (0.5 + f5/f4 + f6/f4 + f7/f4 + … + fi/f4) x CT
where: f4 = initial fluorescence at reading at cycle 4,

125
1 2 3 4 5 6 7 8 9 10 11 12
A Gain - - - - - - - - - - -
B - X1 X2 X3 X4 X5 X6 X7 X8 X9 X10 -
C - B S1 S2 S3 S4 X15 X14 X13 X12 X11 -
D - X10 X9 X8 X7 X6 X5 X4 X3 X2 X1 -
E - X11 X12 X13 X14 X15 S4 S3 S2 S1 B -
F - X1 X2 X3 X4 X5 X6 X7 X8 X9 X10 -
G - B S1 S2 S3 S4 X15 X14 X13 X12 X11 -
H - - - - - - - - - - - -
Where: B = blank, dilution solvent, 20 µL - = 200 µL of 0.075M phosphate buffer
Gain = gain adjustment well that contains 200 µL fluorescein S1-S4 = standards (Trolox), in triplicate, 20 µL X1-X15 = samples, in triplicate, 20 µL
Figure 3.1 Layout of the 96-well microplate used in hydrophilic and lipophilic oxygen radical absorbance capacity assay. The edges were not used for samples and filled-up with 200 µL of 0.075M phosphate buffer to reduce the impact of edge effect.

126
fi = fluorescence reading at cycle i, and
CT = cycle time in minutes. The net AUC was obtained by subtracting the AUC
of the blank from that of the sample.
Net AUC = AUC sample – AUC blankFrom the Net AUC, the software
calculated the H-ORAC or L-ORAC in µM TE/g. The H-ORAC and L-ORAC (µM TE/g) in the
sample or standard were calculated as follows:
μM TE
1
1 H-ORAC or L-ORAC
(μmol TE/g) = L x DF x Weight of peanuts (g) x 1000
where: µM TE/L = H-ORAC or L-ORAC value generated by Optima Software for FLOUstar
The total antioxidant capacity (TAC) was calculated as the sum of H-ORAC and L-
ORAC. Data for H-ORAC, L-ORAC and TAC were expressed as micromolar of Trolox
equivalents (µMTE) per gram of sample (µM TE/g).
4.2 L-ORAC assay
The lipophilic (L-ORAC) and hydrophilic (H-ORAC) assays of Prior et al. (2003) and Wu et
al. (2004) used the ASE 200 Accelerated Solvent Extractor to extract fat from the sample once
with hexane. This procedure was modified in this study by manually extracting fat from peanuts
for three times as follows: About 10 grams peanuts were ground using a coffee mill and 0.125 g
ground peanuts were weighed and mixed with 2.5 mL hexane/dichloromethane (1:1, v/v, Fisher
Scientific, Fair Lawn, NJ) in a 50 mL Teflon centrifuge tube (Fisher Scientific, Fair Lawn, NJ),
mixed using a vortex mixer for 60 s, sonicated at 37oC for 10 min and then centrifuged for 15 min
at 24,000g (14000 rpm) at 10oC. The hexane layer was transferred to a 30 mL vial using a Pasteur
pipet and the residue was extracted again for two times with 2.5 mL hexane/dichloromethane each

127
time, for a total of three extractions sufficient to remove fat fraction from the sample. The residue
after three extractions was set aside for H-ORAC determination. All hexane layers were
combined in the same vial and dried under nitrogen to remove residual hexane from the extract.
The dried hexane extract was dissolved in 2000 µL acetone, then a 50 µL aliquot was diluted with
500 µL of 7% randomly methylated β-cyclodextrin (RMCD, 7 g/100 mL; Trappsol, Pharmacy
grade, Cyclodextrin Tech. Devt. Inc., High Springs, FL, USA) prepared by dissolving 7 g of
RMCD in a 100 mL mixture of acetone and water (1:1, v/v), to completely dissolve the extract to
obtain a clear sample solution. The 7% RMCD was used as a blank and to dissolve trolox
standards and AAPH for L-ORAC assay. Twenty µL each of L-ORAC extracts, blank, and
standards in triplicate were transferred to a 96-well microplate (Costar 3915, Corning Inc.,
Corning, NY, USA), and the plate was loaded to a microplate reader (FLUOstar Optima, BMG
Labtech Inc., Durham, NC, USA) as described above.
4.3 H-ORAC assay
The residue after lipophilic extraction (Section 3.C.4.2 above) was dried under vacuum to
remove residual hexane. Five mL acetone/water/acetic acid, AWA (70:29.5:0.5, v/v/v; VWR, St.
Louis, MO, USA) was added to the dried residue, then the mixture was mixed in a vortex mixer for
30 s, and sonicated using an ultrasonic processor, Model CPX 750 (750 W, 50/60 Hz, Cole
Parmer, Vernon Hills, IL, USA) as follows: Eight centrifuge tubes were immersed at one time and
positioned along the periphery of a 11 cm x 11 cm x 9 cm cubical plastic container. The ultrasonic
probe was positioned in the center of the container and sonicated at 50 % amplitude at 37oC for 5
min shaking the vial to suspend the sample during half time of the sonication. The sonicated
AWA extract was allowed to stand for 10 min at room temperature with occasional shaking, and
then centrifuged at 14,000 rpm for 15 min at 10oC. The AWA extract was transferred to a 30 mL

128
vial using a Pasteur pipet and the residue was discarded. A 20 µL portion of the pure H-ORAC
extract was transferred to a 5 mL test tube and 500 µL of 0.075M phosphate buffer (pH 7.0) was
added to result in H-ORAC levels within the range of the standard curve. Twenty µL each of the
diluted H-ORAC extracts, blank, and standards in triplicate were transferred to a 96-well
microplate (Costar 3915, Corning Inc., Corning, NY, USA), then loaded to a microplate reader
(FLUOstar Optima, BMG Labtech Inc., Durham, NC, USA) as described above.
D. Physico-Chemical Analyses
The physico-chemical analyses including moisture and fat contents, and lightness color L*
value were performed in samples of roasted UV-treated peanuts.
1. Moisture content
Moisture analysis (AACC 44-32) was performed as follows. Aluminum dishes, lids and
liners (55 mm diameter, Fisher Scientific, Fair Lawn, NJ, USA) were dried overnight at 98-100
ºC in a mechanical oven (Model # M01440SC, Lindberg/Blue M, Asheville, NC, USA). The
dried dishes and lids were cooled in a desiccator for 1 h and weighed to constant weight.
Approximately 2 g of ground peanut kernels was weighed into the dried, pre-weighed aluminum
dish with lid, weighing dish. This was the initial weight of the sample. The weighed sample was
placed in a vacuum oven, (Vacuum Isotemp, Model 281A, Fisher Scientific, Fair Lawn, NJ,
USA). The lid was loosened and the sample was dried at 98 to 100°C to constant weight
(approximately 5 h) in partial vacuum at 25 mm Hg. After drying, dry air was admitted into
oven to bring to atmospheric pressure and the oven door was opened. The lid was tightened on
the dish immediately and the covered dish was placed in a desiccator to reach ambient
temperature (23�C), for approximately 45 min under vacuum. The covered dish with sample
was weighed to constant weight. The sample was returned to the vacuum oven to dry following

129
the procedure described above every h until a constant weight was reached. This was the
recorded final weight of the sample. Percent moisture content of the roasted peanut was
calculated as follows:
Initial weight – Final weight % Moisture = Initial weight x 100%
2. Fat content
Fat content analysis (AACC 30-25) was performed as follows: Two grams of moisture free
dried ground peanut kernels (taken from moisture analysis) was weighed into a filter paper and
placed inside a numbered oil extraction thimble. The Goldfisch for fat extraction apparatus
(Model 35001, Laboratory construction Co., Kansas City, MO, USA) was used with petroleum
ether (boiling point 35- 60 ºC, J.T. Baker, Phillipsburg, NJ, USA) as the extraction solvent. The
thimble was placed into a glass sleeve and then into a pre-weighed extraction beaker previously
dried (Model J466004, General Electric, Louisville, KY, USA) at 100oC for approximately 2 h,
cooled in the desiccator for approximately 1 h, to constant weight. The beaker was filled with 30
ml petroleum ether and then attached to the apparatus together with the glass sleeve. The peanut
sample was extracted with petroleum ether for 16 h at a condensation rate of 5-6 drops/sec.
Upon completion of the extraction, the thimble was removed and replaced with a reclaiming
tube. The petroleum ether was collected from the extraction beaker, approximately 2h. The
extraction beaker was placed on top of the heater, on the Goldfisch apparatus at an angle, and the
remaining solvent was allowed to evaporate for approximately 30 min. The extraction beaker
was transferred in a vacuum oven (Vacuum Isotemp, Model 282A, Fisher Scientific, Fair Lawn,
NJ, USA) at 25 mm Hg at 70oC for 2 h to dry off excess petroleum ether and then cooled to
ambient temperature at 25oC for 30 min in a desiccator for approximately 1 h. The extraction

130
beaker was weighed to constant weight. Redrying of samples in the vacuum oven as described
above was done until a constant weight is achieved. Fat content of the sample was calculated
using the following equation:
Weight of fat % Fat = Weight of dried sample x 100%
3. Color
A handheld colorimeter (Chroma meter, Model CR-200/0(, Minolta, Japan) was used to
measure the CIE L*(lightness) a* (redness) b*(yellowness) of the samples. The instrument was
calibrated against a white (L*=97.84; a*=-0.85; b*=3.02) and yellow reference standard tiles
(L*=85.46; a*=0.15; b*=54.57). The sample was filled completely into 60 x 15 mm diameter
Petri dish placed on top of white paper. The colorimeter aperture was placed closely and
perpendicular to the sample. Four readings was taken directly over each quadrant of the sample
in the dish, by turning the dish clockwise after each reading and the average of four readings was
reported as L*.
E. Sensory Evaluation
Descriptive analysis and consumer acceptance tests were conducted on all UV- treated
roasted peanut samples. Before the screening and training sessions of the descriptive analysis test
and the consumer acceptance test, the panelists completed and signed consent to participate
forms approved by the University of Georgia Institutional Review Board. The detailed
procedures for evaluating UV-treated roasted peanuts are as follows:
131
1. Sensory Evaluation Experimental Design
1.1. Descriptive analysis test
Each of the 10 panelists evaluated a total 56 samples over two days, 2 replications of 27
treatments and 1 control. Sensory evaluations were conducted each day with 28 samples
evaluated in 6 sessions separated by mandatory 5 min breaks. Five samples were evaluated in the
first 5 sessions, with the last session having only 3 samples. A time lag of 10 s was given
between each sample evaluation. A complete block design was employed so that all panelists
evaluated all treatment combinations. Samples were presented in a monadic sequential order.
Evaluation sequence was based on balanced, randomized block design so that serving position
and order of sample was balanced throughout the evaluation period. This was controlled by
Compusense five (Version 5.0, Compusense Inc., Guelph, Ontario, Canada).
1.2 Consumer acceptance test
Each of the 25 panelists evaluated a total of 28 samples over 2 days. Each day, panelists
evaluated 14 samples in 3 sessions separated by a mandatory 5 min break between sessions in a 1
h test. The second replicate of 28 samples was evaluated using another set of 25 panelists.
Samples were presented using a balanced randomized design controlled by Compusense five
(Version 5.0, Compusence Inc., Guelph, Ontario, Canada) in a monadic sequential order.
2. Descriptive Sensory Analysis Test 2.1 Panel recruitment
Prospective members of the descriptive analysis panel of at least 10 panelists were recruited
from a database of trained panelists who had previously participated in descriptive analysis tests
at the Department of Food Science and Technology, University of Georgia, Griffin campus or
were recruited based on the following criteria: between 18 and 70 years of age, did not smoke,

132
not allergic to peanuts, consume peanuts at least twice per month, willing to evaluate peanuts,
available for all training and testing sessions, and able to verbally describe characteristics of the
sample. Panelists who passed the criteria were invited to screening tests.
2.2 Screening test
The potential panelists were screened to see if they would qualify by completing a taste and
an aroma test. In the taste test, the panelists were asked to identify coded aqueous solutions of
sucrose, sodium chloride, citric acid, caffeine and one unknown in 5 min. The panelists who
correctly identified all 5 solutions also completed an aroma test; those who did not were dropped
from further participation. In the aroma test, the panelists were asked to identify 7 commonly
occurring aromatics in 10 min. The aromatics included banana, anise, pineapple, orange, vanilla,
peppermint and lemon contained in 120 ml amber glass bottles with screw on lids. The panelists
who identified at least 5 out of 7 aromatics correctly were qualified to undergo training.
2.3 Panel training
All training and test sessions were held in the sensory laboratory at the Griffin campus. Ten
panelists, 1 male and 9 female, were selected. The panelists were trained and calibrated in 3
training sessions for 2 h each, for a total of 6 h over 2 days.
a) Orientation for new and untrained panelists
New and untrained panelists were given a 1-hour overview of sensory evaluation, one hour
before the first training session. They were asked to complete a line scale exercise in 5 min and
asked to estimate shaded regions of different circles by making a mark on 150-mm unstructured
line scales with anchor points at 12.5 and 137.5 mm and were asked to measure their markings
on the scale using a ruler and their responses were compared with the correct rating. Samples
were evaluated using a “hybrid” descriptive analysis method (Einstein, 1991), a combination of

133
Spectrum Analysis Methods (Sensory Spectrum, Inc., Chatham, NJ, USA), which utilizes
universal descriptive scales and extensive use of reference standards (Stone and Sidel, 2004);
Quantitative Descriptive Analysis (Tragon Corp., Redwood City, CA), which employs the use of
150 mm linear graphic scale with anchors (Lawless and Heymann, 1998); and Texture Profile
Techniques. Basic standard solutions of sucrose (2%, 5%, 10%, 15%), sodium chloride (0.2%,
0.35%, 0.5%), citric acid (0.05%, 0.08%, 0.15%) and caffeine (0.05%, 0.08%, 0.15%) were
introduced corresponding to points on the universal line scales for sweet (20, 50, 100, 150), salty
(25, 50, 85), sour (20, 50, 100), and bitter taste (20, 50, 100), respectively (Meilgaard et al.,
2007). Additionally, new panelists were oriented in the use of the computer ballots.
b) First training session
The purpose of the first training session was to develop a sensory ballot and identify
reference standards for each attribute. All panelists, trained and new, attended all succeeding
sessions together. The new panelists were positioned between trained panelists around the
discussion table. Each panelist was presented a total of 3 samples: roasted peanut treated with
low UV dose at a 60 cm distance for 10 min, roasted peanut treated with high UV dose at a 20
cm distance for 30 min, and untreated roasted peanuts, representing the range of UV doses.
Panelists were asked to describe all the perceptible sensory attributes in the samples by listing
the descriptors under appearance, aroma, flavor, taste, and texture on a worksheet. To assist in
attribute generation, lists of terms, definitions, references, and evaluation procedures compiled
from lexicons previously published (Johnsen et al., 1988; Meilgaard et al. 2007, Walker, 2000;
Gills and Resurreccion, 2000; Grosso and Resurreccion, 2002; Rudolf, 2003) and in-house terms
generated during previous descriptive profiling tests on peanut products were provided to
panelists. As intended, the lexicons were used as a starting point and panelists, as a group,

134
generated their own list according to their perception of the product. The panel leader wrote each
descriptor on the whiteboard and then defined. Redundant terms were either combined and used
to form a more precise definition or eliminated in favor of the most appropriate attribute. The
panelists then decided on a comprehensive list of descriptors with definitions, references and
evaluation procedures for the preliminary ballot.
Ratings of reference standards identified by the panelists for each descriptor were from
published lexicons or from previous studies conducted in our sensory laboratory. When panelists
did not come to a consensus, references were rated based on standard solutions intensities. To
come to consensus, intensity ratings were determined by panelists by rating a reference with
flash cards, simultaneously showing their ratings to the panel leader. Panelists with outlying
responses were asked to re-evaluate the reference and adjust their rating accordingly. The final
ratings used were based on the mean of the final intensity ratings. The additional reference
standards identified by the panelists were purchased and evaluated on the next training session.
c) Second training session The purpose of the second training session was to verify reference attribute intensities,
determine ratings for additional references and warm-up sample, to calibrate the panelists against
all the reface standards, and practice around the table. The panelists reviewed the preliminary
ballot, generated additional terms, and revised definitions of the descriptive terms and suggested
additional references, as needed. The reference standards that were not rated during the first
training session were evaluated as described in the first training session section.
The panelists rated a warm-up sample made from roasted peanut treated with medium UV
dose at 40 cm distance for 20 min using a paper ballot. This warm-up sample was used
throughout the study. Intensity ratings for each attribute were called out by each panelist and

135
recorded on spreadsheet, projected on an active board (Promethean Ltd, Blackburn, Lancashire,
UK). Panelists not within the 10% of the mean rating for each attribute were asked to re-evaluate
the sample and adjust their rating. When a consensus (+10% of mean) was reached, the mean
intensity ratings were used as attribute intensity ratings for the warm-up sample.
Panelists practiced by evaluating 3 samples around a table using paper ballots. The 3 samples
are as follows: the warm-up sample, roasted peanut sample treated with high UV dose, and
untreated roasted peanut control. Results were discussed as a group and panelists not within 10%
of the mean rating for each attribute were reminded to focus when evaluating that attribute.
d) Third training session
The purpose of the third training session was to refine the ballot, calibrate, and practice
descriptive sensory evaluation as a group and individually in partitioned sensory booths. The
panelists calibrated as a group using basic solutions and reference standards. The panelists
reviewed the preliminary ballot and discussed additional terms, definitions, references, and
procedures, as necessary. The final descriptive terms (Table 3.4) and final ballot (Figure 3.2)
were developed as agreed upon by all panelists.
Panelists practiced around a table on an unknown sample of roasted peanut using a paper
ballot. This sample was the warm-up sample and was presented to determine panelist
performance. The results were discussed as a group and panelists not within 10% of the mean
rating for each attribute were reminded to focus when evaluating the attribute.
A practice session was conducted in the partitioned sensory booths using the electronic ballot
using Compusense five (Version 5.0, Compusence Inc., Guelph, Ontario, Canada). The panelists
were asked to evaluate three coded peanut samples. The results were discussed as a group and

136
panelists not within 10% of the mean rating for each attribute were reminded to focus when
evaluating the attribute.
2.4 Monitoring of panelist performance and feedback to panelists
To provide feedback and improve panelist performance after each session, the mean ratings
and standard deviations of the panel were calculated for each attribute and were presented on a
table and discussed to the panelists before the next session. Each panelist attribute was
highlighted when their individual ratings were not within +10% of the group mean. Ratings that
were within +10% from the group mean were accepted as calibrated.
2.5 Test sample preparation
A total of 56 samples (10 g each) of roasted functional peanuts and control samples were
placed into 28.57 g capacity plastic cups with lids (Solo Cups Co., Highland, IL, USA). Samples
were coded with three digit random numbers and served at ambient temperature (23oC) on a
stainless steel tray lined with white paper.
2.6 Environmental Conditions
All tests were performed at the Department of Food Science and Technology, University of
Georgia, Griffin campus. The panelists evaluated test samples in environmentally-controlled
partitioned sensory booths, illuminated with two 50-watt white incandescent bulbs providing 739
lux of light.

137
Table 3.4 Terms, definitions, standard references, and respective intensity ratings used in the descriptive tests for roasted peanuts. Sensory Attribute1 Definition Reference sample Brand/Type/Manufacturer Intensity
(mm)2
Appearance Brown color The intensity of brown
color from white to dark brown 3, 4, 5
White bond paper Dry cardboard (L=55) Chocolate syrup
Georgia-Pacific (Georgia-Pacific Corp., Atlanta, GA) Hershey (Hershey Foods Corp., Hershey, PA)
0 42
150
Aromatics Roasted peanutty The aromatic associated
with medium roasted peanuts 3, 4, 7
Medium roasted peanuts (L=50±1) 3, 4, 5
Roasted peanut 1 (L=55) Roasted peanut 2 (L=48)
Georgia green, medium Runner (Golden Peanut Co., Alpharetta, GA) Georgia green, medium Runner (Golden Peanut Co., Alpharetta, GA) Georgia green, medium Runner (Golden Peanut Co., Alpharetta, GA)
73
41
77
Raw/beany The aromatic associated
with raw peanuts and raw green beans
Roasted peanut 1 (L=55) Raw peanuts
Georgia green, medium Runner (Golden Peanut Co., Alpharetta, GA) Georgia green, medium Runner (Golden Peanut Co., Alpharetta, GA)
23
40
Woody/hulls/ skins
The aromatic associated with peanut skins and hulls 3,7,8
Skins from medium roasted peanuts (L=50 ± 1)4, 8
Georgia green, medium Runner (Golden Peanut Co., Alpharetta, GA)
35

138
Table 3.4 continued… Sensory Attribute1 Definition Reference sample Brand/Type/Manufacturer Intensity
(mm)2
Burnt The aromatic associated with burnt peanuts/ espresso coffee 4, 7
Burnt toast Burnt peanuts (L=30)
Great Value white bread (Wal-Mart Stores, Inc., Bentonville, AR) Georgia green, medium Runner (Golden Peanut Co., Alpharetta, GA)
15
78
Cardboard The aromatic associated
with cardboard 7Wet cardboard, 1x1 cm piece with 1 tsp water 4, 8
35
Oxidized The aromatic associated
with rancid fats and oils 4, 9Oxidized peanuts 4 using sweet basic standard solution for intensity
Georgia green, medium Runner (Golden Peanut Co., Alpharetta, GA)
48
Off-flavor Any flavor that will be
specified by the panelists which is not fishy, oxidized, stale, cardboard, burnt, woody/hull/skin, and raw/beany
Bitter, sweet, sour, and salty basic standard solutions
Taste Salty The taste on the tongue
associated with sodium chloride solution 6, 7
0.2% sodium chloride in deionized water 60.35% sodium chloride in deionized water 60.5% sodium chloride in deionized water 6
Salt (Morton International, Inc., Chicago, IL) Salt (Morton International, Inc., Chicago, IL) Salt (Morton International, Inc., Chicago, IL)
25
50
85

139
Table 3.4 continued… Sensory Attribute1 Definition Reference sample Brand/Type/Manufacturer Intensity
(mm)2
Sour The taste on the tongue associated with acid solution 6, 7
0.05% citric acid in deionized water 60.08% citric acid solution in deionized water 60.15% citric acid solution in deionized water 6
Fisher Scientific, Fair Lawn, NJ Fisher Scientific, Fair Lawn, NJ Fisher Scientific, Fair Lawn, NJ
20
50
100
Bitter The taste on the tongue
associated with bitter agents such as caffeine solution 6, 7
0.05% caffeine in deionized water 60.08% caffeine in deionized water 60.15% caffeine in deionized water 6
Food grade caffeine (Fisher Scientific, Fair Lawn, NJ) Food grade caffeine (Fisher Scientific, Fair Lawn, NJ) Food grade caffeine (Fisher Scientific, Fair Lawn, NJ)
20
50
100
Feeling factors Toothpack The amount of sample left in
or on teeth after chewing 4Burnt toast Graham cracker 4
Great Value white bread (Wal-Mart Stores, Inc., Bentonville, AR) Nabisco (East Hanover, NJ)
15
75
Astringent The puckering or drying
sensation on the mouth or tongue surface
Milk of magnesia Grape juice
Phillips (Bayer Healthcare LLC, Morristown, NJ) Welch’s (Skaneateles Falls, NY)
40 65
Tongue sting/throat burn
The degree of sharp tingling sensation or feeling on the tongue or throat which leaves a burning sensation on the tongue surface
Big red gum Wrigley (Chicago, IL) 57

140
Table 3.4 continued… Sensory Attribute1 Definition Reference sample Brand/Type/Manufacturer Intensity
(mm)2
Texture Hardness Force required to bite
through the food Raw peanuts Roasted peanut 2 (L=48)
Georgia green, medium Runner (Georgia Peanut Co., Alpharetta, GA) Georgia green, medium Runner (Georgia Peanut Co., Alpharetta, GA
53
84
Crunchiness Force needed and amount of
sound (lower pitch) generated from chewing a sample with molar teeth 4
Corn Chips 4
Roasted peanut 2 (L=48) Lay’s (Frito-Lay, Plano, TX) Georgia green, medium Runner (Georgia Peanut Co., Alpharetta, GA
75 46
1 Attribute listed in order as perceived by panelists 2 Intensity rating based on 150 mm unstructured line scale 3 Gills and Resurreccion (2000) 4 Grosso and Resurreccion (2002) 5 Rudolf and Resurreccion (2003) 6 Meilgaard et al. (2007) 7 Johnsen et al. (1988) 8 Walker (2000) 9 Muego-Gnanasekharan and Resurreccion (1992)

141
Descriptive Test Ballot for Roasted Peanuts Panelist Code: __________ Date: ____________________ Appearance: Please look at sample as a whole and evaluate its COLOR. Brown Color – the intensity of brown color from white to dark brown. Reference: white paper = 0; dry cardboard (L=55) = 42; chocolate syrup=150; WUP=30 _______|_______________________________________________________________________|_______ Aromatics: Please take at least four pieces of sample and evaluate for the following AROMATICS. Roasted peanutty- the aromatic associated with medium roasted peanuts. Reference: medium roasted peanuts (L=50)= 73; roasted peanut 1 (L=55)= 41; roasted peanut 2 (L=48) =77; WUP= 21
_______|_______________________________________________________________________|_______ Raw/beany - the aromatic associated with raw peanuts and raw green beans. Reference: roasted peanut 1 (L=55) =23; raw peanuts= 40; WUP=0 _______|_______________________________________________________________________|_______ Woody/hulls/skins – the aromatic associated with peanut skins and hulls. Reference: peanut skins = 35; WUP = 18 _______|_______________________________________________________________________|_______ Burnt – the aromatic associated with burnt peanuts/espresso coffee. Reference: Burnt toast=15; burnt peanuts (L=30) = 78; WUP = 0 _______|_______________________________________________________________________|_______
Figure 3.2 The ballot used in descriptive sensory analysis test for roasted peanuts. A warm-up sample was used during test.

142
Cardboard– the aromatic associated with wet cardboard. Reference: wet cardboard=35; WUP = 25 _______|_______________________________________________________________________|_______ Fishy – the aromatic associated with seaweed and fish oil . Reference: Tuna= 50; Cod liver oil=78; WUP = 20 _______|_______________________________________________________________________|_______ Oxidized - the aromatic associated with rancid fats and oils. Reference: oxidized peanuts =48 (using basic standard solutions sweet for intensity); WUP = 27 _______|_______________________________________________________________________|_______ Off-flavor- any flavor that will be specified by the panelists which is not fishy, oxidized, stale, cardboard, burnt, woody/hull/skin/ and raw/beany. Reference: Basic standard solutions bitter, sweet, sour and salty; WUP=0 Please specify the off-flavor perceived on the paper provided on the tray.
_______|_______________________________________________________________________|_______ Tastes: Please take at least 4 pieces of sample and evaluate its TASTES. Bitter - the taste on the tongue associated with bitter agents such as caffeine solution Reference: bitter 20; bitter 50; bitter 100; WUP = 22 _______|_______________________________________________________________________|_______ Sweet – the taste on the tongue associated with sucrose solution Reference: sweet 20; sweet 50; sweet 100; sweet 150; WUP = 15 _______|_______________________________________________________________________|_______ Sour- the taste on the tongue associated with acid solutions Reference: sour 20; sour 50; sour 85; WUP = 0 _______|_______________________________________________________________________|_______
Figure 3.2 (continued)

143
Salty - the taste on the tongue associated with bitter agents such as caffeine Reference: salty 20; salty 50; salty 85; WUP = 12 _______|_______________________________________________________________________|_______ Feeling factors: Please take at least four pieces of sample and evaluate its FEELING FACTORS and TEXTURE. After evaluating this sample, please click the 'next sample' button to go to the next sample. Toothpack - the amount of sample left in or on teeth after chewing. Reference: Burnt toast= 15; graham crackers= 75; WUP =59 _______|_______________________________________________________________________|_______ Astringent - the puckering or drying sensation on the mouth or tongue surface. Reference: milk of magnesia = 40; grape juice=65; WUP=18 _______|_______________________________________________________________________|_______ Tongue sting/throat burn - the degree of sharp tingling sensation or feeling on the tongue or throat which leaves a burning sensation on the tongue surface. Reference: Big red gum=57; WUP =0 _______|_______________________________________________________________________|_______ Texture: Hardness – force required to bite through the food. Reference: raw peanuts= 53; roasted peanut 2 (L=48) =84; WUP=91
_______|_______________________________________________________________________|_______ Crunchiness – the force needed and amount of sound (lower pitch) generated from chewing a sample with molars. Reference: corn chips=75; roasted peanut2 (L=48) = 46; WUP=39 _______|_______________________________________________________________________|_______
Figure 3.2 (continued)

144
2.7 Ballot
The computer ballot used Compusense five (Version 5.0, Compusence Inc., Guelph, Ontario,
Canada). The computerized ballot consisted of 18 questions regarding the attributes on several
screen sequentially according to the order of their perception, each with a 150 mm unstructured
line scale. Using a computer mouse, panelists clicked on each attribute marked the line scale
indicating the intensity rating of the attribute. Panelists could return to each attribute before
proceeding to the next sample but were not allowed to move backward or forward between
samples. Instructions, definitions, references, control and reference intensities were provided as
part of the ballot.
2.8 Calibration of panelists prior to testing
One hour prior to each test session, the panelists convened around the table in the sensory
laboratory and calibrated against 4 standard basic solutions and the reference standards led by the
panel leader. The warm-up sample was evaluated by each panelist using a paper ballot. Results
from the warm-up sample were reviewed and panelists and those who were not within the 10%
of the mean rating were asked to re-evaluate the sample and adjust to the mean rating.
2.9 Test procedure
The panelists individually evaluated the roasted peanut samples in partitioned sensory booths
using the computer ballot. Test sessions were conducted between 10 am and 12 pm of each day.
The samples composed of roasted peanuts made from UV-treated peanuts and controls according
to the experimental design above. Water cup, expectoration cup, and napkin were supplied to
each panelist. Samples were presented in a monadic sequential order. The panelists were
instructed to expectorate and eat unsalted crackers and rinse with water between sample
evaluations. Panelists were paid an honorarium of $12 per session.

145
3. Consumer Acceptance Test
Fifty consumers were recruited from a database of consumers who had previously
participated in consumer tests at the Department of Food Science and Technology, University of
Georgia, Griffin campus. The criteria for consumers were the following: between age of 18-70,
non-smoker, not allergic to peanuts, consumes peanuts and peanut products at least once per
month, willing to evaluate peanuts, and available for the session. The target sample for the
recruitment was 50% males and 50% females in age groups corresponding to the population
found in the US census (2006).
All tests were performed at the Consumer and Sensory Laboratories, Department of Food
Science and Technology, University of Georgia, Griffin campus in 5 sessions hourly from 10:00
am to 5:30 pm. Panelists were greeted in a conference room and asked to sign in. Each consumer
panelist was asked to fill-up a demographic questionnaire and sign two copies of consent to
participate. Consumers were instructed using a PowerPoint presentation on how to evaluate their
samples using a computer ballot and use of booth signal lights. Paper ballots were supplied to
panelists not comfortable with using a computer. Once the consumers completely understood
how to evaluate the samples, they were escorted to the partitioned sensory booths as described in
the Descriptive Analysis Test section.
Panelists were asked to evaluate the overall acceptance and acceptance of aroma, flavor,
appearance, color, and texture of the sample using a 9-point hedonic scale, with 1= dislike
extremely, 5=neither like nor dislike and 9=like extremely (Peryam and Pilgrim, 1957) of roasted
peanuts made from UV-treated peanuts and controls. An example of questions
on a computer ballot (Compusense five, Version 5.0, Compusence Inc., Guelph, Ontario,
Canada) and a paper ballot used to rate the roasted peanut samples is shown on Figures 3.3 and

146
3.4, respectively. Panelists were supplied with water cup, expectoration cup, and napkin.
Panelists rinsed with water between sample evaluations and were instructed to expectorate into
the supplied expectoration cup.
F. Statistical Analysis
Sensory data were collected from Compusense five software (Version 4.8, Compusense
Inc., Guelph, Ontario, Canada). The data on the results of chemical, physico-chemical, and
sensory analyses were analyzed using Statistical Analysis System (SAS), v 8 (SAS, Institute Inc.,
Cary, NC, USA, 1990). The General Linear Model (PROC GLM) was used to detect significant
differences among treatments for trans-resveratrol, trans-piceid, total stilbenes (sum of trans-
resveratrol and trans-picied), total phenolics, TEAC, ORAC and overall acceptance. The
relative significance of the independent variables, distance from UV light (ID), UV exposure
time (IT), and incubation time (IC) was established by Analysis of Variance (ANOVA) in terms
of their percentage contribution to the response (Gaitonde et al., 2008) with the factor
contributing the largest percentage to the total sum of squares as the most significant. Fisher’s
least significant difference (LSD) at P< 0.05 for mean separation test was used to compare
means of response variable’s trans-resveratrol, trans-piceid, total stilbenes, total phenolics,
TEAC, ORAC and overall acceptance.

147
Figure 3.3 Computer ballot used in rating roasted peanuts during consumer test. Panelists used a 9-point hedonic scale to rate acceptance or liking.

148
Panelist Code: ________________ Sample Code: _______ Date: ________________________ Ballot for Roasted Peanuts Consumer Taste Test Please check that the code number of the sample is exactly that shown in this paper ballot. You may spit out the sample using the inverted covered Styrofoam spit cup on your tray. Please keep you spit cup always tightly closed to prevent spills. APPEARANCE AND COLOR Please look at the roasted peanut sample and rate the APPEARANCE and COLOR of this sample using the scales below. APPEARANCE
Dislike extremely
Dislike very much
Dislike moderately
Dislike Slightly
Neither like nor dislike
Like slightly
Like moderately
Like very much
Like extremely
COLOR
Dislike extremely
Dislike very much
Dislike moderately
Dislike Slightly
Neither like nor dislike
Like slightly
Like moderately
Like very much
Like extremely
AROMA Now, please sniff the roasted peanut sample and rate the AROMA of this sample.
Dislike extremely
Dislike very much
Dislike moderately
Dislike Slightly
Neither like nor dislike
Like slightly
Like moderately
Like very much
Like extremely
FLAVOR AND TEXTURE Now, please put 4 pieces of sample into your mouth, chew it then rate the FLAVOR and TEXTURE of this sample. Do not swallow the samples. Spit sample out after you evaluate flavor and texture. FLAVOR
Dislike extremely
Dislike very much
Dislike moderately
Dislike Slightly
Neither like nor dislike
Like slightly
Like moderately
Like very much
Like extremely
Figure 3.4 The ballot used in rating roasted peanuts during consumer test. Panelists used a 9-point hedonic scale to rate acceptance.

149
TEXTURE
Dislike extremely
Dislike very much
Dislike moderately
Dislike Slightly
Neither like nor dislike
Like slightly
Like moderately
Like very much
Like extremely
OVERALL ACCEPTANCE Please put 4 pieces of sample into your mouth, chew it then rate the OVERALL ACCEPTANCE of this sample. Do not swallow the samples. Spit sample out after you evaluate the overall acceptance. OVERALL ACCEPTANCE
Dislike extremely
Dislike very much
Dislike moderately
Dislike Slightly
Neither like nor dislike
Like slightly
Like moderately
Like very much
Like extremely
You are now ready to evaluate the sample for the intensities of the following attributes: 1. Roasted peanutty flavor 2. Off-flavors Please do not rate the sample for its acceptability. Please put 4 pieces of sample into your mouth, chew it then answer the following questions. Please indicate the INTENSITY of the following attributes. Do not swallow the samples. Spit sample out after you evaluate intensities. INTENSITY OF ROASTED PEANUT FLAVOR How do you rate the INTENSITY of ROASTED PEANUT FLAVOR in the sample? None Very
weak Moderately
weak Slightly
weak Neither
Weak nor Strong
Slightly strong
Moderately string
Very Strong
Extremely strong
INTENSITY OF OFF-FLAVOR How do you rate the INTENSITY of OFF-FLAVOR in the sample? None Very
weak Moderately
weak Slightly
weak Neither
Weak nor Strong
Slightly strong
Moderately string
Very Strong
Extremely strong
Figure 3.4 (continued)

150
G. Optimization of UV Process Parameters
Regression analysis (PROC REG) was conducted to develop prediction models for each
dependent variable, resveratrol, piceid, total stilbenes, total phenolics, TEAC, ORAC and overall
acceptance based on independent variables for UV treatment such as distance from UV light
(ID), UV exposure time (IT), and incubation time (IC). A second order polynomial regression
model with three linear terms was used as full model as follows:
Y = βo + β1x1 + β2x2 + β3x3 + β1x12 + β2x2
2 + β3x32 + β12x1 x2 + β13x1 x3
+ β23x2x3 + β123x1x2x3 +ε
Where: Y = response variable, trans-resveratrol, trans-piceid, total stilbenes, total phenolics,
TEAC, ORAC or overall acceptance;
βo = intercept when x1, x2, and x3 are equal to zero;
β1, β2, and β3 = parameter estimates of ID (x1), IT (x2), and IC (x3);
x12, x2
2, and x32 = squared terms;
x1x2, x1x3, x2x3 and x1x2x3 = cross product terms; and
ε = residual term.
Response surface methodology was used to determine the effects of the dependent variables
on the concentrations of trans-resveratrol, trans-piceid, total stilbenes, total phenolics, TEAC,
ORAC and overall acceptance of UV-treated peanut kernels. Significant regression models were
identified (P<0.05) and were used to generate response surfaces and contour plots using PROC
GCONTOUR. Plotting was done using two independent variables at a time, i.e., ID versus IT,
while IC was fixed at one level.
Boundary regions of interest were shaded on the contour plots to at least 2.64 µg/g trans-
resveratrol (McMurtrey et al., 1994); 1.85 µg/g trans-piceid (Lamuela-Raventos et al., 1995); 1.84

151
mg GAE total phenolics (USDA, 2007); 5.01 µM TE/g TEAC (Villaño et al., 2004); and 38 TE/g
ORAC (USDA, 2007) ), representing 100% of these compounds in red wines; and an overall
acceptance rating >5.0. When response variables could not meet the set criteria for the region of
interest, maximum values achievable were shaded in lieu of pre-determined regions of interest.
When higher levels were achieved by the process, the contour plots were shaded starting at these
higher values. Contour plots for all response variables were superimposed to identify the region of
overlap that determined the optimum UV process parameters.
H. Verification of Prediction Models
The prediction models were verified for UV processes using parameters within and outside
the region of overlap. The samples were analyzed for trans-resveratrol, trans-piceid, total
stilbenes, total phenolics, TEAC, and ORAC as well as sensory consumer overall acceptance.
The verified optimum UV process was used as basis for the combined US-UV processing
treatments in Study 3.
II. STUDY 2 - ULTRASOUND PROCESS OPTIMIZATION TO ENHANCE TRANS-
RESVERATROL BIOSYNTHESIS IN PEANUTS
A. Experimental Design
Raw peanuts kernels of varying sizes of chop (2-5 mm), slice (7 mm) and whole (12-14 mm)
were treated with varying doses of US using a 3 x 3 x 3 full fractional design, composed of US
power density (mW/cm3), US exposure time (min), and incubation time at 25oC. The three
factors and levels for each factors were US power density (X1) of 25, 50, 75 mW/cm3; US
exposure times (X2) of 2, 5, and 8 min; and incubation times (X3) at 25oC of 24, 36 and 48 h.
The factors, levels, symbols and codes are shown in Tables 3.5 and 3.6. Two replications of 27
treatments per size and 1 control of untreated raw peanuts were prepared for a total 170 samples.

152
B. Sample Preparation
Peanuts, Arachis hypogaea cv Georgia green medium runners (Golden Peanut Company,
Alpharetta, GA) harvested in 2005 and stored for two months 4oC were used. All processing
implements and surfaces were washed and sanitized with 200 ppm chlorine solution. Peanuts
were sorted, washed in water, sanitized with chlorine solution, soaked in water for full imbibition
for 16 h as described previously in Study 1. Imbibed peanuts were chopped, sliced or kept whole
prior to sonication. Chopping of peanuts to 2-5 mm by placing 600 g of imbibed peanuts in the
sanitized bowl of a commercial food cutter (Model 84142, Hobart, Troy, OH) and chopped at
1725 rpm for 30 s. Slicing of peanuts 0.7 cm thick pieces was done as described previously in
Study 1. Chopped, sliced and whole peanuts were subjected to different US treatments using
power densities of 25, 50 and 75 mW/cm3 for 4, 6 and 8 min in an ultrasonic processor with
temperature controller (750W, 115 VAC, 50/60 Hz, Cole Parmer, Vernon Hills, IL) according to
the experimental design in Table 3.8. Peanuts, 400 g, were weighed in a 1 L plastic beaker and
filled with filtered deionized water up to 800 mL mark. A 25 mm diameter probe of the
ultrasonic processor was placed at the center of peanuts and US was applied continuously at
25oC at amplitudes that will supply the required power densities which were calculated using the
formula,
Power = Power density x Volume level of water in beaker x Time x 1 W (Joule or Watt-s)
(mW/cm3) (cm3) (s) 1000 mW

153
Table 3.5 Treatment variables and their levels for ultrasound processes1.
Levels (Coded Values)
Factors (treatment variables) Factor symbol code -1 0 +1
Ultrasound power density (mW/cm3)
X1 25 50 75
Ultrasound exposure time (min)
X2 2 5 8
Incubation time at 25oC (h)
X3 24 36 48
1Ultrasound processing treatments to determine effects on the concentrations of trans-resveratrol, trans-piceid, total phenolics, antioxidant capacities, and consumer overall acceptance of sliced, chopped, and whole peanut kernels (7 mm).

154
Table 3.6 Experimental design for the three-level, three-factor response surface analysis1
for ultrasound-treated chopped, sliced and whole peanut kernels.
Coded values Uncoded values Treatment X1
Ultrasound power density
(mW/cm3)
X2 Ultrasound
exposure time (min)
X3 Incubation
time (h)
X1 Ultrasound
power density
(mW/cm3)
X2 Ultrasound
exposure time (min)
X3 Incubation
time (h)
1 -1 -1 -1 25 2 24 2 -1 -1 0 25 2 36 3 -1 -1 +1 25 2 48 4 -1 0 -1 25 5 24 5 -1 0 0 25 5 36 6 -1 0 +1 25 5 48 7 -1 +1 -1 25 8 24 8 -1 +1 0 25 8 36 9 -1 +1 +1 25 8 48 10 0 -1 -1 50 2 24 11 0 -1 0 50 2 36 12 0 -1 +1 50 2 48 13 0 0 -1 50 5 24 14 0 0 0 50 5 36 15 0 0 +1 50 5 48 16 0 +1 -1 50 8 24 17 0 +1 0 50 8 36 18 0 +1 +1 50 8 48 19 +1 -1 -1 75 2 24 20 +1 -1 0 75 2 36 21 +1 -1 +1 75 2 48 22 +1 0 -1 75 5 24 23 +1 0 0 75 5 36 24 +1 0 +1 75 5 48 25 +1 +1 -1 75 8 24 26 +1 +1 0 75 8 36 27 +1 +1 +1 75 8 48
1 Experimental design for three factors - ultrasound power density, ultrasound exposure time,
and incubation time at 25oC that will determine the levels of trans-resveratrol, trans-piceid, phenolic compounds, total phenolics, antioxidant capacities, and consumer overall acceptance of sliced (7 mm) peanut kernels (Design-Expert v. 6.0.10, Stat-Ease, Inc., Minneapolis, MN).
155
Amplitudes that provided the required power in joules were empirically determined from
preliminary sonication of peanuts immersed in water resulting in 21, 48, and 68% amplitudes to
achieve power densities of 25, 50 and 75 mW/cm3.
US-treated peanuts were drained in a sanitized colander for 15 min to remove excess water,
packed in a sanitized half gallon glass mason jars, covered and wrapped with to prevent exposure
to light, and incubated at 25oC for 24, 36, and 48 h. The entire process was conducted under
yellow light to avoid isomerization or degradation of light sensitive phenolic compounds. After
incubation, the samples were stored in a walk-in freezer until these were dried and roasted as
described previously in Study 1.
C. Chemical and Physico-Chemical Analyses
US-treated peanuts and controls were analyzed for trans-resveratrol, trans-piceid, total
phenolics, TEAC, ORAC, moisture and fat contents following the procedure described
previously in Study 1.
D. Sensory Evaluation
Descriptive analysis and consumer acceptance tests were conducted as described in Study 1
except for the samples used.
E. Statistical Analysis
The data collected from the chemical and sensory tests were analyzed statistically as
described previously in Study 1.
F. Optimization of Ultrasound Process Parameters
Regression analysis to determine significant prediction models and response surface
methodology to determine optimum US process parameters for were conducted following the
procedure described previously in Study 1.

156
G. Verification of Prediction Models
The verification of the significant prediction models for US processes were conducted
following the procedure described in Study 1, except for samples and parameters inside and
outside the optimum region used.
III. STUDY 3- COMBINED ULTRASOUND-UV PROCESS OPTIMIZATION TO
ENHANCE TRANS-RESVERATROL BIOSYNTHESIS IN PEANUTS
A. Experimental Design
A 3 x 3 x 3 full factorial design was used to treat peanuts with varying doses of combined
US-UV based on a two-stage experimental design depicted in Figure 3.5. A first stage,
represented by the smaller cube, shows the parameters from two separate experiments, reported
previously to optimize either US or UV process (Sales and Resurreccion, 2009). It is embedded
within the parameters of the larger cube representing the second stage for a combined
ultarasound-UV process for this optimization study. The second stage was necessary to allow
for modeling the synergistic potential of combined US-UV treatments.
Factors for the combined ultarasound-UV processing treatments included US power densities
of 40, 80 and 120 mW/cm3, US exposure times of 4, 8, and 12 min, and UV exposure times of
10, 30, and 50 min (Tables 3.7 and 3.8) at a fixed distance of 40 cm from UV light found
optimal in the previous study (Sales and Resurreccion, 2009). All samples were incubated at the
optimal time of 36 h at 25oC (Sales and Resurreccion, 2009). Three controls were used: 1)
untreated raw whole peanuts; 2) roasted peanuts treated with optimum UV process of 30 min at
40 cm distance from UV light and incubated for 36 h (Sales and Resurreccion, 2009); and 3)
roasted peanuts treated with optimized US process of 6 min at 75 mW/cm3 power density and
incubated for 36 h (Sales and Resurreccion, 2009). Two replications of 27

157
Figure 3.5 Two-stage experimental design for combined ultrasound and UV treatments of peanut kernels. The first stage, represented by the smaller cube, shows the parameters from two separate experiments conducted previously to optimize ultrasound or UV processes. The second stage, the larger cube where parameters of the first stage are imbedded, represents the design for optimizing a combined ultrasound-UV to allow for modeling the synergistic potential of ultrasound and UV. Ultrasound exposure time is plotted on the x-axis, UV exposure time on the y-axis, and ultrasound power density on the z-axis. (Reprinted from Food Chemistry, Vol. 122, Sales, J.M. and Resurreccion, A.V.A. Phenolic profile, antioxidants, and sensory acceptance of bioactive-enhanced peanuts using ultrasound and UV. Page No. 796, Copyright 2010, with permission from Elsevier.)

158
Table 3.7 Treatment variables and their levels for combined ultrasound-UV processes1
Levels (Coded Values)
Factors (treatment variables) Symbol
code -1 0 +1
Ultrasound power density (mW/cm3)
X1 40 80 120
Ultrasound exposure time (min) X2 4 8 12
UV exposure time (min) at fixed distance from UV light of 40 cm
X2 10 30 50
1 Experimental design that will determine the ultrasound power density, ultrasound and UV exposure times that will be used to determine the levels of phenolic compounds, total phenolics, antioxidant capacities, and consumer overall acceptance of sliced peanut kernels (7 mm). Fixed factors are 40 cm distance from UV light and incubation time at 25oC for 36 h found optimal in previous studies.
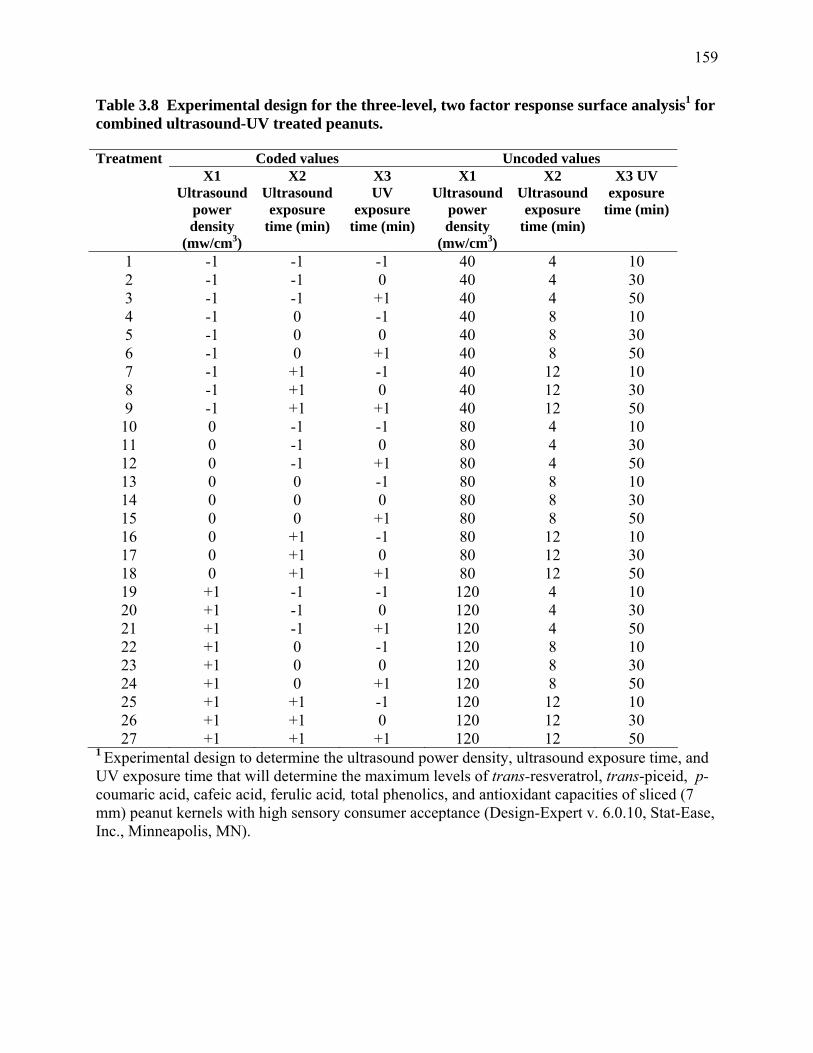
159
Table 3.8 Experimental design for the three-level, two factor response surface analysis1 for combined ultrasound-UV treated peanuts.
Coded values Uncoded values Treatment X1
Ultrasound power density
(mw/cm3)
X2 Ultrasound
exposure time (min)
X3 UV
exposure time (min)
X1 Ultrasound
power density
(mw/cm3)
X2 Ultrasound
exposure time (min)
X3 UV exposure
time (min)
1 -1 -1 -1 40 4 10 2 -1 -1 0 40 4 30 3 -1 -1 +1 40 4 50 4 -1 0 -1 40 8 10 5 -1 0 0 40 8 30 6 -1 0 +1 40 8 50 7 -1 +1 -1 40 12 10 8 -1 +1 0 40 12 30 9 -1 +1 +1 40 12 50 10 0 -1 -1 80 4 10 11 0 -1 0 80 4 30 12 0 -1 +1 80 4 50 13 0 0 -1 80 8 10 14 0 0 0 80 8 30 15 0 0 +1 80 8 50 16 0 +1 -1 80 12 10 17 0 +1 0 80 12 30 18 0 +1 +1 80 12 50 19 +1 -1 -1 120 4 10 20 +1 -1 0 120 4 30 21 +1 -1 +1 120 4 50 22 +1 0 -1 120 8 10 23 +1 0 0 120 8 30 24 +1 0 +1 120 8 50 25 +1 +1 -1 120 12 10 26 +1 +1 0 120 12 30 27 +1 +1 +1 120 12 50
1 Experimental design to determine the ultrasound power density, ultrasound exposure time, and UV exposure time that will determine the maximum levels of trans-resveratrol, trans-piceid, p-coumaric acid, cafeic acid, ferulic acid, total phenolics, and antioxidant capacities of sliced (7 mm) peanut kernels with high sensory consumer acceptance (Design-Expert v. 6.0.10, Stat-Ease, Inc., Minneapolis, MN).

160
combined US-UV treatments, and 3 controls were prepared for a total of 60 samples. Each
sample was analyzed for 16 phenolic compounds simultaneously (Francisco and Resurreccion,
2009b) for benzoic acid derivatives: gallic-, protocatechuic-, and β-resorcylic (internal standard)
acids; flavanols: epigallocatechin, catechin, procyanidin B2, epicatechin, epigallocatechin gallate,
epicatechin gallate, and catechin gallate; stilbenes: trans-resveratrol and trans-piceid; cinnamic
acid derivatives: caffeic, p-coumaric- and ferulic acids; and flavonol: quercetin; total phenolics
(Singleton et al., 1999), and antioxidant capacities by Trolox Equivalent Antioxidant Capacity
(TEAC; Kim et al., 2002) and Oxygen Radical Absorbance Capacity (ORAC; Prior et al., 2003).
B. Sample Preparation
Peanuts (Arachis hypogaea cv Georgia green medium runners, 2008 crop year; McCleskey
Mills Inc., Smithville, GA) were treated with US -UV following the procedure described in
Study 1, except that the experimental design of this study was followed. US-treated peanuts
were drained to remove excess water, then layered in plastic trays and subjected to UV
treatments following the procedure described in Study 2 except that the experimental design of
this study, was followed.
C. Chemical Analyses The combined US-UV treated sliced peanut samples and controls were analyzed for 15
phenolic compounds simultaneously using reverse phase HPLC method (Francisco and
Resurreccion, 2009b) as described below; and for total phenolics (Singleton et al., 1999) and for
antioxidant capacities using ABTS anion scavenging assay (Kim et al., 2002) and ORAC (Prior
et al., 2003) assays as described previously in Study 1.

161
1. Profiling of phenolic compounds
1.1 Preparation of dried crude phenolic extracts
The method of Talcott et al. (2005b) for extraction of total phenolics was adapted to prepare
the liquid crude phenolic extracts of samples. Peanut skins were removed manually and
approximately 20 g were ground in a coffee mill (Model K9M2-4, BrAun, Mexico) to the
smallest obtainable particle size and the unground peanuts were discarded. Approximately 10 g
of ground sample were weighed into a 250 mL centrifuge bottle (Fisher Scientific, Fair Lawn,
NJ, USA) then 20 mL of 80% methanol was added. The method of Talcott et al. (2005b) was
modified by adding 1 mL of 20 ppm internal standard, β-resorcylic acid, a compound not
reported to be present in peanuts (Francisco and Resurreccion, 2009b) and possesses
characteristics of an appropriate internal standard as described by Snyder et al. (1997). The
mixture was homogenized using PowerGen 125 homogenizer (Fisher Scientific, Pittsburg, PA,
USA) for 2 min. The bottle was shaken for 10 min at ambient temperature using a wrist action
shaker (Model 75, Burrell Corp., PA, USA; Francisco and Resurreccion, 2009b) then centrifuged
(Model J2-21M, Beckman, Palo Alto, CA, USA) at 2500G (3000 rpm using rotor # 14) for 5 min
at 18oC. The supernatant extract was passed through a filter paper, Whatman No. 42 (UGA
Central Stores, GA, USA; Rudolf and Resurreccion, 2005) and collected in a 30 mL screw
capped glass vial. The residue was extracted with 20 mL of 80% methanol under the same
conditions as the first extraction, for a total of 3 times. After the last filtration, the filter paper
was washed with 2 mL of 80% methanol and collected in the same vial. The combined filtrate
was transferred into an evaporating flask, the vial was rinsed with 0.5 mL of 80% methanol, and
rinsing was added to the flask to quantitatively transfer all the components. The filtrate was
evaporated to dryness under vacuum in a rotary evaporator (RV05 Basic 1B, IKA, Fisher

162
Scientific Co., Fair Lawn, NJ, USA; Francisco and Resurreccion, 2009b) at 45°C in a water bath
resulting in a dried crude methanolic extract of phenolics.
1.2 Preparation of purified phenolic extracts for HPLC analysis
The method of Francisco and Resurreccion (2009b) was adapted to purify the extract for
HPLC analysis by removing protein and lipid before autosampler injection to obtain a good base
line (Yu et al., 2005). To purity the extract, 3 mL of dichloromethane (DCM, 100%, VWR, West
Chester, PA, USA) and 2 mL of filtered deionized water were added to the dried extract in the
evaporating flask and the mixture was transferred to a test tube. The flask was rinsed with 1 mL
of filtered deionized water and rinsing was added to the same tube. The tube was mixed for 1
min in a vortex mixer (Model VM 3000, VWR, Thorofare, NJ, USA) at setting #6.5 then
centrifuged at 980G (2500 rpm, rotor radius: 14 cm) for 3 min 15 s using a table-top centrifuge
(Vari Hi Speed Centricone, Chicago, IL, USA) to allow partitioning and phase separation. The
water phase (upper layer) was collected in a second clean 20 mL test tube using a Pasteur pipette,
and the lower layer in the test tube was discarded. The water layer was mixed with 5 mL ethyl
acetate (100%, VWR, West Chester, PA, USA) for 1 min using the vortex mixer (setting #6.5) to
cause a phase separation into water and ethyl acetate layers. The ethyl acetate layer containing
phenolics (upper layer) was transferred into an evaporating flask using a Pasteur pipette, and
dried in a rotary evaporator at 35oC under vacuum. The dried phenolics were re-dissolved in 1.5
mL methanol and transferred to a 5 mL vial. The flask was rinsed with 0.5 mL methanol and
rinsing was added to the same vial. Methanol from the vial was evaporated to dryness under
nitrogen gas (Airgas South, Griffin, GA, USA), covered with parafilm and aluminum foil and
stored in the freezer until analyzes. The entire process was completed under yellow light to
prevent degradation of light sensitive phenolics.

163
1.3 Preparation of standard solutions and solvents for HPLC analysis.
a) Preparation of 16 standard stock solutions
A total of 16 standards including gallic acid, quercetin, catechin, (-)-catechin gallate, (-)-
epicatechin gallate, (-)-epigallocatechin, procyanidin B2, and β-resorcylic acid (internal standard,
IS) were purchased from Sigma Chemical Co. (St. Louis, MO, USA). Trans-resveratrol, (-)-
epigallocatechin gallate, caffeic acid, p-coumaric acid, protocatechuic acid, ferulic acid, and (-)-
epicatechin were purchased from Fisher Scientific (Atlanta, GA, USA).
Stock solutions of gallic acid (1000 ppm), quercetin (1000 ppm), (+)-catechin (1000 ppm),
(-)-catechin gallate (2000 ppm), (-)-epicatechin gallate (1000 ppm), (-)-epigallocatechin (2000
ppm), procyanidin B2 (2000 ppm), β-resorcylic acid (1000 ppm), trans-resveratrol (1000 ppm),
(-)-epigallocatechin gallate (1000 ppm), caffeic acid (1000 ppm), p-coumaric acid (1000 ppm),
protocatechuic acid (1000 ppm), ferulic acid (1000 ppm), (-)-epicatechin (1000 ppm) and trans-
piceid (1000 ppm) were prepared. The 1000 ppm stock solutions were prepared by dissolving 50
mg of each compound separately and diluting to 50 mL with 99.99% methanol (Fisher Scientific,
Fair Lawn, NJ, USA). All stock solutions were stored in amber bottles (to protect against light)
at -15(C until needed. To prepare a 2000 ppm stock solution, 100 mg powder of the compound
was dissolved and diluted to 50 mL with 99.99% methanol. A sample calculation is as follows:
1000 mg gallic acid x 50 mL 99.99% methanol To obtain 1000 ppm gallic acid: 1000 mL 99.99% methanol = 50 mg gallic acid
in 50 mL 99.99% methanol
2000 mg catechin gallate x 50 mL 99.99% methanol To obtain 2000 ppm catechin gallate: 1000 mL 99.99% methanol = 10 mg catechin gallate
in 50 mL 99.99% methanol

164
b) Preparation of five calibration standard curve solutions from the standard stock solutions for
the construction of standard calibration curves
Stock standard solutions were used to prepare standard mixture solution for calibration by
mixing the required volumes, calculated by multiplying the final concentration desired in ppm
with the total volume of standard mixture to be prepared and then dividing with the
concentration of the stock standard solution as shown in Table 3.9.
A sample calculation showing the volume of β-resorcylic acid stock solution required in the
preparation of the standard mixture is shown below.
200 ppm x 25 mL 1000 ppm = 0.5 mL or 500 µL
Calibration standard curve solutions consisting of 20, 40, 60, and 80% of the standard
mixture solution were prepared by diluting the required volume of the standard mixture solution
as shown in Table 3.10, with 15% methanol in a 5 mL vial. The 100% calibration standard curve
solution used the standard mixture solution as is.
c) Preparation of Solvents for High Performance Liquid Chromatography (HPLC) Analysis
The solvents were prepared under the hood, using gloves and mask. Solvent A, deionized
water in 0.1% formic acid was prepared by mixing 4 L deionized water previously filtered
through 0.20µm type GN filter (Millipore Corp. Bradford, MA, USA) with 4.0 mL formic acid
(VWR, West Chester, PA, USA). Solvent B, 100% acetonitrile with 0.1% formic acid was
prepared by mixing 4.0 mL formic acid (VWR, West Chester, PA, USA) in 4 L of 100% acetonitrile.

165
Table 3.9 Volumes of individual stock solutions required for preparation of the standard mixture solution for phenolic profiling. Standard Concentration
(ppm) of stock solution
Required volume (µL) of stock solution
Final concentration (ppm) in standard mixture solution
β-Resorcylic acid 1000 20 500
Gallic acid 1000 4 100
Protocatechuic acid 1000 4 100
(-)-Epigallocatechin 2000 20 250
(+)-Catechin 1000 20 500
Procyanidin B2 2000 10 125
(-)-Epicatechin 1000 10 125
(-)-Epigallocatechin gallate 1000 10 125
(-)-Epicatechin gallate 2000 10 125
(-)-Catechin gallate 2000 10 250
Quercetin 1000 4 100
trans-Piceid 1000 4 100
trans-Resveratrol 1000 4 100
Caffeic acid 1000 4 100
p-Coumaric acid 1000 4 100
Ferulic acid 1000 4 100
Total volume (µL) 2,800*
* The total volume of 2,800 µL was mixed in a 25 mL volumetric flask and diluted to 25 mL with 15% methanol.

166
Table 3.10 Volumes of standard mixture solution required for calibration standard curve for phenolic profiling.
Percent of Standard mixture solution
Volume (mL) of standard mixture solution required
Volume (mL) of 15% methanol added to standard mixture solution
Final volume (mL) of solution for HPLC analysis
20 1 4 5
40 2 3 5
60 3 2 5
80 4 1 5
100 2 0 2
167
1.4 HPLC analysis
The dried purified phenolic extract of UV-treated peanuts was redissolved in 0.75 mL of
15% methanol then transferred to a 2 mL HPLC amber vial. The 5 mL vial was washed with
0.25 mL of 15% methanol and washing was poured in the same HPLC vial for analysis. HPLC
analysis was performed using a ProStar HPLC system (Varian Inc., Walnut Creek, CA, USA)
with Eclipse Plus C18 reverse column, 250 x 4.6 mm, 5µm particle size, preceded by an Eclipse
Plus C18 guard column, 7.5 x 4.6 mm, 5µm particle size (Agilent Technologies, Deerfield, IL,
USA) using the conditions described by Francisco and Resurreccion (2009b) shown in Table
3.11. The Star Work Station software (Varian Inc., Walnut Creek, CA, U.S.A) version 6.41 was
used to control the autosampler, gradient settings, diode array detector (DAD) and data
acquisition. The mobile phase consisted of 0.1% (v/v) formic acid (VWR, West Chester, PA,
USA) in filtered deionized water as solvent A and 0.1% (v/v) formic acid in 100% acetonitrile
(VWR, West Chester, PA, USA) as solvent B, with a flow rate of 1.5 mL/min, and the column
temperature was maintained at approximately 25°C, ambient temperature. The gradient elution
increased solvent B linearly from 5 to 7% over 7 min, then to 17% from 7 to 75 min, then
increased to 45% from 75 to 110 min, then to 100% from 110 to 117 min, and finally returned to
its initial concentration of 5% from 117 to 124 min to allow stabilisation and return to initial
concentration. The HPLC analysis of the samples and calibration standard curve solutions were
evaluated by injecting 20 mL in duplicate.
Peak areas of standards of benzoic acid derivatives – gallic acid, protocatechuic acid, and
internal standard, β-resorcylic acid were quantified at 250 nm; flavanols - (+)-catechin, (-)-
catechin gallate, (-)-epicatechin gallate, (-)-epigallocatechin, procyanidin B2, (-)-epigallocatechin
gallate at 280 nm; stilbenes - trans-resveratrol and trans- piceid at 306 nm; cinnamic acid

168
Table 3.11 Chromatographic conditions for the determination of phenolic compounds in extracts of peanut kernels. Chromatographic conditions
Injection volume 20 μL
Guard column C18 guard column, 4.6x12.5 mm, 5μm particle size (Eclipse
Plus, Agilent Technologies, Wilmington, DE)
Analytical column C18 reverse-phase column, 4.6x250mm, 5μm particle size
(Eclipse Plus, Agilent Technologies, Wilmington, DE)
Mobile phase Solvent A (formic acid in water, 0.1% v/v)
Solvent B (formic acid in acetonitrile, 0.1% v/v)
1st segment: 0-7 min: 5 – 7% B
2nd segment: 7-75 min: 7 – 17% B
3rd segment: 75-110 min: 17 – 45% B
Flushing step: 110-117 min: 45 – 100% B
Conditioning step: 117-124 min: 100 – 5% B
Flow rate 1.5 mL/min
Temperature Ambient temperature
Detection conditions
Scanning 200 – 400 nm
Scan rate 10 Hz
Detection wavelength Benzoic acid derivatives: 250 nm
Cinnamic acid derivatives: 320 nm
Flavanols: 280 nm
Stilbenes: 306 nm
Flavonols: 370 nm

169
µg of i in dry sample =
Volume injected in HPLC
µg of i in standard
µg of IS in standard
PA of i in standard
PA of IS in standard
x PA of i in sample
x PA of IS in sample
x µg of IS in volume injected in HPLC x volume of extract
derivatives – caffeic acid, p-coumaric acid and ferulic acid at 320 nm; and flavonol – quercetin
at 370 nm using diode array detector (DAD). The chromatogram of each compound was verified
against the known spectra of the compounds in the calibration standard curve solutions and at the
specified wavelengths and retention time as established by Francisco and Resurreccion (2009b).
The calibration curve for each compound was obtained by plotting peak areas (y-axis) versus
concentrations (x-axis).
The concentration of each of the phenolic compound in µg/g, dry basis was calculated as
follows:
where: i = phenolic compound
IS = internal standard, ß-resorcylic acid
PA = peak area.
D. Sensory Evaluation
Descriptive Analysis and Consumer Acceptance Tests were conducted as described in Study
1 except for the samples, ballot (Figure 3.6), and warm-up samples used.
E. Statistical Analysis
The data collected from the chemical and sensory tests were analyzed statistically as
described previously in Study 1.

170
Descriptive Test Ballot for Roasted Peanuts Panelist Code: _____________________________ Date: ____________________ Appearance: Please look at sample as a whole and evaluate its COLOR. Brown Color – the intensity of brown color from white to dark brown Reference: white paper = 0; dry cardboard (L=55) = 42; chocolate syrup=150; WUP=34 _______|_______________________________________________________________________|_______ Aromatics: Please take at least four pieces of sample and evaluate for the following AROMATICS. Roasted peanutty- the aromatic associated with medium roasted peanuts. Reference: light roasted peanut (L=55) =55; medium roasted peanuts (L=50) = 65; dark roasted peanut (L=45) =76; WUP= 34
_______|_______________________________________________________________________|_______ Raw/beany - the aromatic associated with uncooked or raw peanuts. Reference: light roasted peanut (L=55) =7; raw peanuts= 37; WUP=0 _______|_______________________________________________________________________|_______ Woody/hulls/skins – the aromatic associated with peanut skins and hulls. Reference: peanut skins = 32; WUP = 10 _______|_______________________________________________________________________|_______ Burnt – the aromatic associated with very dark roast or burnt peanuts. Reference: Burnt peanuts (L=30) = 73; Basic solutions; WUP = 27 _______|_______________________________________________________________________|_______ Cardboard– the aromatic associated with wet cardboard. Reference: wet cardboard=36; WUP = 21 _______|_______________________________________________________________________|_______
Figure 3.6 The ballot used for the descriptive test of roasted combined ultrasound-UV treated peanuts.

171
Fishy – the aromatic associated with cod liver oil or old fish . Reference: Cod liver oil=78; WUP = 0 _______|_______________________________________________________________________|_______ Oxidized - the aromatic associated with rancid fats and oils. Reference: oxidized peanuts =48; WUP = 26 _______|_______________________________________________________________________|_______ Painty- the aromatic associated with linseed oil. Reference: Linseed oil (diluted) =58; Linseed oil (pure) =115; WUP=0
_______|_______________________________________________________________________|_______ Tastes: Please take at least 4 pieces of sample and evaluate its TASTES. Bitter - the taste on the tongue associated with bitter agents such as caffeine solution Reference: bitter 20; bitter 50; bitter 100; WUP = 30 _______|_______________________________________________________________________|_______ Sweet – the taste on the tongue associated with sucrose solution Reference: sweet 20; sweet 50; sweet 100; sweet 150; WUP = 12 _______|_______________________________________________________________________|_______ Sour- the taste on the tongue associated with acid solutions Reference: sour 20; sour 50; sour 85; WUP = 8 _______|_______________________________________________________________________|_______ Salty - the taste on the tongue associated with sodium chloride solutions Reference: salty 20; salty 50; salty 85; WUP = 10 _______|_______________________________________________________________________|_______
Figure 3.6 (continued)

172
Please take at least four pieces of sample and evaluate its TEXTURE and FEELING FACTORS. Texture: Crispness – force needed and amount of sound (high pitch) generated from chewing a sample with front teeth. Reference: potato chips=75; WUP=29
_______|_______________________________________________________________________|_______ Crunchiness – the force needed and amount of sound (lower pitch) generated from chewing a sample with molars. Reference: corn chips=75; medium roasted peanut (L=50) = 40; WUP=40 _______|_______________________________________________________________________|_______
Hardness – force needed to compress food between molar teeth. Reference: raw peanuts= 45; medium roasted peanut (L=50) =37; WUP=37 _______|_______________________________________________________________________|_______ Feeling factors: Toothpack - the amount of sample left in or on teeth after chewing. Reference: graham crackers= 75; raw peanuts=86; WUP =59 _______|_______________________________________________________________________|_______ Astringent - the puckering or drying sensation on the mouth or tongue surface. Reference: milk of magnesia = 40; grape juice=65; WUP=22 _______|_______________________________________________________________________|_______ Tongue sting - the degree of sharp tingling sensation or feeling on the tongue or throat which leaves a burning sensation on the tongue surface. Reference: Basic solutions; WUP =0 _______|_______________________________________________________________________|_______
Figure 3.6 (continued)

173
F. Optimization of Combined Ultrasound-UV Process Parameters
Regression analysis to determine significant prediction models and response surface
methodology to determine optimum process parameters for combined were conducted following
the procedure described previously in Study 1, except that boundary regions of interest included 22
µg/g p-coumaric acid, 19 µg/g ferulic acid and 17 µg/g caffeic acid (Ghiselli et al., 1998) in
addition to 2.64 µg/g trans-resveratrol (McMurtrey et al., 1994); 1.85 µg/g trans-piceid (Lamuela-
Raventos et al., 1995); 1.84 mg GAE total phenolics (USDA, 2007); 5.01 µM TE/g TEAC
(Villaño et al., 2004); and 38 TE/g ORAC/g (USDA, 2007) ), representing 100% of these
compounds in red wines; and an overall acceptance rating >5.0.
G. Verification of Prediction Models
The verification of the significant prediction models for the combined US-UV processes
were conducted following the procedure described in Study 1, except for samples and parameters
inside and outside the optimum region used.
IV. STUDY 4 - APPLICATIONS OF RESVERATROL-ENHANCED PEANUTS
SELECTED PRODUCTS AND THEIR SHELF LIFE
A. Goal of the Study
The goal of this study was to apply the resveratrol-enhanced peanuts, prepared using optimal
process of combined US-UV treatment determined in Study 3, as ingredient in peanut products.
With increasing consciousness of consumers with regard to healthy foods, there is a need to find
alternative natural and probably safer sources of food with enhanced levels of bioactive
compounds and antioxidants to improve the quality of food. Products selected for application
are roasted REP and resveratrol-enhanced peanut bars.

174
B. Experimental Design
1. Accelerated Shelf Life Test of Roasted Resveratrol-Enhanced Peanuts
An accelerated shelf life test of roasted REP packaged in polyethylene bags (Ziplock, S.C.
Johnson & Son, Inc., Racine, WI) was performed using three accelerated storage temperatures of
30 (Model 3107, Hotpack Company, Philadelphia), 35 (Model 4-148-CY, American Instrument,
Silver Spring, MD), and 40oC (Model 645 Treas, Precision Scientific, Winchester, VA).
Temperatures higher than 40oC were not selected because it is not recommended that samples be
stored at temperatures greater than 40oC (Taoukis and Labuza, 1996) as phase changes may
occur which can accelerate the reaction such as fat changing from solid to liquid (Labuza, 2000).
Samples were also stored at ambient temperature, about 25oC, for verification of shelf life at
accelerated temperatures (Labuza and Schmidl, 1985). Control untreated samples were stored at
two temperatures, 25oC and 4oC.
The sampling times for the shelf life study of roasted REP were estimated based on Q10 of
1.75 for the lipid oxidation (range is 1.5 -2.0; Labuza and Schmidl, 1985) and a shelf life of 90
days at 25oC for roasted peanuts using the equation (Labuza and Schmidl, 1985),
θ1θ2 = Q10 ΔT/10
where: θ1 = shelf life (day) at lower temperature (oC), T1
θ2 = shelf life (day) at higher temperature (oC), T2
ΔT = T2 – T1
and Q10 = the accelerating factor.
Based on these parameters, REP were predicted to have a shelf life of 68 days at 30oC, 51 days at
35oC and 39 days at 40oC. The sampling scheme (Table 3.12) for the study was a design

175
suggested by Labuza and Schmidl (1985), whereby the samples at each temperature were
sampled at similar times for a minimum of six sampling time per temperature. To achieve
similar days of sampling times, samples for prediction of shelf life at 30, 35, and 40oC (day 0)
were stored on day 29, day 44 and day 55 respectively, of the 25oC storage temperature. In
addition, three sampling times for the prediction of shelf life at 40oC were conducted to provide a
quicker estimation of shelf life at 40oC and therefore, adjust the sampling scheme at other
temperatures as needed. Verification of the shelf life at 25oC was performed by storing samples
at actual ambient temperature, approximately 25oC.
Samples at every sampling time at each storage temperature were analyzed for analyzed for
hexanal, trans-resveratrol, acceptance test by consumer panel, and descriptive sensory test by a
trained panel using the procedures described previously in Study 1, except for the samples and
the ballot for the consumer and descriptive sensory tests used in this study. Total phenolics and
TEAC were analyzed at initial (0 day storage) and at the end of shelf life at each storage
temperature using the procedure described previously in Study 1 except for the samples used in
this study.
2. Storage Study of Resveratrol-Enhanced Peanut Bars
A storage study at 25 and 40oC was conducted on resveratrol-enhanced peanut bars packaged
in polyethylene bags (Ziplock, S.C. Johnson & Son, Inc., Racine, WI) using the scheme
presented in Table 3.13. Samples were analyzed for trans-resveratrol, hexanal, total phenolics,
TEAC, consumer acceptance and sensory descriptive analysis as described above in Item B.1 of
this study.

176
Table 3.12 Sampling scheme for roasted resveratrol-enhanced peanuts stored at accelerated temperatures of 30, 35 and 40oC based on target shelf life of 90 days at 25oC using Q10 of 1.75 for lipid oxidation and verifed at 25oC
Sampling time, day number 1 (Estimated Shelf Life, ESL, %)2 No. of Storage Temperature (oC) samples
Prediction:
30 22 (0) 35 (19) 52 (44) 61 (57) 68 (67 ) 90 (100) 99 (113) 7
35 39 (0) 52 (15) 61 (43) 68 (56) 90 (100) 99 (118) 6
40 51 (0) 61 (25) 68 (43) 90 (100) 99 (123) 5
40 13 (0) 35 (56) 52 (100) 3
Verification:
25 0 (0) 16 (18) 35 (39) 52 (58) 61 (68) 68 (76) 90 (100) 101(112) 8 Controls3:
25 0 (0) 52 (58) 2
4 52 (58) 1 Total 32 1The sampling time, day number, is the withdrawal time of sample from storage based on Day 0 at 25oC. Samples at 30oC (Day 0 storage) was stored on Day 22 of 25oC. Estimated (predicted) end of shelf life at 30oC was 68 days. Samples at 35oC (Day 0 storage) was stored on Day 39 of 25oC. Estimated shelf life at 35oC was 51 days. Samples at 40oC (Day 0 storage) was stored on Day 51 at 25oC. Estimated shelf life at 45oC was 39 days. Additional samples at 40oC (Day 0 storage) was stored on Day 13 of 25oC for quick estimation of shelf life for use a guide for adjusting the schedule of sample withdrawal at lower temperature, as needed.
2Numbers in parentheses indicate estimated shelf life in percent based on the estimated end of shelf life at the specified temperature. 3Controls are samples of roasted peanuts prepared from raw untreated peanuts.
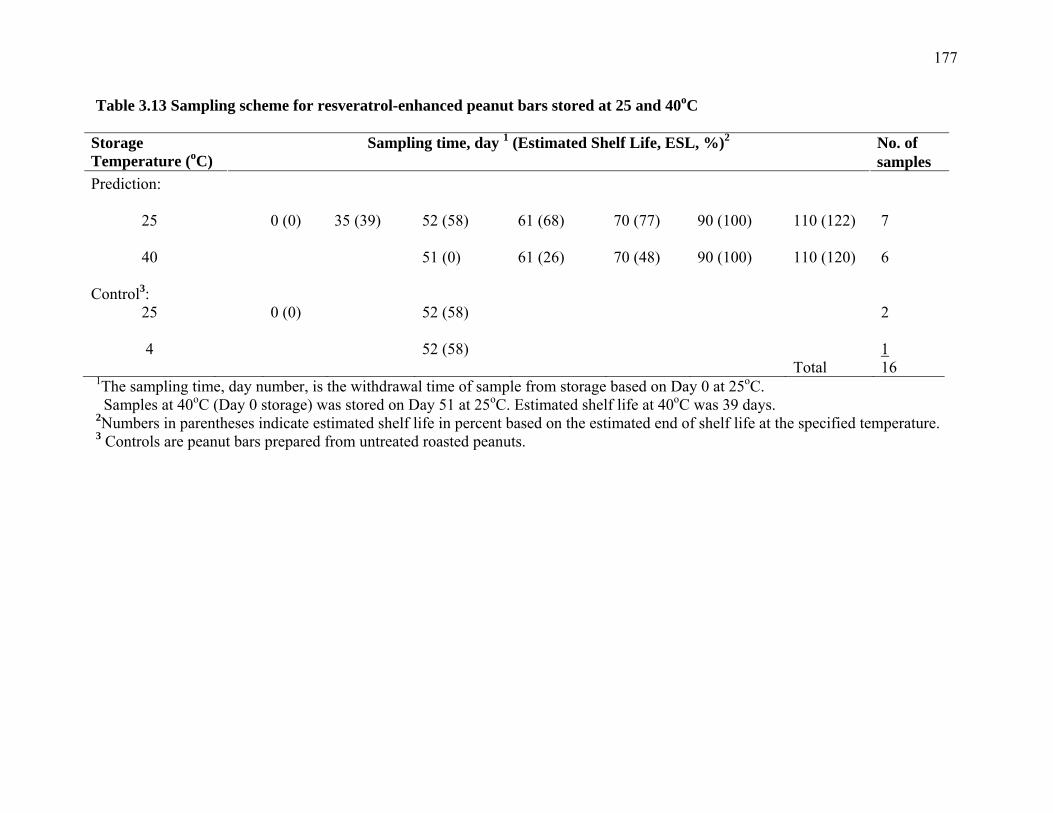
177
Table 3.13 Sampling scheme for resveratrol-enhanced peanut bars stored at 25 and 40oC
Sampling time, day 1 (Estimated Shelf Life, ESL, %)2 No. of Storage Temperature (oC) samples
Prediction:
25 0 (0) 35 (39) 52 (58) 61 (68) 70 (77) 90 (100) 110 (122) 7
40 51 (0) 61 (26) 70 (48) 90 (100) 110 (120) 6
Control3: 25 0 (0) 52 (58) 2
4 52 (58) 1
Total 16 1The sampling time, day number, is the withdrawal time of sample from storage based on Day 0 at 25oC. Samples at 40oC (Day 0 storage) was stored on Day 51 at 25oC. Estimated shelf life at 40oC was 39 days. 2Numbers in parentheses indicate estimated shelf life in percent based on the estimated end of shelf life at the specified temperature. 3 Controls are peanut bars prepared from untreated roasted peanuts.

178
C. Sample Preparation
1. Roasted Resveratrol-Enhanced Peanuts
Raw REP were prepared using the optimal process parameters for the combined US-UV
process determined previously: US processing for 10 min exposure time to US power density 70
mW/cm3 followed by UV processing for 50 min at 40 cm distance from UV light and then
incubation for 36 h at 25oC. Raw REP were prepared in batches such that the samples were
stored as per schedule in the sampling plan in Tables 3.12 and 3.13.
Raw peanuts (40 kg) were prepared for combined US-UV processing treatment as described
previously in Study 3 except for the process parameters used. Sliced peanuts were prepared
using optimal parameters for combined US-UV process of 70 mW/cm3 US power density for 10
min followed by 50 min exposure at 40 cm distance from UV light and then incubated at 25oC
for 36 h. The incubated samples were dried and roasted as described previously in Study 1. The
roasted REP were weighed, 320 g each, and packed in 1 quart (0.97 L) capacity Ziplock bags
(17.78 cm x 19.69 cm, S.C. Johnson & Son, Inc., Racine, WI) according to the experimental
design. Controls using untreated raw peanuts were also prepared. The roasted REP and controls
were prepared in duplicate.
2. Resveratrol-Enhanced Peanut Bars
The ingredients for REP bar were weighed according to the formulation indicated in Table
3.14. Syrup was prepared by mixing refined sugar (Great Value, Walmart Stores, Inc.,
Bentonville, AR), light corn syrup (Karo, Best Food, Engelwood Cliffs, NJ), water, vegetable oil
(Great Value, Walmart Stores, Inc., Bentonville, AR), and salt (Morton International Inc.,
Chicago IL) in a pan placed on top of an electric range (Kitchen Aid Model Superba,
KitchenAid, Benton Harbor, MI) set to medium-high. The mixture was stirred continuously until

179
all solids were dissolved. Mixing was continued intermittently every 5 minutes until it started to
caramelize at about 140oC. Stove setting was set down to medium and stirring continued to a
syrup temperature of 165oC. The pan was removed from the stove top, while stirring of syrup
was continued and temperature increased to 170oC. The roasted REP were mixed with syrup
thoroughly and transferred on the flattening board. The pin was rolled on top of the mixture to
flatten the peanut-syrup mixture to about 0.5 cm thickness. The flattened mixture was cut with a
knife to 10 cm long x 4 cm wide. A template was used to ensure uniform cut of bars. This
resulted in approximately 50 grams per bar. The cut mixture was allowed to cool at room
temperature. After cooling, the cut edges were bent to break into individual bars. The bars easily
broke by bending with hands when adequately cooled. Three bars each were packed in Ziplock
bags. Controls using untreated raw peanuts were also prepared. The roasted resveratrol-enhance
peanut bars and controls were prepared in duplicate.
C. Sample Withdrawal and Analyses
Samples were withdrawn from storage incubators at pre-determined intervals according to
the sampling schemes in Tables 3.12 and 3.13 and kept in walk-in freezers at -15oC until
analyzed. Samples withdrawn every sampling day were analyzed for hexanal analyses (Chu,
2003) on the day of sampling according to the procedure described below. Sampling scheme
was modified based on the results of hexanal analyses and additional sampling times were
performed for hexanal analysis toward the end of shelf life. Samples withdrawn every sampling
day were also analyzed for trans-resveratrol (Potrebko and Resurreccion, 2009) after
accumulation of at least 12 samples; and for consumer acceptance and descriptive tests at the end
of sample withdrawals. Total phenolics (Singleton et al., 2009) and TEAC (Kim et al., 2002)
were analyzed at initial (zero day storage) and at the end of shelf life. Control untreated samples

180
Table 3.14 Formulation for resveratrol-enhanced peanut bars Ingredient % in Formulation
Weight (g) for 1 k g
formulation Roasted resveratrol-enhanced peanuts
43.79
430.8
Water
25.86 258.6
Refined sugar
24.28 242.8
Light corn syrup
4.06 40.6
Oil
1.73 17.3
Industrial salt
0.26 2.6

181
were analyzed at initial at the end of shelf life of REP for all chemical and sensory analyses
conducted for treated samples.
1. Chemical Analyses
Chemical analyses for trans-resveratrol, total phenolics, and TEAC were conducted
following the procedures described previously in Study 1.
2. Hexanal Analysis Using Gas Chromatography Hexanal, the secondary lipid oxidation product was analyzed at initial zero day and every
sampling during storage of roasted REP and resveratrol-enhanced peanut bars bars at accelerated
and ambient temperature conditions according to the conditions for hexanal analysis of Chu
(2003), using 4-heptanone as internal standard.
2.1 Preparation of hexanal and heptanone (internal) standards
Stock solutions, 1000 ppm, each of hexanal and internal standard, 4-heptanone (Sigma, St
Louis, MO, USA) were prepared separately by mixing 5 µL in 5 mL of canola oil (Great Value,
Bentonville, AR, USA) and stored at 4oC until used.
Working heptanone internal standard with concentration of 30 ppm was freshly prepared on
the day of analysis by mixing 150 µL of 1000 ppm heptanone stock solution with 4.85 mL of
canola oil.
Five calibration curve standard solutions, 5 mL each containing 20, 40, 60, 80 and 100 ppm
of hexanal and fixed 30 ppm of 4-heptanone were prepared according to Table 3.15. The
calibration curve standard solutions were placed in 10 mL Kimax cylindrical screw capped vials
and sealed with a Teflon lined rubber septum (Supelco, 2-7451, 20 mm septa, ppfe/silicon, 1.5
mm thick, Supelco Bellefonte, PA, USA).

182
2.2 Sample preparation
About 30 g of peanut sample were ground in a coffee grinder to the smallest possible
particles. Using analytical balance, 3.000 g of ground peanut was weighed into a 10 mL Kimax
cylindrical screw capped vial, and spiked with 50 µL of 30 ppm 4-heptanone internal standard.
The vial was sealed with a Teflon lined rubber septum and tapped to level off the surface of the
sample.
2.3 Hexanal extraction
The sealed vial containing a calibration curve standard solution or a sample was placed into a
Multi-Bloc heater (Lab-line Instruments, Inc., Melrose Park, IL, USA) set at 37oC for 15 min to
allow the volatiles to evaporate in the headspace. After 30 min, the rubber septum lining of the
lid of the vial was initially punctured at the middle using a syringe needle used only for this
purpose. The Solid Phase Micro Extractor (SPME) fiber, 100 µm Polydimethylsiloxane, coated
fiber RED (Supelco, Bellfonte, Pa., USA) secured in a stainless steel needle (as purchased) was
placed inside a SPME holder and dialed to 0.8 cm mark. The SPME needle was pushed through
the pre-punctured septum of the vial and once it had gone through, it was dialed up to 1.6 mark
then the SPME fiber was pushed down and locked into place. The standard or sample was
heated for another 30 min to allow absorption of the volatiles in the vial headspace by the SPME
fiber. After 30 min, the SPME fiber was unlocked, the needle was retracted to 0 cm mark and
removed from the vial.
2.4 Hexanal analysis by gas chromatography
The needle with SPME fiber was dialed to 5 cm mark, pushed into the injection port of the
HPLC, and immediately pushed down the SPME fiber and locked into place. The fiber was left

183
Table 3.15 Volumes of hexanal and 4-heptanone standard stock solutions used to prepare the five calibration curve standard solutions Hexanal concentration, ppm
4-heptanone concentration, ppm
Volume of 1000 ppm hexanal, µL
Volume of 1000 ppm 4 -heptanone, µL
Volume of canola oil, µL
20 30 100 150 4750
40 30 150 150 4700
60 30 300 150 4550
80 30 450 150 4400
100 30 500 150 4350

184
in the HPLC for at least 5 min before removing from the machine. The fiber was held for 10 min
at room before use in the next sample.
Hexanal analysis was performed using a gas chromatograph (Varian Chromopack CP-3800,
Walnut, CA, USA) equipped with capillary column (Supelco Wax 10, 30 m x 0.25 m, 25 µm
film, Supelco, Bellefonte, PA) using helium as the carrier gas. The initial oven temperature was
set at 100oC and was programmed to increase at 10oC per min until it reached 220oC. The
temperature of the injector was set at 220oC. The flow rate for helium was 1.2 mL/min. A flame
ionization detector, set at temperature of 300oC was used to detect the peaks.
2.5 Calculations of hexanal concentrations
A total run time of 17 min was used for each standard or sample. Peak areas from the
chromatographs were obtained for hexanal and heptanone with retention times of 3.59 ± 0.20 and
3.96 ± 0.03 min, respectively. Hexanal concentration in µg/g was calculated using the following
equation (Chu, 2003).
µg of i in standard PA of i in standard x PA of i in sample µg of IS in sample
µg of IS in standard
µg of i in sample =
PA of IS in standard x PA of IS in sample
x
Weight of sample
Where: i = hexanal
IS = internal standard, heptanone
PA = area under the peak
3. Sensory Evaluation
The sensory properties and consumer acceptance of roasted REP were analyzed using
descriptive analysis and consumer acceptance tests, respectively, as described in Study 1 except
for the samples analyzed. Resveratrol-enhanced peanut bars were anayzed for their sensory

185
properties and consumer acceptance following the procedures for descriptive analysis and
consumer acceptance tests, respectively, as described in Study 1 except for the samples and
descriptive sensory ballot used as shown in Figure 3.7.
D. Prediction of Shelf Life
The results of hexanal of samples stored at 40oC were plotted at each sampling time
immediately to predict the shelf life of the samples, and make necessary adjustments for
sampling at lower temperatures of 25, 30 and 35oC based on kinetics using Arrhenius model
described below. The predicted shelf life of roasted REP at 25oC was determined using shelf life
model (Fu and Labuza, 2005) based on the shelf life at accelerated storage temperatures of 30, 35
and 40oC as described below.
1. Accelerated Shelf Life Test Using Arrhenius Model
1.1 Determination of order of reaction (n)
Loss of quality of most food can be represented by the following mathematical equation
(Labuza 1984):
dA dt = k[A]n Equation 1
where:
A= quality factor measured, e.g., sensory rating, concentration of a compound
t = storage time
n = order of reaction
k = reaction rate constant, the slope of the plot of A or ln A against t.

186
Descriptive Test Ballot for Peanut Bars
Sample Code: _____________ Panelist Code: _____________________________ Date: ____________________ Appearance: Please look at sample as a whole and evaluate its COLOR. Brown Color in Peanuts – the intensity of brown color from white to dark brown (look at the cut side) References: white paper = 0; dry cardboard (L=55) = 42; chocolate syrup=150; WUP=27 _______|_______________________________________________________________________|_______ Brown Color in Caramel – the intensity of brown color from beige to brown (look at the underside) References: white paper = 0; beige paper = 19; caramel = 75; chocolate syrup=150; WUP=68 _______|_______________________________________________________________________|_______ Aromatics: Please take at least ¼ portion of sample and evaluate for the following AROMATICS. Caramel- the aromatic associated with caramel. References: Kraft caramel candy= 65; WUP= 18
_______|_______________________________________________________________________|_______ Roasted peanutty- the aromatic associated with medium roasted peanuts. References: light roasted peanut (L=55) =55; medium roasted peanuts (L=50)= 65; dark roasted peanut (L=45) =76; WUP=34
_______|_______________________________________________________________________|_______ Woody/hulls/skins – the aromatic associated with peanut skins and hulls. References: peanut skins = 32; WUP = 5 _______|_______________________________________________________________________|_______ Burnt – the aromatic associated with very dark roast or burnt peanuts. References: Burnt peanuts (L=30) = 73; Basic solutions; WUP = 19 _______|_______________________________________________________________________|_______ Figure 3.7 The ballot used for the descriptive test of resveratrol-enhanced peanut bars.

187
Oily– the aromatic associated with vegetable oil. References: Vegetable oil = 24; WUP=2 _______|_______________________________________________________________________|_______ Fishy – the aromatic associated with cod liver oil or old fish. References: Cod liver oil=78; WUP = 0 _______|_______________________________________________________________________|_______ Oxidized - the aromatic associated with rancid fats and oils. References: oxidized peanuts =48; WUP = 18 _______|_______________________________________________________________________|_______ Painty- the aromatic associated with linseed oil. References: Linseed oil (diluted) =58; Linseed oil (pure) =115; WUP=0
_______|_______________________________________________________________________|_______ Tastes: Please take at least ¼ portion of the sample and evaluate its TASTES. Bitter - the taste on the tongue associated with bitter agents such as caffeine solution References: bitter 20; bitter 50; bitter 100; WUP = 21
_______|_______________________________________________________________________|_______ Sweet – the taste on the tongue associated with sucrose solution References: sweet 20; sweet 50; sweet 100; sweet 150; WUP = 106
_______|_______________________________________________________________________|_______
Sour- the taste on the tongue associated with acid solutions References: sour 20; sour 50; sour 100; WUP = 6
_______|_______________________________________________________________________|_______
Salty - the taste on the tongue associated with sodium chloride solutions References: salty 20; salty 50; salty 85; WUP = 17
_______|_______________________________________________________________________|_______ Figure 3.7 (continued)

188
Please take at least ¼ portion of the sample and evaluate its TEXTURE and FEELING FACTORS. Texture: First bite : Bite through a predetermined size of samples with incisors Hardness – force required to bite through the sample. References: almond = 110; WUP=93
_______|_______________________________________________________________________|_______ Fracturability– force with which the sample crumbles, cracks or shatters References: graham cracker = 42; almond = 89; WUP=71 _______|_______________________________________________________________________|_______ Crunchiness – the force needed and amount of sound (lower pitch) generated from chewing a sample with molars. References: corn chips = 75; medium roasted peanuts (L=50) = 40; WUP=93 _______|_______________________________________________________________________|_______ Chew down: Chew the sample with molars for a predetermined number of chews enough to mix sample with saliva to form a mass. Cohesiveness of mass– degree to which samples hold together in a mass. References: Baby Ruth = 89; Welch’s fruit snack = 125; WUP= 68 _______|_______________________________________________________________________|_______ Chewiness– the force required to masticate the sample, at a constant rate of force application, to reduce it to a consistency suitable for swallowing. References: Welch’s fruit snack = 71; WUP=57 _______|_______________________________________________________________________|_______ Feeling factors: Toothpack - the amount of sample left in or on teeth after chewing. References: graham crackers= 75; WUP =87
_______|_______________________________________________________________________|_______ Astringent - the puckering or drying sensation on the mouth or tongue surface. References: milk of magnesia = 40; grape juice=65; WUP=21
_______|_______________________________________________________________________|_______ Figure 3.7 (continued)

189
Most orders of reactions follow a zero order (n=0) or first order (n=1) (Labuza, 1984). The
order of reaction, n at each accelerated storage temperature was determined by plotting A or ln
A (dependent variable) on the y-axis versus t (independent variable) on the x-axis (Figure 3.7).
Regression analyses for plots of A versus t and ln A versus t were conducted to determine which
line was fitted best for the results. When R-square value is higher in plot of A versus t compared
to plot of ln A versus t, the reaction order was determined to be zero. Otherwise, it was a first
order reaction.
1.2 Calculation of reaction rate constant (k)
For zero order reaction, reaction rate constant, k at each accelerated storage temperature was
determined from the slope of the plot of A versus t (Figure 3.8) or calculated by regression
analysis using Equation 2. For first order reaction, k was determined from the plot of ln A versus
time (Figure 3.8) or calculated by regression analysis using Equation 3.
A= c + kt Equation 2
ln A= c + kt Equation 3
where:
A = quality factor measured
k = reaction rate constant or the slope of the line at each accelerated temperature
c = y-intercept
t = time
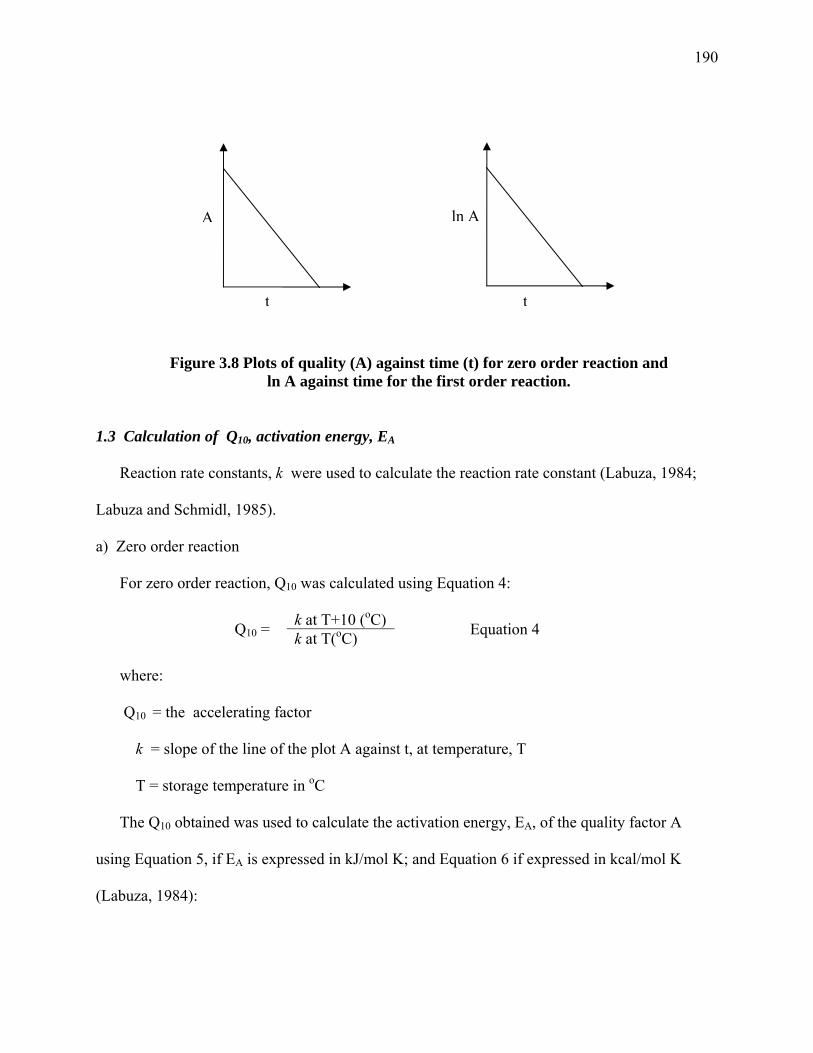
190
A
t
ln A
t
Figure 3.8 Plots of quality (A) against time (t) for zero order reaction and ln A against time for the first order reaction.
1.3 Calculation of Q10, activation energy, EA
Reaction rate constants, k were used to calculate the reaction rate constant (Labuza, 1984;
Labuza and Schmidl, 1985).
a) Zero order reaction
For zero order reaction, Q10 was calculated using Equation 4:
k at T+10 (oC) Q10 = k at T(oC) Equation 4
where:
Q10 = the accelerating factor
k = slope of the line of the plot A against t, at temperature, T
T = storage temperature in oC
The Q10 obtained was used to calculate the activation energy, EA, of the quality factor A
using Equation 5, if EA is expressed in kJ/mol K; and Equation 6 if expressed in kcal/mol K
(Labuza, 1984):

191
0.523 EAlog Q10 = T (T+10)
Equation 5
2.19 EAlog Q10 =
T (T+10)
Equation 6
where:
EA = activation energy expressed in kJ/mol K or kcal/mol
T = storage temperature in K
b) First order reaction
For the first order reaction, an Arrhenius plot of ln k against the reciprocal of the absolute
temperature (1/K) was constructed as shown in Figure 3.8, and the equation of the line was in the
form:
EA 1 ln k = ln ko - R T Equation 7
where:
ln k = ln reaction rate constant or the slope of the line for each temperature from the
plot ln A versus t
ln ko = y-intercept
EA = activation energy (J/mol)
R = universal gas constant, 8.314 J/mol K or 1.9872 cal/mol K
T = temperature in Kelvin (K)

192
ln k
Slope = EA/R
1/T (K)
Figure 3.9 Arrhenius plot of reaction rate constants (ln k) against inverse absolute temperature (1/K).
The slope of the line was determined to calculate activation energy constant, EA using the
equation:
EASlope = R Equation 8
2. Accelerated Shelf Life Test Using Shelf Life Model
The shelf life, θ, at 25oC was predicted using shelf life model based on the overall shelf life
(end-point analysis) as a function of storage temperature (Figure 3.9; Fu and Labuza, 2005). The
shelf life (days) at accelerated temperatures of 30, 35 and 40oC determined when the product’s
consumer overall acceptance rating was ≤ 5 or neither like nor dislike using a 9-point hedonic
rating scale. Since the temperature range used is usually quite narrow, the following exponential
relation exists between shelf life and storage temperature (Fu and Labuza, 2005):
ln θ = -bT + c Equation 9
where:
θ = shelf life (days) at temperature, T
b = slope of the plot of ln θ against T

193
T = storage temperature (oC)
c = intercept
ln shelf life (ln θ)
Slope = -b
Storage temperature (oC)
Figure 3.10 Shelf life plot showing the relation of ln shelf life and storage temperature (oC).
The Q10 or the accelerating factor was calculated using the following equation (Labuza and
Schmidl, 1985):
θ1 Q10 ΔT/10= θ2
Equation 10
where:
θ1 = shelf life (days) at lower temperature (oC), T1
θ2 = shelf life (days) at higher temperature (oC), T2
ΔT = T2 – T1 = difference in temperature
3. Verification of predicted shelf life
The predicted shelf life at 25oC was verified by evaluating the samples stored at actual
ambient conditions of about 25oC. Verification samples were analyzed for trans-resveratrol,
total phenolics, TEAC, consumer acceptance and descriptive sensory properties as described in
Study 1, and for hexanal as described in this study.

194
4. Statistical analysis
Sensory data were collected from Compusense five software (Version 4.8, Compusense Inc.,
Guelph, Ontario, Canada). The data on chemical and sensory analyses were analyzed using SAS
System v 8 (SAS, Institute, Cary, NC, 2001). The effects of storage time, and temperature on the
levels of hexanal, trans-resveratrol, trans-piceid, ORAC, TEAC, and phenolic profile of roasted
REP and peanut bars was evaluated by Analysis of Variance (ANOVA) at 5% level of
significance using General Linear Models (PROC GLM). Fisher’s least signicant difference
mean separation test was performed to determine significant differences between samples at
P<0.05.
V. STUDY 5 - PROFILING OF PHENOLIC COMPOUNDS AND SENSORY
ATTRIBUTES OF PEANUTS TREATED WITH UV, ULTRASOUND AND COMBINED
ULTRASOUND-UV PROCESSES
A. Goal of the Study
The goal of this study was to determine the correlation of phenolic compounds with the
sensory attributes of resveratrol-enhanced peanuts (REP). The specific objectives were to (1)
verify the peaks identified and quantified from representative UV and US-treated samples using
liquid chromatography-mass spectrometry (LC-MS); (2) determine correlation of phenolic
compounds and sensory attributes of UV, US, and combined US-UV treated peanuts.
B. LC-MS analysis
Identified peaks from representative peanut extracts of UV- and US-treated peanut samples
were verified by analyzing their mass spectra. The HPLC unit was attached to a Perkin-Elmer
Sciex API I Plus (Ontario, Canada) with an electrospray ion source. The eluant stream was split
so that 23 (L/min went to the mass spectrometer. The mass spectrometry was operated in

195
negative mode at -3500 V and OR at -60V. The scan range was 145-685 m/z with a 0.2 m/z step
size, and 2.0 msec dwell.
C. Profile of Phenolic Compounds in Resveratrol-Enhanced Peanuts
The profiles of phenolic compounds including trans-resveratrol, trans-piceid, p-coumaric
acid, caffeic acid, and ferulic acid in peanuts treated with UV, US, and combined US-UV were
obtained using the reverse –HPLC method of Francisco and Resurreccion (2009b) for profiling
of phenolic compounds as described previously in the methods for Study 3.
D. Profile of Sensory Attributes of Resveratrol-Enhanced Peanuts
The profiles of the sensory attributes of peanuts treated with UV, US, and combined US-UV
were determined using descriptive analysis tests as described previously in the methods for
Study 1.
E. Statistical Evaluation of the Results of Sensory and Chemical Analyses of UV and
Ultrasound Treated Peanuts
All data on the profiles of phenolic compounds and descriptive sensory attributes were
statistically evaluated using PROC COR program in SAS. Correlations between phenolic
compounds and sensory attributes were determined.

SECTION 4
RESULTS AND DISCUSSION
I. STUDY 1. ULTRAVIOLET LIGHT (UV) PROCESS OPTIMIZATION TO
ENHANCE TRANS-RESVERATROL BIOSYNTHESIS IN PEANUTS
A. Effect of UV Treatment on the Concentrations of Trans-Resveratrol, Trans-Picied and
Total Stilbenes in Peanut Kernels
1. Trans-resveratrol, trans-picied and total stilbenes concentrations in sliced UV-treated
peanuts
Trans- rather than the cis- forms of the stilbenes were analyzed in this study due to their higher
stability and abundance in nature (Trela and Waterhouse, 1997). The mean concentrations of
trans-resveratrol, trans-piceid and total stilbenes of UV treated peanuts are shown in Table 4.1.
UV increased (P<0.05) concentrations of resveratrol, range=0.54 + 0.05 to 3.30 + 0.58 µg/g, and
total stilbenes, 0.66 + 0.04 to 4.00 + 0.07 µg/g, but not trans-piceid, of 27 treated peanuts
compared to controls with 0.02 + 0.002 and 0.05 + 0.004 µg/g, respectively which correspond to
27-165 and 13-80 fold increase. Trans-piceid concentrations were increased (P<0.05) by UV
exposure in only 4 of 27 treatments, with levels ranging from 0.35 + 0.02 to 1.05 + 0.78 µg/g
compared to 0.03 + 0.001 µg/g in raw whole untreated peanuts resulting in a 12-35 fold increase.
The 4 treatments included exposure to UV at 40 cm distance from UV light for 10 min and
incubated for 24 and 48 h; and for 30 min at the same distance from UV light then incubated for 24
and 36 h for which no trend was identified, while the other 23 treatments did not significantly
differ from controls suggesting that UV was not effective in increasing trans-piceid in sliced
peanuts. Thus, the contribution to total stilbenes is mostly from trans-resveratrol with only small

197
Table 4.1 Concentrations (mean ± standard deviation, dry basis) of trans-resveratrol, trans-piceid, and total stilbenes of roasted sliced UV-treated peanuts and controls1
Treat-ment #
ID IT IC Resveratrol
μg/g Piceid
μg/g Total Stilbenes
μg/g 1 20 10 24 2.2443 ± 0.1894cd 0.2584 ± 0.0208cd 0.3858 ± 0.0518cd 2 20 10 36 1.9579 ± 0.4861d 0.1904 ± 0.0417cd 2.1483 ± 0.5249d 3 20 10 48 0.7836 ± 0.3075ef 0.1388 ± 0.0213cd 0.9224 ± 0.3206efgh 4 20 20 24 0.6478 ± 0.0506f 0.1427 ± 0.0162cd 0.7904 ± 0.0483gh 5 20 20 36 0.6665 ± 0.1753f 0.1131 ± 0.0267cd 0.7797 ± 0.1955gh 6 20 20 48 0.5378 ± 0.0680f 0.1223 ± 0.0274cd 0.6601 ± 0.0416h 7 20 30 24 0.5554 ± 0.1160f 0.1632 ± 0.0315cd 0.7185 ± 0.1444gh 8 20 30 36 0.6402 ± 0.1176f 0.1521 ± 0.0403cd 0.7923 ± 0.1387gh 9 20 30 48 0.6686 ± 0.0100f 0.1345 ± 0.0412cd 0.8031 ± 0.0365gh 10 40 10 24 0.8883 ± 0.2216ef 0.3462 ± 0.1037cd 1.2346 ± 0.3103ef 11 40 10 36 0.7746 ± 0.0883ef 0.2405 ± 0.0557cd 1.0150 ± 0.0556efgh 12 40 10 48 0.8835 ± 0.3318ef 0.3498 ± 0.1521cd 1.2333 ± 0.4804ef 13 40 20 24 0.8077 ± 0.1478ef 0.3015 ± 0.0472cd 1.1091 ± 0.1895efg 14 40 20 36 2.4662 ± 0.4687bc 0.2455 ± 0.0420cd 2.7116 ± 0.4636c 15 40 20 48 2.6491 ± 0.3638b 0.2079 ± 0.0225cd 2.8570 ± 0.3859c 16 40 30 24 2.4254 ± 0.6579bc 1.0515 ± 0.7751a 3.4769 ± 0.4788b 17 40 30 36 3.2985 ± 0.5785a 0.6974 ± 0.6270b 3.9958 ± 0.7424a 18 40 30 48 1.9954 ± 0.4858d 0.1977 ± 0.0677cd 2.1931 ± 0.4997d 19 60 10 24 0.8553 ± 0.1139ef 0.1330 ± 0.0075cd 0.9883 ± 0.1107efgh 20 60 10 36 0.6555 ± 0.0375ef 0.1617 ± 0.0322cd 0.8172 ± 0.0595fgh 21 60 10 48 0.7990 ± 0.1475e 0.1655 ± 0.0438cd 0.9645 ± 0.1476efgh 22 60 20 24 1.1265 ± 0.2008f 0.1842 ± 0.0931cd 1.3107 ± 0.2934e 23 60 20 36 0.8281 ± 0.1724ef 0.1473 ± 0.0426cd 0.9754 ± 0.2135efgh 24 60 20 48 0.7022 ± 0.1517f 0.1791 ± 0.0383cd 0.8813 ± 0.1647efgh 25 60 30 24 0.7713 ± 0.0722ef 0.1862 ± 0.0450cd 0.9574 ± 0.0300efgh 26 60 30 36 0.7185 ± 0.0271f 0.1282 ± 0.0165cd 0.8467 ± 0.0367fgh 27 60 30 48 0.6561 ± 0.0466f 0.1677 ± 0.0437cd 0.8238 ± 0.0511fgh
Control2 120 0 0 0.0212 ± 0.0020g 0.0271 ± 0.0010d 0.0482 ± 0.0046i 1 ID = distance from UV light (cm), IT = UV exposure time (min), and IC = incubation time (h) at 25oC. Means ± standard deviation were calculated from two replications for a total of 4 analyses per sample each for trans-resveratrol, trans-piceid and total stilbenes. Means in the same column not followed by the same letter are significant (P<0.05) from each other as determined by Fisher’s least significant difference mean separation test.
2 Control is untreated raw whole peanuts.

198
Figure 4.1 Mean trans-resveratrol, trans-piceid, and total stilbenes of sliced peanuts exposed to varying doses of UV. IC is the incubation time at 25oC and IT is the UV exposure time. Control untreated raw whole peanuts had 0.02 + 0.002 µg/g trans-resveratrol, 0.05 + 0.001 trans-piceid µg/g and 0.05 + 0.001 µg/g total stilbenes.

199
amounts from trans-piceid (Figure 4.1). UV induces increase in enzymes responsible for the
biosynthesis of secondary metabolites such as flavonoids and resveratrol, which act as screens to
prevent UV-induced damage to genetic material of plant cells (Cantos et al., 2000) causing
increased trans-resveratrol in UV-treated peanuts. UV light stimulated the coordinate induction of
phenylammonia lyase, the enzyme that catalyzes the first step in ρ-coumaroyl CoA production
from phenylalanine, and enzymes of stilbene synthesis in the leaves of the vine (Fritzemeier and
Kindl, 1981 in Soleas et al., 1997).
Trans-resveratrol in controls were less than 0.29 to 0.48 µg/g found by Rudolf and
Resurreccion (2005; 2007) but within 0.02-0.31μg/g analyzed 14 of 15 cultivars of three market
types of raw peanuts (Sanders et al., 2000). Sanders et al. (2000) reported 1.79 μg/g trans-
resveratrol only for a small white Spanish cultivar and therefore, we did not include it as basis for
comparison. The highest (P<0.05) trans-resveratrol of 3.30 µg/g and 4.00 µg/g total stilbenes were
achieved after 30 min UV treatment at 40 cm distance from light and incubated for 36h. Rudolf
and Resurreccion (2005) obtained similar maximum trans-resveratrol of 3.42 µg/g in UV-treated
peanuts for 10 min at 40 cm distance from UV light and incubated for 48 h.
Analysis of variance, ANOVA (Table 4.2) showed that all main effects of distance from UV
light, UV exposure time and incubation time and their interactions significantly contributed to the
concentrations of trans-resveratrol and total stilbenes in UV-treated peanuts. Except for the
interactions of UV exposure time with either distance from UV light and incubation time, all main
and interaction effects significantly affect the concentrations of trans-piceid in UV treated peanuts.
Due to interaction effects, no factor used in the experiment could be singled out as the most
significant contributor to the concentrations of trans-resveratrol, trans-piceid, and total stilbenes.

200
Table 4.2 Significant treatment effects on the concentrations of stilbenes, total phenolics, antioxidant capacities, and overall acceptance of sliced UV-treated peanuts. Factors1 Trans-
resveratrol Trans-piceid
Total Stilbenes
Total Phenolics
TEAC H-ORAC L-ORAC TAC Overall Acceptance
Sliced peanuts Main effects ID <0.0001 <0.0001 <0.0001 NS NS <0.0001 <0.0001 <0.0001 NSIT 0.0069 0.0132 <0.0001 NS NS NS NS NS NSIC 0.0006 0.0351 0.0002 NS NS 0.0044 0.0008 0.0006 <0.0001Interactions ID x IT <0.0001 NS <0.0001 NS NS 0.0222 <0.0128 NS NSID x IC <0.0001 0.0014 <0.0001 NS NS <0.0001 NS <0.0001 0.0204IT x IC <0.0001 NS <0.0001 NS NS 0.0033 0.0106 <0.0001 0.0266ID x IT x IC <0.0001 0.0488 <0.0001 NS NS 0.0003 0.0033 <0.0001 NS1ID= distance from UV light ; IT=UV exposure time; IC=incubation time at 25oC. NS = not significantly different (P>0.05)
201
UV-treated peanuts had higher trans-resveratrol, trans-piceid and total stilbenes compared to
blended peanut butters with 0.41+0.02, 0.13+0.01, and 0.54+0.03 µg/g, respectively, and 100%
natural peanut butters with 0.65+0.02, 0.14+0.01, and 0.814+0.03 µg/g, respectively (Ibern-Gomez
et al., 2000).
The amounts of trans-resveratrol of 0.54 - 3.30 µg/g produced in UV-treated peanuts were
within the concentrations of 0.60 to 8.00 (mean=2.48 ) µg/mL in 18 Spanish red wines (Lamuella-
Raventos et al. (1995) and higher those found in white and red grape juices with not detectable to
0.9 (mean=0.05) and not detectable to 1.09 (mean=0.5) µg/mL, respectively (Romero-Perez et al.,
1999); dark chocolate and cocoa liquor with 0.40 and 0.50 µg/g, respectively (Counet et al.,
2006); pistachios with 0.07-0.18 (mean=0.12) µg/g (Grippi et al., 2008); hops with 0.7-2.2 µg/g
(Jerkovic and Collin, 2007); and hop pellets with 0.5 µg/g (Callemien et al., 2005). The levels of
trans-resveratrol in UV-treated peanuts were lower compared to those in dried white and red grape
berry skins with 11.04-47.60 (mean= 22.03) µg/g and 18.32-38.26 (mean=25.79) µg/g,
respectively, (Romero-Perez et al., 2001).
The trans-piceid concentrations of 0.35-1.05 µg/g obtained by UV treatment of sliced peanuts
were higher compared to white grape juices with non-detectable to 0.83 (mean=0.18) µg/mL
(Romero-Perez et al., 1999); similar to 1.00 and 1.20 µg/g in dark chocolate and cocoa liquor,
respectively (Counet et al., 2006); and within the lower limit of 0.74 – 4.01 (mean=1.85) µg/mL in
18 Spanish red wines (Lamuella-Raventos et al., 1995). The concentrations of trans-piceid in
UV-treated peanuts were lower than in pistachios with 6.2-8.15 (mean=6.97) µg/g (Grippi et al.,
2008); hops with 2.3-7.3 µg/g (Jerkovic and Collin, 2007); hop pellets with 2.0 µg/g (Callemien et
al., 2005); dried white and red grape skins with non-quantifiable to 64.41 (mean=16.58) and 5.49-
342.66 µg/g, respectively; and red grape juices with 0.77-7.34 µg/mL (Romero-Perez et al., 1999).

202
B. Effect of UV Treatment on the Total Phenolics Concentrations and Antioxidant
Capacities of Sliced Peanut Kernels
The First International Congress on Antioxidant Methods was convened in June 2004 in
Orlando, FL for the purpose of dealing with analytical issues relative to assessing antioxidant
capacities in foods, botanicals, nutraceuticals, and other dietary supplements and proposing one
or more analytical methods that could be standardized for routine assessment of antioxidant
capacity. Based on the evaluation of data presented at the congress and in the literature, as well
as consideration of potential end uses of antioxidants, it was proposed that procedures and
applications for three assays be considered for standardization: the oxygen radical absorbance
capacity (ORAC) assay, the Folin-Ciocalteu method, and the Trolox equivalent antioxidant
capacity (TEAC) assay (Prior et al., 2005). ORAC represents a hydrogen atom transfer reaction
mechanism, which is most relevant to human biology (Prior et al., 2005). The Folin-Ciocalteu
method is an electron transfer based assay and gives reducing capacity, which has normally been
expressed as phenolic contents. The TEAC assay represents a second electron-transfer based
method. These three methods were used in this study to evaluate the antioxidant capacities of
treated peanuts.
1. Total phenolics concentrations in sliced UV-treated peanuts
Figure 4.2 and Table 4.3 show the mean concentrations of total phenolics in UV-treated
sliced peanuts. UV increased (P<0.05) the total phenolics of treated sliced peanuts to 1.38-1.82
mg GAE/g whereas controls of raw whole peanuts had only 0.84 mg GAE/g. At 24 and 48 h
incubation times, the total phenolics of UV-treated peanuts were not different (P<0.05) from
each other. At 48 h incubation time, peanuts treated at 40 cm distance from UV light for 10 min

203
Table 4.3 Concentrations (mean ± standard deviation, dry basis) of total phenolics, trolox equivalent antioxidant capacity (TEAC), and oxygen radical absorbance capacity (ORAC) total antioxidant capacity (TAC) of roasted sliced UV-treated peanuts and controls1
Treat-ment #
ID IT IC Total Phenolics
mg GAE/g TEAC
μM TE/g H-ORAC μM TE/g
L-ORAC μM TE/g
TAC-ORAC μM TE/g
1 20 10 24 1.58 ± 0.08abc 3.05 ± 0.38a 29.09 ± 6.98efg 20.51 ± 3.21ab 49.60 ± 9.98defg 2 20 10 36 1.43 ± 0.42bc 2.84 ± 0.58a 30.58 ± 6.94defg 17.18 ± 2.41abcd 47.76 ± 8.61efg 3 20 10 48 1.63 ± 0.11abc 3.14 ± 0.4a 33.56 ± 9.83cdefg 19.88 ± 3.92abc 53.44 ± 6.66def 4 20 20 24 1.66 ± 0.09abc 3.33 ± 0.41a 35.19 ± 7.29cdef 15.48 ± 2.47cdefg 50.67 ± 9.19defg 5 20 20 36 1.62 ± 0.02abc 3.28 ± 0.38a 36.64 ± 7.74cdef 18.33 ± 5.41abcd 54.97 ± 8.60de 6 20 20 48 1.51 ± 0.11bc 3.27 ± 0.38a 27.30 ± 8.31efg 15.22 ± 2.98cdefgh 42.52 ± 8.17efgh 7 20 30 24 1.56 ± 0.12abc 3.28 ± 0.44a 33.66 ± 4.82cdefg 14.78 ± 3.24defghi 48.44 ± 7.90efg 8 20 30 36 1.59 ± 0.29abc 3.34 ± 0.45a 31.09 ± 3.70defg 13.74 ± 3.50defghij 44.83 ± 6.28efgh 9 20 30 48 1.53 ± 0.02abc 3.26 ± 0.44a 28.54 ± 8.80efg 17.48 ± 6.02abcd 46.02 ± 2.86efgh 10 40 10 24 1.54 ± 0.19abc 3.37 ± 0.37a 65.69 ± 19.01a 16.12 ± 2.24bcde 81.81 ± 17.00ab 11 40 10 36 1.38 ± 0.37c 2.92 ± 0.63a 42.89 ± 11.71bcd 9.37 ± 2.78jklm 52.26 ± 12.34defg 12 40 10 48 1.38 ± 0.17c 3.24 ± 0.49a 45.01 ± 5.20bc 17.20 ± 4.66abcd 62.21 ± 6.70cd 13 40 20 24 1.62 ± 0.06abc 3.19 ± 0.47a 36.98 ± 5.79cdef 14.53 ± 3.08defghi 51.52 ± 7.88defg 14 40 20 36 1.69 ± 0.02ab 2.89 ± 0.81a 29.44 ± 5.94efg 13.60 ± 3.62defghij 43.04 ± 6.20efgh 15 40 20 48 1.57 ± 0.11abc 2.89 ± 0.60a 50.99 ± 10.51b 21.31 ± 7.03a 72.30 ± 5.81bc 16 40 30 24 1.82 ± 0.50a 3.37 ± 0.48a 78.59 ± 24.07a 21.43 ± 3.54a 100.02 ± 24.44a 17 40 30 36 1.57 ± 0.08abc 3.33 ± 0.49a 38.72 ± 4.00bcde 13.67 ± 1.76defghij 52.38 ± 4.95defg 18 40 30 48 1.62 ± 0.11abc 2.97 ± 0.55a 35.87 ± 9.81cdef 10.31 ± 2.76ijklm 46.18 ± 10.49efg
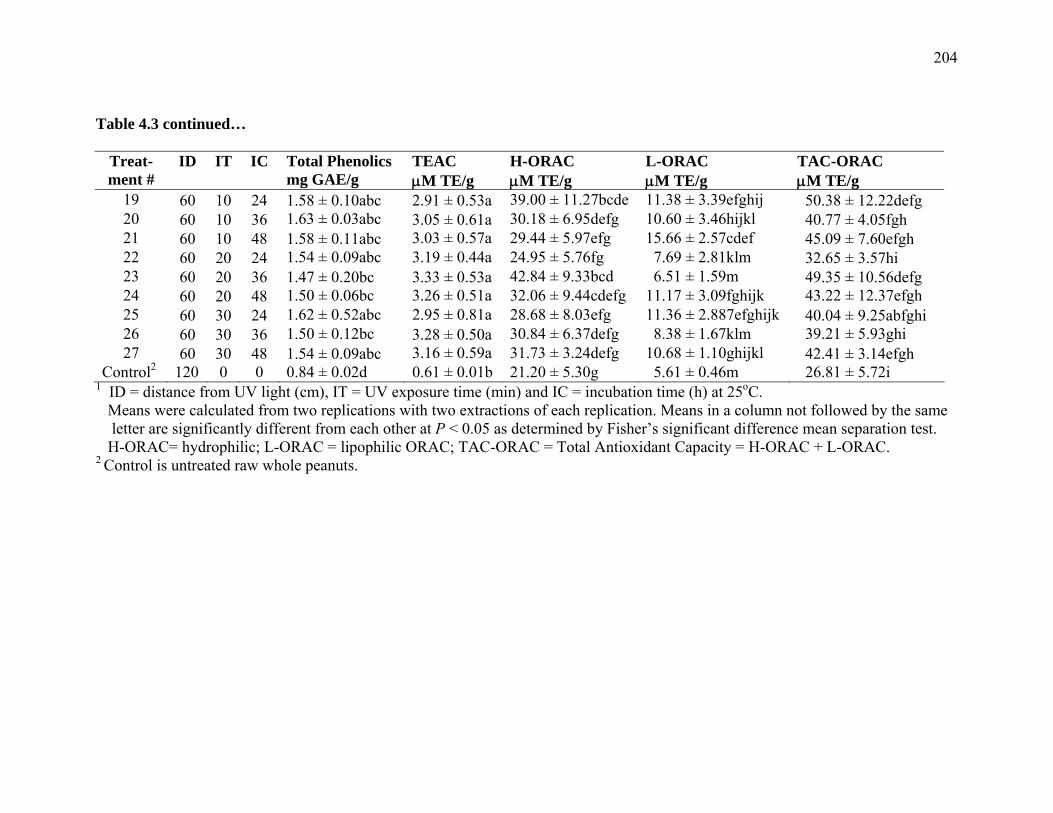
204
Table 4.3 continued…
Treat-ment #
ID IT IC Total Phenolics
mg GAE/g TEAC
μM TE/g H-ORAC μM TE/g
L-ORAC μM TE/g
TAC-ORAC μM TE/g
19 60 10 24 1.58 ± 0.10abc 2.91 ± 0.53a 39.00 ± 11.27bcde 11.38 ± 3.39efghij 50.38 ± 12.22defg 20 60 10 36 1.63 ± 0.03abc 3.05 ± 0.61a 30.18 ± 6.95defg 10.60 ± 3.46hijkl 40.77 ± 4.05fgh 21 60 10 48 1.58 ± 0.11abc 3.03 ± 0.57a 29.44 ± 5.97efg 15.66 ± 2.57cdef 45.09 ± 7.60efgh 22 60 20 24 1.54 ± 0.09abc 3.19 ± 0.44a 24.95 ± 5.76fg 7.69 ± 2.81klm 32.65 ± 3.57hi 23 60 20 36 1.47 ± 0.20bc 3.33 ± 0.53a 42.84 ± 9.33bcd 6.51 ± 1.59m 49.35 ± 10.56defg 24 60 20 48 1.50 ± 0.06bc 3.26 ± 0.51a 32.06 ± 9.44cdefg 11.17 ± 3.09fghijk 43.22 ± 12.37efgh 25 60 30 24 1.62 ± 0.52abc 2.95 ± 0.81a 28.68 ± 8.03efg 11.36 ± 2.887efghijk 40.04 ± 9.25abfghi 26 60 30 36 1.50 ± 0.12bc 3.28 ± 0.50a 30.84 ± 6.37defg 8.38 ± 1.67klm 39.21 ± 5.93ghi 27 60 30 48 1.54 ± 0.09abc 3.16 ± 0.59a 31.73 ± 3.24defg 10.68 ± 1.10ghijkl 42.41 ± 3.14efgh
Control2 120 0 0 0.84 ± 0.02d 0.61 ± 0.01b 21.20 ± 5.30g 5.61 ± 0.46m 26.81 ± 5.72i 1 ID = distance from UV light (cm), IT = UV exposure time (min) and IC = incubation time (h) at 25oC. Means were calculated from two replications with two extractions of each replication. Means in a column not followed by the same
letter are significantly different from each other at P < 0.05 as determined by Fisher’s significant difference mean separation test. H-ORAC= hydrophilic; L-ORAC = lipophilic ORAC; TAC-ORAC = Total Antioxidant Capacity = H-ORAC + L-ORAC. 2 Control is untreated raw whole peanuts.

205
UV processing treatment Ultrasound processing treatment
Figure 4.2 Mean concentrations for total phenolics ( mg GAE/g) of sliced peanuts exposed to varying doses of UV (A) and ultrasound (B). IC is the incubation time at 25oC, IT is the UV exposure time, and PT is the ultrasound exposure time. Control raw peanuts had total phenolics of 0.84 + 0.02 mg GAE/g and represented on each graph by a horizontal line. Means were calculated from 2 replications for a total of four analyses per sample.
206
had higher (P<0.05) total phenolics than those treated for 10 min, but not from the remaining
seven treatments which were not significantly different from each other.
ANOVA (Table 4.2) indicated that neither main effects nor interaction effects of the factors
used in this experiment contributed significantly on the total phenolics concentrations of UV-
treated samples. This finding agrees with Rudolf and Resurreccion (2005) who did not find
significant differences in total phenolics of peanuts incubated for 24 to 48 h after exposure to UV
for 10 min at 40 cm distance from UV light. In contrast, Duh and Yen (1995) reported a
decrease in total phenolics of the methanol extract of peanut hulls as UV exposure time increased
from 0 to 6 days due to the different biological system used and also their longer exposure times
of days compared to only minutes in our study. Studies on grapes showed that the phenolic
compound, resveratrol, was induced by UV particularly in the skins of berries and only trace
amounts in the fruit flesh (Becker et al., 2003) suggesting the limited UV penetration in the flesh.
In our study, UV light may not have penetrated the interiors of sliced peanut kernels and
whatever concentrations of phenolics produced on its surfaces after treatment remained
unchanged during incubation. The enzymes responsible for biosynthesis of phenolic compounds
should be activated by UV to cause their formation in plants (Soleas et al., 1997). UV treatment
was also reported to cause increase in total phenolics contents of fresh cut mangoes (Gonzales-
Aguilar et al., 2007), strawberries (Erkan et al., 2008), and blueberries (Wang et al., 2008).
The total phenolics of UV-treated peanuts of 1.38-1.82 mg GAE/g were slightly higher than
0.91-1.14 mg/g in raw peanuts (Talcott et al., 2005). Our observed values were within the total
phenolics concentrations of blueberry wines with 0.60-1.86 mg GAE/g (Sanchez-Moreno, et al.,
2003), and within the lower limits of 1.81-4.58 mg GAE/g in fresh blueberry purees (Prior et al.,
1998) and 1.31-2.39 mg GAE/mL in red wines (Fernandez-Pachon et al., 2004).
207
2. Trolox equivalent antioxidant capacity (TEAC) in sliced UV-treated peanuts
The mean concentrations of TEAC in UV-treated peanuts are presented in Figure 4.3 and
Table 4.3. UV increased (P< 0.05) TEAC, a measure of antioxidant capacity, in all 27 treated
peanuts to 2.84-3.37 μmol TE/g compared to 0.61 μmol TE/g in untreated controls. However, all
UV-treated peanuts were not significantly different from each other suggesting that all UV
treatments used will produce similar antioxidant activity. ANOVA (Table 4.2) indicated the
main effects of distance from UV light, UV exposure time, and incubation time and their
interactions did not contribute (P< 0.05) to the antioxidant capacities by TEAC of UV-treated
peanuts which disagreed with Rudolf and Resurreccion (2005) who found that antioxidant
capacities of UV treated sliced peanuts decreased (P< 0.05) after 24 and 36 h incubation, then
increased after 48h to levels not different (P< 0.05) from those at 0h. This difference in results is
mainly due to the different reaction mechanisms used in the analytical methods used to measure
antioxidant capacity. The thiocyanate method of Osawa and Namiki used by Rudolf and
Resurreccion (2005) measures the percent inhibition of oxidation of linoleic acid relative to
control whereas the TEAC assay of Kim et al. (2002) that we used in the analysis measures the
ABTS radical scavenging activity.
3. Oxygen radical antioxidant capacity (ORAC) in sliced UV-treated peanuts
3.1 Total Antioxidant Capacity in sliced UV-treated peanuts
The total antioxidant capacity is the sum of the hydrophilic and lipophilic antioxidants (Wu
et al., 2004). The antioxidants in food are mostly hydrophilic in nature. However, it is important
to measure the lipophilic antioxidants in peanuts due to its high fat content of about 50%. The
oxygen radical absorbance capacity (ORAC) assay, analyzes both hydrophilic and lipophilic
antioxidants.
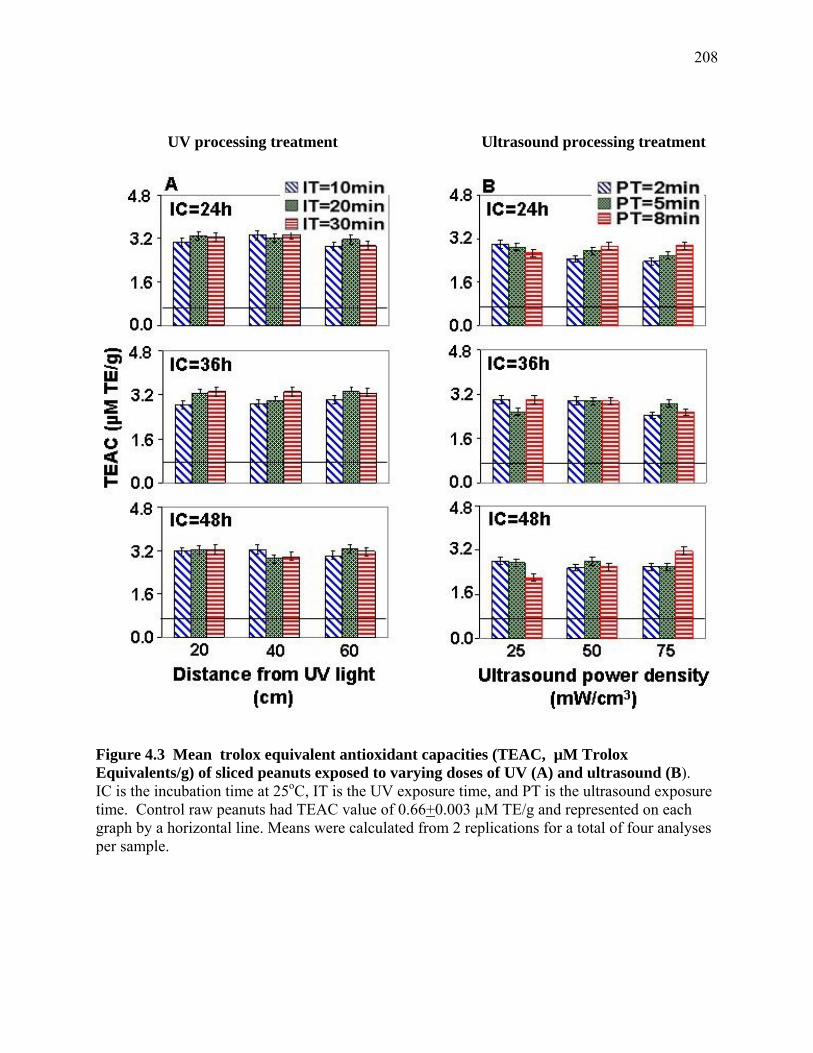
208
UV processing treatment Ultrasound processing treatment
Figure 4.3 Mean trolox equivalent antioxidant capacities (TEAC, µM Trolox Equivalents/g) of sliced peanuts exposed to varying doses of UV (A) and ultrasound (B). IC is the incubation time at 25oC, IT is the UV exposure time, and PT is the ultrasound exposure time. Control raw peanuts had TEAC value of 0.66+0.003 µM TE/g and represented on each graph by a horizontal line. Means were calculated from 2 replications for a total of four analyses per sample.

209
The mean concentrations of ORAC total antioxidant capacity are shown in Table 4.3 and
Figure 4.4. UV increased (P<0.05) the ORAC total antioxidant capacity (TAC) in 24 of 27
treated peanuts which ranged from 32.65-100.20 µM TE/g compared to controls with 26.81 µM
TE/g. The three treatments (#22, 25 and 26) that did not differ (P<0.05) from controls received
the lowest doses of UV and shorter incubation time. These were treated at 60 cm from UV light
for 20 and 30 min then incubated for 24 h, and for 30 min at 36 h incubation time. The highest
(P<0.05) total antioxidant capacity of 100.20 µM TE/g was produced a distance from UV light
of 40 cm after exposure for 30 min and incubation for 24h.
The total antioxidant capacity increased as distance from UV light increased from 20 to 40
cm and then decreased at 60 cm, a trend similar to that observed in total phenolics. Likewise,
UV-C treatment increased the antioxidant capacity of fresh-cut mangoes, with increasing ORAC
and DPPH radical values as UV irradiation time increases (Ayala-Zabala et al., 2007). UV
treatment of strawberries for 5 and 10 min produced the highest ORAC values (Erkan et al.,
2008). Optimum UV-C doses for enhancing antioxidant capacities and phytochemical contents
in blueberries was found to be 2.15 and 4.30 kJ m-2, respectively (Wang et al., 2009).
ANOVA (Table 4.2) showed except for main effect of UV irradiation time and its interaction
with distance from UV light, all other main and interaction effects significantly contributed to
the total antioxidant capacity of UV-treated peanuts. Due to interaction effects, the main factors
of distance from UV light and incubation time cannot singled out as the major contributors to the
total antioxidant capacities of UV-treated peanuts.
3.2 H-ORAC in sliced UV-treated peanuts
The H-ORAC of UV-treated peanuts ranged from 24.95-78.59 µM TE/g whereas controls
had 21.20 µM TE/g (Table 4.4 and Figure 4.5). Twelve of 27 treatments had significantly

210
UV processing treatment Ultrasound processing treatment
Figure 4.4 Mean total antioxidant capacities (TAC-ORAC, µM Trolox Equivalents/g) of sliced peanuts exposed to varying doses of UV (A) and ultrasound (B). IC is the incubation time at 25oC, IT is the UV exposure time, and PT is the ultrasound exposure time. Control raw peanuts had TAC of 26.81+5.70 µM TE/g and represented on each graph by a horizontal line. Means were calculated from 2 replications for a total of four analyses per sample.
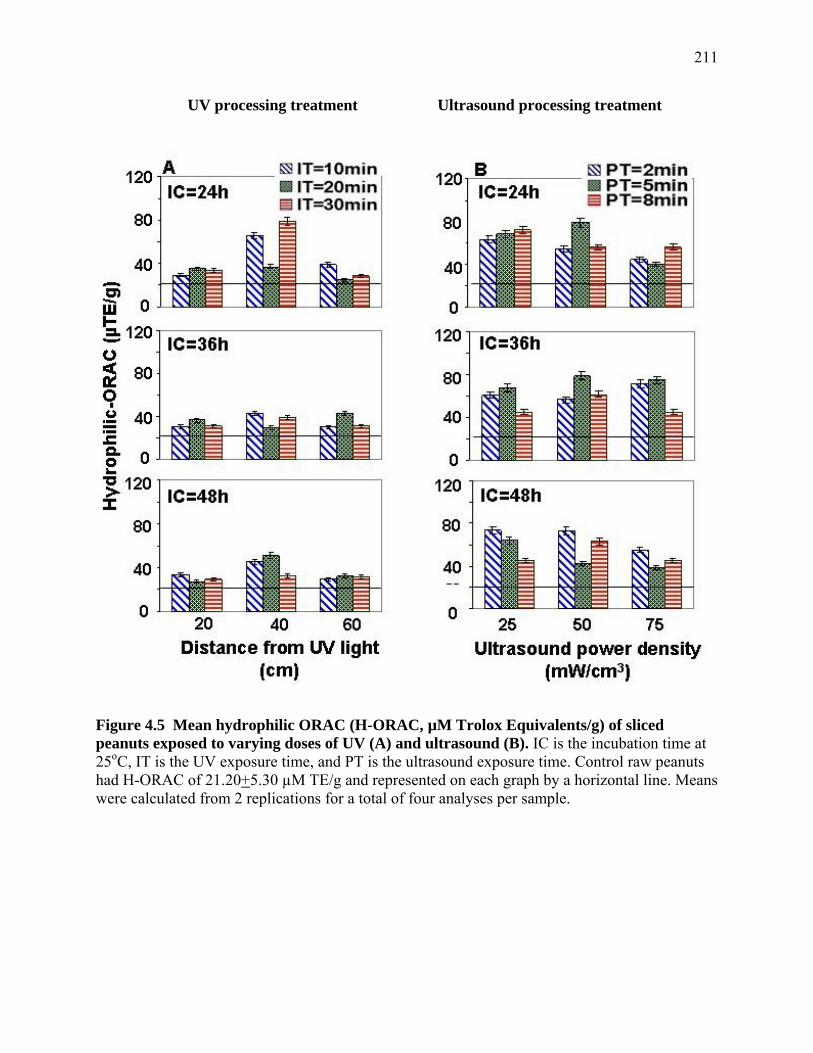
211
UV processing treatment Ultrasound processing treatment
Figure 4.5 Mean hydrophilic ORAC (H-ORAC, µM Trolox Equivalents/g) of sliced peanuts exposed to varying doses of UV (A) and ultrasound (B). IC is the incubation time at 25oC, IT is the UV exposure time, and PT is the ultrasound exposure time. Control raw peanuts had H-ORAC of 21.20+5.30 µM TE/g and represented on each graph by a horizontal line. Means were calculated from 2 replications for a total of four analyses per sample.

212
(P<0.05) higher H-ORAC of 35.19- 78.59 µM TE/g compared to controls whereas the rest of the
15 treatments had the same (P<0.05) degree of antioxidant capacity as controls. Treatments with
higher H-ORAC were exposed to medium distance of 40 cm from UV light suggesting that
medium doses of UV are necessary to enhance the hydrophilic antioxidant capacity of UV-
treated peanuts. The 15 processing treatments with same antioxidant capacities as controls were
either treated at the shortest distance of 20 cm from UV light or at the longest distance of 60 cm
distance from UV light indicating that either low or high doses of UV processing treatments will
not enhance the hydrophilic antioxidant capacities of treated peanuts. These findings agreed
with those of Cantos et al., (2001) who found that 40 cm distance from UV light enhanced the
resveratrol synthesis in grapes.
ANOVA (Table 4.2) showed that except for the main effect of UV exposure time, all other
main and interaction effects significantly contribute to the hydrophilic antioxidants of UV-
treated peanuts. Due to interaction effects, the main factors of distance from UV light and
incubation time cannot singled out as the major contributors to the total hydrophilic antioxidants
of UV-treated peanuts.
3.3 L-ORAC in sliced UV-treated peanuts
The L-ORAC of UV treated peanuts ranged from 8.37-21.31 µM TE/g whereas controls had
5.61 µM TE/g (Figure 4.6). Twenty two of 27 treatments had significantly (P<0.05) higher
lipophilic antioxidant capacities than controls whereas the rest of the five treatments (Trt# 11, 18,
22, 23, 26) had the same L-ORAC values (P<0.05) as untreated controls.
ANOVA showed that except for the main effect of UV exposure time and interaction effect
of distance from UV light and incubation time, all other main and interaction effects significantly
contribute to the lipoophilic antioxidants of UV-treated peanuts (Table 4.2). Due to interaction

213
effects, the main factors of distance from UV light and incubation time cannot singled out as the
major contributors to the total hydrophilic antioxidants of UV-treated peanuts.
C. Effect of UV on the Overall Acceptance of Sliced UV-Treated Peanuts
Table 4.4 presents the consumers’ mean overall acceptance hedonic ratings of UV-treated
peanuts. Consumer test results showed that the overall acceptance ratings of UV-treated peanuts
ranged from 5.0 + 1.7 (neither like nor dislike) to 6.3 + 1.5 (like slightly) which were lower (P<
0.05) than that of controls with 7.4 + 1.4 or like very much. UV exposure initiates lipid
peroxidation resulting in the development of off-flavors to food (Duh and Yen, 1995) and this
could have led to the lower slightly consumer acceptance of our UV-treated products compared
to controls. The results, however, indicate that although UV treatment reduced the acceptance of
peanut kernels, none of the samples were disliked with hedonic ratings > 5.0.
Only incubation time and its interaction with either distance from UV light or UV exposure
time significantly contributed to the overall acceptance of UV-treated peanuts (Table 4.2). The
overall acceptance of UV-treated peanuts decreased with increasing incubation time indicating
that the shortest incubation time of 24 h is conducive to high overall acceptance. Thus at 24 h,
the highest mean overall acceptance of 5.9 or close to like slightly was achieved compared to the
lowest rating of 5.4 or neither like nor dislike obtained when incubated for 48; while those
incubated for 36 had an intermediate mean overall acceptance of had the lowest overall
acceptance rating of 5.6 or neither like nor dislike.

214
UV processing treatment Ultrasound processing treatment
Figure 4.6 Mean lipophilic ORAC (L-ORAC, µM Trolox Equivalents/g) of sliced peanuts exposed to varying doses of UV (A) and ultrasound (B). IC is the incubation time at 25oC, IT is the UV exposure time, and PT is the ultrasound exposure time. Control raw peanuts had L-ORAC of 5.61+0.46 µM TE/g and represented on each graph by a horizontal line. Means were calculated from 2 replications for a total of four analyses per sample.

215
Table 4.4 Consumers’ overall acceptance rating (mean ± standard deviation) of roasted sliced UV-treated peanuts and controls1
Treatment # ID IT IC Overall Acceptance2
1 20 10 24 6.3 ± 1.5b 2 20 10 36 5.8 ± 1.7bcdefg 3 20 10 48 5.0 ± 1.8hi 4 20 20 24 6.2 ± 1.5bcd 5 20 20 36 5.3 ± 1.8efghi 6 20 20 48 5.5 ± 1.6defghi 7 20 30 24 6.0 ± 1.8bcde 8 20 30 36 5.9 ± 1.8bcde 9 20 30 48 5.2 ± 1.7fghi 10 40 10 24 6.0 ± 1.9bcde 11 40 10 36 5.8 ± 1.6bcdefg 12 40 10 48 5.2 ± 1.5fghi 13 40 20 24 6.2 ± 1.3bcd 14 40 20 36 5.5 ± 1.4cdefghi 15 40 20 48 5.1 ± 2.4ghi 16 40 30 24 5.8 ± 2.0bcdef 17 40 30 36 5.4 ± 2.3efghi 18 40 30 48 5.6 ± 2.0cdefghi 19 60 10 24 5.3 ± 2.0efghi 20 60 10 36 5.8 ± 2.1bcdefg 21 60 10 48 5.8 ± 2.0bcdefg 22 60 20 24 6.0 ± 1.9bcde 23 60 20 36 5.0 ± 1.7hi 24 60 20 48 5.9 ± 1.9bcde 25 60 30 24 5.7 ± 2.3bcdefgh 26 60 30 36 6.2 ± 2.0bc 27 60 30 48 5.4 ± 1.7efghi
Control 120 0 0 7.4 ± 1.3a 1 ID = distance from UV light, IT = UV exposure time, and IC = incubation time at 25oC. Means ± standard deviation were calculated from two replications for a total 50
analyses/sample for overall acceptance. Means in the column not followed by the same letter are significant (P<0.05) from each other as determined by Fisher’s least significant difference mean separation test. Controls are roasted untreated peanuts that were sliced prior to evaluation by panelists.
2Rating based on 9-point hedonic rating scale where 1 = dislike extremely, 5= neither like nor dislike, and 9=like extremely.

216
D. Modeling, Mapping of Contour plots and Region of Overlap for UV Processing
Treatments
Table 4.5 shows the regression coefficients, coefficients of determination (R2) and P-values
for the significant models of trans-resveratrol, total stilbenes, H-ORAC, L-ORAC total
antioxidant capacity, and overall acceptance for UV-treated peanuts. The regression models for
total phenolics and TEAC were not significant and are not shown or used in the optimization
procedure. The P–values for the models of trans-resveratrol, trans-piceid, total stilbenes <0.01
indicating that the models were highly significant in predicting the concentrations of these
compounds in UV-treated peanuts. However, their R2 values of 0.41, 0.39, and 0.45 were low
indicating that 42, 39, and 45% of the variability in trans-resveratrol, total stilbenes and overall
acceptance, respectively, was explained by the predictors – distance from UV light, UV exposure
time, and incubation time.
The P–values for the models of total antioxidant capacity, H-ORAC, and L-ORAC were all
<0.0001 and for overall acceptance, 0.0003, indicating that the models were highly significant in
predicting the concentrations of ORAC and overall acceptance of UV-treated peanuts. However,
their R2 values of 0.35, 0.32, 0.44 and 0.02, respectively, were low indicating that 35, 32, 44,
and 2%, of the variabilities in the total antioxidant capacity, H-ORAC, L-ORAC and overall
acceptance, respectively, were explained by the predictors – distance from UV light, UV
exposure time and incubation time.
The contour plots were generated from full models because R2 values were low and were
not reduced further as removal of terms results in significantly different models compared to full
models. The contour plots for the regression models for stilbenes are shown in Figures 4.7 and

217
Table 4.5 Regression coefficients, R2, and P-values for the significant prediction models of response variables in UV-treated peanuts1
Coefficients Trans-
Resveratrol Trans-Piceid Total
stilbenes H-ORAC L-ORAC TAC-ORAC Overall
acceptance Intercept 0.87601 -0.12828 0.74774 -10.5305 52.0253 41.4923 10.92222 Linear
ID 0.08297 0.04020 0.12317 3.8211 -0.2774 3.5443 -0.10111IT -0.20424 -0.02291 -0.22715 1.0951 -0.7515 0.3449 -0.13133IC 0.01339 -0.00985 0.00354 -0.6837 -1.5929 -2.2774 -0.14657
Quadratic
ID*ID -0.00230 -0.00061 -0.00291 0.0372 -0.0039 -0.0412 0.00014 IT*IT 0.00039 0.00088 0.00127 0.0308 0.0071 0.0378 0.00050 IC*IC -0.00155 0.00011 -0.00144 0.0216 0.0191 0.0407 0.00035 Interaction
ID*IT 0.00429 0.000322 0.00144 -0.0467 0.0180 -0.0288 0.02650 ID*IC 0.00020 0.000209 0.00221 -0.0211 0.0108 -0.0103 0.00239 IT*IC -0.00042 -0.000272 0.00389 -0.0618 0.0084 -0.0535 0.00294 ID*IT*IC -0.00008 -0.000007 -0.00009 0.0012 -0.00004 0.0008 -0.00007 Adjusted R2 0.41 0.39 0.45 0.32 0.44 0.35 0.02P-value 0.0069 0.0111 0.0017 <0.0001 <0.0001 <0.0001 0.00031 ID=distance from UV light; IT=UV exposure time; IC=incubation time at 25oC H-ORAC=hydrophilic ORAC, L-ORAC=lipophilic ORAC, TAC= total antioxidant capacity by oxygen radical absorbance capacity
(ORAC) assay, Overall Acceptance using 9-point hedonic rating scale: 1=dislike extremely, 5= neither like nor dislike, 9=like extremely.,
218
for total phenolics, antioxidant capacities and overall acceptance, in Figure 4.8. The
superimposed regions of overlap showing the optimum processes are presented in Figure 4.9.
1. Predicted trans-resveratrol concentrations for UV-treated peanuts
The process combinations of distance from UV light, UV exposure time and incubation time
did not achieve the targeted 2.64 µg/g (McMurtrey, 1994) corresponding to 100% resveratrol in
red wines. Only 2.0 µg/g or 75% of the concentration in red wines was produced at incubation
time of 36 h (Figure 4.7) shown shaded in the contour plots. The maximum resveratrol of 2.06
µg/g was obtained after UV treatment for 29-30 min at 40-44 cm distance from UV light and
incubated for 36h. Trans-resveratrol was highest when incubated for 36 h and then decreased
further when distance from UV was increased or decreased. With increasing exposure time at
about 30-50 cm distance from UV light, trans-resveratrol increased except when incubated for
24h wherein trans-resveratrol concentrations decreased with increasing exposure time from 10-
20 min and at 28-40 cm distance from UV light, and then increased when exposed for 20-30 min
with increasing distance from UV light of 38-48 cm. These results indicate that distance from
UV light of 30 to about 45 cm and exposure time for more than 30 min followed by incubation
for 36h was necessary to allow maximum production of trans-resveratrol in UV-treated peanuts.
2. Predicted trans-piceid concentrations for UV-treated peanuts
The process combinations of distance from UV light, UV exposure time and incubation time
did not achieve the targeted 1.85 µg/g (Lamuella-Raventos et al., 1994) or 100% in red wines.
Only 30% of that in red wines or 0.55 µg/g trans- piceid was produced at 24 h incubation time
(Figure 4.7). Trans-piceid increased with decreasing incubation time from 48 to 24 h and as
exposure time increased from 20-30 min, regardless of incubation time. As exposure time
increased from 10-20 min, trans-piceid increased as 40 cm was approached from 20 or 60 cm

219
Figure 4.7 Contour plots for the significant prediction models for trans-resveratrol (µg/g), trans-piceid (µg/g), and total stilbenes (µg/g) of UV-treated peanuts as affected by distance from UV light and UV exposure times at specified incubation time (IC) at 25oC. Contours plots are shaded to cover the areas that meet the regions of interest, or the maximum concentrations achieved.

220
distance from UV light. As incubation time increased from 24-48 h, a longer exposure time to
UV was needed to obtain equal increase in piceid content. The highest trans-piceid of 0.60 µg/g
or 32% in red wines was achieved when peanuts were exposed to UV for 30 min at 35.5-46 cm
distance from UV light and incubated for 24 h. Results indicated that a distance approaching 40
cm and exposure time greater than 30 min followed by incubation for 24 h would produce the
highest amounts of trans-piceid in UV- treated samples.
3. Predicted total stilbenes concentrations for UV-treated peanuts
The process combinations of distance from UV light, UV exposure time and incubation time
did not achieve the targeted 4.33 µg/g total stilbenes or 100% in red wines (Figure 4.7). Only
55% or 2.4 µg/g total stilbenes was achieved at 36 h incubation and shaded in the contour plots.
The total stilbenes increased when distance of 40 cm was approached either from 20 or 60 cm,
and increased further with increasing exposure time from 17-30 min, or decreasing exposure
time from 17-10 min achieving a maximum 2.55 µg/g after 30 min UV exposure at a distance of
40-42 cm and incubation for 36h. Results show that a distance approaching 40 cm and exposure
time greater than 30 in followed by incubation for 36h achieved the highest total stilbenes.
4. Predicted total antioxidant capacity by ORAC for UV-treated peanuts
The process combinations of distance from UV light, exposure time and incubation time met
the targeted 38.73 µM TE/g corresponding to 100% of total antioxidant capacity in red wines
(USDA, 2007). However, a maximum of 58.10 µM TE/g or 150% total antioxidant capacity in
red wines was achieved and therefore shaded in the contour plots (Figure 4.8). The total
antioxidant capacity increased as 40 cm distance from UV light was approached regardless of
UV exposure time from 10-30 min. A maximum of 72 µM TE/g was produced when peanuts
were incubated for 24 h and exposed to UV for 30 min at 35.25-37.25 cm distance from UV

221
light. The highest antioxidant capacity was obtained when peanuts were exposed to distance of
40 cm from UV light compared to 60 cm or 20 cm. Lower total antioxidant capacity was
achieved when peanuts were exposed to either higher doses of UV (20 cm distance) or lower
doses (60 cm distance). These results were similar to Cantos et al. (2001) where 40 cm distance
from UV light produced highest trans-resveratrol in UV treated grapes compared to 20 and 60
cm.
5. Predicted H-ORAC for UV-treated peanuts
The process combinations of distance from UV light, exposure time and incubation time met
the targeted 38.73 µM TE/g or 100% H-ORAC in red wines and shown shaded in Figure 4.8.
Red wine had no lipid fraction, so its total antioxidant capacity is equal to H-ORAC of 38.73 uM
TE/ g. The maximum H-ORAC was obtained as 40 cm distance from UV light was approached,
regardless of UV exposure time from 10-30 min. The highest H-ORAC of 52 µM TE/g was
obtained after 24 h incubation and exposure to UV for 28-30 min at 32-42 cm distance from UV.
6. Predicted L-ORAC for UV-treated peanuts
The process combinations of distance from UV light, exposure time and incubation time did
not achieve the targeted 38.73 µM TE/g L-ORAC so the contour plot was not shaded (Figure
4.8). L-ORAC increased with decreasing distance from UV light from 60 to 20 cm and
decreasing UV exposure time from 30 to 10 min. The highest L-ORAC of 19 µM TE/g was
obtained when peanuts were exposed to UV for 10-12 min at 20-23 cm distance from UV light
then incubated for 24h; and UV treated for 10-11 min at distance from UV light of 20-37 cm
then incubated for 48h. These results indicate that shorter UV exposure time and distance from
UV light will produce high L-ORAC values.

222
7. Predicted overall acceptance by consumers for UV-treated peanuts
The process combinations of distance from UV light, UV exposure time and incubation time met
the targeted overall acceptance rating of 5 or neither like nor dislike (Figure 4.8). However, a higher
maximum overall acceptance rating >5.5 could be achieved and shown shaded in the contour plots.
A mean rating of 5.5 assumes that half of the panel rated the sample greater or equal to 6.0 or like
slightly while the other half rated it lower or equal to 5.0 or neither like nor dislike. The overall
acceptance increased with decreasing incubation from 48 to 24 h. The high overall acceptance
ratings were met when incubation time, distance from UV light, and UV exposure time decreased
indicating that all UV treatments will diminish acceptance. The highest rating of 6.3 or like slightly
was achieved when peanuts were exposed to UV for 10-14 min at 20 cm distance from UV light and
incubated for 24h.
8. The predicted optimum UV processing treatment parameters for sliced peanuts
The region of overlap (Figure 4.9) represents optimum UV processes that met at least 74%
trans-resveratrol (2.0 µg/g), 55% (2.42 µg/g) total stilbenes, and 142% (55 µM TE/g)
antioxidant capacity by ORAC in red wines and mean overall acceptance rating >5.5. Only UV-
treated peanuts incubated for 36 h met these criteria. Thus, the optimum UV processes included
all process combinations within the area of a triangle bound by the points distances from UV
light of 47, 41, and 33 cm for 30 (point A), 26.5 (point B) and 30 (point C) min, respectively. At
this optimum region of overlap, the predicted concentrations of phenolic compounds and
antioxidant capacities were 2.00 to 2.06 µg/g trans-resveratrol , 2.44-2.55 µg/g total stilbenes
(sum of trans-resveratrol and trans-piceid) , 55.00 µM TE/g total antioxidant capacity by ORAC
assay, and overall acceptance ratings ≥5.6 or neither like nor dislike. The concentrations at the
optimum UV processes correspond to 74-78% trans-resveratrol, 55-59% total stilbenes, and 142-

223
Figure 4.8 Contour plots for the significant prediction models for H-ORAC (hydrophilic ORAC, µM TE/g), L-ORAC (lipophilic ORAC, µM TE/g), TAC (total antioxidant capacity, µM TE/g), and overall acceptance (9-point hedonic rating) of UV-treated peanuts as affected by distance from UV light and UV exposure times at specified incubation time (IC) at 25oC. Contour plots are shaded to cover the areas that meet the regions of interest, or the maximum concentrations or OA ratings achieved.

224
C
B
A
OL
OL
OL
Figure 4.9 Superimposed contour plots for the significant (P<0.05) prediction models of trans-resveratrol (RES, µg/g), trans-piceid (PIC, µg/g), ORAC (total antioxidant capacity, µM TE/g) and overall acceptance (OA) based on 9-point hedonic rating where 1=dislike extremely, 5=neither like nor dislike and 9-like extremely. The regions of overlap (OL) represent the optimum UV processes at the specified incubation time. Arrows indicate directions of increasing concentrations or acceptance ratings.

225
150% total antioxidant capacities, respectively, of that in red wines. On a per serving basis, if a
peanut bar containing 30 g of treated peanuts were prepared using these optimum processes,
about 3 bars, each containing 30 g of peanuts will provide the same amount of total antioxidant
capacity as a 120 mL serving of red wines or 4,950 µM TE.
D. Verification of Prediction Models for UV Processing Treatment Parameters
The prediction models for the UV processing treatment parameters of peanut kernels were
verified by preparing samples of UV-treated peanuts using a process within and outside the
optimum region and then analyzing the samples for trans-resveratrol, trans-piceid, and total
antioxidant capacity. In this study, a sample was UV-treated at 40 cm distance from light for 30
min followed by 36 h incubation at 25oC to represent a process within the optimum region and
another sample was exposed at 20 cm distance from UV light for 10 min followed by followed
by 36 h incubation at 25oC representing a process outside the optimum process. The observed
and predicted values of all response variables analyzed are shown in Table 4.6. Results showed
that the observed and predicted values for trans-resveratrol, and trans-piceid had probabilities >
0.05 indicating that the paired values were not significantly different from each other and
therefore verifying that the regression equations could predict the concentrations of these
compounds. The observed values for ORAC within and outside the optimum regions were
higher than the prediction values with P values of 0.0009 and 0.0019, respectively.

226
Table 4.6 Observed and predicted values of stilbenes concentrations and antioxidant capacity values of UV-treated peanuts for verification of prediction models. Compound Within Optimum Region Outside Optimum Region Observed Predicted PROB1 Observed Predicted PROB Trans-resveratrol (µg/g)
2.06
2.06
0.5988 NS
1.28
1.27
0.9504 NS
Trans-piceid (µg/g)
0.49 0.47 0.1599 NS 0.15 0.14 0.8020 NS
Total Antioxidant Capacity (ORAC, µM TE/g)
227 127 0.0090** 134 58 0.0019**
1 PROB = probability >0.05 means paired values are not significantly different from each other at 5% level of significance
NS = not significant, **significant at 0.01% level

227
II. STUDY 2. ULTRASOUND PROCESS OPTIMIZATION TO ENHANCE TRANS-
RESVERATROL BIOSYNTHESIS IN PEANUTS
A. Effect of Ultrasound Treatment on the Concentrations of Stilbenes, Total Phenolics,
and Antioxidant Capacities of Sliced Peanut Kernels
1. Trans-resveratrol, trans-picied and total stilbenes of sliced ultrasound-treated peanuts
The mean concentrations of trans-resveratrol, trans-piceid and total stilbenes in US- treated
sliced peanuts are shown in Table 4.7 and Figure 4.10. US increased (P<0.05) the mean
concentrations of trans-resveratrol, 0.32+0.16 to 6.39+2.15 µg/g, trans-piceid, 0.16+0.05 to
6.39+2.27 µg/g and total stilbenes, 0.48+0.16 to 9.86+0.82 µg/g, of all 27 sliced US-treated
peanuts compared to controls with 0.02 ± 0.002, 0.03 ± 0.001, and 0.05 ± 0.004 µg/g,
respectively, corresponding to 16-319, 5-213, and 10-197 fold increase, respectively. US
treatment at low intensities of ginseng cell cultures, stimulated growth and biosynthesis of
secondary metabolites through mechanical stress and microstreaming induced by acoustic
cavitations which disrupted the cell wall (Lin et al., 2001). US caused rapid increase in levels of
phenylammonia lyase, polyphenol oxidase, and peroxidase in ginseng cell cultures with
phenylammonia lyase enhanced most dramatically with 5-fold higher at power level 4 after 4
days incubation compared to controls (Wu and Lin, 2002). Phenylammonia lyase is responsible
for the deamination of phenylalanine, the initial step in the biosynthesis of coumaryl CoA, one of
the precursors for trans-resveratrol synthesis (Soleas et al., 1997). We believe that the release of
phenylammonia lyase after US treatment could be responsible for increased concentrations of
trans-resveratrol and trans- piceid in US- treated sliced peanuts in this study.

228
Table 4.7 Concentrations (mean ± standard deviation, dry basis) of trans-resveratrol, trans-piceid, and total stilbenes of roasted ultrasound-treated sliced peanuts and controls1.
Trt # PD PT IC Trans-Resveratrol
μg/g Trans-Piceid
μg/g Total Stilbenes
μg/g 1 25 2 24 0.4100 ± 0.1068h 0.2950 ± 0.2679e 0.7050 ± 0.2358hij 2 25 2 36 4.1225 ± 0.5049bcd 0.5550 ± 0.4608e 4.6775 ± 0.8972de 3 25 2 48 1.9650 ± 1.5505efgh 2.1000 ± 0.8665cde 4.0650 ± 1.3328de 4 25 5 24 2.8650 ± 0.0742cdef 0.8325 ± 0.4322e 3.6925 ± 0.4711efg 5 25 5 36 0.7775 ± 0.2037gh 1.3575 ± 0.3508de 2.1375 ± 0.2257ghi 6 25 5 48 5.2075 ± 0.8898ab 1.4125 ± 0.5082de 6.6175 ± 1.2000bc 7 25 8 24 1.2250 ± 1.3261fgh 1.0575 ± 0.4840e 2.2825 ± .8736fgh 8 25 8 36 2.0725 ± 0.7905defgh 1.8675 ± 0.6070de 3.9375 ± 1.0808ef 9 25 8 48 2.7725 ± 1.0857cdefg 1.3200 ± 1.3638de 4.0950 ± 0.4585de 10 50 2 24 0.5825 ± 0.6286h 0.6400 ± 0.4807e 1.2200 ± 0.3391hij 11 50 2 36 0.7300 ± 0.6704gh 4.3200 ± 2.6532abc 5.0500 ± 2.0701cde 12 50 2 48 0.4450 ± 0.2322h 0.2025 ± 0.1511e 0.6475 ± 1.1127hij 13 50 5 24 0.4700 ± 0.2855h 6.3950 ± 2.2723a 6.8625 ± 2.2131b 14 50 5 36 0.8250 ± 1.2985fgh 4.4750 ± 3.0847ab 5.3000 ± 2.0842bcde 15 50 5 48 0.5175 ± 0.3111h 0.3325 ± 0.3732e 0.8500 ± 0.2205hij 16 50 8 24 0.3175 ± 0.1640h 0.1600 ± 0.0455e 0.4750 ± 0.1529ij 17 50 8 36 1.0925 ± 0.2765fgh 0.5225 ± 0.3709e 1.6125 ± 0.2139hij 18 50 8 48 0.5150 ± 0.5496h 0.7675 ± 0.7140e 1.2800 ± 0.2709hij 19 75 2 24 4.0000 ± 2.1527bcde 0.9375 ± 1.0621e 4.9375 ± 1.5378cde 20 75 2 36 1.3375 ± 0.6038fgh 0.2375 ± 0.1706e 1.5750 ± 0.4886hij 21 75 2 48 6.3892 ± 2.1501a 3.4725 ± 2.2721bcd 9.8625 ± 0.8220a 22 75 5 24 1.1675 ± 0.0634fgh 0.4825 ± 0.5619e 1.6525 ± 0.5126hij 23 75 5 36 6.00930 ± 0.3695ab 3.5525 ± 1.1474ab 9.5625 ± 2.1861a 24 75 5 48 4.7450 ± 2.7460abc 0.6650 ± 0.8077e 5.4075 ± 3.3050bcd 25 75 8 24 4.6150 ± 0.7677abc 0.2350 ± 0.2450e 4.8500 ± 0.9919cde 26 75 8 36 4.0025 ± 1.5115bcde 1.0550 ± 1.3090e 5.0575 ± 1.0514cde 27 75 8 48 3.7725 ± 1.4654bcde 2.0375 ± 1.0517cde 5.8100 ± 0.5854bcd
Control2 0 0 0 0.0212 ± 0.0020i 0.0271 ± 0.0010e 0.0482 ± 0.0046j 1 PD= ultrasound power density (mW/cm3), PT= ultrasound exposure time, and IC= incubation
time at 25oC. Means ± standard deviation were calculated from two replications for a total of 4 analyses/sample.
Means in a column not followed by the same letter are significantly different from each other at P < 0.05 as determined by Fisher’s significant difference mean separation test.
2Control is untreated raw whole peanuts.

229
Figure 4.10 Mean trans-resveratrol (µg/g), trans-piceid (µg/g), and total stilbenes (µg/g) of sliced peanuts exposed to varying doses of ultrasound. IC is the incubation time at 25oC and PT is the ultrasound exposure time. Control untreated raw whole peanuts had 0.02 + 0.002 µg/g trans-resveratrol, 0.05 + 0.001 trans-piceid µg/g and 0.05 + 0.001 µg/g total stilbenes.

230
The analysis of variance (Table 4.8) indicated that all factors of US power density, the main
factors of US exposure time and incubation time, and their interactions significantly (P<0.05)
contributed to the concentrations of trans-resveratrol in sliced peanuts. The concentrations of
trans-piceid in sliced peanuts were significantly contributed by all factors and their interactions
excluding the main effect of power density. All factors and their interactions, excluding the
interaction of power density and exposure time significantly contribute to the concentrations of
total stilbenes in sliced peanuts.
Compared to UV treatment, US resulted in higher (P<0.05) trans-resveratrol, trans-piceid
and total stilbenes in sliced peanuts. US processed sliced peanuts had an overall mean
concentrations of 2.27 + 0.99 µg/g trans-resveratrol, 1.59 + 1.09 µg/g trans-piceid and 3.86 +
0.92 µg/g total stilbenes, while UV-treated sliced samples resulted in 1.19 + 0.22, 0.24 + 0.03,
and 1.43 + 0.23 µg/g, respectively. The average increase in concentrations in US compared to
UV treated peanuts were 91% for resveratrol, 562% for trans-piceid, and 170% for total
stilbenes.
Sliced US-treated peanuts had higher trans-resveratrol, trans-piceid and total stilbenes
compared to blended peanut butters with 0.41+0.02, 0.13+0.01, and 0.54+0.03 µg/g,
respectively, and 100% natural peanut butters with 0.65+0.02, 0.14+0.01, and 0.814+0.03 µg/g,
respectively (Ibern-Gomez et al., 2000). Compared to red wines with mean concentrations of
1.85, 2.48 and 4.33 µg/mL trans- resveratrol, trans-piceid, and total stilbenes, respectively
(Lamuela-Raventos et al., 1995), sliced US-treated peanuts had comparable trans-resveratrol but
lower trans- piceid and total stilbenes. McMurtrey et al. (1994) reported even higher mean
trans-resveratrol in red wines of 2.64 µg/mL, range: 0.99-5.01 µg/mL, but did not report values
for trans-piceid.

231
Table 4.8 Significant treatment effects on the concentrations of stilbenes, total phenolics, antioxidant capacities, and overall acceptance of sliced, chopped, and whole ultrasound-treated peanuts. Size/Factors1 Trans-
resveratrol Trans-piceid
Total Stilbenes
Total Phenolics
TEAC H-ORAC L-ORAC TAC Overall Acceptance
Sliced peanuts Main effects PD <0.0001 NS <0.0001 NS NS 0.0007 <0.0001 <0.0001 0.4595PT 0.0014 0.0034 0.0003 NS NS 0.0253 <0.0001 NS NSIC <0.0001 0.0399 0.0003 0.0051 NS NS <0.0001 NS NSInteractions PD x PT <0.0001 0.0126 NS 0.0051 0.0061 NS <0.0001 NS NSPD x IC 0.0004 0.0020 <0.0001 0.0269 NS 0.0059 <0.0001 0.0004 NSPT x IC 0.0005 0.0032 0.0246 NS NS <0.0001 0.0425 <0.0001 0.0037PD x PT x IC <0.0001 0.0002 <0.0001 <0.0001 0.0256 0.0055 <0.0001 0.0016 <0.0001
Chopped peanuts Main effects PD <0.0001 <0.0001 <0.0001 NS NS 0.0449 0.0009 NS NSPT <0.0001 <0.0001 NS NS NS NS <0.0001 NS NSIC <0.0001 <0.0001 <0.0001 NS 0.0015 NS 0.0018 NS <0.0001Interactions PD x PT <0.0001 NS <0.0001 NS 0.0377 NS <0.0001 NS NSPD x IC <0.0001 <0.0001 <0.0001 0.0028 NS 0.0262 <0.0001 0.0060 0.0105PT x IC <0.0001 0.0005 <0.0001 NS NS NS 0.0231 NS NSPD x PT x IC <0.0001 <0.0001 <0.0001 0.0094 NS <0.0001 <0.0001 <0.0001 NS
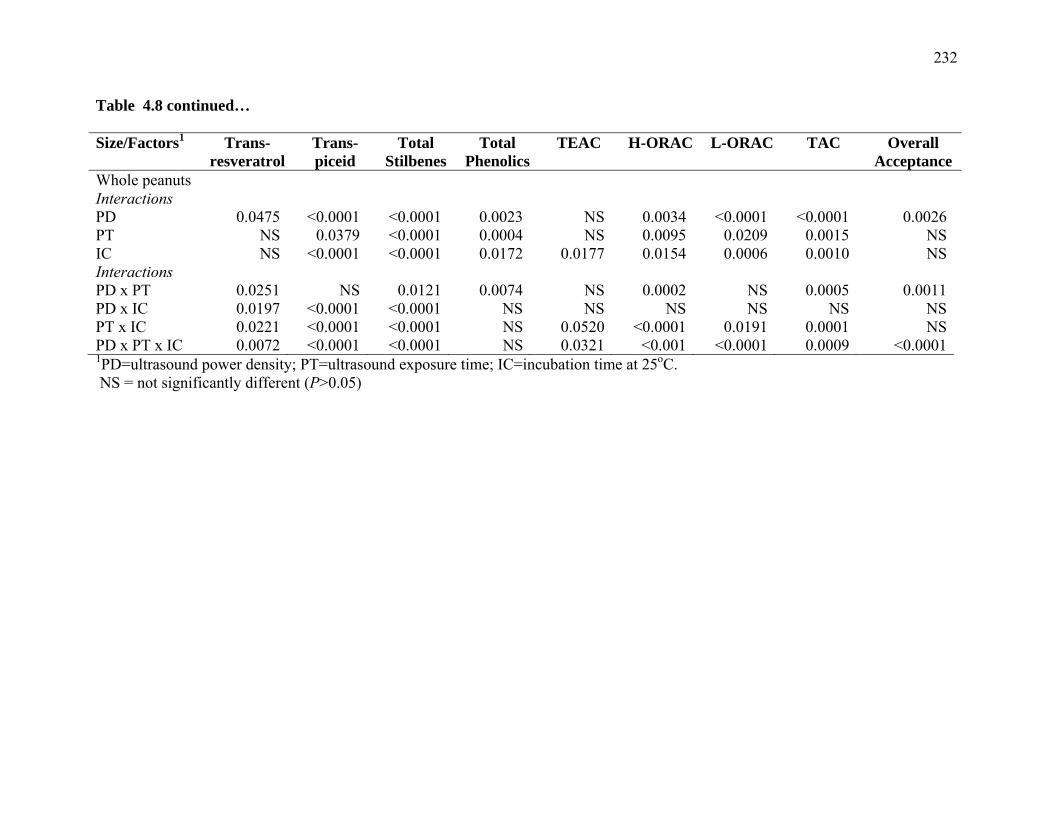
232
Table 4.8 continued… Size/Factors1 Trans-
resveratrol Trans-piceid
Total Stilbenes
Total Phenolics
TEAC H-ORAC L-ORAC TAC Overall Acceptance
Whole peanuts Interactions PD 0.0475 <0.0001 <0.0001 0.0023 NS 0.0034 <0.0001 <0.0001 0.0026PT NS 0.0379 <0.0001 0.0004 NS 0.0095 0.0209 0.0015 NSIC NS <0.0001 <0.0001 0.0172 0.0177 0.0154 0.0006 0.0010 NSInteractions PD x PT 0.0251 NS 0.0121 0.0074 NS 0.0002 NS 0.0005 0.0011PD x IC 0.0197 <0.0001 <0.0001 NS NS NS NS NS NSPT x IC 0.0221 <0.0001 <0.0001 NS 0.0520 <0.0001 0.0191 0.0001 NSPD x PT x IC 0.0072 <0.0001 <0.0001 NS 0.0321 <0.001 <0.0001 0.0009 <0.00011PD=ultrasound power density; PT=ultrasound exposure time; IC=incubation time at 25oC. NS = not significantly different (P>0.05)

233
The trans-resveratrol concentrations of 0.32-6.39 µg/g produced in US-treated peanuts were
higher those found in white and red grape juices with non-detectable to 0.9 (mean=0.05) g/mL and
non-detectable to 1.09 (mean=0.5) µg/mL, respectively (Romero-Perez et al., 1999), dark
chocolate and cocoa liquor with 0.40 and 0.50 µg/g, respectively (Counet et al., 2006), pistachios
with 0.07-0.18 (mean=0.12) µg/g (Grippi et al., 2008), hops with 0.7-2.2 µg/g (Jerkovic and
Collin, 2007), and hop pellets with 0.5 µg/g (Callemien et al., 2005). The trans-resveratrol
concentrations in US-treated peanuts, however, were lower compared to those in dried white and
red grape berry skins with 11.04-47.60 (mean= 22.03) and 18.32-38.26 (mean=25.79),
respectively, (Romero-Perez et al., 2001).
The amounts of trans-piceid of 0.16-6.39 µg/g obtained by US treatment of sliced peanuts
were higher compared to white grape juices with non-detectable to 0.83 (mean=0.18) µg/mL
(Romero-Perez et al., 1999); dark chocolate and cocoa liquor with 1.00 and 1.20 µg/g in
respectively (Counet et al., 2006); Spanish red wines with 0.74 – 4.01 (mean=1.85) µg/mL
(Lamuella-Raventos et al., 1995); and hop pellets with 2.0 µg/g (Callemien et al., 2005). The
piceid concentrations in sliced US-treated peanuts were within that found in red grape juices with
0.77-7.34 µg/mL (Romero-Perez et al., 1999), hops with 2.3-7.3 µg/g (Jerkovic and Collin,
2007), and pistachios with mean of 6.97 (range= 6.2-8.15) µg/g (Grippi et al., 2008), but lower
than those found in dried white and red grape skins with mean concentration of 16.58 (range=
non-quantifiable to 64.41) and 64.15 (range =5.49-342.66 µg/g), respectively (Romero-Perez et
al., 2001).
2. Total phenolics of sliced ultrasound-treated peanuts
Table 4.9 and Figure 4.3 show the mean total phenolics concentrations of US treated sliced
peanuts. US increased (P< 0.05) the total phenolics of all 27 treated sliced peanuts

234
Table 4.9 Concentrations (mean ± standard deviation, dry basis) of total phenolics, trolox equivalent antioxidant capacity (TEAC), and oxygen radical absorbance capacity (ORAC) of roasted sliced ultrasound-treated peanuts and controls 1
Trt # PD PT IC Total Phenolics
mg GAE/g TEAC
μM TE/g H-ORAC
μM TE/g L-ORAC
μM TE/g ORAC-TAC
μM TE/g 1 25 2 24 1.74 ± 0.14abc 3.00 ± 0.02ab 62.80 ± 0.02abcde 15.69 ± 0.02fgh 78.37 ± 11.49cde 2 25 2 36 1.37 ± 0.19efghij 3.00 ± 0.16ab 60.81± 0.16bcdef 18.17 ± 0.16def 78.97 ± 2.93bcde 3 25 2 48 1.76 ± 0.02ab 2.81 ± 0.16abcde 73.29 ± 0.16abc 80.40 ± 0.16jklm 81.33 ± 12.31abcde 4 25 5 24 1.28 ± 0.29ghij 2.90 ± 0.17abc 68.14 ± 0.17abcd 13.78 ± 0.17ghi 81.86 ± 3.42abcd 5 25 5 36 1.72 ± 0.21abcd 2.56 ± 0.52bcdef 67.52 ± 0.52abcd 7.72 ± 0.52jklm 75.23 ± 8.39cdef 6 25 5 48 1.48 ± 0.08cdefghi 2.74 ± 0.58abcde 64.04 ± 0.58abcd 13.80 ± 0.58ghi 77.83 ± 7.54cde 7 25 8 24 1.50 ± 0.02cdefgh 2.68 ± 0.39bcde 71.99 ± 0.39abcd 11.32 ± 0.39hijk 83.37 ± 13.75abcd 8 25 8 36 1.42 ± 0.36efghij 3.00 ± 0.16ab 45.34 ± 0.16efgh 21.07 ± 0.16bcd 66.41 ± 12.23defgh 9 25 8 48 1.53 ± 0.12bcdefg 2.21 ± 0.08f 44.97 ± 0.08fgh 25.27 ± 0.08b 70.24 ± 12.98defg 10 50 2 24 1.23 ± 0.21ij 2.46 ± 0.43cdef 56.64 ± 0.43cdefg 9.58 ± 0.43cdefg 64.12 ± 17.94efgh 11 50 2 36 1.86 ± 0.35a 2.96 ± 0.04ab 54.54± 0.04efgh 7.41 ± 0.04lmn 64.09 ± 15.10efgh 12 50 2 48 1.18 ± 0.22j 2.56 ± 0.38bcdef 72.88 ± 0.38abc 23.40 ± 0.38bc 96.12 ± 23.13ab 13 50 5 24 1.46 ± 0.18defghi 2.76 ± 0.23abcde 78.75 ± 0.23a 19.17 ± 0.23cdef 97.92 ± 31.89a 14 50 5 36 1.34 ± 0.07efghij 2.94 ± 0.30ab 78.52 ± 0.30a 18.40 ± 0.30def 96.92 ± 14.38a 15 50 5 48 1.76 ± 0.08ab 2.99 ± 0.56abcde 12.51 ± 0.56gh 17.00 ± 0.56defga 59.41 ± 7.35fgh 16 50 8 24 1.60 ± 0.03bcde 2.99 ± 0.27ab 55.70 ± 0.27cdefgh 55.70 ± 0.27cdefgh 88.01 ± 7.58abc 17 50 8 36 1.58 ± 0.04bcde 2.95 ± 0.04ab 61.61 ± 0.04abcdef 7.00 ± 0.04m 67.59 ± 6.10defgh 18 50 8 48 1.44 ± 0.05efghij 2.60 ± 0.53bcdef 62.85 ± 0.53abcde 19.51 ± 0.53cdef 82.35 ± 10.10abcd

235
Table 4.9 continued…
Trt # PD PT IC Total Phenolics mg GAE/g
TEAC μM TE/g
H-ORAC μM TE/g
L-ORAC μM TE/g
ORAC-TAC μM TE/g
19 75 2 24 1.26 ± 0.23ghij 2.36 ± 0.24ef 44.67 ± 0.24fgh 8.26 ± 0.24klmn 50.22 ± 8.59gh 20 75 2 36 1.31 ± 0.16fghij 2.43 ± 0.22def 71.40 ± 0.22abcd 11.32 ± 0.22hijk 82.73 ± 9.61abcd 21 75 2 48 1.39 ± 0.04efghij 2.59 ± 0.45bcdef 55.11 ± 0.45defhg 18.11 ± 0.45defhg 66.95 ± 14.97defgh 22 75 5 24 1.27 ± 0.26ghij 2.59 ± 0.35bcdef 40.09 ± 0.35hi 11.09 ± 0.35hi 50.00 ± 9.75h 23 75 5 36 1.89 ± 0.15a 2.59 ± 0.05abcd 74.62 ± 0.05ab 16.45 ± 0.05efg 86.61 ± 18.27abc 24 75 5 48 1.22 ± 0.22ij 2.59 ± 0.42bcdef 38.29 ± 9.60hi 20.61 ± 0.42cde 58.82 ± 8.63fgh 25 75 8 24 1.56 ± 0.02abcdef 2.94 ± 0.27ab 56.02 ± 0.27bcdefg 9.72 ± 0.27ijklm 65.74 ± 10.91defgh 26 75 8 36 1.71 ± 0.36abcd 2.55 ± 0.49bcdef 45.07 ± 0.49fgh 13.47 ± 0.49ghi 58.54 ± 14.53fgh 27 75 8 48 1.71 ± 0.13abcd 3.18 ± 0.20a 44.99 ± 0.49fgh 10.03 ± 0.49ijkl 55.02 ± 2.83gh
Control2 0 0 0.84 ± 0.02k 0.61 ± 0.01g 21.20 ± 0.20i 5.61 ± 0.20m 26.81 ± 5.72i
1 PD is ultrasound power density (mW/cm3); PT is ultrasound exposure time; and IC is incubation time. H-ORAC = hydrophilic ORAC; L-ORAC = lipophilic ORAC; TAC= total antioxidant capacity is the sum of H-ORAC and L-
ORAC. Means ± standard deviation were calculated from two replications for a total of 4 analyses/sample each for trans-resveratrol, trans-
piceid and total stilbenes. Means in a column not followed by the same letter are significantly different from each other at P < 0.05 as determined by Fisher’s
significant difference mean separation test. 2 Control is untreated raw whole peanuts.

236
to 1.18-1.89 mg GAE/g compared to untreated controls with 0.84 mg GAE/g of this study and
controls of 0.91-1.14 mg GAE/g reported by Talcott et al. (2005). These amounts were slightly
higher than the total phenolics of 1.09 to 1.58 mg/g reported by Rudolf and Resurreccion (2005)
in sliced peanuts treated with a single dose of US power density of 39.2 mW/cm3 for 4 min at 24-
48 h incubation.
ANOVA of our data (Table 4.8) indicated that incubation time and all interactions US power
density, exposure time, and incubation time, except that of US exposure time x incubation time,
significantly contributed to the concentrations of total phenolics of sliced US-treated peanuts.
These results agreed with Rudolf and Resurreccion (2005) who found that incubation time did
not cause significant differences in the total phenolics of sliced US-treated peanuts. Our results
disagreed with Wu and Lin (2002) working with sonicated Panax ginseng cells who reported
that increasing power density from 14 to 61 mW/cm3 increased phenolic compounds and
polyphenols produced due to increased enzyme activities needed for biosynthesis of these
compounds.
The observed values of 1.18-1.89 mg GAE/g in sliced US-treated peanuts were within the
total phenolics of blueberry wines with 0.60-1.86 mg GAE/g (Sanchez-Moreno et al., 2003), and
within the lower limits of 1.81-4.58 mg GAE/g in fresh blueberry purees (Prior et al., 1998) and
1.31-2.39 mg GAE/mL in red wines (Fernandez-Pachon et al., 2004).
3. Trolox equivalent antioxidant capacity (TEAC) of sliced ultrasound-treated peanuts
The mean TEAC values of sliced US-treated peanuts are shown in Table 4.9 and Figure 4.4.
US increased (P< 0.05) TEAC of all 27 treated sliced peanuts with 2.21 to 3.18 μM TE/g
compared to controls with 0.61 μM TE/g. The analysis of variance (Table 4.8) indicated that
only the interaction of power density x exposure time and interaction of all three

237
factors but not any single factor, caused significant change (P< 0.05) in the TEAC values of sliced
US-treated peanuts. Sliced US-treated peanuts had lower (P< 0.05) mean TEAC of 2.74 ± 0.37 μM
TE/g compared to UV-treated sliced samples with mean TEAC of 3.15 ± 0.50 μM TE/g at all
incubation times. The TEAC of 2.21-3.18 μM TE/g of sliced US-treated peanuts were in the lower
limit of 16 types of red wines with 3.06 to 11.15 µM TE/mL (Fernandez-Pachon et al., 2004).
4. Oxygen radical antioxidant capacity (ORAC) of sliced ultrasound-treated peanuts
4.1 Total Antioxidant Capacity (TAC) sliced ultrasound-treated peanuts
The mean total antioxidant capacities of sliced US-treated peanuts are presented in Table 4.9
and Figure 4.5. US increased (P<0.05) the total antioxidant capacity of all 27 treated sliced
peanuts with the range of 50.00-96.92 µmol TE/g compared to 26.81 µmol TE/g in controls. The
analysis of variance (Table 4.8) showed that US power density and its interactions with
incubation time, and with both exposure time and incubation time; and the interation of exposure
time with incubation time significantly contributed to the total antioxidant capacity of sliced
US-treated peanuts. The moderate power density of 50 mW/cm3 produced higher (P<0.05) total
antioxidant capacity than 75 mW/cm3 whereas, the lowest power density of 25 mW/cm3
produced concentrations which were not different from either power densities suggesting that
moderate power densities will produce higher antioxidants compared to higher and lower power
densities. Similarly, Lin et al. (2001) working on Panax ginseng cells found that US exposure at
moderate power densities of 34-61 mW/cm3 for 1-2 min produced higher saponins compared to
those treated at 3 and 82 mW/cm3 for the same exposure time. US processing treatment which
produced an overall mean total antioxidant capacity of 73.80 ± 19.02 in sliced peanuts was more
effective than UV processing treatment which achieved an overall mean of 51.21 ± 16.04.
4.2 H-ORAC sliced ultrasound-treated peanuts

238
Table 4.9 and Figure 4.5 show the mean H-ORAC values of sliced US-treated peanuts. The
H-ORAC of sliced US-treated peanuts ranged from 38.21-78.75 µM TE/g, respectively,
compared to controls with 21.20 µM TE/g. Similar to the total antioxidant capacity the analysis
of variance (Table 4.8) US power density and its interactions with incubation time, and with both
exposure time and incubation time; and the interation of exposure time with incubation time
significantly changed the H-ORAC of sliced US-treated peanuts. Sliced US-treated peanuts
achieved significantly higher H-ORAC values with an overall mean of 59.07 ± 17.70 µM TE/g
compared to UV-treated sliced samples with an overall mean of 36.75± 14.26 µmol TE/g.
4.3 L-ORAC sliced ultrasound-treated peanuts
Table 4.9 and Figure 4.5 show the mean L-ORAC values of US-treated peanuts. The L-
ORAC of sliced US-treated peanuts had 5.99-32.31 µM TE/g, compared to 5.61 µM TE/g in
controls. US which produced an overall mean L-ORAC of 14.73 ± 6.84 µM TE/g was equally
effective as UV (overall mean of 14.27 ± 5.12) in increasing L-ORAC of sliced peanuts.
The analysis of variance (Table 4.8) showed that all main and interactions effects
significantly contributed to the lipophilic antioxidants of sliced US-treated peanuts. Due to
interaction effects, no main factor can be singled out as the major contributor to the L-ORAC of
UV-treated peanuts. Sliced US-treated peanuts achieved significantly higher H-ORAC values
with an overall mean of 59.07 ± 17.70 µM TE/g compared to UV-treated sliced samples with an
overall mean of 36.75± 14.26 µmol TE/g.

239
B. Effect of Ultrasound on the Concentrations of Stillbenes, Total Phenolics, and
Antioxidant Capacities of Chopped Peanut Kernels
1. Trans-resveratrol, trans-picied and total stilbenes of chopped ultrasound-treated
peanuts
The mean concentrations of trans-resveratrol, trans-piceid and total stilbenes in US- treated
chopped peanuts are shown in Table 4.10. US increased (P<0.05) the mean concentrations of
trans-resveratrol, 0.51±0.05 to 2.91±0.08 µg/g and total stilbenes, 0.77±0.04 to 5.06±0.18 µg/g
in all 27 treated chopped peanuts compared to controls with 0.02 ± 0.002 µg/g. Trans-piceid
increased in only 19 of 27 chopped US-treated peanuts with mean concentrations of 0.34+0.04
to 2.44±0.08 µg/g compared to controls with 0.03 µg/g; whereas eight of 27 treatments with
piceid of 0.19±0.02 to 0.30±0.04 were not different from controls.
Chopped US-treated peanuts produced lower maximum concentrations of 2.91, 2.44, and
5.06 µg/g, trans-resveratrol, trans-piceid and total stilbenes, respectively, compared to sliced
treated peanuts which produced maximum concentrations of 6.39, 6.39, and 9.86 µg/g,
respectively. This finding suggests that greater severity of damage to peanut cells through size
reduction such as chopping the less enhancement of the stilbenes synthesis in peanuts which
agrees with Rudolf and Resurreccion (2005) who found that sliced peanuts produced the highest
amounts compared to ground and chopped peanuts.
The analysis of variance (Table 4.8) indicated that all main factors of US power density, US
exposure time and incubation time, and their interactions significantly (P<0.05) contributed to
the concentrations of trans-resveratrol in chopped peanuts. The concentrations of trans-piceid in
sliced peanuts were significantly contributed by main factors and their interactions excluding the
interaction of power density and exposure time. Except for US exposure time, all other main

240
Table 4.10 Concentrations (mean ± standard deviation, dry basis) of stilbenes of roasted chopped ultrasound-treated peanuts and controls1.
Trt # PD PT IC Trans-Resveratrol, μg/g
Trans-Piceid, μg/g Total Stilbenes, μg/g
1 25 2 24 0.5921 ± 0.0207kl 0.2140± 0.0080ij 0.8061 ± 0.0287 l 2 25 2 36 0.5614 ± 0.0252l 0.2081± 0.0157ij 0.7695 ± 0.0366 l 3 25 2 48 0.7814 ± 0.0636jk 0.1891± 0.0207ij 0.9705 ± 0.0839jkl 4 25 5 24 1.0228 ± 0.0757hi 0.2749± 0.0383ij 1.2976 ± 0.1139ijk 5 25 5 36 0.8512 ± 0.0632ij 0.2582± 0.0396ij 1.1094 ± 0.0931jkl 6 25 5 48 1.1840 ± 0.0255h 0.4234± 0.0089hi 1.6074 ± 0.0337gh 7 25 8 24 0.6208 ± 0.0175kl 0.2590 ± 0.0050ij 0.8798 ± 0.0225 l 8 25 8 36 0.7002 ± 0.1373jkl 0.2556 ± 0.0442ij 0.9559 ± 0.1811kl 9 25 8 48 2.0755 ± 0.0648f 0.7144 ± 0.0255gh 2.7899 ± 0.0900f 10 50 2 24 1.2202 ± 0.0214h 0.3498 ± 0.0198i 1.5700 ± 0.0200ghi 11 50 2 36 1.4416 ± 0.0277g 0.4188 ± 0.0160hi 1.8600 ± 0.0424g 12 50 2 48 2.0411 ± 0.1531f 2.3322 ± 0.1514ab 4.3733 ± 0.3043b 13 50 5 24 1.4523 ± 0.0778g 0.3411 ± 0.0450i 1.7936 ± 0.0657gh 14 50 5 36 1.1788 ± 0.1164h 0.2996 ± 0.0340ij 1.4784 ± 0.1277hij 15 50 5 48 2.6174 ± 0.1567bcd 2.4442 ± 0.0672a 5.0617 ± 0.1784a 16 50 8 24 0.5631 ± 0.0040kl 0.7111 ± 0.0843gh 1.2742 ± 0.0881ijk 17 50 8 36 0.5098 ± 0.0490 l 1.2490 ± 0.1332cde 1.7588 ± 0.1821gh 18 50 8 48 1.9256 ± 0.0933f 2.1390 ± 0.1434b 4.0645 ± 0.2165bc 19 75 2 24 2.7949 ± 0.1936ab 1.4522 ± 0.8398c 4.2472 ± 0.6469b 20 75 2 36 2.6398 ± 0.0615bcd 0.688 ± 0.0216gh 3.3278 ± 0.0821e 21 75 2 48 2.9093 ± 0.0778a 0.9643 ± 0.1376efg 3.8737 ± 0.1484cd 22 75 5 24 2.7644 ± 0.3372abc 0.8366 ± 0.5613g 3.6001 ± 0.8473de 23 75 5 36 2.4528 ± 0.1713de 1.1424 ± 0.0714def 3.5952 ± 0.2368de 24 75 5 48 2.5655 ± 0.1871cd 0.7454 ± 0.0677g 3.3109 ± 0.2548e 25 75 8 24 2.6391 ± 0.2952bcd 0.8793 ± 0.0941fg 3.5184 ± 0.3684de 26 75 8 36 2.3406 ± 0.4277e 1.3421 ± 0.1738cd 3.6827 ± 0.2840de 27 75 8 48 2.7094 ± 0.1528abc 1.4185 ± 0.0636cd 4.1279 ± 0.2152bc
Control2 0 0 0 0.0212 ± 0.0020m 0.0271 ± 0.0010j 0.0482 ± 0.0046j 1 PD= ultrasound power density (mW/cm3), PT= ultrasound exposure time, and IC= incubation
time at 25oC. Means ± standard deviation were calculated from two replications for a total of 4 analyses/sample.
Means in a column not followed by the same letter are significantly different from each other at P < 0.05 as determined by Fisher’s significant difference mean separation test.
2Control is untreated raw whole peanuts.

241
factors and their interactions, significantly contributed to the concentrations of total stilbenes in
chopped peanuts. Due to interaction effects, no main factor could be singled out as the major
contributor to the concentrations of trans-resveratrol, trans-piceid, and total stilbenes in chopped
US-treated peanuts.
Chopped US-treated peanuts had lower maximum trans-resveratrol but higher trans-piceid
and total stilbenes compared to sliced UV-treated peanuts with 3.30, 1.05 and 4.00 µg/g,
respectively. Chopped US-treated peanuts had higher trans-resveratrol, trans-piceid and total
stilbenes compared to blended peanut butters with 0.41+0.02, 0.13+0.01, and 0.54+0.03 µg/g,
respectively, and 100% natural peanut butters with 0.65+0.02, 0.14+0.01, and 0.814+0.03 µg/g,
respectively (Ibern-Gomez et al., 2000).
The amounts of trans-resveratrol of 0.51- 2.91 µg/g produced in chopped US-treated peanuts
were within the concentrations of 0.60 to 8.00 (mean=2.48) µg/mL in 18 Spanish red wines
(Lamuella-Raventos et al. (1995) and higher those found in white and red grape juices with not
detectable to 0.9 (mean=0.05) and not detectable to 1.09 (mean=0.5) µg/mL, respectively
(Romero-Perez et al., 1999); dark chocolate and cocoa liquor with 0.40 and 0.50 µg/g,
respectively (Counet et al., 2006); pistachios with 0.07-0.18 (mean=0.12) µg/g (Grippi et al.,
2008); hops with 0.7-2.2 µg/g (Jerkovic and Collin, 2007); and hop pellets with 0.5 µg/g
(Callemien et al., 2005). The levels of trans-resveratrol in chopped US-treated peanuts were lower
compared to those in dried white and red grape berry skins with 11.04-47.60 (mean= 22.03) µg/g
and 18.32-38.26 (mean=25.79) µg/g, respectively, (Romero-Perez et al., 2001).
The trans-piceid concentrations of 0.19-2.44 µg/g obtained by US treatment of chopped
peanuts were higher compared to white grape juices with non-detectable to 0.83 (mean=0.18)
µg/mL (Romero-Perez et al., 1999); dark chocolate and cocoa liquor with 1.00 and 1.20 µg/g,

242
respectively (Counet et al., 2006); within the concentrations of 18 Spanish red wines with mean
of 1.85 (range=0.74 – 4.01) µg/mL in (Lamuella-Raventos et al., 1995) and hop pellets with 2.0
µg/g (Callemien et al., 2005); and within the lower limits of red grape juices with 0.77-7.34
µg/mL (Romero-Perez et al., 1999) and hops with 2.3-7.3 µg/g (Jerkovic and Collin, 2007). The
concentrations of trans-piceid in chopped US-treated peanuts were lower compared to pistachios
with mean of 6.97 (range=6.2-8.15) µg/g (Grippi et al., 2008) and dried white and red grape
skins with 16.58 (range=non-quantifiable to 64.41) µg/g and 64.15 (range=5.49-342.66) µg/g,
respectively.
2. Total phenolics of chopped ultrasound-treated peanuts
Table 4.11 shows the mean total phenolics concentrations of US treated chopped peanuts.
US increased (P< 0.05) the total phenolics of 16 of 27 treated chopped peanuts to 1.37-1.80 mg
GAE/g compared to untreated controls with 0.84 mg GAE/g whereas 11 of 27 treatments with
1.04 – 1.23 mg GAE/g were not different from controls of this study and controls of 0.91-1.14
mg GAE/g reported by Talcott et al. (2005). The amounts of total phenolics were slightly higher
than the total phenolics of 1.09 to 1.38 mg/g reported by Rudolf and Resurreccion (2005) in
chopped peanuts treated with a single dose of US power density of 39.2 mW/cm3 for 4 min at 24-
48 h incubation.
ANOVA of our data (Table 4.8) indicated that only interactions of US power density with
incubation time, and with both exposure time and incubation time, significantly contributed to
the concentrations of total phenolics of US-treated chopped. The main effects of US power
density, US exposure time and incubation time did not significantly contribute to the total
phenolics concentrations of chopped US-treated peanuts.

243
Table 4.11 Concentrations (mean ± standard deviation, dry basis) of of total phenolics, trolox equivalent antioxidant capacity (TEAC), and oxygen radical absorbance capacity (ORAC) total antioxidant capacity (TAC) of roasted chopped ultrasound-treated peanuts and controls1.
Trt # PD PT IC Total Phenolics mgGAE/g
TEAC μM TE/g
H-ORAC μM TE/g
L-ORAC μM TE/g
TAC-ORAC μM TE/g
1 25 2 24 1.2124 ± 0.5466 cdefg
2.9511 ± 0.0128 ab
61.9800 ± 5.6897 abcde
8.9125 ± 2.6482 ijk
70.8950 ± 4.5109 bcdefgh
2 25 2 36 1.8022 ± 0.0150a
2.7729 ± 0.2464 abcdefgh
57.9325 ± 4.7285 bcdef
15.3550 ± 0.4949 de
73.2825 ± 15.1567 abcd efgh
3 25 2 48 1.3712 ± 0.3752 bcdef
3.0065 ± 0.1503a
36.7000 ± 9.3538 ghi
6.0275 ± 2.0586 klm
42.7275 ± 9.5065 kl
4 25 5 24 1.5569 ± 0.0673 abcd
2.81665 ± 0.1241 abcdef
50.1260 ± 5.7234 defgh
8.7160 ± 2.3031 jkl
58.8440 ± 7.9746 ghijk
5 25 5 36 1.2053 ± 0.3143 cdefg
2.9014 ± 0.0022 abcd
34.0800 ± 5.6013 hi
11.640 ± 1.3550 ghij
45.7175 ± 5.5737 jk
6 25 5 48 1.5563 ± 0.3728 abcd
2.9214 ± 0.4166 abc
58.4180 ± 9.2333 bcdef
22.2280 ± 2.8038 ab
80.6460 ± 20.0728 abcd
7 25 8 24 1.2090 ± 0.3404 cdefg
2.3897 ± 0.3771 defgh
50.4975 ± 10.7516 defgh
20.0775 ± 2.4692 bc
70.5750 ± 9.9056 bcdefgh
8 25 8 36 1.4901 ± 0.5439 abcde
2.9000 ± 0.1237 abcd
53.6650 ± 10.7756 cdef
11.4650 ± 0.4340 ghij
65.1350 ± 11.1192 cdefghi
9 25 8 48 1.1877 ± 0.3970 cdefg
2.4944 ± 0.6453 abcdefgh
59.7280 ± 13.8805 abcdef
21.1380 ± 3.7401 ab
80.8680 ± 12.0182 abc
10 50 2 24 1.5993 ± 0.1842 abcd
2.7367 ± 0.2663 abcdefgh
47.9025 ± 3.9253 efgh
12.4050 ± 1.5758 efgh
60.3050 ± 4.5662 fghij
11 50 2 36 1.1260 ± 0.2657 efg
3.0098 ± 0.0596a
51.2125 ± 12.7687 defgh
13.4025 ± 3.0763 efg
64.6175 ± 15.1320 cdefghi
12 50 2 48 1.22955 ± 0.0971 cdefg
2.2966 ± 0.3563gh
57.8550 ± 16.9097 bcdef
19.6500 ± 1.2700 bc
77.5050 ± 17.5028 abcdef

244
Table 4.11 continued…
Trt # PD PT IC Total Phenolics mgGAE/g
TEACμM TE/g
H-ORACμM TE/g
L-ORACμM TE/g
TAC-ORACμM TE/g
13 50 5 24 1.4592 ± 0.1471 abcdef
2.3514 ± 0.5853 efgh
52.0880 ± 10.3238 defg
10.1840 ± 1.5382 hij
62.2760 ± 10.879 efghij
14 50 5 36 1.5931 ± 0.1635 abcd
2.9404 ± 0.4839ab 65.0575 ± 9.3513 abcde
8.9450 ± 0.8868 ijk
74.0000 ± 8.4933 abcdefgh
15 50 5 48 1.6091 ± 0.2496 abc
2.3484 ± 0.4433 efgh
72.1500 ± 12.0976 ab
4.3475 ± 0.9181 m
76.4975 ± 12.9224 abcdefg
16 50 8 24 1.6719 ± 0.0190ab
2.5414 ± 0.4381 abcdefgh
69.7600 ± 12.6688 abc
9.7550 ± 2.22082 hij
79.5175 ± 14.4563 abcde
17 50 8 36 1.1056 ± 0.2348 efg
2.8028 ± 0.5965 abcdefg
51.1350 ± 3.2806 defgh
17.1075 ± 5.9856 cd
68.2450 ± 5.3439 cdefgh
18 50 8 48 1.0455 ± 0.3506 fg
2.4161 ± 0.4753 cdefgh
57.5200 ± 11.6840 bcdef
12.5575 ± 3.9024 efgh
70.0750 ± 14.760 cdefgh
19 75 2 24 1.4393 ± 0.5878 abcdef
2.3427 ± 0.4353 fgh
62.0425 ± 17.9066 abcde
13.5600 ± 0.7442 efg
75.6025 ± 18.1250 abcdefg
20 75 2 36 1.1768 ± 0.2128 defg
2.5202 ± 0.4730 abcdefgh
49.3850 ± 4.51246 efgh
11.6075 ± 1.4875 ghij
60.9875 ± 5.1081 fghijk
21 75 2 48 1.6628 ± 0.1865ab
2.4892 ± 0.6077 bcdefgh
58.3000 ± 17.9108 bcdef
15.1925 ± 3.06314 def
73.4925 ± 16.5316 abcdefgh
22 75 5 24 1.3951 ± 0.3616 abcdef
2.8616 ± 0.1078 abcde
70.7375 ± 16.4217 abc
12.0450 ± 0.3218 fghi
82.7800 ± 16.323 abc
23 75 5 36 1.1900 ± 0.2611 cdefg
2.9770 ± 0.1624ab
76.6750 ± 20.4389 a
11.9050 ± 1.31186 ghij
88.5725 ± 19.4278 ab
24 75 5 48 1.6680 ± 0.2523ab
2.2829 ± 0.4063 h
37.7225 ± 5.6900 fgh
11.3175 ± 0.7410 ghij
49.0400 ± 6.23136 ijk
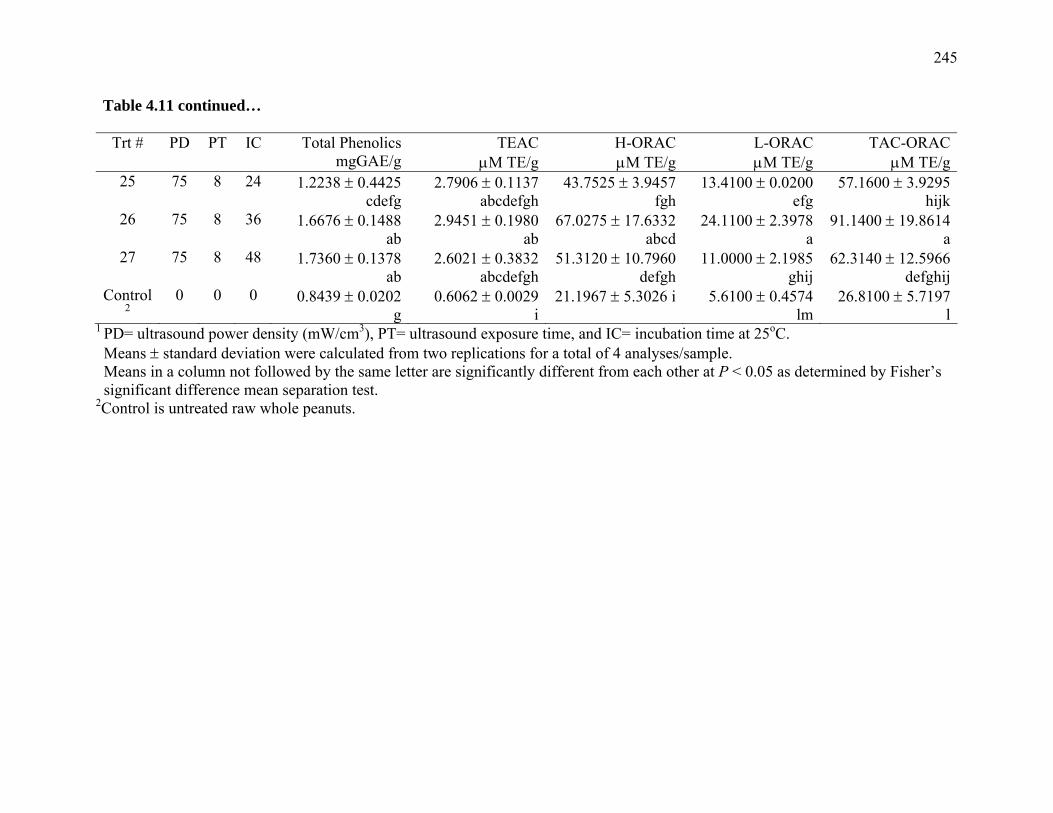
245
Table 4.11 continued…
Trt # PD PT IC Total Phenolics mgGAE/g
TEACμM TE/g
H-ORACμM TE/g
L-ORACμM TE/g
TAC-ORACμM TE/g
25 75 8 24 1.2238 ± 0.4425cdefg
2.7906 ± 0.1137 abcdefgh
43.7525 ± 3.9457 fgh
13.4100 ± 0.0200 efg
57.1600 ± 3.9295 hijk
26 75 8 36 1.6676 ± 0.1488ab
2.9451 ± 0.1980ab
67.0275 ± 17.6332 abcd
24.1100 ± 2.3978 a
91.1400 ± 19.8614 a
27 75 8 48 1.7360 ± 0.1378ab
2.6021 ± 0.3832 abcdefgh
51.3120 ± 10.7960 defgh
11.0000 ± 2.1985 ghij
62.3140 ± 12.5966 defghij
Control2
0 0 0 0.8439 ± 0.0202g
0.6062 ± 0.0029 i
21.1967 ± 5.3026 i 5.6100 ± 0.4574 lm
26.8100 ± 5.7197 l
1 PD= ultrasound power density (mW/cm3), PT= ultrasound exposure time, and IC= incubation time at 25oC. Means ± standard deviation were calculated from two replications for a total of 4 analyses/sample. Means in a column not followed by the same letter are significantly different from each other at P < 0.05 as determined by Fisher’s significant difference mean separation test.
2Control is untreated raw whole peanuts.

246
The maximum total phenolics concentration of 1.80 mg GAE/g achieved in chopped US-
treated peanuts were not significantly different from 1.89 mg GAE/g produced in sliced
ultrasound-treated peanuts and 1.82 mg GAE produced in UV-treated peanuts. The total
phenolics of 1.04-1.80 mg GAE/g in chopped US-treated peanuts obtained in this study were
within the total phenolics of blueberry wines with 0.60-1.86 mg GAE/g (Sanchez-Moreno et al.,
2003), below the lower limits of 1.81-4.58 mg GAE/g in fresh blueberry purees (Prior et al.,
1998) and within the lower concentrations of 1.31-2.39 mg GAE/mL in red wines (Fernandez-
Pachon et al., 2004).
2. TEAC of chopped ultrasound-treated peanuts
Table 4.11 shows the mean TEAC values of chopped US-treated chopped peanuts. US
increased (P< 0.05) TEAC of all 27 treated chopped peanuts with 2.28 to 3.01 μM TE/g
compared to controls with 0.61 μM TE/g. The analysis of variance (Table 4.8) indicated that
only incubation time and the interaction of US power density and exposure time contributed
significantly (P< 0.05) to the TEAC values of chopped US-treated peanuts. Mean separation test
showed that incubation time of 36 h produced the highest mean TEAC of 2.86 μM TE/g
compared to those at 24 and 48 h were not significantly different from each other at levels of
2.64 and 2.54 μM TE/g, respectively.
The maximum TEAC of 3.01 μM TE/g produced in chopped US-treated peanuts was not
different from 3.17 μM TE/g in sliced US-treated and 3.37μM TE/g in sliced UV-treated peanuts.
The TEAC of 2.28-3.01 μM TE/g of chopped US-treated peanuts were below the lower limit of 16
types of red wines with 3.06 to 11.15 µM TE/mL (Fernandez-Pachon et al., 2004).

247
4. Oxygen radical antioxidant capacity (ORAC) of chopped ultrasound-treated peanuts
4.1 Total Antioxidant Capacity (TAC) of chopped ultrasound-treated peanuts
The mean total antioxidant capacities of chopped US-treated peanuts are presented in Table
4.11. US increased (P<0.05) the total antioxidant capacity of 26 of 27 chopped US-treated
peanuts with the range of 45.72 ± 9.51 to 91.14 ± 19.86 μM TE/g compared to 26.81 ± 5.72 µM
TE/g in controls whereas one treatment with 42.73 ± 9.50 μM TE/g was not different from
controls. The analysis of variance (Table 4.8) showed that only the interaction of US power
density and incubation time, and their interaction of exposure time significantly contributed to
the total antioxidant capacity of chopped US-treated peanuts. No main factor significantly
contributed to the total antioxidant capacities of chopped US-treated peanuts.
4.2 H-ORAC of chopped ultrasound-treated peanuts
Table 4.11 shows the mean H-ORAC values of chopped US-treated peanuts. US increased
the H-ORAC in 24 of 27 chopped US-treated peanuts which ranged from 43.75±3.95 to 76.68 ±
20.44 µM TE/g, compared to controls with 21.20 ± 5.30 µM TE/g whereas all other 4 treatments
with 34.08 ± 5.60 to 37.72 ± 5.69 µM TE/g were not different from controls. The analysis of
variance (Table 4.8) showed that US power density and its interactions with incubation time, and
with both exposure time and incubation time significantly contributed to H-ORAC of chopped
US-treated peanuts. Due to interaction effect, the US power density could not be singled out as
the major contributor to the hydrophilic antioxidants in chopped US-treated peanuts. The
maximum H-ORAC of 76.68 µM TE/g in chopped US-treated peanuts were not significantly
different from 78.75 µM TE/g produced in sliced US-treated peanuts suggesting that slicing and
chopping will have the same degree of enhancements of hydrophilic antioxidants in peanuts.

248
4.3 L-ORAC of chopped ultrasound-treated peanuts
Table 4.11 shows the mean L-ORAC values of chopped US-treated peanuts. US increased
the L-ORAC in 24 of 27 treated chopped peanuts with 8.91 ± 2.64 to 24.11± µM TE/g,
compared to 5.61± 0.46 µM TE/g in controls whereas all other 3 treatments were not different
from controls with 4.35 ± 0.92 to 8.72 ± 2.30 µM TE/g.
The analysis of variance (Table 4.8) showed that all main factors and their interactions
significantly contributed to lipophilic antioxidants of chopped US-treated peanuts. The
maximum L-ORAC of 24.11±2.40 µM TE/g in chopped US-treated peanuts was significantly
lower than 32.31 µM TE/g in sliced ultraound-treated peanuts suggesting that slicing enhanced
the lipophilic antioxidants greater than chopping of peanuts.
C. Effect of Ultrasound on the Concentrations of Stillbenes, Total Phenolics, and
Antioxidant Capacities of Whole Peanut Kernels
1. Trans-resveratrol, trans-picied, and total stilbenes of whole ultrasound-treated peanuts
The mean concentrations of trans-resveratrol, trans-piceid and total stilbenes in whole US-
treated peanuts are shown in Table 4.12. US increased (P<0.05) the mean concentrations of
trans-resveratrol to 0.99±1.11 µg/g in only one of 27 treated whole peanuts compared to
controls with 0.02 ±0.002 µg/g, whereas all other 26 treatments with concentrations ranging
from 0.01±0.003 to 0.16±0.009 µg/g were not different from controls. Trans-piceid and total
stilbenes increased in all 27 whole US-treated peanuts with mean concentrations ranging from
0.50±0.04 to 2.60±0.44 µg/g and 0.60±0.06 to 2.76±0.21 µg/g, respectively, compared to
controls with corresponding concentrations of 0.03±0.001 and 0.05± 0.004µg/g. The
concentrations of total stilbenes in whole US-treated peanuts were largely contributed by trans-
piceid rather than trans-resveratrol.

249
Table 4.12 Concentrations (mean ± standard deviation, dry basis) of stilbenes of roasted whole ultrasound-treated peanuts and controls1.
Trt # PD PT IC Trans-Resveratrol μg/g
Trans-Piceid μg/g
Total Stilbenes μg/g
1 25 2 24 0.0102 ± 0.0031b 1.0797 ±0.0054gh 1.0899 ±0.0055hi 2 25 2 36 0.0168 ± 0.0108b 0.9013 ±0.1887hi 0.9181 ±0.1953ij 3 25 2 48 0.0177 ± 0.0015b 1.0779 ±0.0173gh 1.0955 ±0.0188hi 4 25 5 24 0.0109 ± 0.0014b 1.5131 ±0.0392ef 1.5241 ±0.0386g 5 25 5 36 0.0111 ± 0.0030b 1.0682 ±0.0299gh 1.0793 ±0.0272 6 25 5 48 0.0109 ± 0.0030b 1.3062 ±0.1077fg 1.3171 ±0.1082gh 7 25 8 24 0.0141 ± 0.0012b 1.1041 ±0.0516gh 1.1182 ±0.0513hi 8 25 8 36 0.0343 ± 0.0315b 1.3650 ±0.0815fg 1.3992 ±0.0699g 9 25 8 48 0.0229 ± 0.0028b 1.3475 ±0.1110fg 1.3704 ±0.1114g 10 50 2 24 0.1006 ± 0.0075b 2.2509 ±0.0180abc 2.3515 ±0.0186de 11 50 2 36 0.1080 ± 0.0097b 0.5547 ±0.0194ij 0.6627 ±0.0100k 12 50 2 48 0.1405 ± 0.0101b 0.5523 ±0.0200ij 0.6928 ±0.0180jk 13 50 5 24 0.1132 ± 0.0129b 0.5280 ±0.0153ij 0.6412 ±0.0235k 14 50 5 36 0.1122 ± 0.0113b 0.5177 ±0.0132j 0.6300 ±0.0228k 15 50 5 48 0.1598 ± 0.0997b 2.2542 ±0.0585abc 2.4141 ±0.0590cd 16 50 8 24 0.1228 ± 0.0197b 2.5993 ±0.4408a 2.7221 ±0.4604ab 17 50 8 36 0.0959 ± 0.0590b 0.5620 ±0.0535ij 0.6578 ±0.0993k 18 50 8 48 0.1007 ± 0.0162b 0.4948 ±0.0433j 0.5955 ±0.0554k 19 75 2 24 0.0357 ± 0.0100b 2.0757 ±0.1549cd 2.1113 ±0.1620ef 20 75 2 36 0.0386 ± 0.0066b 2.0285 ±0.1704cd 2.0671 ±0.1768f 21 75 2 48 0.0256 ± 0.0030b 2.0850 ±0.0444cd 2.1106 ±0.0462ef 22 75 5 24 0.0292 ± 0.0055b 2.4818 ±0.2067ab 2.5109 ±0.2076bcd 23 75 5 36 0.0252 ± 0.0100b 1.9458 ±0.3356cd 1.9710 ±0.3448f 24 75 5 48 0.0242 ± 0.0069b 2.1028 ±0.1841cd 2.1270 ±0.1886ef 25 75 8 24 0.0321 ± 0.0208b 2.1303 ±0.4200bcd 2.1624 ±0.4289ef 26 75 8 36 0.9875 ± 0.1142a 1.7769 ±1.0638de 2.7643 ±0.1218a 27 75 8 48 0.0208 ± 0.0011 2.5965 ±0.1958a 2.6173 ±0.1969abc
Control2 0 0 0 0.0212 ± 0.0020h 0.0271 ±0.0010k 0.0482 ±0.0046 l 1 PD= ultrasound power density (mW/cm3), PT= ultrasound exposure time, and IC= incubation
time at 25oC. Means ± standard deviation were calculated from two replications for a total of 4 analyses/sample.
Means in a column not followed by the same letter are significantly different from each other at P < 0.05 as determined by Fisher’s significant difference mean separation test.
2Control is untreated raw whole peanuts.

250
The analysis of variance (Table 4.8) indicated that except for the main effects of US exposure
and incubation times, their interactions with other factors and the main factor of power density
significantly (P<0.05) contributed to the concentrations of trans-resveratrol in whole peanuts.
The concentrations of trans-piceid in sliced peanuts were significantly contributed by all factors
and their interactions excluding the interaction effect of power density and esposure time. All
factors and their interactions significantly contributed to the concentrations of total stilbenes in
sliced peanuts. Due to interaction effects, no main effect could be singled out as the major
contributor to the concentrations of trans-resveratrol, trans-piceid, and total stilbenes in whole
US-treated peanuts.
The maximum trans-resveratrol and total stilbenes concentrations of 0.99 and 2.76 µg/g in
whole US-treated peanuts were significantly lower than those sliced peanuts with 6.39 and 9.81
µg/g, respectively (Table 4.10). The maximum trans-resveratrol 0.99 µg/g produced in whole
US-treated peanuts, although lower than 2.91 µg/g in chopped peanuts, was not significant
different. Whole US-treated peanuts had a maximum trans-piceid concentration of 2.60 µg/g
which was not significantly different from chopped with 2.44 µg/g but significantly lower
compared to sliced peanuts with 6.39 µg/g. These findings suggests that less severe size
reduction through slicing will further enhance the synthesis of stilbenes in peanuts more than
chopping. Whole US-treated peanuts had lower maximum trans-resveratrol and total stilbenes
concentrations but higher trans-piceid compared to UV-treated peanuts with 3.30, 4.00 µg/g, and
1.05, respectively.
Whole US-treated sliced peanuts had lower trans-resveratrol but higher trans-piceid and total
stilbenes compared to blended peanut butters with 0.41+0.02, 0.13+0.01, and 0.54+0.03 µg/g,

251
respectively, and 100% natural peanut butters with 0.65+0.02, 0.14+0.01, and 0.814+0.03 µg/g,
respectively (Ibern-Gomez et al., 2000).
Whole US-treated peanuts produced 0.01-0.99 µg/g trans-resveratrol of producedwhich were
higher than pistachios with 0.07-0.18 (mean=0.12) µg/g (Grippi et al., 2008); within the
concentrations of 0.40 and 0.50 µg/g in dark chocolate and cocoa liquor, respectively (Counet et
al., 2006) and 0.5 µg/g in hop pellets (Callemien et al., 2005); and within the lower limit of 0.60 to
8.00 (mean=2.48) µg/mL in 18 Spanish red wines (Lamuella-Raventos et al. (1995), in white and
red grape juices with not detectable to 0.9 (mean=0.05) µg/mL and not detectable to 1.09
(mean=0.5) µg/mL, respectively (Romero-Perez et al., 1999), and in hops with 0.7-2.2 µg/g
(Jerkovic and Collin, 2007). The levels of trans-resveratrol in whole US-treated peanuts were
lower compared to 11.04-47.60 (mean= 22.03) µg/g and 18.32-38.26 (mean=25.79) µg/g in dried
white and red grape berry skins, respectively (Romero-Perez et al., 2001).
The trans-piceid concentrations of 0.50-2.60 µg/g obtained by US treatment of whole
peanuts were higher compared to white grape juices with non-detectable to 0.83 (mean=0.18)
µg/mL (Romero-Perez et al., 1999); dark chocolate and cocoa liquor with 1.00 and 1.20 µg/g,
respectively (Counet et al., 2006); within the concentrations of 18 Spanish red wines with mean
of 1.85 (range=0.74 – 4.01) µg/mL (Lamuella-Raventos et al., 1995), and hop pellets with 2.0
µg/g (Callemien et al., 2005); and within the lower limits of red grape juices with 0.77-7.34
µg/mL (Romero-Perez et al., 1999) and hops with 2.3-7.3 µg/g (Jerkovic and Collin, 2007). The
concentrations of trans-piceid in whole US-treated peanuts were lower compared to pistachios
with mean of 6.97 (range=6.2-8.15) µg/g (Grippi et al., 2008) and dried white and red grape
skins with 16.58 (range=non-quantifiable to 64.41) µg/g and 64.15 (range=5.49-342.66) µg/g,
respectively.

252
2. Total phenolics of whole ultrasound-treated peanuts
Table 4.13 shows the mean total phenolics concentrations of US-treated whole peanuts. US
increased (P< 0.05) the total phenolics of all 27 treated chopped peanuts to 1.14-1.84 mg GAE/g
compared to untreated controls with 0.84 mg GAE/g. The amounts of total phenolics were
slightly higher than the total phenolics of 1.31 to 1.47 mg/g reported by Rudolf and Resurreccion
(2005) in whole peanuts treated with a single dose of US power density of 39.2 mW/cm3 for 4
min at 24-48 h incubation. ANOVA of our data (Table 4.8) indicated that all main effects- US
power density and exposure time and incubation time, and the interaction of power density and
exposure time significantly contributed to the total phenolics concentrations of whole US-treated
peanuts.
The maximum total phenolics concentration of 1.84 mg GAE/g achieved in whole US-treated
peanuts were not significantly different from 1.89 and 1.80 mg GAE/g produced in sliced and
chopped US-treated peanuts, respectively, and from 1.82 mg GAE/g obtained in UV-treated
sliced peanuts. The total phenolics of 1.14-1.84 mg GAE/g in chopped US-treated peanuts
obtained in this study were within the total phenolics of blueberry wines with 0.60-1.86 mg
GAE/g (Sanchez-Moreno et al., 2003), and within the lower limits of 1.81-4.58 mg GAE/g in
fresh blueberry purees (Prior et al., 1998) and 1.31-2.39 mg GAE/mL in red wines (Fernandez-
Pachon et al., 2004).
3. TEAC of whole ultrasound-treated peanuts
Table 4.13 shows the mean TEAC values of US-treated whole peanuts. US increased (P<
0.05) TEAC of all 27 treated whole peanuts with 2.28 to 3.18 μM TE/g compared to controls
with 0.61 μM TE/g. The analysis of variance (Table 4.8) indicated that incubation time, and its
interactions with US exposure time and with US power density and exposure time, significantly

253
Table 4.13 Concentrations (mean ± standard deviation, dry basis) of total phenolics, trolox equivalent antioxidant capacity (TEAC), and oxygen radical absorbance capacity (ORAC) total antioxidant capacity (TAC) of roasted whole ultrasound-treated peanuts and controls1.
Trt # PD PT IC Total Phenolics, mgGAE/g
TEAC, μM TE/g
H-ORAC, μM TE/g
L-ORAC, μM TE/g
TAC-ORAC, μM TE/g
1 25 2 24 1.3408 ± 0.0981ef
2.1600 ± 0.0157fgh
24.4350 ± 6.6097 ef
4.9700 ± 1.774 hi
29.4025 ± 7.6162 fgh
2 25 2 36 1.6148 ± 0.2855 abcd
2.6099 ± 0.5175 abcdefgh
24.2600 ± 5.3332def
5.7600 ± 1.7138 ghi
30.0175 ± 6.7564 efgh
3 25 2 48 1.5906 ± 0.1340 abcde
2.8027 ± 0.4255 abcde
27.3050 ± 8.1658cdef
6.3950 ±1.4325 ghi
33.7025 ± 7.7593 defgh
4 25 5 24 1.3764 ± 0.0968 def
1.9916 ± 0.0381 h 30.5975 ± 7.2396bcdef
3.6050 ±1.3964i
34.2025 ± 6.5433 defgh
5 25 5 36 1.4666 ± 0.0953 cde
2.9499 ± 0.1592 abcd
26.9300 ± 7.2457cdef
10.4275 ± 2.2625 abcde
37.3550 ± 8.4741 bcdefgh
6 25 5 48 1.6210 ± 0.0430 abcd
2.5768 ± 0.5623 abcdefgh
29.9375 ± 7.0309cdef
8.1125 ± 3.6847 defg
38.0500 ± 8.7599 bcdefgh
7 25 8 24 1.5824 ± 0.0148 abcde
3.1332 ± 0.2544 ab
20.3350 ± 3.8471f
6.5675 ± 1.9980 fghi
26.9050± 2.5660
8 25 8 36 1.8159 ± 0.1981a 2.6040 ± 0.6969 abcdefgh
24.8375 ± 7.7150def
4.9000 ± 2.8798i
29.7400 ± 8.0889 efgh
9 25 8 48 1.7920 ± 0.1457ab 2.5996 ± 0.6192 abcdefgh
26.1375 ± 7.3142cdef
10.7050 ± 2.9737 abcd
36.8425 ± 6.4548 cdefgh
10 50 2 24 1.5078 ± 0.1280 cde
2.4009 ± 0.7013 defgh
21.2450 ± 3.6711ef
6.8950 ±1.3135 efgh
28.1375 ± 3.8209 gh
11 50 2 36 1.5400 ± 0.1281 bcde
2.8496 ± 0.2102 abcde
26.0650 ± 2.9290cdef
8.2325 ± 3.9846cdefg
34.2950 ± 6.3943 defgh
12 50 2 48 1.8355 ± 0.3939a 2.4704 ± 0.4190 cdefgh
24.5150 ± 5.4604def
13.2575 ±3.5487 a
37.7725 ± 7.9370 bcdefgh

254
Table 4.13 continued… Trt # PD PT IC Total Phenolics,
mgGAE/g TEAC, μM TE/g
H-ORAC, μM TE/g
L-ORAC, μM TE/g
TAC-ORAC, μM TE/g
13 50 5 24 1.4476 ± 0.1010 cde
2.0191 ± 0.1419 gh
29.9950 ± 1.3086 cdef
8.2175 ± 0.3743 defg
38.2150 ± 1.6168 bcdefg
14 50 5 36 1.1424 ± 0.3259f 2.3151 ± 0.4622 efgh
40.8000 ± 1.2706b
7.5925 ± 1.3934 efgh
48.3950 ±11.0960 b
15 50 5 48 1.4250 ± 0.1224 de
3.1792 ± 0.2002a
25.6875 ± 2.7687cdef
8.1475± 1.3597 defg
33.8350 ± 4.0121 defgh
16 50 8 24 1.4167 ± 0.1523 de
2.5358 ± 0.2952 bcdefgh
28.8300 ± 1.7223cdef
12.1625 ± 2.5016 ab
40.9900 ± 1.3305 bcde
17 50 8 36 1.4490 ± 0.0368 cde
2.7412 ± 0.5325 abcdef
24.1000 ± 2.0194 def
11.4975 ± 2.0545 ab
35.6000 ± 3.4908 defgh
18 50 8 48 1.5280 ± 0.1890 bcde
2.7173 ± 0.3862 abcdef
66.9425 ±18.0597a
8.4350 ±1.0508cdefg
75.3775 ±17.2889 a
19 75 2 24 1.6398 ± 1.6398abcd
2.6780 ± 0.3009 abcdef
27.9925 ± 6.1507cdef
6.3075± 2.6470fghi
34.2975 ± 8.7363 defgh
20 75 2 36 1.8180 ± 0.2434a 2.4648 ± 0.6244 cdefgh
33.9900 ± 9.2933bcd
10.8500 ±1.9915 abcd
44.8400 ± 7.5435 bcd
21 75 2 48 1.8437 ± 0.2770a 2.5890 ± 0.4122 abcdefgh
32.3375 ± 8.3851 bcd
10.9950 ±3.6861 abcd
43.3350 ± 8.4607 bcd
22 75 5 24 1.5297 ± 0.1750 bcde
2.4765 ± 0.6856 bcdefgh
29.5725 ± 2.8948cdef
10.5225 ± 1.5572 abcde
40.0925 ± 2.9426 bcdef
23 75 5 36 1.5156 ± 0.1064 cde
3.0356 ± 0.2010 abc
26.8900 ± 8.2645cdef
9.2475 ± 1.65999 bcdef
36.1425 ± 9.7593 cdefgh
24 75 5 48 1.5939 ± 0.1007 abcde
2.7358 ± 0.6568 abcdef
24.7875 ± 6.2986def
11.2750 ± 0.5319 abc
36.0650 ± 6.4150 cdefgh

255
Table 4.13 continued…
Trt # PD PT IC Total Phenolics, mgGAE/g
TEAC, μM TE/g
H-ORAC, μM TE/g
L-ORAC, μM TE/g
TAC-ORAC, μM TE/g
25 75 8 24 1.7118 ± 0.0924 abc
2.6364 ± 0.6263 abcdef
34.1000 ± 9.6919bcd
10.6550 ± 0.3627 abcd
44.7550 ±10.0036 bcd
26 75 8 36 1.6134 ± 0.0858 abcd
3.0280 ± 0.1389 abcd
31.7950 ±10.2943bcde
10.3225 ±0.6939abcde
42.1150 ±10.1592 bcd
27 75 8 48 1.5224 ± 0.5025 bcde
2.6327 ± 0.5859 abcdef
35.7825 ±10.6806 bc
11.1425 ±1.4593 abcd
46.9250 ±11.8918 bc
Control2
0 0 0 0.8439 ± 0.0202 g
0.6062 ± 0.0029i
21.1967 ± 5.3026ef
5.6100 ± 0.4574 ghi
26.8100 ± 5.7197 2 h
1 PD= ultrasound power density (mW/cm3), PT= ultrasound exposure time, and IC= incubation time at 25oC. Means ± standard deviation were calculated from two replications for a total of 4 analyses/sample. Means in a column not followed by the same letter are significantly different from each other at P < 0.05 as determined by Fisher’s significant difference mean separation test.
2Control is untreated raw whole peanuts.

256
(P< 0.05) contributed to the TEAC values of whole US-treated peanuts peanuts. Due to
interaction effects, incubation time could not be singled out as the major contributor to the TEAC
of whole US-treated peanuts.
The maximum TEAC values achieved in whole US-treated peanuts were not significantly
different from those produced in sliced and chopped US treated peanuts suggesting that size
reduction had no effect in enhancing the TEAC values of US-treated peanuts. The TEAC values of
2.28 to 3.18 μM TE/g μM TE/g in whole US-treated peanuts were within the lower limit of 16
types of red wines with 3.06 to 11.15 µM TE/mL (Fernandez-Pachon et al., 2004).
4. Oxygen radical antioxidant capacity (ORAC) of whole ultrasound-treated peanuts
4.1 Total Antioxidant Capacity (TAC) of whole ultrasound-treated peanuts
The mean total antioxidant capacities of chopped US-treated peanuts are presented in Table
4.13. US increased (P<0.05) the total antioxidant capacity of only 10 of 27 US-treated whole
peanuts with the range of 38.22 – 75.38 μM TE/g compared to 26.81 µmol TE/g in controls
whereas all other 17 treatments with 26.91-38.05 μM TE/g were not different from controls.
The analysis of variance (Table 4.8) showed that all factors and their interactions, excluding the
interaction of US power density with incubation time significantly contributed to the total
antioxidant capacity of whole US-treated peanuts. Due interaction effects, no main factor could
be singled out as the major contributor to the total antioxidant capacities of whole US-treated
peanuts.
4.2 H-ORAC of chopped ultrasound-treated peanuts
Table 4.13 shows the mean H-ORAC values of whole US-treated peanuts. US increased the
H-ORAC in only seven of 27 whole US-treated peanuts with concentrations ranging from 31.80-
66.94 µM TE/g, compared to controls with 21.20 µM TE/g whereas all other 20 treatments with

257
20.34-30.60 µM TE/g were not different from controls. The analysis of variance (Table 4.8)
showed that except for the interaction of US power density and incubation time, all main and
interaction effects significantly contributed to H-ORAC of whole US-treated peanuts. The
maximum H-ORAC of 66.94 µM TE/g in US-treated wholed peanuts were not significantly
different from 78.75 and 76.68 µM TE/g produced in sliced and chopped US-treated peanuts,
respectively, suggesting that slicing and chopping will not further enhance of hydrophilic
antioxidants in US-treated peanuts.
4.3 L-ORAC of whole ultrasound-treated peanuts
Table 4.13 shows the mean L-ORAC values of whole US-treated peanuts. US increased the
L-ORAC in 18 of 27 treated chopped peanuts with 8.11-13.26 µM TE/g, compared to 5.61 µM
TE/g in controls whereas all other 9 treatments were not different from controls with 3.61-7.59
µM TE/g. ANOVA (Table 4.8) showed that except for the interaction of US power density with
either US exposure or incubation times, all main and interaction effects significantly contributed
to lipophlic antioxidants whole US-treated peanuts. Due to interaction effects, no main factor
could be singled out as the major contributor to the L-ORAC of whole US-treated peanuts.
The maximum L-ORAC of 13.26 µM TE/g in whole US-treated peanuts was significantly
lower than 24.11 and 32.31 µM TE/g in chopped and sliced US-treated peanuts; and sliced had
the greatest increase. This finding suggests that size reductions such as chopping and slicing
further enhanced the lipophilic antioxidants in US-treated peanuts and less severe damage to the
cells such as slicing produced the greatest enhancements of lipophilic antioxidants.

258
D. Comparison of the Maximum Levels of Stilbenes, Total Phenolics and Antioxidant
Capacities of the Different Sizes of Ultrasound Treated Peanuts
Table 4.14 shows the comparison of the maximum concentrations of stilbenes and total
phenolics, and antioxidant capacities produced in sliced, chopped and whole US-treated peanuts.
Results showed that sliced peanuts obtained significantly highest (P>0.05) trans-resveratrol and
trans-piceid concentrations, compared to chopped and whole peanuts. The trans-resveratrol
concentration, although higher in chopped peanuts was not significantly different from whole
peanuts. Trans-piceid concentrations were not significantly different between chopped and
whole US-treated peanuts. This result confirms the previous findings of Rudolf and
Resurreccion (2005) who observed increased trans-resveratrol concentrations of US-treated
peanuts as the severity of damage to the cells through size reduction decreased, from 0.75 µg/g
in ground (1-2 mm) peanuts to 1.3 µg/g in chopped (2-5 mm), and the highest concentration of
3.96 µg/g in sliced (~7 mm) peanuts. The whole US-treated peanuts had a maximum trans-
resveratrol of 1.60 µg/g (Rudolf and Resurreccion, 2005) suggesting that wounding is necessary
to achieve the maximum enhancement of trans-resveratrol biosynthesis in peanuts.
No significant differences in the total phenolics concentrations and TEAC values were observed
between chopped, sliced and whole US-treated peanuts. This finding verified the results of
Rudolf and Resurreccion (2005) who found no significant differences in the total phenolics and
antioxidant capacities of ground, chopped, sliced and whole US-treated peanuts. Similarly, the
hydrophilic ORAC and total antioxidant capacities did not differ significantly between chopped,
sliced and whole US-treated peanuts. On the basis of lipophilic antioxidants, slicing produced
the highest antioxidant capacity, followed by chopping and whole peanuts had the least,

259
Table 4.14 Maximum concentrations (mean ± standard deviation, dry basis) of stilbenes, total phenolics, and antioxidants in ultrasound-treated chopped, sliced, and whole ultrasound-treated peanuts1 Compound Sliced Chopped Whole
Trans-resveratrol,µg/g 6.3892±2.1520a 2.9095± 0.0778b 0.9875±0.1142b
Trans-piceid, µg/g 6.3927± 2.2708a 2.4443±0.0672b 2.5993±0.4408b
Total stilbenes, µg/g 9.8620±0.8221a 5.0617± 0.1783b 2.7643±0.1217c
Total phenolics, mgGAE/g 1.8882±0.1454a 1.8022±0.0150a 1.8438±0.2770a
TEAC, µM TE/g 3.1741±0.1969a 3.0098±0.0596a 3.1793± 0.2002a
Hydrophilic ORAC, µM TE/g
78.75 ± 24.37a 76.68 ± 20.44a 66.94±18.06a
Lipophilic ORAC, µM TE/g
32.31± 7.24a 24.11± 2.40b 13.26± 3.55c
Total Antioxidant Capacity µM TE/g
97.92 ± 31.88a 91.14 ± 19.86a 75.38± 17.29a
1Means not followed by the same letter within each row are not significantly (P<0.05) different from each other as determined by Fisher’s least significant difference mean separation

260
suggesting that mild damage to the cell through slicing is needed to achieve the greatest
enhancement of lipophilic antioxidants in US-treated peanuts.
The above findings confirmed that slicing of peanuts prior to US treatment produced the
highest maximum concentrations of trans-resveratrol in peanuts. Process optimization for US
using sliced peanut was therefore performed to determine the process parameters that will
produce peanuts with the highest concentrations of trans-resveratrol, total phenolics
andantioxidant capacities.
E. Consumer Overall Acceptance of Ultrasound-Treated Peanuts
Table 4.15 presents the consumers’ mean overall acceptance hedonic ratings of US-treated
peanuts. Consumer test results showed that the overall acceptance ratings of all US-treated
peanuts regardless of size ranged from 4.2 ± 2.5 to 6.0 ± 1.8 or neither like nor dislike, and were
lower (P< 0.05) than that of controls with 7.4 ± 1.4. Sliced, chopped, and whole US-treated
peanuts had overall acceptance rating of 5.0, 5.0 and 5.1 or neither like nor dislike which were
not significantly different from each other, but significantly lower compared to UV treatment
with 5.7 ± 1.7 or near like slightly. UV-treated peanuts were not expected to have high overall
acceptance compared to US-treated peanuts as UV exposure results in the development of off-
flavors in food due to the initiation of lipid peroxidation (Duh and Yen, 1995). The presence of
higher levels of trans-resveratrol, trans- piceid and polyphenolic antioxidants in US- compared
to UV-treated sliced peanuts may have resulted in lower acceptance of all sizes of US-treated
samples compared to UV. In food, phenolics may contribute to the bitterness, astringency, color,
flavor, and odor of food (Naczk and Shahidi, 2006) resulting in lower overall acceptance of US-
treated peanuts. This finding poses challenge to the researchers in finding ways to mask the off-
flavors/tastes in US-treated peanuts in food applications.

261
Table 4.15 Consumers’ overall acceptance rating (mean ± standard deviation) for roasted ultrasound-treated sliced, chopped, and whole peanuts and controls1 Treatment # PD PT IC Sliced Chopped Whole
1 25 2 24 5.5 + 1.8bcde 4.8 ± 2.2efghij 5.2 ± 1.4 bcdefghi 2 25 2 36 5.0 + 1.8cdefghi 5.2 ± 2.0bcdef 5.2 ± 1.7bcdefghi 3 25 2 48 4.4 + 2.0ij 5.2 ± 2.6bcdef 5.5 ± 2.0bcdefg 4 25 5 24 4.9 + 1.8defghij 5.2 ± 1.8bcdefg 5.3 ± 1.8bcdefgh 5 25 5 36 5.3 + 1.7bcdefg 5.7 ± 1.7bcd 5.0 ± 2.0defghi 6 25 5 48 5.2 + 1.6cdefgh 4.9 ± 2.2defghi 4.5 ± 1.8ijk 7 25 8 24 4.6 + 2.1ghij 5.3 ± 1.6bcdef 5.3 ± 1.4bcdefgh 8 25 8 36 4.9 + 2.3defghij 4.7 ± 2.1fghij 5.5 ± 2.1bcdef 9 25 8 48 4.7 + 2.2fghij 5.1 ± 2.5cdefgh 4.9 ± 2.1efghij 10 50 2 24 6.0 + 1.8b 5.8 ± 2.0bc 5.1 ± 2.2cdefghi 11 50 2 36 4.5 + 2.0hij 4.3 ± 2.1ghij 5.3 ± 2.1bcdefgh 12 50 2 48 4.2 + 2.5j 4.2 ± 1.9ij 3.8 ± 1.9k 13 50 5 24 4.5 + 2.3hij 5.4 ± 2.0bcdef 5.9 ± 1.6b 14 50 5 36 4.8 + 2.0defghij 5.3 ± 2.1bcdef 4.8 ± 1.9fghij 15 50 5 48 5.4 + 2.5bcdef 5.3 ± 2.0bcdef 5.7 ± 1.8bcd 16 50 8 24 5.4 + 2.0bcdef 5.6 ± 2.2bcde 5.3 ± 1.5bcdefgh 17 50 8 36 5.8 + 2.3bc 5.3 ± 1.8bcdef 5.6 ± 1.8bcde 18 50 8 48 4.7 + 2.0efghij 5.0 ± 2.3defgh 5.8 ± 2.0bc 19 75 2 24 5.0 + 1.9cdefghi 6.0 ± 2.0b 4.7 ± 2.2hij 20 75 2 36 5.3 + 2.0bcdefg 5.0 ± 2.0defghi 5.1 ± 1.7cdefghi 21 75 2 48 5.2 + 1.8cdefgh 4.1 ± 2.0j 4.6 ± 1.9hij 22 75 5 24 6.0 + 1.6b 5.0 ± 2.1cdefgh 4.5 ± 2.3ijk 23 75 5 36 4.6 + 2.5ghij 4.6 ± 2.1fghij 5.8 ± 2.0bc 24 75 5 48 4.5 + 2.4hij 4.3 ± 1.9ghij 4.9 ± 2.4efghij 25 75 8 24 4.5 + 2.4hij 5.4 ± 1.9bcdef 4.7 ± 2.6ghij 26 75 8 36 5.2 + 2.2cdefgh 5.2 ± 1.9bcdefg 4.2 ± 2.2jk 27 75 8 48 5.6 + 2.5bcd 4.3 ± 2.2hij 4.9 ± 1.9efghij
Control3 120 0 0 7.4 ± 1.3a 7.4 ± 1.3a 7.4 ± 1.3a Overall mean
5.0 ± 2.1
5.0 ± 2.1
5.1± 2.0
1 PD = distance ultrasound power density; PT = ultrasound exposure time; IC = incubation time at 25oC. 2 Rating based on 9-point hedonic rating where 1 = dislike extremely, 5= neither like nor dislike,
and 9=like extremely. Means ± standard deviation were calculated from two replications for a total 50 analyses/sample for overall acceptance. Means within the column not followed by the same letter are significant (P<0.05) different from each other as determined by Fisher’s Least Significant Difference mean separation test.
3Control is untreated roasted whole peanuts

262
The analysis of variance (Table 4.8) showed that US power density, interactions of US
exposure and incubation time, and their interaction with incubation time significantly contributed
to the overall acceptance of sliced US-treated peanuts. In chopped US treated peanuts, the major
significant contributors to overall acceptance were incubation time and its interaction with power
density. The overall acceptance of whole US-treated peanuts were significantly contributed by
US power density, its interaction with US exposure time, and their interaction with incubation
time. Due to interaction effects, no main factor could be singled out as the major contributor to
the overall acceptance of sliced, chopped, and whole US-treated peanuts.
F. Modeling, Mapping of Contour Plots, and Region of Overlap in Sliced Ultrasound-
Treated Peanut Kernels
Only the parameters for sliced peanuts and notchopped or whole US-treated peanuts were
subjected to process optimization study as findings showed that slicing produced the highest trans-
resveratrol in all treated samples. Table 4.16 shows the significant regression models, coefficients
of determination (R2) and P-values for the response variables - trans-resveratrol, total stilbenes, H-
ORAC, L-ORAC, total antioxidant capacity, TEAC, total phenolics, and overall acceptance for US
treated peanuts. The P–values for the models of trans-resveratrol and
total stilbenes were <0.0001 to 0.05 indicating that the models were highly significant in
predicting these models. However, their R2 values of 0.42, 0.29, 0.22, 0.27, 0.22, 0.29, 0.42 and
0.01 were low indicating that 42, 29, 22, 27, 22, 29, 42 and 1% of the variability in the
resveratrol, trans-resveratrol, total stilbenes, H-ORAC, L-ORAC, total antioxidant capacity,
TEAC, total phenolics, and overall acceptance, respectively, is explained by the predictors – US
power density, US exposure time and incubation. Contour plots were generated from the full

263
Table 4.16 Regression coefficients for the significant prediction models for trans-resveratrol, total stilbenes, antioxidant capacities, total phenolics, and overall acceptance of sliced ultrasound-treated peanuts1.
Coefficients Trans-
Resveratrol Total Stilbenes
H-ORAC L-ORAC TAC-ORAC TEAC Total Phenolics
Overall Acceptance
Intercept
11.56110 -0.01809 2.3779 43.7372 14.6726 -0.0181 0.8203 6.89889
Linear
PD -0.45346 -0.33600 -0.0101 -0.1881 0.6453 -0.3360 -0.0098 -0.00603PT -0.51448 1.12147 -0.0478 -4.0247 -9.2275 -0.0478 0.0679 -0.36148IC -0.11287 0.34505 0.0471 -1.7566 1.8556 0.0471 0.0613 0.04417
Quadratic
PD*PD 0.00399 0.00305 -0.00009 -0.0051 -0.0134 0.00009 0.000002 -0.00004 PT*PT -0.01025 -0.13594 -0.0013 -0.0593 -0.5279 -0.0013 0.0019 -0.00370 IC*IC 0.00123 -0.00482 -0.0007 0.0123 -0.0233 - 0.0007 -0.0008 -0.00030 Interaction
PD*PT 0.01733 -0.01041 0.0009 0.1154 0.0411 0.00092 0.00147 0.00186 PD*IC 0.00215 0.00211 0.00015 0.0205 0.0138 0.00015 -0.00003 0.00030 PT*IC -0.15660 -0.00724 -0.0039 0.1711 -0.1162 -0.00388 -0.00039 0.09440 PD*PT*IC -0.00045 -0.00034 -0.000007 0.0037 -0.0014 0.00004 0.000004 -0.00004 Adjusted R2 0.42 0.29 0.22 0.27 0.22 0.29 0.42 0.01P-value <0.0001 <0.0001 0.0023 0.0001 0.0016 <0.0001 <0.0001 0.05321 H-ORAC=hydrophilic ORAC, L-ORAC=lipophilic ORAC, TAC-ORAC (Total antioxidant capacity by oxygen radical absorbance
capacity assay), TEAC=trolox equivalent antioxidant capacity by ABTS anion scavenging capacity assay, Total phenolics by Folin Ciocalteau assay, Overall acceptance using 9-point hedonic rating scale, PD=ultrasound power density, PT=ultrasound exposure time, and IC=incubation time at 25oC.

264
models because their R2 were low and could not be further reduced as determined by a
significant difference when a variable was dropped from the model.
1. Predicted trans-resveratrol concentrations in sliced ultrasound-treated peanuts
The contour plot for the significant regression model for trans-resveratrol is shown in Figure
4.11. Some process combinations of US power density, exposure time and incubation time
achieved the targeted 2.64 µg/g or 100% of trans-resveratrol in red wines (McMurtrey, 1994).
The trans-resveratrol increased as US power density approached 75 and 25 mW/cm3, with higher
maximum at 75 mW/cm3 regardless of US exposure time from 2-8 min, and with minimum
trans-resveratrol at 44-48 mW/cm3 power density. The areas of minimum trans-resveratrol
concentrations decreased further as incubation time increased from 24-48 h. The highest trans-
resveratrol of 4.4 µg/g was obtained when peanuts were incubated for 48 h and treated with 75
mW/cm3 power density regardless of exposure time from 2-8 min. The results indicated that at
the longest incubation time of 48 h, high trans-resveratrol > 3.96 µg/g or >150% trans-
resveratrol that in red wines will be achieved by treatment with high power densities of 71-75
mW/cm3 for 2-6 min. At medium power densities, e.g. 40-55 mW/cm3, lower trans-resveratrol
concentrations of 0.15 to 1.3 µg/g were predicted.
2. Predicted total stilbenes concentrations in sliced ultrasound-treated peanuts
Figure 4.11 shows the contour plot for the significant regression model of total stilbenes. The
process combinations of US power density, exposure time and incubation time met the targeted total
stilbenes of 4.33 µg/g (Lamuella-Raventos et al., 1995) or 100% in red wines. The total stilbenes is
the sum of trans-resveratrol and trans-piceid concentrations. While trans-piceid concentrations vary
throughout the experimental design, their models were not significant (P<0.05), but contributed t o

265
Figure 4.11 Contour plots for the significant prediction models for trans-resveratrol (µg/g) and total stilbenes (µg/g) of ultrasound treated peanuts, as affected by ultrasound power density and exposure times at specified incubation times at 25oC. Contour plots are shaded to cover the areas that meet regions of interest or the maximum concentrations achieved.

266
the total stilbenes. At 45 mW/cm3, the amount of total stilbenes was minimum, and decreased as
exposure time was either increased or decreased from 5 min. The highest predicted total stilbenes
of 6.5 µg/g, was reached at 75 mW/cm3 for 2-6 min when incubated for 48 and 36 h. Results
indicated that both higher and lower power densities of 65-75 and 25-35 mW/cm3 resulted in
higher total stilbenes, reaching a maximum when using higher power densities, e.g., 75 mW/cm3.
3. Predicted total antioxidant capacity in sliced ultrasound-treated peanuts
The contour plot for the significant regression model of total antioxidant capacity is shown in
Figure 4.12. The process combinations of US power density, exposure time and incubation time
produced the targeted 38.73 µM TE/g corresponding to 100% of total antioxidant capacity in red
wines. However, a higher total antioxidant capacity of 67.78 µM TE/g or 175% total antioxidant
capacity in red wines was achieved and reflected in the shaded area in the contour plot. A
higher total antioxidant capacity was produced as 36 h incubation time was reached, and was
minimum at incubation time of 24 and 48 h. A maximum total antioxidant capacity of 86 µM
TE/g or 222% of TAC in red wines was obtained when peanuts were incubated for 36 h and US
treated for 4.0-4.8 min at power densities of 38-45 mW/cm3.
4. Predicted H-ORAC in sliced ultrasound-treated peanuts
Some process combinations of US power density, exposure time and incubation time met the
targeted minimum of 38.73 µM TE/g or 100% H-ORAC in red wines as shown in Figure 4.12.
However, 58.10 µM TE/g was achieved which correspond to 150% TAC in red wines and
shaded areas of the contour plots reflect these values. The highest H-ORAC values was obtained
as 36h incubation is reached, and decreased when incubation time was either decreased to 24h or
increased to 48h. A maximum H-ORAC of 70 µM TE/g, equal to 181% H-ORAC in red wines

267
Figure 4.12 Contour plots for the significant prediction models for hydrophilic ORAC (H-ORAC), lipophilic ORAC (L-ORAC), total antioxidant capacity (TAC), total phenolics, TEAC, and sensory overall acceptance of ultrasound-treated peanuts as affected by ultrasound power density and exposure times at specified incubation times at 25oC.

268
was produced when peanuts were incubated for 36h and exposed to US for 2.0-4.8 min at PD of
27-45 mW/cm3.
5. Predicted L- ORAC in sliced ultrasound-treated peanuts
The process combinations of US power density, US exposure time, and incubation time did
not achieve the targeted 38.73 µM TE/g L-ORAC so the contour plot was not shaded (Figure
4.12). The L-ORAC increased with increasing US exposure from 2-8 min. The highest L-ORAC
of 20 µM TE/g was achieved when peanuts were incubated for 48 h after exposure to US for 8
min at power densities of 25-48 mW/cm3.
6. Predicted total phenolics concentrations in sliced ultrasound-treated peanuts
No process combination of US power density, US exposure time, and incubation time
produced the targeted total phenolics of 1.84 mg GAE/g (USDA, 2007) corresponding to 100%
in red wines. Only a maximum of 1.47 mg GAE/g or 80% total phenolics in red wines was
achieved and therefore shaded in the contour plots (Figure 4.12). Total phenolics increased with
decreasing US power density from 75 to 25 mW/cm3 and increasing US exposure time from 2-6
min, and then decreased when exposure time increase up to 8 min. The highest total phenolics of
1.72 mg GAE/g was achieved at 36 h incubation after US exposure for 7.8-8 min at 72-75
mW/cm3 power densities.
7. Predicted TEAC in sliced ultrasound-treated peanuts
No process combination of US power density, US exposure time, and incubation time
produced the targeted 5.01 µM TE/g TEAC (Villaño et al., 2004) corresponding to 100% in red
wines. Only a maximum of 2.76 µM TE/g or 55% TEAC in red wines was achieved and
reflected as shaded in the contour plots (Figure 4.12). TEAC increased as US power density
decreased from 75 to 25 mW/cm3 when US exposure time decreased from 6 to 3 min as

269
incubation time increased from 24 to 48h, otherwise it decreased. The highest TEAC of 2.95 µM
TE/g was achieved at 36h incubation time when exposure to US for 7.8-8 min at 67-75 mW/cm3
or 2 min at 25 mW/cm3.
8. Predicted overall acceptance by consumers of sliced ultrasound-treated peanuts
Figure 4.12 shows the contour plot for the significant regression model of overall acceptance for
sliced US-treated peanuts. A large proportion of process combinations of US power density,
exposure time and incubation time will meet the targeted overall acceptance rating ≥ 5 or neither like
nor dislike. The overall acceptance will increase with decreasing incubation time from 48-24 h. At 24
h incubation, the overall acceptance will decrease as exposure time to US is increased from 2-8 min,
remains at the same ratings at 36h incubation time, and then increase at 48h incubation time,
regardless of power densities used. The highest overall acceptance rating of 5.4 will be reached at the
lowest incubation time of 24 h and lowest US exposure time of 2 min at any power densities. This
indicates that the lower the doses of US, the higher will be the product acceptance.
9. Predicted optimum ultrasound processing treatment parameters for sliced peanuts
Figure 4.13 show the regions of overlap of the significant regression models for sliced US-
treated peanuts. The regions of overlap that represent the predicted optimum US process
parameters should produce at least 2.64 µg/g trans-resveratrol, 4.3 µg/g total stilbenes
(Lamuella-Raventos et al., 1995), 67.8 µM TE/g (USDA, 2007), all representing 100% in red
wines, and overall acceptance ratings >5 or neither like nor dislike. Some US processes at all
incubation times will meet all these criteria (Figure 4.13). However, the largest number of US
processes resulting in optimum products were observed at 36 h incubation time. Therefore,
optimum US processes are all combinations within the area of a quadrilateral bound by US

270
OL
OL
OL
Figure 4.13 Superimposed contour plots for the significant (P<0.05) prediction models of trans-resveratrol (RES, µg/g), total stilbenes (TS, µg/g), ORAC total antioxidant capacity (µM trolox equivalents (TE)/g), TEAC (µM TE/g), total phenolics ( TP, mg gallic acid equivalents/g), and overall acceptance (OA) based on 9-point hedonic rating where 1=dislike extremely, 5=neither like nor dislike and 9-like extremely. The regions of overlap (OL) represent the optimum ultrasound and UV processes at the specified incubation times. Arrows indicate directions of increasing concentrations or acceptance ratings.

271
power densities of 75, 75, 69 and 69 mW/cm3 and corresponding exposure times of 5.1, 6.8, 7.9
and 5.1 min, respectively and incubated for 36 h.
G. Verification of Prediction Models Ultrasound Processing Treatment Parameters of
Sliced Peanuts
The prediction models for the US processing treatments of peanut kernels were verified by
preparing samples of US-treated peanuts using a process within and outside the optimum region
and then analyzing the samples for trans-resveratrol, trans-piceid, and total antioxidant capacity.
In this study, a sample was US-treated at 75 mW/cm3 power density for 6 min followed by 36 h
incubation at 25oC to represent a process within the optimum region and another sample was
exposed to 50 mW/cm3 power density for 5 min followed by 36 h incubation at 25oC
representing a process outside the optimum process. The observed and predicted values for all
response variables analyzed are shown in Table 4.18. Results showed that the observed and
predicted values for trans-resveratrol, trans-piceid and total phenolics had probabilities > 0.05
indicating that the paired values were not significantly different from each other and therefore
verifying that the models (regression equations) could predict the concentrations of these
compounds. The observed values for ORAC within and outside the optimum regions were
higher than the predicted values at probability levels of 0.0009 and 0.0019, respectively. The
observed values for TEAC within and outside the optimum regions were slightly lower than
predicted values.

272
Table 4.17 Observed and predicted values of stilbenes concentrations, total phenolics, and antioxidant capacities of ultrasound-treated peanuts for verification of prediction models. Compound Within Optimum Region Outside Optimum Region Observed Predicted PROB1 Observed Predicted PROB Trans-resveratrol
3.79
3.81
0.2884 NS
0.57
0.55
0.0734 NS
Total phenolics
1.65 1.60 0.5387 NS 1.54 1.56 0.9338 NS
Total Antioxidant Capacity (ORAC)
430 69 0.0020** 203 84 0.0070**
Trolox Equivalent Antioxidant Capacity (TEAC)
2.63
2.82
0.0026**
2.68
2.85
0.0018**
1PROB = probability >0.05 means paired values are not significantly different from each other at 5% level of significance
NS = not significant, ** significant at 0.01% level

273
H. Verification of Trans-Resveratrol Biosynthesis in Peanuts
UV and US treatments increased the concentrations of trans-resveratrol in sliced imbibed
raw peanuts. However, it was not clear whether increases of trans-resveratrol in stressed peanuts
were due to efficient physical extraction of the compound in the peanut samples or to its
biosynthesis; or whether non-viable peanut cells will produce trans-resveratrol after abiotic
stress treatments. Thus, an experiment was conducted to verify if non-viable peanut cells
prepared by roasting peanuts to make it non-viable, would generate increased levels of
resveratrol in stressed peanuts.
Figure 4.14 showed the concentrations of trans-resveratrol in non-viable and viable peanuts
stressed by wounding through slicing to ~7 mm, UV and US treatments. Results indicated that
trans-resveratrol concentration of 0.02-0.23 µg/g all in non-treated and treated non-viable
peanuts were not significantly different from each other, and from controls of raw whole
untreated peanuts with 0.004 µg/g. In contrast, viable peanuts treated with UV and US had
resveratrol concentrations of 1.46-2.71 µg/g which were significantly higher from all treated and
un-treated non-viable peanuts, and controls. These findings confirmed that increases in
concentrations in viable peanuts was due biosynthesis trans-resveratrol rather than physical
extraction.
Results also confirmed the earlier finding that US was more effective than UV in increasing
trans-resveratrol in sliced peanuts. US-treated peanuts had twice as much trans-resveratrol of
2.71 µg/g compared to UV-treated samples with 1.46 µg/g. US waves could penetrate deeper
into the cells of peanut kernels where enzymes, phenylammonia lyase, responsible for resveratrol
biosynthesis are released (Wu and Lin, 2002). UV stimulated the coordinate inductions of three
enzymes responsible for resveratrol biosynthesis including stilbene synthase, phenylammonia

274
Control0.0036
RW0.0196
IRst-W0.0112
IRst-S0.0123
IRst-UV0.1827
IRst-US0.2274
UV-Rst1.4560
US-Rst2.7144
0.0
0.4
0.8
1.2
1.6
2.0
2.4
2.8
3.2
3.6
Treatment
Res
vera
trol
(ug/
g)
d
b
ccccc c
Figure 4.14 Trans-resveratrol concentrations (µg/g) in viable and non-viable peanuts to verify trans-resveratrol biosynthesis 1
1 Vertical lines on the bars represent standard deviations. Means not followed by the same letter are significantly (P<0.05) different from each other. Peanuts used had been stored for 1 year at 4oC. Non-viable peanuts were whole raw peanuts
roasted at 153oC for 30 min, prior to treatments by any of the following: a) imbibition in filtered deionized water for 16 h; b) slicing to ~ 7mm; c) UV treatment for 30 min at 40 cm from UV light then incubated for 36 h at 25oC; or d) ultrasound treatment for 6 min at 75 mW/cc power density then incubated for 36 hr at 25oC. Viable peanuts were not roasted prior to treatment. Treatment descriptions are as follows: Control Viable: Control, untreated raw whole peanuts RW Non-viable: Whole roasted peanuts. IRst-W Non-viable: Whole roasted peanuts + imbibition. IRst-S Non-viable: Imbibed whole roasted peanuts, then sliced. IRst-UV Non-viable: Imbibed whole roasted peanuts, then sliced and UV-treated. IRst-US Non-viable: Imbibed whole roasted peanuts, then sliced and ultrasound treated. UV-Rst Viable: Whole raw imbibed peanuts, then sliced, UV-treated and roasted. US-Rst Viable: Whole raw imbibed peanuts, then sliced, ultrasound-treated, and roasted.

275
lyase, and cinnamic acid 4-hydroxylase, characterized by a maximum after 15 h of induction in
grape leaves (Fritzemeier and Kindl, 1981). In grapes, resveratrol was only synthesized in UV-
treated skins and not in the flesh (Coffee and Creasy, 1988) suggesting that in sliced peanuts, UV
light could only pass through within outside surfaces, therefore only cells these areas were
activated. These findings indicate that more enzymes needed for the resveratrol biosynthesis
were released from cells using US compared to UV which could explain the less amounts of
resveratrol in UV-treated compared to US-treated peanuts in this study.
III. STUDY 3. COMBINED ULTRASOUND-UV (US-UV) PROCESS OPTIMIZATION
TO ENHANCE TRANS-RESVERATROL BIOSYNTHESIS IN PEANUTS
A. Effect of Combined Ultrasound –UV Processing Treatments on the Concentrations of
Phenolic Compounds, Antioxidant Capacities, and Overall Acceptance of Roasted Peanut
Kernels
Table 4.18 shows the mean concentrations of phenolic compounds, total phenolics,
antioxidant capacities, and overall acceptance of combined US-UV treated peanuts and controls.
1. Trans-resveratrol concentrations in sliced US-UV treated peanuts
The concentration of trans-resveratrol in all 27 treatments of combined US-UV treated
peanuts ranged from 1.63 ± 0.25 to 7.14 ± 2.03μg/g. Twenty four of 27 combined US-UV
treated peanuts had mean trans-resveratrol concentrations of 2.53 ± 0.57 to7.14 ± 1.96 μg/g
which were significantly (P<0.05) higher than untreated controls with 0.64 ± 0.10 μg/g. Three
(#s 18, 19 and 20) of 27 combined US UV treatments had trans-resveratrol concentrations of
1.63 ± 0.25 to 1.81 ± 0.17 which were not significantly (P<0.05) higher than untreated controls.
Seven (Trt# 4, 9, 10, 11, 21, 25 and 27) of 27 combined US-UV treatments resulted in trans-

276
Table 4.18 Concentrations (mean ± standard deviation, dry basis) of phenolic compounds, total phenolics, and antioxidant capacities, and overall acceptance ratings of roasted ultrasound (US)-UV treated peanuts1 and controls. Trt #
US PD
US PT
UV IT
Res2
μg/g Pic2
μg/g Caf2
μg/g Cou2
μg/g Fer2
μg/g TP3
mgGAE/gTEAC4
μM TE/g
ORAC5
μM TE/g OA6
1 40 4 10 2.7661±0.6166
0.3278±0.0238
0.3858±0.0518
149.3852±12.6713
2.3451±0.1857
1.3522±0.0775
3.9293±0.1569
127.1430±7.1011
4.7±1.9
2 40 4 30 2.5272±0.5739
1.2345±0.1855
0.4167±0.0406
156.9296±34.2364
2.2018±0.5097
1.3953±0.0991
4.0004±0.0875
128.5160±39.0763
4.9±2.1
3 40 4 50 3.0044±0.2308
0.5454±0.0229
0.4804±0.0644
144.9869±1.0940
2.1217±0.3838
1.3498±0.0515
3.8926±0.2577
143.2761±21.2873
5.2±2.0
4 40 8 10 6.0566±0.4734
1.1389±0.3902
2.1801±0.6355
266.4840±78.6901
4.3077±1.4189
1.3740±0.1010
4.0475±0.0170
182.4258±22.9522
4.4±2.0
5 40 8 30 5.4159±0.6824
0.4450±0.1330
0.7482±0.0545
225.5779±34.1292
3.8288±0.5375
1.3344±0.0364
4.0354±0.0462
132.4683±12.8255
5.0±1.9
6 40 8 50 3.6008±0.1182
0.5738±0.0012
1.1466±0.1076
173.5561±10.4183
2.4803±0.4916
1.4206±0.0473
4.0119±0.0484
139.6811±21.0501
5.6±1.9
7 40 12 10 4.1839±1.0731
2.8468±0.0954
0.6037±0.0617
234.3938±10.2305
4.6176±0.8491
1.3229±0.0972
4.1582±0.3007
116.0928±15.4584
5.0±1.9
8 40 12 30 3.1816±0.0585
0.8086±0.1420
0.4916±0.0721
160.8721±21.9636
2.5359±0.5680
1.3191±0.0124
3.9103±0.1177
122.6631±20.3542
5.4±2.0
9 40 12 50 5.9495±1.3890
1.7151±0.2425
0.4018±0.0583
167.8978±8.9095
3.2300±0.9039
1.4217±0.1901
3.8699±0.2288
145.7077±8.7401
4.9±1.9
10 80 4 10 6.3888±0.0618
1.7092±0.5110
0.2541±0.0429
151.4810±3.5167
2.9795±0.0024
1.7360±0.5232
3.9436±0.0290
149.2960±10.9068
4.5±2.1
11 80 4 30 7.1198±0.7706
1.4465±0.1036
0.4567±0.0274
170.4419±15.3316
3.0021±0.1862
1.4515±0.0455
3.9915±0.0325
116.6309±17.7256
5.0±1.9
12 80 4 50 3.6961±0.3738
0.5502±0.0029
0.4953±0.0083
145.8956±19.3628
1.9136±0.1273
1.3994±0.0141
3.9688±0.0513
123.9076±5.2566
4.8±1.9
13 80 8 10 5.8608±1.9645
1.0430±0.3060
0.5652±0.0433
158.9971±5.2433
1.5792±0.4215
1.4731±0.1640
3.9072±0.1721
127.6012±15.3089
5.1±2.2

277
Table 4.18 continued… Trt #
US PD
US PT
UV IT
Res2
μg/g Pic2
μg/g Caf2
μg/g Cou2
μg/g Fer2
μg/g TP3
mgGAE/gTEAC4
μM TE/g
ORAC5
μM TE/g OA6
14 80 8 30 4.0093±0.4343
1.3781±0.3520
0.3385±0.0962
143.0899±30.0945
2.4858±0.3242
1.5159±0.0300
3.8983±0.2037
147.6709±8.6798
4.9±2.2
15 80 8 50 5.6341±1.0234
0.9889±0.2633
0.4406±0.0626
155.5378±23.9280
2.7827±0.2640
1.5271±0.1132
3.9904±0.0237
127.4848±13.3346
4.7±2.0
16 80 12 10 3.9279±0.9950
1.5547±0.0620
0.6558±0.0340
161.4425±37.0707
2.7921±0.8693
1.4051±0.0633
3.9817±0.0506
118.4970±29.0354
5.1±2.1
17 80 12 30 1.6304±0.2504
0.4665±0.0141
1.2266±0.0481
154.4166±37.0374
2.6792±0.9122
1.4832±0.0436
3.8291±0.2182
167.7533±10.3434
5.1±2.1
18 80 12 50 1.6304±0.2504
0.3337±0.0491
0.3689±0.0013
139.6788±4.8136
2.2921±0.1028
1.5216±0.0648
3.9095±0.1326
165.3135±43.5983
5.1±2.2
19 120 4 10 1.6681±0.3219
0.2383±0.0264
0.3185±0.0507
134.3292±9.17555
1.8616±0.4295
1.4778±0.0690
3.9481±0.0824
175.6157±32.2755
4.6±1.9
20 120 4 30 1.8147±0.1663
0.2620±0.0109
0.2988±0.0438
148.4998±36.3642
2.9784±0.9967
1.5162±0.0479
3.8404±0.0896
118.6089±10.6556
5.0±1.9
21 120 4 50 7.1425±1.9577
2.0034±0.6587
0.4914±0.0485
156.0460±2.0153
2.4932±0.2692
1.5317±0.0612
3.9984±0.0164
219.9155±54.8525
4.7±2.1
22 120 8 10 2.8736±0.7004
0.2760±0.0080
0.4480±0.0414
145.1582±21.1959
2.2726±0.1826
1.5535±0.1118
3.8139±0.1202
161.1010±40.2760
4.9±1.8
23 120 8 30 3.3838±0.6479
0.5249±0.0524
1.0482±0.2889
170.6680±36.2477
2.5333±0.6051
1.4757±0.0697
4.0271±0.0636
145.8051±27.0411
5.0±1.9
24 120 8 50 3.6988±0.1050
0.9564±0.3055
1.5289±0.5093
158.8401±6.1325
4.2065±0.1431
1.4598±0.0255
4.0270±0.0297
137.0786±32.3381
4.8±2.0
25 120 12 10 6.5963±1.8331
1.0424±0.3542
1.5485±0.2313
143.0337±18.4045
3.8998±0.5430
1.6068±0.0389
4.0313±0.0196
172.2298±20.9343
4.6±2.2
26 120 12 30 3.5585±1.3245
0.4620±0.0113
1.8036±0.3564
149.8823±27.8836
4.2574±0.9173
1.4919±0.0774
4.0120±0.0314
164.5487±4.4876
5.1±1.8

278
Table 4.18 continued… Trt #
US PD
US PT
UV IT
Res2
μg/g Pic2
μg/g Caf2
μg/g Cou2
μg/g Fer2
μg/g TP3
mgGAE/gTEAC4
μM TE/g
ORAC5
μM TE/g OA6
27 120 12 50 7.1049±2.0270
1.2621±0.0556
1.6082±0.5838
147.1393±42.3031
4.1076±1.3305
1.4846±0.0498
3.9943±0.0254
158.2352±21.5829
4.6±2.0
Controls: Untreated whole peanuts, raw
0.6361±0.0970
1.1246±0.0436
0.5060±0.0229
35.1635±3.8031
0.1914±0.0661
1.2578±0.0426
3.4364±0.1277
44.6634±3.7497
7.7±1.0
UV-treated, roasted7 4.2502±0.4097
0.4003±0.1218
0.5787±0.0866
129.0268±11.5084
2.1325±0.2538
1.4089±0.0263
3.9568±0.0086
164.5699±28.7394
5.8±1.1
Ultrasound-treated, roasted8
4.4767±0.6262
0.2320±0.0499
0.3983±0.1236
138.4985±47.1958
2.6799±0.0282
1.4253±0.0927
3.9726±0.0371
169.5951±46.7394
5.4±1.2
1 Process parameters were US PD=ultrasound power density (mW/cm3); US PT=ultrasound exposure time (min); UV IT= exposure time (min); Fixed parameters were (1) distance from UV light of 40 cm and (2) incubation time at 25oC for 36 h 2 Francisco and Resurreccion (2009b) reversed-phase HPLC: Res= trans-resveratrol, Pic=trans-picied, Caf=caffeic acid,
Cou=coumaric acid, Fer=ferulic acid, μg/g 3 Singleton et al (1999) Folin Ciocalteau assay for total phenolics (TP), mg gallic acid equivalents (GAE)/g 4 Kim et al. (2002) ABTS radical scavenging capacity assay, μM trolox equivalents (TE)/g 5 Prior et al. (2003) ORAC (oxygen radical absorbance capacity) assay, Total antioxidant capacity = Hydrophilic ORAC + Lipophilic-ORAC, μM TE/g
6 Resurreccion (1998) consumer test for overall acceptance (OA) using 9-point hedonic rating scale, 1=disliked extremely, 5=neither liked nor disliked, 9=liked extremely
7 Optimal UV treatment of 30 min at 40 cm distance from UV light followed by incubation at 25oC for 36 h 8 Optimal ultrasound treatment of 6 min at 75 mW/cm3 power density followed by incubation at 25oC for 36 h (Reprinted from Food Chemistry, Vol. 122, Sales, J.M. and Resurreccion, A.V.A. Phenolic profile, antioxidants, and sensory acceptance of bioactive-enhanced peanuts using ultrasound and UV. Page No. 799, Copyright 2010, with permission from Elsevier.)

279
resveratrol of 5.95 ± 1.39 to 7.14 ± 2.03μg/g and were significantly (P<0.05) higher than either
US- or UV-treated controls with 4.48 ± 0.63 and 4.25 ± 0.41 μg/g, respectively.
Exposing peanuts to 120 mW/cm3 US power density for 4 min followed by UV exposure for
50 min at 40 cm was most effective in producing maximum trans-resveratrol of 7.14 μg/g. The
maximum resveratrol of 7.14 μg/g in US-UV treated peanuts was higher than the maximum
concentration of obtained previously in US or UV-treated peanuts of 3.96 and 3.42 μg/g,
respectively (Rudolf and Resurreccion, 2005), 6.39 and 3.30 μg/g, respectively (Sales and
Resurreccion, 2009), 4.29 and 2.36 μg/g, respectively (Potrebko and Resurreccion, 2010).
Compared to combined US-UV treated peanuts, our maximum 7.14 μg/g was higher than 4.73 ±
1.20 μg/g trans-resveratrol produced when peanuts were treated using fixed US power density of
40 mW/cm3 for 4 min followed by 35 min exposure at 40 cm distance from UV light (Potrebko
and Resurreccion, 2010). We used higher doses of US up to 75 mW/cm3 power density and
exposure time up to 12 min with the same dose of UV.
Our maximum trans resveratrol of 7.14 μg/g was higher than that found in red grape juices
with non-detectable to 1.09 μg/mL with a mean of 0.5 μg/mL (Romero-Perez, et al., 1999); and
comparable to that in red wines with 0.60 to 8.00 μg/mL with a mean of 2.48 μg/mL (Lamuella-
Raventos et al., 1995). A serving of roasted combined US-UV treated peanuts, approximately
30 g, would correspond to a maximum intake of 214 μg trans-resveratrol which is 2.3 times less
than that in a serving of red wine (ca. 200 mL/serving) providing an average of 496 μg, and
twice as much as that in a 200 mL serving of red grape juice with a mean of 100 μg. There are
no other food sources than red wines and red grape juice that considerably contribute trans-
resveratrol in the diet.

280
2. Trans-picied concentrations in sliced US-UV treated peanuts
The concentrations of trans-piceid ranged from 0.24 ± 0.03 to 2.85 ± 0.10 μg/g. Four (Trt#
7, 9, 10 and 21) of 27 combined US-UV treatments had trans-piceid concentrations of 1.71 ±
2.85 μg/g which were significantly higher (P<0.05) than untreated controls with 1.12 ±μg/g.
These concentrations were also higher (P<0.05) than 0.40μg/g in UV-treated and 0.23 μg/g in
US-treated controls.
Treating peanuts with US power density of 40 mW/cm3 for 12 min followed by exposure at
40 cm distance from UV light for 10 min (Trt# 7) was most effective resulting in the maximum
trans-piceid of 2.85 μg/g.
The highest trans-piceid of 2.85 ± 0.10 μg/g in combined US-UV treated peanuts were
higher than those of white grape juices with non-detectable to 0.83 μg/g (mean=0.18 μg/g), but
lower than in red grape juices with mean of 3.38 μg/g and a range of 0.77-7.34 μg/g (Romero-
Perez et al., 1999) and in red wines with mean of 1.85 μg/g and a range of 0.74-4.01 μg/g
(Lamuella-Raventos et al., 1995). One serving of roasted combined US-UV treated peanuts
would provide a maximum intake of 85.5 μg piceid which is twice as much as a 200 mL serving
of white grape juices with 36 μg/serving but much less than a serving of red grape juice with
676 μg/serving and red wine with 148-802 μg/serving.
3. p-Coumaric acid concentrations in sliced US-UV treated peanuts
All 27 combined US-UV processing treatments produced significantly (P<0.05) higher p-
coumaric acid concentrations of 134 ± 9.18 to 266 ± 78.7 μg/g compared to untreated controls
with 35.2 ± 3.8 μg/g. The concentrations of p-coumaric acid in US- and UV-treated controls
with 138.50 ± 47.2 and 129.03 ± 11.5 μg/g were also higher than those of untreated controls.
281
These results indicate that any UV, US, or combined US-UV processing treatments will increase
p-coumaric acid concentrations in peanuts. Three of 27 combined US-UV treatments had
significantly higher (P<0.05) levels of p-coumaric acid with 225.58 ± 34.13 to 266.48 ± 78.69
μg/g compared to US- and UV-treated peanuts controls. Exposing peanuts to US power density
of 40 mW/cm3 for 8 min followed by 10 min exposure at 40 cm distance from UV light was
most effective in increasing coumaric acid to a maximum level of 266.48 μg/g. A serving of
roasted combined US-UV treated peanuts would provide up to 7994 μg coumaric acid which is
about twice as much than in a serving of red wine with 4,400 μg/serving (Ghiselli et al., 1998).
4. Caffeic acid concentrations in sliced US-UV treated peanuts
The concentrations of 1.05 ± 0.29 to 2.18 ± 0.64 μg/g caffeic acid in eight of 27 combined
US-UV treated peanuts were significantly higher (P<0.05) than untreated controls, UV-treated,
and US-treated peanuts with 0.51±0.03, 0.58 ± 0.09, and 0.39 ± 0.12 μg/g, respectively. Similar
to coumaric acid, treating peanuts with US power density of 40 mW/cm3 for 8 min followed by
UV exposure for 10 min at a distance of 40 cm from UV light was the most effective treatment
producing the highest caffeic acid of 2.18 μg/g.
One serving of roasted combined US-UV treated peanuts will provide up to 65.4 μg caffeic
acid which is 52 times much less than a serving of red wine with 3,400 μg caffeic acid (Ghiselli
et al., 1998). Caffeic acid is a potent antioxidant comparable to butylated hydroxyanisole (BHA)
and butylated hydroxytoluene (BHT) at concentrations of 10-20 μg/mL but higher than that of α-
tocopherol and trolox on lipid peroxidation of linoleic acid emulsion at 20 μg/mL concentrations
(Gulchin, 2006). It is also an effective ABTS•+, DPPH•, and superoxide anion radical
scavenger, has high, total reducing power and metal chelating properties with ferrous ions
(Gulchin, 2006).

282
5. Ferulic acid concentrations in sliced US-UV treated peanuts
All of the combined US-UV treated peanuts had significantly higher ferulic acid contents of
1.86 ± 0.43 to 4.62 ± 0.85μg/g compared to untreated controls with 0.19 ± 0.07 μg/g.
Similarly, the concentrations of ferulic acid in UV and US-treated peanuts of 2.13 ± 0.25 and
2.68 ± 0.03 μg/g, respectively, were also significantly higher than those in untreated controls.
These findings suggest that any UV, US or combined US-UV effectively enhanced ferulic acid
concentrations in untreated control peanuts.
Six of 27 combined US-UV treatments had significantly (P<0.05) higher ferulic acid
concentrations ranging from 4.11±1.33 to 4.62±0.85 μg/g compared to US with 2.68±0.03μg/g.
Seven of 27 treatments had significantly (P<0.05) higher ferulic acid of 3.83 ± 0.54 to 4.62 ±
0.85 μg/g than 2.13 ± 0.26 μg/g in UV-treated peanuts.
The most effective treatment producing the highest ferulic acid of 4.62 μg/g was US power
density of 40 mW/cm3 for 12 min followed by UV exposure for 10 min at a distance of 40 cm
from UV light. On a per serving basis, roasted US-UV treated peanuts will provide up to 139
μg ferulic acid which is considerably less than a serving of red wine with 3,800 μg ferulic
acid/serving (Ghiselli et al., 1998).
5. Total phenolics concentrations in sliced US-UV treated peanuts
The total phenolics assay of Singleton et al. (1999) used in this study measures all phenolic
compounds including those compounds without antioxidant properties. Sixteen of 27 combined
US-UV treatments had greater (P<0.05) total phenolics of 1.52 to 1.74 mg GAE/g compared to
1.26 mg GAE in untreated controls. Only 2 of 27 combined US-UV treatments with total
phenolics concentrations of 1.61 ± 0.04 and 1.74 ± 0.52 mg GAE/g were significantly (P<0.05)
higher than that of US-treated, and UV-treated with 1.42 ± 0.09, and 1.41± 0.03 mg GAE/g.

283
Treatment of peanuts with 80 mW/cm3 US power density for 4 min followed by 10 min
exposure at 40 cm distance from UV light produced the highest total phenolics of 1.74 mg
GAE/g. The total phenolics of all 27 treated peanuts, however, were lower than found in red
wines, raw blueberries, raw blackberries, and dark chocolate candies with 1.84, 5.31, 6.60, and
12.97 mg GAE/g, respectively (USDA, 2007). On a per serving basis, roasted US-UV treated
peanuts will provide up to 52 mg GAE/serving total phenolics which is considerably lesser than
a serving of dark chocolate candies (220 mg GAE/17g-bar), raw blueberries (293 mg/74g-half
cup), red wine (368 mg/200 mL-glass), and raw blackberries (475 mg GAE/72g-half cup).
6. TEAC in sliced US-UV treated peanuts
All 27 treatments peanuts of combined US-UV and 1 each of UV and US treatment had
significantly higher (P<0.05) TEAC values of 3.81 ± 0.12 to 4.16, 3.96 ± 0.01, and 3.97 ± 0.04
μM TE/g, respectively, compared to 3.44 ± 0.13 μM TE/g in untreated controls. These findings
suggest that treatment of peanuts with UV, US, or combined US -UV will result in increased
antioxidant capacities by TEAC.
Only 1 of 27 combined US-UV treatment had significantly (P<0.05) higher TEAC value of
4.16 ± 0.30 μM TE/g compared to US and UV-treated peanuts indicating that a combined US-
UV process will not enhance TEAC over that of US or UV. US and UV- treated peanuts had
similar (P<0.05) TEAC values.
The most effective treatment resulting in highest TEAC of 4.16 μM TE/g was exposure to 40
mW/cm3 US power density for 12 min followed by 10 min exposure at 40 cm distance from UV
light. The scavenging activity of 4.16 μM TE/g in roasted US-UV treated peanuts, however,
were lower than red wines with mean of 5.01 μM TE/mL (n=16, Villaño et al., 2004), and those
of blackberry, raspberry, black olives, redcurrant and wild strawberries with 20.24, 16.79, 14.73,
284
14.05, and 11.34 μM TE/g, respectively, (Pelligrini et al., 2003), and peanut skins extracts with
620-2560 μM TE/g (Francisco and Resurreccion, 2009a). A serving of roasted combined US-
UV treated peanuts will provide up to 125 μM TEAC which is much less a serving of red wine
(1002 μM TE), and those of blackberry (1457 μM TE/72g-half cup), raspberry (1209 μM
TE/72g-half cup), wild strawberries (1383/122g-half cup), redcurrant (878 μM TE/56 g-half cup
(ca. 56g), μM TE/half cup, black olives (3977 μM TE/10-pieces), and coffee espresso (1462 μM
TE/240 mL-cup).
7. ORAC in sliced US-UV treated peanuts
7.1 Total Antioxidant Capacity in sliced US-UV treated peanuts
The ORAC values shown in Table 4.18 represent the total antioxidant capacity or the sum of
hydrophilic and lipophilic ORAC values. All 27 combined US-UV-treated peanuts had
significantly (P<0.05) higher total antioxidants of 114.92 ± 5.14 to 219.92 ± 54.85 μM TE/g
compared to 44.67 ± 3.75 μM TE/g in untreated controls. Only 1 of 27 combined US -UV
treatments produced significantly higher ORAC of 219.92 ± 54.85 μM TE/g compared to 169.60
± 46.74 μM TE/g in US-treated and 164.57 ± 28.74 μM TE/g in UV- treated controls suggesting
that a combined US -UV process will not enhance total antioxidant capacity over that of US or
UV. US- and UV-treated peanuts had similar total antioxidant capacity values.
The treatment that resulted in highest total antioxidant capacity of 219.92 μM TE/g was
exposure to 120 mw/cm3 US power density for 4 min followed by exposure to 40 cm distance
from UV light for 50 min. However, all treated peanuts had significantly higher total antioxidant
capacity values compared to untreated control (44.67 ± 3.74 μM TE/g) indicating that either US
or UV or combined US -UV will result in increased antioxidant capacities.

285
The total antioxidant capacity values of treated samples were higher than those of red wines,
raw blackberries, raw blueberries, raw cranberries, and pecans with 38.00, 53.47, 62.52 and
179.40 μM TE/g, respectively (USDA, 2007). A serving of roasted US-UV treated peanuts
would provide 6324 μM TE which is about 2/3 of a serving of red wine (9120 μM TE /200mL),
about twice a serving of raw blackberries (3850 μM TE /74g half cup), raw blueberries (4626
μM TE /74g half cup), and raw cranberries (3126 μM TE /50g half cup), and a little more than a
serving of pecans (5382 μM TE/30g).
7.2 H-ORAC in sliced US-UV treated peanuts
All 27 combined US-UV-treated peanuts had significantly (P<0.05) higher H-ORAC of
88.65 ± 20.46 to 173.53 ± 46.53 μM TE/g compared to 38.49 ± 3.34 μM TE/g in untreated
controls. None of the 27 combined US -UV treatments produced significantly higher H-ORAC
than 169.60 ± 46.74 μM TE/g in US-treated whereas one in 27 had higher (P<0.05) H-ORAC of
171.53 ± 46.53 μM TE/g compared to 164.57 ± 28.74 μM TE/g in UV-treated controls
suggesting that a combined US -UV process will not enhance H-ORAC values over that of US or
UV. US- and UV-treated peanuts had similar H-ORAC values.
7.3 L-ORAC in sliced US-UV treated peanuts
Twenty five of 27 combined US-UV treated samples had significantly (P<0.05) higher of L-
ORAC values of 17.43 ± 2.90 to 55.01 ± 12.80 compared to 6.17 ± 0.81 in untreated controls.
Three of the 27 combined US -UV treatments produced significantly higher L-ORAC values of
42.82 ± 2.74 to 55.01 ± 12.80 μM TE/g compared to 31.14 ± 11.07 μM TE/g in US-treated and
30.50 ± 3.19 in UV-treated peanuts suggesting that a combined US -UV process will not enhance
H-ORAC values over that of US or UV. US- and UV-treated peanuts had similar H-ORAC
values.

286
8. Overall acceptance of sliced US-UV treated peanuts
The combined US-UV treated peanuts obtained a highest overall acceptance rating of 5.6 ±
2.2 or neither like nor dislike, which was not significantly different from overall acceptance of
UV- and US-treated peanuts with 5.8 ± 1.1 and 5.4 ± 1.2 ratings, respectively. All treated
peanuts, however, had significantly lower overall acceptance compared to untreated controls
with 7.7 ± 1.0 rating or liked moderately. The lower acceptance ratings of treated peanuts could
be due to off-flavors such bitter and astringent, which resulted from increased concentrations of
phenolic compounds (Naczk & Shahidi, 2006). Lower molecular weight phenolic compounds
tend to be bitter whereas higher molecular weight polymers tend to be astringent (Drewnowski
and Gomez-Carneros, 2000). Astringency is a puckering and drying sensation throughout the
oral cavity (Drewnowski and Gomez-Carneros, 2000), and is related to the ability of dietary
polyphenols to precipitate salivary proteins (Lesschaeve and Noble, 2005). Water soluble
phenols with molecular weights between 500 and 3000 were reported to precipitate proteins, thus
eliciting astringency (Lesschaeve & Noble, 2005).
B. Modeling and Mapping of Contour Plots for US-UV Processing Treatment Parameters
The results of regression analysis are shown in Table 4.19. All models of trans-resveratrol,
trans-piceid, caffeic acid, coumaric acid, ferulic acid, total phenolics, total antioxidant capacity
by ORAC, TEAC and overall acceptance were all significant (P<0.05) with trans-piceid, caffeic
acid, and coumaric acid as the most significant having P<0.0001. The highest R2 value obtained
was 0.43 for caffeic acid indicating that 43% of the variance was explained by the model. The
model for ORAC total antioxidant capacity had the lowest R2 of 0.07 suggesting that only 7% of
the variance was explained by the model. Due to low R2 values, the full models were used in the
generation of contour plots Contour plots for the significant models of trans-resveratrol,

287
trans-piceid, caffeic acid, coumaric acid, ferulic acid, total phenolics, total antioxidant capacity
by ORAC, TEAC and overall acceptance and the superimposed regions of overlap are presented
in Figure. 4.15.
1. Predicted trans-resveratrol concentrations in sliced US-UV treated peanuts
The process combinations of US power density, US and UV exposure times produced the
targeted 2.64 μg/g corresponding to 100% trans-resveratrol in red wines. However, 4.3 μg/g
corresponding to 163% in red wines was achieved and shaded as reflected in the contour plots
(Figure 4.15). At lower UV exposure time of 10 min, trans-resveratrol decreased with
increasing US power density from 52 to 120 mW/cm3 regardless of US exposure time from 4 to
12 min, then reached a maximum as UV exposure time increased to 30 min and as US power
density approached 80 mW/cm3 at US exposure time of 7.5 to 11.5 min. As the UV exposure
increased to 50 min, trans-resveratrol increased with increasing US power density from 40 to
120 mW/cm3 regardless of US exposure time from 4 to 12 min. The maximum trans-resveratrol
content of 5.7 μg/g was reached when peanuts were exposed to US power density of 120
mW/cm3 for 4 min followed by 50 min exposure at 40 cm distance from UV light.
2. Predicted trans-picied concentrations in sliced US-UV treated peanuts
The process combinations of US power density, US and UV exposure times met the targeted
trans-piceid of 1.85 μg/g or 100% in red wines only when exposed for 10 min at 40 cm from UV
light (Figure 4.15). At lower UV exposure time 10 min, trans-piceid increased as US power
density decreased from 120 to 40 mW/cm3 and as US exposure time increased from 6 to 12 min,
then further decreased as UV exposure time increased to 30 min As US exposure time reached
50 min, trans-piceid decreased as US power density decreased from 120 to 40 mW/cm3. The

288
Table 4.19 Regression coefficients for the significant prediction models of the combined US-UV treated peanuts.
Parameters Resveratrol Piceid Caffeic acid
Coumaric acid Ferulic acid
Total Phenolics
ORAC-TAC
Overall Acceptance
Intercept 8.780200 1.656870 1.755580 126.441580 4.812280 1.431740 229.99536 3.102040 Linear Ultrasound power density, PD
-0.041800 -0.00131 -0.053250 -1.573280 -0.075850 0.006110 -1.377560 0.009700
Ultrasound exposure time, PT
-0.269070 0.015440 0.220490 35.706260 0.234520 -0.043660 -7.815110 0.161670
UV exposure time, IT
-0.297490 -0.06800 -0.010250 0.202370 -0.017600 -0.011820 -3.424880 0.071560
Quadratic PD*PD -0.000293 -0.00003 0.000220 0.009080 0.000384 -0.000040 0.006600 0.000001PT*PT -0.016450 0.012350 -0.015910 -1.351170 -0.002950 -0.000005 0.064310 -0.002150IT*IT 0.000173 0.000768 0.000037 -0.005080 -0.000129 0.000063 0.027710 -0.000494 Interaction PD*PT 0.008450 -0.00133 0.001680 -0.126830 -0.000579 0.000372 0.077670 -0.000872PD*IT 0.002790 0.000512 0.001984 0.005180 0.000373 0.000055 0.018970 -0.000352PT*IT 0.017120 -0.00209 -0.001550 -0.259880 -0.003800 0.001260 0.233830 -0.002830PD*PT*IT -0.000254 -0.000008 0.000025 0.002130 0.000037 -0.000011 -0.002450 0.000021 Adjusted R2 0.0790 0.2701 0.4304 0.2443 0.1915 0.2034 0.0680 0.2892P-value 0.0516 <0.0001 <0.0001 <0.0001 0.0005 0.0003 0.0543 0.0556

289
Figure 4.15 Contour plots for the significant prediction models of trans-resveratrol, trans-piceid, p-coumaric-, caffeic-, and ferulic-acids, total phenolics, ORAC, and overall acceptance. The superimposed contour plots show the regions of overlap (shaded areas) representing the optimum processes for the combined ultrasound-UV processes of peanut kernels. Arrows indicate directions of increasing concentrations or acceptance ratings. (Reprinted from Food Chemistry, Vol. 122, Sales, J.M. and Resurreccion, A.V.A. Phenolic profile, antioxidants, and sensory acceptance of bioactive-enhanced peanuts using ultrasound and UV. Page No. 802, Copyright 2010, with permission from Elsevier).

290
maximum trans-piceid of 2.2 μg/g was achieved when peanuts were exposed to US power
density of 40 mW/cm3 for 12 min followed by 10 min exposure at 40 cm distance from UV light.
3. Predicted p-coumaric acid concentrations in sliced US-UV treated peanuts
The process combinations of US power density, US and UV exposure times achieved the
minimum concentration of 140 μg/g p-coumaric acid (Figure 4.15) which exceeded the targeted
22 μg/g or 100% in red wines. p-Coumaric acid increased with increasing UV exposure time 10
to 50 min, as US power density decreases from 110 to 40 mW/cm3 and regardless of US
exposure time from 8 to 10 min. The highest p-coumaric acid concentration of 230 μg/g was
achieved when peanuts were exposed to US power density of 40 mW/cm3 for 8.5 to12 min
followed by UV exposure to 10 min at 40 cm distance from UV light.
4. Predicted caffeic acid concentrations in sliced US-UV treated peanuts
The process combinations of US power density, US and UV exposure times did not meet the
targeted 17 μg/g or 100% caffeic acid in red wines and therefore contour plots were not shaded
(Figure 4.15). Caffeic acid concentration increased as UV exposure time increased from 10 to
50 min and as US power density increased from 80 to 120 mW/cm3 with increasing US exposure
time from 8 to 12 min. The highest caffeic acid concentration of 1.6 μg/g was achieved when
peanuts were exposed to US power density of 120 mW/cm3 for 10-12 min followed by 10 min
UV exposure at 40 cm distance from UV light.
5. Predicted ferulic acid concentrations in sliced US-UV treated peanuts
The process combinations of US power density, US and UV exposure times did not produce
the targeted 19 μg/g ferulic acid or 100% in red wines and therefore contour plots were not
shaded (Figure 4.15). Ferulic acid increased as UV exposure decreased from 10 to 30 min, and
then increased as exposure time increased to 50 min. The maximum ferulic concentration of 3.8

291
μg/g was obtained when peanuts were US-treated for 10-12 min at 120 mW/cm3 followed by 10
min UV treatment at 40 cm distance from UV light.
6. Predicted total phenolics concentrations in sliced US-UV treated peanuts
The process combinations of US power density, US and UV exposure times did not meet the
targeted 1.84 mg GAE/g or 100% total phenolics in red wines. Only 1.42 mg GAE/g or 77% in
red wines was achieved and shaded in the contour plots (Figure 4.15). The total phenolics
content decreased as UV exposure time decreased from 10 to 30 min and remained at the same
levels as UV exposure time further increased to 50 min. The highest total phenolics of 1.57 mg
GAE/g was achieved when peanuts were US-treated at a power density of 120 mW/cm3 for 4-8
min followed by 10 min exposure at 40 cm distance from UV light.
7. Predicted total antioxidant capacity by ORAC in sliced US-UV treated peanuts
The process combinations of US power density, US and UV exposure times achieved the
minimum total antioxidant capacity by ORAC of 130 μM TE/g which exceeded 38 μM TE/g or
100% in red wines. The ORAC value decreased with increasing UV exposure time from 10 to
30 min and then increased when UV exposure increased to 50 min, with increasing US power
density from 80 to 120 mW/cm3, regardless of US exposure time from 4 to 10 min. The
maximum ORAC value of 170 μM TE/g was reached when peanuts were US-treated for 11.5 -12
min at 120 mW/cm3 then UV treated for 10 min at 40 cm distance from UV light.
8. Predicted overall acceptance of sliced US-UV treated peanuts
The process combinations of US power density, US and UV exposure times achieved the
targeted overall acceptance rating of ≥5 was met when US treated peanuts were exposed to UV
for 30 and 50 min, but not for 10 min. The overall acceptance of treated peanuts increased as
UV exposure increased from 10 to 30 min and slightly decreased when UV exposure time was

292
further increased to 50 min. At lower UV exposure time of 10 min, no samples had an overall
acceptance rating of > 5 whereas about 80% of the treatments exposed to UV for 30 min
received overall acceptance > 5, and about half of those exposed to UV for 50 min were rated
with overall acceptance > 5. The overall acceptance ratings of treated samples did not reach
higher than 5 due to off-flavors developed with increased levels of phenolic compounds and
antioxidants.
D. Predicted Optimum Region for US-UV Processing Treatment Parameters of Sliced
Peanuts
Figure 4.15 shows the superimposed contour plots indicating the optimum parameters for the
combined US-UV processes. At 10 min UV exposure time, no overlap was observed because no
treatment received an overall acceptance rating > 5, which is the cut-off point for determining the
optimum process for combined US-UV, as it is the limiting factor for product development
applications. Some treatments that were exposed to UV for 30 and 50 min obtained had overall
acceptance > 5, and thus optimum processes were obtained. However, optimum processes using
50 min UV exposure achieved higher trans-resveratrol up to 4.8 μg TE/g compared to only 4.3
μM TE/g using 30 min UV exposure, and therefore, US-treated peanuts exposed to UV for 50
min were chosen as the optimum processes. The optimum US-UV processes included all
process combinations within a hexagon bounded by six points (A to E in Figure 4.15), US power
densities of 74, 70, 62, 42, 48 and 58 mW/cm3 for 8.3, 10.9, 11.2, 10.4, 8.3, and 9.1 min US
exposure time, respectively; followed by 50 min exposure at 40 cm distance from UV light. The
optimum parameters for a combined US-UV process provided up to 4.8 µg/g trans-resveratrol,
170 µg/g p-coumaric acid, and 150 µM TE/g ORAC or >100% that found in red wines.
Additionally, this process provided 1.0 µg/g trans-piceid, 2.6 µg/g ferulic acid, 1.48 mg GAE/g

293
total phenolics, and consumer acceptance ≥5. Compared to US or UV processes, the optimum
combined US-UV process resulted in 1.3 times or 2.3 times the trans-resveratrol in US at 3.80
µg/g or UV at 2.06 µg/g (Sales and Resurreccion, 2009).
E. Verification of Prediction Models for US-UV Processesing Treatment Parameters for
Sliced Peanuts
The prediction models for the combined US-UV processing treatments of sliced peanut
kernels were verified by preparing samples of US-UV-treated peanuts using a process within and
outside the optimum region and then analyzing the samples for trans-resveratrol, trans-piceid,
and total antioxidant capacity. In this study, a process representing the parameters within the
optimum region was conducted by exposing fully imbibed sliced peanuts to US at 70 mW/cm3
power density for 10 min, followed by exposure to UV for 50 min at 40 cm distance from UV
light, and then incubation at 25oC for 36 h. Another sample of peanuts was exposed to 40
mW/cm3 power density for 4 min, then exposed to UV for 50 min at 40 cm distance from UV
light followed by 36 h incubation at 25oC to represent a process outside the optimum region.
The observed and predicted values for all response variables analyzed are shown in Table 4.21.
Results showed that the observed and predicted values for trans-resveratrol, trans-piceid, ρ-
coumaric acid, caffeic acid, ferulic acid, total phenolics, TEAC, and ORAC total antioxidant
capacities had probabilities > 0.05 indicating that the paired values were not significantly
different from each other and therefore verifying that the models (regression equations) could
predict the concentrations of these compounds.

294
Table 4.20 Observed and predicted values of phenolic compounds concentrations, total phenolics, and antioxidant capacities of combined ultrasound-UV treated peanuts for verification of prediction models. Compound Within Optimum Region Outside Optimum Region Observed Predicted PROB1 Observed Predicted PROB Trans-resveratrol
4.76
4.80
0.3214 NS
3.02
3.22
0.1374 NS
Trans-piceid
0.80 0.82 0.9367 NS 0.68 0.70 0.3201 NS
ρ-Coumaric acid
158.20 160 0.0931 NS 149.4 151 0.4521 NS
Caffeic acid 0.62 0.60 0.3651 NS 0.62 0.60 0.2557 NS
Ferulic acid 2.58 2.60 0.4319 NS
2.15 2.2 0.3419 NS
Total phenolics
1.48 1.50 0.5387 NS 1.54 1.56 0.9338 NS
Total Antioxidant Capacity (ORAC)
148 145 0.4297 NS 135 130 0.3245 NS
1PROB = probability >0.05 means paired values are not significantly different from each other at 5% level of significance
NS = not significant

295
D. Effect of Abiotic Stresses on the Concentrations of Trans-Resveratrol in Peanuts
The effects of abiotic stresses of wounding through size reduction by slicing and chopping,
and treatments with UV, US, and combined US-UV on the concentrations of trans-resveratrol in
peanuts are illustrated in Figure 4.16.
The untreated raw whole control peanuts had 0.02 µg/g trans-resveratrol and slicing
increased the concentration to 0.37 µg/g or 17.5-fold. UV treatment of sliced peanuts further
increase the concentration to 3.3 µg/g or an additional 8-fold increase from slicing or 164-fold
cumulative increase from control. The combined US-UV treatments produced 7.14 µg/g
corresponding an additional 1.2-fold increase from UV treatment, 18-fold increase from slicing
and cumumulative increase of 356-fold from control.
US treatment of sliced peanuts increased trans-resveratrol to 6.35 µg/g which was higher
than in chopped peanuts with 2.88 µg/g and whole peanuts with 0.99 µg/g, translating to 317-,
143-, and 49-fold increases from control, respectively. This finding suggests peanuts mild
wounding of peanuts through slicing achieved the maximum enhancement of trans-resveratrol
biosynthesis. The more severe wounding such as chopping resulted in less biosynthesis whereas
no wounding such as in whole peanuts, provided the least.
US treatment which caused 317-fold increase in trans-resveratrol from 0.37 to 6.35 µg/g in
sliced peanuts was twice as effective as UV which only increased by 164-fold from 0.37 to 3.30
µg/g. The effect of UV treatment in US sliced peanuts, however, only caused very minimal 0.12
fold increase in trans-resveratrol from 6.35 to 7.14 µg/g whereas the effect of US on UV-treated
peanuts had an additive effect with a 2.16 fold increase in trans-resveratrol from 3.3 to 7.14 µg/g.
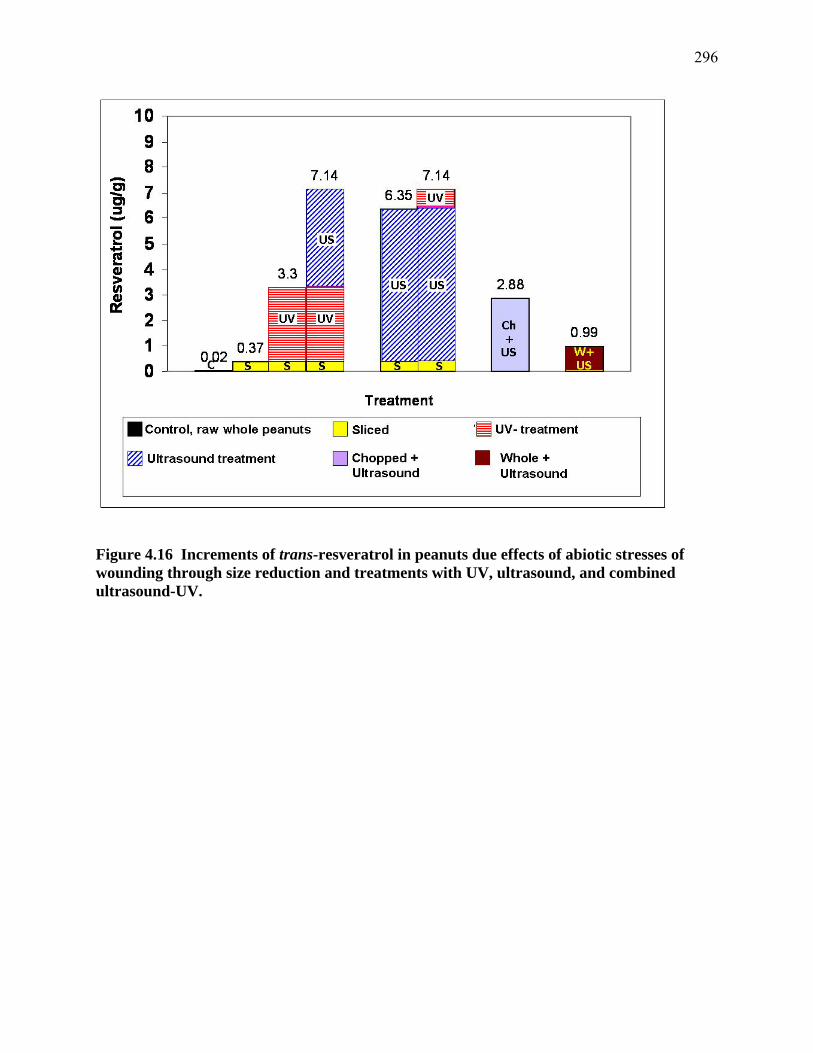
296
Figure 4.16 Increments of trans-resveratrol in peanuts due effects of abiotic stresses of wounding through size reduction and treatments with UV, ultrasound, and combined ultrasound-UV.

297
IV. STUDY 4. APPLICATIONS OF RESVERATROL-ENHANCED PEANUTS
SELECTED PRODUCTS AND THEIR SHELF LIFE
A. Applications of Resveratrol-Enhanced Peanuts (REP)
REP were prepared using the optimal combined US-UV process determined in Study 3 with
the parameters of 70 mW/cm3 US power density, 10 min US exposure time and 50 min UV
exposure time at 40 cm distance from UV light followed by incubation at 25oC for 36 h. The
REP were used to prepare roasted REP and resveratrol-enhanced peanut bars for which shelf life
studies were conducted. An accelerated shelf life test (ASLT) was performed on roasted REP
whereas, a storage study at ambient and at high temperature was done on resveratrol-enhanced
peanut bars.
B. Accelerated Shelf Life Test Study of Roasted Resveratrol-Enhanced Peanuts
Peanuts contain about 50-55% fat, of which approximately is 30% linoleic acid, the fatty acid
responsible for development of off-flavors as a result of lipid oxidation (Warner et al., 1996; Han
et al., 2008). These oxidation reactions lead indirectly to the formation of numerous aliphatic
aldehydes, ketones, and alcohols, of which hexanal is the most prevalent decomposition product
(Warner et al., 1999). Hexanal has been used as indicator compound for the lipid oxidation in
peanuts (Warner et al., 1996; Grosso and Resurreccion, 2002; Han et al., 2008; Jensen et al.,
2005), chocolate peanut spread (Chu, 2003), pork scratchings, and oatmeal and muesli (Jensen,
et al., 2005).
1. Changes in hexanal concentrations during storage
The changes in hexanal concentrations of roasted REP during storage indicated the degree of
lipid oxidation of samples of 30, 35 and 40oC as presented in Figure 4.17. Roasted REP had
initial hexanal concentrations of 6.63, 10.19, and 11.55 µg/g at accelerated temperatures of 30,

298
35 and 40oC (Table 4.21) which were all significantly higher than untreated controls with 2.7
µg/g used in this study, suggesting that hexanal had been formed in REP immediately after
processing treatments, which may be due to UV exposure known to initiate lipid peroxidation
(Duh and Yen, 1995). Grosso and Resurreccion (2002) found an initial hexanal of 1.65 µg/g
hexanal in untreated roasted peanuts which was slightly lower than that found in this study.
Hexanal concentrations of roasted REP increased with increasing storage time at all accelerated
storage temperatures of 30, 35, and 40oC used in the study, with faster rate of increase as
temperature increased from 30 to 40oC (Figure 4.15). At about 40 days of storage, the hexanal
concentrations of REP were 29.45 µg/g at 30oC, 36.84 µg/g at 35oC and 64.23 µg/g at 40oC
(Table 4.23) which were much higher than 3.97 µg/g in normal roasted peanuts found by Grosso
and Resurreccion (2002).
At verification temperature of 25oC, initial hexanal of 8.67 µg/g of REP increased to 106.07
µg/g after 101 days of storage. After 90 days, which is the industry’s shelf life for normal
untreated roasted peanuts, the hexanal of roasted REP increased 9.5-fold to 82.89 µg/g
suggesting that roasted REP will have shorter shelf life than regular untreated roasted peanuts.
2. Changes in trans-resveratrol, total phenolics and TEAC levels during storage
The respective initial (0 day) trans-resveratrol concentrations of REP stored at 30, 35 and
40oC were 3.39, 3.39, and 3.34 µg/g; which decreased to 2.96, 3.12 and 2.80 µg/g or 13%, 8%
and 16% reduction, as storage time increased to 61, 46 and 35 days, respectively (Figure 4.17).
At 25oC, trans-resveratrol was reduced from 3.40 to 2.77 µg/g, an 18% decrease, after 101 days.
Label claim requires that at least 80% of the concentration of the substance or ingredient should
be present in the product during its shelf life (Fu and Labuza, 1993). Control samples had initial

Figure 4.17. Changes in hexanal and trans-resveratrol concentrations of roasted resveratrol-enhanced peanuts during storage at accelerated temperatures of 30, 35 and 40oC and verified at 25oC.
299
Hexanal content
0
20
40
60
80
100
120
80 100 120
ays)
Hex
anal
(ug/
g)
0 20 40 60
Storage time (d
25C30C35C40C
Trans -resveratrol content
2.6
2.8
3.0
3.2
3.4
3.6
0 20 40 60 80 100
Storage time (days)
Tran
s-re
sver
atro
l (ug
/g)
40C35C30C25C

300
Table 4.21 Mean hexanal concentrations (mean ± standard deviation) of roasted resveratrol-enhanced peanuts stored for varying times at accelerated temperatures of 30, 35, and 40oC, and verified at 25oC1 Treatment
No. Storage
Temperature (°C)
Storage time
(days)
Hexanal (µg/g) Trans-resveratrol (µg/g)
Total Phenolics (mg GAE/g)
TEAC (µM TE/g)
1 25 0 8.67 ± 0.27f 3.40 ± 0.16 1.91 ± 0.13 8.26 ± 1.22 2 25 18 9.07 ± 1.80f 3.39 ± 0.36 3 25 35 15.31 ± 1.46ef - 4 25 52 23.57 ± 7.47e 3.29 ± 0.25 1.76 ± 0.01 6.06 ± 1.63 5 25 61 45.07 ± 9.04d 3.15 ± 0.67 6 25 67 44.26 ± 6.66d - 7 25 71 55.49 ± 3.56cd 2.87 ± 0.53 8 25 75 59.62 ± 12.10c - 9 25 81 75.32 ± 26.52b - 10 25 87 79.69 ± 16.27b - 11 25 90 82.89 ± 8.21b 2.77 ± 0.94 12 25 95 77.71 ± 10.69b 13 25 101 106.07 ± 17.65a
Controls 54 25 0 2.77 ± 0.33i 0.29 ± 0.04 1.58 ± 0.00 6.47 ± 0.64 55 25 35 6.16 ± 2.29ij - - 56 25 52 5.85 ± 0.87ij 0.28 ± 0.05 1.48 ± 0.04 6.36 ± 0.12 57 25 61 7.45 ± 1.65j - - 58 4 35 3.21 ± 2.20i - - 59 4 52 4.00 ± 0.89i 0.28 ± 0.03 1.57 ± 0.02 6.42 ± 0.21 60 4 61 3.44 ± 0.94i -

301
Table 4.21 continued… Treatment
No. Storage
Temperature (°C)
Storage time
(days)
Hexanal (µg/g) Trans-resveratrol (µg/g)
Total Phenolics (mg GAE/g)
TEAC (µM TE/g)
14 30 0 6.63 ± 0.70hg 3.39 ± 1.06 2.35 ± 0.07 9.29 ± 0.41 15 30 6 6.93 ± 0.55hg 3.44 ± 1.15 - - 16 30 23 12.07 ± 0.34f 3.37 ± 0.88 - - 17 30 32 14.77 ± 0.93f - - - 18 30 38 15.62 ± 0.78f - - - 19 30 42 29.45 ± 4.68cd 3.04 ± 0.60 2.02 ± 0.03 6.71 ± 1.93 20 30 46 22.33 ± 3.59e - - - 21 30 52 25.78 ± 3.49de - - - 22 30 59 28.47 ± 4.30d - - - 23 30 61 33.19 ± 3.27bc 2.96 ± 0.27 - - 24 30 66 36.91 ± 8.87b - - - 25 30 72 41.87 ± 3.69a - - -
Controls 54 25 0 2.77 ± 0.33h 0.29 ± 0.04 1.58 ± 0.00 6.47 ± 0.64 55 25 35 6.16 ± 2.29gh - - - 56 25 52 5.85 ± 0.87gh 0.28 ± 0.05 1.48 ± 0.04 6.36 ± 0.12 57 25 61 7.45 ± 1.65g - - - 58 4 35 3.21 ± 2.20gh - - - 59 4 52 4.00 ± 0.89gh 0.28 ± 0.03 1.57 ± 0.02 6.42 ± 0.21 60 4 61 3.44 ± 0.94gh - - -
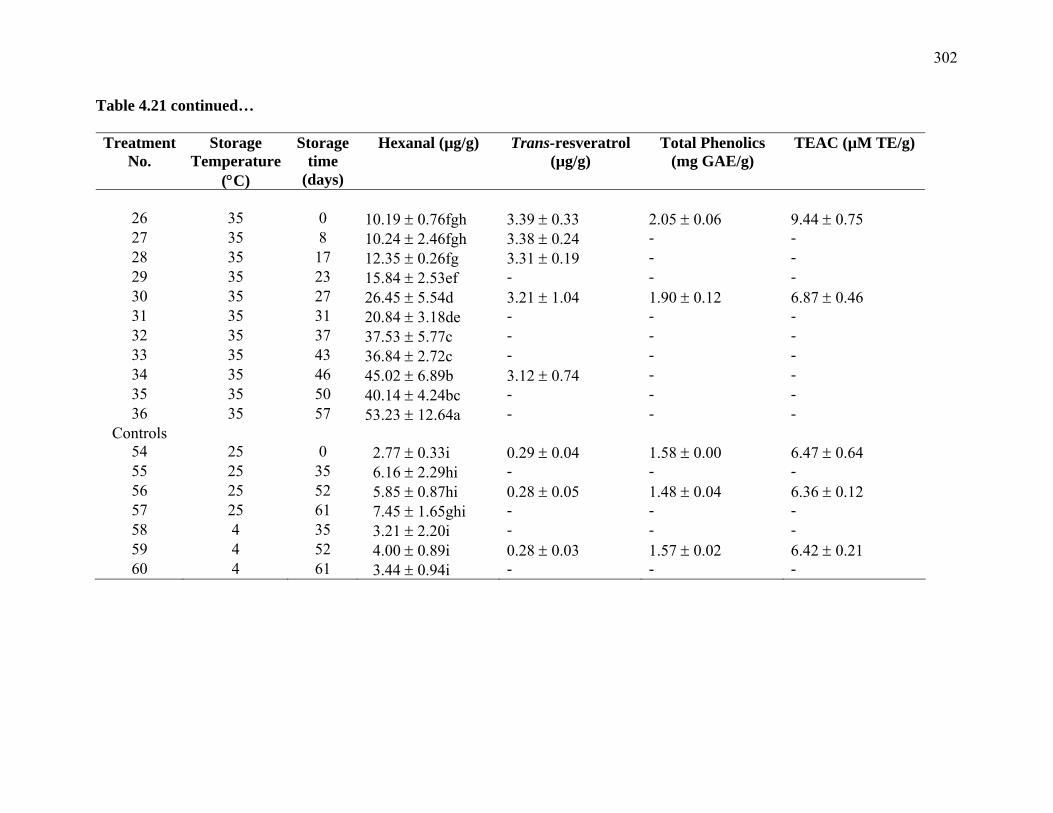
302
Table 4.21 continued… Treatment
No. Storage
Temperature (°C)
Storage time
(days)
Hexanal (µg/g) Trans-resveratrol (µg/g)
Total Phenolics (mg GAE/g)
TEAC (µM TE/g)
26 35 0 10.19 ± 0.76fgh 3.39 ± 0.33 2.05 ± 0.06 9.44 ± 0.75 27 35 8 10.24 ± 2.46fgh 3.38 ± 0.24 - - 28 35 17 12.35 ± 0.26fg 3.31 ± 0.19 - - 29 35 23 15.84 ± 2.53ef - - - 30 35 27 26.45 ± 5.54d 3.21 ± 1.04 1.90 ± 0.12 6.87 ± 0.46 31 35 31 20.84 ± 3.18de - - - 32 35 37 37.53 ± 5.77c - - - 33 35 43 36.84 ± 2.72c - - - 34 35 46 45.02 ± 6.89b 3.12 ± 0.74 - - 35 35 50 40.14 ± 4.24bc - - - 36 35 57 53.23 ± 12.64a - - -
Controls 54 25 0 2.77 ± 0.33i 0.29 ± 0.04 1.58 ± 0.00 6.47 ± 0.64 55 25 35 6.16 ± 2.29hi - - - 56 25 52 5.85 ± 0.87hi 0.28 ± 0.05 1.48 ± 0.04 6.36 ± 0.12 57 25 61 7.45 ± 1.65ghi - - - 58 4 35 3.21 ± 2.20i - - - 59 4 52 4.00 ± 0.89i 0.28 ± 0.03 1.57 ± 0.02 6.42 ± 0.21 60 4 61 3.44 ± 0.94i - - -

303
Table 4.21 continued…
Treatment No.
Storage Temperature
(°C)
Storage time
(days)
Hexanal (µg/g) Trans-resveratrol (µg/g)
Total Phenolics (mg GAE/g)
TEAC (µM TE/g)
41 40 0 11.45 ± 2.77fghi 3.34 ± 0.34 2.01 ± 0.04 8.57 ± 0.46 42 40 6 13.89 ± 1.45effghi 3.08 ± 0.11 - - 43 40 12 19.47 ± 1.83efefg - - - 44 40 16 21.43 ± 2.05eefg 3.05 ± 0.70 - - 45 40 19 22.27 ± 4.29ef 2.86 ± 0.98 1.82 ± 0.03 6.52 ± 0.11 46 40 20 28.95 ± 5.23e - - - 47 40 26 53.98 ± 10.75cd - - - 48 40 28 54.23 ± 3.90c - - - 49 40 32 55.70 ± 10.75c - - - 50 40 35 57.83 ± 3.90c 2.87 ± 0.58 - - 51 40 40 61.36 ± 13.57c - - - 52 40 46 82.81 ± 17.98b - - - 53 40 68 105.12 ± 13.74a - - -
Controls 54 25 0 2.77 ± 0.33j 0.29 ± 0.04 1.58 ± 0.00 6.47 ± 0.64 55 25 35 6.16 ± 2.29hij - - - 56 25 52 5.85 ± 0.87hij 0.28 ± 0.05 1.48 ± 0.04 6.36 ± 0.12 57 25 61 7.45 ± 1.65hij - - - 58 4 35 3.21 ± 2.20j - - - 59 4 52 4.00 ± 0.89ij 0.28 ± 0.03 1.57 ± 0.02 6.42 ± 0.21 60 4 61 3.44 ± 0.94j - - -
1 Means not followed by the same letter within the column at each specified storage temperature along with controls are significantly (P<0.05) different from each other as determined by Fisher’s least significance difference mean separation test.

304
trans-resveratrol contents of 0.29 µg/g which did not change significantly during storage for 52
days at 4 and 25oC.
REP had mean initial total phenolics of 2.35, 2.05, and 2.01 mg GAE/g at 30, 35 and 40oC,
respectively, which decreased to 2.02, 1.90, and 1.82 mg GAE/g or 14%, 17% and 19%
reductions, after 42, 27, and 19 days of storage at respective temperatures. At 25oC, the total
phenolics of REP decreased from 1.91 to 1.76 mg GAE/g or 8% after 52 days. Control samples
had initial total phenolics of 1.58 mg GAEg/g which decreased to 1.48 mg GAE/g after storage
for 52 days at 25oC and did not change during storage for 52 days at 4oC at 1.57 mg GAE/g.
The initial TEAC values of 9.29, 9.44 and 8.57 µM TE/g of REP stored at 30, 35 and 40oC,
respectively, decreased to 5.21, 6.87, and 6.52 µM TE/g after 42, 27, and 19 days of storage at
respective temperatures. At 25oC, TEAC decreased from initial value of 8.26 µM TE/g to 6.06
µM TE/g after 52 days of storage. Control samples had initial TEAC of 6.47 µM TE /g which
decreased slightly to 6.36 and 6.42 µM TE /g after storage for 52 days at 25 and 4oC,
respectively.
3. Changes in the consumer acceptance rating for the different sensory attributes of
roasted REP by consumers
3.1 Overall acceptance of REP by consumers
The overall acceptance of roasted REP stored at varying times at accelerated storage
temperature of 30, 35 and 40oC are shown in Table 4.22. At zero day storage, roasted resveratrol
enhanced peanuts had significantly (α <0.05) lower overall acceptance ratings of 5.30, 5.14 and
4.90 or neither like nor dislike at accelerated storage temperatures of 30, 35 and 40oC,
respectively, compared to controls with 7.10 or like moderately.

305
Table 4.22 Mean hedonic ratings ± standard deviation of consumer panel on roasted resveratrol-enhanced peanuts stored for varying times at 25, 30, 35, and 40oC.
Trt No.1
Temp. (oC)
Time (day)
Appearance2 Color2 Aroma2 Flavor2 Texture2 Overall Acceptance2
1 25 0 5.9 ±1.8a 5.9 ±1.7a 5.5 ±1.6bcd 5.1 ±1.7b 5.9 ±1.8d 5.1 ±1.7b 2 25 18 5.8 ±1.7a 5.9 ±1.7a 5.6 ±1.6bc 4.6 ±1.8bc 5.9 ±1.6d 5.0 ±1.7b 3 25 52 5.7 ±1.6a 5.9 ±1.6a 5.6 ±1.7b 4.7 ±1.9bc 6.0 ±1.6cd 5.0 ±1.6b 4 25 61 5.7 ±1.8a 5.8 ±1.8a 4.9 ±1.5de 4.6 ±1.7bc 6.0 ±1.8d 4.6 ±1.5bc 5 25 71 6.0 ±1.6a 5.9 ±1.7a 4.8 ±1.6de 4.5 ±2.0bc 6.0 ±1.7d 4.4 ±1.7c 6 25 90 5.8 ±1.7a 5.9 ±1.7a 4.9 ±1.5cde 4.3 ±1.6c 6.1 ±1.5cd 4.1 ±1.7c 7 25 101 6.0 ±1.4a 6.2 ±1.4a 4.9 ±1.9e 4.5 ±2.1bc 6.2 ±1.8bcd 4.1 ±1.9c
Control 25 0 6.3 ±1.5a 6.4 ±1.5a 6.8 ±1.9a 7.0 ±2.0a 6.6 ±1.5ab 7.1 ±1.9a Control 25 52 6.6 ±1.2a 6.6 ±1.4a 6.8 ±1.6a 7.2 ±1.6a 6.9 ±1.4a 7.3 ±1.4a Control 4 52 6.3 ±1.4a 6.2 ±1.5a 6.6 ±1.7a 7.1 ±1.4a 6.7 ±1.5ab 7.1 ±1.3a
P-value 0.1493 0.2810 <0.0001 <0.0001 <0.0001 <0.0001 8 30 0 6.2 ±1.6a 6.1 ±1.6a 5.7 ±1.8bc 5.6 ±1.6b 6.4 ±1.4abc 5.3 ±1.6b 9 30 6 5.9 ±1.5a 5.9 ±1.5a 5.6 ±1.2bc 5.3 ±1.2b 6.3 ±1.4bc 5.2 ±1.4b 10 30 23 6.0 ±1.4a 6.1 ±1.4a 5.8 ±1.3b 5.5 ±1.1b 6.3 ±1.2abc 5.3 ±1.5b 11 30 42 5.9 ±1.7a 5.9 ±1.7a 5.3 ±1.9bcd 5.1 ±1.5bc 6.1 ±1.6c 5.0 ±1.4bc 12 30 61 6.1 ±1.5a 6.1 ±1.7a 5.0 ±1.6cd 4.5 ±1.5c 6.2 ±1.6c 4.4 ±1.5cd 13 30 72 6.0 ±1.5a 6.1 ±1.6a 4.9 ±1.4d 4.6 ±1.7c 6.3 ±1.5c 4.1 ±1.7d
Control 25 0 6.3 ±1.5a 6.4 ±1.5a 6.8 ±1.9a 7.0 ±2.0a 6.6 ±1.5abc 7.1 ±1.9a Control 25 52 6.6 ±1.2a 6.6 ±1.4a 6.8 ±1.6a 7.2 ±1.6a 6.9 ±1.4a 7.3 ±1.4a Control 4 52 6.3 ±1.4a 6.2 ±1.5a 6.6 ±1.7a 7.1 ±1.4a 6.7 ±1.5ab 7.1 ±1.3a
P-value 0.3979 0.2136 <0.0001 <0.0001 0.0014 <0.0001

306
Table 4.22 continued…
Trt No.1
Temp. (oC)
Time (day)
Appearance2 Color2 Aroma2 Flavor2 Texture2 Overall Acceptance2
14 35 0 6.1 ±1.4a 5.9 ±1.6bc 5.6 ±1.7bc 5.3 ±1.6bc 6.2 ±1.6cd 5.1 ±1.7b 15 35 8 6.0 ±1.2a 6.0 ±1.4bc 5.8 ±1.2b 5.6 ±1.3bc 6.2 ±1.3bcd 5.3 ±1.2b 16 35 17 5.8 ±1.7a 5.7 ±1.7c 5.1 ±1.6cd 5.0 ±1.7cd 6.0 ±1.3cd 4.8 ±1.6bc 17 35 27 5.9 ±1.3a 5.9 ±1.4bc 5.4 ±1.5cd 5.0 ±1.5bc 6.2 ±1.4cd 5.1 ±1.5b 18 35 46 6.1 ±1.3a 6.0 ±1.4abc 4.9 ±1.2e 4.4 ±1.4d 6.2 ±1.5cd 4.4 ±1.3c 19 35 57 6.0 ±1.7a 5.9 ±1.6bc 4.7 ±1.5e 4.4 ±1.6d 6.2 ±1.3bcd 4.4 ±1.6c
Control 25 0 6.3 ±1.5a 6.4 ±1.5ab 6.8 ±1.9a 7.0 ±2.0a 6.6 ±1.5abc 7.1 ±1.9a Control 25 52 6.6 ±1.2a 6.6 ±1.4a 6.8 ±1.6a 7.2 ±1.6a 6.9 ±1.4a 7.3 ±1.4a Control 4 52 6.3 ±1.4a 6.2 ±1.5abc 6.6 ±1.7a 7.1 ±1.4a 6.7 ±1.5ab 7.1 ±1.3a
P-value 0.1384 0.0096 <0.0001 <0.0001 0.0003 <0.0001
20 40 0 5.9 ±1.5a 6.0 ±1.5a 5.4 ±1.8bcd 5.0 ±1.8b 6.0 ±1.6c 4.9 ±1.7b 21 40 6 6.0 ±1.5a 5.9 ±1.5a 5.9 ±1.4b 5.2 ±1.5b 6.2 ±1.4bc 5.1 ±1.4b 22 40 16 6.0 ±1.6a 6.0 ±1.6a 5.5 ±1.5bcd 5.0 ±1.8b 6.0 ±1.6c 5.0 ±1.4b 23 40 19 6.2 ±1.6a 5.9 ±1.6a 5.6 ±1.3bc 5.2 ±1.5b 5.9 ±1.5c 5.0 ±1.5b 24 40 35 6.0 ±1.5a 6.2 ±1.5a 5.1 ±1.4cd 4.3 ±1.5c 5.9 ±1.7c 4.2 ±1.3c 25 40 46 6.0 ±1.5a 6.0 ±1.6a 4.9 ±1.6d 4.6 ±1.7bc 5.9 ±1.8c 4.2 ±1.7c
Control 25 0 6.3 ±1.5a 6.4 ±1.5a 6.8 ±1.9a 7.0 ±2.0a 6.6 ±1.5abc 7.1 ±1.9a Control 25 52 6.6 ±1.2a 6.6 ±1.4a 6.8 ±1.6a 7.2 ±1.6a 6.9 ±1.4a 7.3 ±1.4a Control 4 52 6.3 ±1.4a 6.2 ±1.5a 6.6 ±1.7a 7.1 ±1.4a 6.7 ±1.5ab 7.1 ±1.3a
P-value 0.2775 0.1276 <0.0001 <0.0001 <0.0001 <0.0001 1 Control samples were prepared from untreated peanuts. 2 Mean ratings for acceptance using 9-point hedonic rating scale: 1="dislike extremely"; 5="neither like nor dislike"; 9="like extremely." Mean ratings within a column at each storage temperature along with controls not followed by the same letter are significantly different (P<0.05) from each other as determined by Fisher’s least significance difference mean separation test.

307
The initial overall acceptance rating of ≥ 5 or neither like nor dislike did not change
significantly (P<0.05) when REP were stored for up to 42 days at 30oC, up to 27 days at 35oC,
and up to 19 days at 40oC. At these storage times, the levels of hexanal were 29.45, 26.45 and
22.27 µg/g for samples stored at 30, 35 and 40oC, respectively. After these storage times, all
REP were disliked by the consumers with OA ratings <5 or dislike slightly, indicating that the
shelf life of REP at accelerated temperature of 30, 35 and 40oC were 42, 27 and 19 days,
respectively. At similar level of acceptance rating of ≥ 5, REP had higher hexanal contents
compared to 6.01 µg/g in untreated roasted peanuts stored at 40oC for 66 days (Grosso and
Resurrecion, 2002). The OA roasted control peanuts in this study did not change (P<0.05) after
storage for 52 days at 25oC and 4oC.
At verification temperature of 25oC, the initial mean OA rating of REP was 5.10 or neither
like nor dislike which did not change (P<0.05) after 52 days with equivalent hexanal of 23.57
µg/g. After 61-101 days, OA decreased to <5 and the samples remained disliked slightly with the
corresponding increases in hexanal to 45.07-106.07 µg/g.
3.2 Acceptance ratings for the different sensory attributes of roasted REP by consumers
Table 4.22 shows the consumer ratings for their liking of the different sensory attributes of
roasted REP.
Acceptance for Appearance and Color. Consumers had similar (P<0.05) acceptance
ratings for the appearance of all REP and untreated controls, except for REP sample stored for 17
days at 35oC. This indicates that in terms of appearance, REP which needs to be sliced, have
potential applications to peanut containing products such as peanut bars, granola, and other
confections.

308
Similarly, consumers liked the color of treated stored REP (5.72 – 6.20 or like slightly) as
much as the untreated controls (6.22-6.48 or like slightly). This implies that in terms of color,
the REP can be used in any product applications where peanuts are visible.
Acceptance for Aroma and Flavor. In terms of aroma, consumers had lower (P<0.05)
acceptance ratings for all REP (ratings = 4.8 – 5.8 or neither like nor dislike to dislike slightly)
compared to untreated controls (ratings= 6.6-6.8 or like slightly). Except for REP stored at 35oC,
consumer’s liking for aroma did not change (P<0.05) from its initial ratings at all storage
temperatures, regardless of storage time and temperature suggesting that this was due to
processing treatment of REP rather than storage effect. At 35oC, consumers’ liking for aroma
decreased from 5.6 or neither like nor dislike to 4.9 or dislike slightly after 46 days of storage.
Although objective measurements of quality characteristics may strongly indicate quality in a
product, in the final analysis, flavor largely determines product acceptance (Morris and Freeman,
1954). In terms of flavor, REP had lower (P<0.05) acceptance ratings of 4.30 to 5.78 or neither
like nor dislike to dislike slightly, compared to untreated controls with 6.98-7.20 or like slightly
to like moderately. The initial acceptance ratings for flavor did not change (P<0.05) when REP
were stored for 42 days at 30oC, 27 days at 35oC, and 19 days at 40oC, suggesting a processing
treatment effect rather than storage effect. The acceptance for flavor compared to initial ratings
decreased after 61 days at 30oC, 46 days 30oC, and 35 days 40oC. At 25oC, REP’ initial flavor
acceptance rating 5.10 did not change (P<0.05) after 71 days, then decreased to 4.3 after 90 days
Acceptance for Texture. Consumers liked (P<0.05) the texture of the stored roasted REP
(rating= 6.04-6.42 or liked slightly) as much as untreated controls (rating=6.64-6.86 or liked
slightly. At 25oC, consumers had lower acceptance ratings for texture or 5.9 – 6.2 (6=like
slightly) compared to untreated controls with ratings of 6.6-6.9 (7=like moderately).

309
4. Changes in the consumers’ just-about-right (JAR) ratings for roasted peanutty flavor
and bitterness
The just-about-right (JAR) rating scale had anchors of “high or too much” or “low or too
little” of a product sensory attribute on either ends on the scale, with just-about-right at the
middle. If not JAR, then consumers will indicate whether the product is higher or lower relative
to their perceptual ideal level of that product attribute (Muñoz, 2004). The 7-point JAR rating
scale with midpoint at 4=JAR was used in this study to determine the consumer perceptions of
the roasted peanutty flavor and bitterness in REP (Table 4. 23), which were expected to be lower
than JAR as a result of exposure to US and UV processing treatments.
4.1 Consumer JAR ratings for roasted peanutty flavor.
Roasted peanutty flavor is the most desirable sensory attribute in peanuts important to
consumers. Roasting remove the tastes of raw peanuts to produce an appetizing product (Morris
and Freeman, 1996). Roasted peanut flavor is composed of a complex blend of heterocyclic and
other volatile compounds formed during roasting through thermal degradation reactions
including Maillard reactions between carbohydrate, free amino acid, and protein (Beet and
Boylston, 1992). Pyrazine derivatives are among the “character impact” compounds of typical
roasted peanuts (Mason et al., 1966). REP used in this study were roasted to medium roast as
this degree produced the most desirable flavor in peanut butters compared to light or heavy
roasts (Morris and Freeman, 1996).
The JAR ratings for roasted peanutty flavor of all REP (ratings= 2.9-4.1) were lower
(P<0.05) than unstored untreated controls (rating=4.5). REP stored for 52 days at 25oC, 23 days
at 30oC, 27 days at 35oC, and 19 days at 40oC had JAR ratings which were not different (P<0.05)
from controls stored for 52 days at 25oC (rating = 4.2). This result was significant indicating that

310
Table 4.23 Consumer panel ratings (mean ± standard deviation) for just-about-right and intensity of sensory attributes of roasted resveratrol-enhanced peanuts stored for varying times at 25, 30, 35, and 40oC1
Trt. No. 2
Storage Tempera-ture (oC)
Storage Time (days)
JAR- Roasted peanutty flavor3
JAR- Bitterness3
Intensity of roasted peanutty
flavor4
Intensity of off-flavor4
4.0
4.6
±1.5b 1 25 0 ±1.0b ±1.0a 5.2 5.4 ±1.5bc 2 25 18 3.9 ±1.0b 4.6 ±1.1a 5.0 ±1.2b 5.4 ±1.5bc 3 25 52 3.9 ±1.1b 4.4 ±1.2a 5.0 ±1.3b 5.3 ±1.6c 4 25 61 3.4 ±1.1c 4.2 ±1.3a 4.3 ±1.2c 5.7 ±1.2abc 5 25 71 3.4 ±1.4c 4.3 ±1.2a 4.3 ±1.6c 5.9 ±1.4abc 6 25 90 3.2 ±1.1cd 4.4 ±1.2a 4.2 ±1.8c 6.1 ±1.2a 7 25 101 2.9 ±1.1d 4.4 ±1.0a 3.5 ±1.2d 6.1 ±1.5ab
Control 25 0 4.5 ±1.1a 4.1 ±0.8a 6.1 ±1.5a 3.3 ±2.3d Control 25 52 4.2 ±1.3ab 4.1 ±0.5a 5.8 ±1.5a 3.1 ±2.0d Control 4 52 4.5 ±1.1a 4.1 ±0.7a 6.0 ±1.4a 3.1 ±1.9d
8 30 0 3.9 ±0.9bc 4.2 ±1.1a 5.1 ±1.0b 5.1 ±1.3b 9 30 6 3.9 ±0.9bc 4.2 ±0.9a 4.9 ±1.0b 5.0 ±1.2b 10 30 23 3.9 ±0.7bc 4.2 ±0.9a 4.8 ±1.0b 5.0 ±1.0ab 11 30 42 3.8 ±1.0c 4.3 ±1.0a 5.2 ±1.2b 5.3 ±1.3ab 12 30 61 3.2 ±0.9d 4.2 ±0.9a 4.1 ±1.1b 5.5 ±1.0ab 13 30 72 3.0 ±01.0d 4.2 ±0.8a 3.7 ±1.2c 5.6 ±1.2a
Control 25 0 4.5 ±1.1a 4.1 ±0.8a 6.1 ±1.5a 3.3 ±2.3c Control 25 52 4.2 ±1.3ab 4.1 ±0.5a 5.8 ±1.5a 3.1 ±1.9c Control 4 52 4.5 ±1.1a 4.1 ±0.7a 6.0 ±1.4a 3.1 ±1.9c

311
Table 4.23 continued…
Trt. No. 2
Storage Tempera-ture (oC)
Storage Time (days)
JAR- Roasted peanutty flavor3
JAR- Bitterness3
Intensity of roasted peanutty
flavor4
Intensity of off-flavor4
14 35 0 4.0 ±1.0cd 4.4 ±1.0a 5.4 ±1.2bc 5.0 ±1.4b 15 35 8 3.9 ±1.0cd 4.1 ±1.0a 4.8 ±1.1d 4.9 ±1.1b 16 35 17 4.1 ±1.0bcd 4.5 ±1.1a 5.0 ±1.2cd 5.3 ±1.3ab 17 35 27 3.9 ±1.0cd 4.2 ±0.9a 4.8 ±1.0d 5.3 ±1.2a 18 35 46 3.2 ±0.8e 4.1 ±1.0a 4.0 ±1.2e 5.8 ±1.1a 19 35 57 3.2 ±1.1e 4.2 ±1.1a 3.8 ±1.4e 5.8 ±1.3a
Control 25 0 4.5 ±1.1ab 4.1 ±0.8a 6.1 ±1.5a 3.3 ±2.3c Control 25 52 4.2 ±1.3abc 4.1 ±0.5a 5.8 ±1.5ab 3.1 ±1.9c Control 4 52 4.5 ±1.1a 4.1 ±0.7a 6.0 ±1.4a 3.1 ±1.9c
20 40 0 4.1 ±1.2ab 4.2 ±1.0a 5.2 ±1.5b 5.0 ±1.5b 21 40 6 3.9 ±1.0ab 4.3 ±1.0a 5.1 ±1.2b 5.3 ±1.1b 22 40 16 3.9 ±1.0bc 4.3 ±1.0a 5.2 ±1.2b 5.4 ±1.3ab 23 40 19 3.8 ±1.0bc 4.3 ±1.0a 5.1 ±1.2b 5.4 ±1.4ab 24 40 35 3.5 ±1.2cd 4.2 ±1.0a 4.4 ±1.3c 5.9 ±1.4ab 25 40 46 3.2 ±1.2d 4.2 ±1.1a 4.3 ±1.4c 5.6 ±1.4ab
Control 25 0 4.5 ±1.1a 4.1 ±0.8a 6.1 ±1.5a 3.3 ±2.3c Control 25 52 4.2 ±1.3ab 4.1 ±0.5a 5.8 ±1.5a 3.1 ±2.0c Control 4 52 4.5 ±1.1a 4.1 ±0.7a 6.0 ±1.4a 3.1 ±1.9c
1 Mean ratings within a column and storage temperature along with controls not followed by the same letter are significantly different (P<0.05) from each other as determined by Fisher’s least significance difference mean separation test. 2 Control samples were prepared from untreated peanuts. 3 Consumer ratings using 7-point just-about-right rating scale: 1="much too weak"; 4="just-about-right"; 7="much too strong”. 4 Consumer ratings using 9-point intensity rating scale: 1="none"; 4="neither weak nor strong"; 9="extremely strong".

312
in terms of roasted peanutty flavor, product reformulations are not needed to meet the
consumers’ desired degree of roasted peanutty flavor in REP stored up to 52 days at 25oC. The
roasted peanutty flavors of REP were less than JAR after 61, 42, 46, and 35 days at 25, 30, 35,
and 40oC; and were lower than controls.
4.2 Consumer JAR ratings for bitterness.
The JAR ratings for bitterness of REP ranged from 4.16-4.37 or just-about-right, and did not
change (P<0.05) during storage at 30, 35 and 40oC. All REP samples had JAR bitterness ratings
which were not different (P <0.05) from controls, except for REP stored at 25oC for 18 days
which had stronger bitterness than controls, although its rating of 4.6 is still within the JAR
category. These results indicate that the bitterness of REP was just-about-right from consumers’
perception of which is unexpected as REP were expected to be bitter due to production of
phenolic compounds that impart bitterness in foods. This finding, however, was significant as
REP will have food applications in products containing peanuts without imparting bitter taste.
5. Changes in the consumer intensity ratings for roasted peanutty flavor and off-flavor
5.1 Consumer intensity rating for roasted peanutty.
The most important sensory characteristic in roasted peanuts is the roasted peanutty flavor.
The intensity of roasted peanutty flavor of all REP stored at 30, 35 and 40oC (Table 4.23) ranged
from 3.7-5.4 or moderately weak to neither weak nor strong, which were lower (P<0.05)
compared untreated controls with ratings of 5.8-6.1 (6= slightly strong). Roasted peanutty flavor
of all REP samples did not change (P<0.05) up to 61, 27 and 19 days of storage at 30, 35 and
40oC, respectively, suggestive of a processing treatment effect rather than a storage effect; but
decreased (P<0.05) after 72, 46, and 35 days at 30, 35, and 40oC, respectively, indicating a
storage effect.

313
At 25oC, all REP had weaker (rating=3.5-5.2) roasted peanutty flavor compared to controls;
which decreased after 52 days from 5.2 (neither weak nor strong) to 4.3 (slightly weak), and
further decreased to 3.5 (moderately weak) after 90 days. Warner et al (1996) also found that
flavor scores for untreated roasted peanuts decreased slightly, leveled-off during storage
whereas, hexanal increased during 38-day storage. The decreasing intensities in roasted peanutty
flavor or ‘flavor fade’of REP during storage could be attributed to masking of pyrazines and
other ‘roasted peanut’ flavor compounds by large quantities of low-molecular weight aldehydes
during lipid oxidation and not due to polymerization and/or degradation of the pyrazines that
produce the characteristic roasted peanut flavor (Warner et al., 1996).
5.2 Consumer intensity ratings for off-flavors.
Lipid oxidation during storage has long been recognized as contributing to the development
of undesirable flavors of peanuts (Bett and Boylston, 1992). All REP had stronger (P<0.05) off-
flavors (ratings = 4.9-6.1 or neither weak nor strong to slightly strong) than controls (ratings =
3.1-3.3 or moderately weak) verifying the higher contents of REP compared to control found in
this study. The initial off-flavors intensities in REP remained at the same levels until these
increased after 90, 72, and 17 days at 25, 30, and 35; but remained at the same levels until 46
days at 40oC. Rancidity, the off-flavor developed due lipid oxidation reactions, makes a food
unacceptable to consumers (Labuza, 1984; St. Angelo, 1996). Increased off-flavors intensities in
REP resulted in decreased roasted peanutty flavor intensities and overall acceptance ratings of
REP.

314
6. Intensity ratings for the different sensory attributes of roasted REP by a descriptive
panel
6.1 Descriptive panel intensity ratings for brown color, roasted peanutty, and raw beany
Table 4.24 and Figure 4.18 show the intensity ratings by a descriptive sensory panel for
brown color, roasted peanutty, and raw beany aromatics of roasted REP stored for varying times
and temperatures.
Brown color. The initial intensities of brown color of all REP samples did not change
during storage at all temperatures studied and were not different from 52-day stored controls at
25oC. The brown color of controls did not change during storage at 25 and 4oC for 52 days.
These results suggest that storage time and temperature had no effect on the brown color of
roasted REP and control peanuts.
Roasted peanutty flavor. The roasted peanutty flavor is the most important sensory attribute
in peanuts. Generally, three types of reactions are responsible for the formation of roasted
peanutty flavor and aroma which include Maillard reaction between sugar and amino acids, lipid
thermal decomposition, and sugar degradation (El-Kayati et al., 1998). More than 300 volatile
flavor components have been identified in roasted peanuts (El-Kayati et al., 1998) since Mason
et al., 1966) first showed that low molecular weight pyrazines were important compounds.
Soonafter, researchers identified additional new volatile compounds in roasted peanuts (Mason et
al., 1967; Johnson et al., 1971; Walradt et al., 1971; Ho et al., 1981).
All REP had less (P<0.05) roasted peanutty flavor compared to controls. This finding agrees
with the results of consumer test, where intensities for roasted peanutty flavor of all REP were
lower (P<0.05) than controls, suggesting that reduction in roasted peanutty flavor was a processing

315
Table 4.24 Changes in the intensity ratings (mean ± standard deviation) for the brown color, roasted peanutty and raw beany aromatics of roasted resveratrol-enhanced peanuts stored for varying times at accelerated temperatures of 30, 35, and 40oC and verified at 25oC1.
Trt. No.
Temp. (oC)
Time (day)
Brown color Roasted peanutty Raw beany
1 25 0 36.5 ± 5.2a 34.5 ± 5.2c 0.6 ± 2.0a 2 25 18 35.4 ± 2.1a 33.2 ± 1.0c 0.2 ± 0.4a 3 25 52 36.0 ± 5.1a 30.9 ± 2.5d 0.2 ± 0.7a 4 25 61 35.0 ± 1.8a 29.3 ± 2.2de 0.8 ± 2.5a 5 25 71 37.4 ± 2.2a 27.8 ± 2.0e 0.5 ± 1.8a 6 25 90 35.4 ± 2.4a 26.0 ± 1.9f 0.8 ± 2.4a 7 25 101 34.5 ± 2.1a 25.1 ± 1.8f 0.6 ± 2.3a
Control 25 0 36.6 ± 2.8a 58.9 ± 3.7a 0.2 ± 0.4a Control 25 52 35.4 ± 4.0a 55.0 ± 4.2a 0.7 ± 2.2a Control 4 52 37.0 ± 3.0a 58.4 ± 4.0a 0.5 ± 2.0a
P-value 0.0811 <0.0001 0.9989 8 30 0 34.9 ± 1.7bc 34.8 ± 1.7c 0.8 ± 3.2a 9 30 6 34.3 ± 2.0c 33.4 ± 1.4c 0.1 ± 0.3a 10 30 23 35.9 ± 4.6abc 31.4 ± 0.2d 0.0 ± 0.2a 11 30 42 36.9 ± 5.1ab 29.7 ± 1.3e 1.7 ± 7.0a 12 30 61 35.4 ± 2.2abc 28.0 ± 1.6f 0.2 ± 0.4a 13 30 72 34.9 ± 3.5bc 26.5 ± 1.7f 0.2 ± 0.4a
Control 25 0 36.6 ± 2.8ab 58.9 ± 3.7a 0.2 ± 0.4a Control 25 52 35.4 ± 4.0abc 55.0 ± 4.2b 0.7 ± 2.2a Control 4 52 37.0 ± 3.0a 58.4 ± 4.0a 0.5 ± 2.0a
P-value 0.1574 <0.0001 0.7291 14 35 0 35.0 ± 1.1c 34.8 ± 1.0c 0.1 ± 0.2a 15 35 8 34.6 ± 1.3c 32.9 ± 1.2d 0.8 ± 2.8a 16 35 17 34.8 ± 3.0abc 31.4 ± 1.2d 0.1 ± 0.3a 17 35 27 34.8 ± 2.8c 28.8 ± 2.4e 0.0 ± 0.2a 18 35 46 34.3 ± 1.8c 27.5 ± 2.1ef 0.6 ± 2.2a 19 35 57 34.8 ± 1.4c 26.1 ± 2.2f 0.1 ± 0.3a
Control 25 0 36.6 ± 2.8ab 58.9 ± 3.7a 0.2 ± 0.4a Control 25 52 35.4 ± 4.0bc 55.0 ± 4.2b 0.7 ± 2.2a Control 4 52 37.0 ± 3.0a 58.4 ± 4.0b 0.5 ± 2.0a
P-value 0.0199 <0.0001 0.6699

316
Table 4.24 continued… Trt. No.
Temp. (oC)
Time (day)
Brown color Roasted peanutty Raw beany
20 40 0 35.6 ± 5.3abc 34.9 ± 1.1c 0.5 ± 2.0a 21 40 6 34.9 ± 5.4abc 32.9 ± 1.2d 0.1 ± 0.3a 22 40 16 34.5 ± 2.7bc 30.7 ± 2.4e 0.2 ± 0.4a 23 40 19 34.1 ± 2.9c 28.7 ± 2.4f 0.2 ± 0.5a 24 40 35 34.3 ± 1.0c 27.9 ± 1.7fg 0.1 ± 0.2a 25 40 46 33.9 ± 1.6c 26.7 ± 1.5g 0.7 ± 2.5a
Control 25 0 36.6 ± 2.8ab 58.9 ± 3.7a 0.2 ± 0.4a Control 25 52 35.4 ± 4.0abc 55.0 ± 4.2b 0.7 ± 2.2a Control 4 52 37.0 ± 3.0a 58.4 ± 4.0a 0.5 ± 2.0a
P-value 0.0125 <0.0001 0.8122 1Intensity ratings using 150 mm unstructured line scale with anchors at 12.5 mm and 137.5 mm by 10 trained descriptive panel.
Means within a column at specified storage temperature along with controls, not followed by the same letter are significantly (P<0.05) different from each other as determined by Fisher’s least significance difference mean separation test.

317
Brown Color
33
35
37
0 30 60 90 120
Storage time days
Inte
nsity
30C
35C
40C
25C
25C 0d
25C 52d
4C 52d
Roasted Peanutty
24
29
34
39
44
49
54
59
0 30 60 90 120
Storage time days
Inte
nsity
30C
35C
40C
25C
25C 0d
25C 52d
4C 52d
Raw beany
0.0
0.4
0.8
1.2
1.6
2.0
0 30 60 90 120
Storage time days
Inte
nsity
30C
35C
40C
25C
25C 0d
25C 52d
4C 52d
Bitter taste
23
25
27
29
31
33
0 30 60 90 120
Storage time days
Inte
nsity
30C
35C
40C
25C
25C 0d
25C 52d
4C 52d
Sweet Taste
8
9
10
11
12
13
14
0 30 60 90 120
Storage time days
Inte
nsity
30C
35C
40C
25C
25C 0d
25C 52d
4C 52d
Sour Taste
5
6
7
8
9
10
0 30 60 90 120
Storage time days
Inte
nsity
30C
35C
40C
25C
25C 0d
25C 52d
4C 52d
Salty Taste
7
8
9
10
11
12
0 30 60 90 120
Storage time days
Inte
nsity
30C
35C
40C
25C
25C 0d
25C 52d
4C 52d
Woody/hulls/skin
8
9
10
11
12
0 30 60 90 120
Storage time days
Inte
nsity
30C
35C
40C
25C
25C 0d
25C 52d
4C 52d
Burnt
17
19
21
23
25
27
29
0 30 60 90 120
Storage time days
Inte
nsity
30C
35C
40C
25C
25C 0d
25C 52d
4C 52d
Figure 4.18 Changes in the intensity ratings of the different sensory attributes of roasted resveratrol-enhanced peanuts during storage at varying times and temperatures, by a descriptive panel. Horizontal lines indicate untreated controls.

318
Astringent
18
20
22
24
26
28
0 30 60 90 120
Storage time days
Inte
nsity
30C
35C
40C
25C
25C 0d
25C 52d
4C 52d
Cardboard
0
4
8
12
16
20
24
0 30 60 90 120
Storage time days
Inte
nsity
30C
35C
40C
25C
25C 0d
25C 52d
4C 52d
Fishy
0.0
0.4
0.8
1.2
1.6
2.0
0 30 60 90 120
Storage time days
Inte
nsity
30C
35C
40C
25C
25C 0d
25C 52d
4C 52d
Oxidized
048
1216202428323640
0 30 60 90 120
Storage time days
Inte
nsity
30C
35C
40C
25C
25C 0d
25C 52d
4C 52d
Painty
0.0
0.5
1.0
1.5
2.0
2.5
3.0
0 30 60 90 120
Storage time days
Inte
nsity
30C
35C
40C
25C
25C 0d
25C 52d
4C 52d
Crispness
24
26
28
30
32
0 30 60 90 120
Storage time days
Inte
nsity
30C
35C
40C
25C
25C 0d
25C 52d
4C 52d
Crunchiness
34
36
38
40
42
44
0 30 60 90 120
Storage time days
Inte
nsity
30C
35C
40C
25C
25C 0d
25C 52d
4C 52d
Hardness
34
36
38
40
42
44
0 30 60 90 120
Storage time days
Inte
nsity
30C
35C
40C
25C
25C 0d
25C 52d
4C 52d
Toothpack
52
54
56
58
60
62
64
0 30 60 90 120
Storage time daysIn
tens
ity
30C
35C
40C
25C
25C 0d
25C 52d
4C 52d
Figure 4.18 continued…

319
treatment effect. The initial intensities of roasted peanutty flavor of REP, decreased significantly
during storage at 25oC indicating processing treatment rather than storage effect.
Raw beany flavor. Raw beany flavor is an unacceptable off-flavor in roasted peanuts which
is removed by proper roasting of peanuts (Morris & Freeman, 1954). REP had low intensity
ratings for raw beany of 0-1.7 which were not significantly different (P<0.05) from controls.
These results indicate that roasting peanuts to medium roast with an L-value of 50 ± 1 was
adequate to remove the raw beany flavor of REP and control peanuts and that processing
treatments and storage had no effect on the raw beany flavor of treated and untreated control
peanuts.
6.2 Descriptive panel intensity ratings for basic tastes
Table 4.25 and Figure 4.18 present the intensity ratings by a descriptive sensory panel for
bitter, sweet, sour and salty tastes of roasted REP stored for varying times and temperatures.
Significant differences between REP and controls were observed in bitter and sour tastes but not
in sweet and salty tastes
Bitter taste. Significant differences in the intensity of bitterness between REP and controls
were observed during storage at 25 and 30oC but not at 35 and 40oC. At 25 and 30oC, REP
samples were significantly more bitter then stored controls, but not different from non-stored
controls.
Sour taste. Significant differences in the intensity of sourness between REP and controls
were observed only at the highest temperature of 40oC. At 40oC, no significant differences in the
sourness of all REP samples were observed during storage, and were not significantly different
from initial control and 52-day control stored at 4oC. However REP stored from 16 to 46 days
(Trt#22, 23, 24 and 25) were significantly more sour than controls stored for 52 days at 25oC.

320
Table 4.25 Changes in the intensity ratings (mean ± standard deviation) for the basic tastes of roasted resveratrol-enhanced peanuts stored for varying times at accelerated temperatures of 30, 35, and 40oC and verified at 25oC1.
Trt. No.
Temp. (oC)
Time (day)
Bitter Sweet Sour Salty
28.9
±7.2a
9.4
±3.3ab
8.7
±3.5a 1 25 0 ±3.8b 7.62 25 18 28.4 ±4.6a 9.5 ±4.0b 7.1 ±3.9ab 8.9 ±3.9a 3 25 52 29.4 ±4.6a 9.1 ±4.0b 7.5 ±3.7ab 8.8 ±3.7a 4 25 61 27.8 ±5.7a 9.9 ±3.8b 7.3 ±3.7ab 9.4 ±3.0a 5 25 71 29.7 ±4.6a 9.3 ±4.5b 6.7 ±3.0ab 9.0 ±3.1a 6 25 90 27.7 ±6.1a 9.2 ±3.9b 7.1 ±3.2ab 9.3 ±3.1a 7 25 101 26.9 ±5.8ab 9.5 ±3.3b 8.3 ±2.0a 9.4 ±4.0a Control 25 0 26.5 ±7.8ab 11.0 ±5.9ab 5.6 ±2.0b 9.4 ±4.0a Control 25 52 23.5 ±7.4b 10.9 ±5.5ab 5.5 ±4.2b 9.0 ±3.3a Control 4 52 23.7 ±7.0b 12.9 ±4.7a 5.5 ±4.0b 9.4 ±4.1a
P-value 0.0057 0.2035 0.3954 0.9997 8 30 0 30.5 ±4.6a 9.4 ±4.2b 7.7 ±2.7a 9.1 ±3.5a 9 30 6 28.4 ±3.7ab 10.0 ±4.7b 7.2 ±3.2a 9.6 ±3.9a 10 30 23 28.3 ±6.5ab 9.5 ±4.5b 7.4 ±3.5a 10.0 ±3.7a 11 30 42 28.6 ±3.9ab 10.0 ±3.7b 6.6 ±3.4a 9.4 ±3.0a 12 30 61 28.0 ±7.2ab 10.1 ±4.2b 7.6 ±2.9a 9.3 ±3.1a 13 30 72 27.7 ±6.7ab 10.8 ±3.9ab 7.8 ±2.2a 9.3 ±3.1a Control 25 0 26.5 ±7.8bc 11.0 ±5.9ab 5.6 ±2.0b 9.4 ±4.0a Control 25 52 23.5 ±7.4c 10.9 ±5.5ab 5.5 ±4.2b 9.0 ±3.3a Control 4 52 23.7 ±7.0c 12.9 ±4.7a 5.5 ±4.0b 9.4 ±4.1a
P-value 0.0099 0.4669 0.3423 0.9911 14 35 0 27.1 ±7.9ab 10.5 ±4.4ab 6.9 ±3.4ab 9.3 ±3.4a 15 35 8 26.7 ±7.3ab 9.7 ±3.9b 8.0 ±2.4a 9.8 ±3.9a 16 35 17 29.5 ±3.7a 10.7 ±4.4ab 7.0 ±2.7ab 10.7 ±2.3a 17 35 27 28.5 ±7.0a 10.0 ±3.3b 7.7 ±3.0ab 10.4 ±3.1a 18 35 46 27.2 ±5.4ab 9.9 ±4.1b 8.1 ±2.4a 9.0 ±3.4a 19 35 57 27.3 ±6.7ab 10.4 ±2.5ab 7.2 ±2.9ab 10.0 ±3.7a Control 25 0 26.5 ±7.8ab 11.0 ±5.9ab 5.6 ±2.0b 9.4 ±4.0a Control 25 52 23.5 ±7.4b 10.9 ±5.5ab 5.5 ±4.2b 9.0 ±3.3a Control 4 52 23.7 ±7.0b 12.9 ±4.7a 5.5 ±4.0b 9.4 ±4.1a
P-value 0.0891 0.4943 0.1739 0.8480

321
Table 4.25 continued… Trt. No.
Temp. (oC)
Time (day)
Bitter Sweet Sour Salty
20 40 0 28.9 ±5.6a 9.8 ±4.0b 7.3 ±2.4abc 8.5 ±3.0a 21 40 6 27.8 ±7.4ab 9.8 ±3.6b 7.5 ±3.0abc 8.8 ±3.4a 22 40 16 27.5 ±8.4ab 9.4 ±4.2b 8.3 ±3.2a 8.5 ±5.4a 23 40 19 27.4 ±6.8ab 9.4 ±3.8b 7.9 ±3.0ab 9.6 ±3.2a 24 40 35 26.9 ±6.2ab 9.2 ±4.1b 8.3 ±3.3a 9.6 ±3.4a 25 40 46 28.1 ±5.1a 9.5 ±4.1b 8.5 ±2.2a 8.9 ±2.0a Control 25 0 26.5 ±7.8ab 11.0 ±5.9ab 5.6 ±2.0bc 9.4 ±4.0a Control 25 52 23.5 ±7.4b 10.9 ±5.5ab 5.5 ±4.2c 9.0 ±3.3a Control 4 52 23.7 ±7.0b 12.9 ±4.7a 5.5 ±4.0c 9.4 ±4.1a
P-value 0.0560 0.0583 0.0378 0.9782 1Intensity ratings using 150 mm unstructured line scale with anchors at 12.5 mm and 137.5 mm by 10 trained descriptive panel.
Means within a column at specific storage temperature along with controls not followed by the same letter are significantly (P<0.05) different from each other as determined by Fisher’s least significance difference mean separation test.

322
6.3 Descriptive panel intensity ratings for woody/hulls/skins, burnt and astringency aromatics
The intensity ratings by a descriptive sensory panel for woody/hulls/skins, burnt and
astringency aromatics of roasted REP stored for varying times and temperatures are shown in
Table 4.26 and Figure 4.19.
Woody/Hulls/Skins. All REP and control peanuts had the same (P<0.05) intensity of
woody/hulls/skins flavor which did not change during storage. This results suggest that
woody/hulls/skins flavor in all peanut samples was not affected by storage and processing
treatments. The absence of peanut skins in all samples resulted in low intensity ratings of 9.7-
10.8 for woody/hulls/skins.
Burnt Flavor. There is no significant difference (P<0.05) in the burnt flavor between REP
and controls. This result suggests that roasting the samples to medium roast did not cause any
burnt flavor in the samples.
Astringency. Polyphenols in the diet, of which trans-resveratrol, caffeic acid, coumaric
acid, and ferulic acid found in REP are examples, precipitate oral proteins producing an
astringent sensation (Baxter et al., 1997). The salivary proline-rich proteins, which are secreted
into the oral cavity, form complexes with and precipitated dietary polyphenols and thus
constitute the primary mammalian defense directed against ingestion of polyphenols (Baxter et
al., 1997).
In this study, the intensity ratings for astringency of all REP stored at accelerated
temperatures of 30, 35 and 40oC were higher, but not significantly (P<0.05) different from
controls. At 25oC, the intensity of astringent aftertaste of REP significantly decreased after 71
days to levels that were significantly different from controls stored for 52 days at 25oC but not
from controls stored at 4oC and REP samples stored from 90-101 days. The initial intensities of

323
Table 4.26 Changes in the intensity ratings (mean ± standard deviation) for woody/hulls/skins and burnt flavors and astringency of roasted resveratrol-enhanced peanuts stored for varying times at accelerated temperatures of 30, 35 and 40oC and verified at 25oC1.
Trt. No.
Temp. (oC)
Time (day)
Woody/Hulls/ Skins
Burnt Astringency
1 25 0 10.1 ±3.0a 25.1 ±6.6a 24.4 ±7.1a 2 25 18 10.4 ±2.9a 25.5 ±7.0a 23.7 ±5.7ab 3 25 52 10.0 ±2.5a 21.4 ±10.8a 23.0 ±3.2ab 4 25 61 10.1 ±2.3a 24.1 ±7.1a 22.4 ±2.4abc 5 25 71 10.7 ±3.4a 23.3 ±9.4a 23.2 ±3.4ab 6 25 90 9.9 ±2.6a 21.6 ±9.9a 21.6 ±5.6abcd 7 25 101 10.0 ±3.9a 20.9 ±8.6a 21.5 ±4.6abcd
Control 25 0 10.2 ±2.7a 24.1 ±10.1a 19.2 ±6.9d Control 25 52 10.3 ±3.3a 17.6 ±10.8a 19.7 ±5.4cd Control 4 52 9.8 ±3.8a 21.2 ±10.8a 20.2 ±5.3bcd
P-value 0.9989 0.1583 0.0250 8 30 0 10.0 ±3.4a 26.3 ±7.2a 21.2 ±5.3a 9 30 6 9.7 ±2.6a 24.0 ±9.0a 21.7 ±5.0a 10 30 23 10.4 ±3.0a 22.2 ±8.8a 21.5 ±5.2a 11 30 42 10.3 ±2.6a 24.2 ±8.8a 21.9 ±5.8a 12 30 61 9.9 ±2.8a 23.2 ±10.1a 21.8 ±5.3a 13 30 72 10.2 ±3.5a 19.5 ±11.5a 21.4 ±5.3a
Control 25 0 10.2 ±2.7a 24.1 ±10.1a 19.2 ±6.9a Control 25 52 10.3 ±3.3a 17.6 ±10.8a 19.7 ±5.4a Control 4 52 9.8 ±3.8a 21.2 ±10.8a 20.2 ±5.3a
P-value 0.9939 0.1218 0.3725 14 35 0 9.6 ±2.8a 24.6 ±9.3a 21.0 ±5.3a 15 35 8 9.7 ±2.7a 22.8 ±9.0a 21.1 ±5.1a 16 35 17 9.8 ±3.4a 24.4 ±7.9a 23.2 ±7.8a 17 35 27 10.6 ±3.0a 25.4 ±8.2a 21.9 ±5.3a 18 35 46 9.5 ±3.1a 21.4 ±9.8a 21.3 ±5.5a 19 35 57 9.2 ±3.5a 20.7 ±10.2a 21.5 ±5.5a
Control 25 0 10.2 ±2.7a 24.1 ±10.1a 19.2 ±6.9a Control 25 52 10.3 ±3.3a 17.6 ±10.8a 19.7 ±5.4a Control 4 52 9.8 ±3.8a 21.2 ±10.8a 20.2 ±5.3a
P-value 0.9645 0.2502 0.6541

324
Table 4.26 continued…
Trt. No.
Temp. (oC)
Time (day)
Woody/Hulls/ Skins
Burnt Astringency
20 40 0 10.8 ±2.7a 23.7 ±6.4a 21.9 ±2.2a 21 40 6 9.8 ±3.1a 24.2 ±6.2a 22.4 ±3.1a 22 40 16 10.5 ±2.0a 20.0 ±10.1a 22.2 ±5.4a 23 40 19 10.0 ±3.2a 23.3 ±7.5a 21.5 ±5.5a 24 40 35 10.3 ±1.8a 20.7 ±10.5a 20.8 ±5.2a 25 40 46 9.8 ±2.9a 21.8 ±10.9a 22.5 ±1.7a
Control 25 0 10.2 ±2.7a 24.1 ±10.1a 19.2 ±6.9a Control 25 52 10.3 ±3.3a 17.6 ±10.8a 19.7 ±5.4a Control 4 52 9.8 ±3.8a 21.2 ±10.8a 20.2 ±5.3a
P-value 0.9794 0.4271 0.2592 1Intensity ratings using 150 mm unstructured line scale with anchors at 12.5 mm and 137.5 mm by 10 trained descriptive panel.
Means within a column at specific storage temperature along with controls not followed by the same letter are significantly (P<0.05) different from each other as determined by Fisher’s least significance difference mean separation test.

325
astringency in REP did not change during storage at all temperatures indicating that astringency
was a processing rather than storage effect.
6.4 Descriptive panel intensity ratings for off-flavors – cardboard, fishy, oxidized and painty
flavors/aromatics
The oxidation of fatty acids in both raw and roasted peanuts leads to off-flavors in peanut
products (Felland and Koehler, 1997). Lipid oxidation products such as low molecular weight
pentanal, hexanal, heptanal, octanal and nonanal create cardboard or oxidized rancid flavor
(Warner et al., 1996). The intensity ratings by a descriptive sensory panel for cardboard, fishy,
oxidized and painty flavors/aromatics of roasted REP stored for varying times and temperatures
are shown in Table 4.27 and Figure 4.19.
Cardboard Flavor. The initial intensities of cardboard flavors of all REP although higher
were not different (P<0.05) from controls. The cardboard flavor of REP did not change during
storage indicating that it was not affected by storage.
Fishy Flavor. The fishy flavor of REP and controls were not different (P<0.05) from each
other; and did not change during storage. The magnitude of fishy intensity ratings of 0.1–1.2
were low in 150-mm scale and of no significant consequence.
Oxidized Flavor. All REP had more oxidized flavor (intensity ratings= 26.1-37.9) than
untreated controls (ratings=3.1-4.6). As storage time increased, the intensities of oxidized flavor
increased significantly until after 101, 72, 57 and 39 days of storage at 25, 30, 35 and 40oC,
respectively. These findings showed that the oxidized flavors in REP were both due to the effects
of processing treatment and storage.
Painty Flavor. The intensities of painty flavors in REP stored at all temperatures were not
significantly different from controls, except for samples stored at 40oC for 46 days which had

326
Table 4.27 Changes in the intensity ratings (mean ± standard deviation) for the cardboard, fishy, oxidized, and painty aromatics of roasted resveratrol-enhanced peanuts stored for varying times at accelerated temperatures of 30, 35 and 40oC and verified at 25oC1.
Trt. No.
Temp. (oC)
Time (day)
Cardboard Fishy Oxidized Painty
1 25 0 22.7 ±4.3a 0.1 ±0.3a 26.1 ±4.3a 0.2 ±0.4a 2 25 18 22.4 ±3.7a 0.2 ±0.4a 28.9 ±4.5a 0.8 ±2.7a 3 25 52 22.1 ±3.8a 0.7 ±2.3a 31.5 ±4.5a 1.4 ±3.5a 4 25 61 22.2 ±2.8a 1.2 ±3.2a 33.7 ±4.9a 1.5 ±3.6a 5 25 71 22.0 ±3.5a 0.6 ±2.0a 34.7 ±3.2a 2.6 ±1.6a 6 25 90 21.7 ±2.9a 0.1 ±0.3a 36.3 ±2.7a 3.4 ±1.3a 7 25 101 22.7 ±4.1a 0.2 ±0.3a 37.9 ±2.6a 4.2 ±0.4a
Control 25 0 0.0 ±0b 0.1 ±0.3a 3.1 ±1.3b 0.1 ±0.3a Control 25 52 1.0 ±0.5b 0.2 ±0.3a 4.6 ±1.9b 0.4 ±0.7a Control 4 52 0.0 ±0b 0.1 ±0.3a 3.4 ±1.3b 0.3 ±1.0a
P-value <0.0001 0.2322 <0.0001 0.3089 8 30 0 22.0 ±3.2a 0.1 ±0.3a 26.2 ±4.2bc 0.2 ±0.4a 9 30 6 22.4 ±3.3a 0.1 ±0.4a 28.9 ±1.7bc 1.1 ±3.1a 10 30 23 20.6 ±5.5a 0.2 ±0.4a 31.1 ±3.1c 0.3 ±1.2a 11 30 42 22.1 ±3.8a 0.2 ±0.3a 33.5 ±3.4c 0.5 ±1.7a 12 30 61 21.7 ±1.9a 0.2 ±0.4a 35.5 ±3.1ab 0.1 ±0.3a 13 30 72 22.0 ±2.6a 0.6 ±2.2a 37.2 ±3.3a 0.2 ±0.3a
Control 25 0 0.0 ±0b 0.1 ±0.3a 3.1 ±1.3d 0.1 ±0.3a Control 25 52 1.0 ±0.5b 0.2 ±0.3a 4.6 ±1.9d 0.4 ±0.7a Control 4 52 0.0 ±0b 0.1 ±0.3a 3.4 ±1.3d 0.3 ±1.0a
P-value <0.0001 0.6381 <0.0001 0.4848 14 35 0 21.9 ±3.7a 0.1 ±0.3a 26.1 ±4.2b 0.4 ±1.0a 15 35 8 22.2 ±3.6a 0.7 ±2.3a 28.3 ±1.0b 0.2 ±0.4a 16 35 17 21.4 ±3.0a 0.1 ±0.3a 3.07 ±2.3b 0.2 ±0.3a 17 35 27 22.4 ±3.62a 0.2 ±0.3a 32.8 ±2.5b 0.7 ±1.7a 18 35 46 22.1 ±3.5a 0.6 ±1.5a 34.9 ±2.6a 0.2 ±0.3a 19 35 57 22.0 ±3.4a 0.6 ±2.0a 37.0 ±4.8a 0.4 ±1.2a
Control 25 0 0.0 ±0b 0.1 ±0.3a 3.1 ±1.3d 0.1 ±0.3a Control 25 52 1.0 ±0.5b 0.2 ±0.3a 4.6 ±1.9d 0.4 ±0.7a Control 4 52 0.0 ±0b 0.1 ±0.3a 3.4 ±1.3d 0.3 ±1.0a
P-value <0.0001 0.5831 <0.0001 0.5234

327
Table 4.27 continued… Trt. No.
Temp. (oC)
Time (day)
Cardboard Fishy Oxidized Painty
20 40 0 21.2 ±3.5a 0.0 ±0.2a 26.2 ±4.2b 0.2 ±0.4b 21 40 6 22.5 ±4.1a 0.1 ±0.3a 28.8 ±2.4ab 0.7 ±1.5b 22 40 16 21.6 ±6.1a 0.7 ±2.5a 31.3 ±3.6ab 1.0 ±2.8b 23 40 19 22.1 ±3.2a 0.2 ±0.6a 33.6 ±3.4ab 0.5 ±1.2b 24 40 35 22.2 ±3.6a 0.1 ±0.2a 35.9 ±3.4ab 0.3 ±1.1c 25 40 46 21.1 ±5.5a 0.1 ±0.4a 37.9 ±4.0c 2.4 ±4.2b
Control 25 0 0.0 ±0b 0.1 ±0.3a 3.1 ±1.3d 0.1 ±0.3b Control 25 52 1.0 ±0.5b 0.2 ±0.3a 4.6 ±1.9d 0.4 ±0.7b Control 4 52 0.0 ±0b 0.1 ±0.3a 3.4 ±1.3d 0.3 ±1.0b
P-value <0.0001 0.3523 <0.0001 0.0111 1Intensity ratings using 150 mm unstructured line scale with anchors at 12.5 mm and 137.5 mm by 10 trained descriptive panel.
Means within a column at specific storage temperature along with controls not followed by the same letter are significantly (P<0.05) different from each other as determined by Fisher’s least significance difference mean separation test.

328
significantly higher painty flavor than controls. The magnitude of painty intensity ratings of 0–
2.4, however, were low in 150-mm scale and of no significant consequence.
6.5 Intensity ratings for texture properties – crispness, crunchiness and hardness, and feeling
factor, toothpack
The intensity ratings for the texture properties – crispness, crunchiness and hardness, and
feeling factor – toothpack, of roasted REP stored for varying times and temperatures, by a
descriptive sensory panel are shown in Table 4.28 and Figure 4.19. The ratings for crispness,
crunchiness, hardness and toothpack of REP during storage at all temperatures were not
different (P<0.05) each other and from controls. This result indicates that the texture properties
and toothpack feeling factor were not affected by both processing treatment and storage.
7. Shelf life prediction of roasted resveratrol-enhanced peanuts using Accelerated Shelf
Life Test (ASLT)
ASLT involves the use of higher testing temperatures in the food quality loss and shelf life
experiments and extrapolation of the results to regular storage conditions through the use of the
Arrhenius equation, which cuts down testing time substantially (Labuza, 2000). In this study the
results of hexanal and overall acceptance of roasted resveratrol-enhanced peanut samples stored
at accelerated temperatures of 30, 35, and 40oC were used to predict the shelf life at any
temperatures between ambient at 25oC and 40oC. As long as the temperature range is not greater
than 30°C to 40°C, then extrapolation to lower temperature may be used to predict the expected
product shelf life (Labuza, 2000). Good linearity and fit of the plot of measure quality (y-axis)
against storage time (x-axis) indicates the order of reaction, whether zero-order (plot of Y versus
time) or first-order (plot of ln Y versus time) (Taoukis and Labuza 1996).

329
Table 4.28 Changes in the intensity ratings (mean±standard deviation) for the texture attributes, and toothpack of roasted resveratrol-enhanced peanuts stored at varying times at accelerated temperatures of 30, 35 and 40oC and verified at 25oC1.
Trt. No.
Temp. (oC)
Time (day)
Crispness Crunchiness Hardness Toothpack
1 25 0 28.9 ±1.5a 40.2 ±3.1a 38.5 ±5.1a 58.4 ±6.7a 2 25 18 28.7 ±3.5a 40.0 ±4.3a 38.6 ±3.0a 59.5 ±5.2a 3 25 52 28.8 ±1.9a 38.0 ±8.2a 38.7 ±4.1a 58.4 ±6.7a 4 25 61 28.8 ±1.9a 38.6 ±7.0a 36.6 ±4.6a 59.5 ±7.6a 5 25 71 29.1 ±2.1a 39.9 ±1.3a 37.5 ±2.7a 57.9 ±6.0a 6 25 90 27.9 ±4.2a 39.5 ±2.6a 37.6 ±1.8a 57.5 ±5.7a 7 25 101 28.0 ±3.5a 40.3 ±1.7a 37.6 ±2.9a 57.1 ±5.3a
Control 0 0 29.7 ±3.1a 41.1 ±2.9a 38.2 ±2.7a 58.8 ±6.2a Control 25 52 28.8 ±2.6a 39.4 ±4.8a 38.2 ±1.7a 58.6 ±6.1a Control 4 52 29.2 ±2.9a 39.8 ±2.1a 38.8 ±2.2a 58.6 ±4.2a
P-value 0.7779 0.6615 0.6051 0.9818 8 30 0 29.3 ±1.8a 40.2 ±2.9a 37.8 ±3.8a 58.3 ±5.4a 9 30 6 29.6 ±1.2a 40.1 ±1.6a 37.9 ±1.6a 58.7 ±6.1a 10 30 23 28.6 ±2.5a 39.3 ±2.3a 38.2 ±2.1a 56.3 ±7.8a 11 30 42 28.7 ±4.1a 39.5 ±1.9a 37.7 ±1.5a 58.5 ±5.1a 12 30 61 28.9 ±3.4a 40.4 ±1.5a 37.4 ±3.8a 56.3 ±6.9a 13 30 72 29.1 ±2.2a 39.0 ±3.4a 37.0 ±5.2a 58.0 ±6.2a
Control 0 0 29.7 ±3.1a 41.1 ±2.9a 38.2 ±2.7a 58.8 ±6.2a Control 25 52 28.8 ±2.6a 39.4 ±4.8a 38.2 ±1.7a 58.6 ±6.1a Control 4 52 29.2 ±2.9a 39.8 ±2.1a 38.8 ±2.2a 58.6 ±4.2a
P-value 0.7518 0.4677 0.7244 0.8798 14 35 0 28.6 ±1.4a 38.7 ±4.3a 36.5 ±4.2a 57.1 ±7.0a 15 35 8 28.9 ±2.5a 39.9 ±3.9a 35.6 ±6.4a 58.0 ±5.8a 16 35 17 29.2 ±1.0a 40.1 ±1.1a 37.6 ±2.0a 57.9 ±5.7a 17 35 27 29.2 ±1.6a 39.3 ±3.4a 37.4 ±2.3a 56.6 ±6.6a 18 35 46 29.6 ±1.2a 40.0 ±1.2a 38.1 ±2.1a 58.1 ±5.6a 19 35 57 28.9 ±2.5a 39.8 ±2.2a 37.9 ±2.2a 57.9 ±6.4a
Control 0 0 29.7 ±3.1a 41.1 ±2.9a 38.2 ±2.7a 58.8 ±6.2a Control 25 52 28.8 ±2.6a 39.4 ±4.8a 38.2 ±1.7a 58.6 ±6.1a Control 4 52 29.2 ±2.9a 39.8 ±2.1a 38.8 ±2.2a 58.6 ±4.2a
P-value 0.9181 0.6501 0.1099 0.9835

330
Table 4.28 continued… Trt. No.
Temp. (oC)
Time (day)
Crispness Crunchiness Hardness Toothpack
20 40 0 28.8 ±3.0a 39.0 ±5.3a 38.0 ±5.8a 57.1 ±7.5a 21 40 6 28.7 ±2.6a 38.4 ±5.1a 36.8 ±4.1a 57.6 ±5.6a 22 40 16 28.8 ±3.4a 39.0 ±4.9a 37.1 ±4.6a 56.9 ±5.9a 23 40 19 28.4 ±2.2a 39.6 ±3.1a 37.8 ±2.5a 57.8 ±7.0a 24 40 35 28.1 ±3.0a 38.7 ±5.3a 36.0 ±4.9a 56.3 ±7.9a 25 40 46 29.5 ±2.3a 38.9 ±4.8a 38.3 ±1.5a 58.9 ±6.9a
Control 0 0 29.7 ±3.1a 41.1 ±2.9a 38.2 ±2.7a 58.8 ±6.2a Control 25 52 28.8 ±2.6a 39.4 ±4.8ab 38.2 ±1.7ab 58.6 ±6.1a Control 4 52 29.2 ±2.9a 39.8 ±2.1ab 38.8 ±2.2ab 58.6 ±4.2a
P-value 0.6120 0.3992 0.1304 0.7615 1Intensity ratings using 150 mm unstructured line scale with anchors at 12.5 mm and 137.5 mm by 10 trained descriptive panel.
Means within a column at specific storage temperature along with controls not followed by the same letter are significantly (P<0.05) different from each other as determined by Fisher’s least significance difference mean separation test.

331
7.1 Reaction order (n) and rate constant (k) of lipid oxidation
The first step in the prediction of shelf life is to determine whether the reaction order of the
mode of deterioration for the productis zero or first order based on the Arrhenius model. Figure
4.19 shows the Arrhenius plots of hexanal (A) and ln hexanal (B) against storage time. Based on
the plots, the lipid oxidation which was measured by hexanal concentrations in REP, followed a
first order reaction due to better fit of the plot of ln hexanal against storage time (Figure 4.19 B).
The plots with ln hexanal (B) had higher R2 values of 0.90, 0.88 and 0.77 at storage temperatures
of 30, 35 and 40oC, respectively, compared to plots with hexanal (A) with 0.80, 0.82, and 0.64,
respectively.
The reaction contants, k at different accelerated temperatures of 30, 35, and 40oC correspond
to the slopes of Arrhenius plots and were found to be 0.026, 0.033, and 0.042/day, respectively
(Figure 4.20). The predicted k at 25oC was 0.017/day.
7.2 Activation energy, EA
The second step in the prediction of shelf life is the determination of activation energy
constant, EA which represents the measure of temperature sensitivity of the lipid oxidation in
roasted REP and demonstrates how much faster the lipid oxidation goes as temperature is raised.
The EA for the lipid oxidation of REP was 300 cal/mol or 1,253 J/mol which was calculated by
multiplying the slope (=150.7/K) of the Arrhenius plot in figure 4.20 by the universal gas
constant, 8.314 kJ/mol K or 1.986 kcal/mol K.
7.3 Shelf life estimation based on shelf life plot method and calculation of Q10
The shelf life of a food is defined as the time period within which the food is safe to consume
and/or has an acceptable quality to consumers (Fu and Labuza, 2005). Based on Table 4.23,
consumer tests showed that REP were acceptable with OA ratings of 5.00, 5.06 and 5.04 or

332
A
y = 0.475x + 3.179830oC R2 = 0.7953
y = 0.8072x + 3.188835oCR2 = 0.8154
y = 1.3593x + 9.98840oC R2 = 0.642
0102030405060708090
100
0 20 40 60 80
Days in storage
Hex
anal
, ppm
RP 30 RP 35 RP 40Linear (RP 30) Linear (RP 35) Linear (RP 40)
B
y = 0.0263x + 1.881630oC R2 = 0.9018
y = 0.033x + 2.149235oC R2 = 0.8774
y = 0.0422x + 2.569340oC R2 = 0.7658
0.0
1.0
2.0
3.0
4.0
5.0
0 20 40 60 8
Days in storage
ln h
exan
al, p
pm
0
30 ln hex 35 ln hex 40 ln hexLinear (30 ln hex) Linear (35 ln hex) Linear (40 ln hex)
Figure 4.19 Plots of hexanal (A) and ln hexanal (B) concentrations against storage time used in the determination of reaction order for roasted resveratrol-enhanced peanuts stored at varying storage times and temperatures.

333
y -0.1507x + 0.5231 =R2 = 0.9901
0.000
0.010
0.020
0.030
0.040
0.050
3.15 3.20 3.25 3.30 3.35 3.40
1/K (x10-3)
ln k
oC
40oC
35oC
30oC
25
y = 150.65x + 0.5231 R2= 0.9901
Figure 4.20 Arrhenius plot showing ln k (rate of increase in hexanal concentration) against reciprocal of absolute accelerated storage temperature in Kelvin at 30, 35, and 40oC used in the determination of activation energy for the lipid oxidation in resveratrol-enhanced peanuts. The dot shows the predicted ln k at 25oC.

334
neither like nor dislike when stored for 42 days at 30oC, 27 days at 35oC, and 19 days at 40oC,
respectively. Using the shelf life model, which is a plot of ln shelf life in days on the y-axis
against accelerated temperatures of 30, 35 and 40oC on the x-axis, the equation of y = -0.0793x +
6.1023, with a high coefficient, R2 of 0.97 (Figure 4.21) was obtained. The predicted shelf life at
25oC of 61 days was calculated from the shelf life plot equation using regression analysis.
The predicted shelf life of 61 days at 25oC from ASLT, was not met as verification samples
stored at actual ambient temperature conditions of about 25oC were not acceptable with overall
acceptance rating of 4.6 or dislike slightly (Table 4.23) with high hexanal content of 45.07 µg/g
(Table 4.22). Samples stored for 52 days, which was 9 days shorter than the predicted 61 days
shelf life, had acceptable overall acceptance rating of 5.0 or neither like nor dislike, and hexanal
content of 23.57 µg/g, and therefore 52 days was considered as the shelf life of REP at 25oC.
This finding indicates that lipid oxidation proceeded faster at actual storage conditions ~25oC
compared to those at higher temperatures. The water activity of dry foods, such as resveratrol-
enhanced peanuts, can increase with temperature and causes an increase in reaction rates for
products of low water activity in sealed packages resulting in over-prediction of true shelf life at
the lower temperature (Labuza and Schmidl, 1985). Verification of the predicted shelf life based
on ASLT must always be performed at actual storage conditions (Labuza and Schmidl, 1985).
Compared to such as resveratrol- enhanced peanuts, controls after 52 days at 25oC had higher
OA rating of 7.3 or like moderately, with low hexanal content of 5.8 µg/g. The shelf life of 52
days of REP at actual ambient conditions was 38 days shorter than the shelf life of regular
roasted peanuts of 90 days. Applications of such as resveratrol- enhanced peanuts in products
that will mask or minimize off-flavors such as in peanut bars and other peanut confections may
increase its shelf life.

335
y = -0.0793x + 6.1023R2 = 0.9957
0
1
2
3
4
5
6
20 30 40 50
Storage temperature (oC)
ln S
tora
ge ti
me
(day
s) 61days =predicted shelf life at 25oC
Figure 4.21 Shelf life plot of roasted resveratrol-enhanced peanuts showing the end of shelf life at different accelerated storage temperatures at 30, 35, and 40oC based on consumer overall acceptance < 5 or neither like nor dislike and hexanal concentration. The predicted shelf life at 25oC of 61 days is represented by the dot.

336
At the end of shelf life of 52 days at 25oC, REP had trans-resveratrol content of 3.29 µg/g
total phenolics of 1.76 mg GAE/g, and TEAC of 6.06 µM TE/g corresponding to reductions of
3, 8, and 27%, respectively, compared to initial concentrations of 3.40µg/g, 1.91 mg GAE/g,
8.26 µM TE/g, respectively. Product label requires that at least 80% of active ingredients or
substance claimed should be the present in the product throughout its shelf life. Based on this,
trans-resveratrol and total phenolics which were reduced by ≤20%, were stable in REP during
shelf of 52 days at 25oC, whereas the antioxidant capacity, TEAC was not. When claimed in
product label, the amount of TEAC should be adjusted such that at least 80% should remain in
REP throughout the product shelf life.
Q10, the accelerating factor used to describe relation between temperature and reaction rate
constant, is defined as the ratio of the rate constants at temperature differing by 10oC (Labuza,
2000). The Q10 for roasted REP calculated based on the shelf life plot model was 2.2. This Q10
is higher than the reported Q10 of 1.6 in regular roasted peanuts of Evranuz (1993) indicating that
lipid oxidation in REP proceeded faster compared to that in regular untreated peanuts. Using Q10
of 2.2, the shelf life of REP at temperatures other than 25oC can be calculated and the resulting
estimated shelf lives were 35 days at 30oC, 24 days at 35oC, and 16 days at 40oC suggesting
greater temperature abuse using higher temperatures during storage will shorten the shelf life of
REP. This finding implies that REP and resveratrol-enhanced peanut containing products should
be stored at low temperature as possible to maintain its shelf life.
C. Storage Study of Resveratrol-Enhanced Peanut Bars at 25 and 40oC
1. Changes in hexanal concentrations during storage of REP bars
The mean hexanal concentrations of REP bars during storage time at 25 and 40oC are
presented in Figure 4.22 and Table 4.29. Two storage temperatures, 25 and 40oC were used in

337
this study. The high storage temperature at 40oC was used to predict the shelf life at 25oC using
a critical hexanal value of 25 µg/g to mark the end of shelf life, which was then used as a guide
to adjust the rate of sampling at 25oC, if needed. The data at ambient conditions at 25oC were
used to determine the actual shelf life of resveratrol-enhanced peanut bars.
1.1 Storage at 40oC
REP bars stored at 40oC had an initial hexanal concentration of 14.27 µg/g of REP bars that
were significantly higher than untreated controls with 2.11 µg/g indicating that hexanal was
formed during UV and US processing treatments prior to storage study. UV exposure is known
to initiate lipid oxidation food (Duh and Yen, 1995) and this could have caused the lipid
oxidation in resveratrol-enhanced peanut bars. During storage at 40oC, the initial hexanal
content of 16.91 µg/g was not significantly different from stored samples until 26 days indicating
a processing rather than storage effect. From 26 to 57 days, there was a rapid significant
increase in hexanal concentration to 25.77 µg/g (Figure 4.22) suggesting a storage effect. The
rate of hexanal increase was 0.23 µg/g/day. Based on the equation, y = 0.2332x +14.034 in
Figure 4.22 and an assumed critical hexanal value of 25 µg/g, the predicted shelf life at 40oC was
47 days. The shelf life at 25oC was then predicted to be 133 days based on 47 days predicted
shelf life at 40oC and an assumed Q10 value of 2.0 for lipid oxidation (range=1.5-3.0; Labuza,
1984) using equation 10 in Section 3.1. This was longer than 90 days shelf life of regular roasted
peanuts used in the experimental design and therefore, sampling time at 25oC was adjusted
accordingly.
1.2 Storage at 25oC
REP bars stored at 25oC had initial hexanal concentration of 12.53 µg/g which were not
significantly (P<0.05) different from those samples stored up to 87 days, suggesting that hexanal

338
y = 0.2332x + 14.03440°C R2 = 0.6912
y = 0.081x + 10.51525°C R2 = 0.8394
0
10
20
30
40
0 25 50 75 100 125 150
Storage Time (Days)
Hex
anal
(µg/
g)25°C40°CLinear (25°C)Linear (40°C)
y = -0.0057x + 2.209625°C R2 = 0.7861
y = -0.0195x + 1.815840°C R2 = 0.927
0
1
2
3
0 25 50 75 100 125 150
Storage Time (Days)
tran
s-R
esve
ratr
ol (u
g/g)
25 C40 CLinear (25 C)Linear (40 C)
Figure 4.22 Changes in hexanal and trans-resveratrol concentrations of resveratrol- enhanced peanut bars during storage at 25 and 40oC.

339
Table 4.29 Changes in concentrations (mean ± standard deviation) of hexanal, trans-resveratrol, total phenolics, and TEAC values of resveratrol-enhanced peanut bars during storage at 25 and 40oC.
Tempe-rature (°C)
Time (days)
Hexanal (µg/g)
Resveratrol (µg/g)
Total Phenolics
(mg GAE/g)
TEAC (µM TE/g)
25 0 12.53 ± 2.03ef 2.10±0.49a 1.80±0.06 6.12±0.31 25 16 11.54 ± 0.91f 2.02±0.05a - - 25 35 14.38 ± 3.97def 2.33±0.47a - - 25 51 13.39 ± 1.17def 2.00±0.55a - - 25 63 15.85 ± 3.06cdef 1.67±0.47b - - 25 71 14.98 ± 2.82cdef - - - 25 77 13.07 ± 2.26def - - - 25 87 17.79 ± 4.77bcd - - - 25 98 19.71 ± 4.00abc 1.62±0.18b - - 25 135 21.74 ± 2.98ab 1.53±0.22b - - 25 146 23.78 ± 5.18a 1.28±0.13c 1.48±0.01 5.46±1.04 -18
Control2
0 2.11 ± 0.44g 0.20±0.001d 0.56±0.01 0.44±0.10
40 0 14.27 ± 4.16f 1.97±0.30a 1.98±0.11 8.02±1.79 40 6 15.68 ± 1.37ef - - - 40 13 15.55 ± 1.38ef - - - 40 16 20.40 ± 1.75cdef 1.34±0.40b 1.87±0.15 7.59±2.03 40 20 15.47 ± 3.05ef - - - 40 26 16.91 ± 2.76def - - - 40 32 22.47 ± 6.96cd - - - 40 36 30.55 ± 4.75ab 0.99±0.15c 1.57±0.02 6.13±1.04 40 41 24.25 ± 4.28bc - - - 40 46 20.65 ± 1.80cde 0.88±0.04c - - 40 57 25.77 ± 5.24abc - - - 40 70 31.08 ± 9.59a 0.41±0.08d - - -18
Control2 0 2.11 ± 0.44g 0.02±0.001e 0.56±0.01 0.44±0.10
1Means followed by the same letter within the same storage temperature are not significantly different at P< 0.05 as determined by Fisher’s least significant difference mean separation test.
(- ) means not analyzed. 2 Controls are peanut bars prepared from untreated raw peanuts.

340
formation is a processing rather than a storage effect. From 87 to 146 days, there was a rapid
increase in hexanal concentration from 17.79 to 23.78 µg/g. The rate of hexanal formation was
0.08 µg/g/day which was slower than that at 40oC.
2. Changes in the concentrations of trans-resveratrol, total phenolics and TEAC during
storage of REP bars
The concentrations of trans-resveratrol in REP bars decreased as storage time increased, with
faster rate of loss of 0.020 µg/g/day at higher temperature, 40oC compared to 0.006 µg/g/day at
25oC. At 40oC, trans-resveratrol was reduced from 1.97 to 0.41 µg/g or 79% loss after 70 days
whereas at 25oC, 39% loss was observed reducing the concentration from 2.10 to 1.28 µg/g after
146 days. Based on the regulations, at least 80% of the claimed value in the product label should
be retained throughout the shelf life of the product (Fu and Labuza, 2005). Using the equation, y
= -0.0057x + 2.2096, at 25oC (Figure 4.22), 80% of the initial trans-resveratrol concentration or
1.68 µg/g will be retained up to 93 days at 25oC.
The initial total phenolics of REP bar at 25 and 40oC were 1.80 and 1.98 mg GAE/g,
respectively, and decreased to 1.48 and 1.87 mg GAE/g or 17.8 and 5.6% losses, after 146 and
36 days of storage at respective temperatures. The loss of >20% indicates that total phenolics in
REP bars were stable during storage. Untreated controls had initial total phenolics of 0.56 mg
GAE/g.
REP bars stored at 25 and 40oC had initial TEAC values of 6.12 and 8.02 µM TE/g
respectively, and decreased to 5.46 and 7.59 µM TE/g or 10.8 and 5.4% losses after 146 and 36
days of storage at respective temperatures. The <20% losses in TEAC values suggest that the
antioxidant capacities were stable in REP bar samples during storage. Untreated controls had
initial TEAC of 0.44 µM TE/g. Untreated controls had initial TEAC of 0.44 µM TE/g.

341
3. Changes in the consumer acceptance of the sensory attributes of REP bars
Table 4.30 shows the mean hedonic ratings for the sensory attributes by consumer panel of
the REP bars stored for varying times at 25 and 40oC.
3.1 Overall acceptance of REP bars during storage
At 25oC, all resveratrol-enhanced peanut bars except for Trt# 5 were acceptable to consumers
with ratings of 5.8 or neither like nor dislike to 6.7 or close to like moderately. Trt#5 received
the lowest overall acceptance rating of 4.5 or dislike slightly. Samples stored up to 135 days,
except Trt# 5 had overall acceptance ratings which were not significantly different from controls
with rating of 6.7 or like slightly. The overall acceptance of resveratrol-enhanced peanut bars
stored for 146 days (Trt#7) with rating of 5.8, although significantly lower from control, were
acceptable to consumers.
At 40oC, all stored REP bars had significantly lower OA ratings of 4.4 to 5.2 (4= dislike
slightly; 5=neither like nor dislike) compared to controls. The OA of all stored REP bars from
16 to 70 days except those stored for 36 days (Trt# 10) were not significantly different from non-
stored samples. Trt#10 had the lowest OA rating which corresponds to a high hexanal of 30.55
µg/g.
Using OA ≥ 5 or neither like nor dislike as the critical value to mark the end of shelf-life at
25oC, REP bars had shelf life of 146 days which was longer than 52 days in roasted resveratrol
peanut kernels. The syrup in REP bars could have acted as a protective coating in each peanut
kernel preventing them from exposure and/or as masking agent from the off-flavors/tastes
produced during UV and US treatments of peanuts.

342
Table 4.30 Consumer hedonic ratings (mean ± standard deviation) for the sensory attributes of resveratrol-enhanced peanut bars1 stored for varying times at 25 and 40oC2
Trt #2
Temp (oC)
Days Appearance3 Color3 Aroma3 Flavor3 Texture3 Overall Acceptance3
1 25 0 6.4 ±1.6a 6.2 ±1.8a 5.7 ±2.0a 6.5 ±1.7ab 6.9 ±1.5a 6.6 ±1.8ab 2 25 35 6.3 ±1.9a 6.3 ±2.0a 6.2 ±1.7a 6.3 ±2.0ab 6.5 ±1.9ab 6.5 ±1.7ab 3 25 51 6.2 ±2.2a 6.3 ±2.1a 6.0 ±1.8a 6.5 ±2.2ab 6.6 ±2.1ab 6.3 ±2.5ab 4 25 63 6.4 ±1.7a 6.0 ±2.0a 6.3 ±1.8a 6.4 ±2.0ab 6.6 ±1.9b 6.4 ±1.9ab 5 25 87 6.8 ±1.9a 6.7 ±1.8a 6.3 ±1.9a 5.0 ±2.1c 5.7 ±2.0c 4.5 ±2.3c 6 25 135 6.4 ±1.8a 6.4 ±1.9a 6.2 ±1.7a 6.1 ±2.1ab 6.0 ±2.3bc 6.1 ±2.0ab 7 25 146 6.7 ±1.9a 6.7 ±1.9a 5.7 ±1.9a 5.9 ±2.1b 5.7 ±2.2c 5.8 ±2.3b
Control 0 6.5 ±2.0a 6.4 ±2.0a 6.7 ±2.0a 6.8 ±2.0a 6.7 ±2.1ab 6.7 ±2.1a P-value 0.2688 0.2758 0.3814 0.0005 0.0189 <0.0001 8 40 0 6.5 ±2.1a 6.8 ±1.9a 5.9 ±1.9a 5.6 ±2.3b 6.4 ±2.2a 5.2 ±2.3b 9 40 16 6.3 ±2.1a 6.3 ±2.2a 5.8 ±1.9a 4.7 ±2.4cd 6.0 ±2.0a 4.4 ±2.3b 10 40 36 6.4 ±2.3a 6.3 ±2.4a 5.4 ±2.3a 4.1 ±2.2d 5.6 ±2.3a 3.3 ±2.1c 11 40 46 6.4 ±2.0a 6.6 ±1.9a 6.0 ±1.6a 5.3 ±2.3bc 6.0 ±2.0a 4.7 ±2.4b 12 40 70 6.9 ±1.7a 6.9 ±1.7a 5.8 ±1.9a 5.0 ±2.1bcd 6.1 ±2.0a 4.5 ±2.1b
Control 0 6.5 ±2.0a 6.4 ±2.0a 6.7 ±2.0a 6.8 ±2.0a 6.7 ±2.1a 6.7 ±2.1a P-value 0.1997 0.2981 0.1391 <0.0001 0.1801 <0.0001
1 Treated peanuts bars were prepared from peanuts processed using optimum ultrasound (US)-UV process of 70 mW/cm3 US power density for 10 min, then exposed for 50 min at 40 cm distance from UV light followed by incubation at 25oC for 36h. Control peanut bars were prepared from untreated peanuts.
2 Means followed by the same letter within the same storage temperature are not significantly different at P< 0.05 as determined by Fisher’s least significant difference mean separation test.
3 Consumer ratings for liking using 9-point hedonic rating scale: 1="dislike extremely"; 5="neither like nor dislike"; 9="like extremely".
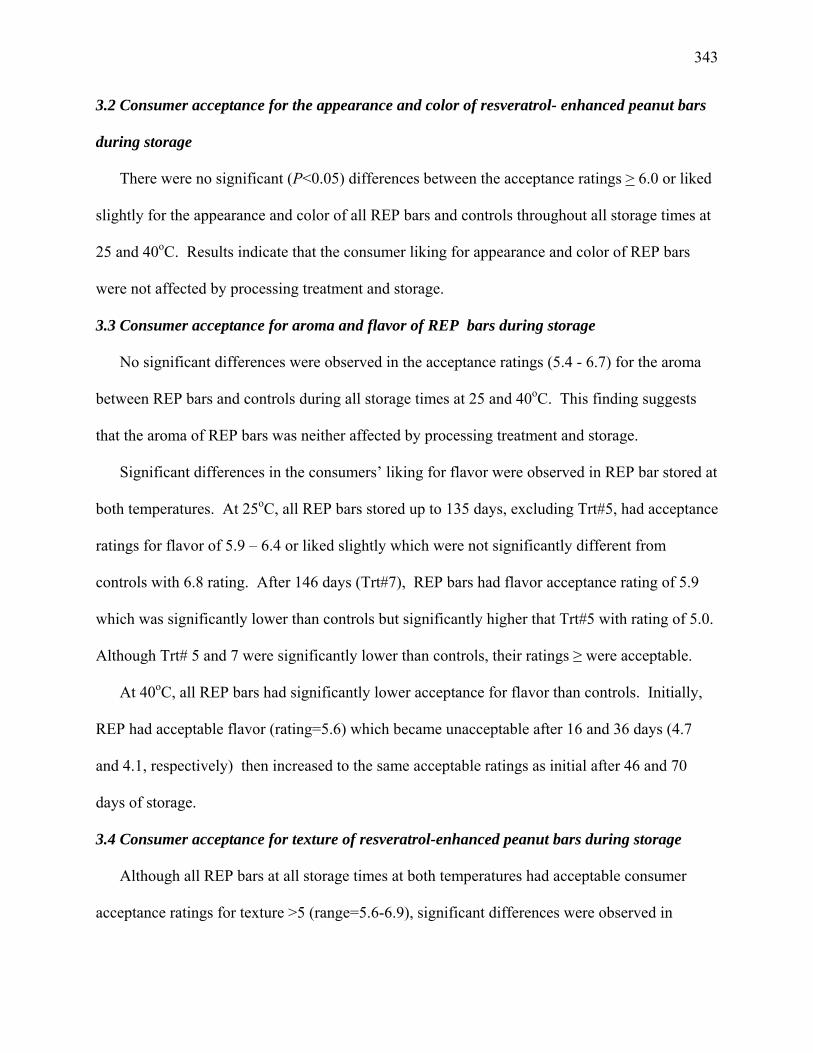
343
3.2 Consumer acceptance for the appearance and color of resveratrol- enhanced peanut bars
during storage
There were no significant (P<0.05) differences between the acceptance ratings > 6.0 or liked
slightly for the appearance and color of all REP bars and controls throughout all storage times at
25 and 40oC. Results indicate that the consumer liking for appearance and color of REP bars
were not affected by processing treatment and storage.
3.3 Consumer acceptance for aroma and flavor of REP bars during storage
No significant differences were observed in the acceptance ratings (5.4 - 6.7) for the aroma
between REP bars and controls during all storage times at 25 and 40oC. This finding suggests
that the aroma of REP bars was neither affected by processing treatment and storage.
Significant differences in the consumers’ liking for flavor were observed in REP bar stored at
both temperatures. At 25oC, all REP bars stored up to 135 days, excluding Trt#5, had acceptance
ratings for flavor of 5.9 – 6.4 or liked slightly which were not significantly different from
controls with 6.8 rating. After 146 days (Trt#7), REP bars had flavor acceptance rating of 5.9
which was significantly lower than controls but significantly higher that Trt#5 with rating of 5.0.
Although Trt# 5 and 7 were significantly lower than controls, their ratings ≥ were acceptable.
At 40oC, all REP bars had significantly lower acceptance for flavor than controls. Initially,
REP had acceptable flavor (rating=5.6) which became unacceptable after 16 and 36 days (4.7
and 4.1, respectively) then increased to the same acceptable ratings as initial after 46 and 70
days of storage.
3.4 Consumer acceptance for texture of resveratrol-enhanced peanut bars during storage
Although all REP bars at all storage times at both temperatures had acceptable consumer
acceptance ratings for texture >5 (range=5.6-6.9), significant differences were observed in
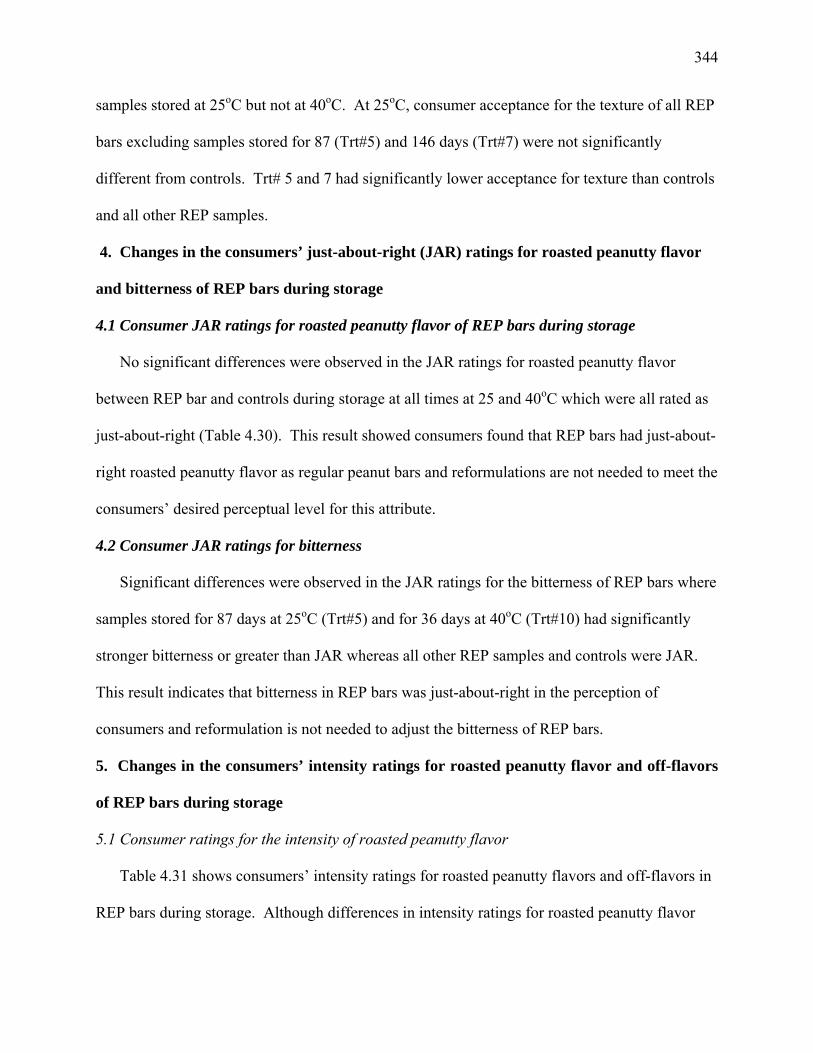
344
samples stored at 25oC but not at 40oC. At 25oC, consumer acceptance for the texture of all REP
bars excluding samples stored for 87 (Trt#5) and 146 days (Trt#7) were not significantly
different from controls. Trt# 5 and 7 had significantly lower acceptance for texture than controls
and all other REP samples.
4. Changes in the consumers’ just-about-right (JAR) ratings for roasted peanutty flavor
and bitterness of REP bars during storage
4.1 Consumer JAR ratings for roasted peanutty flavor of REP bars during storage
No significant differences were observed in the JAR ratings for roasted peanutty flavor
between REP bar and controls during storage at all times at 25 and 40oC which were all rated as
just-about-right (Table 4.30). This result showed consumers found that REP bars had just-about-
right roasted peanutty flavor as regular peanut bars and reformulations are not needed to meet the
consumers’ desired perceptual level for this attribute.
4.2 Consumer JAR ratings for bitterness
Significant differences were observed in the JAR ratings for the bitterness of REP bars where
samples stored for 87 days at 25oC (Trt#5) and for 36 days at 40oC (Trt#10) had significantly
stronger bitterness or greater than JAR whereas all other REP samples and controls were JAR.
This result indicates that bitterness in REP bars was just-about-right in the perception of
consumers and reformulation is not needed to adjust the bitterness of REP bars.
5. Changes in the consumers’ intensity ratings for roasted peanutty flavor and off-flavors
of REP bars during storage
5.1 Consumer ratings for the intensity of roasted peanutty flavor
Table 4.31 shows consumers’ intensity ratings for roasted peanutty flavors and off-flavors in
REP bars during storage. Although differences in intensity ratings for roasted peanutty flavor

345
Table 4.31 Just-about-right (JAR) and intensity ratings (mean ± standard deviation) of consumer panel on resveratrol-enhanced peanut bars1 stored for varying times at 25 and 40oC1
Trt # 2 Temp (oC)
Days JAR- Roasted peanutty flavor4
JAR- Bitterness4
Intensity of roasted
peanutty flavor5
Intensity of off-flavor5
±1.0b
5.0
±1.4b 1 25 0 4.0 ±0.8a 3.9 5.3 ±1.2a 2 25 35 4.0 ±1.0a 3.9 ±1.0b 5.0 ±1.2a 5.0 ±1.3b 3 25 51 3.8 ±1.1a 4.0 ±0.9b 5.0 ±1.6a 5.2 ±1.5b 4 25 63 3.9 ±1.0a 4.1 ±1.2b 5.3 ±1.2a 4.9 ±1.6b 5 25 87 4.3 ±1.4a 4.7 ±1.6a 5.4 ±1.8a 6.0 ±2.0a 6 25 135 4.0 ±1.0a 4.1 ±1.2b 5.5 ±1.6a 5.0 ±1.8b 7 25 146 3.7 ±1.0a 4.1 ±1.2b 4.9 ±1.5a 4.9 ±1.9b
Control2 0 3.9 ±1.0a 3.8 ±1.1b 5.2 ±1.3a 4.9 ±1.6b P-value 0.2242 0.0034 0.4946 0.0255 8 40 0 4.4 ±1.3a 4.8 ±1.3b 5.6 ±1.7a 5.9 ±1.9a 9 40 16 3.9 ±1.6a 4.9 ±1.6b 5.2 ±1.8a 6.1 ±1.9a 10 40 36 4.8 ±1.7a 5.6 ±1.4a 6.6 ±1.9a 6.6 ±2.2a 11 40 46 4.3 ±1.5a 4.9 ±1.5b 5.6 ±1.9a 6.1 ±1.9a 12 40 70 4.2 ±1.5a 4.9 ±1.6b 5.4 ±1.7a 6.3 ±1.7a
Control2 0 3.9 ±1.0a 3.8 ±1.1b 5.2 ±1.3a 4.9 ±1.6b P-value 0.1683 0.0052 0.3340 0.0305
1 Treated peanuts bars were prepared from peanuts processed using optimum ultrasound (US)- UV process of 70 mW/cm3 US power density for 10 min, then exposed for 50 min at 40 cm distance from UV light followed by incubation at 25oC for 36h.
2 Control peanut bars were prepared from raw untreated peanuts. Means followed by the same letter within the same storage temperature are not significantly different at α< 0.05.
3 Consumer ratings using 7-point just-about-right rating scale: 1="much too weak"; 4="just-about-right"; 7="much too strong"
4 Consumer ratings using 9-point intensity rating scale: 1="none"; 4="neither weak nor strong"; 9="extremely strong".

346
were observed between REP bars and controls during storage at 25 and 40oC which ranged from
4.9-5.5 and 5.2-6.6 (5=neither weak nor strong; 6= slightly strong), respectively, these
differences were not significant.
5.2 Consumer ratings for the intensity of off-flavor in peanut bars
Significant differences were observed for the intensity of off-flavors. At 25oC, REP bars
stored for 87 days (Trt#5) had significantly more intense off-flavors (6.0=slightly strong) than all
other REP bars and controls (4.9-5.2 or neither weak nor strong) which were not significantly
different from each other. At 40oC, all REP bars had significantly higher off-flavors intensity
ratings of 5.9-6.6 compared to controls with 4.9, but were not significantly different from each
other. This result indicates that the off-flavor was a processing rather than a storage effect.
6. Changes in the intensity ratings of the different sensory attributes of resveratrol-
enhanced peanut bars by a descriptive sensory panel
Figure 4.23 shows the mean intensity ratings by the descriptive sensory panel using a 150
mm line scale for the 21 sensory attributes of REP bar during storage at 25 and 40oC.
Significant differences were observed in seven of 21 descriptive sensory attributes of REP bars
including brown color of caramel, bitter taste, burnt and oxidized flavors, hardness and
fructurability. No differences were observed all other 14 attributes of REP bars during storage
were not significant from each other and from controls indicating that these attributes were not
affected by processing treatments and storage.
6.1 Changes in the intensities of color, and roasted peanutty flavors in REP bars
Table 4.32 shows the changes in mean intensity ratings for color, caramel and roasted
peanutty flavor of REP bars during storage at 25 and 40oC. Significant differences in intensities
between REP bars and untreated controls were observed only in brown color of caramel whereas

347
Brown Color Peanut
26
27
28
29
30
0 25 50 75 100 125 150
Storage Time (Days)
Inte
nsity 25C
40CControl
Brown Color Caramel
56
60
64
68
72
0 25 50 75 100 125 150
Storage Time (Days)
Inte
nsity 25C
40CControl
Caramel
16
17
18
19
0 25 50 75 100 125 150
Storage Time (Days)
Inte
nsity 25C
40CControl
Roasted Peanutty
32
36
40
44
0 25 50 75 100 125 150
Storage Time (Days)
Inte
nsity 25C
40CControl
Bitter
18
20
22
24
0 25 50 75 100 125 150
Storage Time (Days)
Inte
nsity 25C
40CControl
Sweet
94
98
102
106
0 25 50 75 100 125 150
Storage Time (Days)
Inte
nsity 25C
40CControl
Sour
3
4
5
6
0 25 50 75 100 125 150
Storage Time (Days)
Inte
nsity 25C
40CControl
Salty
15.0
16.0
17.0
18.0
19.0
0 25 50 75 100 125 150
Storage Time (Days)
Inte
nsity 25C
40CControl
Woody/Hull/Skin
3
4
5
6
0 25 50 75 100 125 150
Storage Time (Days)
Inte
nsity 25C
40CControl
Burnt
14
18
22
0 25 50 75 100 125 150Storage Time (Days)
Inte
nsity 25C
40CControl
Oily
1.0
1.4
1.8
2.2
0 25 50 75 100 125 150
Storage Time (Days)
Inte
nsity 25C
40CControl
Astringency
18
20
22
24
0 25 50 75 100 125 150
Storage Time (Days)
Inte
nsity 25C
40CControl
Figure 4.23. Changes in the mean intensity ratings for the different sensory attributes of roasted resveratrol-enhanced peanut bars during storage at 25 and 40oC by a descriptive panel using a 150 mm line scale. Horizontal lines indicate the mean intensity ratings of controls.

348
Fishy
0.0
0.2
0.4
0.6
0 25 50 75 100 125 150
Storage Time (Days)
Inte
nsity 25C
40CControl
Oxidized
8
12
16
20
24
0 25 50 75 100 125 150
Storage Time (Days)
Inte
nsity 25C
40CControl
Painty
0.0
0.6
1.2
1.8
0 25 50 75 100 125 150
Storage Time (Days)
Inte
nsity 25C
40CControl
Hardness
90
92
94
96
98
0 25 50 75 100 125 150
Storage Time (Days)
Inte
nsity 25C
40CControl
Fracturability
70
72
74
76
0 25 50 75 100 125 150
Storage Time (Days)
Inte
nsity 25C
40CControl
Crunchiness
89
90
91
92
93
0 25 50 75 100 125 150
Storage Time (Days)
Inte
nsity 25C
40CControl
Cohesiveness
67
69
71
0 25 50 75 100 125 150
Storage Time (Days)
Inte
nsity 25C
40CControl
Chewiness
56
57
58
59
0 25 50 75 100 125 150
Storage Time (Days)
Inte
nsity 25C
40CControl
Toothpack
85
86
87
88
89
0 25 50 75 100 125 150
Storage Time (Days)
Inte
nsity 25C
40CControl
Figure 4.23 (continued)
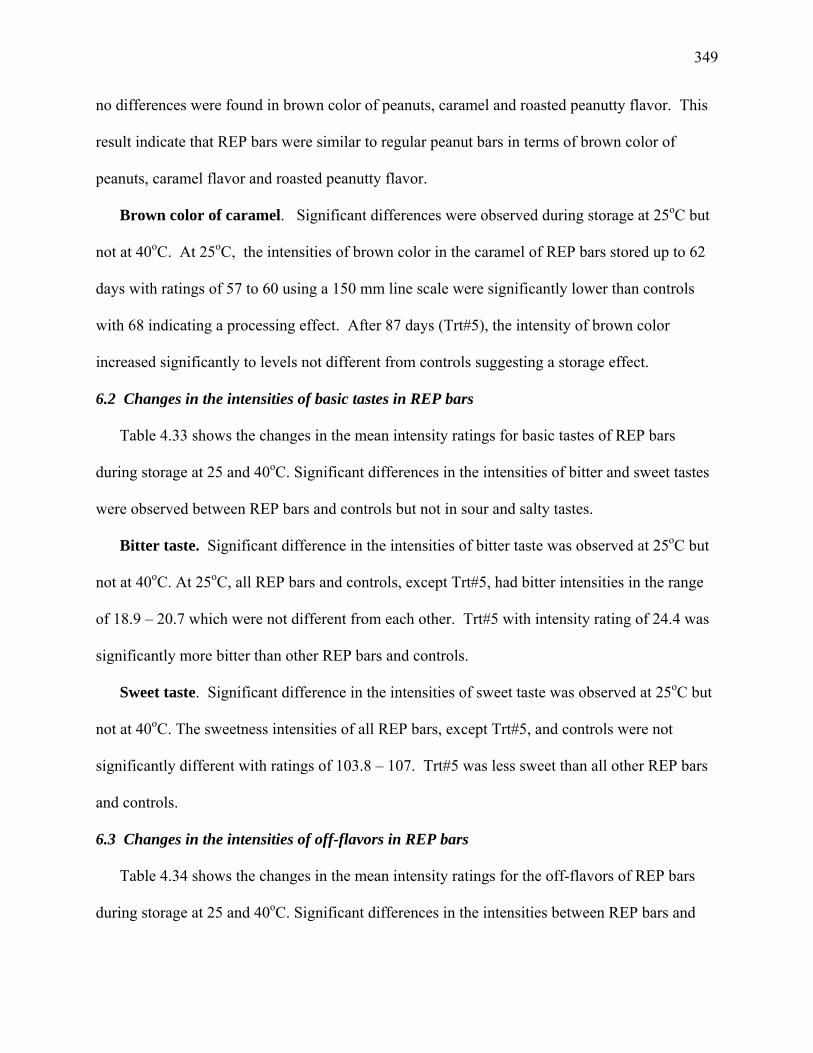
349
no differences were found in brown color of peanuts, caramel and roasted peanutty flavor. This
result indicate that REP bars were similar to regular peanut bars in terms of brown color of
peanuts, caramel flavor and roasted peanutty flavor.
Brown color of caramel. Significant differences were observed during storage at 25oC but
not at 40oC. At 25oC, the intensities of brown color in the caramel of REP bars stored up to 62
days with ratings of 57 to 60 using a 150 mm line scale were significantly lower than controls
with 68 indicating a processing effect. After 87 days (Trt#5), the intensity of brown color
increased significantly to levels not different from controls suggesting a storage effect.
6.2 Changes in the intensities of basic tastes in REP bars
Table 4.33 shows the changes in the mean intensity ratings for basic tastes of REP bars
during storage at 25 and 40oC. Significant differences in the intensities of bitter and sweet tastes
were observed between REP bars and controls but not in sour and salty tastes.
Bitter taste. Significant difference in the intensities of bitter taste was observed at 25oC but
not at 40oC. At 25oC, all REP bars and controls, except Trt#5, had bitter intensities in the range
of 18.9 – 20.7 which were not different from each other. Trt#5 with intensity rating of 24.4 was
significantly more bitter than other REP bars and controls.
Sweet taste. Significant difference in the intensities of sweet taste was observed at 25oC but
not at 40oC. The sweetness intensities of all REP bars, except Trt#5, and controls were not
significantly different with ratings of 103.8 – 107. Trt#5 was less sweet than all other REP bars
and controls.
6.3 Changes in the intensities of off-flavors in REP bars
Table 4.34 shows the changes in the mean intensity ratings for the off-flavors of REP bars
during storage at 25 and 40oC. Significant differences in the intensities between REP bars and

350
controls were observed only in burnt and oxidized flavors but in woody/hulls/skins, oily,
astringency, fishy and painty flavors.
Burnt flavor. At 25oC, all REP bars except Trt#5 had burnt flavor intensity ratings of 14.1-
15.9 which did not significantly differ from each other. Trt#5 had significantly higher burnt
flavor (rating=23.0) compared to all other REP bars and controls (rating=19.4). However, the
burnt flavor of REP bars stored for 35, 51 and 62 days (Trt# 2, 3, & 4) were significantly lower
than controls whereas initial and stored REP bars for 135 and 146 days were not different from
controls.
At 40oC, the intensity ratings of 18.7-22.6 for burnt flavor of all REP bars, except samples
stored for 36 days (Trt#10), were not different from controls at 19.4. Trt#10 (rating=24.1) had
more burnt flavor than controls and REP bars stored for 16 and 46 days (Trt# 9, 11) but were not
different from all other REP bars.
Oxidized flavor. Lipid oxidation products such as low molecular weight pentanal, hexanal,
heptanal, octanal and nonanal create off-flavors such as cardboard or oxidized rancid flavors
(Warner et al., 1996). The intensities of oxidized flavor of all REP bars stored at 25oC, except
Trt#5, with ratings of 14.1-16.2 were not significantly different from each other and from
controls at 9.4 intensity rating. Trt#5 had more oxidized flavor (rating= 24.2) compared to all
other REP bars and controls. All REP bars stored at 40oC with 16.7-25.2 ratings had
significantly more intense oxidized flavors compared to controls.
6.4 Changes in the intensities of texture attributes and feeling factors in REP bars
Table 4.35 shows the changes in the mean intensity ratings for the texture attributes and
feeling factors of REP bars during storage at 25 and 40oC. Significant differences in the

351
intensities between REP bars and controls were observed in hardness and fracturability but not
crunchiness, cohesiveness, chewiness anf toothpack.
Hardness. Hardness is the force required to bite through the sample using incisors. The
hardness of all REP bars with intensities ranging from 90.8-93.5 did not significantly differ from
each other during storage at either 25 or 40oC but significantly less than controls (rating= 97.3),
except for REP bars stored for 62 and 87 days (Trt#4 &5) which were significantly not different
from controls. This result indicates a processing rather than storage effect.
Fracturability. Fracturability is the force with which the sample crumbles, cracks or
shatters. At 25oC, the fructurability of all REP bars with intensities ranging from 70.6-73.7 did
not significantly change during storage but were significantly lower than controls with 75.5,
except for sample stored for 135 days which did not differ from controls. This result indicates a
processing rather than storage effect.
At 40oC, except for samples stored for 70 days (Trt#12), all REP bars had significantly lower
fructurability (ratings=71.1-72.1) compared to controls. Among the REP bars, initial and 36
day-stored samples (Trt#8 & 10) had significantly lower fructurability compared to Trt#12, but
were not different from all other samples stored for 16 and 46 days (Trt#9 & 11). At higher
temperature of 40oC, the fructurability of REP bars increased with increasing storage time.

352
Table 4.32 Changes in the intensity ratings (mean±standard deviation) for color, caramel and roasted peanutty aromatics of resveratrol-enhanced peanut bars by a descriptive panel during storage at 25 and 40oC 1.
Trt # Storage Temp. (oC)
Storage Time (day)
Brown color peanut
Brown color caramel
Caramel
Roasted peanutty
1 25 0 26.3 ± 2.3a 56.9 ± 12.5b 18.2 ± 1.6a 39.9 ± 10.3a 2 25 35 27.4 ± 6.9a 56.5 ± 13.3b 17.9 ± 2.9a 39.3 ± 10.3a 3 25 51 27.3 ± 1.9a 58.3 ± 14.2b 17.6 ± 1.5a 39.5 ± 11.5a 4 25 62 26.9 ± 2.5a 59.8 ± 10.3b 17.9 ± 1.8a 38.9 ± 12.3a 5 25 87 28.1 ± 2.5a 71.1 ± 10.1a 18.2 ± 2.7a 35.2 ± 9.4a 6 25 135 27.0 ± 2.8a 60.5 ± 12.5b 17.6 ± 2.5a 17.6 ± 2.5a 7 25 146 28.0 ± 6.2a 68.0 ± 6.3a 16.4 ± 4.7a 36.1 ± 8.3a
Control2 0 0 29.6 ± 3.0a 69.1 ± 3.6a 17.6 ± 2.9a 46.2 ± 13.4a P-value 0.2338 <0.0001 0.5470 0.0740 8 40 0 28.2 ± 2.8a 71.2 ± 9a 18.0 ± 2.6a 37.2 ± 8.3a 9 40 16 28.2 ± 2.6a 68.7 ± 12a 18.4 ± 1.7a 40.6 ± 12.2a 10 40 36 27.6 ± 2.1a 73.3 ± 8.9a 17.9 ± 4.1a 40.3 ± 10.0a 11 40 46 27.4 ± 1.4a 65.9 ± 6.7a 18.1 ± 1.3a 38.9 ± 11.9a 12 40 70 28.7 ± 3.3a 70.7 ± 6.2a 17.8 ± 2.7a 36.9 ± 10.1a
Control 0 0 29.6 ± 3.0a 69.1 ± 3.6a 17.6 ± 2.9a 46.2 ± 13.4a P-value 0.0941 0.1014 0.9527 0.1021
1 Intensity ratings using a 150 mm unstructured scale with anchors at 12.5 and 137.50 mm Means in within a column at the same storage temperature along with controls, not followed by the same letter is significantly different (P<0.05) from each other as determined by Fisher’s least significant difference mean separation test.
2 Controls were peanut bars prepared from untreated roasted whole peanuts

353
Table 4.33 Changes in the intensity ratings (mean standard deviation) for the basic tastes of resveratrol-enhanced peanut bars by a descriptive panel during storage at 25 and 40oC 1.
Trt # Storage Temp. (oC)
Storage Time (day)
Bitter
Sweet
Sour
Salty
1 25 0 19.7 ± 3.7b 104.1 ± 12.8a 3.6 ± 2.6a 15.5 ± 4.0a 2 25 35 19.1 ± 3.9b 103.8 ± 12.9a 4.1 ± 1.3a 15.9 ± 2.6a 3 25 51 19.3 ± 4.5b 106.6 ± 3.1a 3.9 ± 3.2a 16.5 ± 3.1a 4 25 62 18.9 ± 5.6b 107.0 ± 3.1a 3.1 ± 2.6a 15.4 ± 3.3a 5 25 87 24.4 ± 6.0a 94.5 ± 23.1a 5.8 ± 3.7a 15.3 ± 5.2a 6 25 135 20.5 ± 8.6b 106.1 ± 4.5a 4.1 ± 2.7a 16.4 ± 2.6a 7 25 146 19.1 ± 5.8b 104.7 ± 7.1a 3.9 ± 3.3a 15.5 ± 3.9a
Control2 0 0 20.7 ± 2.9b 104.3 ± 12.4a 3.4 ± 2.7a 16.9 ± 1.1a P-value 0.0323 0.0313 0.1666 0.7437 8 40 0 21.9 ± 2.8a 102.6 ± 9.8a 4.1 ± 2.2a 17.0 ± 1.2a 9 40 16 21.5 ± 8a 99.5 ± 23.9a 4.1 ± 2.6a 15.2 ± 4.4a 10 40 36 23.4 ± 4.6a 102.2 ± 6.5a 5.5 ± 2.6a 16.4 ± 3.3a 11 40 46 20.7 ± 3.2a 102.9 ± 12.7a 4.6 ± 2.3a 15.5 ± 4.4a 12 40 70 21.9 ± 9.1a 102.6 ± 6.1a 5.2 ± 2.8a 18.3 ± 5.9a
Control 0 0 20.7 ± 2.9a 104.3 ± 12.4a 3.4 ± 2.7a 16.9 ± 1.1a P-value 0.6809 0.9229 0.0943 0.1396
1 Intensity ratings using a 150 mm unstructured scale with anchors at 12.5 and 137.50 mm Means in within a column at the same storage temperature along with controls, not followed by the same letter is significantly different (P<0.05) from each other as determined by Fisher’s least significant difference mean separation test.
2 Controls were peanut bars prepared from untreated roasted whole peanuts

354
Table 4.34 Changes in the intensity ratings (mean standard deviation) for the off-flavors of resveratrol-enhanced peanut bars by a descriptive panel during storage at 25 and 40oC 1.
Trt #
Storage Temp. (oC)
Storage Time (day)
Woody/ Hull/Skin
Burnt
Oily
Astringency
Fishy
Oxidized
Painty
1 25 0 4.4 ± 2.6a 15.8 ± 6bc 1.4 ± 1.6a 18.4 ± 4.7a 0.0 ± 0.2a 13.6 ± 10.3bc 0.1 ± 0.2a 2 25 35 3.8 ± 2.6a 15.1 ± 5.2c 1.4 ± 1.3a 18.4 ± 6.8a 0.2 ± 0.4a 14.4 ± 7.8bc 0.5 ± 1.2a 3 25 51 3.6 ± 2.3a 14.1 ± 6.3c 1.8 ± 1.5a 20.0 ± 4.9a 0.6 ± 2.3a 14.2 ± 8.5bc 0.1 ± 0.4a 4 25 62 4.2 ± 2.4a 14.3 ± 6.5c 1.3 ± 1.3a 18.1 ± 6.4a 0.2 ± 0.4a 14.1 ± 8.7bc 0.1 ± 0.4a 5 25 87 5.6 ± 6.8a 23.0 ± 9.3a 1.4 ± 1.6a 23.0 ± 12.0a 0.2 ± 0.4a 24.2 ± 11.3a 1.0 ± 2.7a 6 25 135 3.7 ± 2.1a 15.9 ± 7.0bc 1.6 ± 2.6a 22.1 ± 16.6a 0.2 ± 0.4a 15.2 ± 7.9b 0.3 ± 0.9a 7 25 146 3.7 ± 2.2a 15.4 ± 5.6bc 1.3 ± 1.4a 20.5 ± 2.4a 0.1 ± 0.3a 16.2 ± 9.5b 0.2 ± 0.3a
Control2 0 0 4.0 ± 3.3a 19.4 ± 4.9ab 1.6 ± 1.4a 19.3 ± 5.4a 0.2 ± 0.4a 9.4 ± 8.7c 0.3 ± 0.5a P-value 0.6451 0.0002 0.9733 0.5216 0.6666 0.0004 0.1596 8 40 0 4.5 ± 2.1a 20.7 ± 5.6a 1.4 ± 1.4a 20.6 ± 4.0a 0.6 ± 2.7a 23.2 ± 12.1a 0.2 ± 0.4a 9 40 16 4.3 ± 1.8a 19.1 ± 4.8a 1.2 ± 1.5a 21.9 ± 4.8a 0.2 ± 0.4a 16.7 ± 11.4a 0.2 ± 0.4a 10 40 36 4.5 ± 3.0a 24.1 ± 4.8a 1.2 ± 1.6a 22.2 ± 2.8a 0.2 ± 0.3a 23.3 ± 8.6a 0.7 ± 1.6a 11 40 46 4.5 ± 2.6a 18.7 ± 4.1a 1.3 ± 1.4a 21.0 ± 2.3a 0.1 ± 0.3a 17.5 ± 7.3a 0.8 ± 2.7a 12 40 70 4.3 ± 2.0a 22.6 ± 8.2a 2.2 ± 2.0a 22.2 ± 3.1a 0.2 ± 0.3a 25.2 ± 9.7a 1.8 ± 3.3a
Control 0 0 4.0 ± 3.3a 19.4 ± 4.9a 1.6 ± 1.4a 19.3 ± 5.4a 0.2 ± 0.4a 9.4 ± 8.7d 0.3 ± 0.5a P-value 0.9870 0.0180 0.3579 0.1328 0.6980 <0.0001 0.0664
1 Intensity ratings using a 150 mm unstructured scale with anchors at 12.5 and 137.50 mm Means in within a column at the same storage temperature along with controls, not followed by the same letter is significantly (P<0.05) different from each other as determined by Fisher’s least significant difference mean separation test.
2 Controls are peanut bars prepared from untreated roasted whole peanuts

355
Table 4.35 Changes in the intensity ratings (mean standard deviation) for the texture attributes and feeling factors of resveratrol-enhanced peanut bars by a descriptive panel during storage at 25 and 40oC1.
Trt #
Storage Temp. (oC)
Storage Time (day)
Hardness
Fracturability
Crunchiness
Cohesiveness
Chewiness
Toothpack
1 25 0 91.1 ± 5.2b 70.9 ± 1.8c 91.0 ± 6.7a 68.3 ± 2.7a 57.2 ± 2.4a 86.2 ± 3.5a 2 25 35 92.5 ± 4.9b 72.0 ± 3.7bc 91.1 ± 4.9a 68.7 ± 2.7a 58.5 ± 3.8a 87.0 ± 4.1a 3 25 51 92.7 ± 3.8b 71.5 ± 4.1bc 89.9 ± 6.6a 68.9 ± 2.7a 56.6 ± 2.8a 86.5 ± 2.2a 4 25 62 93.5 ± 3.8ab 71.8 ± 5.1bc 92.5 ± 4.7a 68.2 ± 3.0a 58.0 ± 3.2a 87.1 ± 6.0a 5 25 87 93.4 ± 3.1ab 72.2 ± 4.9bc 91.7 ± 5.8a 67.2 ± 2.6a 56.7 ± 7.4a 86.1 ± 2.6a 6 25 135 90.8 ± 13.4b 73.2 ± 6.5abc 90.0 ± 5a 68.5 ± 3.1a 59.0 ± 5.4a 88.9 ± 1.7a 7 25 146 91.4 ± 5.4bc 70.6 ± 4.9c 92.3 ± 3.2a 68.9 ± 2.1a 56.7 ± 3.0a 87.6 ± 3.7a
Control2 0 0 97.3 ± 4.8a 75.5 ± 5.4a 92.4 ± 6.8a 70.4 ± 3.5a 58.4 ± 2.9a 88.1 ± 3.2a P-value 0.0473 0.0383 0.6761 0.0593 0.4205 0.1857 8 40 0 92.2 ± 3.6b 71.2 ± 1.8c 92.0 ± 2.6a 68.5 ± 2.6a 56.7 ± 3.5a 86.6 ± 3.3a 9 40 16 92.9 ± 4.0b 72.7 ± 5.6bc 92.2 ± 4.3a 68.3 ± 3.4a 56.0 ± 3.6a 86.4 ± 6.8a 10 40 36 92.3 ± 5.3b 71.1 ± 2.9c 92.2 ± 2.9a 71.1 ± 2.9a 57.4 ± 2.1a 87.0 ± 2.4a 11 40 46 92.4 ± 3.5b 72.1 ± 3.2bc 92.9 ± 5.2a 68.7 ± 2.5a 57.2 ± 2.4a 85.9 ± 4.6a 12 40 70 94.2 ± 3.1b 74.1 ± 5.5ab 91.6 ± 7.5a 68.5 ± 3.5a 57.9 ± 5.0a 86.7 ± 4.6a
Control 0 0 97.3 ± 4.8a 75.5 ± 5.4a 92.4 ± 6.8a 70.4 ± 3.5a 58.4 ± 2.9a 88.1 ± 3.2a P-value 0.0007 0.0103 0.9878 0.1675 0.3144 0.6953
1 Intensity ratings using a 150 mm unstructured scale with anchors at 12.5 and 137.50 mm Means in within a column at the same storage temperature along with controls, not followed by the same letter is significantly different (P<.05) from each other as determined by Fisher’s least significant difference mean separation test.
2 Controls are peanut bars prepared from untreated roasted whole peanuts

356
V. STUDY 5 – PROFILING OF PHENOLIC COMPOUNDS AND SENSORY
ATTRIBUTES OF UV, ULTRASOUND AND COMBINED ULTRASOUND-UV
TREATED PEANUTS
A. Results of LC-MS
LC-MS was conducted to verify presence of phenolic compounds in UV and US treated
peanuts based on their mass, and retention time in the chromatograms, and spectra in comparison
with those of known pure standards. Results confirmed presence of two stilbenes, trans-
resveratrol and trans-piceid; and three phenolic acids, ρ-coumaric acid, caffeic acid, ferulic acid;
and the internal standard, β-resorcylic acid, in the UV and US-treated samples as shown in Table
4.36. Quercetin, a flavonoid maybe present although its peak was not distinct. Due to its very
low peak and difficulties of its identification in the chromatogram and spectra, quercetin was not
quantified in this study. All other 7 flavanols, epigallocatechin, catechin, procyanidin B2,
epicatechin, epigallocatechin gallate, epicatechin gallate, and catechin gallate; and 2 benzoic acid
derivatives, gallic acid and protocatechuic acid, analyzed using LC-MS were not detected in US
and UV-treated peanut kernels.
B. Phenolic Profiles of Peanuts Treated with UV, Ultrasound, and Combined Ultrasound-
UV Processing Treatments
1. Phenolic profile of UV-treated peanuts
The phenolic profile of UV-treated peanuts consisting of trans-resveratrol, trans-piceid, p-
coumaric acid, caffeic acid and ferulic acid obtained using the reverse HPLC method for the
simultaneous analysis of 15 phenolic compounds and the internal standard, β-resorcyclic acid,
by Francisco and Resurreccion (2009b) is shown in Table 4.37. The trans-resveratrol
concentrations of treated peanuts ranged from 0.58 to 2.18 µg/g or overall mean of 1.05 µg/g

357
Table 4.36 Sixteen phenolic compounds assayed in peanut kernels using liquid chromatography-mass spectrometry (LC-MS). Wavelength
(nm) Compound Retention time
in standards (min)
Retention time in sample (min)
Mass (g/mole)
Hydroxybenzoic acids 250 Gallic acid 4.6 ND 170
Protocatechuic acid 9.1 ND 154 β-resorcylic acid
(internal standard) 21.1 21.88 153
Flavan-3-ols
280 Epigallocatechin 17.3 ND 290 Catechin 20.1 ND 290 Procyanidin B2 28.4 ND 578 Epicatechin 32.8 ND 290 Epigallocatechin
gallate 35.1 ND 458
Epicatechin gallate 60.2 ND 442 Catechin gallate 63.8 ND 442 Hydroxycinnamic
acids
320 Caffeic acid 23.0 23.97 179 ρ-coumaric acid 36.4 36.75 163 Ferulic acid 45.1 47.20 193 Stilbenes
306 trans-Piceid 55.13 55.49 389 trans-Resveratrol 84.94 84.99 227 Flavonol
370 Quercetin 93.6 93.06* 301 ND means not detected * Very low intensity, may be present in the sample

358
whereas control untreated raw peanuts had 0.31µg/g. These concentrations in the UV-treated
samples were within the values of 0.54 to 3.30 µg/g trans-resveratrol previously found in UV-
treated peanuts using the method of Potrebko and Resurreccion (2009). All 27 UV treatments
had significantly higher trans-resveratrol compared to controls. The distance from UV light and
UV exposure time were the significant factors affecting trans-resveratrol in UV-treated peanuts.
The distance of 40 cm from UV light produced the highest mean overall trans-resveratrol of 1.20
µg/g which was significantly higher (P<0.0058) compared to 0.96 and 0.91 µg/g when exposed
at 20 and 60 cm distance from UV light, respectively. At UV exposure times of 20 and 30 min,
overall mean resveratrol of 1.14 and 1.15 µg/g were obtained which were significantly higher
than 0.81 µg/g produced when exposed to UV for 10 min. These results suggest that a minimum
distance of 40 cm from UV light and a moderate to high UV exposure time of 20 to 30 min are
needed to produce the highest trans-resveratrol in UV-treated peanuts.
The amounts of trans-piceid produced in treated peanuts ranged from 0.47 to 1.74 µg/g or
overall mean of 0.92 µg/g whereas untreated controls of 0.31 µg/g. The values obtained for
treated samples were within the range of 0.35 to 1.05 µg/g previously reported using the method
of Potrebko and Resurreccion (2009). Fourteen of 27 UV treatments had significantly higher
trans-piceid compared to controls while the rest of 13 treatments had similar concentrations as in
controls.
Caffeic acid concentrations of treated peanuts ranged from 0.13 to 0.90 µg/g or overall mean
of 0.38 µg/g and untreated controls had 0.84 µg/g. None of the 27 UV-treated peanut had
significantly higher caffeic acid than controls. Only 3 (Trt# 16, 18, 24 in Table 4.37) of 27
treatments had equal caffeic contents as controls while the rest of 24 treatments produced less
caffeic acid compared to untreated controls indicating that UV process combinations of distance

359
from UV light and exposure time were not effective in increasing caffeic acid in UV-treated
peanuts.
p-Coumaric acid is the major phenolic compound in UV-treated peanuts and their
concentration ranged from 100.39 to 210.00 µg/g or overall mean of 147.81 µg/g whereas
untreated controls had 63.01 µg/g. Twenty four of 27 UV-treated peanuts had significantly
higher p-coumaric acid compared to untreated controls whereas the remaining three treatments
(Trt#1, 19, 27) had concentrations similar to controls. The most significant factor affecting p-
coumaric acid concentrations in treated peanuts was UV exposure time, with 20 and 30 min
exposure times producing the highest overall mean concentrations of 157.65 and 154.62 µg/g,
respectively, compared to 126.79 µg/g obtained when exposed for only 10 min. This result
indicates that UV exposure time of at least 20 min is needed to produce high p-coumaric acid
concentrations in treated peanuts.
Ferulic acid concentrations in treated peanuts ranged from 2.93 to 7.35 µg/g or overall mean
of 4.73 whereas untreated controls had 1.4 µg/g. Twenty three of 27 UV treatments had
significantly higher ferulic acid compared to controls while the rest of four treatments (Trt# 1,
17, 21, 27) produced the same concentrations as controls. UV exposure time was the most
significant factor affecting ferulic concentrations in UV-treated peanuts with 20 and 30 min
exposure times producing the highest overall mean concentrations of 5.22 and 4.93 µg/g,
respectively compared to 3.82 µg/g obtained when exposed for 10 min.
The mean concentration of all phenolic compounds detected or the sum of trans-resveratrol,
trans-piceid, caffeic-, coumaric, and ferulic acids in UV-treated peanuts ranged from 105.38 to
221.08 µg/g or overall mean of 154.90 µg/g while control had 66.93 µg/g. UV exposure time
was the most significant factor affecting the mean concentration of all phenolic compounds with

360
20 and 30 min exposure times to UV producing the highest sum of all phenolic compounds of
165.34 and 162.16 µg/g, respectively, which were significantly higher than when exposed for 10
min obtaining only 132.54 µg/g.
2. Phenolic profile of ultrasound-treated peanuts
The phenolic profile of US-treated peanuts is shown in Table 4.38. The amounts of trans-
resveratrol produced in treated peanuts ranged from 0.76 to 3.23 µg/g or overall mean of 1.57
µg/g whereas untreated controls had 0.31 µg/g. All 27 treatments had significantly higher trans-
resveratrol compared to controls. US power density and incubation time were significant factors
affecting the concentrations of trans-resveratrol in US-treated peanuts. Exposure of peanuts to
75 mW/cm3 power density produced the highest overall mean trans-resveratrol of 1.87 µg/g
compared to 1.41 µg/g obtained when exposed to 25 mW/cm3 but not significantly different from
1.47 µg/g obtained when exposed to 50 mW/cm3. Incubating US-treated peanuts for 24 h
produced the highest overall mean trans-resveratrol of 2.21 µg/g which was significantly higher
than those incubated for 36 and 48 h with mean concentrations of 1.31 and 1.38 µg/g,
respectively,
Trans-piceid concentrations of US treated peanuts ranged from 0.33 to 3.64 µg/g or overall
mean of 1.60 µg/g whereas untreated control had raw peanuts with 0.31 µg/g. Eight of 27 US-
treated peanuts (Trt# 1, 3, 4, 10, 16, 20, 21, 22) had significantly higher, nine treatments (Trt# 5,
7, 9, 13, 15, 19, 23, 25, 27) had significantly lower trans-piceid compared to controls while the
rest of the 10 treatments had concentrations equal to controls. Incubation time significantly
affected the concentrations of trans-piceid of US-treated peanut with 24 h incubation time
producing the highest overall mean concentration of 2.0 µg/g. This was significantly higher than

361
those incubated for 48 h with overall mean of 1.39 µg/g but not significantly different from 1.46
µg/g stored for 36 h.
Caffeic acid concentrations of treated peanuts ranged from 0.33 to 1.32 µg/g or overall mean
of 0.79 µg/g while untreated controls had 0.85 µg/g. Three of 27 US-treated peanuts (Trt# 16,
20 and 24) had significantly higher caffeic acid than untreated controls, 21 treatments produced
the same amounts of caffeic acid as controls and three treatments (Trt# 3, 13, 23) obtained lower
significantly lower caffeic acid compared to controls.
p-Coumaric acid is the major phenolic compound in treated peanuts with 45.22 to 393.55 or
overall mean of 176.79 µg/g whereas untreated controls had 45.22 µg/g. Twenty three of 27 US
treatments produced significantly higher p-coumaric acid concentrations compared to controls
whereas four treatments (Trt# 9, 13, 23, and 25) obtained similar concentrations as controls. US
exposure time was the most significant factor affecting p-coumaric acid concentrations with 2
min exposure time producing the highest overall mean of 205.41 µg/g whereas 8 min exposure
resulted in the lowest overall mean of 157.03 µg/g, and 5 min exposure to US with 170.65 was
intermediate.
The concentrations of ferulic acid in treated peanuts ranged from 1.50 to 14.79 µg/g or
overall mean of 6.82 µg/g whereas untreated controls had 1.4 µg/g. Twenty two of 27 US-
treated peanuts obtained significantly higher ferulic acid compared to untreated controls and 5
treatments (Trt# 9, 13, 15, 23, and 25) had concentration similar to controls.
The overall mean concentrations of all phenolic compounds or the sum of trans-resveratrol,
trans-piceid, caffeic-, p-coumaric- and ferulic acids in US-treated peanuts ranged from 50.70 to
413.08 µg/g or overall mean of 187.56 µg/g which were significantly higher (P<0.05) than
control with 66.93 µg/g. Compared to overall mean concentration of all phenolic compounds

362
obtained previously in UV-treated peanuts (Study 5.A.1 above) of 152.66 µg/g, US processing
treatment was more effective than UV in producing higher concentrations of all phenolic
compounds evaluated in this study.
3. Phenolic profile of combined UV-US treated peanuts
The phenolic profile of peanuts processed with combined US-UV treatments was dicussed in
Study 3 of this section and the mean concentrations of phenolic compounds are shown in Table
4.18. The combined US-UV processing treatments produced total (sum) concentrations of all
phenolic compounds analyzed ranging from 136.39 to 280.17 µg/g compared to untreated
controls of 39.8 µg/g. Compared to US-treated control peanuts with 146.29 µg/g or UV treated
controls with 136.39 µg/g found in the same study (Table 4.20), the combined US-UV treated
peanuts produced a higher maximum of 280.17 µg/g suggesting an additive effect of US and UV.
4. Comparison of concentrations of phenolic compound in peanuts treated with UV,
ultrasound, and combined US-UV processing treatments
The comparison of the mean concentrations of phenolic compounds based on difference
between concentrations of treated (UV, US or combined US-UV) peanuts and untreated controls
is presented in Table 4.39. The differences in concentrations, rather than actual observed values,
were used to compare the three treatments because treated samples were prepared at different
times along with their controls. A positive value means that treated peanuts had higher
concentration whereas a negative rating means lower compared to controls.
Results showed that the mean concentrations of trans- resveratrol, ρ-coumaric acid and
ferulic acid in all treated peanuts were higher than controls whereas trans-piceid in combined
US-UV and caffeic acid in UV and US treatments were lower than controls. Trans-resveratrol
was highest in combined US-UV followed by US alone and lowest in UV treatment.

363
Table 4.37 Profile of phenolic compounds (mean ± standard deviation, µg/g, dry basis) of UV-treated peanuts1. Trt # ID IT IC Trans-
resveratrol Trans- Piceid
Caffeic acid Coumaric acid Ferulic acid
1 20 10 24 0.62±0.03c 0.47±0.10gh 0.31±0.00hijk 115.60±12.39ghi 2.93±0.45ij
2 20 10 36 0.58±0.08c 0.80±0.00cdefgh 0.11±0.04m 100.39±7.43abcdefg 3.50±0.19ghi
3 20 10 48 0.92±0.22ab 1.16±0.40c 0.34±0.01hij 128.07±30.35fgh 4.07±1.23defghi
4 20 20 24 0.87±0.14ab 1.15±0.17cd 0.13±0.04lm 148.21±8.37bcdefgh 5.44±0.40defghi
5 20 20 36 1.25±0.26b 0.74±0.04cdefgh 0.55±0.08cde 137.04±12.67cdefgh 4.38±1.12defghi
6 20 20 48 0.99±0.19ab 0.56±0.15fgh 0.16±0.00klm 132.26±27.61cdefgh 4.57±0.96defghi
7 20 30 24 1.12±0.40ab 1.15±0.36c 0.62±0.08cd 179.87±29.21abcde 5.56±0.46abcde
8 20 30 36 1.00±0.34ab 0.60±0.18efgh 0.42±0.04efgh 141.32±30.99bcdefgh 4.79±1.23cdefgh
9 20 30 48 1.37±0.02b 1.06±0.08cdef 0.53±0.02def 131.07±24.73cdefgh 3.96±0.77fghi
10 40 10 24 0.93±0.30ab 0.90±0.04cdefg 0.37±0.02fghi 133.96±21.37cdefgh 4.19±0.33defghi
11 40 10 36 0.90±0.1ab 0.49±0.08gh 0.38±0.10fghi 128.41±24.70defgh 3.34±0.86hi
12 40 10 48 0.86±0.12ab 0.90±0.14cdefg 0.21±0.02jklm 142.77±42.34bcdefgh 5.24±1.05bdefg
13 40 20 24 1.05±0.10ab 0.75±0.23cdefgh 0.52±0.03defg 142.63±14.68bcdefgh 4.01±0.91defghi
14 40 20 36 1.35±0.36b 1.08±0.31cde 0.23±0.08ijklm 161.52±30.20abcdefg 5.84±1.03abcd
15 40 20 48 0.86±0.06ab 0.81±0.27cdefgh 0.36±0.04fghi 142.60±30.30bcdefgh 3.66±0.18fghi

364
Table 4.37 continued…
Trt # ID IT IC Trans- resveratrol
Trans- Piceid
Caffeic acid Coumaric acid Ferulic acid
16 40 30 24 1.24±0.44b 1.19±0.34bc 0.83±0.15ab 195.90±31.43ab 7.35±0.59a
17 40 30 36 0.84±0.08ab 0.52±0.19gh 0.28±0.09hijkl 124.05±6.94hg 3.04±0.30hij
18 40 30 48 2.18±0.60a 1.74±0.53a 0.90±0.05a 183.27±29.58abcd 6.47±0.36abc
19 60 10 24 0.87±0.17ab 0.64±0.19defgh 0.42±0.06efgh 114.76±16.24ghi 3.24±0.53hi
20 60 10 36 1.00±0.18ab 0.97±0.16cdefg 0.15±0.01lmk 148.24±47.40bcdefgh 4.69±1.49cdefghi
21 60 10 48 0.66±0.10c 0.86±0.18cdefg 0.53±0.18def 128.95±14.43defgh 3.15±1.13hij
22 60 20 24 1.10±0.30ab 0.88±0.26cdefg 0.21±0.03jklm 172.65±25.29abcdef 5.31±0.61bcdef
23 60 20 36 0.85±0.21ab 0.94±0.27cdefg 0.56±0.20cde 155.81±50.34abcdefg 4.40±1.55defghi
24 60 20 48 1.13±0.33ab 1.70±0.41ab 0.69±0.04bc 210.60±14.87a 6.95±0.86ab
25 60 30 24 0.90±0.32ab 0.65±0.05cdefgh 0.38±0.03fghi 132.31±18.25cdefg 4.41±0.72defghi
26 60 30 36 0.89±0.03ab 0.70±0.14defgh 0.29±0.09hijkl 185.81±40.05abc 5.70±0.96abcde
27 60 30 48 0.81±0.22ab 0.75±0.26cdefgh 0.51±0.15defg 117.97±20.49fghi 3.12±0.99hij
Control2 120 0 0 0.31±0.01d 0.31±0.03h 0.84±0.07ab 63.01±10.30i 1.40±0.13j 1ID = distance from UV light (cm); IT = UV exposure time (min); IC = incubation time (h) Means in a column not followed by the same letter is significantly different (P<0.05) from each other as determined by Fisher’s least significant difference mean separation test.
2 Controls are untreated raw whole peanuts.

365
Table 4.38 Profile of phenolic compounds (mean ± standard deviation, µg/g, dry basis) of ultrasound-treated peanuts1. Trt # PD PT IC Trans-
resveratrol Trans- Piceid
Caffeic acid Coumaric acid Ferulic acid
24
2.78±0.84abc
1.09±0.18abc
261.98±36.45bc 1 25 2 2.80±0.94a 8.89±1.89de
2 25 2 36 1.09±0.30efg 1.05±0.12ghijk 0.61±0.13efgh 164.75±47.38ghijk 7.11±1.87efg
3 25 2 48 0.99±0.16efg 1.04±0.32a 0.40±0.11gh 120.91±36.74 ijklmn 3.64±1.03 jkl
4 25 5 24 1.85±0.50c 3.64±1.22a 1.09±0.14abc 244.50±42.82bcd 10.64±2.46cd
5 25 5 36 1.00±0.18efg 0.81±0.25ijk 0.66±0.06defgh 168.01±24.66fghijk 7.09±1.10efg
6 25 5 48 0.83±0.02fg 1.32±0.42fghij 0.59±0.01defg 205.04±64.83cdefg 5.79±1.60ghij
7 25 8 24 1.99±0.52bc 0.52±0.15jk 0.71±0.16defg 157.99±46.84ghijkl 4.72±0.60hijk
8 25 8 36 0.98±0.16efg 0.89±0.17ghijk 0.59±0.08defg 123.10±14.41ijklmn 4.74±0.84hijk
9 25 8 48 1.14±0.11defg 0.49±0.08jk 0.49±0.03fgh 95.54±8.53mno 2.76±0.29klmn
10 50 2 24 2.00±0.25ab 3.37±0.54abcd 0.99±0.07abcd 257.06±33.45bc 10.57±0.24cd
11 50 2 36 0.89±0.03fg 0.92±0.30ghijk 0.60±0.04defg 113.22±6.08jklmn 3.80±0.17jkl
12 50 2 48 2.58±0.81ab 1.31±0.06fghij 1.17±0.41abc 185.61±1.20bcde 8.45±0.38def
13 50 5 24 1.50±0.14cdef 0.33±0.03k 0.45±0.04gh 103.37±13.31lmno 2.46±0.32lmn
14 50 5 36 1.33±0.23cdefg 1.83±0.49defg 0.87±0.26bcde 169.12±19.20efghijk 7.14±0.82efg
15 50 5 48 0.85±0.27fg 0.66±0.22jk 0.53±0.13defg 110.72±12.93klmn 3.09±0.67klmn
16 50 8 24 2.72±0.69a 2.70±0.68abcd 1.23±0.08ab 289.90±42.77b 14.79±2.97a
17 50 8 36 1.16±0.14defg 1.68±0.58efghi 0.70±0.07defg 175.08±26.67efghi 6.53±2.10fgh
18 50 8 48 0.76±0.04fg 1.77±0.03defgh 0.83±0.07cdef 158.43±8.34ghijkl 6.86±0.38efgh

366
Table 4.38 continued… Trt # PD PT IC Trans-
resveratrol Trans - Piceid
Caffeic acid Coumaric acid Ferulic acid
19 75 2 24 1.63±0.29cde 0.85±0.30hijk 0.65±0.19defgh 124.73±20.38hijklm 4.14±0.26hijk
20 75 2 36 0.96±0.31efg 2.27±0.36bcde 1.28±0.05a 226.89±18.86cdef 10.02±0.02cd
21 75 2 48 2.65±0.01ab 2.86±0.68abc 1.00±0.19abcd 393.55±93.90a 13.19±0.81ab
22 75 5 24 1.80±0.20cd 3.14±0.93ab 1.09±0.21abc 228.04±12.47cdef 11.11±1.07ab
23 75 5 36 3.23±0.38a 0.54±0.02jk 0.33±0.06h 82.84±17.93nmo 1.52±0.21mn
24 75 5 48 1.82±0.56cd 2.18±0.64cdef 1.32±0.37a 230.27±6.38bcde 10.23±0.90cd
25 75 8 24 2.81±0.45a 0.69±0.23jk 0.48±0.00fgh 45.22±4.00o 1.50±0.08mn
26 75 8 36 1.09±0.15efg 1.68±0.10efghi 0.69±0.11defgh 172.82±8.77efghij 5.71±0.11efghi
27 75 8 48 0.85±0.06fg 0.87±0.15hijk 0.65±0.09defgh 195.18±45.31defg 6.27±1.40fghi Control2 0 0 0 0.31±0.16h 0.31±0.1fg 0.85±0.10cdef 45.22±10.3o 1.40±0.02n
1PD = ultrasound power density (mW/cm3); PT = ultrasound exposure time (min); IC = incubation time (h) Means in a column not followed by the same letter is significantly different (P<0.05) from each other as determined by Fisher’s least significant difference mean separation test.
2 Controls are untreated raw whole peanuts.
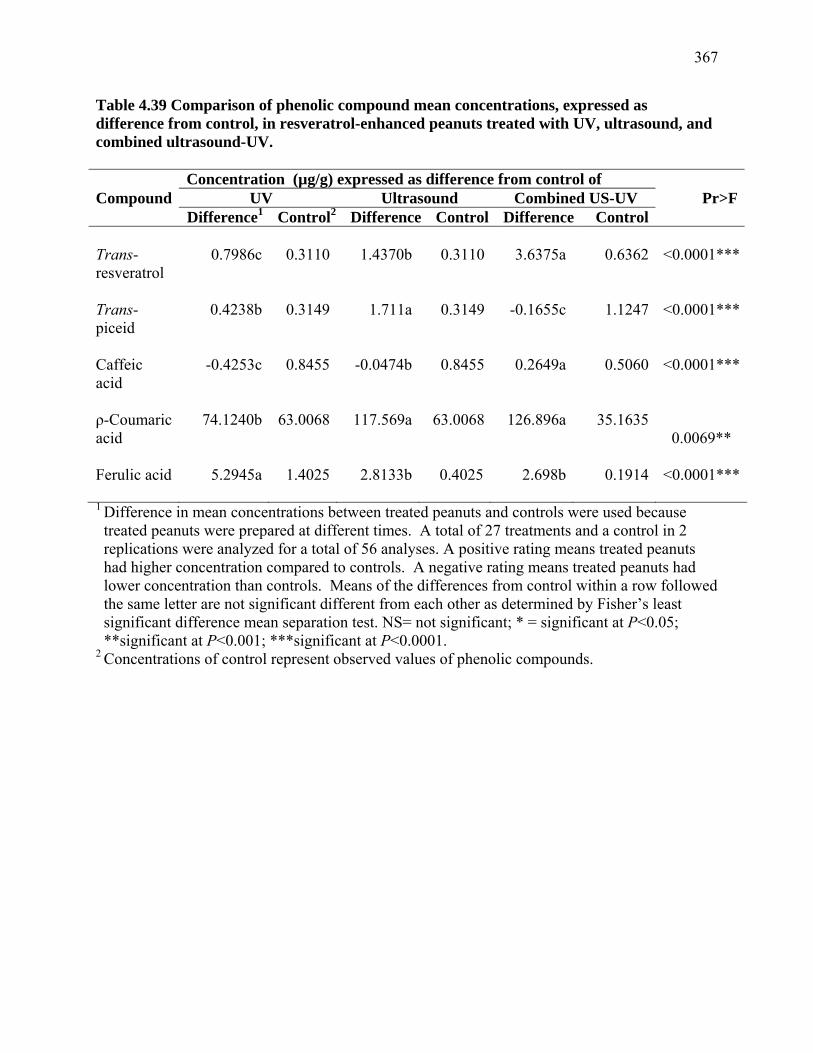
367
Table 4.39 Comparison of phenolic compound mean concentrations, expressed as difference from control, in resveratrol-enhanced peanuts treated with UV, ultrasound, and combined ultrasound-UV. Concentration (µg/g) expressed as difference from control of Compound UV Ultrasound Combined US-UV Pr>F Difference1 Control2 Difference Control Difference Control Trans-resveratrol
0.7986c 0.3110 1.4370b 0.3110 3.6375a 0.6362 <0.0001***
Trans-piceid
0.4238b 0.3149 1.711a 0.3149 -0.1655c 1.1247 <0.0001***
Caffeic acid
-0.4253c 0.8455 -0.0474b 0.8455 0.2649a 0.5060 <0.0001***
ρ-Coumaric acid
74.1240b 63.0068 117.569a 63.0068 126.896a 35.1635 0.0069**
Ferulic acid
5.2945a 1.4025 2.8133b 0.4025 2.698b 0.1914 <0.0001***
1 Difference in mean concentrations between treated peanuts and controls were used because treated peanuts were prepared at different times. A total of 27 treatments and a control in 2 replications were analyzed for a total of 56 analyses. A positive rating means treated peanuts had higher concentration compared to controls. A negative rating means treated peanuts had lower concentration than controls. Means of the differences from control within a row followed the same letter are not significant different from each other as determined by Fisher’s least significant difference mean separation test. NS= not significant; * = significant at P<0.05; **significant at P<0.001; ***significant at P<0.0001.
2 Concentrations of control represent observed values of phenolic compounds.

368
ρ-Coumaric acid concentrations were higher in combined US-UV and US treatments compared
to UV. Ferulic acid was highest in UV-treated peanuts compared to US and combined US-UV
treatments which had similar concentrations. Caffeic acid concentration was only enhanced
when peanuts were treated with combined US-UV whereas US and UV had no effect in
increasing caffeic acid in treated peanuts. Trans-piceid concentrations were highest in US
treated peanuts followed by UV but not enhanced using combined US-UV treatment. In
summary, the concentrations of phenolic compounds except for piceid and ferulic acid were
effectively enhanced when peanuts were treated with combined US-UV process, followed by
US, and then UV process.
B. Sensory Profiles of Peanuts Treated with Treated with UV, Ultrasound, and Combined
US-UV Processing Treatments
1. Sensory profile of UV-treated peanuts by a descriptive panel
1.1 Descriptive panel intensity ratings for brown color and roasted peanutty and raw beany
flavors (Table 4.40)
Brown color. The brown color ratings of UV-treated peanuts ranged from 33.0 to 52.5 with
a control rating of 32.5. Eighteen of 27 UV treated peanuts had significantly greater intensity of
brown color of 38.0 to 52.5 compared to untreated controls with 32.5. The intensities of brown
color of 33.0 to 36.4 of all other 9 treatments (Trt# 2, 4, 8, 10, 13, 14, 18, 24, 26) were not
significantly different from untreated controls. Peanuts treated at a distance from UV light of 60
cm produced the most intense brown color with overall mean rating of 43.4 which was
significantly higher than the brown color at 20 and 40 cm with overall mean ratings of 40.3 and
40.1. UV exposure time and incubation time had no effect on the intensity of brown color of UV-
treated peanuts.

369
Table 4.40 Intensity ratings (mean±standard deviation) for the brown color, roasted peanutty and raw/beany aromatics of roasted sliced UV-treated peanuts by a descriptive panel.
Trt # ID IT IC Brown color Roasted peanutty Raw/beany 1 20 10 24 44.6 ± 6.7defgh 52.1 ± 16.5ab 0.0 ± 0.0c 2 20 10 36 33.9 ± 3.7m 30.0 ± 17.3ghijk 0.0 ± 0.0c 3 20 10 48 42.7 ± 6.7efghi 25.3 ± 10.5k 2.1 ± 4.3ab 4 20 20 24 36.4 ± 4.8klm 36.2 ± 16.3defghij 3.1 ± 5.1a 5 20 20 36 46.5 ± 6.2bcde 42.7 ± 15.8bcde 0.0 ± 0.0c 6 20 20 48 38.0 ± 2.7jkl 28.5 ± 6.7ijk 1.6 ± 4.1abc 7 20 30 24 45.2 ± 7cdefg 45.7 ± 17.1abcd 0.0 ± 0.0c 8 20 30 36 30.0 ± 3.1m 28.0 ± 9.9ijk 1.2 ± 4.1abc 9 20 30 48 42.8 ± 8.4efghi 26.2 ± 8.1k 2.7 ± 5.9ab 10 40 10 24 34.4 ± 4.2lm 33.6 ± 15efghijk 1.8 ± 4.2abc 11 40 10 36 49.2 ± 8.3abc 41.2 ± 15.1bcde 0.0 ± 0.0c 12 40 10 48 40.5 ± 4.6hij 29.9 ± 9ghijk 2.1 ± 4.3ab 13 40 20 24 36.4 ± 4.4lm 31.1 ± 9.2fghijk 2.2 ± 5.5ab 14 40 20 36 34.5 ± 4.2klm 26.8 ± 5.4jk 0.1 ± 0.3c 15 40 20 48 46.6 ± 5.5bcde 49.9 ± 19.1abc 0.0 ± 0.0c 16 40 30 24 38.2 ± 4.5jkl 38.8 ± 14.7efghijk 0.0 ± 0.0c 17 40 30 36 45.8 ± 9.8bcdefg 40.0 ± 17.8cdef 0.0 ± 0.0c 18 40 30 48 35.2 ± 4.3lm 30.9 ± 12.8fghijk 1.6 ± 4.7abc 19 60 10 24 46.3 ± 9.5bcdef 39.7 ± 14.3defg 1.2 ± 4.9abc 20 60 10 36 41.8 ± 7ghij 37.8 ± 16defghi 0.7 ± 2.8bc 21 60 10 48 42.5 ± 5.2fghi 39.1 ± 18.4defgh 0.8 ± 2.8bc 22 60 20 24 39.6 ± 5ijk 40.5 ± 14.7cdef 0.0 ± 0.0c 23 60 20 36 52.5 ± 6.5a 39.6 ± 18.4defg 0.0 ± 0.0c 24 60 20 48 36.4 ± 4.8klm 29.6 ± 13.6ijk 0.06 ± 0.2c 25 60 30 24 47.2 ± 4.6bcd 44.0 ± 16.3bcd 0.0 ± 0.0c 26 60 30 36 34.8 ± 3.5lm 30.0 ± 12.4ghijk 0.0 ± 0.0c 27 60 30 48 49.7 ± 7.1ab 43.9 ± 12.9bcd 0.0 ± 0.0c
Control2 120 0 0 32.5 ± 3.1m 54.9 ± 16a 0.0 ± 0.0c 1ID = distance from UV light (cm); IT = UV exposure time (min); IC = incubation time (h) Means in a column not followed by the same letter is significantly different (P<0.05) from each other as determined by Fisher’s least significant difference mean separation test.
2Controls are untreated raw whole peanuts.

370
Roasted peanutty flavor. The range of intensity ratings for roasted peanutty flavor of UV-
treated samples was 25.3 to 52.1 with controls at 54.9. The intensities of roasted peanutty flavor
of 45.7 to 52.1 three treatments (Trt# 1, 7, 15) were not significantly different from untreated
controls. Twenty four of 27 treated peanuts had significantly lower intensities of roasted
peanutty flavor of 25.3 to 44.0 compared to untreated controls. Distance from UV light, UV
exposure time and incubation time had no effect on the roasted peanutty flavor on UV-treated
peanuts.
Raw beany flavor. The range of raw beany intensity ratings of UV-treated peanuts was 0 to
3.1 with control at 0. Twenty two of 27 UV-treated peanuts had raw beany flavor intensities of 0
to 1.8 which were not significantly different from controls. Five treatments (Trt# 3, 4, 9, 12, 13)
had raw beany flavor intensities of 2.1 to 3.1 which were significantly higher than that of control.
Distance from UV light of 20 cm produced the most intense raw beany flavor with the overall
mean rating of 1.2 which was significantly higher than the rating of 0.3 at 60 cm distance.
Incubation for 48 h resulted in the highest overall mean raw beany flavor intensity of 1.2 which
was significantly higher than 0.2 rating at 36 h incubation but not significantly different from 0.9
rating at 24 h incubation.
1.2 Descriptive panel intensity ratings for basic tastes (Table 4.41)
Bitter taste. The range of intensity ratings for bitter taste of UV-treated peanuts ranged was
18.9 to 23.6 and control was 18.4. Seventeen of 27 UV-treatments had bitter intensity ratings of
19.0 to 21.0 which were not significantly different from that of controls. The intensity ratings of
21.1 to 23.6 in ten treatments were significantly higher than controls. Distance from UV light,
UV exposure time and incubation time did not significantly affect the intensities of bitter tastes
in UV-treated peanuts.

371
Table 4.41 Intensity ratings (mean±standard deviation) for the basic tastes of roasted sliced UV-treated peanuts by a descriptive panel.
Trt # ID IT IC Bitter Sweet Sour Salty 1 20 10 24 23.6 ± 2.6a 13.9 ± 1.8cde 0.9 ± 3.8ef 13.7 ± ab3.1 2 20 10 36 19.9 ± 3.9cdef 14.7 ± 2.4bcd 1.7 ± 4.7def 13.1 ± abc2.69 3 20 10 48 20.2 ± 7.4cdef 12.5 ± 4.0e 5.0 ± 8.4abc 12.6 ± 1.5bcd 4 20 20 24 20.2 ± 3.2cdef 14.7 ± 2.3bcd 1.5 ± 4.1def 12.2 ± 0.8cd 5 20 20 36 19.6 ± 3.8cdef 13.3 ± 1.9de 1.4 ± 3.7ef 12.7 ± 1.8abcd 6 20 20 48 21.0 ± 4.7abcdef 13.3 ± 3.8de 7.6 ± 6.2a 12.5 ± 1.1bcd 7 20 30 24 19.1 ± 3.8def 14.6 ± 2.5bcd 1.3 ± 3.6ef 12.8 ± 1abc 8 20 30 36 23.0 ± 4.1ab 14.1 ± 1.6cde 3.6 ± 5.6bcde 12.1 ± 1.3cd 9 20 30 48 20.2 ± 3.8cdef 14.0 ± 1.5cde 7.8 ± 6.3a 12.3 ± 1cd 10 40 10 24 20.3 ± 3.6cdef 14.1 ± 1.5cd 0.0 ± 0.0f 12.4 ± 1.9bcd 11 40 10 36 22.3 ± 4.5abc 14.2 ± 4.2cd 2.9 ± 5.2cdef 13.3 ± 2.1abc 12 40 10 48 20.3 ± 3cdef 14.6 ± 2.0bcd 3.7 ± 5.7bcde 12.1 ± 1.3cd 13 40 20 24 18.9 ± 3.9ef 16.0 ± 2.2ab 2.3 ± 4.8cdef 12.5 ± 1.5bcd 14 40 20 36 21.1 ± 2.8cdef 13.9 ± 1.4cde 4.7 ± 5.6abcd 12.2 ± 0.6cd 15 40 20 48 21.7 ± 3.9abcd 13.9 ± 1.7cde 3.6 ± 5.6bcde 13.3 ± 2.3abc 16 40 30 24 20.3 ± 3.0cdef 14.9 ± 1.4bcd 0.8 ± 3ef 12.6 ± 1.9bcd 17 40 30 36 21.5 ± 3.9abcde 14.2 ± 3.4cd 0.7 ± 2.8ef 12.6 ± 2.2bcd 18 40 30 48 20.2 ± 2.5cdef 15.0 ± 2.5bc 6.1 ± 7.2ab 11.4 ± 3.6d 19 60 10 24 21.3 ± 3.7abcde 13.9 ± 1.4cde 0.7 ± 2.8ef 12.6 ± 1.1abcd 20 60 10 36 21.3 ± 3.0abcde 14.9 ± 2.2bc 0.8 ± 3ef 12.4 ± 1.9bcd 21 60 10 48 19.0 ± 4.1ef 14.4 ± 2.8bcd 1.9 ± 4.1cdef 12.5 ± 1.1bcd 22 60 20 24 20.0 ± 3.2cdef 14.9 ± 1.9bcd 1.2 ± 3.3ef 12.8 ± 3.1abcd 23 60 20 36 20.7 ± 3.1bcdef 13.4 ± 1.5cde 1.7 ± 4.7def 13.3 ± 2.8abc 24 60 20 48 21.3 ± 2.9abcde 14.6 ± 1.6bcd 2.5 ± 4.5cdef 12.3 ± 0.9bcd 25 60 30 24 20.6 ± 3.1bcdef 14.5 ± 1.6bcd 0.8 ± 3ef 12.2 ± 0.9cd 26 60 30 36 20.7 ± 3.9bcdef 14.3 ± 1.7cd 0.7 ± 2.8ef 12.2 ± 0.9cd 27 60 30 48 22.1 ± 3.9abc 13.9 ± 1.4cde 3.1 ± 5.6bcdef 13 ± 2.4abc
Control 120 0 0 18.4 ± 5.0f 17.3 ± 3.2a 0.0 ± 0.0f 14 ± 3.6a 1ID = distance from UV light (cm); IT = UV exposure time (min); IC = incubation time (h) Means in a column not followed by the same letter is significantly different (P<0.05) from each other as determined by Fisher’s least significant difference mean separation test.
2Controls are untreated raw whole peanuts.

372
Sweet taste. The range of intensity ratings for sweet taste of UV-treated peanuts was 12.5 to
16.0 with control at 17.3. One of 27 UV treatments (Trt#1) with sweetness intensity rating of
16.0 was not significantly different from control with rating of 17.3. The rest of 26 treatments
with intensity ratings of 12.5 to 15.0 were significantly lower than controls. Distance from UV
light, UV exposure time and incubation time did not affect the intensity of sweetness of UV-
treated peanuts.
Sour taste. The range of intensity ratings for sour taste of UV-treated samples was 0 to 7.8
with control at 0. The intensity ratings of sour taste of 0 to 3.05 in 19 of 27 treatments were not
significantly different from control with intensity rating of 0. Eight treatments with intensity
ratings of 3.61 to 7.8 were significantly higher than controls. ANOVA results indicated that
distance from UV light and incubation time were the significant factors affecting the sour taste
intensity of UV treated peanuts. The distance from UV light of 20 cm had the highest mean
overall intensity rating of 3.4 which was significantly higher than 1.5 rating at 60 cm distance
from UV light but not significantly higher than 2.7 rating at 40 cm. The incubation time of 48 h
produced the highest intensity of sourness with overall mean rating of 4.6 compared to 2.0 and
1.0 ratings at 36 and 24 h incubation time, respectively.
Salty taste. Salty taste intensities of UV-treated peanuts ranged from 11.4 to 13.7 with
control rating of 14.0. Ten of 27 UV treatments had salty taste intensity ratings of 12.6 to 13.7
which were not significantly different from controls with ratings of 14.0. The intensity ratings of
27 UV treatments were significantly less than the rating of salty taste in controls. The distance
from UV light, UV exposure time and incubation time did not significantly affect the intensity of
salty taste in UV-treated peanuts.

373
1.3 Descriptive panel intensity ratings for woody/hulls/skins and burnt flavors and feeling
factors astringency and tongue sting(Table 4.42)
Woody/hulls/skins. The intensities of woody/hulls/skin flavor of UV-treated peanuts ranged
from 15.1-18.0 with control rating as 0. In 26 of 27 UV-treated peanuts, ratings for
woody/hulls/skin were not significantly different from those of controls with 18.0 intensity
rating. Only one treatment (Trt #10) had significantly higher intensity rating of 18.0 compared
to controls. ANOVA results indicated that distance from UV light, UV exposure time and
incubation time were not significant factors affecting the woody/hulls/skins flavor of UV-treated
peanuts.
Burnt flavor. The burnt flavor of intensities of UV-treated peanuts ranged from 0 to 20.3
with controls rated as 0.8. Sixteen of 27 UV-treated peanuts had burnt intensity ratings of 0 to
5.81 which are not significantly different from the intensity of burnt flavor in controls of 0.80.
The burnt intensity ratings of 6.5 to 20.3 for 11 other treatments were significantly higher than
controls.
Astringency. Astringent is the puckering or drying sensation on the mouth or tongue
surface. The intensity rating for astringent aftertaste of UV-treated peanuts ranged for 13.3 to
20.2 with controls rated as 18.9. The intensity ratings of 17.9 to 20.2 for the astringent aftertaste
in 26 of 27 UV treatments were not significantly different from untreated controls. Only one
treatment (Trt# 6) was less astringent than control with a rating of 17.1. The factors distance
from UV light, UV exposure time and incubation time were not significant in causing changes in
the intensity ratings for astringency of treated peanuts.
Tongue sting. Tongue sting is the degree of sharp tingling sensation or feeling on the tongue or
throat which leaves a burning sensation on the tongue surface. The intensity rating for tongue

374
Table 4.42 Intensity ratings (mean±standard deviation) for woody/hulls/skins, burnt, astringent, and tongue sting of roasted sliced UV-treated peanuts by a descriptive panel.
Trt # ID IT IC Woody/Hull/
Skin Burnt Astringent Tongue sting 1 20 10 24 16.9 ± 2.5abcd 9.6 ± 10.6cdefg 18.6 ± 1.0b 2.6 ± 5.7abcd 2 20 10 36 17.8 ± 3.5ab 0.8 ± 2.6klm 18.6 ± 1.0b 0.8 ± 3cd 3 20 10 48 15.4 ± 6.6d 1.6 ± 5.3jklm 20.2 ± 4.9a 2.2 ± 4.4bcd 4 20 20 24 16.0 ± 2.4abcd 1.2 ± 4.9klm 18.9 ± 1.3b 0.8 ± 3.2cd 5 20 20 36 16.2 ± 2.9abcd 11.3 ± 12.3bcdef 19.1 ± 2.5ab 2.2 ± 4.2bcd 6 20 20 48 15.9 ± 2.2bcd 0.9 ± 3.8klm 17.1 ± 2.8c 2.8 ± 5.7abc 7 20 30 24 15.1 ± 1.9d 5.7 ± 7.1ghijk 18.4 ± 2.3bc 0.8 ± 3.2cd 8 20 30 36 15.1 ± 4.3d 0.4 ± 1klm 18.5 ± 0.8b 0.8 ± 3cd 9 20 30 48 16.7 ± 3abcd 7.6 ± 8.6efghi 17.9 ± 2.1bc 1.8 ± 4.4bcd 10 40 10 24 18.0 ± 4.7a 1.4 ± 5.5klm 18.8 ± 1.9b 4.2 ± 6.5ab 11 40 10 36 16.0 ± 2.1abcd 13.0 ± 9.2bcd 18.3 ± 3.1bc 2.8 ± 5.2abcd 12 40 10 48 16.6 ± 1.4abcd 3.7 ± 6.3hijklm 18.4 ± 1.7bc 0.7 ± 2.8cd 13 40 20 24 16.3 ± 2.3abcd 1.0 ± 3.1klm 18.5 ± 1.2bc 1.8 ± 4.7bcd 14 40 20 36 17.7 ± 2.0abc 2.6 ± 6.3ijklm 18.6 ± 1.0b 0.7 ± 2.3cd 15 40 20 48 16.8 ± 2.1abcd 20.3 ± 9.2a 18.6 ± 1.9b 2.7 ± 5.1abcd 16 40 30 24 15.6 ± 2.8cd 1.4 ± 3.9klm 18.3 ± 1.1bc 0.6 ± 1.9cd 17 40 30 36 17.1 ± 1.6abcd 12.3 ± 12bcde 17.9 ± 1.5bc 5.3 ± 6.6a 18 40 30 48 15.9 ± 1.8bcd 1.6 ± 5.3jklm 18 ± 1.8bc 2.4 ± 5.2bcd 19 60 10 24 17.0 ± 1.9abcd 9.9 ± 10cdefg 18.4 ± 1.3bc 1.6 ± 4bcd 20 60 10 36 17.5 ± 2.0abc 6.5 ± 9.4fghij 18.6 ± 1.6b 0.05 ± 0.2cd 21 60 10 48 17.1 ± 2.7abcd 5.4 ± 8.7ghijkl 18.5 ± 1.3b 1.1 ± 4.5cd 22 60 20 24 17.1 ± 2.5abcd 5.8 ± 8.7ghijk 17.9 ± 1.3bc 0.0 ± 0.0d 23 60 20 36 16.8 ± 2.4abcd 15.1 ± 5.4b 13.3 ± 1.6bc 0.0 ± 0.0d 24 60 20 48 16.9 ± 2.0abcd 0.7 ± 2.5klm 18.7 ± 1.2b 0.0 ± 0.0d 25 60 30 24 16.7 ± 2.0abcd 8.5 ± 9.2defgh 18.8 ± 1.5b 0.9 ± 3cd 26 60 30 36 16.1 ± 2.3abcd 0.0 ± 0.0m 18.8 ± 1.5b 1 ± 3.9cd 27 60 30 48 16.5 ± 5.2abcd 14.1 ± 11.5bc 18.4 ± 1.3bc 2.2 ± 5.5bcd
Control 120 0 0 15.8 ± 4.9bcd 0.8 ± 3.2klm 18.9 ± 1.8ab 0.0 ± 0.0d 1ID = distance from UV light (cm); IT = UV exposure time (min); IC = incubation time (h) Means in a column not followed by the same letter is significantly different (P<0.05) from each other as determined by Fisher’s least significant difference mean separation test.
2Controls are untreated raw whole peanuts.
375
sting of UV-treated peanuts ranged for 13.3 to 20.2 with controls rated as 18.9. The tongue
sting intensity ratings of 2.8 to 5.2 in three of 27 UV treatments (Trt# 22, 23, 24) were
significantly higher than that of controls. Twenty four of 27 UV treatments with intensity ratings
for tongue sting of 0 to 2.75 were not significantly different from 0 rating in untreated controls
which were exposed to medium doses of UV.
1.4 Descriptive panel intensity ratings for cardboard, fishy, and oxidized flavors (Table 4.43)
Cardboard flavor. The intensities of cardboard flavor in UV-treated peanuts ranged from
18.0 to 25.0 with control rated 16.9. Seven of 27 UV treatments (Trt# 1, 7, 11, 16, 21, 22, and
23) produced cardboard flavor with intensity ratings of 18.0 to 20.9 which were not significantly
different from controls with a 16.9 intensity rating. The intensity ratings for cardboard flavor of
all other 20 UV treatments of 21.0 to 25.0 were significantly higher than controls.
Fishy flavor. The intensities of fishy flavor in UV-treated peanuts ranged from 6.2 to 19.3
with control rated as 11.0. The intensity of fishy flavor in 15 of 27 UV treatments of 9.9 to 15.2
was not significantly different from controls. Eleven of 27 UV-treated peanuts had intensity
ratings of 15.9 to 19.3 for fishy flavor which are significantly higher than controls. Incubation
time was the significant factors affecting the intensity of fishy flavor in UV-treated peanuts.
Incubation for 48 h produced the most intense fishy flavor with overall mean intensity rating of
15.8 which was significantly higher than at 24 h with intensity rating of 12.2 but not different
from 36 h incubation time with fishy flavor rating of 14.3.
Oxidized flavor. The intensities of oxidized flavor in UV-treated peanuts ranged from 17.9
to 31.8 with control rated as 16.8. All treated samples had higher oxidized flavor than controls.
Seven of 27 UV treatments had oxidized flavor intensities of 17.9 to 22.3 which were not
significantly different from the intensity rating of 16.8 in untreated controls. The intensity

376
Table 4.43 Intensity ratings (mean±standard deviation) for the oxidation-related off-flavors of roasted sliced UV-treated peanuts by a descriptive panel.
Trt # ID IT IC Cardboard Fishy Oxidized Off flavor 1 20 10 24 19.5 ± 4.7fgh 10.1 ± 8.4gh 19.9 ± 9.7ghij 0.0 ± 0.0b 2 20 10 36 22.6 ± 6.7abcdef 16.2 ± 5.8abcd 25.2 ± 8.1cdefgh 0.05 ± 0.2b 3 20 10 48 23.8 ± 3.7abcd 19.3 ± 5.4a 31.8 ± 7.6a 0.7 ± 2.6a 4 20 20 24 22.5 ± 3.9abcd 10.9 ± 8.2fgh 22.1 ± 7.6efghij 0.0 ± 0.0b 5 20 20 36 22.5 ± 6.1abcdef 12.6 ± 7.3defg 22.3 ± 8.2efghij 0.0 ± 0.0b 6 20 20 48 24.4 ± 4.7abc 14.4 ± 6.1abcdefg 26.2 ± 4.8bcde 0.0 ± 0.0b 7 20 30 24 18.0 ± 8.6gh 6.2 ± 8.0h 17.9 ± 10.6ij 0.0 ± 0.0b 8 20 30 36 21.4 ± 4.8abcdefg 16.4 ± 6.9abcd 26.2 ± 6.9bcde 0.0 ± 0.0b 9 20 30 48 24.2 ± 3.5abcd 18.3 ± 4.6ab 29.7 ± 5.3abc 0.0 ± 0.0b 10 40 10 24 21.6 ± 7.1abcdefg 13.0 ± 9.8defg 22.8 ± 10.6fghi 0.0 ± 0.0b 11 40 10 36 20.9 ± 5bcdefgh 10.1 ± 6.5gh 26.0 ± 7.2bcde 0.0 ± 0.0b 12 40 10 48 24.6 ± 3.6ab 16.8 ± 6.3abcd 31.4 ± 5.1ab 0.0 ± 0.0b 13 40 20 24 25.0 ± 6.1a 15.9 ± 8.4abcd 22.8 ± 10.2fghi 0.0 ± 0.0b 14 40 20 36 22.7 ± 5abcd 16.0 ± 8abcd 25.5 ± 3.6cdef 0.0 ± 0.0b 15 40 20 48 21.0 ± 4.3abcdefg 13.3 ± 7.6cdefg 27.1 ± 4.2abcde 0.0 ± 0.0b 16 40 30 24 20.5 ± 8.8cdefgh 14.6 ± 6.9abcdefg 23.4 ± 10.3defghi 0.0 ± 0.0b 17 40 30 36 21.2 ± 6.7abcdefg 9.9 ± 8.8gh 24.4 ± 5.5cdefgh 0.0 ± 0.0b 18 40 30 48 23.8 ± 4abcd 16.0 ± 5.7abcd 28.5 ± 4.8abcd 0.0 ± 0.0b 19 60 10 24 24.0 ± 4.7abcd 16.0 ± 4.0abcd 25.3 ± 5.8cdefgh 0.05 ± 0.2b 20 60 10 36 22.4 ± 6.7abcdef 15.3 ± 3.8abcdef 24.1 ± 7.2cdefgh 0.0 ± 0.0b 21 60 10 48 18.6 ± 6.5fgh 13.5 ± 6.1bcdefg 22.5 ± 7.7fghi 0.0 ± 0.0b 22 60 20 24 20.3 ± 6.4defgh 10.8 ± 7.1fgh 21.9 ± 8.1efghij 0.0 ± 0.0b 23 60 20 36 20.8 ± 9bcdefgh 14.4 ± 6.4bcdefg 20.0 ± 13.1fghij 0.0 ± 0.0b 24 60 20 48 24.0 ± 2.7abcd 16.9 ± 5.2abcd 25.5 ± 7.8cdefg 0.0 ± 0.0b 25 60 30 24 22.2 ± 6.7abcdef 12.5 ± 9.3defg 25.1 ± 8.1cdefgh 0.0 ± 0.0b 26 60 30 36 23.6 ± 3.1abcd 18.0 ± 4.3abc 25.0 ± 5.3cdefgh 0.0 ± 0.0b 27 60 30 48 21.3 ± 4.1abcdefg 13.2 ± 6.3cdefg 19.8 ± 11.3hij 0.0 ± 0.0b
Control 120 0 0 16.9 ± 8h 11.2 ± 8.2fg 16.8 ± 11.4j 0.0 ± 0.0b 1ID = distance from UV light (cm); IT = UV exposure time (min); IC = incubation time (h) Means in a column not followed by the same letter is significantly different (P<0.05) from each other as determined by Fisher’s least significant difference mean separation test.
2Controls are untreated raw whole peanuts.

377
ratings of 20 of 27 treatments at 22.5 to 31.8 were significantly higher than controls. Incubation
time was the significant factor affecting the oxidized flavor of UV-treated peanuts with 48 h
incubation time resulting in the highest overall mean intensity rating of 27.0 which was
significantly higher than the overall mean rating of 22.4 when incubated for 24 h, but not
significantly different at 36 h incubation.
Other off-flavors. The intensities of off-flavors ranged from 0 to 0.9 with control rated as 0.
No other off-flavors were detected by the descriptive panel in all UV-treated and untreated
peanuts except for only one treatment (Trt#3) had an off-flavor described as very low painty
flavor with intensity rating of 0.66.
1.5 Descriptive panel intensity ratings for texture properties (Table 4.44)
Crunchiness. The intensities of crunchiness of UV-treated peanuts ranged from 38.4 to 44.3
with control rated as 43.2. Three treatments (Trt# 3, 7, 8) had crunchiness intensity ratings of
38.4 to 40.2 which were significantly lower than controls while the rest of 24 UV treatments had
similar crunchiness as controls.
Hardness. The intensities of hardness ranged from 86.9 to 92.7 with control rated as 91.2.
Two of 27 UV treatments had intensity ratings of 86.7 and 86.9 (Trt# 6 and 8, respectively)
which were significantly less hard than controls. The remaining of 25 of 27 treatments with
hardness intensity ratings of 88.0 to 92.7 were not significantly different from controls.
Toothpack. The intensities of toothpack ranged from 57.9 to 61.1 with control rated as 60.6.
Except for one treatment (Trt# 3), the rest of 26 of 27 treatments were not significantly different
from controls. Trt#3 had intensity rating of 57.9 which was significantly lower than controls and
six treated peanuts (Trt# 15, 17, 18, 19, 20 and 21) but not significantly different from the rest of
20 treatments.

378
Table 4.44 Intensity ratings (mean±standard deviation) for the texture attributes and toothpack of roasted sliced UV-treated peanuts by a descriptive panel. Trt # ID IT IC Crunchiness Hardness Toothpack 1 20 10 24 44.3 ± 4.8abcd 92.7 ± 3.0a 59.7 ± 2.1abcd 2 20 10 36 41.1 ± 3.3ab 91.0 ± 3.4abcd 58.9 ± 2.8abcd 3 20 10 48 38.4 ± 4.8d 88.7 ± 4.4cdef 57.8 ± 4.4d 4 20 20 24 38.6 ± 3.3abcd 88.0 ± 7.5def 59.3 ± 3.3abcd 5 20 20 36 41.3 ± 6.5abcd 89.7 ± 4.8abcdef 57.9 ± 3.3cd 6 20 20 48 40.2 ± 3.9bcd 88.7 ± 11.8f 57.9 ± 4.6cd 7 20 30 24 43.4 ± 5.1d 90.9 ± 3.3abcd 58.8 ± 1.9abcd 8 20 30 36 40.4 ± 2.9d 86.9 ± 5.7ef 59.3 ± 3.4abcd 9 20 30 48 39.0 ± 5.8abcd 88.0 ± 4.6def 59.3 ± 2.3abcd 10 40 10 24 41.5 ± 4.7a 90.5 ± 4.2abcd 60.3 ± 3.3abcd 11 40 10 36 42.0 ± 3.2abcd 90.9 ± 3.7abcd 59.7 ± 3.6abcd 12 40 10 48 39.9 ± 5.0abcd 88.8 ± 4.5cdef 58.9 ± 4.5abcd 13 40 20 24 41.0 ± 4.1abcd 88.8 ± 4.2cdef 60.1 ± 4.4abcd 14 40 20 36 38.8 ± 3.4abc 88.8 ± 3.4cdef 60.2 ± 3.0abcd 15 40 20 48 42.5 ± 3.6abcd 92.7 ± 5.1a 60.8 ± 5.6ab 16 40 30 24 39.1 ± 2.5cd 89.6 ± 3.2abcdef 58.8 ± 3.0abcd 17 40 30 36 42.3 ± 4.6abcd 90.8 ± 3.8abcd 61.1 ± 2.5ab 18 40 30 48 40.7 ± 3.9bcd 89.1 ± 6.1bcdef 61.0 ± 4.1ab 19 60 10 24 39.5 ± 4.1abcd 88.6 ± 4.0cdef 61.1 ± 3.1a 20 60 10 36 41.5 ± 4.9abc 90.0 ± 4.3abcde 60.8 ± 3.3ab 21 60 10 48 42.1 ± 4.5abcd 92.3 ± 2.9ab 61.0 ± 3.5ab 22 60 20 24 42.4 ± 3.4abcd 91.8 ± 3.1abc 59.8 ± 2.6abcd 23 60 20 36 42.5 ± 2.9abcd 91.7 ± 3.1abc 59.7 ± 2.6abcd 24 60 20 48 40.5 ± 1.9abcd 90.7 ± 3.8abcd 58.6 ± 3.0abcd 25 60 30 24 41.9 ± 2.9abcd 90.2 ± 4.7abcd 59.4 ± 2.8abcd 26 60 30 36 39.7 ± 4.2abcd 90.7 ± 4.3abcd 59.4 ± 4.2abcd 27 60 30 48 43.0 ± 5.1abcd 90.5 ± 4.6abcd 58.3 ± 11.4bcd Control 120 0 0 43.2 ± 3.7bcd 91.2 ± 2.8abcd 60.6 ± 3.1abc
1ID = distance from UV light (cm); IT = UV exposure time (min); IC = incubation time (h) Means in a column not followed by the same letter is significantly different (P<0.05) from each other as determined by Fisher’s least significant difference mean separation test.
2Controls are untreated raw whole peanuts.

379
2. Sensory profile of ultrasound-treated sliced peanuts by a descriptive panel
2.1 Descriptive panel intensity ratings for the brown color and roasted peanutty and raw beany
flavors (Table 4.45)
Brown color. The intensities of brown color of US-treated peanuts ranged from 26.0 to
43.2 with control rated as 29.8. Eighteen of 27 US-treated peanuts had brown color intensity
ratings of 26.9 to 34.1 which were similar to untreated controls. The intensity ratings for brown
color of 35.0 to 43.2 in nine treatments (Trt# 4, 5, 7, 19, 22, 23, 25, 26, 27) were significantly
higher than that of controls. The brown color intensity of treated peanuts was affected by US
power density, exposure time and incubation time. Peanuts treated with US power density of 25
mW/cm3 had the most intense brown color with overall mean rating of 34.6 which was
significantly higher that at 50 mW/cm3 (mean rating of 29.0) but not significantly different from
those at 75 mW/cm3 (mean rating of 32.4). US exposure time of 8 min produced the highest
overall mean brown intensity of 33.3 which was significantly higher than at 2 min with overall
mean rating of 30.0 but not significantly different from the overall mean rating of 32.7 when
exposed to 5 min. US-treated peanuts incubated for 24 h had the most intense brown color of
34.1 which was significantly higher than at 48 h with overall mean rating of 29.3 but not
significantly different from 32.2 rating of 36 h incubation.
Roasted peanutty flavor. The intensities of roasted peanutty flavor of US-treated peanuts
ranged from 20.6 to 32.7 with control rated as 3.9. The roasted peanutty flavor of 17 of 27 US
treatments ranging from 25.1 to 32.7 were not significantly different from untreated controls
with 30.9 rating. Ten of 27 treated peanuts had significantly lower intensity of roasted peanutty
flavor of 20.6 to 24.7 compared to untreated controls. Exposing peanuts to US power density of
25 mW/cm3 resulted in higher roasted peanutty flavor (rating of 27.9) compared to those exposed

380
Table 4.45 Intensity ratings (mean±standard deviation) for the brown color, roasted peanutty and raw/beany flavor of roasted sliced ultrasound-treated peanuts by a descriptive panel1.
Trt # PD PT IC Brown color Roasted peanutty Raw/beany 1 25 2 24 26.0 ± 4.0i 24.4 ± 5.3efghi 4.5 ± 6.1ab 2 25 2 36 28.8 ± 3.7hi 24.3 ± 6.1efghi 0.9 ± 3.6cd 3 25 2 48 29.6 ± 3.2ghi 22.7 ± 7.9ghi 0.7 ± 2.8cd 4 25 5 24 43.2 ± 7.9a 25.1 ± 6.0cdefghi 0.0 ± 0.0d 5 25 5 36 36.6 ± 9.3bcd 30.8 ± 10.6abcd 0.3 ± 1.1d 6 25 5 48 27.8 ± 2.7hi 25.4 ± 6.4bcdefghi 2.9 ± 5.2abcd 7 25 8 24 36.4 ± 4.5bcd 31.4 ± 12.3ab 0.0 ± 0.0d 8 25 8 36 28.8 ± 6.6hi 25.1 ± 6.5cdefghi 3.7 ± 5.8abc 9 25 8 48 34.1 ± 5.2def 24.1 ± 8.1efghi 2.5 ± 5.5abcd 10 50 2 24 30.0 ± 5.8fghi 32.7 ± 11.2a 0.0 ± 0.0d 11 50 2 36 33.9 ± 11.7hi 27.1 ± 8.1abcdefgh 4.6 ± 6.5ab 12 50 2 48 28.4 ± 5.1hi 20.7 ± 3.3i 2.1 ± 4.4bcd 13 50 5 24 28.4 ± 4.3hi 26.2 ± 5.0bcdefghi 2.4 ± 5.3bcd 14 50 5 36 26.1 ± 4.4i 23.1 ± 4.4efghi 2.8 ± 6.3abcd 15 50 5 48 26.9 ± 4.3hi 24.7 ± 8.3defghi 2.5 ± 7bcd 16 50 8 24 30.7 ± 1.4efgh 21.8 ± 6.2hi 0.8 ± 3cd 17 50 8 36 28.7 ± 3.4hi 22.4 ± 5.4ghi 0.8 ± 3cd 18 50 8 48 27.5 ± 3.4hi 20.6 ± 2.6i 2.6 ± 5.6abcd 19 75 2 24 35.7 ± 5.6bcd 29.1 ± 15.3abcdef 0.0 ± 0.0d 20 75 2 36 28.4 ± 6.0hi 27.3 ± 9.3abcdefgh 5.8 ± 6.1a 21 75 2 48 29.5 ± 5.0ghi 25.2 ± 6.8bcdefghi 3.7 ± 6.4abc 22 75 5 24 36.3 ± 6.9bcd 25.8 ± 8.1bcdefghi 2.6 ± 5.6abcd 23 75 5 36 39.5 ± 8.4ab 28 ± 9.1abcdefg 0.8 ± 3.2cd 24 75 5 48 29.2 ± 4.9hi 29.4 ± 11.6abcd 2.4 ± 6.2bcd 25 75 8 24 39.9 ± 12.7ab 29.7 ± 14.2abcd 2.1 ± 6bcd 26 75 8 36 38.7 ± 9.1bc 29.7 ± 12.7abcd 0.9 ± 3.6cd 27 75 8 48 35.0 ± 7.9cde 26.5 ± 8.4bcdefghi 2.8 ± 4.9abcd
Control 0 0 0 29.8 ± 5.6fghi 30.9 ± 12.5abc 0.8 ± 3.0cd 1PD = ultrasound power density (mW/cm3); PT = ultrasound exposure time (min); IC = incubation time (h). Means in a column not followed by the same letter is significantly different (P<0.05) from each other as determined by Fisher’s least significant difference mean separation test. 2Controls are untreated raw whole peanuts

381
to 50 mW/cm3 with overall mean ratings of 24.4, but not significantly different from 75 mW/cm3
with mean rating of 25.9
Raw beany flavor. The intensities of roasted peanutty flavor of US-treated peanuts ranged
from 0 to 5.8 with control rated as 0.8. Twenty four of 27 US-treated peanuts had raw beany
flavor intensities of 0.7 to 2.9 which were not significantly different from controls with 0.8
intensity rating for raw beany flavor. Three treatments (Trt# 1, 11 & 20) had raw beany flavor
intensities of 4.5 to 5.8 which were significantly higher than controls.
2.2 Descriptive panel intensity ratings for basic tastes (Table 4.46)
Bitter taste. The intensities of bitter taste of US-treated peanuts ranged from 19.2 to 22.1
with control rated as 19.3. Twenty of 27 US treatments had bitter intensity ratings of 19.2 to
21.3 which were not significantly different from that of controls with 19.3 intensity rating. The
intensity ratings of 21.4 to 22.1 in seven 7 of 27 treatments (Trt# 3, 4, 16, 20, 25, 26, 27) were
significantly higher than controls.
Sweet taste. The intensities of sweet taste of US-treated peanuts ranged from 12.5 to 14.5
with control rated as 13.5. All 27 US treatments with sweetness intensity ratings of 12.5 to 14.5
were not significantly different from controls with rating of 13.5. Only one of 27 treatments
(Trt#1) with intensity ratings of 14.5 was significantly higher than controls.
Sour taste. The intensities of sour taste of US-treated peanuts ranged from 1.4 to 9.5 with
control rated as 3.0. The intensity ratings for sour taste of 1.4 to 6.7 in 25 of 27 treatments were
not significantly different from controls. Only two of 27 treatments (Trt# 9, 12) with intensity
ratings of 7.1 and 9.5 were significantly higher than controls.
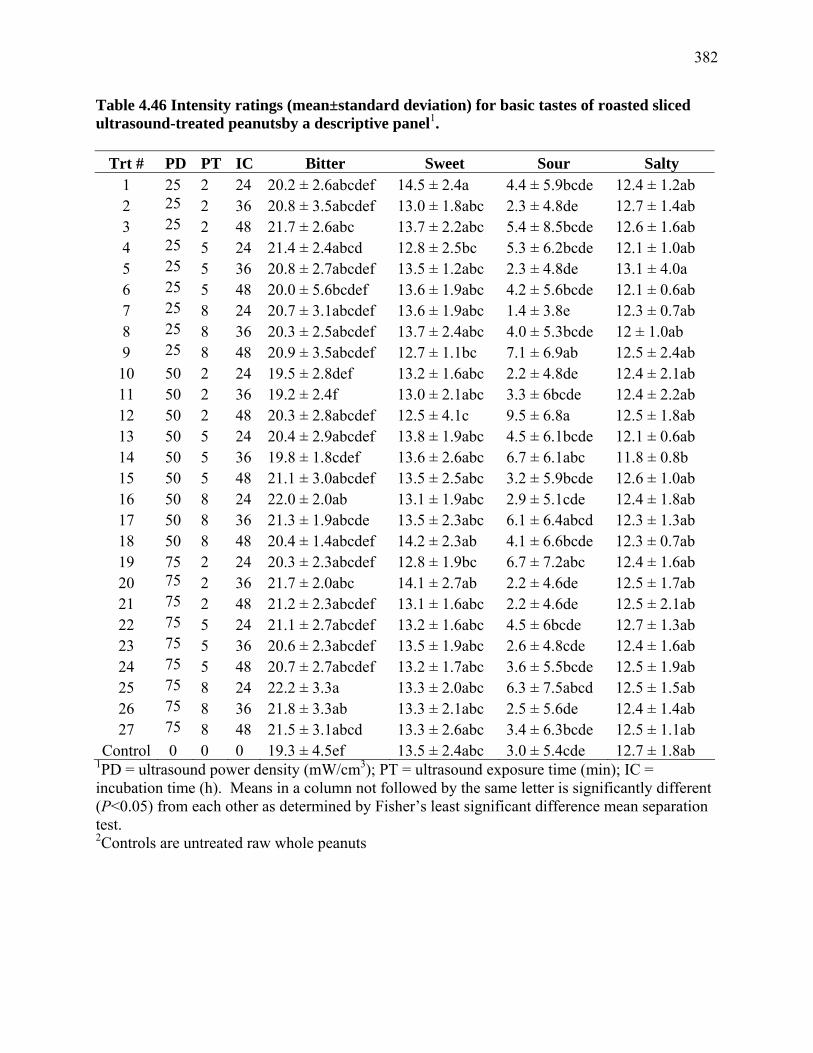
382
Table 4.46 Intensity ratings (mean±standard deviation) for basic tastes of roasted sliced ultrasound-treated peanutsby a descriptive panel1.
Trt # PD PT IC Bitter Sweet Sour Salty 1 25 2 24 20.2 ± 2.6abcdef 14.5 ± 2.4a 4.4 ± 5.9bcde 12.4 ± 1.2ab 2 25 2 36 20.8 ± 3.5abcdef 13.0 ± 1.8abc 2.3 ± 4.8de 12.7 ± 1.4ab 3 25 2 48 21.7 ± 2.6abc 13.7 ± 2.2abc 5.4 ± 8.5bcde 12.6 ± 1.6ab 4 25 5 24 21.4 ± 2.4abcd 12.8 ± 2.5bc 5.3 ± 6.2bcde 12.1 ± 1.0ab 5 25 5 36 20.8 ± 2.7abcdef 13.5 ± 1.2abc 2.3 ± 4.8de 13.1 ± 4.0a
25 6 5 48 20.0 ± 5.6bcdef 13.6 ± 1.9abc 4.2 ± 5.6bcde 12.1 ± 0.6ab 7 25 8 24 20.7 ± 3.1abcdef 13.6 ± 1.9abc 1.4 ± 3.8e 12.3 ± 0.7ab
25 8 36 8 20.3 ± 2.5abcdef 13.7 ± 2.4abc 4.0 ± 5.3bcde 12 ± 1.0ab 9 25 8 48 20.9 ± 3.5abcdef 12.7 ± 1.1bc 7.1 ± 6.9ab 12.5 ± 2.4ab 10 50 2 24 19.5 ± 2.8def 13.2 ± 1.6abc 2.2 ± 4.8de 12.4 ± 2.1ab 11 50 2 36 19.2 ± 2.4f 13.0 ± 2.1abc 3.3 ± 6bcde 12.4 ± 2.2ab 12 50 2 48 20.3 ± 2.8abcdef 12.5 ± 4.1c 9.5 ± 6.8a 12.5 ± 1.8ab 13 50 5 24 20.4 ± 2.9abcdef 13.8 ± 1.9abc 4.5 ± 6.1bcde 12.1 ± 0.6ab 14 50 5 36 19.8 ± 1.8cdef 13.6 ± 2.6abc 6.7 ± 6.1abc 11.8 ± 0.8b 15 50 5 48 21.1 ± 3.0abcdef 13.5 ± 2.5abc 3.2 ± 5.9bcde 12.6 ± 1.0ab 16 50 8 24 22.0 ± 2.0ab 13.1 ± 1.9abc 2.9 ± 5.1cde 12.4 ± 1.8ab 17 50 8 36 21.3 ± 1.9abcde 13.5 ± 2.3abc 6.1 ± 6.4abcd 12.3 ± 1.3ab 18 50 8 48 20.4 ± 1.4abcdef 14.2 ± 2.3ab 4.1 ± 6.6bcde 12.3 ± 0.7ab 19 75 2 24 20.3 ± 2.3abcdef 12.8 ± 1.9bc 6.7 ± 7.2abc 12.4 ± 1.6ab 20 75 2 36 21.7 ± 2.0abc 14.1 ± 2.7ab 2.2 ± 4.6de 12.5 ± 1.7ab 21 75 2 48 21.2 ± 2.3abcdef 13.1 ± 1.6abc 2.2 ± 4.6de 12.5 ± 2.1ab 22 75 5 24 21.1 ± 2.7abcdef 13.2 ± 1.6abc 4.5 ± 6bcde 12.7 ± 1.3ab 23 75 5 36 20.6 ± 2.3abcdef 13.5 ± 1.9abc 2.6 ± 4.8cde 12.4 ± 1.6ab 24 75 5 48 20.7 ± 2.7abcdef 13.2 ± 1.7abc 3.6 ± 5.5bcde 12.5 ± 1.9ab 25 75 8 24 22.2 ± 3.3a 13.3 ± 2.0abc 6.3 ± 7.5abcd 12.5 ± 1.5ab 26 75 8 36 21.8 ± 3.3ab 13.3 ± 2.1abc 2.5 ± 5.6de 12.4 ± 1.4ab 27 75 8 48 21.5 ± 3.1abcd 13.3 ± 2.6abc 3.4 ± 6.3bcde 12.5 ± 1.1ab
Control 0 0 0 19.3 ± 4.5ef 13.5 ± 2.4abc 3.0 ± 5.4cde 12.7 ± 1.8ab 1PD = ultrasound power density (mW/cm3); PT = ultrasound exposure time (min); IC = incubation time (h). Means in a column not followed by the same letter is significantly different (P<0.05) from each other as determined by Fisher’s least significant difference mean separation test. 2Controls are untreated raw whole peanuts

383
Salty taste. The intensities of salty taste of 27 US-treated peanuts ranged from 11.8 to 13.1
with control rated as 12.7. All of 27 US treated peanuts were not significantly different from
controls suggesting that US treatment had no effect on the salty taste of treated peanuts.
2.3 Descriptive panel intensity ratings for woody/hulls/skins and burnt flavors and feeling
factors astringency and tongue sting (Table 4.47)
Woody/hulls/skins. All 27 US treatments had intensity ratings of woody/hull/skins flavor of
16.2 to 18.0 which were not significantly different from those of controls with 16.6 rating.
Result indicate that woody/hulls/skin flavor in peanuts was not affected by US treatment.
Burnt flavor. The intensities of burnt flavor of US-treated peanuts ranged from 0 to 8.0 with
control rated as 1.0. The burnt flavor intensities of 0 to 3.8 in 21 of 27 US -treated peanuts were
not significantly different from controls. The burnt intensity ratings of 4.3 to 8.0 in 6 of 27 other
treatments (Trt# 4, 9, 19, 22, 23, 25) were significantly higher than controls. US power density
and incubation time significantly affected the intensity ratings of burnt flavor in treated peanuts.
The US power density of 25 mW/cm3 produced the significantly highest burnt flavor with overall
mean rating of 3.1 compared to 0.6 when exposed to 50 mW/cm3 but not significantly different
to the rating 2.2 when treated with 75 mW/cm3. Incubation for 24 h resulted in significantly
higher burnt flavor overall mean rating of 3.0 compared to 1.0 when incubated for 48 h but not
significantly different to a rating of 1.8 when incubated for 36 h.
Astringency. The intensities of astringent flavor of US-treated peanuts ranged from 18.0 to
19.4 with control rated as 17.2. The intensity ratings of 18.4 to 19.4 for the astringent aftertaste
in 26 of 27 US treatments were significantly different from 17.2 intensity rating of untreated
controls. One treatment (Trt# 10) with a rating of 18.0 was as astringent as controls.

384
Table 4.47 Intensity ratings (mean±standard deviation) for woody/hulls/skins, burnt, astringent, and tonguesting of roasted sliced ultrasound-treated peanuts by a descriptive panel1.
Trt # PD PT IC Woody/Hull/
Skin Burnt Astringent Tongue sting1 25 2 24 17.4 ± 2.3ab 0.0 ± 0.0e 19.2 ± 1.2ab 0.7 ± 2.8b 2 25 2 36 16.7 ± 1.9ab 0.0 ± 0.0e 18.5 ± 1abc 1.3 ± 3.5b 3 25 2 48 17.5 ± 2.6ab 0.8 ± 2.8de 19 ± 1.5abc 2.2 ± 4.8ab 4 25 5 24 17.3 ± 2.8ab 8 ± 8.4a 18.8 ± 1.9abc 4.2 ± 6.5ab 5 25 5 36 17.7 ± 2.4ab 3.7 ± 5.5bcd 18.8 ± 1.6abc 2.6 ± 5.7ab 6 25 5 48 16.8 ± 2.4ab 0.0 ± 0.0e 18.8 ± 1.3abc 2.3 ± 4.9ab 7 25 8 24 17.9 ± 3.3ab 1.8 ± 4.4cde 18.4 ± 1.0bc 2.3 ± 4.8ab 8 25 8 36 16.2 ± 2.4b 0.8 ± 3de 19.4 ± 2.0a 0.8 ± 3.2b 9 25 8 48 17.2 ± 2.5ab 4.5 ± 6.3bc 19.1 ± 1.5ab 2.3 ± 4.9ab 10 50 2 24 17.1 ± 2.3ab 0.8 ± 2.8de 18.0 ± 0.9cd 2.1 ± 4.6ab 11 50 2 36 16.8 ± 1.8ab 3.3 ± 5.6bcd 18.8 ± 1.4abc 2.4 ± 5.1ab 12 50 2 48 16.6 ± 1.7ab 0.0 ± 0.0e 19.3 ± 1.7ab 2.3 ± 4.9ab 13 50 5 24 17.5 ± 1.7ab 1.6 ± 4.1cde 18.5 ± 1.6abc 2.3 ± 4.9ab 14 50 5 36 17.5 ± 3.0ab 0.0 ± 0.0e 19.0 ± 1.0abc 2.3 ± 4.9ab 15 50 5 48 17.7 ± 3.1ab 0.0 ± 0.0e 18.6 ± 1.2abc 2.4 ± 5.2ab 16 50 8 24 17.7 ± 1.8ab 0.0 ± 0.0e 18.9 ± 0.9abc 2.6 ± 5.7ab 17 50 8 36 17.7 ± 2.0ab 0.0 ± 0.0e 19.4 ± 1.3ab 4.3 ± 6.2ab 18 50 8 48 17.5 ± 2.7ab 0.0 ± 0.0e 19.2 ± 1.1ab 2.6 ± 5.8ab 19 75 2 24 17.5 ± 1.8ab 4.6 ± 7.7bc 18.6 ± 1.3abc 3.8 ± 5.9ab 20 75 2 36 18.0 ± 1.8a 0.8 ± 3de 19.2 ± 1.6ab 2.8 ± 5ab 21 75 2 48 17.1 ± 2.1ab 0.0 ± 0.0e 18.6 ± 1.6abc 2.2 ± 4.7ab 22 75 5 24 17.2 ± 2.0ab 4.3 ± 7.2bc 18.6 ± 1.6abc 3.9 ± 6ab 23 75 5 36 17.3 ± 1.8ab 4.3 ± 7.0bc 18.6 ± 1.7abc 2.7 ± 6ab 24 75 5 48 16.4 ± 2.9ab 0.9 ± 3.6de 18.8 ± 1.47abc 3.9 ± 6ab 25 75 8 24 18.1 ± 2.0a 6.0 ± 6.4ab 19.3 ± 2ab 5.7 ± 6.9a 26 75 8 36 17.3 ± 4.9ab 3.8 ± 10.4bcd 19.4 ± 1.2ab 3.4 ± 6.5ab 27 75 8 48 17.0 ± 2.2ab 2.9 ± 6.4bcde 19.1 ± 1.7ab 4.3 ± 6.9ab
Control 0 0 0 16.6 ± 2.3ab 1.0 ± 4.0de 17.2 ± 2.3d 1.5 ± 4.0b 1PD = ultrasound power density (mW/cm3); PT = ultrasound exposure time (min); IC = incubation time (h). Means in a column not followed by the same letter is significantly different (P<0.05) from each other as determined by Fisher’s least significant difference mean separation test. 2Controls are untreated raw whole peanuts
385
Tongue sting. The intensities of tongue sting of US-treated peanuts ranged from 0.7 to 5.7
with control rated as 1.5. Twenty six of 27 US treatments with intensity ratings for tongue sting
ranging from 0.7 to 4.3 were not significantly different from 1.5 rating of untreated controls.
The tongue sting intensity rating of 5.7 in one treatment (Trt# 25) was significantly higher than
that of controls.
2.4 Descriptive panel intensity ratings for cardboard, fishy, and oxidized flavors (Table 4.48)
Cardboard flavor. The intensities of cardboard flavor of US-treated peanuts ranged from
19.9 to 25.1 with control rated as 18.0. Nine of 27 US treatments (Trt# 5, 7, 13, 19, 20, 23, 24,
27) with intensity ratings for cardboard flavor ranging from 19.8 to 21.5 were not significantly
different from controls. The intensity ratings for cardboard flavor of 18 of 27 US-treated peanuts
of 21.8 to 25.1 were significantly higher than controls.
Fishy flavor. The intensities of fishy flavor of US-treated peanuts ranged from 11.3 to 21.4
with control rated as 12.8. The intensity ratings of fishy flavor in 22 of 27 US treatments ranging
from 11.8 to 17.4 were not significantly different from controls with 12.8 rating. Five of 27 US-
treated peanuts (Trt# 3, 16, 17, 25, 27) had intensity ratings of 18.5 to 21.4 which were
significantly higher than controls.
Oxidized flavor. The intensities of oxidized flavor of US-treated peanuts ranged from 21.8
to 31.6 whereas controls were rated as 22.4. Eighteen of 27 US treatments had oxidized flavor
intensities of 21.8 to 27.2 which were not significantly different from the intensity rating of 12.4
in untreated controls. The intensity ratings of 27.8 to 31.6 in nine of 27 US treatments (Trt# 3, 4,
9, 12, 16, 17, 22, 25, and 27) were significantly higher than controls.

386
Table 4.48 Intensity ratings (mean±standard deviation) for lipid oxidation related off-flavor of roasted sliced ultrasound-treated peanuts by a descriptive panel1.
Trt # PD PT IC Cardboard Fishy Oxidized Off-flavor 1 25 2 24 24.0 ± 4.4abcd 16.5 ± 6.5bcdef 27.2 ± 5abcde 0.0 ± 0.0b 2 25 2 36 22.3 ± 3.4abcdef 14.9 ± 8.5def 26.9 ± 5.7abcde 0.2 ± 0.8b 3 25 2 48 23.4 ± 3.6abcdef 18.6 ± 5.2abcd 31.6 ± 5.4a 0.0 ± 0.0b 4 25 5 24 24.7 ± 2.5ab 12.7 ± 8.8ef 30.0 ± 5.3abc 0.0 ± 0.0b 5 25 5 36 20.7 ± 6.9defg 15.1 ± 6.8cdef 24.1 ± 7.7def 0.0 ± 0.0b 6 25 5 48 21.8 ± 3.7abcdef 11.8 ± 7.11f 24.2 ± 6.3def 0.0 ± 0.0b 7 25 8 24 21.5 ± 6.4abcdefg 13.5 ± 7.6ef 23.7 ± 7.4def 0.0 ± 0.0b 8 25 8 36 21.9 ± 3.8abcdef 13.3 ± 8.7ef 26.9 ± 5.7abcde 0.0 ± 0.0b 9 25 8 48 23.0 ± 3.3abcdef 16.1 ± 4.3cdef 31.1 ± 5.5a 1.6 ± 6.6a 10 50 2 24 19.8 ± 8.5fg 13.4 ± 6.7ef 21.8 ± 8.9ef 0.0 ± 0.0b 11 50 2 36 22.1 ± 7.0abcdef 14.3 ± 6.0def 23.9 ± 8.9def 0.0 ± 0.0b 12 50 2 48 24.8 ± 3.4ab 17.4 ± 5.6abcde 30.3 ± 6.1ab 0.0 ± 0.0b 13 50 5 24 21.5 ± 3.6abcdefg 14.6 ± 7.3def 25.4 ± 6.6cdef 0.0 ± 0.0b 14 50 5 36 23.1 ± 3.9abcdef 16.7 ± 6.4bcde 27.1 ± 3.8abc 0.0 ± 0.0b 15 50 5 48 22.2 ± 6.4abcdef 15.5 ± 8.0cdef 23.8 ± 8.5def 0.0 ± 0.0b 16 50 8 24 25.1 ± 2.8a 20.8 ± 3.8ab 29.6 ± 4.3abc 0.0 ± 0.0b 17 50 8 36 24.5 ± 2.2abc 19.7 ± 3.1abc 30.1 ± 3.0abc 0.0 ± 0.0b 18 50 8 48 23.9 ± 2.2abcde 16.7 ± 7.5abcde 25.8 ± 5.2bcdef 0.0 ± 0.0b 19 75 2 24 20.3 ± 6.9efg 14.8 ± 9.0def 26 ± 8.1bcdef 0.0 ± 0.0b 20 75 2 36 20.0 ± 7.9fg 16.3 ± 7.4bcdef 24.2 ± 7.9def 0.0 ± 0.0b 21 75 2 48 22.5 ± 4.9abcdef 14.8 ± 7.7def 23.6 ± 6.5def 0.0 ± 0.0b 22 75 5 24 23.2 ± 3.4abcdef 15.3 ± 6.0cdef 27.8 ± 5.7def 0.0 ± 0.0b 23 75 5 36 21.5 ± 6.4abcdefg 17 ± 5.6abcde 26.0 ± 8.7bcdef 0.0 ± 0.0b 24 75 5 48 21.2 ± 4.2bcdefg 14.1 ± 7def 24.8 ± 7.4def 0.0 ± 0.0b 25 75 8 24 24.1 ± 3.4abcd 21.4 ± 3.2a 30.9 ± 8.6a 0.0 ± 0.0b 26 75 8 36 22.6 ± 4.6abcdef 15.4 ± 7.7cdef 27.0 ± 8.2abcde 0.0 ± 0.0b 27 75 8 48 20.8 ± 8.1cdefg 18.5 ± 5.4abcd 28.3 ± 4.1abcd 0.0 ± 0.0b
Control 0 0 0 18.0 ± 6.7fg 12.8 ± 8.8ef 22.4 ± 11.6ef 0.0 ± 0.0b 1PD = ultrasound power density (mW/cm3); PT = ultrasound exposure time (min); IC = incubation time (h). Means in a column not followed by the same letter is significantly different (P<0.05) from each other as determined by Fisher’s least significant difference mean separation test. 2Controls are untreated raw whole peanuts

387
Other off-flavors. No other off-flavors were detected by the descriptive panel in all US-
treated and untreated peanuts except for two treatments, Trt# 2 and 9, where a low painty flavor
intensity rating of 0.2 and 1.6, respectively were perceived.
2.5 Descriptive panel intensity ratings for texture properties (Table 4.49)
Crunchiness. The intensities of crunchiness of US-treated peanuts ranged from 33.9 to 42.9
with control rated as 41.6. All 27 US treatments had the same hardness intensity ratings as
controls. This finding suggests that US treatment had no effect on crunchiness of treated
peanuts.
Hardness. The intensity of hardness of 89.2 to 92.4 in all 27 US treatments was not
significantly different from controls with 90.7 rating. This result indicates that US treatment had
no effect on the hardness of treated peanuts.
3. Sensory profile of combined US-UV treated peanuts by a descriptive panel
3.1 Descriptive panel intensity ratings for brown color, roasted peanutty and raw beany flavor
(Table 4.50)
Brown color. The intensities of brown color in combined US-UV treated peanuts ranged
from 34.0 to 34.2 with controls rated as 33.5. Seventeen of 27 combined US-UV treated peanuts
had the same intensity of brown color as controls whereas ten treatments had significantly lower
brown color intensities than controls.
Roasted peanutty flavor. The intensities of roasted peanutty flavor in combined US-UV
treated peanuts ranged from 32.6 to 36.7 with controls rated as 60.2. The intensities of roasted
peanutty flavor of all 27 combined US-UV treatments of 32.1 to 36.7 were significantly lower
than untreated controls. Results indicate that US and UV treatment reduced the roasted peanutty
flavor of treated peanuts.

388
Table 4.49 Intensity ratings (mean±standard deviation) for texture attributes and toothpack off-flavor of roasted sliced ultrasound-treated peanuts1.
Trt # PD PT IC Crunchiness Hardness Toothpack 1 25 2 24 41.1 ± 2.4ab 90.8 ± 3abc 59.3 ± 2.6abc 2 25 2 36 41.2 ± 2.6ab 91.7 ± 3.7ab 59.9 ± 1.8abc 3 25 2 48 41.4 ± 3ab 91.3 ± 2.9abc 59.1 ± 2.4abc 4 25 5 24 42.9 ± 3.3ab 92.3 ± 4.2ab 59.7 ± 2.8abc 5 25 5 36 42.8 ± 2.9ab 92.0 ± 3.6ab 59.6 ± 2.7abc 6 25 5 48 40.9 ± 3.7ab 90.3 ± 3.5abc 59.9 ± 1.9abc 7 25 8 24 40.4 ± 2.8ab 90.4 ± 2.5abc 59.2 ± 1.9abc 8 25 8 36 40.9 ± 3.9b 90.2 ± 4.0abc 59.9 ± 2.3abc 9 25 8 48 41.8 ± 4.3ab 90.2 ± 2.9abc 58.6 ± 1.8c 10 50 2 24 41.8 ± 3.1ab 90.7 ± 3.2abc 59.3 ± 3.4abc 11 50 2 36 42.1 ± 2.8ab 91.2 ± 3.3abc 59.8 ± 3.3abc 12 50 2 48 41.5 ± 3.6ab 91.1 ± 3.8abc 58.9 ± 1.7bc 13 50 5 24 42 ± 3.7ab 90.7 ± 3.2abc 59.8 ± 2.5abc 14 50 5 36 41.5 ± 3.4ab 90.3 ± 3.0abc 59.0 ± 2.2abc 15 50 5 48 41.5 ± 3.5ab 90.2 ± 3.0abc 59.6 ± 2.4abc 16 50 8 24 41.9 ± 3.1ab 91.7 ± 2.9ab 59.9 ± 2.7abc 17 50 8 36 41.8 ± 3.3ab 90.1 ± 3.1abc 60.2 ± 1.7ab 18 50 8 48 42.4 ± 3.2ab 90.8 ± 2.1abc 59.3 ± 1.6abc 19 75 2 24 42.8 ± 2.9ab 90.8 ± 1.7abc 59.6 ± 1.9abc 20 75 2 36 42.0 ± 2.5a 91.9 ± 3.2ab 60.2 ± 1.6ab 21 75 2 48 42.3 ± 3.1ab 91.5 ± 3.1abc 59.4 ± 2.0abc 22 75 5 24 42.7 ± 2.5ab 91.1 ± 2.6abc 60.6 ± 2.7a 23 75 5 36 42.5 ± 3.8ab 91.6 ± 3.9ab 59.4 ± 2.1abc 24 75 5 48 40.7 ± 2.5ab 89.2 ± 2.8c 59.5 ± 2.4abc 25 75 8 24 40.4 ± 2.9a 89.4 ± 4.1c 59.7 ± 2.2abc 26 75 8 36 41.3 ± 2.6ab 92.4 ± 3.2a 59.8 ± 1.7abc 27 75 8 48 39.9 ± 4.5ab 91.3 ± 3.2abc 60.0 ± 2.1abc
Control 0 0 0 41.6 ± 4.9ab 90.7 ± 3abc 59.2 ± 3.1abc 1PD = ultrasound power density (mW/cm3); PT = ultrasound exposure time (min); IC = incubation time (h). Means in a column not followed by the same letter is significantly different (P<0.05) from each other as determined by Fisher’s least significant difference mean separation test. 2Controls are untreated raw whole peanuts

389
Table 4.50 Intensity ratings (mean±standard deviation) for the brown color, roasted peanutty and raw/beany aromatics of roasted sliced ultrasound-UV treated peanuts by a descriptive panel1.
Trt # PD PT IT Brown color Roasted peanutty Raw/beany 1 40 4 10 32.7 ± 3.7abcd 33.6 ± 4.7bc 1.9 ± 3.7a 2 40 4 30 32.3 ± 3.2abcd 36.0 ± 9.0bc 0.1 ± 0.4cd 3 40 4 50 31.7 ± 3.3bdc 35.2 ± 7.6bc 1.0 ± 2.7abc 4 40 8 10 31.9 ± 3.5bdc 33.9 ± 7.0bc 0.2 ± 0.5cd 5 40 8 30 31.2 ± 4.3cd 36.3 ± 5.6bc 0.2 ± 0.6cd 6 40 8 50 31.1 ± 4.6cd 34.9 ± 8.0bc 0.9 ± 2.2bcd 7 40 12 10 31.5 ± 4.4bdc 33.2 ± 2.8bc 0.3 ± 0.5cd 8 40 12 30 32.0 ± 3.8abcd 34.5 ± 7.0bc 0.2 ± 0.5cd 9 40 12 50 33.1 ± 2.0abcd 36.3 ± 10.6bc 0.1 ± 0.4cd 10 80 4 10 32.6 ± 2.5abcd 35.3 ± 4.3bc 0.6 ± 2bcd 11 80 4 30 32.3 ± 4.0abcd 36.2 ± 5.9bc 0.6 ± 2.2bcd 12 80 4 50 32.9 ± 3.7abcd 36.3 ± 7.6bc 0.2 ± 0.7cd 13 80 8 10 32.3 ± 3.2abcd 36.4 ± 9.0bc 0.7 ± 2.1bcd 14 80 8 30 33.0 ± 2.4abcd 35.5 ± 6.8bc 0.6 ± 2bcd 15 80 8 50 32.3 ± 3.0abcd 34.9 ± 6.8bc 0.4 ± 0.8cd 16 80 12 10 32.0 ± 3.7bdc 35.6 ± 10bc 0.2 ± 0.5cd 17 80 12 30 33.0 ± 3.0abcd 34.7 ± 8.3bc 0.3 ± 0.6cd 18 80 12 50 31.9 ± 3.0bdc 32.1 ± 5.6c 0.4 ± 0.9bcd 19 120 4 10 32.6 ± 3.7abcd 33.6 ± 6.1bc 0.4 ± 1.1bcd 20 120 4 30 31.0 ± 5.9d 35.7 ± 3.4bc 0.5 ± 1.4bcd 21 120 4 50 32.2 ± 4.6abcd 36 ± 8.1bc 0.3 ± 0.6cd 22 120 8 10 33.2 ± 2.4abc 35.7 ± 4.9bc 0.3 ± 0.6cd 23 120 8 30 32.1 ± 3.7abcd 34.9 ± 8.1bc 0.3 ± 0.9cd 24 120 8 50 32.6 ± 2.5abcd 36.7 ± 7.2b 1.4 ± 3.8ab 25 120 12 10 32.6 ± 2.9abcd 33.4 ± 5.6bc 0.2 ± 0.8cd 26 120 12 30 31.7 ± 2.7bdc 34.4 ± 8.9bc 0.04 ± 0.8d 27 120 12 50 31.8 ± 3.7bdc 36.1 ± 6.3bc 0.1 ± 0.4cd
Control2 0 0 0 34.2 ± 3.4a 60.2 ± 4.2a 0.6 ± 2.0bcd 1PD = ultrasound power density (mW/cm3); PT = ultrasound exposure time (min); IT = UV exposure time at fixed distance from UV light 40 cm and incubation time at 25oC for 36 h. Intensity ratings using a 150 mm unstructured scale with anchors at 12.5 and 137.50 mm. Means in a column not followed by the same letter is significantly different from each other as determined by Fisher’s least significant difference mean separation test.
2Controls are untreated raw whole peanuts

390
Raw beany flavor. The mean intensities of raw beany flavor in combined US-UV treated
peanuts ranged from 0.04 to 1.94 while controls had rating of 0.64. However, the magnitude of
intensity ratings in 150-mm scale is too low and of no significant consequence.
3.2 Descriptive panel intensity ratings for basic tastes (Table 4.51)
Bitter taste. The mean intensities of bitter taste in combined US-UV treated peanuts ranged
from 24.1 to 27.5 with controls rated as 11.1. All 27 treated peanuts had significantly
higher intensities of bitter taste compared to controls. Among treated samples, two treatments
(Trt# 1, 27) had significantly higher bitter intensity ratings of 27.4-27.5 compared to four other
treatments (Trt# 4, 6, 8, and 22) with ratings of 24.1 to 24.4. This finding indicates that US and
UV increase bitterness of treated peanuts which could be attributed to enhanced levels of
phenolics in the treated peanuts.
Sweet taste. The intensities of sweet taste in combined US-UV treated peanuts ranged from
9.5 to 12.3 with controls rated as 11.9. The sweetness of 26 of 27 US treatments was not
significantly different from controls. Only one treatment (Trt# 12) had significantly lower
sweetness intensity compared to controls. Among the treated samples, Trt# 4 had significantly
higher sweet intensity compared to three treatments, Trt# 5, 12 and 21, but not significantly
different from all 23 other treated peanuts.
Sour taste. The intensities of sour taste in combined US-UV treated peanuts ranged from 4.4
to 7.8 with controls rated as 4.2. The intensity ratings for sour taste 26 of 27 treatments were not
significantly different from controls. Only one treatment (Trt# 7) with mean intensity rating of
7.8 had significantly higher intensity of sourness compared to controls and to seven treated
peanuts (Trt# 12, 13, 15, 16, 20, 22 and 26).

391
Table 4.51 Intensity ratings (mean±standard deviation) for the basic tastes of roasted sliced ultrasound-UV treated peanuts1.
Trt # PD PT IT Bitter Sweet Sour Salty 1 40 4 10 27.5 ± 3.9a 10.8 ± 3.0abc 6.0 ± 4.1ab 10.3 ± 1.9abcd 2 40 4 30 26.1 ± 5.0abcd 11.1 ± 2.7abc 4.9 ± 4.2b 10.8 ± 1.3abcd 3 40 4 50 26.0 ± 4.0abcd 10.4 ± 4.4abc 5.2 ± 4.7ab 10.2 ± 1.6abcd 4 40 8 10 24.4 ± 4.3cd 12.3 ± 3.4a 5.3 ± 4.3ab 10.7 ± 1.4abcd 5 40 8 30 26.3 ± 4.0abcd 9.8 ± 3.5bc 5.1 ± 4.4ab 11.5 ± 5.5abc 6 40 8 50 24.4 ± 6.0cd 11.4 ± 3.1abc 5.9 ± 4.7ab 10.0 ± 1.9abcd 7 40 12 10 24.6 ± 5.8abcd 10.1 ± 4.5abc 7.8 ± 5.2a 9.9 ± 2.5abcd 8 40 12 30 24.1 ± 6.8d 11.4 ± 3.6abc 5.4 ± 4.5ab 9.0 ± 3.6d 9 40 12 50 26.0 ± 6.1abcd 10.1 ± 3.1abc 6.4 ± 4.4ab 9.8 ± 2.4abcd 10 80 4 10 24.9 ± 6.0abcd 10.7 ± 3.5abc 5.5 ± 4.3ab 9.9 ± 2.9abcd 11 80 4 30 24.9 ± 5.6abcd 10.2 ± 3.3abc 5.2 ± 4.4ab 11.9 ± 9.3ab 12 80 4 50 27.2 ± 4.3abc 9.5 ± 4.8c 4.8 ± 4.4b 9.8 ± 2.0bcd 13 80 8 10 26.3 ± 3.9abcd 10.1 ± 4.4abc 5.0 ± 4.6b 9.4 ± 3.5cd 14 80 8 30 26.2 ± 4.0abcd 11.0 ± 4.7abc 5.5 ± 4.6ab 9.6 ± 3.0cd 15 80 8 50 25.4 ± 4.1abcd 10.4 ± 3.5abc 4.9 ± 4.2b 10.0 ± 1.9abcd 16 80 12 10 24.6 ± 4.7bcd 11.0 ± 3.9abc 4.4 ± 4.1b 9.3 ± 3.8cd 17 80 12 30 26.3 ± 5.3abcd 11.2 ± 4.3abc 5.4 ± 4.6ab 10.6 ± 1.8abcd 18 80 12 50 26.0 ± 4.4abcd 10.0 ± 3.6abc 5.7 ± 4.3ab 10.2 ± 1.9abcd 19 120 4 10 26.8 ± 3.3abcd 10.7 ± 3.3abc 6.2 ± 3.3ab 9.5 ± 3.2cd 20 120 4 30 26.0 ± 4.3abcd 10.6 ± 5.2abc 4.8 ± 4.5b 9.9 ± 3.1abcd 21 120 4 50 26.7 ± 3.8abcd 9.7 ± 3.7bc 6.3 ± 4.4ab 9.8 ± 2.0abcd 22 120 8 10 24.4 ± 4.2cd 10.3 ± 4.9abc 4.8 ± 4.6b 9.9 ± 2.8abcd 23 120 8 30 27.2 ± 3.7abc 11.4 ± 3.1abc 5.4 ± 4.1ab 9.8 ± 2.8abcd 24 120 8 50 25.8 ± 5.3abcd 10.4 ± 3.7abc 5.8 ± 4.4ab 9.5 ± 2.6cd 25 120 12 10 26.2 ± 3.8abcd 10.0 ± 3.4abc 5.8 ± 4.4ab 9.9 ± 2.7abcd 26 120 12 30 25.3 ± 4.1abcd 10.5 ± 3.3abc 4.8 ± 4.4b 9.9 ± 2.8abcd 27 120 12 50 27.4 ± 4.4ab 10.0 ± 4.1abc 6.2 ± 4.1ab 9.9 ± 3.3abcd
Control2 0 0 0 11.8 ± 3.7e 11.9 ± 4.6ab 4.2 ± 4.2b 12.1 ± 10.1a 1PD = ultrasound power density (mW/cm3); PT = ultrasound exposure time (min); IT = UV exposure time at fixed distance from UV light 40 cm and incubation time at 25oC for 36 h. Intensity ratings using a 150 mm unstructured scale with anchors at 12.5 and 137.50 mm. Means in a column not followed by the same letter is significantly different from each other as determined by Fisher’s least significant difference mean separation test.
2Controls are untreated raw whole peanuts

392
Salty taste. The intensities of salty taste in combined US-UV treated peanuts ranged from
9.1 to 11.9 with controls rated as 12.1. Twenty two of 27 combined US-UV salty taste had mean
intensity ratings ranging from 9.8 to 11.9 which were not significantly different from controls
with ratings of 12.1.
3.3 Descriptive panel intensity ratings for woody/hulls/skins and burnt flavors and feeling
factors astringency and tooth pack (Table 4.52).
Woody/hulls/skins. Twenty six of 27 combined US-UV treatments had woody/hull/skins
flavor mean intensity ratings ranging from 9.0 to 10.7 which were not significantly different
from those of controls. One treatment (Trt#14) had significantly higher mean rating intensity of
11.4 for woody/hulls/skins flavor compared to controls and Trt# 15.
Burnt flavor. All 27 combined US–UV treated peanuts had burnt mean intensity ratings of
12.1 to 18.1 which were not significantly different from the intensity of burnt flavor in controls.
Result indicated that US and UV had no effect on the burnt flavor of treated peanuts.
Astringency. The mean intensity ratings of 20.7 to 23.7 for the astringent aftertaste in 27
combined US-UV treatments were significantly higher than 3.0 intensity rating of untreated
controls. The astringency of one treatment (Trt#14) was significantly (P<0.05) higher than 8
treatments (Trt# 4, 5, 16, 18, 20, 20, 24 and 26), but significantly lower than Trt# 12 and similar
to all other 17 treated samples. Results suggest that US and UV treatments increased astringency
of treated samples which could be attributed to enhanced concentrations of phenolic compounds,
known to impart astringent aftertaste, in the treated samples.
Toothpack. All 27 combined US-UV treated peanuts had toothpack mean intensity ratings of
52.0 to 58.5 which were similar (P<0.05) to controls with mean rating of 56.6. This finding

393
Table 4.52 Intensity ratings (mean±standard deviation) for woody/hulls/skins, burnt, astringent and toothpack of roasted sliced ultrasound-UV treated peanuts by a descriptive panel1.
Trt # PD PT IT Woody/Hull/Skin Burnt Astringent Toothpack 1 40 4 10 10.7 ± 3.7ab 15.4 ± 10.6a 22.0 ± 2.1abcd 57.7 ± 6.2abc 2 40 4 30 10.2 ± 2.8ab 16.4 ± 2.8a 20.9 ± 1.8bcd 56.9 ± 6.4abc 3 40 4 50 9.9 ± 3.6ab 14.4 ± 11.5a 22.0 ± 3.1abcd 56.3 ± 6.0abc 4 40 8 10 11.0 ± 3.7ab 15.1 ± 11.1a 21.2 ± 1.8bcd 57.4 ± 6.7abc 5 40 8 30 10.3 ± 3.3ab 12.1 ± 11.4a 21.5 ± 3.9bcd 55.9 ± 6.5abc 6 40 8 50 10.2 ± 2.6ab 12.7 ± 11.5a 22.1 ± 2.9abcd 57.2 ± 4.8abc 7 40 12 10 9.2 ± 3.1ab 15.5 ± 10.5a 22.8 ± 4.0abc 57.8 ± 7.0abc 8 40 12 30 10.0 ± 3.3ab 14.3 ± 11.8a 21.8 ± 2.1abcd 56.4 ± 6.5abc 9 40 12 50 9.9 ± 4.0ab 14.8 ± 10.1a 22.9 ± 5.0ab 55.7 ± 8.2abc 10 80 4 10 10.0 ± 2.6ab 15.6 ± 10.9a 21.6 ± 2.5abcd 57.7 ± 6.8abc 11 80 4 30 10.2 ± 3.5ab 16.9 ± 11.5a 21.7 ± 2.5abcd 56.0 ± 6.9abc 12 80 4 50 9.8 ± 3.4ab 13.9 ± 12.0a 20.7 ± 3.4d 57.6 ± 6.3abc 13 80 8 10 10.7 ± 3.4ab 14.6 ± 12.2a 21.9 ± 2.2abcd 56.4 ± 9.4bc 14 80 8 30 11.4 ± 4.8a 18.1 ± 10.6a 23.7 ± 10.0a 55.2 ± 8.9abc 15 80 8 50 9.1 ± 3.5b 14.0 ± 12.1a 22.6 ± 2.3abcd 55.5 ± 8.2abc 16 80 12 10 9.3 ± 3.1ab 14.6 ± 9.9a 21.3 ± 3.1bcd 57.2 ± 6.9abc 17 80 12 30 10.0 ± 4.3ab 16.8 ± 12.2a 21.9 ± 2.3abcd 56.2 ± 7.6abc 18 80 12 50 9.9 ± 2.0ab 18.0 ± 10.3a 20.9 ± 3.4bcd 52.0 ± 14.2c 19 120 4 10 9.4 ± 4.2ab 14.7 ± 11.7a 20.8 ± 3.6abcd 55.1 ± 9.0abc 20 120 4 30 9.7 ± 4.0ab 15.2 ± 10.7a 21.0 ± 2.4bcd 55.3 ± 9.5abc 21 120 4 50 9.6 ± 4.5ab 15.7 ± 11.6a 22.5 ± 2abcd 56.0 ± 8.1abc 22 120 8 10 9.6 ± 4.5ab 14.3 ± 11.1a 22.2 ± 2.3abcd 57.7 ± 6.5abc 23 120 8 30 10.4 ± 3.0ab 16.7 ± 10.5a 22.3 ± 3.0abcd 55.8 ± 8.7abc 24 120 8 50 9.7 ± 2.5ab 14.5 ± 11.0a 21.6 ± 2.5bcd 57.2 ± 6abc 25 120 12 10 10.5 ± 2.8ab 15.1 ± 11.2a 22.4 ± 2.2abcd 57.5 ± 6.1abc 26 120 12 30 10.0 ± 4.2ab 14.2 ± 10.6a 21.3 ± 2.1bcd 55.6 ± 7.2abc 27 120 12 50 10.4 ± 3.1ab 15.2 ± 10.3a 21.6 ± 2.8abcd 58.5 ± 7.0a
Control2 0 0 0 9.0 ± 4.3b 12.0 ± 10.7a 3.0 ± 2.4e 56.6 ± 7.5abc 1PD = ultrasound power density (mW/cm3); PT = ultrasound exposure time (min); IT = UV exposure time at fixed distance from UV light 40 cm and incubation time at 25oC for 36 h. Intensity ratings using a 150 mm unstructured scale with anchors at 12.5 and 137.50 mm. Means in a column not followed by the same letter is significantly different from each other as determined by Fisher’s least significant difference mean separation test.
2Controls are untreated raw whole peanuts

394
indicates that toothpack feeling factor in treated peanuts was not affected by US and UV
treatments.
3.4 Descriptive panel intensity ratings for cardboard, fishy, oxidized and painty flavors
(Table 4.53)
Cardboard flavor. All 27 combined US-UV treatments with mean intensity ratings for
cardboard flavor ranging from 14.4 to 19.1 were significantly higher than untreated controls with
no detected cardboard flavor. This finding suggests that US and UV treatments caused
cardboard flavor which is related to lipid oxidation, in treated peanuts.
Fishy flavor. All 27 combined US-UV treated peanuts had fishy intensity ratings of 0 to
1.27 which were not significantly different from controls where burnt flavor was not detected.
However, the magnitude of intensity ratings in 150-mm scale was too low and of no significant
consequence.
Oxidized flavor. Nine of 27 combined US-UV treated peanuts with mean intensity ratings
ranging from 27.1 to 31.6 had significantly (P<0.05) higher oxidized flavor than controls with
22.4 mean rating. All other 18 treatments were not significantly different from controls.
Painty flavor. The painty flavor, the flavor related to advanced oxidation of food was
detected in peanuts treated with combined US-UV. However, the magnitude of intensity ratings
in 150 mm scale is low ranging from 0 to 1.2 and of no consequence of significance.
3.5 Descriptive panel intensity ratings for texture properties (Table 4.53).
Crispness. All 27 combined US-UV treated peanuts with intensity ratings of 28.4 to 32.1
were as crispy as controls with intensity ratings of 31.4. This finding suggests that any
processing treatment used will not affect the intensity of crispnesss of treated peanuts.

395
Table 4.53 Intensity ratings (mean±standard deviation) for the oxidation related off-flavors of roasted sliced ultrasound-UV treated peanuts by a descriptive panel1.
Trt # PD PT IT Carboard Fishy Oxidized Painty 1 40 4 10 19.1 ± 5.7a 1.3 ± 3.1a 24.5 ± 6.1ef 0.3 ± 1.2a 2 40 4 30 16.4 ± 8.0ab 0.7 ± 2.3a 26.9 ± 26.9abcde 0.3 ± 1.2ab 3 40 4 50 16.8 ± 7.0ab 0.9 ± 3.8a 24.8 ± 3.9cdef 0.2 ± 0.7ab 4 40 8 10 17.6 ± 5.9ab 1.0 ± 2.7a 24.8 ± 3.1cdef 0.3 ± 1.2ab 5 40 8 30 17.4 ± 7.9ab 0.0 ± 0.2a 28.8 ± 6.1a 0.4 ± 1.5ab 6 40 8 50 17.7 ± 8.3ab 1.2 ± 3.1a 24.9 ± 8.1cdef 0.5 ± 1.7ab 7 40 12 10 17.4 ± 7.2ab 0.6 ± 2.2a 27.4 ± 6.8abcde 1.2 ± 3.2ab 8 40 12 30 18.8 ± 6.5ab 1.2 ± 3.2a 26.1 ± 4.9abcdef 1.1 ± 2.3ab 9 40 12 50 15.8 ± 9.4ab 1.0 ± 3.1a 28.5 ± 4.1ab 0.6 ± 2.0ab 10 80 4 10 18.3 ± 6.0ab 0.3 ± 1.3a 26.9 ± 8.1abcde 0.5 ± 1.4ab 11 80 4 30 16.9 ± 8.3ab 0.6 ± 2.3a 27.0 ± 5abcde 0.4 ± 1.8ab 12 80 4 50 17.1 ± 7.6ab 0.3 ± 1.0a 26.9 ± 3.7abcde 0.1 ± 0.5b 13 80 8 10 16.2 ± 8.6ab 0.6 ± 2.0a 26.6 ± 4.4abcde 0.8 ± 2.8ab 14 80 8 30 16.5 ± 8.0ab 0.0 ± 0.2a 24.5 ± 4.4ef 0.8 ± 2.7ab 15 80 8 50 15.4 ± 7.7ab 0.2 ± 0.5a 26.2 ± 3abcdef 0.3 ± 0.7ab 16 80 12 10 15.1 ± 8.8ab 1.2 ± 4.1a 24.8 ± 4.2def 0.1 ± 0.2b 17 80 12 30 16.2 ± 8.0ab 0.1 ± 0.2a 24.8 ± 4.6cdef 0.0 ± 0.2b 18 80 12 50 17.0 ± 5.9ab 0.6 ± 1.8a 24.9 ± 3.7cdef 0.4 ± 1.8ab 19 120 4 10 18.4 ± 5.3ab 1.2 ± 3.3a 23.1 ± 4.4f 0.8 ± 2.2ab 20 120 4 30 15.3 ± 8.2ab 0.2 ± 0.7a 25.2 ± 4.3bcdef 0.5 ± 1.2ab 21 120 4 50 14.4 ± 9.3b 0.6 ± 1.8a 27.5 ± 5.8abcde 0.5 ± 1.4ab 22 120 8 10 16.8 ± 7.0ab 0.3 ± 1.0a 26.4 ± 4.8abcdef 0.2 ± 0.3ab 23 120 8 30 16.4 ± 7.5ab 0.04 ± 0.2a 26.1 ± 6abcdef 0.1 ± 0.2b 24 120 8 50 17.3 ± 7.6ab 0.6 ± 1.8a 25.5 ± 5.3bcdef 0.2 ± 0.7ab 25 120 12 10 15.4 ± 8.5ab 0.8 ± 3.2a 28.0 ± 8.6bcd 0.4 ± 1.0ab 26 120 12 30 18.7 ± 4.4ab 1.0 ± 2.8a 24.6 ± 4.1def 1.0 ± 2.7ab 27 120 12 50 15.5 ± 7.7ab 0.6 ± 2.3a 28.4 ± 8.3ab 0.7 ± 2.4ab
Control2 0 0 0 0.0 ± 0.0c 0.0 ± 0.0a 0.0 ± 0.0g 0.0 ± 0.0b 1PD = ultrasound power density (mW/cm3); PT = ultrasound exposure time (min); IT = UV exposure time at fixed distance from UV light 40 cm and incubation time at 25oC for 36 h. Intensity ratings using a 150 mm unstructured scale with anchors at 12.5 and 137.50 mm. Means in a column not followed by the same letter is significantly different from each other as determined by Fisher’s least significant difference mean separation test.
2Controls are untreated raw whole peanuts.
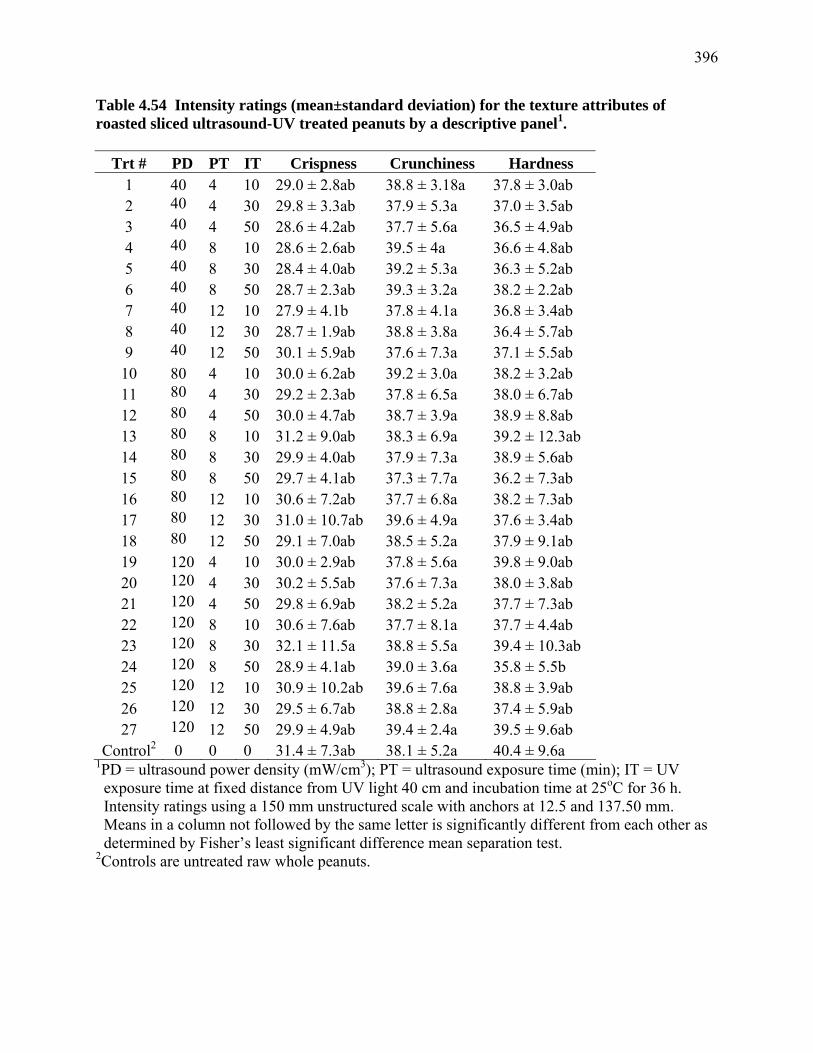
396
Table 4.54 Intensity ratings (mean±standard deviation) for the texture attributes of roasted sliced ultrasound-UV treated peanuts by a descriptive panel1.
Trt # PD PT IT Crispness Crunchiness Hardness 1 40 4 10 29.0 ± 2.8ab 38.8 ± 3.18a 37.8 ± 3.0ab 2 40 4 30 29.8 ± 3.3ab 37.9 ± 5.3a 37.0 ± 3.5ab 3 40 4 50 28.6 ± 4.2ab 37.7 ± 5.6a 36.5 ± 4.9ab 4 40 8 10 28.6 ± 2.6ab 39.5 ± 4a 36.6 ± 4.8ab 5 40 8 30 28.4 ± 4.0ab 39.2 ± 5.3a 36.3 ± 5.2ab 6 40 8 50 28.7 ± 2.3ab 39.3 ± 3.2a 38.2 ± 2.2ab 7 40 12 10 27.9 ± 4.1b 37.8 ± 4.1a 36.8 ± 3.4ab 8 40 12 30 28.7 ± 1.9ab 38.8 ± 3.8a 36.4 ± 5.7ab 9 40 12 50 30.1 ± 5.9ab 37.6 ± 7.3a 37.1 ± 5.5ab 10 80 4 10 30.0 ± 6.2ab 39.2 ± 3.0a 38.2 ± 3.2ab 11 80 4 30 29.2 ± 2.3ab 37.8 ± 6.5a 38.0 ± 6.7ab 12 80 4 50 30.0 ± 4.7ab 38.7 ± 3.9a 38.9 ± 8.8ab 13 80 8 10 31.2 ± 9.0ab 38.3 ± 6.9a 39.2 ± 12.3ab 14 80 8 30 29.9 ± 4.0ab 37.9 ± 7.3a 38.9 ± 5.6ab 15 80 8 50 29.7 ± 4.1ab 37.3 ± 7.7a 36.2 ± 7.3ab 16 80 12 10 30.6 ± 7.2ab 37.7 ± 6.8a 38.2 ± 7.3ab 17 80 12 30 31.0 ± 10.7ab 39.6 ± 4.9a 37.6 ± 3.4ab 18 80 12 50 29.1 ± 7.0ab 38.5 ± 5.2a 37.9 ± 9.1ab 19 120 4 10 30.0 ± 2.9ab 37.8 ± 5.6a 39.8 ± 9.0ab 20 120 4 30 30.2 ± 5.5ab 37.6 ± 7.3a 38.0 ± 3.8ab 21 120 4 50 29.8 ± 6.9ab 38.2 ± 5.2a 37.7 ± 7.3ab 22 120 8 10 30.6 ± 7.6ab 37.7 ± 8.1a 37.7 ± 4.4ab 23 120 8 30 32.1 ± 11.5a 38.8 ± 5.5a 39.4 ± 10.3ab 24 120 8 50 28.9 ± 4.1ab 39.0 ± 3.6a 35.8 ± 5.5b 25 120 12 10 30.9 ± 10.2ab 39.6 ± 7.6a 38.8 ± 3.9ab 26 120 12 30 29.5 ± 6.7ab 38.8 ± 2.8a 37.4 ± 5.9ab 27 120 12 50 29.9 ± 4.9ab 39.4 ± 2.4a 39.5 ± 9.6ab
Control2 0 0 0 31.4 ± 7.3ab 38.1 ± 5.2a 40.4 ± 9.6a 1PD = ultrasound power density (mW/cm3); PT = ultrasound exposure time (min); IT = UV exposure time at fixed distance from UV light 40 cm and incubation time at 25oC for 36 h. Intensity ratings using a 150 mm unstructured scale with anchors at 12.5 and 137.50 mm. Means in a column not followed by the same letter is significantly different from each other as determined by Fisher’s least significant difference mean separation test.
2Controls are untreated raw whole peanuts.

397
Crunchiness. All 27 combined US-UV treated peanuts with intensity ratings of 332.3 to
39.6 were as crunchy as controls, UV-treated and US-treated peanuts with intensity ratings
of 38.1, 37.7, and 38.2, respectively. This finding suggests that any processing treatment used
will not affect the intensity of crunchiness of treated peanuts.
Hardness. The intensities of hardness in combined US-UV treated peanuts ranged from
35.8 to 39.8 with controls rated as 4.4. Only one combined US-UV treated peanuts (Trt # 24)
with intensity rating of 35.8 was significantly less hard than controls and UV-treated peanuts
(rating of 40.0) while all other 26 treatments were similar to controls and UV-treated peanuts.
4. Comparison of the sensory profiles of peanuts treated with UV, US, and combined US-
UV processing treatments
The comparison of the intensity ratings for the different sensory attributes based on
difference between ratings of treated (UV, US or US-UV) peanuts and untreated controls are
presented in Table 4.55. The differences in intensity ratings between treated and control peanuts,
rather than actual observed ratings, were used to compare the three treatments because treated
samples were prepared at different times along with their controls. A positive rating indicates
that treated peanuts had higher intensity ratings compared to controls whereas a negative rating
means lower intensity. .
The roasted peanutty flavor is the most important sensory attribute of roasted peanuts (Mason
et al., 1966). The roasted peanutty flavor of all treated peanuts was consistently lower (Table
4.54), compared to untreated controls. The least difference from control (P<0.05) in roasted
peanutty flavor intensity of -4.4 was observed in US-treated peanuts, followed by UV treatment
at -19.1, and by combined US-UV treatment at -25.1 which was the lowest.

398
Table 4.55 Comparison of the intensity ratings (difference from control) for the different sensory attributes of resveratrol-enhanced peanuts treated with UV, ultrasound, and combined ultrasound-UV by a descriptive panel1. Difference from control ratings for Sensory Attribute
UV Ultrasound Combined US-UV Pr>F
Differ-ence2
Control3 Differ-ence
Control Differ-ence
Control
Brown 8.3a 32.2 3.1b 29.8 -2.0c 34.7 <0.0001***Roasted peanutty
-19.1b 49.7 -4.4a 26.5 -25.1c 60.3 <0.0001***
Raw beany 0.8a 0 1.2a 1.5 -0.2b 0.8 <0.0001***Woody/ hulls/skins
0.7a 17.0 1.2a 17.1 1.1a 9.2 0.1837 NS
Burnt 5.0a 0 1.2c 0 3.1b 12.3 <0.0001***Bitter 2.9b 18.6 2.8b 19.8 14.0a 12.1 <0.0001***Sweet -3.0c 16.4 0.4a 13.6 -1.3b 11.5 <0.0001***Sour 2.5a 0 1.2b 3.0 1.3b 5.0 0.0004**Salty -1.5b 13.2 0.1a 12.6 -2.0b 12.3 <0.0001***Cardboard 5.8b 20.4 5.5b 20.9 16.8a 0 <0.0001***Fishy 2.8a 14.6 3.5a 20.9 0.6b 0 <0.0001***Oxidized 8.4b 19.6 6.1c 24.0 26.1a 0 <0.0001***Painty 0.1b 0 0.1b 0 0.5a 0 <0.0001***Crispness -0.1a 45.7 -0.1a 45.9 -1.6b 46.7 <0.0001***Crunchiness -1.8c 45.5 1.6a 41.0 0.4b 37.9 <0.0001***Hardness 0.5b 90.5 3.3a 90.4 -2.6c 41.1 <0.0001***Toothpack 0.4b 60.0 2.5a 59.1 -0.3b 56.9 <0.0001***Astringency 1.2c 18.5 3.0b 17.4 18.8a 3.4 <0.0001*** Overall acceptance4
5.7a 7.4 5.1b 7.4 4.9b
7.7 0.0432*
1 Intensity ratings using a 150 mm unstructured line scale with anchors at 12.5 and 137.50 mm. 2 Differences in ratings between treated peanuts and untreated controls were used because treated peanuts were prepared at different times. A positive rating means treated peanuts had higher rating than controls. A negative rating means treated peanuts had lower rating than controls. Analyses are based on 54 samples/processing treatment rated by a 10-member descriptive panel. Means of the differences from controls within a row followed the same letter are not significant different from each other as determined by Fisher’s least significant difference mean separation test. NS= not significant; * = significant at P<0.05; **significant at P<0.001; ***significant at P<0.0001.
3 Intensity ratings of controls represent actual observed values for the specified sensory attribute. 4 Mean overall acceptance by 50 consumers using 9-point hedonic rating scale where 1=dislike extremely; 5= neither like nor dislike; and 9=like extremely.
399
Astringent aftertaste and bitter taste are sensory attributes related to the phenolic compounds
(Naczk and Shahidi, 2006). The astringent aftertaste of all treated samples was consistently
higher than controls. The least difference from control of 1.2 in astringency was produced in
UV treatment which was significantly lower than 3.0 in US and 17.4 in combined US-UV treated
peanuts. The bitter taste of all treated peanuts were higher than controls. The least difference
from control of 2.8 and 2.8 was observed in peanuts treated with US and UV, respectively, which
were significantly lower than 14.0 in combined UV-US treatment.
Peanuts contain about 50% fat and are prone to lipid oxidation (Grosso and Resurreccion,
2002; Han et al., 2008). Off-flavors related to lipid oxidation such as oxidized, cardboard, fishy,
raw beany and painty flavors were consistently higher in treated peanuts compared to controls.
The highest (P< 0.05) difference from control rating in oxidized flavor of 26.1 was produced
when peanuts were treated with combined US-UV, followed by 8.4 when UV treated, and then
least at 6.1 when US treated. The highest difference from control in cardboard flavor at 16.8
rating was observed in combined US-UV which was significantly higher than UV and US, both
with 5.5 ratings. Fishy flavor intensity rating was highest in both UV and US treated peanuts at
2.8 and 3.5 ratings which were significantly higher than 0.6 in combined US-UV treated peanuts.
The difference from control ratings of -2 to 1.2 and 0.1 to 0.5 in raw beany and painty flavor ,
respectively, showed significant differences (P<0.05) among treated samples but were too low a
magnitude in a 150 mm scale to establish differences between and among treated and control
samples.
The highest difference from control ratings in brown color of 8.3 was observed in UV,
followed by US at 3.1, while combined US-UV treated peanuts had less intense brown color
compared to control at -2.0. The highest difference from control ratings in burnt flavor of 5.0

400
was also observed in UV-treated peanuts, followed by combined US-UV at 3.1 and US at 1.2
which was the least.
The difference from control ratings in sweet, sour and salty tastes ranging from -3.0 to 2.5
were too low a magnitude. Likewise, differences from control ratings of -1.8 to 3.3 in texture
attributes including crispness, crunchiness, hardness were too low a magnitude to establish
significant differences between and among treated and control samples.
In summary, all treated resveratrol-enhanced peanuts had less intense roasted peanutty flavor,
more bitter and astringent, and more intense off-flavors such as oxidized and cardboard
compared to controls. Among the treatments, the combined US-UV treated peanuts had the least
intense roasted peanutty flavor and most intense bitterness, astringency, oxidized and carboard
compared to US and UV treatments. As a result, US-UV treated samples had the least
acceptance rating by consumers which was not significantly different from the rating of US- but
significantly lower than UV-treated peanuts. US-treated peanuts had the highest roasted
peanutty flavor, least oxidized flavor, and intermediate astringent flavor compared to UV and
combined US-UV treated peanuts. UV-treated peanuts had intermediate intensity of roasted
peanutty flavor and the least astringent flavor among the three treatments. However, it must be
noted that the sensory ratings analyzed in this study were means of all 27 treatments in 2
replications. Optimization studies conducted as discussed in Study 1, 2 and 3 in of this section
showed that US-UV treatment would produce acceptable products with the highest
concentrations of resveratrol compared to US and UV.

401
D. Correlations of Profiles of Phenolic Compounds and Sensory Attributes of Resveratrol-
Enhanced Peanuts
Regression models for the response variables, adjusted R2 and Pearson correlation coefficient
for the significant correlation of profiles of phenolic compounds and sensory properties of UV,
US, and combined US-UV treated peanuts are shown n Table 4.56. Trans-resveratrol was the
only phenolic compound found to have correlations (|r| > 0.50) with the sensory properties of
peanuts treated with UV, US and combined US-UV. Trans-resveratrol was positively correlated
with astringent, painty and burnt aromatics, and bitter taste suggesting that the higher the
concentrations of trans-resveratrol, the higher will be the intensity ratings of these sensory
properties. These results agreed with Naczk and Shahidi (2006) who reported that phenolics in
food contribute to the off-flavors such as bitterness, astringency, color, flavor, and odor which
resulted in the lower acceptance of treated peanuts compared to untreated controls.
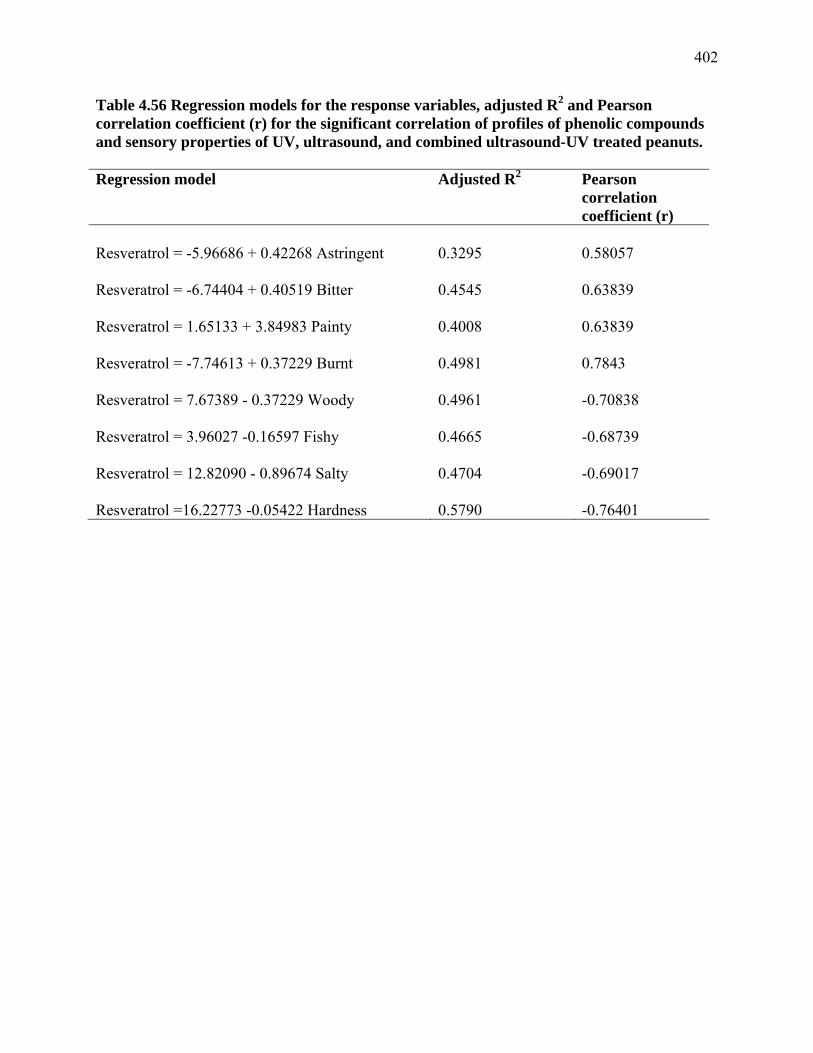
402
Table 4.56 Regression models for the response variables, adjusted R2 and Pearson correlation coefficient (r) for the significant correlation of profiles of phenolic compounds and sensory properties of UV, ultrasound, and combined ultrasound-UV treated peanuts. Regression model Adjusted R2 Pearson
correlation coefficient (r)
Resveratrol = -5.96686 + 0.42268 Astringent
0.3295
0.58057
Resveratrol = -6.74404 + 0.40519 Bitter 0.4545 0.63839 Resveratrol = 1.65133 + 3.84983 Painty
0.4008
0.63839
Resveratrol = -7.74613 + 0.37229 Burnt
0.4981
0.7843
Resveratrol = 7.67389 - 0.37229 Woody
0.4961
-0.70838
Resveratrol = 3.96027 -0.16597 Fishy 0.4665 -0.68739 Resveratrol = 12.82090 - 0.89674 Salty
0.4704
-0.69017
Resveratrol =16.22773 -0.05422 Hardness
0.5790
-0.76401

SECTION 5
SUMMARY AND CONCLUSIONS
Peanuts are a rich food source of trans-resveratrol next to red wines and grape skins. Trans-
resveratrol among other phenolic compounds with antioxidant properties delay aging and reduce
risk of cancer, cardiovascular, and Alzheimer’s diseases. Previous studies reported that single
dose of either UV or ultrasound (US) enhanced the levels of trans-resveratrol in peanuts.
The present study treated raw peanut kernels with abiotic stresses including wounding
through size reduction, and varying doses of UV, US, and combined US-UV to enhance
biosynthesis of trans-resveratrol and other bioactive phenolic compounds. The optimum
parameters for each processing treatment that will produce acceptable resveratrol-enhanced
peanuts (REP) with maximum concentrations of trans-resveratrol and other bioactive compounds
were determined using response surface methodology. Food applications of REP in roasted
peanuts and peanut bars were conducted and their shelf lives were determined. The correlations
of the profiles of phenolic compounds and descriptive sensory attributes of REP were analyzed.
Raw peanuts had 0.02 µg/g trans-resveratrol which increased to 0.37 µg/g after slicing and
increased further to 3.3 µg/g after UV treatment. US treatment of sliced, chopped and whole
peanuts increased trans-resveratrol to 6.35, 2.88 and 0.99 µg/g, respectively, suggesting that only
mild damage to the cells through slicing is needed to induce the maximum enhancement of
trans-resveratrol biosynthesis in peanuts. UV treatment of sliced US-treated peanuts further
increased trans-resveratrol to 7.14 µg/g which is 2.7 times more than the mean concentration of
2.64 µg/g in red wines, the major food source. These results indicated that US was more

404
effective than UV. UV treatment of US-treated peanuts provided minimal additional
enhancement whereas US treatment of UV-treated peanuts had additive effect in trans-
resveratrol biosynthesis of sliced peanuts. Viable but not non-viable peanuts significantly
increased trans-resveratrol in sliced peanuts confirming that trans-resveratrol increase in stressed
peanuts was due to elicitation of biosynthesis rather than the result of efficient physical
extraction of the compound from the treated samples. All UV, US and US-UV treated REP had
less roasted peanutty flavor and more bitter, astringent, cardboard, oxidized and fishy off-flavors
which resulted in lower consumer mean overall acceptance rating of 5.0 or neither like nor
dislike compared to untreated controls of 7.4 or like moderately.
Process optimization showed that the optimum US-UV processes produced the highest trans-
resveratrol of 4.8 µg/g with the maximum consumer overall acceptance ratings ≤5 or neither like
nor dislike, compared to optimum US and UV processes with 3.8 and 2.1µg/g, respectively.
The optimum US-UV processes parameters included all process combinations within a hexagon
bounded by six points with the combination of US power density and time 74 mW/cm3 for 8.3
min, 70 mW/cm3 for 10.9 min, 62 mW/cm3 for 11.2 min, 42 mW/cm3 10.4 min, 48 mW/cm3 for
8.3 min, and 58 mW/cm3 for 9.1 min, respectively, followed by 50 min exposure at 40 cm
distance from UV light, and 36 h incubation at 25oC. The optimum US-UV also produced the
maximum concentrations of 170 µg/g p-coumaric acid and 150 µM TE/g ORAC total
antioxidant capacity which correspond to >100% that found in red wines, as well as 1.0 µg/g
trans-piceid, 2.6 µg ferulic acid, 1.48 mg GAE/g total phenolics and 1.52 µM TEAC/g.
Roasted REP had a shelf life 52 days at 25oC which was shorter than 90 days in regular
roasted peanuts due to weaker peanutty flavor and more intense lipid oxidation-related off-
flavors. At least 80% of the initial trans-resveratrol and total phenolics but not TEAC were

405
retained in roasted REP during its shelf life. Application of REP in peanuts bars resulted in
increased shelf life up to 146 days at 25oC suggesting the sugar coating could have protected
each kernels from exposure to oxygen which slowed down the lipid oxidation or sugar acted to
mask the off-flavors in peanut bars. On a per serving basis, about 3.5 REP bars containing 30 g
peanuts/bar would provide as much as a 140 mL serving of red wine. REP will provide
increased value and profitability for the food industry while providing health benefits to
consumers.
Correlation of the profiles of phenolic compounds and descriptive sensory attributes showed
that trans-resveratrol was the only compound, among five phenolics studied, that was positively
correlated to astringent, bitter and painty flavors/tastes.
In futher studies, the application of REP in many other food product preparations and the
stability of trans-resveratrol and other bioactive compounds with antioxidant activities are
worthy of investigation.

SECTION 6
REFERENCES
Abert-Vian M, Tomao V, Gallet S, Coulomb PO, Lacomb JM. 2005. Simple and rapid method for cis- and trans-resveratrol and piceid isomers determination in wine by high performance liquid chromatography using chromolith columns. J Chromag A 1085:224-9.
Adrian M, Jeandet P, Bessis R, Joubert JM. 1996. Induction of phytoalexin (resveratrol)
synthesis in grapevine leaves treated with aluminum chloride (AlCl3). J Agric Food Chem 44:1979-81.
Aggarwal BB, Bhardwaj A, Aggarwal RS, Seeram, NP, Shishodia S, Takada Y. 2004. Role of
resveratrol in prevention and therapy of cancer: preclinical and clinical studies. Anticancer Res 24 (5A):2783-2840.
Aguamah GE, Langcake P, Leworthy DP, Page JA, Price RJ, Strange RN. 1981. Two novel
stilbene phytoalexins from Arachis hypogaea. Phytochemistry 20:1381-3. AACC (American Association of Cereal Chemists Inc). 1983. Crude fat in wheat and soy flour,
feeds and cooked feeds. Secs. 30-25 and Moisture –modified vacuum oven method. Secs, 44-40.In Approved Methods of American Association of Cereal Chemists, 8th ed., St. Paul, MN.
Andlauer W, Kolb J, Siebert K, Fürst P. 2000. Assessment of resveratrol bioavailability in the perfused small intestine of the rat. Drugs Exp Clin Res 26(2):47-55
Arichi H, Kimura Y, Okuda H, Baba K, Kozawa M, Arichi S. 1982. Effects of stilbene components of the roots of Polygonum cuspidatum Sieb. et Zucc. on lipid metabolism. Chem Pharm Bull 30:1766-70.
Arora MK, Strange RN. 1991. Phytoalexin accumulation in groundnuts in response to wounding.
Plant Sci 78:157-63. Awad AB, Chan KC, Downie AC, Fink, CS. 2000. Peanuts as a source of β-sitosterol, a sterol
with anticancer properties. Nutr and Cancer 36(2):238-41. Ayala-Zavala J F, Wang SY, Wang CY, González-Aguilar GA. 2007. High oxygen treatment
increases antioxidant capacity and postharvest life of strawberry fruit. Food Tech Biotechnol 45:166-73.

407
Azpilicueta CE, Zawoznik MS, Tomaro ML. 2004. Phytoalexins synthesis is enhanced in groundnut plants inoculated with Bradyrhizobium sp. (Arachis). Crop Prot 23:1069-74.
Bais AJ, Murphy PJ, Dry IB. 2000. The molecular regulation of stilbene phytoalexin
biosynthesis in Vitis vinifera during grape berry development. Aust J Plant Physiol 27:425-33.
Baur, JA, Pearson KJ, Price NL, Jamieson HA, Lerin C, Kaira A, Prabhu VV, Allard JS, Lopez-Lluch G, Lewis K, Pistell PJ, Poosala S, Becker KG, Boss O, Gwinn D, Wang M, Ramaswany S, Fishbein KW, Spencer RG, Lakatta EG, Le Couteur D, Shaw RJ, Navas P, Puigserver P, Ingram DK, de Cabo R, Sinclair DA. 2006. Resveratrol improves health and survival of mice on a high calorie diet. Nature 444(7117):280-5.
Bavaresco L. 2003. Role of viticultural factors on stilbene concentrations of grapes and wine.
Drugs Exp Clin Res 29(5-6):181-7. Baxter NJ, Lilley TH, Haslam E, Williamson MP. 1997. Multiple interactions between
polyphenols and a salivary proline-rich protein repeat result in complexation and precipition. Biochem 36:5566-77.
Becker JVW, Armstrong GO, van der Merwe MJ, Lambrechts MG, Vivier MA, Pretorius IS.
2003. Metabolic engineering of Saccharomyces cereviseae for the synthesis of wine-related antioxidant resveratrol. FEMS Yeast Res 4:79-85.
Belguendouz L, Fremont L, Gozzelino MT 1998. Interaction of trans-resveratrol with plasma
lipoproteins. Biochem Pharmacol 55:811-6. Bett KL, Boylston TD. 1992. Effect of storage of roasted peanut quality. In Lipid Oxidation in
Food, A. J. St. Angelo (ed) pp. 322-343. ACS Symposium Series 500, American Chemical Society, Washington, DC.
Biolley JP, Kanoun M, Junqua M, Goulas P. 1998. Elicitation of phytoalexins in bean leaves
(Phaseolus vulgaris L., cv Bergamo) by a moderate chronic ozone stress. 2nd International Electronic Conference on Synthetic Organic Chemistry (ECSOC-2), September 1-30.
Boue SM, Cleveland TE, Carter-Wientjes C, Shih BY, Bhatnagar D, McLachlan JM, Burow ME.
2009. Phytoalexin-enriched functional foods. J Agric Food Chem 57:2614-22. Brandolini V, Maietti A, Tedeschi P, Durini E, Vetuani S, Manfredini S. 2002. Capillary
electrophoresis determination, synthesis, and stability of resveratrol and related 3-O-β-D-glucopyronosides. J Agric Food Chem 50:7407-11.
Buhler DR, Miranda C. 2005. Antioxidant activities of flavonoids. Linus Pauling Institute,
Oregon State University. [Accessed on 2005 Sept 15]. Available from: http:// [email protected]/f-w00/flavonoid.html.

408
Burns J, Yokota T, Ashihara H, Lean MEJ, Crozier A. 2002. Plant foods and herbal sources of resveratrol. J Agric Food Chem 50:3337-40.
Cantos E, Garcia-Viguera C, de Pascual-Teresa S, Tomas-Barberan FA. 2000. Effect of
postharvest ultraviolet irradiation on resveratrol and other phenolics of Cv. Napoleon table grapes. J Agric Food Chem 48:4606-12.
Cantos E, Espin JC, Tomas-Barberan F.A. 2001. Postharvest induction modeling method using
UV irradiation pulses for obtaining resveratrol-enriched table grapes: a new “functional” fruit? J Agric Food Chem 49:5052-8.
Cantos E, Espin JC, Tomas-Barberan FA. 2002. Postharvest stilbene-enrichment of red and
white table grape varieties using UV-C irradiation pulses. J Agric Food Chem 50:6322-9. Cantos E, Espin JC, Fernandez MJ, Oliva J, Tomas-Barberan FA. 2003. Postharvest UV-C
irradiated grapes as a potential source for producing stilbene-enriched red wines. J Agric Food Chem 51:1208-14.
Castañeda P, Perez LM. 1996. Calcium ions promote the response of citrus limon against fungal
elicitors or wounding. Phytochemistry 42(3): 595-8. CDC - Chronic Disease – Cancer Prevention – At A Glance 2010. Centers for Disease Control
and Prevention. 2010a. Cancer: Addressing the cancer burden. [Accessed on 7/1/2010]. Available from: http:/www.cdc.gov/chronicdisease/resources/publications/aag/dcpc.htm
CDC – Chronic Disease – Heart Disease and Stroke Prevention – At A Glance 2010. Centers for
Disease Control and Prevention. 2010b. Heart disease and stroke prevention: Adressing the nation’s leading killers. [Accessed on 7/1/2010]. Available from: http:/www.cdc.gov/chronicdisease/resources/publications/aag/dhdsp.htm
Chan WH. 2005. Effect of resveratrol on high glucose-induced stress in human leukemia K562
cells. J. Cell Biochem 94 (6):1267-79. Chang, JC, Lai Y-H, Djoko B, Wu P-L, Liu C-D, Liu Y-W Chiuo RYY. 2006. Biosynthesis
enhancement and antioxidant and anti-inflammatory activities of peanut (Arachis hyppogaea L.) arachidin-1, arachidin-3, and isopentadienylresveratrol. J Agric Food Chem 54: 10281-7.
Chen RS, Wu PL, Chiou RYY. 2002. Peanut roots as a source of resveratrol. J Agric Food Chem
50:1665-7. Chen L, Han Y, Yang F, Zhang T. 2001. High-speed counter-current chromatography separation
and purification of resveratrol and piceid from Polygonum cuspidatum. J Chromatog A 907: 343–6.
Chu CA. 2003. Development, Sensory Profiling, Modelling and Storage Behavior on Chocolate
Peanut Spread. Master’s Thesis, University of Georgia, Athens, Georgia, U.S.A.

409
Chukwumah Y, Walker LT, Verghese M, Ogutu S, Bokanga M. 2005. Extraction of selected
phytochemicals from peanuts (Arachis hypogaea L.) using high-frequency ultrasonication method. Abstract No. 99B-24, Food Chemistry: Effects of food processing, formulation and component interactions. 2005 IFT Annual Meeting, July 15-20, 2005, New Orleans, Louisiana, U.S.A.
Chukwumah Y, Walker LT, Verghese M, Ogutu S. 2009. Effect of frequency and duration of
ultrasonication on the extraction efficiency of selected isoflavones and trans-resveratrol from peanuts (Arachis hypogaea). Ultrasonics Sonochem 16:293-9.
Chung IM, Park MR, Chun JC, Yun SJ. 2003. Resveratrol accumulation and resveratrol synthase
gene expression in response to abiotic stresses and hormones in peanut plants. Plant Sci 164:103-9.
Creasy LL, Coffee M. 1988. Phytoalexin production potential of grape berries. J Amer Soc Hort
Sci 113(2):230-4. Cooksey CJ, Garrrat PJ, Richards SE, Strange RN. 1988. A dienyl stilbene phytoalexin from
Arachis hypogaea. Phytochemistry 27(4):1015-6. Daigle DJ, Conkerton EJ, Sanders TH, Mixon AC. 1988. Peanut hull flavonoids: their
relationship with peanut maturity. J Agric Food Chem 36:1179-81. Das S, Cordis GA, Maulik N, Das DK. 2005. Pharmacological preconditioning with resveratrol:
role of CREB-dependent Bcl-2-signalling via adenosine A3 receptor activation. Am J Physiol Heart Circ Physiol 288:4328-35.
de la Lastra CA, Villegas I. 2005. Resveratrol as an anti-inflammatory and anti-aging agent:
mechanisms and clinical implications. Mol Nutr Food Res 49:405-30. Delmas D, Jannin B, Latruffe N. 2005. Resveratrol: preventing properties against vascular
alterations and ageing. Mol Nutr Food Res 49(5): 377-95. Dominguez C, Guillen DA, Barroso CG. 2001. Automated solid-phase extraction for sample
preparation followed by high-performance liquid chromatography with diode array and mass spectrometric detection for the analysis of resveratrol derivatives in wine. Chromatogr A 918: 303-10.
Drewnowski A, Gomez-Carneros C. 2000. Bitter taste, phytonutrients, and the consumer: a
review. Am J Clin Nutr 72:1424–35. Duh PD, Yen GC. 1995. Changes in antioxidant activity of components of methanolic extracts of
peanut hulls irradiated with ultraviolet light. Food Chem 54:127-31.

410
Edwards C, Strange RN. 1991. Separation and identification of phytoalexins from leaves of groundnut (Arachis hypogaea) and development of a method for their determination by reverse-phase high-performance liquid chromatography. J Chromatogr 547:185-93.
Eferl R, Wagner EF. 2003. AP-1: a double-edged sword in tumorigenesis. Nature Rev Cancer
3:859-68. Einstein MA. 1991. Descriptive techniques and their hybridization. Sensory Science Theory and
Application in foods. HT Lawless and BP Klein, eds. 317-38. El-Kayati SM, Fadel HHM, Abdel Mageed MA, Farghal SA. 1998. Heat and storage effects on
the flavour of peanuts. Nahrung 42:416-21. Erkan, M, Wang, SY, Wang CY. 2008. Effect of UV treatment on antioxidante capacity,
antioxidant enzyme activity and decay in strawberry fruit. Postharvest Biol Technol 48:163-71.
Evranuz OZ. 1993. The effect of temperature and moisture content on lipid peroxidation during
storage of unblanched salted roasted peanuts: shelf life studies for unblanched salted roasted peanuts. Intl J Food Sci Technol 28: 193-9.
Fernandez-Pachon, MS, Villaño, D, Garcia-Parrilla, MC, Troncoso, AM. 2004. Antioxidant
activity of wines and relation with their polyphenolic composition. Analytica Chimica Acta 513: 113-8.
Ferrero ME, Bertelli AAE, Pellegatta F, Fulgenzi A, Corsi MM, Bertelli A. 1998. Phytoalexin
resveratrol (3-4’-5-trihydroxystilbene) modulates granulocyte and monocyte endothelial adhesion. Transplantation Proceedings 30:4191-3.
Frankel EN, Kanner J, German JB, Parks E, Kinsella JE. 1993. Inhibition of oxidation of human
low density lipoprotein substances in red wine. Lancet 341:454-7. Frankel EN, Waterhouse AL, Kinsella JE. 1993. Inhibition of of human LDL oxidation by trans-
resveratrol. Lancet 341:1103-4. Francisco, MLdL. 2009. Functional components in peanut skins. Ph.D. Dissertation. The
University of Georgia, Athens, GA. 336pp. Francisco MLdL, Resurreccion AVA. 2009a. Total phenolics and antioxidant capacity of heat-
treated peanut skins. J Food Comp Anal 22:16–24. Francisco MLdL, Resurreccion AVA. 2009b. Development of a reverse-phase high performance
liquid chromatography (RP-HPLC) procedure for the simultaneous determination of phenolic compounds in peanut skin extracts. Food Chem 117:353-63.

411
Fritzemeier K-H, Rolfs C-H, Pfau J, and Kindl H. 1983. Action of ultraviolet-C on stilbene formation in callus of Arachis hypogaea. Planta 159:25-9
Fu B, Labuza TP. 1993. Shelf life prediction: theory and application. Food Control 4 (3): 125-
33.
Fu B, Labuza, TP. 2005. Shelf life testing: procedures and prediction methods for frozen foods. [Accessed 11-26-2005]. Accessed from: http://www.Faculty.che.umn.edu/fsch/…/PDF_files/papers/FrozenFood_ShelfLife.pdf
Garcia-Garcia J, Micol V, de Godos A, Gomez-Fernandez JC. 1999. The cancer
chemopreventive agent resveratrol is incorporated into model membranes and inhibits proteine kinase C α activity. Arch Biochem Biophys 372:382-8.
Gao L, Chu Q, Ye, J. 2002. Determination of trans-resveratrol in wines, herbs, and health food
by capillary electrophoresis with electrochemical detection. Food Chem 78:255-60. Geahlen RL, McLaughlin, JL. 1989. Piceatannol (3,4,3’,5’-tetrahydroxy-trans-stilbene) is a
naturally occurring protein-tyrosine kinase inhibitor. Biochem Biophys Res Commun 165:241-5.
Gehm BD, McAndrews JM, Chien PY, Jameson JL. 1997. Resveratrol, a polyphenolic
compound found in grapes and wine is an agonist for the estrogen receptor. Proc Natl Acad Sci 94:14138-43.
Gerogiannaki-Christopoulou M, Athanasopoulos P, Kyriakidis N, Gerogiannaki IA, Spanos M.
2006. trans-Resveratrol in wines from the major Greek red and white grape varieties. Food Control 17:700-6.
Gescher AJ, Steward WP. 2003. Relationship between mechanisms, bioavailability, and pre-
clinical chemopreventive efficiency of resveratrol: a conundrum. Cancer Epidemiol Biomarkers Prevention 12:953-7.
Ghiselli A, Nardini m, Baldi A, Scaccini C. 1998. Antioxidant activity of different phenolic
fractions separated from an Italian red wine. J Agric Food Chem 46(2):361-7. Gills LA, Resurreccion AVA. 2000. Overall acceptability and sensory profiles of unstabilized
peanut butter and peanut butter stabilized with palm oil. J Food Proc Preserv 24:495-516. Giovanni M. 1983. Response surface methodology and product optimization. Food Technol
36(11):41-45, 83. Giorcelli A, Sparvoli F, Mattivi F, Tava A, Balestrazzi A, Vrhovsek U, Calligari P, Bollini R,
Confalonieri, M. 2004. Expression of the stilbene synthase (StSy) gene from grapevine in transgenic white poplar results in high accumulation of the antioxidant compounds resveratrol glucosides. Transgenic Res 13:203-14.

412
Gonzales-Aguilar, GA, Villegas-Ochoa, MA, Martinez-Tellez, MA, Gardea, AA, Ayala-Zavala, JF 2007. Improving antioxidant capacity of fresh-cut mangoes treated with UV-C. J Food Sci 72:S197-S201.
Grimmig B, Schubert R, Fischer R, Hain R, Schreier PH, Betz C, Langebartels C, Ernst D,
Sandermann H Jr.1997. Ozone- and ethylene-induced regulation of a grapevine resveratrol synthase promoter in transgenic tobacco. Acta Physiologiae Plantarum. 19:467-74.
Grippi F, Crosta L, Aiello G, Tolomeo M, Oliveri F, Gebbia N, Curione A. 2008. Determination
of stilbenes in Sicilian pistachio by high-performace liquid chromatographic diode array (HPLC-DAD/FLD) and evaluation of eventually mycotoxin contamination. Food Chem 107: 483-8.
Grosso NR, Resurreccion AVA. 2002. Predicting consumer acceptance ratings of cracker-coated
and roasted peanuts from descriptive analysis and hexanal measurements. J Food Sci 67(4):1530-7.
Gu X, Chu Q, O’Dwyer M, Zeece M. 2000. Analysis of resveratrol in wine by capillary
electrophoresis. J. Chrom A 881:471-81. Gulchin I. 2006. Antioxidant activities of resveratrol: A structure-activity insight. Innovative
Food Sci Emerging Technol 11:210-8. Gupta YK, Sharma M, Brival S. 2004. Antinociceptive effect of trans-resveratrol in rats:
involvement of an opiodergic mechanism. Methods Find Exp Clin Pharmacol 26(9): 667-72. Hain R, Bieseler B, Kindl H, Schroder G, Stocker R. 1990. Expression of stilbene synthase gene
in Nicotiana tabacum results in synthesis of the phytoalexin, resvseartrol. Plant Mol Biol 15 (2):325-35.
Han JH, Wang HM, Min S, Krochta JM. 2008. Coating of Peanuts with edible whey protein film
containing α-tocopherol and scorbyl palmitate. J Food Sci 73(8):349-55. Hanawa F, Tahara S, Mizutani J. 1992. Antifungal stress compounds from veratrum
grandiflorum leaves treated with cupric chloride. Phytochemistry 31:3005-7. Henry C, Vitrac X, Decendit A, Ennamany R, Krisa S, Merillon J-M. 2005. Cellular uptake and
efflux of trans-piceid and its aglycon trans-resveratrol on the apical membrane of human intestinal Caco-2 cells. J Agric Food Chem 53:798-803.
Henry-Vitrac C, Desmouliere A, Girard D, Merillon J-M, Krisa S. 2006. Transport,
deglycosylation, and metabolism of trans-piceid by small intestinal epithelial cells. Eur J Nutr 45:376-82.
Ho CT, Lee MH, Chang SS. 1981. Isolation and identification of volatile compounds from
roasted peanuts. J Food Sci 47:127-33.

413
Holmes-McNary M, Baldwin AS. 2000. Chemopreventive properties of trans-resveratrol are
associated with inhibition of activation of IĸB kinase. Cancer Res 60:3477-83. Hsieh TC, Juan G, Darzynkiewics Z, Wu JM. 1999. Resveratrol increases nitric oxide sythase,
induces accumulation of p53 and p21WAF1/CIP1, and suppresses culture bovine pulmonary artery endothelial cell proliferation by perturbing progression through S and G2. Cancer Res 59: 2596-2601
Hsieh TC, Wu JM. 2000. Grape-derived chemopreventive agent resveratrol decreases prostate-
specific antigen (PSA) expression in LNCaP cells by an androgen receptor (AR)-independent mechanism. Anticancer Res 20:225-8.
Huang SC, Yen GC, Chang, LW, Yen WJ, Duh PD. 2003. Identification of an antioxidant, ethyl
protocatechuate, in peanut seed testa. J Agric Food Chem 51:2380-3. Ibern-Gomez M, Roig-Perez S, Lamuela-Raventos RM, de la Torre-Boronat M.C. 2000.
Resveratrol and piceid levels in natural and blended peanuts. J Agric Food Chem 48:6352-4. Ingham JL. 1976. 3,5,4′-trihydroxystilbene as a phytoalexin from groundnuts (arachis
hypogaea). Phytochemistry. 15:1791-3. Jang M, Cai L, Udeani GO, Slowing KV, Thomas CF, Beecher CWW, Fong HSS, Farnsworth
NR, Kinghorn AD, Mehta RG, Moon RC, Pezzuto JM. 1997. Cancer chemopreventive activity of resveratrol, a natural product derived from grapes. Science 275:218-20.
Jang JH, Surh YJ. 2003. Protective effect of resveratrol on β-amyloid-induced oxidative PC12
cell death. Free Radic Biol Med 34:1100-10. Jeandet P, Bessis R, Maume BF, Meunier P, Peyron D, Trollat P. 1995. Effect of enological
practices on the resveratrol isomer content of wine. J Agric Food Chem 43:316-9. Jensen PN, Danielsen B, Bertelsen G, Skibsted LH, Andersen ML. 2005. Storage stabilities of
pork scratchings, peanuts, oatmeal and muesli: Comparison of ESR spectroscopy, headspace-GC and sensory evaluation for detection of oxidation in dry foods. Food Chem 91:25-38.
Johnsen PB, Civille GV, Vercellotti JR, Sanders TH, Dus CA. 1988. Development of a lexicon
for the description of peanut flavor. J Sensory Studies. 3: 9-17. Johnson BR, Waller GR, Foltz RL. 1971. Volatile components of roasted peanuts: neutral
fraction. J Agric Food Chem 19: 1025-7. Kageura T, Matsuda H, Morikawa T, Toguchida I, Harima S, Oda M., Yoshikawa M. 2001.
Inhibitors from rhubarb on lipopolysaccharide-induced nitric oxide production on macrophages; structural requirements of stilbenes for the activity. Bioorg Med Chem 9: 1887-93.

414
Kalikiri PC, Sachan RSGS. 2004. Ischemic and anesthetic preconditioning of the heart: an insight into the concepts and mechanisms. Internet J Anesthesiol 8(2):1-2.
Kaneuchi M, Sasaki M, Tanaka Y, Yamamoto R, Sakuragi N, Dahiya R. 2003. Resveratrol suppresses growth of Ishikawa cells through down-regulation of EGF. Int J Oncol 23:1167-72.
Kato H, Kodama O, Akatsuka T. 1993. Oryzalexin E, a diterpene phytoalexin from UV-
irradiated rice leaves. Phytochemistry. 33:79-81. Keen NT. 1975. The isolation of phytoalexins from germinating seeds of Cicer aritinum, Vigna
sinensis, Arachis hypogaea, and other plants. Phytopathology 65:91-2. Keen NT, Ingham JL. 1976. New stilbene phytoalexins from American cultivars of Arachis
hypogaea. Phytochemistry 16:1794-5. Kim DO, Lee KW, Lee HJ, Lee, CY. 2002. Vitamin C equivalent antioxidant capacity (VCEAC)
of phenolic phytochemicals. J Agric Food Chem 50:3713-7. Kim, DO, Lee CY. 2004. Comprehensive Study on Vitamin C Equivalent Antioxidant Capacity
(VCEAC) of Various Polyphenolics in Scavenging a Free Radical and its Structural Relationship. Crit Rev Food Sci Nutr 44:253–73.
Kim HI, Kim TH, Song JH. 2005. Resveratrol inhibits Na+ currects in rat dorsal root ganglion
neurons. Brain Res 1045:134-41. Kimura Y, Ohminami H, Okuda H, Baba K, Kozawa M, Arichi S. 1983. Effects of stilbene
components of roots of Polygonum spp. On liver injury in peroxidized oil-fed rats. Planta Med 49:51-4.
Kimura Y, Okuda H, Kudo M. 1995. Effect of stilbenes isolated from medicinal plants on
arachidonate metabolism and degranulation in human polymorphonuclear leukocytes. J Ethnopharmacol 45:131-9.
King RE, Bomser AB, Min DB. 2006. Bioactivity of resveratrol. Comprehensive Rev Food Sci
Food Safety 5:65-70. Kodama O, Suzuki T, Miyakawa J. 1988. Ultraviolet-induced accumulation of phytoalexins in
rice leaves. Agric Biol Chem 52:2469-73. Kolouchova-Hanzlikova I, Melzoch K, Filip V, Smidrkal J. 2004. Rapid method for resveratrol
determination by HPLC with electrochemical and UV detections in wines. Food Chem 87:151-8.

415
Ku K-L, Chang P-S, Cheng Y-C, Lien C-Y. 2005. Production of stilbenoids from the callus of Arachis hypogaea: a novel source of anticancer compound piceatannol. J Agric Food Chem 53:3877-81.
Kuhnle G, Spencer JPE, Chowrimootoo G, Schroeter H, Debnam E. S, Srai SKS, Rice-Evans C,
Hahn U. 2000. Resveratrol is absorbed in the small intestine as resveratrol glucuronide. Biochem Biophys Res Commun 272:212–7.
Laden BP, Porter TD. 2001. Resveratrol inhibits human squalene monooxygenase. Nutr Res
21(5):747-53. Labuza TP. 1984. Application of chemical kinetics to deterioration of foods. J Chem Ed 61: 348-
58. Labuza TP. 2000. The Search for Shelf-life. Food Testing Anal. May. 26-36. Labuza TP, Schmidl MK. 1985. Accelerated shelf-life testing of foods. Food Technol 39(9):57-
62, 64. Lamuela-Raventos RM, Romero-Perez AI, Waterhouse AL, and dela Torre-Boronat MC. 1995.
Direct HPLC analysis of cis and trans-resveratrol and piceid isomers in Spanish red Vitis vinefera wines. J Agric Food Chem 43: 281-3.
Langcake P, Pryce R J. 1976. The production of resveratrol by Vitis vinifera and other members
of the Vitacee as a response to infection or injury. Physiol Plant Path 9:77–86. Langcake P, Pryce RJ. 1977. The production of resveratrol and the viniferins by grapevines in
response to ultraviolet irradiation. Phytochemistry 16:1193-6. Lawless HT, Heymann H. 1998. Sensory evaluation of food: Principles and practices. 1st ed.
New York: Chapman & Hall. Lazarus SA, Adamson GE, Hammerstone JF, Schmitz HH. 1999. High-performance liquid
chromatography/mass spectrometry analysis of proanthocyanidins in food and beverages. J Agric Food Chem 47:3693-3701.
Lee CH, Resurreccion AVAR. 2001. Improved correlation between sensory and instrumental
measurement of peanut butter texture. J Food Sci 57(5):1939-49. Lee SS, Lee SM, Kim M, Chun J, Cheong YK, Lee J. 2004. Analysis of trans-resveratrol in
peanuts and peanut butters consumed in Korea. Food Res Int 37:247–251. Lee SC, Jeong SM, Kim SY, Park HR, Nam KC, Ahn DU. 2006. Effect of far-infrared radiation
and heat treatment on the antioxidant activity of water extracts from peanut hulls. Food Chem 94(4):489-93.

416
Lesschaeve I, Noble AC. 2005. Polyphenols: factors influencing their sensory properties and their effects on food and beverage preferences. Am J Clin Nutr 81(suppl):330S-5S.
Lin LL, Lien CY, Cheng YC, Ku KL. 2007. An effective sample preparation for screening the anticancer compound piceatannol using HPLC coupled with UV and fluorescence detection. J Chromatogr B 853:175-82.
Lin L, Wu J, Ho KP, Qi S. 2001. Ultrasound-induced physiological effects and secondary
metabolite (saponin) production in Panax ginseng cell cultures. Ultrasound Med Biol 27(8):1147-52.
Lou HL, Yuan H, Ma B, Ren D, Ji M, Oka S. 2004. Polyphenols from peanut skins and their
free radical-scavenging effects. Phytochemistry 65:2391-9. Lu R, Serrero G 1999. Resveratrol, a natural product derived from grape, exhibits antiestrogenic
activity and inhibits the growth of human breast cancer cells. J Cellular Physiol 179:297-304. Luan T, Li G, Zhang Z. 2000. Gas-phase postderivatization following solid-phase
microextraction for rapid determination of trans-resveratrol in wine by gas chromatography-mass spectrometry. Anal Chim Acta 424:19–25.
Lyons MM, Yu C, Toma RB. 2003. Resveratrol in raw and baked blueberries and bilberries. J
Agric Food Chem 51:5867-70. Malovana S, Garcia-Montealegro FJ, Perez JP, Rodriguez-Delgado MA. 2001. Optimization of
sample preparation for the determination of trans-resveratrol and other polyphenolic compounds in wines by high perforamance liquid chromatography. Anal Chim Acta 428:245-53.
Manna SK, Mukhapadhyay A, Aggarwal BB. 2000. Resveratrol suppresses TNF-induced
activation of nuclear transcription factors NF-Kappa B, activation protein-1, and apoptosis: potential role of reactive oxygen intermediates and lipid peroxidation. J Immunol 164:6509-19.
Marambaud P, Zhao H, Davies P. 2005. Resveratrol promotes clearance of Alzheimer’s disease
amyloid-β peptides. J Biol Chem Mol Biol 280(45): 37377-82. Marier JF, Vachon P, Gritsas A, Zhang J, Moreau JP, Ducharme MP. 2002. Metabolism and
disposition of resveratrol in rats: extent of absorption, glucuronidation, and enterohepatic recirculation evidenced by a linked-rat model. J Pharmacol Experimental Therapeutics 302:369-73.
Mason ME, Johnson B, Hamming M. 1966. Flavor components of roasted peanuts. Some low
molecular weight pyrazines and a pyrrole. J Agric Food Chem 14: 454-60.

417
Mason TJ. 2003. Sonochemistry and sonoprocessing: the link, the trends and (probably) the future. Ultrasonics Sonochem 10:175-9
Matsuoka A, Takeshita K, Furuta A, Ozaki M, Fukuhara K, Miyata N. 2002. The 4′-hydroxy
group is responsible for the in vitro cytogenetic activity of resveratrol. Mutat Res 521:29-35. McMurtrey KD, Minn J, Pbanz K, Shultz TP. 1994. Analysis of wines for resveratrol using
direct injection high pressure liquid chromatography with electrochemical detection. J Agric Food Chem 42(10):2077-80.
Medina-Bolivar F, Condori J, Rimando AM, Hubstenberger J, Shelton K, O’Keefe SF, Bennett
S, Dolan MC. 2007. Production and secretion of resveratrol in hairy root cultures of peanut. Phytochemistry 68:1992-2003.
Meilgaard MD, Civille GV. 2007. Sensory evaluation techniques. 4th ed. Boca Raton, FL: CRC
Press, Inc. Miloso M, Bertelli AAE, Nicolini G, Tredici G. 1999l. Resveratrol-induced activation of the
mitogen-activated protein kinases, ERK1 and ERK2, in human neuroblastoma SH-SY57 cells. Neuroscience Letters 264:141-4.
Mitchell SH, Zhu W, Young CYF. 1999. Resveratrol inhibits the expression and function of the
androgen receptor in LNCaP prostate cancer cells. Cancer Res 59: 5892–5. Moreno-Labanda JF, Mallavia R, Perez-Fons L, Lizama V, Saura D, Micol V. 2004.
Determination of piceid and resveratrol in Spanish wines deriving from Monastrell (Vitis vinifera L.) grape variety. J Agric Food Chem 52:5396-5403.
Morris NJ, Freeman AF. 1954. Peanut Butter. VI. The effect of roasting on the palatability of
peanut butter. Food Technol August, 377-80. Muego-Gnanasekharan KF, Resurreccion AVA. 1992. Physicochemical and sensory
characteristics of peanut paste stored at different temperatures. J Food Sci 57:1385-89. Muñoz AM. 2004. Hedonics, just about right, purchase and other scales in consumer tests. In
Viewpoints and Controversies in Sensory Science and Consumer Product Testing. Moskowitz HR, Munoz AM, Gacula MC (eds). Trumbull, Connecticut: Food & Nutrition Press. p. 156.
Naczk M, Shahidi R. 2006. Phenolics in cereals, fruits and vegetables: occurrence, extraction and
analysis. J Pharm Biom Anal 41:1523-42.
National Peanut Board. 2010. Fun Facts Peanuts. National Peanut Board [Accessed 11/04/2010] Available from http://www.nationalpeanutboard.org/classroom-funfacts.php.

418
Nepote V, Grosso NR, Guzman CA. 2004. Radical scavenging activity of extracts of Argentine peanut skins (Arachis hypogaea) in relation to its trans-resveratrol content. J Argentine Chem Soc 92(4/6):41-9.
Pace-Asciak CR, Hahn S, Diamandis EP. Soleas G, Goldberg DM. 1995. The red wine phenolics
trans/resveratrol and quercetin block human platelet aggregation and eicosanoid synthesis: implications for protection against coronary heart disease. Clin Chimica Acta 235:207-19.
Pearce G, Merchand PA, Griswold J, Lewis, NG, Ryan CA. 1998. Accumulation of
feruloyltyramine and ρ-coumaroyltyramin in tomato leaves in response to wounding. Phytochemistry 47(4):659-64.
Pelligrini N, Serefini M, Columbi B, Del Rio D, Salvatore MB, Brighenti F. 2003. Total
antioxidant capacity of plant foods, beverages and oils consumed in Italy assessed by three different in vitro assays. J Nutr 133:2812-9.
Peña-Farfal C, Moreda-Piñiero A, Bermejo-Barrera A, Bermejo-Barrrera P, Pinochet-Cancino
H, de Gregori-Henriquez I. 2005. Speeding up enzymatic hydrolysis procedures for multi-element determination in edible seaweed. Analytica Chimica Acta 548(1-2):183-91.
Pennington JAT. 2002. Food composition databases for bioactive food components. J Food
Comp Anal 15:419-34. Peryam DR, Pilgrim FJ. 1957. Hedonic scale method of measuring food preferences. Food
Technol 11(9) 9-14. Potter GA, Patterson LH, Wanogho E, Perry PJ, Butler PC, Ijaz T, Ruparelia KC, Lamb JH,
Farmer PB, Stanley LA, Burke MD. 2002. The cancer preventative agent resveratrol is converted to the anticancer agent piceatonnol by the cytochrome P450 enzyme CYP1B1. British J Cancer 86: 774-8.
Potrebko I, Resurreccion AVA. 2009. Effect of ultraviolet doses in combined ultraviolet-
ultrasound treatment on trans-resveratrol and trans-piceid contents in sliced peanut kernels. J Agric Food Chem 57:7750-6.
Pratt DE, Miller EE. 1984. Flavonoid antioxidant in Spanish peanuts (Arachis hypogoea). J Am
Oil Chem Soc 61:1064-7. Prior RL, Wu L, Schaich K. 2005. Standardized methods for the determination of antioxidant
capacity and phenolics in foods and dietary supplements. J Agric Food Chem 53:4290-302. Prior RL, Cao G., Martin A, Sofic E, McEwan J, O’Brien C, Lischner N, Ehlenfeldt
M, Kalt W, Krewer G, Mainland CM. 1998. Antioxidant capacity as influenced by total phenolic and anthocyanin content, maturity, and variety of Vaccinium species. J Agric Food Chem 46:2686-93.

419
Prior RL, Hoang H, Gu L, Wu X, Bacchiocca M, Howard L, Hampsch-Woodill M, Huang D, Ou B, Jacob R. 2003. Assays for hydrophilic and lipophilic antioxidant capacity (Oxygen radical absorbance capacity (ORACFL) of plasma and other biological and food samples. J Agric Food Chem 51:3273-9.
Ragione FD, Cucciolla V, Criniti V, Indaco S, Borriello A, Zappia V. 2003. P21CiP1 gene
expression is modulated by Egr1: a novel regulatory mechanism involved in the resveratrol antiproliferative effect. J Biol Chem 278: 23360-8.
Regev-Shoshani G, Shoseyov O, Bilkis I, Kerem Z. 2003. Glycosylation of resveratrol protects it
from enzymic oxidation. Biochem J 374:157-63. Resurreccion AVA. 1998. Consumer sensory testing for product development. Gaithersburg,
Maryland: Aspen Publishers, Inc. 682p. Reviere C, Richard T, Quentin L, Krisa S, Merillon J-M, Monti J-P. 2007. Inhibitory activity of
stilbenes on Alzheimer’s β-amyloid fibrils in vitro. Bioorg Med Chem 15:1160-7. Romero-Perez AI, Ibern-Gomez M, Lamuela-Raventos RM, dela Torre-Boronat MC. 1999.
Piceid, the major resveratrol in grape juices. J Agric Food Chem 47:1533-6. Romero-Perez AI, Lamuela-Raventos RM, Andres-Lacueva C, De la Torre-Boronat MC. 2001.
Method for quantitative extraction of resveratrol and piceid isomers in grape berry skins. Effect of powdery mildew on the stilbene content. J Agric Food Chem 49:210-5.
Rudolf JL. 2003. Development of an HPLC method for resveratrol and optimization of post-
harvest stress to induce production in peanuts. [MS thesis]. University of Georgia, Athens, GA.
Rudolf JL, Phillips RD, Chinnan MS and Resurreccion AVA. 2002. Postharvest induction of
resveratrol in peanut kernels by grinding. Abstract No. 15C-9. IFT Annual Meeting, June 13-16, 2002, Anaheim, CA.
Rudolf JL, Resurreccion AVA, Saalia FK, Phillips RD. 2005. Development of reverse-phase
high performance liquid chromatography method for analyzing trans-resveratrol in peanut kernels. Food Chem 89:623-38.
Rudolf JL, Resurreccion AVA. 2005. Elicitation of resveratrol in peanut kernels by application
of abiotic stresses. J Agric Food Chem 53:10186-92. Rudolf JR, Resurreccion AVA. 2007. Optimization of trans-resveratrol concentration and
sensory properties of peanut kernels, by slicing and ultrasound treatment, using response surface methodology. J Food Sci 72(7):S450-62.
Sales JM and Resurreccion AVA. 2009. Maximising resveratrol and piceid contents in UV and
ultrasound treated peanuts. Food Chem 117:674-80.

420
Sales JM and Resurreccion AVA. 2010. Phenolic profile, antioxidants, and sensory acceptance
of bioactive-enhanced peanuts using ultrasound and UV. Food Chem 122:795-803. Samuel MA, Miles GP, Ellis BE. 2000. Ozone treatment rapidly activates MAP kinase signaling
in plants. Plant J 22:367-76. Sanchez-Moreno C, Cao G, Ou B, Prior, RL. 2003. Anthocyanin and proanthocyanidin content
in selected white and red wines. Oxygen Radical Absorbance Capacity comparison with nontraditional wines obtained from highbush blueberry. J Agric Food Chem 51:4889-96.
Sanders TH, McMichael Jr. RW, Hendrix KW. 2000. Occurrence of resveratrol in edible
peanuts. J Agric Food Chem 48:1243-6. Sarig P, Zahavi T. Zutkhi Y, Yannai S, Lisker N, Ben-Arie R. 1996. Ozone for control of post-
harvest decay of table grapes caused by Rhizopus stolonifer. Physiol Mol Plant Path 48:403-15.
Seo JE, Lee SS, Chun J, Lee HB, Lee, J. 2005. Optimization for the post–harvest induction of
trans-resveratrol in raw peanuts. Abstract No. 99B-31. Session 99B, Food Chemistry: Effects of food processing, formulation and component interactions, presented at 2005 IFT Annual Meeting, New Orleans, Louisiana, July 15-20.
She QB, Bode AM, Ma WY, Chen NY, Dong Z. 2001. Resveratrol-induced activation of p53
and apoptosis is mediated by extracellular-signal-regulated protein kinases and p38 kinase. Cancer Res 61: 1604-10.
Singleton VL, Orthofer R, Lamuela-Raventos RM. 1999. Analysis of total phenols and other
oxidation substrates and antioxidants by means of Folin-Ciolcalteu reagent. Methods in Enzymology 299:152-78.
Singleton VL, Rossi JA JR. 1965. Colorimetry of total phenolics with phosphomolybdic-
phosphotungstic acid reagents. Amer J Enol Viticult 16:144-58. Snyder LR, Kirkland JJ, Glajch JL. 1997. Practical HPLC development . New York: John Wiley
and Sons Inc. 327 pp. Sobolev VS, Cole RJ, Dorner JW. 1995. Isolation, purification, and liquid chromatographic
determination of stilbene phytoalexins in peanuts. JAOAC Int. 78(5):1177-82. Sobolev VS, Cole RJ. 1999. trans-Resveratrol content in commercial peanuts and peanut
products. J Agric Food Chem 47:1435-39. Sobolev VS, Neff SA, Gloer JB. 2009. New stilbenoids from peanut (Arachis hypogaea) seeds
challenged by an Aspergillus caelatus strain. J Agric Food Chem 57:62-8.

421
Soleas GJ, Diamandis EP, Goldberg DM. 1997. Resveratrol, a molecule whose time has come? and gone? Clinical Biochem 30(2):91-113.
Soria AC, Villamiel M. 2010. Effect of ultrasound on the technological properties and
bioactivity of food: a review. Food Sci Technol 21:323-31. Spadaro JJ. 1975. Uses of defatted and partially defatted peanut flours. Session K Round Table
Discussions. J Am Oil Chemists Soc 56:474-475. St. Angelo AJ. 1996. Lipid oxidation in foods. Crit Rev Food Sci Nutr 36(3):175-224. Stanley LL, Mazier MJ P. 1999. Potential explanations for the paradox. Nutri Research 19(1):3-
15. Stewart JR, Ward NE, Ionnides CG, O’Brian CA. 1999. Resveratrol preferentially inhibits
protein kinase C-catalyzed phosphorylation of a co-factor-independent, arginine-rich protein substrate by a novel mechanism. Biochem 38:13224-51.
Stojanovik S, Sprinz H, Brede O. 2001. Efficiency and mechanism of the antioxidant action of
trans-resveratrol and its analogues in the radical liposom oxidation. Archives Biochem Biophys 391:79-89.
Stone H, Sidel JL. 2004. Sensory evaluation practices. 3rd ed. San Diego, CA: Elsevier Academic
Press, Inc. 408p. Subba Rao PV, Wadia KDR, Strange RN. 1996. Biotic and abiotic elicitation of phytoalexins in
leaves of groundnut (Arachis hypogaea L.). Physiol Mol Plant Path 49:343-57. Sun AY, Chen Y, James-Kracke M, Wixom P, Cheng Y. 1997. Ethanol-induced cell death by
lipid peroxidation in PC12 cells. Neurochem Res 22(10):1187-92. Szende B, Tyihak E, Kiraly-Veghely Z. 2000. Dose-dependent effect of resveratrol on
proliferation and apoptosis in endothelial and tumor cell cultues. Exp Mol Med 32:88-92. Talcott ST, Howard LR, Brenes CH. 2000. Contribution of periderm material and blanching time
to the quality of pasteurized peach puree. J Agric Food Chem 48:4590-6. Talcott ST, Duncan CE, Pozo-Insfran DD, Gorbet DW. 2005a. Polyphenolic and antioxidant
changes during storage of normal, mid and high oleic acid peanuts. Food Chem 89:77-84. Talcott ST, Passeretti S, Duncan CE, Gorbet DW. 2005b. Polyphenolic content and sensory
properties of normal and high oleic acid peanuts. Food Chem 90:379-88. Taoukis P, Labuza TP. 1996. Ch. 17: Summary: Integrative Concepts. In: Fennema OR, editor.
Food Chemistry. 3rd ed. New York: Marcel Dekker. pp. 1013-1042.
422
Thomzik JE, Stnzel K, Stocker R, Schreier PH, Hain R, Stahl DJ. 1997. Synthesis of a grapevine phytoalexin in transgenic tomatoes (Lycopersicon esculentum Mill.) conditions resistance against Phytophtera infestans. Physiol Mol Plant Path 51:265-78.
Tokusoglo O, Unal MK, Yemis F. 2005. Determination of the phytoalexin resveratrol (3, 5, 4′-
trihydroxystilbene) in peanuts and pistachios by high-performance liquid chromatographic diode array (HPLC-DAD) and gas chromatography-mass spectrometry (GC-MS). J Agric Food Chem 53(12):5003-9.
Trela BC, Waterhouse AL. 1996. Resveratrol: isomeric molar absorptivities and stability. J Agric
Food Chem 44(5):1253-7. USDA (United States Department of Agriculture). 2007. Nutrient Laboratory. Oxygen radical
Absorbance capacity (ORAC) of selected foods. [Accessed 10/02/2008]. Available from: http://www.ars.usda.gov/nutrientdata.
USDA/ERS Food Availability (Per Capita) Data System. 2008. United States Department of
Agriculture/Economic Research Service. [Accessed 10/02/2008]. Available from: http://www.ers.usda.gov/Data/FoodConsumption.
USDA/NASS Peanut Stocks And Processing. 2008. United States Department of Agriculture/
National Agricultural Statistics Service. [Accessed 10/06/2008] Available from: http://www.usda.gov/nass/PUBS/TODAYRPT/pnut0908.txt.
Van den Berg R, Haenen Guido RMM, van den Berg H, Bast A. 1999. Applicability of an
improved Trolox equivalent antioxidant capacity (TEAC) assay for evaluation of antioxidant capacity measurements of mixtures. Food Chem 66:511-7.
Vastano BC, Chen Y, Zhu N, Ho CT, Zhou Z, Rosen, RT. 2000. Isolation and identification of
stilbenes in two varieties of Polygonum cuspidatum. J Agric Food Chem 48:253–6. Vayndorf L. 2005. Antioxidant and toxicological properties of the phytoalexin resveratrol.
[Accesed 8/30/2005]. Available from: http://www.ansci.cornell.edu/courses/as625/2005term/Lena/Resveratrol/Resveratrol.htmL.
Verstraeten SV, Hammerstone JF, Keen CL, Fraga CG, Oteiza PI. 2005. Antioxidant and
membrane effects of procyanidin dimers and trimers isolated from peanut and cocoa. J Agric Food Chem 53:5041-8.
Villaño D, Fernandez-Pachon MS, Troncoso AM, Garcia-Parilla MC. 2004. The antioxidant
activity of wines determined by the ABTS+ method: influence of sample dilution and time. Talanta 64:501-9.
Walker GM. 2000. Sensory profiles, modeling and optimization, and effect of storage time and
temperature on cracker-coated peanut [MSc thesis]. Athens, Georgia: University of Georgia. 177p.

423
Wallerath T, Deckert G, Ternes T, Anderson H, Li H, Witte K, Forstermann U. 2002.
Resveratrol, a polyphenolic phytoalexin present in red wine, enhances expression and activity of endothelial nitric oxide synthase. Circulation 106:1652-8.
Wang MJ, Huang HM, Hsieh SJ, Jeng KCG, Kuo JS. 2001. Resveratrol inhibits interleukin-6
production in cortical mixed glial cells under hypoxia/hypoglycema followed by re-oxygeneration. J Neuroimmunol 112: 28-34.
Wang Y, Catana F, Yang Y, Roderick R, van Breemen RB. 2002. An LC-MS method for
analyzing total resveratrol in grape juice, cranberry juice, and in wine. J Agric Food Chem 50:431-5.
Wang KH, Lai YH, Chang JC, Ko TF, Shyu SL, Chiou RYY. 2005. Germination of peanut
kernels to enhance resvertrol biosynthesis and prepare sprouts as a functional vegetable. J Agric Food Chem 53:242-6.
Wang J, Sun B, Cao Y, Tian Y, Li X. 2008. Optimisation of ultrasound-assisted extraction of
phenolic compounds from wheat bran. Food Chem 106:804-10. Warner KJH, Dimick PS, Zeigler GR, Mumma RO, Hollender R. 1996. “Flavor-fade” and off-
flavors in ground roasted peanuts as related to selected pyrazines and aldehydes. J Food Sci 61: 469-72.
Walradt JP, Pittet AO, Kinlin TE, Muralidhara R, Sanderson A. 1971. Volatile components of
roasted peanuts. J Agric Food Chem 19: 972-79. Waterhouse AL, Lamuela-Raventos RM. 1994. The occurrence of piceid, a stilbene glucoside in
grape berries. Phytochemistry 37:571-3. Wenzel E. Somoza, V. 2005. Metabolism and biovailability of trans-resveratrol. Mol. Nutr. Food
Res. 49 (5): 472-481. Wolter F, Akoglu B, Clausnitzer A, Stein J. 2001. Down regulation of the cyclin D1/Cdk4
complex occurs during resveratrol-induced cell cycle arrest in colon cancer cell lines. J Nutr 101: 2197-2203.
Wotton HR, Strange RN. 1985. Circumstantial evidence for phytoalexin involvement in the
resistance of peanuts for Aspergillus flavus. J Gen Microbiol 131(3):487-94. Wotton HR, Strange RN. 1987. Increased susceptibility and reduced phytoalexin accumulation in
drought-stressed peanut kernels challenged with Aspergillus flavus. Appl Env Microbiol 53(21):270-3.
Wu J, Lin L, Chau, F. 2001. Ultrasound-assisted extraction of ginseng saponins from ginseng
roots and cultured ginseng cells. Ultrason Sonochem 8:347-52.

424
Wu J, Lin L. 2002a. Elicitor-like effects of low-energy ultrasound on plant (Panax ginseng)
cells: induction of plant defense responses and secondary metabolite production. Appl Microbiol Biotechnol 59:51-7.
Wu J, Lin L. 2002b. Ultrasound-induced stress responses of Panax ginseng cells: Enzymatic
browning and phenolics production. Biotechnol Prog 18:862-6. Wu X, Gu L, Holden J, Haytowitz DB, Gebhardt SE, Beecher G, Prior RL. 2004. Development
of a database for total antioxidant capacity in foods: a preliminary study. J Food Comp Anal 17:407-22.
Xiao Y, Wu Q, Cai Y, Lin X-F. 2005. Ultrasound-accelerated enzymatic synthesis of sugar
esters in non-aqueous solvents. Carbohydr Res 340:2097-103. Yu L, Sun Z-J, Wu S-L, Pan C-E. 2003. Effect of resveratrol on cell cycle proteins in murin
transplant liver cancer. World J Gastroenterol 9: 2341-3. Yu J, Ahmedna M, Goktepe I. 2005. Effects of processing methods and extraction solvents on
concentration and antioxidant activity of peanut skin phenolics. Food Chem 90(1-2):199-206. Yu J, Ahmedna M, Goktepe I, Dai J. 2006. Peanut skin procyanidins: Composition and
antioxidant activities as affected by processing. J Food Comp Anal 19: 364-71. Zheng W, Wang SY. 2001. Antioxidant activity and phenolic compounds in selected herbs. J
Agric Food Chem 49:5165-70. Zhu Y, Chaing H, Zhou J, Kissinger PT. 2003. In vitro metabolism study of resveratrol and
identification and determination of its metabolite piceatannol by LC/EC and LC/MSMS. Current Separations 20 (3): 93-6.