Isothermal calorimetry approach to evaluate tissue damage in carrot slices upon thermal processing
Upload
khangminh22Category
view
2download
0
OXIDATIVE RANCIDITY OF PEANUT
BUTTER SLICES UNDER DIFFERENT
PACKAGING AND ATMOSPHERIC
CONDITIONS
By
MIMIN ADHIKARY
Bachelor of Technology
Indian Institute of Technology
Kharagpur, India
1997
Submitted to the Faculty of tbeGraduate College of
Oklahoma State Universityin partial fulfillment ofthe requirements for
the Degree ofMASTER OF SCIENCE
May, 2001

OXIDATIVE RANCIDITY OF PEANUT
BUTTER SLICES UNDER DIFFERENT
PACKAGING AND ATMOSPHERIC
CONDITIONS
Thesis Approved :
Thesis Advisor
~~--
~~~r"/
---~~'----ge-----
li

ACKNOWLEDGEMENTS
I am heartily grateful to Dr. Danielle Bellmer for her patient guidance,
timely advise and friendly support all throughout my study as well as stay in the
department. I am also sincerely thankful to Dr. Gerald Brusewitz who's always been
someone who I could look up to in matters concerning academics or otherwise for
valuable advice. Not to mention, if it had not been for him, I could have never had the
opportunity to do my Masters here at Oklahoma State University. I would always cherish
the support of my two advisors in all that I did during my stay here in this school.
I wish to thank Dr. Tim Bowser, the third member of my committee, for
so willingly attending to my presentations, and helping me with his suggestions as and
when required. I also wish to thank him for his patient under tanding during finalizing
my the is.
I'd like to express my sincere gratitude to Dr.Carla Goad, Department of
Statistics, for her enthusiastic help in the analysis of my data, and for taking time off her
busy schedule for my thesis.
I would like to thank Dr. McGlynn for his approval in making the Fruits
and Vegetables Laboratory available for all my experiments. Dr. Gilliland also deserves
hearty gratitude for allowing me to use his humidity chamber.
I wouldn't forget the help that I received from Lynn and Vijji in the initial
days of my experiments - thanks to them for telling me the right ways to do my work and
bearing with me for all the mistakes I made.
111

Besides, I would take this opportunity to thank all my colleagues and
friends in the Department of Biosystems Engineering - Yu Zou, Missey, Bemadeth,
Shekhar, Sridhar, Alicia, Bruno and Roshani, who made my stay in the department all
the more special by being there for me whenever I needed them, to share a smile with.
A special note of thanks to Barbara for helping me out with every little
problem that I've had, for that smile on her face no matter what time of the day I went to
her with my complaints. I would also like to thank Gloria, Marge and Hope for their
support every time I needed them.
Finally, to say the least, I'm eternally thankful to my parents for their
being there for me, for the love and unconditional encouragement that they've given to
me and for their prayers for my success in every step [ took all the way. Also, [ would
like to make use of this time to thank Santhosh, my fiance, for making each of my days
with his thoughtful and caring ways and my dear friend Sharbari, whose unsdfish
friendship reflects in my life in so many ways.
IV

TABLE OF CONTENTS
Chapter
I. INTRODUCTION 1
Objectives - 2
II. LITERATURE REVIEW 3
Peanut Butter 3Development of Peanut Butter Slices .4
Oxidative Stability of Fats and Oils 7Mechanism of Oxidation 8Tests for Rancidity Analysis 9Antioxidants 14
Packaging of Foods I6Properties of Plastics I 7Penneability 19Examples of Food Packaging 21Packaging of Fatty Foods 23
III. MATERIALS AND METHODS 25
Peanut Butter Slice Preparation 25Chemical Analysis 26
Peroxide Value 26Thio-Barbituric Acid Assay 28
Experimental Design 29Qualitative Analysis 31Statistical Model 32
IV. RESULTS AND DISCUSSION 35
Peroxide Test 35Thio-Barbituric Acid Assay 38Effect of Packaging Material .39Effect of Storage Conditions .42Variation in Qualitative Properties .48Temperature Effect on Rancidity 50Statistical Analysis 56
\.

Chapter
V. CONCLUSIONS 59
VI. RECOMMENDATIONS FOR FUTURE WORK. 61
REFERENCES 62
APPENDICES 66
Al TBA Results for Room Conditions 67A2 TBA Results for Refrigeration 67A3 TBA Results for Oven Temperature 68A4 TBA Results for Conditions in Humidity Chamber 69A.5 Peroxide Values for Room Conditions 70A.6 Peroxide Values for Refrigeration 70A.7 Peroxide Values for Oven Temperature 71A.8 Peroxide Values for Conditions in Humidity Chamber 72A.9 Coefficient of Variation of Data Under Room Conditions 73AI0 Coefficient of Variation of Data Under Refrigeration 74A.II Coefficient of Variation of Data Under Oven Temperature 75A.12 Coefficient of Variation of Data Under Conditions in Humidity Chamber.. 76
B.I TBA Results Under Room Conditions 77B.2 TBA Results Under Refrigeration 77B.3 Peroxide Test ResuJts Under Refrigeration 78B.4 TBA Results Under Conditions in Humidity Chamber 78B.5 Peroxide Test Results Under Conditions in Humidity Chamber 79B.6 Temperature Effects on TBA Results for Saran 79B.7 Temperature Effects on Peroxide Value for Saran 80E.8 Temperature Effects on TBA Results for OK 11 Packaging Material 80B.9 Temperature Effects on Peroxide Value for OK 11 Packaging Material 81B.IO Temperature Effects on TBA Results tor HB I Packaging Material... 8 [B.11 Temperature Effects on Peroxide Value for OK 11 Packaging Material 82
C.l Statistical Analysis of Data - SAS Code 83C.2 Statistical Analysis of Data - SAS Output 86
VI

LIST OF TABLES
Table Page
1. Some Primary Plastics and Their Permeability Properties 21
II. Penneability Values of the 4 Kinds of Packaging Materials Used "J 1
III. Statistical Table of Inputs Used in the Analysis 34
IV. Comparative Table for Qualitative Property Changes During Storage .49
V. Time (weeks) to Onset of Rancidity from Peak Peroxide Values 51
VI. Time (weeks) to Onset of Rancidity from TBA Values " 51
VII

-
LIST OF FIGURES
Figures
I. Peanut Butter Slice Batter Entering the Slice Forming Equipment.. 5
2. A Strand of Peanut Butter Slices Exists the Slice Former and EntersThe Cooling Bath 6
3. Stacks of Individually Wrapped Peanut Butler Slices as TheyEnter Packaging 6
4. Flow Diagram of Statistical Model .13
5. Peroxide Test Results for Slices in Print Pack Material 36
6. Peroxide Test Results for Slices in HBI Material 36
7. Peroxide Test Results for Slices in Saran Material.. 37
8. Peroxide Test Results for Slices in DK 11 Material 37
1.). TBA Results for Slices in Print Pack Material .40
10. TBA Results for Slices in HB 1 Material .40
II. TBA Results for Slices in Saran Material. .41
I2. TBA Results for Slices in OK1 I Material .41
13. Peroxide Test Results Under Room Conditions .44
14. Peroxide Test Results under Oven Conditions .45
15. TBA Results Under Oven Conditions .45
16. Peanut Butter Slices After 6 Months of Storage in Humidity Chamber 46
17. Peanut Butter Slices After 6 Months of Storage in Refrigerator .47
18. Samples Under all 4 Storage Conditions After 6 Months A7
VIII

-
Figures Page
19. Peak Rancidity Time vs Temperature for Peroxide Test - PmtPk & HB 1 52
20. Peak Rancidity Time vs Temperature for Peroxide Test - Saran & DK 11 52
21. Time of Onset of Rancidity vs Temperature for TBA Test - PmtPk & HB 1 53
22. Time of Onset of Rancidity vs Temperature for TBA Test - Saran & OKll 53
23. Temperature Effects on Peroxide Values for HBl Packaging Material 55
24. Temperature Effects on TBA Results for Print Pack Material 55
IX

-
CHAPTER(l)
I TRODUCTION
Peanut butter is a mainstay in the American diet. About 40 million North
Americans use peanut butter everyday, with a total consumption of 800 million pounds
per year (United States Consumer and Marketing Service, 1972). It is primarily used for
its nutritive value, which is due to the high protein content of peanuts. Peanut butter is
used for both individual retail as well as institutional use, such as meals in public schools,
meals in prisons etc.
In the interest of convenience, a new peanut butter slice product has been
developed. Peanut butter, as one finds it in stores now, lacks the convenience of other
ready-to-eat products. An individually wrapped, single slice of peanut butter could be
very beneficial in terms of easy use on sandwiches or crackers. The major selling points
of a slice of peanut butter are convenience of use, easy transportability, portion control
and better hygiene due to less contamination, as each slice is used only once. AI 0,
storage of peanut butter slices is easy as it consumes less space and can be stacked one
above the other.
The peanut butter slice formulation which has been developed consists
mostly of peanut butter with a mi.nimal addition of ingredients. It has a navor and color
nearly identical to peanut butter, and is easily peelable from the wrapper. The product has
been successfully produced in a pilot plant setting on the same slice-forming equi pment
which is used to produce individually wrapped cheese.
- I -

Packaging of peanut butter has evolved from glass jars to plastic
containers over the last two decades. The features of the various kinds of packaging have
also been improved upon to ensure longer shelf-life and provide a higher quality product.
The present study is focused on the shelf-life characteristics of peanut
butter slices under different packaging and storage conditions. Since a peanut butter slice
has a greater surface area of exposure to the atmosphere, it is more prone to degradation
by components like oxygen and moisture than a bulk sample of peanut butter in a closed
container. Since peanut butter is a high fat product, it is highly prone to oxidative
rancidity. Therefore, it is necessary to study its shelf-life characteristics under various
conditions of storage and determine the suitability of different packaging materials to
ensure greater shelf-life of peanut butter slices.
Objectives
The main objective of this study was to investigate the oxidative shelf stability ofpeanut
butter slices when subjected to different kinds of packaging and storage conditions. The
specific objectives were:
1. To evaluate the performance of various packaging materials with respect to
rancidity ofpeanut butter slices.
2. To study the effect of temperature and humidity on the storability ofpeanut butter
slices.
- 2 -
CHAPTER (2)
LITERATURE REVIEW
Peanut Butter
Peanut butter is a mixture of ground roasted peanuts and other ingredients
such as hydrogenated oils, salt and sweeteners. After grinding and mixing, these
ingredients are cooled and packaged at room temperatures. The packaging should be able
to provide substantial resistance against oxidation of fats, since peanut butter is very high
in fat content. Sometimes, it is packaged under inert gas to reduce the content of oxygen
in the headspace to increase the shelf-life. Moisture in the product can be really
degrading to the shelf life of peanut butter, since it turns the color of the product a dark
shade of brown and affects its flavor negatively (United States Consumer and Marketing
Service, 1972).
Originally, peanut butter was ground and stored in a paper pail for retail
consumption. Its sales increased after processors started to pack it in glas jars. The
earlier glass bottles used to pack peanut butter had a metal screw cap that had a vinyl
coated pulp-board liner (United States Consumer and Marketing Service,1972). Some
manufacturers used a glassine membrane over the mouth of the jar to provide greater
resistance to oxidation. In recent years, the glassine membrane has been replaced by a
foil/LOPE (low density polyethylene) laminate seal as a measure of tamper evidence.
During the early 1980's, the metal cap was replaced by plastic caps, primarily injection
molded polypropylene (PP).
In 1987, many of the leading peanut butter manufacturers switched to
plastic jars made of PVC (Poly-Vinyl Chloride) or PET (Poly-Ethylene Terephthalate).

-
The PET jars were made by stretch blow-molding of injection-molded molten polymers,
whereas the PVC jars were made by extrusion blow-molding. Although molding costs for
PVC are lower, the greater strength and clarity of PET has resulted in a higher market for
it (United States Consumer and Marketing Service, 1972).
Plastic jars have been used to pack peanut butter for nearly 15 years.
However, the plastic jars posed closure problems sometimes, as the plasticizer in the
PVC gasket migrated into the plastic jar rim, bonding the lid to the jar. This caused
unwanted locking of the jar cap. The current solution to this has been obtained by using
an injection-molded polypropylene cap and a laminated plastic/foil membrane that was
wax-bonded to a pulp-board liner in the jar cap. After application to the jar, the cap is
sent through an electromagnetic field to produce an eddy current that induces heat in the
aluminum foil in the plastic/foil membrane, and thereby heat seals the foil membrane to
the jar rim. At the same time, it also melts the bonding wax to release the membrane from
the pulp-board backing. It is crucial that the foil membrane be in intimate contact with the
mouth of the jar and that the lid be screwed with enough torque to assure that the eal is
leak-proof (United States Consumer and Marketing Service, I972).
This system provides an excellent barrier to both oxygen and moisture,
and also provides a good tamper-proof seal. The polypropylene (PP) cap protects the foil
seal until it is peeled off by the consumer. Then, it becomes an excellent method of
protecting the food from oxidation until all of the product is utilized.
Development of Peanut Butter Slices
The current peanut butter slice formulation was developed by Dr. Danielle
Bellmer at Oklahoma State University through much trial and error. The actual
- 4 -

ingredients used will not be disclosed here in order to protect the intellectual property
rights. The viability of manufacturing individually wrapped peanut butter slices was
tested using cheese slice manufacturing and packaging equipment at American Dairy
Brands plant in Plymouth, WI. The molten peanut butter slurry is pumped into a slice
forming machine where the individual slices are formed and heat-sealed (Fig. 1). The
strand of slices is then immersed in a cold bath to allow them to set (Fig.2). The cooled
slices are then cut and stacked in rows from where they enter the packaging machine
(Fig.3). The cheese slice forming equipment (KUSTNER Inc.) worked well for
production of the peanut butter slices.
Figure 1.Peanut Butter Slice
Batter Entering the SliceForming Equipment
-- 5 -

-
-
Figure 3.Stacks of
IndividuallyWrapped Peanut
Butter Slices in thePackagingEquipment.
Figure 2.A Strand of
Peanut ButterSlices Exists theSlice Fonner and
Enters theCooling Bath
- 6 -

-
Oxidative Stability of Fats and Oils
Oil stability is the resistance of oils to chemical change or physical
deterioration. A few forms of oil stability are color stability, hydrolytic stability,
resistance to [onnation of foams, flavor stability, emulsion stability, heat stability and
oxidative stability. Of these, the two most important kinds are flavor and oxidative
stability. Most of the time, these need not be proportional to each other, i.e. an oil can
show excellent oxidative stability, but mediocre flavor stability, or vice versa. Cottonseed
and soybean oils are good examples of oils whose oxidation and flavor stabilities don't
match (Smouse, 1985).
The main factors or components affecting oil stability are presence of
phospholipids, soaps, enzymes, metals and antioxidants in the food product. The storage
conditions of the oilseeds prior to processing and after processing, deodorization time,
temperature and cool down rates contribute to the oil stability too. Fatty acid compo ition
of the oil in the product, pigments in the food and exposure to light also determines
stability of fats and oils (Smouse, 1985).
The content of fat, and therefore its oxidation, affects the texture and
flavor of a product to a great extent. For example, if any kind of cheese is stripped of its
fat content completely, the product that is left behind is tough and rubbery (Min and
Smouse, 1989). The fatty phase in milk accumulates the flavor components that form
during ripening of cheese, and therefore the oils centrifuged from cheeses are rich in
cheese-like flavors. However, it is not true that all oxidized flavor are unde irable. There
are toffee tlavors which depend on oxidation of milk tats, and that is achieved by contact
- 7 -

-
of the fats with copper kettles. Also, th ery popular Swiss chee e deri s its typical
flavor from oxidation products (Min and Smouse, 1989)
Fats; like many other unsaturated substances, undergo spontaneous
oxidation.. This leads to rancidity, and in tum, to loss of palatability and unwanted color.
and odors. Produds l;ontaining a higher proportion of unsaturated fatty acids arc more
prone to oxidation than those with lesser amounts. This is due to the fact that oxygen
reacts more readily with unstahle double bond than with stable single bonds ( nig et aI.,
1983). However. this instability can be controlled II ing proper processing teclmique ,
such as the use of antioxidants.
Mechanism f Oxidation
Considerable evidence exists to prove that the first step in oxidation of fats
is the addition of oxygen to the alpha carbon atom at the double bond in a. fatty acid
chain. This causes the fOITnation of hydro-peroxides. Although peroxides are the primary
products of lipid oxidation, they break dov.'l1 and form a range of secondary product like
peracids, aldehydes. ketones, ethylene oxides etc. (Hamilton and Rossell, 1986). During
the early stages of oxidation, there is little apparent change in the composition, flavor or
odor of the product, except that the concentration of peroxides changes within it. With
extended storage time, the peroxides further breakdown to produce other volatile
compounds that give rise to unwanted odors and off-flavors (Schaich, 1995).
During the process of establishing methods to test the stabilit, of fats with
respect to oxidative rancidity, various changes in the content of free fatty acids, iodine
value. saponification value and content ofoxidized fats were correlated to provide indice
- 8 -

-
of fat oxidation (Sanhueza et aI., 2000). In the overall evaluation of fat stability, the
following two criteria were discovered to be essential:
1. A test to indicate the condition of fat at the time of examination.
2. A test to indicate the length of time that the fat may be expected to resist
oxidation.
Tests for Rancidity Analysis
Several different tests exist for the evaluation of oxidative rancidity In
foods. Some of them are discussed below.
The Kreis Test:
This is one of the most primitive tests used to detect rancidity. In this test,
a reagent called phloroglucinol reacts with a fat constituent, and the intensity of color
produced by their reaction is said to indicate the degree of rancidity of the fat in the
product. The procedure involves mixing a definite weight of the product with 0.5%
phloroglucinol in amyl acetate, and adding trichloroacetic acid in amyl acetate to the test
tube. The tube is then placed in a water bath at 45° ± O.l oC for 15min with vigorous
stirring. After the tube is removed from the water bath, more cold trichloroacetic acid is
added along with amyl acetate to stop the reaction, and bring the color of the sample
within range of the instrument that is used to measure the color intensity. Any instrument
may be used to measure the color (Mehlenbacher, 1960). A blank sample is tested
simultaneously in the same way, and the corrected value of the sample is obtained by
subtracting the blank reading from the sample reading.
There is a considerable amount of controversy over the efficiency of this
test. As concluded by Powick (1423), the compound epihydrin aldehyde accounts for a
- 9 -

-
-
positive Kreis test, whereas Deatherage and Mattil (1939) believed that homologues of
this aldehyde might also cause the Kreis test to be positive. It was found by Holm and
Greenbank (1924), that the color intensity is proportional to the amount of oxygen
absorbed by the fat, which need not be a direct measure of its rancidity. The development
of color is not a direct measure of the development of rancidity, and sometimes fresh
samples give rise to some colors when they react with Kreis reagent.
Permanganate Reduction Method:
This test measures the stability of fats in a food product. It was devised by
Grettie and Newton (1931), and involves the passage of air first over a heated sample of
food containing the fat component and then into standardized potassium permanganate
solution. The fat is dispersed on strips of filter paper in glass tubes maintained at high
temperatures in a water bath during the induction period of the fat. [n this process, the
potassium permanganate is reduced by the volatile oxidation products from the fat, and
the degree of its reduction provides an index of fat stabi lity.
This test is mainly used for the analysis of dry products containing fats
like cereals. This was the test used by Horne et a!. (1948) to te 1 the stability of
commercially produced army ration biscuits.
The procedure involves grinding the sample 0 that it has a uniform
particle size. A fixed weight of the ground sample is taken in an open tube and both of
the ends are closed with cotton to keep the sample in place. The sample is inserted into a
water bath at 100°C and washed and dried air is passed over it. Then, this tube is taken
otT the water bath and replaced with a tube containing standardized potassium
permanganate solution. Finally, both, the sample and the potassium permanganate
- 10-

-
-
solution are transferred into an Erlenmeyer flask and 5% potassium iodide is added to the
mixture. The unreacted potassium permanganate solution is titrated with O.005N odium
thiosulphate solution. The difference between the volume of potassium perrnanganate in
the tube and volume of sodium thiosulphate used for titration gives a direct measure of
the potassium perrnanganate reduced by the oxidation products of the fat sample
(Mehlenbacher, 1960).
When the volume of reduced permanganate solution is plotted against the
aeration time, the length of time required to reach the point where significant change
occurs in the rate of oxidation is the Induction Period. Induction Period is the time
required for oxidation to start after all the antioxidants or inhibitive sources are used up in
the food product.
Schaal or Oven Test Method
In this method of analysis, an adequate amount of the sample is placed in a
beaker and held in an oven at a warm temperature (70°C) until rancidity sets in. A regular
time interval is maintained between testing the samples depending on the quality of the
fat in the product. The end-point is determined by an organoleptic evaluation of the odor
of the product. The peroxide values of the samples in torage may be measured, but the
results from Peroxide Test, discussed later in the dissertation, are more accurate by the
Active Oxygen Method than by this method.
This method is most commonly used for bakery products. One major
limitation of this method is its subjective nature (Mehlenbacher, 1960).
- I I -

-
-
Photochemical Methods
Color indicators are sometimes used to determine oxidation/reduction of
fats. Indicators such as methylene blue and eosin-erythrosine are commonly mixed with a
fatty substance and the rate of color reduction, which indicates the rate of oxidation of
fat, is measured with a photoelectric cell. From the studies of Royce (1933), it was found
that in this method, the end-point was unsatisfactory due to the secondary color reactions
that occurred in the mixture.
This method is used to study the stability of vegetable oils. As a general
observation, the natural fluorescence of vegetable oils decreases with extended storage
time as oxidation proceeds (Mehlenbacher, 1960).
Active Oxygen Method
This method was introduced in the 1930's (Mehlenbacher, 1960). It is the
most popular test used to determine fat stability. This method is based on the formation of
compounds containing active oxygen when fats are oxidized, which can further be
reduced by potassium iodide. This is done by heating the ubstance at elevated
temperatures during which the sample is simultaneously aerated with washed air. Heating
and aeration are continued until the peroxide content reaches a pre-determined value.
This value is tixed to approximately match the point where rancidity starts in various
kinds of fats.
Peroxide Test
The primary product formed by the oxidation of any lipid is a hydro
peroxide. In the peroxide test, the food containing tat is su~jected to titration with sodium
thiosulphate to neutralize the peroxides formed. The quantity of sodium thiosulphate
- 12-

..
required to neutralize all the peroxides formed determines the extent of rancidity
developed. The end point of titration is established by a sharp color change in the starch
indicator that is used.
Since peroxides are formed in any kind of fatty foods when rancidity sets
in. the peroxide test is one of the most widely used rancidity tests. However, at later
stages of oxidation, the peroxides finally break down to form other components
(Woodroof,1983). The peroxide value (P.V.) is a measure of the amount of peroxide in
rancid oil expressed in milli equivalents of oxygen per kilogram of food product. If P.V.
is plotted against time, the curve exhibits a gradual rise and then a steady fall indicating
the breakdown of peroxides into other secondary components. Hence, a low P.V. doesn't
necessarily mean absence of rancidity (Lennersten, 1998).
Thio Barbituric Acid Test
The secondary products of oxidization of unsaturated fatty acids consist of
aldehydes and other degradation products. [n this test, the aldehydes react with a reagent
called TBNTCA (Thio Barbituric Acid! Trichloro Acetic Acid) upon heating to produce
a red color which is due to the formation of malondialdehyde (Bernheim et aI., 1948).
The intensity of the red color is measured using a spectrophotometer and that provides an
index of the degree of rancidity.
The advantage of this method is that the reagent causes no separation of
fats from the food product unlike many other reagents that are used to test rancidity
(Guzman and Vicario, 1998). However, the red color formed in this test may also be
partly due to the reaction of the reagent with other aldehydes which form by the
breakdown of the non-fat components in foods, thu interfering with the results.
- 13 -

-
-
The tests that were used for rancidity evaluation of the peanut butter slices
were the Peroxide Test and the Thio Barbituric Assay. These were chosen because they
are the most widely used tests for high fat foods, and peanut butter is high in fat content.
These tests are described in detail in Chapter(4).
Any fatty product may be subjected to shelf-life studies in order to
detennine the time at which rancidity first develops. Accelerated tests may be used to
detennine the effect of a particular parameter on the stability of the product, but in this
case the actual rancidity is not measured (Anderson and Jones, 1999).
Antioxidants
Antioxidants inhibit the oxidation of fats. In the initial stages of oxidation,
any antioxidants present in the oil playa role in inhibiting oxidation. This can occur by
the removal of dissolved oxygen or by the neutralization of free radicals fonned during
auto-oxidation (Chu, 1991). Auto-oxidation in oils takes place primarily by branching
chain reactions.
In either of these form of inhibition, the antioxidants are eventually used
up. It is then that the oxidation process is accelerated. The initial tage, when auto
oxidation doesn't occur, or proceeds slowly, is called the Induction Period, during which
oxidation is rather slow. In the Peroxide Test, if the Peroxide Values are plotted against
time during this period, the Induction Period can be easily determi.ned by the sudden
increase in slope of the graph at the end of this period.
Some studies have been conducted to evaluate new methods of
detennining the oxidative stability of fats in foods and the effectiveness of natural
- 14 -

antioxidants. [n recent years, the use of natural antioxidants has gain d momentum due to
a global trend to avoid the use of synthetic food additives (Frankel,1993).
Many edible fats contain natural antioxidants, the most common of which
is tocopherol. But a portion of the natural antioxidants are removed during processing of
the foods. This loss can be made up using external antioxidants. For the antioxidants to
perform their role, it is essential that the antioxidant be completely oluble in the fat and
that it shouldn't add any flavor, smell or color to the food product even after prolonged
storage. Also, it shouldn't have any detrimental physiological effect and there should be
no significant chemical changes upon heating of the product. The antioxidant should
retain its inhibitive properties even after use of the fat in or with any other food (Emanuel
and Lyaskovskaya, 1967).
The mechanism of inhibition follows a chain reaction between trace
amounts of the antioxidant and the substrate until the rate of the reaction increases toward
termination. This coukl otherwise be called 'chai n termination'. It has been found that a
substance that might act as a very effective antioxidant on one substrate, may be
completely inert on another (Emanuel and Lyaskovskaya, (967).
Butylated Hydroxytoulene (BHT) and Butylated Ilydroxyanisole (BHA)
are the most commonly used antioxidants. Since anyone substance is not fully capable of
meeting all the conditions of a good antioxidant, it is a common practice to use
antioxidant mixtures.
BHA serves as a very good antioxidant for stabilizing fats in pork, turkey,
many fish oils, vegetable oils, orange juice and groundnut oil. BHA mixtures are also
- 15 -

-
..
used to stabilize Vitamin A, dough products, potato chips, wheat and corn flakes etc.
(Emanuel and Lyaskovskaya 1967).
BHT is not only used in the food industry, but also is used to stabilize
waxes, resins, greases, oils, plastics, etc. BHT, either by itself, or when mixed with other
antioxidants, reduces fat oxidation in milk, butter, lard, olive oil, cottonseed oil and
shortening, beef and pork. It also protects carotene in animal fats from oxidation
(Miyazawa et a1., 1991).
Packaging of Foods
Packaging of foods in various forms has been a prevalent practice for a
very long time. The practice began with water, and gradually extended to other products
because it kept them dry and clean, improved transportability, kept them sate trom
insects and germs and inhibited the spoilage of the food products by oxygen, moisture
and light. The modem packaging era began with the advent of canning in the early 1800s
(Briston and Katan, 1974). Better packaging materials came into the picture as new
preservation techniques evolved to expand the variety of more appealing, safe and
nutritious foods that could be transported over long distances and stored over extended
periods of time before consumption.
Different food products are packaged in different forms using ditTerent
kinds of materials, depending on the properties of the material as well as ease of use.
Metal-capped jars, tinned steel, enamelled tin cans. corrugated paperboard, coated paper
and aluminum foil are chiefly used, along with a huge range of plastics in food
packaging. The many versatile properties of plastics make them ideal for packaging
foods. In most cases of usage of plastics, it is a combination of properties that is put to
- 16 -

-
b
use. Plastics exhibit several useful characteristics which make them good for food
packaging.
Properties of Plastics
Densities of most plastics are very low. A range of density from 0.9 to 1.4
glee is typical of most plastics used in packaging. Due to the thin gauges commonly used
in packaging, rigid plastic containers resist breaking much more effectively than glass.
This, along with their low density, makes them more desirable for packaging over glass,
which is otherwise an excellent material from the standpoint of food safety. Also, plastic
containers do not pose the hazard of sharp edges that can occur with glass (Jenkins and
Harrington, 1991).
Most plastics are flexible, and all flexible packages are easy to seal.
During sealing, a coating on the flexible substrate is heated within the packaging
equipment until it melts, and then is held in contact with the similarly coated opposite
side until the two coatings solidify as one layer. Most plastics can be easily formed into
thin, strong and clear films. Plastics are unsurpassed in the ea e with which sp cial
shapes can be readily created (Jenkins and Harrington, 1991).
Plastics don't rot or rust unlike many other materials. They are also
impervious to attack by most degradation factors, except ultraviolet rays. Plastics also
provide considerable barrier to moisture and oxygen. Most foods are sensitive to water
vapor and oxygen. Glass and aluminum foil are totally impermeable to these, whereas
plastics or polymer coated cellophane have much higher permeabilities. However, they
rank. above uncoated paper. Some of the pIa tics have sufficiently high moisture barrier
- 17 -

that is adequate for most foods. In order to achieve a high oxygen barrier, a multi-layer
construction of plastics is normally adopted (Jenkins and Harrington, 1991).
On the other hand, the finite pem1eability of plastics sometimes becomes a
positive attribute for products like freshly harvested fruits and vegetables. The shelf-life
of such products can be greatly enhanced if they are packaged in a material that is
selectively permeable to oxygen and carbon dioxide (Czerniawski et a!., 1997). Most
plastics also provide an excellent barrier against contamination from odors from the
environment.
Plastics have an advantage over other packaging materials in terms of
lightness and appearance. Unmodified plastic films and sheets range in appearance from
crystal-clear to hazy. Pigments or soluble dyes can be added to make them totally opaque
in any color or to make transparent films and sheets. Plastics can be printed on but paper
and cellophane are marginally superior to plastics in this regard. Most plastics require an
inexpensive pre-treatment to develop this attribute, while it is expensive to print on paper
or cellophane. Metal and glass are more difficult as well as expensive to print on. Use of
packaging to advertise and add to the aesthetics of the product is extremely important in
the food industry. Very thin coatings of aluminum can easily be vapor-deposited on
plastic substrates in vacuum chambers. This is usually used to provide barrier to light
moisture and oxygen (Jenkins and Harrington, 1991 ).
Most of the new plastics do not add flavors, nor do they extract essential
flavor components from foods. Most plastic films are more resistant to tearing and
puncture than aluminum foil. Moreover, they also resist cracking, which is very common
in aluminum foil. Plastic films remain tlexible at low temperatures, unlike cellophane
- 18 -

-
which becomes brittle below 40°F. These traits of plastics make them popular materials
for packaging over several other materials that were used in the pa t (Jenkins and
Harrington, 1991).
Permeability
Permeability of the packaging material with respect to moisture, oxygen or
any other component that might contribute to deterioration of the food product is a very
important parameter in determining the suitability of a particular material as a good
packing material. Permeability is expressed in terms of volume or weight of the
degrading component that can diffuse through the packaging material per unit surface
area of the material per unit time. These numbers give an estimate of the extent to which
the packaging material can provide barrier against the degrading components.
Variables Affecting Permeability:
The chemical structure of a polymer influences its permeability as it
determines the level of interaction between the packaging material and the permeate. The
value of permeability changes for each different pair of polymer/permeate. An increa e in
polymer crystallinity (density), orientation or cross-linking, i.e: the morphology of the
polymer, decreases permeability.
Humidity affects permeability (especially in hydrophilic polymers).
Oxygen permeability increases with relative humidity for certain types of polymers, and
decreases for some kinds jjke amorphous nylon. Permeability increases with increase in
temperature. The equation that relates the permeability of a packaging material to the
temperature is P = Po eEp/RT , where Po is a pre-exponential term, Ep is the activation
- 19 -

-
-
energy, R is the gas constant and T is the temperature in Kelvin. The equation can be
written in an alternative form, which is ;
P P Ep/R(lrrl - Irr2) h p' h b'l' l' d P . th2 = Ie, were I IS t e permea 1 Ity at temperature . 1, an 2 IS e
permeability at temperature T2 (Valentas et aI., 1997),
Filler materials generally decrease penneability. However, the effect is
complicated by the type, shape, amount of the filler and interaction with the permeant.
There is no effect of concentration of the permeant on the permeability at low and
moderate pressures for gases and low activity values for organic compounds in the range
of Henry's Law (Perez and Krochta, 2001). Strong effects are found for organic
compounds at high values of activity. Permeability is usually, but not always, increased
by plasticizers.
In principle, film thickness does not affect permeability, diffusion
coefficient or solubility. However, thickness of the tilm may generate different
morphologies, say, by having different cooling characteristics during proces ing (Abe,
1994). Molecular weight of a polymer has been found to have Iittle effect on the
penneability of a polymer except in very low range of molecular weight (Marjanski et at,
1996). Table I shows a wide range of variability in the oxygen and moisture permeability
of various plastics available.
- 20 -
4

-
Table I. Some Primary Plastics Used in Packaging and Their Perrneabilit Properties
Plastic Oxygen Permeability(Cc.l..unlm2.d.kPa)
Moisture Permeability(cq.tmfm2.d.kPa)
Cellophane 1.4 O%RH5.7 76%RH
Polyethylene and 1900Ethylene Copolymers
Polypropylene 620
Polyvinyl Chloride (PYC) 29
Polyvinylidene Chloride 3.3
Ethylene Vinyl Alcohol 0.15 O%RH(EVA) 0.3 65%RH
Polystyrene 1100
Polycarbonates 910
Polyacrylonitriles 3.5
Source: Valentas et aI., 1997
16000000
59000
44000
180000
6000
110000
730000
910000
420000
-
Examples of Food Packaging
Orange juice in aseptic cartons has gained tremendous market all over the
world in the last few years. Aseptically packed juices exhibit high standards of quality,
but there is considerable amount of Havor change during storage in aseptic orange juice.
The polyethylene polymers in the aseptic cartons that come in direct contact with the
juice have been found to accelerate oxidation, non-enzymatic browning and navor
absorption (Jeng et al. 1991).
Low density polyethylene bottles are used for products that need to be
sq ueezed ouL like ketchup.
.. 2\ -

-
-
Meats are shrink wrapped typically into triple-layered co-extruded films
made of EVA copolymer, PVC/PVdC copolymer and EVA copolymer, sometimes with a
polyamide as the barrier layer. The bags are evacuated before sealing using heated jaws
(Robertson, 1993). The color and texture of meats are very prone to degradation by
oxygen since myoglobin, the muscle pigments that render color to muscle fibers, are
susceptible to oxidation rather easily. Hence, multi-layered materials are chosen to pack
meats such that the combined oxygen permeability doesn't effect the quality of stored
meats.
Milk is packaged in glass, coated paper or plastic containers for retail use.
These materials are either used to make re-usable packs or as single-use packaging. Light
destroys ribot1avin in milk, and that is the reason why use of brown glass was proposed
to make milk bottles. The color of the container detennines the amount of light reaching
milk. A study was conducted to detennine the extent of deterioration in milk by light, and
the materials used were clear polyethylene pouch, co-extruded laminated polyethylene
pouch (with inner black pigmented layer), paperboard carton and plastic jug. Milk was
found to develop off-t1avors in all except the laminated pouch (Robertson, 1993)
Breakfast cereals need to be protected against degradation by loss of
crispness, lipid oxidation, loss of vitamins, mechanical damage and loss of llavoL The
grains that are used to make breakfast cereals are very high in unsaturated fats, and
therefore the rate of lipid oxidation is high in these products in the absence of efficient
packaging. These products are typically packed in tiberboard boxes lined with waxed
glassine. A more recent trend is to use various plastic materials like thin gauge HOPE for
lining the boxes instead of glassine (Robertson, 1993).
- 22 -

-
The two mam effects of plastic packaging on fatty foods are stress
cracking and migration (vom Bruck et aI., 1981). It has been shown that there is a definite
mathematical relationship between the concentration of an additive in the polymer, and
the migration into the food material. Therefore, it is recommended that regulations for
plastic food packaging are based on compositional limits, rather than migration limit due
to specific advantages in compliance and control.
Packaging of Fatty Foods
Foods containing fats face the problem of oxidation of unsaturated fatty
acids, which cause off-odors, off-flavors and untimely polymerization of the fatty acids.
Thus, utmost care needs to be taken while packaging such foods to protect them against
oxidation. Moreover. the packaging material needs to be oil-proof and free of
components like lubricants or polymer modifiers that could be extracted or absorbed by
the oil/fat (Michalski and Desobry, 1998).
1M
There exists a kind of glass container developed by Foil Mate that has a
eal impenneable to oxygen, carbon dioxide, water vapor and other undesirable gases. It
has been developed by combining the impermeability of aluminum foil and the adherence
of polymer films. These containers are suitable for Jry products, as well as liquid and
viscous products like fruit juices, sauces, honey, syrup, peanut butter, jams, jellies,
mayonnaise, wine and tomato products (poad.1982)
In the packaging of fatty products like peanut oil, the oxygen permeability
of the packaging material plays a more significant role than the moisture permeability.
Gopalakrishna and Prabhakar (1983) studied the effect of water activity on the rate or
autoxidation on raw peanut oil at 37lJC. It was noticed that in three weeks of storage,
- 23 -

-
-
there was no significant fOimation of peroxides. The results indicate that there is a
protective effect of certain components in peanut oil on the autoxidation at high rate of
water-activity.
- 24 -

CHAPTER (3)
MATERIALS AND METHODS
Peanut Butter Slice Preparation
All the slices of peanut butter were made with the same formulation. The
peanut butter used was 'JiffOriginal' that was bought at the local WALMART
superstore. Each slice weighed about 49gms and contained peanut butter,
monoglycerides, polysaccharide gum, sugar and peanut flour. Each batch was prepared
such that 12 peanut butter slices could be made each time. A water bath was set at a
temperature of 100°C. All the dry ingredients (peanut butter, monoglyceride, peanut flour
and powdered sugar) were first weighed separately on plastic weighing dishes. To
prepare the gum mixture, 115g of water was mixed with 5g of gum. The mixture was
stirred and mixed thoroughly and then heated on a hot plate to a temperature of 80°C. The
mixture was stirred at that temperature for 5 mins. and then kept warm until use to
prevent it tram setting.
The monoglyceride was poured into a hot aluminum bowl on the water
bath and allowed to melt completely. Peanut butter was next poured into the bowl and
mixed well with the monoglyceride using the mixer for about 30 sec. Next, the gum
mixture was weighed out of the beaker onto a weighing di h and poured into the bowl
with peanut butter very quickly (i.e: allowing very little time for it to set or solidify). The
peanut butter mixture was mixed uniformly for 4 mins. and powdered sugar and peanut
flour were then added separately into the mixture. Mixing was continued for another 1
min. Care was taken to ensure that the total mixing time wa at least 5 mins.
- 25 .

-
-
Finally, the bowl was lifted from the water bath and the bottom was wiped
with a towel so that no water dripped into the slice molds. Definite portions of the
mixture were poured into beakers that had been marked such that they could hold 40g of
the mix for each slice. Each portion was then poured into the molds which had been
arranged with a definite kind of packaging material beneath each of them prior to
beginning the experiment. The molds consisted ofteflon cutting boards in each of which
six squares had been cut out, each of 76mm width.
The last two steps needed to be done with as much speed as possible to
prevent the peanut butter mixture from setting before pouring it into the molds. After the
peanut butter mixture solidified on the packaging material, the slices were cut out using a
blunt knife, and the molds were removed. A sheet of the same packaging material was
spread on the slices and each slice was cut out with a layer of packaging material on
either side. The packaging material was sealed on all four sides of each slice using a heat
impulse sealer. Each slice was color coded with respect to the packing material it was
\-Happed in, and the date on which it was made was labelled on the package. The
Peroxide Test and Thio Barbituric Acid Assay were both conducted on the slices at '0'
time period before the slices were packaged. These tests were done within 1-2 hrs after
preparing the slices.
Chemical Analysis
Peroxide Value
Oxidation is the most common cause of rancidity. When an oil is oxidized,
as discussed earlier, the first product formed is a hydro-peroxide. Theretore, the most
common method of assessment of rancidity is by the detellnination of the peroxide value
- 26 -

-
-
(P.V.), reported in units of milli-equivalents of oxygen per kilogram of fat, which is a
direct measure of the amount of fat that has been oxidized. This method is empirical and
the results and accuracy of this test depend on the experimental conditions.
To conduct a test, 5 gm of peanut butter sample was taken in a beaker and
manually ground thoroughly in a 30 ml mixture of 3:2 glacial acetic acid and chlorotorm
sulution. 0.5 ml of saturated potassium iodide solution was added to this mixture, as a
result of which iodine was liberated due to reaction with the peroxide. This was then
titrated against a standard solution of sodium thiosulphate, using starch solution as
indicator. This procedure was followed but without any sample in the beaker to determine
the titration value for a blank sample (Gordon et a!., 1988)
The peroxide value is calculated as follows:
P.Y. = (S - B) * N * 1000 I Sample Weight, where
S = Titration value of the sample (ml)
B = Titration value of the blank sample (ml)
N = Normality of the Sodium Thiosulphate solution = 0.1 N
Sample Weight = 5 gms
There are mainly two sources of error in this test. First, the ab 'orption of
iodine at unsaturated bonds in the fatty acid can lead to a low P.Y. Second, tht:
liberation of iodine from potassium iodide by oxygen in the sample can lead to a high
peroxide value. Therefore care should be taken to ensure that the right amount of
potassium iodide is added to the sample mixture (Hamilton et aI., 1986).
- 27 -

--
Fats that have been stored for some time might show high peroxide values,
though there might not be any undesirable flavor problems. This is because peroxides are
flavorless. However, during prolonged storage, peroxides decompose into aldehydes and
ketones, many of which have pronounced off-flavors (Ahn et al., 1998).
Thio Barbituric Acid Assay
The Thio Barbituric Acid (TBA) Assay is yet another empirical method to
detect rancidity in fats and oils. This method relates to the level of aldehydes present in
an oil. Aldehydes are formed during storage of fatty products as peroxides break down.
The particular aldehyde that reacts in the TBA test is 'malondialdehyde'. It reacts with
the TBA reagent to give a red chromogen, the intensity of which is measured using a
spectrophotometer, which is an empirical measure of the amount of aldehyde in the
rancid fat. But the limitation of this method lies in the fact that though there might be a
considerable amount of aldehydes present in a fatty product after a certain period of
storage, not all of them necessarily are a product of oxidation of fats.
For the experiment,S gms of the peanut butter sample was ground with 15
ml of double distilled water. One ml of the homogenate was taken and two ml of TCA
(trichloro-acetic acid)/TBA reagent was added to it with 50 ~I of BHA (Butylated
Hydroxy Anisole). This solution was thoroughly heated for 15 min. in a boiling water
bath, and then cooled for 10 min. in cold water. The mixture was then centrifugcd at
20000 for 10 min. at 5000 rpm. The supematent liquid was collected and its absorbance
was read using a spectrophotometer at a wavelength of 531 nm against a blank sample.
Finally, a TBA standard curve was construct d.
- 28 -

-
-
However, in this test, it is possible that other aldehydes in the product
would react to form the red chromogen. Also, oxidized proteins and other food
components might contribute to colored products on reaction with the TBA reagent.
Therefore, the spectrophotometer reading need not be in direct proportion with the
amount of fats oxidized during the occurrence of rancidity.
Experimental Design
The design of the experiment is based on evaluation of rancidity of the
peanut butter slices under different combinations of temperature-humidity conditions and
packaging materials. The atmospheric conditions chosen are based on the most probable
conditions of storage and transportation. The packaging materials are selected based on
common materials used in the market, specifically in the packaging industry to pack
oxidation-sensitive food products. The major criteria in choosing the packaging material
is its permeability to oxygen and moisture. Experiments were carried out over six months
of storage time, with the first set of observations being taken after one week of storage
and then tests were done every month.
The following storage conditions were chosen:
• Room Temperature and Humidity (2SoC ± SoC, 4S%RH ± J0%)
• Refrigerated conditions (4°C ± 1°C, <20%RH)
• Oven Temperature (40°C ± 1°C, <20%RH)
• Humidity Chamber (40°C ± JOC, 80% RH ± 2%)
These conditions were chosen keeping in view the range of conditions that
the peanut butter slices might be subjected to during shipping and storage of the product
during all weather and seasonal fluctuations. One point to be noted when drawing
- 29 -

.....
-
conclusions about the results from the experiments is however that the temperature and
humidity conditions were not strictly monitored I especially under room conditions. and
therefore there could have been some fluctuations in storage temperature and humidity
since the experiments were carried alit from summer to winter.
The following packaging materials were used to test the slices:
• Saran wrap
• HB l, a high barrier material from Phillips (Bartlesville, OK)
• DK 11, a low barril:r material from Phillips used for packaging of fresh foods
• Cheese packaging material from Printpack, Inc. (Elgin, IL)
The basis for selection of these materials was to incorporate a wide range
of oxygen and moisture permeability of materials. This would enable the determination
of the extent to which permeability charackristics of the packaging material influences
rancidity of peanut butter slices. Also, the selection of the materials was based on the
most widely available and used polymers. For example, saran wrap is a polymer that is
llsed by people daily for domestic packaging or preservation. The material hy Print Pack
is used for wrapping individual cheese slices for large scale production. !-IS I is a trial
material that has been manufactured by Phillips, and is not yet on the market. It was
chosen since its oxygen and moisture permeability values are much lower as compared
with the other material.
The moisture and oxygen permeability figures for these materials are
illustrated in Table II. The moisture permeability values cover a range from
- 30 -

-
3.0 g.m'2.dai' to 8 times the value, i.e: 24.0 g.m'2.dai'. The range of oxygen
penneabilities is 0.5 ml.m'2.dai1 as the lowest oxygen permeability in the case of HBl
material, and the highest is 6920 mJ.m'2.day"1 for OKII material.
Table II. Permeability Values of the 4 Kinds of Packaging Materials Used
Moisture Permeability( ,2 d .1)g.m . ay
Oxygen Permeability(ml.m·2.day"l)
HBI
4.1075
0.5425
Saran
3.0
20.0
Print-Pack
6.51
160.0
OKII
24.0
6920.0
-
Chemically, DKll is composed of Styrene-Butadiene Copolymers (SBC),
and its thickness is Imil (0.025 mm). Saran technically is Polyvinylidene Chloride, and
its gauge thickness is 0.8 mil (0.02 mrn). The high barrier film has a 2 mil gauge
thickness (0.05 mm) and it is a co-extruded PE (Poly-ethylene) and SBC (Styrene
Butadiene Copolymer) film. The Print-Pack material is a 3-layer co-extruded
polypropylene film of 1.2 mil (0.03 mrn) thickness.
Qualitative Analysis
A subjective analysis of properties such as color, texture and aroma of the
slices was conducted at each time step by making notes describing the pecific changes in
each of the slices subjected to various conditions and packaged in the four different
materials. Though these tests were of a subjective nature, they provide a great deal of
information about the visual and aromatic quality of the samples over time, which may
help to detennine the acceptability of them by consumers at various storage times.
, 3 I '

-
--
Statistical Model
For the purpose of experimentation, two samples were drawn from each
material-storage combination, and two replicates were tested from within the same slice
This means that for either the Peroxide Test or the TBA Test for one point in time, there
were 4 x 4 x 2 x 2 = 64 samples tested from 32 different slices, 8 each from each of the
four storage conditions. Statistically, this is an experiment with a 4 x 4 x 2 factorial
treatment structure in a Completely Randomized Design (CRD) with 2 repetitions at each
combination of storage and material and 2 sub-samples per repetition at 7 time periods.
Figure 4 illustrates a flow diagram of the statistical model.
Since there were 4 different packaging materials and 4 different storage
conditions in the study that were tested at 7 times, there were 4 x 4 = 16 combinations to
be studied at each time step. For each combination, two slice samples were drawn for
each of the two tests, the TBA test and the Peroxide Test. Two test samples were taken
from within each slice. Therefore, for one combination of storage and material, there
were 2 x 2 = 4 replicates that were subjected to the tests. The TBA and P. V. results
reported in Appendices A.I to A.8 are the average of these 4 replicates and their standard
deviations.
- 32 -

~~~
Figure 4. Flow Diagram of Statistical Model
~~~
,VJW,
Ref: Refrigeration at 4°C ± 1°C. <20%RH RT : 2SoC ± SoC, 4S%RH ± )0%0: 40°C ± 1°C. <20%RH HC : 40°C ± IDC. 80% RH ± 2%
Tl - I week, T2 - Imonth, T3 - 2months. T4 - 3months, TS - 4months, T6 - Smooths, n - 6months

-
Table III. Statistical Table of Inputs sed in the Analysis
Source
Material
Storage
Degrees of Freedom (OF)
3
3
Material x Storage
Slice within Material x Storage
Sample within slice
Time
Time x Material
Ti me x Storage
Time x Material x Storage
M~thod
Error
9
16
32
6
18
18
54
288
Assumptions Made in the Experiment
rt was assumed that the sea] ing of all the four packagi ng materials was
adequately etlicient at the same temperature setting in the impulse. ealer. rt was also
assumed that the temperature and humidity variations under all conditions of storage
were negligible. Also, the fact that exposure to light and the intensity of light incident on
the peanut butter slices could cause a part of the oxidative rancidity was not taken into
account. It was a sumed that all part of one slice were equally pron to rancidity, i.e: the
parts of a slice adjacent to the sealed ends w re no different from areas away from the
sealing joints.
- 34 -

-
CHAPTER (4)
RESULTS AND DISCUSSION
This chapter includes the results from both the qualitative analyses and the
two rancidity tests: the Peroxide Test and the Thio Barbituric Acid Test. The data
include results during each storage time and the statistical analysis of those results.
Peroxide Test
The results obtained from the Peroxide Test are shown in Figures 4 - 7 for
each of the different packaging materials. It can be seen that the Peroxide Values (P.V.)
ranged from 80 - 350 meq/kg, i.e: the P.Y. of freshly made samples was about 80meq/kg,
and the maximum P. V. that most of the samples attained during their course of storage
was 350 meq/kg. The time when the samples exhibited the maximum P.V. varied for
each sample dependi ng on the type of packaging material, as well as the storage
condition. In general, the peroxide values seemed to increase steadily from the initial
value until a maximum was reached and then the value' started decreasing, which is in
tune with the normal trend of peroxide formation during oxidation of fatty foods. During
this process, peroxides are formed as the first by-product of fat oxidation, and then they
gradually decompose into secondary by-products.
The average Coefficient of Variation (C.V.) for the Peroxide Values is
3.89%. C.V. 's ranged from 0% to 18.04% in these tests and the values are listed in
Appendices A.I.) - A.12.
·35 -

Figure 5. Peroxide Test Results for Slices in Print Pack Material
400
- 350Cl~ 300--C"Q)
250EQ) 200:;]
ca 150>Q) 100"0')(
500~
Q)0Il.
0 5 10 15
Time (weeks)
20 25 30
-+- Room Conditions
Oven
--- Refrigeration
~ Humidity Cham ber
Figure 6. Peroxide Test Results for Slices in HB I Material
- 400C'l
..lI:: 350-C"Q) 300EQ) 250~
~ 200>Q) 150
"C>< 1000"- 50Q)
a..0
0 5 10 15
Time (weeks)
20 25 30
--+-- Room Conditions
Oven
- 36 -
- Refrigeration
~. Humidity Chamber

-Figure 7. Peroxide Test Results for Slices in Saran Material
l
- 450C)
400..lI::-C"350(J)
E 300(J)
250;j
nl200>
(J) 150"C
>< 1000...(J) 50Q.
0
0 5 10 15 20 25 30
Time (weeks)
r-- - - ----I~ Room Conditions
I Oven
- 1---- Refrigeration I
~Humidity Chamberl
------------------- - -- ---450 --------
- 400C'l.:zI:.- 350c-Q)
E 300Q)
250::;,nJ
200> ~(J)
"C 150'x0 100...Q)
a.. 50
0
Figure 8. Peroxide Test Results for Slices in DKII Material
o 5 10 15 20 25 30
Time (weeks)
-+- Room Conditions
Oven
--- Refrigeration
7'<_ Humidity Chamber
- 37 -

Thio Barbituric Acid Assay
The results obtained from the TBA Test are shown in Figures 8 - 11 for
each of the different packaging materials. It can be seen that the TBA values ranged from
0.1 to 2.2 depending on the packaging material and storage condition. For comparison,
fresh beef has a TBA value between 0.1-0.2, and beef just at the onset of spoilage has a
TBA value of 1.8 (Pearson, 1968). In general, the TBA values seemed to increase
steadily frum the initial value and continued to increase during the entire time of storage.
As the TBA value gives an indirect measure of the aldehydes formed during lipid
oxidation, this trend in the graphs may be explained by the fact that as the duration of
storage increases, more and more aldehydes are fanned within the food product. Some
aldehydes are secondary or tertiary by-products of the fatty acids in the food products.
The rest could be by-products of other non-fat constituents in the food material.
In general, there was a considerable amount of variability in the data and
in the degree of variation from one graph to another for the same m thad, even if the
general trends are more or less similar in most graphs. The reasons for the variabilities
are not well defined, but potential reasons are difficulty in determining the end point in
titration during the Peroxide Tests, and different color intensities during TBA tests. Since
peanut butter has an original color which imparts a yellow color to the reaction mixture
during the Peroxide Tests, it becomes exceedingly difficult to judge the precise end point
during titration, as the end point is determined by color change of yellow potassium
iodide to colorless. The solution almost never becomes colorless due to the original color
of peanut butter. During TBA tests, all the samples are centrifuged together and then their
color intensities are read one at a time. Since the samples whose intensities are read
- 38 -

towards the end are allowed to stand for a few hours longer than the rest, their color
intensities change visually. This could cause the spectrophotometer readings to be
different than what they would have been if all the samples were measured for their color
intensities at the same time. These could be some reasons why the TBA and Peroxide
Val ues exhibit a wide range of variability. A sudden increase in the TBA values for all
materials was observed around the one month storage period. This could indicate that the
reaction mixture was allowed to stand for too long before taking the spectrophotometer
readings. The average Coefficient of Variation of the TBA values was 6.215. with C.V.'s
ranging from 0.153 to 54.562. All C. V.'s are listed in Appendices A9 - A.] 2.
Effect of Packaging Material
Each packaging material displayed different characteristics with respect to
influencing rancidity, as well as other properties like ease of sealing and its peelability
from peanut butter slices. Since the sealer used was a heat-impulse sealer, the factor that
influenced the sealing quality was mainly the temperature. Saran could seal at low
temperature as compared to the others, and the Print Pack material requir d higher
degrees of heating as compared to the others. Also, DK II exhibited minimum adherence
to the peanut butter slices, followed by the Print Pack material. HB] and Saran. However,
these observations with respect to the sealing quality and peelability of the packaging
materials were very subjective in nature.
The Print Pack packaging material displayed the most consi tent behavior
with respect to the rancidity patterns of peanut butter slices. From both the TBA as well
as the Peroxide Test graphs of Print-Pack (Fig 4 and 8). it can be seen that the samples
packed with this material began to degenerate after 16 weeks (4 months) of storage under
- 39 -

room conditions. There was a relatively small change with respect to the P.V. and TBA
values of the slices wrapped with the Print-Pack material and stored under refrigerated
conditions, even after 6 months, when compared with the slices packaged in the other
materials.
The high barrier material, HB 1, also had relatively good performance with
respect to the storability of peanut butter slices. Under refrigerated conditions, there was
no oxidation until about 16-18 weeks, as is evident in both the TBA and the Peroxide
Test results (Fig. 5 and 9). Under room conditions, rancidity developed at around 12
weeks.
Figure 9. TBA Results for Slices in Print Pack Material
2.5
2
C1>::::s 1 5ns>«mt-
0.5
0
0 5 10 15
Time (weeks)
20 25 30
~ Room Conditions
Oven
- 40 -
--- Refrigeration
i< Humidity Chamber

...
Figure 10. TBA Results for Slices in HB I Material
2.5
2Q,)::J 1.5C'C>< 1m~
0.5
00 5 10 15
Time (weeks)
20 25 30
-+- Room Conditions
Oven
Figure 11. TBA Results for Slices in Saran Material
- Refrigeration
-*- Humidity Chamber
2.5
2
(1) 1.5:::Jeu> 1<CDl- 0.5
a
-0.5_ _5 .... __10.. ... .1_5 2..0-__25. _ 3
Time (weeks)
-+- Room Conditions
Oven
.. 4\ -
- Refrigeration
)< Humidity Chamber

-
Figure 12. TBA Results for Slices in OK 11 Material
- --
2 5
2
Q)~
1.5
"'>«[Dl-
0.5
0
0 5
Time (weeks)
j---'-Room Conditions
Oven
~Refrigeration
~HumidityChamber
Saran wrap perfoffi1ed fairly weIJ until about 8-10 weeks under
refrigerated and room conditions. In the oven as well as humidity chamber, the slices
exhibited considerable rancidity in les than 6 weeks (Fig. 6 and 10). There was a little
seepage of oil in Saran under elevated temperatures and humidity, i.e: during storage in
the oven at 40°C, and in the humidity chamber at 40°C and 80% relative humidity.
OK 11 was found to be the most un uitable material for packaging of the
peanut butter slices. There was a lot of visible oil seepage through the DK 11 packaging
material under all conditions of storage, primarily after 3 months of storage. Even under
refrigerated conditions, there appeared to be an adequate amount of rancidity in less than
8 weeks (Fig.7 and II). These results can be expected in light of the oxygen permeability
figures of the packaging materials iIJustrated in Table II. Overall, the slices wrapped in
Print-Pack and HB 1 (the high barrier material) exhibited better shelf-life properties than
Saran and OK 11.
- 42 -

!i""""
Effect of Storage Conditions
Refrigerated storage conditions were ideal for storage of peanut butter
slices. No significant change occurs in the slices stored under refrigeration even after 6
munths of storage, in three of the four packaging materials (all except OKll). There was
rapid aroma loss in the peanut butter slices after about 4 months of storage, except those
stored in the refrigerator. The aroma loss was detected using visual and odor sensing,
and hence the quality of this observation is very subjective. The original color of the
slices is also retained to the highest degree in the refrigerated slices, as shown in Figure
16, which shows the slices packaged in all four kinds of packing materials that had been
refrigerated for 6 months.
Under room conditions, Print Pack performs the best with no significant
rancidity development before 14-15 weeks of storage time. Around that time, the
peroxide values start dropping for the Print Pack material, but they still continue to
increase for the other materials (Figure 12, App.B.t), and the TBA values for the Print
Pack material stabilize at that time, while they are still tluctuating for the rest of the
materials. For all the other packaging materials, con iderable rancidity develops in less
than 10 weeks of storage. The distinctive aroma of peanut butter disappears after 5
months of storage at room conditions irrespective of the packaging material used. After 6
months of storage at room conditions, the slices packed in all materials lose their initial
rich color and become pale looking (Fig. 17).
When stored in the oven at 40°C. the slices packed in the Print-Pack
material last tor about 10 weeks. The remaining samples undergo rancidity changes
within 5-6 weeks of storage (Figures 13 and 14). This is concluded because the TBA
- 43 -

'.values are still fluctuating after 10 weeks for all other materials and peroxide values have
not reached a well defined peak value even after 10 weeks for all materials except the
Print Pack material. The aroma vanishes after 3 months of storage in the oven for all
materials.
For the samples stored in the humidity chamber, a very distinct
characteristic that is observed is the high degree of oil seepage through all the barrier
materials except Print Pack, as compared to the other storage conditions. The oxidative
shelf-life of the peanut butter slices in the humidity chamber is close to that of the slices
in the oven, i.e: 10-12 weeks when packed in Print-Pack, and 5-6 weeks in all other
packaging materials. It was observed that the slices in OK11 develop a dark color and
brittle texture after 4 months of storage in the humidity chanlber. Also, there was a great
deal of fungal growth around the slices that were packed in DKII and stored in the
humidity chamber after 6 months of storage, which is shown in Figure 15.
Figure 13. Peroxide Test Results Under Room Conditions
400 ,-------------------------------,
350
<1>300::3
iti 250>~ 200><e 150<I>0.100
~ I ---l
o 5 10 15
lime ('vWeks)
20 25 30
-+- Saran --- HB1
- 44-
01<11 ' PrntPk

Figure 14. Peroxide Test Results Under Oven Conditions
600
-~500--C"Q)
E400-Q);::,
iU 300>Q)
" 200'>(0...Q)
100a..
a0 5 10 15 20 25 30
lime (weeks)
I-+- Saran --- HB1 -.- DK11 ~Prnt~
Figure 15, TBA Results Under Oven Conditions
~-----
I
I2
-~, ,
I,
Q) . ·oX;::, 1.5III>~lI:l 1I-
0.5
/
aa 5 10 15 20 25 30
Time (weeks)
-+- Saran --- HB1 DK11 ,t. PrntPk
- 45 -
-

-
Igur 16. P ut Butt r lie lJu idi 'ham
- 46·

-
Figur 17. Peanut Butter lie ft r onth f t r 1 in R frig rator
Figure 18. amples Under all 4 Storage Condition fier 6 M nth
- 47 -

Variation in Qualitative Properties
The physical properties of the peanut butter slices that were qualitatively
evaluated, such as aroma, color and texture, showed a wide range of variation under
different conditions of storage. These physical properties seemed to change more with
respect to the storage condition and were less influenced by the kind of packaging
material used. Most slices underwent a color change from original color to very dark
shades of brown during storage in the humidity chamber. In addition, the slices
developed a brittle texture during storage in the humidity chamber. Also, under room
condition, most slices turned pale. Table IV gives an overview of the effect of various
storage conditions on the change in some physical properties of peanut butter slices for
different packaging materials.
- 48-
.

-
Table IV. Qualitative Property Changes During Storage
ote: The storage conditions are abbreviated aR.C. - Room Conditions (25°C ± SoC, 4S%RH ± 10%)Ref. - Refrigeration (4°C ± 1°C, <20%RH)o - Oven (40°C ± 1°C, <20%RH)H.C.- Humidity Chamber (40°C ± jOC, 80% RH ± 2%)
Material
Print Pack
fIB]
Saran
DKII
Color
Darkens in H.c.after 5 months.Turns pale in R. C.after 5 months.
Darkens in H.c.after 4 months.turns pale in R.C.after S months.
Turns pale underR.C. after 3 months.Darkens in H.C.after 4 months.
Darkens after 4months in H.C.Turns pale underR.C. after 3 months
Texture
Turns brittle inH.C. after Smonths. Stickyin 0 after 4months.
Turns brittle inH.C. after Smonths.
Sticky under ovenconditions after 3months. Brittleafter 4 months inH.C.
Brittle after 3months in H.C.
Aroma
Retained underRef. and R.C.Lost after 4 monthsin oven and H.C.
Retained underall conditionsuntil 6 months.
Retained unti I 4months underRef. Lostafter 3 monthsunder all oth rcondition.
Lo ·t after 4 monthsunder all conditions.
- 49 -

Temperature Effects on Rancidity
From the experiments, it was observed that storage temperature had a
more pronounced effect on the development of rancidity than the humidity to which the
peanut butter slices were subjected. A temperature range of SOC-40°C was covered under
the 4 different storage conditions that were selected. Refrigerated storage was at SoC,
room temperature was at 2SoC and the temperatures both in the oven and the humidity
chamber were at 40°C. In Figures S-12, the time at which a Peroxide curve reached its
peak and the time at which the slope of the TBA curve abruptly stopped increasing after
reaching a high value were estimated. The estimated values for each of the experimental
conditions (Tables V and VI) were plotted as a function of storage temperature which are
shown in Figures 19 to 22.
It can be clearly seen that the slices stored under refrigerated conditions
take longer to show signs of rancidity for both the TBA and Peroxide Values. The
relationship between the temperature and the time when the slices start exhibiting
rancidity is linear, as is shown by the regre sian equations in the graphs. All the trend
lines have a negative slope, as the peak time for rancidity development is smaller for
higher temperatures, and the R2 values range from 0.68 to 0.99. In Figures 19 and 20, the
trend line for Prink Pack has the smallest negative slope of -0.11, as compared to the
slopes of the other trend lines which are all approximately -0.21. This may be used to
conclude that Print Pack is less sensitive to temperature differences with respect to
rancidity.
- 50 -

-
Table V. Time (weeks) to Onset of Rancidity from peak Peroxide Values
Time to Onset of Rancidity (weeks)StorageTem~erature
( C)
5
25
40
PrnkPk
16
16
12
HBl
18
12
10
Saran
20
16
12
OKII
16
16
Table VI. Time (weeks) to Onset of Rancidity from TBA Values
Time to Onset of Rancidity (weeks)StorageTem~erature
( C)
5
25
40
PrnkPk
16
12
12
HBI
20
20
15
- 51 -
Saran
16
12
12
OK1l
16
16
12

-Figure 19. Peak Rancidity Time vs Temperature for Peroxide Test - PmtPk & HB 1
y=-Q.11x+ 17.19
~=O.68
y =-o.23x + 18.76
Ff =0.00
..--..~ 20 ,..---------------,(1)(1)
~ 15~
~ 10a..'0 5
! 0 ~--...-------./ I ::~ IIo 20 40 60 1- - - Urea- (PmtA<) !
T~ature(C) --Unear(H31)_ ,I
Figure 20. Peak Rancidity Time vs Temperature for Peroxide Test - Saran & DK11
y=-o.23x + 21.30
~=O.93
y= -o.22x + 18.39
~=O.68
Sacn
X D<11
-Urea (D<11)
Urea(Sacn)60
x
20 40
TEJllBCtLre (C)
...........~ 25 ,.....------------...,(1)
~20-...-.::£ 15CO
~ 10'+-
~ 5~ 0 L..-- ---I
o
- 52 -

..
Figure 21. Time of Onset of Rancidity vs Temperature for TBA Test - PmtPk & HBI
y=-Q.14x + 21.49
Fi =0.68
y=-D.12x+ 16.11
Ff=O.82
•t-_ -- 'f-- ....
25-~ 20-Q)
~ 15-..-Q) 10E~ 5 • AltA< I,
o1--------------' • /-81 !I
o 20 40 6O--Urea-(H31) I
"Ii (C) - - - Urea- (AntA<)€rrp:rctLre L _ _ I
Figure 22. Time of Onset of Rancidity vs Temperature for TBA Test - Saran & DKII
20
20 40
T~atLre(C)
.....-..~ 15 r-~..............~X~__Q) ~
~ 10Q)
~ 5
oo 60
y =.{).12x + 16.11
Ff =0.82
y ='{).11x + 17.19
Ff= 0.68
Saran
X 0<11
Unear (Saran)
-Unear (D<11)
- 53 -
--

The rancidity development at each of the time steps can be seen in Figures
23 & 24. These figures show the actual rancidity values with increasing temperature at
each of the time steps for both the TBA and Peroxide tests for two different packaging
materials. The remaining graphs are shown in appendices A.6-A.II. These graphs
confinn that the temperature effects on rancidity development are significant. During the
early part of storage, rancidity values increase with increasing temperature.
An interesting phenomenon can be observed in some of the graphs at later
time periods. The rancidity increases with increasing temperature during the first part of
the storage period (until the peak is reached), and decreases with increasing temperature
for the second half of the storage period. As it is not feasible that the already rancid
samples can get any better as time progresses, this observation might be explained in
terms of breakdown of those rancidity components that were evaluated in each test into
further by-products. Also, it might be concluded that the higher the temperature, the
higher is the rate of breakdown of the rancidity by-products with progres ing time.
However, this trend is not so evident in the P.V. graphs for DKll, Saran and Print Pack
materials. For these packaging materials, the peroxide values seem to increase with
increasing temperature at every time step. This indicates that the peanut butter fat
continue to get oxidized and form peroxides constantly even after 6 month. This might
be used to conclude that peroxides are more prominent byproducts of oxidation as
compared to the aldehydes.
- 54 -

-Figure 23. Temperature Effects on Peroxide Values for HB 1 Packaging Material
T81p(Q
I
-1w:a<I 1rm1h
1~2rm1h
1;-3nu~sll
~4lto~sli
~5l1uttSII
-Sltuttsll
3J10
4J) ,-------------------,
3D
~:m
~23J
~aD
~ 1SJ...~1CD
SJOl---------r-----,-----------J
o
Figure 24. Temperature Effects on TBA Results for Print Pack MaterialI
j25,------------------,
-1wB<I
1rra1h ,
---1t- 2Ira tt si
1;-3ltof!s
~4rrotts
-+-5rrotts
1-6rrotts'..•
;
V--_---------¥._--~T\. .
._---/::-------( ,•
2
0.5
I ~Cii 1.5>~ 1
or-
3J10
OL--------------------'
oTatp(q
- 55 -

-Statistical Analysis
The statistical model involves two test methods, four packaging materials
and four storage conditions with two repetitions x two sub-samples per repetition and
seven time periods. The treatment structure is a 2x4x4 factorial, and the design structure
is a Completely Randomized Design (CRD).
The statistical analysis of the data and the interactions between all the
variables in the experimental layout is illustrated in Appendix C. The analysis was
performed after converting collected data to log(%Control) + I, which means that all raw
data was transformed into the percentage of initial data (at time '0') which it represented.
The data that was used to plot the graphs shown in Appendix C.3 are that of the least
square means of the Peroxide or TBA values against time. Same plotting symbols
indicate same material.
From the analysis as well as from the graphs, it is apparent that there is
significant interaction between method, material. storage condition and time (p<O.OOO 1).
Also, the packaging materi.als are significantly different from each other, and so are the
storage conditions. All estimations were done at 99.99% confidence interval (page 83,
Type 3 Tests of Fixed Etfects).
The following observations were made with respect to each of the
rancidity tests:
In the peroxide test, samples stored under refrigerated conditions have a
significant material effect across all times. DK I I has no storage effect after 2 months of
storage, which could mean that the samples, when packed in OK 11, undergo maximum
deterioration within 2 months. From results of Thio Barbituric Acid test, refrigerated
- 56 -

....
samples show no material effect after 5 months. The storage conditions affect TBA
results for each material, except Print-Pack at 6 months and HB I at 2 months.
From the analysis of interaction between storage and material for the
Peroxide Test, it may be inferred that the variations among different material and storage
combinations are significantly different (F(9,16) = 5.47, p = 0.0016). Under conditions in
the humidity chamber there is no significant difference between the performance of all 4
packaging materials (F(3, 16) = 1.38, p = 0.2846). This means that all packaging materials
perform equally poor under high temperature, high humidity conditions. Also, there is no
significant storage condition effect on slices packaged with HB 1 material (F(3, 16) = 2.27,
P = 0.1195). Therefore. samples packaged in HB 1 may be less prone to degradation due
to changes in atmospheric conditions for a short period of storage. This could be due to
the HB 1 material having the lowest oxygen permeability of the four materials (Table II).
The Print Pack material exhihits significantly different responses between
storage under high temperature/high humidity and that under low temperature/low
humidity, indicating that temperature has a considerable effect on this packaging
material. It might be a suitable material for long term storage under refrigerated
conditions or under room temperature, but is not optimal at high temperature (page 102).
Saran has a significant storage effect (F(3J6) = 6.47, p = 0.0045).
However, the mean response under room conditions is very much lower than the mean
under other conditions, which suggests that Saran performs best at moderate temperatures
(page 99).
- 57 -
.'

..
The results from the two test methods varied significantly for nearly all
material x storage x time combinations at the 95% level, except in the case of OK II at
room conditions in the 2nd and 41h months, HB 1 in refrigeration in 41h month, Print-Pack
in oven, room conditions and refrigeration in the first week and Print-Pack in
refrigeration after 1st month. This could be used to conclude that one test might not
replace another, and it is advisable to conduct both, the Peroxide Test, as well as the TBA
Test on peanut butter slices.
- 58 -

CHAPTER (5)
CONCLUSIONS
The rancidity studies on peanut butter slices provide some insight
regarding the most suitable kinds of packaging and storage conditions for this product.
The conclusions drawn from this study are as follows :
1. Rancidity begins after 1-2 months of storage under room conditions for all packaging
materials except Print Pack, in which the peanut butter slices last for about 15 weeks
before showing signs of rancidity.
2. The high barrier packaging material, HB 1, and the Print Pack film performed the best
under all conditions of storage. The HB I material may be better for short term storage
owing to its very high oxygen and moisture permeability values.
3. DKI t is the least suitable of the packaging materials tested.
4. Peanut butter slices exhibit good shelf-life properties of up to 6 months under
refrigeration for all kinds of packaging materials used, except DK II, which provides
very low oxygen barrier. Both TBA and Peroxide Values were much smaller for
refrigerated samples than samples at higher temperatures. Peanut butter slices
retained their normal aroma and color even after 6 months or storage in the
refrigerator for all packaging materials except OK It.
5. Storage temperature apparently has a greater effect on the rancidity of peanut butter
slices than humidity. This was concluded based on the fact that under the same
conditions of packaging and storage time, the TBA results and Peroxide Values were
a little higher under oven conditions than in the humidity chamber in mo 't cases.
- 59 -

6. Storage temperature and humidity affects the color of peanut butter slices
significantly. High temperature and humidity cause the slices to turn dark and brittle,
and storage under room conditions causes the color of the slices to go very pale.
7. Temperature plays a vital role in accelerating rancidity of peanut butter slices. For
smaller storage periods, rancidity in terms of peroxide value and aldehyde generation
increases rapidly with rise in temperature.
~L The Print Pack material exhibits the highest efficiency under varying temperatures.
9. Peroxide Test is better than TBA test for rancidity analysis, as shown by the lower
Coefficient of Variation.
- 60 -
-

""'""
CHAPTER (6)
RECOMMENDATIONS FOR FUTURE WORK
Studies should be conducted on the release characteristics of the various
kinds of packaging materials. Release characteristics refer to the ease with which the
peanut butter slices can be separated from the packaging film, which will depend on the
cohesive and adhesive forces between the material and peanut butter.
Microbial tests and shelf-life studies with respect to microbial spoilage
should be conducted to substantiate or complement the tests for oxidative stability.
Organoleptic tests must be carried out, i.e. the slices must be subjected to a sensory panel
in order to assess consumer acceptance of the product after certain periods of storage.
Studies must be conducted to improve upon the laboratory scale packaging
of individual peanut butter slices.
Other kinds of rancidity tests should be carried out on the peanut butter
slices to supplement the Peroxide Test and Thio-Barbituric Assay. Also, the validity of
these two tests used on peanut butter must be ascertained.
- 61 -

REFERENCES
Abe, Yoshiaki; 1994, Active packaging with oxygen absorbers. Mitsubi hi Oas ChemicalCo, Inc., VTT Symposium Proceedings of the Symposium on Minimal Processing ofFoods, Kirkkonummi, Finland, 142.
Ahn, D.U.; Olson, D.O.; Lee, 1.1.; Chen, X.; 1998, Packaging and irradiation effects onlipid oxidation and volatiles in pork patties. Iowa State Univ., Animal Science Dept.Ames, lA, USA, Journal of Food Science,63, 1, 15-19.
Anderson, J.C.; Jones, B.D.; 1999, Principal factor analysis of extruded sorghum andpeanut bar changes during accelerated shelf-life studies. Journal of Food Science, 64, 6,1059-1063.
Bernheim, F.; Bernheim, M.L.C.; Wilbur, K.M.; 1948, The reaction betweenthiobarbituric acid and the oxidation products of certain lipids. Journal of BiologicalChemistry, 174,257.
Briston, J.H., Katan, L.L.; 1974, Plastics in Contact with Food, Food Trade Press Ltd.,r,ondon. 5-27.
Chu, Yan-Hwa; 1991, Comparative study of analytical methods for evaluation ofsoybean oil quality. Journal of the American Oil Chemists Society, 68,6,379-384.
Czerniawski, Bodhan; Pogorzelska, Zofia; 1997, Investigation on overall migration ofvarious plastic materials and articles used in contact with foodstuffs. PackagingTechnology & Science, I0,5, 261-270.
Deatherage, F.E., Mattill, H.A.; 1939, Antioxidants and the auto-oxidation of fats: autooxidation of oleic acid, methyl oleate, oleyl alcohol. and cis-9-octadecene. IndustrialEngineering Chemisty, 31,1425.
Emanuel, .M.; Lyaskovskaya, Yu.N.; L967,Translated by Allen. K.A.; The Inhibition ofFat Oxidation Process, 151 Edition, Oxford, New York, Pergamon Press, I 19-240, 246250.
Enig, M.G.; Pallansch, L.A.; Sampugna, J.; Keeney, M; 1983, Fatty acid composition ofthe fat in selected food items with emphasis on trans components. Journal of theAmerican Oil Chemists' Society, 60, 10, 1788-1795.
Frankel. E.N.; 1993, In search of better methods to evaluate natural antioxidants andoxidative stability in food lipids. Trends in Food Science & Technology, 4, 7, 220-225.
- 62 -

-
~palakrishna, A.G.; Prabhakar, J.V.; 1983, Effect of water activity on autoxidation ofraw peanut oil. Journal of the American Oil Chemists' Society, 60, 5, 968-970.
Gordon, Dr. V.c.; Peasley, B.; Elias, J.; 1988, Two new methods to determine lipidperoxides, malonaldehydes in fresh and frozen seafood: comparison to other methods..Safety Associates, Inc., Tustin, CA, USA.
Grettie, D.P.; Newton, R.C.; 1931, Industrial Engineering Chemisty Analyses, 3rd
Edition, 171.
Guzman-Chozas, Matias; Vicario-Romero, Isabel M., Guillen-Sans, Remedios; 1998, 2Thiobarbituric acid test for lipid oxidation in food: Synthesis and spectroscopic study of2-thiobarbituric acid-malonaldehyde adduct. Journal of the American Oil Chemists'Society, American Oil Chemists' Soc Campaign IL USA, 75, 12, 1711-1715.
Hamilton, RJ.; Rossell, J.B.; 1986, Methods to Access Quality and Stability of Oils.Elsevier Applied Science Publishers, New York, USA, 23-28.
Holm, G.E.; Greenbank, G.R.; 1923, Quantitative Aspects of the Kries Test. IndustrialEngineering Chemistry, 15, 1051.
Holm, G.E.; Greenbank, G.R.; 1924, Quantitative aspects of the Kries Test - II. IndustrialEngineering Chemistry, 16, 518.
Home, L.W.; Stevens, H.H.; Thompson, J.B.; 1948, The effect of shortening stability oncommercially produced army ralion biscuits. 1 initial data and results of acceleratedstability tests. Journal of American Oil Chemists' Society, 25, 314.
Jeng,Jing-Guey; Ching-Chuang Chen; Shin-Jung Lin; CllU-Chin Chen; 1991, Interactionof Orange Juice and Inner Packaging Material of Aseptic Product. Food and PackagingInteractions II, Edited by Sara J.Risch and Joseph H.Hotchikiss, ACS Symposium Series473.
Jenkins, Wilmer A.; Harrington, James P.; 1991, Packaging Foods with Plastics,Technomic Pub. Co.
Marjanski, W.; Jarvela, P.; Penttinen, T.; 1996, Grease resistance test method for polymercoated carton board packaging materials. Journal of Material Science Letters, 15 24,2195-2199.
Mate, Juan 1.; Saltveit, Mikal E.; Krotcha, John M.; 1996, Peanut and walnut rancidity:effects of oxygen concentration and relative humidity. Journal of Food Science, 61, 2,46:'\-470.
Mehlenbacher, V.C.; 1960, Analysis of Fats and Oils. The Garrard Press Pulishers.Champaign, Illinois. 188 - 235.
- 63 -
§

Michalski, Marie-Caroline; Desobry, Stephane; Pons, Marie-Noelle; Hardy, Joel; 1998,Adhesion of edible oils to food contact surfaces. ENSAIA- INPL, Journal of theAmerican Oil Chemists' Society, American Oil Chemists' Soc Campaign IL USA, 75, 4,447-454.
Min, David B.; Smouse, Thomas H.; 1989, Flavor Chemistry of Lipid Foods. TheStephen S.Chang Symposium, AOCS, Champaign, Illinois.
Miyazawa, Teruo; Kikuchi, Mari; Fujimoto, Kenshiro; Endo, Yasushi; Cho, Soon-Yeong;Usuki, Riichiro; Kaneda, Takashi; Jan 1991, Shelf-life dating of fish meats in terms ofoxidative rancidity as measured by chemiluminescence. Tohoku Univ., Journal of theAmerican Oil Chemists' Society, 68, 1,39-43.
Pareja, Giuliana Cecilia Dfaz; 2000, Development of Peanut Butter Slices. M.S.Thesis,Oklahoma State University, Stillwater, Oklahoma.
Pearson, D.; 1968, Application of chemical methods for the assessment of beef qualityIII. Methods related to fat spoilage. Journal of Food and Agricultural Science, 19, 553.
Perez, B. Maria; Krochta, M. John; 2001, Lipid particle size effect on water vaporpermeability and mechanical properties of whey proteinlbeewax emulsion films. Journalof Agricultural Food Chemistry, 2, 49, 996-1002.
Poad, William; 1982, Aluminum foil/polymer laminates as hermetic seals on treatedglass. Packaging Technology, 12, 2, 22-24.
Powick, W.e.; 1923, Compunds developed in rancid fats, with observations on themechanism of their formation. Journal of Agricultural Research, Journal of Oil and Fatfndustry, 26, 323
Robertson,Gordon L.; 1993, Food Packaging Principles and Practice. Marcel Dekker Inc.,73-108,338-621.
Royce, H.D.; 1933, Stability of Fats and Oils. Applications of the Methylene Blue TestIndustrial Engineering Chemistry, Analysis Edition, 5,244.
~nhueza, Julio; Nieto, Susana; Valenzuela, Alfonso; Sep 2000, Thermal stability ofsome commercial synthetic antioxidants. Universidad de Chile, Journal of the AmericanOil Chemists' Society, American Oil Chemists' Soc Campaign IL USA. 77, 9, 933-936.
Schaich, Karen M.; Sept.1995, Rancidity in Foods (3rd Edition), Trends in Food Scienceand Technology, Elsevier Science Ltd. Oxford England, 6, 9, 318.
Amouse. Thomas H.; 1985, Oil and Lecithin Process Research, Archer Daniels MidlandCompany, Decatur, fL, USA.
- 64 -

-
United States Consumer and Marketing Service; 1972 United States Standards for gradeof peanut butter. U.S. Dept. of Agriculture, Consumer and Marketing Service (3 rd
Edition).
Valentas, Kenneth 1.; Enrique Rotstein; R.Paul Singh; 1997,Handbook of FoodEngineering Practice. CRC Press LLC, Food Packaging Materials. barrier Properties andSelection, Ruben J.Hemandez, 291 - 360.
vom Bruck, e.G.; Figge, K.; Rudolph, F.; Aug 1981. Interaction of fat-containing foodwith plastics packaging. Unilever Forschungsges, Hamburg, Germany, Journal of theAmerican Oil Chemists' Society, 58, 8, 811-815.
Woodroof, Jasper Guy; 1983, Peanuts Production, Processing, Products, 3rd Ed., AVIPublishing Company, Inc., Westport, Connecticut, 203-209.
- 65 -

-
APPENDICES
- 66 -
n
.:
J..

APPENDIX A.I
TBA Results for Room Conditions
Time TBA results TBA results TBA results TBA results(weeks) for Saran for HBJ for DK11 for PmtPk
1-1* IT J.l () ~l () 1-1 00**
0 0.102 5.77E-4 0.102 8.08E-3 0.102 5.77E-4 0.102 5.77E-4
0.988 2.56E-2 0.976 2.63E-~ 1.2205 6.59E-2 0.201 3.26E-2
4 0.542 2.49E-2 1.564 5.18E-2 1.32 3.41 E-l 0.443 2.49E-2
8 1.119 1.71 E-3 0.642 6.86E-3 0.385 3.67E-2 0.609 1.14E-2
12 1.405 2.28E-2 0.854 3.08E-2 0.601 1.76E-2 1.628 1.59E-2
16 0.24 5.45E-2 0.16 8.73E-2 0.52 7.89E-2 1.677 1.22E-l
20 1.69 8. t9E-2 1.543 3.62E-2 1.475 3.8E-2 1.81 1.69E-2
24 1.725 1.15E-l 1.744 1.54E-l 0.884 1.67E-1 1.955 1.43E-l
APPENDIX A.2
TBA Results for Refrigeration
Time TBA results TBA results TBA results TBA results(weeks) for Saran for HBJ for DKl1 for PrnLPk
~l (J ~l (J ~l a ~l a
0 0.102 8.08E-3 0.102 7.51 E-3 0.102 8.08E-3 0.102 7.51 £-3
0.122 9.29£-3 0.163 1.05E-2 0.203 6.7E-3 0.143 3.65E-3
.:1- 1.5 5.16E-2 0.604 1.78E-2 0.978 2.47£-2 0.211 3.77£-2
8 0.471 3.8E-2 0.609 9.91 E-3 0.332 3.15E-2 0.39 4.24£-3
12 0.479 1.51£-2 0.622 7.53E-3 0.409 7.14E-3 0.722 1.36E-2
16 0.489 2.92E-2 0.5 1.07E-1 0.505 8.53E-2 1.835 1.73E-2
20 1.832 7.85E-2 1.838 1.21 E-l 2.006 7.92E-2 1.858 5.67E-2
24 2.164 3.01 E-1 2.124 2.31 E-1 2.072 2.2E-J 2.01 1 1.21 E-I
- 67 -

-APPENDIX A.3
TBA Results for Oven Temperature
Time TBA results TBA results TBA results TBA results(weeks) for Saran for HB] forDK11 for PrntPk
~L* cr ~ cr /.l IT ~ cr**
0 0.]02 7.51 E-3 0.102 7.51E-3 0.102 5.77E-4 0.102 8.08E-3
I 0.675 2.32E-2 0.6 7.55E-3 0.408 8.73E-3 0.275 2.38E-2
3 0.642 2.87E-2 0.822 2.32E-2 0.734 4.21E-2 0.4] 9 2.38E-2
4 0.623 3.95E-3 0.9 9.61E-3 0.9 1.02E-2 0.468 3.94E-2
6 1.739 1.96E-2 1,054 5.00E-3 2.099 1.01E-1 0.605 8.42E-3
8 0.593 2.87E-2 0.546 7.07E-3 0.473 5.94E-3 0.7 5.94E-3
10 0.676 5.27E-2 0.603 3.62E-2 0.579 7.3E-2 1.46 6.44E-3
12 0.74 1.02E-2 0.625 2.26E-2 0.628 1.54E-1 1.593 6.9E-2
16 0.622 5.52E-2 0.509 6.27E-2 0.13 3.93E-2 1.806 3.24E-2
20 1.509 4.23E-2 1.516 1.21 E-2 1.696 5.42E-2 1.832 4.85E-2
24 1.295 2.47E-l 2.149 2.94E-I 1.579 3.87E-2 1.9 2.42E-2
- 68 -

-
APPENDIX A.4
TBA Results for Conditions in Humidity Chamber
Time TBA results TBA results TBA results TBA results(weeks) for Saran for HBI for DKII for PmtPk
~* (J ~ a J..t a J..t a**
0 0.102 5.77E-4 U.102 8.08E-3 0.102 7.51E-3 0.102 8.08E-3
1.282 1.33E-2 U.508 2.74E-2 1.0335 3.38E-2 0.389 3.78E-2
3 0.974 1.87E-2 0.494 2.49E-2 0.881 3.99E-2 0.577 3.78E-2
4 0.914 2.48E-2 0.47 2.23E-2 0.744 1.5E-2 0.612 6.04E-2
6 1.192 1.36E-2 1.661 3.05E-2 1.682 1.06E-I 0.707 6.58E-3
8 0.827 1.28E-2 0.707 1.93E-2 0.694 2.4IE-2 0.797 2.28E-2
10 0.928 4.4E-2 0.73786.99E-3 0.732 1.67E-2 1.655 5.43E-3
12 1.3 3.26E-2 1.767 3.81E-2 1.587 3.61E-2 1.314 1.62E-1
16 0.758 8.67E-2 0.302 4.9E-2 0.994 1.12E-l 1.129 1.46E-l
2U 0.836 6.08E-2 1.072 3.1 E-2 1.076 3.06E-2 1.371 4.09E-2
24 1.44 1.09E-1 1.113 5.9E-2 1.308 6.94E-2 1.724 2.47E-2
- 69 -

APPENDIX A.S
Peroxide Values for Room Conditions
Time P.V P.V. P.V. P.V.***(weeks) for Saran for HBI for DKl1 for PmtPk
!J.* (/ ~L () ~L (j ~ 0-**
U 80 14.4J 80 2.89 80 11.55 80 11.55
140 5.00 250 9.57 200 15.0U 130 5.00
4 235 10.00 190 5.00 lOa 9.57 185 17.32
8 130 8.16 240 U.OO 240 5.00 245 5.77
12 [75 5.77 250 5.00 260 8.16 305 5.77
16 300 8.16 257.5 12.58 320 0.00 325 [0.00
20 320 0.00 265 9.57 345 8.16 230 11.55
24 280 17.08 240 0.00 295 10.0U 120 0.00
APPENDIX A.6
Peroxide Values for Refrigeration.~•i 'I
Time P.Y P.Y. P.V.*** P.Y. I
(weeks) for Saran for HB [ for DKll for PrntPk
~l* 0- ~L () ~l 0- ~L 0-**
a 80 0.00 80 14.43 80 [4.43 80 14.43
240 0.00 230 15.00 235 10.00 112.55.00
4 120 0.00 120 0.00 120 0.00 160 1[.55
8 130 0.00 90 0.00 180 8.16 182.5 5.00
12 170 17.08 140 8.16 210 9.57 205 5.77
16 202 9.57 342.5 9.57 282.5 5.00 215 17.32
20 225 12.58 370 5.00 310 9.57 160 0.00
24 195 5.77 295 12.91 260 0.00 120 11.55
- 70 -

--
APPENDIX A.7
Peroxide Yalues for Oven Temperature
Time P.Y P.V.*** P.Y. P.Y.(weeks) for Saran for HB1 for DKII for PmtPk
~t* 0' I-l 0' I-l 0' I-l 0'**
0 80 0.00 80 0.00 80 0.00 80 2.89
230 17.08 215 12.91 140 5.00 215 8.16
3 270 9.57 200 5.00 150 9.57 272 8.16
4 290 0.00 160 8.16 150 8.16 287.55.00
6 550 9.57 210 8.16 310 5.00 327.59.57
8 200 0.00 240 0.00 1XO 20.00 340 0.00
10 220 5.00 245 5.77 200 9.57 360 8.16
12 260 8.16 270 5.00 225 5.77 345 5.77
16 245 5.77 305 5.77 320 8.16 305 12.91
20 270 17.32 335 5.77 335 0.00 250 10
24 250 11.55 300 9.57 285 17.32 220 5.77
- 71 -
-

APPENDIX A.8
Peroxide Values for Conditions in Humidity Chamber
Time P.V*** P.V. P.V. P.V.(weeks) for Saran for HBI for OKII for PmtPk
~* cr ~ cr ~L cr ~L 0'**
0 80 2.8l/ 80 11.55 80 0.00 80 11.55
1 285 5.77 270 5.00 240 5.00 185 8.16
3 270 J 5.00 220 9.57 230 9.57 232.58.16
4 200 5.00 140 0.00 100 9.57 247.59.57
6 400 9.57 390 10.00 200 5.00 287.59.57
8 200 5.00 200 0.00 260 9.57 305 5.77
]0 240 5.00 200 0.00 270 5.00 325 5.77
]2 250 5.00 210 8.16 290 8.16 345 5.77
16 367.59.57 295 11.55 377.5 9.57 315 5.77
20 405 9.57 315 0.00 415.59.57 300 11.55
24 365 5.77 285 0.00 375 30.00 290 0.00
* ~ indicates the mean of 4 replicates
** cr indicates the standard deviation of 4 repl icates
***All peroxide values are in meq. or02/kg of peanut butter.
- 72 -

APPENDIX A.9
Coefficient of Variation (%) of Data Under Room Conditions
0 0.566 18.038 7.921 3.612 0.566 14.437 0.566 14.437
2.591 3.571 2.694 3.828 5.399 7.500 Ih.219 3.846
4 4.594 4.255 3.312 2.631 25.833 9.570 S.621 9.362
8 0.153 6.277 1.068 0.000 9.532 2.083 1.872 2.355
12 1.623 3.297 3.607 2.000 2.928 3.138 0.977 1.892
16 22.708 2.720 54.562 4.885 15.173 0.000 7.318 3.077
20 4.846 0.000 2.346 3.611 2.576 2.365 0.934 5.022
24 6.667 6.100 8.830 0.000 18.891 3.390 7.315 0.000
Time(weeks)
Mean C.V
SaranTBA P.V.
5.468 5.532
HBITBA P.V.
10.543 2.571
- 73 -
DKllTBA P.V.
10.113 5.3 I I
PrntPkTBA P.V.
5.103 4.999

APPENDIX A.tO
Coefficient of Variation (%) of Data Under Refrigeration
0 7.922 0.000 7.363 18.037 7.922 18.037 7.363 18.037
7.615 0.000 6.442 6.522 3.300 4.255 2.552 4.444
4 3.440 0.000 2.947 0.000 2.526 0.000 17.867 7.219
8 8.068 0.000 1.494 0.000 9.488 4.533 1.087 2.740
12 3.152 10.047 1.210 5.829 1.746 4.557 1.884 2.814
16 5.971 4.738 21AOO 2.794 16.891 1.770 0.943 8.056
20 4.285 5.591 6.583 1.351 6.948 3.087 3.052 0.000
24 13.909 2.959 10.876 4.376 10.618 0.000 6.017 9.625
Time Saran(weeks) TBA P.V.
MeanC.V 6.795 2.917
RBITBA P.V.
7.289 4.864
- 74 -
DKllTBA P.V.
7.055 4.530
PmtPkTBA P.V.
5.096 6.617

APPENDIX A.tt
Coefficient ofYariation (%) of Data Under Oven Temperature
Time(weeks)
SaranTBA P.Y.
HBITBA P.Y.
OK11TBA P.Y.
PmtPkTBA P.Y.
0 7.363 0.000 7.363 0.000 0.566 0.000 7.922 3.612
3.437 7.426 1.258 6.005 2.140 3.571 8.655 3.795
3 4.470 3.544 2.822 2.500 5.736 6.380 5.680 3.000
4 0.634 0.000 1.068 5.100 1.133 5.440 8.419 1.739
6 1.127 1.740 0.474 3.886 4.812 1.613 1.392 2.922
8 4.840 0.000 1.295 0.000 1.256 11.111 0.849 0.000
10 7.796 2.273 6.003 2.355 12.608 4.785 0.441 2.267
12 1.378 3.138 3.6] 6 1.852 24.522 2.564 4.331 1.672
16 8.875 2.355 12.318 1.892 30.231 2.550 1.794 4.233
20 2.803 6.415 0.798 1.722 3.196 0.000 2.647 4.000
24 19.073 4.620 13.681 3.190 2.451 6.077 1.274 2.623
Mean C.Y 5.618 2.864 4.609 2.591 8.059 4.008 3.946 2.715

-
APPENDIX A.12
Coefficient ofYariation (%) of Data Under Conditions in Humidity Chamber
0 0.566 3.612 7.922 14.438 7.363 0.000 7.922 14.438
1.037 2.024 5.394 1.852 3.270 2.083 9.717 4.411
3 1.920 ).556 5.040 4.350 4.529 4.161 6.551 3.510
4 2.713 2.500 4.745 0.000 2.016 9.570 9.869 3.867
6 1.141 2..392 1.836 2.564 6.302 2.500 0.931 3.329
8 1.548 2.500 2.730 0.000 3.473 3.681 2.861 1.892
10 4.741 2.083 0.447 0.000 2.281 1.852 0.328 1.775
12 2.508 2.000 2.156 3.886 2.274 2.814 12.329 1.672
16 11.438 2.604 16.225 3.195 12.173 2.535 12.932 1.832
20 7.273 2.363 2.892 0.000 2.844 2.303 2.983 3.850
24 7.570 1.581 5.301 0.000 5.306 8.000 1.433 0.000
Time Saran(weeks) TBA P.V.
Mean C.Y 3.859 2.656
HBITBA P.Y.
5.017 2.818
- 76 -
DKIITBA P.Y.
4.712 3.591
PrntPkTBA P.Y.
6.169 3.689

-
APPE DIX B.t
TBA Results Under Room Conditions
TBA Results Under Refrigeration
30
30
25
25
20
20
DK11 -- PmtPk
15
Time (weeks)
/
15
lirre (v"eeks)
APPENDIX 8.2
10
-+-Saran ---HB1
5
2.5
2Q)
1.5::::l
"'> 1<{ra 0.5....
~.: I0 5 10
2.5
2
Q)::::l 1.5"'>< 1lJl....
0.5
0
0
-+- Saran --- t-IB1 DK11 PmtPk
-77-

-
APPE DIX B.3
Peroxide Test Results Under Refrigeration
400Q):1 300ca>Q) 200"'C><0 100~
Q)£l.
0
0 5 10 15 20 25 30
--
Time (weeks)-+-- Saran -... HB1 DK11 -- PrntPk
APPENDIX 8.4
TBA Results Under Conditions in Humidity Chamber
2 ----_._-- - -- -
/>"
1.5 /Q) / " /::Jcv> 1<aJ....
0.5
.,0 I
0 5 10 15 20 25 30
Time (vveeks)
-+-- Saran -... HB1 DK11 PrntPk
- 78 -

APPENDIX 8.5
Peroxide Test Results Under Conditions in Humidity Chamber
30252015105
450
400
350(I)
;::, 300nI
> 250(I)
"'0'x 200e(I) 150D.
100
50
0'---------------------------,-------1
oTime (weeks)
r
---+- Saran --- HB1 DK11 -,..- PrntPk
APPENDIX 8.6
Temperature Effects on TBA Results for Saran ,.•
2.5-1 v.eek
2 1 rmnthC1I::::I
1.5 ~-2rmnthsC'a> -r3 rront:hs~ 1III ~4rront:hsI-
~0.5 -t-5rmnths
-6rmnths0
0 10 20 2D 40 f()
Terrp.(C)
- 79 -

....
APPENDIX 8.7
Temperature Effects on Peroxide Values for Saran
-1'A€6< II1m::nh
~2"OtflSl-'-3l1otflS
-4lJoitlS '
-+-5110"tf1S
1
1
-6rroitlS I
402010o
40J ,--------------------,
E
~:m
~2f()
~200
~ 100...rf 100
0001...-----,.-----,.-----,....-----.------1
APPE DIX 8.8 f.Temperature Effects on TBA Results for DK II Packaging Material
2.5 .------------------.------1 'v\€€k
I 1 rmnth
- 10(' 2 I'TDlths
--r 3 l'TDltihs
-+- 4 I'TDlths
-+- 5 I'TDlths
-61'TDlths
40 50302010
OL..--------------------'o
2(1)
::Jn; 1.5><C 1tol-
0.5
Terrp. (C)
- 80 -

APPENDIX 8.9
-1 V\ff!k
: 1rrmth II~2rra1hs1,
--.- 3 no111s I
:~4noi:llS
-+- 5nOi:llS I50 -Sno"if1S I
I
4020 30
Terrp. (q
10
Ol---...,.----------...,.------J
o
400 ,..--------------------,
Temperature Effects on Peroxide Values for OKll Packaging Material
Q)
~300I CO
>~200><oQ;100a.
APPENDIX B.IO
Temperature Effects on TBA Results for HB I Packaging Material
25Q) 2~-~ 1.5~ 1t- 0.5
0'---------------'
o
-'-1 \I\S2k
1rrath
--.- 3rraih;
-+-4rraih;
-+-Srraih;
-6rraih;
- 81 -

APPENDIX B.ll
Temperature Effects on Peroxide Valu s for Print Pack Material
-1va:k
1rmih
--*- 2no tf S
;-3110tfS,
-+-4rrotts
-+- SilO tf S
-611otfs
40J)10
4(l) ,--------------------,
E~:m-~2i)
~aD.-~ 150~
~100
50Of-------------r----------J
o
- 81 -

--
APPE DIX C.l
Statistical Analysis of Data
SAS Code
dm 'log; clear; output; clear; ';
*** pbslice.sas ***;
*** This LIBNAME statement corresponds to my computer ***;*libname mimin 'd:\temp\clients\Adhikary, Mimin\';
*** This LIBNAME statement will correspond with the A drive *;*** Change the drive specification to correspond with the directory ***;*** that you save these analysis files in. ***;libname mimin 'a:\';
data mimin.pb; set mimin.pb;pctctrls = sqrt(pctctrl) ;pctctrl2 = log(pctctrl + 1 ) ;pctdiffs = sqrt(pctdiff + 1) ;pctdiff2 = log(pctdiff + 1) ;label pctctrl = 'Percent of Control'
pctctrls= 'Square Root of% of Control'pctctrl2= 'Log 01'% of Control'pctdiff= '%Dif1'from Control'pctdif1's= 'Square Root of (%Diff from Control + I)'pctdiff2= 'Log of (%Diff from Control + I) , ;
/*proc gchart data=mimin.pb ;vbar pctctrl pctdiff / group=method levels=l 5;vbar petctrl2 pctdiff2 / group=method levels= 15 subgroup=storage;vbar pctctrl2 pctdiff2 / group=method levels= 15 subgroup=material:
proc univariate data=mimin.pb normal plot;var pctctrl pctctrls petctrl2 pctdiff pctdiffs pctdiff2;ods Ilsting select testsfornormality plots;*/proe sort data=mimin.pb; by method material storage time slice;proe means data=mimin.pb noprint; by method material storage time slice;var timeD y pctctrl petetrls pctetr12 pctdiff pctdiffs petdiff2;output out=new mean=timeO y pctctrl petctrls pctctrl2 pctdiff pctdiffs petdiff2;
/*proe mixed data=new covtest;
- 83 -

classes method material storage time slice·model pctctrl2 = methodlmateriallstorageltime I ddfm=k.r;random slice(method*storage) ;repeated time ;lsmeans method*material*storage*time I slice= (method*material* torag
material*storage*timemethod*storage*timematerial*method*storage) ;
ods output lsmeans=plotdata ;*1proc sort data=new; by method;proe mixed data=new covtest; where method='Peroxide';TITLE 'Method = Peroxide';classes material storage time slice ;model pctctrl2 = materiallstorageltime I ddfm=kr;random slice(material) .repeated time ;lsmeans material *storage*time I slice = (storage material time storage*timematcrial*time) ;
proc mixed data=new covtest: where method='TBA';title "Method = TBA";classes material storage time slice;model pctctrl2 = materiallstorageltime I ddfm=kr;random slice(material storage) ;repeated time ;lsmeans material*storage*time I slice = (storage material time storage*limematerial*time) ;
data plot; set mimin.plotdata;if method='Peroxide' then m1=1: else m 1=2;ifmaterial='DKII' then m2=1;else if material='HBl , then m2=2;else ifmateriaJ='PmtPk' then m2=3;else if material='Saran' then m2=4;
if storage=' HC' then s=1;else if storage='O' then s=2:else if storage='RT' then s=3;else if storage='Ret' then s=4:
cat = 100*ml + 10*m2 + s ;cat2 = I0*m2 + s;label cat = 'Met/MatiS'
eat2 = 'MatiS';
proe format:
- 84 -

value catfmt 111='Per/DKII/HC' I 12='Per/DKII/0' 113='Per/DKII/RT'114='Per/DKII/Ref
121 ='Per!HB l/HC' I22='Per/HB 1/0' I23='PerfHB l/RT' I24='Per/HB I/Ref13 I='PeriPmtPklHC' I32='PeriPmtPklO' 13 3='Per/PrntPklRT'
134='Per/PmtPklRef141 ='Per/SaranIHC' 142='Per/Saran/O' 143='Per/Saran/RT' 144='Per/Saran/Ref211='TBA/DKll/HC' 212='TBA/DK11/0' 213='TBA/DKII/RT'
214='TBA/DK II/Ref221 ='TBA/HB l/HC' 222='TBA/H B1/0' 223='TBAlHB 1/RT'
224='TBA/HBI!Ref231 ='TBA/PmtPk/HC' 232='TBA/PmtPk/O' 233='TBA/PrntPklRT'
234='TBA/PmtPk/Ref241 ='TBA/Saran/HC' 242='TBA/Saran/O' 243='TBA/Saran/RT'
244='TBA/Saran/Ref ;value cat2fmt 11='DK11/HC' 12='DKll/O' 13='DKll/RT' 14='DKll/Ref
21='HBI/HC' 22='HBI/O' 23='HB1/RT' 24='HB1/Ref31 ='PrntPklHC' 32='PmtPklO' 33='PmtPk/RT' 34='PrntPklRd'41 ='Saran/HC' 42='Saran/O' 43='Saran/RT' 44='SaraniRef
proc sort data=plot; by method;proc gplot data=plot; by method;plot estimate*time=cat2/ vaxis=4 to 8 ;title 'Plot of Method/Material/Storage Means Over Time';format cat2 cat2fmt. ;symboll value=circle cv=orange i=join 1=1;symbol2 value=circle cv=blue i=join 1=1;symbol3 value=circle cv=black i=join 1=1;symbol4 value=circle cv=red i=join 1=1;symbol5 value=square cv=orange i=join 1= I;symbol6 value=square cv=blue i=join 1=1;symbol7 value=square cv=black i=join 1=1;symbol8 value=square cv=red i=join 1=1;symbol9 value=triangle cv=orange i=join 1= I;symbol 10 value=triangle cv=blue i=join 1=1;symbol 11 value=triangle cv=black i=join 1=1;symbol 12 val ue=triangle cv=red i=join 1= 1;symbol13 value=diamond cv=orange i=join 1=1;symbol14 value=diamond cv=blue i=join 1=1;symbol15 val ue=diamond cv=black i=join 1= I;symbo1l6 value=diamond cv=red i=join 1=1;
run;quit;
- 85 -

1. Method = Peroxide
APPENDIX C.2
Statistical Analysis of Data
SAS Output
10:21 Wednesday, March 28, 2001 13
The Mixed Procedure
Model Information
Class Level Information
Class Levels Values
Material 4 OK 11 H81 PmtPk SaranStorage 4 HC 0 RT Ref
time 7 1234567Slice 2 I 2
Data SetDependent VariableCovariance StructureEstimation MethodResidual Variance MethodFixed Effects SE Method
Degrees of Freedom Method
WORK.NEWpctctrl2Variance ComponentsREMLParameterPrasad-Rao-JeskeKackar-HarvilleKenward-Roger
,•
Dimensions
Covariance Parameters 2Columns in X 200k=olumns in Z 8Subjects 1Max Obs Per Subject 224Observations Used 224Observations Not Used 0Total Observations 224
- 86 -

Iteration History
Iteration Evaluations -2 Res Log Like Criterion
0 1 -23.058230 III 1 -50.4696502 0
Convergence criteria met.
Covariance Parameter Estimates
Cov Parm Estimate Standard I, Z PrZError I Value
Slice(Material) 0.006762 0.005213 1.3 0.0973lme 0.01707 0.002322 7.35 <.0001
Fit Statistics
-2 Res Log Likelihood -50.5lAIC (smaller is better) -46.5IAICC (smaller is better) -46.4 I
BIC (smaller is better) -46.3 fI
2. Method = Peroxide 10:21 Wednesday, March 28, 2001 14
The Mixed Procedure
Type 3 Tests of I:;"ixed Effects
Num Den FEffect DF DF Value Pr> F
Material ) 4 0.03 0.991Storage 3 108 70.71 <.0001Material*Storage 9 108 18.45 <.0001Ime 6 108 86.37 <.000 I
Material*time 18 108 20.55 <.0001Storage*time 18 108 6.12 <.0001Material*Storage*time 54 108 4.04 <.0001
- 87 -

Least Squares Means
Ti StandarStora m Estimat d t Pr>
Effect Material ge e e Error OF Value ItI
Material*Storage*time OKII HC 1 5.5791 0.1092 35.3 51.11 <.0001Material *Storage*time OKll HC 2 4.6909 0.1092 35.3 42.98 <.0001 i
Material*Storage*time OK11 HC 3 5.6785 0.1092 35.3 52.02 <.0001Material*Storage*time OKl1 HC 4 5.778 0.1092 35.3 52.94 <.0001Material *Storage*time OKll HC 5 6.0411 0.1092 35.3 55.35 <.0001Material*Storage*time OKll HC 6 6.0411 0.1092 35.3 55.35 <.0001Material*Storage*time OKII He 7 6.0323 0.1092 35.3 55.27 <.0001Material*Storage*time OKl1 0 I 5.1274 0.1092 35.3 46.98 <.0001Material*Storage*time OKll 0 2 5.1777 0.1092 35.3 47.44 <.0001Material*Storage*time DKII 0 3 5.3552 0.1092 35.3 49.06 <.0001Material*Storage*time OKll 0 4 5.5821 0.1092 35.3 51.14 <.0001Material*Storage*time DKll 0 5 5.9332 0.1092 35.3 54.36 <.0001Material*Storage*time DKll 0 6 5.9335 0.1092 35.3 54.36 <.0001lMaterial*Storage*time DKII 0 7 5.8166 0.1092 35.3 53.29 <.0001Material*Storage*time DKll RT I 5.6091 0.1092 35.3 51.39 <.0001,Material*Storage*time DKll RT 2 4.8806 0.1092 35.3 44.71 <.0001Material*Storage*time DK11 RT 3 5.7906 0.1092 35.3 53.05 <.0001Material*Storage* time OKl1 RT 4 5.8598 0.1092 35.3 53.69 <.0001Material*Storage* time OKll RT 5 6.0673 0.1092 35.3 55.59 <.0001Material*Storage* time DKII RT 6 6.0671 0.1092 35.3 55.58 <.0001Material*Storage*time DKll RT 7 5.9857 0.1092 35.3 54.84 <.0001Material*Storage*time DKII Ref 1 5.7302 0.1092 35.3 52.5 <.0001Material*Storage*time OKl1 Ref 2 5.062 0.1092 35.3 46.38 <.0001Material*Storage*time OKll Ref 3 5.4646 0.1092 35.3 50.06 <.0001Material *Storage* time DKII Ref 4 5.6299 0.1092 35.3 51.58 <.0001Material*Storage*time DKll Ref 5 5.9144 0.1092 35.3 54.19 <.0001Material*Storage*time DKII Ref 6 5.9141 0.1092 35.3 54.18 <.0001Material*Storage*time DKII Ref 7 5.8317 0.1092 35.3 53.43 1<.0001Material*Storage*time HBI HC I 5.8884 0.1092 35.3 53.95 <.0001Material*Storage*time HBI HC 2 5.2436 0.1092 35.3 48.04 <.0001Material*Storage*time HBI HC 3 5.5987 0.1092 35.3 51.29 <.0001Material*Storage*time HBI HC 4 5.6468 0.1092 35.3 51.73 <.0001Material*Storage*time HBI HC 5 6.5126 0.1092 35.3 59.67 <.0001Material*Storage* time HBI HC 6 6.5128 0.1092 35.3 59.67 <.0001Material*Storage*time HBI HC 7 5.9341 0.1092 35.3 54.37 <.0001Material*Storage*time HBI 0 1 5.4788 0.1092 35.3 50.2 <.0001Material*Storage*time HBI 0 2 5.1852 0.1092 35.3 47.5 <.0001Material*Storage*time HBI 0 3 5.5897 0.1092 35.3 51.21 <.0001
- 88 -

Material *Storage*time HBl 0 4 5.7162 0.1092 35.3 52.37 <.0001Material*Storage*time HB1 0 5 5.8285 0.1092 35.3 53.4 <.0001Material*Storage*time HB1 0 6 5.8285 0.1092 35.3 53.4 <.0001Material*Storage*time HB1 0 7 5.8034 0.1092 35.3 53.17 <.0001Material*Storage*time HBl RT 1 5.6483 0.1092 35.3 51.75 <.0001!Material*Storage*time HBI RT 2 5.3983 0.1092 35.3 49.46 <.0001
3. Method = Peroxide 10:21 Wednesday, March 28, 2001 15
The Mixed Procedure
Least Squares Means
StandarMateri Storag tstimat d t tpr>
Effect al e ~imee !Error DF lValue tl!
lMaterial*Storage*time I HBI RT 3 5.6182 0.1092 35.3 51.47 <.0001Material*Storage*time HBI RT 4 5.6487 0.1092 35.3 51.75 <.0001Material*Storage*time HB1 RT 5 5.6874 0.1092 35.3 52.11 <.0001Material*Storage*time HBI RT 6 5.6878 0.1092 35.3 52.11 <.0001Material*Storage*time HBI RT 7 5.5315 0.1092 35.3 50.68 <.0001Material*Storage*time HB1 Ref 1 5.7187 0.1092 35.3 52.39 <.0001Material *Storage*time HBI Ref 2 5.062 0.1092 35.3 46.38 <.0001Material*Storage*time HBI Ref 3 4.7765 0.1092 35.3 43,76 <.0001Material*Storage*time HBI Ref 4 5.2139 0.1092 35.3 47.77 <.0001Material *Storage*time HBI Ref 5 6.1063 0.1092 35,3 55.94 <.0001Material*Storage*time HBI Ref 6 6.1065 0.1092 35,3 55.95 <.0001!Material*Storage*time HBl Ref 7 5.9569 0.1092 35.3 54.58 <.0001Material*Storage*time PrntPk HC 1 5.6932 0.1092 35.3 52.16 <.0001Material*Storage*time PmtPk HC 2 5,8105 0.1092 35.3 53.23 <.0001Material*Storage*time PmtPk HC 3 6.0193 0.1092 35.3 55.15 <.0001Material*Storage*time PrntPk He 4 6.1423 0.1092 35.3 56.27 <.0001Material*Storage*ti me PmtPk HC 5 6.0515 0.1092 35.3 55.44 <.0001Material*Storage*time PmtPk HC 6 6.0024 0.1092 35.3 54.99 <.0001.-Material*Storage*time PmtPk HC 7 5.9691 0.1092 35.3 54.69 <.0001Material*Storage*time PmtPk 0 1 5.6585 0.1092 35.3 51.84 <.0001Material*Storage*time PmtPk 0 2 5.7981 0.1092 35.3 53.12 <.0001Material*Storage*time PmtPk 0 3 5.9655 0.1092 35.3 54.65 <.0001lMaterial*Storage*time PrntPk 0 4 5.9799 0.1092 35.3 54.79 <.0001Material*Storage*time PmtPk 0 5 5.8564 0.1092 35.3 53.65 <.0001Material*Storage*time PmtPk 0 6 5.6382 0.1092 35.3 51.65 <.0001Material*Storage*time PrntPk 0 7 5.5084 0.1092 35.3 50.47 k.OOO I
- 89 -

Material*Storage*time PrntPk RT I 5.2608 0.1092 35.3 48.2 <.0001Material *Storage*time PmtPk RT 2 5.5176 0.1092 35.3 50.55 <.0001Material*Storage*time PmtPk RT 3 5.8008 0.1092 35.3 ,53.14 <.0001Material *Storage*time PrntPk RT 4 6.0193 0.1092 35.3 55.15 <.0001Material*Storage*time PmtPk RT 5 6.0824 0.1092 35.3 55.72 <.0001Material*Storage* time PmtPk RT 6 5.737 I 0.1092 35.3 52.56 <.0001Material*Storage*time PmtPk RT 7 5.0904 0.1092 35.3 46.64 <.0001Material*Storage*time PmtPk Ref 1 5.0819 0.1092 35.3 46.56 <.0001Material*Storage*time PmtPk Ref 2 5.3462 0.1092 35.3 48.98 <.0001Material*Storage*time PmtPk Ref 3 5.4788 0.1092 35.3 50.19 <.0001!Material*Storage*time PmtPk Ref 4 5.5946 0.1092 35.3 51.26 <.0001Material*Storage*time PmtPk Ref 5 5.6398 0.1092 35.3 51.67 <.0001Material*Storage*time PmtPk Ref 6 5.4653 0.1092 35.3 50.07 <.0001Material*Storage*time PmtPk Ref 7 5.0586 0.1092 35.3 46.34 <.0001Material *Storage*time Saran HC I 5.7893 0.1092 35.3 53.04 <.0001Material*Storage*time Saran HC 2 5.4239 0.1092 35.3 49.69 <.0001Material *Storage*time Saran HC 3 5.4239 ' 0.1092 35.3 49.69 <.0001Material*Storage* time Saran HC 4 5.6687 0.1092 35.3 51.93 <.0001Material*Storage* time Saran HC 5 6.0428 0.1092 35.3 55.36 <.0001Material*Storage*time Saran HC 6 6.0428 0.1092 35.3 55.36 <.0001Material*Storage*time Saran HC 7 6.0361 0.1092 35.3 55.3 <.0001Material*Storage*time Saran 0 1 5.8804 0.1092 35.3 53.87 <.0001Material*Storage*time Saran a 2 6.1029 0.1092 35.3 55.91 <.0001Material*Storage*time Saran a 3 5.7323 0.1092 35.3 52.52 <.0001Material*Storage*time Saran 0 4 5.9936 0.1092 35.3 54.91 <.0001Material *Storage*time Saran 0 5 5.9345 0.1092 35.3 54.37 <.0001Material *Storage*time Saran 0 6 5.9328 0.1092 35.3 54.35 <.0001Material*Storage*time Saran 0 7 5.954 I 0.1092 35.3 54.55 <.0001Material *Storage*time Saran RT 1 5.2324 0.1092 35.3 47.94 <.0001Material*Storage*time Saran RT 2 5.7303 0.1092 35.3 52.5 <.0001Material*Storage* time Saran RT 3 5.1401 0.1092 35.3 47.09 <.0001Material*Storage*time Saran RT 4 5.4369 0.1092 35.3 49.81 <.0001
- 90-
i

StandarMate Storag Estimat d Pr>
Effect rial e timee Error DF Value tl
Material*Storage*time Saran RT 5 5.9742 0.1092 35.3 54.73 <.0001Material*Storage*time Saran RT 6 5.9744 0.1092 35.3 54.74 <.0001 1
Material*Storage*time Saran RT 7 5.8953 0.1092 35.3 54.01 <.0001Material*Storage*time Saran Ref 1 5.6467 0.1092 35.3 51.73 <.0001Material*Storage*time Saran Ref 2 4.9571 0.1092 35.3 45.41 <.0001Material *Storage*time Saran Ref 3 5.0366 0.1092 35.3 46.14 <.0001Material*Storage*time Saran Ref 4 5.3141 0.1092 35.3 48.69 <.0001Material *Storage*time Saran Ref 5 5.4766 0.1092 35.3 50.17 <.0001Material*Storage*time Saran Ref 6 5.47h 0.1092 35.3 50.17 <.0001Material*Storage*time Saran Ref 7 5.4395 0.1092 35.3 49.84 <.0001
4. Method = Peroxide 10:21 Wednesday, March 28, 2001 16
The Mixed Procedure
Least Squares Means
Tests of Effect Slices
NuI~enMateri Storag m F
Effect al e time DF DF Value Pr> F
Material *Storage*time HC 27 77.4 14.4 <.0001Material *Storage*time 0 27 77.4 6.22 1<.0001Material *Storage* time RT 27 77.4 11.5 1<.0001Material*Storage*time Ref 27 77.4 13.3 <.0001Material*Storage*time OKll I 27 108 16.68 <.0001
. ~.-
Material*Storage*time HB1 27 108 17.41 <.0001Material*Storage*time PrntPk 27 108 11.78 <.0001Material*Storage*time Saran 27 108 13.19 <.0001Material*Storage*time 1 15 65.4 6.66 <.0001Material*Storage*time 2 [5 65.4 11.35 <.0001,Material*Storage*time 3 15 65.4 9.98 <.0001Material*Storage* time 4 15 65.4 5.88 <.0001Material*Storage*time 5 IS 65.4 5.82 <.0001Material*Storage*time 6 15 65.4 6.54 <.0001Material*Storage*time 7 15 65.4 8.73 <.0001Material*Storage*time HC [ 3 35.3 1.47 0.2396Material *Storage*time HC 2 3 35.3 18.18 <.0001Material *Storage*time HC 3 3 35.3 5.24 0.0043
- 91 -

tMaterial*Storage*time HC 4 3 35.3 4.42 0.0097!Material*Storage*time HC 5 3 35.3 4.59 0.0082tMaterial*Storage*time HC 6 3 35.3 4.94 .0.0057lMaterial*Storage*time HC 7 3 35.3 0.21 0.89tMaterial*Storage*time 0 1 3 35.3 8.5 0.0002lMaterial*Storage*time 0 2 3 35.3 17.85 <.0001lMaterial*Storage*time 0 3 3 35.3 5.49 0.0033Material*Storage*time 0 4 3 35.3 3.44 0.027Material*Storage*time 0 5 3 35.3 0.24 0.8645Material *Storage*time a 6 3 35.3 1.62 0.2012Material *Storage*time a 7 3 35.3 2.95 0.0457Material *Storage*time RT 1 3 35.3 4.12 0.0 132Material*Storage*time RT 2 3 35.3 10.95 <.0001Material*Storage*time RT 3 3 35.3 8.05 0.0003Material*Storage*time RT 4 3 35.3 5.39 0.0037Material*Storage*time RT 5 3 35.3 2.82 0.0529Material*Storage*time RT 6 3 35.3 2.81 0.0533Material*Storage*time RT 7 3 35.3 13.93 <.0001Material*Storage* time Ref 1 3 35.3 8.09 0.0003Material*Storage*time Ref 2 3 35.3 2.34 0.0897lMaterial*Storage*time Ref 3 3 35.3 9.89 <.0001Material*Storage* time Ref 4 3 35.3 3.55 0.024Material*Storage*time Ref 5 3 35.3 6.61 0.0012
5. Method = Peroxide 10:21 Wednesday, March 28, 2001 17
The Mixed Procedure
Tests of Effect Slices
NuMateri Storag m Den F
Effect al e time DF DF Value Pr> F
Material*Storage*time Ref 6 3 35.3 8.67 OJJ002Material *Storage*time Ref 7 3 35.3 13.9 <.0001Material *Storage*time OK1! I 3 108 8.18 <.0001Material*Storage*time DKll 2 3 108 5.32 0.0018Material *Storage*time DK11 " 3 108 4.6 0.0046j
Material *Storage*time OK] 1 4 3 108 1.95 0.1265Material*Storage*time OKII 5 3 J08 0.68 0.5634Material *Storage*time DKll 6 " 108 0.68 0.5639j
Material *Storage*time OKl] 7 3 108 1.38 0.2522Material *Storage*time HBI 1 3 108 3.37 0.021 )
- 92 -

!Material*Storage*time HBI 2 3 108 2.29 0.0829Material*Storage*time HBI 3 3 108 19.99 <.0001Material*Storage*time HBI 4 3 108 6.23 0.0006Material*Storage* time HBI 5 3 108 15.49 <.0001Material*Storage* time HBI 6 3 108 15.49 <.0001Material*Storage*time HBI 7 3 108 4.47 0.0053!Material*Storage* time PrntPk I 3 108 10.59 <.0001Material*Storage*time PrntPk 2 3 108 6 0.0008lMaterial*Storage*time PrntPk 3 3 108 6.94 0.0003Material*Storage*time PrntPk 4 3 108 6.56 0.0004Material*Storage* time PrntPk 5 3 108 4.91 0.0031Material*Storage*time PrntPk 6 3 108 5.91 0.0009Materia1*Storage*time PrntPk 7 3 108 21.4 <.0001Material *Storage*time Saran 1 3 108 9.62 <.0001Material*Storage*time Saran 2 3 108 27.56 <.0001Material*Storage*time Saran 3 3 108 11.44 <.0001Material*Storage* time Saran 4 3 108 10.47 <.0001Material *Storage*time Saran 5 3 108 7.77 <.0001Material*Storage*time Saran 6 3 108 7.78 <.0001Material*Storage* time Saran 7 3 108 8.38 <.0001 ···
6. Method = TBA 10:21 Wednesday, March 28, 2001 18
The Mixed Procedure
Model Information
Data SetDependent VariableCovariance StructureEstimation MethodResidual Variance MethodFixed Effects SE Method
Degrees of Freedom Method
- 93 -
WORK.NEWpctctrl2Variance ComponentsREMLParameterPrasad-Rao-JeskeKackar-HarvilleKenward-Roger

Class Level Information
Class Levels Values
Material 4DKl1 HB1 PmtPk
SaranStorage 4 HCORTReflme 7 1234567
Slice 2 1 2
DimensionsCovariance Parameters 2Columns inX 200Columns in Z 32Subjects IMax Obs Per Subject 224Observations Used 224Observations Not Used afotal Observations 224
Iteration History
-2 Res Log CriterioIteration IEvaluations Like n
0 J -125.1095158I 1 -155.4975012 0
Convergence criteria met.
Covariance Parameter Estimates
Standar Zd Valu
Cov Parm Estimate Error e PrZ
Slice(Material'" Storage) 0.003899 0.00167 2.34 0.0098Itime 0.005681 0.00082 6.93 <.0001
- 94 -
G
~~i•··

7. Method = TBA
Fit Statistics
-2 Res Log Likelihood -155.5lAIC (smaller is better) -151.5~lCC (smaller is better) -151.4BIC (smaller is better) -148.6
10:21 Wednesday, March 28, 2001 19
The Mixed Procedure
Type 3 Tests of Fixed Effects
Num Den
Effect DF DF IF Value Pr>F
Material 3 16 10.51 0.0005Storage 3 16 40.68 <.0001Materia1*Storage 9 16 6.33 0.0007lIDe 6 96 1400.49 <.0001
Material*time 18 96 195.96 <.0001Storage*time 18 96 195.35 <.0001Material*Storage*tirne 54 96 50.48 <.0001
Least Squares Means
StandarMateri Storag Estimat d t Pr>
Effect al e time e Error DF Walue tl
Material *Storage*time OKll He 1 6.8992 0.06921 56.2 99.69 <.0001lMaterial'" Storage* time OKll HC 2 6.5712 0.06921 56.2 94.95 <.0001Material'" Storage*time OKII HC 3 6.5007 0.06921 56.2 93.93 <.0001Material'" Storage*time DKll HC 4 7.3277 0.06921 56.2 105.88 <.0001Material'" Storage*time OKll HC 5 6.8556 0.06921 56.2 99.06 <.0001Material*Storage*time OK11 HC 6 6.9523 0.06921 56.2 100.45 <.0001.....Material *Storage*time OK11 HC 7 7.1339 0.06921 56.2 103.08 <.0001
Material*Storage*time OK11 0 1 6.0382 0.06921 56.2 87.24 <.0001Material *Sto rage*time DKII 0 2 6.8285 0.06921 56.2 98.66 <.0001Material *Storage*time OKll 0 3 6.1864 0.06921 56.2 89.39 <.0001
Material *Storage*time OKII 0 4 6.45 0.06921 56.2 93.2 <.0001
Material *Storage*time OK11 0 5 4.8696 0.06921 56.2 70.36 <.0001
Material *Storage*time OK11 0 6 7.4616 0.06921 56.2 J 07.81 <.0001
- 95 -
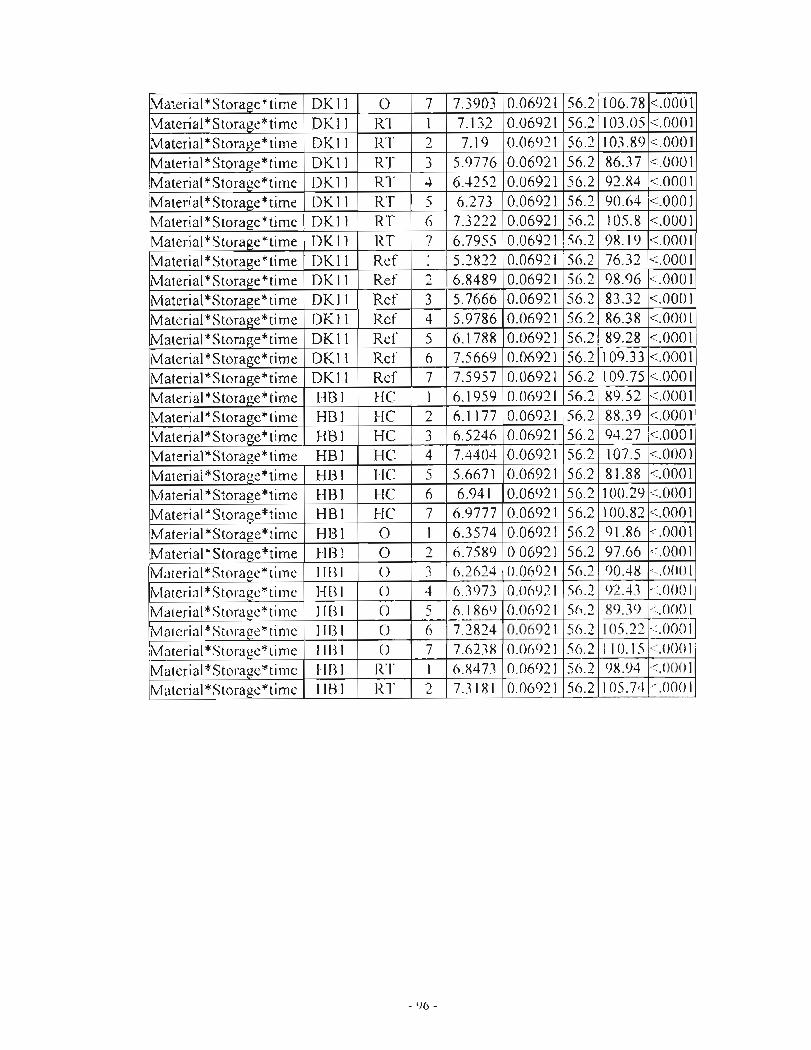
Material*Storage*time DK11 0 7 7.3903 0.06921 56.2 106.78 <.0001Material*Storage*time DKll RT 1 7.132 0.06921 56.2 103.05 <.0001Material*Storage*time OKl1 RT 2 7.19 0.06921 56.2 103.89 <.0001Material*Storage*time DKll RT 3 5.9776 0.06921 56.2 86.37 <.0001Material *Storage*time DKll RT 4 6.4252 0.06921 56.2 92.84 <.0001.Material*Storage*time OKll RT 5 6.273 0.06921 56.2 90.64 <.0001Material *Storage*time OKll RT 6 7.3222 0.06921 56.2 105.8 <.0001Material*Storage*time DKll RT 7 6.7955 0.06921 56.2 98.19 <.0001Material*Storage*time OKll Ref 1 5.2822 0.06921 56.2 76.32 <.0001Material *Storage*time OK 11 Ref 2 6.8489 0.06921 56.2 98.96 <.0001!Material*Storage*time OKll Ref 3 5.7666 0.06921 56.2 83.32 <.0001Material*Storage*time OKll Ref 4 5.9786 0.06921 56.2 86.38 <.0001Material*Storage* time OK11 Ref 5 6.1788 0.06921 56.2 89.28 <.0001Material*Storage*time OKll Ref 6 7.5669 0.06921 56.2 109.33 <.0001!Material*Storage*time DKl1 Ref 7 7.5957 ·0.06921 56.2 109.75 <.0001Material*Storage* time HBI HC 1 6.1959 0.06921 56.2 89.52 <.0001!Material*Storage*time HBI HC 2 6.1177 0.06921 56.2 88.39 <.0001Material*Storage*time HBI HC 3 6.5246 0.06921 56.2 94.27 <.0001!Material*Storage*time HBI HC 4 7.4404 0.06921 56.2 107.5 <.0001Material*Storage*time HB1 HC 5 5.6671 0.06921 56.2 81.88 <.0001Material*Storage*time HBI HC 6 6.941 0.06921 56.2 100.29 <.0001Material*Storage*time HBI HC 7 6.9777 0.06921 56.2 100.82 <.0001Material*Storage*time HBI 0 1 6.3574 0.06921 56.2 91.86 <.0001Material*Storage*time HBI 0 2 6.7589 0.06921 56.2 97.66 <.0001Material*Storage*time HBI 0 3 6.2624 0,06921 56.2 90.48 <.0001!Material*Storage*time HBI 0 4 6.3973 0.06921 56.2 92.43 <.0001Material*Storage*time HBI 0 5 6.1869 0.06921 56.2 89.39 <.0001Material*Storage*time HBI 0 6 7.2824 0.06921 56.2 105.22 <.0001Material *Storage*time HBI 0 7 7.6238 0.06921 56.2 110.15 <.0001Material*Storage*time HBI RT I 6.8473 0.06921 56.2 98.94 <.0001Material*Storage*time HBI RT 2 7.3181 0.06921 56.2 105.74 <.0001
- 96-

StandarMateri Storag Estimat d t Pr>
Effect at e time e Error DF Value tl
Material*Storage*time HBI RT 3 6.4284 0.06921 56.2 92.88 <.0001Material *Storage*time HBI RT 4 6.7134 0.06921 56.2 97 <.0001Material*Storage*time HBI RT 5 4.9194 0.06921 56.2 71.08 <.0001Material*Storage*time HBI RT 6 7.305 0.06921 56.2 105.55 <.0001Material*Storage*time HBI RT 7 7.4245 0.06921 56.2 107.27 <.0001Material*Storage*time HBI Ref I 5.055 0.06921 56.2 73.04 <.0001Material*Storage*time HB1 Ref 2 6.3625 0.06921 56.2 91.93 <.000]Materia]*Storage*time HBI Ref 3 6.3718 0.06921 56.2 92.06 <.0001Material*Storage*time HBI Ref 4 6.3925 0.06921 56.2 92.36 <.0001lMaterial*Storage*time HB1 Ref 5 6.] 578 0.06921 56.2 88.97 <.0001Material*Storage*time HB1 Ref 6 7.4733 0.06921 56.2 107.98 <.0001Material*Storage*time HBI Ref 7 7.6151 0.06921 56.2 110.03 <.0001Material*Storage*time PrntPk HC I 6.2561 0.06921 56.2 90.39 <.0001Material*Storage*time PmtPk HC 2 6.3775 0.06921 56.2 92.15 <.0001Material*Storage*time PrntPk HC 3 6.6449 0.06921 56.2 96.01 <.0001Material *Storage*time PrntPk HC 4 7.3714 0.06921 56.2 106.51 1<.0001Material *Storage*time PrntPk HC 5 6.9867 0.06921 56.2 100.95 <.0001Material*Storage*time PrntPk I-IC 6 7.1868 0.06921 56.2 103.84 <.0001Material*Storage*time PrntPk HC 7 7.416 0.06921 56.2 107.15 <.0001Material*Storage*time PrntPk 0 1 5.8336 0.06921 56.2 84.29 <.0001lMaterial*Storage*time PrntPk 0 2 6.11 0.06921 56.2 88.28 <.0001Material*Storage*time PrntPk 0 3 6.522 0.06921 56.2 94.23 <.0001Material*Storage* time PrntPk 0 4 7.2489 0.06921 56.2 104.74 <.0001Material*Storage*time PmtPk 0 5 7.4624 0.06921 56.2 ]07.82 <.0001Material*Storage*time PmtPk 0 6 7.4765 0.06921 56.2 108.03 <.0001Material*Storage*time PmtPk 0 7 7.5131 0.06921 56.2 108.56 <.0001Material*Storage*time PrntPk RT I 5.453 0.06921 56.2 78.79 <.0001Material*Storage*time PmtPk RT 2 6.0977 0.0692] 56.2 88.1 <.0001Material *Storage*time PmtPk RT 3 6.4386 0.06921 56.2 93.03 <.0001Material*Storage*time PmtPk RT 4 7.421 0.06921 56.2 107.22 <.0001Material *Storage*time PmtPk RT 5 7.4492 0.06921 56.2 107.63 <.0001Material*Storage*time PmtPk RT 6 7.5269 0.0692J 56.2 108.75 <.0001
Material *Storage*time PmtPk RT 7 7.603J 0.06921 56.2 J09.86 <.0001
Material *Storage*time PmtPk Ref I 4.9819 0.06921 56.2 71.98 <.0001
8. Method = TBA 10:21 Wednesday, March 28, 2001 20
The Mixed Procedure
Least Squares Means
- 97 -
..)
•.

Material*Storage*time PrntPk Ref 2 5.3046 0.06921 56.2 ' 76.64 <.0001Material*Storage*time PrntPk Ref 3 5.9267 0.06921 56.2 85.63 <.0001Material*Storage*time PrntPk Ref 4 6.5413 0.06921 56.2 94.51 <.0001Material*Storage*time PrntPk Ref 5 7.4733 ,0.06921 56.2 ]07.98 <.0001Material *Storage*time PrntPk Ref 6 7.4854 0.06921 56.2 108.15 <.0001Material*Storage*time PrntPk Ref 7 7.5635 0.06921 56.2 109.28 <.0001Material*Storage*time Saran HC 1 7.1822 0.06921 56.2 103.77 <.000]Material*Storage*time Saran HC .., 6.8437 0.0692] 56.2 98.88 <.0001Material*Storage*time Saran HC 3 6.7445 0.06921 56.2 97.45 <.0001Material*Storage*time Saran HC 4 7.1925 0.06921 56.2 103.92 <.0001Material*Storage*time Saran HC 5 6.653 0.06921 56.2 96.13 <.000]Material*Storage*time Saran HC 6 6.7532 0.06921 56.2 97.58 <.0001Material*Storage*time Saran HC 7 7.2963 0.06921 56.2 105.42 <.0001Material*Storage*time Saran 0 1 6.4734 0.06921 56.2 93.53 <.0001Material*Storage*time Saran 0 2 6.3945 0.06921 56.2 92.39 <.000]Material*Storage*time Saran 0 3 6.3436 0.06921 56.2 91.66 <.0001Material*Storage*time, Saran 0 4 6.5615 0.0692] 56.2 94.81 <.0001Material*Storage*time Saran 0 5 6.3901 0.0692] 56.2 92.33 <.0001Material*Storage*time Saran 0 6 7.2775 0.0692] 56.2 105.15 <.0001Material*Storage*time Saran 0 7 7.1118 0.06921 56.2 102.76 <.0001lMaterial*Storage*time Saran RT 1 6.9218 0.06921 56.2 100.01 <.0001.Material*Storage* time Saran RT 2 6.3221 0.06921 56.2 91.35 <.0001Material*Storage*time Saran RT 3 7.0466 0.06921 56.2 101.82 <.0001Material*Storage* time Saran RT 4 7.2737 0.06921 56.2 105.1 <.0001
·98·
..i

9. Method = TBA 10:21 Wednesday, March 28 2001 21
The Mixed Procedure
Least Squares Means
~tandar--
Materi Storag Estimat ~ ~ Pr>Effect al e ~ime~ tError DF Ivalue tl
Material*Storage*time Saran RT 5 5.4866 0.06921 56.2 79.28 <.0001Material*Storage*time Saran RT 6 7.4579 0.06921 56.2 107.76 <.0001Material*Storage*time Saran RT 7 7.4772 0.06921 56.2 108.04 <.0001Material*Storage*time Saran Ref I 4.6861 0.06921 56.2 67.71 <.0001Material*Storage*time Saran Ref 2 7.2757 0.06921 56.2 105.12 <.0001Material*Storage*time Saran Ref 3 6.1166 0.06921 56.2 88.38 <.0001lMaterial*Storage*time Saran Ref 4 6.1355 0.06921 56.2 88.65 <.0001Material*Storage*time Saran Ref 5 6.1557 0.06921 56.2 88.94 <.0001lMaterial*Storage*time Saran Ref 6 7.4761 0.06921 56.2 108.02 <.0001Material*Storage*time Saran ~ef 7 7.6341 0.06921 56.2 110.3 <.0001
Tests of Effect Slices
tNuMateri Storag m Den F
Effect al e time DF DF Value Pr> F
Material*Storage* time HC 27 92.6 59.24 <.0001Material*Storage*time 0 27 92.6 137.65 <.0001Material*Storage* time RT 27 92.6 176.38 <.0001Material*Storage*time Ref 27 92.6 295.6 <.0001Material*Storage*time OKII 27 92.6 153.46 <.OOOLMaterial *Storage*time HBI 27 92.6 168.97 <.000 LMaterial*Storage*time PrntPk 27 92.6 206.74 <.0001Material*Storage*time Saran 27 92.6 143 <.0001Material *Storage*tirne 1 15 56.2 137.11 <.0001Material *Storage*time 2 15 56.2 57.07 1<.0001Material*Storage* time 3 15 56.2 21.85 1<.0001Material*Storage*ti me 4 15 56.2 53.15 <.0001lMaterial*Storage*time 5 IS 56.2 139.69 <.0001
Material*Storage*time 6 15 56.2 12 <.0001
lMaterial *Storage*time 7 15 56.2 13.67 <.0001Material *Storage*time HC I 3 56.2 49.1 <.000 I
Material *Storage*time HC 2 3 56.2 19.65 <.0001
Material *Storage*time HC ..,3 56.2 2.67 0.0561.J
- 99 -
.i

Material*Storage* time HC 4 3 56.2 2.28 0.0892Material*Storage*time HC 5 3 56.2 74.74 <.0001Material*Storage*time HC 6
,.,56.2 6.58 0.0007.J
Material*Storage*time HC 7 3 56.2 7.62 0.0002Material*Storage*time 0 I J 56.2 17.92 <.0001Material*Storage*time 0 , ..,
56.2 23.39 <.0001L. .J
Material*Storage*time 0 3 J 56.2 4.33 0.0082Material*Storage*time 0 4 3 56.2 32.68 <.0001Material*Storage*time 0 5 '" 56.2 236.38 <.0001.J
Material*Storage* time a 6 3 56.2 2.5 0.069Material*Storage*time a 7 3 56.2 10.14 <.0001Material'" Storage'" time RT 1 3 56.2 122.68 <.0001 i
Material*Storage*time RT 2 3 56.2 78.2 <.0001Material* Storage*time RT 3 3 56.2 40.19 <.0001Material*Storage*time RT 4 3 56.2 45.77 <.0001Materia] *Storage*time RT 5 3 56.2 250.66 <.0001Material*Storage*time RT 6 3 56.2 2.4 0.0772Material *Storage* time RT 7 3 56.2 27.19 <.0001Material*Storage*time Ref 1 3 56.2 12.63 <.0001Material*Storage* time Ref
....,3 56.2 150.34 <.0001
Material*Storage*time Ref 3 3 56.2 14.16 <.0001Ma.terial*Storage*time Ref 4 3 56.2 13.32 <.0001Material*Storage*time Ref 5 3 56.2 89.48 <.0001
4
10. Method = TBA 10:21 Wednesday, March 28, 2001 22
The Mixed Procedure
Tests of Effect SlicesNu
Materi Storag m Den FEffect al e time DF DF Value Pr> F
Material *Storage*time Ref 6,.,
56.2 0.42 0.7425"Materia!*Storage*time Ref 7 3 56.2 0.19 0.9029Material *Storage*time OKll 1 3 56.2 149.62 <.0001Materia!*Storage*time OKII 2 3 56.2 13.46 <.0001Materia!*Storage*time OKII 3 3 56.2 20.45 <.0001Material *Storage*time OKI! 4 3 56.2 66.58 <.0001Material*Storage*time OK!I 5 3 56.2 146.72 <.OOO!Material *Storage*time OK11 6 " 56.2 15.04 <.0001"Material *Storage*time OKlI 7 3 56.2 24.88 <.0001Material *Storage*time HBI 1
..,56.2 120.05 <.0001.)
- J00 -

Material *Storage* time HBI 2 3 56.2 57.3:3 <.0001Material*Storage*time HBI 3 3 56.2 2.51 0.0682Material*Storage*time HBI 4 3 56.2 50.76 <.0001Material*Storage* time HBI 5 3 56.2 173.26 <.0001Material*Storage* time HBI 6 3 56.2 10.4 <.0001Material *Storage*time HBI 7 3 56.2 19.13 <.0001Material*Storage*time PmtPk 1 3 56.2 61.58 <.0001Material *Storage*time PmtPk 2 3 56.2 44.86 <.0001lMaterial*Storage*time PrntPk 3 3 56.2 20.82 <.0001Material*Storage*time PrntPk 4 ) 56.2 34.98 <.0001Material *Storage*time PmtPk 5 J 56.2 11.79 <.0001Material*Storage*time PmtPk 6 3 56.2 5.1 0.0034Material *Storage*time PmtPk I 7 3 56.2 1.36 0.2632Material*Storage*time Saran
,
1 3 56.2 264.34 <.0001Material *Storage*time Saran 2 "I 56.2 40.91 <.0001-'Material*Storage*time Saran 3 3 56.2 35.79 <.000 I.Material *Storage*time Saran 4 3 56.2 61 <.0001Material*Storage*time Saran 5 3 '56.2 52.12 <.0001Material*Storage* time Saran 6 3 56.2 23.77 <.0001Material*Storage*time Saran 7 3 56.2 10.64 <.0001
11. Method = Peroxide 15:16 Wednesday, April 4, 2001
Time = 1
The Mixed Procedure
Model Information
Data SetDependent VariableCovariance StructureEstimation MethodResidual Variance MethodFixed Effects SE MethodDegrees of Freedom Method
- 101 -
WORK.NEWpctctrl2DiagonalREMLProfileModel-BasedResidual

Class Level lnfonnation
Class Levels Values
Materia DKII HBI PrntPkI 4 Saran
Storage 4 HC 0 RT Ref
Dimensions
Covariance1
ParametersColumns in X 25Columns in Z 0
Subjects 1Max Obs Per Subject 32Observations Used 32Observations Not
0Used
Total Observations 32
"j.)j
~
Covariance Parameter EstimatesCov Standard ZParrn Estimate Error Value PrZ
Residual 0.02536 0.008965 2.83 0.0023
Fit Statistics-2 Res LogLikelihood -2.3
AIC (smaller isbetter) -0.3
AICC (smaller isbetter) 0
BlC (smaller isbetter) 0.5
f F' d Effi3TType ests 0 Ixe eetsNum Den
Effect DF OF F Value Pr> F
Material 3 16 4.43 0.0189Storage 3 16 4.97 0.0127Material*Storage 9 16 5.47 0.0016
- 102 -

-
12. Method = Peroxide 15:16 Wednesday, April 4 2001 2
Time = 1
The Mixed Procedure
MSLeast ;quares eansMateria Standard
Effect I Storage Estimate Error OF t Value y
Material*Storage OK11 HC 5.5791 0.1126 16 49.55 <.0001Material*Storage OK11 0 5.1274 0.1126 16 45.54 <.0001Material*Storage OK11 RT 5.6091 0.1126 16 49.82 <.0001Material *Storage OK11 Ref 5.7302 0.1126 16 50.89 <.0001Material*Storage HB1 HC 5.8884 0.1126 16 52.3 <.0001Material *Storage HB1 0 5.4788 0.1126 16 48.66 <.0001Material*Storage HB1 RT 5.6483 0.1126 16 50.16 <.0001Material *Storage HB! Ref 5.7187 0.1126 16 50.79 <.0001Material *Storage PrntPk HC 5.6932 0.1126 16 50.56 <.0001Material*Storage PrntPk 0 5.6585 0.1126 16 50.25 <.0001Material*Storage PrntPk RT 5.2608 0.1126 16 46.72 <.0001Material *Storage PmtPk Ref 5.0819 0.1126 16 45.13 <.0001Material*Storage Saran HC 5.7893 0.1126 16 51.42 <.0001Material*Storage Saran 0 5.8804 0.1126 16 52.23 <.0001Material*Storage Saran RT 5.2324 0.1126 16 46.47 <.0001Material*Storage Saran Ref 5.6467 0.1126 16 50.15 <.0001
Tests of Effect SlicesMateria Num Den
Effect I Storage DF OF F Value Pr> F
Material*Storage HC 3 16 1.38 0.2846Material*Storage 0 3 16 7.99 0.0018Material*Storage RT 3 16 3.87 0.0295Material*Storage Ref 3 16 7.61 0.0022Material*Storage OK11 3 16 5.51 0.0086Material *Storage HBI 3 16 2.27 O. 1195Material *Storage PrntPk 3 16 7. 13 0.003Material *Storage Saran 3 16 6.47 0.0045
- 103 -

13. Method = Peroxide 15:16 Wednesday April 4,2001 3
Time = IMaterial Storage Material Storage Estimate StdErr OF tValue Probt
OK11 HC OKll 0 0.4518 0.1592 16 2.84 0.0119OKl1 HC DKll RT -0.02991 0.1592 16 -0.19 0.8534OKll HC DKll Ref -0.1511 0.1592 16 -0.95 0.3568DKll HC HBI HC -0.3093 0.1592 16 -1.94 0.0699DKII HC HBl 0 0.1003 0.1592 16 0.63 0.5376DK11 HC HBl RT -0.06919 0.1592 16 -0.43 0.6697DKll HC HBI Ref -0.1395 0.1592 16 -0.88 0.3938DKll HC PrntPk HC -0.114 0.1592 16 -0.72 0.4842DKl1 HC PmtPk 0 -0.07935 0,1592 16 -0.5 0.625DK11 HC PmtPk RT 0.3183 0.1592 16 2 0.0629DKll HC PmtPk Ref 0.4973 0.1592 16 3.12 0.0066DKl1 HC Saran HC -0.2102 0,1592 16 -1.32 0.2054DKll HC Saran 0 -0.3013 0.1592 16 -1.89 0.0767DKll HC Saran RT 0.3467 0.1592 16 2.18 0.0448DKll HC Saran Ref -0.06755 0.1592 16 -0.42 0.6771DKll 0 DKll RT -0.4817 0.1592 16 -3.02 0.008DKl1 0 DKll Ref -0.6029 0.1592 16 -3.79 0.0016DK11 0 HBI HC -0.7611 0.1592 16 -4.78 0.0002DKll 0 HBI 0 -0.3515 0.1592 16 -2.21 0.0423OKl1 0 HBI RT -0.521 0.1592 16 -3.27 0.0048OKl1 0 HBI Ref -0.5913 0.1592 16 -3.71 0.0019OKll 0 PmtPk HC -0.5658 0.1592 16 -3.55 0.0026OKll 0 PrntPk 0 -0.5311 0.1592 16 -3.34 0.0042DKll 0 PrntPk RT -0.1334 0.1592 16 -0.84 0.4144OKll 0 PrntPk Ref 0.04549 0.1592 16 0.29 0.7788OKll 0 Saran HC -0.662 0.1592 16 -4.16 0.0007OK11 0 Saran 0 -0.753 0.1592 16 -4.73 0.0002OK1! 0 Saran RT -0.105 0.1592 16 -0.66 0.5189OK11 0 Saran Ref -0.5193 0.1592 16 -3.26 0.0049OKll RT OKII Ref -0.1212 0.1592 16 -0.76 0.4577OKII RT HB1 HC -0.2794 0.1592 16 -1.75 0.0985OKII RT HBI 0 0.1302 0.1592 16 0.82 0.4255DK11 RT HBI RT -0.03928 0.1592 16 -0.25 0.8083OKII RT HBl Ref -0.1096 0.1592 16 -0.69 0.501OKll RT PrntPk HC -0.08413 0.1592 16 -0.53 0.6045OK11 RT PmtPk 0 -0.04944 0.1592 16 -0.31 0.7602
I OKll RT PmtPk RT 0.3482 0.1592 16 2.19 0.0439OKII RT PrntPk Ref 0.5272 0.1592 16 3.31 0.0044OKII RT Saran HC -0.1803 0.1592 16 -1.13 0.2742OKI1 RT Saran 0 -0.2714 0.1592 16 -1.7 0.1077
- 104 -
,iI
,

DKII RT Saran RT 0.3766 0.1592 16 2.37 0.031DKll RT Saran Ref -0.03764 0.1592 I 16 -0.24 0.8161DK11 Ref HBI HC -0.1582 0.1592 16 -0.99 0.3353DK11 Ref HBl 0 0.2514 0.1592 16 1.58 0.1339DKll Ref HBI RT 0.08191 0.1592 16 0.51 0.614DK11 Ref HBI Ref 0.01156 0.1592 16 0.07 0.943DK11 Ref PmtPk HC 0.03706 0.1592 16 0.23 0.8189DKll Ref PmtPk 0 0.07175 0.1592 16 0.45 0.6584DK11 Ref PmtPk RT 0.4694 0.1592 16 2.95 0.0094DK11 Ref PmtPk Ref 0.6484 0.1592 16 4.07 0.0009OK 11 Ref Saran HC -0.0591 0.1592 16 -0.37 0.7154OK11 Ref Saran 0 -0.1502 0.1592 16 -0.94 0.3597OKll Ref Saran RT 0.4978 0.1592 16 3.13 0.0065OKl1 Ref Saran Ref 0.08355 0.1592 16 0.52 : 0.607HBl HC HBI 0 0.4096 0.1592 16 2.57 0.0205HBI HC HBI RT 0.2401 0.1592 16 1.51 0.1511HBI HC HBI Ref 0.1698 0.1592 16 1.07 0.3022HBI HC PmtPk HC 0.1953 0.1592 16 1.23 0.2378HBI HC PmtPk 0 0.2299 0.1592 16 1.44 0.168HBI HC PmtPk RT 0.6276 0.1592 16 3.94 0.0012 IHBI HC PmtPk Ref 0.8066 0.1592 16 5.07 0.0001HB1 HC Saran HC 0.0991 0.1592 16 0.62 0.5425
"i
14. Method = Peroxide 15:16 Wednesday, April4, 2001 4
Time = IMaterial Storage Material Storage Estimate StdErr DF tValue Prabt
HBI HC Saran 0 0.008034 0.1592 16 0.05 0.9604HBl HC Saran RT 0.656 0.1592 16 4.12 0.0008HBl HC Saran Ref 0.2417 0.1592 16 1.52 0.1485HBI 0 HBI RT -0.1695 0.1592 16 -1.06 0.3029HBI 0 HBl Ref -0.2399 0.1592 16 -1.51 0.1515HBI 0 PmtPk HC -0.2143 0.1592 16 -1.35 0.197HB1 0 PrntPk 0 -0.1797 0.1592 16 -1.13 0.2758HBI 0 I PmtPk RT 0.218 0.1592 16 1.37 0.1899HB1 0 I PmtPk Ref 0.397 0.1592 16 2.49 0.024HB1 0 Saran HC -0.3105 0.1592 16 -1.95 0.0689HBI 0 Saran 0 -0.4016 0.1592 16 -2.52 0.0227HBI 0 Saran RT 0.2464 0.1592 16 1.55 0.1413HBI 0 Saran Ref -0.1679 0.1592 16 -1.05 0.3075
HBI RT HBI Ref -0.07035 0.1592 16 -0.44 0.6645
HBJ RT PmtPk HC -0.04485 0.1592 16 -0.28 0.7818
HBI RT PmtPk 0 -0.0 IOJ7 0.1592 16 -0.06 0.9499
- 105 -

HB1 RT PmtPk RT 0.3875 0.1592 16 2.43 0.027HBI RT PmtPk Ref 0.5665 0.1592 16 3.56 0.0026HBI RT Saran HC -0.141 0.1592 16 -0.89 0.389HBI RT Saran 0 -0.2321 0.1592 16 -1.46 0.1643HBI RT Saran RT 0.4159 0.1592 16 2.61 0.0189HBI RT Saran Ref 0.001638 0.1592 16 0.01 0.9919HBI Ref PmtPk HC 0.02551 0.1592 16 0.16 0.8747HBI Ref PmtPk 0 0.06019 0.1592 16 0.38 0.7104HBI Ref PmtPk RT 0.4579 0.1592 16 2.88 0.011HB1 Ref PmtPk Ref 0.6368 0.1592 16 4 0.001HB1 Ref Saran HC -0.07066 0.1592 16 -0.44 0.6632HBI Ref Saran 0 -0.1617 0.1592 16 -1.02 0.3249HB1 Ref Saran RT 0.4863 0.1592 16 3.05 0.0076HBI Ref Saran Ref 0.07199 0.1592 16 0.45 0.6573
PmtPk HC PmtPk 0 0.03468 0.1592 16 0.22 0.8303PrntPk HC PmtPk RT 0.4324 0.1592 16 2.72 0.0153PmtPk HC PrntPk Ref 0.6113 0.1592 16 3.84 0.0014PrntPk HC Saran HC -0.09616 0.1592 16 -0.6 0.5544PrntPk HC Saran 0 -0.1872 0.1592 16 -1.18 0.2569PrntPk HC Saran RT 0.4608 0.1592 16 2.89 0.0106PrntPk HC Saran Ref 0.04649 0.1592 16 0.29 0.7741PrntPk 0 PmtPk RT 0.3977 0.1592 16 2.5 0.0238PrntPk 0 PrntPk Ref 0.5766 0.1592 16 3.62 0.0023PrntPk 0 Saran HC -0.1308 , 0.1592 16 -0.82 0.4233PrntPk 0 Saran 0 -0.2219 0.1592 16 -1.39 0.1825PrntPk 0 Saran RT 0.4261 0.1592 16 2.68 0.0166PrntPk 0 Saran Ref 0.0118 0.1592 16 0.07 0.9418PrntPk RT PmtPk Ref 0.1789 0.1592 16 1.12 0.2777PrntPk RT Saran HC -0.5285 0.1592 16 -3.32 0.0043PrntPk RT Saran 0 -0.6196 0.1592 16 -3.89 0.0013PrntPk RT Saran RT 0.0284 0.1592 16 0.18 0.8607PmtPk RT Saran Ref -0.3859 0.1592 16 -2.42 0.0276PrntPk Ref Saran HC -0.7075 0.1592 16 -4.44 0.0004PmtPk Ref Saran 0 -0.7985 0.1592 16 -5.0 I 0.0001PrntPk Ref Saran RT -0.1505 0.1592 16 -0.95 0.3585PrntPk Ref Saran Ref -0.5648 0.1592 16 -3.55 0.0027Saran HC Saran 0 -0.09107 0.1592 16 -0.57 0.5753Saran HC Saran RT 0.5569 0.1592 16 3.5 0.003Saran He Saran Ref 0.1426 0.1592 16 0.9 0.3836Saran 0 Saran RT 0.648 0.1592 16 4.07 0.0009Saran 0 Saran Ref 0.2337 0.1592 16 1.47 0.1616Saran RT Saran Ref -0.4143 0.1592 16 -2.6 0.0193
- 106-

15. Method = TBA 15:16 Wednesday, April 4, 2001 5
Time = 1
The Mixed Procedure
Model Information
Data SetDependent VariableCovariance StructureEstimation MethodResidual Variance MethodFixed Effects SE MethodDegrees of Freedom Method
WORK.NEWpctctrl2DiagonalREMLProfileModel-BasedResidual
Class Level InformationClass Levels Values
DKII HBl PmtPkMaterial 4 SaranStorage 4 HC 0 RT Ref
DimensionsCovarianceParameters I
Columns in X 25Columns in Z 0
Subjects 1Max Obs Per Subject 32Observations Used 32Observations Not
Used 0Total Observations 32
Covariance Parameter EstimatesCov Standard ZParm Estimate Error Value Pr Z
Residual 0.006409 0.002266 2.83 0.0023
- 107 -

Fit Statistics2 Res Log
fLikelihood -24.3V\IC (smaller isbetter) -22.3AICC (smaller isbetter) -22BIC (smaller isbetter) -21.5
T 3T t fF' dEffi type es so lxe ec sNum Den
Effect DF DF F Value Pr> F
[Material 3 ]6 134.48 <.0001Storage 3 16 722.29 <.0001!Material*StoraIge 9 16 55.98 <.0001
16. Method = TBA 15:16 Wednesday, April 4, 2001 6
Time = 1
The Mixed Procedure
MST,east iquares eansStandard
Effect Material Storage Estimate Error OF t Value Pr> ItI
Material*Storage DKII HC 6.8992 0.05661 16 121.87 <.0001Material*Storage OKII 0 6.0382 0.05661 16 106.66 <.0001Material*Storage DKII RT 7.132 0.05661 16 125.99 <.0001Material*Storage DKll Ref 5.2822 0.05661 16 93.31 <.0001Material*Storage HBI HC 6.1959 0.05661 16 109.45 <.0001Material*Storage HBl 0 6.3574 0.05661 16 112.3 <.0001Material*Storage HBI RT 6.8473 0.05661 16 120.96 <.0001Material*Storage HBI Ref 5.055 0.05661 16 89.3 <.0001Material*Storage PmtPk HC 6.2561 0.05661 16 110.51 <.0001Material*Storage PrntPk 0 5.8336 0.05661 16 103.05 <.0001Material*Storage PrntPk RT 5.453 0.05661 16 96.33 <.0001Material*Storage PrntPk Ref 4.9819 0.05661 16 88 <.0001Material *Storage Saran He 7.1822 0.05661 16 126.87 <.0001
- 108-

Material*Storage Saran 0 6.4734 0.05661 16 114.35 <.0001Material*Storage Saran RT 6.9218 0.05661 16 122.27 <.0001Material*Storage Saran Ref 4.6861 0.05661 16 82.78 <.0001
Tests of Effect SlicesNum Den
Effect Material Storage DF DF F Value Pr> F
Material*Storage HC 3 16 73.39 <.0001Material*Storage 0 3 16 26.79 <.0001Material*Storage RT 3 16 183.36 <.0001Material*Storage Ref 3 16 18.88 <.0001Material*Storage OKll 3 16 223.64 <.0001Material*Storage HBI 3 16 179.44 <.0001Material'" Storage PmtPk 3 16 92.04 <.0001Material*Storage Saran 3 16 395.11 <.0001
17. Method = TBA 15:16 Wednesday, April 4, 2001 7
Time = 1Material Storage Material Storage Estimate StdErr DF tValue ProbtOKl1 HC DK11 0 0.861 0.08006 16 10.76 <.0001OKll HC OKll RT -0.2328 0.08006 16 -2.91 0.0103OK11 HC OKl1 Ref 1.617 0.08006 16 20.2 <.0001OKII HC HB1 HC 0.7033 0.08006 16 8.78 <.0001OKII HC HBI 0 0.5419 0.08006 16 6.77 <.0001OKll HC HBI RT 0.05193 0.08006 16 0.65 0.5258DKl1 HC HBI Ref 1.8442 0.08006 16 23.04 <.0001OKll HC PrntPk HC 0.6431 0.08006 16 8.03 <.0001OKll HC PmtPk 0 1.0657 0.08006 16 13.31 <.0001DKl1 HC PmtPk RT 1.4462 0.08006 16 18.06 <.0001OK11 HC PrntPk Ref 1.9174 0.08006 16 23.95 <.0001
----OKll HC Saran HC -0.283 0.08006 16 -3.53 0.0028OKll HC Saran 0 0.4259 0.08006 16 5.32 <.0001OKII HC Saran RT -0.02252 0.08006 16 -0.28 0.7821OKl1 HC Saran Ref 2.2131 0.08006 16 27.64 <.0001OK!! 0 DKII RT -1.0938 0.08006 16 -13.66 <.0001OKII 0 DKll Ref 0.756 0.08006 16 9.44 <.0001DK!l 0 HBI HC -0.1577 0.08006 16 -1.97 0.0664DK11 0 HBI 0 -0.3192 0.08006 16 -3.99 0.00 IIOKll 0 HBI RT -0.8091 0.08006 16 -10.11 <.000 IOKII 0 HBI Ref 0.9832 0.08006 16 12.28 <.0001OKll 0 PrntPk HC -0.2179 0.08006 16 -2.72 0.0151OKl1 0 PrntPk 0 0.2046 0.08006 16 2.56 0.0211
- 109 -

OKll 0 I PmtPk RT 0.5852 0.08006 16 7.31 <.0001DKll 0 PmtPk Ref 1.0563 0.08006 16 13.19 <.0001DKII 0 Saran HC -1.144 0.08006 16 -14.29 <.0001OKl1 0 Saran 0 -0.4352 0.08006 16 -5.44 <.0001OKII 0 Saran RT -0.8835 0.08006 16 -11.04 <.0001OKll 0 Saran Ref 1.3521 0.08006 16 16.89 <.0001OKll RT OKll Ref 1.8498 0.08006 16 23.11 <.0001OKll RT HBI He 0.9361 0.08006 16 11.69 <.0001OKll RT HBI 0 0.7747 0.08006 16 9.68 <.0001OK11 RT HBI RT 0.2847 0.08006 16 3.56 0.0026DK11 RT HBI Ref 2.077 0.08006 16 25.94 <.0001OKll RT PrntPk HC 0.8759 0.08006 16 10.94 <.0001DKll RT PrntPk 0 1.2985 0.08006 16 16.22 <.0001DKll RT PrntPk RT 1.679 0.08006 16 20.97 <.0001DKII RT PmtPk Ref 2.1502 0.08006 16 26.86 <.0001OKII RT Saran HC -0.05019 0.08006 16 -0.63 0.5395DKII RT Saran 0 0.6587 0.08006 16 8.23 <.0001OKll RT Saran RT 0.2103 0.08006 16 2.63 I 0.0183OKll RT Saran Ref 2.4459 0.08006 16 30.55 <.0001DKII Ref HBI HC -0.9137 0.08006 16 -11.41 <.0001OKIl Ref HBI 0 -1.0752 0.08006 16 -13.43 <.0001OKI1 Ref HBI RT -1.5651 0.08006 16 -19.55 <.0001OKll Ref HBI Ref 0.2272 0.08006 16 2.84 0.0119OKll Ref PrntPk HC -0.()74 0.08006 16 -12.17 <.0001OKII Ref PrntPk 0 -0.5514 0.08006 16 -6.89 <.0001OKll Ref PrntPk RT -0.1708 0.08006 16 -2.13 0.0487OKl1 Ref PmtPk Ref 0.3003 0.08006 16 3.75 0.0017OKll Ref Saran HC -1.9 0.08006 16 -23.73 <.0001DKll Ref Saran 0 -1.1912 0.08006 16 -14.88 <.0001OKl1 Ref Saran RT -1.6396 0.08006 16 -20.48 <.0001DKll Ref Saran Ref 0.5961 0.08006 16 7.45 <.0001HBI HC HBI 0 -0.1614 0.08006 16 -2.02 0.0609HBI HC HBI RT -0.6514 0.08006 16 -8.14 <.000 IHBI HC HBI Ref 1.1409 0.08006 16 14.25 <.0001HBl HC PrntPk HC -0.06021 0.08006 16 -0.75 ' 0.4629HBl HC PmtPk 0 0.3624 0.08006 16 4.53 0.0003HBI HC PrntPk RT 0.7429 0.08006 16 9.28 <.0001HBI HC PrntPk Ref 1.2141 0.08006 16 15.16 <.0001HBI HC Saran HC -0.9863 0.08006 16 -12.32 <.0001
- 110 -

18. Method = TBA 15: 16 Wednesday, April 4, 2001 R
Time = 1Material Storage Material Storage Estimate StdErr DF tValue Probt
HB1 HC Saran 0 -0.2774 0.08006 16 -3.47 0.0032HBI HC Saran RT -0.7258 0.08006 16 -9.07 <.0001HBI HC Saran Ref 1.5098 0.08006 16 18.86 <.000 IHBI 0 HBI RT -0.4899 0.08006 16 -6.12 <.0001HBI 0 HBl Ref 1.3023 0.08006 16 16.27 <.0001HB1 0 PmtPk HC 0.1012 0.08006 16 1.26 0.2242HBI 0 PmtPk 0 0.5238 0.08006 16 6.54 <.0001HBI 0 PmtPk RT 0.9044 0.08006 16 I 1.3 <.0001HB1 0 PmtPk Ref 1.3755 0.08006 16 17.18 <.0001HBI 0 Saran HC -0.8249 0.08006 16 -10.3 <.0001HBI 0 Saran 0 I -0.ll6 0.08006 16 -1.45 0.1666HBI 0 Saran RT -0.5644 0.08006 16 -7.05 <.0001HB1 0 Saran Ref 1.6713 0.08006 16 20.88 <.0001HBI RT HB1 Ref 1.7923 0.08006 16 22.39 <.0001HBI RT PmtPk HC 0.5912 0.08006 16 7.38 <.0001HB1 RT PmtPk 0 1.0137 0.08006 16 12.66 <.0001HBI RT PmtPk RT 1.3943 0.08006 16 17.42 <.0001HBI RT PmtPk Ref 1.8654 0.08006 16 23.3 <.0001HBI RT Saran HC -0.3349 0.08006 16 -4.18 0.0007HB1 RT Saran 0 0.3739 0.08006 16
I4.67 0.0003
HBI RT Saran RT -0.07444 0.08006 16 -0.93 0.3663HBI RT Saran Ref 2.1612 0.08006 16 27 <.0001HBI Ref PrntPk HC -1.2011 0.08006 16 -15 <.0001HBI Ref PrntPk 0 -0.7785 0.08006 16 -9.72 <.0001HBI Ref PrntPk RT -0.398 0.08006 16 -4.97 0.0001HB1 Ref PrntPk Ref 0.07313 0.08006 16 0.91 0.3745HBI Ref Saran HC -2.1272 0.08006 16 -26.57 <.0001HBI Ref Saran 0 -1.4184 0.08006 16 -17.72 <.0001HBI Ref Saran RT -1.8667 0.08006 16 -23.32 <.0001HBI Ref Saran Ref 0.3689 0.08006 16 4.61 0.0003
PmtPk HC PmtPk 0 0.4226 0.08006 16 5.28 <.0001PrntPk HC PmtPk RT 0.8032 0.08006 16 10.03 <.0001PrntPk HC PrntPk Ref 1.2743 0.08006 16 15.92 <.0001PrntPk HC Saran HC -0.9261 0.08006 16 -11.57 <.0001PrntPk HC Saran 0 -0.2172 0.08006 16 -2.71 0.0 153PrntPk HC Saran RT -0.6656 0.08006 16 -8.31 <.0001PrntPk He Saran Ref 1.57 0.08006 16 19.6 J <.0001PmtPk 0 PrntPk RT 0.3806 0.08006 16 4.75 0.0002PmtPk 0 PrntPk Ref 0.8517 0.08006 16 10.64 <.0001
- II I -

PrntPk 0 Saran HC -1.3487 0.08006 16 -16.85 <.0001PmtPk 0 Saran 0 -0.6398 0.08006 16 -7.99 <.0001PrntPk 0 Saran RT -1.0882 0.08006 16 -13.59 <.0001PrntPk 0 Saran Ref 1.1474 0.08006 16 14.33 <.0001PmtPk RT PrntPk Ref 0.4711 0.08006 16 5.88 <.0001PrntPk RT Saran HC -1.7292 0.08006 16 -21.6 <.0001PrntPk RT Saran 0 -1.0204 0.08006 16 -12.75 <.0001PrntPk RT Saran RT -1.4688 0.08006 16 -18.35 <.0001PrntPk RT Saran Ref 0.7669 0.08006 16 9.58 <.0001PrntPk Ref Saran HC -2.2003 0.08006 16 -27.48 <.0001PrntPk Ref Saran 0 -1.4915 0.08006 16 -18.63 <.0001PrntPk Ref Saran RT -1.9399 0.08006 16 -24.23 <.0001PmtPk Ref Saran Ref 0.2958 0.08006 16 3.69 0.002Saran HC Saran 0 0.7089 0.08006 16 8.85 <.0001Saran HC Saran RT 0.2605 0.08006 16 3.25 0.005Saran HC Saran Ref 2.4961 0.08006 16 31.18 <.0001Saran 0 Saran RT -0.4484 0.08006 16 -5.6 <.0001Saran 0 Saran Ref 1.7873 0.08006 16 22.32 <.0001Saran RT Saran Ref 2.2356 0.08006 16 27.93 <.0001
- I J 2 -

VITA 7
Mimin Adhikary
Candidate for the Degree of
Master of Science
Thesis: OXIDATIVE RANCIDITY OF PEANUT BUTTER SLICES UNDERDIFFERENT PACKAGING AND ATMOSPHERIC CONDITIONS
Major Field: Biosystems Engineering
Biographical:
Personal Data: Born in Calcutta, Eastern India, on December loth, 1975.Daughter of Swapan and Pranati Adhikary.
Education: Higher Secondary schooling from Kendriya Vidyalaya, Vizag, Indiain May 1993. Obtained Bachelor of Technology degree in Agriculturaland Food Engineering from Indian Institute of Technology, Kharagpur,India in June 1997. Completed requirements for the Masters of Sciencedegree with a major in Biosystems Engineering at Oklahoma StateUniversity in May, 2001.
Experience: Employed as a Trainee Engineer at Kwality Dairy Ltd., Faridabad,India between May 1996-July 1996. Worked for Mojj EngineeringSystems, Pune, India as Engineer, Projects Group from August 1997 toMay 1998. Employed as Engineer, Liquid Foods Division, at Alfa LavalIndia Ltd., Pune, India, from June 1998 to June 1999. Employed by theBiosystems and Agricultural Engineering Department at Oklahoma StateUniversity in Stillwater, Oklahoma as a Graduate Assistant, 1999 topresent.
Professional Memberships: Alpha Epsilon, Institute of Food Technologists.
Copyright © 2022 FDOKUMEN


![4Aminopyridine stimulates B50 (GAP43) phosphorylation and [3H]-noradrenaline release in rat hippocampal slices](https://static.fdokumen.com/doc/165x107/6314ccec3ed465f0570b4d12/4aminopyridine-stimulates-b50-gap43-phosphorylation-and-3h-noradrenaline-release.jpg)