Fast and accurate peanut allergen detection with nanobead enhanced optical fiber SPR biosensor
6
Talanta 83 (2011) 1436–1441 Contents lists available at ScienceDirect Talanta journal homepage: www.elsevier.com/locate/talanta Fast and accurate peanut allergen detection with nanobead enhanced optical fiber SPR biosensor J. Pollet a , F. Delport a , K.P.F. Janssen a , D.T. Tran a , J. Wouters b , T. Verbiest b , J. Lammertyn a,∗ a BIOSYST-MeBioS, Katholieke Universiteit Leuven, Willem de Croylaan 42, B-3001 Leuven, Belgium b Molecular and Nanomaterials, Katholieke Universiteit Leuven, Celestijnenlaan 200f, B-3001 Leuven, Belgium article info Article history: Received 16 June 2010 Received in revised form 31 October 2010 Accepted 14 November 2010 Available online 19 November 2010 Keywords: Peanut allergy Surface plasmon resonance Fiber optic biosensor Super-paramagnetic nanobeads abstract This paper is the first report of a fiber optic SPR biosensor with nanobead signal enhancement. We evaluated the system with a bioassay for the fast and accurate detection of peanut allergens in complex food matrices. Three approaches of an immunoassay to detect Ara h1 peanut allergens in chocolate candy bars were compared; a label-free assay, a secondary antibody sandwich assay and a nanobead enhanced assay. Although label-free detection is the most convenient, our results illustrate that functionalized nanobeads can offer a refined solution to improve the fiber SPR detection limit. By applying magnetite nanoparticles as a secondary label, the detection limit of the SPR bioassay for Ara h1 was improved by two orders of magnitude from 9 to 0.09 g/mL. The super paramagnetic character of the nanoparticles ensured easy handling. The SPR fibers could be regenerated easily and one fiber could be reused for up to 35 times without loss of sensitivity. The results were benchmarked against a commercially available polyclonal ELISA kit. An excellent correlation was found between the Ara h1 concentrations obtained with the ELISA and the concentrations measured with the SPR fiber assay. In addition, with the SPR fiber we could measure the samples twice as fast as compared to the fastest ELISA protocol. Since the dipstick fiber has no need for microchannels that can become clogged, time consuming rinsing step could be avoided. The linear dynamic range of the presented sensor was between 0.1 and 2 g/mL, which is considerably larger than the ELISA benchmark. © 2010 Elsevier B.V. All rights reserved. 1. Introduction An increasing number of people is confronted with food hyper- sensitivity. At the very top of the food allergen list is the peanut. Although they have an eminent nutritional value, peanuts can be a serious threat towards sensitized individuals [1]. While other food-induced allergies, e.g. allergies triggered by milk or egg pro- teins, mainly affect children and disappear when growing up, peanut hypersensitivity tends to persist into adulthood [2]. Since no medical prophylactic treatment is available so far, the sensi- tive consumer should strictly avoid peanuts. The allergens are heat resistant and are conserved during food production and processing [3]. Hence, accurate and reliable product information is required, especially since the modern food industry frequently processes peanuts or peanut butter in products such as cookies, chocolate, cereal, crackers, and ice cream. Also, some products might contain these nuts inadvertently through contamination of raw materials or equipment used. Even a trace amount of peanut allergens has the potential to be life-threatening by inducing an anaphylactic ∗ Corresponding author. Tel.: +32 16321459; fax: +32 16322955. E-mail address: [email protected] (J. Lammertyn). shock [4]. Consequently, there is a need for sensitive biosensors that can detect low quantities of peanut allergens in complex food matrices and that can be implemented in food quality and safety laboratories. The current reference method for detecting food allergens is an enzyme-linked immunosorbent assay (ELISA) [5,6]. Although ELISA has proven to be a sensitive and versatile bio-analytical assay, the technique is time-consuming, not reusable, rather expensive, and some steps are difficult to automate [7]. Polymerase chain reac- tion (PCR) techniques have frequently been reported as a promising alternative for ELISA [8]. While the sensitivity of the PCR methods may become superior, there is no fixed correlation between the amount of DNA and the amount of allergens, which may lead to false positive or false negative results. Therefore, immunoassays still remain the method of choice for the quantitative detection of low concentrations of peanut allergens in real food samples [2]. Surface plasmon resonance (SPR) is generally considered as one of the most suited methods to monitor biomolecular interactions and thus can be applied as an accurate allergen immunosensor [9]. Most commercial SPR systems (e.g. Biacore, GE Healthcare, Sweden; Spreeta, Sensata Technologies, Brazil) are fully automated, their sensor chips can be used for many samples and the SPR sen- 0039-9140/$ – see front matter © 2010 Elsevier B.V. All rights reserved. doi:10.1016/j.talanta.2010.11.032
Transcript of Fast and accurate peanut allergen detection with nanobead enhanced optical fiber SPR biosensor

Ffi
Ja
b
a
ARRAA
KPSFS
1
sAaftpntr[epctot
0d
Talanta 83 (2011) 1436–1441
Contents lists available at ScienceDirect
Talanta
journa l homepage: www.e lsev ier .com/ locate / ta lanta
ast and accurate peanut allergen detection with nanobead enhanced opticalber SPR biosensor
. Polleta, F. Delporta, K.P.F. Janssena, D.T. Trana, J. Woutersb, T. Verbiestb, J. Lammertyna,∗
BIOSYST-MeBioS, Katholieke Universiteit Leuven, Willem de Croylaan 42, B-3001 Leuven, BelgiumMolecular and Nanomaterials, Katholieke Universiteit Leuven, Celestijnenlaan 200f, B-3001 Leuven, Belgium
r t i c l e i n f o
rticle history:eceived 16 June 2010eceived in revised form 31 October 2010ccepted 14 November 2010vailable online 19 November 2010
eywords:eanut allergyurface plasmon resonanceiber optic biosensor
a b s t r a c t
This paper is the first report of a fiber optic SPR biosensor with nanobead signal enhancement. Weevaluated the system with a bioassay for the fast and accurate detection of peanut allergens in complexfood matrices. Three approaches of an immunoassay to detect Ara h1 peanut allergens in chocolate candybars were compared; a label-free assay, a secondary antibody sandwich assay and a nanobead enhancedassay. Although label-free detection is the most convenient, our results illustrate that functionalizednanobeads can offer a refined solution to improve the fiber SPR detection limit. By applying magnetitenanoparticles as a secondary label, the detection limit of the SPR bioassay for Ara h1 was improved bytwo orders of magnitude from 9 to 0.09 �g/mL. The super paramagnetic character of the nanoparticlesensured easy handling. The SPR fibers could be regenerated easily and one fiber could be reused for up
uper-paramagnetic nanobeads to 35 times without loss of sensitivity. The results were benchmarked against a commercially availablepolyclonal ELISA kit. An excellent correlation was found between the Ara h1 concentrations obtained withthe ELISA and the concentrations measured with the SPR fiber assay. In addition, with the SPR fiber wecould measure the samples twice as fast as compared to the fastest ELISA protocol. Since the dipstick fiberhas no need for microchannels that can become clogged, time consuming rinsing step could be avoided.The linear dynamic range of the presented sensor was between 0.1 and 2 �g/mL, which is considerably
chma
larger than the ELISA ben. Introduction
An increasing number of people is confronted with food hyper-ensitivity. At the very top of the food allergen list is the peanut.lthough they have an eminent nutritional value, peanuts can beserious threat towards sensitized individuals [1]. While other
ood-induced allergies, e.g. allergies triggered by milk or egg pro-eins, mainly affect children and disappear when growing up,eanut hypersensitivity tends to persist into adulthood [2]. Sinceo medical prophylactic treatment is available so far, the sensi-ive consumer should strictly avoid peanuts. The allergens are heatesistant and are conserved during food production and processing3]. Hence, accurate and reliable product information is required,specially since the modern food industry frequently processeseanuts or peanut butter in products such as cookies, chocolate,
ereal, crackers, and ice cream. Also, some products might containhese nuts inadvertently through contamination of raw materialsr equipment used. Even a trace amount of peanut allergens hashe potential to be life-threatening by inducing an anaphylactic∗ Corresponding author. Tel.: +32 16321459; fax: +32 16322955.E-mail address: [email protected] (J. Lammertyn).
039-9140/$ – see front matter © 2010 Elsevier B.V. All rights reserved.oi:10.1016/j.talanta.2010.11.032
rk.© 2010 Elsevier B.V. All rights reserved.
shock [4]. Consequently, there is a need for sensitive biosensorsthat can detect low quantities of peanut allergens in complex foodmatrices and that can be implemented in food quality and safetylaboratories.
The current reference method for detecting food allergens is anenzyme-linked immunosorbent assay (ELISA) [5,6]. Although ELISAhas proven to be a sensitive and versatile bio-analytical assay, thetechnique is time-consuming, not reusable, rather expensive, andsome steps are difficult to automate [7]. Polymerase chain reac-tion (PCR) techniques have frequently been reported as a promisingalternative for ELISA [8]. While the sensitivity of the PCR methodsmay become superior, there is no fixed correlation between theamount of DNA and the amount of allergens, which may lead tofalse positive or false negative results. Therefore, immunoassaysstill remain the method of choice for the quantitative detectionof low concentrations of peanut allergens in real food samples[2].
Surface plasmon resonance (SPR) is generally considered as one
of the most suited methods to monitor biomolecular interactionsand thus can be applied as an accurate allergen immunosensor[9]. Most commercial SPR systems (e.g. Biacore, GE Healthcare,Sweden; Spreeta, Sensata Technologies, Brazil) are fully automated,their sensor chips can be used for many samples and the SPR sen-
J. Pollet et al. / Talanta 83 (2011) 1436–1441 1437
Fig. 1. (A) Fiber optic SPR probe; (B) schematic representation of the system setup; (C) overview of the Ara h1 immunoassay strategies on the fiber optic SPR biosensor; (D)t tive coc (blacki
sNwacadspbiwooomsgr
apaacshiiwAttc
he spectrum dips in PBS buffer after 10 min incubation of the SPR fiber in: a negaontaining 18 �g/mL Ara h1 subsequently labeled with antibody linked nanobeadss referred to the web version of the article.)
itivity is comparable with the most sensitive ELISA assays [10].evertheless only a limited number of research labs are equippedith a SPR setup, since most commercial systems are expensive
nd bulky instruments with a prism based Otto or Kretchmannonfiguration. Optical fibers offer a more compact and afford-ble alternative to couple light and surface plasmons, howeverue to inherent characteristics of fiber optics, the sensitivity ofuch SPR system is limited compared to systems operating with arism configuration [11–15]. Recently the SPR detection limits haveeen pushed towards impressive thresholds by using functional-
zed nanoparticles as a secondary label [16–22]. In the presentedork this amplification principle is used for the first time on fiber
ptic SPR, improving the sensitivity towards to the detection levelf ELISA and label-free prism based SPR instruments. The fiberptic platform is well suited for the combination with nano- oricrobeads, since unlike many of the commercial available SPR
ystems there are no microfluidics involved, hence there is no clog-ing possible and there is no need for intensive and time consuminginsing procedures.
The advanced sensitivity is demonstrated by tackling the peanutllergen detection challenge. We compared three approaches of aeanut allergen immunoassay on a SPR fiber; a label-free assay,secondary antibody sandwich assay and a nanobead enhanced
ssay. For the latter, we coated magnetite nanoparticles with poly-lonal antibodies against the major peanut allergen Ara h1. Theuper-paramagnetic character of the nanoparticles ensured easyandling. Ara h1 was chosen as peanut allergen biomarker, because
t is the most abundant peanut allergen and it triggers a reactionn up to 95% of the patients [23]. The functionalized nanobeads
ere applied in a sandwich assay on an antibody coated SPR fiber.s such, they offer an elegant solution to improve the SPR detec-
ion limit and to deal with variable matrix effects. The results ofhe nanobead enhanced fiber optic assay were benchmarked to aommercially available ELISA kit.
ntrol sample (blue dip), a sample containing 18 �g/mL Ara h1 (red dip), a sampledip). (For interpretation of the references to color in this figure legend, the reader
2. Materials and methods
2.1. Fiber optic SPR probes
Fig. 1A depicts an illustration of the fiber optic SPR probe. Adetailed description of the fabrication of the fiber probe can befound in Pollet et al. [11]. In order to verify the response of differentfibers after the production process, each fiber was calibrated basedon a six point calibration curve of ethanol–water mixtures with aknown refraction index. The average resolution of the sensors wasapproximately 5 × 10⁻⁵ refraction index units (RIU).
Once calibrated, the gold surface of the sensor was rinsed withethanol and linked with a 1 M mixed self-assembling monolayer(4:1 v/v) of polyethylene glycol and polyethylene glycol acid (Poly-pure, Oslo, Norway) during a 24-h incubation period. Polyclonalrabbit anti-Ara h1 antibodies (Indoor Biotechnologies Limited,Warminster, UK) were coupled to the glycol layer by a carbodiimidereaction. These antibodies are selected to bind to specific epitopespresent on peanut allergen Ara h 1, however they also show avery limited amount of cross-reactivity for peanut allergens Arah2 and Ara h6 when those are present at very high concentrations(<1 mg/mL).
The carboxyl groups on the fiber were first activated for30 min with 0.4 M 1-ethyl-3-[3-dimethylaminopropyl] carbodi-imide hydrochloride (EDC) and 0.1 M N-hydroxysulfosuccinimide(NHS) in a 50 mM 2-(N-morpholino)ethanesulfonic acid (MES)buffer (pH 6). The fibers were then immersed for 1 h in MES bufferwith 100 �g/mL polyclonal Ara h1 antibodies. Afterwards, the func-tionalized fibers were briefly washed with 1 M NaCl in 50 mM
NaOH to remove all non-covalently bound antibodies and storedin a 10 mM phosphate buffered saline (PBS) buffer with 1% bovineserum albumin (BSA) and 0.05% Tween-20 at pH 7.4 (1% BSA PBS-T).The immobilization protocol could be monitored in real time basedon the SPR response.
1 ta 83
2
Oiatrtgbtrv
UtddwMtdm
asboa
2
fs3isr1psnswehtiPb(
aBntts6diwAc
438 J. Pollet et al. / Talan
.2. Apparatus and system setup
White light from a tungsten halogen light source (LS-1, Oceanptics, Dunedin, USA) was guided through a bifurcated optical fiber
n the SPR probes (Fig. 1B). The golden distal end face of the probected as a mirror and reflected the light back to a UV-VIS spec-rophotometer (USB4000, Ocean Optics, Dunedin, USA). Based on aeference spectrum in air, the reflection spectrum of a typical solu-ion showed a spectral resonance SPR-dip. A binding event on theold layer causes a wavelength modulation of this SPR-dip, hence,ased on the resonance wavelength shift, the surface chemistry onhe gold layer was monitored in real time (Fig. 1C and D). In theesulting sensorgrams the SPR wavelength shift (nm) was plottedersus time.
Data were recorded with Spectrasuite (Ocean Optics, Dunedin,SA). Following spectrometer settings were used: integration
ime = 500 ms, average = 1 and boxcar = 10. Further processing wasone using Matlab software (Mathworks, Natick, USA). The rawata were filtered with a Savitsky-Golay-filter. The resonanceavelength was finally calculated using the Minimum Huntethod [15]. In this method, a second order polynomial was fit
o the SPR dip to determine the local minimum. As a result of theifferent data processing steps, the impact of modal noise in theultimode fibers on the signal was minimized.To ensure repeatable, fast and easy immobilization procedures
nd measurements, the setup was integrated into a fully automatedystem with a pre-programmed computer-controlled robot (Colin-us, Hulshout, Belgium). In the systems sample rack 96 PCR tubesf maximum 200 �L and four containers of 25 mL for the reactionnd washing buffers could be placed.
.3. Antibody linked nanoparticles
Super-paramagnetic nanoparticles were prepared using theorced hydrolysis method. First, 2.4 g of anhydrous FeCl3 was dis-olved in 10 mL ethylene glycol and 4 mL MilliQ water. Next,7.5 mL of ethylene glycol and 25 mL of octylamine were mixed
n a 100 mL round bottom flask and heated to 150 ◦C. Aftertirring, the FeCl3 solution was added dropwise to the heatedound bottom flask and further heated to reflux at 185 ◦C for8 h. After cooling, the nanobeads were washed with acetone,recipitated using our homemade magnet and redispersed viaonication. This process was repeated four times. Next, theanoparticles were dried in a vacuum oven. A typical synthe-is yielded around 1 g of dried nanobeads. The nanoparticlesere then silanized using a mixture of N-(trimethoxysilylpropyl)
thylenediamine triacetic acid trisodium salt and 3-[bis(2-ydroxyethyl)amino]propyl-triethoxysilane. The average size ofhe nanoparticles was measured to be 19.0 ± 3.1 nm based onmages made with a scanning electron microscope (XL30 ESEM,hilips Electronics, The Netherlands). This was further verifiedased on images obtained with a transmission electron microscopeMPI KGF, Golm, Germany).
Next, the magnetic nanoparticles were functionalized throughcarbodiimide reaction with polyclonal Ara h1 antibodies (Indooriotechnologies Limited, Warminster, UK). To ensure a maximumumber of antibodies linked to the beads, a slightly different pro-ocol was used compared to the immobilization of antibodies onhe gold surface of the fibers. First, 25 �L of a 10 mg/mL nanobeadstock solution was dissolved in 475 �L of a 100 mM MES buffer (pH). The carboxyl surface of the nanoparticles was washed 3 times by
issolving, magnetically capturing and decanting the nanoparticlesn MES buffer. Next, the carboxyl groups of the cleaned nanobeadsere activated by adding 20 �L of 0.03 M EDC in 480 �L MES.fter 10 min 1 �L of 2 mg/mL of antibodies was added for bio-onjugation. Finally, the functionalized nanoparticles were washed
(2011) 1436–1441
three times and stored in 1% BSA PBS-T in a concentration of2 mg/mL.
2.4. Sample preparation
MarsTM candy bars with a dense chocolate matrix produced byMars Inc (McLean, VA, USA), were purchased at the local super-market and used to evaluate the biosensor. As labeled, this type ofchocolate bar may inadvertently contain allergens, but all evaluatedsamples responded negative on the ELISA and the SPR test.
Chocolate is generally considered as a difficult matrix for theextraction of proteins mainly due to the high concentration ofphenolic compounds, such as tannins, which have an affinitytowards proteins [21]. Not only do they block the allergens, pheno-lic compounds can also bind to the antibodies [26]. The chocolatebar samples were first powdered in liquid nitrogen. Then, 1 g ofskimmed milk powder (Nestlé, Belgium) was added to 1 g of sampleto bind the phenolic compounds of the chocolate. The mixture wasthen extracted for 10 min in 20 mL of a preheated (60 ◦C) TRIS–HClbuffer (pH 8.2) [4,23–27]. Before extraction, some of the sampleswere spiked with known concentrations of Ara h1. Subsequently,the samples were centrifuged at 2500 × g at 4 ◦C to precipitate thebound phenolic compounds [4]. The supernatant was used in boththe standardized ELISA and the fiber optic SPR biosensing assays.
2.5. ELISA protocol
The commercially available ELISA kit ‘Ridascreen fast’ (r-Biopharm, Darmstadt, Germany), which comprised polyclonalantibodies directed against peanut was used as a benchmark. Thiskit is especially designed for a fast ELISA protocol and can be carriedout within 45 min. The main steps of the protocol were executedas described in the manufacturer’s manual. The final color reac-tion was measured at 450 nm (Spectramax M2e, Molecular Devices,Silicon Valley, CA, USA) (Supporting information).
2.6. SPR assay protocol
Similar to the ELISA technique, we used 100 �L of the super-natant samples for each SPR assay. A standard protocol consistedout of six steps, and was performed within 20 min. First, the fiberswere placed in the PBS buffer for 3 min to stabilize and to acquirea baseline signal. Next, the fibers were dipped for 5 min into thesamples. The sensors were then rinsed to remove all non-boundmolecules and transferred to the vial with nanobeads for 10 min toamplify the SPR signals. After each measurement the sensors wereregenerated with a 2 min acid treatment in a glycin buffer at pH 1.7.The rinsing and regeneration procedures were enhanced by vigor-ously moving the sensor head up and down. Afterwards, the sensorwas stored in the 1% BSA PBS-T buffer. One vial of 100 �L antibodyfunctionalized nanoparticles (2 mg/mL) was prepared for a seriesof ten measurements. One in ten samples was a negative controlsample (blank sample).
3. Results and discussion
3.1. ELISA reference measurements for the peanut allergen Ara h1
The standard ELISA calibration curve that came with the assaykit is based on a dilution series of a peanut extract. The sample con-
centrations are accordingly expressed in parts per million (ppm).The data of the calibration curve was experimentally verified andconfirmed (Fig. S1). Because this calibration curve does not provideany quantitative data of the actual allergen exposure, we reevalu-ated the polyclonal ELISA kit with a dose–response experiment of
J. Pollet et al. / Talanta 83 (2011) 1436–1441 1439
Fig. 2. Dose–response curve and calibration curve of the peanut ELISA kit based ondttA
si
oc
Tcoomtpshr
3b
twtctNsiA
Fig. 3. Comparison of the three presented immunoassays on the fiber optic SPR sen-sor for different Ara h1 concentrations. Red bars: the label free assay, green bars:
TO
T
ilution series of Ara h1. The squares represent extraction buffer spiked with Ara h1,he triangles represent chocolate bar sample extractions spiked with Ara h1 afterhe extraction protocol, dots represent chocolate bar sample extraction spiked withra h1 before the extraction process.
piked samples with a known concentration of Ara h1, expressedn microgram Ara h1 per milliliter extraction buffer (Fig. 2).
To verify the extraction procedure and the possible interferencef the chocolate matrix, three types of dose–response curves wereompared.
A first curve was made based on a dilution series of Ara h1 inRIS–HCl extraction buffer. A second curve was made in an identi-al way as the first, but the allergen was added to the supernatantf an extracted chocolate sample. There was no loss of sensitivitybserved when measured in the sample matrix. A third curve wasade with chocolate samples spiked with Ara h1 before the extrac-
ion. As shown in Fig. 2 all dose–response points show a nearlyerfect overlap. Hence, the extraction procedure was considered asuccessful in the evaluated concentration range. For concentrationsigher than 1 �g/mL the signal saturated. Based on a signal-to-noiseatio of 3, the limit of detection was determined to be 0.10 �g/mL.
.2. Ara h1 immunoassay strategies on the fiber optic SPRiosensor
The SPR wavelength shift of the sensor is related not only tohe number of bound target molecules, but also to their weight. Ase previously reported, a 1 nm SPR wavelength shift recorded by
he fiber sensor represents a change of 28.6 ng/cm2 in the molecularoverage [11]. Hence, the higher the molecular weight, the strongerhe SPR wavelength shift, for an equal amount of bound molecules.
evertheless, the binding of larger molecules can be influenced byteric hindrance and diffusion limitations. In the search for low lim-ts of detection and accurate quantification of the peanut allergenra h1, we evaluated three different approaches (Fig. 1C).
able 1verview table of the maximum binding capacity for the different layers of the sandwich
Maximum binding capacity
MW (kDa) Sh
Primary antibody 150 7Ara h1 allergen 63 1Secondary antibody 150 2Functionalized nanoparticle 11,280 2
he average weight sensitivity of the fiber optic SPR sensor was 1 nm shift per 28.6 ng/cm
secondary antibody sandwich assay and blue bars: the nanobead enhanced assay.The error bars indicate standard deviations (n = 3). (For interpretation of the refer-ences to color in this figure legend, the reader is referred to the web version of thearticle.)
3.3. Label-free assay
The binding of the first layer of antibodies to the activated mixedPEG layer resulted in an average shift of 7.0 ± 0.5 nm. The maximumbinding capacity of the Ara h1 proteins at equilibrium (after 15 min,for concentrations >50 �g/mL) was 1.4 ± 0.4 nm. Considering theirrelative difference in weight (the molecular mass of the antibodyis assumed to be 150 kDa, the mass of the Ara h1 protein 63 kDa),approximately 48% of the immobilized antibodies were able to cap-ture an allergen (Table 1). This seems to be in accordance with thefact that the antibodies were not bound with a specific orientation.The label-free response for different Ara h1 concentrations is illus-trated in the red bars of Fig. 3. Based on a signal to noise ratio of 3,the limit of detection for the label-free SPR assay was estimated tobe 9 �g/mL.
3.4. Secondary antibody sandwich assay
As can be perceived from the green bars in Fig. 3, a secondaryantibody sandwich based assay significantly enhanced the sensitiv-ity of the sensor. The maximum SPR wavelength shift at equilibriumwas 2.6 ± 0.3 nm. This indicates that up to 78% of the bound aller-gens could be captured in the formation of an antibody sandwich(Table 1). The detection limit of the polyclonal antibody sandwichassay was estimated to be 0.21 �g/mL. This is almost 35 times
lower than the same assay without application of a secondaryimmuno-tag. Therefore, even though a label-free assay might bemore convenient, a hefty label can significantly enhance the sensi-tivity of the SPR sensor.immunoassay.
ift (nm) ng/cm2 nmol/cm2
.0 ± 0.5 20 ± 1.4 × 10 1.3 ± 0.10
.4 ± 0.4 40 ± 11 0.64 ± 0.18
.6 ± 0.3 74 ± 8.6 0.50 ± 0.061 ± 1.0 60 ± 2.8 × 10 0.05 ± 0.01
2.

1440 J. Pollet et al. / Talanta 83 (2011) 1436–1441
Fig. 4. SPR sensorgrams illustrating the binding of different concentrations of Arah1, followed by an amplification step with nanoparticles functionalized with poly-clonal antibodies. First the fiber was put for 3 min in the main buffer to stabilizeand to acquire a baseline signal. Next, the fiber was dipped for 10 min in one ofthe samples, rinsed and placed again for 3 min in PBS buffer. Finally, the fiber wastransferred to the vial with nanobeads to amplify the signal for 10 min. Desorptionom
3
tootrssbstsntsl
pimsabtltttsiTevaii(
f the beads was monitored during 10 min of incubation in the PBS buffer. After eacheasurement the sensor was regenerated with a 2 min acid treatment.
.5. Nanobead enhanced assay
In the last approach we immobilized the Ara h1 antibodies onhe super-paramagnetic nanoparticles and applied them as a sec-ndary label to amplify the SPR signal (Fig. 1C and D). A diameterf 19 nm was shown to be the most ideal size for the nanobeads inhis assay. Particles larger than 60 nm settled down too rapidly,esulting in fewer successful binding reactions and a decreasedensitivity during the experiments. Recently, Piletska and Pilet-ky described the relation between particle dimensions and theirinding affinity [28]. Taking into account steric hindrance, diffu-ion limitations and the fact that the SPR shift is proportional tohe amount of bound mass, they suggested the use of 50–100 nmilica particles to enhance SPR signals. Because the magnetiteanobeads used in our assay have a higher density as comparedo the silica beads, we could use particles with smaller dimen-ions, diminishing the impact of steric hindrance and diffusionimitation.
With our SPR system we were able to monitor the differentrotocol steps of the bioassay in real time. This is demonstrated
n Fig. 4, where we combined the sensorgrams from a series ofeasurements with different Ara h1 concentrations. In each mea-
urement cycle the fiber was first incubated for 10 min in thellergen spiked samples, subsequently the signal was enhancedy antibody coated nanoparticles. As can be noticed in Fig. 4,he binding process of the nanobeads did not achieve an equi-ibrium for Ara h1 concentrations higher than 2 �g/mL. In ordero reach the point of equilibrium for these high concentra-ions, it was necessary to extend the signal amplification stepo 45 min. Our kinetic studies revealed that in contrast to thelow nanoparticle binding process, the allergen–antibody bind-ng was much faster and was in equilibrium after only 5 min.his difference will probably be related to diffusion limitations,lectrostatic repulsion and steric hindrance. Based on this obser-ation we further used 5 min of incubation for the Ara h1 binding,
nd 10 min for the nanoparticle amplification step. The result-ng dose–response curve is shown in Fig. 5. The detection limits in the same order as the detection limit of the ELISA kit0.1 �g/mL).Fig. 5. Dose–response and calibration curve of Ara h1 based on the results obtainedby a nanobead enhanced SPR sensor. The results were collected after 5 min of aller-gen binding and 10 min of nanobead amplification. The inset figure shows the linearcalibration curve. The error bars indicate standard deviations (n = 3).
Based on the linear part of the data from the dose–responsecurve a calibration curve was made (inset of Fig. 5). For theAra h1 concentrations in this region, the binding process of thenanobeads got to the point of full equilibrium within the time-frame of the used protocol. The detection limit of the nanobeadenhanced assay was estimated at 0.09 �g/mL. Hence, the sensitiv-ity was improved by two orders of magnitude, as compared to thelabel-free assay.
Applying the suggested time protocol, the nanobead enhancedSPR fiber assay could be carried out within 20 min. In compari-son, the execution of the ELISA protocol was done in about 45 min.The extra time necessary for ELISA can be explained by the timeconsuming rinsing steps and the extra step for the enzyme reaction.
The maximum SPR wavelength shift induced at equilibrium was21 ± 1.0 nm. The molecular weight of a spherical 19 nm diametermagnetite (5.15 g/cm3) nanoparticle coated with one antibody isapproximately 11280 kDa. Hence, if we assume a linear relationbetween the increased weight and the signal enhancement, almost9% of the allergens captured by the antibodies on the fiber aresandwiched by a secondary antibody immobilized to a nanobead(Table 1).
After measuring, the SPR fibers could be regenerated within2 min. This is a major advantage compared to microfluidic SPR sys-tems which usually require long washing steps, certainly whennano- or microbeads are being used [22]. The sensors were regen-erated for 35 cycles without any significant loss of sensitivity(Supplementary information).
The non-specific binding of the nanobeads was prevented bythe repulsive character of the mixed PEG layer. Furthermore, thesensor’s binding surface is vertically positioned, hence no particlescan simply settle down on the gold layer of the sensor.
Based on the calibration curves of the ELISA and nanobeadenhanced SPR fiber assay, we compared the assays with a newset of samples. An excellent correlation was found between bothimmunoassays (Fig. 6).
In further research we will further exploit the super-paramagnetic character of the nanobeads. When the beads arecoated with monoclonal antibodies, they can also be applied to
purify and concentrate antigens from different extracts of complexsample matrices. With this technique, even lower detection limitsmight be pursued by concentrating the allergens before measuring.However, this step should not be considered trivial, as in contrast to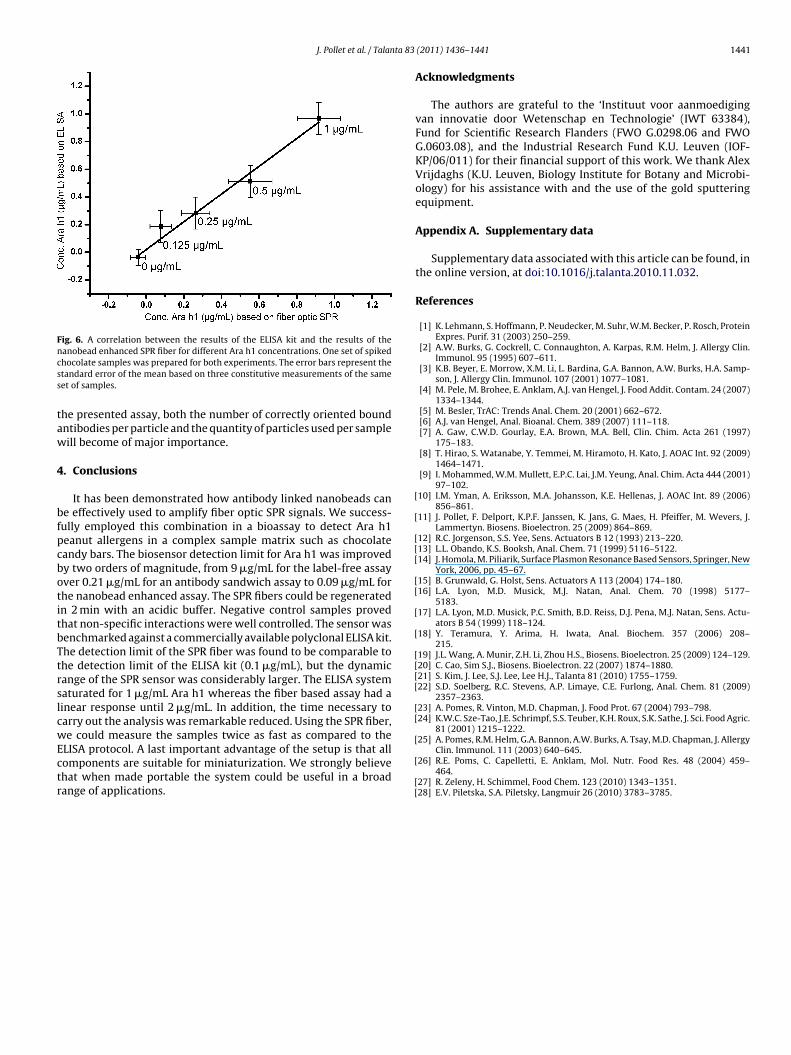
J. Pollet et al. / Talanta 83
Fig. 6. A correlation between the results of the ELISA kit and the results of thencss
taw
4
bfpcbotitbTtrslcwEctr
[
[
[[[
[[
[
[
[[[[
[[
anobead enhanced SPR fiber for different Ara h1 concentrations. One set of spikedhocolate samples was prepared for both experiments. The error bars represent thetandard error of the mean based on three constitutive measurements of the sameet of samples.
he presented assay, both the number of correctly oriented boundntibodies per particle and the quantity of particles used per sampleill become of major importance.
. Conclusions
It has been demonstrated how antibody linked nanobeads cane effectively used to amplify fiber optic SPR signals. We success-ully employed this combination in a bioassay to detect Ara h1eanut allergens in a complex sample matrix such as chocolateandy bars. The biosensor detection limit for Ara h1 was improvedy two orders of magnitude, from 9 �g/mL for the label-free assayver 0.21 �g/mL for an antibody sandwich assay to 0.09 �g/mL forhe nanobead enhanced assay. The SPR fibers could be regeneratedn 2 min with an acidic buffer. Negative control samples provedhat non-specific interactions were well controlled. The sensor wasenchmarked against a commercially available polyclonal ELISA kit.he detection limit of the SPR fiber was found to be comparable tohe detection limit of the ELISA kit (0.1 �g/mL), but the dynamicange of the SPR sensor was considerably larger. The ELISA systematurated for 1 �g/mL Ara h1 whereas the fiber based assay had ainear response until 2 �g/mL. In addition, the time necessary toarry out the analysis was remarkable reduced. Using the SPR fiber,
e could measure the samples twice as fast as compared to theLISA protocol. A last important advantage of the setup is that allomponents are suitable for miniaturization. We strongly believehat when made portable the system could be useful in a broadange of applications.
[
[
[[
(2011) 1436–1441 1441
Acknowledgments
The authors are grateful to the ‘Instituut voor aanmoedigingvan innovatie door Wetenschap en Technologie’ (IWT 63384),Fund for Scientific Research Flanders (FWO G.0298.06 and FWOG.0603.08), and the Industrial Research Fund K.U. Leuven (IOF-KP/06/011) for their financial support of this work. We thank AlexVrijdaghs (K.U. Leuven, Biology Institute for Botany and Microbi-ology) for his assistance with and the use of the gold sputteringequipment.
Appendix A. Supplementary data
Supplementary data associated with this article can be found, inthe online version, at doi:10.1016/j.talanta.2010.11.032.
References
[1] K. Lehmann, S. Hoffmann, P. Neudecker, M. Suhr, W.M. Becker, P. Rosch, ProteinExpres. Purif. 31 (2003) 250–259.
[2] A.W. Burks, G. Cockrell, C. Connaughton, A. Karpas, R.M. Helm, J. Allergy Clin.Immunol. 95 (1995) 607–611.
[3] K.B. Beyer, E. Morrow, X.M. Li, L. Bardina, G.A. Bannon, A.W. Burks, H.A. Samp-son, J. Allergy Clin. Immunol. 107 (2001) 1077–1081.
[4] M. Pele, M. Brohee, E. Anklam, A.J. van Hengel, J. Food Addit. Contam. 24 (2007)1334–1344.
[5] M. Besler, TrAC: Trends Anal. Chem. 20 (2001) 662–672.[6] A.J. van Hengel, Anal. Bioanal. Chem. 389 (2007) 111–118.[7] A. Gaw, C.W.D. Gourlay, E.A. Brown, M.A. Bell, Clin. Chim. Acta 261 (1997)
175–183.[8] T. Hirao, S. Watanabe, Y. Temmei, M. Hiramoto, H. Kato, J. AOAC Int. 92 (2009)
1464–1471.[9] I. Mohammed, W.M. Mullett, E.P.C. Lai, J.M. Yeung, Anal. Chim. Acta 444 (2001)
97–102.10] I.M. Yman, A. Eriksson, M.A. Johansson, K.E. Hellenas, J. AOAC Int. 89 (2006)
856–861.11] J. Pollet, F. Delport, K.P.F. Janssen, K. Jans, G. Maes, H. Pfeiffer, M. Wevers, J.
Lammertyn. Biosens. Bioelectron. 25 (2009) 864–869.12] R.C. Jorgenson, S.S. Yee, Sens. Actuators B 12 (1993) 213–220.13] L.L. Obando, K.S. Booksh, Anal. Chem. 71 (1999) 5116–5122.14] J. Homola, M. Piliarik, Surface Plasmon Resonance Based Sensors, Springer, New
York, 2006, pp. 45–67.15] B. Grunwald, G. Holst, Sens. Actuators A 113 (2004) 174–180.16] L.A. Lyon, M.D. Musick, M.J. Natan, Anal. Chem. 70 (1998) 5177–
5183.17] L.A. Lyon, M.D. Musick, P.C. Smith, B.D. Reiss, D.J. Pena, M.J. Natan, Sens. Actu-
ators B 54 (1999) 118–124.18] Y. Teramura, Y. Arima, H. Iwata, Anal. Biochem. 357 (2006) 208–
215.19] J.L. Wang, A. Munir, Z.H. Li, Zhou H.S., Biosens. Bioelectron. 25 (2009) 124–129.20] C. Cao, Sim S.J., Biosens. Bioelectron. 22 (2007) 1874–1880.21] S. Kim, J. Lee, S.J. Lee, Lee H.J., Talanta 81 (2010) 1755–1759.22] S.D. Soelberg, R.C. Stevens, A.P. Limaye, C.E. Furlong, Anal. Chem. 81 (2009)
2357–2363.23] A. Pomes, R. Vinton, M.D. Chapman, J. Food Prot. 67 (2004) 793–798.24] K.W.C. Sze-Tao, J.E. Schrimpf, S.S. Teuber, K.H. Roux, S.K. Sathe, J. Sci. Food Agric.
81 (2001) 1215–1222.
25] A. Pomes, R.M. Helm, G.A. Bannon, A.W. Burks, A. Tsay, M.D. Chapman, J. AllergyClin. Immunol. 111 (2003) 640–645.26] R.E. Poms, C. Capelletti, E. Anklam, Mol. Nutr. Food Res. 48 (2004) 459–
464.27] R. Zeleny, H. Schimmel, Food Chem. 123 (2010) 1343–1351.28] E.V. Piletska, S.A. Piletsky, Langmuir 26 (2010) 3783–3785.