ORNL/SPR-2020/1500 2
50
ORNL/SPR-2020/1500 2 FINAL REPORT Project Title: Development of Ionic Liquid-Additized, GF-5/6 Compatible Low-Viscosity Oils for Automotive Engine and Rear Axle Lubrication for 4% Improved Fuel Economy Project Start Date: August 4, 2015 Project End Date: December 31, 2019 Oak Ridge National Laboratory (ORNL) General Motors Company (GM) Driven Racing Oil (DRO) PI: Jun Qu, Materials Science and Technology Division, ORNL Technical Team: ORNL: Yan Zhou, Benjamin C. Stump, Sougata Roy, and Chanaka Kumara, Huimin Luo, Harry M. Meyer III, Donovan N. Leonard, Todd Toops, Daniel W. Brookshear, Wei Guo, and Randy J. Parten GM: Michael B. Viola, Khaled Zreik, Hai Xu, Tasfia Ahmed, William Barnhill, Qinghua Wang, Edward Masters, Ron Otto, and Jerry Kowalski DRO: Lake Speed, James P. Coleman, John Martin, and David Chamberlain ACKNOWLEDGEMENTS Research was jointly sponsored by the Vehicle Technologies Office, Office of Energy Efficiency and Renewable Energy, U.S. Department of Energy (DOE) and Tank Automotive Research, Development and Engineering Center (TARDEC), U.S. Army, U.S. Department of Defense (DoD). Electron microscopy characterization was in part performed at ORNL’s Center for Nanophase Materials Sciences, sponsored by the Scientific User Facilities Division, Office of DOE-BES. The authors thank J. Dyck and E. Conrad from Cytec Industries for providing phosphonium cation feedstocks, Dr. A.G. Bro and C. Dubin from ExxonMobil for providing the PAO base oil, D. Coffey from ORNL for preparing STEM samples, and R. Wang from ORNL for report compiling. Notice: This manuscript has been authored by UT-Battelle, LLC under Contract No. DEAC05-00OR22725 with the U.S. Department of Energy. The United States Government retains and the publisher, by accepting the article for publication, acknowledges that the United States Government retains a nonexclusive, paid- up, irrevocable, worldwide license to publish or reproduce the published form of this manuscript, or allow others to do so, for United States Government purposes. The Department of Energy will provide public access to these results of federally sponsored research by the DOE Public Access Plan (http://energy.gov/downloads/doe-public- access-plan)
-
Upload
khangminh22 -
Category
Documents
-
view
1 -
download
0
Transcript of ORNL/SPR-2020/1500 2

ORNL/SPR-2020/1500
2
FINAL REPORT
Project Title: Development of Ionic Liquid-Additized, GF-5/6 Compatible Low-Viscosity Oils for Automotive Engine and Rear Axle Lubrication for 4% Improved Fuel Economy
Project Start Date: August 4, 2015
Project End Date: December 31, 2019
Oak Ridge National Laboratory (ORNL)
General Motors Company (GM)
Driven Racing Oil (DRO)
PI: Jun Qu, Materials Science and Technology Division, ORNL
Technical Team:
ORNL: Yan Zhou, Benjamin C. Stump, Sougata Roy, and Chanaka Kumara, Huimin Luo, Harry M. Meyer III, Donovan N. Leonard, Todd Toops, Daniel W. Brookshear, Wei Guo, and Randy J. Parten
GM: Michael B. Viola, Khaled Zreik, Hai Xu, Tasfia Ahmed, William Barnhill, Qinghua Wang, Edward Masters, Ron Otto, and Jerry Kowalski
DRO: Lake Speed, James P. Coleman, John Martin, and David Chamberlain
ACKNOWLEDGEMENTS
Research was jointly sponsored by the Vehicle Technologies Office, Office of Energy Efficiency and Renewable Energy, U.S. Department of Energy (DOE) and Tank Automotive Research, Development and Engineering Center (TARDEC), U.S. Army, U.S. Department of Defense (DoD). Electron microscopy characterization was in part performed at ORNL’s Center for Nanophase Materials Sciences, sponsored by the Scientific User Facilities Division, Office of DOE-BES. The authors thank J. Dyck and E. Conrad from Cytec Industries for providing phosphonium cation feedstocks, Dr. A.G. Bro and C. Dubin from ExxonMobil for providing the PAO base oil, D. Coffey from ORNL for preparing STEM samples, and R. Wang from ORNL for report compiling.
Notice: This manuscript has been authored by UT-Battelle, LLC under Contract No. DEAC05-00OR22725 with the U.S. Department of Energy. The United States Government retains and the publisher, by accepting the article for publication, acknowledges that the United States Government retains a nonexclusive, paid-up, irrevocable, worldwide license to publish or reproduce the published form of this manuscript, or allow others to do so, for United States Government purposes. The Department of Energy will provide public access to these results of federally sponsored research by the DOE Public Access Plan (http://energy.gov/downloads/doe-public- access-plan)

ORNL/SPR-2020/1500
3
TABLE OF CONTENTS
Abstract ..........................................................................................................................................................4
Objectives.......................................................................................................................................................5
Benefits to the DOE and DoD Funding Offices’ Missions............................................................................5
List of Invention Disclosures, Publications, and Presentations .....................................................................6
Technical Discussion of Work Performed by All Parties ..............................................................................7
Chapter 1. Introduction............................................................................................................................7
Chapter 2. Optimal Concentrations of Ionic Liquid and ZDDP-Ionic Liquid Combination...................9
Chapter 3. Ionic Liquid-Enhanced Low-Viscosity Fully Formulated Engine Oil ................................10
Chapter 4. Impact of Ionic Liquids on the Performance of Pd-Based Three-Way Catalysts................15
Chapter 5. Using Ionic Liquids as Lubricant Additives for Mitigating Rolling Contact Fatigue .........16
Chapter 6. Ionic Liquid-Additized Low-Viscosity Fully Formulated Rear Axle Fluids ......................17
Chapter 7. Additional Tribological Bench Testing at GM ...................................................................25
Chapter 8. Dyno and Vehicle Testing Demonstrating Improved Fuel Economy..................................33
Conclusions..................................................................................................................................................51

ORNL/SPR-2020/1500
4
ABSTRACT
This joint project among ORNL, GM, and DRO successfully developed ionic liquid-additized low viscosity lubricants, SAE 0W-12 and 70W-80, for both IC engine and rear axle lubrication, respectively, and demonstrated combined vehicle fuel economy improvement (FEI). Phosphonium-alkylphosphate ILs have been found to be the most effective among the candidates in protecting surface damage from both sliding wear and rolling contact fatigue, and optimal IL concentrations have been determined. The IL’s impact on three-way catalyst seems to be significantly less adverse than the conventional ZDDP. Oil formulations were optimized for both energy efficiency and wear protection. Tribological bench testing of the IL-additized low-viscosity oils showed at least 40% lower boundary friction, more than 60% lower elastohydrodynamic friction, and greater than 50% less wear compared with commercial baselines. IL-additized lubricants have demonstrated FEI by 9.9% in engine dynamometer tests under extreme conditions and 6.9% increased power output in gear rig tests. Prototype IL-additized engine oil and rear axle fluid exhibited combined FEI of 1.39% and 3.24% benchmarked against the state-of-the-art baselines in vehicle testing of fresh oils under the Federal Test Procedure (FTP) city cycle and Highway Fuel Economy Driving Schedule (HWFET), respectively. Used oil analysis suggested that the IL-additized low-viscosity oils produced less wear than the commercial baselines. The gained fundamental understanding and demonstrated FEI in this work pave the way for future development and implementation of the ionic liquid technology.

ORNL/SPR-2020/1500
5
OBJECTIVES
The objectives of this project are to further develop the ionic liquid-additized low viscosity engine oil meeting the GF-5/6 specifications and possessing superior lubricating characteristics and expand the ionic liquid (ILs) additive technology to rear axle lubricant to gain a combined 4% improvement in vehicle fuel economy.
BENEFITS TO THE DOE and DoD FUNDING OFFICES’ MISSIONS
This project was jointly sponsored by the Vehicle Technologies Office, Office of Energy Efficiency and Renewable Energy, U.S. Department of Energy (DOE) and Tank Automotive Research, Development and Engineering Center (TARDEC), U.S. Army, U.S. Department of Defense (DoD). The mission of VTO is to develop more energy efficient and environmentally friendly highway transportation technologies that enable America to use less petroleum. TARDEC’s mission is to provide warfighters with advanced technological solutions to ground vehicle systems challenges. This project successfully developed a new series of ionic liquids (ILs)-based ashless anti-wear additives for ground vehicle lubrication. Prototype IL-additized engine oil and rear axle fluid with ultra-low viscosities have been developed and demonstrated a combined >4% higher fuel economy in industrial standard full-size engine and gear dynamometer tests and vehicle tests. In addition, the ashless ILs have shown less adverse impact effects on the emission catalysts compared to the conventional ZDDP and therefore may potentially reduce the exhaust emissions. This ionic liquid technology has recently been licensed to DRO and increasing energy savings are expected as the commercial products are being developed and implemented.

ORNL/SPR-2020/1500
6
List of Publications and Presentations
Journal Papers
1. W. Li, C. Kumara, H. Luo, H.M. Meyer, X. He, D. Ngo, S. Kim, J. Qu, “Ultra-low boundary lubrication friction by three-way synergistic interactions among ionic liquid, friction modifier, and dispersant,” ACS Applied Materials & Interfaces (2020) https://doi.org/10.1021/acsami.0c00980.
2. B.C. Stump, Y. Zhou, H. Luo, D.N. Leonard, M.B. Viola, J. Qu, “A new functionality of ionic liquids as lubricant additives: mitigating rolling contact fatigue,” ACS Applied Materials & Interfaces 11 (2019) 30484−30492.
3. Y. Zhou, J. Weber, M.B. Viola, J. Qu, “Is more always better? Tribofilm evolution and tribological behavior impacted by the concentration of ZDDP, ionic liquid, and ZDDP-ionic liquid combination,” Wear 432-433 (2019) 202951.
4. D. Kim, T.J. Toops, K. Nguyen, D.W. Brookshear, M.J. Lance, J. Qu, “Impact of lubricant oil additives on the performance of Pd-based three-way catalysts,” Emissions Control Science and Technology (2019) doi: 10.1007/s40825-019-00138-x.
5. B.C. Stump, Y. Zhou, M.B. Viola, H. Xu, R.J. Parten, J. Qu, “A rolling-sliding bench test for investigating rear axle lubrication,” Tribology International 121 (2018) 450-459.
6. Y. Zhou, D.N. Leonard, W. Guo, J. Qu, “Understanding tribofilm formation mechanisms in ionic liquid lubrication,” Scientific Reports 7 (2017) 8426.
7. Y. Zhou, J. Qu, “Ionic liquids as lubricant additives – a review,” ACS Applied Materials & Interfaces 9 (2017) 3209-3222.
8. C. Xie, T. Toops, M. Lance, J. Qu, M. Viola, S. Lewis, D. Leonard, E. Hagaman, “Impact of lubricant additives on the physicochemical properties and activity of three way catalysts,” Catalysts 6 (2016) 54.
Conference Presentations
1. S. Roy, L. Speed, M.B. Viola, H. Luo, J. Qu, “Effects of ionic liquids on micropitting behavior for rear axle lubrication,” 74th STLE Annual Meeting, Nashville, May 19-23, 2019.
2. J. Qu, L. Speed, M Viola, C. Kumara, W. Barnhill, H. Luo, “Ionic Liquid Enhanced Low-Viscosity (SAE 0W-12) Engine Oils,” SAE World Congress, Detroit, April 9-11, 2019.
3. J. Qu, B.C. Stump, Y. Zhou, H. Luo, D.N. Leonard, M.B. Viola, H. Xu, R.J. Parten, “Ionic Liquids as Novel Additives for Rear Axle Fluids,” STLE 73rd Annual Meeting, May 20-24, 2018, Minneapolis.
4. J. Qu, L. Speed, M.B. Viola, B.C. Stump, W.C. Barnhill, H. Luo, “Using Ionic Liquid to Replace Half the Amount of ZDDP in Automotive Engine Oils,” STLE 73rd Annual Meeting, May 20-24, 2018, Minneapolis.
5. Y. Zhou, D.N. Leonard, W. Guo, J. Qu, “Tribofilm Formation Mechanisms in an Ionic Liquid-Additized Lubricant,” STLE 73rd Annual Meeting, May 20-24, 2018, Minneapolis.
6. J. Qu, B.C. Stump, Y. Zhou, H. Luo, D.N. Leonard, M.B. Viola, H. Xu, R.J. Parten, “Ionic Liquids as Novel Anti-Wear and Anti-Pitting Additives for Rear Axle Lubrication,” SAE World Congress, April 10-12, 2018, Detroit.
7. Y. Zhou, H. Luo, J. Qu, "The effects of ZDDP and ionic liquid concentrations on friction and wear behavior,” STLE 72th Annual Meeting, May 21-25, 2017, Atlanta.
8. “Ionic liquids as novel lubricant additives and their compatibility with other lubricant additives and non-ferrous materials,” 2016 Tribology Gordon Research Conference, Lewiston, ME, Jun. 26 – Jul. 1, 2016 (Invited)
9. J. Qu, “Ionic liquids as engine lubricant additives, impact on emission control catalysts, and compatibility with coatings,” 2016 DOE Vehicle Technologies Program Annual Merit Review, June 8, 2016.
10. “Oil-miscible ionic liquids as multi-functional additives for low-viscosity engine lubricants,” 20th International Colloquium Tribology, Stuttgart, Germany, Jan. 12-14, 2016. (Invited)
ORNL/SPR-2020/1500
7
TECHNICAL DISCUSSION OF WORK PERFORMED BY ALL PARTIES
CHAPTER 1. Introduction
In the U.S. today, there are more than 250 million cars and trucks on the road, traveling three trillion miles per year, which accounts for 70% of the U.S.’s annual oil consumption of ~7 billion barrels. For an automotive vehicle, 10-12% fuel energy is lost to the parasitic friction in the engine and another 3-5% overcomes the friction in the rear axle1,2.
Engine and powertrain parts like piston rings and cylinder bores, valve guides, cams and tappets, fuel injector pumps and plungers, transmission gearing, and face seals are all affected to some degree by friction1. The magnitude of such friction-induced losses depends on engine design, materials of construction, operating conditions, and most importantly lubrication. Automotive companies and lubricant original equipment manufacturers (OEMs) are developing and implementing advanced lubricants to enhance fuel efficiency and engine durability and at the same time, maintain or extend lubricant drain intervals. Lubrication regimes in engines can be divided into three general categories: boundary, mixed, and elastohydrodynamic/hydrodynamic lubrication, among which hydrodynamic lubrication has the lowest friction and wear. Modern engines are designed to minimize the contribution of boundary and mixed friction (although these losses cannot be totally eliminated) and their parasitic friction loss is primarily induced by elastohydrodynamic drag between the piston rings and cylinder liners, which is proportional to the lubricant viscosity.
Since elastohydrodynamic/hydrodynamic drag accounts ~80% parasitic frictional energy loss in the engine2, the viscosity grade of standard internal combustion engine oils has been continuously reduced in the last decade in an attempt to improve fuel economy. Previously SAE 10W-30 was dominant, but now 5W-30 and 5W-20 occupy the largest two market shares. For the rear axle, it was common to use SAE 85W-140 oils and the current oil formulations are 75W-140/75W-90. According to GM’s modeling, further viscosity reduction has the potential to gain 2-3% from the engine and another 0.75-1.5% from the rear axle.
On the other hand, further viscosity reduction posts a challenge for wear protection due to a thinner lubricant film. Commercial lubricants are composed of base stock and several categories of additives including anti-wear, friction modifier, viscosity index improver, antioxidant, detergent, dispersant, etc10. Specifically, anti-wear agents play key roles in reducing wear in boundary and mixed lubrication in engine locations such as the top-ring-reversal region of the piston ring-cylinder liner interface and sliding surfaces in the valve train. Currently, the most common anti-wear additive is zinc dialkyl-dithiophosphate (ZDDP). ZDDP is effective at wear protection; however, it is known to cause deposits upon thermal decomposition (‘ash’) and to poison emission catalysts10. Therefore, there is a need to develop alternative, ashless, and more effective anti-wear additives with potentially less impact on catalyst systems. Improved wear protection would allow the use of lower-viscosity engine oils, providing a further improvement in engine mechanical efficiency.
The ORNL-GM team successfully concluded a 4-year joint project sponsored by DOE Vehicle Technologies Office (VTO) in 2013 under a Cooperative Research and Development Agreement (CRADA) for developing ionic liquids as next-generation anti-wear (AW) additives for engine lubrication. This team made a major breakthrough in developing new groups of oil-miscible ionic liquids (ILs)3-7, with high thermal stability, ashless, non-corrosiveness, and most importantly effective AW characteristics. Fundamental investigation has correlated the anti-wear and friction reduction mechanisms of IL additives to their physical (absorption) and chemical (tribofilm formation) interactions with the metallic bearing surfaces3-5. In addition, accelerated catalyst aging tests of the IL suggested potentially less adverse effects on three-way catalysts compared to ZDDP6. Working with Lubrizol, the team had developed a prototype IL-additized fully-formulated automotive engine oil (first time reported in the literature). The IL-additized engine oil has low-viscosity (comparable to the pending SAE grade 8) and has demonstrated promising lubricating performance6. High-temperature, high-load (HTHL) engine tests showed similar engine wear

ORNL/SPR-2020/1500
8
and oil aging behavior between the IL-additized low-viscosity engine oil and the Mobil 1 5W-30 engine oil6. Further, Sequence VID engine efficiency dynamometer tests of this prototype IL-additized engine oil demonstrated an improved fuel economy benchmarked against the Mobil 1 5W-30 engine oil6. The initial success of our ionic liquid additive technology has been highlighted at Inside Science8 and Green Car Congress9; gaining interest from both academia and industry.
While our previous results of the novel ionic liquid additive technology were promising, technical barriers remain to be overcome. In this follow-on project, the ORNL-GM-DRO team was committed to address the technical challenges, optimize the ILs’ anti-wear functionality, and develop low-viscosity IL-additized lubricants for both the engine and rear axle to gain a combined 4% improvement in vehicle fuel economy.
Specifically, the first experimental IL-additized engine oil did not strictly meet the ILSAC GF-5/6 specifications with over-limit phosphorus content and has mono-grade viscosity without viscosity index improver (VII), which posts both challenges and opportunities in further development. It is necessary to confine the phosphorus content in the regulated range but still provide sufficient wear protection. Our latest discovery of a synergistic effect of combining an IL and a ZDDP on wear protection offers a potential solution. Introducing VII will allow tailoring and improving the rheological behavior. There are a number of bearing components in an automotive vehicle. The second largest parasitic friction induced energy loss is 3-5% at the rear axle (next to the 10-12% in the engine)1,2, and therefore is identified as the next application for the IL additive technology. GM’s modeling predicts a potential recovery of 0.75-1.5% vehicle fuel economy by using a lower viscosity oil. This study proposed to apply ionic liquids to mitigate the challenge of wear protection induced by the reduced oil viscosity. The rolling contact interface for the rear axle is very different from the sliding contact in the engine, therefore the IL chemistry will be tailored to better handle the much higher contact stress and longer oil service life required for the rear axle lubricant. This study aims to gain deeper fundamental understanding of ILs’ anti-wear mechanism such as the roles of the cations and anions, and their advantages in surface absorption and tribofilm formation compared to conventional neutral AW additives. Such understanding will strengthen the scientific basis that we have been building for further material optimization and product development.
References
[1]. S.C. Tung, M.L. McMillan, “Automotive tribology overview of current advances and challenges for the future,” Tribology International 37 (2004) 517–536.
[2]. K. Holmberg, P. Andersson, A. Erdemir, “Global energy consumption due to friction in passenger cars,” Tribology International 47 (2012) 221–234.
[3]. J. Qu, D.G. Bansal, B. Yu, J. Howe, H. Luo, S. Dai, H. Li, P.J. Blau, B.G. Bunting, G. Mordukhovich, D.J. Smolenski, “Anti-Wear Performance and Mechanism of an Oil-Miscible Ionic Liquid As a Lubricant Additive,” ACS Applied Materials & Interfaces 4 (2) (2012) 997–1002.
[4]. J. Qu, H. Luo, M. Chi, C. Ma, P.J. Blau, S. Dai, M.B. Viola, “Comparison of an oil-miscible ionic liquid and ZDDP as a lubricant anti-wear additive,” Tribology International 71 (2014) 88–97.
[5]. J. Qu and M.B. Viola, “Ionic Liquids as Novel Lubricants and/or Lubricant Additives,” CRADA Final Report, NFE-08-01715, DOE Vehicle Technologies Program, Oct. 2013.
[6]. Y. Zhou, J. Qu, “Ionic liquids as lubricant additives – a review,” ACS Applied Materials & Interfaces 9 (2017) 3209-3222.
[7]. J. Qu and H. Luo, “Ionic Liquids Containing Symmetric Quaternary Phosphonium Cations and Phosphorus-Containing Anions, and Their Use as Lubricant Additives,” U.S. Patent #10435642, Oct. 8, 2019.
[8]. “Molten Salts Could Improve Fuel Economy,” Inside Science, Nov. 15, 2013.[9]. “Oak Ridge-GM prototype low-viscosity ionic liquid-additized engine oil delivers 2% fuel economy
improvement over 5W-30,” Green Car Congress, Dec. 30, 2013.

ORNL/SPR-2020/1500
9
CHAPTER 2. Optimal Concentrations of Ionic Liquid and ZDDP-Ionic Liquid Combination
Please see details of this chapter in the following paper. [To avoid any copyright issue, we are not repeating the published contents.]
Y. Zhou, J. Weber, M.B. Viola, J. Qu, “Is more always better? Tribofilm evolution and tribological behavior impacted by the concentration of ZDDP, ionic liquid, and ZDDP-ionic liquid combination,” Wear 432-433 (2019) 202951.

ORNL/SPR-2020/1500
10
Chapter 3. Ionic Liquid-Enhanced Low-Viscosity Fully Formulated Engine Oil
Most recently, ORNL discovered the synergistic effect between ZDDP and phosphonium-organophosphate when used together as hybrid antiwear additives. In addition to the oil solubility and antiwear properties, this IL exhibits high thermal stability, non-corrosive, and ashless properties. The objective of this work was to investigate the tribological properties of ZDDP and IL added fully formulated oils. Several dozens of formulations of ZDDP and IL-additized low-viscosity experimental oils were tested and ranked according to their performance. Scheme 3.1 illustrates the tailoring of experimental CPO oil formulation and their wear performance at RT,100 and 150 oC. After analyzing the friction and wear performance, we have narrow down the list to top four candidates based on the performance at 100 oC. The top four candidates are CPO 316, CPO 334, CPO 355 and CPO 356. Then, considering friction and wear performance at 100 oC, and flat and ball wear volumes at RT tests, CPO 356+IL was selected as the top candidate for further engine tests. However, most fundamental studies carried out using CPO 334 version of oils at 100 and 150 oC.
Scheme 3.1. Flow chart showing the process of tailoring the base oil and additive package for low boundary friction, strong wear protection, and minimal micropitting.
Experimental
Materials
Fully formulated engine oil additives were prepared by DRO. Secondary ZDDP used as an antiwear additive and [P8888][DEHP] used as an ionic liquid (IL) antiwear additive to replace half of the ZDDP. To keep the total phosphate content below the recommended level of 0.4 wt% ZDDP and 0.52 wt% IL added to the experimental CPO formulas. For fair comparison two additional FFO prepared including the 0.8 wt% ZDDP [ CPO 334(ZDDP)] and 1 wt% IL [CPO 334(IL)] in addition to the combination of 0.4 wt%

ORNL/SPR-2020/1500
11
ZDDP and 0.52 wt% IL [CPO 334(ZDDP & IL)] . Commercially available Mobil 1 SAE 0W-20 fully formulated oil was used as a baseline to compare the friction and wear performance of experimental oil.
Tribological tests
Boundary lubrication tests were conducted to examine the tribological behavior of the FFO oil containing ZDDP, IL and combination of ZDDP+IL. The tribological tests were conducted on a Plint TE-77 tribotester using ball-on-flat reciprocating sliding configuration. The AISI 52100 steel balls used to slide against the 35L gray cast iron or AISI 52100 steel flat. All flat surfaces were polished to a roughness (Ra) of 60-80 nm. Tests were carried out at 100 and 150 oC under 100 N at 10 Hz for 20 km of sliding (or ~27 hours of sliding time). Friction force was captured in situ by measuring the tangential force using a piezoelectric load cell. Wear volumes of both ball and flat specimens were quantified using a 3D optical profiler (Wyko NT9100 white light interferometer) aided by a Vision (version 4.10) software. Cylindrical and spherical curvature fittings were applied to flat and ball surfaces in the wear volume calculations, respectively.
Results and Discussion
Mobil 1 SAE 0W-20 was used as a baseline to compare the performance of the ZDDP, and IL added fully formulated oil (FFO). The friction behavior of Mobil 1 0W20 seemed unstable and insensitive to the oil temperature as shown in Figure 3.1a (in a narrow range of 0.06-0.08). The coefficient of friction (COF) of Mobil 1 initially spiked, then decreased during the first 5km and again increased as running-in over the 20 km sliding. Further, the wear volume was increased along with the temperature, presumably due to the reduced oil viscosity. The CPO 334(ZDDP+IL) had an excellent performance at 100oC with low COF (0.048) and low wear (4.3 X 107 µm3). The CPO 334(ZDDP+IL) performed well in friction by reducing boundary COF by 30% at 100 and 150oC compared to the Mobil 1 performance. However, the test conducted at 150oC indicates the little improvement in wear reduction with reference to the Mobil 1 0W20 as shown in Figure 3.1b and Table 3.1.
It should be noted that Mobil 0W20 produced moderate micro-pitting at 100 and 150oC. (also at RT as shown in Scheme 3.1) The high friction of Mobil 1 may be in part of extensive asperity collisions between two contact surfaces as a result of micropitting. However, oil lubricated with CPO(ZDDP+IL) didn’t produce micropitting at 100oC or 150oC.
To understand the synergistic effect of ZDDP and IL([P8888][DEHP] in CPO 334 fully formulated oil, we compared the CPO 334 formula versions containing ZDDP along and IL along as antiwear additives with CPO 334(ZDDP+IL) as shown in Figure 3.2. The test conducted with CPO 334(ZDDP) shows unstable friction behavior (with random frictional spikes), although the average COF maintains at ~0.053. The oil with CPO 334(ZDDP+IL) test shows low and stable friction behavior throughout the test (20 km of sliding distances). In contrast, CPO 334(IL) showed significantly high COF (avg. COF 0.082) with initial friction spike to COF of 11 and then gradually reduce to 0.075 within the first 10 km sliding before increased to final COF of 10. Wear volume increased nearly by two-fold if IL or ZDDP was used as anti-wear additives. This observation reconfirmed the synergetic effect between ZDDP and IL in CPO 334 oil. Unlike the worn surface lubricated with CPO 334(ZDDP+IL) or CPO 334(IL), cast-iron flat lubricated with CPO 334(ZDDP) shows little micropitting on worn surface. Thus, we can assume that ZDDP plays a significant role in micropitting under these long sliding conditions. (Typically to 2 million contacts for each location under contact stress of 100-1000 MPa over 27 h). We later determined that the occurrence of micro-pitting as a combined effect of contact fatigue and tribiochmemical reactions and ZDDP as a major contributor.

ORNL/SPR-2020/1500
12
Figure 3.1: Friction trace (a) and wear volumes (b) of the Mobil 1 0W20, and CPO 334 (ZDDP+IL)
lubricated oil at 100 and 150oC.
Figure 3.2. Friction behavior (left) and wear volume (right) of the 20 km sliding tests conducted on CPO
334(ZDDP), CPO 334(IL), and CPO 334(ZDDP+IL) at 100oC.
Table 3.1. Friction and wear volumes comparison of Mobil 1 0W20 and CPO 334 FFO versions.
LubricantWear volume (x106 µm3) Average COF*
Flat Ball TotalMobil 1 0W20 @100 oC 9.86 0.17 10.03 0.073Mobil 1 0W20 @150 oC 11.5 0.16 11.66 0.063CPO 334(ZDDP+IL) @100 oC 4.12±0.12 0.15±0.05 4.27±0.13 0.048CPO 334(ZDDP+IL) @150 oC 10.40 0.80 11.20 0.050CPO 334(ZDDP) @100 oC 8.16 0.18 8.34 0.053±0.007CPO 334(IL) @100 oC 7.44 0.36 7.80 0.082
* Average COF determined by averaging the COF data from 5-20 km.
a b
ORNL/SPR-2020/1500
13
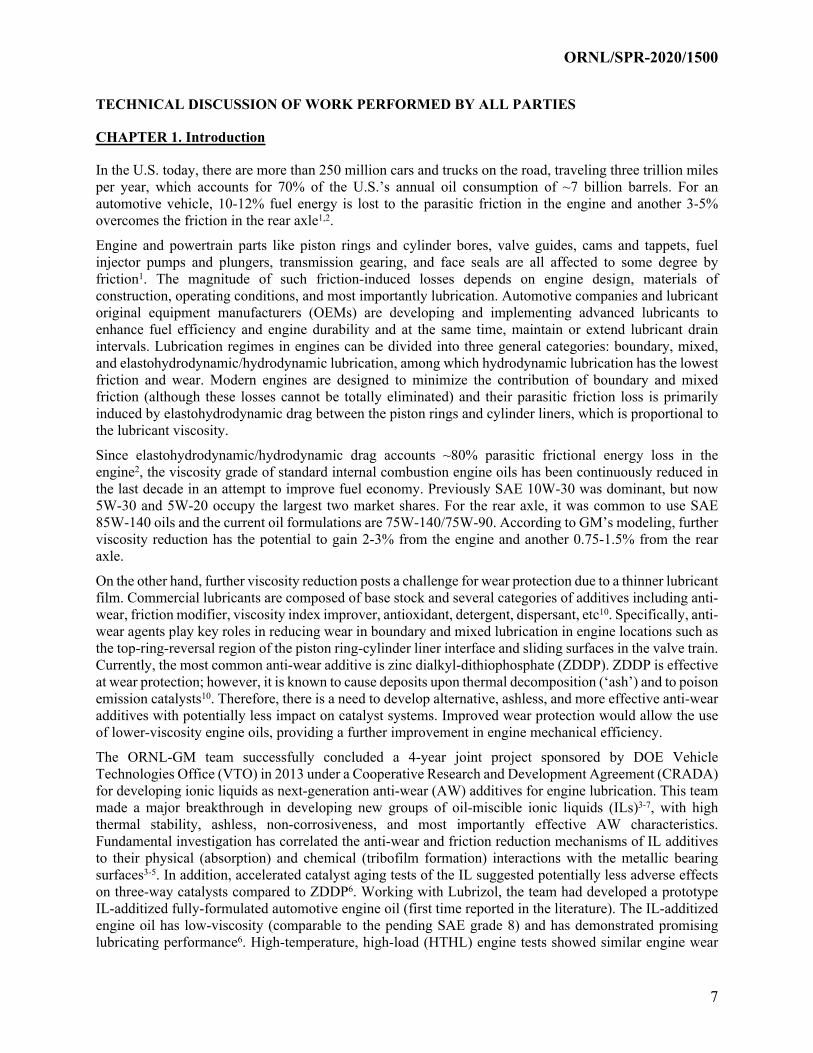
In addition to the AISI 52100 ball rubbing against cast-iron flat, self-mate AISI 52100 ball and flat tests conducted at 100oC to examine the effect of ZDDP+IL synergistic combination on steel-on-steel contacts. Figure 3.3 shows the friction and wear results in comparison with Mobil 1 0W20 at 100oC. Self-mate AISI 52100 ball and flat lubricated by Mobil 1 shows initial high friction stage but drop down over the 5 km sliding and maintained at COF of 0.069 through 20 km sliding. In contrast, CPO 334(ZDDP+IL) maintained stable friction throughout the 20 km sliding at average COF of 0.069.
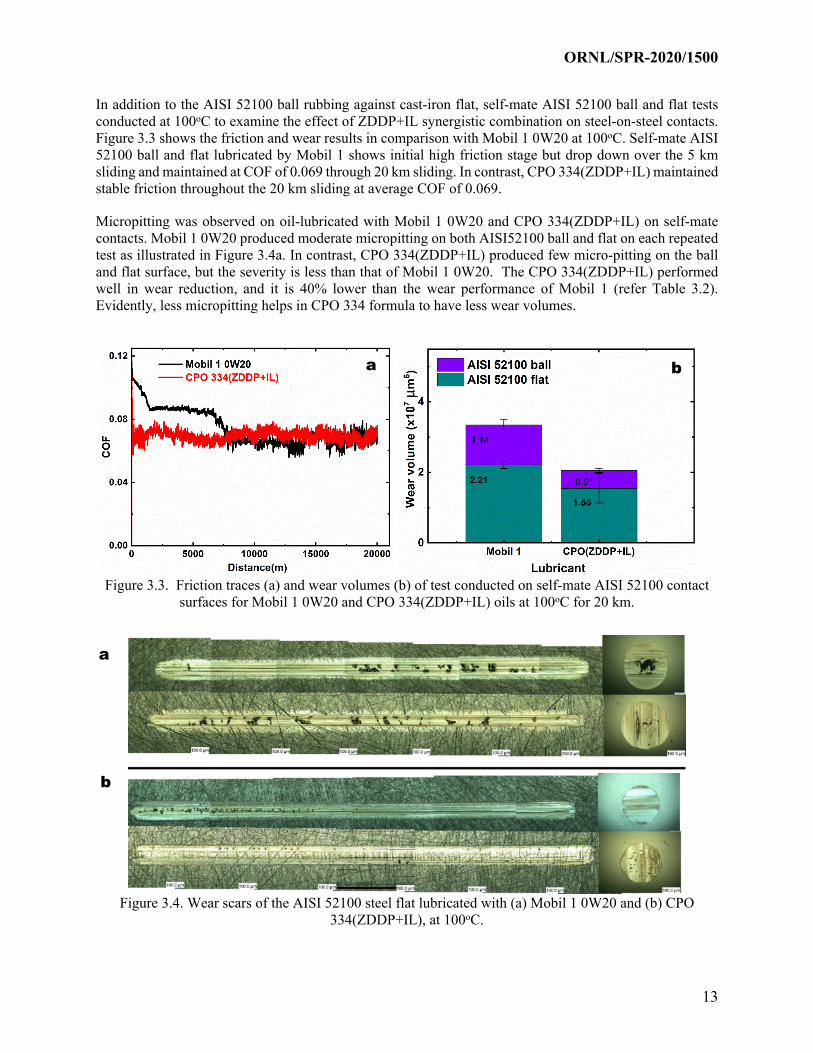
Micropitting was observed on oil-lubricated with Mobil 1 0W20 and CPO 334(ZDDP+IL) on self-mate contacts. Mobil 1 0W20 produced moderate micropitting on both AISI52100 ball and flat on each repeated test as illustrated in Figure 3.4a. In contrast, CPO 334(ZDDP+IL) produced few micro-pitting on the ball and flat surface, but the severity is less than that of Mobil 1 0W20. The CPO 334(ZDDP+IL) performed well in wear reduction, and it is 40% lower than the wear performance of Mobil 1 (refer Table 3.2). Evidently, less micropitting helps in CPO 334 formula to have less wear volumes.
Figure 3.3. Friction traces (a) and wear volumes (b) of test conducted on self-mate AISI 52100 contact
surfaces for Mobil 1 0W20 and CPO 334(ZDDP+IL) oils at 100oC for 20 km.
Figure 3.4. Wear scars of the AISI 52100 steel flat lubricated with (a) Mobil 1 0W20 and (b) CPO 334(ZDDP+IL), at 100oC.
a
b
a b

ORNL/SPR-2020/1500
14
Table 3.2. Friction and wear performance of the Mobil 1 0W20 and CPO 334(ZDDP+IL) at 100oC.
Lubricant Wear volume (x106 µm) Average COF*Flat Ball Total Initial* Final #
Mobil 1 0W20 2.21±0.10 1.14±0.14 3.35±0.17 0.090 0.069CPO 334(ZDDP+IL) 1.55±0.42 0.51±0.06 2.02±0.43 0.070 0.069
*Initial average COF determined by averaging the COF data up to 5 km. #Final average COF determined by averaging the COF data from 5-20 km.
Fully formulated oil containing ZDDP and phosphonium phosphate IL was found to be more effective in friction and wear reduction than formulating oil using two antiwear additives. The CPO 334(ZDDP+IL) formula performed better than the commercially available Mobil 1 0W20 fully formulated oil. The low boundary friction and excellent wear protection on cast-iron and steel are due to the synergistic interaction between ZDDP and [P8888] [DEHP]. The micropitting could be a combined effect of the contact fatigue and tribochemical interaction and could be mitigated using IL added CPO 334 formulation or control by replacing the half of the ZDDP by IL.
ORNL/SPR-2020/1500
15
Chapter 4. Impact of Ionic Liquids on the Performance of Pd-Based Three-Way Catalysts
Please see details of this chapter in the following paper. [To avoid any copyright issue, we are not repeating the published contents.]
D. Kim, T.J. Toops, K. Nguyen, D.W. Brookshear, M.J. Lance, J. Qu, “Impact of lubricant oil additives on the performance of Pd-based three-way catalysts,” Emissions Control Science and Technology (2019) doi: 10.1007/s40825-019-00138-x.

ORNL/SPR-2020/1500
16
Chapter 5. Using Ionic Liquids as Lubricant Additives for Mitigating Rolling Contact Fatigue
Please see details of this chapter in the following papers. [To avoid any copyright issue, we are not repeating the published contents.]
B.C. Stump, Y. Zhou, M.B. Viola, H. Xu, R.J. Parten, J. Qu, “A rolling-sliding bench test for investigating rear axle lubrication,” Tribology International 121 (2018) 450-459.
B.C. Stump, Y. Zhou, H. Luo, D.N. Leonard, M.B. Viola, J. Qu, “A new functionality of ionic liquids as lubricant additives: mitigating rolling contact fatigue,” ACS Applied Materials & Interfaces 11 (2019) 30484−30492.

ORNL/SPR-2020/1500
17
Chapter 6. Ionic Liquid-Additized Low-Viscosity Fully Formulated Rear Axle Fluids
A group of IL-additized fully formulated oils were prepared by DRO and a couple of top performing candidate formulations were screened based on their reciprocating friction and wear test results. Finally, performance of these fully formulated versions was compared against commercial gear oil (SAE 75W-90).
Materials and methods
Benchtop tribological tests
A micropitting test rig (MPR, by PCS Instruments, London, UK) was used to conduct the rolling contact fatigue tests. Figure 6.1 shows the schematic of the test rig. Controlled load can be applied on the strain gauged loading arm using a ball screw arrangement. As shown in Figure 6.1(b), the MPR chamber consists of central roller and 3 counterface rings at 120° arrangement. The load is applied on the top rings and the force is translated equally to all rings based on its geometrical arrangement. The roller sample has 1 mm wide contact zone (refer Figure 6.1c) which is in contact with counterface rings. The bench test experimental protocol was designed to match the temperature, lambda ratio, slide-roll ratio (SRR), contact pressure, and number of cycles experienced during the most intense conditions the rear axle [2]. The vibration signal between the roller and rings were captured and the center line average (CLA) accelerometer signal were plotted during the tests. The friction coefficient, and roller surface topographies were studied at the end of test to evaluate the performance of lubricants. Slide to roll ratio was controlled by regulating roller and ring speeds separately. Slide to roll ratio (SRR) was based on the formula mentioned below:
SRR = [(roller speed-ring speed)/mean speed of roller and rings] ×100 %
This means, if roller velocity is lower than ring velocity, the SRR was regarded as negative SRR condition in present study.
Figure 6.1. (a)Schematic diagram of micropitting test rig (MPR); (b)Experimental setup of roller and rings inside MPR chamber; (c)Representative image of roller (test sample) [44]

ORNL/SPR-2020/1500
18
Table 6.1. Standard RCF test protocol used in current study
Test stage
Lubricant temperatu
re (oC) Load (N)
Hertzian contact pressure (GPa)
Rolling speed of the roller
(m/s)SRR of the
roller
Test duration
(min)
Contact cycles on the roller (million)
1 RT50 25165 0.51.1 13.478 0-1.5 or -30% 302 50 165 1.1 3.478 -1.5 or -30% 30 0.503 5085 25 1.0 0% 304 85 165 1.1 3.478 -1.5 or -30% 60 1.005 85 165 1.1 3.4781.5 -1.5 or -30% 60 0.726 85120 25 1.0 0% 607 120 165230 1.11.3 1.53.478 -1.5 or -30% 7 0.088 120 230 1.3 3.478 -1.5 or -30% 8 0.139 120 230 1.3 3.4781.5 -1.5 or -30% 15 0.1810 120 265350 1.31.6 1.5 -1.5 or -30% 2 0.01
total 302 2.63
Table 6.1 shows the steps involved in each test. It can be observed that the test steps can be broadly divided into three stages based on operating temperature. Stage 1: 25-50°C to simulate the cold start or non-towing conditions, stage 2: 85°C to simulate highway towing and finally stage 3: 120°C to simulate overload or hill climbing. Hertzian contact pressure was varied between 1.1-1.6 GPa during these different stages and the lambda ratios were maintained below 1 (i.e. boundary lubrication regime). Tests were conducted in -1.5% SRR (to simulate near pitch line zone) and -30% SRR (to simulate dedendum regions) conditions. Both rollers and rings were made of AISI 8620 steel. Based on manufacturer’s laboratory reports, rollers and rings microhardness levels were 680 HV and 780 HV. The average roughness (Ra value) of rollers and rings at baseline condition were 0.2 µm and 0.4 µm respectively. The wear volumes of rollers were calculated based on the formula mentioned in previous work [2].
Reciprocating friction and wear tests
Different fully formulated oils were first screened on Plint TE77 reciprocating sliding tribometer (make Phoenix Tribology, UK). The tests were carried out using AISI 52100 balls on grey cast iron flat for 1000m sliding distance using normal load 100N, an oscillating frequency 10Hz, a stroke length 10 mm and lubricating temperature 100°C. The average surface roughness (Ra) for the flats was 0.06 µm. Wear volume was measured using a 3D optical interferometer (Wyko NT9100). Wear volumes of flats only were analyzed to study the performance of lubricants because the wear volume of balls was significantly lower compared to the wear of flat.
Lubricants investigated during the study
The candidate IL used in this study as antiwear/antipitting additive was phosphonium phosphate [P8888] [DEHP]. It has been observed that this particular IL is thermally stable up to 350°C and has above 10% oil solubility [33]. For the first phase of study, the IL only was added to base stock to evaluate its performance devoid of other additive packages. VHVI 8 oil base oil (viscosity 11.78 cSt at 85°C) was treated with 2% of IL and the RCF performance was compared against commercial gear oil SAE 75W-90 (viscosity 21.3 cSt at 85°C). The treat rate was varied to 3% of IL also to study the effect of different concentration level on tribological behavior. In the next stage, 11 different fully formulated versions were tested on reciprocating sliding tribometer. Those results were compared against three commercial gear oils i.e. SAE 75W-90, SAE 75W-110 and GSR 440. Two fully formulated versions which showed great potential on reciprocating tribo tests were evaluated as candidate rear axle lubricants. Their lubrication behavior was

ORNL/SPR-2020/1500
19
compared against SAE 75W-90 oil’s performance. Not all fully formulated versions showed great improvement in the screening tests. For example, version 3 showed poor wear resistance and was not used for the rolling contact fatigue tests.
Worn Surface quantization and characterization
Face width increase of roller samples was measured using 3D optical interferometer (Wyko NT9100). Samples were imaged using Nikon optical microscope. The surface topography and chemical compositions were examined using Hitachi S-4800 Field Emission Scanning Electron Microscope (FESEM) which is also equipped with Energy Dispersive X-Ray Spectroscopy (EDS).
Results and discussion
Performance of VHVI8+2% IL against commercial gear oil (SAE 75W-90)
Figure 6.2a shows the accelerometer signal under SAE 75W-90 oil and IL lubricated conditions. At -1.5% SRR condition, vibration signal for IL lubricated case was higher but for -30% SRR case it was a bit lower than commercial SAE 75W-90. The friction signal for 75W-90 was slightly lower for both low and high SRR conditions (refer Figure 6.2b). At lower SRR, the friction increases more gradually compared to high SRR conditions. This can be attributed to slower running-in at low SRR. The wear volume decreased in IL lubricated case at low SRR but increased at high SRR case compared to 75W-90 (refer Figure 6.2c).
Figure 6.2. (a)Vibration, (b)traction and (c)wear volume of SAE 75W-90 and VHVI8+2% IL in low and high SRR conditions
Figure 6.3 shows the surface topography of roller samples at the end of the tests. Increasing SRR resulted more wide spaced cracks in both lubrication conditions. Also, IL could reduce the crack formation on the surface significantly in both low and high SRR conditions.

ORNL/SPR-2020/1500
20
Figure 6.3. Surface topography of sample surfaces experimented under different test conditions
Effect of different concentration IL on rolling contact fatigue (RCF)
IL concentrations were varied to understand whether increasing IL percentage will result in better RCF behavior or not. RCF tests were carried out using 2% and 3% IL added with VHVI8 base oil. Figure 6.4 shows the vibration, traction and wear data from the tests conducted in low and high SRR conditions. In both concentration of IL cases, the vibration signals (Figure 6.4a) were comparable and higher at lower SRR conditions. There was no significant improvement in traction (Figure 6.4b) and wear (Figure 6.4c) volume also due to increase of IL percentage.
Figure 6.4. (a)Vibration, (b)traction and (c)wear volume of VHVI8+2% and 3% IL in low and high SRR conditions
Figure 6.5 shows the surface topography of samples surfaces in both lubricated conditions for low and high SRR cases. It can be observed that at low SRR there was no significant benefit of using higher concentration of IL. But at high SRR, in case of 3% IL, some transverse directional surface cracks were observed unlike 2% IL case. This confirms that depending on test conditions, increasing IL concentration may show negative impact on surface protection as well.

ORNL/SPR-2020/1500
21
Figure 6.5. Surface topography of sample surfaces experimented under different test conditions
Screening of fully formulated versions as rear axle lubricants
During the next phase, different versions of fully formulated oils were prepared using the same IL but varying other constituting elements. A friction modifier, anti-foaming agent, dispersant, and IL were added with base oils to prepare the blends. It has been reported that although ILs may show improved tribological behavior, there might be compatibility issues when IL is added with friction modifiers and other additive packages [33]. Instead of spending significant time and energy in conducting full length RCF tests, different blends with varied additive packages were tested in reciprocating sliding tests. A total of 11 different blends were prepared, and their friction and wear behavior were compared against three commercial gear oils. In Figures 6.6a and 6.6b friction and wear data are plotted respectively. Friction and wear behavior of three (two of which were most promising and one which was a poor performer) out of 11 formulations are showed below.
It can be observed that, out of three commercial gear oils, SAE 75W-90 showed the best performance from both friction and wear perspectives. One of the formulations FFV3 (fully formulated version 3) showed very high increase of traction coefficient in the beginning and significant wear during the test. This can be attributed to scuffing phenomena in the initial period of test. FFV1 and V2 showed great potential based on their friction and wear behavior. Both these oils had viscosity (7.2 cSt at 100°C) less than half of SAE 75W-90 oil (13.82 cSt at 100°C), but they showed great protection to cast iron surfaces during the reciprocating tests. The friction coefficient of FFV1 was slightly lower and wear resistance was a little bit more consistent compared to FFV2. Based on such great potential these two oils were tested on full phase RCF tests and compared against that of SAE 75W-90.
Figure 6.7 shows the wear track morphology of 75W-90 and FF1V1 lubricated lubricated cases. Although the friction for 75W-90 was slightly lower and wear resistance was comparable, the wear track region for 75W-90 was more damaged compared to FF V1. In some regions delamination of material was also noted. EDS elemental mapping and area spectrum showed more prominent Si, P and S peaks for 75W-90 oil. This can be attributed to thicker tribofilm during the tests. This leads to another interesting observation which is although the tribofilm was thicker for 75W-90, it couldn’t protect the wear track region similar to FFV1.

ORNL/SPR-2020/1500
22
Figure 6.6. Friction and wear behavior of IL based fully formulated and commercial gear oils
Figure 6.7. SEM and EDS based observation of wear tracks tested under IL based fully formulated and commercial gear oils
Rolling contact fatigue performance of fully formulated oils
Figure 6.8 shows the comparative behavior of two fully formulated versions and commercial 75W-90 oil for low (-1.5%) SRR case. It can be observed that vibration was slightly higher at medium temperature region (85°C) for FFV1. The traction coefficients for all three oils were comparable to each other. Wear volume for FFV2 was lower compared to other two oils.

ORNL/SPR-2020/1500
23
Figure 6.8. (a)Vibration, (b) traction and (c)wear volume of commercial and IL based fully formulated oils in low SRR conditions
Figure 6.9 shows the vibration, traction and wear volumes at high SRR condition. It can be observed that all three oils behaved similarly at high SRR conditions. This confirms that although FFV1 and V2 had less than half of the viscosity of 75W-90, they performed similar or even better depending on the perspective being considered.
Figure 6.9. (a)Vibration, (b)traction and (c)wear volume of commercial and IL based fully formulated oils in high SRR conditions
Figure 6.10 shows the surface topography of wear track regions for both low and high SRR under three different lubricated conditions. As we observed before (see Figure 6.3), increasing SRR resulted more wide spaced cracks on the sample surface. For both IL versions, the surface cracks were significantly reduced in low and high SRR conditions. FFV1 showed slightly improved performance than FFV2 in especially high SRR condition.

ORNL/SPR-2020/1500
24
Figure 6.10. Surface topography of sample surfaces experimented under different lubrication conditions
A phosphorous based IL [P8888][DEHP] was studied as a potential rear axle lubricant for boundary lubrication regime. Both IL only and fully formulated versions of this IL were experimented in both low and high SRR and the results were compared against SAE75W-90 oil. The key observations are listed below:
IL added with VHVI 8 base oil resulted significant reduction of surface cracks at high SRR condition compared to SAE75W-90. At low SRR, the surface protection was slightly better compared to commercial oil.
Increasing treat rate of IL above 2% didn’t result great benefit in RCF behavior. At high SRR, 3% IL resulted transverse directional cracks on roller surface.
Fully formulated oils showed great potential in protecting the sample surface in both reciprocating sliding and RCF tests. These IL based oils showed slightly increased vibration in low SRR compared to 75W-90, but reduced the surface crack formation in both SRR conditions significantly (compared to commercial gear oil). Although the fully formulated oils had less than half of the viscosity of 75W-90, they showed better or comparable behavior in terms of vibration, traction and wear protection of samples.
Although the tribofilms were less thick for IL-based fully formulated oils, they protected the surface in a better way compared to 75W-90. High resolution TEM images revealed surface cracks below the tribofilm zones were observed for low SRR 75W-90 cases. The sub-surface regions were also more stressed for 75W-90 oil compared to that of FFV1.
Overall these fully formulated versions showed great potential as rear axle lubricants. Future work includes full length dynamometer tests of these oils and observe the feasibility of these formulation in actual automotive vehicles.

ORNL/SPR-2020/1500
25
Chapter 7. Additional Tribological Bench Testing at GM
Engine Oil
Experimental setup and parameters
Tests were performed using a mini-traction-machine (MTM, PCS Instruments, UK). Polished discs (diameter 46 mm) Material - AISI52100 steel and balls (diameter 19.05 mm) Material - AISI52100 steel were used during the MTM tests. The ball samples have a Vicker’s hardness of 800-920 HV and a surface roughness of Ra =0.02 µm. The disc samples have a Vicker’s hardness of 720-780 HV and a surface roughness of Ra =0.01 µm. All ball and disc samples were carefully cleaned using toluene and acetone prior to the MTM tests. The MTM tests were split into two sequential steps, Stribeck scans and wear tests. The Stribeck scans used a load of 75N, speeds from 10 mm/s to 3200 mm/s, an SRR of 50%, and a temperature of 100°C. The wear tests used a load of 75N, a speed of 20 mm/s, an SRR of 95%, a temperature of 100°C, and lasted 15 hours. The test parameters for the MTM ball-on-disc tests can be found in
Table 7.1.
Table 7.1. MTM ball-on-disc test parameters.
Parameter Stribeck Scans Wear Tests
Load 75 N 75 N
Speed 3200 to 10 mm/s 20 mm/s
Slide-Roll Ratio 50% 95%
Temperature 100 °C 100 °C
Duration 6 s step time 15 hr
Step Size 100 mm/s then 10 mm/s N/A
Volume of Fluid 40 mL 40 mL
Mobil 5W-30 oil results
The baseline engine oil was Mobil 1 5W-30. There were two Mobil 1 5W-30 oils used for baseline testing; original Mobile 1 5W-30 dexos 1 Gen 1 and Mobile 1 5W-30 dexos 1 Gen-2. There were two prototype test oils that were formulated and provided by Driven Racing Oil (DRO): one a fully formulated 0W-12 non-IL and the other was a 0W-12 IL formulation. The test oils include:
a. Mobil 1 5W-30 dexos 1
b. Mobil 1 5W-30 dexos 1 Gen2
c. CPO-356 Non-ionic liquid (IL)
d. CPO-356 IL
The three tests for Mobil 1 5W-30 dexos 1 Gen 2 were run in a sequential order. The Mobil 1 5W-30 dexos 1 Gen2 (b), CPO-356 Non- IL (c) and CPO-356 IL (d), a random test sequence was generated using a random number generator. The test sequence is as follows: b-d-c-d-b-c-b-c-d.

ORNL/SPR-2020/1500
26
Firstly, three 15-hour wear tests were performed using Mobil 1 5W-30 and Mobil 1 5W-30 Gen-2, and the wear and friction data were obtained for these two oils. The wear and friction data of Mobil 1 5W-30 was compared with the old wear and friction data of Mobil 1 5W-30 obtained by William Barnhill to verify the MTM machine is functioning properly.
Figure 7.1 shows the old and new wear data of Mobil 1 5W-30 using both measurement methods. Four sets of data are shown: old measurements of old Mobil 1 5W-30 samples by William Barnhill (Old), new measurements of old Mobil 1 5W-30 samples by William Barnhill (Old (New)), new measurement of new Mobil 1 5W-30 samples by Qinghua Wang (New), and measurements of Mobil 1 5W-30 Gen-2 samples by Qinghua Wang (Gen-2).
Figure 7.1. Wear rates for Mobil 1 5W-30 oils. Two wear measurement methods are used: maximum width-depth method (a) and volume method (b). Each set of data represents the average value of three
tests.
For the wear rates of the Mobil 1 5W-30 oils, the measurement results of (New) show a 33.9% difference (Maximum width-depth method=M) and a 96.9% difference (Volume method=V) compared with the measurement results of (Old). It is confirmed that the measurement difference is resulted from the mismatch between the objective lens and the software setup. The measurement results of (Old (New)) are reasonably similar to the measurement results of (New) (6.0% difference for the M method and 13.9% difference for the V method). Compared with the Mobil 1 5W-30 oil, the wear rate of the Gen-2 oil is 76.2% (M method) and 287.2% (V method) higher.
The friction data for Mobil 1 5W-30 oils can be found in Figure 7.2.
For the 15-hour wear test, the average COF is calculated by averaging the COFs during the last five hours. The average COFs for Mobil 1 5W-30 oil and Mobil 1 5W-30 Gen-2 oil are shown below:
o Mobil 1 5W-30, dexos 1 (Old): 0.100
o Mobil 1 5W-30, dexos 1 (New): 0.096
o Mobil 1 5W-30, dexos 1 Gen-2: 0.131
The COFs for the old and new Mobil 1 5W-30 measurements are very similar with only a 4% difference. The COF of Gen-2 oil is 36.5% higher than that of the original 5W-30 oil.
In the elastohydrodynamic (EHD) lubrication regime, at a rolling speed of 3200 mm/s, the COF of the original Mobil 1 5W-30 oil is 7.8% lower than that of the Gen-2 oil.
0
0.0002
0.0004
0.0006
0.0008
0.001
0.0012
Old Old (New) New Gen-2
Wea
r R
ate
(mm
^3/h
r)
0
0.00001
0.00002
0.00003
0.00004
0.00005
0.00006
Old Old (New) New Gen-2W
ear
Rat
e (m
m^3
/hr)(a) (b)

ORNL/SPR-2020/1500
27
Figure 7.2. Average friction data for Mobil 1 5W-30 oils: time vs. COF curves during the 15-hour wear test (a) and Stribeck curves (b).
Non-IL and IL engine oil results
Mobil 1 5W-30 Gen-2 was used as the baseline oil. The wear and friction data were obtained for the three oils and a comparative study was conducted. Three MTM bench tests were conducted for each oil. A random test sequence was generated using a random number generator.
The friction data can be found in Figure 7.3. Results indicate that the IL-additized engine oil is effective in reducing friction. For the 15-hour wear test, the average COF is calculated by averaging the COFs during the last five hours. The average COFs for the three engine oils are shown below:
o Mobil 1 5W-30, dexos 1 Gen2: 0.131
o CPO 356 Non-IL: 0.0876
o CPO 356 IL: 0.0553
The COF is reduced by 33.1% with CPO-356 Non-IL engine oil and 57.8% with CPO-356 IL engine oil compared to Mobil 1 5W-30 Gen 2 oil. In the elastohydrodynamic (EHD) lubrication regime, at a rolling speed of 3200 mm/s, both CPO-356 engine oils resulted in a of 23.8% reduction in COF compared to Mobil 1 5W-30 Gen-2 oil.
(a)
0.0000
0.0200
0.0400
0.0600
0.0800
0.1000
0.1200
0.1400
0 10000 20000 30000 40000 50000 60000
Fric
tion
Coef
ficie
nt
Time (s)
Old
New
Gen-2
0
0.01
0.02
0.03
0.04
0.05
0.06
0.07
0.08
0.09
0.1
10 100 1000 10000
Fric
tion
Coe
ffic
ient
Rolling Speed (mm/s)
Old
New
Gen-2
7.8% decrease
0.0000
0.0200
0.0400
0.0600
0.0800
0.1000
0.1200
0.1400
0 10000 20000 30000 40000 50000 60000
COF
Time (s)
Mobil 1 5W-30 Gen-2
CPO 356 Non-IL
CPO 356 IL
(a) (b)

ORNL/SPR-2020/1500
28
(b)
Figure 7.3. Average friction data for engine oils: time vs. COF curves during the 15-hour wear test (a) and
Stribeck curves (b).
A Zygo white light interferometer was used to quantify the wear rate using both maximum width-depth method (only considers the maximum depth of the wear scar) and volume method (volumetric measurement of the wear area using a function in the Zygo software). It was found that both CPO-356 oils resulted in slightly lower wear rates compared to Mobil 1 5W-30 dexos 1 Gen2 oil. The wear rate comparisons can be found in Figure 7.4.
Figure 7.4. Wear rates for engine oils. Two wear measurement methods are used: maximum width-depth method (a) and volume method (b). Each set of data represents the average value of all completed tests.
Rear Axle Fluid
Five different fluids were tested: Factory Fill 75W-90 Batch 1, Factory Fill 75W-90 Batch 2, CPO SAE 70W-80 Option 1 w/ IL, CPO SAE 70W-80 Option 2 Batch 1 w/ IL and CPO SAE 70W-80 Option 2 Batch 2 w/ IL. Three tests were conducted for the first four rear axle fluids, while four tests were conducted for the last rear axle fluid (CPO SAE 70W-80 Option 2 Batch 2 w/ IL).
Firstly, the three tests for Factory Fill 75W-90 Batch 1 were run in a sequential order. Secondly, for Factory Fill 75W-90 Batch 2 (a), CPO SAE 70W-80 Option 1 w/ IL (b) and CPO SAE 70W-80 Option 2 Batch 1 w/ IL (c), a random test sequence was generated using a random number generator. The test sequence is as
0
0.01
0.02
0.03
0.04
0.05
0.06
0.07
0.08
0.09
0.1
10 100 1000 10000
CO
F
Rolling Speed (mm/s)
Mobil 1 5W-30 MPG Gen-2
CPO 356 Non-IL
CPO 356 IL
23.8% decrease
0
0.0005
0.001
0.0015
0.002
5W-30 (Gen-2) CPO 356 Non-IL CPO 356 IL
Wea
r R
ate
(mm
^3/h
r)
0
0.000001
0.000002
0.000003
0.000004
5W-30 (Gen-2) CPO 356 Non-IL CPO 356 IL
Wea
r R
ate
(mm
^3/h
r)(a) (b)

ORNL/SPR-2020/1500
29
follows: a-c-b-c-a-b-a-b-c. Lastly, four tests for CPO SAE 70W-8- Option 2 Batch 2 w/ IL were run in a sequential order.
The COFs for all rear axle fluids during the 15-hour wear test and Stribeck tests were obtained. The average friction data for the five rear axle fluids can be found in Figure 7.5.
Boundary lubrication: The average COF on the 15-hour wear test is calculated by averaging the COFs during the last five hours. The boundary COF of the IL-additized low-viscosity rear axle fluids is higher than that of the baseline 75W-90 Batch 2.
Stribeck curves: The IL-additized low-viscosity rear axle fluids show significantly lower elastohydrodynamic COF than the baseline 75W-90 Batch 2.
(a)
(b) Figure 7.5. Average friction data for rear axle fluids: time vs. COF curves during the 15-hour wear test (a)
and Stribeck curve (b).
0.04
0.05
0.06
0.07
0.08
0.09
0.10
0.11
0.12
0 10000 20000 30000 40000 50000 60000
Fric
tion
Coef
ficie
nt
Time (s)
75W-90 Batch 1
75W-90 Batch 2
70W-80 Option 1
70W-80 Option 2 Batch 1
70W-80 Option 2 Batch 2
0
0.01
0.02
0.03
0.04
0.05
0.06
0.07
0.08
0.09
0.1
10 100 1000 10000
Fric
tion
Coe
ffic
ient
Rolling Speed (mm/s)
75W-90 Batch 1
75W-90 Batch 2
70W-80 Option 1
70W-80 Option 2 Batch 1
70W-80 Option 2 Batch 2
13.9~14.4% decrease
64.2% decrease

ORNL/SPR-2020/1500
30
The average wear rates of the two IL-additized low-viscosity rear axle fluids are higher than the baseline 75W-90 Batch 2, as shown in Figure 7.6.
(a)
(b) Figure 7.6. Wear rates for rear axle fluids using max depth method (a) and volume method (b). Each set
of data represents the average value of all competed tests.
The wear rate data for 70W-80 Option 1 had a repeatability issue. Test 1 showed a significantly higher wear rate while Test 2 and Test 3 are lower and very repeatable, as shown in Figure 7.7. Table 7.2 shows the optical images of the wear tracks on the balls and disks for 70W-80 Option 1 after 15-hour wear tests. The optical images reveal the width of wear track for Test 1 is higher than Test 2 and 3, and the amount of wear for Test 1 is also significantly higher. It is also clear that the types of wear for Test 1 and Tests 2 and 3 are different. Micropitting occured on the samples of Test 1 but not on Tests 2 or 3. This helps confirm the higher wear rate for Test 1.
0
0.002
0.004
0.006
0.008
0.01
75W-90 Batch 1 75W-90 Batch 2 70W-80 Option 1 70W-80 Option 2Batch 1
70W-80 Option 2Batch 2
Wea
r R
ate
(mm
^3/h
r)
0
0.000004
0.000008
0.000012
0.000016
0.00002
75W-90 Batch 1 75W-90 Batch 2 70W-80 Option 1 70W-80 Option 2Batch 1
70W-80 Option 2Batch 2
Wea
r R
ate
(mm
^3/h
r)

ORNL/SPR-2020/1500
31
Figure 7.7. Wear rates for the three tests and average wear rate for 70W-80 Option 1. Two wear measurement methods are used: maximum width-depth method (a) and volume method (b). Each set of
data represents the average value of three tests.
Table 7.2. Optical images of the wear tracks on the balls and disks for 70W-80 Option 1 after 15-hour wear tests.
Test no. Disk Ball1
2
3
The wear rate data for 70W-80 Option 2 Batch 2 also had a repeatability issue. Test 1 and Test 3 show higher wear rates compared to Test 2 and Test 4, as shown in Figure 7.8. The optical images of wear scars showed that the widths of wear tracks for Test 1 and Test 3 are higher than Test 2 and Test 4, and the
(a) (b)

ORNL/SPR-2020/1500
32
amounts of wear for Test 1 and Test 3 are also significantly higher. This helps confirm the higher wear rates for Test 1 and Test 3.
Figure 7.8. Wear rates for the four tests and average wear rate for 70W-80 Option 2 Batch 2. Two wear measurement methods are used: maximum width-depth method (a) and volume method (b). Each set of
data represents the average value of four tests.
0
0.002
0.004
0.006
0.008
0.01
0.012
Test 1 Test 2 Test 3 Test 4 Average
Wea
r R
ate
(mm
^3/h
r)
0
0.000004
0.000008
0.000012
0.000016
0.00002
Test 1 Test 2 Test 3 Test 4 Average
Wea
r R
ate
(mm
^3/h
r)
(a) (b)
ORNL/SPR-2020/1500
33
Chapter 8. Dyno and Vehicle Testing Demonstrating Improved Fuel Economy
DRO Engine dyno testing demonstrated nearly 10% FEI with better wear protection, higher torque output, and lower oil temperature by using ionic liquid to replace half amount of ZDDP in the oil formulation
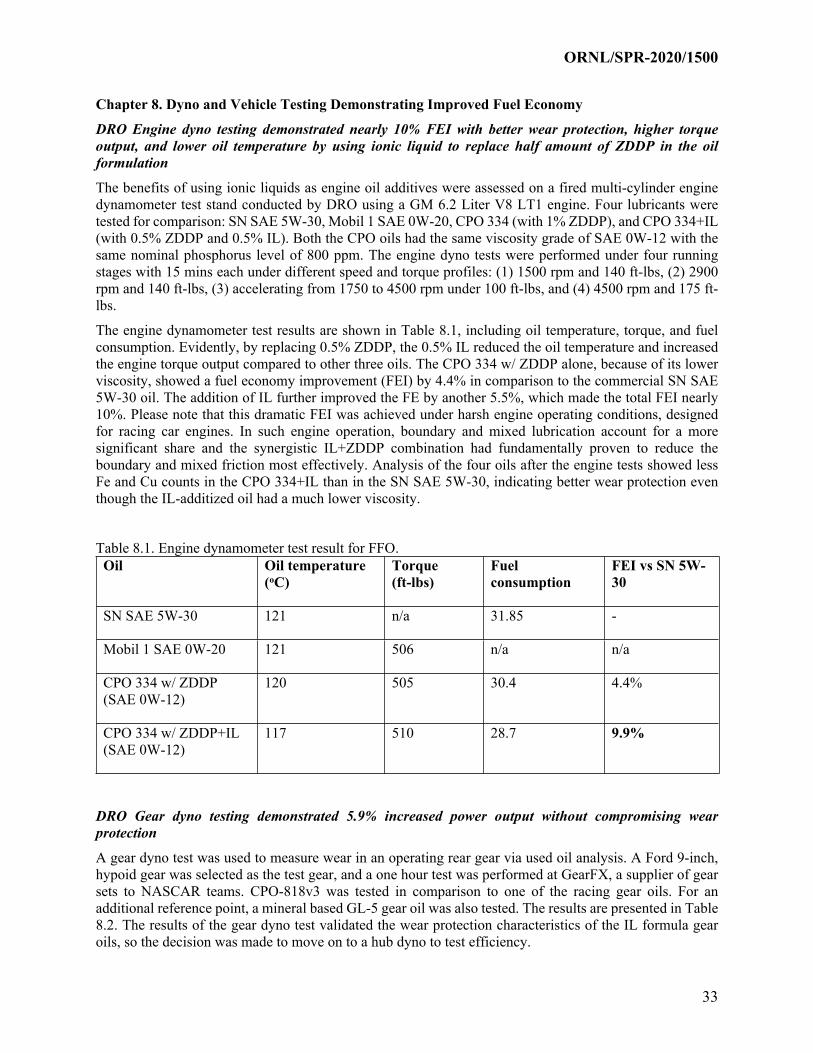
The benefits of using ionic liquids as engine oil additives were assessed on a fired multi-cylinder engine dynamometer test stand conducted by DRO using a GM 6.2 Liter V8 LT1 engine. Four lubricants were tested for comparison: SN SAE 5W-30, Mobil 1 SAE 0W-20, CPO 334 (with 1% ZDDP), and CPO 334+IL (with 0.5% ZDDP and 0.5% IL). Both the CPO oils had the same viscosity grade of SAE 0W-12 with the same nominal phosphorus level of 800 ppm. The engine dyno tests were performed under four running stages with 15 mins each under different speed and torque profiles: (1) 1500 rpm and 140 ft-lbs, (2) 2900 rpm and 140 ft-lbs, (3) accelerating from 1750 to 4500 rpm under 100 ft-lbs, and (4) 4500 rpm and 175 ft-lbs.
The engine dynamometer test results are shown in Table 8.1, including oil temperature, torque, and fuel consumption. Evidently, by replacing 0.5% ZDDP, the 0.5% IL reduced the oil temperature and increased the engine torque output compared to other three oils. The CPO 334 w/ ZDDP alone, because of its lower viscosity, showed a fuel economy improvement (FEI) by 4.4% in comparison to the commercial SN SAE 5W-30 oil. The addition of IL further improved the FE by another 5.5%, which made the total FEI nearly 10%. Please note that this dramatic FEI was achieved under harsh engine operating conditions, designed for racing car engines. In such engine operation, boundary and mixed lubrication account for a more significant share and the synergistic IL+ZDDP combination had fundamentally proven to reduce the boundary and mixed friction most effectively. Analysis of the four oils after the engine tests showed less Fe and Cu counts in the CPO 334+IL than in the SN SAE 5W-30, indicating better wear protection even though the IL-additized oil had a much lower viscosity.
Table 8.1. Engine dynamometer test result for FFO.Oil Oil temperature
(oC)Torque (ft-lbs)
Fuel consumption
FEI vs SN 5W-30
SN SAE 5W-30 121 n/a 31.85 -
Mobil 1 SAE 0W-20 121 506 n/a n/a
CPO 334 w/ ZDDP (SAE 0W-12)
120 505 30.4 4.4%
CPO 334 w/ ZDDP+IL (SAE 0W-12)
117 510 28.7 9.9%
DRO Gear dyno testing demonstrated 5.9% increased power output without compromising wear protection
A gear dyno test was used to measure wear in an operating rear gear via used oil analysis. A Ford 9-inch, hypoid gear was selected as the test gear, and a one hour test was performed at GearFX, a supplier of gear sets to NASCAR teams. CPO-818v3 was tested in comparison to one of the racing gear oils. For an additional reference point, a mineral based GL-5 gear oil was also tested. The results are presented in Table 8.2. The results of the gear dyno test validated the wear protection characteristics of the IL formula gear oils, so the decision was made to move on to a hub dyno to test efficiency.

ORNL/SPR-2020/1500
34
Table 8.2. Results of gear dyno testsOil Viscosity @ 40 C
(cSt)Viscosity @ 100 C (cSt)
Viscosity index Iron in used oil (PPM)
80W-90 GL-5, Mineral
13
Factory fill 75W-85 71.8 11.6 156
Valvoline Synpower (Racing) 75W-90
100 15 150 3
CPO-556 38.4 7.2 154
CPO-818v3 34.7 7.8 210 4
The hub dyno consists of two eddy current electric brakes that connect directly to the rear hubs of a vehicle. We selected a 2019 GMC Yukon as the test vehicle, and the vehicle was taken to EFI University’s test facility in Lake Havasu City, AZ. The vehicle was connected to the hub dyno, and a laptop fitted with HP Tuners software was connected to the vehicles OBDII port. This allowed data logging of vehicles ECU during the test.
The baseline test was completed using the factory fill 75W-85 gear oil, and the base line test consisted of a 5 minute “drive” cycle at 40 MPH. At the end of 5 minutes, 3 consecutive full throttle acceleration tests were completed. The average torque and horsepower were recorded for each of the 3 acceleration tests. The test cycle was repeated for the CPO-556, CPO-818v3, CPO-818v3 plus a limited slip additive, and the final oil was Valvoline Synpower 75W-90. The oil viscosities are compared in Table 8.2.
The efficiency results are presented in Figure 8.1. The results strongly correlate with viscosity at 40oC, with the CPO-818v3 plus the limited slip additive showing the largest power gain compared to the base line oil. Significantly, the two low viscosity oils (CPO-556 and CPO-818v3) demonstrated efficiency gains compared to the factory fill 75W-85. The power gain of CPO-818v3 represents a 5.9% improvement in efficiency. Used oil samples of these products are currently at the lab for testing and evaluation.
Results indicate the IL gear formulas can provide increased efficiency without compromising wear protection.

ORNL/SPR-2020/1500
35
Figure 8.1. Gear dyno test results showing increased power and torque output by using the IL-additized low-viscosity gear oils compared to the commercial gear oils.
GM High Temperature High Load Engine Dynamometer Testing
High-temperature high-load (HTHL) engine dynamometer tests were carried out on the prototype IL-additized engine oil at GM to evaluate its engine wear protection (given the ultra-low viscosity) and aging behavior at extreme engine operation conditions. The Mobil 1TM 5W-30 dexos 1 Gen2 engine oil was also tested to establish a baseline. As shown in Figure 8.2, the HTHL test uses a LSX 6.2L Gen4 small block engine with a cast iron block and cast aluminum heads. The engine operates at a compression ratio of 9:1 to generate a power of 450 HP and a torque of 444 ft-lbs. Tests were conducted for 100 hours at 2700 rpm, 120 N load, 145oC oil sump temperature and 120oC coolant out temperature. Oil samples (2 oz) were taken at fresh, 20, 40, 60, 80 and 100 hours. Oil analyses were conducted to track the viscosity change and metal contents.
The kinematic viscosity at 400C and 1000C are shown below in Figure 8.3 and Figure 8.4, respectively. The Mobil 1 5W-30 baseline runs before and after testing the IL 0W-12 formulation are very repeatable. The Mobil 1 sheared down to a minimum viscosity at 60 hours before and after testing the IL formulation. The viscosity increases in both tests at 80 hours indicating some oxidation of the oil. However, the IL 0W-12, with a lower viscosity, shows no shear down and no increase in viscosity throughout the entire test. The IL formulation showed no viscosity increase due to aging/oxidation compared to the conventional engine oil due to the high thermal stability of the IL.
Factory Fill 75W-85 CPO-556 CPO-818v3 CPO-818v3 +
H397Valvoline 75W-90
AVG HP 227.3333333 232.7 236.7333333 240.5666667 225.1333333AVG TQ 270.7 277.0666667 281.9 286.5666667 268.1
200210220230240250260270280290300
Gear Dyno Test Results Po
wer
(HP,
Blu
e)To
rque
(Ft-
Lb, O
rang
e)

ORNL/SPR-2020/1500
36
Figure 8.2. High temperature high load (HTHL) engine dynamometer test setup at GM Research and
Development Center in Pontiac, MI.
Figure 8.3. Kinematic viscosity at 40°C
0
10
20
30
40
50
60
70
80
0 20 40 60 80 100
Kine
mat
ic V
isco
sity
(cSt
)
Test Hours
Kinematic Viscosity at 40oC
Mobil 1 Before IL 0W-12 Mobil 1 After

ORNL/SPR-2020/1500
37
Figure 8.4. Kinematic viscosity at 100°C
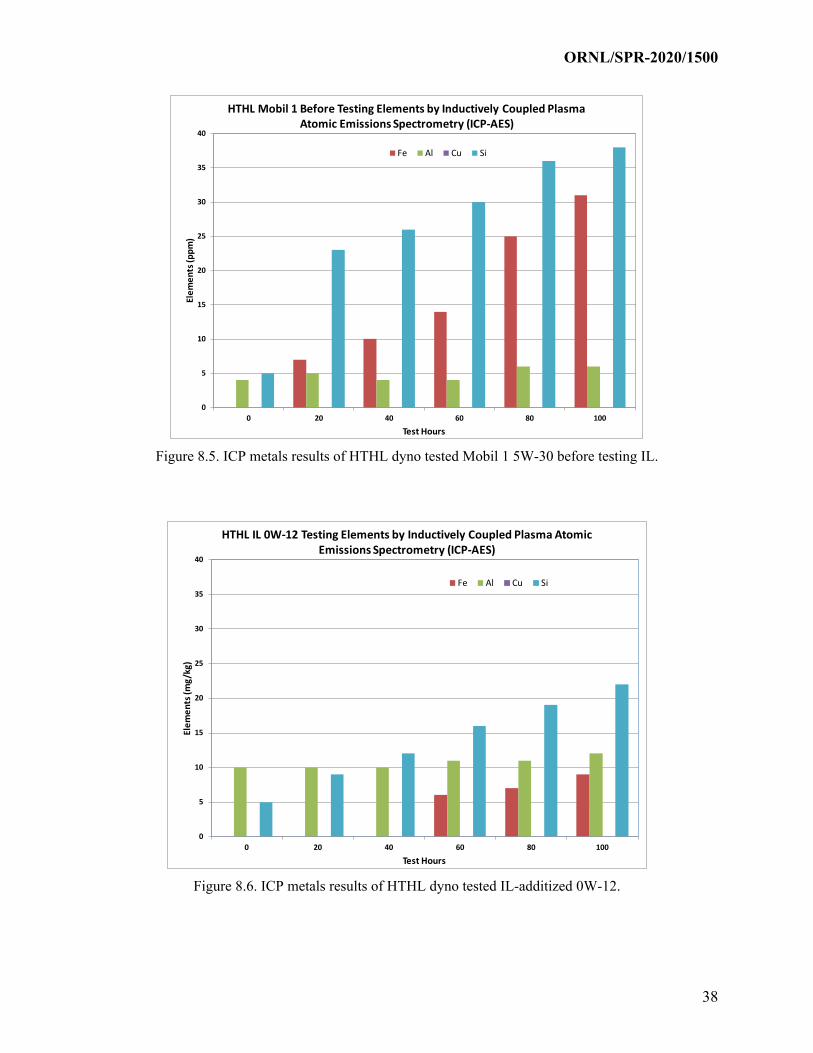
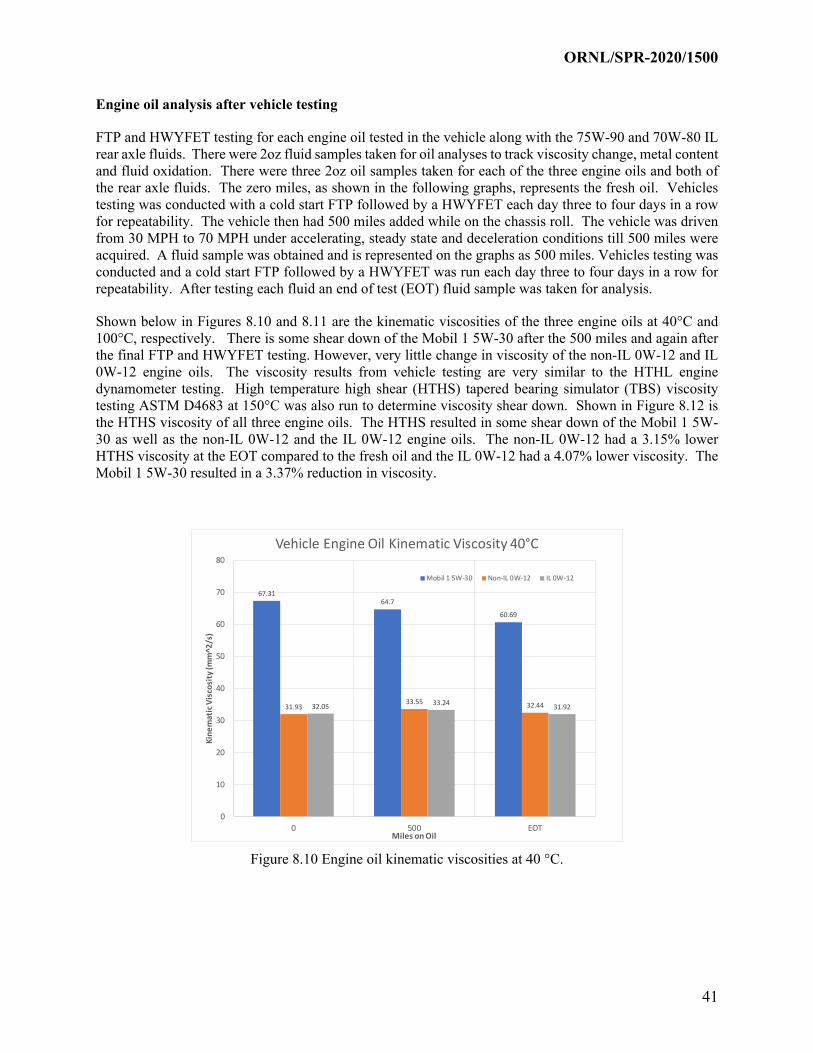
The wear-related metallic elements in the oil samples at different test intervals in the HTHL engine test were quantified using inductively coupled plasma atomic emissions spectrometry (ICP-AES) and results are shown below in Table 8.3.
Table 8.3. ICP analysis of HTHL engine dynamometer testing.
One can see that the IL formulation resulted in lower iron content compared to the Mobil 1, however, there was slightly higher aluminum in the IL formulation. This slight increase in aluminum was not significant and would not be expected to cause concern for engine wear. There was no copper in any of the test results and the silicon for the IL formulation was found to be within the range of the two Mobil 1 tests. The results can also be seen below in Figures 8.5, 8.6 and 8.7.
0
2
4
6
8
10
12
14
0 20 40 60 80 100
Kine
mat
ic V
isco
sity
(cSt
)
Test Hours
Kinematic Viscosity at 100oC
Mobil 1 Before IL 0W-12 Mobil 1 After
Mobil 1 Mobil 1 Mobil 1 Mobil 1 IL 0W-12 IL 0W-12 IL 0W-12 IL 0W-12 Mobil 1 Mobil 1 Mobil 1 Mobil 1Fe Al Si Cu Fe Al Si Cu Fe Al Si Cu<5 4 5 <5 <5 10 5 <5 <5 3 4 <57 5 23 <5 <5 10 9 <5 7 6 8 <5
10 4 26 <5 <5 10 12 <5 9 5 7 <514 4 30 <5 6 11 16 <5 12 7 9 <525 6 36 <5 7 11 19 <5 15 6 9 <531 6 38 <5 9 12 22 <5 18 7 10 <5
Before After
ORNL/SPR-2020/1500
38
Figure 8.5. ICP metals results of HTHL dyno tested Mobil 1 5W-30 before testing IL.
Figure 8.6. ICP metals results of HTHL dyno tested IL-additized 0W-12.
0
5
10
15
20
25
30
35
40
0 20 40 60 80 100
Elem
ents
(ppm
)
Test Hours
HTHL Mobil 1 Before Testing Elements by Inductively Coupled Plasma Atomic Emissions Spectrometry (ICP-AES)
Fe Al Cu Si
0
5
10
15
20
25
30
35
40
0 20 40 60 80 100
Elem
ents
(mg/
kg)
Test Hours
HTHL IL 0W-12 Testing Elements by Inductively Coupled Plasma Atomic Emissions Spectrometry (ICP-AES)
Fe Al Cu Si

ORNL/SPR-2020/1500
39
Figure 8.7. ICP metals results of HTHL dyno tested Mobil 1 5W-30 after testing IL.
GM Engine Oil Vehicle Testing
A 2015 Chevrolet Tahoe with a 5.3L V8 engine was used for engine oil testing. The vehicle was run on a millage accumulation dynamometer (MAD) at the Milford Proving Grounds to obtain 12,000 miles to assure break-in of the engine, transmission and rear axle. This would assure any changes in fuel economy (FE) were due to changes in engine oil or rear axle fluid. The cycle used incorporated a range of city and highway driving conditions. An engine oil flush procedure was used that incorporated three oil and filter changes prior to the next engine oil before any fuel economy testing was conducted. This was to ensure there is no hangover effect from the previous oil. A federal Test Procedure (FTP) followed by a Highway Fuel Economy Test (HWYFET) was conducted three to four days in a row to ensure repeatable results. An in-line fuel meter was used to more accurately measure fuel consumption for each test.
The baseline engine oil was Mobil 1 5W-30 dexos 1 Gen2, the same batch as the MTM2 bench testing. The two test oils were provided by DRO. The two DRO fully formulated engine oils were also the same as tested on MTM2, 0W-12 one is a conventional non-IL and the other is an IL formulation. A list of these oils is as follows:
a. Mobil 1 SAE 5W-30 dexos 1 Gen2
b. CPO-356 w/o IL SAE 0W-12
c. CPO-356 w/ IL SAE 0W-12
Vehicle testing was conducted in the following order, Mobil 1 5W-30 followed by the 0W-12 Non-IL then the 0W-12 IL formulation and then the Mobil 1 5W-30. This was done to ensure there was no change in how the vehicle was running and there were consistent fuel economy results from start to finish. The Mobil 1 FE results were very consistent from start to finish. An average of the start and final Mobil 1 5W-30 FE results were used as the baseline to determine the FE improvement of the two 0W-12 test oils. The testing was conducted with fresh oil and then 500 miles were put on the vehicle (engine oil) and FE testing was repeated to determine FE after engine oil shear down.
0
5
10
15
20
25
30
35
40
0 20 40 60 80 100
Elem
ents
(ppm
)
Test Hours
HTHL Mobil 1 After Testing Elements by Inductively Coupled Plasma Atomic Emissions Spectrometry (ICP-AES)
Fe Al Cu Si

ORNL/SPR-2020/1500
40
As shown below in Figure 8.8, the fuel economy of the 0W-12 non-IL formulation drops off after 500 miles, this is typical for conventional engine oils. However, the fuel economy of the 0W-12 IL formulation slightly increases after 500 miles from 1.13% to 1.24% compared to the Mobil 1 on the FTP. Similar results are found on the HWYFET as shown in Figure 8.9. The conventional engine oil FE results are lower after shear down, however the IL formulation increases from 0.53% to 0.95% from fresh oil to after shear down respectively. These results indicate the IL formulation is more resistant to oil shear down than conventional additive packages as was shown in the HTHS engine dynamometer kinematic viscosity results. Additionally, the improved fuel economy relates to the lower COF from the MTM2 results from both the Stribeck curve and the wear testing.
Figure 8.8. Fuel economy improvement over Mobil 1 SAE 5W-30 on FTP.
Figure 8.9. Fuel economy improvement over Mobil 1 SAE 5W-30 on HWYFET.
1.41
0.85
1.131.24
0.00
0.20
0.40
0.60
0.80
1.00
1.20
1.40
1.60
1.80
2.00
% F
uel E
cono
my
Impr
ovem
ent
Chevrolet Tahoe Vehicle Testing FTPNon-IL Fresh Non-IL After 500 mi
IL Fresh IL After 500 mi
1.77
0.20
0.53
0.95
0.00
0.20
0.40
0.60
0.80
1.00
1.20
1.40
1.60
1.80
2.00
% F
uel E
cono
my
Impr
ovem
ent
Chevrolet Tahoe Vehicle Testing HWYFETNon-IL Fresh Non-IL After 500 mi
IL Fresh IL After 500 mi
ORNL/SPR-2020/1500
41
Engine oil analysis after vehicle testing
FTP and HWYFET testing for each engine oil tested in the vehicle along with the 75W-90 and 70W-80 IL rear axle fluids. There were 2oz fluid samples taken for oil analyses to track viscosity change, metal content and fluid oxidation. There were three 2oz oil samples taken for each of the three engine oils and both of the rear axle fluids. The zero miles, as shown in the following graphs, represents the fresh oil. Vehicles testing was conducted with a cold start FTP followed by a HWYFET each day three to four days in a row for repeatability. The vehicle then had 500 miles added while on the chassis roll. The vehicle was driven from 30 MPH to 70 MPH under accelerating, steady state and deceleration conditions till 500 miles were acquired. A fluid sample was obtained and is represented on the graphs as 500 miles. Vehicles testing was conducted and a cold start FTP followed by a HWYFET was run each day three to four days in a row for repeatability. After testing each fluid an end of test (EOT) fluid sample was taken for analysis.
Shown below in Figures 8.10 and 8.11 are the kinematic viscosities of the three engine oils at 40°C and 100°C, respectively. There is some shear down of the Mobil 1 5W-30 after the 500 miles and again after the final FTP and HWYFET testing. However, very little change in viscosity of the non-IL 0W-12 and IL 0W-12 engine oils. The viscosity results from vehicle testing are very similar to the HTHL engine dynamometer testing. High temperature high shear (HTHS) tapered bearing simulator (TBS) viscosity testing ASTM D4683 at 150°C was also run to determine viscosity shear down. Shown in Figure 8.12 is the HTHS viscosity of all three engine oils. The HTHS resulted in some shear down of the Mobil 1 5W-30 as well as the non-IL 0W-12 and the IL 0W-12 engine oils. The non-IL 0W-12 had a 3.15% lower HTHS viscosity at the EOT compared to the fresh oil and the IL 0W-12 had a 4.07% lower viscosity. The Mobil 1 5W-30 resulted in a 3.37% reduction in viscosity.
Figure 8.10 Engine oil kinematic viscosities at 40 °C.
67.3164.7
60.69
31.9333.55 32.4432.05 33.24 31.92
0
10
20
30
40
50
60
70
80
0 500 EOT
Kine
mat
ic V
isco
sity
(mm
^2/s
)
Miles on Oil
Vehicle Engine Oil Kinematic Viscosity 40°C
Mobil 1 5W-30 Non-IL 0W-12 IL 0W-12

ORNL/SPR-2020/1500
42
Figure 8.11 Engine oil kinematic viscosities at 40 (top) and 100 °C (bottom).
Figure 8.12. HTHS of engine oils on vehicle testing.
The wear-related metallic elements in the oil samples were quantified using inductively coupled plasma atomic emissions spectrometry (ICP-AES) ASTM D5185 and results are shown below in the following graphs. A zero in the graphs represent a value that was below the detectable limits of the method. Typically, very low levels of wear metals are found in engine oil. However, increased levels indicate too much engine wear has occurred and could be due to a lack of engine oil protection. The ICP results for Mobil 1 5W-30 are shown in Figure 8.13 and the only concern is the level of copper in the EOT sample. All other wear metals are very low. Silicon is also used in engine oil formulations and sealers that could be used to
11.49 11.2510.69
6.72 7.02 6.906.74 7.03 6.84
0
2
4
6
8
10
12
14
16
0 500 EOT
Kine
mat
ic V
isco
sity
(mm
^2/s
)
Miles on Oil
Vehicle Engine Oil Kinematic Viscosity 100°C
Mobil 1 5W-30 Non-IL 0W-12 IL 0W-12
2.97 2.93 2.87
2.22 2.19 2.152.21 2.15 2.12
0
0.5
1
1.5
2
2.5
3
3.5
4
0 500 EOT
HTHS
Vis
cosi
ty (m
Pa-s
)
Miles on Oil
Vehicle Engine Oil HTHS Viscosity 150°C
Mobil 1 5W-30 Non-IL 0W-12 IL 0W-12

ORNL/SPR-2020/1500
43
assemble engines. Therefore, it is important to determine if there is an increase in silicon in the oil due to engine sealer, there is not. The non-IL 0W-12 and IL 0W-12 oil analysis does not indicate any wear metals or silicon that are of concern as shown in Figures 8.14 and 8.15, respectively. There is alumina in the two 0W-12 oil formulations as can be seen from the fresh oil sample, but there was no increase.
Figure 8.13. ICP metals results of vehicle tested Mobil 1 5WE-30.
Figure 8.14. ICP metals results of vehicle tested non-IL 0W-12.
0 0 0
4
0 00 0
15
4
2
3
0
2
4
6
8
10
12
14
16
0 500 EOT
Elem
ents
(ppm
)
Miles on Oil
Vehicle Mobil 1 5W-30 Testing Elements by Inductively Coupled Plasma Atomic Emissions Spectrometry (ICP-AES)
Fe Al Cu Si
0 0 0
12
11
12
0 0
6
2
3 3
0
2
4
6
8
10
12
14
16
0 500 EOT
Elem
ents
(ppm
)
Miles on Oil
Vehicle Non-IL 0W-12 Testing Elements by Inductively Coupled Plasma Atomic Emissions Spectrometry (ICP-AES)
Fe Al Cu Si

ORNL/SPR-2020/1500
44
Figure 8.15. ICP metals results of vehicle tested IL-additized 0W-12.
Engine oil will oxidize over time, however, if too much occurs the oil will no longer be able to protect the engine parts and wear is inevitable. Therefore, the oxidation of the oil was measured according to ASTM E2412 Condition Monitoring of Used Lubricants by Trend Analysis Using Fourier Transform Infrared Spectrometry (FTIR). As shown in Figure 8.16 below there is some oxidation in the Mobil 1 5W-30 over time, but not much. The non-IL 0w-12 and IL 0W-12 engine oils are essentially the same in terms of the amount of oxidation including fresh oil. These results demonstrate the oxidative stability of the IL in conjunction with typical engine oil anti-oxidants. Furthermore, these results indicate the potential for extended drain intervals with the IL 0W-12 engine oil. The higher starting oxidation value of the non-IL 0W-12 and IL 0W-12 engine oils relates to the base oil blend of both oils. The Mobil 1 5W-30 demonstrates FTIR spectra typical of an API SN+, ILSAC GF5/6 formulation. The non-IL 0W-12 and IL 0W-12 demonstrate FTIR spectra typical of a racing oil formula, which usually contain ester base stocks. Because ester base oils contain an oxygen atom in each molecule, the oxidation values of an ester-based formula will begin with a higher number than non-ester based formulas. This is evidenced in the results in Figure 8.16. As such, it is the differential between beginning oxidation value and EOT oxidation value that matters, and the IL 0W-12 formula demonstrated no change from fresh to EOT.
0 0 0
15
12 12
0 0
8
4
2
3
0
2
4
6
8
10
12
14
16
0 500 EOT
Elem
ents
(ppm
)
Miles on Oil
Vehicle IL 0W-12 Testing Elements by Inductively Coupled Plasma Atomic Emissions Spectrometry (ICP-AES)
Fe Al Cu Si

ORNL/SPR-2020/1500
45
Figure 8.16. Engine oils oxidation results.
Rear Axle Fluid Testing
After testing was completed on the Mobil 1 5W-30 engine oil following the non-IL and IL engine oil formulations, it was left in the engine for all the rear axle fluid testing. This would ensure any changes in fuel economy were solely due to the different rear axle fluids. Testing of the rear axle fluids was the same as the engine oils, conduct fuel economy testing on the FTP and HWYFET test with fresh fluid and after 500 miles. Therefore, the factory fill 75W-90 rear axle fluid was changed before starting the rear axle fluid testing. There were two flushes with the 75W-90 factory fill before adding the final fill of 75W-90 for testing. Following the factory fill testing there was a flush of the system with the IL 70W-80 rear axle fluid before the final fill of fresh 70W-80 IL rear axle fluid for testing.
Cold start FTP followed by HWYFET tests were conducted three to four times on each fluid for repeatability and the average was used to determine fuel economy improvements. The same in-line fuel meter was used to determine actual fuel usage for accurate fuel economy results. Figure 8.17 shows the FTP and HWYFET percent fuel economy improvements for the fresh and after 500 miles for the 70W-80 IL rear axle fluid. The factory fill 75W-90 is used as the baseline.
Comparing the 70W-80 IL rear axle fluid to the 75W-90 rear axle fluid resulted in a 0.25% and 0.30% improvement in fuel economy on the FTP on fresh and after 500 miles respectfully as shown in Figure 8.18. The FTP is a cold start test cycle and the rear axle fluid does not increase significantly in temperature so it is not surprising there is not a great improvement in fuel economy. However, the HWYFET, which is a higher temperature test, resulted in significant improvements in fuel economy. The 70W-80 IL fresh oil resulted in a 2.71% fuel economy improvement and after 500 miles a 0.67% improvement is shown in Figure 8.19. The drop in fuel economy after 500 miles, may be due to not having any anti-oxidant in the reax axle formulation. One of the additives in the IL rear axle fluid is molybdenum dithiocarbamate (MoDTC) which can interact with the IL and other additives to lose the friction reducing capability resulting in a loss in fuel economy [https://doi.org/10.1021/acsami.0c00980] Future work will need to be done to optimize the IL rear axle formulation to include an anti-oxidant to hopefully maintain the full fuel economy benefit.
10.211.8 11.8
39 39 38.839.1 39.4 39.1
0
10
20
30
40
50
60
0 500 EOT
ASTM
FTIR
Oxi
datio
n (P
eak A
rea)
Miles on Oil
Vehicle Engine Oil ASTM E2412 FTIR Oxidation Peak Area
Mobil 1 5W-30 Non-IL 0W-12 IL 0W-12

ORNL/SPR-2020/1500
46
Figure 8.17. Percent fuel economy improvement of 70W-80 IL rear axle fluid for fresh and after 500 miles on FTP and HWYFET.
Figure 8.18. Percent total fuel economy improvement on FTP with non-IL and IL engine oil and IL rear axle fluid combinations.
0.25 0.30
2.71
0.67
0.00
1.00
2.00
3.00
4.00
% F
uel E
cono
my
Impr
ovem
ent
Chevrolet Tahoe Vehicle Testing FTP IL 70W-80 Fresh FTP IL 70W-80 500 mi
HWYFET IL 70W-80 Fresh HWYFET IL 70W-80 500 mi
1.67
1.151.39
1.54
0.00
1.00
2.00
3.00
4.00
5.00
6.00
% T
otal
Fue
l Eco
nom
y Im
prov
emen
t
Chevrolet Tahoe Vehicle Testing FTPNon-IL Fresh Engine oil & IL Rear Axle FluidNon-IL After 500 mi Engine Oil & IL Rear Axle FluidIL Fresh Engine Oil & IL Rear Axle FluidIL After 500 mi Engine Oil & IL Rear Axle Fluid

ORNL/SPR-2020/1500
47
Figure 8.19. Percent total fuel economy improvement on HWYFET with non-IL and IL engine oil and IL rear axle fluid combinations.
Rear axle fluid analysis after vehicle testing
The rear axle fluid testing was conducted with the 75W-90 base fluid and the IL 70W-80 formulation. The same fluid analysis was conducted on both rear axle fluids as the engine oils. The kinematic viscosity at 40°C for both fluids is shown in Figure 8.20. There is some shear down of the 75W-90 after initial testing and then the 500 miles, however, viscosity is constant afterwards. The same is true at 100°C as shown in Figure 8.21.
Figure 8.20. Rear axle fluid kinematic viscosity at 40°C.
4.49
0.87
3.24
1.63
0.00
1.00
2.00
3.00
4.00
5.00
6.00
% T
otal
Fue
l Eco
nom
y Im
prov
emen
t
Chevrolet Tahoe Vehicle Testing HWYFETNon-IL Fresh Engine oil & IL Rear Axle Fluid
Non-IL After 500 mi Engine Oil & IL Rear Axle Fluid
IL Fresh Engine Oil & IL Rear Axle Fluid
IL After 500 mi Engine Oil & IL Rear Axle Fluid
107.7
68.6 68.48
36.03 35.69 35.78
0
20
40
60
80
100
120
0 500 EOT
Kine
mat
ic V
isco
sity
(mm
^2/s
)
Miles on Rear Axle Fluid
Vehicle Rear Axle Fluid Kinematic Viscosity 40°C
75W-90 IL 70W-80

ORNL/SPR-2020/1500
48
Figure 8.21. Rear axle fluid kinematic viscosity at 100°C.
The HTHS viscosity at 150°C was also determined and shown in Figure 8.22. There is a shear down of the 75W-90 rear axle fluid, however, there is no shear down or loss of viscosity on the IL 70W-80. This does not explain the drop in fuel economy on the HWYFET from fresh to after 500 miles with the IL 70W-80 fluid.
Figure 8.22. HTHS of rear axle fluids on vehicle testing.
The metals content was also determined on the rear axle fluids using the same ICP-AES method. There were significant levels of iron in the 75W-90 in both the 500 mile and EOT fluid samples as shown in Figure 8.23. It is unclear as to why. There is no aluminum and very little copper and silicon. It should be noted that there is a rubber gasket that is used to seal the rear cover of the rear axle. The IL 70W-80 ICP-AES results (Figure 8.24) show significantly less iron in testing, no copper and very little silicon. There is aluminum in the IL 70W-80 formulation as shown in the fresh oil sample, however, there is no increase. The IL 70W-80 ICP-AES resulted in lower iron wear indicating better wear protection than the 75W-90,
15.64
11.28 11.27
8.20 8.13 8.13
0
2
4
6
8
10
12
14
16
18
0 500 EOT
Kine
mat
ic V
isco
sity
(mm
^2/s
)
Miles on Rear Axle Fluid
Vehicle Rear Axle Fluid Kinematic Viscosity 100°C
75W-90 IL 70W-80
4.84
3.78 3.78
3.34 3.34 3.38
0
1
2
3
4
5
6
0 500 EOT
HTHS
Vis
cosi
ty (m
Pa-s
)
Miles on Rear Axle Fluid
Vehicle Rear Axle HTHS Viscosity 150°C
75W-90 IL 70W-80

ORNL/SPR-2020/1500
49
however, the MTM2 wear results showed the opposite in testing on steel balls and disks which may not represent wear on iron.
Figure 8.23. ICP metals results of vehicle tested factory-fill 75W-90 rear axle fluid.
Figure 8.24. ICP metals results of vehicle tested IL-additized 70W-80 rear axle fluid.
0
275 281
0 0 00
24 24
0
20 21
0
50
100
150
200
250
300
350
0 500 EOT
Elem
ents
(ppm
)
Miles on Rear Axle Fluid
Vehicle Rear Axle Fluid 75W-90 Testing Elements by Inductively Coupled Plasma Atomic Emissions Spectrometry (ICP-AES)
Fe Al Cu Si
016 16
27 23 23
0 0 03 3 30
50
100
150
200
250
300
350
0 500 EOT
Elem
ents
(ppm
)
Miles on Rear Axle Fluid
Vehicle Rear Axle Fluid IL 70W-80 Testing Elements by Inductively Coupled Plasma Atomic Emissions Spectrometry (ICP-AES)
Fe Al Cu Si

ORNL/SPR-2020/1500
50
The FTIR oxidation for peak area was also determined for both rear axle fluids and shown in Figure 8.25. As one can see the 75W-90 does show oxidation after initial testing and after the 500-mile accumulation, however, no additional oxidation is observed. The IL 70W-80 had significantly greater oxidation on the fresh fluid, but no additional change during testing. The IL 70W-80 fluid used a Esther based fluid which has oxygen and also the fluid had no anti-oxidation inhibiter in the formulation which would explain the greater oxidation.
Figure 8.25. Rear axle fluid oxidation results.
6.4
46.9 47
155 155 154.8
0
20
40
60
80
100
120
140
160
180
200
0 500 EOT
ASTM
FTIR
Oxi
datio
n (P
eak A
rea)
Miles on Rear Axle Fluid
Vehicle Rear Axle Fluids ASTM E2412 FTIR Oxidation Peak Area
75W-90 IL 70W-80

ORNL/SPR-2020/1500
51
CONCLUSIONS
This project developed ionic liquid-additized low viscosity lubricants for both IC engine and rear axle lubrication for combined vehicle fuel economy improvement (FEI). The viscosity grades of the candidate engine and gear oils are SAE 0W-12 and 70W-80, respectively and different oil formulations have been developed for each application. Phosphonium-alkylphosphate ILs have been found to be superior to the commercial ZDDP and other groups of ILs in protecting surface damage from both sliding wear and rolling contact fatigue, and optimal IL concentrations have been determined for both engine oil and rear axle fluid. The IL’s impact on three-way catalyst for exhaust emission control seems to be significantly less adverse than the conventional ZDDP. Based on compatibility studies of the ILs with other additives supported by bench tribological tests, oil formulations were optimized for both energy efficiency and durability. Tribological bench testing of the IL-additized low-viscosity oils showed significantly lower boundary friction (by more than 40%), elastohydrodynamic friction (by more than 60%), and wear (by more than 50%) compared with commercial baselines. IL-additized lubricants have demonstrated FEI by up to 9.9% in engine dynamometer tests under extreme conditions (simulating racing cars) and 6.9% increased power output in gear dynamometer tests. Prototype IL-additized engine oil and rear axle fluid have been produced and gone through vehicle testing under the Federal Test Procedure (FTP) city cycle and Highway Fuel Economy Driving Schedule (HWFET). The combined FEI for fresh IL-additized low-viscosity engine and rear axle lubricants was 1.39% and 3.24% benchmarked against the state-of-the-art baselines in FTP and HWFET tests, respectively. The FTP and HWFET FEI settled to 1.54% and 1.63% after 500 miles of vehicle running, respectively. Used oil analysis suggested that the IL-additized low-viscosity oils produced less wear than the commercial baselines. The gained fundamental understanding and demonstrated FEI in this work pave the way for future development and implementation of the ionic lubricant additives technology.


![CSE 168 [Spr 20], Lecture 17: Image-Based Rendering](https://static.fdokumen.com/doc/165x107/633317da69509937270211a2/cse-168-spr-20-lecture-17-image-based-rendering.jpg)