Multilayer hydrogel coatings to combine hemocompatibility and antimicrobial activity
Upload
independentCategory
view
6download
0
Gradient Hydrogel Matrix for Microarray and BiosensorApplications: An Imaging SPR Study
Olof Andersson, Andréas Larsson, Tobias Ekblad, and Bo Liedberg*
Division of Sensor Science and Molecular Physics, Department of Physics, Chemistry and Biology,Linkoping University, SE-581 83 Linkoping, Sweden
Received September 14, 2008; Revised Manuscript Received November 11, 2008
A biosensor matrix based on UV-initiated graft copolymerized poly(ethylene glycol) methacrylate and2-hydroxyethyl methacrylate has been studied using imaging surface plasmon resonance (iSPR). By using a photomask and a programmable shutter to vary the exposure time laterally, a gradient of matrix spots with physicalthicknesses ranging from a few to tens of nanometers was generated. To maximize the dynamic range, imagingSPR was employed in wavelength interrogation mode. By finding the minimum in the reflectance spectra fromeach pixel of an image, SPR wavelength maps were constructed. The shift in SPR wavelength upon biospecificinteraction was then measured both as a function of matrix thickness and composition. The performance of thematrix was evaluated in terms of immobilization of human serum albumin, biomolecular interaction with itsantibody, and nonspecific binding of human fibrinogen. In addition, a low molecular weight interaction pair basedon a synthetic polypeptide and calmodulin was also studied to explore the size selectivity of the hydrogel matrix.Our results show that the gradient matrix exhibits excellent properties for quick evaluation and screening ofoptimal hydrogel performance. The mixed hydrogel matrices display very low levels of nonspecific binding. It isalso evident that the low molecular weight calmodulin is capable of freely diffusing and interacting throughoutthe entire hydrogel matrix, whereas the much larger albumin and its corresponding antibody, in particular, arepartly/completely hindered from penetrating the interior of the matrix. This size-selectivity is attributed to asignificant UV-initiated cross-linking or branching of the matrix during fabrication and/or protein mediatedmultipoint attachment during immobilization.
Introduction
The use of surface enhancing matrices, for instance hydrogels,is of great interest for the development of efficient and robustbiosensors. Well-designed biosensor matrices exhibit lownonspecific binding while allowing for covalent immobilizationof ligands with maintained biofunctionality and minimal leach-ing. The carboxymethylated dextran matrix is an example of ahydrogel that has been extensively used in biointeractionanalysis.1 Other approaches include sol-gel encapsulation2,3 andhydrogel matrices based on different forms of poly(ethyleneglycol) (PEG).4-8 In earlier work, we have developed such amatrix, based on graft copolymerization of PEG methacrylateand 2-hydroxyethyl methacrylate (HEMA) monomers.9-11 Inprotein microarray applications, for example, it is crucial to beable to immobilize different proteins to separate regions on thesame sensor chip without cross-contamination between neigh-boring spots. On homogeneous dextran hydrogel surfaces, thishas been accomplished through introduction of reversiblehydrophobic barriers in a grid-like pattern.12,13 A two-dimensional micro array platform based on self-assembledmonolayers (SAMs) of oligo(ethylene glycol) (OEG)-containingalkanethiols was recently developed by Valiokas et al.14 In thiscase, a hydrophobic grid consisting of microcontact printedalkanethiols, later passivated with bovine serum albumin, wasused to prevent cross-contamination between neighboring OEG-spots. Kannan et al.15 used photolithographic techniques tocreate passive barriers of PEG between functional regions on amicro array chip.
In the present work, a biosensor polymer matrix composedof PEG methacrylate with an average EG chain length of 10units (PEG10MA) and HEMA was graft polymerized using UV-initiated free radical copolymerization. By using a photo mask,an array of circular spots, 200 µm in diameter, was exposed toUV light (254 nm). The use of a programmable shutter enabledus to vary the exposure time of adjacent spots in the matrix. Inthis way, rows of spots with thicknesses ranging from 1-50nm were produced on the same chip.9,11 As substrate for graftingof the polymer matrix, a SAM of methoxyl-terminated OEGthiols on glass surfaces coated with a thin layer of gold wasused. The resulting array consisted of circular spots of hydrogelmatrix with varying thicknesses surrounded by a monolayer ofOEG thiols. As will be shown, the OEG thiol layer wascompletely passive in terms of nonspecific adsorption. Monitor-ing of biomolecular binding events to surfaces incorporatingnumerous spots in an array format requires imaging techniqueswith high lateral resolution or capabilities of scanning thesurface. One such method is surface plasmon resonance (SPR),an established optical sensor technique first introduced inbiosensor context in the 1980s16 and which is now commonlyemployed in biomolecular interaction analysis (BIA). SPR is avery surface sensitive technique based on measuring changesin the optical properties in the vicinity of the sensor surface.17,18
A major quality of SPR is the possibility to perform measure-ments in situ in a complex liquid ambient. By using an imagingdetector, SPR can be extended to provide measurements withlateral resolution.19 Typically, the measured quantity in SPRsensors is the shift in resonance angle (∆θSPR) upon binding ofbiomolecules and this shift is proportional to the surfaceconcentration of bound molecules.20 In an imaging SPR (iSPR)
* To whom correspondence should be addressed. Phone: +46-13-28 1689. E-mail: [email protected].
Biomacromolecules 2009, 10, 142–148142
10.1021/bm801029b CCC: $40.75 2009 American Chemical SocietyPublished on Web 12/09/2008

setup, the angle of incidence is usually fixed and the measuredparameter is the change in intensity as the resonance angle shifts.In this case, the dynamic range is limited by the half-width ofthe SPR curve. To extend the dynamic range, the angle ofincidence can be scanned over an interval to find θSPR of eachpixel in the image. Angular scanning, however, can be adisadvantage in an imaging setup because the oblique angle willcause the magnification to be different as the angle of incidenceis varied. In 1988, Zhang et al. introduced an SPR sensor basedon measurement of the resonance wavelength (λSPR) at a fixedangle of incidence.21 More recently, Yuk et al. employed spectralinterrogation imaging SPR to study antigen-antibody interac-tions in an array format.22,23 The sensitivity of SPR sensors indifferent variations based on ∆λSPR measurements has beenthoroughly investigated by Homola24 and Yuk et al.25,26 Becauseof the large difference in thickness of the spots on our sensorsurface, a large dynamic range needs to be covered duringcharacterization. Therefore, in this study, we have used spectraliSPR to study, in situ, immobilization and biointeractions withinour hydrogel matrix spot gradient. As model systems, we haveused the covalent immobilization of human serum albumin(HSA) to the hydrogel matrix and its interaction with anti-HSAand the interaction between an immobilized synthetic polypep-tide and calmodulin. Furthermore, the composition of the matrixspots was varied by changing the PEG10MA/HEMA ratio inthe monomer solution. In addition to ∆λSPR measurements,imaging ellipsometry was used to measure the thickness of thegraft polymerized matrix spots. This type of surfaces, with spotsof varying thicknesses and differently composed surface chem-istries can be used in optimization of matrices for biosensorapplications. Spots of different thicknesses accommodated onthe same chip can be useful in protein micro arraying,particularly when there are large variations in the molecular sizesof the analytes or when the affinities of the ligands are verydifferent. In particular, thick hydrogel matrix spots with largeimmobilization capacity are good for small molecular and lowaffinity interactions, whereas thinner spots with a lower capacityare more suitable for large molecules and high affinity ligands.By using an imaging technique, such as iSPR, and in situmeasurements, screening for optimal biosensor performance canbe made easier.
Materials and Methods
Chip Manufacture. Before use, glass slides (12 × 12 mm2) coatedwith a thin layer of gold (45 nm) were cleaned in a mixture of Milli-Qwater (Milli-Q, Millipore), 30% hydrogen peroxide (Merck KGaA,Germany), and 25% ammonia (Merck KGaA) for 10 min at 85 °C.The surfaces were provided by Biacore (part of GE Healthcare). Aftercleaning the gold surfaces, they were immersed in a solution ofHS(CH2)11CONH(C2H4O)11CH3 (Polypure AS, Norway) with a con-centration of 100 µM in 99.5% ethanol for a minimum of 24 h at roomtemperature, forming oligo(ethylene glycol) monolayers (OEG-SAM).After incubation, the surfaces were rinsed in 99.5% ethanol andultrasonicated for 3 min before being dried under a nitrogen flow. Inearlier work, the process of grafting the hydrogel matrix onto cycloolefinpolymer substrates10 and onto SAMs on gold surfaces11 has beenextensively described. In brief, a chromium-coated quartz wafer wasphotolithographically patterned with circular spots of 200 µm indiameter and used as a photo mask. A small drop of a mixture of themonomers was applied to the quartz mask from beneath and broughtin contact with the SAM-coated gold surface. The surface tension heldthe substrate in place under the mask. A movable shutter was visuallyaligned to the pattern of the photo mask, and the UV exposure timewas varied by moving the motorized shutter. The shutter was movedin steps of 300 µm every 20 s for a total of 5 min. The entire grafting
setup was enclosed in an airtight chamber which was purged withnitrogen gas for one minute before and throughout the grafting process.The lightsource used for the grafting was a Philips TUV PL-L 18WHg lamp with a sharp emission peak at 254 nm. In this work, we haveused the monomers PEG10MA and HEMA (both from Sigma-Aldrich,Sweden AB) dissolved in Milli-Q water to a total concentration of 240mM in mixtures with HEMA content 25, 50, 75, and 100%, respec-tively. Following graft polymerization, carboxyl groups were introducedin the hydrogel matrix by treatment with bromoacetic acid.1 Thecarboxylated hydrogel substrates were stored immersed in Milli-Q waterat 4 °C until further use.
Imaging Ellipsometry. An imaging null ellipsometer (EP3, NanofilmTechnologie, Germany) was used to measure the thickness of the graftpolymerized hydrogel. The ellipsometer was operated at a wavelengthof 831 nm, with the angle of incidence set at 60°. In the imagingellipsometer experiments, surfaces were treated in the same way asdescribed above, but the gold thickness of the substrates was 200 nm.The refractive index of the organic material on the surface was assumedto be 1.5.
Imaging Surface Plasmon Resonance. The iSPR measurementswere performed using an in-house custom built instrument based onspectral interrogation (Figure 1). The iSPR instrument was comprisedof two angular rotation stages (RV160, Newport Inc.) with synchro-nously movable arms, enabling a choice of incidence and reflectionangles ranging from 40-84°. Surface plasmons were excited by meansof a 25 mm equilateral prism (BK7 glass, Melles Griot Inc.), a so-called attenuated total reflection (ATR) coupler. A refractive indexmatching gel (Cargille Inc.) was used to achieve optical contact betweenthe prism and the substrate surfaces. Light from a monochromator(SpectraPro 300i, Acton Research Corp.) was collimated and TM-polarized before being guided toward the prism by means of mirrorsmounted on one of the movable arms. The grating density was 300mm-1 and the wavelength interval used in this work was 600-800nm. A CCD detector (Retiga Exi, Qimaging Corp., 12 bit 1 MP withoutIR filter) with imaging optics was mounted on the opposite movablearm. The camera was connected to a computer through an IEEE-1394interface and custom software designed within the National InstrumentsLabVIEW environment was used to acquire and save image data. The
Figure 1. Schematic view of the imaging SPR instrument consistingof monochromator (A), collimating optics (B), rotatable polarizer (C),mirrors (D1-D3), prism and sensor surface (E), imaging optics (F),and CCD detector (G). The inset shows a magnification of the prismand sensor surface with the PMMA flow system docked: inlet (a),flow cell (b), O-ring casket (c), and outlet (d). The angle of incidence,θ, can be adjusted between 40-84° by simultaneously rotating themirrors and the detector.
Gradient Hydrogel Matrix Biomacromolecules, Vol. 10, No. 1, 2009 143
same software was used to control the monochromator and motorizedarms via an IEEE-488 interface. During the iSPR measurements theangle of incidence was kept fixed at 72.5°. At this angle, one pixel onthe CCD detector corresponded to an area of 2.2 × 8.2 µm2 on thesample surface. The wavelength was scanned at a speed of 100 nm/min. A flow cell milled from PMMA with physical dimensions of 5 ×5 × 0.1 mm3 was used to inject samples over the SPR substrates. ThePMMA cell was sealed to the surface with a nitril rubber O-ring. Asyringe pump was used to keep a constant flow of buffer at a rate of30 µL/min. Wavelength scans were acquired before and after injectionsof samples with the flow system. During the wavelength scans, imageswere saved at a rate of ∼0.6 Hz. Raw data from a complete wavelengthscan comprised an image-stack of reflectivity data. Typically, 121images in the stack constituted a full scan over a range of 200 nm.The output from the monochromator varied with wavelength, as didthe sensitivity of the CCD camera. Normalization was achieved byturning the polarizer 90° and making a scan of the reflection of TE-polarized light. After a complete wavelength scan, the reflectionspectrum of each pixel was interpolated to be equidistant and thereafterdivided by the corresponding pixels spectrum from reflection of TE-polarized light. The wavelength giving a minimum in reflection, theSPR wavelength (λSPR) was found by using a weighted centroidalgorithm.27 To reduce noise, only the pixels with a reflectivity below40% were used in the calculation of the SPR wavelength. The resultof a weighted centroid calculation of the image stack will be referredto as an SPR map throughout this work. In addition to a full SPR map,SPR curves from selected regions of interest could also be acquired.
Biomolecular Interaction Analysis: HSA and HFib. During thebiomolecular interaction analysis, hepes-buffered saline pH 7.4 (HBS-EP, GE Healthcare) also containing 0.005% surfactant Tween P20 wasused as running buffer. The carboxylated hydrogel surfaces wereactivated through a 5 min long injection of an aqueous mixture of 0.05M N-hydroxysuccinimide (NHS) and 0.2 M N-ethyl-N′-[3-(dimethy-lamino)-propyl]carbodiimide (EDC; Figure 2). After immobilization,the hydrogel was deactivated through a 7 min long injection ofethanolamine (1 M). Both the EDC/NHS and the ethanolamine wereprovided by GE Healthcare. Human serum albumin (HSA) waspurchased from Sigma-Aldrich and dissolved to a concentration of 700nM (50 µg/mL) in 10 mM sodium acetate buffer, pH 4.5 (GEHealthcare). Polyclonal rabbit anti-HSA (aHSA) was purchased fromDakocytomation A/S, Denmark, and dissolved in HBS-EP to aconcentration of 300 nM (50 µg/mL). The contact time for all injectionsof HSA and aHSA was 5 min. The nonspecific binding of humanfibrinogen (HFib; Hyphen BioMed SAS) to the hydrogel matrices wasstudied through a 5 min long injection of HFib dissolved in HBS-EPto a concentration of 1.4 µM (500 µg/mL).
Biomolecular Interaction Analysis: Calmodulin. Calmodulin(CaM) and the calmodulin binding domain (CBD), a 20-mer fragmentof myosin light chain kinase were purchased from Calbiochem. Themolecular weight of CaM is 17 kDa and of the CBD-peptide 2.3 kDa.
Calmodulin was reconstituted and diluted to the desired concentrations(0.3-100 µg/mL) in HBS-N (hepes buffer without EDTA or surfactant),with an addition of 6 mM CaCl2 (Merck). The CBD-peptide wasdissolved to a concentration of 90 µM (200 µg/mL) in 10 mM K/Na-phosphate, pH 6.8. The CBD peptide was immobilized to the hydrogelspot gradient surface by activation using EDC/NHS for 6 min, followedby an injection of CBD for 7 min. Ethanolamine was then injected for6 min to deactivate any remaining unreacted esters. The response uponintroduction of calmodulin in the presence of calcium was thenmeasured two minutes into the CaM injections.
Results and Discussion
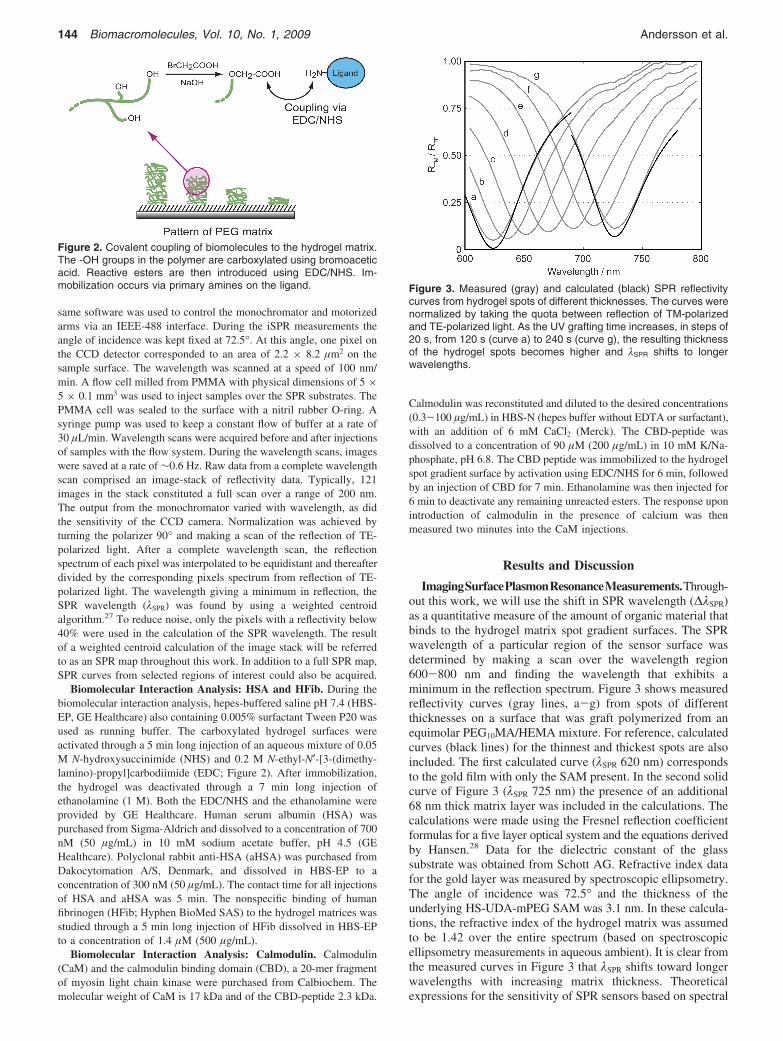
ImagingSurfacePlasmonResonanceMeasurements.Through-out this work, we will use the shift in SPR wavelength (∆λSPR)as a quantitative measure of the amount of organic material thatbinds to the hydrogel matrix spot gradient surfaces. The SPRwavelength of a particular region of the sensor surface wasdetermined by making a scan over the wavelength region600-800 nm and finding the wavelength that exhibits aminimum in the reflection spectrum. Figure 3 shows measuredreflectivity curves (gray lines, a-g) from spots of differentthicknesses on a surface that was graft polymerized from anequimolar PEG10MA/HEMA mixture. For reference, calculatedcurves (black lines) for the thinnest and thickest spots are alsoincluded. The first calculated curve (λSPR 620 nm) correspondsto the gold film with only the SAM present. In the second solidcurve of Figure 3 (λSPR 725 nm) the presence of an additional68 nm thick matrix layer was included in the calculations. Thecalculations were made using the Fresnel reflection coefficientformulas for a five layer optical system and the equations derivedby Hansen.28 Data for the dielectric constant of the glasssubstrate was obtained from Schott AG. Refractive index datafor the gold layer was measured by spectroscopic ellipsometry.The angle of incidence was 72.5° and the thickness of theunderlying HS-UDA-mPEG SAM was 3.1 nm. In these calcula-tions, the refractive index of the hydrogel matrix was assumedto be 1.42 over the entire spectrum (based on spectroscopicellipsometry measurements in aqueous ambient). It is clear fromthe measured curves in Figure 3 that λSPR shifts toward longerwavelengths with increasing matrix thickness. Theoreticalexpressions for the sensitivity of SPR sensors based on spectral
Figure 2. Covalent coupling of biomolecules to the hydrogel matrix.The -OH groups in the polymer are carboxylated using bromoaceticacid. Reactive esters are then introduced using EDC/NHS. Im-mobilization occurs via primary amines on the ligand. Figure 3. Measured (gray) and calculated (black) SPR reflectivity
curves from hydrogel spots of different thicknesses. The curves werenormalized by taking the quota between reflection of TM-polarizedand TE-polarized light. As the UV grafting time increases, in steps of20 s, from 120 s (curve a) to 240 s (curve g), the resulting thicknessof the hydrogel spots becomes higher and λSPR shifts to longerwavelengths.
144 Biomacromolecules, Vol. 10, No. 1, 2009 Andersson et al.

interrogation (δλSPR/δn) have been derived by Homola.24 Thesensitivity depends on the dispersion of the prism, the refractiveindex of the sensing medium and also varies with the wave-length. For a 50 nm gold film on BK7 glass with air as thesensing medium, the sensitivity to changes in the refractive indexin the vicinity of the sensor surface is reported to lie at around8 nm/mRIU at 600 and 11 nm/mRIU at 800 nm. In aqueousmedia the sensitivity is reduced by a factor of 2.25 These valuesare valid under the assumption that the sensing layer extendsthroughout the SPR probe depth, which typically falls in therange 80-150 nm.29 In our case, the hydrogel thickness is muchsmaller than the probe depth. Under these conditions anotherinteresting parameter is the SPR response to changes in thethickness of the hydrogel layer. For example, the sensitivity(δλSPR/δd) has been reported to vary between approximately11 at λ ) 600 nm and 13 at λ ) 700 nm for a thin film in air.24
Our calculations, based on the Fresnel formulas and with ourexperimental setup, show that for addition of a thin film (d )1 nm) with refractive index n ) 1.45 on top of our matrix spots,in an aqueous ambient, the SPR wavelength will shift by ∼2.0nm for the thinnest and by ∼1.8 nm for the thickest spots. Whenthere is a uniform increase in refractive index of the hydrogelmatrix, the SPR wavelength of the thickest spots (d ) 70 nm)increases by (δλSPR/δn) ≈ 1.4 nm/mRIU. Furthermore, thevariation in sensitivity with respect to hydrogel thickness isapproximately linear with a slope of ∼0.02 mRIU-1. Therefore,a quantitative difference in ∆λSPR between spots of differentthickness can be interpreted as signifying more uniform bindingthroughout the hydrogel, whereas when there is no or littledifference between the spots it can be concluded that themolecular species are unable or hindered to penetrate the matrix.
Thickness of the Hydrogel Spot Gradient. Imaging ellip-sometry was employed to study the thickness profile of the graftpolymerized spot gradient. Figure 4 shows the ellipsometricthickness profile of a hydrogel matrix spot gradient from amonomer solution with a 50% HEMA composition. The spotsare 200 µm in diameter with a separation of 100 µm. Thethickest (leftmost) spots were graft polymerized for 5 min,resulting in a final thickness of about 45 nm. The first sign ofgrafting appears after a UV exposure time of 2 min and 20 s,in agreement with previous results for similar patterned sur-faces.9 It is likely that this start-up period is necessitated by thepresence of inhibitors and oxygen, which need to be depletedbefore grafting can begin. Thus, diffusion of these interferingspecies from the nonilluminated areas into the spot areas isbelieved to be the reason for the observed lag time. Analogously,this is also considered to be the cause of the inclined appearanceof the matrix spots, as seen in Figure 5, which are particularlyobvious in the line profiles of Figure 5B. The grafting appears
to be more efficient on the side of the spots facing areas thathave experienced a longer UV light exposure time than on theside adjacent to areas that have been exposed for a shorter time.After about four minutes of grafting, the thickness starts to leveloff. The complete gradient consists of eleven spots withdistinctly different thicknesses ranging from about 5-45 nmin the dry state. Figure 5A shows an iSPR surface map of ahydrogel matrix spot gradient with a HEMA content of 75%.In the SPR surface map, only the first seven spots of thethickness gradient are shown. Chromatic aberration lowers theresolution and somewhat blurs the features of the hydrogel spots,making accurate calculation of λSPR at the edges difficult andresults in sharp rims surrounding the spots in the SPR map andin the line profiles (visible as spikes in Figure 6C and D). TheUV exposure time over the seven spots of the SPR map rangesfrom 140 to 220 s. This is the region of the gradient studied forthe remainder of this paper. The SPR angle varies between about620 and 740 nm over this region. Figure 5B shows line profilestaken across one gradient row from surfaces graft polymerizedwith different PEG10MA/HEMA mixing ratios. With the excep-tion of 100% HEMA (lower dotted line), the mixing ratio ofthe monomer solution seems to have only a minor effect on thefinal thickness of the hydrogel, and the slight variation in slopeand thickness of the 25, 50, and 75% HEMA gradients cannotbe unambiguously interpreted as an effect of polymer mixturebut rather reflects the reproducibility of the grafting method. Inearlier work, we have established that the degradation rate ofpolymerized HEMA, due to UV exposure during grafting, ismuch greater than that of PEG10MA (which hardly degrades atall), leading to an intrinsically thinner matrix when grafting from100% HEMA monomer solutions.10
Immobilization and Biomolecular Interaction Analysis.The ability of the carboxylated matrix to perform in biospecificinteraction analysis was studied by iSPR. As a model system,we used the interaction between HSA (Mw 66 kDa) and aHSA(Mw 146 kDa). Following carboxylation, the spot gradientsurfaces were docked into the iSPR instrument and the proteinligand, HSA, was covalently coupled to the matrix using amine-coupling (Figure 2). In Figure 6A, the SPR angle shift uponHSA immobilization to three differently composed hydrogel
Figure 4. Line profile showing the thickness, determined by ellip-sometry, of an UV grafted hydrogel chip with 50% HEMA content.The exposure time was varied in 20 s steps from left to right, wherethe leftmost spot column was exposed for a total of 300 s. A minimumof 140 s UV-exposure was required for polymer grafting to begin.The background is a thickness map, measured by imaging ellipsom-etry, showing three rows of the hydrogel spot gradient surface.
Figure 5. (A) SPR wavelength map of a hydrogel spot gradientsurface with a HEMA content of 75%. (B) Line profiles of spotgradients grafted with different HEMA content. From the top down,25 (solid), 75 (dashed), 50 (dash-dot), and 100% HEMA (dotted). Therightmost axis shows the calculated hydrogel matrix thickness basedon a refractive index of n ) 1.42.
Gradient Hydrogel Matrix Biomacromolecules, Vol. 10, No. 1, 2009 145

matrix gradients is shown. As can be seen in the line profilesin Figure 6C, the protein loading capacity of the spots increaseswith increasing HEMA content. As expected, the amount ofHSA binding to the matrix is also higher the thicker the spotsare. All substrates were activated in the same manner, by flowingof a mixture of EDC/NHS over the surface for five minutes.After immobilization, any remaining anchors were deactivatedby flow of ethanolamine for 7 min. The lower immobilizationcapacity of the matrices rich in PEG10MA, seemingly reflectsthe higher abundance of protein repellent PEG chains. In part,this could also be attributed to a difference in the susceptibilityof the hydroxyl end groups of the PEG10MA compared to theHEMA monomers to introduction of carboxyl groups andsubsequent EDC/NHS activation, as revealed by recent infraredreflection absorption spectroscopy measurements.10,11 The iSPRresponse upon activation of the hydrogel spots is, however,nearly uniform when taking into account the difference in spotthickness and molecular weight of the two monomers (data notshown). The pH dependence of the immobilization was not
investigated in this work. However, by using a low pH (4.5 inthis case), charge attraction between the negatively charged nonactivated carboxyl groups in the matrix and positive groups onthe protein ligand is likely to aid in immobilization. To controlthe ligand loading capacity of the hydrogel matrix, it is alsonecessary to investigate the influence of the contact time duringactivation, which in the present case was 5 min, and the pH ofthe coupling buffer on the immobilization level.
In this contribution, we have shown that iSPR can be usedto comprehensively visualize and evaluate the binding propertiesof our hydrogel matrix chip. This is useful when optimizingthe performance of hydrogel matrices for future biosensor andmicroarray applications. The fact that the response of HSAbinding increases with the thickness is an indication that thisprotein is able to penetrate, at least partially, into the hydrogelmatrix. The maximum response of ∆λSPR ≈ 20 nm correspondsto an effective thickness (if HSA would bind on top of thematrix) of the HSA layer of ∼10 nm, which is significantlymore than a monolayer. Contrary to the immobilization of HSA,the response after addition of the antibody (aHSA) to the chipsdoes not seem to depend on the hydrogel thickness. As can beseen in the surface map and line profiles of Figure 6C and D,the response of aHSA binding is almost the same to all hydrogelthicknesses. Due to the difference in molecular size of HSAand aHSA, and because aHSA is polyclonal, the change in SPRwavelength upon binding of the antibody is expected to be morethan twice that of the ligand response. This is the case only forthe thinnest spots. The hydrogel matrix spot gradient with 75%HEMA content, onto which the most HSA could be im-mobilized, also binds the most aHSA. However, the effectivethickness (assuming a homogeneous protein layer on top of thehydrogel) of the aHSA layer is e5 nm (∆λSPR ≈ 10 nm), whichis less than a full monolayer. Further, because the response doesnot increase with increasing thickness, it appears that all of theligand is not available for interaction with the analyte. It is verylikely that the hydrogel matrix is too dense or cross-linked, insuch a way that the larger aHSA (146 kDa) antibody is unableto penetrate as deep as the HSA (66 kDa) protein molecules.The increase in aHSA binding with increasing HEMA contentseemingly reflects the level of immobilized HSA. Thus, it seemsreasonable to assume that the antibodies bind to HSA presentin the outermost portion of the hydrogel, forming an adlayeron top of the matrix, and that there is no discernible differencein diffusion of aHSA within the differently composed matrices.Cross-linking can occur during the grafting process but alsoduring immobilization, due to multipoint attachment of HSAproteins to activated carboxyl groups. This finding is alsosupported by infrared reflection absorption-measurements thatpoints toward a large degree of size-selectivity of the hydrogelmatrix.11
CaM-CBD Biointeraction Analysis. To further study thesize-selectivity of the hydrogel spot gradient a low molecularweight ligand-analyte system was employed. A commerciallyavailable 2.2 kDa calmodulin binding peptide was bound to thehydrogel using amine coupling, and the interaction withcalmodulin (17 kDa) was subsequently studied. Based on thefindings from the HSA-aHSA study, we opted in this case fora matrix with 75% HEMA. Figure 7A-D show SPR maps andline profiles of the binding of CBD and CaM. As can be seen,there is a clear dependence on spot thickness of the SPRresponse for both the ligand and analyte. Contrary to the aHSA,the CaM response does not seem to level off as the hydrogelthickness increases. This suggests that the smaller sized CaMis able to penetrate the matrix to a greater extent than the larger
Figure 6. SPR maps of the change in λSPR upon immobilization ofHSA (A) and interaction with aHSA (B). The line profiles in C (HSA)and D (aHSA) show the response of hydrogel spot gradients withdifferent HEMA content: from the top down, 75 (dotted), 50 (dashed),and 25% (solid). No nonspecific binding to the HS-UDA-mPEG inbetween the hydrogel spots can be observed.
146 Biomacromolecules, Vol. 10, No. 1, 2009 Andersson et al.

sized antibody. Hence, the hydrogel matrix exhibits certainselectivity and seems to be capable of filtering with respect tomolecular size, thus acting as a molecular sieve. The responsecurves in Figure 7E further illustrate this point. Herein, thedependence on the CaM concentration of the SPR response isshown for each spot of the gradient. In quantitative terms, onewould expect the response upon binding of CaM to besignificantly larger than the CBD response due to the differencein molecular weight. The fact that this is not the case leads usto suggest that all immobilized CBD peptides might not beaccessible for the CaM. Another plausible cause for this is thatthe level of peptide immobilization is so large that saturation isnot reached for the CaM concentrations used herein. As can beseen in Figure 7E, the slope of the curve does not level offcompletely even for the highest concentration. Even so, sincethe response increases with hydrogel thickness, it can beconcluded that the best performance of the PEG10MA/HEMAhydrogel for a small-sized biomolecular system is achieved forthe thickest matrix.
Nonspecific Binding During Interaction Analysis. The roleof the PEG10 chains of the hydrogel matrix is to improveresistance to protein adsorption and inhibit nonspecific bindingduring the biomolecular interaction analysis. Nonspecific bindingto the differently composed hydrogel matrices was investigatedby flowing of HFib dissolved in buffer over the surfaces. Whenusing an acidic buffer (sodium acetate pH 4.5) and flowing ofHFib at a concentration of 1.4 µM (500 µg/mL) over acarboxylated surface before treatment with EDC/NHS, the SPRwavelength shift due to nonspecifically bound HFib was around1 nm (data not shown). No significant difference between thedifferently composed matrices could be observed. The measuredresponse of the nonspecific binding was taken two minutes afterthe end of the HFib injection. During the injection, however,the hydrogel matrices with a high PEG10MA content showed alower degree of protein adsorption than the HEMA matrix. Theprotein resistant PEG chains probably account for most of thiseffect but it could also be that the HEMA matrix is more porousto the large HFib protein. Figure 8 shows the nonspecific bindingof HFib dissolved in HBS-EP buffer at a pH of 7.4 to surfacesthat were activated with EDC/NHS and thereafter deactivatedwith ethanolamine. The response levels are all very low,typically e1% of the specific response of aHSA in Figure 6,but the nonspecific binding is slightly higher for the 100%HEMA matrix. The difference between the other matrixcompositions is not significant, indicating that a PEG10MAcontent of 25% is sufficient to eliminate nonspecific binding inthis case. For comparison, the iSPR response to the pure OEG-SAM is also included in Figure 8. The nonspecific binding tothe OEG-SAM is also very low, proving the usefulness of theSAM as a passive barrier between the spots. The nonspecificbinding of HFib did not seem to depend on the thickness of thespots, possibly because of size discrimination of the large-sizedprotein HFib (Mw ) 340 kDa); therefore, the responses givenin Figure 8 are taken for the thickest hydrogel spot only,representing an UV graft polymerization time of some 220 s. Itshould be noted that this exposure time results in fairly equalhydrogel thicknesses (d ) 70 nm) for the 25, 50, and 75%HEMA compositions, but that the 100% HEMA hydrogel, whichexhibits the highest level of nonspecific binding, is considerablythinner (d ) 40 nm).
Figure 7. Immobilization of the calmodulin binding domain peptide(CBD) and the subsequent binding of calmodulin (CaM). SPR mapshowing binding of CBD (A) and 100 µg/mL CaM (B) to a hydrogelspot gradient. Line profiles (C and D) taken across the same row asin A and B. SPR response curves (E) showing the calmodulinconcentration dependence for each hydrogel spot (arabic numerals1-7). The solid lines are included as guides.
Figure 8. SPR response after deactivation of hydrogel matrix spotgradients with different HEMA content. The reading was made 2 minafter a finished injection of 1.4 µM HFib dissolved in HBS-EP, pH7.4. The confidence bars shows the standard deviation from threespots on the same sample. For reference, the nonspecific binding tothe HS-UDA-mPEG SAM is also shown. Only the response to thethickest hydrogel spots of each sample is shown (Note thatthe response level for 100% HEMA is close to the resolution of theimaging SPR instrument).
Gradient Hydrogel Matrix Biomacromolecules, Vol. 10, No. 1, 2009 147

Conclusions
A hydrogel matrix spot gradient, suitable as a template forevaluating specific as well as nonspecific binding phenomenato protein microarray sensors, was UV-graft copolymerized froma mixture of PEG10MA and HEMA monomers onto OEG-SAMmodified gold surfaces. By varying the grafting time laterally,using a photomask and a motorized shutter, rows of spots withthicknesses ranging from 0-70 nm surrounded by inert OEGbarriers was grafted on the same chip. The spots exhibited asloping profile, mainly an effect of diffusion of inhibitors andoxygen from unexposed areas that interfered with the graftingprocess. The performance of the hydrogel matrix was studiedthrough an in situ biomolecular interaction study of HSA andaHSA using spot gradients of different relative HEMA:PEG10MA compositions. A PEG10MA content of 25% success-fully eliminated nonspecific adsorption of HFib to the hydrogelmatrix. It was also shown that the loading capacity of HSA tothe carboxyl groups introduced in the matrix, increases withincreasing HEMA content. Therefore, we conclude that, forpractical purposes, a HEMA content of 75% is viable. Theregions in between the matrix spots on the chip were coveredwith a SAM of OEG-thiol. These regions were completelypassive to nonspecific binding of the investigated species, HFib,HSA, and aHSA under in situ conditions, providing excellentgrid barriers to the active spots.
The permeability of the matrix to large molecules seems tobe hampered. This can be disadvantageous as steric constraintsmay hinder the biospecific interactions. On the other hand, lowporosity may aid in reducing nonspecific binding through theexclusion of large biomolecules, and can be an advantage ininteraction analysis of small species. The CBD-CaM interactionanalysis shows that for small molecular systems a thicker matrixis beneficial. For HSA-aHSA there was no difference in responsebetween spots with different thicknesses, owing to size exclusionof the large antibody. Our hydrogel surface fabrication approach,which allows for thin and thick spots to be created with easeon the same chip, is therefore particularly suitable in arrayapplications where detection of analytes with different sizes isdesired.
In all, our approach of using iSPR to evaluate the performanceof the hydrogel spot matrix in biosensor applications was provenefficient. The requirement set by the thickness gradient for alarge dynamic range could be met using iSPR in spectralinterrogation mode. It is furthermore concluded that iSPR is avery useful technique for quick evaluation of the performanceof this type of hydrogel matrices and to screen for optimalthickness and composition.
Acknowledgment. This work was supported by the SwedishResearch Council (VR), the Foundation for Strategic Research(SSF) through the Biomimetic Materials Science Program and
the European Commission through the Integrated Project“HealthCARE by Biosensor Measurements and Networking”(CARE-MAN, NMP4-CT-2006-017333).
References and Notes(1) Lofås, S.; Johnsson, B. J. Chem. Soc., Chem. Commun. 1990, 21,
1526–1528.(2) Ellerby, L. M.; Nishida, C. R.; Nishida, F.; Yamanaka, S. A.; Dunn,
B.; Valentine, J. S.; Zink, J. I. Science 1992, 255 (5048), 1113–1115.(3) Yamanaka, S. A.; Nishida, F.; Ellerby, L. M.; Nishida, C. R.; Dunn,
B.; Valentine, J. S.; Zink, J. I. Chem. Mater. 1992, 4 (3), 495–497.(4) Munoz, E. A.; Yu, H. N.; Hallock, J.; Edens, R. E.; Linhardt, R. J.
Anal. Biochem. 2005, 343 (1), 176–178.(5) Lata, S.; Piehler, J. Anal. Chem. 2005, 77 (4), 1096–1105.(6) Piehler, J.; Brecht, A.; Valiokas, R.; Liedberg, B.; Gauglitz, G. Biosens.
Bioelectron. 2000, 15 (9-10), 473–481.(7) Huang, N. P.; Voros, J.; De Paul, S. M.; Textor, M.; Spencer, N. D.
Langmuir 2002, 18 (1), 220–230.(8) Masson, J. F.; Battaglia, T. M.; Kim, Y. C.; Prakash, A.; Beaudoin,
S.; Booksh, K. S. Talanta 2004, 64 (3), 716–725.(9) Larsson, A.; Du, C.-X.; Liedberg, B. Biomacromolecules 2007, 8 (11),
3511–3518.(10) Larsson, A.; Ekblad, T.; Andersson, O.; Liedberg, B. Biomacromol-
ecules 2007, 8, 287–295.(11) Larsson, A.; Liedberg, B. Langmuir 2007, 23 (22), 11319–11325.(12) Zhou, Y.; Andersson, O.; Lindberg, P.; Liedberg, B. Microchim. Acta
2004, 147 (1-2), 21–30.(13) Zhou, Y.; Andersson, O.; Lindberg, P.; Liedberg, B. Microchim. Acta
2004, 146 (3-4), 193–205.(14) Valiokas, R.; Klenkar, G.; Tinazli, A.; Tampe, R.; Liedberg, B.; Piehler,
J. ChemBioChem 2006, 7 (9), 1325–1329.(15) Kannan, B.; Castelino, K.; Chen, F. F.; Majumdar, A. Biosens.
Bioelectron. 2006, 21 (10), 1960–1967.(16) Liedberg, B.; Nylander, C.; Lundstrom, I. Sens. Actuators 1983, 4,
299–304.(17) Raether, H. Surface Plasmons on Smooth and Rough Surfaces and on
Gratings; Springer-Verlag: Berlin-Heidelberg, 1988; Vol. 111.(18) Kretschmann, E.; Raether, H. Z. Naturforsch. 1968, A23, 2135–2136.(19) Rothenhausler, B.; Knoll, W. Nature 1988, 332 (6165), 615–617.(20) Stenberg, E.; Persson, B.; Roos, H.; Urbaniczky, C. J. Colloid Interface
Sci. 1991, 143 (2), 513–526.(21) Zhang, L. M.; Uttamchandani, D. Electron. Lett. 1988, 24 (23), 1469–
1470.(22) Yuk, J. S.; Hong, D. G.; Jung, H. I.; Ha, K. S. Sens. Actuators, B
2006, 119 (2), 673–675.(23) Yuk, J. S.; Kim, H. S.; Jung, J. W.; Jung, S. H.; Lee, S. J.; Kim,
W. J.; Han, J. A.; Kim, Y. M.; Ha, K. S. Biosens. Bioelectron. 2006,21 (8), 1521–1528.
(24) Homola, J. Sens. Actuators, B 1997, 41, 207–211.(25) Yuk, J. S.; Jung, J. W.; Jung, S. H.; Han, J. A.; Kim, Y. M.; Ha, K. S.
Biosens. Bioelectron. 2005, 20 (11), 2189–2196.(26) Yuk, J. S.; Yi, S. J.; Lee, H. G.; Lee, H. J.; Kim, Y. M.; Ha, K. S.
Sens. Actuators, B 2003, 94 (2), 161–164.(27) Johansen, K.; Ståhlberg, R.; Liedberg, B. Meas. Sci. Technol. 2000,
11, 1630–1638.(28) Hansen, W. N. J. Opt. Soc. Am. 1968, 58 (3), 380–390.(29) Johansen, K.; Arwin, H.; Lundstrom, I.; Liedberg, B. ReV. Sci. Instrum.
2000, 71 (9), 3530–3538.
BM801029B
148 Biomacromolecules, Vol. 10, No. 1, 2009 Andersson et al.
Copyright © 2022 FDOKUMEN


![CSE 168 [Spr 20], Lecture 17: Image-Based Rendering](https://static.fdokumen.com/doc/165x107/633317da69509937270211a2/cse-168-spr-20-lecture-17-image-based-rendering.jpg)