Quantitative Measurement of Melanoma Spread in Sentinel Lymph Nodes and Survival
17
Quantitative Measurement of Melanoma Spread in Sentinel Lymph Nodes and Survival Anja Ulmer 1 *, Klaus Dietz 2 , Isabelle Hodak 3 , Bernhard Polzer 3,4 , Sebastian Scheitler 3 , Murat Yildiz 3 , Zbigniew Czyz 3,4 , Petra Lehnert 1 , Tanja Fehm 5 , Christian Hafner 6 , Stefan Schanz 1 , Martin Ro ¨ cken 1 , Claus Garbe 1 , Helmut Breuninger 1 , Gerhard Fierlbeck 1 , Christoph A. Klein 3,4 * 1 Department of Dermatology, University of Tu ¨ bingen, Tu ¨ bingen, Germany, 2 Department of Medical Biometry, University of Tu ¨ bingen, Tu ¨ bingen, Germany, 3 Chair of Experimental Medicine and Therapy Research, Department of Pathology, University of Regensburg, Regensburg, Germany, 4 Project Group Personalized Tumor Therapy, Fraunhofer-Institut fu ¨ r Toxikologie und Experimentelle Medizin, Regensburg, Germany, 5 Department of Gynecology, University of Du ¨ sseldorf, Du ¨ sseldorf, Germany, 6 Department of Dermatology, University of Regensburg, Regensburg, Germany Abstract Background: Sentinel lymph node spread is a crucial factor in melanoma outcome. We aimed to define the impact of minimal cancer spread and of increasing numbers of disseminated cancer cells on melanoma-specific survival. Methods and Findings: We analyzed 1,834 sentinel nodes from 1,027 patients with ultrasound node-negative melanoma who underwent sentinel node biopsy between February 8, 2000, and June 19, 2008, by histopathology including immunohistochemistry and quantitative immunocytology. For immunocytology we recorded the number of disseminated cancer cells (DCCs) per million lymph node cells (DCC density [DCCD]) after disaggregation and immunostaining for the melanocytic marker gp100. None of the control lymph nodes from non-melanoma patients (n= 52) harbored gp100-positive cells. We analyzed gp100-positive cells from melanoma patients by comparative genomic hybridization and found, in 45 of 46 patients tested, gp100-positive cells displaying genomic alterations. At a median follow-up of 49 mo (range 3–123 mo), 138 patients (13.4%) had died from melanoma. Increased DCCD was associated with increased risk for death due to melanoma (univariable analysis; p,0.001; hazard ratio 1.81, 95% CI 1.61–2.01, for a 10-fold increase in DCCD + 1). Even patients with a positive DCCD #3 had an increased risk of dying from melanoma compared to patients with DCCD = 0 (p= 0.04; hazard ratio 1.63, 95% CI 1.02–2.58). Upon multivariable testing DCCD was a stronger predictor of death than histopathology. The final model included thickness, DCCD, and ulceration (all p,0.001) as the most relevant prognostic factors, was internally validated by bootstrapping, and provided superior survival prediction compared to the current American Joint Committee on Cancer staging categories. Conclusions: Cancer cell dissemination to the sentinel node is a quantitative risk factor for melanoma death. A model based on the combined quantitative effects of DCCD, tumor thickness, and ulceration predicted outcome best, particularly at longer follow-up. If these results are validated in an independent study, establishing quantitative immunocytology in histopathological laboratories may be useful clinically. Please see later in the article for the Editors’ Summary. Citation: Ulmer A, Dietz K, Hodak I, Polzer B, Scheitler S, et al. (2014) Quantitative Measurement of Melanoma Spread in Sentinel Lymph Nodes and Survival. PLoS Med 11(2): e1001604. doi:10.1371/journal.pmed.1001604 Academic Editor: Jonathan L. Rees, University of Edinburgh, United Kingdom Received February 14, 2013; Accepted January 9, 2014; Published February 18, 2014 Copyright: ß 2014 Ulmer et al. This is an open-access article distributed under the terms of the Creative Commons Attribution License, which permits unrestricted use, distribution, and reproduction in any medium, provided the original author and source are credited. Funding: This work was supported by grants from the University of Tu ¨ bingen (IZKF-1686-0-0, to AU) and the Ludwig-Hiermaier Stiftung (to AU) and by grants from the Wilhelm-Sander Stiftung (2003.005), the Deutsche Krebshilfe (108008), and the Bavarian State Ministry of Sciences, Research and the Arts (to CAK). No funding bodies had any role in study design, data collection and analysis, decision to publish, or preparation of the manuscript. Competing Interests: The authors have declared that no competing interests exist. Abbreviations: AJCC, American Joint Committee on Cancer; BIC, Bayes information criterion; CGH, comparative genomic hybridization; DCC, disseminated cancer cell; DCCD, disseminated cancer cell density; RT-PCR, reverse transcriptase polymerase chain reaction. * E-mail: [email protected] (AU); [email protected] (CAK) PLOS Medicine | www.plosmedicine.org 1 February 2014 | Volume 11 | Issue 2 | e1001604
-
Upload
uni-tzuebingen -
Category
Documents
-
view
3 -
download
0
Transcript of Quantitative Measurement of Melanoma Spread in Sentinel Lymph Nodes and Survival

Quantitative Measurement of Melanoma Spread inSentinel Lymph Nodes and SurvivalAnja Ulmer1*, Klaus Dietz2, Isabelle Hodak3, Bernhard Polzer3,4, Sebastian Scheitler3, Murat Yildiz3,
Zbigniew Czyz3,4, Petra Lehnert1, Tanja Fehm5, Christian Hafner6, Stefan Schanz1, Martin Rocken1,
Claus Garbe1, Helmut Breuninger1, Gerhard Fierlbeck1, Christoph A. Klein3,4*
1 Department of Dermatology, University of Tubingen, Tubingen, Germany, 2 Department of Medical Biometry, University of Tubingen, Tubingen, Germany, 3 Chair of
Experimental Medicine and Therapy Research, Department of Pathology, University of Regensburg, Regensburg, Germany, 4 Project Group Personalized Tumor Therapy,
Fraunhofer-Institut fur Toxikologie und Experimentelle Medizin, Regensburg, Germany, 5 Department of Gynecology, University of Dusseldorf, Dusseldorf, Germany,
6 Department of Dermatology, University of Regensburg, Regensburg, Germany
Abstract
Background: Sentinel lymph node spread is a crucial factor in melanoma outcome. We aimed to define the impact ofminimal cancer spread and of increasing numbers of disseminated cancer cells on melanoma-specific survival.
Methods and Findings: We analyzed 1,834 sentinel nodes from 1,027 patients with ultrasound node-negative melanomawho underwent sentinel node biopsy between February 8, 2000, and June 19, 2008, by histopathology includingimmunohistochemistry and quantitative immunocytology. For immunocytology we recorded the number of disseminatedcancer cells (DCCs) per million lymph node cells (DCC density [DCCD]) after disaggregation and immunostaining for themelanocytic marker gp100. None of the control lymph nodes from non-melanoma patients (n = 52) harbored gp100-positivecells. We analyzed gp100-positive cells from melanoma patients by comparative genomic hybridization and found, in 45 of46 patients tested, gp100-positive cells displaying genomic alterations. At a median follow-up of 49 mo (range 3–123 mo),138 patients (13.4%) had died from melanoma. Increased DCCD was associated with increased risk for death due tomelanoma (univariable analysis; p,0.001; hazard ratio 1.81, 95% CI 1.61–2.01, for a 10-fold increase in DCCD + 1). Evenpatients with a positive DCCD #3 had an increased risk of dying from melanoma compared to patients with DCCD = 0(p = 0.04; hazard ratio 1.63, 95% CI 1.02–2.58). Upon multivariable testing DCCD was a stronger predictor of death thanhistopathology. The final model included thickness, DCCD, and ulceration (all p,0.001) as the most relevant prognosticfactors, was internally validated by bootstrapping, and provided superior survival prediction compared to the currentAmerican Joint Committee on Cancer staging categories.
Conclusions: Cancer cell dissemination to the sentinel node is a quantitative risk factor for melanoma death. A model basedon the combined quantitative effects of DCCD, tumor thickness, and ulceration predicted outcome best, particularly atlonger follow-up. If these results are validated in an independent study, establishing quantitative immunocytology inhistopathological laboratories may be useful clinically.
Please see later in the article for the Editors’ Summary.
Citation: Ulmer A, Dietz K, Hodak I, Polzer B, Scheitler S, et al. (2014) Quantitative Measurement of Melanoma Spread in Sentinel Lymph Nodes and Survival. PLoSMed 11(2): e1001604. doi:10.1371/journal.pmed.1001604
Academic Editor: Jonathan L. Rees, University of Edinburgh, United Kingdom
Received February 14, 2013; Accepted January 9, 2014; Published February 18, 2014
Copyright: � 2014 Ulmer et al. This is an open-access article distributed under the terms of the Creative Commons Attribution License, which permitsunrestricted use, distribution, and reproduction in any medium, provided the original author and source are credited.
Funding: This work was supported by grants from the University of Tubingen (IZKF-1686-0-0, to AU) and the Ludwig-Hiermaier Stiftung (to AU) and by grantsfrom the Wilhelm-Sander Stiftung (2003.005), the Deutsche Krebshilfe (108008), and the Bavarian State Ministry of Sciences, Research and the Arts (to CAK). Nofunding bodies had any role in study design, data collection and analysis, decision to publish, or preparation of the manuscript.
Competing Interests: The authors have declared that no competing interests exist.
Abbreviations: AJCC, American Joint Committee on Cancer; BIC, Bayes information criterion; CGH, comparative genomic hybridization; DCC, disseminatedcancer cell; DCCD, disseminated cancer cell density; RT-PCR, reverse transcriptase polymerase chain reaction.
* E-mail: [email protected] (AU); [email protected] (CAK)
PLOS Medicine | www.plosmedicine.org 1 February 2014 | Volume 11 | Issue 2 | e1001604
Introduction
For melanoma staging, sentinel node biopsy has been estab-
lished to assess melanoma cell dissemination and has become the
most widely used procedure to determine the regional lymph node
status in patients with cutaneous melanoma [1,2]. Because an
evidence-based lower threshold for clinically relevant melanoma
spread could not be defined [3], the detection of isolated
melanoma cells in sentinel nodes was included in the latest
American Joint Committee on Cancer (AJCC) staging recom-
mendations [4]. However, the prognostic value of small tumor
deposits in sentinel nodes is not unanimously accepted [5–7]. One
potential reason for this lack of confidence may be that, unlike
measurements of primary tumor thickness, highly sensitive
methods for precise and direct quantification of sentinel node
involvement by histopathology, optimal sample preparation, and
screening are still lacking. The chance of detecting rare tumor cells
by histopathology depends on the number of sections screened [8],
and extensive histopathological protocols [7,9–11] can achieve a
detection rate of 30% but require the analysis of 24 to 36 slides per
node [7]. Since this translates into 42 h of examination time for
about ten melanoma patients a week [12], it is obviously
impracticable for many institutions. Because of a lack of
standardization [7,10,11,13–16], the accuracy of sentinel node
analysis has been limited for the mentioned practical reasons.
We previously developed a quantitative immunocytological
assay to identify early cancer spread in sentinel nodes [17]. In this
assay, the sentinel node is disaggregated, and disseminated cancer
cells (DCCs) are detected by immunostaining for gp100, an
antigen involved in melanin synthesis, using the HMB45 antibody
[17]. The number of DCCs per 106 isolated cells defines the DCC
density (DCCD). In the current study we applied this assay to a
prospective cohort of 1,027 patients. The aim was to evaluate its
predictive value as a quantitative variable in comparison to
qualitative routine histopathology and to address the role of
minimal tumor seeding in the survival of melanoma patients.
Methods
Ethics StatementOur study complied with the guidelines of the Declaration of
Helsinki. As such, the institutional review boards of the University
of Tubingen (ethics vote number 5/99) and the University of
Regensburg (ethics vote number 07/79) approved the study. All
patients provided written informed consent to examination of their
sentinel nodes by disaggregation immunocytology, to the record-
ing of their follow-up data in the Central Malignant Melanoma
Registry of the German Dermatological Society, and to the
molecular characterization of the isolated cells. Control (non-
melanoma) nodes were obtained from patients with chronic
venous insufficiency in whom a lymph node was removed during
crossectomy, or from non-melanoma skin cancer patients. Sample
acquisition was in agreement with the rules of the Ethics
Committee of the University of Tubingen for use of waste tissue.
No personal data were recorded from the control patients.
PatientsFrom February 8, 2000, to June 16, 2008, we enrolled 1,154
patients who underwent lymphatic mapping and sentinel node
biopsy at the University Hospital Tubingen, Germany, for
histopathologically proven first invasive primary cutaneous mel-
anoma. At the Department of Dermatology, University Hospital
Tubingen, sentinel node biopsy is generally recommended for
patients with melanoma lesions with a Breslow’s tumor thickness of
$1.0 mm, with primary tumors of Clark level IV or V, or with
tumors of any Breslow’s thickness but showing regression or
ulceration. Twelve patients without other risk factors requested
sentinel node biopsy although their melanomas were thinner than
1 mm. The preoperative staging to exclude metastatic disease
consisted of a physical examination, ultrasound examination of
regional lymph nodes and the abdomen, chest X-ray, and
computed tomography brain scans. For final analysis 119 patients
were excluded as they had a follow-up of less than 3 mo, and eight
patients were excluded because of missing information about
primary tumor thickness. The remaining 1,027 patients (Table 1)
included 322 whose DCCD results have been reported in an
interim analysis [17], however without follow-up information. Skin
draining control lymph nodes (n = 58) were obtained from 52 non-
melanoma patients (52 skin draining nodes from nonmalignant
conditions, six sentinel nodes from non-melanoma skin cancer
patients) and disaggregated, stained, and evaluated identically to
the lymph nodes of melanoma patients.
Lymphatic Mapping, Sentinel Node Biopsy, and TumorCell Detection
Cutaneous lymphoscintigraphy, sentinel node biopsy, and
sample preparation were performed as previously described [17]
with minor modifications. From the beginning of the study until 31
July 2003, the procedure was as follows. The lymph node was cut
along its longitudinal axis for histopathological and immunocyto-
logical examination. One half of the sentinel node was fixed in
3.5% formaldehyde, paraffin-embedded, and subjected to stan-
dard histopathological treatment, which included hematoxylin and
eosin staining and immunohistochemistry on three 4-mm paraffin
sections from the central level. From 1 August 2003 until the end
of the study, the procedure was as follows. The lymph nodes were
cut perpendicularly to the long axis [15]. For histopathology,
2-mm slices were cut after formalin fixation of the tissue.
Hematoxylin and eosin staining and immunostaining (using
antibodies directed against S100, HMB45, and Melan-A) of
sections from each level was performed as described above. Thus,
the total number of sections examined per node varied according
to the size of the node. However, in all cases at least two levels
(with four 4-mm sections each) were examined. The complete
histopathological workup of the lymph nodes was done at the
Department of Pathology, University of Tubingen, without
knowledge of the immunocytological gp100 result. A patient was
documented as histopathologically positive if at least one node was
considered positive by the histopathological examination. The
patients with isolated tumor cells were considered histopatholog-
ically positive.
Quantitative immunocytology was performed immediately after
sentinel node biopsy at the Department of Dermatology, University
of Tubingen, using the other unfixed half of the lymph node [17].
The lymphatic tissue was cut into 1-mm pieces and disaggregated
mechanically into a single-cell suspension by rotating knifes (DAKO
Medimachine, DAKO), washed with HBSS (Life Technologies),
and centrifuged on a density gradient made of a 60% Percoll
solution (Amersham). Cells were counted using a Neubauer
counting chamber. Per slide, 106 cells from the interphase were
then dispensed onto adhesion slides (Menzel) in a volume of 1 ml of
PBS. After sedimentation for 1 h, the slides were air-dried
overnight. Immunocytological staining was carried out with the
alkaline phosphatase/anti-alkaline phosphatase method using
primary antibodies against gp100 (HMB45, DAKO) and Melan-
A (A103, DAKO), and 5-bromo-4-chloro-3-indolyl phosphate/
Quantification of Melanoma Spread and Survival
PLOS Medicine | www.plosmedicine.org 2 February 2014 | Volume 11 | Issue 2 | e1001604

NBT (DAKO) as substrate, yielding a blue reaction product. A
lymph node was defined as gp100 positive or Melan-A positive if it
contained at least one gp100-positive or one Melan-A-positive cell,
respectively. The number of positive cells per million isolated cells
was recorded after screening of the slides by a technical assistant and
final evaluation by a dermatologist, both experienced in evaluation
of cytological preparations. The recording was done without
knowledge of the histopathological findings or other clinical data.
Positive preparations were air-dried or stored for a maximum of 4 d
in PBS until cell isolation for genomic analyses.
gp100/Melan-A Double StainingFor double immunofluorescence staining, additional slides were
stained with primary antibodies against MART-1/Melan-A
(rabbit monoclonal IgG, Epitomics) and gp100 (clone HMB45,
mouse monoclonal IgG, DAKO). The cells were visualized after
staining with Alexa Fluor 555 (donkey anti-rabbit IgG, Invitrogen)
and Alexa Fluor 488 (donkey anti-mouse IgG, Invitrogen) and
counterstained with 49,6-diamidino-2-phenylindole (DAPI).
Single-Cell Comparative Genomic HybridizationSingle-cell comparative genomic hybridization (CGH) was
performed as previously described [18,19]. In brief, proteinase K
was used to digest cellular proteins after isolation, the single-cell
genome was digested using MseI, adaptors were ligated to the 59
overhangs, and the DNA fragments were amplified by PCR,
resulting in an MseI representation of a single-cell genome. The
reagents and protocol are now commercially available as kit
(Ampli1, Silicon Biosystems). These amplicons were labeled and
hybridized onto metaphase spreads or an Agilent 180 K
microarray for array CGH [35]. Histograms for the CGH data
were generated using the online algorithms at http://progenetix.
net [20]. Twelve of the 46 patients from whom we isolated gp100-
positive cells for the had samples with a median DCCD of 2
gp100-positive cells per million isolated cells (range 1 to 7) and
were included solely to investigate the genomes of the early DCCs.
Statistical AnalysesMelanoma-specific survival rates were calculated from the date of
sentinel node biopsy until death from melanoma or the last follow-
up. The 5-y survival percentages are derived from the Kaplan-Meier
survival estimates, F(t). The 95% confidence intervals were based on
the log(2log F(t)) transformation as described by Kalbfleisch and
Prentice [21]. We calculated Pearson’s correlation coefficient of
log(DCCD + 1) and log(Melan-A + 1) for assessing the association of
DCCD and Melan-A. For the comparison of positive DCCD values
among subgroups of the other six prognostic variables we used either
two-sample t-tests or one-way ANOVA after logarithmic transfor-
mation, i.e. we compared geometric means.
We used dot plots together with quartiles to show the differences
in the distribution of DCCD values among the groups defined by
the other variables.
We used univariable Cox regression models for the following
seven predictors: gender, age, Breslow’s thickness, ulceration,
Table 1. Baseline characteristics of study cohort.
CharacteristicNumber ofPatients Percentage Median Range Interquartile Range
Gender
Female 449 43.7
Male 578 56.3
Age (years) 58 10–86 44–69
Breslow’s thickness (mm) 1.85 0.24–20.00 1.25–3.00
Ulceration
No 738 71.9
Yes 289 28.1
Localization
Extremities 500 48.7
Trunk or head 527 51.3
Nodal status histopathology
Negative 888 86.5
Positive 139 13.5
Clinical stagea
IA 76 7.4
IB 393 38.3
IIA 234 22.8
IIB 138 13.4
IIC 47 4.6
IIIA 73 7.1
IIIB 66 6.4
DCCD 0.5 0–950,000 0–4
aClinical stage according to the AJCC 2009 classification [4]. For nodal status only results of histopathology were taken into account. Information about mitotic rate wasnot available.doi:10.1371/journal.pmed.1001604.t001
Quantification of Melanoma Spread and Survival
PLOS Medicine | www.plosmedicine.org 3 February 2014 | Volume 11 | Issue 2 | e1001604
localization, nodal status pathology, and DCCD. A log transfor-
mation was used for the variable tumor thickness, and the
logarithm of DCCD + 1 was used for the variable DCCD; hazard
ratios are reported together with their 95% confidence intervals.
p-Values are given for the likelihood ratio tests of the Cox models.
In addition, we calculated hazard ratios after grouping of the
three continuous variables age, thickness, and DCCD. We plotted
the hazard ratios of the models with the continuous and the
grouped data for DCCD and tumor thickness in order to verify a
linear model on a logarithmic scale.
For multivariable Cox regression analyses we adopted the
model selection criterion according to Schwarz [22] and used the
minimal value of the Bayes information criterion (BIC) to select
the optimal model. This quantity is the sum of twice the negative
log likelihood of the model plus the number of parameters times
the logarithm of the sample size. Instead of evaluating the
likelihood for all 128 ( = 27) possible models we started with the
model that included all seven variables, and then successively
deleted the variable with the highest p-value. This approach finds
the model with the lowest BIC value for a given number of
variables, which was verified by calculating the BIC value for all
128 models.
For internal validation we used 100 bootstrap samples and
calculated Harrell’s c-index with and without correction for
optimism [23]. We calculated Harrell’s c-index instead of Somer’s
D because Harrell’s c-index (c = (D+1)/2) estimates the proportion
of concordant pairs among all comparable pairs of patients. We
proceeded as follows. Step 1: we determined capp from our model
as selected using the BIC criterion. Step 2: we generated 100
bootstrap samples from the original dataset by sampling with
replacement. Step 3: for each of these 100 bootstrap samples the
same model selection procedure as for the original dataset was
applied. Step 4: for each of the 100 bootstrap samples we
calculated the c-index cboot. Step 5: the 14 different models found
in step 3 were applied to the original dataset, and the
corresponding c-indices corig determined. Step 6: the average
optimism of the fit was calculated as corig2cboot. Step 7: the
bootstrap-corrected performance of the original stepwise model
was calculated as capp2(corig2cboot).
In order to verify the proportional hazards assumption of the
Cox model we divided the patients into two groups for each of the
three final predictors and plotted the ratio of their cumulative
hazard functions as a function of time. According to the Cox
model this ratio should stay constant. As an alternative to the Cox
model we used the lognormal distribution as a model for
predicting outcome by DCCD, thickness, and ulceration. The
lognormal model allows determination of the maximum time-
dependent hazard rate and the time at which it occurs (formulas
for the lognormal survival probability are in Text S1). We used the
lognormal model to determine the 5-y survival probabilities by a
nomogram [24].
Model Validation and ComparisonTo assess the goodness of fit of the models (Table S3), we
divided the 1,027 patients into 18 subgroups according to the
following criteria: three groups of DCCD values, with DCCD = 0
assigned the value 0, 0, DCCD ,100 assigned the value 1, and
DCCD $100 assigned the value 2; three groups of tumor
thickness, with tumor thickness #2 mm assigned the value 1,
2 mm , tumor thickness #4 mm assigned the value 2, and tumor
thickness .4 mm assigned the value 3; and ulceration no/yes. We
restricted the analysis to 18 subgroups because otherwise the
number of patients per subgroup would be too small. Only a slight
difference in the hazard ratio was observed between the categories
0, DCCD #3 and 3, DCCD ,100, as shown in Table 2. These
categories were therefore combined. For each of the 1,027
patients, we calculated the expected failure probability for the
individual follow-up times. The observed numbers of deaths in the
18 subgroups were compared to the expected numbers of deaths
by the chi-square statistics. The goodness of fit of the models was
compared by the sum of the 18 chi-square values, taking into
account the number of degrees of freedom, which depends on the
number of estimated parameters. Since the models were not
nested we did not perform likelihood ratio tests. We provide the
chi-square statistics only for descriptive purposes. The grouping of
patients according to AJCC criteria was based on the AJCC 2009
recommendations (which include assignment of isolated tumor
cells as nodal positive) [4], with the exception that mitotic rate
could not be included because it had not been assessed at the
beginning of the study. For the AJCC grouping, the nodal status
was determined by histopathology and not by immunocytology.
For the parametric model with the variables thickness, DCCD,
and ulceration, each individual patient was characterized by his or
her risk score. This score was a linear combination of the
logarithms of tumor thickness and DCCD and of ulceration. The
purpose was to assess the goodness of fit of our model in four well-
defined groups of patients. Since the precision of Kaplan-Meier
estimates depends essentially on the number of deaths in a sample,
we wanted to achieve similar precision in all four groups. To this
end the 138 patients who died from melanoma were divided into
four groups with increasing risk scores of death, as defined by the
survival model. Subsequently, the risk thresholds of the four
groups were applied to all the patients. For given values of the
three variables included in the predictive models each patient can
uniquely be assigned to one of the four groups. All four groups
differed from each other significantly (all p-values ,0.001 in the
log-rank test comparing group 2 to group 1, group 3 to group 2,
and group 4 to group 3).
We next compared the goodness of fit of the parametric model
with the variables thickness, DCCD, and ulceration with a Cox
model using the same variables. We found that the parametric
model performed better (p = 0.13, sum of x2 values = 21.1) than
the corresponding Cox proportional hazards model (p = 0.03, sum
of x2 values = 27.4) after grouping all 1,027 patients into the 18
risk groups (see above and Table S3).
To assess whether a model that included the information on
Melan-A staining in addition to gp100 staining could further
improve outcome prediction we compared our model based on
DCCD (the maximum number of gp100-positive cells per million
isolated cells per patient), thickness, and ulceration with the model
DCCD 2 (defined as the maximum number of gp100- or Melan-
A-positive cells per million isolated cells), thickness, and ulceration.
We found that the model that included the information on
Melan-A staining was not superior to gp100-based DCCD
reporting (p = 0.09, sum of x2 values = 22.7; Table S3). Finally,
we compared the predictions based on our parametric model and
on AJCC staging [4]. The goodness of fit for our model (p = 0.13,
sum of x2 values = 21.1) was much better than that of the AJCC
staging model (p,0.0002, sum of x2 values = 36.7). For details and
data, see the Table S3.
For comparison with the AJCC model, the patients were
originally divided into three groups according to the differences in
survival predictions between the two models. For individuals in
Group S1 of Table S2, the survival probability for the new model
was at all times greater than the survival probability according to
the AJCC model; the absolute percentage difference was greater
than 13%. In Group S2 the survival probability for the new model
was at all times smaller than the survival probability according to
Quantification of Melanoma Spread and Survival
PLOS Medicine | www.plosmedicine.org 4 February 2014 | Volume 11 | Issue 2 | e1001604
the AJCC model; the maximum absolute percentage difference
was greater than 13%. For Groups S1 and S2, the maximum
absolute percentage difference of 13% was chosen because it
exceeds the maximum absolute percentage differences for those
patients for whom the survival in one model was not always
greater than the survival in the other model. The remaining
patients formed Group S3.
The risk scores were the sums of the products of the individual
predictors multiplied by the corresponding regression coefficients.
Since some tumor thicknesses were less than 1 mm, we also
obtained negative risk scores because tumor thickness was on a log
scale.
We performed statistical analyses with JMP (version 10.0.2).
Results
PatientsThe final analysis included a total of 1,834 sentinel nodes from
1,027 patients examined by quantitative immunocytology and by
histopathology. The baseline characteristics of all 1,027 patients
are summarized in Table 1. The median follow-up was 49 mo
(range 3 to 123 mo), with 370 (36%) patients having a follow-up of
at least 5 y. During follow-up, 138 of 1,027 patients (13.4%) died
from melanoma. The 5-y melanoma-specific survival probability
for all patients was 86% (95% CI 83%–88%).
Detection of Disseminated Melanoma Cells byImmunocytology
The underlying rationale of our detection assay (Figure 1A–1E)
comprises two aspects. First, the spatially inhomogeneous distri-
bution of melanoma cells may be equalized by lymph node
disaggregation and generation of a single-cell suspension, which
facilitates melanoma cell detection when only parts of the sample
are screened; second, the number of melanoma cells can be
counted and the amount of analyzed tissue can be quantified by
referencing the number of melanoma cells to a defined number of
isolated lymph node cells. This allows determining the DCCD, i.e.
the number of DCCs per 1 million isolated cells.
We first assessed whether gp100-positive cells could be detected
in skin draining nodes from non-melanoma patients. These lymph
nodes were prepared identically to the sentinel nodes from
melanoma patients (Figure 1B–1D), except that lymph nodes from
cancer patients had to be split in half to provide tissue for routine
histopathology. We could not detect a single gp100-positive cell
among 1716106 cells isolated from 58 non-melanoma skin
draining lymph nodes.
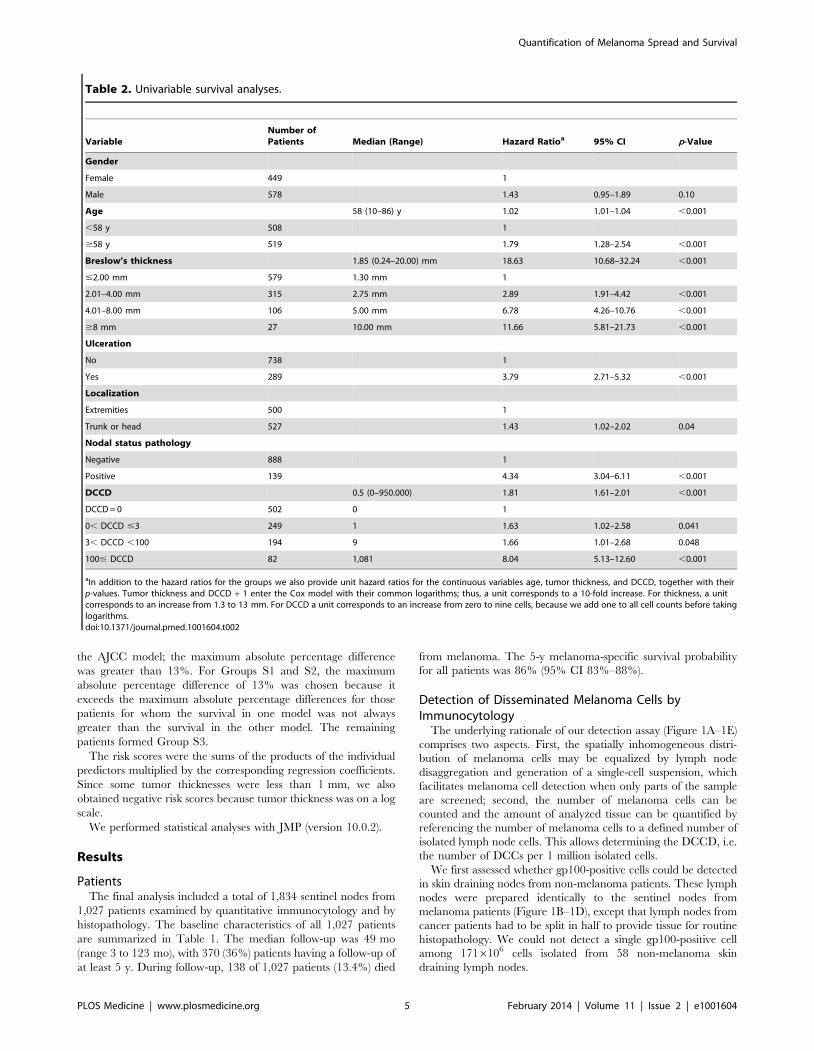
Table 2. Univariable survival analyses.
VariableNumber ofPatients Median (Range) Hazard Ratioa 95% CI p-Value
Gender
Female 449 1
Male 578 1.43 0.95–1.89 0.10
Age 58 (10–86) y 1.02 1.01–1.04 ,0.001
,58 y 508 1
$58 y 519 1.79 1.28–2.54 ,0.001
Breslow’s thickness 1.85 (0.24–20.00) mm 18.63 10.68–32.24 ,0.001
#2.00 mm 579 1.30 mm 1
2.01–4.00 mm 315 2.75 mm 2.89 1.91–4.42 ,0.001
4.01–8.00 mm 106 5.00 mm 6.78 4.26–10.76 ,0.001
$8 mm 27 10.00 mm 11.66 5.81–21.73 ,0.001
Ulceration
No 738 1
Yes 289 3.79 2.71–5.32 ,0.001
Localization
Extremities 500 1
Trunk or head 527 1.43 1.02–2.02 0.04
Nodal status pathology
Negative 888 1
Positive 139 4.34 3.04–6.11 ,0.001
DCCD 0.5 (0–950.000) 1.81 1.61–2.01 ,0.001
DCCD = 0 502 0 1
0, DCCD #3 249 1 1.63 1.02–2.58 0.041
3, DCCD ,100 194 9 1.66 1.01–2.68 0.048
100# DCCD 82 1,081 8.04 5.13–12.60 ,0.001
aIn addition to the hazard ratios for the groups we also provide unit hazard ratios for the continuous variables age, tumor thickness, and DCCD, together with theirp-values. Tumor thickness and DCCD + 1 enter the Cox model with their common logarithms; thus, a unit corresponds to a 10-fold increase. For thickness, a unitcorresponds to an increase from 1.3 to 13 mm. For DCCD a unit corresponds to an increase from zero to nine cells, because we add one to all cell counts before takinglogarithms.doi:10.1371/journal.pmed.1001604.t002
Quantification of Melanoma Spread and Survival
PLOS Medicine | www.plosmedicine.org 5 February 2014 | Volume 11 | Issue 2 | e1001604

On the other hand, we detected gp100-positive cells in the
lymph nodes of 525 of the 1,027 melanoma patients (51%).
Whenever enough cells were isolated from the lymph node half for
immunocytology, we aimed to screen 26106 lymph node cells, i.e.,
two slides, per patient. The median number of slides screened per
node was two (range 104 to 66106 cells). The median DCCD in
patients with DCCD .0 was 4 gp100-positive cells per million
isolated cells (ranging from 0.2 to 950000; Figure 1F). We
evaluated the relation of DCCD with the six established prognostic
factors (Figure 2). Geometric mean values of DCCD were
significantly higher in thicker and ulcerated melanomas (p,
0.001), in melanomas located at other sites than the extremities
(p = 0.02), and in patients with a pathologically positive sentinel
node (p,0.001; Figure 2).
However, severe concerns about the immunocytological assay
may be raised by (1) the loss of architectural information, which
helps to differentiate between intra-lymphatic nevi and colonies of
melanoma cells, (2) the difficulty to identify melanoma colonies by
morphological criteria, and (3) the fact that the gp100 antigen for
melanoma detection may be down-regulated. We addressed these
concerns by careful evaluation of lymph node preparations from
melanoma and non-melanoma patients using a second melanoma-
associated antibody directed against Melan-A and by genetic
analysis of the gp100-positive cells.
We found Melan-A-expressing cells in three out of 38 (8%)
control lymph nodes, all of which were gp100 negative. We then
proceeded to determine the detection rate of the two antibodies for
melanoma cells in sentinel nodes from melanoma patients with
histopathologically proven lymphatic spread by applying a double
staining method. Because Melan-A-positive cells were detected in
8% of control nodes, we restricted the direct comparison of gp100-
and Melan-A-positive cells to samples from histopathologically
Figure 1. Sample preparation, melanoma cell detection, and distribution of disseminated cancer cell densities. (A) The sentinel nodeswere split into halves for routine histopathology and immunocytology. (B–D) After mincing (B), the small pieces were subjected to mechanicaldisaggregation (C), and single-cell suspensions were added to adhesion slides (D). (E) The detection of gp100-positive cells among the unstainedlymphocytes. (a) gp100 staining of Mel Ho cell line cells mixed among peripheral blood leukocytes used as positive control. (b) Isotype control ofpositive control. Note that the large melanoma cells can be identified by size among the peripheral blood leukocytes and are completely unstained.(c) gp100-positive cell from melanoma patient with DCCD = 1. (d) Isotype control of the melanoma patient in (c). All four samples are taken from thesame experiment. (F) The distribution of DCCD (number of DCCs per 106 isolated cells) in the sentinel nodes of 525 gp100-positive patients. Note thatsome patients had DCCD ,1. The 502 zero values for DCCD are not included.doi:10.1371/journal.pmed.1001604.g001
Quantification of Melanoma Spread and Survival
PLOS Medicine | www.plosmedicine.org 6 February 2014 | Volume 11 | Issue 2 | e1001604
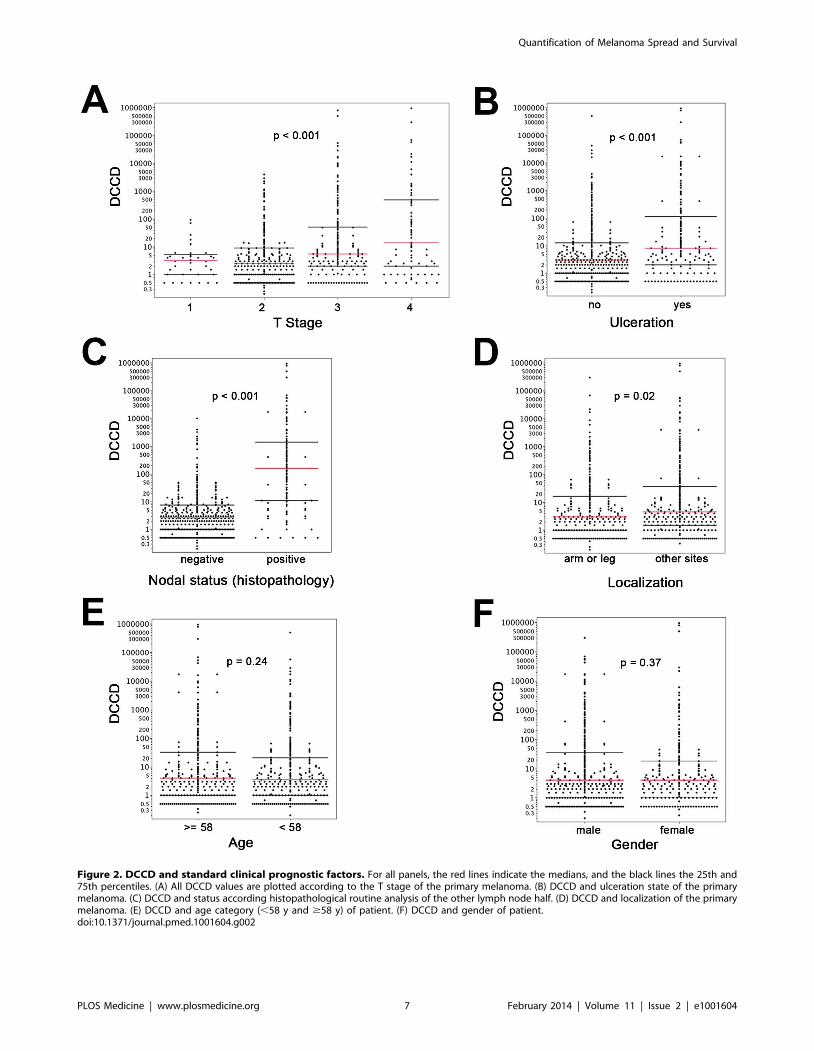
Figure 2. DCCD and standard clinical prognostic factors. For all panels, the red lines indicate the medians, and the black lines the 25th and75th percentiles. (A) All DCCD values are plotted according to the T stage of the primary melanoma. (B) DCCD and ulceration state of the primarymelanoma. (C) DCCD and status according histopathological routine analysis of the other lymph node half. (D) DCCD and localization of the primarymelanoma. (E) DCCD and age category (,58 y and $58 y) of patient. (F) DCCD and gender of patient.doi:10.1371/journal.pmed.1001604.g002
Quantification of Melanoma Spread and Survival
PLOS Medicine | www.plosmedicine.org 7 February 2014 | Volume 11 | Issue 2 | e1001604

positive nodes, where expression of Melan-A by benign cells would
be less likely to confound the analysis. Evaluating 3,055 cells from
43 nodes of 41 patients after immunofluorescence double staining,
we found that 39 of 43 (91%) lymph nodes harbored cells positive
for gp100 and Melan-A (Figure S1), one of 43 (2%) had only
gp100-positive cells, and three of 43 (7%) had only Melan-A-
positive cells.
These data suggest that the slightly higher detection rate of the
Melan-A antibody does not outweigh the lower specificity as
determined by the control samples. However, to completely rule
out that gp100-negative DCCs comprise a relevant confounding
factor, additional slides were stained using the Melan-A antibody
in 710 patients. Comparing the gp100 and Melan-A staining
results of these 710 patients, we confirmed the high correlation of
gp100 and Melan-A staining (r = 0.83, p,0.001) that we had
previously seen by double immunofluorescence. As detailed in
Table S3, we found that the inclusion of Melan-A did not improve
the prognostic power of the gp100-based immunocytological
assay.
Genetic Characteristics of Disseminated Melanoma CellsSince all these findings provided indirect support that gp100-
positive cells represent DCCs, we searched for direct evidence of
their malignant origin. We randomly isolated 65 gp100-positive
cells from 46 patients for a whole-genome screen of chromosomal
aberrations by CGH. The DCCD values of these patients ranged
from 0.2 to 800,000 gp100-positive cells per million isolated cells
(median = 8), and we analyzed between one and three cells per
patient. Metaphase CGH provided direct proof for the malignant
origin of 57 gp100-positive cells (Figure 3A), while eight cells
displayed normal karyotypes. As metaphase CGH has a resolution
of 10–20 Mb, we subsequently applied array CGH [35], which
has a resolution of ,1 Mb, to these eight cells. While we could not
detect any aberration in two cells, the remaining displayed
between one and ten changes (median = 4.5) ranging from 0.1 to
19 Mb (median = 2 Mb). In summary, 63 of 65 gp100-positive
cells (97%) displayed genomic aberrations, which classified 45 of
46 patients (98%) as harboring cancer cells in their sentinel nodes.
There was no difference for cells isolated from lymph nodes
classified as negative or positive by routine histopathology,
demonstrating that our assay is suited to correctly identifying
melanoma cells without morphological assessment of tissue
architecture (Figure 3B).
Disseminated Cancer Cell Density and Melanoma-SpecificSurvival
We evaluated DCCD as biomarker according to the REMARK
criteria [25]. Of the standard prognostic factors, sentinel node
histopathology (p,0.001), age (p,0.001), thickness (p,0.001),
ulceration (p,0.001), and localization of the primary melanoma
(p = 0.04) were associated with poor outcome in the univariable
Cox regression analyses (see Table 2 and Figure S2 for Kaplan-
Meier estimates). Increasing DCCD values were negatively
associated with the time to death from melanoma in the
univariable Cox regression analyses (p,0.001). We assessed the
prognostic impact of DCCD after categorizing the values into four
groups (Table 2). We found that even the detection of low DCCD
values (0,DCCD #3) conferred a significant risk of death (hazard
ratio 1.63, 95% CI 1.02–2.58, p = 0.04; Table 2 and Figure 4A)
compared to patients without DCCs. Increasing hazard ratios
were obtained for categories with higher DCCD values (Table 2).
The relationship of increasing DCCD values and the hazard ratio
Figure 3. Chromosomal aberrations of isolated gp100-positive cells. (A) CGH profiles of gp100-positive cells (n = 57 cells, all displayingchromosomal aberrations in metaphase CGH). The histogram displays the percentage of cells with specific chromosomal alterations. Thechromosomal position is indicated by the horizontal chromosome ideogram (from Chromosome 1 on the left to the X and Y chromosomes on theright). Copy number gains for each region are depicted in green, and copy number losses are depicted in red. (B) Summary of findings for all 65 cellsand 46 patients with respect to the lymph node status as determined by routine histopathology (N0 = histopathologically negative nodes,N1 = histopathologically positive nodes). After analysis of the eight cells with normal karyotypes in metaphase CGH by array CGH, all but two cellsdisplayed genomic aberrations. One of these two cells was isolated from a sample where an additional gp100-positive cell displayed alterations, whilethe other cell was the only gp100-positive cell detected in that patient.doi:10.1371/journal.pmed.1001604.g003
Quantification of Melanoma Spread and Survival
PLOS Medicine | www.plosmedicine.org 8 February 2014 | Volume 11 | Issue 2 | e1001604

is plotted in Figure 4B on the logarithmic scale. The unit risk ratio
(corresponding to a 10-fold increase of DCCD + 1, e.g., from a
DCCD of zero to a DCCD of nine) was 1.81 (95% CI 1.61–2.01),
and a linear relation (on log scale) between DCCD and hazard
ratio was identified (Figure 4B). A similar log-linear relationship
was seen between tumor thickness and hazard ratio (Figure 4C).
We next performed stepwise multivariable Cox regression
analysis starting with all six standard prognostic factors in addition
to DCCD. After each step of the multivariable analysis the
variable with the highest p-value was deleted (Tables 3 and 4). To
identify the optimal model, we determined the BIC, which has a
minimal value for the best model [22]. As can be seen from
Table 4, the BIC value is lowest for the combined variables tumor
thickness, DCCD, and ulceration, for which all p-values were
below 0.001. The unit hazard ratios for this model were 6.96 (95%
CI 3.61–13.28) for thickness, 1.43 (95% CI 1.27–1.61) for DCCD,
and 2.04 (1.4–2.97) for ulceration. It should be noted that nodal
status determined by routine histopathology had a maximum
hazard ratio of 1.75 (95% CI 1.04–2.86) in multivariable analyses
and was rejected already in step 3 (Table 3).
Individual Risk Prediction by Tumor Thickness,Disseminated Cancer Cell Density, and Ulceration
To fully exploit the power of our quantitative assay, we
combined the three most important risk factors identified by
multivariable analysis (tumor thickness, DCCD, and ulceration)
for individual risk assessment at diagnosis and during follow-up.
While results of Cox models represent a useful summary for the
average hazard ratios, we observed that the assumption of
proportional hazards was not fulfilled for tumor thickness and
DCCD (Figure S3). Therefore, we employed a lognormal survival
model based on tumor thickness, DCCD, and ulceration that
allows the calculation of changes in individual risk over time and of
the predicted 5-y survival for all 1,027 patients (Figure 5A).
Figure 5A shows that patients with thin melanomas never
harbored high DCC numbers in their lymph nodes and poorest
outcome was seen for thick tumors and high DCCD. It should be
noted that DCCD and tumor thickness are plotted on a
logarithmic scale, and therefore the curves of equal 5-y survival
probability appear as straight lines. On a linear scale these curves
(isoboles) are convex (Figure S4), which indicates synergism [26].
Using this model, we calculated the time-dependent hazard rates
for 14 individual patients with five different hazard rate curves
(Figure 5B). This calculation revealed that DCC-negative and
DCC-positive patients might display identical hazard rate
functions (e.g., compare Patients 2a and 2b in Figure 5B) and
also that the hazard rate peaks later in low-risk than in high-risk
patients. Furthermore, tumor thickness, DCCD, and ulceration
state can be integrated into a preliminary nomogram to determine
the 5-y survival of individual patients (Figure 5C).
Figure 4. The prognostic impact of disseminated cancer cells insentinel nodes. (A) The figure shows the Kaplan-Meier survivalestimates for 502 patients with DCCD = 0 (blue line) and for 249 patientswith 0, DCCD #3 (red line). Even patients with low numbers of DCCshad a significantly reduced survival in comparison to patients withoutDCCs (86% 5-y survival versus 92% 5-y survival; hazard ratio 1.63, 95%CI: 1.02–2.58). (B) Hazard ratios (in black) for the three DCCD categoriesof Table 2 together with their 95% confidence intervals as a function oftheir median DCCD values on a log scale. The red line provides thehazard ratios for the linear model where log(DCCD + 1) is entered as a
continuous variable. The predicted curve is within the confidenceintervals. The unit risk ratio 1.81 is the hazard ratio corresponding to a10-fold increase of DCCD + 1. (C) Relation of Breslow’s thickness and riskof death from melanoma. Hazard ratios (in black) are given for the threegroups of Table 2 (melanomas with 2 mm # tumor thickness #4 mm;4, tumor thickness #8 mm; tumor thickness .8 mm) together withtheir 95% confidence intervals as a function of their median thicknessvalues on a log scale. The red line shows the predicted hazard ratios forthe model where log(thickness) enters as a continuous variable. Weshow only the values $1.3 mm, i.e., the median value of the referencegroup in Table 2. The predicted line is within the confidence intervals.The unit hazard ratio 18.6 corresponds to a 10-fold increase ofthickness.doi:10.1371/journal.pmed.1001604.g004
Quantification of Melanoma Spread and Survival
PLOS Medicine | www.plosmedicine.org 9 February 2014 | Volume 11 | Issue 2 | e1001604

Internal Validation of the ModelWhile the present survival model based on the predictors
thickness, DCCD, and ulceration awaits validation by an
independent multi-center study, we sought to validate it internally.
For this we applied a bootstrapping approach [23]. We generated
100 bootstrap samples from the original dataset by sampling with
replacement. For each of these 100 bootstrap samples the same
model selection procedure as for the original dataset was applied.
We obtained 14 different ‘‘best models’’ (Table 5). The present
model was selected most often. The variable DCCD was included
in 85 best models, whereas nodal status by routine histopathology
was included in only 36 of the 100 models. Harrell’s c-index, which
estimates the probability of concordance between predicted and
observed responses, for the present model was 0.763 in the original
dataset. Harrell’s c-index based on the current AJCC staging
system was 0.737. This is significantly smaller (p,0.0001;
McNemar’s test). The bootstrap-corrected c-index [23] for the
present model turned out to be 0.748, which is well above the
value of 0.5 representing only random prediction ability.
We then analyzed those patients for whom the predictions of the
AJCC and the new model differed (survival probability in group
S1: new model . AJCC; in group S2: new model , AJCC; group
S3, remaining patients). We calculated the expected number of
deaths at the observed follow-up time for each patient and
compared this number with the observed number of deaths (Table
S2). Only the new model provided an acceptable fit for all three
groups. In Group S2 of Table S2 the number of deaths predicted
in the AJCC model was significantly different from the number of
observed deaths (p,0.0001).
Finally, we combined Groups S1 and S3 from Table S2 to form
two groups. Group 1 now comprised patients for whom the novel
model predicted better survival than the AJCC model and patients
for whom the predictions of both models concurred. Patients for
whom the novel model predicted a worse survival than the AJCC
model formed Group 2.
Nearly 94% of AJCC low-risk patients (,IIB) were in Group 1
(Figure 6A and 6B). Nearly 29% of AJCC high-risk patients (.IIA)
were in Group 2. Patients in Group 2 had higher DCCD values than
patients in Group 1. The geometric means of DCCD + 1 are 2.23
(95% CI 1.98–2.51) in Group 1 and 80.53 (95% CI 59.54–108.94) in
Group 2, respectively (p,0.0001; two-sample t-test for the logarithms).
For the time points 3 and 6 y after sentinel lymph node biopsy
we determined which model provided a better fit for the survival of
patients in Group 1 and 2. Kaplan-Meier plots demonstrated that
Table 3. Multivariable survival analyses: hazard ratios together with their 95% confidence intervals.
Step
Number ofPredictorsin Model Breslow’s Thicknessa DCCDb Ulcerationc Aged Nodal Statuse Localizationf Genderg
1 7 6.51 (3.32–12.58) 1.25 (1.06–1.46) 1.89 (1.30–2.76) 1.02 (1.01–1.03) 1.74 (1.03–2.85) 1.32 (0.91–1.93) 1.05 (0.73–1.52)
2 6 6.46 (3.31–12.45) 1.24 (1.06–1.46) 1.89 (1.30–2.76) 1.02 (1.01–1.03) 1.75 (1.04–2.86) 1.34 (0.94–1.92) —
3 5 6.09 (3.11–11.77) 1.29 (1.11–1.50) 1.90 (1.31–2.78) 1.02 (1.00–1.03) 1.67 (1.01–2.72) — —
4 4 6.63 (3.42–12.71) 1.43 (1.27–1.60) 1.94 (1.33–2.84) 1.01 (1.00–1.03) — — —
5 3 6.96 (3.61–13.28) 1.43 (1.27–1.61) 2.04 (1.40–2.97) — — — —
6 2 10.75 (5.86–19.54) 1.47 (1.31–1.65) — — — — —
7 1 18.63 (10.68–32.24) — — — — — —
alog10 of tumor thickness;, hazard ratios for a 10-fold increase.blog(DCCD + 1); hazard ratios for a 10-fold increase.cHazard ratios for ulceration versus no ulceration.dHazard ratios for one additional year.eHazard ratios for positive versus negative by routine histopathology.fHazard ratios for trunk or head versus extremities.gHazard ratio for male versus female.doi:10.1371/journal.pmed.1001604.t003
Table 4. Multivariable survival analyses: model selection according to p-values and Bayes Information Criterion.
Step
Number ofPredictors inModel
Breslow’sThickness DCCD Ulceration Age
NodalStatusa Localization Gender BIC
1 7 ,0.0001 0.0068 0.0009 0.0051 0.0371 0.1380 0.8052 1,657.8
2 6 ,0.0001 0.0069 0.0008 0.0050 0.0340 0.1035 — 1,650.9
3 5 ,0.0001 0.0011 0.0008 0.0054 0.0475 — — 1,646.6
4 4 ,0.0001 ,0.0001 0.0005 0.0127 — — — 1,643.6
5 3 ,0.0001 ,0.0001 0.0002 — — — — 1,642.9
6 2 ,0.0001 ,0.0001 — — — — — 1,649.8
7 1 ,0.0001 — — — — — — 1,679.1
p-Values are for testing whether a hazard ratio equals 1; low BIC identifies best model.aAs determined by routine histopathology.doi:10.1371/journal.pmed.1001604.t004
Quantification of Melanoma Spread and Survival
PLOS Medicine | www.plosmedicine.org 10 February 2014 | Volume 11 | Issue 2 | e1001604
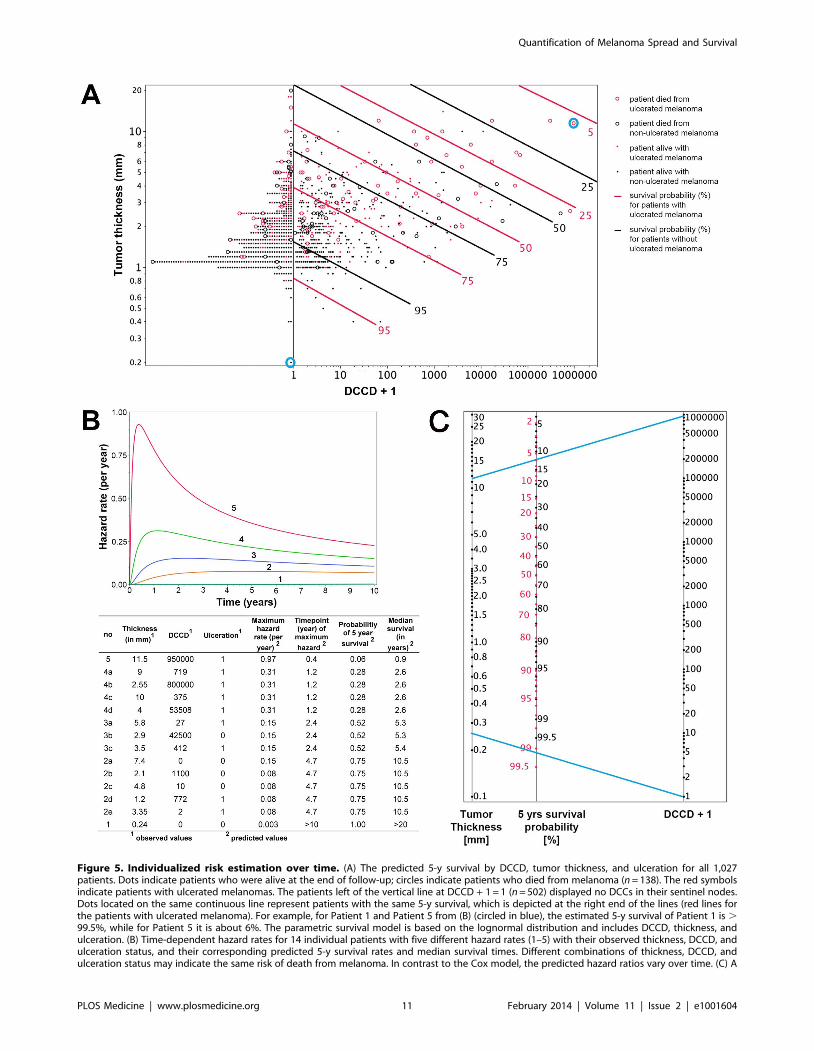
Figure 5. Individualized risk estimation over time. (A) The predicted 5-y survival by DCCD, tumor thickness, and ulceration for all 1,027patients. Dots indicate patients who were alive at the end of follow-up; circles indicate patients who died from melanoma (n = 138). The red symbolsindicate patients with ulcerated melanomas. The patients left of the vertical line at DCCD + 1 = 1 (n = 502) displayed no DCCs in their sentinel nodes.Dots located on the same continuous line represent patients with the same 5-y survival, which is depicted at the right end of the lines (red lines forthe patients with ulcerated melanoma). For example, for Patient 1 and Patient 5 from (B) (circled in blue), the estimated 5-y survival of Patient 1 is .99.5%, while for Patient 5 it is about 6%. The parametric survival model is based on the lognormal distribution and includes DCCD, thickness, andulceration. (B) Time-dependent hazard rates for 14 individual patients with five different hazard rates (1–5) with their observed thickness, DCCD, andulceration status, and their corresponding predicted 5-y survival rates and median survival times. Different combinations of thickness, DCCD, andulceration status may indicate the same risk of death from melanoma. In contrast to the Cox model, the predicted hazard ratios vary over time. (C) A
Quantification of Melanoma Spread and Survival
PLOS Medicine | www.plosmedicine.org 11 February 2014 | Volume 11 | Issue 2 | e1001604
the predicted and observed survival curves diverge particularly for
the AJCC prediction of Group 2 patients (Figure 6C). For both
time points 3 and 6 y (p,0.001 and p,0.01, respectively) the
AJCC model significantly deviated from Kaplan-Meier estimates
for Group 2 patients, whereas our model correctly predicted the
number of deaths (Table 6).
For the low-risk patients of Group 1, both models provided
acceptable fits, although we noted a borderline p-value (p = 0.06)
for the new model at 3 y. However, the fit for predicted and
observed survival becomes excellent for the new model over time
(Figure 6C)—in line with the need for longer observation periods
in low-risk patients. Thus, at 6 y follow-up there is perfect
agreement for the new model, whereas the AJCC model
overestimates the number of deaths (Figure 6C and Table 6).
We assessed the goodness of fit of the model after grouping the
patients according to their risk scores, which was a linear
combination of the logarithms of tumor thickness and DCCD
and of ulceration, into four groups (see Methods). We compared
predicted and observed survival curves and found that Kaplan-
Meier curves and predicted curves were superimposable over the
complete range of disease courses for all four risk groups and that
all four groups differed significantly from each other (Figure 7).
Finally, we compared the goodness of fit for several models (a
model based on Cox regression analysis, a model that includes
data on Melan-A staining, and a model based on the current
AJCC criteria). In summary, we found that the parametric model
based on thickness, DCCD, and ulceration most accurately
predicted melanoma death (Table S3).
Discussion
In this study, we quantified the number of DCCs per one
million isolated lymph node cells (DCCD) and assessed its utility in
predicting melanoma outcome. Based on a median follow-up of
49 mo, with 370 patients having follow-up times of more than 5 y,
we found that at the time of sentinel node biopsy, quantitative
assessment of DCCD predicted melanoma outcome by univariable
and multivariable analysis in a large cohort of patients. Further-
more, quantitative DCCD showed a stronger association with
outcome than qualitative conventional histopathology and, when
combined with primary melanoma thickness and ulceration, had a
synergistic impact on patient survival. Using these variables we
developed a parametric model that proved to be the most accurate
for predicting outcome. Although we currently lack an external
validation cohort with long follow-up, the accepted prognostic role
of sentinel lymph node spread [4] and the successful internal
validation (bootstrap and goodness of fit) give credibility to the
findings.
We found that even the detection of three or fewer DCCs per
million leukocytes in the sentinel node increases the risk of death at
5 y from melanoma by 6% (8% for DCCD = 0 versus 14% for
0, DCCD #3). This finding is in line with reports supporting the
clinical relevance of single DCCs [5,27] and the novel AJCC
recommendation [4] to refrain from using a lower threshold for
sentinel node spread. However, we also identified three
shortcomings of the AJCC categorization approach. First, AJCC
staging does not differentiate between isolated cancer cells and
small and large microscopic metastases. Our data demonstrate
that the number of cells matters over the full range of DCCD.
Second, because any measured DCCD value can be translated
into a 5-y survival rate, the typical exaggerations of categorizing
staging systems, such as upgrading from stage II to stage III
because of the detection of a single melanoma cell, are also
avoided, and individual disease courses can be accommodated
better than by categorizing tumors based on the AJCC staging
system. Third, we provide clinical evidence for the context
dependency of the metastasis-forming potential of DCCs, which
emerges from our observation that DCCD, tumor thickness, and
ulceration—being the leading prognostic factors from the multi-
variable analysis—can be combined in a parametric survival
model where the prognostic value of a single DCC differs for thick
and thin tumors. For example, we observed DCCs in 46% of T1
stage melanomas; however, 5-y survival rates are more than 90%
in this subgroup of patients, indicating that under most conditions
DCCs do not result in clinically relevant metastasis. This may
suggest that cellular programs such as senescence or dormancy are
activated at initial homing to distant sites [28,29] but may be
released once primary tumors grow large. Such a scenario has
gained credibility since secreted factors of primary melanomas,
such as exosomes, were shown to evoke substantial systemic effects
[30] promoting metastasis.
In addition to DCCD and thickness of the primary melanoma,
ulceration status had an impact on survival in melanoma. The
biological interdependencies between destructive growth (ulcera-
tion), tumor-mass-induced systemic alterations (tumor thickness),
and metastatic dissemination (DCCD) for progression of an
individual melanoma may explain why histopathologically node-
positive patients can have a better outcome than histopatholog-
ically node-negative patients if the primary melanoma has more
favorable prognostic features. This phenomenon is not reflected
within a categorizing staging system. For example, the current
AJCC staging predicts a 5-y survival of 53% for stage IIC
(T4bN0M0) and 70% for stage IIIa (T1-4N1aM0). In contrast, the
estimated survival of a patient with tumor thickness 7.4 mm and
DCCD = 0 but without ulceration is identical to the estimated
survival of a patient with ulceration and tumor thickness 3.35 mm
and DCCD = 2, or with tumor thickness 1.2 mm and
DCCD = 772 in our model.
Since summary measures of survival may provide insufficient
information about population dispersion, we asked whether the
new model reflects the prognostic heterogeneity of patients more
accurately. Indeed, we identified a group of patients at high risk for
progression in whom the AJCC model underestimates the risk of
death. Although this group of patients is relatively small (13% in
our cohort), these patients will most likely benefit from adjuvant
therapy, and the model may help to improve patient stratification
for clinical trials. It also identified a group of very low risk patients
who have an excellent long-term outcome and whose risk of dying
is overestimated by the AJCC staging model.
We carefully evaluated the performance of our assay. As lymph
node disaggregation destroys the tissue architecture, some
morphological criteria to identify melanoma cells are lost.
However, we deem it unlikely that benign nevus cells in sentinel
nodes, described in up to 28% of melanoma patients [9], confound
our conclusions. These cells rarely express gp100 [31], and
nomogram enables estimating the 5-y survival probability. The 5-y survival probability is the value at the intersection of a straight line connectingDCCD and tumor thickness with the central straight line. For illustration, the blue lines exemplify the same Patients 1 and 5 that are marked in (A) anddescribed in (B). Patient 5 had an ulcerated melanoma, and therefore the red scale must be used, while Patient 1 had a non-ulcerated melanoma, sosurvival probability is given on the black scale. Note that the nomogram has not been independently validated and therefore is not yet suitable forclinical use.doi:10.1371/journal.pmed.1001604.g005
Quantification of Melanoma Spread and Survival
PLOS Medicine | www.plosmedicine.org 12 February 2014 | Volume 11 | Issue 2 | e1001604

Ta
ble
5.
Var
iab
les
incl
ud
ed
inth
e1
4b
est
mo
de
lsfo
un
din
the
10
0b
oo
tstr
apsa
mp
les
cre
ate
dfo
rin
tern
alva
lidat
ion
.
Mo
de
lB
resl
ow
’sT
hic
kn
ess
DC
CD
Ulc
era
tio
nA
ge
No
da
lS
tatu
saL
oca
liz
ati
on
Nu
mb
er
of
Bo
ots
tra
pS
am
ple
sw
ith
the
Mo
de
l
1+
++
22
22
7
2+
++
+2
22
2
3+
++
++
21
6
4+
+2
+2
29
5+
2+
++
29
6+
+2
++
25
7+
22
++
+3
8+
+2
22
22
9+
22
+2
+2
10
+2
2+
2+
1
11
++
+2
+2
1
12
++
+2
2+
1
13
+2
++
++
1
14
+2
+2
++
1
No
of
bo
ots
trap
sam
ple
sw
ith
the
vari
able
incl
ud
ed
10
08
57
86
83
69
Ap
lus
sig
nin
dic
ate
sth
atth
eva
riab
lew
asin
clu
de
din
the
mo
de
l;a
min
us
sig
nin
dic
ate
sth
atit
was
no
tin
clu
de
d.
aA
sd
ete
rmin
ed
by
rou
tin
eh
isto
pat
ho
log
y.d
oi:1
0.1
37
1/j
ou
rnal
.pm
ed
.10
01
60
4.t
00
5
Quantification of Melanoma Spread and Survival
PLOS Medicine | www.plosmedicine.org 13 February 2014 | Volume 11 | Issue 2 | e1001604

likewise we could not find gp100-expressing cells in non-
melanoma lymph nodes. While this does not rule out the
possibility that truly DCC-negative sentinel nodes from melanoma
patients may contain gp100-expressing benign nevus cells, our
finding that even low numbers of gp100-positive cells are
prognostically relevant would then suggest that gp100-positive
nevus cells may be prognostically informative. Furthermore, in
97% of all analyzed gp100-positive cells we detected chromosomal
or subchromosomal alterations. For only one patient out of 46
could we not confirm the malignant descent of the isolated cell. In
all other cases genetic alterations in gp100-positive cells proved
disseminated melanoma, suggesting that morphological criteria for
DCC identification are dispensable.
Then, we directly addressed the question of whether staining for
another antigen (Melan-A) increases the detection rate and the
prognostic power of the gp100-based immunoassay. However,
while Melan-A staining added a few samples (7%) to the gp100-
identified positive lymph nodes, it also stained 8% of control
nodes. Moreover, assessing the prognostic power of the combined
results of gp100 and Melan-A staining for 710 patients, we found
that the gp100-only model was more accurate.
Compared to our assay, evaluation of sentinel nodes by
pathology has two major limitations. First, sensitivity largely
depends on the number of slides examined. Second, quantification
of lymphatic melanoma spread—a three-dimensional and often
multilocular process—is impossible by histopathology. We re-
solved these problems by homogenizing the patchy spatial
distribution of tumor cells within the node [32]—which greatly
impacts detection in tissue sections but less so in our approach—
and counting the stained cells. Thus, screening of a median of only
two slides (26106 cells) per node revealed a detection rate of 51%,
whereas pathology was positive in only 14% of patients. To
achieve a similar sensitivity by histopathology, it has been
suggested that more than 36 slides per sample need to be
analyzed, indicating that immunocytology might be advantageous
also for practical reasons [7,12]. In the future, both lymph node
preparation and screening may even be subjected to partial
automation and thereby decrease workload further.
The high detection rate of immunocytology is reminiscent of the
sensitivity of RT-PCR methods, which is also around 50% [33].
However, despite 20 y of clinical evaluation, RT-PCR assays have
failed to become clinical routine. Since one of our major findings
consists in the quantitative impact of lymphatic cancer cell
dissemination for patient outcome, we deem the non-quantitative
nature of RT-PCR assays and the failure to prove the malignant
melanoma origin of the detected nucleic acids to be a likely
explanation for its failure. RT-PCR assays do not measure cell
numbers but transcript numbers, which may be generated by a
few high-expressing cells or many low-expressing cells. Since the
unit of selection during malignant progression is a cell and not a
transcript, even quantitative transcript information will always
represent a qualitative assessment of cancer spread. Therefore,
Figure 6. Differences in survival prediction between thisstudy’s model and the AJCC-based model. (A) Joint distributionof the individual risk scores for the 1,027 patients according to twopredictive survival models: (1) ‘‘Risk new model’’ refers to the lognormalmodel with the predictors tumor thickness, DCCD, and ulceration; (2)‘‘Risk AJCC model’’ refers to a lognormal model based on the sevencategories of the AJCC classification (stage IA, IB, IIA, IIB, etc.). The riskscores are sums of products of the individual predictors multiplied withthe corresponding regression coefficients. (Since some tumor thick-nesses are less than 1 mm we obtain also negative risk scores becausetumor thickness enters on a log scale.) The area of the bubbles isproportional to the number of patients with identical combinations ofrisk values. The largest bubble contains 30 patients. The smallestbubbles represent one patient each. In Group 2 (red; n = 136) thesurvival probability for a patient from the new model is at all timessmaller than the survival probability according to the AJCC model. Theremaining patients form Group 1 (blue; n = 891). Note that there are
only seven risk groups for the AJCC model, while the new modelexploits the full risk range. (B) Observed (red filled circles; together withthe exact 95% confidence intervals) and fitted percentages of patientsin Group 2. Almost 29% of patients with AJCC stage . IIA are in Group2, whereas only about 6% of patients with AJCC stage , IIB are inGroup 2. (C) Observed (Kaplan-Meier survival estimates; step functions)and predicted survival probabilities for the new model (continuouslines) and the AJCC model (dashed lines) for the Group 1 (blue) andGroup 2 (red). Note the large difference between the AJCC model andthe new model for Group 2 and the perfect fit of the observed survivaland the new model’s predictions for Group 1 after 60 mo.doi:10.1371/journal.pmed.1001604.g006
Quantification of Melanoma Spread and Survival
PLOS Medicine | www.plosmedicine.org 14 February 2014 | Volume 11 | Issue 2 | e1001604

RT-PCR methods are unable to provide the information delivered
here that the prognostic weight of a single disseminated melanoma
cell is context dependent.
In summary, we provide evidence that quantification of
lymphatic cancer cell dissemination is feasible and can be
combined with other quantitative and qualitative characteristics
of the primary tumor for accurate individual outcome prediction,
probably not only for melanoma but also for other types of solid
cancer [34]. It will be important to validate the findings in an
independent study before the assay and the prediction model are
used clinically.
Supporting Information
Figure S1 gp100 and Melan-A double staining. Detection
of a double-positive melanoma cell in the sentinel lymph node
(gp100/HMB45, green; Melan-A, red; nuclear DAPI, blue). The
right panel shows an overlay of the three images.
(TIF)
Figure S2 Prognostic factors and melanoma survival.The Kaplan-Meier curves for the standard prognostic factors and
grouped DCCDs.
(TIF)
Figure S3 Hazard ratios of tumor thickness, DCCD,and ulceration over time for Cox and lognormal models.The ratio of two cumulative hazard functions is plotted as a
function of follow-up time for the three predictive variables
DCCD, tumor thickness, and ulceration. For DCCD we
compared DCCD .0 with DCCD = 0. For tumor thickness we
compared tumor thickness .1.85 mm ( = median tumor thick-
ness) with tumor thickness #1.85 mm. For ulceration we
compared positive with negative outcome. For each of the three
variables we calculated the empirical ratios of the cumulative
hazard functions as 2log(Kaplan-Meier survival), depicted as
green step functions. The blue lines show the constant hazard
ratios obtained from the corresponding Cox models. The red
curves show the ratios of the cumulative hazard functions of the
corresponding lognormal parametric survival model. There is
clear evidence for DCCD and tumor thickness that the observed
ratios of the cumulative hazard functions depart from a constant
value. They show a steady decline over the whole follow-up
period of more than 10 y.
(TIF)
Figure S4 Synergism between tumor thickness andDCCD for outcome prediction. 5-y survival probability
(percent) as a function of tumor thickness and DCCD for all
patients without ulceration (blue isoboles) and with ulceration (red
isoboles) on a linear scale. Convex isoboles indicate synergism.
(TIF)
Table 6. Kaplan-Meier estimates versus predicted deaths for a follow-up of 3 and 6 y by model and group.
Year ofFollow-Up Group n (Percent) Expected Deaths p-Value
AJCC New ModelKaplan-MeierEstimates AJCC Modela New Modela
3 1 891 (86.8) 61.9 45.8 58.6 0.67 0.06
3 2 136 (13.2) 19.1 33.0 32.8 0.001a 0.97
6 1 891 (86.8) 145.1 124.0 123.0 0.07 0.93
6 2 136 (13.2) 39.2 58.0 55.0 0.01a 0.69
aCompared to Kaplan-Meier estimates.doi:10.1371/journal.pmed.1001604.t006
Figure 7. Goodness of fit of observed and predicted survivalfor four risk groups. The 138 patients who died from melanomawere divided into four groups (see Methods) with increasing risk ofdeath, as defined by the survival model. Subsequently, the riskthresholds of the four groups were applied to all the patients. TheKaplan-Meier estimates (step functions) and the predicted survivalcurves (smooth curves) from the survival model are depicted for thesefour groups. All four of the groups differed from each other significantly(all p-values,0.001 in the log-rank test comparing group 2 to group 1,group 3 to group 2, and group 4 to group 3).doi:10.1371/journal.pmed.1001604.g007
Quantification of Melanoma Spread and Survival
PLOS Medicine | www.plosmedicine.org 15 February 2014 | Volume 11 | Issue 2 | e1001604

Table S1 DCCD in relation to standard prognosticfactors in 1,027 patients.
(DOCX)
Table S2 Observed and expected number of deaths forthree groups of patients at the time of follow-up for eachpatient.
(DOCX)
Table S3 Goodness of fit of four multivariable survivalmodels.
(DOCX)
Text S1 Model equations.
(DOC)
Acknowledgments
We thank Ursula Schiebel and Nadine Luz for their excellent technical
support, and the surgery team for their outstanding cooperation.
Author Contributions
Conceived and designed the experiments: AU GF CAK. Performed the
experiments: IH BP MY SeS ZC. Analyzed the data: KD AU PL TF CG.
Wrote the first draft of the manuscript: AU CK. Contributed to the writing
of the manuscript: AU KD GF CAK. ICMJE criteria for authorship read
and met: AU KD IH BP SeS MY ZC PL TF CH StS MR CG HB GF
CAK. Agree with manuscript results and conclusions: AU KD IH BP SeS
MY ZC PL TF CH StS MR CG HB GF CAK. Enrolled patients: StS MR
HB CH. Provided access to data from the Tubingen Cancer Registry: CG.
Performed immunocytological evaluations: AU. Performed and evaluated
the immunofluorescence staining: AU PL TF.
References
1. Morton DL, Wen DR, Wong JH, Economou JS, Cagle LA, et al. (1992)
Technical details of intraoperative lymphatic mapping for early stage melanoma.
Arch Surg 127: 392–399.2. Reintgen D, Cruse CW, Wells K, Berman C, Fenske N, et al. (1994) The orderly
progression of melanoma nodal metastases. Ann Surg 220: 759–767.3. Gershenwald JE, Soong SJ, Balch CM (2010) 2010 TNM staging system for
cutaneous melanoma…and beyond. Ann Surg Oncol 17: 1475–1477.
4. Balch CM, Gershenwald JE, Soong SJ, Thompson JF, Atkins MB, et al. (2009)Final version of 2009 AJCC melanoma staging and classification. J Clin Oncol
27: 6199–6206.5. Murali R, Desilva C, McCarthy SW, Thompson JF, Scolyer RA (2012) Sentinel
lymph nodes containing very small (,0.1 mm) deposits of metastatic melanomacannot be safely regarded as tumor-negative. Ann Surg Oncol 19: 1089–1099.
6. van Akkooi AC, de Wilt JH, Verhoef C, Schmitz PI, van Geel AN, et al. (2006)
Clinical relevance of melanoma micrometastases (,0.1 mm) in sentinel nodes:are these nodes to be considered negative? Ann Oncol 17: 1578–1585.
7. van der Ploeg AP, van Akkooi AC, Schmitz PI, Koljenovic S, Verhoef C, et al.(2010) EORTC Melanoma Group sentinel node protocol identifies high rate of
submicrometastases according to Rotterdam criteria. Eur J Cancer 46: 2414–
2421.8. van Diest PJ (1999) Histopathological workup of sentinel lymph nodes: how
much is enough? J Clin Pathol 52: 871–873.9. Abrahamsen HN, Hamilton-Dutoit SJ, Larsen J, Steiniche T (2004) Sentinel
lymph nodes in malignant melanoma: extended histopathologic evaluation
improves diagnostic precision. Cancer 100: 1683–1691.10. Cochran AJ, Balda BR, Starz H, Bachter D, Krag DN, et al. (2000) The
Augsburg Consensus. Techniques of lymphatic mapping, sentinel lymphade-nectomy, and completion lymphadenectomy in cutaneous malignancies. Cancer
89: 236–241.11. Starz H, Balda BR, Kramer KU, Buchels H, Wang H (2001) A micro-
morphometry-based concept for routine classification of sentinel lymph node
metastases and its clinical relevance for patients with melanoma. Cancer 91:2110–2121.
12. Murali R, Thompson JF, Scolyer RA (2010) Location of melanoma metastasesin sentinel lymph nodes: what are the implications for histologic processing of
sentinel lymph nodes in routine practice? Am J Surg Pathol 34: 127–129.
13. Bagaria SP, Faries MB, Morton DL (2010) Sentinel node biopsy in melanoma:technical considerations of the procedure as performed at the John Wayne
Cancer Institute. J Surg Oncol 101: 669–676.14. Morton DL, Thompson JF, Cochran AJ, Mozzillo N, Elashoff R, et al. (2006)
Sentinel-node biopsy or nodal observation in melanoma. N Engl J Med 355:1307–1317.
15. Prieto VG, Clark SH (2002) Processing of sentinel lymph nodes for detection of
metastatic melanoma. Ann Diagn Pathol 6: 257–264.16. Scolyer RA, Murali R, McCarthy SW, Thompson JF (2008) Pathologic
examination of sentinel lymph nodes from melanoma patients. Semin DiagnPathol 25: 100–111.
17. Ulmer A, Fischer JR, Schanz S, Sotlar K, Breuninger H, et al. (2005) Detection
of melanoma cells displaying multiple genomic changes in histopathologically
negative sentinel lymph nodes. Clin Cancer Res 11: 5425–5432.18. Klein CA, Blankenstein TJ, Schmidt-Kittler O, Petronio M, Polzer B, et al.
(2002) Genetic heterogeneity of single disseminated tumour cells in minimalresidual cancer. Lancet 360: 683–689.
19. Klein CA, Schmidt-Kittler O, Schardt JA, Pantel K, Speicher MR, et al. (1999)
Comparative genomic hybridization, loss of heterozygosity, and DNA sequenceanalysis of single cells. Proc Natl Acad Sci U S A 96: 4494–4499.
20. Baudis M, Cleary ML (2001) Progenetix.net: an online repository for molecularcytogenetic aberration data. Bioinformatics 17: 1228–1229.
21. Kalbfleisch JD, Prentice RL (1980) The statistical analysis of failure time data.Hoboken (New Jersey): Wiley. 321 p.
22. Schwarz G (1978) Estimating the dimension of a model. Ann Statist 6: 461–464.
23. Harrell FE Jr, Lee KL, Mark DB (1996) Multivariable prognostic models: issuesin developing models, evaluating assumptions and adequacy, and measuring and
reducing errors. Stat Med 15: 361–387.24. Otto E (1963) Nomography. New York: Macmillan.
25. McShane LM, Altman DG, Sauerbrei W, Taube SE, Gion M, et al. (2005)
Reporting recommendations for tumor marker prognostic studies (REMARK).J Natl Cancer Inst 97: 1180–1184.
26. Machado SG, Robinson GA (1994) A direct, general approach based onisobolograms for assessing the joint action of drugs in pre-clinical experiments.
Stat Med 13: 2289–2309.
27. Scheri RP, Essner R, Turner RR, Ye X, Morton DL (2007) Isolated tumor cellsin the sentinel node affect long-term prognosis of patients with melanoma. Ann
Surg Oncol 14: 2861–2866.28. Braumuller H, Wieder T, Brenner E, Assmann S, Hahn M, et al. (2013) T-
helper-1-cell cytokines drive cancer into senescence. Nature 494: 361–365.29. Klein CA (2011) Framework models of tumor dormancy from patient-derived
observations. Curr Opin Genet Dev 21: 42–49.
30. Peinado H, Aleckovic M, Lavotshkin S, Matei I, Costa-Silva B, et al. (2012)Melanoma exosomes educate bone marrow progenitor cells toward a pro-
metastatic phenotype through MET. Nat Med 18: 883–891.31. Prieto VG (2012) Cutaneous melanocytic lesions: do not miss the invisible
gorilla. Adv Anat Pathol 19: 263–269.
32. Riber-Hansen R, Nyengaard JR, Hamilton-Dutoit SJ, Steiniche T (2009) Thenodal location of metastases in melanoma sentinel lymph nodes. Am J Surg
Pathol 33: 1522–1528.33. Mocellin S, Hoon DS, Pilati P, Rossi CR, Nitti D (2007) Sentinel lymph node
molecular ultrastaging in patients with melanoma: a systematic review and meta-analysis of prognosis. J Clin Oncol 25: 1588–1595.
34. Schilling D, Hennenlotter J, Sotlar K, Kuehs U, Senger E, et al. (2011)
Quantification of tumor cell burden by analysis of single cell lymph nodedisaggregates in metastatic prostate cancer. Prostate 70: 1110–1118.
35. Czyz TZ, Hoffmann M, Schlimok G, Polzer B, Klein CA (2004) Reliable singlecell array CGH for clinical samples. PLoS ONE 9: e85907.
Quantification of Melanoma Spread and Survival
PLOS Medicine | www.plosmedicine.org 16 February 2014 | Volume 11 | Issue 2 | e1001604

Editors’ Summary
Background. Because the skin contains many different celltypes, there are many types of skin cancer. The mostdangerous type—melanoma—develops when mutationsoccur in melanocytes, the cells that produce the pigmentmelanin. Less than 5% of skin cancers are melanomas, butmelanoma causes most skin cancer deaths. Early signs ofmelanoma are a change in the appearance of a mole (apigmented skin blemish) or the development of a new andunusual pigmented lesion. If these signs are noticed and themelanoma is diagnosed before it has spread from the skininto nearby lymph nodes and other tissues, surgery oftenprovides a cure. For advanced melanomas, the outlook isgenerally poor, although novel therapies may prolong apatient’s life.
Why Was This Study Done? When a person is diagnosedwith melanoma, it is important to ‘‘stage’’ the tumor.Knowing the extent and severity of the melanoma helpsoncologists plan treatments and estimate their patients’likely outcomes. The detection of isolated melanoma cells insentinel lymph nodes (the nodes to which cancer cells aremost likely to spread from a primary tumor) is included inmelanoma staging recommendations. However, finding raretumor cells in sentinel lymph node biopsies by examiningthe tissue requires the analysis of many slides from eachnode removed from the patient and is extremely time-consuming. In this study, the researchers investigate thepredictive value of a quantitative immunocytological assaythat involves disaggregation of the sentinel node anddetection of disseminated cancer cells (DCCs) by immuno-staining for gp100 (a marker for melanoma cells). They alsouse this new assay to examine the effect of increasingnumbers of DCCs on melanoma-specific survival.
What Did the Researchers Do and Find? The researchersused routine histopathology and immunocytology to ana-lyze 1,834 sentinel lymph nodes from 1,027 patients withmelanoma who underwent sentinel lymph node biopsy atone German hospital. For immunocytology, the researchersrecorded the number of gp100-positive cells per millionlymph node cells (the DCC density). During follow-up, 138patients (13.4%) died from melanoma. The results indicatedthat increased DCC density was associated with an increasedrisk of death due to melanoma. Specifically, every 10-foldincrease in DCC density + 1 was associated with a neardoubling of the risk of death from melanoma (a hazard ratioof 1.81). Even patients with three or fewer gp100-positivecells per million lymph node cells had an increased risk of
dying from melanoma compared to patients with no gp100-positive cells (hazard ratio 1.63). When other predictors ofoutcome such as age and primary tumor location were takeninto account, DCC density was a stronger predictor of deaththan histopathology. Finally, a survival model that includedtumor thickness, tumor ulceration, and DCC density providedsurvival prediction superior to that of a model based on thecurrent standard staging recommendations.
What Do These Findings Mean? These findings showthat quantification of cancer cell dissemination from mela-nomas to sentinel lymph nodes is feasible and can becombined with other characteristics of the primary tumor toprovide an accurate prediction of outcomes for individualpatients with melanoma. Notably, the new prediction modelidentifies a group of patients at high risk of progression forwhom the current clinical standard underestimates the riskof death. These patients may benefit from adjuvanttherapies, so the new analysis presented in this study mayhelp to stratify patients for clinical trials. Importantly,quantitative immunocytology and the new model, althoughinternally validated in this study, need to be validated in anindependent group of patients before they can be consid-ered for routine clinical use. If external validation issuccessful, quantitative immunocytology, which is much lesslabor-intensive than histopathology, has the potential tochange the routine clinical care of patients with melanomaand probably with other solid tumors, conclude theresearchers.
Additional Information. Please access these websites viathe online version of this summary at http://dx.doi.org/10.1371/journal.pmed.1001604.
N The US National Cancer Institute provides information forpatients and professionals on melanoma, cancer staging,and sentinel lymph node biopsy (in English and Spanish)
N The nonprofit organization American Cancer Societyprovides information in several languages on cancer andhow it develops and specific information on melanoma,including the AJCC system for staging and personal stories
N The UK National Health Service Choices website includesan introduction to cancer and a page on melanoma thatincludes personal stories
N The nonprofit organization Cancer Research UK providesbasic information about cancer and detailed informationon melanoma
Quantification of Melanoma Spread and Survival
PLOS Medicine | www.plosmedicine.org 17 February 2014 | Volume 11 | Issue 2 | e1001604