The Characterisation of Oilfield Chemicals by Electrospray ...
Upload
independentCategory
view
0download
0
Quantitative Characterization of Solid EpoxyResins Using Comprehensive Two DimensionalLiquid Chromatography Coupled with ElectrosprayIonization-Time of Flight Mass Spectrometry
Samir Julka,† Hernan Cortes,*,† Robert Harfmann,† Bruce Bell,† Andreas Schweizer-Theobaldt,‡
Matthias Pursch,‡ Luigi Mondello,§ Shawn Maynard,| and David West|
The Dow Chemical Company, Analytical Sciences, 1897 Building, Midland, Michigan 48667, Dow DeutschlandAnlagengesellschaft mbH, Analytical Sciences, Rheinmunster, Germany, Dipartimento Farmaco-chimico, Facolta diFarmacia, Universita dei Messina, Viale Annunziata, I-98168 - Messina, Italy, and The Dow Chemical Company,Epoxy R&D, B-4810, Freeport, Texas 77541
A comprehensive multidimensional liquid chromatogra-phy system coupled to Electrospray Ionization-Mass Spec-trometry (LCxLC-ESI-MS) was developed for detailedcharacterization and quantitation of solid epoxy resincomponents. The two orthogonal modes of separationselected were size exclusion chromatography (SEC) in thefirst dimension and liquid chromatography at criticalconditions (LCCC) in the second dimension. Differentcomponents present in the solid epoxy resins wereseparated and quantitated for the first time based on thefunctional groups and molecular weight heterogeneity.Coupling LCxLC separations with mass spectrometryenabled the identification of components resolved in thetwo-dimensional space. Several different functional groupfamilies of compounds were separated and identified,including epoxy-epoxy and epoxy-r-glycol functional oli-gomers, and their individual molecular weight rangeswere determined. Repeatability obtained ranged from0.5% for the main product to 21% for oligomers at the0.4% concentration level.
Detailed characterization of synthetic polymers is critical forbetter understanding of structure-performance relationships.Performance properties are dependent on a number of variables,such as molecular weight distribution, molecular topology, func-tionality, and chemical composition.
A synthetic polymer of specific interest is epoxy resin. Toanticipate the types of molecular structures that can be expectedin Solid Epoxy Resins (SER) it is necessary to understand someaspects of the manufacturing processes used to make liquid andsolid epoxy resins. The following gives a basic description of theseprocesses and suggests some of the molecules and functionalgroups that can be expected.
Liquid Epoxy Resin. Liquid epoxy resin (LER) is made in atwo step process. First, the dichlorohydrin of bisphenol A isformed by reacting excess epichlorohydrin and bisphenol A. Nextthe dichlorohydrin of bisphenol A is dehydrochlorinated byreaction with aqueous sodium hydroxide giving primarily thediglycidyl ether of bisphenol A (DGEBA) in addition to other lowerconcentration impurities. The impurities may have one, two, orthree epoxy groups, and higher molecular weight oligomers ofDGEBA are also found. Other species may have non-epoxyfunctional end groups. These end groups can be diol or containchlorine, for example, that form from side reactions that occur inthe epoxidation process. The main product DGEBA and thevarious impurities are known collectively as LER.1
Fusion Process for Solid Epoxy Resin. In the so-calledFusion process for SER, excess LER is reacted with moltenbisphenol A in the presence of catalyst to produce a distributionof higher oligomers of LER with even repeat unit (n) values. Theidealized structure and the fusion chemistry are shown in Figure1. The oligomer distribution is controlled by the stoichiometry.LER that contain two epoxy groups (difunctional) are advancedwith bisphenol A to produce the even oligomer pattern. Chainsthat are formed from the advancement of non-epoxy terminatedchains, mono- and trifunctional chains, and branched chains canbe found (as small components) between the even oligomers.1
Taffy Process for Solid Epoxy Resin. In the “Taffy” processexcess epichlorohydrin is mixed with an aqueous solution ofsodium bisphenate forming an epoxy oligomer distribution withboth even and odd repeat units. As the reaction proceeds a whitehighly viscous epoxy resin separates from the solution (the resinbecame known as taffy because of its appearance). Because ofthe large amount of water present during the reaction and thepoor transport of reactants into the resin phase there are two typesof non-epoxy end groups formed: chlorohydrin and diol. Thechlorohydrin is present because of incomplete dehydrochlorina-tion (ring closure). The diol end group is formed either byhydrolysis of an epoxy end group, or from hydrolysis of epichlo-
* To whom correspondence should be addressed. E-mail: [email protected]: 989 631 8207. Fax 989 636 6432.
† The Dow Chemical Company, Analytical Sciences.‡ Dow Deutschland Anlagengesellschaft mbH, Analytical Sciences.§ Universita dei Messina.| The Dow Chemical Company, Epoxy R&D.
(1) Pham, H. Q.; Marks, M. J. Epoxy Resins in Encyclopedia of Polymer Scienceand Technology; John Wiley & Sons Inc.: New York, 2004.
Anal. Chem. 2009, 81, 4271–4279
10.1021/ac9001047 CCC: $40.75 2009 American Chemical Society 4271Analytical Chemistry, Vol. 81, No. 11, June 1, 2009Published on Web 04/29/2009

rohydrin to glycidol and subsequent reaction with sodium bisphen-ate or an oligomer.1
Since the liquid epoxy resins used for the synthesis of solidepoxy resins (SER) often contain considerable amounts of byprod-uct like chlorohydrins or R-glycols as described above, a numberof possible side reactions during advancement with bisphenol Acan lead to considerable macromolecular heterogeneity in the finalSER. The broad molecular weight and functional end-groupdistribution due to advancement of several impurities in combina-tion with linear versus branched distributions makes the detailedcharacterization of solid epoxy resins extremely challenging,.2,3
Reversed-phase liquid chromatography has been shown to providegood separation of the low molecular weight macromoleculesaccording to functionality.4-6 Analyses of solid epoxy resins usingreversed-phase liquid chromatography and mass spectrometryhave been reported.7 However, with only single-dimensionalseparations, the limited peak capacity achieved and the limitedseparation of higher molecular weight components yielded in-complete characterization. Information on the number and chemi-cal structures of side products, how each of the side productsadvances during the polymerization process, and determinationof the molecular weight ranges for each of the side products isnot possible using single dimensional separations.
In the past few years, comprehensive two-dimensional liquidchromatography (LCxLC) has gained popularity for analyses ofsuch complex mixtures.8-10 The separation power of LCxLC hasbeensuccessfullydemonstratedonavarietyofpolymersystems11-15
and in the characterization of samples of biological interest,16-19
triacylglycerides,20 and polyols.21 The higher peak capacitiesobtained, as well as the ability to utilize a variety of orthogonalseparation mechanisms, can prove invaluable in understandingstructure-performance relationships.
The heterogeneity of epoxy resins by LCxLC analyses has beenpreviously studied.3 However, the second dimension used in thosestudies had relatively long cycle times (5 min) limiting the abilityto obtain the desired 3-4 first-dimension cuts per peak to preventloss of information in the two-dimensional experiment.22 Thedifferent eluting components were subsequently identified bycollection of fractions using preparative Liquid Chromatographyat Critical Conditions (LCCC) and analysis of the fractions usingoff-line Matrix-Assisted Laser Desorption/Ionization-Time of Flight(MALDI-ToF) mass spectrometry.
The present report summarizes a research study undertakento develop the LCxLC and LCxLC-ESI-MS methodologies fordetailed characterization of solid epoxy resin functionalities as a
(2) Adrian, J.; Braun, D.; Rode, K.; Pasch, H. Angew. Makromol. Chem. 1999,267, 73–81.
(3) Adrian, J.; Braun, D.; Pasch, H. Angew. Makromol. Chem. 1999, 267, 82–88.
(4) Gloeckner, G.; Van den Berg, J. H. M. J. Chromatogr. 1986, 352, 511–522.
(5) Gorbunov, A. A.; Solovyova, L. Y.; Skvortsov, A. M. Polymer 1998, 39,697–702.
(6) Pasch, H.; Trathnigg, B. HPLC of Polymers; Springer: Berlin, 1997.(7) Fuchslueger, U.; Rissler, K.; Stephan, H.; Grether, H. J.; Grasserbauer, M.
J. Appl. Polym. Sci. 1999, 72, 913–925.(8) Stoll, D. R.; Li, X.; Wang, X.; Carr, P. W.; Porter, S. E. G.; Rutan, S. C.
J.Chromatogr. A 2007, 1168, 3–43.(9) Dugo, P.; Cacciola, F.; Kumm, T.; Dugo, G.; Mondello, L. J. Chromatogr. A
2008, 1184, 353–368.(10) Guiochon, G.; Marchetti, N.; Mriziq, K.; Shalliker, R. A. J. Chromatogr. A
2008, 1189, 106–168.
(11) Pasch, H.; Adler, M.; Rittig, F.; Becker, S. Macromol. Rapid Commun. 2005,26, 438–444.
(12) Pasch, H.; Adler, M.; Knecht, D.; Rittig, F.; Lange, R. Macromol. Symp.2006, 231, 166–177.
(13) Knecht, D.; Rittig, F.; Lange, R. F. M.; Pasch, H. J. Chromatogr. A 2006,1130, 43–53.
(14) Weidner, S.; Falkenhagen, J.; Krueger, R.; Just, U. Anal. Chem. 2007, 79,4814–4819.
(15) van der Horst, A.; Schoenmakers, P. J. Chromatogr. A 2003, 1000, 693–709.
(16) Bushey, M. M.; Jorgenson, J. W. Anal. Chem. 1990, 62, 161–167.(17) Wagner, K.; Miliotis, T.; Marko-Varga, G.; Bischoff, R. Anal. Chem. 2002,
74, 809–820.(18) Delahunty, C.; Yates, J. R. Methods 2005, 35, 248–255.(19) Kajdan, T.; Cortes, H.; Kuppannan, K.; Young, S. J. Chromatogr. A. 2008,
1189, 183–195.(20) Dugo, P.; Kumm, T.; Chiofalo, M. L.; Cotroneo, B. A.; Mondello, L. J. Sep.
Sci. 2006, 29, 1146–1154.(21) Entelis, S. G.; Gorshkov, A. V. Adv. Polym. Sci. 1986, 76, 129–175.
Figure 1. Idealized structures and Epoxy resin fusion chemistry.
4272 Analytical Chemistry, Vol. 81, No. 11, June 1, 2009

function of molecular weight by coupling Size Exclusion Chro-matography (SEC) and LCCC.
LCCC was chosen as the second dimension separation ratherthan the first since relatively fast (90 s) separations were achievedin the LCCC mode. This allowed sufficient sampling of the firstdimension separation with better reproducibility. The objectivesof the study were to separate oligomers with different functionalend groups, determine their molecular weight ranges, and identifyand quantitate the separated components.
EXPERIMENTAL SECTIONAll LCxLC experiments were performed on a Shimadzu
Prominence LC20square Comprehensive LC system (Shimadzu
Scientific Instruments, Columbia, MD). The data wereanalyzed using the LCxLC Manager Version 1.0 software(Shimadzu). Ammonium formate was purchased from Sigma(St. Louis, MO). HPLC-grade methanol (MeOH) and dichlo-romethane (CH2Cl2) were purchased from J.T. Baker (Phil-lipsburg, NJ).
Three different solid epoxy resin samples, poly(bisphenol A-co-epichlorohydrin) glycidyl end-capped were used. 1,3-Bis(4-(2-(4-(oxiran-2ylmethoxy)phenyl)propan-2-yl)phenoxy)propan-2-ol, des-ignated SER-1 (Sigma-Aldrich catalog number 405450); DER 661
(22) Murphy, R. E.; Schure, M. R.; Foley, J. P. Anal. Chem. 1998, 70, 1585–1594.
Figure 2. Representative overlaid size exclusion chromatograms (Diode array detector: Extracted 228nm) of solid epoxy resin sample SER-1.
Figure 3. Representative overlaid chromatograms of liquid chromatography at critical conditions for solid epoxy resin sample SER-1 (U.V.Detector;228nm).
4273Analytical Chemistry, Vol. 81, No. 11, June 1, 2009
made via the process delineated in Figure 1 (The Dow ChemicalCompany, Freeport, TX); and SER-2, prepared by the well-knownTaffy process as described in the introduction.
All samples were prepared as 3.0 wt % solutions in 3.5% MeOHin CH2Cl2. First dimension conditions were as follows: Columnwas a 4.6 mm × 250 mm PLgel MIXED-E, 5 µm particle size(Polymer Laboratories, Varian, Amherst, MA). The mobilephase was 3.5% v/v MeOH in CH2Cl2 with flow rate of 0.100mL/min for 15 min, followed by 0.012 mL/min from 15.01 to160 min. The injection volume was 1 µL. The second dimensionconditions were as follows: Column was a 2.1 mm × 100 mmAgilent Rx-SIL, 1.8-µm particle size (Agilent Technologies,Santa Clara, CA, USA). Mobile phase A and B were 1% v/vand 6% v/v MeOH in CH2Cl2, respectively. The LCCC condi-tions were optimized daily between 48-52 A:B ratios. The flowrate used was 2.1 mL/min with an injection volume of 18 µLvia two parallel loops on a 10-port switching valve. Thetemperature of the entire system was maintained at 30 °C. Thefirst and the second dimension analyses were optimized witha micro-Diode Array Detector (Extract: 228nm) and a UVDetector (228nm), respectively. Quantitation was performedby normalization of UV detector signals, since standards forcomponents separated are not available.
LCxLC-ESI-MS Analysis. The Shimadzu ProminenceLC20square Comprehensive LC system was coupled to a LCT-Premier TOF-MS system (Waters, Framingham, MA) equippedwith a Z-spray source. After the LCxLC analysis, effluent from
the UV detector was split using a graduated splitter such thatapproximately 700-800 µL/min of the split flow was directedtoward the mass spectrometer. This split eluent stream wasmerged with a 100 µL/min solution of 0.03 M ammoniumformate in MeOH. The post-addition of ammonium formatesolution ensured sufficient ionization of eluting epoxy resincomponents. The samples were analyzed in positive ion modein the W configuration under nominal mass conditions. Thecapillary voltage was maintained at 2.5 kV while the sourceand desolvation temperature were maintained at 110 and 250°C, respectively. The scan range was between 250 to 2000 amu.The MCP was maintained at 2250 V and the scan speed wasset at 0.5 s per scan.
RESULTS AND DISCUSSIONTo characterize the different functional groups present in solid
epoxy resins, SEC and LCCC were selected as first and secondseparation dimensions. Before carrying out the LCxLC analyses,the two dimensions were independently optimized. In LCxLCanalyses the first dimension separation is typically performed ona narrow-bore column using low flow rates.23,24 Because of lackof commercially available micro SEC columns, the first dimensionseparation was performed on a conventional-size column. Initialexperimental results revealed that chromatographic peak shapesdid not noticeably deteriorate because of band-broadening at verylow flow rates (12 µL/min). However, the use of the conventional-size column with a flow rate of 12 µL/min resulted in a dwell timeof over 50 min. To shorten the run time and optimize for thesubsequent two-dimensional experiments, the flow rate was setat 0.100 mL/min for the first 15 min. At 15.01 min the flow wasreduced to 12 µL/min. Changing the flow rate in this manner didnot affect peak shapes but significantly reduced the analysis time.Under these conditions, solid epoxy resins separate on the basisof their hydrodynamic volume. Figure 2 represents an overlay ofchromatograms from three successive analyses of the SER-1 solidepoxy resin. The results demonstrate excellent repeatability inthe first dimension separation.
During LCCC analyses, the critical conditions for chromato-graphic separations have been defined as the point where thedistribution coefficient of a polymer is unity regardless of the
(23) Cortes, H. J. Chromatogr. 1992, 626, 3–23.(24) Dugo, P.; Cacciola, F.; Kumm, T.; Dugo, G.; Mondello, L. J.Chromatogr. A
2008, 1184, 353–368.
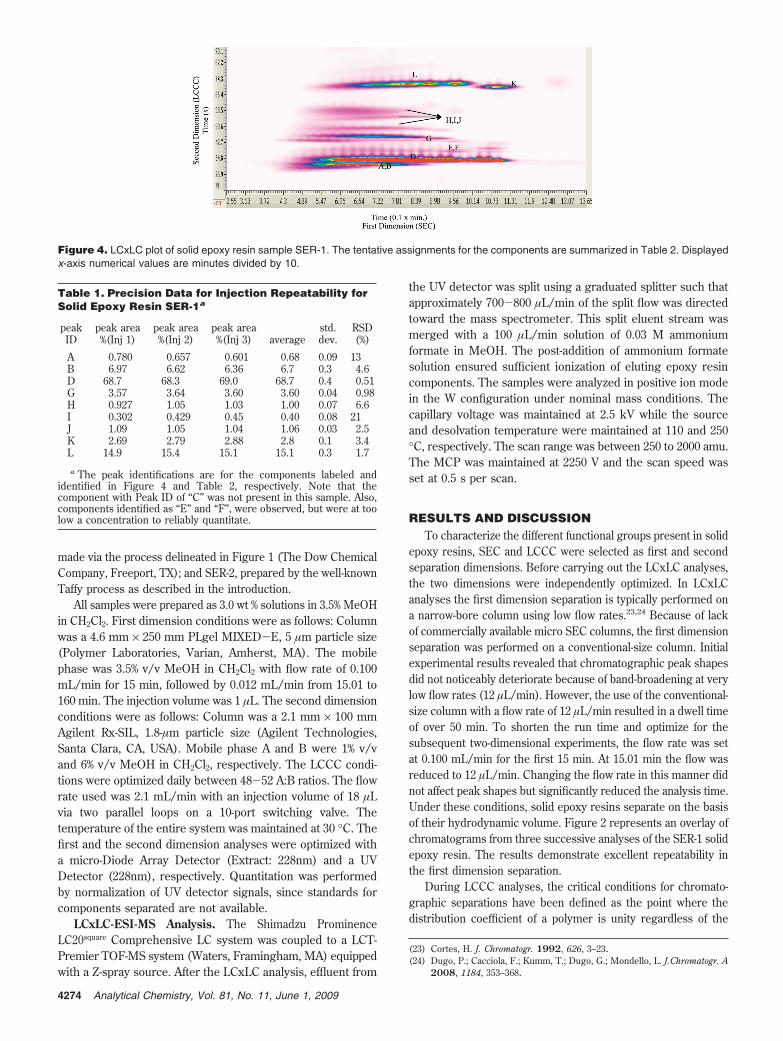
Figure 4. LCxLC plot of solid epoxy resin sample SER-1. The tentative assignments for the components are summarized in Table 2. Displayedx-axis numerical values are minutes divided by 10.
Table 1. Precision Data for Injection Repeatability forSolid Epoxy Resin SER-1a
peakID
peak area%(Inj 1)
peak area%(Inj 2)
peak area%(Inj 3) average
std.dev.
RSD(%)
A 0.780 0.657 0.601 0.68 0.09 13B 6.97 6.62 6.36 6.7 0.3 4.6D 68.7 68.3 69.0 68.7 0.4 0.51G 3.57 3.64 3.60 3.60 0.04 0.98H 0.927 1.05 1.03 1.00 0.07 6.6I 0.302 0.429 0.45 0.40 0.08 21J 1.09 1.05 1.04 1.06 0.03 2.5K 2.69 2.79 2.88 2.8 0.1 3.4L 14.9 15.4 15.1 15.1 0.3 1.7
a The peak identifications are for the components labeled andidentified in Figure 4 and Table 2, respectively. Note that thecomponent with Peak ID of “C” was not present in this sample. Also,components identified as “E” and “F”, were observed, but were at toolow a concentration to reliably quantitate.
4274 Analytical Chemistry, Vol. 81, No. 11, June 1, 2009
molecular weight.25,26 For this condition, the Gibbs free energy(∆G) change of the process must be zero, so that enthalpic
(adsorption) and entropic (exclusion) interactions are balanced.When these conditions are achieved, functional groups will interact
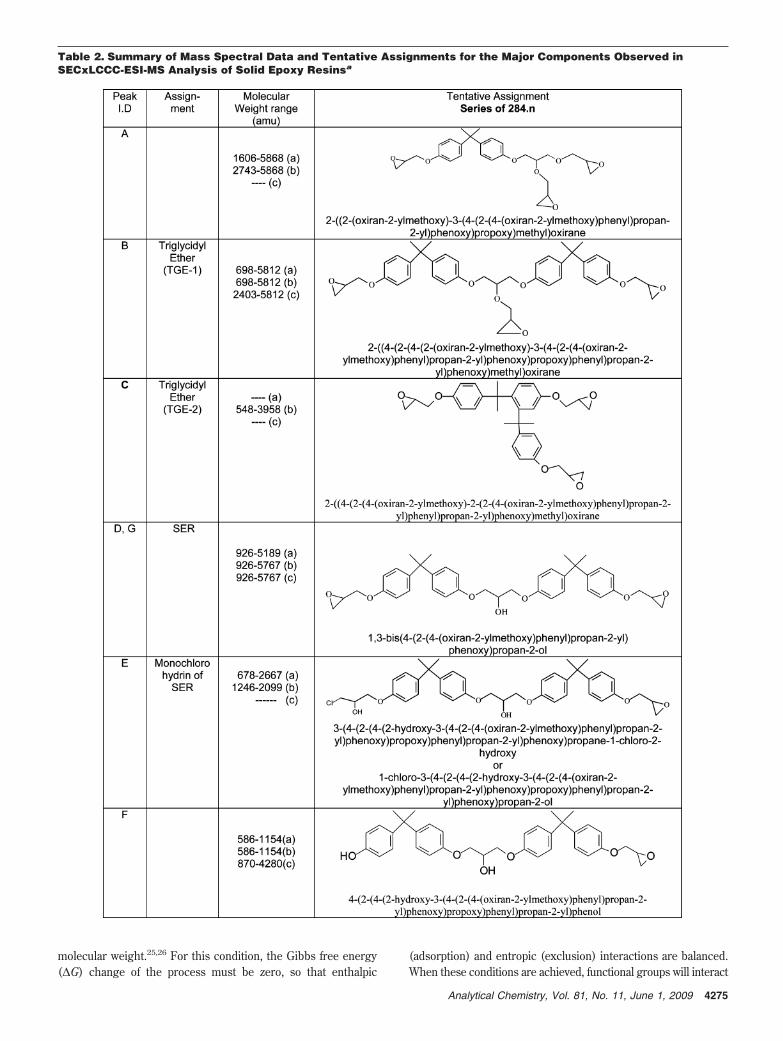
Table 2. Summary of Mass Spectral Data and Tentative Assignments for the Major Components Observed inSECxLCCC-ESI-MS Analysis of Solid Epoxy Resinsa
4275Analytical Chemistry, Vol. 81, No. 11, June 1, 2009

exclusively with the stationary phase, where polymer moleculeswill elute based on “defects” in the molecule independent ofmolecular mass. Critical chromatography has proven useful in thecharacterization of a variety of polymers.26-28
Figure 3 represents an overlay of UV chromatograms fromthree successive analyses of the SER-1 epoxy resin componentseluting under critical conditions. The overlay also demonstratesexcellent repeatability obtained for the second dimension LCCCseparation. Throughout the course of the study, the seconddimension mobile phase ratio was adjusted to achieve criticalseparation conditions whenever fresh mobile phase was prepared.Operating conditions were set so that each second dimensionanalysis was completed in 1.5 min. On the basis of Figure 3, asmany as 12 components are at least partially resolved in the epoxyresin mixture. The first and second dimension columns wereconnected through a 10-port switching valve. Sample loops on the10-port valve captured all of the effluent from the first dimensionanalysis and sequentially injected each onto the second dimension
column. A first dimension flow rate of 12 µL/min and a modulation(valve-switching) time of 1.5 min resulted in a second dimensioninjection volume of 18 µL. A total of 107 first dimension “aliquots”were analyzed in the second dimension using the orthogonalseparation mechanism. The resulting data allowed two-dimensionalcontour plots to be generated for each sample. Figure 4 representsthe LCxLC contour plot of solid epoxy resin sample SER-1. Onthe basis of the orthogonal separation mechanisms chosen,components in the epoxy samples were first separated on the basisof their hydrodynamic volume (molecular weight). Then, co-eluting components with the same hydrodynamic volume werefurther separated based on their functionalities. As observed inthe LCxLC map, substantial overlap of eluting componentsbetween 50-110 min was observed in the first dimension analyses.However, with the availability of additional separation space inthe second dimension, each of the co-eluting components wasfurther resolved.
Currently, quantitation of components separated in the LCxLCspace is in its developmental stage.29 Quantitative information oncomposition of a representative solid epoxy resin sample, SER-1,that was separated into individual components in the 2-dimensionalspace was obtained. Three such replicate injections were analyzed.
(25) Gorshkov, A. V.; Verenich, S. S.; Evreinov, V. V.; Entelis, S. G. Chro-matographia 1988, 26, 338–342.
(26) Pasch, H. Adv. Polym. Sci. 2000, 150, 1–66.(27) Falkenhagen, J.; Much, H.; Stauf, W.; Muller, A. H. E. Macromolecules 2000,
33, 3687–3693.(28) Heinz, L. C.; Macko, T.; Pasch, H.; Weiser, M. S.; Mulllhaupt, R. Int. J.
Polym. Anal. Charact. 2006, 11, 47–55.(29) Mondello, L.; Herrero, M.; Kumm, T.; Dugo, P.; Cortes, H.; Dugo, G. Anal.
Chem. 2008, 80, 5418–5424.
Table 2. Continued
a a, b, c correspond to molecular weight ranges for solid epoxy resins SER-1, DER 661, and SER-2, respectively.
4276 Analytical Chemistry, Vol. 81, No. 11, June 1, 2009

If reliable quantitative information is to be obtained, peak responseand retention times must be reproducible in both analysisdimensions. Since a number of the components separated hadnot been previously identified, and standards were not available,quantitation was performed by normalization of their respectiveUV responses. Because each of the components originated fromthe same epoxy repeating unit, this is not believed to be asignificant detriment. The components present in the LCxLC mapswere quantitated using the LCxLC Manager version 1.0 software.Quantitation repeatability in the 2D separation space was deter-
mined using the integration function of the LCSolution software.Integration results from quantitation of components in theLCxLC separation are presented in Table 1. Excellent injectionrepeatability was demonstrated for the main component, 0.5%.The RSD for components at the percent level ranged from 0.98%to 6.6%. The two components present below 1% had RSD valuesof 13% and 21%, reflecting higher relative error and alsoreflecting the inability to specify the exact size and shape ofthe integration zones using the current beta version of thequantitation software.
Figure 5. (a) Total ion chromatogram (TIC) in the positive ion mode for LCxLC separation of solid epoxy resin sample SER-1 and (b) ExpandedTIC depicting the separation in one of the 2nd dimension cuts (1.5 min window).
4277Analytical Chemistry, Vol. 81, No. 11, June 1, 2009

Figure 6. Extracted ion chromatograms (XICs) for the main product, SER, depicting the representative mass range for oligomers.
Figure 7. Comprehensive LCxLC plots of (a) solid epoxy resin sample DER 661 (Fusion process) and (b) solid epoxy resin sample SER-2(Taffy process). Displayed x-axis numerical values are minutes divided by 10.
4278 Analytical Chemistry, Vol. 81, No. 11, June 1, 2009

LCxLC-ESI-MS Analyses. To identify the different elutingcomponents, the LCxLC instrument was coupled to the ESI-MSas detailed in the Experimental Section. The mass spectrometricanalysis provides an additional complementary dimension to theLCxLC analyses. Figure 5 represents the total ion chromatogramfor the SECxLCCC-ESI-MS separation of SER-1 sample. In Figure5, an expanded total ion chromatogram with a representativeseparation in one of the second dimension cuts is depicted.Different scan rates were evaluated to achieve acceptable resolu-tion for the total ion chromatograms. The scan rate for the massspectral acquisition was optimized at 0.5 scan/sec. Acquiring at afaster scan rate did not result in any further improvement in theresolution. In comparison to Figure 3, a decrease in chromato-graphic resolution was observed in the total ion chromatogramfor the 1.5 min second dimension run depicted in Figure 5b. Thisdecrease in resolution can be attributed to band-broadeningresulting from extra column dead volume introduced by theconnections used to first split off effluent for optimum flowcompatibility with the MS, and then to allow post-addition ofammonium formate to facilitate ionization. Because the MS systemis used only for compound identification and molecular weightassignments, this decrease in resolution is not a significantdetriment if interpretable spectra can be obtained, as was the casein this study. Quantitation and further interpretation were per-formed using UV detection, where resolution was not affected.
The epoxy resin samples depicted a characteristic oligomericseries for the major components with a repeating unit of 284.1amu. Since the separation in the LCCC mode takes place on thebasis of end group functionality, there is limited overlap of otherfunctionalities. This prevents any issues related to quenching ofionization because of co-eluting components. Figure 6 representsthe extracted ion chromatograms for the different oligomers ofthe main product, in the mass range 352.5 amu (n ) 0) to 5188.5amu (n ) 17). Note that this mass range could not be observedin single-dimensional LC-MS analysis because of the polydispersityand significant overlap of components from the side reactions.The other major functional group of interest is the hydrolysisproduct of the glycidyl-ether, the R-glycol group. It was clear thatSECxLCCC provides sufficient separation to provide detailedinformation on the molecular weight distribution of the two maincomponents. Moreover, it also allows for quantitation of these twomain components of interest.
Table 2 represents the summary of the different componentswhich were identified for the solid epoxy resin samples and theirrespective molecular weight ranges. It should be noted that sinceMS cannot differentiate isomers with the same molecular weight,structures described should be considered as tentative assign-ments. As an example, compounds D and G are expected to bedifferent geometric isomers (ortho, para functionalities with samemolecular weight) of the main product, or contain primary versussecondary hydroxyls from opening of the epoxide ring duringpolymerization. Hence, they elute at different retention times inthe LCCC mode, as seen in Figure 4.
Although the components TGE-1, [2-((4-(2-(4-(2-oxiran-2-yl-methoxy)-3-(4-(2-(4-(oxiran-2-ylmethoxy)phenyl)propan-2-yl)phe-noxy)propoxy)phenyl)propan-2-yl)phenoxy)methyl]oxirane], (trig-lycidyl ether of Bisphenol-A), TGE-2, [2-((4-(2-(4-(oxiran-2-ylmethoxy)-2-(2-(4-(oxiran-2-ylmethoxy)phenyl)propan-2-yl)phenyl)propane-2-yl)phenoxy)methyl)oxirane], (triglycidyl etherof Trisphenol), and SER were not well-resolved in the contourplots, the addition of a third dimension in mass spectrometryallowed identification of these components. On the basis of theanalyses, it was observed that the current separation strategy inthe second dimension will not separate species more polar thanthe MHR [3-(4-(2-(4-(2-hydroxy-3-(4-(2-(-4-(oxiran-2-ylmethoxy)phe-nyl)propan-2-yl)phenoxy)propoxy)phenyl)propan-2-yl)phenoxy)pro-pane-1,2-diol], (Monohydroxy resin, epoxy - R-glycol), oligomers.Since the amount of such components is expected to be very low,this restriction does not represent a major disadvantage. Panelsa and b of Figure 7 represent the LCxLC maps of the Fusionprocess and Taffy process resins, respectively. On the basis ofthe contour plots, different side reactions and their respectivemolecular weight ranges can be observed. As evident, significantlymore MHR is made in the sample produced via the Taffy process.
A continuous series of MHRs were observed for the epoxyresin made via the Taffy process in contrast to only evennumbered (n ) 0, 2, 4,...) MHRs observed in the epoxy resin madevia the Fusion process.
CONCLUSIONSLCxLC-ESI-MS analyses can provide unique insights and
understanding of the composition of synthetic polymers asdemonstrated in the present work for epoxy resins. The differentLCxLC patterns clearly depict significant differences in functional-ity and molecular weights caused by differing polymerizationconditions. The technology developed separates numerous specieswith different combinations of end-group functionalities, allowingquantitation and determination of their individual molecular weightranges for the first time. On the basis of the results obtained, itis concluded that LCxLC-ESI-MS provides a powerful techniquefor comparison of epoxy resins developed using different polym-erization conditions. This information is useful for verifyingmolecular architecture models for the production of solid epoxyresins. The technologies developed are expected to be applicableto a wide variety of synthetic polymers.
ACKNOWLEDGMENTThe authors would like to thank Dr. Masayuki Nishimura and
the Shimadzu Corporation for their help, assistance, and use ofthe Shimadzu Prominence LC20square Comprehensive LC system.
Received for review January 15, 2009. Accepted March 29,2009.
AC9001047
4279Analytical Chemistry, Vol. 81, No. 11, June 1, 2009
Copyright © 2022 FDOKUMEN