Extractant Selection Strategy for Solvent-Impregnated Resins in Fermentations
120
In-situ product recovery from fermentation broths The application of solvent-impregnated resins as a product recovery tool Corjan van den Berg, Msc.
Transcript of Extractant Selection Strategy for Solvent-Impregnated Resins in Fermentations

In-situ product recovery from fermentation broths
The application of solvent-impregnated resins as a product recovery tool
Corjan van den Berg, Msc.


In-situ product recovery from fermentation broths
The application of solvent-impregnated resins as a product recovery tool
Proefschrift
ter verkrijging van de graad van doctor aan de Technische Universiteit Delft,
op gezag van de Rector Magnificus Prof. Ir. K.C.A.M. Luyben, voorzitter van het College voor Promoties,
in het openbaar te verdedigen op maandag 13 September 2010 om 15.00 uur
door
Corjan van den Berg, Msc.
Geboren te Bennekom


Dit proefschrift is goedgekeurd door de promotor: Prof. Dr.Ir. L.A.M. van der Wielen Samenstelling promotiecommissie: Rector Magnificus Voorzitter Prof.Dr.Ir. L.A.M. van der Wielen Technische Universiteit Delft, promotor Prof.Dr.Ir. J.T.F. Keurentjes Technische Universiteit Eindhoven Dr.Ir. D. Verdoes TNO Dr.Ir. E.J.A.X. van de Sandt DSM Prof.Dr.Ir. S. Heijnen Technische Universiteit Delft Prof.Dr. G.J. Witkamp Technische Universiteit Delft Dr.Ir. J. de Bont Royal Nedalco Dr. ir. Mark Roelands en Dr.ir Paul Bussmann hebben als begeleiders in belangrijke mate aan de totstandkoming van het proefschrift bijgedragen. This research was financially supported by TNO, the Netherlands Ministry of Economic Affairs and the B-Basic partner organizations (www.b-basic.nl) through B-Basic, a public-private NWO-ACTS programme (Advanced Chemical Technologies for Sustainability, ACTS). Cover design by: Joost van Ingen ISBN: 978-94-90370-06-0 Copyright © 2010 by Corjan van den Berg Printed by Printpartners Ipskamp B.V. All rights reserved. NO part of the material protected by this copyright notice may be reproduced or utilised in any form or by means, electronic or mechanical, including photocopy, recording or by any information storage and retrieval system, without written permission from the publisher.


Table of contents
Chapter Title Page
Table of contents 7 1 General introduction 9 2 Proof of principle: Solvent impregnated resins
as an in-situ product recovery tool 19 3 Extractant selection strategy for solvent
impregnated resins in fermentations 33 4 Preparation and analysis of high capacity
polysulfone capsules 47 5 Techno-economic evaluation of solvent
impregnated resins in a bioreactor 59 6 Short-cut calculations for integrated product
recovery options in fermentative production of bio-bulk chemicals 81
7 Discussion & Future Outlook 109 Summary 113 Samenvatting 115 Bibliography 117 Curriculum vitae 118 Nawoord 119

Chapter 1
8

Chapter 1
9
Chapter 1
General introduction

Chapter 1
10
1.1 White biotechnology Life sciences will be one of the decisive factors in the 21st century [1]. Fundamental new findings in this area of science, the progress made with related technologies and their broad application in health and chemical research will have a far-reaching impact on a sustainable economy [1]. A major part of life sciences is the so-called white biotechnology, also known as industrial biotechnology. White biotechnology is mainly based on fermentation technology and biocatalysis for the production of industrially useful products. Nowadays, white biotechnology has emerged as an important tool in the production of bulk/fine chemicals, pharmaceutical intermediates and active pharmaceuticals [2, 3]. White biotechnology processes can be divided in two major groups: biotransformations and fermentations. In biotransformations, a starting material is converted with the help of either whole cells or isolated enzymes into a desired product. This defined starting material typically has a similar chemical structure as the end product. In fermentations, whole cells produce molecules "from scratch" based on usually simple carbon sources such as sugars or other small carbon-containing molecules. Most parts in the field of white biotechnology are still struggling with relatively low energy efficiency and low carbon yields. In a biotechnological process typically 50-70% of the costs come from downstream processing, accordingly it is important to develop this as an integral part of the overall process [4]. Since the exact requirements are product specific, generic methods are difficult to develop, and research programmes often neglect this important area. This has resulted in a technological bottleneck [4]. However, due to the increasing demand for green processes these hurdles need to be cleared.
1.2 Product inhibition and toxicity One of the reasons for low carbon yields and overall low energy efficiency is that the fermentation products can have a significant physiological impact on the producing micro-organism. Product accumulation in the micro-organisms environment can hamper the production of its primary or secondary metabolites. The traditional way of bio-processing is depicted in figure to the right. The biocatalyst is fed a starting material that is converted into a product until a critical concentration is reached and/or substrate is depleted. Subsequently, the product is separated from the rest of the process stream. This method of running fermentations works relatively well for products that have high final product titers. However, for most fermentations to turn into more economically feasible processes, final product concentrations should exceed their critical concentration [5]. This means that low solubility compounds, such as certain pharma-intermediates and fine chemicals, need to be removed effectively from the biocatalysts environment in order to become economically compatible with chemical processes. In order to achieve higher fermentation yields, the product must be continuously removed from the biocatalysts' environment. One possibility is to use process concepts such as depicted in

Chapter 1
11
paragraph 1.3. When applying in-situ product recovery this can, generally speaking, result in different benefits impacting the overall process [6]: Table 1.1: potential benefits of ISPR
Benefit Impact higher final product concentration smaller fermentor volume, easier DSP
higher yield on biocatalyst lower catalyst costs higher volumetric productivity smaller fermentor volume higher yield on carbon source lower substrate costs
1.3 In-stream & In-situ product recovery To alleviate product inhibition in whole cell biocatalysis several approaches can be taken to remove products from the fermentation broth (such as depicted below in figure 1.1). All these setups are designed to remove compounds that have relatively low water solubilities.
Figure 1.1: Several approaches for removal of products from fermentation broths. A direct contact between adsorbent particles and fermentation broth inside fermentor; B direct contact between adsorbent particles and fermentation broth outside fermentor; C indirect contact between adsorbent particles and fermentation broth outside fermentor; D direct contact between organic phase and fermentation broth inside fermentor; E pertraction inside fermentor; F pertraction in stream with fermentor. Setups A, D and E are known as in-situ separations since the product is separated inside the fermentor from the fermentation broth. These setups have the advantage that they allow high mass transfer of the product into the auxiliary phase due to a relatively high contact area. However, a major drawback is that these auxiliary phases might need to be transported to a compartment that can separate the product from the auxiliary phase again. Setups B, C and F are in-stream separations. These in-stream product separation techniques involve the continuous pumping of the fermentation broth along

Chapter 1
12
or through another column that contains an auxiliary phase selective for the product. Generally speaking, this can result in less efficient product mass transfer but has the advantage of keeping the auxiliary phase separated from the fermentation broth. This can simplify down-stream processing significantly. Setup A has been applied for a wide range of products such as solvents [7, 8], fine chemicals/flavors [9-12], steroids/alkaloids [13] and enzymes [14]. However, the direct contact between the adsorbent and biocatalyst can result in a significant reduction of adsorption capacity towards the product (chapter 2, this thesis). Furthermore there is the concern that the vigorous stirring will impact particle stability. To our knowledge this setup has been studied extensively in the laboratory setups but has never reached commercial scale to our knowledge. These processes generally can run for a limited amount of time since the adsorbent particles have a finite loading and need to be regenerated. In setup B the whole fermentation broth is pumped through a packed bed adsorption column containing adsorbent particles where these particles adsorb the product from the fermentation broth. These setups have the potential for longer fermentation times since these particles can be regenerated when two columns are used in parallel. This setup seems more feasible for (facultative) anaerobic biocatalysts since the micro-organism needs to cope with low-oxygen stress. This setup has been used for the production of fluorobenzene [9], vanillin [15] and 3-phenylcatechol [10]. Extra caution needs to be executed for bio-fouling on the particles since this can result in pressure drops in the packed bed. Setup C is similar to setup B but has a micro-filtration unit to prevent microbial adhesion on the adsorbent particles. Especially when reactive adsorbents are applied this system might give some extra benefits compared to setup B since these adsorbents have a high fouling tendency. Furthermore, the microfiltration unit helps in retaining a higher cell mass density in the fermentor, preventing low oxygen levels in the micro-organisms environment. This setup has been applied to recover butanol from fermentations, which resulted in prolonged run-times, slightly higher yields and increased product productivities [16]. Furthermore, polyvinyl pyridine adsorbents have been applied in the continuous removal of lactic acid. This reactive adsorbent was able to remove the inhibitory effect of lactic acid but each loading/base regeneration cycle resulted in a 14% adsorption capacity loss. The high price and low stability of the adsorbent made this technique economically infeasible for the lactic acid process [17]. Considerable amount of work has been done in the field of Setup D. These systems have been used frequently for a variety of purposes such as the breakdown of low concentration antibiotics or aromatics (such as phenol) using micro-organisms [18-23]. Furthermore, whole cell bioconversions of relatively hydrophobic substrates into products have been applied using this system. The advantage is that high concentrations of toxic substrate and product can be used since these generally remain in the organic phase. This system has been applied frequently in whole-cell systems containing micro-organisms that are relatively tolerant to the addition of a solvent phase. Some major disadvantages are clotting of the biomass and/or possible emulsion formation [24], hampering the downstream processing. Setup E, a pertraction unit inside the fermentor, has also been researched. Compared to setup F this has a higher amount of fermentation broth in contact with membrane

Chapter 1
13
surface area. The use of these pertraction units has been rare. In 2006 Heerema et al successfully integrated such a setup for removal of phenol using 1-Octanol as the stripping solvent [25]. Other attempts in removing products have been limited to water systems [26, 27]. A major concern in these types of setups is membrane stability, since stirring intensity of the fermentor can impact membrane integrity over a longer period of time. Setup F, an in-stream counter-current pertraction unit is a more well-researched setup. Numerous attempts have been made in which several different membrane pertraction setups and products were tested [27]. Some successful reactive extraction concepts resulted in five times higher productivities, 20% increase in higher carbon yields, higher product purity and elevated product concentrations. Furthermore, these setups were stable over a relatively long period of time and gave consistent performance [27]. A drawback of this setup is the involvement of continuous pumping of the fermentation broth along the membrane module. For the production of relatively volatile products such as ethanol, butanol and aldehydes, various pervaporation stripping systems have been developed [28-31]. In these setups the solvent phase is replaced by an air stripping unit. For products such as amino acids crystallization can be applied since these components are zwitterionic by nature. The production therefore overshoots the solubility while being produced at a neutral pH [32]. Crystallization can also be performed outside the fermentor by performing a cooling step [33].
1.4 Solvent impregnated resins as an ISPR tool When removing organic molecules from an aqueous-like phase, adsorption can be very effective but lacks a high capacity and is also sensitive towards fouling with micro-organism. Direct extraction (setup D of figure 1.1) has the high capacity and potential of relatively high selectivity. However, this technique can result in emulsification problems with the fermentation broth and toxicity towards the micro-organism when it is applied as a two-phase system. Stark stated in his review of ISPR in whole cell biotechnology “there is still a lack of highly selective separation techniques with a high capacity, especially for the application of high added value products” [34]. Solvent impregnated resins (SIRs) are polymeric matrices containing an impregnated selective solvent (see figure 1.2). Since Warshawsky [35] introduced the concept of SIRs for removal of heavy metals from aqueous streams, the technology has gone a long way. Nowadays SIRs have been shown to be an effective tool for removal of aromatics [36, 37], heavy metals [38-40], carboxylic acids [41, 42] and amino acids [43] from aqueous streams.

Chapter 1
14
Figure 1.2: Schematic representation of solvent impregnated resins. The heavy metal, aromatic or amino-acid is removed from the aqueous phase using extraction. The application of SIRs can theoretically result in a high capacity product removal technique while lacking the drawbacks of two-phase extraction.
1.5 Aim of thesis and research approach The aim of this thesis is to investigate the potential benefits of using solvent impregnated resins as an in-situ product recovery tool to remove fermentation products. The thesis consists of 6 chapters. The taken approach is scaling up from molecular level to economical impact. Each chapter describes a certain scale of the total concept of in-situ product recovery as described in the figure on below. Chapter 2 is the application of SIRs in a fermentation broth. Here, an enhanced productivity, yield and total product produced due to the removal of an inhibiting product such as phenol is demonstrated. Furthermore, the SIRs are compared to an unimpregnated polystyrene resin in terms of product capacity/selectivity. In chapter 3 a solvent selection procedure is presented that can assist in selecting an appropriate solvent for in-situ extractions. The focus is more towards SIRs and phenol but the approach is more widely applicable towards other uncharged solutes. In chapter 4 a new class of solvent

Chapter 1
15
impregnated resins is presented that have a high solvent capacity. One issue of SIRs when comparing them to adsorbents is that they do not show a significant enhancement capacity-wise. These particles have more the character of capsules than SIRs due to their large void volume. The capsules polymeric backbone also adsorbs phenol due to the sulfonyl groups which interact with phenol giving these particles the same capacity as liquid-liquid extraction. In chapter 5 possible compound classes are discussed where SIRs can have the most benefit to increase productivity. These classes vary from low to high aqueous solubility, corresponding with bulk to pharmaceutical, respectively. Furthermore, an in-situ product recovery process configuration is discussed together with a process model, which can be used to make an evaluation for when to implement capsules or solvent impregnated resins as an in-situ product recovery tool. In Chapter 6 the relevance of the field of integrated separations from fermentations is discussed. Here, three bulk chemicals (1-butanol, lactic acid and phenol) shortcut methods for integration of fermentation and separation are presented. Using these design-rules first estimates can be made on where major costs in the overall process can be expected. Summarizing, this work discusses how and when solvent impregnated resins/capsules should be incorporated as a product recovery tool for fermentation products.
Literature 1. Carrez D. and Soetaert W., Looking ahead in Europe: White biotech by 2025*.
Industrial Biotechnology, 2005. 1(2): p. 95-101. 2. Panke S., Held M., and Wubbolts M., Trends and innovations in industrial
biocatalysis for the production of fine chemicals. Current opinion in Biotechnology, 2004. 15: p. 272-279.
3. Schmid A., et al., Industrial biocatalysis today and tomorrow. Nature, 2001. 409: p. 258-268.
4. Burel C., Industrial or White Biotechnology - Research for Europe. 2006, The European Association for Bioindustries: Brussels.
5. Straathof A.J.J., Auxiliary phase guidelines for microbial biotransformations of toxic substrate into toxic product. Biotechnology Progress, 2003. 19: p. 755-762.
6. Lye G.J. and Woodley J.M., Application of in situ product-removal techniques to biocatalytic processes. Trends in Biotechnology, 1999. 17: p. 395-402.
7. Nielsen D.R. and Prather K.J., In situ product recovery of n-butanol using polymeric resins. Biotechnology and Bio-engineering, 2008. 102(3): p. 811-821.
8. Yang X., Tsai G., and Tsao G.T., Enhancement of in situ adsorption on the acetone-butanol fermentation by Clostridium acetobutyicum. Separation Technology, 1994. 4: p. 81-92.
9. Lynch R.M., Woodley J.M., and Lilly M.D., Process design for the oxidation of fluorobenzene to fluorocatechol by Pseudomonas putida. Journal of Biotechnology, 1997. 58: p. 167-175.
10. Held M., et al., An integrated process for the production of toxic catechols from toxic phenols based on a designer catalyst. Biotechnology and Bioengineering, 1999. 62: p. 641-648.
11. Hua D., et al., Enhanced vanillin production from ferulic acid using adsorbent resin. Applied Microbiology and Biotechnology, 2006. 74(4): p. 783-790.

Chapter 1
16
12. Dufosse L., et al., In situ detoxification of the fermentation medium during y-decalactone production with the yeast Sporidiobolus salmonicolor. Biotechnology Progress, 1999. 15: p. 135-139.
13. Payne G.F., et al., In situ adsorption for enhanced alkaloid production by catharanthus roseus. Biotechnology Letters, 1988. 10(3): p. 187-192.
14. Millitzer M., Wenzig E., and Peukert W., Process modeling of in-situ adsorption of an bacterial lipase. Biotechnology and Bio-engineering, 2005. 92(6): p. 789-801.
15. Alba Perez A., Enhanced microbial production of natural flavors via in-situ product adsorption, in Swisse Federal Institute of Technology Zurich. 2001: Zurich.
16. Yang X. and Tsao T., Enhanced acetone-butanol fermentation using repeated fed-batch operation coupled with cell-recycle to membrane and simultaneous product removal of inhibitory products by adsorption. Biotechnology and Bio-engineering, 1995. 47: p. 444-450.
17. Chen C.C. and Ju L.-L., Coupled lactic acid fermentation and adsorption. Applied Microbiology and Biotechnology, 2002. 59: p. 170-174.
18. Rehmann L. and Daugulis A.J., Biphenyl degradation kinetics by Burkholderia xenovorans LB400 in two-phase partitioning bioreactors. Chemosphere, 2005. 63(6): p. 972-979.
19. Baumann M.D., Daugulis A.J., and Jessop P.G., Phosphonium ionic liquids for degradation of phenol in a two-phase partitioning bioreactor. Applied microbiology and biotechnology, 2005. 67: p. 131-137.
20. Guieysse B., Autem Y., and Soares A., Biodegradation of phenol at low temperature using two-phase partitioning bioreactors. Water science & technology, 2005. 52(10-11): p. 97-105.
21. Vrionis H.A., Kropinski A.M., and Daugulis A.J., Expanded application of a two-phase partition bioreactor through strain development and new feeding strategies. Biotechnology Progress, 2002. 18: p. 458-464.
22. Janikowski T.B., et al., Use of a two-phase partitioning bioreactor for degrading polycyclic aromatic hydrocarbons by a Sphingomonas sp. applied microbiology and biotechnology, 2002. 59: p. 368-376.
23. Malinowski J.J., Two-phase partitioning bioreactors in fermentation technology. Biotechnology advances, 2001. 19: p. 525-538.
24. Heipieper H.J., et al., Solvent-tolerant bacteria for biotransformations in two-phase fermentation systems. Applied Microbiology and Biotechnology, 2007. 74: p. 961-973.
25. Heerema L., et al., In-situ phenol removal from fermentation broth by pertraction. Desalination, 2006. 200(1-3): p. 485-487.
26. Martak J. and S. S., Pertraction of organic acids through liquid membranes containing ionic liquids. Desalination, 2006. 199: p. 518-520.
27. Schlosser S., Kertész R., and Martak J., Recovery and separation of organic acids by membrane-based solvent extraction and pertraction. Separation and purification technology, 2005. 41: p. 237-266.
28. Matsumura M. and Kataoka H., Separation of dilute aqueous butanol and acetone solutions by pervaporation through liquid membranes. Biotechnology and Bio-engineering, 1987. 30: p. 887-895.
29. Geng Q. and P. C-H, Pervaporative butanol dermentation by Clostridium acetobutylicum B18. Biotechnology and Bio-engineering, 1994. 43: p. 978-986.
30. Shabtai Y., et al., Continuous ethanol production by immobilized yeast reactor coupled with membrane pervaporation unit. Biotechnology and Bio-engineering, 1991. 38: p. 869-876.

Chapter 1
17
31. Ohashi R., et al., Continuous production and separation of ethanol without effluence of wastewater using a distiller integrated SCM-reactor system. Journal of Fermentation and Bioengineering, 1998. 86(2): p. 220-225.
32. Ueda H. and Toumori K., Method for producing L-Glutamic acid. 2005, Ajinomoto Co., Inc. p. 46.
33. Buque E.M., In situ removal of solid products during whole-cell biocatalysis, in Department of Biotechnology. 2005, Delft University of Technology: Delft. p. 177.
34. Stark D. and Stockar von U., In situ product removal (ISPR) in whole cell biotechnology during the last twenty years. Advances in Biochemical Engineering/Biotechnology, 2003. 80: p. 149-175.
35. Warshawsky A., Extraction with solvent-impregnated resins, in Ion exchange and solvent extraction, M.Y. Marinsky J.A., Editor. 1981, Marcel Dekker: New York. p. 229-310.
36. Babic K., Ham van der L., and Haan de A., Recovery of benzaldehyde from aqueous streams using extractant impregnated resins. Reactive & Functional Polymers, 2006. 66: p. 1494-1505.
37. Sukhanov P.T., Kalinkina S.P., and Korenman Y.I., Extraction preconcentration of naphtols and phenol with solvent mixtures impregnated into polyurethane foam. Journal of Analytical Chemistry, 2004. 59(12): p. 1153-1157.
38. Juang R-S. and Lin H.C., Metal sorption with extractant-impregnated macroporous resins. 1. Particle diffusion kinetics. Journal of Chemical Technology and biotechnology, 1995. 62: p. 132-140.
39. Kamio E., Matsumoto M., and Kondo K., Extraction mechanism of rare metals with microcapsules containing organophosphorus compounds. Journal of Chemical Engineering of Japan, 2002. 35(2): p. 178-185.
40. Yang W.W., Luo G.S., and Gong X.C., Polystyrene microcapsules containing Aliquat 336 as a novel packaging material for separation of metal ions. Hydrometallurgy, 2005. 80: p. 179-185.
41. Juang R-S. and Chang H., Distribution equilibrium of citric acid between aqueous solutions and tri-n-octylamine-impregnated macroporous resins. Industrial & Engineering Chemistry Research, 1995. 34: p. 1294-1301.
42. Traving M. and Bart H-J., Recovery of organic acids using ion-exchanger-impregnated resins. Chemical Engineering and Technology, 2002. 25: p. 997-1003.
43. Ruiz M.O., et al., Valeric acid extraction with tri-N-butylphosphate impregnated in a macroporous resin. I. Equilibrium and mass transfer rates. Separation Science and Technology, 2004. 39(1): p. 77-95.

Chapter 2
18

Chapter 2
19
Chapter 2
Proof of principle: Solvent impregnated resins as an in-situ product recovery tool
Corjan van den Berg, Nick Wierckx, Johan Vente, Paul Bussmann, Jan de Bont, Luuk van der Wielen
This chapter was published: Biotechnology & Bio-engineering 2008, volume 100, issue 3,
pages 466-472

Chapter 2
20
Summary The sustainable production of fine/bulk chemicals is often hampered by product toxicity/inhibition to the producing micro-organisms. Therefore, product removal from the micro-organisms’ environment is essential for achieving viable processes. To achieve this, SIRs as well as a commercial resin were added to a Pseudomonas putida S12TPL fermentation that can produce phenol from glucose. The SIRs contained Cyphos-104, which extracts phenol effectively. It was observed that the addition of SIRs resulted in an increased phenol production of more than a four-fold while the commercial resin (XAD-4) which is widely used in aromatic removal from aqueous phases, only gave a 2.5-fold increase in volumetric production.
Chapter 2
21
2.1 Introduction Several ISPR techniques in whole cell biotechnology have been developed during the last twenty years [4], for instance: the addition of adsorbents and extractants to fermentation media or the application of pertraction. However, the techniques developed so far have drawbacks. In-stream pertraction requires continuous recycling of the fermentation broth through a membrane module and pumping can result in oxygen/substrate-depletion for the (aerobic) production host [5]. If the pertraction module is applied in-situ it will require high amounts of membrane area to keep product concentrations low. Furthermore, membranes have the tendency to be sensitive to bio-fouling. Extractant addition as a 2nd organic phase can result in solvent toxicity issues or emulsion formation [6]. Unlike extraction, adsorption has the drawback of being solely a surface phenomenon, which therefore limits the capacity of the particles. Warshawsky introduced the concept of so-called solvent impregnated resins [7]. SIRs are porous particles that are loaded with an extractant. A possible advantage of SIRs is that these particles have a high surface area compared to pertraction but still have the high capacity of extraction. Also, in fermentations these particles have the advantage of keeping the solvent separated from the water-phase, which prevents bi-phasic solvent-toxicity and also emulsion formation. In this chapter phenol is used as a model product for ISPR as a representative of the class of hydroxylated aromatics. Wierckx et al. [2] engineered a P. putida S12 strain, which was able to produce phenol through the introduction of the tyrosine phenol lyase-gene (TPL). Still, this strain is severely hindered by product inhibition and severe toxicity towards P. putida S12. The addition of a water-immiscible phase to the fermentation broth resulted in phenol removal from the aqueous phase but also resulted in sub-optimal growth conditions for P. putida S12TPL. Keeping the organic phase separated from the aqueous phase is therefore, even for the solvent-tolerant P. putida S12TPL, important for optimal In-situ extraction [2]. The aim of this chapter is to alleviate phenol inhibition for P. putida S12TPL by applying ISPR. Three different ISPR techniques are compared on their impact of phenol production of P. putida S12TPL. A water-immiscible organic phase was added to fermentations in order to remove the phenol from the fermentation broth. Also a widely used polymeric resin called XAD-4 was also introduced to fermentations. This divinylbenzene polymeric resin has been widely used for removal of phenol from aqueous solutions [8-10]. Furthermore, an ionic liquid (able to extract phenol) was impregnated into the XAD-4 resin to prevent solvent toxicity. These particles were introduced in P. putida S12TPL fermentations as well. A comparison is made between these three methods and their effect on the production of phenol by P. putida S12TPL.
2.2 Experimental set-up and procedure 2.2.1 Chemicals XAD-4 (specific area ≥ 750 m2/g; moisture holding capacity = 54 to 60%; harmonic mean size = 0.49 to 0.69 mm) [11]), salicylic acid, gentamycin, mineral salts and chemicals were purchased from Sigma-Aldrich with >99% purity. Cyphos-104 (trihexyl(tetraddecyl)phosphonium bis 2,4,4-trimethylpentylphosphinate) was provided by Cytec with a purity of >95%. 2.2.2 XAD-4 preparation The adsorbent was washed with demineralised water to remove salts such as NaCl and Na2CO3/organic impurities. This was performed in a beaker that was placed in an

Chapter 2
22
ultrasonification bath for 1 hour. The removal of the salts was performed by washing 100g XAD-4 three times with approximately 200 ml demineralised water for 10 minutes each. Washed XAD-4 (100g) was immersed three times in 200 ml methanol for 10 minutes each cycle for removal of organics. Finally, the washed adsorbent was put in an oven overnight (100 0C) for removal of the methanol/H2O. 2.2.3 SIR preparation The SIR was prepared using the dry impregnation method, which was similar to the procedure of Juang et al. [12]. Cyphos-104 was selected as the extractant-phase since it had a very favorable phenol aqueous/organic phase partition coefficient and also has a negliable vapour pressure. The low vapour pressure prevents solvent losses during the impregnation procedure. 84.0 gram of Cyphos-104 was first diluted using approximately 30 ml methanol to decrease the viscosity. XAD-4 (84.0 g) was then immersed in diluted extractant and subsequently put in an ultrasonification bath for 1 hour. This resulted in the impregnation of the adsorbent. After ultrasonification the SIRs were put in an oven (80 oC) for 4 hours to dry the SIRs and remove the methanol the methanol at the same time. 2.2.4 Shake flask fermentations Cultures were inoculated from an overnight preculture (50 ml) of P. putida S12TPL3 [2]. From this inoculum, 1 ml was added to 19 ml medium which has a 37 mM phosphate buffer at pH 7.0 with 20 mM D-glucose, concentrated mineral salts medium, 0.061 M (NH4)2SO4, 0.1 mM salicylate and 10 mg/l gentamycin[13]. After 2.5 hours of incubation, 0.5 g of 1-Octanol, Cyphos-104, XAD-4 or SIRs (XAD-4 with impregnated Cyphos-104) were added to 200 ml shake flask bottles. The experiment was performein triplicate and at a temperature of 30
d
ph .6.
cientific,
d f
the
g
O, .
d-
oC. After 50 hours a sample was taken from theaqueous phase and was analysed on HPLC using the method described in paragra2 2.2.5 Fed-batch fermentation experiments Fed-batch cultivation was performed in a Bioflo IIc fermentor (New Brunswick SUSA) with a working volume up to 2.5 liters. Pure oxygen was supplied to the headspace at a rate of 300ml/min and was mixed into the culture medium by stirring with a double impeller at the bottom of the reactor. During cultivation, temperature was kept at 30 oC and pH 7.0 was maintained by automatic addition of 4 M NaOH. Dissolveoxygen tension was kept at approximately 20% saturation by automatic adjustment othe impeller speed. The initial batch phase (1.5 liters) was started with washed cells from an overnight culture in 50 ml mineral medium with glycerol. The composition of start-medium contained (per liter) 30 mmol K2HPO4, 20.5 mmol NaH2PO4, 50 mmol glucose, 15 mmol NH4Cl, 1.4 mmol Na2SO4, 1.5 mmol MgCl2, 0.5 g yeast extract, 10 ml trace solution 1, 10 mg gentamycin and 0,1 mmol salicylate. Trace solution 1 contained (per liter) 4 g EDTA, 0.2 g ZnSO4
. 7H2O, 0.1 g CaCl2 . 2H2O, 1.5 g FeSO4
.
7H2O, 0.02 g Na2MoO4 . 2H2O, 0.2 g CuSO4 · 5H2O, 0.04 g CoCl2 · 6H2O, and 0.1
MnCl2 . 4H2O. Trace solution 2 contained (per liter) 4 g EDTA, 0.2 g ZnSO4 · 7H2O, 0.1
g CaCl2 · 2H2O, 6.5 g FeSO4 · 7H2O, 0.02 g Na2 MoO4 · 2H2O, 0.2 g CuSO4 · 5H2
0.04 g CoCl2 · 6H2O, 0.1 g MnCl2 · 4H2O, 0.024 g H3BO3, and 0.02 g NiCl · 6H2OFeeding was started when the ammonium in the fermentation was depleted. The feemedium contained (per liter) 1.5 mol glycerol, 225 mmol NH4Cl, 21 mmol Na2SO4, 7.4 mmol MgCl2, 13 mmol CaCl2, 0.5 g yeast extract, 100 ml trace solution 2, 10 mggentamycin and 1 mmol salicylate. The feed-rate was adjusted based on the biomass in the fermentor, it was 4 ml/h when the cell dry weight (CDW) was less then 3g/l, 9ml/h

Chapter 2
23
when the CDW was between 3 and 4.5 liter and 20 ml/h when the CDW was more th4.5 g/l. Samp
an les were taken at regular intervals and phenol, ammonium and CDW were
etermined.
fter
of 0% acetonitrile and 30% KH2PO4 (0.05 M) at a constant flow-rate of 1.5 ml/min.
.3 Results
04, adsorption by XAD-4 and extraction by SIR (XAD-4 impregnated with Cyphos-104).
d 2.2.6 Regeneration of SIRs/XAD-4 and analysis of samples After samples were drawn from the aqueous phase, the optical density at 600 nm was determined using the CO8000 cell density meter (WPA, Cambridge). The biomass was then removed by centrifugation (at 13000 RCF for 2 minutes on a Eppendorf centrifuge 5415R). To quickly assess the ammonium concentration from the centrifugated solution, a sample was analysed on a LASA 20 spectrofotometer (Hach Lange; Düsseldorf). Athe fermentation was stopped, a known volume of sample was drawn and 10ml 1M NaOH was added to convert the phenol into phenolate. This resulted in the product release from SIRs or adsorbents into the aqueous phase since phenol has a pKa of 9.95 [8]. The sample was centrifugated at 13000 rpm for 2 minutes to remove biomass (Eppendorf centrifuge 5415R). A sample of 100 μl was taken and also 900 μl of 50 mMphosphate buffer (pH = 7.00) was added to dilute the sample. Phenol concentrations were determined by HPLC (Agilent 1100 Series, Zorbax 3.5 μm SB-C18 4.6x50 mm column, λ = 278.4 nm). Samples (30 μl) were injected in a mobile phase consisting7
2 2.3.1 Shake flask results Shake flask fermentations were used for the screening of different ISPR techniques. Figure 2.1 shows the results of: extraction by 1-Octanol and Cyphos-1
Figure 2.1: Comparison of 2-phase extraction, adsorption and SIR addition for P. putidaS12TPL shake flask fermentations. Negative control represents a shake flask fermentation without any form of ISPR applied. The white bars represent the quantity of phenol which can be found in the aqueous phase while the grey
bars represent the quantity of phenol which is found fter regeneration in the aqueous phase.
a

Chapter 2
24
The addition of 1-Octanol or Cyphos-104 as a second liquid phase resulted in a halted growth and decreased production compared to the negative control. The logPo/w of 1-Octanol is 3.00 [14], which is lower than the critical logPo/w for P. putida (3.1) [15] explaining its toxicity. The published partition coefficient of phenol over a H2O/1-Octanol is 30.2 [16] which corresponds well with the value we found (33.4) suggesting that the two phases were indeed in equilibrium. Addition of XAD-4 resulted in 73% product removal from the aqueous phase and therefore gave rise to 30% production increase. Addition of SIRs resulted in even higher product removal and therefore gave a production increase of 54%. Another observation is that Cyphos-104 is toxic as a two-phase but once it is impregnated no adverse effects were observed. The toxicity might be due to the reverse micellar character that Cyphos-104 has. 2.3.2 Fed-batch fermentation results On the basis of the above results it was decided to start a series of experiments to compare the addition of XAD-4 and SIRs to the negative control in fed-batch fermentations since they are closer to industrial practice.
Figure 2.2: P. putida S12TPL fed-batch fermentation. The cell dry weight (g/l), NH4
+ (mg/l) and the phenol concentration in the aqueous phase (mM) are plotted as a function of time. In figure 2.2, results from a typical P. putida S12TPL fed-batch fermentation can be observed. After 47 hours, growth halted and phenol production also stopped due to high product concentrations, resulting in an ammonium concentration accumulation in the medium. For determining the average production rate of the fed-batch fermentation, the amount of phenol produced over the first 47 hours was used since no growth was observed afterwards.

Chapter 2
25
Figure 2.3: P. putida S12TPL fed-batch fermentation with 50 g of XAD-4. The cell dry weight (g/l), NH4
+ (mg/l) and the phenol concentration in the aqueous phase (mM) are plotted as a function of time. In figure 2.3 the results are shown from a P. putida S12TPL fed-batch fermentation to which 50 g of XAD-4 were added at 22 hours. Resin addition resulted in an immediate phenol concentration drop from 1 mM to 0.3 mM in the aqueous phase. Therefore, P. putida S12TPL continued producing phenol and this resulted in a gradual increase of phenol in the aqueous phase even though the XAD-4 was adsorbing phenol. The fermentation was stopped at 71 hours since no bacterial growth was observed, resulting in increasing ammonium concentrations. The overnight (between 25 and 40 hours) NH4
+ concentration increase can be explained due to a lower growth rate then expected.

Chapter 2
26
Figure 2.4: P. putida S12TPL fed-batch fermentation with 50 g of SIRs. The cell dry weight (g/l), NH4
+ (mg/l) and the phenol concentration in the aqueous phase (mM) are plotted as a function of time. In figure 2.4, results from a P. putida S12TPL fed-batch fermentation with 50 g of SIRs are shown. After 23 hours SIRs were added to the fermentation broth, resulting in a phenol concentration drop from 0.7 mM to 0.1 mM. The phenol concentration remained low throughout the fermentation although it slightly increased to 0.5 mM at the end of the experiment. After regeneration a phenol concentration of 9.7 mM was found in the aqueous phase. The fermentation was stopped after 69 hours due to a high fermentation broth volume, which resulted in hampered headspace aeration. The ammonium concentration increased rapidly indicating that the fermentation was coming to an end. In table 1 the phenol loading on the particle at the end of the fermentation, the total amount of phenol produced, average productivity and yield % are shown. Table 2.1: Comparison of three different P. putida S12TPL fed-batch fermentation experiments
Loading on particle (mmol/g)
total phenol (mmol)
average production rate (μmol/L/h)
Yield (C-mol%)
Control n.a. 5.4 74 3
+ 50 g XAD-4 0.18 13.8 90 3.6 + 50 g SIR 0.43 22.8 139 4.2
It can be observed that the addition of 50g SIRs to a fed-batch fermentation resulted in a the total amount of phenol produced increase by more than a four-fold and that XAD-4 addition resulted in a 2.5-fold increase. Moreover, the volume of 50 gram of XAD-4 in the fermentor was almost twice as much as the same amount of SIRs since XAD-4 is not loaded with Cyphos-104 (observed swelling of impregnated XAD-4 was less then

Chapter 2
27
5%). It was also observed that the production rate almost doubled when SIRs were added to the fermentation. This was the result of the effective phenol removal from the fermentation broth minimizing the inhibiting and toxic effects of phenol.
2.4 Discussion In this study, three different techniques (L-L extraction, adsorption and SIR mediated extraction) were compared for in-situ product removal of phenol from P. putida S12TPL fermentations. Shake flask fermentations were used as a screening tool whether certain ISPR techniques were shown to be technically feasible and biocompatible. In shake flask experiments, 1-Octanol and Cyphos-104 both removed phenol from the fermentation media. However, they also hampered the P. putida S12TPL phenol production, resulting in a lower the total amount of phenol produced compared to the negative control. Wierckx et al [2] also added 1-Octanol as a 2nd phase to a fed-batch fermentation but, in contrast to our results, observed a production increase. These different experimental results are explainable with the lack of adaptation-time in the shake flask fermentations in our research. Moreover, in our shake flask fermentations the substrate was limited, while in the fed-batch experiments from Wierckx there is a continuous addition of new substrate [2]. Therefore, Wierckx provided conditions where P. putida S12TPL, which recovered from the solvent-shock, received new substrate while in the shake flask experiment this was not the case. Furthermore, Cyphos-104 formed a stable emulsion, which was most likely due to the reverse micellar character of the ionic liquid. When XAD-4 or SIRs were added to shake flask fermentations there was no solvent phase-toxicity while retaining the product removal ability, which resulted in an increased productivity. For that reason these two techniques were evaluated for fed-batch fermentations. Consequently, three different fed-batch fermentation experiments are compared to observe if ISPR can have a positive effect on phenol productivity, yield and total quantity produced. In the control experiment (no ISPR) the phenol production is stopped at 3.2 mM. The total quantity of phenol produced is 5.4 mmol. Addition of the resin XAD-4 to fed-batch fermentations resulted in a 2.5-fold production increase. However, the amount of adsorbed phenol on XAD-4 is lower than one would expect on the basis of an isotherm measured by Li [17]. With an aqueous phenol concentration of 2.14 mM at the end of the experiment one would expect an adsorbent loading of 0.43 mmol phenol/g XAD-4 assuming equilibrium, while only a loading of 0.18 mmol phenol /g XAD-4 is observed in the fed-batch fermentation. This might be due to adsorption/influence of other substances such as fermentation media, salts and bacterial fouling. Li’s isotherm was determined in an aqueous solution, not taking these phenomena into account. It was noticed that after the addition of XAD-4 the oxygen in the fermentor started fluctuating and as a result the impeller speed was constantly changing, directly impacting growth of the micro-organisms. It is also known that adding high amounts of polystyrene to a fermentation can result in the adsorption of nutrients, resulting in a halted microbial growth [18]. At the end of the SIR containing fed-batch fermentation, the aqueous phenol concentration was 0.50 mM while after product release it was 9.7 mM. Even though SIRs consisted for 50 w/w% of XAD-4, the impregnated solvent resulted in higher phenol removal. This is most likely due to the binding mechanism of the phosphinate group with the hydroxyl group of phenol. Phenol is a very strong hydrogen bond donor while phosphate groups are known to be very strong hydrogen bond acceptors [19]. The phosphinate group is quite similar to tertiary phosphates such as tri-n-butylphosphate, but the oxygen groups share an extra electron. Phosphates or phosphine oxides are known to be effective phenol extractants [20, 21]. Furthermore, Baumann et al. [22] performed phenol degradation in a two-

Chapter 2
28
phase partitioning bioreactor using other phosphonium ionic liquids and observed phenol partition coefficients lower than 18.2. Therefore, the interaction of the phosphonium group with phenol can be neglected. The proposed binding mechanism for phenol and the phosphinate group is depicted in figure 2.5, which is similar to the mechanism proposed by Martak et al [23]. Up to two phenol molecules can bind the phosphinate group.
Figure 2.5: Proposed binding mechanism between phenol and phosphinate group of Cyphos-104. When comparing XAD-4 and SIRs as in-situ product recovery tools, the main advantage of SIRs is that these particles take up approximately half the volume in a fermentor when comparing them to XAD-4 while retaining a higher capacity towards phenol. This is an important feature of SIRs since a lower volume for the ISPR tool can result in higher volumetric amounts of product produced in the fermentor. The yield of product on substrate also increases when ISPR was performed. This was most likely the combined effect of alleviating the product inhibition of the tyrosine phenol lyase enzyme and also relieving the toxic effect of phenol.
2.5 Conclusions Addition of SIRs or XAD-4 to P. putida S12TPL fed-batch fermentation can have a positive effect on the phenol production by P. putida S12TPL. If phenol concentrations are kept low in the fermentation, it will result in increased yields, productivity and total amount of phenol produced. In this chapter we have shown that both XAD-4 and especially SIRs can be applied as an in-situ product recovery tool for phenol.
Literature 1. Simmonds J. and Robinson G.K., Formation of benzaldehyde by Pseudomonas
putida ATCC12633. Applied microbiology and biotechnology, 1998. 50: p. 353-358.
2. Wierckx N.J.P., et al., Engineering of solvent-tolerant Pseudomonas putida S12 for bioproduction of phenol from glucose. Applied and Environmental Microbiology, 2005. 71(12): p. 8221-8227.
3. Freeman A., Woodley J.M., and Lilly M.D., In Situ Product removal as a tool for bioprocessing. Nature Biotechnology, 1993. 11: p. 1007-1012.

Chapter 2
29
4. Stark D. and Stockar von U., In situ product removal (ISPR) in whole cell biotechnology during the last twenty years. Advances in Biochemical Engineering/Biotechnology, 2003. 80: p. 149-175.
5. Leon Y.J. and Lee Y.Y., In situ product separation in butanol fermentation by membrane-assisted extraction. Enzyme and Microbial Technology, 1989. 11: p. 575-582.
6. Diaz M., Three-phase extractive fermentation. Trends in Biotechnology, 1988. 6: p. 126-130.
7. Warshawsky A., Extraction with solvent-impregnated resins, in Ion exchange and solvent extraction, M.Y. Marinsky J.A., Editor. 1981, Marcel Dekker: New York. p. 229-310.
8. Ku Y. and Lee K., Removal of phenols from aqeuous solution by XAD-4 resin. Journal of Hazardous Materials, 2000. 80: p. 59-68.
9. Xu Z., Zhang Q., and Fang H.H.P., Applications of porous resin sorbents in industrial wastewater treatment and resource recovery. Critical Reviews in Environmental Science and Technology, 2003. 33: p. 363-389.
10. Vliet van B.M. and Weber W.J. jr., Comparative performance of synthetic adsorbents and activated carbon for specific compound removal from wastewaters. Water Pollution Control Federation journal, 1981. 53(11): p. 1585-1598.
11. Rohm and Haas, Product data sheet XAD-4. 2001. 12. Juang R. and Chang H., Distribution equilibrium of citric acid between aqueous
solutions and tri-n-octylamine-impregnated macroporous resins. Industrial & Engineering Chemistry Research, 1995. 34: p. 1294-1301.
13. Hartmans S., et al., Metabolism of styrene oxide and 2-phenylethanol in the styrene-degrading xanthobacter strain 124X. Applied and Environmental Microbiology, 1989. 55(11): p. 2850-2855.
14. Hansch C. and L. A., Exploring QSAR. Fundamentals and Applications in Chemistry and Biology, ed. Heller S.R. 1995, Washington, DC: ACS Professional Reference Book.
15. Inoue A. and Horikoshi K., Estimation of solvent-tolerance of bacteria by the solvent parameter log P. Journal of Fermentation and Bioengineering, 1991. 71(3): p. 194-196.
16. Leo A., Hansch C., and Elkins D., Partition coefficients and their uses. Chemical Reviews, 1971. 71(6): p. 525-616.
17. Li A., et al., Adsorption of phenolic compounds on Amberlite XAD-4 and its acetylated derivative MX-4. Reactive and Functional Polymers, 2001. 49: p. 225-233.
18. Qureshi N., et al., Energy-efficient recovery of butanol from model solutions and fermentation broth by adsorption. Bioprocess and Biosystems Engineering, 2005. 27: p. 215-222.
19. Abraham M.H., Scales of solute hydrogen-bonding: Their construction and application to physicochemical and biochemical processes. Chemical Society Reviews, 1993. 22: p. 73-83.
20. Korenman Y.I., Alymova A.T., and Vatutina I.V., Application of solvents mixtures based on tributylphosphate for selective extraction-adsorption concentrating phenol and guayacol. Journal of Radioanalytical and Nuclear Chemistry, 2000. 246(3): p. 629-634.
21. Bright J.H., Extraction of alcohols with phosphine oxides. 1985: USA.

Chapter 2
30
22. Baumann M.D., Daugulis A.J., and Jessop P.G., Phosphonium ionic liquids for degradation of phenol in a two-phase partitioning bioreactor. Applied Microbiology and Biotechnology, 2005. 67: p. 131-137.
23. Martak J. and Schlosser S., Phosphonium Ionic liquids as new, reactive extractants of lactic acid. Chemical Papers, 2006. 60(5): p. 395-398.

Chapter 2
31

Chapter 3
32

Chapter 3
33
Chapter 3
Extractant selection strategy for solvent impregnated resins in fermentations
Corjan van den Berg, Mark Roelands, Paul Bussmann, Dirk Verdoes, Luuk van der Wielen
This chapter was published: Industrial Engineering & Chemistry Research 2008, volume 47, issue 24, pages
1071-1075

Chapter 3
34
Summary
The application of extractants in whole cell biocatalysis can have a positive impact on industrial fermentations in terms of productivity, total amount of product produced and cell growth. When a product is continuously extracted from the biocatalysts’ environment, product inhibition will be diminished. A systematic approach for selection of superior extractants in whole cell biocatalysis is discussed in this paper. The strategy is exemplified using phenol as the product and the extractant is specifically selected for SIRs, which can prevent emulsification problems commonly encountered in in-situ extractive recovery of fermentation products. Three criteria are taken into account, namely extractant toxicity (LogPo/w values), product extraction efficiency and extractant regeneration.

Chapter 3
35
3.1 Introduction In-situ extractions represent an important share of the ISPR-portfolio [1-3]. A new technique for in-situ extractions are the SIRs. It is expected that SIRs are an efficient tool for removing extremely inhibiting chemicals such as aroma’s, flavors, building blocks or pharma intermediates from fermentation broths. The selection of an optimal extractant for SIRs in bioconversions is a crucial part of the product recovery. The rational selection of extractants to impregnate in the polymer matrix is discussed in this chapter. The proposed strategy should target more criteria than product removal efficiency. For ISPR, the three considered criteria indicated in figure 3.1 are of importance.
Figure 3.1: Extractant selection criteria to take into account for solvent impregnated resins in in-situ extractions. 1 is biocompatibility; 2 is product removal efficiency from fermentation broth, 3 is regeneration of extractant phase.
These three factors will be specified and subdivided. Factors like biocompatibility, product removal efficiency, extractant loss, capacity, selectivity and boiling/melting points have to be taken into consideration. Furthermore, a regeneration method has to be taken into account in order to reuse the SIRs. A focus on phenol as the product to recover from the fermentation broth was made because of its extreme toxicity towards the producing organism [4].
3.1.1 Toxicity In fermentations, the main toxicity effects can be splitted up in two types: molecular and phase toxicity. Molecular toxicity represents the effects caused by dissolved molecules in fermentation media and includes enzyme inhibition/denaturation, cell membrane modifications such as membrane expansion, structure disorders and permeability changes [5,6]. Phase toxicity effects include the extraction of nutrients, disruption of the cell wall (extraction of outer cellular components), cell attraction to interfaces resulting in a decreased nutrient uptake and the formation of emulsions [7,8]. It could be expected that when phase toxicity is the dominant mechanism, immobilisation of the extractant would provide protection to the biocatalyst. When organic extractants exert molecular toxicity, impregnation of the extractant can have little effect other than to produce diffusion gradients from the polymeric matrix of the SIRs and thus may offer only a marginal protection. A common method of estimating two-phase extractant toxicity is using the Log Po/w rule of thumb, which can be used to describe extractant-membrane interactions [9, 10]. LogPo/w is defined as;

Chapter 3
36
(-) equation 3.1
Where, [extractant]oct is the concentration of the extractant in a 1-Octanol phase and [extractant]aq is the extractant concentration in the aqueous phase at equilibrium and at infinite dilution. Vrionis [11] pointed out that wild-type P. putida ATCC 11172 and AVP2 had critical LogPo/w values of 3.3. If the LogPo/w of an extractant was lower than 3.3, slower growth, low productivity and low carbon yields were observed at low concentrations of solute/extractant in the aqueous phase. Keeping concentrations of such molecules in the fermentation media negliable is imperative for an efficient fermentation. If an extractant has a logPo/w value higher than 3.3 this will result in a low toxicity since extractant solubility in water is low and P. putida is able to pump these extractants out of the membrane. However, this value was determined for two-phase bioreactors, which is not applicable here. In this chapter the critical logPo/w value of 3.1, which was given by Inoue et al. [12], will be used since P. putida S12 is known to partially withstand a 2nd organic phase of 1-Octanol.
3.1.2 Separation of product from fermentation broth Achieving high removal efficiencies for a given solute can be achieved by selecting an organic phase with a high affinity towards the solute. By taking into account several molecular interaction parameters between extractant and solute such as hydrophobic interactions, hydrogen bonding, polarizability and dipole moment a selection can be made. In order to make a first selection of extractants, only the hydrogen bonding strength between phenol and extractant were taken into account since these are among the stronger non-covalent interactions. When a compound such as phenol needs to be extracted from an aqueous phase an important consideration is that the hydroxyl group of phenol is a strong hydrogen bond donor (see table 3.1). A proper extractant can be selected on the basis of a strong hydrogen bond interaction between phenol and the extractant phase. It is expected that strong proton-acceptors (high basicity) such as tertiary phosphates, tertiary amines and ketones will give high phenol partition coefficients. Extractants such as carboxylic acids and primary alcohols, which have relatively high hydrogen bond acidity/basicity ratios, are expected to give mediocre phenol partition coefficients. Low phenol partition coefficients can be expected for extractants with poor proton-accepting/donating capabilities such as alkanes, alkenes and aromatics. However, it should be noted that water is also a strong hydrogen bond donor and extractants that are able to have a strong interaction with phenol will also interact with water. This will result in an extractant with a relatively high solubility in water and a low LogPo/w value. To characterize hydrogen bond strengths the Abrahams hydrogen bonding scale [13] was applied. See table 3.1 for a summary.
octo/w
aq
(extractant)LogP =
(extractant)

Chapter 3
37
Table 3.1: some values of the solute effective hydrogen-bond acidity and basicity parameters A and B.
An equation that gives more insight in molecular interactions is the Linear Solvation Energy Relationship by Abraham [14]. LogKd = c + eE + sS + aA + bB + vVx (-) equation 3.2 Where Kd is the partitioning of a solute between an extractant/aqueous phase, E is the descriptor for excess molar refraction, S for dipolarity/polarizability, A for overall hydrogen bond acidity, B for overall hydrogen bond basicity and Vx for McGowan molecular volume. Some solute descriptors can be found in [15] or calculated using the ADME Boxes software (v4.0) [16]. The coefficients c, e, s, a, b, v describe a certain water-extractant system and need to be determined experimentally. Once all these parameters are known, partition coefficients of uncharged solutes can be predicted. To our knowledge these coefficients have been determined for 63 water-extractant systems. To calculate partition coefficients of a solute, the molecular descriptors are needed. Molecular descriptors for phenol, used in this chapter can be found in table 3.2. Table 3.2: LSER solute descriptors for phenol
Solute descriptors E S A B Vx phenol 0.805 0.89 0.6 0.3 0.7751
Diluents are not considered here since they lower the amount of hydrogen bonding groups per volume and thus the capacity of the SIR. Due to this criterium all extractants should have a melting point of 25 oC or higher. 3.1.3 Regeneration of extractant phase When selecting an organic extractant, the regeneration efficiency must be taken into account. Important physical properties of both product and extractant such as pKa and vapor pressure need to be considered. A possible phenol extractant regeneration method is applying a pH-shift. The pKa of phenol is 9.95 (see figure 3.2), thus at
Structural group A B
Alkane 0 0 Alkene 0 0.07 Ether 0 0.45
Benzene 0 0.14 Primary amine 0.16 0.61
Secondary amine 0.08 0.69 Tertiary amine 0 0.79
Ketone 0 0.51 Aldehyde 0 0.45
Primary alcohol 0.37 0.48 Secondary alcohol 0.33 0.56
Ester 0 0.45 Carboxylic acid 0.6 0.45
Tertiary phosphate 0 1.15 Phenol 0.6 0.3 Water 0.82 0.35

Chapter 3
38
equilibrium a regeneration of 99% can be achieved by washing the extractant with a solution with a pH of 11.95 or higher. As a result, the extractant phase must be stable at such alkaline conditions.
Figure 3.2: regeneration of phenol using an alkaline wash-step
However, in industry there is a strong trend to regenerate the extractant phase without generating salt side-streams such as gypsum in the process. Regeneration of the SIRs can also be performed with vacuum distillation or steam stripping step, while keeping the extractant inside the resin phase. When a vacuum distillation/steam stripping step is applied, the vapor pressure of the extractant should be significantly lower than the product. Phenol has a vapor pressure of 136 KPa at 180 oC (calculated using the Clausius-Clapeyron relationship) limiting the number of extractants that can be used. Since phenol concentrations in the fermentation broth must be kept low (<2 mM) this automatically results in low mole fractions in the extractant phase, depending on the phenol partition coefficient over the aqueous/extractant phase. In this article, extractant losses during regeneration will not be quantified, but we set as a specific criterion that the vapor pressure of the extractant phase should be smaller than 0.136 KPa at 180 oC (= 1000 times smaller as phenol at 180 oC). The vapor pressures of extractants were calculated using the Clausius-Clapeyron equation.
vap2
1 2
ΔHP 1 1Ln = ( )
P R T T1
(-) equation 3.3
Where P1 and T1 are a corresponding vapor pressure and temperature, P2 and T2 are a corresponding vapor pressure and temperature at another point, R is the gas constant (8.3143 J mol-1 K-1), ∆Hvap
is the molar enthalpy of vaporization. For most extractants considered the ∆Hvap was unknown and therefore a calculated value from the SPARC online calculator (version 4.0) was used [17]. Extractant vapor pressures were taken from the physical properties database [18]. A new category of extractants, which might be applicable here are the ionic liquids since these solvents have a negliable vapor pressure.
3.2 Method and Materials 3.2.1 Chemicals All chemicals were purchased at Sigma Aldrich with a purity of 98% or higher. Except for Cyphos-104 which was purchased from Cytec (purity is >95% according to Cytec MSDS). All chemicals were used as received. 3.2.2 Separation of product from fermentation broth Extractants with different active groups were screened, which all had at least 6 carbon atoms. A 50 ml 0.84 mM phenol solution (10 mM phosphate buffer pH 7.0) was used as aqueous phase and subsequently 50 ml of dry extractant phase was added to the shake flask. The flask was gently stirred over a period of four hours (at 30 oC in a shake

Chapter 3
39
incubator; 120 rpm) and a settling time of 3 hours was allowed. Samples were taken from the aqueous phase, passed through a PTFE filter and analyzed on HPLC (Agilent 1100 Series, Zorbax 3.5 μm SB-C18 4.6x50 mm column, λ = 278.4 nm). Samples (30 μl) were injected in a mobile phase consisting of 70% acetonitrile and 30% KH2PO4 (0.05 M) at a flow-rate of 1.5 ml/min. 3.2.3 TGA measurement of Cyphos-104 TGA analysis was performed on an SDT 2960 (TA Instruments). Samples were analyzed over a temperature range from 30 oC up to 300 oC with a ramp rate of 5 oC/minute. The samples that were analyzed can be found in table 3.3. Table 3.3: samples analysed on TGA
sample nr. Cyphos-104 w/w% H2O w/w% phenol w/w% 1 100 0 0 2 85.3 14.7 n.a. 3 84.8 10.3 4.9
3.3 Results and discussion 3.3.1 Toxicity The first criterion to be passed is toxicity. All primary amines and carboxylic acids do not pass the toxicity criteria since these extractant families influence the pH of the fermentation broth at pH 7, resulting in a change in the proton motive force of the micro-organism. LogPo/w values were taken from the Physical properties database from Syracuse Research [18]. All extractants with a logPo/w lower than 3.1 do not pass this rule of thumb (see equation 3.1 and table 3.4) and are automatically excluded. 3.3.2 Separation of product from fermentation broth The second criterion is efficient product separation from the fermentation broth. Due to the exclusion of diluents the extractants which are solid at 25 oC are excluded (decanoic acid, undecanoic acid, dodecanoic acid and dodecylamine). A high partition coefficient is favorable and from table 3.4 it can be observed that phenol partitioning is the highest at tertiary phosphates. All other tested extractants gave lower product partition coefficients. When only hydrogen bond basicity of the tertiary amine and tertiary phosphate extractants are examined it can be expected that both these extractants would have a high phenol partition coefficient, while this is only applies for tertairy phosphates. It is hypothesized that the polarized phenyl group of phenol results in a repulsion with the alkane chain of the extractant. This effect is less pronounced in tributylphosphate compared to tributylamine since the phosphate group is further from the alkane plane, resulting in a stronger interaction (see figure 3.3).

Chapter 3
40
Figure 3.3: possible repulsion mechanism due to steric hinderance of tertiary amine group of tri-n-butylamine (left). Notably, this effect is less pronounced in tri-butylphosphate (right). Another observation that can be made from table 3.4, is that the location of the double bonded oxygen group is important. If attached to a primary alkane (= aldehyde) this results in relatively low partition coefficients of phenol. However, when the double bonded oxygen is attached to a secondary alkane (= ketone) the phenol partition coefficient increases. This can be explained from table 3.1 where ketones have a higher H-bond basicity compared to aldehydes due to the availability of more polarized alkane subunits near the ketone group. Therefore, the interaction is stronger with the acidic hydroxyl group of phenol. The outcome of LSERs was compared to the measured partition coefficients and a good correlation can be observed in figure 3.4.
y = 0,9778x
R2 = 0,9799standard deviation = 7,7
0
1
10
100
1000
0 1 10 100 1000
predicted phenol Kd
mea
sure
d p
hen
ol
Kd
Figure 3.4: Parity plot of predicted and measured phenol partition coefficient

Chapter 3
41
Alkanes, alkenes and hydrophobic aromatics as an extractant result in phenol partition coefficients lower than 5. Ethers, esters, tertiary amines and alcohols are in the medium performance extractants (partition coefficients ranging 5 to 50).The correlation which is found between the measured and predicted phenol partition coefficients is much better compared to ab initio computational chemistry packages such as COSMO-RS, which are to this point only able to give qualitative predictions [19].
3.3.3 Regeneration Depending on the regeneration technique (alkaline wash or temperature shift) two different extractants are considered. When applying alkaline wash, the extractants should be stable at pH 12. All extractants comply with this criterion and therefore, a biocompatible extractant with the highest partition coefficient was the outcome of the selection. When a vacuum/steam strip is applied for the regeneration, the extractant should have a vapor pressure lower than 0.136 KPa at 180 oC. None of the extractants passed this criterion and therefore alternative solvents such as ionic liquids were considered.
Table 3.4: Results of phenol extractant selection with alkaline wash as regeneration.
Extractants marked as bold in table 3.4 pass the biocompatibility, Tm <25 oC and pH12 stability criteria.
3.3.4 Alternative solvents Since none of the considered extractants passed the vapor pressure criterion ionic liquids were considered since this group of extractants is known to have a negliable vapor pressure. Phosphine oxides [20] and phosphinates are known to be effective phenol extractants. Phosphinates and phosphine oxides are known to have relatively
Biocompatibility Stable at pH 12
Extractant class before selection Measured Kd
phenol (logPo/w > 3.1) Tm < 25 oC
Alkane C6; C7; C8; C9;
C10 0.2; 0.1; 0.1; 0.1; 0.1 C6-C10 C6-C10
Alkene C6; C7; C8; C9;
C10 0.1; 0.1; 0.1; 0.1; 0.1 C6-C10 C6-C10
Ether C6; C8; C10; C12 15.8; 11.8; 9.5; 8.0 C10; C12 C6-C12
Aromatic C6; C7; C8; C9;
C10; C11 2.8; 2.4; 2.1; 1.8; 1.6;
1.5 C9-C11 C6-C11
Primary amine C7; C8; C9; C10;
C11; C12 39.9; 35.5; 32; 26.9;
26.5; 24 None C7-C11
Tertiary amine C9; C12; C15; C18 5.1; 3.8; 3.1; 2.6 C12; C15; C18 C9-C18
3,4,5-Ketone C8; C9; C10; C1138.9; 35.1; 32.1;
29.1; 27.0 C10; C11 C8-C11
2-Ketone C8; C9; C10; C11;
C12 34.7; 30.8; 28.3; 26;
23.9 C9-C12 C8-C12
Aldehyde C8; C9; C10; C11 16.8; 15.1; 13.9; 12.6 C9-C11 C8-C11
Primary alcohol C8; C9; C10; C11;
C12 31.6; 27.9; 25.4;
23.3; 21.5 C9-C12 C9-C12
Sec. alcohol C8, C9, C10,
C11;C12 32.2; 29.2; 26.6;
24.4; 22.5 C9-C12 C9-C12
Acetate C8; C9; C10; C11;
C12 33.7; 30.4; 28.5;
26.5; 24.7 C9-C12 C9-C12
Acid C8; C9; C10; C11;
C12 7.3; 6.5; 6.1; 5.6; 5.3 None C8; C9
Phosphate C9; C12,;C15 369; 323; 290 C12; C15 C12; C15
Phthalate C10; C12; C16;
C20; C24 37.5; 35.0; 30.1;
25.8; 22.7 C16; C20; C24 C16; C20; C24
Chapter 3
42
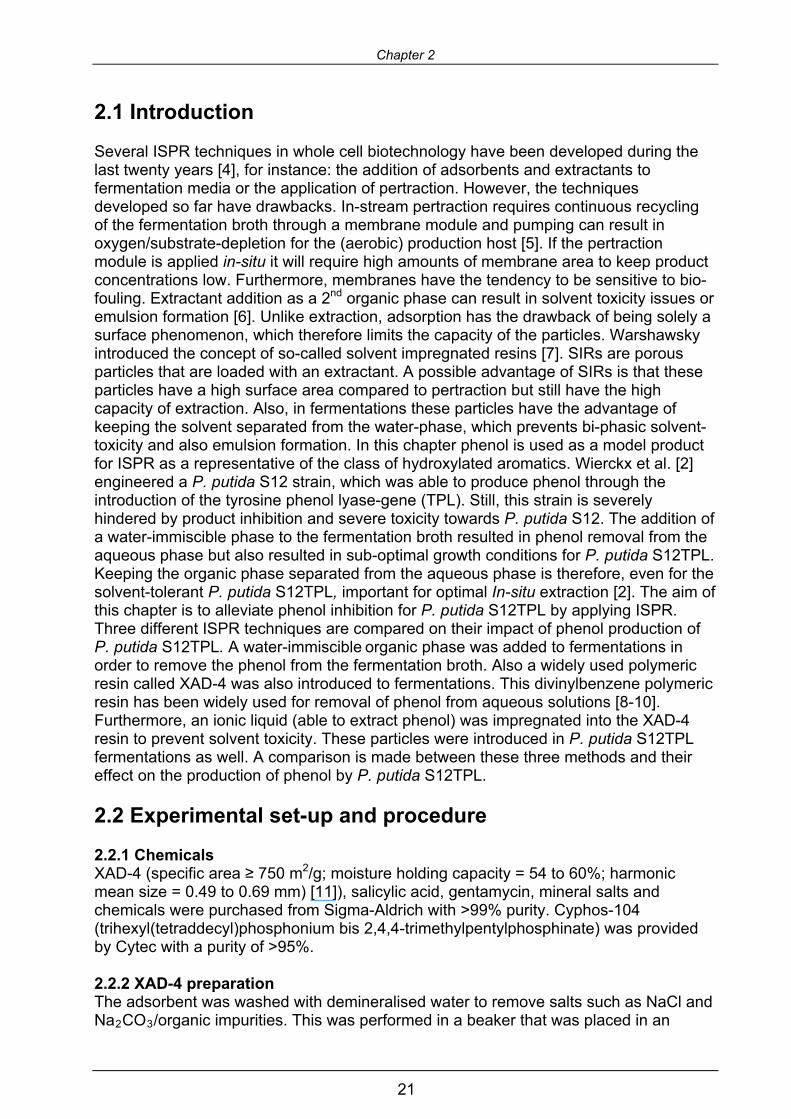
high water solubility. Although Cyphos-104 is a phosphinate, the water solubility is low (16 mg/L) due to the hydrophobic trihexyl(tetradecyl)phosphonium counter-ion. The Cyphos-104 is an effective phenol extractant and in the case of P. putida S12 this extractant is not toxic when encapsulated [21]. However, when applying a heating step to pure Cyphos-104 a significant weight loss was observed (see figure 3.5), most likely due to the breakdown of Cyphos-104 into more volatile compounds.
Figure 3.5: TGA of Cyphos-104, Cyphos-104 + phenol, Cyphos-104 + phenol + water
3.4 Conclusions
The combination of Abraham’s LSER equation, partition coefficient measurements and physical property databases was used for extractant selection for uncharged solutes. A phenol extractant selection strategy for SIRs has been presented, which can be applied to fermentations in particular. To remove phenol effectively from a fermentation broth an extractant with high hydrogen basicity is needed. Moreover, steric hindering of the active group of the extractant should be taken into account. The only phenol regeneration technique considered feasible for SIRs is an alkaline wash. A heat regeneration step was considered not possible for SIRs due to the low vapor pressure of phenol and the breakdown of Cyphos-104 at high temperatures. However, due to the low vapor pressures of ionic liquids they form an interesting class of extractants for products with a relatively high boiling point/low vapor pressure. The presented extractant selection strategy should also be applicable when selecting an organic phase for a biotransformation system that involves the partitioning of multiple products over an organic/water phase. However, this would require an additional selectivity parameter. In the discussed phenol case there are no other competing fermentation products, rendering it less appealing to incorporate this here.

Chapter 3
43
Literature
1. Bruce L.J. and Daugulis A.J., Solvent selection strategies for extractive biocatalysis. Biotechnology Progress, 1991. 7: p. 116-124.
2. Weilnhammer C. and Blass E., Continuous fermentation with product recovery by in-situ extraction. Chemical Engineering and Technology, 1994. 17: p. 365-373.
3. Prpich G.P. and Daugulis A.J., Solvent selection for enhanced bioproduction of 3-methylcatechol in a two-phase partitioning bioreactor. Biotechnology and Bio-engineering, 2007. 97(3): p. 536-543.
4. Wierckx N.J.P., et al., Engineering of solvent-tolerant Pseudomonas Putida S12 for bioproduction of phenol from glucose. Applied and Environmental Microbiology, 2005. 71(12): p. 8221-8227.
5. Heipieper H.J., et al., Mechanisms of resistance of whole cells to toxic organic solvents. Trends in Biotechnology, 1994. 12: p. 409-415.
6. Pinheiro H.M. and Cabral J.M.S., Effects of solvent molecular toxicity and microenvironment composition on the A’dehydrogenation activity of Arthrobacter simplex cells. Biotechnology and Bio-engineering, 1991. 37(2): p. 97-102.
7. Diaz M., Three-phase extractive fermentation. Trends in Biotechnology, 1988. 6: p. 126-130.
8. Heipieper H.J., et al., Solvent-tolerant bacteria for biotransformations in two-phase fermentation systems. Applied Microbiology and Biotechnology, 2007. 74: p. 961-973.
9. Leo A., Hansch C., and Elkins D., Partition coefficients and their uses. Chemical Reviews, 1971. 71(6): p. 525-616.
10. Sikkema S., De Bont J., and Poolman B., Interactions of cyclic hydrocarbons with biological membranes. Journal of Biological Chemistry, 1994. 269(11): p. 8022-8028.
11. Vrionis H.A., Kropinski A.M., and Daugulis A.J., Enhancement of a two-phase partitioning bioreactor system by modification of the microbial catalyst: demonstration of concept. Biotechnology and Bioengineering, 2002. 79(6): p. 587-594.
12. Inoue A. and Horikoshi K., Estimation of solvent-tolerance of bacteria by the solvent parameter log P. Journal of Fermentation and Bioengineering, 1991. 71(3): p. 194-196.
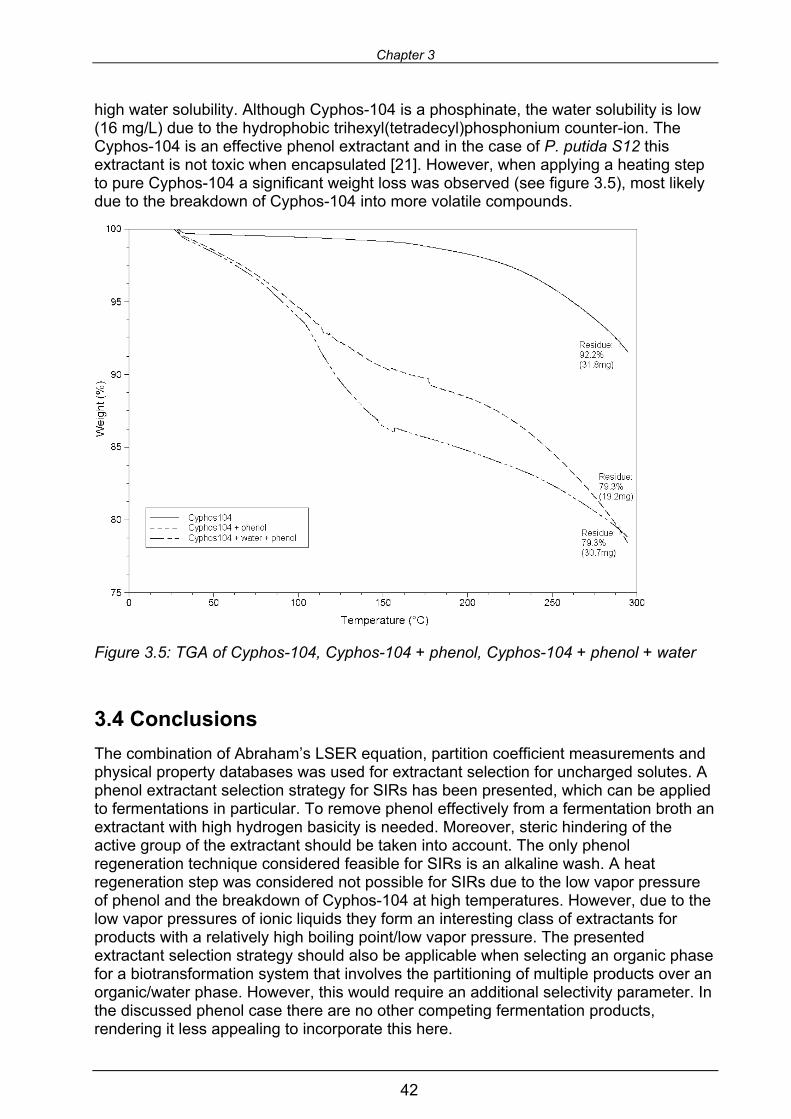
13. Abraham M.H. and Platts J.A., Hydrogen bond structural group constants. Journal of Organic Chemistry, 2001. 66: p. 3484-3491.
14. Abraham M.H., Dearden J.C., and Bresnen G.M., Hydrogen bonding, steric effects and thermodynamics of partitioning. Journal of Physical Organic Chemistry, 2006. 19: p. 242-248.
15. Abraham M.H., Scales of solute hydrogen-bonding: Their construction and application to physicochemical and biochemical processes. Chemical Society Reviews, 1993. 22: p. 73-83.
16. Algorithms, P., Adme Boxes. 2007. 17. Karickhoff S.W., Carreira L.A., and Hilal S.H. SPARC online calculator. 2007
[cited; Available from: http://ibmlc2.chem.uga.edu/sparc/. 18. Syracuse Research Corporation. Physical properties database. 1999 [cited 2007;
Available from: http://www.syrres.com/esc/physdemo.htm. 19. Spieß A.C., et al., Prediction of partition coefficients using COSMO-RS: solvent
screening for maximum conversion in biocatalytic two-phase reaction systems. Chemical Engineering and Processing, 2008. 47: p. 1034-1041.
20. Cichy W., Schlosser S., and Szymanowski J., Recovery of phenol with Cyanex

Chapter 3
44
923 in membrane extraction-stripping systems. Solvent Extraction and ion Exchange, 2001. 19(5): p. 905-923.
21. van den Berg C., et al., Solvent-impregnated resins as an in-situ product recovery tool for phenol recovery from Pseudomonas putida S12TPL fermentations. Biotechnology and Bio-engineering, 2008. 100(3): p. 466-472.

Chapter 3
45

Chapter 4
46

Chapter 4
47
Chapter 4
Preparation and analysis of high capacity polysulfone capsules
Corjan van den Berg, Mark Roelands, Paul Bussmann, Earl Goetheer, Dirk Verdoes, Luuk van der Wielen
This chapter was published: Reactive and Functional Polymers 2009, Volume 69, Issue 10,
Pages 766-770

Chapter 4
48
Summary Since the concept of solvent impregnated resins was introduced in the early 1980s, the technique has been applied to a limited amount of applications. The main disadvantage of the particles was that the amount of solvent inside was limited to approximately 1.5 ml/g polymer. A new generation of solvent impregnated resins is introduced here. These capsules can contain up to 11.8 ml solvent/g polymer and were prepared using modified dry impregnation technique. Due to the high solvent loading, the capacity for extracting products from aqueous phases is therefore dramatically increased per volume of capsule.

Chapter 4
49
4.1 Introduction In chapter 2 it was shown that SIRs containing Cyphos-104 were successfully able to remove phenol from fermentation broths [1]. The XAD-4 polystyrene polymer backbone that was used for SIRs had a pore volume of 1 ml/g [2]. This limited the amount of solvent, which could be impregnated per volume of particle. Limiting the volume of the polymeric matrix of the SIRs in the fermentation broth can theoretically result in higher product capacities. A high solvent to polymer ratio in SIRs can result in more efficient fermentations due to higher product removal capacities since the polymeric backbone has no influence on product removal [3]. These SIRs will have more the appearance of capsules due to their higher pore volumes. Capsules also have been investigated quite thoroughly for various applications ranging from potential extracting tools [4, 5] to a perfume release agents [6]. In 2006 Gong et al introduced new polysulfone capsules [7]. These capsules had the advantage of a void volume up to 90 volume% depending on the particle diameter. This feature gave the particles the potential of a high solvent loading. However, in the described method only 1.186 ml/g solvent was impregnated with solvent losses in the process. More recently Gong presented a method to prepare uniform polysulfone capsules containing 1-Octanol. The capsules had a maximum loading of 6.98 g 1-Octanol/g polymer and a potential to be used as a caprolactam extraction tool from aqueous phases [5]. In a review from Juang [8] it was described that there are generally four ways of impregnating a solvent in a resin phase, namely the dry, wet, modifier addition and dynamic column method. The most common method of impregnation is the so-called dry method. In this article we apply a modified dry impregnation technique that is able to load up to 11.8 ml solvent phase in 1 gram polysulfone polymer without solvent losses in the preparation process.
4.2 Materials & Methods 4.2.1 Materials & chemicals Cyphos-104 was purchased from Cytec and was used as received. Cyphos-104 is a viscous room temperature ionic liquid with a density lower than water (0.89 g/ml). It is colourless to pale yellow, has a negligible vapour pressure and is immiscible with water (H2O solubility is 16 mg/l at 30 oC [1]). It is miscible with hexane, toluene, isopropyl alcohol, diethyl ether, tetrahydrofuran, and methanol [9]. Dimethylformamide, ethanol, XAD-4, phenol (99,9%), polysulfone (Typical Mn = 26000, Tg = 190 oC) were bought from Sigma-Aldrich and were used as received unless indicated differently. 4.2.2 Polysulfone capsule synthesis Capsule synthesis consisted of preparing a polymer and anti-solvent solution similar to Gong’s approach [7]. Since capsule sphericallity is heavily influenced by nozzle distance to anti-solvent, anti-solvent composition and polymer concentration in the solvent, the same conditions were used. The polymer solution was prepared using a 1 g polysulfone/10 ml dimethylformamide ratio. Therefore, 30 g of polysulfone was dissolved in 300 mL of dimethylformamide at 50 oC, taking at least 2 hours. Following this procedure, the polymer solution was then placed in a separation funnel where the nozzle had an inner diameter of 0.47 or 1.46 mm. The nozzle was at a distance of 7 cm from the top of the anti-solvent solution. The anti-solvent consisted of a 30 v/v% ethanol/water solution. The valve was opened in such a way that there was a constant dripping of polysulfone/dimethylformamide droplets. In the anti-solvent bath the instantaneously formed droplets slowly precipitated due to the relatively high density of

Chapter 4
50
the polysulfone backbone. An overhead stirrer was used to prevent grinding of the newly formed capsules. 4.2.3 Loading of solvent in polysulfone capsules The particles were washed with 2 L of water, three times in order to remove the dimethylformamide/ethanol from the particles. The capsules, which contained water, were placed in contact with a Cyphos-104/methanol mixture. This was ultrasonified for 1 hour to equilibrate the water/methanol/Cyphos-104 phases. The volume of added Cyphos-104 was never more than the void volume of the capsules otherwise this would result in leakage of the Cyphos-104. The solution and particles were then placed in a roto-evaporator and continuously rotated (approximately 60 rpm) at 78 oC. As a result the methanol and water were vaporized off from the particles/solution. Furthermore, the high temperature results in a lower viscosity of the Cyphos-104 facilitating impregnation. Due to capillary forces, Cyphos-104 was absorbed in the capsules. After impregnation the capsules were cooled down to room temperature resulting in a lower density of the Cyphos-104 phase. Therefore, the remaining Cyphos-104 that was on the outside layer of the polysulfone shell was absorbed in the porous structure. Using Karl-Fischer (870 KF Titrino plus; Metrohm) measurement the mass% of water in saturated Cyphos-104 was measured. The results showed that 13.1 mass% of the solvent phase consisted of water. This corresponds well with literature values found by Martak et al [10], which was 14.4 mass%. 4.2.4 Preparation XAD-4 solvent impregnated resins XAD-4 (100g) was washed three times with 200ml demineralised water to remove salts and organic impurities. This was performed in a beaker, which was placed in an ultrasonification bath for 1 hour. XAD-4 was subsequently immersed three times in 200 ml methanol for 15 minutes each cycle for removal of trace organics. Finally, washed adsorbent was put in an oven overnight (100 oC) for removal of the methanol/H2O mixture. The SIRs were prepared using the dry impregnation method described by Juang et al [8]. Cyphos-104 was selected as the solvent-phase since it had a favorable phenol partition coefficient and also has a negliable vapor pressure. The low vapor pressure prevents solvent losses during the impregnation procedure. 84.0 gram of Cyphos-104 was first dissolved in approximately 30 ml methanol to decrease the viscosity. XAD-4 (84.0 g) was then immersed in the diluted solvent and subsequently put in an ultrasonification bath for 1 hour. This resulted in impregnation of the adsorbent. After ultrasonification the SIRs were put in an oven (80 oC) for 4 hours to dry the SIRs and remove the methanol. 4.2.5 Uptake rate of SIRs and capsules A 200 ml aqueous solution containing 11.6 mM phenol was placed in contact with 5.00 grams of solvent impregnated resin or capsule. The test was performed at room temperature and mixing was performed using a magnetic stirrer at 800 RPM. Samples of 100 μl were drawn and aqueous phenol concentrations were determined using a spectrophotometer (Ultrospec plus; Pharmacia LKB) at 270 nm. 4.2.6 Capacity of SIRS/capsules and pure extractant Furthermore, a comparison is made with pure L-L extraction using Cyphos-104 as the extracting agent and adsorption using XAD-4 and empty capsules as an adsorbent. A 50 mM phenol solution was contacted for 5 hours with capsules, SIRs or extractant. The weight ratios between the phenol solution and capsules/SIRs or extractant varied between 5 to 160 and aqueous phenol concentrations measured in a similar manner as

Chapter 4
51
in paragraph 2.2.6. The Freundlich isotherm from Li et al [11] was used to calculate the amount of phenol adsorbed on XAD-4. 4.2.7 Stability of polysulfone capsules A 150 ml aqueous solution containing 12.8 mM phenol was placed in contact with 4.65 grams of large polysulfone SIRs. The test was performed at room temperature and mixing was performed using a magnetic stirrer at 800 RPM. The samples were placed on a plate stirrer and an aqueous phase sample was drawn after 8 hours. After 8 hours, the particles were put in a 250ml 1 M NaOH solution to regenerate. After the regeneration, particles were washed twice with 250ml demineralised water for 4 hours to neutralize the pH. After pH neutralization the particles were loaded again with phenol and this process was repeated 5 times. Phenol concentrations were determined using the method described in paragraph 2.4.
4.3 Results & Discussion 4.3.1 SIRs and capsule characteristics The SIRs and capsules were compared on the basis of several properties such as capacity, kinetics and difference in polymeric backbone. In table 4.1, polystyrene and polysulfone polymeric backbones for SIRs and capsules are compared. Table 4.1: Comparison of polymer backbone properties
Polymer backbone property XAD-4 polysulfone small*
polysulfone large**
material pSty-DVB Polysulfone Polysulfone glass transition temperature (o C) 100a 185a 185a
particle diameter of dry particles (mm) 0.49 - 0.69b 2.6 - 3.1f 3.3 – 3.9f Particle volume (dry particle, cm3) 0.001 - 0.0016b 0.0105f 0.0194f
Average pore size (nm) 5b < 500d < 500d total pore volume (ml/g) 0.98b 6.7f 11.8f
a taken from [12]; b taken from product sheet Rohm & Haas; d estimation made on basis of SEM images (see figure 4.4); e based on volume calculations made using microscope; f based on difference between amount of water inside capsule during formation and capsule dry weight. * made using a nozzle diameter of 0.47 mm ** made using internal nozzle diameter of 1.46 mm The high glass temperature of polysulfone gave the capsules the potential for higher temperature regeneration compared to XAD-4 SIRs. The XAD-4 particles have a smaller radii compared to the polysulfone. This results in shorter diffusion lengths through the organic phase and a larger surface area. XAD-4 has smaller pore sizes making these SIRs less susceptible to solvent leaching due to stronger capillary forces. Due to the crosslinked nature of XAD-4 the pore volume is lower than the polysulfone capsules resulting in low solvent capacities. In table 4.2 some properties are given of the XAD-4 SIRs and polysulfone capsules.

Chapter 4
52
Table 4.2: Comparison of SIR and capsule properties SIR/capsule property XAD-4
SIR polysulfone small
Polysulfone large
Number of particles/gram
4475a 116b 50b
Surface area (cm2/gram)
99.2c 29,6c 20,3c
Surface area (cm2/particle)
0.014d 0.26d 0.41d
solvent (cm3/gram) 0,5e 0,83e 0,88e
a calculated using capsule weight and amount of solvent impregnated per gram; b solvent containing capsules were weighed on analytical balance; c area calculated using average sphere radii; d calculated using first two rows of table 4.2; e based on weight difference between dry and filled particle The amount of particles per gram of SIR was calculated using the density of pSty-DVB (1.08 g/ml [2]) and the known amount of Cyphos-104 which was impregnated making it possible to calculate SIR weights. After impregnation no swelling of the polymeric particles was observed under the microscope (<5%). The surface area of XAD-4 according to the product sheet is ≥ 750 m2/g [2]. However, the resin is impregnated with an organic solvent and therefore the contact area between the organic and the aqueous phase is only possible at the resin surface. The amount of solvent inside the polysulfone capsules is directly coupled to the void volume of the polymers. However, the amount of solvent inside the capsules is slightly lower than the total void volume. Selecting exactly the same amount of solvent as the total pore volume resulted in capsules containing Cyphos-104 on the outside (data not shown). Therefore it was opted to use slightly lower amounts of solvent compared to the total capsule pore volume.
Figure 4.2a&b: Empty and fully loaded capsule

Chapter 4
53
Figure 4.3a&b: Outer layer of empty and loaded capsule
Figure 4.4: Membrane layer around an empty capsule Only images of large polysulfone capsules are shown here since the small capsules gave similar results. No scanning electron microscopic (SEM) images were made of the membrane layer of a loaded polysulfone capsule since the resolution became too low for a sharp image at that magnification. A possible explanation could due to surface charging resulting in a distorted image and a lower resolution. Because Cyphos-104 is an ionic liquid the vapor pressure is minimal therefore the solvent could be observed using the scanning electron microscope. This was confirmed by elemental analysis which was carried out on the SEM and a phosphorous peak was observed. The phosphorous peak was not observed in empty polysulfone capsules. From figure 4.2b it can be observed that the particle was not completely loaded. However, when the particles were cut in half the unbound Cyphos-104 was released from the void volume and adhered on the cutting knife. 3.2 SIRs and capsules performance A comparison of capsules and SIRs on the basis of kinetics and capacity can be found in figure 4.5 where 5.00 gram of SIR or capsule was added to 200 ml 11.6 mM phenol solution.

Chapter 4
54
0
2
4
6
8
10
12
0 2000 4000 6000 8000 10000 12000
Time (seconds)
Aqu
eous
phe
nol c
once
ntra
tion
(mM
)
XAD-4 SIRsPSF small capsulePSF large capsule
Figure 4.5: Comparison of kinetics and capacity of different SIRs It can be observed that XAD-4 SIRs have faster uptake kinetics compared to the polysulfone capsules. The SIRs reach equilibrium after approximately 2500 seconds while the capsules need roughly 8000 seconds. This is due to the smaller particle diameter and higher surface area of XAD-4 SIRs. However, the solvent loading capacity of the new capsules is significantly higher compared to XAD-4 SIRs giving the capsules higher product capacities. No significant difference in capacity or kinetics was observed between the small and large polysulfone capsules. The large polysulfone capsules contain more solvent compared to the small capsules and have a lower surface area. Therefore, it can be expected that these capsules would have a higher product removal capacity but slower kinetics. In figure 4.6 the capsules and SIRs are compared to adsorption and L-L extraction. Auxiliary phase is defined here as the total volume of organic and/or polymer phase. For adsorbents such as XAD-4 and the empty polysulfone capsules the pore volume is also taken into account.

Chapter 4
55
0
1
2
3
4
5
0 10 20 30 40 50phenol concentration in auxiliary phase (mM)
phen
ol c
once
ntra
tion
in a
uxili
ary
phas
e (M
)
XAD-4 SIRsPSF capsulesL-L extractionXAD-4empty PSF capsules
Figure 4.6: Isotherm comparison of different auxiliary phases Both SIRs and capsules have significantly higher capacities compared to the XAD-4 adsorbent. However, L-L extraction outperforms the XAD-4 SIRs. This is an expected result since pure solvent contains more hydrogen bonding groups per volume of auxiliary phase. The difference in capacity between the polysulfone capsules and L-L extraction is negligible. When auxiliary phase concentrations are calculated back to phenol concentrations in the organic phase it can be observed that the polysulfone capsules outperform L-L extraction (see figure 4.7).
0
1
2
3
4
5
0 10 20 30 40 50phenol concentration in aqueous phase (mM)
phe
nol
co
ncen
tra
tion
in o
rgan
ic p
has
e (M
)
L-L extractionXAD-4 SIRsPSF capsules
Figure 4.7: Isotherm comparison of different auxiliary phases for phenol removal The observed effect might be due to the polysulfone matrix of the capsules. A polysulfone polymer consists of sulfonyl and ether groups giving the polymer hydrogen bonding basicity characteristics. It is known that phenol interacts strongly with

Chapter 4
56
molecules containing hydrogen bond accepting groups [13, 14]. While the phenol adsorption effect is not very strong in empty polysulfone capsule it is expected that due impregnation of the polysulfone swelling occurs, resulting in more available polysulfone sites. Notably, this effect is absent in XAD-4 since this polymer only contains polystyrene. Although unimpregnated XAD-4 adsorbs phenol, this effect is neutralized due to the excess amount of hydrophobic solvent adsorbing to the polymer. The capsules do not perform significantly worse when compared to L-L extraction due to their high solvent loading and choice of polymer. A concern was that due to larger pore sizes significant leaching would occur. This leaching would result in a decrease of reusability of the capsules. The stability of large polysulfone capsules was therefore measured and results can be observed in figure 4.8.
0.0
0.1
0.2
0.3
0.4
1 2 3 4 5
test run
Cap
acity
(m
mol
phe
nol/g
cap
sule
)
Figure 4.8: Stability of polysulfone capsules over different test runs A slight capacity decrease was observed in the first run. After 5 runs a total 10% capacity decrease was observed due to solvent losses and/or degradation. However, in the fifth run the phenol capacity did not decrease anymore. Gong et al [7] observed similar behaviour, but their capsules contained significantly lower solvent amounts resulting in possible physical adsorption of the solvent onto the polysulfone backbone. This phenomenon is not relevant here since the solvent/polymer ratio is a factor 10 higher. Another observation after 5 runs was that none of the particles showed visual mechanical degradation due to possible grinding with the magnetic flea, indicating that the capsules have a polymeric backbone strong enough to withstand some mechanical stress.
4. Conclusions The relatively low product capacity of solvent impregnated resins could compete with techniques such as adsorption but due to low solvent to polymer ratios was inferior to L-L extraction capacity-wise. Using a method similar as described by Gong et al, polysulfone particles with a high pore volume were produced. These capsules were loaded with a high amount of solvent. In the polysulfone capsule the amount of polymer has been limited and therefore the capacity for solvent and product is increased. The

Chapter 4
57
polysulfone capsules have the highest solvent loading capacity according to our knowledge. Furthermore, the polysulfone matrix adsorbs phenol due to the sulfonyl and ether groups. This feature gave the particles similar phenol capacities as L-L extraction. XAD-4 SIRs have faster kinetics compared to the polysulfone capsules due to their smaller particle radius and larger surface area. These developed capsules might have a possible application as a tool for aromatics or uncharged carboxylic acids from aqueous-like phases. Literature 1. van den Berg C., et al., Solvent-impregnated resins as an in-situ product
recovery tool for phenol recovery from Pseudomonas putida S12TPL fermentations. Biotechnology and Bio-engineering, 2008. 100(3): p. 466-472.
2. Rohm and Haas, Product data sheet XAD-4. 2001. 3. Babic K., Ham van der L., and Haan de A., Recovery of benzaldehyde from
aqueous streams using extractant impregnated resins. Reactive & Functional Polymers, 2006. 66: p. 1494-1505.
4. Yang W.W., et al., Monodispersed microcapsules enclosing ionic liquid of 1-butyl-3methylimidazolium hexafluorophosphate. Reactive and Functional Polymers, 2007. 67: p. 81-86.
5. Gong X.C., et al., Preparation of uniform Microcapsules containing 1-Octanol for caprolactam extraction. Industrial & Engineering Chemistry Research, accepted.
6. Pen˜a B., et al., Vanillin release from polysulfone macrocapsules. Industry and Engineering Chemistry Research, 2009. 48(3): p. 1562 - 1565.
7. Gong X.G., et al., Separation of organic acids by newly developed polysulfone microcapsules containing trioctylamine. Separation and purification technology, 2006. 48: p. 235-243.
8. Juang R-S., Preparation, properties and sorption behavior of impregnated resins containing organophosporus extractants. Proceedings of the National Science Council, 1999. 23(3): p. 353-364.
9. Cytec, Cyphos IL 104 , Phosphonium ionic liquid. 2005. 10. Martak J., Schlosser S., and Vlckova S., Pertraction of lactic acid through
supported liquid membranes containing phosphonium ionic liquid. Journal of membrane science, 2008. 318: p. 298-310.
11. Li A., et al., Adsorption of phenolic compounds on Amberlite XAD-4 and its acetylated derivative MX-4. Reactive and Functional Polymers, 2001. 49: p. 225-233.
12. Schouten A.E. and van der Vegt A.K., Plastics. 1987, Overberg: Delta Press. 13. van den Berg C., et al., Extractant selection strategy for solvent-impregnated
resins in fermentations. Industrial & Engineering Chemistry Research, 2008. 47(4): p. 10071-10075.
14. Burghoff B., Goetheer E.L.V., and de Haan A.B., COSMO-RS-based extractant screening for phenol extraction as model system. Industrial & Engineering Chemistry Research, 2008. 47: p. 4263 - 4269.

Chapter 5
58

Chapter 5
59
Chapter 5
Techno-economic evaluation of solvent impregnated resins in a bioreactor
Corjan van den Berg, Floor Boon, Mark Roelands, Paul Bussmann, Earl Goetheer, Dirk Verdoes, Luuk van der Wielen
This chapter was accepted for publication in Separation & Purification Technology

Chapter 5
60
Summary Most fermentation products have a feedback inhibiting effect on the host organism. In-situ product recovery (ISPR) can be a means to overcome this product inhibition in fermentations. Particles such as solvent impregnated resins or capsules can be a valuable tool for product recovery based on extraction. To evaluate, which kind of particle will be feasible for a certain kind of fermentation product an evaluation is presented here. Furthermore, an assessment is made what the impact is of ISPR for enhancing productivities in relatively non-inhibiting (lactic acid), fairly inhibiting (phenol) and severely inhibiting (erythromycin) fermentation products. A process containing solvent impregnated resins or capsules is evaluated based on enhanced productivities and cost-effectiveness. It is shown that applying these particles inside a fermentor can result in a decrease in ± 30% of total manufacturing costs for pharma-intermediate production.

Chapter 5
61
5.1 Introduction For a wide range of chemicals, bio-transformations can be applied on industrial scale. Biocatalysts can offer high selectivities that can be favorable in the production of fine, specialty chemicals (for instance pharma intermediates) and bulk chemicals. However, microbial transformations are often hampered by product inhibition or toxicity due to increased product concentrations [1]. Product inhibition/toxicity must therefore be prevented in most cases to achieve economically feasible bioprocesses. In order to reach high product concentrations one can opt for applying in-situ product recovery (ISPR). One embodiment of ISPR is so-called in-situ extraction using polar extractants. However, most solvents with polar characteristics integrated with a fermentation broth have the tendency to form emulsions [2]. These emulsions result in more difficult downstream processing and can also affect the fermentation itself due to phase toxicity. These problems can potentially be circumvented by applying polymeric resins impregnated with solvents [3]. Particles containing a solvent to selectively remove fermentation broth products have been applied before. In 2003 Stark used micro-capsules inside a fluidized bed to extract 2-phenylethanol from an S. Cerevisiae fermentation broth [4]. Hexadecane containing capsules were applied to recover lauric acid from a liquid phase [5]. In 2008 van den Berg et al used Cyphos-104 (ionic liquid) containing impregnated resins to enhance volumetric productivities and carbon yields of a phenol producing P. putida S12 strain [3]. Moreover, capsules have recently been developed with improved solvent loading characteristics [9]. 5.1.1 Objective In this article three typical fermentation products are compared where product inhibition is alleviated using the in-situ addition of SIRs or capsules. To compare SIRs and capsules for an integrated bioreactor concept, three different compounds were evaluated that are relatively non-, fairly and severely inhibiting. An evaluation is made on when these SIRs/capsules can have a beneficial effect on the volumetric productivity of the biotransformation. Furthermore, the economical impact of ISPR using SIRs/capsules is evaluated.
5.2. Approach Lactic acid, phenol and erythromycin were chosen as non-inhibiting, fairly and severely inhibiting compounds, respectively. The approach is considering volumetric productivities and carbon yields on the fermentation side while considering product fluxes and regeneration options on the SIRs/capsule side. Furthermore, the phenol case was used to measure particle capacities/kinetics and evaluate SIRs/capsule regeneration options.
5.2.1 Productivity/toxicity considerations In order to alleviate product inhibition, a product removal technique should be able to match the productivities of the biocatalyst. When selecting an ISPR auxiliary phase, fermentation productivities, yields on substrate and critical product concentrations should be known. Furthermore, it should be able to selectively remove the product from the fermentation broth. Straathof [6] correlated the aqueous solubility of compounds to the concentration where no more product accumulated due to product inhibition, known as the critical concentration. The critical concentration is defined as the concentration, where the bio-transformations stop or become too slow [6]. A similar approach is taken here where the aqueous solubility is correlated to the critical concentrations of fermentation products (see figure 5.1). Products never exceed their aqueous solubility unless they contain a

Chapter 5
62
carboxylic acid or amine group attached. When produced at neutral pH these groups are instantaneously converted in charged species, resulting in an enhanced aqueous solubility and a significant lowering of the toxicity of the compounds to the biotransformation system. Compounds containing amino acids, carboxylic acids and amines were therefore excluded from this correlation. Amino acids tend to form complexes at a neutral pH due to their zwitterionic behavior. However, when the carboxylic acids were produced at a pH significantly lower than their pKa, they were included in the correlation.
Figure 5.1: Least squares fit between aqueous solubility and critical concentration of whole cell bioconversion products. The vertical stripe containing ellipsoid contains severely inhibiting compounds such as alkaloids/pharmaceuticals; the squares containing ellipsoid contains highly inhibiting molecules which are mostly fine-chemicals; the ellipse with horizontal lines contains relatively non-inhibiting molecules and consists more of typical bulk chemicals. If this correlation is forced through zero the following least squares fit is obtained: Critical conc. (M) = 0.1729*Solubility (M) correlation 5.1 Correlation 5.1 is similar to what Straathof found [6]. However, the range has been broadened with a log factor of 2.5 on the aqueous solubility scale indicating that this correlation also applies for non-charged pharma-like molecules. To make a priori estimates on the critical concentration of a biotransformation product one can use the aqueous solubility of the compounds. In the cases we will evaluate, the critical concentrations are known and therefore correlation 5.1 will not be applied. However, if critical concentrations of compounds are not known, correlation 5.1 might help in making predictions on final product titers. Another aspect that should be taken into account is the productivity of the fermentation. The inhibition of the product on the production rate should be taken into account. However, all products show different inhibiting effects. In order to make productivity predictions we apply the same model as used by Luong [7] and Levenspiel [8]:

Chapter 5
63
SK
S)
C
C(1Q Q
's
β
crit
aqpmaxp
(-) equation 5.1
In most fed-batch or continuous fermentations substrate concentrations are kept relatively low in order to maximize the yield on the carbon source. Furthermore, a focus is made here on preventing product inhibition. Therefore, substrate inhibition is neglected and equation 5.1 is rewritten as:
β
crit
aqpmaxp )
C
C(1Q Q (-) equation 5.2
If the kinetic constant β>1, the compounds are relatively inhibiting and if 0>β<1, the compounds are less inhibiting compounds. The kinetic constant β is set here as 1.69, which is equal to the constant that Luong used for ethanol inhibition [7]. Making a priori estimations on Qpmax is not possible since this depends on biocatalyst species and whether the fermentation product is a primary or a secondary metabolite. Yields on glucose will be directly coupled to the concentration of the product in the aqueous phase in a similar way as equation 5.2. Therefore, at an aqueous product concentration of 0 the theoretical maximum yield on glucose will be applied. Furthermore, the amount of glucose added will be considered constant so when the yield decreases, the intracellular maintenance will increase.
β
crit
aqxsmaxxs )
C
C(1Y Y (-) equation 5.3
Equation 5.3 will be applied for products part of anabolic routes. However, when fermentation products are part of the catabolic route, the yields will be considered constant at 90% of the maximum theoretical yield.
5.2.2 SIR/Capsule characteristics The main difference between SIRs and capsules is the amount of extractant inside, surface area, tortuosity and particle radius. Capsules are significantly larger than SIRs, resulting in higher product capacities and higher total pore volumes. However, capsule surface area per gram of particle is much lower and the solute diffusion distances are longer. Furthermore, the polymer material of SIRs is polystyrene (XAD-4 polymer) and for the capsules polysulfone. Polysulfone was able to adsorb phenol even though the matrix is loaded with and organic solvent. This gives the capsules an unexpected higher product capacity [9]. Characteristics of the SIR and capsule are summarized in table 5.1.

Chapter 5
64
Table 5.1: SIR/capsule characteristics[9] SIR/capsule property SIRs Capsules Surface area (cm2)/particle 0.014 0.41 Total pore volume (ml/g) 0.98 11.8 Diameter of dry particles (mm) 0.49 - 0.69 3.3 – 3.9 Tortuosity 5.5 [10] 1 The solvent phases for the SIRs/capsules are selected using the extractant selection strategy as described in [11] or taken from literature and are given in table 5.2. Table 5.2: organic phase considerations Solute selected
solvent aqueous solubility of
solvent (g/l) partition
coefficient (-) Dorg (m2/sec)
Lactic acid TOA 5.0E-5 2.9 * 2.7E-10 Phenol Cyphos-104 1.6E-2 596 ** 0.17E-12 Erythromycin Oleyl alcohol 7.0E-6 1100 *** 6.0E-11
* taken from [12] ;** taken from [11] ; *** calculated using approach in [11]
5.2.3 Product flux model The overall mass transfer coefficient Kov of solutes from an aqueous phase into the particle will be calculated using a modified extension of the Glueckauf approximation with a neglected micropore resistance [13]:
orgex
2p
aqov DQ15
τR
D
Δz
K
1
(s/m) equation 5.4
The first term in the equation represents the resistance in the stagnant fluid film surrounding the particle and the second term estimates intraparticle mass transfer. The diffusion coefficient for solutes in the aqueous phase (Daq) was calculated using the Wilke-Chang relationship [14] in equation 5.5:
0.6a
0.5b
8
aqVμ
T)M(107.4D
(m /s) equation 5.5 2
Diffusion coefficients for solutes in organic phases (Dorg) were calculated using the Hayduk-Minhas relationship [15] in equation below (equation 5.6):
71.0a
)(10.2/Vb
1.478org VμT1013.3D
0.791a
(m /s) equation 5.6 2
The flux of product from the aqueous phase into the SIR was defined as Jph.
orgpr tot ov aq
org/aq
CJ a K (C -
K ) (mol/m2 s) equation 5.7

Chapter 5
65
To quantify the product uptake efficiency, the product solvent/water partition coefficient must be known. Korg/aq is the partition coefficient of a solute over an organic/aqueous phase in equilibrium at infinite dilution, which is defined as:
orgorg/aq
aq
(solute)K =
(solute) (-) equation 5.8
In order to evaluate if the presented model agrees with measured values a 200 ml aqueous solution which contained 12.3 mM phenol was placed in contact with 5.00 grams of SIRs or capsules. The test was performed at room temperature and mixing was performed using a magnetic stirrer at 800 RPM. Samples of 100 μl were drawn and aqueous phenol concentrations were determined using a spectrophotometer (Ultrospec plus; Pharmacia LKB) at 270 nm. In figure 5.2 the model is compared to the measured data.
0
2
4
6
8
10
12
14
0 2000 4000 6000 8000 10000 12000
Time (sec)
Co
nc
entr
atio
n p
he
no
l (m
M) XAD-4 SIR measured
XAD-4 SIR modelled
PSF capsule measured
PSF capsule modelled
Figure 5.2: phenol removal efficiency of SIRs/capsules from an aqueous phase. It can be observed that the modeled fluxes correlate well with the experimental data. However, for the capsules a Qex of 1 is assumed due to the reactive nature of the polysulfone polymeric backbone [9] resulting in a better fit with the measured data. 5.2.4 SIR/Capsule regeneration Regeneration of the SIRs/capsules must be taken into account when evaluating SIR/capsule process concepts. For regenerating phenol out of the SIRs/capsules two concepts were evaluated namely base and heat swing. Washing SIRs/capsules with another organic solvent was not considered since this would result in significant solvent losses from the particles. 5.2.4.1 Base swing regeneration For 99% regeneration using base swing, SIR/capsules should be added to an aqueous solution containing a pH higher than 12. In this solution phenol will be converted to phenolate and subsequently transferred to the receiving base/aqueous phase. The phenolate can be converted back to phenol by neutralizing the pH with an acid such as HCl.

Chapter 5
66
5.2.4.2 Heat swing regeneration Regeneration of phenol from the Cyphos-104 phase using a heat strip was investigated. A 55 g phenol/l Cyphos-104 solution was prepared and superheated steam (160 oC) was blown through this solution while the temperature was kept constant at 160 oC. The distillate was condensated in a cold trap and different samples were taken throughout the experiment. Results can be observed in table 5.3. Table 5.3: results of heat-strip
fraction distillate volume (ml) concentration phenol in distillate (mM) 1 4.62 70.35 2 5.8 33.00 3 6.63 24.53 4 6.03 16.55 5 7.46 11.83 6 3.31 8.65
After 2 hours of regeneration only a total of 2 m% of all dissolved phenol was recovered from the Cyphos-104 phase. Furthermore, it was noted that increasing the temperature of the ionic liquid phase resulted in decreasing viscosity, potentially resulting in solvent losses from the SIRs/capsules. This deemed the heating strip unfeasible as a possible regeneration method for the SIRs/capsules. Regeneration of the Cyphos-104 phase at higher temperatures was not investigated since this would result in ionic liquid breakdown [16]. 5.2.4.3 Evaluation of regeneration technique When comparing the two regeneration techniques. It was found that base regeneration was the method that was able to give the highest phenol concentrations in a subsequent phase. Therefore base wash was chosen as the most favorable option for phenol although this results in gypsum formation in the process [11]. Base or acid wash can also be applied for lactic acid and erythromycin since both these molecules have ionizable groups.
5.2.5 Process configuration An in-situ product recovery system was evaluated in order to maximize volumetric productivities. Adding SIRs/capsules to the fermentor can result in lower aqueous product concentrations. However, increasing the amount of SIRs/capsules inside the fermentor increases hold-up and thereby reduces the volume, which can be used for the actual bioconversion process as can be seen in equation 5.9.
SIRSIRtotalferm VN VV (m3) equation 5.9

Chapter 5
67
Figure 5.3: evaluated process concept. In the evaluated process, the SIRs/capsules remain in the fermentor due to a sieve in the bottom (see figure 5.3). After the fermentation is stopped, the fermentation broth is pumped out and subsequently the SIRs/capsules are regenerated using a base wash. Main assumptions:
Organic/water phase partition coefficient of the solute is constant throughout the considered aqueous concentration ranges.
The polystyrene does not adsorb any phenol but the polysulfone matrix does. Therefore, the PSF capsules are considered to have a solvent loading of 100 v/v% [9].
Solvent losses from the capsules/SIRs are neglected. At time is zero for the fermentation broth a maximum volumetric productivity and
glucose yield are assumed. Down-time between fermentation batches is considered to be 12 hours. When
incorporating SIRs, down-time (including regeneration) would be 13 hours and for capsules 16 hours.
Annual total production time is 8000 hours, including down-time.
5.3 ISPR Influence on volumetric productivity Three products will be evaluated for the influence of SIRs/capsules on the annual volumetric productivity of the fermentation unit. In the next paragraph the application of varying amounts of SIRs/capsules is evaluated on how they influence the volumetric productivity of the fermentation vessel. Fermentations are stopped when a set concentration is reached and are evaluated on how SIRs/capsules influence the annual volumetric productivity. In order to perform calculations on the three cases, the parameters in table 5.4 were used.
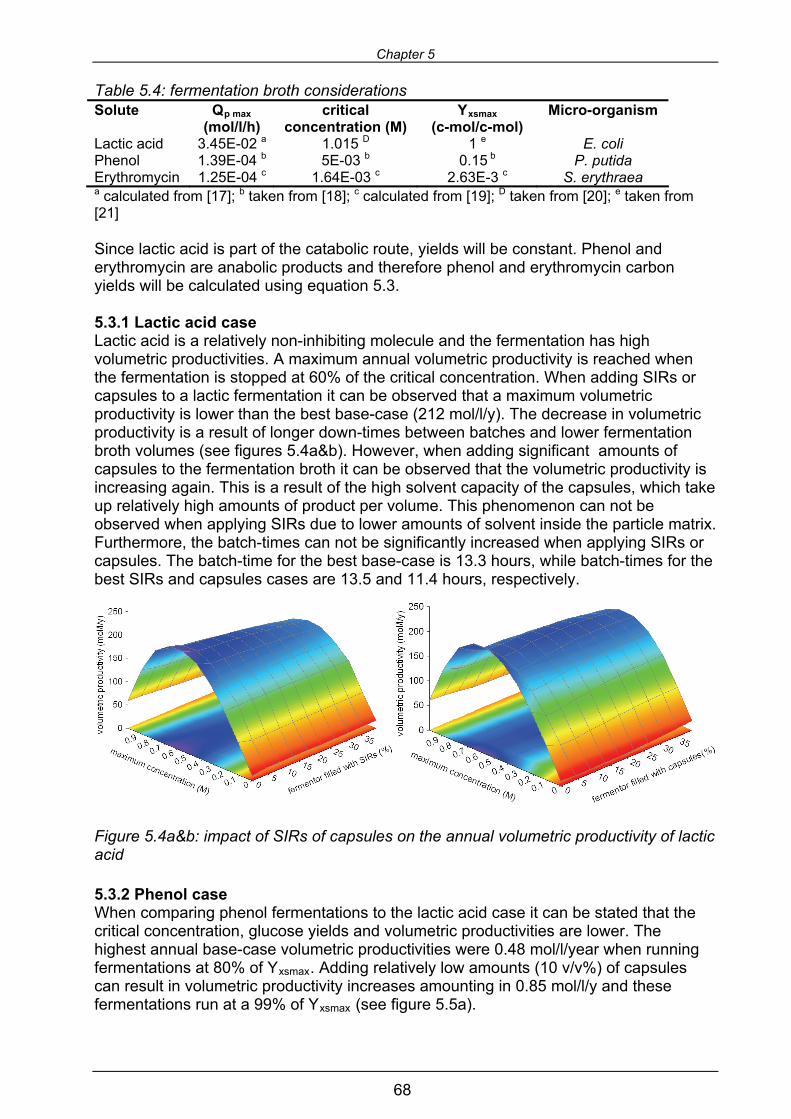
Chapter 5
68
Table 5.4: fermentation broth considerations Solute Qp max
(mol/l/h) critical
concentration (M) Yxsmax
(c-mol/c-mol) Micro-organism
Lactic acid 3.45E-02 a 1.015 D 1 e E. coli Phenol 1.39E-04 b 5E-03 b 0.15 b P. putida Erythromycin 1.25E-04 c 1.64E-03 c 2.63E-3 c S. erythraea a calculated from [17]; b taken from [18]; c calculated from [19]; D taken from [20]; e taken from [21] Since lactic acid is part of the catabolic route, yields will be constant. Phenol and erythromycin are anabolic products and therefore phenol and erythromycin carbon yields will be calculated using equation 5.3. 5.3.1 Lactic acid case Lactic acid is a relatively non-inhibiting molecule and the fermentation has high volumetric productivities. A maximum annual volumetric productivity is reached when the fermentation is stopped at 60% of the critical concentration. When adding SIRs or capsules to a lactic fermentation it can be observed that a maximum volumetric productivity is lower than the best base-case (212 mol/l/y). The decrease in volumetric productivity is a result of longer down-times between batches and lower fermentation broth volumes (see figures 5.4a&b). However, when adding significant amounts of capsules to the fermentation broth it can be observed that the volumetric productivity is increasing again. This is a result of the high solvent capacity of the capsules, which take up relatively high amounts of product per volume. This phenomenon can not be observed when applying SIRs due to lower amounts of solvent inside the particle matrix. Furthermore, the batch-times can not be significantly increased when applying SIRs or capsules. The batch-time for the best base-case is 13.3 hours, while batch-times for the best SIRs and capsules cases are 13.5 and 11.4 hours, respectively.
Figure 5.4a&b: impact of SIRs of capsules on the annual volumetric productivity of lactic acid 5.3.2 Phenol case When comparing phenol fermentations to the lactic acid case it can be stated that the critical concentration, glucose yields and volumetric productivities are lower. The highest annual base-case volumetric productivities were 0.48 mol/l/year when running fermentations at 80% of Yxsmax. Adding relatively low amounts (10 v/v%) of capsules can result in volumetric productivity increases amounting in 0.85 mol/l/y and thefermentations run at a 99% of Y
se xsmax (see figure 5.5a).

Chapter 5
69
Figure 5.5a&b: impact of SIRs of capsules on the annual volumetric productivity of phenol Reaching significant volumetric productivity increases up to 0.82 mol/l/y can also be achieved by adding 5 v/v% of SIRs to a fermentation broth and running fermentations at 95% of Yxsmax (see figure 5.5b). Although the capacity of the SIRs is lower compared to the capsules, the lower regeneration times result in an overall productivity similar as the capsules. The batch-time of the base-case was 20.7 hours and by applying SIRs or capsules the batch-time could be extended to 118 or 144 hours, respectively. 5.3.3 Erythromycin case Erythromycin has the lowest critical concentration, glucose yields and volumetric productivities compared to the other two cases. The best base-case for erythromycin is when a minimal glucose yield of 70% of Yxsmax is considered, amounting to an annual volumetric productivity of 0.28 mol/l/y. When adding 10v/v% fractions of capsules or SIRs to the fermentation broth, significant volumetric productivity gains can be observed for both cases. As can be observed in figure 5.6a, the application of capsules results in a volumetric productivity of 0.72 mol/l/y when considering a Yxsmax of 99%. SIRs show similar productivities (0.70 mol/l/y), but this process needs to be run at a 95% Yxsmax in order to reach this productivity (see figure 5.6b). Furthermore, it should be noted that batch-lengths of both SIRs and capsules are considerably longer compared to the base-case. The best base-case has a running time of 11 hours, while the best cases with SIRs and capsules have running times of 148 and 102 hours, respectively.
Figure 5.6a&b: Impact of SIRs or capsules on the annual volumetric productivity of erythromycin.
5.4 Economic evaluation In order to evaluate the impact of capsules or SIRs on the economy of the fermentation process some cost calculations need to be made. A simplified model is used, allowing

Chapter 5
70
quick comparisons between the different particle systems. Performing a full-scale economic evaluation is beyond the scope of this article. Here we will only focus on minimizing the costs that are directly coupled to the fermentation unit and the capsules/SIRs. These calculations are based on variable costs (VC) and purchased equipment cost (PEC). The total capital investment (TCI) can be calculated on the basis of the PEC, which can be found in appendix 5.2. The total manufacturing costs (TMC) is calculated as the sum of the fixed capital investment and variable costs [22-24]. The fixed capital investment is the sum of the indirect and direct plant costs, which can be found in appendix 5.2&3. TMC = 1.25 * (0.43*FCI + VC) (€/y) equation 5.10 The economic evaluation is limited to the fermentation vessel and capsules/SIRs if these are included. 5.4.1 Cost calculations Considered raw glucose costs are 250 €/tonne (February 2009, USDA). For catabolic products such as lactic acid, the total substrate costs are constant due to the constant yield on glucose. When product concentrations increase, the fermentation is inhibited and regeneration is performed using a base wash and a subsequent acid neutralization step. Calcium hydroxide and hydrochloric acid costs are 110 and 347 €/tonne, respectively. To calculate costs associated with SIRs or capsules the base costs of chemicals/polymers are used (see appendix 5.4). The capsules tend to be more expensive than SIRs due to their higher solvent loadings and ethanol/DMF consumption during the particle preparation process. The cost of SIRs/capsules per tonne is shown in table 5.5. The expected lifetime for all SIRs/capsules is set to 1 year. Table 5.5: Variable costs from SIRs/capsules Case Type of solvent Cost capsules per tonne Cost SIRs per tonne Lactic acid TOA 21000 15000 Phenol Cyphos-104 93000 60000 Erythromycin Oleyl alcohol 14200 10750 Only purchased equipment costs assumed here are fermentation vessel costs (PEC_fermentor). These costs were estimated using Superpro Designer 7.5 [25] and results in correlation 5.2. PEC_fermentor = 208337+ 53383*Vferm
0.6 (€) correlation 5.2
5.5 Results economic evaluation In order to make economic evaluations, three different annual productions are assumed. Lactic acid represents a typical bulk chemical and therefore an annual productivity of 100 Ktonne is assumed. Although phenol is considered to be a typical bulk chemical, it has physical properties that are similar to other fine chemicals shown in figure 5.1. Therefore, a 10 Ktonne/year case will be calculated for phenol. Erythromycin is considered to be a pharma intermediate and therefore an annual volumetric productivity of 1 Ktonne is calculated. These scaling assumptions were made in order to perform economic calculations.

Chapter 5
71
Furthermore, both capsules and SIRs are compared to the best base-case where no in-situ product removal is applied in terms of total manufacturing cost. 5.5.1 Lactic acid case Upon addition of SIRs or capsules to a lactic acid producing fermentation, the total manufacturing costs increase. Due to longer down-time and SIR/capsule costs, the TMC minimum for both lactic acid cases involves no ISPR. In order to minimize the TMC, the maximum lactic acid concentration in the fermentor should be 0.5 M (see figures 5.7a&b). When running at higher concentrations the volumetric productivity decreases significantly due to product inhibition. Stopping the fermentation at lower concentrations will result in more down-time, significantly impacting the overall productivity.
Figure 5.7a&b: Total manufacturing costs of lactic acid when incorporating SIRs or capsules An option to lower TMC for lactic acid might involve continuous removal and regeneration of SIRs or capsules from the fermentation broth. By performing this, the fraction SIRs/capsules inside the fermentor can be minimized. Using this method, a more continuous processing is possible and total down-time is reduced. However, ISPR using capsules or SIRs are economically unfeasible using the process concept described in paragraph 2.5. 5.5.2 Phenol case The lowest TMC can be achieved when running the phenol fermentation without SIRs or capsules and at a minimum glucose yield of 80% (see figures 5.8a&b).
Figure 5.8a&b: Total manufacturing costs of phenol when incorporating SIRs or capsules

Chapter 5
72
Although the volumetric productivity of the fermentation is almost a two-fold lower than the best SIR or capsule case, the TMC of the base-case are still lower due to the high variable costs associated with the expensive ionic-liquid containing SIRs/capsules. 5.5.3 Erythromycin case Both SIRs and capsules can significantly lower the TMC of the erythromycin fermentation. The base-case costs are minimal at a glucose yield of 90% of Yxsmax amounting to a TMC of 56.5 million €/year. In the best scenario involving capsules, costs can be reduced approximately 28% when applying 5 v/v% of capsules and operating at a minimum glucose yield of 99% (see 5.9a). Although the optimum for volumetric productivity is at 10 v/v% the capsule cost needs to be taken into account and therefore smaller capsule fractions should be used inside the fermentor. When applying a 5 v/v% SIRs and operating at a 95% yield a 30% cost reduction can be achieved compared to the base-case (see figure 5.9b).
Figure 5.9a&b: Total manufacturing costs of erythromycin when incorporating SIRs or capsules 5.5.4 Summary of economic evaluation All cases presented here are excluding final purification steps, therefore these costs need to be added at a later stage in order to perform a full economical evaluation. In table 5.6 the lowest manufacturing costs for 9 cases are summarized. It can be observed that ISPR using SIRs or capsules for lactic acid and phenol will not result in direct cost reductions. However, for the erythromycin case substantial cost reductions for both SIRs and capsules can be achieved. Table 5.6: summary manufacturing costs of 9 cases (€/tonne). base-case SIRs capsuleslactic acid 1.08E+03 1.09E+03 1.11E+03phenol 2.49E+04 3.21E+04 3.91E+04erythromycin 5.65E+04 4.41E+04 4.40E+04 An unquantified aspect in the economic evaluation is the concentration enrichment, which is a result of ISPR. This enrichment can significantly reduce cost in further product purification steps. These cost reductions can be very significant for products that have high organic/water phase partition coefficients. The product concentrations will be high in the organic phase and therefore, the base wash can result in efficient subsequent processing.

Chapter 5
73
5.6 Conclusions and final thoughts ISPR using capsules or SIRs can be a useful tool for removing inhibiting products directly from fermentation broths. By removing these products from the biocatalysts environment higher volumetric productivities, substrate yields and longer batch-times can be achieved. Relatively non-inhibiting compounds are hard to remove from the aqueous phase due to the high aqueous solubility associated with these molecules. As a result, low organic/aqueous partition coefficients are achieved, subsequently resulting in low solute concentrations in the organic phase. In-situ product removal using capsules or SIRs is therefore less feasible for highly water-soluble compounds such as lactic acid. However, the more inhibiting compounds are, the more feasible it seems to use SIRs/capsules in-situ to remove the product from the biocatalysts environment. The highly inhibiting compounds can be removed relatively easy due to the high partition coefficients of the solutes into an organic phase. Care should be taken to optimize the fraction of SIRs or capsules inside the fermentor in order to minimize the loss of fermentation broth volume. The application of SIRs or capsules inside a fermentor can result in a decrease in total manufacturing costs of approximately 30% compared to an optimal base-case in especially the production of pharma-intermediates and other inhibiting molecules. With glucose prices expected to rise in the near future, potential profit margins for ISPR setups such as these will increase even more.
Acknowledgements The authors would like to acknowledge José Jimenez for his assistance in the particle development process. This project is financially supported by the Netherlands Ministry of Economic Affairs and the B-Basic partner organizations (www.b-basic.nl) through B-Basic, a public-private NWO-ACTS programme (ACTS = Advanced Chemical Technologies for Sustainability).

Chapter 5
74
Nomenclature atot = total surface area of all capsules/SIRs (m2) β = kinetic constant (-) Corg = concentration of solute in organic phase (mol/m3) Caq = concentration of solute in aqueous phase inside the fermentor (mol/m3) Dorg = diffusivity of solute in the organic phase (m2/s) Daq = diffusivity of solute in aqueous film (m2/s) Δz = aqueous film thickness (set to 10-5 m) Jpr = product flux into particle (mol/m2 s) Korg/aq = partition coefficient of solute (-) Kov = overall mass transfer coefficient (m/s) Ks
’ = monod constant for product formation (mol/ m3) Mb = molecular weight water (18.02 g/mol) µ = viscosity of aqueous phase (Pa.s) µb = viscosity of solvent phase (Pa.s) Nsir = amount of SIR/capsule particles (-) Rp = average particle radius (m) Qex = total pore volume (ml/g) Qp = volumetric productivity (mol/l/h) Qp max = maximum volumetric productivity (mol/ m3/h) S = substrate concentrations (mol/ m3) τ = tortuosity (-) T = temperature (K) Va = molecular volume of solute at its normal boiling point (dm3/mol) Vaq = volume aqueous phase (m3) Vferm = volume of fermentation broth (m3) Vorg = volume of organic phase (m3) Vsir = volume of SIR or capsule particle (m3) Vtotal = total volume of fermentor (m3) Yxs = carbon yield on substrate (-) Yxsmax = maximum theoretical carbon yield (-)
Φ = association factor (2.26)

Chapter 5
75
Appendix Appendix 5.1: data used for least squares fit for figure 5.1. Product critical
concentration (M)
H2O Solubility
(M)
reference critical
concentration
reference log H2O
solubility Taxol 6,1E-06 3,75E-07 [26] [27] Geraniol 1,8E-04 6,48E-04 [28] [29] 1-Butanol 1,7E-01 8,53E-01 [30] [29] Ethanol 3,7E+00 1,71E+01 [31] [6] Phenol 5,0E-03 8,80E-01 [18] [29] 3-Methylcatechol 1,5E-02 2,25E-01 [32] [29] 2-Phenylethanol 2,9E-02 1,82E-01 [33] [29] Styrene 5,0E-03 2,98E-03 [34] [29] Benzene 2,9E-03 2,29E-02 [6] [29] 1,2-Epoxyoctane 2,3E-03 4,30E-02 [6] [35] Toluene 4,0E-03 5,71E-03 [6] [29] Styrene oxide 5,0E-03 2,50E-02 [6] [29] Fluorobenzene 8,3E-03 1,60E-02 [36] [29] Fluorocatechol 1,6E-02 3,62E-01 [36] [37] 2-Methoxy-4-vinylphenol 4,0E-03 4,90E-03 [38] [37] Levodione 6,4E-02 7,24E-02 [39] [39] Oxoisophorone 7,9E-02 9,87E-02 [39] [39] 3-Methyl-1-butanol 5,7E-02 3,03E-01 [40] [29] Acrylonitrile 2,5E-01 5,73E-01 [6] [29] Ethyl 3-oxobutanoate 6,0E-01 5,97E-01 [41] [29] 1-Phenyl-1,2-ethanediol 3,6E-01 3,98E+00 [6] [6] Glycidol 2,0E+00 1,51E+01 [6] [6] 3-Phenylcatechol 2,3E-03 1,06E-02 [42] [43] Cycloheximide 3,6E-03 7,46E-02 [44] [29] Vanillin 3,4E-02 7,23E-02 [45] [29] Benzaldehyde 2,0E-02 6,55E-02 [46] [29] γ-Decalactone 5,9E-04 1,72E-03 [47] [29] Ethyl 3-hydroxybutanoate 6,0E-01 1,20E+00 [41] [29] 2-Naphthol 9,7E-04 5,24E-03 [48] [29] 3,4-Dimethylbenzaldehyde 3,0E-03 7,18E-03 [49] [37] Propionic acid 2,5E-01 4,66E+00 [50] [37] Furfural 4,2E-02 8,01E-01 [51] [29] Furfural alcohol 3,3E-02 1,49E+00 [51] [37] 2,4-Dichlorophenol 3,5E-03 2,76E-02 [52] [29] Octanoic acid 3,1E-04 5,47E-03 [53] [29] Riboflavin 5,0E-05 2,25E-04 [54] [29] β-Carotene 9,4E-04 1,12E-03 [55] [29] Podophyllotoxin 1,2E-04 3,74E-04 [56] [29] 3,4-Dimethylbenzylalcohol 4,2E-03 2,89E-02 [49] [29] p-Hydroxystyrene 5,0E-03 2,75E-02 Person.
comm. S. Verhoef
[29]
Erythromycin 1,6E-03 1,36E-03 [19] [57] Sanguinarine 3,6E-07 7,71E-06 [58] [29] Ajmalicine 1,6E-04 1,37E-04 [59] [29] Capsaicin 3,3E-06 3,37E-05 [60] [29] Camptothecin 1,5E-05 5,95E-04 [61] [29]
Appendix 5.2: Fixed capital investment calculation [24]

Chapter 5
76
item Costs Purchased equipment costs (PEC) Calculated Equipment installation 0.40 PEC Instrumentation 0.20 PEC Piping 0.70 PEC Electrical 0.10 PEC Buildings and storages 0.45 PEC Site development 0.05 PEC Direct plant costs (DPC) 2.90 PEC Design and engineering 0.30 DPC Contractors’ fee 0.05 DPC Contingency 0.10 DPC Indirect plant costs (IPC) 1.30 PEC Fixed capital investment (FCI) 4.20 PEC Appendix 5.3: Total manufacturing costs calculation [24]
item Costs Variable costs (VC) calculated* Maintenance 0.05 FCI Operating labor (OL) 0.10 FCI Laboratory costs 0.20 OL Supervision 0.20 OL Plant overheads 0.50 OL Capital charges 0.15 FCI Patents and royalties 0.01 FCI Local taxes 0.02 FCI Insurance 0.01 FCI General expenses 0.25 × sum of all previous items Appendix 5.4: base chemicals costs
item costs (€/tonne) process water 0.25 ethanol 1000 polysulfone 20000 DMF 1000 Cyphos-104 100000 TOA 10000 oleyl alcohol 1500 XAD-4 20000
Literature 1. Stark D. and Stockar von U., In situ product removal (ISPR) in whole cell
biotechnology during the last twenty years. Advances in Biochemical Engineering/Biotechnology, 2003. 80: p. 149-175.
2. Heipieper H.J., et al., Solvent-tolerant bacteria for biotransformations in two-phase fermentation systems. Applied Microbiology and Biotechnology, 2007. 74: p. 961-973.
3. van den Berg C., et al., Solvent-impregnated resins as an in-situ product recovery tool for phenol recovery from Pseudomonas putida S12TPL fermentations. Biotechnology and Bio-engineering, 2008. 100(3): p. 466-472.
4. Stark D., et al., Novel type of in situ extraction: use of solvent containing microcapsules for bioconversion of 2-phenylethanol from L-phenylalanine bt

Chapter 5
77
saccharomyces cerevisiae. Biotechnology and Bioengineering, 2003. 83(4): p. 376-385.
5. Wyss A., Stockar von U., and M. I.W., Production and characterization of liquid-core capsules made from cross-linked acrylamide copolymers for biotechnological applications. Biotechnology and Bioengineering, 2004. 86(5): p. 563-572.
6. Straathof A.J.J., Auxiliary phase guidelines for microbial biotransformations of toxic substrate into toxic product. Biotechnology Progress, 2003. 19: p. 755-762.
7. Luong J.H.T., Kinetics of ethanol inhibition in alcohol fermentation. Biotechnology and Bio-engineering, 1985. 27: p. 280-285.
8. Levenspiel O., The monod equation: A revisit and a generalization to product inhibition situations. Biotechnology and Bio-engineering, 1980. 22: p. 1671-1687.
9. van den Berg C., et al., Preparation and analysis of high capacity polysulfone capsules. Reactive & functional polymers, accepted.
10. Diez S., et al., Adsorption of phenylalanine onto polymeric resins: equilibrium, kinetics and operation of a parametric pumping unit. Separation and Purification Technology, 1998. 13: p. 25-35.
11. van den Berg C., et al., Extractant selection strategy for solvent-impregnated resins in fermentations. Industrial & Engineering Chemistry Research, 2008. 47(4): p. 10071-10075.
12. Matsumoto M., Yuba S., and Kondo K., Synergistic extraction of lactic acid with tri-n-octylamine and tri-n-butylphosphate. Journal of chemical engineering of Japan, 1998. 31(6): p. 996-998.
13. Ruthven D.M., Principles of adsorption and adsorption processes. 1984, New York: John Wiley & Sons, Inc.
14. Wilke C.R. and Chang P., Correlation of diffusion coefficient in dilute solutions. American Institute of Chemical Engineers Journal, 1955. 1: p. 264-270.
15. Hayduk W. and Minhas B.S., Correlations for prediction of molecular diffusivities in liquids. Canadian Journal of Chemical Engineering, 1982. 60: p. 295-299.
16. Cytec, Cyphos IL 104 , Phosphonium ionic liquid. 2005. 17. Goksungur Y. and Guvenc U., Batch and Continuous Production of Lactic Acid
from Beet Molasses by Lactobacillus delbrueckii IFO 3202. Journal of chemical technology and biotechnology, 1997. 69: p. 399-404.
18. Wierckx N.J.P., et al., Engineering of solvent-tolerant Pseudomonas Putida S12 for bioproduction of phenol from glucose. Applied and Environmental Microbiology, 2005. 71(12): p. 8221-8227.
19. Hamedi J., Khodagholi F., and Hassani-Nasab A., Increased erythromycin production by alginate as medium ingredient or immobilization support in cultures of Saccharopolyspora erythraea. Biotechnology Letters, 2005. 27: p. 661-664.
20. Carlson T.L. and Peters E.M. jr., low pH lactic acid fermentation. 2002, Cargill, Inc.,: United States.
21. Zhou S., et al., Fermentation of 12% (w/v) glucose to 1.2 M lactate by Escherichia coli strain SZ194 using mineral salts medium. Biotechnology Letters, 2006. 28: p. 663 - 670.
22. Cuellar-Soares M.C., Towards the integration of fermentation and crystallization, in Bioseparations Technology Department. 2008, Delft University of Technology: Delft. p. 164.
23. Sinnott R.K., Chemical Engineering. Volume 6. 1993: Butterworth-Heinemann. 24. Douglas J.M., Conceptual design of chemical processes. 1988: McGraw-Hill
International Editions. 25. Intelligen, I., SuperPro Designer: Scotch Plains.

Chapter 5
78
26. Kwon I.C., et al., Enhancement of taxol production by in situ recovery of product. Process biochemistry, 1998. 33(7): p. 701-707.
27. Dordunoo S.K. and Burt H.M., Solubility and stability of taxol: effects of buffers and cyclodextrins. International Journal of Pharmaceutics, 1996. 133: p. 191-201.
28. Schindler J., Terpenoids by microbial fermentation. Industrial Engineering Process Research and Development, 1982. 21(4): p. 537-539.
29. Syracuse Research Corporation. Physical properties database. 1999 [cited 2007; Available from: http://www.syrres.com/esc/physdemo.htm.
30. Yang X., Tsai G., and Tsao G.T., Enhancement of in situ adsorption on the acetone-butanol fermentation by Clostridium acetobutyicum. Separation Technology, 1994. 4: p. 81-92.
31. Weilnhammer C. and Blass E., Continuous fermentation with product recovery by in-situ extraction. Chemical Engineering and Technology, 1994. 17: p. 365-373.
32. Husken L.E., et al., Integrated bioproduction and extraction of 3-methylcatechol. Journal of Biotechnology, 2001. 88: p. 11-19.
33. Serp D., Stockar von U., and Marison I.W., Enhancement of 2-phenylethanol productivity by saccharomyces cerevisae in two-phase fed-batch fermentations using solvent immobilization. Biotechnology and Bio-engineering, 2003. 82(1): p. 103-110.
34. Wubbolts M., et al., Efficient production of optically active styrene epoxides in two-liquid phase cultures. Enzyme and Microbial Technology, 1994. 16: p. 887-894.
35. Krieg H.M., et al., The enantioselective catalytic hydrolysis of racemic 1,2-epoxyoctane in a batch and a continuous process. Journal of Molecular Catalysis B: Enzymatic, 2001. 13: p. 37-47.
36. Lynch R.M., Woodley J.M., and Lilly M.D., Process design for the oxidation of fluorobenzene to fluorocatechol by Pseudomonas putida. Journal of Biotechnology, 1997. 58: p. 167-175.
37. Karickhoff S.W., Carreira L.A., and Hilal S.H. SPARC online calculator. 2007 [cited; Available from: http://ibmlc2.chem.uga.edu/sparc/.
38. Alba Perez A., Enhanced microbial production of natural flavors via in-situ product adsorption, in Swisse Federal Institute of Technology Zurich. 2001: Zurich.
39. Buque E.M., In situ removal of solid products during whole-cell biocatalysis, in Department of Biotechnology. 2005, Delft University of Technology: Delft. p. 177.
40. Molinari F., et al., Aldehyde production by alcohol oxidation with Gluconobacter oxydans. Applied microbiology and biotechnology, 1995. 43: p. 989-994.
41. Chin-Joe I., et al., Effect of high product concentrations in a dual fed-batch asymmetric 3-oxo ester reduction by baker's yeast. Biocatalysis and Biotransformation, 2002. 20(5): p. 337-345.
42. Held M., et al., An integrated process for the production of toxic catechols from toxic phenols based on a designer catalyst. Biotechnology and Bioengineering, 1999. 62: p. 641-648.
43. United States Environmental Protection Agency., Estimation Programs Interface (EPI). 2000-2007.
44. Kominek L.A., Cycloheximide production by streptomyces griseus: control mechanisms of cycloheximide biosynthesis. Antimicrobial agents and chemotherapy, 1975. 7(6): p. 856-860.
45. Hua D., et al., Enhanced vanillin production from ferulic acid using adsorbent resin. Applied Microbiology and Biotechnology, 2006. 74(4): p. 783-790.

Chapter 5
79
46. Simmonds J. and Robinson G.K., Formation of benzaldehyde by Pseudomonas Putida ATCC12633. Applied Microbiology and Biotechnology, 1998. 50: p. 353-358.
47. Dufosse L., et al., In situ detoxification of the fermentation medium during y-decalactone production with the yeast Sporidiobolus salmonicolor. Biotechnology progress, 1999. 15: p. 135-139.
48. Tao Y., Bentley W.E., and Wood T.K., Phenol and 2-naphthol production by toluene 4-monooxygenases using an aqueous/dioctyl phthalate system. Applied Microbiology and Biotechnology, 2005. 68: p. 614-621.
49. Buhler B., et al., Characterization and application of xylene monooxygenase for multistep biocatalysis. Applied and environmental microbiology, 2002. 68(2): p. 560-568.
50. Jin Z. and Yang S-T., Extractive fermentation for enhanced propionic acid production from lactose by propionibacterium acidipropionici. Biotechnology Progress, 1998. 14: p. 457-465.
51. Zhao J., et al., Measurements of inhibitory effects of furfural and furfural alcohol using coupled redox mediators. Enzyme and Microbial Technology, 2005. 37: p. 246-253.
52. Kargi F. and Eker S., Kinetics of 2,4-dichlorophenol degradation by Pseudomonas Putida CP1 in batch culture. International Biodeterioration & Biodegradation, 2005. 55: p. 25-28.
53. Viegas C.A. and Sa-Correia I., Toxicity of octanoic acid in Saccharomyces cerevisiae at temperatures between 8.5 and 30oC. Enzyme and Microbial Technology, 1995. 17: p. 826-831.
54. Yamane Y., Ooshima H., and Kato J., Overproduction of riboflavin by an Arthrobacter sp. mutant resistant to 5-fluorouracil. Enzyme and Microbial Technology, 1993. 15: p. 877-880.
55. Yoon S-H., et al., Increased B-carotene production in recombinant Escherichia coli harboring an engineered isoprenoid precursus pathway with melavonate. Biotechnology Progress, 2007. 23: p. 599-605.
56. Chattopadhyay S., Bisaria V.S., and Srivastava A.K., Enhanced production of podophyllotoxin by Podophyllum hexandrum using in situ cell retention bioreactor. Biotechnology Progress, 2003. 19: p. 1026-1028.
57. Shanghai aladdin reagent co., L., Material Safety Data Sheet Erythromycin. 58. Klvana M., Legros R., and Jolicoeur M., In situ extraction stragety affects
benzophenanthridine alkaloid production fluxes in suspension cultures of Eschscholtzia Californica. Biotechnology and Bio-engineering, 2004. 89(3): p. 280-289.
59. Asada M. and Shuler M.L., Stimulation of ajmalicine production and excretion from Catharanthus roseus: effects of adsorption in situ, elicitors and alginate immobilization. Applied Microbiology and Biotechnology, 1989. 30: p. 475-481.
60. Sudha G. and Ravishankar G.A., Influence of calcium channel modulators in capsaicin production by cell suspensions of Capsicum frutescens Mill. Current Science, 2002. 83(4): p. 480-484.
61. Saito I., et al., Comparison of biotin production by recombinant Sphingomonas sp. under various agitation conditions. Biochemical Engineering Journal, 2000. 5(2): p. 129-136.

Chapter 6
_____________________________________________________________________________
80
Chapter 6
Chapter 6
Short-cut calculations for integrated product recovery options in fermentative production of bio-bulk chemicals
Arjan Oudshoorn, Corjan van den Berg, Mark Roelands, Luuk van der Wielen, Adrie Straathof
This chapter was submitted
_____________________________________________________________________________
81

Chapter 6
Summary
The production rate of various bio-based molecules suffers from the effect of product inhibition and toxicity on its microbial host. However, the integration of separation technologies with fermentations can impact the production costs significantly. Choosing the best integration method requires cost-calculations and can be very labor intensive processes. In order to overcome this we supply some shortcut calculations that can assist the reader in making rational design choices. We have distinguished four main cost categories, being capital and operational expenditure for both fermentation and product recovery. We have applied these cost correlations to the production of three typical bio-based bulk chemicals and the results show where the most significant costs can be found in these integrated bio-processes. The presented basic design rules can be used to direct future research efforts and might assist in evaluating the impact of integrated product recovery techniques on total production costs of bio-chemicals.
_____________________________________________________________________________
82

Chapter 6
6.1 Introduction Fermentative conversions of substrates into desired chemical products have been commercialized over time by pharmaceutical and chemical industry. Biocatalysts usually show a high selectivity towards the product and therefore biological conversions can be used in a wide range of fields. Currently there is a large focus on sustainable resources and production systems. With changing environmental, societal and economic conditions, further usage of biological conversions for the production of chemicals and products might be possible and might even be necessary. This paper details the production of bulk chemicals by de novo fermentative conversions with integrated product recovery. Microbial production of bio-based chemicals is often hampered by product inhibition or product toxicity [1]. The performance of product inhibited fermentations can be enhanced by removal of the product during fermentation, usually referred to as integrated product recovery [2]. Integrated product recovery is not just a downstream operation, but is directly influencing the performance of the fermentor. Thus, a direct coupling exists between the performance of the fermentation and product recovery (see figure 6.1). The system shown in figure 6.1 can be seen as an integrated production system.
Figure 6.1: fermentation with integrated product recovery The (economic) performance of the integrated production system is an optimization problem over multiple unit operations. Table 6.1 shows some available integrated product recovery operations for bio-chemicals.
Table 6.1: Some possible recovery operations for bio-bulk chemicals from fermentation broths.
New Phase Origin Membrane Operation
Gas P/T shift or Composition change Yes Pervaporation [3-6]
Gas Composition change No Gas stripping [7-10]
Liquid / supercritical Composition change No Extraction [11-15]
Liquid Composition change Yes Pertraction [16-20]
Solid Composition change No Adsorption [21-26]
_____________________________________________________________________________
83

Chapter 6
This chapter details the integrated microbial production of lactic acid, 1-butanol and phenol. The main goal of this work is show the economic effect of integrated product recovery on production systems. The results only interpret the effect of product recovery. Other considerations for stream integrations, e.g. substrate utilization and waste management, are not taken into consideration. The obtained economic outline can be used to further focus research and development efforts of integrated product recovery designs. This chapter details the fermentative production of lactic acid, 1-butanol and phenol. Fermentations can be quantified by product yield, volume specific productivity and critical concentration. Table 6.2 lists the fermentation performance as used in this paper. The reported values are used to define the specific fermentations in this paper. Further literature on the production of these chemicals is extensively available. Lactic acid shows the highest critical concentration, volume specific productivity and yields. The butanol case can be characterized by moderate volume-specific productivities, glucose yields and critical concentrations. Phenol is the most inhibiting molecule of the three cases, with the lowest critical concentrations, volume-specific productivities and yields on glucose.
Table 6.2: Product characteristics for evaluating fermentation
Product
critical concentration
(kg/m3)
maximum volume-specific productivity
((kg/m3)/h) maximum yield (C-mol product/C-mol glucose)
lactic acid 91.9 a 11.2 b 1 c
1-butanol 20.9 d 4.6 e 0.67 f
Phenol 0.5 g 0.013 h 0.067 g
a = [27]; b = [28]; c = [29] ; d = [30] ; e =[31]; f = [32]; g = [33]; h = [34] 2.2 Lactic acid Lactic acid has, when compared to butanol and phenol, the highest aqueous solubility and a negligible vapor pressure. The negligible vapor pressure renders recovery options involving an auxiliary gas phase (such as pervaporation) non-feasible. Therefore, only recovery by adsorption, extraction and pertraction are evaluated. Adsorped based recovery can make use of adsorbents, which can range from (organic) resins to inorganic material like, zeolite material [35, 36]. Only lactic acid adsorption on zeolite is considered in this paper, as the stability of the zeolite adsorbent material is considered a valuable property. Solvent selection is crucial in the design of extractive based recovery systems. Solvent selection is often reported [37-39] Among the best extractants for L-L extraction/pertraction of lactic acid is tri-n-octylamine, which has a lactic acid partition coefficient of 4 and dissolves a low amount of water (0.51 m%). Overall mass transfer coefficients for pertraction based recovery have been reported by Huang et al. [40]. Desorption and extractant phase regeneration operations are also limited by the negligible vapor pressure. Desorption needs a chemical auxiliary, introduced in the form of a base or solvent wash. For the adsorption case, desorption using an ethanol washing step is assumed [41]. Regeneration of the extractant will be performed using a base/acid wash. The energy demand during regeneration is then given by ethanol evaporation, see also section 4.4. 2.3 Butanol Due to the moderate aqueous solubility of butanol a wide range of possible product recovery techniques are available [42-44]. Furthermore, butanol has the highest vapor pressure of the three cases, explaining the relative large amount of literature that can be found concerning gas-phase product recovery [45]. Numerous adsorbent based
_____________________________________________________________________________
84

Chapter 6
recovery operations using different adsorption materials can be used [43, 44, 46]. Often zeolite material is suggested and zeolites can be used in its granulated form, increasing the particle size to allow easier handling of the material. However, due to the creation of macropores additional water will be adsorbed into the sorbent phase. Macropores can make-up 40 % of the material [47]. The extractant considered for L-L extraction/pertraction of butanol is Cyanex-923, which is a liquid phosphine oxide with a butanol partition coefficient of 14.8 which is the highest butanol partition coefficient recorded to our knowledge. Cyanex-923 dissolves 6 mass % of water and regeneration will be performed using a heat strip [48]. Butanol can be regenerated from the adsorbent or extractant phase using an evaporation procedure. 2.4 Phenol Phenol removal from aqueous phases is discussed in [49]. Due to the severe toxicity of phenol, only low product concentrations in the aqueous fermentative phase are present. The low concentrations coupled to its relative low vapor pressure [50] will make pervaporation based recovery from a overall process perspective non-feasible. Adsorption of phenol is possible [51-54]. For adsorption based calculations this paper will use activated carbon, which was reported by Costa and Rodriguez [55]. Costa and Rodriguez reported an expression for loading time for multiple experimental runs of the fixed bed, depending on liquid flow-rate through the column [55]. For L-L extraction/pertraction, again, a reactive organic extractant will probably work best. E.g. Cyanex-923, is used in this paper because of phenol’s partition coefficient of 1100 coupled to a modest water uptake of 6 mass %. A base wash with subsequent acid neutralization will be considered for extraction/pertraction and for desorption ethanol will be used.
3. Methods: Definitions, assumptions and boundaries The integrated system shown in figure 6.1 can be described in various degrees of detail. The system is defined as consisting of two coupled unit operations, the fermentation and the integrated product recovery. The main goal is to show the general economic behavior of such an integrated system. Therefore, the economic performance has been divided into two main costs, the capital expenditure (CAPEX) and operational expenditure (OPEX). Both fermentation and product recovery influence the CAPEX and OPEX. This paper reduces the complexity of the optimization problem of integrated systems, by linking all four cost factors to one main process variable, the product concentration in the fermentor, as will be shown in the next section. Highly simplifying general assumptions are used in this paper: the production amount is 100 Ktons annually; the fermentation and integrated product recovery are continuous operations; the microorganisms are retained in the fermentation unit and do not grow significantly; for sizing the fermentation equipment an annual production time of 8,000 hours is assumed. Furthermore, literature values of product fluxes, loading capacities, volume-specific productivities and carbon yields have been obtained to allow modeling of the behavior of the unit operations. A mass balance of the product over the unit operations shown in Figure 6.1 shows the system to operate in a steady state as long the amount produced in the fermentation equals the amount of product removed during product recovery. This assumption is valid as long as a possible bleed or purge is neglected. The productivity of the fermentation (Qfer) and the product flow (Frec) are then equal to:
fer recQ F (kg/h) equation 6.1
_____________________________________________________________________________
85

Chapter 6
Cost optimizations of the system shown in Figure 6.1 are thus possible for any production amount, if both Qfer and Frec
are used to size the process equipment. The specific method applied to calculate the unit operations are detailed per recovery operation for each product and can be found in section 4 while using the details given in section 2. 3.1 CAPEX fermentation The capital expenditure required for the production of bio-chemicals depends on the volume of the fermentation vessel. In order to evaluate the annual capital costs on the fermentation side for a required productivity (kg/h), estimations should be made on the volume-specific productivity of the fermentor ((kg/m3)/h). 3.2 OPEX fermentation In the fermentation, the feedstock is converted into a bio-chemical. The operational expenditure during fermentation is assumed to be mostly determined by the feedstock cost. The OPEX of the fermentation can thus be expressed as a (cost) function of the product yield on substrate depending on the product concentration in the fermentation. 3.3 CAPEX product recovery The capital expenditure is determined by the individual costs of the product recovery unit operations. The costs depend on the product flux per m2 of recovery option. The flux can be calculated using equations presented in section 6.4. 3.4 OPEX product recovery The operational expenditure during the product recovery is determined by the energy costs and the costs of any auxiliary material used (such as acid/base). The energy requirement, as function of the product concentration entering the capture step, is needed for the calculation of the OPEX. The energy requirement during recovery is dependent on the amount of product and auxiliary phase, and the process conditions. The auxiliary phase is the phase facilitating separation of the product compound from the aqueous feed phase. Key parameter is the selectivity of recovery as it details the mass amounts involved in the recovery operation [44]. 3.5 Overview costs functions Combining the previous paragraphs of section 3, it can be generally stated that main cost considerations in the production of bio-chemicals arise from the four parameters stated in table 6.3. In section 4 we will detail the modeling and costs per operation. Table 6.3: Cost determining parameters for fermentation and product recovery Fermentation Product recovery OPEX Product yield on substrate Selectivity CAPEX Volume-specific productivity Product mass flow
_____________________________________________________________________________
86

Chapter 6
4. Modeling The modeling of the fermentation and product recovery requires background process data. First, the process specific data are listed, followed by the method for costs calculations. All cost correlations presented in the next sections can be replaced by readers’ personal correlations. Therefore, these relations should be used as a general guideline for making cost estimations. In this paper we will discuss three different cases (phenol, 1-butanol and lactic acid) where the bio-chemicals vary from severely toxic to relatively non-toxic towards the host micro-organism. Furthermore, these products have varying yields on substrate and varying physical properties such as vapor pressure, aqueous solubility and extractability, amongst others. 4.1 Volume-specific productivity fermentation In order to make CAPEX estimations on the fermentation side, volume-specific productivities should be known. However, inhibition kinetics and final product titers are difficult to predict and are organism and product specific. When products are removed from the microbes’ environment, the yields on substrate and/or volume-specific productivities can be significantly higher. A correlation exists between the aqueous solubility of compounds and the their inhibiting concentration on the microorganisms producing them as given originally by Straathof et al. [56] for bio-transformations (see figure 5.1 and correlation 5.1). Estimating a priori a volume-specific productivity Qmax is not possible since this depends on whether the fermentation product is a primary or secondary metabolite and is also micro-organism specific. Therefore, maximum volume-specific productivities found in literature were used as Qmax (see table 6.2). We use equation 6.2 from Luong et al [36], which is a simplified representation of real product inhibition kinetics.
max 1- ( )
ferm
crit
CQ Q
C ((kg/m3)/h) equation 6.2
The β is an inhibition constant, which is set to 1.69, like in [57]. The volume-specific productivity provides the relevant process information necessary to estimate the size of the fermentation equipment. The listed volumetric productivities in table 6.2 depend on the cell density present. High cell density fermentations can show higher volume-specific productivity. The high cell density fermentation will require the negation of an existing limitation, e.g. mass transfer limitation. 4.2 Fermentation yield Product yields on glucose (Yp/s) will be directly coupled to the concentration of the product in the aqueous phase in a similar way as the volume-specific productivity equation. Products such as phenol, which are not produced by the microbial catabolism, will have product yields on glucose approaching zero near the critical concentration due to their molecular toxicity. Although product yields depend on type of microbial host, metabolic route a simple equation is required. This can be calculated using equation 6.3, which is analogous to equation 2, although it is outside the scope of this article to support it with date.
/ / max 1- ( )
fermp s p s
crit
CY Y
C (-) equation 6.3
In figure 6.3 the yields and volume-specific productivity against the fermentation broth product concentration can be observed. It should be noted that yields of catabolic products are set to a constant of 90% of their maximum theoretical yield since they are produced by the maintenance reaction.
_____________________________________________________________________________
87

Chapter 6
0
0,2
0,4
0,6
0,8
1
1,2
0 2 4 6 8
Concentration of product in aqueous phase
yiel
d o
f p
rod
uct
s/vo
lum
etri
c p
rod
uct
ivit
y
10
yield of products on sugars (anabolic)
yield of products on sugars (catabolic)
volumetric productivity
Figure 6.3: Assumed influence of product concentration in fermentation broth on volume-specific productivity and yield. The operational costs on the fermentation side are dependent on substrate costs. However, the pricing of renewable raw materials experiences large price fluctuations and prices of 2nd generation feedstock derived materials, such as hydrolysate containing a mixture of sugars are not yet known. Therefore, this paper defines one C-6 feedstock, glucose, valued at 0.25 €/kg, which is done for transparency reasons. Additional calculations using actual feedstock and feedstock prices can be carried out to compare the results shown here, if desired. As the glucose costs are set, for a given production of 100 Kton/year the operational expenditure is a function of the product yield on glucose and is shown in figure 6.4.
_____________________________________________________________________________
88

Chapter 6
Figure 6.4: OPEX of fermentation as function of the product yield on glucose. 4.3 Product recovery fluxes The capital expenditure for recovery operations depends strongly on the type of recovery applied and product concentrations in the feed and product recovery phase. The cost of the recovery equipment will be directly linked to the costs of the equipment. Sizing the recovery operation takes place based on the mass transfer of the chemicals involved. The mass transfer is a function of the product concentration and will be calculated using equation 6.4. Most process operations requiring regeneration of the auxiliary phase used to capture the product. Using equation 4, the total interfacial area will be calculated assuming that the concentration in the product recovery phase remains zero.
rec ov eff fermF K A C p (kg/h) equation 6.4
For the listed recovery techniques, the relations linking the product concentration via the equipment size to the expected capital expenditure are given in the next section and are obtained by comparing scientific literature data. In the next sections different recovery techniques are discussed in terms of initial fluxes and costs associated with the operation. If the same unit is used in both operations, either the capturing step or the recovery step determines the size of the equipment. The unit operations are sized in this paper based on the capturing operation. The regeneration operation time is assumed to be equal to the process time for the capturing step.
_____________________________________________________________________________
89

Chapter 6
4.3.1 Adsorption The adsorption and desorption of the desired product are necessary operations during adsorptive recovery of a bio-chemical. Most adsorption processes are column operations and overall mass transfer coefficients can be derived from numerous correlations and approximations. Transport rates for adsorption process for spherical particles will be approximated by [58]:
215 aq
p
Dk
R (1/s) equation 6.5
Equation 6.5 is valid for pore diffusion controlled adsorption. The diffusion coefficient (Daq) can be calculated using the Wilke-Chang correlation [59].
3p
ov
RK k (m/s) equation 6.6
Equation 6.6 describes overall mass transfer for spherical particles, where pore diffusion is the main rate-determining step. However, it is not the goal of this paper to fully calculate the adsorption and desorption profiles. When Kov, the amount of relative interfacial area and feed concentration are known, initial fluxes can be calculated using equation 6.4. 4.3.2 Pervaporation Pervaporation is carried out with aid of membrane material. A characteristic parameter is the trans-membrane flux. Generally, the flux is expressed as a function of the retentate product concentration and membrane thickness. Literature data expressing the membrane flux can be found for various systems. No data on pervaporation, at fermentation temperatures, was found on lactic acid and phenol since these compounds have a low vapor pressure. Therefore only butanol will be discussed in this paper [60, 61]. Trans-membrane flux is mostly dependent on membrane material, temperature and membrane thickness. Many different membrane materials can be used and literature is extensive. An overview of membranes and their performance is given by Vane [3]. When product flux and production amounts are known the required membrane area can be calculated. The CAPEX will be calculated from membrane and membrane housing costs. Capital expenditure can than be estimated when membrane price and lifespan are known, which are given in appendix 1. 4.3.3 L-L Extraction Estimating CAPEX of an in-stream L-L mixer-settler extraction step depends on the product fluxes into the organic phase. In order to calculate product fluxes, the amount of interfacial contact area needed and molecular diffusivities in aqueous and organic phase need to be known. The amount of interfacial area needed depends on the speed of agitation in the mixer-settler. Paulo et al. [62] found an average Sauter mean droplet diameter over a wide range of Reynolds numbers. Therefore, we apply an average drop diameter (dvs) of 3.4 mm in our calculations. It is assumed that the droplets will have an aqueous film layer (Δz) and mass transfer coefficients in this layer will be calculated using equation 6.7.
z
DK aqaq (m/s) equation 6.7
These droplets are assumed to be rigid, resulting in a Sherwood number of 6.6. Organic phase molecular diffusivities can be calculated using the Minhas-Hayduk correlation [63]. When Nsh, Dorg and dvs are known the Korg value can be calculated using:
( ) 6.6org vssh ov
org
K dN
D
(-) equation 6.8
_____________________________________________________________________________
90

Chapter 6
The overall mass transfer coefficient was calculated using equation 6.9: 1 1 1
ov org aqK K p K
(s/m) equation 6.9
When overall mass transfer coefficients are known, the minimum amount of effective interfacial area can be calculated using equation in 6.4, assuming the concentration in the loading phase is zero upon contact with the fermentation broth. To size mixer-settlers, the interfacial area per volume of mixer-settler can be calculated using [64]:
6
d
vs
ad
(m2/m3) equation 6.10
Фd is the solvent phase hold-up and will be set to 0.3. Now sizing and cost-calculations can be performed using cost equations that can be found in appendix 6.1. 4.3.4 Pertraction In order to make CAPEX estimations on hollow-fiber pertraction units, mass transfer coefficients and subsequent product fluxes need to be estimated. High organic/water phase partition coefficients results in main mass transfer limitations on the tube side [65]. Therefore, the main considered parameter influencing the extraction rate is the resistance in the aqueous side since this has much lower mass transfers coefficients than the organic phase [66]. Therefore, flux calculations involving a pertraction unit will be simplified using equation 6.11.
1 1
ov aqK K (s/m) equation 6.11
Kaq calculations will be calculated using Sherwood numbers, and has been normalized for 1 meter length-scale:
1/32
1.62
aq i i aqsh
aq aq
K d dN
D D (-) equation 6.12
However, if products have poor organic/water phase partitioning behavior, mass transfer is influenced by membrane and organic phase as well, making it more complex. For these cases, overall mass transfer coefficients will be taken from literature. After obtaining overall mass transfer coefficients, product fluxes can then be calculated using equation 6.4. Subsequently, sizing of pertraction can be performed. 4.4 Product recovery The regeneration energy penalty of the product recovery can be expressed by the selectivity of the capturing operation. This selectivity is defined as the ratio of the product concentration and the water concentration in the product recovery stream to that of the feed stream (see equation 6.13).
( / )
( / )
permproduct ferm
feedproduct ferm
C CS
C C (-) equation 6.13
Energy input in the product recovery is one of the key parameters when describing its economic feasibility. Based on a steady state flow process, the mass-specific enthalpy flow is given by equation 6.14.
hH Q W (kJ/kg) equation 6.14
Where ΔH is the mass-specific enthalpy change, Qh is the amount of energy added to the system per mass (kJ/kg) and W is mass-specific work (kJ/kg). The process enthalpy of both feed phase and product phase needs to be calculated in order to estimate the energy needed for the recovery operation. This means the mass flows of the species need to be coupled to the enthalpy balance. The non-ideality by which the enthalpy
_____________________________________________________________________________
91

Chapter 6
change of the product phase in comparison to the feed phase occurs is not considered here. However, the values of Qh and W applied on and by the system are dependent on the technique used. One important assumption here is that an azeotrope will not be formed during the regeneration of the product recovery phase, resulting in underestimated energy costs. Usually, the product capture by integrated recovery brings the product from dilute aqueous to a stream containing enriched concentrations of up to 50 mass %. When starting with 20 g/L of product this means that 49 out of 50 water molecules are removed in the concentration step (relative to a product molecule). Most of the energy requirements are in the product recovery step. Upgrading diluted aqueous streams up to 50 mass % of product will have most of the overall energy requirements in the capturing step. Subsequent product purifications steps will require significantly less energy input. Table 6.4: Phase transition properties of pure bio-bulk chemicals and water [47].
Property Tm [oC]
Tb [oC]
ΔHvap [kJ/mol]
ΔHfus [kJ/mol]
Lactic acid 53 n.a. n.a. n.a.
Phenol 40.5 181.7 57.82 11.51
Butanol -88.6 117.7 43.29 9.37
Water 0 100 40.65 6.01
Ethanol -114.3 78.4 35.20 4.973
4.4.1 Adsorption Desorption of product from the adsorbent can be performed either by heat swing or a solvent wash. Organic solvents e.g. ethanol, are used when products with a low vapor pressure are involved. The loaded solvent will still need to be regenerated using temperature swing. The amount of energy input required is determined by the solute concentration in the washing solvent phase. It is assumed that the total column volume minus adsorbent backbone volume will be filled with washing solvent. All of the product will be desorbed in the solvent and energy-efficiency calculations can be performed using equation 6.13 and 6.14. For the butanol case, being a typical example of a high vapor pressure product, a heat strip is considered. 4.4.2 Pervaporation The pervaporation of a product phase requires the feed phase to evaporate and form a separate gas phase. This can be achieved either by heating the feed or by forming a low pressure (vacuum) at the gas side of the membrane. The low pressure can be maintained by either pumping or by cooling the product side of the pervaporation unit. Our method calculates the energy involved in the main phase transition of the product phase. The product phase is usually brought from liquid to gas and back to liquid phase. The total energy requirement is calculated by applying equation 6.14 to the known separation selectivity of the pervaporation operation and the chemical properties shown in table 6.3. Butanol is the only case where pervaporation is calculated and selectivity and fluxes are taken from Hickey et al. [68].
_____________________________________________________________________________
92

Chapter 6
4.4.3 Extraction and Pertraction The main OPEX costs for extraction and pertraction consist of solvent purchase and regeneration costs. The solvent purchase costs depend on what kind of solvent is used. Removal of hydrophilic products needs so-called reactive solvents (such as tertiary amines or phosphine oxides) to reach high product concentrations in the organic phase. However, these reactive solvents also dissolve significant amounts of water, resulting in an expensive regeneration. It was stated in section 4.4 that the selectivity of the organic phase towards the product will determine the regeneration costs. The selectivity can be calculated when the water solubility into the organic phase is known, together with the product partition coefficient. Solvent losses due to their aqueous solubility do not occur in the simplified process scheme of figure 6.1. The amount of solvent needed can be calculated when the total amount of interfacial area needed is known, which can be calculated using equation 6.10. 4.5 Costs All the individual chemical and process equipment prices are compiled in appendix 1&2. Total manufacturing costs (TMC) are calculated by adding the OPEX and CAPEX of both the fermentation and capturing operation. A factor of 4.93 is used to convert purchased equipment costs (PCE) into fixed capital, allowing calculation of the CAPEX of the two defined unit operations [69]. The reader might replace this CAPEX/OPEX calculation by other reasonable ones [70,71]. A linear depreciation over 12 years is applied when calculating cost functions and is detailed in appendix 1.
5. Results & discussion The figures below show the cost lines, predicting the capital expenditure and the operational expenditure for both fermentation and recovery operation as a function of product concentration in the fermentation broth. 5.1 Lactic acid In figure 6.5-7 a comparison of L-L extraction, pertraction and adsorption as product recovery techniques are shown. It can be observed that extraction has the lowest total manufacturing costs (TMC). The low TMC is a result of the relatively low CAPEX costs of the mixer-settlers units and relatively low regeneration costs. Pertraction has a higher CAPEX demand as it includes large membrane area costs. The CAPEX demand of the membrane operation is close to the TMC and the other cost contributions are almost on the base-line in figure 6.7. Extraction and pertraction require a base-wash and acid neutralization step costing about ~20% of the TMC. Running the fermentation at concentrations lower than ~ 18 kg/m3 shows a steep increase in TMC for adsorption and pertraction. The concentration of lactic acid in the adsorbent material will be low, resulting in low concentrations in the washing solvent and subsequently low regeneration efficiency. Similarly, the pertraction operation is strongly affected by operating at low product concentrations. An increase in product concentration will increase the costs of the fermentation. This can be seen most clearly in the TMC profile for the extraction system in figure 6.6. Also, looking only at operational costs, TMC is affected strongly by glucose price. Doubling the price of glucose would increase the TMC by approximately 43% of the integrated recovery using extraction. The caption that be used in figures 6.5-14 can be found in figure 6.5:
_____________________________________________________________________________
93

Chapter 6
0
1
2
3
4
5
6
7
8
0 10 20 30 40 50 60 70 80 90
Lactic acid concentration (kg/m3)
Cos
ts (
€/kg
)
Capex fermentationOpex fermentationOpex product recoveryCapex product recoveryTMC
Figure 6.5: Recovery of lactic acid by adsorption as function of the concentration in the fermentor
0
10
20
30
40
50
60
70
80
0 20 40 60 80
Lactic acid concentration (kg/m3)
Cos
ts (
€/kg
)
100
Figure 6.6: Recovery of lactic acid by pertraction as function of the concentration in the fermentor
_____________________________________________________________________________
94

Chapter 6
0,0
0,2
0,4
0,6
0,8
1,0
1,2
0 20 40 60 80
Lactic acid concentration (kg/m3)
Cos
ts (
€/kg
)
100
Figure 6.7: Recovery of lactic acid by extraction as function of the concentration in the fermentor 5.2 Butanol A comparison of adsorption, pervaporation, L-L extraction and pertraction as product recovery techniques is shown in figures 6.8-11. Due to the product inhibition of butanol, lower volume-specific productivities require larger fermentation vessel volumes, resulting in higher CAPEX. The fermentative production of butanol using integrated recovery by pervaporation has an overall minimum, when operating the fermentation at approximately 14.8 kg/m3 butanol. At lower butanol concentrations the product flux through the membrane is relatively low. The low product flux leads to an increase in membrane area and the relatively low butanol concentration in feed phase results in a subsequently high energy demand for regeneration. The TMC increases strongly at low butanol concentrations. The butanol trans-membrane flux remains mostly below 1 (kg/(m2.h)). An increase in butanol concentration will negatively influence the fermentation productivity, shifting more costs towards the fermentative operation. The lowest TMC are predicted for an adsorption based recovery at 3.33 kg/m3 butanol concentrations in the fermentor. The amount of water adsorbed relative to butanol, dictates the energy efficiency of the overall process and energy costs dramatically increase when more water is adsorbed. For extraction the operational cost of this integrated product removal dominates the TMC. The result is a relatively high price even at low fermentation concentrations. It should be noted that the lowest TMC of extraction are at a higher butanol concentration compared to adsorption. The predicted TMC values of the butanol removal techniques area relatively close to each other, explaining the amount and diversity of research that has been performed on the subject of butanol-recovery [44].
_____________________________________________________________________________
95

Chapter 6
0,0
0,5
1,0
1,5
2,0
2,5
0 5 10 15 20
Butanol concentration (kg/m3)
Cos
ts (
€/kg
)
Figure 6.8: Recovery of butanol by adsorption as function of the concentration in the fermentor
0
2
4
6
8
10
12
0 5 10 15 20
Butanol concentration (kg/m3)
Cos
ts (
€/kg
)
Figure 6.9: Recovery of butanol by pervaporation as function of the concentration in the fermentor
_____________________________________________________________________________
96

Chapter 6
0
2
4
6
8
10
12
0 5 10 15 20
Butanol concentration (kg/m3)
Cos
ts (
€/kg
)
Figure 6.10: Recovery of butanol by pertraction as function of the concentration in the fermentor
0,0
0,5
1,0
1,5
2,0
2,5
3,0
0 5 10 15 20
Butanol concentration (kg/m3)
Cos
ts (
€/kg
)
Figure 6.11: Recovery of butanol by extraction as function of the concentration in the fermentor
_____________________________________________________________________________
97
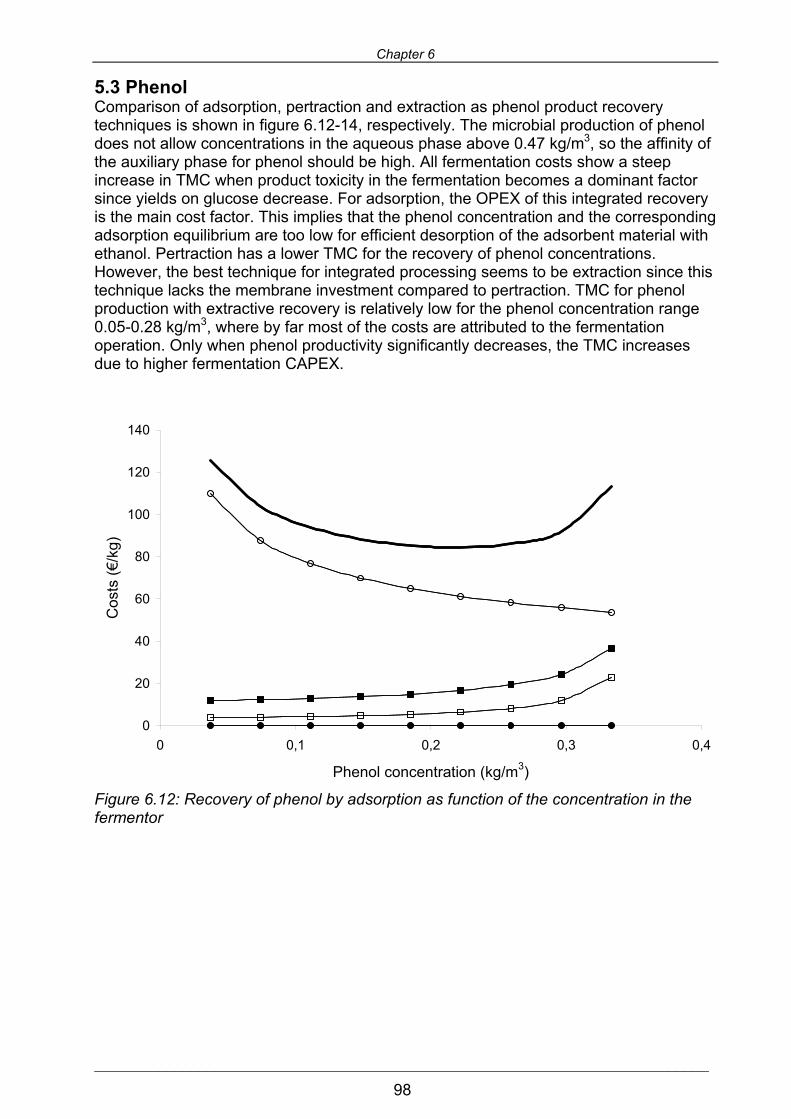
Chapter 6
5.3 Phenol Comparison of adsorption, pertraction and extraction as phenol product recovery techniques is shown in figure 6.12-14, respectively. The microbial production of phenol does not allow concentrations in the aqueous phase above 0.47 kg/m3, so the affinity of the auxiliary phase for phenol should be high. All fermentation costs show a steep increase in TMC when product toxicity in the fermentation becomes a dominant factor since yields on glucose decrease. For adsorption, the OPEX of this integrated recovery is the main cost factor. This implies that the phenol concentration and the corresponding adsorption equilibrium are too low for efficient desorption of the adsorbent material with ethanol. Pertraction has a lower TMC for the recovery of phenol concentrations. However, the best technique for integrated processing seems to be extraction since this technique lacks the membrane investment compared to pertraction. TMC for phenol production with extractive recovery is relatively low for the phenol concentration range 0.05-0.28 kg/m3, where by far most of the costs are attributed to the fermentation operation. Only when phenol productivity significantly decreases, the TMC increases due to higher fermentation CAPEX.
0
20
40
60
80
100
120
140
0 0,1 0,2 0,3 0,4
Phenol concentration (kg/m3)
Cos
ts (
€/kg
)
Figure 6.12: Recovery of phenol by adsorption as function of the concentration in the fermentor
_____________________________________________________________________________
98

Chapter 6
0
10
20
30
40
50
60
70
0 0,1 0,2 0,3 0,4
Phenol concentration (kg/m3)
Cos
ts (
€/kg
)
Figure 6.13: Recovery of phenol by pertraction as function of the concentration in the fermentor
0
10
20
30
40
50
60
70
0 0,1 0,2 0,3 0,4
Phenol concentration (kg/m3)
Cos
ts (
€/kg
)
Figure 6.14: Recovery of phenol by extraction as function of the concentration in the fermentor
_____________________________________________________________________________
99

Chapter 6
6. Conclusions Costs predictions for the biological production of lactic acid, butanol and phenol, using integrated product recovery techniques have been constructed, with the shortcut methods applied as shown in section 3 and 4. We believe the accuracy of the methods to be such that the behavior of cost trends in section 5 is correct, but the absolute cost values are rough approximations. Therefore, the shortcut method may be used to quickly select the process option to be developed further and to be analyzed in much more detail according to conventional methods. The three chemicals show a wide range of physical properties and fermentation parameters resulting in different cost contributions. Whenever the product recovery operation is efficient at low concentrations or inexpensive the production by fermentation can take place at lower product concentration. Both the operational and capital expenditure can be the dominant cost factors. Specifically, one can conclude lactic acid production benefits the most from integrated recovery by extraction. However, in this manuscript no comparison has been made with other configurations such as batch fermentations with a coupled recovery. According to the current analysis, recovery of butanol should be performed using adsorption, although it should be noted that extraction and pervaporation have TMC relatively close to those of adsorption. Although it is not an integrated process, butanol removal from fermentation broths in current industrial practice is performed using distillation,. The scale of the process can also have a significant impact on relative costs of each of the product recovery units. Integrated product recovery can be an important tool when lower TMC need to be reached for phenol and should be performed using extraction. Phenol yields on glucose decrease with increasing phenol concentrations, resulting in an additional beneficial effect of integrated product recovery. Symbol list A area (m2) a volume-specific area (m2/m3) C concentration (kg/m3) Capex capital expenditure (€/year) CT costs (€/kg) d diameter (m) D diffusion coefficient (m2/s) EC equipment or material costs (€/unit) ΔH mass-specific enthalpy change (kJ/kg) F product flow (kg/h) J0 initial flux (kg/(m2.h)) Kov mass transfer coefficient (m/s) k mass transfer rate (1/s) L length of hollow fiber (m) Opex operational expenditure (€/year) M mass (kg) N number (-) p partition coefficient (-) q adsorbed concentration (g/g) Qh heat added per volume (kJ/m3) Q volumetric-specific productivity ((kg/m3)/h) Qfer productivity fermentation (kg/h) R particle size (m) S selectivity (-) T temperature (K)
_____________________________________________________________________________
100

Chapter 6
X mole fraction (-) Y yield (kg/kg) V volume (m3) W mass-specific work (kJ/kg) Greek β inhibition constant (-) Δz axial distance (m) ε porosity (-) η energy efficiency (-) Фd solvent phase hold-up (-) ν flow-rate (m3/s) φ volume flow rate (m3/h) Superscript perm permeate phase (-) feed feed phase (-) Subscript aq water phase b boiling c crystal crit critical eff effective Ferm fermentation Fus fusion i internal diameter of hollow fiber m melting max theoretical maximum mem membrane mix_set mixer settler pervap pervaporation org organic phase ov overall p product p/s product on substrate rec recovery Sh Sherwood Vap vaporization vs Sauter mean drop-size
_____________________________________________________________________________
101

Chapter 6
Appendix 6.1: cost-relations for recovery and fermentation Fermentation vessel [71] fermCAPEX (a V )b c a =4123 [euro/m3] b = 0.608 [-] c = 22530 [euro]
L-L extraction mix_set _
4.93CAPEX ( )
12bmix seta V [72]
a = 161194 [euro/m3] b = 0.4479 [-]
Adsorption adsorp zeolite zeolite
4.93CAPEX =M EC ( )
12ba V c [73]
a = 7650 [euro/m3] b = 0.346755 [-] c = -11525.6 [euro]
Pervaporation & Pertraction pervap mem mem
4.93CAPEX =A EC
12units unitN EC
Appendix 6.2: Cost table Property Unit Costs €/unitglucose kg 0.25 electricity kWh 0.05 solvent kg 1.5 adsorbent material kg 25 membrane area m2 250 membrane housing 900 m2 1333 Zeolite kg 30 Calcium Hydroxide kg 0.110 Hydrochloric acid kg 0.347
Literature 1. Stark D. and Stockar von U., In situ product removal (ISPR) in whole cell
biotechnology during the last twenty years. Advances in Biochemical Engineering/Biotechnology, 2003. 80: p. 149-175.
2. Freeman A., Woodley J.M., and Lilly M.D., In Situ Product Removal as a tool for bioprocessing. Nature Biotechnology, 1993. 11: p. 1007-1012.
3. Vane L.M., A review of pervaporation for product recovery from biomass fermentation processes. Journal of Chemical Technology & Biotechnology, 2005. 80: p. 603-629.
4. Qureshi N., Meagher M.M., Huang J. and Hutkins R.W., Acetone butanol ethanol (ABE) recovery by pervaporation using silicalite-silicone composite membrane from fed-batch reactor of Clostridium acetobutylicum. Journal of Membrane Science, 2001. 187: p. 93-102.
_____________________________________________________________________________
102

Chapter 6
5. Favre E., Nguyen Q.T., and Bruneau S., Extraction of 1-butanol from aqueous solutions by pervaporation. Journal of Chemical Technology & Biotechnology, 1996. 65: p. 221-228.
6. Matsumura M. and Kataoka H., Separation of dilute aqueous butanol and acetone solutions by pervaporation through liquid membranes. Biotechnology and Bio-engineering, 1987. 30: p. 887-895.
7. Ennis B.M., Marshall C.T.,Maddox I.S. and Paterson A.H.J., Continuous Product Recovery by Insitu Gas Stripping Condensation During Solvent Production from Whey Permeate Using Clostridium-Acetobutylicum. Biotechnology Letters, 1986. 8: p. 185-194.
8. Ezeji T.C., Qureshi N., and Blaschek H.P., Acetone butanol ethanol (ABE) production from concentrated substrate: reduction in substrate inhibition by fed-batch technique and product inhibition by gas stripping. Applied Microbiology and Biotechnology, 2004. 63: p.653-658.
9. Ezeji T.C., Qureshi N., and Blaschek H.P., Production of acetone, butanol and ethanol by Clostridium beijerinckii BA101 and in situ recovery by gas stripping. World Journal of Microbiology & Biotechnology, 2003. 19: p. 595-601.
10. Groot W.J., van der Lans R.G.J.M., and Luyben K.C.A.M., Batch and Continuous Butanol Fermentations with Free-Cells - Integration with Product Recovery by Gas-Stripping. Applied Microbiology and Biotechnology, 1989. 32: p. 305-308.
11. Kertes A.S. and King C.J., Extraction chemistry of fermentation product carboxylic acids. Biotechnology and Bioengineering, 1986. 28: p. 269-282.
12. Lazarova Z. and Peeva L., Solvent extraction of lactic acid from aqueous solution. Journal of Biotechnology, 1994. 32: p. 75-82.
13. Groot W.J., Soedjak H.S., Donck P.B., van der Lans R.G.J.M. and Luyben K.Ch.A.M., Butanol recovery from fermentations by liquid-liquid extraction and membrane solvent extraction. Bioprocess Engineering, 1990. 5: p. 203-216.
14. Davison B.H. and Thompson J.E., Continuous Direct Solvent-Extraction of Butanol in A Fermenting Fluidized-Bed Bioreactor with Immobilized Clostridium-Acetobutylicum. Applied Biochemistry and Biotechnology, 1993. 39: p. 415-425.
15. Laitinen A. and Kaunisto J., Supercritical fluid extraction of 1-butanol from aqueous solutions. Journal of Supercritical Fluids, 1999. 15: p. 245-252.
16. Cichy W., Schlosser S., and Szymanowski J., Extraction and pertraction through bulk liquid membranes. Journal of Chemical Technology and Biotechnology, 2005. 80: p. 189-197.
17. Schlosser S., Kertész R., and Martak J., Recovery and separation of organic acids by membrane-based solvent extraction and pertraction. Separation and Purification Technology, 2005. 41: p. 237-266.
18. Martak J. and S. S., Pertraction of organic acids through liquid membranes containing ionic liquids. Desalination, 2006. 199: p. 518-520.
19. Grobben N.G., Eggink G., Cuperus F.P. and Huizing H.J., Production of Acetone, Butanol and Ethanol (Abe) from Potato Wastes - Fermentation with Integrated Membrane Extraction. Applied Microbiology and Biotechnology, 1993. 39: p. 494-498.
20. Leon Y.J. and Lee Y.Y., In situ product separation in butanol fermentation by membrane-assisted extraction. Enzyme and Microbial Technology, 1989. 11: p. 575-582.
21. Yang X., Tsai G., and Tsao G.T., Enhancement of in situ adsorption on the acetone-butanol fermentation by Clostridium acetobutyicum. Separation Technology, 1994. 4: p. 81-92.
_____________________________________________________________________________
103
Chapter 6
22. Qureshi N., Hughes S., Maddox I.S. and Cotta M.A., Energy-efficient recovery of butanol from model solutions and fermentation broth by adsorption. Bioprocess and Biosystems Engineering, 2005. 27: p. 215-222.
23. Yang X. and Tsao T., Enhanced acetone-butanol fermentation using repeated fed-batch operation coupled with cell-recycle to membrane and simultaneous product removal of inhibitory products by adsorption. Biotechnology and Bio-engineering, 1995. 47: p. 444-450.
24. Chen C.C. and Ju L.-L., Coupled lactic acid fermentation and adsorption. Applied Microbiology and Biotechnology, 2002. 59: p. 170-174.
25. Groot W.J. and Luyben K.C.A.M., In-situ Product Recovery by Adsorption in the Butanol Isopropanol Batch Fermentation. Applied Microbiology and Biotechnology, 1986. 25: p. 29-31.
26. Regdon I., Kiraly Z., Dekany I. and Lagaly G., Adsorption of 1-Butanol from Water on Modified Silicate Surfaces. Colloid and Polymer Science, 1994. 272: p. 1129-1135.
27. Carlson T.L. and Peters E.M. jr., low pH lactic acid fermentation. 2002, Cargill, Inc.,: United States.
28. Goksungur Y. and Guvenc U., Batch and Continuous Production of Lactic Acid from Beet Molasses by Lactobacillus delbrueckii IFO 3202. Journal of Chemical Technology and Biotechnology, 1997. 69: p. 399-404.
29. Zhou S., Shanmugam K.T., Yomano L.P., Grabar T.B. and Ingram L.O., Fermentation of 12% (w/v) glucose to 1.2 M lactate by Escherichia coli strain SZ194 using mineral salts medium. Biotechnology Letters, 2006. 28: p. 663 - 670.
30. Chen C.K. and Blaschek H.P., Acetate enhances solvent production and prevents degeneration in Clostridium beijerinckii BA101. Applied Microbiology and Biotechnology, 1999. 52: p. 170-173.
31. Huang W-C., Ramey D.E., and Yang S-T., Continuous production of butanol by Clostridium acetobutylicum immobilized in a fibrous bed bioreactor. Applied Biochemistry and Biotechnology, 2004. 113-116: p. 887-989.
32. Tashiro Y., Shinto H., Hayashi M., Baba S-I., Kobayashi G. and Sonomoto K., Novel high-efficient butanol production from butyrate by non-growing Clostridium saccharoperbutylacetonicum N1-4 (ATCC 13564) with methyl viologen. Journal of Bioscience and Bioengineering, 2007. 104(3): p. 238-240.
33. Wierckx N.J.P., Ballerstedt H., Bont de J.A.M. and Wery J., Engineering of solvent-tolerant Pseudomonas Putida S12 for bioproduction of phenol from glucose. Applied and Environmental Microbiology, 2005. 71(12): p. 8221-8227.
34. van den Berg C., Wierckx N.J.P., Vente J., Bussmann P.J. T., de Bont J. and van der Wielen L.A.M., Solvent-impregnated resins as an in-situ product recovery tool for phenol recovery from Pseudomonas putida S12TPL fermentations. Biotechnology and Bio-engineering, 2008. 100(3): p. 466-472.
35. Monteagudo J.M. and Aldavero M., Production of L-lactic acid by Lactobacillus delbrueckii in chemostat culture using an ion exchange resins system. Journal of Chemical Technology & Biotechnology, 1999. 74(7): p. 627-634.
36. Aljundia S.H., Belovichb J.M., and Talu O., Adsorption of lactic acid from fermentation broth and aqueous solutions on Zeolite molecular sieves Chemical Engineering Science, 2005. 60(18): p. 5004-5009.
37. van den Berg C., Roelands C.P.M., Bussmann P.J. T., Goetheer E.L.V., Verdoes D. and van der Wielen L.A.M.,, Extractant selection strategy for solvent-impregnated resins in fermentations. Industrial & Engineering Chemistry Research, 2008. 47(4): p. 10071-10075.
_____________________________________________________________________________
104

Chapter 6
38. Bruce L.J. and Daugulis A.J., Solvent selection strategies for extractive biocatalysis. Biotechnology Progress, 1991. 7: p. 116-124.
39. Gani R., Jimenez-Gonzalez C., Kate ten A., Crafts P.A., Jones M., Powell L., Atherton J.H. and Cordiner J.L., A modern approach to solvent selection, in Chemical Engineering. 2006. p. 30-42.
40. Huang H., Yang S-T., and Ramey D.E., A hollow-fiber membrane extraction process for recovery and separation of lactic acid from aqueous solution. Applied Biochemistry and Biotechnology, 2004. 114(1-3): p. 671-688.
41. Efe C., High silica zeolites as an alternative to amine based adsorbents in succinic acid recovery. New Biotechnology, 2009. 255: p. S175.
42. Qureshi N. and Ezeji T.C., Butanol, ‘a superior biofuel’ production from agricultural residues (renewable biomass): recent progress in technology. Biofuels, Bioproducts & Biorefining, 2008. 2(4): p. 319-330.
43. Oudshoorn A., van der Wielen L.A.M., and Straathof A.J.J., Assessment of options for selective 1-butanol recovery from aqueous solution. Industrial & Engineering Chemistry Research, 2009. 48: p. 7325 - 7336.
44. Oudshoorn A., van der Wielen L.A.M., and Straathof A.J.J., Assessment of Options for Selective 1-Butanol Recovery from Aqueous Solution. Industrial & Engineering Chemistry Research, 2009. 48(15): p. 7325-7336.
45. Wasewar K.L., Heesink A.B.M., Versteeg G.F. and Pangarkar V.G., Reactive extraction of lactic acid using alamine 336 in MIBK: equillibria and kinetics. Journal of Biotechnology, 2002. 97: p. 59-68.
46. Oudshoorn A., van der Wielen L.A.M., and Straathof A.J.J., Adsorption equilibria of bio-based butanol solutions using zeolite. Biochemical Engineering Journal, 2009. 48(1): p. 99-103.
47. Ahn H., Moon J-H., Hyun S-H. and Lee S-H., Diffusion Mechanism of Carbon Dioxide in Zeolite 4A and CaX Pellets. Adsorption, 2004. 10: p. 111-128.
48. Cytec, Cyanex 923: Solvent extraction agent - A liquid phosphine oxides. 2005. 49. Kujawski W., Warszawski A., Ratajczak W., Porebski T., Capala W. and
Ostrowska I., Removal of phenol from wastewater by different separation techniques. Desalination, 2004. 163: p. 287-296.
50. Hao X., Pritzker M., and Xianshe F., Use of pervaporation for the separation of phenol from dilute aqueous solutions. Journal of Membrane Science, 2009. 335(1-2): p. 96-102.
51. Fierro V., Torne-Fernandez V., Montane D. and Celzard A., Adsorption of phenol onto activated carbons having different textural and surface properties. Microporous and mesoporous materials, 2008. 111(1-3): p. 276-284.
52. Kuleyin A., Removal of phenol and 4-chlorophenol by surfactant-modified natural zeolite. Journal of Hazardous Materials, 2006. 144(1-2): p. 307-315.
53. Su F., Lv L., Hui T.M. and Zhao X.S., Phenol adsorption on zeolite-templated carbons with different structural and surface properties. Carbon, 2005. 43(6): p. 1156-1164.
54. Huang Y., Ma X., Liang G., and Yan H., Adsorption of phenol with modified rectorite from aqueous solution. Chemical Engineering Journal, 2008. 141: p. 1-8.
55. Costa C. and Rodrigues A., Design of fixed-bed adsorption processes. American Institute for Chemical Engineers Journal, 1985. 31(10): p. 1645-1654.
56. Straathof A.J.J., Auxiliary phase guidelines for microbial biotransformations of toxic substrate into toxic product. Biotechnology Progress, 2003. 19: p. 755-762.
57. Luong J.H.T., Kinetics of ethanol inhibition in alcohol fermentation. Biotechnology and Bio-engineering, 1985. 27: p. 280-285.
_____________________________________________________________________________
105

Chapter 6
58. Ruthven D.M., Principles of adsorption and adsorption processes. 1984, New York: John Wiley & Sons, Inc.
59. Wilke C.R. and Chang P., Correlation of diffusion coefficient in dilute solutions. American Institute of Chemical Engineers Journal, 1955. 1: p. 264-270.
60. Groot W.J., Lans van der R.G.J.M., and Luyben K.Ch.A.M., Technologies for butanol recovery integrated with fermentations. Process Biochemistry, 1992. 27: p. 61-75.
61. Hao X., Pritzker M., and Feng X., Use of pervaporation for the separation of phenol from dilute aqueous solutions. Journal of Membrane Science, 2009. 335: p. 96-102.
62. Paulo J.B.A. and Hadjiev D.E., Mixer-Settler Based on Phase Inversion: Design of the Mixing Zone. Industrial Engineering and Chemistry Research, 2006. 45: p. 3821-3829.
63. Hayduk W. and Minhas B.S., Correlations for prediction of molecular diffusivities in liquids. Canadian Journal of Chemical Engineering, 1982. 60: p. 295-299.
64. Seader J.D. and Henley E.J., Separation process principles. 1998: John Wiley & Sonds, Inc.
65. Reis M.T.A., de Freitas O.M.F., Ismael M.R.C. and Carvalho J.M.R., Recovery of phenol from aqueous solutions using liquid membranes with Cyanex 923. Journal of Membrane Science, 2007. 305: p. 313-324.
66. Huang H., Yang S-T., and Ramey D.E., A hollow-fiber membrane extraction process for recovery and separation of lactic acid from aqueous solution. Applied Biochemistry and Biotechnology, 2004. 113-116: p. 671-688.
67. Linstrom P.J. and Mallard W.G. NIST Chemistry WebBook. 2008 september 11, 2009]; Available from: http://webbook.nist.gov/chemistry/.
68. Hickey P.J. and Slater C.S., The Selective Recovery of Alcohols from Fermentation Broths by Pervaporation. Separation & Purification Reviews, 1990. 19(1): p. 93-115.
69. Sinnott R.K., Chemical Engineering. Volume 6. 1993: Butterworth-Heinemann. 70. Yuan J.Q., Guo S.R., Schugerl K. and Bellgardt K.H., Profit optimization for
mycelia fed-batch cultivation. Journal of Biotechnology, 1997. 54: p. 175-193, 71. Grant E.L., Ireson W.G., and Leavenworth R.S., Principles of Engineering
Economy. Wiley New York, 1982 72. Intelligen, I., SuperPro Designer: Scotch Plains. 73. Matches, www.matche.com. 2009. 74. Dutch Association of Cost Engineers, DACE - Pricebook. Vol. 26. 2007,
Doetinchem: Reed business.
_____________________________________________________________________________
106

Chapter 6
_____________________________________________________________________________
107

Chapter 7
_____________________________________________________________________________
108

Chapter 7
_____________________________________________________________________________
109
Chapter 7
Discussion and future outlook

Chapter 7
_____________________________________________________________________________
110
7.1 Innovative product recovery in white biotechnology Product accumulation in the micro-organisms environment can hamper the production of its primary or secondary metabolites. Therefore, bioconversion processes for the production of bio-bulk molecules generally tend to have relatively limited productivities, yields on carbon and final product concentrations. These three phenomena can be prevented when combining findings in the field of system biology and industrial microbiology along with new developments in the field of chemical engineering. In this thesis P. putida S12 has been used as a bio-catalyst, being a solvent-tolerant micro-organism, meaning that it is able to withstand solvents with a low logPo/w value along with higher product concentrations. However, operating at higher product concentrations during fermentation tend to result in sub-optimal fermentation conditions. Moreover, solvents with a low logPo/w tend to have high water solubilities, resulting in higher solvent costs in the end. These two factors will result in the limited application of P. putida as an industrial production strain. Innovative product recovery techniques should have a high molecular selectivity towards the product since most biocatalysts operate in aqueous-like environments where ~90% of the molecules consist of water. To reach high selectivities of product over water, the product should have some hydrophobic characteristics. However, hydrophobic products have low water solubilities and this subsequently results in low final product titers. A paradigm shift should occur where industrial microbiology research efforts need to be directed towards of the production of more hydrophobic substances instead of the hydrophilic products that dominate R&D initiatives nowadays. Furthermore, In order to minimize the conflict between food and the fuel/chemistry sector there should be a strong focus on non-glucose components from the plant material. The majority of all white biotechnology products, manufactured at industrial scale, are catabolic products. The carbon yields on these products remain high at high product concentrations. The production of molecules through the anabolic pathway will remain on a relatively small scale unless the product can be sold at a high price. There is a strong drive to integrate product recovery techniques with these fermentations. However, it should be taken into account that these product recovery techniques do not shift the problem of expensive fermentation broths towards expensive down-stream processing.
7.2 Switchable solvents and modern solvent selection A major problem when applying extraction as a potential product recovery for fermentation products is the regeneration of the product out of the solvent phase without inducing a gypsum side-stream process or using an energy-intensive distillation procedure. Especially in the SIRs/capsule case this seems technically very difficult to prevent since solvent losses can be significant when a heat or vacuum strip is applied. Recently, some developments have been made where the hydrophobicity of a certain solvent could be switched using a simple external field to regenerate a so-called switchable solvent. A switchable solvent can be reversibly switched from one form to another, where the two forms differ significantly in one or more molecular properties. Several strategies can be followed when using switchable solvents [1]. The first switchable solvent was reported by Jessop et al [2] where an alcohol was extracted using an amidine such as 1,8-diazabicyclo-[5.4.0]-undec-7-ene (DBU). DBU has a

Chapter 7
_____________________________________________________________________________
111
dramatically greater polarity in the presence of CO2 than without CO2 as can be seen in figure 7.1. By removing the CO2 from the solvent phase an environmental friendly and possibly economically feasible method for regeneration might be achieved.
Figure 7.1: mechanism of a switchable solvent. Another possible method to reduce regeneration costs is selecting a solvent, which has a melting point close to temperature where the extraction is performed. By lowering the solvent phase temperature, a possible low energy regeneration option is possible. However, this method seems infeasible for SIRs/capsules. Selection of proper solvents for industrial (bio-)chemical processes can be performed using varying methods. In this thesis, linear solvation energy relationships were used to select a solvent from a database of 70 solvents. However, using LSERs only infinite dilution partition coefficients can be calculated while many extraction processes run at high concentrations in both aqueous and organic phase. Another limitation of LSERs is the limited temperature range and the labor intensiveness of adding new solvents to the database. If extraction (or regeneration) efficiency needs to be calculated at higher temperatures other tools need to be applied. Recently, Thermodynamic models based on conductor-like screening models such as COSMO-RS [3] or density functional theories [4] can be used to predict L-L phase equilibria, although these models still give mixed results in when it comes to reactive extractions. With computational power increasing dramatically these methodologies will be applied more often in the next decade.
7.3 Capsules and solvent impregnated resins Although the developed capsules have a higher product capacity, stability in the fermentor is still a concern that needs to be dealt with. Preventing solvent leakage from the capsules, due to vigorous fermentation vessel agitation, might make the usage of capsules more economically feasible. This might be achievable by adding a post-impregnation coating [5-7]. However, it should be noted that the amount of product extracted per gram of SIR will be lowered by approximately 20% due to the coating layer. Furthermore, a selective removal of SIRs/capsules from the fermentation broth might also result in prolonged fermentation times since a percentage of the particles can be regenerated during a running fermentation.
Literature 1. Phan L., et al., Soybean oil extraction and separation using switchable or
expanded solvents. Green Chemistry, 2009. 11: p. 53-59. 2. Jessop P.G., et al., Reversible non-polar-to-polar solvent. Nature, 2005. 436: p.
1102. 3. Spieß A.C., et al., Prediction of partition coefficients using COSMO-RS: solvent
screening for maximum conversion in biocatalytic two-phase reaction systems. Chemical Engineering and Processing, 2008. 47: p. 1034-1041.

Chapter 7
_____________________________________________________________________________
112
4. Cuypers R., et al., Complexation of Phenols and Thiophenol by Phosphine Oxides and Phosphates. Extraction, Isothermal Titration Calorimetry, and ab Initio Calculations. Journal of Physical Chemistry A, 2008. 112: p. 11714-11723.
5. Trochimczuk A.W., et al., Stabilization of solvent impregnated resins (SIRs) by coating with water soluble polymers an chemical crosslinking. Reactive and Functional Polymers, 2004. 59: p. 1-7.
6. Kabay N., et al., Removal of chromate by solvent impregnated resins (SIRs) stabilized by coating and chemical crosslinking. I. Batch-mode sorption studies. Reactive & Functional Polymers, 2004. 59: p. 9-14.
7. Kabay N., et al., Removal of chromate by solvent impregnated resins (SIRs) stabilized by coating and chemical crosslinking. II. Column-mode sorption/elution studies. Reactive & Functional Polymers, 2004. 59: p. 15-22.

_____________________________________________________________________________
114
Summary Life sciences will be one of the decisive factors in the 21st century. A major part of this field is the so-called white biotechnology, also known as industrial biotechnology. White biotechnology is an emerging field where bio-chemicals are produced using micro-organisms. However, the production of bio-chemicals is severely inhibited due to toxicity of the product towards the host-organism. Therefore, it is necessary to remove the products from the micro-organisms’ environment. One approach for achieving this is applying so-called in-situ product removal. In this thesis solvent impregnated resins are added to a fermentation broth as an in-situ product removal tool. These particles contain an organic phase able to selectively extract a certain product from an aqueous phase such as fermentation broths. In 2005 a P. putida S12 strain was developed at TNO that was able to produce phenol out of several carbon sources. However, this strain was severely hindered by product inhibition, resulting in very low productivities, carbon yields and final product concentrations. Upon addition of solvent impregnated resins to this P. putida S12 fermentations, volumetric productivities almost doubled, carbon yields increased with 40% and the total amount of phenol produced almost quadrupled. The most significant part of the solvent impregnated resins consists of a solvent phase. It is therefore critical to select an optimal solvent to impregnate in the polymeric matrix. A selection procedure is presented in chapter 3 where three main criteria are considered, being toxicity, extraction efficiency and regeneration. It was noted that solvent impregnated resins had a relatively limited solvent storage capacity and therefore it was opted to develop particles that had a high porosity and were able to store a ten-fold higher amount of solvent per gram of polymer. Due to the high void volume, the particles had the shape of capsules instead of typical resins. The capsules had a product capacity twice as high as solvent impregnated resin on a volume basis. However, the time needed to reach equilibrium was 4 hours instead of the 20 minutes needed for solvent impregnated resins. Evaluating whether to apply in-situ product recovery using solvent impregnated resins or capsules in a bioreactor in order to overcome product inhibition is evaluated in chapter 5. It was found that solvent impregnated resins or capsules can have a positive effect on severely inhibiting molecules such as phenol or erythromycin. This is mostly due to the low final concentrations in the fermentation broth and extraction efficiency of the organic phase. For lactic acid the potential application of SIRs/capsules seems limited due to low extraction efficiencies and longer down-times of the fermentor. Although productivities of phenol fermentations are higher when incorporating SIRs/capsules, the costs of the expensive ionic liquid render this ISPR system economically non-feasible. For the erythromycin case, the application of SIRS/capsules can result in a fermentation costs decrease of ~30%.

_____________________________________________________________________________
115
In chapter 6 several general design rules for integrated bio-processing are presented. Making these types of cost-calculations can be very labor intensive processes. Therefore, we supply some shortcut calculations that can assist the reader in making rational design choices. We evaluated three different bio-bulk chemicals that can be produced using white biotechnology along with different integrated product recovery techniques. Using the products’ known physical properties, toxicities, fermentation efficiencies and datasets of different recovery techniques some cost calculations could be made along with selecting a favorable product recovery technique.

_____________________________________________________________________________
116
Samenvatting “Life Sciences” zal één van de doorslaggevende factoren in de 21e eeuw worden. Een belangrijk deel van deze bio-wetenschappen is de zogenaamde witte biotechnologie, ook wel bekend onder de naam industriële biotechnologie. Witte biotechnologie is een opkomend gebied waar chemicaliën worden geproduceerd met behulp van micro-organismen. Echter, de productie van bio-chemische stoffen wordt ernstig belemmerd als gevolg van de toxiciteit van het product naar het host-organisme. Daarom is het noodzakelijk om de producten uit het milieu van de micro-organismen te verwijderen. Een methode om dit te bereiken is de toepassing van zogenaamde in-situ product verwijdering. In dit proefschrift zijn oplosmiddel geïmpregneerde harsen direct toegevoegd aan fermentatieprocessen. Deze deeltjes bevatten een organische fase die selectief een product uit een waterige fase zoals fermentatiebeslag kan extraheren. In 2005 was door TNO een P. putida S12 stam ontwikkeld die fenol uit andere koolstofbronnen kon produceren. Echter, deze stam werd ernstig gehinderd door product remming, wat resulteerde in zeer lage productiviteiten, opbrengsten op glucose en eindproduct concentraties. Door oplosmiddel geïmpregneerde harsen toe te voegen aan de P. putida S12 fermentatie werden volumetrische productiviteiten bijna verdubbeld, koolstof-opbrengsten stegen met 40% en de totale hoeveelheid fenol geproduceerd bijna verviervoudigd. Een significant deel van de zogenaamde oplosmiddel geïmpregneerde harsen bestaat uit een organische fase. Bij de winning van een product uit een fermentatieproces is één van de belangrijkste stappen het selecteren van het juiste oplosmiddel. Een selectie is gepresenteerd in hoofdstuk 3 waar de drie criteria in acht worden genomen. Deze criteria zijn de oplosmiddeltoxiciteit, de efficiëntie van de extractie en product regeneratie. Het bleek dat oplosmiddel geïmpregneerde harsen een relatief beperkte oplosmiddel opslagcapaciteit bezaten en daarom werd gekozen voor de ontwikkeling van deeltjes met een hoge porositeit. Deze deeltjes bezaten een tien keer hogere hoeveelheid oplosmiddel per gram polymeer. Vanwege het hoge porievolume hadden de deeltjes meer de vorm van capsules i.p.v. geïmpregneerde harsen. Deze capsules hadden een product capaciteit welke twee keer zo hoog was dan oplosmiddel geïmpregneerde harsen. Echter, de tijd die nodig was om evenwicht te bereiken was 4 uur i.p.v. de 20 minuten die nodig waren voor oplosmiddel geïmpregneerde harsen. Evaluatie van in-situ product verwijdering in de vorm van oplosmiddel geïmpregneerde harsen of capsules in een bioreactor is gedaan in hoofdstuk 5. Het bleek dat oplosmiddel geïmpregneerde harsen of capsules een positief effect hebben op de productie van ernstig remmende moleculen zoals fenol of erytromycine. Dit is meestal te wijten aan de lage concentraties in het uiteindelijke fermentatiebeslag en de hoge extractie-efficiëntie van de organische fase. Voor melkzuur lijkt de toepassing van oplosmiddel geïmpregneerd harsen of capsules beperkt door de beperkte extractie efficiencie en de langere “down-times” van de fermentor. Alhoewel de productiviteiten van de fenol fermentatie verhoogden resulteerde het gebruik van oplosmiddel geïmpregneerd harsen of capsules wel in hogere productiekosten door de hogere oplosmiddelkosten. Het oplosmiddel wat kon worden gebruikt voor erythromycine was goedkoper en daardoor daalden de productiekosten met ongeveer 30% t.o.v. een niet-geïntegreerd systeem.

_____________________________________________________________________________
117
In hoofdstuk 6 is een poging ondernomen om een aantal algemene ontwerpregels voor geïntegreerde fermentatie/scheidingssystemen te construeren. Het maken van kosten berekeningen voor dit soort systemen is een zeer arbeidsintensief proces. Deze ontwerpregels kunnen de lezer helpen bij het maken van rationele keuzes. Er zijn drie verschillende bulk chemicaliën geëvalueerd die geproduceerd kunnen worden m.b.v. fermentatie en verschillende scheidingstechnologie systemen. Mits er kennis is van de fysische eigenschappen van het product, toxiciteit, fermentatie efficiëntie en er bekende datasets van verschillende scheidingstechnieken zijn, kunnen er voorlopige kostenberekeningen gemaakt worden, samen met het selecteren van een optimale scheidingstechniek.

_____________________________________________________________________________
118
Bibliography Van den Berg C., Wierkcx N.J.P., Vente J., Bussmann P., de Bont J., van der Wielen L.A.M. Solvent impregnated resins as an in-situ product recovery tool for phenol recovery from P. putida S12TPL fermentations. Biotechnology and Bioengineering, Vol. 100, No. 3, 466-472 Van den Berg C., Roelands C.P.M., Bussmann P., Goetheer E.L.V., Verdoes D., van der Wielen L.A.M. Extractant selection strategy for solvent impregnated resins in fermentations. Industrial & Engineering Chemistry Research, Vol. 47, no. 24, 10071-10075 Van den Berg C., Roelands C.P.M., Bussmann P., Goetheer E.L.V., Verdoes D., van der Wielen L.A.M. Preparation and analysis of high capacity polysulfone capsules. Reactive and Functional Polymers, Vol. 69, no. 10, 766-770 Van den Berg C., Boon F., Roelands C.P.M., Bussmann P., Goetheer E.L.V., Verdoes D., van der Wielen L.A.M. Techno-economic evaluation of solvent impregnated resins in a bioreactor. Separation and Purification Technology, Accepted
Oudshoorn A., van den Berg C., Roelands C.P.M., van der Wielen L.A.M., Straathof A.J.J., Short-cut calculations for integrated product recovery options in fermentative production of bio-bulk chemicals. Process Biochemistry, Accepted

_____________________________________________________________________________
119
Curriculum vitae Corjan van den Berg was born on the 23th of March in 1981 in Bennekom. He finished Higher General secondary education at the Ichthus College in Veenendaal in 1998. That same year he started his BSc. in Laboratory Science at Larenstein International Agricultural College in Velp, with a specialization on Food Analysis. During this study he did 2 internships. The first internship was done at Royal Numico in Wageningen where he studied the gastro-intestinal breakdown of fibers. The second internship was done at TNO Food where he studied the interaction between folate and the folate binding protein under several physiological conditions. In 2002 he received his BSc. degree and continued with an MSc in Biotechnology at Wageningen University. His specialization was “Food Fermentation and Enzymology” and his thesis was on soy peptide classifications and separations, which was done at the Food Chemistry department. In 2004 he also did an internship in New Zealand where he worked on enzyme isolations from milk. In July 2005 he started working on his PhD at TNO, which is described in this thesis. Currently, he is working at Delft University of Technology as a post-doc researcher on the integration of separations with bio-based production processes.

_____________________________________________________________________________
120
Nawoord Dit proefschrift is het resultaat van vier jaar buffelen/onderzoek bij de Scheidingstechnologie groep bij TNO. Mede door een groot aantal inspirerende collega’s en de goede sfeer heb ik het succesvol weten af te ronde. Daarom wil ik de volgende personen speciaal bedanken. Toen ik in 2005 aan mijn aio-schap begon had ik nog weinig kaas gegeten van scheidingstechnologie. Daarom wil ik de volgende mensen die mij wegwijs hebben gemaakt in dit veld, speciaal bedanken. Promotor Luuk van der Wielen, graag wil ik je bedanken voor het mogelijk maken dat ik kan promoveren (en post-doc’en!). Johan Vente, de hoeveelheid geduld die jij moet hebben gehad aan het begin van mijn project moet toch wel van epische proporties zijn geweest. Dank hiervoor! Paul Bussmann, de quote “het klopt pas als het een differentiaal is” is er eentje om te onthouden en jouw kritische opmerkingen kon ik eigenlijk altijd pas achteraf waarderen! Zen-master Dirk, ik vond het ontzettend fijn om mijn werk met je te bespreken ondanks dat ik meestal weg ging met meer vragen dan antwoorden (sorry voor dit cliché, maar het is niet anders). Mark, jouw onuitputtelijke creativiteit heeft mij op ontzettend veel goede ideeën gebracht. Een andere creatieve wervelwind die niet onvermeld mag blijven is Earl, jij ook van harte bedankt voor alle C6H12O6-geïnduceerde input. De ideëen-yield die jij behaald op een suikerklontje vereist geen “idea-removal”. José, I enjoyed every minute we worked together on making and evaluating the capsules. Yong-Ying, you gave me a lot of insight in how the resins interacted with the micro-organisms. I have fond memories from the time you both did your internship at TNO. Arjan Oudshoorn, helaas hebben we maar één hoofdstuk samen geschreven, maar met de nieuwe onderwerpen waar we beiden aan werken gloort er weer hoop aan de horizon. Adrie Straathof, jij ook bedankt voor je kritische blik op het laatste hoofdstuk. Ik hoop nog vele jaren van je te kunnen leren. Speciaal wil ik Nick Wierckx bedanken voor alle hulp die hij mij heeft geboden tijdens het fermenteren. Zonder jou was ik nu nog bezig met hoofdstuk 2 vrees ik. Floor Boon, enorm bedankt voor de hulp bij al mijn massatransport problemen. De sociale aspecten op het werk mogen ook niet onderschat worden dus ik wil de volgende collega’s vooral bedanken voor de gezelligheid in het printhok/’t Keldertje/hangtafel: Jean-Paul, Frank, Suzanne, Luaine, Harald, Eva, Arjan, Karin en Rita Marjon, ik heb ontzettend veel van je geleerd en ik wil je nogmaals bedanken voor alle support en de dingen die we gedeeld hebben de laatste jaren. Binnenkort weer eens Indisch eten bij jou in de buurt? Peter Geerdink, de vakanties met jou waren onvergetelijk en ik kijk nu al uit naar onze volgende trip (ik heb goede verhalen gehoord over Zuid-Amerika). Marnix, Gert, Fieke, Laurens, de Weekenstrootjes, bedankt voor alle me(n)tal support in wat voor vorm dan ook. Joost, jij speciaal bedankt voor de prachtige voorkant die je hebt gemaakt! Zonder jouw lay-out skills had ik waarschijnlijk een draak van een “paint-voorkant” moeten maken.
_____________________________________________________________________________
121
Tijdens het aio-schap zijn echter de mede-ISPR’ers mijn belangrijkste toeverlaat geworden voor het gehele promotie-traject. Louise, jouw warme persoonlijkheid zal ik nooit vergeten! Jan Harm, wie had er gedacht dat we na onze ludieke actie op de WUR we elkaar nog tegen zouden komen!? Ik vind het ontzettend fijn dat je een persoonlijk toeverlaat kon zijn tijdens periodes waarin ik het promoveren even niet zag zitten. Als laatste wil ik mijn ouders en Maarten bedanken voor de niet aflatende support tijdens mijn aio-schap, maar ook zeker tijdens alle voorgaande studies! Zonder jullie was ik absoluut niet gekomen waar ik nu ben… Corjan