Coupled cell-free synthesis and lipid vesicle insertion of a functional oligomeric channel MscL
Upload
independentCategory
view
4download
0
Quantitative Analysis of Tethered Vesicle Assemblies by QuartzCrystal Microbalance with Dissipation Monitoring: Binding Dynamics
and Bound Water Content
Ankit R. Patel and Curtis W. Frank*
Soft Materials Laboratory, Department of Chemical Engineering, Stanford UniVersity,Stanford, California 94305-5025
ReceiVed April 18, 2006. In Final Form: June 29, 2006
To implement the molecular recognition properties of membrane proteins for applications including biosensors anddiagnostic arrays, the construction of a biomimetic platform capable of maintaining protein structure and function isrequired. In this paper, we describe a tethered phospholipid vesicle assembly that overcomes the major limitationsof planar supported lipid bilayers and alternative biomimetic membrane platforms and characterize it using quartzcrystal microbalance with dissipation monitoring (QCM-D) and fluorescence microscopy. We provide evidence ofa one-step mechanism for bilayer formation and monitor the subsequent adsorption and binding of streptavidin,vesicles, and streptavidin-coated microspheres. For all three species, we identify a critical surface density above whicha significant amount of coupled interstitial water contributes to the response of the quartz resonator in a phenomenonsimilar to dynamic coupling due to surface roughness. A Sauerbrey-type analysis is sufficient to accurately interpretthe QCM-D results for streptavidin binding if water is treated as an additional inertial mass, but viscoelastic modelsmust be invoked for vesicle and microsphere binding. Additionally, we present evidence of vesicle flattening, possiblyenhanced by a biotin-mediated membrane-membrane interaction.
Introduction
Since the first studies of the planar supported lipid bilayer(PSLB) by Tamm and McConnell,1 much attention has beendirected toward the development of a general, robust modelmembrane able to house a variety of membrane proteins. Sucha model system could provide a biomimetic platform to investigateimportant physiological processes such as vesicle fusion.Moreover, it could have potential applications in biologicalsensors, diagnostic devices, molecular separation systems, andlab-on-a-chip devices. Black lipid membranes and those createdfrom patch clamp techniques have been used to probe membraneproteins for quite some time,2,3 but these systems are extremelyunstable with short lifetimes on the order of hours. Although thePSLB is an excellent system for studying the lateral mobility oflipids and small membrane constituents, incorporation offunctional transmembrane proteins has met with limited successdue to the close proximity of the solid substrate. One strategyto overcome unfavorable protein-substrate interactions has beento separate the PSLB from the substrate by the use of a thin,water-swollen polymeric layer.4-7 However, these membranesfrequently suffer from dewetting, defects, and low fluidity inaddition to requiring a great deal of optimization.
In 2001, Boukobza et al.8 reported a lipid assembly in whichintact, phospholipid vesicles were attached to a PSLB via a biotin-
avidin coupling system, thus preventing soluble proteins encap-sulated within the vesicle from interacting unfavorably with thesurface. This system maintains the integrity of the vesicle,passivates the surface, and also provides a fluid, defect-freemembrane for membrane proteins while preventing potentialprotein-substrate interactions. More recently, Yoshina-Ishii andBoxer9 demonstrated that a phospholipid vesicle tethered to alipid bilayer via complementary oligonucleotide coupling islaterally mobile, and they measured diffusion coefficients viasingle-particle tracking.
In this paper, we follow the formation of the tetheredphospholipid vesicle assembly schematically depicted in Figure1a using fluorescence microscopy and quartz crystal microbalancewith dissipation monitoring (QCM-D). Going beyond thenumerous studies using QCM-D to understand various phos-pholipid systems in a qualitative manner that have recentlyappeared in the literature, we attempt to take the first steps towarda more quantitative understanding of QCM-D data through theapplication of appropriate models. The tethered vesicle assemblyconsists of a phospholipid vesicle, composed mostly of phos-phatidylcholine lipids (e.g., a natural lipid mixture extracted fromchicken egg yolk) and a small fraction of biotinylated phos-phoethanolamine, tethered to a similarly biotinylated PSLBthrough streptavidin, a tetrameric,∼60,000 Da protein with highbinding affinity and specificity for biotin. The ubiquitous biotin-streptavidin interaction provides an easy, well-studied linkageto tether the vesicle to the bilayer. The high binding strength,extremely low dissociation constant, and fast binding kineticsprovide a very stable, easily formed coupling.
The tethered vesicles themselves provide a fluid, defect-freeenvironment for the incorporation of membrane proteins, whilethe underlying bilayer passivates the surface and prevents potentialprotein-substrate interactions. Furthermore, because the un-derlying bilayer is also fluid, the assembly should permit thetransport of tethered vesicles and their contents along the surface
* To whom correspondence should be addressed. Phone: (650) 723-4573. E-mail: [email protected].
(1) Tamm, L. K.; McConnell, H. M.Biophys. J.1985, 47, 105-113.(2) Kelly, M. L.; Woodbury, D. J. InPlanar Lipid Bilayers (BLMs) and Their
Applications, 1st ed.; Tien, H. T., Ottova-Leitmannova, A., Eds.; Elsevier ScienceB.V.: Amsterdam, 2003; Vol. 7, pp 699-721.
(3) Winterhalter, M.Curr. Opin. Colloid Interface Sci.2000, 5, 250-255.(4) Sackmann, E.Science1996, 271, 43-48.(5) Wagner, M. L.; Tamm, L. K.Biophys. J.2000, 79, 1400-1414.(6) Knoll, W.; Frank, C. W.; Heibel, C.; Naumann, R.; Offenhausser, A.;
Ruhe, J.; Schmidt, E. K.; Shen, W. W.; Sinner, A.ReV. Mol. Biotechnol.2000,74, 137-158.
(7) Tanaka, M.; Sackmann, E.Nature2005, 437, 656-663.(8) Boukobza, E.; Sonnenfeld, A.; Haran, G.J. Phys. Chem. B2001, 105,
12165-12170. (9) Yoshina-Ishii, C.; Boxer, S. G.J. Am. Chem. Soc.2003, 125, 3696-3697.
7587Langmuir2006,22, 7587-7599
10.1021/la0610452 CCC: $33.50 © 2006 American Chemical SocietyPublished on Web 08/08/2006

of thebilayer forpotential lab-on-a-chipapplications.The integrityof the assembly is assured due to the high stability of phospholipidvesicles. In addition, the configuration permits the use of powerfulsurface-sensitive techniques to probe structure and molecularinteractions. Thus, it may serve as an excellent candidate platformto study interactions between different membranes and betweenmembrane proteins and membranes, as well as protein-proteinand protein-ligand interactions.
Background on QCM Methods
The quartz crystal microbalance has been used routinely sincethe late 1950s to determine thicknesses of evaporated metal films.Lu and Czanderna present an excellent review of the earlyapplications of the QCM in vacuum science.10 The first reports
of a QCM operating in liquid appeared in 1980,11,12 and soonthereafter, Kanazawa and Gordon13,14 showed the dependenceof the resonant frequency on the fluid viscosity and density. Thiswas followed by theoretical predictions of the QCM responsein viscoelastic media as well as experimental and theoreticalwork on the shape of the resonance and other crystal propertiesat resonance (e.g., impedance, conductance).15-18 The QCMtechnique has since been extended to a variety of applications,including the adsorption behavior of soft/biological materials atsolid-liquid interfaces. Several reviews are available.19-21Withinthe past 10 years, a variation on the traditional QCM techniquewas first reported by Rodahl et al.22,23 in which the dissipationfactor (D), essentially a measure of the damping characteristicsof the film, was concurrently measured with the resonantfrequency and then used to extract viscoelastic and structuralinformation about the film atop the resonator.
Sauerbrey’s pioneering work24 showed that the shift of theresonant frequency of the quartz resonator is linearly proportionalto the mass of the deposited film as long as the film is (1) uniform,(2) thin compared to the thickness of the crystal, and (3) rigid/elastic such that it can be treated as an extension of the quartzcrystal:
where∆f is the change in the quartz resonant frequency fromits unloaded state due to addition of a film of mass∆m withdensityFF and thickness∆tF. The constant of proportionality,Cm, is given by
in which fn is the resonant frequency of the unloaded crystal atthenth harmonic,Fq is the density of quartz (2648 kg/m3), andVq is the shear wave propagation velocity in quartz (3340 m/s).
Kanazawa and Gordon13,14 showed that a quartz resonatorwith one face immersed in a Newtonian liquid has a frequencydependence that is proportional to the square root of the productof the viscosity,ηL, and density,FL, of the liquid:
whereµq is the piezoelectrically stiffened elastic shear modulusof quartz (2.947× 10¹⁰ Pa). For appropriately thin and rigidfilms in solution, the frequency shifts due to the liquid and tothe mass of the film are additive, and the film mass can beestablished in liquid environments using a Sauerbrey-type
(10) Lu, C.; Czanderna, A. W.Applications of Piezoelectric Quartz CrystalMicrobalances; Elsevier Science Publishers: New York, 1984; Vol. 7.
(11) Nomura, T.; Minemura, A.Nippon Kagaku Kaishi1980, 1621-1625.(12) Konash, P. L.; Bastiaans, G. J.Anal. Chem.1980, 52, 1929-1931.(13) Kanazawa, K. K.; Gordon, J. G.Anal. Chem.1985, 57, 1770-1771.(14) Kanazawa, K. K.; Gordon, J. G.Anal. Chim. Acta1985, 175, 99-105.(15) Reed, C. E.; Kanazawa, K. K.; Kaufman, J. H.J. Appl. Phys.1990, 68,
1993-2001.(16) White, C. C.; Schrag, J. L.J. Chem. Phys.1999, 111, 11192-11206.(17) Voinova, M. V.; Rodahl, M.; Jonson, M.; Kasemo, B.Phys. Scr.1999,
59, 391-396.(18) Martin, S. J.; Bandey, H. L.; Cernosek, R. W.; Hillman, A. R.; Brown,
M. J. Anal. Chem.2000, 72, 141-149.(19) Ward, M. D.; Buttry, D. A.Science1990, 249, 1000-1007.(20) Buttry, D. A.; Ward, M. D.Chem. ReV. 1992, 92, 1355-1379.(21) Marx, K. A. Biomacromolecules2003, 4, 1099-1120.(22) Rodahl, M.; Hook, F.; Krozer, A.; Brzezinski, P.; Kasemo, B.ReV. Sci.
Instrum.1995, 66, 3924-3930.(23) Rodahl, M.; Kasemo, B. 9th National Conference on Synchrotron Radiation
Instrumentation.ReV. Sci. Instrum.1996, 67, 3238-3241.(24) Sauerbrey, G.Z. Phys.1959, 155, 206-222.
Figure 1. (a) The tethered vesicle assembly consists of a biotinylatedphospholipid vesicle tethered to a planar supported lipid bilayer viastreptavidin and provides a fluid, defect-free environment formembrane proteins while preventing protein-substrate interactions.(b) An overview of the tethered vesicle assembly system and self-assembly process.
∆f ) -Cm∆m ) -CmFF∆tF (1)
Cm )2fn
2
nFqVq(2)
∆f ) -n1/2f13/2( FLηL
πFqµq)1/2
(3)
7588 Langmuir, Vol. 22, No. 18, 2006 Patel and Frank
analysis16,25 provided the film is thin, rigid, and uniform. Forthicker or less rigid films, a more complex analysis must beundertaken, and several viscoelastic models are available.15-18
Materials and Methods
Materials. Egg yolk derivedL-R-phosphatidylcholine (egg PC)and 1,2-dipalmitoyl-sn-glycero-3-phosphoethanolamine-N-(Cap bi-otinyl), sodium salt (Biotin-X-PE), were purchased from AvantiPolar Lipids (Alabaster, AL) in chloroform and used without furtherpurification. Dilutions were performed with “PHOTREX” gradechloroform (J. T. Baker, Phillipsburg, NJ). For fluorescence work,N-(7-nitrobenz-2-oxa-1,3-diazol-4-yl)-1,2-dihexadecanoyl-sn-glyc-ero-3-phosphoethanolamine, triethylammonium salt (NBD-PE), andTexas Red 1,2-dihexadecanoyl-sn-glycero-3-phosphoethanolamine,triethylammonium salt (Texas Red PE), were purchased fromMolecular Probes (Eugene, OR) and used for liposome preparationafter being dissolved in chloroform. Lyophilized, essentially salt-free, affinity-purified streptavidin derived fromStreptomyces aVidiniiwas purchased from Sigma (St. Louis, MO) and used after beingsolubilized in a 10 mM Tris (Invitrogen Life Technologies, Carlsbad,CA), 100 mM sodium chloride (Mallinckrodt Laboratory Chemicals,Phillipsburg, NJ) aqueous solution with pH adjusted to 8.0 (buffer).Streptavidin-coated microspheres were purchased from BangsLaboratories (Fishers, IN) and prepared for use as described below.Sodium dodecyl sulfate (SDS) for substrate cleaning and storagewas purchased from VWR Scientific (West Chester, PA) and useddirectly. Water was obtained from a Milli-Q RO system (Millipore,Billerica, MA) with a product resistivity of 18.2 MΩ.
Preparation of Liposomes.To clean glassware, a 20-25% (byvolume) aqueous solution of 7× detergent concentrate (MPBiomedicals, Aurora, OH) was prepared and heated to clarity. Theglassware was first rinsed with ethanol and water and then incubatedin this bath for a minimum of 20 min followed by extensive rinsingwith deionized water, acetone, and finally chloroform. Chloroformsolutions of lipid were prepared in clean round-bottom flasks at afinal lipid concentration of 5 mg/mL and dried under a slow streamof nitrogen to form a thin, uniform lipid film, which was subsequentlydried in a vacuum desiccator for a minimum of 2 h (usually overnight)to remove residual chloroform. The dried lipid film was then hydratedwith either water or buffer while being mixed vigorously and thenextruded through a track-etched polycarbonate membrane (Millipore)a minimum of 20 times using an Avanti MiniExtruder to achievea narrow, unimodal, vesicle distribution. To obtain vesicles smallerthan 60 nm, the hydrated lipid solution was first extruded throughan 80 nm pore diameter membrane and then a membrane with a 30nm nominal pore size. Vesicle size distribution was immediatelycharacterized using the 90 Plus particle size analyzer (BrookhavenInstruments, Holtsville, NY). The resulting correlation function fromthe dynamic light scattering (DLS) data was fit using both theCONTIN algorithm and the non-negative least squares (NNLS)method, with good agreement between the two calculated sizedistributions. Vesicle solutions were usually used within 1 h ofpreparation, but not more than 36 h after being extruded. Sizedistributions were taken simultaneously with each QCM-D run toensure direct comparability between batches of vesicle solution.Vesicles were prepared at a concentration of∼5 mg/mL, but werediluted to a final lipid concentration of 1 mM before use.
Preparation of Substrates for Fluorescence Microscopy andQCM-D. Glass microscope coverslips were purchased from VWRInternational (West Chester, PA), and quartz crystal substrates witha 50 nm SiO2 surface coating covering one gold electrode werepurchased from Q-Sense, Inc. (Newport Beach, CA). The quartzcrystals were stored in a 0.1 M solution of SDS. Just prior to use,the substrates were rinsed extensively with Milli-Q water and ethanoland dried under a stream of nitrogen gas. Once dried, they weresubjected to oxygen plasma treatment in a March Plasmod (MarchInstruments, Inc., Concord, CA) operating at 1 torr and 100 W forward
power for 2 min. Following plasma treatment, the substrates werebriefly rinsed with ethanol, dried under a stream of N2 gas, and usedimmediately.
QCM-D Measurements.The Q-Sense D300 system with theQAFC301 axial sample chamber (Q-Sense, Inc., Newport Beach,CA) was used for all measurements. A complete description of theinstrument has been given by Rodahl and Kasemo.23 All runs wereperformed at 25.09( 0.02 °C with each solution introduced intothe flow chamber under gravity-driven flow with an approximateflow rate of 8 mL/min. Frequency shifts of all four resonances(fundamental resonance as well as the third, fifth, and seventhharmonics) were recorded using Qsoft 301 software v.1.6.14.47.The frequency search range was(200 kHz around the resonantfrequency, and the crystal drive amplitude was set at 2.00 units.
Fluorescence Microscopy and Fluorescence Recovery AfterPhotobleaching (FRAP).Fluorescence microscopy was performedon a Nikon Eclipse E800 microscope with an epifluorescenceattachment (Nikon USA, Melville, NY). Illumination was providedby a super-high-pressure mercury lamp passed through an NBDfilter set (EX 435-485 nm, DM 500, BA 515-555 nm). Sampleswere imaged by a Photometrics Cool SNAP HQ cooled CCD camera(Tucson, AZ) interfaced with a personal computer running UniversalImaging’s Metamorph 6.0r5 imaging software (Downingtown, PA).
For fluorescence microscopy of the tethered vesicle assembly,the glass substrate was affixed to a poly(dimethylsiloxane) (PDMS)flow cell enabling fast switching of the solutions exposed to thesurface and easy rinsing. All samples were imaged directly throughthe backside of the microscope coverslip substrate using a NikonPlan Fluor 40× objective.
FRAP experiments were performed by closing the field diaphragmof the microscope and bleaching the small exposed region (∼30µmdiameter) of the fluorescently labeled bilayer for 15 s. The diaphragmwas then immediately opened to allow the entire field of view tobe imaged, and data collection began immediately.
Construction of the Tethered Vesicle Assembly.Figure 1bpresents an overview of the assembly process.
In the first step, the cleaned substrate was exposed to an osmoticallyshocked vesicle solution (1 mM lipid concentration) to form abiotinylated supported lipid bilayer. To accomplish this, a 5 mg/mLsolution of biotinylated vesicles was prepared by first hydrating adried lipid film containing a small percentage of biotinylated lipidwith Milli-Q water, then extruding the suspension through an 80 nmpore diameter membrane, and finally extruding it through a 30 nmpore diameter membrane. Immediately prior to injection into thesample chamber, the vesicle solution was diluted with buffer to alipid concentration of 1 mM to provide a difference in osmoticpressure across the membrane.
In the second step, the chamber was flushed several times withboth water and buffer to remove excess vesicles and demonstratestability of the biotinylated supported planar bilayer followed byinjection of a 0.0833 mg/mL solution of streptavidin in buffer, whichwas allowed to bind to the bilayer. This was followed by a bufferrinse to remove excess streptavidin.
In the final step, biotinylated vesicles, prepared in buffer andextruded through a 100 nm pore diameter membrane 41 times toachieve a unimodal size distribution centered around 120 nm( 5nm, were introduced into the chamber after it had been flushed ofexcess streptavidin. One hour was allowed for these vesicles to bindto the surface, after which alternating water and buffer rinses wereused to remove any nonspecifically bound vesicles.
Purification/Preparation of Streptavidin-Coated Micro-spheres.Streptavidin-coated microspheres in batches of 2 mL,supplied in a formulation of 1 mg/mL of 100 mM borate, pH 8.5,0.1% BSA, 0.05% Tween 20, and 10 mM EDTA, were dialyzedagainst 1 L of buffer (10 mM Tris, 100 mM NaCl, pH 8.0) througha 300,000 molecular weight cutoff Spectra/Por cellulose estermembrane (Spectrum Laboratories, Inc., Rancho Dominguez, CA).This was done to remove the Tween 20 detergent, which wouldotherwise disrupt the supported planar bilayer and vesicles, as wellas to prevent differences in the measured resonant frequency anddissipation factor due to small differences in the viscosity and density
(25) Martin, S. J.; Granstaff, V. E.; Frye, G. C.Anal. Chem.1991, 63, 2272-2281.
Tethered Phospholipid Vesicle Assemblies Langmuir, Vol. 22, No. 18, 20067589
of the two differing buffer solutions. The dialysis buffer wasexchanged three times.
The microspheres were diluted to a final concentration of∼8mg/mL to roughly match the concentration of vesicles used in vesicletethering experiments. To prevent aggregation of the microspheres,they were diluted with buffer (10 mM, 100 mM NaCl, pH 8.0)containing 1% bovine serum albumin (BSA) by weight to act as ablocking agent. To break up any aggregates, the diluted solution wasthen sonicated for 90 min atT < 15 °C in a Fisher Scientific FS 20bath sonicator (Hampton, NH) just prior to use. Extensive controlswere run to ensure that the solution did not disrupt the lipid bilayerand that there was no nonspecific adsorption (data not shown).
Results
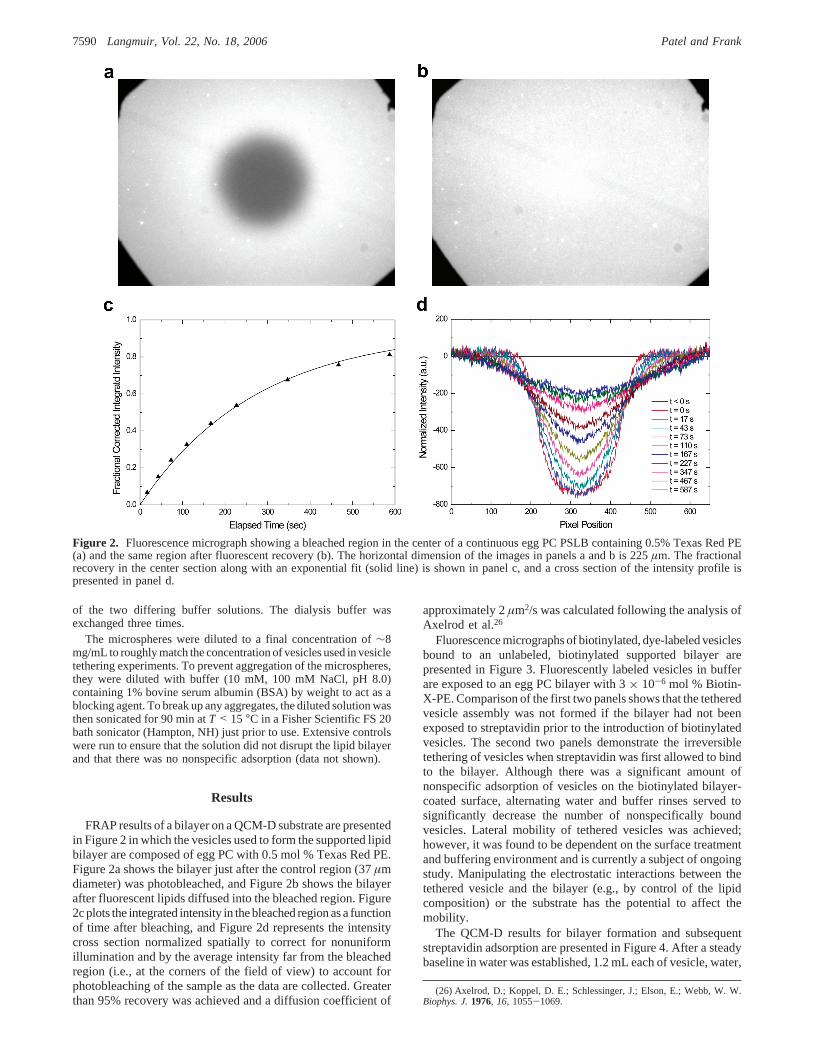
FRAP results of a bilayer on a QCM-D substrate are presentedin Figure 2 in which the vesicles used to form the supported lipidbilayer are composed of egg PC with 0.5 mol % Texas Red PE.Figure 2a shows the bilayer just after the control region (37µmdiameter) was photobleached, and Figure 2b shows the bilayerafter fluorescent lipids diffused into the bleached region. Figure2c plots the integrated intensity in the bleached region as a functionof time after bleaching, and Figure 2d represents the intensitycross section normalized spatially to correct for nonuniformillumination and by the average intensity far from the bleachedregion (i.e., at the corners of the field of view) to account forphotobleaching of the sample as the data are collected. Greaterthan 95% recovery was achieved and a diffusion coefficient of
approximately 2µm2/s was calculated following the analysis ofAxelrod et al.26
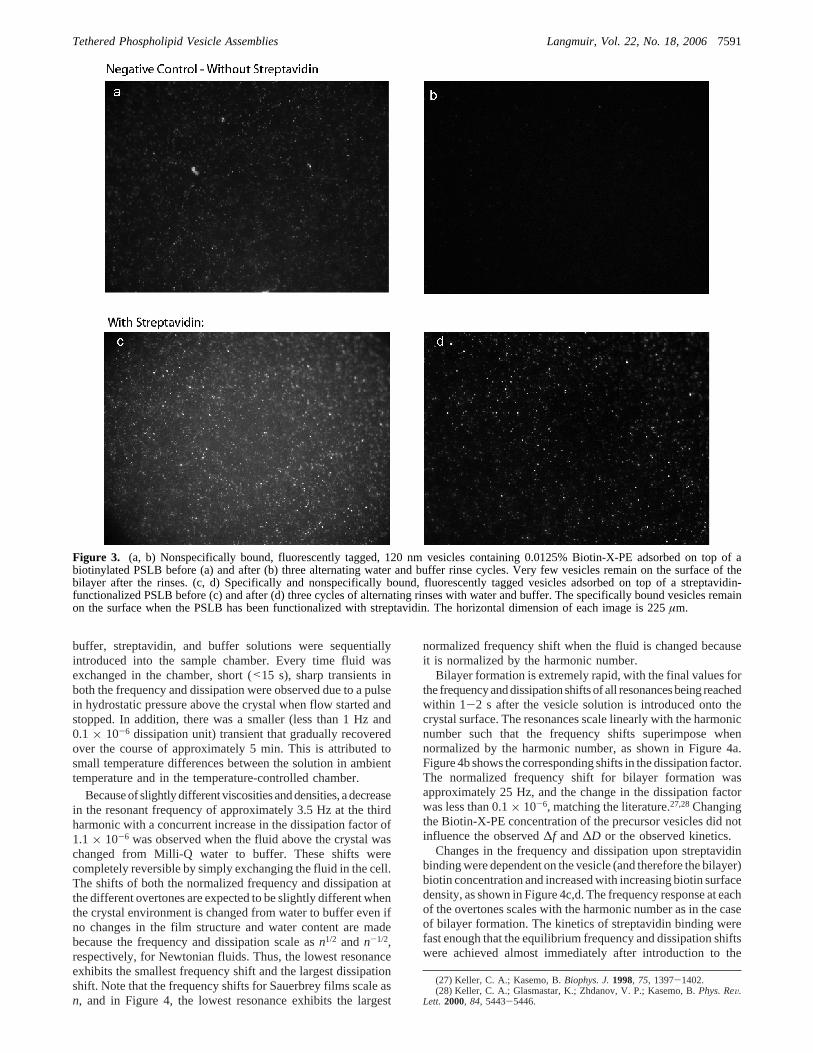
Fluorescence micrographs of biotinylated, dye-labeled vesiclesbound to an unlabeled, biotinylated supported bilayer arepresented in Figure 3. Fluorescently labeled vesicles in bufferare exposed to an egg PC bilayer with 3× 10⁻⁶ mol % Biotin-X-PE. Comparison of the first two panels shows that the tetheredvesicle assembly was not formed if the bilayer had not beenexposed to streptavidin prior to the introduction of biotinylatedvesicles. The second two panels demonstrate the irreversibletethering of vesicles when streptavidin was first allowed to bindto the bilayer. Although there was a significant amount ofnonspecific adsorption of vesicles on the biotinylated bilayer-coated surface, alternating water and buffer rinses served tosignificantly decrease the number of nonspecifically boundvesicles. Lateral mobility of tethered vesicles was achieved;however, it was found to be dependent on the surface treatmentand buffering environment and is currently a subject of ongoingstudy. Manipulating the electrostatic interactions between thetethered vesicle and the bilayer (e.g., by control of the lipidcomposition) or the substrate has the potential to affect themobility.
The QCM-D results for bilayer formation and subsequentstreptavidin adsorption are presented in Figure 4. After a steadybaseline in water was established, 1.2 mL each of vesicle, water,
(26) Axelrod, D.; Koppel, D. E.; Schlessinger, J.; Elson, E.; Webb, W. W.Biophys. J.1976, 16, 1055-1069.
Figure 2. Fluorescence micrograph showing a bleached region in the center of a continuous egg PC PSLB containing 0.5% Texas Red PE(a) and the same region after fluorescent recovery (b). The horizontal dimension of the images in panels a and b is 225µm. The fractionalrecovery in the center section along with an exponential fit (solid line) is shown in panel c, and a cross section of the intensity profile ispresented in panel d.
7590 Langmuir, Vol. 22, No. 18, 2006 Patel and Frank
buffer, streptavidin, and buffer solutions were sequentiallyintroduced into the sample chamber. Every time fluid wasexchanged in the chamber, short (<15 s), sharp transients inboth the frequency and dissipation were observed due to a pulsein hydrostatic pressure above the crystal when flow started andstopped. In addition, there was a smaller (less than 1 Hz and0.1 × 10-6 dissipation unit) transient that gradually recoveredover the course of approximately 5 min. This is attributed tosmall temperature differences between the solution in ambienttemperature and in the temperature-controlled chamber.
Because of slightly different viscosities and densities, a decreasein the resonant frequency of approximately 3.5 Hz at the thirdharmonic with a concurrent increase in the dissipation factor of1.1× 10-6 was observed when the fluid above the crystal waschanged from Milli-Q water to buffer. These shifts werecompletely reversible by simply exchanging the fluid in the cell.The shifts of both the normalized frequency and dissipation atthe different overtones are expected to be slightly different whenthe crystal environment is changed from water to buffer even ifno changes in the film structure and water content are madebecause the frequency and dissipation scale asn1/2 and n-1/2,respectively, for Newtonian fluids. Thus, the lowest resonanceexhibits the smallest frequency shift and the largest dissipationshift. Note that the frequency shifts for Sauerbrey films scale asn, and in Figure 4, the lowest resonance exhibits the largest
normalized frequency shift when the fluid is changed becauseit is normalized by the harmonic number.
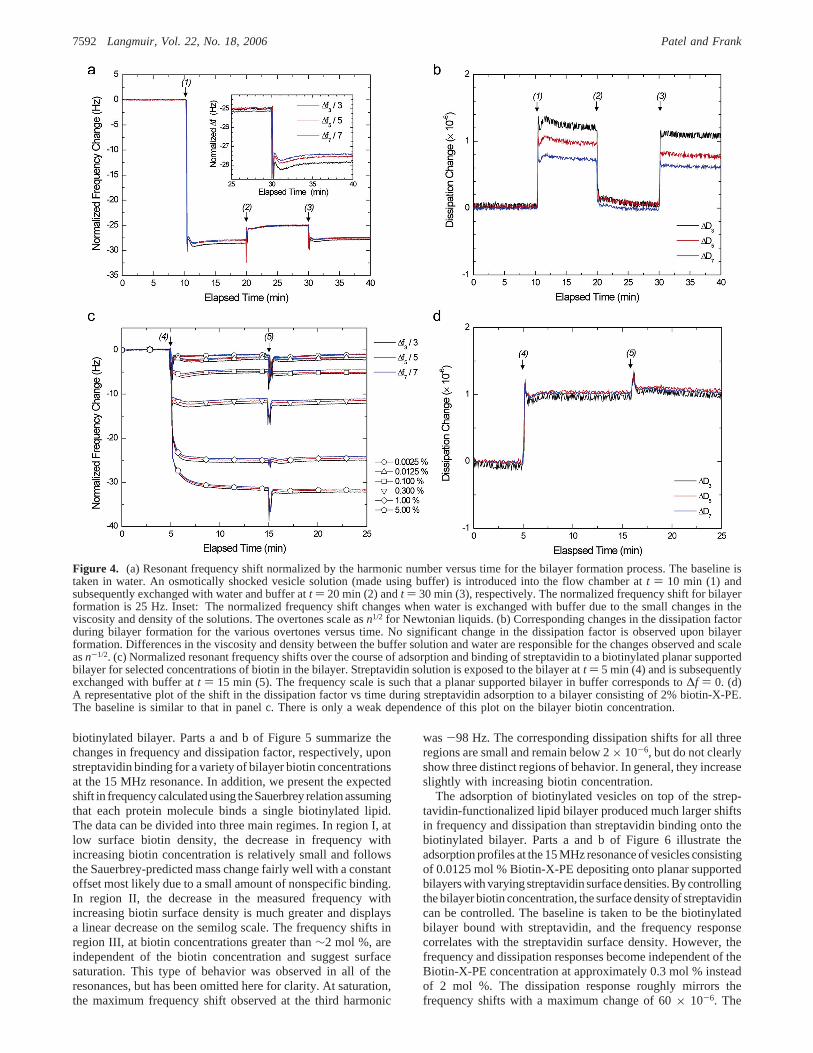
Bilayer formation is extremely rapid, with the final values forthe frequencyanddissipationshiftsofall resonancesbeing reachedwithin 1-2 s after the vesicle solution is introduced onto thecrystal surface. The resonances scale linearly with the harmonicnumber such that the frequency shifts superimpose whennormalized by the harmonic number, as shown in Figure 4a.Figure 4b shows the corresponding shifts in the dissipation factor.The normalized frequency shift for bilayer formation wasapproximately 25 Hz, and the change in the dissipation factorwas less than 0.1× 10⁻⁶, matching the literature.27,28Changingthe Biotin-X-PE concentration of the precursor vesicles did notinfluence the observed∆f and∆D or the observed kinetics.
Changes in the frequency and dissipation upon streptavidinbinding were dependent on the vesicle (and therefore the bilayer)biotin concentration and increased with increasing biotin surfacedensity, as shown in Figure 4c,d. The frequency response at eachof the overtones scales with the harmonic number as in the caseof bilayer formation. The kinetics of streptavidin binding werefast enough that the equilibrium frequency and dissipation shiftswere achieved almost immediately after introduction to the
(27) Keller, C. A.; Kasemo, B.Biophys. J.1998, 75, 1397-1402.(28) Keller, C. A.; Glasmastar, K.; Zhdanov, V. P.; Kasemo, B.Phys. ReV.
Lett. 2000, 84, 5443-5446.
Figure 3. (a, b) Nonspecifically bound, fluorescently tagged, 120 nm vesicles containing 0.0125% Biotin-X-PE adsorbed on top of abiotinylated PSLB before (a) and after (b) three alternating water and buffer rinse cycles. Very few vesicles remain on the surface of thebilayer after the rinses. (c, d) Specifically and nonspecifically bound, fluorescently tagged vesicles adsorbed on top of a streptavidin-functionalized PSLB before (c) and after (d) three cycles of alternating rinses with water and buffer. The specifically bound vesicles remainon the surface when the PSLB has been functionalized with streptavidin. The horizontal dimension of each image is 225µm.
Tethered Phospholipid Vesicle Assemblies Langmuir, Vol. 22, No. 18, 20067591
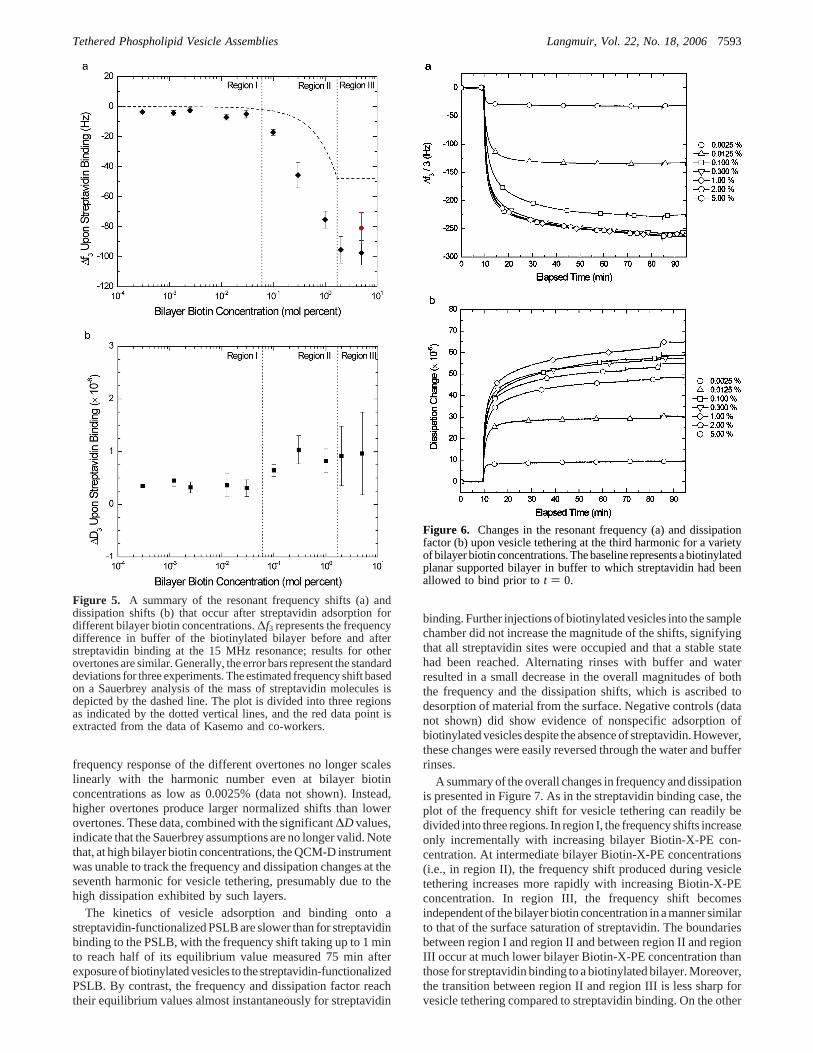
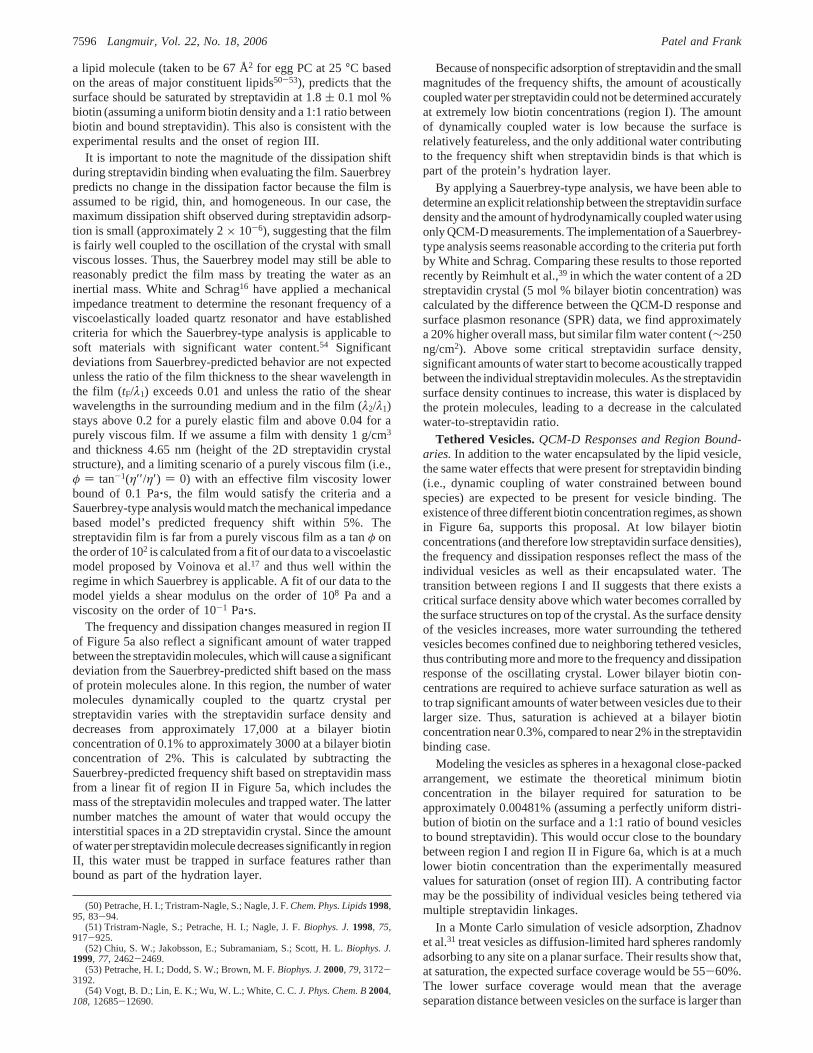
biotinylated bilayer. Parts a and b of Figure 5 summarize thechanges in frequency and dissipation factor, respectively, uponstreptavidin binding for a variety of bilayer biotin concentrationsat the 15 MHz resonance. In addition, we present the expectedshift in frequencycalculatedusing theSauerbrey relationassumingthat each protein molecule binds a single biotinylated lipid.The data can be divided into three main regimes. In region I, atlow surface biotin density, the decrease in frequency withincreasing biotin concentration is relatively small and followsthe Sauerbrey-predicted mass change fairly well with a constantoffset most likely due to a small amount of nonspecific binding.In region II, the decrease in the measured frequency withincreasing biotin surface density is much greater and displaysa linear decrease on the semilog scale. The frequency shifts inregion III, at biotin concentrations greater than∼2 mol %, areindependent of the biotin concentration and suggest surfacesaturation. This type of behavior was observed in all of theresonances, but has been omitted here for clarity. At saturation,the maximum frequency shift observed at the third harmonic
was-98 Hz. The corresponding dissipation shifts for all threeregions are small and remain below 2× 10⁻⁶, but do not clearlyshow three distinct regions of behavior. In general, they increaseslightly with increasing biotin concentration.
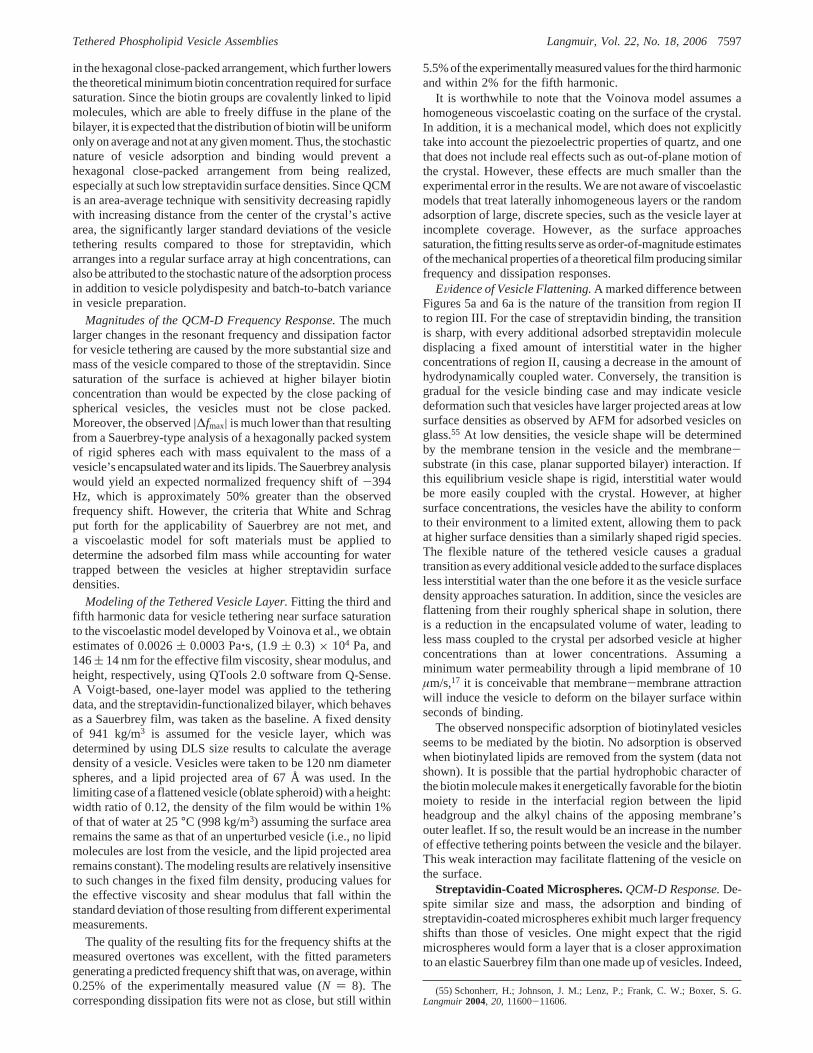
The adsorption of biotinylated vesicles on top of the strep-tavidin-functionalized lipid bilayer produced much larger shiftsin frequency and dissipation than streptavidin binding onto thebiotinylated bilayer. Parts a and b of Figure 6 illustrate theadsorption profiles at the 15 MHz resonance of vesicles consistingof 0.0125 mol % Biotin-X-PE depositing onto planar supportedbilayers with varying streptavidin surface densities. By controllingthe bilayer biotin concentration, the surface density of streptavidincan be controlled. The baseline is taken to be the biotinylatedbilayer bound with streptavidin, and the frequency responsecorrelates with the streptavidin surface density. However, thefrequency and dissipation responses become independent of theBiotin-X-PE concentration at approximately 0.3 mol % insteadof 2 mol %. The dissipation response roughly mirrors thefrequency shifts with a maximum change of 60× 10-6. The
Figure 4. (a) Resonant frequency shift normalized by the harmonic number versus time for the bilayer formation process. The baseline istaken in water. An osmotically shocked vesicle solution (made using buffer) is introduced into the flow chamber att ) 10 min (1) andsubsequently exchanged with water and buffer att ) 20 min (2) andt ) 30 min (3), respectively. The normalized frequency shift for bilayerformation is 25 Hz. Inset: The normalized frequency shift changes when water is exchanged with buffer due to the small changes in theviscosity and density of the solutions. The overtones scale asn1/2 for Newtonian liquids. (b) Corresponding changes in the dissipation factorduring bilayer formation for the various overtones versus time. No significant change in the dissipation factor is observed upon bilayerformation. Differences in the viscosity and density between the buffer solution and water are responsible for the changes observed and scaleasn-1/2. (c) Normalized resonant frequency shifts over the course of adsorption and binding of streptavidin to a biotinylated planar supportedbilayer for selected concentrations of biotin in the bilayer. Streptavidin solution is exposed to the bilayer att ) 5 min (4) and is subsequentlyexchanged with buffer att ) 15 min (5). The frequency scale is such that a planar supported bilayer in buffer corresponds to∆f ) 0. (d)A representative plot of the shift in the dissipation factor vs time during streptavidin adsorption to a bilayer consisting of 2% biotin-X-PE.The baseline is similar to that in panel c. There is only a weak dependence of this plot on the bilayer biotin concentration.
7592 Langmuir, Vol. 22, No. 18, 2006 Patel and Frank
frequency response of the different overtones no longer scaleslinearly with the harmonic number even at bilayer biotinconcentrations as low as 0.0025% (data not shown). Instead,higher overtones produce larger normalized shifts than lowerovertones. These data, combined with the significant∆D values,indicate that the Sauerbrey assumptions are no longer valid. Notethat, at high bilayer biotin concentrations, the QCM-D instrumentwas unable to track the frequency and dissipation changes at theseventh harmonic for vesicle tethering, presumably due to thehigh dissipation exhibited by such layers.
The kinetics of vesicle adsorption and binding onto astreptavidin-functionalized PSLB are slower than for streptavidinbinding to the PSLB, with the frequency shift taking up to 1 minto reach half of its equilibrium value measured 75 min afterexposure of biotinylated vesicles to the streptavidin-functionalizedPSLB. By contrast, the frequency and dissipation factor reachtheir equilibrium values almost instantaneously for streptavidin
binding. Further injections of biotinylated vesicles into the samplechamber did not increase the magnitude of the shifts, signifyingthat all streptavidin sites were occupied and that a stable statehad been reached. Alternating rinses with buffer and waterresulted in a small decrease in the overall magnitudes of boththe frequency and the dissipation shifts, which is ascribed todesorption of material from the surface. Negative controls (datanot shown) did show evidence of nonspecific adsorption ofbiotinylated vesicles despite the absence of streptavidin. However,these changes were easily reversed through the water and bufferrinses.
A summary of the overall changes in frequency and dissipationis presented in Figure 7. As in the streptavidin binding case, theplot of the frequency shift for vesicle tethering can readily bedivided into three regions. In region I, the frequency shifts increaseonly incrementally with increasing bilayer Biotin-X-PE con-centration. At intermediate bilayer Biotin-X-PE concentrations(i.e., in region II), the frequency shift produced during vesicletethering increases more rapidly with increasing Biotin-X-PEconcentration. In region III, the frequency shift becomesindependent of the bilayer biotin concentration in a manner similarto that of the surface saturation of streptavidin. The boundariesbetween region I and region II and between region II and regionIII occur at much lower bilayer Biotin-X-PE concentration thanthose for streptavidin binding to a biotinylated bilayer. Moreover,the transition between region II and region III is less sharp forvesicle tethering compared to streptavidin binding. On the other
Figure 5. A summary of the resonant frequency shifts (a) anddissipation shifts (b) that occur after streptavidin adsorption fordifferent bilayer biotin concentrations.∆f3 represents the frequencydifference in buffer of the biotinylated bilayer before and afterstreptavidin binding at the 15 MHz resonance; results for otherovertones are similar. Generally, the error bars represent the standarddeviations for three experiments. The estimated frequency shift basedon a Sauerbrey analysis of the mass of streptavidin molecules isdepicted by the dashed line. The plot is divided into three regionsas indicated by the dotted vertical lines, and the red data point isextracted from the data of Kasemo and co-workers.
Figure 6. Changes in the resonant frequency (a) and dissipationfactor (b) upon vesicle tethering at the third harmonic for a varietyof bilayer biotin concentrations. The baseline represents a biotinylatedplanar supported bilayer in buffer to which streptavidin had beenallowed to bind prior tot ) 0.
Tethered Phospholipid Vesicle Assemblies Langmuir, Vol. 22, No. 18, 20067593
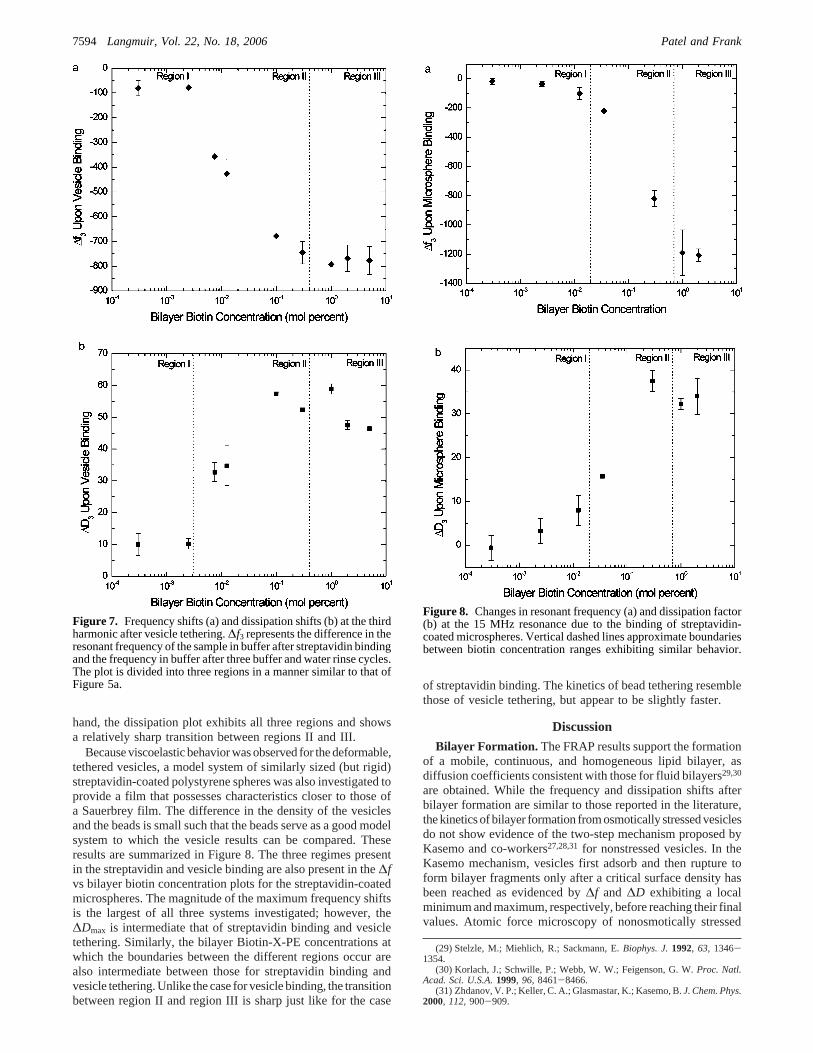
hand, the dissipation plot exhibits all three regions and showsa relatively sharp transition between regions II and III.
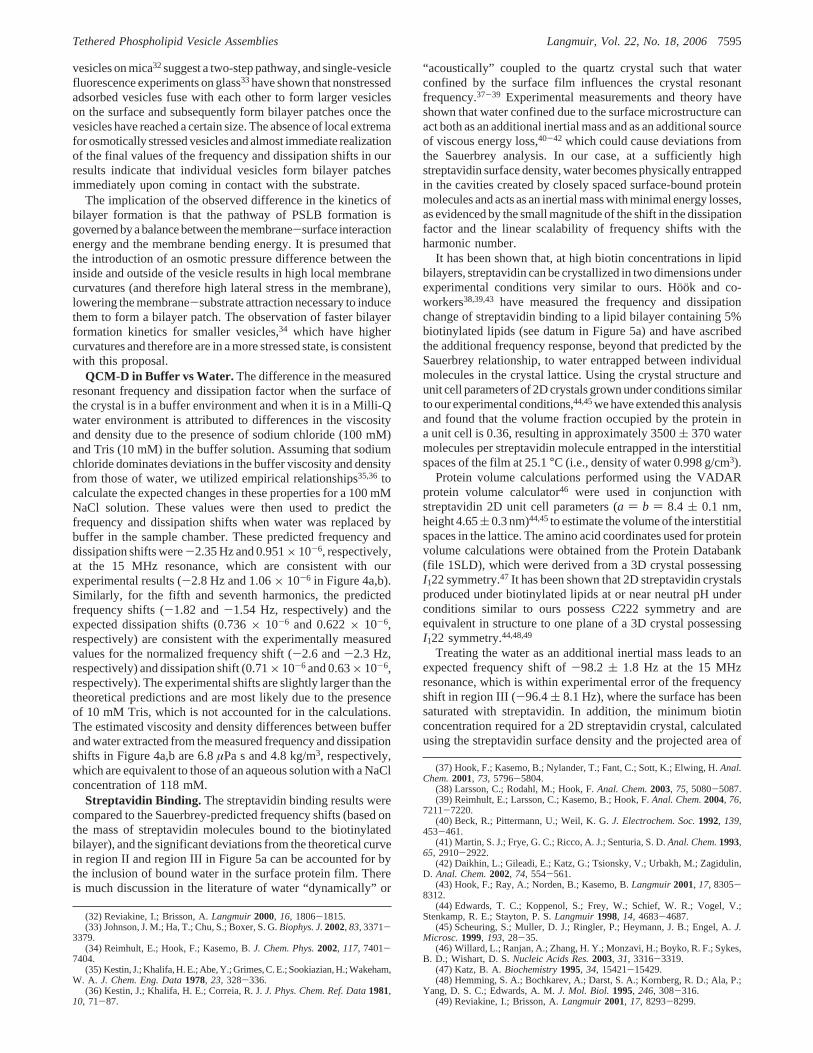
Because viscoelastic behavior was observed for the deformable,tethered vesicles, a model system of similarly sized (but rigid)streptavidin-coated polystyrene spheres was also investigated toprovide a film that possesses characteristics closer to those ofa Sauerbrey film. The difference in the density of the vesiclesand the beads is small such that the beads serve as a good modelsystem to which the vesicle results can be compared. Theseresults are summarized in Figure 8. The three regimes presentin the streptavidin and vesicle binding are also present in the∆fvs bilayer biotin concentration plots for the streptavidin-coatedmicrospheres. The magnitude of the maximum frequency shiftsis the largest of all three systems investigated; however, the∆Dmax is intermediate that of streptavidin binding and vesicletethering. Similarly, the bilayer Biotin-X-PE concentrations atwhich the boundaries between the different regions occur arealso intermediate between those for streptavidin binding andvesicle tethering. Unlike the case for vesicle binding, the transitionbetween region II and region III is sharp just like for the case
of streptavidin binding. The kinetics of bead tethering resemblethose of vesicle tethering, but appear to be slightly faster.
Discussion
Bilayer Formation. The FRAP results support the formationof a mobile, continuous, and homogeneous lipid bilayer, asdiffusion coefficients consistent with those for fluid bilayers29,30
are obtained. While the frequency and dissipation shifts afterbilayer formation are similar to those reported in the literature,the kinetics of bilayer formation from osmotically stressed vesiclesdo not show evidence of the two-step mechanism proposed byKasemo and co-workers27,28,31for nonstressed vesicles. In theKasemo mechanism, vesicles first adsorb and then rupture toform bilayer fragments only after a critical surface density hasbeen reached as evidenced by∆f and ∆D exhibiting a localminimum and maximum, respectively, before reaching their finalvalues. Atomic force microscopy of nonosmotically stressed
(29) Stelzle, M.; Miehlich, R.; Sackmann, E.Biophys. J.1992, 63, 1346-1354.
(30) Korlach, J.; Schwille, P.; Webb, W. W.; Feigenson, G. W.Proc. Natl.Acad. Sci. U.S.A.1999, 96, 8461-8466.
(31) Zhdanov, V. P.; Keller, C. A.; Glasmastar, K.; Kasemo, B.J. Chem. Phys.2000, 112, 900-909.
Figure 7. Frequency shifts (a) and dissipation shifts (b) at the thirdharmonic after vesicle tethering.∆f3 represents the difference in theresonant frequency of the sample in buffer after streptavidin bindingand the frequency in buffer after three buffer and water rinse cycles.The plot is divided into three regions in a manner similar to that ofFigure 5a.
Figure 8. Changes in resonant frequency (a) and dissipation factor(b) at the 15 MHz resonance due to the binding of streptavidin-coated microspheres. Vertical dashed lines approximate boundariesbetween biotin concentration ranges exhibiting similar behavior.
7594 Langmuir, Vol. 22, No. 18, 2006 Patel and Frank
vesicles on mica32suggest a two-step pathway, and single-vesiclefluorescence experiments on glass33have shown that nonstressedadsorbed vesicles fuse with each other to form larger vesicleson the surface and subsequently form bilayer patches once thevesicles have reached a certain size. The absence of local extremafor osmotically stressed vesicles and almost immediate realizationof the final values of the frequency and dissipation shifts in ourresults indicate that individual vesicles form bilayer patchesimmediately upon coming in contact with the substrate.
The implication of the observed difference in the kinetics ofbilayer formation is that the pathway of PSLB formation isgoverned by a balance between the membrane-surface interactionenergy and the membrane bending energy. It is presumed thatthe introduction of an osmotic pressure difference between theinside and outside of the vesicle results in high local membranecurvatures (and therefore high lateral stress in the membrane),lowering the membrane-substrate attraction necessary to inducethem to form a bilayer patch. The observation of faster bilayerformation kinetics for smaller vesicles,34 which have highercurvatures and therefore are in a more stressed state, is consistentwith this proposal.
QCM-D in Buffer vs Water. The difference in the measuredresonant frequency and dissipation factor when the surface ofthe crystal is in a buffer environment and when it is in a Milli-Qwater environment is attributed to differences in the viscosityand density due to the presence of sodium chloride (100 mM)and Tris (10 mM) in the buffer solution. Assuming that sodiumchloride dominates deviations in the buffer viscosity and densityfrom those of water, we utilized empirical relationships35,36 tocalculate the expected changes in these properties for a 100 mMNaCl solution. These values were then used to predict thefrequency and dissipation shifts when water was replaced bybuffer in the sample chamber. These predicted frequency anddissipation shifts were-2.35 Hz and 0.951× 10⁻⁶, respectively,at the 15 MHz resonance, which are consistent with ourexperimental results (-2.8 Hz and 1.06× 10⁻⁶ in Figure 4a,b).Similarly, for the fifth and seventh harmonics, the predictedfrequency shifts (-1.82 and-1.54 Hz, respectively) and theexpected dissipation shifts (0.736× 10⁻⁶ and 0.622× 10⁻⁶,respectively) are consistent with the experimentally measuredvalues for the normalized frequency shift (-2.6 and-2.3 Hz,respectively) and dissipation shift (0.71× 10⁻⁶ and 0.63× 10⁻⁶,respectively). The experimental shifts are slightly larger than thetheoretical predictions and are most likely due to the presenceof 10 mM Tris, which is not accounted for in the calculations.The estimated viscosity and density differences between bufferand water extracted from the measured frequency and dissipationshifts in Figure 4a,b are 6.8µPa s and 4.8 kg/m3, respectively,which are equivalent to those of an aqueous solution with a NaClconcentration of 118 mM.
Streptavidin Binding. The streptavidin binding results werecompared to the Sauerbrey-predicted frequency shifts (based onthe mass of streptavidin molecules bound to the biotinylatedbilayer), and the significant deviations from the theoretical curvein region II and region III in Figure 5a can be accounted for bythe inclusion of bound water in the surface protein film. Thereis much discussion in the literature of water “dynamically” or
“acoustically” coupled to the quartz crystal such that waterconfined by the surface film influences the crystal resonantfrequency.37-39 Experimental measurements and theory haveshown that water confined due to the surface microstructure canact both as an additional inertial mass and as an additional sourceof viscous energy loss,40-42 which could cause deviations fromthe Sauerbrey analysis. In our case, at a sufficiently highstreptavidin surface density, water becomes physically entrappedin the cavities created by closely spaced surface-bound proteinmolecules and acts as an inertial mass with minimal energy losses,as evidenced by the small magnitude of the shift in the dissipationfactor and the linear scalability of frequency shifts with theharmonic number.
It has been shown that, at high biotin concentrations in lipidbilayers, streptavidin can be crystallized in two dimensions underexperimental conditions very similar to ours. Ho¨ok and co-workers38,39,43 have measured the frequency and dissipationchange of streptavidin binding to a lipid bilayer containing 5%biotinylated lipids (see datum in Figure 5a) and have ascribedthe additional frequency response, beyond that predicted by theSauerbrey relationship, to water entrapped between individualmolecules in the crystal lattice. Using the crystal structure andunit cell parameters of 2D crystals grown under conditions similarto our experimental conditions,44,45we have extended this analysisand found that the volume fraction occupied by the protein ina unit cell is 0.36, resulting in approximately 3500( 370 watermolecules per streptavidin molecule entrapped in the interstitialspaces of the film at 25.1°C (i.e., density of water 0.998 g/cm3).
Protein volume calculations performed using the VADARprotein volume calculator46 were used in conjunction withstreptavidin 2D unit cell parameters (a ) b ) 8.4 ( 0.1 nm,height 4.65( 0.3 nm)44,45to estimate the volume of the interstitialspaces in the lattice. The amino acid coordinates used for proteinvolume calculations were obtained from the Protein Databank(file 1SLD), which were derived from a 3D crystal possessingI122 symmetry.47 It has been shown that 2D streptavidin crystalsproduced under biotinylated lipids at or near neutral pH underconditions similar to ours possessC222 symmetry and areequivalent in structure to one plane of a 3D crystal possessingI122 symmetry.44,48,49
Treating the water as an additional inertial mass leads to anexpected frequency shift of-98.2 ( 1.8 Hz at the 15 MHzresonance, which is within experimental error of the frequencyshift in region III (-96.4( 8.1 Hz), where the surface has beensaturated with streptavidin. In addition, the minimum biotinconcentration required for a 2D streptavidin crystal, calculatedusing the streptavidin surface density and the projected area of
(32) Reviakine, I.; Brisson, A.Langmuir2000, 16, 1806-1815.(33) Johnson, J. M.; Ha, T.; Chu, S.; Boxer, S. G.Biophys. J.2002, 83, 3371-
3379.(34) Reimhult, E.; Hook, F.; Kasemo, B.J. Chem. Phys.2002, 117, 7401-
7404.(35) Kestin, J.; Khalifa, H. E.; Abe, Y.; Grimes, C. E.; Sookiazian, H.; Wakeham,
W. A. J. Chem. Eng. Data1978, 23, 328-336.(36) Kestin, J.; Khalifa, H. E.; Correia, R. J.J. Phys. Chem. Ref. Data1981,
10, 71-87.
(37) Hook, F.; Kasemo, B.; Nylander, T.; Fant, C.; Sott, K.; Elwing, H.Anal.Chem.2001, 73, 5796-5804.
(38) Larsson, C.; Rodahl, M.; Hook, F.Anal. Chem.2003, 75, 5080-5087.(39) Reimhult, E.; Larsson, C.; Kasemo, B.; Hook, F.Anal. Chem.2004, 76,
7211-7220.(40) Beck, R.; Pittermann, U.; Weil, K. G.J. Electrochem. Soc.1992, 139,
453-461.(41) Martin, S. J.; Frye, G. C.; Ricco, A. J.; Senturia, S. D.Anal. Chem.1993,
65, 2910-2922.(42) Daikhin, L.; Gileadi, E.; Katz, G.; Tsionsky, V.; Urbakh, M.; Zagidulin,
D. Anal. Chem.2002, 74, 554-561.(43) Hook, F.; Ray, A.; Norden, B.; Kasemo, B.Langmuir2001, 17, 8305-
8312.(44) Edwards, T. C.; Koppenol, S.; Frey, W.; Schief, W. R.; Vogel, V.;
Stenkamp, R. E.; Stayton, P. S.Langmuir1998, 14, 4683-4687.(45) Scheuring, S.; Muller, D. J.; Ringler, P.; Heymann, J. B.; Engel, A.J.
Microsc.1999, 193, 28-35.(46) Willard, L.; Ranjan, A.; Zhang, H. Y.; Monzavi, H.; Boyko, R. F.; Sykes,
B. D.; Wishart, D. S.Nucleic Acids Res.2003, 31, 3316-3319.(47) Katz, B. A.Biochemistry1995, 34, 15421-15429.(48) Hemming, S. A.; Bochkarev, A.; Darst, S. A.; Kornberg, R. D.; Ala, P.;
Yang, D. S. C.; Edwards, A. M.J. Mol. Biol. 1995, 246, 308-316.(49) Reviakine, I.; Brisson, A.Langmuir2001, 17, 8293-8299.
Tethered Phospholipid Vesicle Assemblies Langmuir, Vol. 22, No. 18, 20067595
a lipid molecule (taken to be 67 Å2 for egg PC at 25°C basedon the areas of major constituent lipids50-53), predicts that thesurface should be saturated by streptavidin at 1.8( 0.1 mol %biotin (assuming a uniform biotin density and a 1:1 ratio betweenbiotin and bound streptavidin). This also is consistent with theexperimental results and the onset of region III.
It is important to note the magnitude of the dissipation shiftduring streptavidin binding when evaluating the film. Sauerbreypredicts no change in the dissipation factor because the film isassumed to be rigid, thin, and homogeneous. In our case, themaximum dissipation shift observed during streptavidin adsorp-tion is small (approximately 2× 10⁻⁶), suggesting that the filmis fairly well coupled to the oscillation of the crystal with smallviscous losses. Thus, the Sauerbrey model may still be able toreasonably predict the film mass by treating the water as aninertial mass. White and Schrag16 have applied a mechanicalimpedance treatment to determine the resonant frequency of aviscoelastically loaded quartz resonator and have establishedcriteria for which the Sauerbrey-type analysis is applicable tosoft materials with significant water content.54 Significantdeviations from Sauerbrey-predicted behavior are not expectedunless the ratio of the film thickness to the shear wavelength inthe film (tF/λ1) exceeds 0.01 and unless the ratio of the shearwavelengths in the surrounding medium and in the film (λ2/λ1)stays above 0.2 for a purely elastic film and above 0.04 for apurely viscous film. If we assume a film with density 1 g/cm3
and thickness 4.65 nm (height of the 2D streptavidin crystalstructure), and a limiting scenario of a purely viscous film (i.e.,φ ) tan-1(η′′/η′) ) 0) with an effective film viscosity lowerbound of 0.1 Pa‚s, the film would satisfy the criteria and aSauerbrey-type analysis would match the mechanical impedancebased model’s predicted frequency shift within 5%. Thestreptavidin film is far from a purely viscous film as a tanφ onthe order of 102 is calculated from a fit of our data to a viscoelasticmodel proposed by Voinova et al.17 and thus well within theregime in which Sauerbrey is applicable. A fit of our data to themodel yields a shear modulus on the order of 108 Pa and aviscosity on the order of 10-1 Pa‚s.
The frequency and dissipation changes measured in region IIof Figure 5a also reflect a significant amount of water trappedbetween the streptavidin molecules, which will cause a significantdeviation from the Sauerbrey-predicted shift based on the massof protein molecules alone. In this region, the number of watermolecules dynamically coupled to the quartz crystal perstreptavidin varies with the streptavidin surface density anddecreases from approximately 17,000 at a bilayer biotinconcentration of 0.1% to approximately 3000 at a bilayer biotinconcentration of 2%. This is calculated by subtracting theSauerbrey-predicted frequency shift based on streptavidin massfrom a linear fit of region II in Figure 5a, which includes themass of the streptavidin molecules and trapped water. The latternumber matches the amount of water that would occupy theinterstitial spaces in a 2D streptavidin crystal. Since the amountofwaterperstreptavidinmoleculedecreasessignificantly in regionII, this water must be trapped in surface features rather thanbound as part of the hydration layer.
Because of nonspecific adsorption of streptavidin and the smallmagnitudes of the frequency shifts, the amount of acousticallycoupled water per streptavidin could not be determined accuratelyat extremely low biotin concentrations (region I). The amountof dynamically coupled water is low because the surface isrelatively featureless, and the only additional water contributingto the frequency shift when streptavidin binds is that which ispart of the protein’s hydration layer.
By applying a Sauerbrey-type analysis, we have been able todetermine an explicit relationship between the streptavidin surfacedensity and the amount of hydrodynamically coupled water usingonly QCM-D measurements. The implementation of a Sauerbrey-type analysis seems reasonable according to the criteria put forthby White and Schrag. Comparing these results to those reportedrecently by Reimhult et al.,39 in which the water content of a 2Dstreptavidin crystal (5 mol % bilayer biotin concentration) wascalculated by the difference between the QCM-D response andsurface plasmon resonance (SPR) data, we find approximatelya 20% higher overall mass, but similar film water content (∼250ng/cm2). Above some critical streptavidin surface density,significant amounts of water start to become acoustically trappedbetween the individual streptavidin molecules. As the streptavidinsurface density continues to increase, this water is displaced bythe protein molecules, leading to a decrease in the calculatedwater-to-streptavidin ratio.
Tethered Vesicles.QCM-D Responses and Region Bound-aries.In addition to the water encapsulated by the lipid vesicle,the same water effects that were present for streptavidin binding(i.e., dynamic coupling of water constrained between boundspecies) are expected to be present for vesicle binding. Theexistence of three different biotin concentration regimes, as shownin Figure 6a, supports this proposal. At low bilayer biotinconcentrations (and therefore low streptavidin surface densities),the frequency and dissipation responses reflect the mass of theindividual vesicles as well as their encapsulated water. Thetransition between regions I and II suggests that there exists acritical surface density above which water becomes corralled bythe surface structures on top of the crystal. As the surface densityof the vesicles increases, more water surrounding the tetheredvesicles becomes confined due to neighboring tethered vesicles,thus contributing more and more to the frequency and dissipationresponse of the oscillating crystal. Lower bilayer biotin con-centrations are required to achieve surface saturation as well asto trap significant amounts of water between vesicles due to theirlarger size. Thus, saturation is achieved at a bilayer biotinconcentration near 0.3%, compared to near 2% in the streptavidinbinding case.
Modeling the vesicles as spheres in a hexagonal close-packedarrangement, we estimate the theoretical minimum biotinconcentration in the bilayer required for saturation to beapproximately 0.00481% (assuming a perfectly uniform distri-bution of biotin on the surface and a 1:1 ratio of bound vesiclesto bound streptavidin). This would occur close to the boundarybetween region I and region II in Figure 6a, which is at a muchlower biotin concentration than the experimentally measuredvalues for saturation (onset of region III). A contributing factormay be the possibility of individual vesicles being tethered viamultiple streptavidin linkages.
In a Monte Carlo simulation of vesicle adsorption, Zhadnovet al.31 treat vesicles as diffusion-limited hard spheres randomlyadsorbing to any site on a planar surface. Their results show that,at saturation, the expected surface coverage would be 55-60%.The lower surface coverage would mean that the averageseparation distance between vesicles on the surface is larger than
(50) Petrache, H. I.; Tristram-Nagle, S.; Nagle, J. F.Chem. Phys. Lipids1998,95, 83-94.
(51) Tristram-Nagle, S.; Petrache, H. I.; Nagle, J. F.Biophys. J.1998, 75,917-925.
(52) Chiu, S. W.; Jakobsson, E.; Subramaniam, S.; Scott, H. L.Biophys. J.1999, 77, 2462-2469.
(53) Petrache, H. I.; Dodd, S. W.; Brown, M. F.Biophys. J.2000, 79, 3172-3192.
(54) Vogt, B. D.; Lin, E. K.; Wu, W. L.; White, C. C.J. Phys. Chem. B2004,108, 12685-12690.
7596 Langmuir, Vol. 22, No. 18, 2006 Patel and Frank
in the hexagonal close-packed arrangement, which further lowersthe theoretical minimum biotin concentration required for surfacesaturation. Since the biotin groups are covalently linked to lipidmolecules, which are able to freely diffuse in the plane of thebilayer, it is expected that the distribution of biotin will be uniformonly on average and not at any given moment. Thus, the stochasticnature of vesicle adsorption and binding would prevent ahexagonal close-packed arrangement from being realized,especially at such low streptavidin surface densities. Since QCMis an area-average technique with sensitivity decreasing rapidlywith increasing distance from the center of the crystal’s activearea, the significantly larger standard deviations of the vesicletethering results compared to those for streptavidin, whicharranges into a regular surface array at high concentrations, canalso be attributed to the stochastic nature of the adsorption processin addition to vesicle polydispesity and batch-to-batch variancein vesicle preparation.
Magnitudes of the QCM-D Frequency Response.The muchlarger changes in the resonant frequency and dissipation factorfor vesicle tethering are caused by the more substantial size andmass of the vesicle compared to those of the streptavidin. Sincesaturation of the surface is achieved at higher bilayer biotinconcentration than would be expected by the close packing ofspherical vesicles, the vesicles must not be close packed.Moreover, the observed|∆fmax| is much lower than that resultingfrom a Sauerbrey-type analysis of a hexagonally packed systemof rigid spheres each with mass equivalent to the mass of avesicle’s encapsulated water and its lipids. The Sauerbrey analysiswould yield an expected normalized frequency shift of-394Hz, which is approximately 50% greater than the observedfrequency shift. However, the criteria that White and Schragput forth for the applicability of Sauerbrey are not met, anda viscoelastic model for soft materials must be applied todetermine the adsorbed film mass while accounting for watertrapped between the vesicles at higher streptavidin surfacedensities.
Modeling of the Tethered Vesicle Layer.Fitting the third andfifth harmonic data for vesicle tethering near surface saturationto the viscoelastic model developed by Voinova et al., we obtainestimates of 0.0026( 0.0003 Pa‚s, (1.9( 0.3) × 104 Pa, and146( 14 nm for the effective film viscosity, shear modulus, andheight, respectively, using QTools 2.0 software from Q-Sense.A Voigt-based, one-layer model was applied to the tetheringdata, and the streptavidin-functionalized bilayer, which behavesas a Sauerbrey film, was taken as the baseline. A fixed densityof 941 kg/m3 is assumed for the vesicle layer, which wasdetermined by using DLS size results to calculate the averagedensity of a vesicle. Vesicles were taken to be 120 nm diameterspheres, and a lipid projected area of 67 Å was used. In thelimiting case of a flattened vesicle (oblate spheroid) with a height:width ratio of 0.12, the density of the film would be within 1%of that of water at 25°C (998 kg/m3) assuming the surface arearemains the same as that of an unperturbed vesicle (i.e., no lipidmolecules are lost from the vesicle, and the lipid projected arearemains constant). The modeling results are relatively insensitiveto such changes in the fixed film density, producing values forthe effective viscosity and shear modulus that fall within thestandard deviation of those resulting from different experimentalmeasurements.
The quality of the resulting fits for the frequency shifts at themeasured overtones was excellent, with the fitted parametersgenerating a predicted frequency shift that was, on average, within0.25% of the experimentally measured value (N ) 8). Thecorresponding dissipation fits were not as close, but still within
5.5% of the experimentally measured values for the third harmonicand within 2% for the fifth harmonic.
It is worthwhile to note that the Voinova model assumes ahomogeneous viscoelastic coating on the surface of the crystal.In addition, it is a mechanical model, which does not explicitlytake into account the piezoelectric properties of quartz, and onethat does not include real effects such as out-of-plane motion ofthe crystal. However, these effects are much smaller than theexperimental error in the results. We are not aware of viscoelasticmodels that treat laterally inhomogeneous layers or the randomadsorption of large, discrete species, such as the vesicle layer atincomplete coverage. However, as the surface approachessaturation, the fitting results serve as order-of-magnitude estimatesof the mechanical properties of a theoretical film producing similarfrequency and dissipation responses.
EVidence of Vesicle Flattening.A marked difference betweenFigures 5a and 6a is the nature of the transition from region IIto region III. For the case of streptavidin binding, the transitionis sharp, with every additional adsorbed streptavidin moleculedisplacing a fixed amount of interstitial water in the higherconcentrations of region II, causing a decrease in the amount ofhydrodynamically coupled water. Conversely, the transition isgradual for the vesicle binding case and may indicate vesicledeformation such that vesicles have larger projected areas at lowsurface densities as observed by AFM for adsorbed vesicles onglass.55 At low densities, the vesicle shape will be determinedby the membrane tension in the vesicle and the membrane-substrate (in this case, planar supported bilayer) interaction. Ifthis equilibrium vesicle shape is rigid, interstitial water wouldbe more easily coupled with the crystal. However, at highersurface concentrations, the vesicles have the ability to conformto their environment to a limited extent, allowing them to packat higher surface densities than a similarly shaped rigid species.The flexible nature of the tethered vesicle causes a gradualtransition as every additional vesicle added to the surface displacesless interstitial water than the one before it as the vesicle surfacedensity approaches saturation. In addition, since the vesicles areflattening from their roughly spherical shape in solution, thereis a reduction in the encapsulated volume of water, leading toless mass coupled to the crystal per adsorbed vesicle at higherconcentrations than at lower concentrations. Assuming aminimum water permeability through a lipid membrane of 10µm/s,17 it is conceivable that membrane-membrane attractionwill induce the vesicle to deform on the bilayer surface withinseconds of binding.
The observed nonspecific adsorption of biotinylated vesiclesseems to be mediated by the biotin. No adsorption is observedwhen biotinylated lipids are removed from the system (data notshown). It is possible that the partial hydrophobic character ofthe biotin molecule makes it energetically favorable for the biotinmoiety to reside in the interfacial region between the lipidheadgroup and the alkyl chains of the apposing membrane’souter leaflet. If so, the result would be an increase in the numberof effective tethering points between the vesicle and the bilayer.This weak interaction may facilitate flattening of the vesicle onthe surface.
Streptavidin-Coated Microspheres.QCM-D Response.De-spite similar size and mass, the adsorption and binding ofstreptavidin-coated microspheres exhibit much larger frequencyshifts than those of vesicles. One might expect that the rigidmicrospheres would form a layer that is a closer approximationto an elastic Sauerbrey film than one made up of vesicles. Indeed,
(55) Schonherr, H.; Johnson, J. M.; Lenz, P.; Frank, C. W.; Boxer, S. G.Langmuir2004, 20, 11600-11606.
Tethered Phospholipid Vesicle Assemblies Langmuir, Vol. 22, No. 18, 20067597
the results show a lower∆Dmaxfor microsphere binding than forvesicle binding. Moreover, the frequency shift at saturation iswithin 18% of the Sauerbrey-expected frequency shift of ahexagonal close-packed layer. However, this Sauerbrey-predictedfrequency shift does not take into account dynamically coupledwater. If the mass of the water trapped in the interstitial spacesaround the spheres is included, the normalized, Sauerbrey-predicted frequency shift would be-730 Hz for the hexagonalclose-packed packing structure, which is 50-75% greater thanthe observed frequency shifts depending on the overtonemonitored. The dependence of the normalized frequency on theovertone is clear evidence that the film of microspheres cannotbe treated as a Sauerbrey film and would fall short of the criteriapresented by White and Schrag, due to the interstitial water contentas well as inefficient packing. Thus, viscoelastic models mustbe employed for an accurate measure of the film mass.
At saturation, application of the model developed by Voinovaet al. results in an effective film height of approximately 97(5 nm and estimates for the effective film viscosity and shearmodulus of 0.006( 0.001 Pa‚s and (7.5( 3.4) × 104 Pa,respectively. A density of 1050 kg/m3 is used for the layer ofbound polystyrene microspheres, and as in the case of the vesicles,the results are relatively insensitive to small changes in the layerdensity. Also as in the case of the vesicles, the fitted parametersproduced predicted frequency shifts that were, on average, within0.25% of the experimentally measured values (N) 4). The model-predicted dissipation shifts were within 5%, 1.5%, and 0.5% ofthe experimentally measured values for the third, fifth, and seventhharmonics, respectively. For the rigid microspheres, the modelyields an effective film viscosity that is approximately a factorof 2 greater than that of the flexible vesicle layer and a shearmodulus that is approximately 4 times greater than that of thevesicle layer.
Comparison with Tethered Vesicles.It was expected that thebiotin concentration at which the microspheres saturate the surfacewould be intermediate between the values required for streptavidinand vesicles to saturate the surface because of the size differencebetween the microspheres (∼8 × 10⁵ nm3) and the streptavidin(∼59 nm3) and the ability of the vesicles to flatten and increasetheir projected area. However, the minimum bilayer biotinconcentration at which saturation is achieved, calculated assuminga hexagonal close-packed arrangement of the microspheres, wouldbe approximately 0.0052%, resulting in an area of approximately11000 nm2 per biotin molecule. This biotin concentration is over2 orders of magnitude smaller than the experimentally measuredminimum biotin concentration at which saturation is achievedand cannot be accounted for by inefficient surface packing alone.It is important to consider the discrepancy between the projectedarea of the microsphere and the contact area of the microspherewith the bilayer, which we define as the area swept out by theradius of a circle in which the separation between the surface ofthe microsphere and the surface of the bilayer is not greater thanthe height of the biotin group above the bilayer. Therefore, toensure that the entire surface is capable of tethering a microsphere,a biotin density equivalent to the inverse of this contact areawould be required as opposed to the inverse of the projected areaof the rigid microsphere. Since the vesicle can flatten or deformon the surface, the contact area is much larger than for themicrospheres of similar size, which accounts for the disparitybetween bilayer biotin concentrations at saturation for the twosimilarly sized species. The bilayer biotin density at whichsaturation is achieved,∼1%, indicates that the contact area ofthe microsphere would be on the order of 100 nm2. The biotinbinding capacity of the microspheres suggests that the streptavidin
density on the sphere is high enough to support tethering of amicrosphere even if the contact area between the sphere and thebilayer is on the order of 100 nm2.
Another notable difference between the vesicle tethering andthe microsphere tethering data is the transition from region II toregion III. The sharp transition between the surface biotinconcentrations at which saturation is achieved and the concentra-tions leading up to the saturated state seems to indicate that theamount of water molecules dynamically coupled to the crystalper adsorbed microsphere decreases as the microsphere surfacedensity approaches saturation. The amount of water that isdynamically coupled with the crystal decreases faster than forthe microsphere case in the higher biotin concentrations becausethe vesicles have the ability to deform and pack closer thansimilarly sized rigid microspheres. The closer packing expelsinterstitial water that normally would be preserved for the caseof microspheres. Thus, as more vesicles are added to a filmapproaching saturation, the interstitial regions grow smaller,leading to more water being expelled than just that displaced bythe volume of the incoming vesicle.
Because the adsorbed vesicles have the abilty to conform totheir neighbors, it is expected that the surface topography of thetethered vesicle system will be smoother than for the boundmicrospheres. One might expect that the microspheres wouldtherefore entrap a greater amount of interstitial water due to theincreased surface roughness; however, this effect is not easilydeconvoluted from effects such as vesicle flattening and astochastic adsorption process.
Summary
We have presented a self-assembly-based technique for theformation of a tethered vesicle assembly. Fluorescence micros-copy provides a global view of the system and demonstrateslateral mobility of the lipids in both the bilayer and the tetheredvesicles. QCM-D provides structural information regarding thesurface density and conformation of streptavidin, vesicles, andstreptavidin-coated microspheres.
A mechanism of bilayer formation on SiO2 from osmoticallyshocked vesicles has been described in which the predominantpathway appears to be single-vesicle rupture and fusion to forma continuous, fluid lipid bilayer. A Sauerbrey treatment issufficient to describe the frequency shifts for streptavidin bindingprovided the mass of water trapped between streptavidinmolecules bound to the bilayer is included. Comparing theexperimental frequency shifts to those that would occur if onlythe mass of the streptavidin were detected by QCM-D, we areable to extract the water content in the streptavidin films. Wehave shown that the tethered vesicles exhibit viscoelastic behavior,and comparison of QCM-D results to those obtained fromstreptavidin-coated microspheres suggests that biotinylatedvesicles deform on the surface of a streptavidin-functionalizedlipid bilayer with a surface contact area that is similar to thevesicle projected area, possibly with multiple tethers per vesiclestabilizing the structure. In addition, there is a critical surfacecoverage for any given species above which significant amountsof water are dynamically trapped in the film in an effect similarto that of water confinement due to surface roughness. Thiscritical coverage is denoted by a large increase in the magnitudesof the frequency and dissipation shifts with increasing surfacedensities. We have presented quantitative modeling results forstreptavidin binding and entrapped water content, and we haveapplied a traditional viscoelastic model for laterally homogeneousfilms to obtain order-of-magnitude estimates of the mechanicalproperties of an effective film representing the layer of bound
7598 Langmuir, Vol. 22, No. 18, 2006 Patel and Frank
vesicles and microspheres. We are unaware of any existing modelthat describes the random adsorption and binding of large specieson the surface of a quartz resonator. For all three species studied,saturation of the surface results at high surface site densities.
Acknowledgment. We are especially grateful for the manyvaluablediscussionswithDr.KayKanazawaregarding thevariousQCM viscoelastic models. In addition, we thank Professor JamesSwartz at Stanford University (Stanford, CA) for his usefulfeedback during the progress of this work as well as Dr.Christopher White at the National Institute of Standards and
Technology (Gaithersburg, MD) for several useful discussionson the application of a viscoelastic model to the QCM data. Thiswork was supported by the National Science Foundation (NSFGrant BES 9980799), Center on Polymer Interfaces andMacromolecular Assemblies (NSF Grant DMR-0213618),National Aeronautics and Space Administration (NASA GrantNAG8-1843), National Institutes of Health Graduate Trainingin Biotechnology Program, and National Defense Science andEngineering Graduate Fellowship (NDSEG) Program.
LA0610452
Tethered Phospholipid Vesicle Assemblies Langmuir, Vol. 22, No. 18, 20067599
Copyright © 2022 FDOKUMEN