Quality control of automated hyperspectral remote sensing measurements from a seaborne platform
26
OSD 8, 613–638, 2011 Quality control of automated hyperspectral measurements S. P. Garaba et al. Title Page Abstract Introduction Conclusions References Tables Figures Back Close Full Screen / Esc Printer-friendly Version Interactive Discussion Discussion Paper | Discussion Paper | Discussion Paper | Discussion Paper | Ocean Sci. Discuss., 8, 613–638, 2011 www.ocean-sci-discuss.net/8/613/2011/ doi:10.5194/osd-8-613-2011 © Author(s) 2011. CC Attribution 3.0 License. Ocean Science Discussions This discussion paper is/has been under review for the journal Ocean Science (OS). Please refer to the corresponding final paper in OS if available. Quality control of automated hyperspectral remote sensing measurements from a seaborne platform S. P. Garaba 1,2 , M. R. Wernand 3 , and O. Zielinski 2 1 University of Bremen, Department of Geosciences, P.O. Box 330440, 28334 Bremen, Germany 2 Institute of Marine Resources, Department of Marine Physics and Sensors, Bussestraße 27, 27570 Bremerhaven, Germany 3 Royal Netherlands Institute for Sea Research, Physical Oceanography, Marine Optics & Remote Sensing, P.O. Box 59, 1790AB Den Burg, Texel, The Netherlands Received: 28 December 2010 – Accepted: 18 March 2011 – Published: 30 March 2011 Correspondence to: S. P. Garaba (s [email protected]) Published by Copernicus Publications on behalf of the European Geosciences Union. 613
Transcript of Quality control of automated hyperspectral remote sensing measurements from a seaborne platform

OSD8, 613–638, 2011
Quality control ofautomated
hyperspectralmeasurements
S. P. Garaba et al.
Title Page
Abstract Introduction
Conclusions References
Tables Figures
J I
J I
Back Close
Full Screen / Esc
Printer-friendly Version
Interactive Discussion
Discussion
Paper
|D
iscussionP
aper|
Discussion
Paper
|D
iscussionP
aper|
Ocean Sci. Discuss., 8, 613–638, 2011www.ocean-sci-discuss.net/8/613/2011/doi:10.5194/osd-8-613-2011© Author(s) 2011. CC Attribution 3.0 License.
Ocean ScienceDiscussions
This discussion paper is/has been under review for the journal Ocean Science (OS).Please refer to the corresponding final paper in OS if available.
Quality control of automatedhyperspectral remote sensingmeasurements from a seaborne platformS. P. Garaba1,2, M. R. Wernand3, and O. Zielinski2
1University of Bremen, Department of Geosciences, P.O. Box 330440, 28334 Bremen,Germany2Institute of Marine Resources, Department of Marine Physics and Sensors, Bussestraße 27,27570 Bremerhaven, Germany3Royal Netherlands Institute for Sea Research, Physical Oceanography, Marine Optics &Remote Sensing, P.O. Box 59, 1790AB Den Burg, Texel, The Netherlands
Received: 28 December 2010 – Accepted: 18 March 2011 – Published: 30 March 2011
Correspondence to: S. P. Garaba (s [email protected])
Published by Copernicus Publications on behalf of the European Geosciences Union.
613

OSD8, 613–638, 2011
Quality control ofautomated
hyperspectralmeasurements
S. P. Garaba et al.
Title Page
Abstract Introduction
Conclusions References
Tables Figures
J I
J I
Back Close
Full Screen / Esc
Printer-friendly Version
Interactive Discussion
Discussion
Paper
|D
iscussionP
aper|
Discussion
Paper
|D
iscussionP
aper|
Abstract
In this study four data quality flags are presented for automated and unmanned above-water hyperspectral optical measurements collected underway in the North Sea, TheMinch, Irish Sea and Celtic Sea in April/May 2009. Coincident to these optical mea-surements a DualDome D12 (Mobotix, Germany) camera system was used to capture5
sea surface and sky images. The first three flags are based on meteorological con-ditions, to select erroneous incoming solar irradiance (ES) taken during dusk, dawn,before significant incoming solar radiation could be detected or under rainfall. Further-more, the relative azimuthal angle of the optical sensors to the sun is used to identifypossible sunglint free sea surface zones. A total of 629 spectra remained after apply-10
ing the meteorological masks (first three flags). Based on this dataset, a fourth flag forsunglint was generated by analysing and evaluating water leaving radiance (LW) andremote sensing reflectance (RRS) spectral behaviour in the presence and absence ofsunglint salient in the simultaneously available sea surface images. Spectra conditionssatisfying “mean LW (700–950 nm)<2 mW m−2 nm−1 Sr−1” or alternatively “minimum15
RRS (700–950 nm)<0.010 Sr−1”, mask the most measurements affected by sunglint,providing efficient flagging of sunglint in automated quality control. It is confirmed thatvalid optical measurements can be performed 0◦ ≤Φ≤360◦ although 90◦ ≤Φ≤135◦
is recommended.
1 Introduction20
Remote sensing has become a key tool in the investigation of marine biochemical andgeophysical characteristics on a regional or global scale (IOCCG, 2000; Schofield etal., 2004; Dierssen, 2010). During the last few decades, technical progress in remotesensing has made it possible to carry out optical measurements from in-water, above-water, airborne and satellite platforms (Moore et al., 2009). However, automated and25
unmanned optical measurements from any of these platforms are likely to be erroneous
614

OSD8, 613–638, 2011
Quality control ofautomated
hyperspectralmeasurements
S. P. Garaba et al.
Title Page
Abstract Introduction
Conclusions References
Tables Figures
J I
J I
Back Close
Full Screen / Esc
Printer-friendly Version
Interactive Discussion
Discussion
Paper
|D
iscussionP
aper|
Discussion
Paper
|D
iscussionP
aper|
due to meteorological conditions (e.g. rainfall, cloud cover, humidity, and dusk/dawnconditions), sunglint, and sensor setup (Gordon and Jacobs, 1977; Wernand, 2002;Zhang and Wang, 2010). Therefore quality control to eliminate these disturbing factorsis a crucial procedure in determining colour of seawater.
Sunglint is a phenomenon resulting from a direct beam of sunlight reflected from5
a seawater surface directly into the down looking optical sensor (Morel and Gordon,1980; Ottaviani et al., 2008). Studies suggest that sunglint is caused by Fresnel re-flection from a number of “dancing facets” on the wind affected seawater surface andis controlled by the position of the sun, optical sensor viewing angle, water refractiveindex, wind direction and speed (Kay et al., 2009; Zhang and Wang, 2010). In a recent10
audit of sunglint correction models for optical measurements in marine environmentsit is conceded that despite their benefits most of these models rely partly on the blackpixel assumption and therefore tend to moderately correct glint pixels (Kay et al., 2009).This black pixel assumption, water leaving radiance is insignificant in the near infra-redspectrum, has been reported to be inconsistent to some degree in coastal and turbid15
waters, which contributes also to the fact that correction models come with a proba-bility of over- or underestimation of apparent and inherent optical properties (Siegel etal., 2000; Shi and Wang, 2009). This framework provides the motivation to develop asunglint flag with the objective of masking affected data, hence minimising the proba-bility of errors likely to occur when using correction models.20
Wernand (2002) described a meteorological quality flagging method to optimise au-tomated hyperspectral measurements for coastal and shelf seas. To minimise sunglinthe suggests the use of two optical sensors looking in different azimuthal directions tomeasure water surface leaving radiance and utilises the lowest water surface leavingradiance for each measurement, so as to select the spectrum with the least sunglint.25
While this setup is useful and minimises sunglint effect on measurements, it requiresadditional sensors to be installed with the possible risk of sunglint still affecting bothsensors.
615

OSD8, 613–638, 2011
Quality control ofautomated
hyperspectralmeasurements
S. P. Garaba et al.
Title Page
Abstract Introduction
Conclusions References
Tables Figures
J I
J I
Back Close
Full Screen / Esc
Printer-friendly Version
Interactive Discussion
Discussion
Paper
|D
iscussionP
aper|
Discussion
Paper
|D
iscussionP
aper|
This study presents a set of four quality control flags for automated and unmannedabove-water hyperspectral measurements, a flag to mask sunglint is generated hereto compliment meteorological flags reported by Wernand (2002). These hyperspectralmeasurements are supplemented by simultaneous sky and sea surface images from acamera system. Parallel to the image and spectrum analysis, optimum azimuthal zones5
for sensor measurement were assessed with the goal to identify sunglint affected andnon affected zones. The sea surface images act as “sea-truth” in the validation stepof spectra and the Solar Position Algorithm, SPA (Reda and Andreas, 2004) generatedestimate azimuthal angles of the sun during the field campaign.
In the next section, the measurement methodology will be explained followed by a10
presentation of the results and a discussion of the study findings. Finally, the newflagging method will be presented along with possible future developments.
2 Data and methods
Underway optical measurements in the North Sea, Scotland Sea, Irish Sea and CelticSea were performed aboard R/V Heincke cruise HE302 between 21 April and 14 May15
2009. Ocean Data View (Schlitzer, 2010) was used to generate the study area map,Fig. 1, which shows the ship track for which above-water hyperspectral measurementswere obtained.
2.1 Instrumentation
A RAMSES-ACC hyperspectral cosine irradiance meter (TriOS, Germany) was used to20
measure incoming solar radiation, ES (λ) and two RAMSES-ARC hyperspectral radi-ance meters with a field-of-view of 7◦ in air, were used to detect respectively the seasurface radiance Lsfc (θsfc, Φ, λ) and sky radiance Lsky (θsky, Φ, λ). A frame (seeFig. 2) designed to hold the irradiance sensor facing upwards, the sky and sea surfaceradiance sensors at zenith angels θsfc = 45◦ and θsky = 135◦, was fixed to the mast of25
616

OSD8, 613–638, 2011
Quality control ofautomated
hyperspectralmeasurements
S. P. Garaba et al.
Title Page
Abstract Introduction
Conclusions References
Tables Figures
J I
J I
Back Close
Full Screen / Esc
Printer-friendly Version
Interactive Discussion
Discussion
Paper
|D
iscussionP
aper|
Discussion
Paper
|D
iscussionP
aper|
the ship facing the starboard, 12 m above sea surface. These spectral measurementswere automatically collected at 15 min intervals over a spectral range λ=320–950 nmin steps of 5 nm. Spectrum classification, visible (VIS), λ=320–700 nm, and near infra-red (NIR), λ=700–950 nm, was implemented.
A DualDome D12 (Mobotix, Germany) camera system with customised lense objec-5
tive L43 with a field-of-view of 45◦, was used to capture simultaneous images of thesky and sea surface during hyperspectral measurements as illustrated in Fig. 2. Thepositioning height of the camera system and optical sensors proved to be unaffectedby sea spray. The ship’s position and heading were recorded using a Differential GlobalPosition System (DGPS) and sampling times were logged in UTC.10
2.2 Methods
The first step in quality control data processing, involved implementing the meteo-rological flagging (Wernand, 2002) on ES (λ) measurements using MATLAB 2010a(MathWorks, USA). The flag conditions; (1) ES (λ= 480 nm) >20 mW m−2 nm−1 setsa threshold for which significant ES (λ) can be measured, (2) ES (λ= 470 nm)/ES (λ=15
680 nm)<1 will mask spectra affected by dawn/dusk radiation, (3) ES (λ= 940 nm)/ES(λ= 370 nm)<0.25 will mask spectra affected by rainfall and high humidity. ES (λ) andcorresponding Lsfc (θsfc, Φ, λ), Lsky (θsky, Φ, λ) measurements that passed this meteo-rological flagging were then used to derive water leaving radiance, LW (θsfc, Φ, λ), andremote sensing reflectance, RRS (θ, Φ, λ) according to Eq. (1) (Mueller et al., 2003);20
RRS =LW
ES=Lsfc−
(ρair-sea ·Lsky
)ES
(1)
where ρair-sea is the air-sea interface reflection coefficient which is dependent on cloudcover, sensor viewing angle, and wind speed. It has been reported that for measure-ments Lsky (λ= 750 nm)/ES(λ= 750 nm)≥0.05, ρair-sea = 0.0256 is suitable, also con-sistent with the available collected spectra (Ruddick et al., 2006). The radiometric25
617

OSD8, 613–638, 2011
Quality control ofautomated
hyperspectralmeasurements
S. P. Garaba et al.
Title Page
Abstract Introduction
Conclusions References
Tables Figures
J I
J I
Back Close
Full Screen / Esc
Printer-friendly Version
Interactive Discussion
Discussion
Paper
|D
iscussionP
aper|
Discussion
Paper
|D
iscussionP
aper|
optical measurements used and computed in Eq. (1) are available on PANGAEA(Garaba et al., 2010a, b, c, d).
2.2.1 Sunglint flag
The derived LW and RRS from Eq. (1) were utilised in the testing and evaluation ofthe new sunglint flag intended to mask measurements affected by sunglint. Parallel to5
this investigation, the SPA and DGPS data were utilised along with Eq. (2) as compli-mentary tools to derive the relative angle of the optical sensors to the sun’s azimuthposition, Φderived;
Φderived =(Φsun−
(Φship+Φsensor
))modulo 360◦ (2)
where Φsun is the sun’s azimuthal position, Φship ship’s azimuthal heading, and the10
sensor azimuthal heading Φsensor =85◦. In order to maintain the circular nature of angle0◦ ≤Φderived ≤ 360◦, the modulo arithmethic was applied. A test was then performedon Φderived, using corresponding sea surface images as “sea truth”, to identify thenumber of optical measurements consistent with 90◦ ≤Φ≤ 135◦ (Fougnie et al., 1999;Mueller et al., 2003; Deschamps et al., 2004). This test was also aimed to answer:15
is it possible to obtain useful optical measurement from an automated and unmannedseaborne platform for 0◦ ≤Φderived <90◦ and 135◦ <Φderived ≤360◦?
The sunglint flag was developed on the premise that water absorbs light in the NIR,but reflects light due to a wind roughened sea surface and/or scattering influenced byoptically active water constituents. In Fig. 3 a simplified activity diagram illustrates the20
steps that were implemented in this sunglint flag investigation and evaluation;
1. Sea surface images were retrieved, matching the unmasked spectra validatedwith the meteorological flagging (Wernand, 2002), visually inspected and classi-fied into; Nns – image set without sunglint or Ns – image set with sunglint,
2. Analysis of the two sets Nns and Ns was now focussed on identifying unique25
characteristics using LW and RRS. It involved looking at individual spectra and618

OSD8, 613–638, 2011
Quality control ofautomated
hyperspectralmeasurements
S. P. Garaba et al.
Title Page
Abstract Introduction
Conclusions References
Tables Figures
J I
J I
Back Close
Full Screen / Esc
Printer-friendly Version
Interactive Discussion
Discussion
Paper
|D
iscussionP
aper|
Discussion
Paper
|D
iscussionP
aper|
mean spectra for the two sets over the whole spectrum range (λ= 320–950 nm),to obtain a general overview on typical spectra for set Nns and Ns,
3. The goal of this step was to eliminate spectra with images in Ns while converselyretaining as much as possible spectra in Nns. Hence utilising the findings fromstep 2, i.e. spectrum shape, behaviour and magnitude variations of both LW and5
RRS in the VIS and NIR, a combination of inequality equations and band ratioswere implemented to assess and generate the sunglint flag;
– first evaluation test used the NIR mean values for set Nns and Ns to obtain thresh-old values specific to each set, this test was then repeated using the minimumvalues in the NIR,10
– next test involved using the classical band ratioing based on dominant spectralbands both in the VIS and NIR i.e. λ=400 nm, 460 nm, 760 nm, 940 nm (Halthoreet al., 1997; Wernand, 2002; Kay et al., 2009).
4. In the last step the sunglint flag was produced after quality and quantity controlcheck from step 3.15
3 Results and discussion
In the previous section the methods used in spectra measurement during the fieldcampaign were explained and in this section the new proposed quality control will bepresented along with other findings. A total of 629 spectra measurements satisfied thetest conditions of the meteorological flagging. Sea surface image assessment of these20
corresponding to the unmasked 629 spectra, revealed 501 images free of sunglint, Nnsand 128 images affected by sunglint, Ns.
619

OSD8, 613–638, 2011
Quality control ofautomated
hyperspectralmeasurements
S. P. Garaba et al.
Title Page
Abstract Introduction
Conclusions References
Tables Figures
J I
J I
Back Close
Full Screen / Esc
Printer-friendly Version
Interactive Discussion
Discussion
Paper
|D
iscussionP
aper|
Discussion
Paper
|D
iscussionP
aper|
3.1 Sunglint image analysis
Automated and unmanned optical measurements from a seaborne platform are chal-lenging. It is difficult to adhere to recommended sensor setups for θsfc, θsky, Φ; thusinevitable to collect erroneous measurements affected by sunglint, whitecap and foam(Gordon, 1985; Moore et al., 1998; Fougnie et al., 1999; Hooker and Morel, 2003; Kay5
et al., 2009). In this study, underway measurements were made aboard R/V Heincke onthe track illustrated in Fig. 1. Figure 4 demonstrates typical sources of error, revealedby the image inspection in step 2 of Fig. 3. The image inspection was performed by twoinvestigators with an additional referee. Main sources of contamination were identifiedas sunglint, whitecaps and foam, the latter two resulting in similar sunlight influenced10
spectral patterns.
3.2 Sunglint flag
The assessment of the spectra from the sample sets Nns and Ns indicated that RRS(NIR) and LW (NIR) were significantly higher in the presence of sunglint. LW valuesover the whole measured spectrum, λ=320–950 nm, were higher for the set Ns relative15
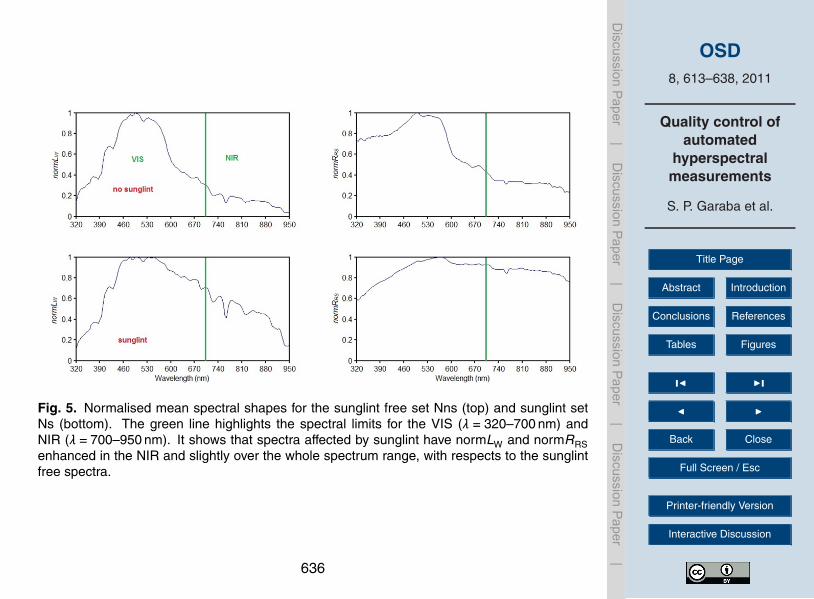
to set Nns in both VIS and NIR ranges. RRS values were enhanced for the set Nscompared to set Nns. In Fig. 5 normalised sample mean spectra shapes for Nns (501spectra) and Ns (128 spectra) are presented to illustrate the aforesaid findings. Datanormalisation was applied to maintain the spectral shape while simplifying comparisonof spectra, dividing each LW and RRS measurement by the maximum value for each20
measurement. However, for determining the new flag, the actual computed spectralmeasurements LW and RRS were used.
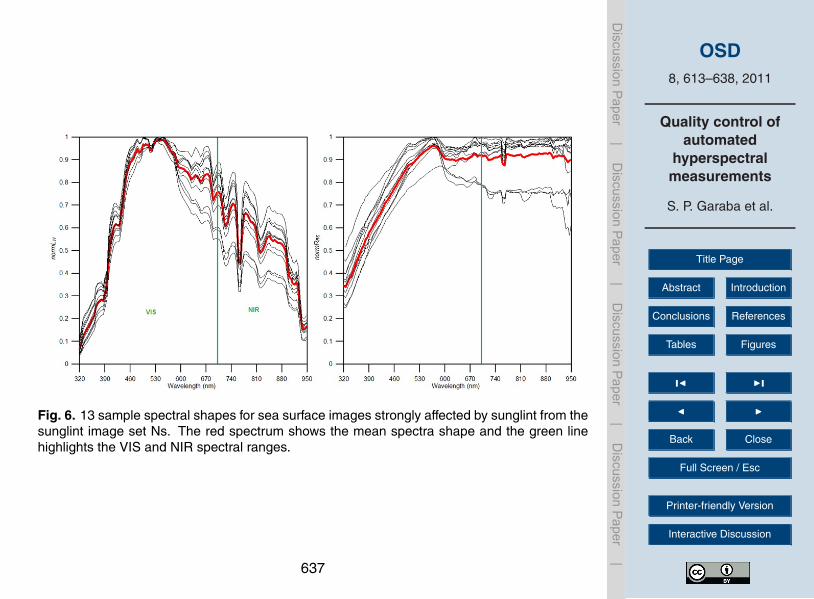
The mean Ns spectrum in Fig. 5 shows normLW and normRRS values elevated bysunglint compared to mean Nns spectrum. To further investigate and understandsunglint spectral characteristics, 13 of the 128 sea surface images in Ns were iden-25
tified to be completely affected by sunglint and in Fig. 6 their spectral shapes revealthe same trend shown in Fig. 5. The findings confirm that in the presence of sunglint,
620

OSD8, 613–638, 2011
Quality control ofautomated
hyperspectralmeasurements
S. P. Garaba et al.
Title Page
Abstract Introduction
Conclusions References
Tables Figures
J I
J I
Back Close
Full Screen / Esc
Printer-friendly Version
Interactive Discussion
Discussion
Paper
|D
iscussionP
aper|
Discussion
Paper
|D
iscussionP
aper|
sea water will reflect light due to a wind roughened sea surface, evident in the sea sur-face images, and/or multiple scattering by optically active water constituents. This wasa unique characteristic in both LW and RRS for optical measurements from this studywhich aided in developing the new sunglint flag.
Spectral band ratioing, a classical method in quantitative colour of seawater inter-5
pretation that is known to reveal diversity in RRS shapes of seawater surface features(Lee and Carder, 2000), was implemented to help reveal the differences in Nns and Ns.The spectral bands used include; oxygen absorption band (λ≈760 nm) which has beenused in a prior sunglint correction model (Kutser et al., 2009), precipitable water vapourabsorption band (λ≈ 940 nm) known to interact with solar radiation in the NIR among10
other greenhouse gases e.g. methane or carbon (Halthore et al., 1997; Kleidman etal., 2000), chromophoric dissolved organic material absorption from UV to visible, hereinvestigated at (λ≈ 400 nm) and (λ≈ 460 nm) contribute to sunglint through particulatemultiple scattering (Bricaud et al., 1981; Gallegos et al., 1990).
To summarise and evaluate the tests implemented in obtaining the best sunglint15
flag/mask Table 1 was generated. A ranking was introduced so as to order the methodsaccording to their performance when eliminating or selecting the most sunglint affectedmeasurements.
The methods in Table 1 provide an easy and simplified evaluation procedure be-cause they include basic mathematical operations; division and inequalities. The20
threshold criteria was, chosen because it is a widely used technique in develop-ing flagging and validation algorithms e.g. (Lavender et al., 2005), performed by it-erative testing, i.e. first using mean values as threshold for sets Nns and Ns andthen adjusting to obtain better performance. Adjusting these threshold values wasaimed at; (i) masking/eliminating as many measurements in the sunglint affected25
set Ns, and (ii) unmasking/keeping as many measurements in the sunglint free setNns. The performance test summarized in Table 1, revealed the best sunglint flagconditions; “mean (LW)NIR < 2 mW m−2 nm−1 Sr−1”, at least 90% effective in sets Nns(97.21%) and Ns (91.41%) but falls short as 14 valid spectra (2.79% of Nns) were
621

OSD8, 613–638, 2011
Quality control ofautomated
hyperspectralmeasurements
S. P. Garaba et al.
Title Page
Abstract Introduction
Conclusions References
Tables Figures
J I
J I
Back Close
Full Screen / Esc
Printer-friendly Version
Interactive Discussion
Discussion
Paper
|D
iscussionP
aper|
Discussion
Paper
|D
iscussionP
aper|
masked and 11 erroneous spectra (8.59% of Ns) kept; or alternatively “minimum(RRS)NIR < 0.010 Sr−1”, which despite the relatively low performance in set retainingmeasurements in Nns (94.01%) it however reduces the number of erroneous spectrakept after validation to 7 spectra (5.47% of Ns).
3.3 Remote sensing reflectance5
In the previous section, a sunglint flag was generated which can be implemented us-ing LW or RRS. In Table 2, the meteorological flagging (Wernand, 2002) conditionsand sunglint flag conditions are conjointly presented. The first three flags rely on theincoming radiation, Es, thus masking measurements taken during dusk or before signif-icant incoming solar radiation can be detected (Flag 1), dawn (Flag 2), or under rainfall10
(Flag 3). Equation (1) is then implemented to derive water leaving radiance, LW andremote sensing reflectance, RRS, followed by the sunglint flag validation. In this studythe sunglint flag was implemented using LW (Flag 4a) because it is the first product ofEq. (1) but can be replaced by RRS (Flag 4b) as summarised in Table 2. ProposingFlag 4a or Flag 4b was aimed at not limiting flagging to one remote sensing product15
e.g. LW or RRS only.This proposed quality control method (meteorological and sunglint flagging) aims
to eliminate erroneous spectral measurements collected from an unmanned and au-tomated platform. When all the flags were applied to the available measurements,Flag 1–Flag 4a, a subset was selected to illustrate typical spectra for case 2 waters20
along the cruise track (Fig. 7).
3.4 Relative azimuth angle between the sun and the sensor
In the previous section, sunglint flags were developed using LW and RRS. Using SPAand sea surfaces images as complimentary tools, an additional evaluation based onspectra kept after running the flagging proposed in Table 2 and the matching Φderived25
was performed. The main goal was to answer these two questions; how many of
622

OSD8, 613–638, 2011
Quality control ofautomated
hyperspectralmeasurements
S. P. Garaba et al.
Title Page
Abstract Introduction
Conclusions References
Tables Figures
J I
J I
Back Close
Full Screen / Esc
Printer-friendly Version
Interactive Discussion
Discussion
Paper
|D
iscussionP
aper|
Discussion
Paper
|D
iscussionP
aper|
the optical measurements of this study conform to the recommended 90◦ ≤Φ≤ 135◦?At which Φ can valid and useful measurements be collected from an unmanned andautomated platform?
According to the available measurements, valid spectra can be collected at 0◦ ≤Φ≤360◦. However, the validity of the spectra is dependent on the accuracy of air-sea5
interface reflection coefficient estimate. Table 3 summarises these findings, it is shownthat ∼85% of the optical measurements at the recommended 90◦ ≤Φ≤135◦ are valid.In the other regions 0◦ ≤Φderived < 90◦ and 135◦ <Φderived ≤ 360◦ valid measurementswere also collected. This can be attributed to the R/V “pitch, roll and yaw”, also validfor ferries equipped with radiometers, motions causing fluctuations in optical sensor10
setup; azimuth and zenith angle changes (Mishra and Nath, 1999; Aas, 2010). The dy-namic changes in the optical sensor setup on an unmanned and automated seaborneplatform influence the collection of valid and invalid measurements as shown in Table 3.
4 Conclusions
Hyperspectral optical measurements from an unmanned and automated seaborne plat-15
form are often affected by meteorological conditions and sunglint. To overcome thesedisturbances, the new proposed sunglint flag, masks spectra affected by sunglint basedon either LW or RRS, and the meteorological flags (Wernand, 2002), mask spectra af-fected by rainfall, dusk and dawn based on ES to mitigate collectable erroneous mea-surements. A camera system, to obtain sea surface images (evidence for sunglint,20
whitecaps, foam) and sky images (evidence for cloud cover or overhead sun), and theSPA to estimate the azimuthal angle of the sun relative to optical sensors, can bothbe used as complimentary tools. Optical measurements collected as proposed in thisstudy, e.g. the planned permanent installation of this system on R/V Heincke, will pro-vide test datasets for further validation of the meteorological and sunglint flagging for25
different water bodies.
623

OSD8, 613–638, 2011
Quality control ofautomated
hyperspectralmeasurements
S. P. Garaba et al.
Title Page
Abstract Introduction
Conclusions References
Tables Figures
J I
J I
Back Close
Full Screen / Esc
Printer-friendly Version
Interactive Discussion
Discussion
Paper
|D
iscussionP
aper|
Discussion
Paper
|D
iscussionP
aper|
In this study it is assumed sunglint was the main cause of error in the collectedmeasurements after applying the meteorological flagging (Wernand, 2002). However,the influence of whitecaps and foam has been reported to cause both; (i) a decrease inreflectance in the NIR due to radiation absorption by large air bubbles (Whitlock et al.,1982; Frouin et al., 1996), or physical coolness of residual foam (Marmorino and Smith,5
2005), (ii) enhanced reflectance occurring as soon as waves break generating thickstrong reflecting foam (Moore et al., 1998). Image analysis revealed that in sea surfaceimages influenced by whitecaps/foam, sunglint was also present and it was not possibleto distinguish how each contribute to the spectra. It was therefore assumed that for theavailable measurements sunglint and whitecaps/foam led to erroneous measurements.10
It is therefore important that in future studies the contribution of whitecaps and foam bespecifically investigated with respect to sunglint flagging.
Automated and unmanned above-water optical measurements based on recom-mend optical sensor setup for example the reported 90◦ ≤Φ ≤ 135◦ (Mueller et al.,2003) cannot be completely achieved and does not guarantee valid measurements,15
also reported by Aas (2010). In this study it has been shown that valid measurementscan be obtained for 0◦ ≤Φ≤ 360◦ from an unmanned seaborne platform. It is recom-mended that prior to the automated and unmanned optical measurements the SPA beutilised to predict or identify optimal Φ despite the limiting factors of R/V “pitch, rolland yaw” motions. Here the idea is not to necessarily change the cruise track but to20
perfom underway measurements avoiding sunglint. Alternatives approaches to min-imise sunglint, but increasing technical requirements, would be (a) to turn the sensorsby some automatic device or (b) to have more sensors looking at different azimuthaldirections. However for fixed platforms, such as piles, these altenative approaches canbe avoided if SPA is utilised beforehand to limit sunglint influenced measurements. Fur-25
thermore, investigations in coastal and turbid waters using hyperspectral radiometersare still needed to fully understand the sunglint spectral signatures both in the VIS andNIR ranges.
624

OSD8, 613–638, 2011
Quality control ofautomated
hyperspectralmeasurements
S. P. Garaba et al.
Title Page
Abstract Introduction
Conclusions References
Tables Figures
J I
J I
Back Close
Full Screen / Esc
Printer-friendly Version
Interactive Discussion
Discussion
Paper
|D
iscussionP
aper|
Discussion
Paper
|D
iscussionP
aper|
Acknowledgements. The data used in this study was collected during the North Sea CoastHarmful Algal Bloom (NORCOHAB II) field campaign onboard R/V Heincke cruise HE302. Theauthors extend their gratitude to the captain and crew of R/V Heincke, and to R. H. Henkel,B. Krock, B. Saworski and D. Voß for their support during the field campaign. Many thanks toD. Brockman, J. Busch, B. Mahleko, K. Nute, J. Schulz, and the two anonymous referees for5
their valuable input and critics. The Institute of Marine Resources (IMARE) GmbH is subsidizedby European Regional Development Fund (ERDF).
References
Aas, E.: Estimates of radiance reflected towards the zenith at the surface of the sea, OceanSci., 6, 861–876, doi:10.5194/os-6-861-2010, 2010.10
Bricaud, A., Morel, A., and Prieur, L.: Absorption by dissolved organic matter of the sea (yellowsubstance) in the UV and visible domains, Limnol. Oceanogr., 26, 43–53, 1981.
Deschamps, P.-Y., Fougnie, B., Frouin, R., Lecomte, P., and Verwaerde, C.: SIMBAD:A Field Radiometer for Satellite Ocean-Color Validation, Appl. Optics, 43, 4055–4069,doi:10.1364/AO.43.004055, 2004.15
Dierssen, H. M.: Perspectives on empirical approaches for ocean color remote sens-ing of chlorophyll in a changing climate, P. Natl. Acad. Sci., 107, 17073–17078,doi:10.1073/pnas.0913800107, 2010.
Fougnie, B., Frouin, R., Lecomte, P., and Deschamps, P.-Y.: Reduction of Skylight ReflectionEffects in the Above-Water Measurement of Diffuse Marine Reflectance, Appl. Optics, 38,20
3844–3856, doi:10.1364/AO.38.003844, 1999.Frouin, R., Schwindling, M., and Deschamps, P.-Y.: Spectral reflectance of sea foam in the vis-
ible and near-infrared: In situ measurements and remote sensing implications, J. Geophys.Res., 101, 14361–14371, doi:10.1029/96jc00629, 1996.
Gallegos, C. L., Correll, D. L., and Pierce, J. W.: Modeling spectral diffuse attenuation, ab-25
sorption, and scattering coefficients in a turbid estuary, Limnol. Oceanogr., 35, 1486–1502,1990.
Garaba, S., Zielinski, O., Krock, B., Henkel, R., and Voß, D.: Spectral sky radiance duringthe North Sea Coast Harmful Algal Bloom (NORCOHAB II) RV HEINCKE cruise HE302,
625

OSD8, 613–638, 2011
Quality control ofautomated
hyperspectralmeasurements
S. P. Garaba et al.
Title Page
Abstract Introduction
Conclusions References
Tables Figures
J I
J I
Back Close
Full Screen / Esc
Printer-friendly Version
Interactive Discussion
Discussion
Paper
|D
iscussionP
aper|
Discussion
Paper
|D
iscussionP
aper|
Hochschule Bremerhaven – University of Applied Sciences, doi:10.1594/PANGAEA.753832,2010a.
Garaba, S., Zielinski, O., Krock, B., Henkel, R., and Voß, D.: Downward Irradiance duringthe North Sea Coast Harmful Algal Bloom (NORCOHAB II) RV HEINCKE cruise HE302,Hochschule Bremerhaven – University of Applied Sciences, doi:10.1594/PANGAEA.753830,5
2010b.Garaba, S., Zielinski, O., Krock, B., Henkel, R., and Voß, D.: Upward radiance during the North
Sea Coast Harmful Algal Bloom (NORCOHAB II) RV HEINCKE cruise HE302, HochschuleBremerhaven – University of Applied Sciences, doi:10.1594/PANGAEA.753839, 2010c.
Garaba, S., Zielinski, O., Krock, B., Henkel, R., and Voß, D.: Remote sensing reflectance during10
the North Sea Coast Harmful Algal Bloom (NORCOHAB II) RV HEINCKE cruise HE302,Hochschule Bremerhaven – University of Applied Sciences, doi:10.1594/PANGAEA.753840,2010d.
Gordon, H. R.: Ship perturbation of irradiance measurements at sea. 1: Monte Carlo simula-tions, Appl. Optics, 24, 4172–4182, doi:10.1364/AO.24.004172, 1985.15
Gordon, H. R. and Jacobs, M. M.: Albedo of the ocean-atmosphere system: influence of seafoam, Appl. Optics, 16, 2257–2260, doi:10.1364/AO.16.002257, 1977.
Halthore, R. N., Eck, T. F., Holben, B. N., and Markham, B. L.: Sun photometric measurementsof atmospheric water vapor column abundance in the 940-nm band, J. Geophys. Res., 102,4343–4352, doi:10.1029/96JD03247, 1997.20
Hooker, S. B. and Morel, A.: Platform and Environmental Effects on Above-Water Determina-tions of Water-Leaving Radiances, J. Atmos. Ocean. Tech., 20, 187–205, doi:10.1175/1520-0426(2003)020<0187:PAEEOA>2.0.CO;2, 2003.
IOCCG: Remote sensing of ocean colour in coastal, and other optically-complex, waters,in: Reports of the International Ocean-Colour Coordinating Group, No. 3, edited by:25
Sathyendranath, S., Dartmouth, Canada, 140 pp., 2000.Kay, S., Hedley, J., and Lavender, S.: Sun Glint Correction of High and Low Spatial Resolution
Images of Aquatic Scenes: a Review of Methods for Visible and Near-Infrared Wavelengths,Remote Sensing, 1, 697–730, doi:10.3390/rs1040697, 2009.
Kleidman, R. G., Kaufman, Y. J., Gao, B. C., Remer, L. A., Brackett, V. G., Ferrare, R. A.,30
Browell, E. V., and Ismail, S.: Remote sensing of total precipitable water vapor in the near-IRover ocean glint, Geophys. Res. Lett., 27, 2657–2660, doi:10.1029/1999GL011156, 2000.
626

OSD8, 613–638, 2011
Quality control ofautomated
hyperspectralmeasurements
S. P. Garaba et al.
Title Page
Abstract Introduction
Conclusions References
Tables Figures
J I
J I
Back Close
Full Screen / Esc
Printer-friendly Version
Interactive Discussion
Discussion
Paper
|D
iscussionP
aper|
Discussion
Paper
|D
iscussionP
aper|
Kutser, T., Vahtmae, E., and Praks, J.: A sun glint correction method for hyperspectral imagerycontaining areas with non-negligible water leaving NIR signal, Remote Sens. Environ., 113,2267–2274, doi:10.1016/j.rse.2009.06.016, 2009.
Lavender, S. J., Pinkerton, M. H., Moore, G. F., Aiken, J., and Blondeau-Patissier, D.: Modi-fication to the atmospheric correction of SeaWiFS ocean colour images over turbid waters,5
Cont. Shelf Res., 25, 539–555, doi:10.1016/j.csr.2004.10.007, 2005.Lee, Z. and Carder, K. L.: Band-Ratio or Spectral-Curvature Algorithms for Satellite Remote
Sensing?, Appl. Optics, 39, 4377–4380, doi:10.1364/AO.39.004377, 2000.Marmorino, G. O. and Smith, G. B.: Bright and dark ocean whitecaps observed in the infrared,
Geophys. Res. Lett., 32, L11604, doi:10.1029/2005gl023176, 2005.10
Mishra, A. K. and Nath, A. N.: Determination of satellite nadir and azimuth angles for a tiltingsensor, Int. J. Remote Sens., 20, 3265–3272, doi:10.1080/014311699211318, 1999.
Moore, K. D., Voss, K. J., and Gordon, H. R.: Spectral Reflectance of Whitecaps: Instrumenta-tion, Calibration, and Performance in Coastal Waters, J. Atmos. Ocean. Tech., 15, 496–509,doi:10.1175/1520-0426(1998)015<0496:SROWIC>2.0.CO;2, 1998.15
Morel, A. Y. and Gordon, H. R.: Report of the working group on water color, Bound.-Lay.Meteorol., 18, 343–355, doi:10.1007/bf00122030, 1980.
Mueller, J. L., Davis, C., Arnone, R., Frouin, R., Carder, K., Lee, Z. P., Steward, R. G., Hooker,S., Mobley, C. D., and McLean, S.: Above-Water Radiance and Remote Sensing ReflectanceMeasurement and Analysis Protocols, in: Radiometric Measurements and Data Analysis20
Protocols Ocean Optics Protocols For Satellite Ocean Color Sensor Validation, Revision 4,Volume III, edited by: Mueller, J. L., Fargion, G. S., and McClain, C. R., Goddard SpaceFlight Space Center, Greenbelt, Maryland, 2003.
Ottaviani, M., Spurr, R., Stamnes, K., Li, W., Su, W., and Wiscombe, W.: Improving the descrip-tion of sunglint for accurate prediction of remotely sensed radiances, J. Quant. Spectrosc.25
Ra., 109, 2364–2375, doi:10.1016/j.jqsrt.2008.05.012, 2008.Reda, I. and Andreas, A.: Solar position algorithm for solar radiation applications, Sol. Energy,
76, 577–589, doi:10.1016/j.solener.2003.12.003, 2004.Ruddick, K. G., De Cauwer, V., Park, Y. J., and Moore, G.: Seaborne measurements of
near infrared water-leaving reflectance: The similarity spectrum for turbid waters, Limnol.30
Oceanogr., 51, 1167–1179, 2006.Schlitzer, R.: Ocean Data View, http://odv.awi.de, 2010.Schofield, O., Arnone, R. A., Bissett, P. W., Dickey, T. D., Davis, C. O., Finkel, Z., Oliver, M.,
627

OSD8, 613–638, 2011
Quality control ofautomated
hyperspectralmeasurements
S. P. Garaba et al.
Title Page
Abstract Introduction
Conclusions References
Tables Figures
J I
J I
Back Close
Full Screen / Esc
Printer-friendly Version
Interactive Discussion
Discussion
Paper
|D
iscussionP
aper|
Discussion
Paper
|D
iscussionP
aper|
and Moline, M. A.: Watercolors in the Coastal Zone: What Can We See?, Oceanography,17, 24–31, 2004.
Shi, W. and Wang, M.: An assessment of the black ocean pixel assumption for MODIS SWIRbands, Remote Sens. Environ., 113, 1587–1597, doi:10.1016/j.rse.2009.03.011, 2009.
Siegel, D. A., Wang, M., Maritorena, S., and Robinson, W.: Atmospheric Correction of Satel-5
lite Ocean Color Imagery: The Black Pixel Assumption, Appl. Optics, 39, 3582–3591,doi:10.1364/AO.39.003582, 2000.
Wernand, M. R.: Guidelines for (ship-borne) auto-monitoring of coastal and ocean colour, Pro-ceedings of Ocean Optics XVI: 18–22 November 2002, Santa Fe, New Mexico, USA, 13 pp.,2002.10
Whitlock, C. H., Bartlett, D. S., and Gurganus, E. A.: Sea foam reflectance and influence onoptimum wavelength for remote sensing of ocean aerosols, Geophys. Res. Lett., 9, 719–722,doi:10.1029/GL009i006p00719, 1982.
Zhang, H. and Wang, M.: Evaluation of sun glint models using MODIS measurements, J.Quant. Spectrosc. Ra., 111, 492–506, doi:10.1016/j.jqsrt.2009.10.001, 2010.15
628

OSD8, 613–638, 2011
Quality control ofautomated
hyperspectralmeasurements
S. P. Garaba et al.
Title Page
Abstract Introduction
Conclusions References
Tables Figures
J I
J I
Back Close
Full Screen / Esc
Printer-friendly Version
Interactive Discussion
Discussion
Paper
|D
iscussionP
aper|
Discussion
Paper
|D
iscussionP
aper|
Table 1. A summarized evaluation of the best sunglint flag conditions ranked according to theirperformance in masking sunglint spectra. To check for effectiveness, the percentage E (Ns) %and E (Nns) % was derived by dividing the number of spectra masked or unmasked by eachcondition with the actually number of spectra in sets, sunglint set Ns – 128 spectra and nonsunglint set Nns – 501 spectra. NIR refers to λ=700–950 nm.
Sunglint flag test condition Sunglint affected E (Ns) Sunglint free E (Nns)observations % observations %
masked unmasked
Minimum (LW)NIR <0.3 mW m−2 nm−1 Sr−1 123 96.09 454 90.62Mean (RRS)NIR <0.010 Sr−1 123 96.09 453 90.42Minimum (RRS)NIR <0.010 Sr−1 121 94.53 471 94.01Minimum (LW)NIR <0.4 mW m−2 nm−1 Sr−1 119 92.97 478 95.41Mean (LW)NIR <2.000 mW m−2 nm−1 Sr−1 117 91.41 487 97.21Minimum (LW)NIR <0.5 mW m−2 nm−1 Sr−1 115 89.84 486 97.01Minimum (RRS)NIR <0.012 Sr−1 115 89.84 479 95.61Mean (RRS)NIR <0.015 Sr−1 112 87.50 475 94.81LW (940)/LW (400)<0.145 111 86.72 480 95.81Mean (LW)NIR <2.500 mW m−2 nm−1 Sr−1 110 85.94 492 98.20LW (765)/LW (460)<0.290 110 85.94 477 95.21Minimum(RRS)NIR <0.015 Sr−1 109 85.16 490 97.80RRS (765)/RRS (400)<0.700 109 85.16 468 93.41RRS (760)/RRS (400)<0.700 108 84.38 470 93.81LW (940)/LW (460)<0.090 108 84.38 488 97.41RRS (760)/RRS (460)<0.650 107 83.59 473 94.41
629

OSD8, 613–638, 2011
Quality control ofautomated
hyperspectralmeasurements
S. P. Garaba et al.
Title Page
Abstract Introduction
Conclusions References
Tables Figures
J I
J I
Back Close
Full Screen / Esc
Printer-friendly Version
Interactive Discussion
Discussion
Paper
|D
iscussionP
aper|
Discussion
Paper
|D
iscussionP
aper|
Table 2. Summarised meteorological and sunglint flag conditions. The meteorological (Wer-nand, 2002) flags are represented by Flag 1–3. The sunglint flag can be implemented either asFlag 4a or Flag 4b depending on availability of measured water leaving radiance, LW or remotesensing reflectance RRS. For the flagging purposes of this study Flag 4a was implemented.
Flag Purpose Test conditionsname
Flag 1 The “minimal flag” sets the lower limitfor which significant incoming solarradiation can be measured.
ES (480 nm)>20 mW m−2 nm−1.
Flag 2 The “shape flag” will mask opticalmeasurements influenced by dusk“red colouring of the sky” or dawnradiation.
ES (470 nm)/Es (680 nm)>1
Flag 3 The “rainfall flag” will mask opticalmeasurements influenced byprecipitation or high humidity.
ES (940 nm)/Es (370 nm)>0.25
Flag 4a The “sunglint flag” will mask opticalmeasurements influence by sunglintbased on LW.
Mean LW (700–950 nm)<2 mW m−2 nm−1 Sr−1
Flag 4b Alternative “sunglint flag” basedon RRS.
Minimum (RRS)NIR <0.010 Sr−1
630

OSD8, 613–638, 2011
Quality control ofautomated
hyperspectralmeasurements
S. P. Garaba et al.
Title Page
Abstract Introduction
Conclusions References
Tables Figures
J I
J I
Back Close
Full Screen / Esc
Printer-friendly Version
Interactive Discussion
Discussion
Paper
|D
iscussionP
aper|
Discussion
Paper
|D
iscussionP
aper|
Table 3. The percentage of sunglint free observations in relation to the azimuthal angle Φderived.These observations were obtained after filtering with the meteorological masks (Wernand,2002).
Φderived Number of observations Number of sunglint free %collected at Φderived observations at Φderived
0◦ <Φderived ≤45◦ 82 47 5745◦ <Φderived ≤90◦ 48 26 5490◦ <Φderived ≤135◦ 107 89 83135◦ <Φderived ≤180◦ 80 67 85180◦ <Φderived ≤225◦ 56 52 94225◦ <Φderived ≤270◦ 94 85 90270◦ <Φderived ≤315◦ 87 76 87315◦ <Φderived ≤360◦ 75 59 80
Total 629 501
631

OSD8, 613–638, 2011
Quality control ofautomated
hyperspectralmeasurements
S. P. Garaba et al.
Title Page
Abstract Introduction
Conclusions References
Tables Figures
J I
J I
Back Close
Full Screen / Esc
Printer-friendly Version
Interactive Discussion
Discussion
Paper
|D
iscussionP
aper|
Discussion
Paper
|D
iscussionP
aper|
Fig. 1. R/V Heincke HE302 cruise track were above-water hyperspectral optical measurementswere performed between 21 April and 14 May 2009. The blue line represents the track wereoptical measurements were collected, and the red line is for the return cruise to Bremerhavenwithout measurements. The annotated sites are; the German Bight (GB), the Central North Sea(CNS), Atlantic inflow into North Sea (ANS), Irish Sea (IRS), and the Celtic Sea–St. George’sChannel (CS–SGC).
632

OSD8, 613–638, 2011
Quality control ofautomated
hyperspectralmeasurements
S. P. Garaba et al.
Title Page
Abstract Introduction
Conclusions References
Tables Figures
J I
J I
Back Close
Full Screen / Esc
Printer-friendly Version
Interactive Discussion
Discussion
Paper
|D
iscussionP
aper|
Discussion
Paper
|D
iscussionP
aper|
Fig. 2. The optical sensor and camera system setup. Highlighted in red on the left side is theRAMSES hyperspectral radiometers setup, and on the right side is the DualDome D12 camerasystem with a sample set of captured sky and sea surface images, not to scale.
633

OSD8, 613–638, 2011
Quality control ofautomated
hyperspectralmeasurements
S. P. Garaba et al.
Title Page
Abstract Introduction
Conclusions References
Tables Figures
J I
J I
Back Close
Full Screen / Esc
Printer-friendly Version
Interactive Discussion
Discussion
Paper
|D
iscussionP
aper|
Discussion
Paper
|D
iscussionP
aper|
Fig. 3. A simplified activity diagram showing the 4 steps involved in generating the new sunglintflag. Please refer to the text for a detailed description of the individual steps.
634

OSD8, 613–638, 2011
Quality control ofautomated
hyperspectralmeasurements
S. P. Garaba et al.
Title Page
Abstract Introduction
Conclusions References
Tables Figures
J I
J I
Back Close
Full Screen / Esc
Printer-friendly Version
Interactive Discussion
Discussion
Paper
|D
iscussionP
aper|
Discussion
Paper
|D
iscussionP
aper|
Fig. 4. Starboard side sky (top) and sea surface (bottom) images captured during R/V Heinckefield campaign HE302 showing sources of erroneous measurements; A – sunglint, B1 –sunglint and B2 – whitecap or foam, and C – a combination of sunglint, whitecaps and foam.
635
OSD8, 613–638, 2011
Quality control ofautomated
hyperspectralmeasurements
S. P. Garaba et al.
Title Page
Abstract Introduction
Conclusions References
Tables Figures
J I
J I
Back Close
Full Screen / Esc
Printer-friendly Version
Interactive Discussion
Discussion
Paper
|D
iscussionP
aper|
Discussion
Paper
|D
iscussionP
aper|
Fig. 5. Normalised mean spectral shapes for the sunglint free set Nns (top) and sunglint setNs (bottom). The green line highlights the spectral limits for the VIS (λ= 320–700 nm) andNIR (λ= 700–950 nm). It shows that spectra affected by sunglint have normLW and normRRSenhanced in the NIR and slightly over the whole spectrum range, with respects to the sunglintfree spectra.
636
OSD8, 613–638, 2011
Quality control ofautomated
hyperspectralmeasurements
S. P. Garaba et al.
Title Page
Abstract Introduction
Conclusions References
Tables Figures
J I
J I
Back Close
Full Screen / Esc
Printer-friendly Version
Interactive Discussion
Discussion
Paper
|D
iscussionP
aper|
Discussion
Paper
|D
iscussionP
aper|
Fig. 6. 13 sample spectral shapes for sea surface images strongly affected by sunglint from thesunglint image set Ns. The red spectrum shows the mean spectra shape and the green linehighlights the VIS and NIR spectral ranges.
637

OSD8, 613–638, 2011
Quality control ofautomated
hyperspectralmeasurements
S. P. Garaba et al.
Title Page
Abstract Introduction
Conclusions References
Tables Figures
J I
J I
Back Close
Full Screen / Esc
Printer-friendly Version
Interactive Discussion
Discussion
Paper
|D
iscussionP
aper|
Discussion
Paper
|D
iscussionP
aper|
Fig. 7. Typical reflectance spectra from; the German Bight (GB), the Central North Sea (CNS),Atlantic inflow into North Sea (ANS), Irish Sea (IRS) and Celtic Sea–St. George’s Channel(CS–SGC) collected during HE302 field campaign. These were filtered out as examples afterapplying the meteorological (Flag 1–3) and sunglint (Flag 4a) flagging from Table 2.
638