Qlik Enterprise Manager Setup and User Guide
316
Qlik Enterprise Manager Setup and User Guide Qlik Enterprise Manager TM November 2020 SR1 Last updated: June 28, 2021 Copyright © 1993-2021 QlikTech International AB. All rights reserved. HELP.QLIK.COM
-
Upload
khangminh22 -
Category
Documents
-
view
1 -
download
0
Transcript of Qlik Enterprise Manager Setup and User Guide
Qlik Enterprise Manager Setup and User GuideQlik Enterprise ManagerTM
November 2020 SR1
Last updated: June 28, 2021
Copyright © 1993-2021 QlikTech International AB. All rights reserved.
HELP.QLIK.COM

© 2021 QlikTech International AB. All rights reserved. All company and/or product namesmay be tradenames, trademarks and/or registered trademarks of the respective owners with which they are associated.
Setup and User Guide - Enterprise Manager, November 2020 SR1 3
1 Introduction 9
1.1 Example Enterprise Manager environment 10
1.2 Enterprise Manager architecture 11
2 Installation and setup 12
2.1 Preparing your system for Enterprise Manager 12
Hardware requirements 12Software requirements 13Qlik product compatibility matrix 13Replication management license 14
2.2 Installing Enterprise Manager 15
Installing Qlik Enterprise Manager using the Setup Wizard 15Upgrading Enterprise Manager 16Migrating the Enterprise Manager repository 16Silently installing Enterprise Manager 17Silently upgrading Enterprise Manager 18Silently uninstalling Enterprise Manager 19
2.3 Changing the Enterprise Manager service account 20
2.4 Setting the login authentication method 21
Setting Single Sign-on authentication 22Setting Single Sign-on authentication with Kerberos 22Setting form authentication 22Setting up SAML authentication 23
2.5 Starting to work with the Qlik Enterprise Manager Console 27
Registering Licenses 283 Security considerations 29
3.1 Setting up HTTPS for the Enterprise Manager console 29
Checking if an SSL Certificate is installed 29Using the self-signed certificate 29
3.2 Setting up HSTS on Enterprise Manager 32
Enabling HSTS 32Disabling HSTS 32
3.3 Replacing the self-signed certificate on Windows 33
3.4 Setting the hostname and changing the SSL port 34
3.5 Replacing the Master User Password 35
The Master Key 35High Availability mode 36Encrypting the user permissions file 36
3.6 Encrypting the user permissions file 37
3.7 Controlling execution of user-defined commands 38
4 Managing servers 40
4.1 Server requirements 40
Qlik Replicate Server requirements 40Qlik Compose Server requirements 41
4.2 Adding Servers 41
Contents
Setup and User Guide - Enterprise Manager, November 2020 SR1 4
4.3 Server monitoring 42
Customizing server columns 44Searching for servers 44
4.4 Server settings 44
Global error handling 45Resource control 45File Transfer Service 46Operating System level credentials 48Logging 49Server management permissions 52
4.5 Additional server management options 54
4.6 Registering a license for a monitored server 56
4.7 Viewing server messages 58
5 Defining and managing tasks 59
5.1 Adding tasks 59
Bidirectional replication 615.2 Editing and viewing a task description 64
5.3 Adding and managing endpoints 64
Adding an endpoint 65Configuring an endpoint 65Viewing endpoint configuration information 66Testing an endpoint connection 66Duplicating endpoints 66Searching for endpoints 67Deleting endpoints 67
5.4 Adding a source and target endpoint to a task 67
5.5 Selecting tables and/or views for replication 68
Searching for tables/views to use in a replication task 70Selecting specific tables/views for replication 71Setting load order 72Removing specific tables/views from a replication task 73Creating table/view selection patterns 73
5.6 Editing a replication task 75
5.7 Searching for tasks 75
5.8 Deleting a replication task 75
5.9 Exporting and importing tasks 76
6 Customizing tasks 78
6.1 Table Settings 78
Performing General tasks for a single table/view 79Defining transformations for a single table/view 80Using filters 88Parallel Load 95Handling LOB columns 99Message format 102
Contents

Setup and User Guide - Enterprise Manager, November 2020 SR1 5
6.2 Defining Global transformations 102
Limitations for global transformations 103Starting the New Transformation Rule wizard 103Selecting the transformation type 104Under what conditions to transform 105Defining the transformation rule 108Viewing all Global transformation rules 125
6.3 Using the Expression Builder (for filters, transformations, and global transformations) 126
Overview of the Expression Builder 126Build an expression 128Parse an expression 129Test an expression 129Using elements in the Expression Builder 131
6.4 Task Settings 149
Metadata 150Bidirectional 155Full Load 155Change Processing 158Error handling 170Logging 174Character substitution 176File uploads 177Message Format 178
7 Monitoring and controlling tasks 185
7.1 Monitoring Replicate tasks 185
Task progress summary 185Viewing specific tasks 189Monitoring Full Load replication 191Monitoring Change Processing replication 197
7.2 Monitoring Compose tasks 204
Task progress summary 205Monitoring Data Lake tasks 208Monitoring Data Warehouse tasks 209
7.3 Searching for tasks 210
7.4 Column and list actions 210
7.5 Grouping tasks 211
7.6 Running tasks 214
How to run a task 214Using the Run button options 215Start Processing 215Reload target 215Advanced run options 216Recovering from data folder loss or corruption 220
7.7 Error handling 222
Contents
Setup and User Guide - Enterprise Manager, November 2020 SR1 6
Task error handling 222Data error handling 222
7.8 Using the monitor tools 223
Logging 223Downloading a memory report 225Downloading a diagnostics package 225
7.9 Scheduling jobs 226
8 Messages and notifications 229
8.1 Message Center overview 229
8.2 Customizing the Message Center 231
Searching for messages 2318.3 Viewing additional information 232
8.4 Notifications 232
Setting a task notification 232Setting a server notification 239Managing notifications 243Required permissions 244Event IDs in Windows Event Log 244
8.5 Viewing and downloading log files 245
9 Administration 248
9.1 Enterprise Manager settings 248
Logging settings 248Message Center purge settings 250Repository connection settings 251Qlik Catalog Server connection 251Analytics - Data collection and purge settings 252Configuring mail server settings 254Registering and managing licenses 255
9.2 User permissions 257
Encrypting the User Permissions File 258Granular access control 258Roles and permissions 262Working with local groups 264Managing user permissions 265
9.3 Creating an audit trail 267
Decoding an encoded stream payload 26910 Configuring Enterprise Manager using the CLI 271
10.1 Setting the Enterprise Manager host address 271
10.2 Setting the Enterprise Manager HTTP port 271
10.3 Setting the Enterprise Manager HTTPS port 272
10.4 Setting the Enterprise Manager root URL 272
10.5 Showing the Enterprise Manager version 272
10.6 Showing the Enterprise Manager CLI Help 272
10.7 Service Commands 272
Contents

Setup and User Guide - Enterprise Manager, November 2020 SR1 7
10.8 Cleaning the self-signed certificate 273
10.9 Setting the audit trail retention size and age 273
10.10 Master User Password commands 273
Generating a random Master User Password 273Setting or changing the MUK (Master User Key) 273Setting or changing the Java MUK (Master User Key) 274
10.11 Showing the connectivity and login settings 275
Connectivity settings 275SAML settings 275
11 Cataloging tasks in Qlik Catalog 276
11.1 Catalog columns 276
11.2 Prerequisites 277
11.3 Setting up connectivity to Qlik Catalog 277
11.4 Limitations and considerations 277
11.5 Catalog operations 278
Cataloging tasks 278Uncataloging tasks 280Recataloging tasks 280
12 Analytics 281
12.1 Prerequisites 281
Install PostgreSQL 281Create a dedicated database and assign the required privileges 281Configure connectivity to PostgreSQL 282Set up data collection and purging from PostgreSQL 282Register a license 282Obtaining a license 282Port 282Hardware 283
12.2 Permissions 283
12.3 Analytics dashboards 283
Trends 283Trends by server 285Trends by tasks 286Top servers 287Top tasks 288Capacity planning 290
12.4 Exporting to TSV 291
12.5 Creating filters 292
12.6 Using the Pivot Menu 293
12.7 Analytics repository schema 293
aem_endpoint_type 293aem_meta_source_database 294aem_meta_target_database 294aem_server 294
Contents

Setup and User Guide - Enterprise Manager, November 2020 SR1 8
aem_source_database 294aem_target_database 295aem_target_processes 295aem_task 295aem_task_name 298aem_task_previous_metrics 299aem_task_profile 299aem_task_state 299aem_task_stop_reason 299Sample Queries 300
A Setting up High Availability 303
A.1 Installing Qlik Enterprise Manager in a Windows cluster 303
Installing Enterprise Manager in a Windows 2012 R2 cluster or in a Windows 2016 cluster 303Installing Enterprise Manager in a Windows 2008 R2 cluster 306
A.2 Upgrading Qlik Enterprise Manager in a Windows cluster 307
Upgrading Enterprise Manager in a Windows 2012 R2 or Windows 2016 cluster 307Upgrading Enterprise Manager in a Windows 2008 R2 cluster 309
A.3 Uninstalling Qlik Enterprise Manager from a Windows cluster 310
B Impact of DST change on Qlik Replicate 314
Contents

1 Introduction
1 Introduction Qlik Enterprise Manager, also referred to as Enterprise Manager, provides a single point of control for designing, executing, and monitoring Qlik Replicate and Compose tasks throughout your organization. If your site has multiple Qlik servers with tens, if not hundreds of tasks, Enterprise Manager greatly eases the design, management, and monitoring of these tasks. Whether your site deploys a single Qlik server or multiple servers, Enterprise Manager is your single go-to interface to create data endpoints, design tasks, execute them, and monitor the replication process in near real-time. In addition, Enterprise Manager lets you view all tasks in a tabular format that offers advanced grouping and filtering capabilities.
The following figures show a high-level view of a possible Enterprise Manager installation environment and a more detailed architecture diagram.
Note that components labeled as "Qlik Server" can either be Qlik Replicate or Qlik Compose.
Setup and User Guide - Enterprise Manager, November 2020 SR1 9

1 Introduction
1.1 Example Enterprise Manager environment
Setup and User Guide - Enterprise Manager, November 2020 SR1 10

1 Introduction
1.2 Enterprise Manager architecture
Setup and User Guide - Enterprise Manager, November 2020 SR1 11

2 Installation and setup
2 Installation and setupThis topic describes how to install and set up Qlik Enterprise Manager (Enterprise Manager).
For instruction on installing Enterprise Manager in a Windows Cluster, see Installing Qlik Enterprise Manager in a Windows cluster (page 303).
Enterprise Manager collects information from Qlik Replicate and/or Qlik Compose Servers to allow a central point of monitoring for all Replicate and/or Compose Servers in your organization. Therefore, you also need to install Qlik Replicate and/or Qlik Compose in your organization. For a description of the respective installation procedures, refer to the Qlik Replicate and/or Qlik Compose product Help.
2.1 Preparing your system for Enterprise ManagerThis section describes the hardware and software requirements for Qlik Enterprise Manager and the monitored Replicate Servers.
In this section:
l Hardware requirements (page 12)
l Software requirements (page 13)
Hardware requirementsIt is recommended that the machine hosting Qlik Enterprise Manager meets the configuration requirements listed in the following table:
Component Configuration
Processor 8-core base
Memory 16 GB
Disk requirements 500 GB
10,000 RPM
Network 1 Gb
Hardware requirements
Firewall port 443 should be open inbound on the Enterprise Manager machine.
Setup and User Guide - Enterprise Manager, November 2020 SR1 12
2 Installation and setup
Software requirements
Parts of the software use Java components utilizing OpenJDK JRE, which is included in the Enterprise Manager installation.
Supported Windows platformsIt is strongly recommended to install Qlik Enterprise Manager on a dedicated Windows server, separate from the Replicate and/or Compose Servers that it manages.
Enterprise Manager can be installed on any of the following Windows platforms:
l Windows Server 2008 R2 (64-bit)
l Windows Server 2012 R2 (64-bit)
l Windows Server 2016 (64-bit)
l Windows Server 2019 (64-bit)
Supported browsersThe following browsers can be used to access the Enterprise Manager Console:
l Google Chrome (recommended): Latest version
l Mozilla Firefox: Version 38 and above
l Microsoft Internet Explorer: 11Required Resolution: 1366x768 pixels and above
Additional software requirementsQlik Enterprise Manager requires the following software:
l Microsoft Visual Studio C++ 2010 X64 Redistributable and 2015 X64 Redistributable
l .NET Framework 4.8 or above
l To use the Analytics feature, PostgreSQL 10.1 or above should be installed either on the Enterprise Manager machine or on a machine that is accessible from Enterprise Manager.
See also: Qlik product compatibility matrix (page 13).
Qlik product compatibility matrix
Replicate CompatibilityQlik Enterprise Manager November 2020 SR1 is compatible with Replicate November 2020 SR1, Replicate November 2020, Replicate April 2020, and Replicate 6.5.
Qlik Compose CompatibilityQlik Enterprise Manager November 2020 SR1 is compatible with Compose for Data Warehouses November 2020 and Compose for Data Lakes April 2020 only.
Setup and User Guide - Enterprise Manager, November 2020 SR1 13

2 Installation and setup
Qlik Catalog CompatibilityQlik Enterprise Manager November 2020 SR1 is compatible with Qlik Catalog November 2020 only.
Replication management licenseThis section explains how to obtain a Replication Management license and lists the processes that continue even when the license expires or is invalid.
Obtaining a Replication Management licenseA Replication Management license is required in order to use Qlik Enterprise Manager. If no license is detected, a Register License message will be displayed when you open the Qlik Enterprise Manager Console.
The procedure below does not apply when installing Enterprise Manager in a High Availability Cluster. To obtain a Replication Management license for Enterprise Manager in a High Availability Cluster, you must provide your Qlik Sales Representative with the following information, depending on which Windows version the cluster is running:
l Windows 2016: The official cluster FQDN.
l Windows 2008 R2 and 2012 R2: The FQDN of each of the cluster nodes and the official cluster FQDN.
To obtain a license
1. Open the Qlik Enterprise Manager Console and copy the Enterprise Manager machine name from either of the following locations:
l The Register License message that is displayed when you open the Qlik Enterprise Manager Console.
l The bottom of the Licenses tab in the Settings window.
2. Request a license from your Qlik Sales Representative, making sure to include the Enterprise Manager machine name in your request.
Process that continue if the license expires or is invalidThe following processes will continue, even if the Replication Management license expires or is invalid:
l Notifications will continue to be sent.
l Tasks monitoring information and messages will continue to be collected from Replicate. However, they will not be visible until a valid Replication Management license is installed.
In such a situation, do one of the following:
l Register a valid Replication Management license.
l Stop the Enterprise Manager service or uninstall the product if you do not intend to use it anymore.
Setup and User Guide - Enterprise Manager, November 2020 SR1 14
2 Installation and setup
2.2 Installing Enterprise Manager
Enterprise Manager must be installed under an Administrator account.
In this section:
l Installing Qlik Enterprise Manager using the Setup Wizard (page 15)
l Silently installing Enterprise Manager (page 17)
l Silently upgrading Enterprise Manager (page 18)
l Silently uninstalling Enterprise Manager (page 19)
Installing Qlik Enterprise Manager using the Setup WizardThe following section describes how to install Enterprise Manager.
To install Enterprise Manager:
1. Run the Enterprise Manager setup file (AttunityEnterpriseManager_<version.build>_<systemtype>.exe, such as AttunityEnterpriseManager_3.0.0.105_X64.exe).The Enterprise Manager setup wizard opens.
2. Optionally, change the installation directory; then click Next.
3. Optionally, change the data directory; then click Next.All of the data that is created when you use Enterprise Manager is stored in a directory called data. By default, this directory is located in the installation directory where you install Enterprise Manager.
If you change the data directory location, you must prefix all command line actions with:-d path_to_the_data_directory
Example:
<product_dir>\bin\AemCtl.exe -d F:\data configuration set -a 123.123.12.1
4. Click Next again to start the installation.
5. When the installation completes, click Finish.As part of the installation, a new Windows Service called Enterprise Manager is created.The Enterprise Manager analytics module require a PostgreSQL database. If you plan on using this module, you will need to install PostgreSQL on either the Enterprise Manager machine or on a machine that is accessible from Enterprise Manager. For your convenience, PostgreSQL is included with Enterprise Manager and you will be prompted to install it after clicking Finish.
6. Click Yes to install PostgreSQL on the Enterprise Manager server or No to exit without installing PostgreSQL. You can always install PostgreSQL at a later time by running the PostgreSQL installer from the following location:<Enterprise_Manager_INSTALLATION_FOLDER>\postgresqlkit
Setup and User Guide - Enterprise Manager, November 2020 SR1 15

2 Installation and setup
For instructions on installing and maintaining PostgreSQL, refer to the PostgreSQL Help.
7. Open the Enterprise Manager console as described in Starting to work with the Qlik Enterprise Manager Console (page 27).
Upgrading Enterprise ManagerThe upgrade process also describes how to back up the Enterprise Manager "data" folder, which will allow you to restore your settings if you encounter any issues with the upgrade.
To upgrade Enterprise Manager:
1. Back up your currently installed version, by copying the Enterprise Manager data folder to a location outside the product folder. The default data folder location is C:\Program Files\Attunity\Enterprise Manager\data.
2. Run the Enterprise Manager setup wizard to install the new version.
3. If you notice an issue with the upgrade, you can revert to the previous version as described below or do the following:
a. Stop all the Enterprise Manager services.
b. Overwrite the data folder with the data folder that you backed up earlier.
c. Start all the Enterprise Manager services.
Reverting to a Previous VersionTo revert to a previous version:
1. Back up the Enterprise Manager data directory to a location outside the product folder.
2. Uninstall the product and then reinstall to the same directory.
3. Once the installation is complete, stop all Enterprise Manager services.
4. Overwrite the data directory with the data directory that you backed up earlier.
5. Start all Enterprise Manager services.
Migrating the Enterprise Manager repositoryIn certain situations, you may need to migrate Replicate or Compose Servers and settings from one Enterprise Manager Server to another. This may be required, for example, if you need to move from a test environment to a production environment or if you need to decommission the Enterprise Manager Server machine. In the migration procedure, which is described below, Server A is the Enterprise Manager Server configured with Replicate or Compose Servers, while Server B is a clean installation of Enterprise Manager Server.
All commands should be run as administrator.
1. On Server A:
a. Run the following commands:Command 1 - Sets the Master User Key:
Setup and User Guide - Enterprise Manager, November 2020 SR1 16
2 Installation and setup
<INSTALL_DIR>\bin\aemctl.exe [-d data_folder_path] masterukey set
-p password
where -d data_folder_path is only required if the <INSTALL_DIR>\data folder is in a non-default location.Command 2 - Sets the Java Master User Key:<INSTALL_DIR>\java\bin\atajs.bat [-d java_data_folder_path]
masterukey set password
where -d java_data_folder_path is only required if the <INSTALL_DIR>\data\java folder is in a non-default location.
b. Restart the QlikEnterprise Manager service.
2. On Server B:
a. Stop the Qlik Enterprise Manager service.
b. Delete the <INSTALL_DIR>\data folder.
c. Copy the data folder from Server A to Server B.
d. Run the following commands:Command 1:
<INSTALL_DIR>\bin\aemctl.exe [-d data_folder_path] masterukey set
-p password
where -d data_folder_path is only required if the <INSTALL_DIR>\data folder is in a non-default location.Command 2:<INSTALL_DIR>\java\bin\atajs.bat [-d java_data_folder_path]
masterukey set password
e. Start the QlikEnterprise Manager service.
f. Log in to Enterprise Manager and verify that the Replicate and Compose Servers have been migrated from Server A to Server B, and that all of Server A's configuration settings have been migrated as well.
Silently installing Enterprise ManagerEnterprise Manager can be installed silently (i.e. without requiring user interaction). This option is useful, for example, if you need to install Enterprise Manager on several machines throughout your organization.
Before commencing the installation, make sure that the prerequisites have been met.
The installation process consists of two stages:
1. Creating a response file (page 17)
2. Running the silent install (page 18)
Creating a response fileBefore starting the installation, you need to create a response file.
Setup and User Guide - Enterprise Manager, November 2020 SR1 17

2 Installation and setup
To create the response file:
1. From the directory containing the Qlik Enterprise Manager setup file, run the following command (note that this will also install Enterprise Manager):AttunityEnterpriseManager_version_X64.exe /r /f1my_response_file
where:my_response_file is the full path to the response file that will be generated. Example:AttunityEnterpriseManager_6.1.0.536_X64.exe /r /f1C:\Enterprise Manager_install.iss
At the end of the Enterprise Manager installation, when you are prompted to run the PostgreSQL installer, click No.
2. To change the default installation directory, open the response file in a text editor and edit the first szDir value as necessary.
3. To change the default data directory, edit the third szDir value as necessary.
4. Save the file as <name>.iss, e.g. silent_inst_64.iss.
Running the silent installTo silently install Qlik Enterprise Manager, open a command prompt and change the working directory to the directory containing the Enterprise Manager setup file. Then issue the following command:
Syntax: AttunityEnterpriseManager_version_X64.exe /s /f1my_response_file [/f2log_file]
where:
my_response_file is the full path to the response file you created earlier and log_file is the path to the optional log file.
Example:
C:\>AttunityEnterpriseManager_6.1.0.536_X64.exe /s /f1C:\temp\1\Enterprise Manager_install.iss
/f2C:\temp\1\silent_x64_install.log
If the installation was successful, the log file should contain the following rows:
[ResponseResult]
ResultCode=0
Silently upgrading Enterprise ManagerSilently upgrading Enterprise Manager consists of two stages:
1. Creating a response file (page 19)
2. Running a silent upgrade (page 19)
Setup and User Guide - Enterprise Manager, November 2020 SR1 18

2 Installation and setup
Creating a response fileBefore starting the upgrade, you need to create a response file. You may also want to back up your current installation as described in Upgrading Enterprise Manager (page 16).
For an explanation of how to create a response file, see Step 1 of Creating a response file (page 17).
Running a silent upgradeTo silently upgrade Enterprise Manager, open a command prompt and change the working directory to the directory containing the Enterprise Manager setup file.
Then issue the following command:
Syntax: AttunityEnterpriseManager_version_X64.exe /s /f1my_response_file [/f2log_file]
where:
my_response_file is the full path to the response file you created earlier and log_file is the path to the optional log file.
Example:
C:\>AttunityEnterpriseManager_6.1.0.536_X64.exe /s /f1C:\temp\1\Enterprise Manager_upgrade.iss
/f2C:\temp\1\silent_x64_up.log
If the upgrade was successful, the log file should contain the following rows:
[ResponseResult]
ResultCode=0
Silently uninstalling Enterprise ManagerSilently uninstalling Enterprise Manager consists of two stages:
1. Creating a response file (page 19)
2. Running a silent uninstall (page 20)
Creating a response fileBefore starting the uninstall, you need to create a response file.
To create the response file:
1. Copy the following (response file) text into a text editor:[{999A7077-16C9-4B3B-AFD2-CBBA9FA72C15}-DlgOrder]
Dlg0={999A7077-16C9-4B3B-AFD2-CBBA9FA72C15}-SdWelcomeMaint-0
Count=3
Setup and User Guide - Enterprise Manager, November 2020 SR1 19
2 Installation and setup
Dlg1={999A7077-16C9-4B3B-AFD2-CBBA9FA72C15}-MessageBox-0
Dlg2={999A7077-16C9-4B3B-AFD2-CBBA9FA72C15}-SdFinish-0
[{999A7077-16C9-4B3B-AFD2-CBBA9FA72C15}-SdWelcomeMaint-0]
Result=303
[{999A7077-16C9-4B3B-AFD2-CBBA9FA72C15}-MessageBox-0]
Result=6
[{999A7077-16C9-4B3B-AFD2-CBBA9FA72C15}-SdFinish-0]
Result=1
bOpt1=0
bOpt2=0
2. Save the file as <name>.iss, e.g. silent_uninst_64.iss.
Running a silent uninstallTo silently uninstall Enterprise Manager, open a command prompt and issue the following command:
Syntax: "C:\Program Files (x86)\InstallShield Installation Information\<directory_containing_setup_
file>\setup.exe" /s /f1my_response_file /f2log_file
where:
my_response_file is the full path to the response file you created earlier and log_file is the path to the optional log file.
The directory containing the Enterprise Manager setup file always ends with the following string: CBBA9FA72C15
Example:
C:\>"C:\Program Files (x86)\InstallShield Installation Information\{999A7077-16C9-4B3B-AFD2-
CBBA9FA72C15}\setup.exe" /s /f1C:\temp\response.iss /f2C:\temp\1\silent_uninstall.log
If the uninstall was successful, the log file should contain the following rows:
[ResponseResult]
ResultCode=0
2.3 Changing the Enterprise Manager service accountBy default, Enterprise Manager is installed with Administrator privileges. For secuirty reasons, you may want Enterprise Manager to run under a user account that does not have Administrator privileges.
To do this:
1. Install Enterprise Manager.
2. Create a local user without administrative privileges.
Setup and User Guide - Enterprise Manager, November 2020 SR1 20

2 Installation and setup
3. Reserve the URL for the user you just created by running the following commands:netsh http add urlacl url=https://+:443/AttunityEnterpriseManager
user=DOMAIN\yourusernetsh http add urlacl url=http://+:80/AttunityEnterpriseManager
user=DOMAIN\youruser
4. Grant the new user the Full control permission for the Enterprise Manager data folder (<EM_INSTALL_DIR>\data).
5. Open the Local Security Policy window and select Local Policies>User Rights Assignment. Then grant the Log on as a service policy to the new user.
6. Stop the Enterprise Manager service.
7. In the Log On tab of the Enterprise Manager service properties, select This account and specify the new user name in the following format:.\NewUser
8. Save your changes.
9. Start the Enterprise Manager service.
2.4 Setting the login authentication methodBy default, Enterprise Manager uses Single Sign-on through Windows Authentication to authenticate users. This allows users to open the Enterprise Manager Console without providing additional authentication. To require users to authenticate themselves at login, you can change the authentication method to Form or SAML. Setting the authentication method is done using the Enterprise Manager CLI, as described below.
To see the current authentication settings, run the command described in Showing the connectivity and login settings (page 275).
l All commands in this section should be "Run as administrator" from the Enterprise Manager bin directory. The default location is C:\Program Files\Attunity\Enterprise Manager\bin.
l When the Enterprise Manager data folder is in a non-default location (such as in a cluster installation), make sure to include the --d data_folder parameter in all commands, where data_folder is the location of the data folder. The parameter should immediately follow the name of the Enterprise Manager executable file (e.g. aemctl --d f:\mydatafolder {command} {parameters})
l Changes to the authentication method will take affect only after you restart the Enterprise Manager service.
l If Form authentication is used, all Login/Logout operations are reported to the Audit Trail.
In this section:
Setup and User Guide - Enterprise Manager, November 2020 SR1 21
2 Installation and setup
l Setting Single Sign-on authentication (page 22)
l Setting Single Sign-on authentication with Kerberos (page 22)
l Setting form authentication (page 22)
l Setting up SAML authentication (page 23)
Setting Single Sign-on authenticationThis is the default authentication method, which uses Windows authentication.
To set the authentication method to single sign-on, run:
aemctl.exe configuration set --authentication_method sso
Abbreviated form of --sso: -w
Setting Single Sign-on authentication with KerberosKerberos is an enterprise authentication protocol that uses the concept of tickets and three-way authentication to enable users and computers to identify themselves and secure access to resources.
Using Kerberos SSO, users can seamlessly log into Enterprise Manager and administrators can completely externalize and centrally manage users or group memberships using their existing Kerberos infrastructure.
To set the authentication method to single sign-on with Kerberos, run:
aemctl.exe configuration set --authentication_method sso-kerberos
If the Kerberos protocol fails, Enterprise Manager will try to log in using NTLM authentication. If NTLM authentication is not enabled in the system, an error will be returned.
Setting form authenticationAs opposed to Single Sign-on through Windows Authentication, this method requires users to provide a user name and password at login.
To set the authentication method to Form, run:
aemctl.exe configuration set --authentication_method form
Abbreviated parameter: -f
Setting a user timeoutParameter: --user_timeout
Abbreviated form: -u
When setting --form authentication, you can use this parameter to override the default user idle timeout period (5 minutes) or to disable user idle timeout entirely.
Setup and User Guide - Enterprise Manager, November 2020 SR1 22

2 Installation and setup
When a user idle timeout value is specified, Enterprise Manager will automatically log out users that have been inactive for the specified time period (or longer).
To set a user timeout when using Form authentication, run:
aemctl.exe configuration set --authentication_method form --user_timeout timeout
Where timeout is the length of time in minutes after which users will be logged out. The minimum permitted value is 1 minute.
For example, to set a user-idle timeout period of two minutes, run:
aemctl.exe configuration set --authentication_method form --user_timeout 2
To disable the user-idle timeout entirely, run:
aemctl.exe configuration set --authentication_method form --user_timeout -1
Specifying an Active Directory domainParameter: --domain
Abbreviated form: -m
When setting --form authentication, you can use this parameter to specify an Active Directory domain name that will be used when a user logs in with a user name only (i.e. without a domain name).
To set a user timeout when using Form authentication, run:
aemctl.exe configuration set --authentication_method form --domain DomainName
Where DomainName is the name of the domain.
For example, to set the domain to ad2_acme, run:
aemctl.exe configuration set --authentication_method form --domain ad2_acme
By default, when only a user name is provided in the login form, the domain of the server is used. If the server does not belong to any domain the server machine name will be used instead.
A user who logs in as "doe" will be assumed to identify as "ad2_acme\doe". If a user specifies a fully qualified domain name when logging in, this parameter is ignored.
Setting up SAML authenticationThis method requires you to log in via your organization's SAML Identity Provider. The command parameters for setting SAML authentication are the same regardless of your SAML provider, although the parameter values are slightly different.
The setup procedure consists of the following steps:
Setup and User Guide - Enterprise Manager, November 2020 SR1 23
2 Installation and setup
l Step 1: Set up SAML on Enterprise Manager (page 24)
l Step 2: Set Up an Enterprise Manager Superuser (page 25)
l Step 3: Log in to Enterprise Manager and create SAML users (page 26)
Before running the commands, you must have already configured Enterprise Manager as an application in your SAML Identity Provider.
When Enterprise Manager is not installed in a Cluster, the Enterprise Manager Assertion Consumer Service (ACS) URL is:
https://{host_name}/attunityenterprisemanager/rest/?action=login_saml
See below for the Assertion Consumer Service (ACS) URL when Enterprise Manager is installed on a cluster.
Prerequisites for SAML on when Enterprise Manager is Installed in a Cluster
l Finish the cluster install on all nodes before configuring SAML.
l In order to propagate the configuration changes, make sure to include the -d data_folder parameter in the SAML configuration commands described below, where data_folder is the location of the cluster's shared data folder.
l The Assertion Consumer Service (ACS) URL which the IDP should call when redirecting SAML calls should be the cluster wide DNS name (as opposed to a specific machine name). This is how it should look:https://{em-cluster-fqdn}/attunityenterprisemanager/?action=login_saml
For more information about setting up Enterprise Manager in a cluster, see Installing Qlik Enterprise Manager in a Windows cluster (page 303).
Step 1: Set up SAML on Enterprise Manager
To set the Enterprise Manager authentication method to SAML, run:
Syntax: aemctl [--d data_folder] configuration set --authentication_method SAML --idp_url SsoUrl --idp_issuer
issuer_name --idp_certificate_file CertificateFile [--idp_user_displayname_attribute displayname] [--
idp_username_attribute username] [--idp_user_groups_attribute groups]
Example: using Microsoft Azure as the SAML IdP
aemctl configuration set --authentication_method SAML --idp_url
https://login.microsoftonline.com/12854727-3c42-4866-ab29-0c418b8310a1/saml2 --idp_issuer aemdevtest
--idp_certificate_file AEMDevTest.pem
Where:
Setup and User Guide - Enterprise Manager, November 2020 SR1 24

2 Installation and setup
l SsoUrl is the URL of the SAML IdP (Identity Provider) that handles sign-in requests. When using Okta, this is the Okta Single Sign-On URL.When using Microsoft Azure, this is the Azure AD SAML single sign-on URL. Enterprise Manager will direct users to this URL to complete the SAML login operation.
l issuer_name is a unique name that the identity provider uses for SAML 2.0. When using Okta, this should be a URL. When using Azure, this should be a string.
l CertificateFile - The certificate is used by the IdP to sign the SAML assertions sent to Enterprise Manager. The certificate file can be anywhere on the Enterprise Manager machine, but only needs to be specified with a path when it does not reside in the Enterprise Manager bin directory. When using Okta, the certificate must be in .cert format.When using Microsoft Azure, the certificate must be in .pem format.
l data_folder - The location of the data folder when it is not the default location such as when Enterprise Manager is installed in a Windows cluster.
Optional Parameters:
The following parameters are optional and should only be used if required by your SAML IdP:
l --idp_user_displayname_attribute - The user display name attribute.
l --idp_username_attribute - By default, with SSO, the SAML Assertion’s “Subject” attribute is used to define the username. Using the subject is the right solution in most situations, but in extreme cases (such as the subject being a transient ID) it may be necessary to provide the username in some other form.
l --idp_user_groups_attribute - The user group attribute.
Once you have set up SAML, you need to restart the Qlik Enterprise Manager service for the settings to take effect.
Step 2: Set Up an Enterprise Manager SuperuserThe first time you log in to Enterprise Manager using SAML, you must log in as an Enterprise Manager superuser. This is because none of the existing (or default) Enterprise Manager users are authorized SAML users.
The instructions below assume that you have already changed the default Master User key. For instruction on how to do this, see Configuring Enterprise Manager using the CLI (page 271) and Configuring Enterprise Manager using the CLI (page 271) respectively.
To set up a superuser, run the following command:
aemctl authorization setsuperuser -s username -e ExpirationTimeoutInMinutes
-m MasterUserKey
Where:
Setup and User Guide - Enterprise Manager, November 2020 SR1 25

2 Installation and setup
l username is the superuser user name. The user must be an existing SAML user and can contain any Unicode character up to 255 characters.
l ExpirationTimeInMinutes is the expiration time for the specified user. The maximum is 60 minutes.
l MasterUserKey is your Master User Key.
Step 3: Log in to Enterprise Manager and create SAML usersAfter setting up SAML authentication, you will be presented with the following page when you try to open the Qlik Enterprise Manager console:
After clicking Log In with SAML, you will be directed to Okta or Microsoft Azure to provide your SAML login credentials. After successfully authenticating yourself with SAML, you will be redirected back to the Enterprise Manager Console home page.
Once you are logged in to Enterprise Manager, you must then add authorized SAML users and groups, as described in Managing user permissions (page 265).
For information about other CLI options, see Configuring Enterprise Manager using the CLI (page 271).
Switching between SAML and SSO/Form authenticationIf you wish to switch from SAML to SSO/Form authentication (or vice versa), you may need to clear the existing users from Enterprise Manager. When switching from SAML to SSO/Form authentication, you will not be able to change user permissions or add users unless you clear the existing SAML users. However, when switching from SSO/Form authentication to SAML, you do not need to clear the existing users in order to add/delete users or edit user permissions. You may still want to do this however if you find the presence of non-SAML users distracts you from managing the SAML users.
Before clearing the users, it is strongly recommended to export them as this will save time (by importing them) should you later need to revert the authentication type.
Setup and User Guide - Enterprise Manager, November 2020 SR1 26

2 Installation and setup
To export all users to a JSON file, run the following command:
aemctl repository export_acl -f [fullpath\]filename
where filename is the name of the file to which the users will be exported. By default, the file will be exported to the Enterprise Manager bin directory. If you wish the file to be exported to a custom path, include [fullpath\] in the command.
Example:
aemctl repository import_acl -f C:\temp\Enterprise ManagerUsers
To clear all users, run the following command:
aemctl repository clear_acl
To import users from the exported JSON file, run the following command:
aemctl repository import_acl -f [fullpath\]filename
where filename is the name of the file to import. Unless you specified a custom export path, the file will be located in the Enterprise Manager bin directory. If you wish the file to be imported from a custom path, include [fullpath\] in the command.
Example:
aemctl repository import_acl -f C:\temp\Enterprise ManagerUsers
2.5 Starting to work with the Qlik Enterprise Manager Console
To start working with Enterprise Manager, you need to open the Qlik Enterprise Manager Console and register a Replication Management license.
You can use a Web browser to access the Console from any computer in your network. For information on supported browsers, see Preparing your system for Enterprise Manager (page 12).
The user logged into Enterprise Manager must be an authorized Qlik Enterprise Manager user.
To access the Qlik Enterprise Manager Console:
l From the machine on which it is installed, select All Programs > Qlik Enterprise Manager > Qlik Enterprise Manager Console from the Windows Start menu.ORType the following address in the address bar of your Web browser:https://<computer name>/attunityenterprisemanager
Setup and User Guide - Enterprise Manager, November 2020 SR1 27

2 Installation and setup
On a machine running Microsoft Windows 10 or Windows Server 2012, you need to run the Console as Administrator.
l From a remote browser, type the following address in the address bar of your Web browser:https://<computer name>/attunityenterprisemanagerwhere <computer name> is the name or IP address of the computer where Qlik Enterprise Manager is installed.
If no server certificate is installed on the Enterprise Manager machine, a page stating that the connection is untrusted opens. This is because when Enterprise Manager detects that no server certificate is installed, it installs a self-signed certificate. Because the browser has no way of knowing whether the certificate is safe, it displays this page.
For more information, see Setting up HTTPS for the Enterprise Manager console (page 29).
If prompted, enter your user name and password.
The user name may need to include domain information in the following format:
<domain name>@<user name>
For more information, see Setting the login authentication method (page 21).
Registering LicensesIf this is the first time you are using Enterprise Manager, you will be prompted to register a Replication Management license when the console opens. You may also need to register a Replication Analytics license (required for the Analytics (page 281) module), depending on whether you have obtained such a license from your Qlik Sales Representative.
For information on registering licenses, see Registering and managing licenses (page 255).
Setup and User Guide - Enterprise Manager, November 2020 SR1 28

3 Security considerations
3 Security considerationsThis topic provides a detailed rundown of the various security-related procedures that need to be performed to ensure that your data is secure.
3.1 Setting up HTTPS for the Enterprise Manager consoleIndustry-standard security practices dictate that web user interface for enterprise products must use secure HTTP (HTTPS). Qlik Enterprise Manager enforces the use of HTTPS and will not work if HTTPS is configured incorrectly.
As Enterprise Manager uses the built-in HTTPS support in Windows, it relies on the proper setup of the Windows machine it runs on to offer HTTPS access. In most organizations, the IT security group is responsible for generating and installing the SSL server certificates required to offer HTTPS. It is strongly recommended that the machine on which Enterprise Manager is installed already has a valid SSL server certificate installed and bound to the default HTTPS port (443).
Checking if an SSL Certificate is installedTo check whether an SSL certificate is installed, you can use the following command:
netsh http show sslcert | findstr /c:":443"
If an SSL certificate is installed, the output should look like this:
netsh http show sslcert | findstr /c:":443 "
IP:port : 192.168.1.13:443
IP:port : 192.168.1.11:443
IP:port : [fe80::285d:599c:4a55:1092%11]:443
IP:port : [fe80::3d0e:fb1c:f6c3:bc52%23]:443
With a valid SSL certificate installed, the Enterprise Manager web user interface will automatically be available for secure access from a web browser using the following URL:
https://<machine-name>/attunityenterprisemanager
Using the self-signed certificateDue to the way the HTTPS protocol works, there is no way for Enterprise Manager to automatically provide and install a valid SSL server certificate. Still, in the event that no SSL server certificate is installed, Enterprise Manager automatically generates and installs a self-signed SSL server certificate (as a temporary measure). This certificate is generated on the Enterprise Manager machine and cannot be exported or used elsewhere.
It should be noted that browsers do not consider the certificate to be valid because it was not signed by a trusted certificate authority (CA). When connecting with a browser to a server that uses a self-signed certificate, a warning page is shown such as this one in Chrome:
Setup and User Guide - Enterprise Manager, November 2020 SR1 29
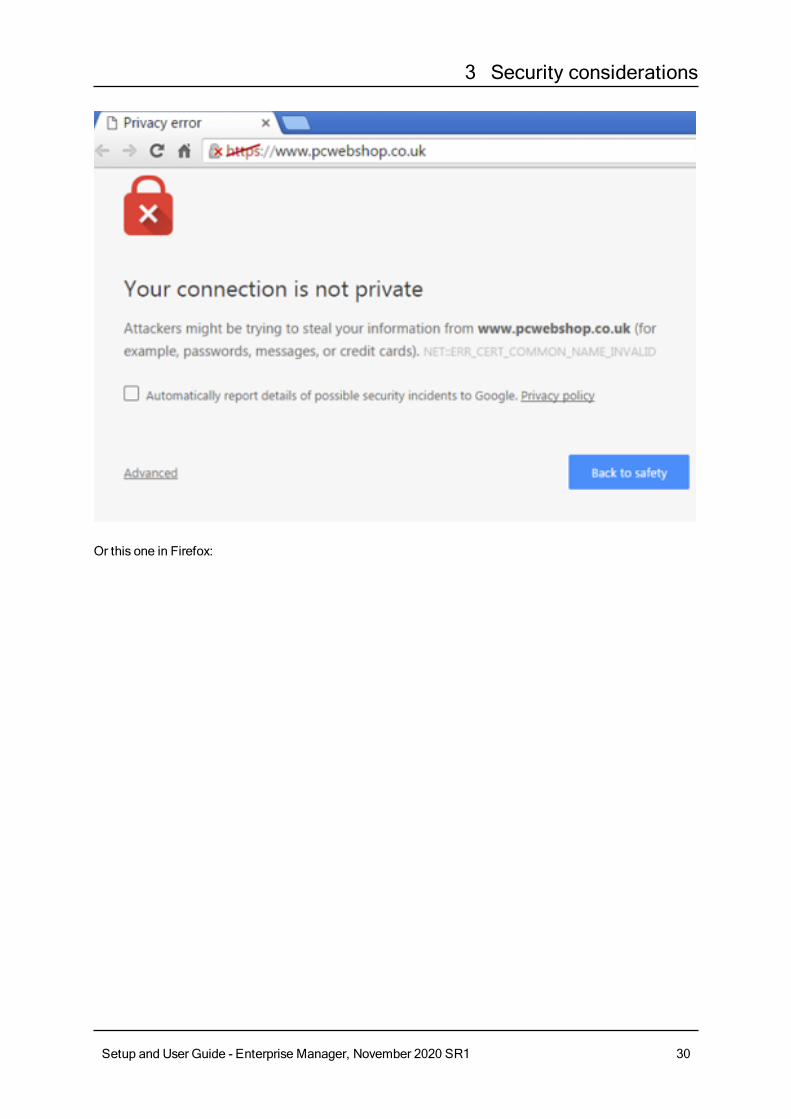
3 Security considerations
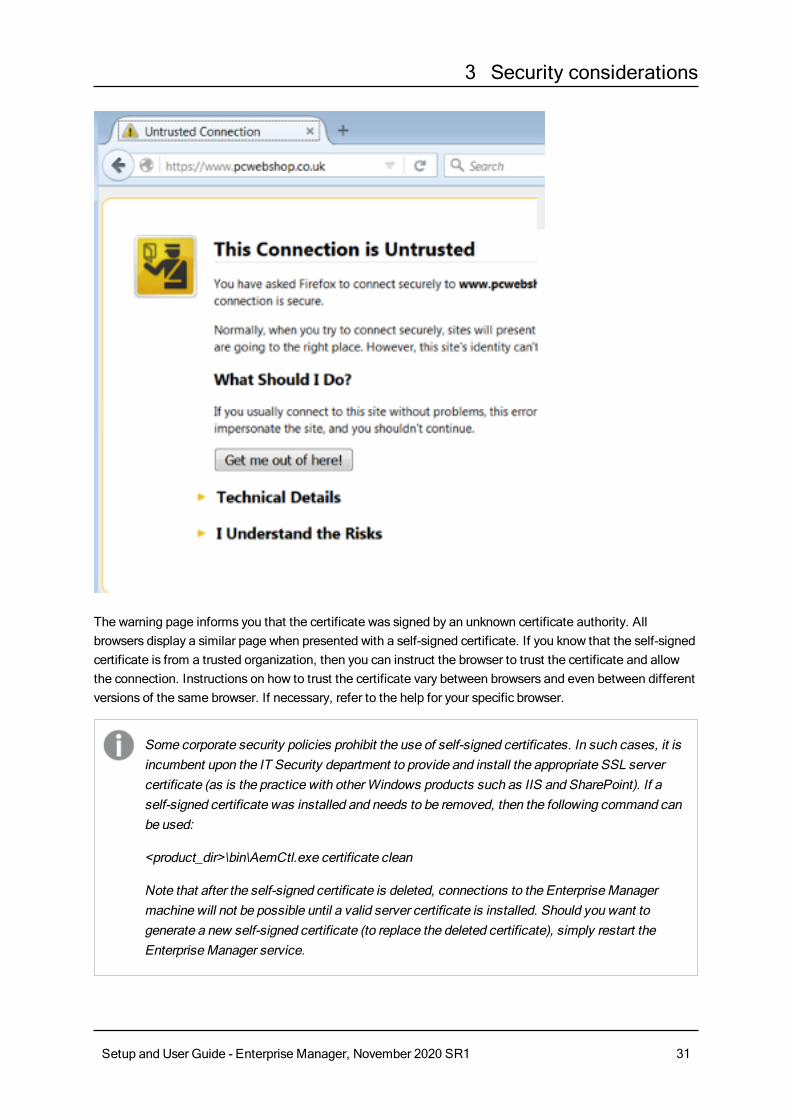
Or this one in Firefox:
Setup and User Guide - Enterprise Manager, November 2020 SR1 30
3 Security considerations
The warning page informs you that the certificate was signed by an unknown certificate authority. All browsers display a similar page when presented with a self-signed certificate. If you know that the self-signed certificate is from a trusted organization, then you can instruct the browser to trust the certificate and allow the connection. Instructions on how to trust the certificate vary between browsers and even between different versions of the same browser. If necessary, refer to the help for your specific browser.
Some corporate security policies prohibit the use of self-signed certificates. In such cases, it is incumbent upon the IT Security department to provide and install the appropriate SSL server certificate (as is the practice with other Windows products such as IIS and SharePoint). If a self-signed certificate was installed and needs to be removed, then the following command can be used:
<product_dir>\bin\AemCtl.exe certificate clean
Note that after the self-signed certificate is deleted, connections to the Enterprise Manager machine will not be possible until a valid server certificate is installed. Should you want to generate a new self-signed certificate (to replace the deleted certificate), simply restart the Enterprise Manager service.
Setup and User Guide - Enterprise Manager, November 2020 SR1 31
3 Security considerations
3.2 Setting up HSTS on Enterprise ManagerHSTS is a web security policy mechanism that helps to protect websites against man-in-the-middle attacks such as protocol downgrade attacks and cookie hijacking. It allows web servers to declare that web browsers (or other complying Dilqam) should automatically interact with it using only HTTPS connections, which provide Transport Layer Security (TLS/SSL).
You can force the Enterprise Manager Web UI and/or the Enterprise Manager REST API connections to use HSTS (HTTP Strict Transport Security). To do this, run the commands described below.
All commands should be run from as Admin from the product bin folder.
Enabling HSTS
Syntax: aemctl.exe configuration set --static_http_headers header_list --rest_http_headers header_list
where --static_http_headers are the headers required to connect to the Enterprise Manager Web UI and --rest_http_headers are the headers required to connect using the API.
Headers should be specified using the following format:
aemctl.exe configuration set --static_http_headers "header1:value1" "header2:value2" --rest_http_
headers "header1:value1" "header2:value2"
Example:
The following instructs the browser to treat the domain as an HSTS host for a year (there are approximately 31536000 seconds in a year). The optional includeSubDomains directive means that subdomains (i.e. secure.myhealthcare.example.com) should also be treated as an HSTS domain.
aemctl.exe configuration set --static_http_headers "Strict-Transport-Security:max-age=31536000;
includeSubDomains;" --rest_http_headers "Strict-Transport-Security":"max-age=31536000;
includeSubDomains;"
Disabling HSTSYou can revert to regular HTTPS connections by running the following command:
To disable static_http_headers, run:
aemctl.exe configuration set --static_http_headers ""
To disable rest_http_headers, run:
aemctl.exe configuration set --rest_http_headers ""
Setup and User Guide - Enterprise Manager, November 2020 SR1 32
3 Security considerations
3.3 Replacing the self-signed certificate on WindowsThe instructions below are intended for organizations who wish to replace the built-in self-signed certificate automatically generated by the Enterprise Manager UI Server on Windows with their own certificate. This is achieved by removing the self-signed certificate and then importing the new certificate.
See also Setting up HTTPS for the Enterprise Manager console (page 29).
Before starting, make sure that the following prerequisites have been met:
l The replacement certificate must be a correctly configured SSL PFX file containing both the private key and the certificate.
l The common name field in the certificate must match the name browsers will use to access the machine.
To remove the self-signed certificate created by Enterprise Manager:
1. Stop the Qlik Enterprise Manager service.
2. Open a command prompt (using the "Run as administrator" option) and change the path to the bin directory. The default path is: C:\Program Files\Qlik\Enterprise Manager\bin.
3. Run the following command:AemCtl.exe certificate clean
To import your own certificate:
1. Run mmc.exe to open the Microsoft Management Console.
2. From the File menu, select Add/Remove Snap-in.The Add or Remove Snap-ins dialog box opens.
3. In the left pane, double-click Certificates.The Certificates snap-in wizard opens.
4. Select Computer account and then click Next.
5. In the Select Computer screen, make sure that Local computer is selected and then click Finish.
6. Click OK to close the Add or Remove Snap-ins dialog box.
7. In the left pane, expand the Certificates folder. Then, right-click the Personal folder and select All Tasks>Import.
8. In the File to Import screen, select your PFX certificate file. Note that by default the Open dialog box displays CER files. In order to see your PFX files, you need to select Personal Information Exchange from the drop-down list in the bottom right of the dialog box.
9. Click Next and enter the private key password.
10. Continue clicking Next until you reach the Completing the Certificate Import Wizard screen. Then click Finish to exit the wizard.
11. In the Personal> Certificates folder, double-click the newly imported certificate.The Certificate dialog box opens.
Setup and User Guide - Enterprise Manager, November 2020 SR1 33

3 Security considerations
12. Scroll down the Details tab until you see the Thumbprint details and copy them to the clipboard.
13. Open a command prompt and run one of the following commands:
Syntax: ¢ netsh http add sslcert ipport=0.0.0.0:443 certhash=[YOUR_CERTIFICATE_THUMBPRINT_WITHOUT_
SPACES] appid={4dc3e181-e14b-4a21-b022-59fc669b0914}
Example:
netsh http add sslcert ipport=0.0.0.0:443 certhash=5f6eccba751a75120cd0117389248ef3ca716e61
appid={4dc3e181-e14b-4a21-b022-59fc669b0914}
Syntax: ¢ netsh http add sslcert ipport=[::]:443 certhash=[YOUR_CERTIFICATE_THUMBPRINT_WITHOUT_SPACES]
appid={4dc3e181-e14b-4a21-b022-59fc669b0914}
Example:
netsh http add sslcert ipport=[::]:443 certhash=5f6eccba751a75120cd0117389248ef3ca716e61
appid={4dc3e181-e14b-4a21-b022-59fc669b0914}
14. Close the command prompt and Microsoft Management Console.
15. Start the Qlik Enterprise Manager service.
3.4 Setting the hostname and changing the SSL portAfter installing Qlik Enterprise Manager, you can use the Enterprise Manager CLI to set the hostname and SSL port for accessing the Enterprise Manager server machine.
Under normal circumstances, you should not need to set the hostname. However, on some systems, connecting using HTTPS redirects to localhost. If this occurs, set the hostname of the Enterprise Manager machine by running the command shown below.
To set the hostname:
Run the following command:
<product_dir>\bin\AemCtl.exe configuration set -a hostAddress
where hostAddress is the address of the Enterprise Manager server machine.
When using a Load Balancer, hostAddress should be the Load Balancer host address.
To change the SSL port:
Run the following command:
<product_dir>\bin\AemCtl.exe configuration set -s httpsPort
where httpsPort is the SSL port number of the Enterprise Manager server machine.
Setup and User Guide - Enterprise Manager, November 2020 SR1 34
3 Security considerations
3.5 Replacing the Master User PasswordQlik goes to great lengths to ensure that sensitive information is protected from unauthorized parties, which is why all passwords and other sensitive information are encrypted (and decrypted) using the Enterprise Manager Master Key. Enterprise Manager uses only FIPS 140-2 compliant algorithms for hashing and encryption: SHA256 for hashing and AES256 for encryption.
This topic provides an overview of how the Enterprise Manager Master Key is generated and applied as well as explaining how to encrypt the User Permissions file.
The Master Key 1. Using the Enterprise Manager CLI, the user provides the system with an alphanumeric password
(Master User Password), which must be at least 32 characters.
By default (i.e. after first time installation), the Master User Password is randomly generated by Enterprise Manager. It is strongly recommended to change the Master User Password as soon as possible (especially in a production environment) as this will allow recovery of backed up data in the event of disk failure. The password should of course be kept in a secure location for future use.You can either use your own password or run the genpassword utility to generate a password for you.
2. Enterprise Manager uses a one way hashing functions to generate a key (Master User Key) from the Master User Password.
The one way hash function guarantees that, given the same Master User Password as input, the same Master User Key will be generated. This is what happens in high availability scenarios - the same Master User Password is entered on two different machines.
3. Enterprise Manager encrypts the Master User Key using the local machine’s key (Windows) and stores it in a file named muk.dat. The muk.dat file can contain several entries (and indeed does in a high availability environment), with each entry uniquely identifying the machine on which Enterprise Manager is running.
4. Enterprise Manager generates a random Master Key, encrypts it with the Master User Key and stores it in a common location (e.g. the root repository).
5. On software startup, the following occurs:
l The Master User Key is read and decrypted (using the local machine’s key)
l The Master Key is read and decrypted using the Master User Key
Once this process is complete, Enterprise Manager is able to encrypt and decrypt all sensitive information.
Setup and User Guide - Enterprise Manager, November 2020 SR1 35

3 Security considerations
High Availability modeIn a High Availability environment, Enterprise Manager runs on at least two machines that share the same data folder. As there are two machines, there will also be two different keys - one for each machine.
As mentioned earlier, the Master User Key file (muk.dat) is constructed of entries, with each entry corresponding to one machine. Both machines scan the entries searching for an entry they can decrypt.
If no matching entry can be found, an error will be returned. In this case, simply use the Enterprise Manager CLI to enter the Master User Password again, and create an entry for the new machine.
See also Installing Qlik Enterprise Manager in a Windows cluster (page 303).
Encrypting the user permissions fileUser permissions are stored in the following repository file:
<product_dir>\Data\cfgrepo.sqlite
To prevent unauthorized access of this file, you can encrypt it using the procedure described below. After you perform the procedure, the repository file will be encrypted with the AES-256 bit cipher.
The length of any passwords specified during the procedure must be at least 32 characters.
To encrypt the repository file:
1. Open a command prompt as administrator and change the working directory to:<product_dir>\bin
2. Run the following command to set the master user key:aemctl.exe masterukey set --password your_MasterUserPassword
Example:aemctl.exe masterukey set --password ANqaGYERP3UKmGLK6UNuMqrkAGxwH8FM
3. Restart the Qlik Enterprise Manager service.
4. Run the following command to set the repository password:aemctl.exe repository setpassword --master-user-password your_MasterUserPassword --repository-
password your_RepositoryPassword
Example:aemctl.exe repository setpassword --master-user-password ANqaGYERP3UKmGLK6UNuMqrkAGxwH8FM --
repository-password 12345678901234567890123456789000
Steps 1-4 only need to be performed the first time you want to encrypt the repository file. If you subsequently need to decrypt the repository file and then re-encrypt it, they are not required.
5. Run the following command to encrypt the repository:aemctl.exe repository secure --on --master-user-password your_MasterUserPassword
Example:aemctl.exe repository secure --on --master-user-password ANqaGYERP3UKmGLK6UNuMqrkAGxwH8FM
6. Restart the Qlik Enterprise Manager service.
Setup and User Guide - Enterprise Manager, November 2020 SR1 36

3 Security considerations
To disable encryption for the repository:
l Run the following command:aemctl.exe repository secure --off --master-user-password your_MasterUserPassword
For information on setting user permission, see User permissions (page 257).
For more information on commands related to the master user password, see Commands Related to the Master User Password.
3.6 Encrypting the user permissions fileUser permissions are stored in the following repository file:
<product_dir>\Data\cfgrepo.sqlite
To prevent unauthorized access of this file, you can encrypt it using the procedure described below. After you perform the procedure, the repository file will be encrypted with the AES-256 bit cipher.
The length of any passwords specified during the procedure must be at least 32 characters.
To encrypt the repository file:
1. Open a command prompt as administrator and change the working directory to:<product_dir>\bin
2. Run the following command to set the master user key:aemctl.exe masterukey set --password your_MasterUserPassword
Example:aemctl.exe masterukey set --password ANqaGYERP3UKmGLK6UNuMqrkAGxwH8FM
3. Restart the Qlik Enterprise Manager service.
4. Run the following command to set the repository password:aemctl.exe repository setpassword --master-user-password your_MasterUserPassword --repository-
password your_RepositoryPassword
Example:aemctl.exe repository setpassword --master-user-password ANqaGYERP3UKmGLK6UNuMqrkAGxwH8FM --
repository-password 12345678901234567890123456789000
Steps 1-4 only need to be performed the first time you want to encrypt the repository file. If you subsequently need to decrypt the repository file and then re-encrypt it, they are not required.
5. Run the following command to encrypt the repository:aemctl.exe repository secure --on --master-user-password your_MasterUserPassword
Example:aemctl.exe repository secure --on --master-user-password ANqaGYERP3UKmGLK6UNuMqrkAGxwH8FM
6. Restart the Qlik Enterprise Manager service.
Setup and User Guide - Enterprise Manager, November 2020 SR1 37

3 Security considerations
To disable encryption for the repository:
l Run the following command:aemctl.exe repository secure --off --master-user-password your_MasterUserPassword
For information on setting user permission, see User permissions (page 257).
For more information on commands related to the master user password, see Commands Related to the Master User Password.
3.7 Controlling execution of user-defined commandsSeveral endpoints support running user-defined commands for pre/post-processing files. In the Operating System Level Credentials tab shown in SERVER view, you can provide user credentials for user-defined commands that needs to be executed at operating system level. By default, such commands are executed under the Replicate Server service account. This may constitute a security risk, as it allows any Replicate user with Admin or Designer permissions to specify user-defined commands that could lead to a full compromise of the server.
Note that when Replicate Server is installed on Linux, the Operating System level credentials (page 48) tab will be hidden as the potential security risk is relevant to Windows only.
You can also determine whether to allow user-defined commands to be executed at all.
To do this:
1. On the Replicate Server machine, open the <PRODUCT_DIR>\bin\repctl.cfg file and set the enable_execute_user_defined_commands parameter to "true" or "false" (the default) as required.
2. If Another account is selected in the Operating System Level Credentials tab and you changed the default Attunity Replicate Server service Log On user (see the Replicate Help for instructions on how to do this):
a. For both admin and non-admin users: Add the user specified in the Attunity Replicate Server service Log On tab to the "Replace a process level token" policy in the "Local Security Policy" settings.
b. For non-admin users only:
i. Grant the user full control over the Replicate data folder. The default location of the data folder is C:\Program Files\Qlik\Replicate\data
ii. Grant the user full control over the folder containing the user-defined command to be executed.
Setup and User Guide - Enterprise Manager, November 2020 SR1 38

3 Security considerations
The user must be the same as the non-admin user specified in the Attunity Replicate Server service Log On tab.
3. Restart the Qlik Replicate services.
Setup and User Guide - Enterprise Manager, November 2020 SR1 39
4 Managing servers
4 Managing serversServers View is where you manage the Replicate and Compose Servers to be monitored by Enterprise Manager. This view also provides information about the number of tasks defined on each server as well as their current status. To switch from Tasks View to Servers View, click the Servers tab in the top left of the console.
Some of the management options described in this chapter are available for Replicate servers only. In such cases, a note will clearly indicate that the described management option is not available for Compose servers.
4.1 Server requirementsThe following section lists the requirements for connecting to a Replicate or Compose Server.
Qlik Replicate Server requirementsTo be able to connect to a Replicate Server, Enterprise Manager requires the following for each Replicate Server to be monitored:
l A Replicate administrator user. Enterprise Manager uses this user to connect to the Qlik Replicate instance. This means:
l If the connection is made directly to the replication server, you can use the fixed user name admin. In this case, the default port is 3552. You set the admin user password on the Replicate server using the repctl setserverpassword command, as follows: On the Replicate server, run the following command from the bin directory; then restart the Replicate service:Repctl.exe setserverpassword <adminPassword>
For more details, see the Replicate documentation.
l If the connection is made to the Replicate UI server, you must specify a user with Admin role. This can be the user that installed Replicate, an Active Directory user with the Replicate Admin role, or a member of the AttunityReplicateAdmins Active Directory group. The default port is 443. For information on setting user roles within Qlik Replicate, refer to the Qlik Replicate Setup and User Guide.
It is recommended that you configure this user with a strong password that does not need to be changed frequently. If the administrator password changes, you also need to change it in Enterprise Manager
l The port that Enterprise Manager uses for connecting to Qlik Replicate needs to be opened inbound on the Replicate server machine. Depending on your network architecture (for example a WAN environment), you may also need to open ports on routers and border firewalls. If you block outbound traffic from the Enterprise Manager machine, you need to make an exception on the Enterprise Manager machine for the ports used to connect to the Replicate Server.
For additional information, see Software requirements (page 13).
Setup and User Guide - Enterprise Manager, November 2020 SR1 40

4 Managing servers
Qlik Compose Server requirementsTo be able to connect to a Compose Server, Enterprise Manager requires the following for each Compose Server to be monitored:
l A Compose administrator user. Enterprise Manager uses this user to connect to the Qlik Compose instance. It is recommended that you configure this user with a strong password that does not need to be changed frequently. If the administrator password changes, you also need to change it in Enterprise Manager
l The port that Enterprise Manager uses for connecting to Qlik Compose needs to be opened inbound on the Compose server machine. Depending on your network architecture (for example a WAN environment), you may also need to open ports on routers and border firewalls. If you block outbound traffic from the Enterprise Manager machine, you need to make an exception on the Enterprise Manager machine for the ports used to connect to the Compose Server.
4.2 Adding ServersYou can add both Replicate Servers and Compose Servers to Enterprise Manager. Once a Server is added and monitoring is enabled, Enterprise Manager establishes a connection to it and automatically discovers and retrieves all tasks and messages, along with basic information about the server.
You need the admin role to be able to add a server.
To add a server:
1. Open Qlik Enterprise Manager.
2. Click Add Server.The Add Server dialog box opens.
3. Provide the following information:
l Name: A unique name not exceeding 64 characters. The name can contain Latin characters, spaces, dots, dashes, and underscores.
l Description: Optional. Cannot exceed 250 characters.
l Type: Choose Replicate, Compose for Data Lakes, or Compose for Data Warehouses according to the server you wish to add.
l Host: The server’s host name or IP address. The combination of host and port must be unique.
l Port: The port on which the host listens. The combination of host and port must be unique.
l Username: The user name for the server. Enterprise Manager uses this user to connect to the server. The name can contain Latin characters, spaces, dots, dashes, and underscores.For a domain user, use the following format: <domain>\<user name>For example: Qlik_LOCAL\JohnMiller
l Password: The user password for the server.
Setup and User Guide - Enterprise Manager, November 2020 SR1 41
4 Managing servers
For details, see Server requirements (page 40).
4. Verify server certificate. Select this option to ensure the Server certificate is trusted. As a rule, to reduce the chance of "man-in-the-middle" attacks, this option should always be selected.
l When connecting directly to an Replicate replication server (default port 3552) with its automatically generated self-signed certificate, Enterprise Manager is able to validate the certificate without requiring any additional setup.
l When connecting to a Replicate Server via the Replicate UI Server (typically using port 443) or to the Replicate replication server with a user-installed certificate, you must make sure that the SSL/TLS certificate used by the server is trusted by the Enterprise Manager machine. The same applies when connecting to a Compose Server with a user-installed certificate. You can easily verify whether the certificate is trusted by opening a Chrome browser window on the Enterprise Manager machine and connecting to Replicate. If there are no security warnings, the certificate is trusted.
For information on the different ways of connecting to Qlik Replicate, see Qlik Replicate Server requirements (page 40).
5. Select the Monitor this server’s tasks and messages check box if you want Enterprise Manager to retrieve tasks and messages from this server.
6. Click Test Connection to verify that Qlik Enterprise Manager is able to establish a connection to the server.
7. Click OK to save your settings.
4.3 Server monitoringQlik Enterprise Manager shows server information in table format. The following columns are available. Note that columns marked with an asterisk (*) are not available for Compose servers.
General columns:
l State: The current state of the server. When the server is being monitored, the state can be Monitored (green icon), which means that the Enterprise Manager connected and synchronized successfully, or Error, including error details (red icon). When the server is not being monitored, the state is Not Monitored and the connection icon is grayed out.
When a server experiences connection issues, tasks for this server are grayed out in the Tasks View.
l Name: The server’s display name
l Host: The server’s hostname or IP address
l Port: The port through which the server is accessed
l Type: The server version (i.e. Compose or Replicate)
l Version: The server version
l License Expiration: The expiration date of the server license
Setup and User Guide - Enterprise Manager, November 2020 SR1 42
4 Managing servers
l Last Connection: The date and time of the last successful sync/retrieval of tasks and messages
l Message: The error message displayed if Qlik Enterprise Manager cannot connect to the server
Not displayed by default:
l Days to Expiration: Days remaining until the license expires
l Description: A description of the server
l Issue Date: When the license was issued
l License State: The current license state (e.g. valid, expired, etc.)
l Platform: The operating system on which the server is installed, which will be Windows or Linux for Replicate servers or Windows for Compose servers.
*Resource utilization columns:
l *Disk Usage (MB): The amount of disk space that the server is currently consuming. This is the sum of disk usage of all tasks on this server. For details about a task’s disk usage, see Task progress summary (page 185).
l *Memory (MB): The amount of memory that the server is currently consuming. This is the sum of memory usage of all active tasks on this server, not including stopped tasks. For details about a task’s memory usage, see Task progress summary (page 185).
Not displayed by default:
l *Qlik CPU (%): The amount of CPU being utilized on the server machine by Replicate and Enterprise Manager processes only.
l *Machine CPU (%): The amount of CPU being utilized by all processes on the server machine (including Replicate and Enterprise Manager processes).
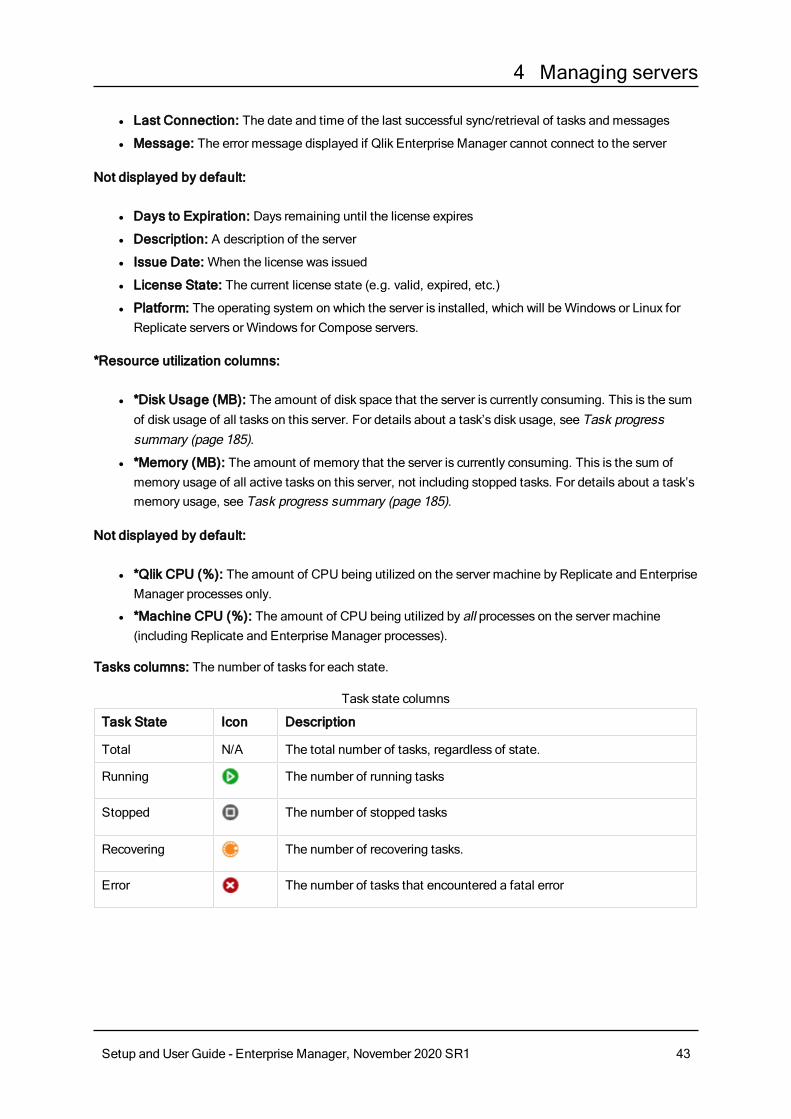
Tasks columns: The number of tasks for each state.
Task State Icon Description
Total N/A The total number of tasks, regardless of state.
Running The number of running tasks
Stopped The number of stopped tasks
Recovering The number of recovering tasks.
Error The number of tasks that encountered a fatal error
Task state columns
Setup and User Guide - Enterprise Manager, November 2020 SR1 43

4 Managing servers
Customizing server columnsYou can use the Columns Settings dialog box to select the columns to display and to arrange the order in which they appear. In addition, from the context menu, you can hide a column, export the list to a TSV file, or sort by column in ascending or descending order. For more information, see Column and list actions (page 210).
Searching for serversYou can search for specific servers by typing a string into the Search Servers box above the table. Note that Enterprise Manager searches only textual columns, not numeric columns. The following columns are included in the search, even if a column is not displayed in the user interface:
l State
l Name
l Host
l Port
l Description
l License Expiration
l Message
l Platform
l Version
You can also restrict a search to a specific column by preceding the search string with the column name and a colon, as follows: ColumnName:value (for example: Name:john-vm.abc.local). This is applicable to all available columns, not only the columns listed above.
When searching for a number, only enter whole numbers, no commas or special characters. For example, to search for 2,500, as displayed in the user interface, enter 2500; to search for 100%, enter 100.
4.4 Server settingsYou can modify Replicate and Compose server settings.
This feature requires the monitored Replicate servers to be version 6.0 or above. Currently, only the logging settings for Compose servers can be modified.
To modify server settings, switch to Servers view and select the desired server. Then, from the Server Management drop-down menu, select Settings.
The Settings for Server "<Name>" window opens.
The following items are displayed on the left of the window:
Setup and User Guide - Enterprise Manager, November 2020 SR1 44

4 Managing servers
l Global error handling (page 45) (Replicate servers only)
l Resource control (page 45)(Replicate servers only)
l File Transfer Service (Replicate servers only)
l Logging (page 49)
Global error handlingYou can configure how Qlik Replicate responds to specific types of errors. You can define error handling on the task level or the server level. The configurations you make in the Server Settings affect all tasks created for this instance of Qlik Replicate unless you define a task to use the definitions you create for that task. For information on how to configure error handling for a specific task, see Error handling (page 170) in the Customizing tasks (page 78) chapter.The following tabs are available:
l Environmental Errors: An error that is caused by an environmental problem in the source or target endpoint or on the network. Environmental errors can be restarted.The information you enter in this tab is the same as the information you enter in the Environmental Errors tab for tasks. For information about the options available in this tab, see Environmental errors (page 171).
l Data Error: An error related to data processing at the record level. The information you enter in this tab is the same as the information you enter in the Data Error tab for tasks. For information about the options available in this tab, see Data Error (page 171) in the Customizing Tasks chapter.
l Table Error: An error in processing data or metadata for a specific table. This only includes general table data and not an error that relates to a specific record.The information you enter in this tab is the same as the information you enter in the Table Error tab for tasks. For information about the options available in this tab, see Table Errors (page 173) in the Customizing Tasks chapter.
l Apply Conflicts: Errors that occur when the target endpoint is not synchronized with the source endpoint when processing changes. This can cause duplicate key errors on INSERT operations or zero rows affected on UPDATE/DELETE operations.The information you enter in this tab is the same as the information you enter in the Apply Conflicts tab for tasks. For information about the options available in this tab, see Apply Conflicts (page 173) in the Customizing Tasks chapter.
Resource controlYou can set high and critical disk space and memory utilization thresholds.
Disk space is checked only for the drive where the data folder resides.
Setup and User Guide - Enterprise Manager, November 2020 SR1 45
4 Managing servers
Thresholds are calculated as a percentage of total capacity. So, for example, a disk space utilization threshold of 80% would mean that 20% of available disk space remains.
After setting the thresholds, you can click the New Notification button to define a notification that will be sent whenever a given threshold is exceeded and/or returns to normal.
Disk space controlBefore you can modify settings, you first need to select the Disk Space check box. To disable Disk Space resource control, clear the Disk Space check box.
In the High Disk Space Utilization Threshold section, specify the high disk space utilization threshold (in terms of percentage). When the threshold is reached, a notification will be sent (if defined).
In the Critical Disk Space Utilization Threshold section, specify the critical disk space utilization threshold (in terms of percentage). When the threshold is reached, all tasks will be stopped and a notification will be sent (if enabled). Replicate will resume the tasks automatically when there is sufficient disk space to do so.
System memory controlBefore you can modify settings, you first need to select the System Memory check box. To disable System Memory resource control, clear the System Memory check box.
Memory utilization is calculated using the following formula (note that “swap file” is used generically to refer to both page file memory on Windows and swap file memory on Linux):
(used_swap_file + used_physical_memory) / (total_swap_file + total_physical_memory) * 100
Example:
(5 GB + 5 GB) / (10 GB + 10 GB) * 100 = 50%
In the High System Memory Utilization Threshold section, specify the high system memory utilization threshold (in terms of percentage). When the threshold is reached, a notification will be sent (if defined).
In the Critical System Memory Utilization Threshold section, specify the critical system memory utilization threshold (in terms of percentage). When the threshold is reached, Replicate will start stopping tasks and a notification will be sent (if enabled). The tasks will be resumed automatically when there is sufficient memory to do so.
File Transfer ServiceThe Qlik File Transfer Service (FTS) is a robust and reliable file transfer engine designed to efficiently transfer files over the WAN. This can dramatically improve transfer speeds when the source endpoint and the target endpoint are located on different LANs.
Changes to File Transfer Service settings will not affect running tasks.
Setup and User Guide - Enterprise Manager, November 2020 SR1 46
4 Managing servers
How it worksA solution using FTS consists of two Qlik Replicate Servers: A local Qlik Replicate Server installed on the source endpoint LAN and a remote Qlik Replicate Server installed on the target endpoint LAN.
A local task on the local server is defined from the source endpoint to a File Channel target. A remote task on the remote Qlik Replicate Server is defined from a File Channel source to the target endpoint.
The FTS runs on the remote Qlik Replicate Server only and transfers the File Channel files from the storage location defined in the local task to the storage location defined in the remote task.
Upon file transfer, and before Compression (page 47) and Encryption (page 47), large files are split into smaller blocks which form recoverable transport units, and small files are merged into bigger blocks to be sent at the same time. The blocks are then transferred and reconstructed into File Channel files when received by the FTS server.
For information on setting up a File Channel source or target to use FTS, refer to the Qlik Replicate Setup and User Guide.
CompressionFile Channel files are compressed upon sending using GZIP. You can disable the compression and control the compression level.
EncryptionAfter compression, File Channel files are encrypted using a randomly generated AES-256 session key. The session key is exchanged between the client and server using the Diffie-Hellman key exchange protocol which is authenticated using a secret key that is shared between the client and the server.
The File Transfer Service should be configured on the remote Qlik Replicate Server only.
Defining a File Transfer ServiceDefine a File Transfer Service as described below.
To add a File Transfer Service:
1. In the File Transfer Service tab, click Add File Transfer Service.The Add File Transfer Service window opens.
2. Edit the values in the Name, Host and Port columns as follows:
l Name: The name of the File Transfer Service.
l Host: The host name or IP address of machine on which the remote Qlik Replicate Server is installed. The default is 0.0.0.0 (all interfaces). If the server has multiple NICs (Network Interface Cards), you can define a different File Transfer Service for each card.
l Port: The port through which the File Channel files are received.
l Enabled: select the check box to enable the File Transfer Service.
3. Click Save to save your settings.
Setup and User Guide - Enterprise Manager, November 2020 SR1 47
4 Managing servers
Editing a File Transfer ServiceYou can edit a File Transfer Service as described below.
To edit a File Transfer Service:
1. Select the File Transfer Service you want to edit.
2. Edit the values in the Name, Host and Port columns as follows:
a. Click the cell to make it editable.
b. Change the value as required and then click Save.
When you edit a File Transfer Service, make sure that any File Channel targets configured to use the File Transfer Service are also updated accordingly. For more information on File Channel Targets, refer to the Qlik Replicate Setup and User Guide.
Deleting a File Transfer ServiceYou can delete File Transfer Services that you no longer want to use.
To delete a File Transfer Service:
1. In the File Transfer Services List, select the item you want to delete.
2. Click the Remove button.
Operating System level credentialsSeveral endpoints support running user-defined commands for pre/post-processing files. In this tab, you can provide user credentials for user-defined commands that needs to be executed at operating system level.
By default, such commands are executed under the Replicate Server service account. This may constitute a security risk, as it allows any Replicate user with Admin or Designer permissions to specify user-defined commands that could lead to a full compromise of the server.
Note that when Replicate Server is installed on Linux, this tab will be hidden as the potential security risk is relevant to Windows only.
Changes to operating system credentials will not affect running tasks.
Endpoints that support user-defined commands are as follows:
l Amazon S3 target
l File source
l File target
l Google Cloud Storage target
l Microsoft Azure ADLS target
Setup and User Guide - Enterprise Manager, November 2020 SR1 48

4 Managing servers
IMPORTANT Execution of user-defined commands is blocked by default. To allow execution of user-defined commands, follow the procedure described in Controlling execution of user-defined commands (page 38).
To run user-defined commands under the Replicate service (Log On) account (the default):
l Select Replicate service account.
To run user-defined commands under a different account:
1. Select Another account and then specify a user name and password in the designated fields.For domain users, the user name should be entered in the following format: Domain/UsernameFor local users, the Domain is not required.
2. If you changed the default Attunity Replicate Server service Log On user, add the user specified in the Attunity Replicate Server service Log On tab to the "Replace a process level token" policy in the "Local Security Policy" settings.
LoggingThe following topics describe the log management options:
l Setting Logging Levels for the Server and File Transfer Service
l Setting Automatic Roll Over and Cleanup
l Viewing and downloading logs (page 51)
l Deleting server, task and FTS log files (page 52)
Setting logging levelsYou set the logging level for the Replicate Server, File Transfer Service logs, Compose Server and Compose Agent logs in Server view. The level you set determines what information is written to the logs. The Server logs provide information about the Qlik Replicate Server instance you are working with as opposed to individual tasks. For information on configuring the task logs, see Logging (page 174).
The following logging levels are available, ordered from the lowest level to the highest:
1. Errors
2. Warnings
3. Info
4. Trace
5. Verbose
The higher levels always include the messages from the lower levels. Therefore, if you select Error, only error messages are written to the log. However, if you select Info, informational messages, warnings, and error messages are included. Selecting Verbose writes all possible messages to the log.
Setup and User Guide - Enterprise Manager, November 2020 SR1 49
4 Managing servers
You can set a global logging level for all components or you can set a separate logging level for each component.
To set the logging levels:
1. To set a global logging level, move the top slider (the slider with the labels) to the log level you want. Note that all of the sliders for the individual modules move to the same position that you set in the main slider.
2. Make any changes to the sliders for the individual modules. This is optional. Note that if you change the main slider, all of the individual sliders are reset to the new position. If you want to maintain a different logging level for a specific module, you need to reset it.
3. Click Save at the bottom of the window.
Storing trace and verbose logging in memory
This option is relevant to Replicate tasks only.
When the logging level is set to "Trace" or "Verbose", you can instruct Replicate to store the logging information in memory until an error occurs. On detecting an error, Replicate will begin writing to the physical logs and continue to do so for a few minutes after the initial occurrence of the error.
If no error occurs before the allocated memory is used up, Replicate will empty the memory buffer and start afresh.
This option is useful for tasks that fail unpredictably and for no obvious reason. The problem with continually writing large amounts of information to the logs is twofold:
l Running in "Trace" or "Verbose" logging mode will quickly use up available disk space (unless the logging settings have been configured to prevent this).
l Continually writing large amounts of data to the logs will affect performance.
To use this option
1. Select the Store trace/verbose logging in memory, but if an error occurs, write to the logs check box at the top of the tab.
2. In the Allocate memory up to (MB) field, specify the amount of memory you want to allocate for storing logging information.
Setting automatic rollover and cleanupIn the Log File Management tab, you can define when to roll over the log files and when to delete old log files from the system.
Automatic rolloverYou can determine when to stop logging to the current log file and begin to log to a new log file. Rolled over log files are appended with a 12-digit timestamp.
Setup and User Guide - Enterprise Manager, November 2020 SR1 50

4 Managing servers
l Roll over the log if the log file is older than (days): Select the check box and then specify the maximum number of days the current log file is allowed to exist before being rolled over.The default value is 7 days.
This option is not available for Compose servers.
l Roll over the log if the log file is larger than (MB): Select the check box and then specify the maximum number of megabytes the current log file is allowed to reach before being rolled over.
When the Store trace/verbose logging in memory, but if an error occurs, write to the logs option is enabled, the actual size of the repsrv.log may reach the sum of the Allocate memory up to (MB) size and the Roll over the log if the log file is larger than (MB) size, before it is rolled over.For more information on the "Store trace/verbose logging in memory" option, see Setting logging levels (page 49)
The default value is 100 megabytes.
l If you edit this setting while tasks are running, the new setting will not affect the task log files until the tasks are stopped and then resumed. The server log files are not affected by this limitation.
l The scheduled process (LogFileCleanLogs) that checks the log file size runs every five minutes. Consequently, the actual size/age of the rolled over log file may deviate slightly from the specified value(s).
l The time of a file is determined by its "modified" time as opposed to its "created" time.
Automatic cleanupYou can determine the maximum number of days old log files (i.e. log files that have been rolled over) are retained before being deleted.
l Delete log files that are older than (days): Select the check box and then specify the maximum number of days to retain a saved log file. Log files that are older than the specified number of days will be automatically deleted from the system. For example, if you specify 4, then on the fifth day, any log file older than 4 days will be deleted.The default value is 45 days.
Viewing and downloading logsYou can view the server or File Transfer Service log files and download them if necessary.
Setup and User Guide - Enterprise Manager, November 2020 SR1 51
4 Managing servers
File Transfer Service log files are not relevant for Compose servers.
To view or download log files:
1. In Servers view:
1. Select a server and then select Settings from the Server Management drop-down menu.
2. Select Logging on the left of the Settings for Server <server_name> window.
2. Select the Server Logging Levels or the File Transfer Service Logging Level tab as required.
3. Click the View Logs button.The Log Viewer window opens.
4. Continue from step 2 in Viewing and downloading log files.
Deleting server, task and FTS log filesYou can manually delete task, server, and File Transfer Service log files older than the specified number of days.
Log files from Compose servers cannot be deleted.
To delete the log files:
1. In Servers view:
1. Select a server and then select Settings from the Server Management drop-down menu.
2. Select Logging on the left of the Settings for Server <server_name> window.
2. Click the Delete Logs button in any of the available tabs.The Delete Logs window opens.
3. Select which logs to delete and, for each log, optionally change the default number of days (45).
4. Click Delete.Selected logs older than the specified number of days will be deleted.
Server management permissionsThe following table describes the required permissions for viewing and managing server settings.
Only permissions related to logging settings are relevant for Compose servers.
For information on managing user permissions, see Managing user permissions (page 265).
Setup and User Guide - Enterprise Manager, November 2020 SR1 52

4 Managing servers
Permission ToRequires: Admin
Requires: Designer
Requires: Operator
Requires: Viewer
View Global Error Handling
All Tasks All Tasks - -
Edit Global Error Handling
All Tasks All Tasks - -
Global Error Handling setting permissions
Permission ToRequires: Admin
Requires: Designer
Requires: Operator
Requires: Viewer
View server logging levels
Server Server Server -
Edit server logging levels
Server Server Server -
View/download server logs
Server Server Server -
Delete server/FTS logs Server Server Server -
Delete task logs Server Server Server -
Server Logging Levels setting permissions
Permission ToRequires: Admin
Requires: Designer
Requires: Operator
Requires: Viewer
View FTS log levels Server Server Server -
Edit FTS log levels Server Server Server -
View/download FTS logs
Server Server Server -
Delete server/FTS logs
Server Server Server -
Delete task logs Server Server Server -
FTS Logging Levels setting permissions
Permission ToRequires: Admin
Requires: Designer
Requires: Operator
Requires: Viewer
View Compose Agent log levels
Server Server Server -
Edit Compose Agent log levels
Server Server Server -
Compose Agent Logging setting permissions
Setup and User Guide - Enterprise Manager, November 2020 SR1 53

4 Managing servers
Permission ToRequires: Admin
Requires: Designer
Requires: Operator
Requires: Viewer
View/download Compose Agent logs
Server Server Server -
Permission ToRequires: Admin
Requires: Designer
Requires: Operator
Requires: Viewer
View Cleanup/Rollover policy for server/FTS/Compose Agent
Server Server Server -
View Cleanup/Rollover policy for tasks Server Server Server -
Edit Cleanup/Rollover policy for server/FTS/Compose Agent
Server Server Server -
Edit Cleanup/Rollover policy for tasks Server Server Server -
Delete server/FTS logs Server Server Server -
Delete task logs Server Server Server -
Log File Management setting permissions
Permission ToRequires: Admin
Requires: Designer
Requires: Operator
Requires: Viewer
View Resource Control
Server Server Server -
Edit Resource Control
Server Server - -
Resource Control setting permissions
Permission ToRequires: Admin
Requires: Designer
Requires: Operator
Requires: Viewer
View FTS list Server Server Server -
Add/Edit/Remove FTS
Server Server - -
File Transfer Service (FTS) setting permissions
4.5 Additional server management optionsIn addition to adding servers, you can also perform other management tasks, as described in the following table. Note that before performing any of the actions, you must first select the desired server or servers (multiple selection is supported for some actions).
Setup and User Guide - Enterprise Manager, November 2020 SR1 54
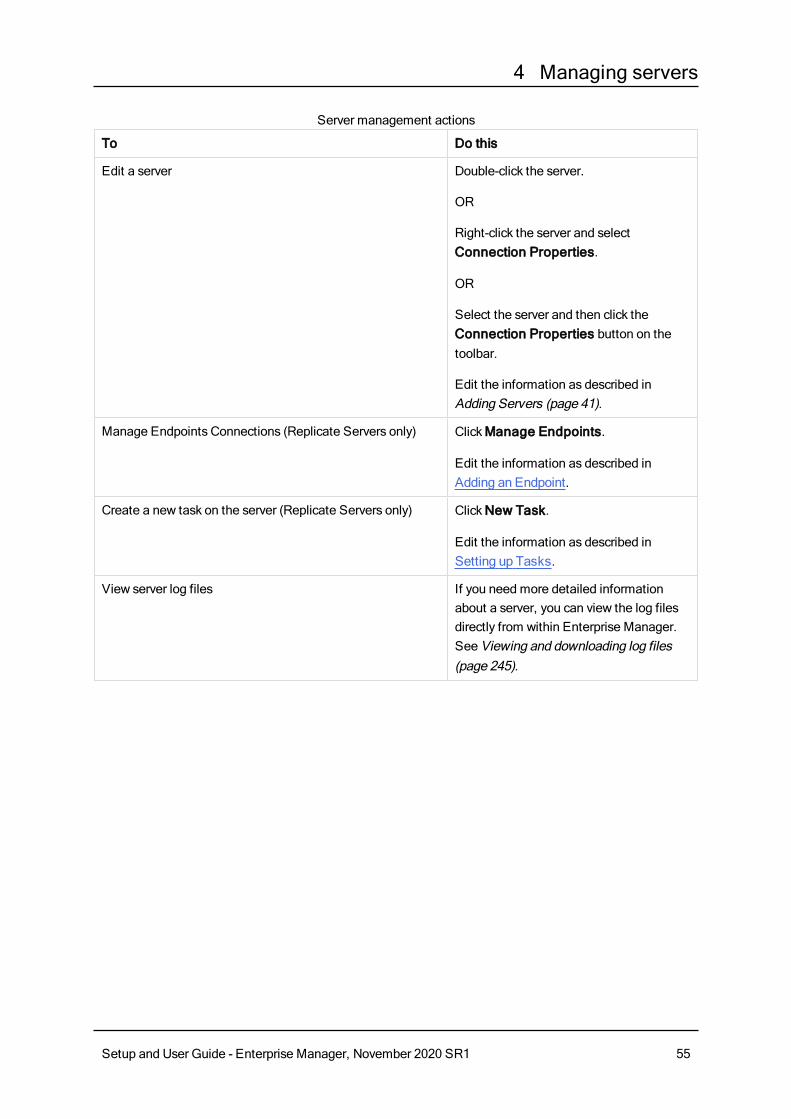
4 Managing servers
To Do this
Edit a server Double-click the server.
OR
Right-click the server and select Connection Properties.
OR
Select the server and then click the Connection Properties button on the toolbar.
Edit the information as described in Adding Servers (page 41).
Manage Endpoints Connections (Replicate Servers only) Click Manage Endpoints.
Edit the information as described in Adding an Endpoint.
Create a new task on the server (Replicate Servers only) Click New Task.
Edit the information as described in Setting up Tasks.
View server log files If you need more detailed information about a server, you can view the log files directly from within Enterprise Manager. See Viewing and downloading log files (page 245).
Server management actions
Setup and User Guide - Enterprise Manager, November 2020 SR1 55
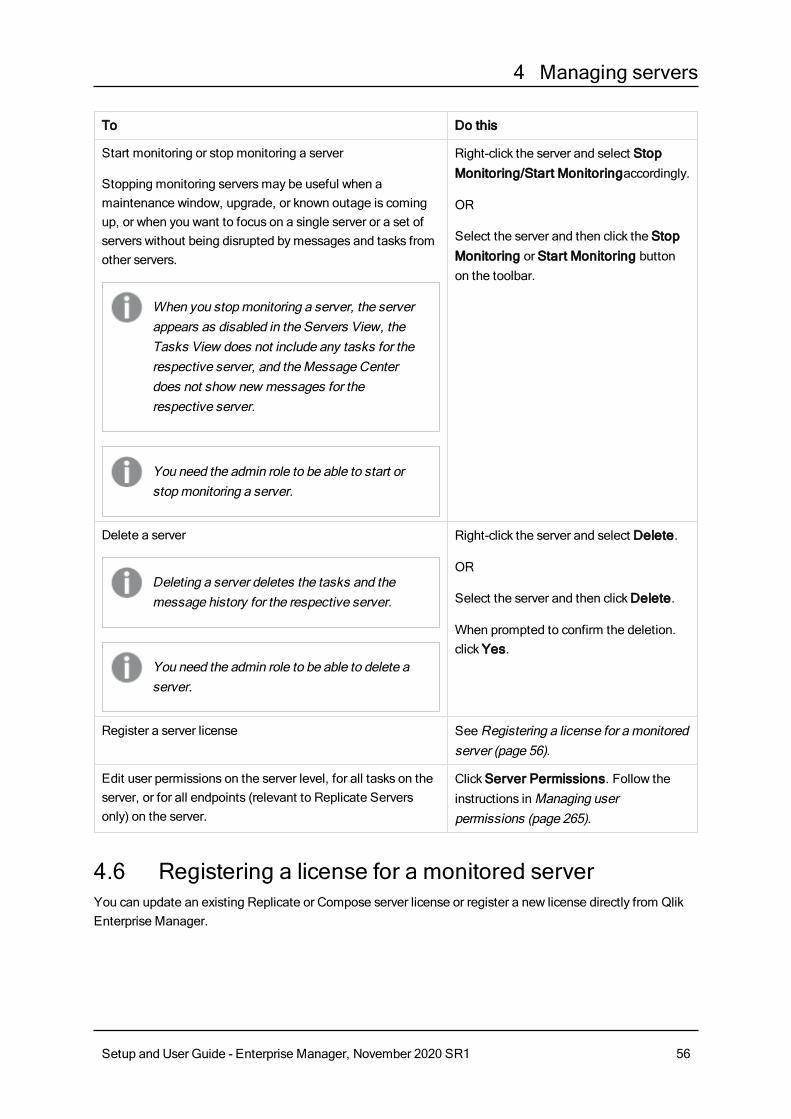
4 Managing servers
To Do this
Start monitoring or stop monitoring a server
Stopping monitoring servers may be useful when a maintenance window, upgrade, or known outage is coming up, or when you want to focus on a single server or a set of servers without being disrupted by messages and tasks from other servers.
When you stop monitoring a server, the server appears as disabled in the Servers View, the Tasks View does not include any tasks for the respective server, and the Message Center does not show new messages for the respective server.
You need the admin role to be able to start or stop monitoring a server.
Right-click the server and select Stop Monitoring/Start Monitoringaccordingly.
OR
Select the server and then click the Stop Monitoring or Start Monitoring button on the toolbar.
Delete a server
Deleting a server deletes the tasks and the message history for the respective server.
You need the admin role to be able to delete a server.
Right-click the server and select Delete.
OR
Select the server and then click Delete.
When prompted to confirm the deletion. click Yes.
Register a server license See Registering a license for a monitored server (page 56).
Edit user permissions on the server level, for all tasks on the server, or for all endpoints (relevant to Replicate Servers only) on the server.
Click Server Permissions. Follow the instructions in Managing user permissions (page 265).
4.6 Registering a license for a monitored server You can update an existing Replicate or Compose server license or register a new license directly from Qlik Enterprise Manager.
Setup and User Guide - Enterprise Manager, November 2020 SR1 56

4 Managing servers
To register a license:
1. Copy the license file to your computer or any computer in your network you have access to.
2. Select Register License from the Server Management drop-down menu or right-click the server and select Server Management > Register License.The Register License dialog box opens.
3. Do one of the following:
l Click Load and browse to locate and select the license file.
l Copy the license text and paste it into the License text field.
The license text is displayed in the dialog box as shown below. Check to be sure that the details are correct.
4. Click Register License to register the license.A message indicating that the license was registered successfully is displayed.
Setup and User Guide - Enterprise Manager, November 2020 SR1 57
4 Managing servers
4.7 Viewing server messagesYou can view server messages in the Message Center. The Message Center is located at the bottom of the console and contains messages about the servers and tasks. For more information, see Messages and notifications (page 229).
Setup and User Guide - Enterprise Manager, November 2020 SR1 58
5 Defining and managing tasks
5 Defining and managing tasksThis topic describes how to design a replication task. To design a replication task, you must first be sure that you have configured at least one source endpoint and one target endpoint to work with Qlik Replicate.
The operations described in this section are relevant for Replicate tasks only.
It is also possible to customize a task by creating new tables or columns for the target endpoint or by selecting only some of the data from each column to be replicated. This is done using transformations and filters.
A number of variables affect the amount of tasks that can be run on a single Replicate Server, including the task configuration (e.g. how many tables are being replicated), the size of the source tables and the hardware configuration of the Replicate Server machine. Bearing this in mind, the number of tasks that can be run on a single Replicate Server should not exceed 100 (and may need to be significantly less depending on the aforementioned variables). Best practice is to perform load testing in a Test environment before moving to Production.
For more information, see "Replication Tasks" in the Qlik Replicate Setup and User Guide.
5.1 Adding tasksBefore you get started with designing the features that you need for a task, you must first define the task's default behavior.
To add a task:
1. In Tasks view or Servers view, click New Task. The New Task dialog box opens.When you open this dialog box from the Servers view, the server is already selected and cannot be changed.
Setup and User Guide - Enterprise Manager, November 2020 SR1 59

5 Defining and managing tasks
2. From the Server Name list, select the server for the task.You can only select the server name when you open the dialog box from the Tasks view. When you open the dialog box from the Servers view, it opens in context of the selected server.
3. Enter a name for the task. The name should be descriptive to indicate the purpose of the task. The name cannot exceed 32 characters, contain non-Latin characters, or contain any of the following characters: | \ / : * ? " < >
4. Optionally, enter a description for the task.
5. Choose one of the following replication profiles:
l Unidirectional - Choose to replicate between endpoints for the purpose of Unidirectional.
l Bidirectional - Choose to synchronize records between two endpoints.For more information, see the instructions on setting up Bidirectional replication (page 61).
l Log Stream Staging - Log Stream Staging enables a dedicated Replicate task to save data changes from the transaction log of a single source database and apply them to multiple targets, without the overhead of reading the logs for each target separately.For information about Log Stream Staging, refer to the Qlik Replicate Setup and User Guide.
Setup and User Guide - Enterprise Manager, November 2020 SR1 60
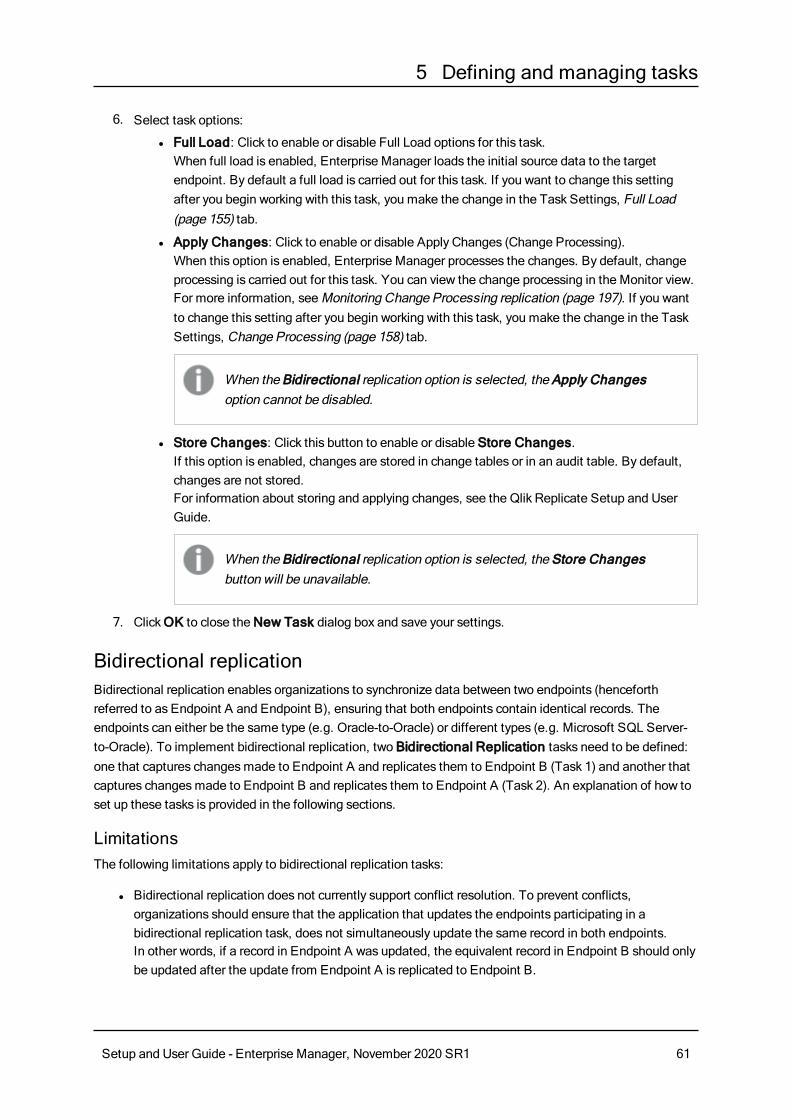
5 Defining and managing tasks
6. Select task options:
l Full Load: Click to enable or disable Full Load options for this task.When full load is enabled, Enterprise Manager loads the initial source data to the target endpoint. By default a full load is carried out for this task. If you want to change this setting after you begin working with this task, you make the change in the Task Settings, Full Load (page 155) tab.
l Apply Changes: Click to enable or disable Apply Changes (Change Processing).When this option is enabled, Enterprise Manager processes the changes. By default, change processing is carried out for this task. You can view the change processing in the Monitor view. For more information, see Monitoring Change Processing replication (page 197). If you want to change this setting after you begin working with this task, you make the change in the Task Settings, Change Processing (page 158) tab.
When the Bidirectional replication option is selected, the Apply Changes option cannot be disabled.
l Store Changes: Click this button to enable or disable Store Changes.If this option is enabled, changes are stored in change tables or in an audit table. By default, changes are not stored.For information about storing and applying changes, see the Qlik Replicate Setup and User Guide.
When the Bidirectional replication option is selected, the Store Changes button will be unavailable.
7. Click OK to close the New Task dialog box and save your settings.
Bidirectional replicationBidirectional replication enables organizations to synchronize data between two endpoints (henceforth referred to as Endpoint A and Endpoint B), ensuring that both endpoints contain identical records. The endpoints can either be the same type (e.g. Oracle-to-Oracle) or different types (e.g. Microsoft SQL Server-to-Oracle). To implement bidirectional replication, two Bidirectional Replication tasks need to be defined: one that captures changes made to Endpoint A and replicates them to Endpoint B (Task 1) and another that captures changes made to Endpoint B and replicates them to Endpoint A (Task 2). An explanation of how to set up these tasks is provided in the following sections.
LimitationsThe following limitations apply to bidirectional replication tasks:
l Bidirectional replication does not currently support conflict resolution. To prevent conflicts, organizations should ensure that the application that updates the endpoints participating in a bidirectional replication task, does not simultaneously update the same record in both endpoints.In other words, if a record in Endpoint A was updated, the equivalent record in Endpoint B should only be updated after the update from Endpoint A is replicated to Endpoint B.
Setup and User Guide - Enterprise Manager, November 2020 SR1 61
5 Defining and managing tasks
l Bidirectional replication tasks currently only support DDL statements from one of the sources involved in the task only. This means that for one of the sources, you must set the Apply Changes DDL Handling Policy to "Ignore" for all of the options (DROP, TRUNCATE, and ALTER).
The CREATE TABLE DDL is not supported.
l To ensure that the source and target endpoints are identical, transformations and filters should not be used in bidirectional replication tasks.
l The Use direct path full load option in the Oracle target endpoint settings is not supported.
l The Stopping the Task after Full Load options in the task settings' Full Load Settings tab is not supported.
l The task's Change Processing Mode must be set to Transactional apply.
Supported endpointsBidirectional tasks support the following endpoints:
Source Endpoints:
l Oracle
l Microsoft SQL Server
l MySQL
l PostgreSQL
l All AIS sources
l All ARC sources
l File Channel
l SAP Sybase ASE
l IBM DB2 for iSeries
l Amazon RDS for MySQL
l Amazon RDS for PostgreSQL
l Amazon RDS for SQL Server
l AWS Aurora Cloud for PostgreSQL
l Google Cloud SQL for MySQL
l SAP HANA
l Teradata
l IBM DB2 for z/OS
l IBM DB2 for LUW
Target Endpoints:
l Oracle
l Microsoft SQL Server
l MySQL
l Google Cloud SQL for MySQL
Setup and User Guide - Enterprise Manager, November 2020 SR1 62

5 Defining and managing tasks
l PostgreSQL
l ODBC
l File Channel
l SAP Sybase ASE
Setting up Bidirectional replicationThis section describes how to set up a Bidirectional replication task in Enterprise Manager .
To set up Bidirectional Task 1:
1. Define a Bidirectional Replication task that replicates data from Endpoint A to Endpoint B.
In a bidirectional replication task, Full Load replication is not enabled by default since it is assumed that both endpoints contain identical tables. If this is not the case (for instance, if Endpoint A contains tables that do not exist in Endpoint B), enable Full Load replication as well.
2. Specify a source and target Loopback prevention table schema in the task settings’ Loopback Prevention tab. For more information about loopback prevention settings, see Bidirectional (page 155).
3. Run the task.
To set up Bidirectional Task 2:
1. Define another Bidirectional Replication task that replicates data from Endpoint B to Endpoint A.
2. Specify a source and target Loopback prevention table schema in the task settings’ Loopback Prevention tab. For more information about loopback prevention settings, see Bidirectional (page 155).
3. If Full Load was enabled when replicating data from Endpoint A to Endpoint B, you must first wait for the Full Load replication to complete before running the task. Otherwise, run the task immediately.
Using bidirectional replication with the File Channel endpointYou can use bidirectional replication together with the File Channel endpoint. This is useful if you need to synchronize two endpoints that are either not able to communicate with each other (i.e. are not physically connected) or are located in the WAN. The process involves setting up six separate tasks: Two Full Load-only Unidirectional tasks and four Apply Changes-only Bidirectional tasks.
For information on setting up the File Channel endpoint, see the Qlik Replicate Setup and User Guide.
To set up bidirectional replication with File Channel Endpoints:
1. Set up and run two Full Load only Unidirectional tasks.Example (FC = File Channel):Task 1: MySQL --> FC Target Task 2: FC Source --> Oracle
Setup and User Guide - Enterprise Manager, November 2020 SR1 63

5 Defining and managing tasks
2. Wait for the Full Load-only tasks to finish.
3. Set up and run four Apply Changes-only Bidirectional tasks.Example (FC = File Channel):Task 1: MySQL Source --> FC Target Task 2: FC Source 1 --> Oracle TargetTask 3: Oracle Source --> FC Target 2 Task 4: FC Source 2 --> MySQL Target
5.2 Editing and viewing a task descriptionYou can provide a description for specific tasks and then easily view or edit that description as required.
To provide or edit a task description:
1. Open the desired task.
2. In Designer or Monitor view, click the toolbar button on the left.
3. Enter a description.
4. Click OK.
To view a task's description:
1. Open the desired task.
2. In Designer or Monitor view, hover your mouse over the toolbar button on the left.
A tooltip will display the description.
5.3 Adding and managing endpointsEnterprise Manager requires information to connect to the source and target endpoints that you want to use in a task. For a list of endpoints you can work with in Qlik Replicate, see the Qlik Replicate Setup and User Guide.
You use the Manage Endpoint Connections window to add endpoints and edit and view the endpoint connection information.
The name cannot exceed 32 characters, contain non-Latin characters, or contain any of the following characters: | \ / : * ? " < >
l Adding an endpoint (page 65)
l Configuring an endpoint (page 65)
l Viewing endpoint configuration information (page 66)
l Testing an endpoint connection (page 66)
l Duplicating endpoints (page 66)
Setup and User Guide - Enterprise Manager, November 2020 SR1 64
5 Defining and managing tasks
l Searching for endpoints (page 67)
l Deleting endpoints (page 67)
Adding an endpointBefore you can begin to design a task, you must add endpoints to the Replicate server. To use an endpoint, you must have access to it somewhere in your system. When you add the endpoint to the Replicate server, you must provide connection information and proper user credentials.
Once you add endpoints to the Replicate server, you can begin to use them to build a replication task. For information on how to add an endpoint to a replication task, see Adding a source and target endpoint to a task (page 67).
To add an endpoint:
1. In the Servers view or on a dedicated task tab, click Manage Endpoint Connections.The Manage Endpoint Connections window opens. The server is already selected and cannot be changed.
2. In the Manage Endpoint Connections window, click New Endpoint.
3. Select the type of endpoint you are using. The information that you must enter depends on which endpoint you select.For a list of supported endpoints and for more information on setting up a specific endpoint, see the Qlik Replicate Setup and User Guide.
Configuring an endpointAfter you add the endpoint to the Replicate server and provide the connection information, you can make changes to some of the information.
You cannot change the following information in the endpoint window:
l The name you provided for the endpoint.
l The endpoint Type, for example Oracle or Microsoft SQL Server.
l The endpoint role, either SOURCE or TARGET.
To edit endpoint configuration information:
1. In the Manage Endpoint Connections window, select the endpoint you want to edit.ORIn the Endpoints list on the left of the Designer view, double-click the endpoint you want to edit. Note that this option is only available when editing a specific task.The Manage Endpoint Connections window opens with the selected endpoint settings.
2. Make changes to the information in any of the tabs in the window.
Setup and User Guide - Enterprise Manager, November 2020 SR1 65
5 Defining and managing tasks
For more information, see the chapter for the specific Qlik Replicate endpoint you are using in the Qlik Replicate Setup and User Guide. For a list of supported endpoints, see the Qlik Replicate Setup and User Guide.
Viewing endpoint configuration informationAfter you add the endpoint to the Replicate server and provide the connection information, you can view the information in the Manage Endpoint Connections window.
To view endpoint configuration information:
l Select an endpoint from the Endpoints list in the left pane; then click the tabs to view the information.
Testing an endpoint connectionYou can try to contact the endpoint to make sure that you are connected to the endpoint you want to work with.
To test the endpoint connection:
1. In the Manage Endpoint Connections window, select the endpoint you want to work with.
2. At the bottom of the endpoint’s General tab, click Test Connection.If the connection is successful, a success message is displayed and a green check mark icon appears next to the Test Connection button.If the connection fails, an error message is displayed at the bottom of the dialog box and the View Log button becomes available.
3. If the connection is successful, click Close.If the connection fails, click View Log to view the server log entry with information for the connection failure.
Duplicating endpointsYou can duplicate an endpoint if you need to define a new endpoint with similar settings. Except for the name, all endpoint settings are duplicated to the new endpoint.
To duplicate an endpoint:
1. In the left panel of the Manage Endpoint Connections window, click the endpoint you want to duplicate.
2. Click Duplicate.
3. On the General tab, edit the name for the endpoint.
4. Make any other necessary changes.
5. Click Save; then click Close.
Setup and User Guide - Enterprise Manager, November 2020 SR1 66
5 Defining and managing tasks
Searching for endpointsYou can search for endpoints by typing a sequence of letters in the Filter by box above the endpoints list. For example, to search for all endpoints whose names contain the string "Oracle", type "or". Only endpoints that match the search string are displayed.
Deleting endpointsYou can delete endpoints that you no longer require. Note that to delete an endpoint that is defined as a source or target in a task, you first need to remove the endpoint from the task.
To delete an endpoint:
l In the left panel of the Manage Endpoint Connections window, Select the endpoint and click Delete.
5.4 Adding a source and target endpoint to a taskOnce you have added the endpoints, you can design the replication task. The first step in this process is to define the source endpoint where your data is currently stored and the target endpoints where you want to replicate the data. To do this, you just drag one of the endpoints you added into the task map (in Designer mode).
Once you select the endpoint for your task, you must select the tables from the source endpoint to be replicated. The next step in creating a replication task is Selecting tables and/or views for replication (page 68).
To add source and target endpoints to a task:
1. Do one of the following:
l Create a new task. When you click OK in the Create New Task dialog box, the task opens on a dedicated tab. For more information, see Adding tasks (page 59).
l In the Tasks view, select the task to which you want to add endpoints and click View Task. The task opens on a dedicated tab.
2. On the dedicated tab for the task, click Designer to switch to Designer mode.The Task map is displayed, with the available endpoints listed in the pane on the left, as shown in the following figure.
Setup and User Guide - Enterprise Manager, November 2020 SR1 67

5 Defining and managing tasks
3. Drag a source endpoint to the top circle in the task map (that contains the text Drop source endpoint here). If dragging is not possible, make sure that the endpoint you are using is defined as a source endpoint.
4. Drag a target endpoint to the bottom circle in the task map (that contains the text Drop target endpoint here). If dragging is not possible, make sure that the endpoint you are using is defined as a target endpoint.
5. Click Save.
5.5 Selecting tables and/or views for replicationThis procedure describes how to select the source tables or views that you want to replicate. Note that tables can be selected from any supported endpoint, but views can only be selected from the following endpoints:
l Teradata
l Amazon Redshift
Setup and User Guide - Enterprise Manager, November 2020 SR1 68
5 Defining and managing tasks
l PostgreSQL
l MySQL
l SAP Sybase ASE
l IBM DB2 for LUW
l IBM DB2 for z/OS
l Oracle
l Microsoft SQL Server
l ODBC with CDC
l ODBC
l Replication of views is supported in Full Load Only tasks only, except when replicating from the following sources:
l Amazon Redshift
l Teradata
l ODBC with CDC
l Views are replicated to the target endpoint as tables
l When replicating views, the corresponding tables are created without a primary key. This presents an issue for Apply Changes tasks, which require the target tables to have a primary key. Therefore, if you are also running Apply Changes tasks (using one of the CDC-capable endpoints mentioned above), you need to define one or more primary keys for each of the target tables using a transformation. For an explanation of how to accomplish this, see Using the Transform tab (page 82) in Defining transformations for a single table/view (page 80).
When working with ODBC with CDC and Teradata source endpoints, any views and tables that you want to replicate must have the same context field(s). If you only want to replicate views, then all of the views must have the same context field(s).
For information on setting up context fields, see "Configuring Change Processing Settings" in the Qlik Replicate Setup and User Guide.
Once you have selected tables/views to replicate, you can run the replication task. However, if you need to make any changes to the structure of the tables in the target endpoint or only select specific columns, you will need to carry out one or both of the following procedures:
To select tables/views:
1. Open the task you are working with if it is not already displayed in a dedicated tab.For information on opening a task, see Editing a replication task (page 75).
2. In Designer mode, on the right side, click Table Selection.
Setup and User Guide - Enterprise Manager, November 2020 SR1 69

5 Defining and managing tasks
If the source endpoint does not support view selection, the Select Tables dialog box opens. If the source endpoint supports view selection, the Select Tables/Views dialog box opens.See the following for information on how to work with the Select Tables/Select Tables/Views dialog box:
l Searching for tables/views to use in a replication task (page 70)
l Selecting specific tables/views for replication (page 71)
l Creating table/view selection patterns (page 73)
l Setting load order (page 72)
Searching for tables/views to use in a replication taskThis topic walks you through searching for specific tables/views in preparation for including them in a replication task. You first search for tables that match specific criteria. Then you select the required tables/views from the search results to include them in the task. You can also carry out another search with new criteria and then add additional tables/views to the replication task.
After you finish searching, you can select tables/views for replication. Continue with Selecting specific tables/views for replication (page 71).
To search for tables/views to use in a replication task:
1. In Designer mode, click Table Selection.
2. In the Select Tables dialog box, if the source endpoint supports view selection, select one of the following:
l All to search for tables and views
l Tables to search for tables only
l Views to search for views only
Otherwise, skip to the next step.
3. From the Schema drop-down list, select a table/view schema.
When working with Microsoft SQL Server, quote characters in schema names - such as "\" or "[" - must be doubled in order to show the list of tables in the specified schema. For example, My\Schema should be specified as My\\Schema.
When selecting tables from the SAP Application or SAP Application (DB) endpoint, "Business Groups" will appear instead of "Schema".
4. Optionally, in the Table/View field, type the name or partial name of a table/view you wish to replicate. If you do not do this, Replicate will search for all of the tables/views in the selected schema.
Setup and User Guide - Enterprise Manager, November 2020 SR1 70
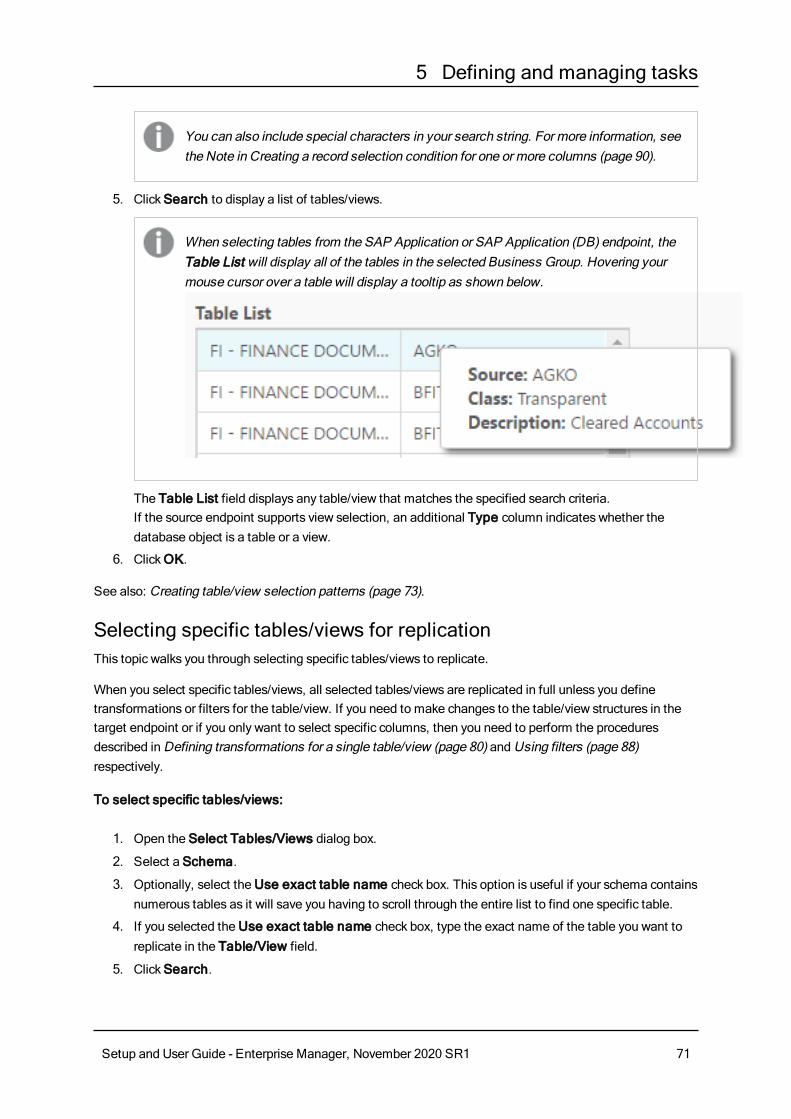
5 Defining and managing tasks
You can also include special characters in your search string. For more information, see the Note in Creating a record selection condition for one or more columns (page 90).
5. Click Search to display a list of tables/views.
When selecting tables from the SAP Application or SAP Application (DB) endpoint, the Table List will display all of the tables in the selected Business Group. Hovering your mouse cursor over a table will display a tooltip as shown below.
The Table List field displays any table/view that matches the specified search criteria.If the source endpoint supports view selection, an additional Type column indicates whether the database object is a table or a view.
6. Click OK.
See also: Creating table/view selection patterns (page 73).
Selecting specific tables/views for replicationThis topic walks you through selecting specific tables/views to replicate.
When you select specific tables/views, all selected tables/views are replicated in full unless you define transformations or filters for the table/view. If you need to make changes to the table/view structures in the target endpoint or if you only want to select specific columns, then you need to perform the procedures described in Defining transformations for a single table/view (page 80) and Using filters (page 88) respectively.
To select specific tables/views:
1. Open the Select Tables/Views dialog box.
2. Select a Schema.
3. Optionally, select the Use exact table name check box. This option is useful if your schema contains numerous tables as it will save you having to scroll through the entire list to find one specific table.
4. If you selected the Use exact table name check box, type the exact name of the table you want to replicate in the Table/View field.
5. Click Search.
Setup and User Guide - Enterprise Manager, November 2020 SR1 71

5 Defining and managing tasks
The table or tables (If you did not select the Use exact table name check box) will be shown in the search results.
6. Select the table by adding it to the list on the right.
7. To add additional tables from the same schema, repeat steps 3-6. To add additional tables from a different schema, repeat steps 2-6.
8. Click OK to save your settings.
If you rename a table in the database, the Designer tab will still show the original table name. The Monitor tab, on the other hand, will show the new table name.
Setting load orderYou can set the load order for each of the selected tables. This may be useful, for example, if your selected tables list contains tables of different sizes and you want the smaller tables to be loaded before the larger tables. When a group of tables are set with the same load order, Replicate will load the tables according to the table ID.
Load order can be set and modified (see note below) in the following places:
l The Select Tables window (opened in Designer view by clicking the Table Selection button in the right of the console).
l The Patterns and Selected Tables list in the right of the console (in Designer view).
l Load order cannot be changed during a task. If you want to change the load order, first stop the task, then change the load order as desired, and finally reload the target.
l Load order cannot be set for "Exclude" patterns.
To set the load order for a specific table:
1. Select the desired table in the Selected Tables list.
2. From the Load Order drop-down list, select one of the available priority levels (Lowest Priority, Low Priority, Normal Priority, High Priority, and Highest Priority).
3. This step is only relevant if you are setting load order in the Select Tables window. Click OK to save your settings and close the Select Tables window.
To set the same load order for multiple tables:
1. Select the desired tables in the Selected Tables list.
2. From any of the selected items' Load Order drop-down list, select one of the available priority levels.
3. This step is only relevant if you are setting load order in the Select Tables window. Click OK to save your settings and close the Select Tables window.
Setup and User Guide - Enterprise Manager, November 2020 SR1 72

5 Defining and managing tasks
Removing specific tables/views from a replication taskThis topic walks you through removing specific tables/views from the replication task.
To remove tables from the Selected Tables list:
1. From the Selected Tables list, select a table that you want to remove from the replication task and then click the button with a single left-facing arrowhead (Remove).
2. To remove all of the tables/views from the Selected Tables or Selected Tables/Views list, click the button with two left-facing arrowheads (Remove All).
3. Click OK to close the Select Tables or Select Tables/Views dialog box.
4. Click Save to make sure that Enterprise Manager saves the table information for this task.
Creating table/view selection patternsThis topic walks you through selecting tables/views using patterns. For example, you can include all tables/views that belong to the HR schema except for one or two tables/views that you exclude. You can also only exclude one or more table/view schemas or tables/views. This replicates the entire endpoint, except for those tables/views that you excluded.
The following example shows a pattern that replicates all tables that are members of the dbo schema except for the dbo.PRODUCT_1% table.
Include dbo.%
Exclude dbo.PRODUCT_1%
You can also use the "_" wildcard character to match a single character. For example, specifying Exclude m_d% will exclude all tables that begin with m and end with d%, such as model or msdb.
Wildcard characters need to be escaped to prevent them from being interpreted as standard characters. As the escape character conventions differ across databases, you should consult your database Help for guidance about supported escape characters. Some examples (where an underscore is the wildcard character) are as follows:
l MySQL and PostgreSQL - \\_
l Microsoft SQL Server - [_]
l Oracle - For Oracle, use the escapeCharacter internal parameter to define a custom escape character.
When you explicitly select tables/views, all selected tables/views are replicated in full unless you define transformations or filters for the table/view. If you need to make changes to the table/view structures in the target endpoint or if you only want to select specific columns, then you need to perform the procedures described in Defining transformations for a single table/view (page 80) and Using filters (page 88) respectively.
Setup and User Guide - Enterprise Manager, November 2020 SR1 73
5 Defining and managing tasks
To view all of the tables/views included when you use a table selection pattern, click the Full Table List tab in Designer view. The Full Table List lists all of the tables/views included in any table pattern you defined as well as all explicitly selected tables/views. To view only patterns and explicitly selected tables/views, click the Patterns and Selected Tables tab in Designer view.
To create table/view selection patterns:
1. In the Designer view, in the Select Tables/Views dialog box, do any of the following:
l Select a schema from the Schema drop-down list. All tables/views that belong to that schema are included in the table/view selection pattern.
l Type the name or partial name of a table/view in the Table/View field. Any string that you enter here is included in the table/view selection pattern.
l If the table/view that you type here is a member of the schema you selected in the Schema drop-down list, then you only have to type the name of the table/view.
l If you did not select a schema or the table/view belongs to another schema, include the schema with the table name in the following format: HR.Employees, where HR is the schema.
2. Click Include to include all of the tables/views that match the selection criteria.
3. Click Exclude to exclude any tables that match the selection criteria.
4. Click OK to close the Select Tables/Views dialog box.
5. Click Save to make sure that Enterprise Manager saves the table/view information for this task.
Excluding specific tables from the replication taskYou can easily exclude specific tables from being replicated.
To do this:
1. Open the the Select Tables/Views dialog box.
2. Select a Schema and then click Search.Any tables in that schema will be shown in the search results.
3. Select the tables by adding them to the list on the right.
4. Click the Include button.Include <schema_name>.% will be added to the Table Selection Patterns list.
5. Select the Use exact table name check box.
6. Type the name of the table you want to exclude in the Table/View field.
7. Click the Exclude button.Exclude <schema_name>.<table_name> will be added to the Table Selection Patterns list.
8. To exclude additional tables from the same schema, repeat Steps 6-7. To exclude tables from a different schema, clear the Use exact table name check box and then repeat Steps 2-7.
9. Click OK to save your settings.
Setup and User Guide - Enterprise Manager, November 2020 SR1 74

5 Defining and managing tasks
5.6 Editing a replication taskYou can make changes to tasks that you previously created. Just open the task and make the changes in the same way that you did when you created the task.
To edit a task:
1. In Tasks view, select the task and click Open.The task opens, displaying the source and target endpoints and which tables have been selected for replication.
2. Continue with any of the following procedures:
l Adding a source and target endpoint to a task (page 67)
l Selecting tables and/or views for replication (page 68)
l Defining transformations for a single table/view (page 80)
l Using filters (page 88)
l Task Settings (page 149)
5.7 Searching for tasksIn Tasks view, you can search for tasks by typing a sequence of letters in theSearch Tasks box above the tasks. For example, to search for all tasks with names that begin with "Oracle-to", type "or". Only tasks that match the search string are displayed.
5.8 Deleting a replication taskYou can delete tasks that you created. To prevent complications, it is recommended not to use the name of a deleted task for a new task you create. Such a task would be created with the same settings as the deleted task.
If you use a Microsoft SQL Server endpoint, a Microsoft SQL Server system administrator must delete the Microsoft SQL Server Replication Publisher definitions for the endpoint that was used in the task from SQL Server.
For more information, see the "Limitations" section in the Microsoft SQL Server chapter in the Qlik Replicate Setup and User Guide.
To delete a task:
1. Stop the task that you want to delete.
2. In Tasks view, click Delete Task.The task is deleted.
Setup and User Guide - Enterprise Manager, November 2020 SR1 75

5 Defining and managing tasks
5.9 Exporting and importing tasks
This functionality is supported with Replicate tasks only.
The ability to export tasks is useful if you need to migrate tasks between different Enterprise Manager machines, which may be necessary if you need to decomission a machine or when moving from a test machine to a production machine, for example. Tasks can be exported with or without endpoints.
Export Task
When
With Endpoints
l The task's endpoints do not exist in the target environment. This way, the task will be created with endpoints when it is imported.
l The endpoints already exist in the target environment but with a different configuration that you would like to override.
In both of the above cases, after importing the task, you need to edit the endpoints and re-enter the passwords. This will encrypt the passwords using the Master User Key of the target machine.
Without Endpoints
The task's endpoints already exist in the target environment with a suitable configuration.
Task export use cases
For information on what permissions are required to export and import tasks, see Roles and permissions (page 262).
To export a task:
1. In Tasks view, do one of the following:
l Select or open the task you want to export and then click the Export Task toolbar button.
l Right-click the task you want to export and select Export Task from the context menu.
2. Select Without Endpoints or With Endpoints accordingly.Depending on your browser settings, the task JSON file will either be downloaded to your default Downloads folder or you will be prompted to save it to you preferred location.The file name format is as follows:AEM_<ReplicateServerName>_<TaskName>_<Date>_<Time>.json
To import a task:
1. If the task is running on the target server, stop the task.
2. In Servers view, do one of the following:
Setup and User Guide - Enterprise Manager, November 2020 SR1 76
5 Defining and managing tasks
l Select the target server (i.e. the server to which you want the task to be imported).
l Right-click the target server and select Import Task from the context menu.
The Import Task window opens.
3. Either select the task JSON file using the Browse button or drag the file to the window.
4. Click Import.
5. Optionally, when the import completes, start the task.
Setup and User Guide - Enterprise Manager, November 2020 SR1 77
6 Customizing tasks
6 Customizing tasks This topic describes how to customize a replication task. For example, you can create new tables or columns for the target endpoint or select only some of the data from each column to be replicated. This is done using transformations and filters.
Although the descriptions in this section only refer to tables, the procedures described herein are applicable to views as well. When a transformation is defined for a view, the word "View(s)" appears in the UI instead of the word "Table(s)".
6.1 Table SettingsIn the <Table_Name> - Table Settings window, you can define how the data for each individual table/view is replicated to the target.
Some of the table settings are not available in a Log Stream Staging setup.
For information on the availability of table settings in a Log Stream Staging setup, refer to the Qlik Replicate Setup and User Guide.
To open the Table Settings window:
1. Open the task you are working with. For information on opening a task, see Editing a replication task (page 75).
2. In Designer view, select the desired table from one of the following tabs on the right of the console:
l The Patterns and Selected Tables tab - if the desired table was explicitly selected.
l The Full Table List tab - if the desired table was selected using a table inclusion pattern.For information on how to define table selection patterns, see Creating table/view selection patterns (page 73).
3. Click the Table Settings button above the table list. The <Table_Name> - Table Settings window opens.
4. In the Table Settings window, perform any of the following tasks:
l Performing General tasks for a single table/view (page 79)
l Defining transformations for a single table/view (page 80)
l Using filters (page 88)
l Define Parallel Load Settings
l Define LOB Column Replication Settings
5. Click OK to close the Table Settings window.
6. Click Save to preserve the table and column information for this task.
Setup and User Guide - Enterprise Manager, November 2020 SR1 78
6 Customizing tasks
To restore the default table values:
l Click Restore Table Defaults at the bottom left of the Table Settings window. This option is available in all tabs.Any changes you made will be discarded and the table's default settings will be restored.
The names of modified tables will be followed by the word (changed), enabling you to easily identify which tables have been modified.
Performing General tasks for a single table/view
Although the descriptions in this section only refer to tables, the procedures describe herein are applicable to views as well. When a task is being performed for a view, the word "View(s)" will appear in the UI instead of the word "Table(s)"
The General tab in the Table Settings window displays basic information about the selected table and allows you to define new names for the table/schema on the target as well as override the default tablespace for the table and its index (Oracle target only).
To edit the general table settings:
1. Open the Table Settings (page 78) window.
2. Click the General tab on the left side of the window, as shown below.
Setup and User Guide - Enterprise Manager, November 2020 SR1 79

6 Customizing tasks
In the Map to target table section, the following options are available:
l Table Schema: Specify the schema in which you want the table to be created on the target.
l Table Name: Specify a new name for the table on the target.
l Table tablespace: This option is only available when the task is defined with an Oracle target endpoint. Specify the name of the tablespace in which you want the table to be created on the target. By default (i.e. when this field is empty), the table will either be created in the source table tablespace on the target (when replicating from an Oracle source) or in the default tablespace (when replicating from any other source).
l Index tablespace: This option is only available when the task is defined with an Oracle target endpoint. Specify the name of the tablespace in which you want the table's index to be created on the target. By default (i.e. when this field is empty), the index will either be created in the source table tablespace on the target (when replicating from an Oracle source) or in the default tablespace (when replicating from any other source).
Defining transformations for a single table/view
Although the descriptions in this section only refer to tables, the procedures describe herein are applicable to views as well. When a transformation is defined for a view, the word "View(s)" will appear in the UI instead of the word "Table(s)".
Setup and User Guide - Enterprise Manager, November 2020 SR1 80

6 Customizing tasks
This section describes how to define data transformations. Data transformations are performed when the task is run. They are optional. If you do not define any transformations, the data is replicated "as is" from the source to the target.
Enterprise Manager lets you make the following changes to the tables and columns:
l Rename any column for the target table
l Delete a target column
l Change the data type and/or the length of any target column
l Add additional target columns
l Designate which target columns (i.e. segments) will comprise the Unique Index
l Recalculate the data
LimitationsTransformations are subject to the following limitations:
l They are not supported for calculating columns of Right-to-Left languages.
l Transformations cannot be performed on columns that contain special characters (e.g. #, \, /, -) in their name.
l They cannot be performed on columns that have a pound character (#) in their name.
l The only supported transformation for LOB/CLOB data types is to drop the column on the target.
You can use the method described here for transformations that are specific to a single table or a few tables in your task. To make a similar change over multiple tables, see Defining Global transformations (page 102).
For an explanation of how to configure transformations, see Using the Transform tab (page 82).
To define a data transformation for a single table:
1. Select the table you want to transform and open the Table Settings (page 78) window.
2. Click Transform on the left side of the window.
The following figure shows the information in the Transform tab of the Table Settings window.
Setup and User Guide - Enterprise Manager, November 2020 SR1 81
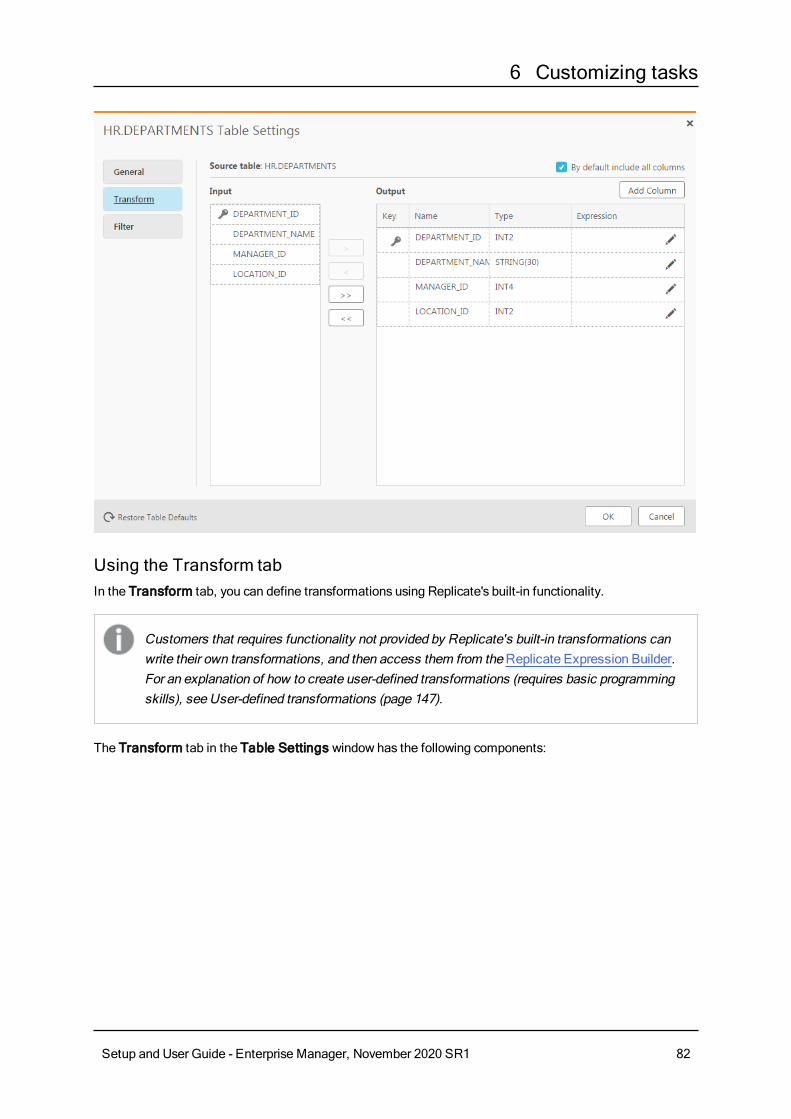
6 Customizing tasks
Using the Transform tabIn the Transform tab, you can define transformations using Replicate's built-in functionality.
Customers that requires functionality not provided by Replicate's built-in transformations can write their own transformations, and then access them from the Replicate Expression Builder. For an explanation of how to create user-defined transformations (requires basic programming skills), see User-defined transformations (page 147).
The Transform tab in the Table Settings window has the following components:
Setup and User Guide - Enterprise Manager, November 2020 SR1 82

6 Customizing tasks
l Input: This lists the columns on which you can perform transformations.
When creating a transformation for the SAP Application source endpoint, you can hover your mouse cursor over an Input column to see a tooltip with the table’s actual name:
l Output: This table shows the defined output for the columns in the table where you are performing the transformations. It contains the following columns:
l Key: This indicates whether the column is a segment of the Unique Index. A key icon is displayed next to columns that are segments of the Unique Index. Click the column to add and remove keys.
l Name: The name of the column. To change the name of the column, select the field with the column name you want to change and type a new name in this column if you want to change the name of the column or if the column is calculated (added to the table). See the table Using the Transform tab (page 82) for more information.
l Type: The data type for the column. To change the data type for the column, select the field with the data type you want to change and select a new data type. See the following table for more information.
l Expression: An expression using SQLite operators to define the data in the column. For information on how to create an expression, see the table below.
The following table describes the actions you can carry out in the Transform Table window.
Dropping a column, saving your changes, and then adding a column with the same name and defining an expression corresponding to the dropped column's data, is not supported. If you mistakenly drop a column, simply add the column back again without an expression.
To Do This
Rename a column Select the Name column for the table column you want to change. Type in a new name.
The top right corner turns blue when the name is changed. To view the original name, hover the mouse pointer over the field and the original name is displayed.
Transform actions
Setup and User Guide - Enterprise Manager, November 2020 SR1 83
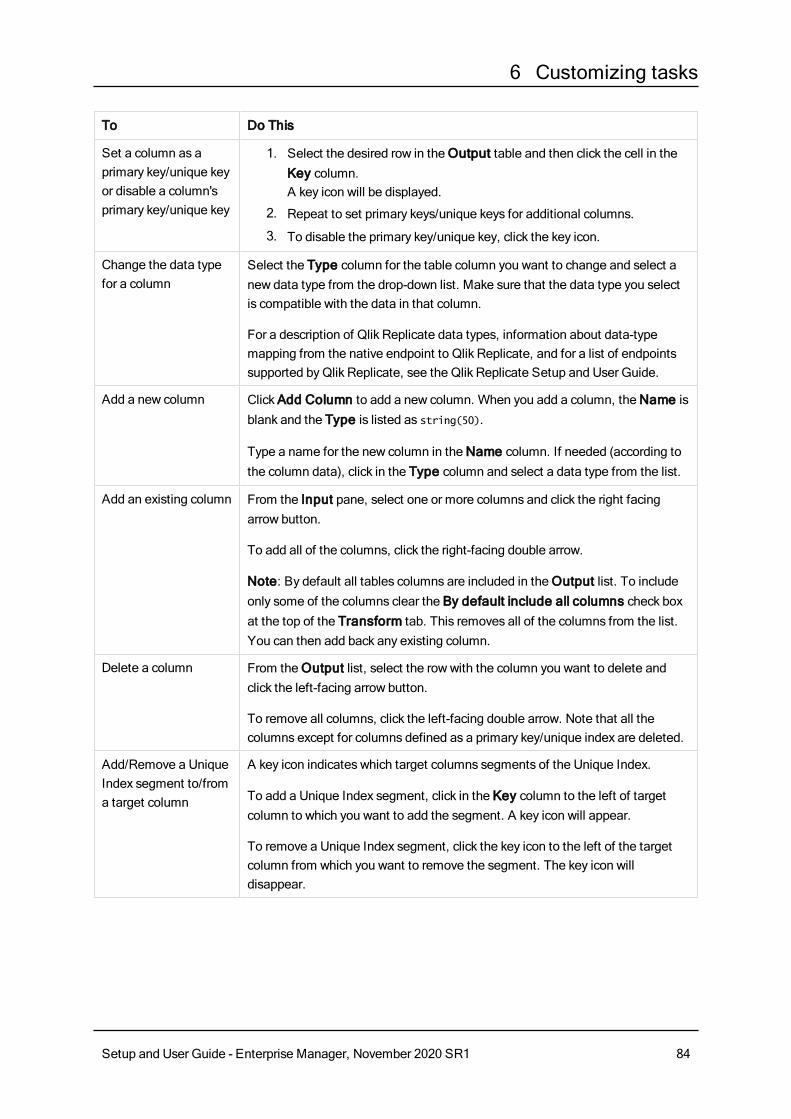
6 Customizing tasks
To Do This
Set a column as a primary key/unique key or disable a column's primary key/unique key
1. Select the desired row in the Output table and then click the cell in the Key column. A key icon will be displayed.
2. Repeat to set primary keys/unique keys for additional columns.
3. To disable the primary key/unique key, click the key icon.
Change the data type for a column
Select the Type column for the table column you want to change and select a new data type from the drop-down list. Make sure that the data type you select is compatible with the data in that column.
For a description of Qlik Replicate data types, information about data-type mapping from the native endpoint to Qlik Replicate, and for a list of endpoints supported by Qlik Replicate, see the Qlik Replicate Setup and User Guide.
Add a new column Click Add Column to add a new column. When you add a column, the Name is blank and the Type is listed as string(50).
Type a name for the new column in the Name column. If needed (according to the column data), click in the Type column and select a data type from the list.
Add an existing column From the Input pane, select one or more columns and click the right facing arrow button.
To add all of the columns, click the right-facing double arrow.
Note: By default all tables columns are included in the Output list. To include only some of the columns clear the By default include all columns check box at the top of the Transform tab. This removes all of the columns from the list. You can then add back any existing column.
Delete a column From the Output list, select the row with the column you want to delete and click the left-facing arrow button.
To remove all columns, click the left-facing double arrow. Note that all the columns except for columns defined as a primary key/unique index are deleted.
Add/Remove a Unique Index segment to/from a target column
A key icon indicates which target columns segments of the Unique Index.
To add a Unique Index segment, click in the Key column to the left of target column to which you want to add the segment. A key icon will appear.
To remove a Unique Index segment, click the key icon to the left of the target column from which you want to remove the segment. The key icon will disappear.
Setup and User Guide - Enterprise Manager, November 2020 SR1 84
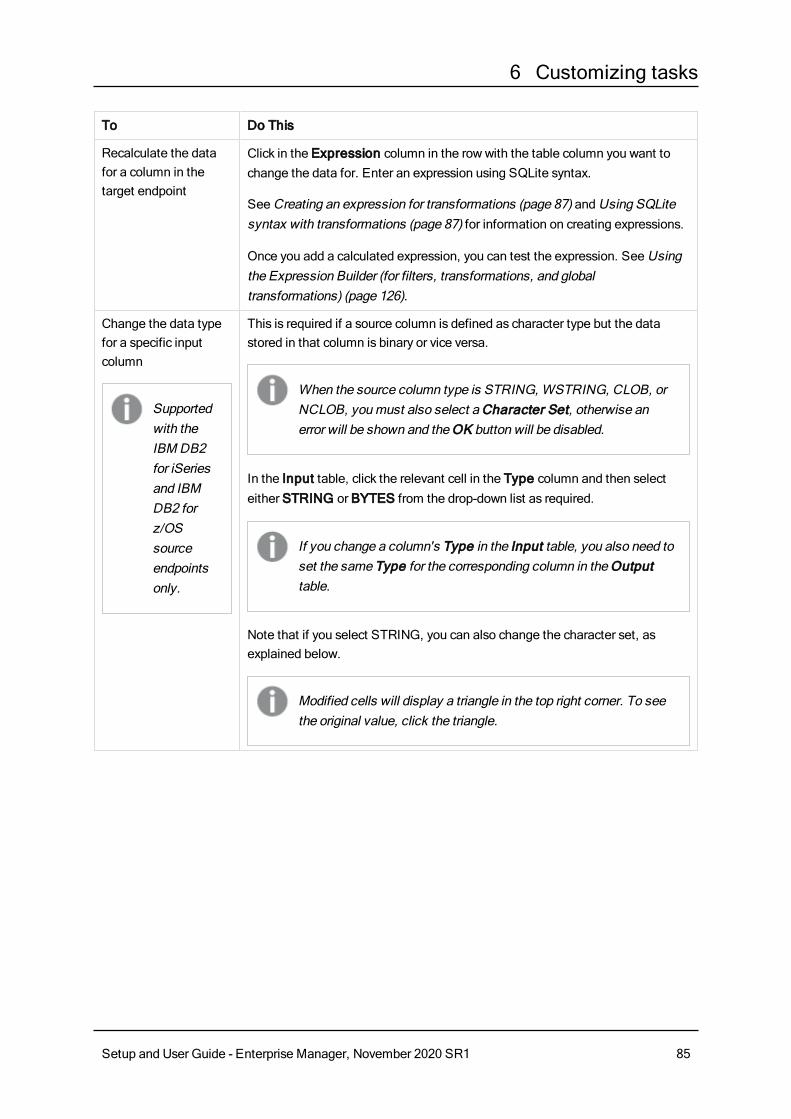
6 Customizing tasks
To Do This
Recalculate the data for a column in the target endpoint
Click in the Expression column in the row with the table column you want to change the data for. Enter an expression using SQLite syntax.
See Creating an expression for transformations (page 87) and Using SQLite syntax with transformations (page 87) for information on creating expressions.
Once you add a calculated expression, you can test the expression. See Using the Expression Builder (for filters, transformations, and global transformations) (page 126).
Change the data type for a specific input column
Supported with the IBM DB2 for iSeries and IBM DB2 for z/OS source endpoints only.
This is required if a source column is defined as character type but the data stored in that column is binary or vice versa.
When the source column type is STRING, WSTRING, CLOB, or NCLOB, you must also select a Character Set, otherwise an error will be shown and the OK button will be disabled.
In the Input table, click the relevant cell in the Type column and then select either STRING or BYTES from the drop-down list as required.
If you change a column's Type in the Input table, you also need to set the same Type for the corresponding column in the Output table.
Note that if you select STRING, you can also change the character set, as explained below.
Modified cells will display a triangle in the top right corner. To see the original value, click the triangle.
Setup and User Guide - Enterprise Manager, November 2020 SR1 85

6 Customizing tasks
To Do This
Change the Character Set for a specific input column
Supported with the IBM DB2 for iSeries and IBM DB2 for z/OS source endpoints only.
This is required if a source character column is wrongly encoded. For example, if a source character column is described as encoded in CCSID X, but the data stored in that column is actually encoded in CCSID Y.
You can also set a custom character set as described in Setting a custom character set (page 86) below.
In the Input table:
1. Click the relevant cell in the Type column and select STRING from the drop-down list.
2. Click the relevant cell in the Character Set column and then select the appropriate character set from the drop-down list.
Only character sets compatible with the selected Type will be available for selection.
Modified cells will display a triangle in the top right corner. To see the original value, click the triangle.
Setting a custom character setThe following procedure is supported with the IBM DB2 for iSeries and IBM DB2 for z/OS source endpoints only.
Perform the steps below if the source table is defined with an incorrect CCSID and the correct definition is actually in a UCM file.
1. Create a mapping data file with the file extension .ucm.
Note If you edit an existing UCM file, you must also change the values of the <code_set_name> and <icu:alias> properties. If the file does not contain an <icu:alias> property, then you only need to change the value of the <code_set_name> property.
2. Create a CNV file for the UCM file by running the following command:<product_dir>\bin\makeconv.exe -v <file_name>.ucm
Example:
"c:\Program Files\Attunity\Replicate\bin\makeconv.exe" -v 1047_EX.ucm
This will create a CNV file with the same name as the UCM file (e.g. 1047_EX.cnv).
3. Copy the file to the following location:
Setup and User Guide - Enterprise Manager, November 2020 SR1 86

6 Customizing tasks
<product_dir>\bin\icudt58l
4. Restart the Qlik Replicate UI Server service.
5. Select the custom character set from the Character Set drop-down list; it will appear as the CNV file name followed by the word "Custom" e.g. 1047_EX.cnv (Custom).
Using a column's before-image data in a transformationYou can use a column's before-image data in a transformation. This is useful if you need to store the before-image data on the target.
To do this, simply specify the source column name in Output table's Expression column, in the following format:
$BI__MyColumn
Where $BI__ is a mandatory prefix (that instructs Replicate to capture the before-image data) and MyColumn is the source column name.
Although you can store the before-image data in an existing target column, it is recommended to create a new target column (using the Add Column button) in which to store the before-image data.
Creating an expression for transformationsUse an expression to define the contents of a new or re-calculated column.
To create an expression:
1. In the Transform tab, select the row with the column for which you want to create an expression.orClick Add Column to add a new column.
2. Click the button in the Expression column.The Expression Builder opens.
3. Build an expression as described in Using the Expression Builder (for filters, transformations, and global transformations) (page 126).
Using SQLite syntax with transformationsThe following table lists the SQLite operators that are supported with transformations.
Operator Description
|| Concatenate strings.
FIRST_NAME||LAST_NAME
PHONE_NUMBER||<Office Only> (adds the string Office Only to the telephone number).
SQLITE syntax operators
Setup and User Guide - Enterprise Manager, November 2020 SR1 87

6 Customizing tasks
Operator Description
+ Adds two values together.
DEPARTMENT_ID+100 (adds 100 to each ID number). Any column used in an expression with this operator must be a numeric data type.
- Subtracts a value from another value.
MANAGER_ID-100 (subtracts 100 from each ID number). Any column used in an expression with this operator must be a numeric data type.
% Uses the remainder of a division expression as the value.
%SALARY/7 (Divides the value of the Salary column by 7 and uses any remainder from the expression as the column value).
/ Divides one value into another.
SALARY/.16 (Divides the value of the Salary column by .16.
If the two values in the division expression are integers (two NUMERIC columns with no digits after the decimal) and the result is a fractional value, the result returned will be 0.
* SALARY*.16 (Multiplies the value of the Salary column by .16. This could be used to calculate taxes that are subtracted from a salary).
For more information about SQLite syntax, see the SQLite documentation.
Using filtersFilters let you include or exclude records from a replication task based on the value(s) of the source table columns, thereby allowing you to replicate only the specific data that you need.
In this section:
l Filter limitations (page 88)
l Opening the Filter tab (page 89)
l Creating a filter condition for a specified column (page 90)
l Creating a record selection condition for one or more columns (page 90)
l Adding or removing filter ranges (page 92)
l Using SQLite syntax with filtering (page 93)
Filter limitationsWhen creating a filter, the following limitations apply:
Setup and User Guide - Enterprise Manager, November 2020 SR1 88
6 Customizing tasks
l Filters are not supported for calculating columns of Right-to-Left languages.
l Filters can only be applied to immutable columns.
l Filters on mutable columns:When a filter is created to exclude/include specific rows in a column, the specified rows will always be excluded/included, even if the rows that were originally excluded/included are later changed. For example, if you chose to exclude/include rows "1-10" in a column named "Age" and those rows were later changed to "11-20", the rows will continue to be excluded/included, even though the data is no longer the same.Additionally, if a row outside the filter scope was changed (i.e. updated or updated and then deleted) so that it should now be excluded/included (as defined by the filter), it will not be replicated to the target. So, for example if you created a filter to exclude/include rows less than 5 and then changed row 6 to -6, it will not be replicated (even though it is included in the filter's criteria range).
l Filter cannot be applied to LOB columns.
Opening the Filter tabThe Filter Table tab contains the following information:
l Data Columns list: This list contains a list of the columns for the table where you filtering data. You can use these to select the columns to use in the filtering operations.This list has the following tabs:
l Source: This tab lists the original source columns in the table.
l Header: This tab lists the available header columns. You can create filters using these columns and include them in expressions. For information on these header columns, see Headers (page 145).
l Calculated: This tab lists the columns added to the table. You add columns through transformations. For more information, see Defining transformations for a single table/view (page 80).
l Filter Conditions table: This table has the following columns:
l Name: The name of the column where you are filtering the data.
l Type: The data type for the column.
l Include/Exclude: Indicate whether to include or exclude the filtered data for this column.
l Ranges: Click the button on the right of the Ranges field to open the Range Builder. For information on creating a value or ranges with the Range Builder, see Adding or removing filter ranges (page 92).For more information on typing in the filter ranges manually, see Using SQLite syntax with filtering (page 93).
l Record Selection Condition: Enter a complex condition that can include multiple columns. The condition must evaluate to TRUE to be accepted. You can create a condition using SQLite operators or by Using the Expression Builder (for filters, transformations, and global transformations) (page 126). For information on using the SQLite operators, see Creating a record selection condition for one or more columns (page 90).
The following figure is an example of the information in the Filter tab of the Table Settings window.
Setup and User Guide - Enterprise Manager, November 2020 SR1 89
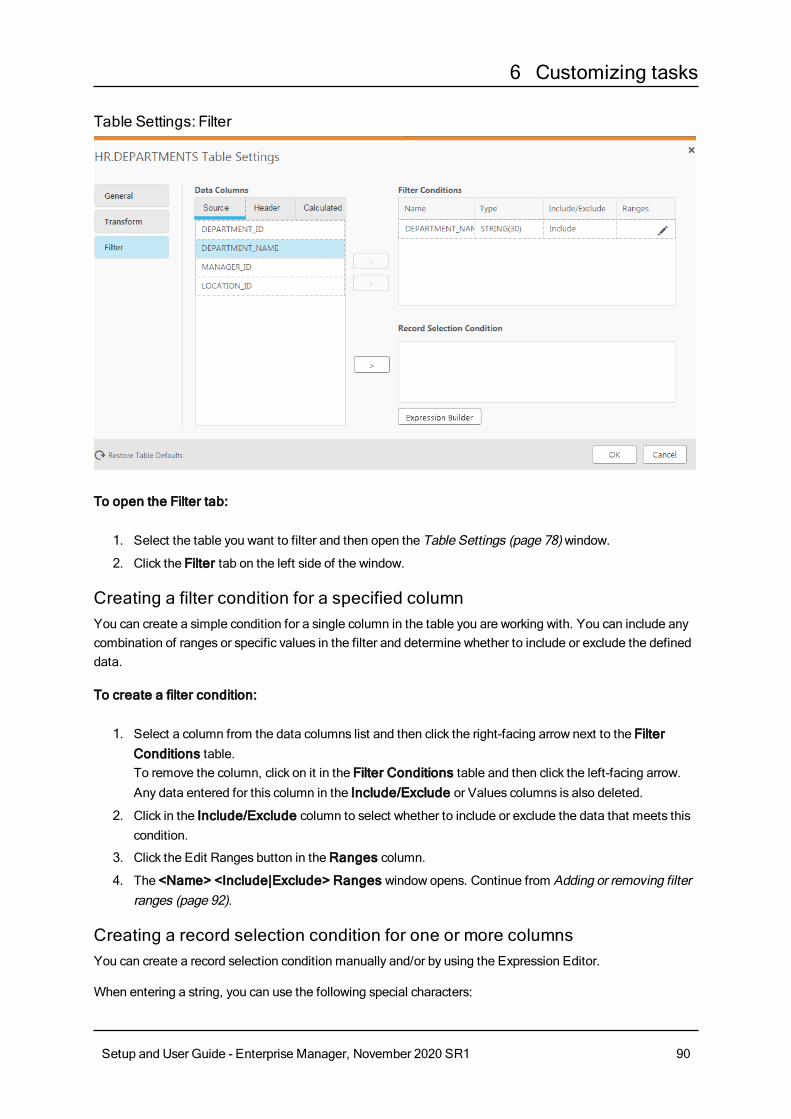
6 Customizing tasks
Table Settings: Filter
To open the Filter tab:
1. Select the table you want to filter and then open the Table Settings (page 78) window.
2. Click the Filter tab on the left side of the window.
Creating a filter condition for a specified columnYou can create a simple condition for a single column in the table you are working with. You can include any combination of ranges or specific values in the filter and determine whether to include or exclude the defined data.
To create a filter condition:
1. Select a column from the data columns list and then click the right-facing arrow next to the Filter Conditions table.To remove the column, click on it in the Filter Conditions table and then click the left-facing arrow. Any data entered for this column in the Include/Exclude or Values columns is also deleted.
2. Click in the Include/Exclude column to select whether to include or exclude the data that meets this condition.
3. Click the Edit Ranges button in the Ranges column.
4. The <Name> <Include|Exclude> Ranges window opens. Continue from Adding or removing filter ranges (page 92).
Creating a record selection condition for one or more columnsYou can create a record selection condition manually and/or by using the Expression Editor.
When entering a string, you can use the following special characters:
Setup and User Guide - Enterprise Manager, November 2020 SR1 90
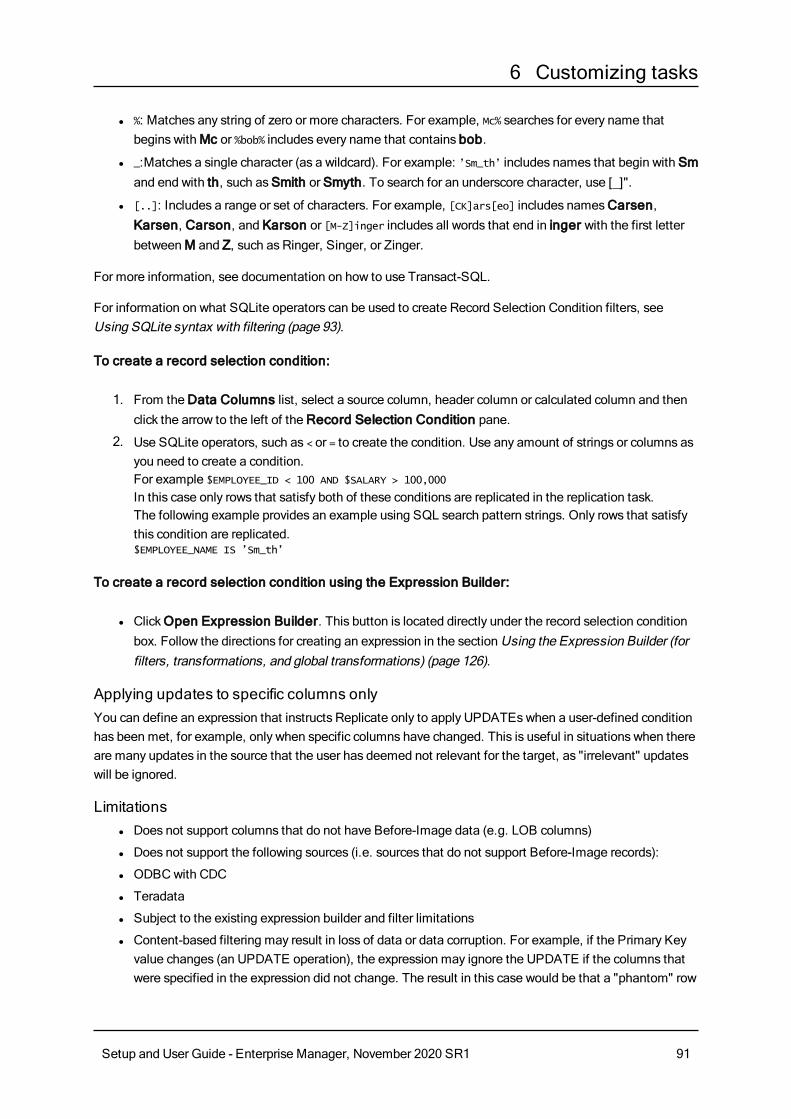
6 Customizing tasks
l %: Matches any string of zero or more characters. For example, Mc% searches for every name that begins with Mc or %bob% includes every name that contains bob.
l _:Matches a single character (as a wildcard). For example: ’Sm_th’ includes names that begin with Sm and end with th, such as Smith or Smyth. To search for an underscore character, use [_]".
l [..]: Includes a range or set of characters. For example, [CK]ars[eo] includes names Carsen, Karsen, Carson, and Karson or [M-Z]inger includes all words that end in inger with the first letter between M and Z, such as Ringer, Singer, or Zinger.
For more information, see documentation on how to use Transact-SQL.
For information on what SQLite operators can be used to create Record Selection Condition filters, see Using SQLite syntax with filtering (page 93).
To create a record selection condition:
1. From the Data Columns list, select a source column, header column or calculated column and then click the arrow to the left of the Record Selection Condition pane.
2. Use SQLite operators, such as < or = to create the condition. Use any amount of strings or columns as you need to create a condition.For example $EMPLOYEE_ID < 100 AND $SALARY > 100,000In this case only rows that satisfy both of these conditions are replicated in the replication task.The following example provides an example using SQL search pattern strings. Only rows that satisfy this condition are replicated.$EMPLOYEE_NAME IS ’Sm_th’
To create a record selection condition using the Expression Builder:
l Click Open Expression Builder. This button is located directly under the record selection condition box. Follow the directions for creating an expression in the section Using the Expression Builder (for filters, transformations, and global transformations) (page 126).
Applying updates to specific columns onlyYou can define an expression that instructs Replicate only to apply UPDATEs when a user-defined condition has been met, for example, only when specific columns have changed. This is useful in situations when there are many updates in the source that the user has deemed not relevant for the target, as "irrelevant" updates will be ignored.
Limitations l Does not support columns that do not have Before-Image data (e.g. LOB columns)
l Does not support the following sources (i.e. sources that do not support Before-Image records):
l ODBC with CDC
l Teradata
l Subject to the existing expression builder and filter limitations
l Content-based filtering may result in loss of data or data corruption. For example, if the Primary Key value changes (an UPDATE operation), the expression may ignore the UPDATE if the columns that were specified in the expression did not change. The result in this case would be that a "phantom" row
Setup and User Guide - Enterprise Manager, November 2020 SR1 91

6 Customizing tasks
with the old row contents will remain, even if a change was later applied to the columns specified in the expression.
How toAssume that you have a source table named table1 with columns c1-c10 but you are only interested in updating columns c7, c8 and c9 on the target.
To do this, you would need to:
1. Open the Table Settings for table1 and select the Filter tab.
2. Click the Expression Builder button at the bottom right of the tab.The Expression Builder opens.
3. Optionally, select the Headers tab.
Although selecting the Headers tab is optional, selecting it will enable you to add $AR_H_OPERATION to your expression (as required in Step 4 below) simply by double-clicking the column on the left of the tab.
4. Enter the following expression in the Build Expression pane and then click OK:($AR_H_OPERATION != 'UPDATE') OR
(($AR_H_OPERATION = 'UPDATE') AND (( $BI__c7 != $c7) OR ( $BI__c8 != $c8) OR ( $BI__c9 !=
$c9)))
The above expression means that changes will be applied to c7, c8 and c9 only if one of the following is true:
l The operation is not an UPDATE.
l The value of c7, c8 or c9 has changed as the result of an UPDATE operation.
When used in an expression, Before-Image columns must be prefixed with $BI__. For operations other than UPDATE, the value of the specified columns will be NULL.
Adding or removing filter rangesYou can add one or more values to the Ranges column using the Range Builder. Values that match any of the ranges in the list are included in the replication.
You can also delete a filter range using the Range Builder.
Filter ranges that you enter manually are also displayed in the Filter Builder. You can use the Filter Builder to delete them.
Setup and User Guide - Enterprise Manager, November 2020 SR1 92
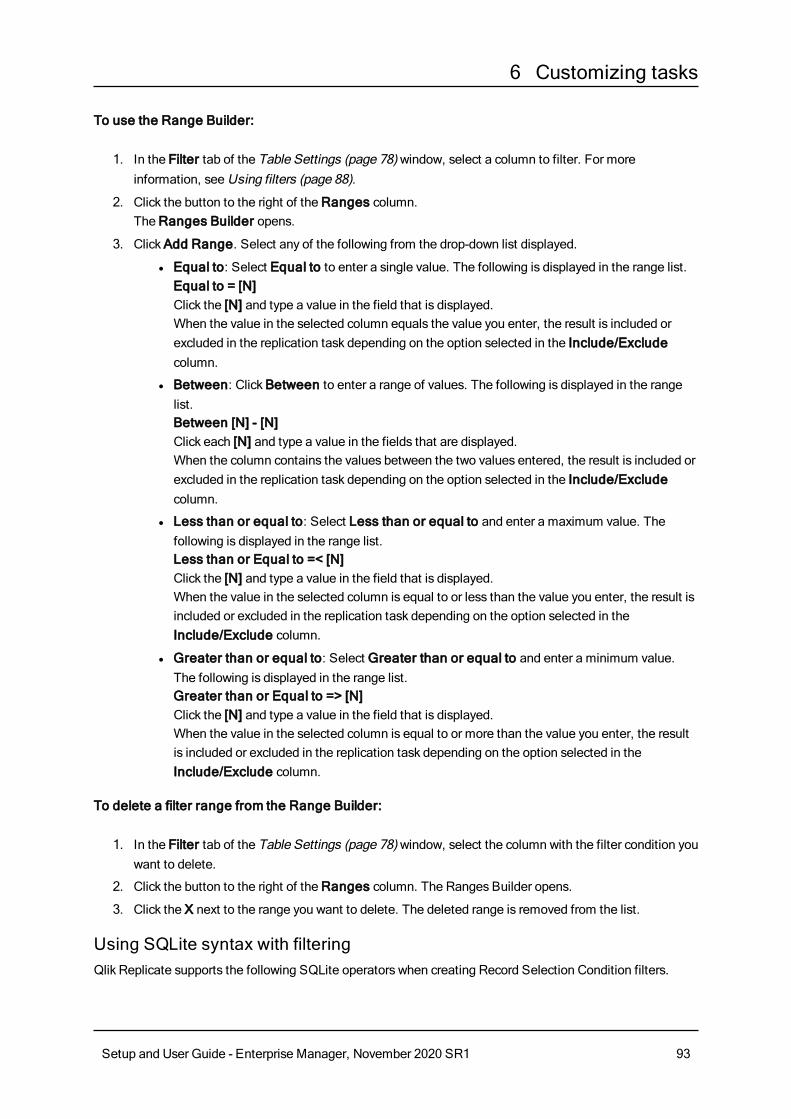
6 Customizing tasks
To use the Range Builder:
1. In the Filter tab of the Table Settings (page 78) window, select a column to filter. For more information, see Using filters (page 88).
2. Click the button to the right of the Ranges column. The Ranges Builder opens.
3. Click Add Range. Select any of the following from the drop-down list displayed.
l Equal to: Select Equal to to enter a single value. The following is displayed in the range list.Equal to = [N]Click the [N] and type a value in the field that is displayed.When the value in the selected column equals the value you enter, the result is included or excluded in the replication task depending on the option selected in the Include/Exclude column.
l Between: Click Between to enter a range of values. The following is displayed in the range list.Between [N] - [N]Click each [N] and type a value in the fields that are displayed.When the column contains the values between the two values entered, the result is included or excluded in the replication task depending on the option selected in the Include/Exclude column.
l Less than or equal to: Select Less than or equal to and enter a maximum value. The following is displayed in the range list.Less than or Equal to =< [N]Click the [N] and type a value in the field that is displayed.When the value in the selected column is equal to or less than the value you enter, the result is included or excluded in the replication task depending on the option selected in the Include/Exclude column.
l Greater than or equal to: Select Greater than or equal to and enter a minimum value. The following is displayed in the range list.Greater than or Equal to => [N]Click the [N] and type a value in the field that is displayed.When the value in the selected column is equal to or more than the value you enter, the result is included or excluded in the replication task depending on the option selected in the Include/Exclude column.
To delete a filter range from the Range Builder:
1. In the Filter tab of the Table Settings (page 78) window, select the column with the filter condition you want to delete.
2. Click the button to the right of the Ranges column. The Ranges Builder opens.
3. Click the X next to the range you want to delete. The deleted range is removed from the list.
Using SQLite syntax with filteringQlik Replicate supports the following SQLite operators when creating Record Selection Condition filters.
Setup and User Guide - Enterprise Manager, November 2020 SR1 93
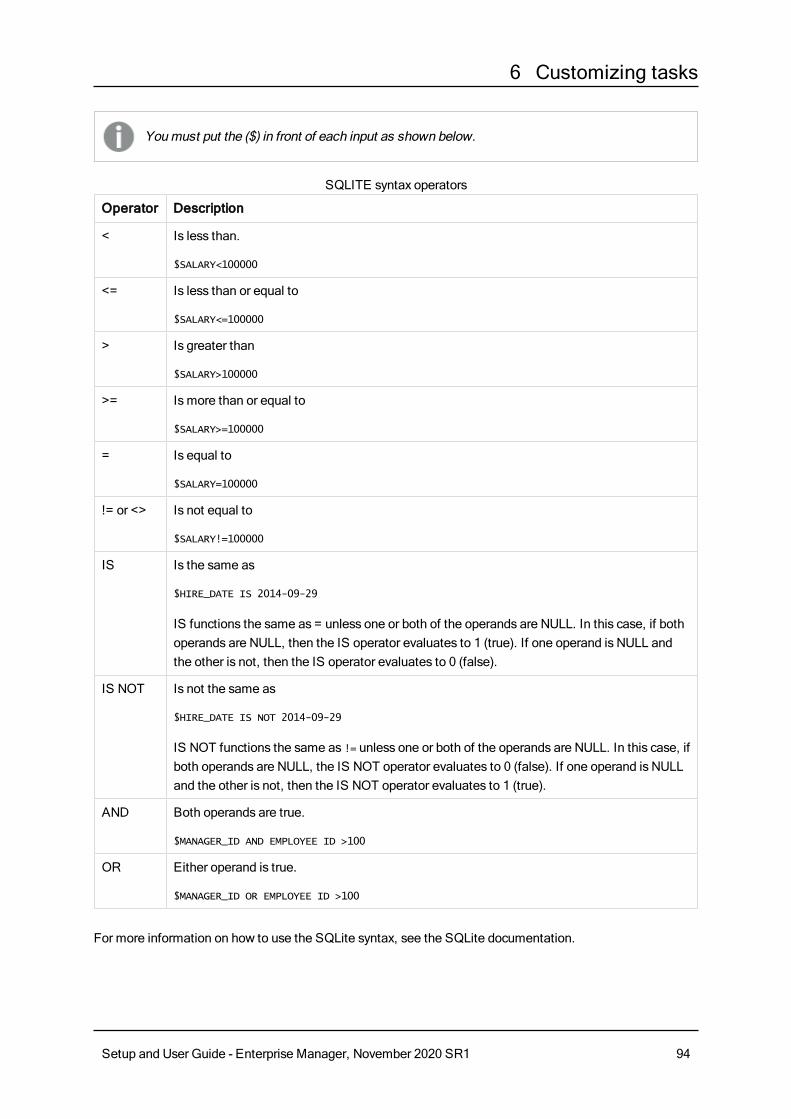
6 Customizing tasks
You must put the ($) in front of each input as shown below.
Operator Description
< Is less than.
$SALARY<100000
<= Is less than or equal to
$SALARY<=100000
> Is greater than
$SALARY>100000
>= Is more than or equal to
$SALARY>=100000
= Is equal to
$SALARY=100000
!= or <> Is not equal to
$SALARY!=100000
IS Is the same as
$HIRE_DATE IS 2014-09-29
IS functions the same as = unless one or both of the operands are NULL. In this case, if both operands are NULL, then the IS operator evaluates to 1 (true). If one operand is NULL and the other is not, then the IS operator evaluates to 0 (false).
IS NOT Is not the same as
$HIRE_DATE IS NOT 2014-09-29
IS NOT functions the same as != unless one or both of the operands are NULL. In this case, if both operands are NULL, the IS NOT operator evaluates to 0 (false). If one operand is NULL and the other is not, then the IS NOT operator evaluates to 1 (true).
AND Both operands are true.
$MANAGER_ID AND EMPLOYEE ID >100
OR Either operand is true.
$MANAGER_ID OR EMPLOYEE ID >100
SQLITE syntax operators
For more information on how to use the SQLite syntax, see the SQLite documentation.
Setup and User Guide - Enterprise Manager, November 2020 SR1 94

6 Customizing tasks
Parallel LoadIn Full Load replication mode, you can accelerate the replication of large tables by splitting the table into segments and loading the segments in parallel. Tables can be segmented by data ranges, by partitions, or by sub-partitions.
Supported endpointsThe task must be defined with a combination of the following source and target endpoints:
Supported source endpoints:
l Oracle
l Microsoft SQL Server
l MySQL
l PostgreSQL
Table segmentation by partitions or sub-partitions is not supported with the PostgreSQL source endpoint.
l IBM DB2 for LUW
l IBM DB2 for z/OS
Table segmentation by partitions or sub-partitions is not supported with the IBM DB2 for z/OS source endpoint.
l SAP Sybase ASE
l SAP Application
l SAP Application (DB)
l Amazon RDS for Microsoft SQL Server
l Teradata
Supported target endpoints:
l Oracle
l Microsoft SQL Server
l Hadoop (Hortonworks, Cloudera, and MapR)
l PostgreSQL
l Google Cloud SQL for PostgreSQL
l Sybase ASE
l Vertica
l MySQL
l File
l Amazon S3
Setup and User Guide - Enterprise Manager, November 2020 SR1 95
6 Customizing tasks
l Amazon Redshift
l Amazon EMR
l Databricks on AWS
l Microsoft Azure SQL Database
l Microsoft Azure Database for MySQL
l Microsoft Azure ADLS
l Microsoft Azure Database for PostgreSQL
l Microsoft Azure Databricks
l Microsoft Azure Data Warehouse
l Microsoft Azure HDInsight
l Google Cloud SQL for MySQL
l Google Cloud BigQuery
l Google Dataproc
l Google Cloud Storage
l Hortonworks Data Platform (HDP)
l Snowflake on AWS
l Snowflake on Azure
l Snowflake on Google
l Cloudera Data Platform (CDP) Private Cloud
Setting up Parallel Load
To define segment boundaries by data range:
1. In the Parallel Load tab's Select Parallel Load Method section, select Use Data Ranges.
2. In the Select Details section, click Select Segment Columns.The Columns window opens
3. For all endpoints, the Unique Index column is automatically selected. Select which additional columns whose data you wish to use to delineate the ranges and then click OK.
l Selecting indexed columns will significantly improve performance
l You can select up to ten columns (multi-selection is supported)
l Records with null values will not be replicated
l The following data types cannot be used to define segments by ranges: DOUBLE, FLOAT, and LOB (BLOB, CLOB, NCLOB)
4. In the Define Segment Boundaries section:
a. Click Add Segment to add a segment.The columns that you selected will appear as table headings.
b. Enter the upper data range for the segment in the selected columns.
Setup and User Guide - Enterprise Manager, November 2020 SR1 96

6 Customizing tasks
Values in DATE columns must be entered in the format supported by the source. For example, for an Oracle source, the correct format would be:
l ALTER SESSION SET NLS_DATE_FORMAT: 'YYYY-MM-DD HH24:MI:SS' (specifying YYYY-MM-DD only is also valid)
l ALTER SESSION SET NLS_TIMESTAMP_FORMAT: 'YYYY-MM-DD HH24:MI:SS.FF9'
l ALTER SESSION SET NLS_TIMESTAMP_TZ_FORMAT: 'YYYY-MM-DD HH24:MI:SS.FF9 TZH:TZM'
c. Add additional segments as required.
d. Click Validate to validate that the specified data corresponds to the source column data type and that all of the defined segments contain values.
e. To delete a segment, select the desired segment and then click Delete.
5. Click OK to save your settings.
When Use Data Ranges is selected, all of the table data will be replicated, even if data ranges are not defined for all of the columns.
Usage exampleLet's assume that the following segments are defined in the Define Segment Boundaries table:
Column_1 Column_2 Column_3
10 30 105
20 20 120
100 12 99
Example table data
In this case, the following "WHERE" clauses will be created for each load segment:
l Segment 1: ((COL1 < 10) OR ((COL1 = 10) AND (COL2 < 30)) OR ((COL1 = 10) AND (COL2 = 30) AND (COL3 < 105)))
l Segment 2: NOT ((COL1 < 10) OR ((COL1 = 10) AND (COL2 < 30)) OR ((COL1 = 10) AND (COL2 = 30) AND (COL3 < 105))) AND ((COL1 < 20) OR ((COL1 = 20) AND (COL2 < 20)) OR ((COL1 = 20) AND (COL2
= 20) AND (COL3 < 120)))
l Segment 3: NOT ((COL1 < 20) OR ((COL1 = 20) AND (COL2 < 20)) OR ((COL1 = 30) AND (COL2 = 20) AND (COL3 < 120))) AND ((COL1 < 100) OR ((COL1 = 100) AND (COL2 < 12)) OR ((COL1 = 100) AND
(COL2 = 12) AND (COL3 < 99)))
l Segment 4: NOT ((COL1 < 100) OR ((COL1 = 100) AND (COL2 < 12)) OR ((COL1 = 100) AND (COL2 = 12) AND (COL3 < 99)))
Setup and User Guide - Enterprise Manager, November 2020 SR1 97
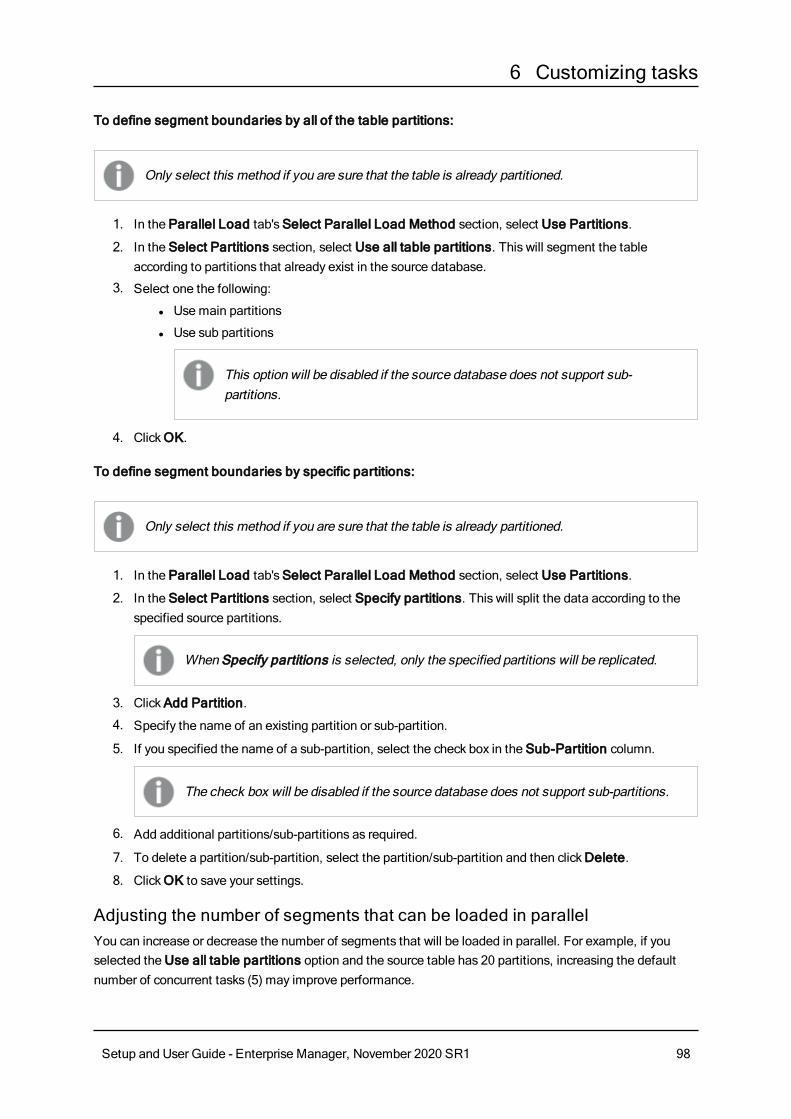
6 Customizing tasks
To define segment boundaries by all of the table partitions:
Only select this method if you are sure that the table is already partitioned.
1. In the Parallel Load tab's Select Parallel Load Method section, select Use Partitions.
2. In the Select Partitions section, select Use all table partitions. This will segment the table according to partitions that already exist in the source database.
3. Select one the following:
l Use main partitions
l Use sub partitions
This option will be disabled if the source database does not support sub-partitions.
4. Click OK.
To define segment boundaries by specific partitions:
Only select this method if you are sure that the table is already partitioned.
1. In the Parallel Load tab's Select Parallel Load Method section, select Use Partitions.
2. In the Select Partitions section, select Specify partitions. This will split the data according to the specified source partitions.
When Specify partitions is selected, only the specified partitions will be replicated.
3. Click Add Partition.
4. Specify the name of an existing partition or sub-partition.
5. If you specified the name of a sub-partition, select the check box in the Sub-Partition column.
The check box will be disabled if the source database does not support sub-partitions.
6. Add additional partitions/sub-partitions as required.
7. To delete a partition/sub-partition, select the partition/sub-partition and then click Delete.
8. Click OK to save your settings.
Adjusting the number of segments that can be loaded in parallelYou can increase or decrease the number of segments that will be loaded in parallel. For example, if you selected the Use all table partitions option and the source table has 20 partitions, increasing the default number of concurrent tasks (5) may improve performance.
Setup and User Guide - Enterprise Manager, November 2020 SR1 98

6 Customizing tasks
Sub-tasks are allocated for each segment \ partition \ sub partition.
For example: If you select a table with 6 partitions and load the table using the Use Partitions method, 5 partitions will be loaded in parallel, corresponding with the default number of concurrent tasks (5). When one of the sub-tasks completes its run, it will be assigned to loading the sixth partition.
The currently set value is displayed at the bottom of the Parallel Load tab. You can modify this value in the Maximum number of tables to load in parallel field in the Full Load Tuning (page 157) tab.
Handling LOB columnsYou can override the task's LOB settings for individual tables.
This option is only available for tasks defined with any combination of the following source and target endpoints: Oracle source, Oracle target, PostgreSQL source, PostgreSQL target, Microsoft SQL Server source, Microsoft SQL Server target, MySQL source, and MySQL target.
l During CDC or during Full Load when the Allow unlimited LOB size option is enabled, LOB data types are supported only in tables with a primary key.
l When replicating from Microsoft SQL Server, inline LOBS will always be read directly from the logs (i.e. without lookup).
The following LOB handling options are available:
Option Description
Replicate LOB columns
When this option is selected (the default), LOB columns will be replicated.
Note that replicating LOBs may impact performance. This is especially true in the case of the large LOBs which require Replicate to perform a lookup from the source table in order to retrieve the source LOB value.
LOB handling options
Setup and User Guide - Enterprise Manager, November 2020 SR1 99
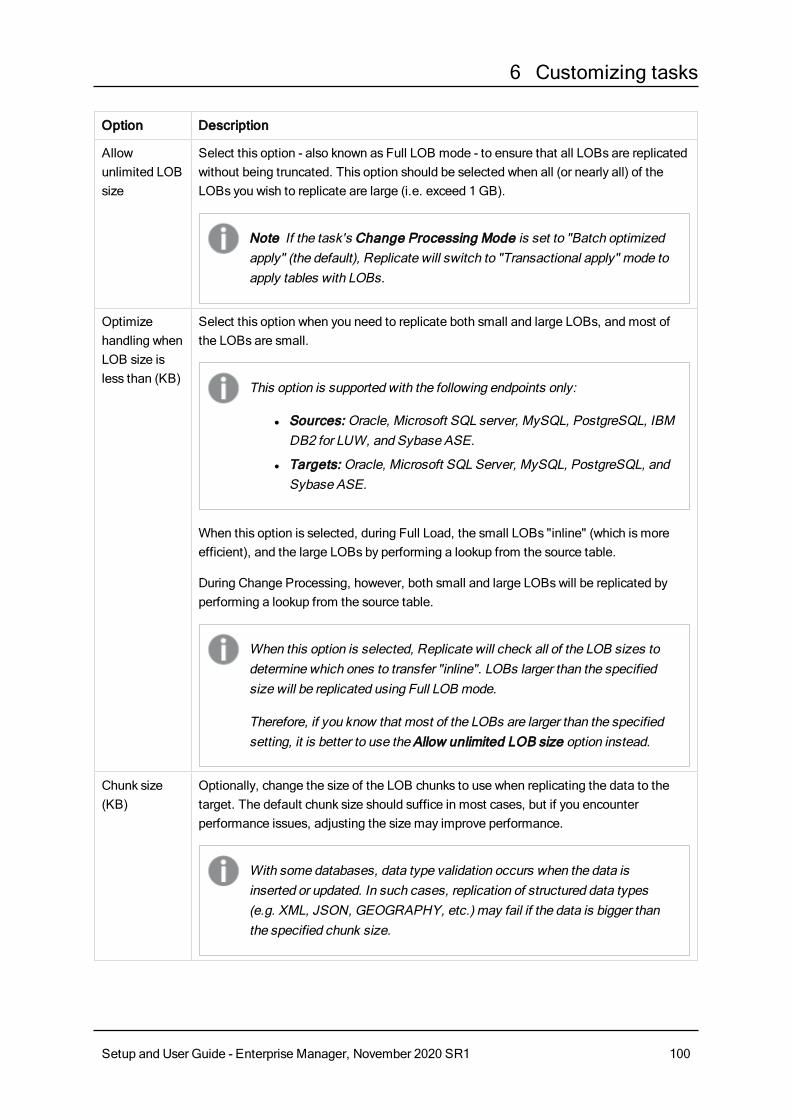
6 Customizing tasks
Option Description
Allow unlimited LOB size
Select this option - also known as Full LOB mode - to ensure that all LOBs are replicated without being truncated. This option should be selected when all (or nearly all) of the LOBs you wish to replicate are large (i.e. exceed 1 GB).
Note If the task's Change Processing Mode is set to "Batch optimized apply" (the default), Replicate will switch to "Transactional apply" mode to apply tables with LOBs.
Optimize handling when LOB size is less than (KB)
Select this option when you need to replicate both small and large LOBs, and most of the LOBs are small.
This option is supported with the following endpoints only:
l Sources: Oracle, Microsoft SQL server, MySQL, PostgreSQL, IBM DB2 for LUW, and Sybase ASE.
l Targets: Oracle, Microsoft SQL Server, MySQL, PostgreSQL, and Sybase ASE.
When this option is selected, during Full Load, the small LOBs "inline" (which is more efficient), and the large LOBs by performing a lookup from the source table.
During Change Processing, however, both small and large LOBs will be replicated by performing a lookup from the source table.
When this option is selected, Replicate will check all of the LOB sizes to determine which ones to transfer "inline". LOBs larger than the specified size will be replicated using Full LOB mode.
Therefore, if you know that most of the LOBs are larger than the specified setting, it is better to use the Allow unlimited LOB size option instead.
Chunk size (KB)
Optionally, change the size of the LOB chunks to use when replicating the data to the target. The default chunk size should suffice in most cases, but if you encounter performance issues, adjusting the size may improve performance.
With some databases, data type validation occurs when the data is inserted or updated. In such cases, replication of structured data types (e.g. XML, JSON, GEOGRAPHY, etc.) may fail if the data is bigger than the specified chunk size.
Setup and User Guide - Enterprise Manager, November 2020 SR1 100

6 Customizing tasks
Option Description
Limit LOB size to (KB)
Select this option if you only need to replicate small LOBs or if the target endpoint does not support unlimited LOB size. The maximum permitted value for this field is 102400 KB (100 MB).
When replicating small LOBs, this option is more efficient than the Allow unlimited LOB size option since the LOBs are replicated "inline" as opposed to via "lookup" from the source. During Change Processing, small LOBs are usually replicated via "lookup" from the source.
As the value of the Limit LOB size to is in bytes, the size should be calculated according to the following formulas:
l BLOB – The length of the largest LOB.
l NCLOB – The length of the longest TEXT in characters multiplied by two (as each character is handled as a double-byte).If the data includes 4-byte characters, multiply it by four.
l CLOB – The length of the longest TEXT in characters (as each character is handled as a UTF8 character). If the data includes 4-byte characters, multiply it by two.
l Any LOBs larger than the specified size will be truncated.
l During Change Processing from Oracle source, inline BLOBs are replicated inline.
l Changes to this setting will only affect existing tables after they are reloaded.
In some scenarios, tasks configured to replicate tables with multiple LOB columns may consume a large amount of memory. This is because Replicate allocates memory by multiplying the Limit LOB size to value by the Commit rate during full load value, the sum of which, it multiplies by the number of LOB columns being replicated. So, for example, if LOB size is limited to 5 MB and the default commit rate is used (10000 events), a task replicating 6 LOB columns will consume 30 GB of memory. Note that other factors such as the database type and version may also affect memory consumption.
Should you encounter memory consumption issues and suspect that a combination of the above factors may be the cause, stop the task and lower the value in the Commit rate during full load field. Then resume the task. Repeat this process until acceptable performance/memory levels are reached.
These instructions apply to Change Processing and Full Load tasks.
Setup and User Guide - Enterprise Manager, November 2020 SR1 101
6 Customizing tasks
Changes to a column’s LOB size while a task is running will not be reflected in the Change Table, unless the target tables are created by Qlik Replicate. In such cases, the task must be configured to drop and create the Change Table (the default) and the target tables need to be reloaded (after the LOB size has changed).
For more information on the Change Table, see Store Changes Settings (page 159). For information on reloading target tables, see the Qlik Replicate User Guide and Reference.
Message formatThis tab is only available for tasks defined with a supported streaming endpoint.
When a task is defined with such an endpoint, you can specify a custom message format that will override the default Replicate message format. This may be useful if the consumer application needs to process the message in a particular format.
The custom message format can be defined at task level and/or at table level. When it is defined at both task and table level, the message format defined for the table will take precedence over the message format defined for the task.
To define a custom message at table level:
1. Select a table.
2. Open the Table Settings window as described in Table Settings (page 78).
3. Select the Message Format tab and click the Change to Table Policy button.
4. Configure the message format as described in Message Format (page 178).
5. To use the message format defined for the task, click the Change to Task Policy button.
For information on defining a custom message at task level, see Message Format (page 178).
6.2 Defining Global transformationsUse Global transformations to make similar changes to multiple tables, owners, and columns in the same task.
Global transformations are not available in a Log Stream Staging setup.
For information on Log Stream Staging, refer to the Qlik Replicate Setup and User Guide.
You may need to use this option when you want to change the names of all tables. You can change the names using wildcards and patterns. For example, you may want to change the names of the tables from account_% to ac_%. This is helpful when replicating data from an Microsoft SQL Server endpoint to an Oracle endpoint where the Microsoft SQL Server endpoint has a limit of 128 characters for a table name and the Oracle endpoint has a limit of 31 characters.
Setup and User Guide - Enterprise Manager, November 2020 SR1 102

6 Customizing tasks
You may also need to change a specific data type in the source to a different data type in the target for many or all of the tables in the task. Global transformation will accomplish this without having to define a transformation for each table individually.
Table-specific transformations override global transformations. For example, you can define a global transformation that changes the data type for all tables from DATE to DATETIME(6) and then define another transformation for a specific table that changes the data type from DATE to STRING(50).
For information on defining a transformation for a specific table, see Defining Transformations for a Single Table/View.
This section includes the following topics:
l Limitations for global transformations (page 103)
l Starting the New Transformation Rule wizard (page 103)
l Selecting the transformation type (page 104)
l Under what conditions to transform (page 105)
l Defining the transformation rule (page 108)
l Viewing all Global transformation rules (page 125)
Limitations for global transformationsThe following limitations apply to global transformations:
l Transformations are not supported for columns with Right-to-Left languages.
l Transformations cannot be performed on columns that contain special characters (e.g. #, \, /, -) in their name.
l Performing several transformations to the same table/column/row etc. may fail, because the transformation has already changed the metadata of the table in the task.
l The only supported transformation for columns that are mapped to BLOB/CLOB data types (by Replicate) is to drop the column on the target.
Starting the New Transformation Rule wizardYou define a rule for global transformation using the New Transformation Rule wizard. The transformation affects all of the tables in the task as you define them using the wizard.
To start the New transformation Rule wizard:
1. Open the task for which you want to create a global transformation.You can click View Task above the Tasks list or double-click the task.
2. If you are not in the Designer mode, click Designer at the top right of the screen. For more information on the Designer mode, see Designer mode (page 189).
3. In Designer mode, click Global Transformations.
Setup and User Guide - Enterprise Manager, November 2020 SR1 103
6 Customizing tasks
The Global Transformation Rules window opens.
4. From the top of the Global Transformation Rules window, click New Global Transformation.The New Transformation Rules wizard opens.
5. Enter the information to define a global transformation rule. The first step is Selecting the transformation type (page 104).
Selecting the transformation typeIn the Which Global Transformation step of the New Transformation Rule wizard, you define the type of transformation you want to be performed.
You can only create one rule for each transformation type on the same object (e.g. a column). If you create multiple rules for a single transformation type on the same object, only the last rule you create will be valid. For example, if you create the following rules (in order) to rename a schema:
Rename Schema: Add Prefix
Rename Schema: Add Suffix
OR
Rename Column: Add Prefix
Rename Column: Add Suffix
Only the second rule (adding a suffix) will be executed.
To select the transformation type:
1. Enter a name for the rule.The name cannot exceed 32 characters, contain non-Latin characters, or contain any of the following characters: \/:*?"<>|
2. Select one of the following:Table or Schema:
l Rename schema: Select this to change the schema name for multiple tables. For example, if you want all HR tables to be renamed PERS.
l Rename table: Select this to change the name of multiple tables. For example, if you want all tables named SALARY to be called WAGES.
Tablespace:
l Change table tablespace: Select this to change the table tablespace on the target. You can change the table tablespace regardless of what objects it contains or you can specify a condition for it to be renamed. For example, change all table tablespaces that contain the table Employees in the schema Company.
Setup and User Guide - Enterprise Manager, November 2020 SR1 104
6 Customizing tasks
By default (i.e. when this option is not selected), the tables will either be created in the source table tablespace on the target (when replicating from an Oracle source) or in the default database tablespace (when replicating from any other source).
This option is only available for tasks with an Oracle target endpoint.
l Change index tablespace: Select this to change the index tablespace on the target. You can change the index tablespace regardless of what objects it contains or you can specify a condition for it to be renamed. For example, change all table tablespaces that contain the table Employees in the schema Company.By default (i.e. when this option is not selected), the indexes will either be created in the source table tablespace on the target (when replicating from an Oracle source) or in the default database tablespace (when replicating from any other source).
This option is only available for tasks with an Oracle target endpoint.
Column:
l Rename column: Select this to change the name of multiple columns. For example, if you want to change all columns with word MINIMUM to MIN.
l Add column: Select this to add a column with a similar name to multiple tables.
l Drop column: Select this to drop a column with a similar name from multiple tables.
l Convert data type: Select this if you want to change a specific data type to a different one across multiple tables. For example, if you want to change all Integer data types to a string.
Change Table:Change Table transformations are only available when the Store Changes replication option is enabled.For more information on Change Tables, refer to the Qlik Replicate Setup and User Guide.
l Rename Change Table: Select this to rename the Replicate Change Table for all tables or for any table that matches the specified schema name and/or table name.
l Rename Change Table schema: Select this to change the schema under which the Replicate Change Table will be created, for all tables or for any table that matches the specified schema name and/or table name.
3. Click Next to proceed to the Under what conditions to transform (page 105) step.
Under what conditions to transformIn the Under what conditions to transform? step of the New Transformation Rule wizard, you define to which tables the transformation rule is applied. For example, you can apply the rule to all tables that contain the word SALARY as part of its name.
The options displayed in this screen depend on the Transformation Type selected.
Setup and User Guide - Enterprise Manager, November 2020 SR1 105

6 Customizing tasks
The following table describes all available options. The second column lists the Transformation Type(s) required for the option to be available.
OptionRequired Type
Description
Schema name is like %
Always Leave the % sign to include all schemas in your global transformation.
Click the % sign to add a filter. In this case you can enter any name combination to include only that schema in your global transformation rule.
For example, enter HR to include only tables that have the schema HR.
You can use the % sign as a wildcard. For example, H% includes all tables with a schema that begins with the letter H, such as HR, HELLO, or HQ.
The % wildcard can be used in any position. For example, if you use it at the beginning, %H, then all table names that end in H are included in the transformation rule. The % can also be used in a middle position.
If you are using an Oracle target, you must enter a schema that exists on the target endpoint. Qlik Replicate does not create new schemas on an Oracle endpoint. If you want to use a new schema for the target, create the schema on the Oracle endpoint before running the task. For more information, see the topic "Configuring an Oracle database as a Qlik Replicate Target" in the Qlik Replicate User and Reference Guide.
Table tablespace is like %
Change table tablespace
This option is only available if the task is defined with an Oracle target endpoint.
Leave the % sign to include all table tablespace names in your global transformation.
Click the % sign to add a filter. In this case, you can enter any name combination to include only the specified table tablespace in your global transformation rule.
For example, enter SYSTEM to include only table tablespaces called SYSTEM.
You can also use the % sign as a wildcard anywhere in the string. For example, H% includes all table tablespaces that begin with the letter "H" whereas %H includes all table tablespaces that end with the letter "H".
Transformation conditions
Setup and User Guide - Enterprise Manager, November 2020 SR1 106

6 Customizing tasks
OptionRequired Type
Description
Index tablespace is like %
Change index tablespace
This option is only available if the task is defined with an Oracle target endpoint.
Leave the % sign to include all index tablespace names in your global transformation.
Click the % sign to add a filter. In this case, you can enter any name combination to include only the specified index tablespace in your global transformation rule.
For example, enter SYSTEM to include only index tablespaces called SYSTEM.
You can also use the % sign as a wildcard anywhere in the string. For example, H% includes all index tablespaces that begin with the letter "H" whereas %H includes all index tablespaces that end with the letter "H".
Table name is like %
Always Leave the % sign to include all table names in your global transformation rule.
Click the % sign to add a filter. In this case you can enter any name combination to include only tables with that specific name in your global transformation rule.
You can use the % sign as a wildcard. For example, J% includes all tables with a name that begins with the letter J, such as JOBS, JOBS_HISTORY, or JACKSONVILLE.
The % wildcard can be used in any position. For example, if you use it at the beginning, %H, then all table names that end in H are included in the transformation rule. The % can also be used in a middle position.
Column name is like %
Rename Column
Drop Column
Convert Data Type
Leave the % sign to include all column names in your global transformation rule.
Click the % sign to add a filter. In this case you can enter any name combination to include only columns with that specific name in your global transformation rule.
You can use the % sign as a wildcard. For example, N% includes all columns with a name that begins with the letter N, such as NAME, NAME_FIRST, or NAME_LAST.
The % wildcard can be used in any position. For example, if you use it at the beginning, %IES, then all column names that end in with the string "IES" are included in the transformation rule. The % can also be used in a middle position.
Setup and User Guide - Enterprise Manager, November 2020 SR1 107

6 Customizing tasks
OptionRequired Type
Description
Data type is
Convert Data Type
Select a new data type from the drop-down list. Make sure that the data type you select is compatible with the data in that column.
For a description of Qlik Replicate data types, information about data type mapping from the native endpoint to Qlik Replicate, or for a list of endpoints supported by Qlik Replicate, see the Qlik Replicate User and Reference Guide.
After you complete defining the transformation rule definitions, click Next to go to the Defining the transformation rule (page 108) step.
If the global transformation type you are defining is Drop Column, you do not need to create a Transformation Rule. In this case, click Finish to add the rule to the Global Transformation Rules list.
Defining the transformation ruleIn the How to transform screen, you define what happens to the objects that the transformation rule is applied to. For example, you can define a new name for the affected objects or add a prefix to the table names. For more information on defining the affected tables, see Under what conditions to transform (page 105).
You define the rule to be carried out using the options on this page. Limitations for transformation rules (page 108) apply. See the section for any of the following transformation types you are using:
l Rename Schema (page 109)
l Change table tablespace (page 112)
l Change index tablespace (page 113)
l Rename Table (page 113)
l Rename Column (page 116)
l Add column (page 118)
l Drop Column (page 119)
l Convert data type (page 119)
l Rename Change Table schema (page 122)
l Rename Change Table (page 119)
When done, click Next.
Limitations for transformation rulesThe following limitations apply to transformation rules:
Setup and User Guide - Enterprise Manager, November 2020 SR1 108

6 Customizing tasks
l Transformations are not supported for columns with Right-to-Left languages.
l Transformations cannot be performed on columns that contain special characters (e.g. #, \, /, -) in their name.
l Performing several transformations to the same table/column/row etc. may fail, because the transformation has already changed the metadata of the table in the task.
l The only supported transformation for columns that are mapped to BLOB/CLOB data types (by Replicate) is to drop the column on the target.
The options displayed in this screen depend on the Transformation Type selected.
Rename SchemaIf your transformation type is Rename Schema, you can do the following:
l Rename schema to (string) (page 109)
l Add a prefix or suffix (page 109)
l Remove a prefix or suffix (page 110)
l Replace a prefix or suffix with different characters (page 110)
l Convert schema name to uppercase (page 111)
l Convert schema name to lowercase (page 111)
l Rename schema (Expression) (page 112)
Rename schema to (string) Use the Rename schema to: [string] option to change the name of all table schemas that you defined in the Under what conditions to transform (page 105) step to a different name. For example, if you have a schema called Human_Resources and want to change all instances of this name to HR then enter the string HR. You can enter any string in this field.
Add a prefix or suffixUse the Add a prefix or suffix option to add additional characters to the beginning or end of the schema name for all schemas that fit the definition you created in the Under what conditions to transform (page 105) step. For example, if the schema name is HR, you can add a suffix, such as TAR or _TAR to the schema name for all tables with that schema name. In this case, the resulting schema name will be HRTAR or HR_TAR.
If you are using Oracle as your target endpoint, Qlik Replicate does not create a new schema. Therefore, the schema name that is the result of replacing a prefix or suffix with a different string of characters must exist in the Oracle target endpoint. If the resulting schema name does not exist, you must create the schema in the Oracle endpoint before carrying out this task.
For more information, see the Qlik Replicate Setup and User Guide.
Setup and User Guide - Enterprise Manager, November 2020 SR1 109

6 Customizing tasks
To globally add a prefix or suffix
1. Select Add <Prefix/Suffix> Insert Characters to matching schema names.
2. Click the word Prefix or Suffix and select one of these two from the list.
3. Click [string] to activate the field.
4. Type the characters you want as the prefix or suffix. If you want to include an underscore or other legal character to separate the prefix/suffix from the original name, you must add it as part of the character string.
5. Click Finish to add the rule to the Global Transformation Rules list.
Remove a prefix or suffixUse the Remove a prefix or suffix option to remove a string of characters from the beginning or end of a schema name for all schema that fit the definition you created in the Under what conditions to transform (page 105) step.
For example, you can use this option to remove the letters _REV from the schema name for all tables in the schema HR_REV. In this case the schema name in the target will be HR.
If you are using Oracle as your target endpoint, Qlik Replicate does not create a new schema. Therefore, the schema name that is the result of replacing a prefix or suffix with a different string of characters must exist in the Oracle target endpoint. If the resulting schema name does not exist, you must create the schema in the Oracle endpoint before carrying out this task.
For more information, see the Qlik Replicate Setup and User Guide.
To globally remove a prefix or suffix
1. Select Remove <Prefix/Suffix> Insert Characters from matching schema names.
2. Click the word Prefix or Suffix and select one of these two from the list.
3. Click [string] to activate the field.
4. Type the characters you want to remove. If you want to remove an underscore or other legal character from the original name, you must add it as part of the character string.
5. Click Finish to add the rule to the Global Transformation Rules list.
Replace a prefix or suffix with different charactersUse the Replace a prefix or suffix option to replace a string of characters with a different string of characters. You determine whether to replace the characters at the beginning or end of a schema name for all schema that fit the definition you created in the Under what conditions to transform (page 105) step.
For example, you can use this option to replace the letters _ORIG with _REPL in the schema name for all tables in the schema HR_ORIG. In this case the schema name in the target will be HR_REPL.
Setup and User Guide - Enterprise Manager, November 2020 SR1 110

6 Customizing tasks
If you are using Oracle as your target endpoint, Qlik Replicate does not create a new schema. Therefore, the schema name that is the result of replacing a prefix or suffix with a different string of characters must exist in the Oracle target endpoint. If the resulting schema name does not exist, you must create the schema in the Oracle endpoint before carrying out this task.
For more information, see the Qlik Replicate Setup and User Guide.
To globally replace a prefix or suffix
1. Select Replace <Prefix/Suffix> Insert Characters by Insert Characters for all matching schema names.
2. Click the word Prefix or Suffix and select one of these two from the list.
3. Click the first [string] to activate the field.
4. Type the characters from the existing (source) schema that you want to replace. If you want to include an underscore or other legal character from the original name in the string that you want to replace, you must add it as part of the character string.
5. Click the second [string] to activate the field.
6. Type the characters you want to use in the target. These characters replace the original (source) characters in the target.
7. Click Finish to add the rule to the Global Transformation Rules list.
Convert schema name to uppercase Use the convert to uppercase option to convert all of the letters in a schema name to upper case. For example:
Schema_cat, becomes SCHEMA_CAT
schema_cat, becomes SCHEMA_CAT
sChEMa_Cat, becomes SCHEMA_CAT
To globally change the schema name to all uppercase
1. Select Convert schema name to uppercase.
2. Click Finish to add the rule to the Global Transformation Rules list.
Convert schema name to lowercase Use the convert to lowercase option to convert all of the letters in a schema name to lower case. For example:
Schema_cat, becomes schema_cat
SCHEMA_CAT, becomes schema_cat
sChEMa_Cat, becomes schema_cat
Setup and User Guide - Enterprise Manager, November 2020 SR1 111

6 Customizing tasks
To globally change the schema name to all uppercase
1. Select Convert schema name to lowercase.
2. Click Finish to add the rule to the Global Transformation Rules list.
Rename schema (Expression)Use the Rename schema to [expression] option to change the name of all table schemas that you defined in the Under what conditions to transform (page 105) step to a different name. For example, if you have a schema called Human_Resources and want to change all instances of this name to HR.
If you are using Oracle as your target endpoint, Qlik Replicate does not create a new schema. Therefore, the schema name that is the result of replacing a prefix or suffix with a different string of characters must exist in the Oracle target endpoint. If the resulting schema name does not exist, you must create the schema in the Oracle endpoint before carrying out this task.
For more information, see the Qlik Replicate Setup and User Guide.
To globally change a schema name
1. Select Rename schema to [expression]
2. Click the button to the right of the Rename schema option to open the Expression Editor. For information on how to use the Expression Editor, see Using the Expression Builder (for filters, transformations, and global transformations) (page 126). Then go to step 4.orClick [expression] to activate the field and continue with step 3.
3. Type an SQLite expression or a string (in quotes) to rename the schema. For example:
l "New_Schema"
l ’PREF_’||$SCHEMA_NAME_VAR||’_SUFF’
You can use the following variables in the SQLite expression:
l $SCHEMA_NAME_VAR
l $TABLE_NAME_VAR
l $COLUMN_NAME_VAR
l $COLUMN_DATATYPE_VAR
4. Click Finish to add the rule to the Global Transformation Rules list.
Change table tablespaceIf your transformation type is Change table tablespace, you can change the table tablespace on an Oracle target. You can also set certain conditions that must exist in the source for the table tablespace to be changed. These include schema name, table name and table tablespace name.
For more information, see the following topics:
Setup and User Guide - Enterprise Manager, November 2020 SR1 112
6 Customizing tasks
l Selecting the transformation type (page 104)
l Defining the transformation rule (page 108)
Change index tablespaceIf your transformation type is Change index tablespace, you can change the index tablespace on an Oracle target. You can also set certain conditions that must exist in the source for the tablespace to be changed. These include schema name, table name and index tablespace name.
For more information, see the following topics:
l Selecting the transformation type (page 104)
l Defining the transformation rule (page 108)
Rename TableIf your transformation type is Rename Table, you can do the following:
l Rename table to (string) (page 113)
l Add a prefix or suffix (page 113)
l Remove a prefix or suffix (page 114)
l Replace a prefix or suffix with different characters (page 114)
l Convert table name to uppercase (page 114)
l Convert table name to lowercase (page 115)
l Rename table (expression) (page 115)
Rename table to (string) Use the Rename table to: [string] option to change the name of all tables that you defined in the Under what conditions to transform (page 105) step to a different name. For example, if you have a table called EMPLOYEE and want to change all instances of this name to EMP then enter the string EMP. You can enter any string in this field.
Add a prefix or suffixUse the Add a prefix or suffix option to add additional characters to the beginning or end of the table name for all tables that fit the definition you created in the Under what conditions to transform (page 105) step. For example, if the table name is EMPLOYEES, you can add a suffix, such as TAR or _TAR to the table name for all tables with that table name. In this case, the resulting table name will be EMPLOYEESTAR or EMPLOYEES_TAR.
To globally add a prefix or suffix:
1. Select Add <Prefix/Suffix> Insert Characters to matching table names.
2. Click the word Prefix or Suffix and select one of these two from the list.
3. Click [string] to activate the field.
Setup and User Guide - Enterprise Manager, November 2020 SR1 113

6 Customizing tasks
4. Type the characters you want as the prefix or suffix. If you want to include an underscore or other legal character to separate the prefix/suffix from the original name, you must add it as part of the character string.
5. Click Finish to add the rule to the Global Transformation Rules list.
Remove a prefix or suffixUse the Remove a prefix or suffix option to remove a string of characters from the beginning or end of a table name for all tables that fit the definition you created in the Under what conditions to transform (page 105) step.
For example, you can use this option to remove the letters _REV from the table name for all tables with the name EMPLOYEES. In this case the table name in the target will be EMPLOYEES.
To globally remove a prefix or suffix:
1. Select Remove <Prefix/Suffix> Insert Characters from matching table names.
2. Click the word Prefix or Suffix and select one of these two from the list.
3. Click [string] to activate the field.
4. Type the characters you want to remove. If you want to remove an underscore or other legal character from the original name, you must add it as part of the character string.
5. Click Finish to add the rule to the Global Transformation Rules list.
Replace a prefix or suffix with different charactersUse the Replace a prefix or suffix option to replace a string of characters with a different string of characters. You determine whether to replace the characters at the beginning or end of a table name for all tables that fit the definition you created in the Under what conditions to transform (page 105) step.
For example, you can use this option to replace the letters _ORIG with _REPL in the table names for all tables called EMPLOYEE_ORIG. In this case the table name in the target will be EMPLOYEE_REPL.
To globally replace a prefix or suffix:
1. Select Replace <Prefix/Suffix> Insert Characters by Insert Characters for all matching schema names.
2. Click the word Prefix or Suffix and select one of these two from the list.
3. Click the first [string] to activate the field.
4. Type the characters from the existing (source) schema that you want to replace. If you want to include an underscore or other legal character from the original name in the string that you want to replace, you must add it as part of the character string.
5. Click the second [sting] to activate the field.
6. Type the characters you want to use in the target. These characters replace the original (source) characters in the target.
7. Click Finish to add the rule to the Global Transformation Rules list.
Convert table name to uppercase Use the convert to uppercase option to convert a table name to all upper case. For example:
Setup and User Guide - Enterprise Manager, November 2020 SR1 114

6 Customizing tasks
Table_cat, becomes TABLE_CAT
table_cat, becomes TABLE_CAT
taBLe_Cat, becomes TABLE_CAT
To globally change the table name to all uppercase:
1. Select Convert table name to uppercase.
2. Click Finish to add the rule to the Global Transformation Rules list.
Convert table name to lowercase Use the convert to lowercase option to convert a table name to all lower case. For example:
Table_cat, becomes table_cat
TABLE_CAT, becomes table_cat
taBLe_Cat, becomes table_cat
To globally change the table name to all lowercase:
1. Select Convert table name to lowercase.
2. Click Finish to add the rule to the Global Transformation Rules list.
Rename table (expression)Use the Rename table to [expression] option to change the name of all tables that fit the definition you created in the Under what conditions to transform (page 105) step. For example, if you have a table called EMPLOYEE and want to change all instances of this name as defined in the previous step it to EMP.
To change the table name:
1. Select Rename table to: [expression]
2. Click the button to the right of the Rename table option to open the Expression Editor. For information on how to use the Expression Editor, see Using the Expression Builder (for filters, transformations, and global transformations) (page 126). Then go to step 4.orClick [expression] to activate the field and continue with step 3.
3. Type an SQLite expression or a string (in quotes) to rename the table. For example:
l "New_Table"
l ’PREF_’||$TABLE_NAME_VAR||’_SUFF’
3. You can use the following variables in the SQLite expression:
l $SCHEMA_NAME_VAR
l $TABLE_NAME_VAR
l $COLUMN_NAME_VAR
l $COLUMN_DATATYPE_VAR
Setup and User Guide - Enterprise Manager, November 2020 SR1 115

6 Customizing tasks
Rename ColumnIf your transformation type is Rename Column, you can do the following:
l Rename column to (string) (page 116)
l Add a prefix or suffix (page 116)
l Remove a prefix or suffix (page 116)
l Replace a prefix or suffix with different characters (page 117)
l Convert column name to uppercase (page 117)
l Convert column name to lowercase (page 117)
l Rename column (expression) (page 118)
Rename column to (string) Use the Rename column to: [string] option to change the name of all columns that you defined in the Under what conditions to transform (page 105) step to a different name. For example, if you have a table called SALARY and want to change all instances of this name to EMP then enter the string SAL. You can enter any string in this field.
Add a prefix or suffixUse the Add a prefix or suffix option to add additional characters to the beginning or end of the column name for all columns that fit the definition you created in the Under what conditions to transform (page 105) step. For example, if the column name is SALARY, you can add a suffix, such as TAR or _TAR to the table name for all tables with that table name. In this case, the resulting table name will be SALARYTAR or SALARY_TAR.
To globally add a prefix or suffix:
1. Select Add <Prefix/Suffix> Insert Characters to matching column names.
2. Click the word Prefix or Suffix and select one of these two from the list.
3. Click the [string] to activate the field.
4. Type the characters you want as the prefix or suffix. If you want to include an underscore or other legal character to separate the prefix/suffix from the original name, you must add it as part of the character string.
5. Click Finish to add the rule to the Global Transformation Rules list.
Remove a prefix or suffixUse the Remove a prefix or suffix option to remove a string of characters from the beginning or end of a column name for all columns that fit the definition you created in the Under what conditions to transform (page 105) step.
For example, you can use this option to remove the letters _REV from the column name for all columns with the name SALARY. In this case the column name in the target will be SALARY.
Setup and User Guide - Enterprise Manager, November 2020 SR1 116

6 Customizing tasks
To globally remove a prefix or suffix:
1. Select Remove <Prefix/Suffix> Insert Characters from matching column names.
2. Click the word Prefix or Suffix and select one of these two from the list.
3. Click [string] to activate the field.
4. Type the characters you want to remove. If you want to remove an underscore or other legal character from the original name, you must add it as part of the character string.
5. Click Finish to add the rule to the Global Transformation Rules list.
Replace a prefix or suffix with different charactersUse the Replace a prefix or suffix option to replace a string of characters with a different string of characters. You determine whether to replace the characters at the beginning or end of a column name for all columns that fit the definition you created in the Under what conditions to transform (page 105) step.
For example, you can use this option to replace the letters _ORIG with _REPL in the column names for all columns called SALARY_ORIG. In this case the column name in the target will be SALARY_REPL.
To globally replace a prefix or suffix:
1. Select Replace <Prefix/Suffix> Insert Characters by Insert Characters for all matching schema names.
2. Click the word Prefix or Suffix and select one of these two from the list.
3. Click the first [string] to activate the field.
4. Type the characters from the existing (source) column that you want to replace. If you want to include an underscore or other legal character from the original name in the string that you want to replace, you must add it as part of the character string.
5. Click the second [string] to activate the field.
6. Type the characters you want to use in the target. These characters replace the original (source) characters in the target.
7. Click Finish to add the rule to the Global Transformation Rules list.
Convert column name to uppercase Use the convert to uppercase option to convert a column name to all upper case. For example:
Column_cat, becomes COLUMN_CAT
column_cat, becomes COLUMN_CAT
coLUMnM_Cat, becomes COLUMN_CAT
To globally change the table name to all uppercase
1. Select Convert column name to uppercase.
2. Click Finish to add the rule to the Global Transformation Rules list.
Convert column name to lowercase Use the convert to lowercase option to convert a column name to all lower case. For example:
Column_cat, becomes column_cat
Setup and User Guide - Enterprise Manager, November 2020 SR1 117

6 Customizing tasks
column_cat, becomes column_cat
coLUMnM_Cat, becomes column_cat
To globally change the column name to all lowercase:
1. Select Convert column name to lowercase.
2. Click Finish to add the rule to the Global Transformation Rules list.
Rename column (expression)Use the Rename column to [expression] option to change the name of all tables that fit the definition you created in the Under what conditions to transform (page 105) step. For example, if you have a column called SALARY and want to change it to SAL.
To change the column name:
1. Select Rename column to: [expression]
2. Click the button to the right of the Rename column option to open the Expression Editor. For information on how to use the Expression Editor, see Using the Expression Builder (for filters, transformations, and global transformations) (page 126). Then go to step 4.orClick [expression] to activate the field and continue with step 3.
3. Type an SQLite expression or a string (in quotes) to rename the column. For example: l "New_Column"
l ’PREF_’||$COLUMN_NAME_VAR||’_SUFF’
You can use the following variables in the SQLite expression: l $SCHEMA_NAME_VAR
l $TABLE_NAME_VAR
l $COLUMN_NAME_VAR
l $COLUMN_DATATYPE_VAR
Add columnWhen you add a column to multiple tables, you must provide a name, define the data type for the column and define the data that the column contains. The column that you define here is added to all tables that fit the definition you created in step Under what conditions to transform (page 105).
The following describes the information you must enter in the transformation rule page for adding a column.
l Column name: Click the [string] to activate the field. Type the name for the column in the field. A column with this name is added to all tables that fit the definition you created in step Under what conditions to transform (page 105).
l Column data type: Click the drop-down for a list of data types and select a new data type from the drop-down list. Make sure that the data type you select is compatible with the data in that column.For a description of available data types and for a list of endpoints supported by Qlik Replicate, see the Qlik Replicate Setup and User Guide. For information about data type mapping from the native endpoint to Qlik Replicate data types, see the chapter for the endpoint you use.
Setup and User Guide - Enterprise Manager, November 2020 SR1 118
6 Customizing tasks
l Computation expression: Click the button to the right of this field to open the Expression Editor or type an expression using SQLite operators to define the data in the column.For information on how to use the Expression Editor to create an expression, see Using the Expression Builder (for filters, transformations, and global transformations) (page 126).For more information on creating expressions, see Creating an expression for transformations (page 87) and Using SQLite syntax with transformations (page 87).
Drop ColumnThis option does not require a transformation rule. For this option you complete the Global transformation rule after the Under what conditions to transform (page 105) step.
Convert data typeWhen you convert the data type for a column, use this page to select the data type you want to convert to. The data type that you define in this step is applied to all columns and tables that fit the definition you created in the Under what conditions to transform (page 105) step. Make sure that the data type you select is compatible with the data in columns you defined.
To select a converted data type:
l Select a Qlik Replicate data type from the drop-down list.
For a description of Qlik Replicate data types, see the Qlik Replicate Setup and User Guide.
For information about data type mapping from the native endpoint to Qlik Replicate data types, see the chapter for the endpoint you are using. For a list of supported databases, see see the Qlik Replicate Setup and User Guide.
Rename Change TableIf your transformation type is Rename Change Table, you can do the following:
l Rename Change Table to (string) (page 120)
l Add a prefix or suffix (page 120)
l Remove a prefix or suffix (page 120)
l Replace a prefix or suffix with different characters (page 121)
l Convert Change Table name to uppercase (page 121)
l Convert Change Table name to lowercase (page 121)
l Rename Change Table (expression) (page 122)
Setup and User Guide - Enterprise Manager, November 2020 SR1 119

6 Customizing tasks
l Globally renaming a Change Table will override the Change Table suffix defined in the task settings.
l The Change Table name must be different from the source table names. Otherwise, a table error will occur.
Rename Change Table to (string) Use the Rename Change Table to: [string] option to change the name of all Change Tables that you defined in the Under what conditions to transform (page 105) step to a different name. For example, if you have a Change Table called EMPLOYEE and want to change all instances of this name to EMP then enter the string EMP. You can enter any string in this field.
Add a prefix or suffixUse the Add a prefix or suffix option to add additional characters to the beginning or end of the Change Table name for all Change Tables that fit the definition you created in the Under what conditions to transform (page 105) step. For example, if the Change Table name is EMPLOYEES, you can add a suffix, such as TAR or _TAR to the Change Table name for all Change Tables with that name. In this case, the resulting Change Table name will be EMPLOYEESTAR or EMPLOYEES_TAR.
To globally add a prefix or suffix:
1. Select Add <Prefix/Suffix> <String> to matching Change Table names.
2. Click the word Prefix or Suffix and select one of these two from the list.
3. Click [string] to activate the field.
4. Type the characters you want as the prefix or suffix. If you want to include an underscore or other legal character to separate the prefix/suffix from the original name, you must add it as part of the character string.
5. Click Finish to add the rule to the Global Transformation Rules list.
Remove a prefix or suffixUse the Remove a prefix or suffix option to remove a string of characters from the beginning or end of a Change Table name for all Change Tables that fit the definition you created in the Under what conditions to transform (page 105) step.
For example, you can use this option to remove the letters _REV from the Change Table name for all Change Tables with the name EMPLOYEES. In this case the Change Table name in the target will be EMPLOYEES.
To globally remove a prefix or suffix:
1. Select Remove <Prefix/Suffix> <String> from matching Change Table names.
2. Click the word Prefix or Suffix and select one of these two from the list.
3. Click [string] to activate the field.
Setup and User Guide - Enterprise Manager, November 2020 SR1 120
6 Customizing tasks
4. Type the characters you want to remove. If you want to remove an underscore or other legal character from the original name, you must add it as part of the character string.
5. Click Finish to add the rule to the Global Transformation Rules list.
Replace a prefix or suffix with different charactersUse the Replace a prefix or suffix option to replace a string of characters with a different string of characters. You determine whether to replace the characters at the beginning or end of a Change Table name for all Change Tables that fit the definition you created in the Under what conditions to transform (page 105) step.
For example, you can use this option to replace the letters _ORIG with _REPL in the Change Table names for all Change Tables called EMPLOYEE_ORIG. In this case the Change Table name in the target will be EMPLOYEE_REPL.
To globally replace a prefix or suffix:
1. Select Replace <Prefix/Suffix> <String> by <String> for all matching Change Table names.
2. Click the word Prefix or Suffix and select one of these two from the list.
3. Click the first [string] to activate the field.
4. Type the characters from the existing (source) schema that you want to replace. If you want to include an underscore or other legal character from the original name in the string that you want to replace, you must add it as part of the character string.
5. Click the second [sting] to activate the field.
6. Type the characters you want to use in the target. These characters replace the original (source) characters in the target.
7. Click Finish to add the rule to the Global Transformation Rules list.
Convert Change Table name to uppercase Use the convert to uppercase option to convert a Change Table name to all upper case. For example:
Table_cat, becomes TABLE_CAT
Change Table_cat, becomes TABLE_CAT
taBLe_Cat, becomes TABLE_CAT
To globally change the Change Table name to all uppercase:
1. Select Convert Change Table name to uppercase.
2. Click Finish to add the rule to the Global Transformation Rules list.
Convert Change Table name to lowercase Use the convert to lowercase option to convert a Change Table name to all lower case. For example:
Table_cat, becomes Change Table_cat
TABLE_CAT, becomes Change Table_cat
taBLe_Cat, becomes Change Table_cat
Setup and User Guide - Enterprise Manager, November 2020 SR1 121
6 Customizing tasks
To globally change the Change Table name to all lowercase:
1. Select Convert Change Table name to lowercase.
2. Click Finish to add the rule to the Global Transformation Rules list.
Rename Change Table (expression)Use the Rename Change Table to [expression] option to change the name of all Change Tables that fit the definition you created in the Under what conditions to transform (page 105) step. For example, if you have a Change Table called EMPLOYEE and want to change all instances of this name as defined in the previous step it to EMP.
To change the Change Table name:
1. Select Rename Change Table to: [expression]
2. Click the button to the right of the Rename Change Table option to open the Expression Editor. For information on how to use the Expression Editor, see Using the Expression Builder (for filters, transformations, and global transformations) (page 126). Then go to step 4.orClick [expression] to activate the field and continue with step 3.
3. Type an SQLite expression or a string (in quotes) to rename the table. For example:
l "New_Change_Table_Name"
l ’PREF_’||$AR_M_SOURCE_TABLE_NAME||’_SUFF’You can use the following metadata in the SQLite expression:
l $AR_M_SOURCE_COLUMN_DATATYPE
l $AR_M_SOURCE_COLUMN_NAME
l $AR_M_SOURCE_SCHEMA
l $AR_M_SOURCE_TABLE_NAME
Rename Change Table schema If your transformation type is Rename Change Table schema, you can do the following:
Rename Change Table schema to (string) (page 123)
Add a prefix or suffix (page 123)
Remove a prefix or suffix (page 123)
Replace a prefix or suffix with different characters (page 123)
Convert Change Table schema name to uppercase (page 124)
Convert Change Table schema name to lowercase (page 124)
Rename Change Table schema (expression) (page 125)
Setup and User Guide - Enterprise Manager, November 2020 SR1 122

6 Customizing tasks
Rename Change Table schema to (string) Use the Rename Change Table schema to: [string] option to change the name of all Change Table schemas that you defined in the Under what conditions to transform (page 105) step to a different name. For example, if you have a Change Table schema called EMPLOYEE and want to change all instances of this name to EMP then enter the string EMP. You can enter any string in this field.
Add a prefix or suffixUse the Add a prefix or suffix option to add additional characters to the beginning or end of the Change Table schema name for all tables that fit the definition you created in the Under what conditions to transform (page 105) step. For example, if the Change Table schema name is EMPLOYEES, you can add a suffix, such as TAR or _TAR to the Change Table schema name for all Change Table schemas with that Change Table schema name. In this case, the resulting Change Table schema name will be EMPLOYEESTAR or EMPLOYEES_TAR.
To globally add a prefix or suffix:
1. Select Add <Prefix/Suffix> Insert Characters to matching Change Table schema names.
2. Click the word Prefix or Suffix and select one of these two from the list.
3. Click [string] to activate the field.
4. Type the characters you want as the prefix or suffix. If you want to include an underscore or other legal character to separate the prefix/suffix from the original name, you must add it as part of the character string.
5. Click Finish to add the rule to the Global Transformation Rules list.
Remove a prefix or suffixUse the Remove a prefix or suffix option to remove a string of characters from the beginning or end of a Change Table schema name for all tables that fit the definition you created in the Under what conditions to transform (page 105) step.
For example, you can use this option to remove the letters _REV from the Change Table schema name for all Change Table schemas with the name EMPLOYEES. In this case the Change Table schema name in the target will be EMPLOYEES.
To globally remove a prefix or suffix:
1. Select Remove <Prefix/Suffix> <String> from matching Change Table schema names.
2. Click the word Prefix or Suffix and select one of these two from the list.
3. Click [string] to activate the field.
4. Type the characters you want to remove. If you want to remove an underscore or other legal character from the original name, you must add it as part of the character string.
5. Click Finish to add the rule to the Global Transformation Rules list.
Replace a prefix or suffix with different charactersUse the Replace a prefix or suffix option to replace a string of characters with a different string of characters. You determine whether to replace the characters at the beginning or end of a Change Table schema name for all tables that fit the definition you created in the Under what conditions to transform (page
Setup and User Guide - Enterprise Manager, November 2020 SR1 123

6 Customizing tasks
105) step.
For example, you can use this option to replace the letters _ORIG with _REPL in the Change Table schema names for all Change Table schemas called EMPLOYEE_ORIG. In this case the Change Table schema name in the target will be EMPLOYEE_REPL.
To globally replace a prefix or suffix:
1. Select Replace <Prefix/Suffix> <String> by <String> for all matching schema names.
2. Click the word Prefix or Suffix and select one of these two from the list.
3. Click the first [string] to activate the field.
4. Type the characters from the existing (source) Change Table schema name that you want to replace. If you want to include an underscore or other legal character from the original name in the string that you want to replace, you must add it as part of the character string.
5. Click the second [sting] to activate the field.
6. Type the characters you want to use in the target. These characters replace the original (source) characters in the target.
7. Click Finish to add the rule to the Global Transformation Rules list.
Convert Change Table schema name to uppercase Use the convert to uppercase option to convert a Change Table schema name to all upper case. For example:
Table_cat, becomes TABLE_CAT
table_cat, becomes TABLE_CAT
taBLe_Cat, becomes TABLE_CAT
To globally change the Change Table schema name to all uppercase:
1. Select Convert Change Table schema name to uppercase.
2. Click Finish to add the rule to the Global Transformation Rules list.
Convert Change Table schema name to lowercase Use the convert to lowercase option to convert a Change Table schema name to all lower case. For example:
Table_cat, becomes table_cat
TABLE_CAT, becomes table_cat
taBLe_Cat, becomes table_cat
To globally change the Change Table schema name to all lowercase:
1. Select Convert Change Table schema name to lowercase.
2. Click Finish to add the rule to the Global Transformation Rules list.
Setup and User Guide - Enterprise Manager, November 2020 SR1 124

6 Customizing tasks
Rename Change Table schema (expression)Use the Rename Change Table schema to [expression] option to change the name of all tables that fit the definition you created in the Under what conditions to transform (page 105) step. For example, if you have a Change Table schema called EMPLOYEE and want to change all instances of the Change Table schema name as defined in the previous step to EMP.
To change the table name:
1. Select Rename Change Table schema to: [expression]
2. Click the button to the right of the Rename table option to open the Expression Editor. For information on how to use the Expression Editor, see Using the Expression Builder (for filters, transformations, and global transformations) (page 126). Then go to step 4.orClick [expression] to activate the field and continue with step 3.
3. Type an SQLite expression or a string (in quotes) to rename the table. For example:
l "New_Change_Table_Schema"
l ’PREF_’||$AR_M_SOURCE_SCHEMA||’_SUFF’You can use the following metadata in the SQLite expression:
l $AR_M_SOURCE_COLUMN_DATATYPE
l $AR_M_SOURCE_COLUMN_NAME
l $AR_M_SOURCE_SCHEMA
l $AR_M_SOURCE_TABLE_NAME
Viewing all Global transformation rulesThe Global Transformation Rules dialog box lists the name and description of all notification rules that are defined for the Qlik Replicate instance you are working with. This is where you go to edit or delete a transformation rule.
In this section:
l Edit a global transformation rule (page 125)
l Delete a global transformation rule (page 126)
Edit a global transformation ruleYou can make changes to any transformation rule.
You cannot change the name of a transformation rule
To edit a global transformation rule:
1. In the Global Transformation Rules dialog box, select the transformation rule you want to edit.
2. Click Open (at the top of the list).
Setup and User Guide - Enterprise Manager, November 2020 SR1 125

6 Customizing tasks
The Edit Existing Transformation Rule wizard opens.
3. Make any changes you need in the wizard. For information on how to work with each of the pages in the New transformation Rule wizard, see Defining Global transformations (page 102).
Delete a global transformation ruleYou can delete a global transformation rule.
To delete a global transformation rule:
1. In the Global Transformation Rules dialog box, select the transformation rule you want to edit.
2. Click Delete (above the list).
3. When prompted for confirmation, click OK.The transformation rule is removed from the list and deleted from the system.
6.3 Using the Expression Builder (for filters, transformations, and global transformations)
The Qlik Replicate Expression Builder provides an easy way to build an expression. It provides you with easy access to the required elements for your expression without having to type out any information manually. You access the Expression Builder through the dialog boxes where you define Filters, Defining transformations for a single table/view (page 80), and Global Transformations when you do any of the following:
l Rename Schema (page 109)
l Rename Table (page 113)
l Rename Column (page 116)
The following topics describe the Expression Builder:
l Overview of the Expression Builder (page 126)
l Build an expression (page 128)
l Parse an expression (page 129)
l Test an expression (page 129)
l Using elements in the Expression Builder (page 131)
Overview of the Expression BuilderThe following is an example of the Expression Builder with its four main parts shown. The Expression Builder you are working with may look different depending on whether you want to build an expression for a filter, a transformation, or a global transformation.
Setup and User Guide - Enterprise Manager, November 2020 SR1 126
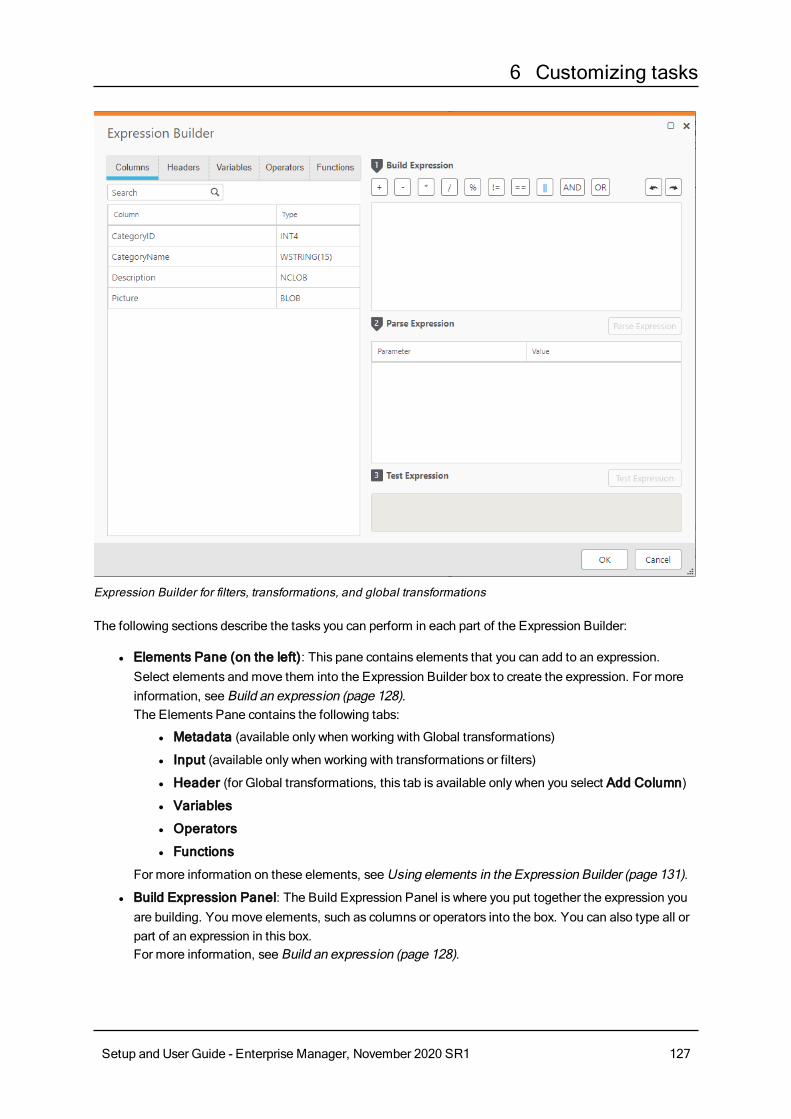
6 Customizing tasks
Expression Builder for filters, transformations, and global transformations
The following sections describe the tasks you can perform in each part of the Expression Builder:
l Elements Pane (on the left): This pane contains elements that you can add to an expression. Select elements and move them into the Expression Builder box to create the expression. For more information, see Build an expression (page 128).The Elements Pane contains the following tabs:
l Metadata (available only when working with Global transformations)
l Input (available only when working with transformations or filters)
l Header (for Global transformations, this tab is available only when you select Add Column)
l Variables
l Operators
l Functions
For more information on these elements, see Using elements in the Expression Builder (page 131).
l Build Expression Panel: The Build Expression Panel is where you put together the expression you are building. You move elements, such as columns or operators into the box. You can also type all or part of an expression in this box. For more information, see Build an expression (page 128).
Setup and User Guide - Enterprise Manager, November 2020 SR1 127

6 Customizing tasks
l Parse Expression Panel: This panel displays the parameters for the expression. After you build the expression, click Parse Expression to list the expression parameters. You can then enter a value or argument for each of the parameters. For more information, see Parse an expression (page 129).The top part of the Expression panel contains the Operator toolbar. This toolbar contains the most common operators. Click the operator you want to use to add it to the expression. You can also add operators from the Element Pane, Operators tab.
l Test Expression Panel: This panel displays the results of a test that you can run after you provide values to each of the parameters in your expression. For more information, see Test an expression (page 129).
Build an expressionThe first step in using the expression builder is to build an expression. The expression that you build is displayed in the top section of the right pane. You can open the Expression when:
l You define Defining transformations for a single table/view (page 80) for a single table.
l You define Filters for a single table.
l You use the Global transformations dialog box to Rename Schema (page 109), Rename Table (page 113), Rename Column (page 116), or Add column (page 118).
Note: To add operators to your expression, you can use the Operator tab in the Element pane or the Operator buttons at the top of the Build Expression panel or any combination of these. See Operators (page 132) and Operator toolbar (page 128).
For example, to create an expression that will combine the first name and last name, do the following:
1. In the Input Columns tab add the FIRST_NAME column to the Build Expression box.
2. Click the concatenate (||) operator from the Operator bar at the top of the Build Expression box.
3. In the Input Columns tab add the LAST_NAME column into the Build Expression box.
To build an expression:
1. In the Elements Pane, select any element you want to include in your expression. For information on the elements you can use in an expression, see Functions (page 136).
2. Add an element to the Build Expression panel by selecting it and then clicking the arrow to the right of the element.
3. Continue to add elements as needed.
Operator toolbarThe Operator toolbar is above the Build Expression box. It contains the most common operators so you can easily add them to an expression.
The following operators are available in the Operator toolbar: addition, subtraction, multiplication, division, percentage, not equal, equal, concatenate, AND, OR.
Setup and User Guide - Enterprise Manager, November 2020 SR1 128

6 Customizing tasks
For information on these operators, see Operators (page 132).
To use the Operator toolbar:
1. Click the place in the Build Expression box where you want to add the operator.
2. Click the operator you want to add. It is added to the expression.
Parse an expressionYou can parse an expression to determine its parameters and to determine whether the expression is valid.
To parse an expression:
1. In the Expression Builder window, create an expression as described in Build an expression (page 128).
2. Click Parse Expression.If the expression is not valid, an error message is written in red at the bottom of the Expression Builder window. If the expression is valid, the expression parameters are displayed in the Parameter column in the Parse Expression section. See the figure under Test an expression (page 129).
3. Type a valid value for each of the parameters in the Value column to Test an expression (page 129).For example, type John for the FIRST_NAME and Smith for the LAST_NAME in the Value column. Once you type in values, you can Test an expression (page 129).
Test an expressionYou can use the Qlik Replicate Test procedure to display the results of a test expression. The following figure is an example of a built expression that is evaluated and contains a test result.
Setup and User Guide - Enterprise Manager, November 2020 SR1 129
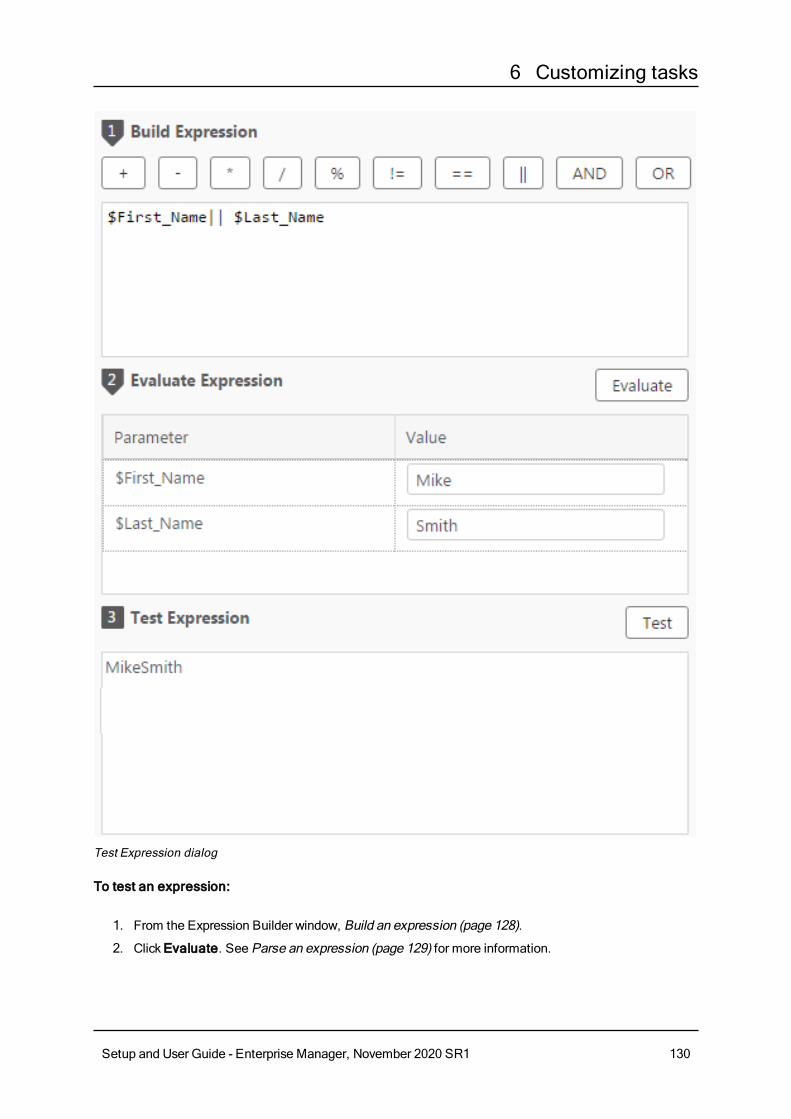
6 Customizing tasks
Test Expression dialog
To test an expression:
1. From the Expression Builder window, Build an expression (page 128).
2. Click Evaluate. See Parse an expression (page 129) for more information.
Setup and User Guide - Enterprise Manager, November 2020 SR1 130
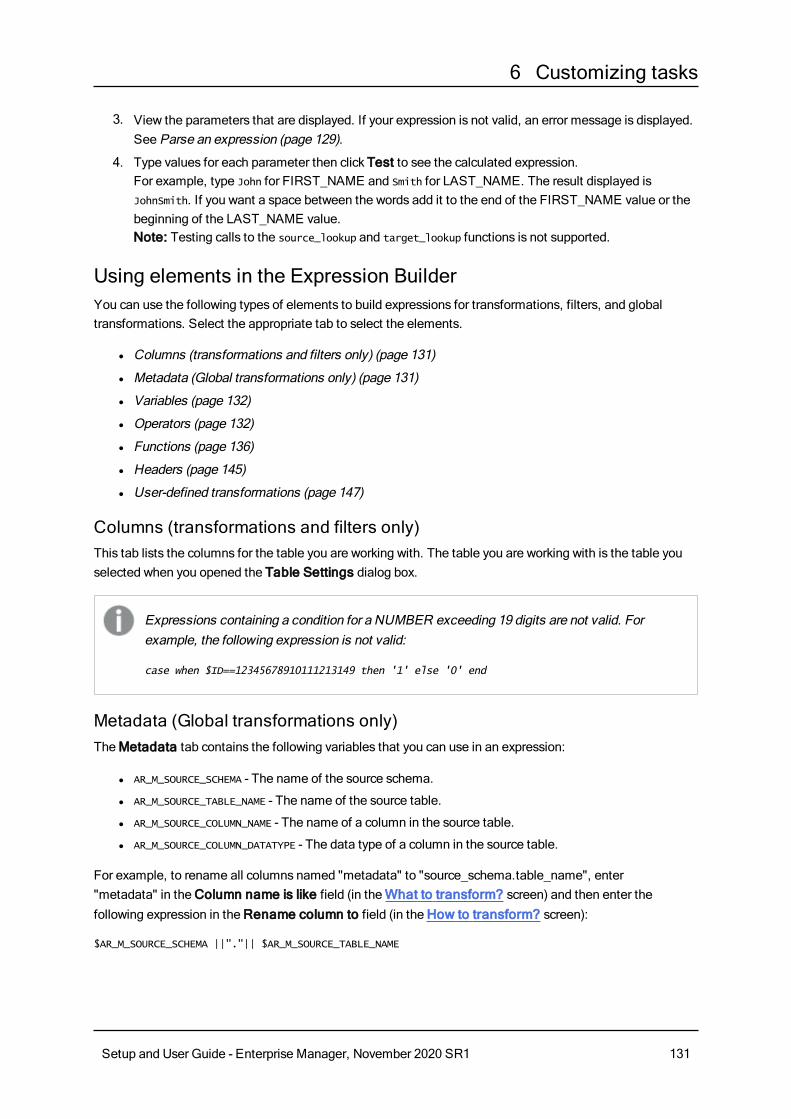
6 Customizing tasks
3. View the parameters that are displayed. If your expression is not valid, an error message is displayed. See Parse an expression (page 129).
4. Type values for each parameter then click Test to see the calculated expression.For example, type John for FIRST_NAME and Smith for LAST_NAME. The result displayed is JohnSmith. If you want a space between the words add it to the end of the FIRST_NAME value or the beginning of the LAST_NAME value.Note: Testing calls to the source_lookup and target_lookup functions is not supported.
Using elements in the Expression BuilderYou can use the following types of elements to build expressions for transformations, filters, and global transformations. Select the appropriate tab to select the elements.
l Columns (transformations and filters only) (page 131)
l Metadata (Global transformations only) (page 131)
l Variables (page 132)
l Operators (page 132)
l Functions (page 136)
l Headers (page 145)
l User-defined transformations (page 147)
Columns (transformations and filters only)This tab lists the columns for the table you are working with. The table you are working with is the table you selected when you opened the Table Settings dialog box.
Expressions containing a condition for a NUMBER exceeding 19 digits are not valid. For example, the following expression is not valid:
case when $ID==12345678910111213149 then '1' else '0' end
Metadata (Global transformations only)The Metadata tab contains the following variables that you can use in an expression:
l AR_M_SOURCE_SCHEMA - The name of the source schema.
l AR_M_SOURCE_TABLE_NAME - The name of the source table.
l AR_M_SOURCE_COLUMN_NAME - The name of a column in the source table.
l AR_M_SOURCE_COLUMN_DATATYPE - The data type of a column in the source table.
For example, to rename all columns named "metadata" to "source_schema.table_name", enter "metadata" in the Column name is like field (in the What to transform? screen) and then enter the following expression in the Rename column to field (in the How to transform? screen):
$AR_M_SOURCE_SCHEMA ||"."|| $AR_M_SOURCE_TABLE_NAME
Setup and User Guide - Enterprise Manager, November 2020 SR1 131
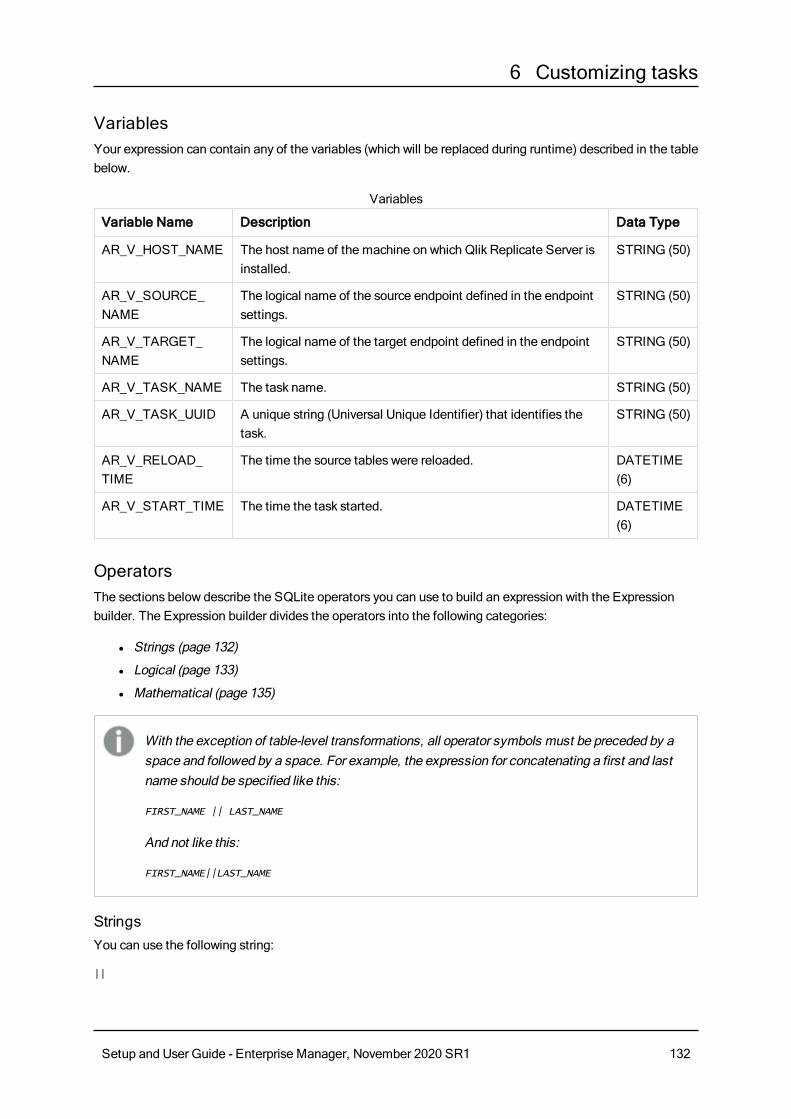
6 Customizing tasks
VariablesYour expression can contain any of the variables (which will be replaced during runtime) described in the table below.
Variable Name Description Data Type
AR_V_HOST_NAME The host name of the machine on which Qlik Replicate Server is installed.
STRING (50)
AR_V_SOURCE_NAME
The logical name of the source endpoint defined in the endpoint settings.
STRING (50)
AR_V_TARGET_NAME
The logical name of the target endpoint defined in the endpoint settings.
STRING (50)
AR_V_TASK_NAME The task name. STRING (50)
AR_V_TASK_UUID A unique string (Universal Unique Identifier) that identifies the task.
STRING (50)
AR_V_RELOAD_TIME
The time the source tables were reloaded. DATETIME (6)
AR_V_START_TIME The time the task started. DATETIME (6)
Variables
OperatorsThe sections below describe the SQLite operators you can use to build an expression with the Expression builder. The Expression builder divides the operators into the following categories:
l Strings (page 132)
l Logical (page 133)
l Mathematical (page 135)
With the exception of table-level transformations, all operator symbols must be preceded by a space and followed by a space. For example, the expression for concatenating a first and last name should be specified like this:
FIRST_NAME || LAST_NAME
And not like this:
FIRST_NAME||LAST_NAME
StringsYou can use the following string:
||
Setup and User Guide - Enterprise Manager, November 2020 SR1 132
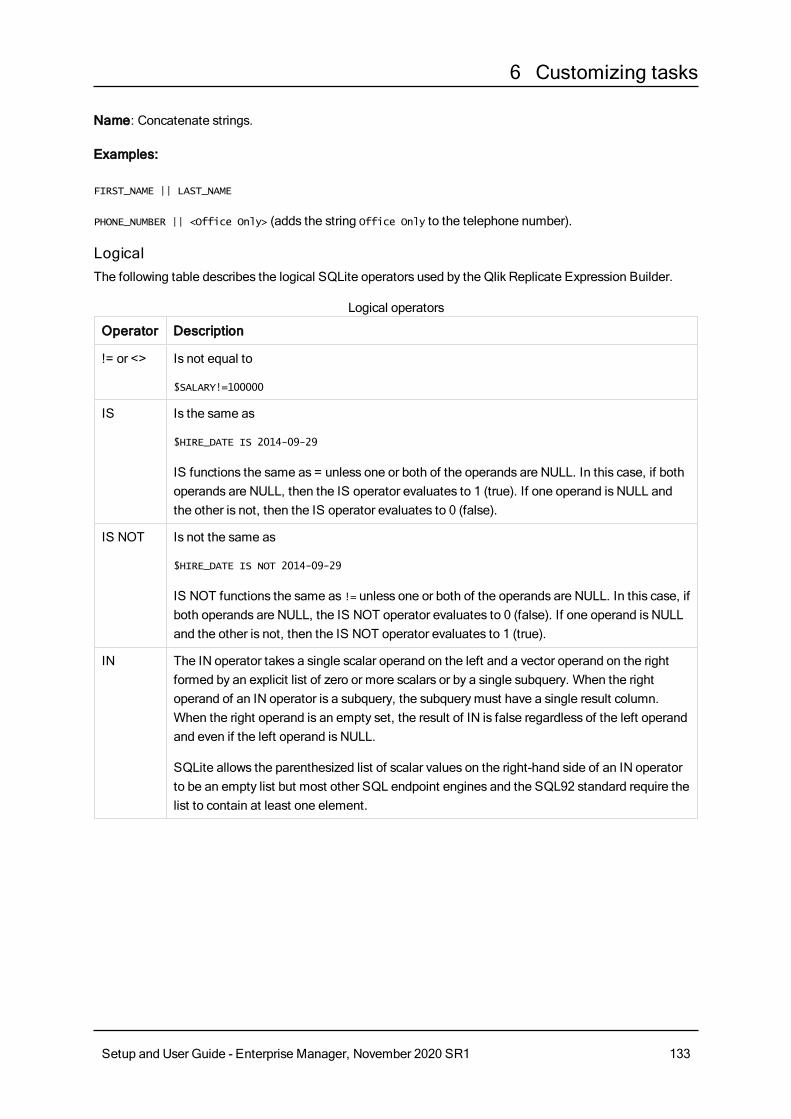
6 Customizing tasks
Name: Concatenate strings.
Examples:
FIRST_NAME || LAST_NAME
PHONE_NUMBER || <Office Only> (adds the string Office Only to the telephone number).
LogicalThe following table describes the logical SQLite operators used by the Qlik Replicate Expression Builder.
Operator Description
!= or <> Is not equal to
$SALARY!=100000
IS Is the same as
$HIRE_DATE IS 2014-09-29
IS functions the same as = unless one or both of the operands are NULL. In this case, if both operands are NULL, then the IS operator evaluates to 1 (true). If one operand is NULL and the other is not, then the IS operator evaluates to 0 (false).
IS NOT Is not the same as
$HIRE_DATE IS NOT 2014-09-29
IS NOT functions the same as != unless one or both of the operands are NULL. In this case, if both operands are NULL, the IS NOT operator evaluates to 0 (false). If one operand is NULL and the other is not, then the IS NOT operator evaluates to 1 (true).
IN The IN operator takes a single scalar operand on the left and a vector operand on the right formed by an explicit list of zero or more scalars or by a single subquery. When the right operand of an IN operator is a subquery, the subquery must have a single result column. When the right operand is an empty set, the result of IN is false regardless of the left operand and even if the left operand is NULL.
SQLite allows the parenthesized list of scalar values on the right-hand side of an IN operator to be an empty list but most other SQL endpoint engines and the SQL92 standard require the list to contain at least one element.
Logical operators
Setup and User Guide - Enterprise Manager, November 2020 SR1 133

6 Customizing tasks
Operator Description
LIKE The LIKE operator does a pattern matching comparison. The operand to the right of the LIKE operator contains the pattern and the left operand contains the string to match against the pattern. A percent symbol ("%") in the LIKE pattern matches any sequence of zero or more characters in the string. An underscore ("_") in the LIKE pattern matches any single character in the string. Any other character matches itself or its lower/upper case equivalent. (By default SQLite only understands upper/lower case for ASCII characters. The LIKE operator is case sensitive by default for unicode characters that are beyond the ASCII range.
For example, the expression 'a' LIKE 'A' is TRUE but 'æ' LIKE 'Æ' is FALSE.)
LIKE can be preceded by the NOT keyword.
CASE Evaluates a list of conditions and returns one of multiple possible result expressions.
Example 1:
WHEN $NEWEST = 'Y' THEN '1' ELSE '0' END
Example 2:
case length($month)
when 2 then $year||$month
when 1 then $year||0||$month end
GLOB The GLOB operator acts in the same way as the LIKE operator but uses the UNIX file globbing syntax for its wildcards. GLOB is case sensitive.
GLOB can be preceded by the NOT keyword to invert the sense of the test. The infix GLOB operator is implemented by calling the function glob(Y,X) and can be modified by overriding that function.
MATCH The MATCH operator is a special syntax for the match() application-defined function. The default match() function implementation raises an exception and is not really useful for anything. But extensions can override the match() function with more helpful logic.
REGEXP The REGEXP operator is a special syntax for the regexp() user function. No regexp() user function is defined by default and so use of the REGEXP operator will normally result in an error message.
AND Both operands are true.
$MANAGER_ID AND EMPLOYEE ID >100
OR Either operand is true.
$MANAGER_ID OR EMPLOYEE ID >100
Setup and User Guide - Enterprise Manager, November 2020 SR1 134

6 Customizing tasks
Operator Description
<< Bitwise shift left.
x << n
A bitwise shift to the left of x by n bits.
>> Bitwise shift right.
x >> n
A bitwise shift to the right of x by n bits.
& Unary and
| Unary or
< Is less than.
$SALARY<100000
<= Is less than or equal to
$SALARY<=100000
> Is greater than
$SALARY>100000
>= Is more than or equal to
$SALARY>=100000
= or == Is equal to
$SALARY=100000
MathematicalThe following table describes the mathematical SQLite operators used by the Expression Builder.
Operator Description
+ Adds two values together.
DEPARTMENT_ID+100 (adds 100 to each ID number). Any column used in an expression with this operator must be a numeric data type.
- Subtracts a value from another value.
MANAGER_ID-100 (subtracts 100 from each ID number). Any column used in an expression with this operator must be a numeric data type.
Mathematical operators
Setup and User Guide - Enterprise Manager, November 2020 SR1 135
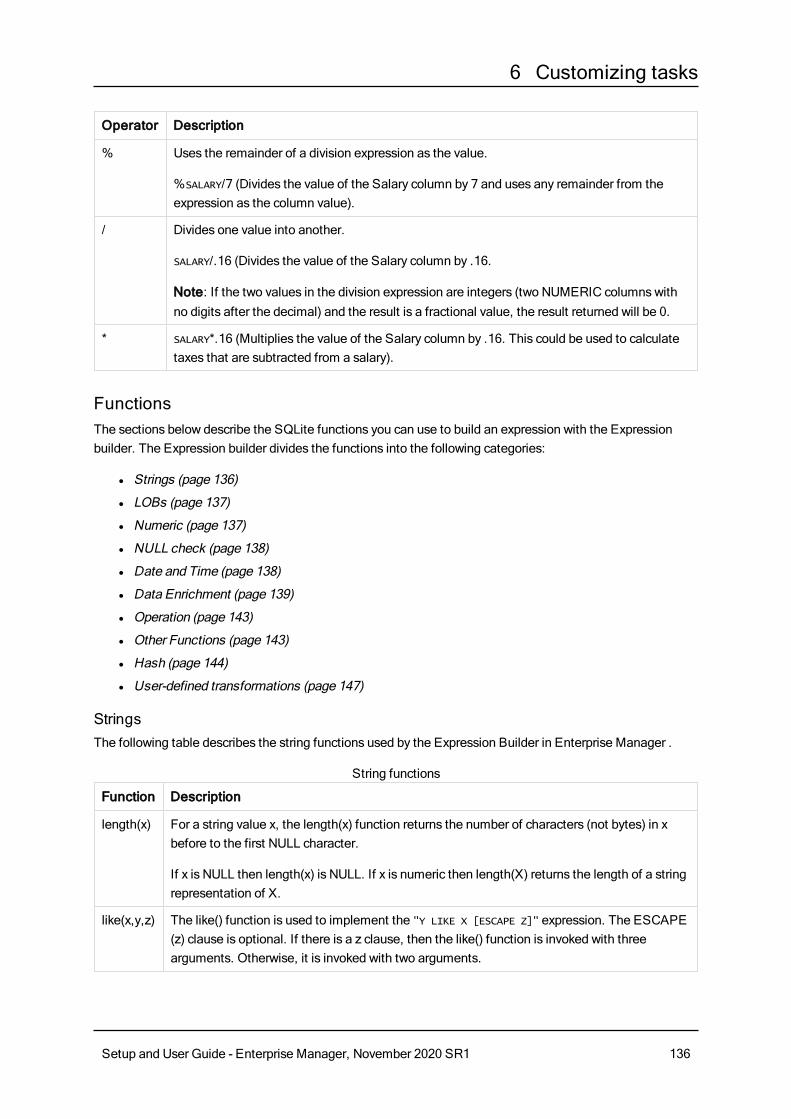
6 Customizing tasks
Operator Description
% Uses the remainder of a division expression as the value.
%SALARY/7 (Divides the value of the Salary column by 7 and uses any remainder from the expression as the column value).
/ Divides one value into another.
SALARY/.16 (Divides the value of the Salary column by .16.
Note: If the two values in the division expression are integers (two NUMERIC columns with no digits after the decimal) and the result is a fractional value, the result returned will be 0.
* SALARY*.16 (Multiplies the value of the Salary column by .16. This could be used to calculate taxes that are subtracted from a salary).
FunctionsThe sections below describe the SQLite functions you can use to build an expression with the Expression builder. The Expression builder divides the functions into the following categories:
l Strings (page 136)
l LOBs (page 137)
l Numeric (page 137)
l NULL check (page 138)
l Date and Time (page 138)
l Data Enrichment (page 139)
l Operation (page 143)
l Other Functions (page 143)
l Hash (page 144)
l User-defined transformations (page 147)
StringsThe following table describes the string functions used by the Expression Builder in Enterprise Manager .
Function Description
length(x) For a string value x, the length(x) function returns the number of characters (not bytes) in x before to the first NULL character.
If x is NULL then length(x) is NULL. If x is numeric then length(X) returns the length of a string representation of X.
like(x,y,z) The like() function is used to implement the "Y LIKE X [ESCAPE Z]" expression. The ESCAPE (z) clause is optional. If there is a z clause, then the like() function is invoked with three arguments. Otherwise, it is invoked with two arguments.
String functions
Setup and User Guide - Enterprise Manager, November 2020 SR1 136
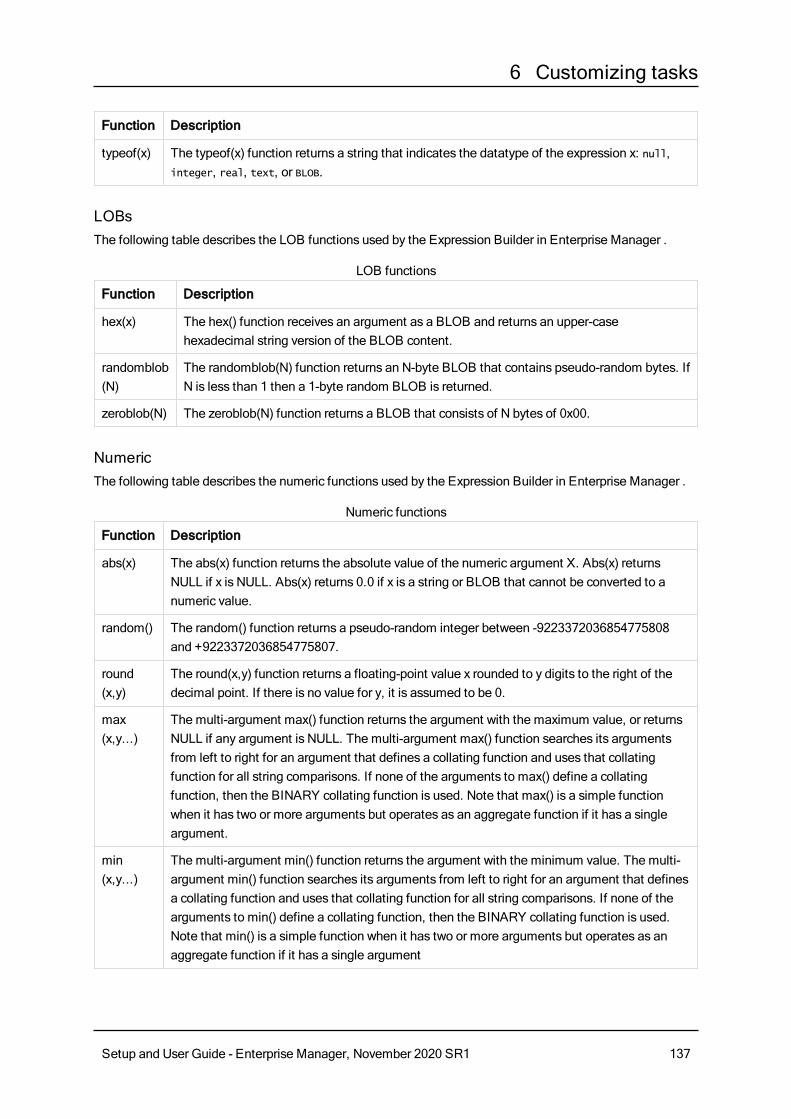
6 Customizing tasks
Function Description
typeof(x) The typeof(x) function returns a string that indicates the datatype of the expression x: null, integer, real, text, or BLOB.
LOBsThe following table describes the LOB functions used by the Expression Builder in Enterprise Manager .
Function Description
hex(x) The hex() function receives an argument as a BLOB and returns an upper-case hexadecimal string version of the BLOB content.
randomblob(N)
The randomblob(N) function returns an N-byte BLOB that contains pseudo-random bytes. If N is less than 1 then a 1-byte random BLOB is returned.
zeroblob(N) The zeroblob(N) function returns a BLOB that consists of N bytes of 0x00.
LOB functions
NumericThe following table describes the numeric functions used by the Expression Builder in Enterprise Manager .
Function Description
abs(x) The abs(x) function returns the absolute value of the numeric argument X. Abs(x) returns NULL if x is NULL. Abs(x) returns 0.0 if x is a string or BLOB that cannot be converted to a numeric value.
random() The random() function returns a pseudo-random integer between -9223372036854775808 and +9223372036854775807.
round(x,y)
The round(x,y) function returns a floating-point value x rounded to y digits to the right of the decimal point. If there is no value for y, it is assumed to be 0.
max(x,y...)
The multi-argument max() function returns the argument with the maximum value, or returns NULL if any argument is NULL. The multi-argument max() function searches its arguments from left to right for an argument that defines a collating function and uses that collating function for all string comparisons. If none of the arguments to max() define a collating function, then the BINARY collating function is used. Note that max() is a simple function when it has two or more arguments but operates as an aggregate function if it has a single argument.
min(x,y...)
The multi-argument min() function returns the argument with the minimum value. The multi-argument min() function searches its arguments from left to right for an argument that defines a collating function and uses that collating function for all string comparisons. If none of the arguments to min() define a collating function, then the BINARY collating function is used. Note that min() is a simple function when it has two or more arguments but operates as an aggregate function if it has a single argument
Numeric functions
Setup and User Guide - Enterprise Manager, November 2020 SR1 137

6 Customizing tasks
NULL checkThe following table describes the NULL check functions used by the Expression Builder in Enterprise Manager .
Function Description
coalesce(x,y...)
The coalesce() function returns a copy of its first non-NULL argument, it returns NULL if all arguments are NULL. Coalesce() have at least two arguments.
ifnull(x,y) The ifnull() function returns a copy of its first non-NULL argument, it returns NULL if both arguments are NULL. Ifnull() must have exactly two arguments. The ifnull() function is the same as coalesce() with two arguments.
nullif(x,y) The nullif(x,y) function returns a copy of its first argument if the arguments are different and returns NULL if the arguments are the same. The nullif(x,y) function searches its arguments from left to right for an argument that defines a collating function and uses that collating function for all string comparisons. If neither argument to nullif() defines a collating function then the BINARY is used.
NULL check functions
Date and TimeThe following table describes the Date and Time functions used by the Expression Builder in Enterprise Manager .
Function Description
date(timestring, modifier, modifier...)
Returns the date in the format YYYY-MM-DD.
time(timestring, modifier, modifier...)
Returns the time in the format HH:MM:SS.
datetime(timestring, modifier, modifier...)
Returns the date and time in the format YYYY-MM-DD HH:MM:SS.
julianday(timestring, modifier, modifier...)
The julianday() function returns the number of days since noon in Greenwich on November 24, 4714 B.C.
Date and Time functions
Setup and User Guide - Enterprise Manager, November 2020 SR1 138
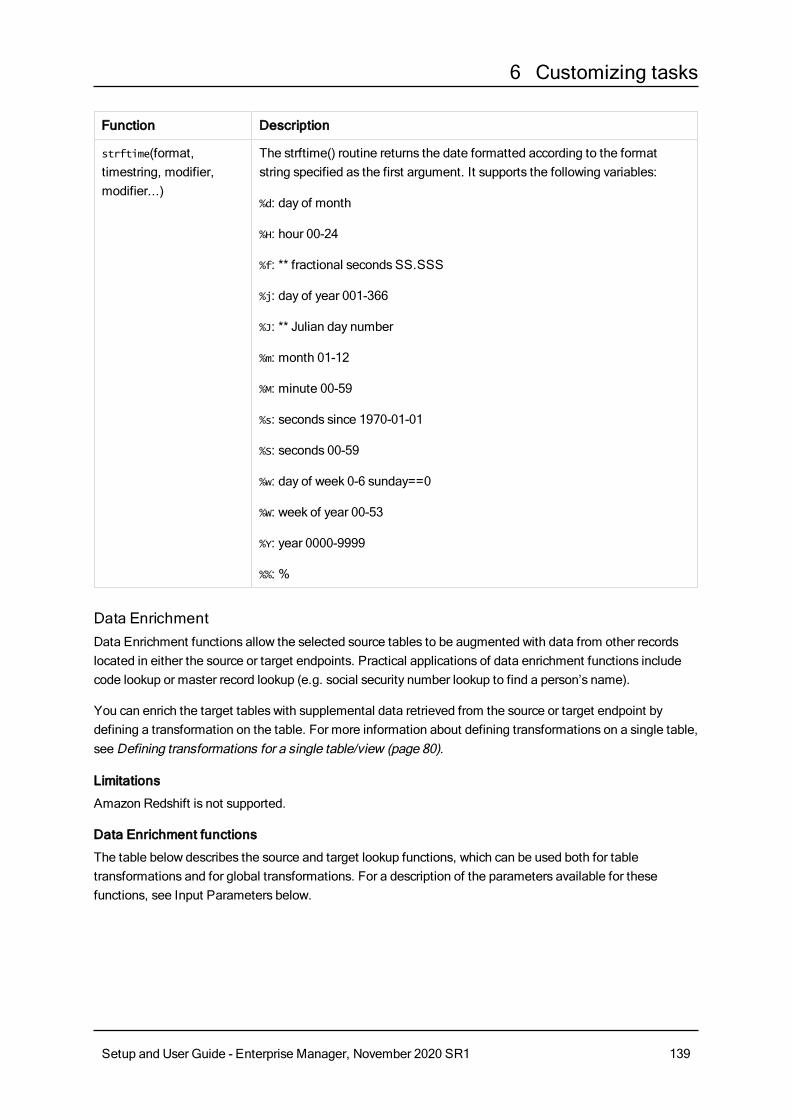
6 Customizing tasks
Function Description
strftime(format, timestring, modifier, modifier...)
The strftime() routine returns the date formatted according to the format string specified as the first argument. It supports the following variables:
%d: day of month
%H: hour 00-24
%f: ** fractional seconds SS.SSS
%j: day of year 001-366
%J: ** Julian day number
%m: month 01-12
%M: minute 00-59
%s: seconds since 1970-01-01
%S: seconds 00-59
%w: day of week 0-6 sunday==0
%W: week of year 00-53
%Y: year 0000-9999
%%: %
Data EnrichmentData Enrichment functions allow the selected source tables to be augmented with data from other records located in either the source or target endpoints. Practical applications of data enrichment functions include code lookup or master record lookup (e.g. social security number lookup to find a person’s name).
You can enrich the target tables with supplemental data retrieved from the source or target endpoint by defining a transformation on the table. For more information about defining transformations on a single table, see Defining transformations for a single table/view (page 80).
Limitations
Amazon Redshift is not supported.
Data Enrichment functions
The table below describes the source and target lookup functions, which can be used both for table transformations and for global transformations. For a description of the parameters available for these functions, see Input Parameters below.
Setup and User Guide - Enterprise Manager, November 2020 SR1 139
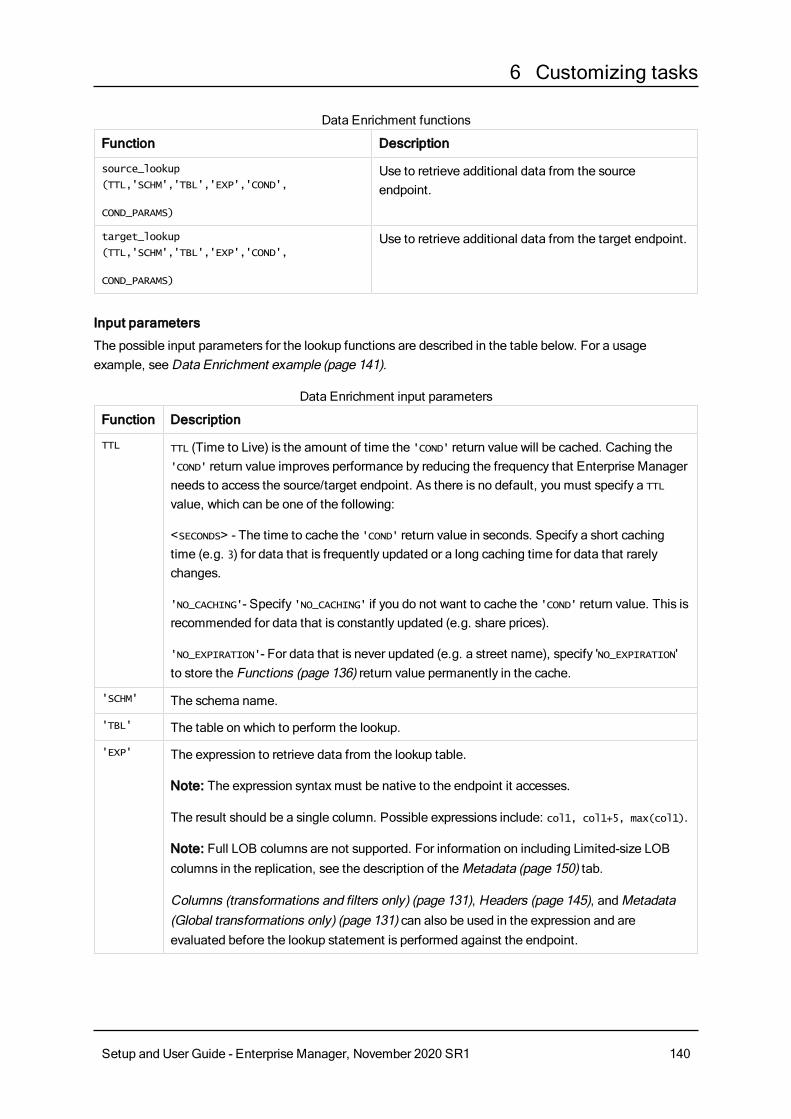
6 Customizing tasks
Function Description
source_lookup
(TTL,'SCHM','TBL','EXP','COND',
COND_PARAMS)
Use to retrieve additional data from the source endpoint.
target_lookup
(TTL,'SCHM','TBL','EXP','COND',
COND_PARAMS)
Use to retrieve additional data from the target endpoint.
Data Enrichment functions
Input parameters
The possible input parameters for the lookup functions are described in the table below. For a usage example, see Data Enrichment example (page 141).
Function Description
TTL TTL (Time to Live) is the amount of time the 'COND' return value will be cached. Caching the 'COND' return value improves performance by reducing the frequency that Enterprise Manager needs to access the source/target endpoint. As there is no default, you must specify a TTL value, which can be one of the following:
<SECONDS> - The time to cache the 'COND' return value in seconds. Specify a short caching time (e.g. 3) for data that is frequently updated or a long caching time for data that rarely changes.
'NO_CACHING'- Specify 'NO_CACHING' if you do not want to cache the 'COND' return value. This is recommended for data that is constantly updated (e.g. share prices).
'NO_EXPIRATION'- For data that is never updated (e.g. a street name), specify 'NO_EXPIRATION' to store the Functions (page 136) return value permanently in the cache.
'SCHM' The schema name.
'TBL' The table on which to perform the lookup.
'EXP' The expression to retrieve data from the lookup table.
Note: The expression syntax must be native to the endpoint it accesses.
The result should be a single column. Possible expressions include: col1, col1+5, max(col1).
Note: Full LOB columns are not supported. For information on including Limited-size LOB columns in the replication, see the description of the Metadata (page 150) tab.
Columns (transformations and filters only) (page 131), Headers (page 145), and Metadata (Global transformations only) (page 131) can also be used in the expression and are evaluated before the lookup statement is performed against the endpoint.
Data Enrichment input parameters
Setup and User Guide - Enterprise Manager, November 2020 SR1 140
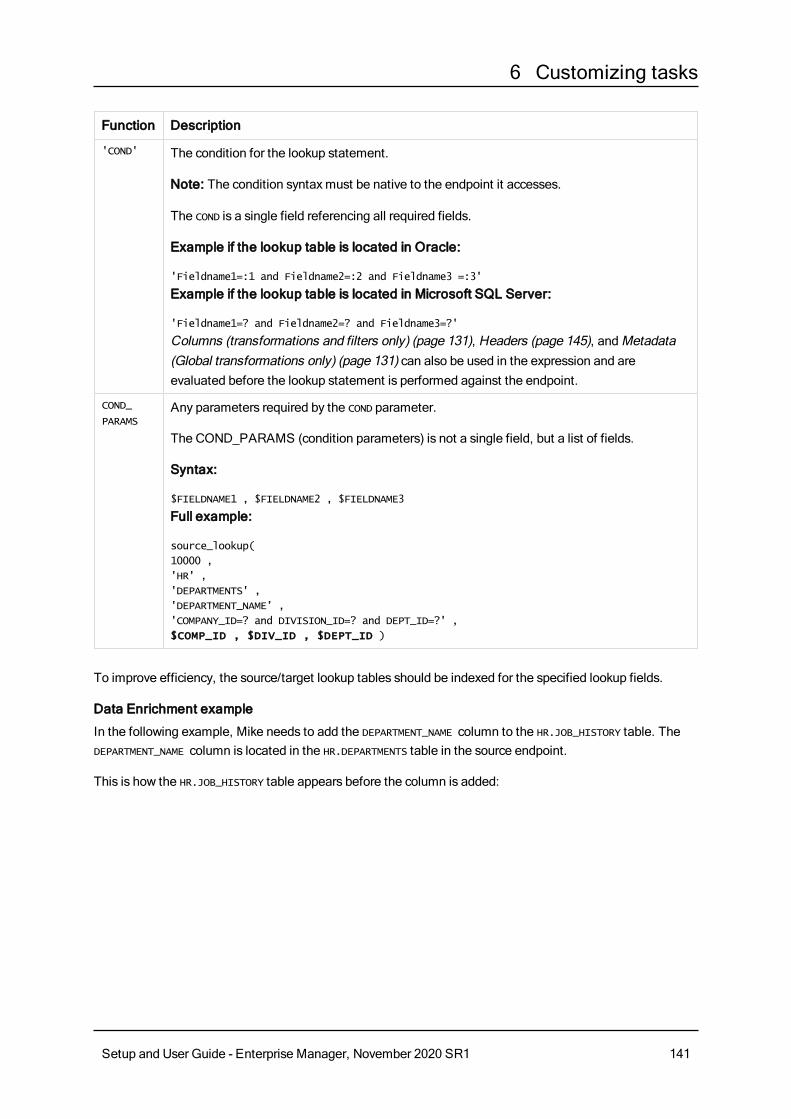
6 Customizing tasks
Function Description
'COND' The condition for the lookup statement.
Note: The condition syntax must be native to the endpoint it accesses.
The COND is a single field referencing all required fields.
Example if the lookup table is located in Oracle:
'Fieldname1=:1 and Fieldname2=:2 and Fieldname3 =:3'
Example if the lookup table is located in Microsoft SQL Server:
'Fieldname1=? and Fieldname2=? and Fieldname3=?'
Columns (transformations and filters only) (page 131), Headers (page 145), and Metadata (Global transformations only) (page 131) can also be used in the expression and are evaluated before the lookup statement is performed against the endpoint.
COND_
PARAMSAny parameters required by the COND parameter.
The COND_PARAMS (condition parameters) is not a single field, but a list of fields.
Syntax:
$FIELDNAME1 , $FIELDNAME2 , $FIELDNAME3
Full example:
source_lookup(
10000 ,
'HR' ,
'DEPARTMENTS' ,
'DEPARTMENT_NAME’ ,
'COMPANY_ID=? and DIVISION_ID=? and DEPT_ID=?' ,
$COMP_ID , $DIV_ID , $DEPT_ID )
To improve efficiency, the source/target lookup tables should be indexed for the specified lookup fields.
Data Enrichment example
In the following example, Mike needs to add the DEPARTMENT_NAME column to the HR.JOB_HISTORY table. The DEPARTMENT_NAME column is located in the HR.DEPARTMENTS table in the source endpoint.
This is how the HR.JOB_HISTORY table appears before the column is added:
Setup and User Guide - Enterprise Manager, November 2020 SR1 141

6 Customizing tasks
This is how the HR.JOB_HISTORY table appears after the Full Load completes:
To add the DEPARTMENT_NAME column, Mike needs to:
1. Create a new task and select the HR.JOB_HISTORY table for replication.
2. Apply a “New Column” transformation to the HR.JOB_HISTORY table. For more information on defining transformations, see Defining transformations for a single table/view (page 80).
3. Open the Expression Builder and choose Data Enrichment from the Functions tab. For more information on the Expression Builder, see Using the Expression Builder (for filters, transformations, and global transformations) (page 126).
4. Select the source_lookup function and configure it as follows (using the native syntax of the source endpoint):If the lookup table is located in Oracle:source_lookup(10000,'HR','DEPARTMENTS','DEPARTMENT_NAME',
'DEPARTMENT_ID=:1',$DEPARTMENT_ID)
If the lookup table is located in Microsoft SQL Server:source_lookup
(10000,'HR','DEPARTMENTS','[DEPARTMENT_NAME]',
'[DEPARTMENT]=?',$DEPARTMENT_ID)
Where:
l 10000 is the TTL parameter.
l HR is the schema name.
l DEPARTMENTS is the table name.
l DEPARTMENT_NAME is the expression.
Setup and User Guide - Enterprise Manager, November 2020 SR1 142

6 Customizing tasks
l DEPARTMENT_ID=:1 (or ? on Microsoft SQL Server) is the condition.
l $DEPARTMENT_ID is the condition parameter.
5. Run the task.
OperationThe following table describes the Operation functions used by the Expression Builder in Enterprise Manager .
Function Description
operation_
indicator
(value_on_
delete,
value_on_
update,
value_on_
insert)
When the operation_indicator function is invoked on its own or as part of an expression, records deleted from the source endpoint will not be deleted from the target endpoint. Instead, the corresponding target record will be flagged (with a user-provided value) to indicate that it was deleted from the source. The operation_indicator function also requires you to provide values to indicate records that were inserted or updated in the source endpoint.
Note: The operation_indicator function is not supported on tables that do not have a Primary Key.
Note: It is recommended to add a dedicated column for the flag values, for example, OPERATION. For an explanation of how to add a column, see Using the Transform tab (page 82).
To specify the function values:
Replace value_on_delete, value_on_insert and value_on_update with the values that you want to appear in the target endpoint.
Values should be formatted according to the corresponding column type.
Example when the column type is INT4:
operation_indicator(’1’, ’0’, ’0’)
Example when the column type is STRING:
operation_indicator(’Deleted’, ’Updated’, ’Inserted’)
Operation functions
Other FunctionsThe following table describes additional functions used by the Expression Builder in Enterprise Manager .
Setup and User Guide - Enterprise Manager, November 2020 SR1 143

6 Customizing tasks
Function Description
length(x) For a string value x, the length(x) function returns the number of characters (not bytes) in x before to the first NULL character.
If x is NULL then length(x) is NULL. If x is numeric then length(X) returns the length of a string representation of X.
like(x,y,z) The like() function is used to implement the "Y LIKE X [ESCAPE Z]" expression. The ESCAPE (z) clause is optional. If there is a z clause, then the like() function is invoked with three arguments. Otherwise, it is invoked with two arguments.
typeof(x) The typeof(x) function returns a string that indicates the datatype of the expression x: null, integer, real, text, or BLOB.
Other functions
HashThe Hash function generates a hash value for an inputted column (using the SHA-256 algorithm) and then returns the hex value of the generated hash value.
To use the function in an expression, add the hash_sha256(x) function to the Build Expression pane and then replace the "x" with the desired source column name (from the Input Columns tab).
The function is especially useful for masking sensitive information. In the expression below, for example, the Hash function has been used to obfuscate employees' email addresses.
Setup and User Guide - Enterprise Manager, November 2020 SR1 144
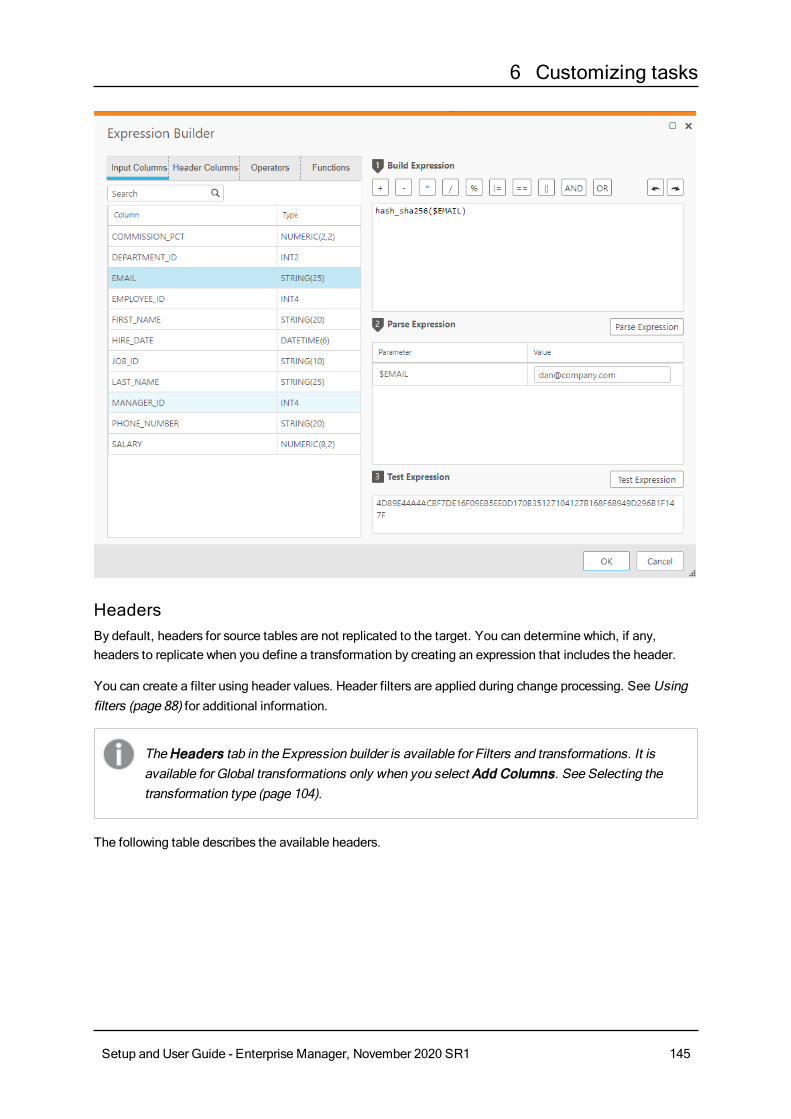
6 Customizing tasks
HeadersBy default, headers for source tables are not replicated to the target. You can determine which, if any, headers to replicate when you define a transformation by creating an expression that includes the header.
You can create a filter using header values. Header filters are applied during change processing. See Using filters (page 88) for additional information.
The Headers tab in the Expression builder is available for Filters and transformations. It is available for Global transformations only when you select Add Columns. See Selecting the transformation type (page 104).
The following table describes the available headers.
Setup and User Guide - Enterprise Manager, November 2020 SR1 145
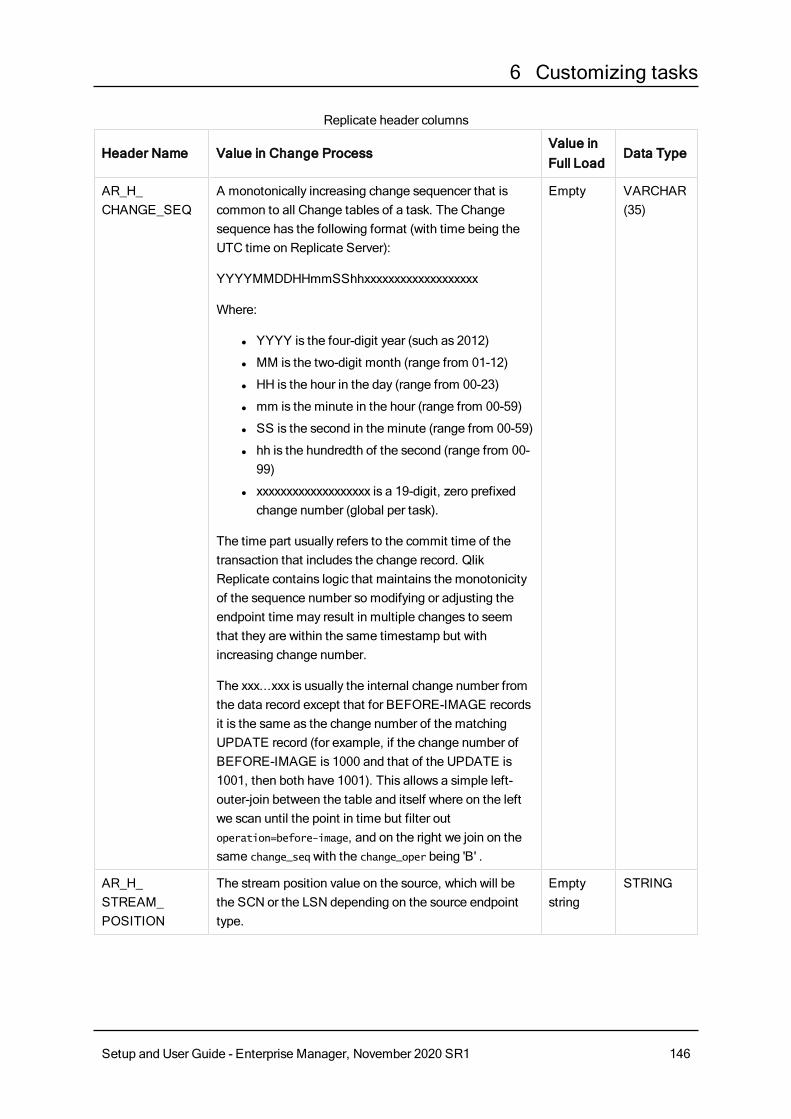
6 Customizing tasks
Header Name Value in Change ProcessValue in Full Load
Data Type
AR_H_CHANGE_SEQ
A monotonically increasing change sequencer that is common to all Change tables of a task. The Change sequence has the following format (with time being the UTC time on Replicate Server):
YYYYMMDDHHmmSShhxxxxxxxxxxxxxxxxxxx
Where:
l YYYY is the four-digit year (such as 2012)
l MM is the two-digit month (range from 01-12)
l HH is the hour in the day (range from 00-23)
l mm is the minute in the hour (range from 00-59)
l SS is the second in the minute (range from 00-59)
l hh is the hundredth of the second (range from 00-99)
l xxxxxxxxxxxxxxxxxxx is a 19-digit, zero prefixed change number (global per task).
The time part usually refers to the commit time of the transaction that includes the change record. Qlik Replicate contains logic that maintains the monotonicity of the sequence number so modifying or adjusting the endpoint time may result in multiple changes to seem that they are within the same timestamp but with increasing change number.
The xxx...xxx is usually the internal change number from the data record except that for BEFORE-IMAGE records it is the same as the change number of the matching UPDATE record (for example, if the change number of BEFORE-IMAGE is 1000 and that of the UPDATE is 1001, then both have 1001). This allows a simple left-outer-join between the table and itself where on the left we scan until the point in time but filter out operation=before-image, and on the right we join on the same change_seq with the change_oper being 'B' .
Empty VARCHAR(35)
AR_H_STREAM_POSITION
The stream position value on the source, which will be the SCN or the LSN depending on the source endpoint type.
Empty string
STRING
Replicate header columns
Setup and User Guide - Enterprise Manager, November 2020 SR1 146
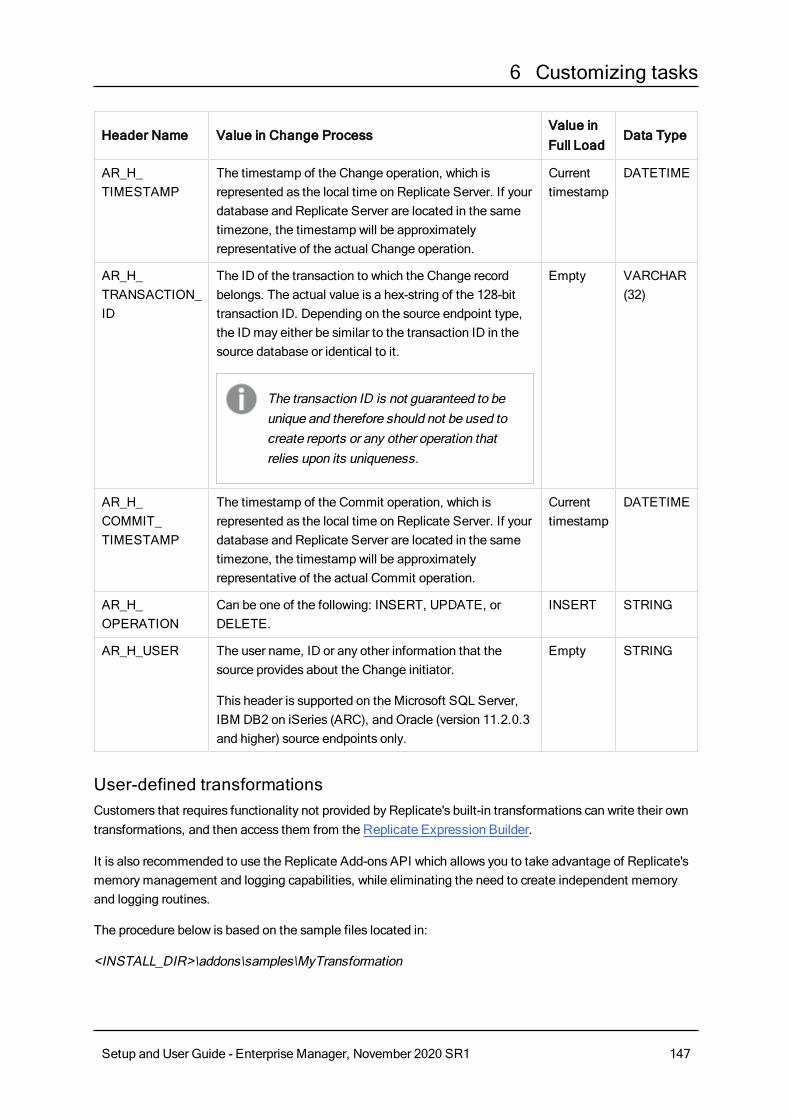
6 Customizing tasks
Header Name Value in Change ProcessValue in Full Load
Data Type
AR_H_TIMESTAMP
The timestamp of the Change operation, which is represented as the local time on Replicate Server. If your database and Replicate Server are located in the same timezone, the timestamp will be approximately representative of the actual Change operation.
Current timestamp
DATETIME
AR_H_TRANSACTION_ID
The ID of the transaction to which the Change record belongs. The actual value is a hex-string of the 128-bit transaction ID. Depending on the source endpoint type, the ID may either be similar to the transaction ID in the source database or identical to it.
The transaction ID is not guaranteed to be unique and therefore should not be used to create reports or any other operation that relies upon its uniqueness.
Empty VARCHAR (32)
AR_H_COMMIT_TIMESTAMP
The timestamp of the Commit operation, which is represented as the local time on Replicate Server. If your database and Replicate Server are located in the same timezone, the timestamp will be approximately representative of the actual Commit operation.
Current timestamp
DATETIME
AR_H_OPERATION
Can be one of the following: INSERT, UPDATE, or DELETE.
INSERT STRING
AR_H_USER The user name, ID or any other information that the source provides about the Change initiator.
This header is supported on the Microsoft SQL Server, IBM DB2 on iSeries (ARC), and Oracle (version 11.2.0.3 and higher) source endpoints only.
Empty STRING
User-defined transformationsCustomers that requires functionality not provided by Replicate's built-in transformations can write their own transformations, and then access them from the Replicate Expression Builder.
It is also recommended to use the Replicate Add-ons API which allows you to take advantage of Replicate's memory management and logging capabilities, while eliminating the need to create independent memory and logging routines.
The procedure below is based on the sample files located in:
<INSTALL_DIR>\addons\samples\MyTransformation
Setup and User Guide - Enterprise Manager, November 2020 SR1 147

6 Customizing tasks
The path is the same on Linux, but with slashes (/)instead of backslashes (\). Similarly, although the explanation below refers to a DLL file (Windows), on Linux this should be an SO file.
Changing the default addon nameYou can change the default addon name (MyTransformation) simply by renaming the <INSTALL_DIR>\addons\samples\MyTransformation\MyTransformation.dll file as desired. Note that if you rename the DLL, you may also need to specify the new name when editing the addons_def.json.sample file described below (depending on which parameters you use).
Creating a user-defined transformation
To create a user-defined transformation:
1. Create a shared library that implements the following exported initialization function:typedef int AR_ADDON_INIT_FUNC(AR_ADDON_CONTEXT *context);
All of the types and prototypes are defined in the ar_addon.h and ar_addon_transformation.h files located under <INSTALL_DIR>\addons\include.
2. Make sure your shared library is in the following location:<INSTALL_DIR>\addons\samples\addon_name
When setting up Qlik Replicate in a Cluster Environment, the created binaries should be installed on all of the cluster instances.
3. Compile the transformation. The DLL is automatically created in the following location: <installation_dir>\addons\addon_name\addon_name.dll
4. Register the library in the addons_def.json.sample file located under <INSTALL_DIR>\addons.{
"addons": [{
"name": "MyTransformation",
"type": "STARTUP",
//"lib_path": "C:\\Program Files\\Attunity
Replicate\\addons\\samples\\MyTransformation\\MyTransformation.dll",
//"lib_path":
"/opt/attunity/replicate/addons/samples/MyTransformation/MyTransformat
ion.so",
"init_function": "my_transformation_init_func"
}]
}
Where:
Setup and User Guide - Enterprise Manager, November 2020 SR1 148

6 Customizing tasks
l name is the logical name of the DLL (can be any name). If you do not use the lib_path parameter to specify the DLL path (see below), then the DLL file must reside in <INSTALL_DIR>\addons\<addon_name>. On Linux, the <addon_name> folder needs to be created manually and should either be the default addon name (MyTransformation) or its new name (if you changed it).
l type is an optional parameter that specifies when to load the DLL. The only value that is currently supported is STARTUP.
l lib_path is the full path of your DLL (e.g. C:\Transformations\MyManipulator.dll). This is required only if the DLL does not reside in <INSTALL_DIR>\addons\<addon_name> (as mentioned in the description of the name parameter above).
l init_function is the function name, as it appears in the C file used to generate the DLL.
5. Save the file as addons_def.json.
6. Register the new function in the addon initialization function (mentioned in Step 1) as in the following example:USER_DEFINED_TRANSFORMATION_DEF *transdef = GET_AR_AO_TRANSFORMATION_
DEF();
transdef->displayName = "prefix_with(X, Y)";
transdef->functionName = "prefix_with";
transdef->description = "prefix_with adds the prefix <Y_> to a given
string X";
transdef->func = trans_prefix_with;
transdef->nArgs = 2;
AR_AO_REGISRATION->register_user_defined_transformation(transdef);
7. Restart the Qlik Replicate Server service.
The new "prefix_with" function will be available in the Expression Builder under Functions->User Defined.
6.4 Task SettingsTask-specific replication settings can be configured in the Task Settings dialog box.
Some of the task settings are not available in a Log Stream Staging setup.
For information on the availability of task settings in a Log Stream Staging setup, refer to the Qlik Replicate Setup and User Guide.
To open the Task Settings dialog box:
1. Open the desired task.For information on opening a task, see Editing a replication task (page 75).
2. Click the Task Settings toolbar button.
Setup and User Guide - Enterprise Manager, November 2020 SR1 149
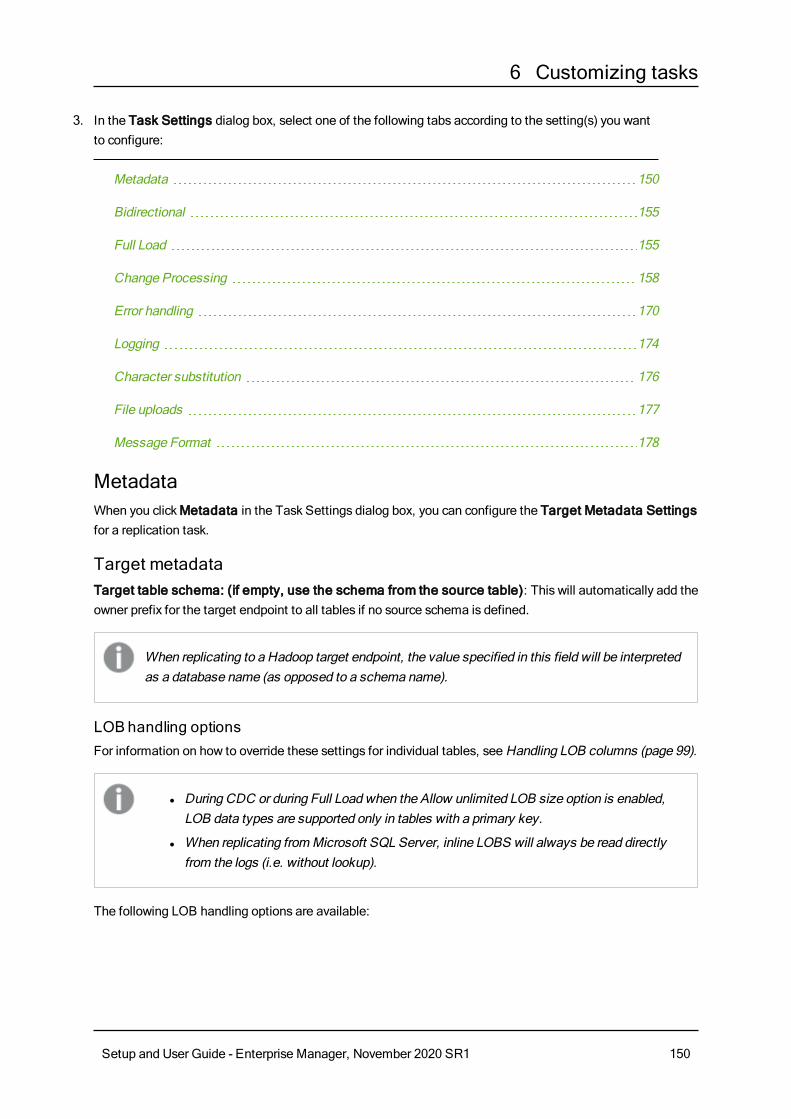
6 Customizing tasks
3. In the Task Settings dialog box, select one of the following tabs according to the setting(s) you want to configure:
Metadata 150
Bidirectional 155
Full Load 155
Change Processing 158
Error handling 170
Logging 174
Character substitution 176
File uploads 177
Message Format 178
MetadataWhen you click Metadata in the Task Settings dialog box, you can configure the Target Metadata Settings for a replication task.
Target metadataTarget table schema: (if empty, use the schema from the source table): This will automatically add the owner prefix for the target endpoint to all tables if no source schema is defined.
When replicating to a Hadoop target endpoint, the value specified in this field will be interpreted as a database name (as opposed to a schema name).
LOB handling optionsFor information on how to override these settings for individual tables, see Handling LOB columns (page 99).
l During CDC or during Full Load when the Allow unlimited LOB size option is enabled, LOB data types are supported only in tables with a primary key.
l When replicating from Microsoft SQL Server, inline LOBS will always be read directly from the logs (i.e. without lookup).
The following LOB handling options are available:
Setup and User Guide - Enterprise Manager, November 2020 SR1 150
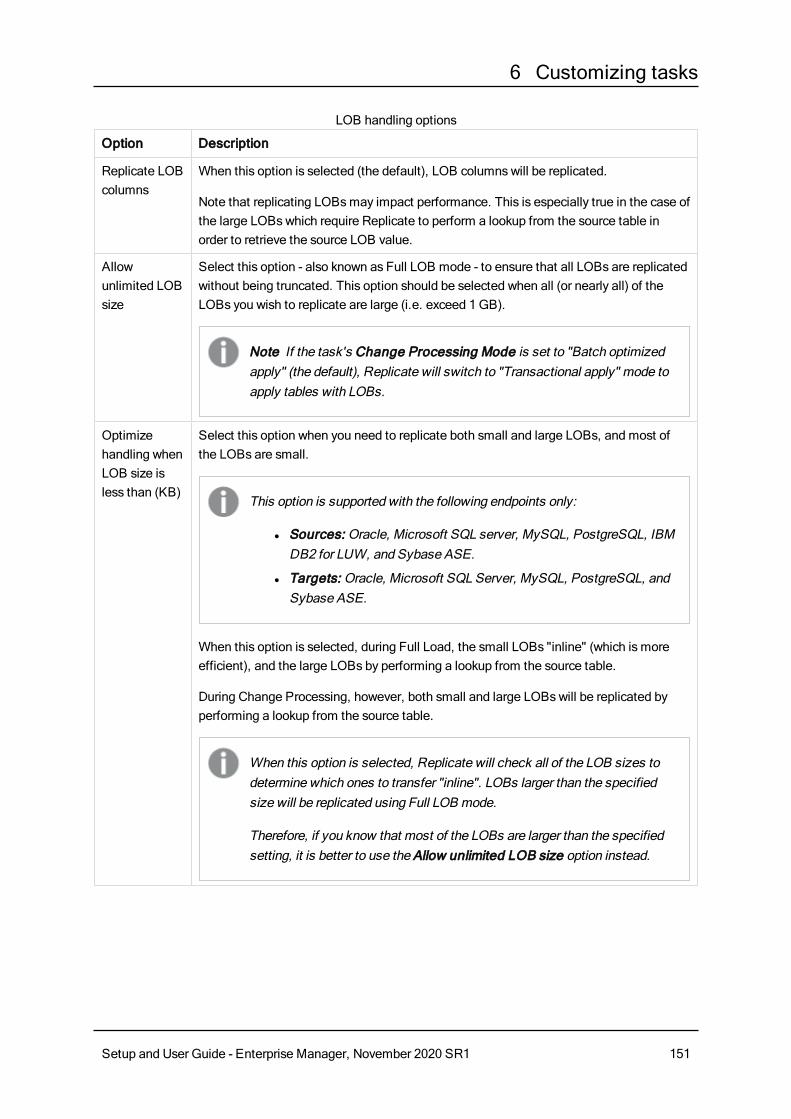
6 Customizing tasks
Option Description
Replicate LOB columns
When this option is selected (the default), LOB columns will be replicated.
Note that replicating LOBs may impact performance. This is especially true in the case of the large LOBs which require Replicate to perform a lookup from the source table in order to retrieve the source LOB value.
Allow unlimited LOB size
Select this option - also known as Full LOB mode - to ensure that all LOBs are replicated without being truncated. This option should be selected when all (or nearly all) of the LOBs you wish to replicate are large (i.e. exceed 1 GB).
Note If the task's Change Processing Mode is set to "Batch optimized apply" (the default), Replicate will switch to "Transactional apply" mode to apply tables with LOBs.
Optimize handling when LOB size is less than (KB)
Select this option when you need to replicate both small and large LOBs, and most of the LOBs are small.
This option is supported with the following endpoints only:
l Sources: Oracle, Microsoft SQL server, MySQL, PostgreSQL, IBM DB2 for LUW, and Sybase ASE.
l Targets: Oracle, Microsoft SQL Server, MySQL, PostgreSQL, and Sybase ASE.
When this option is selected, during Full Load, the small LOBs "inline" (which is more efficient), and the large LOBs by performing a lookup from the source table.
During Change Processing, however, both small and large LOBs will be replicated by performing a lookup from the source table.
When this option is selected, Replicate will check all of the LOB sizes to determine which ones to transfer "inline". LOBs larger than the specified size will be replicated using Full LOB mode.
Therefore, if you know that most of the LOBs are larger than the specified setting, it is better to use the Allow unlimited LOB size option instead.
LOB handling options
Setup and User Guide - Enterprise Manager, November 2020 SR1 151

6 Customizing tasks
Option Description
Chunk size (KB)
Optionally, change the size of the LOB chunks to use when replicating the data to the target. The default chunk size should suffice in most cases, but if you encounter performance issues, adjusting the size may improve performance.
With some databases, data type validation occurs when the data is inserted or updated. In such cases, replication of structured data types (e.g. XML, JSON, GEOGRAPHY, etc.) may fail if the data is bigger than the specified chunk size.
Limit LOB size to (KB)
Select this option if you only need to replicate small LOBs or if the target endpoint does not support unlimited LOB size. The maximum permitted value for this field is 102400 KB (100 MB).
When replicating small LOBs, this option is more efficient than the Allow unlimited LOB size option since the LOBs are replicated "inline" as opposed to via "lookup" from the source. During Change Processing, small LOBs are usually replicated via "lookup" from the source.
As the value of the Limit LOB size to is in bytes, the size should be calculated according to the following formulas:
l BLOB – The length of the largest LOB.
l NCLOB – The length of the longest TEXT in characters multiplied by two (as each character is handled as a double-byte).If the data includes 4-byte characters, multiply it by four.
l CLOB – The length of the longest TEXT in characters (as each character is handled as a UTF8 character). If the data includes 4-byte characters, multiply it by two.
l Any LOBs larger than the specified size will be truncated.
l During Change Processing from Oracle source, inline BLOBs are replicated inline.
l Changes to this setting will only affect existing tables after they are reloaded.
Setup and User Guide - Enterprise Manager, November 2020 SR1 152
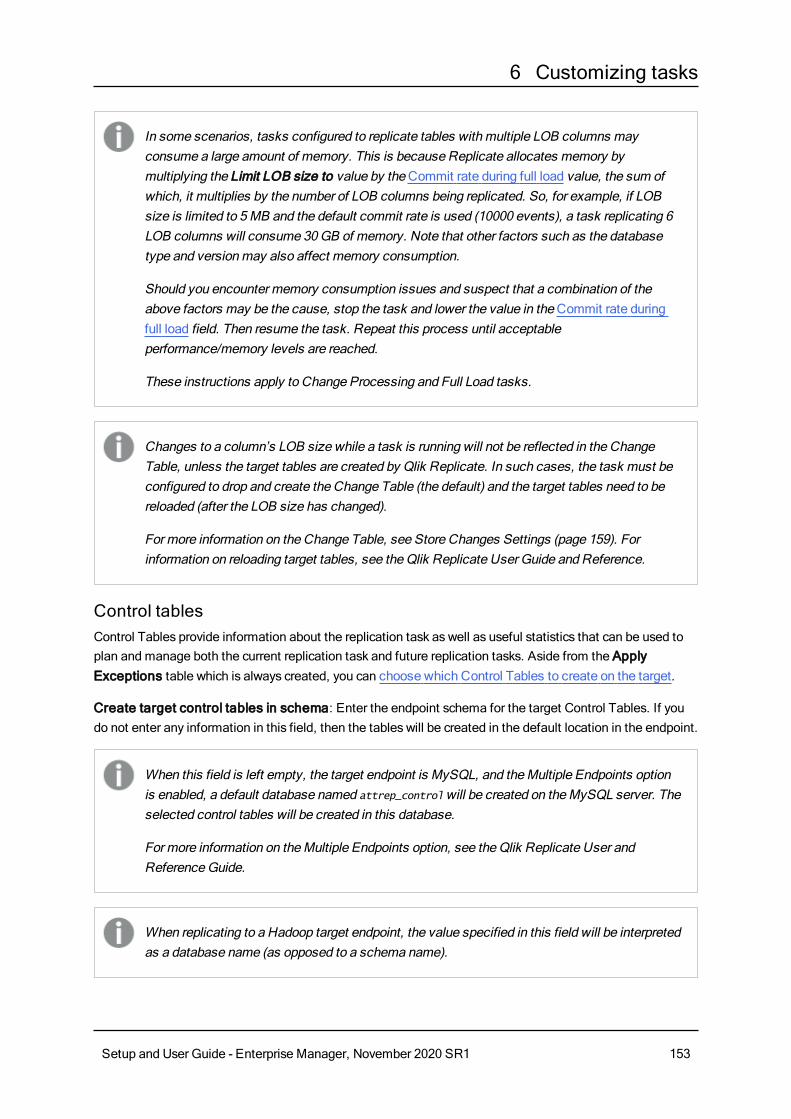
6 Customizing tasks
In some scenarios, tasks configured to replicate tables with multiple LOB columns may consume a large amount of memory. This is because Replicate allocates memory by multiplying the Limit LOB size to value by the Commit rate during full load value, the sum of which, it multiplies by the number of LOB columns being replicated. So, for example, if LOB size is limited to 5 MB and the default commit rate is used (10000 events), a task replicating 6 LOB columns will consume 30 GB of memory. Note that other factors such as the database type and version may also affect memory consumption.
Should you encounter memory consumption issues and suspect that a combination of the above factors may be the cause, stop the task and lower the value in the Commit rate during full load field. Then resume the task. Repeat this process until acceptable performance/memory levels are reached.
These instructions apply to Change Processing and Full Load tasks.
Changes to a column’s LOB size while a task is running will not be reflected in the Change Table, unless the target tables are created by Qlik Replicate. In such cases, the task must be configured to drop and create the Change Table (the default) and the target tables need to be reloaded (after the LOB size has changed).
For more information on the Change Table, see Store Changes Settings (page 159). For information on reloading target tables, see the Qlik Replicate User Guide and Reference.
Control tablesControl Tables provide information about the replication task as well as useful statistics that can be used to plan and manage both the current replication task and future replication tasks. Aside from the Apply Exceptions table which is always created, you can choose which Control Tables to create on the target.
Create target control tables in schema: Enter the endpoint schema for the target Control Tables. If you do not enter any information in this field, then the tables will be created in the default location in the endpoint.
When this field is left empty, the target endpoint is MySQL, and the Multiple Endpoints option is enabled, a default database named attrep_control will be created on the MySQL server. The selected control tables will be created in this database.
For more information on the Multiple Endpoints option, see the Qlik Replicate User and Reference Guide.
When replicating to a Hadoop target endpoint, the value specified in this field will be interpreted as a database name (as opposed to a schema name).
Setup and User Guide - Enterprise Manager, November 2020 SR1 153
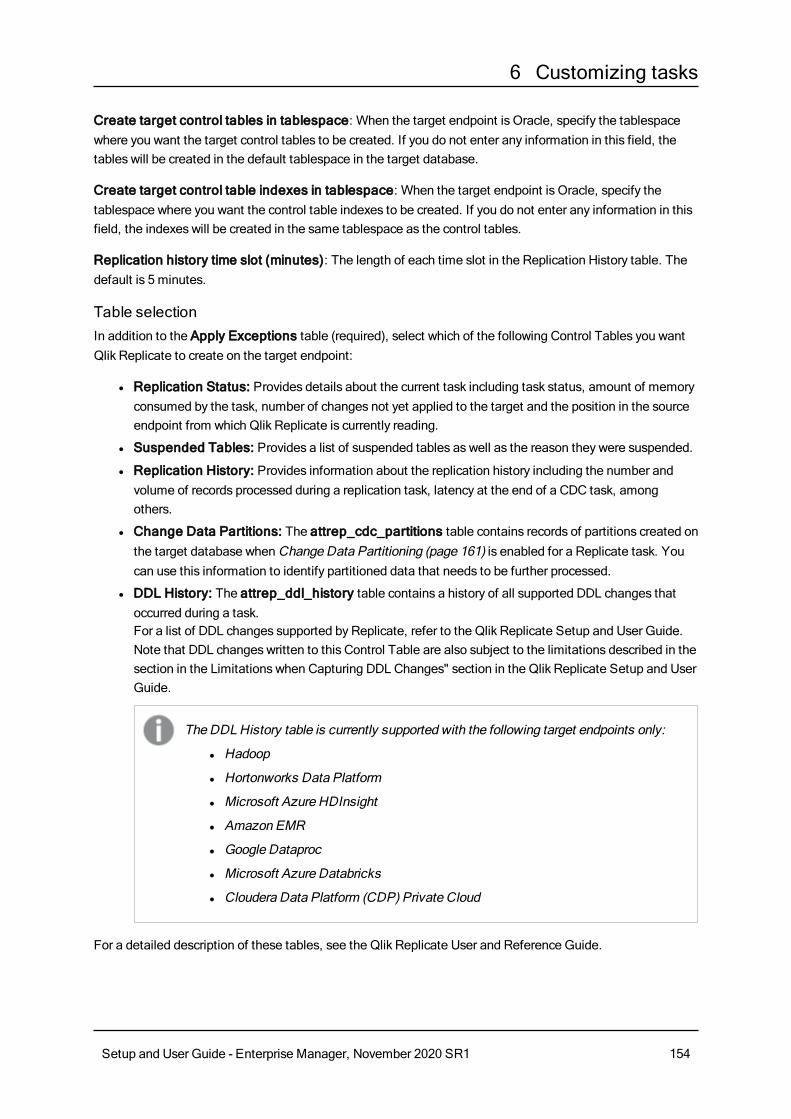
6 Customizing tasks
Create target control tables in tablespace: When the target endpoint is Oracle, specify the tablespace where you want the target control tables to be created. If you do not enter any information in this field, the tables will be created in the default tablespace in the target database.
Create target control table indexes in tablespace: When the target endpoint is Oracle, specify the tablespace where you want the control table indexes to be created. If you do not enter any information in this field, the indexes will be created in the same tablespace as the control tables.
Replication history time slot (minutes): The length of each time slot in the Replication History table. The default is 5 minutes.
Table selectionIn addition to the Apply Exceptions table (required), select which of the following Control Tables you want Qlik Replicate to create on the target endpoint:
l Replication Status: Provides details about the current task including task status, amount of memory consumed by the task, number of changes not yet applied to the target and the position in the source endpoint from which Qlik Replicate is currently reading.
l Suspended Tables: Provides a list of suspended tables as well as the reason they were suspended.
l Replication History: Provides information about the replication history including the number and volume of records processed during a replication task, latency at the end of a CDC task, among others.
l Change Data Partitions: The attrep_cdc_partitions table contains records of partitions created on the target database when Change Data Partitioning (page 161) is enabled for a Replicate task. You can use this information to identify partitioned data that needs to be further processed.
l DDL History: The attrep_ddl_history table contains a history of all supported DDL changes that occurred during a task. For a list of DDL changes supported by Replicate, refer to the Qlik Replicate Setup and User Guide. Note that DDL changes written to this Control Table are also subject to the limitations described in the section in the Limitations when Capturing DDL Changes" section in the Qlik Replicate Setup and User Guide.
The DDL History table is currently supported with the following target endpoints only:
l Hadoop
l Hortonworks Data Platform
l Microsoft Azure HDInsight
l Amazon EMR
l Google Dataproc
l Microsoft Azure Databricks
l Cloudera Data Platform (CDP) Private Cloud
For a detailed description of these tables, see the Qlik Replicate User and Reference Guide.
Setup and User Guide - Enterprise Manager, November 2020 SR1 154

6 Customizing tasks
BidirectionalThis tab is only applicable to bidirectional replication tasks. When you click Bidirectional in the Task Settings dialog box, the Loopback Prevention tab is displayed. In bidirectional replication, loopback prevention is a mechanism that prevents the same data from being replicated back and forth in an endless loop. To enable loopback prevention, you need to specify a source and target Loopback prevention table schema.
Bidirectional replication consists of two separate tasks: Task 1 captures changes made to Endpoint A and replicates them to Endpoint B. Task 2 captures changes made to Endpoint B and replicates them to Endpoint A. When configuring Task 1 of a bidirectional replication setup, the source loopback prevention table schema must be identical to the target loopback prevention table schema specified in the Loopback Prevention settings of Task 2.
Likewise, when configuring Task 2 of a bidirectional replication setup, the source loopback prevention table schema must be identical to the target loopback prevention table schema specified in the Loopback Prevention settings of Task 1.
Oracle schemas are case-sensitive. Therefore, when specifying an Oracle table schema, make sure to use the correct case in the Loopback Prevention settings in both Tasks.
For instructions on setting up bidirectional replication, see Bidirectional replication (page 61).
Full LoadWhen you click Full Load in the Task Settings dialog box, you can configure the following:
l Full Load Settings (page 155)
l Full Load Tuning (page 157)
Full Load SettingsClick the Full Load Settings sub-tab to configure the following:
Full is ON/OFF.
Click this button to toggle full load on or off. The initial setting is determined when Adding tasks (page 59).
When full load is ON, Qlik Replicate loads the initial source data to the target endpoint.
Full load can be turned on or off at any stage even if change processing is on. Once the task begins to process changes, the full load on/off switch is used only as additional protection against accidental or unauthorized reload.
Target table preparation:
Setup and User Guide - Enterprise Manager, November 2020 SR1 155

6 Customizing tasks
If target table already exists: Select one of the following from the list to determine how you want to handle loading the target at full-load start up:
The option to drop or truncate the target tables is relevant only if such operations are supported by the source endpoint.
l DROP and Create table: The table is dropped and a new table is created in its place.
Replicate Control Tables will not be dropped. However, any suspended tables that are dropped will also be deleted from the attrep_suspended_tables Control Table if the associated task is reloaded.
l TRUNCATE before loading: Data is truncated without affecting the table metadata. Note that when this option is selected, enabling the Create primary key or unique index after full load completes option will have no effect.
l ARCHIVE and CREATE table: A copy of the existing table will be saved to the same schema before the new table is created. The archived table name will be appended with a timestamp, indicating when the archiving operation occurred (e.g. Customers_20170605175601).
Currently this option is only available for the Hadoop target endpoint .
l Do nothing: Existing data and metadata of the target table will not be affected. New data will be added to the table.
Replicate expects the source column data types to be compatible with the corresponding target column data types. If you choose either TRUNCATE before loading or Do nothing and one or more target data types are different than the data types for the corresponding source columns, use a transformation to convert the data types as required.
For information on creating data type transformations, see Defining transformations for a single table/view (page 80).
Create primary key or unique index after full load completes: Select this option if you want to delay primary key or unique index creation on the target until after full load completes.
After Full Load completes, stop the task: You can set the task to stop automatically after Full Load completes. This is useful if you need to perform DBA operations on the target tables before the task’s Apply Changes (i.e. CDC) phase begins.
During Full Load, any DML operations executed on the source tables are cached. When Full Load completes, the cached changes are automatically applied to the target tables (as long as the Before/After cached changes have been applied option(s) described below are disabled).
Setup and User Guide - Enterprise Manager, November 2020 SR1 156

6 Customizing tasks
This feature is not available for bidirectional replication tasks.
Select Before cached changes have been applied to stop the task before the cached changes are applied and/or After cached changes have been applied to stop the task after the cached changes are applied.
Selecting the Before cached changes have been applied option will stop the task immediately after Full Load completes. Selecting the After cached changes have been applied option will stop the task as soon as data is consistent across all tables in the task.
When configuring Replicate to stop the task after Full Load completes, note the following:
l The After cached changes have been applied option is not supported with all file-based and Hadoop-based target endpoints, namely:
l File-based: File, Amazon S3, Microsoft Azure ADLS, and Google Storage.
l Hadoop-based: Hadoop, Hortonworks Data Platform, Amazon EMR, Microsoft Azure HDInsight , Google Dataproc, Cloudera Data Platform (CDP) Private Cloud, and Microsoft Azure Databricks.
l The task will stop after Full Load completes even if there are no cached changes to apply.
l Choosing to stop the task before cached changes have been applied may adversely affect performance, since the cached changes will only be applied to tables (even those that have already completed Full Load) after the last table completes Full Load.
l When the Before/After cached changes have been applied option is selected and a DDL is executed on one of the source tables during the Full Load process (in a Full Load and Apply Changes task), Replicate will reload the table. This effectively means that any DML operations executed on the source tables will be replicated to the target before the task stops.
l When working with the File Channel endpoint, these options should be set in the remote File Channel task and not in the local File Channel task.For more information on the File Channel endpoint, see the Qlik Replicate Setup and User Guide.
Full Load TuningClick the Full Load Tuning sub-tab to configure the following:
Setup and User Guide - Enterprise Manager, November 2020 SR1 157

6 Customizing tasks
Tuning settings:
l Maximum number of tables to load in parallel: Enter the maximum number of tables to load into the target at one time. The default value is 5.
l Transaction consistency timeout (seconds): Enter the number of seconds that Qlik Replicate waits for transactions to close, if they are open when the task starts, before beginning the Full Load operation. The default value is 600 (10 minutes). Qlik Replicate will begin the full load after the timeout value is reached even if there are open transactions.Note: To replicate transactions that were open when Full Load started but were only committed after the timeout value was reached, you need to reload the target tables.
l Commit rate during full load: The maximum number of events that can be transferred together. The default value is 10000.
Change ProcessingWhen you click Change Processing in the Task Settings dialog box, you can configure the following:
l Apply Changes Settings (page 158)
l Store Changes Settings (page 159)
l Change Processing Tuning (page 165)
Apply Changes SettingsClick the Apply Changes Settings sub-tab to configure the following:
Apply Changes is ON/OFF:
Click this button to toggle Apply Changes (Change Processing) on or off. The initial setting is determined when Adding tasks (page 59).
When Apply Changes is ON, Qlik Replicate processes the changes. You can view the change processing in the Monitor. For more information, see the Qlik Replicate Setup and User Guide.
When you turn on apply changes you must reload the task or position back to the point of the previous reload.
DDL handling policy: Determine how to handle the target table for the change capture:
l Executing a DDL on a source table during the Full Load process in a Full Load and Apply Changes task will cause Replicate to reload the table.
l The option to drop or truncate the target tables is relevant only if such operations are supported by the source endpoint.
Setup and User Guide - Enterprise Manager, November 2020 SR1 158

6 Customizing tasks
l When source table is dropped, select one of the following:
l DROP target table
l Ignore DROP
l When source table is truncated, select one of the following:
l TRUNCATE target table
l Ignore TRUNCATE
l When source table is altered, select one of the following:
l ALTER target table
l Ignore ALTER
Store Changes SettingsWhen you click Store Changes in the Task Settings dialog box, you can configure the Store Changes Settings for a replication task.
Store changes processing is ON/OFF:
Click this button to toggle Store Changes on or off. The initial setting is determined when Adding tasks (page 59). If this option is ON, changes are stored in either Change Tables or an Audit Table.
For more information about storing and applying changes, see the Qlik Replicate Setup and User Guide.
Store Changes can be turned on or off at any time without affecting anything in the task. Changes that are processed and not stored as a result of change storage being turned off can be recovered only by setting the task to an earlier point in time.
If Store Changes is ON, use the following options to determine how to store changes. Changes can be stored in Change Tables or in a single Audit table. From the Store changes in drop-down list, choose either Change tables or Audit table according to your needs.
Storing changes in Change TablesThe following section describes the options that are available when storing changes in Change Tables.
l Suffix: Type a string to use as the suffix for all Change Tables. The default value is __ct.The Change Table names are the name of the target table with the suffix appended. For example, if you have a table called HR and use the default value, the name of the Change Table will be HR__ct.For more information, see the Qlik Replicate Setup and User Guide.
l Header column prefix: Type a string to use as the prefix for all of the Change Table header columns. The default value is header__.For example, the header column stream_position when using the default value is called header__stream_position.For more information, see the Qlik Replicate Setup and User Guide.
l DDL options: Select one of the following options to determine how to handle DDL operations on the source tables:
Setup and User Guide - Enterprise Manager, November 2020 SR1 159
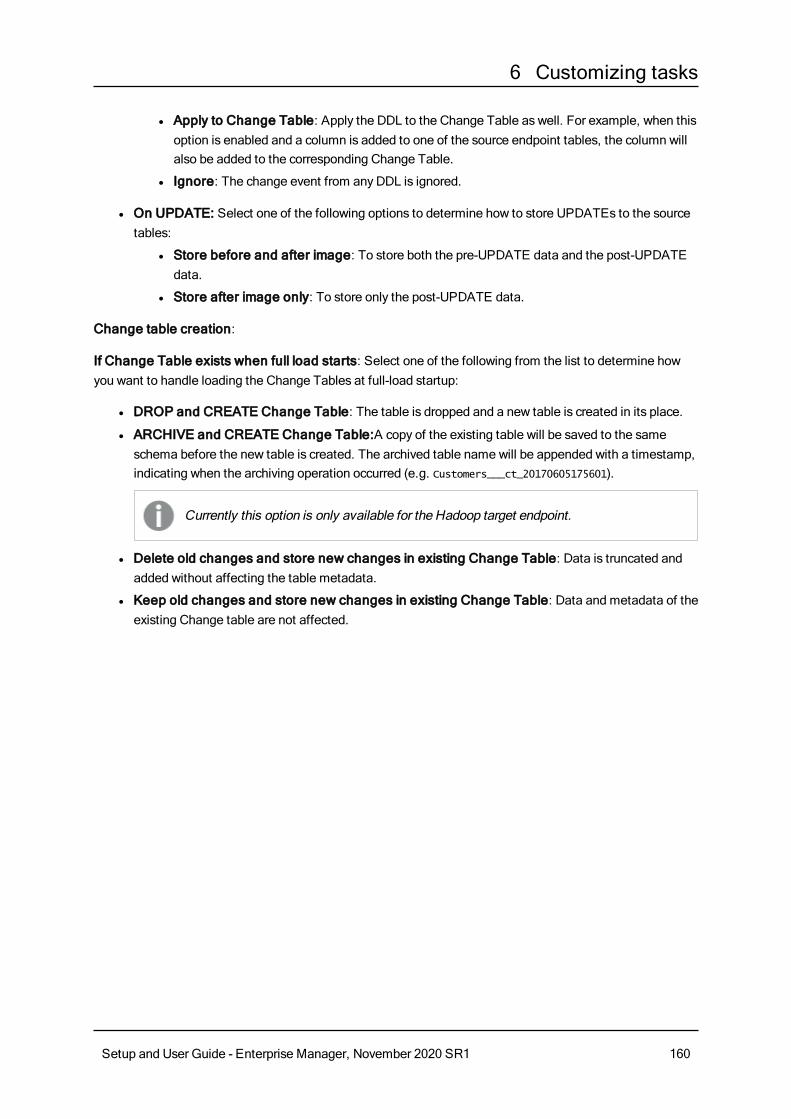
6 Customizing tasks
l Apply to Change Table: Apply the DDL to the Change Table as well. For example, when this option is enabled and a column is added to one of the source endpoint tables, the column will also be added to the corresponding Change Table.
l Ignore: The change event from any DDL is ignored.
l On UPDATE: Select one of the following options to determine how to store UPDATEs to the source tables:
l Store before and after image: To store both the pre-UPDATE data and the post-UPDATE data.
l Store after image only: To store only the post-UPDATE data.
Change table creation:
If Change Table exists when full load starts: Select one of the following from the list to determine how you want to handle loading the Change Tables at full-load startup:
l DROP and CREATE Change Table: The table is dropped and a new table is created in its place.
l ARCHIVE and CREATE Change Table:A copy of the existing table will be saved to the same schema before the new table is created. The archived table name will be appended with a timestamp, indicating when the archiving operation occurred (e.g. Customers___ct_20170605175601).
Currently this option is only available for the Hadoop target endpoint.
l Delete old changes and store new changes in existing Change Table: Data is truncated and added without affecting the table metadata.
l Keep old changes and store new changes in existing Change Table: Data and metadata of the existing Change table are not affected.
Setup and User Guide - Enterprise Manager, November 2020 SR1 160
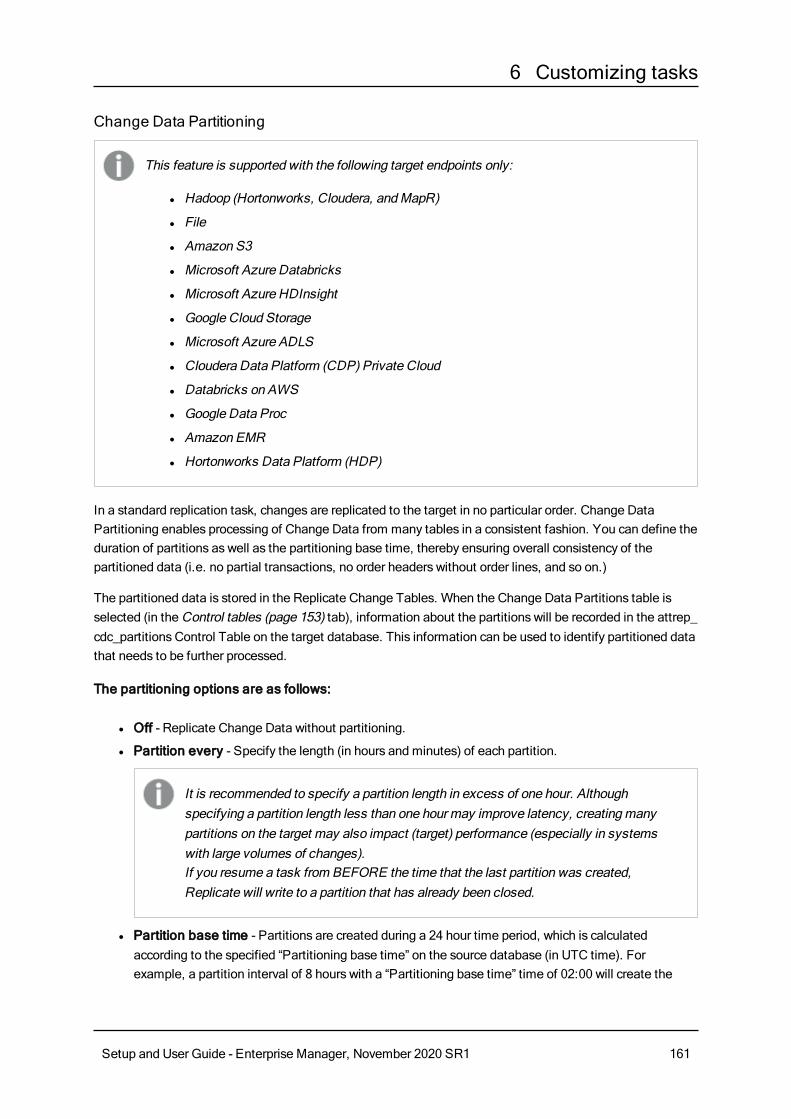
6 Customizing tasks
Change Data Partitioning
This feature is supported with the following target endpoints only:
l Hadoop (Hortonworks, Cloudera, and MapR)
l File
l Amazon S3
l Microsoft Azure Databricks
l Microsoft Azure HDInsight
l Google Cloud Storage
l Microsoft Azure ADLS
l Cloudera Data Platform (CDP) Private Cloud
l Databricks on AWS
l Google Data Proc
l Amazon EMR
l Hortonworks Data Platform (HDP)
In a standard replication task, changes are replicated to the target in no particular order. Change Data Partitioning enables processing of Change Data from many tables in a consistent fashion. You can define the duration of partitions as well as the partitioning base time, thereby ensuring overall consistency of the partitioned data (i.e. no partial transactions, no order headers without order lines, and so on.)
The partitioned data is stored in the Replicate Change Tables. When the Change Data Partitions table is selected (in the Control tables (page 153) tab), information about the partitions will be recorded in the attrep_cdc_partitions Control Table on the target database. This information can be used to identify partitioned data that needs to be further processed.
The partitioning options are as follows:
l Off - Replicate Change Data without partitioning.
l Partition every - Specify the length (in hours and minutes) of each partition.
It is recommended to specify a partition length in excess of one hour. Although specifying a partition length less than one hour may improve latency, creating many partitions on the target may also impact (target) performance (especially in systems with large volumes of changes).If you resume a task from BEFORE the time that the last partition was created, Replicate will write to a partition that has already been closed.
l Partition base time - Partitions are created during a 24 hour time period, which is calculated according to the specified “Partitioning base time” on the source database (in UTC time). For example, a partition interval of 8 hours with a “Partitioning base time” time of 02:00 will create the
Setup and User Guide - Enterprise Manager, November 2020 SR1 161
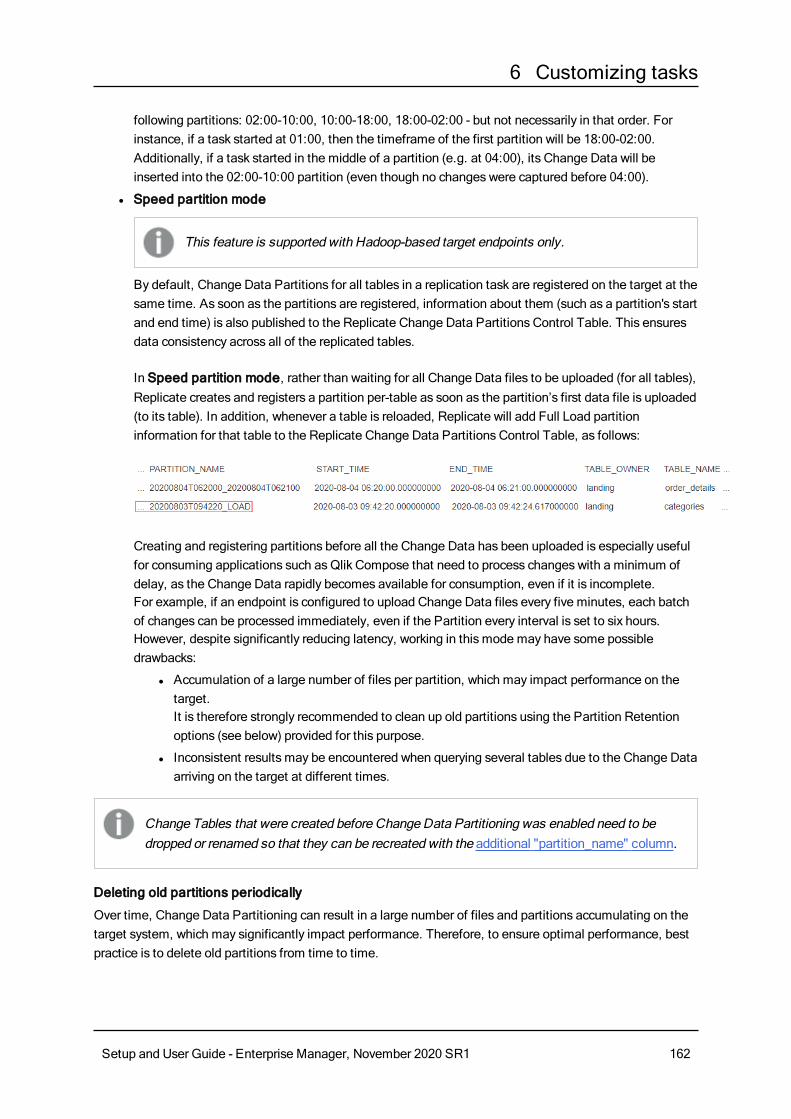
6 Customizing tasks
following partitions: 02:00-10:00, 10:00-18:00, 18:00-02:00 - but not necessarily in that order. For instance, if a task started at 01:00, then the timeframe of the first partition will be 18:00-02:00. Additionally, if a task started in the middle of a partition (e.g. at 04:00), its Change Data will be inserted into the 02:00-10:00 partition (even though no changes were captured before 04:00).
l Speed partition mode
This feature is supported with Hadoop-based target endpoints only.
By default, Change Data Partitions for all tables in a replication task are registered on the target at the same time. As soon as the partitions are registered, information about them (such as a partition's start and end time) is also published to the Replicate Change Data Partitions Control Table. This ensures data consistency across all of the replicated tables. In Speed partition mode, rather than waiting for all Change Data files to be uploaded (for all tables), Replicate creates and registers a partition per-table as soon as the partition’s first data file is uploaded (to its table). In addition, whenever a table is reloaded, Replicate will add Full Load partition information for that table to the Replicate Change Data Partitions Control Table, as follows:
Creating and registering partitions before all the Change Data has been uploaded is especially useful for consuming applications such as Qlik Compose that need to process changes with a minimum of delay, as the Change Data rapidly becomes available for consumption, even if it is incomplete.For example, if an endpoint is configured to upload Change Data files every five minutes, each batch of changes can be processed immediately, even if the Partition every interval is set to six hours.However, despite significantly reducing latency, working in this mode may have some possible drawbacks:
l Accumulation of a large number of files per partition, which may impact performance on the target.It is therefore strongly recommended to clean up old partitions using the Partition Retention options (see below) provided for this purpose.
l Inconsistent results may be encountered when querying several tables due to the Change Data arriving on the target at different times.
Change Tables that were created before Change Data Partitioning was enabled need to be dropped or renamed so that they can be recreated with the additional "partition_name" column.
Deleting old partitions periodically
Over time, Change Data Partitioning can result in a large number of files and partitions accumulating on the target system, which may significantly impact performance. Therefore, to ensure optimal performance, best practice is to delete old partitions from time to time.
Setup and User Guide - Enterprise Manager, November 2020 SR1 162
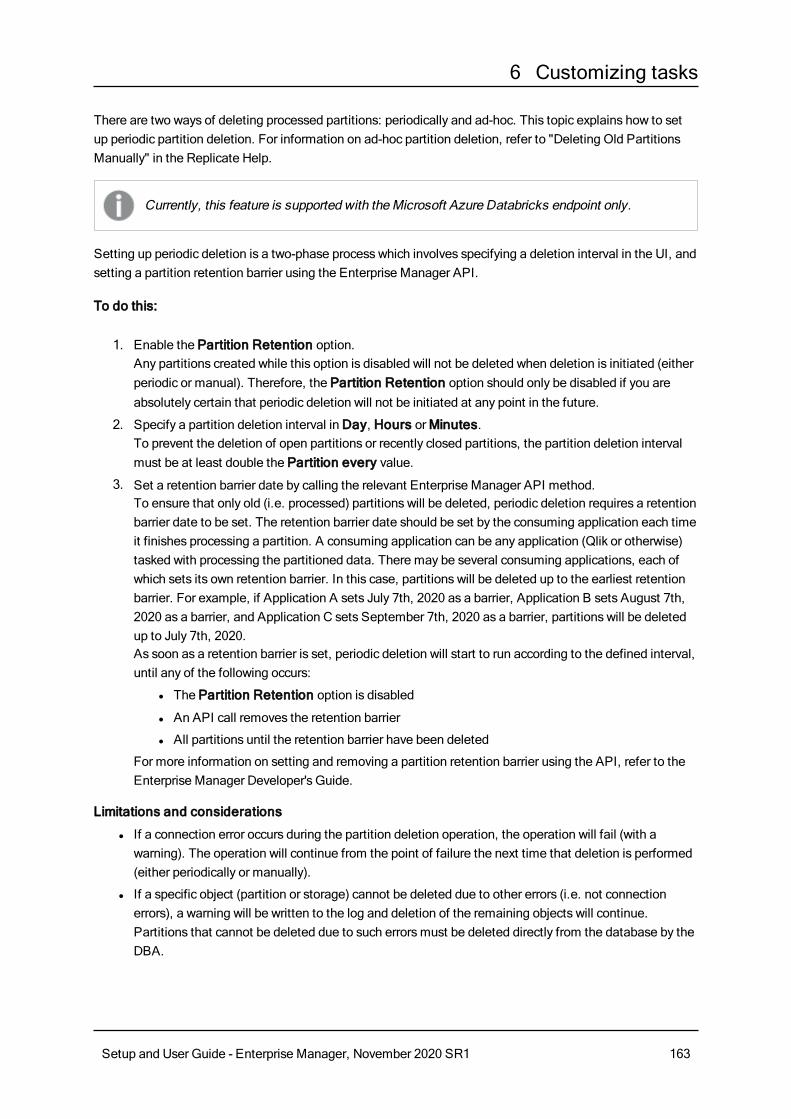
6 Customizing tasks
There are two ways of deleting processed partitions: periodically and ad-hoc. This topic explains how to set up periodic partition deletion. For information on ad-hoc partition deletion, refer to "Deleting Old Partitions Manually" in the Replicate Help.
Currently, this feature is supported with the Microsoft Azure Databricks endpoint only.
Setting up periodic deletion is a two-phase process which involves specifying a deletion interval in the UI, and setting a partition retention barrier using the Enterprise Manager API.
To do this:
1. Enable the Partition Retention option.Any partitions created while this option is disabled will not be deleted when deletion is initiated (either periodic or manual). Therefore, the Partition Retention option should only be disabled if you are absolutely certain that periodic deletion will not be initiated at any point in the future.
2. Specify a partition deletion interval in Day, Hours or Minutes.To prevent the deletion of open partitions or recently closed partitions, the partition deletion interval must be at least double the Partition every value.
3. Set a retention barrier date by calling the relevant Enterprise Manager API method. To ensure that only old (i.e. processed) partitions will be deleted, periodic deletion requires a retention barrier date to be set. The retention barrier date should be set by the consuming application each time it finishes processing a partition. A consuming application can be any application (Qlik or otherwise) tasked with processing the partitioned data. There may be several consuming applications, each of which sets its own retention barrier. In this case, partitions will be deleted up to the earliest retention barrier. For example, if Application A sets July 7th, 2020 as a barrier, Application B sets August 7th, 2020 as a barrier, and Application C sets September 7th, 2020 as a barrier, partitions will be deleted up to July 7th, 2020.As soon as a retention barrier is set, periodic deletion will start to run according to the defined interval, until any of the following occurs:
l The Partition Retention option is disabled
l An API call removes the retention barrier
l All partitions until the retention barrier have been deleted
For more information on setting and removing a partition retention barrier using the API, refer to the Enterprise Manager Developer's Guide.
Limitations and considerations
l If a connection error occurs during the partition deletion operation, the operation will fail (with a warning). The operation will continue from the point of failure the next time that deletion is performed (either periodically or manually).
l If a specific object (partition or storage) cannot be deleted due to other errors (i.e. not connection errors), a warning will be written to the log and deletion of the remaining objects will continue. Partitions that cannot be deleted due to such errors must be deleted directly from the database by the DBA.
Setup and User Guide - Enterprise Manager, November 2020 SR1 163

6 Customizing tasks
l To prevent deletion of open partitions, the last partition in a table will not be deleted, even if meets the criteria for deletion.
l Deletion of partitions in renamed tables is not supported.
l Reloading a target with the Drop and Create tables option (the default) will delete both the tables and their partitions, regardless of any partition deletion policy. However, reloading a target with the Do nothing option, will leave the partitions untouched. In this case, partitions created prior to the target reload cannot be deleted using the Replicate partition deletion tools.
Selecting Change Table header columnsThe Change Table header columns provide information about the Change Processing operation such as the type of operation (e.g. INSERT), the commit time, and so on. If you do not need this information, you can configure Replicate to create the Change Tables without some or all of the header columns, thereby reducing their footprint in the target database. To do this, clear the check boxes next to the header columns that you wish to exclude.
Note that you cannot remove additional columns or restore columns while a task is running. To change your initial selection, you first need to stop the task, then modify your selection, and finally reload the target tables.
When Change Data Partitioning is enabled, an extra header column named "partition_name" is added to the Change Tables and automatically selected in the UI. As this column is required, it cannot be excluded.
For a description of the header columns, refer to the Qlik Replicate User Guide and Reference .
Storing changes in an Audit tableThe following section describes the options that are available for storing changes in an Audit table.
LOB columns with unlimited size are not supported in the CHANGE_RECORD and BU_CHANGE_RECORD fields. The other fields will be recorded but the LOB will have a NULL value.
For a description of the audit table structure, see the Qlik Replicate Setup and User Guide.
l Audit table schema: Specify a schema if you do not want the Audit table to be created under the target endpoint's default schema.
The default schema are as follows:
Endpoint Default Schema
Pivotal Greenplum Public
Default schema by endpoint
Setup and User Guide - Enterprise Manager, November 2020 SR1 164

6 Customizing tasks
Endpoint Default Schema
Amazon Redshift Public
Oracle The connected user’s user name.
Teradata The endpoint name.
All others The user’s default schema.
l Audit table tablespace: This option is only available when the task's target endpoint is Oracle. Enter the tablespace name on the target where you want the Audit table to be created. If you do not enter any information in this field, then the tables will created in the default permanent tablespace.
l Audit table name: Specify a name for the Audit table. The default value is attrep__audit_table.
Audit table creation:
If audit table exists when the target is reloaded: Select one of the following to determine how you want to handle the Audit table when the target is reloaded:
l DROP and CREATE audit table: The Audit table is dropped and a new table is created in its place.
l ARCHIVE and CREATE audit table: A copy of the existing table will be saved to the same schema before the new table is created. The archived table name will be appended with a timestamp, indicating when the archiving operation occurred (e.g. attrep_audit_table_20170605175601).
Currently this option is only available for the Hadoop target endpoint.
l Delete old changes and store new changes in existing audit table: Data is truncated and added without affecting the Audit table metadata.
l Keep old changes and store new changes in existing audit table: Data and metadata of the existing Audit table are not affected.
For a description of the audit table structure, see the Qlik Replicate Setup and User Guide.
Change Processing TuningClick the Change Processing Tuning sub-tab to fine-tune the Apply Changes settings.
Change Processing ModeDetermine which method will be used to apply changes.
Changes to tables without a Unique Index or Primary Key will always be applied in Transactional apply mode.
l Transactional apply: Select this to apply each transaction individually, in the order it is committed. In this case, strict referential integrity is ensured for all tables.
Setup and User Guide - Enterprise Manager, November 2020 SR1 165
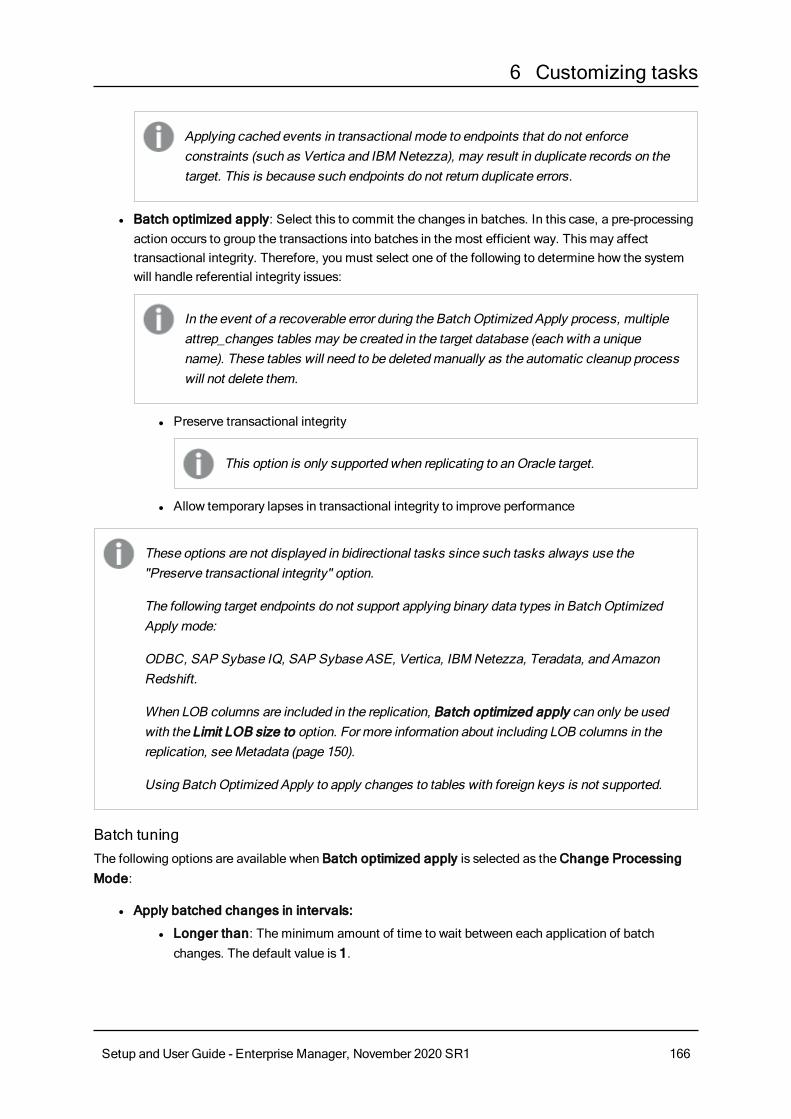
6 Customizing tasks
Applying cached events in transactional mode to endpoints that do not enforce constraints (such as Vertica and IBM Netezza), may result in duplicate records on the target. This is because such endpoints do not return duplicate errors.
l Batch optimized apply: Select this to commit the changes in batches. In this case, a pre-processing action occurs to group the transactions into batches in the most efficient way. This may affect transactional integrity. Therefore, you must select one of the following to determine how the system will handle referential integrity issues:
In the event of a recoverable error during the Batch Optimized Apply process, multiple attrep_changes tables may be created in the target database (each with a unique name). These tables will need to be deleted manually as the automatic cleanup process will not delete them.
l Preserve transactional integrity
This option is only supported when replicating to an Oracle target.
l Allow temporary lapses in transactional integrity to improve performance
These options are not displayed in bidirectional tasks since such tasks always use the "Preserve transactional integrity" option.
The following target endpoints do not support applying binary data types in Batch Optimized Apply mode:
ODBC, SAP Sybase IQ, SAP Sybase ASE, Vertica, IBM Netezza, Teradata, and Amazon Redshift.
When LOB columns are included in the replication, Batch optimized apply can only be used with the Limit LOB size to option. For more information about including LOB columns in the replication, see Metadata (page 150).
Using Batch Optimized Apply to apply changes to tables with foreign keys is not supported.
Batch tuningThe following options are available when Batch optimized apply is selected as the Change Processing Mode:
l Apply batched changes in intervals:
l Longer than: The minimum amount of time to wait between each application of batch changes. The default value is 1.
Setup and User Guide - Enterprise Manager, November 2020 SR1 166

6 Customizing tasks
Increasing the Longer than value decreases the frequency with which changes are applied to the target while increasing the size of the batches. This can improve performance when applying changes to target endpoints that are optimized for processing large batches, such as Teradata, Vertica, and Pivotal Greenplum.
l But less than: The maximum amount of time to wait between each application of batch changes (before declaring a timeout). In other words, the maximum acceptable latency. The default value is 30. This value determines the maximum amount of time to wait before applying the changes, after the Longer than value has been reached.
l Force apply a batch when processing memory exceeds (MB): The maximum amount of memory to use for pre-processing in Batch optimized apply mode. The default value is 500.For maximum batch size, set this value to the highest amount of memory you can allocate to Qlik Replicate. This can improve performance when applying changes to target endpoints that are optimized for processing large batches, such as Teradata, Vertica, and Pivotal Greenplum.
l Apply batched changes to multiple tables concurrently: Selecting this option should improve performance when applying changes from multiple source tables.
l Maximum number of tables: The maximum number of tables to apply batched changes to concurrently. The default is five, the maximum is 50, and the minimum is two.
Setup and User Guide - Enterprise Manager, November 2020 SR1 167
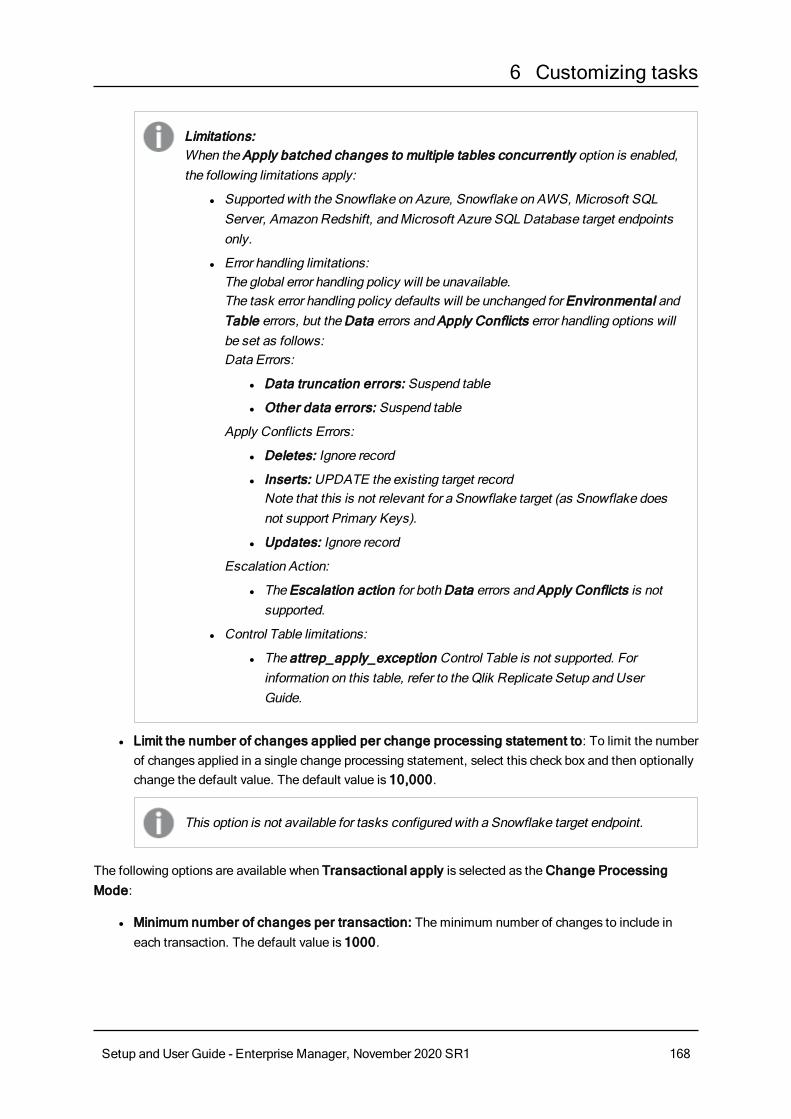
6 Customizing tasks
Limitations: When the Apply batched changes to multiple tables concurrently option is enabled, the following limitations apply:
l Supported with the Snowflake on Azure, Snowflake on AWS, Microsoft SQL Server, Amazon Redshift, and Microsoft Azure SQL Database target endpoints only.
l Error handling limitations:The global error handling policy will be unavailable.The task error handling policy defaults will be unchanged for Environmental and Table errors, but the Data errors and Apply Conflicts error handling options will be set as follows:Data Errors:
l Data truncation errors: Suspend table
l Other data errors: Suspend table
Apply Conflicts Errors:
l Deletes: Ignore record
l Inserts: UPDATE the existing target recordNote that this is not relevant for a Snowflake target (as Snowflake does not support Primary Keys).
l Updates: Ignore record
Escalation Action:
l The Escalation action for both Data errors and Apply Conflicts is not supported.
l Control Table limitations:
l The attrep_apply_exception Control Table is not supported. For information on this table, refer to the Qlik Replicate Setup and User Guide.
l Limit the number of changes applied per change processing statement to: To limit the number of changes applied in a single change processing statement, select this check box and then optionally change the default value. The default value is 10,000.
This option is not available for tasks configured with a Snowflake target endpoint.
The following options are available when Transactional apply is selected as the Change Processing Mode:
l Minimum number of changes per transaction: The minimum number of changes to include in each transaction. The default value is 1000.
Setup and User Guide - Enterprise Manager, November 2020 SR1 168
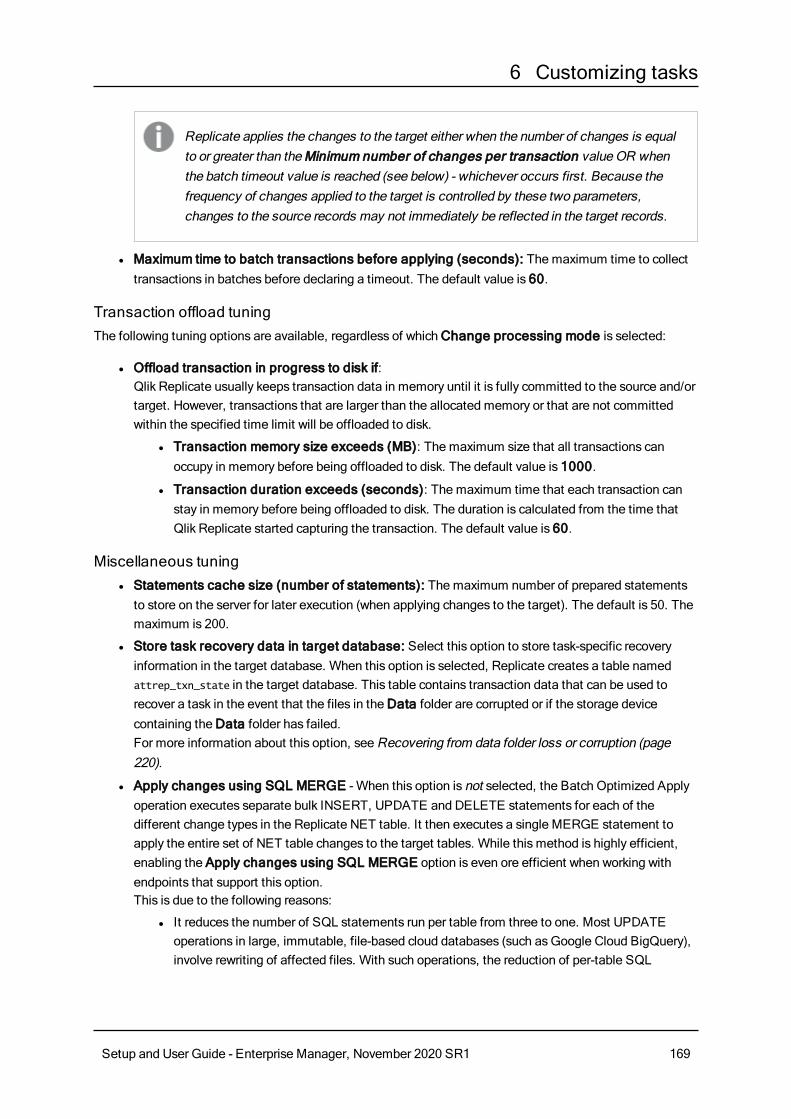
6 Customizing tasks
Replicate applies the changes to the target either when the number of changes is equal to or greater than the Minimum number of changes per transaction value OR when the batch timeout value is reached (see below) - whichever occurs first. Because the frequency of changes applied to the target is controlled by these two parameters, changes to the source records may not immediately be reflected in the target records.
l Maximum time to batch transactions before applying (seconds): The maximum time to collect transactions in batches before declaring a timeout. The default value is 60.
Transaction offload tuningThe following tuning options are available, regardless of which Change processing mode is selected:
l Offload transaction in progress to disk if:Qlik Replicate usually keeps transaction data in memory until it is fully committed to the source and/or target. However, transactions that are larger than the allocated memory or that are not committed within the specified time limit will be offloaded to disk.
l Transaction memory size exceeds (MB): The maximum size that all transactions can occupy in memory before being offloaded to disk. The default value is 1000.
l Transaction duration exceeds (seconds): The maximum time that each transaction can stay in memory before being offloaded to disk. The duration is calculated from the time that Qlik Replicate started capturing the transaction. The default value is 60.
Miscellaneous tuning l Statements cache size (number of statements): The maximum number of prepared statements
to store on the server for later execution (when applying changes to the target). The default is 50. The maximum is 200.
l Store task recovery data in target database: Select this option to store task-specific recovery information in the target database. When this option is selected, Replicate creates a table named attrep_txn_state in the target database. This table contains transaction data that can be used to recover a task in the event that the files in the Data folder are corrupted or if the storage device containing the Data folder has failed.For more information about this option, see Recovering from data folder loss or corruption (page 220).
l Apply changes using SQL MERGE - When this option is not selected, the Batch Optimized Apply operation executes separate bulk INSERT, UPDATE and DELETE statements for each of the different change types in the Replicate NET table. It then executes a single MERGE statement to apply the entire set of NET table changes to the target tables. While this method is highly efficient, enabling the Apply changes using SQL MERGE option is even ore efficient when working with endpoints that support this option. This is due to the following reasons:
l It reduces the number of SQL statements run per table from three to one. Most UPDATE operations in large, immutable, file-based cloud databases (such as Google Cloud BigQuery), involve rewriting of affected files. With such operations, the reduction of per-table SQL
Setup and User Guide - Enterprise Manager, November 2020 SR1 169

6 Customizing tasks
statements from three to one is very significant.
l The target database only needs to scan the NET table once, significantly reducing I/O.
l This option is currently in beta.
l When this option is enabled, non-fatal data errors or data errors that cannot be recovered will be referred as table errors.
l This option is not supported with the Salesforce and Oracle source endpoints. For more information, see the "Limitations and Considerations" topic for these endpoints.
l This option is available for tasks configured with the Google Cloud BigQuery and Microsoft Azure Databricks Delta target endpoints only.
l When this option is enabled, both the global error handling policy and the task-level error handling policy for Apply Conflicts will be unavailable.
Error handlingQlik Replicate handles different types of errors during its operation. The way the system should respond to these errors depends on several aspects, including the component where the error occurred, the type of error, and the scope of the error. Because different sites may have different requirements for error behavior, Qlik Replicate lets you configure the error handling.
You can also add an environment variable that instructs Replicate to create dump files in the event of a crash. The dump files can then be used by Qlik Support to troubleshoot the cause of the crash. For more information, refer to the Qlik Replicate setup and User Guide.
When you click Error Handling in the Task Settings dialog box, you can configure the following:
l Error Handling Settings:You can determine whether or not to override the global error handling settings.
The option to set a Global Error Handling policy is not available when the Apply batched changes to multiple tables concurrently option is selected in the Task Settings' Change Processing Tuning tab.
l Environmental Errors: An error that is caused by an environmental problem in the source or target endpoint or on the network. Some examples of environmental errors are loss of communication with the source or target endpoint, restarting a database, or network problems.
l Data Errors: An error related to data processing at the record level. Some examples of data errors are conversion errors, errors in transformations, or bad data.
l Table Errors: An error in processing data or metadata for a specific table. This only includes general table data and not an error that relates to a specific record.
l Apply Conflicts: Errors that occur when the target endpoint is not synchronized with the source endpoint when processing changes.
Setup and User Guide - Enterprise Manager, November 2020 SR1 170

6 Customizing tasks
This can cause duplicate key errors on INSERT operations or zero rows affected on UPDATE/DELETE operations.
Error Handling settingsThe option to switch between the Global Error Handling policy and a Task Error Handling policy is available in each of the Error Handling sub-tabs. However, the policy you enable will be applied to all error types, regardless of where it was enabled. For example, you cannot enable a Task Error Handling policy for Data Errors and then enable the Global Error Handling policy for Table Errors and Environmental Errors.
For information on setting the global error handling policy, see the Qlik Replicate Setup and User Guide.
To set a Task-Specific Error Handling policy:
l Click the Change to Task Policy button in any of the Error Handling sub-tabs.
To revert to the Global Error Handling policy:
1. Click the Change to Global Policy button in any of the Error Handling sub-tabs.
2. Click OK when prompted to confirm your action.
Environmental errorsClick the Environmental Errors sub-tab and then click Change to Task Policy to configure the following:
l Maximum retry count: Select this option and then specify the maximum number of attempts to retry a task when a recoverable environmental error occurs.
1. To never retry a task, clear the check box or specify "0".
2. To retry the task an infinite number of times, specify "-1" (the global error handling default).
When the system attempts to retry the task the designated number of times, the task is stopped and manual intervention is required.
l Interval between retry attempts: Use the counter to select or type the number of seconds that the system waits between attempts to retry a task. Valid values are 0-2,000.
l Increase retry interval for long outages: Select this check box to increase the retry interval for long outages. When this option is enabled, Replicate doubles the interval between each retry attempt and the next, until the Maximum retry interval is reached (and continues retrying according to the specified maximum interval).
l Maximum retry interval: Use the counter to select or type the number of seconds to wait between attempts to retry a task when the Increase retry interval for long outages option is enabled. Valid values are 0-2,000.
Data ErrorClick the Data Error sub-tab and then click Change to Task Policy to configure the following:
l For a data truncation error: Click the triangle to open the list and select what happens when an truncation occurs in one or more specific records. You can select one of the following from the list:
Setup and User Guide - Enterprise Manager, November 2020 SR1 171

6 Customizing tasks
l Ignore record: The task continues and the error is ignored.
l Log record to the exceptions table (default): The task continues and the error is written to the exceptions table.
l Suspend table: The task continues but data from the table with the error record is moved into an error state and its data is not replicated
l Stop task: The task is stopped and manual intervention is required.
Data truncation error handling is only supported in the following cases:
l Replication is to the following target endpoints: MySQL, PostgreSQL, Oracle, Microsoft SQL Server, SAP Sybase ASE, File, and Amazon Redshift.
l Change Processing replication only (i.e. not Full Load)
l For other data errors: Click the triangle to open the list and select what happens when an error occurs in one or more specific records. You can select one of the following from the list:
l Ignore record: The task continues and the error is ignored.
l Log record to the exceptions table (default): The task continues and the error is written to the exceptions table.
l Suspend table: The task continues but data from the table with the error record is moved into an error state and its data is not replicated
l Stop task: The task is stopped and manual intervention is required.
l Escalate error handling when other data errors reach (per table): Select this check box to escalate error handling when the number of non-truncation data errors (per table) reaches the specified amount. Valid values are 1-10,000.
l Escalation action: Choose what action Replicate should perform when error handling is escalated. Note that the available actions are dependent on the action selected from the For other data errors drop-down list described above.
l Log record to the exceptions table: The task continues and the error is written to the exceptions table.
l Suspend table (default): The task continues but data from the table with the error record is moved into an error state and its data is not replicated.
The behavior differs according to the Change Processing Mode:
l In Transactional apply mode, the last changes will not be replicated
l In Batch optimized apply mode, a situation is possible where there will be no replication of data or data replication will occur in part
l Stop task: The task is stopped and manual intervention is required.
Setup and User Guide - Enterprise Manager, November 2020 SR1 172
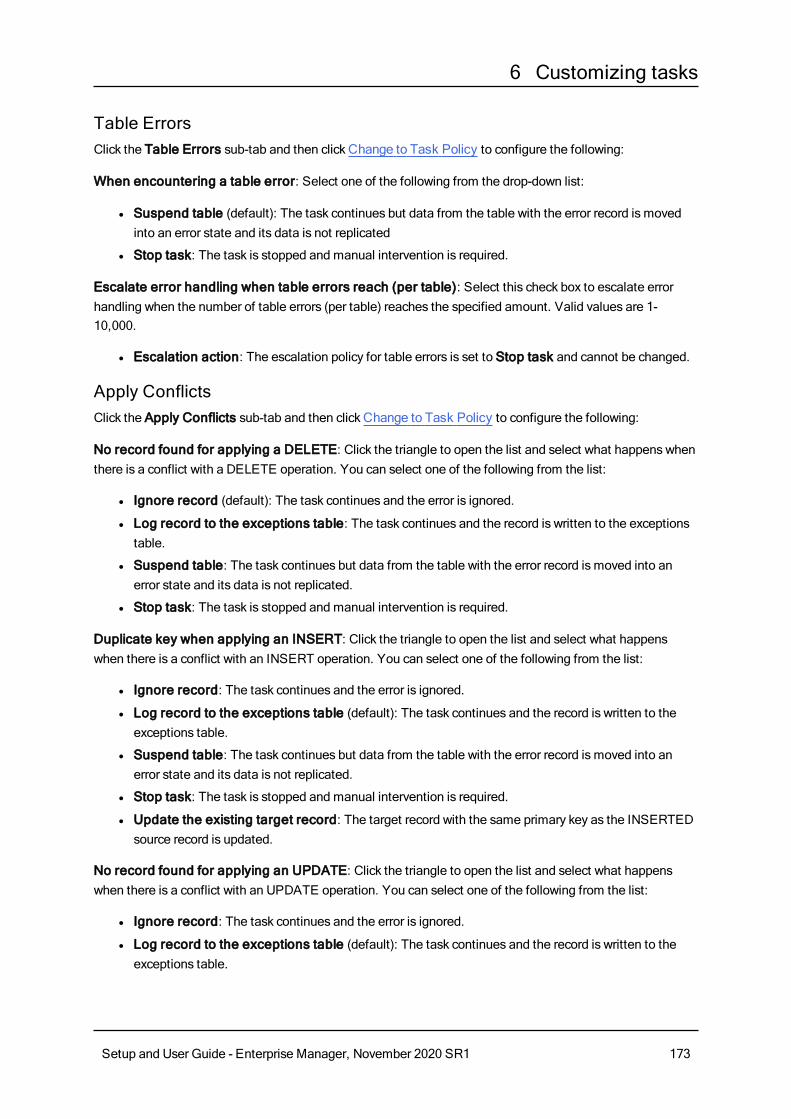
6 Customizing tasks
Table ErrorsClick the Table Errors sub-tab and then click Change to Task Policy to configure the following:
When encountering a table error: Select one of the following from the drop-down list:
l Suspend table (default): The task continues but data from the table with the error record is moved into an error state and its data is not replicated
l Stop task: The task is stopped and manual intervention is required.
Escalate error handling when table errors reach (per table): Select this check box to escalate error handling when the number of table errors (per table) reaches the specified amount. Valid values are 1-10,000.
l Escalation action: The escalation policy for table errors is set to Stop task and cannot be changed.
Apply ConflictsClick the Apply Conflicts sub-tab and then click Change to Task Policy to configure the following:
No record found for applying a DELETE: Click the triangle to open the list and select what happens when there is a conflict with a DELETE operation. You can select one of the following from the list:
l Ignore record (default): The task continues and the error is ignored.
l Log record to the exceptions table: The task continues and the record is written to the exceptions table.
l Suspend table: The task continues but data from the table with the error record is moved into an error state and its data is not replicated.
l Stop task: The task is stopped and manual intervention is required.
Duplicate key when applying an INSERT: Click the triangle to open the list and select what happens when there is a conflict with an INSERT operation. You can select one of the following from the list:
l Ignore record: The task continues and the error is ignored.
l Log record to the exceptions table (default): The task continues and the record is written to the exceptions table.
l Suspend table: The task continues but data from the table with the error record is moved into an error state and its data is not replicated.
l Stop task: The task is stopped and manual intervention is required.
l Update the existing target record: The target record with the same primary key as the INSERTED source record is updated.
No record found for applying an UPDATE: Click the triangle to open the list and select what happens when there is a conflict with an UPDATE operation. You can select one of the following from the list:
l Ignore record: The task continues and the error is ignored.
l Log record to the exceptions table (default): The task continues and the record is written to the exceptions table.
Setup and User Guide - Enterprise Manager, November 2020 SR1 173

6 Customizing tasks
l Suspend table: The task continues but data from the table with the error record is moved into an error state and its data is not replicated
l Stop task: The task is stopped and manual intervention is required.
l Insert the missing target record: The missing target record will be inserted into the target table. When the source endpoint is Oracle, selecting this option requires supplemental logging to be enabled for all the source table columns.
When the INSERT the missing target record option is selected, LOB columns in the source tables will not be replicated to the target (even if the task’s Replicate LOB columns option is enabled).
Escalate handling when apply conflicts reach (per table): Select this check box to escalate error handling when the number of apply conflicts (per table) reaches the specified amount. Valid values are 1-10,000.
l When this option is selected and the number of conflicts reaches the specified number,
l Apply Conflicts errors are counted for each table separately when a task is run. When a task stops, the error count reverts to zero. When a task is resumed/reloaded, the number of errors for all the tables are reset.
l When working in Batch optimized apply Change Processing mode, the calculation of the Apply Conflicts amount does not include DELETE and UPDATE conflicts that were ignored (as a result of enabling the Ignore Record option described above).
Escalation action: Choose what action Replicate should perform when handling is escalated. Note that the available actions are dependent on the action selected in the drop-down lists described above.
When this option is selected and the number of conflicts reaches the specified number, only the escalation action will be performed (i.e. the original action set for the Apply conflict will not be performed).
l Log record to the exceptions table (default): The task continues and the error is written to the task log and to the exceptions table.
l Suspend table: The task continues but data from the table with the error record is moved into an error state and its data is not replicated.
l Stop task: The task is stopped and manual intervention is required.
LoggingYou can set the logging level for task logs by selecting the Logging tab in the Task Settings dialog box and then selecting the Logging Level sub-tab.The level you set determines what information is written to the log.
Setup and User Guide - Enterprise Manager, November 2020 SR1 174
6 Customizing tasks
You can also set the task logging level from the Tools menu in Monitor view.
For more information, see Monitor mode (page 190) and Logging (page 223).
For more information on monitoring, see Monitor mode (page 190). For more information on setting the task logging level in Qlik Replicate, see the Qlik Replicate Setup and User Guide.
The following are the available logging levels. The list is in order from the lowest level to the highest level.
1. Error
2. Warning
3. Info
4. Trace
5. Verbose
The higher levels always include the messages from the lower levels. Therefore, if you select Error, only error messages are written to the log. However, if you select Info, informational messages, warnings, and error messages are included. Selecting Verbose writes all possible messages to the log.
For information on how to set the logging level in Qlik Replicate, see the Qlik Replicate Setup and User Guide.
Storing trace and verbose logging in memory
This option is relevant to Replicate tasks only.
When the logging level is set to "Trace" or "Verbose", you can instruct Replicate to store the logging information in memory until an error occurs. On detecting an error, Replicate will begin writing to the physical logs and continue to do so for a few minutes after the initial occurrence of the error.
If no error occurs before the allocated memory is used up, Replicate will empty the memory buffer and start afresh.
This option is useful for tasks that fail unpredictably and for no obvious reason. The problem with continually writing large amounts of information to the logs is twofold:
l Running in "Trace" or "Verbose" logging mode will quickly use up available disk space (unless the logging settings have been configured to prevent this).
l Continually writing large amounts of data to the logs will affect performance.
To use this option
1. Select the Store trace/verbose logging in memory, but if an error occurs, write to the logs check box at the top of the tab.
2. In the Allocate memory up to (MB) field, specify the amount of memory you want to allocate for storing logging information.
Setup and User Guide - Enterprise Manager, November 2020 SR1 175
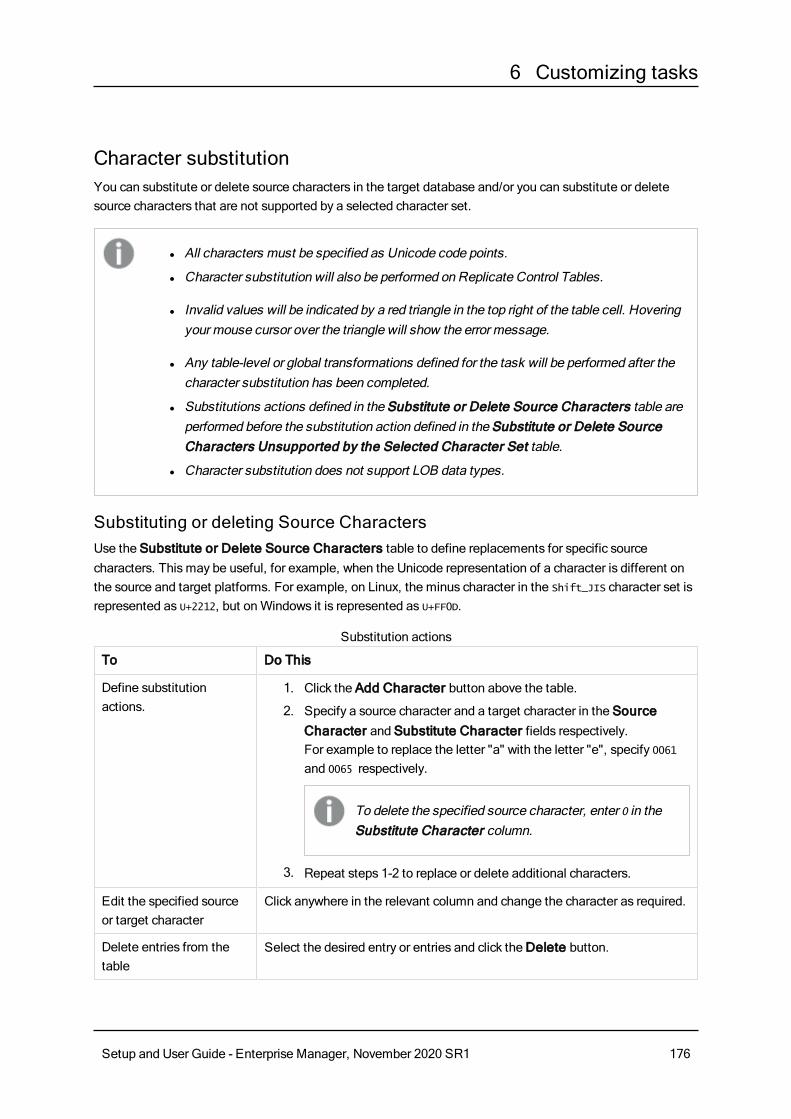
6 Customizing tasks
Character substitutionYou can substitute or delete source characters in the target database and/or you can substitute or delete source characters that are not supported by a selected character set.
l All characters must be specified as Unicode code points.
l Character substitution will also be performed on Replicate Control Tables.
l Invalid values will be indicated by a red triangle in the top right of the table cell. Hovering your mouse cursor over the triangle will show the error message.
l Any table-level or global transformations defined for the task will be performed after the character substitution has been completed.
l Substitutions actions defined in the Substitute or Delete Source Characters table are performed before the substitution action defined in the Substitute or Delete Source Characters Unsupported by the Selected Character Set table.
l Character substitution does not support LOB data types.
Substituting or deleting Source CharactersUse the Substitute or Delete Source Characters table to define replacements for specific source characters. This may be useful, for example, when the Unicode representation of a character is different on the source and target platforms. For example, on Linux, the minus character in the Shift_JIS character set is represented as U+2212, but on Windows it is represented as U+FF0D.
To Do This
Define substitution actions.
1. Click the Add Character button above the table.
2. Specify a source character and a target character in the Source Character and Substitute Character fields respectively.For example to replace the letter "a" with the letter "e", specify 0061 and 0065 respectively.
To delete the specified source character, enter 0 in the Substitute Character column.
3. Repeat steps 1-2 to replace or delete additional characters.
Edit the specified source or target character
Click anywhere in the relevant column and change the character as required.
Delete entries from the table
Select the desired entry or entries and click the Delete button.
Substitution actions
Setup and User Guide - Enterprise Manager, November 2020 SR1 176

6 Customizing tasks
Substituting or deleting Source Characters unsupported by the selected character setUse the Substitute or Delete Source Characters Unsupported by the Selected Character Set table to define a single replacement character for all characters not supported by the selected character set.
To Do This
Define or edit a substitution action.
1. Select a character set from the Character Set drop-down list in the table.Any characters not supported by the selected character set will be replaced on the target by the character specified in step 2 below.
2. In the Substitute Character column, click anywhere in the column and specify the replacement character. For example, to replace all unsupported characters with the letter "a", enter 0061.
To delete all unsupported characters, enter 0.
Disable the substitution action.
Select the blank entry from the Character Set drop-down list.
Unsupported character substitution actions
File uploadsNote that the File Uploads tab will only be shown if the task is defined with an endpoint that supports this feature.
Click the Optimize File Uploads button to improve performance when replicating to file-based targets such as Amazon S3 and Hadoop. When this feature is enabled, the button text changes to Disable File Upload Optimization. Click the Disable File Upload Optimization button to disable file upload optimization.
The upload mode depends on the task type:
l Full Load - Multiple files created from the same table are transferred in parallel, in no particular order.
l Apply Changes - Files created from multiple tables are transferred in parallel. Files created from the same table are transferred sequentially according to creation time.
l Change Data Partitioning - Files created from multiple tables and files created from the same table are transferred in parallel.
Note that disabling this option after the task has already started will require you to do one of the following:
l If the task is in the Full Load stage, reload the target using the Reload Target Run option.
l If the task is in the Change Processing stage, resume the task using the Start processing changes from Run option.
Setup and User Guide - Enterprise Manager, November 2020 SR1 177
6 Customizing tasks
l Supported by the following target endpoints only: Amazon S3, Hadoop (Hortonworks, Cloudera, and MapR) Microsoft Azure ADLS, Microsoft Azure Databricks, Databricks on AWS, Microsoft Azure HDInsight, Hortonworks Data Platform (HDP), Google Cloud Storage, Google Cloud Dataproc, Amazon EMR, and Cloudera Data Platform (CDP) Private Cloud.
l General Limitations and Considerations:
l Post Upload Processing endpoint settings are not supported.
l Hadoop - Limitations and Considerations:
l When replicating to a Hadoop target, only Text and Sequence file formats are supported.
l Hive jobs are not supported as they will prevent the file upload.
l Append is not supported when using Text file format.
l Amazon S3 and Microsoft Azure ADLS - Limitations and Considerations:
l When working with Reference Files, a new entry is added to the Reference File immediately after the data file is uploaded (even if the DFM file has not been uploaded yet).
l The existence of the DFM file does not necessarily mean that the associated data file has also been uploaded.
Message FormatThe Message Format tab will only be shown if the task is defined with a streaming target endpoint that supports this feature.
When a task is defined with such an endpoint, you can specify a custom message format that will override the default Replicate message format. This may be useful if the consumer application needs to process the message in a particular format.
The custom message format can be defined at task level and/or at table level. When it is defined at both task and table level, the message format defined for the table will take precedence over the message format defined for the task.
For information on defining a custom message format at table level, see Message format (page 102).
l Supported by the Kafka target endpoint only
l The custom message format feature cannot be used in conjunction the Attunity Avro Message Decoder SDK
l Hierarchical structured messages are not supported.
Setup and User Guide - Enterprise Manager, November 2020 SR1 178

6 Customizing tasks
General rules and usage guidelinesWhen defining a custom message, it is import to consider the rules and usage guidelines listed below.
Section names:
The following naming rules apply:
l Section names must start with the characters a-z, A-Z, or _ (an underscore) and can then be followed by any of the following characters: a-z, A-Z, 0-9, _
l With the exception of the Record name and Key name sections (that do not end with a slash), removing the slash from section names will flatten the hierarchy of the associated section (see Slashes below).
l All section names except Record name and Key name can be deleted (see Deletion: (page 180) below)
l The Data name and Include record Before-data section names cannot both be deleted
l The Data name and Include record Before-data section names cannot be the same
Slashes:
Some of the section names in the UI end with a slash (e.g. beforeData/). The purpose of the slash is to maintain a hierarchy of the different sections within the message. If the slash is removed, the following will occur:
l The hierarchical structure of that section will be flattened, resulting in the section name being removed from the message
l The section name will be prefixed to the actual metadata, either directly or using a separator character (e.g. an underscore) that you appended to the name
Example of a data message when headers/ is specified with a slash:
"message":{
"data":{
"COL1": "159",
"COL2": "159"
},
"beforeData": null,
"headers": {
"operation": "INSERT",
"changeSequence": "2018100811484900000000233",
Example of a data message when headers_ is specified with an underscore instead of a slash:
"message":{
"data":{
"COL1": "159",
"COL2": "159"
Setup and User Guide - Enterprise Manager, November 2020 SR1 179
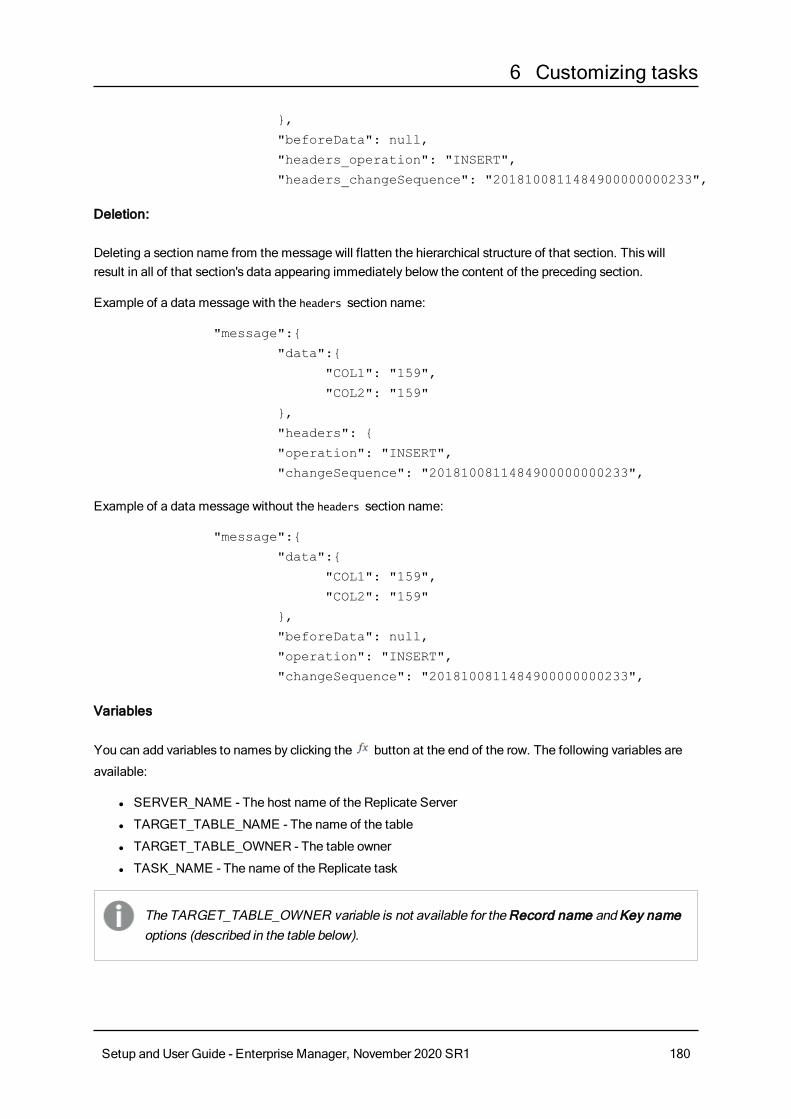
6 Customizing tasks
},
"beforeData": null,
"headers_operation": "INSERT",
"headers_changeSequence": "2018100811484900000000233",
Deletion:
Deleting a section name from the message will flatten the hierarchical structure of that section. This will result in all of that section's data appearing immediately below the content of the preceding section.
Example of a data message with the headers section name:
"message":{
"data":{
"COL1": "159",
"COL2": "159"
},
"headers": {
"operation": "INSERT",
"changeSequence": "2018100811484900000000233",
Example of a data message without the headers section name:
"message":{
"data":{
"COL1": "159",
"COL2": "159"
},
"beforeData": null,
"operation": "INSERT",
"changeSequence": "2018100811484900000000233",
Variables
You can add variables to names by clicking the button at the end of the row. The following variables are
available:
l SERVER_NAME - The host name of the Replicate Server
l TARGET_TABLE_NAME - The name of the table
l TARGET_TABLE_OWNER - The table owner
l TASK_NAME - The name of the Replicate task
The TARGET_TABLE_OWNER variable is not available for the Record name and Key name options (described in the table below).
Setup and User Guide - Enterprise Manager, November 2020 SR1 180

6 Customizing tasks
Defining a custom message formatTo define a custom message format, click the Custom Message Format button and configure the options as described in the table below.
To revert to the default message format, click the Default Message Format button.
Setup and User Guide - Enterprise Manager, November 2020 SR1 181
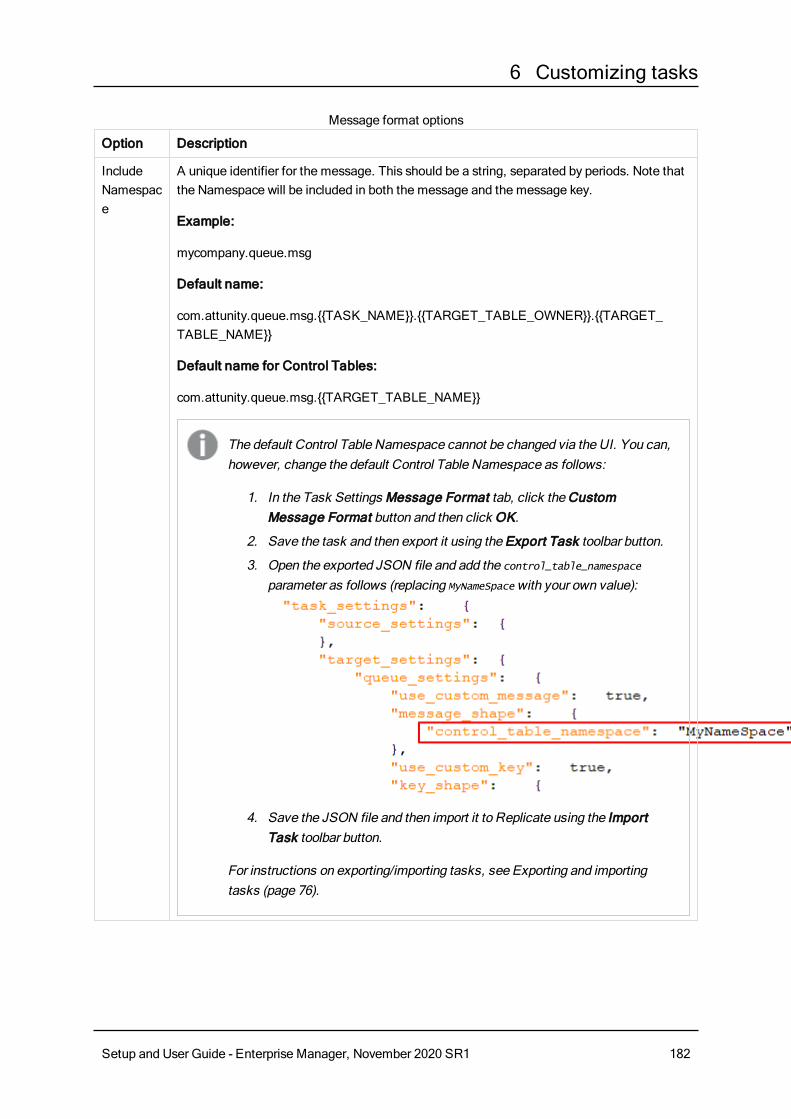
6 Customizing tasks
Option Description
Include Namespace
A unique identifier for the message. This should be a string, separated by periods. Note that the Namespace will be included in both the message and the message key.
Example:
mycompany.queue.msg
Default name:
com.attunity.queue.msg.{{TASK_NAME}}.{{TARGET_TABLE_OWNER}}.{{TARGET_TABLE_NAME}}
Default name for Control Tables:
com.attunity.queue.msg.{{TARGET_TABLE_NAME}}
The default Control Table Namespace cannot be changed via the UI. You can, however, change the default Control Table Namespace as follows:
1. In the Task Settings Message Format tab, click the Custom Message Format button and then click OK.
2. Save the task and then export it using the Export Task toolbar button.
3. Open the exported JSON file and add the control_table_namespace parameter as follows (replacing MyNameSpace with your own value):
4. Save the JSON file and then import it to Replicate using the Import Task toolbar button.
For instructions on exporting/importing tasks, see Exporting and importing tasks (page 76).
Message format options
Setup and User Guide - Enterprise Manager, November 2020 SR1 182
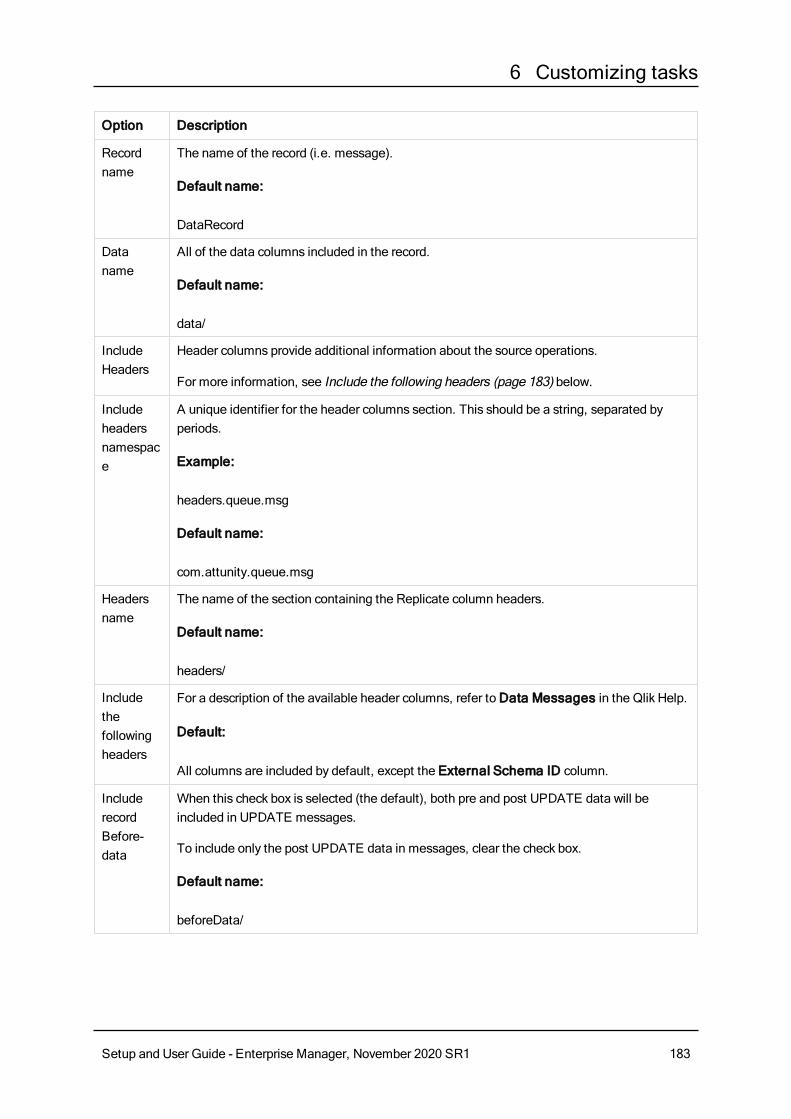
6 Customizing tasks
Option Description
Record name
The name of the record (i.e. message).
Default name:
DataRecord
Data name
All of the data columns included in the record.
Default name:
data/
Include Headers
Header columns provide additional information about the source operations.
For more information, see Include the following headers (page 183) below.
Include headers namespace
A unique identifier for the header columns section. This should be a string, separated by periods.
Example:
headers.queue.msg
Default name:
com.attunity.queue.msg
Headers name
The name of the section containing the Replicate column headers.
Default name:
headers/
Include the following headers
For a description of the available header columns, refer to Data Messages in the Qlik Help.
Default:
All columns are included by default, except the External Schema ID column.
Include record Before-data
When this check box is selected (the default), both pre and post UPDATE data will be included in UPDATE messages.
To include only the post UPDATE data in messages, clear the check box.
Default name:
beforeData/
Setup and User Guide - Enterprise Manager, November 2020 SR1 183

6 Customizing tasks
Option Description
Key name The name of the section containing the message key.
Default name:
keyRecord
This option is only applicable when:
l The Encode the message key in Avro format option is enabled
l The Metadata Publishing Method is set to Publish data schemas to Confluent Registry Schema or Publish data schemas to Hortonworks Schema Registry
l The Message key is not set to None
Setup and User Guide - Enterprise Manager, November 2020 SR1 184

7 Monitoring and controlling tasks
7 Monitoring and controlling tasks By default, Qlik Enterprise Manager opens in Tasks View. Tasks View is where you monitor and control your Replicate and Compose tasks. To switch between Servers View and Tasks View, click the Tasks tab in the top left of the console.
Currently, the following options are not available for Compose tasks:
l Task drill-down
l Deleting tasks
l Enabling/disabling scheduling
l Generating task instructions
l Monitoring of Compactor tasks, Command tasks, and Workflows
l Monitoring of tasks with the same name that originated from different Compose projects
For information on managing user permissions for all tasks on a server or for a specific task, see Managing user permissions (page 265).
7.1 Monitoring Replicate tasks
Task progress summaryThe Tasks View displays a list of tasks in tabular format in the middle pane.
For each task, Enterprise Manager can display the following columns:
General columns l State: The current state of a task. Possible states are described in the table below.
You can filter the table by state by selecting or clearing the respective check box in the States pane above the table.
Task State
Icon
Description
Running The task is running.
A spinning circle icon will be shown when the task is in a "Starting" state.
Task states
Setup and User Guide - Enterprise Manager, November 2020 SR1 185

7 Monitoring and controlling tasks
Task State
Icon
Description
Stopped The task has not been run yet or when the task has stopped at some point during the replication.
A spinning circle icon will be shown when the task is in a "Stopping" state.
Error The task has stopped due to a fatal error.
Recovering The task is recovering from a recoverable error.
l Server: The name of the server
l Task: The name of the task
l Stage: The current stage of the task: Loading or Change Processing.
l Tables with Error: The number of tables with error.
Not displayed by default:
l Reason: An explanation for the current state
l Description: A description of the task, as entered by the user
l Data Errors: The total number of data errors in all tables involved in the task. The count is affected by data errors and the Reset Data Errors option available when you drill down to a task.
l Profile: The task profile, which can be either unidirectional or bidirectional
l Log Stream Staging: The name of the Log Stream Staging task, both for the actual Log Stream Staging task and for any tasks associated with the Log Stream Staging task. For more information about the Log Stream Staging feature, refer to the Qlik Replicate Setup and User Guide.
l Type: The type of task, such as Full Load, CDC, or Full Load & CDC
l Loading Ended: Indicates whether loading has completed. This refers to completion of the Full Load stage in Replicate tasks and completion of the Full Load and/or Change Processing stage in Compose tasks.
l Source Name: The name of the source
l Source Type: The database type of the source
l Target Name: The name of the target
l Target Type: The target’s database type
l Memory (MB): The current utilization of memory, in MB. A task’s memory utilization is sampled approximately every 10 seconds. When the task is not running, the value is set to zero (0).
l Disk Usage (MB): The current utilization of disk space, in MB. A task’s disk utilization is sampled approximately every minute.
l CPU (%): The amount of CPU being used by a specific task. The CPU sampling rate is approximately
Setup and User Guide - Enterprise Manager, November 2020 SR1 186

7 Monitoring and controlling tasks
10 seconds.
l Tags: The tags associated with a task
Loading columns l Progress (%): The percentage of loading completed
l Target Throughput (rec/sec): The current target throughput, in rec/sec
Not displayed by default:
l Started: The date and time the loading started
l Ended: The date and time the loading ended
l Load Duration: The duration of the load process, in hh:mm:ss
l Total Tables: The total number of tables
l Tables Completed: The number of completed tables
l Tables Left: The number of tables remaining to be loaded
l Tables Loading: The number of tables currently loading
l Tables Queued: The number of tables in queue
l Records Completed: The number of completed records
l Records Left: The number of records remaining to be loaded
l Source Throughput (kbyte/sec): The current source throughput, in kbyte/sec
l Source Throughput (rec/sec): The current source throughput, in rec/sec
l Table Notes: Table notes, such as "0 tables failed loading"
l Target Throughput (kbyte/sec): The current target throughput, in kbyte/sec
l Total Records: The total number of records
With Compose tasks, canceled tables are reflected in the Total Tables counter but not in the Completed/Loading/Queued/Error counters. Therefore, when one or more tables is canceled in a task, the sum of these counters will be less than the Total Tables.
Change Processing columns l Incoming Changes: The number of changes currently being processed
l Applied Changes: The number of changes applied
l Apply Throughput (rec/sec): The apply throughput, in rec/sec
l Apply Latency: The apply latency
l Apply Throughput (kbyte/sec): The apply throughput, in kbyte/sec
l Changes for Apply - In Memory (Target): The number of changes in memory during apply and until target commit
l Changes for Apply - On Disk (Target): The number of changes on disk during apply and until target commit
Setup and User Guide - Enterprise Manager, November 2020 SR1 187

7 Monitoring and controlling tasks
l Changes In Memory (Source): The number of changes accumulated in memory until source commit
l Changes on Disk (Source): The number of changes accumulated on disk until source commit
l COMMIT Change Records: The number of COMMIT change records
l COMMIT Change Volume: The number of COMMIT change volume, in MB
l COMMIT Transactions: The number of COMMIT transactions
l DDLs: The total number of applied DDLs
l DDLs (%): The percentage of applied DDLs
l DELETEs: The total number of DELETEs applied
l DELETEs (%): The percentage of DELETEs applied
l Incoming Transactions: The number of incoming transactions
l INSERTs: The total number of INSERTs applied
l INSERTs (%): The total percentage of INSERTs applied
l ROLLBACK Change Records: The number of ROLLBACK change records
l ROLLBACK Change Volume: The number of ROLLBACK change volume, in MB
l ROLLBACK Transactions: The number of ROLLBACK transactions
l Source Latency: The current source latency, in hh:mm:ss
l Source Throughput (kbyte/sec): The current source throughput, in kbyte/sec
l Source Throughput (rec/sec): The current source throughput, in rec/sec
l Total Latency: The overall latency, in hh:mm:ss
l Transactions (Source): The number of transactions accumulated until source commit
l Transactions for Apply (Target): The number of transaction during apply and until target commit
l UPDATES: The total number of UPDATEs applied
l UPDATES (%): The percentage of UPDATEs applied
Status summaryThe Status Summary at the bottom of the window provides a quick overview of the current status of all monitored tasks and servers. It lists the following information:
l For tasks: The total number of monitored tasks as well as the number of tasks that are running (green icon), stopped (gray icon), recovering (orange icon), and encountered an error (red icon)
The "running" state also includes "starting" tasks. Similarly, the "stopped" state also includes "stopping" tasks.
You can double-click the task counters to open the corresponding Tasks View.Note: The task counters do not consider tasks on servers that are not currently monitored. For more information, see Additional server management options (page 54).
Setup and User Guide - Enterprise Manager, November 2020 SR1 188
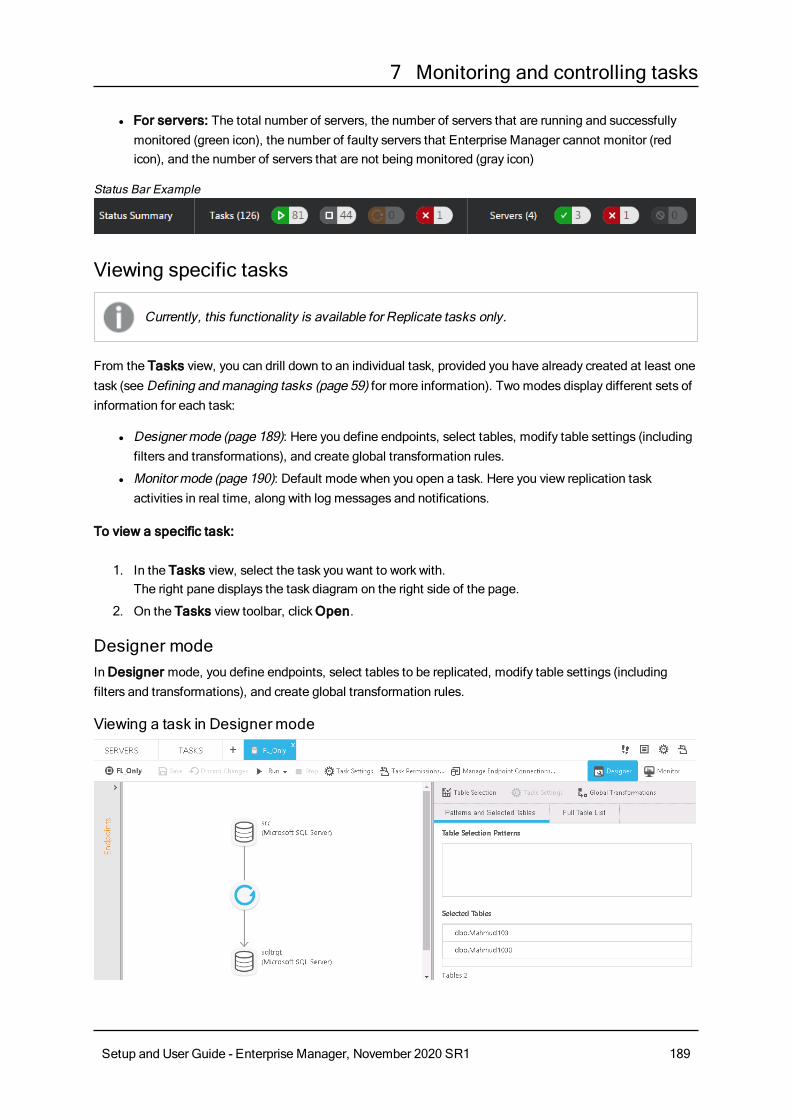
7 Monitoring and controlling tasks
l For servers: The total number of servers, the number of servers that are running and successfully monitored (green icon), the number of faulty servers that Enterprise Manager cannot monitor (red icon), and the number of servers that are not being monitored (gray icon)
Status Bar Example
Viewing specific tasks
Currently, this functionality is available for Replicate tasks only.
From the Tasks view, you can drill down to an individual task, provided you have already created at least one task (see Defining and managing tasks (page 59) for more information). Two modes display different sets of information for each task:
l Designer mode (page 189): Here you define endpoints, select tables, modify table settings (including filters and transformations), and create global transformation rules.
l Monitor mode (page 190): Default mode when you open a task. Here you view replication task activities in real time, along with log messages and notifications.
To view a specific task:
1. In the Tasks view, select the task you want to work with.The right pane displays the task diagram on the right side of the page.
2. On the Tasks view toolbar, click Open.
Designer modeIn Designer mode, you define endpoints, select tables to be replicated, modify table settings (including filters and transformations), and create global transformation rules.
Viewing a task in Designer mode
Setup and User Guide - Enterprise Manager, November 2020 SR1 189
7 Monitoring and controlling tasks
The Designer mode includes the following elements:
l Endpoints list: Lists the source and target endpoint connections that you added to Qlik Replicate. For more information, see Adding and managing endpoints (page 64). The figure shows the Endpoints List in a collapsed state, hiding the endpoints. To expand the list, click the right arrow at the top or anywhere below it. To close the panel, click the left arrow.
l Endpoints map: Illustrates the connection between the source and target endpoints for the task. The round icon between the endpoints represents the task type, which can indicate Full Load only, Full Load and Apply Changes, or Apply Changes only.
l When you create a task, you can drag the endpoints to the source and target drop spots as required. For more information, see Adding a source and target endpoint to a task (page 67).
l Monitor and Designer buttons: Switch between Monitor mode and Designer mode. See also Monitor mode (page 190).
l Run button: Lets you run the task at hand.
l Task Settings button: Opens the Task Settings dialog box. For more information, see Task Settings (page 149).
l Manage Endpoint Connections button: Lets you view the endpoints defined, edit them, or add new endpoints. For more information, see Adding and managing endpoints (page 64).
l Select and Define Tables: Lets you select the tables you want to include in your replication task. In addition, you can use transformation and filter operations to create new tables or to replicate parts of tables. For more information, Selecting tables and/or views for replication (page 68), Using filters (page 88), and Defining transformations for a single table/view (page 80).
l Global Transformations option: Lets you create transformations for all tables in a task. For more information, see Defining Global transformations (page 102).
To display a task in Designer mode:
l On the right side of the toolbar, click Designer.
Monitor modeIn Monitor mode, you view the replication task activities in real time. This is the default mode when you open a task.
Setup and User Guide - Enterprise Manager, November 2020 SR1 190

7 Monitoring and controlling tasks
Viewing a task in Monitor mode
The Monitor mode includes the following elements:
l Run button: Lets you run the task at hand.
l Manage Endpoint Connections button: Lets you view the endpoints defined, edit them, or add new endpoints. For more information, see Adding and managing endpoints (page 64).
l Monitor and Designer buttons: Switch between Monitor mode and Designer mode. See also Designer mode (page 189) and Defining and managing tasks (page 59).
l Tools list: Provides access to history, log management, and status information.
l Change Processing/Full Load tabs: Lets you select the information you want to focus on. By default, Enterprise Manager displays the Change Processing view.
l Task Map: Illustrates the connection between the source and target endpoints for the task. The round icon between the endpoints represents the task type, which can indicate Full Load only, Full Load and Apply Changes, or Apply Changes only.
l Message Center: Displays notifications and logging messages. By default, the Message Center is minimized to a message tray at the bottom left of the console. For more information, see Messages and notifications (page 229).
To display a task in Monitor mode:
l On the right side of the toolbar, click Monitor.
Monitoring Full Load replicationYou can view general information on the progress of a Replicate Full Load operation in the Loading tab, which is located in the Task Dashboard to the right of the Task List. You can also drill down to more detailed information in a dedicated tab for the task by clicking a bar or gauge in the Task Dashboard, or by double-clicking the task in the table.
In this section:
Setup and User Guide - Enterprise Manager, November 2020 SR1 191

7 Monitoring and controlling tasks
l General information for loading replication (page 192)
l Detailed information for Full Load replication (page 192)
General information for loading replicationThe Loading tab in the right pane shows the following general progress information:
l Source: The name and type of the source endpoint.
l Target: The name and type of the target endpoint.
l Loading and Change Processing tabs containing the information described below.
l Load Duration: The duration of the loading operation
l Ended: When the loading operation completed
l Overall Progress bar: The overall progress of the loading operation
l Table bars: The status of the tables being loaded, which can be:
l Completed - The number of tables that have been loaded into the target.
l Loading - The number of tables that are currently being loaded into the target.
l Queued - The number of tables that are waiting to be loaded into the target.
l Error - The number of tables that could not be loaded due to an errorSee Messages and notifications (page 229) and Data error handling (page 222) for more information about error messages.
l Tables: The number of total tables, the number of tables that have completed loading into the target, and the number of tables remaining to be loaded into the target.
l Records: The number of total records, records that have completed loading into the target endpoint, and records remaining to be loaded into the target endpoint
l Throughput gauge: The current throughput, which is the number/volume of records being retrieved from the source and applied to the target at any given timeFor more information, see Setting the unit of throughput measurement (page 197).
Detailed information for Full Load replication
This functionality is currently available for Replicate tasks only.
You can view more detailed information about the Full Load status by double-clicking a status bar or about throughput by double-clicking the throughput gauge. This opens the task in the <task name> tab, in the context of the bar or gauge that you clicked. The information that is displayed is the same information that you would see if you were monitoring the task in Replicate.
In this section:
l Information about the overall progress (page 193)
l Information about all tables that are being loaded (page 193)
l Information about tables that Replicate has finished loading (page 194)
Setup and User Guide - Enterprise Manager, November 2020 SR1 192
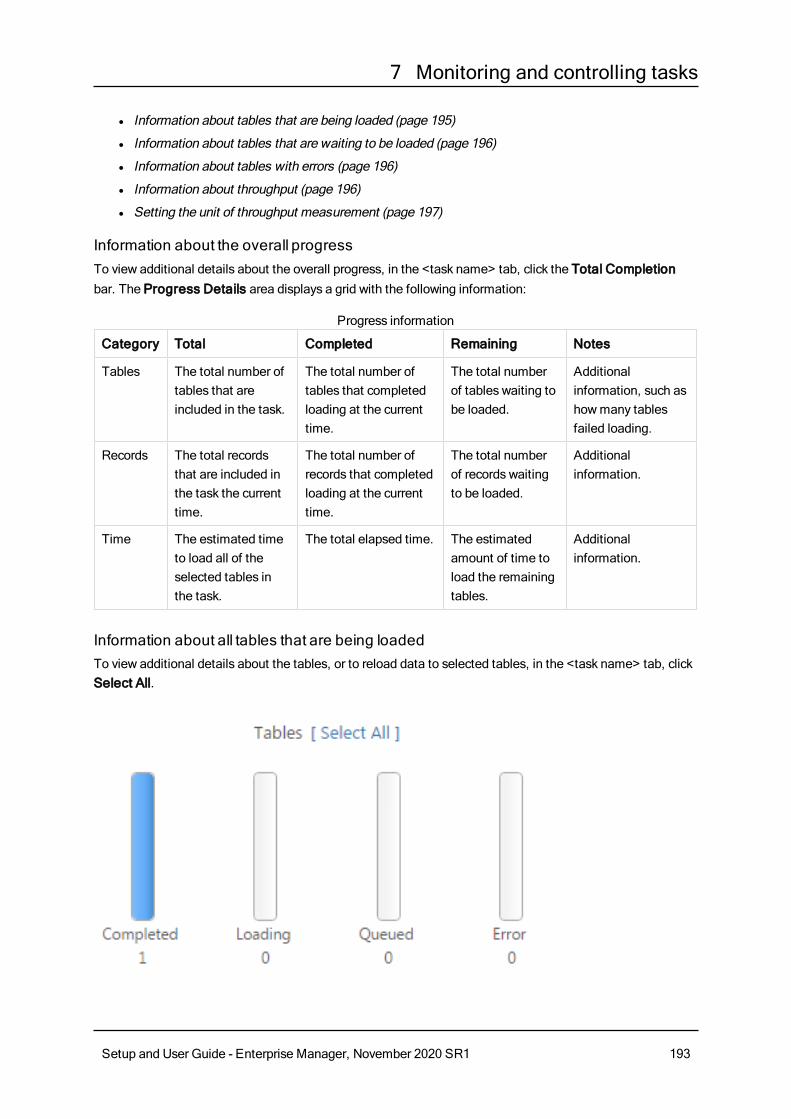
7 Monitoring and controlling tasks
l Information about tables that are being loaded (page 195)
l Information about tables that are waiting to be loaded (page 196)
l Information about tables with errors (page 196)
l Information about throughput (page 196)
l Setting the unit of throughput measurement (page 197)
Information about the overall progressTo view additional details about the overall progress, in the <task name> tab, click the Total Completion bar. The Progress Details area displays a grid with the following information:
Category Total Completed Remaining Notes
Tables The total number of tables that are included in the task.
The total number of tables that completed loading at the current time.
The total number of tables waiting to be loaded.
Additional information, such as how many tables failed loading.
Records The total records that are included in the task the current time.
The total number of records that completed loading at the current time.
The total number of records waiting to be loaded.
Additional information.
Time The estimated time to load all of the selected tables in the task.
The total elapsed time. The estimated amount of time to load the remaining tables.
Additional information.
Progress information
Information about all tables that are being loadedTo view additional details about the tables, or to reload data to selected tables, in the <task name> tab, click Select All.
Setup and User Guide - Enterprise Manager, November 2020 SR1 193

7 Monitoring and controlling tasks
The Tables - All area displays a grid with the following information:
l Table Name: The name of the source table that is included in the task
l Status: The task status, which can be any of the following:
l Queued - The table is in the queue waiting to be loaded to the target endpoint.
l Loading - The table is being processed but is not finished loading.
l Completed - All of the table records are loaded to the target.
l Error - The table stopped loading due to an error. See Messages and notifications (page 229) and Data error handling (page 222) for more information about error messages.
With Compose tasks, canceled tables are reflected in the Total Tables counter but not in the Completed/Loading/Queued/Error counters. Therefore, when one or more tables is canceled in a task, the sum of these counters will be less than the Total Tables.
l Estimated Count: The estimated number of records that have been loaded to the target
l Elapsed Time: The total elapsed time since Replicate started processing the records
l Progress: The loading progress in terms of percentage
l Reload: To reload selected tables, select the tables you want to reload and then click Reload above the table list. When prompted to confirm the operation, click OK. The data in the selected tables will be reloaded to the target endpoint. Note that this option is not available for Apply Changes Only tasks.
You can also:
l Reload tables. To reload selected tables, select the tables you want to reload and then click Reload above the table list. When prompted to confirm the operation, click OK. The data in the selected tables will be reloaded to the target endpoint. Note that this option is not available for Apply Changes Only tasks.
l Use the Columns Settings dialog box to select which columns to display and to arrange the order in which they appear. For more information, see Column and list actions (page 210).
l Hide a column, export the list to a TSV file, or sort by column in ascending or descending order. For more information, see Column and list actions (page 210).
Information about tables that Replicate has finished loadingTo view more information about tables that Replicate has finished loading, or to reload data to selected tables, in the <task name> tab, click the Completed bar. The Tables - Completed area displays a grid with the following information:
l Table name: The name of the source table that has completed loading.
l Loaded On: The time that the table completed loading all of its records to the target.
l Transferred Count: The number of records loaded to the target.
Setup and User Guide - Enterprise Manager, November 2020 SR1 194
7 Monitoring and controlling tasks
l Transferred Volume (MB): The volume of the records (in KB) loaded to the target.
l Load Duration: The amount of time that it took for all records to load to the target.
l Throughput Records: The average throughput rate for the table. Throughput describes the number of records read per second. See also Setting the unit of throughput measurement (page 197).
l Throughput Volume (KB/sec): The average throughput rate for the table. Throughput describes the volume of records (in KB) read per second. See also Setting the unit of throughput measurement (page 197).
You can also:
l Reload tables. To reload selected tables, select the tables you want to reload and then click Reload above the table list. When prompted to confirm the operation, click OK. The data in the selected tables will be reloaded to the target endpoint. Note that this option is not available for Apply Changes Only tasks.
l Use the Columns Settings dialog box to select which columns to display and to arrange the order in which they appear. For more information, see Column and list actions (page 210).
l Hide a column, export the list to a TSV file, or sort by column in ascending or descending order. For more information, see Column and list actions (page 210).
Information about tables that are being loadedTo view more information about tables that Replicate is currently loading, or to reload data to selected tables, in the <task name> tab, click the Loading bar. The Tables - Loading area displays a grid with the following information:
l Table Name: The names of the source tables that are currently loading.
l Load Duration: The amount of time that it took for all records to load to the current point in time.
l Estimated Count: The estimated number of rows that are waiting to be loaded in the full load operation.
l Transferred Count: The number of records that are loaded to the target endpoint.
l Current Throughput: The current throughput rate for the table. Throughput describes the number of records read per second. For more information about throughput, see also Setting the unit of throughput measurement (page 197).
l Cached Changes: The number of changes that were cached during full load when the source tables changed. Cached changes are typically applied to tables after the last table completes full load.
l Estimated Finish Time: The approximate date and time the task will finish loading the tables.
l Progress: The table status and the time the table entered that status.
You can also:
l Reload tables. To reload selected tables, select the tables you want to reload and then click Reload above the table list. When prompted to confirm the operation, click OK. The data in the selected tables will be reloaded to the target endpoint. Note that this option is not available for Apply Changes Only tasks.
Setup and User Guide - Enterprise Manager, November 2020 SR1 195
7 Monitoring and controlling tasks
l Use the Columns Settings dialog box to select which columns to display and to arrange the order in which they appear. For more information, see Column and list actions (page 210).
l Hide a column, export the list to a TSV file, or sort by column in ascending or descending order. For more information, see Column and list actions (page 210).
Information about tables that are waiting to be loadedTo view more information about tables in the loading queue, in the <task name> tab, click the Queued bar. The Tables - Queued area displays a grid with the following information:
l Table Name: The names of the source tables that are currently in the queue waiting to be loaded.
l Estimated Count: The estimated number of rows that are waiting to be loaded in the full load operation.
You can also:
l Use the Columns Settings dialog box to select which columns to display and to arrange the order in which they appear. For more information, see Column and list actions (page 210).
l Hide a column, export the list to a TSV file, or sort by column in ascending or descending order. For more information, see Column and list actions (page 210).
Information about tables with errorsTo view more information about tables that could not be loaded due to an error, in the <task name> tab, click the Error bar. The Tables - Error area displays a grid with the following information:
l Table Name: The names of the source tables that could not be loaded to the target.
l Failed On: The time that the error occurred.
l Loaded Count: The number of records loaded when the error occurred.
You can also:
l Reload tables. To reload selected tables, select the tables you want to reload and then click Reload above the table list. When prompted to confirm the operation, click OK. The data in the selected tables will be reloaded to the target endpoint. Note that this option is not available for Apply Changes Only tasks.
l Use the Columns Settings dialog box to select which columns to display and to arrange the order in which they appear. For more information, see Column and list actions (page 210).
l Hide a column, export the list to a TSV file, or sort by column in ascending or descending order. For more information, see Column and list actions (page 210).
For more information, see Data error handling (page 222).
Information about throughputTo view a graph representing the number or volume of records (depending on the selected measurement unit) processed during the Full Load operation, click the Throughput gauge. The Throughput Details area displays a graph illustrating the source and target throughput rate. This rate indicates how fast the table
Setup and User Guide - Enterprise Manager, November 2020 SR1 196

7 Monitoring and controlling tasks
records are being replicated to the target endpoint.
Setting the unit of throughput measurementYou can set the throughput measurement values either to the number of records replicated per second or to the number of kilobytes replicated per second. The display is always based on the current load operation.
To set the unit of throughput measurement:
l From the list above the Throughput gauge, select rec/sec or kbyte/sec.
Monitoring Change Processing replicationYou can view general information on the progress of Change Data Capture (CDC) processing in the Change Processing tab, which is located in the Task Dashboard to the right of the Task List. You also have the option to drill down to more detailed information in a dedicated tab for the task by clicking a bar, graph, or gauge in the Task Dashboard, or by double-clicking the task in the table.
This functionality is currently relevant to Replicate tasks only.
In this section:
l General Change Processing information (page 197)
l Detailed Change Processing information (page 200)
General Change Processing informationGeneral information about change processing is presented in a graphical format, as shown in the following figure.
Setup and User Guide - Enterprise Manager, November 2020 SR1 197

7 Monitoring and controlling tasks
Task Dashboard - Change Processing Status
Setup and User Guide - Enterprise Manager, November 2020 SR1 198

7 Monitoring and controlling tasks
Setup and User Guide - Enterprise Manager, November 2020 SR1 199

7 Monitoring and controlling tasks
This following information is displayed:
l Overall Progress bar: The overall progress of the task.
l Incoming Changes: The number of records that were processed for the task.
l Transactions: The number of transactions that were processed for the task.
l Applied Changes: A pie chart showing information about the processed changes:
l The number of INSERT operations processed. Roll over the Inserts section with your mouse to see the number and percentage of the accumulated inserts.
l The number of UPDATE operations processed. Roll over the Updates section with your mouse to see the number and percentage of the accumulated updates.
l The number of DELETE operations processed. Roll over the Deletes section with your mouse to see the number and percentage of the accumulated deletes.
l The number of metadata changes (DDL) processed. DDL changes include information about events like changes to table names or to column names.
l Commit: The number of committed transactions and change records as well as the change volume, in MB.
l Rollback: The number of rolled back transactions and change records as well as the change volume, in MB.
l Apply Throughput: A gauge that describes the number of change events read per second. For additional details, see Information about Change Processing throughput (page 203).
l Apply Latency: A gauge that displays latency information.The latency values in Qlik Enterprise Manager measure the time delay (latency) between the time when a change is visible to the source (and committed), and the time when this same change is visible to the target. The display is always based on the current change being applied.
For additional details, see Information about Change Processing latency (page 204).
Detailed Change Processing informationYou can view more detailed information about the Change Processing status by double-clicking the status bar, the pie chart, or a gauge, or by double-clicking the task in the table. This opens the task in the <task name> tab, in context of the bar, chart, or gauge that you clicked (if any). The information that displays is the same information that you would see if you were monitoring the task in Replicate.
In this section:
l Information about incoming changes (page 201)
l Information about applied changes (page 202)
l Information about Change Processing throughput (page 203)
l Information about Change Processing latency (page 204)
Setup and User Guide - Enterprise Manager, November 2020 SR1 200

7 Monitoring and controlling tasks
Information about incoming changesTo view more information about incoming changes, in the Change Processing tab, double-click the Incoming Changes bar. A dedicated tab opens for the task, displaying at the top the Incoming Changes bar and at the bottom the Incoming Changes Details area with bar graphs that show the following information:
l Accumulating: Two bars indicating the number of records currently being read from the source endpoint. These records are accumulated in a queue until they are applied to the target.
l In Memory: The number of accumulating records that are currently in the computer memory.
l On Disk: The number of accumulating records that are currently stored on disk.
l Applying: Two bars indicating he number of records currently being written to the target. These are the applied changes.
l In Memory: The number of records being applied that are currently in the computer memory.
l On Disk: The number of records being applied that are currently stored on disk.
Incoming Changes Bar
Setup and User Guide - Enterprise Manager, November 2020 SR1 201

7 Monitoring and controlling tasks
Incoming Changes Details Area
Information about applied changesTo view more information about applied changes, in the <task name> tab, click the Applied Changes pie chart. The Applied Changes pie chart displays two grids, each in its own tab, with information about the applied changes.
Recent Activity
The grid in the Recent Activity tab includes information about which changes occurred in each table:
l Table Name: The names of the source tables that are included in the task.
l Update: The number of UPDATE operations processed for the specific table.
l Insert: The number of INSERT operations processed for the specific table.
Setup and User Guide - Enterprise Manager, November 2020 SR1 202

7 Monitoring and controlling tasks
l Delete: The number of DELETE operations processed for the specific table.
l DDL: The number of metadata changes (DDL) processed. DDL changes include information about events like changes to table names or to column names.
l Total Applied: The total number of changes applied to the target.
l Data Errors: The number of errors related to data processing at the record level, such as conversion errors, errors in transformations, or bad data.
l Last Modified: The time the last change occurred for the specific table.
You can also:
l Filter the grid by entering a string in the Filter By box. This allows you to focus on specific tables.
l Reload tables. To reload selected tables, select the tables you want to reload and then click Reload above the table list. When prompted to confirm the operation, click OK. The data in the selected tables will be reloaded to the target endpoint. Note that this option is not available for Apply Changes Only tasks.
l Reset data errors for a specific table. For details, see Data error handling (page 222).
l Use the Columns Settings dialog box to select which columns to display and to arrange the order in which they appear. For more information, see Column and list actions (page 210).
l Hide a column, export the list to a TSV file, or sort by column in ascending or descending order. For more information, see Column and list actions (page 210).
Aggregates
The grid on the Aggregates tab includes information about the total number of changes (for all tables) per change type (INSERT, UPDATE, DELETE, DDL) and transaction type (COMMIT, ROLLBACK).
Information about Change Processing throughputTo view information about how fast change records are loaded to the target endpoint during a change processing operation, in the <task name> tab, click the Apply Throughput gauge. The Apply Throughput Details area displays a graph illustrating the source and target throughput rate.
See also Setting the unit of throughput measurement (page 197).
Setup and User Guide - Enterprise Manager, November 2020 SR1 203

7 Monitoring and controlling tasks
Information about Change Processing latencyTo view information about the time delay (latency) between the time when a change is visible to the source (and committed) and the time when this same change is visible to the target, in the <task name> tab, click the Apply Latency gauge. The Apply Latency Details area displays a graph illustrating the source and target latency. The display is always based on the current change being applied.
You should take the following into consideration:
l Latency when applying large transactions:For example, when the most recent latency value was 10 seconds and now a transaction of one million rows gets committed at the source endpoint, Qlik Enterprise Manager starts to apply that transaction to the selected target and it will take some time to write all the changes to the target (for example 60 seconds). During the next 60 seconds, the latency value gradually grows to 70 seconds for the last change in the transaction. Once the transaction is committed, the latency drops back to the 'regular' latency (10 seconds in this case).
l Latency when no transactions are being applied:When a time period passes with no changes applied to the target, the latency calculation is based on the time difference between the current time and the timestamp of the last change event read from the transaction log. This could happen if, for example, there is high activity on tables that are not selected for replication in the current task.
7.2 Monitoring Compose tasks
In this section:
l Task progress summary (page 205)
l Monitoring Data Lake tasks (page 208)
l Monitoring Data Warehouse tasks (page 209)
Setup and User Guide - Enterprise Manager, November 2020 SR1 204
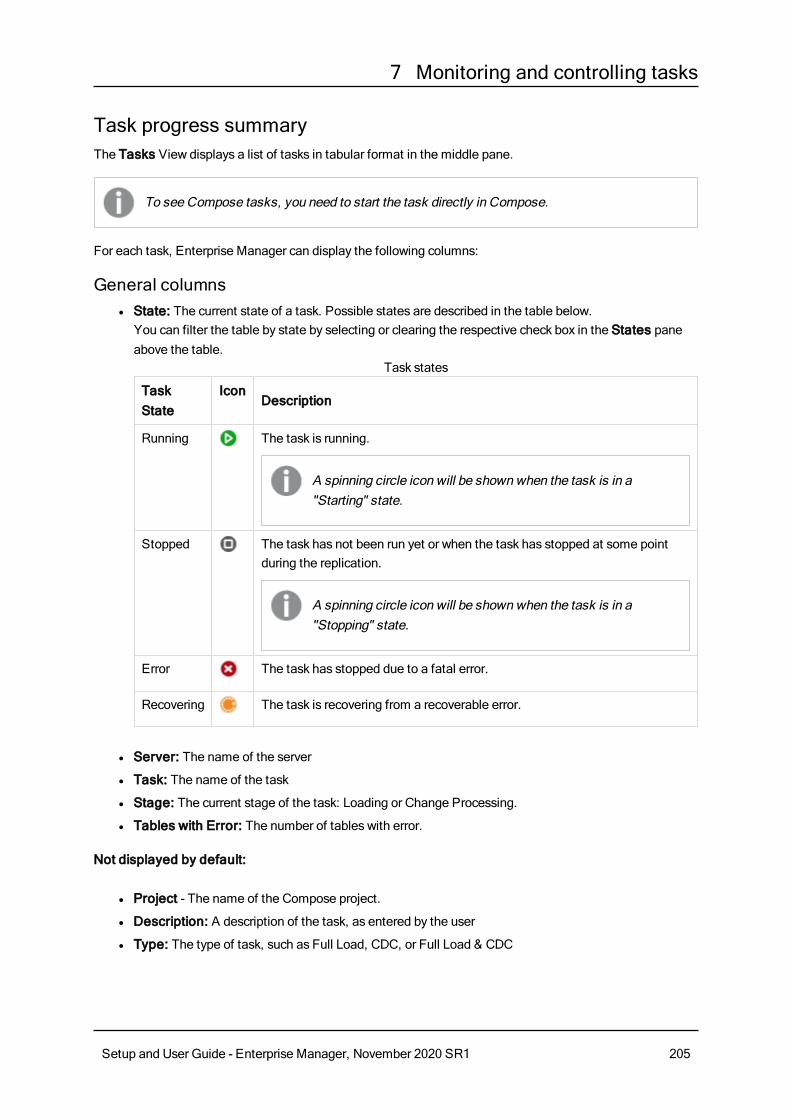
7 Monitoring and controlling tasks
Task progress summaryThe Tasks View displays a list of tasks in tabular format in the middle pane.
To see Compose tasks, you need to start the task directly in Compose.
For each task, Enterprise Manager can display the following columns:
General columns l State: The current state of a task. Possible states are described in the table below.
You can filter the table by state by selecting or clearing the respective check box in the States pane above the table.
Task State
Icon
Description
Running The task is running.
A spinning circle icon will be shown when the task is in a "Starting" state.
Stopped The task has not been run yet or when the task has stopped at some point during the replication.
A spinning circle icon will be shown when the task is in a "Stopping" state.
Error The task has stopped due to a fatal error.
Recovering The task is recovering from a recoverable error.
Task states
l Server: The name of the server
l Task: The name of the task
l Stage: The current stage of the task: Loading or Change Processing.
l Tables with Error: The number of tables with error.
Not displayed by default:
l Project - The name of the Compose project.
l Description: A description of the task, as entered by the user
l Type: The type of task, such as Full Load, CDC, or Full Load & CDC
Setup and User Guide - Enterprise Manager, November 2020 SR1 205

7 Monitoring and controlling tasks
l Loading Ended: Indicates whether loading has completed. This refers to completion of the Full Load stage in Replicate tasks and completion of the Full Load and/or Change Processing stage in Compose tasks.
l Source Name: The name of the source
l Source Type: The database type of the source
l Target Name: The name of the target
l Target Type: The target’s database type
l Tags: The tags associated with a task
Loading columns l Progress (%): The percentage of loading completed
Not displayed by default:
l Started: The date and time the loading started
l Ended: The date and time the loading ended
l Load Duration: The duration of the load process, in hh:mm:ss
l Total Tables: The total number of tables
l Tables Completed: The number of completed tables
l Tables Left: The number of tables remaining to be loaded
l Tables Loading: The number of tables currently loading
l Tables Queued: The number of tables in queue
l Total Commands: The number of commands executed in a Compose Task
l Commands Completed: The number of commands completed in a Compose Task
With Compose tasks, canceled tables are reflected in the Total Tables counter but not in the Completed/Loading/Queued/Error counters. Therefore, when one or more tables is canceled in a task, the sum of these counters will be less than the Total Tables.
Change Processing columns
These columns are relevant for Replicate tasks only.
l Incoming Changes: The number of changes currently being processed
l Applied Changes: The number of changes applied
l Apply Throughput (rec/sec): The apply throughput, in rec/sec
l Apply Latency: The apply latency
l Apply Throughput (kbyte/sec): The apply throughput, in kbyte/sec
Setup and User Guide - Enterprise Manager, November 2020 SR1 206

7 Monitoring and controlling tasks
l Changes for Apply - In Memory (Target): The number of changes in memory during apply and until target commit
l Changes for Apply - On Disk (Target): The number of changes on disk during apply and until target commit
l Changes In Memory (Source): The number of changes accumulated in memory until source commit
l Changes on Disk (Source): The number of changes accumulated on disk until source commit
l COMMIT Change Records: The number of COMMIT change records
l COMMIT Change Volume: The number of COMMIT change volume, in MB
l COMMIT Transactions: The number of COMMIT transactions
l DDLs: The total number of applied DDLs
l DDLs (%): The percentage of applied DDLs
l DELETEs: The total number of DELETEs applied
l DELETEs (%): The percentage of DELETEs applied
l Incoming Transactions: The number of incoming transactions
l INSERTs: The total number of INSERTs applied
l INSERTs (%): The total percentage of INSERTs applied
l ROLLBACK Change Records: The number of ROLLBACK change records
l ROLLBACK Change Volume: The number of ROLLBACK change volume, in MB
l ROLLBACK Transactions: The number of ROLLBACK transactions
l Source Latency: The current source latency, in hh:mm:ss
l Source Throughput (kbyte/sec): The current source throughput, in kbyte/sec
l Source Throughput (rec/sec): The current source throughput, in rec/sec
l Total Latency: The overall latency, in hh:mm:ss
l Transactions (Source): The number of transactions accumulated until source commit
l Transactions for Apply (Target): The number of transaction during apply and until target commit
l UPDATES: The total number of UPDATEs applied
l UPDATES (%): The percentage of UPDATEs applied
Status summaryThe Status Summary at the bottom of the window provides a quick overview of the current status of all monitored tasks and servers. It lists the following information:
l For tasks: The total number of monitored tasks as well as the number of tasks that are running (green icon), stopped (gray icon), recovering (orange icon), and encountered an error (red icon)
The "running" state also includes "starting" tasks. Similarly, the "stopped" state also includes "stopping" tasks.
You can double-click the task counters to open the corresponding Tasks View.
Setup and User Guide - Enterprise Manager, November 2020 SR1 207

7 Monitoring and controlling tasks
Note: The task counters do not consider tasks on servers that are not currently monitored. For more information, see Additional server management options (page 54).
l For servers: The total number of servers, the number of servers that are running and successfully monitored (green icon), the number of faulty servers that Enterprise Manager cannot monitor (red icon), and the number of servers that are not being monitored (gray icon)
Status Bar Example
Monitoring Data Lake tasksYou can view general information on the progress of a Compose Full Load and/or Change Processing operation in the Task Dashboard, located to the right of the task list.
References to provisioning tasks are only relevant for versions preceding Qlik Compose February 2021.
Use the arrow to collapse or expand the Task Dashboard.
The top of the dashboard provides buttons for stopping and starting task(s), and viewing task log files. The following information about the task is also provided:
l The task name and state
l A link to the Compose project
l Source: The Landing Zone name and type in a Data Storage task or the project name and Landing Zone type in a Provisioning task.
l Target: The task name and target type in a Provisioning task or the project name and Landing Zone type in a Data Storage task.
The Loading tab in the right pane shows the following general progress information:
l Loading tab containing the information described below.
l Load Duration: The duration of the loading operation
l Ended: When the loading operation completed
l Overall Progress bar: The overall progress of the loading operation
l Table bars: The status of the tables being loaded, which can be:
l Completed - The number of tables that have been loaded into the target.
l Loading - The number of tables that are currently being loaded into the target.
l Queued - The number of tables that are waiting to be loaded into the target.
l Error - The number of tables that could not be loaded due to an error
Setup and User Guide - Enterprise Manager, November 2020 SR1 208
7 Monitoring and controlling tasks
See Messages and notifications (page 229)and Data error handling (page 222) for more information about error messages.
With Compose tasks, canceled tables are reflected in the Total Tables counter but not in the Completed/Loading/Queued/Error counters. Therefore, when one or more tables is canceled in a task, the sum of these counters will be less than the Total Tables.
l The number of Commands Completed out of the Total Commands.
Monitoring Data Warehouse tasksYou can view general information on the progress of a Compose Full Load and/or Change Processing operation in the Task Dashboard, located to the right of the task list.
Use the arrow to collapse or expand the Task Dashboard.
The top of the dashboard provides buttons for stopping and starting task(s), and viewing task log files. The following information about the task is also provided:
l The task name and state
l A link to the Compose project
l Source: The display name and type of the source database
l Target: The display name and type of the target database. Note that as the target database does not have a display name in Compose, the project name is displayed instead.
The Loading tab in the right pane shows the following task information:
l Load duration time
l Load end time
l Overall progress bar
l The number of ETL commands completed
l Total number of tables loaded
l Total number of records loaded (also represented in a pie graph)
l Total number of INSERT operations
l Total number of UPDATE operations
l Error marts (Not displayed for Data Mart tasks as Data Quality rules are run in the Data Warehouse only)
l Total number of tables with errors
l Total number of data errors
Setup and User Guide - Enterprise Manager, November 2020 SR1 209

7 Monitoring and controlling tasks
7.3 Searching for tasksYou can search for specific tasks by typing a string into the Search Tasks box above the table. Enterprise Manager searches only textual columns, not numeric columns. The following columns are included in the search, even if a column is not displayed in the user interface:
l State
l Reason
l Server
l Task
l Profile
l Type
l Stage
l Loading Ended
l Source Name
l Source Type
l Target Name
l Target Type
l Tags
l Project (relevant for Compose tasks only)
You can also restrict a search to a specific column by preceding the search string with the column name and a colon, as follows: ColumnName:value (for example: Server:john-vm.abc.local). This is applicable to all available columns, not only the columns listed above.
When searching for a number, only enter whole numbers, no commas or special characters. For example, to search for 2,500, as displayed in the user interface, enter 2500; to search for 100%, enter 100.
7.4 Column and list actionsYou can choose to display or hide certain columns as well as sort columns as desired.
To Do this
Hide a column Right-click the heading of the column you want to hide and select Hide Column.
Note that once you hide a column, if you want to display it again, you need to select it in the Column Settings dialog box (see below).
Column customization actions
Setup and User Guide - Enterprise Manager, November 2020 SR1 210

7 Monitoring and controlling tasks
To Do this
Select which columns to display
1. Right-click a column heading and select Column Settings.The Column Settings dialog box opens.
2. To display additional columns, in the left pane, select the columns you want to display and click the right arrow to move them to the right pane.
3. To hide columns, select them in the right pane and use the left arrow to move them to the left pane.
4. To change the column order, select a column in the right pane and use the up or down arrow to move it to the required position.
5. To reset column selection and order, click Restore Defaults.
6. Click OK.
Restore default columns
1. Right-click a column heading and select Column Settings.The Column Settings dialog box opens.
2. To reset the column selection and order, click Restore Defaults.
3. Click OK.
Sort by column
Click anywhere in the column heading to change the sorting order.
OR
Right-click the column and select Sort Ascending or Sort Descending as desired.
An upward facing arrow indicates ascending order whereas a downward facing arrow indicates descending order.
Export the list to a TSV file
Right-click any of the column headings and select Export to TSV file. When prompted, save the file in your desired location. Note that only currently displayed columns will be exported.
7.5 Grouping tasksIn the Tasks View, the left side (expanded by default) represents the Tags pane. It displays all available tags. Tags serve as attributes that you can attach to tasks to arrange them in Enterprise Manager. Tags allow you to group tasks that have a common denominator, and to filter by them, too. For example, you can organize tasks by flavor, such as all tasks that are part of a particular distribution process, by organization structure, by environment, by location, by application, by customer, and so on.
All tags:
l Are static: They remain constant during a task’s life time. For example, the task type (CDC, FL, or both), source database type, or region of a task do not change as long as the task exists.
l Are public: All tags are available to all Enterprise Manager users.
l Can be associated with any number of tasks: You can associate a task with more than one tag.
Setup and User Guide - Enterprise Manager, November 2020 SR1 211

7 Monitoring and controlling tasks
Enterprise Manager comes with built-in tag categories as well as built-in tags. The following table lists all categories that are built in:
Category Tag
Custom l Untagged
Task Type l Full Load Only
l CDC Only
l Full Load & CDC
Task Profile
l Bidirectional
l Unidirectional
l Log Stream Staging - For more information about the Log Stream Staging feature, refer to the Qlik Replicate Setup and User Guide.
Source Database Type
If more than one source database type is available in your task list, one tag for each available source database type.
Target Database Type
If more than one target database type is available in your task list, one tag for each available target database type.
Replicate Servers
One tag for each managed Replicate server
Log Stream Staging
One tag for each Log Stream Staging task. Selecting a tag in this category will show all tasks that are associated with the Log Stream Staging task (i.e. the Log Stream Staging task and all tasks that read from the same Log Stream staging folder).
Selecting Other Tasks will show tasks that are not reading from Log Stream or tasks that are defined as Log Stream Staging tasks but that do not currently have a Log Stream target endpoint.
Task categories
Enterprise Manager automatically associates built-in tags with a task based on the task’s characteristics, as derived from its definition. You cannot change the association of tasks with such tags.
In addition, you can create your own custom tags and assign tasks to them. You can delete such tags at any time. All tag names must:
l Be unique.
l Not exceed 64 characters.
l Only contain Latin characters, digits, spaces, dots (.), dashes (-), and underscores (_).
l Start with a digit or character.
Deleting a custom tag does not delete its associated tasks, and vice versa.
For each tag, Enterprise Manager displays the following information:
Setup and User Guide - Enterprise Manager, November 2020 SR1 212

7 Monitoring and controlling tasks
l The tag name
l The total number of tasks associated with this tag
l An icon that indicates when any associated task experiences a problemIf a task with a problem is associated with more than one tag, all corresponding tags indicate a problem.
The Tags column in the Tasks view presents a quick way to identify which tags are associated with each task.
The following table describes all options for viewing and managing tags.
To Do this
Add a custom tag In the Tags pane on the left, under Custom, in the New tag text box, enter a name for the tag and click the check mark to the right (or press Enter).
Delete a custom tag
Note: Deleting a tag does not delete the tasks associated with it.
In the Tags pane, under Custom, right-click the tag you want to delete and select Delete.
When prompted for confirmation, click Yes.
The tag is removed from the list.
Filter by tags In the Tags pane, do one of the following:
l Select the check boxes of tags you want to include in the Tasks View.
l Clear the check boxes of tags you want to exclude from the Tasks View.
When you select different tags:
l Within the same category, Enterprise Manager uses the logical OR operator. For example, if you select both Oracle and Netezza in the Target DB Type category, Enterprise Manager displays tasks to Oracle or Netezza targets.
l In different categories, Enterprise Manager uses the logical AND operator. For example, if you select the Oracle tag in the Target DB Type category and the Finance tag in the Custom category, Enterprise Manager displays only task to an Oracle target that are also associated with the Finance tag.
Tag management options
Setup and User Guide - Enterprise Manager, November 2020 SR1 213

7 Monitoring and controlling tasks
To Do this
Assign custom tags to a task or remove tag assignments
Note: This is only possible for custom tags. Built-in tags are assigned by default. Those assignments cannot be removed.
1. In the task list, select one ore more tasks to which you want to assign a tag and click Assign Tags.
2. In the Assign Tags window, select the required tag(s) or enter a new tag name in the New tag text box and click the check mark.
3. Click OK.
7.6 Running tasks
Currently, this functionality is available for Replicate tasks only.
After you design a task (see Defining and managing tasks (page 59)), you can run and monitor its progress with one click in Enterprise Manager. This simple Click-2-Replicate function is described in this topic. In addition, the various types of run options available are also described. This topic has the following sub-topics.
l How to run a task (page 214)
l Using the Run button options (page 215)
The task run buttons area available in the toolbar at the top of the console in the following views:
l Tasks View (in both Designer mode (page 189) and Monitor mode (page 190))
l When Viewing specific tasks (page 189)
How to run a taskClick the Run button to execute a replication task. The task process continues to run until you click the Stop button to stop the task.
When you click Run, the following occurs:
l If this is the first time that a task is run, the Start Processing (page 215) operation is run.
l If the task has been started and stopped, the Resume Processing operation described in Advanced run options (page 216) is run.
l If changes were made to the endpoint, change processing takes place after the full load operation. If you do not want change processing to occur or if you want to start change processing from a predetermined point, you must make the appropriate Advanced run options (page 216) selection.
Setup and User Guide - Enterprise Manager, November 2020 SR1 214
7 Monitoring and controlling tasks
In some cases, task replication may stop due to an error although the task process is still running.
See Task progress summary (page 185)for information on the task status and how Qlik Replicate displays information on the current task status.
The Run button is available in the following views:
l The Tasks view when you select a task from the Task List.
l For the individual task, both the Designer mode and Monitor mode have the Run and Stop buttons available.
You must be in the Monitor mode to view the task progress.
Using the Run button optionsClicking the Run button runs a full-load replication task from the source to the target. This is a first time task that creates the target endpoints and loads the source data to the target according to your task definitions.
Subsequent runs allow you to resume processing from a specific point and process changes. In addition, you can also specify from what point you want the replication to start.
The following options are available:
l Start Processing (page 215) (switches to Resume Processing after the task has started)
l Resume Processing: Resumes task execution from the point that it was stopped. You can also resume processing by clicking the Run button if the task has been stopped.
If the schema or a filter was changed after the task stopped, the task should be reloaded as opposed to resumed (see below).
l Reload target (page 215) (Only available when the Full Load or Full Load and Apply Changes replication options are enabled)
l Advanced run options (page 216)
Start ProcessingThis is available the first time you run the task only. This will execute the initial full load operation. If Change Processing is also enabled for the task or if it is an Apply Changes only task type, change processing will start as soon as any changes are made to the source endpoint.
Reload targetStarts the Full Load and Change Processing (if enabled) from the beginning. Tables that have already been processed are handled according to the relevant "Target table preparation" setting.
Setup and User Guide - Enterprise Manager, November 2020 SR1 215

7 Monitoring and controlling tasks
To replicate tables that were added to the local file channel task after the initial full load, you need to reload both the local and the remote file channel tasks.
Advanced run optionsAdvanced Run Options provide you with additional options for resuming and restarting tasks.
Some of the advanced run options are not available in a Log Stream Staging setup.
For information on the availability of advanced run options in a Log Stream Staging setup, refer to the Qlik Replicate Setup and User Guide.
To use Advanced Run Options, click the triangle next to the Run button and select Advanced Run Options.
The Advanced Run Options dialog box opens.
The Advanced Run Options dialog box lets you do the following:
l **Restart task and start processing changes from current time: This starts the Apply Changes replication task from the beginning (as if the task has not run before). **Only available for Apply Changes replication tasks.
l Tables are already loaded. Start processing changes from:
l Date and Time: Select the date and time from where you want to Replicate to start processing changes.
l When logs are deleted from the database (e.g. due to a purge policy), a log matching the specified date and time may not exist. In this case, Replicate will resume the task from the earliest point possible, after the specified date and time.
l With the IBM DB2 for LUW source endpoint, this option cannot be used to start Apply Changes tasks from a point before the original start time of the Apply Changes task. Or, to put it another way, it can only be used to start tasks from any time after the original start time of the Apply Changes task.
l The timestamp uses the local time of the browser machine.
l This option is not relevant for the File Source endpoint.
l DDLs performed on the source while a task is stopped (e.g. drop column) will not be replicated when the task is resumed from timestamp.
Setup and User Guide - Enterprise Manager, November 2020 SR1 216

7 Monitoring and controlling tasks
l Source change position (e.g. SCN or LSN): Specify the position in the log from where to resume change processing. The source change position format differs according to your source endpoint. For more information, see How to Find the Source Change Position (page 219).
The Source change position option is supported with the following source endpoints only:Oracle, Microsoft SQL Server, MySQL, PostgreSQL, IBM DB2 for z/OS, and IBM DB2 for LUW.
Metadata Only:
The "Metadata only" options described below allow you to:
l Create empty tables on the target and then manually edit them.
l Create tables during a task.
Enabling the options will also ensure that supplemental logging is set up correctly on the source tables before starting the actual replication task.
The "Metadata only" feature is not supported when the task is defined with the Apply Changes only task option. any of the following task options:
l Apply Changes only
l Store Changes only
l Apply Changes and Store Changes
l Recreate all tables and stop: Select this option to recreate the target tables as defined in the Full Load Settings tab. When "Store Changes" is enabled, the Change tables/Audit table will be created as defined in the Store Changes Settings tab. To use this option, stop the existing task, run the task with this option enabled (the task will stop automatically) and finally, resume the task.
l Create missing tables and stop: Select this option to create missing target tables including Change Tables. You can use this option to create Change Tables on the target after enabling the "Store Changes" option (in the Store Changes Settings tab) for an existing task. To use this option, stop the existing task, run the task with this option enabled (the task will stop automatically) and finally, resume the task.
The table below shows which tables are created in the target database when the Metadata only option is enabled for a unidirectional task. As the table shows, when certain task options are enabled, Control tables and the Audit table will not be created on the target.
Enabled Task Options Tables Created on the Target
Full Load All tables except for Control tables
Full Load and Apply Changes All tables except for Control tables
Setup and User Guide - Enterprise Manager, November 2020 SR1 217

7 Monitoring and controlling tasks
Enabled Task Options Tables Created on the Target
Full Load, Apply Changes and Store Changes - When changes are stored in Change tables
All tables except for Control tables
Full Load and Store Changes - When changes are stored in an Audit table
All tables except for Control tables and the Audit table
Full Load, Apply Changes and Store Changes - When changes are stored in an Audit table
All tables except for Control tables and the Audit table
Recovery:
l Recover using locally stored checkpoint: Use this option if recovery is not possible using the Resume Processing or Start process changes from options (due to corrupt swap files, for example). When this option is selected, Replicate uses the checkpoint data stored in <Data_Folder_Path>\data\tasks\<task_name>\StateManager to recover the task.
When using this option, the following limitations apply:
l The following source endpoints are supported only:
l Oracle
l Microsoft SQL Server
l MySQL
l PostgreSQL
l IBM DB2 for z/OS
l SAP HANA
l Tasks can only be recovered during Change Processing (i.e. after Full Load Completes)
l With the exception of the File Channel endpoint, all target endpoints are supported. The following limitations apply:
l In Transactional apply Change Processing mode: All target endpoints that support transactions are supported.
l In Batch optimized apply Change Processing mode: Oracle target endpoint only is supported. Also requires the Preserve transactional integrity option to be enabled.
l For all other target endpoints or Change Processing modes, recovery is supported, but may cause duplicates on the target.
l Recover using checkpoint stored on target: Select to recover a task using the CHECKPOINT value from the attrep_txn_state table (created in the target database).
Setup and User Guide - Enterprise Manager, November 2020 SR1 218
7 Monitoring and controlling tasks
When using this option, the following limitations apply:
l Only the following source and target endpoints are supported:
l Oracle
l Microsoft SQL Server
l Tasks can only be recovered during Change Processing (i.e. after Full Load Completes)
l The task Change Processing mode must be set to either:Batch optimized apply with the Preserve transactional integrity option enabled. Note that this mode is only supported with the Oracle target endpoint.ORTransactional applyFor information about setting the Change Processing mode, see Changes Processing Tuning.
This option will only be available if the Store task recovery data in target database option was enabled in the Task Settings' Change Processing Tuning (page 165) tab before Change Processing completed.Select this option (as opposed to the Recover using locally stored checkpoint option) if the files in the Data folder are corrupted or if the storage device containing the Data folder has failed.For a detailed explanation of how to set up and implement recovery using the attrep_txn_state table, see Recovering from data folder loss or corruption (page 220).
How to Find the Source Change PositionThe following topic explains how to locate the source change position for each of the supported databases.
MySQL
OPTION 1:
1. Execute: SHOW BINARY LOGS;
2. Choose a binlog file (e.g. log.000123).
3. Execute: SHOW BINLOG EVENTS IN 'binlog_filename';
Example:SHOW BINLOG EVENTS IN 'log.000123';
4. Locate the position of a BEGIN or DDL statement (e.g. 1777888).
MySQL does not support a "start from position" located in the middle of a transaction, which is why you must select either BEGIN or DDL.
5. Set the internal parameter: StartFromPosition = binlog_filename:begin_or_ddl_position
Setup and User Guide - Enterprise Manager, November 2020 SR1 219

7 Monitoring and controlling tasks
Example:StartFromPosition = log.000123:1777888
OPTION 2:
1. Execute: SHOW MASTER STATUS;
2. Set the "Start from position" as:firstColumnValue:secondColumnValue Example:mysql.007472:775
Microsoft SQL Server
Execute:
SELECT MAX([Current LSN]) FROM fn_dblog(null,null);
Example: 00002717:00000e08:0003
Oracle
Execute:
SELECT current_scn FROM V$DATABASE;
Example: 1471212002
PostgreSQL
Execute:
SELECT * FROM pg_current_xlog_location();
Example: 0/67A47288)
IBM DB2 for z/OS
Specify the LSN, which is the RBA in a non data sharing environment, and the LRSN in a data sharing environment
IBM DB2 for LUW
1. Execute db2pd to find the correct log name.
2. Execute db2flsn with the returned log name and use the current LRI value.For more information, refer to "Resuming or Starting a Task from LRI in a pureScale Environment" in the Replicate Help.
Recovering from data folder loss or corruptionDuring normal operation, Qlik Replicate maintains the replication state in the following location:
<Data_Folder_Path>\data\tasks\<task_name>\StateManager
This enables tasks that cannot be resumed normally (due to corrupt swap files, for example) to be recovered using the Recover using locally stored checkpoint option described in Advanced run options (page 216).
Setup and User Guide - Enterprise Manager, November 2020 SR1 220

7 Monitoring and controlling tasks
However, if the files in the data folder become corrupted or if the storage device containing the data folder fails, tasks must be recovered using the means described below.
This option is supported when replicating between the following endpoints only:
Supported source endpoints Supported target endpoints
l Amazon RDS for MySQL
l Amazon RDS for PostgreSQL
l Amazon RDS for SQL
l AWS Aurora Cloud for PostgreSQL
l Google Cloud SQL for MySQL
l Google Cloud SQL for PostgreSQL
l IBM DB2 for z/OS
l Microsoft Azure Database for MySQL
l Microsoft Azure SQL Managed Instance
l Microsoft SQL Server
l MySQL
l Oracle
l PostrgreSQL
l SAP HANA
l Amazon Redshift
l Google Cloud SQL for PostgreSQL
l Microsoft Azure Database for MySQL
l Microsoft Azure Database for PostgreSQL
l Microsoft SQL Server
l MySQL
l Oracle
l PostgreSQL
l Snowflake on Azure
l Snowflake on Google
l Snowflake on AWS
Supported source and target endpoints
Setting up and initiating task recoveryFor recovery to be successful, the source database transaction logs must be available from the time the task failed.
To set up a task for recovery
1. Design a task. Make sure to enable the Store task recovery data in target database option in the Task Settings' Change Processing Tuning (page 165) tab. This option can be enabled at any time during Change Processing, although it must be enabled before Change Processing completes.
2. Export the task definitions as described in the Qlik Replicate User Guide and Reference.
3. Run the task.
In addition to the selected source tables, the task will write the checkpoint data to the following table in the target database (and automatically create the table if it has not already been created by another task):
attrep_txn_state
To initiate recovery
1. Import the task definition exported when you set up the task.
2. Enter the passwords in the endpoint connection settings.
Setup and User Guide - Enterprise Manager, November 2020 SR1 221
7 Monitoring and controlling tasks
3. Access the attrep_txn_state table on the target database and locate the failed task in the TASK_NAME column. If there are tasks with the same name running on multiple Replicate Servers, you will also need to locate the appropriate server in the SERVER_NAME column. After locating the relevant task, copy the value in the corresponding CHECKPOINT column.
4. Select the Recover using checkpoint stored on target option and then provide the CHECKPOINT value (preferably by pasting) as described in Advanced run options (page 216).
5. Click OK to start the recovery.
During recovery, Replicate does not write anything to the target database until it identifies the commit event corresponding to the CHECKPOINT value. Once it identifies the CHECKPOINT commit event, recovery is performed and the task reverts to standard operation.
7.7 Error handlingThe following sections describe how to best handle task and data errors:
l Task error handling (page 222)
l Data error handling (page 222)
The descriptions in this section are relevant to Replicate tasks only.
Task error handlingWhen a tasks fails with an error, Tasks View displays a red error icon in the State column. The following flow suggests a proper action path for handling task errors.
1. Move the pointer over the error icon to display a tooltip with a high-level error message and a time stamp.
2. For more information on the problem, do one of the following:
l Open the Messages and notifications (page 229) to view all messages for the task.If you do not see any relevant messages, you may need to:Select Selected Item to only view messages for the selected task.Change the time frame. The Message Center only displays the last 20,000 messages.
l Click View Logs to find the error message in the log files.
l Click View Task to see more detailed information about the current state of the task.
3. If possible, fix the error based on the information provided in the message.
For more information on error handling in Qlik Replicate, see the Qlik Replicate User Guide and Reference.
Data error handlingData errors are errors related to data processing at the record level. When Qlik Replicate encounters a data error during replication, it issues an error warning. Enterprise Manager indicates when a task has data errors in any of its tables. For each task in the task list, Enterprise Manager shows its data error count, which is the
Setup and User Guide - Enterprise Manager, November 2020 SR1 222

7 Monitoring and controlling tasks
sum of all data errors that occurred in the task’s tables.
You can drill down to the task to view this information per table. You have the option to reset the counter per table when the data errors are no longer of interest to you. To view this information per task in the task list, you can display the Data Errors column. For information on column selection, see Column and list actions (page 210).
Take the following into account:
l Reloading a table automatically resets the corresponding counter.
l Resetting has no effect on the task’s exception table.
l The error handling behavior of escalation handling for repeating data errors is affected by counter reset.
7.8 Using the monitor toolsThe monitor tools let you view additional information about the task. The following topics describe the information available through these tools:
l Setting the logging levels (page 223)
l Viewing and downloading logs (page 224)
l Deleting logs (page 225)
l Downloading a diagnostics package (page 225)
l Downloading a memory report (page 225)
LoggingIn the Logging <Task_Name> window, you can set the logging level for the task you are currently monitoring as well as view, download, and delete log files.
l Any changes to the task logging levels take effect immediately without needing to restart the task.
l The logging level can also be set in the Logging Level sub-tab in the Task Settings dialog box. For more information, see Logging (page 174).
Setting the logging levels
To set logging levels:
1. Drill-down to Monitor View as described in Viewing specific tasks (page 189).
2. Then, click the Tools toolbar button and select Logging. The <Task_Name> Logging window opens.
Setup and User Guide - Enterprise Manager, November 2020 SR1 223
7 Monitoring and controlling tasks
3. At the top of the <Task_Name> Logging window, set the Component Logging Level slider to the log level you want. This sets the logging level for all log modules. Note that all of the sliders for the individual modules move to the same position that you set in the main slider.
4. Make any changes to the sliders for the individual modules. This is optional. Note that if you change the main slider, all of the individual sliders are reset to the new position. If you want to maintain a different logging level for a specific module, you need to reset it.
Storing trace and verbose logging in memory
This option is relevant to Replicate tasks only.
When the logging level is set to "Trace" or "Verbose", you can instruct Replicate to store the logging information in memory until an error occurs. On detecting an error, Replicate will begin writing to the physical logs and continue to do so for a few minutes after the initial occurrence of the error.
If no error occurs before the allocated memory is used up, Replicate will empty the memory buffer and start afresh.
This option is useful for tasks that fail unpredictably and for no obvious reason. The problem with continually writing large amounts of information to the logs is twofold:
l Running in "Trace" or "Verbose" logging mode will quickly use up available disk space (unless the logging settings have been configured to prevent this).
l Continually writing large amounts of data to the logs will affect performance.
To use this option
1. Select the Store trace/verbose logging in memory, but if an error occurs, write to the logs check box at the top of the tab.
2. In the Allocate memory up to (MB) field, specify the amount of memory you want to allocate for storing logging information.
Viewing and downloading logsTo view and download logs
1. Drill-down to Monitor View as described in Viewing specific tasks (page 189).
2. Then, click the Tools toolbar button and select Logging. The <Task_Name> Logging window opens.
3. Select the log file you want to view or download from the list in the Log Files pane. If you want to download the file, skip to Step 7.
4. The contents of the log file will be displayed in the right pane. When you select a row in the log file, a tooltip will be display the full message of the selected row.
5. You can browse through the log file using the scroll bar on the right and the navigation buttons at the top of the window.
6. To search for a specific string in the log file, enter the search string in the search box at the top of the
Setup and User Guide - Enterprise Manager, November 2020 SR1 224
7 Monitoring and controlling tasks
window.Any terms that match the specified string will be highlighted blue.
7. To download the log file, click the toolbar button.
Depending on your browser settings, one of the following will occur:
l The task JSON file will be automatically downloaded to the default download location
l You will be prompted for a download location. In this case, save the JSON file to your preferred location.
Deleting logsTo delete logs
1. Drill-down to Monitor View as described in Viewing specific tasks (page 189).
2. Then, click the Tools toolbar button and select Logging. The <Task_Name> Logging window opens.
3. Click the Delete Logs button.The Delete Logs window opens.
4. Optionally change the default number of days (45) and then click the Delete button.All log files older than the specified number of days will be deleted.
Downloading a memory reportThe memory report is a diagnostics tool that can be used to diagnose memory-related issues, such as unusually high memory consumption by a specific task.
Usually, multiple memory reports showing the gradual increase in memory consumption will need to be generated.
To download a memory report:
1. Drill-down to Monitor View as described in Viewing specific tasks (page 189).
2. Click the Tools toolbar button and then select Support > Download Memory Report. Depending on your browser settings, the following file will either be automatically downloaded to your designated download folder or you will be prompted to download it:File name: <task_name>__diagnostics__<timestamp>.memp
Example: MyTask__diagnostics__20180109161333.memp
3. Send the report to Qlik.
Downloading a diagnostics packageYou can generate a task-specific diagnostics package for Support to review. The diagnostics package contains the task log files and various debugging data that may assist in troubleshooting task-related issues.
Setup and User Guide - Enterprise Manager, November 2020 SR1 225

7 Monitoring and controlling tasks
To download a diagnostics package:
1. Drill-down to Monitor View as described in Viewing specific tasks (page 189).
2. Click the Tools toolbar button and then select Support > Download Diagnostics Package. Depending on your browser settings, the following file will either be automatically downloaded to your designated download folder or you will be prompted to download it:File name: <task_name>__diagnostics__<timestamp>.zip
Example: MyTask__diagnostics__20180109161333.zip
7.9 Scheduling jobsUse the Scheduler to schedule a one-time job or a recurrent job for specific Replicate task operations. A job is essentially an operation that can be scheduled to occur once, daily, weekly or monthly.
The following operations can be scheduled:
l Run/Resume a task
l Stop a task
l Reload a task
l Changes to Scheduler settings will not affect running tasks.
l Compose tasks are not supported.
To schedule a new job:
1. Switch to Servers view.
2. Click the Scheduler toolbar button. The Scheduler for <server_name> window opens.The window is divided into two tabs: Scheduled Jobs and Executed Jobs. The Scheduled Jobs tab contains a list of jobs that are scheduled to run periodically or once only while the Executed Jobs tab contains a list of jobs that have already run.
The Executed Jobs tab will only show executed jobs that were scheduled to run once only. In other words, jobs scheduled to run periodically (e.g. Daily, Weekly, Monthly) will not be shown.
3. Click the New Scheduled Job toolbar button.The New Scheduled Job window opens.
4. Specify a Job Name and then, from the Select scheduled job type drop-down list, select one of the following:
Setup and User Guide - Enterprise Manager, November 2020 SR1 226

7 Monitoring and controlling tasks
l Run task to run or resume the task(s) at the scheduled time.
For Full Load only tasks, it is preferable to select Reload target rather than Run task when the scheduling is set to Daily, Weekly or Monthly. This will update the table’s data whereas Run task will replace the existing table.
l Stop task
l Reload target
Selecting Reload target will execute the task according to the task's replication settings. For example, if the task's Full Load and Apply Changes options are enabled, Reload target will reload the target tables and apply any subsequent changes.
5. Select one of the following time conventions:
l Use server local time - When this option is selected (the default), the job will run when the specified time is reached in the server's location.See also: Impact of DST Change on Qlik Replicate.
l Use universal time (UTC) - When this option is selected, the job will run at the specified UTC time. So, for example, if the server is located in a UTC + 2 timezone, a job scheduled to run at 13:00 UTC time will actually run at 15:00 local server time. Scheduling a job to run in UTC mode may be useful if you need tasks on several Replicate servers (located in different timezones) to run concurrently.
For reference, both the server local time and the UTC time are displayed to the right of the Scheduled Time heading.
6. Select and define one of following scheduling options:
l Once (Run the job once on the specified day and at the specified time)
l Daily - (Run the job every day at the specified time)
l Weekly - (Run the job on the specified days and at the specified time)
l Monthly - (Run the job on the specified day of the month)
To run the job on the last day of evey month, select Last day of every month from the Day of month drop-down list.
7. For the Apply to tasks option, select which tasks to schedule. Select either All tasks to apply the job to all current and future tasks or Selected tasks to apply the job to specific tasks. If you choose Selected tasks, a list of currently defined tasks is displayed. Select which tasks to apply the job to.
8. Click OK to save your settings.
Setup and User Guide - Enterprise Manager, November 2020 SR1 227

7 Monitoring and controlling tasks
To enable or disable a scheduled job:
l In the Scheduled Jobs tab, select or clear the check box in the Enabled column as required.
To edit a scheduled job:
1. Select the job in the Scheduled Jobs or Executed Jobs list.
2. Click the Open toolbar button and edit the job as required.
To delete a scheduled job:
1. Select the job in the Scheduled Jobs or Executed Jobs list.
2. Click the Delete toolbar button.
Setup and User Guide - Enterprise Manager, November 2020 SR1 228
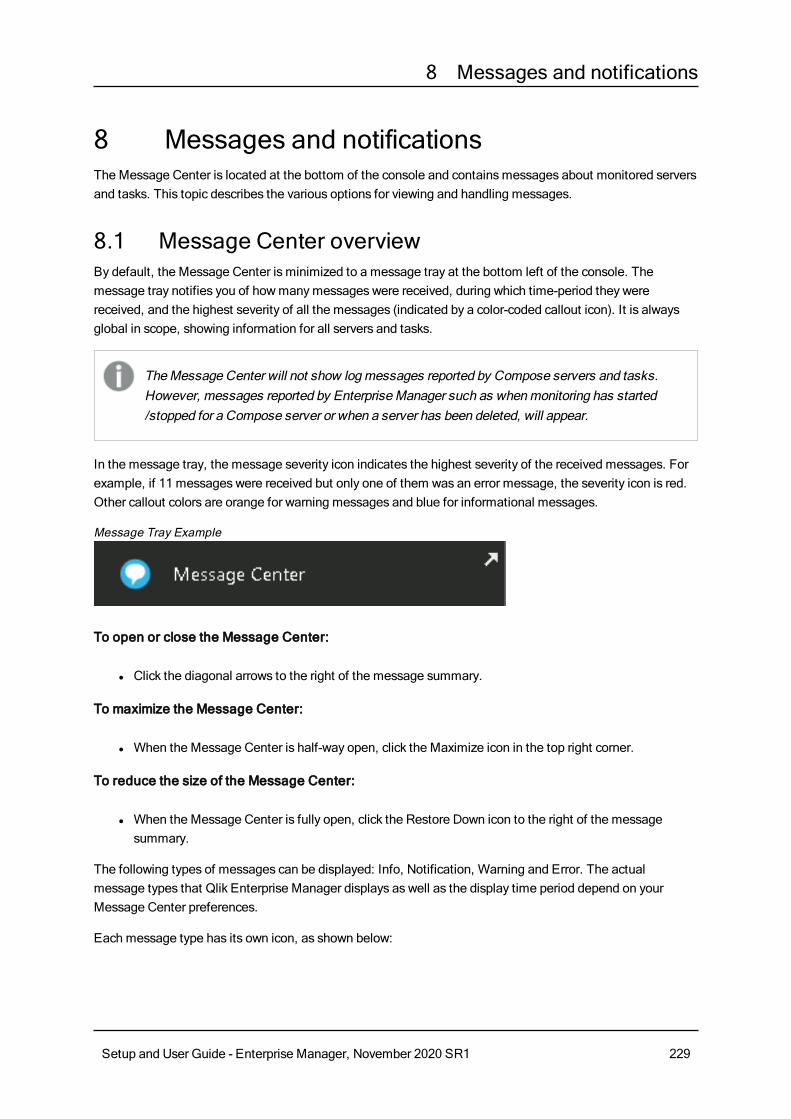
8 Messages and notifications
8 Messages and notificationsThe Message Center is located at the bottom of the console and contains messages about monitored servers and tasks. This topic describes the various options for viewing and handling messages.
8.1 Message Center overviewBy default, the Message Center is minimized to a message tray at the bottom left of the console. The message tray notifies you of how many messages were received, during which time-period they were received, and the highest severity of all the messages (indicated by a color-coded callout icon). It is always global in scope, showing information for all servers and tasks.
The Message Center will not show log messages reported by Compose servers and tasks. However, messages reported by Enterprise Manager such as when monitoring has started /stopped for a Compose server or when a server has been deleted, will appear.
In the message tray, the message severity icon indicates the highest severity of the received messages. For example, if 11 messages were received but only one of them was an error message, the severity icon is red. Other callout colors are orange for warning messages and blue for informational messages.
Message Tray Example
To open or close the Message Center:
l Click the diagonal arrows to the right of the message summary.
To maximize the Message Center:
l When the Message Center is half-way open, click the Maximize icon in the top right corner.
To reduce the size of the Message Center:
l When the Message Center is fully open, click the Restore Down icon to the right of the message summary.
The following types of messages can be displayed: Info, Notification, Warning and Error. The actual message types that Qlik Enterprise Manager displays as well as the display time period depend on your Message Center preferences.
Each message type has its own icon, as shown below:
Setup and User Guide - Enterprise Manager, November 2020 SR1 229
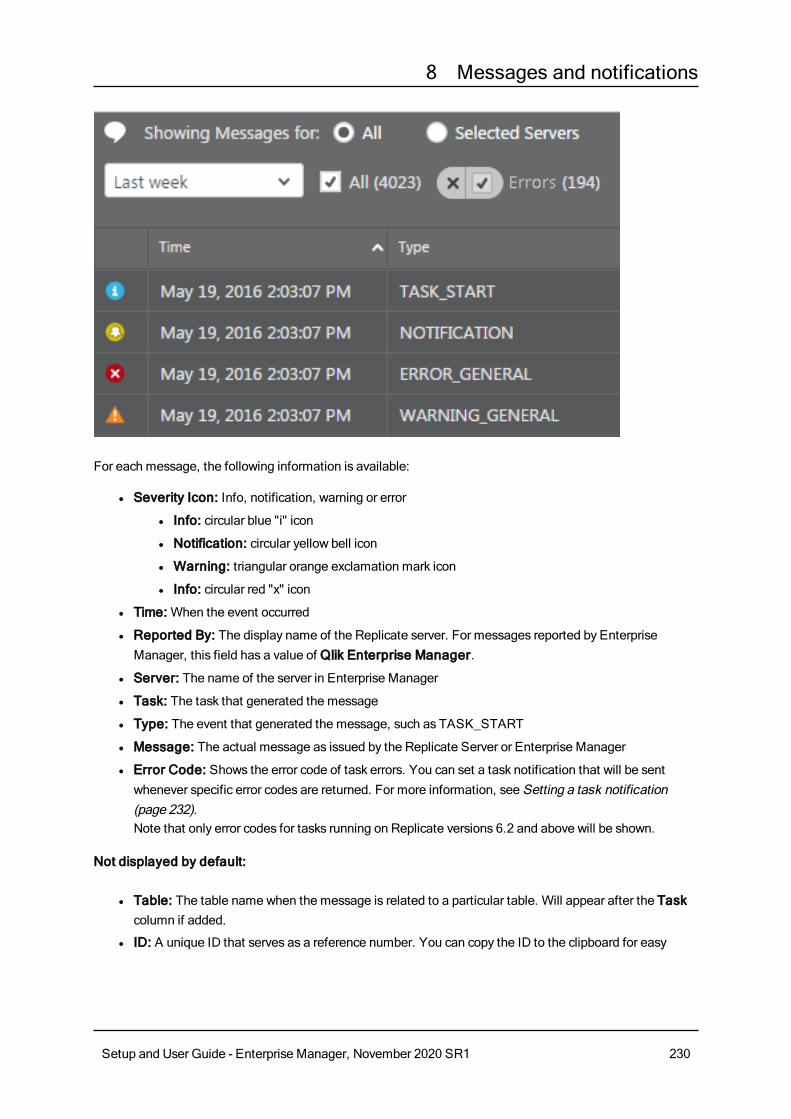
8 Messages and notifications
For each message, the following information is available:
l Severity Icon: Info, notification, warning or error
l Info: circular blue "i" icon
l Notification: circular yellow bell icon
l Warning: triangular orange exclamation mark icon
l Info: circular red "x" icon
l Time: When the event occurred
l Reported By: The display name of the Replicate server. For messages reported by Enterprise Manager, this field has a value of Qlik Enterprise Manager.
l Server: The name of the server in Enterprise Manager
l Task: The task that generated the message
l Type: The event that generated the message, such as TASK_START
l Message: The actual message as issued by the Replicate Server or Enterprise Manager
l Error Code: Shows the error code of task errors. You can set a task notification that will be sent whenever specific error codes are returned. For more information, see Setting a task notification (page 232).Note that only error codes for tasks running on Replicate versions 6.2 and above will be shown.
Not displayed by default:
l Table: The table name when the message is related to a particular table. Will appear after the Task column if added.
l ID: A unique ID that serves as a reference number. You can copy the ID to the clipboard for easy
Setup and User Guide - Enterprise Manager, November 2020 SR1 230
8 Messages and notifications
reference, for example to paste it into an email when you need to refer to a specific message or to search for the message later. Will appear after the Error Code column if added.
8.2 Customizing the Message CenterYou can customize the Message Center according to your business needs. The table below describes the available options.
To Do this
Display messages for all tasks
Under Showing Messages for, select All.
Display messages only for the selected tasks or servers
Under Showing Messages for, select Selected Tasks or Selected Servers, respectively.
Hide current messages Click Hide Current Messages above the message list to only show new messages coming in. Note that this option is only available when you view all system tasks.
To bring back all messages, click Show All Messages.
Change the time period
From the drop-down list at the top left of the Message Center, select one of the available time periods: Last 6 hours, Last 12 hours, Last day, Last 3 days, or Last week.
Filter message severity Select or clear the Errors, Warnings, Notifications or Info check boxes above the message list as desired.
Message Center customization options
The Message Center also includes buttons to view log files, open the Task tab to view a task, or view server information. In addition, you can:
l Customize the columns to display. For more information, see Column and list actions (page 210).
l Configure the message purge policy. For more information, see Message Center purge settings (page 250).
Searching for messagesYou can search for specific messages by typing a string into the Search messages box above the table. Note that Enterprise Manager searches only textual columns, not numeric columns. The following columns are included in the search, even if a column is not displayed in the user interface:
l Severity
l Reported By
l Server
l Task
l Message
Setup and User Guide - Enterprise Manager, November 2020 SR1 231

8 Messages and notifications
l Error Code
l ID
You can also restrict a search to a specific column by preceding the search string with the column name and a colon, as follows: ColumnName:value (for example: Type:TASK_STOP). This is applicable to all available columns, not only the columns listed above.
8.3 Viewing additional informationFrom the Message Center, you can directly open the task or server for a particular message or view its log file.
Click To View
Log information: See Viewing and downloading log files (page 245).
Task information: See Monitoring Full Load replication (page 191) and Monitoring Change Processing replication (page 197).
Server information: See Server monitoring (page 42).
Message Center icon actions
These buttons are only available at a certain window size. If the window is too small, they do not display. In this case, these options are only available from the context menu that appears when you right-click a table row.
8.4 NotificationsYou can configure Enterprise Manager to notify you on the occurrence of a task and/or server event.
Notifications defined in Enterprise Manager do not conflict with notifications defined in Replicate. Although Replicate notifications cannot be managed via Enterprise Manager, Replicate notification messages will be shown in the Enterprise Manager Message Center.
Instructions for setting up notifications are provided in the following sections:
l Setting a task notification (page 232)
l Setting a server notification (page 239)
Setting a task notification
Task notifications apply to Replicate tasks only.
Notifications can be set for the following events:
Setup and User Guide - Enterprise Manager, November 2020 SR1 232
8 Messages and notifications
l Excessive task latency
l Excessive memory usage
l Excessive disk usage
l Processing errors
l Other errors
To set a task notification:
1. Click the toolbar button on the right of the console.
The Notification Rules window opens.
2. Click the Tasks tab and then click New.The New Task Notification wizard opens.
3. Provide a name for the notification.
4. Select a notification in one of the available categories and, where applicable, set the time/size threshold for sending the notification.Performance/Resources:
l Latency is higher than [N] secondsSpecify the desired threshold value and unit of measurement (seconds or minutes).
l Memory usage exceeds [N] GBSpecify the desired threshold value and unit of measurement (GB or MB).
l Disk usage exceeds [N] GBSpecify the desired threshold value and unit of measurement (GB or MB).
Errors:
l Any Error: Sends a notification when any error occurs in the system. Note that notification will not be sent for the following error types:
l Recoverable errors. Recoverable errors are printed as INFO in the log (unless the task logging is set to TRACE, in which case they will be printed as ERROR).
l Certain user-defined error handling policies. For example, if the Duplicate key when applying INSERT Apply Conflicts handling option is set to Log record to the exceptions table, no notification will be sent. However, if it set to Stop task, a notification will be sent.
Setting this option may result in a large volume of notifications, depending on the number of tasks running and their current status. It is therefore recommended to define this notification for selected tasks rather than for all current and future tasks.
l Table processing was suspended due to errors
l Task stopped due to a non-recoverable error
An additional notification will be sent when the Performance/Resource threshold returns to normal (where "normal" is 10% below the defined threshold).
l Errors containing one of these codes
Setup and User Guide - Enterprise Manager, November 2020 SR1 233

8 Messages and notifications
When this option is selected a notification will be sent whenever an error matching one of the specified error codes occurs. Error codes for tasks that ended with an error are shown in the Message Center. You can copy the desired codes from the Message Center and paste them into this field.
Multiple error codes can be specified. In this case, error codes should be separated by a comma.Error codes must contain numeric values onlySupported with Replicate 6.2 and above only.
5. Click Next.The Associate screen is displayed.
6. Choose whether to associate the notification with Selected Tasks or with All Current and Future Tasks.Note that when you complete the Task Notification wizard, the Associated with column in the Notification Rules window will display either Selected Tasks or All Current and Future Tasks depending on which of these options you selected.If you chose Selected Tasks, from the Server drop-down list, select All Servers or a specific server.Then, select the desired tasks using the arrow buttons in the middle of the screen (multiple selection is supported).
The Server drop-down list only displays servers:
l That are monitored
l For which the user who defines the notification has View permission
The Tasks list only displays tasks:
l That are running on monitored servers (that are not in an error state)
l For which the user who defines the notification has View permission
7. Click Next.The Recipients screen is displayed.
8. Notifications will always be displayed in the Message Center. If you also want the notification to sent to the Windows Event Log and/or specified Email Recipients, select their respective check boxes.See also Replicate Event IDs in Windows Event Log.If you selected Email Recipients, specify a list of email recipients (separated by semi-colons) in the To, Cc and/or Bcc fields.
Sending notifications to email recipients requires your organization's outgoing mail server settings to be defined.
9. Click Next.
Setup and User Guide - Enterprise Manager, November 2020 SR1 234
8 Messages and notifications
The Message screen displays a default email subject and email/Windows Event Log message for the selected notification. You can change the default subject and/or message and make use of any of the variables listed to the right of the message.
The message shown in the Message Center is system generated and cannot be edited.
10. Click Finish to add the notification to Enterprise Manager.A summary of the notification settings will be displayed in the Tasks tab in the Notification Rules window.
New notifications are always created as enabled and are active immediately without any need to stop/resume tasks.
Task notification variablesIn addition to allowing you to edit the default messages, the Message window also provides a list of variables that you can insert into the notification message. These are described in the table below.
To insert a variable:
1. Select the desired variable.
2. Place the cursor in the message where you want the variable to be inserted.
3. Click the arrow to the left of the variable list.
The table below describes all of the message variables. However, the variables available for selection in the Message window will vary according to the notification event you select.
Variable Description
${CDC_APPLIED_CHANGES_COUNT} The number of changes applied to the target tables during Change Processing.
${CDC_APPLY_LATENCY} The overall Change Processing latency.
${CDC_APPLY_THROUGHPUT_KB_SEC} The Change Processing throughput speed in kilobytes per second.
${CDC_APPLY_THROUGHPUT_REC_SEC} The Change Processing throughput speed in records per second.
${CDC_CHANGES_FOR_APPLY_IN_MEMORY_UNTIL_TARGET_COMMIT}
The number of change records in memory waiting to be committed on the target.
${CDC_CHANGES_FOR_APPLY_ON_DISK_UNTIL_TARGET_COMMIT}
The number of change records on disk waiting to be committed on the target.
Task notification variables
Setup and User Guide - Enterprise Manager, November 2020 SR1 235
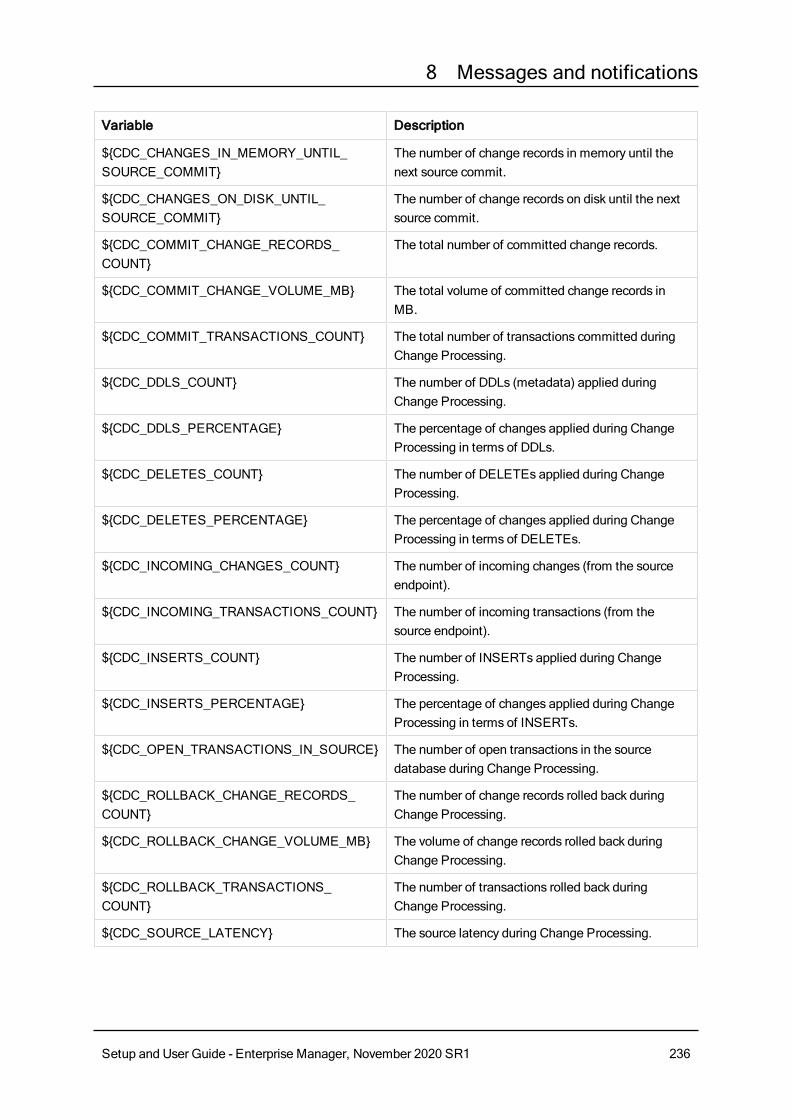
8 Messages and notifications
Variable Description
${CDC_CHANGES_IN_MEMORY_UNTIL_SOURCE_COMMIT}
The number of change records in memory until the next source commit.
${CDC_CHANGES_ON_DISK_UNTIL_SOURCE_COMMIT}
The number of change records on disk until the next source commit.
${CDC_COMMIT_CHANGE_RECORDS_COUNT}
The total number of committed change records.
${CDC_COMMIT_CHANGE_VOLUME_MB} The total volume of committed change records in MB.
${CDC_COMMIT_TRANSACTIONS_COUNT} The total number of transactions committed during Change Processing.
${CDC_DDLS_COUNT} The number of DDLs (metadata) applied during Change Processing.
${CDC_DDLS_PERCENTAGE} The percentage of changes applied during Change Processing in terms of DDLs.
${CDC_DELETES_COUNT} The number of DELETEs applied during Change Processing.
${CDC_DELETES_PERCENTAGE} The percentage of changes applied during Change Processing in terms of DELETEs.
${CDC_INCOMING_CHANGES_COUNT} The number of incoming changes (from the source endpoint).
${CDC_INCOMING_TRANSACTIONS_COUNT} The number of incoming transactions (from the source endpoint).
${CDC_INSERTS_COUNT} The number of INSERTs applied during Change Processing.
${CDC_INSERTS_PERCENTAGE} The percentage of changes applied during Change Processing in terms of INSERTs.
${CDC_OPEN_TRANSACTIONS_IN_SOURCE} The number of open transactions in the source database during Change Processing.
${CDC_ROLLBACK_CHANGE_RECORDS_COUNT}
The number of change records rolled back during Change Processing.
${CDC_ROLLBACK_CHANGE_VOLUME_MB} The volume of change records rolled back during Change Processing.
${CDC_ROLLBACK_TRANSACTIONS_COUNT}
The number of transactions rolled back during Change Processing.
${CDC_SOURCE_LATENCY} The source latency during Change Processing.
Setup and User Guide - Enterprise Manager, November 2020 SR1 236

8 Messages and notifications
Variable Description
${CDC_SOURCE_THROUGHPUT_KB_SEC} The Change Processing throughput from the source endpoint in kilobytes per second.
${CDC_SOURCE_THROUGHPUT_REC_SEC} The Change Processing throughput from the source endpoint in records per second.
${CDC_TRANSACTIONS_FOR_APPLY_ON_TARGET}
The number of transactions pending apply on the target
${CDC_UPDATES_COUNT} The number of UPDATEs applied during Change Processing.
${CDC_UPDATES_PERCENTAGE} The percentage of changes applied during Change Processing in terms of UPDATEs.
${CPU_USAGE_PERCENTAGE}
Only available for Replicate 6.2 and above. For earlier Replicate versions, this variable will appear as -1 in the notification message.
The percentage of CPU utilized by the task.
${DISK_USAGE_MB} The total disk usage in MB.
${EVENT_TIME} When the notification event occurred (e.g. when latency exceeded N MB, when latency returned to normal, and so on).
${FL_END_TIME} When the Full Load operation ended.
${FL_LOAD_DURATION} The duration of the Full Load operation.
${FL_PROGRESS_PERCENTAGE} The percentage of the Full Load operation already completed.
${FL_RECORDS_COMPLETED_COUNT} The current number of processed records during Full Load replication.
${FL_RECORDS_LEFT_COUNT} The current number of records awaiting processing during Full Load replication.
${FL_SOURCE_THROUGHPUT_KB_SEC} The Full Load throughput from the source endpoint in kilobytes per second.
${FL_SOURCE_THROUGHPUT_REC_SEC} The Full Load throughput from the source endpoint in records per second.
${FL_TABLES_COMPLETED_COUNT} The current number of tables loaded to the target during Full Load replication.
Setup and User Guide - Enterprise Manager, November 2020 SR1 237

8 Messages and notifications
Variable Description
${FL_TABLES_LEFT_COUNT} The current number of tables still waiting to be loaded during Full Load replication.
${FL_TABLES_LOADING_COUNT} The number of tables currently being loaded during Full Load replication.
${FL_TABLES_QUEUED_COUNT} The current number of queued tables during Full Load replication.
${FL_TARGET_THROUGHPUT_KB_SEC} The Full Load throughput to the target endpoint in kilobytes per second.
${FL_TARGET_THROUGHPUT_REC_SEC} The Full Load throughput to the target endpoint in records per second.
${FL_TOTAL_RECORDS_COUNT} The total number of records replicated during Full Load.
${FL_TOTAL_TABLES_COUNT} The total number of tables replicated during Full Load.
${FULL_LOAD_ENDED} A boolean indicating whether or not Full Load has completed.
${HOST_NAME} The host name of the Replicate Server machine.
${MEMORY_USAGE_MB} The total amount of memory being used.
${SERVER_NAME} The Replicate server display name, specified by the user when the server was added to Enterprise Manager.
${SOURCE_NAME} The name of the source endpoint.
${SOURCE_TYPE} The source endpoint type (e.g. Microsoft SQL Server).
${TABLES_WITH_ERROR_COUNT} The number of tables with errors.
${TAGS} The name of any tags applied in Enterprise Manager at the time of the notification.
${TARGET_NAME} The name of the target endpoint.
${TARGET_TYPE} The target endpoint type (e.g. Microsoft SQL Server).
${TASK_DATA_ERRORS_COUNT} The number of data errors encountered by the task.
${TASK_DESCRIPTION} The task description (entered by the user when the task was defined).
${TASK_NAME} The task name.
${TASK_PROFILE} The task profile (unidirectional or bidirectional).
Setup and User Guide - Enterprise Manager, November 2020 SR1 238
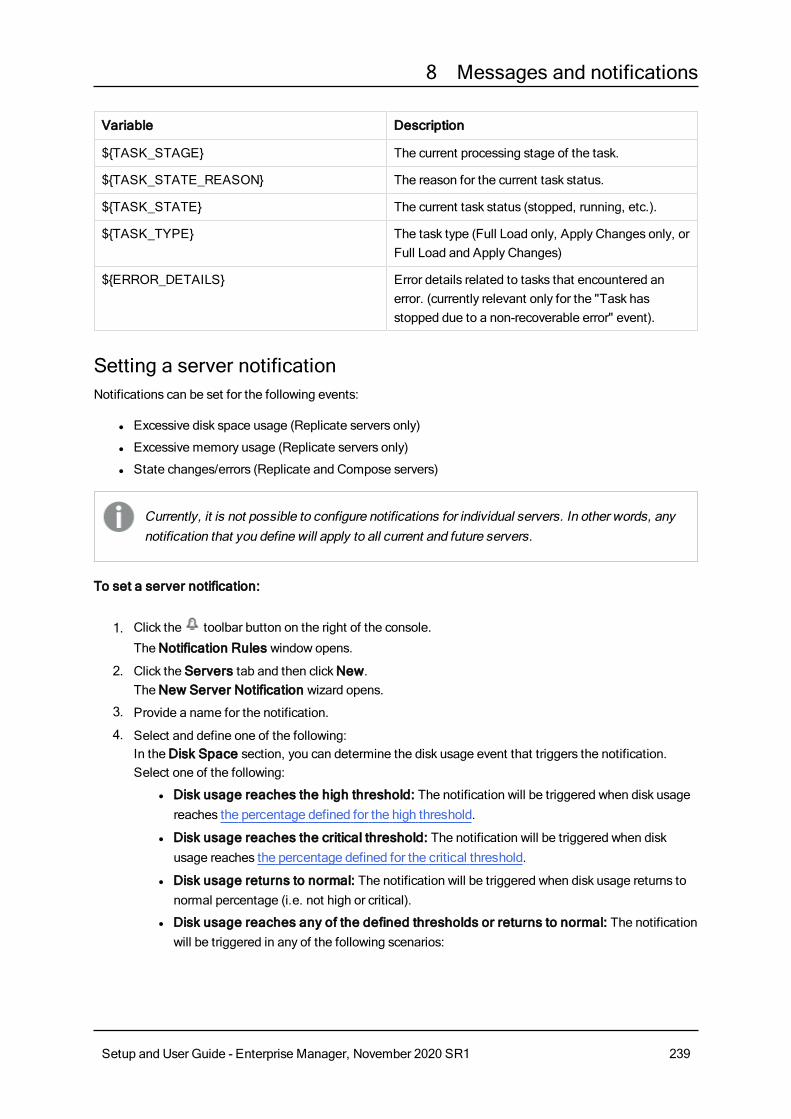
8 Messages and notifications
Variable Description
${TASK_STAGE} The current processing stage of the task.
${TASK_STATE_REASON} The reason for the current task status.
${TASK_STATE} The current task status (stopped, running, etc.).
${TASK_TYPE} The task type (Full Load only, Apply Changes only, or Full Load and Apply Changes)
${ERROR_DETAILS} Error details related to tasks that encountered an error. (currently relevant only for the "Task has stopped due to a non-recoverable error" event).
Setting a server notificationNotifications can be set for the following events:
l Excessive disk space usage (Replicate servers only)
l Excessive memory usage (Replicate servers only)
l State changes/errors (Replicate and Compose servers)
Currently, it is not possible to configure notifications for individual servers. In other words, any notification that you define will apply to all current and future servers.
To set a server notification:
1. Click the toolbar button on the right of the console.
The Notification Rules window opens.
2. Click the Servers tab and then click New.The New Server Notification wizard opens.
3. Provide a name for the notification.
4. Select and define one of the following:In the Disk Space section, you can determine the disk usage event that triggers the notification. Select one of the following:
l Disk usage reaches the high threshold: The notification will be triggered when disk usage reaches the percentage defined for the high threshold.
l Disk usage reaches the critical threshold: The notification will be triggered when disk usage reaches the percentage defined for the critical threshold.
l Disk usage returns to normal: The notification will be triggered when disk usage returns to normal percentage (i.e. not high or critical).
l Disk usage reaches any of the defined thresholds or returns to normal: The notification will be triggered in any of the following scenarios:
Setup and User Guide - Enterprise Manager, November 2020 SR1 239
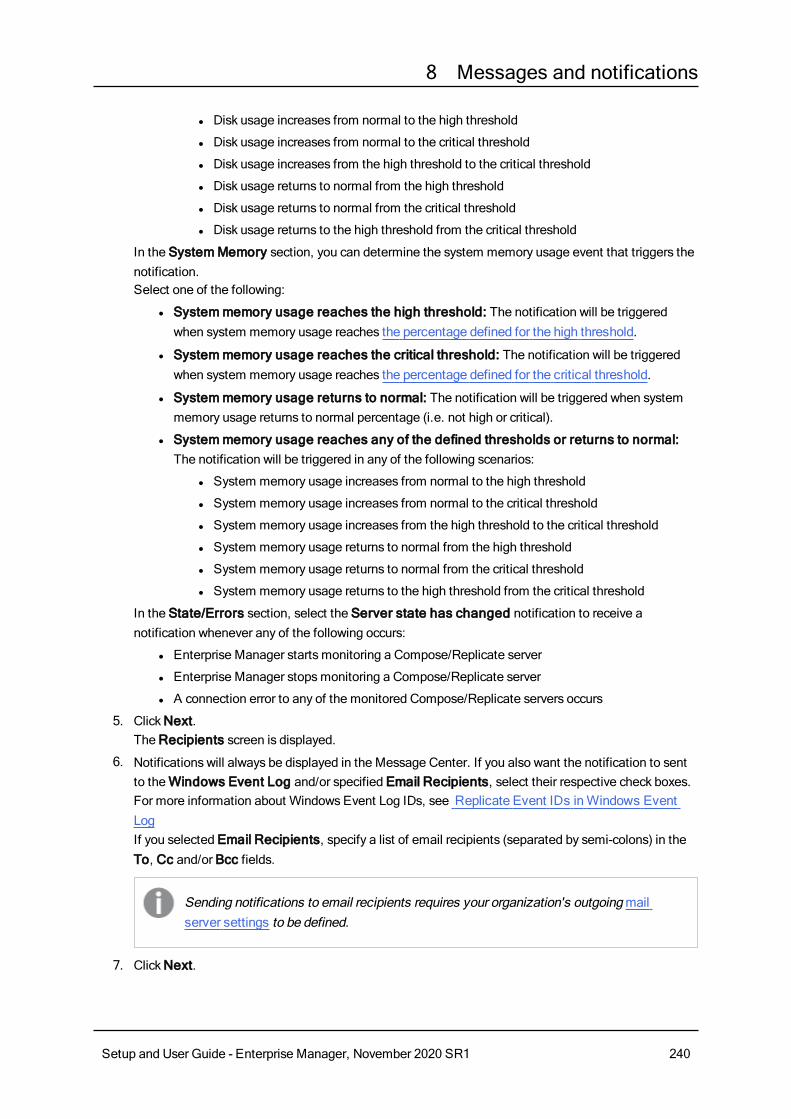
8 Messages and notifications
l Disk usage increases from normal to the high threshold
l Disk usage increases from normal to the critical threshold
l Disk usage increases from the high threshold to the critical threshold
l Disk usage returns to normal from the high threshold
l Disk usage returns to normal from the critical threshold
l Disk usage returns to the high threshold from the critical threshold
In the System Memory section, you can determine the system memory usage event that triggers the notification. Select one of the following:
l System memory usage reaches the high threshold: The notification will be triggered when system memory usage reaches the percentage defined for the high threshold.
l System memory usage reaches the critical threshold: The notification will be triggered when system memory usage reaches the percentage defined for the critical threshold.
l System memory usage returns to normal: The notification will be triggered when system memory usage returns to normal percentage (i.e. not high or critical).
l System memory usage reaches any of the defined thresholds or returns to normal: The notification will be triggered in any of the following scenarios:
l System memory usage increases from normal to the high threshold
l System memory usage increases from normal to the critical threshold
l System memory usage increases from the high threshold to the critical threshold
l System memory usage returns to normal from the high threshold
l System memory usage returns to normal from the critical threshold
l System memory usage returns to the high threshold from the critical threshold
In the State/Errors section, select the Server state has changed notification to receive a notification whenever any of the following occurs:
l Enterprise Manager starts monitoring a Compose/Replicate server
l Enterprise Manager stops monitoring a Compose/Replicate server
l A connection error to any of the monitored Compose/Replicate servers occurs
5. Click Next.The Recipients screen is displayed.
6. Notifications will always be displayed in the Message Center. If you also want the notification to sent to the Windows Event Log and/or specified Email Recipients, select their respective check boxes.For more information about Windows Event Log IDs, see Replicate Event IDs in Windows Event LogIf you selected Email Recipients, specify a list of email recipients (separated by semi-colons) in the To, Cc and/or Bcc fields.
Sending notifications to email recipients requires your organization's outgoing mail server settings to be defined.
7. Click Next.
Setup and User Guide - Enterprise Manager, November 2020 SR1 240

8 Messages and notifications
The Message screen displays a default email subject and email/Windows Event Log message for the selected notification. You can change the default subject and/or message and make use of any of the variables listed to the right of the message.
The message shown in the Message Center is system generated and cannot be edited.
8. Click Finish to add the notification to Enterprise Manager.A summary of the notification settings will be displayed in the Servers tab in the Notification Rules window.
New notifications are always created as enabled and are active immediately without any need to stop/start monitoring servers.
Server notification variablesIn addition to allowing you to edit the default messages, the Message window also provides a list of variables that you can insert into the notification message. These are described in the table below.
To insert a variable:
1. Select the desired variable.
2. Place the cursor in the message where you want the variable to be inserted.
3. Click the arrow to the left of the variable list.
The table below describes all of the message variables. However, the variables available for selection in the Message window varies according to the notification event you select.
Variables related to Disk, Memory, Qlik CPU, and Machine CPU usage are not available for Compose servers. If defined, these variables will appear as -1 in the notification message.
Variables related to Qlik CPU and Machine CPU usage are only available for Replicate 6.2 and above. For earlier Replicate versions, these variables will appear as -1 in the notification message.
${ATTUNITY_CPU_USAGE_PERCENTAGE}
Total percentage of CPU utilized by the Replicate Server's services and tasks.
${MACHINE_CPU_USAGE_PERCENTAGE}
Total percentage of CPU utilized by the machine on which the server is installed.
${DISK_TOTAL_GB} The total size of the disk on which the Replicate "Data" folder is installed.
Setup and User Guide - Enterprise Manager, November 2020 SR1 241

8 Messages and notifications
${DISK_USAGE_GB} The total amount of disk space(in GB) utilized by the Replicate "Data" folder.
${DISK_USAGE_MB} The total amount of disk space(in MB) utilized by the Replicate "Data" folder.
${DISK_USAGE_PERCENTAGE}
The total percentage of disk space utilized by the Replicate "Data" folder.
${DISK_USAGE_PREV_STATE}
The previous disk usage state (Normal, High, or Critical)
${DISK_USAGE_STATE} The current disk usage state (Normal, High, or Critical)
${ERROR_DETAILS} Information about server connection errors.
${ERROR_TASKS_COUNT} The total number or tasks in an "Error" state.
${EVENT_TIME} When the notification event occurred.
${HOST_NAME} The host name of the server machine.
${LAST_CONNECTION} The last successful connection to the server.
${LICENSE_DAYS_TO_EXPIRATION}
The number of days left until the license expires.
${LICENSE_EXPIRATION} When the license is due to expire.
${LICENSE_ISSUE_DATE} When the license was issued.
${LICENSE_STATE} The current license state.
${MEMORY_TOTAL_GB} The total amount of memory available on the Replicate Server machine.
${MEMORY_USAGE_GB} The amount of memory (in GB) consumed by Replicate tasks on the Replicate Server machine.
${MEMORY_USAGE_MB} The amount of memory (in MB) consumed by Replicate tasks on the Replicate Server machine.
${MEMORY_USAGE_PERCENTAGE}
The percentage of total memory consumed by Replicate tasks on the Replicate Server machine.
${MEMORY_USAGE_PREV_STATE}
The previous memory state (Normal, High, or Critical)
${MEMORY_USAGE_STATE} The current memory state (Normal, High, or Critical)
${PLATFORM} The platform on which the server machine is installed (Linux or Windows)
${PORT} The server port.
${RECOVERING_TASKS_COUNT}
The total number of tasks with a "Recovering" status.
${RUNNING_TASKS_COUNT} The total number of tasks with a "Running" status.
Setup and User Guide - Enterprise Manager, November 2020 SR1 242

8 Messages and notifications
${SERVER_DESCRIPTION} The server description in Enterprise Manager.
${SERVER_NAME} The server name in Enterprise Manager.
${SERVER_PREV_STATE} The previous server state (Not Monitored, Monitored, or Error)
${SERVER_STATE} The current server state (Not Monitored, Monitored, or Error)
${STOPPED_TASKS_COUNT} The total number of tasks with a "Stopped" status.
${TASKS_TOTAL_COUNT} The total number of tasks, regardless of state.
${USER_NAME} The user name for accessing the server.
${VERSION} The server version.
Managing notificationsYou can manage task and server notification in their respective tabs.
The following management options are available:
All of the actions described below can also be performed via the context menu.
To Do this
Delete a notification Select the desired notification(s) and then click the Delete toolbar button.
When prompted to confirm your action, click Yes.
Edit a notification Select the desired notification(s) and then click the Open toolbar button.
Enable a notification Select the desired notification(s) and then click the Enable toolbar button.
Disable a notification Select the desired notification(s) and then click the Disable toolbar button.
Search for a notification Use the search box to perform a search on all the columns in the notification list.
OR
Search by column value by specifying the column name as a prefix.
Example 1:
To find all enabled notifications specify:
Enabled: true
Example 2:
To find all notifications where "Jeff" is one of the recipients, specify:
Recipients: Jeff
Notification actions
Setup and User Guide - Enterprise Manager, November 2020 SR1 243
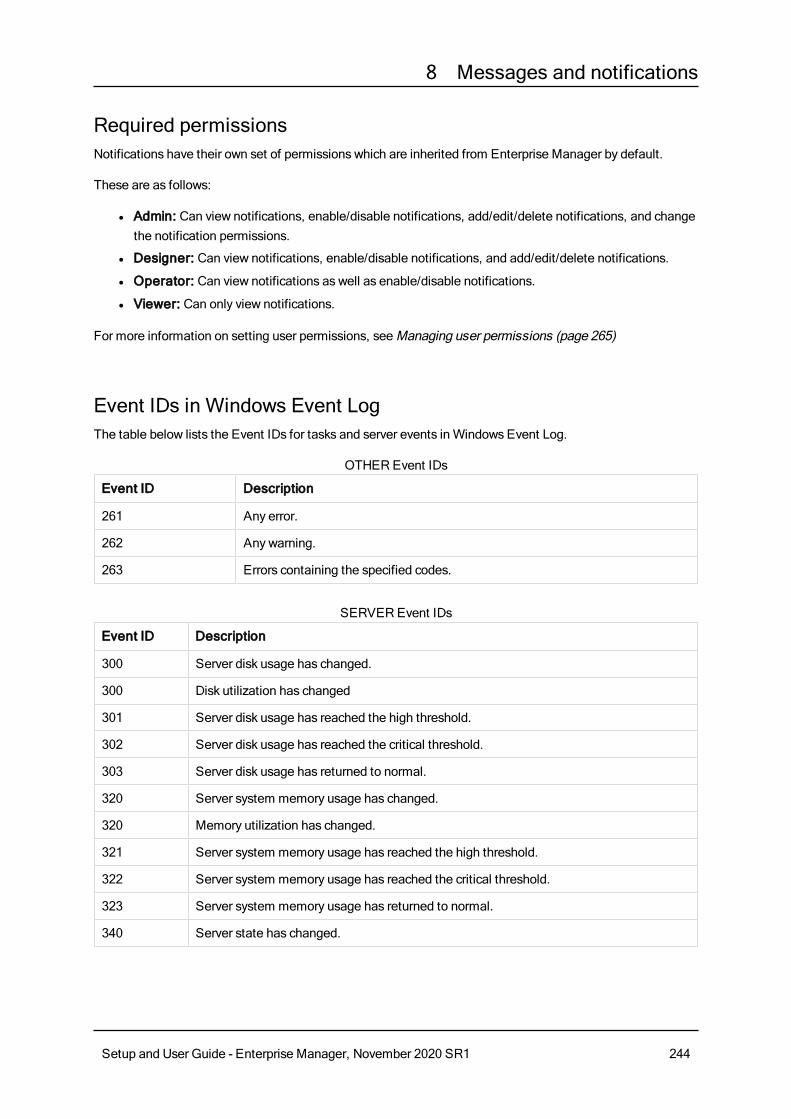
8 Messages and notifications
Required permissionsNotifications have their own set of permissions which are inherited from Enterprise Manager by default.
These are as follows:
l Admin: Can view notifications, enable/disable notifications, add/edit/delete notifications, and change the notification permissions.
l Designer: Can view notifications, enable/disable notifications, and add/edit/delete notifications.
l Operator: Can view notifications as well as enable/disable notifications.
l Viewer: Can only view notifications.
For more information on setting user permissions, see Managing user permissions (page 265)
Event IDs in Windows Event LogThe table below lists the Event IDs for tasks and server events in Windows Event Log.
Event ID Description
261 Any error.
262 Any warning.
263 Errors containing the specified codes.
OTHER Event IDs
Event ID Description
300 Server disk usage has changed.
300 Disk utilization has changed
301 Server disk usage has reached the high threshold.
302 Server disk usage has reached the critical threshold.
303 Server disk usage has returned to normal.
320 Server system memory usage has changed.
320 Memory utilization has changed.
321 Server system memory usage has reached the high threshold.
322 Server system memory usage has reached the critical threshold.
323 Server system memory usage has returned to normal.
340 Server state has changed.
SERVER Event IDs
Setup and User Guide - Enterprise Manager, November 2020 SR1 244
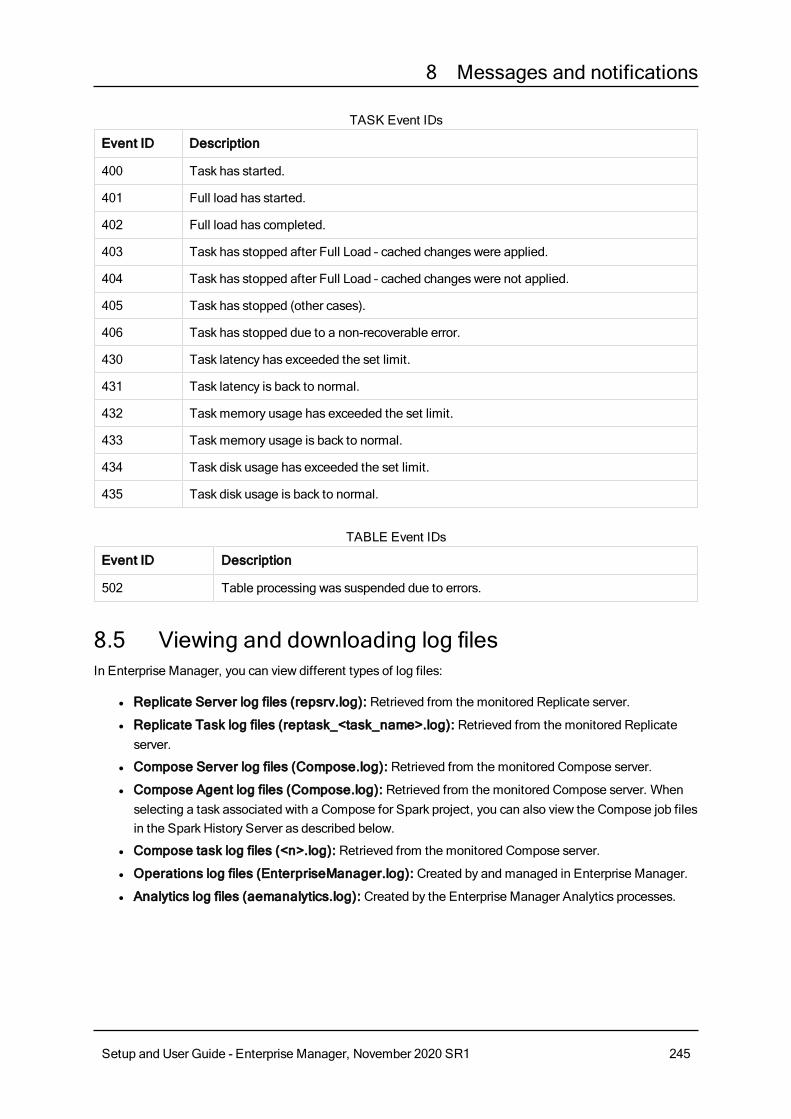
8 Messages and notifications
Event ID Description
400 Task has started.
401 Full load has started.
402 Full load has completed.
403 Task has stopped after Full Load – cached changes were applied.
404 Task has stopped after Full Load – cached changes were not applied.
405 Task has stopped (other cases).
406 Task has stopped due to a non-recoverable error.
430 Task latency has exceeded the set limit.
431 Task latency is back to normal.
432 Task memory usage has exceeded the set limit.
433 Task memory usage is back to normal.
434 Task disk usage has exceeded the set limit.
435 Task disk usage is back to normal.
TASK Event IDs
Event ID Description
502 Table processing was suspended due to errors.
TABLE Event IDs
8.5 Viewing and downloading log filesIn Enterprise Manager, you can view different types of log files:
l Replicate Server log files (repsrv.log): Retrieved from the monitored Replicate server.
l Replicate Task log files (reptask_<task_name>.log): Retrieved from the monitored Replicate server.
l Compose Server log files (Compose.log): Retrieved from the monitored Compose server.
l Compose Agent log files (Compose.log): Retrieved from the monitored Compose server. When selecting a task associated with a Compose for Spark project, you can also view the Compose job files in the Spark History Server as described below.
l Compose task log files (<n>.log): Retrieved from the monitored Compose server.
l Operations log files (EnterpriseManager.log): Created by and managed in Enterprise Manager.
l Analytics log files (aemanalytics.log): Created by the Enterprise Manager Analytics processes.
Setup and User Guide - Enterprise Manager, November 2020 SR1 245

8 Messages and notifications
To view a log file:
1. Do one of the following to open the Log Viewer:
l For server log files: In the Servers list, select a server and click View Logs above the list.
This option is only available for servers that are connected.
l For Compose and Replicate task log files: In the Tasks list, select a task and click View Logs above the list.
This option is only available for tasks associated with connected servers.
When selecting a task associated with a Compose for Spark project, a View Spark History Server link appears at the bottom of the window. Clicking the link will open a window displaying the Compose Spark jobs.
If you encounter an access error when clicking the View Spark History Server link, try one or both of the following:
l Add an entry to the client host file that maps the Spark History Server host name to its externally accessible IP address.
l Open the necessary firewall ports to allow Enterprise Manager to access the Spark History Server.
l For Operations log files: Click the View Logs icon in the top right corner. Then select Operations from the Log Files drop-down list in the top left of the window.
You can also view log files for messages in the Message Center. The View Logs option is available for all messages reported by Enterprise Manager, for messages reported by a server that is connected, and for tasks pertaining to a server that is connected.
l For Analytics log files: Click the View Logs icon in the top right corner. Then select Analytics from the Log Files drop-down list in the top left of the window.
2. In the Log Viewer window, in the Log Files pane on the left, select the log file you want to view.The content of the log file is displayed in the right pane. When you select a row in the log file, a tooltip displays the full message of the selected row.
3. Browse through the log file using the scroll bar on the right.
4. To search for a specific string in the log file, enter the search string in the search box at the top of the window.Any terms that match the specified string are highlighted blue. The number of matches is displayed next to the search box. You can use the navigation errors to move to the first, next, previous, or last occurrence of the search string.
Setup and User Guide - Enterprise Manager, November 2020 SR1 246

8 Messages and notifications
5. To start a new log file, click Roll Log File.The log file gets saved with a 12-digit timestamp appended to its name, such as EnterpriseManager_160619073410.log or repsrv_160703131920.log.
This option is not available for Compose log files.
This option is not available when you open the Log Viewer window from the Message Center.
6. Click Close.
To download a log file:
l In the Log Viewer window, select the log file you want to download and click the Download Log File icon at the top right.
Setup and User Guide - Enterprise Manager, November 2020 SR1 247

9 Administration
9 AdministrationThis topic describes how to configure message purge and logging settings in Qlik Enterprise Manager.
For information on setting up and using Analytics, see Analytics (page 281).
9.1 Enterprise Manager settingsIn the Settings window you can configure the following:
l Logging settings (page 248)
l Message Center purge settings (page 250)
l Repository connection settings (page 251)
l Analytics - Data collection and purge settings (page 252)
l Configuring mail server settings (page 254)
l Registering and managing licenses (page 255)
To open the Settings window, click the toolbar button in the top right of the console.
Logging settingsIn Enterprise Manager, you can modify the logging settings for system log files. This includes specifying:
l Logging levels (page 248)
l Automatic log rollover and cleanup (page 249)
To modify logging settings for server and task log files, you need to access the web console for the respective monitored Replicate server.
Logging levelsThe logging level you set determines what information is written to the system log file, EnterpriseManager.log, and whether information is written to the Attunity.WebLog.log file. The system log file provides information about events, warnings, and errors occurring in Enterprise Manager, but not for the monitored Replicate servers and their respective tasks. The WebLog file captures requests and responses between the client and server, but only when the logging level for the WebLog component is set to Trace or Verbose.
Because the WebLog file grows quickly in size, it is recommended that you only set the logging level for the WebLog component to Trace or Verbose for short periods of time, such as when troubleshooting an issue.
The following logging levels are available, from the lowest to the highest:
Setup and User Guide - Enterprise Manager, November 2020 SR1 248

9 Administration
l Error: Include only error messages.
l Warning: Include error and warning messages.
l Info: Include error, warning, and info messages.
l Trace: In addition to error, warning, and info messages, include debug data.
l Verbose: In addition to error, warning, and info message, include detailed debug data.
Within the log file, the logging level is indicated by the initial letter: E for error, W for warning, and so on. The higher levels always include the messages from the lower levels. Therefore, if you select Error, only error messages are written to the log. However, if you select Info, informational messages, warnings, and error messages are included. Selecting Verbose writes all possible messages to the log.
You can set a global logging level for all log components or separate logging levels for each component. For example, you can define a logging level of Info for Message Center logs and a logging level of Warning for Replicate tasks.
To set the logging level:
1. In the top right corner, click the gear icon.
2. In the Settings window, in the Logging Levels tab, move the top slider to the log level you want.This sets the log level for all components. Note that the sliders for all components move along to the same position.
3. Optionally, modify the individual logging level for any component.
4. Click OK.
Automatic log rollover and cleanupYou can define when Enterprise Manager should roll over the system log file and WebLog file and when to purge old log files. The current log files are called EnterpriseManager.log and Attunity.WebLog.log, respectively. Rolled over log files have a 12-digit timestamp appended to their name, such as EnterpriseManager_160407111842.log or Attunity.WebLog_160717115348.log.
Automatic rollover is enabled by default. You can also perform rollover manually if needed. See Manual log rollover (page 250).
To configure automatic rollover and cleanup:
1. In the top right corner, click the gear (settings) icon.
2. In the Settings window, in the Logging|Log File Management tab:
l Select the Enable automatic rollover check box to have log files rolled over at the default size of 100 MB. By default, this check box is selected.
l If you prefer a different cutoff size for rollover, select the check box Roll over the log if the log file is larger than (MB): and specify a different file size. When the log file reaches the specified size, the old log is saved with a timestamp appended to its name and a new log file is started. The maximum file size is 1,024 MB.
l Under Maximum number of newest log files to keep, specify the maximum number of log files to keep. By default, this is 45 files. The maximum number of files cannot exceed 100.
Setup and User Guide - Enterprise Manager, November 2020 SR1 249

9 Administration
Enterprise Manager keeps the newest log files and removes any files beyond the specified number.
3. Click OK.
Manual log rolloverIf you need to start a new system log file or WebLog file before the current file has reached the size specified for automatic rollover, or if you want to start a new server or task log file, you can do this manually. Manual rollover is only available for active log files and for log files pertaining to tasks that are currently running.
To manually roll over a log file:
1. In the top right corner, click the View Logs icon.
2. In the Log Viewer window, select the current log file and click Roll Log File.Enterprise Manager starts logging to a new log file. Rolled over log files have a 12-digit timestamp appended to their name, such as EnterpriseManager_160407111842.log or Attunity.WebLog_160717115348.log.
3. Click Close.
Message Center purge settingsEnterprise Manager pulls error, warning, information, and notification messages from all managed Replicate Servers and stores them locally on the machine where Enterprise Manager is installed. The Enterprise Manager console then retrieves these messages from the local storage and displays them in the Message Center, see: Messages and notifications (page 229).
To avoid storage issues, you can specify the interval at which Enterprise Manager should purge messages from the Message Center and the maximum number of messages to be stored. By default, Enterprise Manager purges messages after 14 days and when the number of messages exceeds 200,000. Purged messages are no longer available for retrieval.
The message purge policy you define in Enterprise Manager does not affect any log purge policy of the monitored Replicate servers.
To modify Message Center purge settings:
1. Click the gear icon in the top right corner.The Settings window opens.
2. In the Message Center tab, specify:
l After how many days or weeks to purge messages. The default value is 14 days; the maximum value 91 days (13 weeks). You can enter any value between 1 and 91.
l The maximum number of messages to be stored in Enterprise Manager. The default value is 200,000. The maximum value is 1,000,000; the minimum 100. You can enter any value between 100 and 1,000,000.
3. Click OK.
Setup and User Guide - Enterprise Manager, November 2020 SR1 250

9 Administration
Repository connection settingsThe repository is used to store data from the Analytics module. Once PostgreSQL is installed, you need to configure the connection settings to the repository.
To set up connectivity:
1. Switch to Operations View and then click the Settings button in the top right corner.
2. In the Settings window, click the Repository Connection tab.
3. Enter the following information:
Field Value
Repository host The IP address or host name of the PostgreSQL machine.
Port The port through which the PostgreSQL machine is accessed.
Database The name of the PostgreSQL database where you want the analytics data to be stored.
User name The user name for accessing the PostgreSQL database.
Password The password for accessing the PostgreSQL database.
Maximum number of connections
The number of concurrent connections to the specified PostgreSQL database. You may need to increase the number of connections based on task activity.
Additional connection properties
Enter any additional connection properties for the PostgreSQL database. Properties should be formatted as follows:"key=value;key=value"
For a description of JDBC connection properties, visit:Connecting to the Database - PostgreSQL
Repository connection fields
4. To test the settings (recommended), click Test Connection.
5. If the connection test is successful, click Save. Note, after clicking Save, if you have specified a new database, you will also need to click Initialize Analytics Repository to enable the Analytics module.
Clicking Initialize Analytics Repository will delete all data from an existing Repository. Therefore, you should only initialize them if you are configuring connectivity to a new database.
6. Configure the data collection and purging settings for Analytics as described in Analytics - Data collection and purge settings (page 252).
Qlik Catalog Server connectionFor information on these settings, please refer to Cataloging tasks in Qlik Catalog (page 276).
Setup and User Guide - Enterprise Manager, November 2020 SR1 251

9 Administration
Analytics - Data collection and purge settingsWhen working with the Analytics module, after configuring the connection settings to your repository, you then need to configure data collection and purge settings.
You can also change the log level and management settings if desired.
Defining data collection and purging settings
To set up and start the collector:
1. Select the Analytics tab.
2. In the Collector properties section, optionally change the following information:
Field Value
Collect data every
The number of minutes to wait between data collection operations.
Store data up to The number of days to store data from the moment it is collected.
If the repository is unavailable, store data in memory for up to
The number of minutes of data that should be stored in memory if the Analytics repository is unavailable for any reason.
Analyze database tables during data collection
When selected (the default), the Collector process will analyze the tables in the Analytics repository during each run. If unchecked, the Collector process will not analyze the tables and the customer should ensure that statistics are being updated periodically. As the size of the database gets larger, it is less important to update statistics frequently and it may start to impact the performance of the Collector, so it is recommended to disable if you notice the Analytics dashboards being updated less frequently.
Collector property fields
3. Click Start Collector.
To stop the collector:
l Click the Stop Collector button in the Collector properties section.
To resume data collection, click the Start Collector button.
Setup and User Guide - Enterprise Manager, November 2020 SR1 252

9 Administration
To start and stop the purger:
l Click the Start Purger button. Data will be purged according to the value specified in the Store data up to field described above. To prevent data from being purged, click the Stop Purger button.
Setting logging levelsIn the Logging Levels sub-tab, you can set the logging levels for the log files generated by the Analytics service. The level of information in the log files is determined by the logging level set in this tab. Analytics log files can be viewed in the Log Viewer as described in Viewing and downloading log files (page 245).
Because the WebLog file grows quickly in size, it is recommended that you only set the logging level for the WebLog component to Trace or Verbose for short periods of time, such as when troubleshooting an issue.
The following logging levels are available, from the lowest to the highest:
l Error: Include only error messages.
l Warning: Include error and warning messages.
l Info: Include error, warning, and info messages.
l Trace: In addition to error, warning, and info messages, include debug data.
l Verbose: In addition to error, warning, and info message, include detailed debug data.
Within the log file, the logging level is indicated by the initial letter: E for error, W for warning, and so on. The higher levels always include the messages from the lower levels. Therefore, if you select Error, only error messages are written to the log. However, if you select Info, informational messages, warnings, and error messages are included. Selecting Verbose writes all possible messages to the log.
You can set a global logging level for all log components or separate logging levels for each component. For example, you can define a logging level of Info for Message Center logs and a logging level of Warning for Replicate tasks.
To set the logging level:
1. Move the top slider to the log level you want.This sets the log level for all components. Note that the sliders for all components move along to the same position.
2. Optionally, modify the individual logging level for any component.
3. Click OK.
Automatic rollover and cleanupYou can define when Enterprise Manager should roll over the Analytics log file and when to purge old log files. The current log file is called aemanalytics.log. Rolled over log files have a 12-digit timestamp appended to their name, such as aemanalytics_180407111842.log.
Setup and User Guide - Enterprise Manager, November 2020 SR1 253
9 Administration
Automatic rollover is enabled by default. If needed, you can also perform rollover manually as described in Viewing and downloading log files (page 245).
To configure automatic rollover and cleanup:
1. Select the Log File Management sub-tab.
2. In the Settings window, in the Logging|Log File Management tab:
l Select the Enable automatic rollover check box to have log files rolled over at the default size of 100 MB. By default, this check box is selected.
l If you prefer a different cutoff size for rollover, select the check box Roll over the log if the log file is larger than (MB): and specify a different file size. When the log file reaches the specified size, the old log is saved with a timestamp appended to its name and a new log file is started. The maximum file size is 1024 MB.
l Under Maximum number of newest log files to keep, specify the maximum number of log files to keep. By default, this is 45 files. The maximum number of files cannot exceed 100.Enterprise Manager keeps the newest log files and removes any files beyond the specified number.
3. Click OK.
Configuring mail server settingsMail server settings are required for sending Enterprise Manager notifications.
To configure the mail server settings:
1. Click toolbar button in the right of the console.
The Settings window opens.
2. Select the Mail Server Settings tab and enter the following information:
l Mail server: The host name or IP address of your organization's outgoing mail server.Example: smtp.example.com
l Port: The port used to communicate with the mail server. The default value is 25.
l Use SSL: Select to connect to the mail server (for sending notifications) using SSL.
l Verify peer: Select if you want the mail server to send a certificate proving its identity. On Windows, the certificate will be authenticated using the default CA certificates.
l CA Path: On Linux, specify the location of the server CA certificate.
l Verify host: Select to verify that the host name in the certificate matches the host name of the mail server.
l Anonymous login: Select this to allow users to receive notifications without having to provide login credentials.
l User name: The user name for the email user account that is sending notifications.
l Password: The password for the email user account that is sending notifications.
l Sender email address: The email address from which notifications will be sent. The address will appear in the From field of the email notification.
Setup and User Guide - Enterprise Manager, November 2020 SR1 254

9 Administration
3. To send a test mail, specify an email address in the Send to field and then click the Send Test Mail button.If the mail server settings are correct, an email will be sent to the specified email recipient. Otherwise, an error will be shown at the top of the console.
4. Click OK to save your settings.
Registering and managing licensesIn the Licenses tab, you can view and register licenses for each of the Qlik Enterprise Manager modules. Currently, the following modules require a license:
l Replication Management - Enables design, customization, monitoring, and control of Replicate tasks as well as Replicate Server management.
l Replication Analytics - Provides measurements of server and task metrics over a specific time-period.
When the Replication Analytics license expires, data collection will no longer occur. However, the Analytics dashboards will continue to show the analytics that were collected before the license expired. Additionally, the Analytics tab will also remain available.
Registering a license
To register a license:
1. Do one of the following:
l Click the Register License link in the Register License message that is displayed when you open Qlik Enterprise Manager, or that is displayed in the main Analytics tab (after you have already registered a Replication Management license). The Register <Module Name> License window opens.Continue from Step 5 below.
l Click the toolbar button in the right of the console.
2. The Settings window opens.
3. Select the Licenses tab.The following sub-tabs are displayed (one for each module):
l Replication Management
l Replication Analytics
4. To register a license, select the relevant tab, and then click the Register License button at the top of the tab.The Register <Module Name> License window opens.
5. Click Load to load the license from a file, or copy the license text (e.g. from an email message) into the License text area.
Setup and User Guide - Enterprise Manager, November 2020 SR1 255

9 Administration
If the license you loaded or pasted is for a different module (e.g. you intended to load a Replication Management license, but mistakenly loaded a Replication Analytics license), a warning will appear at the top of the Register <Module Name> License window. In such a case, you can either register the license anyway (since you may have intended to register that license later) or load/paste another the license (i.e. the license that you originally intended to register).
6. Click the Register License button at the bottom of the window.If the license is valid, a confirmation that the license was registered successfully will be shown at the top of the Settings window. Otherwise, an appropriate error message will be shown.
Viewing licensesYou can view the properties of registered licenses (such as when the license is due to expire).
To view a license:
1. Click the toolbar button in the right of the console.
The Settings window opens.
2. Select the Licenses tab.
3. Select the Replication Management or Replication Analytics sub-tab accordingly.A list of properties will be shown.
Showing/hiding the Analytics DashboardsThe main Analytics tab is shown by default, regardless of whether or not you have registered a Replication Analytics license. If you do not intend to use the Replication Analytics module, you can hide the tab by either clicking the Hide Analytics Dashboards link in the Analytics tab or by following the procedure described below.
To show/hide the main Analytics tab:
1. Click the toolbar button in the right of the console.
The Settings window opens.
2. Select the Licenses tab.
3. Select the Replication Analytics sub-tab.
4. Clear or select the Hide Analytics Dashboards check box as required.
This option is only available when no Replication Analytics license has been registered.
5. Click Save.
Setup and User Guide - Enterprise Manager, November 2020 SR1 256

9 Administration
License alertsIf any of the Enterprise Manager licenses are invalid, due to expire, or have already expired, a License Alerts link will appear at the top of the console. Clicking the link will list the issue(s) and provide links to resolve them (e.g. Register License).
PermissionsFor information on permissions required to perform the various the license-related operations (i.e. registering licenses, viewing licenses, and hiding the Analytics tab) see Roles and permissions (page 262).
9.2 User permissionsYou can grant Qlik ReplicateEnterprise Manager users different roles according to the tasks you want them to perform. Qlik ReplicateEnterprise Manager comes with the following predefined security roles: Admin, Designer, Operator and Viewer. Each role has its own set of permissions, as described in Roles and permissions (page 262). For more information on permissions, seeGranular access control (page 258)
You can associate a user with a security role by adding the user to the appropriate Active Directory group or by assigning a role directly to the user. By default, the user under whose account you install Enterprise Manager is associated with the Admin role. In addition, you can fine-tune access control per user or group. For more information, see Granular access control (page 258).
As a user with the relevant permissions, you can view and change the permissions for existing users or groups, or add users or groups that do not yet exist in Enterprise Manager.
The advantage of adding groups over users is that you can assign a security role to a group as a whole, instead of to individual users, and any new user that gets added to an existing group automatically acquires the security role granted to that group.
You can also:
l Add users as domain users that are not related to an active directory group.
l Add local groups. However, this is not possible by default. To set up Enterprise Manager to work with local groups, perform the steps in Working with local groups (page 264).
To set user permissions using Active Directory groups, you can either create Active Directory groups with the names listed in the table below, or you can create Active Directory groups with different names. Then, add users to the groups according to the role you want them to perform.
If you create your own Active Directory groups, you need to add them to the User Permissions tab in the Settings window and set their permissions as described in Managing user permissions (page 265).
Role Active Directory Group
Administrator AttunityEnterpriseManager Admin
Designer AttunityEnterpriseManager Designers
Roles and AD groups
Setup and User Guide - Enterprise Manager, November 2020 SR1 257

9 Administration
Role Active Directory Group
Operator AttunityEnterpriseManager Operators
Viewer AttunityEnterpriseManager Viewer
Effective permissions are the permissions that take effect when a user is part of more than one group, or when there is a conflict between the user's permission and the group's permission, or in the hierarchy. For details, see Inheritance and overrides (page 259).
Encrypting the User Permissions FileUser permissions are stored in the following repository file:
<product_dir>\Data\cfgrepo.sqlite
To prevent unauthorized access of this file, you can encrypt it using the procedure described in Encrypting the user permissions file (page 36).
Granular access controlFor each user, Enterprise Manager lets you set granular access permissions for different hierarchy levels in the system and for different objects at the same hierarchy level. This granular access control facilitates decentralization of control, effectively preventing the same user from, for example, accessing endpoints and defining and running tasks. As such, granular access control lets you create a buffer between those who can create and access endpoints (DBAs) and those who can create and run tasks.
Enterprise Manager handles permission management as follows:
l Admins can add, remove, and change permissions.
l Designers and Operators can view permissions.
l Viewers cannot view permissions.
By default, each object inherits its permissions from its parent. The following hierarchy is in place, where:
l Enterprise Manager Root refers to all Enterprise Manager server settings and all Replicate servers monitored by Enterprise Manager.
Changes to Enterprise Manager root permissions will affect all levels that inherit those permissions.
l All Servers refers to all Replicate servers monitored by Enterprise Manager. This level does not have access to Enterprise Manager server settings.
l Specific Server refers to a server monitored by Enterprise Manager and all its child objects (server settings, tasks, and endpoints).
l All Tasks refers to all tasks that run on a specific Replicate server.
l Specific Task refers to all parameters of the particular task.
Setup and User Guide - Enterprise Manager, November 2020 SR1 258
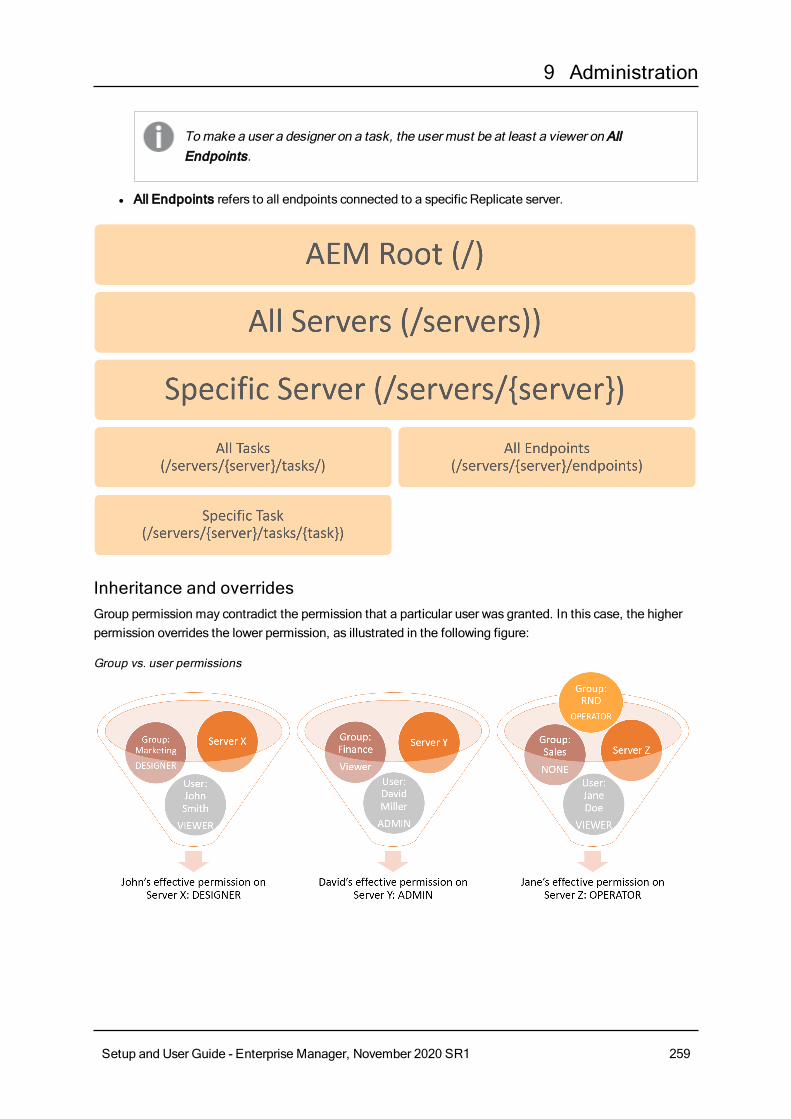
9 Administration
To make a user a designer on a task, the user must be at least a viewer on All Endpoints.
l All Endpoints refers to all endpoints connected to a specific Replicate server.
Inheritance and overridesGroup permission may contradict the permission that a particular user was granted. In this case, the higher permission overrides the lower permission, as illustrated in the following figure:
Group vs. user permissions
Setup and User Guide - Enterprise Manager, November 2020 SR1 259

9 Administration
By default, the permission of a user or group object is inherited from the access control list (ACL) of the object's parent. However, a lower or higher permission may override this permission. In this case, the overriding higher permission is the effective permission for the object, stopping inheritance from the parent. As a result, any changes to the parent no longer affect this user or group.
The following figures illustrate these concepts:
Inheritance overriden by higher permission
Setup and User Guide - Enterprise Manager, November 2020 SR1 260

9 Administration
Inheritance overriden by lower permission
In the User Permissions window, inheritance is indicated by a checkmark in the Inherited column. By default, inheritance is enabled for all users and groups on any level. Changing permissions by using the slider automatically stops inheritance for the selected user or group. Enterprise Manager also lets you disable inheritance by disconnecting the entire authorization level from the parent level. For information on how to do this, see Managing user permissions (page 265).
Override exceptionsWhen a user or group is granted any permission higher than None on an object (except an endpoint), it automatically receives Viewer permission on all parent objects in the hierarchy. However, the Viewer permission granted to the parent objects does not enable the user or group to see items in the hierarchy that they were not permitted to see before they received Viewer permission. For clarification, see the example in the following table:
- Granted Permission Effective Permission
Server X None Viewer
All Tasks on Server X None Viewer (limited to Task Z)
Task Z on Server X Designer Designer
Permission override example
Setup and User Guide - Enterprise Manager, November 2020 SR1 261
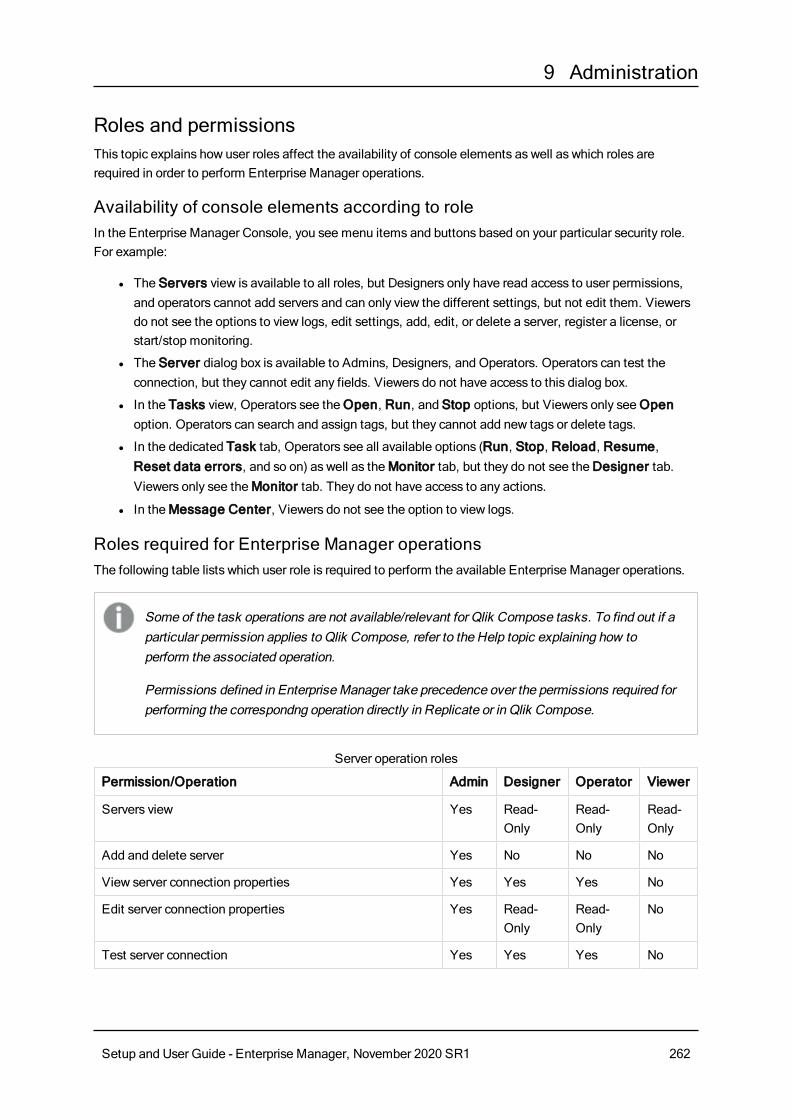
9 Administration
Roles and permissionsThis topic explains how user roles affect the availability of console elements as well as which roles are required in order to perform Enterprise Manager operations.
Availability of console elements according to roleIn the Enterprise Manager Console, you see menu items and buttons based on your particular security role. For example:
l The Servers view is available to all roles, but Designers only have read access to user permissions, and operators cannot add servers and can only view the different settings, but not edit them. Viewers do not see the options to view logs, edit settings, add, edit, or delete a server, register a license, or start/stop monitoring.
l The Server dialog box is available to Admins, Designers, and Operators. Operators can test the connection, but they cannot edit any fields. Viewers do not have access to this dialog box.
l In the Tasks view, Operators see the Open, Run, and Stop options, but Viewers only see Open option. Operators can search and assign tags, but they cannot add new tags or delete tags.
l In the dedicated Task tab, Operators see all available options (Run, Stop, Reload, Resume, Reset data errors, and so on) as well as the Monitor tab, but they do not see the Designer tab. Viewers only see the Monitor tab. They do not have access to any actions.
l In the Message Center, Viewers do not see the option to view logs.
Roles required for Enterprise Manager operationsThe following table lists which user role is required to perform the available Enterprise Manager operations.
Some of the task operations are not available/relevant for Qlik Compose tasks. To find out if a particular permission applies to Qlik Compose, refer to the Help topic explaining how to perform the associated operation.
Permissions defined in Enterprise Manager take precedence over the permissions required for performing the correspondng operation directly in Replicate or in Qlik Compose.
Permission/Operation Admin Designer Operator Viewer
Servers view Yes Read-Only
Read-Only
Read-Only
Add and delete server Yes No No No
View server connection properties Yes Yes Yes No
Edit server connection properties Yes Read-Only
Read-Only
No
Test server connection Yes Yes Yes No
Server operation roles
Setup and User Guide - Enterprise Manager, November 2020 SR1 262

9 Administration
Permission/Operation Admin Designer Operator Viewer
Edit column settings in the server list, search for servers, and access the context menu for a specific server.
Yes Yes Yes Yes
Permission/Operation Admin Designer Operator Viewer
Access Design view (Replicate only) Yes Yes No No
Access Monitor view (Replicate only) Yes Yes Yes Yes
Add and design tasks Yes Yes No No
Add and design endpoints Yes Yes No No
Import Task
When a task with the same name already exists on the target server.
Yes Yes* (see note below)
No No
Import Task
When a task with the same name does not exist on the target server.
Yes Yes* (see note below)
No No
Export task without endpoints Yes Yes Yes No
Export task with endpoints Yes Yes Yes* (see note below)
No
Task operation roles
For both of the Import Task permissions mentioned above, if the the exported JSON includes endpoints, then the Enterprise Manager user must also have the role of Designer on All Endpoints on the target server.
For the 'Export Task with endpoints' permissions mentioned above, the Enterprise Manager user must have the role of Operator on the task as well as on both endpoints.
Permission/Operation Admin Designer Operator Viewer
Set logging levels, set log file cleanup/rollover, and edit Message Center settings
Yes Yes Read-Only No
Edit user permissions Yes Read-Only
Read-Only No
Other operation roles
Setup and User Guide - Enterprise Manager, November 2020 SR1 263
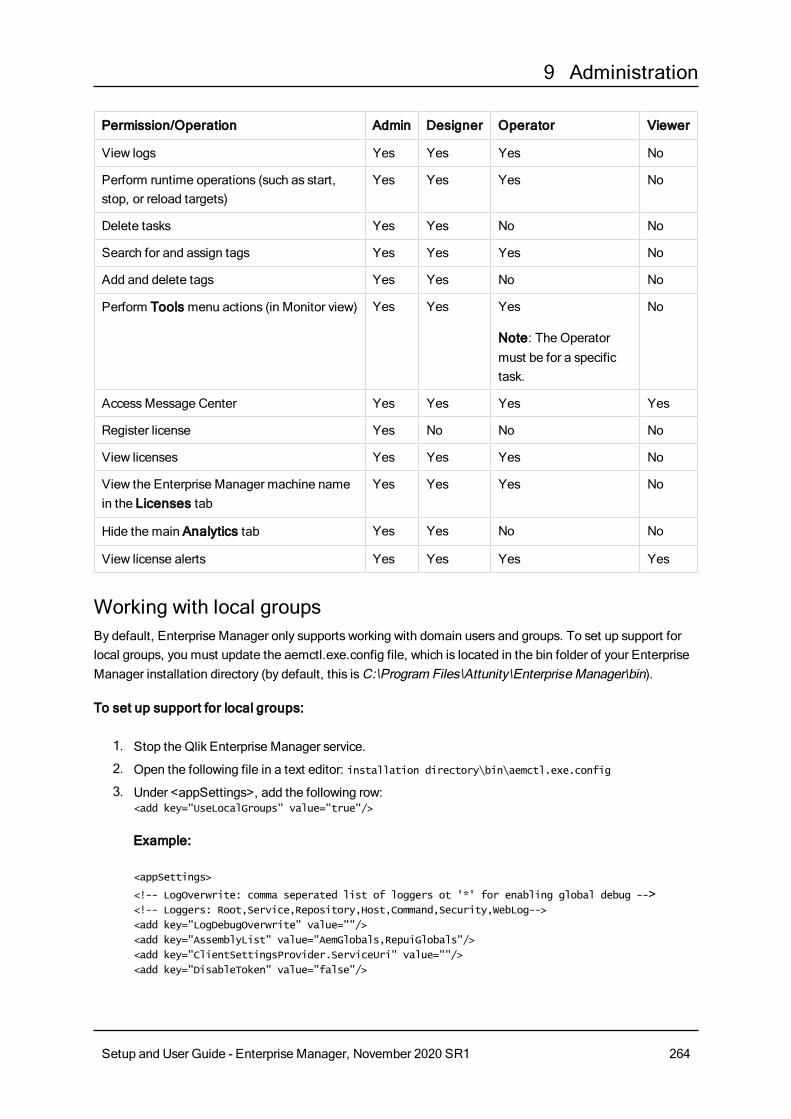
9 Administration
Permission/Operation Admin Designer Operator Viewer
View logs Yes Yes Yes No
Perform runtime operations (such as start, stop, or reload targets)
Yes Yes Yes No
Delete tasks Yes Yes No No
Search for and assign tags Yes Yes Yes No
Add and delete tags Yes Yes No No
Perform Tools menu actions (in Monitor view) Yes Yes Yes
Note: The Operator must be for a specific task.
No
Access Message Center Yes Yes Yes Yes
Register license Yes No No No
View licenses Yes Yes Yes No
View the Enterprise Manager machine name in the Licenses tab
Yes Yes Yes No
Hide the main Analytics tab Yes Yes No No
View license alerts Yes Yes Yes Yes
Working with local groupsBy default, Enterprise Manager only supports working with domain users and groups. To set up support for local groups, you must update the aemctl.exe.config file, which is located in the bin folder of your Enterprise Manager installation directory (by default, this is C:\Program Files\Attunity\Enterprise Manager\bin).
To set up support for local groups:
1. Stop the Qlik Enterprise Manager service.
2. Open the following file in a text editor: installation directory\bin\aemctl.exe.config
3. Under <appSettings>, add the following row:<add key="UseLocalGroups" value="true"/>
Example:
<appSettings>
<!-- LogOverwrite: comma seperated list of loggers ot '*' for enabling global debug --><!-- Loggers: Root,Service,Repository,Host,Command,Security,WebLog-->
<add key="LogDebugOverwrite" value=""/>
<add key="AssemblyList" value="AemGlobals,RepuiGlobals"/>
<add key="ClientSettingsProvider.ServiceUri" value=""/>
<add key="DisableToken" value="false"/>
Setup and User Guide - Enterprise Manager, November 2020 SR1 264
9 Administration
</appSettings>
4. Save and close the file.
5. Restart the service.
Managing user permissionsThis section explains how to edit user permissions, add and remove users or groups, disable or enable inheritance, restore inherited permissions if they were overridden, and view effective permissions for a user.
By default, inheritance is enabled for all objects (users and groups). This means that permissions are automatically carried over from the parent object. You can turn inheritance on or off for all objects at the current level.
Effective permissions are the permissions that are in effect for a user at any particular level.
For more information on the underlying concepts, see Granular access control (page 258) and Inheritance and overrides (page 259).
To access user permissions at the Enterprise Manager, Analytics, Notifications or All Servers level:
1. Click the User Permissions icon in the top right corner.
2. In the Enterprise Manager User Permissions window, select one of the following tabs:
l Enterprise Manager to specify Enterprise Manager-wide user permissions.
Note Changes to Enterprise Manager permissions will affect all levels that inherit those permissions.
l Analytics to specify Analytics permissions.
l Notifications to specify notification permissions.
l All Servers to specify permissions for all monitored servers.
To access user permissions for a specific Server, All Tasks, or All Endpoints:
1. In Servers view, select the desired server and then select Permissions from the Server Management toolbar drop-down menu.
2. In the User Permissions for server: '{server name}' window, select one of the following tabs:
l Server to specify server-wide user permissions.
l All Tasks to specify permissions for all tasks on this server.
l All Endpoints to specify permissions for all endpoints on this server.
To access user permissions for a specific Task:
l In the tab for a specific task, click the task permissions icon in the task toolbar.
The User Permissions for task: {task name} window opens.
To disable inheritance:
1. In the User Permissions window, click Disable Inheritance.
Setup and User Guide - Enterprise Manager, November 2020 SR1 265

9 Administration
This option disconnects the entire authorization level from the parent level.
2. In the Disable Inheritance dialog box, select whether you want to:
l Convert inherited permissions on this object into explicit permissions: This option changes inherited permissions to explicit permissions. Any new users or groups will not inherit permissions from the parent.
l Remove all inherited permissions from this object: This option removes all existing permissions inherited from the parent level. Any new users or groups will not inherit permissions from the parent.
3. Click Disable.If you chose to convert inherited permissions, the check mark in the Inherited column changes into an X. If you chose to remove inherited, all users and groups disappear from the list.
4. Click Save or OK to accept the changes, or Discard Changes or Cancel to undo them.
To enable inheritance:
1. In the User Permissions window, click Enable Inheritance.
This option enables inheritance for all users and groups on this level.
2. In the Enable Inheritance dialog box, select whether you want to:
l Inherit all permissions from parent and override any definition manually made at this level: This option reinstates inherited permissions for all users and groups that are already defined, and new users and groups will inherit their permissions from the parent level.
l Inherit all permissions from parent but keep definitions manually made at this level: This option preserves the permissions already defined for the existing users and groups and adds all permissions from the parent level. New users and groups will inherit permissions from the parent level.
3. Click Enable.
4. Click Save or OK to accept the changes, or Discard Changes or Cancel to undo them.
To edit user permissions:
1. In the User Permissions window, adjust the permission slider for a user or group as desired.
Adjusting the slider stops inheritance from the parent object.
2. Click Save or OK to accept the changes, or Discard Changes or Cancel to undo them.
To add a user or group:
1. In the User Permissions window, click Add.
2. In the Add User/Group dialog box, select User or Group.
3. Enter the name for the new user or group in the following format:
Setup and User Guide - Enterprise Manager, November 2020 SR1 266
9 Administration
l NetBIOS_name\user (for example: qa\qa)
l machine_name/local_user (for example: re2008r2js1\JohnMil1)
l username - This format is supported with SAML authentication only. The user/group name can contain any Unicode character up to 255 characters and must be a valid Identity Provider user (Okta or Microsoft Azure).
4. Click OK to add the group and close the dialog box.
5. Click Save or OK to accept the changes, or Discard Changes or Cancel to undo them.
To remove a user or group:
1. In the User Permissions window, select the user or group you want to remove.
2. Click Remove.
3. When prompted, click Yes to confirm.
4. Click Save or OK to accept the changes, or Discard Changes or Cancel to undo them.
To restore inherited permissions for a single user or group if they were overridden:
1. In the User Permissions window, select the user or group.
2. Click Restore Inheritance .
The check mark returns to the Inherited column to indicate that permissions for this user or group are inherited from the parent.
To view effective permissions for a user:
1. In the User Permissions window, do one of the following:
l Select a user in the list on the left.
l If a user does not appear in the list but exists in the system and is part of a group, enter the user name in the text field in the Effective Permissions pane on the right.Make sure to use the following format:
l NetBIOS_name\user (for example: qa\qa)
l machine_name/local_user (for example: re2008r2js1\JohnMil1)
2. Click Get Effective Permissions.The effective permissions for the user you entered appear below the button.
9.3 Creating an audit trailAn audit trail provides you with information about the transactions executed in Enterprise Manager. Enterprise Manager traces operations that require a minimum role of operator. For these operations, the audit trail shows who did what, when, and on which objects. By default, the audit trail is enabled. Audit trail files are located in the following folder: <Enterprise Manager installation folder>\data\AuditTrail\audit_service.
The audit trail is secure. Audit files are compressed and protected by checksum.
Setup and User Guide - Enterprise Manager, November 2020 SR1 267

9 Administration
Do not edit or delete the audit files. Any changes to these files might cause the system to crash.
Enterprise Manager retains audit files for two weeks or until they reach a total size of 500 MB (50 files). You can configure these settings through the command line interface (CLI). For more information, see Configuring Enterprise Manager using the CLI (page 271), in particular the aemctl.exe audit_trail control command.
In addition, you can manually download an audit trail file in .csv format. This file includes filtered actions for a specific time frame or a custom time range.
Audit trail files may contain all or some of the following information, depending on whether the object exists in Enterprise Manager:
l Timestamp (UTC)
l User
l Node
l Requested Action
l Required Permission
l Effective Permission
l Security Result
l Action Result
l Error Message
l Server
l Task
l Endpoint
l Notification
l Enable
l Delete_task_logs
l Tag
l Schema
l Table
l Delete_fts_logs
l FTS (File Transfer Service)
l PayloadTo view payload information, you can copy the link in the Payload column and paste it into the address bar of a browser window.For information on decoding stream payloads, see Decoding an encoded stream payload (page 269).
The REST information listed in the following table is not presented in the audit trail columns. It is only accessible via the payload.
Setup and User Guide - Enterprise Manager, November 2020 SR1 268

9 Administration
REST Info Access From
puterrorbehavior payload - task name
tablecontrol payload - task name
test_database_async payload - endpoint name
browse_connection_async payload - endpoint name
action=test_async_complete payload - endpoint name
action=browse_connection_async payload - endpoint name
REST access points
To manually download an audit trail file:
1. Click the Audit Trail icon in the top right corner.
2. In the Audit Trail dialog box, from the Time Range list, select a time range.
3. If you select Custom, also specify the From date and time and the To date and time.The time you select is the local machine time. This gets converted to coordinated universal time (UTC) in the resulting CSV file.
4. Click Generate.The AuditTrail.csv file is created and downloaded. Depending on your browser, you should see it at the bottom of your browser window or in a separate window.
Decoding an encoded stream payloadSome audit records (e.g. RegisterLicenses) may contain an encoded stream payload. Encoded payloads are displayed as byte arrays and need to be decoded using Base64.
To decode an encoded stream payload:
1. Locate the payload URL in the audit record.
2. Copy the URL into your browser's address bar and press [Enter].A byte array will be displayed.
Setup and User Guide - Enterprise Manager, November 2020 SR1 269

9 Administration
3. Copy the byte array into a Base64 decoder and decode it.
Setup and User Guide - Enterprise Manager, November 2020 SR1 270
10 Configuring Enterprise Manager using the CLI
10 Configuring Enterprise Manager using the CLIYou can use the Enterprise Manager command line interface (CLI) to modify the data directory, change the default configuration settings, and manage the Qlik Enterprise Manager service during installation or when configuring Enterprise Manager to run on a cluster.
All commands should be run from <PRODUCT_INSTALLATION_DIRECTORY>\bin
To get help when using the command line, you can run the Help command. For example, for help about the parameters available with the service command, run the following command (shown with the default installation path):
C:\Program Files\Attunity\Enterprise Manager\bin>aemctl.exe service help
This brings up the list of help parameters.
Or, for a list of the available commands, run:
aemctl.exe help
When the Enterprise Manager data directory is installed in a non-default location, the -d <data_directory> parameter must be included in all commands, where data directory is the location of the data directory.
Running CLI commands requires the admin role. For more information, see User permissions (page 257).
The login authentication method is also set using the CLI. For more information, see Setting the login authentication method (page 21).
10.1 Setting the Enterprise Manager host addressTo set the host address, run the following command:
aemctl.exe configuration set --address hostAddress
where hostAddress is the address of the Enterprise Manager server machine.
When using a Load Balancer, hostAddress should be the Load Balancer host address.
Abbreviated parameter: -a
10.2 Setting the Enterprise Manager HTTP portTo set the HTTP port, run the following command:
aemctl.exe configuration set --http_port port
Abbreviated parameter: -p
Setup and User Guide - Enterprise Manager, November 2020 SR1 271

10 Configuring Enterprise Manager using the CLI
Default: 80
10.3 Setting the Enterprise Manager HTTPS portTo set the HTTPS port, run the following command:
aemctl.exe configuration set --https_port port
Abbreviated parameter: -s
Default: 443
10.4 Setting the Enterprise Manager root URLTo set the root URL, run the following command:
aemctl.exe configuration set --root_url url
Abbreviated parameter: -r
10.5 Showing the Enterprise Manager versionTo show the version, run the following command:
aemctl.exe configuration set --version
10.6 Showing the Enterprise Manager CLI HelpTo show the Help, run the following command:
aemctl.exe configuration set --help
10.7 Service Commands
To stop the Qlik Enterprise Manager service, run the following command:
aemctl.exe service stop --name servicename [--timeout seconds]
Where:
servicename is the name of the Enterprise Manager service
seconds is the time to wait in seconds before stopping the service
To start the Qlik Enterprise Manager service, run the following command:
aemctl.exe service start --name servicename [--timeout seconds]
Where:
servicename is the name of the Enterprise Manager service
Setup and User Guide - Enterprise Manager, November 2020 SR1 272

10 Configuring Enterprise Manager using the CLI
seconds is the time to wait in seconds before starting the service
To bring up a list of other service-related parameters, run the following command:
aemctl.exe service
10.8 Cleaning the self-signed certificate
To clean (i.e. clear) the self-signed certificate, run the following command:
aemctl.exe cerificate clean
10.9 Setting the audit trail retention size and age
To se the audit trail size and/or age limit, run the following command:
aemctl.exe audit_trail control [--age weeks] [--size megabytes]
Where:
weeks is the number of weeks to retain the audit trail file (default 2 weeks)
megabytes is the maximum size of the audit file to retain (default 500 MB)
10.10 Master User Password commandsThe following section describes commands that can be used to generate a Master User Password, set the Master User Key, and change the Master User Key.
For more information on the role of the master user password and the master user key, see Replacing the Master User Password (page 35).
Generating a random Master User Password
To generate a random master user password, run the following command:
aemctl.exe utils genpassword
Setting or changing the MUK (Master User Key)Run this command to set the Enterprise Manager MUK (Master User Key) as part of the corporate security policy or when configuring Enterprise Manager to work in a cluster.
For information on installing Enterprise Manager on a cluster, see Installing Qlik Enterprise Manager in a Windows cluster (page 303)
The password must be at least 32 characters.
Setup and User Guide - Enterprise Manager, November 2020 SR1 273

10 Configuring Enterprise Manager using the CLI
If you add the --prompt parameter to the command and omit the -p and -c parameters, the CLI will prompt you for the password. When you enter the password, it will be obfuscated. This is especially useful if you do not want passwords to be retained in the command prompt history.
Syntax: aemctl.exe [-d data_directory] masterukey set --prompt
To set the MUK, run the following command:
aemctl.exe [--data data_directory] masterukey set --password password
Where:
--data (or -d in its abbreviated form) is used to specify the location of the Enterprise Manager data folder, but is only required if the data folder is not on the same drive as the bin folder.
To change the MUK, run the following command:
aemctl.exe [--data data_directory] masterukey set --password new_password --current old_password
Where:
--data (or -d in its abbreviated form) is used to specify the location of the Enterprise Manager data folder, but is only required if the data folder is not on the same drive as the bin folder.
Setting or changing the Java MUK (Master User Key)Run this command to set the Enterprise Manager MUK (Master User Key) as part of the corporate security policy or when configuring Enterprise Manager to work in a cluster.
For information on installing Enterprise Manager on a cluster, see Installing Qlik Enterprise Manager in a Windows cluster (page 303)
The password must be at least 32 characters.
To set the Java MUK, run the following command:
atajs.bat [--data JavaDataFolderFullPath] masterukey set password
Where:
--data (or -d in its abbreviated form) is used to specify the location of the Enterprise Manager data folder, but is only required if the data folder is not on the same drive as the bin folder.
To change the Java MUK, run the following command:
atajs.bat [--data JavaDataFolderFullPath] masterukey set new_password old_password
Where:
Setup and User Guide - Enterprise Manager, November 2020 SR1 274
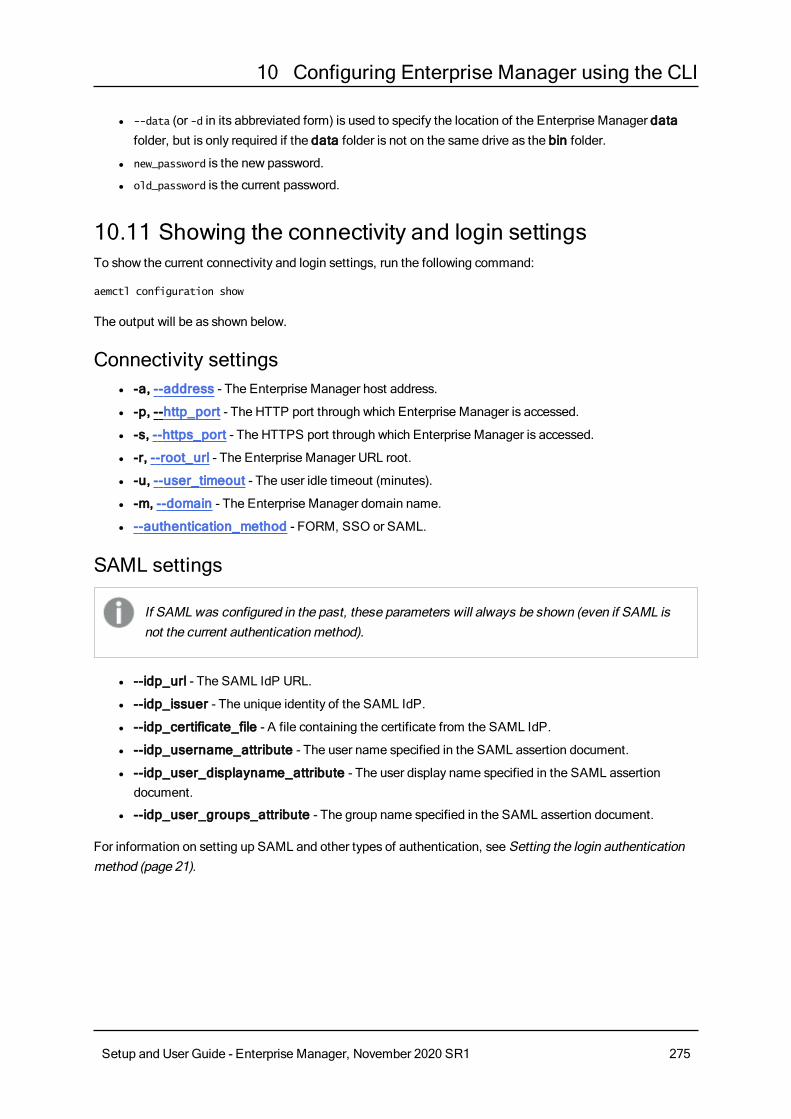
10 Configuring Enterprise Manager using the CLI
l --data (or -d in its abbreviated form) is used to specify the location of the Enterprise Manager data folder, but is only required if the data folder is not on the same drive as the bin folder.
l new_password is the new password.
l old_password is the current password.
10.11 Showing the connectivity and login settingsTo show the current connectivity and login settings, run the following command:
aemctl configuration show
The output will be as shown below.
Connectivity settings l -a, --address - The Enterprise Manager host address.
l -p, --http_port - The HTTP port through which Enterprise Manager is accessed.
l -s, --https_port - The HTTPS port through which Enterprise Manager is accessed.
l -r, --root_url - The Enterprise Manager URL root.
l -u, --user_timeout - The user idle timeout (minutes).
l -m, --domain - The Enterprise Manager domain name.
l --authentication_method - FORM, SSO or SAML.
SAML settings
If SAML was configured in the past, these parameters will always be shown (even if SAML is not the current authentication method).
l --idp_url - The SAML IdP URL.
l --idp_issuer - The unique identity of the SAML IdP.
l --idp_certificate_file - A file containing the certificate from the SAML IdP.
l --idp_username_attribute - The user name specified in the SAML assertion document.
l --idp_user_displayname_attribute - The user display name specified in the SAML assertion document.
l --idp_user_groups_attribute - The group name specified in the SAML assertion document.
For information on setting up SAML and other types of authentication, see Setting the login authentication method (page 21).
Setup and User Guide - Enterprise Manager, November 2020 SR1 275

11 Cataloging tasks in Qlik Catalog
11 Cataloging tasks in Qlik CatalogLeveraging Qlik Catalog's powerful cataloging capabilities allows you to gain insights into your data assets and take appropriate action. You can select any Replicate task in Enterprise Manager and catalog all of the target table metadata.
Replicate users may find some of the Qlik Catalog terminology a little confusing at first; for instance, the Replicate target endpoint is referred to as the Source Connection in Qlik Catalog. To lessen the potential for confusion, some of the cataloging terms used in Enterprise Manager differ from those used in Qlik Catalog. While this may seem counter-intuitive at first, it is hoped that using terms that are appropriate within the specific context of each application will actually create a far more intuitive user experience.
Before getting started then, it's important to understand how the cataloging and replication terminology used in Enterprise Manager is reflected in Qlik Catalog.
The table below lists the terms in use by Enterprise Manager and the equivalent term in Qlik Catalog.
Enterprise Manager Term
Catalog Term Enterprise Manager Default Value
N/A Source <ReplicateServer>_<TargetEndpoint>_<Schema>
Datastore Source Connection
<ReplicateServer>_<TargetEndpoint>
Location Source Hierarchy
Replicate.<ReplicateServer>_<ReplicateTask>
Data Asset Datasets <ReplicateServer>_<ReplicateTask>
Catalog AD Group Group <The Active Directory group defined in the Qlik Catalog connection settings>
Column Field N/A
Table Entity N/A
Equivalent terms and values
11.1 Catalog columnsWhen you configure connectivity to a Qlik Catalog server, the following columns become visible in Tasks View.
l Cataloged - Indicates whether or not the task is cataloged.
l Name - The task's data asset (dataset) name in Qlik Catalog.
l Location - The task's location in the Qlik Catalog hierarchy.
l Datastore - The task's datastore (source connection) name in Qlik Catalog.
l AD Group - The Active Directory group in Qlik Catalog under which the task is cataloged.
Setup and User Guide - Enterprise Manager, November 2020 SR1 276
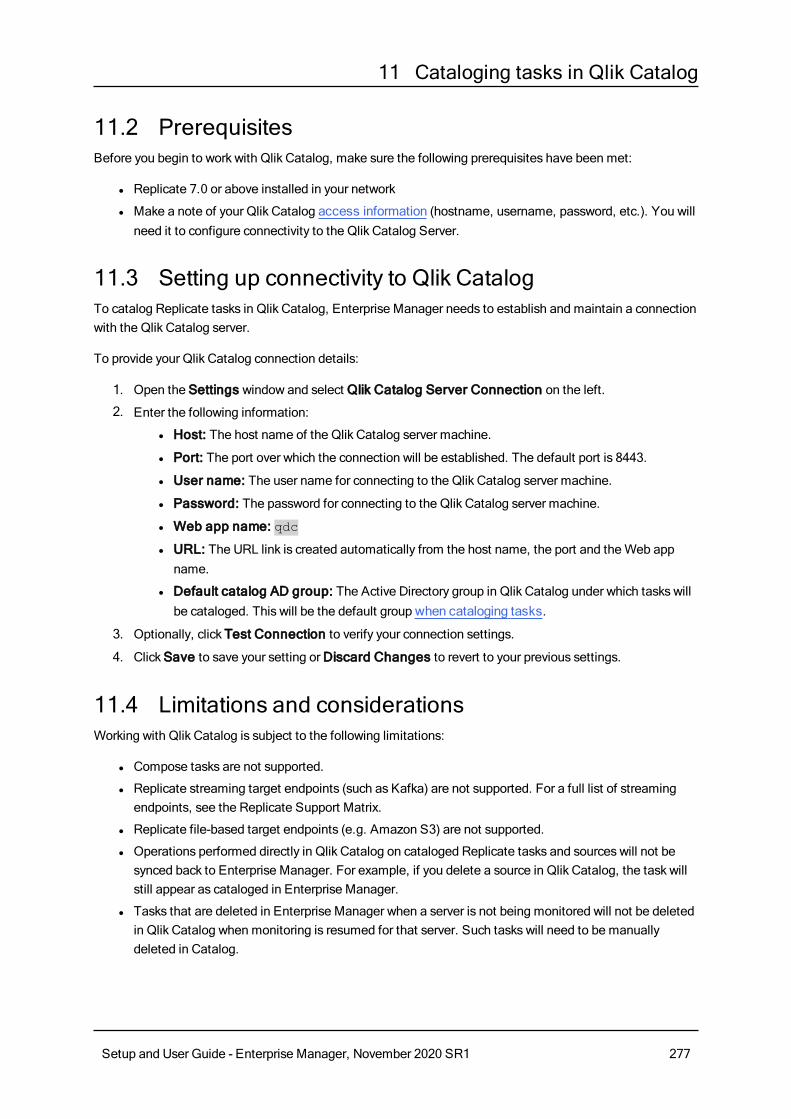
11 Cataloging tasks in Qlik Catalog
11.2 PrerequisitesBefore you begin to work with Qlik Catalog, make sure the following prerequisites have been met:
l Replicate 7.0 or above installed in your network
l Make a note of your Qlik Catalog access information (hostname, username, password, etc.). You will need it to configure connectivity to the Qlik Catalog Server.
11.3 Setting up connectivity to Qlik CatalogTo catalog Replicate tasks in Qlik Catalog, Enterprise Manager needs to establish and maintain a connection with the Qlik Catalog server.
To provide your Qlik Catalog connection details:
1. Open the Settings window and select Qlik Catalog Server Connection on the left.
2. Enter the following information:
l Host: The host name of the Qlik Catalog server machine.
l Port: The port over which the connection will be established. The default port is 8443.
l User name: The user name for connecting to the Qlik Catalog server machine.
l Password: The password for connecting to the Qlik Catalog server machine.
l Web app name: qdc
l URL: The URL link is created automatically from the host name, the port and the Web app name.
l Default catalog AD group: The Active Directory group in Qlik Catalog under which tasks will be cataloged. This will be the default group when cataloging tasks.
3. Optionally, click Test Connection to verify your connection settings.
4. Click Save to save your setting or Discard Changes to revert to your previous settings.
11.4 Limitations and considerationsWorking with Qlik Catalog is subject to the following limitations:
l Compose tasks are not supported.
l Replicate streaming target endpoints (such as Kafka) are not supported. For a full list of streaming endpoints, see the Replicate Support Matrix.
l Replicate file-based target endpoints (e.g. Amazon S3) are not supported.
l Operations performed directly in Qlik Catalog on cataloged Replicate tasks and sources will not be synced back to Enterprise Manager. For example, if you delete a source in Qlik Catalog, the task will still appear as cataloged in Enterprise Manager.
l Tasks that are deleted in Enterprise Manager when a server is not being monitored will not be deleted in Qlik Catalog when monitoring is resumed for that server. Such tasks will need to be manually deleted in Catalog.
Setup and User Guide - Enterprise Manager, November 2020 SR1 277

11 Cataloging tasks in Qlik Catalog
l After upgrading to Enterprise Manager 7.0, existing tasks need to be stopped and then resumed in order to be eligible for cataloging.
l Data cannot currently be ingested from the Replicate target tables (entities) into Qlik Catalog.
11.5 Catalog operationsYou can catalog, recatalog, and uncatalog tasks. This topic describes how and when such operations should be performed.
Cataloging tasksTo catalog a task:
1. In Tasks view, select the task you want to catalog and then click the Catalog toolbar button and select Catalog. A window displaying the following auto-generated properties opens:
l Data asset name in catalog: This is a combination of the Replicate server and task name. So, for example, if the server name is RepServer and the task name is SQLtoAWS, the data asset name will be RepServer_SQLtoAWS.
l Catalog data asset under: By default, all data assets are cataloged under Replicate. For example, a data asset named RepServer_SQLtoAWS would appear as Replicate.RepServer_SQLtoAWS. You can create additional hierarchies (or sub-locations using Enterprise Manager terminology), using dots as separators. For example, to add a top-level container called QDI to Replicate.RepServer_SQLtoAWS, you would need to enter the following:QDI.Replicate.RepServer_SQLtoAWS
l Datastore in catalog: This is a combination of the Replicate server name and the target endpoint name.
l Catalog AD group: The name of the Active Directory Group defined in Qlik Catalog under which the task will be cataloged.
You can edit these properties as required.
2. Click Catalog.If the cataloging operation is successful, a confirmation will be displayed at the top of the page and a new Catalog tab with the cataloging properties (described in step 1 above) will be added to the monitoring dashboard in the right pane.
Cataloging exampleIn the following example, a Replicate task has copied the following tables (shown as schema.table) from a PostgreSQL on-premises database to a PostgreSQL in the cloud (AWS): HumanResources.Department, HumanResources.Employee, Purchasing.ShipMethod, Purchasing.Vendor, Sales.Customer, and Sales.Store. The customer needs to ensure the validity and integrity of these tables for the purpose of analytics. To this end, the customer has decided to catalog the Replicate task.
After cataloging the Replicate task, the associated target tables immediately become visible in Qlik Catalog:
Setup and User Guide - Enterprise Manager, November 2020 SR1 278

11 Cataloging tasks in Qlik Catalog
Clicking the Source tab shows the list of schemas to which the tables belong.
For a detailed description of the tasks that can be performed within Qlik Catalog, refer to the Qlik Catalog Help.
Setup and User Guide - Enterprise Manager, November 2020 SR1 279
11 Cataloging tasks in Qlik Catalog
Uncataloging tasksYou can uncatalog a task by simply selecting the desired task, clicking the Catalog toolbar button and then selecting Uncatalog.
When you delete a cataloged task from Enterprise Manager, the task is automatically removed from Qlik Catalog as well.
Recataloging tasksRecataloging task uncatalogs and then catalogs a task in a single operation. Recataloging can be used to remedy out-of-sync situations resulting from actions performed directly in Catalog (such as deleting a source).
You can recatalog a task by simply selecting the desired task, clicking the Catalog toolbar button and then selecting Recatalog.
Setup and User Guide - Enterprise Manager, November 2020 SR1 280
12 Analytics
12 AnalyticsEnterprise Manager Analytics can be used to measure server and task metrics over a specific time-period. Examples of server metrics that can measured include memory consumption and disk usage. Examples of task metrics that can measured include the number of tables and records processed, throughput, and the number of changes applied.
You can also filter the information according to server, source database, target database, and task type.
Analytics is currently provided for Replicate tasks only.
Analytics information is useful in the following cases:
l Capacity Planning
l Sizing of Replicate Servers
l Replicate Performance Monitoring
l Historical Trend Analysis
12.1 PrerequisitesThis section describes the prerequisites for working with the Enterprise Manager Analytics module.
Install PostgreSQLEnterprise Manager Analytics data is stored in a PostgreSQL database. Therefore, prior to using Enterprise Manager Analytics, make sure that PostgreSQL 10.1 or above is installed either on the Enterprise Manager machine or on a machine that is accessible from Enterprise Manager.
For your convenience, the PostgreSQL setup file is included with Enterprise Manager. If you would like to install PostgreSQL on the Enterprise Manager machine and did not do so during the Enterprise Manager installation, you can find the PostgreSQL installer in the following location:
<Enterprise_Manager_INSTALLATION_FOLDER>\postgresqlkit
For instructions on installing and maintaining PostgreSQL, refer to the PostgreSQL Help.
Create a dedicated database and assign the required privileges l Create a dedicated database and user in PostgreSQL that will own the tables accessed by the
Enterprise Manager Analytics module.
l Recommended: Create a dedicated tablespace for the Enterprise Manager tables and allocate it as the default tablespace for the Enterprise Manager database.
l The Enterprise Manager user will need ALL PRIVILEGES on the Enterprise Manager database.
Setup and User Guide - Enterprise Manager, November 2020 SR1 281
12 Analytics
Configure connectivity to PostgreSQLConfigure connectivity to the PostgreSQL repository as described in Repository connection settings (page 251).
Set up data collection and purging from PostgreSQL Configure data collection and purging settings as described in Analytics - Data collection and purge settings (page 252).
Register a licenseA Replication Analytics license is required in order to use Analytics. If no license is detected, a Register License message will be displayed in the main Analytics tab.
If you have a license, you can register it by following the procedure described in Registering a license (page 255).
If you do not intend to use the Analytics feature, you can hide the main Analytics tab by clicking the Hide Analytics Dashboards link in the Register License message.
Obtaining a license
The procedure below does not apply when installing Enterprise Manager in a High Availability Cluster. To obtain a Replication Analytics license for Enterprise Manager in a High Availability Cluster, you must provide your Qlik Sales Representative with the following information, depending on which Windows version the cluster is running:
l Windows 2016: The official cluster FQDN.
l Windows 2008 R2 and 2012 R2: The FQDN of each of the cluster nodes and the official cluster FQDN.
If you do not have a license, you can obtain one as follows:
1. Copy the Enterprise Manager machine name from either of the following locations:
l The Register License message that is displayed in the main Analytics tab.
l The bottom of the Licenses tab in the Settings window.
2. Request a license from your Qlik Sales Representative, making sure to include the Enterprise Manager machine name in your request.
PortMake sure that the PostgreSQL port (5432 by default) is open for outbound communication.
Setup and User Guide - Enterprise Manager, November 2020 SR1 282

12 Analytics
HardwareIf the PostgreSQL database is installed on the Enterprise Manager server and there are less than 1000 tasks, then the Enterprise Manager hardware guidelines should be enough for the PostgreSQL database as well.
If you wish to install PostgreSQL on a different server, then the following minimum system requirements are recommended:
l 8 GB RAM
l 4 CPU Cores
l 10 GB disk space database tablespace
12.2 PermissionsAnalytics has its own set of permissions which are inherited from Enterprise Manager by default.
These are as follows:
l Viewers, Operators and Designers can access the Analytics dashboards and run reports.
l Administrators can access the Analytics dashboards and also access the Analytics settings to configure the PostgreSQL repository, control how much data is stored in the Repository and start/stop the Analytics processes.
12.3 Analytics dashboardsIn the Analytics tab, you can review server and task trends over a specific time period. For each graph, you can choose whether to display weekly, hourly, daily (the default), monthly, or by minute data. You can also filter the data to show information for a particular timeframe and for particular tasks, Replicate servers, source databases, and target databases.
Dashboards can be accessed either by selecting the desired dashboard from the drop-down list on the left of the toolbar, or by expanding the pivot menu on the right of the Analytics tab and clicking the desired dashboard link.
The following dashboards are available:
l Trends
l Trends by Server
l Trends by Task
l Top Servers
l Top Tasks
l Capacity Planning
TrendsThe Trends dashboard plots key performance and activity metrics for the given time frame. Below each chart, you can toggle to view the trending data by hour, by day, by week, by month, or by minute.
Setup and User Guide - Enterprise Manager, November 2020 SR1 283
12 Analytics
For the specified filters, the Trends dashboard displays the following charts:
l Server utilization (page 284)
l Full load (page 284)
l Change processing (page 284)
l Errors (page 285)
Server utilizationThe Server Utilization section contains the following graphs:
l Memory - Shows the average and maximum memory consumption across all specified servers and tasks.
l Disk Utilization - Shows the average and maximum disk space utilization across all specified servers and tasks.
l Qlik CPU - Shows the average and maximum Qlik CPU per server (as a percentage) across all specified servers and tasks.
l Machine CPU - Shows the average and maximum machine CPU per server (as a percentage) across all specified servers and tasks.
l Task CPU - Shows the average and maximum CPU per task (as a percentage of server CPU) across all specified servers and tasks.
Full loadThe Full Load section contains the following graphs:
l Throughput - Shows the average source and target throughput (in rec/sec) per task.
l Tables - Shows the total number of completed, loading, queued and error tables across all specified servers and tasks.
l Records - Shows the total number of completed and remaining records across all specified servers and tasks.
For the Full Load charts, the data is not aggregated and cannot be viewed by hour, by day, by week, by month, or by minute. Rather, data is displayed for key points in time for the given time frame.
Change processingThe Change Processing section contains the following graphs:
l Applied Changes - Shows the total number of changes applied, grouped by INSERT, UPDATE, DELETE and DDLs across all specified servers and tasks.
l Throughput and Latency- Shows the average source and target throughput (in rec/sec) and the average source and apply latency (in seconds) per task.
l Change Volume - Shows the total COMMIT change volume across all servers and tasks.
Setup and User Guide - Enterprise Manager, November 2020 SR1 284
12 Analytics
l Changes in Memory and Disk - Shows the average number of changes accumulated in memory and on disk until source commit as well as the average number of changes in memory and on disk during apply, and until target commit per task.
ErrorsThe graph in the Errors sections shows the total number of data errors across all specified servers and tasks, including both Full Load and Change Processing tasks.
Trends by serverThe Trends by Server dashboard plots key performance and activity metrics for the given time frame, according to server. Trends for the top 10 servers will be displayed based on the selected Rank By metric. If necessary, narrow your filter set to investigate a specific set of servers.
Below each chart, you can toggle to view the trending data by hour, by day, by week, by month, or by minute. For the specified filters, the Trends by Server dashboard displays the following charts:
l Server utilization (page 285)
l Full load (page 285)
l Change processing (page 285)
l Data errors (page 286)
Server utilizationThe Server Utilization section contains the following graphs:
l Average Memory - The average memory consumed by all tasks on a server.
l Average Disk Utilization - The average disk space utilization by all tasks on a server.
l Average Qlik CPU - The average CPU utilization per server by Replicate and Enterprise Manager processes only.
l Average Machine CPU - The average CPU utilization per server by all processes (including Replicate and Enterprise Manager processes).
l Average Task CPU - The average CPU utilization per task (as a percentage of server CPU) for each server.
Full loadThe Full Load section contains the following graph:
l Average Throughput - The average target throughput (in rec/sec) per task for each server
Change processingThe Change Processing section contains the following graphs:
l Total Applied Changes - The total number of applied changes for all tasks on a server.
l Average Target Throughput - The average target throughput (in rec/sec) per task for each server.
Setup and User Guide - Enterprise Manager, November 2020 SR1 285

12 Analytics
l Average Apply Latency- The average apply latency (in seconds) per task for each server.
l Total Change Volume - The total COMMIT change volume for all tasks on a server.
Data errorsThe total number of data errors across all tasks on a server, including both Full Load and Change Processing tasks.
Trends by tasksThe Trends by Task dashboard plots key performance and activity metrics for the given time frame, according to task. Trends for the top 10 tasks will be displayed based on the selected Rank By metric. If necessary, narrow your filter set to investigate a specific set of tasks.
Below each chart, you can toggle to view the trending data by hour, by day, by week, by month, or by minute. For the specified filters, the Trends by Task dashboard displays the following charts:
l Server utilization (page 286)
l Full load (page 286)
l Change processing (page 286)
l Data errors (page 286)
Server utilizationThe Server Utilization section contains the following graphs:
l Average Memory - The average memory consumed by each task.
l Average Disk Utilization - The average disk space utilized by each task.
l Average Task CPU - The average CPU (as a percentage of server CPU) consumed by each task.
Full loadThe Full Load section contains the following graph:
l Average Throughput - The average target throughput (in rec/sec) for each task.
Change processingThe Change Processing section contains the following graphs:
l Total Applied Changes - The total number of applied changes for each task.
l Average Target Throughput - The average target throughput (in rec/sec) for each task.
l Average Apply Latency- The average apply latency (in seconds) for each task.
l Total Change Volume - The total COMMIT change volume for each task.
Data errorsThe total number of data errors for each task, including both Full Load and Change Processing tasks.
Setup and User Guide - Enterprise Manager, November 2020 SR1 286
12 Analytics
Top serversThe Top Servers dashboard provides a summary of activity and performance metrics for the given time frame and filter set. It also provides a bubble chart comparing three key metrics for your top servers together with a corresponding data grid. You can customize the bubble chart by selecting the number of servers to view and the three metrics to plot, including the Rank By metric, the X-Axis metric and the Y-Axis metric. The Rank By selection in the bubble chart will also control the sorting of the data in the grid below. You can also choose whether to rank the bubble chart data in Ascending or Descending order. The grid can be further customized as described in Column and list actions (page 210).
For the specified filters, the Top Servers dashboard displays the following key metrics:
l Server utilization (page 287)
l Full load (page 287)
l Change processing (page 287)
Server utilizationThe Server Utilization section contains the following metrics:
l Average Memory - The average memory consumed by all tasks on a server.
l Average Disk Utilization - The average memory consumed by all tasks on a server.
l Average Qlik CPU - The average Qlik CPU (as a percentage) for each server.
l Average Machine CPU - The average machine CPU (as a percentage) for each server.
l Average Task CPU - The average CPU per task (as a percentage of server CPU) for each server.
Full loadThe Full Load section contains the following metrics:
l Total Tables: The total number of tables for all tasks on a server.
l Total Records: The total number of records for all tasks on a server.
l Max Load Duration: The longest duration of the load process (in seconds).
l Average Load Duration: The average duration of the load process for all completed tasks on a server (in seconds).
l Average Source Throughput (rec/sec): The average source throughput (in rec/sec) per task.
l Average Source Throughput (kb/sec): The average source throughput (in kb/sec) per task.
l Average Target Throughput (rec/sec): The average target throughput (in rec/sec) per task.
l Average Target Throughput (kb/sec): The average target throughput (in kb/sec) per task.
Change processingThe Change Processing section contains the following metrics:
l Total Applied Changes: The total number of applied changes for all tasks on a server.
l Total INSERTs: The total number of INSERTs applied.
l Total UPDATEs: The total number of UPDATEs applied.
Setup and User Guide - Enterprise Manager, November 2020 SR1 287

12 Analytics
l Total DELETEs: The total number of DELETEs applied.
l Total DDLs: The total number of DDLs applied.
l Total COMMIT Change Volume: The total COMMIT change volume for all tasks on a server.
l Total COMMIT Change Records: The total number of COMMIT change records for all tasks on a server.
l Total Applied Transactions: The total number of COMMIT transactions for all tasks on a server.
l Average Changes in Memory (Source): The average number of changes accumulated in memory until source commit per task.
l Average Changes on Disk (Source): The average number of changes accumulated on disk until source commit per task.
l Average Changes for Apply in Memory (Target): The average number of changes in memory during apply and until target commit per task.
l Average Changes for Apply on Disk (Target): The average number of changes on disk during apply and until target commit per task.
l Average Source Throughput (rec/sec): The average source throughput (in rec/sec) per task.
l Average Source Throughput (kb/sec): The average source throughput (in kb/sec) per task.
l Average Target Throughput (rec/sec): The average target throughput (in rec/sec) per task.
l Average Target Throughput (kb/sec): The average target throughput (in kb/sec) per task.
l Average Apply Latency (secs): The average apply latency (in seconds) per task.
l Average Source Latency (secs): The average source latency (in seconds) per task.
Top tasksThe Top Tasks dashboard provides a summary of activity and performance metrics for the given time frame and filter set. It also provides a bubble chart comparing three key metrics for your top tasks together with a corresponding data grid. You can customize the bubble chart by selecting the number of tasks to view and the three metrics to plot, including the Rank By metric, the X-Axis metric and the Y-Axis metric. You can also choose whether to rank the bubble chart data in Ascending or Descending order. The grid can be further customized as described in Column and list actions (page 210).
For the specified filters, the Top Tasks dashboard displays the following key metrics:
l Server utilization (page 288)
l Full load (page 289)
l Change processing (page 289)
Server utilizationThe Server Utilization section contains the following metrics:
l Average Memory - The average memory consumed by a task.
l Average Disk Utilization - The average disk space utilization by a task.
l Average Task CPU - The average CPU (as a percentage of server CPU) consumed by each task.
Setup and User Guide - Enterprise Manager, November 2020 SR1 288
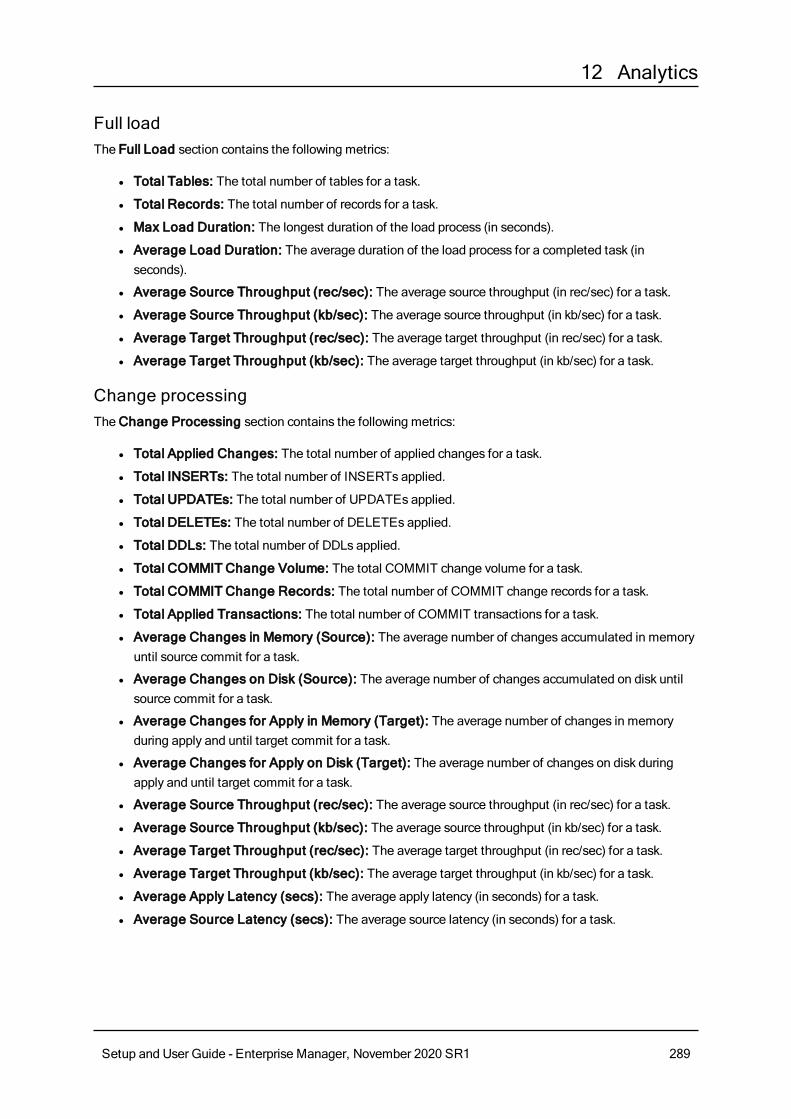
12 Analytics
Full loadThe Full Load section contains the following metrics:
l Total Tables: The total number of tables for a task.
l Total Records: The total number of records for a task.
l Max Load Duration: The longest duration of the load process (in seconds).
l Average Load Duration: The average duration of the load process for a completed task (in seconds).
l Average Source Throughput (rec/sec): The average source throughput (in rec/sec) for a task.
l Average Source Throughput (kb/sec): The average source throughput (in kb/sec) for a task.
l Average Target Throughput (rec/sec): The average target throughput (in rec/sec) for a task.
l Average Target Throughput (kb/sec): The average target throughput (in kb/sec) for a task.
Change processingThe Change Processing section contains the following metrics:
l Total Applied Changes: The total number of applied changes for a task.
l Total INSERTs: The total number of INSERTs applied.
l Total UPDATEs: The total number of UPDATEs applied.
l Total DELETEs: The total number of DELETEs applied.
l Total DDLs: The total number of DDLs applied.
l Total COMMIT Change Volume: The total COMMIT change volume for a task.
l Total COMMIT Change Records: The total number of COMMIT change records for a task.
l Total Applied Transactions: The total number of COMMIT transactions for a task.
l Average Changes in Memory (Source): The average number of changes accumulated in memory until source commit for a task.
l Average Changes on Disk (Source): The average number of changes accumulated on disk until source commit for a task.
l Average Changes for Apply in Memory (Target): The average number of changes in memory during apply and until target commit for a task.
l Average Changes for Apply on Disk (Target): The average number of changes on disk during apply and until target commit for a task.
l Average Source Throughput (rec/sec): The average source throughput (in rec/sec) for a task.
l Average Source Throughput (kb/sec): The average source throughput (in kb/sec) for a task.
l Average Target Throughput (rec/sec): The average target throughput (in rec/sec) for a task.
l Average Target Throughput (kb/sec): The average target throughput (in kb/sec) for a task.
l Average Apply Latency (secs): The average apply latency (in seconds) for a task.
l Average Source Latency (secs): The average source latency (in seconds) for a task.
Setup and User Guide - Enterprise Manager, November 2020 SR1 289

12 Analytics
Capacity planningThe Capacity Planning dashboard is meant to be run for a small number of representative servers and Change Processing tasks to help you forecast sizing requirements. It provides an overview of key metrics related to activity and performance as well as providing a summary of key capacity indicator metrics.
Charts related to Server Utilization and Change Processing Performance are also shown for the given time frame. Below each chart, you can toggle to view the trending data by hour, by day, by week, by month, or by minute. For the specified filters, the Capacity Planning dashboard displays the following information and charts:
Overall activity l Time Frame Start and End: The start and end time for the tasks that were run.
l Total Tasks: The total number of tasks that were run.
l Total Tables: The total number of tables for all tasks.
l Total INSERTs: The total number of INSERTs applied.
l Total UPDATEs: The total number of UPDATEs applied.
l Total DELETEs: The total number of DELETEs applied.
l Total DDLs: The total number of DDLs applied.
l Total Applied Changes: The total number of applied changes for all tasks.
l Total COMMIT Change Volume: The total COMMIT change volume for all tasks.
l Total COMMIT Change Records: The total number of COMMIT change records for all tasks.
l Total Applied Transactions: The total number of COMMIT transactions for all tasks.
l Applied Changes by Task: Pie chart showing the total number of applied changes by task.
l Applied Transactions by Task: Pie chart showing the total number of COMMIT transactions by task.
l COMMIT Change Records by Task: Pie chart showing the total number of COMMIT change records by task.
l COMMIT Change Volume by Task: Pie chart showing the total COMMIT change volume by task.
Overall performance l Average Memory: The average memory per task.
l Average Disk Usage: The average disk space utilization per task.
l Avg Qlik CPU - The average Qlik CPU (as a percentage) per server.
l Avg Machine CPU - The average machine CPU (as a percentage) per server.
l Throughput: The average, minimum and maximum target throughput (in rec/sec) per task.
l Latency: The average, minimum and maximum apply latency (in seconds) per task.
Capacity indicators l Average Tables per Task: The average number of tables per task.
l Average Applied Changes per Task: The average number of applied changes per task.
Setup and User Guide - Enterprise Manager, November 2020 SR1 290

12 Analytics
l Average Applied Transactions per Task: The average number of COMMIT transactions per task.
l Average Transaction Size: The average COMMIT change volume per COMMIT transaction.
l Average Number of Changes per Transaction: The average number of applied changes per COMMIT transaction.
Server utilization l Average Memory: The area chart shows the average memory consumed by all tasks. The lines show
the average memory for each task that was run.
l Average Task CPU: The area chart shows the average task CPU (as a percentage). The lines show the average CPU for each task that was run.
l Total Applied Changes and Change Volume: The total number of applied changes as well as the total COMMIT change volume for all tasks.
l Average Disk Usage: The area chart shows the average disk space utilization for all tasks. The lines show the average disk usage for each task that was run.
l Changes in Memory and Disk: The average number of changes accumulated in memory and on disk until source commit as well as the average number of changes in memory and on disk during apply and until target commit per task.
Change processing performance l Applied Changes: The total number of applied changes for all tasks.
l Throughput and Latency: The average source and target throughput (in rec/sec) and the average source and apply latency (in seconds) per task.
12.4 Exporting to TSVFor each dashboard, you can export the data to a TSV file.
To export Trends, Trends by Server, Trends by Task and Capacity Planning data:
1. Click the Export to TSV button to the right of the Filters button.The Export to TSV window opens.
2. Optionally, move the slider to change the default resolution level.
3. Select which charts to export. A separate file will be created for each of the selected charts.
4. Click Export.Depending on your browser settings, the file will either be exported (downloaded) to your browser's default "Downloads" location or you will be pompted to save the file to your preferred location.
To export Top Servers and Top Tasks grid data:
l Click the Export to TSV button to the right of the Filters button.Depending on your browser settings, the file will either be exported (downloaded) to your browser's default "Downloads" location or you will be pompted to save the file to your preferred location.
Setup and User Guide - Enterprise Manager, November 2020 SR1 291

12 Analytics
12.5 Creating filtersYou can filter the dashboards to only show data for a particular timeframe and/or for particular objects (tasks, Replicate servers, source endpoints, and target endpoints).
To create a timeframe filter:
1. Click the icon to the right of the From field and select a "from" date using the calendar
control.OREnter the date manually.
2. Specify a "from" time in the two fields to the right of the icon.
3. Click the icon to the right of the To field and select a "to" date using the calendar control.OREnter the date manually.
4. Specify a "to" time in the two fields to the right of the icon.
5. Click the Apply toolbar button.
To create an object filter
1. Click the Filters toolbar button.The Filters window opens.
2. From the left pane, choose one of the following object types:
l Servers
l Source endpoints
l Target endpoints
l Tasks
By default, all instances of the selected object type are shown.
3. To search for a specific object, in the Name field, enter all or part of the object name and then click Search.
4. If you selected Source endpoints or Target endpoints, optionally filter the search results by Type as well. If you do not select an endpoint type, all endpoints will be shown in the Source Endpoint List/Target Endpoint List.
5. If you selected Tasks, optionally filter the search results by Task Type and/or Status as well.If you do not select a type, all tasks will be shown in the Task List.
Setup and User Guide - Enterprise Manager, November 2020 SR1 292

12 Analytics
6. To exclude a specific object, select the object(s) and click the Exclude button (multiple selection is supported). The object is added to the list on the right.
7. To include a specific object, select the object(s) and click the Include button (multiple selection is supported). The object is added to the list on the right.
8. To include or exclude all objects that match a pattern, type the pattern in the Name field and then click the Include or Exclude button accordingly.For example, to include all task names that start with Bus, type Bus*. The pattern is added to the <Object_Name> Selection Patterns list on the right.
The patterns list can contain both include and exclude patterns.
9. Click OK to save your settings and then click Apply to apply the filter.
12.6 Using the Pivot MenuThe Pivot Menu is located on the right of the Analytics tab. You can select any item in a chart or any row from a grid, and the pivot menu will open up allowing you to pivot, or drill, to another dashboard. When you pivot/drill to another dashboard, the selected item(s) will be applied as filters to the selected dashboard.
12.7 Analytics repository schemaIn addition to the data provided by the Enterprise Manager Analytics dashboards, organizations can also use their own BI tools to generate reports based on the available metrics. To assist with this, the following topic provides a description of the Analytics repository schema together with a couple of sample queries.
The Analytics repository contains the following tables:
l aem_endpoint_type (page 293)
l aem_meta_source_database (page 294)
l aem_meta_target_database (page 294)
l aem_server
l aem_source_database
l aem_target_database
l aem_target_processes
l aem_task
l aem_task_name
l aem_task_previous_metrics
l aem_task_profile
l aem_task_state
l aem_task_stop_reason
aem_endpoint_typeThe aem_endpoint_type table provides lookup information about the Replicate endpoints.
Setup and User Guide - Enterprise Manager, November 2020 SR1 293

12 Analytics
Column Data Type Description
endpoint_type_id Integer The endpoint type ID.
endpoint_type_name Character varying(1024) The endpoint type.
Available table columns
aem_meta_source_databaseThe aem_meta_source_database table provides lookup information about the source endpoint.
Column Data Type Description
meta_source_database_id Integer The source endpoint ID.
meta_source_database_name Character varying(1024) The source endpoint name.
endpoint_type_id Integer The endpoint type ID.
Available table columns
aem_meta_target_databaseThe aem_meta_target_database table provides lookup information about the target endpoint.
Column Data Type Description
meta_target_database_id Integer Target Endpoint ID
meta_target_database_name Character varying(1024) Target Endpoint Name
endpoint_type_id Integer Endpoint Type ID
Available table columns
aem_serverThe aem_server table provides lookup information about the Replicate server.
Column Data Type Description
server_id Integer The Replicate server ID.
server_name Character varying(1024) The Replicate server name.
Host Character varying(1024) The host name or IP address.
port Integer The Replicate port.
platform Character varying(1024) The Replicate server platform.
version Character varying(1024) The Replicate version.
Available table columns
aem_source_database The aem_source_database table provides information about the source endpoint used in a specific task.
Setup and User Guide - Enterprise Manager, November 2020 SR1 294
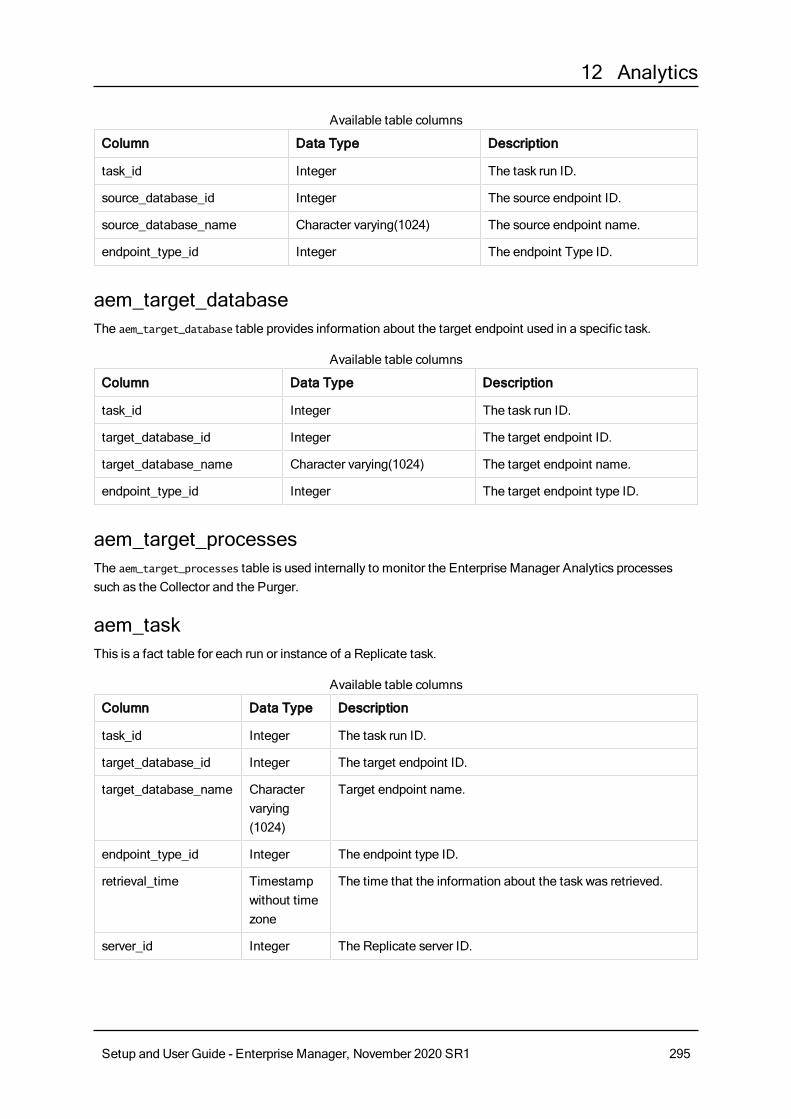
12 Analytics
Column Data Type Description
task_id Integer The task run ID.
source_database_id Integer The source endpoint ID.
source_database_name Character varying(1024) The source endpoint name.
endpoint_type_id Integer The endpoint Type ID.
Available table columns
aem_target_databaseThe aem_target_database table provides information about the target endpoint used in a specific task.
Column Data Type Description
task_id Integer The task run ID.
target_database_id Integer The target endpoint ID.
target_database_name Character varying(1024) The target endpoint name.
endpoint_type_id Integer The target endpoint type ID.
Available table columns
aem_target_processesThe aem_target_processes table is used internally to monitor the Enterprise Manager Analytics processes such as the Collector and the Purger.
aem_taskThis is a fact table for each run or instance of a Replicate task.
Column Data Type Description
task_id Integer The task run ID.
target_database_id Integer The target endpoint ID.
target_database_name Character varying(1024)
Target endpoint name.
endpoint_type_id Integer The endpoint type ID.
retrieval_time Timestamp without time zone
The time that the information about the task was retrieved.
server_id Integer The Replicate server ID.
Available table columns
Setup and User Guide - Enterprise Manager, November 2020 SR1 295

12 Analytics
Column Data Type Description
task_name_id Integer The task name ID.
task_state_id Integer The task state ID.
task_stop_reason_id Integer The task stop Reason ID.
task_profile_id Integer The task profile ID.
cdc_evt_applied_insert_count
Integer The number of INSERTs since the last retrieval time or since the task was started.
cdc_evt_applied_update_count
Integer The number of UPDATEs since the last retrieval time or since the task was started.
cdc_evt_applied_delete_count
Integer The number of DELETEs since the last retrieval time or since the task was started.
cdc_evt_applied_ddl_count
Integer The number of DDLs since the last retrieval time or since the task was started.
full_load_tables_completed_count
Integer The number of completed tables loaded to the Target at retrieval time.
full_load_tables_loading_count
Integer The number of tables being loaded to the target at retrieval time.
full_load_tables_queued_count
Integer The number of tables waiting to be loaded to the target at retrieval time.
full_load_tables_with_error_count
Integer The number of tables that could not be loaded to the target at retrieval time due to an error.
full_load_total_records_transferred
Integer The total number of records that have completed loading to the target at retrieval time.
full_load_est_records_count_for_all_tables
Integer The estimated number of records to be loaded to the target.
full_load_completed Integer Indicates if the Full Load has completed.
full_load_start Timestamp without time zone
The start time of the Full Load.
full_load_finish Timestamp without time zone
The finish time of the Full Load.
full_load_thrput_src_thrput_records_count
Integer The Full Load source throughput (in rec/sec) at retrieval time.
full_load_thrput_src_thrput_volume
Integer The Full Load source throughput (in kb/sec) at retrieval time.
Setup and User Guide - Enterprise Manager, November 2020 SR1 296
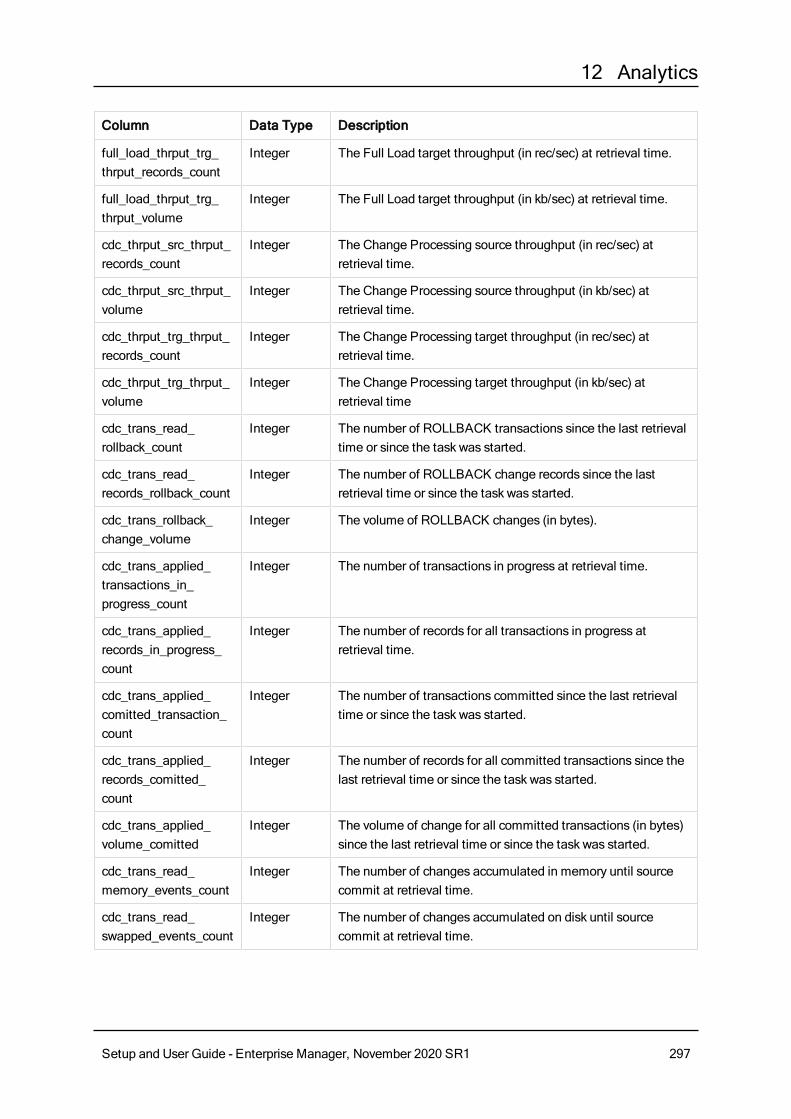
12 Analytics
Column Data Type Description
full_load_thrput_trg_thrput_records_count
Integer The Full Load target throughput (in rec/sec) at retrieval time.
full_load_thrput_trg_thrput_volume
Integer The Full Load target throughput (in kb/sec) at retrieval time.
cdc_thrput_src_thrput_records_count
Integer The Change Processing source throughput (in rec/sec) at retrieval time.
cdc_thrput_src_thrput_volume
Integer The Change Processing source throughput (in kb/sec) at retrieval time.
cdc_thrput_trg_thrput_records_count
Integer The Change Processing target throughput (in rec/sec) at retrieval time.
cdc_thrput_trg_thrput_volume
Integer The Change Processing target throughput (in kb/sec) at retrieval time
cdc_trans_read_rollback_count
Integer The number of ROLLBACK transactions since the last retrieval time or since the task was started.
cdc_trans_read_records_rollback_count
Integer The number of ROLLBACK change records since the last retrieval time or since the task was started.
cdc_trans_rollback_change_volume
Integer The volume of ROLLBACK changes (in bytes).
cdc_trans_applied_transactions_in_progress_count
Integer The number of transactions in progress at retrieval time.
cdc_trans_applied_records_in_progress_count
Integer The number of records for all transactions in progress at retrieval time.
cdc_trans_applied_comitted_transaction_count
Integer The number of transactions committed since the last retrieval time or since the task was started.
cdc_trans_applied_records_comitted_count
Integer The number of records for all committed transactions since the last retrieval time or since the task was started.
cdc_trans_applied_volume_comitted
Integer The volume of change for all committed transactions (in bytes) since the last retrieval time or since the task was started.
cdc_trans_read_memory_events_count
Integer The number of changes accumulated in memory until source commit at retrieval time.
cdc_trans_read_swapped_events_count
Integer The number of changes accumulated on disk until source commit at retrieval time.
Setup and User Guide - Enterprise Manager, November 2020 SR1 297
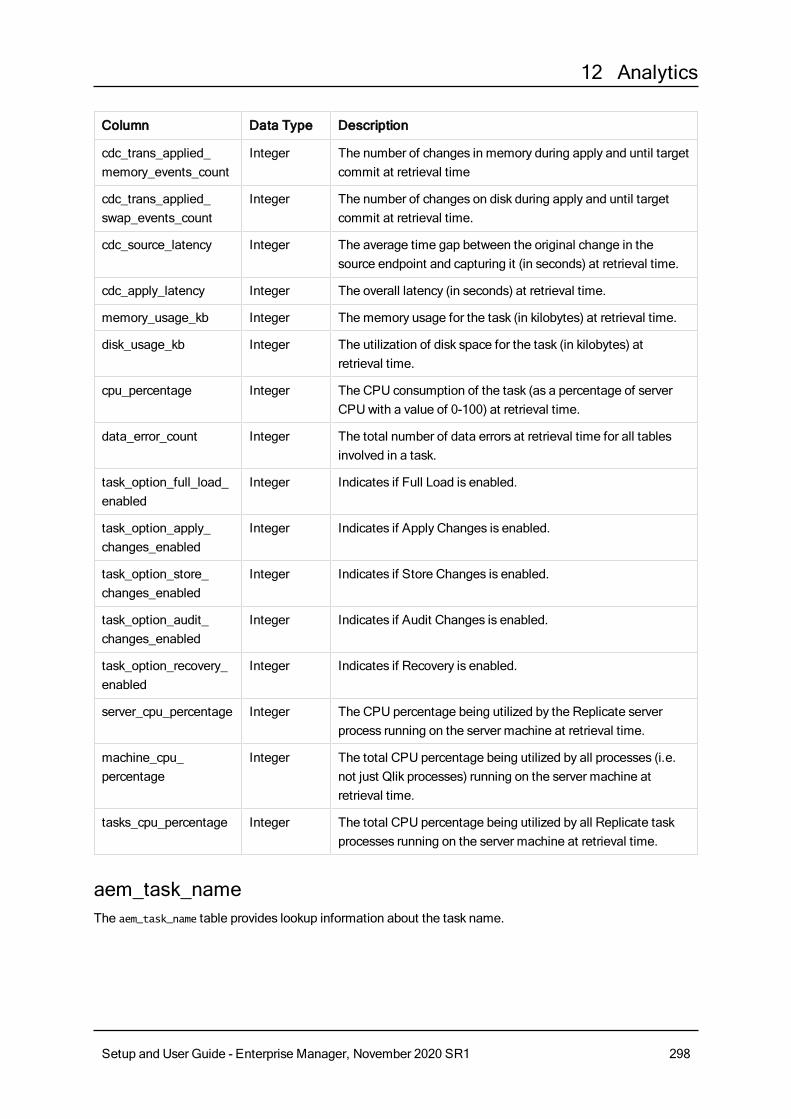
12 Analytics
Column Data Type Description
cdc_trans_applied_memory_events_count
Integer The number of changes in memory during apply and until target commit at retrieval time
cdc_trans_applied_swap_events_count
Integer The number of changes on disk during apply and until target commit at retrieval time.
cdc_source_latency Integer The average time gap between the original change in the source endpoint and capturing it (in seconds) at retrieval time.
cdc_apply_latency Integer The overall latency (in seconds) at retrieval time.
memory_usage_kb Integer The memory usage for the task (in kilobytes) at retrieval time.
disk_usage_kb Integer The utilization of disk space for the task (in kilobytes) at retrieval time.
cpu_percentage Integer The CPU consumption of the task (as a percentage of server CPU with a value of 0-100) at retrieval time.
data_error_count Integer The total number of data errors at retrieval time for all tables involved in a task.
task_option_full_load_enabled
Integer Indicates if Full Load is enabled.
task_option_apply_changes_enabled
Integer Indicates if Apply Changes is enabled.
task_option_store_changes_enabled
Integer Indicates if Store Changes is enabled.
task_option_audit_changes_enabled
Integer Indicates if Audit Changes is enabled.
task_option_recovery_enabled
Integer Indicates if Recovery is enabled.
server_cpu_percentage Integer The CPU percentage being utilized by the Replicate server process running on the server machine at retrieval time.
machine_cpu_percentage
Integer The total CPU percentage being utilized by all processes (i.e. not just Qlik processes) running on the server machine at retrieval time.
tasks_cpu_percentage Integer The total CPU percentage being utilized by all Replicate task processes running on the server machine at retrieval time.
aem_task_nameThe aem_task_name table provides lookup information about the task name.
Setup and User Guide - Enterprise Manager, November 2020 SR1 298
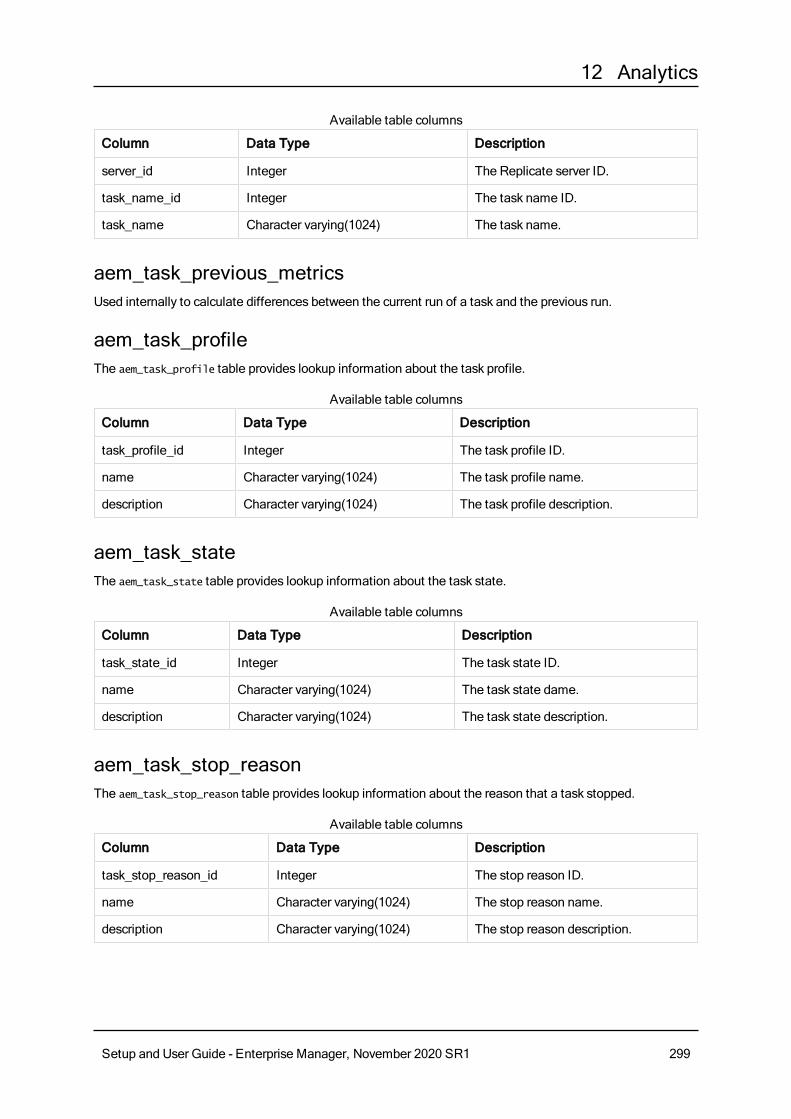
12 Analytics
Column Data Type Description
server_id Integer The Replicate server ID.
task_name_id Integer The task name ID.
task_name Character varying(1024) The task name.
Available table columns
aem_task_previous_metricsUsed internally to calculate differences between the current run of a task and the previous run.
aem_task_profileThe aem_task_profile table provides lookup information about the task profile.
Column Data Type Description
task_profile_id Integer The task profile ID.
name Character varying(1024) The task profile name.
description Character varying(1024) The task profile description.
Available table columns
aem_task_stateThe aem_task_state table provides lookup information about the task state.
Column Data Type Description
task_state_id Integer The task state ID.
name Character varying(1024) The task state dame.
description Character varying(1024) The task state description.
Available table columns
aem_task_stop_reasonThe aem_task_stop_reason table provides lookup information about the reason that a task stopped.
Column Data Type Description
task_stop_reason_id Integer The stop reason ID.
name Character varying(1024) The stop reason name.
description Character varying(1024) The stop reason description.
Available table columns
Setup and User Guide - Enterprise Manager, November 2020 SR1 299

12 Analytics
Sample QueriesThe following sample queries demonstrate how useful information can be extracted from the schema.
Query 1:
Provides a sampling of Full Load and Change Processing metrics for all tasks with a source endpoint named "Teradata DB" for the month of August 2017.
SELECT
AEM_SERVER.SERVER_NAME AS "Server"
,AEM_TASK_NAME.TASK_NAME AS "Task"
,AVG(AEM_TASK.MEMORY_USAGE_KB / 1024::float) AS "Avg Memory"
,AVG(AEM_TASK.DISK_USAGE_KB) / 1024::float AS "Avg IO"
,MAX((CASE WHEN AEM_TASK.FULL_LOAD_TABLES_COMPLETED_COUNT IS NULL THEN 0
ELSE AEM_TASK.FULL_LOAD_TABLES_COMPLETED_COUNT END)+(CASE WHEN AEM_
TASK.FULL_LOAD_TABLES_LOADING_COUNT IS NULL THEN 0 ELSE AEM_TASK.FULL_LOAD_
TABLES_LOADING_COUNT END)+(CASE WHEN AEM_TASK.FULL_LOAD_TABLES_QUEUED_COUNT
IS NULL THEN 0 ELSE AEM_TASK.FULL_LOAD_TABLES_QUEUED_COUNT END)+(CASE WHEN
AEM_TASK.FULL_LOAD_TABLES_WITH_ERROR_COUNT IS NULL THEN 0 ELSE AEM_
TASK.FULL_LOAD_TABLES_WITH_ERROR_COUNT END)) AS "Full Load Total Tables"
,MAX(FULL_LOAD_TOTAL_RECORDS_TRANSFERRED) AS "Full Load Total Records"
,MAX(AEM_TASK.FULL_LOAD_FINISH-AEM_TASK.FULL_LOAD_START) AS "Full Load
Max Load Duration"
,AVG(AEM_TASK.FULL_LOAD_FINISH-AEM_TASK.FULL_LOAD_START) AS "Full Load
Avg Load Duration"
,AVG((CASE WHEN AEM_TASK.FULL_LOAD_THRPUT_TRG_THRPUT_RECORDS_COUNT IS
NULL THEN 0 ELSE AEM_TASK.FULL_LOAD_THRPUT_TRG_THRPUT_RECORDS_COUNT END))
AS "Full Load Avg Target Throughput Records per Second"
,SUM((CASE WHEN AEM_TASK.CDC_EVT_APPLIED_INSERT_COUNT IS NULL THEN 0 ELSE
AEM_TASK.CDC_EVT_APPLIED_INSERT_COUNT END)+(CASE WHEN AEM_TASK.CDC_EVT_
APPLIED_UPDATE_COUNT IS NULL THEN 0 ELSE AEM_TASK.CDC_EVT_APPLIED_UPDATE_
COUNT END)+(CASE WHEN AEM_TASK.CDC_EVT_APPLIED_DELETE_COUNT IS NULL THEN 0
ELSE AEM_TASK.CDC_EVT_APPLIED_DELETE_COUNT END)+(CASE WHEN AEM_TASK.CDC_
EVT_APPLIED_DDL_COUNT IS NULL THEN 0 ELSE AEM_TASK.CDC_EVT_APPLIED_DDL_
COUNT END)) AS "CDC Total Applied Changes"
,SUM((CASE WHEN AEM_TASK.CDC_TRANS_APPLIED_COMITTED_TRANSACTION_COUNT IS
NULL THEN 0 ELSE AEM_TASK.CDC_TRANS_APPLIED_COMITTED_TRANSACTION_COUNT
END)) AS "CDC Total Applied Transactions"
,AVG((CASE WHEN AEM_TASK.CDC_THRPUT_TRG_THRPUT_RECORDS_COUNT IS NULL THEN
0 ELSE AEM_TASK.CDC_THRPUT_TRG_THRPUT_RECORDS_COUNT END)) AS "CDC Avg
Target Throughput Records per Second"
,AVG((CASE WHEN AEM_TASK.CDC_APPLY_LATENCY IS NULL THEN 0 ELSE AEM_
TASK.CDC_APPLY_LATENCY END)) AS "CDC Avg Apply Latency"
FROM
Setup and User Guide - Enterprise Manager, November 2020 SR1 300
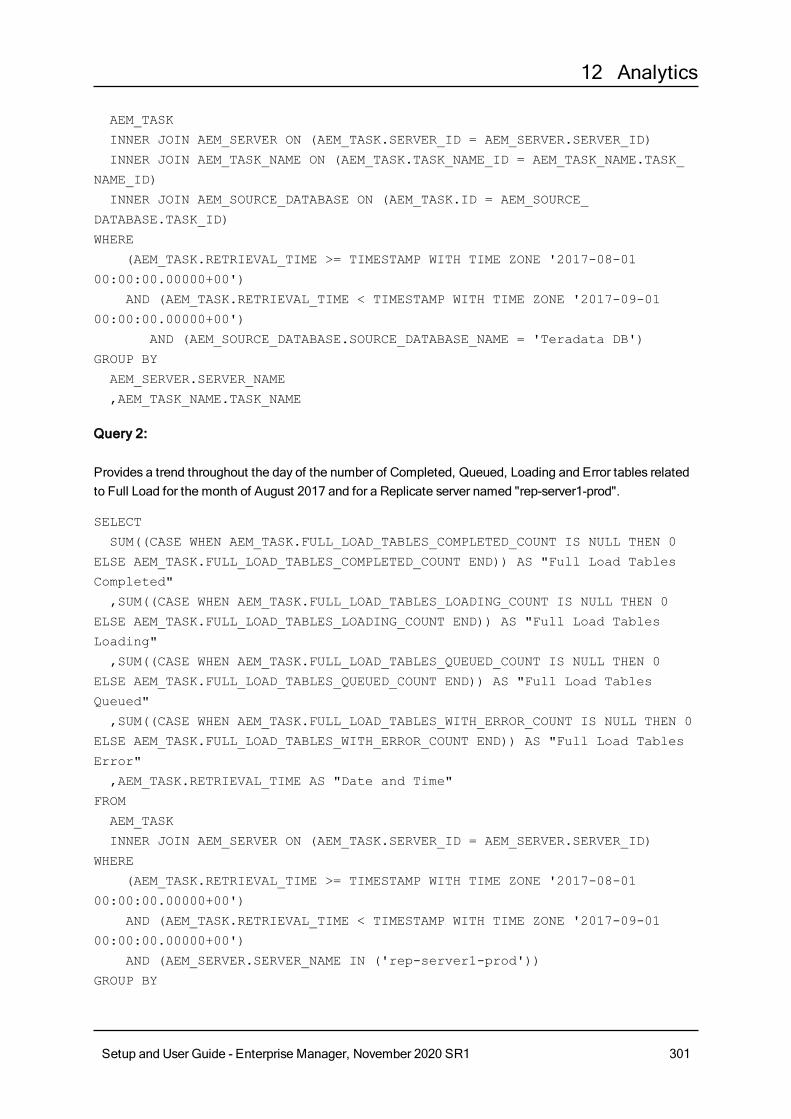
12 Analytics
AEM_TASK
INNER JOIN AEM_SERVER ON (AEM_TASK.SERVER_ID = AEM_SERVER.SERVER_ID)
INNER JOIN AEM_TASK_NAME ON (AEM_TASK.TASK_NAME_ID = AEM_TASK_NAME.TASK_
NAME_ID)
INNER JOIN AEM_SOURCE_DATABASE ON (AEM_TASK.ID = AEM_SOURCE_
DATABASE.TASK_ID)
WHERE
(AEM_TASK.RETRIEVAL_TIME >= TIMESTAMP WITH TIME ZONE '2017-08-01
00:00:00.00000+00')
AND (AEM_TASK.RETRIEVAL_TIME < TIMESTAMP WITH TIME ZONE '2017-09-01
00:00:00.00000+00')
AND (AEM_SOURCE_DATABASE.SOURCE_DATABASE_NAME = 'Teradata DB')
GROUP BY
AEM_SERVER.SERVER_NAME
,AEM_TASK_NAME.TASK_NAME
Query 2:
Provides a trend throughout the day of the number of Completed, Queued, Loading and Error tables related to Full Load for the month of August 2017 and for a Replicate server named "rep-server1-prod".
SELECT
SUM((CASE WHEN AEM_TASK.FULL_LOAD_TABLES_COMPLETED_COUNT IS NULL THEN 0
ELSE AEM_TASK.FULL_LOAD_TABLES_COMPLETED_COUNT END)) AS "Full Load Tables
Completed"
,SUM((CASE WHEN AEM_TASK.FULL_LOAD_TABLES_LOADING_COUNT IS NULL THEN 0
ELSE AEM_TASK.FULL_LOAD_TABLES_LOADING_COUNT END)) AS "Full Load Tables
Loading"
,SUM((CASE WHEN AEM_TASK.FULL_LOAD_TABLES_QUEUED_COUNT IS NULL THEN 0
ELSE AEM_TASK.FULL_LOAD_TABLES_QUEUED_COUNT END)) AS "Full Load Tables
Queued"
,SUM((CASE WHEN AEM_TASK.FULL_LOAD_TABLES_WITH_ERROR_COUNT IS NULL THEN 0
ELSE AEM_TASK.FULL_LOAD_TABLES_WITH_ERROR_COUNT END)) AS "Full Load Tables
Error"
,AEM_TASK.RETRIEVAL_TIME AS "Date and Time"
FROM
AEM_TASK
INNER JOIN AEM_SERVER ON (AEM_TASK.SERVER_ID = AEM_SERVER.SERVER_ID)
WHERE
(AEM_TASK.RETRIEVAL_TIME >= TIMESTAMP WITH TIME ZONE '2017-08-01
00:00:00.00000+00')
AND (AEM_TASK.RETRIEVAL_TIME < TIMESTAMP WITH TIME ZONE '2017-09-01
00:00:00.00000+00')
AND (AEM_SERVER.SERVER_NAME IN ('rep-server1-prod'))
GROUP BY
Setup and User Guide - Enterprise Manager, November 2020 SR1 301

12 Analytics
AEM_TASK.RETRIEVAL_TIME
ORDER BY
"Date and Time" ASC
Query 3:
Provides an daily trend of Average Throughput and Latency metrics related to Change Processing for the month of August 2017 and for a Replicate server named "rep-server1-prod".
SELECT
AVG((CASE WHEN AEM_TASK.CDC_THRPUT_SRC_THRPUT_RECORDS_COUNT IS NULL THEN
0 ELSE AEM_TASK.CDC_THRPUT_SRC_THRPUT_RECORDS_COUNT END)) AS "CDC Avg
Source Throughput Records"
,AVG((CASE WHEN AEM_TASK.CDC_THRPUT_TRG_THRPUT_RECORDS_COUNT IS NULL THEN
0 ELSE AEM_TASK.CDC_THRPUT_TRG_THRPUT_RECORDS_COUNT END)) AS "CDC Avg
Target Throughput Records"
,AVG((CASE WHEN AEM_TASK.CDC_SOURCE_LATENCY IS NULL THEN 0 ELSE AEM_
TASK.CDC_SOURCE_LATENCY END)) AS "CDC Avg Source Latency"
,AVG((CASE WHEN AEM_TASK.CDC_APPLY_LATENCY IS NULL THEN 0 ELSE AEM_
TASK.CDC_APPLY_LATENCY END)) AS "CDC Avg Apply Latency"
,EXTRACT(YEAR from AEM_TASK.RETRIEVAL_TIME) AS "Year"
,EXTRACT(MONTH from AEM_TASK.RETRIEVAL_TIME) AS "Month"
,EXTRACT(DAY from AEM_TASK.RETRIEVAL_TIME) AS "Day"
FROM
AEM_TASK
INNER JOIN AEM_SERVER ON (AEM_TASK.SERVER_ID = AEM_SERVER.SERVER_ID)
WHERE
(AEM_TASK.RETRIEVAL_TIME >= TIMESTAMP WITH TIME ZONE '2017-08-01
00:00:00.00000+00')
AND (AEM_TASK.RETRIEVAL_TIME < TIMESTAMP WITH TIME ZONE '2017-09-01
00:00:00.00000+00')
AND (AEM_SERVER.SERVER_NAME IN ('rep-server1-prod'))
GROUP BY
EXTRACT(YEAR from AEM_TASK.RETRIEVAL_TIME)
,EXTRACT(MONTH from AEM_TASK.RETRIEVAL_TIME)
,EXTRACT(DAY from AEM_TASK.RETRIEVAL_TIME)
ORDER BY
"Year", "Month", "Day"
Setup and User Guide - Enterprise Manager, November 2020 SR1 302
A Setting up High Availability
A Setting up High AvailabilityThis topic describes how to set up Enterprise Manager in a Windows High Availability Cluster.
When the Enterprise Manager data directory is installed in a non-default location, the -d <data_directory> parameter must be included in all commands, where data directory is the location of the data directory.
To obtain a Replication Management license for Enterprise Manager in a High Availability Cluster, you must provide your Qlik Sales Representative with the official cluster FQDN.
Throughout this chapter "Node 1" and "Node 2" are used to refer to the primary and secondary clustering nodes respectively.
A.1 Installing Qlik Enterprise Manager in a Windows cluster
This topic explains how to install Enterprise Manager in a Windows 2008 R2 cluster, a Windows 2012 R2 cluster, and a Windows 2016 cluster.
l For information on obtaining a license for Enterprise Manager in a Windows cluster, see Replication management license (page 14).
l For information on upgrading and uninstalling Enterprise Manager in/from a Windows cluster, see Upgrading Qlik Enterprise Manager in a Windows cluster (page 307) and Uninstalling Qlik Enterprise Manager from a Windows cluster (page 310) respectively.
l For information on the Master User Key commands mentioned in this section, see Replacing the Master User Password (page 35) and Configuring Enterprise Manager using the CLI (page 271).
Installing Enterprise Manager in a Windows 2012 R2 cluster or in a Windows 2016 cluster
Unless specified otherwise, all commands should be run from the Enterprise Manager bin folder. The default location is:
C:\Program Files\Attunity\Enterprise Manager\bin
Setup and User Guide - Enterprise Manager, November 2020 SR1 303

A Setting up High Availability
To install Enterprise Manager in a Windows 2012 R2 cluster or in a Windows 2016 cluster:
1. Open Failover Cluster Manager and connect to a network that contains the cluster nodes and a clustered disk (for the Enterprise Manager "data" folder).
2. Install Enterprise Manager on Node 1. This node should be the Cluster Disk owner. You can specify any Destination Location, but the "data" folder must be installed on a clustered disk (i.e. a disk that is accessible to the other cluster node).
The "data" folder contains a "java" subfolder. At various points in the cluster setup, you will need to specify the location of both the "data" folder and the "java" folder. It is therefore recommended to make a note of the "data" folder location.
3. Set the Enterprise Manager Master User Key by opening a command prompt and running the following command:aemctl.exe -d data_folder_path masterukey set -p password
where -d data_folder_path is the path to the shared Enterprise Manager data folder.
4. Set the Java Master User Key by opening a command prompt and running the following command from the Java bin folder (<INSTALL_DIR>\Enterprise Manager\java\bin by default):atajs.bat -d java_data_folder_path masterukey set password
where -d java_data_folder_path is the path to the shared Enterprise Manager data\java folder.
5. On Node 1, open the Windows Services console and stop the Enterprise Manager service.
6. Move the shared Cluster Disk to Node 2.
7. Install Enterprise Manager on Node 2. The Destination Location can be any local folder, but make sure to install the "data" folder on the same clustered disk specified in step 2 above.
8. Make sure the Enterprise Manager service is stopped on Node 2.
Setup and User Guide - Enterprise Manager, November 2020 SR1 304
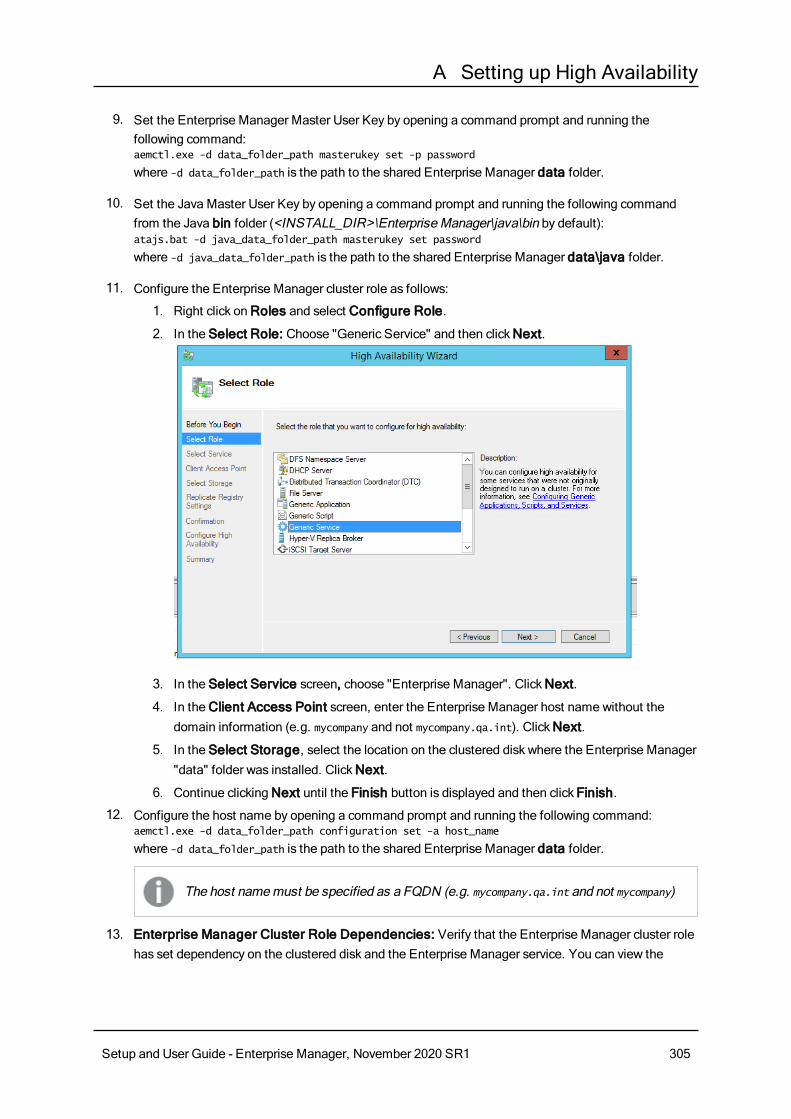
A Setting up High Availability
9. Set the Enterprise Manager Master User Key by opening a command prompt and running the following command:aemctl.exe -d data_folder_path masterukey set -p password
where -d data_folder_path is the path to the shared Enterprise Manager data folder.
10. Set the Java Master User Key by opening a command prompt and running the following command from the Java bin folder (<INSTALL_DIR>\Enterprise Manager\java\bin by default):atajs.bat -d java_data_folder_path masterukey set password
where -d java_data_folder_path is the path to the shared Enterprise Manager data\java folder.
11. Configure the Enterprise Manager cluster role as follows:
1. Right click on Roles and select Configure Role.
2. In the Select Role: Choose "Generic Service" and then click Next.
3. In the Select Service screen, choose "Enterprise Manager". Click Next.
4. In the Client Access Point screen, enter the Enterprise Manager host name without the domain information (e.g. mycompany and not mycompany.qa.int). Click Next.
5. In the Select Storage, select the location on the clustered disk where the Enterprise Manager "data" folder was installed. Click Next.
6. Continue clicking Next until the Finish button is displayed and then click Finish.
12. Configure the host name by opening a command prompt and running the following command:aemctl.exe -d data_folder_path configuration set -a host_name
where -d data_folder_path is the path to the shared Enterprise Manager data folder.
The host name must be specified as a FQDN (e.g. mycompany.qa.int and not mycompany)
13. Enterprise Manager Cluster Role Dependencies: Verify that the Enterprise Manager cluster role has set dependency on the clustered disk and the Enterprise Manager service. You can view the
Setup and User Guide - Enterprise Manager, November 2020 SR1 305
A Setting up High Availability
dependencies in the role properties.Your Enterprise Manager cluster should now be ready for use.
Installing Enterprise Manager in a Windows 2008 R2 cluster
All commands should be run from the Enterprise Manager bin folder. The default location is:
C:\Program Files\Attunity\Enterprise Manager\bin
To install Enterprise Manager in a Windows 2008 R2 cluster:
1. Open Failover Cluster Manager and connect to a network that contains the cluster nodes and a clustered disk (for the Enterprise Manager "data" folder).
2. Install Enterprise Manager on Node 1. This node should be the Cluster Disk owner. During the installation, you can specify any Destination Location, but the "data" folder must be installed on a clustered disk (i.e. a disk that is accessible to the other cluster node).
3. Set the Enterprise Manager Master User Key by opening a command prompt and running the following command:aemctl.exe -d data_folder_path masterukey set -p password
where -d data_folder_path is the path to the shared Enterprise Manager data folder.
4. Set the Java Master User Key by opening a command prompt and running the following command from the Java bin folder (C:\Program Files\Attunity\Enterprise Manager\java\bin by default):atajs.bat -d java_data_folder_path masterukey set password
where -d java_data_folder_path is the path to the shared Enterprise Manager data\java folder.
5. On Node 1, open the Windows Services console and stop the Enterprise Manager service.
6. Move the clustered disk to Node 2. This can either be performed using a command line in PowerShell or by adding a service to the cluster that allows both of the cluster nodes to communicate with the clustered disk.
7. Install Enterprise Manager on Node 2. The Destination Location can be any local folder, but make sure to install the "data" folder on the same clustered disk specified in step 2 above.
8. Make sure the Enterprise Manager service is stopped on Node 2.
9. Set the Enterprise Manager Master User Key by opening a command prompt and running the following command:aemctl.exe -d data_folder_path masterukey set -p password
where -d data_folder_path is the path to the shared Enterprise Manager data folder.
10. Set the Java Master User Key by opening a command prompt and running the following command from the Java bin folder (C:\Program Files\Attunity\Enterprise Manager\java\bin by default):atajs.bat -d java_data_folder_path masterukey set password
where -d java_data_folder_path is the path to the shared Enterprise Manager data\java folder.
Setup and User Guide - Enterprise Manager, November 2020 SR1 306
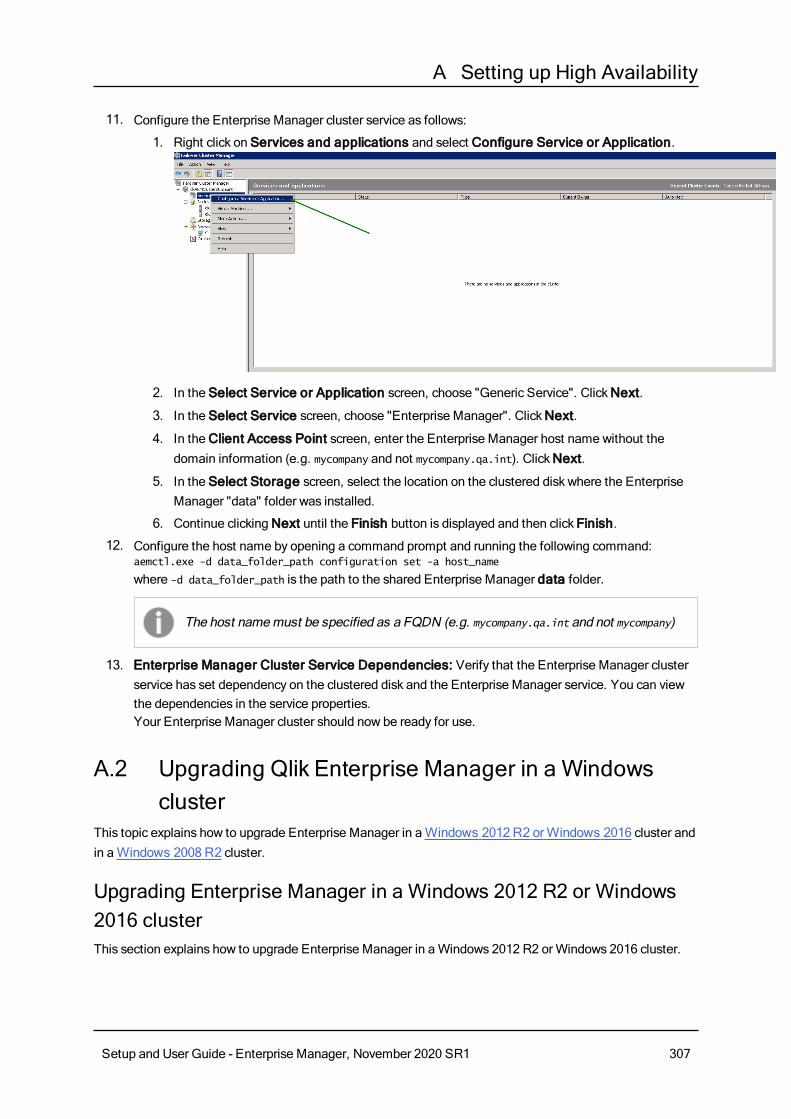
A Setting up High Availability
11. Configure the Enterprise Manager cluster service as follows:
1. Right click on Services and applications and select Configure Service or Application.
2. In the Select Service or Application screen, choose "Generic Service". Click Next.
3. In the Select Service screen, choose "Enterprise Manager". Click Next.
4. In the Client Access Point screen, enter the Enterprise Manager host name without the domain information (e.g. mycompany and not mycompany.qa.int). Click Next.
5. In the Select Storage screen, select the location on the clustered disk where the Enterprise Manager "data" folder was installed.
6. Continue clicking Next until the Finish button is displayed and then click Finish.
12. Configure the host name by opening a command prompt and running the following command:aemctl.exe -d data_folder_path configuration set -a host_name
where -d data_folder_path is the path to the shared Enterprise Manager data folder.
The host name must be specified as a FQDN (e.g. mycompany.qa.int and not mycompany)
13. Enterprise Manager Cluster Service Dependencies: Verify that the Enterprise Manager cluster service has set dependency on the clustered disk and the Enterprise Manager service. You can view the dependencies in the service properties.Your Enterprise Manager cluster should now be ready for use.
A.2 Upgrading Qlik Enterprise Manager in a Windows cluster
This topic explains how to upgrade Enterprise Manager in a Windows 2012 R2 or Windows 2016 cluster and in a Windows 2008 R2 cluster.
Upgrading Enterprise Manager in a Windows 2012 R2 or Windows 2016 clusterThis section explains how to upgrade Enterprise Manager in a Windows 2012 R2 or Windows 2016 cluster.
Setup and User Guide - Enterprise Manager, November 2020 SR1 307

A Setting up High Availability
To upgrade Enterprise Manager in a Windows 2012 R2 or Windows 2016 cluster:
1. Open Failover Cluster Manager on the active cluster node.
2. Stop the Enterprise Manager service on both nodes.
3. Verify that the Enterprise Manager Cluster Role status is "Failed".
4. Run the upgrade on Node 1.
5. Move the Enterprise Manager Role to Node 2.
6. Stop the Enterprise Manager service on both nodes.
7. Verify that the Enterprise Manager Cluster Role status is "Failed".
8. Run the upgrade on Node 2.
9. Start the Enterprise Manager Cluster Role.
Setup and User Guide - Enterprise Manager, November 2020 SR1 308

A Setting up High Availability
The upgrade should now be complete.
Upgrading Enterprise Manager in a Windows 2008 R2 clusterThis section explains how to upgrade Enterprise Manager in a Windows 2008 R2 Cluster.
To upgrade Enterprise Manager in a Windows 2008 R2 Cluster:
1. Open Failover Cluster Manager on the active cluster node.
2. Pause the cluster activity on Node 1.
3. On Node 1, verify that the shared cluster disk is available and then run the upgrade.
4. Verify that the service is not running.
5. Move the Enterprise Manager clustered service to Node 2.
6. Pause the cluster activity on Node 2.
Setup and User Guide - Enterprise Manager, November 2020 SR1 309

A Setting up High Availability
7. On Node 2, verify that the shared cluster disk is available and then run the upgrade.
8. Resume cluster activity on both nodes.
9. Bring the Enterprise Manager Cluster Service online.The upgrade should now be complete.
A.3 Uninstalling Qlik Enterprise Manager from a Windows cluster
This topic explains how to uninstall Enterprise Manager from a Windows 2012 R2 or Windows 2016 cluster and from a Windows 2008 R2 cluster.
To uninstall Enterprise Manager from a Windows 2012 R2 or Windows 2016 cluster:
1. Open Failover Cluster Manager on the active cluster node.
2. On each of the cluster nodes, open the Windows Services console and stop the Enterprise Manager service.
3. Verify in Failover Cluster Manager that the status of the Enterprise Manager cluster role is "Failed".
4. Go to Node 1 that should be owner to Enterprise Manager Cluster Role and Cluster Disk. Uninstall the service.
5. Move the Enterprise Manager Role to Node 2.
Setup and User Guide - Enterprise Manager, November 2020 SR1 310
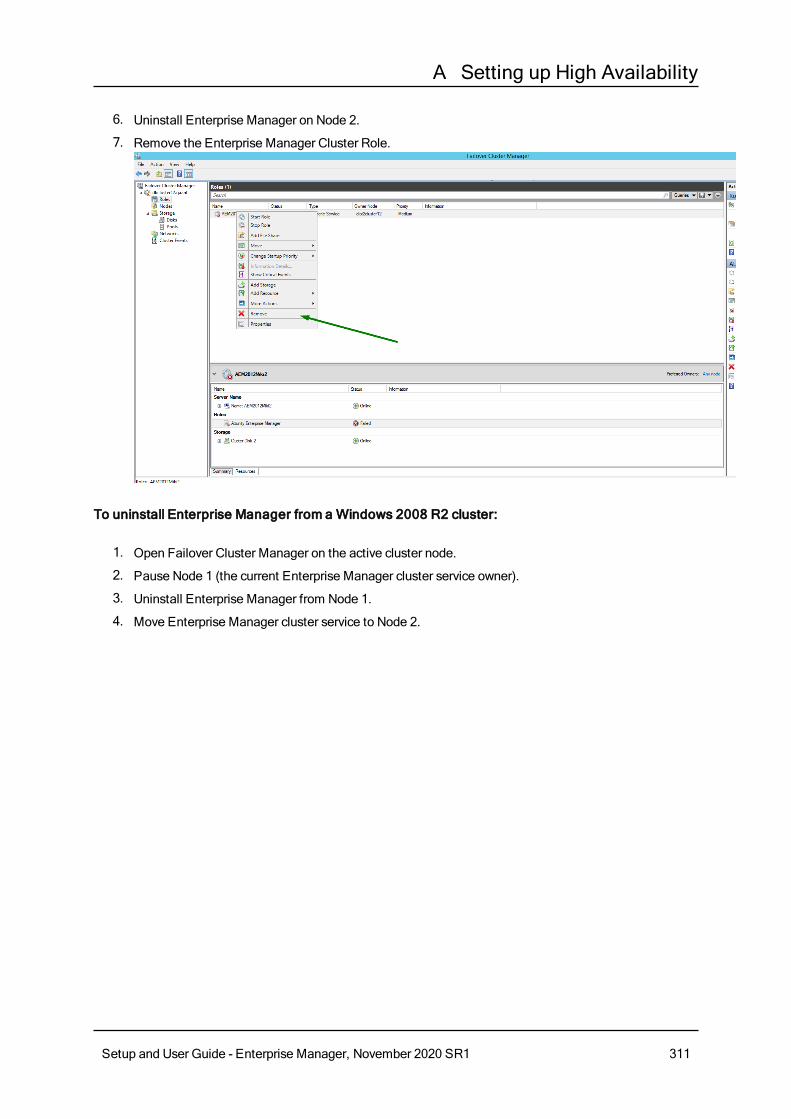
A Setting up High Availability
6. Uninstall Enterprise Manager on Node 2.
7. Remove the Enterprise Manager Cluster Role.
To uninstall Enterprise Manager from a Windows 2008 R2 cluster:
1. Open Failover Cluster Manager on the active cluster node.
2. Pause Node 1 (the current Enterprise Manager cluster service owner).
3. Uninstall Enterprise Manager from Node 1.
4. Move Enterprise Manager cluster service to Node 2.
Setup and User Guide - Enterprise Manager, November 2020 SR1 311

A Setting up High Availability
5. Uninstall Enterprise Manager from Node 2.
6. Remove the Enterprise Manager Cluster Service.
Setup and User Guide - Enterprise Manager, November 2020 SR1 312

A Setting up High Availability
Setup and User Guide - Enterprise Manager, November 2020 SR1 313
B Impact of DST change on Qlik Replicate
B Impact of DST change on Qlik Replicate This topic describes the impact of Daylight Saving Time (DST) on Qlik Replicate and provides guidelines for handling changes brought about by DST.
Tasks that move from Full Load to Change Processing when DST comes into effect may encounter data loss. However, such data loss can be prevented by adhering to the guidelines outlined in this appendix.
Additionally, the times displayed in the Replicate Console may not be synced with the server. Should you encounter any time discrepancy issues, either restart the Qlik Replicate Server service or stop and resume the tasks.
There are two types of DST changes:
l DST On - Occurs approximately when Summer starts (actual date is country specific). Its impact on local time is that local time is moved one hour forward (so, for example, 01:00 AM becomes 02:00 AM). This DST change does not impact Qlik Replicate because it does not result in time overlap.
l DST Off - Occurs approximately when Winter starts (actual date is country specific). Its impact on local time is that local time is moved back one hour (so, for example, 02:00 AM becomes 01:00 AM). This DST change results in time overlap where local time travels over the same hour twice in a row.
The comments below assume that the customer has not changed the time but rather the timezone or the DST setting. Changing the actual time (not for minor time adjustments) is a sensitive operation and is best done when Qlik Replicate is stopped.
Running Qlik Replicate tasks do not depend on the timezone or DST for correctly scanning and processing the transaction logs. Internally, Qlik Replicate timers use UTC.
Still, there are several places where DST may have an effect:
1. Timestamps in logs and audit messages are in local time. As a result, when Winter time starts, the logs will show the time going back an hour; conversely, when Summer time starts, the logs may appear to be missing one hour.
2. Scheduled jobs as well as the global and table manipulation variables timestamp and commit_timestamp use local time so these will also be affected. The impact of this depends on the manipulation done and on the intended use of the timestamp based data.
Setup and User Guide - Enterprise Manager, November 2020 SR1 314

B Impact of DST change on Qlik Replicate
To prevent timestamp and scheduling anomalies resulting from DST starting or ending, the following best practices should be observed:
l DST Off (summer to winter): Do not schedule a task to start from the time the clock changes until the following hour. For example, if DST ends at 02:00 am, do not schedule a task to run between 02:00 and 02:59, as the task will run twice.
l DST On (winter to summer): Do not schedule a task to start from the time the clock changes until the following hour. For example, if DST starts at 02:00 am, do not schedule a task to run between 02:00 and 02:59 as this hour does not exist.
l The initial Full Load of tables or reloading of tables should not be done during the DST change window. It is recommended to perform such operations either an hour before or an hour after DST.
If you have existing jobs scheduled to start at the overlap time and you do not want to modify them, then you need to stop the Qlik Replicate Server. Going in to Winter time, for example, if at 02:00 AM the clock is to be set back to 01:00 AM then when the time is 00:55 AM the Qlik Replicate Server should be stopped and, after an hour and ten minutes (at 01:05 AM), should be started again.If you forget to do this, all scheduled jobs will run an hour earlier than intended. You can rectify this by setting the desired scheduling time and then restarting the Qlik Replicate Server service.
3. Statistics shown on the console are also sensitive to local time and thus may also show confusing/inaccurate data in the overlap period (going in to Winter time) or for the skipped period (going into Summer time).
4. If the clock on Qlik Replicate Server machine is one hour behind the clock on the Qlik Replicate Console (UI) machine, the following issues are known to occur:
l The Applied Changes circle graph will be updated as the changes are applied, but the information in the Recent Activity tab will not be updated.
l Scheduled jobs will start according to the Qlik Replicate Server time (as expected), but will remain in the Active Jobs list after execution instead of moving to the Expired Jobs tab.
For more information on scheduling jobs, see Scheduling jobs (page 226).
In general, it is recommended to avoid non-critical task design changes during the first overlap period (going in to Winter time) so as to prevent confusion about when the changes took place.
In addition to Qlik Replicate, other components are also involved including:
l The source endpoint system
l The target endpoint system
l The local operating system
l The task design (specifically using timestamp based variables)
Setup and User Guide - Enterprise Manager, November 2020 SR1 315
B Impact of DST change on Qlik Replicate
Given the complexity of the topic and the involvement of many independent components and settings, Qlik generally recommends that customers first verify the impact of DST changes in their test environment.
Setup and User Guide - Enterprise Manager, November 2020 SR1 316


![Mission Manager[1]](https://static.fdokumen.com/doc/165x107/6313fe215cba183dbf075a68/mission-manager1.jpg)