PWR Pressure Vessel Nozzle Appendix G Evaluation.
100
PRESSURIZED WATER REACTOR OWNERS GROUP PWROG-15109-NP Revision 0 WESTINGHOUSE NON-PROPRIETARY CLASS 3 PWR Pressure Vessel Nozzle Appendix G Evaluation Materials Committee PA-MSC-1091, Revision 4 February 2018 @Westinghouse framatome
-
Upload
khangminh22 -
Category
Documents
-
view
0 -
download
0
Transcript of PWR Pressure Vessel Nozzle Appendix G Evaluation.

PRESSURIZED WATER REACTOR OWNERS GROUP
PWROG-15109-NP Revision 0
WESTINGHOUSE NON-PROPRIETARY CLASS 3
PWR Pressure Vessel Nozzle Appendix G Evaluation Materials Committee
PA-MSC-1091, Revision 4
February 2018
@Westinghouse framatome

WESTINGHOUSE NON-PROPRIETARY CLASS 3
PWROG-15109-NP, Revision 0
PWR Pressure Vessel Nozzle Appendix G Evaluation
PA-MSC-1091, Revision 4
Verifier:
Verifier:
Verifier:
February 2018
J. Brian Hall* Churchill Laboratory Services
Justin Webb* Structural Design & Analysis I
Benjamin E. Mays* Structural Design & Analysis 111
Anees Udyawar* Structural Design & Analysis 111
Reviewer: Jianwei Chen* Radiation Engineering & Analysis
Approved: James P. Molkenthin*, Program Director, PWR Owners Group PMO
Approved: David B. Love* Manager, Churchill Laboratory Services
Approved: Stephen P. Rigby* Manager, Structural Design & Analysis I
Approved: Lynn A. Patterson* Manager, Structural Design & Analysis Ill
*Electronically approved records are authenticated in the electronic document management system.
Westinghouse Electric Company LLC 1000 Westinghouse Drive
Cranberry Township, PA 16066, USA
© 2018 Westinghouse Electric Company LLC All Rights Reserved
*** This record was final approved on 2/22/2018 11 :54:21 AM. ( This statement was added by the PRIME system upon its validation)

WESTINGHOUSE NON-PROPRIETARY CLASS 3 iii
ACKNOWLEDGEMENTS
This report was prepared for and funded by the PWR Owners Group under the leadership of the participating utility representatives of the Materials Committee. The author would like to thank the following people and/or organizations for their valuable contributions to this report:
• Warren Bamford for his overall support and advice, • Dan Denis, Amy Freed , Alley Carolan , and Andy Ruminski for author/verification of the
supporting materials and fracture mechanics calculations, • Rick Rishel for his verification of the non-destructive examination flaw size section, • Ramin M. Rafatpanah, Gordon Hall, Sarah Lax, and Thomas E. Demers for their
extensive effort and expertise with the three-dimensional finite element analysis, • Ben Amiri , Greg Fischer, and Arzu Alpan for fluence advice, • Jim Andrachek for his licensing input and overall review, • Matt Devan and Ashok Nana (both from Framatome) for providing the B&W materials
information and overall review, • Gary Stevens (SIA) and Nathan Palm (EPRI) for providing constructive comments which
yielded an improved analysis and report, • Mo Dingler (Wolf Creek), Tim Wells (Southern), Chris Wax (APS) , Bernie Rudell
(Exelon), Heather Malikowski (Exelon) and Scott Boggs (FP&L) for their review from the utility perspective.
PWROG-15109-NP February 2018 Revision 0
••• This record was final approved on 2/22/2018 11 :54:21 AM. ( This statement was added by the PRIME system upon its validation)

WESTINGHOUSE NON-PROPRIETARY CLASS 3 iv
WESTINGHOUSE ELECTRIC COMPANY LLC PROPRIETARY
LEGAL NOTICE
This report was prepared as an account of work performed by Westinghouse Electric Company LLC. Neither Westinghouse Electric Company LLC, nor any person acting on its behalf:
1. Makes any warranty or representation , express or implied including the warranties of fitness for a particular purpose or merchantability, with respect to the accuracy, completeness, or usefulness of the information contained in this report, or that the use of any information, apparatus, method, or process disclosed in this report may not infringe privately owned rights ; or
2. Assumes any liabilities. with respect to the use of, or for damages resulting from the use of, any information, apparatus, method, or process disclosed in this report.
COPYRIGHT NOTICE
This report has been prepared by Westinghouse Electric Company LLC and bears a Westinghouse Electric Company copyright notice. Information in this report is the property of, and contains copyright material owned by, Westinghouse Electric Company LLC and /or its subcontractors and suppliers. It is transmitted to you in confidence and trust, and you agree to treat this document and the material contained therein in strict accordance with the terms and conditions of the agreement under which it was provided to you .
DISTRIBUTION NOTICE
This report was prepared for the PWR Owners Group. This Distribution Notice is intended to establish guidance for access to this information. This report (including proprietary and non-proprietary versions) is not to be provided to any individual or organization outside of the PWR Owners Group program participants without prior written approval of the PWR Owners Group Program Management Office. However, prior written approval is not required for program participants to provide copies of Class 3 Non-Proprietary reports to third parties that are supporting implementation at their plant, or for submittals to the USN RC.
PWROG-15109-NP February 2018 Revision 0
••• This record was final approved on 2/22/2018 11 :54:21 AM. ( This statement was added by the PRIME system upon its validation)

~--------- -------- --------------------------~
WESTINGHOUSE NON-PROPRIETARY CLASS 3 V
PWR Owners Group United States Member Participation* for PA-MSC-1091, Revision 4
Utility Member
Ameren Missouri
American Electric Power
Arizona Public Service
Dominion Connecticut
Dominion VA
Duke Energy Carolinas
Duke Energy Progress
Entergy Palisades
Entergy Nuclear Northeast
Entergy Operations South
Exelon Generation Co. LLC
FirstEnergy Nuclear Operating Co.
Florida Power & Light \ NextEra
Luminant Power
PWROG-15109-NP
Plant Site(s)
Callaway (W)
D.C. Cook 1 & 2 (W)
Palo Verde Unit 1, 2, & 3 (CE)
Millstone 2 (CE)
Millstone 3 (W)
North Anna 1 & 2 (W)
Surry 1 & 2 (W)
Catawba 1 & 2 (W)
McGuire 1 & 2 (W)
Oconee 1, 2, & 3 (B&W)
Robinson 2 (W)
Shearon Harris (W)
Palisades (CE)
Indian Point 2 & 3 (W)
Arkansas 1 (B&W)
Arkansas 2 (CE)
Waterford 3 (CE)
Braidwood 1 & 2 (W)
Byron 1 & 2 (W)
TMI 1 (B&W)
Calvert Cliffs 1 & 2 (CE)
Ginna (W)
Beaver Valley 1 & 2 (W)
Davis-Besse (B&W)
St. Lucie 1 & 2 (CE)
Turkey Point 3 & 4 (W)
Seabrook (W)
Pt. Beach 1 & 2 (W)
Comanche Peak 1 & 2 (W)
Participant
Yes No
X
X
X
X
X
X
X
X
X
X
X
X
X
X
X
X
X
X
X
X
X
X
X
X
X
X
X
X
X
February 2018 Revision 0
••• This record was final approved on 2/22/2018 11 :54:21 AM. ( This statement was added by the PRIME system upon its validation)

WESTINGHOUSE NON-PROPRIETARY CLASS 3 vi
PWR Owners Group United States Member Participation* for PA-MSC-1091, Revision 4
Participant
Utility Member Plant Site(s) Yes No
Pacific Gas & Electric Diablo Canyon 1 & 2 (W) X
PSEG - Nuclear Salem 1 & 2 (W) X
South Carol ina Electric & Gas V.C. Summer (W) X
So. Texas Project Nuclear Operating Co. South Texas Project 1 & 2 (W) X
Farley 1 & 2 (W) X Southern Nuclear Operating Co.
Vogtle 1 & 2 (W) X
Sequoyah 1 & 2 (W) X Tennessee Valley Authority
Watts Bar 1 & 2 (W) X
Wolf Creek Nuclear Operating Co. Wolf Creek (W) X
Xcel Energy Prairie Island 1 & 2 (W) X
* Project participants as of the date the final deliverable was completed. On occasion, additional members will join a project. Please contact the PWR Owners Group Program Management Office to verify participation before sending this document to participants not listed above.
PWROG-15109-NP February 2018 Revision 0
*** This record was final approved on 2/22/2018 11 :54:21 AM. ( This statement was added by the PRIME system upon its validation)

WESTINGHOUSE NON-PROPRIETARY CLASS 3 vii
PWR Owners Group International Member Participation* for PA-MSC-1091, Revision 4
Participant
Utility Member Plant Site(s) Yes No
AXPOAG Beznau 1 & 2 (W) X
EDF Energy Sizewell B (W) X
Electrabel (Belgian Utilities) Doel 1, 2 & 4, Tihange 1 & 3 (W) X
Electricite de France 58 Units X
Electronuclear ETN ANGRA 1 (W) X
Emirates Nuclear Energy Corporation Barakah 1 & 2 X
EPZ Borssele X
Eskom Koeberg 1 & 2 X
Hokkaido Tomari 1, 2 & 3 (MHI) X
Japan Atomic Power Company Tsuruga 2 (MHI) X
Kansai Electric Co., Ltd Mihama 3, Ohi 1, 2, 3 & 4, X Takahama 1, 2, 3 & 4 (W & MHI)
Kori 1, 2, 3, & 4 (W) X
Korea Hydro and Nuclear Power Corp. Hanbit 1 & 2 (W)
Hanbit 3, 4, 5 & 6 (CE) X Hanul 3, 4, 5, & 6 (CE)
Kyushu Genkai 2, 3 & 4, Sendai 1 & 2 (MHI) X
Nuklearna Elektrarna KRSKO Krsko (W) X
Ringhals AB Ringhals 2, 3 & 4 (W) X
Shikoku lkata 1, 2 & 3 (MHI) X
Spanish Utilities Asco 1 & 2, Vandellos 2, Almaraz 1 & 2 (W) X
Taiwan Power Co. Maanshan 1 & 2 (W) X
* Project participants as of the date the final deliverable was completed. On occasion, additional members will join a project. Please contact the PWR Owners Group Program Management Office to verify participation before sending this document to participants not listed above.
PWROG-15109-NP February 2018 Revision 0
••• This record was final approved on 2/22/2018 11 :54:21 AM. ( This statement was added by the PRIME system upon its validation)
WESTINGHOUSE NON-PROPRIETARY CLASS 3 viii
TABLE OF CONTENTS
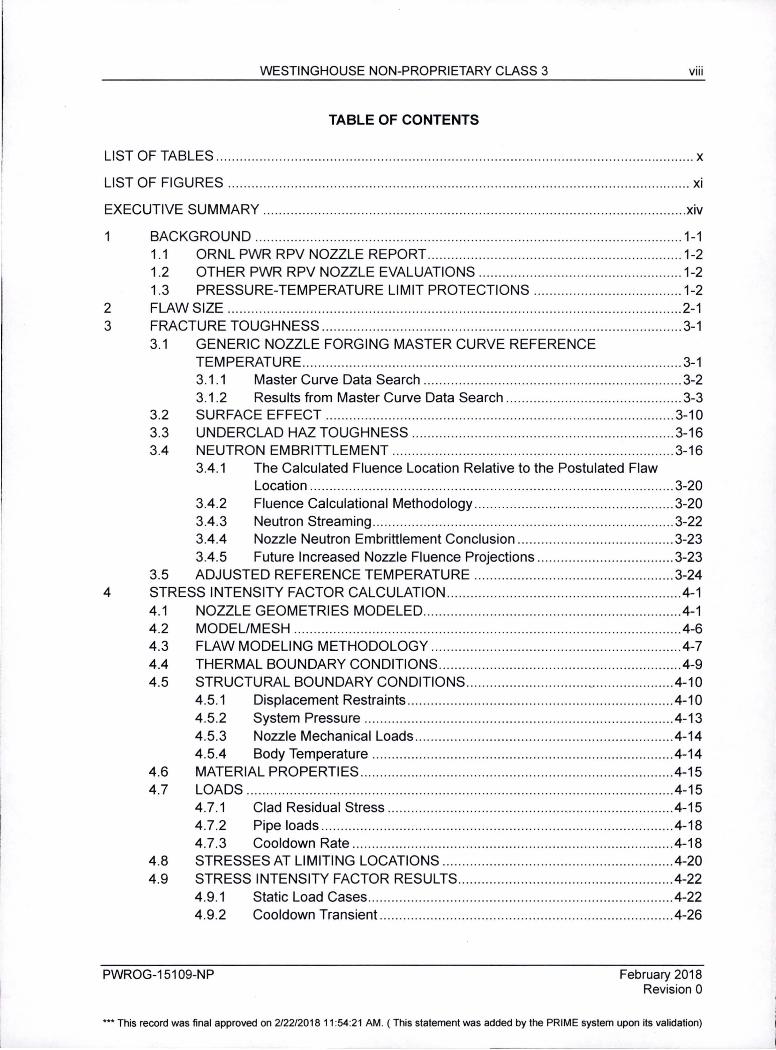
LIST OF TABLES .................. ....... .. .. ................... .. ... .. ........ .... ... ... ............... ... ...... .. .. ... .. ...... .... ..... . X
LIST OF FIGURES ............. ........... .... ......... ... ........................... .. ......... ... ......... ..... .. .... .... ....... ...... xi
EXECUTIVE SUMMARY ... .... ...... .... ................. ........... ................. .... ............... .......... ... .. .. .... .. ... . xiv
1 BACKGROUND ...... ... ...... .. .. .. ........ ..... ... .... .. .. ... ... .......... .... .. ................ ... ... .......... .. ........ 1-1 1.1 ORNL PWR RPV NOZZLE REPORT ....... ........ ... ......... .. .............. .. ...... .... .. .... .. .. 1-2 1.2 OTHER PWR RPV NOZZLE EVALUATIONS ................................... .... .... .. ....... 1-2 1.3 PRESSURE-TEMPERATURE LIMIT PROTECTIONS ... ...... ... ...... .. ........ ... .... ... 1-2
2 FLAW SIZE ..... .. ............... .... ...................................... .. .............. .. ......... ....... .. .. .. .. ..... .. ... 2-1 3 FRACTURE TOUGHNESS ........ .. ............................... ...... ............... .. .. ... ... ... .. ..... ... .... ... 3-1
3.1 GENERIC NOZZLE FORGING MASTER CURVE REFERENCE TEMPERATURE .. .. .. ..... .. .. .. .... .... .. .. .. .. .. .. .. ..... ..... .. ........... ..... .. .. .. .. ... ......... .... ... ... 3-1 3.1 .1 Master Curve Data Search .... ..... .... .. ............ .. .......... .... .... .. .. .. .. .... .... ... 3-2 3.1.2 Results from Master Curve Data Search ......... ........ ... ......... .... .. ... ... .. .. 3-3
3.2 SURFACE EFFECT .... ....................................... .. ........................ .. .............. .... 3-10 3.3 UNDERCLAD HAZ TOUGHNESS ............ ....... .... .... ................................ .. .... .. 3-16 3.4 NEUTRON EMBRITTLEMENT ... ... ... ......... .......... .. ..................... ... .................. 3-16
3.4.1 The Calculated Fluence Location Relative to the Postulated Flaw Location ... .... .. ...... .. ... ..... ... ... .. .. .... ....... .. .. .... .... .. .. ..... ... .. .. .... .... .. ......... 3-20
3.4.2 Fluence Calculational Methodology .......... ................ ............ .... ........ . 3-20 3.4.3 Neutron Streaming ... ................... ........... ......... .. ... ..... ....... ....... ... .... .. .. 3-22 3.4.4 Nozzle Neutron Embrittlement Conclusion ......... ... ... .......... .. ...... ..... .. 3-23 3.4.5 Future Increased Nozzle Fluence Projections .. .. .... ... ..... .... .. ......... .... 3-23
3.5 ADJUSTED REFERENCE TEMPERATURE .. .... ..... .... ........... .... ... .. .. ....... .... ... 3-24 4 STRESS INTENSITY FACTOR CALCULATION ................... .... ... ... ..... ......... ........ .... ..... 4-1
4.1 NOZZLE GEOMETRIES MODELED ................ .. .... .. ... ..... .. ... ................. ... .. ....... 4-1 4.2 MODEL/MESH ... ...... ....... .. .. .. ...... .............. .... ... ... ... ................... ... ... .... .... ..... ...... 4-6 4.3 FLAW MODELING METHODOLOGY ... .. ..... ..... .... ......... ... .... .... ... .. .... ... .... ..... .. .. 4-7 4.4 THERMAL BOUNDARY CONDITIONS ..... .. .. ..... .... .. ..... .. ... ............... .. ....... ... ..... 4-9 4.5 STRUCTURAL BOUNDARY COND1TIONS .... .... .... ... ..... ... ..... .. . v·· ······· ····· ······ 4-10
4.5.1 Displacement Restraints .... ..... .. .. .. .... .. .. ............ .................... ....... .. .... 4-10 4.5.2 System Pressure .......... .. .. .. .. ..... ... ... ... .. .. .. .... .. .... .. .... .. .. ... .. ... ............. 4-13 4.5.3 Nozzle Mechanical Loads ....... .......... .. .. .... .. ........................ .... .. ........ .4-14 4.5.4 Body Temperature .... ... .......... ... ... .. ... ... .. .... .. ........ .... ...... .. ... ... ... ...... ... 4-14
4.6 MATERIAL PROPERTIES ....... ... ... ..... ... .... ...... .... ..... .. ... ... ..... ......... ........... ....... 4-15 4.7 LOADS ..... ... ........... .... .... ................ ... .......... ...... .... .... .. .. .. ..... .. .......... .. ........ ... .. .4-15
4.7.1 Clad Residual Stress ....... .... .. ..... .. .... .. ..... ..... .. .... ..... ... .. .. .. ............ .... . 4-15 4.7.2 Pipe loads .. .. .. .................. .. ..... ... ... ......... .. ... ... ........ ...... ... ... .. .. .... .. .. .... 4-18 4.7.3 Cooldown Rate .......... ..... ... .... ... ........ .. .... .... ...... ... ... ...... .. ... .......... ... ... 4-18
4.8 STRESSES AT LIMITING LOCATIONS ... ....... ... .... .. ... ..... .......... .... ....... ... .. ..... .4-20 4.9 STRESS INTENSITY FACTOR RESULTS ... .... ........... ........ ........ .... .. ... ..... .... ... 4-22
4.9.1 4.9.2
PWROG-15109-NP
Static Load Cases .. ....... ... .. .... .... .. ...... .... .... ...... ........ .... .. .......... .......... 4-22 Coo Id own Transient ..... .. ... ... ...... ... .. .... ..... ... ...... .... .... ..... .... .... .. .......... 4-26
February 2018 Revision 0
••• This record was final approved on 2/22/2018 11 :54:21 AM. ( This statement was added by the PRIME system upon its validation)

WESTINGHOUSE NON-PROPRIETARY CLASS 3 ix
4.10 CONSTRAINT AND CLADDING EFFECT .. .. .. .. ... ... .. .... ..... .. .. ..... .......... .... ...... . 4-29 4.10.1 Constraint .. .. ...... .. .. .. ........ .. ... .... .. .. .... ..... .. ............. ..... .. ...... .... .. .... .. .... 4-29 4.10.2 Cladding ........ ....... ...... ... ... ....... ...... ......... ...... ... ..... ... .. ..... .... .. .. ....... ..... 4-31
5 PRESSURE-TEMPERATURE LIMIT CURVES .. .......... ............. ... .. .. ....... .. ........... ......... 5-1 5.1 GENERATION OF NOZZLE P-T LIMIT CURVES ........ ........ ...... ...... .. .... ... .... ..... 5-1
5.1.1 Generation of Nozzle P-T Limit Curves with Postulated Small Flaw ... 5-1 5.1.2 Generation of Nozzle P-T Limit Curves with Postulated ~ T Beltline
Thickness Size Flaw ...... ..... .. .......... .... ....... .. ... ...... ...... ........ .... ...... ....... 5-6 5.2 COMPARISON OF NOZZLE TO TRADITIONAL NRC APPROVED
PRESSURE-TEMPERATURE LIMIT CURVES ........... ... ......... ...... ........ .. ........... 5-8 6 CONCLUSION ... .. ........ .. ....... ..... .......... ... ..................... ... ... .. .. .... ........... ... .... .... .. .. ... .... ... 6-1 7 REFERENCES .... ... ...... .. ... .. .... ..... ... ... .. .. .. ...... ... ..... .. .. .. .......... ... ............... ... .... .... ...... .... . 7-1
PWROG-15109-NP February 2018 Revision 0
••• This record was final approved on 2/22/2018 11 :54:21 AM. ( This statement was added by the PRIME system upon its validation)

WESTINGHOUSE NON-PROPRIETARY CLASS 3 X
LIST OF TABLES
Table 3-1 Specifications for A-508 Class 2 Type Forgings .... ... ......... ..... ..... .. ... ... ...... ... .. ... ........ 3-3
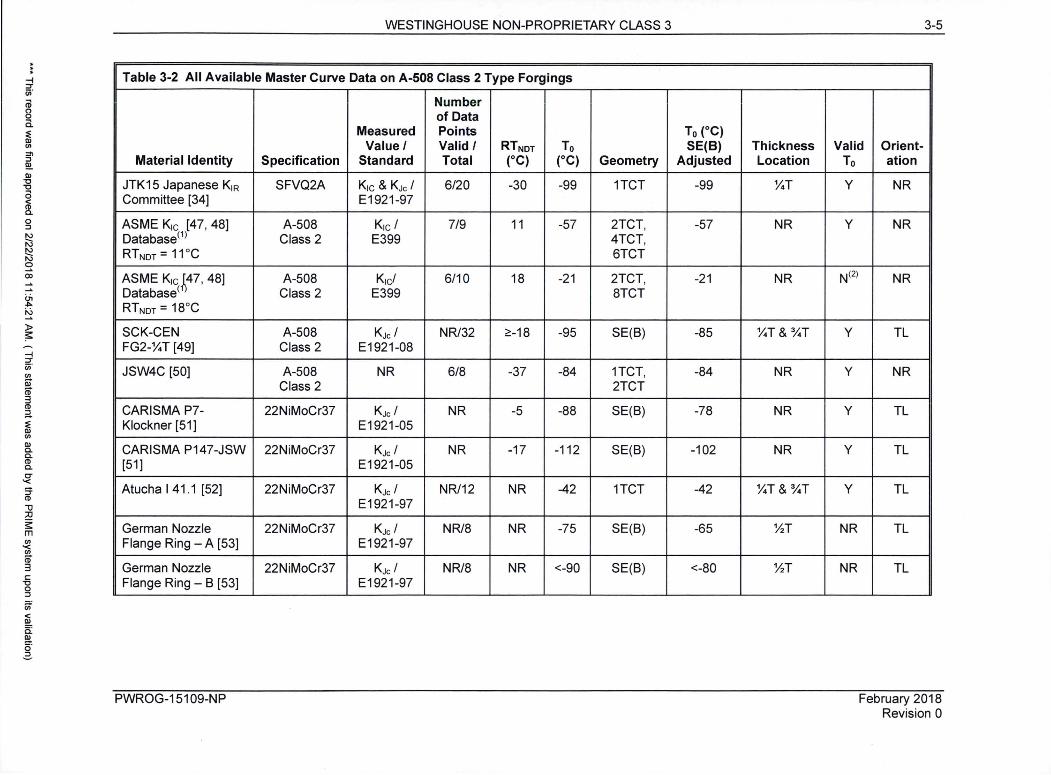
Table 3-2 All Available Master Curve Data on A-508 Class 2 Type Forgings ... ... ... ... .... .. .... .... .. 3-5
Table 3-3 Summary of Transition Temperature Shifts for LT and TL Specimens ... ..... .... ... .... . 3-13
Table 3-4 Generic Material Properties and T cold for the U.S. PWR Fleet Nozzles ... .. .. ....... ..... 3-18
Table 3-5 Comparison of a Representative Westinghouse 4-Loop Plant 54 EFPY Fluence Values using DORT, TORT, and RAPTOR-M3G ... .. .. .... ...... .... .... .. ... .... ...... ...... 3-21
Table 4-1 Model Geometry Comparison ... .. ... .... .... ...... .. ... ....... .... .. .... ... .. .... ....... ... .. ......... ....... . .4-2
Table 4-2 Flaw Case List.. ... ........ ... .... .. ... ... ..... .. ...... .... ... .... .... ..... ... .... .... .......... .. .... .... ...... ...... : . .4-7
PWROG-15109-NP February 2018 Revision 0
••• This record was final approved on 2/22/2018 11 :54:21 AM. ( This statement was added by the PRIME system upon its validation)
WESTINGHOUSE NON-PROPRIETARY CLASS 3 xi
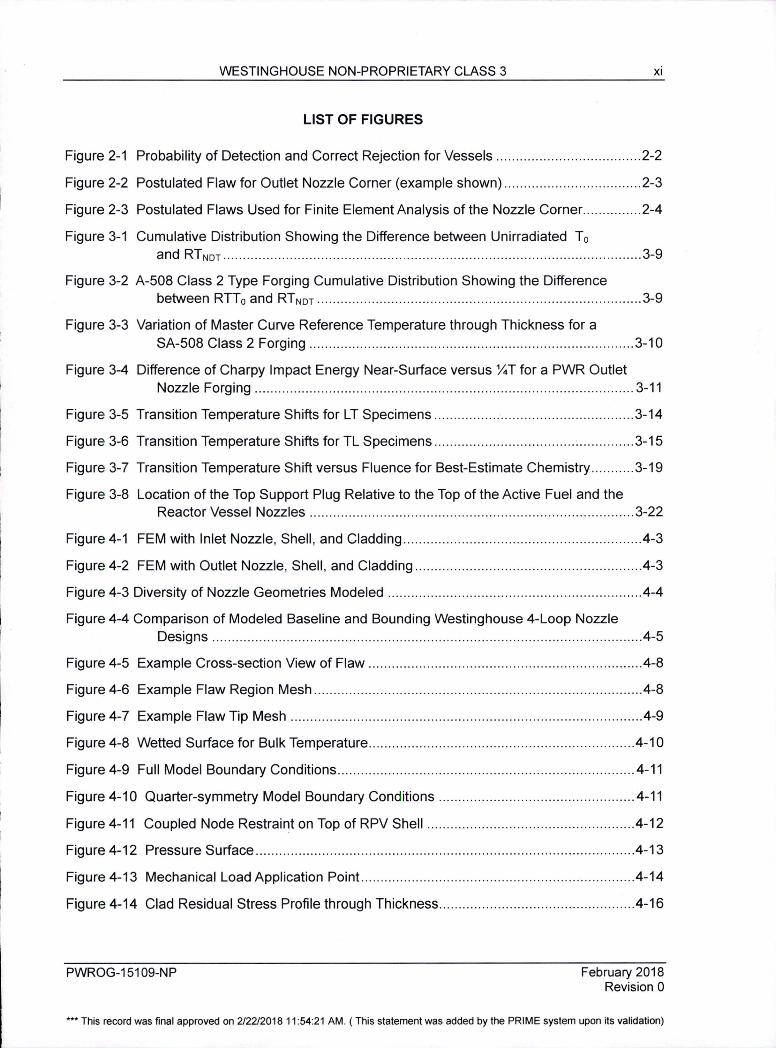
LIST OF FIGURES
Figure 2-1 Probabil ity of Detection and Correct Rejection for Vessels .. .... ... ...... ... ... ............ .... 2-2
Figure 2-2 Postulated Flaw for Outlet Nozzle Corner (example shown) ..... ........... ... .... .... .... .. .. 2-3
Figure 2-3 Postulated Flaws Used for Finite Element Analysis of the Nozzle Corner .. ....... .... .. 2-4
Figure 3-1 Cumulative Distribution Showing the Difference between Unirradiated T0
and RT NOT ... . ... . .... .. .. ........... .. ..... . .. . ...... . . . ........ ... ......... .. . . . . . .. .. ... ...... ... . .. .. ........... . 3-9
Figure 3-2 A-508 Class 2 Type Forging Cumulative Distribution Showing the Difference between RTT o and RT NOT .... . ...... ...... ..... . ........ .. ........... . ........... .. . .. .. .. . . ............ . ... 3-9
Figure 3-3 Variation of Master Curve Reference Temperature through Thickness for a SA-508 Class 2 Forging ..... .............. .... ...... .. .... .. .... ... ............. ...... ... ... ......... ..... 3-1 O
Figure 3-4 Difference of Charpy Impact Energy Near-Surface versus YiT for a PWR Outlet Nozzle Forging ..... .. ... ....... .. .... ........ ... .... ............ .. ........ .... ...... ... .. ... .... ..... .. ...... .. 3-11
Figure 3-5 Transition Temperature Shifts for LT Specimens .... ..... ...... ..... .... .... .. .. .... .. ...... ..... .. 3-14
Figure 3-6 Transition Temperature Shifts for TL Specimens ....... .......................... ... · .. .... ..... .... 3-15
Figure 3-7 Transition Temperature Shift versus Fluence for Best-Estimate Chemistry .... ....... 3-19
Figure 3-8 Location of the Top Support Plug Relative to the Top of the Active Fuel and the Reactor Vessel Nozzles .. .. .... .... .. .. .. .. .. .... ............... .. ................. ......... .. .... ...... .. 3-22
Figure 4-1 FEM with Inlet Nozzle, Shell , and Cladding ... .... .. .... .. .. .. .. ..... ... .... .. ...... ............ ....... .4-3
Figure 4-2 FEM with Outlet Nozzle, Shell , and Cladding .... ..... ..... ... .... .... ... .. .. ...... ..... .. ............ .4-3
Figure 4-3 Diversity of Nozzle Geometries Modeled ........ .... ... .... ....... .. .. .. ........ .... ..... ..... ... ... .... . 4-4
Figure 4-4 Comparison of Modeled Baseline and Bounding Westinghouse 4-Loop Nozzle Designs .......... ............. .. .. .. ...... ... .......... ........ ... ....... ..... .... ............. ..... ........ .. .... ... 4-5
Figure 4-5 Example Cross-section View of Flaw ........ ..... ..... ..... .... ... ... ...... ...... ... .. .. .... ...... ........ 4-8
Figure 4-6 Example Flaw Region Mesh ... .. .. ........ .. ..... ... .. ... ... ........ ..... ........ .............. ............. .. .4-8
Figure 4-7 Example Flaw Tip Mesh ... ....... .. ... ....... ... ... ..................... ... ... ................ ... ...... .... .. ... . 4-9
Figure 4-8 Wetted Surface for Bulk Temperature .... ...... .. .. ... ... ... ... ... ...... .... ... ....... ...... .. .... ...... .4-10
Figure 4-9 Full Model Boundary Conditions .......... ...... .. ......... ...... .. .. .... ... .. .... .... .................. .... 4-11
Figure 4-10 Quarter-symmetry Model Boundary Conditions ....... .... ..... .. .......... .. ... ... ... .... ....... 4-11
Figure 4-11 Coupled Node Restraint on Top of RPV Shell ...... ....... .. .... .... ..... ........ ....... ........ .. 4-12
Figure 4-12 Pressure Surface ... .. .... .. .... .. .. ................ ... ... .. .. .... .. .. .... .. ...... ... ... ......... ............ .. .. .4-13
Figure 4-13 Mechanical Load Appl ication Point ..... .. ...... .... ... ....... .. .... .... ... .. .. ......... ... .... ....... .. .4-14
Figure 4-14 Clad Residual Stress Profile through Thickness ....... ........... ..... ...... .. .... .. .... .. ... ... .4-16
PWROG-15109-NP February 2018 Revision 0
••• This record was final approved on 2/22/2018 11 :54:21 AM. ( This statement was added by the PRIME system upon its validation)

WESTINGHOUSE NON-PROPRIETARY CLASS 3 xi i
Figure 4-15 SIF Result Comparison for Explicit Method and Reference Temperature Method ..... ................ ................... ............... .. ......... ......... .............. ... ... .... ... ...... .4-18
Figure 4-16 Bounding Normal Cooldown Transient ... ... .. .. ...... .. .. ... ...... ..... ........ ...... .... ............ 4-19
Figure 4-17 Inlet Model without Crack - Stress for 1,000 psi Pressure .................. .. .............. 4-20
Figure 4-18 Inlet Model without Crack - Maximum Stress during Cooldown ........ ..... ........ ... . .4-21
Figure 4-19 Outlet Model without Crack - Stress for 1,000 psi Pressure ..... .... .. .... .. .. .. ... .. ..... 4-21
Figure 4-20 Outlet Model without Crack - Maximum Stress during Cooldown ... ........... ...... ... 4-22
Figure 4-21 SIF Output Location Definition .................. .. ... ... ...... .... .. ....... ................... ............ .4-23
Figure 4-22 Pressure SIF along Crack Front for Baseline Outlet Nozzle with a= 1.18 Inch, L = 2.36 Inch Flaw for 1,000 psi ... ....... ... .... .. .... ..... .... .. ...... .. .... ... .... ... ... .......... ..... .. .4-24
Figure 4-23 Pressure SIF along Crack Front for Baseline Outlet Nozzle with a= 1.18 Inch, L = 7.08 Inch Flaw for 1,000 psi ... .. ............................. .... ... ... ..... ... .... .. .... .. .... .. ...... .4-25
Figure 4-24 SIF for Baseline Outlet Nozzle along Crack Front with a= 1.18 Inch, L = 7.08 Inch Flaw for Deadweight + Normal Operating Thermal Mechanical Load .. ......... .. .4-25
Figure 4-25 Pressure SIF along Crack Front for Outlet Nozzle for Different Modeled Geometries using Limiting LAS Flaw Size of 6:1 Ratio , 0.5-lnch Depth ............ .. .... ......... ... 4-26
Figure 4-26 SIF Time-history for Baseline Outlet Nozzle with a= 1.18 Inch, L = 7.08 Inch Flaw at Various Locations along the LAS Crack Front during Cooldown (Thermal and Residual) .... ........... ................. ..... .... .. .. ... ........ .. .. ... ... ...... .... ......... .. ..... .... ......... .4-27
Figure 4-27 SIF for Baseline Outlet Nozzle with a= 1.18 Inch, L = 7.08 Inch Flaw at t = 16,092 Seconds of Cooldown (Thermal and Residual) ..... ........ ....................... 4-28
Figure 4-28 SIF Cooldown Time-history for Outlet Nozzle for Different Modeled Geometries using Limiting LAS Flaw Size of 6: 1 Ratio, 0.5 Inch Depth .. ... ...... ............. ..... .4-28
Figure 4-29 T-stress/oy versus T0 Dependency ....................... ..... ...... ... ... .. ....... ... .. ... ..... ..... .. .4-30
Figure 5-1 Inlet Nozzle Cooldown P-T Limit Curves with Flaw Depth of 0.3 Inch (ART= 21 °F) ..... .... .... ....... .. ........... .. ... ... ........ ...... ... .... .... ... ...... .. .. ........ 5-2
Figure 5-2 Inlet Nozzle Cooldown P-T Limit Curves with Flaw Depth of 0.75 Inch (ART= 21 °F) .. ... .. .... ...... .. .... .. .... .. .......... .. .. .... ............. ..... ....... ......... .. 5-3
Figure 5-3 Outlet Nozzle Cooldown P-T Limit Curves with Flaw Depth of 0.9 Inch (ART= 21 °F) .............................. ...... ..... ..... ... ..... ......... ....... ..... .. ........ .. 5-3
Figure 5-4 Outlet Nozzle Cooldown P-T Limit Curves with Flaw Depth of 1.18 Inch (ART= 21 °F) ....... .... ... ..... .. ....... ..... .... .... ... ......... ..... .... ........ .... ... ........ 5-4
Figure 5-5 Outlet Nozzle 100°F/hour Cooldown P-T Limit Curves Comparing Four Models with Limiting Flaw Geometry/Location (Surface Tip, Aspect Ratio = 6: 1, 0.5-lnch Flaw in LAS) .... .... ... .... .. .. .... .... .... .. .. .. .. ............................ ...... ....... ........ ... .. .. .. .... .. .. .... .. . 5-5
PWROG-15109-NP February 2018 Revision 0
••• This record was final approved on 2/22/2018 11 :54:21 AM. ( This statement was added by the PRIME system upon its validation)

WESTINGHOUSE NON-PROPRIETARY CLASS 3 xiii
Figure 5-6 Nozzle Corner Stress Path for Pressure and Thermal Stress Analysis (Inlet Nozzle Shown) .... ... ...................... .... .. .. .. ..... .. .... .......... ..... .. .... .. ..... ...... ........ ........ ... ...... .. 5-6
Figure 5-7 Nozzle Cooldown P-T Limit Curves with Flaw Depth Comparable to Y..T Beltline .. 5-7
Figure 5-8 U.S. PWR 10 CFR 50 Appendix G NRC Approved P-T Limit Curves .. .... ..... ... .... .... 5-8
Figure 5-9 Westinghouse 4-Loop Bounding Nozzle P-T Limit Curves Compared to U.S. PWR NRC Approved Appendix G P-T Limit Curves (See Figure 5-1 O through Figure 5-14 for Plant-Specific Cases not included) ... ... ............... ....... .. .... .... .. .. .. 5-9
Figure 5-10 Westinghouse 4-Loop Bounding Nozzle P-T Limit Curves Compared to Flange-Exempt Plant C NRC Approved Appendix G P-T Limit Curves .................... .... 5-1 O
Figure 5-11 Westinghouse 4-Loop Bounding Nozzle P-T Limit Curves Compared to FlangeExempt Plants D, E, J, and K NRC Approved Appendix G P-T Limit Curves ... 5-11
Figure 5-12 Westinghouse 4-Loop Bounding Nozzle P-T Limit Curves Compared to Flange-Exempt Plants F, G and H NRC Approved Appendix G P-T Limit Curves ...... .. 5-11
Figure 5-13 Westinghouse 4-Loop Bounding Nozzle P-T Limit Curves Compared to Flange-Exempt Plant I NRC Approved Appendix G P-T Limit Curves ...... .... ...... ... .. .. .. . 5-12
Figure 5-14 Plant-Specific Large Flaw Nozzle P-T Limit Curves Compared to Plant A NRC Approved Appendix G P-T Limit Curves .... .. .......... .. .... .. ...... .. .. ........... .. ..... .. .... . 5-12
Figure 5-15 CE System-80 Nozzle P-T Limit Curves Compared to U.S. CE and B&W Design NRC Approved Appendix G P-T Limit Curves ......... .................. .. ... ....... .. ... .... .. 5-13
PWROG-15109-NP February 2018 Revision 0
••• This record was final approved on 2/22/2018 11 :54:21 AM. ( This statement was added by the PRIME system upon its validation)

WESTINGHOUSE NON-PROPRIETARY CLASS 3 xiv
EXECUTIVE SUMMARY
Since the implementation of pressure-temperature (P-T) limit curves in the 1960s for light water reactors, the P-T limit curves have been based on the limiting locations in the reactor coolant system, which are typically the irradiated reactor pressure vessel (RPV) region adjacent to the core (beltline) and the closure head flange. Recently, it has been questioned as to whether the inlet or outlet nozzle corners could be more limiting due to the stress concentration at these locations. The work presented herein conclusively demonstrates that the RPV nozzle corner P-T limit curves are bounded by the NRC approved traditional P-T limit curves for the U.S. pressurized water reactors (PWRs).
The Nuclear Regulatory Commission (NRC) has issued Requests for Additional Information (RAls) for License Amendment Requests (LARs) that proposed revisions to the 10 CFR 50 Appendix G P-T limit curves. The RAls inquired as to whether the beltline region of the RPV bounds the inlet and outlet nozzle corners. NRC Regulatory Information Summary (RIS) 2014-11 was also issued clarifying that ASME Section XI, Appendix G evaluations must address the RPV nozzles. To address this issue, this report presents generic PWR fracture mechanics analyses of the RPV inlet and outlet nozzle corners in accordance with the requirements of Appendix G.
A generic fracture toughness transition reference temperature was establ ished for the PWR nozzle forgings near the surface at the postulated flaw location as allowed by ASME Section Ill , Subparagraph NB-2223.2. A generic ~ thickness fracture toughness was established based on conservative measurements of 22 representative forgings with a margin of two standard deviations to ensure a conservative lower bound toughness using NRC approved ASME Section XI Code Case N-629. The near-surface forging toughness was conservatively determined through evaluation of 31 near-surface toughness measurements. The fluence effect at the nozzle corner region was considered and was determined to have an insignificant effect on the fracture toughness at the postulated flaw location.
Detailed three-dimensional finite element analyses of postulated reliably detectable % inch (excluding clad thickness) and smaller surface breaking flaws in the high stress RPV inlet and outlet nozzle corners were performed. Four typical U.S. PWR plant nozzle designs were modeled to ensure the analyses bound all the U.S. PWR designs. The finite element models were used to generate stresses and stress intensity factors considering all the applicable loads, including clad residual stress, pressure, mechanical pipe loads and thermal stress for a bounding normal cooldown transient. In addition , a flaw size comparable to the beltline ~ -thickness flaw (-2.1 inch) that is considered in the traditional P-T curves was postulated in the nozzle using stresses from unflawed finite element models and the ASME Section XI , Appendix G closed form stress intensity factor solution.
The generic PWR nozzle Appendix G P-T limit curves that were developed were compared to the NRC approved Appendix G P-T limit curves for the operating U.S. PWR fleet. The results demonstrated that the nozzle P-T limit curves were bounded in every case by the current NRC approved U.S. PWR P-T limit curves. The PWR nozzle P-T limit curves are applicable through 60 years of operation. With licensee evaluation of subsequent license renewal (SLR) or other changes to nozzle fluence projections, new fluence projections can be compared to the values used in this work for applicability as discussed in the conclusion section .
Based on the results of this detailed and conservative assessment, the current operating U.S. PWR fleet P-T limit curves which have used NRC approved methodologies bound the nozzle P-T limit curves.
PWROG-15109-NP February 2018 Revision 0
••• This record was final approved on 2/22/2018 11 :54:21 AM. ( This statement was added by the PRIME system upon its validation)

WESTINGHOUSE NON-PROPRIETARY CLASS 3 1-1
1 BACKGROUND
Plant-specific fracture mechanics analyses of the reactor pressure vessel (RPV) inlet and outlet nozzle corners have been performed per the requirements of ASME Section XI , Appendix G [1] to address Nuclear Regulatory Commission (NRC) issued Requests for Additional Information (RAls) for License Amendment Requests (LARs) related to 10 CFR 50, Appendix G [2] pressure-temperature (P-T) limit curves. NRC Regulatory Information Summary (RIS) 2014-11 [3] was issued clarifying that ASME Section XI , Appendix G evaluations must address the RPV nozzles. Eleven units have been evaluated using the traditionally postulated Xi thickness flaw for the nozzle corners, confirming that the nozzles are bounded by P-T limits based on the RPV beltline region and flange in each case. All of these evaluations were approved by the NRC:
• Seabrook Unit 1 (4] • Farley Units 1 and 2 [5] • Indian Point Units 2 and 3 (6 and 7] • Point Beach Units 1 and 2 [8] • Catawba Unit 1 [9] • McGuire Units 1 and 2 (10] • H. B. Robinson Unit 2 (11]
RIS 2014-11 clarified that acceptable P-T limit curve submittals must address RPV structural discontinuities (such as nozzles), not just the limiting adjusted reference temperature values in the cylindrical portion of the RPV.
The Westinghouse NRC approved methodology used to develop reactor coolant system (RCS) heatup and cooldown P-T limit curves (12] does not explicitly address the nozzles. An analysis done in 1975 using an upper bound nil-ductility reference temperature (RT NOT) of 60°F for nozzles and a 1.25-inch flaw was postulated for the nozzle and it showed that the nozzles were not limiting relative to the larger RT NOT and larger postulated flaw in the beltline (13] . Therefore, the nozzles were not considered limiting in the Westinghouse Appendix G P-T limit curve methodology and have not been specifically addressed in subsequent methodology updates.
Over the course of the Combustion Engineering (CE) fabrication history, the inlet and outlet nozzles were considered, but not necessarily specifically evaluated, in the analysis to establish brittle fracture limits for a CE plant as stated in the NRC approved methodology [14] . As part of RPV design and fabrication of the CE RPV, a P-T limit evaluation in accordance with ASME Section Ill , Appendix G requirements was performed for some or all of the RPV, as appropriate. The results of those evaluations were used to establish an initial set of P-T limits for plant operation . Per the CE methodology, the P-T limit evaluations for the regions outside of the RPV beltline, once established, do not change significantly due to exposure to neutron flux unless they are updated through regulation or more recent advances in the technology.
Framatome's NRC approved Appendix G P-T limit curve methodology considers the nozzles (15] . The limiting nozzle considered is the outlet nozzle with a 3-inch deep postulated nozzle corner flaw. The nozzle stress intensity factor (SIF) used is from Welding Research Council Bulletin , WRC-175 [16]. In Revision 4 of BAW-10046 (17] , it is noted that when using a
PWROG-15109-NP February 2018 Revision 0
••• This record was final approved on 2/22/2018 11 :54:21 AM. ( This statement was added by the PRIME system upon its validation)

WESTINGHOUSE NON-PROPRIETARY CLASS 3 1-2
0.1T postulated flaw the nozzle corner flaw is always bounded by the beltline P-T limit. However, this approach [17] was never used in any subsequent P-T limits submittals. Instead, consistent with Appendix G of the applicable ASME Section XI Code and Framatome's NRC approved methodology [15] , a 3-inch deep postulated flaw was used to construct the limiting composite P-T limit curve in all submittals to date.
1.1 ORNL PWR RPV NOZZLE REPORT
A separate PWR and BWR RPV nozzle corner analysis performed by Oak Ridge National Laboratory (ORNL), as reported in ORNL/TM-2010/246, Revision 1 [18] , was used as a comparison to the fracture mechanics evaluation performed herein. The ORNL work was performed to gain a better understanding of nozzle stress and fracture mechanics solutions as they apply to P-T limit curves. The analysis in Reference [18] investigated a 4-loop PWR outlet and inlet nozzle having generally consistent geometry to that of one of the models considered in this report. The ORNL PWR and BWR RPV analysis considered a % thickness (%T) circular corner crack and an approximated shallower 0.1 T corner crack. The three-dimensional (30) SIF analysis results and conclusions from ORNL analysis are considered and compared to the evaluations performed in this report.
1.2 OTHER PWR RPV NOZZLE EVALUATIONS
Stevens, et al. performed a probabilistic evaluation of the RPV nozzles using a modified version of the FAVOR Code [19] . For normal operational cooldown transients it was stated that the "analysis demonstrates that, given the range of material properties for nozzles in the fleet, it is highly unlikely that the nozzle will ever be the limiting condition for this loading/flaw combination ." The conclusion was: "Neglecting nozzles in FAVOR calculations for flaws of sizes expected in PWR RPVs is reasonable." However, the analysis demonstrated that for low embrittled PWRs using deterministic evaluations with the larger %T postulated nozzle flaw, that the nozzles can produce more limiting P-T limits than the beltline %T flaw.
Using a detailed 30 finite element analysis (FEA), Siegele, et al. [20], demonstrated for various flaw sizes and both loss of coolant accident scenarios and normal operating transients that crack initiation would not occur in the nozzle in a German 1300 MW PWR.
1.3 PRESSURE-TEMPERATURE LIMIT PROTECTIONS
At RCS temperatures lower than approximately 350°F, the RPV becomes more vulnerable to non-ductile failure. The P-T limit curves protect against pressures that might lead to failure. To provide further protection , all plants are required to have a low-temperature overpressure protection (LTOP) system. The LTOP system protects against brittle fracture of the RPV ferritic steel components such as the beltline and the nozzles during an unanticipated event when the system pressure might reach the P-T limit curve. 'LTOP may also be referred to as cold overpressure protection system (COPS) or cold overpressure mitigating system (COMS) .
Depending upon the plant design and operations, LTOP is ensured by one or a combination of the following types of plant system components:
PWROG-15109-NP February 2018 Revision 0
••• This record was final approved on 2/22/2018 11 :54:21 AM. ( This statement was added by the PRIME system upon its validation)
WESTINGHOUSE NON-PROPRIETARY CLASS 3 1-3
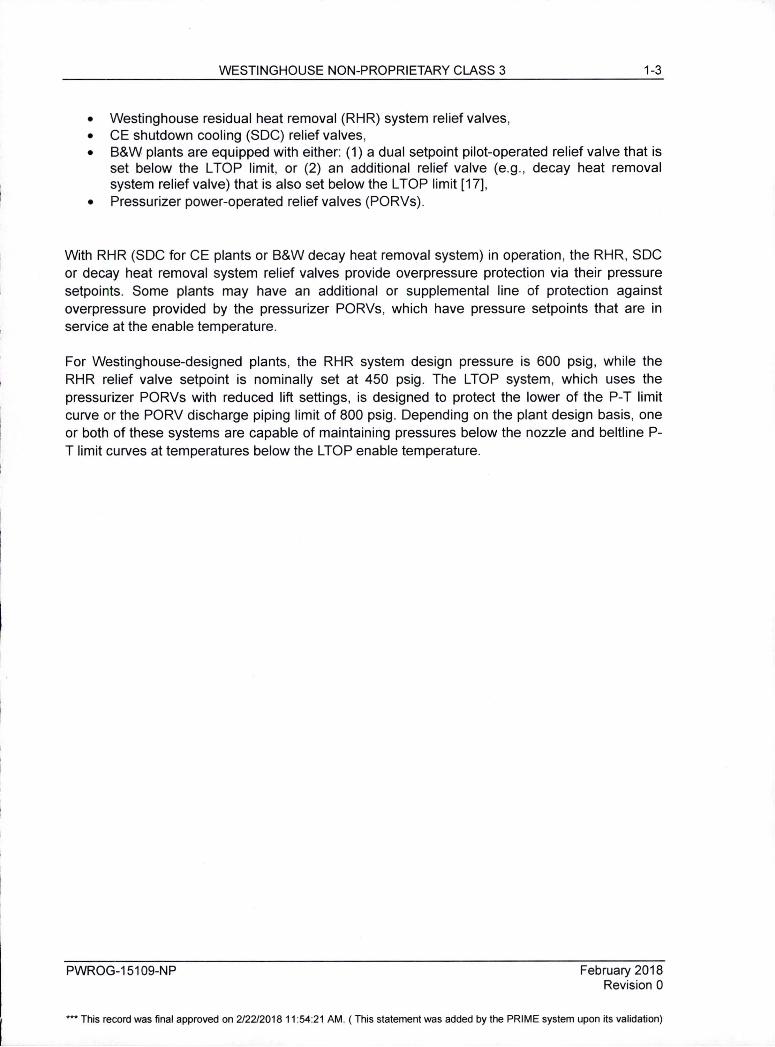
• Westinghouse residual heat removal (RHR) system relief valves, • CE shutdown cooling (SOC) relief valves, • B&W plants are equipped with either: (1) a dual setpoint pilot-operated relief valve that is
set below the L TOP limit, or (2) an additional relief valve (e.g., decay heat removal system relief valve) that is also set below the L TOP limit [17),
• Pressurizer power-operated relief valves (PORVs).
With RHR (SOC for CE plants or B&W decay heat removal system) in operation , the RHR, SOC or decay heat removal system relief valves provide overpressure protection via their pressure setpoints. Some plants may have an additional or supplemental line of protection against overpressure provided by the pressurizer PORVs, which have pressure setpoints that are in service at the enable temperature.
For Westinghouse-designed plants, the RHR system design pressure is 600 psig , while the RHR relief valve setpoint is nominally set at 450 psig . The LTOP system, which uses the pressurizer PORVs with reduced lift settings, is designed to protect the lower of the P-T limit curve or the PORV discharge piping limit of 800 psig . Depending on the plant design basis, one or both of these systems are capable of maintaining pressures below the nozzle and beltline PT limit curves at temperatures below the LTOP enable temperature.
PWROG-15109-NP February 2018 Revision 0
••• This record was final approved on 2/22/2018 11 :54:21 AM. ( This statement was added by the PRIME system upon its validation)

WESTINGHOUSE NON-PROPRIETARY CLASS 3 2-1
2 FLAW SIZE
The nozzle corner region is examined at various times in the manufacturing process, during the pre-service inspection, and during periodic in-service inspections (ISi) . Such pre-service examinations (consisting of surface and volumetric methods) were intended to preclude the existence of inside diameter surface planar flaws (cladding surface origin) and underclad (clad/base metal interface origin) planar flaws prior to plant operation. In addition , volumetric examinations have been conducted of the inlet and outlet nozzle inner regions since the inception of ASME Section XI in 1970 through 2003 when the NRC approved [21) ASME Code Case N-648-1 . Since then , some licensee examinations have elected to apply enhanced visual examinations using a 0.001-inch width wire resolution on these same nozzle inner region surfaces in lieu of the volumetric examinations. To date, no flaws have been found in PWR inlet and outlet nozzle corner regions using volumetric or visual exams.
A postulated Y-iT flaw in the nozzle corner region can result in a depth of approximately 4 to 5 inches as measured at a 45° angle from the nozzle corner to the RPV outside. The nozzle and RPV are thicker in the vicinity of nozzles per the ASME design requirements . The reference postulated flaw for the ASME Section XI , Appendix G, Subsubarticle G-2120, "Maximum Postulated Defect," flaw evaluation may be less than 25% of the section thickness [1] :
"Smaller defect sizes may be used on an individual case basis if a smaller size of maximum postulated defect can be ensured. "
Such sizes are permissible as long as the reference flaw satisfies the following statement, which was taken from paragraph 5.C.(2) of Welding Research Council bulletin WRC-175 [16) :
" .. . examination methods must be able to assure smaller defects in those locations (are detectable). "
Magnetic particle examination of the nozzle forging was performed at the time of fabrication in accordance with ASME Code Section Ill , Paragraph NB-2545. Indications greater in length than 1/16 inch were considered relevant. The postulated flaw size must be greater than the smallest indication that can be detected.
The postulated flaw size must also be detectable by ISi, and this can be demonstrated using Performance Demonstration Initiative (POI) data obtained in 2001 by the Electric Power Research Institute (EPRI) Nondestructive Evaluation (NOE) Center, as shown in Figure 2-1. This figure depicts the expected rejection probability as a function of flaw depth. The probability of correct rejection considers both the detection capability and sizing capability for flaws. For example, Figure 2-1 shows that the probability of correctly detecting and rejecting a flaw with a depth of 0.25 inches is 90%. ASME Code Section XI, Appendix VIII POI demonstrations were initiated in 1994, for Supplements 4 and 6. Five inspection vendors and more than 50 personnel have completed Appendix VIII Supplement 4, clad-to-base-metal demonstrations per the 2001 Reference [22) . In this time no individual , even those who failed the test, failed to detect cracks deeper than approximately 0.25 inch.
PWROG-15109-NP February 2018 Revision 0
••• This record was final approved on 2/22/2018 11 :54:21 AM. ( This statement was added by the PRIME system upon its validation)

/'.: ::J co <{ Q)
0 0::: a..
1.1
1.0
0.9
0.8
0.7
0.6
0.5
/ / -
0.4
0.3
0.2
0.1
0.0 0 0.1
~- - --~ ------------------
WESTINGHOUSE NON-PROPRIETARY CLASS 3
PROBABILITY OF CORRECT REJECTION SIZING , Std. Dev. = 0.12
ACCEPTABLE FLAW SIZE 0.15
--i..----
~
0.2
----
0.3 0.4
TRUE SIZE (INCH)
0.5
2-2
0.6 0.7
Figure 2-1 Probability of Detection and Correct Rejection for Vessels [23]
The results shown in Figure 2-1 are based on ultrasonic test (UT) qualification tests for the RPV shell regions. The probability of detection for the more complicated nozzle corner would also be high since the pre-service UT inspection was performed from both the inside of the RPV shell and the inside surface of the nozzle bore, so there is more opportunity to find reflectors.
EPRI NOE Center concluded the following regarding boiling water reactor (BWR) Nozzle Blend Radii [23) :
"Performance capabilities of ultrasonic techniques for examination of the reactor pressure vessel shell nozzles and shell welds have improved substantially since 1985. Analysis of the POI database has provided valuable insight into the effectiveness of these ultrasonic examinations. Evaluations presented herein demonstrate that the probability of detecting and sizing flaws equal to and greater than 0.25 inches in depth, located at the inside surface and the clad-to-base metal interface, is excellent."
A 0.25-inch initial flaw size is used for BWR feedwater nozzle crack growth analyses based on the ability of modern ultrasonic testing techniques to accurately locate and size cracks as small as 0.25 inch in depth [24].
In light of the capability to reliably detect a 0.25-inch· flaw, a 0.5-inch postulated flaw was conservatively chosen for assessment. The 0.5-inch flaw depth was postulated from the clad low-alloy steel (LAS) interface to the deepest point of the flaw. The total depth of the postulated flaw considering the cladding thickness can be substantially larger, as shown in Figure 2-2. For example, in Figure 2-2 , the total depth of the flaw from the wetted surface is 1.18 inches for the
PWROG-15109-NP February 2018 Revision 0
••• This record was final approved on 2/22/2018 11 :54:21 AM. ( This statement was added by the PRIME system upon its validation)

WESTINGHOUSE NON-PROPRIETARY CLASS 3 2-3
outlet nozzle corner, but the depth in the LAS nozzle forging is 0.5 inches due to the relatively thick cladding on the outlet nozzle corner. The flaw depth defined from the clad-LAS interface into the LAS is consistent with the required examination volume in Figure IWB-2500-?(a) and (b) and the Section XI , Appendix G, Figure 2223-1 definition. Since the flaw sizes postulated for both the inlet and outlet nozzle corners are larger than those which can be detected with high certainty, the requirements of ASME Section XI, Appendix G, Subsubarticle G-2120 are met. Therefore, such postulated flaw sizes are acceptable in regards to the requirements of 10 CFR 50, Appendix G.
Figure 2-2 Postulated Flaw for Outlet Nozzle Corner (example shown)
In addition to the postulated flaw that extends 0.5 inch into LAS; a smaller flaw (0.05 inch) was postulated to address the high stress imparted near the clad-LAS interface due to clad-LAS differential coefficients of thermal expansion (CTE). Two flaw aspect ratios were also postulated for each postulated flaw size. A circular flaw with a/L = Yi and a semi-ellipse with a/L = 1/6 were postulated. Figure 2-3 graphically shows the eight postulated flaws. The use of the smaller flaw sizes and the two different aspect ratios were also evaluated by ORNL (18].
There are three principal margins inherent in the non-ductile failure rules of the ASME Code. These are the postulated flaws, the lower bound fracture toughness, and the required factor of safety of 2.0 on the mechanical stresses. Therefore, the reduction of one of these margins (i.e.
PWROG-1 5109-NP February 2018 Revision 0
... This record was final approved on 2/22/2018 11 :54:21 AM. ( This statement was added by the PRIME system upon its validation)

WESTINGHOUSE NON-PROPRIETARY CLASS 3 2-4
flaw size) in discontinuity regions was deemed to be acceptable by the original authors of Appendix G, and its basis document, Welding Research Council bulletin WRC-175 [16].
Shallow Flaw (0.05 inches into Low Alloy Steel)
0.5 inches into Low Alloy Steel
a -= O.J in . l.• 0.6 in
a• O. 75 in . l.• 1.5 in
Inlet Nozzle Outlet Nozzle
l
Figure 2-3 Postulated Flaws Used for Finite Element Analysis of the Nozzle Corner
PWROG-15109-NP February 2018 Revision 0
••• This record was final approved on 2/22/2018 11 :54:21 AM. ( This statement was added by the PRIME system upon its validation)

WESTINGHOUSE NON-PROPRIETARY CLASS 3 3-1
3 FRACTURE TOUGHNESS
The fracture toughness is generically established for the U.S. PWR fleet of nozzle forgings from test data of typical representative forgings using the master curve method. Then , since the postulated flaws are relatively small , the toughness is adjusted to account for the improved near-surface properties using a database of measurements. The potential effect of neutron embrittlement on the fracture toughness is evaluated . Finally, a generic bounding adjusted reference temperature (ART) is established for the nozzles, which is then used with the applied SIF for the P-T limit curve calculations.
The master curve method for locating the ductile-brittle transition reference temperature is more accurate than RT NOT since it is based on fracture toughness data as described in Section 3.1. Another significant advantage to using a generically established master curve reference temperature is the avoidance for the need to estimate RT NOT· Many of the RPVs in the U.S. PWR fleet were fabricated to ASME Code years prior to 1972, the first year in which the definition RT NOT was codified in Subarticle NB-2300. Therefore, methods were developed, such as NRC Branch Technical Position 5-3, to estimate RT NOT from material test data which was available from RPVs fabricated in prior years. The conservatism of this estimation method was called into question [25] , therefore use of a generically established master curve reference temperature does not have this potential non-conservatism.
3.1 GENERIC NOZZLE FORGING MASTER CURVE REFERENCE TEMPERATURE
The use of the lower bound K1e curve has inherent margin since RT NOT is a conservative method for locating the K1e curve [26 and 27]. The temperature index, RT NOT, is based on drop weight testing , which is a crack arrest transition temperature measurement, and the Charpy impact test, which is a blunt notch impact test. These data are conservatively bounded by the K1c curve, which is a lower bound crack initiation fracture toughness curve. In contrast, the master curve method is based on an initiation transition temperature true fracture toughness test technique. The master curve index temperature (Ta) provides a much more accurate measure of the material fracture toughness than RT NOT and K1e [28]. Existing master curve fracture toughness data for A-508 Class 2 type forgings was gathered to establish a generic mean and standard deviation alternate RT NOT for the U.S. PWR inlet and outlet nozzles. This information is used with ASME Section XI Code Case N-629 [29], which has been endorsed by the NRC per Regulatory Guide 1.147 [21] and endorsed by reference in 10 CFR 50.55a [30] as an alternative to RT NOT· As precedent, generic RTT0 values, as defined in Code Case N-629, have been approved for use for the high copper (Cu) Linde 80 class of materials as an alternate to RT NOT
by the NRC [31]. Additionally, NRC Regulatory Issue Summary 2004-04 [32] states the following :
Use of NRG approved ASME Code Cases (e.g., N-588, N-640, and N-641) in conjunction with earlier versions of the ASME Code endorsed in 1 O CFR 50. 55a may also be used for the development of P-T limit curves without the need for an exemption.
PWROG-15109-NP February 2018 Revision 0
••• This record was final approved on 2/22/2018 11 :54:21 AM. ( This statement was added by the PRIME system upon its validation)

WESTINGHOUSE NON-PROPRIETARY CLASS 3 3-2
Since Code Case N-629 is endorsed by reference in 10 CFR 50.55a, an exemption is not required for its use by the licensees.
3.1.1 Master Curve Data Search
Master curve data were gathered from the open literature, the EPRI fracture toughness database, and internal Westinghouse references. Thick section A-508 Class 2 or similar forgings that were used in RPV fabrication or are representative of the materials used to construct the U.S. PWR inlet and outlet nozzles are included. Materials that were heat treated specifically to represent embrittled materials were excluded. The intent is to capture all available transition temperature fracture toughness data to establish a generic master curve transition reference temperature for A-508 Class 2 type forgings . The data and variability bound the U.S. RPV A-508 Class 2 forgings . Only quasi-static data were collected.
The nozzle forgings used in the U.S. PWR fleet are all ASME SA-508 Class 2 or ASTM A-508 Class 2 with the following exceptions: Prairie Island Units 1 and 2 nozzles, which are SA-508 Class 3, Palo Verde Units 2 and 3 (which are a combination of SA-508 Classes 2 and 3) , and Ginna (which are SA-336). Note that the Ginna nozzles meet the A-508 Class 2 specification requirements per the Ginna Certified Material Test Reports (CMTRs). Substantial master curve data assessed (33) for A-508 Class 3 showed generic RTT0 of A-508 Class 3 to be better than A-508 Class 2 by 16°C (28°F), therefore the A-508 Class 2 generic RTT0 developed herein is conservative relative to A-508 Class 3 forgings.
The SA-508 Class 2 and A-508 Class 2 designations are synonymous and are nearly the same as the current ASME SA-508 Grade 2 Class 1 designation , although the specified chemistry limits changed slightly through the years. A-508-64 Class 2 is the ASTM specification and was used prior to ASME adoption of the same specification as SA-508 Class 2. Japanese Industrial Standard (JIS) G 3204 SFVQ2A steel forgings have essentially the same chemistry, tensile and Charpy requirements as SA-508 Class 2 (34). In addition, the Deutsche lndustrie Normen (DIN) 22NiMoCr37 specification is similar to SA-508 Class 2 [35) . Table 3-1 compares chemical and mechanical requirements for 22NiMoCr37, ASTM A-508-64 Class 2, SA-508 Class 2 (1971), and SA-508 Grade 2 Class 1 (2007). The differences in these specification limits are minor, with all being considered the same alloy (36).
The data search included SA-508 Class 2, A-508 Class 2, 22NiMoCr37, and SFVQ2A materials that were commonly used to construct RPVs. In addition, one heat of 20NiMoCr26 was also included, having chemistry and mechanical properties that meet the SA-508 Class 2 specification. The forging specification commonly used for the French RPVs was RCC-M 16MND5, which is similar to SA-508 Class 3 (39); therefore, data from these materials were not included. Class 2 includes a specified range of Cr (Class 3 limits Cr to a lower level) , while Class 3 has a higher Mn content than Class 2 (38). The EURO forging , for which extensive master curve testing was conducted, appeared to meet neither 22NiMoCr37 or SA-508 Class 3, although it has been claimed as 22NiMoCr37 (40) . For this reason, the EURO forging was not included.
PWROG-15109-NP February 2018 Revision 0
••• This record was final approved on 2/22/2018 11 :54:21 AM. ( This statement was added by the PRIME system upon its validation)

WESTINGHOUSE NON-PROPRIETARY CLASS 3 3-3
Table 3-1 Specifications for A-508 Class 2 Type Forgings
Chemical Composition Mechanical
C Mn p s Si Ni Cr Mo V YS(1) Tensile Specification % % % % % % % % % ksi ksi
22NiMoCr37 0.17- 0.50- 0.025 0.025 0.35 0.60- 0.30- 0.50- 0.05 57 81-102 [35] 0.25 1.00 max max max 1.00 0.50 0.80 max min
ASTM A-508- 0.27 0.50- 0.025 0.025 0.15- 0.50- 0.25- 0.55- 0.05 50 80 min 64 Class 2 [37] max 0.80 max max 0.35 0.90 0.45 0.70 max min
SA-508 0.27 0.50- 0.025 0.025 0.15- 0.50- 0.25- 0.55- 0.05 50 80 min Class 2 (1971) max 0.90 max max 0.35 0.90 0.45 0.70 max min [38]
SA-508 0.27 0.50- 0.025 0.025 0.40 0.50- 0.25- 0.55- 0.05 50 80-105 Grade 2 max 1.00 max max max 1.00 0.45 0.70 max min Class 1 (2007) [38]
Note: 1. YS = Yield Strength
3.1.2 Results from Master Curve Data Search
Transition temperature fracture toughness data sufficient to calculate T0 or calculated T0 values were found for 22 distinct forgings. These forgings are, in most cases, the same as were used in commercial PWRs or BWRs. In all cases, the heats selected are representative of the forgings used in commercial PWRs and BWRs. The forgings represent Japanese, Swedish, German, and U.S. RPVs. The references were checked to ensure that all data were collected from unique forgings. Although the production year of each forging with T0 data could not be confirmed , the majority of the forgings were determined to have been produced in a similar time frame to the nozzle forgings in the U.S. PWR fleet.
One master curve test data set was found for SFVQ2A steel. The bulk of master curve testing was performed on 22NiMoCr37 forgings. Some older K1e data is available for A-508 Class 2 forgings. The results are detailed in Table 3-2. RT NOT for many of the forgings was reported as shown in Table 3-2. The range of RT NOT values in Table 3-2 exceeds the range of the RT NOT values generally observed in U.S. PWR nozzle forgings utilizing NB-2300 criteria , which typically fall between -34 °C and -12°C. Additionally, the average RT NOT of the values from Table 3-2 (-11°C) falls above this typical range of RTNoT values observed for U.S. PWR nozzle forgings based on measured data and NB-2300 criteria. Since RTT O is an alternate to RT NOT, the developed RTT0 can be considered conservatively representative of the U.S. PWR fleet forgings.
In some cases, only K1e was reported. The master curve reference temperature can conservatively be developed from K1e values. K1e values are always the same or lower than the
PWROG-15109-NP February 2018 Revision 0
*** This record was final approved on 2/22/2018 11 :54:21 AM. ( This statement was added by the PRIME system upon its validation)

WESTINGHOUSE NON-PROPRIETARY CLASS 3 3-4
KJe value from the same test, and thus the developed To value would be conservative. Due to the ASTM E399 [41] limitation on ductility, the resulting TO from K1e values and KJe values are reasonably close [42] . K1e is defined by ASTM E399 and is K where the load displacement trace deviates from linearity by 5%, whereas KJe is K converted from J at cleavage, as defined in ASTM E1921 [43]. Only data from standard ASTM E1921 specimen geometries were included. Test data from wedge opening loading (WOL) specimen geometry was excluded since it is not an ASTM E1921 standard geometry.
The typical location for removing a test specimen from a forging is at the % or % thickness (%T or %T) location. If reported in the data source, the thickness location of specimen removal is indicated in Table 3-2. The toughness is better near the quenched and tempered forging surfaces. Therefore, it is standard conservative practice to remove specimens at the Y.. thickness location. Specimens related to RPV surveillance programs that comply with ASTM E185 are required to be removed for the Y.. thickness locations [44] . For these reasons, it is assumed that the specimens for which thickness location values were not reported were removed at or between Y..T and %T locations.
3.1.2.1 Specimen Geometry Constraint Adjustment
The tested specimen geometries are shown in Table 3-2. Tregoning and Joyce observed a systematic, non-conservative bias toward the Single Edge Notched Bend (SE(B)) specimen of generally 5°C to 10°C relative to the compact tension (CT) specimen geometry due to its lower constraint [45] . The NRC used a 4.7°C bias term for the Kewaunee RPV [46] . The Babcock & Wilcox Owners Group (B&WOG) data showed a varying SE(B) bias averaging 10°C, which was approved by the NRC [31]. More recently, the ASTM committee recognized an average difference between the CT and SE(B) of 10°C, which is included in the E1921 consensus standard [43]. Therefore, a bias of 10°C was added to the SE(B) T0 values to adjust for the lower constraint SE(B) geometry, as shown in Table 3-2.
PWROG-15109-NP February 2018 Revision 0
••• This record was final approved on 2/22/2018 11 :54:21 AM. ( This statement was added by the PRIME system upon its validation)
)> s::
--i :::r ;;;· (/)
iii ro 3 CD ;:!.
~ (/)
Dl C. C. CD C. r:::r '< :T CD
"U ;:c ~ m ~ !!?. CD 3 C 'O 0 ::,
WESTINGHOUSE NON-PROPRIETARY CLASS 3
Table 3-2 All Available Master Curve Data on A -508 Class 2 Type Forgings
Number of Data
Measured Points Value/ Valid/ RTNDT To
Material Identity S pacification Standard Total (OC) (OC) Geometry
JTK15 Japanese K1R SFVQ2A Kie & KJc I 6/20 -30 -99 1TCT Committee [34] E1921 -97
ASME K1e [47, 48] A-508 Kie / 7/9 11 -57 2TCT, Database<1) Class 2 E399 4TCT, RT Nor = 11 °c 6TCT
ASME K1e~47, 48] A-508 Kie/ 6/10 18 -21 2TCT, Database< Class 2 E399 8TCT RTNDT = 18°C
SCK-CEN A-508 KJc / NR/32 ;;:-18 -95 SE(B) FG2-Y..T [49] Class 2 E1921-08
JSW4C [50] A-508 NR 6/8 -37 -84 1TCT, Class 2 2TCT
CARISMA P7- 22NiMoCr37 KJc / NR -5 -88 SE(B) Kleckner [51] E1921-05
CARISMA P147-JSW 22NiMoCr37 KJc / NR -17 -112 SE(B) [51] E1921-05
Atucha I 41.1 [52] 22NiMoCr37 KJc / NR/12 NR -42 1TCT E1921-97
German Nozzle 22NiMoCr37 KJc / NR/8 NR -75 SE(B) Flange Ring - A [53] E1921-97
German Nozzle 22NiMoCr37 KJc / NR/8 NR <-90 SE(B) Flange Ring - B [53] E1921-97
PWROG-15109-NP
To (°C) SE(B) Thickness
Adjusted Location
-99 Y..T
-57 NR
-21 NR
-85 Y..T & %T
-84 NR
-78 NR
-102 NR
-42 Y..T & %T
-65 %T
<-80 %T
3-5
Valid Orient-To
y
y
N<2)
y
y
y
y
y
NR
NR
ation
NR
NR
NR
TL
NR
TL
TL
TL
TL
TL
February 2018 Revision 0

0 :J
-I :J" iii' (/)
Ej' en ~ 3.
~ (/)
Q) C. C. CD C.
~ g CD "U ::0 ~ m (/)
~ en 3 C: 'O 0 :J
WESTINGHOUSE NON-PROPRIETARY CLASS 3
Table 3-2 All Available Master Curve Data on A-508 Class 2 Type Forgings (cont.)
Number of Data
Measured Points Value/ Valid/ RTNDT To
Material Identity Specification Standard Total (OC) (OC) Geometry
German Nozzle 22NiMoCr37 KJc / NR/8 NR -17 SE(B) Flange Ring - C [53] E1921-97
German Nozzle 22NiMoCr37 KJc / NR/8 NR -43 SE(B) Flange Ring - D [53] E1921-97
KRB-A GEB2 20NiMoCr26<4) KJc / 16/18 NR -53 ~TCT Gundremmingen [54] E813-81
CARINA 22NiMoCr37 KJc / NR -10 -109 SE(B) P150-JSW E1921-13 [55, 56, 57]
CARINA 22NiMoCr37 KJc / NR -15 -110 SE(B) P 151-Klockner E1921-13 [55, 56, 57]
Ringhals 4 SA-508 KJc / NR -47 -135 SE(B) Lower Shell [56] Class 2 E1921-11
Ringhals 4 SA-508 KJc / NR -47 -123 SE(B) Inter. Shell [56] Class 2 E1921-11
Ringhals 3 SA-508 KJc / NR 44<5) _79<5) SE(B) Lower Shell [56] Class 2 E1921-11
Ringhals 3 SA-508 KJc / NR 20(5) -82<5) SE(B) Inter. Shell [56] Class 2 E1921-11
Borssele Ring 3 22NiMoCr37 KJc / NR -10 -106 SE(B) [36, 58] E1921-05
PWROG-15109-NP
To (°C) SE(B) Thickness
Adjusted Location
-7 2:55mm from
surface<3)
-33 2:55mm from
surface<3)
-53 Y..T & ~T
-99 NR
-100 NR
-125 Y..T
-113 Y..T
-69 Y..T
-72 Y..T
-96 Y..T
3-6
Valid Orient-To
NR
NR
y
y
y
NR
NR
NR
NR
NR
ation
TL
TL
TL
TL
TL
TL
TL
TL
TL
TL
February 2018 Revision 0

WESTINGHOUSE NON-PROPRIETARY CLASS 3 3-7
Table 3-2 All Available Master Curve Data on A-508 Class 2 Type Forgings (cont.)
Number of Data
Measured Points To (°C) Value/ . Valid/ RTNDT To SE(B) Thickness Valid Orient-
Material Identity Specification Standard Total (OC) (OC) Geometry Adjusted Location To ation
Borssele Ring 4 22NiMoCr37 KJc / NR -20 -106 SE(B) -96 Y.iT NR TL [36, 58] E1921-05
BMWi [59] 22NiMoCr37 KJc / NR NR -65 various -55 NR y NR E1921-02
NR = not reported; SE(B) = three point bend specimen; xTCT = x-inch thick compact tension fracture specimen; TL= transverse to the primary working direction
Notes: 1. There is a third heat of A-508 Class 2 that was included in this old dataset, which was used to construct the ASME K1c curve, but it is not included here
since the specimen geometry was WOL The To for this heat is -84°C. 2. While this measurement did not produce a valid To value, it was still included in the analysis, as it is the highest TO found and therefore ensures a
conservative result 3. This German nozzle flange ring forging is exceptionally thick at 640mm (25 inches). To was measured through thickness from the surface. The relevant
location for U.S. RPV beltline forgings is at Y.T location which is approximately 2 inches (-55 mm) from the surface. Therefore, the To measurement at this depth location is used for the German nozzle flange rings C and D.
4. The measured chemistry and mechanical properties meet the SA-508 Class 2 specification for this forging . This forging is from a decommissioned 250MW BWR which was placed in service in 1966. It had a thinner wall than PWRs (4.7 inches versus 6.5 to 11 inches).
5. These are irradiated to 4.3x10¹⁹ n/cm2. The unirradiated To would be significantly lower; therefore, the irradiated To used is conservative. RTNor is
adjusted for irradiation for comparison purposes only.
PWROG-15109-NP February 2018 Revision 0

WESTINGHOUSE NON-PROPRIETARY CLASS 3 3-8
3.1.2.2 Calculation of Generic Mean Alternate RT NDT
Averaging all the A-508 Class 2 type forging heat adjusted T0 values in Table 3-2 provides a mean SE(B) adjusted T0 of -74.1°C (-101.4°F) with a standard deviation of 30.3°C (54.5°F). When the 19.4°C (35°F) is added per ASME Code Case N-629 to T0 , the resultant alternate mean RT NOT (RTT o) is
Alternate generic mean RTNoT = RTT0 = -74.1°C + 19.4°C = -54.?°C (-66.4°F)
This can be substituted for the initial RT NOT in the following equation :
ART= Initial RT NOT+ Margin + ~RT NOT (60]
Where:
"a1 is the standard deviation obtained from the set of data used to establish the mean." [60 and 61) and was determined to be a 1 = 30.3°C (54.5°F) from the 22 measurements reported in Table 3-2.
If there is no ~RT NOT due to embrittlement then a6 = 0 and
Margin= 2 a 1 = 61 °C (109°F)
The resultant generic alternate ART at the %T location is
RTT0 (with margin)= -54.?°C + 2 * 30.3°C = 6°C (43°F} .
This value is lower than the NRC approved upper bound of 60°F for forgings [62].
The difference between RT NOT and TO can be substantial for most RPV materials as demonstrated in Figure 3-1 . This difference has been used to demonstrate margin between RT NOT and RTT0 [up to 80°C (150°F)] . However, it is material dependent and unknown for any particular material without testing. Figure 3-2 shows the cumulative distribution of the difference between RT NOT and RTT O for the A-508 Class 2 type forging data gathered in Table 3-2. This heat-specific data supports the above conclusion that there is an improvement in the generic upper bound value of RTT0 relative to RT NOT even with the large variation (a1} seen in the A-508 type forgings.
The approach of using a generic initial alternate RT NOT for RTT O is beneficial because it is based on fracture toughness data and , thus, gives a more realistic representation of the actual toughness of the nozzle forgings. This approach also avoids using RT NOT estimation methods, which are required for many nozzles, and the approach is conservative. The approach taken herein to establish the alternate RTT O is conservative because the data used to establish the mean and standard deviation included irradiated materials, Kie data, a material with RT NOT greater than 60°F, and a large diversity of relevant forgings . The relatively large a1 due to the diversity of forgings assessed ensures conservatism when applied with the margin term.
PWROG-15109-NP February 2018 Revision 0
*** This record was final approved on 2/22/2018 11 :54:21 AM. ( This statement was added by the PRIME system upon its validation)

WESTINGHOUSE NON-PROPRIETARY CLASS 3
.t:J co
.t:J 0 ... c.. Q) > -co
E ::,
100%
80%
60%
40%
U 20%
0%
<> Forging Plate
6 Weld
-50 0 50
0
0
100 150
3-9
200
Figure 3-1 Cumulative Distribution Showing the Difference between Unirradiated To and RT NOT [27]
100% V
0 0
~ 80% - 0 .c 0 n, 0 .c 60% - 0 0 ...
0 ~
QI 0 > · .. 40% - 0 n, 0 :::,
E 0 :::, 20% - 0 u
0 0
0% I
0 50 100 150 200
RT NOT· RTT0 (F)
Figure 3-2 A-508 Class 2 Type Forging Cumulative Distribution Showing the Difference between RTT o and RT NOT
PWROG-15109-NP February 2018 Revision 0
••• This record was final approved on 2/22/2018 11 :54:21 AM. ( This statement was added by the PRIME system upon its validation)

WESTINGHOUSE NON-PROPRIETARY CLASS 3 3-10
3.2 SURFACE EFFECT
Since quenching thick forgings results in a faster cooling rate near the surface of the forging , surface mechanical properties are typically superior to internal mechanical properties, as a result of grain size and microstructural differences. An increased cooling rate results in a finer microstructure and , therefore, a better toughness (63] . The critical cooling rate for bainite is lower than martensite [64] . Thus, since the cooling rate is faster at the surface, it is likely that the forging surface will have a smaller carbide phase and more tempered martensite. These differences at the surface result in improved fracture toughness (e.g ., Figure 3-3) and better Charpy impact properties (e.g. , Figure 3-4).
-75 IS 118T /4T 1f2T 3/4T 718T OS
-80
-85
- -90 u It-! .95 ::,
°! -100 !. E -105 .. -8 -11 0
/ ~ 5 11 -1 1 'ti • a:: -120
-125
-130
-135
0 20 40 60 80 100 120 140 160 1IO 200
Thirtnus position (mm)
Figure 3-3 Variation of Master Curve Reference Temperature through Thickness for a SA-508 Class 2 Forging [63]
PWROG-15109-NP February 2018 Revision 0
*** This record was final approved on 2/22/2018 11 :54:21 AM. ( This statement was added by the PRIME system upon its validation)

WESTINGHOUSE NON-PROPRIETARY CLASS 3 3-11
200
180 --e-1 ---lr-2
160
- 140 "' .:: "T ,::: 120 -- -'-' ~ ef 100 ~ = Near ~
7. 80 Surfac > u 60
0 l:=::r:::::=~~::.L:~-1.---.1._J_...__l_..,__..l..._.....,____L__,__l----1_.J -300 -2110 - 100 0 100 200 300 400 500 600
Temperature {° F)
Figure 3-4 Difference of Charpy Impact Energy Near-Surface versus %T for a PWR Outlet Nozzle Forging
For very thick and complex forgings , ASME Subparagraph NB-2223.2 [65] requires that the longitudinal axes of the specimens used to determine RT NOT shall not be nearer than % inch to any heat-treated surface. Use of the transition temperature near the surface is, therefore, appropriate since the largest postulated flaw in this evaluation is % inch deep into the LAS.
Through thickness variation measurements of ductile-to-brittle transition temperature were gathered for as many applicable ASTM A-508, Class 2 (and similar specification) forgings as possible from the published literature [34, 49, 66, 67, 68 and 69] and internal sources from Westinghouse and Framatome.
In the analysis, the surface transition temperature (as measured by Charpy 30 ft-lb or Master Curve T 0) was compared against the Y-iT transition temperature for 24 sets of longitudinal (LT) and seven sets of transverse (TL) data. Note that data without a reported orientation was considered with the LT data. The data is from 24 different forgings. In three cases, measurements were made relative to two surfaces (i.e . inside and outside of the ring forging) on the same forging. In two cases, both TL and LT transition temperatures were measured from the same forging . Five of the measurement sets are from nozzle forgings , while the others are from RPV shell forgings .
While both the LT and TL direction showed an average decrease in transition temperature of the forging surface when compared to the Y-iT location , this decrease was more pronounced in the TL direction. The TL direction had an average shift from the surface to the Y-iT location of
PWROG-15109-NP February 2018 Revision 0
••• This record was final approved on 2/22/2018 11 :54:21 AM. ( This statement was added by the PRIME system upon its validation)

WESTINGHOUSE NON-PROPRIETARY CLASS 3 3-12
26.4°C (47.5°F) with a standard deviation of 12.1 °C (21 .?°F). The shifts of all seven TL datasets considered were positive. Compared to the TL direction, the LT direction had a smaller average shift of 20.3°C (36.5°F) and a larger standard deviation of 16.1 °C (28.9°F). Two of the 24 LT datasets considered exhibited a negative shift. Given the average and standard deviation, these negative shifts are not unexpected. Since Charpy testing has a large inherent scatter and the shifts for these two LT data sets [-12.1°C (-21 .?°F) and -3.6°C (-6.5°F)] were relatively small , it is likely that these shifts are a result of Charpy data scatter. Both forgings with negative shifts were used by B&W in RPV manufacture. Additionally, one of the forgings with a negative shift had limited data in the vicinity of the 30 ft-lb region . The other forging with negative shift had many measurements in the transition region , but the scatter in the data is substantial compared to the data from the other forgings .
In all cases where the LT and TL difference in transition temperature was measured on the same forging , the TL showed a greater decrease in transition temperature near the surface. Since both directions showed a clear trend , credit can be taken for a decreased transition temperature at the surface of a forging when compared to the 'XIT location. The near-surface versus in-depth transition temperature measurements included four separate A-508, Class 2 (3 PWR and 1 BWR) nozzle forgings , and all showed a decrease in the near-surface transition temperature. The results of the through-thickness forging analysis are shown in Figure 3-5 for the LT and unreported orientation specimens. The figure shows the distance from the forging surface to the center of the specimen with the deepest point being approximately the 'XIT measurement location. The vertical axis shows the difference in transition temperature between the deeper 'XIT depth location with the measurements made closer to the surface. Figure 3-6 shows the same information for the TL-oriented specimens. Note that in some cases more than two measurements were made through thickness. In these cases the trend is generally linear improvement with measurement made closer to the surface. The results are summarized in Table 3-3. For subsequent analysis, the more conservative LT orientation is used, which has the smaller average improvement and larger standard deviation.
It is appropriate to take credit for the difference in properties at the surface, because the measurements that were used to determine the generic RTT0 were taken at a through-thickness location. Of the measurements that give a fractional through-thickness depth , each of them was at the 'XIT or %T location. For the measurements without a recorded through-thickness depth, it was assumed that the measurement was taken at 'XIT or deeper, consistent with accepted industry practice [44]. The ASME Code, Section Ill specifies that quenched and tempered fracture toughness impact specimens from forgings must have their longitudinal axes at least 'XIT from any surface [65] .
The LT orientation dataset has a larger amount of data and can conservatively be used since it has a smaller improvement than the TL orientation and a larger standard deviation. For subsequent analysis, the following near-surface toughness improvement will be used:
~RT NDTsurface = -36.5°F
01surface = 28.9°F.
PWROG-15109-NP February 2018 Revision 0
••• This record was final approved on 2/22/2018 11 :54:21 AM. ( This statement was added by the PRIME system upon its validation)

WESTINGHOUSE NON-PROPRIETARY CLASS 3
Table 3-3 Summary of Transition Temperature Shifts for LT and TL Specimens LT(1>
Number of Data Sets Studied 24
Average Shift (°F) 36.5
Standard Deviation (°F) 28.9
Maximum Shift (°F) 90.6
Minimum Shift (°F) -21 .7
Note: 1. The LT grouping included datasets with no reported orientation.
PWROG-15109-NP
3-13
TL
7
47.5
21 .7
79.2
24.9
February 2018 Revision 0
i I
1
_ ___ ~ ·· ~his record was final approved on 2/22/2018 11 :54:21 AM. ( This statement was added by the PRIME system upon its validation)

-I ::r en· iil 0 0 a :!: Q) Cf)
::::!> ::, !!!. Q)
'Cl 'Cl 0 < ~ 0 ::,
~ ~ I\.)
~ CD
'i. is, ~
)> s:: -I ::r en· Cf)
iii en 3 (1)
;a?.
~ Cf)
Q) C. C. (1) C. C" '< ::f (1)
"'O ;:a ~ m Cf)
'< Cf)
en 3 C
'Cl 0 ::,
i.n' < !!!. a: Q)
g-2.
100
80 G::' ~
; E 0 ,: 60 Cl> ... :, ... .. ... 8.. E ~ 40 C 0 :, -;; C .. ...
E--.o ,... ... 20 0
c:, <"')
E--E--
~
WESTINGHOUSE NON-PROPRIETARY CLASS 3
--Westinghouse l\vo-Loop Intermediate Shell - Westinghouse Toree·Loop ozzle aitout - Westinghouse Three-Loop Upper Shell _._ Westinghouse Four-Loop Inlet ozzle -+- Westinghouse Four-Loop Outlet ozzle # I - Westinghouse Four-Loop Outlet ozzle #2 --Westinghouse Four-Loop Upper Shell ID
- Westinghouse Four·Loop Upper Shell OD --B&WTop Shell #I ...-a&WTop Shell #2 --a&WTopSbell #3 --a&WTopShell 114
- BethForge Forging-ID BethForge Forging-OD
--Forging Ml --Forging! ~ B\VR. ozzle Forging
French Forging -.-a&w Lower Shell # I --B&WLower Shell #2 --B&W Lower Shell #3 --B&, 3
- B&W9 --B&WIO
u .: 0 +--------~------
~ 00
C Cl> ... ~ 25
-20
-40
PWROG-15109-NP
0.5 1.0
Distance from Surface to Specimen Center (In.)
Note: ID = Inner Diameter,
OD = Outer Diameter
Figure 3-5 Transition Temperature Shifts for LT Specimens
3-14
3.0
February 2018 Revision 0

--f :::r cii'
cil C'> 0 a. :E "' "' ::,, ::, !!!.
"' "O "O
0 < ~ 0 ::,
~ ~ ~ a,
~ ,-:, ~
l> s::
--f :::r cii'
"' 6j' ro 3 (1)
a :E "' "' "' a. a. (1) a. C" '< :T (1)
"U ::0 ~ rn "' '< "' ro 3 C
"O 0 ::,
ui < !!!. ci ~ 6' 2.
E-"'f' ...... -E Q ~ ~ -::::, ... ~ lo,
~ E ~ C Q '.:i '! -~ ~ E= e_.,
~ lo, Q
Q M
~ ~ u .5 ~
I! ~ I.
~ '-Q
90
80
70
60
50
40
30
20
10
WESTINGHOUSE NON-PROPRIETARY CLASS 3
~ Westinghouse lbree-Loop Upper Shell
-+-BWR Nozzle Forging
....,_ BWR Beltline Forging
'"*" Flange Ring C
-+-Flange Ring D
-a-FG2 lnner Diameter
FG 2 Outer Diameter
3-15
0 +--------~-------~---------~----'""---'-">''1,--- - -=----~---=-----~ 0.0 0.5 1.0 1.5 2.0
Distance from Surface to Specimen Center (in)
Figure 3-6 Transition Temperature Shifts for TL Specimens
PWROG-15109-NP
2.5 3.0
February 2018 Revision 0

WESTINGHOUSE NON-PROPRIETARY CLASS 3 3-16
3.3 UNDERCLAD HAZ TOUGHNESS
A significant portion of a small postulated flaw would be in the underclad heat-affected zone (HAZ). Therefore, the properties of the HAZ relative to the adjoining base metal must be considered . ORNL conducted Charpy impact testing on a stainless steel clad plate used to determine the effect of clad on the propagation of small surface flaws. The plate was specifically heat treated to produce a high transition temperature. It was not quenched and only slightly tempered . Charpy impact testing of the plate showed that the clad HAZ had significantly better properties (i.e. lower transition temperature) than the ~T location in the plate [70) . Since the plate was not quenched, the improved HAZ transition temperature would not be due to a faster cooling rate from quenching, but the tempering of the cladding operation. Another test program tested master curve reference temperature of a clad cylinder HAZ relative to the base metal and found that the T0 reference temperature was much lower for the clad HAZ [71) .
A comprehensive study of U.S. surveillance capsule testing of HAZ 30 ft-lb transition temperature values compared with 30 ft-lb values for companion plate or forging concluded that essentially all the 30 ft-lb values of HAZ were lower than the 30 ft-lb values of the companion plate or forging [72) . Structural welds have many passes, which improves HAZ toughness properties relative to the base metal due to grain refinement, small regions of coarse grains, and tempering of martensite, all of which tend to increase toughness. Underclad HAZ does not experience as many thermal cycles, although the cladding of the nozzle corners is comprised of at least a two layer clad process [73) .
In conclusion , the underclad HAZ in the nozzles is as tough , or tougher than , the adjacent forging base metal.
3.4 NEUTRON EMBRITTLEMENT
In 2014, the NRC issued RIS 2014-11 [3] , which discussed that all ferritic components within the entire RPV be considered in the development of P-T limit curves. In this RIS , the NRC staff considers materials with a projected neutron fluence greater than 1 x 10¹⁷ neutrons per square centimeter (n/cm2
) (E > 1.0 MeV) at the end of license (EOL) to experience sufficient neutron damage to be included in the beltline. The effect of neutron damage is dependent on material chemistry and irradiation temperature [60) . Sufficient neutron damage such that it is indistinguishable from data scatter is not apparent at 1 x 10¹⁷ n/cm2 for low Cu RPV steels. Therefore, the NRC provided additional guidance on what is considered sufficient damage such that embrittlement effects must be considered as discussed in NRC Technical Letter Report TLR-RES/DE/CIB-2013-01 [74) :
"Embrittlement effects may be neglected for any region of the RPV if either of the following conditions are met:
(1) neutron fluence is less than 1 x 10¹⁷ nlcm2 (E > 1.0 Me VJ at EOL, or
PWROG-15109-NP February 2018 Revision 0
••• This record was final approved on 2/22/2018 11 :54:21 AM. ( This statement was added by the PRIME system upon its validation)

WESTINGHOUSE NON-PROPRIETARY CLASS 3 3-17
(2) the mean value of L1 T30 estimated using an ETC (embrittlement trend correlation) acceptable to the staff is less than 25°F at EOL. The estimate of I:::,. T30 at EOL shall be made using best-estimate chemistry values."
Nozzle fluence values are typically conservatively assumed to be equal to the upper-shell-tonozzle weld fluence value (below the bottom of the nozzle forging) . Even at this conservative location, nozzle forging fluence projections are frequently less than 1 x 10¹⁷ n/cm2
. However for some plants, the 60-year fluence projection at this location is greater than 1 x 10¹⁷ n/cm2
.
Therefore, an estimate of 1:::,.T30 at EOL is made using best-estimate chemistry values for PWR nozzle forgings generically to determine the fluence limit where I:::,. T 30 reaches 25°F.
Even if the nozzle fluence is projected to be greater than 1 x 10¹⁷ n/cm2, but the calculated 1:::,.T30
is less than 25°F using Regulatory Guide 1.99, Revision 2 [60] , the embrittlement can be neglected per TLR-RES/DE/CIB-2013-01 [74]. The l:::,.T30 limit of 25°F was used for H. B. Robinson Unit 2 nozzles to justify not adding embrittlement shift and was approved by the NRG in a P-T limit license amendment [11]. The Cu content was not measured for all the nozzles manufactured for the U.S. PWR fleet , however it was measured for a substantial number covering nearly the full range of manufacturing dates and all major fabricators used by the U.S. RPV fabricators. Copper measurements were averaged for 178 inlet and outlet nozzles yielding an average of 0.0947% with a standard deviation of 0.0319%. The definition in Regulatory Guide 1.99, Revision 2 for a generic best-estimate is the mean plus one standard deviation yielding 0.127% for Cu . As precedent, this methodology was approved by the NRG for a plant license renewal application [75 and 76] . For nickel (Ni) , the upper limit of the SA-508 Class 2 specification during the fabrication time period is used, which was 0.90%. All U.S. plant nozzles meet A-508 Class 2 or A-508 Class 3 specifications. The Ni limit for A-508 Class 3 is 0.80%. Considering the permitted variation of Ni in the check analysis (0.03%), the chemistry factor tables in Regulatory Guide 1.99, Revision 2 for forgings do not change above 0.80% Ni at this Cu level. Generic properties for U.S. PWR nozzles are shown in Table 3-4.
The BWRVIP-173 [77] report had Cu measurements from 65 A-508 Class 2 forgings, not all of which were nozzle forgings. The best-estimate Ni and Cu contents discussed above and shown in Table 3-4 are appropriate for the U.S. PWR nozzles, since the database was established from Cu measurements from PWR nozzle forgings only.
Using the Regulatory Guide 1.99, Revision 2 and ASTM E900-15 [78] ETCs, the fluence value at which 1:::,.RTNor (l:::,.T30) is equal to 25°F was determined. The results are plotted in Figure 3-7.
Using Regulatory Guide 1.99, Revision 2, it can be determined that a shift of 25°F is not predicted to occur at a fluence value less than 4.28 x 10¹⁷ n/cm2
. The more recent ASTM E900-15 correlation , which is a function of irradiation temperature, gives a value of 2.73 x 10¹⁷ n/cm2
for a 25°F shift at 528°F. The 528°F value used for E900-15 is conservative because it represents the time-weighted average downcomer temperature of the lowest cold leg temperature plant. The nominal irradiation temperature as defined by Regulatory Guide 1.99, Revision 2 is 550°F. Therefore, it is not surprising that near this temperature (at 550.8°F), the ASTM E900-15 and Regulatory Guide 1.99, Revision 2 ETCs give the same fluence value of 4.28 x 10¹⁹ n/cm2 (E > 1.0 MeV) for a 25°F l:::,.RT NDT· Approximately 50% of the U.S. PWR fleet
PWROG-15109-NP February 2018 Revision 0
••• This record was final approved on 2/22/2018 11 :54:21 AM. ( This statement was added by the PRIME system upon its validation)

WESTINGHOUSE NON-PROPRIETARY CLASS 3 3-18
has downcomer temperatures greater than or equal to 550.8°F based on the time-weighted average irradiation temperature of their most recently removed capsule. Outlet nozzle temperatures (That) are significantly greater than the inlet temperatures (Tcoid) and, therefore, are predicted to have less embrittlement than the inlet nozzles. As discussed in Section 5.1.1 , the limiting SIF location is at the outlet nozzle corner due to the geometric difference. Given that E900-15 ETC gives a very similar result to the Regulatory Guide 1.99, Revision 2 at a nominal irradiation temperature and the higher temperature outlet nozzles are limiting , it is conservative to use the Regulatory Guide 1.99, Revision 2 fluence value of 4.28 x 10¹⁷ n/cm2 (E > 1.0 MeV) as a screening criterion for the embrittlement of U.S. PWR nozzles.
Table 3-4 Generic Material Properties and T cold for the U.S. PWR Fleet Nozzles
Generic Value
Cu wt. % 0.127<1>
Niwt. % 0.90<2>
Mn wt.% 1.11 <3>
Pwt. % 0.016(3)
Tco1d (4) 528°F (275.6°C)
Notes: 1. Generic best estimate determined through use of a database of 178 inlet and outlet nozzle forgings. 2. Upper bound value of ASME SA-508, Class 2 specification before the Summer 1975 Addenda (79] . 3. Generic value per 10 CFR 50.61a [80]. 4. Lowest T cold (normal operation inlet coolant temperature) value for any U.S. PWR most recently removed
capsule.
PWROG-15109-N P February 2018 Revision 0
••• This record was final approved on 2/22/2018 11 :54:21 AM. ( This statement was added by the PRIME system upon its validation)

WESTINGHOUSE NON-PROPRIETARY CLASS 3 3-19
35 ~ - - - ---------~ --------Regulator~· Guide 1.99, Re\·. 2
• • • •AS1M E900-15 (528"F)
30 •AS1M E900-15 (5S0.8"F) 2.73 x 10¹⁷ n/cm2
- •AS1M E900-15 (6QOOF) •• •• ••
--.'-'··· •••• ••
•• ••
•••• ••••
••••
•• 25 +-------------------,,-..:·~·---------....,,,.,;.;,,,,'.'.::.._ __ _
• • • --- -- .... • • • •
•• •• .•..... -.--••
•• •• ••
.·· . --. , . , . .,-
---------------s +--- "--........ - -------------------------------
:/ / .:. / .~s-.,
o ~ ------~------~------~------~-----~ O.OOE+OO 1.00E+ l 2.00E+ l 3.00E+ l 4.00E+ l 5.00E-17
Fluence (n/cm1 (E > 1.0 Me\ ) )
Figure 3-7 Transition Temperature Shift versus Fluence for Best-Estimate Chemistry
A review of the 60-year nozzle fluence data available to Westinghouse indicated that the fluence at the lowest extent of the nozzle forging (or the upper-shell-to-nozzle forg ing weld location) has been calculated for approximately three-quarters of the 65 operating PWRs. The PWRs analyzed include the B&W, CE, and Westinghouse (2, 3, and 4-loop) plant designs. The only nozzles that exceeded the screening criterion were two Westinghouse 3-loop design inlet nozzles [54 effective full power years (EFPY) at the RPV shell-to-nozzle forging weld] and the CE System-80 outlet nozzles (54 EFPY at the RPV upper-shell-to-nozzle forging weld) . These specific higher-fluence nozzles were evaluated using nozzle specific properties. This evaluation showed that these nozzle specific ART values are bounded by the generic ART discussed in Section 3.5.
The PWR fleet nozzle fluence values contain two identified conservatisms: the calculated fluence location relative to the postulated flaw location and the fluence calculational methodology. These conservatisms are documented in the following two sections.
PWROG-1 5109-NP February 2018 Revision 0
••• This record was final approved on 2/22/2018 11 :54:21 AM. ( This statement was added by the PRIME system upon its validation)

WESTINGHOUSE NON-PROPRIETARY CLASS 3 3-20
3.4.1 The Calculated Fluence Location Relative to the Postulated Flaw Location
In situations where fluence projections are high enough that embrittlement must be considered, the typical approach that has been used is to more accurately determine the fluence at the postulated flaw location. Nozzle fluence values are typically conservatively assumed to be equal to the RPV upper-shell-to-nozzle forging weld fluence value or the lowest extent of the nozzle forging . Since the current postulated flaws for this assessment are at the nozzle corners, the fluence value of the lowest extent of the nozzle forging or weld is greater than the fluence value of the postulated flaw itself.
During the recent analyses of five Westinghouse 3-loop plants at a 60-year life, the fluence nearer to the postulated flaw location was determined in addition to the lowest extent of the nozzle forging location. Using RPV drawings, an elevation was determined at which the fluence value should be determined which was higher in elevation than the lowest extent of the nozzle but still conservatively lower than the postulated YiT flaw location. Use of this higher elevation for evaluation of the fluence values reduced the nozzle projected fluence values by greater than 50% for each of the 25 nozzles considered .
The postulated flaws identified in Section 2 are smaller than the YiT flaw evaluated in the above referenced evaluations. Therefore, the flaw tip is located at a higher elevation, thus resulting in an even larger decrease in the fluence value when the actual flaw fluence value is considered relative to the RPV upper-shell-to-nozzle forging weld location. The fluence at the postulated flaw locations are expected to be considerably lower than the RPV upper shell to nozzle forging weld location.
3.4.2 Fluence Calculational Methodology
The use of new fluence evaluation methods can more accurately determine the nozzle fluence reducing the needed conservatisms. Table 3-5 shows an example of the difference in nozzle fluence values between the previous NRC approved method of fluence evaluation using DORT, and the new TORT and RAPTOR-M3G (RApid Parallel Transport Of Radiation - Multiple 30 Geometries) methods. RAPTOR-M3G has been approved on a plant-specific basis [81], and generic approval for the traditional beltline is currently being pursued [82].
DORT-based calculations use the traditional fluence rate synthesis technique, in which two-dimensional and one-dimensional discrete ordinates models are combined to yield a synthesized three-dimensional solution. This method is effective in the traditional RPV beltline, but introduces conservatism in the nozzle region where three-dimensional effects become more pronounced. TORT uses a three-dimensional discrete ordinates technique to produce a true three-dimensional solution . However, TORT is a single-processor code, and is subject to limitations in the amount of detail that can be modeled in any given problem. RAPTOR-M3G is a parallel-processing Westinghouse code that, like TORT, uses a three-dimensional discrete ordinates technique to produce a true three-dimensional solution . The parallel-processing feature of RAPTOR-M3G allows large, 30 radiation transport calculations to be performed that would otherwise be prohibitively time consuming or cannot be performed with TORT.
PWROG-15109-NP February 2018 Revision 0
••• This record was final approved on 2/22/2018 11 :54:21 AM. ( This statement was added by the PRIME system upon its validation)
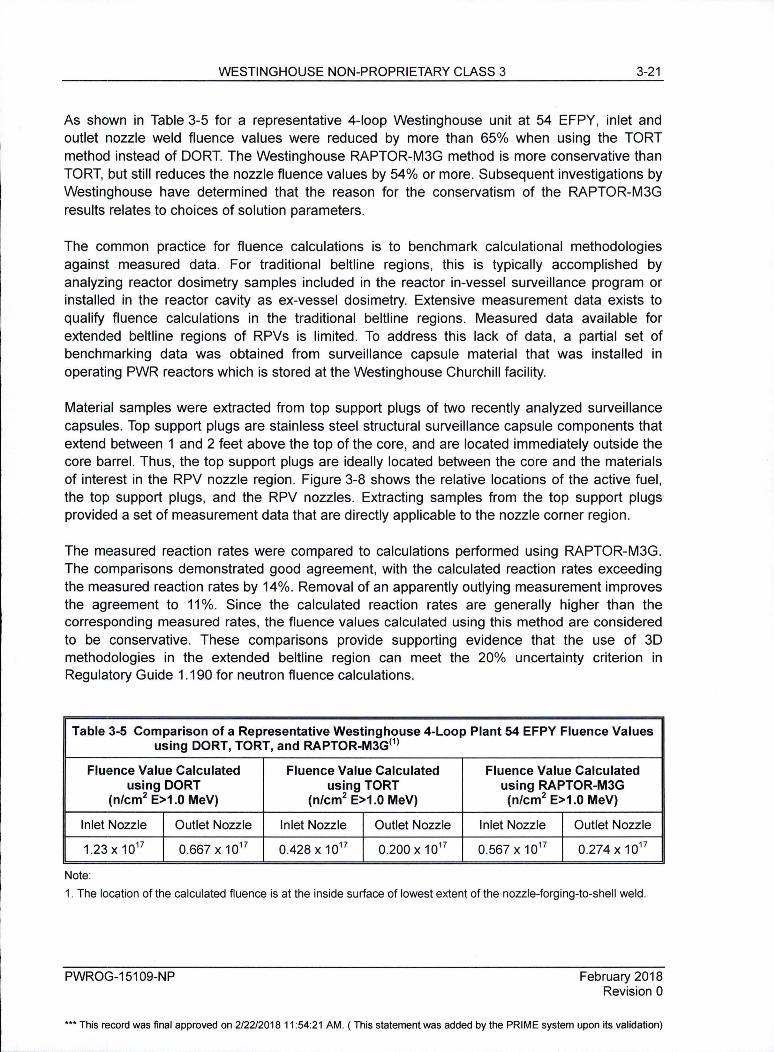
WESTINGHOUSE NON-PROPRIETARY CLASS 3 3-21
As shown in Table 3-5 for a representative 4-loop Westinghouse unit at 54 EFPY, inlet and outlet nozzle weld fluence values were reduced by more than 65% when using the TORT method instead of DORT. The Westinghouse RAPTOR-M3G method is more conservative than TORT, but still reduces the nozzle fluence values by 54% or more. Subsequent investigations by Westinghouse have determined that the reason for the conservatism of the RAPTOR-M3G results relates to choices of solution parameters.
The common practice for fluence calculations is to benchmark calculational methodologies against measured data. For traditional beltline regions, this is typically accomplished by analyzing reactor dosimetry samples included in the reactor in-vessel surveillance program or installed in the reactor cavity as ex-vessel dosimetry. Extensive measurement data exists to qualify fluence calculations in the traditional beltline regions. Measured data available for extended beltline regions of RPVs is limited. To address this lack of data, a partial set of benchmarking data was obtained from surveillance capsule material that was installed in operating PWR reactors which is stored at the Westinghouse Churchill facility.
Material samples were extracted from top support plugs of two recently analyzed surveillance capsules. Top support plugs are stainless steel structural surveillance capsule components that extend between 1 and 2 feet above the top of the core, and are located immediately outside the core barrel. Thus, the top support plugs are ideally located between the core and the materials of interest in the RPV nozzle region. Figure 3-8 shows the relative locations of the active fuel , the top support plugs, and the RPV nozzles. Extracting samples from the top support plugs provided a set of measurement data that are directly applicable to the nozzle corner region.
The measured reaction rates were compared to calculations performed using RAPTOR-M3G. The comparisons demonstrated good agreement, with the calculated reaction rates exceeding the measured reaction rates by 14%. Removal of an apparently outlying measurement improves the agreement to 11 %. Since the calculated reaction rates are generally higher than the corresponding measured rates, the fluence values calculated using this method are considered to be conservative. These comparisons provide supporting evidence that the use of 30 methodologies in the extended beltline region can meet the 20% uncertainty criterion in Regulatory Guide 1.190 for neutron fluence calculations.
Table 3-5 Comparison of a Representative Westinghouse 4-Loop Plant 54 EFPY Fluence Values using DORT, TORT, and RAPTOR-M3G(1l
Fluence Value Calculated Fluence Value Calculated Fluence Value Calculated using DORT
(n/cm2 E>1.0 MeV) using TORT
(n/cm2 E>1 .0 MeV) using RAPTOR-M3G (n/cm2 E>1.0 MeV)
Inlet Nozzle Outlet Nozzle Inlet Nozzle Outlet Nozzle Inlet Nozzle Outlet Nozzle
1.23 X 10¹⁷ 0.667 X 10¹⁷ 0.428 X 10¹⁷ 0.200 X 10¹⁷ 0.567 X 10¹⁷ 0.274 X 10¹⁷
Note:
1. The location of the calculated fluence is at the inside surface of lowest extent of the nozzle-forging-to-shell weld .
PWROG-15109-NP February 2018 Revision 0
••• This record was final approved on 2/22/2018 11 :54:21 AM. ( This statement was added by the PRIME system upon its validation)

Top of Active Fuel
WESTINGHOUSE NON-PROPRIETARY CLASS 3 3-22
Figure 3-8 Location of the Top Support Plug Relative to the Top of the Active Fuel and the Reactor Vessel Nozzles
3.4.3 Neutron Streaming
It is recognized that there is neutron streaming up the cavity to the nozzle region from the beltline. Because of this, the traditional fluence attenuation equation used in the beltline (Regulatory Guide 1.99, Revision 2) is not appropriate in the nozzle region when only considering fluence calculated at the inside surface. The fluence profile has been calculated along the 45-degree cut from the nozzle corner to the RPV outer diameter [83] . The results show for the Westinghouse 3-loop and 4-loop designs that there is a slightly higher fluence at the location where the shallow flaws are postulated than at the inside surface. Since this increase is relatively small , it is more than compensated for as discussed in Sections 3.4.1 and 3.4.2.
This analysis also showed that the fluence at the outside diameter lowest extent of the nozzles can be significantly higher than the fluence at the lowest extent of the nozzle forging at the RPV inside surface due to cavity neutron streaming [83] . The stresses at the inlet and outlet nozzles both due to pressure and the thermal cooldown transient can be seen in the Section 4.8 figures from the 30 finite element analysis. These figures demonstrate that the stresses at the lowest extent outside diameter of the nozzles are significantly lower than at the nozzle inside corner, and when pressure stress and thermal stress are considered together, the combined stress is
PWROG-15109-NP February 2018 Revision 0
••• This record was final approved on 2/22/2018 11 :54:21 AM. ( This statement was added by the PRIME system upon its validation)

WESTINGHOUSE NON-PROPRIETARY CLASS 3 3-23
likely compressive. Even if the lowest extent of the nozzles at the outside diameter of the RPV is embrittled more due to the higher fluence than the other locations, a flaw could not propagate since the stress is compressive or very low. As is discussed in Section 4.8, the flaw is postulated at the nozzle inside surface corner at a geometric discontinuity where the highest stresses exist. As a result, the nozzle inside surface corner is the limiting location, and this location is where the fluence is considered for embrittlement.
3.4.4 Nozzle Neutron Embrittlement Conclusion
Although there is not enough data available to generically support quantitative reductions in fluence values based on the fluence value location and fluence evaluation method, the reductions shown in the available data demonstrate that the fluence values used in this assessment are very conservative. The fluence at the location of the postulated flaws is expected to be significantly lower than the screening limit shown in Figure 3-7. Even for the few nozzles which had a fluence higher than the screening limit at the lowest extent of the forging , nozzle specific evaluations demonstrated that they are bounded by the generic ART discussed in Section 3.5. In addition, the limiting SIF location is the outlet nozzle corner due to the geometric difference (See Section 5.1.1 ). The outlet nozzle temperatures are significantly greater than the inlet temperatures and are predicted to have significantly less embrittlement than predictions at inlet nozzle temperatures. Therefore, embrittlement is not considered to be significant and any embrittlement effects for the nozzle postulated flaw locations can be neglected.
3.4.5 Future Increased Nozzle Fluence Projections
When a licensee applies for SLR or the nozzle fluence projections increase for other reasons, the new projected nozzle fluence values can be compared to the fluence screening criterion establ ished in Section 3.4 (4.28 x 10¹⁷ n/cm2
) . If the projected nozzle corner fluence remains less than the screening criterion, then this analysis is applicable. If the fluence exceeds the screening criterion, then a shift can be calculated for those nozzles on a plant-specific basis using an NRC approved method; as long as the shift remains below 25°F or the plant-specific nozzle ART values remain below the ART used in this report, then this analysis is applicable.
PWROG-15109-NP February 2018 Revision 0
*** This record was final approved on 2/22/2018 11 :54:21 AM. ( This statement was added by the PRIME system upon its validation)

WESTINGHOUSE NON-PROPRIETARY CLASS 3 3-24
3.5 ADJUSTED REFERENCE TEMPERATURE
The generic nozzle forging RTT0 discussed in Section 3.1.2.2 along with the improvement near the surface for the postulated small flaw as described in Section 3.2 is as follows:
• Generic RTT 0
Alternate generic mean RT NOT = RTTa = -66.4 °F
Margin = o1 = 54.5°F
• Near-Surface Toughness
~RT NOTsurface = -36.5°F
01surface = 28.9°F
The surface effect on toughness is statistically independent from the uncertainty in RTT0;
therefore, these uncertainties can be combined using the square root of the sum of the squares as is recommended in Regulatory Guide 1.99, Revision 2:
ART= -66.4°F - 36.5°F + 2(54.5°F2 + 28.9°F2}* = 21°F (Conservatively rounded up)
Reference [84] demonstrates that the measured near-surface RTT0 and adjusted near surface RTT0 data is likely normally distributed using the Anderson-Darling test and that 99% of the data is expected to be bounded by the 21 °F near-surface generic alternate RT NOT·
Section 3.4 demonstrated that the embrittlement effects for the nozzle postulated locations can be neglected if the nozzle fluence value is less than 4.28 x 10¹⁷ n/cm2
. All U.S. PWR nozzles have a fluence value below this threshold for 60 years or were dispositioned individually. Therefore, no embrittlement shift term or associated uncertainty is required. The conservative generic ART for the nozzle corners that is used in this analysis for the location of the postulated small flaws is 21 °F. For deeper postulated flaws, the generic RTT0 of 43°F is also used (Section 3.1.2.2).
PWROG-15109-NP February 2018 Revision 0
*** This record was final approved on 2/22/2018 11 :54:21 AM. ( This statement was added by the PRIME system upon its validation)

WESTINGHOUSE NON-PROPRIETARY CLASS 3 4-1
4 STRESS INTENSITY FACTOR CALCULATION
Detailed three-dimensional finite element analyses (30 FEAs) of the RPV inlet and outlet nozzles were performed to derive stresses and stress intensity factors (SIFs) for development of nozzle P-T limit curves.
Nozzle cooldown P-T limit curves were generated using two different methods, which both comply with ASME Section XI , Appendix G:
1. Various small flaw sizes and aspect ratios (Section 2) were explicitly modeled in the 30 FEAs to calculate the SIFs (described in detail in Section 4). The pressure and thermal transient SIFs were then combined to develop nozzle P-T limit curves (Section 5.1.1 ).
2. A nozzle corner flaw size, comparable to the beltline Yi thickness flaw (-2.1-inch flaw depth) used in traditional P-T curves, was postulated using stresses from unflawed finite element models (FEMs) with the ASME Section XI , Appendix G SIF solution. This approach using the modeled nozzle geometries is described in Section 5.1 .2.
4.1 NOZZLE GEOMETRIES MODELED
The stress and fracture mechanics analyses were initially performed for a Westinghouse designed 4-loop PWR 28-inch diameter inlet nozzle and a 30-inch PWR outlet nozzle (baseline cases). These particular nozzle FEMs are shown in Figure 4-1 and Figure 4-2 for the inlet and outlet nozzles, respectively. The geometry and material used in the development of the FEM for the inlet and outlet nozzles is considered to be representative and useful for identifying the important characteristics that need to be considered to ensure bounding analyses are performed for all the U.S. PWR designs [Westinghouse 2-loop, 3-loop, 4-loop, Combustion Engineering and Babcock and Wilcox (B&W)] based on the consideration of geometry, primary and secondary stresses, and the material specifications.
From the stress analysis perspective, the primary stresses considered in the fracture mechanics are due to the internal pressure within the RPV. The primary stresses are used intrinsically to calculate the SIF for pressure along the postulated crack front. The basis for using a representative RPV design for determining the SIFs is that all of the PWR RPVs were constructed to withstand the design pressure necessary for the plant operation at high pressures. Therefore, the design thickness calculated per ASME Section Ill was based on the consideration of the primary stress due to high internal design pressures with nozzle reinforcement considerations. The internal hoop and axial pressure stresses are related to the internal pressure based on a ratio of the RPV inside radius (R) to the wall thickness (t). As a result, the R/t ratios for the RPV are similar for the design pressures for all PWRs. Based on a review of the drawings for the various RPV designs at the nozzle shell regions, the R/t ratio is approximately eight, ranging from seven to nine because of variations in reinforcement thickness in the nozzle region. Thus, the primary stresses and the resulting pressure SIF results are similar for all of the PWR RPV designs. However, to ensure that all design variations are bounded, several diverse plant nozzle designs were modeled for the 30 FEA ensuring that the
PWROG-15109-NP February 2018 Revision 0
••• This record was final approved on 2/22/2018 11 :54:21 AM. ( This statement was added by the PRIME system upon its validation)

WESTINGHOUSE NON-PROPRIETARY CLASS 3 4-2
nozzle shell R/t range extremes were modeled. The different nozzle shell R/t ratios modeled are described in Table 4-1 and are graphically shown in Figure 4-3. The variation in geometry is also important for the consideration of secondary stresses due to the cooldown transient. Thermal stresses are tied to temperature gradients, which are affected by thermal inertial effects due to mass and conduction. For these reasons, variations in both RPV and nozzle geometry can create a range of thermal responses that are important to the development of P-T limit curves.
The models shown in Figure 4-3 are aligned about a common centerline to demonstrate the different sizes and RPV diameters. The important characteristics that affect the nozzle corner stress and SIF were assessed to ensure representative or bounding models were chosen for the whole U.S. PWR fleet. The important characteristics are nozzle shell R/t ratio, clad thickness, nozzle corner geometry, and nozzle diameter. Table 4-1 shows how the chosen plant models either represent or bound the variation of the important characteristics of the operating U.S. PWR fleet. Comparison of modeled baseline and bounding Westinghouse 4-loop nozzle designs are shown in Figure 4-4.
Table 4-1 Model Geometry Comparison
FEM Description
Basel ine Representative Westinghouse 4-Loop Westinghouse 4-loop
Design design Largest diameter outlet
CE System-80 nozzle design;
Comparable to the B&W outlet nozzle desiQn
Bounding Westinghouse 4-loop
Westinghouse 4-Loop design
Design
Westinghouse 2-Loop Representative 2-loop Design Westinghouse design
PWROG-15109-NP
Nozzle Shell Radius/Thickness
Ratio
7.95 Typical 4-loop
8.1 Higher than the
B&W design
8.9 Largest of the Westinghouse
designs 7.3
Smallest of the Westinghouse
desiQns
Clad Thickness
Design maximum
Representative of the thicker B&W
RPV shell cladding
Design maximum
Design maximum
February 2018 Revision 0
••• This record was final approved on 2/22/2018 11 :54:21 AM. (- This statement was added by the PRIME system upon its validation)

WESTINGHOUSE NON-PROPRIETARY CLASS 3
• Cladding included in FEM • Portion of RV Shell • Nozzle Support Features Omitted
Figure 4-1 FEM with Inlet Nozzle, Shell, and Cladding
• Cladding included in FEM • Portion of RV Shell • Nozzle Support Features Omitted
Figure 4-2 FEM with Outlet Nozzle, Shell, and Cladding
PWROG-15109-NP
4-3
February 2018 Revision 0
*** This record was final approved on 2/22/2018 11 :54:21 AM. ( This statement was added by the PRIME system upon its validation)

+
a I
.. ~? 0
PWROG-15109-NP
WESTINGHOUSE NON-PROPRIETARY CLASS 3
Figure 4-3 Diversity of Nozzle Geometries Modeled
4-4
February 2018 Revision 0
••• This record was final approved on 2/22/2018 11 :54:21 AM. ( This statement was added by the PRIME system upon its validation)
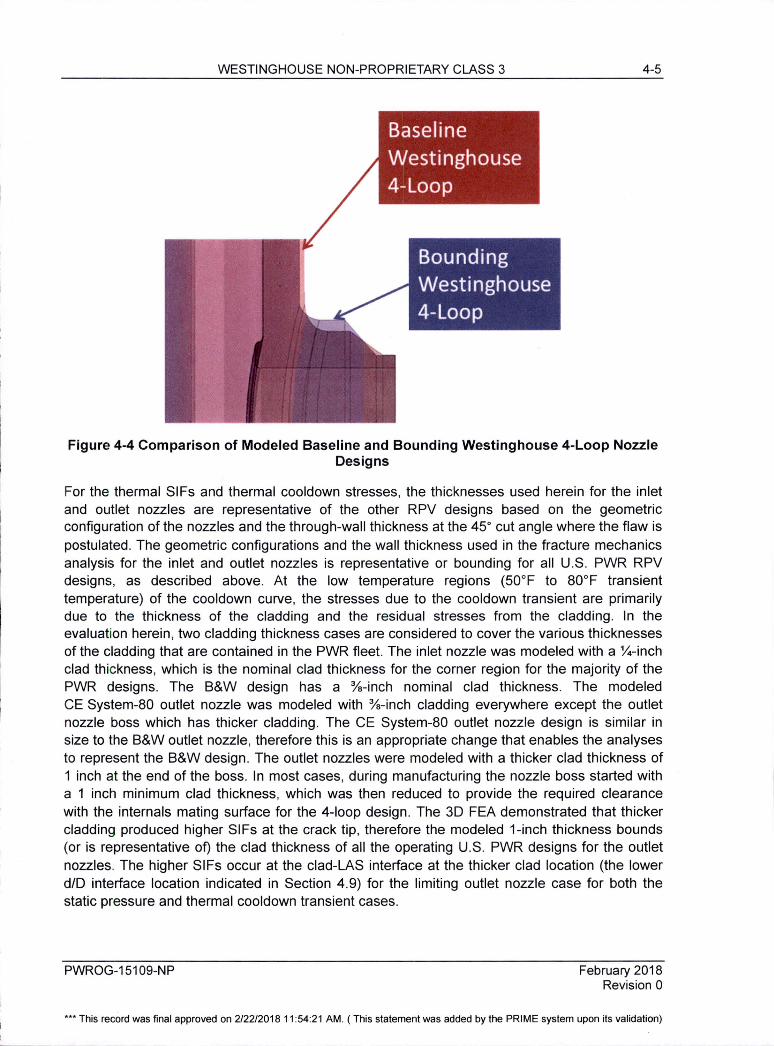
I
l
WESTINGHOUSE NON-PROPRIETARY CLASS 3 4-5
Figure 4-4 Comparison of Modeled Baseline and Bounding Westinghouse 4-Loop Nozzle Designs
For the thermal SIFs and thermal cooldown stresses, the thicknesses used herein for the inlet and outlet nozzles are representative of the other RPV designs based on the geometric configuration of the nozzles and the through-wall thickness at the 45° cut angle where the flaw is postulated. The geometric configurations and the wall thickness used in the fracture mechanics analysis for the inlet and outlet nozzles is representative or bounding for all U.S. PWR RPV designs, as described above. At the low temperature regions (50°F to 80°F transient temperature) of the cooldown curve, the stresses due to the cooldown transient are primarily due to the thickness of the cladding and the residual stresses from the cladding. In the evaluation herein, two cladding thickness cases are considered to cover the various thicknesses of the cladding that are contained in the PWR fleet. The inlet nozzle was modeled with a ~-inch clad thickness, which is the nominal clad thickness for the corner region for the majority of the PWR designs. The B&W design has a %-inch nominal clad thickness. The modeled CE System-80 outlet nozzle was modeled with %-inch cladding everywhere except the outlet nozzle boss which has thicker cladding . The CE System-80 outlet nozzle design is similar in size to the B&W outlet nozzle, therefore this is an appropriate change that enables the analyses to represent the B&W design. The outlet nozzles were modeled with a thicker clad thickness of 1 inch at the end of the boss. In most cases, during manufacturing the nozzle boss started with a 1 inch minimum clad thickness, which was then reduced to provide the required clearance with the internals mating surface for the 4-loop design. The 30 FEA demonstrated that thicker cladding produced higher SIFs at the crack tip, therefore the modeled 1-inch thickness bounds (or is representative of) the clad thickness of all the operating U.S. PWR designs for the outlet nozzles. The higher SIFs occur at the clad-LAS interface at the thicker clad location (the lower d/D interface location indicated in Section 4.9) for the limiting outlet nozzle case for both the static pressure and thermal cooldown transient cases.
PWROG-15109-NP February 2018 Revision 0
••• This record was final approved on 2/22/2018 11 :54:21 AM. ( This statement was added by the PRIME system upon its validation)

WESTINGHOUSE NON-PROPRIETARY CLASS 3 4-6
Thus, the diversity of PWR inlet and outlet nozzles considered in the evaluations herein are representative or bounding for all the U.S. PWR RPV designs and configurations.
4.2 MODEUMESH
30 FEMs of the inlet and outlet nozzles were created using ANSYS® 14.5.7. Flaw sizes of various aspect ratios (e.g ., circular and semi-elliptical) are incorporated into the FEMs. A temperature degree of freedom (DOF) model and a displacement DOF model are created for each nozzle and flaw geometry set. The temperature DOF model inputs the conservative cooldown transient described in Section 4.7.3. The temperature DOF generates spatiallyvarying temperature profiles at discrete time points during the plant cooldown transient. The temperature profiles, RCS pressure transients, and RPV safe-end mechanical loads are input to the displacement DOF models. The displacement DOF models output, spatially-varying stress profiles at discrete time points during the cooldown transient. The stress and displacement results at the flaw tip are further processed to calculate SIFs.
The inlet and outlet nozzle baseline FEMs used various flaw shapes and sizes. The flaw geometries are shown in Table 4-2 and in Figure 2-3. The smallest flaw depths (i.e., cases 1, 2, 5, and 6) are based on a surface breaking flaw extending 0.05 inch into the LAS nozzle forging through the cladding . The dimensions were sized to allow a suitable mesh to be developed without mesh discontinuities affecting the results. Cases 3, 4, 7, and 8 were sized to have 0.5-inch flaw depth into the LAS, which is conservative relative to the NOE detection capability as described in Section 2. The flaw location in the FEM is located on the vertical (x-y) plane because the hoop stress from the RPV shell adds to the hoop stress at the nozzle, which is conservative. The orientation of the nozzle mechanical loads was adjusted to maximize the SIF in the flaw; however, the mechanical SIFs have insignificant impact on the P-T limit curves.
The displacement DOF models used for pressure and thermal stress analyses contain 20-noded hexahedral elements and 10-noded tetrahedral elements. The temperature DOF models were generated by converting the stress elements to thermal hexahedral and tetrahedral elements.
The models include a portion of the RPV shell , with boundaries sufficiently distant from the region of interest as to not affect the results. For the mechanical load models, a portion of main loop piping was added to move the load application point away from the region of interest.
PWROG-15109-NP February 2018 Revision 0
••• This record was final approved on 2/22/2018 11 :54:21 AM. ( This statement was added by the PRIME system upon its validation)

WESTINGHOUSE NON-PROPRIETARY CLASS 3 4-7
Table 4-2 Flaw Case List
Flaw Flaw Flaw Location Ratio, d/D(3l
Depth Length Deepest LAS(5l LAS(5l
Case Geometry (in) (1l (in) Aspect Ratio(2l Point(4l Surface 1 Surface 2
1 Inlet 0.3 0.6 2: 1 (Circular) 0.500 0.319 0.681
2 0.3 1.8 6 : 1 (Semi-elliptical) 0.500 0.277 0.723
3 0.75 1.5 2 :1 (Circular) 0.500 0.120 0 .880
4 0 .75 4.5 6: 1 (Semi-elliptical) 0.500 0.090 0 .910
5 Outlet 0.9 1.8 2 :1 (Circular) 0.651 0.439 0.846
6 0.9 5.4 6: 1 (Semi-elliptical) 0.662 0.435 0 .875
7 1.18 2.36 2 : 1 (Circular) 0.642 0.367 0.901
8 1.18 7.08 6: 1 (Semi-ellipt ical) 0 .639 0.367 0.898
Notes: 1. Flaw depth is the distance from the deepest point at a 45-degree angle to the clad wetted surface. For the
outlet nozzle, the clad thickness at this point is in transition from 1 tci 0.25 inches (See Section 2). 2. Aspect ratio = Ua, where a is the flaw depth and L is the total flaw length; see Figure 2-2. 3. See Figure 4-21 and Section 4.9.1 for a discussion on flaw location ratio d/D. 4. Deepest point defined at the maximum distance between the flaw tip and the LAS/cladding surface
boundary. 5. Location on flaw where LAS and cladding meet.
4.3 FLAW MODELING METHODOLOGY
Nozzle corner flaws of various sizes and aspect ratios were modeled explicitly in the FE Ms. The nozzle corner flaws were oriented axially relative to the nozzle geometry. The flaws pass through the cladding into the nozzle forging, as shown in Figure 4-5. Examples of the flaw mesh are shown in Figure 4-6 and Figure 4-7. The model is divided into four regions:
1. Singularity mesh generated by a zero-radius sweep (region 1 in Figure 4-6 and Figure 4-7)
2. Fracture affected zone mesh surrounding the flaw tip mesh (region 2) 3. Transition mesh (region 3) 4. Remote mesh on the nozzle and RPV shell
Regions 1 and 2 are composed of 20-noded hexahedral elements, with wedge elements (i.e., degenerate elements) at the flaw tip. Region 3 is composed of degenerate transition elements at the interface to region 4, and tetrahedral elements in the interior region of the buffer zone. Region 4 is composed of coarser 20-noded hexahedral elements.
PWROG-15109-NP February 2018 Revision 0
••• This record was final approved on 2/22/2018 11 :54:21 AM. ( This statement was added by the PRIME system upon its validation)
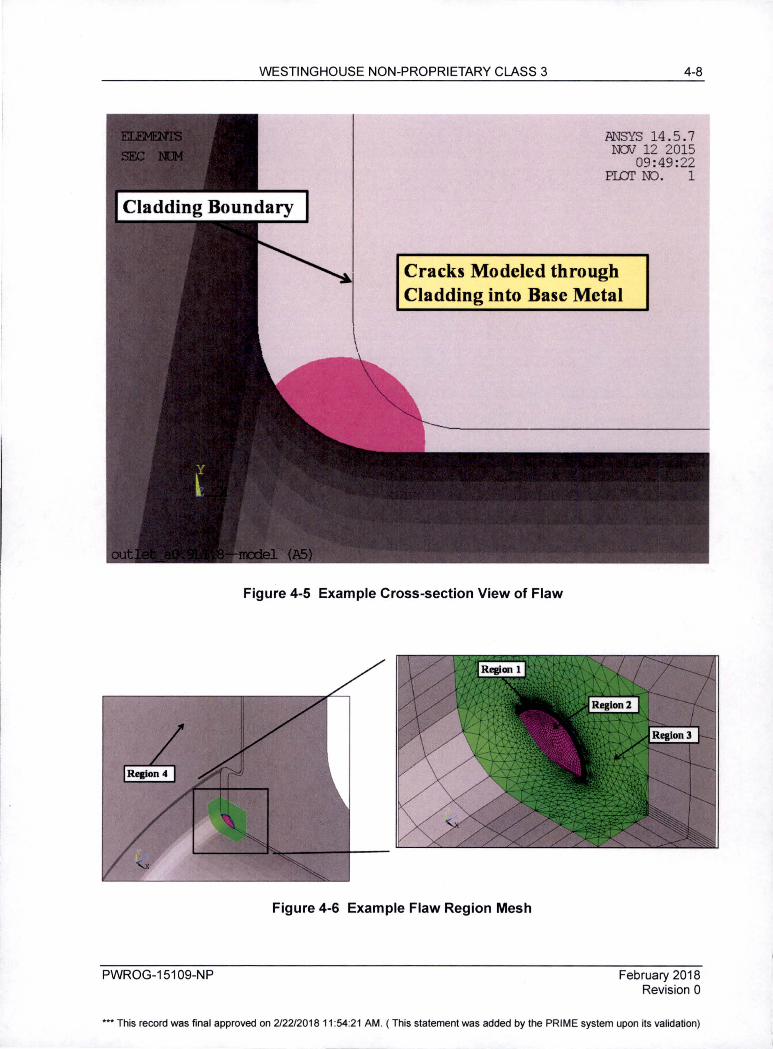
PWROG-15109-NP
WESTINGHOUSE NON-PROPRIETARY CLASS 3 4-8
ANSYS 14 .5 .7 NJii' 12 2015
09 :49 :22 PI.Or ID. 1
Cracks Modeled through Cladding into Base Metal
Figure 4-5 Example Cross-section View of Flaw
Figure 4-6 Example Flaw Region Mesh
February 2018 Revision 0
••• This record was final approved on 2/22/2018 11 :54:21 AM. ( This statement was added by the PRIME system upon its validation)

WESTINGHOUSE NON-PROPRIETARY CLASS 3 4-9
Figure 4-7 Example Flaw Tip Mesh
4.4 THERMAL BOUNDARY CONDITIONS
The surface for temperature application is shown in Figure 4-8. The wetted surface for temperature includes only the inner surface of the RPV shell and nozzle; the flaw gap is assumed to be very small and water in the gap would act as an infinite conductor. This is modeled by coupling the temperatures at the coincident flaw nodes. The RCS flow rate is very large; therefore, it is appropriate to treat the heat transfer coefficient as infinite and directly apply the RCS temperature to the metal surface (i.e. , the metal surface temperature is instantaneously equal to the RCS water temperature) . The model external surfaces are adiabatic because they are insulated . The sliced surfaces at the top, bottom, and sides of the model are adiabatic because the un-modeled structure would not significantly impact the thermal gradients in the region of interest. The temperature gradients would be radial , which is captured accurately with the adiabatic boundary condition.
PWROG-15109-NP February 2018 Revision 0
*** This record was final approved on 2/22/2018 11 :54:21 AM. ( This statement was added by the PRIME system upon its validation)

WESTINGHOUSE NON-PROPRIETARY CLASS 3
RCS Temperature applied to Inside Surfaces excluding Crack Face
High Flow Region ~ T .,,r = T bulk
Figure 4-8 Wetted Surface for Bulk Temperature
4.5 STRUCTURAL BOUNDARY CONDITIONS
4-10
The boundary conditions consist of displacement restraints, system pressure, mechanical loads and temperature described in the following sections.
4.5.1 Displacement Restraints
The RPV nozzle boundary conditions are shown in Figure 4-9 through Figure 4-11 . The bottom and side boundaries to un-modeled portions of the RPV shell are fixed normal to the boundary surface. Therefore, the side boundaries are fixed in the circumferential direction, and the bottom boundary is fixed in the vertical direction. For the quarter-symmetry models used for the outlet nozzle analyses, the bottom boundary is aligned with the centerline of the nozzle, and one of the side boundaries passes through the nozzle centerline, but does not include the flaw face. These conditions are shown in Figure 4-10. For the transient and pressure cases, the top boundary is restrained to remain planar, but allows for upward and radial expansion relative to the centerline of the RPV shell; see Figure 4-11 . The fixed displacement boundaries and planar restraint boundary provide appropriate fixity without over-restraining the model for thermal growth. For the mechanical load cases, the top boundary is fixed vertically to distribute the applied load evenly.
PWROG-15109-NP February 2018 Revision 0
••• This record was final approved on 2/22/2018 11 :54:21 AM. ( This statement was added by the PRIME system upon its validation)
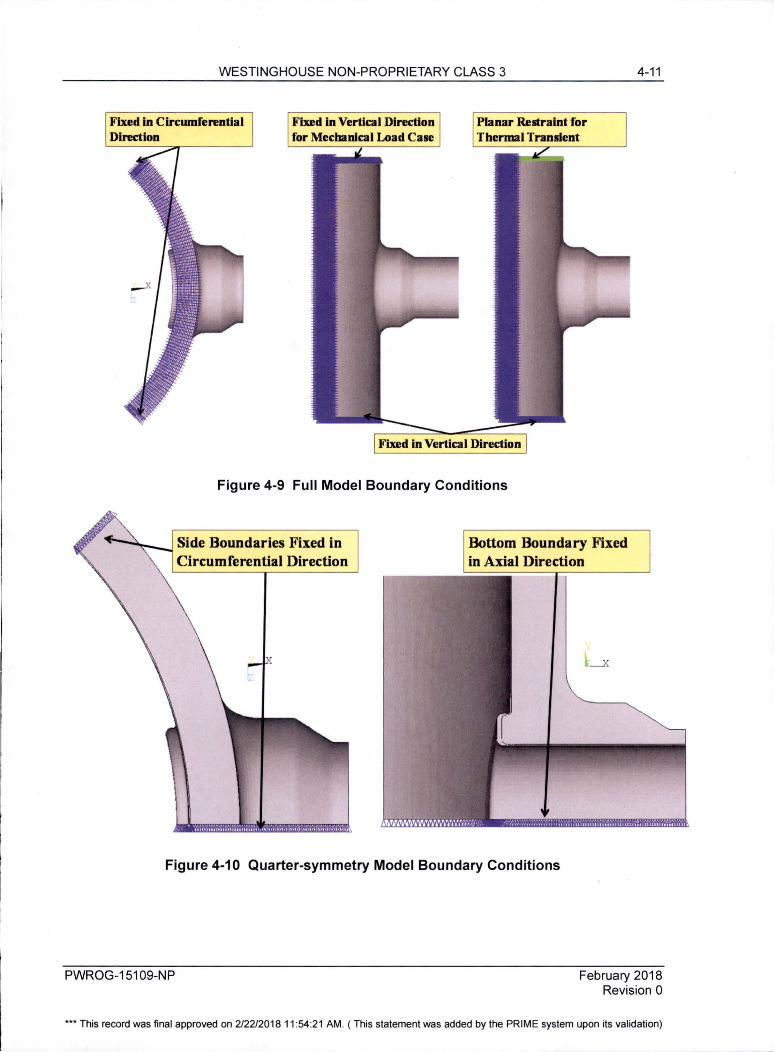
WESTINGHOUSE NON-PROPRIETARY CLASS 3
Fixed In Clrcurnferendal Direction
Fixed In Vertical Direction for Mechanical Load Caiie
Planar Reltralnt for Thermal Tnntlent
Figure 4-9 Full Model Boundary Conditions
Side Boundaries Fixed in Circumferential Direction
Bottom Boundary Fixed in Axial Direction
Figure 4-10 Quarter-symmetry Model Boundary Conditions
4-11
PWROG-15109-NP February 2018 Revision 0
••• This record was final approved on 2/22/2018 11 :54:21 AM. ( This statement was added by the PRIME system upon its validation)

WESTINGHOUSE NON-PROPRIETARY CLASS 3 4-12
RV Top Boundary Planar Restraint 7allows axial and radial deformation
Figure 4-11 Coupled Node Restraint on Top of RPV Shell
PWROG-15109-NP February 2018 Revision 0
*** This record was final approved on 2/22/2018 11 :54:21 AM. ( This statement was added by the PRIME system upon its validation)

WESTINGHOUSE NON-PROPRIETARY CLASS 3 4-13
4.5.2 System Pressure
A unit RCS pressure of 1,000 psi is applied to all wetted surfaces of the displacement DOF models, including the flaw face , as shown in Figure 4-12 . The 1,000 psi is input into the 30 FEM in order to calculate the pressure SIF. The SIF results are combined with the thermal stress, which is then used to calculate the actual limiting pressure (P-T limit curve) using the ASME Kie
curve at a given temperature. The pressure stresses and SIF are linearly related for a given geometry. The nozzle safe-end and RPV shell are not capped ; therefore, a blowoff pressure is calculated to generate the appropriate tensile load on these components. The blowoff pressure is based on the ratio of the uncapped open area to the cross-section area.
RCS Unit Pressure of 1,000 psi applied to Inside Surf aces including Crack Face
Figure 4-12 Pressure Surface
PWROG-15109-NP February 2018 Revision 0
••• This record was final approved on 2/22/2018 11 :54:21 AM. ( This statement was added by the PRIME system upon its validation)

WESTINGHOUSE NON-PROPRIETARY CLASS 3 4-14
4.5.3 Nozzle Mechanical Loads
Nozzle loads from the piping are applied to the displacement DOF model. The loads are for the safe-end; however, the loads are applied at the end of a length of pipe to isolate the boundary conditions for load application . The loads are applied to a node that is rigidly connected to the pipe cut surface. This boundary condition is shown in Figure 4-13.
Nozzle Mechanical Loads applied at end of Pipe Segment
Figure 4-13 Mechanical Load Application Point
4.5.4 Body Temperature
The displacement DOF models input the results of the temperature DOF model. The two types of models are generated from the same mesh; therefore, the temperature contours from the thermal DOF model can be applied directly to the displacement DOF model without interpolation. The temperature contours for each time point in the thermal solution are mapped to every node in the displacement DOF model, which generates only thermal stresses for the cooldown transient.
PWROG-15109-NP February 2018 Revision 0
*** This record was final approved on 2/22/2018 11 :54:21 AM. ( This statement was added by the PRIME system upon its validation)

WESTINGHOUSE NON-PROPRIETARY CLASS 3 4-15
4.6 MATERIAL PROPERTIES
The 1974 ASME Code [85] was used as the Code year of reference to be representative of PWROG plants. SA-508 Class 2 composition is taken from [86] to determine the elastic modulus. The cladding is assumed to be a typical Type 304 stainless steel. The displacement DOF model inputs are elastic modulus, Poisson's ratio , and coefficient of thermal expansion. The temperature DOF model inputs density, thermal conductivity, and specific heat. Poisson's ratio and density are not listed in the 197 4 Code, and are therefore obtained from Table PRO of the 2013 ASME Code, Section II Part D [87] . The ASME Code does not provide specific heat directly; the value is calculated as a function of density, thermal conductivity, and thermal diffusivity.
The linear elastic FEM inputs include elastic modulus, coefficient of thermal expansion , thermal conductivity, and thermal diffusivity. Variations in these properties between different applicable code years for the bounded plants are not expected to significantly change the FEA results.
4.7 LOADS
4. 7 .1 Clad Residual Stress
The cladding on the inside surfaces of the inlet and outlet nozzle corners is thicker than for the RPV beltline. It consists of at least 2 layers of cladding , and the manual shielded metal arc process was used at the nozzle corners . The cladding thickness on the inlet nozzle corner is approximately Yi inch thick (% inch for the B&W design), while the cladding on the outlet nozzle corner at the end of the boss could be up to one inch thick. The thicker cladding can have a higher imposed stress in the LAS than a thinner layer simply due to the greater volume of clad thickness. The cladding imposes tensile stress due to the different thermal expansion coefficients of the stainless steel cladding versus the LAS nozzle forging at lower temperatures.
Residual stresses due to the nozzle/shell attachment weld are not considered in the analysis because they were stress relieved and any remaining stresses that that might still exist are remote from the region of interest.
The Swedish Nuclear Power Inspectorate compiled an extensive summary of the cladding effects on structural integrity in which they reviewed a number of measurement programs conducted on clad RPVs [88]. The authors concluded that it is reasonable to assume a peak clad residual stress at room temperature equal to yield stress of the cladding material (approximately 300 MPa [43 ksi]) . Some measurements are reported at locations on an inlet and an outlet nozzle for the Lemoniz 2 RPV which show peak clad stresses higher than 300 MPa using the ring core method. Based on the cited reference in this report by Leggat, the ring core technique can produce higher results due to the introduction of excessive plastic strains. In addition , the Lemoniz 2 plant never operated. The measurements performed by Neber and Roth as reported in Reference [88] compared the clad residual stress from an RPV head which had been in operation to a component that had never been in operation . The head peak residual stress measurements were lower, which was attributed to stress relaxation during operation. For these reasons, it is concluded that the peak measurements on the Lemoniz 2
PWROG-15109-NP February 2018 Revision 0
••• This record was final approved on 2/22/2018 11 :54:21 AM. ( This statement was added by the PRIME system upon its validation)

WESTINGHOUSE NON-PROPRIETARY CLASS 3 4-16
nozzles are higher than the PWROG fleet of nozzles that have been in operation for decades. Measurements were made by Westinghouse using a layer-removal technique for a two layer clad after stress-relief [89 and 90] . These results show a peak stress in the clad of 20 ksi with a compressive stress peaking at -6 ksi to -17 ksi in the LAS at room temperature. The clad stress through thickness averaged approximately 1 O ksi.
In another reference , a numerical simulation was performed with a finite element code [91]. The heat source of the model representing the welding process was calibrated against the temperature profiles measured during welding . The temperature-dependent material properties, as well as the transformation behavior of the ferritic LAS, were taken into account. The calculated residual stresses showed tensile stresses in the cladding with significant variation depending on location relative to the clad strip edge in addition to the distance from the surface. This reasonably explains some of the variation seen among the various measurement programs reported in the literature. Other factors which would cause variation would be the heat input, welding speed, clad thickness, and alloy composition . The analysis simulation also showed a significant compressive stress in the LAS that is in agreement with measurements performed with an X-ray diffraction technique and that is needed to counteract for the tensile stress in the clad .
The NESC-IV [92] (and PVP2015-45086 [93]) measurements are more representative of the . Ringhals head measurements [88] and scaled down Lemoniz 2 results . These results were determined to be representative of the U.S. PWR operating fleet nozzles and are reproduced in Figure 4-14.
-·;; =-"' "' ~ "" -00
40
35
30
25
20
15
IO
5
0 0. ,o
-5
- IO
-15
Cladding - Thickness
0.10 0.20
0.25 inches
Distance from Cladding Surface [in]
-+-axial ..... hoop
Figure 4-14 Clad Residual Stress Profile through Thickness [92]
PWROG-15109-NP February 2018 Revision 0
••• This record was final approved on 2/22/2018 11 :54:21 AM. ( This statement was added by the PRIME system upon its validation)

WESTINGHOUSE NON-PROPRIETARY CLASS 3 4-17
For the thermal transient analyses of the nozzle corner flaws discussed in this document, the cladding in the displacement DOF models was provided with an elevated reference temperature for the CTE. This offset generated a tensile stress at room temperature, and was calibrated for each model type (i.e., inlet and outlet) to generate the appropriate average stress in the postulated flaw location. A test analytical model of a representative inlet was created to determine the appropriate average residual stress from the test data . The test model includes an inlet type nozzle on a thick flat plate, which is an approximation of the shell as being locally flat. The through-wall varying residual stress was input directly into the test FEM using table arrays and local coordinate systems. The test model input included only tensile cladding residual stresses because it is conservative to not include the compressive stresses in the LAS, as shown in Figure 4-14. The stresses from Figure 4-14 are based on limiting hoop and axial stresses with respect to the nozzle. The SIF solution was generated along the flaw front, representing the most accurate solution.
The analysis method described in the previous paragraph represents the most accurate solution by util izing the spatially varying (i.e . through the th ickness of the cladding) residual stress profile . However, this methodology is not practical for the wide variation of geometries used in this report for the determination of P-T limit curves, therefore an alternate approach was taken to demonstrate that the thickness varying residual stress profile could be replaced with an average residual stress and produce a similar result at the flaw tip. A series of analyses were made adjusting the cladding CTE reference temperatu re in the same test model as described in the previous paragraph . The variation of CTE reference temperature is a common approach for developing a pre-stress between two materials. This model was analyzed with the flaw open and with the flaw closed; load step 1 provides the SIF values for the activated flaw for a given reference temperature value and load step 2 provides the average cladding stress for the same reference temperature with the flaw deactivated. The iterations were performed until the SIF result from load step 1 (i.e., flaw open) was similar to the SIF from the explicit residual stress solution described in the preceding paragraph. When this was achieved , the average stress from load step 2 (i .e., flaw closed) was recorded . Figure 4-15 shows the SIF solution using the explicitly-applied data and the SIF solution for a uniform 22 ksi developed using the offset reference temperature method. The two methods show good agreement in the LAS region . The uniform stress value determined through the iterative process is similar to the calculated average of the cladding stress from Figure 4-15. Therefore, it is appropriate to use the analysisderived uniform stress value of 22 ksi for the detailed inlet and outlet models. For the detailed models used in the analysis in Section 4.2, the cladding reference temperature was adjusted until the desired average cladding stress was achieved ; this reference temperature is unique to each nozzle type due to different global stiffness.
In summary, the 30 FEM was designed to match the SIF imposed by the measured residual stress profile at room temperature as shown in Figure 4-14 rather than matching a specific stress-free temperature as was done in the ORNL work [18] .
PWROG-15109-NP February 2018 Revision 0
*** This record was final approved on 2/22/2018 11 :54:21 AM. ( This statement was added by the PRIME system upon its validation)

WESTINGHOUSE NON-PROPRIETARY CLASS 3 4-18
"' d = 10 ·;;;
=--::( 5
~ T
+-
0 J
+- ' l t I
HI j: --+
+ + +- .. _,_ + -
I
0.0 0.1 0.2 0.3 0.4 0.5 0.6 0.7 0.8 0.9 1.0
Position (d/D)
- Explicit through-wall varying stress - Offset CTE Reference Temperature - - LAS boundary
Figure 4-15 SIF Result Comparison for Explicit Method and Reference Temperature Method
4.7.2 Pipe loads
The RPV nozzle mechanical loads included typical deadweight and normal operation (NOp) thermal loads. The loads were applied to the model to maximize the hoop stress at the postulated flaw location. This included combining the magnitude of the deadweight and NOp loads to generate the largest magnitude even when the signs were different. The 3D FEA demonstrated that there was insignificant impact of pipe loads on the nozzle P-T limit curves.
4. 7 .3 Cool down Rate
It has been determined that the limiting case is the normal cool-down transient, therefore only the normal cooldown transient was analyzed in this evaluation. The reasons for this determination are:
• Siegele, et al. [20] found that the normal cooldown transient is more severe than the heatup transient for the nozzles,
• Due to the differing thermal expansion of the cladding and the LAS, the warmer cladding relative to the LAS shell during heatup would result in a reduction of stress on a postulated inside surface flaw,
PWROG-15109-NP February 2018 Revision 0
••• This record was final approved on 2/22/2018 11 :54:21 AM. ( This statement was added by the PRIME system upon its validation)

WESTINGHOUSE NON-PROPRIETARY CLASS 3 4-19
• Due to the temperature gradient during heatup, the thermal stress (excluding the cladding contribution) would produce compressive stress on the postulated inside surface flaw,
• The radii for the inside corners are significantly smaller than for the outside nozzle-toshell transition making the postulated inside surface corner flaw limiting due to higher stress concentration .
Initially, the following realistic bounding cooldown transient was used (Figure 4-16) for all the cases identified in Table 4-2 for the baseline cases:
• 100°F/hr from operating temperature to 110°F then switch to • 50°F/hr from 110°F to 100°F then
• 20°F/hr below 100°F.
600
500
.-, ~
400 0 '-' ~ .. = 300 -ell .. ~ Q,
e ~ 200
100
0 0 2 3 4 5 6
Time (hr)
-a-RCS Temperature
7 8
Figure 4-16 Bounding Normal Cooldown Transient
9
This transient bounds the hypothetical fastest cooldown rate that the residual heat removal (RHR) systems (or shut down cooling systems [SOC]) can achieve under the best circumstances for any U.S. PWR design. In addition, 32 actual cooldown transients were reviewed from the 2, 3, and 4-loop Westinghouse and various CE designs. Based on data pertaining to the 32 cooldown transients from six different plants, it is concluded that:
• The maximum plant cooldown rate averaged from actuation of RHR or SOC system until just prior to shutdown of last RCP was 13°F/hour
• The maximum plant cooldown rate averaged from just prior to shutdown of last RCP until near atmospheric pressure was 11 °F/hour
PWROG-15109-N P February 2018 Revision 0
••• This record was final approved on 2/22/2018 11 :54:21 AM. ( This statement was added by the PRIME system upon its validation)

WESTINGHOUSE NON-PROPRIETARY CLASS 3 4-20
• The lowest temperature at which any significant pressure (> 200 psig) was maintained in the RCS was above 90°F for all cooldowns. At and below this temperature, there was no significant pressure in the RCS. Additionally, the maximum temperature change in any 1-hour increment with all RCPs shut down never exceeded 45°F (above 110°F), with averages throughout the phase never exceeding 11 °F/hour
Based on the hypothetical most aggressive case RHR or SOC system capability and operating experience, the above cooldown transient is conservative.
However, since some licensees have allowable cooldown rates of 100°F/hour from operating temperature to 50°F, a 100°F/hour cooldown rate was used in the 30 FEA for the limiting case (outlet nozzle, 6:1 flaw aspect ratio , 0.5-inch deep flaw into LAS) for several nozzle geometries. The 100°F/hour rate from operating temperature to 50°F is very conservative relative to what can be realistically achieved at lower temperatures and is consistent with the U.S. PWR highest allowable cooldown rate .
4.8 STRESSES AT LIMITING LOCATIONS
Figure 4-17 through Figure 4-20 show the stresses in the inlet and outlet models without a flaw at the nozzle corner. These plots demonstrate the nozzle corner is the limiting location for both pressure and thermal gradient induced stresses, which confirms the selection of this region as the location for placing the detailed flaw meshes.
Nozzle Corner Stress bounds Nozzle/RV \\'eld
Hoop Stress (psi) -CJ
CJ CJ -
-1033 .3 1647 .39 4328 .08 7008 .77 9689 .46 12370 .2 15050 .8 17731.5 20412 .2 23092 .9
Figure 4-17 Inlet Model without Crack- Stress for 1,000 psi Pressure
PWROG-15109-NP February 2018 Revision 0
••• This record was final approved on 2/22/2018 11 :54:21 AM. ( This statement was added by the PRIME system upon its validation)

WESTINGHOUSE NON-PROPRIETARY CLASS 3
Nozzle Corner Stress bounds Nozzle/RV Weld
Hoop Stress (psi) -D D D
D D D -
-28514 .7 -23490 .4 -18466 .2 -13442 -8417 . 75 -3393 .52 1630 .71 6654 . 94 11679 .2 16703 .4
Figure 4-18 Inlet Model without Crack- Maximum Stress during Cooldown
Hoop Stress (psi) -CJ CJ
CJ CJ CJ -Nozzle Corner Stress
bounds Nozzle/RV \Veld
-74 . 6223 2329 . 93 4734.47 7139 . 02 9543 .57 11948 .1 14352.7 16757 .2 19161.8 21566 .3
Figure 4-19 Outlet Model without Crack- Stress for 1,000 psi Pressure
4-21
PWROG-15109-NP February 2018 Revision 0
*** This record was final approved on 2/22/2018 11:54:21 AM. ( This statement was added by the PRIME system upon its validation)

WESTINGHOUSE NON-PROPRIETARY CLASS 3 4-22
Hoop Stress (psi) -CJ CJ CJ
CJ CJ CJ -
Nozzle Corner Stress bounds Nozzle/RV Weld
-36873 .8 -30819 .8 -24765 .7 - 18711 . 6 - 12657 . 6 - 6603 .48 -549 .417 5504 . 65 11558 .7 17612 .8
Figure 4-20 Outlet Model without Crack - Maximum Stress during Cooldown
The analyses reported in an ORNL report [18] showed higher stresses for the 1,000 psi unit pressure cases. Close inspection of the figures of the model provided in [18] shows a simpler fillet on the inlet nozzle corner; the top-view in the drawing used for this FEM of the inlet nozzle corner shows a more complicated blend between the conical shaped opening and the RPV inner diameter. This creates a larger effective radius of curvature that lowers the pressure induced stresses. For the outlet nozzle, it is not apparent from inspection of the ORNL model if the significant cladding build-up on the nozzle corner was included; the thicker cladding is present in the FEM included in this report and would tend to reduce stresses for pressure loading.
4.9 STRESS INTENSITY FACTOR RESULTS
In this section , results are presented for the outlet nozzle. Although evaluations were carried out for both inlet and outlet nozzles with the cases identified in Table 4-1, only the results for the limiting case (outlet nozzle, 6: 1 flaw aspect ratio , 0.5-inch deep flaw into LAS) are shown. Demonstration that the outlet nozzle is more limiting than the inlet nozzle is contained in Section 5.1.1.
4.9.1 Static Load Cases
A 1,000 psi pressure case and a mechanical load case were performed for the flaw cases from Table 4-2. The "CINT" command in ANSYS was used to calculate the SIF during solution
PWROG-15109-NP February 2018 Revision 0
••• This record was final approved on 2/22/2018 11 :54:21 AM. ( This statement was added by the PRIME system upon its validation)

WESTINGHOUSE NON-PROPRIETARY CLASS 3 4-23
processing. This command performs contour integration at several distances about the flaw front to generate SIF values, which were extracted for each case. The output for six contours is provided , which show convergence from contours 2 through 6 in Figure 4-22 through Figure 4-24.
Example plots for the outlet nozzle with crack depth, a, equal to 1.18 inches and the crack length, L, equal to 2.36 inches and 7.08 inches are shown in Figure 4-22 through Figure 4-24. The curves for the pressure case shown in Figure 4-22 and Figure 4-23 demonstrate the difference in the location of the maximum SIF (i.e., inversion of the curve) for circular and semi-elliptical flaws , respectively. The normalized location along the flaw front, d/D, is illustrated in Figure 4-21. Figure 4-24 shows the relatively low SIF for deadweight plus normal operating thermal mechanical loads.
Additional static pressure results for the geometries listed in Table 4-1 are compared to the baseline results in Figure 4-25. The comparison shows that the CE System-BO and the bounding Westinghouse 4-loop geometries are bounding. The three limiting results are included in the evaluation in Section 5.
PWROG-15109-NP
d/D = 1.0 d/D = 0.5 d/D = 0.0
Total Flaw Tip
Figure 4-21 SIF Output Location Definition
February 2018 Revision 0
••• This record was final approved on 2/22/2018 11 :54:21 AM. ( This statement was added by the PRIME system upon its validation)

"' ,:;
·= ·;;; ..:.i:
-:::to:
45
40
35
30
25
20
15
10
5
0 0.0 0.1
WESTINGHOUSE NON-PROPRIETARY CLASS 3
0.2 0.3
I
:-1
I I I~
1--, ---1-
I I 1-1-1-
I I I-+ I
I -1 I
r1
0.4 0.5 0.6
Position (d/D)
t
0.7 0.8 0.9
- contour I - contour 2 - contour 3 - contour 4 - contour 5 - contour 6 - - - LAS boundary
4-24
1.0
Figure 4-22 Pressure SIF along Crack Front for Baseline Outlet Nozzle with a = 1.18 Inch, L = 2.36 Inch Flaw for 1,000 ps i
I PWROG-15109-NP February 2018 Revision 0
I ____ ~· This record was final approved on 2/22/2018 11 :54:21 AM. ( This statement was added by the PRIME system upon its validation)

WESTINGHOUSE NON-PROPRIETARY CLASS 3 4-25
40
35
30
"' 25 = .!:
] 20 -~ 15
10
5
0 0.0 0.1 0.2 0.3 0.4 0.5 0.6 0.7 0.8 0.9 1.0
Position ( d/D) contour I - contour 2 - contour 3 - contour 4 - contour 5 - contour 6 --- LAS boundary
Figure 4-23 Pressure SIF along Crack Front for Baseline Outlet Nozzle with a= 1.18 Inch, L = 7.08 Inch Flaw for 1,000 psi
0 .---+---+----+--"'--+----+----+----+----+---fl----t 0.0 0.1 0.2 0.3 0.4 0.5 0.6 0.7 0.8 0.9 1.0
Position (d/D) - contour I - contour 2 - contour 3 - contour 4 - contour 5 - contour 6 --- LAS boundary
Figure 4-24 SIF for Baseline Outlet Nozzle along Crack Front with a= 1.18 Inch, L = 7.08 Inch Flaw for Deadweight + Normal Operating Thermal Mechanical Load
PWROG-15109-NP February 2018 Revision 0
••• This record was final approved on 2/22/2018 11 :54:21 AM. ( This statement was added by the PRIME system upon its validation)

WESTINGHOUSE NON-PROPRIETARY CLASS 3 4-26
40
35
30
"i 25 = C
·;;; .:ii: 20
,;;: 15 - WEC2-Loop
- Bounding WEC 4-Loop
10 - CE System-SO
- Baseline WEC 4-Loop
5
0 0.0 0.1 0.2 0.3 0.4 0.5 0.6 0.7 0.8 0.9 1.0
Position (d/D)
Figure 4-25 Pressure SIF along Crack Front for Outlet Nozzle for Different Modeled Geometries using Limiting LAS Flaw Size of 6:1 Ratio, 0.5-lnch Depth
4.9.2 Cooldown Transient
The flaw cases from Table 4-2 were evaluated with the cooldown transient from Figure 4-16 and the residual stress (Figure 4-14). A time-history of K values for all locations along the crack front was extracted from the model.
Example plots for the outlet nozzle with crack depth, a, equal to 1.18 inches and the crack length , L, equal to 7.08 inches are shown in Figure 4-26 and Figure 4-27 for the time-history and time point for the maximum SIF, respectively. The time-history plot shows data for locations in the LAS only.
The time-history solution shows that the peak SIF occurs at the end of the 100°F/hour cooldown rate when the nozzle temperature gradient is the largest both for the transient with the constant 100°F/hour to 60°F and the stepped cooldown rate transient. The SIF decreases during the 50°F/hour and 20°F/hour portions of the cooldown transient, and continues to reduce as the gradient settles to a steady-state condition at 60°F (i.e., no temperature gradient) .
Additional cooldown results for the geometries listed in Table 4-1 are compared to the baseline results in Figure 4-28. The comparison shows that the CE System-80 design is bounding of the other geometries due to the larger outlet nozzle diameter. These limiting results are included in the evaluation in Section 5. The additional nozzles were analyzed with a constant cooldown
PWROG-15109-NP February 2018 Revision 0
••• This record was final approved on 2/22/2018 11 :54:21 AM. ( This statement was added by the PRIME system upon its validation)

WESTINGHOUSE NON-PROPRIETARY CLASS 3 4-27
transient of 100°F/hour from operating temperature to 50°F, while the "baseline" cases had the changing cooldown rate shown in Figure 4-16 down to 60°F. The additional cases are very conservative as shown in Figure 4-28 by the higher peak stress at the end of the cooldown when plant systems cannot achieve the 100°F/hour rate. The Westinghouse 2-loop design is not considered in Section 5, since it is not close to limiting in both the static and transient cases as shown in Figure 4-25 and Figure 4-28.
40
3!i
30
~~
.;:;-, :?O al .8 15 ·-.,, 10 Q. .... 5 ~
0
-5
-10
-15
-20
-25 0 5,000 10.000 15 .000 20.000 25 .000 30.000 35,000
T ime (s]
Figure 4-26 SIF Time-history for Baseline Outlet Nozzle with a= 1.18 Inch, L = 7.08 Inch Flaw at Various Locations along the LAS Crack Front during Cooldown
(Thermal and Residual)
PWROG-1 5109-NP February 2018 Revision 0
••• This record was final approved on 2/22/2018 11 :54:21 AM. ( This statement was added by the PRIME system upon its validation)

WESTINGHOUSE NON-PROPRIETARY CLASS 3
,;;-40 +---.'---+---+---+----i-+---+----+----+--......... ~t--~-tt~ .-.---i ,.; .!: ] ~35 4--,j~~+---+---+-____.--\---+---t----t----t----t--....-,.-ll'--- -\---l ~
20 ... __ ... __ ... __ ... _ _ ... __ ...., __ ...., __ ...., __ ...., ___ _ _
0.0 0.1 0.2 0.3 0.4 0.5 0.6 0.7 0.8 0.9 1.0
Position (d/D) - K l --- LAS boundary
Figure 4-27 SIF for Baseline Outlet Nozzle with a= 1.18 Inch, L = 7.08 Inch Flaw at t = 16,092 Seconds of Cooldown (Thermal and Residual)
so 45
40
JS
JO
25
:2 20 ·=
] 15
~ 10
5
0
-5
-10
- IS
-20
-25 0 5,000 10,000 15,000
Time Is)
20,000
-+-Baseline WEC 4-Loop
...... lOOF per hr, Baseline WEC 4-Loop
- lOOF per hr, Boundin1 WEC 4-loop
-+- lOOF per hr, CE SYS-80
- lOOF per hr, WEC 2-loop
- lOOF per hr, SOF min, WEC 4-loop
25,000 J0,000 JS,000 40,000
Figure 4-28 SIF Cooldown Time-history for Outlet Nozzle for Different Modeled Geometries using Limiting LAS Flaw Size of 6:1 Ratio, 0.5 Inch Depth
4-28
PWROG-15109-NP February 2018 Revision 0
••• This record was final approved on 2/22/2018 11 :54:21 AM. ( This statement was added by the PRIME system upon its validation)

WESTINGHOUSE NON-PROPRIETARY CLASS 3
4.10 CONSTRAINT AND CLADDING EFFECT
4.10.1 Constraint
4-29
The standard deeply-cracked fracture toughness specimen (CT specimen) has a relatively high constraint condition . This enables testing that produces conservative fracture toughness results. When applying this information to a structure with a postulated flaw, there may be loss of constraint depending on the loading condition and flaw size. There has been an effort in the last two decades to understand and quantify the effect of constraint condition on fracture toughness. The SE(B) specimen has a somewhat lower constraint condition than the CT specimen, which produces lower T0 values (greater toughness) , hence the bias adjustment applied to the SE(B) specimen geometry as discussed in Section 3.1.2.1. There have been a number of methods developed to quantify the constraint condition (94). The most common is T-stress for application to ductile-brittle fracture toughness of RPVs. T-stress is an elastic parameter that corresponds to the higher order non-singular term in the series expansion of the stress field equation . T-stress is normally expressed in terms of the biaxiality ratio . Details of the T-stress can be found in Wallin 's Reference (94) . T-stress is a measure of constraint and is correlated to toughness as expressed in T 0. Wallin provides a correlation for various specimen geometries and T-stress. The standard CT fracture toughness specimen has the highest constraint among various test specimen geometries and produces the highest T0 (lowest toughness) . Thus when this data is applied to a structure with a lower constraint condition , the high constraint toughness is conservative.
A number of analysts have calculated the T-stress for relevant nozzle geometries to assess the amount of conservatism. Siegele et al. evaluated various sized nozzle corner flaws postulated in a German PWR under various loading conditions, including normal cooldown (20 and 95) . They concluded that the nozzle corner flaw had a significant negative T-stress, indicating loss of constraint, resulting in an increase in toughness. The reduction in T0 for this level of constraint relative to the CT specimen constraint condition was in the range of 40°C to 80°C (95) . The correlation between T-stress and T0 has been shown by Wall in and others per Figure 4-29.
PWROG-15109-NP February 2018 Revision 0
••• This record was final approved on 2/22/2018 11 :54:21 AM. ( This statement was added by the PRIME system upon its validation)

b) -$0
-100
- -110 0
~ o -120
-130
-140
WESTINGHOUSE NON-PROPRIETARY CLASS 3
Biaxia ben~
SE(B)/ am 0.1
~.8
±10 C
~ .2
,•
22NiMoCr37 aY i:467 MPa
an • 620 MPa
0.0 0.2 0.4
Figure 4-29 T-stresslay versus T0 Dependency [94]
4-30
Corner flaws have also been assessed for T-stress and were determined to have negative T-stress values [96). Qin et al. evaluated a nozzle corner flaw for a BWR nozzle of varying depth from Y..T and greater (97]. The T-stress was found to be slightly negative considering both pressure and thermal loads on average along the flaw front for a 100°F/hour cooldown transient. The analysis did not include cladding and the Y..T flaw is approximately 2 inches deep (smaller than a PWR RPV nozzle Y..T flaw and larger than the flaws postulated in this assessment).
Two intermediate test vessels with inside nozzle corner flaws were pressurized to failure at ORNL under the Heavy Section Steel Technology (HSST) Program (98). Vessel V-5 leaked without fracturing and Vessel V-9 failed by fast fracture as expected . The nozzle corner failure strains were considerably greater than the pretest plane-strain estimates. The inside nozzle corner tangential strains were negative, implying transverse contraction along the flaw front. Merkle reassessed these tests considering the constraint condition by using the Irwin beta formula . This is empirical evidence that demonstrates that there is a constraint condition for nozzle corner flaws which demonstrates conservativeness in the approach taken in this report, which does not consider constraint.
Section 5.1.1 demonstrates that the limiting geometry case was the outlet nozzle with the flaw depth and length equal to 1.18 inches and 7.08 inches, respectively. The limiting transient time point shown in Figure 4-26 and the pressure case were performed in ANSYS 16.1 to calculate the T-stress along the flaw tip.
The calculated T-stress is negative for the pressure cases; however, a review of the thermal case shows that the limiting cooldown time point partially negates the pressure effect. The result
PWROG-15109-NP February 2018 Revision 0
••• This record was final approved on 2/22/2018 11 :54:21 AM. ( This statement was added by the PRIME system upon its validation)

WESTINGHOUSE NON-PROPRIETARY CLASS 3 4-31
shows a small negative T-stress of approximately -2 ksi occuring at the limiting location near the cladding boundary at d/0 = 0.359. Relative to the minimum A-508 Class 2 yield stress, it is a ratio slightly less than 0. Comparing this T-stress/oy ratio relative to the constraint condition of the CT specimen in Figure 4-29, an expected improvement in T0 for the constraint condition of the limiting SIF case results in approximately 25°F (14°C) .
Other analyses of nozzle corners, the 30 FEA conducted for this report, and empirical evidence show loss of constraint in the nozzle corner region. Loss of constraint is associated with increased toughness. No credit is taken for the increased toughness due to constraint loss of the evaluated nozzles, adding conservatism to the approach used.
4.10.2 Cladding
Cladding has the ability to restrain a flaw from opening due to its superior ductility. A semi-elliptical flaw introduced by fatigue was covered by stainless steel cladding and specimens were tested under biaxial conditions in the ductile-to-brittle transition regime. Test results showed that cladding plays a significant role and contributes to an additional safety margin . In addition, cladding increases the potential for crack arrest (99] . Therefore, one conservativism of this analysis is that it does not credit the potential ability for the ductile cladding to restrain crack growth.
PWROG-15109-NP February 2018 Revision 0
••• This record was final approved on 2/22/2018 11 :54:21 AM. ( This statement was added by the PRIME system upon its validation)

WESTINGHOUSE NON-PROPRIETARY CLASS 3 5-1
5 PRESSURE-TEMPERATURE LIMIT CURVES
The nozzle P-T limits are determined based on ASME Section XI, Appendix G. The procedures in Appendix G are based on the principles of linear elastic fracture mechanics. Using a postulated flaw, the Mode I SIF, K1, is calculated based on membrane (and bending for nozzles) stresses due to normal loading conditions. The calculated K1 is compared to a reference value K1e based on the metal temperature and the material 's ART.
5.1 GENERATION OF NOZZLE P-T LIMIT CURVES
Nozzle cooldown P-T limit curves were generated using two different methods, both of which comply with ASME Section XI, Appendix G.
1. The pressure and time-dependent thermal SIFs using FEMs containing the explicit postulated small flaws (Section 2) were determined as described in Section 4 to develop nozzle P-T limit curves. This is described in Section 5.1. 1.
2. For the larger postulated flaws , pressure and time-dependent thermal stresses from unflawed FEMs were determined. The closed form SIF solution based on ORNL/TM-2010/246 [18] was used to develop nozzle P-T limit curves with a postulated flaw size comparable to the beltline % thickness flaw used in traditional P-T curves (-2.1 inches) . This simpler method using the larger postulated flaw is described in Section 5.1.2.
In Section 5.2 the nozzle P-T limit curves are then compared to current plant traditional NRC approved P-T limit curves to determine if the nozzles are more limiting or are bounded by the traditional P-T limit curves.
5.1.1 Generation of Nozzle P-T Limit Curves with Postulated Small Flaw
In order to determine the nozzle corner P-T limit curves, the allowable pressure has to be calculated for each time step in the cooldown transient. To calculate the allowable pressure, the allowable K1m, membrane SIF, has to be calculated . Based on the ASME Code, Appendix G [1], the Kim is determined as follows :
Where:
• K1e = 33.2 + 20.734*e<002<T-RTNorll in units of ksi -Vin. This is the fracture toughness calculated based on Section XI , Appendix G.
• T = crack-tip temperature.
• RT NDT = ART = material reference nil-ductility temperature as shown in Section 3.5.
• K11 = stress intensity factor calculated for the thermal stress gradient for a cooldown transient based on the methodology in Section 4.9.2.
PWROG-15109-NP February 2018 Revision 0
••• This record was final approved on 2/22/2018 11 :54:21 AM. ( This statement was added by the PRIME system upon its validation)

WESTINGHOUSE NON-PROPRIETARY CLASS 3 5-2
The allowable pressure <Pauowabie) was determined by taking the ratio of the allowable membrane SIF, K1m, from above and the pressure SIF, K1p, which is linearly related to the 1,000 psi unit pressure input into the FEM in Section 4.9.1 (PFEM). The pressure SIF (K1p) was determined based on the FEM that contains the postulated flaw at the nozzle corner cut as shown in Section 4.9.1. The allowable pressure is as follows:
P allowable = Kim* PFEM / (Kip)
The allowable pressure can be plotted versus temperature for various time steps for the cooldown transient or for the steady-state case to generate the nozzle P-T limit curves.
Figure 5-1 through Figure 5-4 show the inlet and outlet nozzle P-T limits (where the indicated pressure is Pauowabie) developed for the postulated flaws with the Westinghouse 4-loop baseline geometry. The flange-notch requirement which requires a minimum pressure of 621 psig is also shown in Figure 5-1 through Figure 5-4. The flange requirements are based on 10 CFR 50 Appendix G, which requires the allowable pressure to be 20% of pre-service hydrostatic pressure (3,107 psig) , which is 621 psig for the PWR design.
QO ·;;; E:
C1J ... :::s "' "' C1J ...
Cl.
2500
2250
2000
1750
1500
/ I I
I I
1250
1000
750 - Flaw Length 0.6" (AR = 2:1) Deepest Tip
--------- -------------------· - Flaw Length 0.6" (AR= 2:1) Su rface Tip
500 - Flaw Length 1.8" (AR = 6:1) Deepest Tip
250 - Flaw Length 1.8" (AR = 6:1) Su rface Tip
--- Flange Limit - lOCFRSO Appendix G 0
0 50 100 150 200 250 300 Fluid Temperature (°F)
Figure 5-1 Inlet Nozzle Cooldown P-T Limit Curves with Flaw Depth of 0.3 Inch (ART= 21°F)
PWROG-15109-NP February 2018 Revision 0
••• This record was final approved on 2/22/2018 11 :54:21 AM. ( This statement was added by the PRIME system upon its validation)
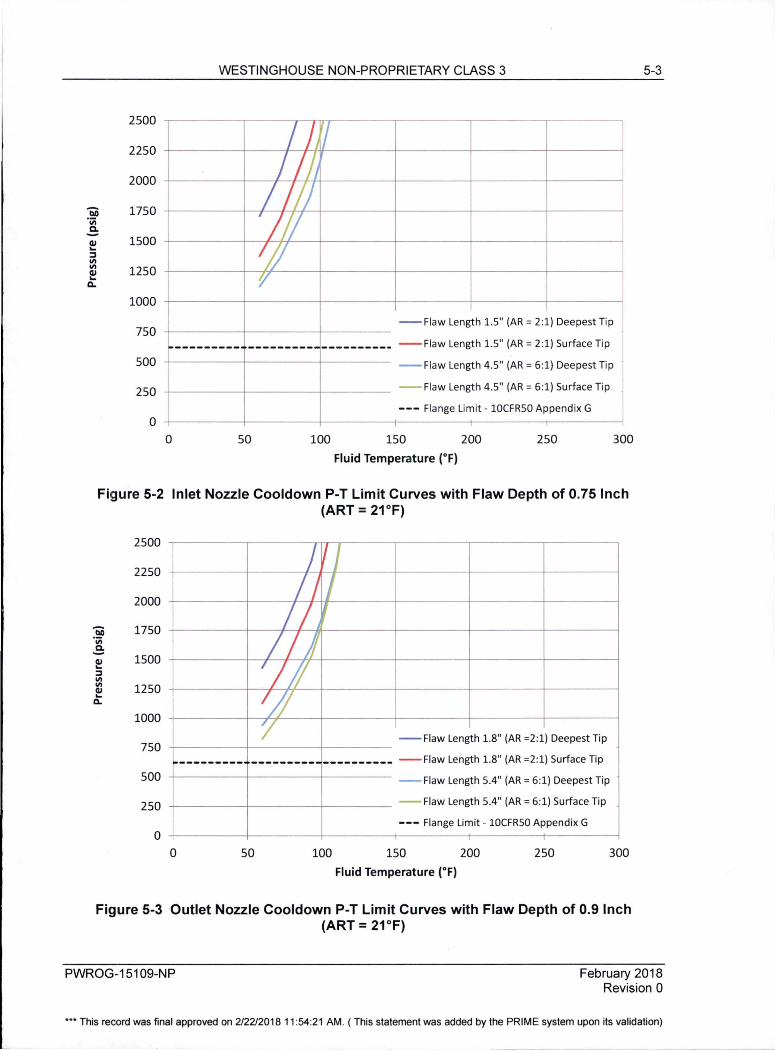
WESTINGHOUSE NON-PROPRIETARY CLASS 3
2500
2250
2000
QO 1750 'iii C. - 1500 (1J ... ::,
"' "' 1250 (1J ... C.
f l 'l I Ii
I Ill , I ll 111 ~
1000
750 - Flaw Length 1.5" (AR= 2:1) Deepest Tip
--------- ---------- ---------- - Flaw Length 1.5" (AR = 2:1) Surface Tip
500 - Flaw Length 4.5" (AR= 6:1) Deepest Tip
250 - Flaw Length 4.5" (AR= 6:1) Surface Tip
--- Flange Limit - 10CFR50 Appendix G 0
0 50 100 150 200 250 300
Fluid Temperature (°F)
Figure 5-2 Inlet Nozzle Cooldown P-T Limit Curves with Flaw Depth of 0.75 Inch (ART= 21°F)
2500
2250
2000
1750
1500
1250
1000
750
500
250
0
- Flaw Length 1.8" (AR =2:1) Deepest Tip +-------i-----+-----
- - - - - - - - - - - Flaw Length 1.8" (AR =2:1) Surface Tip
- Flaw Length 5.4" (AR= 6:1) Deepest Tip
+-------<-----+----- - Flaw Length 5.4" (AR = 6:1) Surface Tip
--- Flange Limit - lOCFRSO Appendix G
0 50 100 150 200 250 Fluid Temperature (°F)
300
Figure 5-3 Outlet Nozzle Cooldown P-T Limit Curves with Flaw Depth of 0.9 Inch (ART= 21°F)
5-3
PWROG-15109-N P February 2018 Revision 0
••• This record was final approved on 2/22/2018 11 :54:21 AM. ( This statement was added by the PRIME system upon its validation)

WESTINGHOUSE NON-PROPRIETARY CLASS 3 5-4
2500
2250
2000
iio 1750 'iii ~ QI
1500 ... :J "' "' QI 1250 ... 0..
1000
750 - Flaw Length 2.36" (AR = 2:1) Deepest Tip
- Flaw Length 2.36" (AR = 2:1) Surface Tip
500 - Flaw Length 7 .08" (AR = 6:1) Deepest Tip
250 - Flaw Length 7.08" (AR = 6:1) Surface Tip
- - Flange Limit - lOCFRSO Appendix G
0 0 so 100 150 200 250 300
Fluid Temperature (°F)
Figure 5-4 Outlet Nozzle Cooldown P-T Limit Curves with Flaw Depth of 1.18 Inch (ART= 21°F)
Based on the results shown in Figure 5-1 through Figure 5-4, the outlet nozzle with a 1.18 inch flaw depth (flaw size of 0.5 inch into the LAS) , with a 7.08 inch flaw length (aspect ratio of 6:1) for the surface tip (cladding to LAS forging interface) is the limiting flaw case using the generic ART = 21 °F. Similarly, for the inlet nozzle, the limiting nozzle P-T limits using the generic ART= 21 °F is for the flaw depth = 0.75 inch (flaw size of 0.5 inch into the LAS) , with flaw length = 4.5 inch (aspect ratio = 6: 1) for the deepest tip of the postulated flaw.
Therefore, it was concluded that the 0.5-inch flaw size into the low alloy steel is more limiting than the 0.05-inch small flaw size for both the inlet and outlet nozzle. Because, the larger flaw (flaw size of 0.5 inch into the LAS) is the worst case since it has the greater SIF due to the larger flaw and the greater SIF due to clad induced stress at the LAS surface tip. This conclusion is valid for the various geometries and ART values that are evaluated in Section 5.2. The 0.5-inch flaw size is able to be detected as discussed in Section 2, and is an appropriate flaw size for use in the comparison of the nozzle corner P-T limit with the traditional P-T limit curves. The 0.05-inch small flaw size was investigated for the cladding effects on the low alloy steel at the deepest and surface tips of the crack front; and this particular flaw size was demonstrated to be less limiting than the 0.5-inch flaw into the base metal.
The limiting case identified above (outlet nozzle; surface tip; aspect ratio= 6:1, 0.5-inch flaw in LAS) was assessed for the four different limiting geometries, as discussed in Section 4.1, using the 100°F/hour cooldown transient. These P-T limit curves are shown in Figure 5-5.
PWROG-15109-NP February 2018 Revision 0
*** This record was final approved on 2/22/2018 11 :54:21 AM. ( This statement was added by the PRIME system upon its validation)

WESTINGHOUSE NON-PROPRIETARY CLASS 3 5-5
Based on Figure 5-5, it is concluded that the Westinghouse 4-loop bounding geometry is appropriate for use in comparison with the traditional NRC approved P-T limit curves. At the lower part of the curve, the CE System-80 curve could be limiting so it is compared with the CE and B&W designed plant NRC approved P-T limit curves.
'iio "iii C. -~ .. :::, Ill Ill ~ ..
Cl.
2250
2000
1750
1500
1250
1000
750
500
250
0 0
lOO"F/hour Cooldown Outlet Nozzle Limit (ART= 21 "Fl
Surface Tip; AR=6:1; 0.5'' Flaw in LAS
Westinghouse 2-loop (Flaw Size= 1.0")
Westinghouse 4-Loop Baseline (Flaw Size= 1.18"; 1" Clad)
CE System 80 (Flaw Size = 1.27")
Westinghouse 4-Loop Bounding (Flaw Size= 1.18"; 1" Clad)
50 100 150
Temperature (°F)
200
Figure 5-5 Outlet Nozzle 100°F/hour Cooldown P-T Limit Curves Comparing Four Models with Limiting Flaw Geometry/Location
(Surface Tip, Aspect Ratio= 6:1, 0.5-lnch Flaw in LAS)
250
In Section 5.1.2, a larger flaw size comparable to the beltline % thickness is postulated in the nozzle corner using stresses from unflawed FEMs and the ASME Section XI , Appendix G SIF closed form solution.
PWROG-15109-N P February 2018 Revision 0
••• This record was final approved on 2/22/2018 11 :54:21 AM. ( This statement was added by the PRIME system upon its validation)

WESTINGHOUSE NON-PROPRIETARY CLASS 3
5.1.2 Generation of Nozzle P-T Limit Curves with Postulated Y4T Beltline Thickness Size Flaw
5-6
Postulated nozzle corner flaws with depth on the order of %T beltline thickness size flaws were postulated in the outlet nozzle (-2.1 inches for Westinghouse 4-loop and 2.27 inches for CE System-80 models). Unflawed FEM models for three different outlet nozzle designs that bound the fleet were used to generate through-wall pressure and thermal stresses. Due to the large postulated flaw size, the modeled geometries did not need to consider the clad-induced near surface stresses. The SIFs generated for the pressure and thermal gradient were based on the methodology described in ORNL/TM-2010/246 [18]. The stresses taken from the limiting path (1A through 18) shown in Figure 5-6 from the unflawed model were used to produce P-T nozzle curves for the deepest point of the flaw. A cooldown rate of 100°F/hour from 557°F to 60°F (or 50°F as needed) was used. A few NRC approved P-T limit curves extend to 50°F, so for completeness the cooldown transient was extended to 50°F.
Lx
Figure 5-6 Nozzle Corner Stress Path for Pressure and Thermal Stress Analysis (Inlet Nozzle Shown)
The RT Nor = ART = material reference nil-ductility temperature as shown in Section 3.1.2.2 of 43°F (6°C) , which is RTT0 plus 2 o1 was used. Credit is not taken for better near-surface toughness due to the larger postulated flaw size.
Outlet nozzle P-T curves are generated as shown in Figure 5-7 for the three limiting models. The Westinghouse 2-loop design is not shown since it has much lower SIF (see Figure 4-25 and Figure 4-28) and is not a limiting case for nozzle P-T limits.
Based on Figure 5-7, it is concluded that the Westinghouse 4-loop bounding geometry is appropriate for use in comparison with the traditional NRC approved P-T limit curves. Although ,
PWROG-15109-NP February 2018 Revision 0
••• This record was final approved on 2/22/2018 11 :54:21 AM. ( This statement was added by the PRIME system upon its validation)

WESTINGHOUSE NON-PROPRIETARY CLASS 3 5-7
the CE System-BO curve can be limiting so it is compared with the CE and B&W designed plant NRC approved P-T limit curves.
tiii 'iii E: QI .. ::::,
"' "' QI .. 0..
2250
2000
Westinghouse 4-Loop Baseline Outlet Nozzle Limit
(Flaw Size = 2.156")
1750 Westinghouse 4-Loop Baseline Inlet Nozzle Limit
(Flaw Size = 2.156")
1500
Westinghouse 4-Loop Bounding
1250 Inlet Nozzle Limit (Flaw Size = 2.156")
1000
750
500
250
0 0 so
Westinghouse 4-Loop Bounding Outlet Nozzle Limit
CE System 80 Outlet Nozzle Limit
(Flaw Size= 2.266")
CE System 80 Inlet Nozzle Limit
(Flaw Size = 2.266")
100 150
Temperature (°F)
(Flaw Size= 2.156")
1/4T Beltline Size Circular Flaw
200
Figure 5-7 Nozzle Cooldown P-T Limit Curves with Flaw Depth Comparable to %T Beltline
250
In Section 5.2, a detailed comparison of the NRC approved plant traditional P-T limit curves is performed with the limiting small flaw nozzle corner P-T limit curve described in Section 5.1.1 and the large flaw postulated from Section 5.1.2.
PWROG-15109-NP February 2018 Revision 0
••• This record was final approved on 2/22/2018 11 :54:21 AM. ( This statement was added by the PRIME system upon its validation)

WESTINGHOUSE NON-PROPRIETARY CLASS 3
5.2 COMPARISON OF NOZZLE TO TRADITIONAL NRC APPROVED PRESSURE-TEMPERATURE LIMIT CURVES
5-8
All the current U.S. PWR NRC approved Appendix G P-T limit cooldown curves are plotted in Figure 5-8. These NRC approved P-T curves are shown without instrument uncertainty adjustments to readily compare with the unadjusted nozzle curves.
2250
2000
1750
1500
! 1250
~ :, ::: 1000 ! ..
750
500
250
0 0 50 100 150 200
Temperature ("Fl
250 300 350 400
Figure 5-8 U.S. PWR 10 CFR 50 Appendix G NRC Approved P-T Limit Curves
With the exception of eleven plant P-T curves, the NRC approved Appendix G plant cooldown curves bound the limiting 4-loop Westinghouse design nozzle curves (see Figure 5-9) with the generic ART value of 21 °F for the explicit small flaw modeled in the nozzles and 43°F for the >2-inch flaw based on the %T beltline thickness. The eleven P-T curves that intersect the limiting generic nozzle curves are addressed on a plant-specific basis later in this section , most of which have P-T curves with an exemption to the 1 O CFR 50 Appendix G closure flange requirement approved by the NRC. P-T limit curves at low temperatures, i.e. below the closure flange minimum temperature, cannot exceed 20% of the preservice system hydrostatic test pressure. The most limiting, i.e. highest, NRC approved P-T curve is less than 625 psig at temperatures less than the closure flange minimum temperature (except for the plants with an NRC approved flange requirement exemption). The 4-loop Westinghouse design limiting generic nozzle P-T curve remains above 625 psig at 60°F as shown in Figure 5-9.
PWROG-1 5109-NP February 2018 Revision 0
••• This record was final approved on 2/22/2018 11 :54:21 AM. ( This statement was added by the PRIME system upon its validation)

WESTINGHOUSE NON-PROPRIETARY CLASS 3 5-9
The traditional beltline P-T limit operating curves are more restrictive than the nozzle P-T limit curves. As plants continue to operate and the P-T curves are updated with higher ART values due to higher fluence, the traditional beltline P-T limit curves will shift downward, moving away from the bounding nozzle corner P-T limit curve increasing the margin. The analyzed nozzle corner P-T limit curves are applicable for a 60-year license and represent the most limiting flaw size and shape postulated from both the inlet and outlet nozzles as discussed in Section 5.1.
.. ! " ~ ::: ~
0..
2250
Q1.111e1~2nl11:Umit 2000 lt22ldQ~D AB! = U •E)
(Flaw Size = 1.18" )
1750
1500 Qull~l ~12uhr: Limit
(CQ:Qldown RTI11 = 43.FI (Flaw Size = 2.156")
1250
Inlet Npzzle limit
1000
750
500
250
0 +-----~~ ~ ~ -~--------~----~---~---~----·
0 50 100 150 200
Temperature ("F)
250 300 350 400
Figure 5-9 Westinghouse 4-Loop Bounding Nozzle P-T Limit Curves Compared to U.S. PWR NRC Approved Appendix G P-T Limit Curves
(See Figure 5-10 through Figure 5-14 for Plant-Specific Cases not included)
The U.S. PWR fleet P-T limit curve comparison identified 11 NRC approved P-T curves (identified as A through K) that do not bound the generic bounding nozzle curves (all are of Westinghouse design) . Nine of these P-T curves (C through K) use an NRC approved exemption to the 10 CFR 50 Appendix G flange requ irement by using a fracture mechanics justification. For plants that have excellent beltline fracture toughness, removal of the flange requirement improves the P-T limit curves significantly. The plant P-T curves which do not bound the generic nozzle curves are evaluated separately in Figure 5-10 through Figure 5-14. Plants C through I had nozzle RT NOT values measured to the requirements of post-1973 ASME Subarticle NB-2300. Since the RT NOT values of these seven plants were all measured to the requirements of NB-2300, the uncertainty associated with an RT NOT estimation method does not affect the RT NOT values shown in Figure 5-1 O through Figure 5-13. The limiting RT NOT from the plant nozzles was used instead of the generic RTT0 value developed in Section 3.5 (and Section 3.1 .2.2). For convenience, the plants are grouped together when their highest nozzle RT NOT was the same as shown in Figure 5-11 through Figure 5-13. The plant A nozzle curve had
PWROG-15109-NP February 2018 Revision 0
••• This record was final approved on 2/22/2018 11 :54:21 AM . ( This statement was added by the PRIME system upon its validation)

WESTINGHOUSE NON-PROPRIETARY CLASS 3 5-10
been calculated in previous work using a very large Y..T nozzle corner flaw. It is compared to the current NRC approved Appendix G P-T curve in Figure 5-14. The plant B traditional P-T limit curves were previously shown to not be impacted by the nozzle curves using the very large Y..T nozzle corner flaw [9]. Since it was shown in Figure 5-7 the CE System 80 nozzles can be more limiting than the Westinghouse 4-loop bounding outlet nozzle limit, the CE System 80 generic nozzles curves are compared to B&W and CE design NRC approved P-T limit curves in Figure 5-15. In every case, the nozzle P-T limit curves are bounded by the traditional NRC approved beltline P-T limit curves.
2250
Inlet N9z1le bimit 2000 J.!!.!w = ·ZO"Fl
(Flaw Size = 2.156" )
1750
1500
Q!.Ulel N2n le Llm11 1250 · i!!.!w = +lQ"fl ..
! (Flaw Size = 2.156")
~ 1000 ~ ~
750
500
250
0
0 so
Outlet Nozzle limit f..B1--=..!lo:El
(Flaw Size = 1.18")
100
Temperature ("F)
150
f!i!!ll Traditional P-T Curve
fil..lliYl
200 250
Figure 5-10 Westinghouse 4-Loop Bounding Nozzle P-T Limit Curves Compared to Flange-Exempt Plant C NRC Approved Appendix G P-T Limit Curves
PWROG-15109-NP February 2018 Revision 0
••• This record was final approved on 2/22/2018 11 :54:21 AM. ( This statement was added by the PRIME system upon its validation)

oil
! I!! ~ ct
i .!!,
I!! :,
~ ...
2250
2000
1750
1500
1250
1000
750
500
250
0 0
WESTINGHOUSE NON-PROPRIETARY CLASS 3
Outlet Nozzle Limit
l.!!Iwr = -lO"Fl (Flaw Size= 2. 156")
Outlet Nozzle Limit
.rnr_ = -lO"Fl (Flaw Size = 1.18")
50
Inlet Nozzle Limit
.rnr_ = +l°Fl (Flaw Size= 2.156")
Pla nt E Traditional P-T Curve
(30.S EFPYl
Plant D Traditional P-T Curve (32 EFPYl
100
PlantJ Traditional P-T Curve
(32 EFPYl
150
Temperature ("F)
5-11
200 250
Figure 5-11 Westinghouse 4-Loop Bounding Nozzle P-T Limit Curves Compared to Flange-Exempt Plants D, E, J, and K NRC Approved Appendix G P-T Limit Curves
2250
2000
1750
1500
1250
1000
750
500
250
0 0
Inlet Nozzle Limit
~ = O"Fl (F law Size= 2.156")
so 100
Oytlet Nozzle Limit
.rnr_= O"Fl (Flaw Size= 2.156")
150
Temperature ("F)
Plant F Traditional P-T Curve
132 EFPYl
f1in1..li Traditional P-T Curve
fil.illYI
PlantG Traditional P-T Cyrve
ill.illYl
200 250
Figure 5-12 Westinghouse 4-Loop Bounding Nozzle P-T Limit Curves Compared to Flange-Exempt Plants F, G and H NRC Approved Appendix G P-T Limit Curves
PWROG-15109-NP February 2018 Revision 0
••• This record was final approved on 2/22/2018 11 :54:21 AM. ( This statement was added by the PRIME system upon its validation)

i .s, ~ ::, ::: ~ ...
i .s, ~
5 l
2250
2000
1750
1500
1250
1000
750
500
250
0
WESTINGHOUSE NON-PROPRIETARY CLASS 3
Inlet Nozzle Limit
J.!!!,w: = -10. FI (Flaw Size = 2.156")
Outl~t Noni~ Limit J.l!Iim = +10. FI
(Flaw Size = 0.99")
Outlet Nozzle Limit
J.!!!,w: = +10. FI (Flaw Size = 2.156")
f1inU Traditional P·T Curve
132 EFPYI
+-------~-~-----~--0 so 100 150
Temperature (· F)
5-1 2
200 250
Figure 5-13 Westinghouse 4-Loop Bounding Nozzle P-T Limit Curves Compared to Flange-Exempt Plant I NRC Approved Appendix G P-T Limit Curves
2250
2000
1750
1500
1250
1000
750
500
250
0 0
0y11e1 Nozzle umtt ~~
(Flaw Size • 4.587")
Jntet Nozzle limit w..u~
(Flaw Size = 3. 77")
50
Tr~itional P·T Curve
100 150 200 250
Temperature (°F)
Figure 5-14 Plant-Specific Large Flaw Nozzle P-T Limit Curves Compared to Plant A NRC Approved Appendix G P-T Limit Curves
PWROG-15109-NP February 2018 Revision 0
••• This record was final approved on 2/22/2018 11 :54:21 AM. ( This statement was added by the PRIME system upon its validation)

.. ! ~ :,
~ .. ri.
2250
2000 Outlet Nozzle Limit
(Coqldqwn ART • 21 •FJ (Fl~w Size = 1.27")
1750
1500
1250
1000 Inlet Noule Umit
(~down, RTI11 • 4r FJ (Flaw Size = 2.266")
750
500
250
0
0 so
WESTINGHOUSE NON-PROPRIETARY CLASS 3
100 150 200
Temperature ("F)
/
250 300
5-13
350 400
Figure 5-15 CE System-SO Nozzle P-T Limit Curves Compared to U.S. CE and B&W Design NRC Approved Appendix G P-T Limit Curves
PWROG-15109-NP February 2018 Revision 0
••• This record was final approved on 2/22/2018 11 :54:21 AM. ( This statement was added by the PRIME system upon its validation)

WESTINGHOUSE NON-PROPRIETARY CLASS 3 6-1
6 CONCLUSION
P-T limit curves were developed with postulated -2.1-inch, 0.5-inch (excluding the clad thickness) , and smaller surface breaking flaws in the high stress inlet and outlet nozzle corner regions to assess their impact on the traditional NRC approved 1 O CFR 50, Appendix G P-T limit curves.
A generic fracture toughness transition reference temperature was established for the PWR nozzle forgings near the surface at the postulated flaw location as allowed by ASM E Section 111 , Subparagraph NB-2223.2. The fracture toughness was established based on conservative measurements of 22 representative forgings with a margin of two standard deviations, to ensure conservative lower bound toughness using NRC approved ASME Code Case N-629. The nearsurface forging toughness was conservatively determined through evaluation of 31 near-surface fracture toughness measurements. The fluence effect at the nozzle corner region was considered and was determined to have an insignificant effect on the fracture toughness at the postulated flaw location .
Detailed three-dimensional finite element analyses of the postulated RPV inlet and outlet nozzles corner flaws for a typical Westinghouse 4-loop plant design were performed to identify the limiting case. The limiting case was then analyzed for four different PWR nozzle designs to ensure that the analyses bound all the U.S. PWR geometrical differences. The analyses were used to generate stresses and stress intensity factors considering typical clad residual stress, pressure, mechanical pipe loads and thermal stress for a bounding normal cooldown transient. In addition, the constraint condition for the postulated flaws was assessed during the cooldown transient. The constraint condition showed additional conservatism in the analysis.
The conservatively-derived generic nozzle Appendix G P-T limit curves were then compared to all the NRC approved P-T limit curves for the U.S. PWR fleet. The results demonstrated that nozzle P-T limit curves were bounded in every case by the NRC approved U.S. PWR P-T limit curves. The nozzle P-T limit curve results are applicable through 60 years of operation. With licensee evaluation of SLR or other operational changes, updated nozzle fluence projections can be compared to the values used in this work for applicability (See Section 3.4.5). If the projected nozzle corner fluence remains less than the screening criterion of 4.28 x 10¹⁷ n/cm2
,
then this analysis is applicable. If the fluence exceeds the screening criterion, then a shift can be calculated for those nozzles on a plant-specific basis using an NRC approved method; as long as the shift remains below 25°F or the plant-specific nozzle ART values remain below the ART used in this report, then this analysis is applicable. As the plants operate longer, the traditional beltline allowable pressures typically decrease and the curves will become more restrictive ; thereby, providing additional margin between the traditional beltline and the nozzle P-T limit curves.
Based on the results of this detailed conservative assessment, the current licensed traditional U.S. PWR P-T limit curves that have used the NRC approved methods of developing P-T limit curves (WCAP-14040-A, Rev. 4, CE NPSD-683-A, Rev. 06 and BAW-10046A, Rev. 2) bound the nozzle P-T limit curves.
PWROG-15109-NP February 2018 Revision 0
••• This record was final approved on 2/22/2018 11 :54:21 AM. ( This statement was added by the PRIME system upon its validation)

WESTINGHOUSE NON-PROPRIETARY CLASS 3 7-1
7 REFERENCES
1. ASME Boiler and Pressure Vessel Code, 2008 Addenda , Section XI , Division 1, Appendix G "Fracture Toughness Criteria for Protection against Failure," ASME, 2008.
2. U. S. Nuclear Regulatory Commission, Code of Federal Regulations, 1 O CFR 50, Appendix G, "Fracture Toughness Requirements," Federal Register, Volume 78, No. 75450, dated December 12, 2013.
3. U. S. Nuclear Regulatory Commission Regulatory Issue Summary 2014-11 , "Information on Licensing Applications for Fracture Toughness Requirements for Ferritic Reactor Coolant Pressure Boundary Components," October 2014. [Agencywide Document Access and Management System (ADAMS) Accession Number ML 14149A165]
4. U. S. Nuclear Regulatory Commission Letter, "Seabrook Station , Unit No.1 - Issuance of Amendment Re: Revision to the Applicability of the Reactor Coolant System Pressure-Temperature Limits and the Cold Overpressure Protection Setpoints," April 2013. [ADAMS Accession Number ML 120820510)
5. U. S. Nuclear Regulatory Commission Letter, "Joseph M. Farley Nuclear Plant, Units 1 and 2, Issuance of Amendments Regarding Technical Specifications Revisions Associated with the Low Temperature Overpressure Protection System and the Pressure and Temperature Limits Report," October 2013. [ADAMS Accession Number ML 13249A386]
6. U. S. Nuclear Regulatory Commission Letter, "Indian Point Nuclear Generating Unit No. 2- Issuance of Amendment Re: Pressure-Temperature Limit Curves and Low Temperature Over Pressure Requirements," March 2014. [ADAMS Accession Number ML 14045A248]
7. U. S. Nuclear Regulatory Commission Letter, "Indian Point Nuclear Generating Unit No. 3 - Issuance of Amendment Re: Changes to Reactor Vessel Heatup and Cooldown Curves and Low Temperature Overpressure Protection System Requirements," September 2015. [ADAMS Accession Number ML 15226A 159)
8. U. S. Nuclear Regulatory Commission Letter, "Point Beach Nuclear Plant, Units 1 and 2 - Issuance of Amendment Regarding Change to Technical Specification 5.6.5, Reactor Coolant System (RCS) Pressure And Temperature Limits Report (PTLR), " June 2014. [ADAMS Accession Number ML 14126A378]
9. Duke Energy Letter CNS-15-007, "Duke Energy Carolinas, LLC (Duke Energy) Catawba Nuclear Station , Units 1 and 2 Docket Numbers 50-413 and 50-414 License Amendment Request (LAR) for Measurement Uncertainty Recapture (MUR) Power Uprate Response to NRC Requests for Additional Information (RAls) ," January 2015. [ADAMS Accession Number ML 15029A417]
PWROG-15109-NP February 2018 Revision 0
••• This record was final approved on 2/22/2018 11 :54:21 AM. ( This statement was added by the PRIME system upon its validation)
WESTINGHOUSE NON-PROPRIETARY CLASS 3 7-2
10. U. S. Nuclear Regulatory Commission Letter, "McGuire Nuclear Station, Units 1 and 2, Issuance of Amendments Regarding Measurement Uncertainty Recapture Power Uprate," May 2013. [ADAMS Accession Number ML 13073A041]
11 . U. S. Nuclear Regulatory Commission Letter, "H. B. Robinson Steam Electric Plant, Unit No. 2 - Issuance of Amendment to Revise Reactor Coolant System Pressure and Temperature Limits Applicable for 50 Effective Full Power Years," November 2016. [ADAMS Accession Number ML 16285A404]
12. Westinghouse, "Methodology Used to Develop Cold Overpressure Mitigating System Setpoints and RCS Heatup and Cooldown Limit Curves," WCAP-14040-A, Revision 4, May 2004. [ADAMS Accession Number ML050120209]
13. Westinghouse, "Basis for Heatup and Cooldown Limit Curves," WCAP-7924-A, April 1975.
14. Westinghouse, "Development of a RCS Pressure and Temperature Limits Report for the Removal of P-T Limits and LTOP Requirements from the Technical Specifications," Combustion Engineering Owners Group, CE NPSD-683-A, Revision 06, April 2001 . [ADAMS Accession Number ML010780017]
15. Framatome (formerly AREVA, Framatome Technologies, and Babcock & Wilcox) "Methods of Compliance with Fracture Toughness and Operational Requirements of 10 CFR 50, Appendix G," B&W Owners Group Document BAW-10046A, Revision 2, June 1986.
16. The Welding Research Council , "PVRC Recommendations on Toughness Requirements for Ferritic Materials ," Bulletin WRC-175, August 1972.
17. Framatome (formerly AREVA, Framatome Technologies, and Babcock & Wilcox) , "Methods of Compliance with Fracture Toughness and Operational Requirements of 1 O CFR 50, Appendix G," B&W Owners Group Document BAW-10046, Revision 4, November 1999. [ADAMS Accession Number ML003673256]
18. Yin , S. and Bass, B., "Stress and Fracture Mechanics Analyses of Boiling Water Reactor and Pressurized Water Reactor Pressure Vessel Nozzles - Revision 1," Oak Ridge National Laboratory, ORNL/TM-2010/246, June 2012. [ADAMS Accession Number ML 12181A162]
19. Stevens, G. et al., "Probabilistic Fracture Mechanics Evaluations That Consider Nozzles in the Extended Beltline Region of Reactor Pressure Vessels," Proceedings of the ASME Pressure Vessels and Piping Conference, PVP2015-45065, 2015. [ADAMS Accession Number ML 16273A005/ML 16273A006]
PWROG-15109-NP February 2018 Revision 0
••• This record was final approved on 2/22/2018 11 :54:21 AM. ( This statement was added by the PRIME system upon its validation)

WESTINGHOUSE NON-PROPRIETARY CLASS 3 7-3
20. Siegele, Varfolomeyev and Nagel, "Brittle Failure Assessment of a PWR-RPV for Operating Conditions and Loss of Coolant Accident, " Journal of Pressure Vessel Technology, Vol. 130, August 2008.
21 . U. S. Nuclear Regulatory Commission, "l nservice Inspection Code Case Acceptability, ASME Section XI , Division 1," Regulatory Guide 1.147, Revision 13, June 2003 through Revision 17, August 2014.
22 . Bamford, W. , et al. , "Technical Basis for Elimination of Reactor Vessel Nozzle Inner Radius Inspections, " Proceedings of ASME Pressure Vessels and Piping Conference, 2001 .
23. BWRVIP-108NP: BWR Vessel and Internals Project, Technical Basis for the Reduction of Inspection Requirements for the Boiling Water Reactor Nozzle-to-Vessel Shell Welds and Nozzle Blend Radii. EPRI , Palo Alto , CA: 2007. 1016123. [ADAMS Accession Number ML073300050]
24. U. S. Nuclear Regulatory Commission Letter from Stuart A. Richards to W. Glenn Warren, Final Safety Evaluation of BWR Owners' Group Alternate Boiling Water Reactor (BWR) Feedwater Nozzle Inspection, "Alternate BWR Feedwater Nozzle Inspection Requirements," GE-NE-523-A71-0594-A, Revision 1, May 2000. [ADAMS Accession Number ML003723265]
25. Long, E. , "Material-Orientation Toughness Assessment (MOTA) for the Purposes of Mitigating Branch Technical Position (BTP) 5-3 Uncertainties," PWR Owners Group, PWROG-15003-NP, June 2015. [ADAMS Accession Number ML 15268A086]
26. "Application of Master Curve Fracture Toughness Methodology for Ferritic Steels (PWRMRP-01 )," PWR Materials Reliability Project (PWRMRP), EPRI Report TR-108390-R1 , May 1999 [Publically available at WWW.EPRI.COM].
27. EricksonKirk, M., Bass, B.R. , Dickson , T., Pugh, C., Santos, T. , Williams, P., "Probabilistic Fracture Mechanics - Models, Parameters, and Uncertainty Treatment Used in FAVOR Version 04.1 (NUREG-1807)," U.S. Nuclear Regulatory Commission, June 2007. [ADAMS Accession Number ML072010411]
28. VanDerSluys, W. , et al., "Fracture Toughness Master Curve Development: Application of Master Curve Fracture Toughness Methodology for Ferritic Steels," Welding Research Council Bulletin 458, January 2001.
29. ASME Boiler and Pressure Vessel Code Case, "Use of Fracture Toughness Test Data to Establish Reference Temperature for Pressure Retaining Materials," Section XI, Division 1, Code Case N-629, Approval date: May 7, 1999.
30. U. S. Nuclear Regulatory Commission, 1 O Code of Federal Regulations 50.55a, "Codes and Standards," 82 FR 52825, November 15, 2017.
PWROG-15109-NP February 2018 Revision 0
*** This record was final approved on 2/22/2018 11 :54:21 AM. ( This statement was added by the PRIME system upon its validation)

WESTINGHOUSE NON-PROPRIETARY CLASS 3 7-4
31. Framatome (formerly AREVA, Framatome Technologies and Babcock & Wilcox) , "Initial RT NOT of Linde 80 Weld Materials," BAW-2308, Revision 1-A, March 2008. [ADAMS Accession Number ML052070408]
32. U. S. Nuclear Regulatory Commission , Regulatory Issue Summary 2004-04, "Use of Code Cases N-588, N-640, and N-641 in Developing Pressure-Temperature Operating Limits," April 2004. [ADAMS Accession Number ML040920323]
33. Kirk, M., "NRC Review of the Technical Basis for Use of the Master Curve in Evaluation of Reactor Pressure Vessel Integrity," Proceedings of the 28th Water Reactor Safety Meeting , U.S. Nuclear Regulatory Commission, 1999. [ADAMS Accession Number ML010570184 and ML093540004]
34. Yoon , K., et al. , "Japanese Fracture Toughness Data Analysis Using Master Curve Method ," The 2001 ASME Pressure Vessels and Piping Conference, 2001 .
35. Fohl , J., Leitz, Ch., and Anders, D. , "Irradiation Experiments in the Testing Nuclear Power Plant VAK," Effects of Radiation on Materials: Eleventh Conference, ASTM STP 782 , Brager, H.R., and Perrin , J.S., Eds., ASTM , 1982, pp. 520-527.
36. Framatome (formerly AREVA), "KCB RPV Safety Assessment Assuming 60 Years of Operation," NTCM-G/2009/en/0549, Revision B, 2010.
37. ASTM A-508, "Quenched and Tempered Vacuum-Treated Carbon and Alloy Steel Forgings for Pressure Vessels," ASTM International, 1964.
38. ASME SA-508, "Quenched and Tempered Vacuum-Treated Carbon and Alloy Steel Forgings for Pressure Vessels," ASME Boiler and Pressure Vessel Code, Section 11 , Part A, ASME International , New York, NY, 1971 and 2007.
39. "Code Comparison Report for Class 1 Nuclear Power Plant Components, " STP-NU-051, ASME Standards Technology, January 2012.
40. Joyce, J. A. , and Gao. X. , "Analysis of Material Inhomogeneity in the European Round Robin Fracture Toughness Data Set," Journal of ASTM International, Vol. 5, No. 9, Paper ID JAl101512, www.astm.org , 2008.
41 . ASTM E399, "Standard Test Method for Linear-Elastic Plane-Strain Fracture Toughness Kie of Metallic Materials, " ASTM International, 2012.
42. Siegele, D., Keim, E., Nagel, G., "Validation of RTTo for German Reactor Pressure Vessel Steels," Journal of Pressure Vessel Technology, Vol. 130, ASME, 2008.
43. ASTM E 1921 , "Standard Test Method for Determination of Reference Temperature, T 0,
for Ferritic Steels in the Transition Region ," ASTM International , 2013.
PWROG-15109-NP February 2018 Revision 0
••• This record was final approved on 2/22/2018 11 :54:21 AM. ( This statement was added by the PRIME system upon its validation)

WESTINGHOUSE NON-PROPRIETARY CLASS 3 7-5
44. ASTM E 185, "Standard Practice for Conducting Surveillance Tests for Light-Water Cooled Nuclear Power Reactor Vessels," ASTM, 1982.
45. Joyce, J. A. and Tregoning , R. L., "Development of the T0 Reference Temperature from Precracked Charpy Specimens," Engineering Fracture Mechanics 68, Pergamon, Elsevier, 2001 , pp. 861-894.
46. U.S. Nuclear Regulatory Commission , "Safety Evaluation by the Office of Nuclear Reactor Regulation Regarding Amendment of the Kewaunee Nuclear Power Plant License to Include the Use of a Master Curve-Based Methodology for Reactor Pressure Vessel Integrity Assessment," May 2001 . [ADAMS Accession Number ML011210180]
47. Sokolov, M. A. , "Statistical Analysis of the ASME K1c Database," Transactions of the ASME, Vol. 120, February 1998.
48. Marston, T.U., "Flaw Evaluation Procedures, Background and Application of ASME Section XI Appendix A," Report NP-719-SR, EPRI , 1978.
49. Lucon , E., Leenaers, A. , Vandermeulen , W., Scibetta , M., "Investigation of Transition Fracture Toughness Variation within the Thickness of Reactor Pressure Vessel Forgings," Journal of ASTM International, Vol. 7, No. 1, 2009.
50. VanDerSluys, W.A. , et al. , "Fracture Toughness Master Curve Development: Fracture Toughness of Ferritic Steels and ASTM Reference Temperature (T0}," Welding Research Council Bulletin 457, December 2000.
51. Hein, H., Keim , E., Schnabel , H. , Seibert, T., and Gundermann, A. , "Final Results from the Crack Initiation and Arrest of Irradiated Steel Materials Project on Fracture Mechanical Assessments of Pre-Irradiated RPV Steels Used in German PWR," Journal of ASTM International , Vol. 6, No. 7, 2009.
52. Chomik E., Liendo, M., and Iorio, A. "Master Curve Testing on 22NiMoCr37 Material," Proceedings of the IAEA Technical Meeting , Master Curve Testing and Results Application, TWG-LMNPP-01/3, 2002, pp. 104.
53. Nagel, G., Blauel , J.G., Siegele, D., "Fracture Toughness Evaluation for a RPV Nozzle using Small Specimens and the Master Curve Approach," Proceedings of the IAEA Technical Meeting , Master Curve Testing and Results Application , TWG-LMNPP-01/3, 2002, p. 238.
54. Hawthorne, J. R. and Hiser, A. L., "Experimental Assessments of Gundremmingen RPV Archive Material for Fluence Rate Effects Studies," NUREG-CR/5201 , 1988.
55. Hein, H., Keim, E. , Bechler, E., Efsing , P., et al , "CARINA - A Programme for Experimental Investigation of the Irradiation Behaviour of German Reactor Pressure Vessel Materials," VGB PowerTech 5/2013.
PWROG-15109-NP February 2018 Revision 0
••• This record was final approved on 2/22/2018 11 :54:21 AM. ( This statement was added by the PRIME system upon its validation)

WESTINGHOUSE NON-PROPRIETARY CLASS 3 7-6
56. May, J., Rouden , J. , Efsing, P. , Valo, M., and Hein , H., "Extended Mechanical Testing of RPV Surveillance Materials Using Reconstitution Technique for Small Sized Specimen to Assist Long Term Operation," Small Specimen Test Techniques: 61
h Volume, STP 1576, Sokolov, M. and Lucon , E. , Eds., ASTM International, West Conshohocken, PA, 2015.
57. Hein H., Ganswind, J., Gundermann, A. , Keim , E. and Schnabel, H., "CARINA: A New Project to Extend the Data Base for Fracture Mechanical Characteristics of Irradiated German RPV Materials at High Neutron Fluences," PVP2009-77035, pp. 613-620, ASME Pressure Vessels and Piping , 2009.
58. Barthelmes, J., Keim, E., Hein , H., and Jong, A. , "RPV Testing for Borssele PLEX," Nuclear Engineering Journal, August 2010.
59. Hohe, J., Friedmann, V. , Siegele, D., "Reviewing the Master Curve Concept for Evaluation of Brittle Fracture of Ferritic Steels - Application , Limits and Suggestions for Extension," Materialpruefung (2006), 48(5), 239-250.
60. U.S. Nuclear Regulatory Commission, "Radiation Embrittlement of Reactor Vessel Materials," Regulatory Guide 1.99, Revision 2, 1988.
61 . Code of Federal Regulations, Title 10, Part 50.61 , "Fracture Toughness Requirements for Protection Against Pressurized Thermal Shock Events," 60 Federal Register 65468, Dec. 19, 1995, as amended at 61 FR 39300, July 29, 1996.
62 . U.S. Nuclear Regulatory Commission , "Standard Review Plan , Branch Technical Position 5-3," NUREG-0800, Revision 2, March 2007.
63. Lucon , E. , et al. , "Investigation of Transition Fracture Toughness Variation within the Thickness of Reactor Pressure Vessel Forgings," Journal of ASTM International 7 (2010): JAl102431 .
64. U.S. Nuclear Regulatory Commission , "Effect of Welding Conditions on Transformation and Properties of Heat-Affected Zones in LWR Vessel Steels," NUREG/CR-3873, November 1990.
65. ASME Boiler and Pressure Vessel Code, Section Ill , Division 1, Subarticle NB-2220, "Procedure for Obtaining Test Coupons and Specimens for Quenched and Tempered Material ," 2008 Addenda.
66. International Atomic Energy Association Document, TWG-LMNPP-01/3, "Master Curve Testing and Results Application ," 2002.
67. U.S. Nuclear Regulatory Commission , "Experimental Assessments of Gundremmingen RPV Archive Material for Fluence Rate Effects Studies," NUREG/CR-5201 , October 1988.
PWROG-15109-NP February 2018 Revision 0
••• This record was final approved on 2/22/2018 11 :54:21 AM. ( This statement was added by the PRIME system upon its validation)

WESTINGHOUSE NON-PROPRIETARY CLASS 3 7-7
68. Nelson, T. D., Bodnar, R. L., and Fielding, J. E., "A Critical Assessment of ASTM A508 Class 2 Steel for Pressure Vessel Applications," 32nd Mechanical Working and Steel Processing , Volume 28, pp. 323-341 , 1990.
69. Saillet, S., Rupa, N., and Benhamou, C. , "Impact of Large Forging Macrosegregations on the Reactor Pressure Vessel Surveillance Program," SFEN, French Nuclear Energy Society, 2006.
70. U.S. Nuclear Regulatory Commission , "Experimental Results of Tests to Investigate Flaw Behavior of Mechanically Loaded Stainless Steel Clad Plates," NUREG/CR-5785, April 1992.
71 . Joint Research Centre, European Commission , "Network for Evaluating Structural Components (NESC-1) Project Overview," EUR 19051 EN, 2001 .
72. Troyer, G. and Erickson, M., "Empirical Analyses of Effects of the Heat Affected Zone and Post Weld Heat Treatment on Irradiation Embrittlement of Reactor Pressure Vessel Steel ," Effects of Radiation on Nuclear Materials: 26th Volume, STP 1572, Mark Kirk and Enrico Lucon , Eds., pp. 163-178, ASTM International, West Conshohocken , PA, 2014
73. Westinghouse, "Summary of RV Vendor Nozzle Clad Practice Survey," PE-RVP-2806, November 1979.
74. U.S. NRC Technical Letter Report TLR-RES/DE/CIB-2013-01, "Evaluation of the Beltline Region for Nuclear Reactor Pressure Vessels," Office of Nuclear Regulatory Research [RES] , dated November 14, 2014. [ADAMS Accession Number ML 14318A177]
75. U.S. Nuclear Regulatory Commission, "Safety Evaluation Report Related to the License Renewal of Beaver Valley Power Station, Units 1 and 2, " NUREG-1929, Vol. 2, October 2009. [ADAMS Accession Number ML093000278]
76. Westinghouse, "Analysis of Capsule Y from Beaver Valley Unit 1 Reactor Vessel Radiation Surveillance Program ," WCAP-15571, Supplement 1, Revision 1, April 2008, (Table 2, Note g). [ADAMS Accession Number ML082740205]
77. BWRVIP-173NP-A: BWR Vessel and Internals Project: Evaluation of Chemistry Data for BWR Vessel Nozzle Forging Materials. EPRI, Palo Alto, CA, 2011. 1022835. [ADAMS Accession Number ML 12083A268]
78. ASTM E900-15, "Standard Guide for Predicting Radiation-Induced Transition Temperature Shift in Reactor Vessel Materials," ASTM International, 2015.
79. Summer 1975 Addenda of ASME Boiler and Pressure Vessel Code, Section II , "Material specification Part A- Ferrous," dated June 30, 1975.
PWROG-15109-NP February 2018 Revision 0
*** This record was final approved on 2/22/2018 11 :54:21 AM. ( This statement was added by the PRIME system upon its validation)

WESTINGHOUSE NON-PROPRIETARY CLASS 3 7-8
80. Code of Federal Regulations, 10 CFR Part 50.61a , "Alternate Fracture Toughness Requirements for Protection against Pressurized Thermal Shock Events," U.S. Nuclear Regulatory Commission, Washington D. C., Federal Register, Volume 75, No. 1, dated January 4, 2010, and No. 22 with corrections to part (g) dated February 3, 2010, March 8, 2010, and November 26, 2010.
81 . U.S. Nuclear Regulatory Commission Letter, "Catawba Nuclear Station, Units 1 and 2 -Issuance of Amendments Regarding Measurement Uncertainty Recapture Power Uprate (CAC Nos. MF4526 and MF4527) ," April 29, 2016. [ADAMS Accession Number ML 16081A333]
82. Westinghouse, "Fluence Determination with RAPTOR-M3G and FERRET," WCAP-18124-NP, Revision 0, January 2017. [ADAMS Accession Number ML 17030A377]
83. Jones, E., Retzke, K. and Richardson , B., "Evaluation of DPA Profiles in Westinghouse 3-Loop and 4-Loop PWR Inlet and Outlet Nozzle Forgings using the RAMA Fluence Methodology," International Boiling Water Reactor and Pressurized Water Reactor Materials Reliabil ity Conference and Exhibition , EPRI , July 2012.
84. Hall , J., Mays, B., and DeVan, M., "Large SA-508 Class 2 Nozzle Forging Near-Surface Fracture Toughness," ASME Pressure Vessels and Piping Conference, PVP2017-65982, 2017.
85. ASME Boiler and Pressure Vessel Code, Section Ill , Nuclear Power Plant Components, 197 4 without Addenda.
86. ASME Boiler and Pressure Vessel Code, Section II , Part A, "Ferrous Materials," 1974.
87. ASME Boiler and Pressure Vessel Code, Section II , Part D, "Properties," 2013.
88. Swedish Nuclear Power Inspectorate (SKI) , Report 2006:23, "Cladding Effects on Structural Integrity of Nuclear Components," ISSN 1104-1374, June 2006.
89. Westinghouse Report, "A Review of Cracking Associated with Weld Deposited Cladding in Operating PWR Plants," WCAP-15338-A, October 2002. [ADAMS Accession Number ML083530289]
90. Bamford, W. and Bush, A. , "Effects of Cladding on Fracture Analysis," ASME Pressure Vessels and Piping Conference, PVP Vol. 374, Fatigue, Environmental Factors, and New Materials , 1998.
91 . Brand M., Hohe, J. and Siegele, D., "Numerical Investigations on the Residual Stress Field in a Gladded Plate Due to the Cladding Process," Welding In The World, Vol. 56, 2012.
PWROG-15109-NP February 2018 Revision 0
••• This record was final approved on 2/22/2018 11 :54:21 AM. ( This statement was added by the PRIME system upon its validation)

WESTINGHOUSE NON-PROPRIETARY CLASS 3 7-9
92. Joint Research Centre, European Commission, "An Investigation of the Transferability of Master Curve Technology to Shallow Flaws Reactor Pressure Vessel Application ," NESC-IV Report No. 4 (05) , 2005.
93. Kusnick, Joshua, Mark Kirk, B. Richard Bass, Paul Williams, and Terry Dickson , "Effect of Cladding Residual Stress Modeling Technique on Shallow Flaw Stress Intensity Factor in a Reactor Pressure Vessel ," ASME Pressure Vessels and Piping Conference, PVP2015-45086, 2015.
94 . Wallin, K. , "Fracture Toughness of Engineering Materials, Estimation and Application ," EMAS Publishing , ISBN: 0-9552994-6-2, 2011 , p. 399-415.
95. Siegele, D., Varfolomeyev, I. , Hohe, J. and Hardenacke, V., "Integrity Assessment of a German PWR RPV Considering Loss of Constraint," ASME Pressure Vessels and Piping Conference, PVP2010-25615, 2010.
96. Zhoa, L. , Tong , J. , and Byrne, J. , "Stress intensity factor Kand the elastic T-stress for corner cracks ," International Journal of Fracture 109: 209-225, 2001.
97. Qin , M., et al. "3-Dimensional Finite Element T-Stress Calculation for Reactor Pressure Vessel Nozzle Blend Radius Semi-Elliptical Surface Cracks," ASME Pressure Vessels and Piping Conference, PVP2015-45693, 2015.
98. Merkle, J. G, "An Approximate Method of Elastic-Plastic Fracture Analysis for Nozzle Corner Cracks," Elastic-Plastic Fracture, ASTM STP 668, J. D. Landes, et al. Eds., ASTM International, 1979, 674-702.
99. Scibetta, M., Lucon, E. , and Houben, T. , "Effect of Cladding on Biaxially Loaded Underclad Part-Through Cracks", Journal of ASTM International, Vol. 7, No. 4, pp. 1-18, 2010.
PWROG-15109-NP February 2018 Revision 0
••• This record was final approved on 2/22/2018 11 :54:21 AM. ( This statement was added by the PRIME system upon its validation)

PWROG-15109-NP Revision 0 Proprietary Class 3
**This page was added to the quality record by the PRIME system upon its validation and shall not be considered in the page numbering of this document.••
Approval Information
Author Approval Hall J Brian Feb-20-2018 10:02:07
Verifier Approval Udyawar Anees Feb-20-2018 11 :44:34
Verifier Approval Mays Benjamin E Feb-22-2018 09:39:51
Verifier Approval Webb Justin D Feb-22-2018 09:56:59
Reviewer Approval Chen Jianwei Feb-22-2018 10:59:46
Manager Approval Patterson Lynn Feb-22-2018 11 :05:13
Manager Approval Love David Feb-22-2018 11 :28 :28
Manager Approval Rigby Stephen Feb-22-2018 11 :49: 15
Program Manager Approval Molkenthin James Feb-22-2018 11 :54:21
Files approved on Feb-22-2018
••• This record was fina l approved on 2/22/2018 11 :54:21 AM . ( This statement was added by the PRIME system upon its validation)