Public transport, well-being and inequality - Repositorio CEPAL
20
Public transport, well-being and inequality: coverage and affordability in the city of Montevideo Diego Hernández Abstract Public transport is key to ensuring people’s ability to access the opportunities offered by the city. Unlike other types of transport such as automobiles, public transport is the means that exerts the least monetary pressure on users and most decommodifies mobility. This article analyses the levels of spatial coverage of public transport and the affordability of the service in Montevideo. It also seeks to identify patterns of stratification among diverse socioeconomic groups. The indicators presented show high levels of basic network coverage, coinciding with a growth pattern developed by following spatial and timetable demand. This coverage has a number of stratified differences in access, in particular when affordability is considered. The evidence indicates that household expenditure shows a regressive distribution in relation to access. Keywords Public transport, transport policy, social welfare, equality, household expenditures, cities, Uruguay JEL classification R40, R48, Z13, Z18 Author Diego Hernández is an assistant professor at the Department of Social and Political Sciences of the Catholic University of Uruguay. [email protected]
-
Upload
khangminh22 -
Category
Documents
-
view
0 -
download
0
Transcript of Public transport, well-being and inequality - Repositorio CEPAL

Public transport, well-being and inequality: coverage and affordability in the city of MontevideoDiego Hernández
Abstract
Public transport is key to ensuring people’s ability to access the opportunities offered by the city. Unlike other types of transport such as automobiles, public transport is the means that exerts the least monetary pressure on users and most decommodifies mobility. This article analyses the levels of spatial coverage of public transport and the affordability of the service in Montevideo. It also seeks to identify patterns of stratification among diverse socioeconomic groups. The indicators presented show high levels of basic network coverage, coinciding with a growth pattern developed by following spatial and timetable demand. This coverage has a number of stratified differences in access, in particular when affordability is considered. The evidence indicates that household expenditure shows a regressive distribution in relation to access.
KeywordsPublic transport, transport policy, social welfare, equality, household expenditures, cities, Uruguay
JEL classificationR40, R48, Z13, Z18
AuthorDiego Hernández is an assistant professor at the Department of Social and Political Sciences of the Catholic University of Uruguay. [email protected]
152 CEPAL Review N° 122 • August 2017
Public transport, well-being and inequality: coverage and affordability in the city of Montevideo
I. Introduction
Urban mobility facilitates access to other goods and opportunities, and thus has a major impact on people’s quality of life. In fact, it plays an important role in the production and reproduction of social structures which, at the same time, influence the characteristics of daily mobility (Cass, Shove and Urry, 2005; Kaufmann, 2002; Manderscheid, 2009; Ohnmacht, Maksim and Bergman, 2009). Mobility is not a matter of free personal choice and can be subject to very strong structural limitations (Massot and Orfeuil, 2005; Wenglenski and Orfeuil, 2006). It would be naïve to think that mobility reaches all social strata equally; the fact that greater speed of transport and movement are an imperative for modern societies does not mean that the entire population has access to it (Kaufmann, 2002; Urry, 2007). In short, mobility is not equitably distributed: some people have more transport possibilities than others and some can travel much faster than others and in more directions.
The accessibility of goods, services and opportunities is key to people’s well-being and, for that reason, public transport is as much a matter of social policy as other more traditional social policy areas, such as health and education. Public transport is the greatest decommodifier of accessibility, such that someone who has to travel across the city will find public transport the cheapest way of doing so. Aside from the fact that it involves out-of-pocket expenses (payment of a fare), public transport is the means that demands least payment capacity from the individual. This lower demand makes affordability, to an extent, more independent of a person’s performance in the labour market. Decommodification is based on its conception as a social entitlement rather than as a product with monetary value that depends solely on market fluctuations.
Thus, like other social policies, public transport must be analysed on the basis of three fundamental variables: (i) level of coverage, (ii) affordability of the service, and (iii) the existence of specific mechanisms of financial decommodification. This article analyses the three variables for the case of the city of Montevideo, from the perspective of well-being and equity in the provision of a social good.
This article is intended as a contribution to the study of urban mobility in the region from the perspective of welfare State structures and social policies. It also contributes to the analysis of social policies on the continent, insofar as it analyses a sectoral policy that is always mentioned as crucial, but rarely studied systematically to find rationales of provision and stratification.
This article is structured as follows. Section II presents the conceptual framework, with a particular emphasis on the role of accessibility in well-being and the decommodification function of public transport (using the scheme of assets and opportunities structures). Section III conducts a brief analysis of the case of the city of Montevideo and describes the methodology used to build the indicators analysed. Section IV presents the results in terms of coverage and affordability by socioeconomic level. This evidence is complemented with a review of the decommodification mechanisms identified for the Montevidean transport system. The article closes with a discussion of the empirical evidence in section V.
II. Conceptual framework: accessibility, well-being and public transport
1. The concept of accessibility
For Miralles and Cebollada, accessibility refers to the ease with which people can bridge the distance separating two places and thus exercise their autonomy as citizens (Miralles-Guasch and Cebollada,
153CEPAL Review N° 122 • August 2017
Diego Hernández
2003, p. 14).1 An individual can have very little capacity to travel large spatial distances, yet enjoy very good accessibility through proximity. And, conversely, an individual may be able to travel to many different points in the city, but not to the particular one he or she needs to reach, so that, despite having high mobility, that person continues to have poor accessibility. A person may also make many trips —and thus be highly “mobile”— but still have only poor accessibility if he or she has to travel long distances. In this regard, the location of activities is important. In theory, distances can be overcome by the individual moving towards the activity, or by the activity “moving” towards the individual (proximal localization). Problems of accessibility of work, for example, can be resolved in two ways: with a good transport system that takes people to areas with high concentrations of work opportunities or by work opportunities being located near people’s areas of residence.
On the basis of studies on mobility, accessibility and poverty, a set of variables have been identified that facilitate or hinder access (Cass, Shove and Urry, 2005; Church, Frost and Sullivan, 2000; Flamm, Jemelin and Kaufmann, 2008; Titheridge, 2006; Urry, 2007). Focusing on public transport, these can be summarized in the following dimensions:2
(i) Transport opportunities: the road network and its extent, and the extent of the public transport network, travel times, the characteristics of public transport (timetables, regularity, coverage at different times of day), the quality in terms of convenience and safety or rolling stock and static facilities, and the information made available to passengers.
(ii) Institutional configuration: the extent of State participation in the configuration of transport opportunities and the definition of who pays and who is benefited in relation to travel costs. Another question is the priority given to private forms of transport with respect to public transport (or vice versa), driving costs (for example, if there are urban toll roads or highways, payments and so on), the fare structure of public transport and the existence of regulation and subsidy mechanisms.
(iii) Individual characteristics: the extent to which individuals can take advantage of transport opportunities and the place they occupy in relation to the institutional configuration. In this regard, considerations are people’s income, the time available and how they can organize it (in relation to their activities), and their skills and abilities to master the system and its operation (for example, knowing how to drive or being able to understand how public transport works) and being physically able to access transport.
(iv) Urban form: this concerns socioterritorial dynamics such as the location of households and opportunities in the city.
These dimensions cover various structural aspects and various individual characteristics which, combined, define people’s capacity to overcome geographical distances. For example, a person may live in an area with excellent public transport provision, but if that person cannot afford the fare, accessibility will be limited.
In order to capture this interaction between individual and structural aspects, the paradigm of assets and opportunities structures may be used (Hernández, 2012). Under this approach, the analysis centres on the concept of vulnerability as a tool for looking beyond the poor/non-poor dichotomy in examining household and individual well-being.
1 Another concept that, although terminologically different, has much to do with accessibility is that of motility developed by Kaufmann, Bergman and Joye, who define it as “the capacity to be mobile in the social and geographical space or as the way in which entities access and appropriate the capacity for sociospatial mobility” (Kaufmann, Manfred and Joye, 2004, p. 750).
2 Adapted from Hernández (2012).
154 CEPAL Review N° 122 • August 2017
Public transport, well-being and inequality: coverage and affordability in the city of Montevideo
2. Mobility assets and opportunities structures
As noted, the vulnerability-assets approach arises from the need to learn more about the heterogeneity of poverty and the rationale for the behaviours of lower-income households. It proposes looking beyond the question of whether a household is poor or non-poor. From this perspective, what is important is the household’s capacity to deal with risks that jeopardize basic levels of well-being. In other words, the vulnerability of these households is what must be ascertained. Moser (1998) defines vulnerability as the risk to individual and household well-being posed by a changing environment, as well as their capacity to respond to and recover from unfavourable change. Moser argues that learning about poor households’ portfolios of assets and strategies for managing them facilitates interventions to ensure that these households can use their assets productively.
Kaztman (1999) proposes that more attention should be paid to a society’s opportunities structure, since the degree of vulnerability of a household is given by the mismatch between opportunities and the household’s asset portfolio. Following Kaztman, the concept of household assets can only be assessed in relation to the structures of opportunities generated by the market, society and the State. In other words, the portfolio of assets and asset mobilization by vulnerable households, which is at the heart of Moser’s formulation, can only be examined in the light of overall rationales of asset production and reproduction, which cannot be reduced to the rationale of families and their strategies (Kaztman, 1999, p. 34).
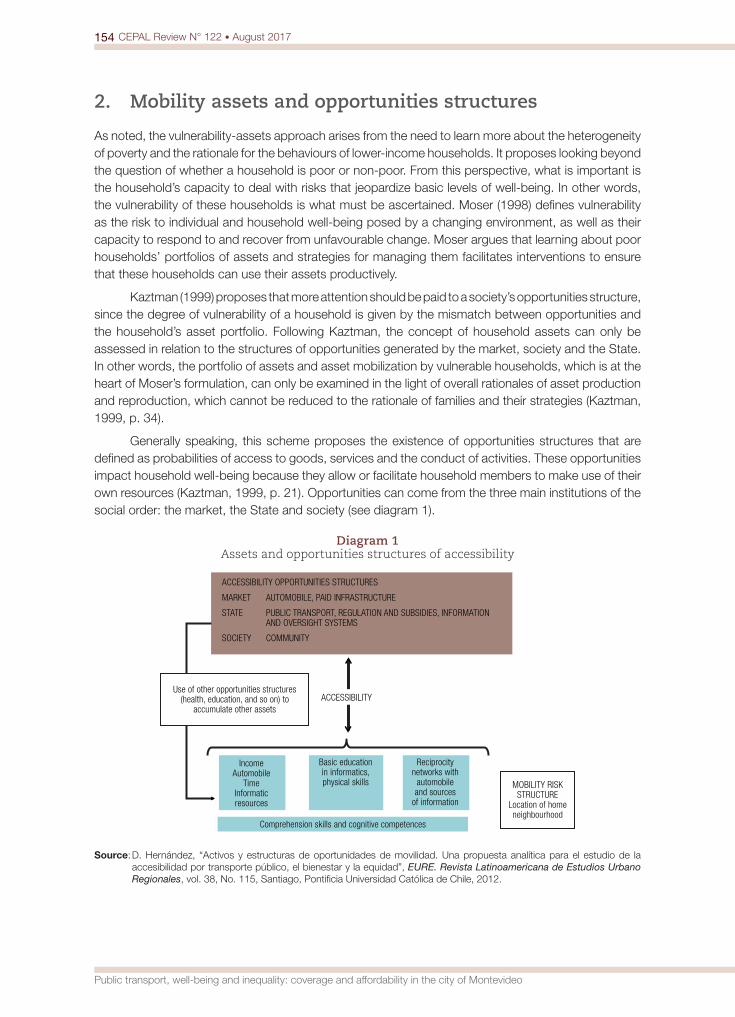
Generally speaking, this scheme proposes the existence of opportunities structures that are defined as probabilities of access to goods, services and the conduct of activities. These opportunities impact household well-being because they allow or facilitate household members to make use of their own resources (Kaztman, 1999, p. 21). Opportunities can come from the three main institutions of the social order: the market, the State and society (see diagram 1).
Diagram 1 Assets and opportunities structures of accessibility
ACCESSIBILITY
IncomeAutomobile
TimeInformaticresources
Comprehension skills and cognitive competences
ACCESSIBILITY OPPORTUNITIES STRUCTURES
MARKET AUTOMOBILE, PAID INFRASTRUCTURE
STATE PUBLIC TRANSPORT, REGULATION AND SUBSIDIES, INFORMATION AND OVERSIGHT SYSTEMS
SOCIETY COMMUNITY
Use of other opportunities structures (health, education, and so on) to
accumulate other assets
Basic educationin informatics,physical skills
Reciprocitynetworks with
automobileand sources
of information
MOBILITY RISKSTRUCTURE
Location of homeneighbourhood
Source: D. Hernández, “Activos y estructuras de oportunidades de movilidad. Una propuesta analítica para el estudio de la accesibilidad por transporte público, el bienestar y la equidad”, EURE. Revista Latinoamericana de Estudios Urbano Regionales, vol. 38, No. 115, Santiago, Pontificia Universidad Católica de Chile, 2012.

155CEPAL Review N° 122 • August 2017
Diego Hernández
The ability to take advantage of these opportunities structures depends on the resources and assets households have. Resources are all the tangible and intangible goods a household controls, while the idea of asset (the term “capital” could also be used) refers to the subset of those resources whose mobilization allows a household to actually take advantage of the opportunities structures existing at a given time, either to raise its level of well-being or to protect it from situations that could threaten it (Kaztman, 1999, pp. 31-32). This approach may be used to identify tension between resources under the control of households and opportunities structures that reflect the limitations of the context. As the authors of this approach argue, it is meaningless to look at assets but disregard opportunities structures. It is necessary to complement the analysis of asset mobilization strategies with the study of access to opportunities structures and examine possible stratification patterns in this regard. By contrast, adjustment or adaptation is what defines household vulnerability (Kaztman, 1999 and 2009; Kaztman and Filgueira, 2006).
The resources that households can mobilize (and convert into capital) reflect the traditional classification of physical capital (income), human capital (educational level) and social capital (participation in reciprocity networks).
In the rationale of this scheme, accessibility is located at the point of encounter between opportunities structures and the resources households have to make use of them. Vulnerability, or the mismatch between the two variables, could be caused by either of them. For example, a typical high-risk mobility structure could consist of those poor households without private options for motorized transport. Where public transport exists, households that lack sufficient income to pay the fare can hardly make use of it. In this case, the vulnerability could be resolved from the public transport side through compensatory financial mechanisms, or by changing the resources available to households (increasing their income). The possibility of these households making use of market-based opportunities can be completely ruled out, because if they cannot afford public transport, they are unlikely to travel by urban toll roads.
One of the key elements for this article is that the opportunities arising from public transport be treated as part of the State order, owing to the State’s leading role —whether it assumes that role or not— in the regulation and design of the good being provided, including, of course, the fares. The State’s central role in the discussion, however, has mainly to do with the fact that public transport is the motorized transport mechanism that has the greatest potential to decommodify mobility, and this is where the discussion should focus. The notion of decommodification (Esping-Andersen, 1990) is linked to individuals’ capacity to access well-being independently of their market performance.
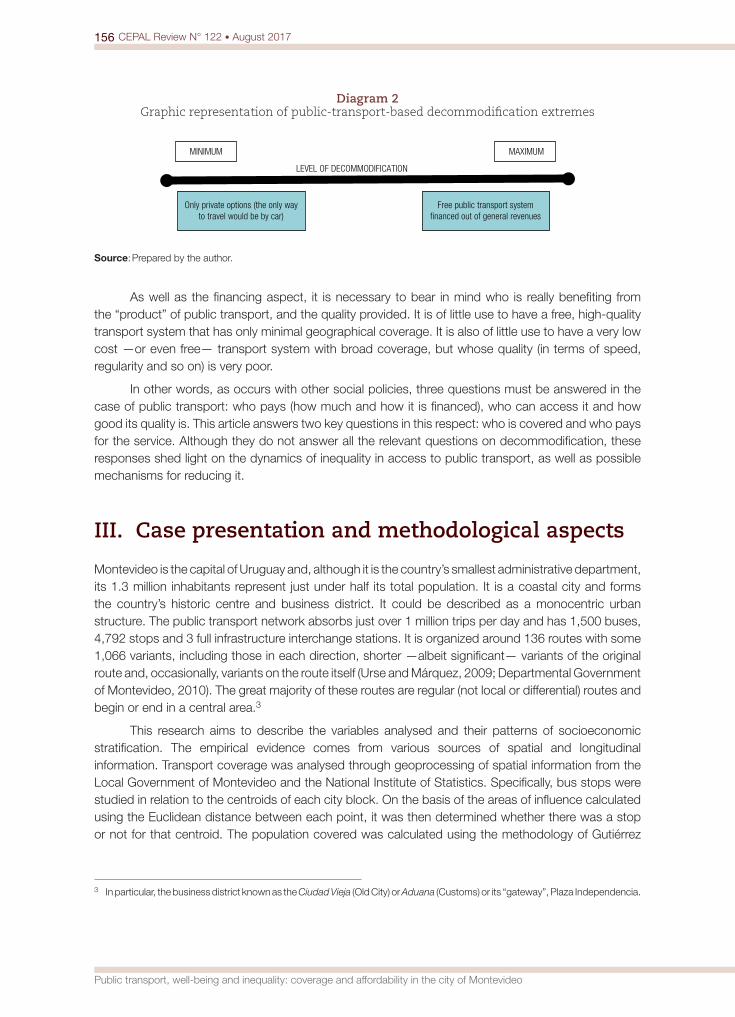
How is decommodification manifested? In a scenario of maximum decommodification, an individual’s ability to afford something is practically independent of his or her ability to use the system. In a scenario of minimum decommodification, an individual’s capacity to travel from one point of the city to the other depends almost exclusively on affordability, which is associated in turn with labour market performance or inherited physical capital. In a highly commoditized context, the capacity for motorized mobility of an unemployed individual without savings or other income is virtually nil. In fact, at this extreme, if there are no elements of fare regulation, it could be argued that the State provides no opportunities for mobility beyond basic road infrastructure. In the opposite scenario, affordability would be irrelevant because there would be no out-of-pocket spending. In the scenario of maximum decommodification, the delivery of the good is financed out of general revenues, so that the tax regimes, subsidy structures and targeting become important elements. Clearly, neither of these extremes are real and the discussion lies in the definition of situations between the two (see diagram 2).
156 CEPAL Review N° 122 • August 2017
Public transport, well-being and inequality: coverage and affordability in the city of Montevideo
Diagram 2 Graphic representation of public-transport-based decommodification extremes
MAXIMUMMINIMUM
LEVEL OF DECOMMODIFICATION
Only private options (the only way to travel would be by car)
Free public transport system financed out of general revenues
Source: Prepared by the author.
As well as the financing aspect, it is necessary to bear in mind who is really benefiting from the “product” of public transport, and the quality provided. It is of little use to have a free, high-quality transport system that has only minimal geographical coverage. It is also of little use to have a very low cost —or even free— transport system with broad coverage, but whose quality (in terms of speed, regularity and so on) is very poor.
In other words, as occurs with other social policies, three questions must be answered in the case of public transport: who pays (how much and how it is financed), who can access it and how good its quality is. This article answers two key questions in this respect: who is covered and who pays for the service. Although they do not answer all the relevant questions on decommodification, these responses shed light on the dynamics of inequality in access to public transport, as well as possible mechanisms for reducing it.
III. Case presentation and methodological aspects
Montevideo is the capital of Uruguay and, although it is the country’s smallest administrative department, its 1.3 million inhabitants represent just under half its total population. It is a coastal city and forms the country’s historic centre and business district. It could be described as a monocentric urban structure. The public transport network absorbs just over 1 million trips per day and has 1,500 buses, 4,792 stops and 3 full infrastructure interchange stations. It is organized around 136 routes with some 1,066 variants, including those in each direction, shorter —albeit significant— variants of the original route and, occasionally, variants on the route itself (Urse and Márquez, 2009; Departmental Government of Montevideo, 2010). The great majority of these routes are regular (not local or differential) routes and begin or end in a central area.3
This research aims to describe the variables analysed and their patterns of socioeconomic stratification. The empirical evidence comes from various sources of spatial and longitudinal information. Transport coverage was analysed through geoprocessing of spatial information from the Local Government of Montevideo and the National Institute of Statistics. Specifically, bus stops were studied in relation to the centroids of each city block. On the basis of the areas of influence calculated using the Euclidean distance between each point, it was then determined whether there was a stop or not for that centroid. The population covered was calculated using the methodology of Gutiérrez
3 In particular, the business district known as the Ciudad Vieja (Old City) or Aduana (Customs) or its “gateway”, Plaza Independencia.

157CEPAL Review N° 122 • August 2017
Diego Hernández
and García (2005), which consists of calculating the proportion of the area covered by the area of influence and applying that to the number of people living in it, assuming that they are covered by that area of influence. For example, if 100 people live in a given census area and the buffer drawn outwards from the bus stop covers 50% of that territory, it is assumed that 50 people are covered by that area of influence. In this case, if the area covered reaches 90%, it will be assumed that all the people in that area are covered. The data on theoretical frequency of the bus service come from information published on the website of the Local Government of Montevideo.
Data on affordability and expenditure on transport were derived from the National Survey of Household Expenditure and Income of the National Statistical Institute. Most of the information came from expenditure on urban transport, which excludes transport for leisure and other purposes (for example, pleasure travel abroad).
Socioeconomic level comes from the division of Montevideo households by income quintile. For the spatial calculations, the levels are the proportion of households in the two poorest income quintiles, which is calculated on the basis of the census segment (approximately six city blocks) and imputed to every block in the segment.
IV. Results
1. Coverage of the public transport network
The network shows considerable density across the city as a whole, leaving few stretches of populated territory uncovered. Generally speaking, the coverage can be said to have developed relatively successfully in relation to demand. The great majority of the most densely populated areas are crossed by a public transport route. Many of the areas that at first sight do not appear to have service belong to the city’s rural areas, which have a very low density. This is a very dense network that appears to reach all areas of the city with potential demand, some with a larger number of services, some with fewer. In this regard, Montevideo can be said to be a city with high public transport connectivity.
It is notable that observation of the areas of influence built around the bus stops within the system shows that the centre and seafront appear uniformly marked by the indicator of 300 m. from a bus stop. There are only a very few interruptions to this pattern, with small portions of the territory in which the distance to a bus stop is between 300 and 500 m. (see map 1). In the other districts of the department, the situation is more uneven, with some areas more than 500 m. or even 750 m. from a stop. On the periphery, the areas of influence are still quite continuous, with the exception of the eastern area. On the suburban periphery, the areas of influence begin to “follow” the rationale of the routes entering in radial form, with much less transversal rationale visible.
As shown in table 1, the number of people without a bus stop within 750 m. is marginal in proportional terms. Looking at the percentage of the city territory at that distance, it is readily discernible that areas with major obstacles to basic access have very low population density. This is a sign of the system’s effectiveness in following demand, and its capacity to avoid extending into areas with low potential demand.

158 CEPAL Review N° 122 • August 2017
Public transport, well-being and inequality: coverage and affordability in the city of Montevideo
Map 1 Montevideo: location of bus stops and areas of influence (300, 500 and 750 metres)
MONTEVIDEO:
0 2,5 5 7,51,25Kilometers
SAN JOSÉ
CANELONES
N
S
W E
AREA OF INFLUENCE AND URBAN BUS STOPS
SUBURBAN PERIPHERY
PERIPHERY
CENTRE
EASTERN COASTBus stopsStops at 300 m.Stops at 500 m.Stops at 750 m.Central areas (+ 750 m.)Canelones metropolitan areaSan josé metropolitan area RIVER PLATE
Source: Prepared by the author, on the basis of information from the Departmental Government of Montevideo and the National Institute of Statistics.
Table 1 Montevideo: area and population, by thresholds of distance to the public transport network
(Percentages, people and metres)
Distance to the stop Area (percentages)
People(percentages) Number of people Average distancea
Over 300 metres 53.70 8.83 117 045 604
Over 500 metres 38.72 2.17 28 752 1 006
Over 750 metres 26.48 0.70 9 348 1 322
Source: Prepared by the author, on the basis of information from the Departmental Government of Montevideo and the National Institute of Statistics.
a This is the average distance of the centroids of census areas which are not intersected by the area of influence of the bus stop at each of the thresholds (300 m., 500 m. and 750 m.). The calculation does not take into account areas partially intersected.
The capacity to avoid extending into areas with little potential demand is, a priori, positive, insofar as there are very few areas with transport needs that the system has not reached in one form or another. Moving to a higher —though still moderate— level of obstacles to access to public transport (stops at over 500 m.), the number of people without coverage rises to just over 2% of the Montevidean population. Once again, the area in this situation suggests a very low population density, although clearly a substantially higher density than the preceding situation. At this level, cases begin to arise in all districts, although slightly more on the periphery and in the southern band of the suburban periphery.
The first fact to notice in the analysis of basic access to public transport stops in Montevideo is that almost 9 out of 10 people reside in a census area with a bus stop within 300 m. This reflects a very high connectivity of the city’s territory and its people, although it also shows a few areas that, owing to location, have certain slight obstacles for around 9% of the population (more than 300 m. from a bus stop) and considerable obstacles for 2% (just under 30,000 people). These clusters of deficits in basic access are likely the result of areas that used to be unpopulated, and which the system has never
159CEPAL Review N° 122 • August 2017
Diego Hernández
reached. This could serve as a warning that areas that used to be sparsely populated are beginning to be more inhabited.
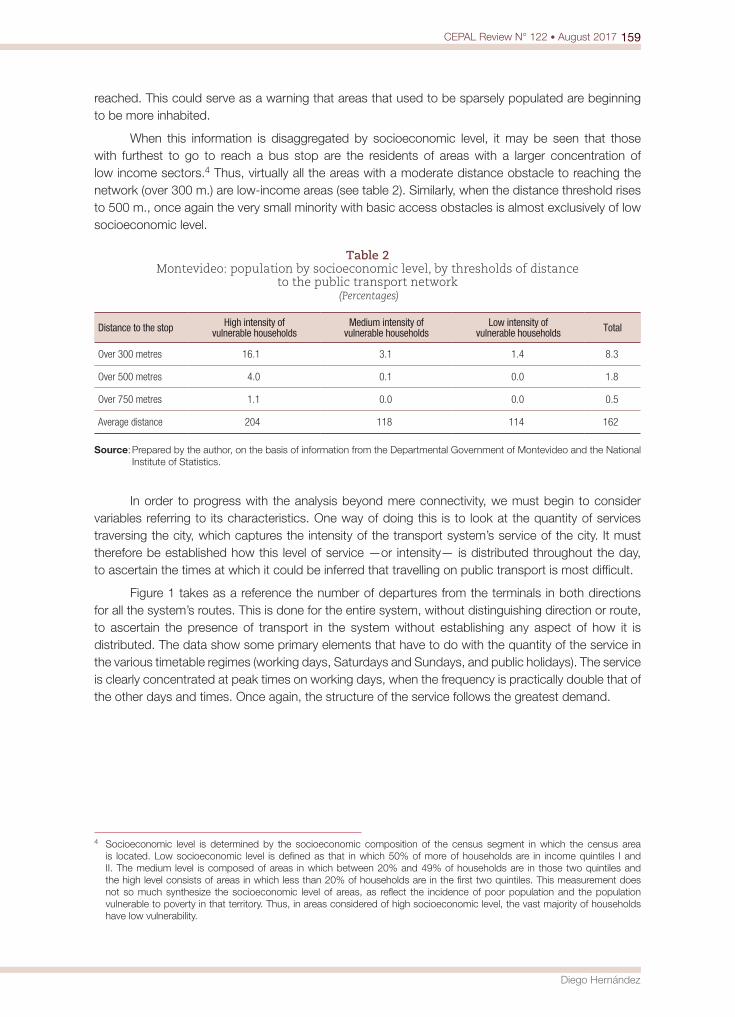
When this information is disaggregated by socioeconomic level, it may be seen that those with furthest to go to reach a bus stop are the residents of areas with a larger concentration of low income sectors.4 Thus, virtually all the areas with a moderate distance obstacle to reaching the network (over 300 m.) are low-income areas (see table 2). Similarly, when the distance threshold rises to 500 m., once again the very small minority with basic access obstacles is almost exclusively of low socioeconomic level.
Table 2 Montevideo: population by socioeconomic level, by thresholds of distance
to the public transport network (Percentages)
Distance to the stop High intensity of vulnerable households
Medium intensity of vulnerable households
Low intensity of vulnerable households Total
Over 300 metres 16.1 3.1 1.4 8.3
Over 500 metres 4.0 0.1 0.0 1.8
Over 750 metres 1.1 0.0 0.0 0.5
Average distance 204 118 114 162
Source: Prepared by the author, on the basis of information from the Departmental Government of Montevideo and the National Institute of Statistics.
In order to progress with the analysis beyond mere connectivity, we must begin to consider variables referring to its characteristics. One way of doing this is to look at the quantity of services traversing the city, which captures the intensity of the transport system’s service of the city. It must therefore be established how this level of service —or intensity— is distributed throughout the day, to ascertain the times at which it could be inferred that travelling on public transport is most difficult.
Figure 1 takes as a reference the number of departures from the terminals in both directions for all the system’s routes. This is done for the entire system, without distinguishing direction or route, to ascertain the presence of transport in the system without establishing any aspect of how it is distributed. The data show some primary elements that have to do with the quantity of the service in the various timetable regimes (working days, Saturdays and Sundays, and public holidays). The service is clearly concentrated at peak times on working days, when the frequency is practically double that of the other days and times. Once again, the structure of the service follows the greatest demand.
4 Socioeconomic level is determined by the socioeconomic composition of the census segment in which the census area is located. Low socioeconomic level is defined as that in which 50% of more of households are in income quintiles I and II. The medium level is composed of areas in which between 20% and 49% of households are in those two quintiles and the high level consists of areas in which less than 20% of households are in the first two quintiles. This measurement does not so much synthesize the socioeconomic level of areas, as reflect the incidence of poor population and the population vulnerable to poverty in that territory. Thus, in areas considered of high socioeconomic level, the vast majority of households have low vulnerability.

160 CEPAL Review N° 122 • August 2017
Public transport, well-being and inequality: coverage and affordability in the city of Montevideo
Figure 1 Montevideo: intensity of urban public transport service by time of departure
and timetable regime, 2010 (Number of departures)
0
200
400
600
800
1 000
1 200
0 1 2 3 4 5 6 7 8 9 10 11 12 13 14 15 16 17 18 19 20 21 22 23
Num
ber o
f dep
artu
res
Time of departure
Working days Saturdays Sundays
Source: Prepared by the author, on the basis of scheduled frequencies published on the website of the Departmental Government of Montevideo.
2. Household expenditure on transport
Thus far we have presented evidence on the spatial availability of the network, which does not necessarily guarantee its use. Also conditioning that use is affordability, which is a non-spatial element that also plays a part in defining basic access to public transport. It is therefore extremely important to include in the analysis the monetary burden of access to the service.
As argued by Thompson (2002), urban transport represents a high cost for countries and families. That cost has a basic component consisting of “mandatory” trips and another “optional” component that has to do with the choice of higher and lower quality modes of transport. The cost assumed by families gives clues to the affordability of public transport for households, and to the different ways in which those costs are distributed between socioeconomic levels and users (Carruthers, Dick and Saurkar, 2005; Falavigna, Nassi and Peixoto, 2011; Serebrisky and others, 2009). Analysis of the structure of household expenditure makes it possible to infer the monetary pressure imposed by motorized mobility on families at the different socioeconomic levels. To this end, first the percentage of income that is effectively used to consume transport-related products and services must be determined. Second, it must be ascertained which goods “compete” with transport expenditures, that is, how much of the money that is spent in households goes to basic —and relatively non-substitutable— goods and how much to goods that would probably not seriously compromise household welfare if their consumption were forgone.
Observation of the expenditure of Montevidean households shows that the largest items are food, housing, health and transport, and the item corresponding to saving. The first two are the largest percentages for the population overall (see table 3). When the information is by household income level, the expenditure structure changes. In the case of food, the distribution by income level is very marked. For households in the first income quintile, food takes up over a third of income. Moving up the income quintiles, the proportion of income spent on food decreases to virtually a tenth of current income in the highest quintile. The other large item —housing— shows a rather more even structure

161CEPAL Review N° 122 • August 2017
Diego Hernández
across the income quintiles, as the percentage devoted to this item is only a little higher in the bottom three quintiles than in the top two. As for other items that are significant as a proportion of household income, the distribution of spending on transport is only weakly associated with income level and is slightly higher in the richest households, a subject that will be explored later.
Table 3 Montevideo (simple averages): spending on expenditure items as a percentage of total
household income, by income quintile, 2006Expenditure item I II III IV V TotalHousing 28.2 28.4 27.5 24.7 24.9 26.7
Foods and non-alcoholic beverages 34.8 23.7 18.6 15.3 10.6 20.6
Transport 7.7 7.8 7.8 8.4 8.6 8.1
Health 3.2 7.9 10.0 10.1 8.7 8.0
Recreation and culture 4.7 4.5 4.7 6.0 6.4 5.3
Diverse goods and services 5.8 4.3 4.0 4.0 4.1 4.5
Communications 4.5 4.7 4.7 4.2 3.9 4.4
Furnishings, households articles and their maintenance 4.3 3.0 3.1 3.2 4.5 3.6
Clothing and footwear 4.5 3.1 3.2 3.2 2.9 3.4
Restaurants and accommodation 1.6 1.8 2.8 3.3 4.3 2.8
Education 0.5 1.1 2.2 2.5 2.2 1.7
Alcoholic beverages, tobacco and narcotics 2.3 1.8 1.7 1.3 1.0 1.6
Non-consumption expenditure 1.0 1.2 1.4 1.7 2.6 1.6
Saving -2.5 7.1 8.9 12.4 16.2 8.4
Source: Prepared by the author, on the basis of data from the 2006 National Survey of Household Expenditure and Income of the National Institute of Statistics.
In the case of health, the association is more noticeable and direct: the wealthiest households tend to spend more on this item than the poorest. In this case there is a break starting in the second quintile, in which this item rises, probably because the users of free State health services are concentrated in the first quintile. In the other quintiles, this spending is affected by more extensive participation in the mutual system, in which specific instalments and co-payments are made for certain services. The other item with a predictable and very high association with income level is household saving, i.e. the difference between monthly income and the expenditures made. Saving turns negative among the lowest 20% of households by income. This means that, proportionally speaking, their monthly expenditures exceed their income. Once again, in the second quintile there is a large jump in saving capacity, which continues to rise up to 16% of income in the richest quintile.
The figures shown in table 3 show a situation marked by household socioeconomic level in terms of the priority afforded to basic goods. In the lowest two household income quintiles —especially in the first— a very high priority is afforded to food expenditures and to housing (in the latter case with a similar weight across all the income levels). Of course, the reasons for this may be found in the actual amount of income which is divided into expenditures and, in the case of food, the fact that the most numerous households are concentrated in the lowest income quintiles. All this means that basic goods exercise enormous pressure and make the budget more rigid, insofar as much of income is consumed by food. Put another way, in the poorest households, only a very small disposable income is left after deducting spending on food, rent and household maintenance, and this income has to accommodate transport spending which, if it is high, will compete with the basic goods mentioned.
As noted earlier, besides food and housing, other items (such as health and education) show the footprint of the social protection matrix. The poorest households do not appear to devote large parts of their income to these items (which would indicate they are receiving them from the State), whereas the richest households do, because they consume them in the market. It is clear that, in these cases, the differentiated investment may translate into differentiated quality; there is nothing new in
162 CEPAL Review N° 122 • August 2017
Public transport, well-being and inequality: coverage and affordability in the city of Montevideo
the notion that the market may give more careful attention to several dimensions (of greater or lesser importance) than the State does free of charge.
Concentrating the analysis on urban transport shows that the poorest households spend the bulk of their transport expenditure on trips within the city.5
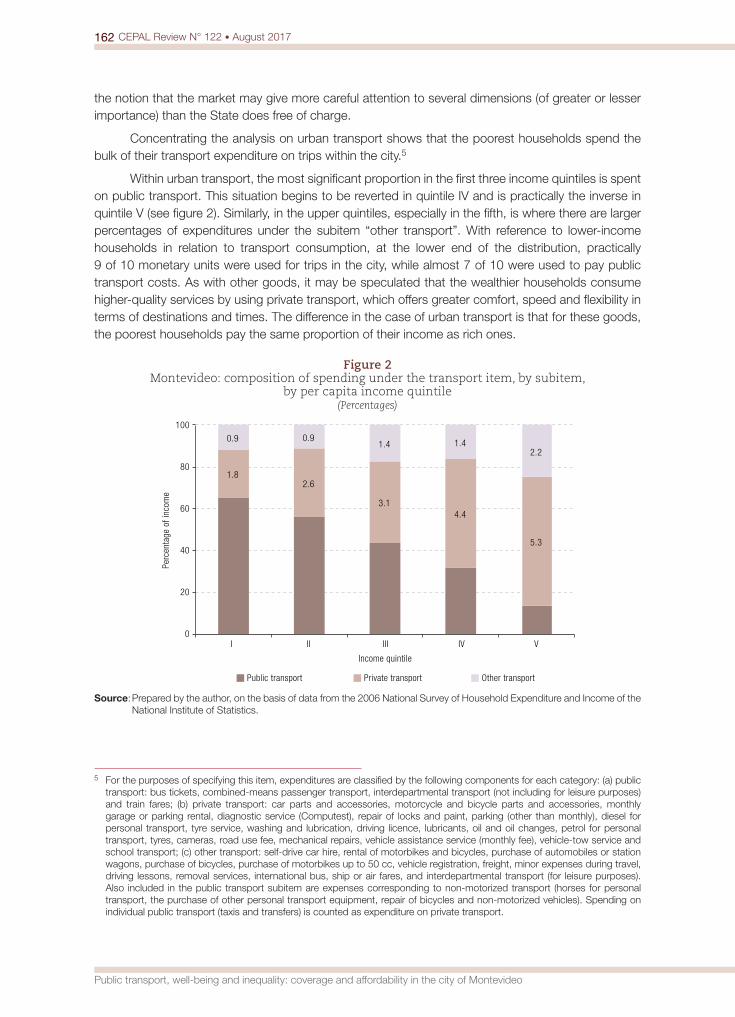
Within urban transport, the most significant proportion in the first three income quintiles is spent on public transport. This situation begins to be reverted in quintile IV and is practically the inverse in quintile V (see figure 2). Similarly, in the upper quintiles, especially in the fifth, is where there are larger percentages of expenditures under the subitem “other transport”. With reference to lower-income households in relation to transport consumption, at the lower end of the distribution, practically 9 of 10 monetary units were used for trips in the city, while almost 7 of 10 were used to pay public transport costs. As with other goods, it may be speculated that the wealthier households consume higher-quality services by using private transport, which offers greater comfort, speed and flexibility in terms of destinations and times. The difference in the case of urban transport is that for these goods, the poorest households pay the same proportion of their income as rich ones.
Figure 2 Montevideo: composition of spending under the transport item, by subitem,
by per capita income quintile(Percentages)
1.8 2.6
3.1 4.4
5.3
0.9 0.9 1.4 1.4
2.2
0
20
40
60
80
100
I II III IV V
Perc
enta
ge o
f inc
ome
Income quintile
Public transport Private transport Other transport
Source: Prepared by the author, on the basis of data from the 2006 National Survey of Household Expenditure and Income of the National Institute of Statistics.
5 For the purposes of specifying this item, expenditures are classified by the following components for each category: (a) public transport: bus tickets, combined-means passenger transport, interdepartmental transport (not including for leisure purposes) and train fares; (b) private transport: car parts and accessories, motorcycle and bicycle parts and accessories, monthly garage or parking rental, diagnostic service (Computest), repair of locks and paint, parking (other than monthly), diesel for personal transport, tyre service, washing and lubrication, driving licence, lubricants, oil and oil changes, petrol for personal transport, tyres, cameras, road use fee, mechanical repairs, vehicle assistance service (monthly fee), vehicle-tow service and school transport; (c) other transport: self-drive car hire, rental of motorbikes and bicycles, purchase of automobiles or station wagons, purchase of bicycles, purchase of motorbikes up to 50 cc, vehicle registration, freight, minor expenses during travel, driving lessons, removal services, international bus, ship or air fares, and interdepartmental transport (for leisure purposes). Also included in the public transport subitem are expenses corresponding to non-motorized transport (horses for personal transport, the purchase of other personal transport equipment, repair of bicycles and non-motorized vehicles). Spending on individual public transport (taxis and transfers) is counted as expenditure on private transport.

163CEPAL Review N° 122 • August 2017
Diego Hernández
As noted earlier, in the poorest households, the “competition” for transport expenditure clearly comes from basic goods. Figure 3 depicts the notion of the competitive impact of transport on basic goods, attempting, precisely, to capture some of the tensions faced by households with fewer resources and to estimate the threat to their budget posed by their current spending on transport or by a possible rise in transport spending.6 The greater that pressure, the more the consumption of certain goods will be threatened if the need to consume transport is inexorable, and, of course, a high competitive impact value very likely means a deficit in transport provision. This could take the form of the suspension of activities that require outlays or the search for other alternatives without monetary cost, but high personal costs (for example, travelling large distances on foot).
Figure 3 Montevideo: measure of competitive impact of urban transport on basic goods, 2006
(Expenditure on public transport as a proportion of substitutable spending)
1.1
0.5
0.4 0.3
0.2
0.0
0.2
0.4
0.6
0.8
1.0
1.2
1 2 3 4 5
Income quintiles
Impact of urban transport
Source: Prepared by the author, on the basis of data from the 2006 National Survey of Household Expenditure and Income of the National Institute of Statistics.
The data are categorical in relation to the regressive distribution of this measurement, in particular in the case of households in the first income quintile, where the proportion of income devoted to urban transport is 110% of disposable income. This figure falls to half for households in the second quintile and continues dropping as income rises, leaving plenty of room to meet and increase transport needs without comprising other consumption needs. Another trait of the behaviour of this variable is that the competitive impact is similar in the lower quintile for both transport overall and urban transport alone. The higher the income quintile, the larger this difference in proportional terms.
Another element that must be borne in mind when analysing transport expenditure has to do with the quantity of people living in the household. This is a different way of looking at the same phenomenon, in that the number of people is associated with expenditure on food, which makes up a large part of the set of basic goods and is one of the items with the largest absolute differences between the quintiles, which to an extent defines the percentage of income available. The indicator chosen to include in the analysis of the number of people living in households is the ratio of transport
6 This measure is the simple ratio of the percentage of income devoted to transport to the percentage devoted to substitutable expenditures (leisure and saving).
164 CEPAL Review N° 122 • August 2017
Public transport, well-being and inequality: coverage and affordability in the city of Montevideo
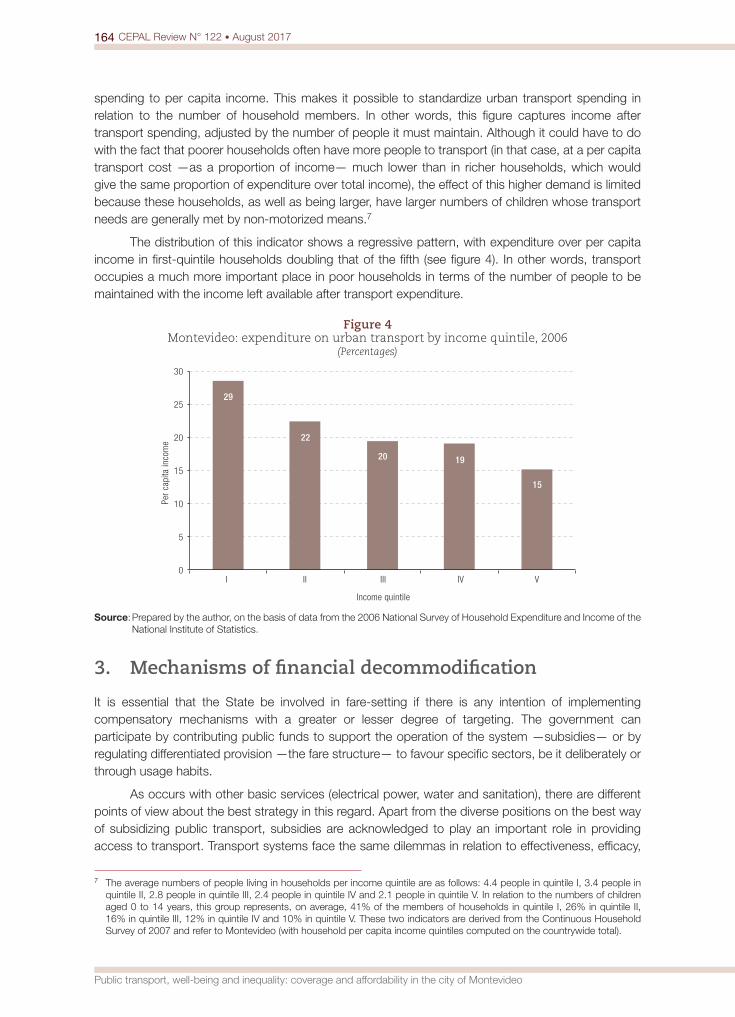
spending to per capita income. This makes it possible to standardize urban transport spending in relation to the number of household members. In other words, this figure captures income after transport spending, adjusted by the number of people it must maintain. Although it could have to do with the fact that poorer households often have more people to transport (in that case, at a per capita transport cost —as a proportion of income— much lower than in richer households, which would give the same proportion of expenditure over total income), the effect of this higher demand is limited because these households, as well as being larger, have larger numbers of children whose transport needs are generally met by non-motorized means.7
The distribution of this indicator shows a regressive pattern, with expenditure over per capita income in first-quintile households doubling that of the fifth (see figure 4). In other words, transport occupies a much more important place in poor households in terms of the number of people to be maintained with the income left available after transport expenditure.
Figure 4 Montevideo: expenditure on urban transport by income quintile, 2006
(Percentages)
29
22
20 19
15
0
5
10
15
20
25
30
I II III IV V
Per
capi
ta in
com
e
Income quintile
Source: Prepared by the author, on the basis of data from the 2006 National Survey of Household Expenditure and Income of the National Institute of Statistics.
3. Mechanisms of financial decommodification
It is essential that the State be involved in fare-setting if there is any intention of implementing compensatory mechanisms with a greater or lesser degree of targeting. The government can participate by contributing public funds to support the operation of the system —subsidies— or by regulating differentiated provision —the fare structure— to favour specific sectors, be it deliberately or through usage habits.
As occurs with other basic services (electrical power, water and sanitation), there are different points of view about the best strategy in this regard. Apart from the diverse positions on the best way of subsidizing public transport, subsidies are acknowledged to play an important role in providing access to transport. Transport systems face the same dilemmas in relation to effectiveness, efficacy,
7 The average numbers of people living in households per income quintile are as follows: 4.4 people in quintile I, 3.4 people in quintile II, 2.8 people in quintile III, 2.4 people in quintile IV and 2.1 people in quintile V. In relation to the numbers of children aged 0 to 14 years, this group represents, on average, 41% of the members of households in quintile I, 26% in quintile II, 16% in quintile III, 12% in quintile IV and 10% in quintile V. These two indicators are derived from the Continuous Household Survey of 2007 and refer to Montevideo (with household per capita income quintiles computed on the countrywide total).
165CEPAL Review N° 122 • August 2017
Diego Hernández
convenience and impact. These themes are addressed in regional research works focusing mainly on the impact of transport affordability (Carruthers, Dick and Saurkar, 2005; Estupiñán and others, 2007; Gómez-Lobos, 2007; Gomide, Leite and Rebelo, 2005; Gutiérrez, 2004; Rogat, 2009; Serebrisky and others, 2009).8
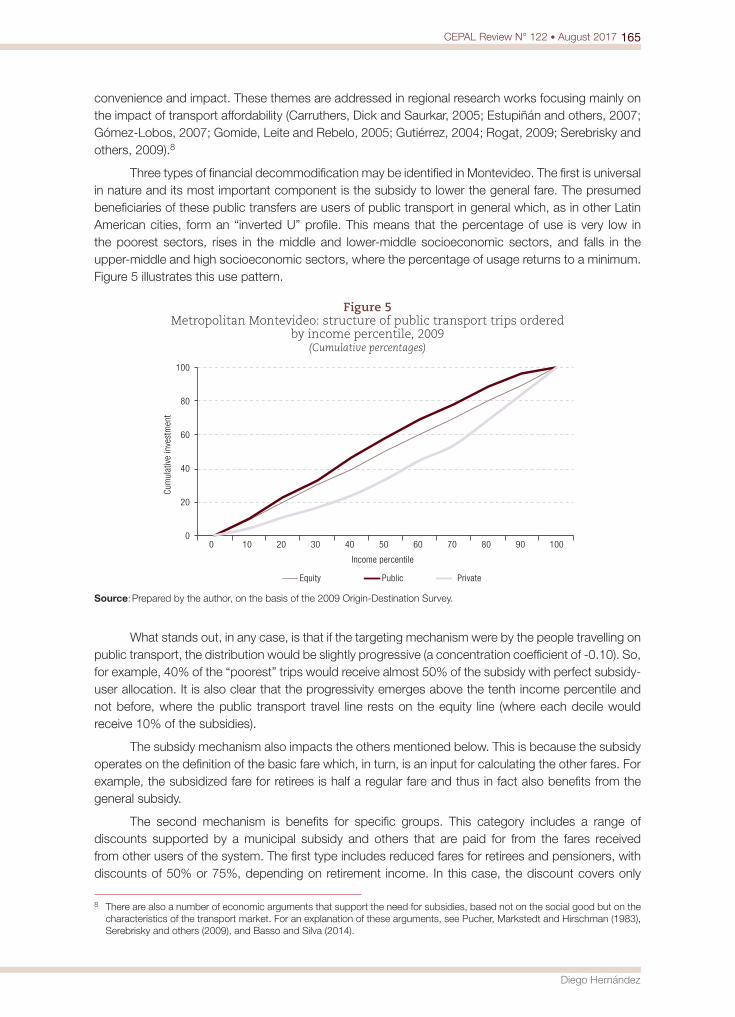
Three types of financial decommodification may be identified in Montevideo. The first is universal in nature and its most important component is the subsidy to lower the general fare. The presumed beneficiaries of these public transfers are users of public transport in general which, as in other Latin American cities, form an “inverted U” profile. This means that the percentage of use is very low in the poorest sectors, rises in the middle and lower-middle socioeconomic sectors, and falls in the upper-middle and high socioeconomic sectors, where the percentage of usage returns to a minimum. Figure 5 illustrates this use pattern.
Figure 5 Metropolitan Montevideo: structure of public transport trips ordered
by income percentile, 2009 (Cumulative percentages)
0
20
40
60
80
100
0 10 20 30 40 50 60 70 80 90 100
Cum
ulat
ive
inve
stm
ent
Income percentile
Equity Public Private
Source: Prepared by the author, on the basis of the 2009 Origin-Destination Survey.
What stands out, in any case, is that if the targeting mechanism were by the people travelling on public transport, the distribution would be slightly progressive (a concentration coefficient of -0.10). So, for example, 40% of the “poorest” trips would receive almost 50% of the subsidy with perfect subsidy-user allocation. It is also clear that the progressivity emerges above the tenth income percentile and not before, where the public transport travel line rests on the equity line (where each decile would receive 10% of the subsidies).
The subsidy mechanism also impacts the others mentioned below. This is because the subsidy operates on the definition of the basic fare which, in turn, is an input for calculating the other fares. For example, the subsidized fare for retirees is half a regular fare and thus in fact also benefits from the general subsidy.
The second mechanism is benefits for specific groups. This category includes a range of discounts supported by a municipal subsidy and others that are paid for from the fares received from other users of the system. The first type includes reduced fares for retirees and pensioners, with discounts of 50% or 75%, depending on retirement income. In this case, the discount covers only
8 There are also a number of economic arguments that support the need for subsidies, based not on the social good but on the characteristics of the transport market. For an explanation of these arguments, see Pucher, Markstedt and Hirschman (1983), Serebrisky and others (2009), and Basso and Silva (2014).

166 CEPAL Review N° 122 • August 2017
Public transport, well-being and inequality: coverage and affordability in the city of Montevideo
those in receipt of a pension or retirement benefit. There are also differentiated fares for students in secondary and tertiary education, consisting of a discount ranging from 50% to 100%, depending on the level of education and the age of the beneficiary.
The total discounts arising from crossed subsidies include free transport for primary school pupils and, on Sundays, for those aged over 70 or under 12. Free transport for schoolchildren has been traditional in Montevidean public transport, and free travel for children and older persons for leisure purposes was instituted after 1990.
Mechanisms based on social groups are affected by self-selection. In the case of students this is obvious: children or young people who are not in the education system are concentrated in the poorest sectors. It is also true that a high proportion of students, especially in primary and lower-secondary school, walk to and from educational establishments. The discount for retirees and pensioners can suffer a similar effect in relation to certain minimum formal requirements —a carnet must be obtained from a social security institute— which can exclude the poorest sectors.
Lastly, the third type of mechanism identified is spatial and time-based, through the diversification of the fares offered to passengers. By purchasing tickets under one of these modalities, passengers can make a trip —or several legs of the same trip— more cheaply than if they bought equivalent tickets at the regular price. This mechanism may be interpreted in two dimensions: time and space. There are two differentiated flat-fare and semi-flat-fare products defined in terms of time: the “2-hour” ticket, which allows the passenger to use the system freely for two hours for the price of roughly 1.4 regular tickets, and the “1-hour” ticket, which allows passengers to take two trips on public transport for the cost of the regular fare.9 So, strictly speaking, the regular fare (known as the “common ticket”) is actually a semi-flat 1-hour fare. This fare structure favours those who, first, use these fares and, second, make most use of the possibilities in relation to the trips taken. Accordingly, those who make two trips on a single ticket are financed by those who make just one. Something similar occurs with those who make several trips on a 2-hour ticket. There is thus a cross-subsidy between those using the 2-hour ticket and those who are not, as there is also between passengers who make more intensive use of the system and those who use it less intensively.10
In the spatial dimension, there are zonal or local routes, which have a 50% discount on the regular fare. These routes include local services, short routes, some circular routes, those that travel to areas not served by the regular network or connect distant points with exchange points in the system. They also include some portions of regular routes which issues zone fares after a certain points. The latest modality incorporated into the system is a peripheral ring which was classified as zonal: all trips beginning and ending within the ring can be taken at the zone fare. This type of fare is particularly progressive because most of the local services are located in peripheral areas where low-income sectors are concentrated. In particular, the zone ticket for the third ring recently mentioned is highly progressively self-selective.
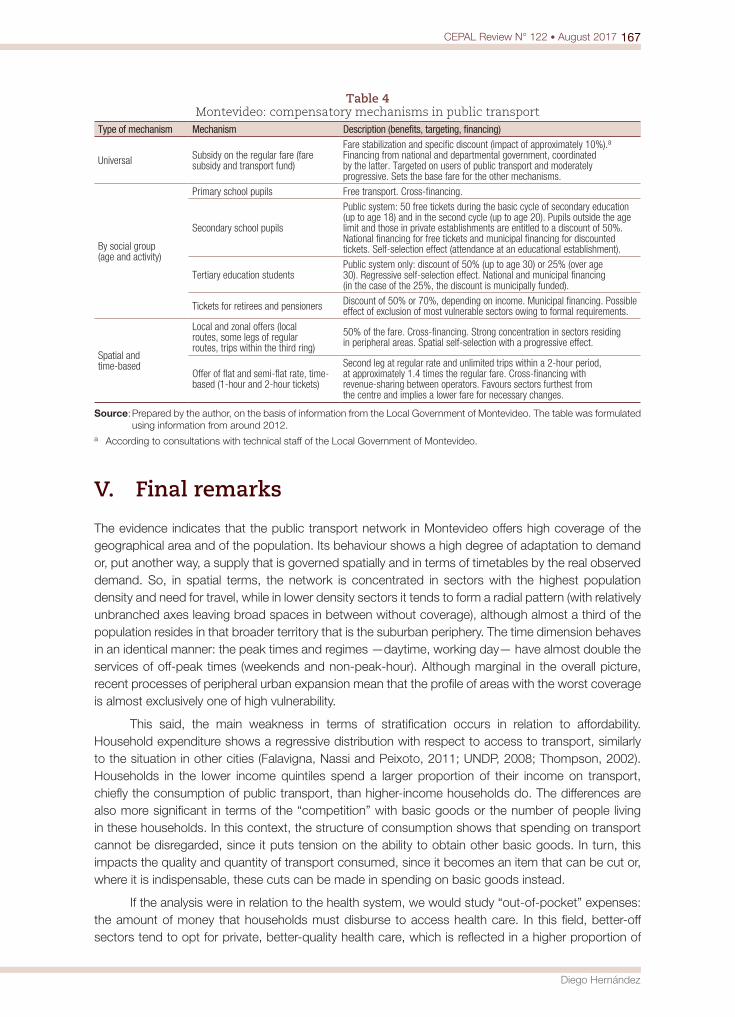
Table 4 summarizes the three mechanisms analysed and each of their components.11
9 This fare allows a third trip when some of the legs are boarded at certain points of the system (generally, terminals or changeover stops).
10 There is a revenue-sharing scheme at the level of the operators, whereby income is divided in equal parts for each leg used and each company receives the equivalent to the number of legs that the passenger used in the system.
11 It bears mentioning that the transport system has other mechanisms that are not included here because their effect is marginal in terms of impact on the purchase of trips or on beneficiaries. These are: the institutional ticket, which gives a discount on the fare for packets of tickets purchased by employees of firms that have an agreement with the Departmental Government of Montevideo, and free transport for some persons with disabilities.
167CEPAL Review N° 122 • August 2017
Diego Hernández
Table 4 Montevideo: compensatory mechanisms in public transport
Type of mechanism Mechanism Description (benefits, targeting, financing)
Universal Subsidy on the regular fare (fare subsidy and transport fund)
Fare stabilization and specific discount (impact of approximately 10%).a Financing from national and departmental government, coordinated by the latter. Targeted on users of public transport and moderately progressive. Sets the base fare for the other mechanisms.
By social group(age and activity)
Primary school pupils Free transport. Cross-financing.
Secondary school pupils
Public system: 50 free tickets during the basic cycle of secondary education (up to age 18) and in the second cycle (up to age 20). Pupils outside the age limit and those in private establishments are entitled to a discount of 50%. National financing for free tickets and municipal financing for discounted tickets. Self-selection effect (attendance at an educational establishment).
Tertiary education studentsPublic system only: discount of 50% (up to age 30) or 25% (over age 30). Regressive self-selection effect. National and municipal financing (in the case of the 25%, the discount is municipally funded).
Tickets for retirees and pensioners Discount of 50% or 70%, depending on income. Municipal financing. Possible effect of exclusion of most vulnerable sectors owing to formal requirements.
Spatial and time-based
Local and zonal offers (local routes, some legs of regular routes, trips within the third ring)
50% of the fare. Cross-financing. Strong concentration in sectors residing in peripheral areas. Spatial self-selection with a progressive effect.
Offer of flat and semi-flat rate, time-based (1-hour and 2-hour tickets)
Second leg at regular rate and unlimited trips within a 2-hour period, at approximately 1.4 times the regular fare. Cross-financing with revenue-sharing between operators. Favours sectors furthest from the centre and implies a lower fare for necessary changes.
Source: Prepared by the author, on the basis of information from the Local Government of Montevideo. The table was formulated using information from around 2012.
a According to consultations with technical staff of the Local Government of Montevideo.
V. Final remarks
The evidence indicates that the public transport network in Montevideo offers high coverage of the geographical area and of the population. Its behaviour shows a high degree of adaptation to demand or, put another way, a supply that is governed spatially and in terms of timetables by the real observed demand. So, in spatial terms, the network is concentrated in sectors with the highest population density and need for travel, while in lower density sectors it tends to form a radial pattern (with relatively unbranched axes leaving broad spaces in between without coverage), although almost a third of the population resides in that broader territory that is the suburban periphery. The time dimension behaves in an identical manner: the peak times and regimes —daytime, working day— have almost double the services of off-peak times (weekends and non-peak-hour). Although marginal in the overall picture, recent processes of peripheral urban expansion mean that the profile of areas with the worst coverage is almost exclusively one of high vulnerability.
This said, the main weakness in terms of stratification occurs in relation to affordability. Household expenditure shows a regressive distribution with respect to access to transport, similarly to the situation in other cities (Falavigna, Nassi and Peixoto, 2011; UNDP, 2008; Thompson, 2002). Households in the lower income quintiles spend a larger proportion of their income on transport, chiefly the consumption of public transport, than higher-income households do. The differences are also more significant in terms of the “competition” with basic goods or the number of people living in these households. In this context, the structure of consumption shows that spending on transport cannot be disregarded, since it puts tension on the ability to obtain other basic goods. In turn, this impacts the quality and quantity of transport consumed, since it becomes an item that can be cut or, where it is indispensable, these cuts can be made in spending on basic goods instead.
If the analysis were in relation to the health system, we would study “out-of-pocket” expenses: the amount of money that households must disburse to access health care. In this field, better-off sectors tend to opt for private, better-quality health care, which is reflected in a higher proportion of
168 CEPAL Review N° 122 • August 2017
Public transport, well-being and inequality: coverage and affordability in the city of Montevideo
spending in relation to income. This does not happen in the case of transport. Although middle and upper sectors also have access to better-quality options —and likely make more trips to different destinations within the city—, proportionally speaking, they use less of their income than other households (or the same amount). This occurs despite efforts by the authorities —quite significant efforts compared with the rest of the region— to keep fares down and maximize affordability.
The research results encourage the adoption of a regional approach to analysing accessibility and public transport policies. First, because transport affordability is a pending issue in the region, and points to the risk of increasing precariousness in low-income sectors, either because they cannot move about the city or because they must do so in inadequate conditions when they cannot afford the service. Second, because, unlike in Montevideo, in several Latin American cities even basic coverage is still an unresolved problem (see, for example, CAF, 2009; Bocarejo and Oviedo, 2012; Vasconcellos, 2012). Third, because the question of quality is central throughout the region. This article has not addressed the quality of transport in Montevideo, but for the future agenda it is essential to ask what level of service and what frequency and regularity would constitute a highly accessible system. This is a key question when analysing the degree of decommodification.
BibliographyBasso, L. and H.S. Silva (2014), “Efficiency and substitutability of transit subsidies and other urban transport
policies”, American Economic Journal: Economic Policy, vol. 6, No. 4, Nashville, Tennessee, American Economic Association.
Bocarejo, J.P. and D.R. Oviedo (2012), “Transport accessibility and social inequities: a tool for identification of mobility needs and evaluation of transport investments”, Journal of Transport Geography, vol. 24, Amsterdam, Elsevier.
CAF (Andean Development Corporation) (2009), Observatorio de Movilidad Urbana para America Latina. Información para mejores políticas y mejores ciudades, Caracas.
Carruthers, R., M. Dick and A. Saurkar (2005), “Affordability of public transport in developing countries”, Transport Papers, No. 3, Washington, D.C., World Bank.
Cass, N., E. Shove and J. Urry (2005), “Social exclusion, mobility and access”, The Sociological Review, vol. 53, No. 3, Wiley.
Church, A., M. Frost and K. Sullivan (2000), “Transport and social exclusion in London”, Transport Policy, vol. 7, No. 3, Amsterdam, Elsevier.
Departmental Government of Montevideo (2010), Plan Montevideo. Memoria de Ordenación, Montevideo.Esping-Andersen, G. (1990), The Three Worlds of Welfare Capitalism, Princeton, Princeton University Press.Estupiñán, N. and others (2007), “Affordability and subsidies in public urban transport: what do we mean,
what can be done?”, Policy Research Working Paper, No. 4440, Washington, D.C., World Bank.Falavigna, C., C.D. Nassi and M. Peixoto (2011), “As despesas em transporte e seu impacto no orcamento
familiar: um indicador para considerar equidade no planejamento de transportes”, paper presented at the XXIV Congresso de Pesquisa e Ensino em Transportes, Salvador de Bahia.
Flamm, M., C. Jemelin and V. Kaufmann (2008), Travel Behaviour Adaptation Processes during Life Course Transitions. A Methodological and Empirical Study using a Person-based GPS Tracking System, Laboratoire de Sociologie Urbaine (LASUR).
Gómez-Lobo, A. (2007), “Affordability of public transport: a methodological clarification”, Documentos de Trabajo, No. 261, Santiago, University of Chile.
Gomide, A., S. Leite and J. Rebelo (2005), “Public transport and urban poverty: a synthetic index of adequate service”, Working Paper, No. 33901, Washington, D.C., World Bank.
Gutiérrez, A. (2004), “Concentración empresaria y eficiencia en el autotransporte urbano de Buenos Aires”, EURE. Revista Latinoamericana de Estudios Urbano Regionales, vol. 30, No. 91, Santiago, Pontificia Universidad Católica de Chile.
Gutiérrez, J. and J.C. García (2005), “Sobreestimaciones del cálculo de distancias en línea recta con respecto al de distancias viarias en el análisis de cobertura de las redes de transporte público”, Madrid, Complutense University of Madrid.

169CEPAL Review N° 122 • August 2017
Diego Hernández
Hernández, D. (2012), “Activos y estructuras de oportunidades de movilidad. Una propuesta analítica para el estudio de la accesibilidad por transporte público, el bienestar y la equidad”, EURE. Revista Latinoamericana de Estudios Urbano Regionales, vol. 38, No. 115, Santiago, Pontificia Universidad Católica de Chile.
Kaufmann, V. (2002), Re-thinking Mobility. Contemporary Sociology, Aldershot, Ashgate.Kaufmann, V., M. Bergman and D. Joye (2004), "Motility: mobility as capital", International Journal of Urban
and Regional Research, vol. 28, No. 4, Wiley.Kaztman, R. (2009), “Territorio y empleo: circuitos de realimentación de las desigualdades en Montevideo”, paper
prepared for the XXVIII International Congress of the Latin American Studies Association, Rio de Janeiro.(1999), Activos y estructuras de oportunidades. Estudios sobre las raíces de la vulnerabilidad social en Uruguay (LC/MVD/R.180/E), Montevideo, United Nations Development Programme (UNDP)/Economic Commission for Latin America and the Caribbean (ECLAC).
Kaztman, R. and F. Filgueira (2006), “Las normas como bien público y como bien privado: reflexiones en las fronteras del enfoque AVEO”, Documentos de Trabajo del IPES – Colección Aportes Conceptuales, No. 4, Montevideo, Catholic University of Uruguay.
Manderscheid, K. (2009), “Unequal mobilities”, Mobilities and Inequality, Surrey, Ashgate.Massot, M.-H. and J.-P. Orfeuil (2005), “La mobilité au quotidien, entre choix individuel et production sociale”,
Cahiers internationaux de sociologie, No. 118.Miralles-Guasch, C. and A. Cebollada (2003), “Movilidad y transporte. Opciones políticas para la ciudad”,
Documentos de Trabajo, No. 25, Barcelona, Laboratorio de Alternativas.Moser, C. (1998), “The asset vulnerability framework: reassessing urban poverty reduction strategies”, World
Development, vol. 26, No. 1, Amsterdam, Elsevier.Ohnmacht, T., H. Maksim and M. Bergman (2009), “Mobilities and inequalities - Making connections”,
Mobilities and Inequality, Surrey, Ashgate.Pucher, J., A. Markstedt and I. Hirschman (1983), “Impacts of subsidies on the costs of urban public transport”,
Journal of Transport Economics and Policy, vol. 17, No. 2.Rogat, J. (2009), Regulación y planificación de buses en America Latina. Resumen orientado a tomadores
de decisiones, UNEP Risø Centre.Serebrisky, T. and others (2009), “Affordability and subsidies in public urban transport: what do we mean,
what can be done?”, Transport Reviews, vol. 29, No. 6, Taylor & Francis.Thompson, I. (2002), “Impacto de las tendencias sociales, económicas y tecnológicas sobre el transporte público:
una investigación preliminar en ciudades de América Latina”, Recursos Naturales e Infraestructura series, No. 41 (LC/L.1717-P), Santiago, Economic Commission for Latin America and the Caribbean (ECLAC).
Titheridge, H. (2006), “Social exclusion and transport policy”, London, University College, unpublished.UNDP (United Nations Development Programme) (2008), “El futuro de la movilidad en Bogotá. Reflexiones
a propósito del Plan Maestro de Movilidad y Estacionamientos”, Cuadernos del Informe de Desarrollo Humano para Bogota, No. 1, Bogota.
Urry, J. (2007), Mobilities, Cambridge, Polity Press.Urse, G. and G. Márquez (2009), “Un modelo de gestión alternativo en el transporte urbano: el caso de
Montevideo”, paper prepared for the Latin American Congress for Public and Urban Transportation (CLATPU), Buenos Aires.
Vasconcellos, E.A. (2012), Transporte urbano y movilidad en los países en desarrollo: reflexiones y propuestas, São Paulo, Instituto Movimiento.
Wenglenski, S. and J.-P. Orfeuil (2006), “The differences in the accessibility to the job market according to the social status and the place of residence in the Paris area”, unpublished.