Flexible Genome Retrieval for Supporting In-Silico Studies of Endobacteria-AMFs
Upload
independentCategory
view
1download
0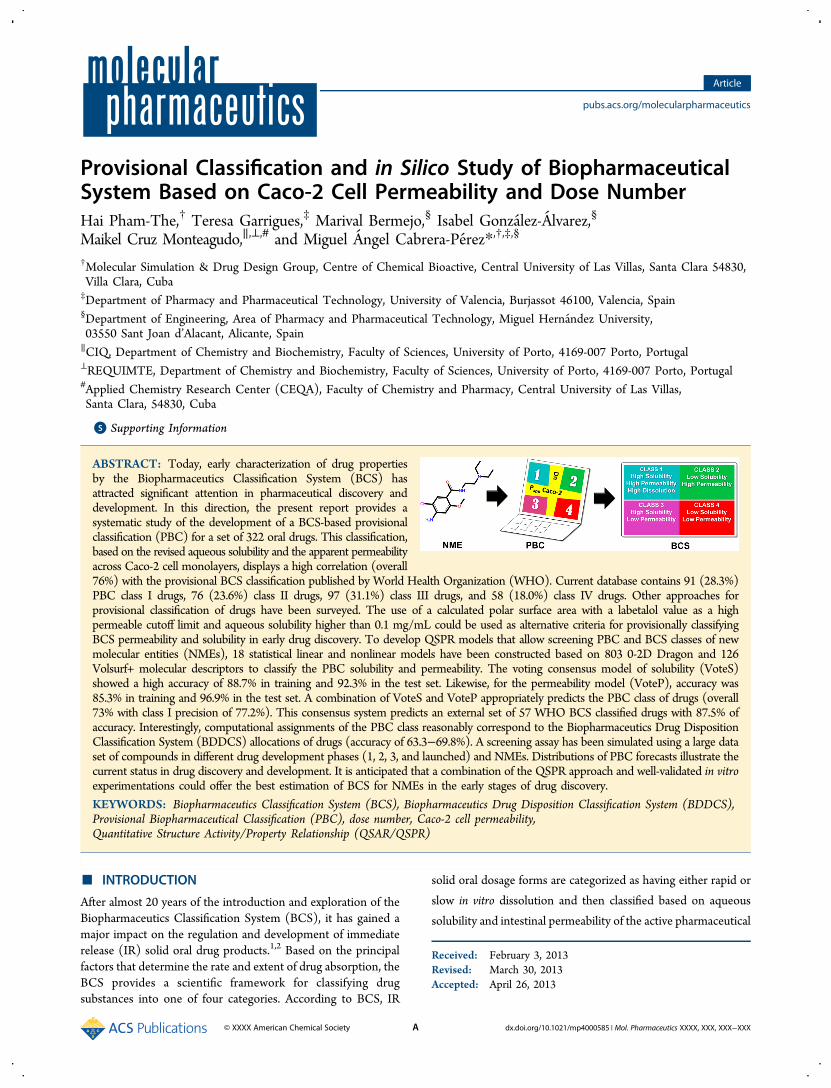
Provisional Classification and in Silico Study of BiopharmaceuticalSystem Based on Caco‑2 Cell Permeability and Dose NumberHai Pham-The,† Teresa Garrigues,‡ Marival Bermejo,§ Isabel Gonzalez-Alvarez,§
Maikel Cruz Monteagudo,∥,⊥,# and Miguel Angel Cabrera-Perez*,†,‡,§
†Molecular Simulation & Drug Design Group, Centre of Chemical Bioactive, Central University of Las Villas, Santa Clara 54830,Villa Clara, Cuba‡Department of Pharmacy and Pharmaceutical Technology, University of Valencia, Burjassot 46100, Valencia, Spain§Department of Engineering, Area of Pharmacy and Pharmaceutical Technology, Miguel Hernandez University,03550 Sant Joan d’Alacant, Alicante, Spain∥CIQ, Department of Chemistry and Biochemistry, Faculty of Sciences, University of Porto, 4169-007 Porto, Portugal⊥REQUIMTE, Department of Chemistry and Biochemistry, Faculty of Sciences, University of Porto, 4169-007 Porto, Portugal#Applied Chemistry Research Center (CEQA), Faculty of Chemistry and Pharmacy, Central University of Las Villas,Santa Clara, 54830, Cuba
*S Supporting Information
ABSTRACT: Today, early characterization of drug propertiesby the Biopharmaceutics Classification System (BCS) hasattracted significant attention in pharmaceutical discovery anddevelopment. In this direction, the present report provides asystematic study of the development of a BCS-based provisionalclassification (PBC) for a set of 322 oral drugs. This classification,based on the revised aqueous solubility and the apparent permeabilityacross Caco-2 cell monolayers, displays a high correlation (overall76%) with the provisional BCS classification published by World Health Organization (WHO). Current database contains 91 (28.3%)PBC class I drugs, 76 (23.6%) class II drugs, 97 (31.1%) class III drugs, and 58 (18.0%) class IV drugs. Other approaches forprovisional classification of drugs have been surveyed. The use of a calculated polar surface area with a labetalol value as a highpermeable cutoff limit and aqueous solubility higher than 0.1 mg/mL could be used as alternative criteria for provisionally classifyingBCS permeability and solubility in early drug discovery. To develop QSPR models that allow screening PBC and BCS classes of newmolecular entities (NMEs), 18 statistical linear and nonlinear models have been constructed based on 803 0-2D Dragon and 126Volsurf+ molecular descriptors to classify the PBC solubility and permeability. The voting consensus model of solubility (VoteS)showed a high accuracy of 88.7% in training and 92.3% in the test set. Likewise, for the permeability model (VoteP), accuracy was85.3% in training and 96.9% in the test set. A combination of VoteS and VoteP appropriately predicts the PBC class of drugs (overall73% with class I precision of 77.2%). This consensus system predicts an external set of 57 WHO BCS classified drugs with 87.5% ofaccuracy. Interestingly, computational assignments of the PBC class reasonably correspond to the Biopharmaceutics Drug DispositionClassification System (BDDCS) allocations of drugs (accuracy of 63.3−69.8%). A screening assay has been simulated using a large dataset of compounds in different drug development phases (1, 2, 3, and launched) and NMEs. Distributions of PBC forecasts illustrate thecurrent status in drug discovery and development. It is anticipated that a combination of the QSPR approach and well-validated in vitroexperimentations could offer the best estimation of BCS for NMEs in the early stages of drug discovery.
KEYWORDS: Biopharmaceutics Classification System (BCS), Biopharmaceutics Drug Disposition Classification System (BDDCS),Provisional Biopharmaceutical Classification (PBC), dose number, Caco-2 cell permeability,Quantitative Structure Activity/Property Relationship (QSAR/QSPR)
■ INTRODUCTION
After almost 20 years of the introduction and exploration of theBiopharmaceutics Classification System (BCS), it has gained amajor impact on the regulation and development of immediaterelease (IR) solid oral drug products.1,2 Based on the principalfactors that determine the rate and extent of drug absorption, theBCS provides a scientific framework for classifying drugsubstances into one of four categories. According to BCS, IR
solid oral dosage forms are categorized as having either rapid or
slow in vitro dissolution and then classified based on aqueous
solubility and intestinal permeability of the active pharmaceutical
Received: February 3, 2013Revised: March 30, 2013Accepted: April 26, 2013
Article
pubs.acs.org/molecularpharmaceutics
© XXXX American Chemical Society A dx.doi.org/10.1021/mp4000585 | Mol. Pharmaceutics XXXX, XXX, XXX−XXX
ingredient (API).1 This system has been formally adopted by theUS Food and Drug Administration (FDA),3 the EuropeanMedicines Agency (EMA),4 and the World Health Organization(WHO)5 as a technical standard for waiving bioequivalence (BE)test requirements for oral drugs. A recent study of the economicimpact of granting biowaivers for class I and III BCSdemonstrated an impressive saving annual expenditure onrunning BE studies, being more than 120 million dollars betweenthe two classes.6 Because it avoids unnecessary drug exposures tohealthy subjects, while maintaining the high public healthstandard for therapeutic equivalence, the BCS is, without doubt,a potential tool for speeding up and reducing the cost of drugdevelopment.Initially, BCS-based in vivo BE study waivers were granted for
Scale-Up and Post-Approval Changes (SUPAC).7 Currentbiowaiver approval is also applied for generic IR oral drugproducts of BCS class I API. Therefore, pharmaceutical scientistsin the early drug development always attempt to utilizepharmaceutical profiling data to establish the preliminary BCSclassification for the lead compound.8 The most popular form ofsuch classification is based on the secondary aqueous solubilityreferences and permeability estimations (e.g., clogP).9 The so-calledprovisional BCS classification gives a round prediction of solubilityand permeability class membership that can be revised as moreexperimental data become available.10 A precise BCS classificationbased on more extensive solubility, dissolution, and permeabilityexperiments to officially support a biowaiver application is furtherneeded.Several works have been carried out to provisionally classify
large groups of drugs.9,11−15 In these studies, aqueous solubilitycriterion was obtained from commonly available referencessuch as US Pharmacopeia16 and Merck Index,17 considering theUS FDA3 or the WHO guidance.5 Following these rules, a drugsubstance can be seen as a highly soluble drug when the highestdose strength is soluble in 250 mL or less of aqueous media overthe pH range of 1 to 7.5 (US FDA) or 1.2 to 6.8 (WHO) at 37 °C.However, in most of the cases the authors could neither fill outmulti-pH profiles nor clarify the appropriate method of solubilitydetermination.14 In addition, reported maximum dose strengthsvary depending on the references.On the other hand, the permeability classification is based on
diverse estimations, which remain somewhat uncertain. First, asthe principal purpose of regulatory authorities when utilizingBCS is to support BE study, no benchmarking exists for thelow-permeability term which would define BCS class III or IV. Upto now, it is commonly accepted that, if a drug does not meet thehigh permeability criterion, it can be seen as a low permeabilitydrug. From the FDA and WHO guidance, the permeability classboundary can be determined directly by measuring the rateof mass transfer across human intestinal membrane. It can alsobe determined indirectly based on the extent of absorption(specifically, fraction of dose absorbed, Fa) of a drug substance inhumans.2,3,5 However, the definitions of highly permeable drugsbetween guidances are different. According to FDA, a drugsubstance is considered highly permeable when Fa is 90% ormore of the oral dose. This absorption-based permeabilitycriterion was relaxed to 85% in the WHO acceptance.5 Thisshifting causes some changes in the allocation of class I and IIIdrugs.5 There are five main approaches to demonstrate highpermeability in BCS: (i) absolute bioavailability or mass balancestudies in humans, (ii) urinary recovery of unchanged drugin humans, (iii) in vivo intestinal perfusion studies in humans,(iv) in vitro permeation studies across a monolayer of cultured
epithelial cells, and/or (v) high metabolism as defined underBDDCS (Biopharmaceutical Drug Disposition ClassificationSystem).2,18 Among these methods, in vitro assays are widelyused as high throughput screening (HTS) methods formeasuring permeability and appropriately estimate the oralabsorption of drug-like molecules in early preclinical phase. Itshould be noted that the Caco-2 (adenocarcinoma cells derivedfrom colon) monolayers are recommended by both the US FDAand EMA3,4 as the most suitable model for estimating intestinalpermeability. This cell culture exhibits morphological andfunctional similarities to human enterocytes that makes it abetter surrogate for in vivo drug absorption potential than otherepithelial cell cultures.19 The expression of multiple transportersin Caco-2 cells, such as P-glycoprotein (P-gp), the proton-coupled oligopeptide transporter (PEPT1) among others,20
offers great advantages over other simplified models ininvestigating the interplay among different transport systemsand to establish the relative contributions of passive and activetransport mechanisms to the overall permeability.19
In this report, we attempt to provide a ProvisionalBiopharmaceutical Classification (PBC) for a group of drug anddrug-like uncharged molecules, using consensus-revised referencesfor BCS solubility and Caco-2 cell permeability measurements foridentifying high permeability class in the context of BCS. Thisclassification was compared to current available allocations accord-ing to BCS and BDDCS. Based on computed physicochemicalproperties of this data set some computational models weredeveloped to assign a provisional biopharmaceutical class for newmolecular entities (NMEs). These models were rigorously validatedon various published BCS class drug sets,5,9,11,12,18 and the feasibilityof performing PBC prediction in early drug discovery is discussed.
■ MATERIALS AND METHODS
Data Set. BCS based-provisional classification requires bothsolubility and permeability measurements. In this work, a set of322 drugs was obtained from published works. A provisionalclassification was executed by means of an extensive literaturerevision of experimental values and assigned classes, as follows.
Solubility Data. The drug solubility data (in mg/mL) can beobtained from standard references,9 such as the Pharmacopeia16
or the Merck Index.17 Since the FDA criteria for solubilityspecifies water as a solvent, simulated intestinal fluid containing asurfactant cannot be used.21 Furthermore, the cutoff value betweenhigh and low solubility requires knowledge of the lowest solubilityover the wide pH range (as stated in the FDA or WHO guidance).The temperature condition of the assay is also specified to be 37 °C.However, all of these requirements are seldom fulfilled. Hence, wepropose the use of other reliable sources apart from current standardreferences. There are many free databases which provide a vastnumber of physicochemical data, including aqueous solubility, inuser-friendly web servers. For instance, it can be mentioned thePhysprop database with more than 25 000 compounds (available athttp://www.srcinc.com/what-we-do/databaseforms.aspx?id=386)or ChemIDplus, a database of about 350 000 chemical compounds(available at http://chem.sis.nlm.nih.gov/chemidplus/chemidheavy.jsp), and so on. As the number of experimental dataincreases, the final consensus choice is more reliable. A valuablereference is a recent application of BDDCS to 927 drugs.21 Sinceboth BCS and BDDCS use the same criteria for solubility, this workhas been taken as reliable source to standardize our data set. Due tothe extensive survey, herein we only report the lowest solubilityunder the conditions listed above. In addition, scale-up guidelines
Molecular Pharmaceutics Article
dx.doi.org/10.1021/mp4000585 | Mol. Pharmaceutics XXXX, XXX, XXX−XXXB
were taken from Kasim et al.9 whenever solubility data was notavailable or was undefined.Maximum Dose Strength. Two reference sources were
mainly used for searching values of maximum dose strength(mg): (i) the WHOModel List of Essential Medicines22 and (ii)Orange Book.23 For drugs that are not included in thesedocuments or exist in different market presentations, the firstintroduced strengths were revised and used as highest dosages.Doses in mg/kg were transformed into mg assuming 70 kg asadult body weight.Dose Number Calculations. The dose number (D0) was
calculated using the following equation
=DM V
S( / )
00 0
(1)
where M0 is the highest dose strength (mg), S is the aqueoussolubility (mg/mL) determined under conditions mentionedabove, and water volume V0 is assumed to be 250 mL.1,9 Drugswith D0 ≤ 1 were classified as high-solubility drugs. Conversely,drugs with D0 > 1 were assigned as low solubility drugs.9
Permeability Estimations. There are different forms toestimate the BCS permeability class.9,13,24 As mentioned above,the scientific community currently accepts the application of fivemethods to prove the high permeability class (BCS class I or II).However, as the number of available data increases, it is morereasonable to use these references in combination forpermeability assignments. In this work, in vitro Caco-2 cellpermeability is used to classify drug according to BCS. For thispurpose, we take advantage of our previous research where anextensive literature survey of this kind of data was processed.25
Besides, we have adopted the same method proposed by Kim etal.,24 taking the average permeability value of Metoprolol(average apparent permeability Papp = 20 × 10−6 cm/s) forbenchmarking the high permeability class boundary. Allexperimental data was revised taking into account the mainfactors contributing to data variability, such as passage range(28−65), confluence (>85%), transport assay in range of 18−21days postseeding in pH medium of 6.5−7.4 at 37 °C, and soforth.26 There is not an official standard protocol for Caco-2available to predict drug absorption in the context of the BCS.Behrens and Kissel have published four important points thatshould be considered: filter inserts (polycarbonate, PC), collagencoating, average seeding density of 4 × 10⁴ to 6 × 10⁴ cells/cm2
and invariable medium supplement.27 The apparent coefficientof permeation (Papp) must be calculated (cm/s) at sinkcondition:
= × × ×PQt m A
Vdd
1 1app
odonor
(2)
where dQ/dt is the permeability rate (steady state transport rate)obtained from the mass transport-time profile of the substrate,e.g. counts/s, A (cm2) the surface area of the monolayer, m0 theoriginal mass of the marker substance in the donor compartment,for e.g. counts, and Vdonor (cm3) is the volume of donorcompartment. Due to the large revised literature, themean valueswere listed, excluding those laid outside of the mean ±2 SD(standard deviation) ranges. Additionally, available data obtainedon both directions apical to basolateral (Papp,A‑B) and vice versa(Papp,B‑A) were taken into account.Computational Methods. BCS is very important for drug
authorization. It also predicts drug probability for achieving goodoral absorption. This fact makes early provisional biopharma-
ceutics classification very useful for identifying good drugcandidates (or NMEs) as it provides a round approximation oftheir actual BCS allocations. However, since the clinical dose andthe absorbed fraction are unknown at the initial stage of drugdiscovery, such a classification remains a challenge. Computa-tional or in silico methods made important advancements overthe past decade, and they are the first choice for facing thischallenge. Previous attempts for BDDCS modeling were carriedout and demonstrated that consensus models based on two-separated properties (dose number and % total metabolism)predictions can achieve reasonable performance.28,29 That is tosay, a robust prediction of dose number, despite being a propertyof drug in its formulation that can only be defined for NMEs in aclinical context,29 can be effectively conducted using appropriatephysicochemical or molecular descriptors such as thoseimplemented in Volsurf+ package.30
On the other hand, several researchers have exploredQuantitative Structure−Property Relationship (QSPR) classi-fication approaches involving Caco-2 cell permeability forpredicting highly absorbed NMEs. All of these models presentedappropriate performances.25 Up to now, a threshold of Papp≥ 8×10⁻⁶ cm/s has been used for identifying compounds with Fa ≥80%.25,31 Rank-order relationships between high Caco-2 cellpermeability and high absorption level showed wide variability.For example, Papp ≥ 1 × 10⁻⁶ cm/s has been associated tocomplete absorption,32 Papp ≥ 10 × 10−6 cm/s with Fa ≥ 70%,33
Papp ≥ 14 × 10−6 cm/s related to Fa ≥ 90%,34 and so on. Byadopting a new cutoff value derived from an internal standarddrug (Metoprolol, Papp ≥ 20 × 10−6) to define the low/highpermeability class boundary,24 Caco-2 measurement basedclassificationmodels could suitably classify the BCS permeability.Finally, a cutoff value of 16 × 10−6 cm/s was used forclassification.Taking all of the above together, in this work computational
efforts have been made to construct potential predictors of BCSclasses for NMEs based on two separate model series of dosenumber and Caco-2 cell permeability. To attain this purpose, thefollowing computational procedures were considered: (i)suitably computing physicochemical and molecular descriptors,(ii) rational selection of training and test sets, (iii) establishmentof modeling strategy and appropriated variable selection, (iv)rigorous validation with BCS classified known drugs, and (v)prediction of BCS classes for NMEs according to chemical spacecovered by obtained models.
Molecular Descriptor Calculations. Chemical structures of322 drugs from current data set were expressed as 2D SMILEstrings. Using this encoded inputs, 803 simple (0-2D)descriptors belonging to 29 families implemented in Dragonsoftware version 6.0,35 and 126 molecular descriptors in VolSurf+version 1.0.430 were calculated. A preliminary variable selection wascarried out removing missing and nonvariance variables (standarddeviation, SD < 10−4). Detailed descriptions of molecular descriptors(MDs) calculated by the Dragon and VolSurf packages can be foundin the literature.36,37
Rational Design of the Training and Test Sets. Thisprocedure was carried out by means of k-mean cluster analysis(k-MCA), a multivariate technique implemented in the Statisticasoftware version 8.0.38 To guarantee acceptable statistical qualityof data cluster, the number of members in each cluster andthe SD of the variables in the cluster (as low as possible)were considered. Additionally, the SD between and withincluster, the respective Fisher ratio, and p-level of significance(p < 0.05) were inspected.
Molecular Pharmaceutics Article
dx.doi.org/10.1021/mp4000585 | Mol. Pharmaceutics XXXX, XXX, XXX−XXXC
Compounds of the training and test sets were randomlycollected from the previous clusters. This procedure allowsselecting, in a representative way and in all level of the linkingdistance (Y-axis), compounds for both sets. Compoundsbelonging to the test set (around 20% of the complete database)were not used in the development of the discriminant functionsand were set aside to validate the obtained models. The splittingprocedures according to solubility and permeability responsevariables were performed independently.Model Building and Feature Selection. Three statistical
classification algorithms were applied in order to detect allpossible (linear or nonlinear) relationships between solubility/permeability and computed parameters: LDA (linear discrim-inant analysis), QDA (quadratic discriminant analysis), and BLR(binary logistic regression). LDA and QDA are well-known to beparametric statistical algorithms based on Fisher’s discriminantanalysis,39 while BLR is a parametric system derived from themethod of maximum likelihood.40
Briefly, LDA searches for a hyperplane which divides thep-dimensional space of attributes to distinguish the two classes(±) and is represented by a linear discriminant function f LDA(±)
+ − = + + + ··· +f a a x a x a x( / ) p pLDA 0 1 1 2 2 (3)
where a0 is a constant, a1 to ap are the regression coefficients for pvariables (x1 to xp). This method makes the parametricalassumptions such as noncolinearity, normality, and homocedasticitythat were further ascertained.The quadratic discrimination is similar to the linear one, but in
this case the hypersurfaces, which divide the classes, arequadratic. Then the QDA function is f QDA(±)
+ − = + + ··· + + + ···
+ + + ··· +
f a a x a p a x x
a x x a x a x
( / ) p xp
n i j p p
QDA 0 11 1 1 21 1 2
2 31 12
32
(4)
where a0 is a constant, a11 to a1p, a21 to a2n, and a31 to a3p arequadratic coefficients, and xi and xj are the i/jth predictorvariables.The BLR method produces a mathematic formula that output
the probability P of each case to belong to one class, for example,positive (P+), in function (typically a sigmoidal dependency) ofpredictive variables. That is
= + + + ··· ++ −P P a a x a x a xln( / ) p p0 1 1 2 2 (5)
where (P+/P−) is called the odds ratio and ln(P+/P−) the logittransform of P+; a1 to ap are the regression coefficients for pvariables (x1 to xp). A probability (P+) of 0.5 is considered asdefault cutoff for BLR classification rules. As expected, QDA andBLR are useful for capturing nonlinear relationships betweendependent variable and predictors. The model building wasperformed using SPSS and Statistica software.38,41
Stepwise discriminant analysis was mainly used to identify theappropriate subset of variables and to build discriminant models.Forward stepwise methods were first employed for eachdescriptor family. Specifically, in case of LDA and QDA, ateach step all variables were reviewed and evaluated, consideringthe p-level (p) or Fisher ratio (F), to determine the mostinfluential variable on the discrimination between classes.Subsequently, the “best subset” technique was applied takingWilks’ λ as subset significance evaluator. Hence the fundamentalhypothesis of being equal variance could be refused, leading todevelop model that properly separates two groups. Standardstatistical parameters such as the square of Mahalanobis distance
(D2), F, and corresponding p were also considered. In the case ofBLR, Forward Selection (Conditional) was used. This is astepwise selection method with entry testing based on thesignificance of the score statistic and removal based on theprobability of a likelihood-ratio statistic (p < 0.05) based onconditional parameter estimates. As a default, entry scores lowerthan 0.05 and removal scores higher than 0.1 were applied.Additionally, to compare the potency of Dragon and Volsurf+
approaches for BCS classification, discriminant models (LDA,QDA, and BLR) were analyzed according to descriptor families.In silico models were constructed under different combinations:0-2D Dragon, Volsurf+ and 0-2D Dragon plus Volsurf+. Thesame procedure was carried out for both solubility andpermeability.
Model Validation. From the three models obtained withdifferent descriptor groups, the best one was chosen for eachclassification algorithm (LDA, QDA, and BLR). The finalconsensus system (for solubility and permeability) wasconstructed with the predictions of these three selected models.The validation procedure was carried out using results ofconsensus models.Performances of models were evaluated using false positive
rate (FPr), true negative rate (TN, for specificity), true positiverate (TP, for sensitivity), Matthews Correlation Coefficient(MCC), and predictive accuracy, as defined below:
= +specificity TN/(TN FP) (6)
= +sensitivity TP/(TP FN) (7)
= +precision TP/(TP FP) (8)
= × × ×
+ + + − +
MCC [(TP TN) (FP FN)]
/[(TP FP)(TP FN)(TN FP) (TN FN)]1/2
(9)
= + + + +accuracy (TN TP)/(TN TP FN FP) (10)
The TP (true positive), FP (false positive), TN (truenegative), and FN (false negative) were extracted from confusionmatrix (Table SI3 in the Supporting Information). The highsolubility/permeability class was seen as the positive class.Additionally, the receiver operating characteristic curve (ROC)was used to evaluate the accuracy of the discriminant functions.The ROC curve is a representation of sensitivity versus1-specificity. The closer the curve follows the left-hand borderand the top border of the ROC space, the more accurate the test.Meanwhile the closer the curve comes to the 45-degree diagonalof the ROC space, the less accurate the test is. Accuracy ismeasured by the area under the ROC curve (AUC). An area of 1represents a perfect test; an area of 0.5 represents a worthlesstest.42
Application for BCS Prediction Purposes. The developedmodels need to be validated with the published BCS drugclassifications. Asmany of them are based on estimations of otherparameters, such as logP/CLogP or surface area for permeability,they only serve as a reference for comparing the predictions.Even in WHO guidelines,5 many drugs display inconclusiveclassification, for example, ciprofloxacin (I/III), cyclosporineA (III/IV), etoposide (II/IV), haloperidol (III/IV), saquinavir(II/IV), and much more. Besides, some commonly occurringdeficiencies are recognized, related to incomplete information ofcurrent reported studies.14 Here, three data sets were utilized fortesting computational models: (i) 57 BCS-classified drugs
Molecular Pharmaceutics Article
dx.doi.org/10.1021/mp4000585 | Mol. Pharmaceutics XXXX, XXX, XXX−XXXD
extracted from reliable references,5,9,12 (ii) 679 BDDCS-classified oral drugs obtained from a recent in-depth study ofBenet et al.,21 and (iii) 37 377 compounds belonging to differentcategories that have been previously employed for provingcomputational BDDCS forecast in early drug discovery.29
For reliable predictions of these three external data sets, it isimportant to consider all applicability domains (ADs) defined bythe chemical spaces of the training set. There are manyapproaches for AD estimation.43 Here, the leverage approach, ageometric method commonly used for QSAR problems, wasemployed. The leverage of a compound in the original variablespace is defined as hi = [X(X′X)−1X′], where X is the descriptormatrix derived from the training set descriptor values.43 Thewarning leverage (h*) is defined as h* = 3(p + 1)/n, where n isthe number of training compounds and p is the number ofpredictor variables. Compounds with hi > h* were observed toreveal their influence on classification performance. It is notnecessary to exclude them from predictions although they appearto be outside AD. However, compounds are considered to beoutliers if they lay outside the ±3 standardized residual (δ)range.43 Since the final PBC classification is performed by aconsensus system obtained from six models (three solubility andthree permeability models) and outlier predictions are excluded,some cases become nonconclusive-classified ones.
■ RESULTSA number of 123 orally administered drugs on the World HealthOrganization (WHO) Essential Medicine List (EML) wereinitially classified into BCS.9,12 Later, 200 oral drug products inthe United States, Great Britain, Spain, and Japan were classifiedbased on published solubility data and permeability dataestimated by calculated log P.11 Recently, increasing attentionhas been turned out for determining the ProvisionalBiopharmaceutical location of orally administered immediate-release (IR) drug products using different estimated gastro-intestinal permeability, such as partition coefficients (log D andlog P), molecular surface area (PSA), or other in vitropermeability.13−15,44 It is emphasized that the distributions ofBCS class I, II, III, and IV drugs in each classification are quitedifferent. In this report, taking advantage of the availability ofexperimental in vitro Caco-2 cell data, a Provisional Biopharma-ceutical Classification (PBC) of 322 oral drug products gatheredfrom literature was performed. To our knowledge, it is the largestdata set for such classification.Classification of Drug Solubility. It was carried out by the
direct comparison between dimensionless Do parameter andunity. On the basis of this criterion, 188 of the 322 drugs wereclassified as high-solubility. Compounds with aqueous solubilitylower than 0.1 mg/mL could negatively affect the oralabsorption.45 This is a useful thumb rule for classifying theBCS solubility. The application of this rule to the currentdata reveals that 218 compounds had a minimum solubility value(Smin)≥ 0.1 mg/mL, and 171 of them haveDo ≤ 1, correspondingto 78.44% of true positive (TP). Conversely, from 104 compoundswith Smin < 0.1 mg/mL, 90 are low solubility entities, correspondingto 86.54% of true negative (TN).With respect to the maximum dose (Dmax), values that
correspond to the 10th percentile, the 25th percentile, themedian, the average, the 75th percentile and 90th percentile ofthe dose distribution for this data were determined to be 5, 20,100, 203, 300, and 500 mg. Based on these k-th percentile, therank-order relationship betweenDmax andDo could be examined.BCS background leads to expect that low Dmax would usually
correspond to high BCS solubility compounds. Herein, 23 of25 compounds (92%) with Dmax < 5 mg are classified as highsolubility substances. This concordance is 81.69% for drugswithDmax < 20 mg and dropped quickly to 68.49% for drugs withDmax < 100 mg. On the contrary, when Dmax increases, drugs aremore likely to fall into the low solubility class. However, this rulewas found to be misleading for this data. Less than 54% of drugswith Dmax ≥ 203, 300, or 500 belong to low solubility class.To investigate the correlation and impact of solubility and
dose on the classification of BCS solubility, the maximumreported aqueous solubility (Smax) and the drug’s lowest dosestrength (Dmin) were used for Do calculation (Figure SI1 in theSupporting Information). A high opposite correlation (r2 > 0.76)between solubility and Do was observed, while dose and Doexhibit a low proportional correlation (r2 < 0.24). In addition, 28drugs changed their solubility classification (low to high class)when the Smax was used to calculate Do. Meanwhile, the use ofDmin changed the classification of 23 drugs from low to high class.
Correlation with Calculated Solubility. pH dependentsolubility (mg/mL) was calculated using Volsurf + v.1.0.4,30
ALOGPS v.2.1,46 and ACD/Laboratories v.3.0 (AdvancedChemistry Development: Toronto, Canada, http://www.acdlabs.com/products/pc_admet/physchem/physchemsuite/).For Volsurf and ACD/Laboratories, the lowest predictedsolubility between pH ranges of 3−8 and 2−8, respectively,were employed for the calculations of Do. For highly solubledrugs classified by reported data, solubility predictions of ACD/Laboratories package correlate 63.1% on classification. The truepositive rates were 79.1% with Volsurf and 57.2% with ALOGPS.Conversely, the calculated solubility of ACD/Laboratoriesaccurately predicted 88.1% of low solubility class; meanwhileVolsurf achieved 80% accuracy, and the prediction accuracy ofALOGPS was 85.9%.
Classification of in Vitro Permeability. The mean Caco-2permeability values ranged from 0.049 (raffinose) to 378.33 ×10⁻⁶ cm/s (ethinyl estradiol). The mean and median values ofdata set were 25.09 and 17.33 × 10⁻⁶ cm/s, respectively. Theinternal standard (metoprolol) was applied as class boundary forhigh permeability.9,24 However, the Fa value of metoprolol (Fa ≥95%)47 is considerably more conservative than permeability criteriaof the FDA (Fa ≥ 90%) and WHO (Fa ≥ 85%) guidelines.3,5,48
Based on Kim et al.’s method, the lower limit of 90% confidenceinterval of the mean permeability test/reference ratio to be greaterthan 0.8 is an acceptable criteria of highly permeable drug.24 The90% confidence interval can be calculated from the meanpermeability ratio of the test drug and the internal permeabilitystandard. Applying this scheme for classifying current data, 167compounds were found in the high permeability category.Interestingly, 51 drugs fall into the [0.8−1.25] confidence intervalof metoprolol, and 26 compounds display a lower permeability thanmetoprolol. Among them, only three drugs: etodolac, ketoconazol,and vitamin B2 have a lower GI absorption than 85%.
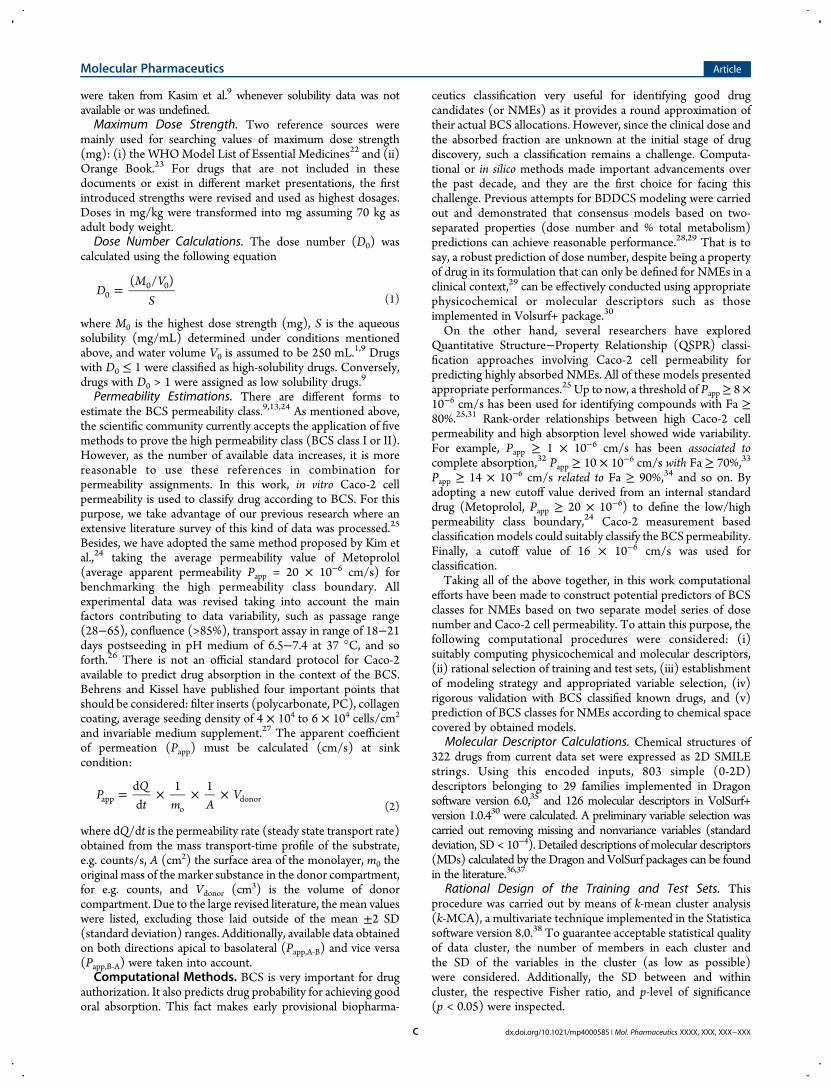
Suitability of Permeability Classification. To furtherverify the suitability of the permeability class assignments basedon Caco-2 permeability, correlation of in vitro permeability/in vivo intestinal absorption was obtained for 282 drugs. Allqualitatively reported drug absorptions (poor, complete, etc.)were not included in the analysis. The scatter plots with errorbars of apparent permeability versus fraction of dose absorbedFa(%) are shown in Figure 1.A relative good correlation between Papp and Fa was achieved. The
fitted sigmoidal curvewithmean values had aproportional correlationand a high standard error (StdE ≈ 18.5%). The rank-order
Molecular Pharmaceutics Article
dx.doi.org/10.1021/mp4000585 | Mol. Pharmaceutics XXXX, XXX, XXX−XXXE
relationship between high permeability and high absorption can beclearly appreciated.24,34 141 compounds from this set are categorizedas high permeability class: 131 of themhave Fa≥ 85% (92.9% of truepositive with WHO criteria),5 and 123 had Fa ≥ 90% (beingequivalent to 87.2% of TP with US FDA guideline).3 Only for 10compounds, the Caco-2 model overestimates their absorption extentin human: bromazepam (PBC class I), chloropheniramine (class I),danazol (class II), efavirenz (class II), etodolac (class II), flecainide(class I), griseofulvin (class II), guanabenz (class I), ketoconazole(class II), and riboflavin (class I). From the Table SI1 in theSupporting Information, bromazepam displays a Fa value of 84%.This value is slightly lower than absorption boundary (85%) used bythe WHO for BCS permeability classification.5 Because 85% is anarbitrary value and because we can tolerate the threshold by applyingthe [0.8, 1.25] confidence interval rule,24 bromazepam can beconsidered as unclassified permeability drug. Similarly, riboflavin(active transport),49 guanabenz and flecainide (passive diffusion)show a Fa ≈ 80%. For compounds such as chlorpheniramine anddanazol, widely varied absorption data have been reported in theliterature. Other water-insoluble drugs are griseofulvin,50 efavirenz(higher Fa at dose ≤ 100 mg),51 and ketoconazole (Fa decreases atgastric pH 4.0−6.5).52 Furthermore, the efflux effects limit theabsorption of efavirenz and ketoconazol (saturable).53 In case ofetodolac, which is a weak acid, different absorption (Fa frombioavailability) data were found in the literature. This compound haspH-dependent absorption with a higher value (bioavailability >80%)at basicmedium. Previous report has classified this compound asBCSclass I at pH 7.4 alone.54
On the other hand, weak correlation was found between lowpermeability and low Fa. The scatter plot reveals this limitationsince 30.5% of low permeability compounds display Fa ≥ 85%.Other Criteria for Permeability Classification. There are
two common ways to conduct a BCS permeability classification.
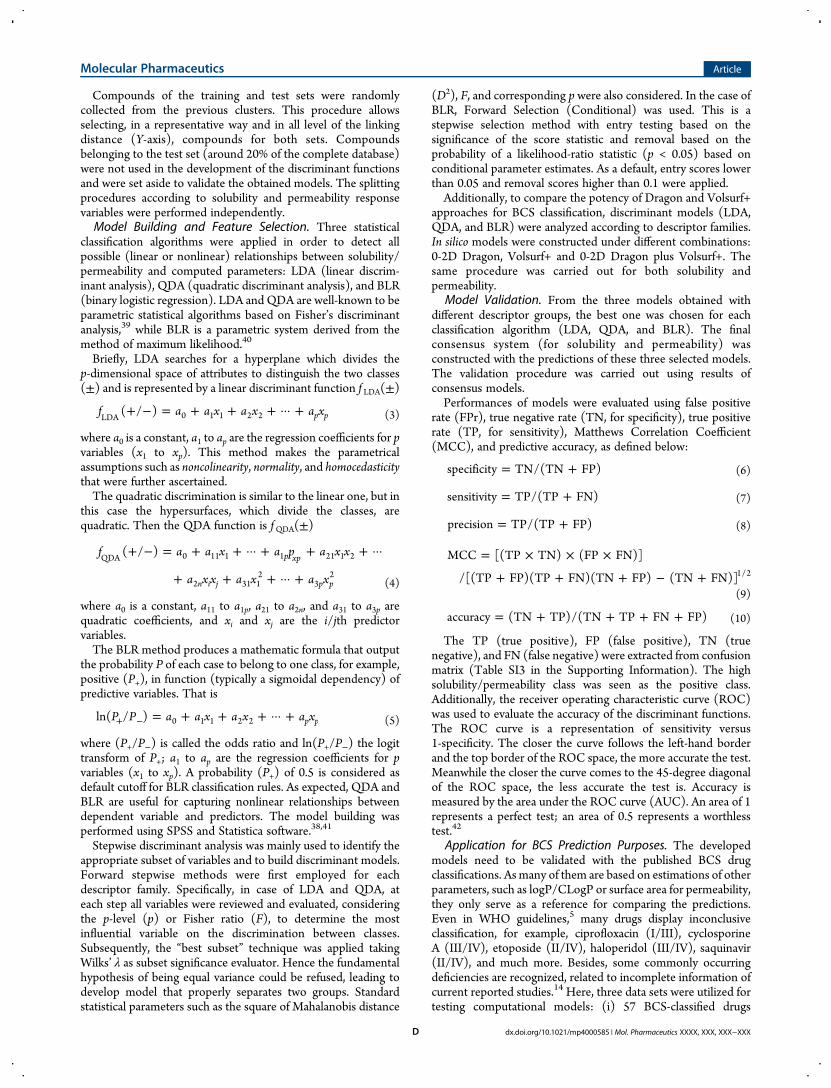
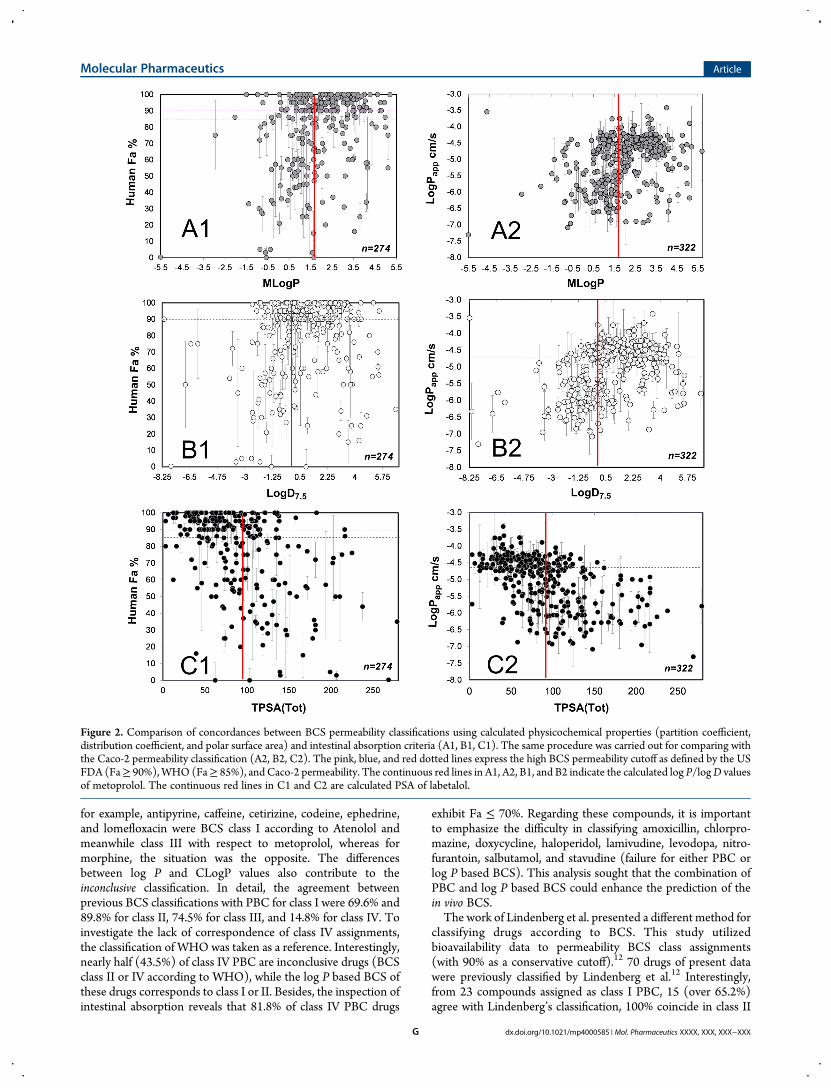
The first one is based on correlations of human intestinalpermeability with of pH-dependent and pH-independent n-octanol/water partition coefficients (log P) and n-octanol/water distributioncoefficients (log D).9,11 This method also takes metoprolol as thereference compound for directly comparing the estimated log D orlogP. The secondwork applies criteria of polar surface area (PSA) forpermeability class assignments.15 It involves the use of labetalol (Fa≈90%) as a high permeable internal standard.55 These methods can beconsidered as in silico approaches since they provide a simple, fast,and conservative classification. Herein we considered interesting toevaluate such criteria for current data. TheMlog P, logD7.5 (at pH =7.5), and TPSA(Tot) descriptors of Dragon and Volsurf softwareswere used.35−37 Figure 2 reveals the suitability of this classification andcorrelation of in vitroCaco-2 permeability with computed properties.As can be seen from the scatter plots, there is no clear trend
between Fa or in vitro permeability and three parameters.Likewise Caco-2 permeability, compounds with Fa < 85% (or90%) could not be identified. Mlog P and log D7.5 of Metoprololare 1.65 and 0.09, respectively. It was evidenced that Mlog Pprovides a better correlation with high absorption than log D7.5.Among 155 drugs with Mlog P ≥ 1.65, 111 compounds haveFa ≥ 85%, and 101 have Fa ≥ 90%, corresponding to 71.6% and65% of TP according to WHO and FDA criteria, respectively.Interestingly, TPSA(Tot) yields slightly better prediction of highabsorption than Mlog P. Calculated TPSA(Tot) for labetalol byDragon software receives a value of 95.85 Å2.35 From data set,172 drugs have TPSA(Tot) ≤ 95.85 Å2. As the results, 124 ofthem show a Fa ≥ 85% (accuracy of 72.1%), and 116 have Fa ≥90% (correctly 67.4%). This descriptor also predicts the highin vitro permeability class better than the others with 67.7%TP rate.It should be noted that TPSA(Tot) shows an inverse relationshipwith Fa and Caco-2 Papp. In the literature, polar molecular surface isrecognized as a relevant physicochemical property governing drugtransfer across cell membranes and oral absorption.56,57
Provisional Biopharmaceutical Classification (PBC) ofDrugs. Previous solubility and permeability classificationsenable to develop a PBC for current data. According to this, 91drugs have been classified as PBC class I (28.3% of data), 76drugs as PBC class II (23.6%), 97 drugs as PBC class III (31.1%),and 58 drugs as PBC class IV (18.0%). Table SI1 details all of theclassifications and other related absorption properties. Addition-ally, 171 drugs are encountered with BCS classification in reliablereferences,5,9,11,12,18,44 and 264 drugs are published recently withBDDCS.21 They were analyzed to ascertain the concordancedegree between PBC with literature. Please note that, for caseswhich could not be found a specific BCS class (also, namely,inconclusive data),12 the drug classification of PBC is consideredto be accurate if it agrees with one of the assignments of existingBCS. Consequently, of the 79 orally administered drugs on theBCS classification of WHO list,5 60 were correctly classified byPBC (76% of global precision). The accuracies were 80.8% forClass I, 78.6% for Class II, 62.5% for Class III, and 86.67% forClass IV. The translocation was adopted to BCS class I of somedrugs that were previously considered to be in class III in WHOreport,5 such as paracetamol, acetylsalicylic acid, allopurinol,lamivudine, and promethazine.In comparison with other studies that used the permeability
criteria of log P or logD,9,11 172 drugs have been analyzed. In thereport of Takagi et al., together with the use of metoprolol as areference drug for permeability classification, atenolol, cimeti-dine, and ranitidine were also used for comparing the correlationbetween the BCS (based on estimated log P) and BDDCS.Therefore, some drugs appeared with two or more classifications;
Figure 1. Scatter plots with error bar illustrating the sigmoidal and rank-order relationships between Caco-2 cell permeability (Papp) and humanintestinal absorption (Fa). The fitting constants (A; B; C) of Fa functionf(x) = A(1 + B exp(−C·Papp) were determined as (103.837; 0.001;1.124). The pink and blue dotted lines express the high BCSpermeability cutoff as defined by US FDA (Fa ≥ 90%) and WHO(Fa ≥ 85%) guidelines. The continuous red line indicates the high PBCpermeability criterion derived from Caco-2 permeability of metoprolol.
Molecular Pharmaceutics Article
dx.doi.org/10.1021/mp4000585 | Mol. Pharmaceutics XXXX, XXX, XXX−XXXF
for example, antipyrine, caffeine, cetirizine, codeine, ephedrine,and lomefloxacin were BCS class I according to Atenolol andmeanwhile class III with respect to metoprolol, whereas formorphine, the situation was the opposite. The differencesbetween log P and CLogP values also contribute to theinconclusive classification. In detail, the agreement betweenprevious BCS classifications with PBC for class I were 69.6% and89.8% for class II, 74.5% for class III, and 14.8% for class IV. Toinvestigate the lack of correspondence of class IV assignments,the classification of WHO was taken as a reference. Interestingly,nearly half (43.5%) of class IV PBC are inconclusive drugs (BCSclass II or IV according to WHO), while the log P based BCS ofthese drugs corresponds to class I or II. Besides, the inspection ofintestinal absorption reveals that 81.8% of class IV PBC drugs
exhibit Fa ≤ 70%. Regarding these compounds, it is importantto emphasize the difficulty in classifying amoxicillin, chlorpro-mazine, doxycycline, haloperidol, lamivudine, levodopa, nitro-furantoin, salbutamol, and stavudine (failure for either PBC orlog P based BCS). This analysis sought that the combination ofPBC and log P based BCS could enhance the prediction of thein vivo BCS.The work of Lindenberg et al. presented a different method for
classifying drugs according to BCS. This study utilizedbioavailability data to permeability BCS class assignments(with 90% as a conservative cutoff).12 70 drugs of present datawere previously classified by Lindenberg et al.12 Interestingly,from 23 compounds assigned as class I PBC, 15 (over 65.2%)agree with Lindenberg’s classification, 100% coincide in class II
Figure 2. Comparison of concordances between BCS permeability classifications using calculated physicochemical properties (partition coefficient,distribution coefficient, and polar surface area) and intestinal absorption criteria (A1, B1, C1). The same procedure was carried out for comparing withthe Caco-2 permeability classification (A2, B2, C2). The pink, blue, and red dotted lines express the high BCS permeability cutoff as defined by the USFDA (Fa≥ 90%),WHO (Fa≥ 85%), and Caco-2 permeability. The continuous red lines in A1, A2, B1, and B2 indicate the calculated log P/logD valuesof metoprolol. The continuous red lines in C1 and C2 are calculated PSA of labetalol.
Molecular Pharmaceutics Article
dx.doi.org/10.1021/mp4000585 | Mol. Pharmaceutics XXXX, XXX, XXX−XXXG
BCS assignment, 67% coincide in class III BCS, and 73% is inagreement with previous class IV BCS. More than 41% of drugsclassified as III PBC are of class I and I/III in the Lindenberg’sstudy,12 suggesting the risk of high false negative when Caco-2data is used. However, this in vivo permeability criterion (humanoral bioavailability) seems to be too exigent with respect to theBCS application.Furthermore, current PBC was compared with the BCS
classification scheme proposed by Wu and Benet.18,44 Althoughtheir method was not specified, this data has been widely appliedfor comparing many classification results according to BCS andBDDCS.10,13,21 Current data includes 98 drugs of that study.Likewise analysis above, the PBC agrees with the otherclassification: 87.1% for class I BCS, 82.6% for class II BCS,69.0% for class III BCS, and 13.3% for class IV BCS. Indeed, 81.2%of PBC class IV drugs are classified as class II byWu and Benet.18,44
Most of them (92.9%) have Fa≤ 70%, and the BCS classification ofWHO shows that they are rather inconclusive data.Strong correlation (about 90−95%) between extent of
metabolism and intestinal permeability of drugs is recognized.18,21
This correlation was also inspected with PBC assignments.Recently, over 900 marketed drugs were classified for BDDCS20
and 264 of them appeared in current PBC data. Based on BDDCS,90 drugs are class I, 89 are class II, 68 are class III, and 17 are classIV. The concordance between the BDDCS and our PBCwas quitegood, being a 73.3% for class I, 63.0% for class II, 78.1% for class III,and 64.7% for class IV. Besides, from 179 extensively metabolizeddrugs, only 126 display high Caco-2 permeability for a correlationof 70.4%. In contrast, according to the criterion of WHO, only71.4% of high metabolism class of BDDCS matches with the highpermeability of BCS (regardless of inconclusive data).PBC and Efflux Transport Effect. ABC (ATP-binding
cassette) efflux transporters such as P-glycoprotein (P-gp), themultidrug resistance-associated protein 2 (MRP2), andthe breast cancer-resistant protein (BCRP) are expressed onthe mucosal membrane of Caco-2.58,59 These proteins located atthe apical membrane are considered as the rate-limiting barrier tomonolayer permeation and intestinal drug absorption. Thereforethe BCS and/or PBC may be strongly influenced by efflux-mediated transport drugs. To ascertain whether a drug is
substrate of the efflux transporter, the efflux ratio (EfR) iscalculated as follows:
= →
→
P
PEfR Aapp,B
app,A B (11)
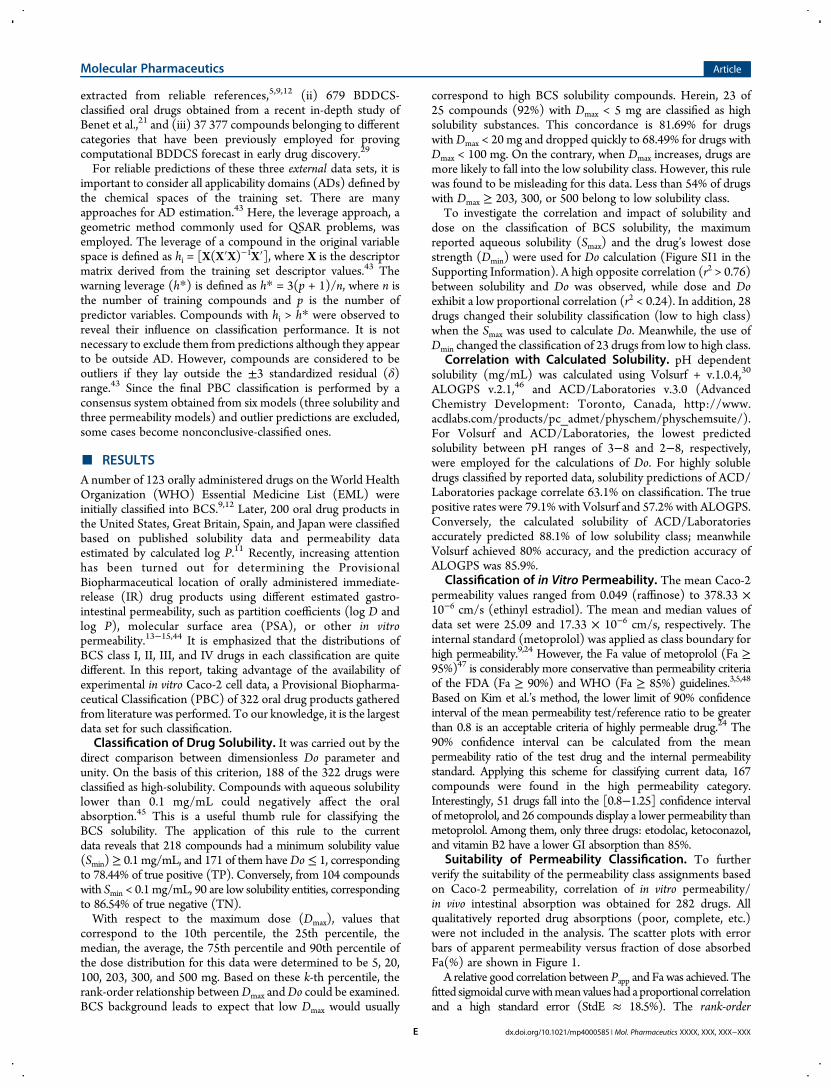
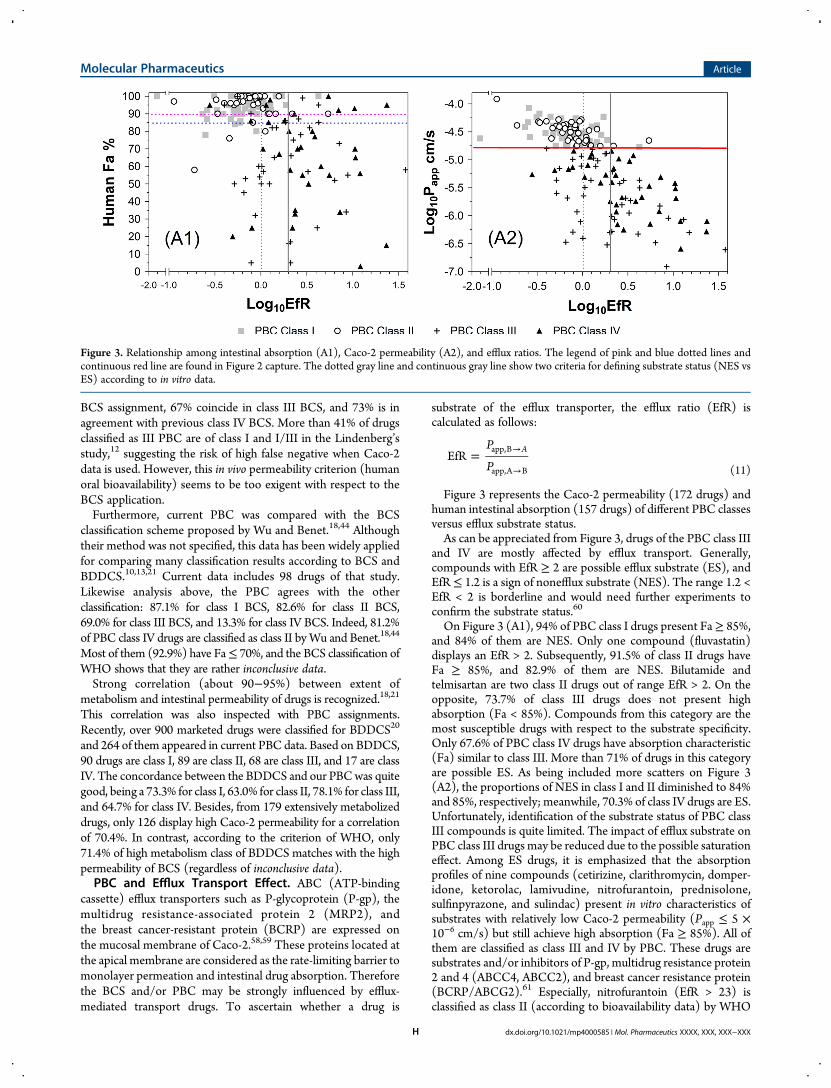
Figure 3 represents the Caco-2 permeability (172 drugs) andhuman intestinal absorption (157 drugs) of different PBC classesversus efflux substrate status.As can be appreciated from Figure 3, drugs of the PBC class III
and IV are mostly affected by efflux transport. Generally,compounds with EfR ≥ 2 are possible efflux substrate (ES), andEfR ≤ 1.2 is a sign of nonefflux substrate (NES). The range 1.2 <EfR < 2 is borderline and would need further experiments toconfirm the substrate status.60
On Figure 3 (A1), 94% of PBC class I drugs present Fa≥ 85%,and 84% of them are NES. Only one compound (fluvastatin)displays an EfR > 2. Subsequently, 91.5% of class II drugs haveFa ≥ 85%, and 82.9% of them are NES. Bilutamide andtelmisartan are two class II drugs out of range EfR > 2. On theopposite, 73.7% of class III drugs does not present highabsorption (Fa < 85%). Compounds from this category are themost susceptible drugs with respect to the substrate specificity.Only 67.6% of PBC class IV drugs have absorption characteristic(Fa) similar to class III. More than 71% of drugs in this categoryare possible ES. As being included more scatters on Figure 3(A2), the proportions of NES in class I and II diminished to 84%and 85%, respectively; meanwhile, 70.3% of class IV drugs are ES.Unfortunately, identification of the substrate status of PBC classIII compounds is quite limited. The impact of efflux substrate onPBC class III drugs may be reduced due to the possible saturationeffect. Among ES drugs, it is emphasized that the absorptionprofiles of nine compounds (cetirizine, clarithromycin, domper-idone, ketorolac, lamivudine, nitrofurantoin, prednisolone,sulfinpyrazone, and sulindac) present in vitro characteristics ofsubstrates with relatively low Caco-2 permeability (Papp ≤ 5 ×10⁻⁶ cm/s) but still achieve high absorption (Fa ≥ 85%). All ofthem are classified as class III and IV by PBC. These drugs aresubstrates and/or inhibitors of P-gp, multidrug resistance protein2 and 4 (ABCC4, ABCC2), and breast cancer resistance protein(BCRP/ABCG2).61 Especially, nitrofurantoin (EfR > 23) isclassified as class II (according to bioavailability data) by WHO
Figure 3. Relationship among intestinal absorption (A1), Caco-2 permeability (A2), and efflux ratios. The legend of pink and blue dotted lines andcontinuous red line are found in Figure 2 capture. The dotted gray line and continuous gray line show two criteria for defining substrate status (NES vsES) according to in vitro data.
Molecular Pharmaceutics Article
dx.doi.org/10.1021/mp4000585 | Mol. Pharmaceutics XXXX, XXX, XXX−XXXH
and Lindenberg et al.;5,12 meanwhile all log P based BCS,BDDCS as well as current PBC identify it as class IV. The activeuptake involved nitrofurantoin in vivo transport62 may be thereason for this apparent contradiction.Distribution of Drug Therapeutic Category. The PBC
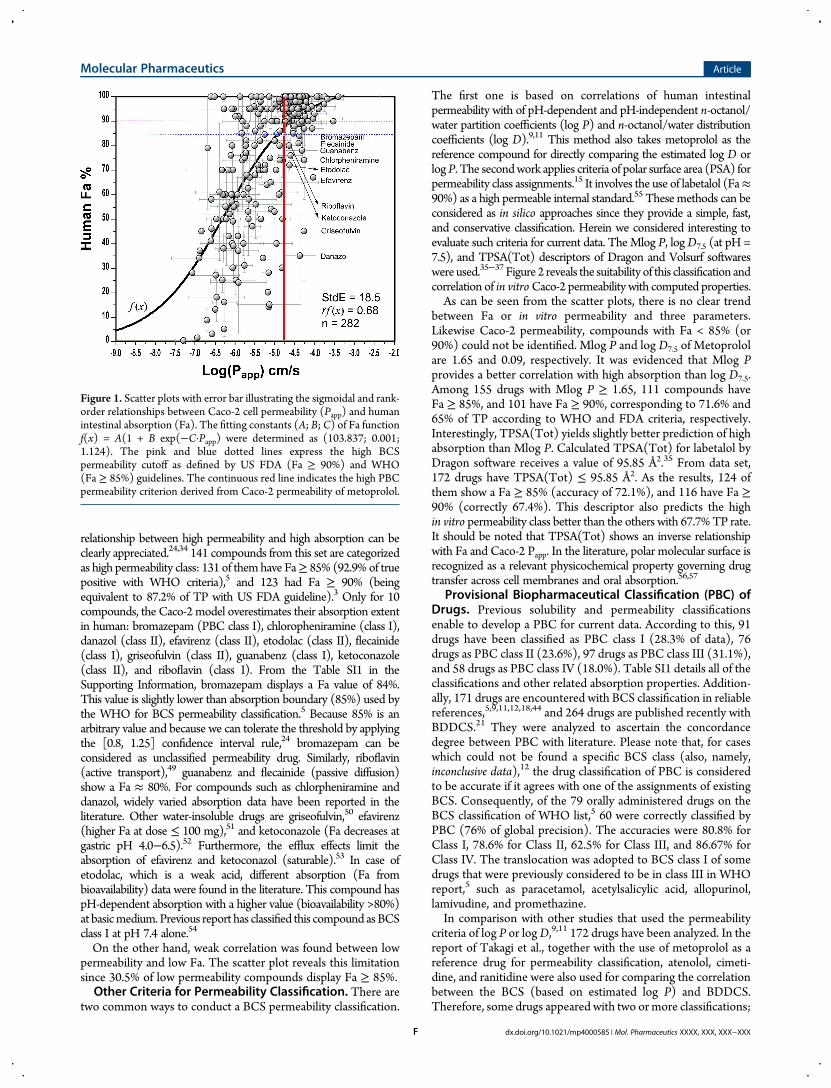
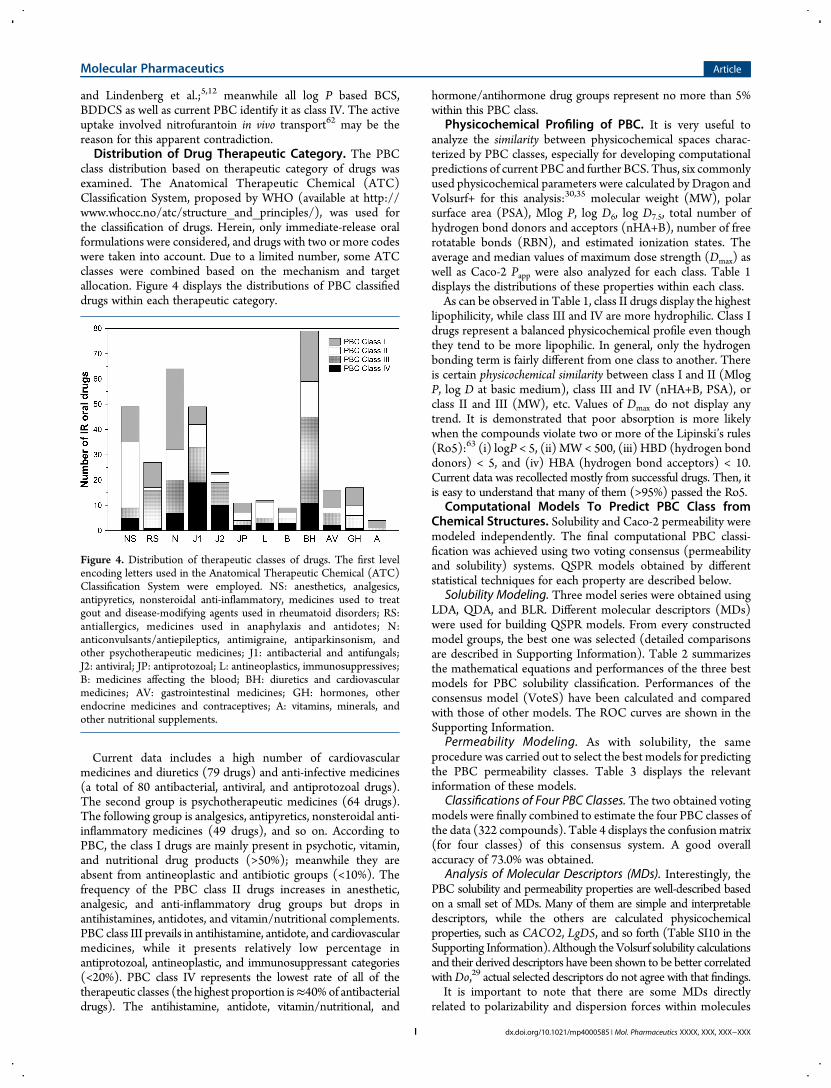
class distribution based on therapeutic category of drugs wasexamined. The Anatomical Therapeutic Chemical (ATC)Classification System, proposed by WHO (available at http://www.whocc.no/atc/structure_and_principles/), was used forthe classification of drugs. Herein, only immediate-release oralformulations were considered, and drugs with two or more codeswere taken into account. Due to a limited number, some ATCclasses were combined based on the mechanism and targetallocation. Figure 4 displays the distributions of PBC classifieddrugs within each therapeutic category.
Current data includes a high number of cardiovascularmedicines and diuretics (79 drugs) and anti-infective medicines(a total of 80 antibacterial, antiviral, and antiprotozoal drugs).The second group is psychotherapeutic medicines (64 drugs).The following group is analgesics, antipyretics, nonsteroidal anti-inflammatory medicines (49 drugs), and so on. According toPBC, the class I drugs are mainly present in psychotic, vitamin,and nutritional drug products (>50%); meanwhile they areabsent from antineoplastic and antibiotic groups (<10%). Thefrequency of the PBC class II drugs increases in anesthetic,analgesic, and anti-inflammatory drug groups but drops inantihistamines, antidotes, and vitamin/nutritional complements.PBC class III prevails in antihistamine, antidote, and cardiovascularmedicines, while it presents relatively low percentage inantiprotozoal, antineoplastic, and immunosuppressant categories(<20%). PBC class IV represents the lowest rate of all of thetherapeutic classes (the highest proportion is≈40%of antibacterialdrugs). The antihistamine, antidote, vitamin/nutritional, and
hormone/antihormone drug groups represent no more than 5%within this PBC class.
Physicochemical Profiling of PBC. It is very useful toanalyze the similarity between physicochemical spaces charac-terized by PBC classes, especially for developing computationalpredictions of current PBC and further BCS. Thus, six commonlyused physicochemical parameters were calculated by Dragon andVolsurf+ for this analysis:30,35 molecular weight (MW), polarsurface area (PSA), Mlog P, log D6, log D7.5, total number ofhydrogen bond donors and acceptors (nHA+B), number of freerotatable bonds (RBN), and estimated ionization states. Theaverage and median values of maximum dose strength (Dmax) aswell as Caco-2 Papp were also analyzed for each class. Table 1displays the distributions of these properties within each class.As can be observed in Table 1, class II drugs display the highest
lipophilicity, while class III and IV are more hydrophilic. Class Idrugs represent a balanced physicochemical profile even thoughthey tend to be more lipophilic. In general, only the hydrogenbonding term is fairly different from one class to another. Thereis certain physicochemical similarity between class I and II (MlogP, log D at basic medium), class III and IV (nHA+B, PSA), orclass II and III (MW), etc. Values of Dmax do not display anytrend. It is demonstrated that poor absorption is more likelywhen the compounds violate two or more of the Lipinski’s rules(Ro5):63 (i) logP < 5, (ii) MW< 500, (iii) HBD (hydrogen bonddonors) < 5, and (iv) HBA (hydrogen bond acceptors) < 10.Current data was recollected mostly from successful drugs. Then, itis easy to understand that many of them (>95%) passed the Ro5.
Computational Models To Predict PBC Class fromChemical Structures. Solubility and Caco-2 permeability weremodeled independently. The final computational PBC classi-fication was achieved using two voting consensus (permeabilityand solubility) systems. QSPR models obtained by differentstatistical techniques for each property are described below.
Solubility Modeling. Three model series were obtained usingLDA, QDA, and BLR. Different molecular descriptors (MDs)were used for building QSPR models. From every constructedmodel groups, the best one was selected (detailed comparisonsare described in Supporting Information). Table 2 summarizesthe mathematical equations and performances of the three bestmodels for PBC solubility classification. Performances of theconsensus model (VoteS) have been calculated and comparedwith those of other models. The ROC curves are shown in theSupporting Information.
Permeability Modeling. As with solubility, the sameprocedure was carried out to select the best models for predictingthe PBC permeability classes. Table 3 displays the relevantinformation of these models.
Classifications of Four PBC Classes. The two obtained votingmodels were finally combined to estimate the four PBC classes ofthe data (322 compounds). Table 4 displays the confusionmatrix(for four classes) of this consensus system. A good overallaccuracy of 73.0% was obtained.
Analysis of Molecular Descriptors (MDs). Interestingly, thePBC solubility and permeability properties are well-described basedon a small set of MDs. Many of them are simple and interpretabledescriptors, while the others are calculated physicochemicalproperties, such as CACO2, LgD5, and so forth (Table SI10 in theSupporting Information). Although the Volsurf solubility calculationsand their derived descriptors have been shown to be better correlatedwithDo,29 actual selected descriptors do not agree with that findings.It is important to note that there are some MDs directly
related to polarizability and dispersion forces within molecules
Figure 4. Distribution of therapeutic classes of drugs. The first levelencoding letters used in the Anatomical Therapeutic Chemical (ATC)Classification System were employed. NS: anesthetics, analgesics,antipyretics, nonsteroidal anti-inflammatory, medicines used to treatgout and disease-modifying agents used in rheumatoid disorders; RS:antiallergics, medicines used in anaphylaxis and antidotes; N:anticonvulsants/antiepileptics, antimigraine, antiparkinsonism, andother psychotherapeutic medicines; J1: antibacterial and antifungals;J2: antiviral; JP: antiprotozoal; L: antineoplastics, immunosuppressives;B: medicines affecting the blood; BH: diuretics and cardiovascularmedicines; AV: gastrointestinal medicines; GH: hormones, otherendocrine medicines and contraceptives; A: vitamins, minerals, andother nutritional supplements.
Molecular Pharmaceutics Article
dx.doi.org/10.1021/mp4000585 | Mol. Pharmaceutics XXXX, XXX, XXX−XXXI
(nCp, nCt), molecular size (nR10, P_VSA_v_3), lipophilicity andhydrophobicity (BLTD48, CATS2D_04_AL, CMC-50), andespecially, the polar, chargeable, and hydrogen bond forming
capacity (A, Me, nO, nArC=N, C-005, N-067, NssNH, LgD5).Besides, rule-based MDs, which represent common physico-chemical combination trends of known drug-like and lead-like
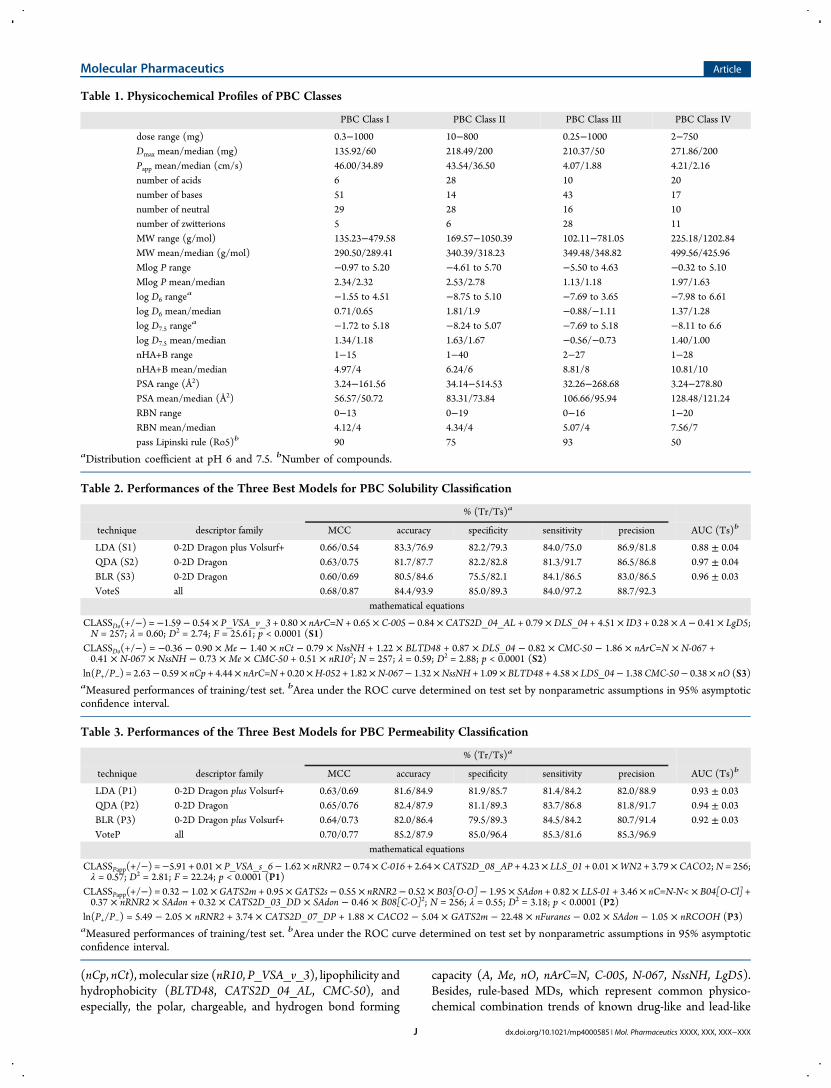
Table 1. Physicochemical Profiles of PBC Classes
PBC Class I PBC Class II PBC Class III PBC Class IV
dose range (mg) 0.3−1000 10−800 0.25−1000 2−750Dmax mean/median (mg) 135.92/60 218.49/200 210.37/50 271.86/200Papp mean/median (cm/s) 46.00/34.89 43.54/36.50 4.07/1.88 4.21/2.16number of acids 6 28 10 20number of bases 51 14 43 17number of neutral 29 28 16 10number of zwitterions 5 6 28 11MW range (g/mol) 135.23−479.58 169.57−1050.39 102.11−781.05 225.18/1202.84MW mean/median (g/mol) 290.50/289.41 340.39/318.23 349.48/348.82 499.56/425.96Mlog P range −0.97 to 5.20 −4.61 to 5.70 −5.50 to 4.63 −0.32 to 5.10Mlog P mean/median 2.34/2.32 2.53/2.78 1.13/1.18 1.97/1.63log D6 range
a −1.55 to 4.51 −8.75 to 5.10 −7.69 to 3.65 −7.98 to 6.61log D6 mean/median 0.71/0.65 1.81/1.9 −0.88/−1.11 1.37/1.28log D7.5 range
a −1.72 to 5.18 −8.24 to 5.07 −7.69 to 5.18 −8.11 to 6.6log D7.5 mean/median 1.34/1.18 1.63/1.67 −0.56/−0.73 1.40/1.00nHA+B range 1−15 1−40 2−27 1−28nHA+B mean/median 4.97/4 6.24/6 8.81/8 10.81/10PSA range (Å2) 3.24−161.56 34.14−514.53 32.26−268.68 3.24−278.80PSA mean/median (Å2) 56.57/50.72 83.31/73.84 106.66/95.94 128.48/121.24RBN range 0−13 0−19 0−16 1−20RBN mean/median 4.12/4 4.34/4 5.07/4 7.56/7pass Lipinski rule (Ro5)b 90 75 93 50
aDistribution coefficient at pH 6 and 7.5. bNumber of compounds.
Table 2. Performances of the Three Best Models for PBC Solubility Classification
% (Tr/Ts)a
technique descriptor family MCC accuracy specificity sensitivity precision AUC (Ts)b
LDA (S1) 0-2D Dragon plus Volsurf+ 0.66/0.54 83.3/76.9 82.2/79.3 84.0/75.0 86.9/81.8 0.88 ± 0.04QDA (S2) 0-2D Dragon 0.63/0.75 81.7/87.7 82.2/82.8 81.3/91.7 86.5/86.8 0.97 ± 0.04BLR (S3) 0-2D Dragon 0.60/0.69 80.5/84.6 75.5/82.1 84.1/86.5 83.0/86.5 0.96 ± 0.03VoteS all 0.68/0.87 84.4/93.9 85.0/89.3 84.0/97.2 88.7/92.3
mathematical equations
CLASSDo(+/−) = −1.59 − 0.54 × P_VSA_v_3 + 0.80 × nArC=N + 0.65 × C-005 − 0.84 × CATS2D_04_AL + 0.79 ×DLS_04 + 4.51 × ID3 + 0.28 × A − 0.41 × LgD5;N = 257; λ = 0.60; D2 = 2.74; F = 25.61; p < 0.0001 (S1)
CLASSDo(+/−) = −0.36 − 0.90 × Me − 1.40 × nCt − 0.79 × NssNH + 1.22 × BLTD48 + 0.87 × DLS_04 − 0.82 × CMC-50 − 1.86 × nArC=N × N-067 +0.41 × N-067 × NssNH − 0.73 × Me × CMC-50 + 0.51 × nR102; N = 257; λ = 0.59; D2 = 2.88; p < 0.0001 (S2)
ln(P+/P−) = 2.63− 0.59 × nCp + 4.44× nArC=N + 0.20×H-052 + 1.82×N-067− 1.32×NssNH + 1.09× BLTD48 + 4.58× LDS_04− 1.38 CMC-50− 0.38× nO (S3)aMeasured performances of training/test set. bArea under the ROC curve determined on test set by nonparametric assumptions in 95% asymptoticconfidence interval.
Table 3. Performances of the Three Best Models for PBC Permeability Classification
% (Tr/Ts)a
technique descriptor family MCC accuracy specificity sensitivity precision AUC (Ts)b
LDA (P1) 0-2D Dragon plus Volsurf+ 0.63/0.69 81.6/84.9 81.9/85.7 81.4/84.2 82.0/88.9 0.93 ± 0.03QDA (P2) 0-2D Dragon 0.65/0.76 82.4/87.9 81.1/89.3 83.7/86.8 81.8/91.7 0.94 ± 0.03BLR (P3) 0-2D Dragon plus Volsurf+ 0.64/0.73 82.0/86.4 79.5/89.3 84.5/84.2 80.7/91.4 0.92 ± 0.03VoteP all 0.70/0.77 85.2/87.9 85.0/96.4 85.3/81.6 85.3/96.9
mathematical equations
CLASSPapp(+/−) =−5.91 + 0.01 × P_VSA_s_6− 1.62 × nRNR2− 0.74 × C-016 + 2.64 × CATS2D_08_AP + 4.23 × LLS_01 + 0.01 ×WN2 + 3.79 × CACO2;N = 256;λ = 0.57; D2 = 2.81; F = 22.24; p < 0.0001 (P1)
CLASSPapp(+/−) = 0.32 − 1.02 × GATS2m + 0.95 × GATS2s − 0.55 × nRNR2 − 0.52 × B03[O-O] − 1.95 × SAdon + 0.82 × LLS-01 + 3.46 × nC=N-N< × B04[O-Cl] +0.37 × nRNR2 × SAdon + 0.32 × CATS2D_03_DD × SAdon − 0.46 × B08[C-O]2; N = 256; λ = 0.55; D2 = 3.18; p < 0.0001 (P2)
ln(P+/P−) = 5.49 − 2.05 × nRNR2 + 3.74 × CATS2D_07_DP + 1.88 × CACO2 − 5.04 × GATS2m − 22.48 × nFuranes − 0.02 × SAdon − 1.05 × nRCOOH (P3)aMeasured performances of training/test set. bArea under the ROC curve determined on test set by nonparametric assumptions in 95% asymptoticconfidence interval.
Molecular Pharmaceutics Article
dx.doi.org/10.1021/mp4000585 | Mol. Pharmaceutics XXXX, XXX, XXX−XXXJ
data sets,64,65 are selected. Generally, current finding structure−property (Do) relationships (SDoR) are rather similar withKhandelwal et al.’s analysis.28
On the other hand, the ionization state (GATS2s, P_VSA_s_6,nRNR2), molecular size (GATS2m, nFuranes, C-016), andhydrogen bond donor and acceptor regions (nRCOOH, nRNR2,nC=N−N<, CATS2D_03_DD, CATS2D_07_D, CATS2-D_08_AP, SAdon, WN2, etc.) are well-correlated with Caco-2permeability. The ADME descriptor CACO2 was selected twotimes in permeabilitymodels. Please note that numeric values of thisvariable are result of partial least-squares (PLS) discriminant analysisdeveloped by Zamora et al.66 Unfortunately, although being usefulfor the prediction, the use of this descriptor does not provide preciseknowledge of any physicochemical property impact on PBCpermeability class.External Validation and Applications of in Silico PBC
Models. A robust forecast of PBC class is very useful in early drugdiscovery, especially for many NMEs whose therapeutic dose-ranges are not available in preclinical stages. This is alsoimportant for estimating BCS memberships, since there is a highconcordance between proposed PBC and BCS scheme in WHOguidelines. However, the reliability of the predictions from insilicomodels is limited into the chemical spaces of training set. Asregard to this concern, ADs of all the QSPR models weredetermined prior to their external prediction (Figure SI4, SI5 inthe Supporting Information).Three external sets with defined or calculated BCS or BDDCS
class were predicted by two solubility and permeability consensus
systems. First, 57 drugs with BCS classification reported byWHO,5 which do not belong to current PBC data set were usedfor external validation of computational models. Their computa-tional PBC assignments are listed in Table 5.As many drugs appeared as an inconclusive class, the
computational assignment for a drug was considered accurateif it corresponds with one of two classes. As outliers, five drugs(ascorbic acid, clofazimine, ergocalciferol, lumefantrine, andtriclabendazole) are predicted as nonconclusive-classification,and they are analyzed independently. In conclusion, from 22drugs predicted as PBC class I, 20 are BCS class I or I/III (91% ofaccuracy). Meanwhile, nine of eleven drugs predicted as PBCclass II are class II or II/IV drugs (82% of accuracy). From 13drugs predicted as PBC class III, 11 are of BCS class III or I/III(85% of accuracy). Finally, six drugs were predicted as class IV,one of them (Senna) is undefined BCS class, three are class II/IVdrugs, and one is a class III/IV drug. In silico PBC classificationsof ascorbic acid, clofazimine, lumefantrine, and triclabendazolecoincide with one of the WHO BCS classifications (see Table 5).Ergocalciferol PBC prediction does not agree with the BCSclassification. Computational PBC predictions fairly correlate withWHO BCS for this set.Based on high correlation between BDDCS vs BCS, and
BDDCS vs PBC, it is of interest validating in silico PBC on definedBDDCS drugs. 679 BDDCS classified oral drugs reported byBenet et al.21 were predicted by PBC based models. Four drugs(cyanocobalamin, propantheline, propoxyphene napsylate, andcilazaprilat) appeared with error in descriptor calculations.
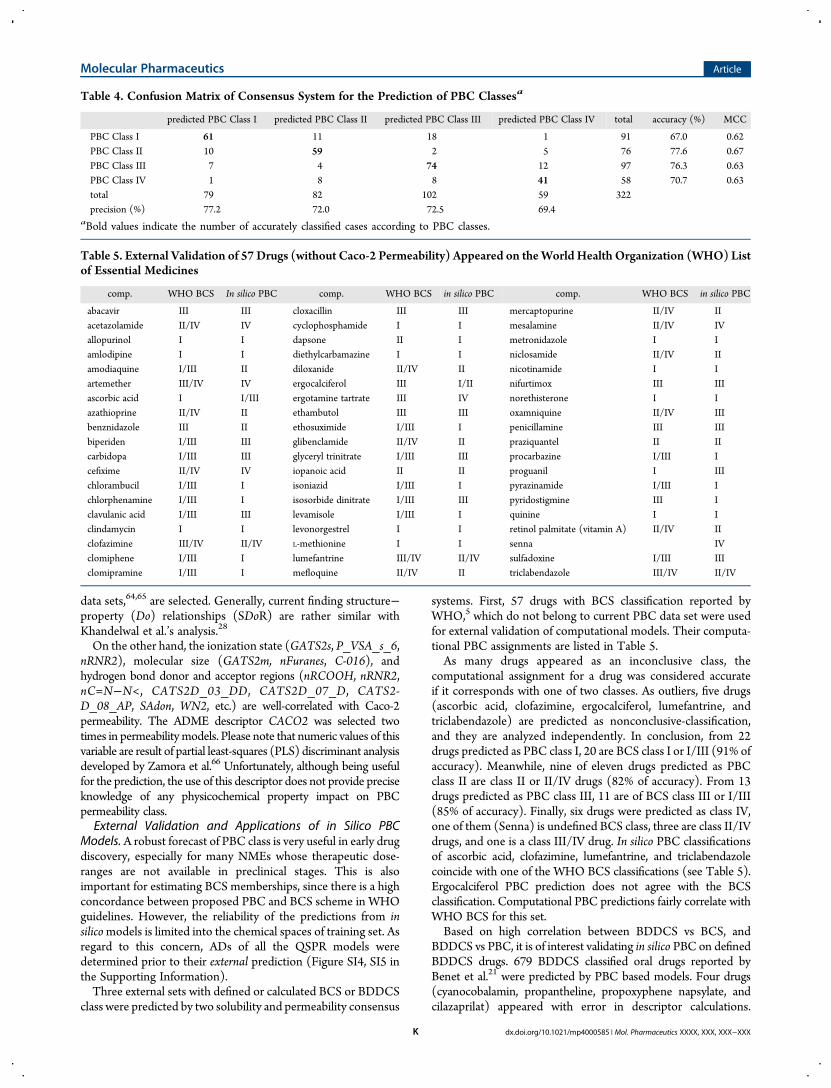
Table 4. Confusion Matrix of Consensus System for the Prediction of PBC Classesa
predicted PBC Class I predicted PBC Class II predicted PBC Class III predicted PBC Class IV total accuracy (%) MCC
PBC Class I 61 11 18 1 91 67.0 0.62PBC Class II 10 59 2 5 76 77.6 0.67PBC Class III 7 4 74 12 97 76.3 0.63PBC Class IV 1 8 8 41 58 70.7 0.63total 79 82 102 59 322precision (%) 77.2 72.0 72.5 69.4
aBold values indicate the number of accurately classified cases according to PBC classes.
Table 5. External Validation of 57 Drugs (without Caco-2 Permeability) Appeared on theWorld Health Organization (WHO) Listof Essential Medicines
comp. WHO BCS In silico PBC comp. WHO BCS in silico PBC comp. WHO BCS in silico PBC
abacavir III III cloxacillin III III mercaptopurine II/IV IIacetazolamide II/IV IV cyclophosphamide I I mesalamine II/IV IVallopurinol I I dapsone II I metronidazole I Iamlodipine I I diethylcarbamazine I I niclosamide II/IV IIamodiaquine I/III II diloxanide II/IV II nicotinamide I Iartemether III/IV IV ergocalciferol III I/II nifurtimox III IIIascorbic acid I I/III ergotamine tartrate III IV norethisterone I Iazathioprine II/IV II ethambutol III III oxamniquine II/IV IIIbenznidazole III II ethosuximide I/III I penicillamine III IIIbiperiden I/III III glibenclamide II/IV II praziquantel II IIcarbidopa I/III III glyceryl trinitrate I/III III procarbazine I/III Icefixime II/IV IV iopanoic acid II II proguanil I IIIchlorambucil I/III I isoniazid I/III I pyrazinamide I/III Ichlorphenamine I/III I isosorbide dinitrate I/III III pyridostigmine III Iclavulanic acid I/III III levamisole I/III I quinine I Iclindamycin I I levonorgestrel I I retinol palmitate (vitamin A) II/IV IIclofazimine III/IV II/IV L-methionine I I senna IVclomiphene I/III I lumefantrine III/IV II/IV sulfadoxine I/III IIIclomipramine I/III I mefloquine II/IV II triclabendazole III/IV II/IV
Molecular Pharmaceutics Article
dx.doi.org/10.1021/mp4000585 | Mol. Pharmaceutics XXXX, XXX, XXX−XXXK
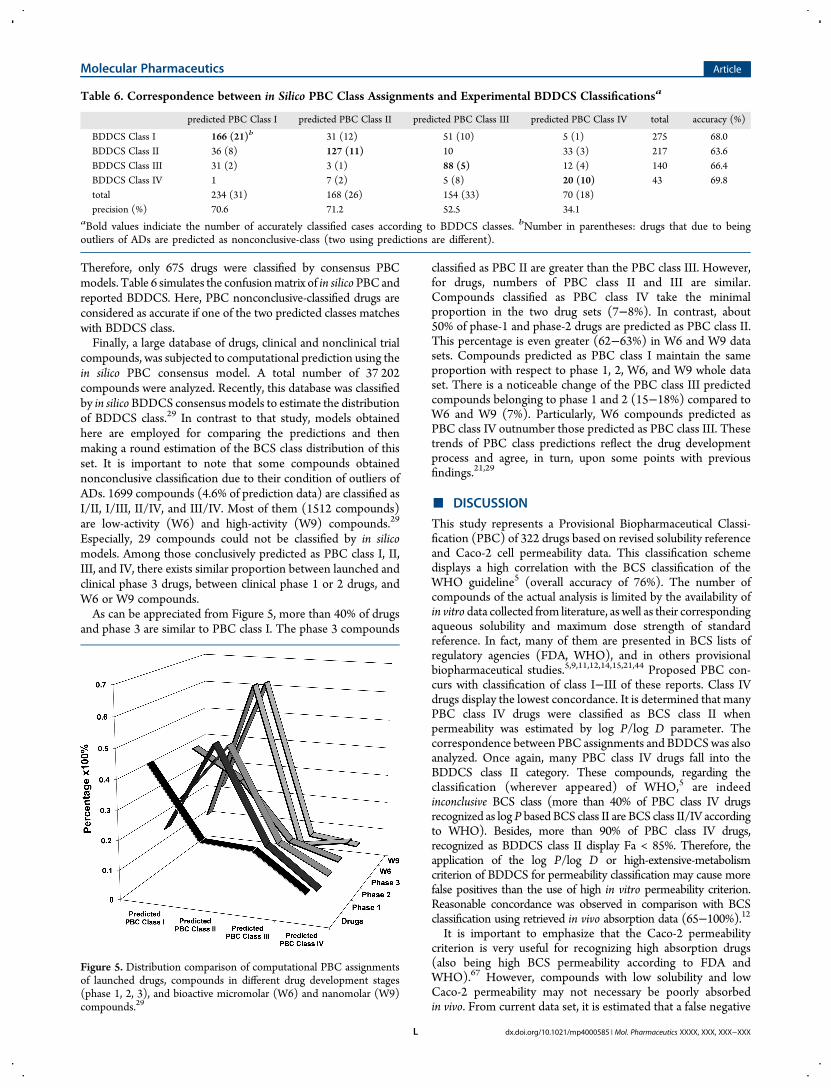
Therefore, only 675 drugs were classified by consensus PBCmodels. Table 6 simulates the confusionmatrix of in silico PBC andreported BDDCS. Here, PBC nonconclusive-classified drugs areconsidered as accurate if one of the two predicted classes matcheswith BDDCS class.Finally, a large database of drugs, clinical and nonclinical trial
compounds, was subjected to computational prediction using thein silico PBC consensus model. A total number of 37 202compounds were analyzed. Recently, this database was classifiedby in silico BDDCS consensus models to estimate the distributionof BDDCS class.29 In contrast to that study, models obtainedhere are employed for comparing the predictions and thenmaking a round estimation of the BCS class distribution of thisset. It is important to note that some compounds obtainednonconclusive classification due to their condition of outliers ofADs. 1699 compounds (4.6% of prediction data) are classified asI/II, I/III, II/IV, and III/IV. Most of them (1512 compounds)are low-activity (W6) and high-activity (W9) compounds.29
Especially, 29 compounds could not be classified by in silicomodels. Among those conclusively predicted as PBC class I, II,III, and IV, there exists similar proportion between launched andclinical phase 3 drugs, between clinical phase 1 or 2 drugs, andW6 or W9 compounds.As can be appreciated from Figure 5, more than 40% of drugs
and phase 3 are similar to PBC class I. The phase 3 compounds
classified as PBC II are greater than the PBC class III. However,for drugs, numbers of PBC class II and III are similar.Compounds classified as PBC class IV take the minimalproportion in the two drug sets (7−8%). In contrast, about50% of phase-1 and phase-2 drugs are predicted as PBC class II.This percentage is even greater (62−63%) in W6 and W9 datasets. Compounds predicted as PBC class I maintain the sameproportion with respect to phase 1, 2, W6, and W9 whole dataset. There is a noticeable change of the PBC class III predictedcompounds belonging to phase 1 and 2 (15−18%) compared toW6 and W9 (7%). Particularly, W6 compounds predicted asPBC class IV outnumber those predicted as PBC class III. Thesetrends of PBC class predictions reflect the drug developmentprocess and agree, in turn, upon some points with previousfindings.21,29
■ DISCUSSION
This study represents a Provisional Biopharmaceutical Classi-fication (PBC) of 322 drugs based on revised solubility referenceand Caco-2 cell permeability data. This classification schemedisplays a high correlation with the BCS classification of theWHO guideline5 (overall accuracy of 76%). The number ofcompounds of the actual analysis is limited by the availability ofin vitro data collected from literature, as well as their correspondingaqueous solubility and maximum dose strength of standardreference. In fact, many of them are presented in BCS lists ofregulatory agencies (FDA, WHO), and in others provisionalbiopharmaceutical studies.5,9,11,12,14,15,21,44 Proposed PBC con-curs with classification of class I−III of these reports. Class IVdrugs display the lowest concordance. It is determined that manyPBC class IV drugs were classified as BCS class II whenpermeability was estimated by log P/log D parameter. Thecorrespondence between PBC assignments and BDDCSwas alsoanalyzed. Once again, many PBC class IV drugs fall into theBDDCS class II category. These compounds, regarding theclassification (wherever appeared) of WHO,5 are indeedinconclusive BCS class (more than 40% of PBC class IV drugsrecognized as logP based BCS class II are BCS class II/IV accordingto WHO). Besides, more than 90% of PBC class IV drugs,recognized as BDDCS class II display Fa < 85%. Therefore, theapplication of the log P/log D or high-extensive-metabolismcriterion of BDDCS for permeability classification may cause morefalse positives than the use of high in vitro permeability criterion.Reasonable concordance was observed in comparison with BCSclassification using retrieved in vivo absorption data (65−100%).12It is important to emphasize that the Caco-2 permeability
criterion is very useful for recognizing high absorption drugs(also being high BCS permeability according to FDA andWHO).67 However, compounds with low solubility and lowCaco-2 permeability may not necessary be poorly absorbedin vivo. From current data set, it is estimated that a false negative
Table 6. Correspondence between in Silico PBC Class Assignments and Experimental BDDCS Classificationsa
predicted PBC Class I predicted PBC Class II predicted PBC Class III predicted PBC Class IV total accuracy (%)
BDDCS Class I 166 (21)b 31 (12) 51 (10) 5 (1) 275 68.0BDDCS Class II 36 (8) 127 (11) 10 33 (3) 217 63.6BDDCS Class III 31 (2) 3 (1) 88 (5) 12 (4) 140 66.4BDDCS Class IV 1 7 (2) 5 (8) 20 (10) 43 69.8total 234 (31) 168 (26) 154 (33) 70 (18)precision (%) 70.6 71.2 52.5 34.1
aBold values indiciate the number of accurately classified cases according to BDDCS classes. bNumber in parentheses: drugs that due to beingoutliers of ADs are predicted as nonconclusive-class (two using predictions are different).
Figure 5. Distribution comparison of computational PBC assignmentsof launched drugs, compounds in different drug development stages(phase 1, 2, 3), and bioactive micromolar (W6) and nanomolar (W9)compounds.29
Molecular Pharmaceutics Article
dx.doi.org/10.1021/mp4000585 | Mol. Pharmaceutics XXXX, XXX, XXX−XXXL
rate of 30% can be expected with the use of low Caco-2permeability criterion for predicting low BCS permeability drugsif they are characterized by Fa ≤ 85%. Interestingly, some drugsclassified as BCS class III (chloramphenicol, chlorpromazine,codeine, and hydralazine) or class III/IV (pyrimethamine andspironolactone) by WHO5 have a human Fa of 90% or higher.According to PBC, they are all classified as class I or II. With noin vivo evidence for carrier-mediated transport, it is suspected thatthese basic drugs are segmental/pH dependent absorbed,analogous to Sotalol mechanism.55 For example, chlorpromazinepermeability has been recently determined by low-efflux MDCK(Madin-Darby canine kidney) assay at apical pH 6.5 and 7.4.Experimental results showed that MDCK Papp at pH 7.4significantly exceeds those at pH 6.5, suggesting that thiscompound should be absorbed mainly at lower small intestine.13
Additionally, drugs classified as BCS I (digoxin and riboflavin) orII (griseofulvin) byWHO5 are found with low or erratic Fa valuesin the literature. Without interaction with known drugtransporters, low absorption of griseofulvin is most likelyattributed to its poor solubility and appreciable intersubjectand intrasubject variation.50 The erratic oral absorption ofdigoxin and riboflavin should be due to critical interaction withP-gp and/or uptake transporters.49,68
Due to the nature of in vitro assay, efflux mediated transportshows a noticeable impact on PBC classification, as well asintestinal absorption. As can be appreciated from Figure 3, eitherabsorption or permeability classifications were in agreement withsubstrate/nonsubstrate criteria. More than 80% of PBC class I orII drugs are NES, meanwhile >70% of PBC class IV drugs are ES.It is recognized that Do is a property of the drug in a
formulation and not an intrinsic characteristic of the API itself.29
This parameter is used by either BCS or BDDCS for solubilityclassification. However, correlation analysis between Do andsolubility or doses fairly demonstrates that solubility and itsrelated properties (e.g., pKa) are predominant factors on definingBCS solubility class. By varying solubility values, Do still stronglycorrelates with solubility (r2 > 76%). On the contrary, changingdose in Do calculation can slightly improve its correlation withDo; however at any rate this relationship remains quite low (r2 <25%), as shown in Figure SI1. It is important to take into accountthe possible displacement from low BCS solubility classes(especially for class IV) to high BCS solubility classes of somedrugs when the maximum aqueous solubility (in the defined pHrange, at 37 °C) or minimum effective dose is used. Sinceaqueous solubility has been widely predicted by QSPRapproaches, this observation reveals the possibility of in silicoclassification of BCS solubility. The pH-dependent solubility canbe calculated by various ADME softwares, such as Volsurf+,ALOGP, and ACD/Laboratories. Although their predictionspoorly correlate with the measured values (r2 = 0.2−0.3),21 thepredicted Do values with calculated pH-dependent minimumsolubility by Volsurf+ and ACD/Laboratories were acceptablefor classifying PBC solubility. In addition, the solubility cutoff of0.1 mg/mL is reasonable for a preliminary classification ofsolubility (78% of TP and 86% of TN rates).On the other hand, the BCS permeability predictions using
calculated log P/log D and PSA descriptors are commonly usedin the literature.9,11,15 Applying these methods for classifyingcurrent data set, the accuracies of high absorption/high in vitropermeability were 71−72%, but low absorption/low in vitropermeability was, in fact, unpredictable (see Figure 2). Theclassification with TPSA(Tot) descriptor (with labetalol as thestandard reference) seems to be slightly better than log P/log D.
To further investigate the use of these descriptors for classifyingBCS permeability, they were applied for WHO BCS and PBCclassifications. Regarding the WHO BCS classification, from 34drugs with TPSA(Tot) ≥ 95.85 Å2, 21 drugs were class III, IV,II/IV, or III/IV (about 61.7% of true negative). In turn, from45 drugs with TPSA(Tot) < 95.85 Å2, 35 were class I, II, I/III, orII/IV (about 77.8% of true positive). Please note that thenumbers of compounds in WHO BCS class II/IV plus III/IVwere 12 and in class I/III plus II/IV were 9. With regard to PBC,the TP and TN rates are 67.5% and 73.7%, respectively. Thesame procedure was carried out withMlog P, and the TP and TNrates according to BCS classification of WHO were 80.5% and51.2%, respectively. For the classification of PBC, TP and TNrates were 66.3% and 68.9%. This analysis confirms the ability ofsimple calculated descriptors as Mlog P and TPSA(Tot) forprovisional classification of high BCS permeability drugs.However, they seem to be useless for identifying low BCSpermeability drugs.QSPR approaches have been explored in this study as an
attempt to computationally predict PBC class of NMEs. Thisprediction is very useful in early phases of drug developmentwhen the therapeutic doses are not completely defined. Themodeling strategy which combines the independent solubilityand permeability predictions in a final consensus system appearsto be appropriated for in silico provisional biopharmaceuticalclassification.29 Herein, three statistical techniques (LDA, QDA,and BLR) were explored to develop 18 models to predict thePBC solubility and permeability classes. They were able to detectthe linear and nonlinear relationships between response variableand selectedMDs. Additionally, the balance between of solubility(188 high/134 low) and permeability (167 high/155 low) data isfavorable for the modeling task.As pointed out previously,29 developing a robust model for
BCS or BDDCS solubility classification is not an easy task.Structural factors are not sufficient for describing theDo variable.Besides, the solubility properties related to ionizable capacity ofmolecules makes the solubility prediction more difficult, sincecalculated descriptors are generally based on nonionized states.Lately, Broccatelli et al.,29 in an in silico classification of BDDCS,used the predicted dose number (PDN) which derived fromsome hypothetical doses as experimental variable for the FDAsolubility model construction. In the present work, the main goalwas to develop appropriated QSPR models for qualitativelypredicting the Do term without any addition of experimentalvariables. Advances in computational modeling field today hadput evidence enough to admit that clinical dose, toxicity effect,and many ADME related properties (e.g., distribution volume,bioavailability) can be effectively predicted by QSAR/QSPRapproaches. Likewise, the Do values of drug molecules wereshown to be highly correlated with aqueous solubility, a commonmodeling property. Addressing this issue, the best three statisticalmodels developed for classifying PBC solubility were selectedand displayed good performance (see Table 2). Their consensusmodel (VoteS) outperforms all of the stand-alone models withhigh overall accuracy of 88.7% for training and 92.3% for the testset. Considering the coefficients of statistical equations, the polarityand hydrogen bond forming capacity (weighted by descriptorsnArC=N, C-005, H-052, N-067, ID3, and A) positively contributeto a high PBC solubility class.On the other hand, the Caco-2 permeability has been
demonstrated to be a predictable measure.25,31 Here, for thefirst time, a new cutoff value adapted to the BCS permeabilityclassification was used for modeling. As an important finding, the
Molecular Pharmaceutics Article
dx.doi.org/10.1021/mp4000585 | Mol. Pharmaceutics XXXX, XXX, XXX−XXXM
CACO2 descriptor implemented in Volsurf+ package played acritical role in model building. Besides, the MDs expressingpolarizability and hydrogen bond forming capacity (weighted bydescriptors GATS2s, P_VSA_s_6, CATS2D_07_DP, CATS2-D_08_AP, and WN2) demonstrated their importance to definehigh PBC permeability class. The consensus model exhibitedgood accuracy for training (85.3%) and for the test set (96.9%).The consensus system that outputs the predicted PBC class
was finally achieved (see Table 4). Analyzing the confusionmatrix of PBC predictions from the same viewpoint ofKhandelwal et al.,28 the designated type I and II errors werecalculated. As consequence, % type I error (predicted PBC classIV drugs that were class I−III and predicted PBC class II or IIIthat were class I) was 14.6% and % type II error (predicted PBCclass I drugs that were class II−IV and predicted PBC class II orIII from actual class IV) was 10.6%. Theoretically, PBC class I canbe considered to be prioritized, class IV drugs should not beeligible, and class II and III drugs are prosperous candidates.Therefore, for screening purpose, it is in the investigator’sinterest to keep type II error as low as possible. Then thisclassification scheme should be suitable for screening largedatabase. Particularly, for PBC class I, it might be more desirableto have good precision instead of accuracy. Since PBC class Icriterion correlates with WHO BCS class I in more than 80%,current in silico prediction (with PBC class I precision of 77.2%)seems to be appropriated to prioritize the compounds morelikely for biowaivers.The final predictions of three data sets by PBC consensus
systems confirm the suitability of obtained models forbiopharmaceutical classification purposes. Visualizing the ADsestablished by leverage method is needed for eliminatingunreliable extrapolations. There is a significant number ofscreening compounds outside the ADs (see Figures SI4 and SI5).Their predictions might be doubtful and should not beconsidered.As can be appreciated, in silico model robustly (87.5% of
overall accuracy) predicts the BCS classes of an external set of 57drugs classified by the WHO. Subsequently, the PBC classpredictions and BDDCS class assignments of 675 oral drugs werecarried out (see Table SI11 in the Supporting Information).Interestingly, the BDDCS class I and II are well-predicted byPBC basedmodels. Unsurprisingly, many predicted PBC class IVare BDDCS class II. This is due to some specified uptake and/orefflux effects that current models cannot capture since most ofdrugs involved in Caco-2 permeability models are likely transportedby cell passive diffusion mechanisms. Finally, a large database waspredicted by PBC consensus model to estimate the distribution ofPBC class of NMEs. Based on the predictions, the distribution ofcommercially available drugs and clinical trial phase 3 drugs are quitesimilar (% predicted PBC class I: 42−45%, class II: 21−32%, classIII: 12−20%, and class IV: 6−8%).Drugs encountered in the clinicalphases 1 and 2 display similar PBC class distributions (about 50% ofdrugs are predicted as PBC class II). Compounds fromW6 andW9data set are also predicted mostly as PBC class II (more than 60%).From a logical standpoint, the prediction distributions reflect thestatus of drug development process. It was recognized that about60% ofNMEs evaluated in early drug discovery are poorly soluble.29
A similar percentage of PBC class II (62−63%) and PBC class IV(5−10%) was predicted in the W6 and W9 data sets. Candidatesthat were selected to start the clinical trials (phase 1 and 2) maintainthe same proportion, and predicted PBC class II keeps being thehighest fraction. However, there are some changes in the overallproportion: number of predicted PBC class I drugs slightly
increases, predicted PBC class III markedly increases, thepercentages of predicted PBC class II decrease to 47−50%;meanwhile numbers of predicted PBC class IV do not vary.Throughout the clinical assays, the number of candidates in phase 3strongly decreases. The percentage of selected candidates thatdisplay appropriate physicochemical profiles increases: 42%of drugsare predicted as PBC class I, 32% as class II, 12% as class III, and 7%as class IV. Reasonably, this proportion is most likely similar tolaunched drugs. The number of predicted PBC class II drugsdecreases further to a similar number of predicted PBC class III(20%). Overall, this finding agrees with previous estimations.14,21,29
All of the above scenarios demonstrate the applicability of in silicomodels for screening the NMEs in early phases of drug discovery.
■ CONCLUSIONSIn this report, a systematic study was carried out to standardize aBCS-based provisional classification of 322 drugs, namely, PBC,and develop computational predictions of BCS class for NMEs. Itis of great interest to assign as soon as possible the probable BCSclass of a drug candidate. By using extensively revised referencesof solubility and in vitro Caco-2 permeability, a very commonlyused preclinical assay in pharmaceutical industry, a better in vivoBCS classification of drugs is anticipated. Consequently, theclassification results in this study display a high concordance withBCS classification of WHO and FDA guidance. Otherclassification schemes were reviewed and compared with PBC.A large amount of additional information concerning the BCSclassification of current data was analyzed to identify advantagesas well as limitations when using PBC. As an attempt to developQSPR models able to predict the PBC class, it was demonstratedthe possibility of screening NMEs in the early phase of drugdevelopment. A combination of in silico and in vitro approachesprovides a basis for robust estimation of the BCS class of NMEswithout clinical information and contribute to early selection ofbiopharmaceutical promissory drug candidates. As a relevantlimitation, this data set still consists of a relative small number ofdrugs. Besides, the uncertainty of the relationship betweenabsorption extent and proposed provisional classification(especially for low absorbed drugs) remains. A modification ofcurrent PBC classification scheme (particularly for class II,considering the high-moderate-low permeability classes, andclass III, relaxing the solubility boundary by assuming greaterwater volume, e.g. 500 mL) could be useful for predicting theintestinal absorption of drugs. A further compilation of in vitropermeability data and aqueous solubility may enhance theapplicability domain of in silico classifications.
■ ASSOCIATED CONTENT*S Supporting InformationSupplementalTable SI1 lists data set drugs, their BCS classification bycurrent PBC, and other published sources. Also it includes additionalinformation of absorption; dosages used and revised aqueoussolubility. Supplemental Table SI2 lists some in silico parameters forclassifying solubility and permeability commonly used in literature.Supplemental Table SI3 displays confusion matrix. SupplementalTables SI4, SI5, and SI6 list performances of statistical models forPBC solubility classification. Supplemental Tables SI7, SI8, and SI9list performances of statistical models for PBC permeabilityclassification. Supplemental Table SI10 lists all of the moleculardescriptors included in statistical models, their meanings andcontributions for the classification of solubility and permeability.Supplemental Table SI11 lists the PBC in silico classifications of dataset with previous BDDCS classifications. Supplemental Table SI12
Molecular Pharmaceutics Article
dx.doi.org/10.1021/mp4000585 | Mol. Pharmaceutics XXXX, XXX, XXX−XXXN
shows the prediction distributions of the large medicinal chemistrydata set. Supplemental Figure SI1 evidences the relationship betweenaqueous solubility, dose, and Do. Supplemental Figures SI2 and SI3show the ROC curve analysis and comparison between obtainedstatistical models. Supplemental Figures SI4 and SI5 display ADs ofobtained models. This material is available free of charge via theInternet at http://pubs.acs.org.
■ AUTHOR INFORMATION
Corresponding Author*E-mail: [email protected]; [email protected];[email protected]. Phone/fax: 53-42-281192/53-42-281130.
NotesThe authors declare no competing financial interest.
■ ACKNOWLEDGMENTS
The authors acknowledge financial support of Agencia Espanola deCooperacion Iberoamericana para el Desarrollo (AECID) for theprojects: 1-A1/036687/11: Montaje de un Laboratorio de QuimicaComputacional, con Fines Academicos y Cientificos, para el Disenode Potenciales Candidatos a Farmacos, en Enfermedades de AltoImpacto Social and 2-DCI-ALA/19.09.01/10/21526/245-297/ALFA 111(2010)29: Red-Biofarma. Red para el Desarrollo deMetodologias Biofarmaceuticas Racionales que Incrementen laCompetencia y el Impacto Social de las Industrias FarmaceuticasLocales. M.C.-M. acknowledges the Portuguese Fundacao para aCiencia e a Tecnologia (FCT) (SFRH/BPD/90673/2012) forfinancial support. M.A.C. also thanks to the program: EstadesTemporals per a Investigadors Convidats, developed at ValenciaUniversity in 2012. Finally, the authors also acknowledge StephenJones Barigye for his contributions to the English revision.
■ ABBREVIATIONS
BCS, Biopharmaceutics Classification System; API, active pharma-ceutical ingredient; US FDA, US Food and Drug Administration;EMA, European Medicines Agency; WHO, World HealthOrganization; EML, Essential Medicine List; IR, immediate release;BA, bioavailability; BE, bioequivalence; Fa, % fraction absorbed; GI,gastrointestinal; BDDCS, Biopharmaceutical Drug DispositionClassification System; P-gp, P-glycoprotein; PBC, ProvisionalBiopharmaceutical Classification; NMEs, new molecular entities;D0, dose number; Caco-2, adenocarcinoma cells derived from colon;Papp, Caco-2 cell apparent permeability; QSAR/QSPR, QuantitativeStructure Activity/Property Relationship; MD, molecular descrip-tor; ADME, absorption-distribution-metabolism-excretion; SD,standard deviation; LDA, linear discriminant analysis; QDA,quadratic discriminant analysis; BLR, binary logistic regression;FN, false negative; FP, false positive; TN, true negative; TP, truepositive; MCC, Matthews correlation coefficient; ROC, receiveroperating characteristic curve; AUC, area under ROC curve; AD,applicability domains; Smin, minimum aqueous solubility in the pHrange of 1.2−6.8 at 37 °C; Smax, maximum aqueous solubility in thepH range of 1.2−6.8 at 37 °C; Dmax, drug’s highest dose strength;Dmin, drug’s lowest dose strength; log P, pH-independent n-octanol/water partition coefficients; log D, pH-dependent n-octanol/waterpartition coefficients; PSA, polar surface area; EfR, efflux ratio; ES,efflux substrate; NES, nonefflux-substrate; ATC, anatomicaltherapeutic chemical; VoteS, solubility consensus model; VoteP,permeability consensus model; HTS, high throughput screening
■ REFERENCES(1) Amidon, G. L.; Lennernas, H.; Shah, V. P.; Crison, J. R. Atheoretical basis for a biopharmaceutic drug classification: thecorrelation of in vitro drug product dissolution and in vivobioavailability. Pharm. Res. 1995, 12 (3), 413−420.(2) Chen, M. L.; Amidon, G. L.; Benet, L. Z.; Lennernas, H.; Yu, L. X.The BCS, BDDCS, and regulatory guidances. Pharm. Res. 2011, 28 (7),1774−1778.(3) CDER/FDA. FDA Guidance for Industry: Waiver of In VivoBioavailability and Bioequivalence Studies for Immediate-Release Solid OralDosage Forms Based on a Biopharmaceutics Classification System; FederalDrug and Food Administration: Rockville, MD, Center for DrugEvaluation and Research, 2000; www.fda.gov/downloads/Drugs/GuidanceComplianceRegulatoryInformation/Guidances/ucm070246.pdf (accessed July 26, 2012).(4) CPMP/EWP/QWP/1401/98 Note for Guidance on the Inves-tigation of Bioavailability and Bioequivalence; The European Agency forthe Evaluation of Medicinal Products (EMEA): London, Evaluation ofMedicines for Human Use, December 14, 2000; http://www.ema.europa.eu/docs/en_GB/document_library/Scientific_guideline/2009/09/WC500003519.pdf (accessed July 26, 2012).(5) Annex 8: Proposal to waive in vivo bioequivalence requirements forWHOModel List of Essential Medicines immediate-release, solid oral dosageforms; Technical Report Series No. 937; 40th; WHO Expert Committeeon Specification for Pharmaceutical Preparations, WHO TechnicalReport Series, No. 937, 2006; pp 391−461; http://www.who.int/medicines/publications/essentialmedicines/en/index.html (accessedMarch 3, 2012).(6) Cook, J. A.; Davit, B. M.; Polli, J. E. Impact of BiopharmaceuticsClassification System-Based Biowaivers.Mol. Pharmaceutics 2010, 7 (5),1539−1544.(7) CDER/FDA Immediate Release Solid Oral Dosage Forms Scale-Upand Postapproval Changes: Chemistry, Manufacturing, and Controls, InVitro Dissolution Testing, and In Vivo Bioequivalence Documentation;Center for Drug Evaluation and Research (CDER), November, 1995;http://www.fda.gov/downloads/Drugs/GuidanceComplianceRegulatoryInformation/Guidances/ucm070636.pdf (accessed July 26, 2012).(8) Ku, M. S. Use of the Biopharmaceutical Classification System inearly drug development. AAPS J. 2008, 10 (1), 208−212.(9) Kasim, N. A.; Whitehouse, M.; Ramachandran, C.; Bermejo Sanz,M.; Lennernas, H.; Hussain, A. S.; Junginger, H. E.; Stavchansky, S. A.;Midha, K. K.; Shah, V. P.; Amidon, G. Molecular Properties of WHOEssential Drugs and Provisional Biopharmaceutical Classification. Mol.Pharmaceutics 2004, 1 (1), 85−96.(10) Dahan, A.; Miller, J. M.; Amidon, G. L. Prediction of solubility andpermeability class membership: provisional BCS classification of theworld’s top oral drugs. AAPS J. 2009, 11 (4), 740−746.(11) Takagi, T.; Ramachandran, S.; Bermejo, M.; Yamashita, S.; Yu, L.X.; Amidon, G. L. A Provisional Biopharmaceutical Classification of theTop 200 Oral Drug Products in the United States, Great Britain, Spain,and Japan. Mol. Pharmaceutics 2006, 3 (6), 631−643.(12) Lindenberg, M.; Kopp, S.; Dressman, J. B. Classification of orallyadministered drugs on the World Health Organization Model list ofEssential Medicines according to the biopharmaceutics classificationsystem. Eur. J. Pharm. Biopharm. 2004, 58 (2), 265−278.(13) Varma, M. V.; Gardner, I.; Steyn, S. J.; Nkansah, P.; Rotter, C. J.;Whitney-Pickett, C.; Zhang, H.; Di, L.; Cram, M.; Fenner, K. S.; El-Kattan, A. F. pH-Dependent Solubility and Permeability Criteria forProvisional Biopharmaceutics Classification (BCS and BDDCS) inEarly Drug Discovery. Mol. Pharmaceutics 2012, 9 (5), 1199−1212.(14) Nair, A. K.; Anand, O.; Chun, N.; Conner, D. P.; Mehta, M. U.;Nhu, D. T.; Polli, J. E.; Yu, L. X.; Davit, B. M. Statistics on BCSClassification of Generic Drug Products Approved Between 2000 and2011 in the USA. AAPS J. 2012, 14 (4), 664−666.(15) Shawahna, R.; Rahman, N. U. Evaluation of the use of partitioncoefficients and molecular surface properties as predictors of drugabsorption: a provisional biopharmaceutical classification of the list ofnational essential medicines of Pakistan. DARU 2011, 19 (2), 83−99.
Molecular Pharmaceutics Article
dx.doi.org/10.1021/mp4000585 | Mol. Pharmaceutics XXXX, XXX, XXX−XXXO
(16) The International Pharmacopoeia, 4th ed.; World HealthOrganization, WHO Press: Geneva, 2006; Vols. 1 & 2, p 1520.(17) The Merck Index, 14th ed.; Merck Research Laboratories:Whitehouse Station, NJ, 2006.(18) Wu, C. Y.; Benet, L. Z. Predicting drug disposition via applicationof BCS: transport/absorption/ elimination interplay and developmentof a biopharmaceutics drug disposition classification system. Pharm. Res.2005, 22 (1), 11−23.(19) Ungell, A. L.; Artursson, P. An Overview of Caco-2 andAlternatives for Prediction of Intestinal Drug Transport and Absorption.In Drug Bioavailability. Estimation of Solubility, Permeability, Absorptionand Bioavailability, 2nd ed.; van de Waterbeemd, H., Testa, B., Eds.;Wiley-VCH: Weinheim, 2008; Vol. 40; pp 133−159.(20) Sun, H.; Pang, K. S. Permeability, transport, and metabolism ofsolutes in Caco-2 cell monolayers: a theoretical study. Drug Metab.Dispos. 2008, 36 (1), 102−123.(21) Benet, L. Z.; Broccatelli, F.; Oprea, T. I. BDDCS Applied to Over900 Drugs. AAPS J. 2011, 13 (4), 519−547.(22) WHOModel List of Essential Medicines (17th list), March 2011;http://www.who.int/medicines/publications/essentialmedicines/en/index.html (accessed July 26, 2012).(23) Electronic Orange Book, Approved Drug Products withTherapeutic Equivalence Evaluations, 32nd ed.; Office of GenericDrugs Center for Drug Evaluation and Research, Food and DrugAdministration, updated August 2012; http://www.fda.gov/downloads/Drugs/InformationOnDrugs/UCM086233.pdf (accessedJuly 26, 2012).(24) Kim, J. S.; Mitchell, S.; Kijek, P.; Tsume, Y.; Hilfinger, J.; Amidon,G. L. The Suitability of an in Situ Perfusion Model for PermeabilityDeterminations: Utility for BCS Class I Biowaiver Requests. Mol.Pharmaceutics 2006, 3 (6), 686−694.(25) Pham-The, H.; Gonzalez Diaz, I.; Bermejo Sanz, M.; MangasSanjuan, V.; Centelles, I.; Garriges, T. M.; Cabrera Perez, M. A. In SilicoPrediction of Caco-2 Permeability by a Classification QSAR Approach.Mol. Inf. 2011, 30 (4), 376−385.(26) Prieto, P.; Hoffmann, S.; Tirelli, V.; Tancredi, F.; Gonzalez, I.;Bermejo, M.; De Angelis, I. An Exploratory Study of Two Caco-2 CellModels for Oral Absorption: A Report on Their Within-laboratory andBetween-laboratory Variability, and Their Predictive Capacity. Altern.Lab. Anim. 2010, 38 (5), 367−386.(27) Behrens, I.; Kissel, T. Do cell culture conditions influence thecarrier-mediated transport of peptides in Caco-2 cell monolayers? Eur. J.Pharm. Sci. 2003, 19 (5), 433−442.(28) Khandelwal, A.; Bahadduri, P. M.; Chang, C.; Polli, J. E.; Swaan, P.W.; Ekins, S. Computational models to assign biopharmaceutics drugdisposition classification from molecular structure. Pharm. Res. 2007, 24(12), 2249−2262.(29) Broccatelli, F.; Cruciani, G.; Benet, L. Z.; Oprea, T. I. BDDCSclass prediction for new molecular entities. Mol. Pharmaceutics 2012, 9(3), 570−580.(30) VolSurf+, version 1.0.4; available from Molecular Discovery Ltd.,London, U.K., 2010; http://www.moldiscovery.com.(31) Marrero-Ponce, Y.; Cabrera, M. A.; Romero, V.; Bermejo, M.;Siverio, D.; Torrens, F. Prediction of Intestinal Epithelial Transport ofDrug in (Caco-2) Cell Culture from Molecular Structure using in silicoApproaches During Early Drug Discovery. Internet Electron. J. Mol. Des.2005, 4 (2), 124−150.(32) Artursson, P.; Karlsson, J. Correlation between oral drugabsorption in humans and apparent drug permeability coefficients inhuman intestinal epithelial (Caco-2) cells. Biochem. Biophys. Res.Commun. 1991, 175 (3), 880−885.(33) Yee, S. In vitro permeability across Caco-2 cells (colonic) canpredict in vivo (small intestinal) absorption inman–fact or myth. Pharm.Res. 1997, 14 (6), 763−766.(34) Volpe, D. A., Drug Permeability Studies in Regulatory BiowaiverApplications. In Drug Absorption Studies: In Situ, In Vitro and In SilicoModels; Ehrhardt, C., Kim, K.-J., Eds.; Springer: New York, 2008; Vol.VII, pp 665−680.
(35) DRAGON for Windows (Sof tware for Molecular DescriptorCalculator). 6.0; Talete srl, Milano Chemometrics and QSAR ResearchGroup: http://www.talete.mi.it/products/dragon_description.htm.(36) Todeschini, R.; Consonni, V. Molecular Descriptors for Chemo-informatics; Wiley VCH Verlag GmbH & Co.: Weinheim, Germany,2009; Vols. I & II.(37) Cruciani, G.; Crivori, P.; Carrupt, P. A.; Testa, B. Molecular fieldsin quantitative structure−permeation relationships: the VolSurfapproach. J. Mol. Struct.: THEOCHEM 2000, 503 (1−2), 17−30.(38) STATISTICA (data analysis software system), 8.0; StatSoft, Inc.:Tulsa, OK, 2007; www.statsoft.com.(39) Fisher, R. A. The use of multiple measurements in taxonomicproblems. Ann. Eugenic 1936, 7, 179−188.(40) Hosmer, D. W.; Lemeshow, S. Applied Logistic Regression, 2nd ed.;John Wiley & Sons, Inc.: Hoboken, NJ, 2000; p 392.(41) SPSS (Statistical Software for the Social Sciences) 17.0; SPSS Inc.:Chicago, IL, 2008; http://www.spss.com.(42) Hanley, J. A.; McNeil, B. J. The meaning and use of the area undera receiver operating characteristic (ROC) curve. Radiology 1982, 143(1), 29−36.(43) Netzeva, T. I.; Worth, A.; Aldenberg, T.; Benigni, R.; Cronin, M.T.; Gramatica, P.; Jaworska, J. S.; Kahn, S.; Klopman, G.; Marchant, C.A.; Myatt, G.; Nikolova-Jeliazkova, N.; Patlewicz, G. Y.; Perkins, R.;Roberts, D.; Schultz, T.; Stanton, D. W.; van de Sandt, J. J.; Tong, W.;Veith, G.; Yang, C. Current status of methods for defining theapplicability domain of (quantitative) structure-activity relationships.The report and recommendations of ECVAMWorkshop 52.Altern. Lab.Anim. 2005, 33 (2), 155−173.(44) Custodio, J. M.; Wu, C. Y.; Benet, L. Z. Predicting drugdisposition, absorption/elimination/transporter interplay and the roleof food on drug absorption. Adv. Drug Delivery Rev. 2008, 60 (6), 717−733.(45) Dressman, J.; Butler, J.; Hempenstall, J.; Reppas, C. The BCS:Where Do We Go from Here? Pharm. Technol. 2001, 7, 69−76.(46) Tetko, I. V. Computing chemistry on the web. Drug DiscoveryToday 2005, 10 (22), 1497−1500.(47) Regardh, C. G.; Borg, K. O.; Johansson, R.; Johnsson, G.; Palmer,L. PK studies on the selective beta1-receptor antagonist metoprolol inman. J. Pharmacokinet. Biopharm. 1974, 2 (4), 347−364.(48) Polli, J. E.; Yu, L. X.; Cook, J. A.; Amidon, G. L.; Borchardt, R. T.;Burnside, B. A.; Burton, P. S.; Chen,M. L.; Conner, D. P.; Faustino, P. J.;Hawi, A. A.; Hussain, A. S.; Joshi, H. N.; Kwei, G.; Lee, V. H.; Lesko, L.J.; Lipper, R. A.; Loper, A. E.; Nerurkar, S. G.; Polli, J. W.; Sanvordeker,D. R.; Taneja, R.; Uppoor, R. S.; Vattikonda, C. S.; Wilding, I.; Zhang, G.Summary workshop report: Biopharmaceutics classification system–implementation challenges and extension opportunities. J. Pharm. Sci.2004, 93 (6), 1375−1381.(49) Tomei, S.; Yuasa, H.; Inoue, K.; Watanabe, J. Transport functionsof riboflavin carriers in the rat small intestine and colon: Site differenceand effects of tricyclictype drugs. Drug Delivery 2001, 8 (3), 119−124.(50) Bates, T. R.; Sequeira, J. A. Use of 24-hr urinary excretion data toassess bioavailability of griseofulvin in humans. J. Pharm. Sci. 1975, 64(5), 709−710.(51) Takano, R.; Sugano, K.; Higashida, A.; Hayashi, Y.; Machida, M.;Aso, Y.; Yamashita, S. Oral absorption of poorly water-soluble drugs:computer simulation of fraction absorbed in humans from a miniscaledissolution test. Pharm. Res. 2006, 23 (6), 1144−1156.(52) Blum, R. A.; D’Andrea, D. T.; Florentino, B. M.; Wilton, J. H.;Hilligoss, D. M.; Gardner, M. J.; Henry, E. B.; Goldstein, H.; Schentag, J.J. Increased gastric pH and the bioavailability of fluconazole andketoconazole. Ann. Intern. Med. 1991, 114 (9), 755−757.(53) Elsby, R.; Surry, D. D.; Smith, V. N.; Gray, A. J. Validation andapplication of Caco-2 assays for the in vitro evaluation of developmentcandidate drugs as substrates or inhibitors of P-glycoprotein to supportregulatory submissions. Xenobiotica 2008, 38 (7−8), 1140−1164.(54) Yazdanian, M.; Briggs, K.; Jankovsky, C.; Hawi, A. The “highsolubility” definition of the current FDA Guidance on Biopharmaceut-ical Classification System may be too strict for acidic drugs. Pharm. Res.2004, 21 (2), 293−299.
Molecular Pharmaceutics Article
dx.doi.org/10.1021/mp4000585 | Mol. Pharmaceutics XXXX, XXX, XXX−XXXP
(55) Dahan, A.; Miller, J. M.; Hilfinger, J. M.; Yamashita, S.; Yu, L. X.;Lennernas, H.; Amidon, G. L. High-Permeability Criterion for BCSClassification: Segmental/pH Dependent Permeability Considerations.Mol. Pharmaceutics 2010, 7 (5), 1827−1834.(56) Kelder, J.; Grootenhuis, P. D.; Bayada, D. M.; Delbressine, L. P.;Ploemen, J. P. Polar molecular surface as a dominating determinant fororal absorption and brain penetration of drugs. Pharm. Res. 1999, 16(10), 1514−1519.(57) Stenberg, P.; Norinder, U.; Luthman, K.; Artursson, P.Experimental and computational screening models for the predictionof intestinal drug absorption. J. Med. Chem. 2001, 44 (12), 1927−1937.(58) Hunter, J.; Jepson, M. A.; Tsuruo, T.; Simmons, N. L.; Hirst, B. H.Functional expression of P-glycoprotein in apical membranes of humanintestinal Caco-2 cells. Kinetics of vinblastine secretion and interactionwith modulators. J. Biol. Chem. 1993, 268 (20), 14991−14997.(59) Hirohashi, T.; Suzuki, H.; Chu, X. Y.; Tamai, I.; Tsuji, A.;Sugiyama, Y. Function and expression of multidrug resistance-associatedprotein family in human colon adenocarcinoma cells (Caco-2). J.Pharmacol. Exp. Ther. 2000, 292 (1), 265−270.(60) Polli, J. W.; Wring, S. A.; Humphreys, J. E.; Huang, L.; Morgan, J.B.; Webster, L. O.; Serabjit-Singh, C. S. Rational use of in vitro P-glycoprotein assays in drug discovery. J. Pharmacol. Exp. Ther. 2001, 299(2), 620−628.(61) Lin, X.; Skolnik, S.; Chen, X.; Wang, J. Attenuation of IntestinalAbsorption by Major Efflux Transporters: Quantitative Tools andStrategies Using a Caco-2 Model. Drug Metab. Dispos. 2011, 39 (2),265−274.(62) Merino, G.; Jonker, J. W.; Wagenaar, E.; van Herwaarden, A. E.;Schinkel, A. H. The breast cancer resistance protein (BCRP/ABCG2)affects pharmacokinetics, hepatobiliary excretion, and milk secretion ofthe antibiotic nitrofurantoin.Mol. Pharmacol. 2005, 67 (5), 1758−1764.(63) Lipinski, C. A.; Lombardo, F.; Dominy, B. W.; Feeney, P. J.Experimental and computational approaches to estimate solubility andpermeability in drug discovery and development settings. Adv. DrugDelivery Rev. 2001, 46 (1−3), 3−26.(64) Chen, G.; Zheng, S.; Luo, X.; Shen, J.; Zhu, W.; Liu, H.; Gui, C.;Zhang, J.; Zheng, M.; Puah, C. M.; Chen, K.; Jiang, H. Focusedcombinatorial library design based on structural diversity, druglikenessand binding affinity score. J. Comb. Chem. 2005, 7 (3), 398−406.(65) Ghose, A. K.; Viswanadhan, V. N.; Wendoloski, J. J. A knowledge-based approach in designing combinatorial or medicinal chemistrylibraries for drug discovery. 1. A qualitative and quantitative character-ization of known drug databases. J. Comb. Chem. 1999, 1 (1), 55−68.(66) Zamora, I.; Oprea, T. I.; Ungell, A. L. Prediction of oral drugpermeability. In Rational Approaches to Drug Design; Holtje, H. D., Sippl,W., Eds.; Prous Science Press: Barcelona, Spain, 2001; pp 271−280.(67) Dahan, A.; Lennernas, H.; Amidon, G. L. The Fraction DoseAbsorbed, in Humans, and High Jejunal Human PermeabilityRelationship. Mol. Pharmaceutics 2012, 9 (6), 1847−1851.(68) Igel, S.; Drescher, S.; Murdter, T.; Hofmann, U.; Heinkele, G.;Tegude, H.; Glaeser, H.; Brenner, S. S.; Somogyi, A. A.; Omari, T.;Schafer, C.; Eichelbaum, M.; Fromm, M. F. Increased absorption ofdigoxin from the human jejunum due to inhibition of intestinaltransporter-mediated efflux. Clin. Pharmacokinet. 2007, 46 (9), 777−785.
Molecular Pharmaceutics Article
dx.doi.org/10.1021/mp4000585 | Mol. Pharmaceutics XXXX, XXX, XXX−XXXQ
Copyright © 2022 FDOKUMEN