Physicochemical properties, form, and formulation selection strategy for a biopharmaceutical...
15
RESEARCH ARTICLE – Drug Discovery-Development Interface Physicochemical Properties, Form, and Formulation Selection Strategy for a Biopharmaceutical Classification System Class II Preclinical Drug Candidate SACHIN LOHANI, 1 HARRIET COOPER, 1 XIAOLING JIN, 1 BECKY P. NISSLEY, 2 KIMBERLY MANSER, 2 LINDA HUONG RAKES, 3 JOHN J. CUMMINGS, 4 SCOTT E. FAUTY, 5 ANNETTE BAK 6 1 Department of Discovery Pharmaceutical Sciences, Merck and Company, Inc., Rahway, New Jersey 07065 2 Department of Biopharmaceutics, Merck and Company Inc., West Point, Pennsylvania 19486 3 Global Project Management, Merck and Company Inc., Pennsylvania 19454 4 Department of Pharmacokinetics, Pharmacokinetics and Drug Metabolism, Merck and Company Inc., Rahway, New Jersey 07065 5 Department of Safety Assessment and Laboratory Animal Resources—General Toxicology, Merck and Company Inc., West Point, Pennsylvania 19486 6 Department of Discovery Pharmaceutical Sciences, Merck and Company, Inc., Kenilworth, New Jersey 07033 Received 24 February 2014; revised 13 May 2014; accepted 23 June 2014 Published online 29 July 2014 in Wiley Online Library (wileyonlinelibrary.com). DOI 10.1002/jps.24088 ABSTRACT: This work summarizes the pharmaceutical evaluation of a preclinical drug candidate with poor physicochemical properties. Compound 1 is a weakly basic, GPR-119 agonist designated to Biopharmaceutics Classification System Class II because of good permeability in a Caco-2 cell line model and poor solubility. Compound 1 showed good oral bioavailability from a solution formulation at low doses and oral exposure sufficient for toxicological evaluation at high doses from a nanosuspension of Form A—the only known polymorph of 1 during drug discovery. The identification of the thermodynamically stable polymorph, Form B, during early development adversely affected the bioperformance of the nanosuspension. The poor solubility of Form B resulted in a significant reduction in the oral exposure from a nanosuspension to a level that was insufficient for toxicological evaluation of compound 1. Subsequent to the discovery of Form B, multiple form and formulation engineering strategies were evaluated for their ability to enhance the oral exposure of 1. Formulations based on cocrystals and amorphous solid dispersions showed a statistically significant increase in exposure, sixfold and sevenfold, respectively, over the benchmark formulation, a suspension of Form B. The physicochemical characterization of 1, and the solid form and formulation engineering approaches explored to address the insufficient oral exposure of Form B are discussed along with insights on improving the physicochemical properties of the follow-on drug candidates in discovery. C 2014 Wiley Periodicals, Inc. and the American Pharmacists Association J Pharm Sci 103:3007–3021, 2014 Keywords: BCS Class II; polymorphism; solid dispersion; cocrystal; solubility; bioavailability; physicochemical properties INTRODUCTION Improving research and development (R&D) productivity is the most critical challenge facing the pharmaceutical indus- try, as the increase in R&D cost has outpaced the number of new drugs launched in the recent decades. 1 Failure to accu- rately predict the efficacy and safety of drug candidates is the primary reason for the high attrition rates of candidates in clinical development. 2–5 In fact, a recent review of Phase II failures from 2008 to 2010 showed that efficacy was the major cause of attrition in pharmaceutical pipelines (51%) followed by strategic (29%) and then safety reasons (19%). 5 Therefore, drug discovery and early development have focused on better Correspondence to: Annette Bak (Telephone: +908-740-4489; E-mail: annette [email protected]) Sachin Lohani’s present address is Center for Drug Evaluation and Re- search, FDA, 10903 New Hampshire Ave Silver Spring, Maryland 20993. E-mail: [email protected], Tel: 204-402-4575. Harriet Cooper’s present address is Salvona Technologies, Product Develop- ment Department, Hamilton, New Jersey 08610 This article contains supplementary material available from the authors upon request or via the Internet at http://onlinelibrary.wiley.com/. Journal of Pharmaceutical Sciences, Vol. 103, 3007–3021 (2014) C 2014 Wiley Periodicals, Inc. and the American Pharmacists Association assessment of toxicity and efficacy early on to mitigate late- stage attrition. Pharmaceutical sciences, in terms of assessing physicochemical properties and developing formulations, play a key role in achieving the desired in vivo exposure that en- able successful evaluation of toxicity and efficacy. 6 A key tool used to relate physicochemical properties to absorption and bioperformance is the Biopharmaceutical Classification Sys- tem (BCS). 7,8 Most frequently, the focus of exposure enhance- ment efforts are BCS II or IV drugs and the solubility and/or dissolution-limited absorption that is frequently encountered with these classes of drugs. It has been estimated that approx- imately 40% of the world’s top oral drugs are classified as BCS II and IV compounds, 9 and that the problem persists in dis- covery pipelines. 10 Therefore, although the issues are not new, they still remain front-and-center for scientists working at the discovery to development interface. At a high level, there are two strategies to deal with poor solubility and/or dissolution: (1) proactively ensuring that good physicochemical properties are incorporated in the molecule during the drug design stage in discovery and (2) when that is not feasible, mitigating the problem with form and formulation engineering. Selecting the balance between opti- mizing the molecule and resolving the problem with form and Lohani et al., JOURNAL OF PHARMACEUTICAL SCIENCES 103:3007–3021, 2014 3007
-
Upload
independent -
Category
Documents
-
view
2 -
download
0
Transcript of Physicochemical properties, form, and formulation selection strategy for a biopharmaceutical...

RESEARCH ARTICLE – Drug Discovery-Development Interface
Physicochemical Properties, Form, and Formulation SelectionStrategy for a Biopharmaceutical Classification System Class IIPreclinical Drug Candidate
SACHIN LOHANI,1 HARRIET COOPER,1 XIAOLING JIN,1 BECKY P. NISSLEY,2 KIMBERLY MANSER,2 LINDA HUONG RAKES,3
JOHN J. CUMMINGS,4 SCOTT E. FAUTY,5 ANNETTE BAK6
1Department of Discovery Pharmaceutical Sciences, Merck and Company, Inc., Rahway, New Jersey 070652Department of Biopharmaceutics, Merck and Company Inc., West Point, Pennsylvania 194863Global Project Management, Merck and Company Inc., Pennsylvania 194544Department of Pharmacokinetics, Pharmacokinetics and Drug Metabolism, Merck and Company Inc., Rahway, New Jersey 070655Department of Safety Assessment and Laboratory Animal Resources—General Toxicology, Merck and Company Inc., West Point,Pennsylvania 194866Department of Discovery Pharmaceutical Sciences, Merck and Company, Inc., Kenilworth, New Jersey 07033
Received 24 February 2014; revised 13 May 2014; accepted 23 June 2014
Published online 29 July 2014 in Wiley Online Library (wileyonlinelibrary.com). DOI 10.1002/jps.24088
ABSTRACT: This work summarizes the pharmaceutical evaluation of a preclinical drug candidate with poor physicochemical properties.Compound 1 is a weakly basic, GPR-119 agonist designated to Biopharmaceutics Classification System Class II because of good permeabilityin a Caco-2 cell line model and poor solubility. Compound 1 showed good oral bioavailability from a solution formulation at low dosesand oral exposure sufficient for toxicological evaluation at high doses from a nanosuspension of Form A—the only known polymorphof 1 during drug discovery. The identification of the thermodynamically stable polymorph, Form B, during early development adverselyaffected the bioperformance of the nanosuspension. The poor solubility of Form B resulted in a significant reduction in the oral exposurefrom a nanosuspension to a level that was insufficient for toxicological evaluation of compound 1. Subsequent to the discovery of Form B,multiple form and formulation engineering strategies were evaluated for their ability to enhance the oral exposure of 1. Formulations basedon cocrystals and amorphous solid dispersions showed a statistically significant increase in exposure, sixfold and sevenfold, respectively,over the benchmark formulation, a suspension of Form B. The physicochemical characterization of 1, and the solid form and formulationengineering approaches explored to address the insufficient oral exposure of Form B are discussed along with insights on improving thephysicochemical properties of the follow-on drug candidates in discovery. C© 2014 Wiley Periodicals, Inc. and the American PharmacistsAssociation J Pharm Sci 103:3007–3021, 2014Keywords: BCS Class II; polymorphism; solid dispersion; cocrystal; solubility; bioavailability; physicochemical properties
INTRODUCTION
Improving research and development (R&D) productivity isthe most critical challenge facing the pharmaceutical indus-try, as the increase in R&D cost has outpaced the number ofnew drugs launched in the recent decades.1 Failure to accu-rately predict the efficacy and safety of drug candidates is theprimary reason for the high attrition rates of candidates inclinical development.2–5 In fact, a recent review of Phase IIfailures from 2008 to 2010 showed that efficacy was the majorcause of attrition in pharmaceutical pipelines (51%) followedby strategic (29%) and then safety reasons (19%).5 Therefore,drug discovery and early development have focused on better
Correspondence to: Annette Bak (Telephone: +908-740-4489;E-mail: annette [email protected])
Sachin Lohani’s present address is Center for Drug Evaluation and Re-search, FDA, 10903 New Hampshire Ave Silver Spring, Maryland 20993. E-mail:[email protected], Tel: 204-402-4575.
Harriet Cooper’s present address is Salvona Technologies, Product Develop-ment Department, Hamilton, New Jersey 08610
This article contains supplementary material available from the authors uponrequest or via the Internet at http://onlinelibrary.wiley.com/.
Journal of Pharmaceutical Sciences, Vol. 103, 3007–3021 (2014)C© 2014 Wiley Periodicals, Inc. and the American Pharmacists Association
assessment of toxicity and efficacy early on to mitigate late-stage attrition. Pharmaceutical sciences, in terms of assessingphysicochemical properties and developing formulations, playa key role in achieving the desired in vivo exposure that en-able successful evaluation of toxicity and efficacy.6 A key toolused to relate physicochemical properties to absorption andbioperformance is the Biopharmaceutical Classification Sys-tem (BCS).7,8 Most frequently, the focus of exposure enhance-ment efforts are BCS II or IV drugs and the solubility and/ordissolution-limited absorption that is frequently encounteredwith these classes of drugs. It has been estimated that approx-imately 40% of the world’s top oral drugs are classified as BCSII and IV compounds,9 and that the problem persists in dis-covery pipelines.10 Therefore, although the issues are not new,they still remain front-and-center for scientists working at thediscovery to development interface.
At a high level, there are two strategies to deal with poorsolubility and/or dissolution: (1) proactively ensuring that goodphysicochemical properties are incorporated in the moleculeduring the drug design stage in discovery and (2) whenthat is not feasible, mitigating the problem with form andformulation engineering. Selecting the balance between opti-mizing the molecule and resolving the problem with form and
Lohani et al., JOURNAL OF PHARMACEUTICAL SCIENCES 103:3007–3021, 2014 3007
3008 RESEARCH ARTICLE – Drug Discovery-Development Interface
formulation engineering is related to risk adversity and com-pany culture. The current trends are leaning toward a bal-anced approach where the molecule is optimized while still in-corporating timeline, resources, and competitive aspects.11,12
The following properties are typically evaluated and optimizedin discovery to assess a drug candidate’s risk for manifest-ing oral absorption issues: solubility, lipophilicity, permeability,physical form, physical and chemical stability, biopharmaceu-tical characteristics, and formulation options, sometimes alsocalled “formulatability.” These properties translate to fractionabsorbed, bioavailability, and systemic exposure.13,14 Duringdrug discovery and early development, chemists and pharma-ceutical scientists are in a position to influence drug absorp-tion through molecular design, physical form selection (e.g.,salts, hydrates, cocrystals, and amorphous forms), and formula-tion engineering (e.g., particle size control, excipient selection,as well as solubilized, lipid-based, self-emulsifying, and amor-phous formulations).15,16 If a drug candidate has been identi-fied that has suboptimal solubility and dissolution, the mostcommon strategy is attempting to increase absorption by solu-bilizing the drug and/or maintaining the drug in solution stateby slowing precipitation sufficiently, so that the drug can beabsorbed before it precipitates.17–21
This work describes the challenges faced during early devel-opment of a BCS Class II drug candidate, compound 1, a GPR-119 agonist developed for the treatment of type 2 diabetes.22
Compound 1 had a high risk of not meeting the exposure tar-gets because of its poor physicochemical properties. Herein, wediscuss the drug substance form and formulation engineeringapproaches explored to mitigate the risks of insufficient oralabsorption in the preclinical species.
MATERIAL AND METHODS
Materials
Compound 1 was synthesized at Merck and Company, RahwayNJ,.22 The scale-up procedure for the two cocrystals, benzoicacid (1-BA) and maleic (1-MA), has been described in previ-ous work.23 Common reagents and solvents were of analyticalgrade and were used as received. Polymers were obtained fromthe respective suppliers: hydroxypropyl methylcellulose, hy-droxypropyl methylcellulose acetate succinate (HPMCAS; LFgrade), and hydroxypropyl methylcellulose phthalate (HPMCP;HP55 grade) from Shin-Etsu Chemical Company Ltd., Phoenix,AZ, methylcellulose (MC; viscosity = 400 cPs) from Sigma–Aldrich, St. Lois MO, and polyvinyl pyrrolidone (PVP; molec-ular weight 58 kDa) from Alfa Aesar, Ward Hill MA. Surfac-tants were obtained from the respective suppliers: sodium lau-ryl sulfate (SLS) was obtained from ThermoFisher, WalthamMA, and polysorbate 80 (Tween 80) was obtained from Fluka,distrubuted by Sigma-Aldrich St. Lois MO.
Methods
Cocrystals were characterized by differential scanningcalorimetry (DSC), modulated differential scanning calorime-try (MDSC), thermogravimetric analysis (TGA), Fourier trans-form Raman spectroscopy, and X-ray powder diffraction (XRPD)analysis. High-performance liquid chromatography (HPLC)was used to measure the concentration of various molecularspecies in solution.
Differential Scanning Calorimetry
Data were collected using a TA Instruments Q2000 DSC usinga ramp rate of 10◦C/min to 200◦C with an initial temperaturebetween 25◦C and 30◦C. MDSC data were collected using a TAInstruments Q2000 DSC using modulation of ±0.80◦C every60 s and a ramp rate of 5◦C/min from −20◦C to 250◦C. TGAdata were collected using a TA Instruments Q5000 TGA usinga 10◦C/min ramp rate to 300◦C with an initial temperaturebetween 25◦C and 30◦C.
X-ray Powder Diffraction
Patterns were measured using a Pananalytical X’Pert Pro X-ray powder diffractometer with a PW3040/60 console using acontinuous scan from 3◦ to 40◦ 22. Copper K-Alpha 1 (K"1) andK-Alpha 2 (K"2) radiation was used as the source. The step sizeranged from 0.008◦ to 0.017◦ 22and measurement time per stepranged from 10.2 to 8.3 s.
HPLC Measurement
HPLC data were obtained using an Agilent 1100 HPLCequipped with a fused-core C-18, 4.6 × 100 mm2 column witha 2.7-:m particle size using a UV/Vis detector at 210 nm wave-length. Analysis was conducted using a mobile phase of a mix-ture of water with 0.1% phosphoric acid and acetonitrile ina gradient elution at 1.8 mL/min at 40◦C. An HPLC-basedmethod described previously24 was also used to measure logD at pH 7.
pH Measurement
The pH measurement was performed using an Accumet XL20pH meter from Fisher Scientific. The instrument was calibratedprior to each set of measurements using appropriate standardbuffers.
Solubility Measurement and Slurry Experiments
The solubility analysis was performed at 25◦C with a tempera-ture bath unless otherwise stated. Excess amount of the solidphase being analyzed was added to the liquid phase and equili-brated with stirring for 24 h unless otherwise stated. At the endof the equilibration, excess solids were separated using PTFE(polytetrafluorethylene) based 0.45-:m centrifuge filters. Thesolution phase was diluted if needed using methanol, and theconcentration was determined using HPLC. Excess solids werecharacterized using XRPD. Similar protocol was used for slurryexperiments, wherein excess solids were isolated and analyzedby XRPD. Samples that showed a solubility value of less than0.01 mg/mL were reanalyzed by separating the supernatantfrom excess solids using centrifugation without using the filter,followed by HPLC analysis of the undiluted solution.
Dissolution Under Nonsink Conditions
The dissolution profile under nonsink condition was measuredin simulated gastric fluid (SGF, pH 1.8, see subsequent prepa-ration method) and fasted-state simulated intestinal fluid (FaS-SIF) by suspending 30 mg of 1-Form II or equivalent amountsof 1-BA or 1-MA in 25 mL of SGF and FaSSIF (prepared usingPhares R© SIF powder in pH 6.5 buffer, see subsequent prepara-tion method). In each case, the total concentration was 1.2 mgequivalent of 1 per milliliter of slurry. Solutions were stirredcontinuously using a magnetic stir bar at 25◦C. At various pre-determined time points (5, 15, 30, and 120 min), 0.2 mL aliquots
Lohani et al., JOURNAL OF PHARMACEUTICAL SCIENCES 103:3007–3021, 2014 DOI 10.1002/jps.24088

RESEARCH ARTICLE – Drug Discovery-Development Interface 3009
were drawn and filtered using a 0.45-:m PTFE centrifuge fil-ters. The concentrations of 1 and cocrystal formers in the so-lution phase were determined using HPLC and excess solidswere characterized by XRPD.
Solubility Product Measurement
The solubility product (Ksp) of 1-BA and 1-MA cocrystals wereestimated by measuring pH and the concentrations of drug andthe cocrystal former in the supernatant by HPLC when the ex-cess solid in equilibrium with the solution was confirmed to bethe cocrystal phase. The 1-MA cocrystal was prone to completedisproportionation and excess MA was added to stabilize the1-MA solid phase. The 1-BA cocrystal underwent only partialdisproportionation and did not require addition of excess BA atpH 1.9. All solubility product measurements were performed at25◦C with a temperature-controlled water bath.
Preparation of Simulated Media
Fasted-State Simulated Intestinal Fluid. In a 10-mL volumet-ric flask, 22.4 mg of Phares SIF powder was dissolved in ap-proximately 5 mL of the FaSSIF phosphate buffer. Solutionwas stirred until the Phares SIF powder was dispersed and aclear solution was obtained; the volume was made up to 10 mLwith the FaSSIF phosphate buffer. FaSSIF was used within48 h of preparation. The FaSSIF phosphate buffer consisted of2.1 g of NaOH pellets, 17.19 g of anhydrous sodium dihydrogenphosphate, and 30.93 g of sodium chloride in 5 L of water withthe final pH 6.5 adjusted using 1 N HCl or NaOH.
Simulated Gastric Fluid (pH 1.8). About 950 mL of deionizedwater was transferred to a 1-L volumetric flask. To ensure ho-mogeneity, 1.4 mL concentrated HCl (12 N) and 2 g NaCl wasadded and stirred. To get a final pH of 1.8, it was diluted to 1 Lwith deionized water.
Particle Size Measurement
Nanosuspensions were analyzed using a laser diffraction-basedparticle sizing instrument, Horiba LA-910, whereas microsus-pensions were analyzed using light microscopy.
Two-stage Dissolution Method
The two-stage dissolution of free form compound 1, amorphousspray-dried material, and benzoic acid and maleic acid cocrys-tal formulations was tested using a DISTEK model 2100C dis-solution system with water heater TCS 0200C and Evolution4300 automatic sampler (DISTEK Inc., North Brunswick, NewJersey). The solids were suspended in appropriate vehicles andadded to 25 ml of SGF (pH 1.8) equilibrated at 37◦C. After 2 h,an equal volume of double-strength FaSSIF was added so thatthe final pH after addition was 6.5. At designated time points,0.5 mL aliquots were taken using the autosampler and dilutedwith an equal volume of 0.5 mL methanol–water (1:1, v/v) forHPLC analysis. All samples were filtered using 0.45 :m inlinefilters.
Preparation of Suspensions
Suspensions were prepared by adding the solid phase to theformulation vehicle followed by mixing using a homogenizer for10 min to ensure homogeneity. The majority of particles (D90)in the crystalline suspensions evaluated in this work were lessthan 80 :m.
Table 1. Instrument Parameters for Preparation of Solid Dispersion
Experimental Parameter Value
Solvent TetrahydrofuranDrug loading (%) 35Recovery HPMCAS-LF 61%Recovery HPMCP HP-55 80%Drying gas (m3/min) 0.35Inlet temperature (◦C) 110Outlet temperature (◦C) 55 ± 4Cyclone size MediumCyclone pressure drop (mBar) 55 ± 5Nozzle size (mm) 0.6Spray rate (mL/min) 5Atomization airflow (L/min) 4
Preparation of Nanosuspensions
Nanosuspensions were prepared in a 50- or 100-mL chamberAlkermes benchtop nanomill and were composed of 0.2% (w/w)of SLS as surfactant, 20% (w/w) of either sucrose or glycine ascryoprotectant, up to 2.5% (w/w) of HPC-SL as stabilizer, andup to 16% (w/w) of 1 depending on the dose. The componentslisted above were added to the chamber followed by an additionof 80% (w/w) of 500 :m polystyrene beads and milled for 60–90min at 2600 rpm. Nanosuspensions were harvested by filtrationand centrifugation. The formulation was prepared 1 day aheadof the rat study, stored at −70◦C overnight, and thawed prior todosing. The thawed nanosuspensions had an average particlesize in the range of 100–200 nm.
Preparation of Solid Dispersion
Solid dispersions were prepared using ProCepT microspraydrying system. The instrument operation parameters associ-ated with the preparation of spray-dried solid dispersion arelisted in Table 1.
Permeability
Donor solutions (0.5 :Ci/mL) of 1 for apical to basolateral (A-B)and basolateral to apical (B-A) studies were prepared by addingappropriate amounts of 3H-labeled 1 to Hank’s balanced saltsolution (HBSS) buffered at pH 6.5 and 7.4, respectively. Per-meability was measured across a confluent monolayer of differ-entiated Caco-2 cells grown on BD-HTS 24-well collagen-coatedplates with PET filter membranes via a bidirectional transportexperiment. Four replicates were performed in each direction.For the A-B transport experiment, 0.4 mL of 1 solution (pH 6.5)was added to the apical (donor) compartment and 1.2 mL ofHBSS containing 4% bovine serum albumin (BSA; pH 7.4) wasadded to the basolateral (receiver) compartment. For the B-Aexperiment, 1.2 mL of 1 solution (pH 7.4) was added to the ba-solateral (donor) compartment and 0.4 mL of HBSS containing4% BSA (pH 6.5) was added to the apical (receiver) compart-ment. Samples were taken from the receiver compartment at0 and 60 min and from the donor compartment at 0 and 60min. Immediately following the experiment, the samples wereanalyzed by liquid scintillation counting. Permeability of meto-prolol and mannitol was assessed simultaneously in the sameplate in a similar fashion. Mannitol permeability was low (<2× 10⁻⁶ cm/s), indicating acceptable monolayer integrity. Goodmass balance for mannitol (>80%) confirmed that the solution
DOI 10.1002/jps.24088 Lohani et al., JOURNAL OF PHARMACEUTICAL SCIENCES 103:3007–3021, 2014

3010 RESEARCH ARTICLE – Drug Discovery-Development Interface
preparation and experimental procedures were performed ac-curately.
In Vivo Pharmacokinetic Studies in Rats
All rats were housed in an AAALAC-accredited facility in accor-dance with USDA guidelines. The study was performed undera protocol approved by the local IACUC. In vivo studies wereconducted using jugular vein precatheterized male Sprague–Dawley rats weighing between 0.23 and 0.30 kg. Rats werefasted with food removed approximately 16 h prior to dosing,and water provided ad libitum. Formulations were adminis-tered at a dosing volume of 5 mL/kg via oral gavage. Blood wassampled from jugular vein cannula (0.45 mL) at the followingtime points: 0, 0.25, 0.5, 1, 2, 4, 6, 8, and 24 h and was placed intopreheparinized microcentrifuge tubes held on ice, centrifugedfor 4 min at 4000g at 5◦C; plasma was then transferred to 1.2mL polypropelene tube and stored at −70◦C until analysis byLC–MS/MS (Liquid chromatography-mass spectrometry-massspectrometry). The samples were collected using an AutomatedBlood Sampler (ABS) system (Instech Labs). During sampling,the ABS replaced the volume of blood drawn from each subjectwith an equal volume of saline.
Bioanalytical Method
Concentrations of 1 in rat plasma were determined by pro-tein precipitation followed by LC–MS/MS analysis. Calibrationcurves were generated and verified using standard and qual-ity control (QC) samples prepared from an initial weighing ofhigh-purity compound. For the analysis of the plasma samples,standard samples were prepared by adding to 50 :L aliquotsof control plasma, 10 :L of standard solutions containing 5,10, 25, 50, 250, 500, 1000, 2500, 5000, 10,000, 25,000, and50,000 ng/mL target compound in 1:1 acetonitrile–water (v/v).This yielded standard samples effectively containing 1, 2, 5,10, 50, 100, 200, 500, 1000, 2000, 5000, and 10,000 ng/mL ofthe target compound. The assay had a lower limit of quanti-tation of 5.0 ng/mL for compound 1. The standard curve hada linear range from 5 ng/mL to 10,000 ng/mL for the assay.For all unknown samples, 50 :L were used from each sam-ple vial for analysis. To all aliquots of standards and QC sam-ples, 10 :L of 1:1 acetonitrile–water were then added. Thiswas followed by protein precipitation with 400 :L of acetoni-trile containing 100–200 ng/mL of internal standards mixture.Sample mixtures were then lightly vortex mixed. After spin-ning in a centrifuge for 5 min at 1250 G, the supernatants weretransferred to clean 96-well plates. The sample mixtures wereanalyzed by LC–MS/MS. The LC–MS/MS system consisted of aThermo Scientific LX2 autosampler, Waltham MA, coupled toan Applied Biosystems/MSD Sciex API 5000 mass spectrome-ter, Framingham MA. Chromatographic separation of the an-alytes was achieved on a Waters Acquity HSS T3 column (2.1× 50 mm2, 1.8 :m particle size), Waters Corporation, MilfordMA, in conjunction with gradient conditions and mobile phasesA (0.1% formic acid in water) and B (0.1% formic acid in ace-tonitrile). Total run time was 3.5 min. Mass spectrometric de-tection of the analytes was accomplished using the turbo sprayinterface operated in the positive ion mode. Analyte responsewas measured by multiple reaction monitoring of transitionsunique to each compound. Data were acquired and integratedby Sciex Analyst 1.5.1 software, and processed using ThermoElectron Corporation Watson v7.3. Peak area ratios of analyte
Table 2. Summary of the Physicochemical Properties of Compound 1
Properties Value
MolecularStructure22
Molecular weight 377.5Calculated log P
(ACD Labs)3.7
Number of HBD 0Number of HBA 5Polar surface area 83.8pKa, experimental pKa1 = 3.3 (pyrazine), pKa2 = 1.9 (pyrimidyl)Log D pH 7,
experimental3.6
Polymorphism Two polymorphs: Form A and Form BSolubility at 24 h Form A, pH 1.8, SGF = 0.08 mg/mL
Form B, pH 1.8, SGF = 0.02 mg/mLForm B, pH 6.5, FaSSIF ≤ 0.001 mg/mL
Permeability(CACO-2monolayer)
51.4 × 10⁻⁶ cm/s
Chemical stability Crystalline 1-Form A and B were chemicallystable and showed no significantdegradation after a week at 40◦C/75% RHand 60◦C/ambient RH. Solutions of 1 werestable at pH 2.2–7.9 where no appreciabledegradation was observed after 1 week at60◦C. Furthermore, solutions of the 1buffered at pH 7.9–12.5 were stable after aweek of exposure to ambient laboratorylight, whereas under the same conditions,0.5% degradation was observed at pH 2.3.
to IS were plotted as a function of the nominal concentrationsof the analyte. A line of best fit was generated from the curvepoints using linear regression. The equation of this line wasused to calculate the concentrations in all samples. The areaunder the plasma concentration versus time curve (AUC) wasdetermined using the Watson software (version 7.3). Toxicoki-netic calculation method was performed and Cmax, Tmax, andAUC were reported.
RESULTS AND DISCUSSION
Physiochemical Profile of Compound 1
Table 2 provides a summary of the physiochemical propertiesof 1. The molecular weight, calculated log P, numbers of H-bond donors, and acceptors of compound 1 follow Lipinski’sRule of Five.25 Compound 1 had low aqueous solubility, whichshowed significant pH dependence because of the two weaklybasic pyrazine and pyrimidyl groups. In particular, the solubil-ity of 1-Form B decreased by 20-fold as pH increased from 2to 7, which suggested the risk of precipitation in the intesti-nal compartment.26 Compound 1 was assigned as BCS Class-IIbecause of its high permeability in the Caco-2 cell line model.1 showed good oral bioavailability at low doses administeredas solutions (>66% at 2 mg/kg in mice, rats, and dogs; Merck,
Lohani et al., JOURNAL OF PHARMACEUTICAL SCIENCES 103:3007–3021, 2014 DOI 10.1002/jps.24088

RESEARCH ARTICLE – Drug Discovery-Development Interface 3011
Figure 1. Reference XRPD data for two polymorphs of 1, Form A andForm B. Data are shown from 7◦ to 30◦ 22.
unpublished data). However, it showed a less-than proportionalincrease in exposure at higher doses administered as suspen-sions, attributed to solubility limited absorption typically seenwith BCS II compounds.23 Significant medicinal chemistry ef-forts were undertaken to mitigate the poor exposure with thelead series leading up to the selection of compound 1. This isoutside the scope of this research article and has previouslybeen published.22
Characterization of Polymorphs of Compound 1
Only one crystalline phase, Form A, was known when 1 was se-lected as a preclinical drug candidate. The thermodynamicallymore stable polymorph, Form B, was identified during earlydevelopment and showed fourfold lower solubility in SGF pH1.8 (Table 2). The fourfold decrease in solubility is not unex-pected. In a study27 of 81 pairs of polymorphs, the solubilityratio between polymorphs was found to vary between 1.1 and23.2. Figure 1 shows the XRPD data for the two polymorphs.Figure 2 shows the DSC plots of the two polymorphs; FormB shows a single endotherm attributed to melting of Form Bwith onset at 173◦C and maxima at 175◦C, whereas Form Ashows an additional lower temperature endotherm with on-set at 168◦C and maxima at 170◦C. TGA data (not shown)suggest that the two forms, A and B, are not solvated. Fur-thermore, the high heat of fusion of Form B, 118 J/g (or42 kJ/mole) would contribute to low aqueous solubility, as thesolvation process would have to compensate for the high energy
Figure 2. Differential scanning calorimetry data for two polymorphsof 1, Form A and Form B.
Figure 3. The mean plasma concentration versus time profile afteroral administration of a 200-mg/kg dose of 1 to rats (n = 4). It showsthe impact of solid-state polymorphism on bioperformance. The errorbars refer to standard deviations.
required to free a molecule of 1 from its crystal, in addition tothe energy required for breaking the hydrogen bonds betweenwater molecules to create a cavity for molecules of 1, as de-scribed by the Hildebrand solubility theory.28,29 Investigationsinto the thermodynamic relationship between the polymorphsshowed that Form A spontaneously converted to Form B uponslurry in water and other solvents at 25◦C (confirmed by XRPD,data not shown). Furthermore, hot-stage XRPD analysis onForm A revealed that it undergoes solid to solid transforma-tion and spontaneously converts to Form B above 160◦C (datain supporting documents). In summary, solid-state characteri-zation confirmed that Form B is thermodynamically more sta-ble within the temperature range of 25◦C–160◦C than Form A.Once Form B was discovered, pure Form A could not be iso-lated again, which is not an unusual observation; Dunitz andBernstein30 have discussed several examples of disappearingmetastable polymorphs that could no longer be isolated afterthe discovery of the thermodynamically stable polymorph.
Impact of Polymorphism on Bioperformance
The plasma concentration versus time profile for the nanosus-pension of Forms A and B (Fig. 3), and the pharmacokinetic(PK) parameters (Table 3), show that the discovery of the ther-modynamically stable polymorph of 1 with significantly lower
Table 3. Summary of Rat Pharmacokinetic Parameters ObtainedAfter Dosing the Nanosuspension Formulations of the TwoPolymorphs, Forms A and B
Formulation (Dose)AUC(0–24)
(:M/h, SD)Cmax
(:M, SD)Tmax
(h, Range)
Nanosuspension, Form A(200 mg/kg)
1081 (32.2) 73.7 (9.5) 4 (1–4)
Nanosuspension, Form A(800 mg/kg)
799.5 (64.9) 39.4 (4.4) 8 (6–24)
Nanosuspension, Form B(200 mg/kg)
286.3 (156.4) 19.4 (10.0) 5.3 (4–6)
DOI 10.1002/jps.24088 Lohani et al., JOURNAL OF PHARMACEUTICAL SCIENCES 103:3007–3021, 2014

3012 RESEARCH ARTICLE – Drug Discovery-Development Interface
solubility had a major impact on its bioperformance. It resultedin an approximately fourfold reduction in AUC and Cmax at adose of 200 mg/kg. The dose was selected as relevant for latediscovery/early development toxicology studies. It also appearsthat there is a correlation between the decrease in solubility(Table 2) and exposure as measured by Cmax or AUC (Table 3).However, because of the early development stage of this re-search, we did not make attempt to further investigate thein vitro–in vivo relationship. Evidence suggests that if earlyin vitro studies are designed carefully and combined with ap-propriate modeling, it may lead to such relationships.31
Efficacy for Compound 1 is driven by Cmax, and the targetis 20 :M (Merck, unpublished data). When this target is com-pared with the data in Table 3, it can be seen that the nanosus-pension of Form A provided fourfold greater Cmax than the tar-get, which was deemed adequate for toxicological evaluation.However, as also illustrated in Figure 3, after the thermody-namically stable polymorph, Form B, was discovered and usedfor preparation of the nanosuspension, the exposures obtainedin rat PK studies decreased by fourfold, thereby eliminating themargins. Therefore, this formulation approach was no longerviable for toxicological evaluation studies. In addition, it wasnoted that the average AUC and Cmax values achieved after dos-ing the nanosuspension of Form A decreased when the dose wasincreased from 200 to 800 mg/kg. Drug substance properties,such as particle size, have a large impact on the absorption of in-soluble compounds, as recently illustrated by four pharmaceu-tical development case studies.32 In addition, it was recently re-viewed that designing nanosuspensions that are physically sta-ble in the formulation and in vivo is a major development task.33
A possible explanation for the observations in the present re-search could be that the nanosuspensions of 1, Form A, at theconcentration used in the formulation for the 800-mg/kg doseformed aggregates upon dilution in the gastrointestinal mediain vivo. This could lead to decreased dissolution rate and resultin lower AUC compared with the 200-mg/kg dose. Alternatively,the decrease in exposure could also be explained by conversionto Form B in vivo. More research would need to be conducted tosubstantiate these hypotheses, but as mentioned above, it wasno longer feasible to isolate pure Form A after the discovery ofForm B.
Following the isolation of Form B and its suboptimal physic-ochemical properties and poor exposure, additional phase andformulation engineering-based approaches were undertaken toattain appropriate exposure margins of 1. For reasons statedabove, 200 mg/kg was chosen as a reference dose for evaluatingthe effect of phase and formulation in improving oral exposurein the subsequent in vivo studies. A traditional salt screen wasperformed on 1 (Merck, unpublished data), but because of theweakly basic nature of 1, the formation of stable salts with acidswas not feasible. On the basis of the physicochemical charac-terization of Forms A and B and the nanosuspension PK data(Fig. 3), the strategy pursued was to explore form and formu-lation approaches that would be able to increase solubility ofcompound 1 and sustain high concentrations for a sufficientamount of time to allow for absorption prior to precipitation ofa lower solubility form. Several recent studies have reportedthe application of cocrystals and amorphous solid dispersion-based formulations to increase the exposure of poorly sol-uble compounds.20,34 Therefore, we moved on to identifyingcocrystals of 1 that exhibit high solubility and a suitable soliddispersion.
Cocrystals have emerged within the last couple of decadesas an alternate crystal engineering approach to deal with poorsolubility of drug candidates. This approach has the additionaladvantage of being applicable to drugs with weakly ionizablegroups35–38 such as compound 1. A cocrystal screen was con-ducted after the salt screen did not provide a suitable formcandidate. The screen design, outcome, and basic characteriza-tion of the cocrystals, as well as scale-up procedure, have beendescribed in a previous communication.23 As described later inthis article, the neat amorphous phase of compound 1 showed ahigh propensity to crystallize, and it was imperative to exploreapproaches to stabilize the amorphous 1. Various pharmaceu-tically acceptable polymers have been reported to stabilize theamorphous drug in solid dispersions in the literature.39 In thiswork, we evaluated two polymers, HPMCAS and HPMCP, fortheir ability to stabilize the amorphous compound 1 in the soliddispersions as well as in formulation vehicles. These two poly-mers were selected based on literature reports40,41 and priorexperience at the author’s institution.42 In particular, HPM-CAS has been shown to be especially effective in achieving andmaintaining a higher degree of supersaturation during disso-lution for over 41 small molecules.43
Characterization of Amorphous Drug, Solid Dispersions, andCocrystals
The unstabilized amorphous phase of compound 1 showed alow glass transition temperature (Tg) of 36◦C, crystallized dur-ing the MDSC run with an exotherm (Tc) at 81◦C (Fig. 4), andunderwent rapid crystallization on storage as well as in suspen-sions of vehicles that are typically used in preclinical studies atthe author’s institution (Lohani, unpublished data). Compound1 also showed a low reduced glass transition temperature (Tred)value of 0.32, calculated as described below, which suggested ahigh propensity of amorphous 1 to crystallize. Tred is a normal-ized measure of how far above the Tg an amorphous compoundmust be heated before spontaneous crystallization occurs attemperature Tc. It is an empirical parameter defined as theratio (Tc − Tg)/(Tm − Tg), where Tm is the melting point ofForm B.44 Figure 4 also shows the overlay for the MDSC datafor the amorphous compound 1, solid dispersions containing
Figure 4. Overlay of the MDSC data for spray-dried solid dispersionswith 35% loading of 1 in HPMCAS-LF and in HPMCP-HP55. Alsoshown is the MDSC data for amorphous phase of 1 prepared by quenchcooling.
Lohani et al., JOURNAL OF PHARMACEUTICAL SCIENCES 103:3007–3021, 2014 DOI 10.1002/jps.24088

RESEARCH ARTICLE – Drug Discovery-Development Interface 3013
Figure 5. X-ray data for spray-dried solid dispersions with 35% load-ing of 1 in HPMCP-HP55 and HPMCAS-LF.
35% (w/w) drug loading in HPMCP-HP55 and in HPMCAS-LF.Accordingly, the solid dispersion based on HPMCAS-LF has aTg of 57◦C with a heat capacity change of 0.52 Jg−1◦C−1 andthe solid dispersion based on HPMCP-HP55 has a higher Tg of81◦C associated with a heat capacity change of 0.53 Jg−1◦C−1.The TGA (see supplementary data) showed a weight loss of3.6% up to 150◦C for solid dispersion based on HPMCP-HP55and a weight loss of 1.8% up to 150◦C for solid dispersion basedon HPMCAS-LF. Both were confirmed to be primarily becauseof the residual moisture by Karl–Fisher titration. The amor-phous nature of the two solid dispersions was also confirmed bythe absence of crystalline peak in the XRPD data (see Fig. 5).The DSC and XRPD data on cocrystals have been reportedpreviously.23 The solid-state physical and chemical stability ofthe cocrystals were evaluated at 25◦C/40% RH, 40◦C/75% RH,and at 5◦C. As physical instability can be an inherent issue foramorphous materials, the physical stability of the solid disper-sions was evaluated at −20◦C and 5◦C. The two cocrystals andthe solid dispersion were physically and chemically stable un-der the evaluated conditions for 4 weeks (Cooper, unpublisheddata), which was sufficient to cover supplies for early develop-ment toxicology studies.
Vehicle Selection—General Considerations
Form B is the least soluble of the known solid forms of 1. Conse-quently, unless otherwise stabilized, the higher solubility solidforms of 1 such as Form A, the amorphous phase, and thetwo cocrystals, have a thermodynamic drive to spontaneouslyconvert to Form B during dissolution or on storage via dis-proportionation or crystallization. Whether the conversion oc-curs is determined by the supersaturation ratio, kinetics of theprocess, and on the presence of stabilizing excipients such as
polymers and surfactants in the formulations of amorphoussolid dispersions45 and cocrystals.46
On the basis of the fundamental understanding of exper-imental parameters affecting the conversion kinetics includ-ing solubility of the forms involved, the preparation procedure,storage conditions, and nature of excipients, pharmaceuticalscientists design formulations that are able to thermodynam-ically or kinetically stabilize the metastable phases to benefitfrom their higher solubility and higher exposure. In the case ofcocrystals, this was recently illustrated for a Danazol cocrystal,where careful selection of excipients for the preclinical formula-tion played an essential role in improving the bioavailability.49
A similar conclusion can be made from a study of various soliddispersion of the insoluble drug itraconazole.48
The scope of this work is preclinical development where for-mulations are required to be physically and chemically stablefor at least 6 h to facilitate preparation and dosing to animals.This may vary based on experimental settings, under which apreclinical study is being conducted, but the authors think 6h is a conservative estimate. The evaluation of a drug candi-date in a preclinical toxicity study often requires much higherdoses than in a clinical study and carries additional species-specific requirements for dosing volume and exposure targets.Furthermore, the list of acceptable formulation vehicles in apreclinical toxicity study is also restrictive owning to concernsof excipients to potentially confound the toxicity profile of thedrug. It depends on the specific goals of the discovery programas well as on institutional preference.49 Next, we describe thesteps involved in defining formulations that stabilize the soliddispersions and the cocrystals for dosing in preclinical species.
Vehicle Selection—Cocrystals
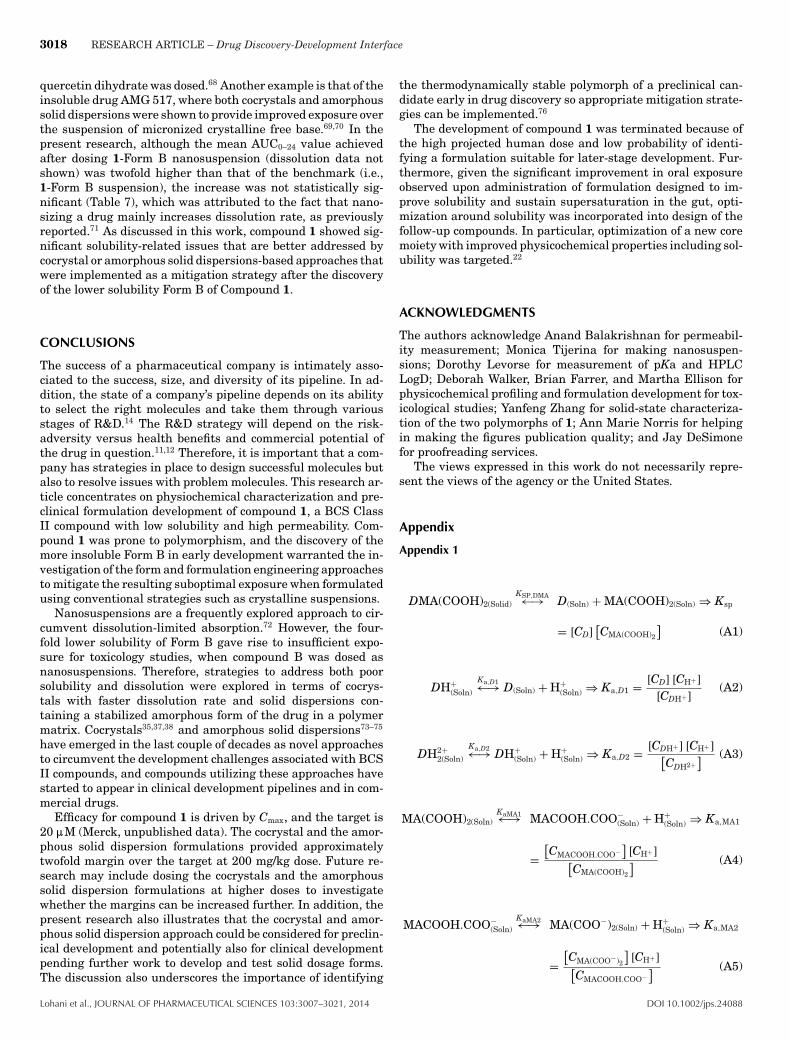
Prior work by Bethune et al.50 have shown that the effect of pHon the solubility and disproportionation behavior of cocrystalscan be estimated by measuring the solubility product. Table 4lists the solid phase in equilibrium with the solution, the sol-ubility values used in the calculation of the Ksp values, thesolution pH, the corresponding Ksp values of 1-BA and 1-MA,and the intrinsic solubility of 1 (S0). In addition, Table 5 alsolists the calculated value of pHmax or pH at which both cocrystaland drug are thermodynamically stable and below which theconcentration of the unionized form of 1 in the solution is lessthan S0. Consequently, at pH < pHmax, there is no thermody-namic risk of disproportionation of the 1-MA or 1-BA cocrystalto Form B. The equations involved in the calculation of Ksp val-ues are given in appendix 1. The application of pHmax to designstable cocrystal formulations has been discussed previously.50,51
Table 4. Solubility Products of the Two Cocrystals
Phase Total Solubility (mg/mL) Solution pH Solubility ValuepHmax
49: pH Below Which There Is NoRisk of Disproportionation to 1-Form B
1 Cocrystal former1-Form B 0.02 Not applicable 1.9 Intrinsic solubility, S0 = 7.4 × 10⁻⁷ M2 Not applicable
0.71 1.01-BA 0.02 0.17a 1.9 Solubility product, Ksp = 1.8 × 10⁻⁹ M2 0.9
0.71 0.23a 1.01-MA 0.27 33.4b 1.1 Solubility product, Ksp = 2.5 × 10⁻⁷ M2 −0.2
0.35 60.2b 1.0
aBenzoic acid.bMaleic acid.
DOI 10.1002/jps.24088 Lohani et al., JOURNAL OF PHARMACEUTICAL SCIENCES 103:3007–3021, 2014

3014 RESEARCH ARTICLE – Drug Discovery-Development Interface
Table 5. Results of XRPD Analysis of Excess Solids at Various Time Points During Kinetic Solubility Experiment in SGF and FaSSIF
Media pH at 120 min Time (min)Solid Phase at Time Point(Initial Phase: 1-BA Cox)
Solid Phase at Time Point(Initial Phase: 1-MA Cox)
SGF 1.9 5 1-BA Cox 1-MA Cox + Form B15 1-BA Cox + Form B Form B30 1-BA Cox + Form B Form B120 1-BA Cox + Form B Form B
FaSSIF 6 5 1-BA Cox 1-MA Cox + Form B15 1-BA Cox + Form B Form B30 1-BA Cox + Form B Form B120 Form B Form B
Figure 6. Panel on the left side shows the dissolution profile under nonsink conditions for 1-Form B, 1-BA cocrystal, and 1-MA cocrystal inSGF, whereas the panel on the right side shows the dissolution profile for the two cocrystals in FaSSIF. Cox, cocrystal; CFF, cocrystal former.Note that the concentration values for 1-Form B in FaSSIF were below the limit of detection and therefore are not shown on the right panel. Theerror bars refer to standard deviations.
From the solubility product studies, it may be inferred that1-BA will be more stable at higher pH values than 1-MA, al-though the pHmax values for both cocrystals are outside thephysiological range. The stability of cocrystals in biorelevantmedia was further investigated by evaluating their dissolutionprofile under nonsink conditions. As shown in the panel on theleft in Figure 6, 1-Form B shows the slowest dissolution rateand low release, wherein at the 5-min time point, the concentra-tion of 1 reaches only 31.5% of the maximum value measuredin the study.
On the contrary, the two cocrystals show a fast dissolutionrate and a higher concentration of 1. The maximum concentra-tion of 1 is reached at the 5-min time point, and it is sixfoldand eightfold higher than the solubility of 1-Form B in SGF(i.e., 0.02 mg/mL) for 1-BA and 1-MA, respectively. However,it is followed by a decrease in the concentration of 1 betweenthe 15- and 30-min time points for the two cocrystals. Finally,the concentration of 1 levels off close to the solubility value of1-Form B in SGF after 120 min.
In addition, the right panel in Figure 6 shows that the con-centration of 1 achieved at the 5-min time point for 1-BA and1-MA in FaSSIF is fourfold and sixfold higher, respectively, thanthe solubility of 1-Form B in FaSSIF. However, this is followedby a decrease in the concentration of 1 until it levels off close tothe solubility value of 1-Form B in FaSSIF at the 30-min timepoint.
The XRPD data on excess solids from dissolution profile un-der nonsink condition studies are summarized in Table 5 andsuggest that 1-MA undergoes rapid and complete dispropor-
tionation to 1-Form B within the first 15 min of slurry in SGF,whereas 1-BA undergoes only partial disproportionation to 1-Form B even after 120 min of slurry in SGF. Similarly, in FaS-SIF, 1-MA undergoes complete disproportionation to 1-Form Bwithin the first 15 min, whereas 1-BA undergoes partial dis-proportionation to 1-Form B within 15 min of slurry and iscompleted within 120 min. The solution concentration of thecocrystal formers, BA and MA, during this time course pro-vides additional supporting evidence into the solid phase inequilibrium with the solution at various time points.
The concentration of BA at the 120-min time point in theSGF is 50% of the maximum possible based on the cocrystalloading (i.e., 0.4 mg/mL), which supports the conclusions fromXRPD data that 1-BA cocrystals underwent partial dispropor-tionation during the study. On the contrary, the solution con-centration of MA is close to 100% of the maximum possiblebased on cocrystal loading at the 15-min time point, suggestingcomplete disproportionation of 1-MA within 15 min. Similarly,for cocrystal studies in FaSSIF, the solution concentration ofcocrystal former is close to 100% of the maximum possible basedon cocrystal stoichiometry within 15 min, suggesting completedisproportionation of both cocrystals within that time. This ob-servation is also consistent with the Ksp value of 1-MA cocrys-tal, which is almost an order of magnitude greater than that of1-BA cocrystal (Table 4). Furthermore, based on the Ksp valueof 1-BA and the intrinsic solubility of 1, the 1-BA cocrystalis predicted to be thermodynamically stable toward dispropor-tionation at pH < 0.9; similarly, 1-MA cocrystal is predicted tobe thermodynamically stable at pH ≤ − 0.2 However, the above
Lohani et al., JOURNAL OF PHARMACEUTICAL SCIENCES 103:3007–3021, 2014 DOI 10.1002/jps.24088

RESEARCH ARTICLE – Drug Discovery-Development Interface 3015
Table 6. Solubility Values of 1-Form B and 1-BA and 1-MA in SelectVehicles
Vehicle
Solubility of1-Form B(mg/mL)a
Solubility of1-BA Cocrystal(mg/mL of 1)b
Solubility of1-MA Cocrystal(mg/mL of 1)c
Initial SolidPhase Stable
for6 h: Yes or No
Initial SolidPhase Stable
for6 h: Yes or No
Initial SolidPhase Stable
for6 h: Yes or No
Water <0.001 0.036 0.26Yes No No
pH 7.2phosphatebuffer
<0.001 0.018 0.077
Yes No No10% PVP <0.001 0.015d 0.29d
Yes Yes Yes1% PVP <0.001 0.014 0.29
Yes Yes No0.5% MC/0.25%
SLS0.022d 0.21 0.7
Yes No No0.5% MC/pH 4
citrate buffer0.006 0.043 0.04
Yes No No10% Tween
80/pH 4citrate buffer
0.1 2.2 4
Yes No NoImwitor–Tween
(1:1, w/w)2.5 ND ND
Yes No No
aAnalysis time point = 24 h.bAnalysis time point = 6 h.cAnalysis time point = 30 min.dVehicle selected for in vivo study.ND, solubility not determined.Yes, indicates that the initial solid phase was stable for at least 6 h in the
formulation vehicle.No, indicates that the initial solid phase underwent phase transformation to
1-Form B within 6 h.
pHmax values are lower than the minimum acceptable formu-lation pH for oral dosing of aqueous formulations (i.e., pH 2),52
indicating the need for additional formulation efforts beyondpH adjustment. Identifying a vehicle in which the cocrystalswere physically stable was challenging because the aqueoussuspensions of the cocrystals were found to rapidly convertto Form B. Furthermore, rapid disproportionation of 1-BA to1-Form B was observed in cosolvent/surfactant-based vehiclessuch as imwitor-Tween 80 (see Table 6 and Fig. 7).
Cocrystal solution/suspension instability is a frequently en-countered phenomenon. In a recent review, the authors investi-gated the solution stability, defined as the ability to stay in so-lution and not readily crystallize, of 32 cocrystals derived frommarketed and pipeline therapeutics. It was found that 19 of the32 were not stable in solution. As per the review, it seemed to berelated to conformer solubility, with high-solubility conformersgiving rise to more unstable cocrystals.53 These findings tie wellinto results obtained in the current research, where 1-MA hasa higher solubility product than 1-BA, which could be relatedto MA having a significantly higher solubility in water thanBA.54,55
Figure 7. Representative XRPD data on initial 1-BA cocrystal, 1-Form B, and excess solids obtained after stirring 70 mg/mL of 1-BAcocrystal in imwitor–Tween 80 (1:1, w/w). Data show disproportiona-tion of 1-BA cocrystal to 1-Form B within 15 min of stirring in thevehicle. Data are shown from 7◦ to 30◦ 22.
Two general approaches have been proposed in literatureto prevent disproportionation of cocrystals: (1) inhibit precipi-tation of the free form by using polymers as precipitation in-hibitors or (2) use surfactants, which act by increasing the in-trinsic solubility of the free form.47,50,51 On the basis of the aboveapproaches, a solubility/stability screen was performed using asubset of vehicles commonly used in discovery at the author’sinstitution, including polymeric antinucleating agents (i.e., MCand PVP) and surfactants (i.e., SLS, Tween 80), to identify asuitable vehicle in which the respective cocrystal phase wasphysically stable for at least 6 h. This screen identified PVP(see Table 6) to be the most promising polymer in terms of pre-venting disproportionation of the cocrystal phase. Therefore,10% PVP was used as the dosing vehicle for the two cocrystals.Similar to what was encountered in the present research, thereare several examples in the scientific literature on stabiliza-tion of cocrystals in formulations and in vivo during gastroin-testinal transit. For example, the dissolution and solubility ofcelecoxib/nicotinamide cocrystals were found to be vehicle de-pendent, which was attributed to differences in conversion ofthe cocrystal to various polymorphs. The authors also reportedthat by selecting appropriate excipients, they could affect thepolymorphic nature of drug substance that precipitated fromthe cocrystal suspensions.56
Vehicle Selection—Solid Dispersions
The following two attributes were desired in a solid dispersion-based formulation: (1) a drug loading of at least 35% (w/w) inthe solid dispersion intermediate to enable adequate systemicexposure for toxicological evaluation after oral dosing, and (2)a formulation that is physically stable for at least 6 h and couldbe dosed in terms of flow and viscosity. As mentioned earlierin the text, two polymers, namely, HPMCAS-LF and HPMCP-HP55, were evaluated for their ability to stabilize the amor-phous state of 1 in solid dispersion. Drug loading is a criticalattribute of the solid dispersions that is often the key deter-minant of the long-term stability toward undesirable eventssuch as phase separation and crystallization.57–59 In general,for identical drug and polymer combination, the solid disper-sions with low drug loading tend to be more stable than thosewith high drug loading. On the basis of the analysis of HPMCASsolid dispersions of 139 compounds, Friesen et al.60 proposed aplot of Tm/Tg versus log P and identified various regions on thisplot in terms of preferred drug loading for long-term stability of
DOI 10.1002/jps.24088 Lohani et al., JOURNAL OF PHARMACEUTICAL SCIENCES 103:3007–3021, 2014

3016 RESEARCH ARTICLE – Drug Discovery-Development Interface
Figure 8. Representative XRPD data on excess solids isolated afterstirring two solid dispersions in vehicle containing either 10% Tween 80or 0.5% methyl cellulose in 10 mM pH 4 citrate buffer. Legend: HPMCP-HP55 solid dispersions with 35% (w/w) of compound 1 patterns a–c;(a) starting material, (b) after 6 h of stirring in vehicle with 0.5% MC,and (c) after 3 h of stirring in vehicle with 10% Tween 80. HPMCAS-LF solid dispersions with 35% (w/w) of compound 1 patterns d–f;(d) starting material, (e) after 3 hours of stirring in vehicle with 0.5%MC, and (f) after 3 h of stirring in vehicle with 10% Tween 80.
solid dispersions. It is interesting to note that compound 1 hasa Tm/Tg value of 1.44 and a calculated log P value of 3.6, whichplaces HPMCAS dispersions of compound 1 in the region (iii)of the above-mentioned plot, indicating that HPMCAS disper-sions with high (35–50 wt %) loading of compound 1 were likelyto have long-term stability issues. In addition to the projectedlong-term stability concern, a screen conducted to identify asuitable dosing vehicle (see discussion on vehicle selection forHPMCP for details) for stabilizing the HPMCAS dispersionswith 35% (w/w) compound 1 was unsuccessful, because of crys-tallization from the suspensions within 6 h of stirring (see X-raydiffraction patterns d, e, and f in Fig. 8). Therefore, HPMCASdispersions were not considered further as an option for com-pound 1.
Although hydrophilic polymers and surfactants are com-monly used to stabilize suspensions in early/preclinical formu-lations, unless appropriately optimized their use can sometimesmake the formulation difficult to dose using standard oral gav-age equipment.61 A buffer screen was conducted with suspen-sions containing 35% (w/w) 1 in HPMCP solid dispersion inneat buffers at pH 2 (0.01 N HCl), pH 4 (10 mM citrate buffer)and pH 6 (10 mM phosphate buffer) resulted in crystalliza-tion within 6 h (Cooper, unpublished data). Crystallization atpH 2 was attributed to the high solubility of the drug at pH 2(Table 2), whereas crystallization at pH 6 was attributed to en-hanced solubility of HPMCP-HP55, an enteric polymer, at pHgreater than 5.5.62 Next, we adopted the strategy of keeping theamorphous drug encapsulated within the undissolved polymermatrix during the preparation and dosing of the suspensionsof HPMCP solid dispersion. Therefore, pH 4 citrate buffer wasselected as a vehicle for further optimization. On the basis ofthe literature reports,43,63 two excipients, 10% Tween 80 and0.5% MC, were explored as potential precipitation inhibitorsto prevent the fraction of drug that may have dissolved fromprecipitating during the preparation. These excipients are ex-pected to act like “parachutes” and delay precipitation from thesupersaturated solutions of drugs.64 In particular, 10% Tween80 was selected because 1-Form B showed a significant solu-bility increase in this vehicle (Table 6). However, in the case of10% Tween in pH 4 citrate buffer, the suspension of 35% (w/w)
1 in HPMCP solid dispersion crystallized after 3 h, whereas inthe case of 0.5% MC in pH4 citrate buffer, the suspension wasstable for more than 6 h (see X-ray diffraction patterns a, b,and c in Fig. 8). Consequently, HPMCP-HP55-based solid dis-persion suspended in 0.5% MC in 10 mM pH 4 citrate wasselected as the formulation for in vivo evaluation. Further-more, it was noted that the solubility of Form B in 0.5% MC in10 mM pH 4 citrate buffer was 0.006 mg/mL (Table 6), whichwas approximately 18-fold higher than the value estimatedby the Henderson–Hasselbalch equation,65 as calculated be-low under the assumption that pKa values of 1 do not changesignificantly in the vehicle:
Intrinsic solubility S0 = 7.6 × 10⁻⁷ M (Table 4), pKa1 = 3.3,and pKa2 = 1.9 (Table 2):
Stotal (CH) = S0 + S∗0CH/ (ka1) + S∗
0C2H/ (ka1 ∗ ka2)
= 8.9 × 10⁻⁷M = 0.0003 mg/mL at pH4.
The solubility enhancement above the value predicted bythe Henderson–Hasselbalch equation could indicate a solu-tion interaction between compound 1 and other molecularspecies in 0.5% MC in 10 mM pH 4 citrate buffer, which mayhave contributed to the stabilization of the solid dispersion.The enhanced solubilization and stabilization of solutions ofcyclodextrin–drug complexes in the presence of hydroxy acidssuch as citric acid has been previously reported.66
In Vitro and In Vivo Evaluation of the Formulation
The two-stage dissolution data for formulations of the vari-ous solid phases of 1 are shown in the two separate panels inFigure 9. The panel on the left-hand side indicates that 1-FormB suspension formulation gives the smallest overall release,whereas the formulation based on HPMCP-HP55 solid disper-sion shows the largest overall release. Furthermore, consistentwith its dissolution profile, the 1-Form B suspension, the bench-mark formulation, achieved the lowest mean AUC0–24 values(Table 7 and Fig. 10), whereas HPMCP-HP55-based solid dis-persion achieved the highest average AUC0–24 value, showinga sevenfold increase over the benchmark. When comparing thedissolution data (Fig. 9) and PK data (Fig. 10 and Table 7) forthe 1-Form B suspension and the HPMCP-H55 solid dispersion,it can also be seen that the slower dissolution of the enteric-release solid dispersion translates to a longer Tmax in the ratPK study.
The right panel in Figure 9 shows that during dissolution inSGF pH 1.8, the formulations based on the two cocrystals gavea higher release than 1-Form B suspension but a lower releasethan the HPMCP-HP55 solid dispersion. This translated intolower but not statistically different AUC and Cmax for the twococrystals formulations compared with the solid dispersion sus-pension. In addition, the 1-MA cocrystal formulation showed ahigher release than the 1-BA cocrystal formulation during dis-solution in SGF, but the two release profiles were similar afterthe addition of FaSSIF. As shown in Table 7 and Figure 10,the mean AUC0–24 values achieved after dosing the two formu-lations based on 1-MA and 1-BA cocrystals showed a statisti-cally significant increase of 5.5- and 5.9-fold over the bench-mark, respectively. It is also evident that the higher concen-trations of compound 1 achieved with the MA cocrystal duringdissolution experiments (Fig. 9) did not translate into higherrat exposure compared with the BA cocrystal. This could be
Lohani et al., JOURNAL OF PHARMACEUTICAL SCIENCES 103:3007–3021, 2014 DOI 10.1002/jps.24088

RESEARCH ARTICLE – Drug Discovery-Development Interface 3017
Table 7. Summary of the PK Parameters Obtained After Administering Different Solid Phases of 1 in Various Formulations at a Dose of200 mg Equivalent of 1 Per Kilogram of Animal Weight
Formulation Average AUC(0–24)(:M/h, SD)
Average Cmax (:M, SD) Tmax (h, Range) AUC EnhancementFactor
Freebase Form B as suspension in 0.5%MC/0.25% SLS 140.1a (85.6) 11.1 (5.8) 5.8 (1–8) 1Nanosuspension, Form B 286.3a (156.4) 19.4 (10.0) 5.3 (4–6) 2Maleic acid cocrystal as suspension in 10% PVP 764.5ab (150.1) 43.7 (6.6) 5.5 (4–8) 5.5Benzoic acid cocrystal as suspension in 10% PVP 822.5ab (119.8) 45.6 (14.2) 14 (4–24) 5.9Amorphous solid dispersion based on HPMCP-HP55
as suspension in 0.5% MC in10 mM pH 4 citratebuffer
994.3ab (242.2) 52.2 (11.2) 10 (4–24) 7.1
aAUC values are not different from each other at 5% significance.bAUC values are significantly different from that obtained by dosing 1-Form B in 0.5% MC (p < 0.05).
Figure 9. Two-stage dissolution data on the 1-Form B suspension, the 1-MA and 1-BA cocrystal suspensions, and the HPMCP-HP55 soliddispersion. The dashed vertical line at 120 min refers to the time point at which double-strength FaSSIF was added to the dissolution media.The error bars refer to standard deviations.
Figure 10. The mean plasma concentration versus time profile after oral administration of 200 mg/kg dose of 1 to rats (n = 4). The legend liststhe phase and formulations evaluated in the study. Cox refers to cocrystal phase. The error bars refer to standard deviations.
related to variability in the PK study. It is worth noting, how-ever, that the dissolution studies are conducted using SGF (pH1.8) and FaSSIF (pH 6.5) relevant to conditions in the humangastrointestinal tract. The rat stomach pH (pH 3.9, fasted) andsmall intestine (pH 6.0, fasted) have a significantly differentphysiology from humans.67 These pH differences will affect theionization state and therefore the solubility of the cocrystals,compound 1, MA, and BA. Compound 1 has two basic pKa val-ues (1.9 and 3.3, see Table 2) and hence is expected to be lesssoluble in the rat stomach pH compared with humans. MA is adiacid with pKa values of 1.83 and 6.0755 and BA is a monoacidwith a pKa value of 4.19.54 Benzoic acid will therefore be par-tially ionized and more soluble in rat stomach fluids comparedwith humans. MA will be partially ionized in both species.As previously noted, physical stability of cocrystals may be
related to solubility of the conformer.53 It is possible that thesechanges in ionization state of compound 1, MA, and BA maylead to faster disproportionation in vivo in rats than what ispredicted from the SGF and FaSSIF nonsink dissolution rateexperiments. This would, however, have to be investigated inmore details to make a definite conclusion.
In summary, the AUC0–24 achieved after dosing the solid dis-persion formulation and the two cocrystals formulation werehigher than the benchmark (i.e., 1-Form B suspension), butthey were not statistically different from one another. Thecocrystal and solid dispersion approaches have been previouslyreported to increase oral exposure of poorly soluble compounds,for example, the bioavailability of quercetin, a flavonoid, wasshown to increase by almost 10-fold when the cocrystal ofquercetin with theobromine was dosed compared with when
DOI 10.1002/jps.24088 Lohani et al., JOURNAL OF PHARMACEUTICAL SCIENCES 103:3007–3021, 2014
3018 RESEARCH ARTICLE – Drug Discovery-Development Interface
quercetin dihydrate was dosed.68 Another example is that of theinsoluble drug AMG 517, where both cocrystals and amorphoussolid dispersions were shown to provide improved exposure overthe suspension of micronized crystalline free base.69,70 In thepresent research, although the mean AUC0–24 value achievedafter dosing 1-Form B nanosuspension (dissolution data notshown) was twofold higher than that of the benchmark (i.e.,1-Form B suspension), the increase was not statistically sig-nificant (Table 7), which was attributed to the fact that nano-sizing a drug mainly increases dissolution rate, as previouslyreported.71 As discussed in this work, compound 1 showed sig-nificant solubility-related issues that are better addressed bycocrystal or amorphous solid dispersions-based approaches thatwere implemented as a mitigation strategy after the discoveryof the lower solubility Form B of Compound 1.
CONCLUSIONS
The success of a pharmaceutical company is intimately asso-ciated to the success, size, and diversity of its pipeline. In ad-dition, the state of a company’s pipeline depends on its abilityto select the right molecules and take them through variousstages of R&D.14 The R&D strategy will depend on the risk-adversity versus health benefits and commercial potential ofthe drug in question.11,12 Therefore, it is important that a com-pany has strategies in place to design successful molecules butalso to resolve issues with problem molecules. This research ar-ticle concentrates on physiochemical characterization and pre-clinical formulation development of compound 1, a BCS ClassII compound with low solubility and high permeability. Com-pound 1 was prone to polymorphism, and the discovery of themore insoluble Form B in early development warranted the in-vestigation of the form and formulation engineering approachesto mitigate the resulting suboptimal exposure when formulatedusing conventional strategies such as crystalline suspensions.
Nanosuspensions are a frequently explored approach to cir-cumvent dissolution-limited absorption.72 However, the four-fold lower solubility of Form B gave rise to insufficient expo-sure for toxicology studies, when compound B was dosed asnanosuspensions. Therefore, strategies to address both poorsolubility and dissolution were explored in terms of cocrys-tals with faster dissolution rate and solid dispersions con-taining a stabilized amorphous form of the drug in a polymermatrix. Cocrystals35,37,38 and amorphous solid dispersions73–75
have emerged in the last couple of decades as novel approachesto circumvent the development challenges associated with BCSII compounds, and compounds utilizing these approaches havestarted to appear in clinical development pipelines and in com-mercial drugs.
Efficacy for compound 1 is driven by Cmax, and the target is20 :M (Merck, unpublished data). The cocrystal and the amor-phous solid dispersion formulations provided approximatelytwofold margin over the target at 200 mg/kg dose. Future re-search may include dosing the cocrystals and the amorphoussolid dispersion formulations at higher doses to investigatewhether the margins can be increased further. In addition, thepresent research also illustrates that the cocrystal and amor-phous solid dispersion approach could be considered for preclin-ical development and potentially also for clinical developmentpending further work to develop and test solid dosage forms.The discussion also underscores the importance of identifying
the thermodynamically stable polymorph of a preclinical can-didate early in drug discovery so appropriate mitigation strate-gies can be implemented.76
The development of compound 1 was terminated because ofthe high projected human dose and low probability of identi-fying a formulation suitable for later-stage development. Fur-thermore, given the significant improvement in oral exposureobserved upon administration of formulation designed to im-prove solubility and sustain supersaturation in the gut, opti-mization around solubility was incorporated into design of thefollow-up compounds. In particular, optimization of a new coremoiety with improved physicochemical properties including sol-ubility was targeted.22
ACKNOWLEDGMENTS
The authors acknowledge Anand Balakrishnan for permeabil-ity measurement; Monica Tijerina for making nanosuspen-sions; Dorothy Levorse for measurement of pKa and HPLCLogD; Deborah Walker, Brian Farrer, and Martha Ellison forphysicochemical profiling and formulation development for tox-icological studies; Yanfeng Zhang for solid-state characteriza-tion of the two polymorphs of 1; Ann Marie Norris for helpingin making the figures publication quality; and Jay DeSimonefor proofreading services.
The views expressed in this work do not necessarily repre-sent the views of the agency or the United States.
Appendix
Appendix 1
DMA(COOH)2(Solid)KSP,DMA←→ D(Soln) + MA(COOH)2(Soln) ⇒ Ksp
= [CD][CMA(COOH)2
](A1)
DH+(Soln)
Ka,D1←→ D(Soln) + H+(Soln) ⇒ Ka,D1 = [CD] [CH+ ]
[CDH+ ](A2)
DH2+2(Soln)
Ka,D2←→ DH+(Soln) + H+
(Soln) ⇒ Ka,D2 = [CDH+ ] [CH+ ][CDH2+
] (A3)
MA(COOH)2(Soln)KaMA1←→ MACOOH.COO−
(Soln) + H+(Soln) ⇒ Ka,MA1
=[CMACOOH.COO−
][CH+ ][
CMA(COOH)2
] (A4)
MACOOH.COO−(Soln)
KaMA2←→ MA(COO−)2(Soln) + H+(Soln) ⇒ Ka,MA2
=[CMA(COO−)2
][CH+ ][
CMACOOH.COO−] (A5)
Lohani et al., JOURNAL OF PHARMACEUTICAL SCIENCES 103:3007–3021, 2014 DOI 10.1002/jps.24088

RESEARCH ARTICLE – Drug Discovery-Development Interface 3019
Kw = CH+COH− (A6)
Mass balance:
CD,Total = CD + CDH+ + CDH2+ = CDu,
where u =(
1 + CH+
Ka,D1+ C2
H+
Ka,D1Ka,D2
)(A7)
CMA,Total = CMA(COOH)2 + CMACOOH.COO− + CMA(COO−)2
= CMA(COOH)2 v,
where v =(
1 + Ka,MA1
CH++ Ka,MA1Ka,MA2
C2H+
)(A8)
Charge balance:
CDH+ + 2CDH2+ + CH+ = CMACOOH.COO− + 2CMA(COO−)2 + COH−
= CMACOOH.COO− + 2CMA(COO−)2 + Kw
CH+
(A9)
DBA(COOH)(Solid)D(Soln) + BA(COOH)(Soln) ⇒ Ksp
= [CD][CBA(COOH)
](A10)
DH+(Soln)D(Soln) + H+
(Soln) ⇒ Ka,D1 = [CD] [CH+ ][CDH+ ]
(A11)
DH2+2(Soln)
Ka,D2←→ DH+(Soln) + H+
(Soln) ⇒ Ka,D2 = [CDH+ ] [CH+ ][CDH2+
] (A12)
BA(COOH)(Soln)BACOO−(Soln) + H+
(Soln) ⇒ Ka,BA
=[CBACOO−
][CH+ ][
CBA(COOH)] (A13)
Kw = CH+COH− (A14)
Mass balance:
CD,Total = CD + CDH+ + CDH2+ = CDu (A15)
CBA,Total = CBA(COOH) + CBACOO− = CBA(COOH)2 v′,
where v′ =(
1 + Ka,BA
CH+
)(A16)
Charge balance:
CDH+ + 2CDH2+ + CH+ = CBACOO− + COH− = CBACOO− + Kw
CH+
(A17)
REFERENCES
1. Paul SM, Mytelka DS, Dunwiddie CT, Persinger CC, Munos BH,Lindborg SR, Schacht AL. 2010. How to improve R&D productivity:The pharmaceutical industry’s grand challenge. Nat Rev Drug Discov9:203–214.2. Kumar RA. 2011. A 2011 wakeup call for pharmaceutical com-panies. Accessed, at: http://wwwbio-itworldcom/2011/02/18/pharma-trend-commenthtml on July12, 2014.3. Kessel M. 2011. The problems with today’s pharmaceutical business-an outsider’s view. Nat Biotechnol 29(1):27–33.4. Wilson D. 2011. Drug firms face billions in losses in‘11 as patents end. Accessed, at: http://wwwnytimescom/2011/03/07/business/07drughtml on July 12, 2014.5. Arrowsnith J. 2010. Trial watch: PII failures: 2008–2010. Nat RevDrug Discov 10:328–329.6. Kwong AD, Kauffman RS, Hurter P, Mueller P. 2011. Discovery anddevelopment of telaprevir: An NS3–4A protease inhibitor for treat-ing genotype 1 chronic hepatitis C virus. Nat Biotechnol 29(11):993–1003.7. Amidon GL, Lennernas H, Shah VP, Crison JR. 1995. Theoreticalbasis for a biopharmaceutical drug classification: Correlation of in vitrodrug product dissolution and in vivo bioavailability. Pharm Res 12:413–420.8. Martinez MN, Amidon GL. 2002. A mechanistic approach to under-standing the factors affecting drug absorption: A review of fundamen-tals. Clin Pharmacol 42(6):620–643.9. Dahan A, Miller JM, Amidon GL. 2009. Prediction of solubility andpermeability class membership: Provisional BCS Classification of theworld’s top oral drugs. AAPS J 11(4):740–746.10. Lipinski C. 2002. Poor aqueous solubility—An industry wide prob-lem in drug discovery. Am Pharm Rev 5(3):82–85.11. Bak A, McGregor C, Templeton A. July 2010. Scientific risk assess-ment strategies for managing the transition from discovery to develop-ment. AAPS News Magazine.12. DeVita RJ, Wuelfing WP, McGregor C, Bak A. July 2012. The chang-ing drug discovery paradigm—An industrial perspective. AAPS NewsMagazine.13. Huang LF, Tong WQ. 2004. Impact of solid state properties ondevelopability assessment of drug candidates. Adv Drug Deliv Rev56(3):321–334.14. Saxena V, Panicucci R, Joshi Y, Garad S. 2009. Developability as-sessment in pharmaceutical industry: An integrated group approachfor selecting developable candidates. J Pharm Sci 98(6):1962–1979.15. Palucki M, Higgins JD, Kwong E, Templeton AC. 2010. Strategies atthe interface of drug discovery and development: Early optimization ofthe solid state phase and preclinical toxicology formulation for potentialdrug candidates. J Med Chem 53:5897–5905.16. Gardner CR, Walsh CT, Almarsson O. 2004. Drugs as materials:Valuing physical form in drug discovery. Nat Rev Drug Discov 3:926–934.17. Babcock WC, Friesen DT, Mccray SB. 2005. Method and device forevaluation of pharmaceutical compositions. US Patent WO2005095950A1.18. Brouwers J, Brewster ME, Augustijns P. 2009. Supersaturatingdrug delivery systems: The answer to solubility-limited oral bioavail-ability? J Pharm Sci 98(8):2549–2572.19. Gao P, Shi Y. 2012. Characterization of supersaturatable for-mulations for improved absorption of poorly soluble drugs. AAPS J14(4):703–713.
DOI 10.1002/jps.24088 Lohani et al., JOURNAL OF PHARMACEUTICAL SCIENCES 103:3007–3021, 2014

3020 RESEARCH ARTICLE – Drug Discovery-Development Interface
20. Kawakami K. 2012. Modification of physicochemical characteris-tics of active pharmaceutical ingredients and application of supersat-uratable dosage forms for improving bioavailability of poorly absorbeddrugs. Adv Drug Deliv Rev 64(6):480–495.21. Singh A, Worku ZA, Van Den Mooter G. 2011. Oral formulationstrategies to improve solubility of poorly water-soluble drugs. ExpertOpin Drug Deliv 8(10):1361–1368.22. Szewczyk JW, Acton J, Adams AD, Chicchi G, Freeman S, HowardAD, Huang Y, Li C, Meinke PT, Mosely R, Murphy E, Samuel R, SantiniC, Yang M, Zhang Y, Zhao K, Wood HB. 2011. Design of potent andselective GPR119 agonists for type II diabetes. Bioorg Med Chem Lett21(9):2665–2669.23. Leung DH, Lohani S, Ball RG, Canfield N, Wang Y, Rhodes T,Bak A. 2012. Two novel pharmaceutical cocrystals of a developmentcompound screening, scale-up, and characterization. Cryst Growth Des12(3):1254–1262.24. Isabel E, Mellon C, Boyd MJ, Chauret N, Deschenes D, DesmaraisS, Falgueyret J-P, Gauthier JY, Khougaz K, Lau CK, Leger S, LevorseDA, Li CS, Masse F, David Percival M, Roy B, Scheigetz J, Therien M,Truong VL, Wesolowski G, Young RN, Zamboni R, Cameron Black W.2010. Difluoroethylamines as an amide isostere in inhibitors of cathep-sin K. Bioorg Med Chem Lett 21(3):920–923.25. Lipinski CA, Lombardo F, Dominy BW, Feeney PJ. 1997. Experi-mental and computational approaches to estimate solubility and per-meability in drug discovery and development settings. Adv Drug DelivRev 23(1–3):3–25.26. Gu CH, Rao D Gandhi RB, Hilden J, Raghavan K. 2005. Usinga novel multicompartment dissolution system to predict the effect ofgastric pH on the oral absorption of weak bases with poor intrinsicsolubility. J Pharm Sci 94(1):199–208.27. Pudipeddi M, Serajuddin ATM. 2004. Trends in solubility of poly-morphs. J Pharm Sci 94(5):929–939.28. Hildebrand JH. 1916. Solubility. J Am Chem Soc 38:1452–1473.29. Williams HD, Trevaskis NL, Charman SA, Shanker RM, CharmanWN, Pouton CW, Porter CJH. 2013. Strategies to address low drugsolubility in discovery and development. Pharmacol Rev 65(1):315–499.30. Dunitz JD, Bernstein J. 1995. Disappearing polymorphs. Acc ChemRes 28(4):193–200.31. Bergstrom CAS, Holm R, Jørgensen SA, Andersson SBE, Arturs-son P, Beato S, Borde A, Box K, Brewster M, Dressman J, Feng KI,Halbert G, Kostewicz E, McAllister M, Muenster U, Thinnes J, Tay-lor R, Mullertz A. 2014. Early pharmaceutical profiling to predict oraldrug absorption: Current status and unmet needs. Eur J Pharm Sci57:173–199.32. Kesisoglou F, Wu Y. 2008. Understanding the effect of API proper-ties on bioavailability through absorption modeling. AAPS J 10(4):516–525.33. Wang Y, Zheng Y, Zhang L, Wang Q, Zhang D. 2013. Stability ofnanosuspensions in drug delivery. J Control Release 172:1126–1141.34. Alam MA, Ali R, Al-Jenoobi FI, Al-Mohizea AM. 2012. Solid dis-persions: A strategy for poorly aqueous soluble drugs and technologyupdates. Expert Opin Drug Deliv 9(11):1419–1440.35. Brittain HG. 2013. Pharmaceutical cocrystals: The coming wave ofnew drug substances. J Pharm Sci 102(2):311–317.36. Friscic T, Jones W. 2010. Benefits of cocrystallisation in pharmaceu-tical materials science: An update. J Pharm Pharmacol 62:1547–1559.37. Qiao N, Mingzhong L, Schlindwein W, Nazneen M, Davies A, Trap-pitt G. 2011. Pharmaceutical cocrystals: An overview. Int J Pharm419:1–11.38. Shan N, Zaworotko MJ. 2008. The role of cocrystals in pharmaceu-tical science. Drug Discov Today 13(9–10):440–446.39. Alonzo DE, Gao Y, Zhou D, Mo H, Zhang GG, Taylor LS. 2011.Dissolution and precipitation behavior of amorphous solid dispersions.J Pharm Sci 100(8):3316–3331.40. Ghosh I, Snyder J, Vippagunta R, Alvine M, Vakil R, Tong WQ, Vip-pagunta S. 2013. Comparison of HPMC based polymers performance ascarriers for manufacture of solid dispersions using the melt extruder.Int J Pharm 419(1–2):12–19.
41. Sertsou G, Butler J, Hempenstall J, Rades T. 2003. Physical sta-bility and enthalpy relaxation of drug-hydroxypropyl methylcellulosephthalate solvent change co-precipitates. J Pharm Pharmacol 55(1):35–41.42. Sotthivirat S, McKelvey C, Moser J, Rege B, Xu W, Zhang D. 2013.Development of amorphous solid dispersion formulations of a poorlywater-soluble drug, MK-0364. Int J Pharm 452(1–2):73–81.43. Curatolo W, Nightingale JA, Herbig SM. 2009. Utility of hydrox-ypropylmethylcellulose acetate succinate (HPMCAS) for initiation andmaintenance of drug supersaturation in the GI milieu. Pharm Res26(6):1419–1431.44. Zhou D, Zhang GGZ, Law D, Grant DJW, Schmitt EA. 2002. Phys-ical stability of amorphous pharmaceuticals: Importance of configura-tional thermodynamic quantities and molecular mobility. J Pharm Sci91(8):1863–1872.45. Bhugra C, Pikal MJ. 2008. Role of thermodynamic, molecular, andkinetic factors in crystallization from the amorphous state. J PharmSci 97(4):1329–1349.46. Alhalaweh A, Ali HRH, Velaga SP. 2014. Effects of polymer andsurfactant on the dissolution and transformation profiles of cocrystalsin aqueous media. Cryst Growth Des 14(2):643–648.47. Childs S, Kandi P, Lingireddy SR. 2013. Formulation of a danazolcocrystal with controlled supersaturation plays an essential role inimproving bioavailability. Mol Pharm 10:3112–3127.48. Engers D, Teng J, Jimenez-Novoa J, Gent P, Hossack S, CampbellC, Thompson J, Ivanisevic I, Templeton A, Byrn S, Newman A. 2010. Asolid-state approach to enable early development compounds: Selectionand animal bioavailability studies of an itraconazole amorphous soliddispersion. J Pharm Sci 99(9):3901–3921.49. Higgins J, Cartwright ME, Templeton AC. 2012. Progressing pre-clinical drug candidates: Strategies on preclinical safety studies and thequest for adequate exposure. Drug Discov Today 17(15–16):828–836.50. Bethune SJ, Huang N, Jayasankar A, Rodriguez-Hornedo N. 2009.Understanding and predicting the effect of cocrystal components andpH on cocrystal solubility. Cryst Growth Des 9(9):3976–3988.51. Huang N, Rodriguez-Hornedo N. 2011. Engineering cocrystal sol-ubility, stability, and pHmax by micellar solubilization. J Pharm Sci100(12):5219–5234.52. Turner PV, Pekow C, Vasbinder MA, Brabb T. 2011. Administrationof substances to laboratory animals: Equipment considerations, vehicleselection, and solute preparation. J Am Assoc Lab Anim Sci 50(5):614–627.53. Schultheiss N, Newman A. 2009. Pharmaceutical cocrystals andtheir physicochemical properties. Cryst Growth Des 9(6):2950–2967.54. NIH. 2014. Benzoic acid. Accessed, at: http://toxnet.nlm.nih.gov/cgi-bin/sis/search/a?dbs+hsdb:@term+@DOCNO+704, Accessed on July12, 2014.55. NIH. 2014. Maleic Acid. ed., http://toxnet.nlm.nih.gov/cgi-bin/sis/search/a?dbs+hsdb:@term+@DOCNO+666, Accessed July 12,2014.56. Remenar JF, Peterson ML, Stephens PW, Zhang Z, Zimenkov Y,Hickey MB. 2007. Celecoxib: Nicotinamide dissociation: Using excipi-ents to capture the cocrystal’s potential. Mol Pharm 4(3):386–400.57. Calahan JL, Zanon RL, Alvarez-Nunez F, Munson EJ. 2014.Isothermal microcalorimetry to investigate the phase separation foramorphous solid dispersions of AMG 517 with HPMC-AS. Mol Pharm10(5):1949–1957.58. Tian Y, Booth J, Meehan E, Jones DS, Li S, Andrews GP. 2012.Construction of drug–polymer thermodynamic phase diagrams usingFlory–Huggins interaction theory: Identifying the relevance of tem-perature and drug weight fraction to phase separation within soliddispersions. Mol Pharm 10(1):236–248.59. Marsac PJ, Rumondor ACF, Nivens DE, Kestur US, Stanciu L,Taylor LS. 2009. Effect of temperature and moisture on the miscibilityof amorphous dispersions of felodipine and poly(vinyl pyrrolidone). JPharm Sci 99(1):169–185.60. Friesen DT, Shanker R, Crew M, Smithey DT, CuratoloWJ, Nightingale JAS. 2008. Hydroxypropyl methylcellulose acetate
Lohani et al., JOURNAL OF PHARMACEUTICAL SCIENCES 103:3007–3021, 2014 DOI 10.1002/jps.24088

RESEARCH ARTICLE – Drug Discovery-Development Interface 3021
succinate-based spray-dried dispersions: An overview. Mol Pharm5(6):1003–1019.61. Li P, Zhao L. 2007. Developing early formulations: Practice andperspective. Int J Pharm 341:1–19.62. Shin-Etsu Chemical Company, Ltd. 2013. HPMCP(hypromellose phthalate). Accessed, at: http://www.metolose.jp/e/pharmaceutical/hpmcp.shtml, Accessed July 12, 2014.63. Warren DB, Benameur H, Porter CJH, Pouton CW. 2010. Usingpolymeric precipitation inhibitors to improve the absorption of poorlywater-soluble drugs: A mechanistic basis for utility. J Drug Target18(10):704–731.64. Guzman HR, Tawa M, Zhang Z, Ratanabanangkoon P, Shaw P,Gardner CR, Chen H, Moreau J-P, Almarsson O, Remenar JF. 2007.Combined use of crystalline salt forms and precipitation inhibitors toimprove oral absorption of celecoxib from solid oral formulations. JPharm Sci 96(10):2686–2702.65. Henderson LJ. 1908. Concerning the relationship between thestrength of acids and their capacity to preserve neutrality. Am J Physiol21:173–179.66. Redenti E, Szente L, Szejtli J. 2000. Drug/cyclodextrin/hydroxy acidmulticomponent systems. Properties and pharmaceutical applications.J Pharm Sci 89(1):1–8.67. McConnell EL, Basit AW, Murdan S. 2008. Measurements of ratand mouse gastrointestinal pH, fluid and lymphoid tissue, and impli-cations for in-vivo experiments. J Pharm Pharmacol 60(1):63–70.68. Smith AJ, Kavuru P, Wojtas L, Zaworotko MJ, Shytle RD. 2011.Cocrystals of quercetin with improved solubility and oral bioavailabil-ity. Mol Pharm 8(5):1867–1876.
69. Bak A, Gore A, Yanez E, Stanton M, Tufekcic S, Akrami A, RoseM, Surapaneni S, Syed R, Bostick T, King A, Neervannan S, OstovicD, Koparkar A. 2008. The co-crystal approach to improve the expo-sure of a water-insoluble compound—AMG 517 sorbic acid co-crystalcharacterization and pharmacokinetics. J Pharm Sci 97(9):3942–3956.70. Kennedy M, Hu J, Gao P, Li L, Ali-Reynolds A, Chal B, Gupta V,Ma C, Mahajan N, Akrami A, Surapaneni S. 2008. Enhanced bioavail-ability of a poorly soluble VR1 antagonist using an amorphous soliddispersion approach: A case study. Mol Pharm 5(6):981–993.71. Kwok PC, Chan HK. 2014. Nanotechnology versus other techniquesin improving drug dissolution. Curr Pharm Des 20(3):474–482.72. Leung DH, Lamberto DJ, Liu L, Kwong E, Nelson T, Rhodes TB,Bak A. 2014. A new and improved method for the preparation of drugnanosuspension formulations using acoustic mixing technology. Int JPharm. 473:1-10.73. Alam MA, Al-Jenoobi FI, Al-mohizea AM. 2013. Commerciallybioavailable proprietary technologies and their marketed products.Drug Discov Today 18(19–20):936–949.74. Kawabata Y, Wada K, Nakatani M, Yamada S, Onoue S. 2011. For-mulation design for poorly water-soluble drugs based on biopharmaceu-tics classification system: Basic approaches and practical applications.Int J Pharm 420:1–10.75. Le-Ngoc Vo C, Park C, Lee B-J. 2013. Current trends and futureperspectives of solid dispersions containing poorly water-soluble drugs.Eur J Pharm Biopharm 85:799–813.76. Miller JM, Collman BM, Greene LR, Grant DJW, Blackburn AC.2005. Identifying the stable polymorph early in the drug discovery &development process. Pharm Dev Technol 10(2):291–297.
DOI 10.1002/jps.24088 Lohani et al., JOURNAL OF PHARMACEUTICAL SCIENCES 103:3007–3021, 2014