Modelling of CaCO 3 Nanoparticle Formation During Overbasing of Lubricating Oil Additives
15
Modelling of CaCO 3 Nanoparticle Formation During Overbasing of Lubricating Oil Additives Rajdip Bandyopadhyaya, ² R. Kumar, ‡ and K. S. Gandhi* Department of Chemical Engineering, Indian Institute of Science, Bangalore 560 012, India Received January 10, 2000. In Final Form: October 11, 2000 A framework of population balance equations has been developed to model formation of CaCO3 nanoparticles during overbasing of lubricating oil. The process involves carbonation of a reverse micellar solution containing lime, present both in the micelles and as a suspension of lime particles in the oil. The mechanism leading to CaCO3 nanoparticles in this setup consists of a number of elementary events such as CO2 transport from gas to reverse micelles through the organic phase, reaction in the reverse micellar core, nucleation of CaCO3, particle growth, and Brownian collisions leading to material exchange, both among reverse micellar drops and between drops and lime particles. A time scale analysis of these steps permits simplification and enables us to divide the whole process into two stages. The first consists of reaction of existing lime in micelles and a burst of nucleation of very short duration, wherein some reverse micelles beget a single nucleus each. The number of such nucleated reverse micelles depends on the relative rates of mass transfer, nucleation, and growth by intermicellar Brownian collisions. This is followed by a slow growth phase of these initial particles through Brownian collisions between nucleated reverse micelles and lime particles. The model predicts the data of Roman et al. (J. Colloid Interface Sci. 1991, 144, 324.), where on average only 10 initial reverse micelles contribute to form a CaCO3 nanoparticle. A simplified version of the model, obtained in the limit of instantaneous gas transfer, is also able to approximately predict the results of Kandori et al. (J. Colloid Interface Sci. 1988, 122, 78.) where, in contrast, a huge number of 10 8 reverse micelles contribute to form one particle. The model is quite general and can be used for other gas-liquid micellar precipitation systems wherein similar relative orders of time scales are involved. 1. Introduction Overbased lubricating oil additives aid in proper functioning of internal combustion engines. During over- basing, detergent-stabilized CaCO 3 nanoparticles are synthesized in situ in the lube oil, to function later as an additive. These nanoparticles inhibit acid corrosion in the engine and are required to be stable and of uniform size. The process of overbasing involves the passage of CO 2 gas through a hydrocarbon having a surfactant, water, and micron sized particles of Ca(OH) 2 . The water and surfactant form swollen reverse micelles which contain Ca(OH) 2 . On passage of CO 2 , CaCO 3 (l) is generated in the liquid cores of the reverse micelles which nucleate at appropriate supersaturation. These nuclei grow not only by absorption of CaCO 3 (l) from within the micelle in which they have formed but also through coalescence (and redispersion) with other reverse micelles containing CaCO 3 (l). Henceforth, we will use the terms micelles and reverse micelles interchangeably, while keeping in mind that we are all the time dealing with swollen reverse micelles. Kandori et al. 1 had investigated the formation of CaCO 3 nanoparticles in reverse micelles containing an aqueous solution of Ca(OH) 2 using CaOT as surfactant. All the Ca(OH) 2 present in the system was in dissolved form in the reverse micelles. The precipitation was brought about by sparging CO 2 for a short time and subsequently desorbing CO 2 with N 2 . They observed that the average particle size formed was about 100 nm and approximately 10 8 micelles contributed to the formation of each particle. These values were quantitatively predicted by Bandyo- padhyaya et al. 2 by considering the diffusion of CO 2 into the micelles and the reactions therein to produce super- saturation, followed by nucleation and growth of particles by collision and fusion of the micelles. Roman et al. 3 also prepared nanoparticles of CaCO 3 by a slightly different procedure. These authors used as surfactant a calcium salt of a dialkyl-aryl sulfonic acid, the salt being made in situ. Methanol added as cosur- factant and water liberated during the formation of the surfactant together gave rise to reverse micelles. The Ca- (OH) 2 was provided as micron sized solid particles, and a large amount of it remained unreacted after formation of the surfactant. CO 2 gas was passed 4 at a rate of 1.8 × 10 -4 mol s -1 into the suspension of Ca(OH) 2 particles in the reverse micellar medium to prepare nanometer sized CaCO 3 particles. Under these conditions, which are superficially mildly different from those used by Kandori et al. 1 (e.g., a different surfactant, presence of Ca(OH) 2 particles, etc.), the authors found the nanoparticle size to be just 6 nm (against ∼100 nm of Kandori et al. 1 ) and only 10 micelles to be participating in the formation of a nanoparticle (against 10 8 of Kandori et al. 1 ). The present paper proposes a generalized framework which explains the very interesting results of Roman et al. 3 The earlier model 2 used to explain the results of Kandori et al. 1 becomes a special case of the present model. 2. The Model 2.1. The Physical Process. In the process used by Roman et al. 3 before sparging of CO 2 is started, there are a large number of swollen reverse micelles containing Ca- * To whom correspondence should be addressed. E-mail: [email protected]. ² Presently at Ben-Gurion University of Negev. ‡ Also at Jawaharlal Nehru Centre for Advanced Scientific Research, Bangalore. (1) Kandori, K.; Kon-No, K.; Kitahara, A. J. Colloid Interface Sci. 1988, 122, 78. (2) Bandyopadhyaya, R.; Kumar, R.; Gandhi, K. S.; Ramkrishna, D. Langmuir 1997, 13, 3610. (3) Roman, J.-P.; Hoornaert, P.; Faure, D.; Biver, C.; Jacquet, F.; Martin, J. J. Colloid Interface Sci. 1991, 144, 324. (4) Roman, J.-P. Communication through the Editor, May 2000. 1015 Langmuir 2001, 17, 1015-1029 10.1021/la000023r CCC: $20.00 © 2001 American Chemical Society Published on Web 01/19/2001
-
Upload
independent -
Category
Documents
-
view
1 -
download
0
Transcript of Modelling of CaCO 3 Nanoparticle Formation During Overbasing of Lubricating Oil Additives

Modelling of CaCO3 Nanoparticle Formation DuringOverbasing of Lubricating Oil Additives
Rajdip Bandyopadhyaya,† R. Kumar,‡ and K. S. Gandhi*
Department of Chemical Engineering, Indian Institute of Science, Bangalore 560 012, India
Received January 10, 2000. In Final Form: October 11, 2000
A framework of population balance equations has been developed to model formation of CaCO3nanoparticles during overbasing of lubricating oil. The process involves carbonation of a reverse micellarsolution containing lime, present both in the micelles and as a suspension of lime particles in the oil. Themechanism leading to CaCO3 nanoparticles in this setup consists of a number of elementary events suchas CO2 transport from gas to reverse micelles through the organic phase, reaction in the reverse micellarcore, nucleation of CaCO3, particle growth, and Brownian collisions leading to material exchange, bothamong reverse micellar drops and between drops and lime particles. A time scale analysis of these stepspermits simplification and enables us to divide the whole process into two stages. The first consists ofreaction of existing lime in micelles and a burst of nucleation of very short duration, wherein some reversemicelles beget a single nucleus each. The number of such nucleated reverse micelles depends on therelative rates of mass transfer, nucleation, and growth by intermicellar Brownian collisions. This is followedby a slow growth phase of these initial particles through Brownian collisions between nucleated reversemicelles and lime particles. The model predicts the data of Roman et al. (J. Colloid Interface Sci. 1991,144, 324.), where on average only 10 initial reverse micelles contribute to form a CaCO3 nanoparticle. Asimplified version of the model, obtained in the limit of instantaneous gas transfer, is also able toapproximately predict the results of Kandori et al. (J. Colloid Interface Sci. 1988, 122, 78.) where, incontrast, a huge number of 108 reverse micelles contribute to form one particle. The model is quite generaland can be used for other gas-liquid micellar precipitation systems wherein similar relative orders of timescales are involved.
1. IntroductionOverbased lubricating oil additives aid in proper
functioning of internal combustion engines. During over-basing, detergent-stabilized CaCO3 nanoparticles aresynthesized in situ in the lube oil, to function later as anadditive. These nanoparticles inhibit acid corrosion inthe engine and are required to be stable and of uniformsize. The process of overbasing involves the passage ofCO2 gas through a hydrocarbon having a surfactant, water,and micron sized particles of Ca(OH)2. The water andsurfactant form swollen reverse micelles which containCa(OH)2. On passage of CO2, CaCO3(l) is generated in theliquid cores of the reverse micelles which nucleate atappropriate supersaturation. These nuclei grow not onlyby absorption of CaCO3(l) from within the micelle in whichthey have formed but also through coalescence (andredispersion) with other reverse micelles containingCaCO3(l). Henceforth, we will use the terms micelles andreverse micelles interchangeably, while keeping in mindthat we are all the time dealing with swollen reversemicelles.
Kandori et al.1 had investigated the formation of CaCO3nanoparticles in reverse micelles containing an aqueoussolution of Ca(OH)2 using CaOT as surfactant. All theCa(OH)2 present in the system was in dissolved form inthe reverse micelles. The precipitation was brought aboutby sparging CO2 for a short time and subsequentlydesorbing CO2 with N2. They observed that the averageparticle size formed was about 100 nm and approximately108 micelles contributed to the formation of each particle.
These values were quantitatively predicted by Bandyo-padhyaya et al.2 by considering the diffusion of CO2 intothe micelles and the reactions therein to produce super-saturation, followed by nucleation and growth of particlesby collision and fusion of the micelles.
Roman et al.3 also prepared nanoparticles of CaCO3 bya slightly different procedure. These authors used assurfactant a calcium salt of a dialkyl-aryl sulfonic acid,the salt being made in situ. Methanol added as cosur-factant and water liberated during the formation of thesurfactant together gave rise to reverse micelles. The Ca-(OH)2 was provided as micron sized solid particles, anda large amount of it remained unreacted after formationof the surfactant. CO2 gas was passed4 at a rate of 1.8 ×10⁻⁴ mol s-1 into the suspension of Ca(OH)2 particles inthe reverse micellar medium to prepare nanometer sizedCaCO3 particles. Under these conditions, which aresuperficially mildly different from those used by Kandoriet al.1 (e.g., a different surfactant, presence of Ca(OH)2particles, etc.), the authors found the nanoparticle size tobe just 6 nm (against ∼100 nm of Kandori et al.1) and only10 micelles to be participating in the formation of ananoparticle (against 108 of Kandori et al.1).
The present paper proposes a generalized frameworkwhich explains the very interesting results of Roman etal.3 The earlier model2 used to explain the results ofKandori et al.1 becomes a special case of the present model.
2. The Model
2.1. The Physical Process. In the process used byRoman et al.3 before sparging of CO2 is started, there area large number of swollen reverse micelles containing Ca-* To whom correspondence should be addressed. E-mail:
[email protected].† Presently at Ben-Gurion University of Negev.‡ Also at Jawaharlal Nehru Centre for Advanced Scientific
Research, Bangalore.(1) Kandori, K.; Kon-No, K.; Kitahara, A. J. Colloid Interface Sci.
1988, 122, 78.
(2) Bandyopadhyaya, R.; Kumar, R.; Gandhi, K. S.; Ramkrishna, D.Langmuir 1997, 13, 3610.
(3) Roman, J.-P.; Hoornaert, P.; Faure, D.; Biver, C.; Jacquet, F.;Martin, J. J. Colloid Interface Sci. 1991, 144, 324.
(4) Roman, J.-P. Communication through the Editor, May 2000.
1015Langmuir 2001, 17, 1015-1029
10.1021/la000023r CCC: $20.00 © 2001 American Chemical SocietyPublished on Web 01/19/2001
(OH)2 along with methanol and a small amount of water.These reverse micelles are continuously interacting witheach other, fusing, redispersing, and exchanging fluidcontents in the process.
The sparged CO2 dissolves in the organic phase anddiffuses into the swollen reverse micelles, where it reactswith the pre-existing lime. CaCO3(l) thus formed attainssupersaturation and may nucleate in a random way,provided the number of these molecules present in amicelle is more than the minimum required to form astable nucleus (∼5 for CaCO3). Once nucleation begins,the micelles can be classified as those which have nuclei(or a nanoparticle) and those which do not. The numbersof these two will vary with time. Both receive CO2molecules and both have access to suspended Ca(OH)2particles through Brownian collisions. The processes ofnucleation and growth can continue through formation ofnew CaCO3(l) molecules in the micelles and throughcollisions between nucleated and non-nucleated yet su-persaturated micelles, until the final particle size distri-bution is established at the end of the process.
The processes of particle formation and growth aresignificantly influenced by the collisional interactionsamong micelles. Depending on the rate at which micellesinteract, the final results as well as the analysis of thephenomena will vary. For example, nucleation mayprecede all growth or nucleation as well as growth fromwithin the micelles and through fusion with other micellescan proceed simultaneously. The latter possibility cannotbe ignored a priori. For instance, after nucleation in amicelle, another micelle may fuse with it before thesupersaturation has been exhausted. Such fusion can giverise to yet another nucleus in the same micelle. In sucha situation, because of their strong interactions it will benecessary to consider all three processes of nucleation,growth, and fusion to determine the number of nanopar-ticles formed in each micelle together. If, however, thetime scales for various steps are known, their comparisoncan lead to a specific and simpler mechanism of particleformation.
2.2. Time Scale Analysis. Analysis of time scales ofvarious processes occurring during the formation ofnanoparticles is central to the present model-buildingexercise. In this, we follow Bandyopadhyaya et al.,2 whohave shown how a hierarchy of time scales can becalculated to arrive at the sequence of events taking placein the semibatch reactor used by Kandori et al.1 However,compared to Kandori et al.,1 experiments of Roman et al.3involve additional processes and also some differences inprocess conditions, which influence the time scale analysis,and we discuss these first.
Initial Lime Content. The rate of nucleation depends onthe CaCO3(l) present in each micelle. The CaCO3(l)molecules are formed by reaction between CO2 and thelime initially present in the micelles. An additional sourceof formation of CaCO3(l) molecules is through the reactionbetween CO2 and Ca(OH)2 picked up by micelles, unsat-urated with respect to Ca(OH)2, when they collide withthe solid lime particles. At saturation conditions, on theaverage, a molecule of Ca(OH)2 is present in about 15micelles. Thus, we do not expect this additional source ofCaCO3(l) to be activated till almost all the initially presentlime is exhausted by reaction, and we expect collisionsbetween the micelles containing Ca(OH)2 molecules andthe solid lime particles to be infructuous. The initial limecontent of the micelles is therefore needed to makeestimates of the nucleation rates. The amount of Ca(OH)2present initially in the micelles has been calculated intwo different ways. Roman et al.3 provide a size estimate
of 7.2 Å for the CaCO3 particle, which would have formedin a single micelle, if only the amount of lime present ina single micelle was used in its making. The size isequivalent to 25 molecules of carbonate being present inthe particle. Thus, initially 25 molecules of Ca(OH)2 wouldhave been present in each micelle. The same value of 25Ca(OH)2 molecules per micelle is also obtained from small-angle X-ray scattering measurements3 of the initial sizesof micelles prepared under different conditions. We usethis figure in our calculations.
If all lime molecules are in dissolved form, the concen-tration of Ca(OH)2 present in the micelles at the beginningis considerably high, approximately 400 times the bulksolubility in the micellar core. Although there exist reportsin the literature on enhanced solubility of many solutesin micellar water because of its altered state, theenhancements are modest, being of the order of 5-7 times(e.g., for poorly soluble protein in Matzke et al.5). We donot address the question of the form in which Ca(OH)2 ispresent. We merely assume that the following reactionoccurs inside the micelle whenever Ca(OH)2 and CO2 arepresent together:
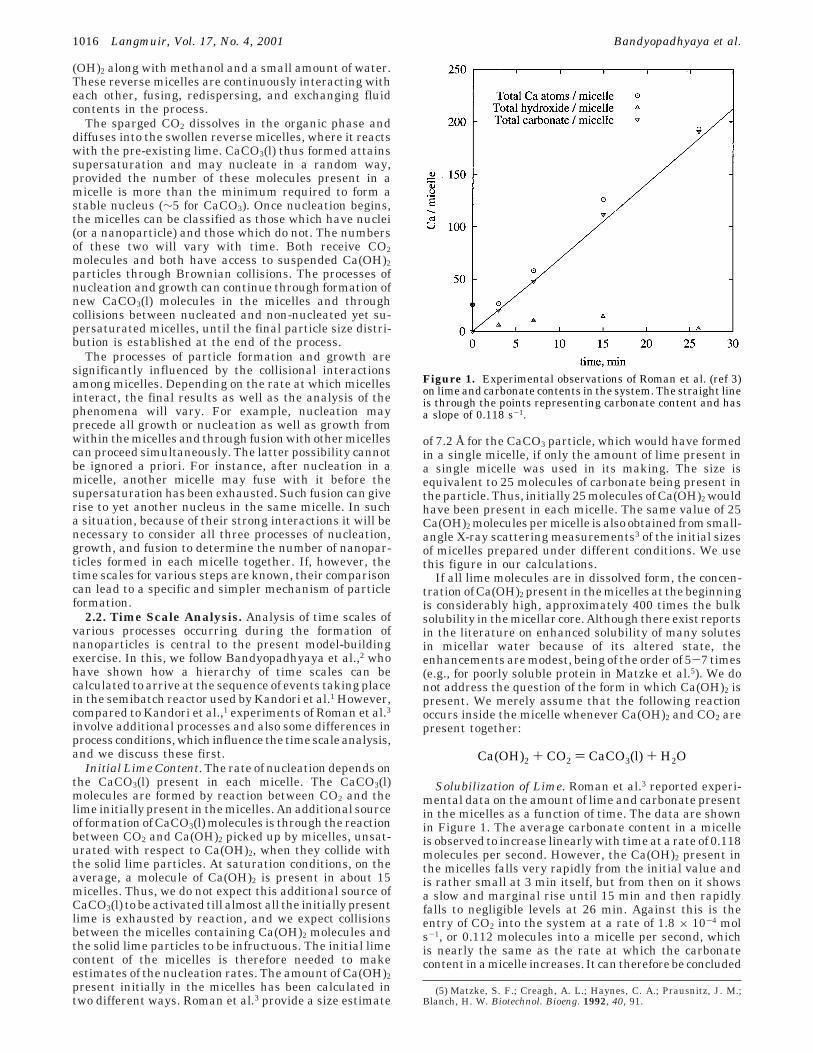
Solubilization of Lime. Roman et al.3 reported experi-mental data on the amount of lime and carbonate presentin the micelles as a function of time. The data are shownin Figure 1. The average carbonate content in a micelleis observed to increase linearly with time at a rate of 0.118molecules per second. However, the Ca(OH)2 present inthe micelles falls very rapidly from the initial value andis rather small at 3 min itself, but from then on it showsa slow and marginal rise until 15 min and then rapidlyfalls to negligible levels at 26 min. Against this is theentry of CO2 into the system at a rate of 1.8 × 10⁻⁴ mols-1, or 0.112 molecules into a micelle per second, whichis nearly the same as the rate at which the carbonatecontent in a micelle increases. It can therefore be concluded
(5) Matzke, S. F.; Creagh, A. L.; Haynes, C. A.; Prausnitz, J. M.;Blanch, H. W. Biotechnol. Bioeng. 1992, 40, 91.
Figure 1. Experimental observations of Roman et al. (ref 3)on lime and carbonate contents in the system. The straight lineis through the points representing carbonate content and hasa slope of 0.118 s-1.
Ca(OH)2 + CO2 ) CaCO3(l) + H2O
1016 Langmuir, Vol. 17, No. 4, 2001 Bandyopadhyaya et al.

that all the CO2 is absorbed by the organic phase andreacts completely. Further, in view of the steady increasein the carbonate content, the very small increase in theCa(OH)2 content shows that the rate of CO2 entry is alsoapproximately balanced by the rate of entry of Ca(OH)2molecules through collisions between micelles and solidlime particles from about 3 min onward. We thereforeassume a linear trend for the pickup of lime by micelles.However, the very steep drop in the lime content seen inthe experimental data between 0 and 3 min suggests thatlime pickup is possible only after exhaustion of the initiallime content. We implement this by assuming that micellesbecome unsaturated with respect to lime after completereaction of the initial lime and that, from then on, eachtime an unsaturated micelle collides with a solid limeparticle, a molecule of lime can enter it with an efficiencyâp, which has been determined to stoichiometrically matchthe experimental rate of sparging of CO2. The value of âpturns out to be equal to 0.055 after assuming that thesolid lime particles are 1 µm in size.
Relative Rates of Events. To arrive at the sequence ofevents and to compare their relative rates, we list thevarious events in the process that involve a micelle inTable 1 along with the associated time scales. The valuesof the time scales listed are equal to the reciprocal of therates of the corresponding processes.
(i) Mass transfer versus reaction rate: Comparison ofthe time scales of mass transfer (τm and τcp) and reaction(τr) shows that both the rate of entry of CO2 molecules intoa micelle and the rate of pickup of lime by micelles arevery much slower than the rate at which they react. So,in our model we assume that CO2 reacts instantaneouslywith lime in the micelle. Further, both τm and τcp are largerthan τc, indicating that even if CO2 is absorbed by a micellewhich does not contain Ca(OH)2 molecules it gets redis-tributed rapidly and reacts with lime present in someother micelle. We therefore have eliminated any calcula-tion of chemical reaction rates and equated the entry rateof CO2 to the formation rate of CaCO3(l), as long as limeis present inside the micelles.
(ii) Nucleation rate versus growth rate: The concentra-tion of CaCO3(l) in micelles increases because of thereaction between lime and CO2. We estimate two timescales associated with nucleation. One is the average timetaken between two nuclei formed in a single micelle (τn
(m)),if supersaturation inside remains uniform at a particularlevel. The second is the time scale over which nucleation
occurs per unit volume of the total liquid present in thesystem, τnn
(m). The latter is an overall nucleation time scaleand will be discussed a little later. The time scale ofnucleation in a single micelle (τn
(m)), containing theminimum number required to nucleate, five molecules ofCaCO3(l), is 10-1 s. It has been calculated on the basis ofthe solubility of CaCO3 in methanol, because essentiallyonly methanol is present in the micelles in the beginning.
As CO2 is passed, new CaCO3(l) molecules are generatedin the micelle, if unreacted lime exists. For a nucleatedmicelle, the new carbonate molecules can be used up eitherfor particle growth or for generating a second nucleus. Ifthe growth rate is less than the nucleation rate in themicelle, one can have more than one nucleus born in thesame micelle. If, on the other hand, the growth rate ismuch higher, then the additional molecule adds to thesize of the particle without generating an extra nucleusin the micelle.
Even when growth is fast enough to consume the excessmolecules present in the micelle after the first nucleus isformed, there exists another way in which the nucleatedmicelle can have more than one nucleus. All micellesundergo collision and fusion with other micelles in themedium. When a nucleated micelle fuses with a non-nucleated micelle having a sufficient number of CaCO3(l)molecules, two alternative events can occur in thetransient dimer: either the newly acquired carbonatemolecules are incorporated in the existing CaCO3 particlevia growth or, in view of the attendant buildup ofsupersaturation in the original mononucleated micelle, asecond nucleus is born in it. Here also, relative rates ofnucleation and growth decide whether the increasedsupersaturation would result in an additional nucleus orgrowth of the existing nucleus. Thus, we need to comparethe nucleation and growth time scales to decide whethera nucleated micelle can have two or more nuclei.
In Table 1, it is seen that τn(m) is far higher than the
growth time scale, τg. This would imply that once a nucleusis formed, it exhausts the supersaturation by growth beforeanother nucleus can be produced, both when the firstnucleus is formed and also when the nucleated micellecoalesces with a supersaturated micelle. It is further seenthat τg , τc, implying the growth of a CaCO3 particle insidea micelle to be much faster than the collision time of thatparticular micelle with other non-nucleated but super-saturated micelles. This prevents further buildup ofsupersaturation in a nucleated micelle. Similarly, τg , τmor τcp. Together, these comparisons imply that if anucleated micelle develops supersaturation, either bycollision-fusion with a non-nucleated but supersaturatedmicelle or by intake of CO2 or lime, it is instantaneouslydissipated by very fast particle growth. Two conclusionscan therefore be drawn. First, each micelle can at besthave only one particle. Second, any CaCO3(l) formed in anucleated micelle is incorporated by growth into theexisting CaCO3 particle, and growth is completed beforeany other process can affect the micellar state. In fact, τgis the smallest of all time scales involving a micelle, andhence growth may be treated as instantaneous. Itsdynamics does not have to be specifically incorporated inthe analysis. It occurs in discrete amounts at specificinstants, as and when supersaturation in a nucleatedmicelle gets generated.
The high rate at which supersaturation is absorbed bya nanoparticle has a very important, though indirect, effecton the overall nucleation rate in the entire system, whichdetermines the total number of nanoparticles formed inthe process. When a micelle containing CaCO3(l) collides
Table 1. Time Scales of Roman et al.a
event formulatime scale
(s)
mass transfer entry of one CO2molecule (τm)
1/kg 10
reaction of a CO2 molecule withlime (τr)b
1/k1[OH-] 10-5
collision-fusion with any micelle (τc) 1/âmqm N 0(0) 10-1
nucleation of CaCO3 particle in a micelle(assuming only MeOH in core) (τn
(m))1/kn (k) 10-1
nucleation of CaCO3 particle in unitvolume of system (τnn
(m))1/kn (k)N 0
(0) 10-17
growth of a CaCO3 particle inside amicelle (τg)
Vmic (1/q) 10-10
Ca(OH)2 pickup by micelle-particlecollision and solubilization (τcp)
1/âpqp N p(0) 10
collision-fusion with a nucleatedmicelle (τcn)
1/âmqm N 1(0) 1
a Reference 3. b k1 ) 6000 L mol-1 s-1 is the reported rate constantfor the reaction CO2 + [OH-] f HCO3
-. See: Danckwerts, P. V.Gas-Liquid Reactions; McGraw-Hill Book Company: New York,1970; p 239.
Modelling of CaCO3 Nanoparticle Formation Langmuir, Vol. 17, No. 4, 2001 1017

with a micelle containing a particle, all the CaCO3(l) isabsorbed by the particle instantaneously. As a result, theaverage concentration of CaCO3(l) in the system is lowered.The rate of nucleation in the entire system is given by therate of nucleation in a micelle that contains at least thefive molecules required to form a nucleus multiplied bythe fraction of micelles containing that many molecules.The latter is proportional to the average concentration ofCaCO3(l) in the system, and the relationship will bediscussed shortly. However, to get a feel for the numberwe give an estimate. The overall nucleation time scale,τn
(m), is of the order of 10-17 s for Roman et al.3 if we assumethat the mean CaCO3(l) content in a micelle is unity, andthe Poisson distribution holds. If the mean population ofCaCO3(l) is 0.5, the above time scale increases by a factorof 50. The mean population thus plays an important roleand can be determined only by a model.
(iii) Rate of intermicellar exchange of CaCO3(l): Thestate of non-nucleated micelles, characterized in terms ofCaCO3(l), evolvesbyacquiringCaCO3(l)molecules throughreaction. It starts from zero molecules and builds up toa level at which nucleation can occur. Apart fromnucleation, it can also decrease because of the simulta-neous loss of CaCO3(l) molecules when collision withnucleated micelles occurs. Finally, the state is also affectedwhen Brownian collisions take place among non-nucleatedmicelles, rendering redistribution of the CaCO3(l) mol-ecules.
From Table 1, we find that τc, which is indicative of thetime scale in which CaCO3(l) molecules are redistributedin the non-nucleated micelles, is less than the time scalesof two other events affecting a non-nucleated micelle, τcnand τcp. Rearrangement of carbonate molecules in non-nucleated micelles thus being very fast when comparedto other relevant processes, it is reasonable to assumethat the distribution of CaCO3(l) molecules in thesemicelles is given by Poisson statistics. To calculate thePoisson distribution, we need to specify only the first twomoments, namely, the number of non-nucleated micellesand the total number of carbonate molecules in them. Thewhole hierarchy of higher moment equations then followsfrom the definition of the Poisson distribution. This thenobviates the need to use a population balance equationfor non-nucleated micelles in terms of CaCO3(l) molecules.
The results of the time scale analysis will lead tosimplifications in the model development, as will be shownin section 2.4. Before discussing those, we propose thefollowing mechanism for the process.
2.3. Proposed Mechanism of Overbasing. Thoughτm and τcp are similar in magnitude, solubilization of limefrom particles can occur only when the initially existingCa(OH)2 in the micelles is exhausted and the micellesbecome unsaturated with respect to lime. Therefore, limeparticles suspended in oil would not contribute to reaction,nucleation, or growth during this initial phase. Only afterreaction exhausts the initial lime present in the micellescan further solubilization from lime particles take place.Additional CaCO3(l) generated by reaction between CO2and lime solubilized in this manner contributes towardthe growth of existing nanoparticles and possibly to thenucleation of new particles. The whole process of over-basing therefore may be divided into two distinct phasesas summarized below.
Phase I is the period of nucleation and growth of CaCO3particles formed from the 25 molecules of Ca(OH)2 initiallypresent in each micelle. During this phase, new particlesare formed by nucleation and instantaneous growth byabsorption of supersaturation present in the micelle.Further growth of the particle may also occur because of
coalescence between micelles containing CaCO3(l). Asmentioned earlier, this type of growth has an adverseeffect on nucleation. Phase I continues until the limeinitially present in the micelles is converted into carbonate,present mostly as CaCO3 nanoparticles and a few CaCO3(l)molecules. So, the end of phase I occurs when the micellesdo not contain any residual lime from that present at thebeginning, thus making them unsaturated with respectto Ca(OH)2 and capable of picking up lime from the solidparticles.
Phase II mostly is a growth phase of particles formedduring phase I. In this phase, Ca(OH)2 comes into themicelles from the lime particles and CO2 comes from thegas being sparged. The CaCO3(l) formed contributesprimarily to the increase in the size of the existingnanoparticle. The lime is picked up because of particle-micelle collisions, the efficiency of which has been adjustedto match the observation that solubilized lime reacts withthe incoming CO2 without accumulating; that is, the ratesof entry of CO2 and solubilization of Ca(OH)2 are matchedstoichiometrically. Thus in phase II, particles formed inphase I grow and add to their size with marginalnucleation. The result is the formation of a large numberof relatively uniform sized particles.
The entire process of particle formation and growth isdepicted in Figure 2. The schematic shows the sequenceof steps a typical micelle can undergo starting from initiallypresent lime. While supersaturation in the micelle buildsup, it can collide with a nucleated micelle. Otherwise, itcan nucleate after attaining the critical number ofmolecules. The nucleated micelle can further grow byabsorption of CO2 or lime as well as through collision withnon-nucleated yet supersaturated micelles. The finalnumber of particles formed is dictated by the delicatebalance among the rate of formation of CaCO3(l), the rateof nucleation, and the rate of growth of nanoparticles bycollision-fusion processes.
2.4. Number Densities. We have two kinds of mi-celles: the nucleated ones containing nanoparticles ofCaCO3 and the non-nucleated ones, containing dissolvedCaCO3(l). Our interest is in the variation of their numberswith time and also in the distribution of calcium carbonatemolecules therein. To this end, we start with two generalnumber density functions n0
+(i,j,l,t) and n1+(i,j,k,t) for non-
nucleated and nucleated micelles, respectively. n0+(i,j,l,t)
is the number of non-nucleated micelles per unit volumeof the system, which at time t contain i Ca(OH)2 molecules,j CO2 molecules, and l CaCO3(l) molecules. Correspond-ingly, n1
+(i,j,k,t) denotes the number of nucleated micellesper unit volume at time t, containing a CaCO3 particlehaving k molecules.
In phase I, the incoming CO2 molecules react instan-taneously on entering a micellar drop, because of thepresence of a significant amount of Ca(OH)2, leaving nofree CO2 and implying j ) 0. Similarly, throughout phaseII both i and j are equal to 0, because Ca(OH)2 and CO2
are supplied in stoichiometric ratio and react instanta-neously. Because i is in excess and j ) 0 in phase I andboth i and j are equal to 0 in phase II, there is no needto keep track of populations of i and j in individual micelles.This results in simpler number density functions. Thus,we now have n0(l, t) and n1(k, t) as the number of micellescontaining l molecules of CaCO3(l) and k molecules ofCaCO3 in non-nucleated and nucleated micelles, respec-tively, per cm3 of the dispersion at time t. Phase I beginswith n1(k,t) being zero for all k and only n0(0,t) beingnonzero. This phase ends when the total molecules of
1018 Langmuir, Vol. 17, No. 4, 2001 Bandyopadhyaya et al.

CaCO3 present in the system equals the total moleculesof Ca(OH)2 initially present in the micelles.
The total number of nucleated and non-nucleatedmicelles can be expressed in terms of these numberdensities as follows:
We have started with k ) kc for the sum, because at leastthe critical number of CaCO3(l) molecules (kc) is requiredfor nucleation to occur. The superscript indicates that itis the zeroth moment.
2.5. Distribution of CaCO3(l) in Non-nucleatedMicelles. As indicated earlier, the population of CaCO3(l)molecules in the micelles attain Poisson distributionbecause of extremely fast coalescence and redispersionamong micelles. If Pl(t) is the probability that l numberof CaCO3(l) molecules are present in a non-nucleatedmicelle, then
From the Poisson distribution then, Pl(t) is given by
In the above, lh(t) is the average number of CaCO3(l)molecules present in a non-nucleated micelle at any given
time and is given by N0(1)(t)/N0
(0)(t), the ratio of first tozeroth moments. Thus, solution of eq 4 requires theknowledge of N0
(0)(t) as well as N0(1)(t). As fusion and
fission do not change the total number of non-nucleatedmicelles, it can decrease only because of nucleation events.Thus N0
(0)(t) is given by the following equation:
where the right-hand side gives the rate of nucleation.The equation for N0
(1)(t), which gives the total number ofCaCO3(l) molecules in the micelles is given below.
The first two terms on the right-hand side indicate therate at which N0
(1)(t) is decreasing: the first one becauseof nucleation and the second because of coalescence withnucleated micelles. We have shown previously that entryof CO2 is controlling in phase I, and pickup of Ca(OH)2 aswell as supply of CO2 are equal in phase II. Hence, eithercan be treated as the controlling step in phase II. We willpresent the equations in a form in which availability ofCa(OH)2 is made the controlling step, which yields adifferent last term in eq 6 for phase II. This is done becauseif the rate of sparging of CO2 is increased, solubilization
Figure 2. Schematic of the assumed overbasing process in phase I and phase II. The buildup of supersaturation is due to intakeof CO2 in phase I and intake of CO2 and Ca(OH)2 in phase II.
N1(0)(t) ) ∑
k)kc
∞
n1(k,t) (1)
N0(0)(t) ) ∑
l)0
∞
n0(l,t) (2)
n0(l,t) ) N0(0)(t) Pl(t) l ) 0, 1, 2, 3... (3)
Pl(t) )lh(t)l exp[-lh(t)]
l!l ) 0, 1, 2, 3... (4)
dN0(0)(t)
dt) -∑
l)kc
∞
kn(l) n0(l, t) (5)
dN0(1)(t)
dt) -∑
l)kc
∞
lkn(l) n0(l,t) -
âmqmN1(0)(t)N0
(1)(t) + kgN0(0)(t) (6)
Modelling of CaCO3 Nanoparticle Formation Langmuir, Vol. 17, No. 4, 2001 1019

of lime from solid particles can become controlling in phaseII. Hence, to make the model applicable to more generalsituations (including other systems as well as higher gasflow rates), the more complex case of the solubilizationrate controlled process has been presented in the equa-tions. Generation of new CaCO3(l) molecules by reactionof lime with CO2 in phase I is indicated by the last termin eq 6. Thus, for phase II kg in the equation would bereplaced by âpqpNp
(0).This equation clearly indicates the importance of the
balance between rates of collisional growth of particles,nucleation, and rate of formation of CaCO3(l). If âmqm islarge, then even for small values of N1
(0), that is, evenwhen a small fraction of micelles nucleate, âmqmN1
(0) N0(1)
can exceed kgN0(0). From then on, the mean population of
CaCO3(l) in the micelles decreases. Hence, formation ofnew particles stops, and the existing particles will grow,absorbing all the CaCO3(l) forming in the system. Hence,a smaller number of particles are formed as the rate ofcollisional growth of particles outstrips the rate of forma-tion of CaCO3(l).
2.6. Distribution of CaCO3 in Nucleated Micelles.As nucleated micelles cannot exchange CaCO3 nanopar-ticles through collision, the Poisson distribution is notapplicable here. Hence, we have to make use of populationbalance equations and obtain moment equations fromthem. Therefore, we first write number balance equationsfor micelles containing critical sized nuclei and thosecontaining more than critical, for phase I and phase II.
Phase I:
Phase II:
The first term on the right-hand side of eqs 8 and 10gives the generation of nucleated micelles having a particlecontainingk CaCO3 molecules. The second term representsloss due to growth of the particle of k molecules, whenfusion with any carbonate containing non-nucleated
micelle occurs. In contrast, the third term accounts forgain due to formation of a micelle containing a particle ofk molecules during fusion between a nucleated and a non-nucleated micelle of appropriate carbonate contents.Similarly, the last two terms in these two equationsrepresent loss and gain of nucleated micelles, respectively,because of particle growth, the loss and gain being due toCO2 absorption in phase I and by way of lime solubilizationin phase II.
The number of micelles containing a particle and theaverage size of the particle in terms of the number of CaCO3molecules k need to be calculated from the model, for thepurposes of comparison with the experimental observa-tions. These can be derived from the zeroth and firstmoments of eqs 7-10, whereas standard deviation re-quires the corresponding second moment. In general, thenth moment is given by
A similar expression can also be written for non-nucleatedmicelles. The equations for the moments are given below.
The equation for the zeroth moment of nucleatedmicelles N1
(0)(t), giving the total number of nucleatedmicelles, is
The average size of the particle can be calculated fromthe average number of carbonate molecules contained ina nucleated particle. The first moment of nucleatedmicelles is required for this purpose, and for phase I it isgiven by
The first term on the right-hand side of the above equationrepresents nucleation, and the second term gives colli-sional growth. The last term implies growth due to CO2absorption and subsequent reaction. During phase II, thisterm is replaced by growth due to lime pickup and reaction,whence kg is substituted by âpqpNp
(0).We need the second moment of nucleated micelles for
estimating standard deviation in particle size, which isgiven by the following equation in phase I:
The last two moment equations have been obtaineddirectly from the population balance eqs 7-10. As usualin phase II, kg is replaced by âpqpNp
(0).Combining eqs 5 and 12, we note that the rate of change
of the total number of micelles in the system is zero, asassumed in the physical mechanism. Also, on adding eqs6 and 13 we find the total rate of formation of carbonatemolecules (including liquid and solid forms) is kg[N0
(0)(t) +N1
(0)(t)] in phase I and âpqpNp(0)[N0
(0)(t) + N1(0)(t)] in phase
II.
dn1(kc,t)
dt) kn(kc) n0(kc,t) -
âmqm n1(kc,t) N0(0)(t) ∑
l)1
∞
Pl(t) - kg n1(kc,t) (7)
dn1(k,t)
dt) kn(k) n0(k,t) - âmqm n1(k,t) N0
(0)(t) ∑l)1
∞
Pl(t) +
âmqm ∑l)1
k-kc
n1(k- l,t) n0(l,t) - kg n1(k,t) + kg n1(k- 1,t)
k ) kc + 1, kc + 2, kc + 3... (8)
dn1(kc,t)
dt) kn(kc) n0(kc,t) -
âmqm n1(kc,t) N0(0)(t) ∑
l)1
∞
Pl(t) - âpqpNp(0) n1(kc,t) (9)
dn1(k,t)
dt) kn(k) n0(k,t) - âmqm n1(k,t) N0
(0)(t) ∑l)1
∞
Pl(t) +
âmqm ∑l)1
k-kc
n1(k- l, t) n0(l,t) - âpqpNp(0) n1(k,t) +
âpqpNp(0) n1(k- 1,t)
k ) kc + 1, kc + 2, kc + 3... (10)
N1(n)(t) ) ∑
k)kc
∞
kn n1(k,t) n ) 0, 1, 2, 3... (11)
dN1(0)(t)
dt) ∑
l)kc
∞
kn(l) n0(l,t) (12)
dN1(1)(t)
dt) ∑
l)kc
∞
lkn(l) n0(l,t) +
âmqmN1(0)(t)N0
(1)(t) + kgN1(0)(t) (13)
dN1(2)(t)
dt) ∑
l)kc
∞
l2kn(l)n0(l,t) + âmqm[2N0(1)(t)N1
(1)(t) +
N0(2)(t)N1
(0)(t)] + kg[2N1(1)(t) + N1
(0)(t)] (14)
1020 Langmuir, Vol. 17, No. 4, 2001 Bandyopadhyaya et al.
2.7. Balance for Ca(OH)2. Having considered thebalance for distribution of carbonate molecules over thenucleated and non-nucleated micelles, we need to writedown the balance for obtaining the total number of Ca-(OH)2 molecules in the micelles. This would determinewhen the model equations have to be changed from phaseI to phase II. Initially, the simulation starts with 25 Ca-(OH)2 molecules per micelle, which continuously decreasesduring phase I. Once this number decreases to zero, thesolution is based on model equations of phase II. Thechangeover is tracked by the following equation, whoseright-hand side represents loss of lime via reaction.
Thus, phase I lasts while kgt e 25. Because the increasein lime molecules resulting from pickup by collisions withsolid Ca(OH)2 particles is stoichiometrically balanced bythe loss due to very fast reaction with CO2, the left-handside is equal to zero in phase II.
2.8. Nondimensionalization and Moment Equa-tions. To compare with the experimental data of Romanet al.,3 the number density and moments are normalizedwith the initial number of micelles, N0
(0)(0). The nondi-mensional number density function of non-nucleatedmicelles is hence given by
where N0(0)(0) ) n0(0,t)0).
The nondimensional moments are then defined asfollows.
where
is nondimensional time.The nondimensional number of the suspended, micron-
sized lime particles remains unchanged during the wholeprocess as only the particle size reduces because ofprogressive dissolution. This constant number is given as
The total number of molecules in the lime particles innondimensional form is expressed as
The total number of molecules of Ca(OH)2 in the micelles,at any instant, in nondimensional form is given by
Two nondimensional parameters appear in the system ofequations which characterize the relative rates of inter-micellar exchange due to Brownian coalescence to thenucleation rate (at the critical number of molecules) onone hand and the frequency of lime pickup by micelle-particle Brownian collisions to the nucleation rate on theother hand.
Another important parameter is ú(l), denoting the ratioof the nucleation rate in a micelle having l CaCO3molecules to its absorption rate of CO2 by mass transfer.
The nondimensional moment equations are now writtenin the following fashion. All the dependent variables areunderstood to be functions of τ. In phase I, the equationstake the following form.
In phase II, the equations become
dNCa(OH)2
(1) (t)
dt) -kg[N0
(0)(t) + N1(0)(t)] ) -kg (15)
nj0(l,τ) )n0(l,t)
N0(0)(0)
(16)
µ1(n)(τ) )
N1(n)(t)
kcnN0
(0)(0)n ) 0, 1, 2, 3... (17)
µo(n)(τ) )
N0(n)(t)
kcnN0
(0)(0)n ) 0, 1, 2, 3... (18)
τ ) kgt (19)
µp(0) )
Np(0)
N0(0)(0)
(20)
µp(1)(τ) )
Np(1)(t)
N0(0)(0)
(21)
µCa(OH)2
(1) (τ) )NCa(OH)2
(1) (t)
kcN0(0)(0)
(22)
Ω(kc) )âmqmN0
(0)(0)
kn(kc)(23)
Ωp(kc) )âpqpN0
(0)(0)
kn(kc)(24)
ú(l) )kn(l)kg
(25)
dµ1(0)
dτ) ∑
l)kc
∞
ú(l) nj0(l,τ) (26)
dµ1(1)
dτ) ∑
l)kc
∞ l
kc
ú(l) nj0(l,τ) +
ú(kc) Ω(kc) µ0(l)(τ ) µ1
(0)(τ) +µ1
(0)(τ)
kc
(27)
dµ1(2)
dτ) ∑
l)kc
∞ ( l
kc)2
ú(l) nj0(l,τ) + ú(kc) Ω(kc)[2µ0(1)(τ) µ1
(1)(τ) +
µ0(2)(τ) µ1
(0)(τ)] +1
kc[2µ1
(1)(τ) +1
kc
µ1(0)(τ)] (28)
dµ0(0)
dτ) -
dµ1(0)
dτ(29)
dµ0(1)
dτ) -∑
l)kc
∞ l
kc
ú(l) nj0(l,τ) -
ú(kc) Ω(kc) µ0(1)(τ) µ1
(0)(τ) +µ0
(0)(τ)
kc
(30)
dµCa(OH)2(1)
dτ) - 1
kc(31)
dµ1(0)
dτ) ∑
l)kc
∞
ú(l) nj0(l,τ) (32)
Modelling of CaCO3 Nanoparticle Formation Langmuir, Vol. 17, No. 4, 2001 1021
The process of dissolution of solid lime begins only in phaseII and continues until 26 min when 95% of the lime isexhausted.4 This can be followed by solving the aboveequations till the specified value of time is reached.
The moment eqs 28 and 34 contain µ0(2)(τ), which is the
dimensionless second moment of n0(l, t). For the Poissondistribution, the second moment is the sum of the varianceand square of the first moment, and the variance is sameas its mean. Thus, we obtain µ0
(2)(τ) as follows.
where
is the Poisson mean.Further, we define the coefficient of variation in particle
radius (COVrp) as a measure toward the relative spreadin the particle size distribution. It is the ratio of standarddeviation to mean radius found from the model.
The authors3 have however reported the standard devia-tion of the particle radius (σrp) from their experiments.They have used a log-normal distribution for this pur-pose. We hence calculated their experimental coefficientof variation from the expression (exp[σrp
2] - 1)1/2 (whichis known as the COV of a log-normal variable). Thisexpression gave us the same value as the σrp reported by
them. This value we compared with that obtained fromour model (eq 40).
2.9. Initial Conditions. In the beginning, none of themicelles is nucleated and hence all moments related tonucleated micelles are zero. The mean number of Ca(OH)2molecules per micelle is calculated from the known amountof Ca(OH)2 present in the micellar core and the numberof micelles existing at the beginning of the experiment.The latter quantity is experimentally obtained by Romanet al.3 Thus, the relevant set of initial conditions is asfollows.
Because each micelle at τ ) 0 has 25 molecules of lime,the onset of phase II occurs when the solution showsµCa(OH)2
(1) ) 0, which happens when τ ) 25. This value of τis independent of the values of qm, qp, kg, or kn(l) we use.From this time onward, the equations differ, as discussedpreviously. The conditions at the end of phase I naturallyform the initial conditions for phase II.
2.10. Nucleation Rate. Heterogeneous nuclei will notbe present in the micelles in view of their small size andthe absence of foreign bodies. The theory of the homo-geneous nucleation rate can therefore be used. We usethe expression for I, which is nucleation rate per unitvolume from a condensed phase, quoted by Adamson6
(originally derived by Turnbull and Fisher).
∆Gmax is equal to one-third of the surface free energyof the nucleus, the expression for which has been givenby Gibbs and is quoted by Adamson.6
In the above equation, λ is the supersaturation with respectto CaCO3 and its value is dependent on the number ofCaCO3(l) molecules present in a micelle. In a micellecontaining l such molecules, it is given by
where
(6) Adamson, A. W. Physical Chemistry of Surfaces; John Wiley &Sons: New York, 1990; p 369.
dµ1(1)
dτ) ∑
l)kc
∞ l
kc
ú(l) nj0(l,τ) + ú(kc) Ω(kc) µ0(1)(τ) µ1
(0)(τ) +
ú(kc) Ωp(kc) µp(0)
kc
µ1(0)(τ) (33)
dµ1(2)
dτ) ∑
l)kc
∞ ( l
kc)2
ú(l) nj0(l,τ) + ú(kc) Ω(kc) ×
[2µ0(1)(τ) µ1
(1)(τ) + µ0(2)(τ) µ1
(0)(τ)] +
ú(kc) Ωp(kc) µp(0)
kc[2µ1
(1)(τ) +1
kc
µ1(0)(τ)] (34)
dµ0(0)
dτ) -
dµ1(0)
dτ(35)
dµ0(1)
dτ) -∑
l)kc
∞ l
kc
ú(l) nj0(l,τ) - ú(kc) Ω(kc) µ0(1)(τ) µ1
(0)(τ) +
ú(kc) Ωp(kc) µp(0)
kc
µ0(0)τ (36)
dµCa(OH)2
(1)
dτ) 0 (37)
µ0(2)(τ) )
µ0(0)(τ)
kc2
[lh(τ) + lh2(τ)] (38)
lh(τ) ) kc
µ0(1)(τ)
µ0(0)(τ)
(39)
COVrp(τ) )
[µ1(2)(τ)/µ1
(0)(τ)]1/3 - [µ1(1)(τ)/µ1
(0)(τ)]2/31/2
[µ1(1)(τ)/µ1
(0)(τ)]1/3(40)
µ1(0)(0) ) 0 (41)
µ1(1)(0) ) 0 (42)
µ1(2)(0) ) 0 (43)
µ0(0)(0) ) 1 (44)
µ0(1)(0) ) 0 (45)
µCa(OH)2(1) (0) ) 5 (46)
µp(1,0)(0) ) 8.37 × 10⁹ (47)
I ) cA exp(-∆Gmax
kBT ) (48)
∆Gmax )16πσ3Vm
2
3(kBT)2(ln λ)2(49)
λl )[CaCO3(l)]l
Ks1/2
(50)
[CaCO3(l)]l ) lNAVmic
(51)
1022 Langmuir, Vol. 17, No. 4, 2001 Bandyopadhyaya et al.

The nucleation rate kn(l) in a non-nucleated micellecontaining l molecules of CaCO3(l) therefore is obtainedby multiplying I from eq 48 with the volume of the micelle.However, c multiplied by the volume of the micelle isexactly equal to the number of CaCO3(l) molecules presentin the non-nucleated micelle. Hence,
with supersaturation being calculated from eq 50, cor-responding to the prevailing concentration of l moleculesof CaCO3(l) in the micelles.
For micelles of the size encountered in the experimentsof Roman et al.,3 the condition of supersaturation isattained even if one molecule of CaCO3(l) is present in amicelle. It would be unrealistic to expect a nucleus to formwith just one CaCO3(l) molecule. Clearly, nucleation canbe permitted only in those micelles which possess aminimum number of CaCO3(l) molecules required to forma nucleus. In our previous paper,2 we had used a value ofkc ) 5. We have retained the same value in the presentwork. On the basis of this consideration, the modifiedexpression for the nucleation rate obtained from eqs 49and 50 is the following.
Thus, eq 53 can be used to calculate the nucleation ratein conjunction with the moment equations.
2.11. Collision Frequency. We have used Browniancollision frequencies between three kinds of species:nucleated micelles (n), non-nucleated micelles (m), andlime particles (p). Among these, collisions among limeparticles and between nucleated micelles themselves areinconsequential. This stems from the absence of anyagglomeration of solid particles. In general, the collisionfrequency between species 1 and 2 given by Smoluchowski7
is
where v1 and v2 are volumes of the colliding micelles orparticles. The volume of a micelle is taken to be thatcorresponding to the reported initial micellar diameter.The volume of each nucleated micelle with time is alsokept the same as the initial diameter, because the changein collision frequency, resulting from the growth of theparticle inside, is only about 2%. Thus, for collision betweenequisized micelles (both m-m and m-n types) the abovereduces to
For micellar collisions with lime particles (both m-pand n-p types), eq 54 is used, with initial diameters beingused for simplicity. The coalescence efficiency betweenmicelles and lime particles and among micelles themselvesmodifies the fusion rate and is described in the next section.
3. Results and Discussion
3.1. Parameter Estimation. Computations have beencarried up to 26 min, which is the duration of theexperiments of Roman et al.3 for obtaining stable, amor-phous CaCO3 nanoparticles. Toward this end, we solveeqs 26-31 for phase I and eqs 32-37 for phase II. Thevalues of the various parameters are shown in Table 2.
Out of 26 g of lime initially present, 2.294 g goes towardreaction with sulfonic acid to generate the surfactant. Theremaining lime particles are taken to be of size 1 µm(micron size range was mentioned by the authors), therebygiving a total of 2.08 × 10¹³ lime particles. These aredispersed in the dispersion of total volume, Vd ) 225.1cm3, calculated based on their data of volume of eachcomponent. Hence, the number density of lime particlesis Np
(0) ) 9.24 × 1010 cm-3. From these particles, eachmicelle gets 25 molecules. The authors report a total of9.7 × 1020 micelles in the dispersion, each of diameter24.4 Å to start with. Thus there are N0
(0) ) 4.31 × 10¹⁸
micelles per cm3 of dispersion. Therefore at t ) 0, thenondimensional number of lime particles to be used inthe model equations given before is µp
(0) ) 2.14 × 10⁻⁸.Furthermore, kg ) 0.112 s-1 has been used for the gasentry rate into micelles. As mentioned earlier, this valueof kg is evaluated from the experimental condition that allthe sparged CO2 is consumed4 without any excess beingleft into the atmosphere. However, if gas is passed inexcess, it will escape the system in the form of bubbles,and the method of calculation of kg for using the presentanalysis under those circumstances is given in AppendixA. Also, the implications of the variation in sparging rateof CO2 have been discussed in section 4.2 where simulationresults are presented.
As was mentioned earlier, the coalescence efficiencybetween micelles and lime particles is evaluated from theexperimentally fitted parameter âp and works out to be0.055. So is the case with âm which also has been obtainedto match the final results with experiments. The value ofâm turns out to be 7 × 10⁻⁶. This is a rather low value. Forexample, the value of âm for an AOT-water-cyclohexanesystem8 is about 5 × 10⁻⁵. However, the surfactant usedby Roman et al.3 has a tail consisting of alkyl groups andthe solvent is xylene, which is aromatic in nature, and itis possible that the value of âm may be lower. The viscosityof the medium η for use in eqs 54 and 55 is taken to be0.50 P, as reported by Roman et al.3 The coalescencefrequencies were calculated from eqs 54 and 55 using thevalues of efficiencies discussed above and are listed inTable 2.
The nucleation rate kn(l) is obtained from eq 53. In eq53, A is a pre-exponential factor and only a range of its
(7) Smoluchowski, M. V. Phys. Z. 1916, 17, 557.(8) Flethcer, P. D. I.; Howe, A. M.; Robinson, B. H. J. Chem. Soc.,
Faraday Trans. 1 1987, 83, 985.
kn(l) ) lA exp(-∆Gmax
kBT ) (52)
kn(l) ) 0, l e 4
lA exp[-16πσ3Vm
2
3(kBT)3(ln λl)2] l g 5 (53)
q1-2 )2kBT
3η [2 + (v1
v2)1/3
+ (v2
v1)1/3] (54)
qm )8kBT
3η(55)
Table 2. Parameters for the Model of CaCO3 ParticleFormation in Overbasing
variable value variable value
Vd 225.1 cm3 qp 2.204 × 10⁻¹¹ cm3 s-1
N p(0)(0) 9.24 × 1010 cm-3 qm 2.194 × 10⁻¹³ cm3 s-1
N 0(0)(0) 4.31 × 1018 cm-3 A 278.42 s-1
âp 0.055 kc 5âm 7 × 10⁻⁶ Vm 6.13 × 10⁻²³ cm3
kg 0.112 s-1 σ 97 dyne cm-1
kB 1.3806 × 10⁻¹⁶ erg K-1 Vmic 4.68 × 10⁻²⁴ L-1
η 0.50 P Ks 3.31 × 10⁻¹² mol2 L-2
T 298 K
Modelling of CaCO3 Nanoparticle Formation Langmuir, Vol. 17, No. 4, 2001 1023

values is available. In our previous paper (Bandyo-padhyaya et al.2), we fitted the parameter in this range,to quantitatively explain the experiments of Kandori etal.1 We have retained the same value of 278.42 s-1 forpredictions from the present model. The critical numberof molecules has also been kept the same as in the previouspaper, that is, kc ) 5. Other parameters, such as Vm andσ, required in eq 53, are specific to CaCO3 and hence aretaken from our previous paper.2 The values are shown inTable 2. The micelles in the beginning contain mostlymethanol and little water. A burst of nucleation is foundto occur in a very short period after sparging begins, andnucleation occurs at a very slow rate thereafter. Hence,for the purposes of calculating supersaturation, weconsider the micellar core to be purely methanol. The corevolume to be used in eqs 51 and 53 is Vmic ) 4.68 × 10⁻²⁴
L. The solubility of sparingly soluble salts such as CaCO3is proportional to the cube of the dielectric constant of thesolvent. Thus, we find that Ks in methanol (needed in eq50) is 0.5% of Ks in water. The latter is 6.61 × 10⁻⁹ mol2
L-2. Thus, we have used Ks ) 3.31 × 10⁻¹² mol2 L-2 in eq50 for calculating supersaturation.
The population of non-nucleated micelles for highervalues of l is small because lh(t) generally does not reachup to the maximum value of 25 molecules because of rapidnucleation. Hence, in computations the sum appearing ineqs 26-37 has been truncated beyond l ) 50.
3.2. Model Prediction. In predicting the experimentalfindings of Roman et al.,3 we have first calculated theamount of lime present in each micelle in the beginningand used the experimentally reported CO2 transfer rate,kg. We have then solved the moment eqs 26-37 together.
Solution of the above equations also furnishes thenumber and evolution in the size of CaCO3 particles withtime, which are of principal interest. Figure 3 shows thevariation in predicted diameter of a CaCO3 particle (dp)with time. The predicted size at all times compares verywell with the experiments. Though the first experimentalvalue reported is at 3 min (τ ) kgt ) 20.2), the sharpestevolution (nucleation and initial growth) occurs duringphase I, for a duration of about 10 s (τ ∼ 1). Phase I
continues till the lime initially present in the micelles isexhausted (τ ) 25). Phase II then begins. The finalpredicted size is 60.2 Å at the end of 26 min, and theexperimental measurement given in symbols (reportedby Roman et al.3) indicates 59.6 Å, indicating closeagreement between the two.
To explain how CaCO3(l) molecules build (by reaction)and decay (by nucleation and growth) with time and inturn influence nucleation, the moments µ0
(1) and µ1(0) are
plotted in Figures 4 and 5. Figure 4 shows that the meannumber of molecules per micelle reached a maximum ofonly 0.14×lc ∼ 0.7 molecules at τ ∼ 1 or at about 10 s. Ifnucleation did not occur, the mean number at this timeshould have been 1. Thus, nucleation occurs even before10 s. Further, this implies that some micelles nucleateeven though the mean occupancy is well below kc ) 5.
Figure 3. Comparison of experimental and model predictionof the temporal evolution of CaCO3 particle diameter (dp is incm units).
Figure 4. Variation in the nondimensional first moment ofnon-nucleated micelles. The inset shows the detail in the initialpart of phase I.
Figure 5. Variation in the nondimensional zeroth moment ofnucleated micelles. The inset shows the detail in the initialpart of phase I.
1024 Langmuir, Vol. 17, No. 4, 2001 Bandyopadhyaya et al.

This is due to the fact that the Poisson distribution createsa substantial number of micelles containing the criticalnumber even when the mean occupancy is around unity.This is also confirmed from the plot of µ1
(0) presented inFigure 5. It shows an initial burst of nucleation and thatabout 5% of the initially present micelles have nucleatedin about 10 s. Subsequently also, CaCO3(l) moleculescontinue to form. However, the CaCO3(l) molecules aremore rapidly absorbed by nanoparticles for their growth.Hence, there is a rapid decrease in the CaCO3(l) moleculesin the micelles as shown in Figure 4. Thus, the meanoccupancy falls quickly to about 0.25 near the end of phaseI and decreases further. Because of this, after the initialburst nucleation slows down. As can be seen from Figure5, only about 2% more of the initially present micelleshave nucleated by the end of phase I (τ ∼ 1), and another2% more nucleate till the end of the process. Figure 5shows that the number of nuclei reaches a value of 0.092,which compares well with the experimental value of 0.1.Thus, we conclude that about 10 micelles result in oneCaCO3 particle at the end. In other words, around 10%of the micelles nucleate.
The authors also present COV for different times andconclude that their values indicate nucleation over a veryshort time and constant growth thereafter. The COVvalues based on the model have been presented in Figure6 along with the experimental values reported by theauthors. It is seen that though there is a systematicdeviation between experimental and predicted values inphase I, the trend in both the cases is the same. In eachcase, the COV decreases relatively sharply at low τ andtends to reach an asymptotic value toward the end ofoverbasing, there being very good agreement in thislimiting value. Thus, the model captures the basic featureof the evolution of the distribution in particle radius.
The success of the model is not just in its ability toreproduce the experimental values and trends but in itsability to do so with the choice of the same parametricvalues for the nucleation pre-exponential factor (A) andcritical number (kc), obtained on an entirely different set
of data reported by Kandori et al.1 The importance of thepresent model is then the generalized framework withinwhich we have been able to closely predict the radicallydifferent number of particles obtained by Roman et al.3(10% of initial micelles) compared to the very small numberof particles of Kandori et al.1 (10-6% of initial micelles).
Also of significance to us is to explore the principalreasons for such a huge orders of magnitude difference inthe experimental results, as identified by the model. Ahigh amount of lime initially present in the micellesencourages an increased extent of formation of CaCO3(l)per micelle. In contrast, the lime population in micelleswas very low (<0.1) in the work of Kandori et al.1 Thehigher population of carbonate molecules in the experi-ments of Roman et al.3 translates into a very high fractionof micelles that can nucleate. The presence of methanolin the micellar core reduces the solubility of carbonateeven further, making nucleation more facile. Moreover,the medium used by Roman et al.3 is about 55 times moreviscous, thus reducing intermicellar exchange frequencyand hence particle growth.
4. Implications of Rate of Gas Transfer
Instantaneous Gas Transfer Rate. The presentmodel has been based on time scale analysis, relevant tothe experimental conditions of Roman et al.3 Rapidnucleation has been possible primarily because of thepresence of a large number of Ca(OH)2 molecules initiallyin the micelles. In fact, the formation of CaCO3(l) moleculeswas limited by the availability of CO2. It may be possibleto obtain even higher rates of nucleation if CO2 could bepumped into the micelles at still higher rates. This maybe realized in practice by (i) sparging gas in excess suchthat bubbles leave the reaction mixture (dealt with in theAppendix), (ii) using high pressure to increase theconcentration gradient, and (iii) increasing the gas-liquidinterfacial area through the use of better contactors.Matson et al.9 have prepared Al(OH)3 particles by injectingammonia in the continuous phase of supercritical propane.The AOT reverse micelles in propane had predissolvedAl(NO3)2 solution. They have speculated that operationin the supercritical fluid regime may allow high masstransfer rates of reactants (in this case ammonia) to andacross the micelles and should relax rate limitations whenone of the reactants is a gas.
The calculation presented in the Appendix shows thateven under atmospheric pressure, if gas is passed in excessthe value of kg is of the order of 2300 s-1. It is 23 000 timesmore than the rate at which the gas was made availablein the experiments of Roman et al.3 Hence, as an extremecase we analyze the implications of instantaneous CO2transfer into the micelles. Nucleation now takes placeonly after all micelles have acquired 25 CaCO3(l) moleculesby instantaneous CO2 transfer and reaction, renderingthe initial nucleation rate for the micelles to be equal.However, micelles containing only water are generatedby fusion of nucleated and supersaturated micelles andthrough subsequent fission of the dimer. Initially at least,the water micelles will constitute only a small fraction ofthe population. If we neglect the collisions of these watermicelles with the supersaturated ones until all thesupersaturation corresponding to the initial lime contentis exhausted via nucleation or by fusion with nucleatedmicelles, we obtain an analytical solution to the numberof particles.
(9) Matson, D. W.; Fulton, J. L.; Smith, R. D. Mater. Lett. 1987, 6,31.
Figure 6. Comparison of experimental and model predictionof the temporal evolution in COV (coefficient of variation) ofCaCO3 particle radius. The inset shows the initial part ofphase I.
Modelling of CaCO3 Nanoparticle Formation Langmuir, Vol. 17, No. 4, 2001 1025

On the basis of the two steps of nucleation and collision-fusion discussed above, the zeroth moments of non-nucleated and nucleated micelles are written as follows.
Now dividing both sides of eqs 56 and 57 by kn(25)N0
(0)(0), we obtain the nondimensional moments. Theseare
where
and
The analytical solution derived from the coupled nonlineareqs 58 and 59 is
where
In the limit of large times (τ′ f ∞), from eq 62 we findµ1
(0)(τf) ) µ1(0)+. The ratio of the final number of particles
to the initial number of micelles therefore is
The analytical solution brings out the relative impor-tance of collision and nucleation rates on particle forma-tion, in terms of the nondimensional parameter Ω(25)defined in eq 61. Thus, the higher the ratio, the smallerthe nucleation rate and hence the number of particles.Hence, if Ω(25) > 1 then all micelles would not nucleate.
With the micelle-micelle collision frequency qm ) 2.194× 10⁻¹³ cm3 s-1, the intermicellar coalescence efficiencyâm ) 7 × 10⁻⁶, and the nucleation rate in methanol kn(25)) 119.2 s-1, we obtain Ω(25) ) 0.056. Equation 64 thengives the desired ratio to be 0.973, indicating 97.3% ofmicelles can nucleate. Thus, the limiting analysis showsthat an increase in the sparging rate and/or pressure inthe vessel can indeed help in producing still largernumbers of particles, from 10% obtained in experiments
to a maximum of 97.3% of initial micelles. The particleswould necessarily be smaller as the total amount of productis the same. Knowing the initial amount of lime, one canthen estimate the CaCO3 particle size. The approximatesolution provided by eq 64 is therefore of interest. We canestimate the maximum number of nanoparticles and hencethe smallest size that can be synthesized with very highCO2 transport. On the other hand, for a particular sizerequirement one can a priori specify the range of valuesof some key experimental conditions required to befollowed.
In the limit of instantaneous gas transfer and reaction,the process of Kandori et al.1 also reduces to the presentanalysis. The differences in their experiments are thefollowing. The lime present initially in a dissolved formbeing very scarce, the CaCO3(l) molecules are distributedin a Poisson manner, and the intermicellar coalescenceefficiency varies from 10% to 0.5% depending on R. WhenΩ . 1, as in their experiment, the limiting form of eq 64is x1/Ω. For their experiment, we define
The numerator gives the rate at which a particle in anucleated micelle undergoes fusion-growth due to col-lisions with supersaturated micelles. The term (1 - P0)gives the fraction of the supersaturated micelles, that is,those containing one or more molecules. The denominatoris a product of the intrinsic nucleation rate of a micellehaving kc number of CaCO3(l) molecules with the fractionof such micelles, thus giving the average rate with whicha non-nucleated micelle can nucleate. Hence, Ωk(kc) is ameasure of the relative rates of the two steps that weconsider in the simplified analysis. We find that for kc )5, our calculated value of Ωk for their process is ∼1014.Thus, the ratio x1/Ωk is 10-7, which is close to the orderof 10-8, found in the experiments of Kandori et al.1
Effect of Sparging Rate. If gas is sparged at a ratesmaller than that calculated in the Appendix, all of it willbe absorbed and none of it will escape in the form of bubblesas in the experiments of Roman et al.3 In such a case, thevalue of kg is simply given by the flow rate of gas inmolecules per second divided by the number of micellesin the system, the latter being equal to 9.7 × 10²⁰. As thevalue of kg is increased, the rate of formation of CaCO3(l)increases, and hence the mean occupancy also increases.As argued in the previous section, this in turn leads to theformation of a greater number of nuclei and, in view of thefixed amount of lime available, a smaller particle size.This is shown in Figure 7, keeping all the other parametersin the model constant. Curve C shows the results for kg) 10, and curve B shows the results for kg ) 0.224. It canbe seen that the particle size is reduced significantly inthe former case. The particle size decreases significantlyonly when nucleation can dominate growth by collision-fusion. This in turn can occur only when the meanpopulation of CaCO3(l) can be raised more rapidly thancan be consumed by collisional growth. The ratio of therates of these two processes is kg/τcn
-1 and is about 0.1 forthe condition of Roman et al.3 (kg ∼ 0.1). Thus, significantchanges in the final particle size cannot be expected tillthe ratio exceeds 1, as with curve C of Figure 7.
The above discussion has certain practical implicationsfor the conduct of the overbasing process. If duringsparging of CO2 significant unevenness in the availabilityof CO2 to micelles is created because of poor mixing, itwould affect the final particle size considerably.
dN0(0)(t)
dt) -kn(25)N0
(0)(t) - âmqmN1(0)(t)N0
(0)(t) (56)
dN1(0)(t)
dt) kn(25)N0
(0)(t) (57)
dµ0(0)
dτ′ ) -µ0(0)(τ′) - Ω(25) µ1
(0)(τ′) µ0(0)(τ′) (58)
dµ1(0)
dτ′ ) µ0(0)(τ′) (59)
τ′ ) kn(25)t (60)
Ω(25) )âmqmN0
(0)(0)
kn(25)(61)
µ1(0)(τ′) ) µ1
(0)+ +2x1 + 2Ω(25)
Ω(25)×
µ1(0)+ exp(-τ′x1 + 2Ω(25))
µ1(0)- - µ1
(0)+ exp(-τ′x1 + 2Ω(25))(62)
µ1(0)( ) - 1
Ω(25)[1 - x1 + 2Ω(25)] (63)
µ1(0)(τf) )
x1 + 2Ω(25) - 1Ω(25)
(64)
Ωk )âmqmN0
(0)(0)(1 - P0)
kn(kc)Pkc
(65)
1026 Langmuir, Vol. 17, No. 4, 2001 Bandyopadhyaya et al.

5. Conclusions
During the formation of nanoparticles through swollenreverse micelles, nucleation based on supersaturation andgrowth based on Brownian collisions decide both thenumbers and the size distribution of the particles. Thoughmass transfer, reaction, nucleation, growth, and collisionsoccur simultaneously, a comparison of various time scalescan lead to models in which processes occur sequentiallyand hence can be analyzed easily. It is seen that aframework of population balance equations obtainedthrough the application of time scale analysis is able toexplain results of the carbonation of lime, which differ bymany orders of magnitude.
Though tested for carbonation of lime, the model is quitegeneral and is applicable to situations where gas-liquidreactions yield nanoparticles in a fashion such that growthtime scales are much lower than nucleation and collisiontime scales.
Roman et al.3 also make an interesting observation intheir paper that if carbonation is carried out further upto about 40 min, the dispersion becomes unstable. Theyattribute this to crystallization of CaCO3. The modelpresented does not address morphological issues, andfurther work is needed in this direction to be able to explainthe observed effect.
Acknowledgment. We thank Professor D. Ramkrish-na of Purdue University for the analytical solution andMr. M. R. Durairaj for carrying out model calculationsduring the course of revision of the paper.
Appendix
CalculationofCO2 TransferRateatHighSpargingRates. In this Appendix, we calculate the maximum gasinput rate to the micelles at atmospheric pressure. Tothis end, gas is assumed to be sparged at such a rate thatthe excess CO2 escapes from the reaction mixture in theform of bubbles. We use the penetration theory formalismto calculate the rate of transfer of CO2. CO2 diffuses from
the gas bubbles into the organic solvent and then into themicelles. The thickness of the diffusion layer around thebubbles is of the order of a micron. The micelles are verysmall and hence will be present in the diffusion layer itself.As the bubbles are large compared to the diffusion layerthickness, we can treat the gas-liquid interface as planar.Consider CO2 (A) diffusing from a planar interface intoa semi-infinite organic medium. The interface at x ) 0 ismaintained at a saturation concentration of CA0. A isabsorbed into the micelles where it reacts with Ca(OH)2(B) present in excess. As this reaction is instantaneous,the rate of absorption of A into a single micelle is givenby (2D/dm)(πdm
2/4)CA. Thus, the equation for diffusion ofA in the organic medium is given by
where
Here, D ) 10-5 cm2 s-1 is the diffusivity of CO2 in theorganic medium, Nt ) 9.7 × 10²⁰ is the total number ofmicelles in dispersion, dm ) 24.4 × 10⁻⁸ cm is the diameterof micelle, and Vd ) 225.1 cm3 is the total volume ofdispersion. Hence, k′ ) 1.65 × 10⁷ s-1.
The relevant initial and boundary conditions are givenby
Bird et al.10 give a solution of eq A1 and an expressionfor moles of A absorbed (MA) through unit gas-liquidcontact area, between t ) 0 and t0. As k′t0 . 1, we use thesimplified expression given for this condition.
For large k′, as we have found here, the mass transferrate of A (i.e., CO2) is hence
where ag-l ) 15 cm2/cm3 is the maximum gas-liquidinterfacial area in mechanically stirred gas in liquiddispersion (Doraiswamy and Sharma11) and CA0 is thesaturation concentration of CO2 in the organic phase andis12 0.085 mol L-1. The right-hand side of eq A4 gives theCO2 mass transfer rate to be 16.38 mol L-1 s-1. The numberof CO2 molecules entering per micelle per second istherefore obtained by multiplying it with NAVd/(1000 Nt),giving the CO2 entry rate into a micelle as kg ) 2289 s-1.This corresponds to passing CO2 at a rate of 220 mol/min,a rate that may be difficult to reach in practice. Further,as mentioned in the main text, if gas is passed at a rate
(10) Bird, R. B.; Stewart, W. E.; Lightfoot, E. N. TransportPhenomena;John Wiley & Sons: New York, 1960; p 621.
(11) Doraiswamy, L. K.; Sharma, M. M. Heterogeneous Reactions;John Wiley & Sons: New York, 1984; Vol. 2, p 330.
(12) Just, G. Z. Phys. Chem. 1901, 37, 342.
Figure7. The effect of sparging rate of CO2 on particle diametershown in cm units. The top curve (A) is for kg ) 0.112 s-1, themiddle curve (B) is for kg ) 0.224 s-1, and the bottom curve (C)is for kg ) 10 s-1.
∂CA
∂t) D
∂2CA
∂x2- k′CA (A1)
k′ ) 2Ddm
Nt
Vd
πdm2
4(A2)
t ) 0 CA ) 0
x ) 0 CA ) CA0
x ) ∞ CA ) 0
MA ) xDk′CA0(t0 + 12k′) (A3)
d[CO2]dt
) xDk′ag-lCA0(A4)
Modelling of CaCO3 Nanoparticle Formation Langmuir, Vol. 17, No. 4, 2001 1027

less than that calculated above (74.95 mol L-1 s-1 or kg )2289 s-1), all the sparged gas is expected to dissolve, asis the case with the sparging rate used by Roman.4
Nomenclature
A Pre-exponential factor in nucleation rate, s-1
[CaCO3(l)] Molar concentration of CaCO3(l) in micellar core,mol L-1
COV Coefficient of variationc Number concentration of any species in micellar
core, cm-3
I Nucleation rate from condensed phase, cm-3 s-1
i Number of Ca(OH)2 molecules in a micellej Number of CO2 molecules in a micelleKs Solubility product of CaCO3, mol2 L-2
k Number of CaCO3 molecules in a particle insidea micelle
kB Boltzmann constant, 1.3806 × 10⁻¹⁶ erg K-1
kc Critical number of CaCO3(l) molecules requiredin a micelle for nucleation
kg Entry rate of number of CO2 molecules into amicelle, s-1
kn(l) Homogeneous nucleation rate in a micellecontaining l CaCO3(l) molecules, s-1
k1 Rate constant of reaction between CO2 andOH-1, L mol-1 s-1
l Number of CaCO3(l) molecules in a non-nucle-ated micelle
lh Mean number of CaCO3(l) molecules in a non-nucleated micelle
NA Avogadro’s number, 6.023 × 10²³ mol-1
NCa(OH)2
(1) Total number of Ca(OH)2 molecules in allmicelles per unit volume of dispersion, cm-3
Np(0) Number of suspended lime particles per unit
volume of dispersion, cm-3
Np(1) Total number of Ca(OH)2 molecules in sus-
pended lime particles per unit volume ofdispersion, cm-3
N0(n) nth moment of non-nucleated micelle population
per unit volume of dispersion, cm-3
N0(0) Total number of non-nucleated micelles per unit
volume of dispersion, cm-3
N0(0)(0) Total number of micelles present in the begin-
ning per unit volume of dispersion, cm-3
N0(1) Total number of CaCO3(l) molecules in non-
nucleated micelles per unit volume of disper-sion, cm-3
N0(2) Second moment of CaCO3(l) population in
non-nucleated micelles per unit volume ofdispersion, cm-3
N1(n) nth moment of nucleated micelle population per
unit volume of dispersion, cm-3
N1(0) Total number of nucleated micelles per unit
volume of dispersion, cm-3
N1(1) Total number of CaCO3 molecules in nucleated
micelles per unit volume of dispersion, cm-3
N1(2) Second moment of CaCO3 population in nucle-
ated micelles per unit volume of dispersion,cm-3
n0(l, t) Number of non-nucleated micelles per unitvolume of dispersion containing l moleculesof CaCO3(l), cm-3
nj0(l, τ) Scaled number of non-nucleated micelles con-taining l molecules of CaCO3(l)
n1(k, τ) Number of nucleated micelles per unit volumeof dispersion containing k molecules of CaCO3,cm-3
nj1(k, τ) Scaled number of nucleated micelles containingk molecules in the CaCO3 particle
Pl Probability of a micelle containing l moleculesof CaCO3(l)
q Brownian collision frequency between nucleusand solute molecules in micellar core, cm3 s-1
qm Brownian collision frequency between micelles,cm3 s-1
qp Brownian collision frequency between micellesand lime particles, cm3 s-1
R Molar ratio of dispersed phase (water andmethanol) to surfactant
T Temperature of experiment, 298 Kt Time, sVd Volume of the entire system, cm3
Vm Volume of a CaCO3 (calcite) molecule, 6.1265 ×10⁻²³ cm3
Vmic Volume of micellar core, L
Greek Symbols
âm Coalescence efficiency in intermicellar collisionsâp Coalescence efficiency in micelle-particle col-
lisions∆Gmax Maximumfreeenergychangeduringnucleation,
ergú(l) Nondimensional ratio of nucleation rate in a
micelle (for l CaCO3(l) molecules) to CO2 entryrate
η Viscosity of continuous organic medium, 0.009g cm-1 s-1
λl Supersaturation due to l molecules of anysparingly soluble salt
µCa(OH)2
(1) Scaled number of Ca(OH)2 molecules in allmicelles
µp(0) Scaled number of suspended lime particles
µp(1) Scaled number of Ca(OH)2 molecules in sus-
pended lime particles
µp(1,0) Mean number of Ca(OH)2 molecules in any
suspended lime particle
µ0(n) nth nondimensional moment of non-nucleated
micelle population per unit volume of disper-sion
µ1(n) nth nondimensional moment of nucleated mi-
celle population per unit volume of dispersionσ Interfacial tensionbetweennucleusandmicellar
core liquid, 97 dyne cm-1
τ Nondimensional time based on kg
τS Time scale of a micellar event with subscript S,s
τ′ Nondimensional time based on kn
Ω(kc) Nondimensional ratio of coalescence rate of agiven micelle with another micelle to its ownnucleation rate (for kc CaCO3(l) molecules)
Ω(25) Nondimensional ratio of coalescence rate of agiven micelle with another micelle to its ownnucleation rate (for 25 CaCO3(l) molecules)
Ωk(kc) Same nondimensional ratio as above, definedfor Kandori et al.'s experiment
Ωp(kc) Nondimensional ratio of coalescence rate of agiven micelle with a lime particle to its ownnucleation rate (for kc CaCO3(l) molecules)
Subscripts
c Coalescence with any micellecb Coalescence with a blank micellecn Coalescence with a nucleated micellecp Coalescence with lime particle
1028 Langmuir, Vol. 17, No. 4, 2001 Bandyopadhyaya et al.
g Growth of particle inside micellem Mass transfer of CO2 into micellen Nucleation in a single micellenn Nucleation in any micelle in the mediump Lime particler Reaction in a micelle0 Non-nucleated micelle1 Nucleated micelle
Superscripts
(m) Methanol(n) nth moment of the distribution(0) Zeroth moment(1) First moment(2) Second moment
LA000023R
Modelling of CaCO3 Nanoparticle Formation Langmuir, Vol. 17, No. 4, 2001 1029