Repeated exposure of Caco-2 versus Caco-2/HT29-MTX ...
55
1 Repeated exposure of Caco-2 versus Caco-2/HT29-MTX intestinal cell models to (nano)silver in vitro: comparison of two commercially available colloidal silver products Kévin GILLOIS 1 , Charlotte STOFFELS 2 , Mathilde LEVEQUE 1 , Isabelle FOURQUAUX 3 , Justine BLESSON 1 , Valérie MILS 1 , Sébastien CAMBIER 2 , Julien VIGNARD 1 , Hélène TERRISSE 4 , Gladys MIREY 1 , Jean-Nicolas AUDINOT 2 , Vassilia THEODOROU 1 , Marie- Hélène ROPERS 5 , Hervé ROBERT 1 , and Muriel MERCIER-BONIN 1,* 1 - Toxalim, Université de Toulouse, INRAE, INP-ENVT, INP-EI-Purpan, Université de Toulouse 3 Paul Sabatier, Toulouse, France. 2 - Luxembourg Institute of Science and Technology (LIST), 41, rue de Brill, Belvaux, L-4422, Luxembourg. 3 - Centre de Microscopie Électronique Appliquée à la Biologie, CMEAB, 133 route de Narbonne, 31062 Toulouse, France. 4 - Université de Nantes, CNRS, Institut des Matériaux Jean Rouxel, IMN, F-44000 Nantes, France 5 - INRAE, UR BIA, F-44316, Nantes, France. * Corresponding author: Muriel Mercier-Bonin, PhD, Toxalim, UMR INRAE 1331, 180 chemin de Tournefeuille, BP 93173, 31027 TOULOUSE cedex 3, France; Tel: +33 (0)5 82 06 64 58; E-mail: [email protected]
-
Upload
khangminh22 -
Category
Documents
-
view
0 -
download
0
Transcript of Repeated exposure of Caco-2 versus Caco-2/HT29-MTX ...

1
Repeated exposure of Caco-2 versus Caco-2/HT29-MTX intestinal cell
models to (nano)silver in vitro: comparison of two commercially available
colloidal silver products
Kévin GILLOIS1, Charlotte STOFFELS2, Mathilde LEVEQUE1, Isabelle FOURQUAUX3,
Justine BLESSON1, Valérie MILS1, Sébastien CAMBIER2, Julien VIGNARD1, Hélène
TERRISSE4, Gladys MIREY1, Jean-Nicolas AUDINOT2, Vassilia THEODOROU1, Marie-
Hélène ROPERS5, Hervé ROBERT1, and Muriel MERCIER-BONIN1,*
1 - Toxalim, Université de Toulouse, INRAE, INP-ENVT, INP-EI-Purpan, Université de
Toulouse 3 Paul Sabatier, Toulouse, France.
2 - Luxembourg Institute of Science and Technology (LIST), 41, rue de Brill, Belvaux, L-4422,
Luxembourg.
3 - Centre de Microscopie Électronique Appliquée à la Biologie, CMEAB, 133 route de
Narbonne, 31062 Toulouse, France.
4 - Université de Nantes, CNRS, Institut des Matériaux Jean Rouxel, IMN, F-44000 Nantes,
France
5 - INRAE, UR BIA, F-44316, Nantes, France.
* Corresponding author: Muriel Mercier-Bonin, PhD, Toxalim, UMR INRAE 1331, 180 chemin
de Tournefeuille, BP 93173, 31027 TOULOUSE cedex 3, France; Tel: +33 (0)5 82 06 64 58;
E-mail: [email protected]

2
Abstract
Colloidal silver products are sold for a wide range of disinfectant and health applications. This
has increased the potential for human exposure to silver nanoparticles (AgNPs) and ions (Ag+),
for which oral ingestion is considered to be a major route of exposure. Our objective was to
evaluate and compare the toxicity of two commercially available colloidal silver products on
two human intestinal epithelial models under realistic exposure conditions.
Mesosilver™ and AgC were characterized and a concentration range between 0.1 and 12 µg/mL
chosen. Caco-2 cells vs co-culture of Caco-2 and mucus-secreting HT29-MTX cells (90/10)
were used. Repeated exposure was carried out to determine cell viability over 18 days of cell
differentiation in 24-well plates. Selected concentrations (0.1, 1, and 3 µg/mL) were tested on
cells cultured in E-plates and Transwells with the same repeated exposure regimen, to determine
cell impedance, and cell viability and trans-epithelial electrical resistance (TEER), respectively.
Silver uptake, intracellular localisation, and translocation were determined by CytoViva™,
HIM-SIMS, and ICP-MS. Genotoxicity was determined on acutely-exposed proliferating Caco-
2 cells by γH2AX immunofluorescence staining.
Repeated exposure of a given concentration of AgC, which is composed solely of ionic silver,
generally exerted more toxic effects on Caco-2 cells than Mesosilver™, which contains a mix
of AgNPs and ionic silver. Due to its patchy structure, the presence of mucus in the Caco-
2/HT29-MTX co-culture only slightly mitigated the deleterious effects on cell viability.
Increased genotoxicity was observed for AgC on proliferating Caco-2 cells. Silver uptake,
intracellular localisation, and translocation were similar.
In conclusion, Mesosilver™ and AgC colloidal silver products show different levels of gut
toxicity due to the forms of distinct silver (AgNPs and/or Ag+) contained within. This study

3
highlights the applicability of high-resolution (chemical) imaging to detect and localize silver
and provides insights into its uptake mechanisms, intracellular fate and cellular effects.
Keywords
colloidal silver; silver nanoparticles; repeated exposure in vitro; gut toxicity; genotoxicity;
high-resolution chemical imaging

4
1 Introduction
Silver nanoparticles (AgNPs) are increasingly used in a wide range of consumer products, such
as cleaning products, food storage containers, personal care products, and dietary supplements
(Tulve et al., 2015), as inventoried by the project on Emerging Nanotechnologies (The
Woodrow Wilson International Center for Scholars 2019). The high surface area of AgNPs
allows for redox-driven dissolution and the release of ionic silver (Ag+), which provides broad-
spectrum antimicrobial properties to products (Wijnhoven et al., 2009). Amongst the forms
consumed by humans, AgNPs may be present in colloidal silver (defined as a suspension of
silver-containing particles between 1 and 1000 nm in size), commercially available as over-the-
counter (OTC) drug products and proposed in the US and Europe as a dietary supplement (Reed
et al., 2014; Rong et al., 2018) for the claimed benefits of supporting a healthy human immune
system. Although the Food and Drug Administration (FDA) did not recognize OTC colloidal
silver products as safe and effective in 1999 (FR Doc. 99–21253), the sale of colloidal silver as
a dietary supplement is not prohibited, as Federal law does not require it to be proven safe or to
have health benefits. In Europe, silver no longer appears on the list of vitamins and minerals
authorized in food supplements (directive 2002/46/EC of the European Parliament and of the
Council in June 2002).
The intentional oral uptake of colloidal silver dietary supplements represents the most direct
exposure route of silver for humans, which can result in exposure of up to 0.02 mg/kg body
weight/day (Larsen et al., 2015). From a risk assessment perspective, understanding their fate,
cellular uptake, and bioavailability upon ingestion is of paramount importance to assess their
impact on human health. As the first line of defence, as well as the portal of entry and target for
AgNPs, the gut has been extensively studied in terms of toxicological endpoints, mainly in vitro

5
and under high-concentration and acute-exposure conditions. Cellular uptake, oxidative stress,
cytotoxic, genotoxic, and/or inflammatory effects have been reported, despite conflicting
findings, explained by different concentration ranges, in vitro cellular models, methods of
detection, and physico-chemical characteristics of the AgNPs under study (Pietroiusti et al.,
2017). However, these in vitro studies were mainly focused on commercially available or
laboratory-synthesized nanoparticles, which are not fully representative of the ingested forms
present in colloidal silver dietary supplements. Thus, it is critical to evaluate the effects of “real”
ingested AgNPs, which exhibit specific physico-chemistry, behaviour, and gut toxicity, under
realistic conditions that mimic human exposure (i.e. low dose, repeated exposure). Rogers et al.
(2018) and later De Leersnyder et al. (2020) characterized large panels of commercially
available silver-containing products and reported high variability in the AgNP/Ag+
concentration, AgNP size/shape, and AgNP/Ag+ ratio (De Leersnyder et al., 2020; Rogers et
al., 2018), confirming previous results obtained on drinkable colloidal silver-containing
products (Cascio et al., 2015). Recent studies have explored the fate of commercial colloidal
silver supplements in simulated human digestive environments (Rogers et al., 2020; Rong et
al., 2018; Wu et al., 2018). In particular, Mesosilver™, composed of monodisperse spherical
AgNPs (mean diameter of 9.5 ± 5.0 nm), with a 90% AgNPs/10% Ag+ ratio, has been shown
to be much more reactive than both laboratory synthesized and commercially available AgNPs,
possibly due to differences in their intrinsic physico-chemical properties (such as size and
surface charge) (Rong et al., 2018). Little is known about the toxic effects of these commercially
available products in vitro. Rogers et al. (2020) reported cytotoxicity of five commercial
colloidal silver spray products, which was attributed to the particulate silver, soluble silver,
and/or non-silver matrix constituents, using a rat intestinal epithelial cell (IEC-6) model. In
addition, Reed et al. (2014) observed a decrease in the number of microvilli in human intestinal

6
Caco-2 cells treated with liquid AgNP-containing dietary supplements relative to untreated
cells.
Based on these data, the gut toxicity of two commercially available colloidal silver products,
Mesosilver™ and AgC, was evaluated in vitro under realistic conditions (i.e. low dose and
repeated exposure) to mimic human chronic exposure (Chen et al., 2016; Vila et al., 2017). Two
intestinal epithelial cell models were considered and compared: (i) a Caco-2 monoculture which
is a widely used model of intestinal barrier function for toxicological studies (Böhmert et al.,
2015; Imai et al., 2017; Juling et al., 2017; Lichtenstein et al., 2015; Vila et al., 2018) and (ii) a
Caco-2/HT29-MTX co-culture as a more physiologically relevant intestinal model to mimic a
mucus-producing epithelium (Béduneau et al., 2014; Hilgendorf et al., 2000; Lozoya-Agullo et
al., 2017). Mucus is indeed the first physical and chemical barrier against toxicants (Gillois et
al., 2018), particularly AgNPs (Bi et al., 2020), as illustrated in a Caco-2/HT29-MTX co-culture
following 24 h of acute exposure (Abdelkhaliq et al., 2020; Georgantzopoulou et al., 2016). In
the present study, the following toxicological endpoints, typically used for AgNPs (Böhmert et
al., 2014; Saez-Tenorio et al., 2019; Vila et al., 2018) were prioritised for the assessment of
colloidal silver toxicity to Caco-2 and Caco-2/HT29-MTX cells: cytotoxicity, genotoxicity,
real-time monitoring of cell impedance, and trans-epithelial electrical resistance, as well as
silver uptake, intracellular localisation, and translocation. High-resolution chemical imaging
(Helium Ion Microscope coupled to a Secondary Ion Mass Spectrometer (HIM-SIMS)) was
used, for the first time, in combination with CytoViva™ hyperspectral imaging, as developed
to study AgNPs by Fizeşan et al. (2019).
2 Materials and Methods

7
2.1 Colloidal silver products and chemicals
A suspension of Mesosilver™ (20 µg/mL), sold as a dietary supplement, was purchased in 2018
from Purest Colloids, Inc (Westampton, NJ, USA). A Colloidal Silver product (15 µg/mL), sold
for external use in health and disinfectant applications (hereafter referred to as AgC), was also
purchased in 2018 from the Laboratoire Bio Colloidal (Saint-Fort, France). Both colloidal silver
products were stored at room temperature in the dark. Phosphate buffered saline (PBS), bovine
serum albumin (BSA, CAS N°9048-46-8, ≥ 98%), and Triton X-100 (CAS N°9002-93-1, ≥
97%) were obtained from Euromedex (Souffelweyersheim, France). Dulbecco’s Modified
Eagle’s Medium with phenol red (DMEM) 10X (CAT#D2429) and 1X (CAT#5546), fetal
bovine serum (FBS), penicillin/streptomycin, D-(+)-glucose (CAS N°50-99-7), sodium
bicarbonate (CAS N°144-55-8, ≥ 99.7%), and folic acid (CAS N°59-30-3, ≥ 97%) were
obtained from Sigma (Saint-Quentin Fallavier, France). Non-essential amino acids (NEAA),
Glutamax and Tryple Express were obtained from Gibco (Illkirch, France). AlamarBlue®
reagent, Alexa Fluor 488 goat anti-mouse IgG antibody, and ProLong Gold antifade reagent
with DAPI (4′,6-diamidino-2-phenylindole) were obtained from Invitrogen (Eugene, OR,
USA). Mouse anti-phospho-Histone2AX (Ser139) antibody clone JBW301 was obtained from
Merck Millipore (Molsheim, France). Calicheamicin-γ1 (CAS N°108212-75-5, 98.44%) was
obtained from Pfizer (Paris, France). Epon resin (Embed 812), formaldehyde solution (CAS
N°50-00-0, 16%), glutaraldehyde (CAS N°111-30-8, 25%), osmium tetroxide (CAS N° 20816-
12-0, 4%), and Sorensen phosphate buffer were obtained from Electron Microscopy Sciences
(Hatfield, PA, USA). HNO3 (CAS N°7697-37-2) was obtained from ChemLab (Zedelgem,
Belgique).
2.2 Physico-chemical characterization of Mesosilver™ and AgC
8
2.2.1 Transmission electron microscopy (TEM)
TEM was used to determine the size and shape of the AgNPs in the colloidal silver suspensions.
Samples were prepared by depositing a drop of the colloidal suspension onto a carbon-coated
copper grid and allowing it to air-dry at room temperature. TEM images were obtained using a
Hitachi H-9000 NAR (300 kV, Scherzer resolution 0.18 nm; Tokyo, Japan) coupled to an
energy dispersive X-ray spectrometer (EDX, Kevex; Valencia, CA, USA) to confirm the
presence of silver. Images representative of 10 different locations and 580 particles on the grid
were processed using the program Image J (National Institutes of Health) to determine the shape
and size distribution of the nanoparticles.
2.2.2 Dynamic and electrophoretic light scattering
The hydrodynamic diameter and zeta potential of AgNPs in the colloidal silver products or
suspended at 3 µg/mL in DMEM culture medium (with or without 2% (v/v) FBS) were
determined by dynamic light scattering (DLS) and electrophoretic light scattering (ELS),
respectively, using a Zetasizer Nano ZS (Malvern, Orsay, France). AgNP suspensions were
kept in an incubator (37°C, 5% CO2/95% air) for 0 to 48 h and analysed at various timepoints.
Measurements were performed in triplicate at a controlled temperature of 25°C in a folded
capillary zeta cell (Malvern) with a 633-nm laser source and a scattering angle of 173°. The
intensity size distribution, diameter at the maximum peak, and polydispersity index (PDI) were
determined.
2.2.3 UV–Vis spectroscopy
Modifications of the AgNP suspension (3 µg/mL) in DMEM culture medium (with or without
2% (v/v) FBS) over time were measured by UV–vis spectroscopy. The absorbance spectrum of
AgNP samples from 300 to 500 nm was recorded at room temperature in UV microplates

9
(Greiner Bio-One, Frickenhausen, Germany) using a SPARK spectrophotometer (TECAN,
Männedorf, Switzerland). Culture medium, with or without FBS, was used as a blank,
depending on the condition to be tested. Three independent experiments were performed.
2.3 Cell lines and cell culture
The human colon adenocarcinoma Caco-2 cell line was obtained from the European Collection
of Cell Cultures (ECACC, Salisbury, UK). The mucus-secreting colon adenocarcinoma HT29-
MTX cell line was kindly provided by Dr. Thécla Lesuffleur (INSERM Lille). Cells were used
at passage 49-55 and 9-15 for Caco-2 and HT29-MTX, respectively. Both cell lines were
maintained in DMEM with phenol red and 4.5g/L D-(+)-glucose, supplemented with 1% (v/v)
penicillin/streptomycin, 1% (v/v) NEAA, 1% (v/v) Glutamax, and 10% (v/v) heat-inactivated
FBS at 37°C in a humidified atmosphere of 5% CO2/95% air. The culture medium was changed
every 2 to 3 days and the cells were split upon confluency using Tryple Express.
2.4 Repeated cell exposure to Mesosilver™ and AgC suspensions
A schematic representation of the experimental design is presented in Figure S1. For all
experiments with Caco-2 and Caco-2/HT29-MTX cultures to be performed in 24-well plates
(Corning Costar, Kaiserslautern, Germany), E-plates (Ozyme, Saint-Cyr-l'École, France), and
6.5 mm polycarbonate membrane Transwell systems with a 0.4-μm pore size (Corning Costar),
cells were seeded at 150,000 cells per cm², at a 90/10 ratio for the co-culture, and grown at
37°C until day 10 under the culture conditions described above. At day 10, the medium was
discarded and the cells washed with PBS. Then, a new culture medium was used for treatment,
based on 10X DMEM and diluted to 1X with a final concentration of 4.5 g/L D-(+)-glucose,
3.7 g/L sodium bicarbonate, 0.004 g/L folic acid, 1% (v/v) penicillin/streptomycin, 1% (v/v)
NEAA, 1% (v/v) Glutamax, 2% (v/v) FBS, and various concentrations of Mesosilver™ or AgC

10
suspension (concentration range between 0.1 and 12 µg/mL; diluted with sterilized milliQ grade
water). This medium was added every 2 days from day 10 for 18 days of cell differentiation.
The control condition corresponded to the same treatment medium with sterilized milliQ grade
water replacing the silver-containing product. At the end of the exposure period, samples were
collected for further analysis.
2.4.1 Cellular viability
The AlamarBlue® assay was used to evaluate the viability of cells grown on 24-well plates or
Transwells and treated with Mesosilver™- or AgC (concentrations of 0.1-12 µg/mL and 0.1, 1,
and 3 µg/mL, respectively). At the end of treatment as described above, the cell culture medium
was removed and the cells washed with PBS at 37°C before adding diluted AlamarBlue® (1:10
dilution) in minimal medium (DMEM without FBS) and incubation for 3 h at 37°C. The
medium was then transferred to a microplate reader and the fluorescence immediately measured
at 570 nm excitation and 610 nm emission using a SPARK spectrophotometer. Three
independent experiments were performed, at least in triplicate.
2.4.2 Cell impedance
Cell impedance was monitored in situ and in real-time using an xCELLigence system (ACEA
Biosciences, San Diego, USA). The impedance measurement is based on the effect of the cells,
attached to the xCELLigence electrodes, on the local ionic environment at the electrode-
solution interface. Impedance depends on the number of attached cells and their interaction with
the electrodes. An increase in cell number, cell adhesion, and/or spreading results in a change
in electrode impedance, which is displayed as a cell index (CI) value. Caco-2 or Caco-2/HT29-
MTX cells, grown on E-plates, were repeatedly treated with the Mesosilver™ or AgC
suspension (concentration of 0.1, 1, and 3 µg/mL) vs. control, as already described. Cell

11
impedance was measured every day during the 18-day exposure period. Three independent
experiments were performed in triplicate.
2.4.3 Trans-epithelial electrical resistance
The trans-epithelial electrical resistance (TEER) of Caco-2 monocultures and Caco-2/HT29-
MTX co-cultures was continuously monitored using a cellZScope version 2 (nanoAnalytics,
Münster, Germany). Cells were grown on Transwells in 10% (v/v) FBS medium until day 9
and transferred to the cellZScope device for a 24-h stabilization in the same medium. At day
10, basal TEER values were measured. Then, the medium was removed and cells repeatedly
exposed at the apical side to the Mesosilver™ or AgC suspension (concentrations of 1 and 3
µg/mL) vs. control for 18 days, as already described. The medium from the basolateral side was
replaced every 2 to 3 days with DMEM 2% (v/v) FBS at the same time as the treatment medium
was refreshed on the apical side. TEER was monitored daily during the 18-day exposure period.
Three independent experiments were performed in triplicate.
2.4.4 Silver uptake, intracellular fate and translocation from apical to basolateral
compartments
2.4.4.1 Sample preparation
At the end of the exposure period (day 28) to Mesosilver™ or AgC suspension (concentration
of 3 µg/mL), Transwells were fixed in 2 % glutaraldehyde in 0.1 M Sorensen phosphate buffer
(pH 7.4) overnight at 4°C, washed overnight in 0.2 M phosphate buffer and then post-fixed for
1 h at room temperature with 1% osmium tetroxide in 250 mM glucose and 0.05 M phosphate
buffer. The samples were then dehydrated in a series of graded ethanol solutions; membranes
were cut out from the wells and embedded in an Epon resin. Finally, samples were sliced into
300-nm semi-thin sections and mounted on microscope glass slides for high-resolution dark-

12
field hyperspectral imaging (CytoViva™) and silicon wafers for high-resolution chemical
imaging (Helium Ion Microscope coupled with a Secondary Ion Mass Spectrometer, HIM-
SIMS).
2.4.4.2 CytoViva™
CytoViva™ analyses were carried out as previously described by Mehennaoui et al. (2018).
The semi-thin layers were covered with a drop of mineral oil without the need of a cover slide,
as the samples were embedded in Epon-resin, making them inert to mineral oil. The samples
were visualized using a CytoViva™ dark-field hyperspectral imaging system (CytoViva Inc.,
Auburn, Alabama, USA) mounted on Olympus BX-43 optical microscope. Images of the
samples were captured at 60-fold magnification with oil immersion using a hyperspectral
camera controlled by environment for visualization ENVI software (version 4.8 from Harris
Corporation, Melbourne, FL, USA and modified by CytoViva™, Inc.). Spectral libraries of
exposed cells were manually generated, with approximately 200 spectra acquired per sample.
Acquired libraries were filtered against non-exposed samples to filter out all spectra non-related
to AgNPs or Ag colloids using a spectral angle mapper (SAM) algorithm with a 0.05-radian
tolerance. Filtered libraries were mapped onto images of exposed samples using SAM with a
0.05-radian tolerance, which allows highlighting similarities between the spectra in the image
and spectral library. The signature of AgNPs and/or Ag colloids was artificially red-tagged
using ImageJ software (National Institutes of Health, Bethesda, MD). One sample for each
condition was used for image analysis.
2.4.4.3 Helium Ion Microscope coupled with a Secondary Ion Mass Spectrometer (HIM-
SIMS)

13
Secondary Ion Mass spectrometry (SIMS) images were acquired with a HIM-SIMS (Zeiss,
Peabody, US) using Ne+ primary bombardment accelerated at 20 keV. The lateral resolution
was in the range 20 to 30 nm, with an intensity of 1.5 pA. Both polarities, positive and negative,
were used for the respective detection of ion silver (107Ag+) and the ion cluster 12C14N-. Images
were recorded as a matrix of 512 x 512 image points with a counting time of 5 ms/pixel. One
sample for each condition was used for image analysis.
2.4.4.4 Inductively Coupled Plasma - Mass Spectrometry (ICP-MS)
Silver (AgNPs and/or ionic silver) translocation from the apical to basolateral compartments
was determined by measuring the silver concentration in both compartments by Inductively
Coupled Plasma - Mass Spectrometry (ICP-MS). At the end of the exposure period (day 28) to
Mesosilver™ or AgC suspension (3 µg/mL), all the medium from the apical (300 µL) and
basolateral (800 µL) compartments of each Transwell was collected into 1.5 mL microtubes.
Samples were concentrated by evaporation with a SpeedVac concentrator (Thermo Fisher
Scientific, Illkirch, France) at 35°C for 2 h and stored one week at -80°C before use. Samples
were then digested in 65% HNO3 for 30 min to obtain a perfectly clear solution and then water
was added to obtain a 2% HNO3 solution for ICP-MS-Q analysis (Varian 820-MS quadrupole
inductively-coupled plasma spectrometer; Melbourne, Australia). Measurements on two
samples for each condition were performed in the Laboratoire de Planétologie et Géodynamique
(LPG Nantes laboratory, UMR 6112, France). The total silver concentration was determined by
external calibration using certified single-element reference standard solutions (IONEX
reference standard from ChemLab, Zedelgem, Belgium at 1000 µg/mL). Each standard was
prepared to obtain a 2% HNO3 solution, as for the samples. Two isotopes of silver were
analysed (107Ag and 109Ag) and gave consistent results. 115In was used as an internal standard.
14
2.5 DNA damage analysis
DNA damage in proliferating Caco-2 cells was detected using antibodies against
phosphorylated histone H2AX (γH2AX), a marker of DNA double-strand breaks (DSBs)
(Bonner et al., 2008; Rogakou et al., 2000). First, 150,000 Caco-2 cells/cm² were seeded on
coverslips. After 24 h to allow attachment, the cells were exposed for 1, 6, or 24 h to 0.1, 1, or
3 µg/mL Mesosilver™ or AgC suspension. Exposure to 500 fM calicheamicin was used as a
positive control for inducing genotoxicity. At the end of treatment, cells were immediately fixed
with 4% paraformaldehyde in PBS. After PBS washing, cells were permeabilized with 0.1%
Triton X-100, washed in PBS, and blocked in PBS with 1% BSA overnight. After blocking,
cells were incubated with mouse anti-phospho-Histone2AX (Ser139) antibody clone JBW301
at a 1:1,000 dilution, followed by incubation with Alexa Fluor 488 goat anti-mouse IgG
antibody at a 1:100 dilution. Coverslips were mounted using ProLong Gold antifade reagent
with DAPI to counterstain the nuclei. Slides were visualized under a 40× objective on a Leica
TCS SP8 AOBS inverted confocal microscope (Leica Microsystems, Mannheim, Germany).
The number of γH2AX positive cells, expressed as the percentage of the total cell number, was
calculated, based on the determination of a threshold of γH2AX intensity for untreated cells.
The intensity of γH2AX was compared to this threshold for each treated cell, visualized with
DAPI staining. A minimum of 50 cells per image and eight images for each condition were
analysed in a blinded fashion.
2.6 Statistical analysis
Data are expressed as the mean ± standard error (SD). Statistical significance was calculated
using one-way or two-way ANOVA with Dunnett’s multiple comparison test using GraphPad
Prism software version 8.3 for Windows (GraphPad Software, San Diego, CA). Differences
were considered statistically significant for a p-value < 0.05.

15
3 Results
3.1 Characterisation of Mesosilver™ and AgC suspensions in pure form and diluted in
cell-culture medium
The physico-chemical properties of Mesosilver™ (20 µg/mL) and AgC (15 µg/mL)
suspensions, in their pure form or diluted in culture medium (containing or not FBS 2% (v/v)),
were monitored. Various techniques were used in parallel. TEM provided information about
the core size, shape, and agglomeration state of the AgNPs. UV–vis spectroscopy made it
possible to follow the surface plasmon resonance peak (SPR) of the AgNPs. In addition, the
hydrodynamic diameter was established by DLS, while the zeta potential was determined by
ELS.
In its pure form, the Mesosilver™ suspension had a brown colour, with a strong absorption
peak at a maximum wavelength (λmax) of 396 nm, as a result of plasmon resonance,
characteristic of metal nanoparticles (Ashkarran et al., 2012; Gao et al., 2017) (Figure 1C). As
observed in TEM images, the AgNPs were spherical (Figure 1A), with a diameter between 4
and 31 nm (Figure 1B). Their mean diameter was 12.0 ± 4.1 nm, while the hydrodynamic size
distribution was multimodal, with a large peak between 10 and 300 nm and a diameter at the
maximum peak of 79 nm (Table S1 and Figure 1D). The zeta potential at the intrinsic pH of the
Mesosilver™ suspension (pH=7.3) was −30.1 ± 4.8 mV. The AgC suspension was uncoloured
and exclusively composed of ionic silver with no AgNPs observed by TEM or UV-vis
spectroscopy (data not shown).

16
The modifications that occurred to the AgNPs, present in the Mesosilver™ suspension and
diluted to a concentration of 3 µg/mL in the cell culture medium, containing or not 2% (v/v)
FBS, were regularly monitored for a 48-h contact period (Figure S2). In contact with the culture
medium, the λmax value at t = 0, initially 396 nm in pure form, increased slightly, reaching 402
and 408 nm, with or without 2% (v/v) FBS, respectively (Figure S2B and S2A). The absorbance
of MesosilverTM only slightly decreased after 24 h of exposure to the culture medium with 2%
(v/v) FBS, which was accompanied by a redshift of λmax from 402 to 416 nm (Figure S2B).
There was little change in the hydrodynamic diameter distribution (Figure S2D), with a slight
increase in the hydrodynamic diameter at the maximum peak from 79 nm at t = 0 to 91 nm at t
= 48 h (Table S1). In contrast, there was a large decrease in the intensity of the Mesosilver™
absorbance peak around 400 nm over time in the culture medium without FBS (Figure S2A),
which was associated with an increase in the hydrodynamic diameter at the maximum peak
from 164 nm at t = 0 to 1,281 nm at t = 48 h (Table S1, Figure S2C). The zeta potential changed,
independently of the presence of FBS in the culture medium, becoming less negative, with
values reaching -9.2 ± 0.2 mV at t = 0 and -13.5 ± 0.3 mV at t = 48 h in the absence of FBS and
-9.0 ± 1.0 mV at t = 0 and -9.7 ± 0.4 mV at t = 48 h, in the presence of FBS (Table S1).
3.2 Determination of cell viability of Caco-2 and Caco-2/HT29-MTX cell cultures
during repeated exposure to Mesosilver™ and AgC suspensions
First, the effect of Mesosilver™ and AgC suspensions on cell viability in Caco-2 monocultures
and Caco-2/HT29-MTX co-cultures in 24-well plates during 18 days of repeated exposure (i.e.
every 2 days) was evaluated for a wide range of concentrations (0-12 µg/mL). Both
Mesosilver™ and AgC induced a loss in cell viability, as measured using the AlamarBlue®
assay, in a concentration-, time-, cell model-, and colloidal silver product-dependent manner.
The AlamarBlue® assay estimates the oxidative metabolism of viable cells by converting a

17
redox dye (resazurin) into a fluorescent end product (resorufin). Indeed, after 2 days of
exposure, cell viability gradually and significantly decreased (P < 0.001 or P < 0.0001) for both
Mesosilver™ and AgC at concentrations from 6 µg/mL in both monoculture and co-culture cell
models (Figure 2). Early signs of loss of cell viability were also observed at 3 µg/mL AgC for
Caco-2 cells (P < 0.0001, Figure 2B). A significant loss of cell viability was obtained (P < 0.01
or P < 0.0001) after 7 days of exposure, regardless of the cell model for both Mesosilver™ and
AgC from concentrations of 3 µg/mL, which was further confirmed (P < 0.0001) after 18 days
of exposure; once again, a decrease in viability was observed for AgC only from 1 µg/mL in
Caco-2 monocultures (P < 0.01, Figure 2B) and Caco-2/HT29-MTX co-cultures (P < 0.05 or P
< 0.01, Figure 2D). Interestingly, a significant increase in metabolic activity occurred in the
Caco-2/HT29-MTX co-culture after 7 and 18 days of exposure to a low concentration of
Mesosilver™ or AgC of 0.5 µg/mL (P < 0.01 or P <0 .0001, Figure 2C and 2D); this was also
true for the Caco-2 monoculture treated with AgC at a concentration of 0.1 or 0.5 µg/mL (P <
0.01, Figure 2B).
Based on these results, further assays were carried out using Mesosilver™ and AgC at a
restricted concentration range of 0.1, 1, and 3 µg/mL. Impedance measurements were
performed using the xCELLigence system for the Caco-2 monoculture and Caco-2/HT29-MTX
co-culture. The xCELLigence system measures the electrical impedance of cells grown on
electrodes in situ and in real time. The electrical impedance is displayed as the change in cell
index (Figure 3), which provides information on the cell number and inherent morphological
and adhesive characteristics of the cells (Solly et al., 2004). The repeated exposure of Caco-2
and Caco-2/HT29-MTX cells to Mesosilver™ or AgC had no visible influence on the cell index
for concentrations of 0.1 and 1 µg/mL. In contrast, for the highest concentration of 3 µg/mL,
the cell index gradually decreased to reach statistical significance (P < 0.001) after 5 days of

18
exposure on monocultures (Figure 3A) or co-cultures (Figure 3B), with similar profiles for the
two types of colloidal silver products. Finally, cell viability using the AlamarBlue® assay was
measured for Caco-2 and Caco-2/HT29-MTX cells cultured on Transwells after 18 days of
exposure (Figure 4A and 4D). For the Caco-2 monoculture, there was a significant and marked
decrease in cell viability at 3 µg/mL Mesosilver™ and from 1 µg/mL AgC (P < 0.0001, Figure
4A). For the Caco-2/HT29-MTX co-culture, the loss in metabolic activity occurred from 1
µg/mL, regardless of the colloidal silver-containing product, with P < 0.0001 for AgC and P <
0.01 for Mesosilver™ (Figure 4D).
3.3 Determination of trans-epithelial electrical resistance in Caco-2 and Caco-2/HT29-
MTX cell cultures during repeated exposure to Mesosilver™ and AgC suspensions
The measurement of TEER is classically used to assess the intestinal barrier integrity and
permeability (Brun et al., 2014; García-Rodríguez et al., 2018; Vila et al., 2018). Here, TEER
was monitored in situ and in real time using the cellZScope system for Caco-2 and Caco-
2/HT29-MTX cells grown on Transwells and repeatedly exposed to Mesosilver™ and AgC at
concentrations of 1 and 3 µg/mL for 18 days. For the Caco-2 monoculture, a significant
decrease in TEER (P < 0.05) was observed for Mesosilver™ at 3 µg/mL and AgC from 1 µg/mL
(Figure 4B and 4C). In contrast, TEER was not impaired by the repeated exposure of the Caco-
2/HT29-MTX co-culture to Mesosilver™ (Figure 4E) or AgC (Figure 4F). A slight and
transient increase in TEER was only recorded between the 11th and 13th day of exposure for
AgC at 3 µg/mL (P < 0.05, Figure 4F).

19
3.4 Determination of silver uptake and translocation in Caco-2 and Caco-2/HT29-MTX
cell cultures after repeated exposure to Mesosilver™ and AgC suspensions
Silver uptake by Caco-2 and Caco-2/HT29-MTX cells, after 18 days of repeated exposure to
Mesosilver™ or AgC at a concentration of 3 µg/mL, was monitored by CytoViva™
hyperspectral imaging (Figure 5). Regardless of the cell model, discrete silver spots, consisting
of AgNPs and/or Ag colloids, were distributed within the cell layer, with slightly preferential
accumulation at the basolateral side, in close vicinity to the Transwell surface (Figure 5). High-
resolution chemical imaging using HIM-SIMS was performed on the Caco-2 monoculture to
gain further insight into the intracellular localisation of silver. The elemental distribution of
107Ag+ and 12C14N- in the cells is shown in Figure 6. The distribution of the 12C14N- cluster was
chosen as a cell “fingerprint”. The intracellular presence of Ag was observed for both
Mesosilver™ and AgC (Figure 6). In addition to CytoViva™ and HIM-SIMS imaging,
demonstrating silver uptake by intestinal epithelial cells, ICP-MS was carried out to evaluate
silver translocation from the apical to basolateral compartments in Caco-2 monocultures and
Caco-2/HT29-MTX co-cultures after the 18 days of exposure to Mesosilver™ or AgC at 3
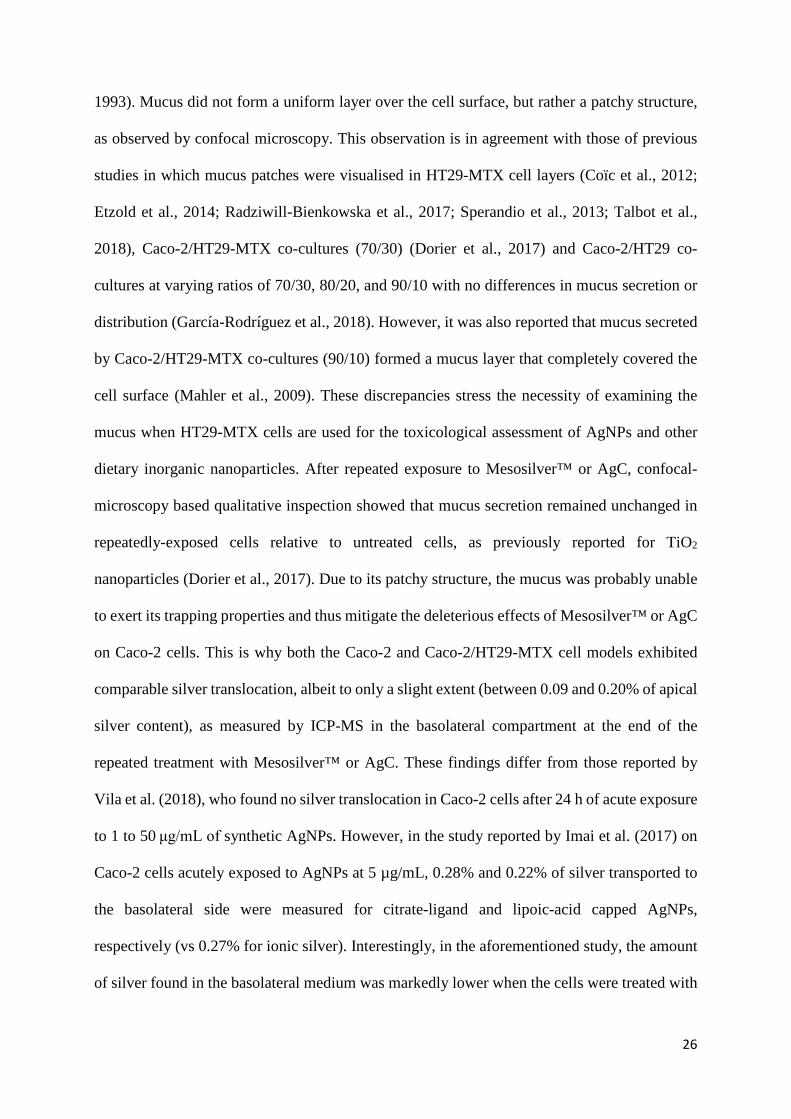
µg/mL (Figure 7A and 7C and Figure 7B and 7D, respectively). Silver concentrations were
measured by ICP-MS in the apical (Figure 7A and 7B) and basolateral (Figure 7C and 7D)
media. The silver concentration was close to 1000 ng/mL in the apical medium and between 1
and 2 ng/mL in the basolateral medium, regardless of the colloidal silver product and cell model
(Figure 7). Overall, these results imply that the silver present in the Mesosilver™ and AgC
products was internalized and able to cross the epithelial barrier of the Caco-2 and Caco-
2/HT29-MTX cells, although it was not possible at this stage to determine in what form (i.e.
AgNPs and/or ionic silver). In parallel, immunofluorescence staining of mucus in the Caco-
2/HT29-MTX cells was performed using the anti-MUC5AC antibody. Mucus did not form a
uniform layer over the cell surface, but rather showed a patchy structure for untreated cells

20
(Figure S3C), as well as cells repeatedly exposed to Mesosilver™ and AgC (Figure S3D and
S3E).
3.5 Evaluation of genotoxicity induced by Mesosilver™ and AgC suspensions on
proliferative Caco-2 cells
The presence of DNA double-strand breaks (DSBs) was examined in proliferating Caco-2 cells
acutely exposed for 1, 6, or 24 h at concentrations of 0.1, 1, and 3 µg/mL to evaluate whether
Mesosilver™ and AgC products are potential genotoxic agents. The presence of phosphorylated
H2AX (γH2AX), a classic marker for DNA DSBs, was therefore studied by
immunofluorescence. All results are presented in Table 1 and representative images obtained
after 6 h of treatment at 1 µg/mL are shown in Figure S4. Cells exposed to 500 fM calicheamicin
were used as a positive control.
No genotoxic effect occurred after treatment with either colloidal silver product at 0.1 µg/mL
or 1 h of treatment (Table 1). However, γH2AX intensity significantly increased after 6 h of
exposure to Mesosilver™ (P < 0.05) or AgC (P < 0.0001) at 1 µg/mL (Figure S4 and Table 1).
The percentage of γH2AX-positive cells was significantly higher for AgC than Mesosilver™
(P < 0.001), with 31.0 ± 4.2% versus 16.0 ± 3.1%, respectively (vs 4.4 ± 1.4% for untreated
cells), suggesting higher genotoxicity of the AgC suspension. This was confirmed following 24
h of treatment at 1 µg/mL: at this timepoint, exposure to AgC induced cytotoxicity, whereas
Mesosilver™ exposure induced genotoxicity (21.1 ± 5.1% positive cells, P < 0.0001) (Table
1). For the highest concentration of 3 µg/mL, more deleterious effects were once again observed
for AgC than Mesosilver™: after 1 h, exposure to AgC induced genotoxicity that resulted in
cytotoxicity after 6 or 24 h of exposure, whereas Mesosilver™ induced genotoxicity at 6 h (41.5

21
± 5.5% positive cells, P < 0.0001), which was further associated with cytotoxicity after 24 h of
treatment (Table 1).
4 Discussion
Given the growing interest in the antimicrobial properties of AgNPs and/or ionic silver,
numerous colloidal silver products are currently being marketed for a wide range of health and
disinfectant applications. In particular, dietary supplements advertised as immune boosters can
easily be found in the US and Europe, even though silver no longer appears in the list of
authorized vitamins and minerals in Europe. Toxicity studies have mainly focused on
commercially available or laboratory-synthesized AgNPs tested at high unrealistic
concentrations, up to 100 µg/mL (Georgantzopoulou et al., 2016; Saez-Tenorio et al., 2019;
Williams et al., 2016), which are not representative of the ingested forms present in such dietary
supplements. Indeed, the structural and physico-chemical characteristics of “real” AgNPs, such
as concentration, particle size distribution, and/or interfacial properties, may differ from those
of model AgNPs. Few studies have characterized the presence of AgNPs in colloidal silver
products (Cascio et al., 2015; De Leersnyder et al., 2020; Reed et al., 2014; Rogers et al., 2020;
Rong et al., 2018) and, furthermore, little is known about their fate, behaviour, or toxicity in
the gastro-intestinal tract (Reed et al., 2014; Rogers et al., 2020; Rong et al., 2018).
The aim of the present study was to compare the physico-chemical properties of two colloidal
silver products, Mesosilver™, produced by Purest Colloid in US (Farmen et al., 2012; Reed et
al., 2014; Rong et al., 2018) and AgC marketed in France, and to assess their respective effects
in vitro using realistic scenarios that mimic human exposure (i.e. low dose and repeated
exposure). First, the physico-chemical properties of the AgNPs present in Mesosilver™ in its

22
pure form were assessed. The AgNPs were spherical with a core diameter deduced from TEM
analysis, of approximately 12 nm, a hydrodynamic diameter, measured by DLS, of 33 nm, and
a negative zeta potential of -30 mV, in accordance with published data (Rong et al., 2018). In
the aforementioned study, the authors found 10.6% of silver as dissolved silver (ionic silver),
whereas the rest was present as AgNPs (Rong et al., 2018). This is lower than the 22% and 46%
values reported by Farmen et al. (2012) and Rogers et al. (2018) respectively. These
discrepancies are likely explained by differences in the measurement methods and preparation
of the samples. In contrast to Mesosilver™, the AgC suspension was only composed of ionic
silver (i.e. no AgNPs detected), confirming the high variability in the relative percentage of
particulate vs. soluble silver, observed among drinkable commercial colloidal silver-containing
products (Cascio et al., 2015) and later on a broader range of consumer products advertised to
contain colloidal silver (Rogers et al., 2018).
UV-visible spectroscopy was complementarily used to identify the presence of metallic AgNPs
in the Mesosilver™ suspension. An absorption peak at 396 nm (λmax) was detected,
corresponding to a size of the AgNPs of approximately 10 nm (Paramelle et al., 2014), in
accordance with published data (Rogers et al., 2018). As interactions of AgNPs with their
environment can lead to major physico-chemical modifications with subsequent modulation of
their toxicity (Durán et al., 2015), the stability of AgNPs present in Mesosilver™ was evaluated
in the cell culture medium used for the further assessment of their toxicological impact in vitro.
In the presence of FBS, a relatively small redshift of λmax of 20 nm was observed, suggesting
the binding of biomolecules to AgNPs (Ashkarran et al., 2012; Burcza et al., 2015); such a
biomolecular corona around the AgNPs may be involved in the protective role exerted by FBS.

23
As colloidal silver is consumed orally, the first barrier to exposure is the gastrointestinal tract.
Two in vitro gut models, a Caco-2 monoculture and a Caco-2/HT29-MTX co-culture, were thus
used to evaluate the toxicological impact of Mesosilver™ and AgC suspensions. AgNPs and/or
ionic silver are known to induce interference with a large number of viability assays (Mello et
al., 2020; Riaz Ahmed et al., 2017). Therefore, the resazurin-based AlamarBlue® assay,
reported to be a non-interfering method (Mello et al., 2020), was chosen to evaluate the
cytotoxicity of Mesosilver™ and AgC. A loss in cell viability was observed for both
Mesosilver™ and AgC in Caco-2 monocultures and Caco-2/HT29-MTX co-cultures in a
concentration-dependent manner; for the 24-well culture, time-dependent effects were also
found with increased cytotoxicity after repeated exposure. Despite the different culture systems
used, the cytotoxicity profiles in the 0.1 to 3 µg/mL range were similar. However, for the 3
µg/mL concentration, Caco-2 and Caco-2/HT29-MTX cells cultured in Transwells and
repeatedly exposed to Mesosilver™ or AgC for 18 days were less sensitive than those cultured
in 24-well plates, probably due to differences in cell differentiation. For a low concentration of
0.5 µg/mL, there was an increase in metabolic activity after 7 or 18 days of treatment of Caco-
2/HT29-MTX cells with Mesosilver™ or AgC (also seen for AgC in Caco-2 cells). This ability
to stimulate cell growth at low (nano)silver concentrations, or “hormetic effect” (Iavicoli et al.,
2018), is in accordance with published results on synthetic AgNPs in Caco-2 cells after short-
term exposure (Chen et al., 2016). Comparison of the cytotoxicity induced by the colloidal
silver products showed AgC to undoubtedly have more deleterious effects than Mesosilver™,
as seen in the 24-well plate and Transwell culture systems. The presence of γH2AX was thus
studied as a classic marker for DNA DSBs and genotoxicity to further the analysis and explain
the observed cytotoxicity. For a given concentration and exposure time, γH2AX levels were
higher for AgC- than Mesosilver™-exposed Caco-2 cells. These differences undoubtedly
originate from the predominance of the ionic form of silver in the AgC suspension, generally

24
described to be the main driver for silver toxicity (De Matteis et al., 2015; van der Zande et al.,
2016), although several studies have reported specific AgNP-mediated toxic effects (Arai et al.,
2015; Garcia-Reyero et al., 2014). Overall, a loss of viability was observed for differentiated
Caco-2 cells, raising the issue of the toxicity of chronic exposure to colloidal silver, and
proliferating Caco-2 cells showed increased levels of γH2AX, suggesting a genotoxic effect, as
recently reviewed (Hadrup et al., 2020).
Real-time cellZScope measurements of Caco-2 cells repeatedly exposed to Mesosilver™ for 18
days showed a concentration- and time-dependent decrease in TEER, as an indicator of
progressive intestinal barrier impairment. In contrast, the same TEER alterations were obtained
at 1 and 3 µg/mL of AgC, reinforcing the more deleterious impact of this 100% ionic-silver
containing product. Interestingly, exposure of the Caco-2/HT29-MTX co-culture to
Mesosilver™ or AgC did not induce any marked changes in TEER when using the 1 and 3
µg/mL concentrations, suggesting that intestinal barrier integrity remained unaffected under
these conditions, even though a loss in cell viability and a decrease in the cell index were
observed. A similar trend of a decrease in cell viability without TEER changes was previously
described for a Caco-2/HT29 mucus-secreting cell model exposed to synthetic AgNPs (Saez-
Tenorio et al., 2019). One possible explanation is that mucus compensates, at least to some
extent, for intestinal barrier alterations, as it was shown to contribute to TEER in HT29-MTX
cells (Pontier et al., 2001). Due to the multilayer conformation of Caco-2/HT29-MTX cells
(Figure S3B), it is also possible that cell mortality occurred without affecting intestinal barrier
integrity, contrary to the Caco-2 monolayer (Figure S3A).
Concerning the influence of the cell model and the role of mucus, no striking differences in
terms of cell viability were observed between Caco-2 and Caco-2/HT29-MTX cells, the key

25
driver rather being the type of colloidal silver product. Due to its physical and chemical
properties, mucus may trap dietary inorganic nanoparticles, such as AgNPs, thereby decreasing
their toxicity to the host or, on the contrary, inducing high local accumulation with subsequent
increased toxicity (Gillois et al., 2018). To date, few in vitro studies using intestinal cell models
have considered mucus in the toxicological assessment of AgNPs and were limited to short-
term exposure conditions. In the study of Georgantzopoulou et al. (2016), Caco-2TC7/HT29-
MTX (90/10) cells were acutely exposed to synthetic AgNPs (10–100 µg/mL) for 24 h. The
mucus layer was able to trap 200-nm AgNPs, thus reducing their interaction with the cellular
membrane and resulting in lower levels of toxicity, oxidative stress, IL-8 release, and proteomic
alterations than for 20-nm AgNPs and silver nitrate, used as a control (Georgantzopoulou et al.,
2016). More recently, Caco-2/HT29-MTX (75/25) cells were acutely exposed to pristine vs in
vitro digested lipoic acid- and citrate-coated 50-nm AgNPs (250–2500 µg/mL) for 24 h.
Exposure to increasing concentrations of AgNPs resulted in a concentration-dependent increase
of total Ag and AgNP content in the cellular fractions, with lower levels observed for digested
AgNPs relative to their pristine counterparts. Confocal microscopy imaging showed clusters of
silver or AgNPs mainly localized to the cell cytoplasm and, to some extent, the nucleus
(Abdelkhaliq et al., 2020). Moreover, Saez-Tenorio et al. (2019) described a time-dependent
increase in cellular uptake and internalization after exposure of Caco-2/HT29 cells to small
(approximately 5 nm) laboratory-synthesized AgNPs. After 24 h of exposure, most of the
AgNPs were embedded in the mucus layer and at the end of the exposure period (96 h), a higher
number of AgNPs was able to cross the mucus barrier and enter the cells (Saez-Tenorio et al.,
2019). To gain further insights of the role of mucus in our conditions (commercial colloidal
silver products, low doses, Caco-2/HT29-MTX cell model, repeated exposure),
immunofluorescence staining of mucus was performed using the anti-MUC5AC antibody, as
MUC5AC is the major gel-forming mucin produced by HT29-MTX cells (Lesuffleur et al.,
26
1993). Mucus did not form a uniform layer over the cell surface, but rather a patchy structure,
as observed by confocal microscopy. This observation is in agreement with those of previous
studies in which mucus patches were visualised in HT29-MTX cell layers (Coïc et al., 2012;
Etzold et al., 2014; Radziwill-Bienkowska et al., 2017; Sperandio et al., 2013; Talbot et al.,
2018), Caco-2/HT29-MTX co-cultures (70/30) (Dorier et al., 2017) and Caco-2/HT29 co-
cultures at varying ratios of 70/30, 80/20, and 90/10 with no differences in mucus secretion or
distribution (García-Rodríguez et al., 2018). However, it was also reported that mucus secreted
by Caco-2/HT29-MTX co-cultures (90/10) formed a mucus layer that completely covered the
cell surface (Mahler et al., 2009). These discrepancies stress the necessity of examining the
mucus when HT29-MTX cells are used for the toxicological assessment of AgNPs and other
dietary inorganic nanoparticles. After repeated exposure to Mesosilver™ or AgC, confocal-
microscopy based qualitative inspection showed that mucus secretion remained unchanged in
repeatedly-exposed cells relative to untreated cells, as previously reported for TiO2
nanoparticles (Dorier et al., 2017). Due to its patchy structure, the mucus was probably unable
to exert its trapping properties and thus mitigate the deleterious effects of Mesosilver™ or AgC
on Caco-2 cells. This is why both the Caco-2 and Caco-2/HT29-MTX cell models exhibited
comparable silver translocation, albeit to only a slight extent (between 0.09 and 0.20% of apical
silver content), as measured by ICP-MS in the basolateral compartment at the end of the
repeated treatment with Mesosilver™ or AgC. These findings differ from those reported by
Vila et al. (2018), who found no silver translocation in Caco-2 cells after 24 h of acute exposure
to 1 to 50 μg/mL of synthetic AgNPs. However, in the study reported by Imai et al. (2017) on
Caco-2 cells acutely exposed to AgNPs at 5 µg/mL, 0.28% and 0.22% of silver transported to
the basolateral side were measured for citrate-ligand and lipoic-acid capped AgNPs,
respectively (vs 0.27% for ionic silver). Interestingly, in the aforementioned study, the amount
of silver found in the basolateral medium was markedly lower when the cells were treated with
27
AgNPs or ionic silver at 4°C, suggesting active transport (Imai et al., 2017). Abdelkhaliq et al.
(2020) obtained values below 0.1% for the translocation of either pristine or digested AgNPs
through acutely-exposed Caco-2/HT29-MTX cells, either as total Ag or AgNPs. This is of the
same order of magnitude as our results, despite different products and exposure regimes.
TEM was used as a first approach to visualize internalized AgNPs to support these findings on
silver uptake and fate in vitro, but no clear presence of these particles was detected inside the
cells, probably due to the granulated nature of the cell cytoplasm (data not shown). Dark-field
hyperspectral imaging (CytoVivaTM) and high-resolution SIMS-based chemical imaging are
powerful techniques that are increasingly used to investigate the distribution of NPs and
chemical elements within biological matrices. CytoViva™ hyperspectral imaging was thus
performed on Caco-2 and Caco-2/HT29-MTX cells repeatedly exposed to Mesosilver™ or
AgC. CytoViva™ is a high contrast optical dark‐field system , used in the nanotoxicology field
for imaging TiO2 NPs (Konstantinova et al., 2017) and, more recently, AgNPs (Fizeşan et al.,
2019; Mehennaoui et al., 2018). Nanoparticles and other light-scattering objects appear as
bright features on a dark background; thus, fluorescent labelling of NPs, which could modify
their physico-chemical properties, is not required. Complementarily to CytoViva™, high-
resolution chemical imaging was used on the same repeatedly-exposed samples; only Caco-2
cells were considered. Helium Ion Microscopy (HIM, ZEISS, Peabody, USA) consists of
scanning the sample with a finely focussed He+ ion beam of sub-nm resolution and detecting
secondary electrons to generate images (Hlawacek and Gölzhäuser, 2016). In contrast to
conventional Scanning Electron Microscopy (SEM), which uses an electron beam to scan the
sample, HIM provides better contrast details due to smaller beam-sample interaction volumes,
a better depth of field, and the possibility to image insulating samples without prior deposition
of a conductive film. In addition, the HIM used for this study was equipped with a Secondary

28
Ion Mass Spectrometer (SIMS) system developed by LIST, Luxembourg (Dowsett and Wirtz,
2017; Wirtz et al., 2019). The integrated HIM-SIMS instrument allows the acquisition of both
high-resolution structural information and elemental/chemical information from the same field
of view. It has been successfully applied to imaging a lithium titanate and magnesium oxide NP
mixture (Dowsett and Wirtz, 2017) and correlating the morphology and composition of AgNPs
(Fizeşan et al., 2019). In the present study, the CytoViva™ and HIM-SIMS results converged
on the cell uptake and internalization of silver (AgNPs and/or ionic silver) for both colloidal
silver products and cell models, which may be influenced by the formation and nature of the
biomolecular corona around AgNPs (Barbalinardo et al., 2018; Monteiro-Riviere et al., 2013).
In conclusion, the results of this study demonstrate that differences in the relative percentage
of particulate (AgNPs) vs. soluble silver (ionic silver) in commercially available colloidal silver
products, here Mesosilver™ and AgC, influence their toxicological impact in vitro on Caco-2
and Caco-2/HT29-MTX intestinal cell models, under realistic conditions that mimic human
exposure, with low doses (0.1-12 µg/mL) and a repeated exposure regimen (every two days for
18 days). The most striking effects, including cytotoxicity and intestinal barrier impairment on
differentiated Caco-2 cells, and genotoxicity on proliferating Caco-2 cells, were observed with
the commercial product containing only ionic silver (AgC). Due to its patchy structure, the
presence of mucus on intestinal cells in the Caco-2/HT29-MTX co-culture model only slightly
mitigated these effects, underlining the necessity of examining mucus when HT29-MTX cells
are used for the toxicological assessment of dietary inorganic nanoparticles and other
chemicals. Regardless of the cell model, silver uptake and intracellular localization, as shown
by CytoViva™ and HIM-SIMS, and subsequent silver translocation, were similar for both
colloidal silver products. These findings demonstrate that high-resolution (chemical) imaging
is a powerful approach to provide novel insights into mechanisms behind nanoparticle toxicity.

29
Beyond analytical developments for the in-depth characterization of silver forms in native
colloidal-silver based consumer products and biological fluids and tissues after exposure, future
studies are needed to explore their gut toxicity in physiologically relevant in vitro and in vivo
models to better understand the potential human exposure risks posed by these consumer
products, which are becoming a growing concern.

30
Author contributions
MHR, VT, HR, and MMB conceived and designed the study. MHR and MMB obtained
funding. KG, ML, JB, and VM performed and analysed the in vitro experiments on cell cultures.
IF, CS, SC, and JNA prepared, performed, and analysed the high-resolution imaging
experiments. KG, JV, and GM designed, performed, and analysed the genotoxicity
experiments. HT and MHR designed, performed, and analysed the ICP-MS experiments. KG,
CS, JNA, MHR, HR, and MMB wrote the manuscript. All authors contributed to the discussion
and approved the final manuscript.
Acknowledgements
The authors would like to thank T. Lesuffleur (INSERM U938, Paris, France) for her generous
gift of the HT29-MTX cells, and Anne Fernandez-Vidal (University of Toulouse, Toulouse,
France) for helpful discussions. The authors also thank Jelena Lorvic for fruitful scientific
collaboration, Carole La and Marion Rivoal from the Laboratoire de Planétologie et
Géodynamique (LPG, UMR 6112) for help to perform the ICP-MS and Eric Gautron from the
Institut des Matériaux Jean Rouxel (Nantes, France) for performing the TEM measurements.
Funding
This work was supported by INRAE (TRANSFORM/MICA/AlimH inter-division 2018 call,
NanoStress project).
The work of LIST was financed by the FluoGut project, INTER/ANR/18/12545362.
Disclosure of interest
The authors report no conflicts of interest.

31
Bibliography
Abdelkhaliq, A., van der Zande, M., Undas, A.K., Peters, R.J.B., Bouwmeester, H., 2020.
Impact of in vitro digestion on gastrointestinal fate and uptake of silver nanoparticles with
different surface modifications. Nanotoxicology 14, 111–126.
https://doi.org/10.1080/17435390.2019.1675794
Arai, Y., Miyayama, T., Hirano, S., 2015. Difference in the toxicity mechanism between ion
and nanoparticle forms of silver in the mouse lung and in macrophages. Toxicology 328,
84–92. https://doi.org/10.1016/j.tox.2014.12.014
Ashkarran, A.A., Ghavami, M., Aghaverdi, H., Stroeve, P., Mahmoudi, M., 2012. Bacterial
effects and protein corona evaluations: Crucial ignored factors in the prediction of bio-
efficacy of various forms of silver nanoparticles. Chem. Res. Toxicol. 25, 1231–1242.
https://doi.org/10.1021/tx300083s
Barbalinardo, M., Caicci, F., Cavallini, M., Gentili, D., 2018. Protein Corona Mediated Uptake
and Cytotoxicity of Silver Nanoparticles in Mouse Embryonic Fibroblast. Small 14,
1801219. https://doi.org/10.1002/smll.201801219
Béduneau, A., Tempesta, C., Fimbel, S., Pellequer, Y., Jannin, V., Demarne, F., Lamprecht, A.,
2014. A tunable Caco-2/HT29-MTX co-culture model mimicking variable permeabilities
of the human intestine obtained by an original seeding procedure. Eur. J. Pharm.
Biopharm. 87, 290–298. https://doi.org/10.1016/j.ejpb.2014.03.017
Bi, Y., Marcus, A.K., Robert, H., Krajmalnik-Brown, R., Rittmann, B.E., Westerhoff, P.,
Ropers, M.H., Mercier-Bonin, M., 2020. The complex puzzle of dietary silver
nanoparticles, mucus and microbiota in the gut. J. Toxicol. Environ. Heal. - Part B Crit.
Rev. 7404. https://doi.org/10.1080/10937404.2019.1710914

32
Böhmert, L., Girod, M., Hansen, U., Maul, R., Knappe, P., Niemann, B., Weidner, S.M.,
Thünemann, A.F., Lampen, A., 2014. Analytically monitored digestion of silver
nanoparticles and their toxicity on human intestinal cells. Nanotoxicology 8, 631–642.
https://doi.org/10.3109/17435390.2013.815284
Böhmert, L., Niemann, B., Lichtenstein, D., Juling, S., Lampen, A., 2015. Molecular
mechanism of silver nanoparticles in human intestinal cells. Nanotoxicology 9, 852–860.
https://doi.org/10.3109/17435390.2014.980760
Bonner, W.M., Redon, C.E., Dickey, J.S., Nakamura, A.J., Sedelnikova, O.A., Solier, S.,
Pommier, Y., 2008. γH2AX and cancer. Nat. Rev. Cancer.
https://doi.org/10.1038/nrc2523
Brun, E., Barreau, F., Veronesi, G., Fayard, B., Sorieul, S., Chanéac, C., Carapito, C.,
Rabilloud, T., Mabondzo, A., Herlin-Boime, N., Carrière, M., 2014. Titanium dioxide
nanoparticle impact and translocation through ex vivo, in vivo and in vitro gut epithelia.
Part. Fibre Toxicol. 11, 13. https://doi.org/10.1186/1743-8977-11-13
Burcza, A., Gräf, V., Walz, E., Greiner, R., 2015. Impact of surface coating and food-
mimicking media on nanosilver-protein interaction. J. Nanoparticle Res. 17, 1–15.
https://doi.org/10.1007/s11051-015-3235-7
Cascio, C., Geiss, O., Franchini, F., Ojea-Jimenez, I., Rossi, F., Gilliland, D., Calzolai, L., 2015.
Detection, quantification and derivation of number size distribution of silver nanoparticles
in antimicrobial consumer products. J. Anal. At. Spectrom. 30, 1255–1265.
https://doi.org/10.1039/c4ja00410h
Chen, N., Song, Z.-M., Tang, H., Xi, W.-S., Cao, A., Liu, Y., Wang, H., 2016. Toxicological
Effects of Caco-2 Cells Following Short-Term and Long-Term Exposure to Ag
Nanoparticles. Int. J. Mol. Sci. 17, 974. https://doi.org/10.3390/ijms17060974
Coïc, Y.M., Baleux, F., Poyraz, Ö., Thibeaux, R., Labruyere, E., Chretien, F., Sobhani, I.,

33
Lazure, T., Wyplosz, B., Schneider, G., Mulard, L., Sansonetti, P.J., Marteyn, B.S., 2012.
Design of a specific colonic mucus marker using a human commensal bacterium cell
surface domain. J. Biol. Chem. 287, 15916–15922.
https://doi.org/10.1074/jbc.M111.310003
De Leersnyder, I., Rijckaert, H., De Gelder, L., Driessche, I. Van, Vermeir, P., Van Driessche,
I., Vermeir, P., 2020. High variability in silver particle characteristics, silver
concentrations, and production batches of commercially available products indicates the
need for a more rigorous approach. Nanomaterials 10, 1–22.
https://doi.org/10.3390/nano10071394
De Matteis, V., Ada Malvindi, M., Galeone, A., Brunetti, V., De Luca, E., Kote, S., Kshirsagar,
P., Sabella, S., Bardi, G., Paolo Pompa, P., Malvindi, M.A., Galeone, A., Brunetti, V., De
Luca, E., Kote, S., Kshirsagar, P., Sabella, S., Bardi, G., Pompa, P.P., 2015. Negligible
particle-specific toxicity mechanism of silver nanoparticles: The role of Ag + ion release
in the cytosol. Nanomedicine Nanotechnology, Biol. Med. 11, 731–739.
https://doi.org/10.1016/j.nano.2014.11.002
Dorier, M., Béal, D., Marie-Desvergne, C., Dubosson, M., Barreau, F., Houdeau, E., Herlin-
Boime, N., Carriere, M., 2017. Continuous in vitro exposure of intestinal epithelial cells
to E171 food additive causes oxidative stress, inducing oxidation of DNA bases but no
endoplasmic reticulum stress. Nanotoxicology 11, 751–761.
https://doi.org/10.1080/17435390.2017.1349203
Dowsett, D., Wirtz, T., 2017. Co-Registered in Situ Secondary Electron and Mass Spectral
Imaging on the Helium Ion Microscope Demonstrated Using Lithium Titanate and
Magnesium Oxide Nanoparticles. Anal. Chem. 89, 8957–8965.
https://doi.org/10.1021/acs.analchem.7b01481
Durán, N., Silveira, C.P., Durán, M., Martinez, D.S.T., 2015. Silver nanoparticle protein corona

34
and toxicity: A mini-review. J. Nanobiotechnology 13, 55.
https://doi.org/10.1186/s12951-015-0114-4
Etzold, S., Kober, O.I., Mackenzie, D.A., Tailford, L.E., Gunning, A.P., Walshaw, J.,
Hemmings, A.M., Juge, N., 2014. Structural basis for adaptation of lactobacilli to
gastrointestinal mucus. Environ. Microbiol. 16, 888–903. https://doi.org/10.1111/1462-
2920.12377
Farmen, E., Mikkelsen, H.N., Evensen, Einset, J., Heier, L.S., Rosseland, B.O., Salbu, B.,
Tollefsen, K.E., Oughton, D.H., 2012. Acute and sub-lethal effects in juvenile Atlantic
salmon exposed to low μg/L concentrations of Ag nanoparticles. Aquat. Toxicol. 108, 78–
84. https://doi.org/10.1016/j.aquatox.2011.07.007
Fizeşan, I., Cambier, S., Moschini, E., Chary, A., Nelissen, I., Ziebel, J., Audinot, J.N., Wirtz,
T., Kruszewski, M., Pop, A., Kiss, B., Serchi, T., Loghin, F., Gutleb, A.C., 2019. In vitro
exposure of a 3D-tetraculture representative for the alveolar barrier at the air-liquid
interface to silver particles and nanowires. Part. Fibre Toxicol. 16.
https://doi.org/10.1186/s12989-019-0297-1
Gao, X., Topping, V.D., Keltner, Z., Sprando, R.L., Yourick, J.J., 2017. Toxicity of nano- and
ionic silver to embryonic stem cells: A comparative toxicogenomic study. J.
Nanobiotechnology 15, 31. https://doi.org/10.1186/s12951-017-0265-6
Garcia-Reyero, N., Kennedy, A.J., Escalon, B.L., Habib, T., Laird, J.G., Rawat, A., Wiseman,
S., Hecker, M., Denslow, N., Steevens, J.A., Perkins, E.J., 2014. Differential effects and
potential adverse outcomes of ionic silver and silver nanoparticles in vivo and in vitro.
Environ. Sci. Technol. 48, 4546–4555. https://doi.org/10.1021/es4042258
García-Rodríguez, A., Vila, L., Cortés, C., Hernández, A., Marcos, R., 2018. Exploring the
usefulness of the complex in vitro intestinal epithelial model Caco-2/HT29/Raji-B in
nanotoxicology. Food Chem. Toxicol. 113, 162–170.

35
https://doi.org/10.1016/j.fct.2018.01.042
Georgantzopoulou, A., Serchi, T., Cambier, S., Leclercq, C.C., Renaut, J., Shao, J., Kruszewski,
M., Lentzen, E., Grysan, P., Eswara, S., Audinot, J.N., Contal, S., Ziebel, J., Guignard, C.,
Hoffmann, L., Murk, A.T.J., Gutleb, A.C., 2016. Effects of silver nanoparticles and ions
on a co-culture model for the gastrointestinal epithelium. Part. Fibre Toxicol. 13, 9.
https://doi.org/10.1186/s12989-016-0117-9
Gillois, K., Lévêque, M., Théodorou, V., Robert, H., Mercier-Bonin, M., 2018. Mucus : An
Underestimated Gut Target for Environmental Pollutants and Food Additives. Microorg.
Rev. 6, 1–18. https://doi.org/10.3390/microorganisms6020053
Hadrup, N., Sharma, A.K., Loeschner, K., Jacobsen, N.R., 2020. Pulmonary toxicity of silver
vapours, nanoparticles and fine dusts: A review. Regul. Toxicol. Pharmacol. 115, 104690.
https://doi.org/10.1016/j.yrtph.2020.104690
Hilgendorf, C., Spahn-Langguth, H., Regårdh, C.G., Lipka, E., Amidon, G.L., Langguth, P.,
2000. Caco-2 versus Caco-2/HT29-MTX co-cultured cell lines: Permeabilities via
diffusion, inside- and outside-directed carrier-mediated transport. J. Pharm. Sci. 89, 63–
75. https://doi.org/10.1002/(SICI)1520-6017(200001)89:1<63::AID-JPS7>3.0.CO;2-6
Hlawacek G, G.A., 2016. Helium Ion Microscopy. Springer.
Iavicoli, I., Leso, V., Fontana, L., Calabrese, E.J., 2018. Nanoparticle exposure and hormetic
dose–responses: An update. Int. J. Mol. Sci. 19. https://doi.org/10.3390/ijms19030805
Imai, S., Morishita, Y., Hata, T., Kondoh, M., Yagi, K., Gao, J.Q., Nagano, K., Higashisaka,
K., Yoshioka, Y., Tsutsumi, Y., 2017. Cellular internalization, transcellular transport, and
cellular effects of silver nanoparticles in polarized Caco-2 cells following apical or
basolateral exposure. Biochem. Biophys. Res. Commun. 484, 543–549.
https://doi.org/10.1016/j.bbrc.2017.01.114
Juling, S., Niedzwiecka, A., Böhmert, L., Lichtenstein, D., Selve, S., Braeuning, A.,

36
Thünemann, A.F., Krause, E., Lampen, A., 2017. Protein Corona Analysis of Silver
Nanoparticles Links to Their Cellular Effects. J. Proteome Res. 16, 4020–4034.
https://doi.org/10.1021/acs.jproteome.7b00412
Konstantinova, V., Ibrahim, M., Lie, S.A., Birkeland, E.S., Neppelberg, E., Marthinussen,
M.C., Costea, D.E., Cimpan, M.R., 2017. Nano-TiO2 penetration of oral mucosa: in vitro
analysis using 3D organotypic human buccal mucosa models. J. Oral Pathol. Med. 46,
214–222. https://doi.org/10.1111/jop.12469
Larsen, P.B., Christensen, F., Jensen, K.A., Brinch, A., Mikkelsen, S.H., 2015. Exposure
assessment of nanomaterials in consumer products. Danish Environ. Prot. Agency,
Environ. Proj. No. 1636, 2015.
Lesuffleur, T., Porchet, N., Aubert, J.P., Swallow, D., Gum, J.R., Kim, Y.S., Real, F.X.,
Zweibaum, A., 1993. Differential expression of the human mucin genes MUC1 to MUC5
in relation to growth and differentiation of different mucus-secreting HT-29 cell
subpopulations. J. Cell Sci. 106, 771–783.
Lichtenstein, D., Ebmeyer, J., Knappe, P., Juling, S., Böhmert, L., Selve, S., Niemann, B.,
Braeuning, A., Thünemann, A.F., Lampen, A., 2015. Impact of food components during
in vitro digestion of silver nanoparticles on cellular uptake and cytotoxicity in intestinal
cells. Biol. Chem. 396, 1255–1264. https://doi.org/10.1515/hsz-2015-0145
Lozoya-Agullo, I., Araújo, F., González-Álvarez, I., Merino-Sanjuán, M., González-Álvarez,
M., Bermejo, M., Sarmento, B., 2017. Usefulness of Caco-2/HT29-MTX and Caco-
2/HT29-MTX/Raji B coculture models to predict intestinal and colonic permeability
compared to Caco-2 monoculture. Mol. Pharm. 14, 1264–1270.
https://doi.org/10.1021/acs.molpharmaceut.6b01165
Mahler, G.J., Shuler, M.L., Glahn, R.P., 2009. Characterization of Caco-2 and HT29-MTX
cocultures in an in vitro digestion/cell culture model used to predict iron bioavailability. J.

37
Nutr. Biochem. 20, 494–502. https://doi.org/10.1016/j.jnutbio.2008.05.006
Mehennaoui, K., Cambier, S., Serchi, T., Ziebel, J., Lentzen, E., Valle, N., Guérold, F.,
Thomann, J.S., Giamberini, L., Gutleb, A.C., 2018. Do the pristine physico-chemical
properties of silver and gold nanoparticles influence uptake and molecular effects on
Gammarus fossarum (Crustacea Amphipoda)? Sci. Total Environ. 643, 1200–1215.
https://doi.org/10.1016/j.scitotenv.2018.06.208
Mello, D.F., Trevisan, R., Rivera, N., Geitner, N.K., Di Giulio, R.T., Wiesner, M.R., Hsu-Kim,
H., Meyer, J.N., 2020. Caveats to the use of MTT, neutral red, Hoechst and Resazurin to
measure silver nanoparticle cytotoxicity. Chem. Biol. Interact. 315.
https://doi.org/10.1016/j.cbi.2019.108868
Monteiro-Riviere, N.A., Samberg, M.E., Oldenburg, S.J., Riviere, J.E., 2013. Protein binding
modulates the cellular uptake of silver nanoparticles into human cells: Implications for in
vitro to in vivo extrapolations? Toxicol. Lett. 220, 286–293.
https://doi.org/10.1016/j.toxlet.2013.04.022
"Over-the-counter drug products containing colloidal silver ingredients or silver salts," Federal
Register, 1999, 21 CFR Part 310, Rules and Regulations, FR Doc. 99–21253, Department
of Health and Human Services, Food and Drug Administration, 44653.
Paramelle, D., Sadovoy, A., Gorelik, S., Free, P., Hobley, J., Fernig, D.G., 2014. A rapid
method to estimate the concentration of citrate capped silver nanoparticles from UV-
visible light spectra. Analyst 139, 4855–4861. https://doi.org/10.1039/c4an00978a
Pietroiusti, A., Bergamaschi, E., Campagna, M., Campagnolo, L., De Palma, G., Iavicoli, S.,
Leso, V., Magrini, A., Miragoli, M., Pedata, P., Palombi, L., Iavicoli, I., 2017. The
unrecognized occupational relevance of the interaction between engineered nanomaterials
and the gastro-intestinal tract: A consensus paper from a multidisciplinary working group.
Part. Fibre Toxicol. https://doi.org/10.1186/s12989-017-0226-0

38
Pontier, C., Pachot, J., Botham, R., Lenfant, B., Arnaud, P., 2001. HT29-MTX and Caco-2/TC7
monolayers as predictive models for human intestinal absorption: Role of the mucus layer.
J. Pharm. Sci. 90, 1608–1619. https://doi.org/10.1002/jps.1111
Radziwill-Bienkowska, J.M., Robert, V., Drabot, K., Chain, F., Cherbuy, C., Langella, P.,
Thomas, M., Bardowski, J.K., Mercier-Bonin, M., Kowalczyk, M., 2017. Contribution of
plasmid-encoded peptidase S8 (PrtP) to adhesion and transit in the gut of Lactococcus
lactis IBB477 strain. Appl. Microbiol. Biotechnol. 101, 5709–5721.
https://doi.org/10.1007/s00253-017-8334-1
Reed, R.B., Faust, J.J., Yang, Y., Doudrick, K., Capco, D.G., Hristovski, K., Westerhoff, P.,
2014. Characterization of nanomaterials in metal colloid-containing dietary supplement
drinks and assessment of their potential interactions after ingestion. ACS Sustain. Chem.
Eng. 2, 1616–1624. https://doi.org/10.1021/sc500108m
Riaz Ahmed, K.B., Nagy, A.M., Brown, R.P., Zhang, Q., Malghan, S.G., Goering, P.L., 2017.
Silver nanoparticles: Significance of physicochemical properties and assay interference on
the interpretation of in vitro cytotoxicity studies. Toxicol. Vitr. 38, 179–192.
https://doi.org/10.1016/j.tiv.2016.10.012
Rogakou, E.P., Nieves-Neira, W., Boon, C., Pommier, Y., Bonner, W.M., 2000. Initiation of
DNA fragmentation during apoptosis induces phosphorylation of H2AX histone at serine
139. J. Biol. Chem. 275, 9390–9395. https://doi.org/10.1074/jbc.275.13.9390
Rogers, K.R., Henson, T.E., Navratilova, J., Surette, M., Hughes, M.F., Bradham, K.D.,
Stefaniak, A.B., Knepp, A.K., Bowers, L., 2020. In vitro intestinal toxicity of
commercially available spray disinfectant products advertised to contain colloidal silver.
Sci. Total Environ. 728, 138611. https://doi.org/10.1016/j.scitotenv.2020.138611
Rogers, K.R., Navratilova, J., Stefaniak, A., Bowers, L., Knepp, A.K., Al-Abed, S.R., Potter,
P., Gitipour, A., Radwan, I., Nelson, C., Bradham, K.D., 2018. Characterization of

39
engineered nanoparticles in commercially available spray disinfectant products advertised
to contain colloidal silver. Sci. Total Environ. 619–620, 1375–1384.
https://doi.org/10.1016/j.scitotenv.2017.11.195
Rong, H., Garg, S., Westerhoff, P., Waite, T.D., 2018. In vitro characterization of reactive
oxygen species (ROS) generation by the commercially available MesosilverTM dietary
supplement. Environ. Sci. Nano 5, 2686–2698. https://doi.org/10.1039/c8en00701b
Saez-Tenorio, M., Domenech, J., García-Rodríguez, A., Velázquez, A., Hernández, A., Marcos,
R., Cortés, C., 2019. Assessing the relevance of exposure time in differentiated Caco-
2/HT29 cocultures. Effects of silver nanoparticles. Food Chem. Toxicol. 123, 258–267.
https://doi.org/10.1016/j.fct.2018.11.009
Solly, K., Wang, X., Xu, X., Strulovici, B., Zheng, W., 2004. Application of real-time cell
electronic sensing (RT-CES) technology to cell-based assays. Assay Drug Dev. Technol.
2, 363–372. https://doi.org/10.1089/adt.2004.2.363
Sperandio, B., Fischer, N., Chevalier-Curt, M.J., Rossez, Y., Roux, P., Masselot, C.R.,
Sansonetti, P.J., 2013. Virulent shigella flexneri affects secretion, expression, and
glycosylation of gel-forming mucins in mucus-producing cells. Infect. Immun. 81, 3632–
3643. https://doi.org/10.1128/IAI.00551-13
Talbot, P., Radziwill-Bienkowska, J.M., Kamphuis, J.B.J., Steenkeste, K., Bettini, S., Robert,
V., Noordine, M.L., Mayeur, C., Gaultier, E., Langella, P., Robbe-Masselot, C., Houdeau,
E., Thomas, M., Mercier-Bonin, M., 2018. Food-grade TiO2 is trapped by intestinal mucus
in vitro but does not impair mucin O-glycosylation and short-chain fatty acid synthesis in
vivo: Implications for gut barrier protection. J. Nanobiotechnology 16, 53.
https://doi.org/10.1186/s12951-018-0379-5
The Woodrow Wilson International Center. Consumer products inventory. . Accessed Apr
2016. http://www.nanotechproject.org/cpi/

40
Tulve, N.S., Stefaniak, A.B., Vance, M.E., Rogers, K., Mwilu, S., LeBouf, R.F., Schwegler-
Berry, D., Willis, R., Thomas, T.A., Marr, L.C., 2015. Characterization of silver
nanoparticles in selected consumer products and its relevance for predicting children’s
potential exposures. Int. J. Hyg. Environ. Health 218, 345–357.
https://doi.org/10.1016/j.ijheh.2015.02.002
Van der Zande, M., Undas, A.K., Kramer, E., Monopoli, M.P., Peters, R.J., Garry, D., Antunes
Fernandes, E.C., Hendriksen, P.J., Marvin, H.J.P., Peijnenburg, A.A., Bouwmeester, H.,
2016. Different responses of Caco-2 and MCF-7 cells to silver nanoparticles are based on
highly similar mechanisms of action. Nanotoxicology 10, 1431–1441.
https://doi.org/10.1080/17435390.2016.1225132
Vila, L., García-Rodríguez, A., Cortés, C., Marcos, R., Hernández, A., 2018. Assessing the
effects of silver nanoparticles on monolayers of differentiated Caco-2 cells, as a model of
intestinal barrier. Food Chem. Toxicol. 116, 1–10.
https://doi.org/10.1016/j.fct.2018.04.008
Vila, L., Marcos, R., Hernández, A., 2017. Long-term effects of silver nanoparticles in caco-2
cells. Nanotoxicology 11, 771–780. https://doi.org/10.1080/17435390.2017.1355997
Wijnhoven, S.W.P., Peijnenburg, W.J.G.M., Herberts, C.A., Hagens, W.I., Oomen, A.G.,
Heugens, E.H.W., Roszek, B., Bisschops, J., Gosens, I., Van De Meent, D., Dekkers, S.,
De Jong, W.H., Van Zijverden, M., Sips, A.J.A.M., Geertsma, R.E., 2009. Nano-silver -
A review of available data and knowledge gaps in human and environmental risk
assessment. Nanotoxicology. https://doi.org/10.1080/17435390902725914
Williams, K.M., Gokulan, K., Cerniglia, C.E., Khare, S., 2016. Size and dose dependent effects
of silver nanoparticle exposure on intestinal permeability in an in vitro model of the human
gut epithelium. J. Nanobiotechnology 14. https://doi.org/10.1186/s12951-016-0214-9
Wirtz, T., De Castro, O., Audinot, J.-N., Philipp, P., 2019. Imaging and Analytics on the Helium

41
Ion Microscope. Annu. Rev. Anal. Chem. 12, 523–543. https://doi.org/10.1146/annurev-
anchem-061318-115457
Wu, W., Zhang, R., McClements, D.J., Chefetz, B., Polubesova, T., Xing, B., 2018.
Transformation and Speciation Analysis of Silver Nanoparticles of Dietary Supplement in
Simulated Human Gastrointestinal Tract. Environ. Sci. Technol. 52, 8792–8800.
https://doi.org/10.1021/acs.est.8b01393

42
Table 1. Proportion of γH2AX-positive cells after exposure of proliferating Caco-2 cells to
Mesosilver™ or AgC. Values correspond to the mean ± SD of eight images for each condition.
Values for the positive control with 500 fM calicheamicin and untreated cells are given.
* P < 0.05; **** P < 0.0001 vs untreated cells; ### P < 0.001 vs Mesosilver TM.

43
Figure 1. Physico-chemical characterization of commercial colloidal silver Mesosilver™ in its
pure form. (A) Representative TEM image of AgNPs and (B) Core size distribution of AgNPs
based on diameters measured on TEM images. (C) UV–vis spectrum with the maximum
absorption wavelength (λmax) labelled. (D) Hydrodynamic diameter distribution of AgNPs
obtained from DLS measurements.

44
Figure 2. Effect of colloidal silver products on cell viability for Mesosilver™ (A,C) and AgC
(B,D) after 2, 7 and 18 days of repeated exposure in Caco-2 monoculture (A,B) and Caco-
2/HT29-MTX co-culture (C,D) in 24-well plates. Cell viability is expressed as the percentage
of that of control (untreated cells). Significant differences from untreated cells are marked with
asterisks (* P < 0.05; ** P < 0.01; *** P < 0.001; **** P < 0.0001).

45
Figure 3. Changes in the cell index measured in real-time using the xCELLigence system.
Caco-2 cells (A) or Caco-2/HT29-MTX cells (B) cultured in E-plates were exposed to
Mesosilver™ or AgC at each medium refreshment (red arrow) every two days for 18 days.
Significant differences from untreated cells are marked with asterisks (** P < 0.01; *** P <
0.001).

46
Figure 4. Cell viability after 18 days of repeated exposure to Mesosilver™ and AgC and
changes in trans-epithelial electrical resistance (TEER). Cell viability, expressed as the
percentage of that of control (untreated cells), was measured on Caco-2 monoculture (A) and
Caco-2/HT29-MTX co-culture (D) in Transwells, at the end of the 18-day repeated exposure to
Mesosilver™ or AgC. TEER was monitored in real-time using the cellZScope system on Caco-
2 cells (B,C) and Caco-2/HT29-MTX cells (E,F) exposed to Mesosilver™ or AgC. The culture
medium was refreshed every two days for 18 days (red arrow). Significant differences from
untreated cells are marked with asterisks (* P < 0.05; ** P < 0.01; **** P < 0.0001).

47
Figure 5. High-resolution dark-field microscopy images (CytoVivaTM) of Caco-2 cells (A,B)
and Caco-2/HT29-MTX cells (C,D) repeatedly exposed to Mesosilver™ (A,C) or AgC (B,D)
at a concentration of 3 µg/mL for 18 days. The Caco-2 monolayer and the Caco-2/HT29-MTX
multilayer, as well as the Transwell membrane, are visible; silver spots are artificially labelled
in red. Scale bar corresponds to 12 µm.

48
Figure 6. Distribution maps of Ag element (first column) and CN cluster (allowing
visualization of the cell morphology, second column) detected by the Helium Ion Microscopy
– Secondary Ion Mass Spectrometry (HIM-SIMS) instrument on Caco-2 cells cultured on
Transwells and repeatedly exposed to Mesosilver™ or AgC at a concentration of 3 µg/mL for
18 days. The third column corresponds to image overlapping (silver in red, CN in green,
overlapping of both in yellow). Silver spots are highlighted by white circles. Scale bar
corresponds to 2 μm.
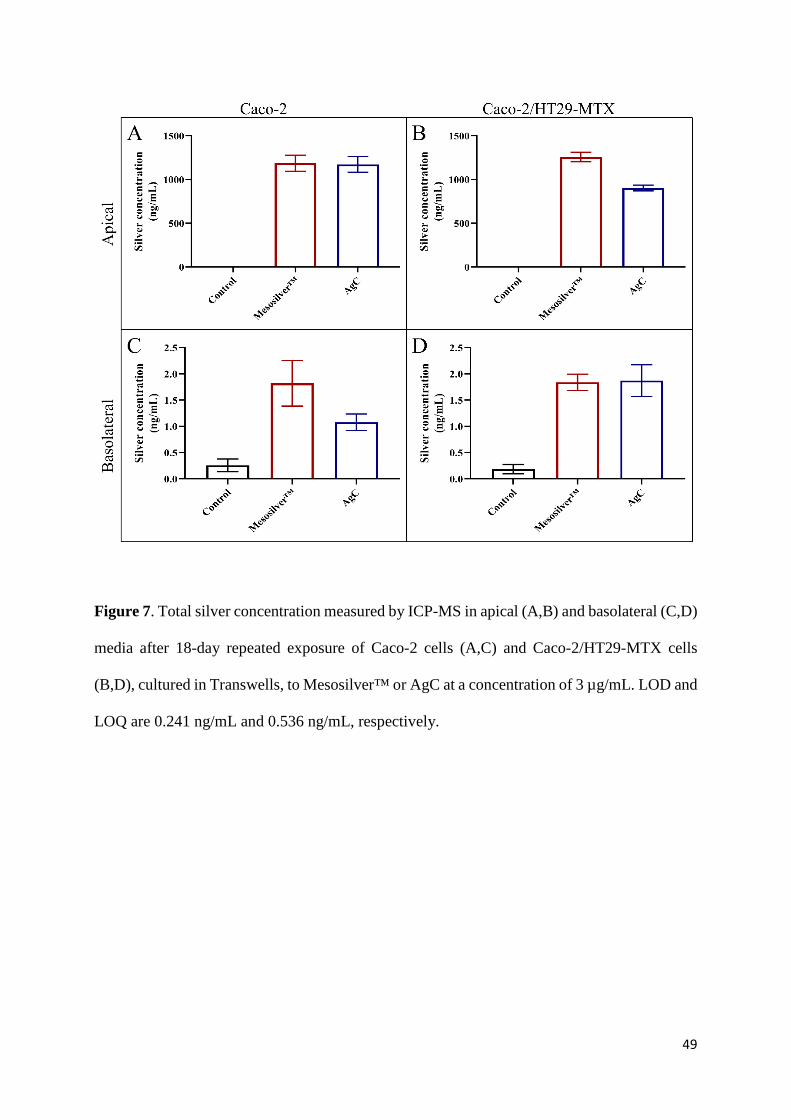
49
Figure 7. Total silver concentration measured by ICP-MS in apical (A,B) and basolateral (C,D)
media after 18-day repeated exposure of Caco-2 cells (A,C) and Caco-2/HT29-MTX cells
(B,D), cultured in Transwells, to Mesosilver™ or AgC at a concentration of 3 µg/mL. LOD and
LOQ are 0.241 ng/mL and 0.536 ng/mL, respectively.

50
Supplementary Information
Material and Methods
Histology of Caco-2 and Caco-2/HT29-MTX cells
Caco-2 and Caco-2/HT29-MTX (90/10) cells were cultured in Transwells for 28 days.
Transwells were washed with PBS and fixed in Carnoy’s fixative (60% (v/v) ethanol, 30% (v/v)
chloroform, 10% (v/v) glacial acetic acid) for 20 min. Thereafter, polycarbonate membranes
were cut and processed by a Shandon™ Excelsior™ ES Tissue Processor using the following
program: 2 × 60 min anhydrous ethanol, 2 × 60 min butanol, 480 min butanol, 3 × 80 min
paraffin at 60 °C. Samples were included in paraffin blocks using a HistoStar™ Embedding
Workstation (Thermo Fisher Scientific). 5-µm transversal sections were made using a
Microm™ HM 340 E microtome (Thermo Fisher Scientific) and attached on slides. Samples
were deparaffinised using Ottix Plus™ (Microm Microtech, Brignais, France) and subsequently
dehydrated by increasingly diluted ethanol-water series. Staining was performed by 2 min in
Hematoxylin, 10 min in running water, 15 min in Alcian Blue solution (pH 3.0) followed by 5
min in running water, 2 min in Eosin, 2 min in 95% (v/v) ethanol, 2 min in dry ethanol and
ending with 3 baths of American Ottix Plus™, followed by mounting with Diamount mountant
(DiaPath, Martinengo, Italy). Samples were imaged using a Nikon Eclipse 90i microscope fitted
with a DXM 1200 F Digital Camera. Image sets were taken with 200x magnification.
Immunostaining of Caco-2/HT29-MTX cells for mucus detection
At the end of the 18-day exposure period to the Mesosilver™ or AgC suspension (concentration
of 3 µg/mL), Caco-2/HT29-MTX cells were fixed with 4% (w/v) paraformaldehyde in PBS and

51
permeabilized with 0.5% (v/v) Triton X-100. Untreated cells were also considered as control.
After PBS washing, cells were blocked in PBS with 3% (w/v) BSA and 0.1% (v/v) Igepal
(Sigma) overnight. After blocking, cells were incubated with a rabbit anti Muc5AC (Abcam,
Paris, France) at a 1:250 dilution, followed by incubation with Alexa Fluor 594 goat anti-rabbit
IgG antibody (Invitrogen) at a 1:100 dilution. Transwell membranes were cut with a scalpel
and mounted using ProLong Gold antifade reagent with DAPI (4′,6-diamidino-2-phenylindole,
Invitrogen). Slides were visualized under a 20× objective on a TCS SP8 AOBS
inverted confocal microscope (Leica Microsystems, Mannheim, Germany).
Table and figures
Table S1. Main characteristics of Mesosilver™ in pure or diluted form (at a concentration of 3
µg/mL) in cell culture medium containing or not 2 % (v/v) FBS after 48 h of exposure.
Mesosilver™ [FBS] Time TEM_Diameter DLS_ Diameter PDI Zeta potential pH % (v/v) (h) (nm) (Maximum Peak - nm) (mV)
In pure form - - 12.0 ± 4.1 79 0.60 -30.1 ± 4.8 7.3
In culture medium at 3 µg/mL
0 0 - 164 0.27 -9.2 ± 0.2 7.2
0 48 - 1281 0.45 -13.5 ± 0.3 7.7
2 0 - 79 0.22 -9.0 ± 1.0 7.2
2 48 - 91 0.47 -9.7 ± 0.4 7.7

52
Figure S1. Schematic representation of repeated exposure of Caco-2 and Caco-2/HT29-MTX
cells to Mesosilver™ and AgC.

53
Figure S2. Physico-chemical characterization of Mesosilver™ at 3 µg/mL in cell culture
medium without (A,C) or with (B,D) 2% (v/v) FBS. (A,B) Time variation of UV–vis
absorbance during 48 h of exposure with the maximum absorption wavelength (λmax) labelled;
(C,D) hydrodynamic diameter distribution of AgNPs, initially and after 48 h of exposure,
obtained from DLS measurements.

54
Figure S3. Characterization of in vitro cell models. (A,B) Representative images of Caco-2
monoculture (A) and Caco-2/HT29-MTX co-culture (B) after Hemalun & Eosine staining with
Alcian Blue; (C-E) MUC5AC immunofluorescence staining of Caco-2/HT29-MTX cells,
untreated (C) or repeatedly exposed to Mesosilver™ (D) and AgC (E) at a concentration of 3
µg/mL for 18 days.

55
Figure S4. Representative images of genotoxicity induction by Mesosilver™ or AgC
(concentration of 1 µg/mL) on Caco-2 proliferating cells after a 6 h acute exposure.
Genotoxicity induction was measured by γH2AX immunofluorescence staining (A-D); DAPI
was used to stain cell nucleus (E-H). Positive control with 500 fM calicheamicin (A,E);
untreated cells (B,F); cells exposed for 6 h to 1 µg/mL Mesosilver™ (C,G) or AgC (D,H). Scale
bar corresponds to 75 μm.