Good Caco-2 cell culture practices
13
Cell Growing Density Affects the Structural and Functional Properties of Caco-2 Differentiated Monolayer MANUELA NATOLI, 1 BRUNO D. LEONI, 1 IGEA D’AGNANO, 1 MARA D’ONOFRIO, 2 ROSSELLA BRANDI, 2 IVAN ARISI, 2 FLAVIA ZUCCO, 1 AND ARMANDO FELSANI 1,3 * 1 CNR, Institute of Neurobiology and Molecular Medicine, Rome, Italy 2 European Brain Research Institute, Rome, Italy 3 Fondazione Santa Lucia, IRCCS, Rome, Italy The human intestinal Caco-2 cell line has been extensively used as a model of the intestinal barrier. However, it is widely reported in literature that culture-related conditions, as well as the different Caco-2 cell lines utilized in different laboratories, often lead to problems of reproducibility making difficult to compare results. We developed a new cell-maintenance protocol in which Caco-2 cells were subcultured at 50% of confluence instead of 80% of confluence, as usually suggested. Using this new protocol, Caco-2 cells retained a higher proliferation potential resulting in a cell population, which, on reaching confluence, was able to differentiate almost synchronously, forming a more homogeneous and polarized cell monolayer, as compared to that obtained using a high cell growing density. This comparison has been done by analyzing the gene expression and the structural characteristics of the 21-days differentiated monolayers by microarrays hybridization and by confocal microscopy. We then investigated if these differences could also modify the effects of toxicants on 21-days-differentiated cells. We analyzed the 2 h-acute toxicity of CuCl 2 in terms of actin depolymerization and metallothionein 2A (MT2A) and heat shock protein 70 (HSPA1A) genes induction. Copper treatment resulted in different levels of actin depolymerization and gene expression induction in relationship with culture protocol, the low-density growing cells showing a more homogeneous and stronger response. Our results suggest that cell growing density could influence a number of morphological and physiological properties of differentiated Caco-2 cells and these effects must be taken in account when these cells are used as intestinal model. J. Cell. Physiol. 226: 1531–1543, 2011. ß 2010 Wiley-Liss, Inc. In the last 20 years animal experimentation has been paralleled by and in some cases replaced with in vitro models especially in the fields of pharmacokinetics and pharmacodynamics. Advances in combinatorial chemistry have revolutionized the field of drug discovery, producing an increasing number of compounds, which need to be tested for their safety. In this context, the US Food and Drug Administration (FDA) developed new guidelines for bioequivalence studies based on the biopharmaceutical classification system in which solubility and permeability are considered fundamental properties to define the rate of absorption of the active ingredient of a drug product (van de Waterbeemd, 1998). To define these two parameters, many studies on intestine in vitro models have been done in the context of the FDA directive and many cell lines are still under investigation to define the best predictive models for biopharmaceutical studies. The human Caco-2 cancer cell line is one of the most used cell model to study absorption, metabolism, and bioavailability of drugs and xenobiotics (Artursson et al., 2001). Notwithstanding it, represents a well established and accepted in vitro model for the human intestinal epithelium and its use is recognized by the FDA (van de Waterbeemd, 1998; Kim et al., 2006), many papers claim that cell culture conditions, such as the composition of the medium and the culturing system adopted, as well as the passage number, could affect Caco-2 cells differentiation and transport properties (Briske-Anderson et al., 1997; Sambuy et al., 2005). The Caco-2 cell population maintained in culture is characterized by an intraclonal variability revealed by the presence of subpopulations with different morphologies (Vachon and Beaulieu, 1992) and different physiological characteristics (Mahraoui et al., 1992; Vachon et al., 1996). This property of Caco-2 cells led to the existence of different sub-lines, often of clonal origin maintained in different laboratories. This fact plus the variability of culture protocols often makes the comparison of results obtained in different laboratories particularly difficult (Hayeshi et al., 2008). In the last few years many studies have been focused on the inter-laboratories variability produced by the cell-culture related factors such as the animal serum used, the supplements added to the culture media, the passage number and the source of the clones (Briske-Anderson et al., 1997; Zucco et al., 2005). Although all these studies underlined the importance of the cell- culture related factors for the reproducibility between laboratories, up to date, there are no studies that focused on the necessity to standardize the protocols used to manage the propagation of this cell line. Caco-2 cells differentiate spontaneously in culture without supplementation of differentiating factors and, usually, standard protocols, such as those suggested by ATCC (http:// www.lgcstandards-atcc.org/), recommend to subculture cell when culture reaches at least 80% of confluence. In a cell model Additional Supporting information may be found in the online version of this article. Contract grant sponsor: European Commission LSHB-CT-2006- 037499. Contract grant sponsor: FP6 Project ‘‘LIINTOP’’. Contract grant sponsor: Finanziaria Laziale di Sviluppo (FILAS). *Correspondence to: Armando Felsani, CNR, Istituto di Neurobiologia e Medicina Molecolare, via del Fosso di Fiorano, 64, 00143 Roma. E-mail: [email protected] Received 6 July 2010; Accepted 30 September 2010 Published online in Wiley Online Library (wileyonlinelibrary.com), 13 October 2010. DOI: 10.1002/jcp.22487 ORIGINAL RESEARCH ARTICLE 1531 Journal of Journal of Cellular Physiology Cellular Physiology ß 2010 WILEY-LISS, INC.
Transcript of Good Caco-2 cell culture practices

Cell Growing Density Affectsthe Structural and FunctionalProperties of Caco-2Differentiated MonolayerMANUELA NATOLI,1 BRUNO D. LEONI,1 IGEA D’AGNANO,1 MARA D’ONOFRIO,2
ROSSELLA BRANDI,2 IVAN ARISI,2 FLAVIA ZUCCO,1 AND ARMANDO FELSANI1,3*1CNR, Institute of Neurobiology and Molecular Medicine, Rome, Italy2European Brain Research Institute, Rome, Italy3Fondazione Santa Lucia, IRCCS, Rome, Italy
The human intestinal Caco-2 cell line has been extensively used as a model of the intestinal barrier. However, it is widely reported inliterature that culture-related conditions, as well as the different Caco-2 cell lines utilized in different laboratories, often lead to problemsof reproducibility making difficult to compare results. We developed a new cell-maintenance protocol in which Caco-2 cells weresubcultured at 50%of confluence instead of 80%of confluence, as usually suggested.Using this newprotocol, Caco-2 cells retained a higherproliferation potential resulting in a cell population,which, on reaching confluence,was able to differentiate almost synchronously, forminga more homogeneous and polarized cell monolayer, as compared to that obtained using a high cell growing density. This comparison hasbeen done by analyzing the gene expression and the structural characteristics of the 21-days differentiated monolayers by microarrayshybridization and by confocal microscopy. We then investigated if these differences could also modify the effects of toxicants on21-days-differentiated cells. We analyzed the 2 h-acute toxicity of CuCl2 in terms of actin depolymerization and metallothionein 2A(MT2A) and heat shock protein 70 (HSPA1A) genes induction. Copper treatment resulted in different levels of actin depolymerization andgene expression induction in relationshipwith culture protocol, the low-density growing cells showing amore homogeneous and strongerresponse. Our results suggest that cell growing density could influence a number of morphological and physiological properties ofdifferentiated Caco-2 cells and these effects must be taken in account when these cells are used as intestinal model.J. Cell. Physiol. 226: 1531–1543, 2011. � 2010 Wiley-Liss, Inc.
In the last 20 years animal experimentation has been paralleledby and in some cases replaced with in vitro models especially inthe fields of pharmacokinetics and pharmacodynamics.Advances in combinatorial chemistry have revolutionized thefield of drug discovery, producing an increasing number ofcompounds, which need to be tested for their safety. In thiscontext, the US Food and Drug Administration (FDA)developed new guidelines for bioequivalence studies based onthe biopharmaceutical classification system in which solubilityand permeability are considered fundamental properties todefine the rate of absorption of the active ingredient of a drugproduct (van de Waterbeemd, 1998).
To define these two parameters, many studies on intestine invitro models have been done in the context of the FDAdirective and many cell lines are still under investigation todefine the best predictive models for biopharmaceuticalstudies. The human Caco-2 cancer cell line is one of the mostused cell model to study absorption, metabolism, andbioavailability of drugs and xenobiotics (Artursson et al., 2001).Notwithstanding it, represents a well established and acceptedin vitro model for the human intestinal epithelium and its use isrecognized by the FDA (van de Waterbeemd, 1998; Kim et al.,2006), many papers claim that cell culture conditions, such asthe composition of the medium and the culturing systemadopted, as well as the passage number, could affect Caco-2cells differentiation and transport properties (Briske-Andersonet al., 1997; Sambuy et al., 2005). The Caco-2 cell populationmaintained in culture is characterized by an intraclonalvariability revealed by the presence of subpopulations withdifferent morphologies (Vachon and Beaulieu, 1992) anddifferent physiological characteristics (Mahraoui et al., 1992;Vachon et al., 1996). This property of Caco-2 cells led to theexistence of different sub-lines, often of clonal originmaintainedin different laboratories. This fact plus the variability of culture
protocols often makes the comparison of results obtained indifferent laboratories particularly difficult (Hayeshi et al., 2008).
In the last few years many studies have been focused on theinter-laboratories variability produced by the cell-culturerelated factors such as the animal serum used, the supplementsadded to the culture media, the passage number and the sourceof the clones (Briske-Anderson et al., 1997; Zucco et al., 2005).Although all these studies underlined the importanceof the cell-culture related factors for the reproducibility betweenlaboratories, up to date, there are no studies that focused onthe necessity to standardize the protocols used to manage thepropagation of this cell line.
Caco-2 cells differentiate spontaneously in culturewithout supplementation of differentiating factors and, usually,standard protocols, such as those suggested by ATCC (http://www.lgcstandards-atcc.org/), recommend to subculture cellwhen culture reaches at least 80% of confluence. In a cell model
Additional Supporting information may be found in the onlineversion of this article.
Contract grant sponsor: European Commission LSHB-CT-2006-037499.Contract grant sponsor: FP6 Project ‘‘LIINTOP’’.Contract grant sponsor: Finanziaria Laziale di Sviluppo (FILAS).
*Correspondence to: Armando Felsani, CNR, Istituto diNeurobiologia e Medicina Molecolare, via del Fosso di Fiorano, 64,00143 Roma. E-mail: [email protected]
Received 6 July 2010; Accepted 30 September 2010
Published online in Wiley Online Library(wileyonlinelibrary.com), 13 October 2010.DOI: 10.1002/jcp.22487
ORIGINAL RESEARCH ARTICLE 1531J o u r n a l o fJ o u r n a l o f
CellularPhysiologyCellularPhysiology
� 2 0 1 0 W I L E Y - L I S S , I N C .

in which the start of differentiation is not directly under theoperator control, it is probable that one of the factorsinfluencing the well-documented inter-laboratory variabilitycould be the degree of subculture confluence.
We tested a novel cell-line-maintenance protocol, (LowDensity protocol or LD protocol) where cells are sub-culturedwhen they reached 50% of confluence with an approximatedensity of 5.4� 104 cells/cm2. Using this protocol we avoidedheterogeneous cell-growth conditions in which asubpopulation of cells could start to differentiate during the linemaintenance procedure. In this paper, we used LD protocol incomparison with a Caco-2 maintenance protocol in which cellsare subcultured at a confluence of 1� 105 cells/cm2 (herereferred as High Density protocol or HD protocol),corresponding to the higher extreme of the cell density rangesuggested by ATCC for subculture. We chose to compare ourLD model with this extreme condition to enhance the long-term effects due to high cell density.
Since theCaco-2 cell line still remains one of the best choicesto study the intestinal physiology, the aim of this study was todefine how the degree of cell confluence when subculturingcould influence the capability of this cell line to differentiatecorrectly in structurally and functionally mature enterocytes.
Materials and MethodsCaco-2 cell line maintenance and differentiation
The human intestinal Caco-2 cell line was originally obtained fromProf. Alain Zweibaum (INSERM, Villejuif, France). To carry out theLow Density (LD) and High Density (HD) protocols, cells wereseeded at 6.2� 103 cells/cm2 and subcultured for at least 10passages either at 50% or 90% of confluence (5.4� 104
and 105 cells/cm2, respectively); subsequently, a large stock of cellswas produced and maintained in liquid nitrogen to perform all theexperiments within a range of four passages after cells thawing.
Both LD and HD cells were maintained at 378C in a 90% air/10% CO2 atmosphere in DMEM containing 25mM glucose, 3.7 g/LNaHCO3 and supplemented with 4mM L-glutamine, 1% non-essential amino acids, 100U/L penicillin, 100mg/L streptomycin,and 10%heat-inactivated foetal calf serum (completemedium). Theserum was purchased by Hyclone (SH30071.03) and the same lotnumber (ATE32026) has been used through all the experimentshere reported.
For the differentiation experiments, cells were seeded onpolyethylene-terephtalate (PET) filter inserts (Falcon Becton-Dickinson, 0.4mm pore diameter, area 4.21 cm2, pore density2� 0.2� 106/cm2) at a density of 3� 105 cell/cm2 and maintainedfor 21 days in complete medium; the medium was changed threetimes a week (Sambuy et al., 2005).
TEER (trans epithelial electric resistance) and Papp (apparentpermeability) measurements
At the end of 21 days of differentiation, the permeability of the tightjunctions was determined by measuring the TEER of cellmonolayers using a commercial apparatus (Millicell ERS; MilliporeCo., Bedford, MA) employing Ag-AgCl electrodes, according tomanufacturer’s instructions. The final values are expressed asVcm2 on the basis of the following equation: TEER¼ (R�Rb)�A,where R is the resistance of filter insert with cells, Rb is theresistance of the filter alone and A is the growth area of the filter.
Phenol red apparent permeability was measured as previouslydescribed (Ferruzza et al., 2003). The trans-epithelial flux wasexpressed as the apparent permeability coefficent (Papp), which isreported in units of mass per area per unit time according toequation: Papp¼K�Vt�A�1 where K is the steady-state rate ofchange in concentration in the receiver chamber versus time,K¼ (Ct/C0� t) where Ct is the concentration in the receivercompartment after 60min, C0 is the initial concentration in the AP
chamber, Vt is the volume of the receiver chamber (ml), A is thesurface area of the filter membrane (cm2) and t is the time (sec).
Plating efficiency assay
Cycling cells were collected during the growth phase, 18 h after thesubculture passage. LD and HD cycling Caco-2 cells were washedtwice with phosphate buffer saline (PBS), treated with the trypsinsolution (trypsin 0.25%, 50mM EDTA in PBS) directly on the platefor 5min, and then harvested. The 21-days differentiated LD andHD cells were treated directly in the inserts, for 1min with thetrypsin solution in the apical (AP) compartment and a solution of0.03% collagenase (type IV, Sigma–Aldrich, St. Louis, MO) in PBS inthe basolateral (BL) compartment, and subsequently incubated foradditional 5min with the trypsin solution both in the AP and BLcompartments. One-thousand LD or HD Caco-2 cells wereseeded on a 35mmØdish in complete medium. After 1 week fromseeding, cells were washed twice with PBS supplemented with1mM CaCl2 and MgCl2, respectively (PBS
þþ) and fixed for 30minwith a solution of absolute methanol and 0.001% crystal violet.Dishes were then accurately washedwith double distilled H2O andcolonies were counted. The number of colonies formed wasexpressed as percent of colonies with respect to the number ofseeded cells. A total of three independent experiments wereperformed.
Copper toxicity assay
To investigate the effects of copper, 21-days differentiated Caco-2cells were treated for 1 or 2 h at 378C with increasingconcentrations of CuCl2 in Hanks’ balanced salt solution (HBSS,137mMNaCl, 5.36mM KCl, 0.44mM KH2PO4, 0.34mMNa2PO4,1mM CaCl2, 1mM MgCl2, and 5.6mM glucose) with 20mMMES, pH 6.0 only in the AP compartment. The BL compartmentcontained HBSS containing 20mM HEPES at pH 7.4.
Cell cycle
Cell cycle analysis was performed by pulse-chasebromodeoxyuridine (BrdU, Sigma) incorporation and propidiumiodide DNA staining, as previously described (Bucci et al., 2005).
For the BrdU incorporation, 30min before starting theexperiment a pulse of 20mM BrdU was given to the cell culture.Afterwards, BrdU-free medium was added to the cell cultureand samples were taken every 2 h for further 24 h. Mouseanti-BrdU (Becton-Dickinson, Franklin Lakes,NJ; cat# 347580) andFITC-conjugated F(Ab’) rabbit anti-mouse IgG (DAKO, Glostrup,DK; cat# F-0313) antibodies were used to detect the BrdUincorporation. Twenty-thousand events per sample were acquiredby using a FACScan cytofluorimeter. The top region of thecytograms represents BrdUrd-positive cells. The percentages ofthe cell cycle distributionwere estimated on linear PI histograms byusing the MODFIT software.
Western blot analysis
LD and HD Caco-2 cells were seeded on PET filters at the densityof 3� 105 cells/cm2 and harvested at different days ofdifferentiation (cycling cells C, 1, 3, 6, 9, 12, 15, 21 days afterseeding). Cells were then incubated in urea buffer (8M urea,100mM NaH2PO4, 10mM Tris pH 8), for 30min on ice and thenbriefly sonicated. Proteins were subjected to SDS–polyacrylamidegels electrophoresis. The resolved proteins were blottedovernight to nitrocellulose membranes, which then were blockedin PBS containing 5% non-fat milk for at least 1 h. Blots wereincubated with the following primary anti-human antibodies:anti-cyclin A polyclonal antibody (C-19), anti-p27Kip1 polyclonalantibody (C-19), anti-SI polyclonal antibody (T-17), all from SantaCruz Biotechnology, Santa Cruz, CA; anti-pRB monoclonalantibody (clone G3-245; BD-Pharmigen, Franklin Lakes, NJ) andanti-ezrin monoclonal antibody (clone 3C12; Zymed-Invitrogen,Carlsbad, CA). The membranes were then incubated 45min with
JOURNAL OF CELLULAR PHYSIOLOGY
1532 N A T O L I E T A L .

the relevant secondary antibody (anti mouse, anti-rabbit or anti-goat IgG (Hþ L)) conjugated with Alexa fluor 680 (Invitrogen,Carlsbad, CA) or IRDye 800 (LI-COR Biosciences, Lincoln, NE)and analyzed with the Licor Odyssey Infrared Image System(LI-COR Biosciences) in the 700 or 800 nm channel.
Total RNA preparation
Total cellular RNA was isolated using standard Trizol (Invitrogen)protocol and subsequently purified and DNAse treated onRNAeasyQiagen (Hilden, DE) columns. Alternatively, total cellularRNA was isolated using NucleoSpin RNA II silica columns(Macherey-Nagel, Duren, DE). RNA quantity was determined byabsorbance at 260 nm using a NanoDrop UV-VISspectrophotometer. Each sample was then quality checked usingthe RNA 6000 Nano kit with a BioAnalyzer 2100 (Agilent, SantaClara, CA): samples with a RIN index lower than 8.0 werediscarded (Schroeder et al., 2006).
Real-time RT-PCR analysis
RNA (500 ng) was retro-transcribed using standard conditions andthe cDNA was then subjected to real time PCR analysis with anApplied Biosystems 7900HT thermal cycler, using the SensiMixSYBR Kit (Bioline, London, UK) and the following specific primers:PPARG (sense [s]: GACCTGAAACTTCAAGAGTACCAAA,antisense [as]: TGAGGCTTATTGTAGAGCTGAGTC), CDX2(s: GAGCTGGAGAAGGAGTTTCACTA, as:GCGGTTCTGAAACCAGATTTT), CLDN4 (s:TCCGCCAAGTATTCTGCTG, as:CGTGGCACCTTACACGTAGTT), MYO1A (s:TGGCAGATTTCATCTACAAGAGC, as:GTTTGTGGATGGCAAATTGTT), ANPEP (s:CATCCATCAGAGATGGCAGAC, as:TGCTGAAGAGATCGTTCTGG), SLC11A2 (s:CACCGTCAGTATCCCAAGGT, as:CCGATGATAGCCAACTCCAC), SI (s:AATCCTTTTGGCATCCAGATT, as:GCAGCCAAGAATCCCAAAT), ALPI (s:CATACCTGGCTCTGTCCAAGA, as:GTCTGGAAGTTGGCCTTGAC), CYP3A4 (s:GATGGCTCTCATCCCAGACTT, as:AGTCCATGTGAATGGGTTCC), MT2A (s:CTCTAGCCGCCTCTTCAGC, as:ACTCTTTGCATTTGCAGGAAC), HSPA1A (s:AAGGACCGAGCTCTTCTCG, as:GCTCGGCTCTGAGATTGG), PPIA (s:ATGCTGGACCCAACACAAAT, as:TCTTTCACTTTGCCAAACACC) and TBP (s:GAACATCATGGATCAGAACAACA, as:ATAGGGATTCCGGGAGTCAT). Experiments were done inbiological triplicates and in technical quadruplicates. Expressiondata were normalized using the Ct values of the internal controlsPPIA and TBP.
Whole genome expression profiling
The gene expression profiling was performed using the Agilenttwo-colormicroarray system (http://www.genomics.agilent.com/).Two different experiments have been performed, with a total of 10samples: the first one (called ‘‘Diff/Cycl’’) to compare Caco-2 LDcells in the proliferating phase with Caco-2 LD cells at the end of21-days differentiation period; the second one (called ‘‘LD/HD’’) tocompare Caco-2 LD with Caco-2 HD differentiated cells. In the‘‘Diff/Cycl’’ experiment two different pairs of biological replicates(isolated from two different LD cell passages) were analyzed, whilein the ‘‘LD/HD’’ experiment only one pair of samples was used. Inboth experiments, for each pair of samples a technical dye-swapreplicate was included (see Supplementary Fig. S1 for a scheme ofthe experiments).
Total RNA (500 ng) were retrotranscribed using oligo-dTprimers linked to the T7-promoter and the resulting cDNA wasused as a template for cyanine 3-CTP or cyanine 5-CTP labeledcRNA preparation, using the Agilent Low Input LinearAmplification Kit. The labeled cRNA were purified with Qiagen’sRNeasy mini spin columns. To monitor both the labeling reactionsand the microarray performance, Agilent Spike-In Mix was addedto the mRNA samples prior to labeling reactions according to theRNA Spike-In protocol.
Two-color mixes of labeled cRNA pairs were hybridized eitherto 44K (‘‘Diff/Cycl’’ experiment) or 4� 44K (‘‘LD/HD’’experiment) whole human genome oligonucleotide microarray(Agilent G4112A and G4112F, respectively, 41,000 unique probes)at 658C for 17 h using Agilent’s Gene Expression Hybridization Kit.The hybridized microarrays were disassembled at roomtemperature in Agilent Gene Expression Wash Buffer 1. After thedisassembly, the microarrays were washed in Gene ExpressionBuffer 1 for 1min at room temperature, followed by washing withGene ExpressionWashBuffer 2 for 1min at 378C. Themicroarrayswere then treatedwith acetonitrile for 1min at room temperature.
Post-hybridization image acquisitionwas accomplished using theAgilent Scanner G2564B, equipped with two lasers (532 nm and635 nm) and a 48-slide auto-sampler carousel. The ‘‘extendedrange’’ scanning protocol was used for the 4� 44K chip, where theoutput of two following scannings at 10% and 100% of laser powerare numerically combined. Data extraction from the images wasaccomplished by Agilent Feature Extraction 9.1 software using thestandard Agilent two-color gene expression extraction protocol(GE2-v4_91).
Raw data filtering was performed in Microsoft Excel using any ofthe following criteria to discard spots: spots with more than 5% ofsaturated pixel in any of the two channels, spots flagged as ‘‘notfound’’ by the Feature Extraction software in any of the twochannels, spots with a Signal/Noise ratio smaller than 3 in any of thetwo channels, where Signal¼ (median of the spot�median spotbackground level) and Noise is the interquantile range of themedian spot background. Basic data analysis was performed onfiltered data using Agilent GeneSpring GX 7.3 and Microsoft Excel.In every array the normalized channel ratio Nr was normalized bythe Lowess algorithm within GeneSpring, using 20% of data assmoothing window. In the cluster of Supplementary Figure S3, theseparated Lowess normalized Red (R_norm) andGreen (G_norm)channels are obtained by the formulas Log2(R_norm)¼(Log2(Nr)þ Log2(R�G))/2 and Log2(G_norm)¼ (�Log2(Nr)þLog2(R�G))/2, where R and G are the non-normalized channelvalues. For the ‘‘Diff/Cycl’’ experiment two separate normalizationprocedures were used, the Lowess and the dye-swap method, thatcombines and averages two dye-swapped replicates. Differentiallyexpressed genes were identified as those showing an average foldchange larger than 1.5 and lower than 1.5 in the ‘‘LD/HD’’experiment, in the linear scale. In the ‘‘Diff/Cycl’’ experimentdifferential genes were identified with a more stringent criteria, asthose showing an average fold change larger than 2.0 or lower than1/2.0 in the linear scale but in both sets of normalized data, Lowessand dye-swap, except for Figure 4where the thresholdwas 1.5. Theanalysis of over- and under-represented functional annotationswasperformed, pooling up- and down- regulated genes, using theDAVID web tool (http://david.abcc.ncifcrf.gov/) (Huang et al.,2009), selecting the following categories both for functionalclustering (high stringency) and charts: goterm_bp_4,goterm_bp_5, goterm_cc_4, goterm_cc_5, goterm_mf_4,goterm_mf_5, panther_bp_all, panther_mf_all, interpro,pir_superfamily, smart, panther_family, panther_subfamily,kegg_pathway, panther_pathway, chromosome, cytoband,cog_ontology, sp_pir_keywords, up_seq_feature. Gene clusteringanalysis was done using MeV 4.4 (MultiExperiment Viewer, TM4suite, http://www.tm4.org/mev/)(Saeed et al., 2006).
The data of the ‘‘Diff/Cycl’’ and ‘‘LD/HD’’ experiments areMIAME compliant and have been deposited with all raw data in
JOURNAL OF CELLULAR PHYSIOLOGY
O P T I M I Z E D C A C O - 2 C E L L C U L T U R E C O N D I T I O N S 1533

the GEO repository (Accession numbers GSE21519 andGSE21518).
Fluorescence and immunofluorescence microscopy
Caco-2 cells were seeded on PET filter inserts in completemediumand cultured for the time indicated in the legend of the figures. For-F-actin localization, cells were fixed in 2% paraformaldehyde inPBSþþ containing 2% sucrose for 30min, washed with PBSþþ ,blockedwith 5%non-fat drymilk in PBSþþ and incubated for 30minwith 0.33mg/ml TRITC-phalloidin (0.25mM) in PBSþþ containing0.2% BSA; double-labeling of the nuclei was performed with 1mg/ml DAPI for 30 sec in PBS. Finally, cells were washed in PBS, brieflyrinsed in ddH2O and glasses were mounted with ProLong Goldanti-Fade Reagent (Molecular Probes-Invitrogen, Carlsbad, CA).
To study the localization of ZO-1 protein and the colocalizationof ZO-1 with claudin 4 or villin 1, we used a confocal laser scanningmicroscope (Leica Confocal Microsystem TCS SP5, Wetzlar, DE).ZO-1 was detected using the polyclonal anti-ZO-1 antibodypurchased byZymed (cat # 61-7300)while for claudin-4 and villin-1the antibodies were fromAbcam (Cambridge, UK) and Santa Cruz,respectively (cat # AB15104-500 and cat # 58898). The secondaryantibodieswere: Alexa Fluor 594Goat anti-mouse IgG,Alexa Fluor555 Donkey anti-rabbit IgG and Alexa Fluor 488 Goat antirabbitF(ab’)2 fragment antibodies. In order to avoid any possible cross-talk between secondary antibodies we chose antibodies generatedin Donkey, a species known to show negligible cross-reactivity, orF(ab’)2 fragments. Each image represented the maximal projectionof 100-frames z-stack; images were processed using LeicaApplication Suite 6000. Brightness and contrast were adjusted.
ResultsLD cells have a higher cell proliferation rate
Caco-2 cells in the growing phase tend to generate islets,showing a core constituted by prismatic epithelial-like moredifferentiated cells surrounded, at the border, by large flattenedgrowing cells.When cells approach confluence, the proportionof the prismatic epithelial-like cells increases, up to a point inwhich these cells represent the largemajority of the population.Each time cells are trypsinized and sub-cultured to anotherplate, the number of growing cells increases, but not all thereplated cells enter the cell cycle.
To explore differences in proliferation of Caco-2 cellsmaintained eitherwith LDorHDprotocol, we first investigatedthe cell cycle phase’s distribution after propidium iodidestaining. In Figure 1A is shown the ratio of cell cycle phasespercentages evaluated in growing LD and HD cells. Animportant increase in the proliferative compartment wasobserved in LD vs. HD cells (S phase ratio¼ 0.6 and G2þMratio¼ 0.3), indicating that in LD cells a higher number of cellswere in the proliferative phases.
To investigate whether the increase in LD cell proliferationwas due to a faster cell cycle transition, we performed a pulse-chase BrdU incorporation experiment by flow cytometry. Cellswere exposed toBrdU for a pulseof 30min. In order to calculatethe cell-cycle phase length, BrdU incorporation was monitoredimmediately at the endof theBrdUpulse andevery2 hduring thesubsequent24 h. In Figure 1Bare shown theBrdU-incorporationcytograms in LDandHDcells at 0, 6 and 12 h after the pulse. Thecalculationof the cell-cycle phase length indicated that both S andG1 phases in LD cells were shorter than in HD cells (S-phaselength¼ 12vs. 17 h;G1phase length¼ 4 vs. 6.5 h), thus, resultingin a reduced total cell cycle duration (LD cells¼ 19 h vs. HDcells¼ 25 h). It was therefore evident that LD cells entered andcompleted the cell cycle faster than HD cells. The colonyformation assay (Fig. 1C, right and left part) also demonstratedthat theLDcells have ahigherproliferativepotential than theHDones: cycling LDcells show60%of colonies formedcompared tothe 29% of the HD ones (Fig. 1C, left part) and this difference is
Fig. 1. Effects of cell-growth density on cell-cycle length and platingefficiency. A: Cell cycle phase ratios of growing LD versus HD cells.B: Representative cytograms of BrdU pulse-chase experiments. Eachcytogram shows the different distribution of LD and HD cells 0, 6 and12 h after the BrdU pulse. C: Plating efficiency of growing (left part)and differentiated (right part) LD and HD cells referred as percent ofcolony formed after plating.
JOURNAL OF CELLULAR PHYSIOLOGY
1534 N A T O L I E T A L .
still maintained after 21-days of differentiation, when LD cellsshow 45% of colony formed compared to the 15% of HD cells(Fig. 1C, right part).
LD cells show a slower exit from cell cycle but expressthe same level of differentiation markers as compared tothe HD cells
To determine if cells with different proliferative potential wereequally able to exit from the cell cycle and differentiate
spontaneously into mature enterocytes, we followed theexpression levels of some cell-cycle regulating proteins andintestinal differentiation markers during the 21 days ofdifferentiation.
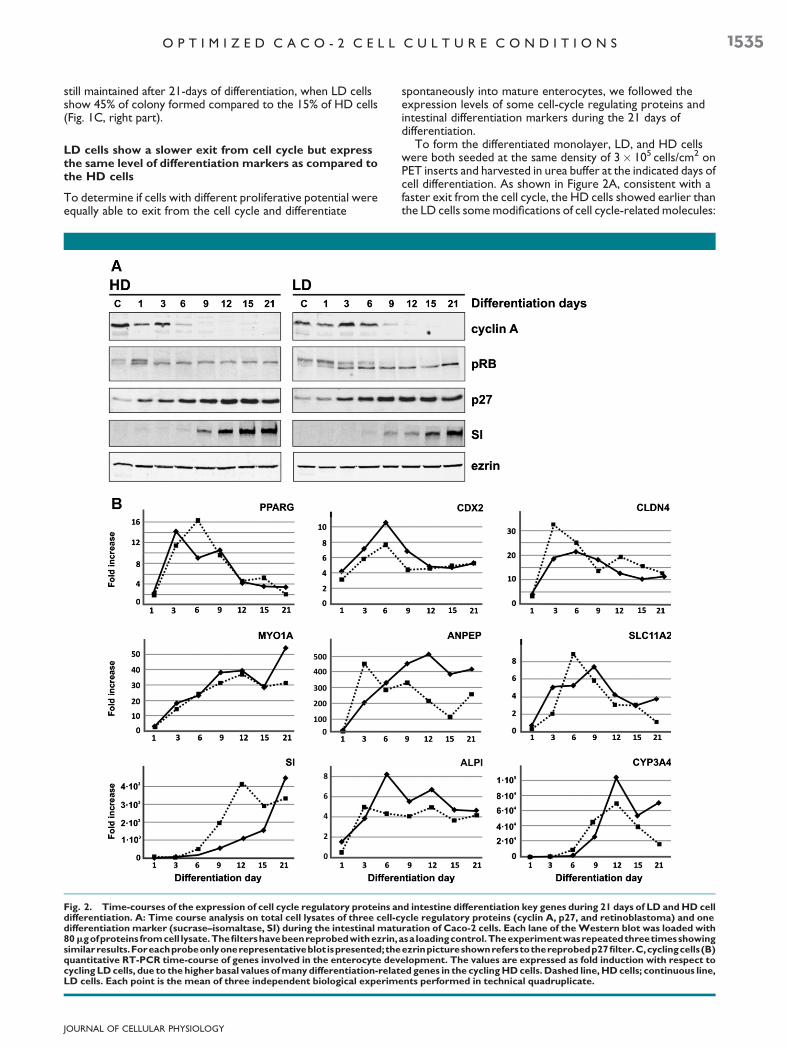
To form the differentiated monolayer, LD, and HD cellswere both seeded at the same density of 3� 105 cells/cm2 onPET inserts and harvested in urea buffer at the indicated days ofcell differentiation. As shown in Figure 2A, consistent with afaster exit from the cell cycle, the HD cells showed earlier thanthe LD cells somemodifications of cell cycle-related molecules:
Fig. 2. Time-courses of the expression of cell cycle regulatory proteins and intestine differentiation key genes during 21 days of LD andHD celldifferentiation. A: Time course analysis on total cell lysates of three cell-cycle regulatory proteins (cyclin A, p27, and retinoblastoma) and onedifferentiation marker (sucrase–isomaltase, SI) during the intestinal maturation of Caco-2 cells. Each lane of theWestern blot was loaded with80mgofproteins fromcell lysate.Thefiltershavebeenreprobedwithezrin,asa loadingcontrol.Theexperimentwasrepeatedthreetimesshowingsimilarresults.Foreachprobeonlyonerepresentativeblot ispresented;theezrinpictureshownreferstothereprobedp27filter.C,cyclingcells(B)quantitative RT-PCR time-course of genes involved in the enterocyte development. The values are expressed as fold induction with respect tocycling LDcells, due to thehigher basal values ofmany differentiation-related genes in the cyclingHDcells.Dashed line,HDcells; continuous line,LD cells. Each point is the mean of three independent biological experiments performed in technical quadruplicate.
JOURNAL OF CELLULAR PHYSIOLOGY
O P T I M I Z E D C A C O - 2 C E L L C U L T U R E C O N D I T I O N S 1535

the dephosphorylation of the retinoblastoma gene product(pRB; day 3 vs. day 9 in LDcells), the down-regulation of cyclin A(day 6 vs. day 9 in LD cells) and the accumulation of p27 (day 1vs. day 3 in LD cells). Correspondingly, an important increase ofthe differentiation protein marker sucrase was already evidentin HD cells at day 9, while LD cells showed similar amounts ofsucrase only at day 15.
Differences between the LD and the HD cell were alsoobserved by examining the trends of expression during thedifferentiation process of genes involved in intestinaldevelopment. As shown in Figure 2B, during the 21 days ofdifferentiation,weanalyzedbyqRT-PCR the expressionof genesencoding for intestinal enzymes, such as CYP3A4 (cytochromeP450), ALPI (alkaline phosphatase intestinal), ANPEP(aminopeptidase N), and SI (sucrase–isomaltase); for brushborder transporters, such as SLC11A2 (orDMT1, divalentmetaltransporter 1); for structural proteins, such as CLDN4 (claudin4), MYO1A (villin1); for transcriptional factor essential in thecrypt-to-villus transition, such as PPARG (peroxisomeproliferative activated receptor gamma) andCDX2 (caudal-typehomeobox transcription factor 2). The general trend ofinductionofCDX2and PPARGgeneswas almost the same in LDand HD cells, whereas the increase (expressed as fold changes)was higher in LD cells. The pattern of expression did not differalso for the structural genes CLDN4 and MYO1A, and thetransporter SLC11A2. On the contrary, the genes coding forbrush-border enzymes ANPEP, SI, and ALPI showed the largestdifferences both in trend of expression and fold increase. Adifference between LD and HD cells was also suggested by thesubstantial induction of CYP3A4 gene in LD cells.
The differentiated LD Caco-2 cells possess a well-definedenterocyte-like gene expression profile
To investigate thoroughly if the higher growth rate shown byLD cells could affect their differentiation capability, we used thetwo-color Agilent microarray technology to compare thewhole gene expression profiles of (i) 21-days differentiated LDcells versus LD cycling cells; and (ii) 21-days differentiated LDcells versus 21-days differentiated HD cells.
The first experiment, called ‘‘Diff/Cycl’’, was designed in thetwo-color dye-swap configuration with biological duplicates ofthe samples (as schematized in Supplementary Fig. S1), the datawere normalized using the Lowess and the dye-swap methods.The differential expressed genes were selected by filtering acombination of both normalized datasets and hierarchicallyclustered as shown in Supplementary Figures S2 and S3. Figure 3shows the hierarchical cluster of the filtered differentiallyexpressed genes sorted in up- and down-regulated transcripts(values are expressed as log2 ratio of differentiated/cyclingcells). On the right are reported some relevant non-redundantbiological functional categories statistically significant(10�2< P< 10�15) obtained submitting the two-fold filteredgenes to the DAVID Bioinformatics Database (http://david.abcc.ncifcrf.gov/) (Sherman et al., 2007). Themarks beloweach category indicate the position in the hierarchical cluster ofthe genes belonging to that category. The up-regulated genesbelonged to the PPAR-signaling pathway, the intestinal genes,the lipid metabolism, the xenobiotics metabolism by CYP450,and the UDP-glucoronosyl/UDP-glucosyl transferases. Thedown-regulated genes were mainly those belonging to thepathways controlling cell cycle progression and regulation. Acomplete list of the statistically significant (10�2< P< 10�15)annotated functional categories is reported in SupplementaryTable S1 and in Supplementary Figure S4.
We then compared the whole gene expression profile of21-days differentiated LD cells versus 21-days differentiatedHD cells, obtaining the list of the genes whose level ofexpression was different between LD and HD cells: we called
this the ‘‘LD/HD’’ experiment. In this case, we lowered thefold-threshold used for the analysis, since the differencesbetween the two samples were minimal. Only 163 genes ofLD cells showed at least 1.5-fold increase or decrease withrespect to the HD cells (as reported in Supplementary TableS2). Among these, genes coding for proteins typical of theenterocytes, such as transporters (SLCO4A1, SLC12A2,SLC2A14, etc.), enzymes (GSTM3, GPX7, CP) and othersrelated to cell polarization processes (PBK, DLG7, LAMA1),were up-regulated in LD cells.
Figure 4A shows the intersection of two sets of differentialexpressedgenesobtained fromthe twomicroarrayexperimentsdescribedabove: the setof genes increasingordecreasing at least1.5-fold in the Diff/Cycl’’ experiment and the set of genesincreasing or decreasing at least 1.5-fold in the ‘‘LD/HD’’experiment. It is quite surprising that out of the 163 genesdifferentially expressed between LD and HD cells, 56 alsobelonged to the set of 2,888 genes differentially expressedbetween differentiated and cycling LD cells. We thereforeanalyzed the distributionof these genes byplotting the Log2 ratioof each gene, as shown in Figure 4B. This scatter plot shows boththe extent and direction of gene expression variations. About50% of the genes in common between the two sets are locatedinto the right quadrants (b and c), representing genes up-regulated at the end of differentiation andmore expressed in LD(b quadrant) or in HD differentiated cells (c quadrant). Thesegenes are reported in Supplementary Table S3. The leftquadrants (a andd)of the plot contain the genes thatweredown-regulated at the end of differentiation. Interestingly, the other50%of the genes in commonbetween the two sets formaclusteronly in the (a) quadrant, and include those that were moreexpressed in LD cells and down-regulated during differentiation.Among these genes (reported in Supplementary Table S3) mostare related to apoptosis, cell cycle and DNA repair.
Cell-growth density deeply influence the architecture ofpolarized monolayer
We then investigated the effects of the LD cell culture protocolon the characteristics of differentiated cell monolayer, analyzingits permeability properties and the organization of someproteins belonging to the tight junction complex (Paris et al.,2008) and to the brush border (Khurana and George, 2008).
Figure 5A shows the mean plus SEM of TEER and Pappmeasured at 21-days of differentiation both in LD and HD cellmonolayers. The values were significatively different bothfor Papp (LD 6.52�10�8� 0.52�10�8 vs. HD10.3�10�8� 1.26�10�8 cm/sec) and TEER (LD 348� 2.52 vs.HD 377� 5.6Vcm2). Interestingly, the cumulative distribution(Fig. 5B) of TEER values of the two culture conditions wassignificantly different and showed the more variablepermeability properties of the HD monolayers.
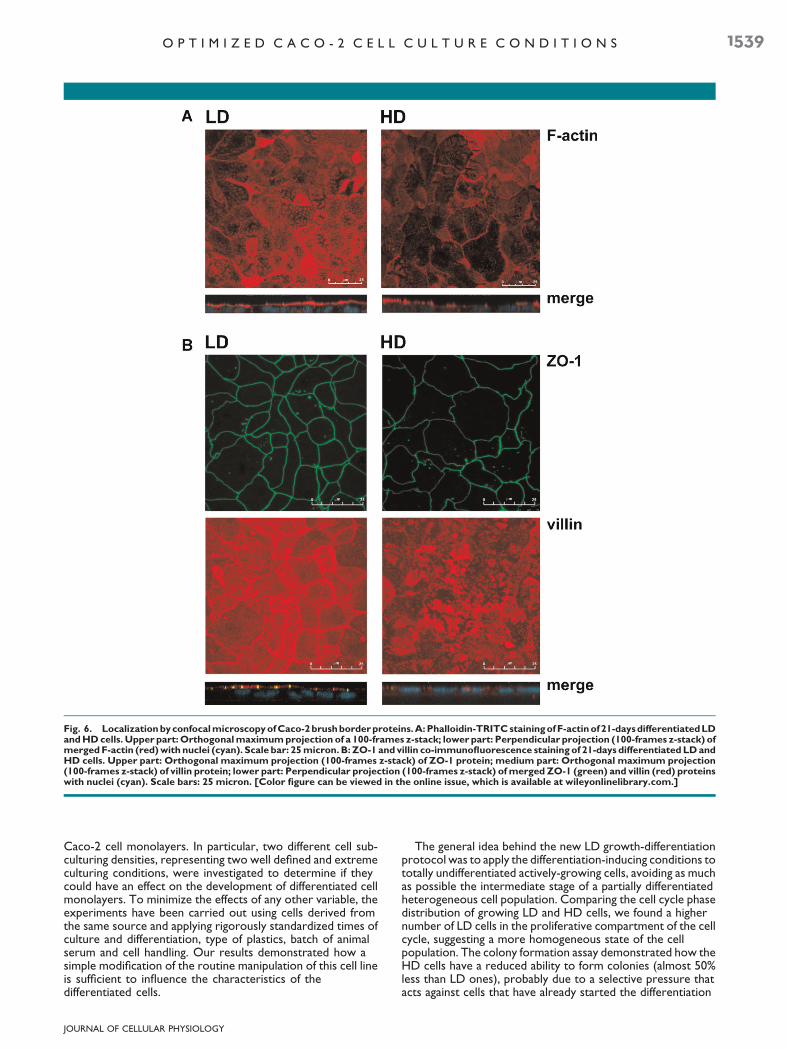
Figure 6A shows representative images obtained by confocalmicroscopy of 21-days differentiated LD and HD cells stainedwith phalloidin-TRITC. This staining is specific for the fractionof actin present in polymerized form (F-actin), which, in theintestinal epithelium, constitutes the cytoskeleton that runsalong the length of the microvilli, anchoring them to theterminal web located at the their base (Friederich et al., 1990).The LDcells showed a regular brush border,withmicrovilli welldistributed all over themonolayer surface and clearly definedbytheir content of F-actin, whereas the monolayer formed by HDcells was characterized by scarce amount of polymerized actin,showing large unstained regions.
Figure 6B shows the localization of the protein villin, one ofthe main structural components of the microvilli (Khurana andGeorge, 2008). The co-staining with the tight-junction proteinzonula occludens 1 (ZO-1) allowed to identify the border of theAP domain of the cells (Fanning et al., 1998). In this case, the
JOURNAL OF CELLULAR PHYSIOLOGY
1536 N A T O L I E T A L .

signal of villin was almost comparable between the LD and HDsamples, but in HD cells, its localization in relation to the ZO-1position was considerably altered, appearing more diffuse andless tightly associated with cellular borders.
To investigate the molecular basis of the variability shown bythe permeability values of LD and HD cell monolayers, weanalyzed the localization of the tight junction proteins ZO-1 andclaudin 4. These proteins are key components for the assemblyand functionality of the tight junction barrier, and normally theypossess a well-defined localization along the perimeter of thecells. ZO-1, localized to the tight junctions, surrounds theupper side of the cell, defining the border of AP domain, whileclaudin 4, in addition to its localization to the tight junction is
also distributed along the BL membrane as previously shown inother epithelia (Acharya et al., 2004).
Figure 7A shows the immunostaining of ZO-1 indifferentiated LD and HD cells. The ZO-1 localization in theorthogonal projection of the LD monolayer appears veryregular, defining homogeneous and narrow cell boundaries,further confirmed by the perpendicular projection, in whichZO-1 fluorescence is aligned in a narrow (about 4mm) andwell-defined region. On the contrary, HD cells form amore irregular monolayer, both in orthogonal andperpendicular view. The region containing the ZO-1 signals iswider (about 10mm) and the signals are scattered and notaligned.
Fig. 3. Hierarchical clustering of filtered normalized expression data obtained from the two-color microarray experiment ‘‘Diff/Cycl’’. Log2 ofrelative expression values are shown. The set used for clustering is composedby the 1,183 genes that show anaverage ratio differentiated/cycling>2.0 or smaller than 1/2.0 (in the linear scale) in normalized data, where the normalization procedure included both the Lowess and dye-swapmethods (see Materials and Methods Section). The four columns correspond to the Log2 ratio differentiated/cycling for the four arrays: Twocouples of biological replicates and the corresponding two dye-swapped technical replicates. The column headers have the following meaning:C,cyclingcells;D,differentiatedcells,1and2referstothebiologicalreplicatesamples;redandgreen,referstothecyanine label(eitherred,cyanine5 or green, cyanine 3). The sample tree on the top of the diagram shows that the technical replicates cluster together as expected. The geneannotation using the DAVID system is shown to the right: On the top are listed themain statistically significant functional categories (under- orover-representedinthegeneset),beloweveryblackmarkindicatesthatthecorrespondinggenebelongstothecategoryonthetop.Thecategoriesarenumberedandtheirdefinitionsandthegenesbelongingtothemare listed inSupplementaryTableS1. [Colorfigurecanbeviewed in theonlineissue, which is available at wileyonlinelibrary.com.]
JOURNAL OF CELLULAR PHYSIOLOGY
O P T I M I Z E D C A C O - 2 C E L L C U L T U R E C O N D I T I O N S 1537

Figure7Bshowsthe localizationof claudin-4.The twopictureswere chosen to document the high degree of monolayerheterogeneity that could be found in the HD cells. While in theLD monolayer ZO-1 and claudin-4 are regularly aligned aroundthe boundaries of the cells, that appear well defined andhomogeneously stained, in some region of HD monolayer thecorrect membrane localization of claudin 4 is unquestionablyaltered, both in theorthogonal and theperpendicular projection,showing a very irregular, weakly stained pattern.
Different cell line maintenance protocols lead todifferent responses to toxic injury
On the basis of the above described differences in the structureof the junctional complex and in the aspect of the brush border,we asked whether the changes observed between LD and HDcells could also result in a different cellular response to toxicinjury.
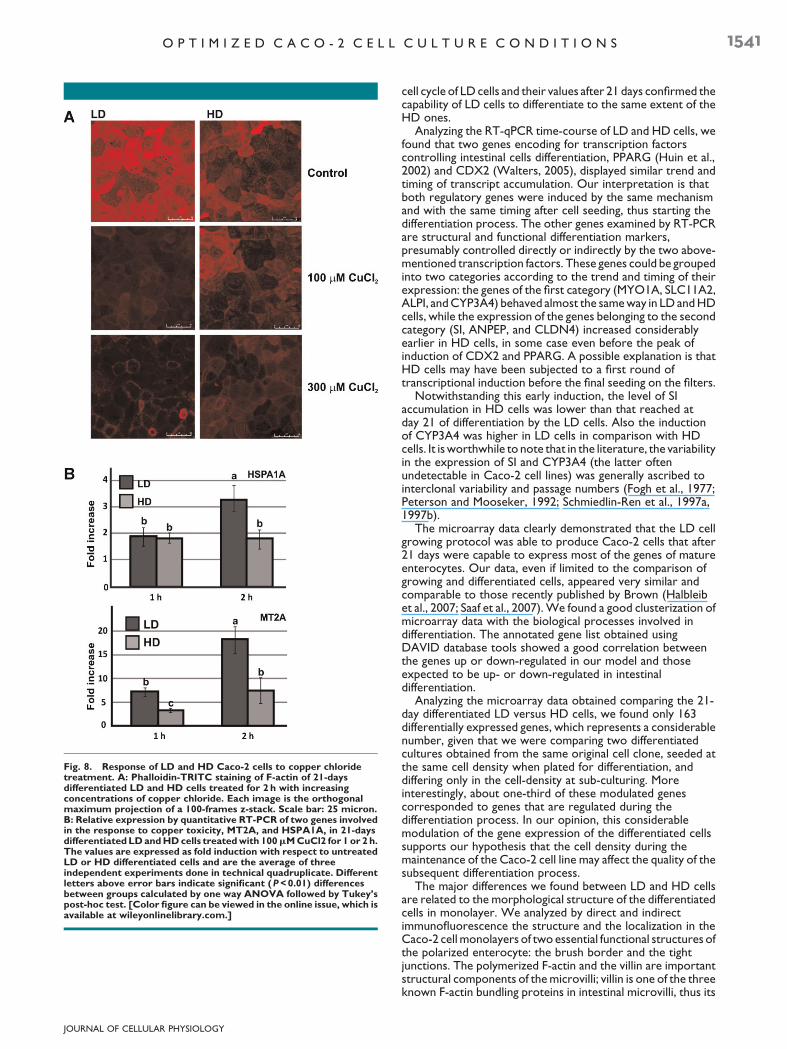
To address this question, we carried out an acute treatmentwith increasing concentrations of copper chloride, a compoundthat enters into the Caco-2 cells mainly by its AP transportersCTR1 (SLC31A1) and DMT1 (SLC11A2) (Arredondo et al.,2003) and whose effects on the cells structure in terms ofdepolymerization of F-actin have previously been described(Ferruzza et al., 1999a, 1999b; Ferruzza et al., 2002). InFigure 8A, the effect of 2 h treatment with 100 and 300mMCuCl2 on F-actin staining with fluorescent phalloidin is shown.We observed a decrease in F-actin both in LD and HD cells, butthe dose–effect ratiowas not comparable between cell types. In
HD cells, the treatment with 100mM CuCl2 had almost noeffect on the F-actin fraction, while the effect of the sameconcentration on LD cells were extremely evident, resulting ina dramatic decrease in F-actin staining.Only at 300mMCuCl2 F-actin had almost completely disappeared, showing a similar levelof decrease in both cell types.
To see if the different response of the two cell types was alsoreflected at the gene expression level, wemeasured by real-timeRT-PCR the expression level of two genes involved in coppermetabolism and toxic response: the heat shock protein 70(HSPA1A) and the metallothionein 2A (MT2A) (Song andFreedman, 2005). Figure 8B shows that after 1 and 2 h of 100mMCuCl2 treatment, the expression of MT2A was significantlyhigher in LD compared with HD cells. In the same experimentalconditions, the increase of HSPA1A was time-dependent andmore pronounced in LD cells, with a strong increase after 2 h oftreatment. Moreover, it is worthwhile to note that in all theexperiments about toxic injuries, which have been repeatedmany times also with different experimental set-ups (chronicexposure to ethanol, 1.25 to 5%; acute treatment with Fe(II)/ascorbate, 15–100mM; acute treatment with etoposide, 3.25–50mM; acute treatment with cisplatin, 1.25–10mM) theresponse of LD cells were always more reproducible andconstant compared to the HD ones (data not shown).
Discussion
We studied the effects of different culture protocols on thestructural and functional properties of the differentiated
Fig. 4. Intersection of the sets of differentially expressed genesobtained from Diff/Cycl’’ and ‘‘LD/HD’’ experiments. From Lowessnormalized data a total of 2,888 genes (‘‘Diff/Cycl’’ experiment) and163 genes (‘‘LD/HD’’ experiment) were selected, showing an averagerelative ratio >1.5 or smaller than 1/1.5 in the linear scale. The relativeLog2 ratios of genes belonging to both sets, {Diff/Cycl \ LD/HD} inblue in the Venn diagram, are shown in the scatter plot. The threegene sets located in the quadrants (a), (b), and (c) of the plot are listedin the Supplementary Table S3, functionally annotated using theDAVID system. The 163 genes belonging to the LD/HD set, {LD/HD},were also functionally annotated using the DAVID system and arereported in Supplementary Table S2. The most significant DAVIDkeywords are shown for the subset in quadrant (a).
Fig. 5. Permeability properties of LD and HD cell monolayers.A: Mean plus SEM of TEER and Papp values measured at 21-days ofdifferentiationbothinLDandHDcellmonolayers(Papp:Unpairedtwo-sided T-test, P<0.05 and two-sided Wilkoxon Mann–Witney test,P<0.01, nU 24; TEER: Unpaired two-sided T-test, P<0.0001 and two-sidedWilkoxonMann–Witney test,PU 0.0001,nU 36).B:Cumulativedistribution of TEER values of LD and HD cell monolayers(Kolmogorov–Smirnov one-sided test, P<0.05).
JOURNAL OF CELLULAR PHYSIOLOGY
1538 N A T O L I E T A L .
Caco-2 cell monolayers. In particular, two different cell sub-culturing densities, representing two well defined and extremeculturing conditions, were investigated to determine if theycould have an effect on the development of differentiated cellmonolayers. To minimize the effects of any other variable, theexperiments have been carried out using cells derived fromthe same source and applying rigorously standardized times ofculture and differentiation, type of plastics, batch of animalserum and cell handling. Our results demonstrated how asimple modification of the routine manipulation of this cell lineis sufficient to influence the characteristics of thedifferentiated cells.
The general idea behind the new LD growth-differentiationprotocol was to apply the differentiation-inducing conditions tototally undifferentiated actively-growing cells, avoiding as muchas possible the intermediate stage of a partially differentiatedheterogeneous cell population. Comparing the cell cycle phasedistribution of growing LD and HD cells, we found a highernumber of LD cells in the proliferative compartment of the cellcycle, suggesting a more homogeneous state of the cellpopulation. The colony formation assay demonstrated how theHD cells have a reduced ability to form colonies (almost 50%less than LD ones), probably due to a selective pressure thatacts against cells that have already started the differentiation
Fig. 6. LocalizationbyconfocalmicroscopyofCaco-2brushborderproteins.A:Phalloidin-TRITCstainingofF-actinof21-daysdifferentiatedLDandHDcells. Upper part:Orthogonalmaximumprojection of a 100-frames z-stack; lower part: Perpendicular projection (100-frames z-stack) ofmergedF-actin (red)with nuclei (cyan). Scale bar: 25micron. B:ZO-1 and villin co-immunofluorescence staining of 21-days differentiatedLDandHD cells. Upper part: Orthogonal maximum projection (100-frames z-stack) of ZO-1 protein; medium part: Orthogonal maximum projection(100-frames z-stack) of villin protein; lower part: Perpendicular projection (100-frames z-stack) ofmerged ZO-1 (green) and villin (red) proteinswith nuclei (cyan). Scale bars: 25 micron. [Color figure can be viewed in the online issue, which is available at wileyonlinelibrary.com.]
JOURNAL OF CELLULAR PHYSIOLOGY
O P T I M I Z E D C A C O - 2 C E L L C U L T U R E C O N D I T I O N S 1539

programme.On the contrary, the LD cells were less affected bythis type of selection, since only a small subpopulation of thesecells reached a degree of confluence sufficient to trigger thedifferentiation process.
The analysis of proteins involved in the exit from the cellcycle during 21 days of differentiation has been veryinformative. Results on pRB protein dephosphorylation(Tamrakar et al., 2000) showed that the HD cells withdrewfrom cell cycle at least 3–6 days before LD cells. The same delay
was confirmed analyzing the time-course of the levels of proteinexpression of cyclin A and kinase inhibitor p27Kip (Reed, 1997).The early exit from cell cycle showed by the HD cells can be aconsequence of the higher degree of confluence in which thesecells were maintained and it is consistent with their reducedability to form colonies. Both the delay in the onset of sucrase–isomaltase at the gene expression (Beaulieu et al., 1989), and thelater accumulation of sucrase at the protein level compared toHD cells, were in accord with the general delay in the exit from
Fig. 7. LocalizationbyconfocalmicroscopyofCaco-2 tight junctionproteins.A:ZO-1 immunofluorescencestainingof21-daysdifferentiatedLDand HD cells. Each image is the orthogonal maximum projection of a 50-frames z-stack. Upper part: Orthogonal maximum projection of ZO-1protein; medium part: Perpendicular projection ofmerged ZO-1 protein (green) and nuclei (cyan); lower part: Detail of the distribution of ZO-1protein along the z-axis. Scale bar: 50micron. B: ZO-1 and claudin-4 co-immunofluorescence staining of 21-days differentiated LD andHD cells.Eachimageistheorthogonalmaximumprojectionofa100-framesz-stack.Upperpart:OrthogonalmaximumprojectionofZO-1protein;mediumpart: Orthogonal maximum projection of claudin-4 protein; lower part: Perpendicular projection of merged ZO-1 (green), claudin-4 (red), andnuclei (cyan). Scale bar is 25 micron. [Color figure can be viewed in the online issue, which is available at wileyonlinelibrary.com.]
JOURNAL OF CELLULAR PHYSIOLOGY
1540 N A T O L I E T A L .
cell cycle of LD cells and their values after 21 days confirmed thecapability of LD cells to differentiate to the same extent of theHD ones.
Analyzing the RT-qPCR time-course of LD and HD cells, wefound that two genes encoding for transcription factorscontrolling intestinal cells differentiation, PPARG (Huin et al.,2002) and CDX2 (Walters, 2005), displayed similar trend andtiming of transcript accumulation. Our interpretation is thatboth regulatory genes were induced by the same mechanismand with the same timing after cell seeding, thus starting thedifferentiation process. The other genes examined by RT-PCRare structural and functional differentiation markers,presumably controlled directly or indirectly by the two above-mentioned transcription factors. These genes could be groupedinto two categories according to the trend and timing of theirexpression: the genes of the first category (MYO1A, SLC11A2,ALPI, andCYP3A4) behaved almost the sameway in LD andHDcells, while the expression of the genes belonging to the secondcategory (SI, ANPEP, and CLDN4) increased considerablyearlier in HD cells, in some case even before the peak ofinduction of CDX2 and PPARG. A possible explanation is thatHD cells may have been subjected to a first round oftranscriptional induction before the final seeding on the filters.
Notwithstanding this early induction, the level of SIaccumulation in HD cells was lower than that reached atday 21 of differentiation by the LD cells. Also the inductionof CYP3A4 was higher in LD cells in comparison with HDcells. It isworthwhile to note that in the literature, the variabilityin the expression of SI and CYP3A4 (the latter oftenundetectable in Caco-2 cell lines) was generally ascribed tointerclonal variability and passage numbers (Fogh et al., 1977;Peterson and Mooseker, 1992; Schmiedlin-Ren et al., 1997a,1997b).
The microarray data clearly demonstrated that the LD cellgrowing protocol was able to produce Caco-2 cells that after21 days were capable to express most of the genes of matureenterocytes. Our data, even if limited to the comparison ofgrowing and differentiated cells, appeared very similar andcomparable to those recently published by Brown (Halbleibet al., 2007; Saaf et al., 2007).We found a good clusterization ofmicroarray data with the biological processes involved indifferentiation. The annotated gene list obtained usingDAVID database tools showed a good correlation betweenthe genes up or down-regulated in our model and thoseexpected to be up- or down-regulated in intestinaldifferentiation.
Analyzing the microarray data obtained comparing the 21-day differentiated LD versus HD cells, we found only 163differentially expressed genes, which represents a considerablenumber, given that we were comparing two differentiatedcultures obtained from the same original cell clone, seeded atthe same cell density when plated for differentiation, anddiffering only in the cell-density at sub-culturing. Moreinterestingly, about one-third of these modulated genescorresponded to genes that are regulated during thedifferentiation process. In our opinion, this considerablemodulation of the gene expression of the differentiated cellssupports our hypothesis that the cell density during themaintenance of the Caco-2 cell line may affect the quality of thesubsequent differentiation process.
The major differences we found between LD and HD cellsare related to the morphological structure of the differentiatedcells in monolayer. We analyzed by direct and indirectimmunofluorescence the structure and the localization in theCaco-2 cell monolayers of twoessential functional structures ofthe polarized enterocyte: the brush border and the tightjunctions. The polymerized F-actin and the villin are importantstructural components of themicrovilli; villin is one of the threeknown F-actin bundling proteins in intestinal microvilli, thus its
Fig. 8. Response of LD and HD Caco-2 cells to copper chloridetreatment. A: Phalloidin-TRITC staining of F-actin of 21-daysdifferentiated LD and HD cells treated for 2 h with increasingconcentrations of copper chloride. Each image is the orthogonalmaximum projection of a 100-frames z-stack. Scale bar: 25 micron.B: Relative expression by quantitative RT-PCR of two genes involvedin the response to copper toxicity, MT2A, and HSPA1A, in 21-daysdifferentiatedLDandHDcells treatedwith 100mMCuCl2 for 1 or 2 h.The values are expressed as fold induction with respect to untreatedLD or HD differentiated cells and are the average of threeindependent experiments done in technical quadruplicate. Differentletters above error bars indicate significant (P<0.01) differencesbetween groups calculated by one way ANOVA followed by Tukey’spost-hoc test. [Color figure can be viewed in the online issue, which isavailable at wileyonlinelibrary.com.]
JOURNAL OF CELLULAR PHYSIOLOGY
O P T I M I Z E D C A C O - 2 C E L L C U L T U R E C O N D I T I O N S 1541

localization is influenced by the level of actin polymerization(Bartles, 2000; George et al., 2007). In HD cells, the poorer andless organized F-actin staining indicated lower levels of actinpolymerization of than in LD cells. Although the amount andlocalization of villin was similar in both cell types, the overallaspect of the punctuated microvillar pattern in HD cells waslocally disorganized, with large regions in which they wereless visible by F-actin and villin staining. Since intestinalenzymes and transporters are often localized at the brushborder, this disorganization of microvilli could have also alteredthe localization and functionality of these proteins (Lange,2010).
Other cell structures whose aspect were very differentbetween LD and HD cells were the tight junctions, as shown bythe localization of two of their principal proteins, ZO-1 andclaudin-4. In both cases the amount of the proteins wasapparently similar in HD and LD cells, but their localization wasclearly different. In LD cells, ZO-1 localization in the wholemonolayer plane was very regular, both orthogonally andperpendicularly. This organization was lost in some regions ofthe HD cell monolayer, where the cell edges were much morejagged than the LD ones and the vertical alignment of ZO-1completelymissing. In these regions, themisplacement of ZO-1deeply affected the localization of claudin-4, which wasdetectable intracellularly, and did not localize to the plasmamembrane at the level of tight junctions. The ZO-1 scaffoldingprotein has a fundamental role in the organization and functionof tight junctions: its PDZ domain confers to this protein thecapability to connect itself with transmembrane tight-junctionproteins such as claudins. The localized structural collapse ofthe complex ZO-1/claudin-4 observed in 21-days differentiatedHD monolayers could alter their permeability properties andtheir ability to function as intestinal mucosa barrier. Thesefrequent local alterations of the monolayer of HD cells, neverdetectable in the LD samples, were randomly distributed andmightwell be the origin of the significantly higher variance of theTEER and Papp data shown by HD samples.
The structural alteration of the differentiated monolayerobserved in HD cells could at least be partially responsible forthe stronger level of response to the toxicity of copper chlorideshown by LD with respect to HD cells. Copper chloride entersthe Caco-2 cells by two AP transporters, mainly by CTR1(SLC31A1) (Lonnerdal, 2008) and also by DMT1 (SLC11A2)(Arredondo et al., 2003). It is well documented, its ability todepolymerize F-actin without producing a disruption of themonolayer but altering its permeability (Ferruzza et al., 1999a,1999b; Ferruzza et al., 2002).One possible interpretation of thedifferent sensitivity to copper ions displayed by the two cellmonolayers is that the LD brush border was more efficient intransporting copper ions into the cells, thus generating in LDcell a higher effective concentration than in HD ones. Thishigher concentration could have elicited in LD cells a strongerdepolymerization of the actin fibers and a stronger induction ofthe MT2A and HSPA1A genes (Song and Freedman, 2005).
In conclusion, we think that this study indicates a possiblecause of some of the variability of response described in theliterature about the Caco-2 cell line (Sambuy et al., 2005). It isclear that a cellular model used to predict safety concentrationsof drugs and toxicant, should be carefully standardized in all theaspects concerning the cell-growth and differentiationprocedures, and the results of this work contribute to theoptimization of the Caco-2 cell line as a model in studies ofintestinal transport, metabolism and toxicity.
Acknowledgments
We are indebted with Dr. Yula Sambuy and Dr. Maria LauraScarino for useful discussion. We thank Dr. Yula Sambuy forcritical reading of the manuscript. The microarray experiments
have been done in the EBRI-CNR genomic facility. This workwas supported by EU FP6 Project ‘‘LIINTOP’’ Contract numberLSHB-CT-2006-037499 to Flavia Zucco, and by grant of FILAS,Finanziaria Laziale di Sviluppo to CNR, Institute ofNeurobiology and Molecular Medicine, Rome.
Literature Cited
Acharya P, Beckel J, Ruiz WG, Wang E, Rojas R, Birder L, Apodaca G. 2004. Distribution ofthe tight junction proteins ZO-1, occludin, and claudin-4, -8, and -12 in bladder epithelium.Am J Physiol Renal Physiol 287:F305–F318.
Arredondo M, Munoz P, Mura CV, Nunez MT. 2003. DMT1, a physiologically relevant apicalCu1þ transporter of intestinal cells. Am J Physiol Cell Physiol 284:C1525–C1530.
Artursson P, Palm K, Luthman K. 2001. Caco-2 monolayers in experimental and theoreticalpredictions of drug transport. Adv Drug Deliv Rev 46:27–43.
Bartles JR. 2000. Parallel actin bundles and their multiple actin-bundling proteins. Curr OpinCell Biol 12:72–78.
Beaulieu JF, Nichols B, Quaroni A. 1989. Posttranslational regulation of sucrase–isomaltaseexpression in intestinal crypt and villus cells. J Biol Chem 264:20000–20011.
Briske-AndersonMJ, Finley JW,Newman SM. 1997. The influenceof culture time and passagenumber on themorphological and physiological development ofCaco-2 cells. Proc Soc ExpBiol Med 214:248–257.
Bucci B, D’Agnano I, Amendola D, Citti A, Raza GH, Miceli R, De PU, Marchese R, Albini S,Felsani A, Brunetti E, Vecchione A. 2005. Myc down-regulation sensitizes melanoma cellsto radiotherapy by inhibiting MLH1 and MSH2 mismatch repair proteins. Clin Cancer Res11:2756–2767.
Fanning AS, Jameson BJ, Jesaitis LA, Anderson JM. 1998. The tight junction protein ZO-1establishes a link between the transmembrane protein occludin and the actin cytoskeleton.J Biol Chem 273:29745–29753.
Ferruzza S, Sambuy Y, Rotilio G, Ciriolo MR, Scarino ML. 1999a. The effect of copper ontight junctional permeability in a human intestinal cell line (Caco-2). Adv Exp Med Biol448:215–222.
Ferruzza S, Scarino ML, Rotilio G, Ciriolo MR, Santaroni P, Muda AO, Sambuy Y. 1999b.Copper treatment alters the permeability of tight junctions in cultured human intestinalCaco-2 cells. Am J Physiol 277:G1138–G1148.
Ferruzza S, Scacchi M, Scarino ML, Sambuy Y. 2002. Iron and copper alter tight junctionpermeability in human intestinal Caco-2 cells by distinct mechanisms. Toxicol In Vitro16:399–404.
Ferruzza S, Scarino ML, Gambling L, Natella F, Sambuy Y. 2003. Biphasic effect of iron onhuman intestinalCaco-2 cells: Early effect on tight junction permeabilitywith delayedonsetof oxidative cytotoxic damage. Cell Mol Biol (Noisy-le-grand) 49:89–99.
Fogh J, Fogh JM, Orfeo T. 1977. One hundred and twenty-seven cultured human tumor celllines producing tumors in nude mice. J Natl Cancer Inst 59:221–226.
Friederich E, Pringault E, Arpin M, Louvard D. 1990. From the structure to the function ofvillin, an actin-binding protein of the brush border. Bioessays 12:403–408.
George SP, Wang Y, Mathew S, Srinivasan K, Khurana S. 2007. Dimerization and actin-bundling propertiesof villin and its role in the assembly of epithelial cell brush borders. J BiolChem 282:26528–26541.
Halbleib JM, Saaf AM, Brown PO, Nelson WJ. 2007. Transcriptional modulation of genesencoding structural characteristics of differentiating enterocytes during development of apolarized epithelium in vitro. Mol Biol Cell 18:4261–4278.
Hayeshi R, Hilgendorf C, Artursson P, Augustijns P, Brodin B, Dehertogh P, Fisher K, FossatiL, Hovenkamp E, Korjamo T, Masungi C, Maubon N, Mols R, Mullertz A, Monkkonen J,O’Driscoll C, Oppers-Tiemissen HM, Ragnarsson EG, Rooseboom M, Ungell AL. 2008.Comparison of drug transporter gene expression and functionality in Caco-2 cells from 10different laboratories. Eur J Pharm Sci 35:383–396.
Huang dW, Sherman BT, Lempicki RA. 2009. Systematic and integrative analysis of large genelists using DAVID bioinformatics resources. Nat Protoc 4:44–57.
Huin C, Schohn H, Hatier R, Bentejac M, Antunes L, Plenat F, Bugaut M, Dauca M. 2002.Expression of peroxisome proliferator-activated receptors alpha and gamma indifferentiating human colon carcinoma Caco-2 cells. Biol Cell 94:15–27.
Khurana S, George SP. 2008. Regulation of cell structure and function by actin-bindingproteins: Villin’s perspective. FEBS Lett 582:2128–2139.
Kim JS, Mitchell S, Kijek P, Tsume Y, Hilfinger J, Amidon GL. 2006. The suitability of an in situperfusion model for permeability determinations: Utility for BCS class I biowaiverrequests. Mol Pharm 3:686–694.
Lange K. 2010. Fundamental role of microvilli in the main functions of differentiated cells:Outline of a universal regulating and signaling system at the cell periphery. J Cell Physiol.DOI: 10.1002/jcp.22302 [epub ahead of print].
Lonnerdal B. 2008. Intestinal regulation of copper homeostasis: A developmentalperspective. Am J Clin Nutr 88:846S–850S.
Mahraoui L, Rousset M, Dussaulx E, Darmoul D, Zweibaum A, Brot-Laroche E. 1992.Expression and localization of GLUT-5 in Caco-2 cells, human small intestine, and colon.Am J Physiol 263:G312–G318.
Paris L, Tonutti L, Vannini C, Bazzoni G. 2008. Structural organization of the tight junctions.Biochim Biophys Acta 1778:646–659.
Peterson MD, Mooseker MS. 1992. Characterization of the enterocyte-like brush bordercytoskeleton of the C2BBe clones of the human intestinal cell line Caco-2. J Cell Sci102:581–600.
Reed SI. 1997. Control of the G1/S transition. Cancer Surv 29:7–23.Saaf AM, Halbleib JM, Chen X, Yuen ST, Leung SY, Nelson WJ, Brown PO. 2007. Parallelsbetween global transcriptional programs of polarizing Caco-2 intestinal epithelial cells in vitroand gene expression programs in normal colon and colon cancer. Mol Biol Cell 18:4245–4260.
Saeed AI, Bhagabati NK, Braisted JC, LiangW, Sharov V, Howe EA, Li J, Thiagarajan M,White JA,Quackenbush J. 2006. TM4 microarray software suite. Method Enzymol 411:134–193.
Sambuy Y, de Angelis I, Ranaldi G, Scarino ML, Stammati A, Zucco F. 2005. The Caco-2 cellline as a model of the intestinal barrier: Influence of cell and culture-related factors onCaco-2 cell functional characteristics. Cell Biol Toxicol 21:1–26.
Schmiedlin-Ren P, Edwards DJ, Fitzsimmons ME, He K, Lown KS, Woster PM, Rahman A,Thummel KE, Fisher JM, Hollenberg PF,Watkins PB. 1997a. Mechanisms of enhanced oralavailability of CYP3A4 substrates by grapefruit constituents. Decreased enterocyteCYP3A4 concentration and mechanism-based inactivation by furanocoumarins. DrugMetab Dispos 25:1228–1233.
JOURNAL OF CELLULAR PHYSIOLOGY
1542 N A T O L I E T A L .
Schmiedlin-Ren P, Thummel KE, Fisher JM, Paine MF, Lown KS, Watkins PB. 1997b.Expression of enzymatically active CYP3A4 byCaco-2 cells grown on extracellularmatrix-coated permeable supports in the presence of 1alpha,25-dihydroxyvitamin D3. MolPharmacol 51:741–754.
Schroeder A, Mueller O, Stocker S, Salowsky R, Leiber M, Gassmann M, Lightfoot S, MenzelW, Granzow M, Ragg T. 2006. The RIN: An RNA integrity number for assigning integrityvalues to RNA measurements. BMC Mol Biol 7:3.
Sherman BT, Huang dW, Tan Q, Guo Y, Bour S, Liu D, Stephens R, Baseler MW, Lane HC,Lempicki RA. 2007. DAVID Knowledgebase: A gene-centered database integratingheterogeneous gene annotation resources to facilitate high-throughput gene functionalanalysis. BMC Bioinformatics 8:426.
Song MO, Freedman JH. 2005. Expression of copper-responsive genes in HepG2 cells. MolCell Biochem 279:141–147.
Tamrakar S, Rubin E, Ludlow JW. 2000. Role of pRB dephosphorylation in cell cycleregulation. Front Biosci 5:D121–D137.
Vachon PH, Beaulieu JF. 1992. Transient mosaic patterns of morphological and functionaldifferentiation in the Caco-2 cell line. Gastroenterology 103:414–423.
Vachon PH, Perreault N, Magny P, Beaulieu JF. 1996. Uncoordinated, transient mosaicpatterns of intestinal hydrolase expression in differentiating human enterocytes. J CellPhysiol 166:198–207.
van de Waterbeemd H. 1998. The fundamental variables of the biopharmaceuticsclassification system (BCS): A commentary. Eur J Pharm Sci 7:1–3.
Walters JR. 2005. Recent findings in the cell andmolecular biology of the small intestine. CurrOpin Gastroenterol 21:135–140.
Zucco F, Batto AF, Bises G, Chambaz J, Chiusolo A, Consalvo R, Cross H, Dal NG,deA FI, Fabre G, Guillou F, Hoffman S, Laplanche L, Morel E, Pincon-Raymond M,Prieto P, Turco L, Ranaldi G, Rousset M, Sambuy Y, Scarino ML, Torreilles F, StammatiA. 2005. An inter-laboratory study to evaluate the effects of medium composition onthe differentiation and barrier function of Caco-2 cell lines. Altern Lab Anim 33:603–618.
JOURNAL OF CELLULAR PHYSIOLOGY
O P T I M I Z E D C A C O - 2 C E L L C U L T U R E C O N D I T I O N S 1543