
THE DEGRADATION AND ANALYSIS OF LUBRICATING OIL ...
238
THE DEGRADATION AND ANALYSIS OF LUBRICATING OIL IN DIESEL ENGINES. Abdul Hamied Fakir B Sc (Hons). Thesis submitted in partial fulfilment of the requirements for Doctor of Philosophy of the Council for National Academic Awards. School of Mechanical and Production Engineering. School of Applied Chemistry. Leicester Polytechnic. October 1990.
-
Upload
khangminh22 -
Category
Documents
-
view
1 -
download
0
Transcript of THE DEGRADATION AND ANALYSIS OF LUBRICATING OIL ...
THE DEGRADATION AND ANALYSIS OF LUBRICATING OILIN DIESEL ENGINES.
Abdul Hamied Fakir B Sc (Hons).
Thesis submitted in partial fulfilment of the requirements forDoctor of Philosophy of the Council for National Academic Awards.
School of Mechanical and Production Engineering.School of Applied Chemistry.
Leicester Polytechnic.
October 1990.

ACKNOWLEDGEMENTS.
I wish to express my gratitude to my supervisors, Professor D J Picken, Dr. M F Foxand Dr. D A Armitage, all of Leicester Polytechnic, for their guidance,encouragement, patience and great effort throughout the course of the research.
I would also like to thank Mr. C English and Mr. R J Smith from the School ofMechanical and Production Engineering, and Mr. R White from the School ofChemistry for their technical assistance given in preparing apparatus and equipmentused during the course of the research.
I am extremely grateful to the Ministry of Defence (MQAD/DQATS, Harefield andRAE, Cobham) and British Rail Research, Derby for financing the research work. Iam grateful for their effort and time spared by Mr. Les Butcher of the Ministry ofDefence, and Mr. Philip Jerrison and Mr. David Smith of British Rail in making thiswork possible.
Lastly, I am indebted to my wife and children for their encouragement, motivationand patience given in the writing of this thesis.
THE DEGRADATION AND ANALYSIS OF LUBRICATING OILIN DIESEL ENGINES.
Abdul Hamied Fakir BSc (Hons).October 1990.
ABSTRACfInvestigations into lubricating oil degradation and engine wear were carried outduring the course of this work. Lubricating oil degradation models were studied andverified. This study has resulted in the development of an integrated, miniaturised,automated oil analysis system for the determination of water content, Total BaseNumber and Total Insoluble Matter for new and used oils.
The study on the engine wear and oil degradation was based on two air- cooled PetterAA1, single cylinder engines running on a 1% sulphur diesel fuel and a minimummilitary specification oil (OMD 75). The results obtained indicated that thecombination of engine operating conditions, diesel fuel and lubricating oil used,resulted in the premature loss of oil consumption control due to severe bore polishwhich was caused by corrosive wear. Oil analysis methods were developed requiringminimal quantities of oil sample in order not to disturb the engine/lubricating oilsystem integrity. The oil analysis methods developed were automated into a singleintegrated instrument for the determination ofwater content, Total Base Number andTotal Insoluble Matter for new and used oils using 1gram (or less) of oil sample andwith analysis times in the region of three minutes for doing all three analysis.
A detailed study into new and used formulated oil chemistry revealed that themeasurement of Total Base Number as determined by the Institute of Petroleumstandard test methods (IP 177 and IP 276) provided information that were over-estimates of the true levels of basicity of the oil. A new technique, based on the samechemistry as the original (IP) method, was developed for the Total Base Numberdetermination with improved end-point detection for not only new oils, but moreimportantly for used oils as well. Other oil analysis data obtained during this studyrevealed the need to modernise the existing Industry test methods with regard tochemistry, equipment and functionality, for example Total Acid Numberdetermination.
The data obtained from the analysis of the used oil was studied and the rates of changeof each of the measured parameters were calculated, based on the Quasi-ContinuousStirred Tank Reactor model. The data obtained from this model was compared to. two previously proposed models which indicated that the QCSTR model is a bettermodel for representing the degradation of lubricating oils in running engines.
This work has shown the need for the trapping of oil from the top-ring zone tounderstand the nature of the degradation and interaction of this oil with that (bulk)oil in the sump in order to successfully model the degradation characteristics of theoil.
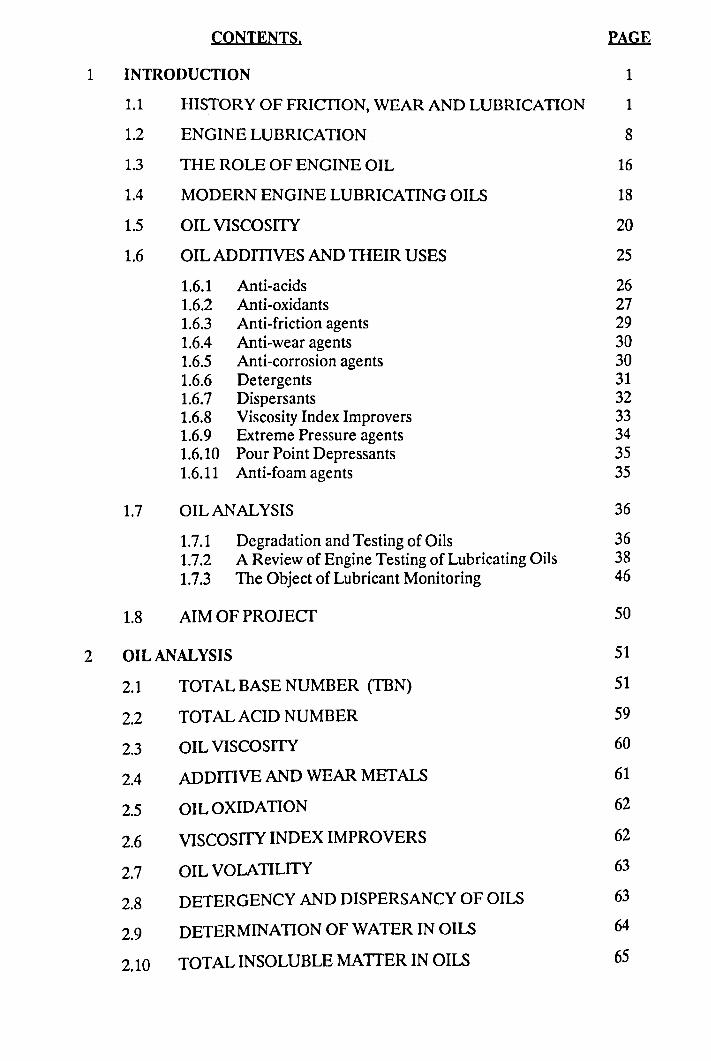
CONTENTS. PAGE
1 INTRODUCTION 11.1 HISTORY OF FRICTION, WEAR AND LUBRICATION 11.2 ENGINE LUBRICATION 81.3 THE ROLE OF ENGINE OIL 161.4 MODERN ENGINE LUBRICATING OILS 181.5 OIL VISCOSITY 201.6 OIL ADDmVES AND THEIR USES 25
1.6.1 Anti-acids 261.6.2 Anti-oxidants 271.6.3 Anti-friction agents 291.6.4 Anti-wear agents 301.6.5 Anti-corrosion agents 301.6.6 Detergents 311.6.7 Dispersants 321.6.8 Viscosity Index Improvers 331.6.9 Extreme Pressure agents 341.6.10 Pour Point Depressants 351.6.11 Anti-foam agents 35
1.7 OIL ANALYSIS 361.7.1 Degradation and Testing of Oils 361.7.2 A Review of Engine Testing of Lubricating Oils 381.7.3 The Object of Lubricant Monitoring 46
1.8 AIM OF PROJECf 50
2 OIL ANALYSIS 512.1 TOTAL BASE NUMBER (TBN) 512.2 TOTAL ACID NUMBER 592.3 OIL VISCOSITY 602.4 ADDmVE AND WEAR METALS 61
2.5 OIL OXIDATION 62
2.6 VISCOSITY INDEX IMPROVERS 62
2.7 OIL VOLATILITY 63
2.8 DETERGENCY AND DISPERSANCY OF OILS 63
2.9 DETERMINATION OF WATER IN OILS 64
2.10 TOTAL INSOLUBLE MATTER IN OILS 65
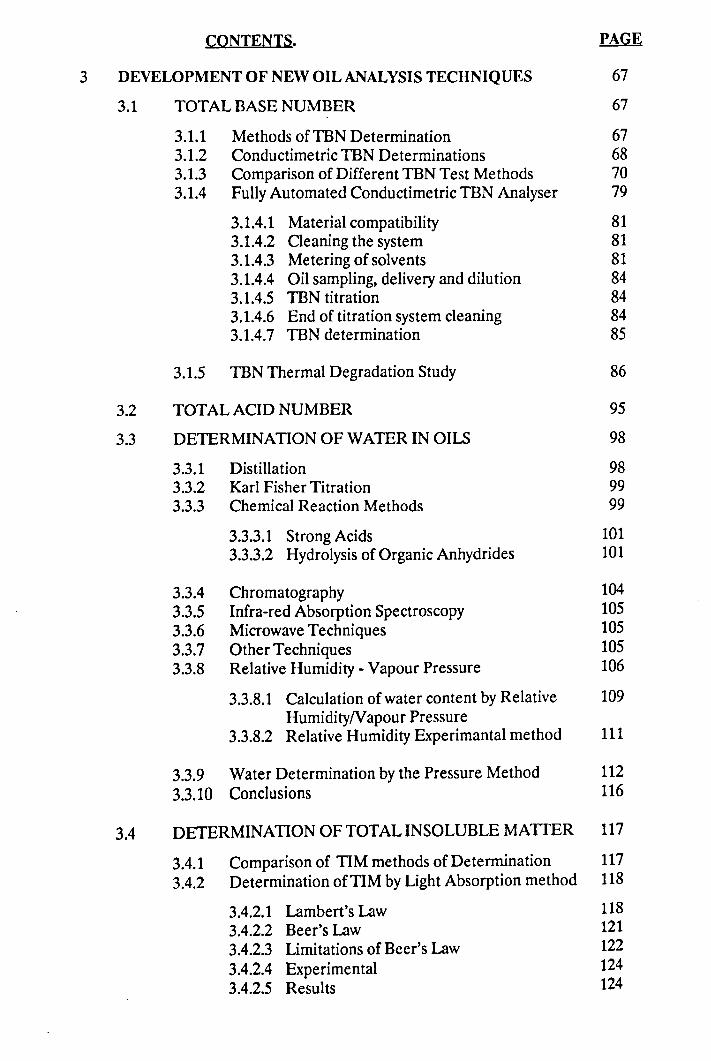
CONTENTS. PAGE
3 DEVELOPMENT OF NEW OIL ANALYSISTECHNIQUES 673.1 TOTAL BASE NUMBER 67
3.1.1 Methods of TBN Determination 673.1.2 Conductimetric TBN Determinations 683.1.3 Comparison of Different TEN Test Methods 703.1.4 Fully Automated Conductimetric TBN Analyser 79
3.1.4.1 Material compatibility 813.1.4.2 Cleaning the system 813.1.4.3 Metering of solvents 813.1.4.4 Oil sampling, delivery and dilution 843.1.4.5 TBN titration 843.1.4.6 End of titration system cleaning 843.1.4.7 TEN determination 85
3.1.5 TEN Thermal Degradation Study 86
3.2 TOTAL ACID NUMBER 953.3 DETERMINATION OF WATER IN OILS 98
3.3.1 Distillation 983.3.2 Karl Fisher Titration 993.3.3 Chemical Reaction Methods 99
3.3.3.1 Strong Acids 1013.3.3.2 Hydrolysis of Organic Anhydrides 101
3.3.4 Chromatography 1043.3.5 Infra-red Absorption Spectroscopy 1053.3.6 Microwave Techniques 1053.3.7 Other Techniques 1053.3.8 Relative Humidity - Vapour Pressure 106
3.3.8.1 Calculation of water content by Relative 109Humidity/Vapour Pressure
3.3.8.2 Relative Humidity Experimantal method 111
3.3.9 Water Determination by the Pressure Method 1123.3.10 Conclusions 116
3.4 DETERMINATION OF TOTAL INSOLUBLE MATIER 1173.4.1 Comparison of TIM methods of Determination 1173.4.2 Determination of TIM by Light Absorption method 118
3.4.2.1 Lambert's Law 1183.4.2.2 Beer's Law 1213.4.2.3 Limitations of Beer's Law 1223.4.2.4 Experimental 1243.4.2.5 Results 124
CONTENTS. PAGE
3.4.3 Conclusion 1293.4.4 TIM Automation 129
3.5 CONCLUSIONS (for Chapter 3) 130
4 ENGINE TESTING 133
4.1 ENGINE MONITORING 134
4.2 ENGINE WEAR MEASUREMENT 134
4.3 CYLINDER BORE WEAR 134
4.4 PISTON, RING AND RING-GROOVE WEAR 140
4.5 ASSESSMENT OF ENGINE CONDmON 140
4.6 OIL CONSUMPTION 140
4.7 OIL ANALYSIS 140
4.8 RESULTS 141
4.8.1 Engine Wear 1414.8.2 Engine Oil Analysis 152
4.9 OIL TREND ANALYSIS 160
4.9.1 TBN 1614.9.2 100°C Viscosity 1624.9.3 20 °c and 40°C Viscosity 1624.9.4 Total Insoluble Matter and Oil Make-up 1624.9.5 Oil Blackness, Oxidation, Iron, Calcium 1634.9.6 Wear Metals, Sodium and Silicon 1644.9.7 Zinc and Phosphorus 1644.9.8 Total Acid Number 1864.9.9 Trend Analysis from cross-plots 186
4.9.9.1 Total Insoluble Matter versus Oil Make-up 1864.9.9.2 Zinc and Phosphorus versus Calcium 1864.9.9.3 Calcium versus Oxidation 1874.9.9.4 Total Acid Number versus Oxidation 1874.9.9.5 Total Base Number versus Total Acid No. 1934.9.9.6 Iron Content versus Oxidation 1934.9.9.7 Oil Blackness versus Oxidation 1934.9.9.8 20 °c Viscosity versus Oxidation 194
4.10 SUMMARY OF OIL ANALYSIS 194
CONTENTS, PAGE
5 ENGINE WEAR AND OIL DEGRADATION MODELS - AN 195INTRODUCTION
5,1 LUBRICATING OIL DEGRADATION MODEL 195
5,2 COMPARISONS WITH OTHER OIL 200DEGRADATION MODELS
5,3 THE GENERAL QUASI-CONTINUOUS STIRRED 202TANK REACfOR (QCSTR) MODEL
5.4 SUMMARY 206
6 CONCLUSIONS AND IMPLICATIONS FOR FURTHER WORK 210
6,1 NEW OIL ANALYTICAL TECHNIQUES 210
6,6,1 Conclusions6,6,2 Further Work
210210
6,2 USED OIL ANALYSIS FROM OPERTATINGDIESEL ENGINES
210
6.2.1 Conclusions of Oil Degradation6,2,2 Conclusions on Oil Degradation Model6.2.3 Further Work6,2.4 Other Further Work
210211211211
6,3 OTHER WORK 211
APPENDICES
REFERENCES
CHAPTERl.1. INrRODUCTION.
1.1 Hjstory of Friction. Wear and Lubrication.
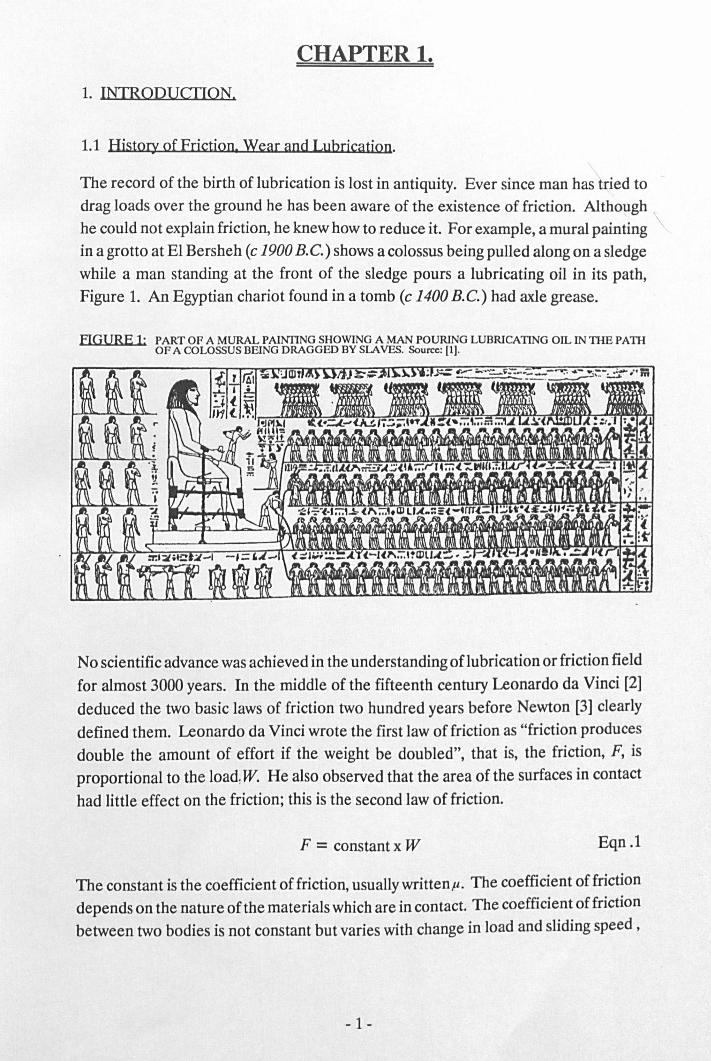
The record of the birth of lubrication is lost in antiquity. Ever since man hastried todrag loads over the ground he has been aware of the existence of friction. Although \he could not explain friction, he knew how to reduce it. For example, a mural painting \in a grotto at El Bersheh (c 1900 B.C.) shows a colossus being pulled along on a sledgewhile a man standing at the front of the sledge pours a lubricating oil in its path,Figure 1. An Egyptian chariot found in a tomb (c 1400 B.C.) had axle grease.
FIGURE I: PART OF A MURAL PAINTING SHOWING A MAN POURING LUBRICATING OIL INmE PATHOF A COLOSSUS BEING DRAGGED BY SLAVES. Source: [1].
No scientific advance was achieved in the understanding oflubrication or friction fieldfor almost 3000 years. In the middle of the fifteenth century Leonardo da Vinci [2]deduced the two basic laws of friction two hundred years before Newton [3] clearlydefined them. Leonardo da Vinci wrote the first law of friction as "friction producesdouble the amount of effort if the weight be doubled", that is, the friction, F, isproportional to the load,W. He also observed that the area of the surfaces in contacthad little effect on the friction; this is the second law of friction.
F = constant x W Eqn.l
The constant is the coefficient of friction, usually written«. The coefficient of frictiondepends on the nature of the materials which are in contact. The coefficient of frictionbetween two bodies is not constant but varies with change in load and sliding speed,
- 1-
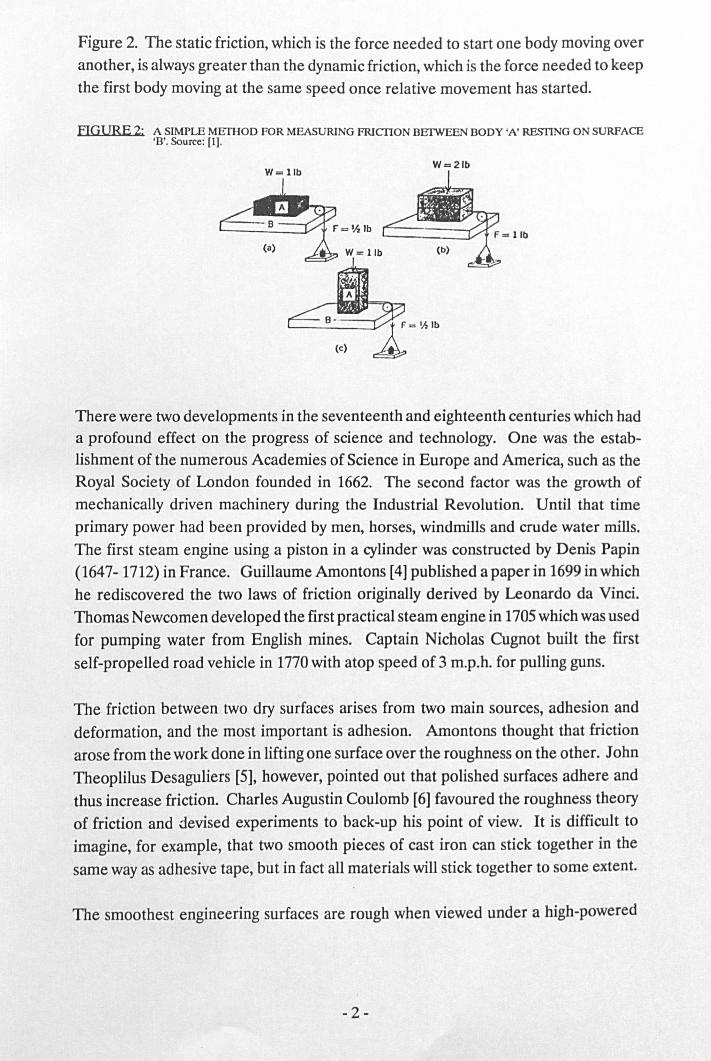
Figure 2. The static friction, which is the force needed to start one body moving overanother, is always greater than the dynamic friction, which is the force needed to keepthe first body moving at the same speed once relative movement has started.
FIGURE 2: A SIMPLE MEfHOD FOR MEASURING FRICTION BEIWEEN BODY 'A' RESTING ON SURFACE'B'. Source: [1].
W=21b
There were two developments in the seventeenth and eighteenth centuries which hada profound effect on the progress of science and technology. One was the estab-lishment of the numerous Academies of Science in Europe and America, such as theRoyal Society of London founded in 1662. The second factor was the growth ofmechanically driven machinery during the Industrial Revolution. Until that timeprimary power had been provided by men, horses, windmills and crude water mills.The first steam engine using a piston in a cylinder was constructed by Denis Papin(1647- 1712) in France. Guillaume Amontons [4]published a paper in 1699 in whichhe rediscovered the two laws of friction originally derived by Leonardo da Vinci.Thomas Newcomen developed the first practical steam engine in 1705which was usedfor pumping water from English mines. Captain Nicholas Cugnot built the firstself-propelled road vehicle in 1770with atop speed of 3 m.p.h. for pulling guns.
The friction between two dry surfaces arises from two main sources, adhesion anddeformation, and the most important is adhesion. Amontons thought that frictionarose from the work done in lifting one surface over the roughness on the other. JohnTheoplilus Desaguliers [5], however, pointed out that polished surfaces adhere andthus increase friction. Charles Augustin Coulomb [6] favoured the roughness theoryof friction and devised experiments to back-up his point of view. It is difficult toimagine, for example, that two smooth pieces of cast iron can stick together in thesame way as adhesive tape, but in fact all materials will stick together to some extent.
The smoothest engineering surfaces are rough when viewed under a high-powered
-2-
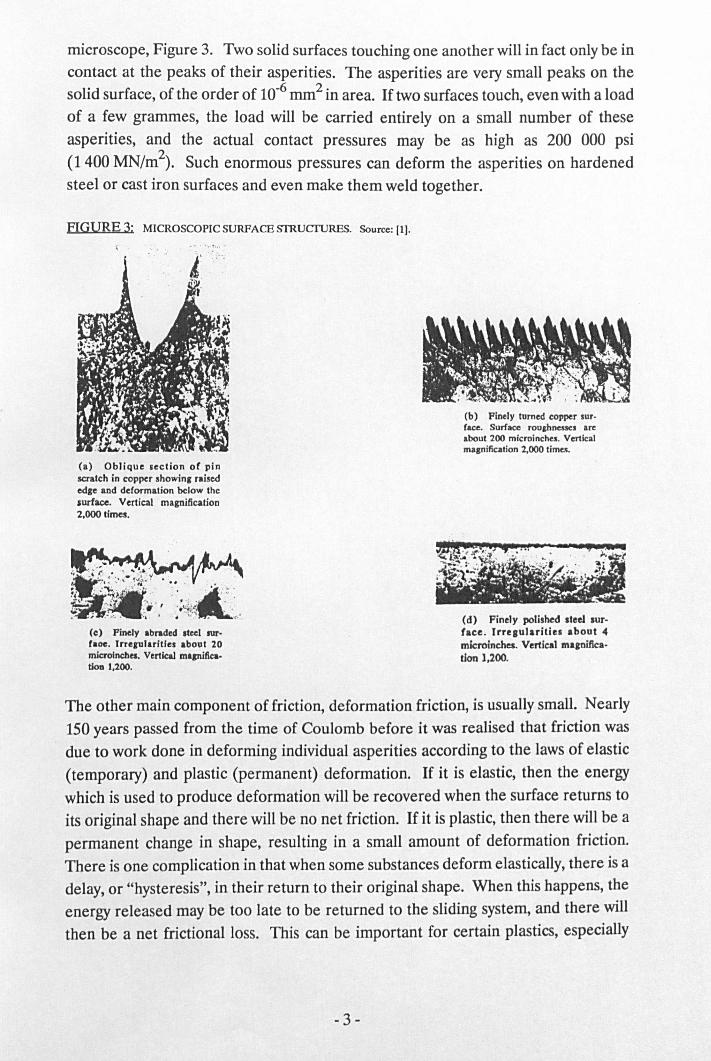
microscope, Figure 3. Two solid surfaces touching one another will in fact only be incontact at the peaks of their asperities. The asperities are very small peaks on thesolid surface, of the order of 10-6mm2 in area. If two surfaces touch, even with a loadof a few grammes, the load will be carried entirely on a small number of theseasperities, and the actual contact pressures may be as high as 200 000 psi(1400 MN/m2). Such enormous pressures can deform the asperities on hardenedsteel or cast iron surfaces and even make them weld together.
FIGURE 3: MICROSCOPIC SURFACE srnucruaas, Source: [IJ .
. " ··.·t·.. -
(b) Finely turned copper sur-face. Surface rou&hnessc:s areabout 200 micrninebes, Verticalmagnification 2,000 tlmes,
(a) Oblique scction of pinscratch in copper showing raisededge and deformation below thcsurface. Vertical magnification2.000 times.
(c) Finely abraded steel 1Ur'
raoe. lrre,ularitles about 20microlnchea. Vertical magnifIca-tion 1,200.
(d) Finely polished steel sur-face. IrreBularities about 4microlnches. Vertical maenilica-tlon 1,200.
The other main component of friction, deformation friction, is usually small. Nearly150 years passed from the time of Coulomb before itwas realised that friction wasdue to work done in deforming individual asperities according to the laws of elastic(temporary) and plastic (permanent) deformation. If it is elastic, then the energywhich is used to produce deformation will be recovered when the surface returns toits original shape and there will be no net friction. If it is plastic, then there will be apermanent change in shape, resulting in a small amount of deformation friction.There is one complication in that when some substances deform elastically, there is adelay, or "hysteresis", in their return to their original shape. When this happens, theenergy released may be too late to be returned to the sliding system, and there willthen be a net frictional loss. This can be important for certain plastics, especially
- 3-

certain rubbers. "High hysteresis" rubbers for vehicle tyres are deliberatelyformulated to produce high hysteresis friction. In addition, elastic deformation cancause some loss of energy in the form of heat, and can contribute to fatigue damage.
It has long been known that liquids and greases reduce the friction between slidingsurfaces. Until beyond the middle of the nineteenth century it was believed that theliquid or grease filled the surface hollows and so presented a smoother surface forsliding. This point of view was shared by Amontons, Coulomb and engineers of thattime. Until the Industrial Revolution animal and vegetable oils were the lubricants ingeneral use. In fact it was only in the latter half of the last century that their limitationswere becoming apparent. The introduction of the reciprocating engine, particularlythe heavy duty internal combustion engine, gave rise to a demand for cylinderlubricants which would not lose their physical and chemical properties at hightemperatures. This demand, coupled with the rapidly increasing demand for animaland vegetable oils for other purposes, resulted in an increase in their cost which ledto the wide adoption of mineral oils for lubrication purposes. Animal and vegetableoils, however, still play an important role in the manufacture of compounded oils andgreases today. The physical properties of fatty oils are relatively constant but thoseof mineral derivatives can vary considerably, for example viscosity.
It is not clear at what stage mineral oils were first used as lubricants. It was probablya case of a product being generally available and its particular application beingaccidental. Petroleum was long used for medicinal and illuminating purposes and wasavailable from seepages from the earth as surface deposits. The earliest well drilledfor the specific purpose of obtaining oil is credited to 'Colonel' Drake of the SenecaOil Company. This well was drilled in 1859 in Titusville, Pennsylvania and had adepth of 69 feet. The modern petroleum industry is generally regarded as startingfrom this date.
As late as 1890, Phillips [7] in his 'Engineering Chemistry' gives the following list oflubricants and the best purposes for which they could be applied (Table 1).
He adds the note:
'It may be stated, however, that in all cases where possible, a mineral oil of suitablebody should be used, especially for cylinders, the high temperature of whichdecomposes fatty oils with the production of free fatty acids which attack copper, iron,etc., forming metallic soaps which cause much damage to fittings, etc.'
-4-
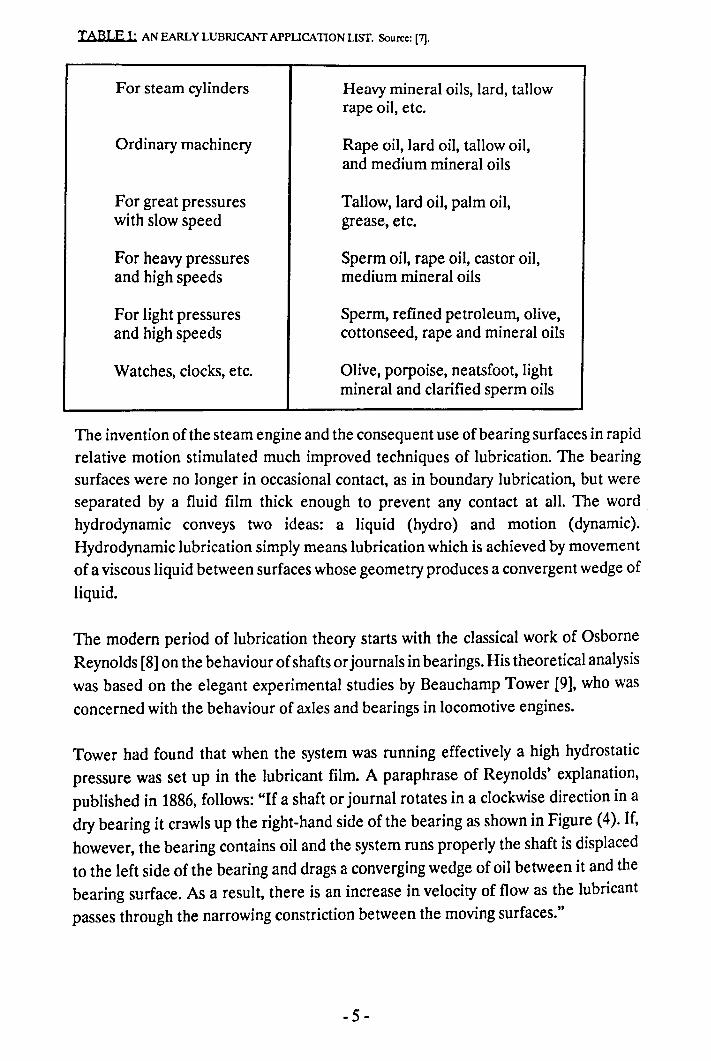
TABLE 1: AN EARLYLUBRICANf APPLICAnON LISf. Source: [7].
For steam cylinders Heavy mineral oils, lard, tallowrape oil, etc.
Ordinary machinery Rape oil, lard oil, tallow oil,and medium mineral oils
For great pressureswith slow speed
Tallow, lard oil, palm oil,grease, etc.
For heavy pressuresand high speeds
Sperm oil, rape oil, castor oil,medium mineral oils
For light pressuresand high speeds
Sperm, refined petroleum, olive,cottonseed, rape and mineral oils
Olive, porpoise, neatsfoot, lightmineral and clarified sperm oils
Watches, clocks, etc.
The invention of the steam engine and the consequent use of bearing surfaces in rapidrelative motion stimulated much improved techniques of lubrication. The bearingsurfaces were no longer in occasional contact, as in boundary lubrication, but wereseparated by a fluid film thick enough to prevent any contact at all. The word.hydrodynamic conveys two ideas: a liquid (hydro) and motion (dynamic).Hydrodynamic lubrication simply means lubrication which is achieved by movementof a viscous liquid between surfaces whose geometry produces a convergent wedge ofliquid.
The modern period of lubrication theory starts with the classical work of OsborneReynolds [8]on the behaviour of shafts or journals in bearings. His theoretical analysiswas based on the elegant experimental studies by Beauchamp Tower [9], who wasconcerned with the behaviour of axles and bearings in locomotive engines.
Tower had found that when the system was running effectively a high hydrostaticpressure was set up in the lubricant film. A paraphrase of Reynolds' explanation,published in 1886, follows: "If a shaft or journal rotates in a clockwise direction in adry bearing it crawls up the right-hand side of the bearing as shown in Figure (4). If,however, the bearing contains oil and the system runs properly the shaft is displacedto the left side of the bearing and drags a converging wedge of oil between it and thebearing surface. As a result, there is an increase in velocity of flow as the lubricantpasses through the narrowing constriction between the moving surfaces."
-5-
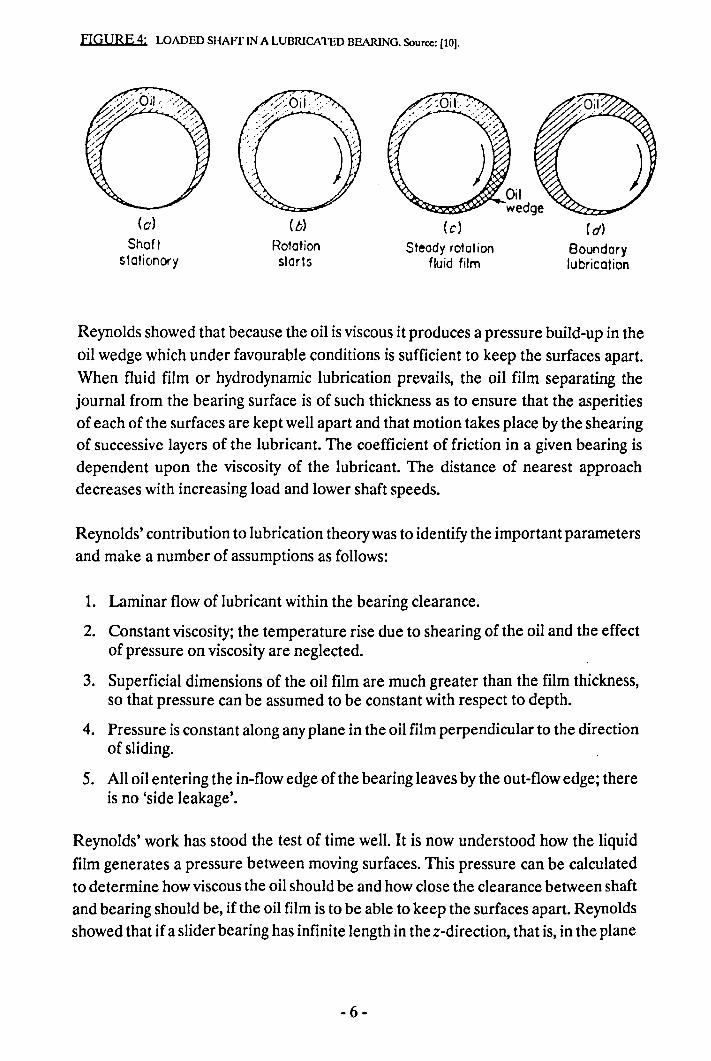
FIGURE 4: LOADED SHAFf IN A LUBRICATED BEARING. Source: [10].
(0)Shaft
stotionory
(b)
Rolationstarts
(c)
Steady rotationfluid film
(d)
Boundarylubrication
Reynolds showed that because the oil is viscous it produces a pressure build-up in theoil wedge which under favourable conditions is sufficient to keep the surfaces apart.When fluid film or hydrodynamic lubrication prevails, the oil film separating thejournal from the bearing surface is of such thickness as to ensure that the asperitiesof each of the surfaces are kept well apart and that motion takes place by the shearingof successive layers of the lubricant. The coefficient of friction in a given bearing isdependent upon the viscosity of the lubricant. The distance of nearest approachdecreases with increasing load and lower shaft speeds.
Reynolds' contribution to lubrication theory was to identify the important parametersand make a number of assumptions as follows:
1. Laminar flow of lubricant within the bearing clearance.
2. Constant viscosity; the temperature rise due to shearing of the oil and the effectof pressure on viscosity are neglected.
3. Superficial dimensions of the oil film are much greater than the film thickness,so that pressure can be assumed to be constant with respect to depth.
4. Pressure is constant along any plane in the oil film perpendicular to the directionof sliding.
5. All oil entering the in-flow edge of the bearing leaves by the out-flow edge; thereis no 'side leakage'.
Reynolds' work has stood the test of time well. It is now understood how the liquidfilm generates a pressure between moving surfaces. This pressure can be calculatedto determine how viscous the oil should be and how close the clearance between shaftand bearing should be, if the oil film is to be able to keep the surfaces apart. Reynoldsshowed that if a slider bearing has infinite length in thez-direction, that is, in the plane
-6-
of the oil film perpendicular to the direction of sliding, the pressure distribution withinthe oil film can be expressed in the one dimensional form:
Eqn.2
The above equation connects the normal pressures, p, acting on the bearing surfaceswith the velocity, U, of the moving surface, the viscosity, 7], of the oil and the filmthickness, h, at any point.
A special type of hydrodynamic lubrication can take place in certain heavily loadedcontacts such as in ball or roller bearings and many types of gear. If the geometry andthe type of movement are suitable, lubricant can be trapped in the entry zone of sucha contact, and become subject to very high pressures as it is squeezed into the confinedspace in the most highly loaded part of the contact. These pressures have twoimportant effects. They cause the viscosity of the lubricant to increase considerably,thus increasing its load carrying capacity. At the same time they cause the loadedsurfaces to deform elastically in such a way as to spread the load over a greater area.This phenomenon is known as elasto-hydrodynamic lubrication as it is controlled byelastic and hydrodynamic effects. Several equations have been produced to calculatethe elasto-hydrodynamic lubrication film thickness; probably the best known is theDowson-Higginson Equation [11]:
h =2.65 (7]Q cq;7 ROA3 aO•54
.3 ~o.13 Eqn.3
where ~, is the contact pressure; R, the effective radius; E, Young's modulus ofelasticity; 7], is the viscosity of the lubricant in the entry zone; and a, the extent to whichviscosity increases with pressure.
Although, technically, hydrodynamic lubrication refers to lubrication by a liquid, itcan also be applied to lubrication by gas, provided that the load and speed conditionsare suitable for the very low viscosity of gases.
The significance of boundary lubrication conditions had not been appreciated untilthe first systematic investigations into the mechanism of thin-film lubrication werecarried out by Hardy [12] who first used the term 'boundary' lubrication. Underboundary lubrication the distance apart of the mating surfaces is very much less thanfor hydrodynamic lubrication conditions, being of the order ofthe height of the surface
-7-
asperities. When the oil film is squeezed out, metal-to-metal contact can take placeand the load would be carried on the high spots of the journal and the bearing.Appreciable heat would be generated and the two surfaces may become weldedtogether. When the two surfaces adhere together, 'seizure' is said to take place. Ifmotion is then forced, removal of metal may take place from one or both the surfacesresulting in what is known as 'scuffing'. In practice, seizure or scuffing, is delayed bythe fact that metals tend to have oxide films on their surfaces and these temporarilyprevent direct metal-to-metal contact. In addition to the surface oxide layers,adsorption of lubricant or other chemicals may become attached to the metal surface.
1.2 Engine Lubrication Systems.
The simplest method of applying lubricant to a bearing is from an oil-can through asmall hole in the top of a bearing. This method is crude as it allows moisture and solidcontaminants into the bearing. A simple improvement is to close the hole by aspring-loaded ball which fulfils the requirements of a lubricator by excluding dirt andmoisture. In addition, a lubricator should have adequate storage capacity to minimiseconstant attention. The simplest possible lubrication system consists of a gravity feedof the lubricant to the point of application. The gravity supply tank must have thenecessary head for oil flow to take place. The tank may be replaced by a pump in a'forced- feed system'. The oil is either consumed or lost, that is, the system is a 'totalloss' one.
In many cases, for example in enclosed engines it is possible, after the oil has done itswork, for the oil to flow into a sump from where it can be recirculated. In a total losssystem fresh oil has to be continuously fed into the system. In a recirculation systemthe same oil is used continuously although some oil loss may occur in leakages,combustion, evaporation and degradation which then requires the oil to be changedregularly or the level 'made-up' with fresh oil. In a recirculation system anyparticulatematter must be removed by filtration whereas in a total loss system any dirt would bewashed away with the oil.
In enclosed reciprocating engines it was common practice to place the sump at thebottom of the crankcase so that as the crankshaft revolves, the big-end connecting-rodbearings dip in the oil and are thus regularly lubricated. At the same time oil issplashed on to the walls of the cylinders and the small-end bearings of the connecting-rod. A constant mist of oil exists in the crankcase whilst the engine is running. Thismethod of lubrication is known as 'splash lubrication' and it requires that the oil inthe sump to be maintained above some definite, minimum level. Small internalcombustion engines, up to 250 cc, still use this.
-8-
In the high-speed totally enclosed steam reciprocating engine, it was inevitable thatsteam would mix with the oil in the crankcase. High working temperatures and thechurning together of oil, air and water leads to the oxidation of the oil, the formationof water-oil emulsions and the deposition of sludge in the crankcase. Large steamturbines are invariably fitted with forced-feed recirculation systems where thelubricant may also have to function as the operating fluid in governors and controlgear. The high speed of a marine turbine is reduced to low propeller speed usingdouble helical gearing. Efficient lubrication of the gear teeth is called for and the oilhas to act as a coolant.
Small two-stroke internal combustion engines may operate on a 'total loss' system.Early systems involved injecting or supplying a continuous drip feed of oil to thecrankcase, but the modern method is to dissolve the lubricating oil in the petrol. Theoil is deposited in the crankcase when the fuel charge is compressed. The mostcommon system, universal in automobile engines, is the wet sump system. Splash isrelied upon to lubricate the cylinder walls, the big end and the small end bearings. Agear or valve type pump is generally used to force oil to the crankshaft, rocker gear,etc., the surplus oil draining back to the sump. In the dry sump system a separate oiltank is used and the amount of oil in the sump is reduced to a minimum. Oil from thetank is pumped to the connecting rod bearings, the camshaft and crank bearings.Lubrication of the cylinder walls and also cooling of the underside of the piston maybe effected by an oil-jet in one of the crankwebs. The oil then drains back to the sumpfrom which it is drawn through a filter back to the tank by means of a 'scavenge' pump.The scavenge pump usually has a greater capacity than the circulating pump to ensurethat there is no accumulation of oil in the crankcase. The advantages of this systemare that better filtering and cooling of the lubricating oil is possible. The system canbe used in radial, inverted engines and also in any type of aircraft reciprocating enginewhere inverted flight is possible.
The disadvantage of wet and dry sump engine lubrication systems is that the oil isexpected to cope with both extremes. The same oil is used for cylinder lubricationwhere it is subjected to high temperatures and for piston cooling and bearinglubrication, in which capacity it must be a heavy duty lubricant. It is also used for thelubrication of camshafts and timing gears, and in some cases as a hydraulic mediumfor operating accessories. An improvement on this would be to have separatelubrication systems for bearings and cylinders as in the case with very large marinediesel engines. The oil may be supplied under pressure to a number of points in thecylinder through 'quills' each of which is supplied by a pump. The spring-loaded valvein the quill prevents blow-back of the combustion gases into the oil feed lines.
-9-
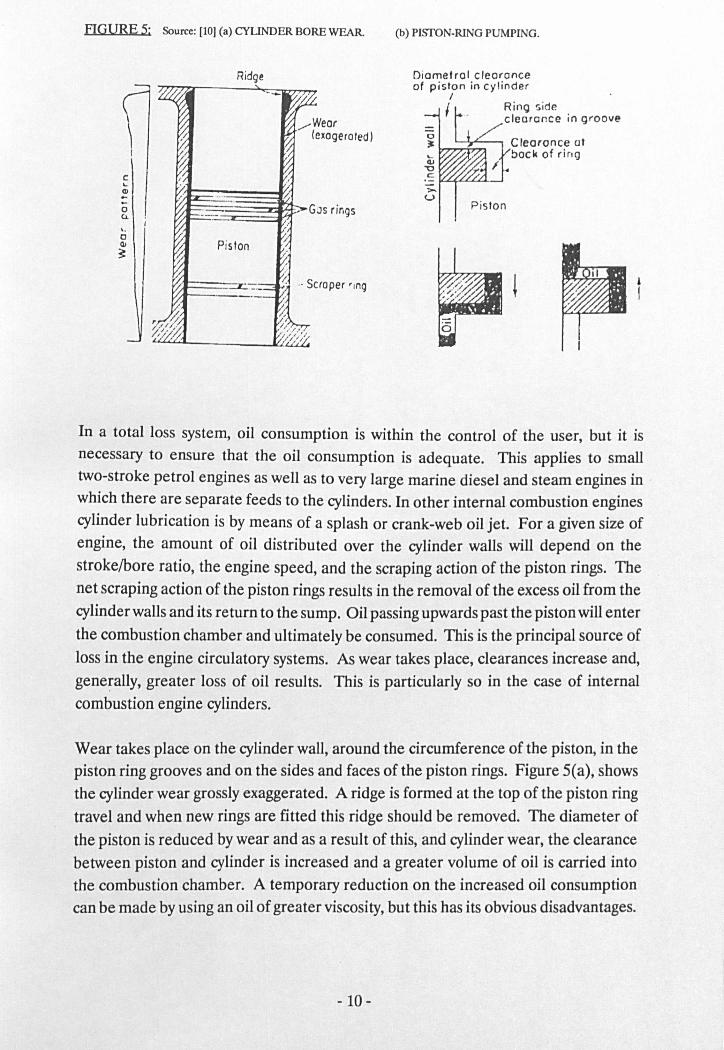
FIGURE 5: Source: [10] (a) CYLINDER BORE WEAR (b) PIsrON-RING PUMPING.
Ridge Diametrol cleoronceof piston in cylinder
I
I~Rin9Side... clecrcnce in groove
Clearance 01. bock of ringI
cLCl)--oCl.
Piston
..oCl)
~
.' Scraper 'Ing
In a total loss system, oil consumption is within the control of the user, but it isnecessary to ensure that the oil consumption is adequate. This applies to smalltwo-stroke petrol engines as well as to very large marine diesel and steam engines in .which there are separate feeds to the cylinders. In other internal combustion enginescylinder lubrication is by means of a splash or crank-web oil jet. For a given size ofengine, the amount of oil distributed over the cylinder walls will depend on thestrokelbore ratio, the engine speed, and the scraping action of the piston rings. Thenet scraping action of the piston rings results in the removal of the excess oil from thecylinder walls and its return to the sump. Oil passing upwards past the piston will enterthe combustion chamber and ultimately be consumed. This is the principal source ofloss in the engine circulatory systems. As wear takes place, clearances increase and,generally, greater loss of oil results. This is particularly so in the case of internalcombustion engine cylinders.
Wear takes place on the cylinder wall, around the circumference of the piston, in thepiston ring grooves and on the sides and faces of the piston rings. Figure 5(a), showsthe cylinder wear grossly exaggerated. A ridge is formed at the top of the piston ringtravel and when new rings are fitted this ridge should be removed. The diameter ofthe piston is reduced by wear and as a result of this, and cylinder wear, the clearancebetween piston and cylinder is increased and a greater volume of oil is carried intothe combustion chamber. A temporary reduction on the increased oil consumptioncan be made by using an oil of greater viscosity, but this has its obvious disadvantages.
- 10-
A result of piston ring groove wear combined with wear on the side faces of the ringsis that piston rings tend to act as pumps, pumping oil up into the combustion spaceand thus increasing oil consumption. On the downward motion of the piston the ringis in contact with the top of the groove and the space beneath it becomes filled withoil. On the up-stroke this oil is transferred from beneath the ring, past the back of thering, into the space above the ring and ultimately into the combustion chamber,Figure 5(b). Various special types of piston rings have been devised to overcome thisdefect and thus reduce oil consumption, and to prolong the engine life. The bestremedy for excessive oil consumption is a cylinder re-bore and fitting new pistons andrings. Piston rings may also wear on their rubbing faces and may lose their"springiness" resulting in reduced ring wall pressure. Top rings are particularlysubject to heavy scuffing due to the onerous lubrication conditions at the top of thestroke and the intrusion of small pieces of hard carbon dislodged from the pistoncrown or the combustion chamber.
Control of oil consumption in an internal combustion engine results from thecombined scraping action of all the rings, but most of this work is done by the bottomrings which are known as scraper rings. The top piston rings act as gas seals. Variousdesigns of scraper rings in cross-section are shown in Figure 6(a), the severity of theindividual scraping action increasing from top to bottom. The scraping action is leastwith a rounded edge and greatest with an acute angled 'cutting' edge; the action maybe increased by providing each ring with two scraping edges and suitable oil escapeholes in the rings and piston ring grooves. The maximum scraping action will not beobtained if suitable escape holes for the scraped-off oil are not provided or if theseholes are not kept open. The scraping action of any ring will also depend upon thecircumferential wall pressure it exerts upon the cylinder wall. Various methods havebeen devised for assessing the value of, or the variation in, circumferential ring-cylinder wall pressure but none has come into general use. Piston compression ringscan be obtained with one degree of face taper intended to facilitate running in. Theamount of initial narrow land removed after a short duration run permits anassessment of the circumferential distribution of piston ring wear.
The distribution ofwear can be studied from wear patterns, for example, cylinder wearand piston ring groove wear patterns can be obtained from direct measurements usinga micrometer or feeler gauges. Wear patterns can serve to indicate the nature ofrelative motion of the parts concerned, for example, the piston ring groove wearpattern, Figure 6(b), could be explained on the basis of ring rotation plus the rockingof the piston at the end of the stroke. Wear traces on the upper faces of rings mayindicate ring "flutter". The amount of piston-ring and bearing wear can be found fromchanges in their mass before and after tests of known duration. Assessment of overall
-11-
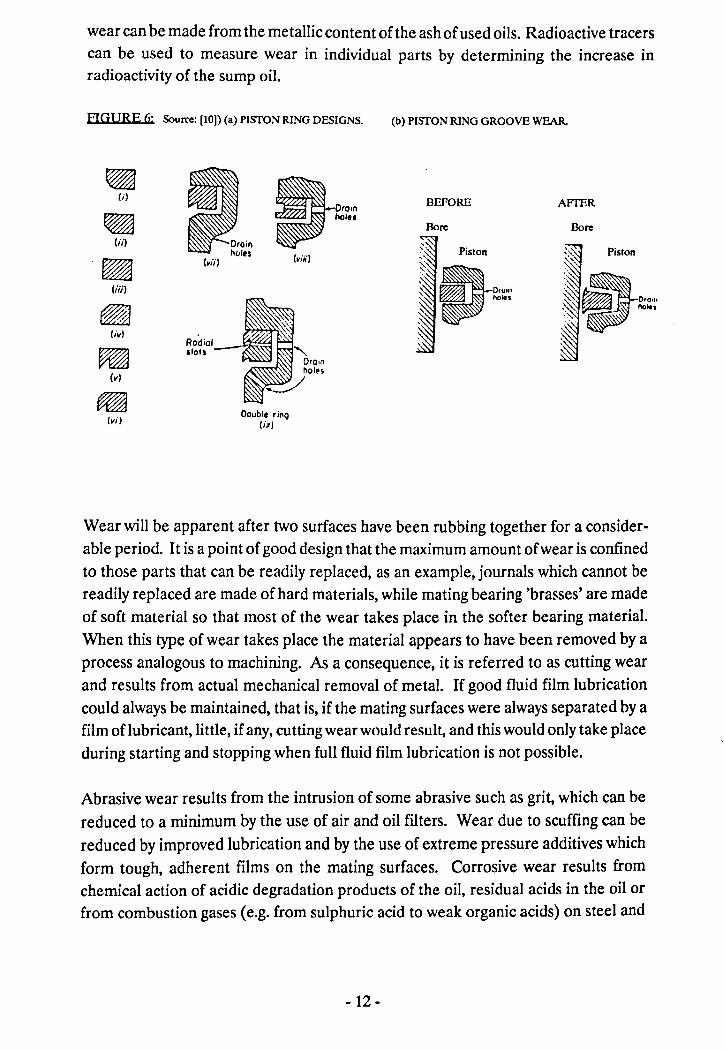
wear can be made from the metallic content of the ash of used oils. Radioactive tracerscan be used to measure wear in individual parts by determining the increase inradioactivi ty of the sump oil.
FIGURE 6: Source: [10)) (a) PISfON RING DESIGNS.
(iii)
(iv)
~(v)
(vi)
(b) PISfON RING GROOVE WEAR.
__ oral"p hoi ••
BEFORE AFfER.
Bore Bore
(viii)(vii)
Double rinQ(ix)
Wear will be apparent after two surfaces have been rubbing together for a consider-able period. It is a point of good design that the maximum amount of wear is confinedto those parts that can be readily replaced, as an example, journals which cannot bereadily replaced are made of hard materials, while mating bearing 'brasses' are madeof soft material so that most of the wear takes place in the softer bearing material.When this type of wear takes place the material appears to have been removed by aprocess analogous to machining. As a consequence, it is referred to as cutting wearand results from actual mechanical removal of metal. If good fluid film lubricationcould always be maintained, that is, if the mating surfaces were always separated by afilm of lubricant, little, if any, cutting wear would result, and this would only take placeduring starting and stopping when full fluid film lubrication is not possible.
Abrasive wear results from the intrusion of some abrasive such as grit, which can bereduced to a minimum by the use of air and oil filters. Wear due to scuffing can bereduced by improved lubrication and by the use of extreme pressure additives whichform tough, adherent films on the mating surfaces. Corrosive wear results fromchemical action of acidic degradation products of the oil, residual acids in the oil orfrom combustion gases (e.g. from sulphuric acid to weak organic acids) on steel and
- 12-
bearing metals such as copper, bronze, tin and aluminium. The corrosive wear isaccelerated by the presence of water in the oil and high temperature.
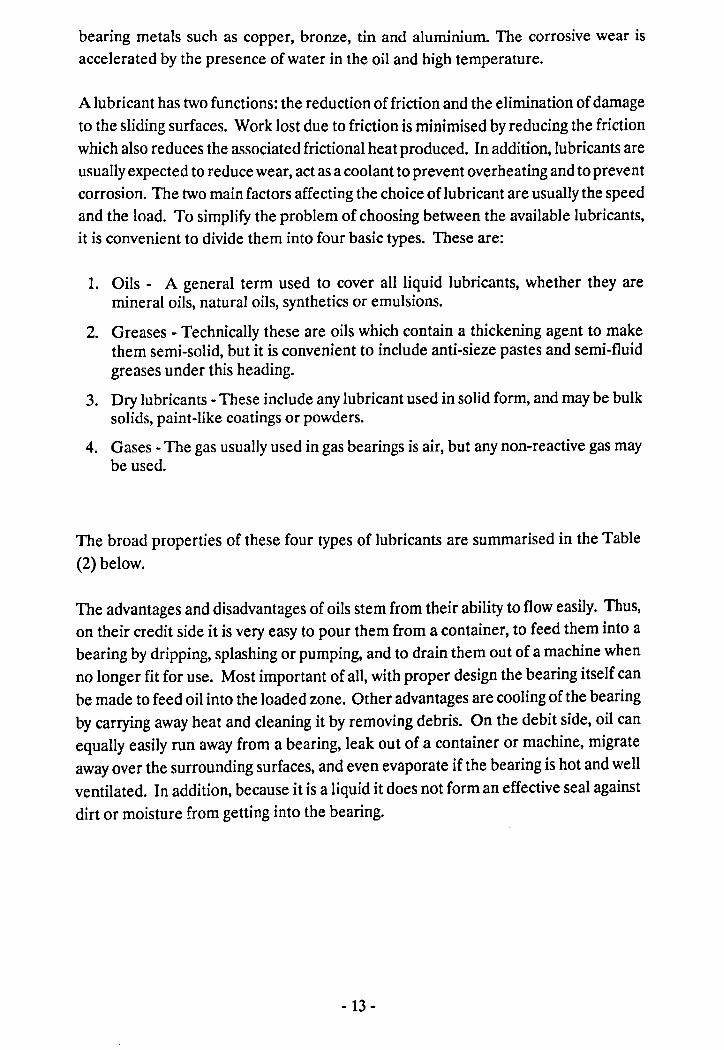
A lubricant has two functions: the reduction of friction and the elimination of damageto the sliding surfaces. Work lost due to friction is minimised by reducing the frictionwhich also reduces the associated frictional heat produced. In addition, lubricants areusually expected to reduce wear, act as a coolant to prevent overheating and to preventcorrosion. The two main factors affecting the choice of lubricant are usually the speedand the load. To simplify the problem of choosing between the available lubricants,it is convenient to divide them into four basic types. These are:
1. Oils - A general term used to cover all liquid lubricants, whether they aremineral oils, natural oils, synthetics or emulsions.
2. Greases - Technically these are oils which contain a thickening agent to makethem semi-solid, but it is convenient to include anti-sieze pastes and semi-fluidgreases under this heading.
3. Dry lubricants - These include any lubricant used in solid form, and may be bulksolids, paint-like coatings or powders.
4. Gases - The gas usually used in gas bearings is air, but any non-reactive gas maybe used.
The broad properties of these four types of lubricants are summarised in the Table(2) below.
The advantages and disadvantages of oils stem from their ability to flow easily. Thus,on their credit side it is very easy to pour them from a container, to feed them into abearing by dripping, splashing or pumping, and to drain them out of a machine whenno longer fit for use. Most important of all, with proper design the bearing itself canbe made to feed oil into the loaded zone. Other advantages are cooling of the bearingby carrying away heat and cleaning it by removing debris. On the debit side, oil canequally easily run away from a bearing, leak out of a container or machine, migrateaway over the surrounding surfaces, and even evaporate if the bearing is hot and wellventilated. In addition, because it is a liquid it does not form an effective seal againstdirt or moisture from getting into the bearing.
- 13 -
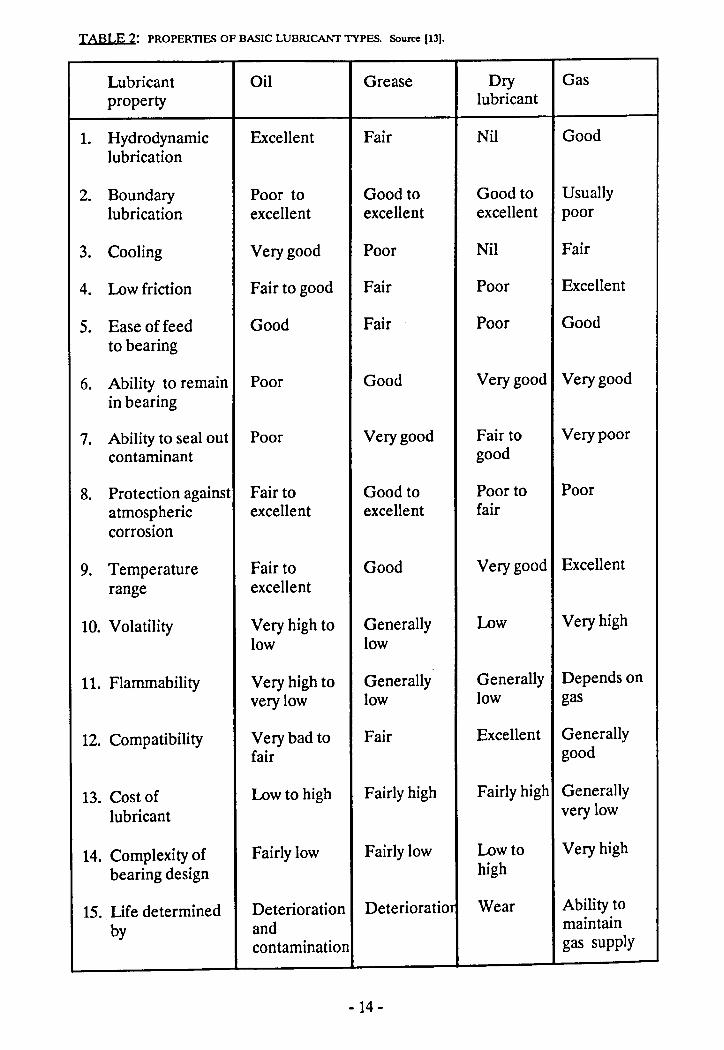
TABLE 2: PROPERTIES OF BASIC LUBRICANT TYPES. Source (13).
Lubricant Oil Grease Dry Gasproperty lubricant
1. Hydrodynamic Excellent Fair Nil Goodlubrication
2. Boundary Poor to Good to Good to Usuallylubrication excellent excellent excellent poor
3. Cooling Very good Poor Nil Fair
4. Low friction Fair to good Fair Poor Excellent
5. Ease of feed Good Fair Poor Goodto bearing
6. Ability to remain Poor Good Very good Very goodin bearing
7. Ability to seal out Poor Very good Fair to Very poorcontaminant good
8. Protection against Fair to Good to Poor to Pooratmospheric excellent excellent faircorrosion
9. Temperature Fair to Good Very good Excellent
range excellent
10. Volatility Very high to Generally Low Very highlow low
11. Flammability Very high to Generally Generally Depends onvery low low low gas
12. Compatibility Very bad to Fair Excellent Generallyfair good
13. Cost of Low to high Fairly high Fairly high Generally
lubricant very low
14. Complexity of Fairly low Fairly low Low to Very high
bearing design high
15. Life determined Deterioration Deterioration Wear Ability to
by and maintaincontamination gas supply
- 14-
Greases behave in many ways as oils do, but are used where the advantages of easyflow are outweighed by the disadvantages. Greases do not easily leak out of a machineor container, or migrate away, and form an effective seal against contaminants. Onthe other hand, greases are much less easy to feed into a bearing, and are almostuseless for cooling. Solid lubricants are rather like the extremes for greases, wherethe lubricant will not flow at all and similarly gas lubricants are like the extremes ofoils, where the flowproperties are almost too good. Solid and gas lubricants have veryspecialised advantages and disadvantages and are generally used only in specialsituations.
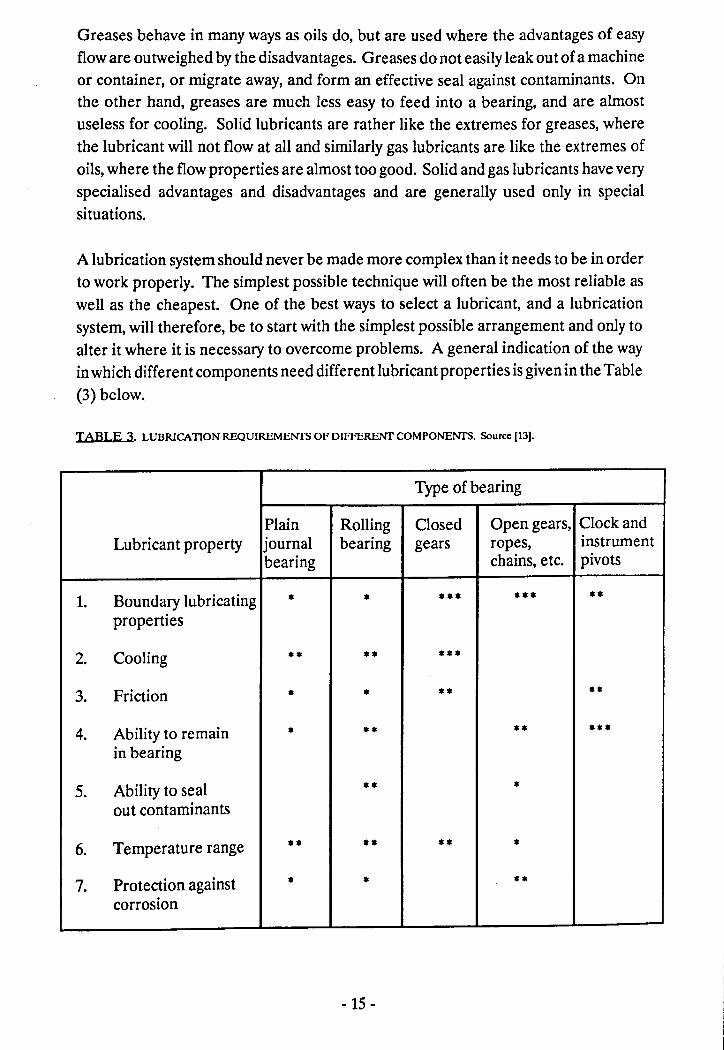
A lubrication system should never be made more complex than it needs to be in orderto work properly. The simplest possible technique will often be the most reliable aswell as the cheapest. One of the best ways to select a lubricant, and a lubricationsystem, will therefore, be to start with the simplest possible arrangement and only toalter it where it is necessary to overcome problems. A general indication of the wayinwhich different components need different lubricant properties is given in the Table(3) below ..
TABLE 3. LUBRICATION REQUIREMENTS OF DIFFERENT COMPONENTS. Source [13].
Type of bearing
Plain Rolling Closed Open gears, Clock andLubricant property journal bearing gears ropes, instrument
bearing chains, etc. pivots
1. Boundary lubricating * * *** *** **properties
2. Cooling ** ** ***
3. Friction * * ** **
4. Ability to remain * ** -* ***in bearing
5. Ability to seal ** *out contaminants
6. Temperature range ** ** ** -7. Protection against * - --
corrosion
- 15-
1.3 The Role of Engine on.
For internal combustion engines and compressor cylinders, the oil must give botheffective lubrication under very onerous conditions and also act as a high pressure sealthat reduces leakage to a minimum between piston, rings, cylinder and valve guides.Since the motion will be reciprocating, it is probable that full fluid film lubricationwill not always be maintained. The amount of oil passing the piston into thecombustion chamber must be reduced to a minimum so as to keep oil consumptionlow and, in the case of compressors, to prevent excessive contamination of thecompressed gas. An "acceptable" lubricating oil for use in internal combustionengines must have sufficient viscosity at the working temperature of the engine and ahigh viscosity index so that the oil will not be too viscous when the engine is cold.
For practically all steam engines the steam becomes wet towards the end of theexpansion stroke and the water formed tends to wash the oil from the cylinder walls.Bearing in mind the necessity for increased oil adhesion to the mating surfaces, thereis a high probability that boundary lubrication conditions will prevail for at least partof the cycle. The emulsions thus formed can be a problem especially in the case ofenclosed steam engines, where straight mineral oils are better than compounded oils.In internal combustion engines steam is a product of fuel combustion, and some ofthe steam may getpast the piston rings and condense in the crankcase. In cold weatherthis water in the crankcase may emulsify with the oil to produce (white) 'cold sludge'.Used oils emulsify more readily than new oils because of oxidation products beingpresent in used oils.
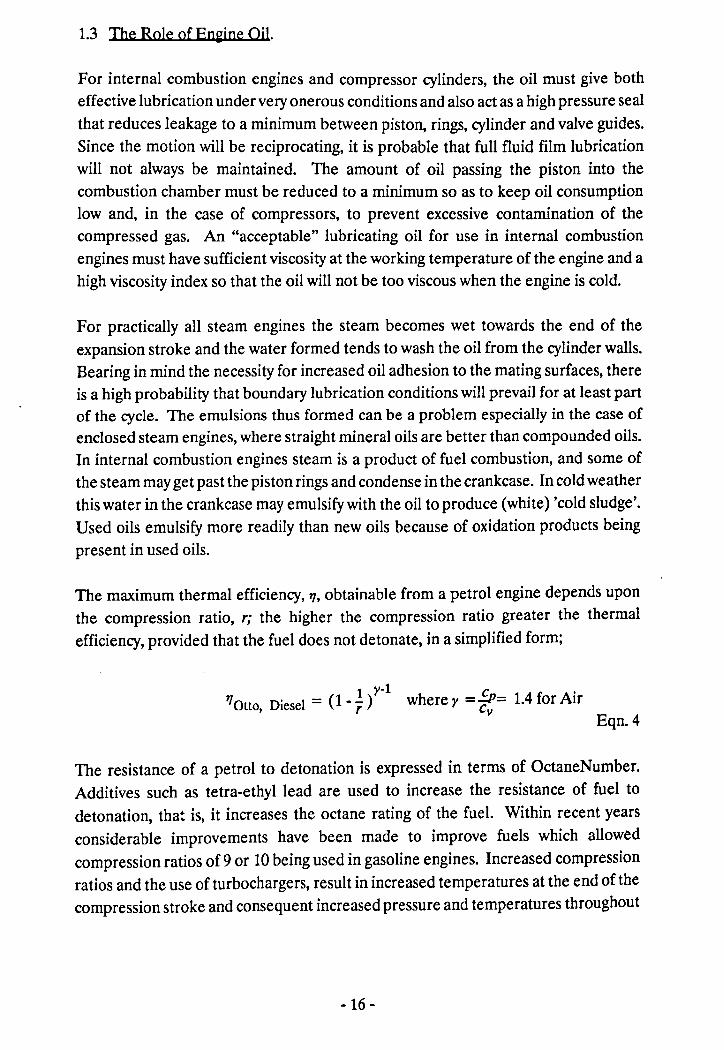
The maximum thermal efficiency, 'I, obtainable from a petrol engine depends uponthe compression ratio, r; the higher the compression ratio greater the thermalefficiency, provided that the fuel does not detonate, in a simplified form;
1 y-l c'lOtto, Diesel = (1- , ) where y =~= 1.4 for Air
Eqn.4
The resistance of a petrol to detonation is expressed in terms of OctaneNumber.Additives such as tetra-ethyl lead are used to increase the resistance of fuel todetonation, that is, it increases the octane rating of the fuel. Within recent yearsconsiderable improvements have been made to improve fuels which allowedcompression ratios of 9 or 10being used in gasoline engines. Increased compressionratios and the use of turbochargers, result in increased temperatures at the end of thecompression stroke and consequent increased pressure and temperatures throughout
- 16-
the expansion stroke.
Engine lubricating oils are required to effect lubrication at these increasedtemperatures and also to act as coolants. During the process of splash lubrication, oilis splashed on to the hot cylinder walls, oil-jets in the crank- webs squirt oil up insidethe piston to cool the piston crown and help with cylinder lubrication; at the sametime oil flowing through the bearings serves to cool them. If the oil is to functionsatisfactorily as a lubricant at these elevated temperatures it must have a high viscosityindex, see later section. The portion of oil coming into contact with the hot pistonsand cylinder walls is liable to 'crack' or decompose into carbon particles, form complexresinous materials or asphaltic products and lighter oil fractions may readilyevaporate. The carbon and asphaltic products formed as a result of the oil degradationwill work their way into the piston ring grooves where they will tend to "gum" thepiston rings. Other decomposition products will appear as a lacquer deposit on thepiston skirt and under the piston crown. Some of the oil that manages to pass into thecombustion chamber will be burned, or partially burned or turned into carbontogether with some of the fuel. This will be deposited on the piston crown, which mayrequire periodic removal (decarbonisation or decoking). In consequence, carbonresidue tests are included in oil specifications for use in internal combustion engines.
Other products of oil deterioration are:
1. Fatty acids from the oxidation of aliphatic chains which are likely to attacklead-bronze and cadmium-nickel bearings.
2. Black sludge, a pasty substance which may be deposited in the cold regions ofthe engine, oil channels or on moving parts. Ideally, it should be held insuspension in the oil until it is removed by the oil filter. Sludge is an oxidationproduct resulting from the aeration of the hot oil, sometimes referred to as 'hotsludge'.
The lubrication of valve stems and the maintenance of adequate lubrication in theupper portion of the cylinder is a difficult problem. The oil must act as a seal in anarrow, hot, moving surface. In an attempt to ameliorate upper cylinder lubricatingconditions, lubricants are sometimes added to the fuel. Such lubricants usually consistof a thin mineral oil with a high ignition point and containing additives such as solventsfor asphaltenes, e.g. tetrahydro-naphthalene.
In a diesel engine, temperatures and compression pressures are much higher than ina petrol engine, but the combustion takes place largely at constant pressure and partlyat constant volume. In general, the lubrication problems of diesel engines are thesame as for petrol engines. Diesel engines are, however larger, and may work on
- 17-
either the two- or four-stroke cycle. Two-stroke engines suffer from build-up ofdeposits in their transfer ports, which restrict the flow of incoming air and outgoingexhaust gas, thus impairing its working efficiency.
Piston ring "gumming" may be a serious problem in diesel engines as also may be fueldilution, products offuel combustion and sulphur compounds from the fuel. Depositson the piston skirt usually referred to as 'varnish' are present and vary from light brownto black in colour. The nature of the deposits formed in the piston ring zone isimportant. Paraffinic base oils, which in general have a number of desirable qualitiesas cylinder oils, such as a good viscosity index and resistance to oxidation, producehard, fine grained carbonaceous deposits. Naphthenic base oils give a softer type of'carbon'. This has led to improvement in other properties of naphthenic base oils byrefining methods together with the use of additives, and to the blending of paraffinicand naphthenic base oils.
In large diesel engines having separate lubrication systems for the cylinders and thebearings it is possible to use specially formulated oils containing detergent, dispersantand anti-wear additives for cylinder lubrication. These are different from the sumpoil which lubricate the bearings.
A good lubricating oil formulated for automobile engines must, therefore, also keepoil degradation products to a minimum. The degradation products that are formedmust be kept in suspension so that they may be removed from circulation by the oilfilter.
1.4 Modern Engjne Lubricatjng QUs.
The single most important property of a lubricating oil is its viscosity. As far as actuallubrication is concerned, the only other important factor is the boundary lubricationquality. Many other properties may be important for various applications, but if atany instant the combination of viscosity and boundary lubrication is satisfactory, thenthe oil has been chosen correctly.
In practice, many other factors must be taken into account, to make sure that the oilcontinues to lubricate properly over a long period of time and a range of conditions.The following are some of these factors;
1. Thermal stability. As an oil becomes hot when used, then it is important that theheat does not induce thermal degradation such that the oil ceases to lubricateproperly.
-18 -
2. Chemical stability. The ability of the oil to resist chemical attack by atmosphericoxygen, water, or other substances with which it comes into contact. Chemicalstability is related to thermal stability, because the rate of chemical degradationincreases with increasing temperature.
3. Compatibility. This factor generally refers to the interaction between the oil andother solid materials present as, for example, an oil may cause the rubber seal ofa bearing, or shaft, to swell, shrink, soften or harden.
4. Corrosiveness. Corrosion arising due to acidic compound production in the oilor environment attacking metal components in the system.
5. Thermal conductivity. An important property where the oil is required toconduct heat away from bearings and cylinders. The amount of heat conductedaway depends on the rate of oil flow and on the specific heat capacity of the oil.
6. Flammability. It is important that the oil should not ignite in use, especially inaviation and coal mining use. Thus, oils must have high flash- points (as definedby ASTMJIP).
7. Toxicity. The oil must be safe to use and handle without risks to health or theenvironment.
8. Cost and Availability. The cost of certain synthetic oils may be three times thatfor a natural formulated oil but the cost must be secondary to its suitability for aparticular use. Availability of the correct oil in different parts of the world maybecome both important and difficult. Long service life of the oil is also desirable.
The word "mineral" originally meant mineral oils obtained from petroleum. Themineral oils used for lubrication were originally just the fractions obtained from thedistillation of petroleum which had a suitable viscosity for lubrication, much the sameas heavy fuel oils. During the last 50 years the manufacture of lubricating oils hasbecome much more sophisticated. Vacuum distillation allows for enhanced and moreefficient production. "Sweetening" is used to remove sulphur compounds.Hydrogenation of unsaturated components produces more stable oils. The chemicalconstituents of mineral oils are mainly hydrocarbons, which contain mainly carbonand hydrogen. These are of three basic types, the majority of which are paraffins, inwhich the carbon atoms are in straight or branched chains, but not rings. The secondmost cornmon type are naphthenes, in which some carbon atoms form aliphatic oralicyclic rings. Finally, there is a small proportion, about 2% of aromatics, in whichcarbon rings are present, but the proportion of hydrogen to carbon is reduced. Thereare small quantities of compounds containing oxygen, sulphur, nitrogen andphosphorus, called asphaltenes, present in mineral oils.
Although the amounts of aromatics and asphaltenes are small, they play an important
- 19-
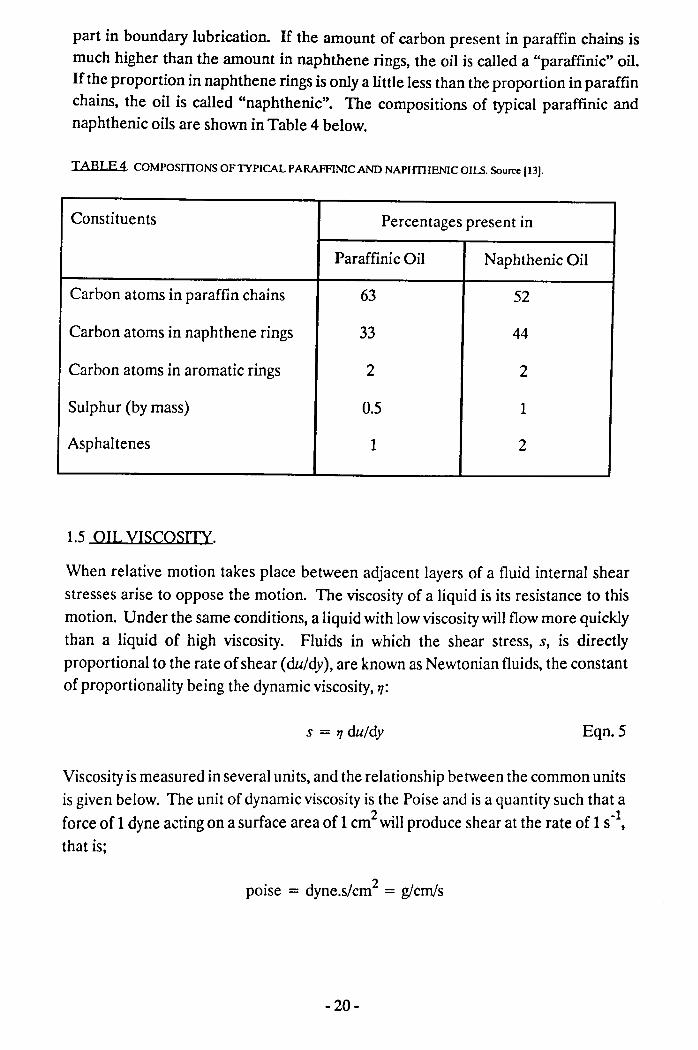
part in boundary lubrication. If the amount of carbon present in paraffin chains ismuch higher than the amount in naphthene rings, the oil is called a "paraffinic" oil.lf the proportion in naphthene rings is only a little less than the proportion in paraffinchains, the oil is called "naphthenic", The compositions of typical paraffinic andnaphthenic oils are shown in Table 4 below.
TABLE 4 covrosrrroxs OFlYPICAL PARAFANIC AND NAPHTI-IENIC OILS. Source (13].
Constituents Percentages present in
Paraffinic Oil Naphthenic Oil
Carbon atoms in paraffin chains 63 52Carbon atoms in naphthene rings 33 44
Carbon atoms in aromatic rings 2 2
Sulphur (by mass) 0.5 1
Asphaltenes 1 2
1.5 OIL VISCOSITY.
When relative motion takes place between adjacent layers of a fluid internal shearstresses arise to oppose the motion. The viscosity of a liquid is its resistance to thismotion. Under the same conditions, a liquid with lowviscositywill flowmore quicklythan a liquid of high viscosity. Fluids in which the shear stress, s, is directlyproportional to the rate of shear (du/dy), are known as Newtonian fluids, the constantof proportionality being the dynamic viscosity, 71:
s = 71 du/dy Eqn.5
Viscosity is measured in several units, and the relationship between the common unitsis given below. The unit of dynamic viscosity is the Poise and is a quantity such that aforce of 1dyne acting on a surface area of 1 cm2will produce shear at the rate of 1 s·l,that is;
poise = dyne.s/cm/ = glcm/s
- 20-
The kinematic viscosity is defined as the dynamic viscosity divided by the density; theunit is the Stoke.
Stokes = poise/g cm-3 = cm2 s-1
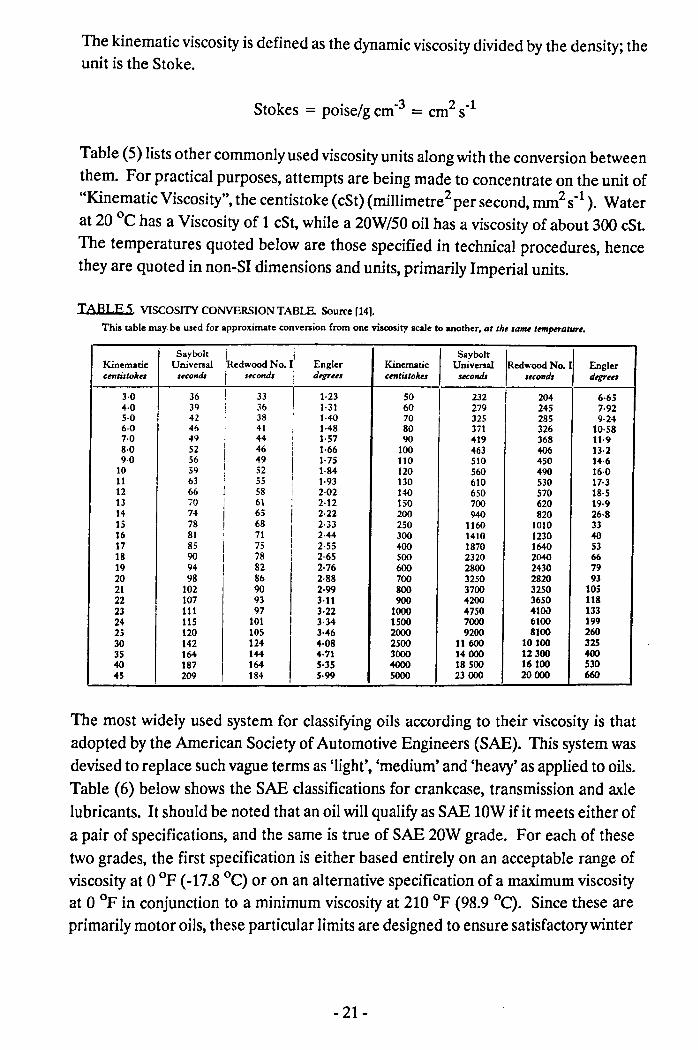
Table (5) lists other commonly used viscosity units along with the conversion betweenthem. For practical purposes, attempts are being made to concentrate on the unit of"Kinematic Viscosity", the centistoke (cSt) (millimetre+ per second, mm2 s-1). Waterat 20 °c has a Viscosity of 1 cSt, while a 20W/50 oil has a viscosity of about 300 cSt.The temperatures quoted below are those specified in technical procedures, hencethey are quoted in non-SI dimensions and units, primarily Imperial units.
TABLE 5 VISCOSITY CONVERSION TABLE. Source 1141.This table may be used for approximate conversion from one viscosity scale to another, at the stmU temperature.
SayboJc!RedWOOdNo. II I
SayboltKinematic Universal Engler Kinematic Universal IRedWood No. II Englercentistolrn seconds .econds ! d'f!Teu centistolru seconds second» degru,
3·0 36 ! 33!
1·23 SO I 232 I 204 6·654·0 39 i 36 1·31 60 279 I 245 '·925·0 42 38 1·40 70 325 I 285 9·246·0 46 , 41 I H8 80 371 326 10·58'·0 49 ; 44 I 1·57 90 419 368 11·98·0 52 I 46 , 1-66 100 463 406 1].2I I9·0 56 49 I 1·75 110 510 450 14·610 59 I 52 1·84 120 560 490 16·0
11 63 i 55 I 1·93 130 610 530 17·3I12 66 I 58 I 2·02 HO 650 570 18·513 iO I 61 I 2·12 150 700 620 19·914 74
I65 I 2·22 200 940 820 26·8
15 78 68 I 2·33 250 1160 1010 3316 81 , 71 2·44 300 1410 1230 4017 85 I 75 I 2·55 400 1870 1640 53I
18 90 ! 78 i 2·65 500 2320 2040 6619 94 I 82 2·76 600 2800 2430 7920 98 86 2-88 700 3250 2820 9321 102 90 2-99 800 3700 3250 10522 107 93 HI 900 4200 3650 11823 111 97 3·22 1000 4750 4100 13324 115 101 I 3·34 1500 7000 6100 19925 120 105 3·46 2000 9200 8100 26030 142 124 4·08 2500 11600 10100 32535 164 144 4·71 3000 14000 12300 40040 187 164 5·35 4000 18500 16100 53045 209 184 5·99 5000 23000 20000 660
The most widely used system for classifying oils according to their viscosity is thatadopted by the American Society of Automotive Engineers (SAE). This system wasdevised to replace such vague terms as 'light', 'medium' and 'heavy' as applied to oils.Table (6) below shows the SAE classifications for crankcase, transmission and axlelubricants. It should be noted that an oil will qualify as SAE lOW if it meets either ofa pair of specifications, and the same is true of SAE 20W grade. For each of thesetwo grades, the first specification is either based entirely on an acceptable range ofviscosity at 0 OF(-17.8 °C) or on an alternative specification of a maximum viscosityat 0 OFin conjunction to a minimum viscosity at 210 OF(98.9 QC). Since these areprimarily motor oils, these particular limits are designed to ensure satisfactory winter
- 21 -
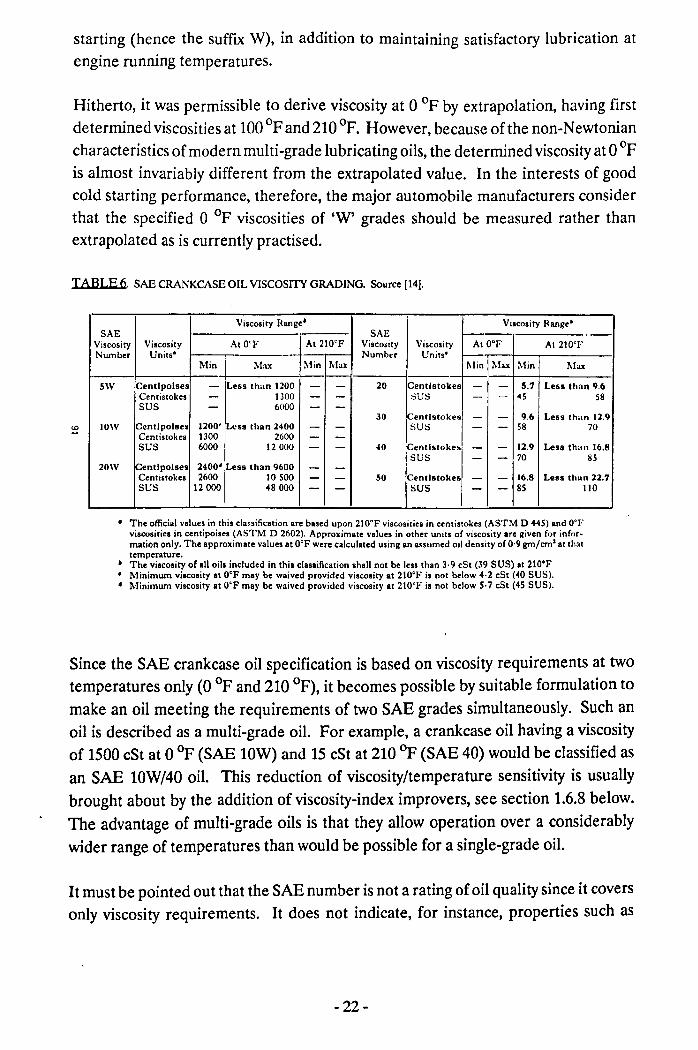
starting (hence the suffix W), in addition to maintaining satisfactory lubrication atengine running temperatures.
Hitherto, it was permissible to derive viscosity at 0 of by extrapolation, having firstdetermined viscosities at 100of and 210 oF. However, because ofthe non-Newtoniancharacteristics of modern multi-grade lubricating oils, the determined viscosity at 0 ofis almost invariably different from the extrapolated value. In the interests of goodcold starting performance, therefore, the major automobile manufacturers considerthat the specified 0 of viscosities of 'W' grades should be measured rather thanextrapolated as is currently practised.
TABLE 6. SAE CRANKCASE OIL VISCOSITY GRADING. Source [14).
Viscosity Range' Viscosity Range'SAE SAE
Viscosity Viscosity AtO'F At 210°F Viscosity Viscosity At O°F A1210'FNumber Units· Number Units"
Min Max Min Max Min Max Min Max
5W Centlpolses - Less than 1200 - - 20 Centlstokes - - 5.7 Less than 9.6Centistoke. - 1300 - - :jUS - - 4S 58SUS - 6000 - -
30 Centlstokes - - 9.6 Less than 12.9IOW Centlpolses 1200' Less than 2400 - - SUS - - 58 70
Centistoke. 1300 2600 - -SUS 6000 12000 - - 40 Centis tokes - - 12.9 Less than 16.8
SUS - - 70 8520W Centlpolses 2400' Less than 9600 - -
Centistoke. 2600 10 SOD - - 50 Centistokes - - 16.8 Leis than 22.7SUS 12000 48000 - - Isus - - 85 lID
• The official values in this classification are based upon 210°F viscosities in centistokes (ASTM D 445) and O'Fviscosities in centipoises (AS1'M D 2602). Approximate values in other units of viscosity are given for infor-mation only. The approximate values at O°Fwere calculated using an assumed oil density of 0·9 gm/cm> 8t thattemperature.
• The viscosity of' ell oils included in this classification shall not be less than 3·9 cSt (39 SUS) at 210°F• Minimum viscosity at O°F may be waived provided viscosity at 210°1-"is not below 4·2 cSt (40 SUS)., Minimum viscosity at O'F may be waived provided viscosity at 210°F is not below 5·7 cSt (45 SUS).
Since the SAE crankcase oil specification is based on viscosity requirements at twotemperatures only (0 of and 210 of), it becomes possible by suitable formulation tomake an oil meeting the requirements of two SAE grades simultaneously. Such anoil is described as a multi-grade oil. For example, a crankcase oil having a viscosityof 1500 cSt at 0 of (SAE lOW) and 15 cSt at 210 of (SAE 40) would be classified asan SAE lOW/40 oil. This reduction of viscosity/temperature sensitivity is usuallybrought about by the addition of viscosity-index improvers, see section 1.6.8 below.The advantage of multi-grade oils is that they allow operation over a considerablywider range of temperatures than would be possible for a single-grade oil.
It must be pointed out that the SAE number is not a rating of oil quality since it coversonly viscosity requirements. It does not indicate, for instance, properties such as
- 22-
detergency and pour-point. Neither does the SAE number in itself give more than anapproximation of the viscosity/temperature behaviour of the oil except in the case of'multi-grade' oils which have low viscosity-temperature variation.
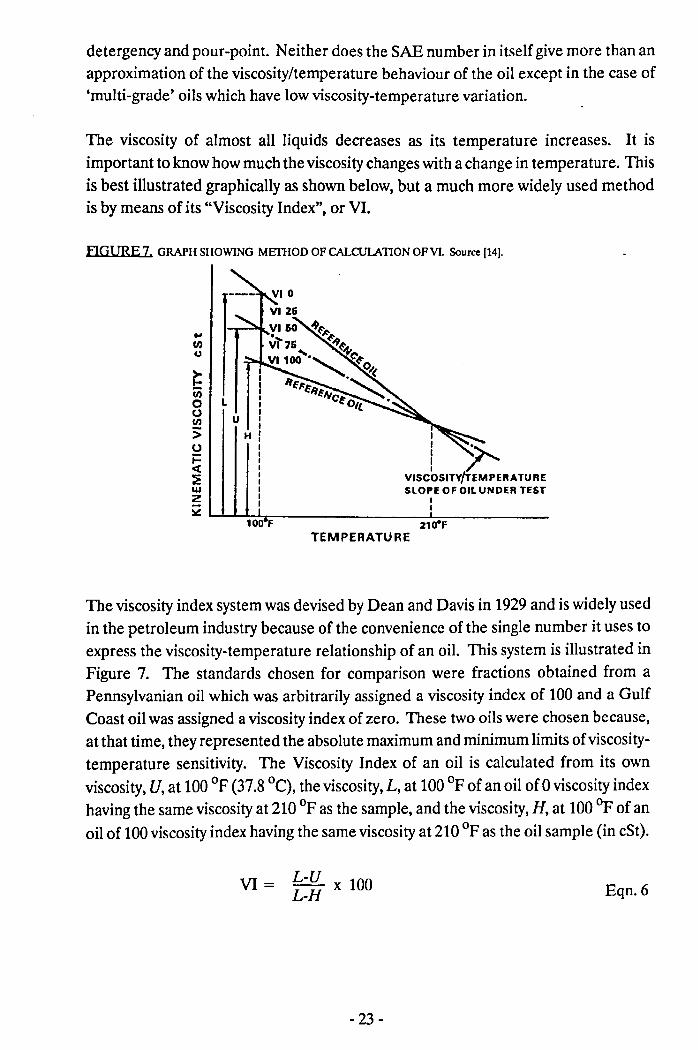
The viscosity of almost all liquids decreases as its temperature increases. It isimportant to know how much the viscosity changes with a change in temperature. Thisis best illustrated graphically as shown below, but a much more widely used methodis by means of its "Viscosity Index", or VI.
FIGURE 7. GRAPH SHOWING METIIOD OF CALCULATION OF VI. Source [14].
..(I)o
~Cl)o L
~ Uso;:::et~wZ
~ ~~~~------------------------------~----------------100 f 21ctf
I
1'1'VlscoSITV/TfMPERATURESLOPE OF OIL UNDER TEST
TEMPERATURE
The viscosity index system was devised by Dean and Davis in 1929 and is widely usedin the petroleum industry because of the convenience of the single number it uses toexpress the viscosity-temperature relationship of an oil. This system is illustrated inFigure 7. The standards chosen for comparison were fractions obtained from aPennsylvanian oil which was arbitrarily assigned a viscosity index of 100 and a GulfCoast oil was assigned a viscosity index of zero. These two oils were chosen because,at that time, they represented the absolute maximum and minimum limits of viscosity-temperature sensitivity. The Viscosity Index of an oil is calculated from its ownviscosity,U,at 100OF(37.8 °C), the viscosity,L, at 100OFof an oil ofO viscosity indexhaving the same viscosity at 210 OFas the sample, and the viscosity,H, at 100OFof anoil of 100viscosity index having the same viscosity at 210 OFas the oil sample (in cSt).
VI= L-UL-H x 100 Eqn.6
- 23-
Substitution in the above equation gives the required VI, where L, Hand U are theviscosities at 100 of of the zero-VI standard, the 100-VI standard, and the samplerespectively. The normal range of VI is from 0 to 100. A VI of 0 indicates a rapidchange of viscositywith a change in temperature. A VI of 100indicates a lower changein viscosity with a change in temperature. Amongst the mineral oils the highestnatural viscosity index is obtained with paraffinic oils and the lowest with naphthenicoils. Oils with natural VI above 80 are called High Viscosity Index (HVI) oils, thosebelow 30 are called Low Viscosity Index (LVI) oils and those of intermediate VI areMedium Viscosity Index (MVI) oils.
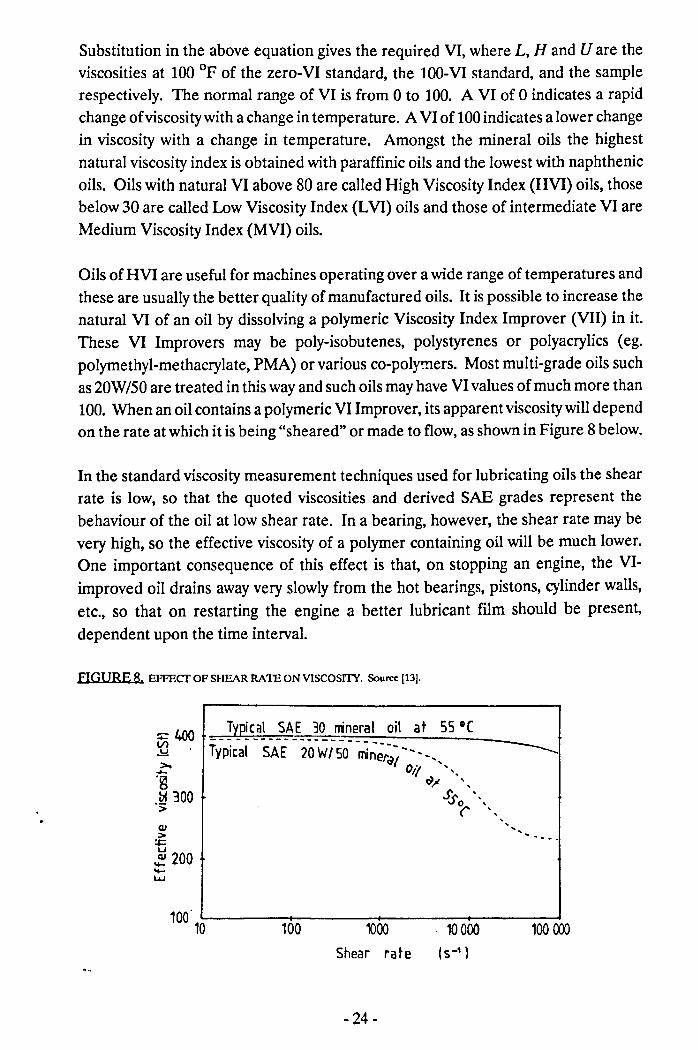
Oils of HVI are useful for machines operating over a wide range of temperatures andthese are usually the better quality of manufactured oils. It is possible to increase thenatural VI of an oil by dissolving a polymeric Viscosity Index Improver (VII) in it.These VI Improvers may be poly-isobutenes, polystyrenes or polyacrylics (eg.polymethyl-methacrylate, PMA) or various co-polymers, Most multi-grade oils suchas 20W/50 are treated in this way and such oils may have VI values of much more than100. When an oil contains a polymeric VI Improver, its apparent viscositywill dependon the rate at which it is being "sheared" or made to flow, as shown in Figure 8 below.
In the standard viscosity measurement techniques used for lubricating oils the shearrate is low, so that the quoted viscosities and derived SAE grades represent thebehaviour of the oil at low shear rate. In a bearing, however, the shear rate may bevery high, so the effective viscosity of a polymer containing oil will be much lower.One important consequence of this effect is that, on stopping an engine, the VI-improved oil drains away very slowly from the hot bearings, pistons, cylinder walls,etc., so that on restarting the engine a better lubricant film should be present,dependent upon the time interval.
FIGURE 8. EFFECf OF SHEAR RATE ON VISCOSITY. Source [13].
:;: 400'C .>.....~.~ 300>
Typical SAE 30 nineral oil at 55 GC
CI.I>!t::u~ 200-4J100·10~---10t-O---1O~OOI----.-,o-10001-----1-00--l00J
Shear rate Is-1)
- 24-
There is, however, a disadvantage. If the multi-grade oil is to have a viscosity at 0 ofequivalent to an SAE 20W oil, then the base oil must have a lower viscosity, as theviscositywill be increased by the polymer. When the oil is then sheared rapidly, it willbehave as if its viscosity is the same as that of the base oil. In other words, in a highshear rate bearing at 210 of the 20W/50 oil will be behaving, not as a SAE 50 oil, butas a SAE lOW or SAE 15Woil.
At low temperatures the viscosity of an oil may increase very rapidly, as the variousliquid molecules approach their freezing points. With paraffinic mineral oils thereis a tendency for waxy molecules to separate out and to thicken the oil into a greaseor jelly. This tendency may be reduced by dewaxing the oil, or by adding a very smallquantity of a polymeric "Pour Point Depressant" to it, see section 1.6.10.
1.6OHAdditiyes and their uses.
Straight mineral oils produced by petroleum refining have properties which wouldusually satisfy the vast majority of industrial applications. It is possible to enhancecertain (natural) properties of an oil by the incorporation of relatively small quantitiesof other materials, these being known as additives. Such substances must be solubleor dispersible in oil. Where the oil is likely to come into contact with water, as insteam engines or turbines, they must be insoluble in water otherwise they could bewashed out of the oil.
The purpose of these additives is to improve the physical and chemical performanceof the oil and to protect the engine from the harmful combustion products. The effectof an additive may be peculiar to the oil in which it is used, that is, an additive whichis effective in one oil may not necessarily be as effective in another oil. Some additivesassist each other, that is, they have a synergistic effect. Many additives perform morethan one function, that is, they are multi-functional; for example, an anti-oxidant suchasZinc-lliethyl-llithio-fhosphate (ZDDP) also acts as an anti-acid, extreme pressureand anti-wear additive. The effectiveness of an additive will vary according to thenature of the base stock. The ultimate criterion of a formulated oil, with regard toadditive composition and concentration, is its suitability for its intended use and itsperformance in practice.
The increasing level of performance for contemporary internal combustion engineshas required a progressive advance in the formulation technology of the availablelubricating oils. As new engine designs demand higher specification oils so does thedemand upon the role of chemical additives in the form of an additive packageincreases. Work on the development of oil additives during recent years has been
- 25-
prolific, the resultant patent specifications have been numerous, and the chemistry oftheir manufacture often complex.
Most modern engine lubricating oils contain the following principal additive types:-
1. Anti-acids
2. Anti-oxidants·
3. Anti-friction Compounds
4. Anti-wear Agents
5. Corrosion Inhibitors
6. Detergents
7. Dispersants
8. Viscosity Index Improvers
9. Extreme Pressure Additives
10. Pour Point Depressants
11. Anti-foaming Agents
The classification of the additives in the list above categorises a particular additiveproperty. In practice, some of the definitions are misleading and the boundariesbetween different classes often overlap. Each class of additive is discussed in greaterdetail below.
1.6.1Anti-acids
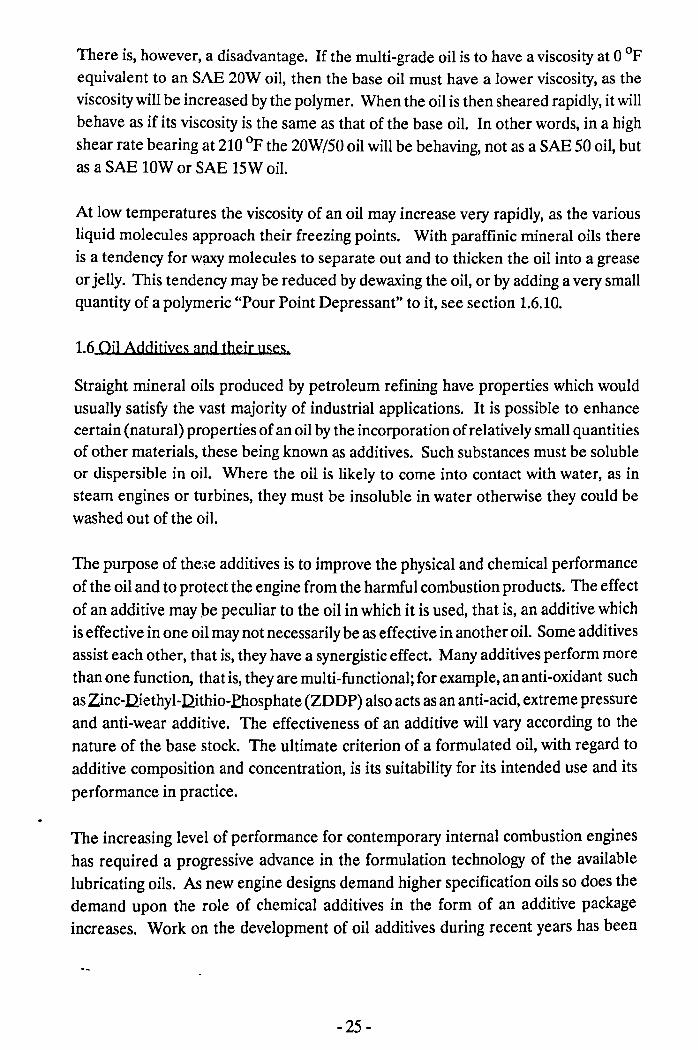
A number of acidic compounds are formed during combustion, such as the sulphurand nitrogen oxides, hydrochloric and hydrobromic acids. The formation of sulphuricacid is prevalent in diesel engines using fuels containing sulphur in amounts rangingfrom 0.5 to 5%. These acids find their way into the crankcase via the "blow-by" fromthe combustion chambers. They can then cause serious degradation of the oil andengine components. Anti-acid additives are usually calcium, barium or magnesiumcarbonates, phenates, sulphonates and soaps, hence they are often classed as anti-oxidants and detergents as well. Detergents today usually contain a non-stoichiometric amount of metal compound in the 'metallic soap' (often 10 times thestoichiometric amount). For example, phenates and sulphonates can be 'over-based'.This is achieved by the thermal reaction, in the presence of a catalyst, between an oilsoluble sulphonate or phenate and a metallic base. The metal base forms a colloid(lnm -1,Jm diameter), which can impart Base Numbers of around 300 to the additive.
- 26-
The Base Number of an oil is defined as the amount of acid required to neutralise thebasic constituents in the oil. Blowby and acidic oil deterioration products, whichwould otherwise corrode bearings, can be effectively neutralised by these over-baseddetergents which form oil soluble or dispersible salts.
Alkyl •• IIcy"le.
o 0
©rll II
.S-O-M-O-S1§J'II IIo 0
R R
~ijO O~~~ C-O-M-O-C ~
R R
Alkylph~nalu 1\1 = Ca, RaR = iso·octyl. iso·nonyl
A R
1.6.2 Anti-oxidants.
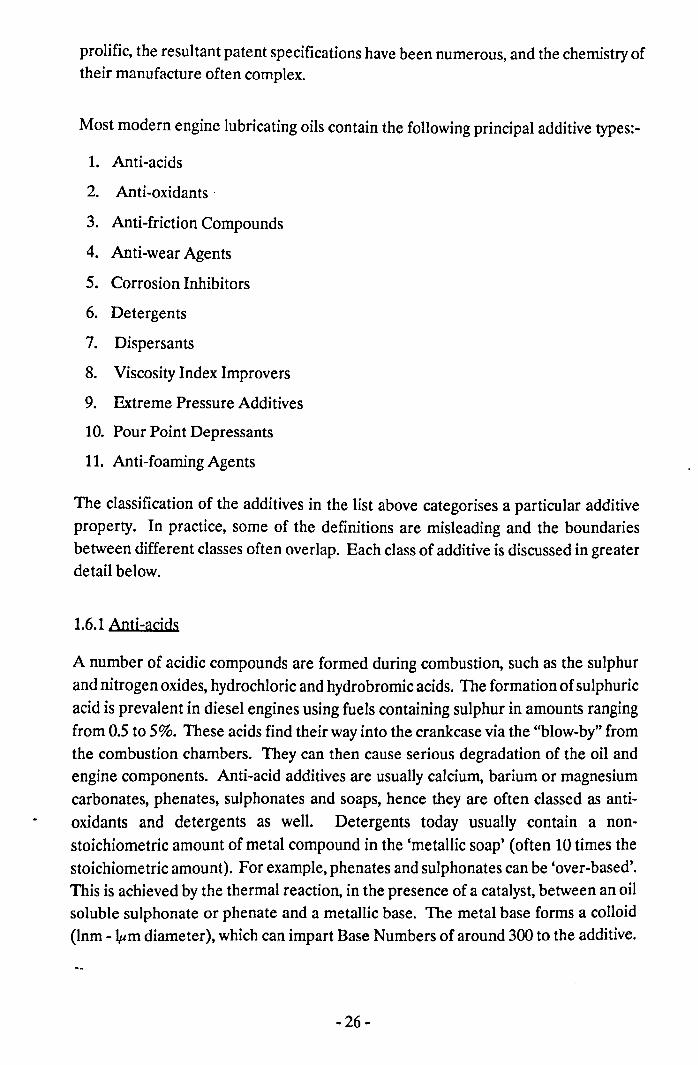
The main source of chemical breakdown is oxidation. Most of the chemicals presentin lubricating oils react to a greater or lesser extent with atmospheric oxygen.Oxidation is accelerated by high temperatures (about 200°C in the ring zone area)and the action of water and catalysts such as copper and ferrous metals.J Iydropcroxides are produced when oxygen and hydrocarbons combine by a freeradical mechanism:
Initiation:
"v or heat. R-O-OII heatRII + O2I~O' + 110' , R' + 1100' 1.
2.R' + 0 - R-O-O'2
Propagation:
R-O-O' + RII- R0211+ R.
R' + 02 - R-O-O'
3.
Termination:
2RO' - RO+ + RO-2 2 2
RO' + R- - Inactive products
2R'
- 27-
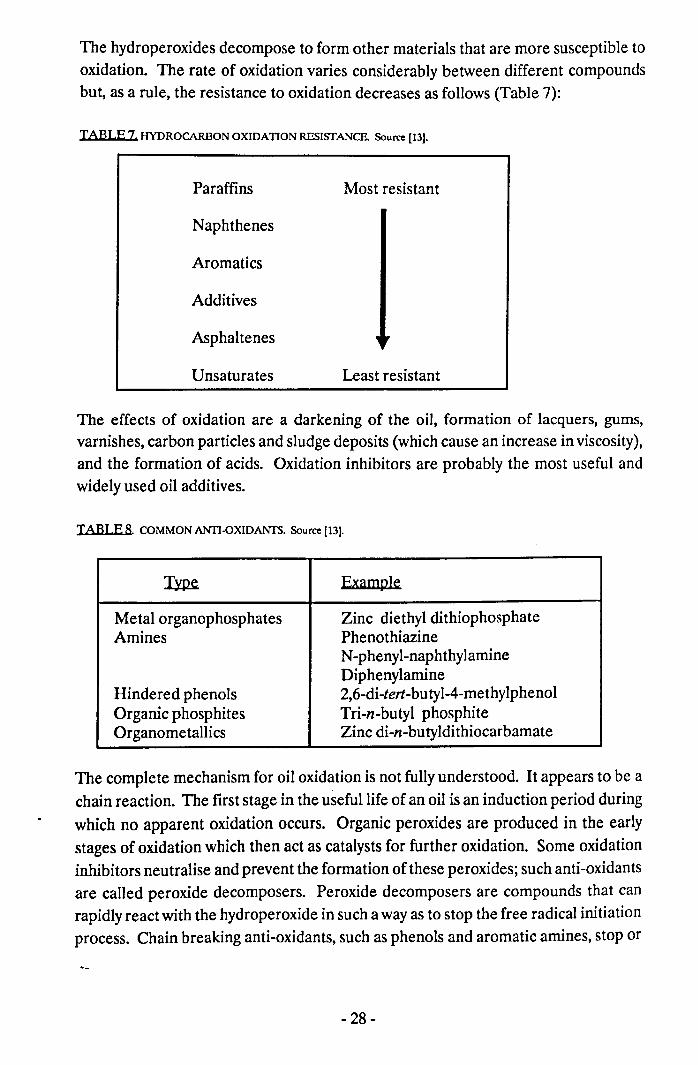
The hydroperoxides decompose to form other materials that are more susceptible tooxidation. The rate of oxidation varies considerably between different compoundsbut, as a rule, the resistance to oxidation decreases as follows (Table 7):
TABLE 7. HYDROCARBON OXIDATION RESISfANCE. Source [13].
Naphthenes
Paraffins Most resistant
Aromatics
Additives
Asphaltenes
Unsaturates Least resistant
The effects of oxidation are a darkening of the oil, formation of lacquers, gums,varnishes, carbon particles and sludge deposits (which cause an increase in viscosity),and the formation of acids. Oxidation inhibitors are probably the most useful andwidely used oil additives.
TABLE 8 COMMON ANTI-OXIDANTS. Source [13].
~ ExalDPl~
Metal organophosphates Zinc diethyl dithiophosphateAmines Phenothiazine
N-phenyl-naphthylamineDiphenylamine
Hindered phenols 2,6-di-tert-butyl-4-methylphenolOrganic phosphites Tri-a-butyl phosphiteOrganometallics Zinc di-n-butyldithiocarbamate
The complete mechanism for oil oxidation is not fully understood. It appears to be achain reaction. The first stage in the useful life of an oil is an induction period duringwhich no apparent oxidation occurs. Organic peroxides are produced in the earlystages of oxidation which then act as catalysts for further oxidation. Some oxidationinhibitors neutralise and prevent the formation of these peroxides; such anti-oxidantsare called peroxide decomposers. Peroxide decomposers are compounds that canrapidly react with the hydroperoxide in such a way as to stop the free radical initiationprocess. Chain breaking anti-oxidants, such as phenols and aromatic amines, stop or
- 28-
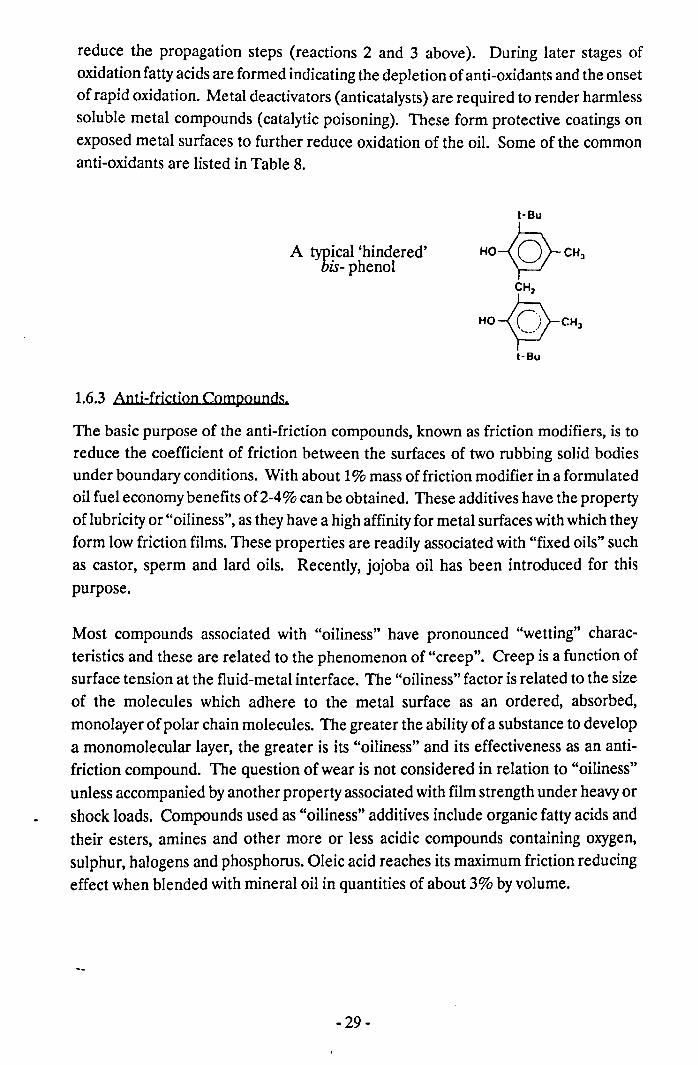
reduce the propagation steps (reactions 2 and 3 above). During later stages ofoxidation fatty acids are formed indicating the depletion of anti-oxidants and the onsetof rapid oxidation. Metal deactivators (anticatalysts) are required to render harmlesssoluble metal compounds (catalytic poisoning). These form protective coatings onexposed metal surfaces to further reduce oxidation of the oil. Some of the commonanti-oxidants are listed in Table 8.
A typical 'hindered'-bis- phenol
1.6.3 Anti-friction Compounds.
The basic purpose of the anti-friction compounds, known as friction modifiers, is toreduce the coefficient of friction between the surfaces of two rubbing solid bodiesunder boundary conditions. With about 1% mass of friction modifier in a formulatedoil fuel economy benefits of2-4% can be obtained. These additives have the propertyof lubricity or "oiliness", as they have a high affinity for metal surfaces with which theyform low friction films. These properties are readily associated with "fixed oils" suchas castor, sperm and lard oils. Recently, jojoba oil has been introduced for thispurpose.
Most compounds associated with "oiliness" have pronounced "wetting" charac-teristics and these are related to the phenomenon of "creep". Creep is a function ofsurface tension at the fluid-metal interface. The "oiliness" factor is related to the sizeof the molecules which adhere to the metal surface as an ordered, absorbed,monolayer of polar chain molecules. The greater the ability of a substance to developa monomolecular layer, the greater is its "oiliness" and its effectiveness as an anti-friction compound. The question of wear is not considered in relation to "oiliness"unless accompanied by another property associated with film strength under heavy orshock loads. Compounds used as "oiliness" additives include organic fatty acids andtheir esters, amines and other more or less acidic compounds containing oxygen,sulphur, halogens and phosphorus. Oleic acid reaches its maximum friction reducingeffect when blended with mineral oil in quantities of about 3% by volume.
- 29-
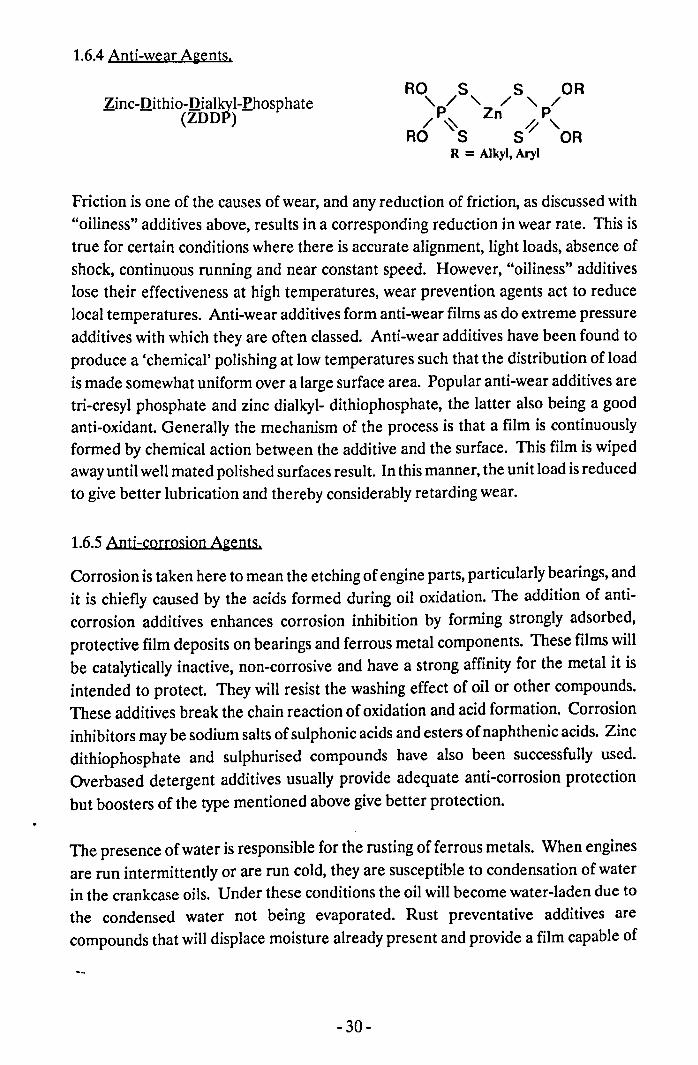
1.6.4Anti-wear A&ents.
Zinc-Dithio-Dialkvl-fhosphate(ZDDP)
RO S S OR'p/ -, / -, // ~ Zn 1'P,
RO S S ORR = Alkyl, Aryl
Friction is one of the causes of wear, and any reduction of friction, as discussed with"oiliness" additives above, results in a corresponding reduction in wear rate. This istrue for certain conditions where there is accurate alignment, light loads, absence ofshock, continuous running and near constant speed. However, "oiliness" additiveslose their effectiveness at high temperatures, wear prevention agents act to reducelocal temperatures. Anti-wear additives form anti-wear films as do extreme pressureadditives with which they are often classed. Anti-wear additives have been found toproduce a 'chemical' polishing at low temperatures such that the distribution of loadis made somewhat uniform over a large surface area. Popular anti-wear additives aretri-cresyl phosphate and zinc dialkyl- dithiophosphate, the latter also being a goodanti-oxidant. Generally the mechanism of the process is that a film is continuouslyformed by chemical action between the additive and the surface. This film is wipedawayuntil well mated polished surfaces result. In this manner, the unit load is reducedto give better lubrication and thereby considerably retarding wear.
1.6.5Anti-corrosion Agents.
Corrosion is taken here to mean the etching of engine parts, particularly bearings, andit is chiefly caused by the acids formed during oil oxidation. The addition of anti-corrosion additives enhances corrosion inhibition by forming strongly adsorbed,protective film deposits on bearings and ferrous metal components. These films willbe catalytically inactive, non-corrosive and have a strong affinity for the metal it isintended to protect. They will resist the washing effect of oil or other compounds.These additives break the chain reaction of oxidation and acid formation. Corrosioninhibitors may be sodium salts of sulphonic acids and esters of naphthenic acids. Zincdithiophosphate and sulphurised compounds have also been successfully used.Overbased detergent additives usually provide adequate anti-corrosion protectionbut boosters of the type mentioned above give better protection.
The presence of water is responsible for the rusting of ferrous metals. When enginesare run intermittently or are run cold, they are susceptible to condensation of waterin the crankcase oils. Under these conditions the oil will become water-laden due tothe condensed water not being evaporated. Rust preventative additives arecompounds that will displace moisture already present and provide a film capable of
- 30-
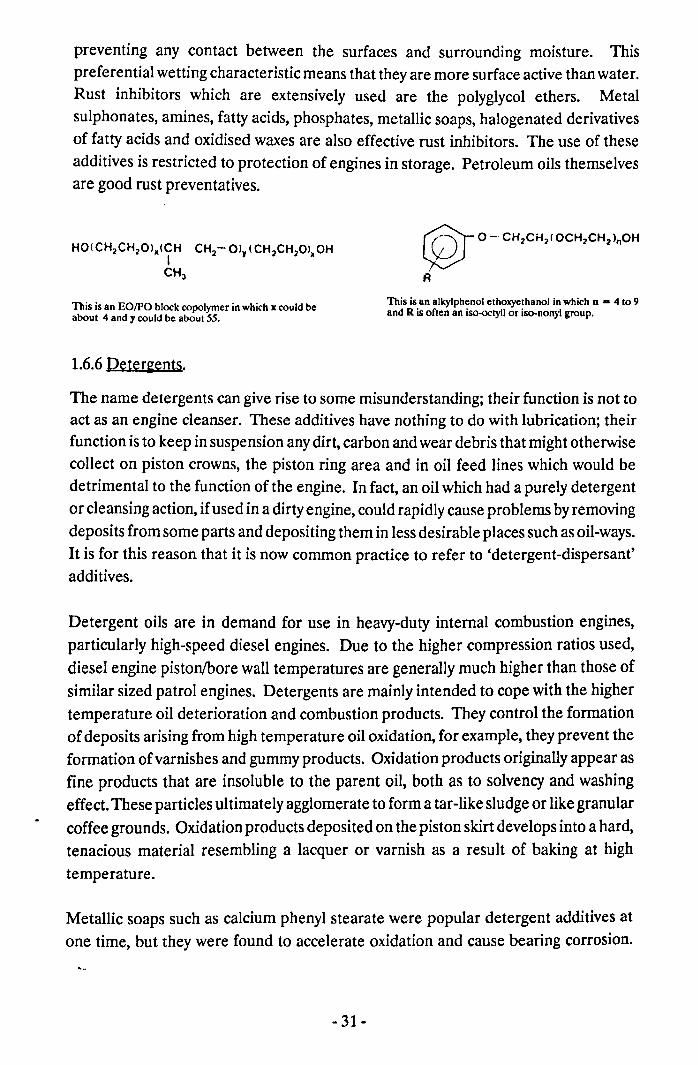
preventing any contact between the surfaces and surrounding moisture. Thispreferential wetting characteristic means that they are more surface active than water.Rust inhibitors which are extensively used are the polyglycol ethers. Metalsulphonates, amines, fatty acids, phosphates, metallic soaps, halogenated derivativesof fatty acids and oxidised waxes are also effective rust inhibitors. The use of theseadditives is restricted to protection of engines in storage. Petroleum oils themselvesare good rust preventatives.
@r 0 - CH,CH,fOCH,CH,'.OH
A
This is an EO/PO block copolymer in which x could beabout 4 and y could be about 55.
This is an alkylphenol ethoxyethanol in which n - 4 to 9and R is often an iso-octyll or iso-nonyl group.
1.6.6Deter~ents.
The name detergents can give rise to some misunderstanding; their function is not toact as an engine cleanser. These additives have nothing to do with lubrication; theirfunction is to keep in suspension any dirt, carbon and wear debris that might otherwisecollect on piston crowns, the piston ring area and in oil feed lines which would bedetrimental to the function of the engine. In fact, an oil which had a purely detergentor cleansing action, if used in a dirty engine, could rapidly cause problems by removingdeposits from some parts and depositing them in less desirable places such as oil-ways.It is for this reason that it is now common practice to refer to 'detergent-dispersant'additives.
Detergent oils are in demand for use in heavy-duty internal combustion engines,particularly high-speed diesel engines. Due to the higher compression ratios used,diesel engine piston/bore wall temperatures are generally much higher than those ofsimilar sized patrol engines. Detergents are mainly intended to cope with the highertemperature oil deterioration and combustion products. They control the formationof deposits arising from high temperature oil oxidation, for example, they prevent theformation of varnishes and gummy products. Oxidation products originally appear asfine products that are insoluble to the parent oil, both as to solvency and washingeffect. These particles ultimately agglomerate to form a tar-like sludge or like granularcoffee grounds. Oxidation products deposited on the piston skirt develops into a hard,tenacious material resembling a lacquer or varnish as a result of baking at hightemperature.
Metallic soaps such as calcium phenyl stearate were popular detergent additives atone time, but they were found to accelerate oxidation and cause bearing corrosion.
- 31-
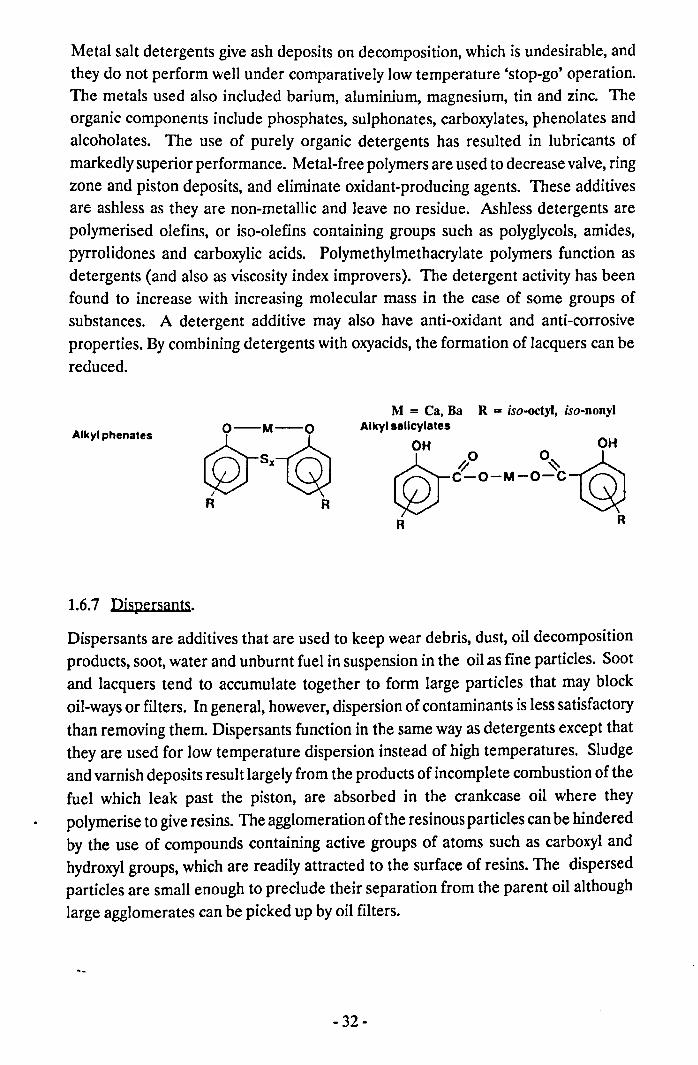
Metal salt detergents give ash deposits on decomposition, which is undesirable, andthey do not perform well under comparatively low temperature 'stop-go' operation.The metals used also included barium, aluminium, magnesium, tin and zinc. Theorganic components include phosphates, suiphonates, carboxylates, phenolates andalcoholates. The use of purely organic detergents has resulted in lubricants ofmarkedly superior performance. Metal-free polymers are used to decrease valve, ringzone and piston deposits, and eliminate oxidant-producing agents. These additivesare ashless as they are non-metallic and leave no residue. Ashless detergents arepolymerised olefins, or iso-olefins containing groups such as polyglycols, amides,pyrrolidones and carboxylic acids. Polymethylmethacrylate polymers function asdetergents (and also as viscosity index improvers). The detergent activity has beenfound to increase with increasing molecular mass in the case of some groups ofsubstances. A detergent additive may also have anti-oxidant and anti-corrosiveproperties. By combining detergents with oxyacids, the formation of lacquers can bereduced.
Alkyl phenates ©-:.-©R R
M = Ca, Ba R = iso-octyl, iso-nonylAlkyl sallcylates
~60 O~_,,£~ C~O-M-O~C ~
R R
1.6.7 Dispersants.
Dispersants are additives that are used to keep wear debris, dust, oil decompositionproducts, soot, water and unburnt fuel in suspension in the oil.as fine particles. Sootand lacquers tend to accumulate together to form large particles that may blockoil-ways or filters. In general, however, dispersion of contaminants is less satisfactorythan removing them. Dispersants function in the same way as detergents except thatthey are used for low temperature dispersion instead of high temperatures. Sludgeand varnish deposits result largely from the products of incomplete combustion of thefuel which leak past the piston, are absorbed in the crankcase oil where theypolymerise to give resins. The agglomeration of the resinous particles can be hinderedby the use of compounds containing active groups of atoms such as carboxyl andhydroxyl groups, which are readily attracted to the surface of resins. The dispersedparticles are small enough to preclude their separation from the parent oil althoughlarge agglomerates can be picked up by oil filters.
- 32-
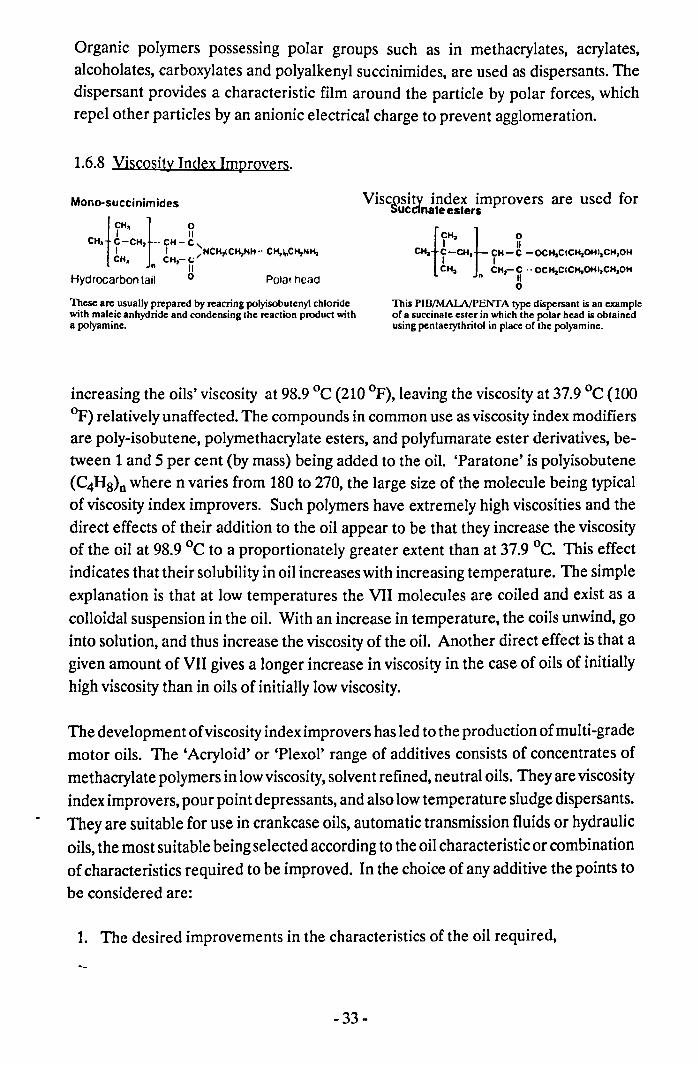
Organic polymers possessing polar groups such as in methacrylates, acrylates,alcoholates, carboxylates and polyalkenyl succinimides, are used as dispersants. Thedispersant provides a characteristic film around the particle by polar forces, whichrepel other particles by an anionic electrical charge to prevent agglomeration.
1.6.8 Viscosity Index Improvers.
Mono-succinimides Viscosity index improvers are used forSuccinate esters
fCH,} 0I II
CH. C-CH •... CH - CI I >~CH,ICH,NH- CH,I"CH,NH,CH. CH.-(;
" IIHydrocarbon tail ° Palm head
CHatf~CH,t fH-g -OCH"CICH,OHI.CH,OHCH. CH,- C ." OCH,CICH,OHI,CH,OH
n IIo
This rIB/MALA/PENTA type dispersant is an exampleof a succinate ester in which the polar head is obtainedusing pentaerythritol in place of the polyamine.
These are usually prepared by reacring polyisobutenyl chloridewith maleic anhydride and condensing the reaction product witha polyamine.
increasing the oils' viscosity at 98.9 °c (210 of), leaving the viscosity at 37.9 °c (100OF) relatively unaffected. The compounds in common use as viscosity index modifiersare poly-isobutene, polymethacrylate esters, and polyfumarate ester derivatives, be-tween 1 and 5 per cent (by mass) being added to the oil. 'Paratone' is polyisobutene(C4Hg)n where n varies from 180 to 270, the large size of the molecule being typicalof viscosity index improvers. Such polymers have extremely high viscosities and thedirect effects of their addition to the oil appear to be that they increase the viscosityof the oil at 98.9 °c to a proportionately greater extent than at 37.9 °c. This effectindicates that their solubility in oil increases with increasing temperature. The simpleexplanation is that at low temperatures the VII molecules are coiled and exist as acolloidal suspension in the oil. With an increase in temperature, the coils unwind, gointo solution, and thus increase the viscosity of the oil. Another direct effect is that agiven amount of VII gives a longer increase in viscosity in the case of oils of initiallyhigh viscosity than in oils of initially low viscosity.
The development of viscosity index improvers has led to the production of multi-grademotor oils. The 'Acryloid' or 'Plexol' range of additives consists of concentrates ofmethacrylate polymers in low viscosity, solvent refined, neutral oils. They are viscosityindex improvers, pour point depressants, and also low temperature sludge dispersants.They are suitable for use in crankcase oils, automatic transmission fluids or hydraulicoils, the most suitable being selected according to the oil characteristic or combinationof characteristics required to be improved. In the choice of any additive the points tobe considered are:
1. The desired improvements in the characteristics of the oil required,
-33 -
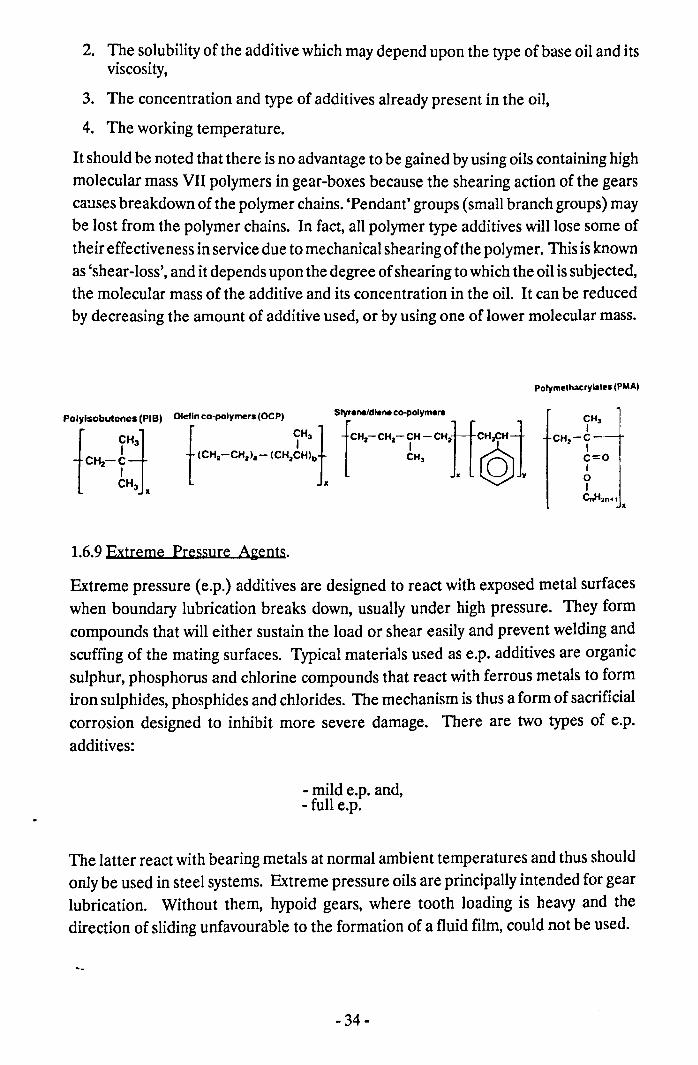
2. The solubility of the additive which may depend upon the type of base oil and itsviscosity,
3. The concentration and type of additives already present in the oil,
4. The working temperature.
It should be noted that there is no advantage to be gained by using oils containing highmolecular mass VII polymers in gear-boxes because the shearing action of the gearscauses breakdown of the polymer chains. 'Pendant' groups (small branch groups) maybe lost from the polymer chains. In fact, all polymer type additives will lose some oftheir effectiveness in service due to mechanical shearing of the polymer. This is knownas 'shear-loss', and it depends upon the degree of shearing to which the oil is subjected,the molecular mass of the additive and its concentration in the oil. It can be reducedby decreasing the amount of additive used, or by using one of lower molecular mass.
Polymelhacrylale. (PMA,
Polylsobutenes (PIB)
1 CjHCHz-iCH3 a
CH3I
CH -C-1 I
C=OIoICnH'MI
1.6.9 Extreme Pressure Agents.
Extreme pressure (e.p.) additives are designed to react with exposed metal surfaceswhen boundary lubrication breaks down, usually under high pressure. They formcompounds that will either sustain the load or shear easily and prevent welding andscuffing of the mating surfaces. Typical materials used as e.p. additives are organicsulphur, phosphorus and chlorine compounds that react with ferrous metals to formiron sulphides, phosphides and chlorides. The mechanism is thus a form of sacrificialcorrosion designed to inhibit more severe damage. There are two types of e.p.additives:
- mild e.p. and,- full e.p.
The latter react with bearing metals at normal ambient temperatures and thus shouldonly be used in steel systems. Extreme pressure oils are principally intended for gearlubrication. Without them, hypoid gears, where tooth loading is heavy and thedirection of sliding unfavourable to the formation of a fluid film, could not be used.
- 34-
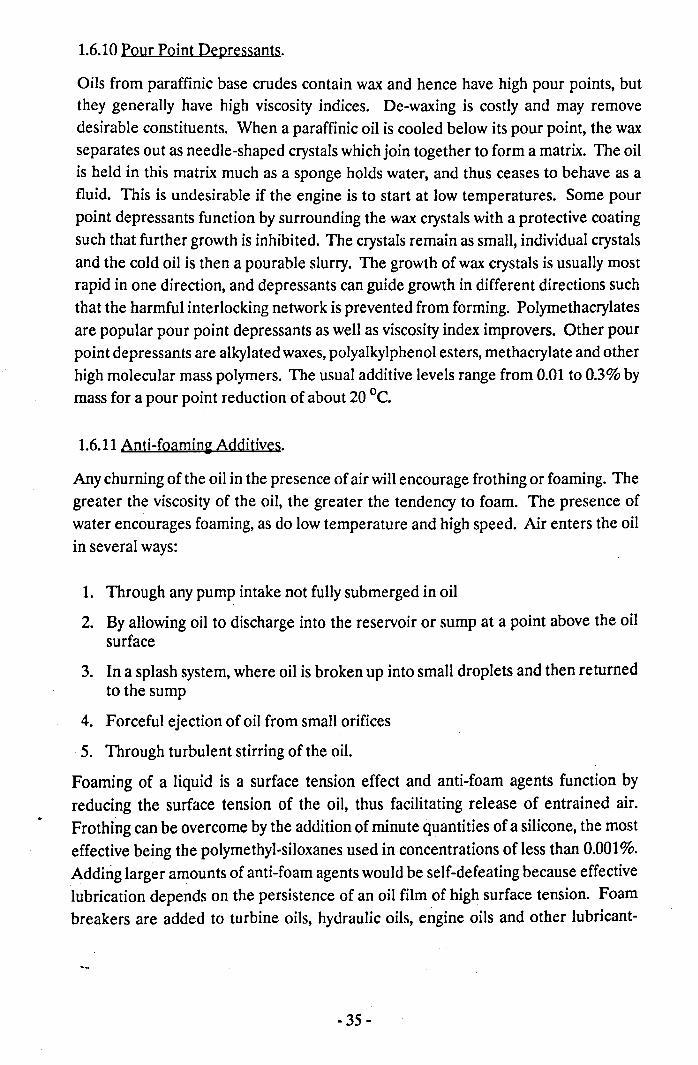
1.6.10 Pour Point Depressants.
Oils from paraffinic base crudes contain wax and hence have high pour points, butthey generally have high viscosity indices. De-waxing is costly and may removedesirable constituents. When a paraffinic oil is cooled below its pour point, the waxseparates out as needle-shaped crystals which join together to form a matrix. The oilis held in this matrix much as a sponge holds water, and thus ceases to behave as afluid. This is undesirable if the engine is to start at low temperatures. Some pourpoint depressants function by surrounding the wax crystals with a protective coatingsuch that further growth is inhibited. The crystals remain as small, individual crystalsand the cold oil is then a pourable slurry. The growth of wax crystals is usually mostrapid in one direction, and depressants can guide growth in different directions suchthat the harmful interlocking network is prevented from forming. Polymethacrylatesare popular pour point depressants as well as viscosity index improvers. Other pourpoint depressants are alkylated waxes, polyalkylphenol esters, methacrylate and otherhigh molecular mass polymers. The usual additive levels range from 0.01 to 0.3% bymass for a pour point reduction of about 20 QC.
1.6.11Anti-foamin~ Additives.
Any churning of the oil in the presence of air will encourage frothing or foaming. Thegreater the viscosity of the oil, the greater the tendency to foam. The presence ofwater encourages foaming, as do low temperature and high speed. Air enters the oilin several ways:
1. Through any pump intake not fully submerged in oil
2. By allowing oil to discharge into the reservoir or sump at a point above the oilsurface
3. In a splash system, where oil is broken up into small droplets and then returnedto the sump
4. Forceful ejection of oil from small orifices
. 5. Through turbulent stirring of the oil.
Foaming of a liquid is a surface tension effect and anti-foam agents function byreducing the surface tension of the oil, thus facilitating release of entrained air.Frothing can be overcome by the addition of minute quantities of a silicone, the mosteffective being the polymethyl-siloxanes used in concentrations of less than 0.001%.Adding larger amounts of anti-foam agents would be self-defeating because effectivelubrication depends on the persistence of an oil film of high surface tension. Foambreakers are added to turbine oils, hydraulic oils, engine oils and other lubricant-
-35-
circulating systems. The most popular anti-foam agents are the polyorgano-silicones,such as polymethylsiloxane (shown below) .
(CH3)3 - SiO - [Si(CH3)zO -]0 - SiO(CH3)3
Poly-methyl siloxane (n = 1 to 2000)
1.7OIL ANALYSIS.
The specification for an important lubricant will often contain compositionrequirements. performance test requirements. and simple batch control tests. Thesespecifications are often written to meet specific requirements and for particularapplications. Specification limits as set out by purchasing contracts often becomecontractual obligations. No specification can be met without some type of approvaltesting. The sections that follow explain the various functional, performance andchemical testing that are most often encountered when testing engine lubricating oils.
1.7.1Deiradation and Testini of Oils.
Engine lubricants in general are required to operate under much more onerous andcomplex conditions than machine lubricants. Not only must they lubricate workingparts satisfactorily, but they must do this under the relatively cool conditionsprevailing in the crankcase and also in the high temperatures of the piston crowns andvalve stems. In so doing. they are subject to considerable churning and oxidation.They also act as coolants in removing heat from under the piston. Oil finding its wayinto the combustion chamber may be thermally degraded or burned. Conditions mayvary considerably from light automobile engines (which are themselves variable inspeed and load) to aircraft engines. It is probable that no single laboratory test couldassess the reaction of the oil to all such conditions. Reproducible and meaningfultesting cannot be simulated except in real engines. Consequently, oil companies,government departments, research establishments and large users of vehicles have setup engine test laboratories. Engine testing of oils is confined to the requirements ofpetrol and diesel engines. Various engine tests have now been incorporated in oilspecifications.
In attempting to differentiate between oils of different kinds, and specify the oils mostsuitable for definite applications, the usual approach has been to define the essentialproperty or properties required of the oil for a given purpose and then find means ofassessing that property or properties. Viscosity is the predominant factor in selectingthe oil. Temperature effects, the results of oil deterioration, carbon deposittendencies, etc., are subsidiary effects which become important in special cases.
- 36-
Very few lubrication problems indeed are concerned with one variable only. Simplechemical and physical tests assess one property, often in arbitrary units. Where anumber of such tests are involved, their interpretation and the relative stress to beplaced on each can seriously complicate the selection of suitable oils. Therefore,while simple specification tests do provide some checks as to consistency of qualityfor batches of oils, in practice, they give little indication of the performance of a givenoil.
Engine tests may be designed to assess or rate lubricating oil on the basis of one ormore of the following as primary considerations, though other qualities may bereported upon:
Lacquer formation
Sludge formation
Ring sticking
Bearing corrosionWear
Engine cleanliness
Tests may be designed to test the quality of the base oil or to compare the qualities offormulated oils containing special additives. The general procedure is to select an oilwhich has given complete satisfaction in service to form a basis for comparison. Suchan oil is referred to as a test reference oil. Test conditions will be such that as just topass the reference oil and the criterion of the accuracy of the test must be therepeatability of the test on any test oil. Control of all temperatures, oil consumptionand conditions is essential. Gruse and Livingstone [15] found that at low oilconsumption paraffinic oils produced ring-sticking, while naphthenic oils left the ringsfree. At high oil consumption, naphthenic oils produced ring-sticking, while paraffinicoils left the rings free. A rise in oil consumption is probably indicative of the fact thatring-gumming has taken place.
It is essential that a proper running-in schedule should be followed before each test,the speed and engine duty (measured by brake mean effective pressure) being builtup until test conditions are reached. The running-in should be done on the test oiland until the oil consumption remains reasonably constant, when running-in wouldbe complete. After each test the engine has to stripped down and the condition ofeach component reported upon. Test results are then compared with those obtainedwith the reference oil, the oils being graded as better, equal to, or worse than thereference oil. Some report methods include a point system whereby points areawarded for various bases of comparison, for example, the degree and colour oflacquer formation under the piston crown.
-37 -
The engine should be reassembled after thoroughly cleaning it and new cylinder (orliner), pistons and piston rings fitted by selective assembly. New bearings should befitted if bearing corrosion is being investigated. All clearances, ring gaps and ring wallpressures should be carefully checked and be within fine reproducible limits. It hasbeen suggested that the continuous monitoring of the piston crown temperature is thebest control temperature in oil rating tests. The temperature at the backs of the gasring grooves is thought to be the best indicator for incipient ring-sticking.
1.7.2 A Review of En2ine Testin2 of Lubricatjn2 OUs.
The world-wide engine testing scene of today is a vast subject and are of two maintypes, namely, in-house research procedures and the industry developed tests withwritten methods operated by a number of different laboratories. The in-houseprocedures vary from laboratory to laboratory, are restricted and confidential. Thesecond category of industry wide engine tests, their historical development, primarilyin the USA and Europe, is examined and linked to the current state of key tests. Theseare categorised into various types and consideration is given to the different levels ofcontrol and surveillance in the USA and Europe. Analysis of data published on theUS sequence tests indicate where improvements have been made in precision andhow some of these lessons may be applied to other procedures to provide improvedtesting in the future. Finally, a review of where engine testing may go in the next 5-10years, is considered.
The first industry tests were developed in the USA, in the 1930's, in which theCaterpillar Tractor Company played a leading role in the development oflubricatingoil engine tests. The main developments since then has been in the peripherals, thatis, in controls, instrumentation and rating. On the instrumentation front the old typeof instrumentation with large recorders and dial gauges have been replaced by thenew type of digital displays based on printed circuit boards and integrated circuitsyielding much more information. This technology when linked to modern controlsystems allows for better control and standardisation of test procedures.
Up to the 1930's, bench tests were considered adequate to determine the quality oflubricants but about that time considerable development work was carried out byCaterpillar and General Motors. The work done by Caterpillar is still largelyrecognised by the various procedures available today. The basic crankcase has notchanged much since those days although changes have been made to other parts ofthe hardware and procedure to obtain more power and thus keep pace with the generalincrease in engine output. It was not until 1942 that the British Governmentrecognised the need for engine testing in their specification DID 472. However, by
- 38-
that time the Americans were well on their way to developing specifications containinga number of engine tests.
The American Petroleum Institute and the Society of Automotive Engineerssponsored the Coordinating Research Council (C.R.C) to standardise the enginetesting of lubricating oils. The C.R.C. issued five test procedures in 1943, usingaccumulated data and experience on standard engines. The C.R.C. test proceduredesignation L-l, L-2, and L-3 all used Caterpillar diesel engines to assess detergency,running-in characteristics and oxidation, and bearing corrosion tendencies,respectively. The L-4 test also assessed bearing corrosion tendencies but used aChevrolet petrol engine, while test L-5 used a General Motors diesel engine to assessoxidation stability, bearing corrosion and detergency (500 hour test). Ultimately, onlythe L-l and L-4 tests were found to be adequate and the other tests were omitted fromspecifications. In 1948, the introduction of a new level (Supplement 1) was made,which required the Caterpillar L-l to be run on 1% sulphur fuel. In addition, at thistime a significant increase in quality level was established called Series IIwhichincluded for the first time a supercharged diesel requirement - the Caterpillar I-Dusing a 1% sulphur fuel. In 1953, the numbering system was changed to the familiarMIL-L-2104 type designation. In 1958, the MIL-L-2104B specification was issuedand it is at this stage that the present day multi-grade gasoline tests appear on thescene. At the same time the need for higher duty engine lubricants was accepted bythe issuance of MIL-L-45199, requiring the Caterpillar I-G and I-D tests. Thisrecognised the Series III level issued by Caterpillar in 1956. These specifications hadquite a long life although there were changes in the tests and limits required whichmade it difficult to compare MIL- L-2104B lubricants qualified during the total lifeof the specification. The next major change took place in 1970when the numberingsystem was revised to the present system. Thus, MIL-L-2104C and MIL-L-46152 wereissued and have remained with until the present time, although, as with MIL-L-2104B, there have been modifications along the way to represent changes in thequality level required and to reflect the need to change specific engines as partsbecame unavailable. This again makes comparison difficult. A summary of thedevelopment of US Engine Test Specifications is given in Table 9.
As a result of the close co-operation of key US industry groups such as Caterpillar,Ford and GM together with the ASTM and CRC, the USA developed an effectiverange of specifications and test procedures to support them. In addition, the testsbecame relatively well controlled with reference fuels being required, a panel toreview the test results and more recently the establishment of the Test MonitoringCentre (TMC) to organise reference testing and generally control the waylaboratoriesrun tests. No such parallel system developed in Europe, even allowing for the lag in
- 39-
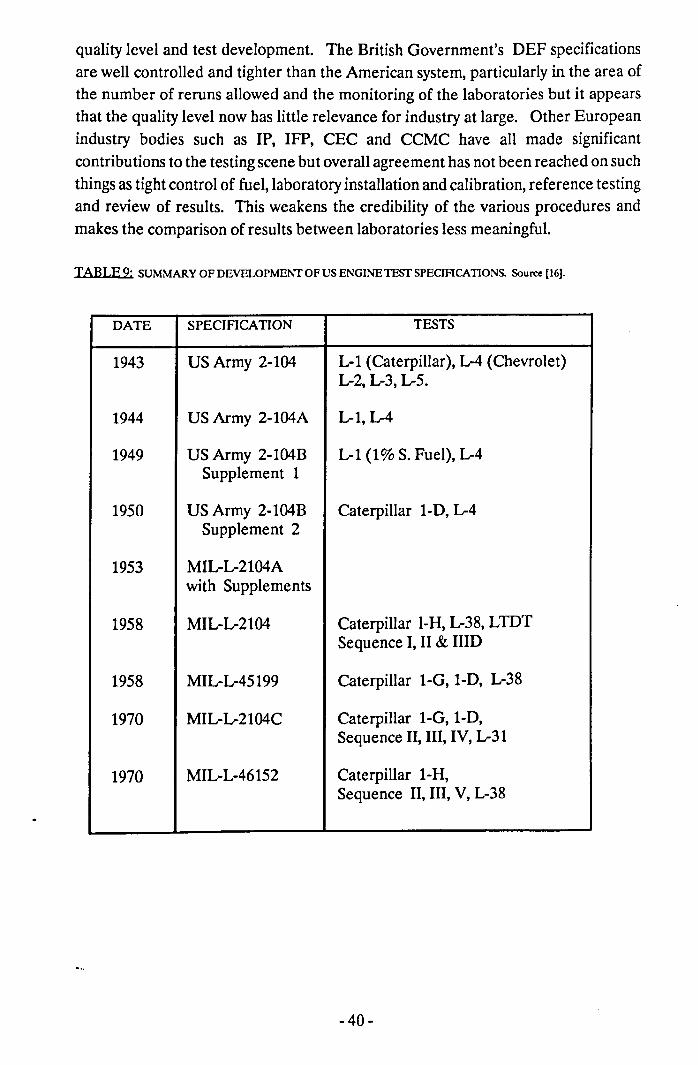
quality level and test development. The British Government's DEF specificationsare well controlled and tighter than the American system, particularly in the area ofthe number of reruns allowed and the monitoring of the laboratories but it appearsthat the quality level now has little relevance for industry at large. Other Europeanindustry bodies such as lP, IFP, CEC and CCMC have all made significantcontributions to the testing scene but overall agreement has not been reached on suchthings as tight control of fuel, laboratory installation and calibration, reference testingand review of results. This weakens the credibility of the various procedures andmakes the comparison of results between laboratories less meaningful.
TABLE 9: SUMMARY OF DEVELOPMENT OF US ENGINE TEST SPECIFICATIONS. Source [16].
DATE SPECIFICATION TESTS
1943 US Army 2-104 L-I (Caterpillar), L-4 (Chevrolet)L-2, L-3, L-5.
1944 US Army 2-104A L-1,L-4
1949 US Army 2-I04B L-I (1% S. Fuel), L-4Supplement 1
1950 US Army 2-I04B Caterpillar I-D, L-4Supplement 2
1953 MIL-L-2I04Awith Supplements
1958 MIL-L-2104 Caterpillar I-H, L-38, LTDTSequence I, II& IIID
1958 MIL-L-45199 Caterpillar I-G,I-D, L-38
1970 MIL-L-2104C Caterpillar I-G, I-D,Sequence II, III, IV, L-3I
1970 MIL-L-46152 Caterpillar I-H,Sequence II, III, V, L-38
- 40-
The other achievement in the USA is the willingness of the manufacturers to rely oneach others tests which has avoided proliferation of procedures, although thissituation may not hold for much longer in the heavy duty diesel area. Thus, althoughthe US tests are relatively expensive to run in Europe, some UK laboratories dooperate all the tests required by the MIL-L-46I52 and 2I04C specifications and fullyparticipate in the industry groups in controlling and developing these tests.
TIle first British Standard Specification lubricating oil engine test was B.S. 1905published in 1952. Two types of tests were specified; one for ring- sticking, pistonlacquer deposit formation and piston and cylinder wear characteristics based on theC.R.C. L-1-545 specification in a 480 hour test. The second test was for oxidation andbearing corrosion characteristics based on C.R.C. test L-4-545 in a 36 hour test. TheAmerican procedures were followed very closely and all engine spare parts had to beimported. These tests were expensive and of long duration. The satisfactorycompletion of these tests was required for the approval of a lubricating oil under theUnited States Army Ordnance Specification MIL-0-2104, and the British Ministry ofDefence Specification DEF 2101. In 1953, the Symposium of the Institute ofPetroleum on the engine testing oflubricating oils, proposed a review on test enginesavailable with the view to develop a British engine test.
As a result the Petter A.V.B. single cylinder four stroke diesel engine was put forwardas a cheap small-scale test unit capable of giving preliminary screening tests ofcomparatively short duration of 120 hours. The Petter W.1. single cylinder fourstroke spark ignition engine was adopted to replace the Chevrolet engine intended toassess the oxidation stability of oils and bearing corrosion. Extensive tests by theInstitute of Petroleum had shown that the Petter W.1. and Chevrolet engines behavedin a similar waywith regard to oil oxidation and bearing corrosion. Both the Ministryof Defence and the Institute of Petroleum thus accepted the Petter W.1. as areplacement for the Chevrolet engine. The Caterpillar engine test was retained forthe assessment of ring-sticking, deposit formation and wear characteristics.
Other attempted test standardisation were undertaken, for example, with theSunbury single cylinder gasoline engine, developed by BP under the auspices of thelP, together with the Shell/Ricardo diesel engine. These specific test engines werepriced out of the market and the Petter engines took their place and have continuedto the present day.
The Institute of Petroleum publication 'LP. Standards for Petroleum and its products,Part III', is based on the work of the Engine Tests of Lubricants Panel and details fourengine test methods together with the procedure for determining numerical ratings
-41-
of the engine components after the test.
Test lP. 124/64 is basically equivalent to the C.R.C. L-l test procedure and theCaterpillar Al test, and is equivalent to the methods described in the DEF 21D1-Cand B.S. 1905:1965 specifications. It assesses the ability of an oil to prevent or reducethe formation of:
1. piston ring-groove deposits which may lead to ring-sticking,
2. cylinder deposits likely to lead to cutting of the top piston land,
3. excessive lacquer deposits on the piston,
4. piston ring and cylinder wear.
Test lP. 173/60 is based on the Caterpillar D test and is intended to assess the sameproperties of the oil as LP. 124, but with the engine running under super-chargedconditions, and is claimed to evaluate oils for use in heavy duty internal combustionengines.
Test J.P. 175/64 is similar in purpose to method J.P. 124 and uses a modified PetterA.V.B. laboratory compression ignition engine in a 120 hour test with kerosene ascoolant flowing in reverse to avoid excessive cylinder head temperature but givingraised piston temperature.
Test lP. 176/64uses a Petter W.1. spark ignition engine to assess oil oxidation, pistondeposits and bearing corrosion of copper-lead bearing shells.
Until comparatively recently, there has not been strong co-ordination of engine testdevelopment in Europe and hence the procedures have not become so widelyrecognised and specified as those developed in the USA. The post war dominationof the motor vehicle market by Ford and GM also contributed to the greateracceptance of the US test procedures.
At the present time, the USA situation appears to be relatively stable with theSequence and Caterpillar tests dominating the world-wide quality scene. Very littleproliferation of tests is likely in the gasoline area although new tests on smaller enginesare being developed by GM to replace the lID and IIID, probably to run on lead freefuel. Similarly, a V-D replacement test is under development. Multicylinder dieseltests are being introduced with the Detroit Diesel6V53T being required for the newMIlrlr2104D specification. Some proliferation of such tests appears likely with theMack T-6, Caterpillar 3406 and Cummins NTC 400 already on the scene. A newCaterpillar procedure is being developed and likely to be in addition to the present
- 42-
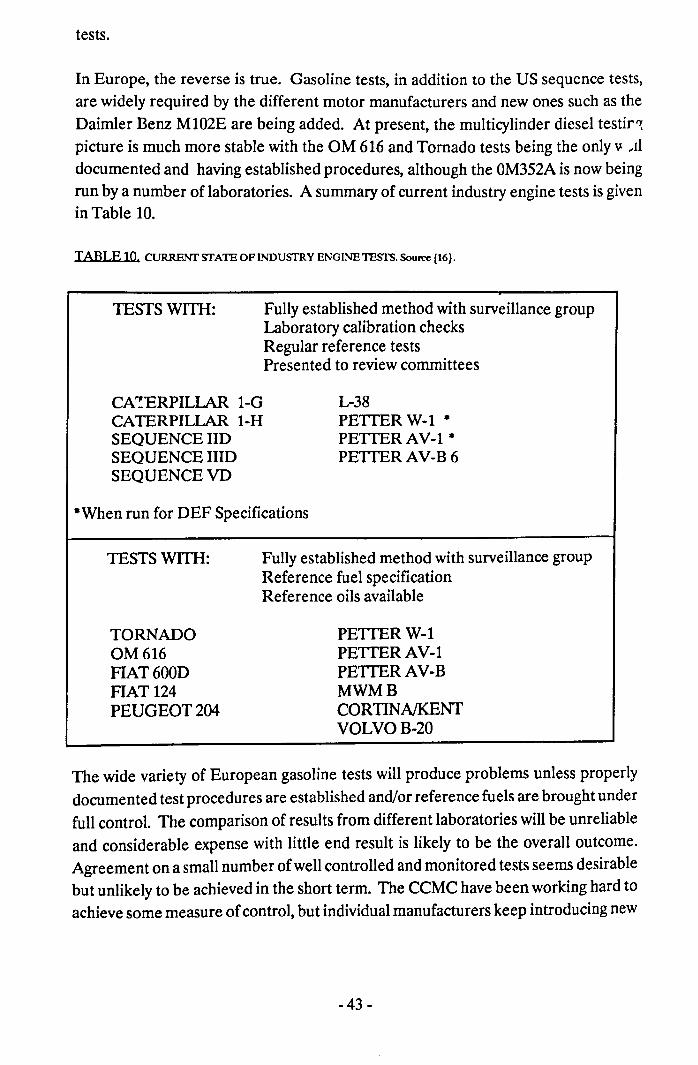
tests.
In Europe, the reverse is true. Gasoline tests, in addition to the US sequence tests,are widely required by the different motor manufacturers and new ones such as theDaimler Benz MI02E are being added. At present, the multi cylinder diesel testir-tpicture is much more stable with the OM 616 and Tornado tests being the only v ...11documented and having established procedures, although the OM352Ais now beingrun by a number of laboratories. A summary of current industry engine tests is givenin Table 10.
TABLE 10 CURRENT STAlE OF INDUSTRY ENGINE TESTS. Source [16}.
TESTS WITH: Fully established method with surveillance groupLaboratory calibration checksRegular reference testsPresented to review committees
The wide variety of European gasoline tests will produce problems unless properlydocumented test procedures are established and/or reference fuels are brought underfull control. The comparison of results from different laboratories will be unreliableand considerable expense with little end result is likely to be the overall outcome.Agreement on a small number of well controlled and monitored tests seems desirablebut unlikely to be achieved in the short term. The CCMC have been working hard toachieve some measure of control, but individual manufacturers keep introducing new
CA~ERPILLAR 1-0CATERPILLAR I-HSEQUENCE lIDSEQUENCE IIIDSEQUENCEVD
L-38PETfER W-t *PETfERAV-l *PETfER AV-B 6
*When run for DEF Specifications
TESTS WITH: Fully established method with surveillance groupReference fuel specificationReference oils available
TORNADOOM616FIAT600DFIAT 124PEUGEOT204
PETTER w-iPETTER AV-lPETTER AV-BMWMBCORTINNJ(ENTVOLVOB-20
- 43-

tests and requiring lubricant manufacturers to run them if an oil is to be listed as arecommended lubricant.
The possibility of European and US requirements coming closer together is oftendiscussed but appears very unlikely within the next 5-10 years for the reasonsmentioned previously. If agreement cannot be established within Europe, it seemsvery unlikely that agreement will be achieved on a much wider issue involving evenmore loss of direct control.
As far as the tests themselves are concerned, improved instrumentation and controlwill be developed by individual laboratories within the framework of the present testprocedures. These will be essential as researchers require more data from the veryexpensive tests and managers need to make decisions following a smaller number oftests. Again, however, close industry wide involvement will be essential to ensure thatthe tests run, still produce results in line with other laboratories unless the end productis for purely in-house research purposes. This problem is already causing concern inrelation to the US sequence tests and at the recent ASTM meetings in Arizona, theASTM Technical Guidance Committee charged the surveillance group chairman,together with the test sponsors, where appropriate, to have discussions with the TMCadministrator and develop recommendations for data logging. In addition, a sub-group is to be set up to investigate different instrument practices and calibrationprocedures.
Thus, it is likely that new instrumentation and control developments will have to satisfylaid down standards and any laboratory deviating from these will be closelyinvestigated before the modified test stands are qualified as referenced stands.Overall, engine tests have improved dramatically, particularly during the last six orseven years, but there is still a long way to go. With fuel and manpower costsincreasing rapidly, engine testing will continue to be a very expensive, but verynecessary part of lubricating oil and additive development. Apart from the largeamount of money at risk from wasted tests, it must also be recognised that largecommercial decisions, sometimes involving millions of pounds, may rest on resultsobtained from an engine test. It is, therefore, up to all those involved in the enginetest business to produce tests which are meaningful, well controlled and whichproduce the maximum amount of useful data.
The precision of an engine test is affected by a number of different factors and can bequantified as follows:
Variance (Rating) + Variance (Test operation) = Variance (Total)
- 44-
Test operation includes such things as fuel, build procedures and test operation, butit is difficult to obtain data to separate out these parameters. However, data areavailable on rating and total test precision from the various US tests to allow areasonable estimate to be made of the actual part played by test operation and all thatincludes. Real improvements in rating precision have been made during the last tenyears as a result of the activities of the various CRC rating workshops. These ratingworkshops are now an essential part of the system. In order to qualify as a rater forrating reference tests for submission to TMC, two out of three possible attendancesper year at the appropriate symposia must be achieved.
In general, for parameters such as Caterpillar WID, Rust, Sludge and HID (%viscosity increase) engine tests, the standard deviation of results have been found toincrease as the result worsens and this is true for both the overall result and rating.
The sequence HD test is a well controlled test with the overall variation in resultsbeing virtually explained by rating variance. This possibly surprising result may bedue to the fact that if problems with this test occur with test operation, results varywidely from those expected and hence the test may have to be withdrawn or declaredinvalid due to operational reasons. This would mean the result would not be includedin the statistics. Also, laboratories do take special care with reference tests and hencethe result obtained may be more accurate than usual. Furthermore, more detailedanalysis of results would indicate that not all of the variance of the individual rustratings can be explained by rating variance alone.
In the case of the Caterpillars and the HID very considerable variance may beattributed to test operations. This is best shown in the next table which summarisesthe standard deviation due to rating, test operation and total test, at key levels for thevarious tests. The precision of the viscosity measurements are so good that thestandard deviation for this has been assumed as zero. Thus all the variance is in testoperation. For example, at the 300 WfD level in the Caterpillar test, the standarddeviation due to test operation is 115 and the viscosity increase standard deviation inthe HID at 350% is 94. Nevertheless, there is still room for considerable improvementif important decisions on the commercialisation of new additives are to be made inthe shortest possible time and without many repeat tests. This whole question of testreproducibility is one of the reasons whyfull computer control on a range of key enginetests have increased in number, industry wide.
- 45-
1.7.3 The Object of Lubricant Monitoring.
By taking a sample of oil from an engine (system) and examining it from time to time,a great deal can be learned about the condition of the oil and also of the engine(system). This information about the state and history of the oil can then be used asa basis for a number of decisions:
1. If the condition of the oil is very bad, this may indicate poor oil quality and maywarrant immediate replacement.
2. If there are signs of oil breakdown, and the additives are becoming depleted, itmay be possible to plan a convenient service for an oil change or system overhaulat some time in the near future.
3. Ifthe oil and additives are not degraded, but there is either water present or solidor fuel contamination, it may be desirable to drain and "launder" the oil beforereturning it to the system.
4. If the oil isvirtually as new, itmaybe possible to confidently delay the next servicedate.
The testing of samples of engine oil makes it possible to use the oil:
1. More economically by draining it only when absolutely necessary and thuseliminates the need for fixed time or mileage service periods.
2. To assess the state of the engine and pinpoint component (impending) failuressuch that it may be possible to plan a system shut-down and overhaul at someconvenient time in the near future. Thus system down-time and failure duringoperation can be reduced to a minimum.
3. To confidently produce a list of problem components and establish componentand system life from past data.
Various models have been put forward for the consumption of lubricating oil ininternal combustion engines, most recently the model of Yasutomi, Maeda andMaeda [17]. Their model is based on the two reactor model, one reactor is in thecombustion zone of the engine which is a small but intensive reactor and the secondbeing the relatively large sump reservoir which in reactor terms, is relatively benign.There must be some interaction between these two reactors as the oil is known tocirculate to some extent between the sump and the top of the piston-ring pack. Thiskinetic treatment assumes a continuous decline in the lubricating oil components andproperties, using the Marquardt equation [18],with service life of the oil and is basedupon measurement of sump samples, Figure 9(a).
- 46-
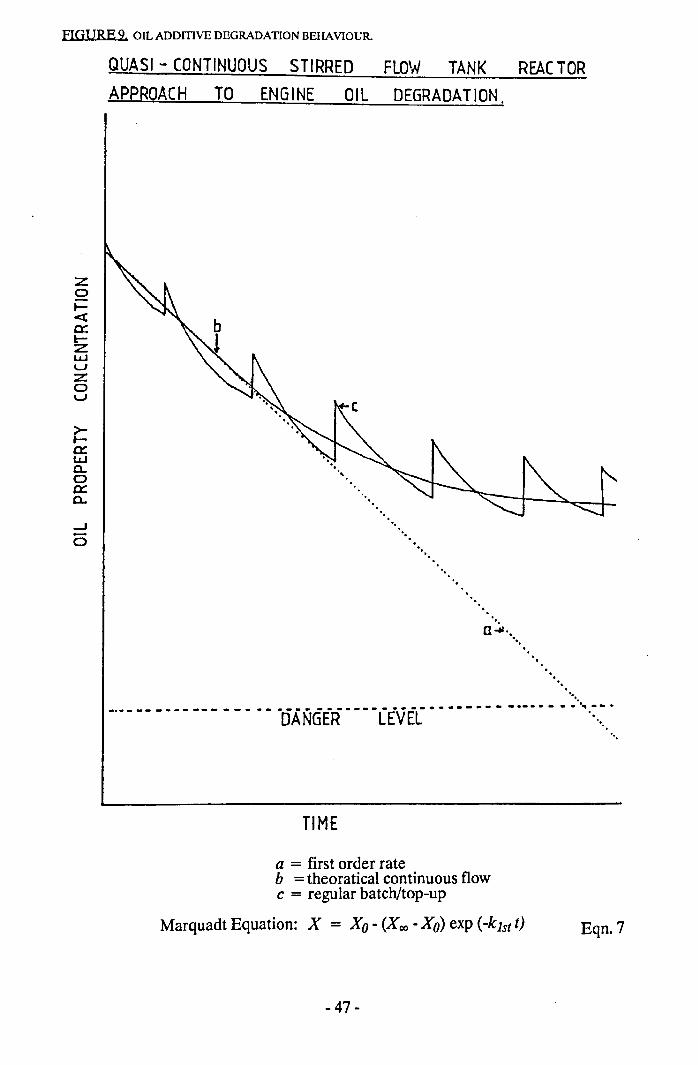
FIGURE 9. OIL ADDmVE DEGRADATION BEHAVIOUR.
QUASI - CONTINUOUS STIRRED FLO't'/ TANK REACTORAPPROACH TO ENGINE OIL DEGRADATION.
zoI--e0::I:-ZUJUZou
~0::UJ0-o0:0-
...J-o '.",
-, '.'.-,
"
-,a~,."."
. ......- _. - - - - -.- - ..- - - - - ._.- - - .- - " - - .-·-----------------OANGER LEVEL -.".
TIME
a = first order rateb = theoratical continuous flowc = regular batch/top-up
Marquadt Equation: X = Xo - (X 00 - Xo) exp (-k 1st t) Eqn.7
- 47-
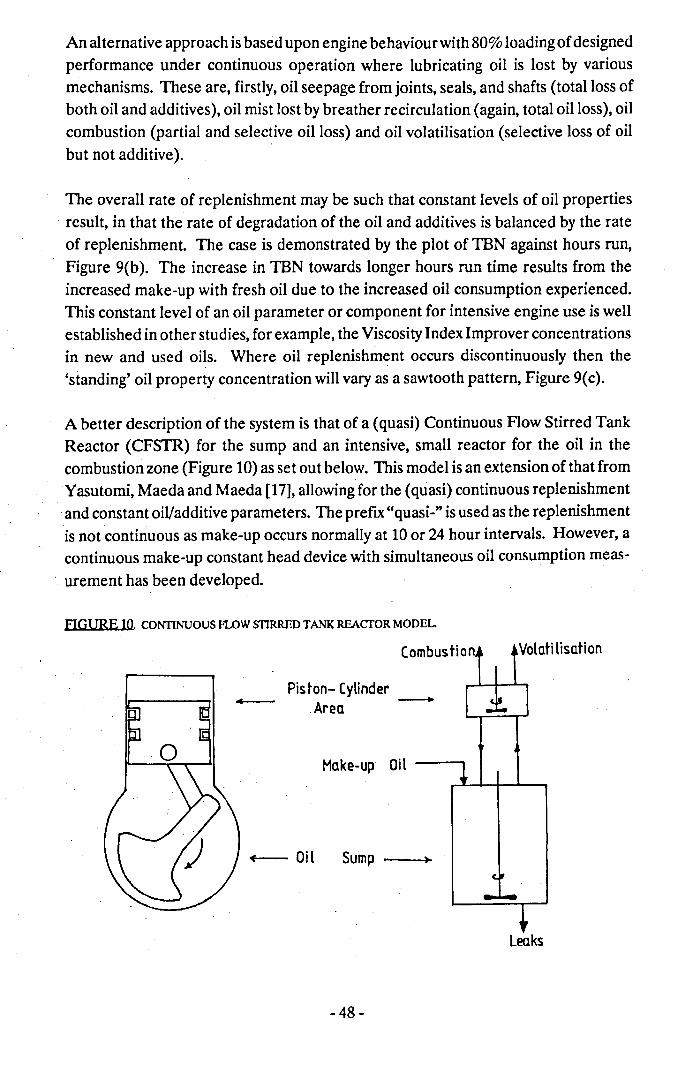
An alternative approach isbased upon engine behaviour with 80% loading of designedperformance under continuous operation where lubricating oil is lost by variousmechanisms. These are, firstly, oil seepage from joints, seals, and shafts (total loss ofboth oil and additives), oil mist lost by breather recirculation (again, total oil loss), oilcombustion (partial and selective oil loss) and oil volatilisation (selective loss of oilbut not additive).
The overall rate of replenishment may be such that constant levels of oil propertiesresult, in that the rate of degradation of the oil and additives is balanced by the rateof replenishment. The case is demonstrated by the plot of TBN against hours run,Figure 9(b). The increase in TBN towards longer hours run time results from theincreased make-up with fresh oil due to the increased oil consumption experienced.This constant level of an oil parameter or component for intensive engine use is wellestablished in other studies, for example, the Viscosity Index Improver concentrationsin new and used oils. Where oil replenishment occurs discontinuously then the'standing' oil property concentration will vary as a sawtooth pattern, Figure 9(c).
A better description of the system is that of a (quasi) Continuous Flow Stirred TankReactor (CFSTR) for the sump and an intensive, small reactor for the oil in thecombustion zone (Figure 10) as set out below. This model is an extension of that fromYasutomi, Maeda and Maeda [17], allowing for the (quasi) continuous replenishmentand constant oil/additive parameters. The prefix "quasi-" is used as the replenishmentis not continuous as make-up occurs normally at 10 or 24 hour intervals. However, acontinuous make-up constant head device with simultaneous oil consumption meas-
. urement has been developed.
FIGURE 10. CONTINUOUS FLOW snRRED TANKRFACTOR MODEL
Combustion Volati lisation
Pis ton- CylinderArea -Make-up Oil
+-- OJ l Sump --~
Leaks
- 48-
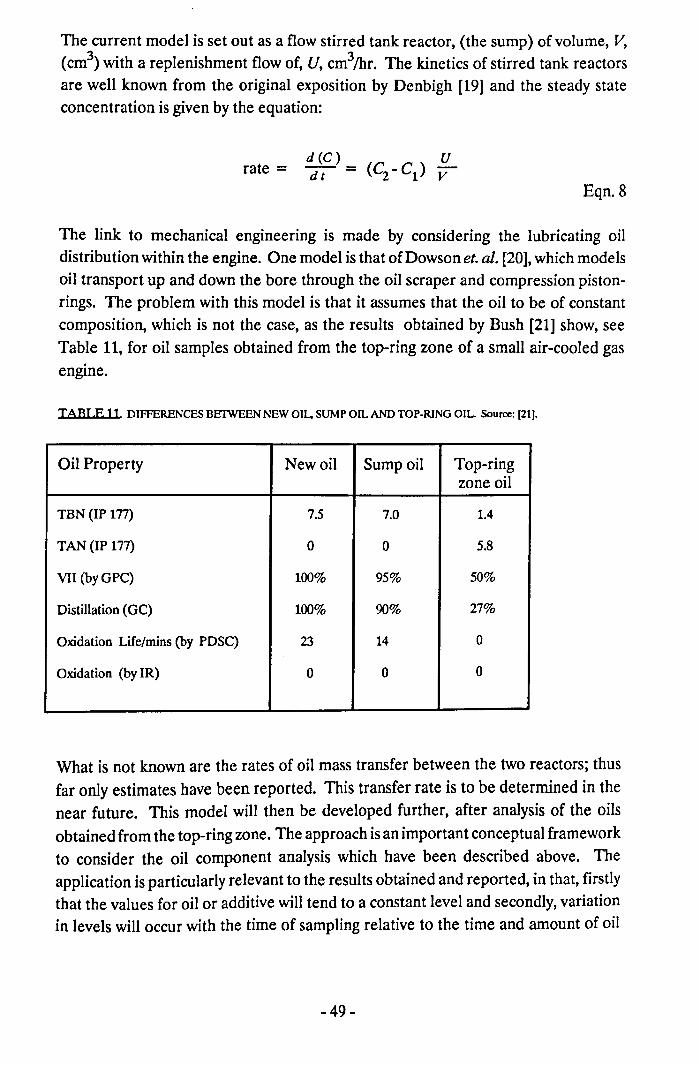
The current model is set out as a flow stirred tank reactor, (the sump) of volume, V,(cm3) with a replenishment flow of, U, cm3Jhr. The kinetics of stirred tank reactorsare well known from the original exposition by Denbigh [19] and the steady stateconcentration is given by the equation:
rate =
Eqn.8
The link to mechanical engineering is made by considering the lubricating oildistribution within the engine. One model is that of Dawson et. al. [20],which modelsoil transport up and down the bore through the oil scraper and compression piston-rings. The problem with this model is that it assumes that the oil to be of constantcomposition, which is not the case, as the results obtained by Bush [21] show, seeTable 11, for oil samples obtained from the top-ring zone of a small air-cooled gasengine.
TABLE 11 DIFFERENCES BEIWEEN NEW OIL,SUMP OIL ANDTOP·RING OIL Source: [21].
Oil Property New oil Sump oil Top-ringzone oil
TBN (IP In) 7.5 7.0 1.4
TAN (IP 177) 0 0 5.8
VII (by GPC) 100% 95% 50%
Distillation (GC) 100% 90% 27%
Oxidation Life/mins (by PDSC) 23 14 0
Oxidation (by IR) 0 0 0
What is not known are the rates of oil mass transfer between the two reactors; thusfar only estimates have been reported. This transfer rate is to be determined in thenear future. This model will then be developed further, after analysis of the oilsobtained from the top-ring zone. The approach isan important conceptual frameworkto consider the oil component analysis which have been described above. Theapplication is particularly relevant to the results obtained and reported, in that, firstlythat the values for oil or additive will tend to a constant level and secondly, variationin levels will occur with the time of sampling relative to the time and amount of oil
- 49-
that the values for oil or additive will tend to a constant level and secondly, variationin levels will occur with the time of sampling relative to the time and amount of oilmake- up. This will be the case for an engine operating at high power levels withsignificant wear, giving a consequently high throughput of lubricating oil.
1.8 AIMS OF THE PROJECf.
An engine lubricant has become a critical component of modern, high performanceengines and is often overlooked by engine manufacturers. The engine wear is closelylinked to the lubricating oil quality during the service life of an engine.
The aim of this project were:
1. To examine the 'top end' mechanical wear in a single cylinder Petter AAl dieselengine fuelled with a reference high sulphur diesel fuel.
2. To determine the degradation of a reference lubricating oil used in the dieselengine.
3. To develop new physical and chemical test techniques for new and usedlubricating oils.
- 50-
CHAPTER2.2. OIL ANALYSIS.
2.1 TOTAL BASE NUMBER (IBN).
The combustion of fuels produces acids. The combustion of sulphur-containing fuelproduces sulphur oxides which, in the presence of water vapour, condense to formsulphur acids. Similarly, the use of lead scavengers in petrol, such as the chloro-bromo-alkenes, results in hydrochloric and hydrobromic acid formation. Hightemperatures and pressures during combustion in internal combustion engines resultin significant production of nitrogen oxides which combine with water to givenitric/nitrous acids. These strong acids, if not neutralised, will diffuse into thelubricating oil of an engine and attack engine components, resulting in corrosive wearof bearings, cylinder liners and the valve train. Convenient ways of expressing thebase or acid concentration in petroleum products are the Total Base Number (IBN)and Total Acid Number (TAN). A positive IBN value indicates the absence of strongacids. Engine lubricating oils are formulated with alkaline additives which willneutralise these acids. The majority of present day alkali additives are overbased(alkaline) metallic detergents. The Total Base Number (IBN) is a measure of thealkaline additive reserve present,in the lubricating oil formulation. IBN is defined[22]in terms of the number ofmilligrams of potassium hydroxide which are chemicallyequivalent to the alkali that is present in 1gramme of oil sample and is expressed asmg KOH/gm of oil.
Several methods for measuring IBN have been reported in the literature and the mostwidely used of these are summarised in Table 12.
Other methods ofTBN determination have been proposed, such as that based on theuse of concentrated sulphuric acid [23]. The TBN method using a propan-z-ol/toluenesolvent mixture and hydrochloric acid as titrant was a proposed method in 1942 andserved for a number of years. Through several revisions, it was published as anaccepted IP method, designated IP 177/ASTM D-664, in 1964. However, seriousdiscrepancies appeared when new additives were used. Many users modified the IP177version by using a back titration or a variation using acetic acid/chlorobenzene asa solvent medium and perchloric acid as titrant. The full text of the latter method wasproposed in JP standards in 1969 and as a Tentative Standard Method IP276/ASTMD2896, in 1971, and subsequently accepted as a full standard.
- 51-
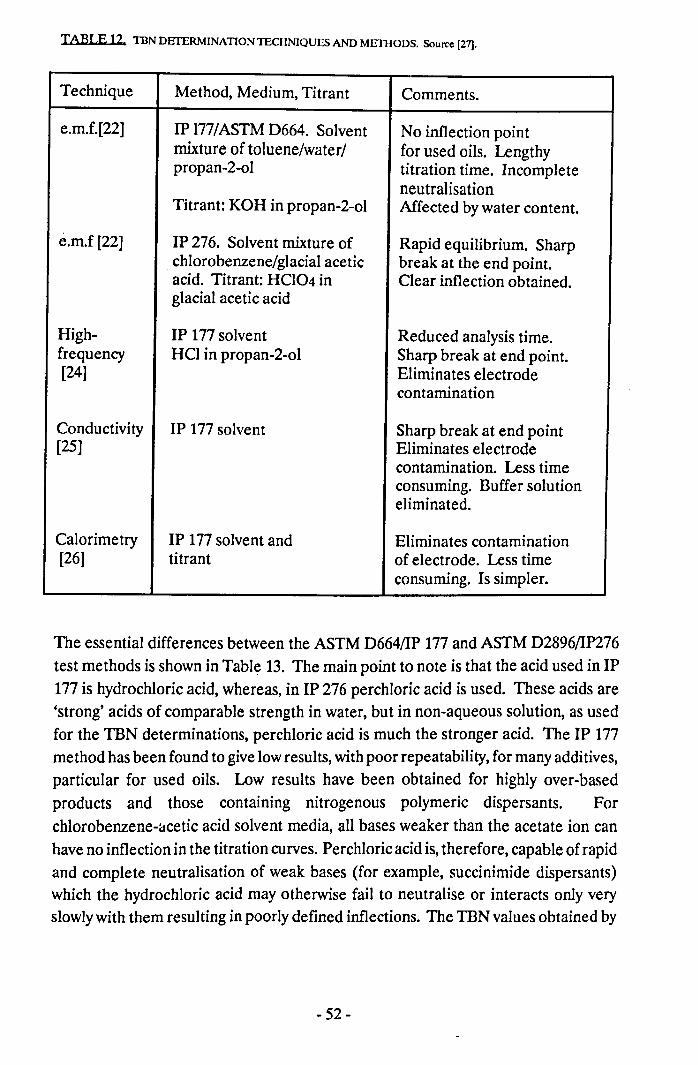
TABLE 12 TBN DETERMINATION TECHNIQUES AND METIIODS. Source (27).
Technique Method, Medium, Titrant Comments.
e.m.f.[22] IP 177/ASTM D664. Solvent No inflection pointmixture of toluene/water/ for used oils. Lengthypropan-2-o1 titration time. Incomplete
neutralisationTitrant: KOH in propan-Z-ol Affected bywater content.
e.rn.f [22] IP 276. Solvent mixture of Rapid equilibrium. Sharpchlorobenzene/glacial acetic break at the end point.acid. Titrant: HCI04 in Clear inflection obtained.glacial acetic acid
High- IP 177 solvent Reduced analysis time.frequency HCI in propan-z-ol Sharp break at end point.[24] Eliminates electrode
contamination
Conductivity IP 177 solvent Sharp break at end point[25] Eliminates electrode
contamination. Less timeconsuming. Buffer solutioneliminated.
Calorimetry IP 177 solvent and Eliminates contamination[26] titrant of electrode. Less time
consuming. Is simpler.
The essential differences between the ASTM D664/1P 177 and ASTM D2896/1P276test methods is shown in Table 13. The main point to note is that the acid used in IP177 is hydrochloric acid, whereas, in IP 276 perchloric acid is used. These acids are'strong' acids of comparable strength in water, but in non-aqueous solution, as usedfor the TBN determinations, perchloric acid is much the stronger acid. The IP 177method has been found to give low results, with poor repeatability, for many additives,particular for used oils. Low results have been obtained for highly over-basedproducts and those containing nitrogenous polymeric dispersants. Forchloro benzene-acetic acid solvent media, all bases weaker than the acetate ion canhave no inflection in the titration curves. Perchloric acid is, therefore, capable of rapidand complete neutralisation of weak bases (for example, succinimide dispersants)which the hydrochloric acid may otherwise fail to neutralise or interacts only veryslowlywith them resulting in poorly defined inflections. The TBN values obtained by
- 52-
the IP 276 method are often higher than those obtained by IP 177. Differentiationbetween TBN values is observed when samples contain additives with differentbasicity, for example calcium sulphonate, carbonate and hydroxide [23]. Hooks' [28]results for TBN determinations of diesel engine oil using three different acids,perchloric, sulphuric and hydrochloric acids in chlorobenzene/acetic acid andtoluene/propan-z-ol/water media respectively, shows three curves with decreasingTBN values from perchloric, sulphuric to hydrochloric acid,respectively.
High frequency oscillator procedures have been used to determine TBN and TAN'\-giving sharp breaks at the end point, indicating values comparable with those obtainedpotentiometrically [25 .and 29]. The method of conductimetric analysis inpropanol/toluene/water in titrating new and used samples of oil [30] and in abenzene/alcohol solvent medium in titrating phenolates and sulphonates has beenfound satisfactory. However, as benzene is a Class A carcinogen, it is no longer usedin open laboratories. Conventional thermometric titrimetry was used to determineacids and bases in light and heavy petroleum derivatives, including lubricating oil [31],crude oils [24] and petroleum distillates [32,33]. Studies [34] show that the acids inthe oils not determined by the thermometric method are weaker thanpKa (H20) = 10. Thermometric titration values are comparable with the standardmethods of determination ofTBN and TAN.
More recently [34], attention has been given to the application of a tri-solvent systemcontaining chloroform for TBN determination. Chloroform, as a carcinogen, will bereplaced by a more acceptable chlorinated solvent such as trichloroethene ("trike").Replacement of chloroform by trichloroethene requires re-validation of thetrichloroethene system. Values obtained for the TBN of an oil sample are generallyhigher than those obtained using IP standard potentiometric methods.
Acid or base character is not an absolute property of the solute but can only bespecified in relation to the solvent used. The ability of a liquid to dissolve ioniccompounds depends strongly, although not exclusively, on its dielectric constant(permittivity). The acidity of any aqueous system is limited by the fact that thestrongest acid that can exist in the presence of water is H30 +. Any stronger acidsimply transfers its protons to H20 to form H30 +. A base in an 'acidic' medium willbe more reactive than that in water as water has a great 'levelling-up effect' on acidand base strengths due to the large solvation effects of water resulting from its highpermittivity. The range of acid and base strengths in water are, therefore, restricted;this restriction will be removed in solvents of much lower permittivity,ngiving muchwider ranges of acid and base strength. A base in an 'acidic' solvent will be morereactive than when it reacts in aqueous solution. Thus, an acid which is stronger in
- 53-
low permittivity, non-aqueous solvents will titrate weaker bases and thus give adifferent TBN value to that obtained by using another, weaker acid. There are anumber of liquids that are considerably more acidic than concentrated solutions ofnitric and sulphuric acids, by as much as 10+ 6 to 10+ 10 times in the case of super acids,e.g. fluorosulphonic acid. Acid-base interaction in non-aqueous solvents are bestunderstood by defining an acid as an electron pair acceptor and a base as an electronpair donor - the Lewis acid base definition. Protic solvents, e.g. H20, NH3, HF, HCN,H2S04 undergo autodissociation and supply H + to stronger bases than theircorresponding depronated species. Perchloric acid has only a single proton and fouroxygen atoms around the central chlorine atom which, on auto-dissociation, forms avery stable anion due to the very effective delocalisation of the negative charge on theperchlorate anion. In the IP 276 titration solvent of glacial acetic acid andchlorobenzene, the strongest acid that can exist would be H3C +C02H. In the IP 177titration solvent of isopropanol, water and toluene, the strongest acid is H30 +. TheH3C +C02H is the "stronger" Lewis acid than H30 + and would, therefore, becapable of neutralising those weak bases which are not neutralised by H30 + .Therefore, the acid strength range of the IP 276 solvent would be larger than that ofthe IP 177 solvent. The TBN values obtained by IP 276 are, therefore, usually higherthan that obtained by IP177, even for new oils.
The progress of the titrations of the IP 177and IP 276TBN determinations is followedpotentiometrically using glass and calomel electrodes. These electrodes are prone tocontamination and need frequent replacement. In addition, these electrodes needfrequent conditioning and require considerable time to equilibrate. The quality ofresults obtained from these determinations is often poor, as the sigmoidal titrationcurve becomes flat and indistinct, particularly for used oils, Figure 11. The problemlies in the interpretation of the mid-point of the sigmoidal plot of electrochemicalpotential against titrant volume. For most new oils a smooth curve is obtained whichhas a readily defined end-point at the mid-point of a sigmoidal curve (Figure 11). Forused oils, the definition of the titration curve gradually degrades, becoming more andmore diffuse with increase in the service life of the oil, making the end-point definitionmore difficult. Eventually, an inflection point cannot be observed and a back titrationor buffer end-point method must then be used, as defined by the Institute ofPetroleum, givingwide error bands that are acceptable for reproducibility (see Table14). It is probable that the chemical species being titrated in used oils have a spreadof alkalinity values, in contrast to the much more homogeneous species (pureadditives) in new oils. Used oils, therefore, must consist of a large number of differentbasic constituents, ranging from the strong metallic bases (hydroxides, carbonates,and soaps), through to ashless detergents and numerous weak bases and salts arisingfrom the degradation of the two former additive types.
- 54-
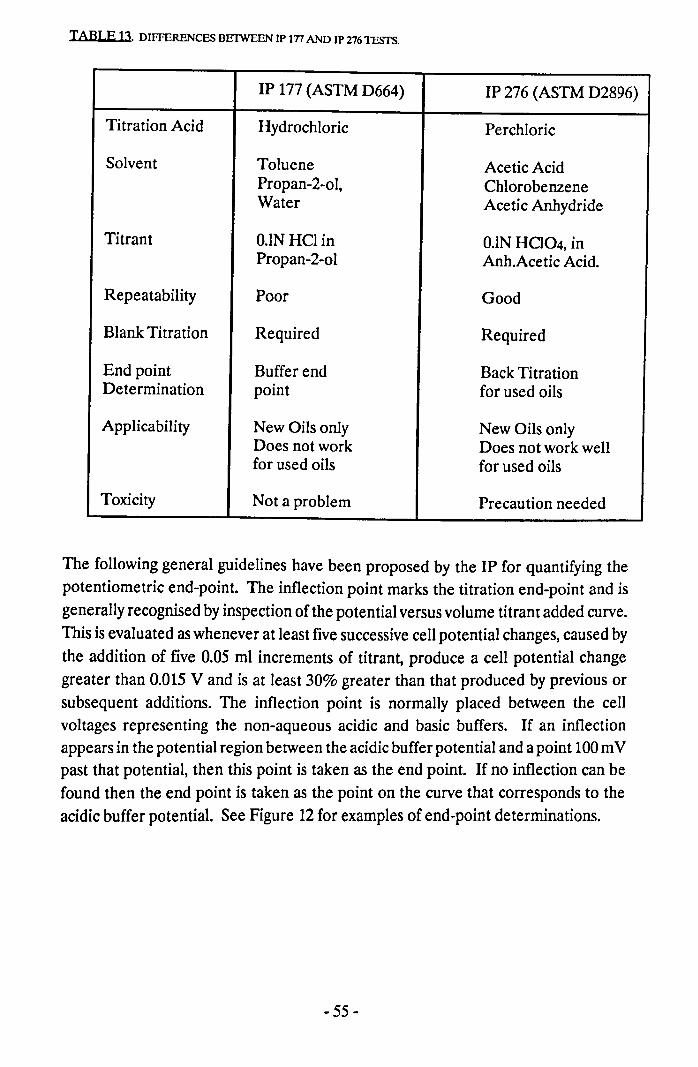
TABLE 13. DIFFERENCES BElWEEN JP InAND JP 276TESTS.
IP 177 (ASTM 0664) IP 276 (ASTM 02896)
Titration Acid Hydrochloric Perchloric
Solvent Toluene Acetic AcidPropan-2-ol, ChlorobenzeneWater Acetic Anhydride
Titrant O.lN HClin O.lN HCI04, inPropan-2-o1 Anh.Acetic Acid.
Repeatability Poor Good
Blank Titration Required Required
Endpoint Buffer end Back TitrationDetermination point for used oils
Applicability New Oils only New Oils onlyDoes not work Does not work wellfor used oils for used oils
Toxicity Not a problem Precaution needed
The following general guidelines have been proposed by the IP for quantifying thepotentiometric end-point. The inflection point marks the titration end-point and isgenerally recognised by inspection of the potential versus volume titrant added curve.This is evaluated aswhenever at least five successive cell potential changes, caused bythe addition of five 0.05 ml increments of titrant, produce a cell potential changegreater than 0.015 V and is at least 30% greater than that produced by previous orsubsequent additions. The inflection point is normally placed between the cellvoltages representing the non-aqueous acidic and basic buffers. If an inflectionappears in the potential region between the acidic buffer potential and a point 100mVpast that potential, then this point is taken as the end point. If no inflection can befound then the end point is taken as the point on the curve that corresponds to theacidic buffer potential. See Figure 12 for examples of end-point determinations.
- 55-
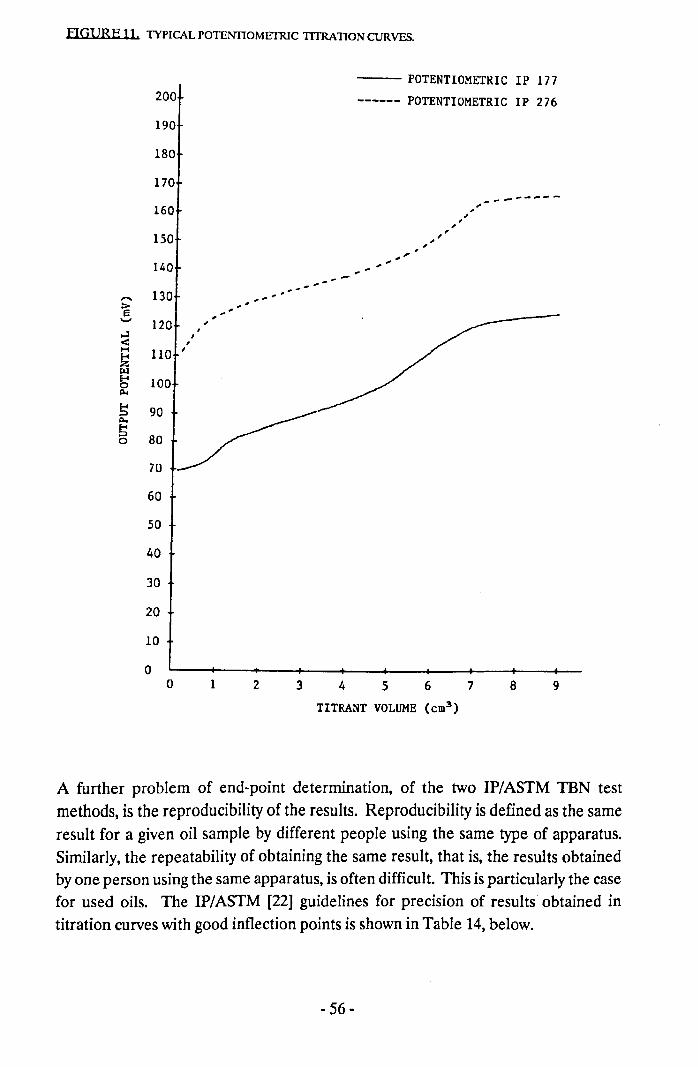
FIGURE 11, TYPICAL POTENTIOMEfRIC TITRATION CURVES,
200
190
180
170160
150
140
...... 130>E'-' 120 ,..:I ,< ,1-4 110 ,tto:!~ 1000~~ 90~S 800
70
60
50
40
30
20
10
00 1
-- POTENTIOMETRIC IP 177------ POTENTIOMETRIC IP 276
-------,"~"-,,,,,
~---~,-, , .
2 3 4 5 6 7 8 9TITRANT VOLUME (cm3)
A further problem of end-point determination, of the two IP/ASTM TBN testmethods, is the reproducibility of the results. Reproducibility is defined as the sameresult for a given oil sample by different people using the same type of apparatus.Similarly, the repeatability of obtaining the same result, that is, the results obtainedby one person using the same apparatus, is often difficult. This is particularly the casefor used oils. The IP/ASTM [22] guidelines for precision of results obtained intitration curves with good inflection points is shown in Table 14, below.
- 56-
Pawlak, Fox et.al. [21] have shown that acid-base "neutralisation" in non- aqueoussolution can be spread over a large range of pKa dependent upon the nature of boththe acid and of the base, the solvent, and the nature of the proton transfer, i.e.,complete transfer from AH + to B, or a bridged structure, A-H +B. These effectscontribute to the differences obtained for TEN values from IP 177and IP 276, whereacids of different strengths are used which react with different ranges of basicity.
TABLE 14. IP TBN ACCEPT ABILfIY LIMITS (All values are in miVg oil). Source (22).
Acid or Base Number Repeatability Reproducibility
0.05 to 1.00 0.02 0.041.0 to 5.0 0.1 0.25.0 to 20.0 0.5 1.0
20.0 to 100 2.0 4.0100.0 to 250 5.0 10.0
When poor or undefined inflections are obtained in the titration curves,the values forrepeatability and reproducibility will be larger than those indicated in the Table 14,above. In practice, for used oils of varying degrees of degradation, it is usuallynecessary to carry out back-titration, in order that a satisfactory end-point is obtained.The application of two alternative techniques to determine the TEN for either of thetwo IP/ASTM standards causes confusion and concern. Some knowledge of thehistory or origin of the samples is, therefore, required to minimise wastage of timeand resources. The IP/ASTM guidelines for the reproducibility of used oils allows for.the variation in TEN values in the range 10% to 80%. These factors do not allow foran automated process, except if all the used oils are to be back-titrated for TENdeterminations.
The equilibration times between additions of titrant have an effect on the TBN resultobtained. An equilibration period of 90 seconds between titrant additions of 0.1 mIcan lead to titrations of one per hour based on a maximum titrant volume of 4 mIs.Such slow titrations are, therefore, tedious and inefficient with respect to time,equipment and resources. Time savings can be achieved by rapid titrant addition untila given potential is reached or by reducing the sample mass, with some loss inprecision.
This multitude of different applicable test methods and the difficulty of obtainingreasonable end-points, does not make the automation of Total Base Numberdetermination easy. It was, therefore, necessary to find a better method of
- 57-
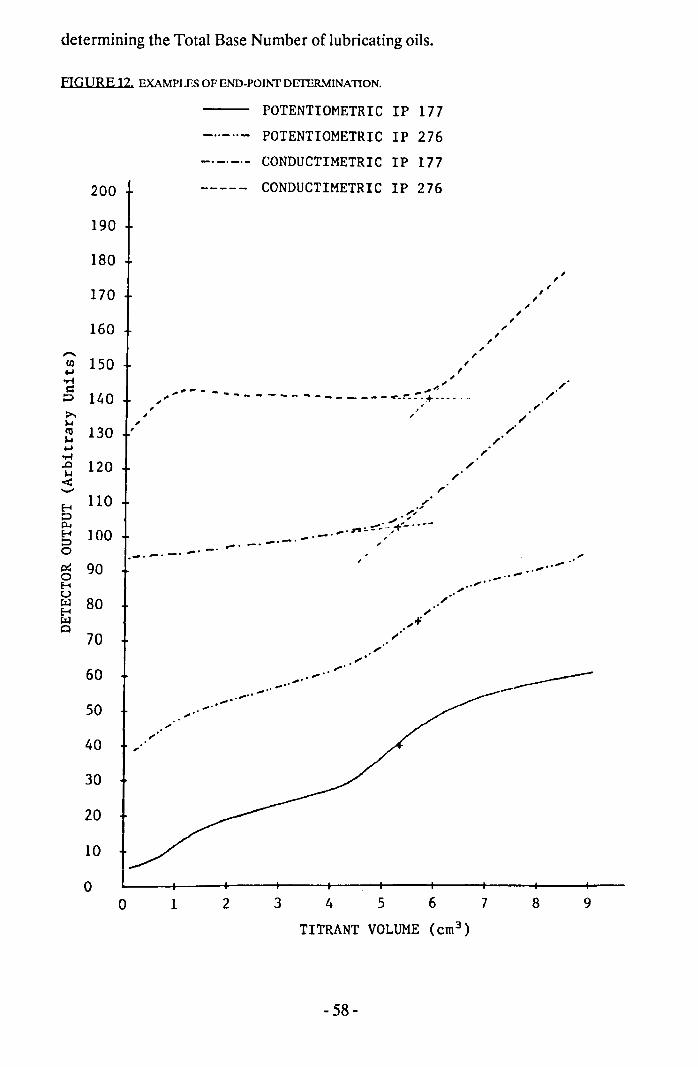
determining the Total Base Number of lubricating oils.
FIGURE 12. EXAMPLES OF END-POINf DETERMINATION.
"Cl)~..-ts:=D
>-j...jro~~..-t.0 120j...j
<-
60
50
40
30
20
la
o
200
190
180
170
160
150
140 ,,,130 ,
70
POTENTIOMETRIC IP 177
- .. -,,_ POTENTIOMETRIC IP 276
--_._._ CONDUCTIMETRIC IP 177
----- CONDUCTIMETRIC IP 276
,,,,,,,,I',,,,,
I,,~--- ,;;-",' --- - --- --------~-:--:-:*.- ...-...
/
/'.;",
_",..' -"'.::.... -",. • ,. :. - , .~.~ I__._0 ,
.... _ • .,..-' ;I_. _. _. __ . _..,.. .. .,.,. .., ". .,.0'-
»:./-'
",'".,pO ".0__ .,_.,......>"__ .
_----",,'
.:,.
o 2 3 6 95 7 841
TITRANT VOLUME (cm3)
- 58 _
2.2 TOTAL ACID NUMBER (TAN).
The Total Acid Number is defined [20]as the quantity of base, expressed in milligramsof potassium hydroxide, that is required to neutralise all acidic constituents presentin 1.00gramme of oil. Alternatively, the TAN is equivalent to a quantitative titrationrequired to raise the "pH" of the sample to 11. The "Strong Acid Number"(SAN),refers to the quantitative titration with KOH required to bring the sample"pH" to 4. The weak acids and the effect of some additives are indicated by thedifference between TAN and SAN. The determination of the Total Acid Number(TAN) has been a standard test specification for unused straight (Le. withoutadditives) mineral oils. The object is to check that:
1. Naturally occurring acids have been removed during refining, and
2. Acids used in the course of refining are not present in the finished oil.
New, highly refined straight mineral oils have a TAN (neutralisation) number of0.10 mg KOH/g,or less. Formulated lubricating oils containing fatty acids, metallicdetergents and acidic organic compounds may possess significant Total AcidNumbers, typically 0.3 mg KOH/g, even though no free acid is actually present. Usedlubricating oils may show lower TAN values compared to that originally present.Used oils with higher TAN values indicate that the oil has depleted its TEN reserveand accelerated wear rates, due to corrosion, are imminent.
High TAN values would arise due to oil oxidative, organic, degradation products,depletion ofTEN reserves by acidic, inorganic, combustion products and the eventualpredominant acid levels from the combination of these acids. In diesel engines, aTotal Acid Number of up to 4 mg KOH/g can be tolerated, above which oil oxidationmay proceed more rapidly [32]. Regular determination of the oil's Total AcidNumber therefore provides a useful indication of the quality of the oil in order toextend its life in the engine.
Direct titration of an oil by an aqueous solution is difficult due to the immiscibility ofoil in water. Emulsions may be formed and colour indicators cannot be noticed indark coloured mixtures. These difficulties are overcome by dissolving the oil in asolvent consisting of toluene (50% v/v), anhydrous propan-z-ol (49.5%) and water(0.5%). This solution is titrated against a standard O.lNalcoholic potassium hydroxidesolution using a potentiometric titration. The end-point is the point of inflection inthe sigmoidal curve in the plot of electrode potential against volume titrant added.
There are a number of variations of the above method for Total Acid Numberdetermination which forms the basis of the ASTM D664-58 and IP 177 tests. These
- 59-
potentiometric titrations in non-aqueous media suffer from similar difficulties inobtaining clear end-points along with the problems of electrode contamination,conditioning and short life as experienced by that in Total Base Numberdetermination. A better end-point indicator system was, therefore, sought.
2.3 OIL VISCOSITY.
The most important physical property of a fluid lubricant is its viscosity. The viscosityof a liquid can be most simply defined as its resistance to flow, and is a measure of thefriction of the fluid molecules when moving past each other. A freely flowing liquidsuch as water has a low viscosity whereas a thick syrup has a high viscosity.
Viscosity is measured in several units, and the relationship between the common unitshas been given in Table 5, see Chapter 1. The regular determination of an oil'sviscosity and its variation against operating engine hours can be used as an indicatorof the oils quality for its continued use and can indicate severe cases of oxidation,sludge formation or fuel dilution.
Kinematic Viscosity, v, is a measure of the resistance to gravity flow of a fluid, thepressure head being proportional to its density, p. For any particular viscometer, thetime of flow of a fixed volume of fluid is directly proportional to its kinematic viscosityv = ",lp,where", is the dynamic viscosity coefficient. The cgsunit of kinematic viscosityis one centimetre (squared) per second and is called one Stokes (St). The IP standardfor viscosity measurement (IP 71) employs a capillary viscometer and requiresaccurate temperature control. This type of viscosity measurement is slow and thecleaning of the viscometers can be difficult, especially when large numbers of used oilsamples are to be tested.
Dynamic Viscosity, 1/, is the ratio between the applied shear stress and rate of shear.The cgs unit of dynamic viscosity is one gram per centimetre per second and is calledone poise (P). The IP standard dynamic viscosity is calculated from the kinematicviscosity and the density of the sample and, therefore, has the added complication ofdetermining the latter parameter.
The dynamic viscosity of an oil can be easily and accurately measured by the rotatingdisc apparatus. A rotating disc and cone viscometer, that requires small quantities ofoil sample, is used to determine the viscosity of the lubricating oil. The viscosity isdetermined over a wide range of speeds at the three standard temperatures (namely0, 100 and 210 of) in order to calculate any change in Viscosity Index (VII). Thismethod of viscosity measurement allows the viscosity change at high shear rates to be
- 60-
ascertained and is indicative of the conditions experienced in the engine.
2.4 ADDmYE AND WEAR METALS.
The metallic content of an oil can be obtained by ashing, ferrographic analysis andspectrographic analysis. The quickest and most accurate method is the spectrographicanalysis which was first investigated by American Railways in 1954. It was found togive a very useful early indication of failures of railway diesel engines which could bewithdrawn from service for overhaul in time to avoid any catastrophes or disruptionduring operation. The technique was extended to the USAF in 1955 and by 1968 theUSAF replaced scheduled jet aircraft engine overhaul with "On-condition Overhaul"based on regular Spectrometric Oil Analysis. By 1970Spectrometric Oil Analysis wasbeing used regularly by most air forces and by 1980,most airlines had followed suit.The technique has found application in naval vessels as well as ships.
The two main instruments used in spectrographic oil analysis are the Emission andAtomic Absorption Spectrometers. Both depend on the fact that when metal atomsare excited, such as by heating, their different energy states are separated by steps(quanta) of particular frequency or wavelength which are characteristic of thedifferent metals. In the emission spectrograph a sample is ignited by an electric arcfrom a carbon electrode. The light intensity at the characteristic frequencies isproportional to the concentration of each element. In the latest technology, plasmasources are used to excite the atoms. In Atomic Absorption a sample is burnt in anacetylene or nitrous oxide flame. A concentrated beam of light is passed through theflame, and some of the light is absorbed at frequencies characteristic of the metalelements present. The amount of absorption at the characteristic frequency dependson the concentration of the element present in the oil sample. The metal elementsthat are of interest to the engineer include calcium, zinc, iron, magnesium, aluminium,chromium, copper, lead, and sodium. Non-metals such as sulphur, silicon andphosphorus are also of interest to the engineer.
The metal content of the oil can be as large as several percent for additive metals oras small as a few parts per million for wear metals. To avoid erroneous readings dueto the presence of large particles of wear debris, the oil sample must be filtered suchthat only finely divided metals, metal oxides and organo-metallics are analysed. Anindividual spectrographic metal analysis is of little value. The value of spectrographicanalysis lies in the continuous monitoring and trend analysis of the data, comparingthe new data with that of the new oil and that of the previous tests, in order to notedeviations that are indicative of potential, imminent failures. The technique ofspectrographic oil analysis requires minute amounts of sample and is fairly cheap. The
- 61-
main drawback of spectrographic analysis is that the exact source of metals and certaintypes mechanical damage cannot be distinguished. The results obtained byspectrographic analysis has been assessed as being reliable between 90% and 98%,by various users [13].
A number of IP methods exist for the determination of additive and wear elements,most of which require wet-chemical analysis. The spectrographic technique canelucidate, simultaneously, several elements from the same oil sample.
2.5 OIL OXIDATION.
The most important type of chemical reaction affecting oils in service is oxidation,which very often determines its service life. The effect of oxidation is to introduceoxygen atoms into the hydrocarbon molecules of the oil, to produce aldehydes, acidsand highly oxidised gums, lacquers and solids residues. Oxidation rates can beaccelerated in the absence of anti-oxidants, at high temperature, acids and thosemetals that have a catalytic effect on oxidation. Oxidation products cause corrosionof bearings and other surfaces and may result in increasing viscosity,sludges andcoatings on various surfaces.
The IP 48 test method for the oxidation of lubricating oil involves heating the oil at200°C in an air stream, for two 6 hour periods followed by a kinematic viscosity (at40°C) and Ramsbottom carbon residue test ([22], IP 14) on the oxidised sample.These results are compared with that of the new oils. The ratio between the oxidisedover the new oil parameters is used to assess the oxidation resistance quality of theoil. This type of testing is very time-consuming and cannot be used to test a largenumber of samples without a large amount of resources and equipment.
A rapid, alternative test method based on Pressure Differential Scanning Calorimetryhas been evaluated to determine the oxidation resistance of lubricating oils. Manyoxidation products contain a carbonyl group, > C=0, in which a carbon atom is linkedto an oxygen atom by a double bond. The carbonyl group produces a characteristicabsorption band (at abou t 1700em-1) in the infrared spectrum and can serve as a quick.check for oxidation.
2.6 VISCOSITY INDEX IMPROVERS.
The IP 226 standard test method is based on the kinematic viscosity of the oil at 40°Cand 100 °c (IP 71) as described in section 2.3 above. The calculation and Tables areprovided in the IP test procedure [22] in order to determine the Viscosity Index of an
- 62-
oil.
The Viscosity Index Improver (VII) in certain lubricating oil is poly-methyl methacrylate (PMA) with an average molecular mass of 270,000 g/rnol. Inservice use, the VII will be degraded with a resulting decrease in molecular mass. Twoproperties are important, namely, the change in the concentration of VII in the oilwith service life and the VII molecular mass distribution. The VII can be separatedfrom the oil and measured by gel permeation chromatography (GPC).
2.7 OIL YOLATILITY.
Lubricating oils are not generally volatile, and it is only with low viscosity oils at hightemperatures or in vacuum applications that evaporation is likely to be significant. Itseffect is to increase the viscosity of the oil. The IP 45 test method for flux oil lossrequires the oil to be heated at 162 to 164QCfor 5 hours. Such a thermo-gravimetrictest is slow and is better suited for the determination offuel and water present in oils.This method was investigated for determining fuel dilution of the oil.
2.8 DETERGENCY AND DISPERSANCY OF OILS.
There is no IP test method for the determination of detergents or dispersants. Thereis a blotting paper test which is used in assessing dirt levels in used oils. The policythat it is better to remove dirt rather than keeping it suspended in the oil is basicallycorrect. With care and experience the blotting-paper test can give a very usefulindication of the state of the oil of an engine. A drop is placed in the centre of a sheetof filter paper (or blotting paper) will spread slowly to give concentric rings of lightand dark regions. A new oil gives a translucent, pale yellow spot. A used oil will givea dark central spot, the size and intensity depending on the dirt level of the oil. Theeffectiveness of the dispersants and detergents can be noted by the distance of thedark spots when compared to that of the clear edge of the base oil. An alternativetechnique involves the use of High Pressure Liquid or Gel PermeationChromatography which can separate the polymeric Viscosity Index Improvers,detergents and dispersants from the base oil. These chromatography techniques allowthe quantity of polymeric additives to be determined, along with changes in chemicalcomposition or molecular mass. Wear debris and carbon levels present in the usedoil, however, cannot be determined by these chromatographic methods as they arelarge and insoluble in the solvent system.
- 63-
2.9 DETERMINATION OF WATER IN OILS.
The combustion of any hydrocarbon in the presence of oxygen results in the formationof water and carbon dioxide. Most of the water is lost through the exhaust system.Some products of combustion find their way into the crankcase as a result of blowbypast the piston rings or through direct absorption by any circulating oil that it maycome into contact with. Formulated lubricating oils can take up significant quantitiesof water vapour and used oils probably even more. The water vapour will almostcertainly be associated with the oil additives such as the metallic detergents and theinorganic anti-acid agents. Water vapour will condense in the cold regions of theengine although some of this water may be evaporated if the engine oil temperatureis allowed to exceed 100 °C. If the water is allowed to accumulate in an engine dueto infrequent oil checks or due to frequent short journeys, especially in cold and humidclimates, then the water may extract acids and additives out of the oil and causecorrosion of bearings, cylinder bores and other engine components. The water mayalso emulsify with the oil to form sludge which may result in poor lubrication andeventual catastrophic failure due to oil ways becoming blocked.
It is essential to determine therefore, the presence of unacceptable levels of water inan oil. Ifwater levels in lubricating engine oils can be monitored regularly, then anyharmful buildup of water can be avoided. In addition, if the engine is water cooled,then any coolant leaks from seals and gaskets can be ascertained at the earliest possibletime, before the engine breaks down during service.
There are two IP test standards, namely IP 74 and IP 75, for the determination ofwaterin oils. IP 74 isbasically a Dean and Stark distillation and IP 75 is based on a centrifugemethod. Neither of these two test standards are applicable to small samples of oilcontaining less than 0.5% water. Alternative methods for the determination of waterin such cases is given in section 3.3. The Karl-Fisher water determination is the mostwidely used wet chemical analysis technique. The Karl-Fisher analysis allows watercontent below the 0.5% level to be determined. The Karl-Fisher analysis requires therigorous exclusion of atmospheric moisture and employs the use of obnoxiouschemicals/solvents. The chemical selectivity of the Karl-Fisher reagent isquestionable when applied to used lubricating oils and is reflected by the poorrepeatability of results on used oils. These problems of the Karl-Fisher analysis, takentogether, cannot offer a satisfactory, simple or reliable route for an automated analysisof water content in used oils.
- 64-
2.10 TOTAL INSOLIJBLE MAUER IN OILS.
The combustion of any hydrocarbon in the presence of oxygen results in the formationof water, carbon dioxide and partially oxidised compounds such as aldehydes andnitrogen oxides. In the case of combustion where the amount of hydrocarbon is farin excess to the amount of oxygen available to completely oxidise the hydrocarbon,soot formation is favoured. These products of incomplete combustion enter thelubricating through blowby and accelerate the oxidative degradation of the oil.Also,it is argued that the presence of finely divided wear debris further assists in thedegradation of the oil. The lubricating oil in internal combustion engines becomesdiscoloured with engine operational time. The presence of soot, wear debris andpartially oxidised material in the oil eventually changes the oil's physical and chemicalcharacteristics such that it may damage the mechanical integrity of the engine. Thiswould arise due to resinous material of high molecular mass being formed which maybecome deposited in oil ways and various other parts of the engine thereby causinginadequate lubrication and heat transfer. The presence of resins of high molecularmass may also increase the viscosity thus further impairing the operation of the engine,especially during starting. It is therefore important that the lubricating oil is changed.regularly or, better, as soon as it is likely to be a cause of concern.
The state of the oil can be easily ascertained by noting its viscosity,colour and smell.These subjective tests may be difficult for the untrained person and may be a healthrisk if done frequently. Therefore,an easy physical test needs to be carried out. Manytypes of oil viscosity checks are in use, including a simple timed-flow comparatorbetween a new and a used oil. The quality of "smell" between oils of varying stagesof degradation is subjective and is unlikely to be used,except by those who have aprofessional "nose" for it and its practice cannot be recommended for health reasons.The blackness of an oil can be determined by various instrumental techniques basedon light radiation and absorption characteristics of the oil. Alternative tests such asthe blotter spot test and the IP 316 (ASTM D-892) "pentane insolubles" test are usedbut both methods suffer from drawbacks. The main drawbacks of the "pentaneinsoluble" test are:
1. It requires the use of pentane-oil mixtures to be centrifuged at high speeds withsome risk of explosion,
2. Repeatabihty of the test arising from dilution errors and the problems ofinterpretation of the results, and
3. Difficulty to automate.
In the case of the oil-blotter spot test, the main drawbacks are its repeatability, timetaken to develop a reasonably sized spot and its interpretation in the degree of
- 65-

blackness of dark used oils.
Therefore, new approaches to used lubricating oil analyses are required, as areexplained in the next chapter.
- 66-
CHAPTER3.3. DEVELOPMENT OF NEW OIL ANALYSIS TECHNIOUES.
Many of the accepted lubricant analysis and test methods, as designated by theInstitute of Petroleum and its North American counterpart, the ASTM, originatedfrom engineers who had little in-depth understanding about the physical and chemicalnature of the test procedures they developed. These out-of-date test methods havebecome industrial standards even though some of the knowledge, equipment andworking practices are no longer viable. When these standards were proposed, it waslikely that testing of large numbers of samples was not considered.
In any case, these standard test methods are long, expensive and cannot be automatedat reasonable cost. There has been much development in recent years to understandthe basic chemistry of formulated lubricating oils, friction and wear. The followingsections discuss details of new methods that have been extensively developed to carryout automated analysis with a throughput of at least 15 samples per hour.
3.1 TOTAL BASE NUMBER.
3.1.1 Methods ofTBN Determination.
The history, chemistry and techniques available for Total Base Number (IBN)determination has been described in Chapter 2, section 2.1. The chemistry of acid-base titrations in aqueous solution is well defined and clearly understood. Water is apeculiar solvent which imposes limits and constraints that are all too often over-looked. The chemistry of acid-base titrations in non-aqueous solvent systems can beunderstood only if it is not compared with that which takes place in aqueous solution.The choices of solvent for the non-aqueous IBN determinations are complex mixturesand the composition of formulated lubricating oil complicates effects them evenfurther, in addition to the changed chemical composition and characteristics of used
oils.
Given that acid-base titrations, in whatever solvent system, are basically one ofchemical equilibrium between the various species involved, the only factor that needsto be addressed is that of measuring the species under investigation, without alteringthe status quo in the process. The choice to find a better method for determining IBNwas simplified by deciding that the same solvent, titrant and their quantities were tobe used as in the accepted standard IP methods. Thus, the basic chemistry of any newtest method would remain unchanged from that using the accepted methods, themethod of detection was to be investigated.
- 67-
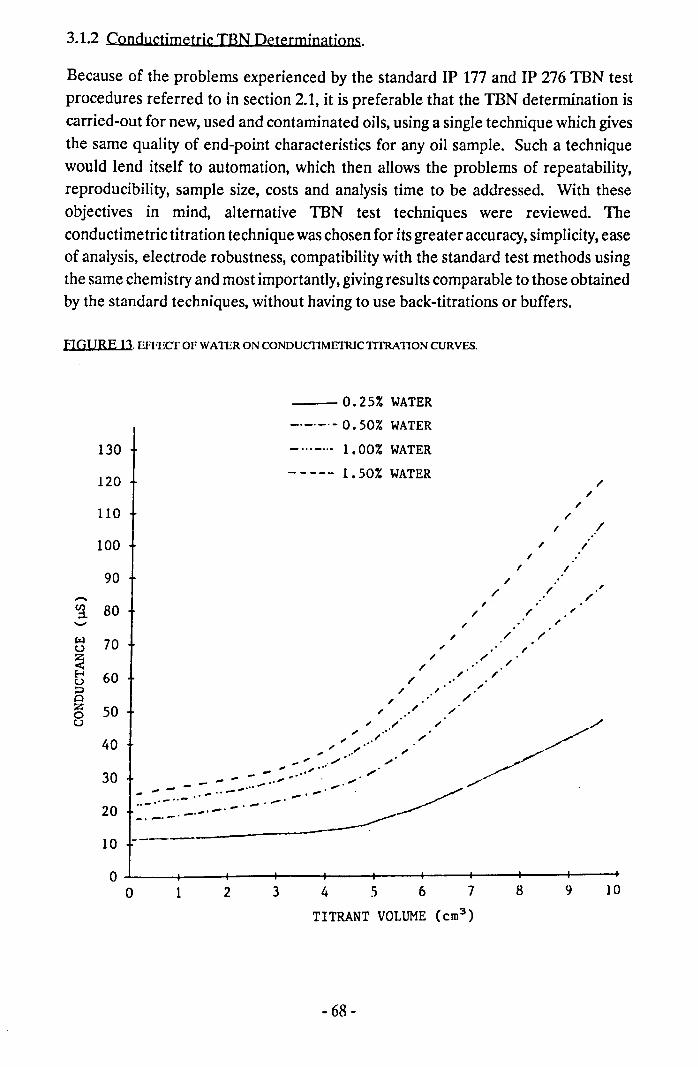
3.1.2 Conductjmetric IBN Determinations.
Because of the problems experienced by the standard JP 177 and JP 276 TEN testprocedures referred to in section 2.1, it is preferable that the TEN determination iscarried-out for new, used and contaminated oils, using a single technique which givesthe same quality of end-point characteristics for any oil sample. Such a techniquewould lend itself to automation, which then allows the problems of repeatability,reproducibility, sample size, costs and analysis time to be addressed. With theseobjectives in mind, alternative TEN test techniques were reviewed. Theconductimetric titration technique was chosen for its greater accuracy, simplicity, easeof analysis, electrode robustness, compatibility with the standard test methods usingthe same chemistry and most importantly, giving results comparable to those obtainedby the standard techniques, without having to use back-titrations or buffers.
FIGURE 13. EFFECf OF WATER ON CONDUCI1METRIC 1ITRA nON CURVES.
130
120
110
100
90-ca 80-~ 70o~f-l 60o~~ 500u
4030
20
--- 0.25% WATER
_._._.- 0.50% WATER
_ ..• _... 1.00% WATER
----- 1.50% WATER/
//
I'I /
/ //
I I/
/ /,
/,/ / ,
/ /
/ / /.- /
/ /
"//
/ /0'
/ , '", /, / ", / " _//'" '" o'., '" ,.,.
- - - ~_:-:;:.:..<-~.::.:.~/~' /- •. _ o· _. ..-'.. _0· __ . ."........ .".. ....._._o_. _.
10 ----
O~---+----~--~--~----+----r----~--~---+--~o 1 2 3 7 108 94 5 6
TITRANT VOLUME (cm3)
- 68-
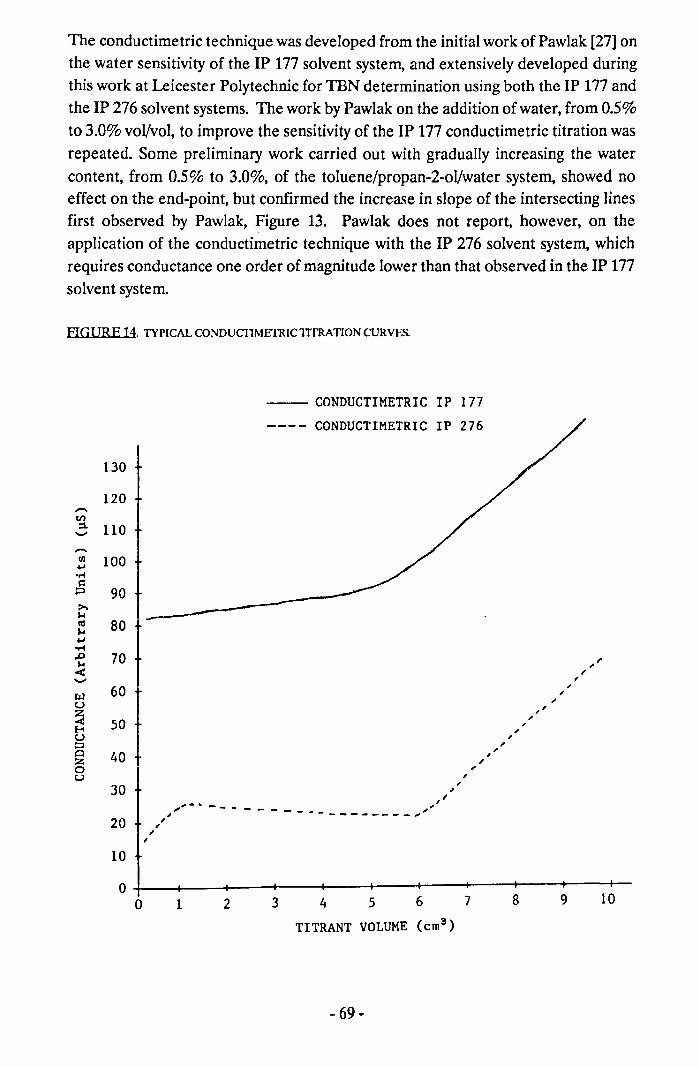
The conductimetric technique was developed from the initial work of Pawlak [27] onthe water sensitivity of the JP 177 solvent system, and extensively developed duringthis work at Leicester Polytechnic for TEN determination using both the JP 177 andthe JP 276 solvent systems. The work by Pawlak on the addition of water, from 0.5%to 3.0% vol/vol, to improve the sensitivity of the JP 177 conductimetric titration wasrepeated. Some preliminary work carried out with gradually increasing the watercontent, from 0.5% to 3.0%, of the toluene/propan-z-ol/water system, showed noeffect on the end-point, but confirmed the increase in slope of the intersecting linesfirst observed by Pawlak, Figure 13. Pawlak does not report, however, on theapplication of the conductimetric technique with the IP 276 solvent system, whichrequires conductance one order of magnitude lower than that observed in the IP 177solvent system.
ElGl IRE 14 TYPICAL CONDUCIlMETRIC1TfRATiON CURVES.
130
120-rJ);:1. llO.....,
-en 100...'"~p 90~~III 80~...""',D 70~<.....,w 60u~ 50HU;:J0 40:;;!:0u
30
20
100
0
-- CONDUCTIMETRIC IP 177
---- CONDUCTIMETRIC IP 276
",,,.-,,
",.-",,,,,
I',,,",,,,,. -. - - .. - - - - - - - - - - - - - - - ,_, ",",,,,
1 2 3 6 7 8 9 104 5
TITRANT VOLUME (cm3)
- 69-
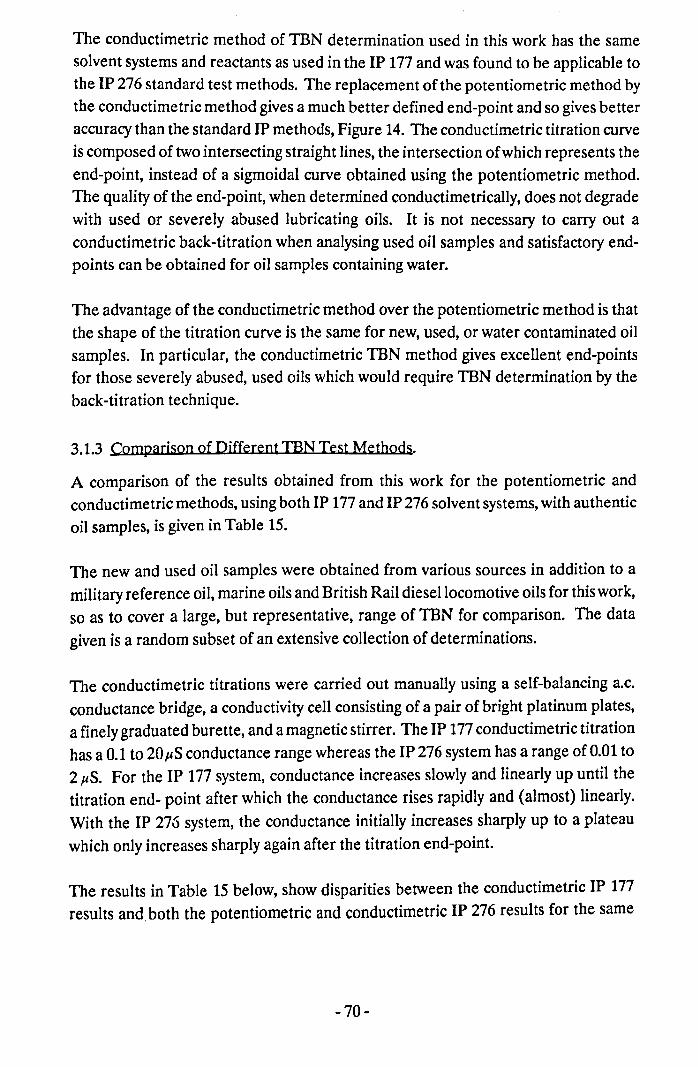
The conductimetric method of TBN determination used in this work has the samesolvent systems and reactants as used in the IP 177 and was found to be applicable tothe IP 276 standard test methods. The replacement of the potentiometric method bythe conductimetric method gives a much better defined end-point and so gives betteraccuracy than the standard IP methods, Figure 14. The conductimetric titration curveis composed of two intersecting straight lines, the intersection ofwhich represents theend-point, instead of a sigmoidal curve obtained using the potentiometric method.The quality of the end-point, when determined conductimetrically, does not degradewith used or severely abused lubricating oils. It is not necessary to carry out aconductimetric back-titration when analysing used oil samples and satisfactory end-points can be obtained for oil samples containing water.
The advantage of the conductimetric method over the potentiometric method is thatthe shape of the titration curve is the same for new, used, or water contaminated oilsamples. In particular, the conductimetric TBN method gives excellent end-pointsfor those severely abused, used oils which would require TBN determination by theback-titration technique.
3.1.3 Comparison of Different IBN Test Methods.
A comparison of the results obtained from this work for the potentiometric andconductimetric methods, using both IP 177and IP 276 solvent systems, with authenticoil samples, is given in Table 15.
The new and used oil samples were obtained from various sources in addition to amilitary reference oil, marine oils and British Rail diesel locomotive oils for thiswork,so as to cover a large, but representative, range of TBN for comparison. The datagiven is a random subset of an extensive collection of determinations.
The conductimetric titrations were carried out manually using a self-balancing a.c.conductance bridge, a conductivity cell consisting of a pair of bright platinum plates,a finely graduated burette, and amagnetic stirrer. The IP 177conductimetric titrationhas a 0.1 to 20pS conductance range whereas the IP 276 system has a range of 0.01 to214S. For the IP 177 system, conductance increases slowly and linearly up until thetitration end- point after which the conductance rises rapidly and (almost) linearly.With the IP 27(j system, the conductance initially increases sharply up to a plateauwhich only increases sharply again after the titration end-point.
The results in Table 15 below, show disparities between the conductimetric IP 177results andboth the potentiometric and conductimetric IP 276 results for the same
-70 -
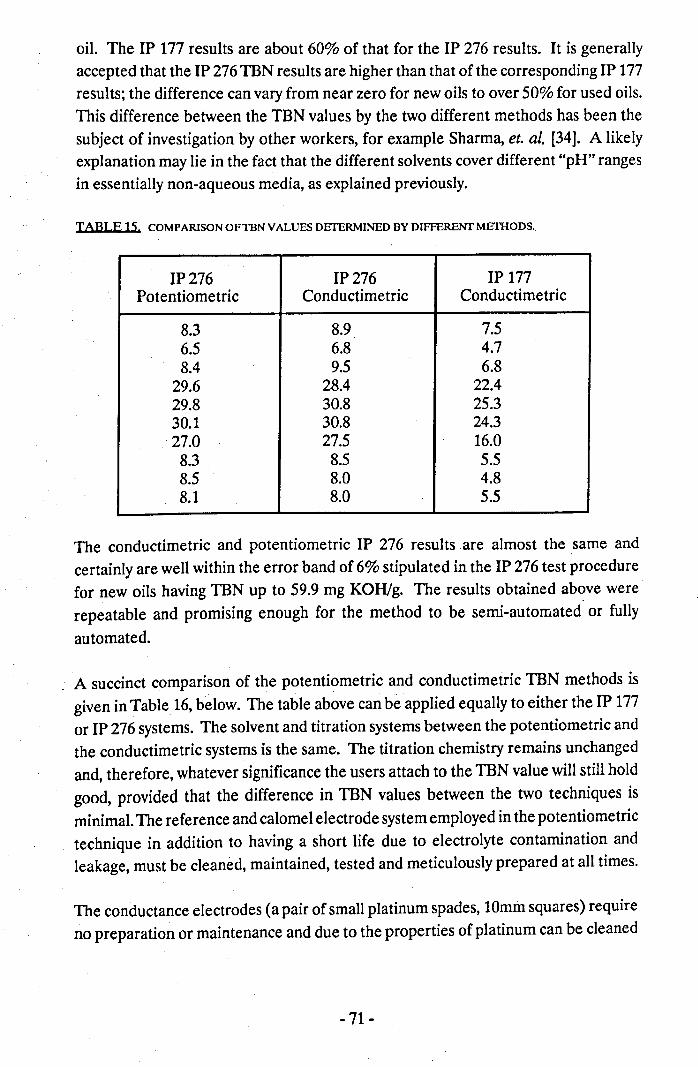
oil. The IP 177 results are about 60% of that for the IP 276 results. It is generallyaccepted that the IP 276 TBN results are higher than that of the corresponding JP 177results; the difference can vary from near zero for new oils to over 50% for used oils.This difference between the TBN values by the two different methods has been thesubject of investigation by other workers, for example Sharma, et. al. [34]. A likelyexplanation may lie in the fact that the different solvents cover different "pH" rangesin essentially non-aqueous media, as explained previously.
TABLE 15. COMPARISON OFTBN VALUES DEfERMINED BY DIFFERENT METHODS ..
IP276 IP276 IP 177Potentiometric Conductimetric Conductimetric
8.3 8.9 7.56.5 6.8 4.78.4 9.5 6.8
29.6 28.4 22.429.8 30.8 25.330.1 30.8 24.327.0 27.5 16.08.3 8.5 5.58.5 8.0 4.88.1 8.0 5.5
The conductimetric and potentiometric JP 276 results are almost the same andcertainly are well within the error band of 6% stipulated in the IP 276 test procedurefor new oils having TBN up to 59.9 mg KOH/g. The results obtained above were.repeatable and promising enough for the method to be semi-automated or fullyautomated.
A succinct comparison of the potentiometric and conductimetric TBN methods isgiven in Table 16,below. The table above can be applied equally to either the IP 177or IP 276 systems. The solvent and titration systems between the potentiometric andthe conductimetric systems is the same. The titration chemistry remains unchangedand, therefore, whatever significance the users attach to the TBN value will still holdgood, provided that the difference in TBN values between the two techniques isminimal. The reference and calomel electrode system employed in the potentiometrictechnique in addition to having a short life due to electrolyte contamination andleakage, must be cleaned, maintained, tested and meticulously prepared at all times.
The conductance electrodes (a pair of small platinum spades, lOmm squares) requireno preparation or maintenance and due to the properties of platinum can be cleaned
-71-
by firing or washing. The potentiometric TBN methods work best with large amountsof sample (20 g maximum) but, in so doing, overcome any problem due to non-rep-resentative samples for analysis. However, in some applications, such as top-ring zoneoil sampling, only milligrammes of sample may be used without significantly affectingthe test viability.
The conductimetric technique with its better accuracy is capable of analysingmilligrammes of sample as the electrodes and cell can be miniaturised in proportionto give the same magnitude in conductance readings for bigger apparatus. The use ofsmaller sample sizes means a saving on expensive solvents and the additionalproblems of hazardous waste disposal.
The a.c. conductance measured does not perturb the titration medium and theresponse is extremely rapid, whereas, the potentiometric measurement is limited bythe slowness of equilibration at the many interfaces present. The potentiometrictechnique with its drawbacks of time, back-titrations, buffers, blank titrations and theother above mentioned reasons, cannot compete with those characteristics offered bythe conductimetric technique which make the latter the superior choice forautomation.
The next step was to determine the reproducibility of the conductimetric TBNtechnique. The more difficult IP 276 method was chosen for the reproducibility studyas it requires lower conductance measurement and in the difficulty of interpretationof the end-point from the complex titration curve. The reproducibility study involvedsix (academic, commercial, government and railway) laboratories familiar with thestandard TBN measurements all of which were given the same oil samples and a copyof the conductimetric TBN test method. Eleven oil samples, covering a wide rangeof different oils and TBN range, were supplied to each of the laboratories involved inthe correlation study. Many of these laboratories chose to test their own standardTBN samples by the new TBN method aswell. In most cases, it was the first time thatthe conductimetric TBN method had been used.
-72 -
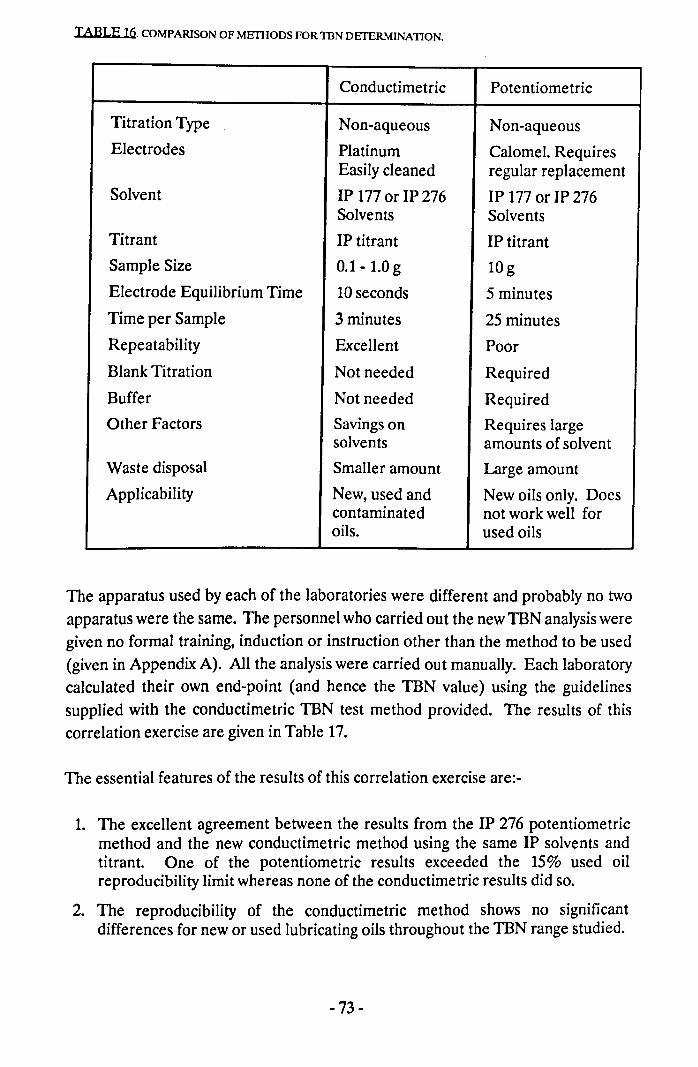
TABLE 16. COMPARISON OF MEIlIODS FOR TBN DETERMINATION.
Conductimetric Potentiometric
Titration Type Non-aqueous Non-aqueousElectrodes Platinum Calomel. Requires
Easily cleaned regular replacementSolvent IP 177 or IP 276 IP 177 or IP 276
Solvents SolventsTitrant IP titrant IP titrantSample Size O.l-l.Og 109Electrode Equilibrium Time 10 seconds 5 minutesTime per Sample 3 minutes 25 minutesRepeatability Excellent PoorBlank Titration Not needed RequiredBuffer Not needed RequiredOther Factors Savings on Requires large
solvents amounts of solventWaste disposal Smaller amount Large amountApplicability New, used and New oils only. Does
contaminated not work well foroils. used oils
The apparatus used by each of the laboratories were different and probably no twoapparatus were the same. The personnel who carried out the new TBN analysis weregiven no formal training, induction or instruction other than the method to be used(given in Appendix A). All the analysis were carried out manually. Each laboratorycalculated their own end-point (and hence the TBN value) using the guidelinessupplied with the conductimetric TBN test method provided. The results of thiscorrelation exercise are given in Table 17.
The essential features of the results of this correlation exercise are:-
1. The excellent agreement between the results from the IP 276 potentiometricmethod and the new conductimetric method using the same IP solvents andtitrant. One of the potentiometric results exceeded the 15% used oilreproducibility limit whereas none of the conductimetric results did so.
2. The reproducibility of the conductimetric method shows no significantdifferences for new or used lubricating oils throughout the TBN range studied.
-73 -
3. AIl the results for the conductimetric method were obtained using the forwardtitration only, whereas some of the potentiometric results had to be obtainedusing the back-titration.
A limited number of results were obtained for the reproducibility of theconductimetric JP 177TBN test method. These results are summarised in Table 18.The essential features of the results of this exercise are similar to that of the JP 276reproducibility investigation. The point of particular interest is that two of the oilsshowed no inflection (N.l) when tested by the standard potentiometric method,whereas the three participating laboratories each successfully obtained satisfactoryresults for the same oil.
Following the successful manual conductimetric TBN reproducibility exercise anautomated system was developed and assembled in order to miniaturise the systemand to make the task of a repeatability exercise less daunting. The automation wascarried out in stages and the study was carried out with a semi-automated, computercontrolled system.
The semi-automation of the conductimetric TBN (JP 177 or JP 276) determinationconsisted of an automatic ranging, self-balancing conductance bridge. The analogueoutput from this conductance bridge was read by a Commodore 64 Microcomputerwhich reads the conductivity data via a Digital Voltmeter (NO converter). A pistonburette, driven by a stepper motor, is controlled by the Commodore 64Microcomputer which can add discrete amounts of titrant with microlitres precision.A mass of oil (0.5 - 1.0g) is placed in a tall reaction flask to which (30 cm3) of solventmixture is added. The computer adds the titrant from the digital burette into areaction flask containing a known mass of oil and the TBN solvent mixture. Theoil-solvent-titrant mixture is stirred using a magnetic stirrer with a Teflon-coatedfollower. A computer programme(Appendix B) waswritten to ask for the mass of oil,titrant concentration and aliquot size before it measures the initial conductancereading of the oil-solvent mixture, then adding the first quantity of titrant and allowingthe mixture to equilibrate for 30 seconds before measuring the conductance again.The titrant addition and conductance measurement was repeated fifteen to thirtytimes depending on the mass of oil used, the titrant aliquot size and the TBN of theoil. The schematic flow chart of the semi-automated conductimetric TBN analysisprocess is shown in Figure 15.
-74 -
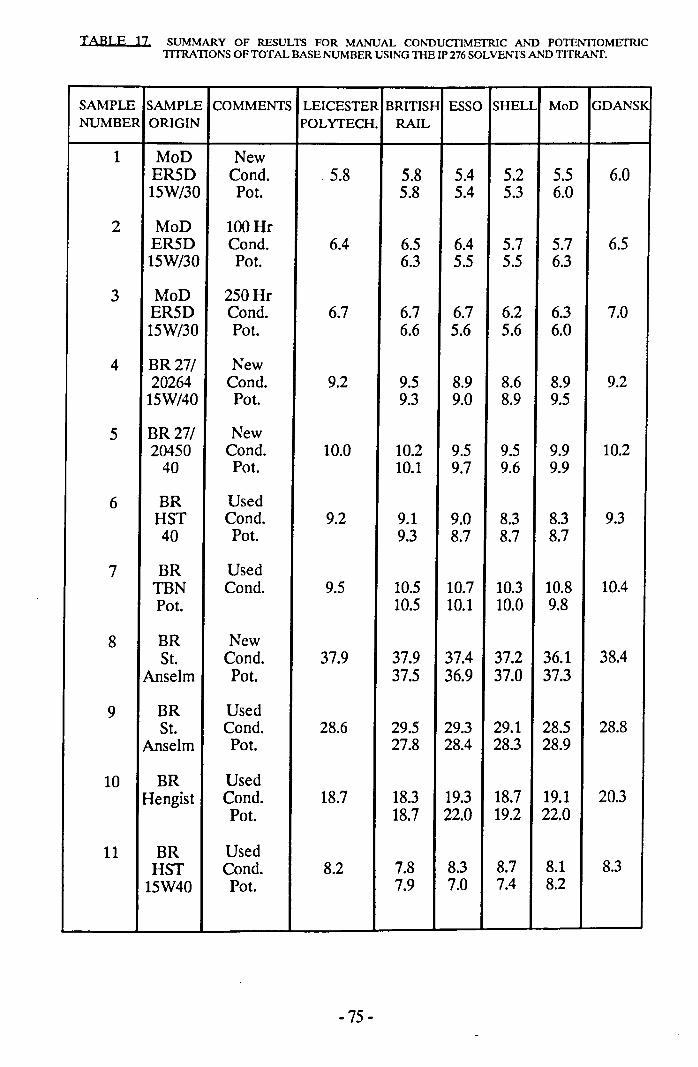
TABLE 17 SUMMARY OF RESULTS FOR MANUAL CONDUCllMEfRIC AND POTENTIOMETRICTITRA nONS OF TOTAL BASE NUMBER USING THE IP 276 SOLVENTS AND TITRANT.
SAMPLE SAMPLE COMMENTS LEICESTER BRITISH ESSO SHELL MoD GDANSKNUMBER ORIGIN POLYTECH. RAIL
1 MoD NewER5D Condo 5.8 5.8 5.4 5.2 5.5 6.0l5W/30 Pot. 5.8 5.4 5.3 6.0
2 MoD 100HrER5D Condo 6.4 6.5 6.4 5.7 5.7 6.5l5W/30 Pot. 6.3 5.5 5.5 6.3
3 MoD 250HrER5D Condo 6.7 6.7 6.7 6.2 6.3 7.0l5W/30 Pot. 6.6 5.6 5.6 6.0
4 BR27/ New20264 Condo 9.2 9.5 8.9 8.6 8.9 9.2l5W/40 Pot. 9.3 9.0 8.9 9.5
5 BR27/ New20450 Condo 10.0 10.2 9.5 9.5 9.9 10.2
40 Pot. 10.1 9.7 9.6 9.96 BR Used
HST Condo 9.2 9.1 9.0 8.3 8.3 9.340 Pot. 9.3 8.7 8.7 8.7
7 BR UsedTBN Condo 9.5 10.5 10.7 10.3 10.8 10.4Pot. 10.5 10.1 10.0 9.8
8 BR NewSt. Condo 37.9 37.9 37.4 37.2 36.1 38.4
Anselm Pot. 37.5 36.9 37.0 37.39 BR Used
St. Condo 28.6 29.5 29.3 29.1 28.5 28.8Anselm Pot. 27.8 28.4 28.3 28.9
10 BR UsedHengist Condo 18.7 18.3 19.3 18.7 19.1 20.3
Pot. 18.7 22.0 19.2 22.0
11 BR UsedHST Condo 8.2 7.8 8.3 8.7 8.1 8.3
15W40 Pot. 7.9 7.0 7.4 8.2
-75 -
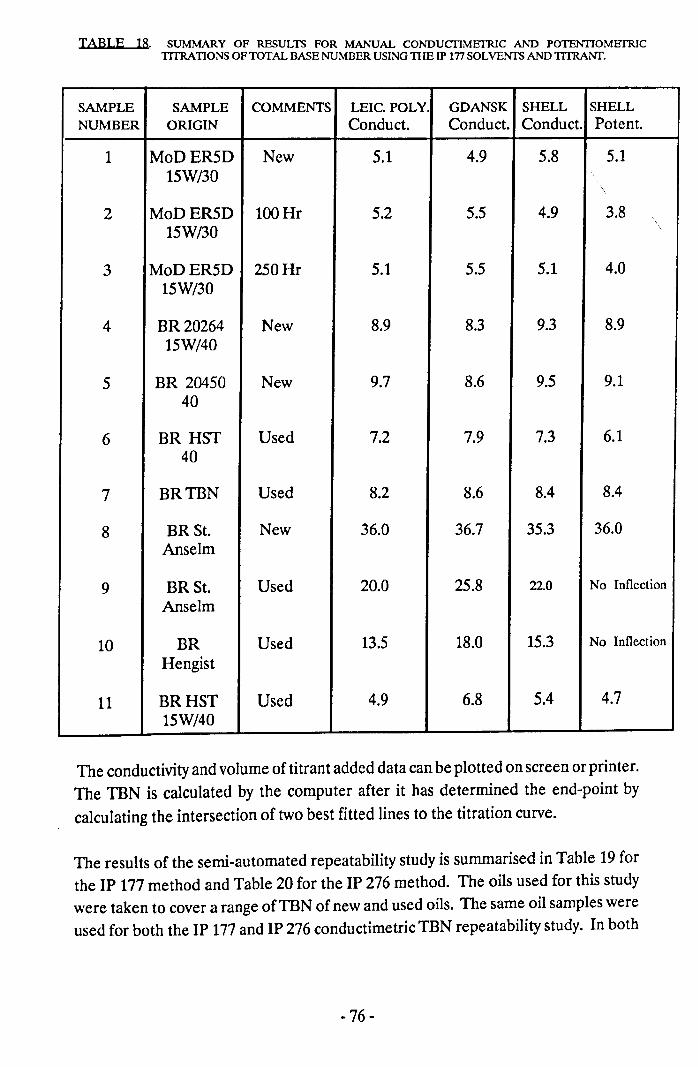
TABLE 18. SUMMARY OF RESULTS FOR MANUAL CONDUCI1METRIC AND POTENTIOMETRICTlTRATIONS OF TOTAL BASE NUMBER USING1H.E IP In SOLVENTS AND 1ITRANT.
SAMPLE SAMPLE COMMENTS LEIC. POLY. GDANSK SHELL SHELLNUMBER ORIGIN Conduct. Conduct. Conduct. Potent.
1 MoDER5D New 5.1 4.9 5.8 5.115W/30
\
2 MoDER5D 100Hr 5.2 5.5 4.9 3.8 ,\
15W/30 \
3 MoDER5D 250Hr 5.1 5.5 5.1 4.015W/30
4 BR20264 New 8.9 8.3 9.3 8.915W/40
5 BR 20450 New 9.7 8.6 9.5 9.140
6 BR HST Used 7.2 7.9 7.3 6.140
7 BRTBN Used 8.2 8.6 8.4 8.4
8 BR St. New 36.0 36.7 35.3 36.0Anselm
9 BRSt. Used 20.0 25.8 22.0 No Inflection
Anselm
10 BR Used 13.5 18.0 15.3 No Inflection
Hengist
11 BRHST Used 4.9 6.8 5.4 4.715W/40
The conductivity and volume of titrant added data can be plotted on screen or printer.The TBN is calculated by the computer after it has determined the end-point bycalculating the intersection of two best fitted lines to the titration curve.
The results of the semi-automated repeatability study is summarised in Table 19 forthe IP 177 method and Table 20 for the IP 276 method. The oils used for this studywere taken to cover a range ofTBN of new and used oils. The same oil samples wereused for both the IP 177and IP 276 conductimetric TBN repeatability study. In both
-76 -
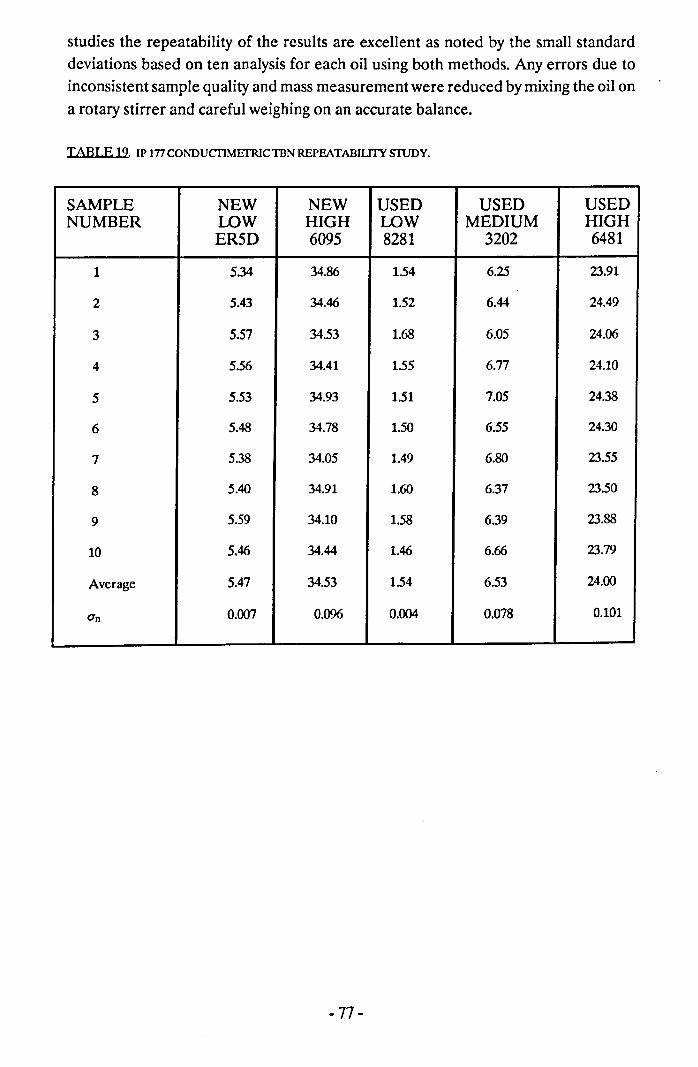
studies the repeatability of the results are excellent as noted by the small standarddeviations based on ten analysis for each oil using both methods. Any errors due toinconsistent sample quality and mass measurement were reduced bymixing the oil ona rotary stirrer and careful weighing on an accurate balance.
TABLE 19 IP InCONDUCIlMEfRlCTBN REPEATABILITY SIUDY.
SAMPLE NEW NEW USED USED USEDNUMBER WW HIGH LOW MEDIUM HIGH
ER5D 6095 8281 3202 6481
1 5.34 34.86 1.54 6.25 23.91
2 5.43 34.46 1.52 6.44 24.49
3 5.57 34.53 1.68 6.05 24.06
4 5.56 34.41 1.55 6.77 24.10
5 5.53 34.93 1.51 7.05 24.38
6 5.48 34.78 1.50 6.55 24.30
7 5.38 34.05 1.49 6.80 23.55
8 5.40 34.91 1.60 6.37 23.50
9 5.59 34.10 1.58 6.39 23.88
10 5.46 34.44 1.46 6.66 23.79
Average 5.47 34.53 1.54 6.53 24.00
O'n 0.007 0.096 0.004 0.078 0.101
-77 -
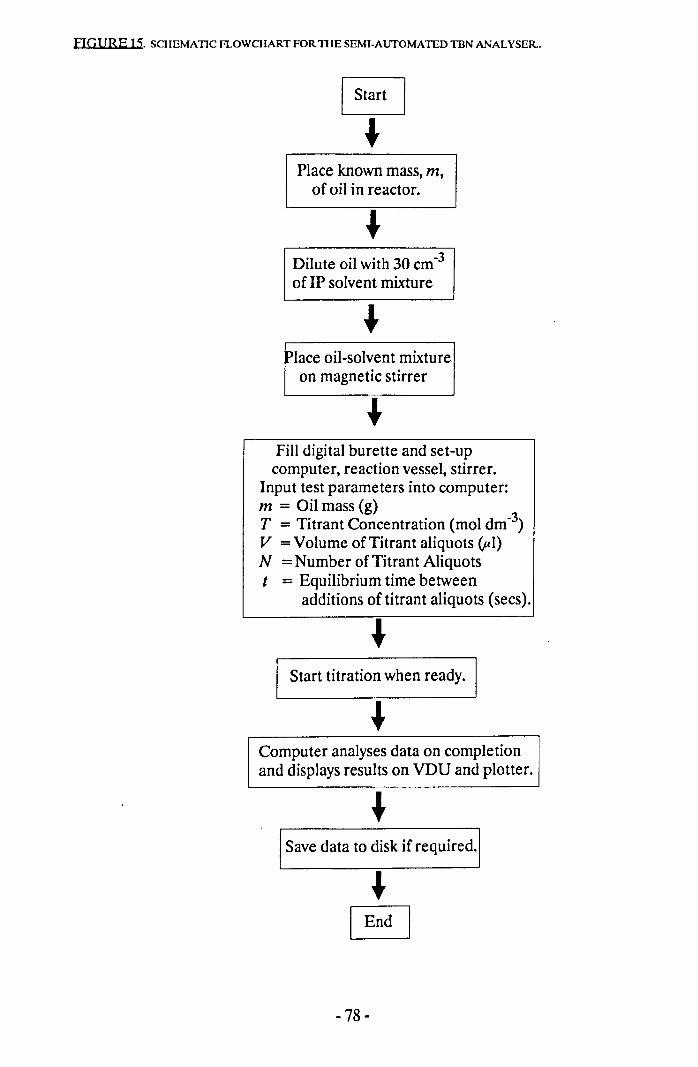
FIGURE 15. SCHEMATIC FLOWCHART FOR TIlE SEMI-AUTOMATED TBN ANALYSER..
Place known mass, m,of oil in reactor.
Dilute oil with 30 cm-3of IP solvent mixture
Place oil-solvent mixtureon magnetic stirrer
Fill digital burette and set-upcomputer, reaction vessel, stirrer.
Input test parameters into computer:m = Oil mass (g)T = Titrant Concentration (mol dm-3)V =Volume of Titrant aliquots (ul)N =Number of Titrant Aliquotst = Equilibrium time between
additions of titrant aliquots (secs).
Start titration when ready.
Computer analyses data on completionand displays results on VDU and plotter.
Save data to disk if required.
-78 -
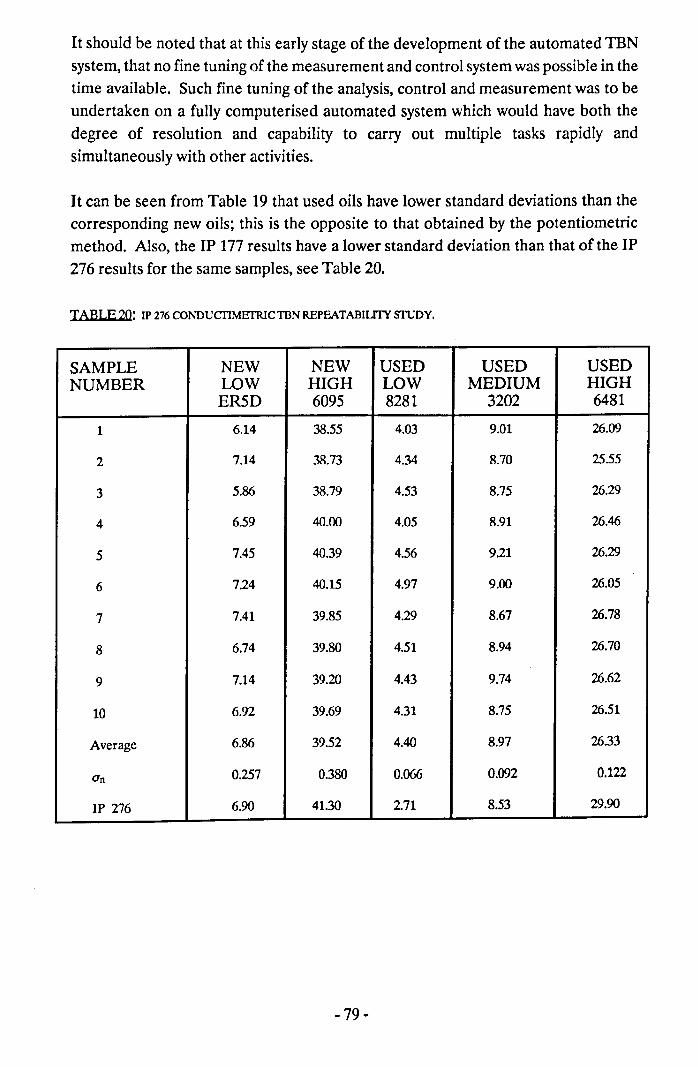
It should be noted that at this early stage of the development of the automated TBNsystem, that no fine tuning of the measurement and control system was possible in thetime available. Such fine tuning of the analysis, control and measurement was to beundertaken on a fully computerised automated system which would have both thedegree of resolution and capability to carry out multiple tasks rapidly andsimultaneously with other activities.
It can be seen from Table 19 that used oils have lower standard deviations than thecorresponding new oils; this is the opposite to that obtained by the potentiometricmethod. Also, the IP 177 results have a lower standard deviation than that of the JP276 results for the same samples, see Table 20.
TABLE 20: JP 276 CONDUCI1METRICTDN REPEATABJUIY SfUOY.
SAMPLE NEW NEW USED USED USEDNUMBER LOW HIGH LOW MEDIUM HIGH
ER5D 6095 8281 3202 6481
1 6.14 38.55 4.03 9.01 26.09
2 7.14 38.73 4.34 8.70 25.55
3 5.86 38.79 4.53 8.75 26.29
4 6.59 40.00 4.05 8.91 26.46
5 7.45 40.39 4.56 9.21 26.29
6 7.24 40.15 4.97 9.00 26.05
7 7.41 39.85 4.29 8.67 26.78
8 6.74 39.80 4.51 8.94 26.70
9 7.14 39.20 4.43 9.74 26.62
10 6.92 39.69 4.31 8.75 26.51
Average 6.86 39.52 4.40 8.97 26.33
Un 0.257 0.380 0.066 0.092 0.122
IP 276 6.90 41.30 2.71 8.53 29.90
-79 -
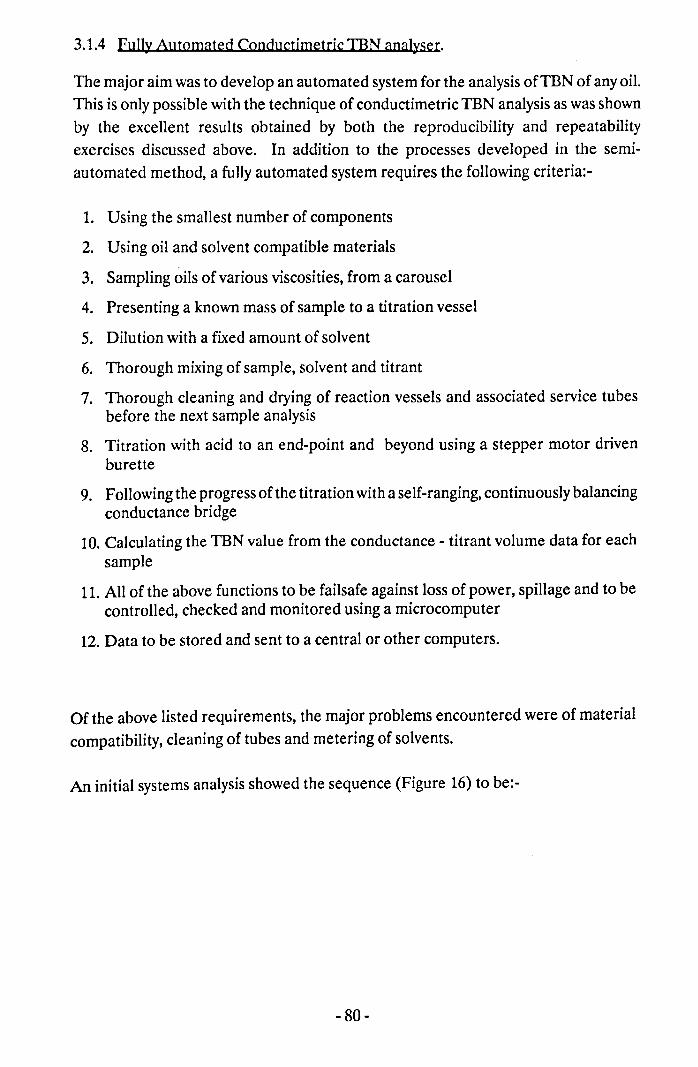
3.1.4 Fully Automated Conductimetric IBN analyser.
The major aim was to develop an automated system for the analysis ofTEN of any oil.This is only possible with the technique of conductimetric TEN analysis as was shownby the excellent results obtained by both the reproducibility and repeatabilityexercises discussed above. In addition to the processes developed in the semi-automated method, a fully automated system requires the following criteria:-
1. Using the smallest number of components
2. Using oil and solvent compatible materials
3. Sampling oils of various viscosities, from a carousel
4. Presenting a known mass of sample to a titration vessel
5. Dilution with a fixed amount of solvent
6. Thorough mixing of sample, solvent and titrant
7. Thorough cleaning and drying of reaction vessels and associated service tubesbefore the next sample analysis
8. Titration with acid to an end-point and beyond using a stepper motor drivenburette
9. Following the progress of the titration with a self-ranging, continuously balancingconductance bridge
10. Calculating the TBN value from the conductance - titrant volume data for eachsample
11. All of the above functions to be failsafe against loss of power, spillage and to becontrolled, checked and monitored using a microcomputer
12. Data to be stored and sent to a central or other computers.
Of the above listed requirements, the major problems encountered were of materialcompatibility, cleaning of tubes and metering of solvents.
An initial systems analysis showed the sequence (Figure 16) to be:-
- 80-
FIGURE 16 SCHEMATIC LA your FOR TIIEAurOMATED CONDUCTIMETRlC DETERMINATION OFTBN.
~<,COMPUTER
-- ,II \- - ._--IP 177 or IP 276 IP 177 or IP 276AUTO-SAMPLER
SOLVENT TITRANT
t tr+r:
REAC r ION AUTOMATIC
~ CDNDUC lIVIT'fVESSEL BRIDGE
3.1.4.1 Material compatibility.
It was discovered that chlorobenzene attacked and caused swelling of most rubberswhereas the glacial acetic acid would attack those rubbers and plastics that wereresistant to chlorobenzene. This incompatibility meant that peristaltic meteringpumps could not be used for the IP 276 solvents. Teflon and glass were the onlymaterials to effectively withstand the IP 276 solvents and titrants.
3.1.4.2 Cleaning the system.
Having chosen teflon and glass, the cleaning problem was overcome by the use of aventuri system which created small, air bubbles at regular intervals, in a stream oftitrant solvent mixture. This combined action of air and solvent "pulses" in the smallbore teflon tubes, effectively and efficiently removed all traces of contamination. Thistube washing is akin to a type of solvent extraction involving many thousands ofindividual extractions.
3.1.4.3 Metering of solvents.
In order to ensure a rapid and accurate metering of solvents, a regulated dry, air supplywas found to offer the best and cheapest answer, and offering the added bonus of'blow-drying' the tubes and titration vessel when required.
- 81-
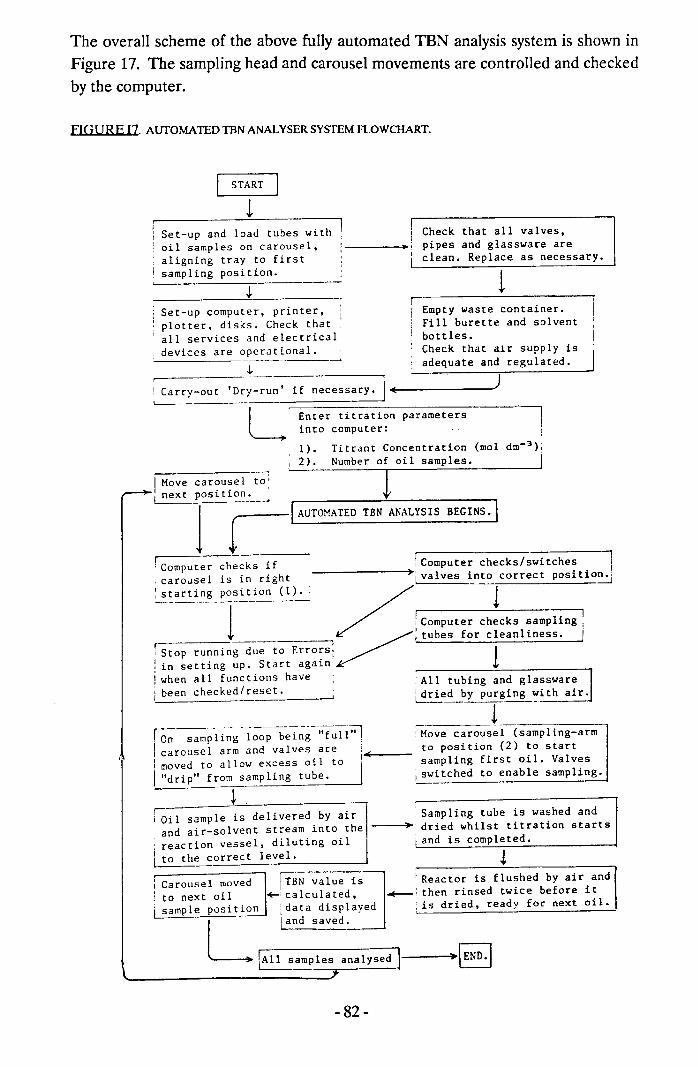
The overall scheme of the above fully automated TBN analysis system is shown inFigure 17. The sampling head and carousel movements are controlled and checkedby the computer.
FIGURE I7. AUfOMA TED TBN ANALYSER SYSTEM FLOWCHART.
START
Set~up and load tubes withoil samples on carousel,aligning tray to firstsampling position.
Check that all valves,pipes and glassware areclean. Replace as necessary.
Set-up computer, printer,plotter, disks. Check thatall services and electricaldevices are operational.
: Carry-out 'Dry-run' if necessary •.~====~--------~L Enter titration parametersinto computer:1) •
I 2).Titrant Concentration (mol dm-3)iNumber of oil samples. I
rI Move carousel to:r-""" ~ posi t~.:'_~._~1 ~IAuToMArED
f~:-c-o-m-p-u~t~e-r-c--hecksif 'Computer checks/switches I
carousel is in right --------------~ivalves into correct positiO~:starting position (1). / 1---- ··-----1------ ! Computer checks sampling I
________ --,~; tubes for cleanliness. Ir Stop running due to Errors: 1i in setting up. Start again'1 wh enail fun ctions ha ve ' :All tU-b-l-'n-g-'a~n-d--g-l-a-s-s-w-a-r-e---'i been checked/reset. ~ i dried by purging with air.
~.---=----! ..--_. ---,,On-s-a-m-;ii~g -l;;-;;;-bei~g--'-'f-u--ll~ 'Move carousel (sampl ing-armI carousel arm and valves are: to position (2) to starti moved to allow excess oil to !~--- sampling first oil. ValvesI "drip" from sampling tube. ;switched to enable sampling.
TBN ANALYSIS BEGINS. I
Sampling tube is washed anddried whilst titration startsland is completed •
!
ri Oil sample is delivered by airand air-solvent stream into the
. reaction vessel, diluting oilI to the correct level.
Carousel moved ITBN value isto next oil ~: calculated,sample position i'data displayed
Land saved.
[All samples analysed II----\END.''---------------------/~
;Reactor is flushed by air and_, then rinsed twice before it
,is dried, ready for next oil.
- 82-
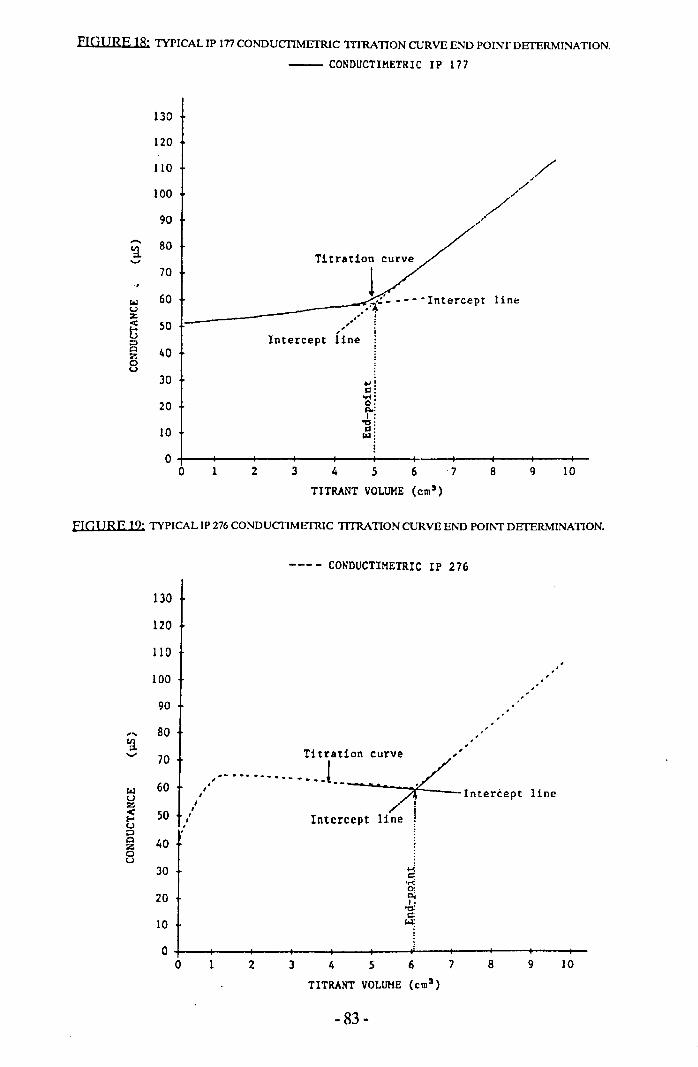
FIGURE 18' lYPICAL IP In CONDUCI1METRIC 1ITRATION CURVE END POINT DETERMINATION.
----- CONDUCTIMETRIC IP 177
1:30120
110
100
90.-.. 80ca.....
70.,
loW 60u:z:« 50t;~c:l 40z0u
:30
20
10
00 1 2
Titration curve
1 ,__ --,.1/ - .--.Intercept-------------- .' ,/' i
Intercept line
lint!
3 4 65 7 8 9 10TITRANT VOLUME (cm')
FIGl IRE 19: lYPICAL IP 276 CONDUCI1METRIC 1ITRATION CURVE END POINT DETERMINATION.
130
120
110
100
90
.... 80ca..... 70
I&l 60u~ 50f-<U ,::I .Q 40:z:0u
)0
20
10
00
--- - CONDUCTIMETRIC IP 276
.'"
.:
"
Tit,.tio. cu,v. ~" •__..... _... I, --..i
," ._- •. /i-InterceptI I
,.. Intercept line Iline
2
..;,c:::.""0:C>jI,'0:c;
Ilo.l:
3 4 5 6 7 8 9 10
TITRANT VOLUME (cm')
- 83-
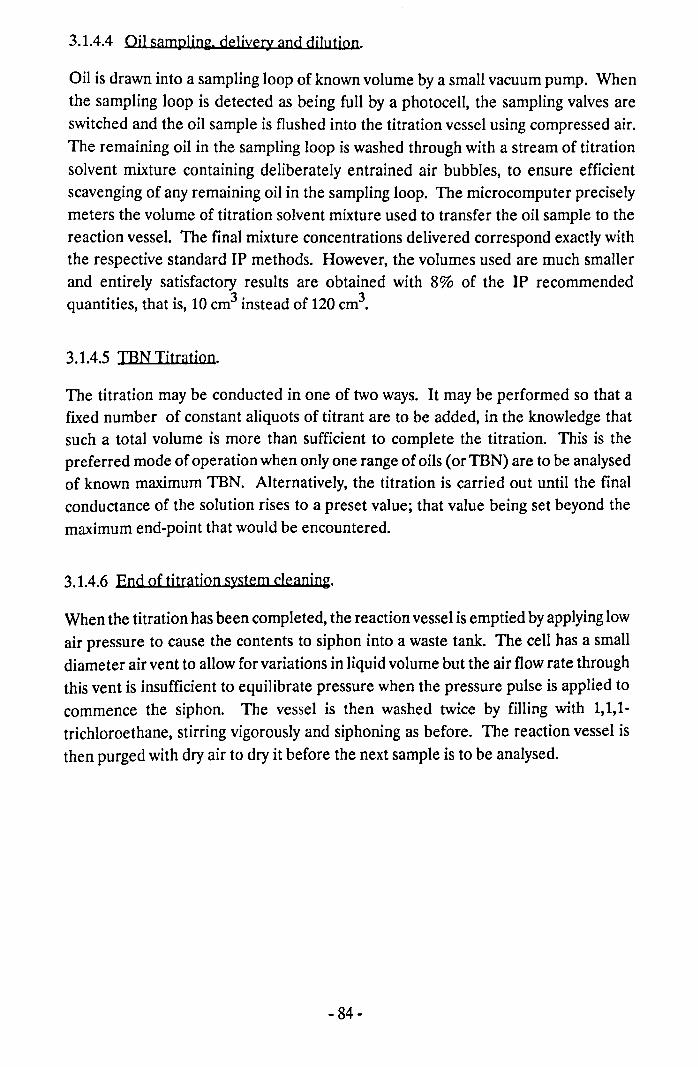
3.1.4.4 Oil sampling. delivery and dilution.
Oil is drawn into a sampling loop of known volume by a small vacuum pump. Whenthe sampling loop is detected as being full by a photocell, the sampling valves areswitched and the oil sample is flushed into the titration vessel using compressed air.The remaining oil in the sampling loop is washed through with a stream of titrationsolvent mixture containing deliberately entrained air bubbles, to ensure efficientscavenging of any remaining oil in the sampling loop. The microcomputer preciselymeters the volume of titration solvent mixture used to transfer the oil sample to thereaction vessel. The final mixture concentrations delivered correspond exactly withthe respective standard IP methods. However, the volumes used are much smallerand entirely satisfactory results are obtained with 8% of the IP recommendedquantities, that is, 10 cm3 instead of 120 cm3.
3.1.4.5 IBN Tjtratjon.
The titration may be conducted in one of two ways. It may be performed so that afixed number of constant aliquots of titrant are to be added, in the knowledge thatsuch a total volume is more than sufficient to complete the titration. This is thepreferred mode of operation when only one range of oils (or TBN) are to be analysedof known maximum TBN. Alternatively, the titration is carried out until the finalconductance of the solution rises to a preset value; that value being set beyond themaximum end-point that would be encountered.
3.1.4.6 End of titratjon system cleaning.
When the titration has been completed, the reaction vessel is emptied by applying lowair pressure to cause the contents to siphon into a waste tank. The cell has a smalldiameter air vent to allow for variations in liquid volume but the air flow rate throughthis vent is insufficient to equilibrate pressure when the pressure pulse is applied tocommence the siphon. The vessel is then washed twice by filling with 1,1,1-trichloroethane, stirring vigorously and siphoning as before. The reaction vessel isthen purged with dry air to dry it before the next sample is to be analysed.
- 84-
3.1.4.7 IBN determinatjon
The conductance/titrant volume for the fixed volume of oil (if the density is known,then a known oil mass) is first analysed to roughly locate the end-point by a simpledifference method. This is essentially looking for large positive difference betweenconsecutive readings following a series of small (negative, zero or positive)differences. Having obtained an initial rough estimate of the end-point position,sevenpoints either side of the selected point are best-fitted to either a straight line (JP 177)or a quadratic equation (JP 276) and their intersection is taken as the final end-point,see Figures 18 and 19, respectively.
The cycle time between oil IBN analysis is of the order of four minutes for the JP 276conductimetric IBN, enabling a total throughput of approximately fifteen samplesper hour. The cycle time between the oil analysis for the JP 177 conductimetric IBNis of the order of twelve samples per hour due to its longer equilibration times. Thecomplete listing of the computer programme for the fully automated conductimetricIBN method is given in Appendix C.
The fully automated instrument layout is shown in Figure 20. The instrument wasassessed for repeatability using both the JP 177 and JP276 solvent systems for the sameeleven oil samples used in the reproducibility exercise and an additional oil as a qualitycheck. The results from these tests are summarised in Table 21 and are given in detailin Table 22 for the JP 177 system and Table 23 for the JP 276 system. The essentialfeatures of these results are:-
1. The excellent repeatability, with a standard deviation of about 5% on both newand used oils, which is within the Institute of Petroleum quoted figures onprecision (Table 14). It should be noted that only the forward titration isemployed in the conductimetric method, whereas, most of these used oils wouldrequire a back titration.
2. The results show no significant differences in precision for new or usedlubricating oils throughout the TBN range of oils and oil types studied.
3. The conductimetric IBN method has been shown to be superior in versatility,application, performance and cost over the standard JP methods.
- 85-
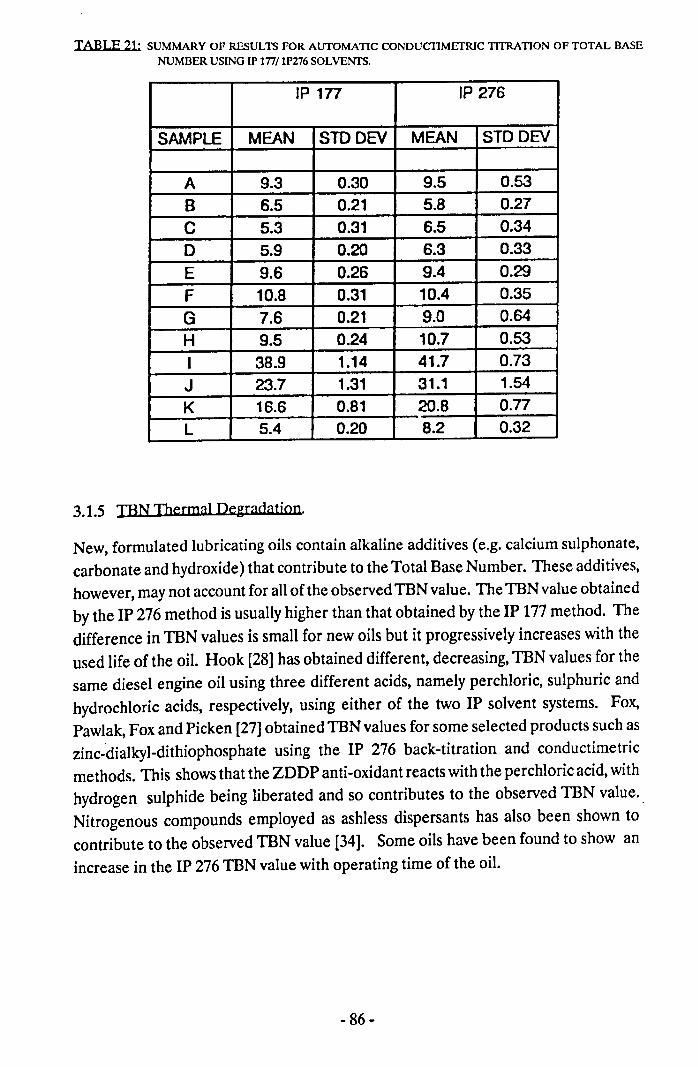
TABLE 21' SUMMARY OF RESULTS FOR AtJrOMATIC CONDUCTIMETRIC 1ITRATION OF TOTAL BASENUMBER USING IP 177/1P276 SOLVENTS,
JP 177 IP 276
SAMPLE MEAN STDDEV MEAN STD DEV
A 9.3 0.30 9.5 0.53B 6.5 0.21 5.B 0.27C 5.3 0.31 6.5 0.340 5.9 0.20 6.3 0.33E 9.6 0.26 9.4 0.29F 10.8 0.31 10.4 0.35G 7.6 0.21 9.0 0.64H 9.5 0.24 10.7 0.53I 38.9 1.14 41.7 0.73J 23.7 1.31 31.1 1.54K 16.6 0.81 20.8 0.77L 5.4 0.20 8.2 0.32
3.1.5 IBN Thermal Degradatjon.
New, formulated lubricating oils contain alkaline additives (e.g. calcium sulphonate,carbonate and hydroxide) that contribute to the Total Base Number. These additives,however, may not account for all of the observed TBN value. The TBN value obtainedby the IP 276 method is usually higher than that obtained by the IP 177method. Thedifference in TBN values is small for new oils but it progressively increases with theused life of the oil. Hook [28] has obtained different, decreasing, TBN values for thesame diesel engine oil using three different acids, namely perchloric, sulphuric andhydrochloric acids, respectively, using either of the two IP solvent systems. Fox,Pawlak, Fox and Picken [27]obtained TBN values for some selected products such aszinc-'dialkyl-dithiophosphate using the IP 276 back-titration and conductimetricmethods. This shows that the ZnDP anti-oxidant reacts with the perchloric acid, withhydrogen sulphide being liberated and so contributes to the observed TBN value ..Nitrogenous compounds employed as ashless dispersants has also been shown tocontribute to the observed TBN value [34]. Some oils have been found to show anincrease in the IP 276 TBN value with operating time of the oil.
- 86-
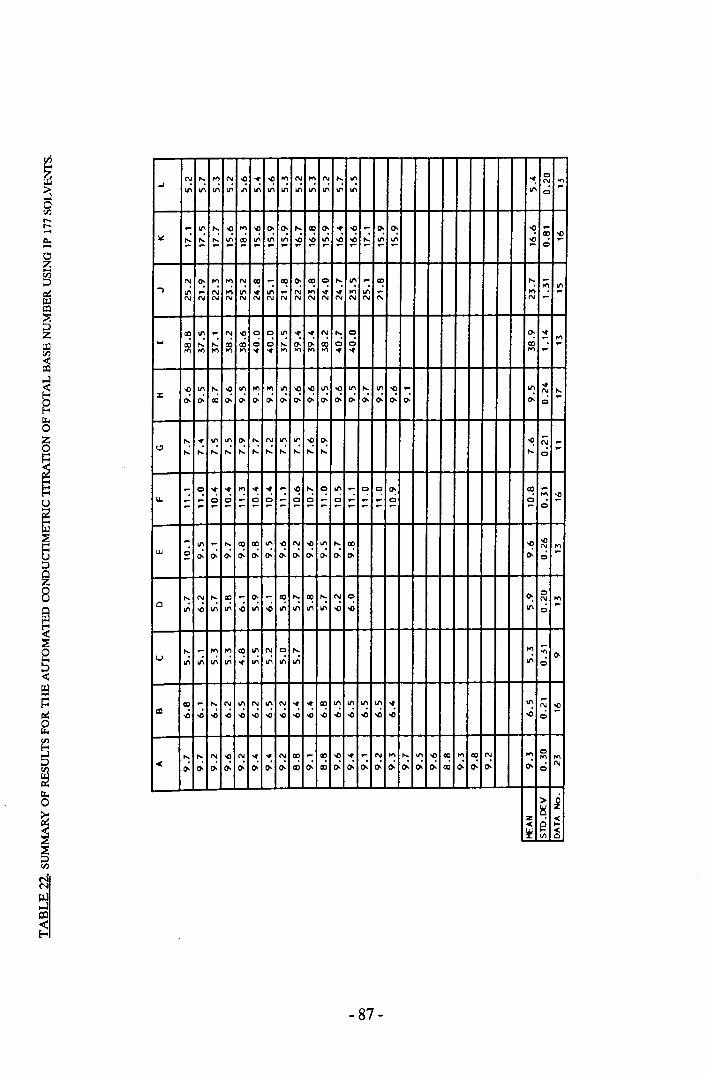
~ ": '" ~ ~ "': ~ '" ~ '" ~ ": ": "': Cl
....I
'" '"~ '"II' II' II' II' II' II' II' II' II' II' II' II' -Cl
- II' '" ~ '" ~ 0: 0: r-, ~ 0: • ~ - 0: 0: '<! -lot ,... '" '" II' ~ II' II' '" ~ ~ '" ~ ~ '" '" II' ~ ~ ~- - - - - - - - - - - Cl
N 0: '" '" N ~ - ~ 0: ~ Cl '" II' - ~ '" -...; '" '" 11'1..,11'1 - N '" 11'1 • II' - N '" • • - '" -N N N N N N N N N N N N N N N N -~ '" - N '<! Cl Cl 11'1 • • N ": Cl 0: •0 0 - '".. CO ,... ,... CO CO ,... 0- 0- ~ Cl Cl ex) -"" '" '" '" '" • • '" '" '" • • '" -~ '" ,... '<! 11'1 '" '" 11'1 '<! '<! 11'1 '<! II' ,... 11'1 '<! - II' •
% rJ.. rJ.. rJ.. rJ.. rJ..N ,...
0- CO 0- 0- 0- 0- 0- 0- 0- 0- 0- 0- 0- 0 -": "': II' '" 0- ": ~ ": '" '<! 0: '<! -
I.!l ,..: N -,... ,... ,... ,... ,... ,... ,... ,... ,... ,... ,... -Cl
- Cl "': • '" • • - '<! ,... Cl II' - Cl Cl 0: ~ -0 0 0 0 "" ~~ - - Cl - - Cl - Cl - - - Cl Cl- - - - - - - - - - - - - - - - - Cl
- 11'1 - ,... CO ex) II' ~ N '<! 11'1 ,... ex) ~ ~N '"UJ Cl 0- 0- 0- 0- 0- 0- 0- 0- 0- r:. 0- 0- 0- -- Cl
,... N ,... CO - 0: - ~ ,... ~ ,... N Cl 0: Cl
~ '"Q
'" -11'1 ~ II' II' -0 '" ~ '" 11'1 II' ~ ~ II' Cl
,... - "" '" CO II' N Cl ": '" -U
'" '" -i '" '" on "! 0-11'1 II' '" II' Cl
~ - ,... N '" N II' N "': • CO 11'1 II' 11'1 II' "': II' -al .0 .0 .0 .0 ~ ~~ ~ ~ oD oD oD oD oD oD oD oD oD ~ Cl
,... ,... N ~ N • • N CO - CO oD • - N "" ... 11'1 ~ ~ '" ~ N ""Cl
"" '"< rJ. r:. N0- (). 0- 0- 0- (). 0- (). CO (). CO (). 0- (). 0- 0- 0- 0- ex) 0- 0- 0- Cl
> ~~Z << Q ~~ ~ <
VI 0
- 87-
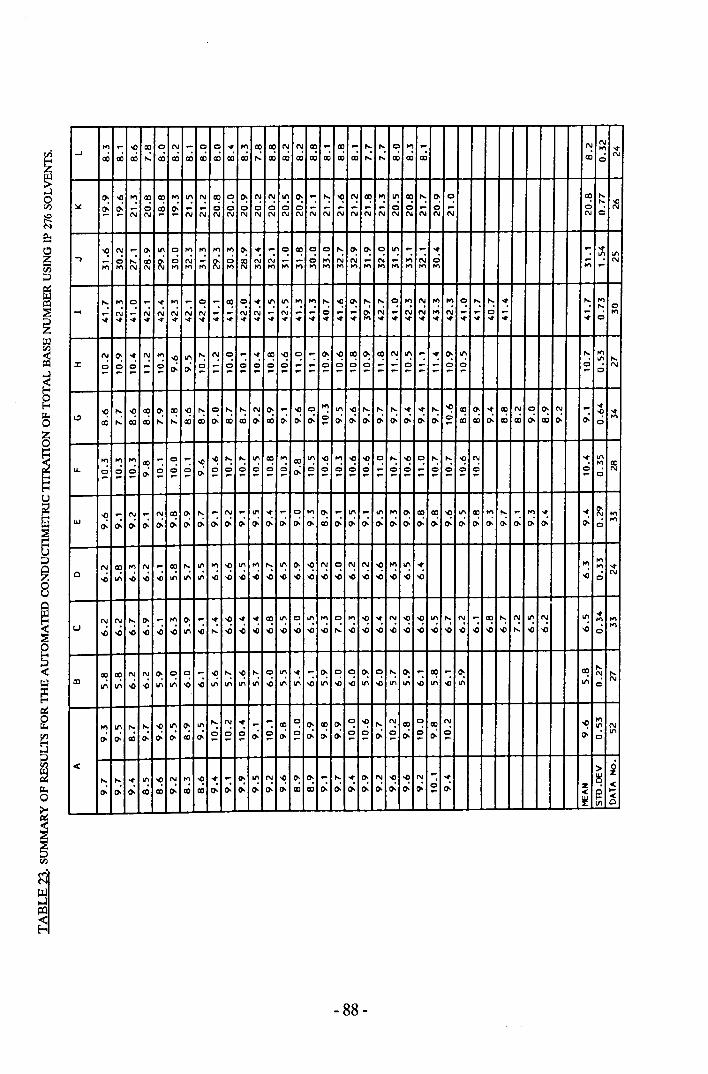
,." - "! <Xl 0 N - 0 0 ~ ,." «! «! N N <Xl - <Xl - ,._ ,._ 0 ,." - N N
oJ<Xi <Xi
,." ~<Xl <Xl eo ,._ <Xl <Xl <Xl <Xl <Xl ,._ <Xl <Xl <Xl <Xl CXl CXl CXl ,._ ,._ CXl CXl CXl <Xl 0 N
~ -o ,." «! «! ,." 11\ N «! 0 ~ N N 11\ ~ - ,._ "! N «! Pt) 11\ «! ,._ ~ 0 <Xl ,._0
,._ -e:..: ~ ~ - 0 ~ ~ - - 0 0 0 0 0 0 0 - - - - - - 0 - 0 - 0 NN N N N N N N N N N N N N N N N N N N N N N N 0
"! N - ~ 11\ 0 ,." ,." ,." ,." ~ ~ - 0 «! 0 0 ,._ ~ ~ 0 11\ - - ~ - ~0 0 N 0 N ,.; N 0 11\ 11\.., - 0 ,._ CXl ~ N - ~ ee N - - ,." N - N - - N
,." ,." N N ,." ,." ,." ,." N ,." ,." ,." ,." ,." ,." ,." ,." ,." ,." ,." ,." ,." ,." ,." -,._ ,." 0 - ~ ,." - 0 - «! 0 ~ 11\ 11\ ,." ,." ,._ "! ~ ,._ ,._ 0 Pt) N Pt) Pt) 0 ,._ ,._ ~ ,._ ,."
N N ,.; 0,._ 0... - N - N N N N N - - N N - N - - 0 - - 0- N - N - - - - ,."
~ ~ ~ ~ ~ ~ ~ ~ ~ ~ ~ ~ ~ ~ ~ ~ ~ ~ ~ ,." ~ ~ ~ ~ ~ ~ ~ ~ ~ ~ ~ 0
N ~ ~ N ,." ~ 11\ "- N 0 - ~ «! "! 0 - ~ "! «! ~ «! N 11\ - ~ ~ III ,._ ,."
0 0 0 0 0 0 0 III ,._:z: 0 0 - 0 - 0 0 0 - - 0 0 0 0 - - - - 0 N- - - - - 0- 0- - - - - - - - - - - - - - - - - - - - - - 0
"! ,._ "! <Xl 0- «! "! "- 0 ,._ "- N ~ - "! 0 ~ 11\ "! ,._ ,._ ,._ ~ ~ ,._ "! «! ~ ~ <Xl N 0 ~ N - ~~ ~
<.:I ,..: 0- 0- 0- 0- 0 0- 0 <Xi 0- 0- 0- ,."
<Xl ,._ <Xl <Xl ,._ <Xl <Xl <Xl <Xl <Xl 0- - 0- 0- 0- 0- 0- 0- 0- - <Xl <Xl 0- <Xl <Xl 0
,." ,." ,." <Xl - 0 - -=? -=? ": "- 11\ «! ~ «! 11\ "! ,." ~ "! 0 ,._ ~ 0 ,._ ,._-=? N ~ 11\
0 0 0 0 0 0 0 ,." <Xl... 0 0 0 0- 0 0- 0 0 0 0 0 0 0- 0 0 0 0 - - 0 0 0 0 N- - - - - - - - - - - - - - - - - - - - - - - - - -~ - N - N <Xl ~ "- - N - 11\ ~ - 0 ,." ~ - 11\ - 11\ ,." ~ <Xl <Xl ~ III <Xl ,." "- - ,." ~ ~ ~ ,."
LU0- 0- 0- 0- 0- 0- 0- 0- 0- 0- 0- 0- 0- 0- 0- <Xl 0- 0- 0- 0- 0- 0- 0- 0- 0- 0- 0- 0- 0- 0- 0- 0- 0- 0 '"0-
,." N - «! "- III ~ -=? III '" ": III ~ "! N 0 N N ~ Pt) 11\ ~ ~ ,."
N <Xl '" ~0 ~ .0 N~ 11\ ~ ~ 11\ 11\ III ~ ~ ~ ~ ~ ~ ~ ~ ~ ~ ~ ~ ~ ~ ~ ~ 0
0- - ,." 0: - ~ ~ ~ ~ <Xl III 0 11\ ,." 0 ,." -=? ~ N ~ ~ 11\ ,._ N - <Xl "- N 11\ N 11\ ~N N ": '" ,."
u .0 ,."
~ ~ ~ ~ ~ ~ 11\ ~ ,._ ~ ~ ~ ~ ~ ~ ~ ,._ ~ ~ ~ ~ ~ ~ ~ ~ ~ ~ -0 ~ ,._ ~ -0 ~ 0
N 0- 0 0 - -=?,._ ~ ": 0 III ~ - ~ 0 0 ~ 0 ,._ ~ - «! - ~ IX) "-
«! «! N ~ ,._<Xl .,; .0 .,; .0 .,; N
11\ 11\ ~ ~ 11\ ~ 11\ 11\ 11\ -0 III 11\ -0 11\ ~ ~ 11\ ~ 11\ 11\ -0 11\ III 0
~ 11\ 0: III,._ N ~ - - «! 0 ~ <Xl 0: 0 "! ,._ N Cl) 0 Cl) N -0
,.",." 11\ "': ,._
0 0 0 III N
0- 0 0 0 0 0 0- 0 0 11\0- 0- <Xl 0- 0- CXl 0- - - - 0- - 0- - 0- 0- 0- - - 0- - - 0- - 0- 0
0( > ~N '" -=? ~ - 0- 11\ N ~ 0: ~ - "- ~ 0- N "! -0 N - ~ ~,._ ,._ ~ III -0 0
0- 0- 0- 0- 0- 0- Cl) Cl) 0- 0- 0- 0- 0- 0- 0- 0- 0- Z 0(
0- 0- 0- IX) Cl) 0- Cl) Cl) - 0( 0 to-
~ to- <III 0
- 88-
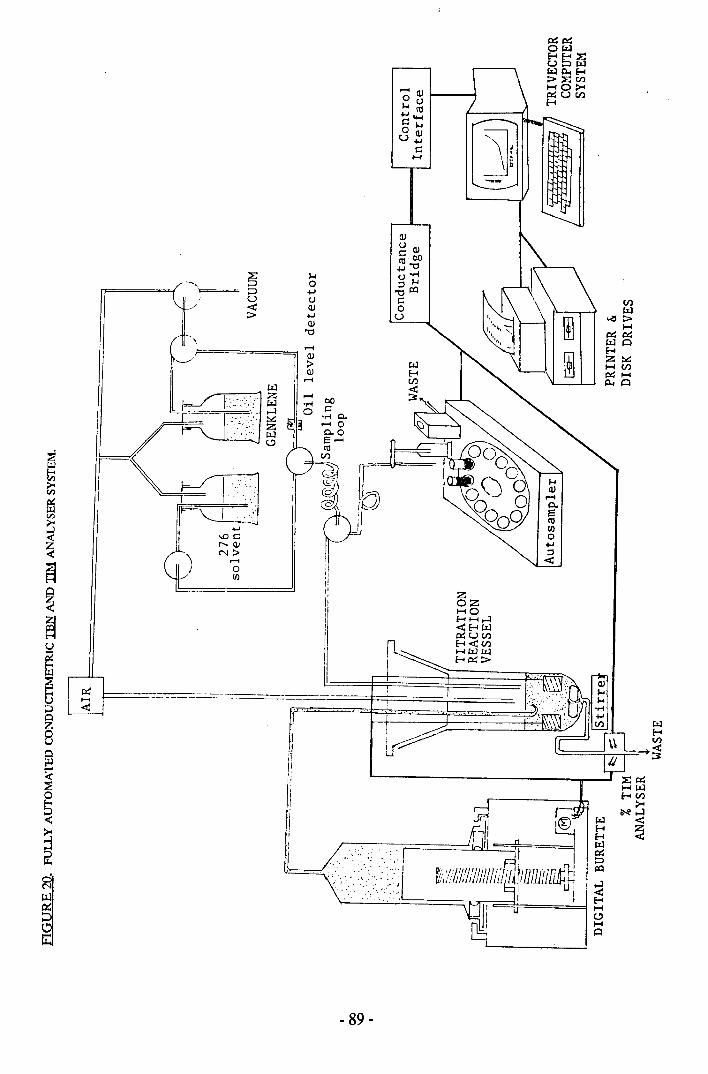
l(I1III!~;
- 89-
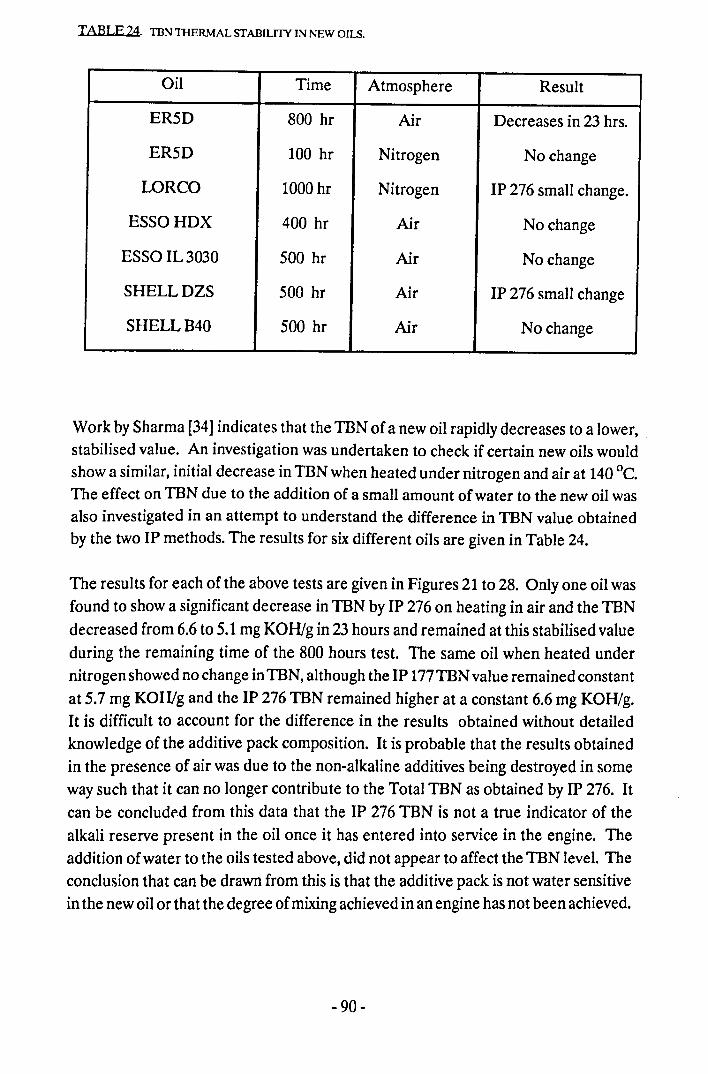
TABLE 24. TBN TIIERMAL STABILITY IN NEW OILS.
Oil Time Atmosphere Result
ER5D 800 hr Air Decreases in 23 hrs.
ER5D 100 hr Nitrogen No change
LORCO 1000 hr Nitrogen IP 276 small change.
ESSOHDX 400 hr Air No change
ESSOIL3030 500 hr Air No change
SHELLDZS 500 hr Air IP 276 small change
SHELLB40 500 hr Air No change
Work by Sharma [34] indicates that the TBN of a new oil rapidly decreases to a lower,stabilised value. An investigation was undertaken to check if certain new oils wouldshow a similar, initial decrease in TBN when heated under nitrogen and air at 140QC.The effect on TBN due to the addition of a small amount of water to the new oil wasalso investigated in an attempt to understand the difference in TBN value obtainedby the two IP methods. The results for six different oils are given in Table 24.
The results for each of the above tests are given in Figures 21 to 28. Only one oil wasfound to show a significant decrease in TBN by IP 276 on heating in air and the TBNdecreased from 6.6 to 5.1 mg KOH/g in 23 hours and remained at this stabilised valueduring the remaining time of the 800 hours test. The same oil when heated undernitrogen showed no change inTBN, although the IP 177TBN value remained constantat 5.7 rng KOHIg and the IP 276 TBN remained higher at a constant 6.6 rng KOHIg.It is difficult to account for the difference in the results obtained without detailedknowledge of the additive pack composition. It is probable that the results obtainedin the presence of air was due to the non-alkaline additives being destroyed in someway such that it can no longer contribute to the Total TBN as obtained by IP 276. Itcan be concluded from this data that the IP 276 TBN is not a true indicator of thealkali reserve present in the oil once it has entered into service in the engine. Theaddition of water to the oils tested above, did not appear to affect the TBN level. Theconclusion that can be drawn from this is that the additive pack is not water sensitivein the new oil or that the degree ofmixing achieved in an engine has not been achieved.
- 90-
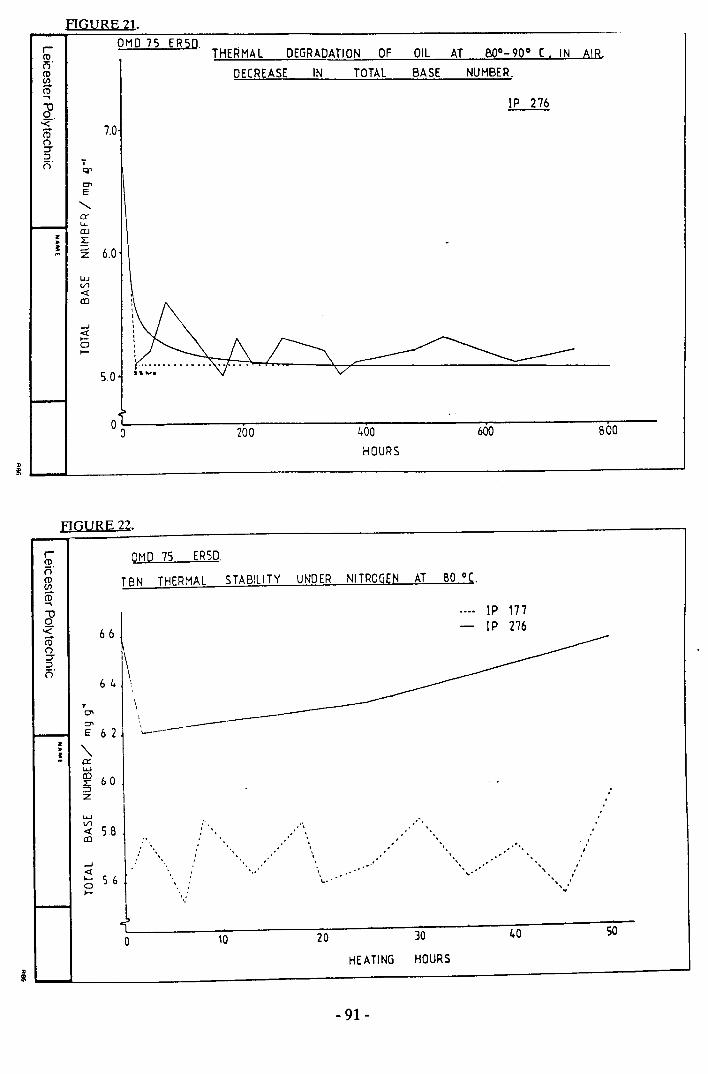
FIGURE 21.
»~L-__L_ ~
GMD 75 ERSO.THERMAL DEGRADATION OF OIL AT 80°-90° C ,IN AIR.
7.0
r1:;)'
c:7'E<,er.._CD~...- 6.0z
L.UVl<t:CD
_J
;:!0~
50
IP 276
DECREASE TOTAL BASE NUMBER.IN
BOO200 400HOURS
600
FIGURE 22.
i L--L ----------------~
r(I)er(I)(J)
CD....."'U0-< 66CDozr:>n'
6 4
TOl
OlE 6 2
z -,•! 0:w([) 60:r::;)zUJVl<I: 5 BCD
_J
<I:~ 5 (,0~
OMP 75 ER5P.
TeN THERMAL STABILITY UNDER NITROGEN AT eo ac.IP 177IP 276
\
'\_------ -----:
:.,,
-. ,,
.''.." ,..
"-,
20 30
HEATING HOURS
40 soo 10
- 91-
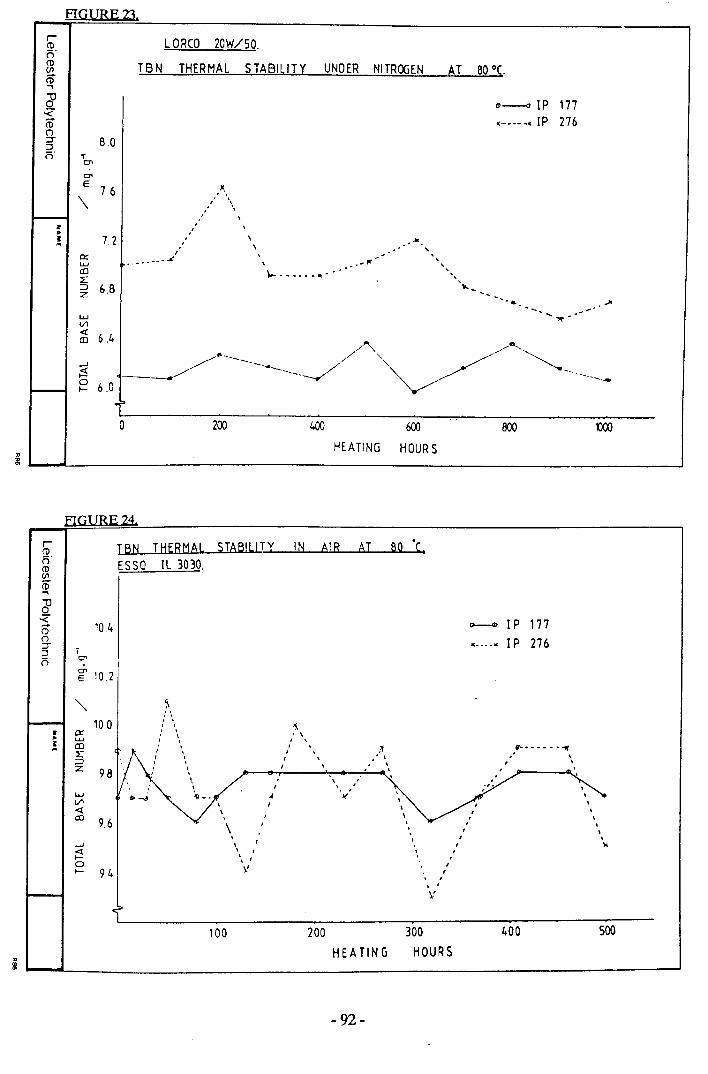
FIGURE23.
f--"..!
~ L ORca 20W/SO.er~ TB N THERMAL STABILITY UNDER NITRCKiENro..,d'.;zroC')
5" B.Oo· T
C1l
AT BO 0(.
0"
E 76\
..... """ .......
"--0 JP 177.--,--. IP 276
,, ,, ,7.2 ...I
•. " .",.Iter:UJcol:~ s.s
~""" .. ",'''',
UJV1
~ 6.4
_ ..o 200
~ ~ __L- ~
400 600
HEATING HOUR S
i ~~ ~
800
FIGURE 24.
r STABILITY IN AIR AT BO.C,CD TBN THERMAL
i')" ESSG IL 3030.CD(flro..,d'.;z
10 4 ~ JP 177(i)(') JC ____ IC JP 276"::J:J ;0 0"
~ 10.2
-, )
10.0 , .," a:: , ,.. UJ , ,! co ,
if fl'--·- - ' ....L
,.' \ .~ I . \
Z I .98 ,,, ,
w "'-.I 01 >(Vl I-etco 9.6 \ ... , .....J \ , )0-et . ,..... I. '0 v..... 94 . ,
I
I'~
100 200 300 400 SOOHEATING HOURS
- 92-
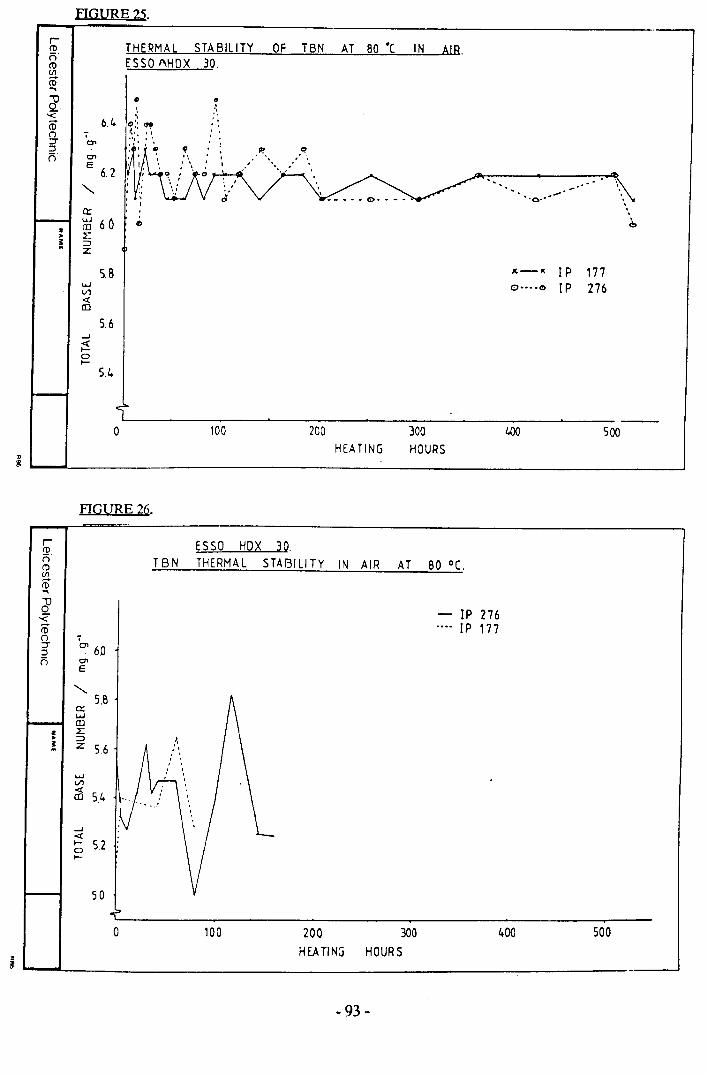
FIGURE 25.
0 100 200 300 400 500HEATING HOURS~
ill
FIGURE 26.
r ESSO HQl; 30.mR TBN THERMA L STABILITY IN AIR AT 80 °C,menro"'I
1]- IP 276-<ro .••• IP 177
() ,zr c> 60::lR c>
E
<,5.8
a:L.o.JCD
z L• :::>~ z: 56
......VI« 5.4CD
......«~ 5.20~
50
0 100 200 300 400 500HEA TING HOURS~
ill
- 93-
• o,:~
rCl)RCl)enro...1]-< 6.4ro() r:r c>::lR c>
E6.2
<,
a:::"-J 6.0z CD
• LI :::>~ z
S,B......VI«CD
5.6......~C>~
5.4
THERMAL STABILITY OF IBN AT 80·C IN AIR.ESSO AHDX 30.
.. -~.'0-' ,
,
". ,: .
=." ,
14-01 IP 177o····~ IP 276
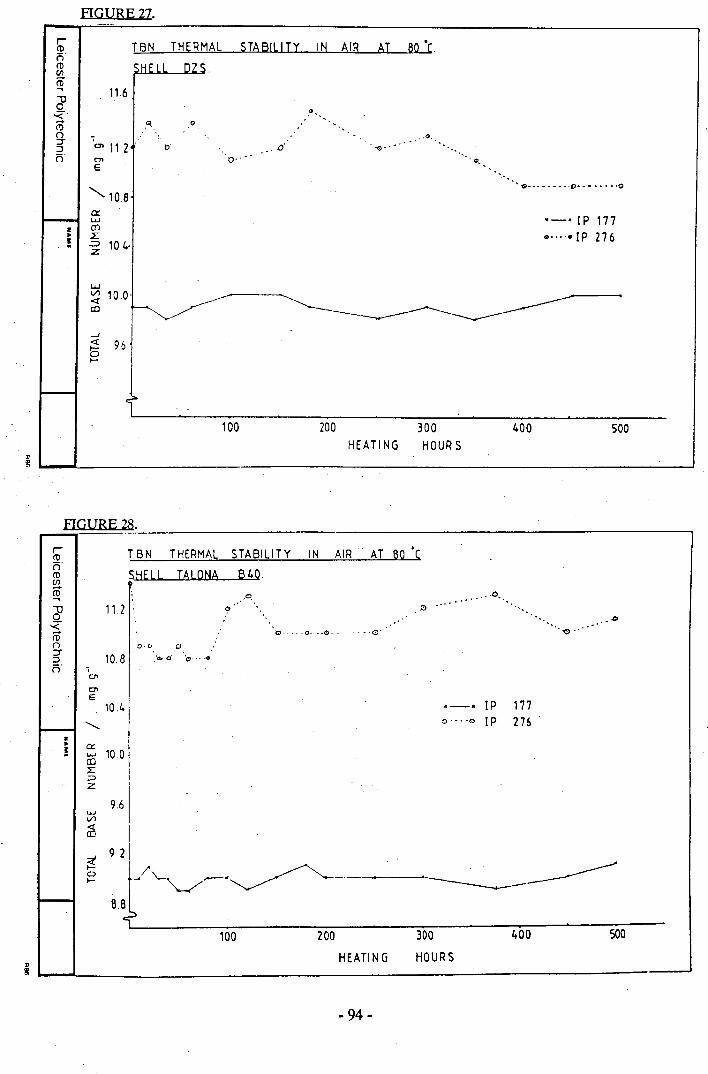
FIGURE 27.
AT 80 "c.
11.6
.a.. e...1).
'0> 11.2 . bO'
0> 0'"E
"Q' .
Q.
<, 1OB.~ " .,
a::I.LJroI:.~ 10.4·
·_·[P 177.. ·····[P276
z•.!
I.LJ
~ 10.0ro
100 200HEATING
300HOUR S
400 500
FIGURE 28.
"~ ~~----------------------------------------------------------.--~
STABILITY IN AIR AT 80 "CT BN THERMAL
...... 0<." .'
Q ..... 0· •.Q.- . Q',,,,,.,
10.B,C1'
0>E
10.4<,
a::I.o..J 10.0enL:;J
z
9.6I.LJVl
as
[P 1770····" [P 276'
9 2;! / ~ . . -----~ .... ~__..~ --.----~. ------
8.~L._ __ ___:_~-----:_:_:__--____:~--__;~--___;:=_-100 200 300 400 SOO
HOURSHEATING
- 94-
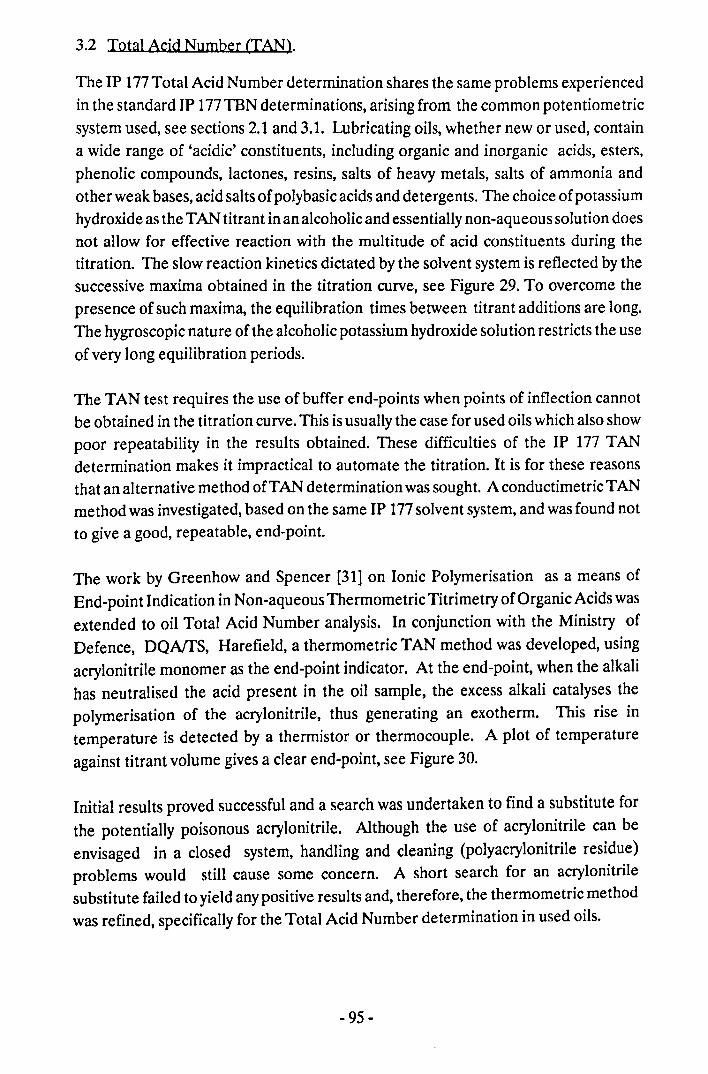
3.2 TQtal Acid Number (TAN).
The IP 177Total Acid Number determination shares the same problems experiencedin the standard IP 177IBN determinations, arising from the common potentiometricsystem used, see sections 2.1 and 3.1. Lubricating oils, whether new or used, containa wide range of 'acidic' constituents, induding organic and inorganic acids, esters,phenolic compounds, lactones, resins, salts of heavy metals, salts of ammonia andother weak bases, acid salts of polybasic acids and detergents. The choice of potassiumhydroxide as the TAN titrant in an alcoholic and essentially non-aqueous solution doesnot allow for effective reaction with the multitude of acid constituents during thetitration. The slow reaction kinetics dictated by the solvent system is reflected by thesuccessive maxima obtained in the titration curve, see Figure 29. To overcome thepresence of such maxima, the equilibration times between titrant additions are long.The hygroscopic nature of the alcoholic potassium hydroxide solution restricts the useof very long equilibration periods.
The TAN test requires the use of buffer end-points when points of inflection cannQtbe obtained in the titration curve. This is usually the case for used oils which also showpoor repeatability in the results obtained. These difficulties of the IP 177 TANdetermination makes it impractical to automate the titration, It is for these reasonsthat an alternative method QfTAN determination was sought. A conductimetric TANmethod was investigated, based on the same IP 177solvent system, and was found nQtto give a good, repeatable, end-point.
The work by Greenhow and Spencer [31] Qn Ionic Polymerisation as a means ofEnd-point Indication in Non-aqueous Thermometric Titrimetry of Organic Acids wasextended to oil Total Acid Number analysis. In conjunction with the Ministry ofDefence, DQNfS, Harefield, a thermometric TAN method was developed, usingacrylonitrile monomer as the end-point indicator. At the end-point, when the alkalihas neutralised the acid present in the oil sample, the excess alkali catalyses thepolymerisation of the acrylonitrile, thus generating an exotherm, This rise intemperature is detected by a thermistor or thermocouple. A plot of temperatureagainst titrant volume gives a clear end-point, see Figure 30.
Initial results proved successful and a search was undertaken to find a substitute forthe potentially poisonous acrylonitrile. Although the use of acrylonitrile can beenvisaged in a closed system, handling and cleaning (polyacrylonitrile residue)problems would still cause some concern. A short search for an acrylonitrilesubstitute failed to yield anypositive results and, therefore, the thermometric methodwas refined, specifically for the Total Acid Number determination in used oils.
- 95-
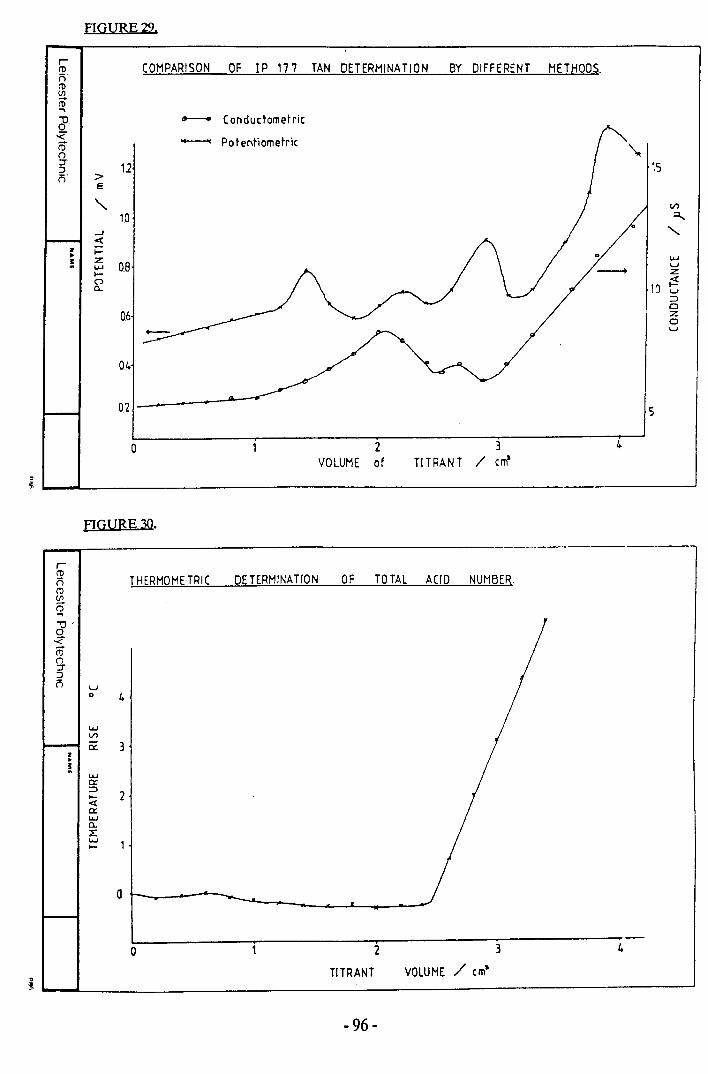
FIGURE29.
COMPARISON OF JP 177 TAN DETERMINATION BY DIFFERENT METHODS.
-- Conductometric
-- Potenflometric
12>E
-,lO
...Je(
i=:z:
0.8.....l-D0..
06
04
o 2VOLUME of
3TITRANT / c~
-,15
VI=,<,
.....uz
10;!:w::J0Z0w
5
_-r-----------------------------------rroRroeniD....\J0-<iDozr:Ji'i u
0 4
FIGURE 30.
THERMOMETRIC DETERMINATION OF TOTAL ACID NUMBER
wVI0:: 3•.
!w0::::J 2l-e(0::w0..:I:.......I-
o 2 3
TITRANT VOLUME / cm·
- 96-
4
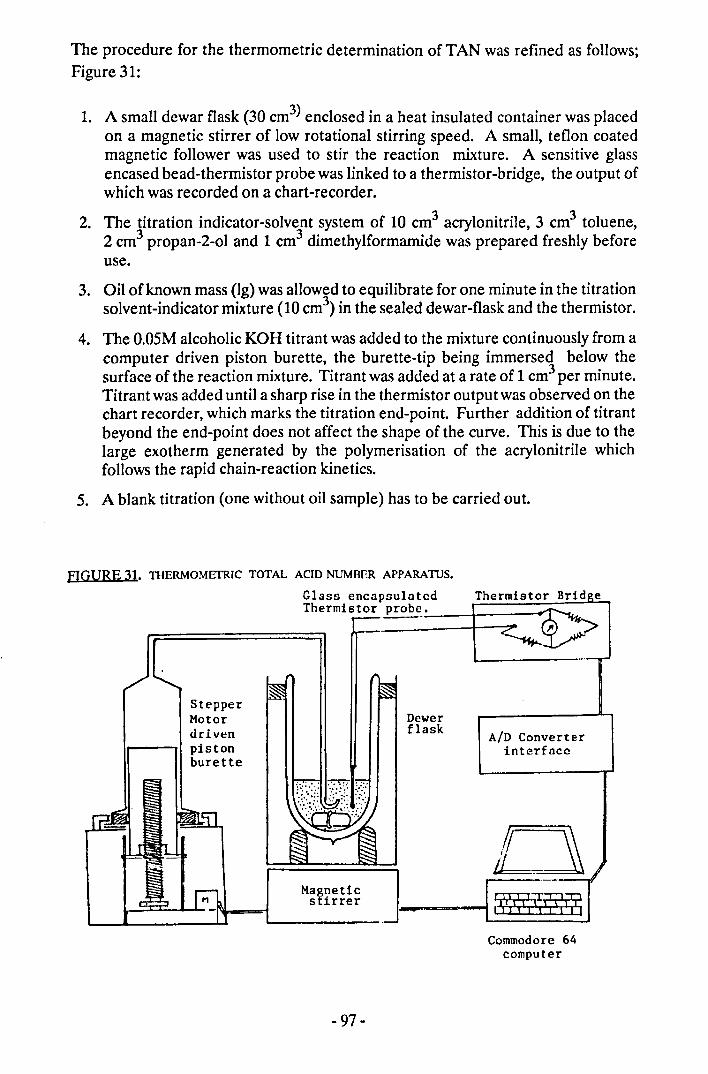
The procedure for the thermometric determination of TAN was refined as follows;Figure 31:
1. A small dewar flask (30 cm3) enclosed in a heat insulated container was placedon a magnetic stirrer of low rotational stirring speed. A small, teflon coatedmagnetic follower was used to stir the reaction mixture. A sensitive glassencased bead-thermistor probe was linked to a thermistor-bridge, the output ofwhich was recorded on a chart-recorder.
2. The titration indicator-solvent system of 10 cm3 acrylonitrile, 3 cm3 toluene,2 cm3 propan-z-ol and 1 cm3 dimethylformamide was prepared freshly beforeuse.
3. Oil of known mass (lg) was allowed to equilibrate for one minute in the titrationsolvent-indicator mixture (10 crrr') in the sealed dewar-flask and the thermistor.
4. The 0.05M alcoholic KOH titrant was added to the mixture continuously from acomputer driven piston burette, the burette-tip being immersed below thesurface of the reaction mixture. Titrant was added at a rate of 1 cm3 per minute.Titrant was added until a sharp rise in the thermistor output was observed on thechart recorder, which marks the titration end-point. Further addition of titrantbeyond the end-point does not affect the shape of the curve. This is due to thelarge exotherm generated by the polymerisation of the acrylonitrile whichfollows the rapid chain-reaction kinetics.
5. A blank titration (one without oil sample) has to be carried out.
FIGURE 31. TIIERMOMETRlC TOTAL ACID NUMBER APPARATUS.
Glass encapsulatedThermistor. probe.:.,--+----"1
StepperMotorurlvt!n
1----.1 pistonburette
Magneticstirrer
- 97-
Dewerflask AID Converter
interface
oI_-=----i f5?Z~'\SYJ
Commodore 64computer
Studies [21, 22] show that the acids in the oils not determined by the thermometricmethod are weaker than pKa (H20) = 10(phenol, pKa 9.89, can be determined by thismethod). This thermometric method works equally well for new and used oils. Newoils have been found to possess high initial TAN values which may become reducedin levels with engine running before increasing due to oil degradation.
The main disadvantages of the thermometric TAN method are its toxicity (handlingand waste disposal), limited shelf-life of the indicator-solvent mixture, temperatureequilibration of the system-solvents-titrant, cleaning of the dewar-flask betweendeterminations and the need to carry out a blank titration.
The advantages of the thermometric TAN method are its suitability to new,used orbadly degraded oils, the rapid nature of the reaction, its relative cheapness onequipment, sample and solvents, and can be easily automated. If automated, thesealed system and small volumes will drastically reduce the occupational health hazardof using acrylonitrile.
3.3 DETERMINATION OF WATER IN OILS.
The IP standard methods for the determination of water were discussed in Chapter 2,section 2.9 along with its drawbacks. There are a number of physical and chemicaltests that are currently used for the determination of water in non- aqueous solventsand lubricating oils. A book by Dorsey [35] gives a comprehensive treatise on theproperties of water. The sections that follow give details of water determinationtechniques in general use and this list is by no means exhausted.
3.3.1 Distillatioo.
The oil can be distilled directly, or it can be mixed with a water immiscible solvent,in a Dean and Stark apparatus. On heating the oil mixture, water distils and is thencondensed, collecting in the bottom of a graduated vessel where the volume of watercan be ascertained. This technique for water determination is a standard Instituteof Petroleum (IP 74, ASTM D95) method [22] and the procedure is given in detail inthat work.
The distillation methods for the determination of water in oils requires large oilsamples (1 litre or more) and prolonged heating. The presence of any volatileconstituents in the oil or any ignition source may result in fires. As some of the waterwould be bound in the additive pack, this technique would not necessarily give a trueindication of the concentration of water present in the oil. This method is too slow
- 98-
and its automation, therefore, cannot even be considered for this and the abovementioned reasons.
3.3.2 Karl Fisher Titration.
The most widely accepted chemical method for the determination of water is theKarl-Fisher technique. A detailed description of the subject is given in the book byMitchell and Smith [36]. The basic Karl Fisher reagent contains sulphur dioxide,iodine and pyridine in methanol. The iodine reacts quantitatively with water in the \presence of methanol to form pyridine hydrogen iodide (pyridinium iodide):
3 CsHsN + 12 + S02 + H20 ---+ 2 CsHsNHI + CsHsNS03 and
CsHsNS03 + CH30H ---+ CsHsNHS04CH3
The reaction is extremely sensitive to moisture and ingress of water from the atmos-phere and surroundings must be prevented by the use of air tight reaction vessels. Thetitration process may involve both direct titration with the primary Karl Fisher reagentor back titration of the mixture. In both cases the end-point can be determined byvisual, coulometric or electrometric means. A large number of Karl Fisherinstruments are made commercially, having different degrees of automation and dataanalysis. The Karl-Fisher technique is best used for water concentrations below the0.1% level.
Karl-Fisher determinations of water in new oils suggest that the reagent reacts withthe additive pack and with any bound water in it. In some cases it had been found thatthe additive (water) reaction contribution was greater than the amount of 'free' wateractually present in the oil. The use of the Karl-Fisher technique must therefore betreated with caution when used with formulated lubricating oils as allowance has tobe made for reaction with the additive pack, which in itself may be an unknownquantity, with used oils.
3.3.3 Chemical Reaction Methods.
The addition of solid and liquid chemicals to react with the 'water in the oil wasextensively investigated. With solids such as calcium hydride, the oil appears to coatthe solid reagent, preventing complete reaction and result in poor repeatability. Theuse of metal hydrides is not favoured for health and safety reasons due to the explosivenature of the reaction with water. Reaction of the reactants with atmosphericmoisture during reactant mass determination and sample preparation was found to
- 99-
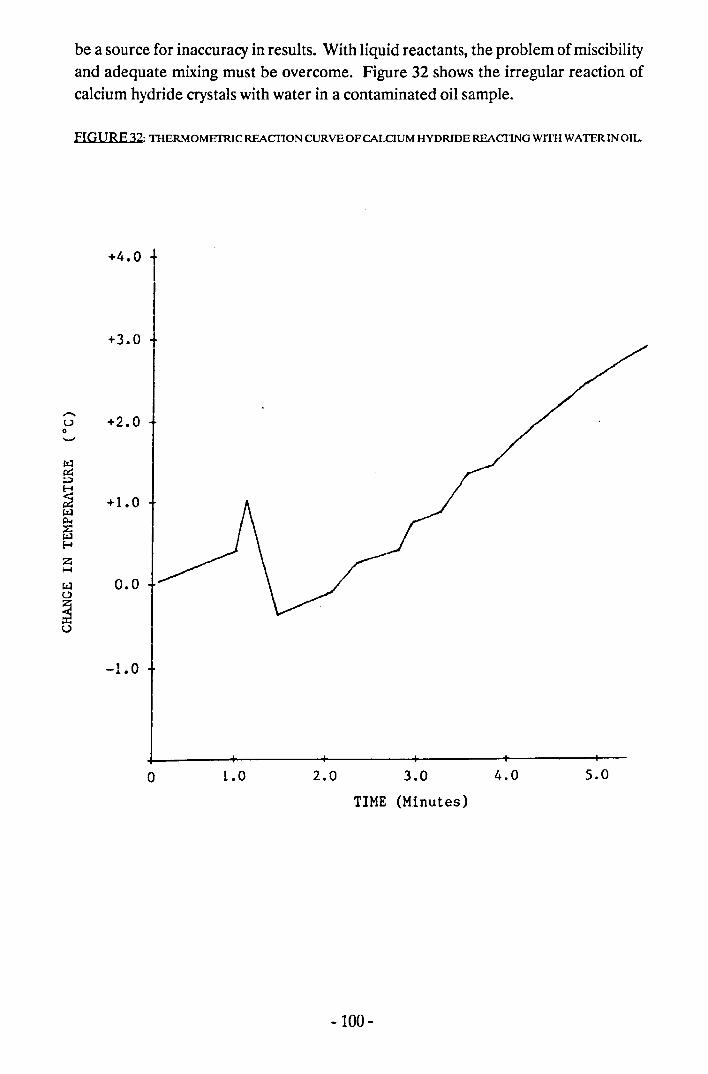
be a source for inaccuracy in results. With liquid reactants, the problem of miscibilityand adequate mixing must be overcome. Figure 32 shows the irregular reaction ofcalcium hydride crystals with water in a contaminated oil sample.
FIGURE 32: TIIERMOMEIlUC REACTION CURVE OF CALCIUM HYDRIDE REACTING WIDI WATER IN OIL
+4.0 tI
+3.0
- +2.0u0'-'
fr.l~:JH
~ +1.0fr.l~~w~ZH
~ 0.0~
~o
-1.0
o 1.0 2.0 4.0 5.03.0TIME (Minutes)
-100 -
3.3.3.1 Strong Acids.
It is well known that the addition of strong and concentrated acids to water results inthe temperature of the solution to increase. The increase in temperature depends onthe amount of water present, the amount of acid added and the concentration of theacid. The heat of dilution of the acid can be followed thermometrically. This methodwas applied to the determination of water in oils. A sensitive thermistor andthermistor bridge circuit was used to follow the titration. The solubility ofconcentrated sulphuric acid in oil was overcome by dissolving the oil inchlorobenzene. The amount of water was determined by comparing the temperatureincrease with that on a calibration chart. Despite using all possible precautions tominimise any heat losses, the repeatability of the method was found to be poor,particularly when testing used oils of known water content. It was observed that withsome used oils the acid and oil mixture produced a sludge which could not easily beremoved from the dewar reaction vessel. Glacial acetic acid was tried as a replace-ment for the concentrated sulphuric acid. The rise in temperature was as expected,lower than that obtained for the sulphuric acid (Figure 33) but, the repeatability wasagain poor, whether the oil was used neat or dissolved in chlorobenzene.
3.3.3.2 Hydrolysjs of Organjc Anhydrides.
The use of the hydrolysis of organic anhydrides had shown initial potential when thereaction is followed thermometrically, using a thermistor. However, the response wasslow and long equilibration times were required as the reaction is kinetically a slowone. It was thought that if a suitable catalyst could be found to catalyse the hydrationof acetic anhydride, then such a system would be unique to presence of water. It was,therefore, necessary to find an anhydrous catalyst that could be mixed with either thesample or the anhydride solution. The use of strong acids was precluded due to itslarge heat of dilution effects. The use of Friedel-Krafts catalysts in organic chemistrywas investigated. Anhydrous aluminium chloride was found to be very reactive withatmospheric moisture, even when in solution. A similar salt was, therefore, soughtand the search culminated in finding anhydrous stannic chloride to be a suitablecatalyst.
The results of the stannic chloride catalysed hydration of acetic anhydride in watercontaining lubricating oils are shown in Table 25 and typical titration curves are shownin Figure 34. Although the titration appears to work well for synthetic, homogeneous,calibration mixtures of water in a special formulated synthetic oil, the reaction of thereagent with water contaminated used oils was found to be unreliable and gavedifferent results with different lubricant formulations containing, gravimetrically, the
-101-
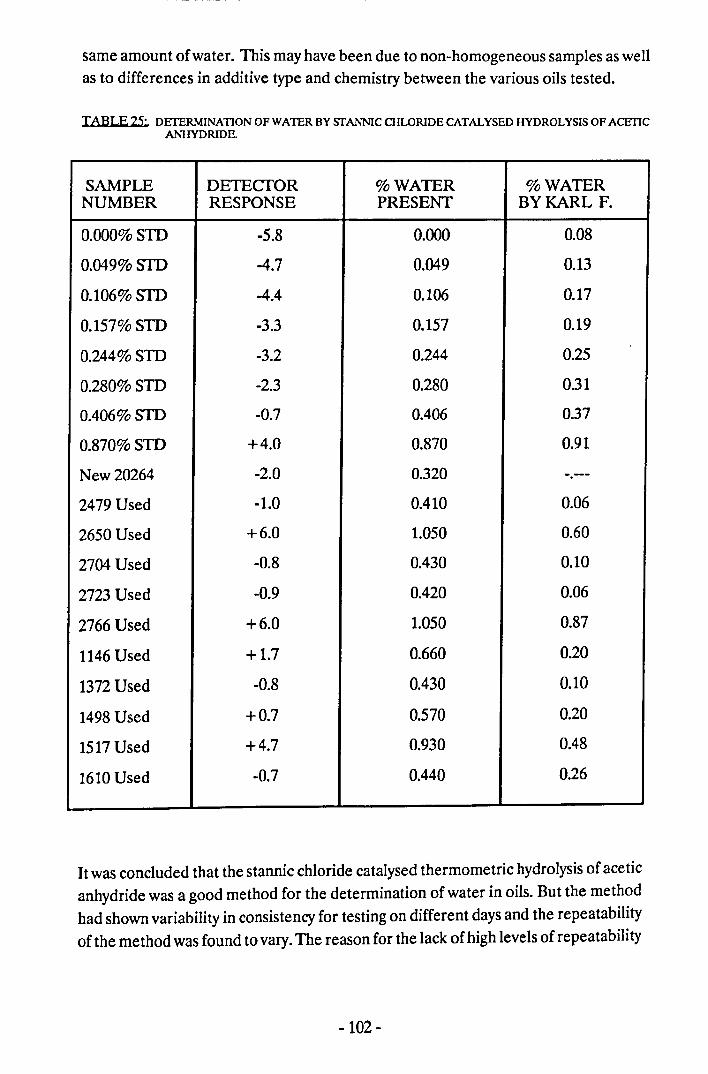
same amount of water. This may have been due to non-homogeneous samples aswellas to differences in additive type and chemistry between the various oils tested.
TABLE 25: DEITERMINAnON OF WATER BY STANNIC CHLORIDE CATALYSED HYDROLYSIS OF ACETICANHYDRIDE.
SAMPLE DETECfOR %WATER %WATERNUMBER RESPONSE PRESENT BY KARL F.
O.OOO%STD -5.8 0.000 0.08
0.049%STD -4.7 0.049 0.13
0.106%STD -4.4 0.106 0.17
0.157% STD -3.3 0.157 0.19
0.244%STD -3.2 0.244 0.25
0.280%STD -2.3 0.280 0.31
0.406% STD -0.7 0.406 0.37
0.870%STD +4.0 0.870 0.91
New20264 -2.0 0.320 .2479 Used -1.0 0.410 0.06
2650 Used +6.0 1.050 0.60
2704 Used -0.8 0.430 0.10
2723 Used -0.9 0.420 0.06
2766 Used +6.0 1.050 0.87
1146Used +1.7 0.660 0.20
1372Used -0.8 0.430 0.10
1498Used +0.7 0.570 0.20
1517Used +4.7 0.930 0.48
1610Used -0.7 0.440 0.26
It was concluded that the stannic chloride catalysed thermometric hydrolysis of aceticanhydride was a good method for the determination of water in oils. But the methodhad shown variability in consistency for testing on different days and the repeatabilityof the method was found to vary.The reason for the lack of high levels of repeatability
-102 -
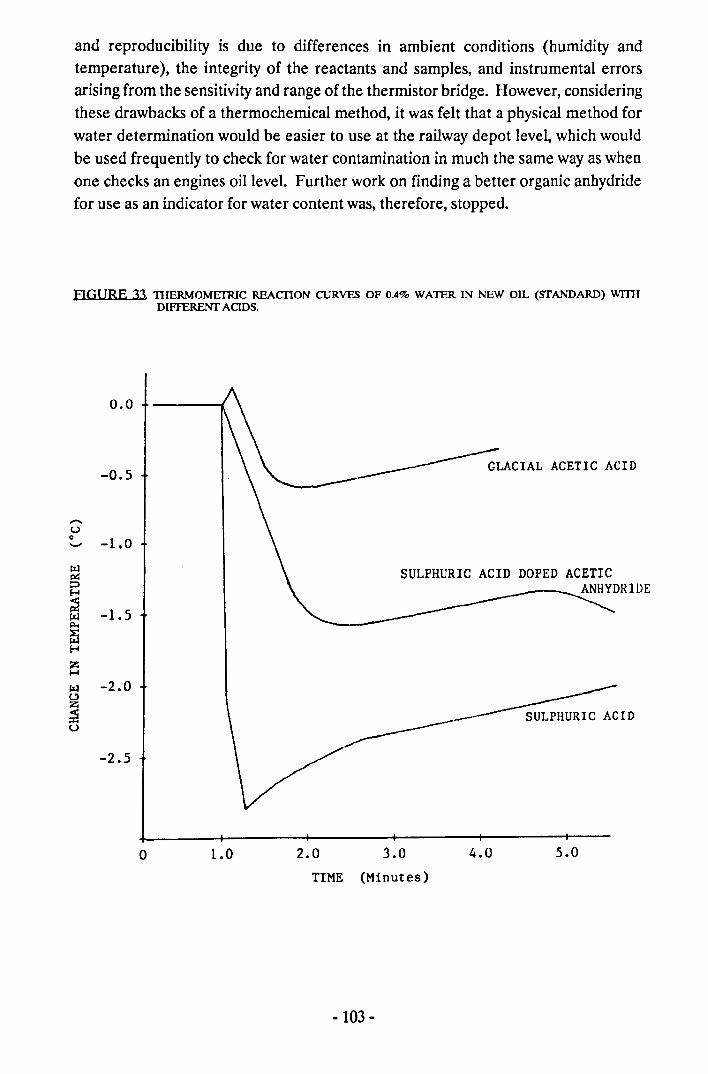
and reproducibility is due to differences in ambient conditions (humidity andtemperature), the integrity of the reactants and samples, and instrumental errorsarising from the sensitivity and range ofthe thermistor bridge. However, consideringthese drawbacks of a thermochemical method, it was felt that a physical method forwater determination would be easier to use at the railway depot level, which wouldbe used frequently to check for water contamination in much the same way as whenone checks an engines oil level. Further work on finding a better organic anhydridefor use as an indicator for water content was, therefore, stopped.
FIGURE 33 TIIERMOMETRIC REACIlON CURVES OF 0.4% WATER IN NEW OIL (STANDARD) WmIDIFFERENT ACIDS.
0.0
-0.5 ~LACIAL ACETIC ACID
,....,u0 -1.0'-'
~ SULPHURIC ACID DOPED ACETIC~::J ANHYDRIDEH;2 -1.5~Po.
15H
Z....~ -2.0
~IDt-'
~u .>:-2.5
o 1.0 2.0 3.0 4.0 5.0TIME (Minutes)
-103 -
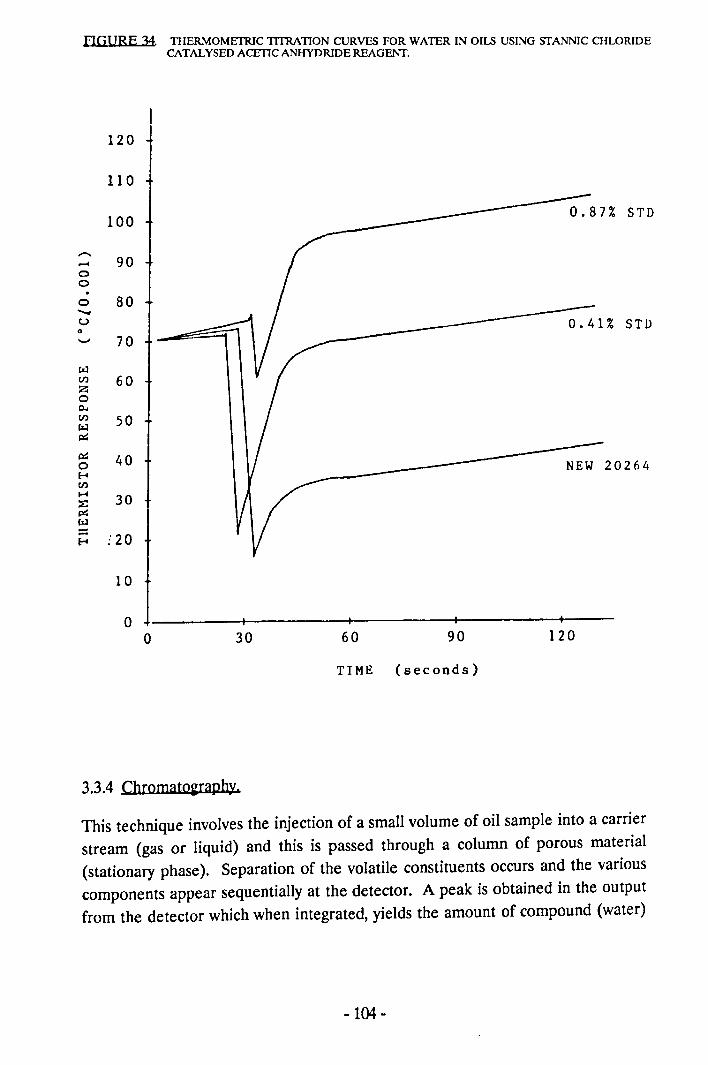
BGURE 34 TIIERMOMETRIC 1TfRATION CURVES FOR WATER IN OILS USING SfANNIC CHLORIDECATALYSED ACEllCANHYDRIDE REAGENT.
I120 i110
100
-..... 9000.0 80-u0- 70wCl) 60z0c...Cl) 50w~~ 400E-tCl)
H 30)::~W:I: .:20E-t
10
00 30
NEW 20264
60 90 120
TIME (seconds)
3.3.4 Chromatography.
This technique involves the injection of a small volume of oil sample into a carrierstream (gas or liquid) and this is passed through a column of porous material(stationary phase). Separation of the volatile constituents occurs and the variouscomponents appear sequentially at the detector. A peak is obtained in the outputfrom the detector which when integrated, yields the amount of compound (water)
-104 -
present in the original sample. This technique can be accurate but depends on welldefined peaks and can be expensive on short column life caused by viscous used oils.The measurement time can be reduced to minutes by back flushing the column afterthe appearance of the water peak. This technique may find favour if the presence ofother contaminants such as fuel are also to be determined.
3.3.5 Infrared Absorption Spectroscopy.
Infrared radiation is absorbed bywater molecules at the wavelength around 1.47, 1.93and 2.94 .urn, corresponding with the 0-11 bond vibration modes. The subject ofinfrared absorption as a quantitative analysis technique has been covered in manybooks and basically follows the Beer Lambert Law. Fluids of high viscosity or highopacity in the critical infrared absorption regions require the use of attenuated totalreflection techniques. Used oils are generally contaminated with finely dividedcarbon particles which causes strong absorption/dispersion of the infrared radiation.The problem of keeping the containing cells clean and the effect of water onhydrophilic cell materials (e.g. sodium chloride cells) limits the applicability of thetechnique to new oils or oils with microscopic water content. Interference byoverlapping or coincident infrared absorption bands by -N1I2(from amines) and -OH(from glycols and acids) groups present in used oils may result in inaccurate,high watercontent determinations.
3.3.6 Microwaye Techniques.
Microwaves can be used to measure water content in three ways:
1. Absorption measurement (loss factor)
2. Dielectric measurement (dielectric constant)
3. Gravimetric techniques (selective heating)
Various instruments are available but none are satisfactory for formulated lubricatingoils due in part to additives present in the oil and the problem of dissolved gases inthe oil.
3.3.7 Other Techniques.
Moisture determination byphysical techniques such as Nuclear Magnetic Resonance,Capacitance, Conductivity, or Density were found to be unsuccessful for use indetermining water content in lubricating oils.
-105 -
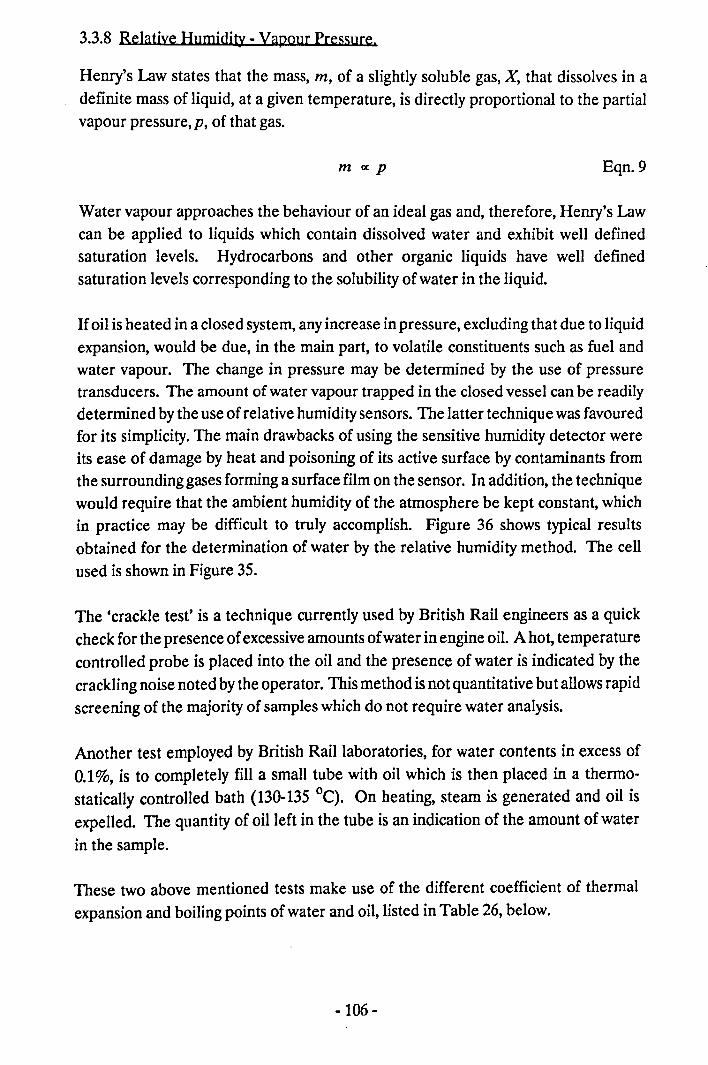
3.3.8 Relatiye Humidity - Vapour Pressure.
Henry's Law states that the mass, m, of a slightly soluble gas, X, that dissolves in adefinite mass of liquid, at a given temperature, is directly proportional to the partialvapour pressure, p, of that gas.
m cx:p Eqn.9
Water vapour approaches the behaviour of an ideal gas and, therefore, Henry's Lawcan be applied to liquids which contain dissolved water and exhibit well definedsaturation levels. Hydrocarbons and other organic liquids have well definedsaturation levels corresponding to the solubility of water in the liquid.
Ifoil is heated in a closed system, any increase in pressure, excluding that due to liquidexpansion, would be due, in the main part, to volatile constituents such as fuel andwater vapour. The change in pressure may be determined by the use of pressuretransducers. The amount of water vapour trapped in the closed vessel can be readilydetermined by the use of relative humidity sensors. The latter technique was favouredfor its simplicity. The main drawbacks of using the sensitive humidity detector wereits ease of damage by heat and poisoning of its active surface by contaminants fromthe surrounding gases forming a surface film on the sensor. In addition, the techniquewould require that the ambient humidity of the atmosphere be kept constant, whichin practice may be difficult to truly accomplish. Figure 36 shows typical resultsobtained for the determination of water by the relative humidity method. The cellused is shown in Figure 35.
The 'crackle test' is a technique currently used by British Rail engineers as a quickcheck for the presence of excessive amounts ofwater in engine oil. A hot, temperaturecontrolled probe is placed into the oil and the presence of water is indicated by thecrackling noise noted by the operator. This method is not quantitative but allows rapidscreening of the majority of samples which do not require water analysis.
Another test employed by British Rail laboratories, for water contents in excess of0.1%, is to completely fill a small tube with oil which is then placed in a thermo-statically controlled bath (130-135 QC). On heating, steam is generated and oil isexpelled. The quantity of oil left in the tube is an indication of the amount of waterin the sample.
These two above mentioned tests make use of the different coefficient of thermalexpansion and boiling points of water and oil, listed in Table 26, below.
-106 -
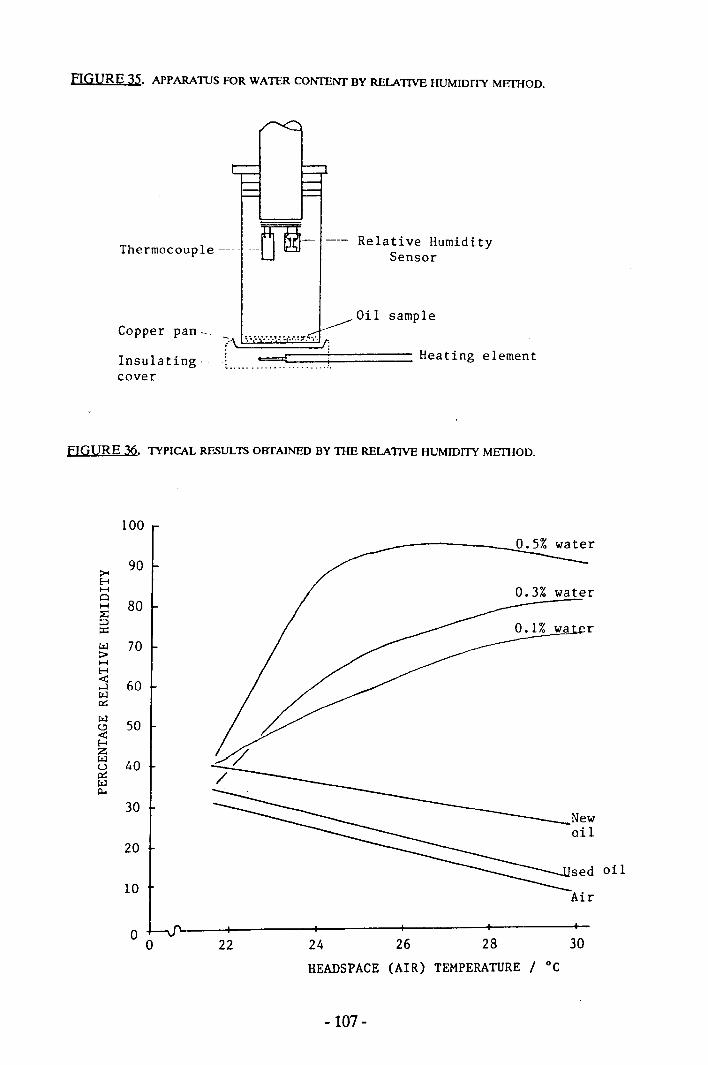
FIGURE 35, APPARATUS FOR WATER CONTENf BY RELATIVE HUMIDITY METIIOD.
~--- Relative HumidityThermocouple - --U I8J Sensor
____ Oil sampleCopper pan ,
Heating elementInsulating _.cover
. .'- .
FIGURE 36, TYPICAL RESULTS OBTAINED BY TIlE RELATIVE HUMIDITY METIfOD.
100
>- 90HHCl 80H~:::J r;I::
~ 70::>HH<!! 60...l~0:::~ 50CC)<!!HZ~ 40u0:::~p.,
30Newail
20sed oil
10 Air
0 22 24 26 28 300HEADSPACE (AIR) TEMPERATURE/ °c
-107 -
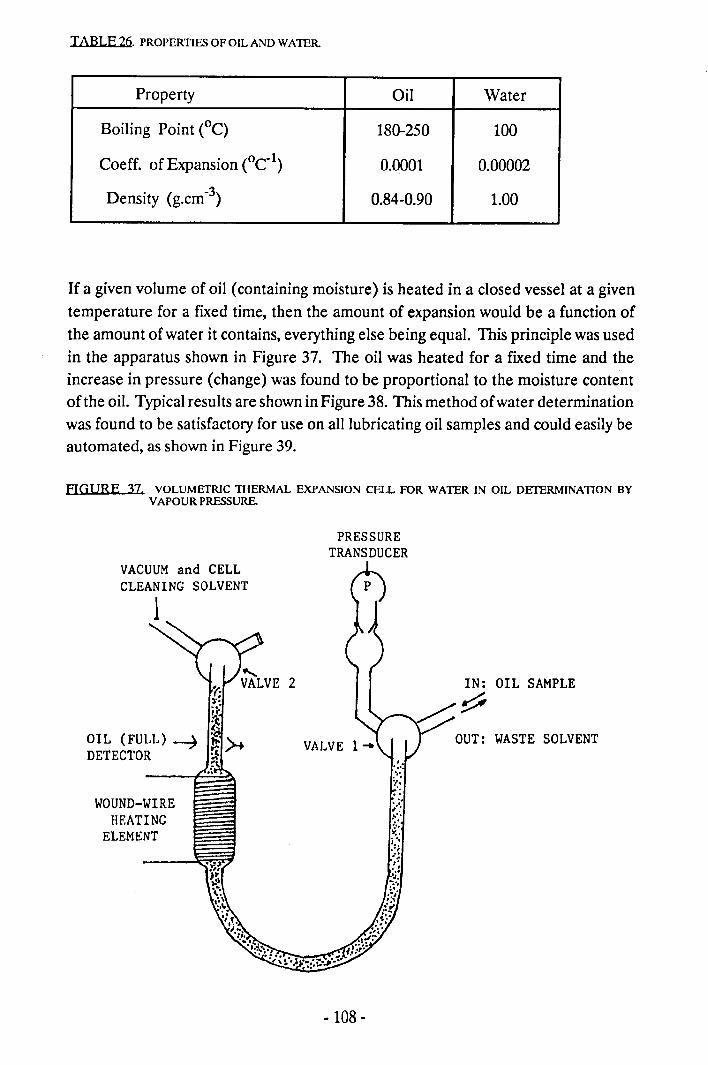
TABLE26. PROPERTIESOFOILANDWATER
Property Oil Water
Boiling Point (oC) 180-250 100
Coeff. of Expansion (oC-1) 0.0001 0.00002
Density (g.cm-3) 0.84-0.90 1.00
If a given volume of oil (containing moisture) is heated in a closed vessel at a giventemperature for a fixed time, then the amount of expansion would be a function ofthe amount of water it contains, everything else being equal. This principle was usedin the apparatus shown in Figure 37. The oil was heated for a fixed time and theincrease in pressure (change) was found to be proportional to the moisture contentof the oil. Typical results are shown in Figure 38. This method of water determinationwas found to be satisfactory for use on all lubricating oil samples and could easily beautomated, as shown in Figure 39.
FIGURE 37e VOLUMETRIC TIIERMAL EXPANSION CELL FOR WATER IN OIL DETERMINATION BYVAPOUR PRESSURE.
VACUUM and CELLCLEANING SOLVENT
1
WOUND-WIREHEATING
ELEMENT
PRESSURETRANSDUCER
2 IN: OIL SAMPLE~
~OUT: WASTE SOLVENTle
e ••
'"~i
-108 -
3.3.8.1 Calculation of water content by Relative Humidity I Vapour Pressure.
Relative Humidity is defined as the ratio of water vapour present to the pressure ofvapour that would be present if vapour were saturated at the same temperature:
% R.H. =J h~~Y)x 100Eqn.lO
Daltons Law of Partial Pressures states that provided gases do not react,the pressureof a mixture of gases is equal to the sum of the partial pressures of each componentmaking up the mixture. The partial pressure of each component is the pressure thatit would exert if it alone occupied that space.
p =Eqn.11
where: p = partial pressure of gas 1n1 = number of moles of gas 1n2 = number of moles of gas 2P = Mixture (gas) pressure
The equation of state for an ideal gas relates the number of moles of a gas such thatany two variables of the three variables P, V, and T suffice to specify the state of agiven amount of gas and to fix the value of the third variable.
PV=nRT Eqn.12
where: n = number of moles of gasR = Gas constant (8.3143 JIK/mol)T = Gas temperature in KelvinV = Gas volumeP = Gas pressure
Assuming that the ambient air is dry, it is possible to calculate the vapour pressureand relative humidity at a given temperature, if a water containing oil sample is heatedin a closed vessel such that all the water is driven into vapour in the gas head-space.It can be assumed, under normal constant atmospheric conditions, that the air andwater vapour behaviour are ideal. Consider X goil sample of Y%water content whichis heated to 60 QCin a dry atmosphere of a closed vessel of V cm3 headspace, thenthe Relative Humidity and Vapour pressure can be calculated:
Apply Daltons Law of partial pressures to Equation 10:
-109 -
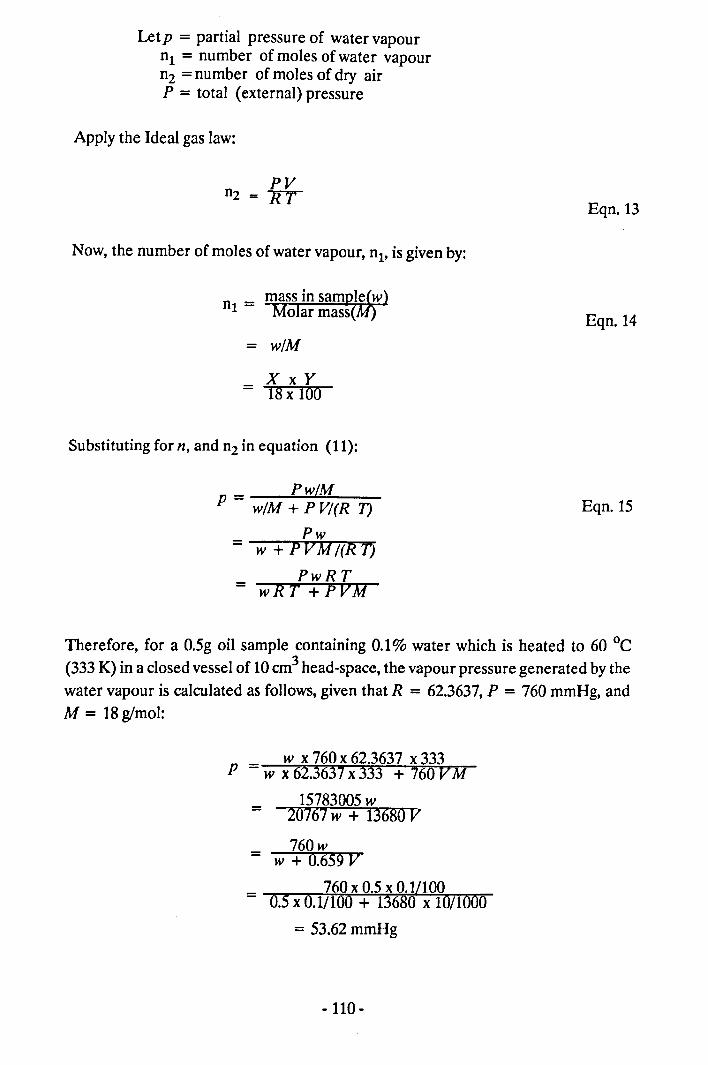
Let p = partial pressure of water vapournl = number of moles of water vapourn2 = number of moles of dry airP = total (external) pressure
Apply the Ideal gas law:
Eqn.13
Now, the number of moles of water vapour, nI' is given by:
Eqn.14= w/M
_ X x Y- 18x 100
Substituting for n, and n2 in equation (11):
_ PwlMp - w/M + PV/(R T)
Pw
Eqn.15
= w + PVM/(RT)PwRT
= wRT +PVM
Therefore, for a O.5goil sample containing 0.1% water which is heated to 60°C(333 K) in a closed vessel of 10 cm3 head-space, the vapour pressure generated by thewater vapour is calculated as follows, given that R = 62.3637,P = 760 mmHg, andM = 18g!mol:
w x 760 x 62.3637 x 333p = w x 62.3637x333 + 760VM
15783005 w= 20767 w + 13680 V
760w= w + 0.659 V
760 x 0.5 x 0.11100= 0.5 x O.l/loo + 13680x 10/1000
= 53.62mmHg
-110 -
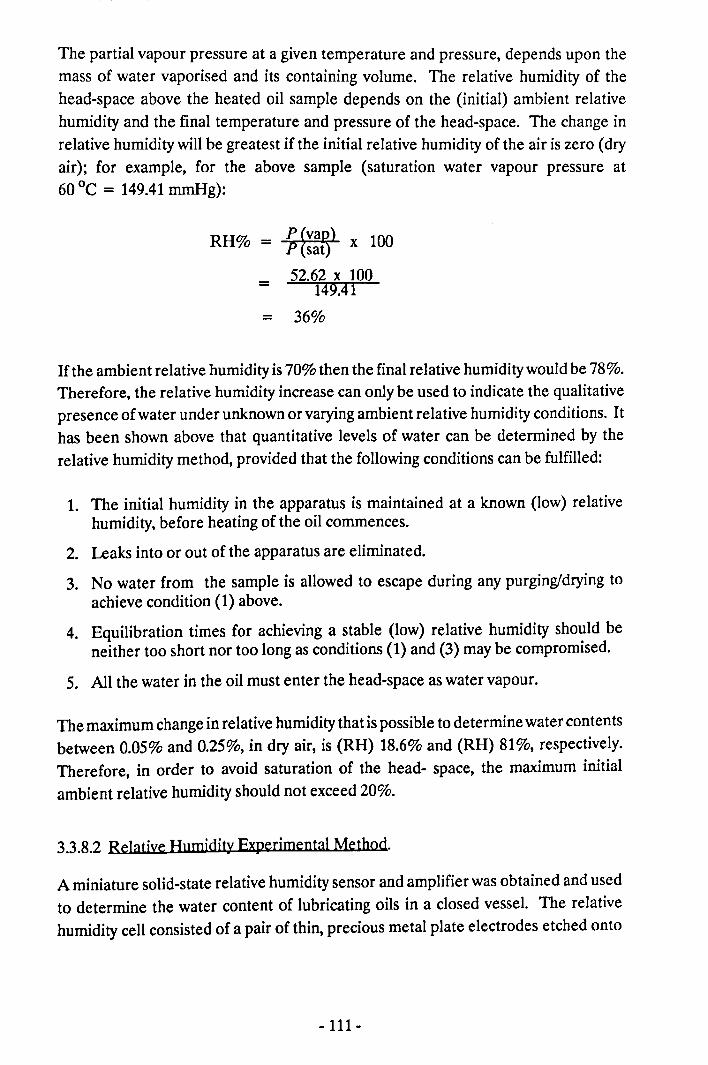
The partial vapour pressure at a given temperature and pressure, depends upon themass of water vaporised and its containing volume. The relative humidity of thehead-space above the heated oil sample depends on the (initial) ambient relativehumidity and the final temperature and pressure of the head-space. The change inrelative humidity will be greatest if the initial relative humidity of the air is zero (dryair); for example, for the above sample (saturation water vapour pressure at60°C = 149.41mmHg):
RH% - _ x 100
52.62 x 100149.41=
= 36%
If the ambient relative humidity is 70% then the final relative humidity would be 78%.Therefore, the relative humidity increase can only be used to indicate the qualitativepresence of water under unknown or varying ambient relative humidity conditions. Ithas been shown above that quantitative levels of water can be determined by therelative humidity method, provided that the following conditions can be fulfilled:
1. The initial humidity in the apparatus is maintained at a known (low) relativehumidity, before heating of the oil commences.
2. Leaks into or out of the apparatus are eliminated.
3. No water from the sample is allowed to escape during any purging/drying toachieve condition (1) above.
4. Equilibration times for achieving a stable (low) relative humidity should beneither too short nor too long as conditions (1) and (3) may be compromised.
5. All the water in the oil must enter the head-space as water vapour.
The maximum change in relative humidity that is possible to determine water contentsbetween 0.05% and 0.25%, in dry air, is (RH) 18.6% and (RH) 81%, respectively.Therefore, in order to avoid saturation of the head- space, the maximum initialambient relative humidity should not exceed 20%.
3.3.8.2 Relative Humidity Experimental Method.
A miniature solid-state relative humidity sensor and amplifier was obtained and usedto determine the water content of lubricating oils in a closed vessel. The relativehumidity cell consisted of a pair of thin, precious metal plate electrodes etched onto
- 111-
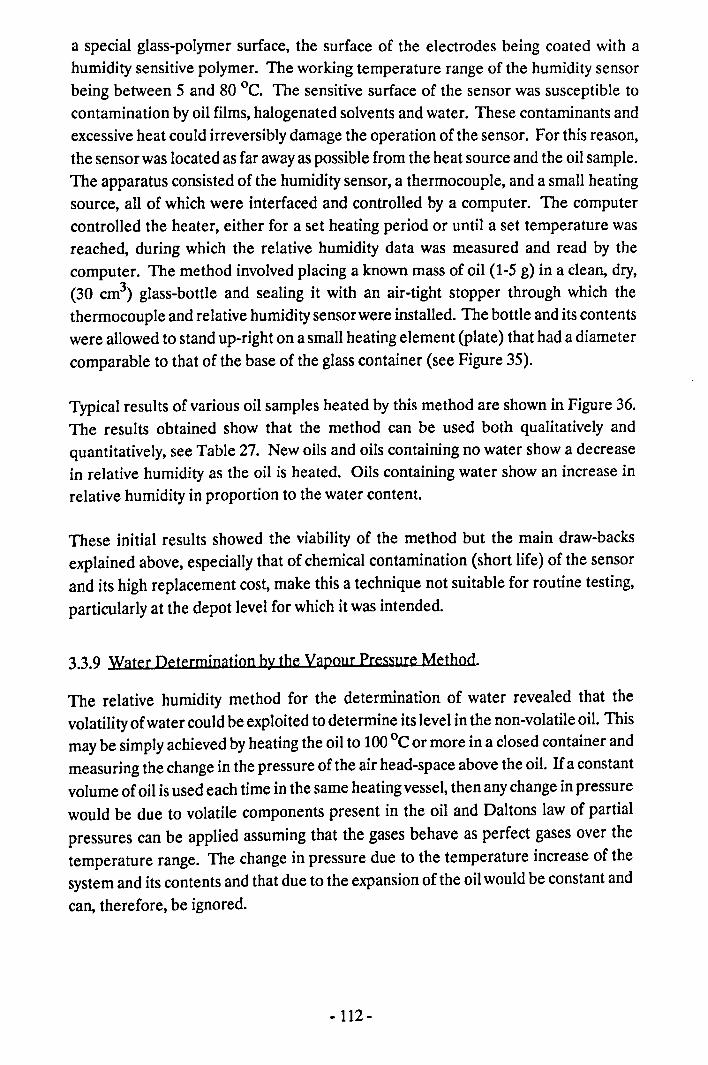
a special glass-polymer surface, the surface of the electrodes being coated with ahumidity sensitive polymer. The working temperature range of the humidity sensorbeing between 5 and 80 QC. The sensitive surface of the sensor was susceptible tocontamination by oil films, halogenated solvents and water. These contaminants andexcessive heat could irreversibly damage the operation of the sensor. For this reason,the sensor was located as far away as possible from the heat source and the oil sample.The apparatus consisted of the humidity sensor, a thermocouple, and a small heatingsource, all of which were interfaced and controlled by a computer. The computercontrolled the heater, either for a set heating period or until a set temperature wasreached, during which the relative humidity data was measured and read by thecomputer. The method involved placing a known mass of oil (1-5 g) in a clean, dry,(30 cm3) glass-bottle and sealing it with an air-tight stopper through which thethermocouple and relative humidity sensor were installed. The bottle and its contentswere allowed to stand up-right on a small heating element (plate) that had a diametercomparable to that of the base of the glass container (see Figure 35).
Typical results of various oil samples heated by this method are shown in Figure 36.The results obtained show that the method can be used both qualitatively andquantitatively, see Table 27. New oils and oils containing no water show a decreasein relative humidity as the oil is heated. Oils containing water show an increase inrelative humidity in proportion to the water content.
These initial results showed the viability of the method but the main draw-backsexplained above, especially that of chemical contamination (short life) of the sensorand its high replacement cost, make this a technique not suitable for routine testing,particularly at the depot level for which it was intended.
3.3.9 Water Determination by the Vapour Pressure Method.
The relative humidity method for the determination of water revealed that thevolatility of water could be exploited to determine its level in the non-volatile oil. Thismay be simply achieved by heating the oil to 100QCor more in a closed container andmeasuring the change in the pressure of the air head-space above the oil. Ifa constantvolume of oil is used each time in the same heating vessel, then any change in pressurewould be due to volatile components present in the oil and Daltons law of partialpressures can be applied assuming that the gases behave as perfect gases over thetemperature range. The change in pressure due to the temperature increase of thesystem and its contents and that due to the expansion of the oil would be constant andcan, therefore, be ignored.
- 112-
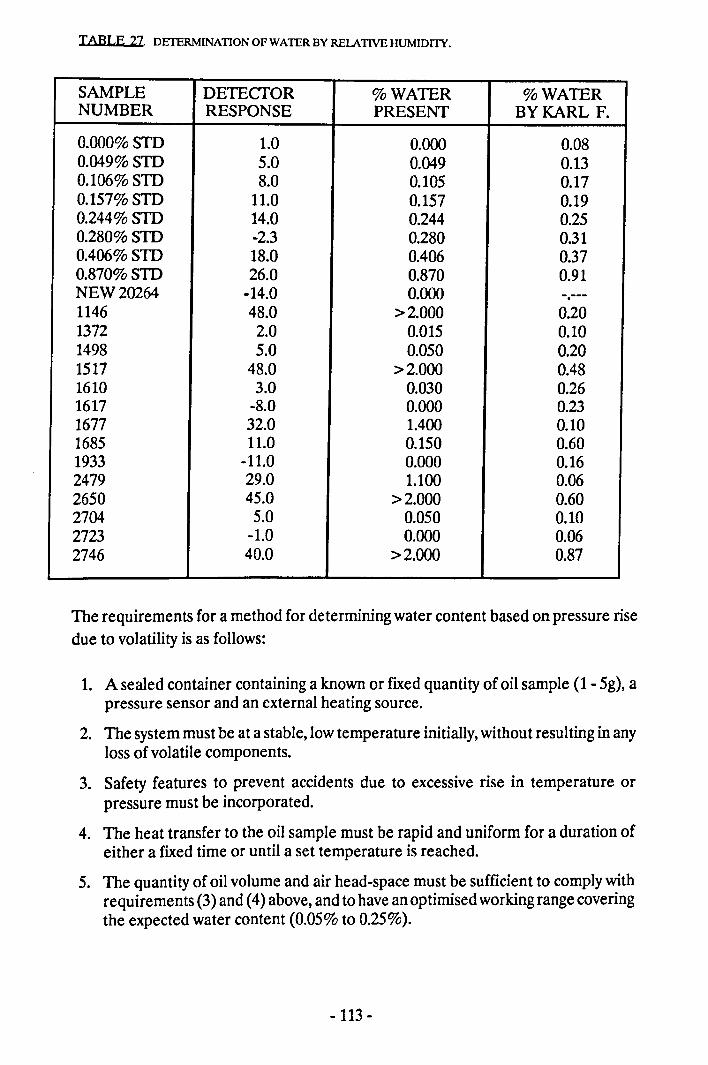
TABLE 27. DEfERMINATION OF WATER BY RELATIVEHUMIDITY.
SAMPLE DETECfOR %WATER %WATERNUMBER RESPONSE PRESENT BY KARL F.
O.OOO%STD 1.0 0.000 0.080.049% STD 5.0 0.049 0.130.106% STD 8.0 0.105 0.170.157%STD 11.0 0.157 0.190.244%STD 14.0 0.244 0.250.280%STD -2.3 0.280 0.310.406%STD 18.0 00406 0.370.870%STD 26.0 0.870 0.91NEW20264 -14.0 0.000 .1146 48.0 >2.000 0.201372 2.0 0.015 0.101498 5.0 0.050 0.201517 48.0 >2.000 00481610 3.0 0.030 0.261617 -8.0 0.000 0.231677 32.0 1.400 0.101685 11.0 0.150 0.601933 -11.0 0.000 0.162479 29.0 1.100 0.062650 45.0 >2.000 0.602704 5.0 0.050 0.102723 -1.0 0.000 0.062746 40.0 >2.000 0.87
The requirements for a method for determining water content based on pressure risedue to volatility is as follows:
1. A sealed container containing a known or fixed quantity of oil sample (1- 5g), apressure sensor and an external heating source.
2. The system must be at a stable, low temperature initially, without resulting inanyloss of volatile components.
3. Safety features to prevent accidents due to excessive rise in temperature orpressure must be incorporated.
4. The heat transfer to the oil sample must be rapid and uniform for a duration ofeither a fixed time or until a set temperature is reached.
5. The quantity of oil volume and air head-space must be sufficient to comply withrequirements (3) and (4) above, and to have an optimised working range coveringthe expected water content (0.05% to 0.25%).
-113 -
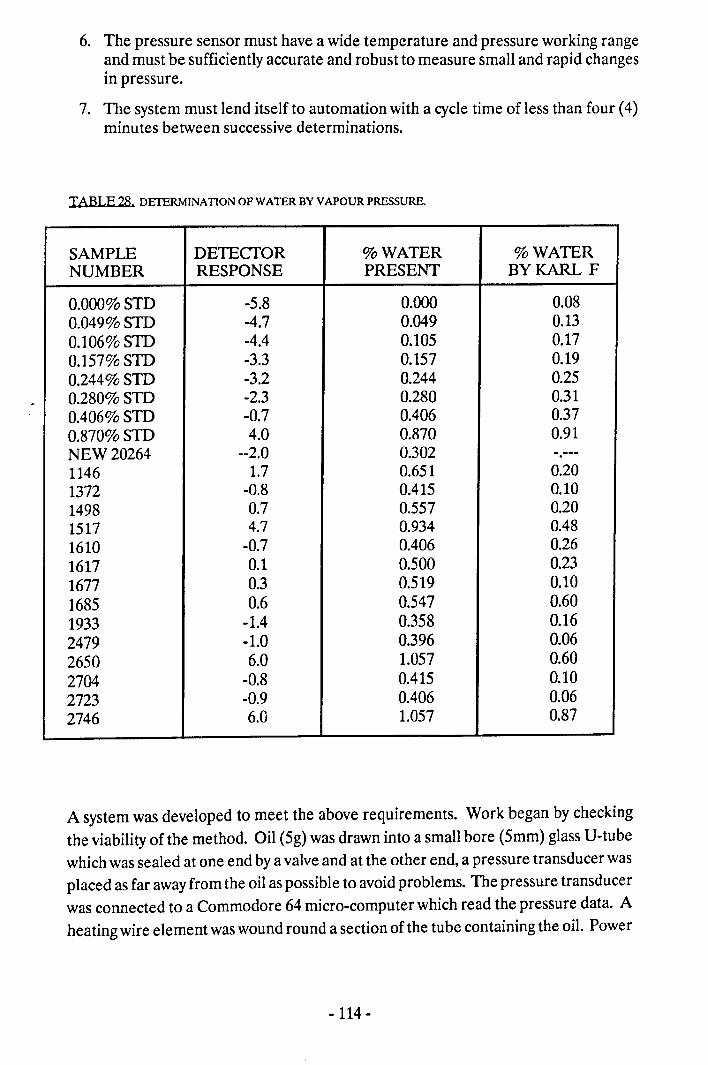
6. The pressure sensor must have a wide temperature and pressure working range?nd must be sufficiently accurate and robust to measure small and rapid changesin pressure.
7. The system must lend itself to automation with a cycle time of less than four (4)minutes between successive determinations.
TABLE28. DETERMINATION OF WATER BY VAPOUR PRESSURE.
SAMPLE DETECfOR %WATER %WATERNUMBER RESPONSE PRESENT BY KARL F
O.OOO%STD -5.8 0.000 0.080.049%STD -4.7 0.049 0.130.106%STD -4.4 0.105 0.170.157%STD -3.3 0.157 0.190.244%STD -3.2 0.244 0.250.280%STD -2.3 0.280 0.310.406%STD -0.7 00406 0.370.870%STD 4.0 0.870 0.91NEW20264 --2.0 0.3021146 1.7 0.651 0.201372 -0.8 00415 0.101498 0.7 0.557 0.201517 4.7 0.934 00481610 -0.7 00406 0.261617 0.1 0.500 0.231677 0.3 0.519 0.101685 0.6 0.547 0.601933 -1.4 0.358 0.162479 -1.0 0.396 0.062650 6.0 1.057 0.602704 -0.8 DAIS 0.102723 -0.9 00406 0.062746 6.0 1.057 0.87
A system was developed to meet the above requirements. Work began by checkingthe viability of the method. Oil (5g) was drawn into a small bore (5mm) glass U-tubewhich was sealed at one end by a valve and at the other end, a pressure transducer wasplaced as far away from the oil as possible to avoid problems. The pressure transducerwas connected to a Commodore 64 micro-computer which read the pressure data. Aheating wire element waswound round a section of the tube containing the oil. Power
-114 -
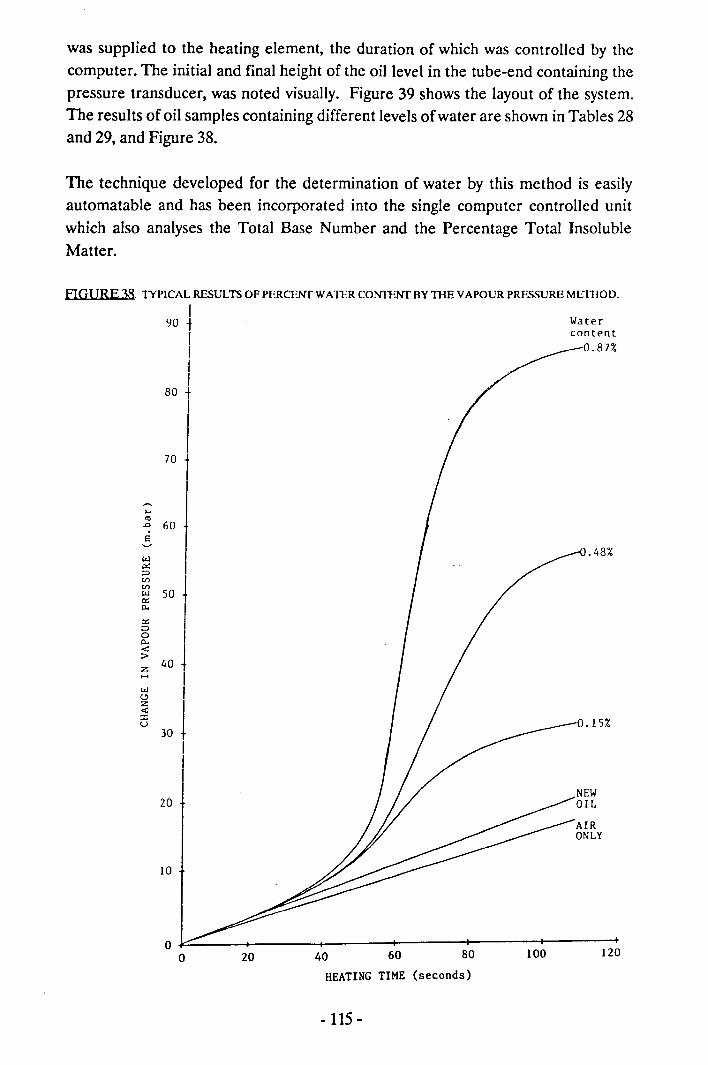
was supplied to the heating element, the duration of which was controlled by thecomputer. The initial and final height of the oil level in the tube-end containing thepressure transducer, was noted visually. Figure 39 shows the layout of the system.The results of oil samples containing different levels of water are shown in Tables 28and 29, and Figure 38.
The technique developed for the determination of water by this method is easilyautomatable and has been incorporated into the single computer controlled unitwhich also analyses the Total Base Number and the Percentage Total InsolubleMatter.
FIGURE 38. TYPICAL RESULTS OF PERCENT WATER CONTENT BYTI-lE VAPOUR PRESSURE METHOD.
I90 t
IIII
80 t
Watercontent
70
0.87%
....'".D 60EO
.48%w0:::::>
SO I(fl
(fl
W0::0-
0:::::>0 I0--e I> 40 tz..... Iw IoZ I...;:c Iu
30 tIII
20
10
o ~=-----~----------------~------------~------------+-------------~------------1~20o 20 40 60 80 100
HEATING TIME (seconds)
- 115 -
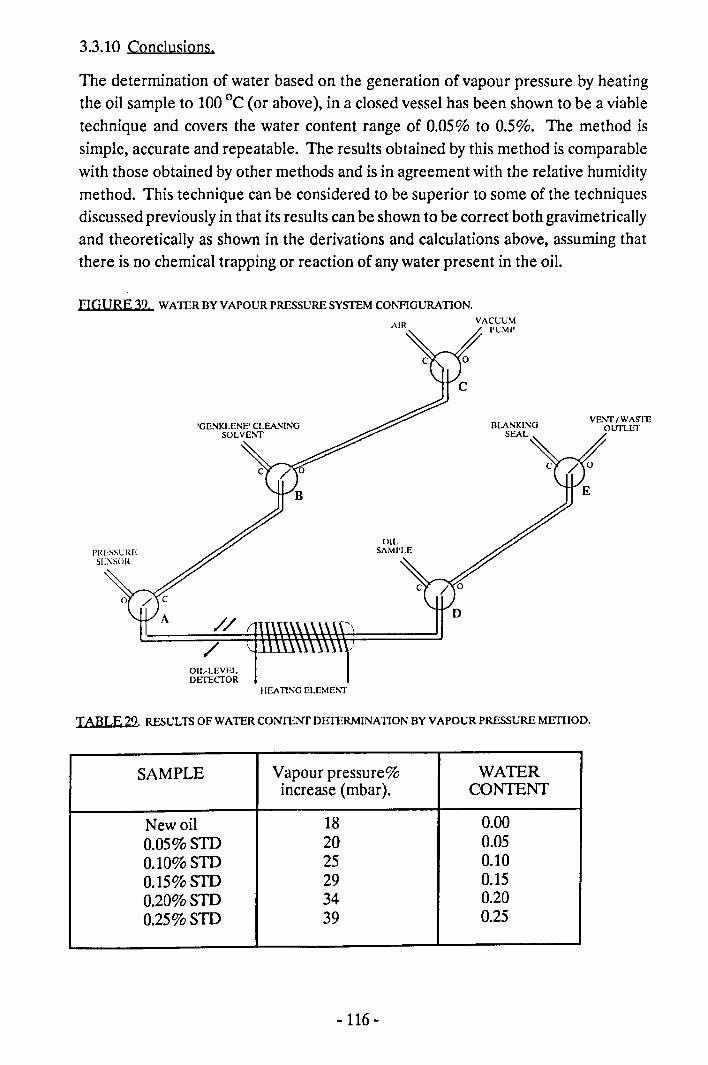
3.3.10 Conclusions.
The determination of water based on the generation of vapour pressure by heatingthe oil sample to 100°C (or above), in a closed vessel has been shown to be a viabletechnique and covers the water content range of 0.05% to 0.5%. The method issimple, accurate and repeatable. The results obtained by this method is comparablewith those obtained by other methods and is in agreement with the relative humiditymethod. This technique can be considered to be superior to some of the techniquesdiscussed previously in that its results can be shown to be correct both gravimetricallyand theoretically as shown in the derivations and calculations above, assuming thatthere is no chemical trapping or reaction of any water present in the oil.
FIGURE 39. WATER BY VAPOUR PRESSURE SYSTEM CONFIGURATION.VACCU\1
I'L\1I'
VENT/WASTEOUTLET
///
OIL·LEVELDETECfOR
IlEAllSG ELEME:-'T
TABLE 29. RESULTS OF WATER CONTENf DEfERMINATION BY VAPOUR PRESSURE METIIOD.
SAMPLE Vapour pressure% WATERincrease (mbar). CONTENT
New oil 18 0.000.05%STD 20 0.050.10%STD 25 0.100.15%STD 29 0.150.20%STD 34 0.200.25%STD 39 0.25
-116 -
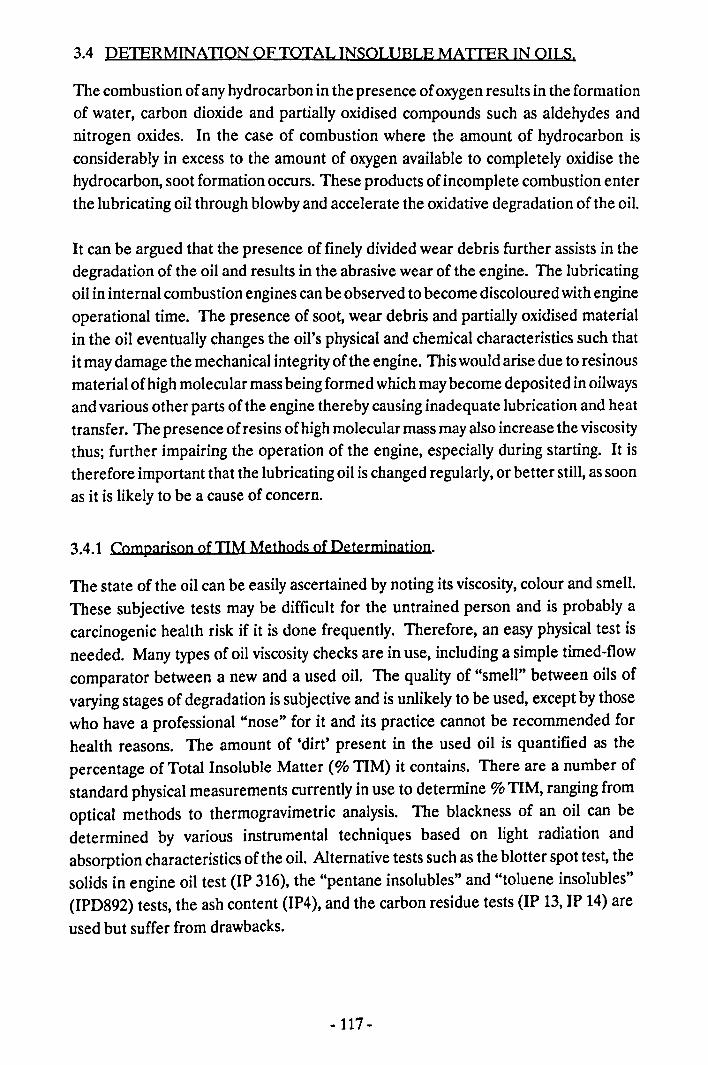
3.4 PETERMINATION OF TOTAL INSOWBLE MATTER IN OILS.
The combustion of any hydrocarbon in the presence of oxygen results in the formationof water, carbon dioxide and partially oxidised compounds such as aldehydes andnitrogen oxides. In the case of combustion where the amount of hydrocarbon isconsiderably in excess to the amount of oxygen available to completely oxidise thehydrocarbon, soot formation occurs. These products of incomplete combustion enterthe lubricating oil through blowby and accelerate the oxidative degradation of the oil.
It can be argued that the presence of finely divided wear debris further assists in thedegradation of the oil and results in the abrasive wear of the engine. The lubricatingoil in internal combustion engines can be observed to become discoloured with engineoperational time. The presence of soot, wear debris and partially oxidised materialin the oil eventually changes the oil's physical and chemical characteristics such thatit may damage the mechanical integrity of the engine. This would arise due to resinousmaterial of high molecular mass being formed which maybecome deposited in oilwaysand various other parts of the engine thereby causing inadequate lubrication and heattransfer. The presence of resins of high molecular mass may also increase the viscositythus; further impairing the operation of the engine, especially during starting. It istherefore important that the lubricating oil is changed regularly, or better still, as soonas it is likely to be a cause of concern.
3.4.1 Comparison of TIM Methods of Determination.
The state of the oil can be easily ascertained by noting its viscosity, colour and smell.These subjective tests may be difficult for the untrained person and is probably acarcinogenic health risk if it is done frequently. Therefore, an easy physical test isneeded. Many types of oil viscosity checks are in use, including a simple timed-flowcomparator between a new and a used oil. The quality of "smell" between oils ofvarying stages of degradation is subjective and is unlikely to be used, except by thosewho have a professional "nose" for it and its practice cannot be recommended forhealth reasons. The amount of 'dirt' present in the used oil is quantified as thepercentage of Total Insoluble Matter (% TIM) it contains. There are a number ofstandard physical measurements currently in use to determine % TIM, ranging fromoptical methods to thermogravimetric analysis. The blackness of an oil can bedetermined by various instrumental techniques based on light radiation andabsorption characteristics of the oil. Alternative tests such as the blotter spot test, thesolids in engine oil test (IP 316), the "pentane insolubles" and "toluene insolubles"(IPD892) tests, the ash content (IP4), and the carbon residue tests (IP 13, JP 14) areused but suffer from drawbacks.
-117 -
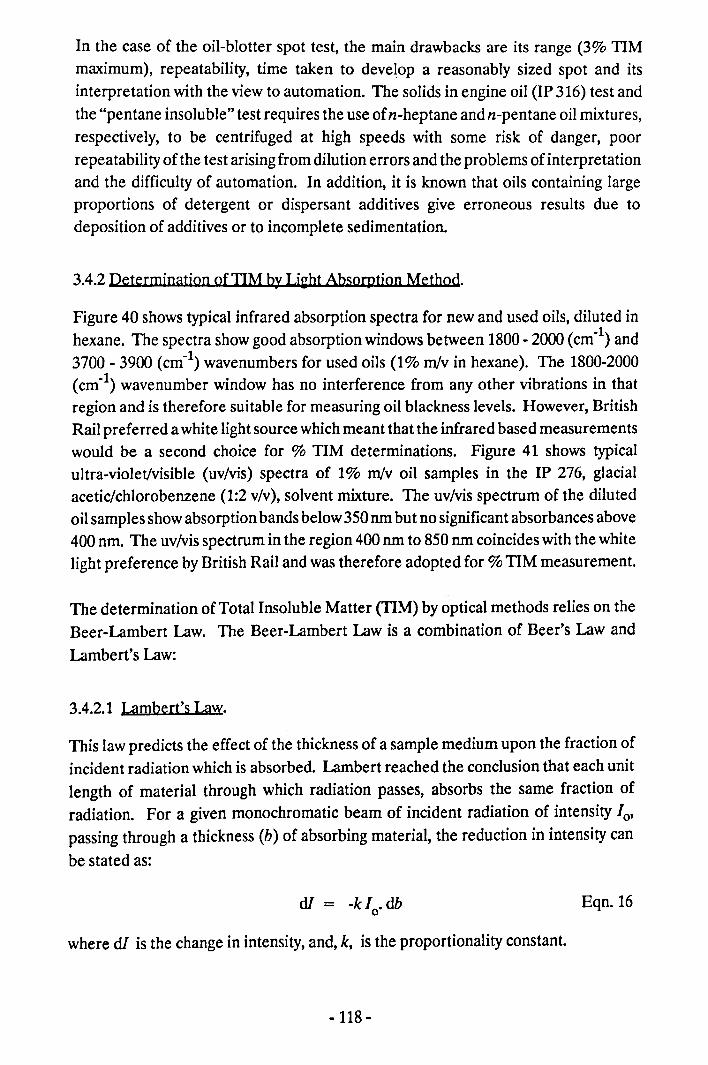
In the case of the oil-blotter spot test, the main drawbacks are its range (3% TIMmaximum), repeatability, time taken to develop a reasonably sized spot and itsinterpretation with the view to automation. The solids in engine oil (IP 316) test andthe "pentane insoluble" test requires the use of n-heptane and n-pentane oil mixtures,respectively, to be centrifuged at high speeds with some risk of danger, poorrepeatability of the test arising from dilution errors and the problems of interpretationand the difficulty of automation. In addition, it is known that oils containing largeproportions of detergent or dispersant additives give erroneous results due todeposition of additives or to incomplete sedimentation.
3.4.2 Determination of TIM by Li~ht Absorption Method.
Figure 40 shows typical infrared absorption spectra for new and used oils, diluted inhexane. The spectra show good absorption windows between 1800 - 2000 (em-I) and3700 - 3900 (em-I) wavenumbers for used oils (1% m/v in hexane). The 1800-2000(em-I) wavenumber window has no interference from any other vibrations in thatregion and is therefore suitable for measuring oil blackness levels. However, BritishRail preferred a white light source which meant that the infrared based measurementswould be a second choice for % TIM determinations. Figure 41 shows typicalultra-violet/visible (uv/vis) spectra of 1% m/v oil samples in the IP 276, glacialacetic/chlorobenzene (1:2 v/v), solvent mixture. The uv/vis spectrum of the dilutedoil samples show absorption bands below 350 nm but no significant absorbances above400 nm. The uv/vis spectrum in the region 400 nm to 850 nm coincides with the whitelight preference by British Rail and was therefore adopted for % TIM measurement.
The determination of Total Insoluble Matter (TIM) by optical methods relies on theBeer-Lambert Law. The Beer-Lambert Law is a combination of Beer's Law andLambert's Law:
3.4.2.1 Lambert's Law.
This law predicts the effect of the thickness of a sample medium upon the fraction ofincident radiation which is absorbed. Lambert reached the conclusion that each unitlength of material through which radiation passes, absorbs the same fraction ofradiation. For a given monochromatic beam of incident radiation of intensity 10,
passing through a thickness (b) of absorbing material, the reduction in intensity canbe stated as:
Eqn.16
where dl is the change in intensity, and, k, is the proportionality constant.
-118 -
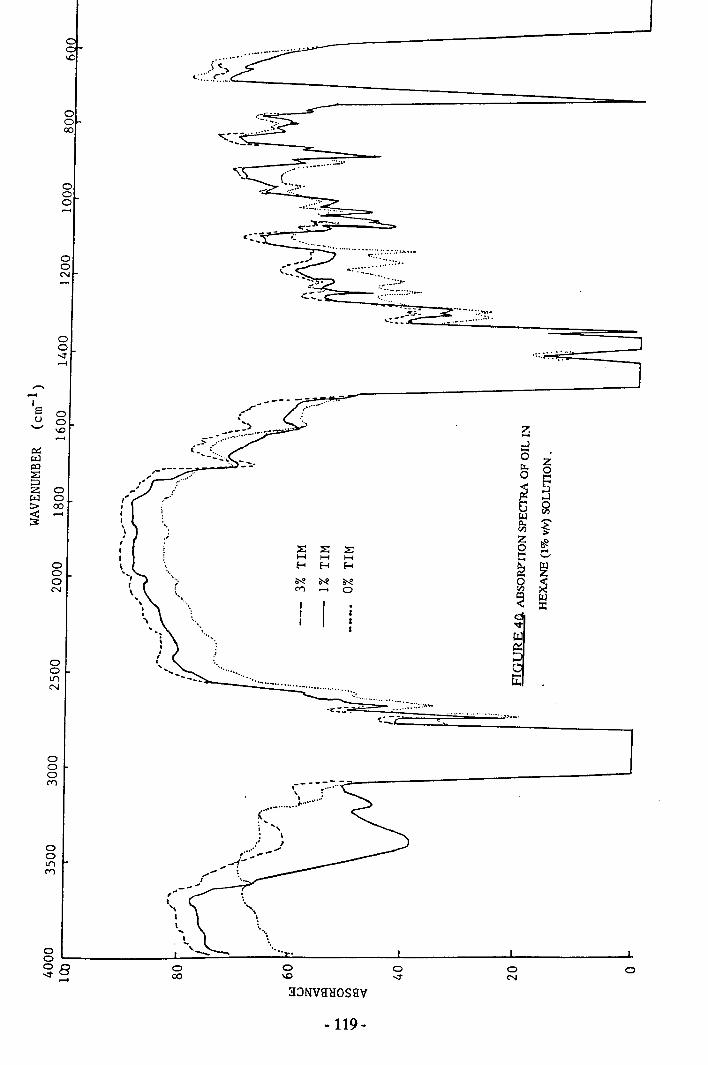
oooC")
oo00
ooo......
ooC'.j......
00<r......
.............,El 0u 0.._,
\D.......
0:::WI'Q~~z 0w 0:> 00
~......
000N
ooLI')
N
ooLI')C")
oo:;80-1
'~:.:'," ......
zo§ss
.'
-,". ........
.................... ,>_.................:.::::...~~
'C,"_':-
,~---;:......- ~ :
("; ....,: I:' ,,..... _""../~ ..., ...
-- .
o00
oN
o
3JNVHHOSHV
-119-
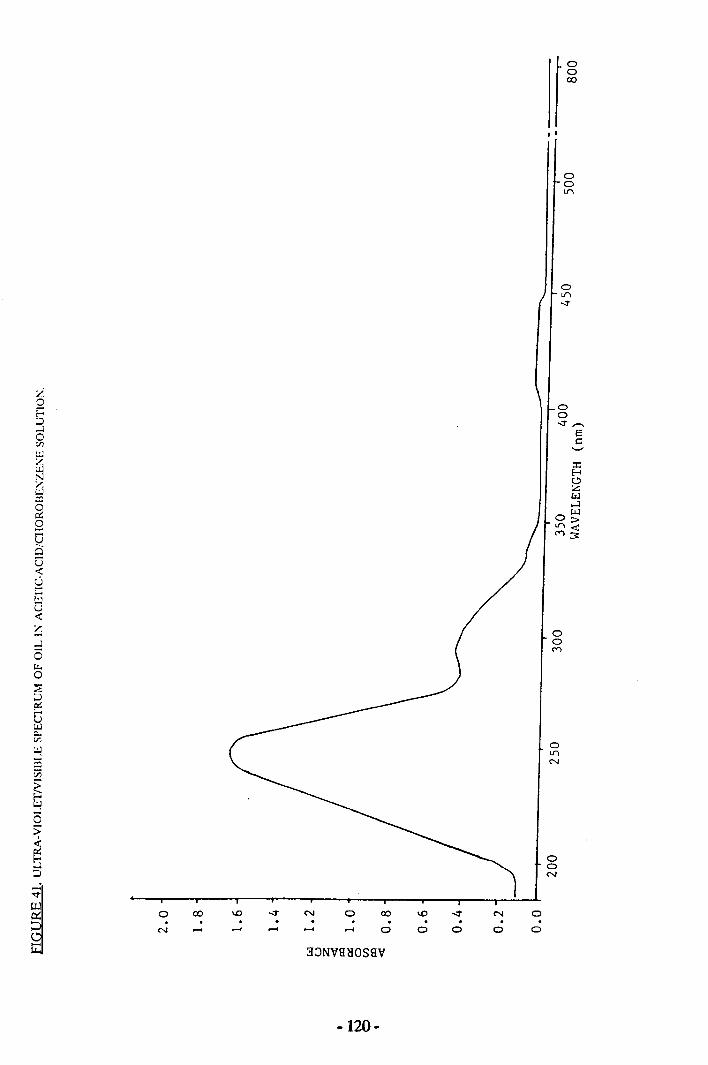
7.Q5.....losr:~ZUJNZW:::::lo0:::QQQo<oCt:.JU<7......li5~o
o co o
3::JNVH~OSgV
-120-
coo '"o .
o
, ,
ooV"\
oo--r '"'
Ec::........
ooC""\
ooN
N
ooo
The right hand side of the equation is negative because, I, becomes smaller as bbecomes larger. Rearranging the above equation shows that the fraction of radiationabsorbed is proportional to the thickness transversed:
d/. = -k db10 Eqn.17
If lois the incident radiation when b = 0, the above equation can be integrated togive:
Eqn.18
which gives:
In -!- = - k b10 Eqn.19
log+ =-kb2.303
This equation is the final form of Lambert's law. It is an exact law and applies to anyhomogeneous, non-scattering medium regardless whether it is a gas, liquid or solid.The proportionality constant, k, depends on the temperature, pressure, wavelengthand concentration of the system.
3.4.2.2 Beer's Law.
This law deals with the effect of the intensity of radiation on the concentration of asolution of absorbing molecules in a transparent solvent. Beer found that increasingthe concentration (of radiation absorbing solute in solution) had the same effect as aproportional increase in the radiation absorbing path (thickness). This means thatthe constant, k, in the Lambert law derivation above, is a function of soluteconcentration, C, :
nfu- = aCEqn.20
where, a, is a new proportionality constant, a characteristic for solute and wavelength
- 121-
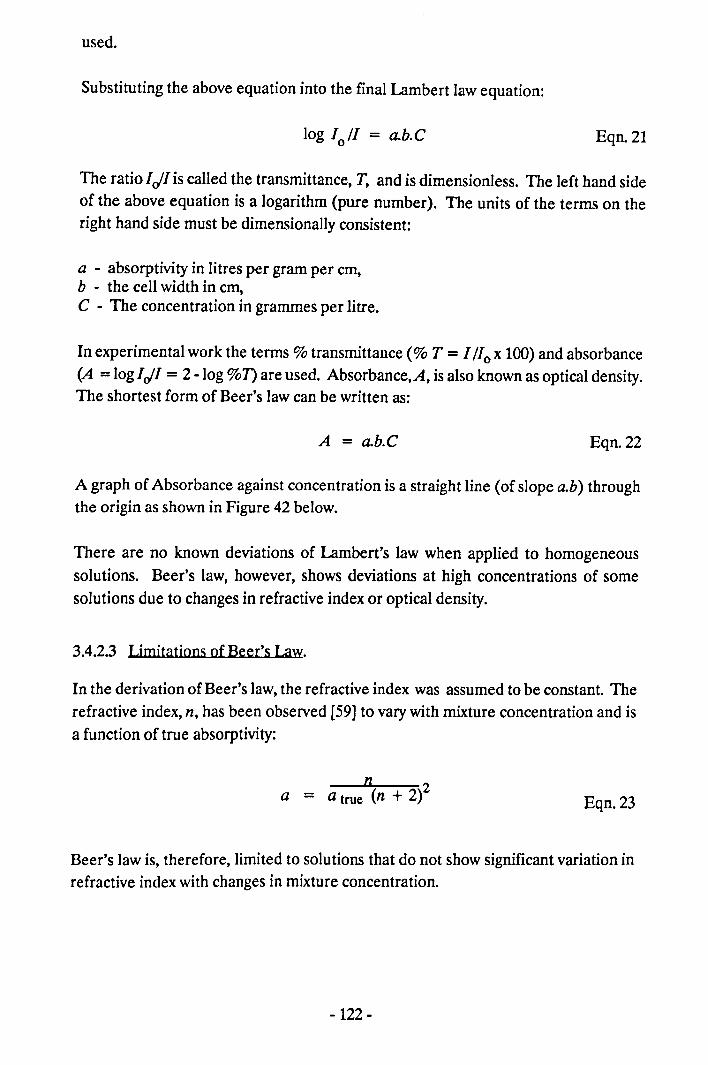
used.
Substituting the above equation into the final Lambert law equation:
Eqn.21
The ratio Ie/I is called the transmittance, T, and is dimensionless. The left hand sideof the above equation is a logarithm (pure number). The units of the terms on theright hand side must be dimensionally consistent:
a - absorptivity in litres per gram per cm,b - the cell width in cm,C - The concentration in grammes per litre.
In experimental work the terms % transmittance (% T = I Ilo x lOO)and absorbance(A = logIe/I = 2 -log %1) are used. Absorbance,A, is also known as optical density.The shortest form of Beer's law can be written as:
A = a.b.C Eqn.22
A graph of Absorbance against concentration is a straight line (of slope a.b) throughthe origin as shown in Figure 42 below.
There are no known deviations of Lambert's law when applied to homogeneoussolutions. Beer's law, however, shows deviations at high concentrations of somesolutions due to changes in refractive index or optical density.
3.4.2.3 Limitations of Beer's Law.
In the derivation of Beer's law, the refractive index was assumed to be constant. Therefractive index, n, has been observed [59] to vary with mixture concentration and isa function of true absorptivity:
n 2a = a true (n + 2) Eqn.23
Beer's law is, therefore, limited to solutions that do not show significant variation inrefractive index with changes in mixture concentration.
-122 -
FIGURE 42. IDEAL BEER LAW PLOT OF ABSORBANCE VERSUS CONCENTRATION.
A - ab.C
Slope a.b
O¥-----~----~------+-----~----~~-CONCENTRATION (e.g. % TIM)
- 123-
There are four assumptions implicit to the derivation of Beer's law:
1. The only mechanism of interaction between electromagnetic radiation and thesolute is absorption. True absorption is defined by:
x + hv--' X·
X* --. X + heat
where h v - energy of incident radiationX - Ground state of absorbing particleX· - Particle in excited state.
There are three other types of interaction which cause attenuation of radiation,namely, resonance emission, fluorescence (or phosphorescence) and scattering.Resonance emission is a rare phenomenon and is not discussed here (see [37]for further details). Fluorescence results in the emission of radiation of lowerenergy than that initially absorbed:
X* --. X + heat + hvi
where hvi - radiation of lower energy than h v.
The radiation, h vI, is emitted in all directions and causes the apparentabsorbance to be less than the true absorbance.
Scattering is the most likely source of deviation of the Beer law for the % TIMof used oils which contain large, solid, irregular shaped particles of manydifferent sizes and type. The incident light will be scattered in all directionsresulting in higher than expected absorbance measurements.
2. Only monochromatic radiation is used. Monochromatic radiation is assumed inthe derivation of both Beer's and Lambert's Laws. Spectrometers pass a bandor range of wavelengths through the sample cell and the narrowness of the banddepends on the instrument specification and the nature of the test beingconducted. Provided that the same cells, instrument and procedures are used,the errors arising from differences in instrumentation will be minimal.
3. For Beer's law to be followed, all absorbing species must act independently ofone another regardless of number or kind. Interactions between absorptioncentres will have the effect of changing the energy requirements for absorptiondue to changes in quantum levels. As a result, absorption peaks may be alteredin shape, position and intensity as the concentration varies. Therefore, for theBeer's Law based % TIM determination, the part of the absorption spectrumwhere absorbance does not vary over a range ofwavelengths would be preferred.Absorbances for each component of mixtures are additive provided they areindependent of each other:
La. C"I IEqn.24
- 124-
4. If the absorption cross-section of the specimen solution is not uniform, thendeviations of Beer's lawwill occur due to the above factors as well as that of theexit beam of radiation being misaligned from the detector.
3.4.2.4 Experimental.
Used oil samples of known % TIM (ex British Rail) were homogenised using a highspeed vortex stirrer-vibrator. Oil solutions (3% m/m) in acetic acid:chlorobenzene(1:2, v/v) mixture were prepared in 50 ml conical flasks. Reference and samplesolutions were placed in matched 10mm silica cells of 1mm path length, previouslycleaned with Genklene and dried. A Perkin- Elmer uv-vis spectrometer was set upto measure the absorption spectrum in the 400 to 850 om range, first for the solventsonly (to 'zero' the machine) and then for the samples. Each sample was prepared justbefore use and all glassware was thoroughly cleaned and dried after use. Theabsorbance at 650 nm was noted from the spectra and plotted against % TIM.
During the preparation of the diluted oil samples it was noted that some of the oilsamples would not dissolve or remain homogeneous for more than a few minutes.These samples had to be prepared and used as quickly as possible.
3.4.2.5 Results.
The results of a number of different oils of known %TIM (by spot test,ex British Railand Burmah Castrol by IP 316) is given in Table 30, below. The results indicate thedependence of % TIM on oil type and method of determination. The % TIM of theIP 316 based results byBurmah Castrol, show a discontinuity of linear behaviour whencompared with British Rail 'spot' method, Figures 43 and 44.
-125 -
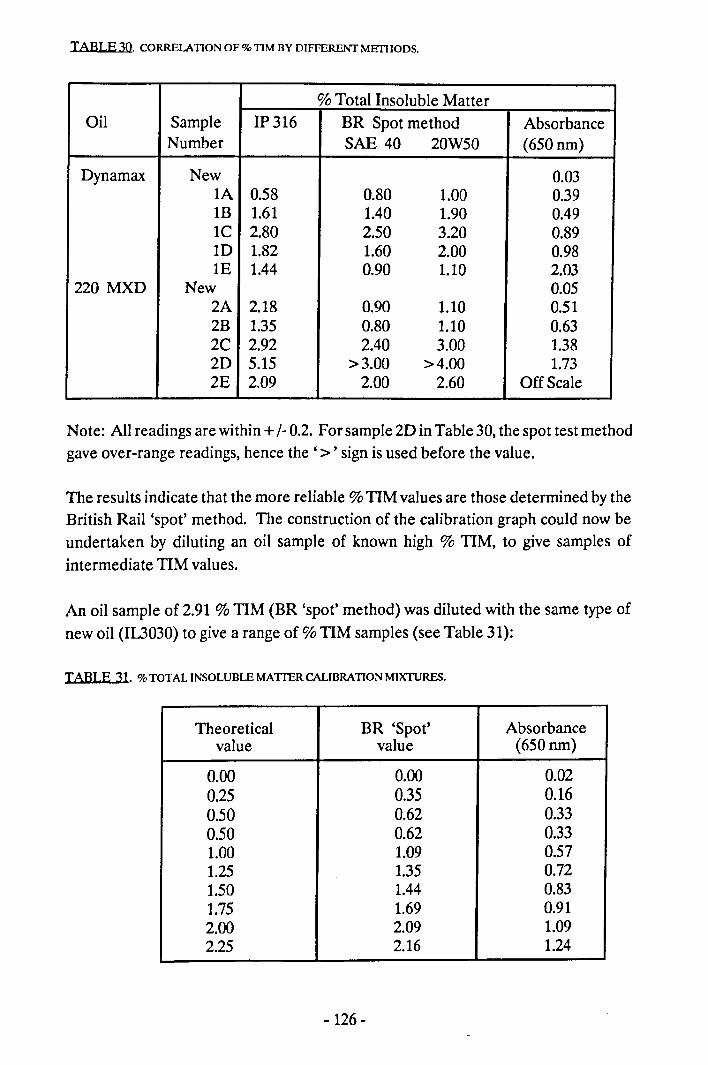
TABLE 30. CORRELATION OF % TIM BY DIFFERENT METIIODS.
% Total Insoluble MatterOil Sample IP 316 BR Spot method Absorbance
Number SAE 40 20W50 (650 nm)
Dynamax New 0.03lA 0.58 0.80 1.00 0.391B 1.61 1.40 1.90 0.491C 2.80 2.50 3.20 0.89ID 1.82 1.60 2.00 0.98lE 1.44 0.90 1.10 2.03
220 MXD New 0.052A 2.18 0.90 1.10 0.512B 1.35 0.80 1.10 0.632C 2.92 2.40 3.00 1.382D 5.15 >3.00 >4.00 1.732E 2.09 2.00 2.60 Off Scale
Note: All readings are within +l- 0.2. For sample 2D in Table 30, the spot test methodgave over-range readings, hence the' > ' sign is used before the value.
The results indicate that the more reliable %TIM values are those determined by theBritish Rail 'spot' method. The construction of the calibration graph could now beundertaken by diluting an oil sample of known high % TIM, to give samples ofintermediate TIM values.
An oil sample of 2.91 % TIM (BR 'spot' method) was diluted with the same type ofnew oil (IL3030) to give a range of % TIM samples (see Table 31):
TABLE 3l. %TOTAL INSOLUBLE MAITER CALIBRATION MIXTURES.
Theoretical BR 'Spot' Absorbancevalue value (650 nm)
0.00 0.00 0.020.25 0.35 0.160.50 0.62 0.330.50 0.62 0.331.00 1.09 0.571.25 1.35 0.721.50 1.44 0.831.75 1.69 0.912.00 2.09 1.092.25 2.16 1.24
- 126-
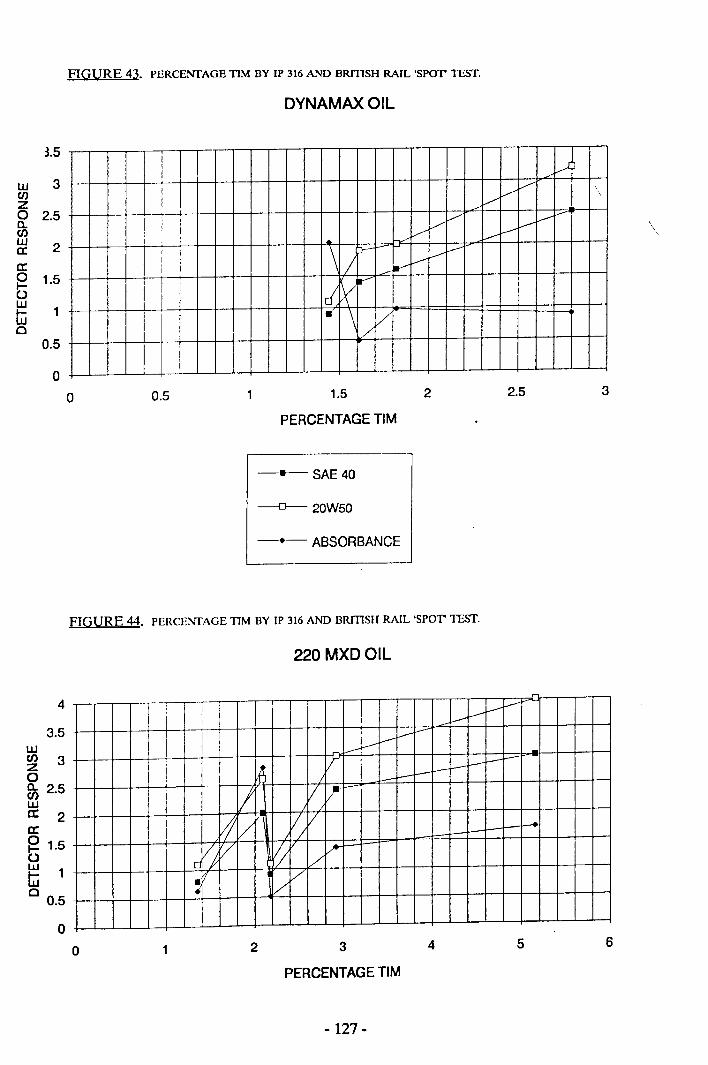
3.5
LU 3enz0 2.5Cl.Cl)LU 2a:Cl:0 1.5I-0LU 1tuCl
0.5
UJCl) 3zo5s 2.5UJa: 2a:oI- 1.5oUJ 1G:ic 0.5
FIGURE 43. PERCENTAGE TIM BY JP 316 AND BRITISH RAIL 'SPOT' TEST.
DYNAMAXOIL
vVV
:/\
!V vv
V V... V i>v\ >-- v l->/
----v
Id ~.--
- \ V/
\
oo 0.5 1.5
PERCENTAGE TIM
2 2.5 3
---SAE40
-0--- 20W50
-+- ABSORBANCE
FIGURE 44. PERCENTAGE TIM BY IP 316 AND BRmSII RAIL 'SPOT' TESf.
220 MXDOIL
4~
l--vl--l--
v I--
Vvl---II I--l- t--
~ l- I-- I---f...--
V II 1/-
~ V I~1/ ...10-
Di~ V ~ ./~
- VV
•
3.5
oo 2 3
PERCENTAGE TIM
4 5 6
-127 -
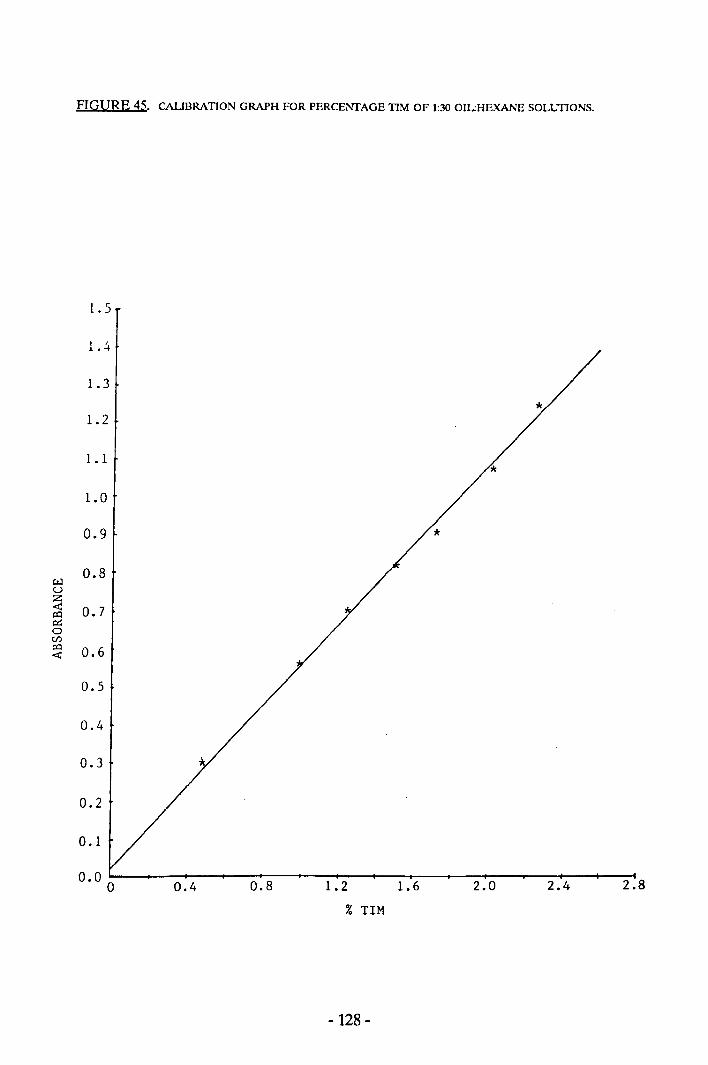
FIGURE 45. CALIBRATION GRAPH FOR PERCENfAGE TIM OF 1:30 OIL:HEXANE SOLUTIONS.
1.5
1. ~
1.3
1.2
1.1
1.0
0.9
0.8wuz<t: 0.7IX)
~0U)IX) 0.6<t:
0.5
0.4
0.3
0.2
0.1
0.0 0
*
0.8 1.2% TIM
1.6 2.0 2.4 2.80.4
-128 -
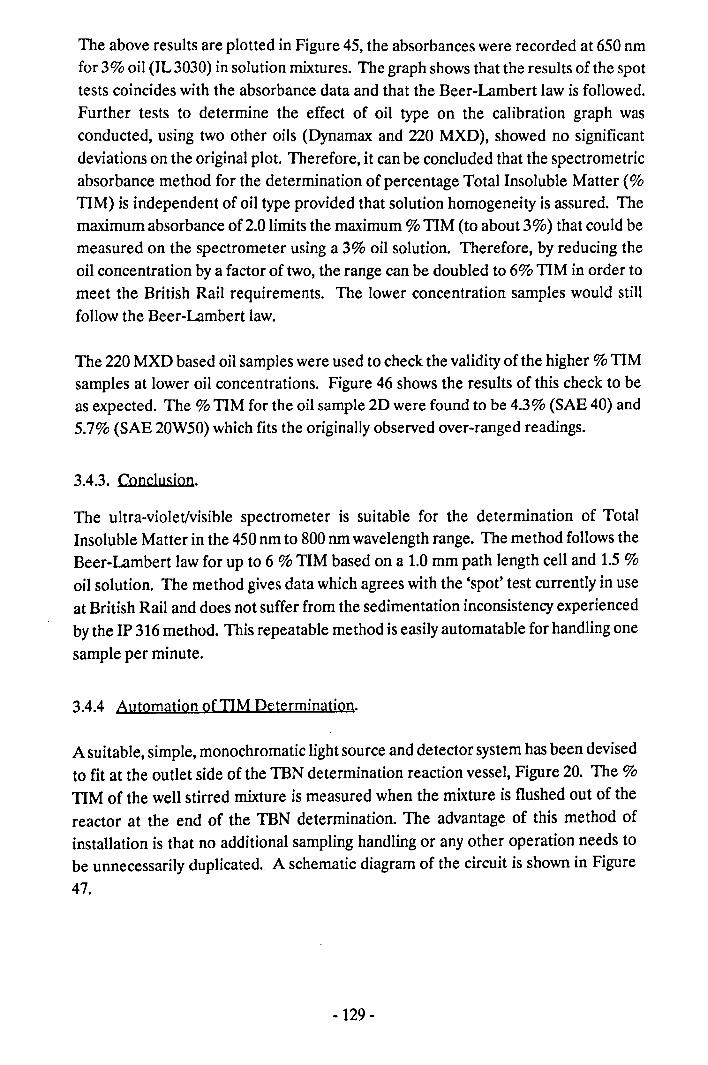
The above results are plotted in Figure 45, the absorbances were recorded at 650 nmfor 3% oil (IL 3030) in solution mixtures. The graph shows that the results of the spottests coincides with the absorbance data and that the Beer-Lambert law is followed.Further tests to determine the effect of oil type on the calibration graph wasconducted, using two other oils (Dynamax and 220 MXD), showed no significantdeviations on the original plot. Therefore, it can be concluded that the spectrometricabsorbance method for the determination of percentage Total Insoluble Matter (%TIM) is independent of oil type provided that solution homogeneity is assured. Themaximum absorbance of 2.0 limits the maximum % TIM (to about 3%) that could bemeasured on the spectrometer using a 3% oil solution. Therefore, by reducing theoil concentration by a factor of two, the range can be doubled to 6% TIM in order tomeet the British Rail requirements. The lower concentration samples would stillfollow the Beer-Lambert law.
The 220 MXD based oil samples were used to check the validity of the higher % TIMsamples at lower oil concentrations. Figure 46 shows the results of this check to beas expected. The % TIM for the oil sample 2D were found to be 4.3% (SAE 40) and5.7% (SAE 20W50) which fits the originally observed over-ranged readings.
3.4.3. Conclusion.
The ultra-violet/visible spectrometer is suitable for the determination of TotalInsoluble Matter in the 450 nm to 800 nm wavelength range. The method follows theBeer-Lambert law for up to 6 % TIM based on a 1.0 mm path length cell and 1.5%oil solution. The method gives data which agrees with the 'spot' test currently in useat British Rail and does not suffer from the sedimentation inconsistency experiencedby the IP 316 method. This repeatable method is easily automatable for handling onesample per minute.
3.4.4 Automation of TIM Determination.
A suitable, simple, monochromatic light source and detector system has been devisedto fit at the outlet side of the TBN determination reaction vessel, Figure 20. The %TIM of the well stirred mixture is measured when the mixture is flushed out of thereactor at the end of the TBN determination. The advantage of this method ofinstallation is that no additional sampling handling or any other operation needs tobe unnecessarily duplicated. A schematic diagram of the circuit is shown in Figure47.
-129 -
3.5 CONCLUSIONS (for Chapter 3).
Three new and improved oil analyses methods have been developed during thecourse of this work, namely, Total Base Number (for both JP 177 and JP 276), TotalInsoluble Matter and Water Content.
These new methods have been shown to work well for new formulated oils but moreimportantly, for used or severely abused oils as well.
The basic, proven systems has been shown to have excellent repeatability andreproducibility and further development is required to fine tune these systems forquality assurance usage/automation.
Other potential methods have been extensively examined but the three analysismethods chosen are superior.
-130-
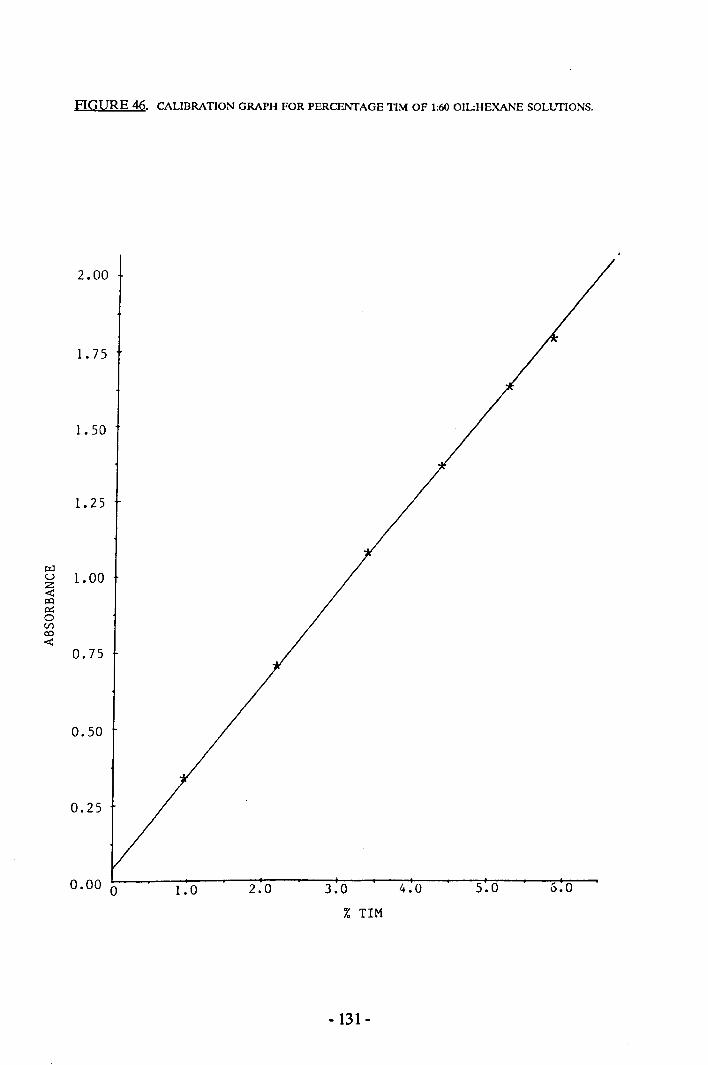
FIGURE 46. CALIBRATION GRAPH FOR PERCENfAGE TIM OF 1:60OIL:HEXANE SOLUTIONS.
2.00
1.75
1.50
1.25
0.75
0.50
0.25
0.00 0 1.0 2.0 3.0% TIM
4.0 5.0 6.0
- 131-
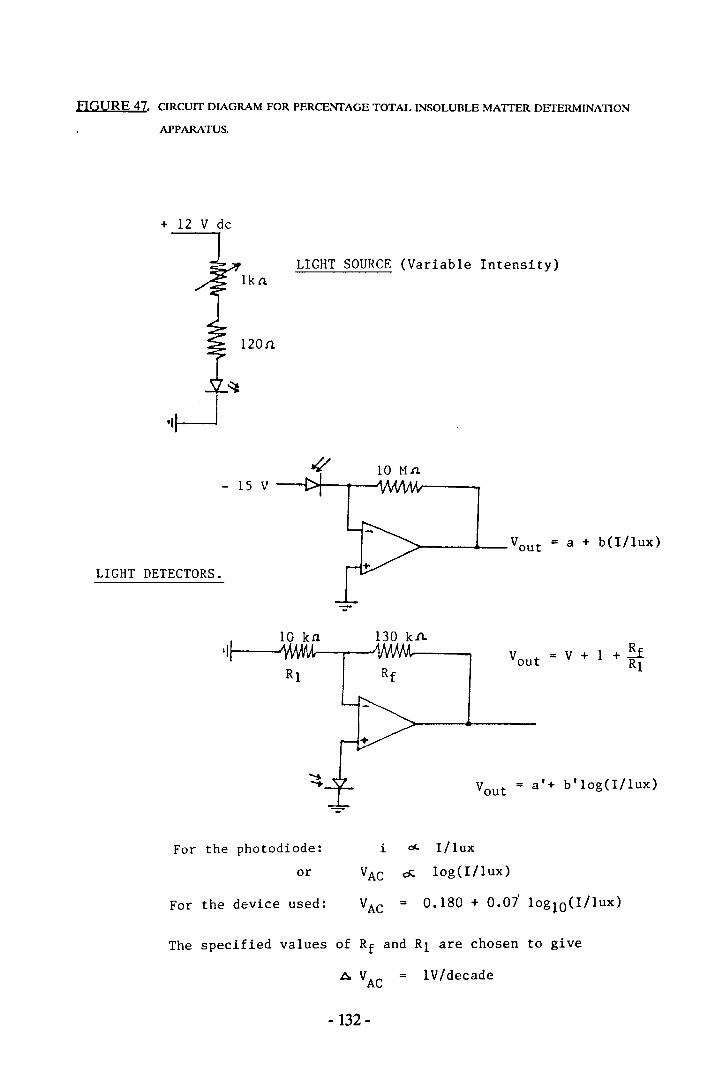
FIGURE 47. CIRCUIT DIAGRAM FOR PERCENTAGE TOTAL INSOLUBLE MATTER DETERMINATION
APPARATUS.
+ 12 V dcI LIGHT SOURCE (Variable Intensity)
- 15 V
LIGHT DETECTORS.
130k1l.V + 1 + ~RI
Vout = a'+ b'log(I/lux)
ori d.. I/lux
VAC 0:.. log(I/lux)For the photodiode:
For the device used: 0.180 + o.oi loglO(I/lux)
The specified values of Rf and RI are chosen to give
A VAC = IV/decade
-132 -
CHAPTER4.4. ENGINE TESTING.
Engine operational life has been modelled successfully for a gas fuelled reciprocatinginternal combustion engine by Hassaan [35]. Hassaan's work was based on both themechanical wear (rate), blowby and performance of the engine, and also on thecontamination and deterioration of the lubricating oil. It was concluded that theengine's service life was more of a function of cylinder liner wear limits rather thanthat of any other engine part. Hassaan's work overlooked the wearing out of anothercritical component - the lubricating oil itself. Although derating an engine from itsdesigned full power can prolong engine life, the use of a poorly suited or poor qualityoil can nullify any such gains. Therefore, in order to model or predict the ultimatelife of any engine, the engine wear must be considered in parallel with the lubricatingoil life.
This work was undertaken to determine the ultimate life of a lubricating oil as well asthat of a single cylinder, air cooled, diesel engine. The oil degradation was to bedetermined by a number of chemical and physical tests on the used oil. The enginelife was to be followed bywear measurement of components byoriginal and traditionaltechniques. The engine lubricating oil consumption was to be monitored regularly andsamples of the used oil taken for analysis. The form that the engine wear or oildeterioration would take could not be known in advance under the operatingconditions adopted, see below.
The experiment was set up by running two similar engines, under the same conditionsbut one of the engines, namely engine E2, was to receive regular servicing and oilchanges whilst the other engine was to receive only oil top-up, namely engine E3. Theformer, serviced engine is the control for the latter engine which was expected to yielddata on oil life aswell as mechanical wear rates. In order not to have prolonged testingtimes, the engines were to be operated at the peak power (1.2 kW) speed of 3000revolutions per minute.
The engine liner, piston, piston rings, valve stems and valve clearances were measuredat regular intervals. The engines were run for 10 hour periods after which the sumpoil was drained (overnight) and reused after weighing. Any oil shortage in the sumpwas made up with a measured quantity of fresh oil. The lubricating oil used was amilitary reference oil (OMD 75 specification) designated ER5D, a lOW30 oil. Theengines were run on a military reference diesel fuel containing 1% sulphur. Oilsamples (lOg)were taken during the drain down period.
- 133-
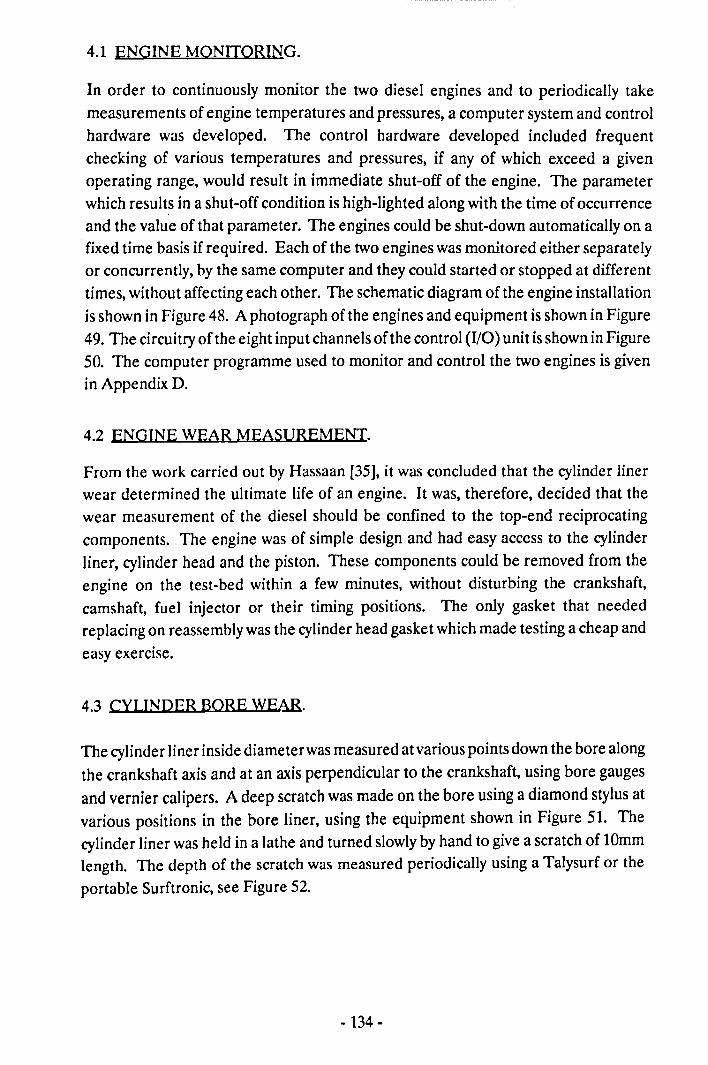
4.1 ENGINE MONITORING.
In order to continuously monitor the two diesel engines and to periodically takemeasurements of engine temperatures and pressures, a computer system and controlhardware was developed. The control hardware developed included frequentchecking of various temperatures and pressures, if any of which exceed a givenoperating range, would result in immediate shut-off of the engine. The parameterwhich results in a shut-off condition is high-lighted along with the time of occurrenceand the value of that parameter. The engines could be shut-down automatically on afixed time basis if required. Each of the two engines was monitored either separatelyor concurrently, by the same computer and they could started or stopped at differenttimes, without affecting each other. The schematic diagram ofthe engine installationis shown in Figure 48. A photograph of the engines and equipment is shown in Figure49. The circuitry of the eight input channels of the control (110) unit is shown in Figure50. The computer programme used to monitor and control the two engines is givenin Appendix D.
4.2 ENGINE WEAR MEASUREMENT.
From the work carried out by Hassaan [35], it was concluded that the cylinder linerwear determined the ultimate life of an engine. It was, therefore, decided that thewear measurement of the diesel should be confined to the top-end reciprocatingcomponents. The engine was of simple design and had easy access to the cylinderliner, cylinder head and the piston. These components could be removed from theengine on the test-bed within a few minutes, without disturbing the crankshaft,camshaft, fuel injector or their timing positions. The only gasket that neededreplacing on reassembly was the cylinder head gasket which made testing a cheap andeasy exercise.
4.3 CYLINDER BORE WEAR.
The cylinder liner inside diameter wasmeasured at various points down the bore alongthe crankshaft axis and at an axis perpendicular to the crankshaft, using bore gaugesand vernier calipers. A deep scratch was made on the bore using a diamond stylus atvarious positions in the bore liner, using the equipment shown in Figure 51. Thecylinder liner was held in a lathe and turned slowlyby hand to give a scratch of 10mmlength. The depth of the scratch was measured periodically using a Talysurf or theportable Surftronic, see Figure 52.
-134 -
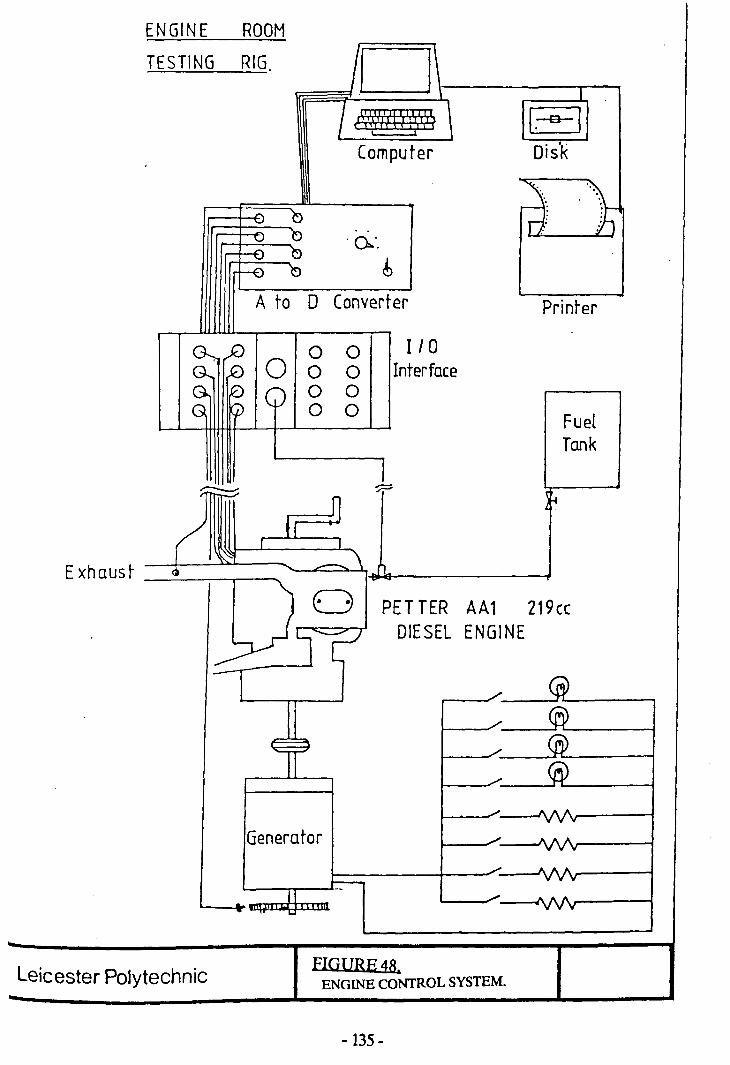
ENGINE ROOM
TESTING RIG D'-_,......----,EJDis'kComputer
'0.:.6
0 Converter Printer
0 0 I100 0 Interface0 00 0 Fuel
Tank
s=
PETTER AA1 219(cDIESEL ENGINE
Generator
Leicester PolytechnicFIGIlRE48.ENGINE CONTROL SYSTEM.
-135 -

..~a~Cl)
~1Q
~~-.~
~ ~~
~~
~U.l
~0:>
~:c~
~""N
-<~ 0cc
cc......J
.......~
...cc
'-'
~§.......'0'-'
.... ....~
~~0
G~
as-ez
..J;....
U.lQ
1flu
is
~;....
~
~
z
~ e0-,_...&>'-'
,_....'-'
- 136-
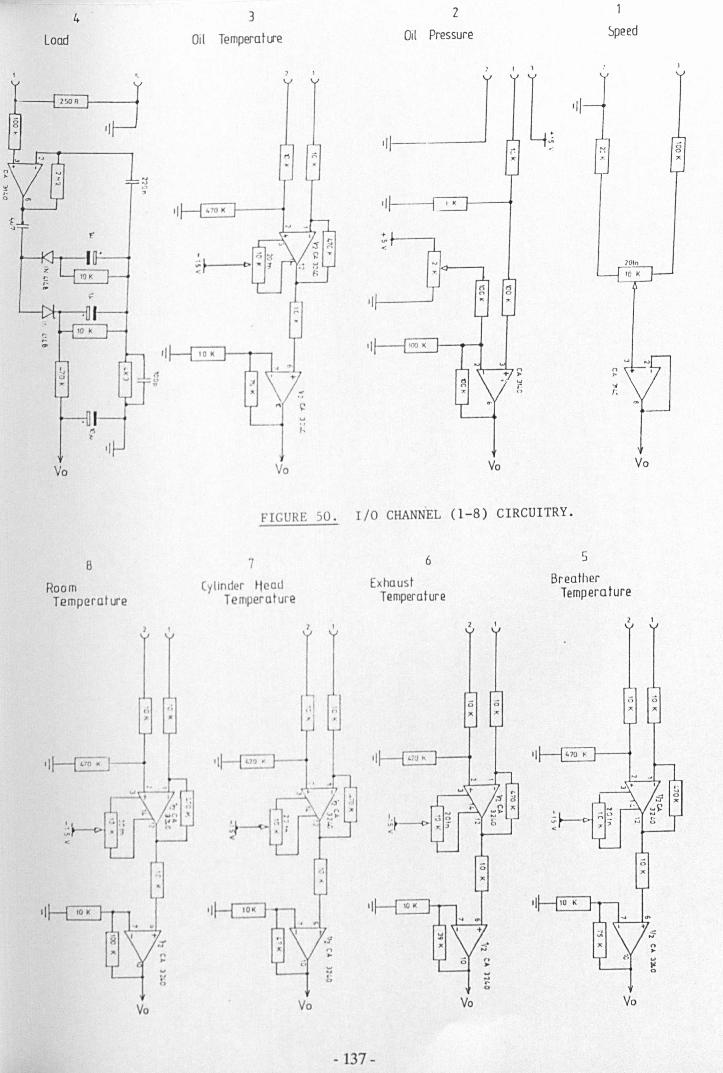
4Load
Vo
aRoomTemperature
Vo
3
Oil Temperature
2
OiI Pressure ~peed
Vo Vo Vo
FIGURE SO. I/O CHANN'EL (1-8) CIRCUITRY.
7Cylinder Mead
T mperature
6ExhaustTemperature
Vo Vo
- 137-
5
BreatherTemperature
Vo
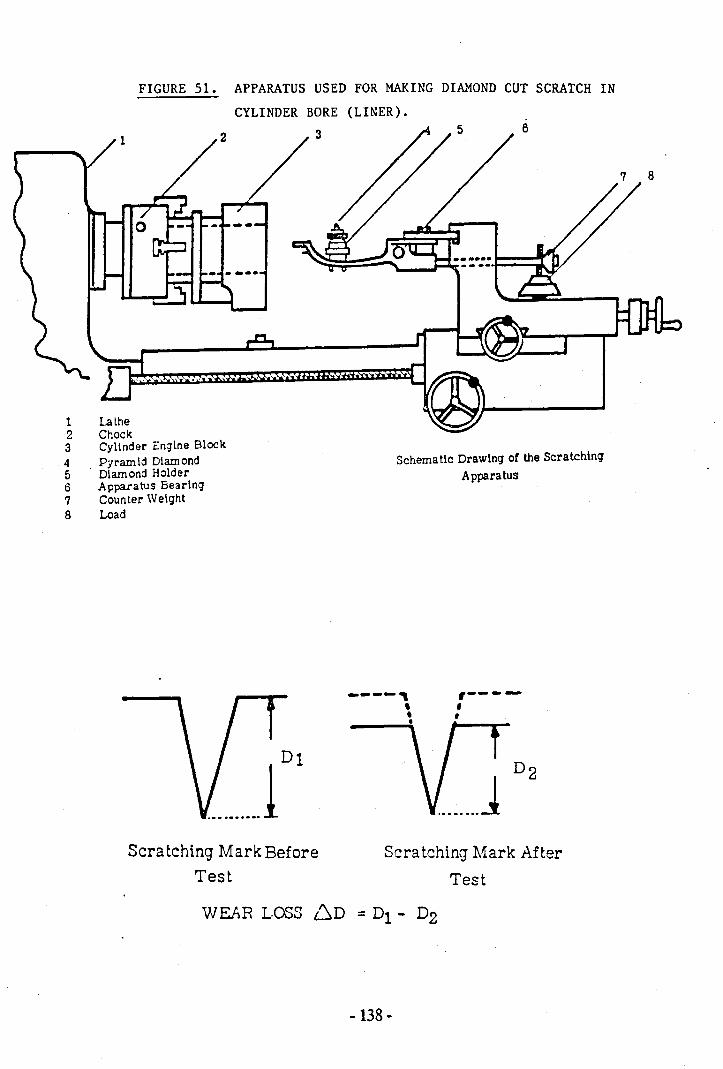
FIGURE 51. APPARATUS USED FOR MAKING DIAMOND CUT SCRATCH INCYLINDER BORE (LINER).
3 6
1 Lathe2 Chock3 Cylinder En1ine Block
. 4 Pyram Id Dlam ond5 . Diamond Holdert3 Apparatus Bearing7 Counter Weight8 Load
Schema tic Drawlng of the ScratchingApparatus
----,,••
,----,,
D2
........JScratching Mark Before
TestSera tehing Mark After
Test
-138 -
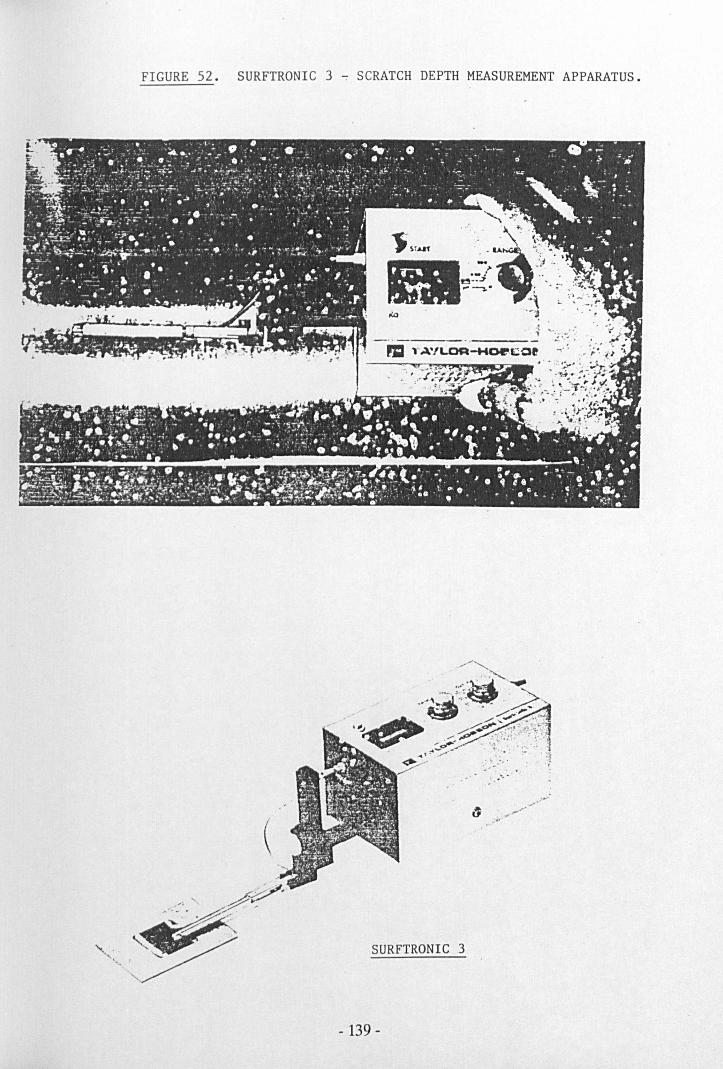
FIGURE 52. SURFTRONIC 3 ~ SCRATCH DEPTH MEASUREMENT APPARATUS.
(
SURFTRONIC 3
- 139-
4.4 PISTON. PISTON RING AND GROOVE WEAR.
Due to the high pressures encountered in diesel engines, it was decided to determinethe wear characteristics of the piston. Changes in colour underneath the piston crowncould also be assessed whilst the piston was removed, to give an estimate of thetemperatures experienced in that region. Wear measurement of the piston rings andring-grooves can give information about performance losses, oil consumption andblowby flow rates.
4.5 ASSESSMENT OF ENGINE CONDmON.
The condition of the engines could be assessed from examination of the abovemeasured components. The best indicator of engine condition was, however, notsolely due to the condition of the liner wear factor, but equally, a function of oilconsumption control. Liner wear, as shown by the removal of metal near the top ofpiston-ring travel area, was observed to increase with operational time. Theunexpected polishing and scuffing of the liner resulted in premature loss of engine oilconsumption control. This polishing of the cylinder liner is the result of the high (1%)sulphur content of the fuel, the poor oil quality and the operation of the engine at thedesigned maximum output. These characteristics determine the ultimate life of theengine and renewal of these components would be necessary to overhaul the engine.
4.6 OIL CONSUMrDON.
Loss of oil consumption control depends on the sealing efficiency of the piston rings,the smoothness (oil retention ability) of the liners and of the valve stem, valve guidesand seals. These components determine the economically useful life of the engineprovided that unexpected catastrophic main or big-end bearings failures do not occurfirst. Loss of oil consumption control can impair engine performance due tounacceptable oil levels and high oil consumption may result in legal andenvironmental infringements as well as the cost of frequently making up for the lostoil.
4.7 OIL ANALYSIS.
The oil samples generated by the diesel engine was analysed using both chemical andphysical test methods. The physical tests included viscosity determination at 100 of(37.8 °C) and at 210 of (98.9 °C), oil blackness, oxidation (FTIR) and total insolublematter determination. Chemical analysis of the oil included TAN, TBN, wear andadditive elements (Ca, Zn, P, S,Na, Cr, AI, Pb, Fe, Cu, Ba, Si), viscosity index improver
-140 -
degradation, oil oxidation and volatility.
4.8 RESULTS.
4.8.1 En~ine Wear.
The engines (E2 and E3) initially consumed oil at a high rate at the beginning of the. running-in. The oil consumption, measured as a percentage of oil charge of the sumpand also as a percentage of the fuel consumption, gradually decreased during running-in and settled to a value lower than the 8% (per ten hours) level recommended by theengine manufacturer. After 350 hours of engine operation, the oil consumption of.engine E3 began to increase steadily, up to 50% (per ten hours) at 550 hours, anunacceptably high level, Figures 53 and 54.
Various measures were taken to try to reduce the oil consumption of engine E3. Figure55. In turn, it was thought that the oil was leaking down the valve stem as a result of. increasing wear. Comparative measurements of the installed and new valve stemsshowed no evidence of excessivewear of the valve stems or the valve guides. A simpleleak test comparison between the existing engine (E3) cylinder head and a newcylinder head showed an approximately doubled rate of leakage of the worn cylinder
. head when compared with that of the new cylinder head. Valve stem oil-seals werereplaced on the existing cylinder head after which the oil consumption rate, per tenhours, initially decreased to 30% from 50% before increasing again. In turn, thecylinder head was replaced, then the piston and rings were replaced, all of thesechanges having only a small or temporary effect on oil consumption. The conclusionwas that the cylinder bore had become 'polished' or 'glazed' in 550 hours running.
Table 32 and Figures 56 and 57 show the surface metrology analysis of the cylinderbore or Engine (3), for two positions, one sample trace obtained on the worn (top,thrust) side of the bore, the other on the originally machined, but unworn part of thebore, below the lowest. travel limit of the piston. From the traces obtained and fromthe surface analysis parameters, it is clear that the bore is very much smoother after550 hours than when it was originally installed, as shown by the unworn part of thebore. The diametral wear of the bore is shown in Figures 58 and 59. Moreover, thepattern of wear for the original set of piston and rings, Figures 60, 61 and 62, do notshow any excessive wear (rates) and would, therefore, not be the cause of theconsiderably high oil consumption. It was concluded that the bore wear andsmoothness was the cause of the excessive oil consumption after 550 hours runningwith only oil make-up, no oil changes being made.
-141-
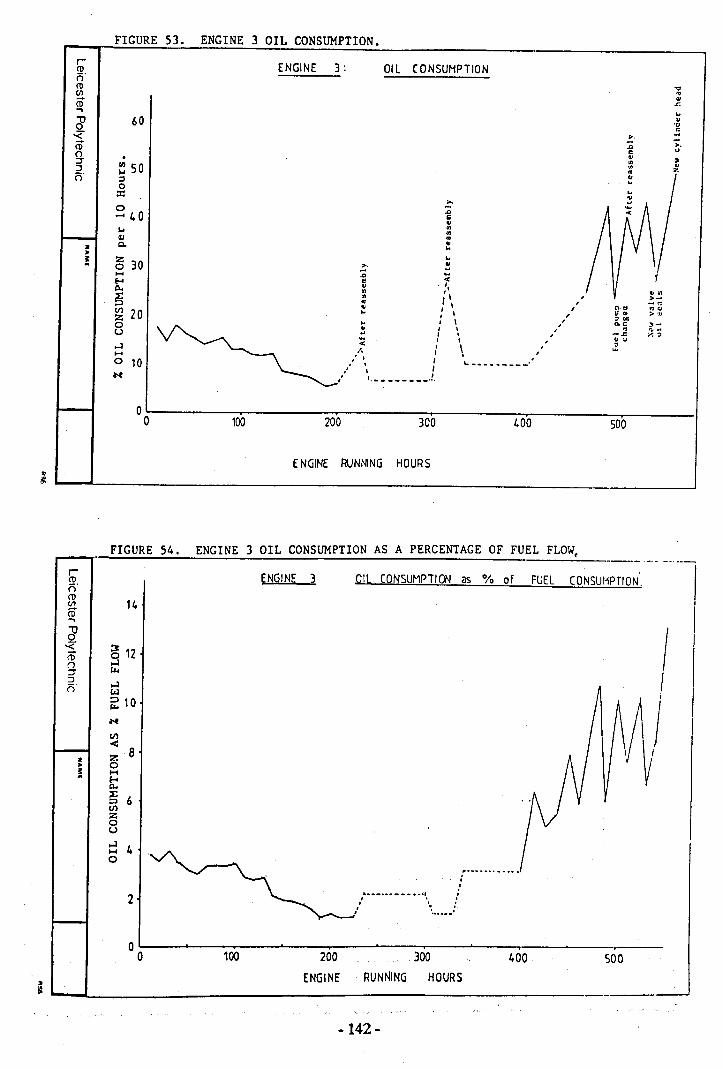
FIGURE 53. ENGINE 3 OIL CONSUMPTION.
r- ENGINE 3 : OIL CONSUHPTIONCDi'j'CD "0en ..CD "or._, ...~ 60 ..
'CC-< >. ..
ro >,Cl u
tr . :a::l ~ 50 ";7.i'j' ='0
:I:>.
0 oD- 40 eII
loo.,<II
III ..a P- OI
• ..! z 30 ..
0 >. s-.... oD owE-< E <~ II . ,',
"~ .."
,.. ,Cl) 20 ..
I ', 0.."
Z..
I I , e"~000 .. I I ,, Q.C 3-U !: I \ , .. "'~I . -.<: ;.o:~.... , I , .. u,.J < , \ , ~.... I, I , ...0 10 :. I ... - ........ --- _'
,.\ I
N , '.•_------,!.I
0 0 100 200 300 1.00 500
ENGINE RUNNING HOURS
FIGURE 54.r-et>f)'et>
14(/)
CO..."J-< ~ 12COo ,.Jzr to.::l
,.JR 41~ 10N
Cl)
<z z 8• 0! ....
E-<p..
~ 6Cl)
z0u,.J 4....0
2
00
:0g:
ENGINE 3 OIL CONSUMPTION AS A PERCENTAGE OF FUEL FLOW.r---r'-__;""';;~"';;'_;;"'__;~=_':;_~;__:_;~----------._:_":",::,,,:,_,:_-.---.,- .-.. --,.-~
ENGINE 3 OIL CONSUMPTION as % of FUEL CONSUt1PTlON,
~.- ... · ...··oo ........:
, ••• _ ••• --- •• '1, .,'. ," ~'''..--'
100 300RUNNING HOURS
200ENGINE
400 500
-142 -
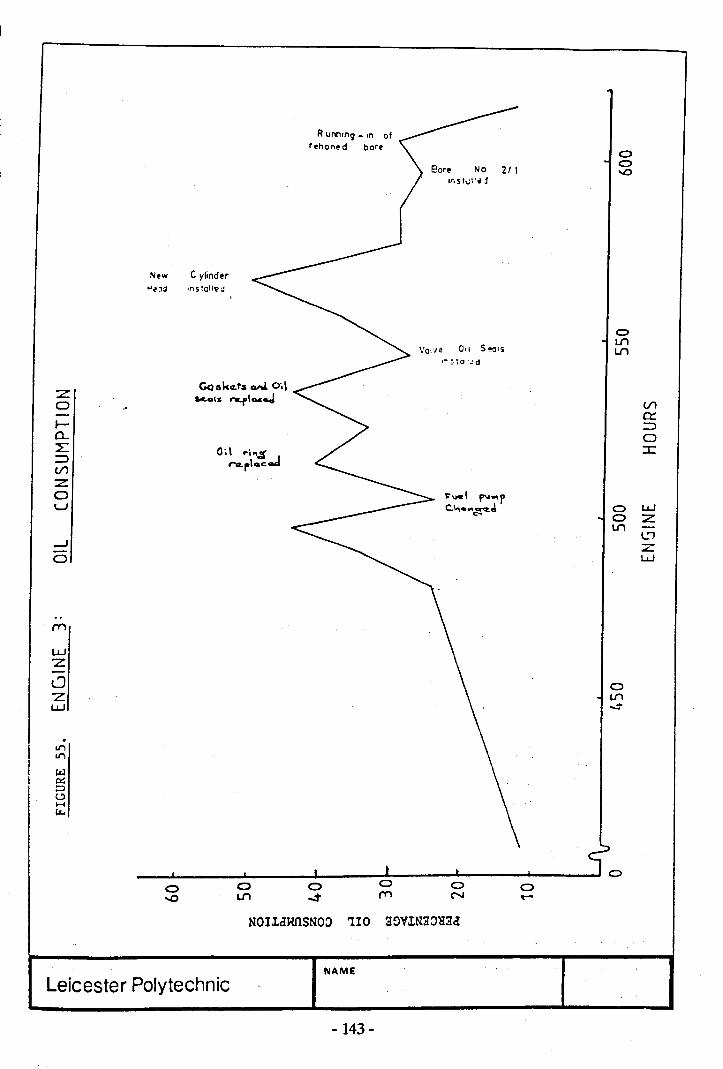
R UM'"9 _ ,n ofrl!ho"l!d bore
No 211'''51,;1 '01 j
New Cylinder"tJ~ instcllt>~
00,1 S.-o' 5
lI'llI'l
,,..~to·',.:d
:z GQokcz.tsW 0',1
0 kols rc.r1.....J (/)
I-er.:::>
0... 0L: 0;\ "i'\1..J :I::=> ,...lZ.r1o.c(/)
:z0 ~_I """",.U c."' .....~J C> w
0 ZlI'l
....JL'"JZ
0 w
('\""I
WZ-LJ C>Z LJ'lW ~
.11"111"1
W~::J'-'H~
oU"'I
NOIldHOSNO~ 110 a~VINa~~ad
Leicester PolytechnicNAME
-143 -
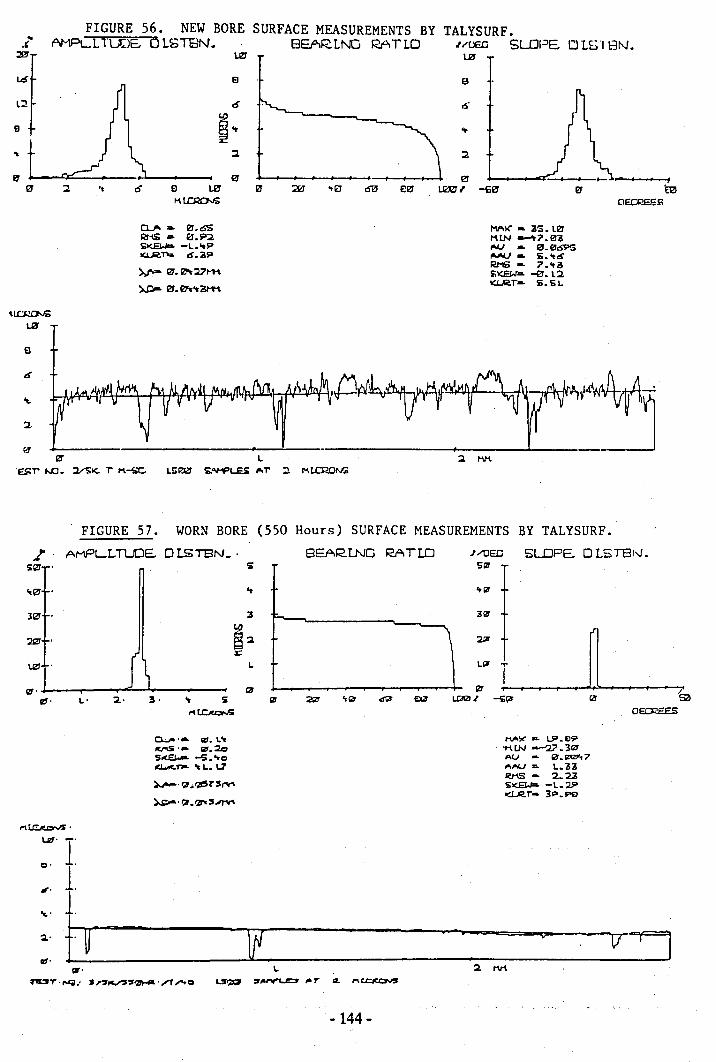
FIGURE 56. NEW BORE SURFACE MEASUREMENTS BY TALYSURF.AMPLL TUlS OLST8N. BEARLNG RATLO UUE.O SUJI::>E.DLS'IBN.
U'1U!I'
El
15
§~:l
127:2. 't 15 El l2l' IIJ
Q._JII,... IIJ. CSSRNS'" er.~~ -L.'tPICL,R.-r... 6.:ilP
:>.t- 127. 0't Z'I'M
~ er.0'tlt:aM't
HAl(" .. lIS.ll27KIN --'t?127l!fI'tAJ .. 127.0695""tAU __ S.'t6RMS" ?'tiSbK.EWA -0. l:lKUi!.r- S. s L
El
FIGURE 57. WORN BORE (550 Hours) SURFACE MEASUREMENTS BY TALYSURF •.1' ' AMPLLTUJE. DLSTEN_, BEARING RATto J/OE.O 5LDPE.. OLSTBr-..I.
L
I9<'
1127
~,~---~------~~~------~----~111' L' 2" J' It $ ~
0.:".. ,__ fiD. L't
~'''' fiD.2Ds.ca-. -s. 't 0lC1..iIC.no. "L. L1
~,t;lJ.t;ZI5r'f'V'
~, t;lJ.':ZJ'I5J1"V'
HJOo~ ... L.P.£)9, 'H. IN ----2? 3Ci1
AV - 1iJ.1<'CZ"t7AI'U'" L.lIl1RMS -- 2..2.6S~ -L.29'IdR.r- lp.PO
f'\~,
lJz1' I0' l.~,
1.'to'
M2"
rd'
v=
'8'~T', rJ'fl.' "~fC.I"SS'llH'l· /T ......O
-144 -
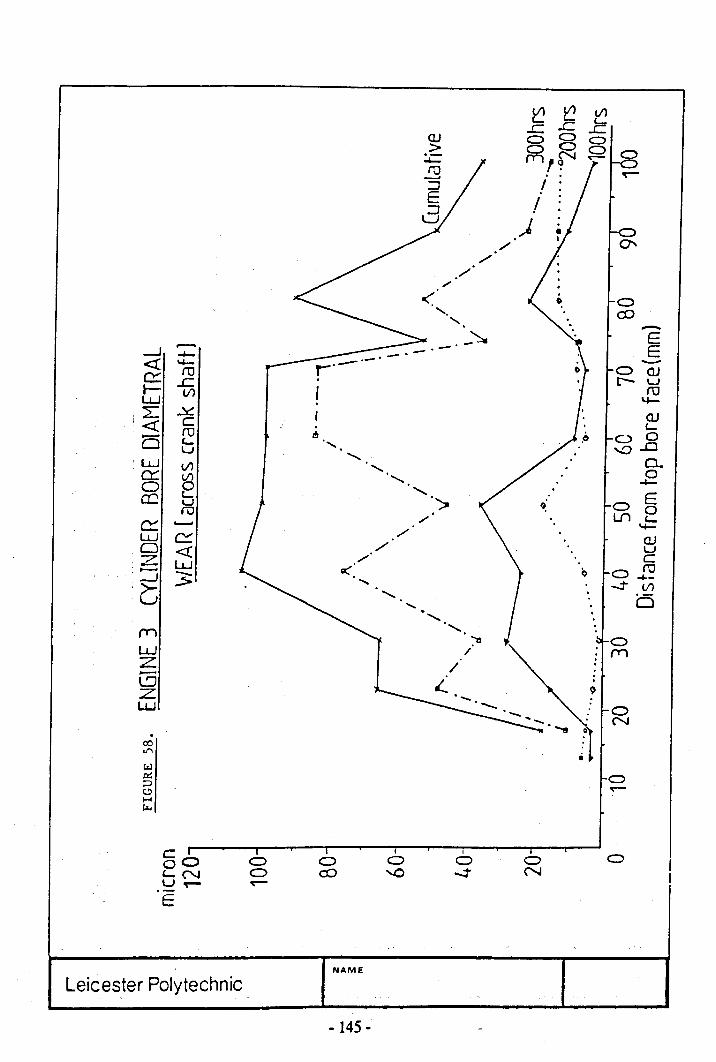
_J .._<t ~c:: rox:t- V')LW:L ~<t c
roCS '-uLW VIa: Vi0 eCO wroc::: ..........w c::::0 <tZ w...-_J -r .s-u
('T"'I
wZ-~ZLW
.00LI'\
t<l~::;I0~~
§O 0'- N 0.~~ ~E
6
" <,<,
<,<,
'>./
/',/
/'g(
" <,
" <,<,
-OOJr- wro4-
OJL-
oa-..0..0
Cl.E
o §LnJ::
OJuCro....--:tV1b
I
o'-0
Io...j"
oN
ocD
NAME
Leicester Polytechnic
- 145-
ocD -E
E
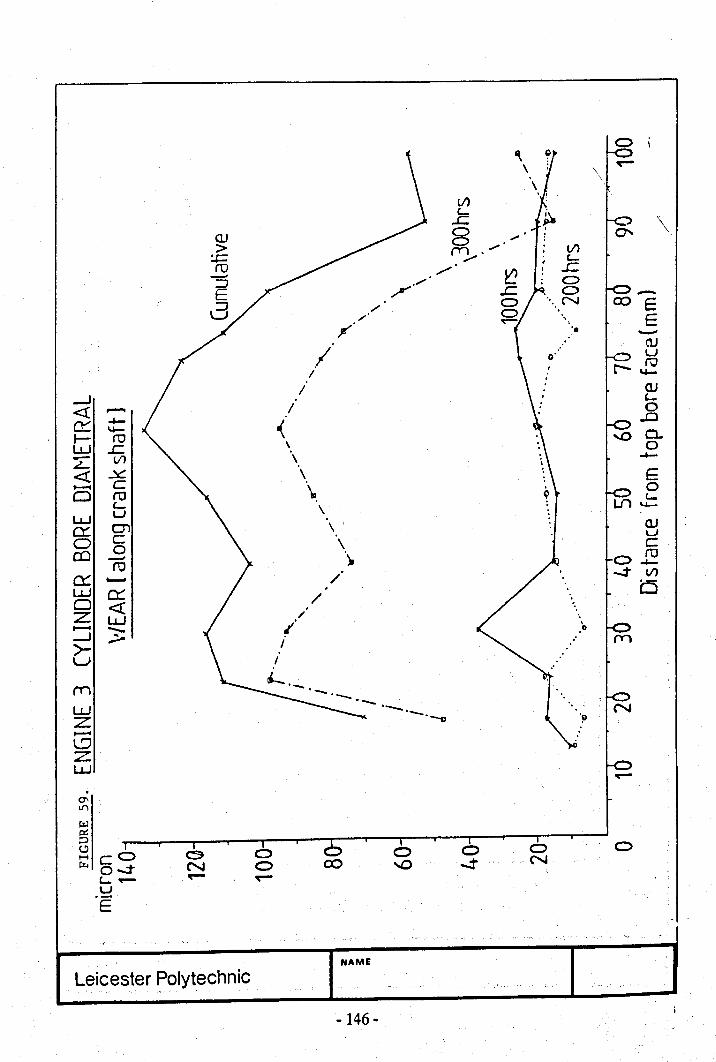
l/)'-...c \8 ...("II , .", l/)..... C-
/" s:_"r/ 0
0/'
",N,/ "
",:. -
,I aJQ' U
I, ro
"I-
_.J/ OJ
« _... /'-
.._ 0
0::: \4- -(..0
t- ro ci,
w s: \ 0- Vl \L-_._
« ~ \ E~ c
"'-Cl ro 9 0
'- L.f)~
w u \
er: c:n \ OJ0 c \
wCO 0 c- ~ 02ro0::: ....... /
. -:t VI
W er: 00 <I:
/ "
Z W /
~ 3: ,J' 0_.J
>- i "
wrnw .--........ ___Z -., '"---l:JZw.0'LI'I
Wp::::JC,!) 0H~ co
~ ~
NAME
Leicester Polytechnic
-146 -
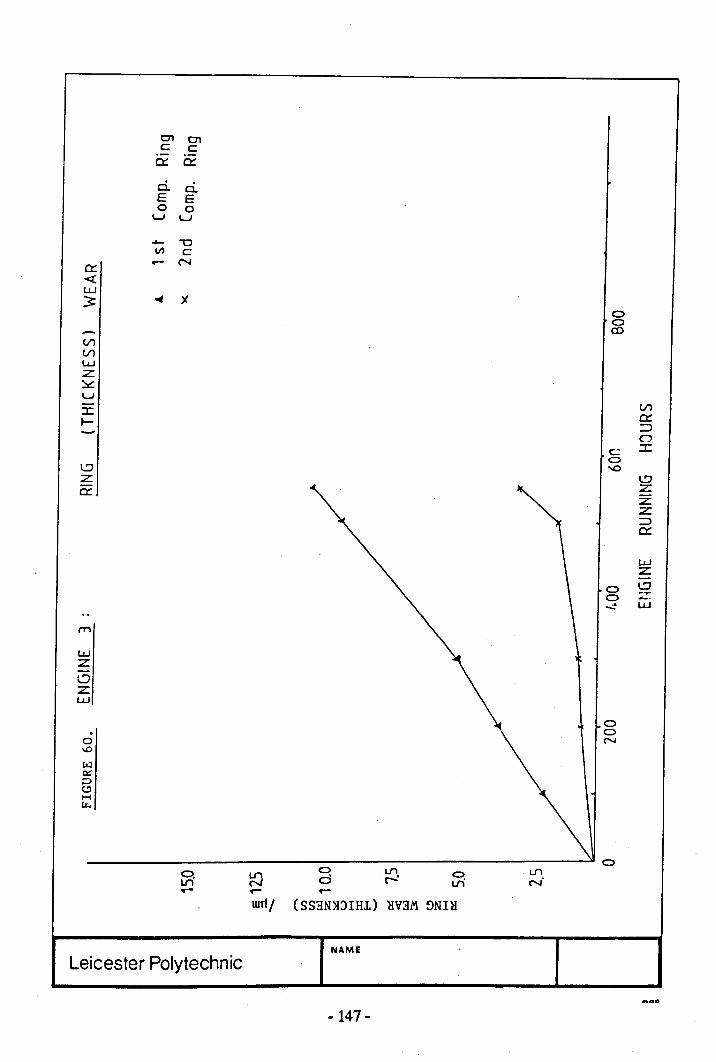
O'l 01c: c:e::: e:::ci Cl.E E0 0w w
..... "0
'" c:0: - N
<tl.L.J
3 ~ x00co
(/')
U1l.L.JZ~u:I: U1l- e:::
~(")
c; :I:0
l!J -.0Z l!Jc::: Z
Zz~c:::
LWZ
0 l!J0 Z.~ LW
(T"I
l.L.JZl:lz;LW
0. 00 N\0
t<J~~(.!)~~
--------------------------------------------------------------~ 0od-O.
IJ1- oui
wri/ (SS3N~~IH1)EV3~ ~NIE
NAME
Leicester Polytechnic
- 147-.....
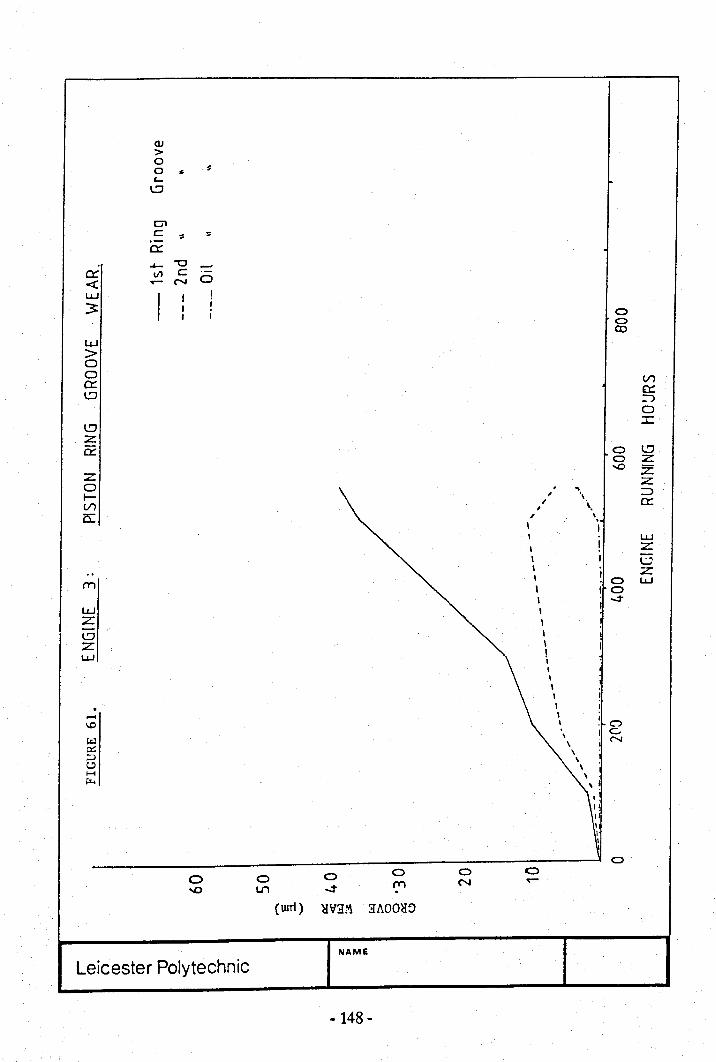
QJ>00 .. 1c....l!J
Ulc " ",-0::...._ "0 --0:: c.n c .-
-c .- N 0li..J I I !:> I
,I I 0
0CO
W>000:: Vl
l!J0:::J0
I.!:J::r::
z0::: 0 I.!:J
0 Z
Z-.0 Z
0Z
l-. '" =>,
\
VlI \ c:::
0:,, \
I I, li..JI I ZI I -LJ,. , z
m I I0 W
I , 0W
I I ....:t
ZI
- I
l:J I
Z I II.L.J !,, I,
I iI. I I...... I
'", I
Cl. I c..~ \ N~ \
;:J,
l:)\
1-1\
~,\ ~I.
"",I,0
0 0 0 0 0 <::)
(T'\ N .-'" ~ ....:t
(wrl) ~V3.:'1 3AOO~!)
NAME
Leicester Polytechnic
-148 -
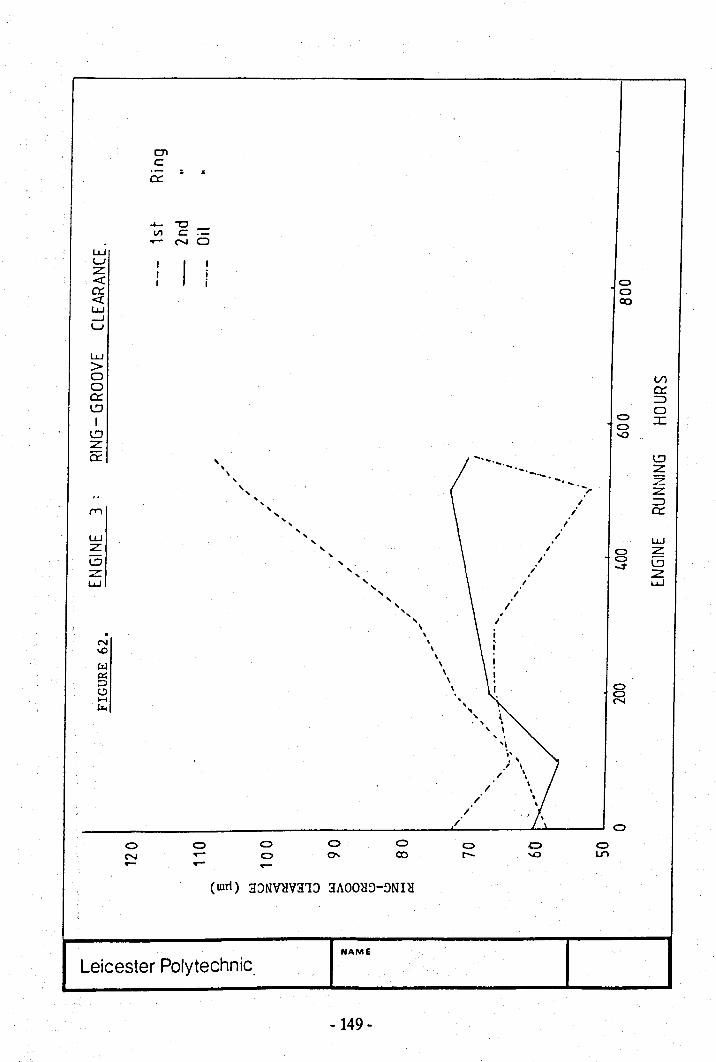
ClC.- ~ s0::
..... '"'0 -c.n c .-..- N 0WW I I IZ , i-c , i 0er: 0« COw-.lW
W
>0 V10 er:0:: :::>l.:J 0I 0 ::r:0
l.:J -.0Z0: , .................. l.:J, ...... _._ .... Z\ , Z
" " 'r z.. , :::>, I(TI
, i 0::,.., I..W
, I
Z, w, I 0 Z- ,
L:l , I 0 L:lZ
, ,. ...t2.. .
w , ,. u.J,, ",, I.... ,, I,i. \
N \ '.\0 \ I
\ ,W \
~ ,I
0 \ .c.!) \ I 0
0H , N~ ,.., I, ., I...
'It'.,, \
"\\
/\\
/ \\
/ ../ .. <::)
0 <::) <::) <::) <::) 0 .0 0N ..- <::) 0- CX) r- -.0 LrI~ .... ...-
(wrl) 3:JNV}{V31:J 3AOO}{D-DNI}{
NAME
Leicester Polytechnic.
-149 -
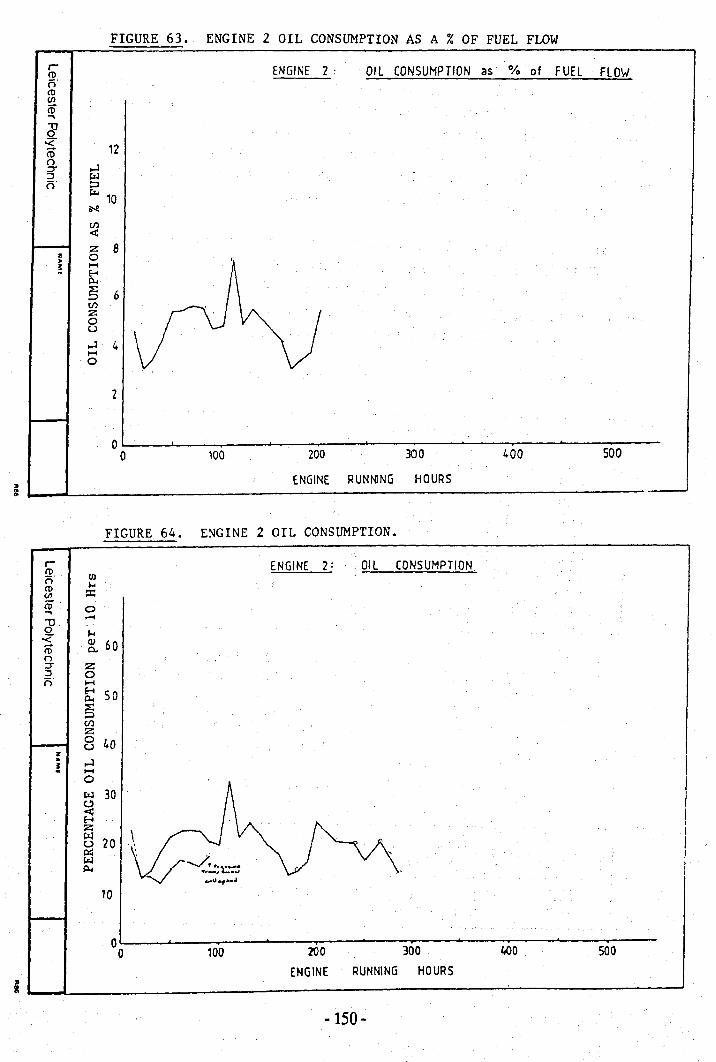
FIGURE 63. ENGINE 2 OIL CONSUMPTION AS A % OF FUEL FLOWr ENGINE 2: Oil CONSUMPTION as % of FUEl FLOWroo·ro(flco...,"8.z 12coo
,..J::J"::l Wo· ::>
~ 10or-eCl)
<z Bz 0~
! Hf-'Il<
S 6Cl)z0u,..J 4H0
2
0300 400 5000 100 200
ENGINE RUNNING HOURS"~
FIGURE 64. ENGINE 2 OIL CONSUMPTION.
r ENGINE 2: OIL CONSUMPTION.ro U)0ro ""C/I ::=CD 0..., -d' "".z ~ 60CDozr Z::l 00 H
E-I SOp..
SCl)z0 40uz~ ,..J! H0w 30~E-IZ
\w 20up::wp..
10
0100 200 300 l.oOO 5000
ENGINE RUNNING HOURS"I
-150-
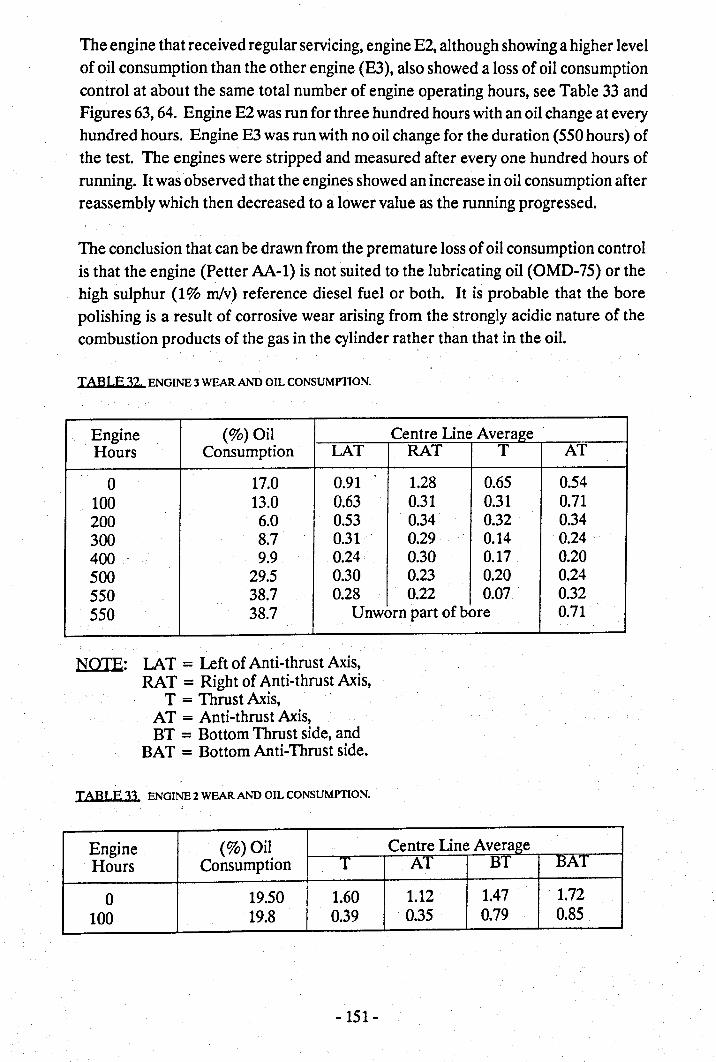
The engine that received regular servicing, engine E2, although showing a higher levelof oil consumption than the other engine (E3), also showed a loss of oil consumptioncontrol at about the same total number of engine operating hours, see Table 33 andFigures 63, 64. Engine E2 was run for three hundred hours with an oil change at everyhundred hours. Engine E3 was run with no oil change for the duration (550 hours) ofthe test. The engines were stripped and measured after every one hundred hours ofrunning. It was observed that the engines showed an increase in oil consumption afterreassembly which then decreased to a lower value as the running progressed.
The conclusion that can be drawn from the premature loss of oil consumption controlis that the engine (Petter AA-1) is not suited to the lubricating oil (OMD-75) or thehigh sulphur (1% m/v) reference diesel fuel or both. It is probable that the borepolishing is a result of corrosive wear arising from the strongly acidic nature of thecombustion products of the gas in the cylinder rather than that in the oil.
TABLE 32. ENGINE 3WEAR AND OIL CONSUMPTION.,
Engine (%) Oil Centre Line AverageHours Consumption LAT RAT T AT
0 17.0 0.91 1.28 0.65 0.54100 13.0 0.63 0.31 0.31 0.71200 6.0 0.53 0.34 0.32 0.34300 8.7 0.31 0.29 0.14 0.24 '400 . 9.9 0.24 0.30 0.17 0.20500 29.5 0.30 0.23 0.20 0.24550 '38.7 0.28 0.22 0.07 0.32550 38.7 Unworn part of bore 0.71
NOTE: LAT = Left of Anti-thrust Axis,RAT = Right of Anti-thrust Axis,
T = Thrust Axis,AT = Anti-thrust Axis,BT = Bottom Thrust side, and
BAT = Bottom Anti-Thrust side.
TABLE 33 ENGINE 2 WEAR AND OIL CONSUMPTION.
, Engine (%)Oil Centre Line AverageHours Consumption T AT BT BAT
0 19.50 1.60 1.12 1.47 1.72100 19.8 0.39 0.35 0.79 0.85
- 151-
The unexpected, premature and extensive nature of the bore polishing rendered thefurther testing of the oil degradation investigation useless. The high rate ofreplenishment of the used oil in the sump with fresh oil (make-up) would mask anynoticeable oil degradation from being observed. It is for this reason that further oiltesting was stopped in favour of furthering the oil analysis techniques for thedetermination of TAN, TBN, water content and Total Insoluble Matter, and theautomation of these analyses.
4.8.2 Engine Oil Analyses.
The oil analysis results for each of the engine test runs 2A, 2B, 2C, 3A, 3B, 3C and3DEF are summarised in the tables 34 to 40, respectively. The trends of each of theoil parameters is discussed briefly below.
IBN. The TBN (IP 276) values diminish to a stabilised value of about 4.5 mg KOH/gand are consistent for all test runs. The period bywhich time stabilisation of the TBNvalue occurs is approximately 30 to 40 hours of testing.
TAN. The TAN values on the other hand, generally rise rapidly to a value of 1.9mgKOH/g and thereafter tend to rise at a reduced rate.
Viscosity. The viscosity at 20 °c and 40 °c generally increase with time whereas the100 °c value decreases with time. The level of oil consumption, and therefore, theamount of top-up, moderates the changes in level of the viscosity.
Zinc and Phosphorus. The difference in amount of zinc and phosphorus levelsappeared to remain in constant proportion through all the test runs. The levels ofthese two elements increased linearly throughout the test runs.
Imn. The iron levels showed greater percentage change in levels than any of the otherwear metals. Its general rising trend during a test run was moderated only by high oilconsumption.
Other Metals. In almost all cases and for all test runs, the amounts of metals generallyincreased with time.
Oil Blackness. The intensity of the blackness quality of the used oil increased withtime and was moderated only by high levels of oil consumption.
-152 -
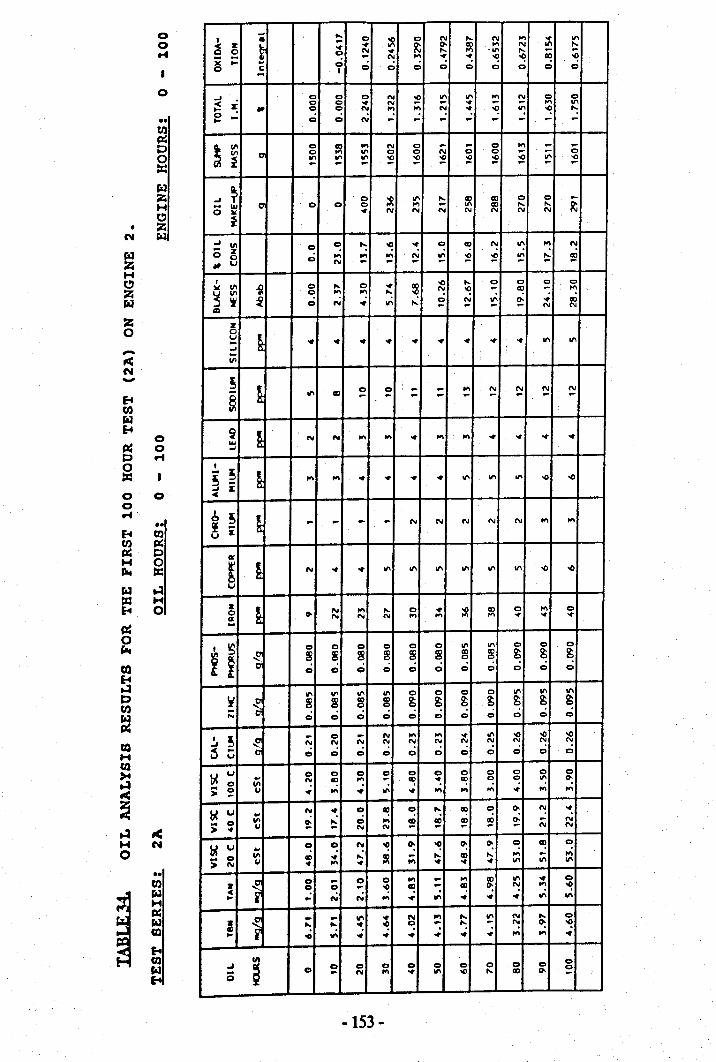
00pt
0
••CIl~t:>0:r::r.l~....Cl
• ~N W
~....Cl~~Z0-~N-~CIl~~
0~ 0t;) pt
0
==0 00pt
••~ et)
CIl ~~ t:>.... 0Il!of :r::~ ..:l
==....
E-t 0
~0~caE-t..:lt:>CIl
~Ctl....til>tM~~~ fICH N0
••til
~
WM~WCD
- ....,i - Cl ~ Cl N .... N .... ~ ."
< Z ~ ~ RI 0- 00 .... N '" ....0 0 Cl N ~ .... .... .." ,.._ - -x - - N .... ~ ~ "! "! Cl! "!.... 0 0 0 00 c , Cl Cl Cl Cl Cl Cl-...J Cl Cl Cl N ~ ." ." .... N 0 Cl
< s: Cl 0 ~ N - ~ - - .... .".... .. Cl 0 "! "'! .... "! ~ "! ~ "! "':Cl - 0.... 0 N - - - - - - - -~
11\ 0 ~ .... N 0 - - 0 .... - -'" 0 0 ." 0 0 N 0 0 - - 0
~ It' It' ." ~ ~ ~ 0() ~ ~ '" 0()- - - - - -...J ~
CI10 ~ ." .... ~ 00 Cl 0 -
0 IU 0 0 0 .... .- 00 ,.._ .... RIiOC ~ N N N N N N N
~...J '" c:: "': "! • c:: Cl! "! ~ .... "!0 0z NCl C ... .... '" ." 0() ~ ." .... ~.. U N - - - - .- - .-
I '0 ,.._ Cl Cl 0 Cl~ 11\ ~ 0 .... 0 • ~~ '" c:: '" "'! .... "! "! - 00 - "'!..J ~ ~ 0 N • II' ...: Cl ~ .,; ~ ~ 00
CD - - N N
Z0
~u- .. • ~ • ~ ~ • • ~ '" ."...J-'"~
~0 0 - - .... N N N N
~II' II) .. - - .. - - .. .. ...
~ § N N ... ... ~ '" '" ~ ~ ~ ........J
,~~
~ ... .... ... ... ... ... ." '" '" '0 -0
< i
6 ~ § .- .. .. .. N N ....!! i
N N N '"U
0<
~~N ... ... '" ." ." '" II' ." '0 '0
U
Z
~N '" .... 0 • ~ 00 0 .... 00 0-
0< N N N .... '" .... ~ ~ ~-, i ~Cl 0 0 Cl 0 0 III '" Cl Cl Cl
~~ ~ ~ ~ ~ ~ ~ 00 ~ ~ ~~Cl Cl 0 C 0 0 c 0 0 0 0
~II' '" '" '" Cl 0 0 0 II' '" '"I' ~ ~ ~ ~ ~ ~ ~ ~ ~ ~ ~
N C Cl 0 C Cl 0 Cl Cl 0 0 Cl
I
~ ~ - 0 .. N '" .... ~ II' -0 -0 -0..J N N N ~ "! "! N "! N ~ "!~ v c; Cl C Cl Cl 0 0 0 0 0 Cl 0
b! u .. Cl 0 0 ~ Cl 0 0 0 0 0 0
Cl '"N Cl) .... Cl! ~ Cl! 0 ~ ~ 0:... 0 1.1 ~ ,..; ~ .,; ... ,..; '"
..; • .... ....> -b! u .. N .. 0 Cl! 0 .... Cl! c:: 0: "! ~... 0 '" ~ .... c '" ~ 00 II) 00 ~ ... N
> .. 1.1 - N N - .- N N
b! u .. c:: c:: "! "! 0: "! 0: 0: c:: Cl! 0
s: 0 11\ lID ... .... ~ - .... lID .... .... - ,..;N 1.1 .. '" .. .... • • .. ." ." II'
j Cl .. 0 0 .... ... .... 00 II' • 0z Cl 0 - "! II) ... Cl! 0: "! "'! "!« N N .,;~ .- '" ... ~ • • '" '"z
~
... ... '" ~N ... .... '" N .... 0
.... .... • 0 .. "': .- "! 0: "!III .,; ~ ~ .; .;~ -0 • ... ... '" •oJ ; Cl et Cl et 0 Cl 0 Cl 0 0... Cl - N .... ~ '" -0 .... II) 0- Cl
0..
·153 -
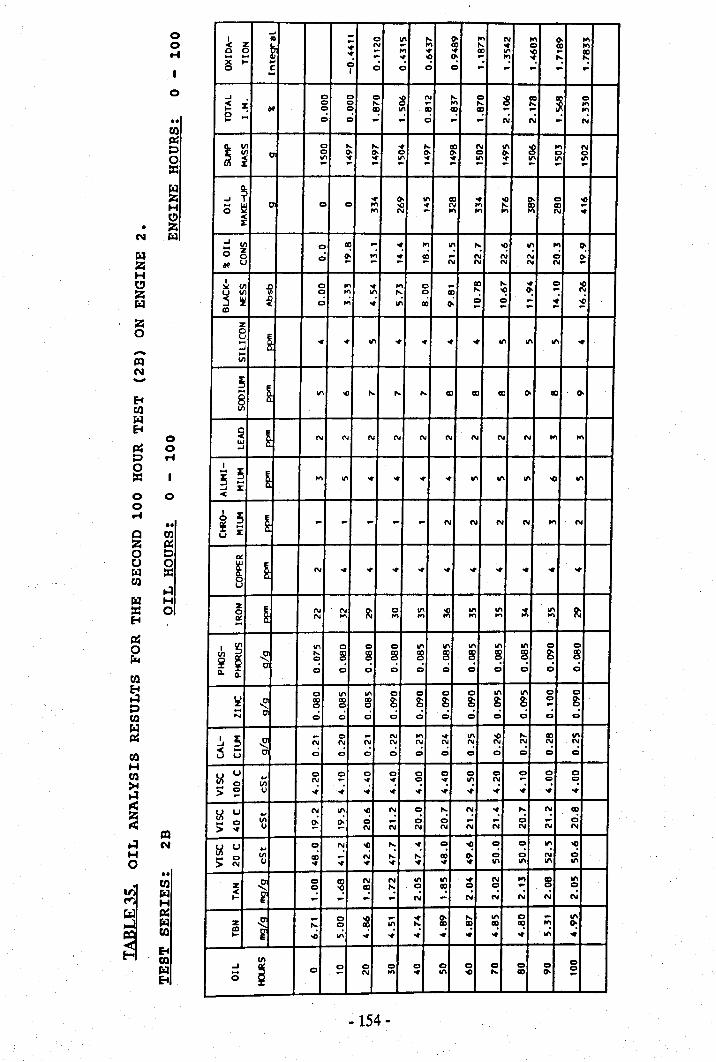
00
"0
00
til~t;)0
==r.1liZ<He
• liZ<N ~~ZHt!)Zr.:I
Z0-~N-E-ttilr.:IE-t
0~ 0t;) "0
==0 00
" ••0 tilZ ~0 t;)CJ 0~
==til..:I
r.1 H
== 0E-4p;0~tilE-4..:It;)tilr.:I~tilHtil)04..:I~~
~..:I NH0 ..
tilr.:IHi p::~to
~ E-4tor.:If4
oJ ...~ z i ... C 11\ I:i 0- ... N ... 0- ""~ N ;;; CID .... ~ C CID ""a a ~ ... ~ ~ ~ ~ ... CIDX j: Q
... ~ "! 0: ... .... to;... Qa c I c 0 0 ... ... ... ... ........J 0 0 0 ;g N .... 0 ;g CID
~0-c ~ 0 c .... ... ... .... .... ...
I- .. "! c Cl! ~ CID Cl! Cl! ... ... ...a .. Q N NI- 0 ... ... 0 ... ... N ...
~III 0 .... .... ~ .... CID N 11\ ~ "" NIII C 0 0- 0- 0 0- 0- 0 ~ 0 0
~ 11\ ~ ~ 11\ ~ ~ 11\ 11\ 11\ 11\... ... ... ... ... ... ... ... ... ... ...
...J ~0
~ 0- Il' CID ~ ;e ~0 ~0 UJ 0 0 ... -(I ~ N ... CID~ ... N ... ... ... ... N ~
~...J III CID ... ~ ... II'
0 "! ": "! ~ ... 0:z ,.; Q0 0 ~ ~ ~ N N N N ~.. u ... ... N N N N
I CID .... ~ 0 -(I:It III D 0 '" ~ ... 0 ...~ III III 0 "! ~ ": ~ CID .... "! 0: ... N
~ D Q Q...J < '" ~ II' CID 0- 0 ... ~ -(IIZ) ... ... ... ... ...
z0
§u.. ~ ~ II' ~ ~ ~ ~ II' 11\ 11'1 ~...J..III
~~
.. 11'1 -0 .... .... .... CID CID CID 0- CID 0-
~
5! ~ N N N N N N N N N "" '"W...J
I
~~ ~ ... 11'1 ~ ~ ~ ~ 11'1 11'1 11\ 'Cl 11'1i<
6 ~ ~ ...~ .. ... ... ... ... N N N N "" N
U X
co:
! § N ~ ~ ~ ~ ~ ~ ~ ~ ~ ~u
z §0 N N ~ 0 11\ ~ 11'1 11\ ~ 11'1 ~co: N "" ... '" ... .., .., ..,..I III 11\ 0 0 0 II' II' 11'1 11'1 11'1 0 0VI :J ~ "- co ~ CID ~ ~ ~ ~ ~ ~ ~~ ~ ~ ~ "!11-
C0 0 Q 0 Q Q Q c:i c:i c:i c:i
11.
~ ~0 11'1 11\ 0 0 0 0 11'1 11'1 0 0CIO CIO CIO ~ ~ ~ ~ ~ ~ 0 ~0 0 0 ..... " Q c:i Q c:i c:i Q c:i c:i c:i c:i c:iN
I~ ~
... 0 N ... ~ 11\ '" .... CID 11'1...J N ~ N ~ ~ ~ ~ ~ ~ N ~~ u C Q 0 0 0 0 0 0 0 C> c:i 0
bI u ... 0 0 C> 0 0 0 0 0 0 0 00 VI ~ ... ~ ~ C> ~ ~ N ... "! "!
:; 0 u ~ ~ ~ ~ ~ ~ ~ -i -i ~ ~...bI u ... N 11\ "! ~ 0 ": f'! ~ ": f'! Cl!:; 0 VI ~ ~ 0 ... Q 0 ... ... 0 ... 0
~ U N N N N N N N N N
bI u ... "! ~ "! ": ~ "! "! "! "! ~ "!III CID ... N .... .... CID 0- 0 0 N 0:; C> UN ~ ~ ~ ~ ~ ~ ~ 11'1 11\ 11\ 11'1
Z ~ 0 ~ N N 11\ 11\ ~ N ,.,~ 11'1
0 Cl! .... 0 III! ~ ~ ... ~< ~ N N NI- ... ... ... ... ... N N N
Z 1 ... 0 C8... ~ 0- .... 11\ 0 ... 11'1.... ~ 11\ to; Cl! III! Cl! Cl! ... 0:co .nI- -(I 11'1 ~ ~ ~ ~ ~ ~ ~ ~
1/1 0oJ ; 0 0 0 0 0 C> 0 0 0:>... 0 ... N ... ~ 11'1 '" .... CID 0- C>
0...
-154 -
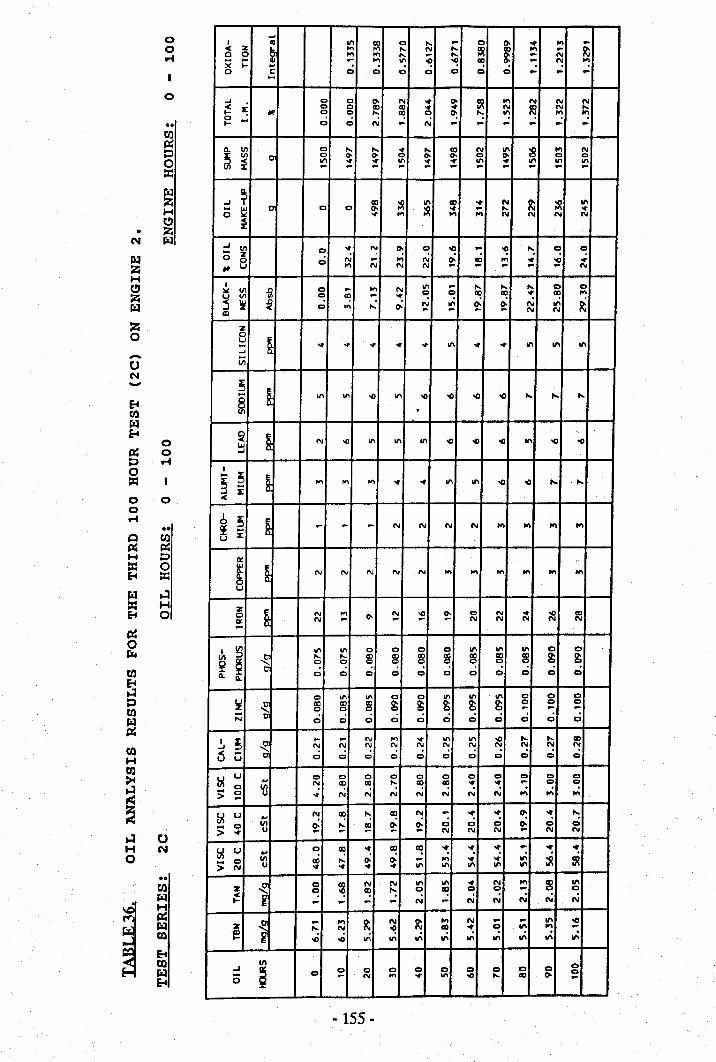
00
"0
..tIJp:;t:l0:z::IIIzHCl
• ZN III
IIIZHClZIII
Z0-tJN-foetIJIIIfoe
0p:; 0p "0:z::0 00
" ..0 tIJp:; p:;H P:z:: 0E-t :z::III ..:I:z:: HE-t 0~0rr.CIlfoe..:It:ltIJIil~CIlHtIJ~..:IIII:~..:I tJH N0
00
tIJ
iIilHp:;IIIctl
Eo4DlIIIfoe
~I i 11\ ~ 0 I'- .. 0 0- ~ '" ..< z .... I'- N I'- ~ CD '" po leCl 0 .... .... I'- po I'-
~ - N
X ;: - .... In 00 "! CD po f'! ":... Q Q Q Q0 c: 0 0 0 .. po ......
..J 0 0 0- N ~ 0- ~ .... N N N< z: 0 0 CD CD ~ ~ N CD N I'-~ /ill ~ ~ ": "'! 0 0: ": ~ f'! ": ":Cl ... N~ 0 0 N - po - - - .. po
c. I/) 0 I'- I'- .. I'- CD N '" ~ .... N
~III 0 0 Cl' 0- Cl 0- 0- 0 Cl' 0 Cl
~ 11\ ;! ~ II' .. ~ 11\ ~ 11\ V'I 11\- - - - - - - - po -..J ~ e CD ;S? 11\ CD ~ N le ;S? 11'1
0 !:II 0 0 Cl' ;S? .. po I'- .... .... .... '" N N N N
~..J I/) ~ N 0: Cl "! .. "! I'- 0 00 0z N ~0 c:i N - .... ~ CD ... .. ~1/1 U .... N N N - po - N
I '" - I'- I'- I'- 0 0:..: III -51 0 - .... N
j III ~ CD - ~ ~ 0 CD CD ~ "'! ....~ ~ 0 '" ~ 0- N '" ~ ~ N '" ~CD - - N N
ZCl
§U.... .. .. .. .. .. '" .. .. '" 11\ 11\..J
Vi
~ §8 11\ II' 00 11\ -0 -0 -0 -0 I'- I'- I'-
III ,
~~ N -0 '" '" '" -0 -0 -0 '" 'II 'II
UJ..J
I
~~ ~ '" '" '" .. .. 11\ 11\ -0 -0 ~ .1'-
i<
b ~ § - - - N N~ iN N '" '" '" '"u
~It' § N N N N '" '" '" '" '" '" '"~uz §0 N := 0- N ~ ~ Cl '" .. 'II CO~ N - N N N N N....
I ~ ~ '" '" Cl 0 0 0 11\ 11'1 11\ 0 0I/) I'- ,... CD ~ CD ~ CD ~ ~ ~ ~~ ~ ~ Cl ~ ~ ~Q.
tiCl Q Cl Q Cl Q 0 Q Q Q Qc.
~ .z 0 11\ 11\ 0 0 11\ 11\ 11\ 0 0 0CD CD CD ~ ~ ~ ~ ~ Cl Cl Cl
~ Cl ~ po - -N C 0 c:i 0 c:i c:i c:i c:i c:i c:i c:i c:i
I ~ ~ - - N ... .. 11\ 11\ -0 ,... ... CD..J N N f'! f'! f'! f'! f'! f'! f'! ~ ~< ti c c:iu Cl Cl 0 Cl 0 Cl Cl 0 Cl 0
I7l u ... Cl 0 0 0 0 0 Cl Cl Cl 0 00 III f'! IX! IX! ": IX! IX! ~ ~ - ~ ~:> Cl (J .. N N N N N '" '" .,; '" '"-
I7l u ... N IX! "': CD N po ~ ~ 0: ~ ":0 III .,.. ... CD ~ 0- c:i 0 0 ~ 0 0.... (J> .. .. - - N N N N N
I7l u .. 0 IX! ~ CD ~ ~ ~ ~ .. ~ ~0 III cD I'- 0- 0- - '" .. .. .,; ~ ~:> N (J .. .. .. .. 11\ 11\ 11'1 11\ 11\
~ 0 ~ N N 11'1 11\ .. N '" ~ 11'1Z Cl "'! ": Cl ~ Cl ~ .. 0< ~ N N N N~ - - po - - N N
Z 1 .. '" le N le '" N .. .. 11'1 ~... N "! CD ~ 0 11\ '"CD .0 .,; .,; .,; .,; .,;~ -0 11\ V'I '" 11\
III_,~
Cl 0 Cl Cl Cl Cl 0 Cl 0 0
0 Cl po '" '" .. 11\ 'II ... CO 0- Cl-- 155-
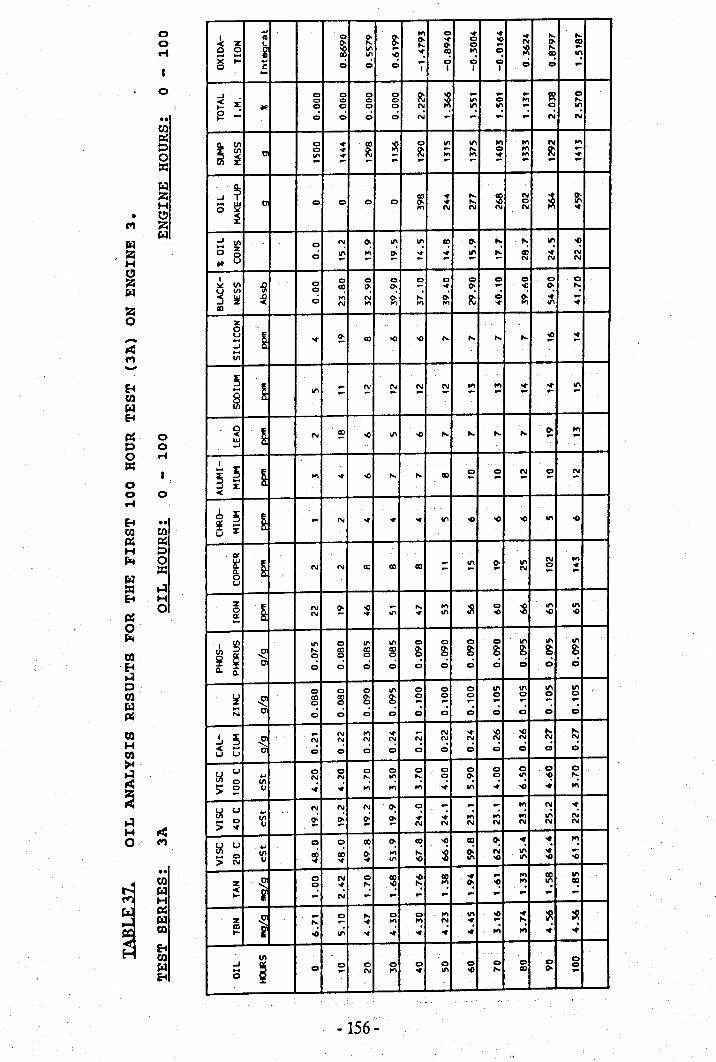
00ri
0
00
m~p0:x:~:z;HCl
ti1 :z;lit
lit:z;HClZlit
Z0-,er:ti1-f4mlitE-4~ 0p 00 ":x:00 0
"E-4 00
m mIl'. ~H Pfzt 0:x:lit:x: ~E-4 H
Il'.0
0fzttilf4~PtillitIl'.
tilHtil>t~,er:~~H ,er:0 ti1
00
imlitHIl'.littoE-4tolitE-4
... '" 0 ...I ftI 0 0-
~... ... .... ....
< z~
0- .... 0- ... 0 -o N 11::CD
0 8 ~ III .... 0- 0 ...is! ...
X III "! ~ II! '" 0 «! III~ 0 0 ... 0 0 0 00 c 0 co ,...... I I I I
...J 0 0 0 0 ~ ~... ... - ~ co
< :I:0 0 0 0 on 0 '" ....~ /II ~ 0 0 0 I'! ~ ~ - ~ ~e .... 0 0 0 0 N ... ... ... ... N N
~III 0 ... CD is! co III III '" '" N '"III C co ... ~ ~ ... .... co '" ~ ...~ on ~ ... '" '" ~ '" ~,.. ... ... ... ... ... ... ... ... ... ...
...J ~C
CD ... .... ~ N ... ~0 !!! co co 0 co 0- ... .... 0 is!'" N N N N ...
~..J III I'! 0: ~ ~ II! 0: ": ": ~0 z ~ "!
0 co ~ '" ~ ~ ;! III .... CD ... N
/II U ... ... ... ... N N N
I Cl 0 0 Cl 0 0 co 0 0 co~ III -£l coj VI co II! Cl'; Cl'; ... ... 0: ... '<l 0: ":
~ ~ 0 "" N 0- ...: et. ~ 0 ~ ... ...aI
N '" "" "" "" ... III ...Z0
~u ~ ~ ....... ... CD '<l '<l .... .... .... ......J
.......III
~ § ... N N '" '"~
III N N ... ... III... - ... ... ... ... ... ... ... ...,
~ ~ N ~ '<l '" '<l .... .... .... .... ~ '"... ......J
I
§~~ '" ... '<l .... .... aI co co N co N
i... ... ... ... ...
<
6 ~ e ... N~ i... ~ ~ '" '<l '<l '<l III '<l
U
IS!
eIt N N... '" ~ '" N '"
Cl.CD CD CD ... ... N co ~
0... ...
u
z § N ~ -0 '"0 ... .... ~ 0 ~ '" III
IS! N ... '" ... on '<l '<l '<l....
I III
~'" co '" III co co co co '" III III
III :J .... CD CD ~ ~ ~ ~ ~ ~ ~ ~~ ~ ~ ~ Cl
Cl. ~ 0 0 0 0 0 0 0 0 0 0 0
!i ~Cl Cl Cl '" Cl Cl 0 III '" '" '"CD <Xl ~ ~ Cl co co Cl 0 0 00 co ... ... ... ... ... ... ...
.... c .; .; .; .; .; .; .; .;N co 0 co
I ~ ~... N '" ... ... N ... '<l '<l .... ....
...J N I'! N ~ N I'! I'! I'! I'! I'! I'!< .... c .;u u co co 0 0 0 0 co co co 0
bI u .. 0 co Cl co 0 co co 0 0 co 0
.... co III I'! I'! "; ~ ": ~ 0: ~ ~ "! ":> co U ... ... '" '" '" ' ... '" ... '<l ... til...bI u .. N N I'! 0: ~ ... ... ... ~ I'! ~
> 0 III ~ ~ ~ ~ ~ ~ ,.; '" '" '" N... U N N N N N N N
bI u .. co ~ II! 0: «! "! CD 0: ~ ~ ~
> co III CD CD 0- '" .... ~ 0- N '" ... ...N U ... ... ... on '<l '" '<l on '<l '<l
i 0 N co ~ '<l ~ ... ... '" :R '"z ~ ~ ": ": 0: '<l ~ «!<~ ,.. N ,.. ... ,.. ,.. ,.. ,.. ,.. ... ...z j ... co .... co co '" '" '<l ... ~ is!aI
.... ,.. ~ '" '" I'! ~ ,.. ":~ '<l .,; ... .. .. ... ... ,.; '" ... ...
III 0..J ; co 0 0 co co co co co co... 0 ,.. N '" ... 11\ '<l .... CD 0- 0
0...
-156 -
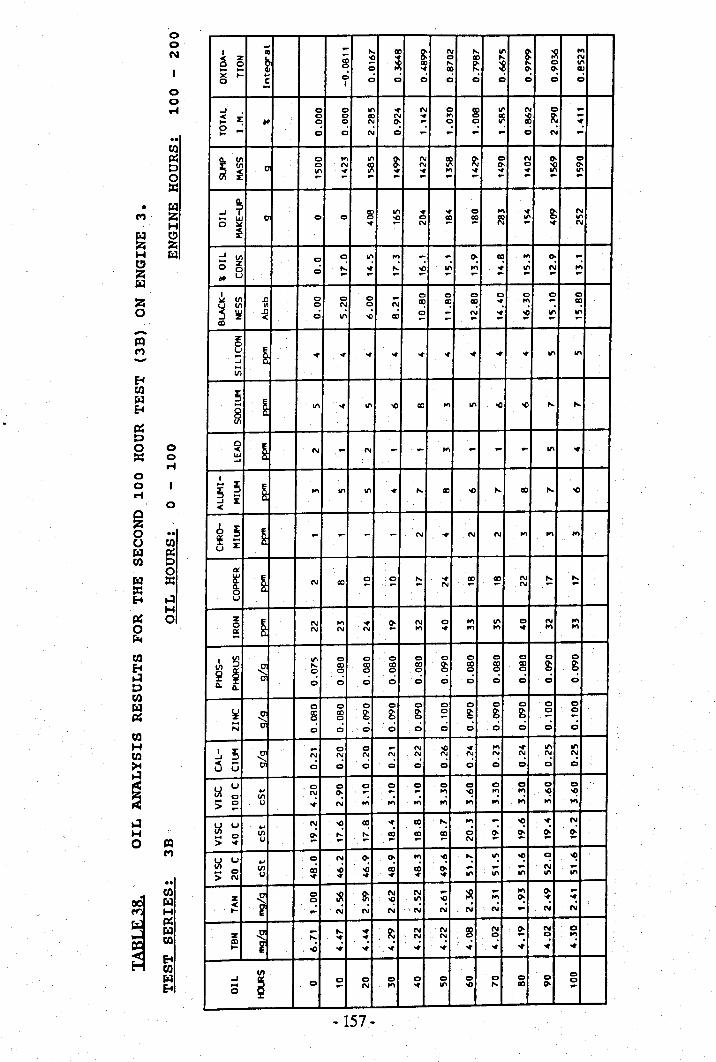
00N
00ri
{Ilp::00:z::~,., ZH
r.:I t!)Z ZH ~eZr.:I
Z0-~,.,-~{Ilr.:I~p::00 0= c
ri00ri
0ClZ0t) {Ilr.:I p::{Il 0
0r.:I ==~ ~
H~ 00~{IlE-4~0{Ilr.:I~COH{Il~~
~~H0 =,.,
00
~
COr.:IHp::r.:Ito~tor.:IE-t
.... -I i - .... CO s N .... II'
~ ;s: ...-e z lB ~ ~ 0 CD .... NC C ;s: CO .... it s 0 II'
X .... .; 0 ~ II! 0: 0: ~~ .; .; .;C C I C C 0 C C C....
..J 0 C U'\ • N 0 ~ II' N C --c z: CO 0 CD N ~ '" ~ ;8 ~ -~ ~ co ~ N 0: - ~ ~ •C .... N .; N~ c 0 c - - - - -0. III 0 '" U'\ s N ~ ~ C N 0- Ca III e o N ~ N 0- Cl ~ 0-
~ II' 0# ~ ~ '" • ~ ~ U'\- - - - - - - - - - ....J ~
01 s U'\ ~ ~ c ... ~ s N
0 UJ 0 0 ~ co ~ ~ CD III II':w: ~ N N - ~ N-c:£
..J III ~ ": ": - - 0: II! '" 0: ..0 z Cl
c .; .... • .... -0 II' '" • U'\ N ..;~ u - - .. - .. .. - - ..I
Cl co 0 0 0 0 0 0 0lot III ~ 0 -U III 0 ~ ~ ~ II! II! II! "': ": .. Cl)
~ ~ ~ .; U'\ -0 Cl) ~ - ~ • ~ .,; .,;ao - - .. ..
z0
~u.... • ~ ~ ~ ~ ~ • • ~ II' U'\..J....III
~~
.... U'\ 0# U'\ -0 Cl) '" U'\ -0 -0 .... ....~
~ § N .. N - .. '" .. .. .. 11\ •'"..JI
~~ a '" 11\ U'\ 0# .... Cl) -0 .... co .... -0i«
6 ~ § .. - - - N~ i0# N N '" '"
,.,U
et
e~ N CD 0 ~ .... ~ CD ~ N .... ....~ - .. N - N - -u
z § N N 0 ... 11\ C N ...0 '" ~ ~~ N N N ... ~ '" '" 0# ... ,.,
I III
~U'\ 0 0 0 0 0 0 0 0 0 0
III :::l .... co CD CD CD ~ co ~ Cl) ~ ~~ ~ ~ ~ c:: c:: ~ ~ 0
0. C C C C C 0 C 0 0 0 .;0.
Ii~
0 0 Cl 0 0 Cl Cl Cl Cl Cl C(Xl (Xl ~ ~ ~ ~ g; g; ~ 0 c0 0 - -.... .; .; .; .; 0 c c c c c CN
I ~ ~.. 0 <0 - N -0 ~ '" • U'\ 11\
..J N ": N N ~ ~ ~ ~ ~ ": N
« ti Cu 0 0 0 0 0 c c Cl c c
l;! u ... <0 0 0 0 Cl 0 0 Cl 0 Cl 0
Cl III N 0: .. - .. ": "! ": ": "! "!;;: 0 u • N '"
..; ..; ... ... ... ,., '" ...-l;! u ... N "! Cl) • co .... '" .. "! • N
... C III ~ .... .... CD 00 co C ~ ~ ~ ~> • u .. - .. - - N
l;! U ... ~ ~ 0: 0: ": -0 "': ": "! ~ "!;;: 0 III (Xl -0 -0 (Xl (Xl 0- .. .. .. N ..
N U ~ 0# ~ 0# 0# ~ 11\ U'\ 11\ U'\ 11\
1 0 ~ 0- N N .. ;s: - ... 0- -z ~ ": "! ": -0 '" 0: "': •« N N~ .. N N N N N ... N N
z 1 - .... • ~ N N ~ N ~ N 0.... • 0# N N 0 ~ ":ao .; .; .;~ . -0 • • • • • • •
III 0..J a 0 0 0 0 0 0 Cl 0 0... 0 - N ... • II' -0 .... co 0- 0
0..
-157 -
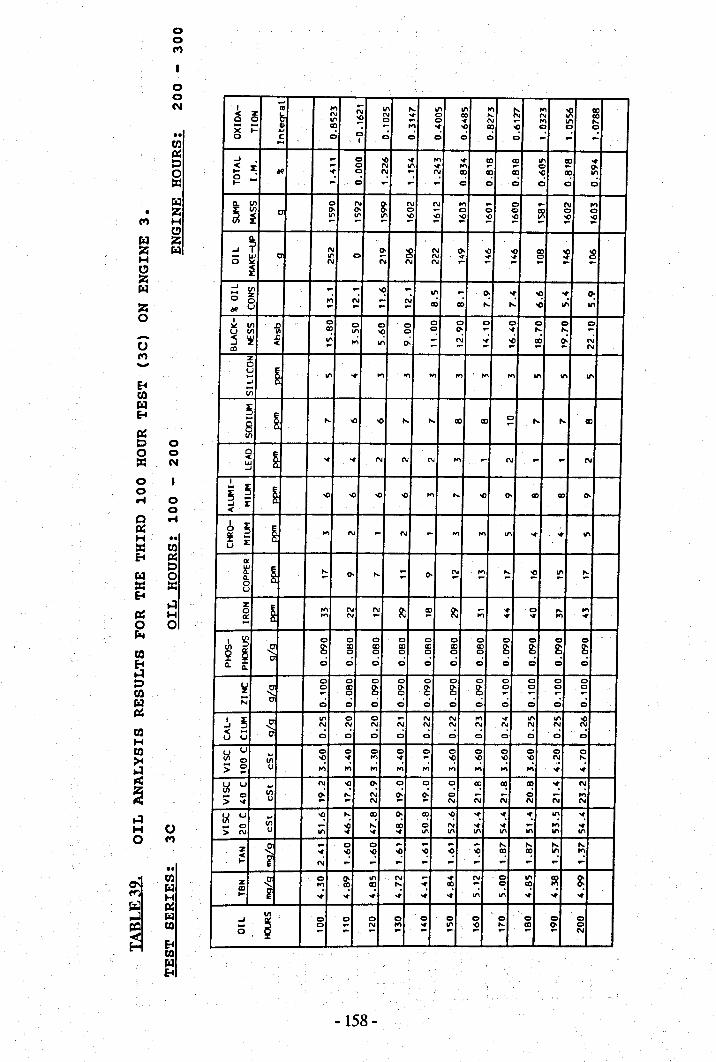
00tt)
00N
00
til~tJ0=:r.lZ
tt) Ht!l
r.l ZZ r.lHeZr.l
Z0
CJtt)-E-ftilr.lE-4~tJ 00 0=: N
00... 0
0Cl ...~H 00
=: tilE-4 ~
tJr.l 0=: =:E-4
..:I~ H0 0ra.tilE-f..:ItJtilr.l~tilHtil:>4~
~~H 00 tt)
..
~
tilr.lH~~til
E-ttilr.lE-t
~ -I i '" N III ~ '" III '" ~ '" ~ Cl)-e Z N N ... Cl CIO ,._ N N0 0 II' s CIOCl - Cl ~ N - '" II' ,._- .. Cl) - '" ... ~ Cl:? ~ Cl ~ ~X ... c:i c:i c:i c:i c:i0 c Cl Cl Cl - - -.. I
...J - Cl '0 ... '" ~ ~ CD II' Cl) ...-c J: - Cl N II' ... '" - Cl - 0-... ~ ": Cl N - N Cl) Cl) Cl) ~ Cl) II'Cl - c:i c:i c:i c:i c:i c:i... - - - - Cl
0.. 11'1 Cl N s N N '" - Cl - N '"~
11'1 C7 0- 0- Cl - Cl Cl Cl Cl) Cl Cl
~ II' II' II' ',!i! ',!i! s ',!i! ',!i! II' ',!i! '0- - - - -...J ~
0'N ~ 8 N 0- '0 '0 Cl) ~ 80 IU II' Cl N ... ~ ... Cl~ N N N N - - - - - -~
...J 11'1 - - ~ -- z ,.; N NII' - 0: ... '0 ": 0:Cl 0 -u - - - - CD Cl) ~ ~ '0 III III~
I Cl Cl Cl Cl Cl Cl Cl Cl~ 11'1 il Cl Cl ClU 11'1 Cl:? ~ '<! Cl ~ 0: - ... ~ ,._ -< ~ .0 III
'" - N .i '0 Cl) ~ N...J ..: II' 0-m - - - - - N
Z0
eu'" '" '" '".. ... '" '" '" 11\ '" 11\
...J
Vi
~ § .... '0 '0 ~ ~ Cl) Cl) Cl ~ ~ Cl)8 -11'1
0
~..: ~ ~ N N N '" - N - - NUJ...J
I.. ~ e~ '0 '0 '0 '0 '" ... '0 0- Cl) CIO 0-..J i:<
b ~ e '" N - N -~ i: '" .... '" ... ... '"U
ex~ e ,._
0- ~ - 0- N .... ~ ',!i! '" ~CL - - - - - - -0U
z e0 '" N N ~ ~ ~ - ... Cl ,.. '"ex ,., N - ,., ~ ... ,., .....I ~
~Cl Cl Cl Cl Cl Cl Cl Cl Cl Cl Cl
11'1 g; co Cl) Cl) co co CD g; g; g; g;2 ~Cl ~ Cl Cl Cl Cl
0.. 0..c:i 0 Cl c:i c:i Cl c:i c:i c:i c:i c:i
~~
Cl 0 Cl Cl Cl Cl Cl 0 Cl Cl ClCl co g; 0- g; g; g; Cl Cl Cl Cl- Cl Cl - - - -N c:i c:i c:i c:i c:i c:i Cl c:i c:i c:i c:i
I ~ ~II' Cl Cl - N N '" ... '" III '0
...J "! "! "! "! "! N "! "! "! "! "!< ..u u Cl Cl Cl Cl Cl Cl Cl Cl Cl Cl Cl
~ U ~ Cl Cl Cl Cl :: Cl Cl Cl Cl Cl Cl
~ ~ '" ... ~ ~ '0 ~ N ....Cl 11'1 ,.; ,.; ,.; .,> Cl (J '" '" .... .... '" '" ... ...-~ u ~ "! ~ 0: ~ Cl Cl
Cl:? Cl:? Cl:? ": "!Cl 11'1 0- ~ N ~ 0- c:i - - Cl - '"> ... (J - - N N N N N N N
:;.: U ~ ~ ~ co 0: Cl:? ~ ": ": ": ~ ":> Cl 11'1 - '0 ~ Cl) Cl N ... ... - '" ...
N (J III ... ... ~ '" '" 11\ '" III 11\ 11\
Z i - Cl Cl - - - - ~ ~ ~ ~..: ... ~ ~ '<! "! "! "! Cl:? Cl:? ~ ~... N - - - - - - - - - -z } Cl 0- '" N - ... N Cl III l5: ~'" Cl:? Cl:? ~ ... Cl) - Cl Cl:?m ~ ~ .,; .,; ~... ... ... ... ... ... ...
11'1Cl Cl Cl Cl Cl Cl Cl Cl Cl...J
~Cl Cl
0 Cl - N '" ... '" '0 ~ Cl) ~ Cl- - - - - - - - - N
-158 -
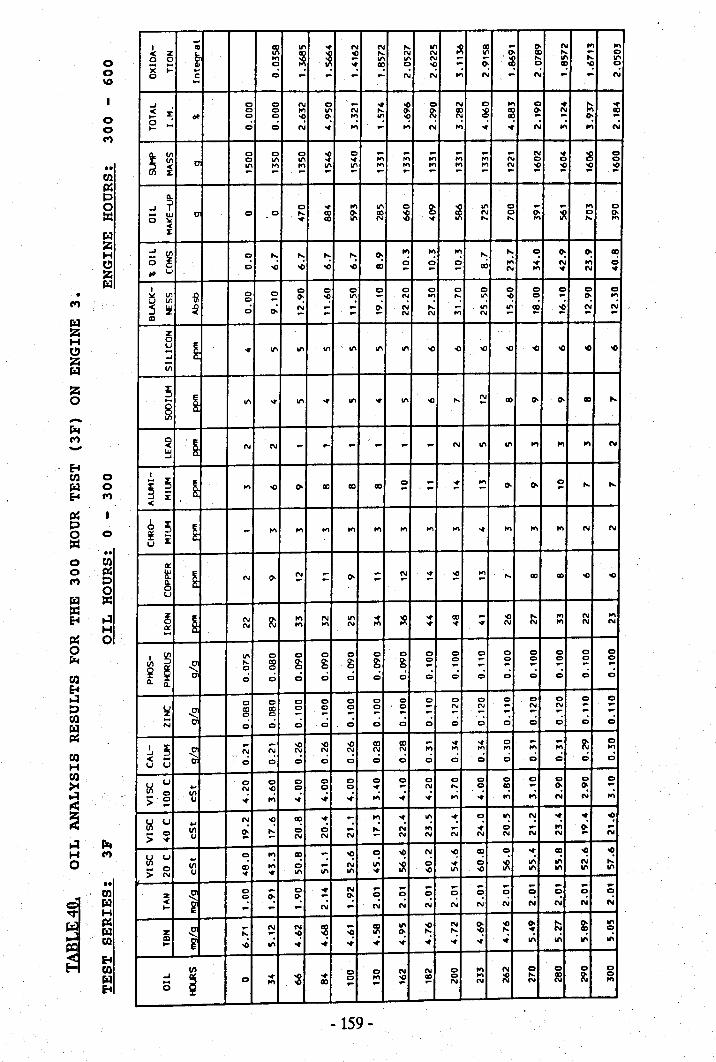
00\D
00C")
..til~t:>0::z::~zHt.J)ZriI
•C")
~:zooHt.J):zoo~z0-~C")-E-ttil 0~ 0E-t C")
~p0 0
== ..0 til0 ~C") p
0riI ::z:::z::E-t ..:I
H~ 00j";I:c
tilE-t..:IptilriI~tilHtil~..:IfCC
~~ lilt1-1 C")
0••
itilriIH~riItil
E-tE- tariIE-t
~I i ~ '" ~ N N ,.. '" ~ ~ ... 0- N .., ..,-e Z0 0 .., ~ ~ ~ ,.. N N 0- CD ,.. ... C>
'" '" N ... ... ;8 ,.. In ,.. '"X ;: C> ~ ~ C> "'! ... 0: C> ~ "'! C!0 c 0 ... ... ... ... N N ..; N ... N ... ... N....J 0 0 N 0 ... ~ -0 0 N 0 .., 0 ~ ~ ~-c :Ii 0 0 .., II' N ,.. 0- le CD ;8 CD ~ N ~..... /jq C! ~ "'! 0: ~ ~ "'! N ~ ... 0:0..... .. 0 0 N .., N ..; N ..; N~ ... .., ~ ~ ..,~ VI 0 0 0 -0 0 ... ... ... ... ... ... N ~ ;8 C>
~VI t7 0 '" '" .. ~ .., .., .., .., .., N 0 0 0
~ In .., .., In In .., '".., .., '" N -0 ~ ~ ~... ... ... ... ... ... ... ... ... ... ... ...
..J ~t
0 ~ .., '" 0 s -0 II' 0 ... ... .., 0
0 III 0 0 ,.. ce 0- CD :g ~ N 0 0- ;R 0 0-
'" ~ ce In N ~ ... ... .., ... ..,'":t
..J VI ~ ~ ..,0 C> ,.. ... ... ,.. 0: "': "': Cl 0: 0: CD
z 0 ~ ~ 0 00 -0 -0 CD 0 0 CD.., ~ N ..,
H U ... ... ... N .., .. N ~I 0 0 0 0 0 0 0 0 0 0 0 0 0!Ii III .D 0 0U VI f/I 0 ... 0: "'! ~ ... N .., ... '" "'! C> ... 0- ~'" ~ ~ 0 N ,..: .,; N..J 0- N ... ... ~ ... II' ~ ~ N
CD... ... ... N N .., N ... ... ...
Z0
8u.. ~ '" II' II' III In In -0 -0 -0 -0 -0 -0 -0 -0..J..III
;S.. III .. II' ~ '" ~ In -0 ... N CD 0- 0- ce ,..
~...
~ ~ N N ... ... ... ... ... ... N III III .., .... .... NIII..J
I
S~ ~ '" -0 0- ce CD CD Cl ... ~ ..,0- 0- 0 ... ,..... ... ... ... ...
..J :t
'"b !5 § '"
.., .., '" ..,~ i
... '".., .., .. '" .., .., N N
U
IX
§It' N 0- N ... 0-... N ~ ~ .., ... CD Cl) -0 -0
~... ... ... ... ... ...
U
Z
~.... ...
0 N le N In ~ ~ ~ CD -0 ... '" N ..,IX N
.., .., N .., ~ .. .. N N '" N N..I ~
~III 0 0 0 0 0 0 0 0 Cl 0 Cl 0 Cl C>
VI .... CD ~ ~ ~ ~ g 0 0 ... 0 0 0 C> 0
~ ~0 0 ... ... ... ... ... ... ... ...
~ Cl.0 0 0 0 0 0 0 Q Q 0 0 0 0 0 0
~~
0 0 0 0 0 0 0 0 0 0 0 0 0 0 0
to to 0 0 0 Cl 0 ... N N ... N N ... ...0 0 ... ... ... ... ... ... ... ... ... ... ... ... ...- 0 Q 0 0 Q 0 0 0 Q 0 0 0 0 0 0N
I !5 ~... ... -0 -0 -0 CD Cl) ... .. ~ 0 ... ... le 0
..J N N ~ N C'! N N '".., '" '"
.., .., '"'" ti 0 0 Q Q 0 0 Q 0 0 Q 0u 0 0 C> C>
b! u .. 0 0 0 0 0 0 0 0 C> C> C> 0 C> C> C>N "" 0 C> <:> ~ ... N ,.. C> Cl) ... 0: 0: ...
:; 0 VI ..; ~ ~ ~ ..; ~ ~ ..; ~ ..; ..; ..;0 U ~ N N...
b! u .. N "'! ~ ~ ... .., ~ ": ~ C! ~ ~ ~ ~ "'!:; 0 VI 0- ,.. C> 0 ... ,..: N '" ... ~ C> ... .., ~ ...
~ U ... ... N N N ... N N N N N N N N
b! u .. C> '" ~ ... "'! C! "'! ~ "'! ~ C! ~ ~ "'! "'!
:; Cl VI Cl) '" 0 ... N 11\ ;R 0 ~ Cl ;R In 11\ N ,..N U .. ~ In 11\ 11\ .. -0 In "" 11\ 11\ 11\ '"
i 0 ... 0 .. N ... ... ... ... ... ... ... ... ... ...Z c:> 0: 0: ... 0: Cl 0 0 0 0 Cl 0 0 Cl 0
'" N.... ... ... ... ... N N N N N N N N N N
j ... N N
~... ~ In -0 N 0- -0 0- ,.. 0- 11\
Z ... ... "'! -0 0: "': "': "'! "': ~ N ~ ~CD ~ .,; ~..... .. .. .. ~ .. .. .. .. 11\ '" 11\ In
VI 0 C> N N 0 .., N C> C> 0 C>..J
~C> .. ~ .. C> .., ~ CD c:> .., ""
,.. CD le 0
0 '" CD ... ... ... N N N N N ..,
-159 -
Total Insoluble Matter. The initial trend for TIM was a rapid increase in the first 30hours of the test, after which its level stabilised or changed to a slower rate of increase.The TIM level, like most of the other parameters mentioned above, was alsomoderated by the amount of oil make-up.
Oxjdatjon. The amount of oxidation products generally increased in proportion tothe amount of oil blackness, with the age of the oil. The level of oxidants decreasedon addition of large quantities of fresh oil (make-up).
4.9 OIL TREND ANALYSIS.
The brief trend analysis given above was deduced from the tables of data. An in-depthcorrelation and trend analysis can be obtained from a graphical representation of theresults. The raw data were smoothed (mathematically) and (quadratic) curve-fittedwhen plotted in the graphs that follow, below, to clearly show any trends and to allowaverage rates of change of the parameters to be elucidated. From the discussion givenin the previous section, the parameters can be grouped into various categories. Twocategories that are evident from the data are:
(a) parameters that increase in concentration with the age of the oil, and(b) those parameters whose concentration decrease with the age of the oil.
Only two parameters fall into the latter category, namely, TBN and 100°c Viscosity.All the rest of the parameters fall into the former category, where their respectiveconcentrations increase with the age of the oil.
The large number of oil parameters that show an increase in concentration with theaging of the oil, can be further sub-divided into:
1. those parameters that appear to behave similarly and have some proportionalrelationship to each other, and
2. those parameters that do not have a proportional relationship to thosementioned in (1) above, but mayor may not be related proportionally to otherparameters.
Each of these categories will now be examined and discussed in relation to the relevantparameters.
-160·
4.9.1 IBN.
The TBN values are expected to decrease with the aging of the oil. The rate of TENdepletion will depend on the amount of acids entering the oil that become neutralised,the amount of fresh TBN added from oil make-up, and also on the initial TENconcentration (of the new oil). The first and second parts of the above statementrequires no explanation. The dependence of the TBN value of the used oil on theinitial (new oil) TBN value, requires some explanation.
The TBN value of a new oil when determined by JP 177 measures the inorganic(strong) TBN, whereas that determined by JP 276, measures both the inorganic andthe (weaker) organic TBN as well. Therefore, the TBN determined by JP 276 doesnot represent a true measure of the oil's alkaline reserve. TBN as determined by JP276, does in reality, over-estimate the alkaline reserve, for the reasons mentioned inChapter 2, Section (2.1). The weak bases present in the new and used oil probablyare ineffective in neutralising the weaker (organic) acids. In any case, the morereactive alkaline additives present in the oil will become consumed in a very shortspace of time, from a theoretical treatise based on the percentage sulphur in fuel,blowby flow rate and composition of blowby gases (see Dyson model [33] andequation (39), page 200, Chapter 5). The period for the complete neutralisation ofthe inorganic TBN (be it be a gross over-estimate by JP 276 or not) can be shown tobe in the region of a few hours. The "TBN" that remains within the used oil afterthree hours should approach zero, but this is seldom, if at all, observed in formulatedoils. This is because:
1. most of the acids enter the exhaust,
2. most of the (acidic) blowby gases (e.g. sulphur dioxide) are dissolved in the oilwithout reacting with the TBN, and
3. the lack of water at elevated temperatures to convert the gases into acids.
The "TBN" that remains in the used oil, therefore, contains little, if any, effective(inorganic) neutralising reagents. The level of the non-effective (slow reacting),organic bases can, therefore, be expected to show relatively little change in TBN valueas the organic bases can be burned during combustion along with the oil. This willhold true provided that the TAN value is not in excess over the TBN value. This hasindeed been observed during the tests. Therefore, depending on the initial quantityof these weak bases present in the formulated oil, the TBN value of a oil after a fewhours use will stabilise at some value lower than the original TBN value of the newoil.
-161-
Any TBN arising from fresh additions (oil top-ups) can be expected to becomeneutralised within a fraction of the time taken when beginning with a complete sumpof fresh oil. This is because the used oil is now a reservoir consisting of a wide rangeof acids (amongst a myriad of other chemicals) and further additions of fresh acidduring engine running will quickly seek out and neutralise the tiny amount of new,fast reacting, (inorganic) TBN reagent.
4.9.2 100°C Viscosity.
The kinematic viscosity of the used oil at 100°C generally decreases initially duringthe first 30 hours of a test. The changes in viscosity although being small, does showa general increase, after 60 hours of testing. The reason for the initial decrease inviscosity at the high temperature, is due to shear thinning by removal of pendantgroups from the (VII) polymers' carbon backbone and the breaking down of the long,polymer chain into smaller fragments of low molecular mass, thereby lowering thebulk viscosity. The viscosity increases again after the oil becomes oxidised by asignificant extent, which then results in long chains of newly oxidised oil and polymerbecoming cross-linked to give high molecular mass deposits and gums. The increasein soot content of the oil will also increase the viscosity of the oil.
4.9.3 20°C and 40 °c Viscosity.
The viscosity of the used oil at 20°C and 40 °c appears to be closely related to oneanother. This may be the case as the two temperatures 20°C (293 K) and 40°C(313 K) are kinetically not very different from the standpoint of polymer and longhydrocarbon chain chemistry. The viscosity generally increases steadily throughoutthe aging of the oil, being moderated only by high oil make-up levels. The rise inviscosity is due to the longer, curled up, VII polymeric chains being fragmented togive a higher proportion of lower molecular weight polymers which increase theviscosity of the oil at low temperatures.
4.9.4 Total Insoluble Matter and Oil Make-up.
The Total Insoluble Matter measurement appears to be closely related to the amountof oil make-up. The reason for this may be due to the dilution effect of adding newoil to a quantity which does not increase in level during the course of the test. Thisidea may not be as strange as it may seem for a quantity that is expected to risecontinuously. Considering that the engine bedding-in period requires a fixed time toaccomplish, the wear debris, oil stabilisation and engine stabilisation would then alsobe completed to a large extent. Therefore, no change in TIM can occur except through
-162 -
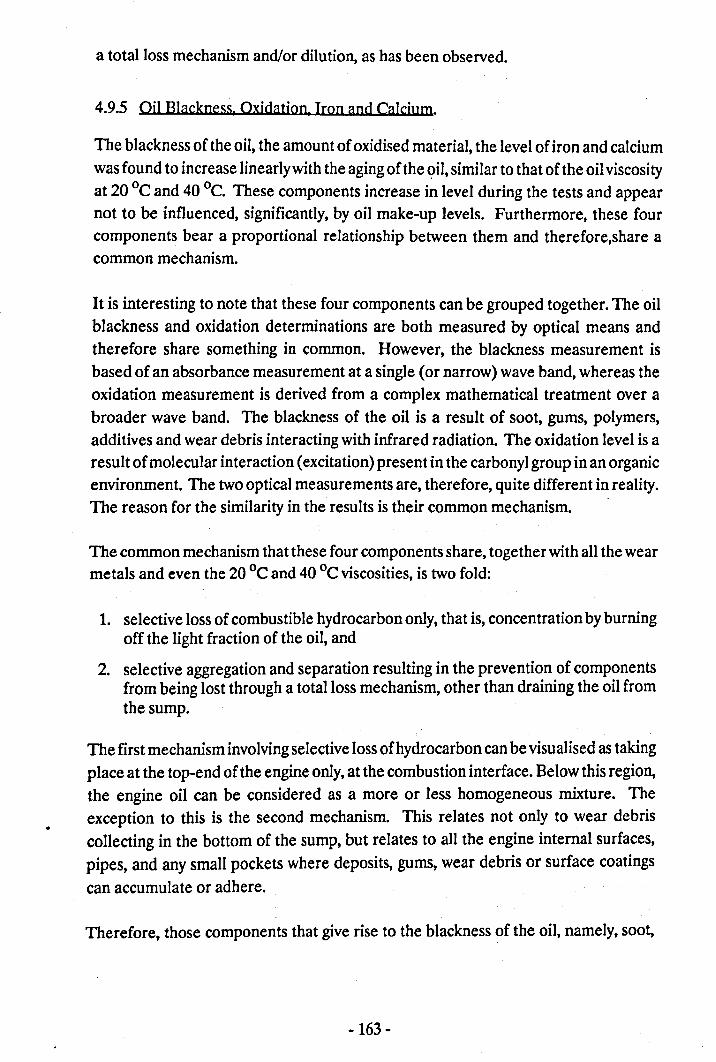
a total loss mechanism and/or dilution, as has been observed.
4.9.5 Oil Blackness. Oxidation. Iron and Calcium.
The blackness of the oil, the amount of oxidised material, the level of iron and calciumwas found to increase linearly with the aging of the oil, similar to that of the oil viscosityat 20°C and 40 QC. These components increase in level during the tests and appearnot to be influenced, significantly, by oil make-up levels. Furthermore, these fourcomponents bear a proportional relationship between them and therefore,share acommon mechanism.
It is interesting to note that these four components can be grouped together. The oilblackness and oxidation determinations are both measured by optical means andtherefore share something in common. However, the blackness measurement isbased of an absorbance measurement at a single (or narrow) wave band, whereas theoxidation measurement is derived from a complex mathematical treatment over abroader wave band. The blackness of the oil is a result of soot, gums, polymers,additives and wear debris interacting with infrared radiation. The oxidation level is aresult of molecular interaction (excitation) present in the carbonyl group in an organicenvironment. The two optical measurements are, therefore, quite different in reality.The reason for the similarity in the"results is their common mechanism.
The common mechanism that these four components share, together with all the wearmetals and even the 20°C and 40 °c viscosities, is two fold:
1. selective loss of combustible hydrocarbon only, that is, concentration by burningoff the light fraction of the oil, and
2. selective aggregation and separation resulting in the prevention of componentsfrom being lost through a total loss mechanism, other than draining the oil fromthe sump.
The first mechanism involving selective loss of hydrocarbon can be visualised as takingplace at the top-end of the engine only, at the combustion interface. Below this region,the engine oil can be considered as a more or less homogeneous mixture. Theexception to this is the second mechanism. This relates not only to wear debriscollecting in the bottom of the sump, but relates to all the engine internal surfaces,pipes, and any small pockets where deposits, gums, wear debris or surface coatingscan accumulate or adhere.
Therefore, those components that give rise to the blackness of the oil, namely, soot,
-163 -
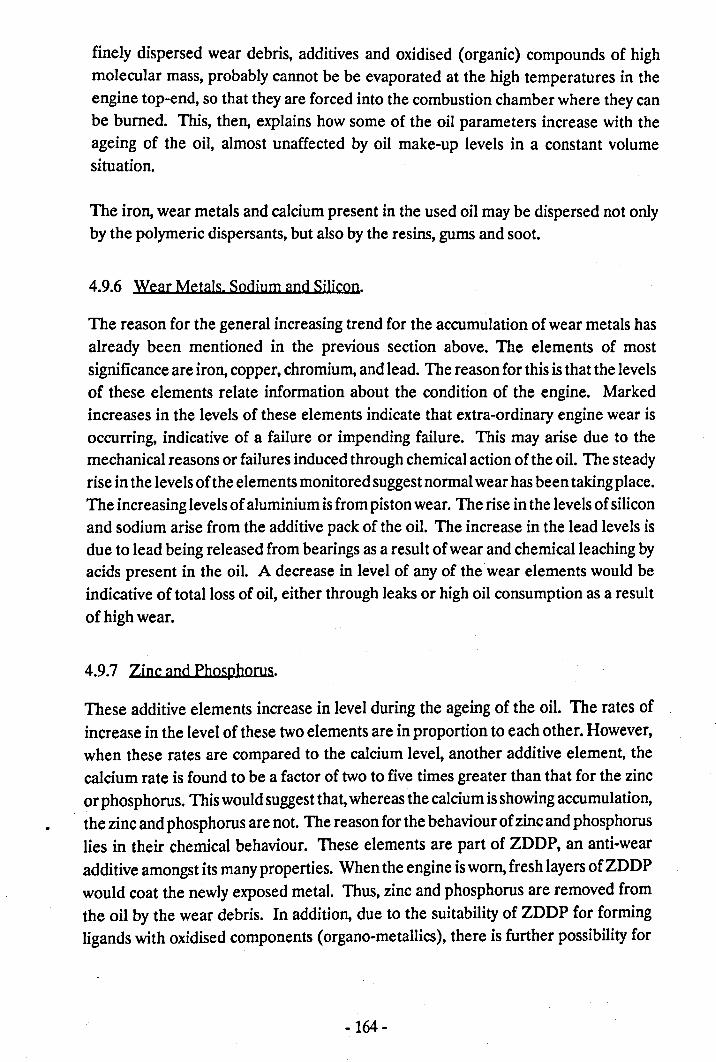
finely dispersed wear debris, additives and oxidised (organic) compounds of highmolecular mass, probably cannot be be evaporated at the high temperatures in theengine top-end, so that they are forced into the combustion chamber where they canbe burned. This, then, explains how some of the oil parameters increase with theageing of the oil, almost unaffected by oil make-up levels in a constant volumesituation.
The iron, wear metals and calcium present in the used oil may be dispersed not onlyby the polymeric dispersants, but also by the resins, gums and soot.
4.9.6 Wear Metals. Sodium and Silicon.
The reason for the general increasing trend for the accumulation of wear metals hasalready been mentioned in the previous section above. The elements of mostsignificance are iron, copper, chromium, and lead. The reason for this is that the levelsof these elements relate information about the condition of the engine. Markedincreases in the levels of these elements indicate that extra-ordinary engine wear isoccurring, indicative of a failure or impending failure. This may arise due to themechanical reasons or failures induced through chemical action of the oil. The steadyrise in the levels of the elements monitored suggest normal wear has been taking place.The increasing levels of aluminium is from piston wear. The rise in the levels of siliconand sodium arise from the additive pack of the oil. The increase in the lead levels isdue to lead being released from bearings as a result of wear and chemical leaching byacids present in the oil. A decrease in level of any of the wear elements would beindicative of total loss of oil, either through leaks or high oil consumption as a resultof high wear.
4.9.7 Zinc and Phosphorus.
These additive elements increase in level during the ageing of the oil. The rates ofincrease in the level of these two elements are in proportion to each other. However,when these rates are compared to the calcium level, another additive element, thecalcium rate is found to be a factor of two to five times greater than that for the zincor phosphorus. This would suggest that, whereas the calcium is showing accumulation,
. the zinc and phosphorus are not. The reason for the behaviour of zinc and phosphoruslies in their chemical behaviour. These elements are part of ZDDP, an anti-wearadditive amongst its many properties. When the engine isworn, fresh layers ofZDDPwould coat the newly exposed metal. Thus, zinc and phosphorus are removed fromthe oil by the wear debris. In addition, due to the suitability of ZDDP for formingligands with oxidised components (organo-metallics), there is further possibility for
-164 -
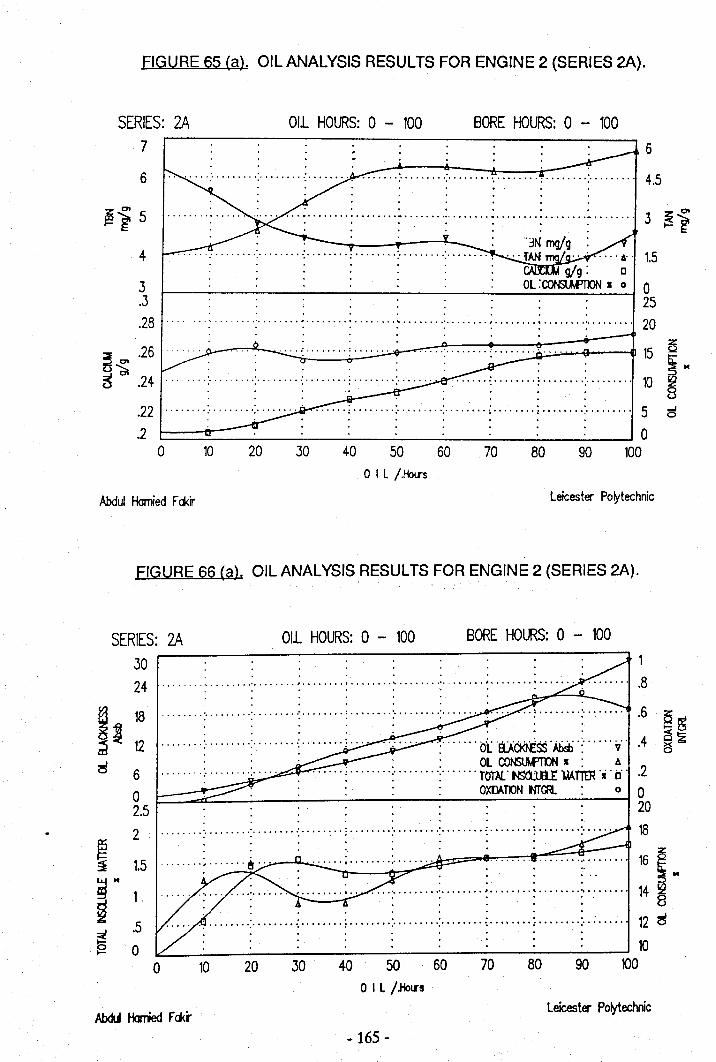
FIGURE 65 (a). OIL ANALYSIS RESULTS FOR ENGINE 2 (SERIES 2A).
SERIES: 2A7
~i54
3.3.28
~ .26~B .24
.22
.20
OIL HOURS: 0 - 100 BORE HOURS: 0 - 1006
. . . . .6 -: -: :- : ; ; : : 4.5
. . . . . . . .. ..... . .
.. "••••••••••••••••• 0 ••••••••••••••••••••••••••••••••••••••••
o • • • • •
... .· . . . . . .... ~ ; '. : ~ ; '. : :. . . . . . . .. 20
· .· .· . . " '".... , 0 0........ . ,0 ......••.•............· . . .. '" · .. . . . ........ .: ;......... . ; : : ; ; : 5 cS· . . . . . . . ... ..C=~==~ __~ __~~ __~ __~ __~~ __~O
10010 20 9030 40 50 60 70 80Oil /.Holrs
Abdul Homied Fddr leicester Polytechnic
FIGURE 66 (a). OIL ANALYSIS RESULTS FOR ENGINE 2 (SERIES 2A).
OIL HOURS: 0 - 100 BORE HOURS: 0 - 100SERIES: 2A
I~:•....•.•~•....·.•••·•.••L.. ··••····.,··••···••·••.·••O(~~T ••·.•.•:: : OL CONSUWOON I: ~...... : : : TOT,lL'NSctLar 'W,TTER',j' cl' .2. Oxna.mN M'CR. 0 0
20
30 . . . . . . . .24 : : : : ~ : : : : 8
. . . . , . .
6o2.52
1.5
.•••.•.• :. '.0 ••••• : ••••••••• : •••••••• ; •••••••• :•••••••.•• : •••••••• : ••••.•••• : •••••••• :••••••. . 18
.5o
., .". . . .. .: : ~ ..•..... ; : : ~ 0: .·0 : .
., .
., .~--~---.----.-------------.--~.----.-----.--~~70 80 90 100o 10 20 30 40 50 60OIL /YDlrS
Leicester Po~echnic
-165 -
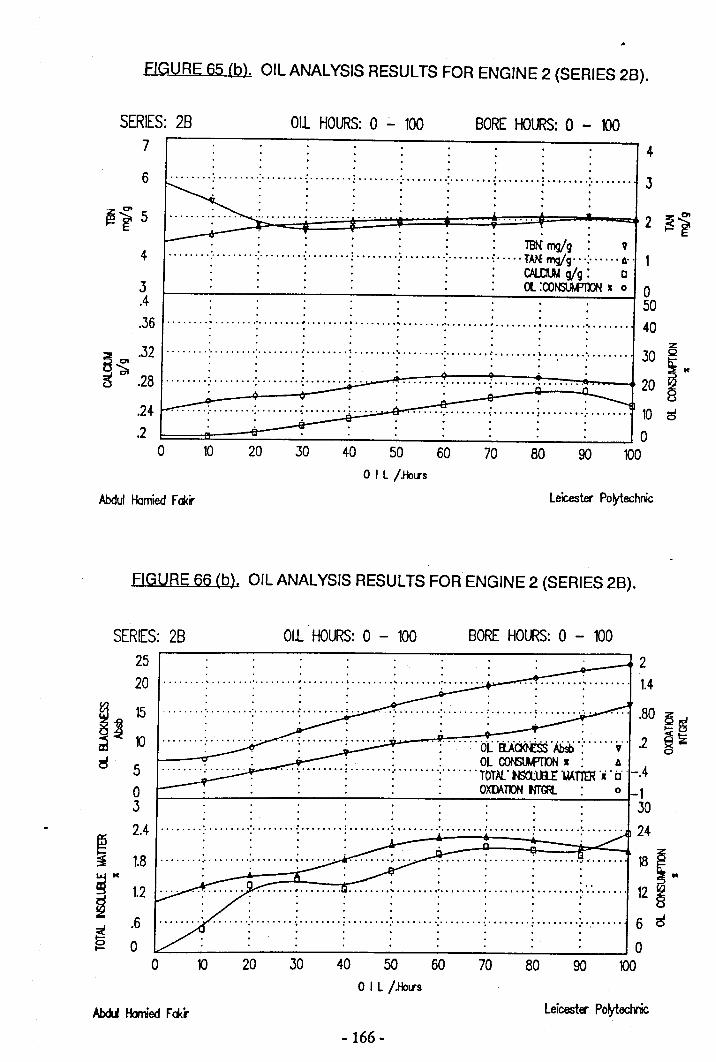
FIGURE 65 (b). OIL ANALVSIS RESULTS FOR ENGINE 2 (SERIES 28).
SERIES: 287
6
;;;!l .32lJ~5 .28
OIL HOURS: 0 - 100 BORE HOURS: 0 - 100
4. ........ -: -: :- ; -: : ~ : .; 3· . . . . . . . .· . . . . . . . .. . . .~~~~==~~==~~~~~2 ~i
· . : : TIN mg/g. v4 : ; ~ : ; ; ; rm mg/g ; A" 1
· ...•• (')LCW g/g. 0: : . . . Cl :CO~N I 0 0
503.4.36 ~ : : : ~ : : : ~ 40
. . . . . . . .· . . . . . . " z........: :- : ; : : : : :........30 ~· : . . : " : ~ ..
20 8cS
. ................. ; •...•..• ; ......• .;......... 1024 . . . .· .· . ..2 . . o
100o 10 20 30 40 50 60 70 BD 90o Il /.HOll'S
Abdul Homied Fok; leicester Po~echnic
FIGURE 66 (b). OIL ANALVSIS RESULTS FOR ENGINE 2 (SERIES 28).
SERIES: 2825~----------------------------------------.2
~ 15irl ~ 10
Oil HOURS: 0 - 100 BORE HOURS: 0 - 100
· . . .20 : : : : ~ : .· . . . . .
........ : : ~ ; .. · .. ;·.. · ·; · .. ·i ; ··:·· BO z: . . . . . . .. E~
........ :......... :.. .. ..:........ ; ....... : ·:·.. ·.. ·OCEU/~i..~·1~~·:......v... 2 ~ ~• " \A\I~~ NR!U • 0· : : : OL CONStJ.f'OON I: A... '.' , '.' '.' TOm: Ul£w.~ 'i .Cl . -.4• • •• .~ ,111:.1\
O~mN tmR5o3
o -130
2.4 .; .; : ; -; : : .; 24. . . . .18 : : : : ~ : ; ; 18!· : . .: :::: ... . . . ' ..12 , ' .................•........•......... ~ 12· : : : : : : : :: 8. . . . . . . . ..6 : ~ ! ; : ~ ! : 6 is
. . . . . . . .~ . . . . . . . .__ ~ 0100
oo 30 904010 20 50 60 70 80
OIL /Jbrs
leicester Po~eclvlic
-166 -
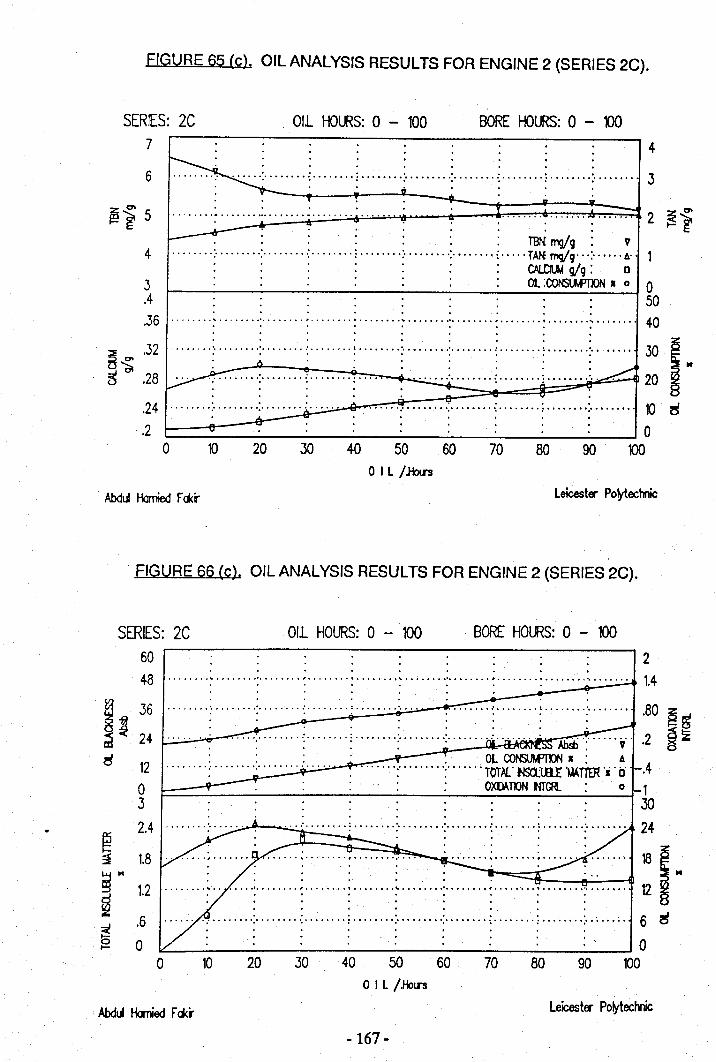
FIGURE 65 (c). OIL ANALYSIS RESULTS FOR ENGINE 2 (SERIES 2C).
SERIES: 2C7 4
OIl. HOURS: 0 - 100 BORE HOURS: 0 - DO
· . . . .6 -: ~ : -: : ~ ·····;·······.;·········3
. .: : . : . : : TBN mg,/g: v4 : : : ; : ··:········:·····TA!>Cmg/g···:·· 6. 1· : . : : : : ~g/g. D
. . . . Ol .COt&M'lXlN. 0 050· .· ..36 ~ : : : : :········:········:········:·······40
· . . . . .. .· . . . . .. . z....... -; : : ; : -; : : -: 30 s;2
.... ·:.. -:': ~:-····~.. ·; ..~···:·l··~;.. ·~··._.;._:~·: ~:~: ~: ~20 I".24 : : :. . . : ; ~ ~ :........ 10 r5.2 : : : : : 0
90 100
~ .32~~5 .28
3.4
. ". . . . .. . .. . . ..... ... . . . ... ... . .. . . .. . .....
o 10 20 30 40 50 70 8060o IL /Jbrs
Abdul I-bmied Fd<ir Leicester Po~echnic
FIGURE 66 (c). OIL ANALYSIS RESULTS FOR ENGINE 2 (SERIES 2C).
SERIES: 2C60~--------------------------------------~2OIl. HOURS: 0 - 100 BORE HOURS: 0 - 100
. " .48 ~ : : : ~ :········:········:········,·······1.4. ..36 : :- : :....... . : 80 z
.. .::::' I!iH~24 ..... ..: ..... :......... ~........ >"....~...."...:.........:.......: ~.;....",".2 ~!i:
. : OL CONStM'Jl)N I: 6....•.•• :•••.••••• : ..•..•. TOTM..· NSctlll! ~m'j' ci '-.4
OXDAmN MGR.12o3
o -130. . .
••• : ••••• '.' ': •••••••• : ••••••••• : •••••••• :, •• o· •• 0: :..... 24. . . . .~---e--=::~....._' . .: I
• : ...... ; ...... "~ ". ":" .. • ..... -,' '~. '-=::" '::::' '=i' ':_" ._ .. _.. ~'.:..' ._ ... ~. 1218 lie
• • • • • • • • • ••• ot, ••••••• , ••••.••..•• , f, ••••••• , ••••• ' ••• , ••••••• ,0 ••••••••· . . . . . . . .· . . .. . . . . .
~~ ..~ 1.2
.6. .. . . . . . .
•••• ,. .: ••••••• '0' ••••••• '.' ••• , • ,., : •••••••• : ••••••• '0' '.' ••••• , : •••. , .. . .. .. . " .~ __ __,. __,. .__,.__. .__,.~.--..__ --__,._.__ ~ 0~ ~ M m 00 00 re
2.4
1.8
oo
6 r5
10 3020OIL /.HolrS
leicester Po~echnic
-167 -
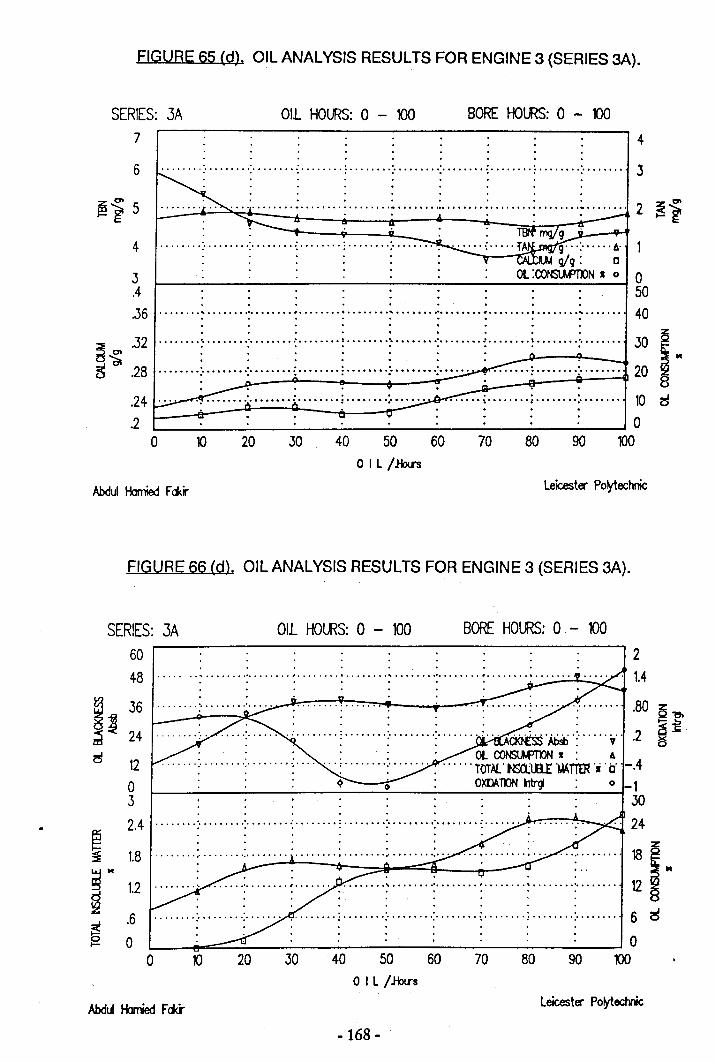
FIGURE 65 (d). OIL ANAL VSIS RESULTS FOR ENGINE 3 (SERIES 3A).
SERIES: 3A7
011 HOURS: 0 - 100 BORE HOLRS: 0 - m
· .· .. . ......... : -: : : -: :- : : .: 3· . . . . . . . .· . . . . .. . . . .. ......... : : : : ~ : : ~ ~ 2 ~i
4
6
4 -: :- : ; .; .. .. .gg" .:••.•. '6'g/g: c
Ol :CONSU.POON I 0 050
3.4
~~ .32~ .28
.24 C---il~~-~--c---o-
.210
~ __ ~ __ ~ __ ~ ~O100o 10 20 30 40 50 60 70 80 90
OIL /Jb.rsAbdul Hamied Fd<ir leicester Po¥technic
FIGURE 66 (d). OIL ANAL VSIS RESULTS FOR ENGINE 3 (SERIES 3A).
SERIES: 3A 011 HOURS: 0 - 100 BORE HOURS: 0 - 10060 2. ., .48 . . . .. ..: : : : : : : : . . . . . . . . . . . . . 1.4
~~ 36m 24
~~ ..~ 1.2 . . . . . . . . .
.6 " : ": : ! : " .:"" ~ "! ,,".: 6 ~.. ..~ __ ~~~ · · · ·__ ~O
100
1.8
12o3 . .2.4 _ : : : : : : : ' .. ..
oo 10 20 30 40 50 60 70 80 90
OIL /J-btrS
leicester Po¥technic
-168 -
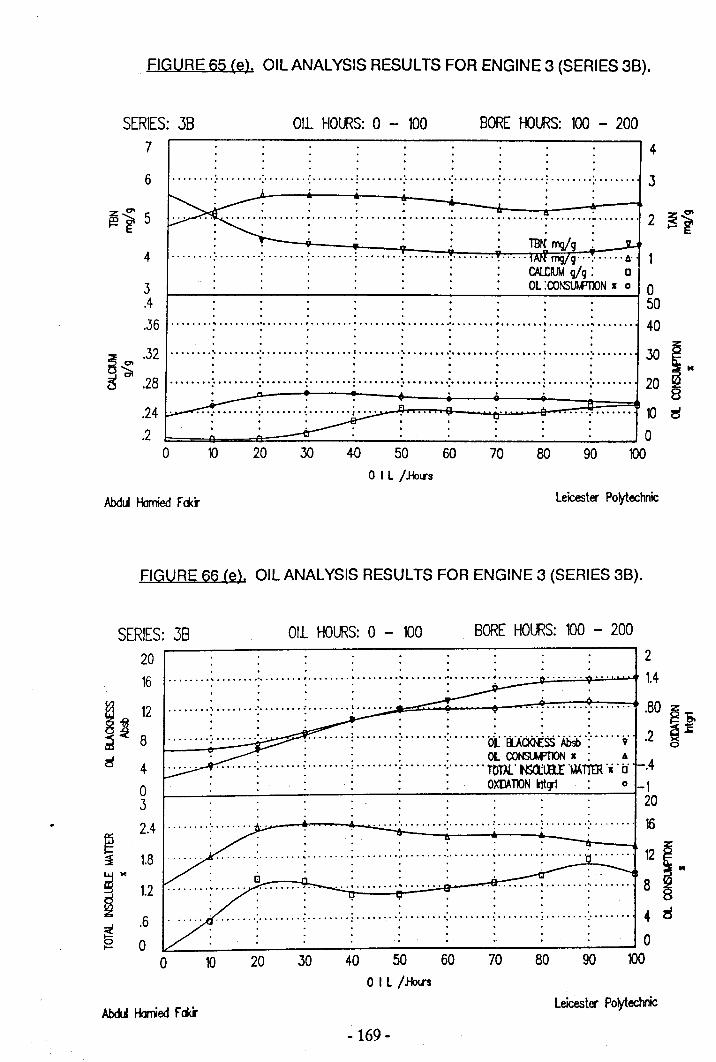
FIGURE 65 (e). OIL ANALYSIS RESULTS FOR ENGINE 3 (SERIES 38).
011 HOURS: 0 - 100 BORE HOURS: 100 - 200SERIES: 387
~ .32~~~ .28
.24
.2
3.4
JO I.20 8
c:J
4. . .
6 : ;. :- : -: : ~ : -: .3• • • • • I. . .. . .
... "': ~ ~ ~ ~ ~ : : ~ 2 ~i· .· . .4 -: ;. :- : ,' .· . . .. .. . .. . or------------.----.-------------------------150. ..36 ~ : : : ~ : : : ~ 40· . . . . . . . ... .
•••••••• '\ ••••••• 0°0 ••••••• : t ••••••• 0"' ••••••• 0" ••••••• I •••••••• , •••••••• 0, •• , • " •
• • • • I • • • •· . . . . . . . .• • • • • • • I •· . . . . . ,. . .......................................................................................· . . . . . . . .· . . . .
o 10 20 30 40 50 60 70 80o Il /Jbtrs
Abdul Hamied Fd<r Leicester Po~echnic
SERIES: 38
FIGURE 66 (e). OIL ANALYSIS RESULTS FOR ENGINE 3 (SERIES 38).
011 HOURS: 0 - 100 BORE HOURS: 100 - 200
20 2• I • •16 ~ : : : ~ : :........ 1.4· . .
4o3 . . . .
• • ••• 0°' •••••••• :- : •••••••• : •••••••• :••••••••• 16· . . .
:::.. ~ .. ', .:::T:::: .! ..... :: :.:.. .;::: : I·· ••••• • .,J· :. : ; .: :. ; ; .:........ 4 0
• I'"
: .: : 00~--1~O---2~O----30-----4-0---5~O---6~O--~70~~8~O---~9~O--~IDO
2.4
.6o
OIL /Jbr.rsLeicester Po~echnic
- 169-
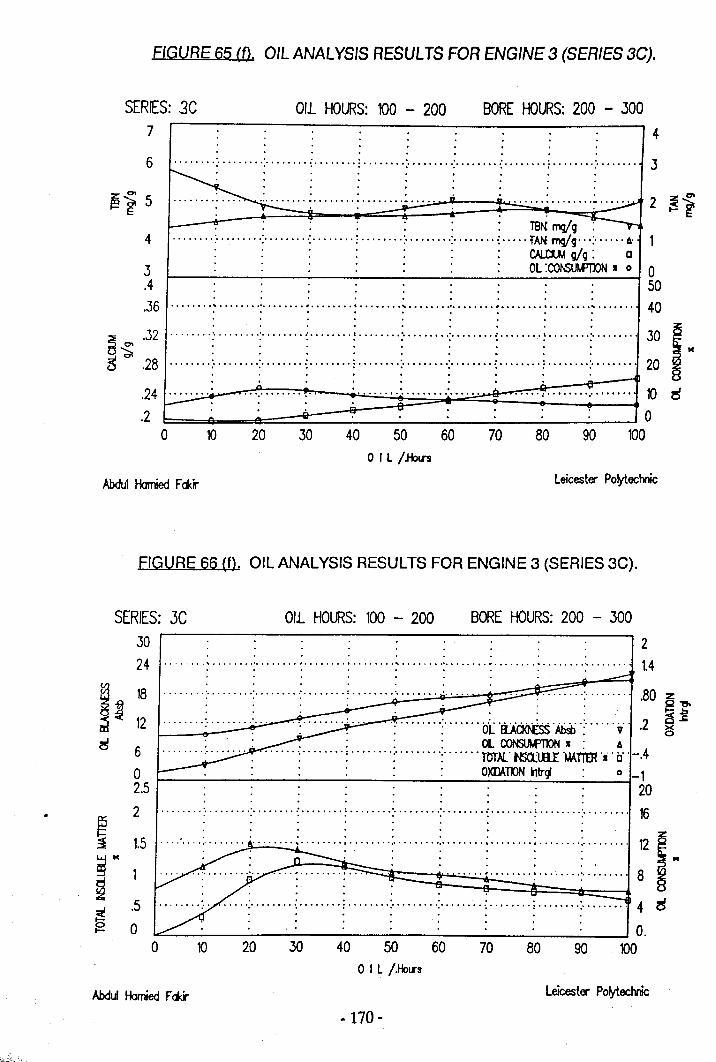
B~ .32B .28
FIGURE 65 (f). OIL ANAL VSIS RESULTS FOR ENGINE 3 (SERIES sci
SERIES: 3C7
OIL HOURS: 100 - 200 BORE HOURS: 200 - 3004
. . . . . . . .
Oi~: ~···:·L···::C:.·:L.·.···r··"T·.···.·r·::·:L.::~·:~~.....~ ~~. . --"r . . _. ~E
. . . ":' 7 • ; TB.;~/~r- . . . . . . . ",,'\Vg. n
4 -: -: :- : -: :- : iAIi mg,Ig .. .; 6" 1: : . : : : : CN..CU.t gig : 0
3' .:.: OL:CO~N I 0 0.4 . . 50· ..36 ~ : : : ~ : : : ~. . . . . . . 40
· . . . . . . . .· . . . . . . .. !........: : : ! : ; : ! ;......... .30
: : : : : : : :: ~ M........ : : : : :..••..••. : ......•. ~ ...•... 0: ....•... :........ 20• ••• I • • •
· . . : : ~.-r:-..':":"..~..:.:-:-:.•:-:-:..-:-:..~:-:-..~..~J 10 ..J
.24 L~:··~···~··t·==..:.":.:..:..:..~..:.;;±=~=:~~~======j0.2 b : : : 0100o .30 40 50 60 80 9010 20 70
OIL /.Hotn
Abdul Hamied Fd<ir Leicester Po~echnic
3024!~1812
~ 6
02.5
~
2
1.5~ ..~ 1
~.5
0 0I-
0
FIGURE 66 (f). OIL ANALYSIS RESULTS FOR ENGINE 3 (SERIES 3C).
SERIES: 3C OIL HOURS: 100 - 200 BORE HOURS: 200 - 3002
. .· " : ; : : :...•..... :......•. : : :..... . .. 16
. . . . . . . . .· ~ : : ~ ~ ~ ~ ~ ~ 121
.' .. .·. . . . .~ :.. . : : . . .. , ~ :.. . . . . . .. 8
. . . . .
10 .30 50 9040 60 7020 80OIL /Jbrs
Leicester Po~echnicAbdul Hamied Fd<r
-170 -
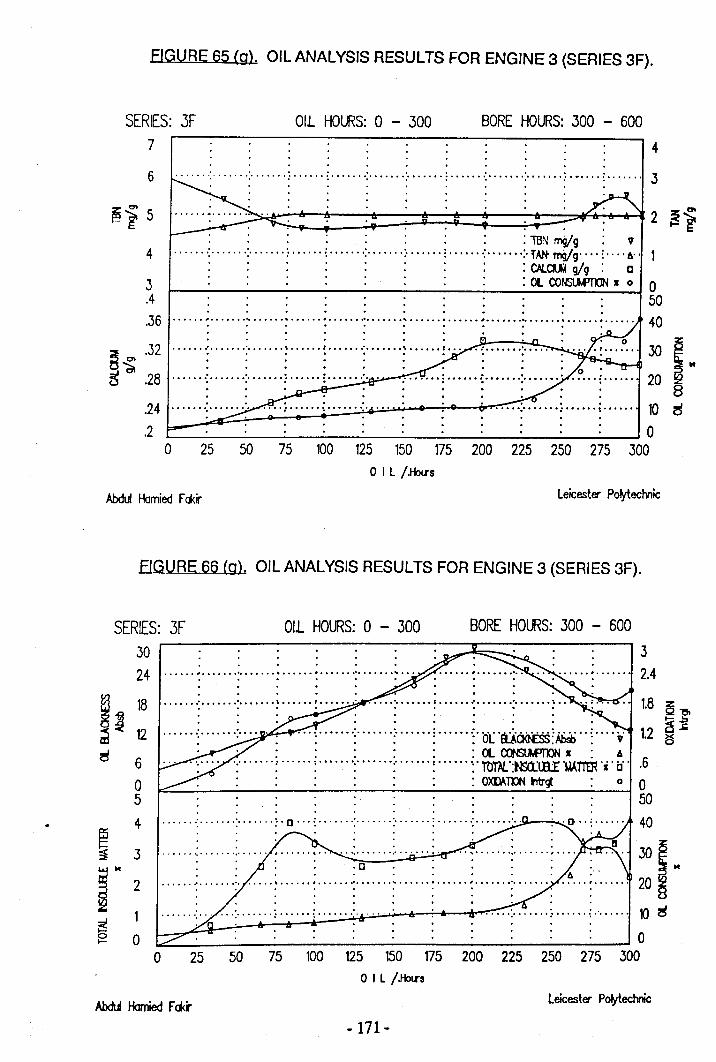
FIGURE 65 (g). OIL ANAL VSIS RESULTS FOR ENGINE 3 (SERIES 3F).
SERIES: 3F7
Oli HOURS:0 - 300 BORE HOURS:300 - 600
. . . .. ........ : : ; : : : : : : ".;. _ :, 3
. . . . . . . . . . ." ... .
4
6
~Ot5~-~
4.3.4.36
~ .32~B .28
.24
.20
...... : ~ : : : : : ~ ~ : : . . . . . . 40· .· .
I·8~
· . . . .......................................· . . .· . . . . . .· . . . . .L··:..·2...:·~..·~··.'::::·~ ~;..~ ~.;.~:...:.:.:~:..~ ~~~ . ...,.-;-; ; ; 10~ ~ 0175 200 225 250 275 30025 50 75 100 125 150
OIL j.Holl's
Abdul Homied Fftir leicester Po~echnic
FIGURE 66 (g), OILANALVSIS RESULTS FOR ENGINE 3 (SERIES 3F).
SERIES: 3F 011 HOURS:0 - 300 BORE HOURS:300 - 60030 · .24 ~ : : : : ~...
., ...3
. .0 •.. ~ ....•• 0:_. ''' .. 0' ••• :...... 2.4.. .· . . .. .,~j 1128 ....... ~ ....... ~....... : ...... ~ ; · : .. • j ·T..·..·f.... · .. f .... ; 11.
2
8 ~:ras : .. ·: .. • : ·: ·: ·:·bCIUOO£SS:~ .. : ,· . ~
. : : : : : :OLCQNSLWOONI: A':" : :."." .: :" : " :·ltl'TN.::NSa.UU: '~T'l"rn 'i .ci' .6
: OXDATPN ntr~ 0 050
6o54
· . . ., ........ :- -: :. 0···:·······:-····· -: ; :- '.~.----: ....... 40
~~M
~ 21
o
3
. . .Lja' ~.~. ~.~. ~~~., . '....... '.' .. .. '.' : ,.... .. .. . '.' \ .~ ~O
175 200 225 250 275 30025 50 75 100 125 150oOIL /.Hotrs
Leicester Po~echnic
-171-
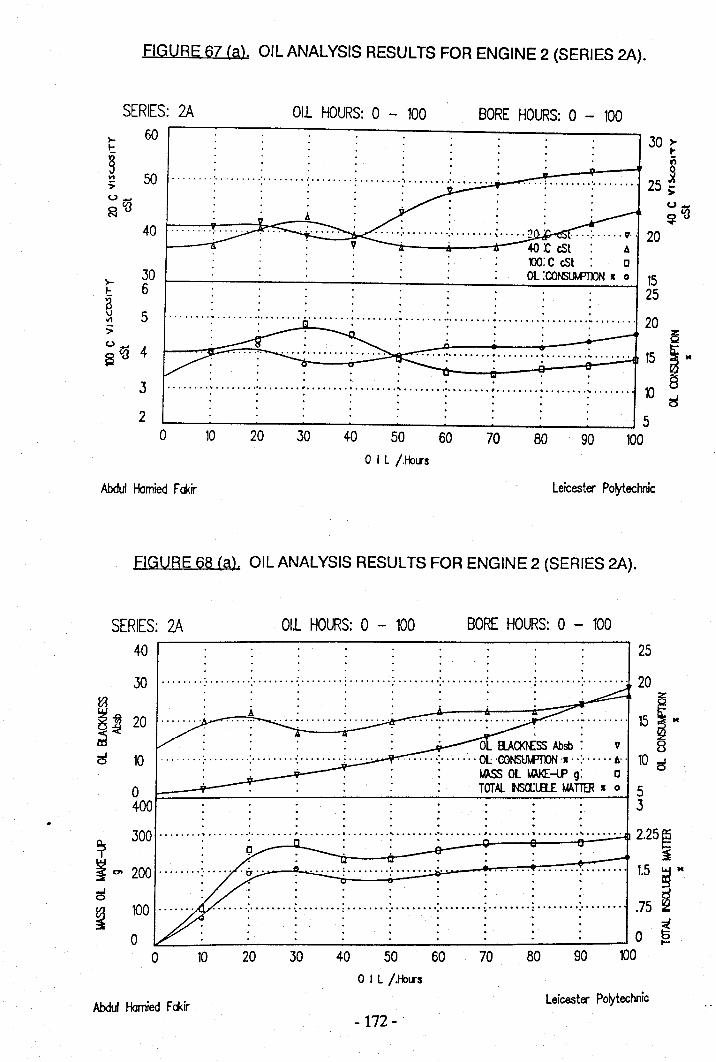
FIGURE 67 (a). OIL ANALVSIS RESULTS FOR ENGINE 2 (SERIES 2A).
SERIES: 2A OIL HOURS: 0 - 100 BORE HOURS: 0 - 100
. .50 : : : ; : .. . .. . .
60r---~--~--~--~--~---------------------,30~to
:. R.... , '" 25 ~
" >u_~ca
... .:...... v·· 20--a----,jr---.~ 4O:C cSt: A
'00: C cSt: cOl :CONStJ..PTX)N 1 0 15
25
40
>- 30I- 6~ 5.,..>u ....
4S'a
.3
20
........ : : : : ~ ; : : ~. . . . . . .. 20CS: ~.__;_. ~:~: ~~ I"
I , " ••••• , ••••••••••• , ••••• '10 ••• "'" .' ••••••• t" •• I •••• ,. • •••• • • ••• ••• 10: . : : : : : :: i!5. . , .
~--~------~--~------ · __ ~· __ ~· ~510010 20 30 40 50 60 70 80 90
Oil /.Hotrs
Abdul Homied Fd<ir Leicester Po~echnic
FIGURE 68 (a). OIL ANALVSIS RESULTS FOR ENGINE 2 (SERIES 2A).
SERIES: 2A40 .----------------------:-----, 25
OIL HOURS: 0 - 100 BORE HOURS: 0 - 100
30 : : : ; ; ; : ~ : 20. . . . . . .. ~
15 iM8
10 <5o EUOO£SS Absb : v
........ :- ...... Ol 'CONSlM'IDN '1.. :...... A"
tJASS Ol J.W<E -LP g: oTOTALNSOCL8£ w.nrn I 0 5
.3
OIL /.Hotrs
Abdul Homied Fd<ir Leicester Polytechnic-172 -
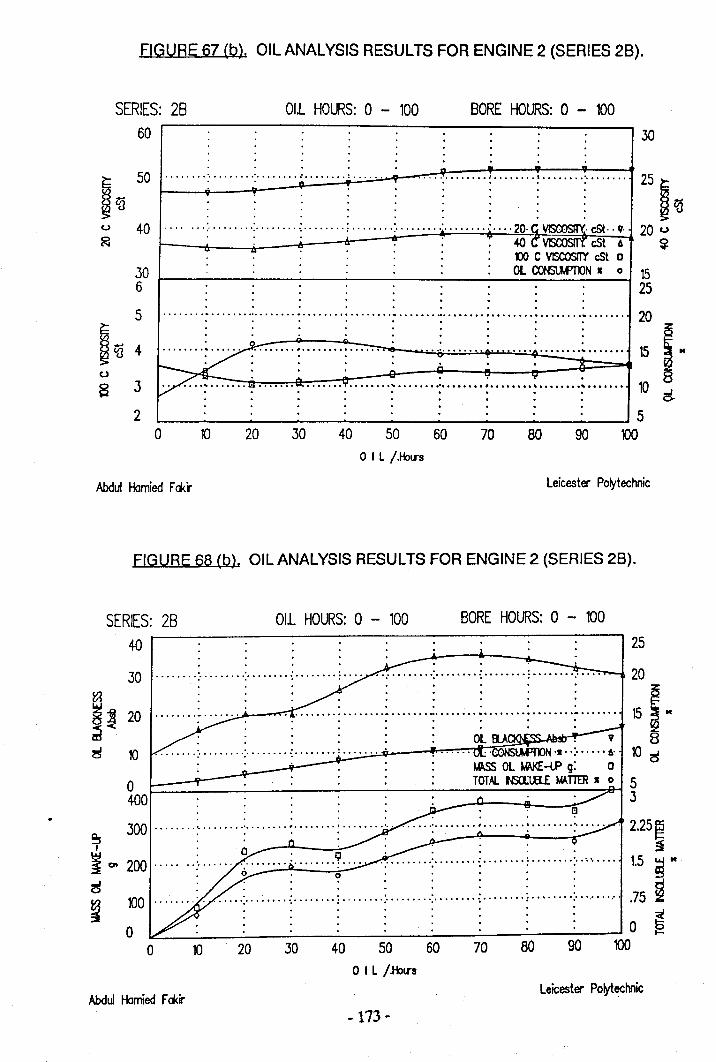
FIGURE 67 (b). OIL ANALVSIS RESULTS FOR ENGINE 2 (SERIES 28).
SERIES: 2860
OIL HOURS: 0 - 100 BORE HOURS: 0 - 100
~~
50
c.> 40~
306
5~
~<a 4c.>
S 3
2
. .. .:.
.30
...:..; ; ::····r··r·····r····· 25 ~ ~
....... : : : ; : : : 20· c VlSCOSIrf.. cSt .. , .. 20 c.>. .. :.roe VBCOSIT't: cSt 6 ~w ~ : tlO C VISCOSITY cSt 0
OL CONSUMPnON. 0 1525
~ .......... ~ : : : ~ : : : ~....... 20.. .. . .. .. .. .. .
. . ..•••. ~.•.•..•• ; : :...•..•. :. • ..•. : ..••.••• ~....... 15: : .:. ;.. . .. . ':' ................ : ~ :...•.... : .•..•... : ......•. ~••..... 10
.. .. .. .. .. .. ..
.... ........~ __ ~·__ ~ ~ __ ~ · ~·__ ~· __ ~ ~5100o 10 20 30 40 50 60 70 80 90
OIL /HolJ"s
Abdul Hamied FcJ<ir Leicester Polytechnic
FIGURE 68 (b), OIL ANALYSIS RESULTS FOR ENGINE 2 (SERIES 28).
SERIES: 2840 ~-----------------------------------------,25
20
s I·8lOc;
OIL HOURS: 0 - 100 BORE HOURS: 0 - 100
30 : ;. ~ : ... .
OIL /JblJ"'S
Abdul Hamied FcJ<irLeicester Polytechnic
-173 -
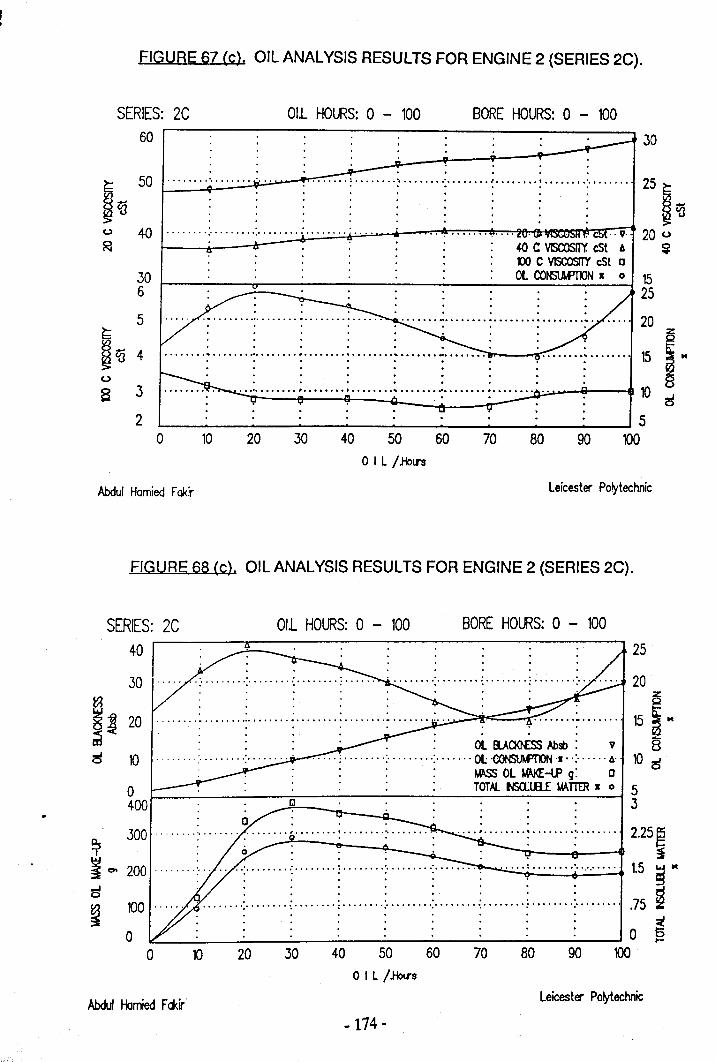
SERIES: 2C60
306
5~Vl0_
4~I{l
u
S 32
0
FIGURE 67 (c). OIL ANAL VSIS RESULTS FOR ENGINE 2 (SERIES 2C).
Oil HOURS: 0 - 100 BORE HOURS: 0 - 10030
. .. .. .50 : : : : : ; : 25 ~
: : :': : :: ca. . . . . . .40 : '.' : . . . . . . . . . . . . . . .. 17·· 20 u
40 C VISCOSrrt cSt 6 ~co C VISCOSrTY cSt 0Ol CONSUWOON 1 0 15
2520
· .· . ............ " .· . . .· .· .
. .. - .. . .. . .. .· . .. ................... 0 •••••••• #. • • • .. •• • • • • • •• • • •• • • •• • • • • • • • • .· . . . ,. .· .· .. . .
~ ~ ~ ~5oo10 30 9040 5020 60 70 80
OIL /JtJIIS
Abdul Hamied Fakir Leicester Po~technic
SERIES: 2C4030
~g~20c5 o
0400
Abdul Homied F<tir
FIGURE 6B (c), OIL ANAL VSIS RESULTS FOR ENGINE 2 (SERIES 2C).
Oli HOURS: 0 - 100 BORE HOURS: 0 - 10025
..•...•• : ..•.•.••• : ....••. 0; •..•...• :... ..•. 20. . ~
:: 15 ~ ... . OL flAOOESS Absb : v 8
..... : -; :- Ol: ·CONSUt.PrnN '1' .:...•.. 6" 10 ~MlSS Ol WJ<E -lP g: 0TOTAL. NSClUlE MA.TTER1 0 5
3
leicester Po~echnic
-174 -
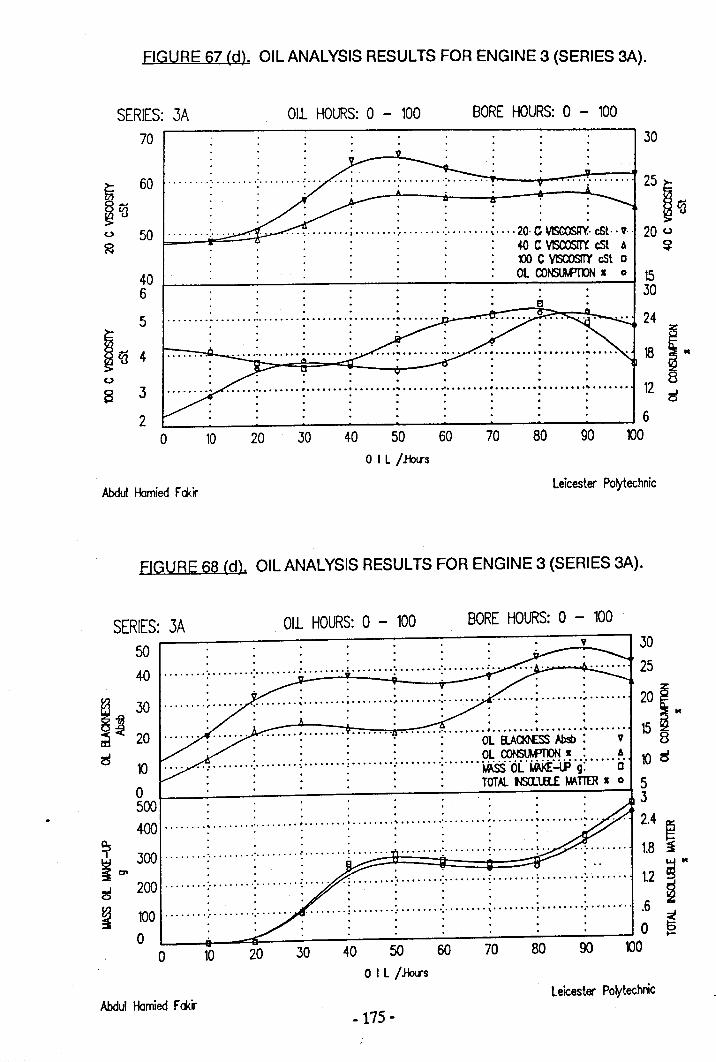
FIGURE 67 (d). OIL ANALVSIS RESULTS FOR ENGINE 3 (SERIES 3A).
SERIES: 3A70 .-----------------------------------------~30
011 HOURS: 0 - 100 BORE HOURS: 0 - 100
60. . .
. . . '.' ; : : ~ ·20·C VISCOSIlY.. cSt· . , ..40 C VISCClSfT't cSt 6co C VISCOSITY cSt 0Ol CONSl.U'Tl>N I 0 15
30
25 ~~t6
20 u~
u 50 .
406
5
~~ 4
.' ............................................... - .. . . . .· . . .· . ... 24
(.)
............ " ........... ..... .. . .. . .· .. ....· . . .' ..•••••• 0 0 .· . . . . . . .
• • .. • • • III •.. .....~ __~ . ·__~ · · · · ·__~610010 20 30 40 50 60 70 80 90
8 32
oOIL /JbtrS
Abdul Homied FakirLeicester Po~technic
FIGURE 68 (d). OIL ANALYSIS RESULTS FOR ENGINE 3 (SERIES 3A).
SERIES: 3A all HOURS: 0 - 100 BORE HOURS: 0 - 100~ ~-------.-----------------.--------~--~'~--,30
. . .40 -: :- : : -: :- t , • 25. .
~~ 3Dm 20
• • • • • • • • •• - •• - •• ~, .- •• -: •• - •• -:iI. -:-:-•• ~•• ~•• ....:. :~ .. ~ •• •••• '0 " ; : .
: : : : : OL aAOOESS Absb : ,. . . . . Ol CONStJM'OON I' A
.• _. ;. ;. ; : ;. iii''':'': 'O'l' ',lii/F'ID' .:.•••.. i:i. . . . . . -= ~-vr g.o ~--~:--~:-----:----:----:-----:--~T-m-~-~--·-~--~-I-lffi--I-105500 .' . . . .3
..' 2400 ~ : ~ : : : : : : , .4 ~. . . . . .~ :..... . -cI 300· : : : f1.-= . -::;.' '::::' . :::' . tt'=' '=' '=:' '1':-:::' ':::' '=' .~. :~.. =' ':::' '::1' . f: . ;,.-' 1.8 :::Ii
~O> :::'.. ~ ..cS 200 : : : : : :- : : : 1.2 ~
~ 100 ~ : ~ : ~ : ~ ~ ~ ~ · ·.6 ~o .::::::: 0.-
o 10 W ~ ~ W 00 m 00 00 m
10
OIL /JbtrSLeicester po~technic
Abdul Homied Fakir-175 -
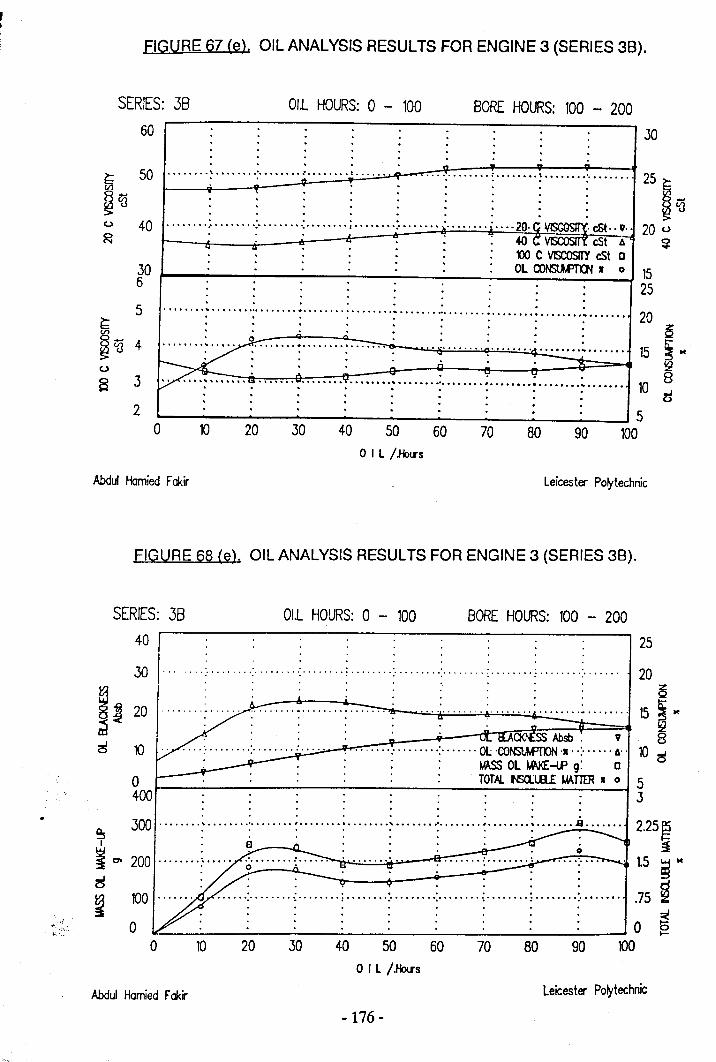
FIGURE 67 (e). OIL ANALYSIS RESULTS FOR ENGINE 3 (SERIES 38).
SERIES: 3860
01.L HOURS: 0 - 100 BORE HOURS: 100 - 200
. .50 : :- ~ : . ...30
-_ : ; : .\
(.)
. ... .. .. .. .. .. .. .. ..40 .: : .: ; .: 20· ~~ cSt· . 11·
. :. .;: 40 C VI:IW:)II T. cSt ~~ ': : . : : : '00 C VISCOSITY cSt c
•• '" Ol CONSLWTKJN I 0 1525
.306
.. .. .. .. .. .. .. .. .......... ~ : : : ~ : : : ~. . . . . . . 20: . . . . . . " 5
4 %' ;:c; ..·l..;·..=· ;·~· ·;;: ±" ~ ;; ::;; ;=.: ==¥:..~..... 15 8~": : . _,:,__ " ~. ': -: .3 ..e ...........••• 't ~....... 10• . • . . •• cS
5
2 ~--~--~--~--~--~------~ ~5o ID W ~ ~ ~ ro m 00 00 re
o IL /Jhlrs
Abdul Homied Fakir Leicester Poo/technic
FIGURE 68 (e). OIL ANALYSIS RESULTS FOR ENGINE 3 (SERIES 38).
SERIES: 384030
!j 20
c5 10
0400
01.L HOURS: 0 - 100 BORE HOURS: 100 - 200
.••• :••••••••• : .••••• , •• : ••••••• 0: •• 0 ••• 0.: •• 0 •••••• : •••••• , •• : •••••••• : "0 ••••• :•••••••• 20
25
oo 10 20 .30 40 50 60 70 80 90
OIL /JblrS
Abdul Homied Fakir leicester Po~technic
- 176-
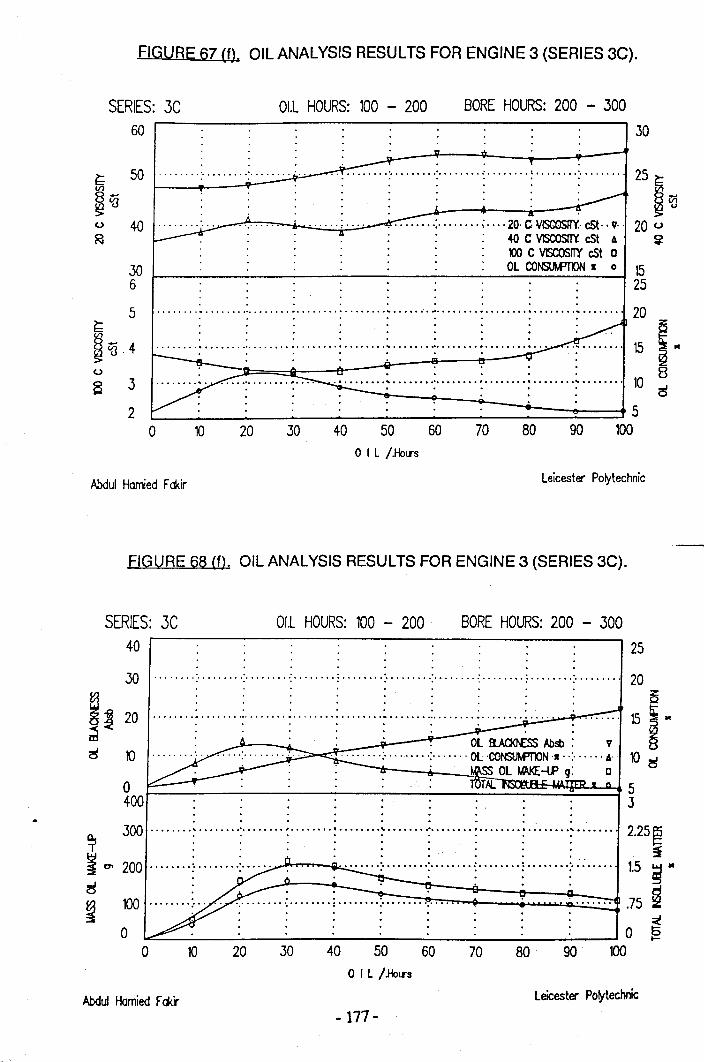
FIGURE 67 (f). OIL ANALYSIS RESULTS FOR ENGINE 3 (SERIES 3C).
SERIES: 3C60
011 HOURS: 100 - 200 BORE HOURS: 200 - 300
~ 50III
~~u 40~
306
5~III0 .... 4~<{J
u
S .3
20
25 ~~'O
20 u~
30
.. ........................................ \ .. .. . . .. .....••••. :••...•.. ~.•.. 20· C VlSCOSIlY.· cSt·· , ..
40 C VISCOsm: cSt Am C VlSCOSI!Y cSt 0Ol CONSUWOON I 0 15
25
· .,· . . .•••••••• ~ •••••••• 0 0. • • • • • • • • • • • • • • • • • • • • • .· . . . . ., .. . . .
10 20 30 40 50 60 70 80 90OIL /JiolTS
Abdul Hamied Fakir Leicester Polytechnic
FIGURE 68 (f). OIL ANALYSIS RESULTS FOR ENGINE 3 (SERIES 3C).
SERIES: 3C40
011 HOURS: 100 - 200 BORE HOURS: 200 - 30025
.30 : : : ; : ··:·········:········:········:·········20
oo 10 20 30 40 50 60 70 80 90
OIL /JiolTS
Abdul Homied Fd<ir leicester Polytechnic
- 177-
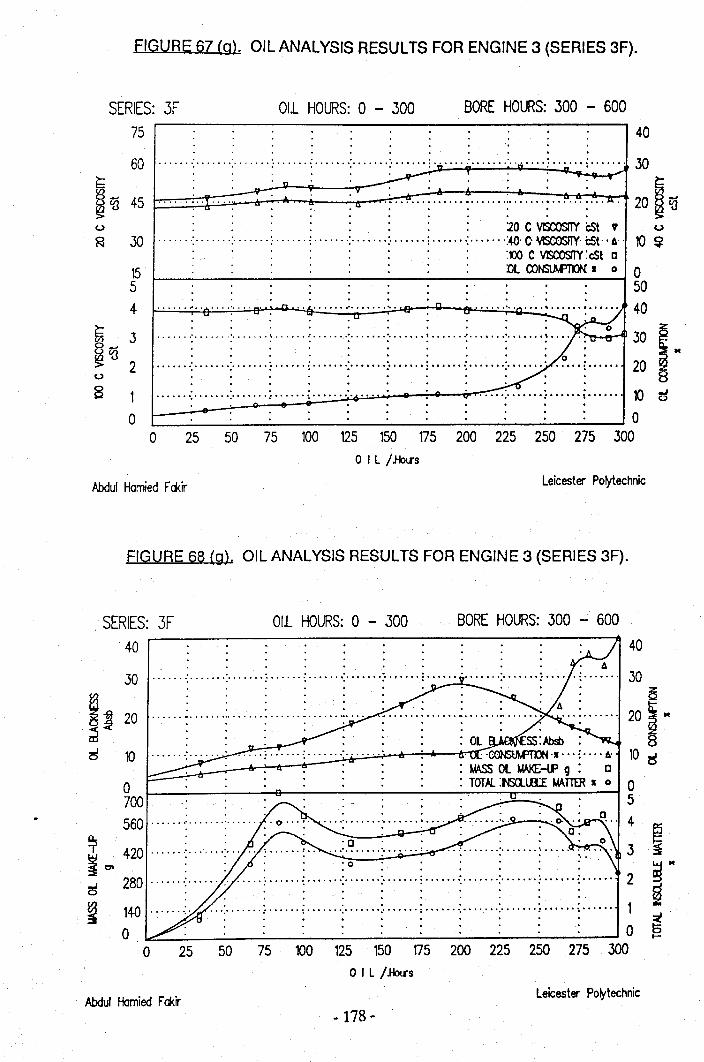
FIGURE 67 (g). OIL ANALYSIS RESULTS FOR ENGINE 3 (SERIES 3F).
SERIES: 3F75
BORE HOURS: 300 - 600011 HOURS: 0 - 300
. .. . . . . . .60 ':' -: : ': ;. -: : '':'" .' '.. ~ ~ : -;... :.:;
~ . __....-._,n.-"'i'--_-V--
~ i{j 45 ~.=..=..~.-~..I=1,=, .~...::::::;~--;==~.:;_..~.~~..~..:-:-..~:.~..-:-:-..~.:~..-:-:..-:-:.'0'~'~'.~..~..~:.:7. u:~•. ,.-~•. ~:•~.. ""tr~..
· . . .• ..:20 C VISCOSITY CSt V30 : -: : : ;. -: : :- <40, C VISCOSflY. CSt· . 6' .
.oo C VISCOSITY: cSt 0:Ol CONSlJM'TK)N. 015
54
. . . .. . ....... ; : n. .. ~ : :.. • n ~ ~ /
· .. .u ":.. ~../.. ••••••. 0
· : -: : : : : ! : : ~. ... .: '0' "'C'. .. .· : : ~ ~ : : i : : : ..? .. ~ .. .. .u
· . . . .• ••••• °0•••••• '0° •••••• : •••••• ~ • • • • • • •• • ••. .
• .... '0° ••• ,. •• : •••••• , ••••••
Abdul Homied Fddr Leicester Po~technic
FIGURE 68 (g). OIL ANALYSIS RESULTS FOR ENGINE 3 (SERIES 3F).
all HOURS: 0 - 300 BORE HOURS: 300 - 600SERIES: 3F40~-----------------------------~40
40.30
20 ~~u
1O~0504030 ;.20
10 <oJ0
4
.3 i~ ..
2 d. . . . . . . . . .. ~140 :. ; ~ : ; ; ~ > ..; ~ :...... t
o : ., . .' 0 ~
o ~ ~ ~ m ~ ~ ~ ~ m ~ ill DOIL /.Holl'S
Abdul Homied Fakir Leicester Po~technic- 178 - .
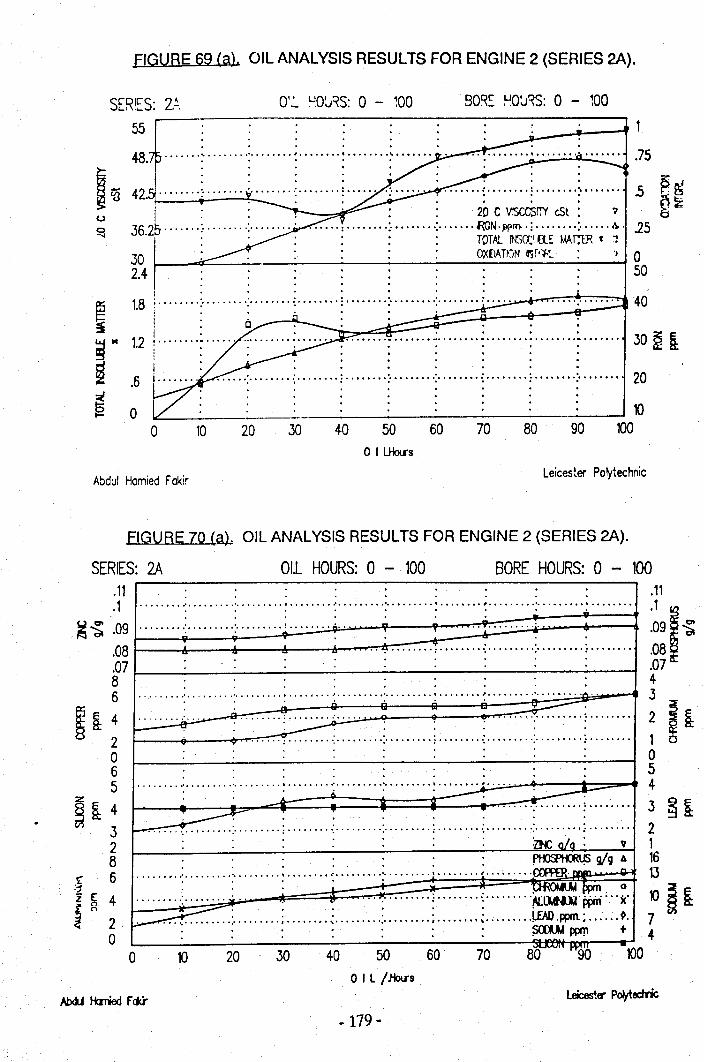
FIGURE 69 (a). OIL ANALVSIS RESULTS FOR ENGINE 2 (SERIES 2A).
SER':::S: 2.!.55 ~----------------------------------------~
0'.:" uOV6: 0 - ~OO SO~~ ~mRS: 0 - ~OO
.. .. ..48. . ~ : ~ ! ~.............. . .75
42 -: : :- ; -: ~ : : .5 P: ~. . : : : 20 C vsccsrr cSt : "1 ~ ~
...... : .:.•....... :....•.• iroN· W~ . : .:.•.... Il.. .25: : : TOT.AJ.. INSO~'RE M-\11ER ' :1: : : OX[lAH:JN Il'jf,",f,L " 0
50302.4
~
1.8
~M 1.2
~ .6
~ 0I"-
0
· . .· . . .. .. . ., : 0 eo· I : : '0· .
: .::. -:::::::!=---&--~-· .~,_......~-40
. . ....... • : : : : : ~ : : 0 20
.. ... . .. .. ... . .. .. .. . . . . 1010 W ~ ~ ~ ro m M 00 m
o I LHotrs
Abdul Homied FakirLeicester Polytechnic
. .. . .~..~ .. . ........:................. .'.' ........:.........07 :: : .078 . . . . . . : . : 46 ·········:·········:·········2·········:········.: ~ ~ ~..... 3
~ ~ 24 I~_._ .• '__.,,".. .. .. ...... : ........ ;;.-_;,:.• ~..• _._.."",?--~.-~ .....-:-.. -:-:-;-_.•..•.... ; . . . . . . • • 21 S ~1----+--.........r~··~··~··0·:····..····:·········:·········:·······..: : :........ 0
o : ::: 06 : . . . : : : : . 5
z 5 ·········:·········i······~········:·········:········.: ~ ::.~ 4
~e:4 ~ . : . : . . : 3 ~~3 I ._.. -.. -v ,' : : :........ 22 . . : . : : : OC a/a : v 1B . . . . . . . Ptm'OOruS !!Ig A 16
· . . . . • • :"""""""'.1:1.6 .- ~- 13: : : .' ~.wm 0 ~......... :- : .. : ~ .. : ........ : ......... : ~tJit,UC·Wir( "Se' n ~ K~ : ; ......•. ~ :.•....... ; ...•.••. ~ ,!..EAO.ppm.; •..... ~. 7
• • ' • • • • • SCXlA.J,f IVV'I'I t 4• • • • • • • • .A, ,.....:.
10 20 30 40 50 60 70 80~ -100oOIL /JbIJS
-179 -
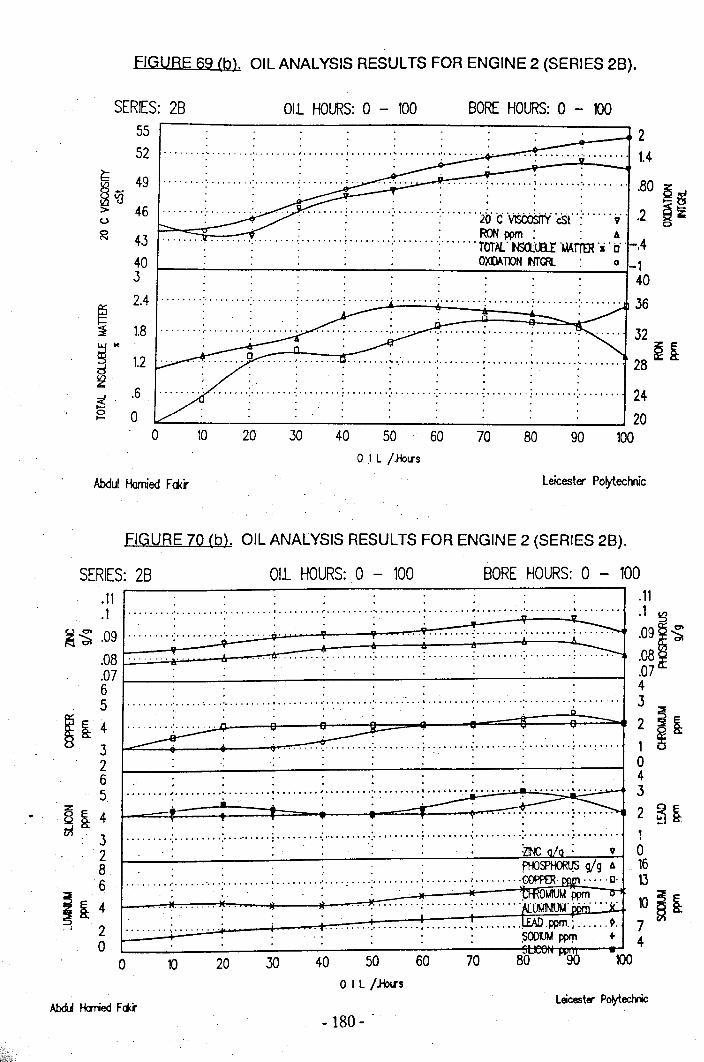
FIGURE 69 (b). OIL ANALYSIS RESULTS FOR ENGINE 2 (SERIES 28).
SERIES: 28 OIL HOURS: 0 - 100 BORE HOURS: 0 - 100
G 49§qj> 46
. ": : : ; 80 ~. . " ... ~........ ; :.. ... : : ; : ~o·c 'V!StbSrrv' 'cSt' .: ,".2 ~ ~
43 .:::: RON ppm : . A........ : : : : : : "TOTM.· NS<lJ.a.r '1Mri'rn'i' t],-.4
340 t--_-:-- ;___O:..;,,;XDA:....;TK>.:..:..::..:..:N ..:.,:ffi'.:..:,<R-=--_.:..__..:....j0 -1
40. ......... : :. , ~ : ' ' ~ : :. . . . . . . . 36
OJ L I.Holl's
Abdul Homied Fd<r Leicester Po~echnic
FIGURE 70 (b). OIL ANALYSIS RESULTS FOR ENGINE 2 (SERIES 28).
SERIES: 28 011 HOURS: 0 - 100 BORE HOURS: 0 - 100
· ..~~ . ~ .~==-""'__--+- _ __,;.."""""""...c-:-:.. ~.~'.' ...•..• .; ...•••..• ; .:.' •.•••• : •.•••••• .: ••••.•.•. ; .•• , ., •.. .
• • • • • >-' •· :: '" : ~ :. ' ': ~ : : '6' .-
.11
.1 s
.Og~~
.08~
.0743~i~o4.3
2 ~ e:
.11
.1
~ ~ .09 L----'l,_,_--,.-.08.07 I---_;__-_..:._-;__--_;__------------:--___,65
~ ~ 43265.
z8 ~ 4~ . 3
28'6i~4
. I 2o
. . .· . . . . . .· : : : : : ~ ~ :;.; ; .
. ., ---................................ ft ••.•••••••••• :- •••••••••••••••••• ~ ••••• ~
.... ":' .: : ; : .: ;~
· . .. . . . . . .• :' •••••• ; •• ,; •••••• : ••••••••• : •••••••• ; ••••••••• : ••••••••• ; ..... io • '0' ; •••••••• .;._•••••••• : ••••• .......-4. .. :~.
. . _.--___;_ ......: ........ ;.~.' ... .
.......... : ••••••••• :••• ,0' •••• : ••••••••• : ,' ~:. •••••••• : ••••••••• : ••••••••• :. •••••••• ;, • • • • • • • • ~
: . ':::ZlNC a/a : v 0.., .' . . . pf()SP~ 919 A 16
· : ' : ; : : : : ......•. : ·COPPER· prun o· 13.. : :.:.: . . . ~HWMWppm (r": :5E
L~· ..~r: ;,.:.;..'.. :...;.-.'.. +-' . _. ~__......,~:-:-:-:" 't' '-:7:" '-:-:-:' •• ~. : '-:-:-:' • '-:-:-:' •• ~. ' .: ~ ••• ~ •• '1'.K~·tJM1MUM::!.. OO~'rT'j.~.. :i:n'. 710 ~ 8:. ' :.........•........ , !.£AD .ppm.; 9....................
.. ~IUU ppry1 + 4-100o 10 20 30 40 50
OIL / ihll's
60 70 8(r~~' ~90
AbdtA Hanied F<if'Leicester Polytechnic
- 180 - .
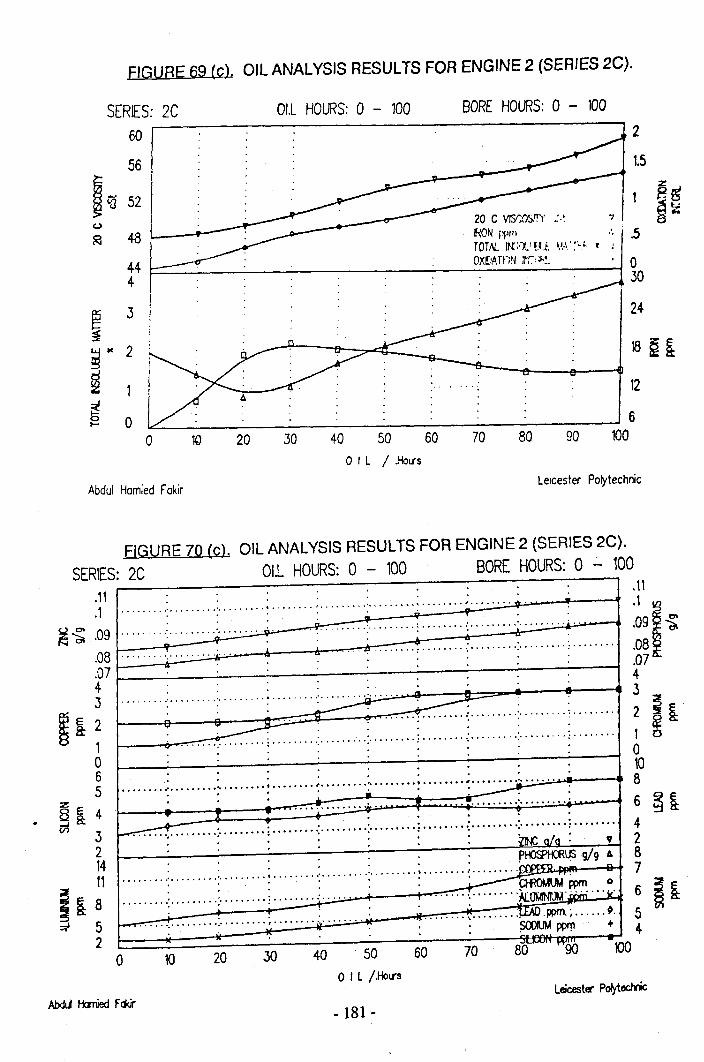
FIGURE 69 (c). OIL ANALYSIS RESULTS FOR ENGINE 2 (SEAlES 2C).
SERIES: 2C60
56
I~521
01.L HOURS: 0 - 100 BORE HOURS: 0 - 1002
1.5
12
~ ~ __ ~ __ ~ __ ~ ~ 6o 10 20 30 40 50 60 70 80 90 100
OIL / .Holl"s
Abdul Homied FakirLeicester Polytechnic
FIGURE 70 (cl. OIL ANALYSIS RESULTS FOR ENGINE 2 (SERIES 2C).SERIES: 2C 01.L HOURS: 0 - 100 BORE HOURS: 0 - 100
.11 . : : . : : : : ..:.
~"'a.- :.~l:~=·~··=··=··fr·:·=·~··~··=··±·:··~~··~··~··:·:·=~·'="=":":'="="="~'1':'~"="="~'j':~"~"~"'~j''~";";"~':''''f.'='~~t='='1~. ..:. : : .......... : ;;.. . . . . . . . . . . . . .. . ...................... .., . , : , , .:' .
.07 ~ _ _..:.____ _:_-___;~-~-~-____;.--..;__-------t4.3
~ ~ 21o65
:z:8 E 4~8:
.321411i~8
-;f 52
· . .......... : ; : : : ~~'''. : ~ ~ : ~ ..
~_~~ ..~;,.0.:.·······:·········.·········..········:· : .. .. . .
.11
.1 I.09 ~
.08
.074.3~i~o
· . . . . . .' 10· . . . . . . ......... , , ,' , .....•...... 0.,· I .. ··· ,;;..~.'.:.:''.,:..:.'.~---. 8: : : ~ .. : : . .
•••••.•••••••••••• .'!". •••••••••••••••••••• 6-y'" •••..
~ ; 4: ~ ~ : : ~ ~.~~.~ ~. 2
· . . . . . . P~USg/9 A 8......... : : ; ; ; ; ~ ~: 7
: :. PRO~wm 0......•.. : ...••... -:..•.•.... : ..•..... :. . . . . . . ..... ': .•.•.•••. A[OMINIUt;r.;,,:,m .•. it 6
· .'... ~ : ; : , . . , , 1..EAD .wm·;··· .,. ~. 5.' .: ~pprr1 + 410 20 30 40 . 50 60 70 80uvv, Woo -100
..:
oOIL /PlJlIs
Leicester Po¥echnic
- 181 -
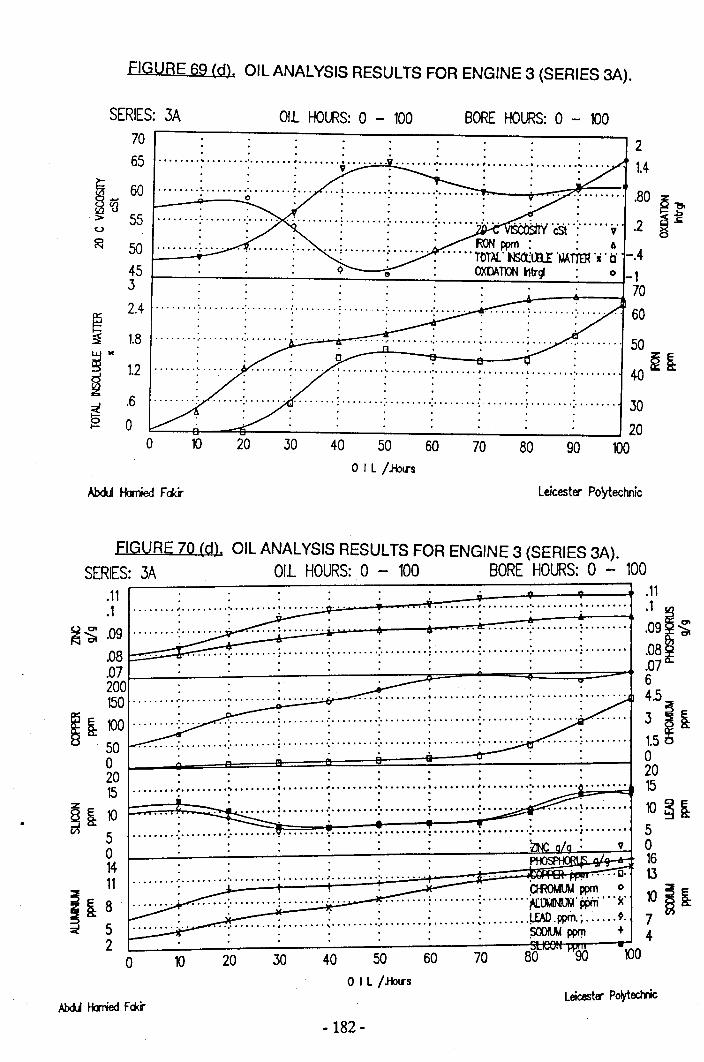
FIGURE 69 (d). OIL ANAL VSIS RESULTS FOR ENGINE 3 (SERIES 3A).
SERIES:3A OIL HOURS: 0 - 100 BORE HOURS: 0 - 1007065 Ii'~""" •• :' ••••••• ~ •••••• Ii "9° : ~ : ~ .
.. ." . ~'--~~~42
. 1.4~ 60
~ <{j 55(J
!~ ..~ 1.2
.6o
45 t-------------=- ......:.__;__-40 -13 . . 70'. ..2.4 : :- : ; : :- ; : 60. . . " '". . . . .
A·_:_;..,_,_.......-r-"·~····· : ; ......•. ;.... . 50: : : . : : . ': ~ a:........ ~ . . :...... .: : : ~ : :.. . . . . . . 40
1.8
o 10 20 30 40 50 60 70 80 90OIL /.HolTS
Abdul Harried Fd<ir Leicester Poo/technic
FIGURE 70 (d). OIL ANAL VSIS RESULTS FOR ENGINE 3 (SERIES 3A).SERIES:3A Oil HOURS:0 - 100 BORE HOURS:0 - 100
.11
.1 I.09 ~
.08
.0764.53 ~ a:1.5 ~o2015
1O~a:5o1613
lOai74
100
.11
o 10OIL /JtJlTS
Leicester Po~ecMic
-182 -
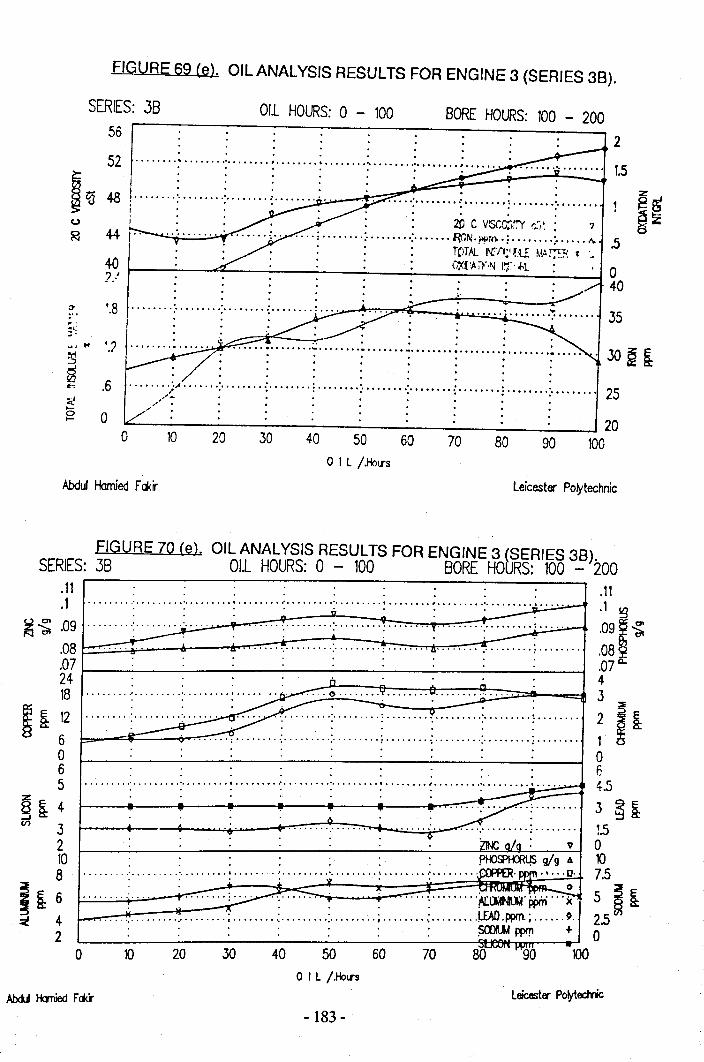
FIGURE 69 (e). OIL ANALYSIS RESULTS FOR ENGINE 3 (SERIES 38).
SERIES; 3856
OIL HOURS: 0 - 100 BORE HOURS: 100 - 200
2
44 I"
40?.!
. . . . . . . .52 : ; : : : : :::::::.. :::::::;:~.:::.. =--+. -"-"'-";-"-"'-"-t" 1.5
I . . " "48 i·······-:·········;-·······-;········ft..:··_·-o:!Y?.:: ;- ; : ; .
i ; 20 C V:SGC4ir:'!' r,:;~ ; ?.... ; ; ; mN.;'I'rn..; ; .5
; TOTAL 1N?,1',;, HI w. ~}: .t :.
: (;Xl 'AiroN I!';> "'1 • 040
0- '.8.~.:(.'u. .. '.7~dIQ .6tr.
~.,_0 0.,_
0
· . . . -~~~~~~~~....... ';' ';' :' , .· . ." '" .........:......~....··:..·....T......·~..·····~......··~........~........~..·... 3D ~ ~
. . . . . . . .· . . . . . . . ........ )" -: ~ : .; :....•... ~ ; .; 25
/... . . . . . . . .~" . . . . . . . . .
.;'. '" .... .~---.----.-----.--------.-----.----.-- __ . . __ ~ 20
10010 20 30 40 50 60 70 80 90o J L j.Holl's
Abdul Hamied F~ir Leicester Poo/technic
. .. '.' : 0:' : ; ." .b----~-_..,...,"""..,..,--; ;. .: ; ; :. ; .
. . :" ' .
. . . . . . . . .~ ~ ~ ~ : : ~ : : . 4.5
Abdt.d Hanied F00' Leicestlf' Po~ectvic
- 183-
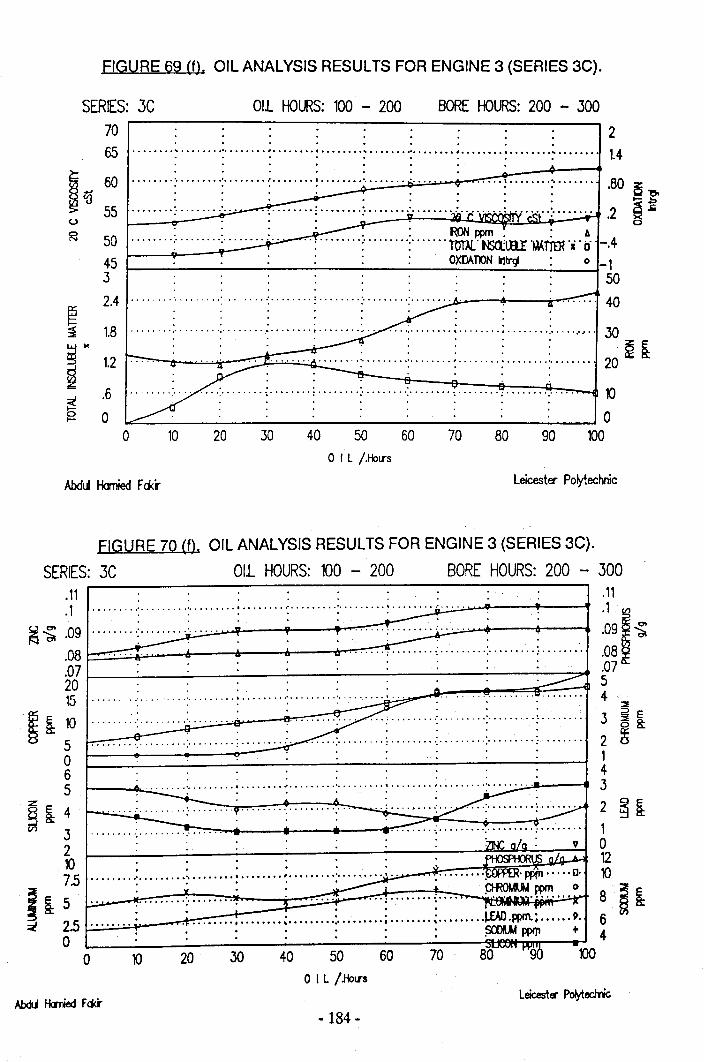
FIGURE 69 (f). OIL ANALYSIS RESULTS FOR ENGINE 3 (SERIES 3C).
SERIES: 3C 011 HOURS: 100 - 200 BORE HOURS: 200 - 30070 265 , , , .................•........ , "" 14· . . . . . . . . .. . . .. . . . .60 : : : !................. ." ..; ,; 80 z
· . ., .•.• Q "eo· ., ~.::.55 .; , .'. . . . : : -: '. , : , .. : , , -: , . .2 ~-'"
.. : RONppm. : 0\50 ": ':""'" ":' , , lom: NSOClll!'~~'i' ci -.445 OXDAOON 1rltr9 0 -13 50
~~M
~ 1.2.6
. .. . " '"
18. . . . . . . . .. . _,........•............. ············,········,········.·····.·11·· 30: : : . , : : :: ;il:; ~.. a: R:..... ., .. " , , ': ':' , : .. , ,.:' , .. :'.,., 20
.~~~~~~~·---~' l. ,. . . , . ,, ,.,' ,. '.' ':"""":""'" ':"""" ':"""" """"':""'" ':"'" 10, ., , 0
100
2.4 .
oo 10 20 30 40 so 60 70 80 90
OIL j,HoLTS
Abdul Hamied Fci<r Leicester Poo/technic
FIGURE 70 (f). OIL ANALYSIS RESULTS FOR ENGINE 3 (SERIES 3C).
SERIES: 3C 011 HOURS: 100 - 200 BORE HOURS: 200 - 300.11 : : ' : . .: ,11.1 ,.," , . , ':' ,. , ., .. ':' " .. , ",:,."",.~., " , ':' ., :' ." .. , .. ' ,._:_;.. ~ ,..._--+----'t .1 ~
~ ~ .os I:::::::::~""'--+' -~'''-----C!r---~' rr:.. -:-:--.. '., ;. .. ..,. ; ' :~: ; ~
ill ID20 "., 515 ' , , .. , " ' , , , : ':." .. , : ".. . .. 4 :::Ii
~ ~ ~o " .. .i: ".."~··"~·,~,·,;..;..·,~··-~,..,...·,·:-:-:··-:-:··~",G ; :-- .. " .. -:.. ".".-; ~ !~o 16 .....,. 45 r--~~ .."'.. ':'.'.'.' .. : ~.'.'." ..: ".: .. ' :"."."': __:_.;_;.I.. ~--- 3
8~4 ' .. 2~~~ 3 . , , , . , ., ',' ., . " ..:-:-.:~.,~....,.,..........--4I--<It--....,.-:-: 1~r-~---~---~---~---~---:-~==~~~~~~
7.5 10
j ~~j L:..::::..=:.t~~:..~..=..=:..~..==..~.~.::..:::::::..~.:.:-; : iLID.""";........ : ~ ~o ~pprJl + 4
80 90 100o 10 20 30 40 50 60 70OIL /JtJLTS
-184 -
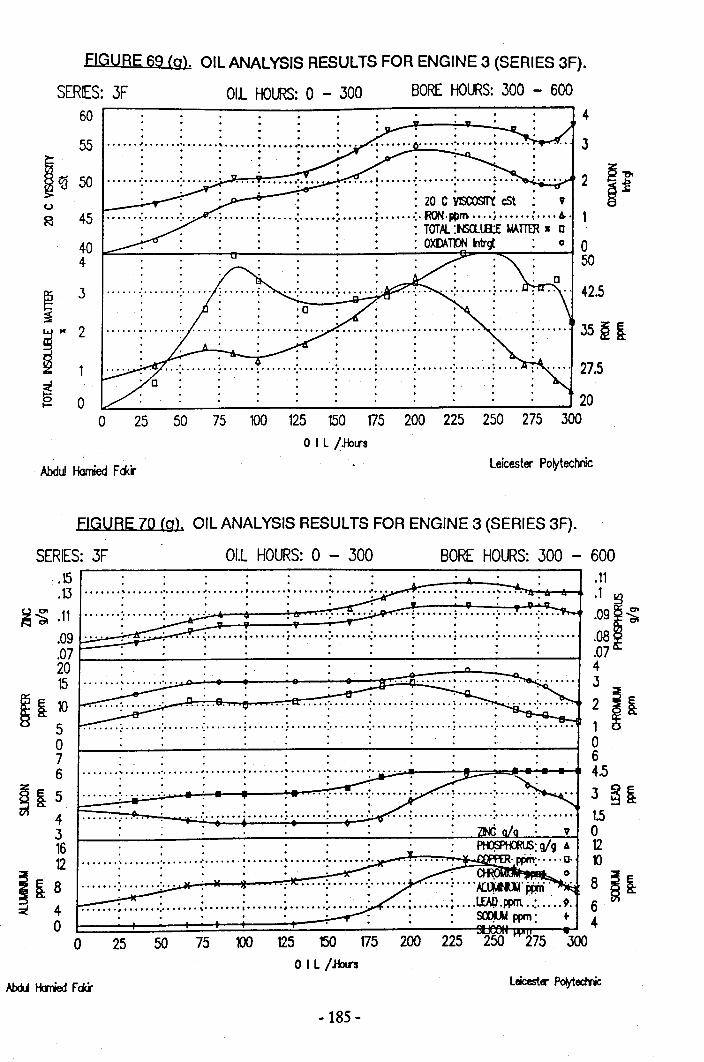
fiGURE 69 (g). OIL ANALVSIS RESULTS fOR ENGINE 3 (SERIES 3f).
SERIES:3F OIL HOURS:0 - 300 BOREHOURS:300 - 6006055
~~ 50u~ 45
404
• '. • • : 20 C VISCOSIT'C cSt : ,.. : ••••.• \ ....... :...... .;....... ; ••••••• :. RQN.pj)m •••• : •••••• i···· ~. 1
: TOT.6L :tm..L8:E M4.mR I 0: OXDA'OON ~~ 0 0
50
. .. . ...... : ... -:....... ; ...... ; ....... :....... :....... : ....... ;. ...... :....... : .... ;' ..... 27.5
. 0: : : : . : : : ; :.. ... 20o 25 50 75 100 125 150 175 200 225 250 275 300
OIL /.Holl'S
Abduf Homied F<ii' Leicester Poo/technic
4
fiGURE 70 (g). OIL ANALVSIS RESULTS fOR ENGINE 3 (SERIES 3f).
SERIES:3F 01.L HOURS:0 - 300 BORE HOURS:300 - 600.15.13
~~ .11.09 _~ __ _".071-- __;_ -I
2015
m ~ 105o76
:z
~ ~ 5431612
iiB~ 4
o
· . . . . . .· . . . . . .• • , •••• , •••••• 0° ••••••• , ••••••• , ••••••• , .· . . . . . .· . . . . . .
. . . . .· . .. .,. ..• •••••• : •••••• '0' •••••• '0' •••••• : ••••••• : •••••• "0' •••••• '0' •••••• ~ ••••••• : ••••••• : •••••• '0' ••••••
., .,.., ...· . . . . . .· . . . . . .
.......~ : : ! ': ': :'.',;.;.''.-.J' -___.--t-:==~.....,---_.· . . . . . .· .................
· : .. .. ., .................... : .
· . . . . . .• I • I • • •.......\ , r-~~~· . .. . . .., •.•..• . 0
. .': ; ;... ..... ~ }[~.t#ri '.......... ~...•... : , ; ...•... ; : .' ; •...... ; t.rAO.ppm.~ 9.
· . . • • :: ~ppm: +
OIL /JbrsLeicesterP~edric
-185 -
.11
.1 I.09 ~
.08
.0743~i~o64.53 ~ §:1.5o1210
B a i
its removal from the bulk used oil. Neither of these two removal mechanisms wouldbe likely for the highly cationic nature of calcium.
4.9.8 Total Acid Number.
The Total Acid Number appears to increase initially and then stabilise at a constant2.5 mg KOH/g after about 40 hours of testing. The new oil has a TAN value of1.3 mg KOH/g. Just like the TBN values, therefore, the TAN value does not appearto represent a wholly true measure of the acidity of the oil. The TAN values stabiliseat about the same time that the TBN values stabilise. All that can be deduced fromthis is that the conclusion drawn from the rapid decline in TBN is confirmed by theopposite characteristics of the TAN values. That is, the TAN and TBN trends doconform to the same theory of new formulated oils having acidity/alkalinity values thatare over-estimates of the true values. An alternative reason for the stabilisation oftheTAN values is that the TBN of the make-up oil is sufficient to neutralise the acidsproduced during that time interval before the next top-up. This reason would be mostunlikely considering the arguments discussed in section (4.9.1).
4.9.9 Trend Analysis from Parameter Cross-plots.
The trends that were found on studying the various oil parameters in the sectionsabove were cross-plotted, that is, one parameter was plotted against anotherparameter, instead of the test time. This method of analysis reveals the inter depend-ence of the parameters. Each of the plots that showed some sort of inter-dependenceis discussed below:
4.9.9.1 Total Insoluble Matter versus OHMake-up.
The plot of Total Insoluble Matter against the amount of Oil Make-up, Figure 71,shows a linear inter-relationship between these two parameters. The gradient of thisplot (TIM/Make-up) was found to be 3.1/550 (%/g). This indicates that the percentageTIM increases at a fixed rate, dependent only on the oil consumption level. Thebuild-up of TIM may be the result of the selective combustion of the base oil's lightfraction. The dilution of the used oil by addition of fresh oil will, therefore, lower theTIM levels by an amount dependent upon the oil-make level.
4.9.9.2 Zinc and Phospborus versus Calcium.
The plot of Zinc against Phosphorus, Figure 72, shows an almost 1:1relationship. Thisindicates that both these elements are involved in the same chemical reactions and
-186 -
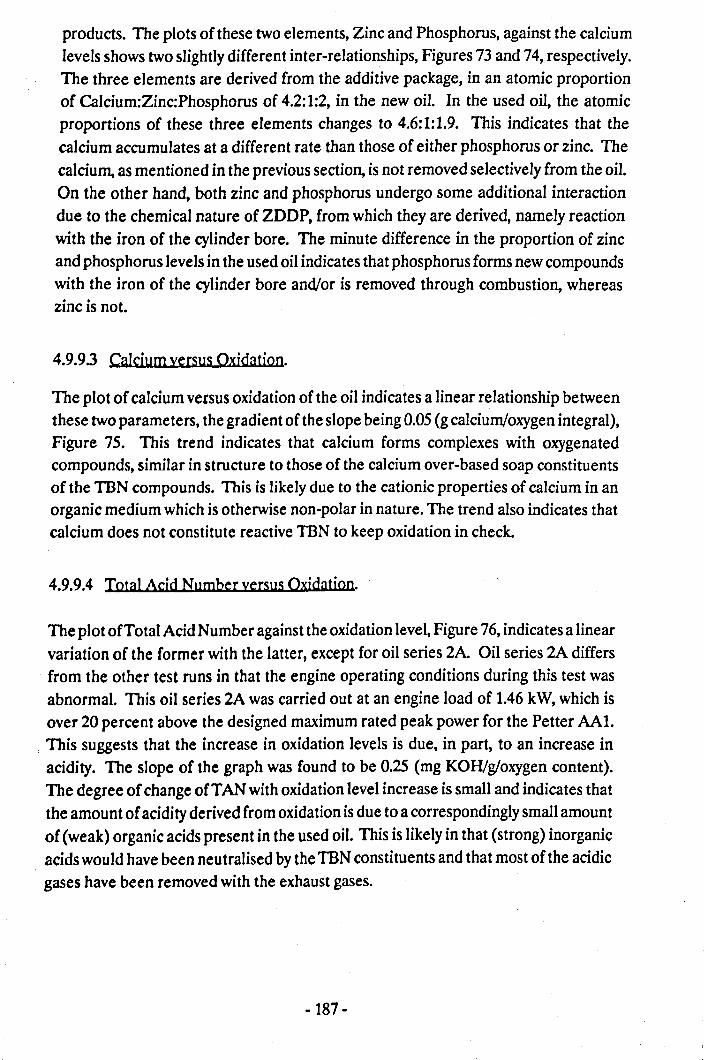
products. The plots of these two elements, Zinc and Phosphorus, against the calciumlevels shows two slightly different inter-relationships, Figures 73 and 74, respectively.The three elements are derived from the additive package, in an atomic proportionof Calcium:Zinc:Phosphorus of 4.2:1:2, in the new oil. In the used oil, the atomicproportions of these three elements changes to 4.6:1:1.9. This indicates that thecalcium accumulates at a different rate than those of either phosphorus or zinc. Thecalcium, as mentioned in the previous section, is not removed selectively from the oil.On the other hand, both zinc and phosphorus undergo some additional interactiondue to the chemical nature of ZDDP, from which they are derived, namely reactionwith the iron of the cylinder bore. The minute difference in the proportion of zincand phosphorus levels in the used oil indicates that phosphorus forms new compoundswith the iron of the cylinder bore and/or is removed through combustion, whereaszinc is not.
4.9.9.3 Calcium versus Oxidation.
The plot of calcium versus oxidation of the oil indicates a linear relationship betweenthese two parameters, the gradient of the slope being 0.05 (g calcium/oxygen integral),Figure 75. This trend indicates that calcium forms complexes with oxygenatedcompounds, similar in structure to those of the calcium over-based soap constituentsof the TBN compounds. This is likely due to the cationic properties of calcium in anorganic medium which is otherwise non-polar in nature. The trend also indicates thatcalcium does not constitute reactive TBN to keep oxidation in check.
4.9.9.4 Total Acid Number versus Oxjdatjon.
The plot of Total Acid Number against the oxidation level, Figure 76, indicates a linearvariation of the former with the latter, except for oil series 2A. Oil series 2A differsfrom the other test runs in that the engine operating conditions during this test wasabnormal. This oil series 2A was carried out at an engine load of 1.46 kW, which isover 20 percent above the designed maximum rated peak power for the Petter AAl.This suggests that the increase in oxidation levels is due, in part, to an increase inacidity. The slope of the graph was found to be 0.25 (mg KOH/gloxygen content).The degree of change ofT AN with oxidation level increase is small and indicates thatthe amount of acidity derived from oxidation is due to a correspondingly small amountof (weak) organic acids present in the used oil. This is likely in that (strong) inorganicacids would have been neutralised by the TBN constituents and that most of the acidicgases have been removed with the exhaust gases.
-187 -
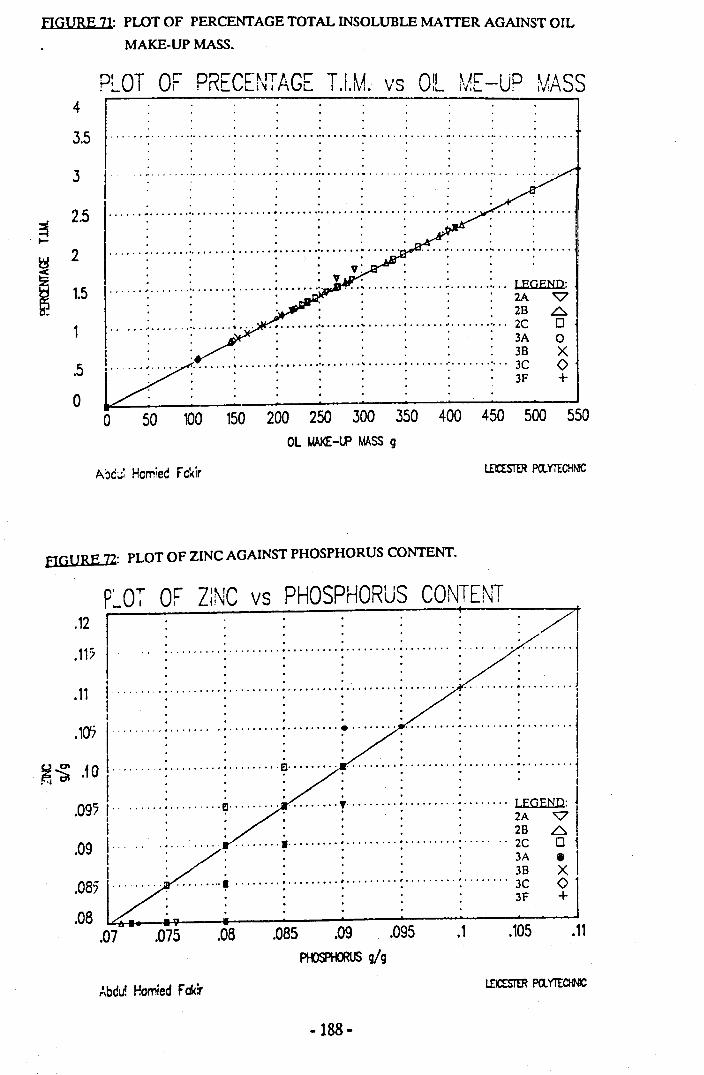
FIGURE 71: PLOT OF PERCENTAGE TOTAL INSOLUBLE MATTER AGAINST OIL
MAKE-UP MASS.
4p: OT OC DRFCC'~ITA·GC T q A I OIL ~1.[" U'D "ASS• .... I! _ L...I~I L.. 1.1.lvi. vs I iV.L -: IV:
· .I .. . , '" .... ... ............. ..... .. .I
3. . . . . ..5 0 0 •••••••••••••· . . . . . . . . .
3
· v: : . ....... ; : : : :. v ~ : ; : 1.EGEND:
· . . : 2A "V· .' 28 6
.. .. . , , 2C 00 1.' .
• 3Ar : : : : : : . • • 38 OX+ j.5 1!7" ~ : : ~ : ~ : : : 3C
~ : : : : : : : . 3Fo _ . . . . . . . . .o 50 100 150 200 250 300 350 400 450 500 550
· . . . ............... '" ••••••••••••• _ •••••• ,0, •••••• <It • • • • • • • 0'••••••••••••••· . . . ". .
· ., .2 5 ~......................•....... 0,............................ . .. .
2
1.5
Ol UAI<E -LP MASS9
A~c~:Harried Fakir LEICESTER PO..YiECHNIC
fiGURE 72: PLOT OF ZINC AGAINST PHOSPHORUS CONTENT.
P~O-;- OF Z:NC vs PHOSPHORUS CONTE~~T.12 I : : : : : ~ : 7111? I : : : : ; : : ··..·1· .
• I • • • • •
11 1·········:·········:·········:·········:·········:·· : : · ·1• •••••.• I
! : : : : : : : II101:.1······ .. .. : : ;. : : .• I • • • • • • •· . . . . . .
~ ~ f 0 I. .: : ~ : : : ; i•• j • I : : : : : : : I· . . . ., J
095 , : ~ ' y ; : l.EGEND: I• I : : : : • • 2A"V
I . . .' 28 6.
.09 !zr=:;·t······l·····): ..~~~1085 l········· , 1 •••• ••••• ••••••••••••••••••• 3C <> 1• :::::: 3F +08 : : : : :: I
• • 0 • ~
.07 .075 .08 .085 .09 .095 .1 .105 .11~g/9
Abdu! Homied F01<1
·188·
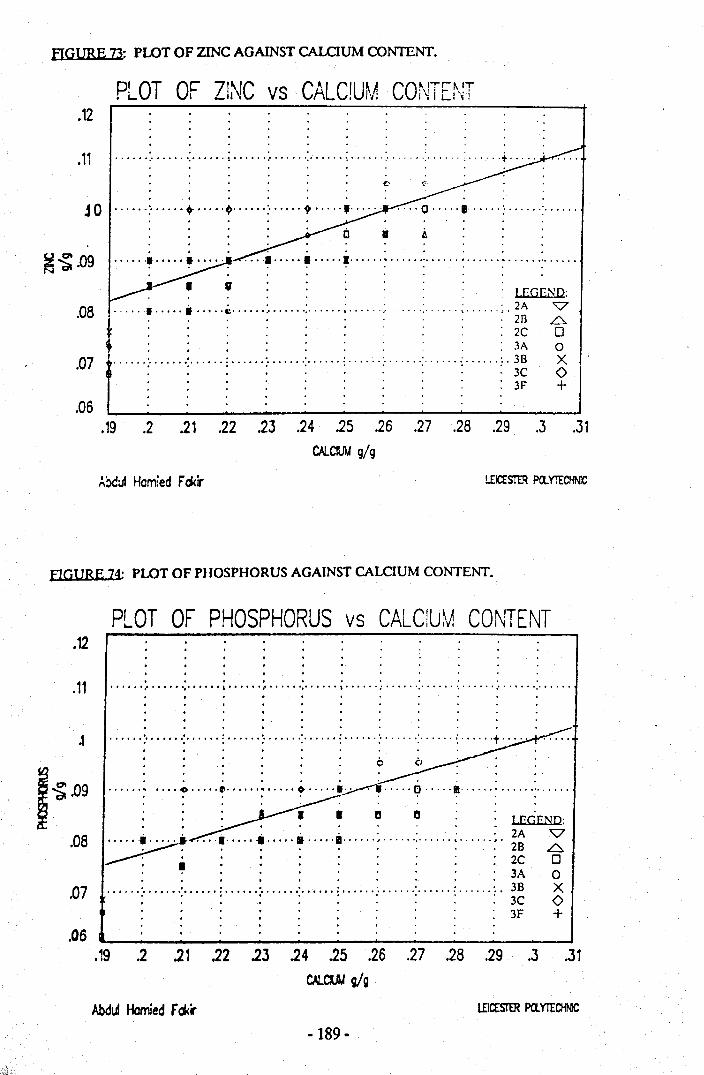
FIGURE 73: PLOT OF ZINC AGAINST CALCIUM CONTENT.
~~.09
PLOT OF ZINC vs CALCIUM CONTE~··JT.12
.11 : : ; : : ; : : '; .j. .
. .J 0 -:.. " .. t ·t· -: t ,...... . 0 '1Ii' : ••... -: .. .
i A. . . . .. . . .
....•.....•.... ·1············ .. . . . . . . .: lEGEND:
08 ·· .. ·i ··i..·..c.. ··.. : ·:.. ·.. ·; ··:· ; ;.2A 'V. . . . . . . . . . . . 21l 6
. . . . . . . . . : 2C 0
: : : . . .. : 3A 007 : : : : : : ·.. 38 X• .........: 3C 0
: 3F +.06
.19 .2 .21 .22 .23 .24 .25 .26 .27 .28 .29 .3 .31CALCIUM gig
Axul Hom:ed f'okir LEICESTER PCl. YTECHNiC
fiGURE 74: PLOT OF PHOSPHORUS AGAINST CALCIUM CONTENT.
i~.o9.08
.12PLOT OF PHOSPHORUS vs CALCIUM CONTENT
.11· .• • • • • f • • • • •........... t. '," tl •. , •................. "'" t ••• '0······ '.' ·0····· .· . . . .. .. .· . .
.1· .· . . .
..... -: ;. : .; ;. : -: :-.····:······t .. ··
· .. . . . . . . . . .......: ! ~ : ~.....•_;...:.;" !? I!I : : .· . . . . . . . . .· . • l! l! : LEGEND:: : : : : : : : : : 2A 'V...... ~ !" ~ ~ ~ ~ ~ : : ~. 28 6-
, : : 2C 0•• . . . . . . . . : 3A 0.07 : ' .' : : : 3B X: . . • . . . . . . 3C 0
: 3F +.06
.19 .2 .21 .22 .23 .24 .25 .26 .27 ,28 .29 ,3 .31CALClUJJ g/g
Abdul Hamed f'd<r LEKl:STER PClYTECHNIC
-189 -
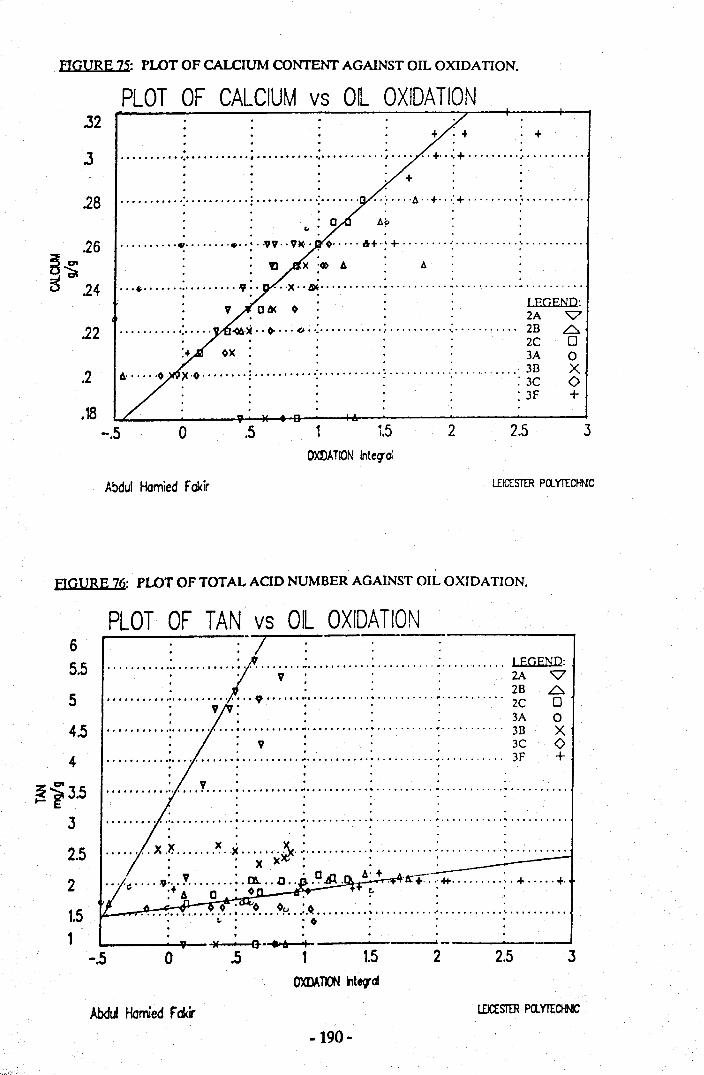
FIGURE 75: PLOT OF CALCIUM CONTENT AGAINST OIL OXIDATION.
.26~~5 .24
PLOT OF CALCIUM vs OIL OXIDATION.32
+.3 ; : : ~. . .. .. + :+ : .
. .
·.28 : ; :- ··;····A··+···:+·········;···········. .· . . . . .
.......... ~........•.. :. ·vv··v~·· . 0·····.!-+.~ + : : .A
.22
.. . . . . .••• " -9 •• ···x··/V<·············································
• • Oft( 0: . . lEGEND:., 2A "V
.<16.)( •• 0- ••. <.0 •• : ••••••••••• ;.·.······.·:···········28 6• 2C 0
:+ ox: 3A 0: : : : ·38 X)( ·0 .••.•••• : •••••••••• '...••••..... : ' '. 3C 0
• • • • o· •
: 3F +.2.18
-.5 2.5 31.5 2o .5 1I
OXDATION Integ-of
Abdul Homied rakir LEICESTER pcx.YTECHNIC
FIGURE 76: PLOT OF TOTAL ACID NUMBER AGAINST OIL OXIDATION.
65.554.5
4
~i3.532.52
1.51
-.5
PLOT OF TAN vs OIL OXIDATION· :-/ ----
......••••• :...•...••.. : ~...•..•.... : ~. . . . . . . . . .. lEGEND:• . V: . . 2A 'V· ., 28 6
•••••••.••• :••••• ","':" Cl •••••• : .•••.•.••.. ~ ~.•......... 2C 0: : : : : 3A 0
....... , ": ••• , I : , : ~ •••••••••• :. • • • • • • • • •• 3B X• • V' . . 3C 0
.... I ••••••• : I : , •• ; : •••••••••• ; •••• , • •• •• 3F +· . . . .v
•••••• II •••••• '0·0 ••• to "' II' 0 •••••• 1 I.
I • • • •
· .••••••••••••••••• II. I 1 •••••••••• .- 0· .
• • • • 0 •
:.. .. .'------vi- M [t- .. A I -------
.5 1o 1.5 2 2.5 3
Abdul Homied Fokir·190-
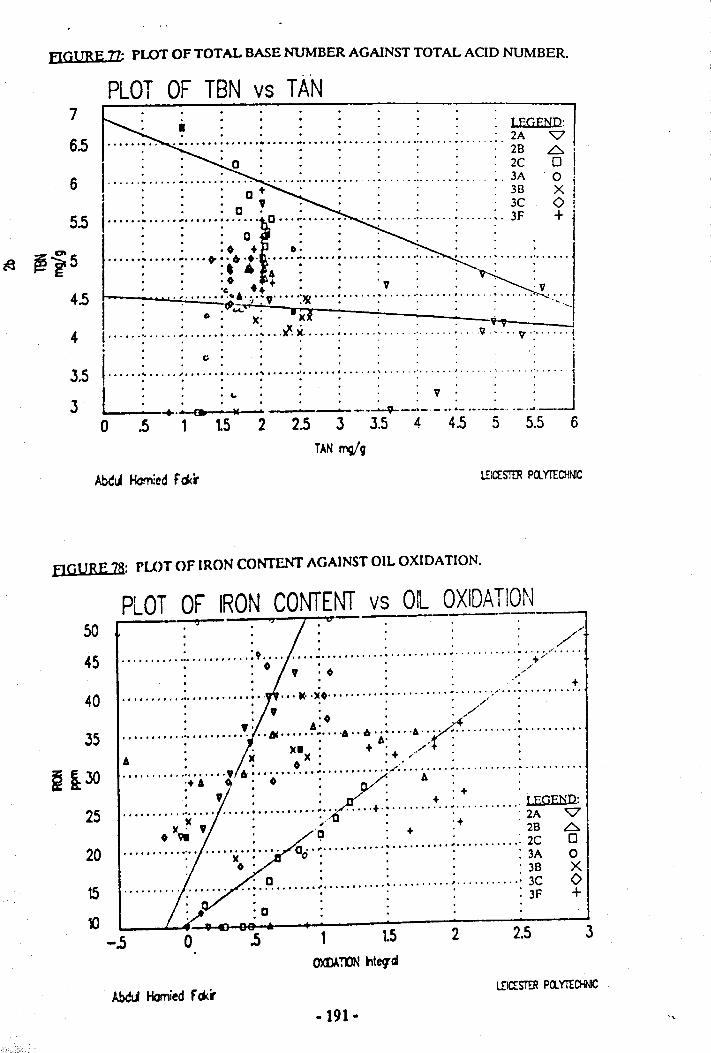
fiGURE n PWT OF TOTAL BASE NUMBER AGAINST TOTAL ACID NUMBER.
7
6.565.5
~ ~i54.543.53
PLOT OF TBN vs TANi : : : : : : : :LEGEND I
.; •••••• : •••••• : •••.• ~•••••• : •.•... : : ~ :. 2A "7. . . . . . . . 28 6'
I :. 0: : : : : : : 2C 0 I1 : ; : : : : : : .. 3A O!I : : : 0 + . : : : : : 38 X II : : : C! : . : : : : 3C 0 l............. _..•.. ••. . .. •. D."~"'''''' ...•..... '" . . . . . . . . . . . ... 3F +:
: : : c : : : : :: 1: : :0 + 0: : : : : : :: : :. 4 A: : : : : : :• • ·0 +. . . . . . .• • 'Co +. . . V. • . . V· .~ ;j.:, :)f( : •..... ~ : : : .' . :,": : 0: ~c )(: • Xi . : . . : :
! : ~ : ~ .J.~ : : : ~ 9 .~ .. V·:······1
"
: : c: : : : : : : ' : I............. 1' •......... ,. • " ., •••••• ", ••••• , ,' •••••• I ••••.• '••••••• eo •••• '1· . . . . . . . . . .
I : : : ,-: : : : : v: : : J· .. . ,. . . . . . . .~_--+.eA ~ t M 0 .--..-.--~--,,-.- •• ~- ........ -- ••• _ ...... -
o .5 1 t5 2 2.5 3 3.5 4 4.5 5 5.5 6TAN mg/g
Abdul Homied f'd<r WCESTER Pa.YTECHNIC
flGURE 78: rU>T OF IRON CONTENT AGAINST OIL OXIDATION.
50
45
PLOT OF IRON CONTENT vs all OXIDATION· .. --" --a '-/1· . . . . .. /'· . . ' . . /"· . . . . .
•••• " ••••••••• I ••••• 'I' ••• 9 .• "' " •. ',' ,0"' •••••• • 0 • . . . +/· .,·0 . . ',/'· . . . . .-: +
•• t ••• , , ~ , ''"f ••• , •••••••• ' "'" Ie•• )(,0" ••••• , • " •••••••••••• , •••• " ." . . . . /" .· .,. . . ,,/ .• • -0 • . ,. .• ,. A' • ..~ •
, ••••• , •• I I" • I •••••••••• /!JJI. •••••• _.,.·6" ,. ..••.. '6'0(" "" .• • A' . •• ·)cI· +. //" .
A • )( )( • .+ ,,' .• • O· • ," . .
•••• , • , ••• e., ••••• ·9 6············~ :,(,/ ..+ A .: 0 : '" • A: :: ,. . Y· .+ ............; : ~.:?..+: ~..:~ : ~ZGEN~
O)t..,. , .~ : +: . 28 .6-0 2C 0o . : : : 3A 0
o . : . . . 38 X.. : • ~ ....•.• ; ...•....... : ; : 3C 0
. : 3F +
4035
25
2015
10-.5
.: c
1 1.5 2 2.5 3.5oLrcEsrr..R pa. YTECh'NIC
-191-
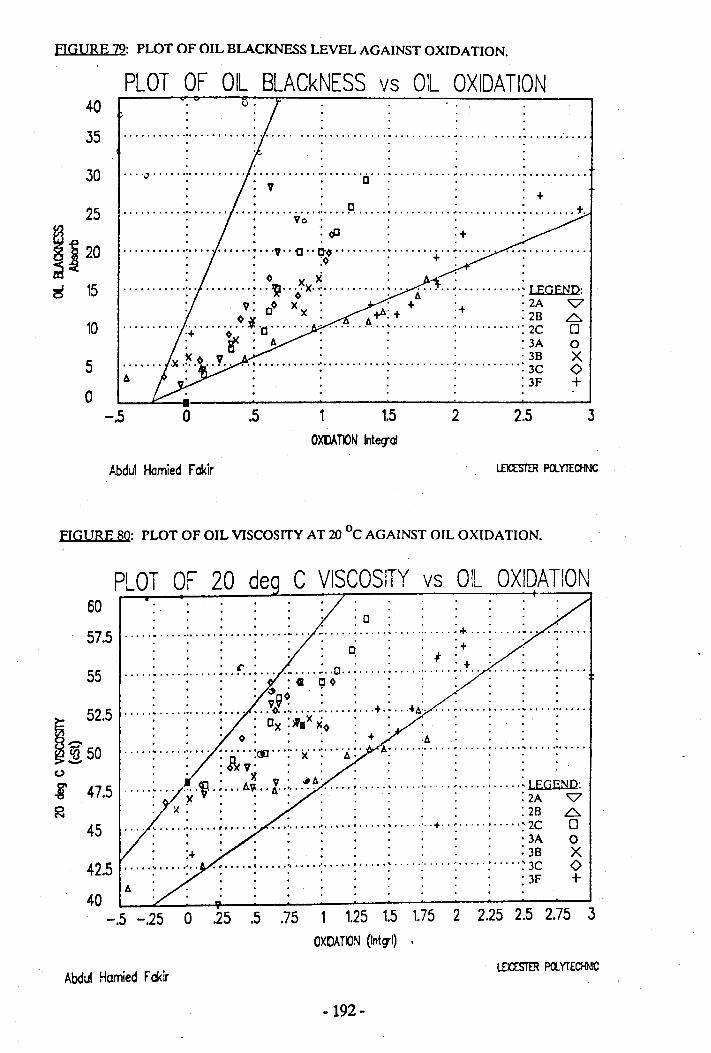
FIGURE 79: PLOT OF OIL BLACKNESS LEVEL AGAINST OXIDATION.
25
h20
~ 15
10
PLOT OF OIL BLACkNESS vs OIL OXIDATION40
.35
o.· . . . . .
•••••••••••••••••• 0·0 •••••••••••••• 0' •• ' .· . . . . .
.30. . .· " '" ......... . ~ .· . . c· . .· . v . . . .· .. " +· . . c· . .·. . . . . . . . . . . . . .. . '" .....................•.................... t.
• • Vo' . . •: <P . +· .
• •••••••••• 0 •••••••••••••• " •• 'D •• ~o ~.. . . . . . .: : :0 : +: :: : 0 x X : : :........... : : .. iI" o' x· .: : A····· ~ : LEGEND:• V· 0 X' . +. . 2A 'V· 0 . ex: A~: + :+ : 28 6..............•...... 11 ' , .......................• 2C 0.+ O' U • • • •
: ~: A : : : : 3A 0)( V . . . . 38 X
.. .. .X .., ' " : 3C <>A : 3F +
5o
-.5 o .5 1.5OXDATK>N Integ-of
2 2.5 .3
Abdul Hamied Fakir
FIGURE 80: PLOT OF OIL VISCOSITY AT 20 QCAGAINST OIL OXIDATION.
1_52.5i{j 50-
-8 47.5
6057.5
PLOT OF 20 dea C VISCOSITY vs Oil OXIDATION. .
· . . . . . : a :........... ,. . . .... . ...... . . . .. . '" ..: : ; : : : 0 : : :+ . . .· . . . . . . . . t· . . .
.....: : :..f..: ~..c .. : : : ;. +.. / : : .: : : : :G QO: : : /: : :· . . . ~oo . . ., .. .
..... : : : v/..: ~ ; +.: +A:' ; : : : .. . x· . .. °x·lfw ><0 •., 0:::. + :A· . . .
..... ~..... :.... : ..... :ClD... :··x···:····j.:· A:·····:·····:·····:·····:·····:·····: : :~v~ : : . : : : : : :· • • 'I V' i#A' . . . . . .· • , •.••• , ...• ~ ••••• A.v. •• A' .' ..........•.....•.... ,' .....•.....•.....• lEGEND:· X y. • • • • • . • • : 2A 'V: x . :28 6
.......................... :...... :..... : ..... : .. · .. :.. +· ..: .... ·: .... ·'2C 0· :. .......: 3A 0
:+ : 38 X., ".0 ,'. '.f. t 3C 0. . . . . . . . . : 3F +..
55
45
42.5
40-.5 -.25 0 .25 .5 .75 1 1.25 1.5 1.75 2 2.25 2.5 2.75 .3
OXOATION (Int~l) ,
Abdul Hamied FaklrLEICESTER Pel.YTECHNIC
-192 -
4.9.9.5 Total Base Number versus Total Acid Number.
The plot of Total Base Number against Total Acid Number gives a negative gradientof 0.5, Figure 77. This indicates that the TAN value increases at twice the rate atwhich the TBN value decreases. The graph indicates that the TAN value will be equalto the TBN value of 4.5 mg KOH/g. When this condition is passed, then it may beconsidered that the oil's safe alkaline reserve threshold (limit) has been exceeded andaccelerated wear rates may result. Retrospective analysis of the data (Figures 65(a)and 65(d» show that when the TBN values fall below the 4.5 mg KOH/g level, theTAN values do not change significantly but the oil consumption rises above previouslevels recorded for that test series. The continued trends of these results suggest thatthe loss of oil consumption control would follow soon after the TBN having fallenbelow the 4.5 mg KOH/g level. This data suggests that the engine loses oilconsumption control as a result of corrosive wear which also causes severe borepolishing.
4.9.9.6 Iron Content versus Oxidatjon.
The plot of iron content against oxidation level was made to see whether or not thewear rate was being accelerated by increasing levels of oxidation of the oil, Figure 78.The cross-plot of iron against oxidation does indicate a certain degree of catalysis ofthe oxidation products on the wear of the cylinder bore. The results are scattered andno generalisation can be made on the rates or minimum oxidation level because ofthis. The accelerated wear cannot, however, be credited solely to the oxidation of theoil, as the acidity imparted by the high sulphur diesel fuel to the combustion gaseswould be the more likely candidate (for the corrosive wear). What is possible in thebulk of the used oil, is that the iron is kept in suspension by the oxidised oil, similarin manner to that for the calcium mentioned above.
4.9.9.7 OHBlackness versus Oxidation.
There is an initially linear relationship between the degree of Oil Blackness andOxidation, which depends on the oil consumption and engine load (engine E2 beingabnormally, high loaded during test 2A), Figure 79. For the high engine loads, theblackness increases rapidly with the oxidation of the oil. For an engine accompaniedby high oil consumption, the blackness increase is lowered by the diluting effect of oilmake-up levels. For an engine under normal operating conditions, the blacknessincreases linearly with the oxidation of the oil, at a rate of about 20(Absorbance/Oxidation). This suggests that the oil becomes progressively oxidisedand contaminated with soot and wear debris which are selectively accumulated in the
-193 -
oil.
4.9.9.8 20°C Viscosity versus Oxidation.
The plot of the viscosity at 20°C against oxidation shows a linear relationship. Test2A again displays a higher level of degradation than the other tests. The other testsdiffer from 2A with the slope of the graph being 4 (cSt/Oxidation), Figure 80. Thisrelationship suggests that the increase in viscosity is a result of the oxidation of the oilin addition to the fragmentation of the viscosity index improver polymers discussedpreviously. The oxidation products must be forming high molecular mass cross-linkednetworks to a greater extent than at first thought. It is, therefore, possible that thesmaller VII fragments only make a minor contribution to the low temperatureviscosity on their own,but once they become cross-linked with oil oxidation products,then they increase the viscosity of the oil significantly.
4.10 SUMMARY OF OIL ANALYSIS.
The TBN and 100°C viscosity decline with time. The TAN and TBN trendscompliment one another but stabilise to a constant value after 40 hours. The TBNvalues stabilise to about 4.5 mg KOH/g and the TAN values stabilise at about 2.0mgKOHlg. The rapid initial decline ofTBN suggests the presence of both fast reacting,inorganic TBN constituents and the presence of slow reacting, organic TBNconstituents. The trends suggest that the organic TBN constituents are removednon-selectively, along with the combustion of the base oil.
The oil viscosities at 20°C and 40°c have a rising trend with the aging of the oil, alongwith calcium, oxidation, metals, and oil blackness. This trend indicates that theseparameters are accumulating due to selective removal of light oil fractions.
The Total Insoluble Matter is related, proportionally, to the mass of oil make-up.These two parameters are directly related due to the dilution effect of high oilmake-up, which in turn, is due to high oil consumption. The trends indicate non-selective removal of these components.
Zinc and phosphorus levels are proportionally related to one another(stoichiometrically) and have a different removal mechanism from all the otherparameters. These elements are being selectively accumulated at an apparently lowerrate than that for the other elements.
-194 -
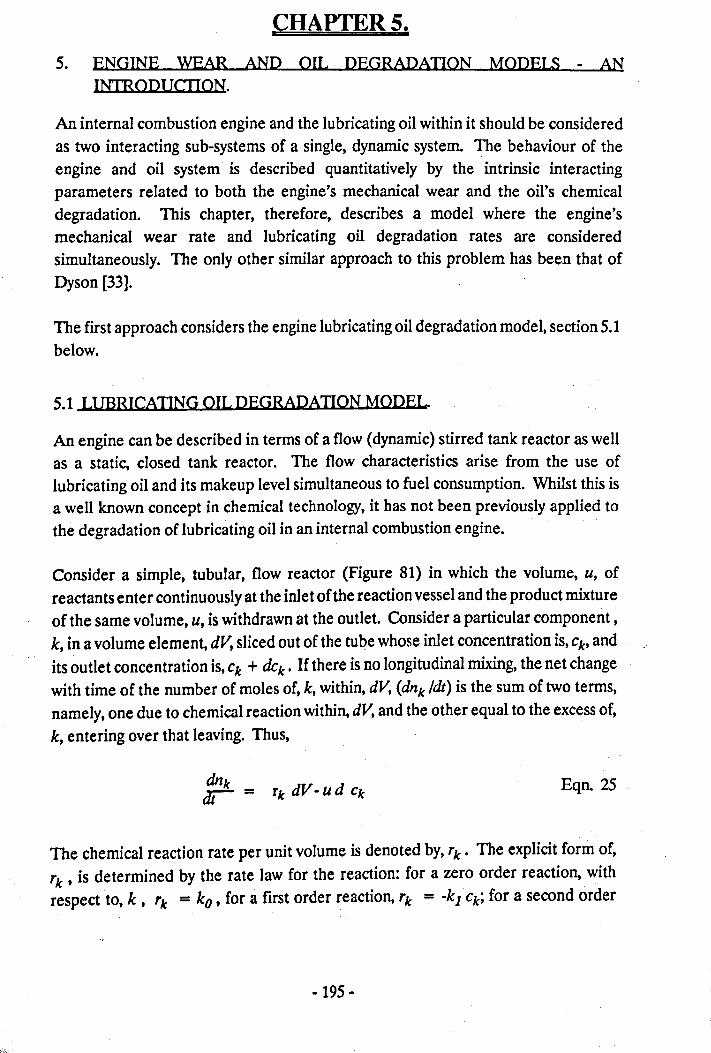
CHAPTERS.
5. ENGINE WEAR AND OIL DEGRADATION MODELS - ANINTRODUCTION.
An internal combustion engine and the lubricating oil within it should be consideredas two interacting sub-systems of a single, dynamic system. The behaviour of theengine and oil system is described quantitatively by the intrinsic interactingparameters related to both the engine's mechanical wear and the oil's chemicaldegradation. This chapter, therefore, describes a model where the engine'smechanical wear rate and lubricating oil degradation rates are consideredsimultaneously. The only other similar approach to this problem has been that ofDyson [33].
The first approach considers the engine lubricating oil degradation model, section 5.1below.
5.1 WBRICATING OIL DEGRADATION MODEL.
An engine can be described in terms of a flow (dynamic) stirred tank reactor as wellas a static, closed tank reactor. The flow characteristics arise from the use oflubricating oil and its makeup level simultaneous to fuel consumption. Whilst this isa well known concept in chemical technology, it has not been previously applied tothe degradation of lubricating oil in an internal combustion engine.
Consider a simple, tubular, flow reactor (Figure 81) in which the volume, U, ofreactants enter continuously at the inlet of the reaction vessel and the product mixtureof the same volume, U, is withdrawn at the outlet. Consider a particular component,k; in a volume element, dV, sliced out of the tube whose inlet concentration is, ck' andits outlet concentration is, ck + dci: If there is no longitudinal mixing, the net changewith time of the number of moles of, k, within, dV, (dnk Idt) is the sum of two terms,namely, one due to chemical reaction within, dV, and the other equal to the excess of,k, entering over that leaving. Thus,
Eqn.25
The chemical reaction rate per unit volume is denoted by, rk' The explicit form of,rk , is determined by the rate law for the reaction: for a zero order reaction, withrespect to, k, rk = ko, for a first order reaction, rk = -kIck; for a second order
-195 -
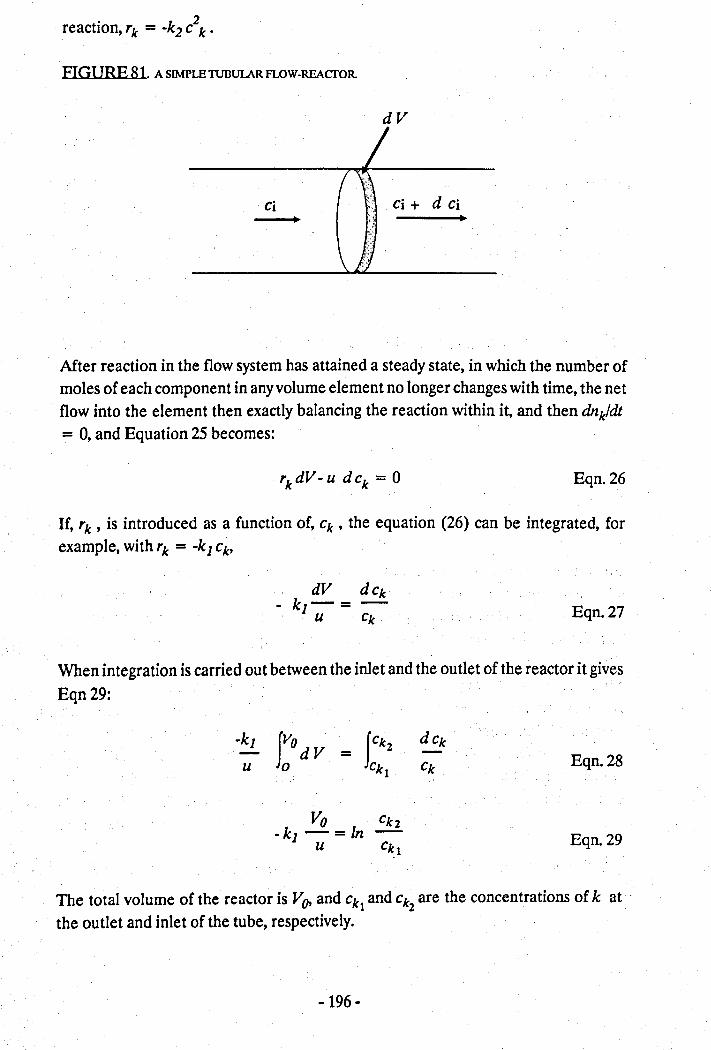
· k 2reaction, rk = - 2 C k :
FIGI IRE 81 A SIMPLE TUBULAR FLOW-REACTOR.
dV
Ci Ci + d Ci
After reaction in the flow system has attained a steady state, in which the number ofmoles of each component in anyvolume element no longer changes with time, the netflow into the element then exactly balancing the reaction within it, and then dnJ/dt= 0, and Equation 25 becomes:
Eqn.26
If, rk , is introduced as a function of, ck ' the equation (26) can be integrated, forexample, with rk = -kJ ck'
Eqn.27
When integration is carried out between the inlet and the outlet of the reactor it givesEqn29:
-k] f:odV r- dCk-u Ck! ek
Vo ckl-k] - = Inu Ck!
Eqn.28
Eqn.29
The total volume of the reactor is V0. and ck! and ckl are the concentrations of k at .the outlet and inlet of the tube, respectively.
-196 -
It may be noted that Eqn. (29) reduces to the integrated rate law for a first orderreaction in a static system if the time, t , is substituted for (Vo /u), where (Vrfu) isdefined as the contact time for the reaction; this is the average time that a moleculewould take to pass through the reactor. Thus Eqn. (29) allows the rate constant k1 ,
to be calculated from a knowledge of the contact time and of the reactantconcentrations at the inlet and the outlet of the reactor.
The fundamental approach of the above kinetic derivation of a flow reactor needs tobe extended further, to incorporate the stirred nature of engine oil degradation. Thederivation of Eqn (26) tacitly assumed that there was no volume change, dV, as a resultof the reaction. A volume change would affect the flow rate at constant pressure,particularly for gaseous flow reactions, but for liquid flow systems the effects of changein volume are generally negligible.
But in a stirred flow reactor in which the inlet flow is exactly equal to that of the outletflow, the composition of the mixture in the reactor is unchanged when a steady stateis achieved. Eqn. (26) still applies, but in this casedV = V() the total reactor volume,and d ck = ckl - ckz where ck 1and ckz are the initial and final concentrations of thecomponent, k. Thus,
urk - Vo (Ckz - Ck1) = Eqn.30
With this method, there is no need to integrate the rate equation. One point on therate curve is obtained from each steady-state measurement of a number of tests withdifferent feed rates and initial concentrations is required to determine the order ofthe reaction. Applying this approach to an engine lubrication system, if the engine oillevel in the sump is kept quasi- constant byperiodic topping-up, then the above kineticderivation can be applied to the study of engine oil degradation. Due to thecontinuous loss of oil and its degradation compared to the periodic nature of oilvolume top-up, the total engine and oil system isbest described as a Quasi-ContinuousStirred Tank Reactor (QCSTR). A single engine lubricant degradation system is asimplification. Two areas of lubricant degradation are the sump and the combustionchamber/piston/bore region. This engine reactor model comprises of two interactingmixing chambers (Maeda, Maeda and Yasutomi, [17], namely:
1. Engine "top-end" - an intensive (high temperature and pressure) and highlyreactive, small volume, stirred, flow reactor, and
-197 -
2. Engine sump - a relatively benign (low temperature and pressure), large volumereactor which is vigorously stirred by the rotating (dipping) crankshaft, gears andoil pump.
The lubricating oil within the engine sump of volume, ~ , is periodically topped upwith fresh oil volume, V" of the same composition as that in that originally present inthe sump. Part of the sump oil that is pumped to the "top-end" of the engine is lost,V; , through leaks, combustion and selective evaporation of volatile oil constituents,before the remaining oil and part of the reacted oil is returned to the sump. Thevolumes and reaction rates between the two reactors are the subject of a separate,higher degree thesis by S.D. Cupples at Leicester Polytechnic. This thesis isconcerned with a single reactor approach centred on the engine sump only.
The concentration of an oil additive or degradation product, X, can be described bythe mass balance equation (30), containing zero and first order rate constants, ko andk t- respectively:
where:dX/dt = -k1 + ko
k 1 = kf + ks + kv
kO-kaddXO = (kf+ks+kv)Xo
where:kf = rate constant for oil leaks from the engineKs = rate constant for oil samplingkv = rate constant for oil volatilisation
kadd = rate constant for oil (fresh) addition
Integration of Eqn. 31 gives:
where:x = Xa - (Xa-XO) exp(- kf)
Xa = kaddXO lk1
Xa = equilibrium concentrationXo = initial concentration
From Eqn ..35, kadd can also be represented by kadd - k 1XiXo
Eqn.31
Eqn.32
Eqn.33
Eqn.34
Eqn.35
The value of kadd can be calculated from those of kb Xa andXo which are determinedby the analysis according to Eqn. 34. The mass rate of oil addition, Radd can beobtained from the Eqn. 36, by knowing the quantity of engine (sump) oil charge, Q.
-198 -
Eqn.36
Consider the depletion of Total Base Number of the oil:
Eqn.37
where CTBNl and CTBN2are the initial and final TBN values, respectively.
From the original exposition by Denbigh [19] concerning the kinetics of stirred tankreactors, where the overall inlet oil flow is equal to the overall outlet oil flow, it followsthat the steady-state concentration is given by Eqn. 38:
-dTBN U--ar = (CTBN1- CTBN.) V = "TBN Eqn.38
An example calculation based on Table 38 (Series 3B, 80 and 90 hours data, column2 from the left):-
- dTBN = (4.19 - 4.02) x 154/1402 = "TBN
"TBN= 0.17 x 154/1402
"TBN= 0.019 mg KOHlgllO Hours
"TBN= 0.002 mg KOHIg/Hr
The high rate of oil consumption and its subsequent replenishment is probably themost important factor preventing any significant depletion of TBN. The other maincontributory factors include the level of sulphur within the fuel, the fuel flow rate andthe rate of flow of blowby gases, which in turn reflects the mechanical wear rate of theengine.
Table 42 summarises the 10 hourly rate data averaged over each of the test runs forseries 2A - 3C. Table 43 summarises the averaged rate data (per hour) for each of thetest series over each 100hour test. Note that the averages of the averaged data in thetwo tables, calculated by the two different methods give similar rate values. The first
-199·
(fresh oil) data points were not included in the calculation of the averages.
5.2 COMPARISON WITH OTHER OIL DEGRADATION MODELS.
A different approach, namely, that of Dyson, et ai, [33] proposed a mathematicalmodel predicting the TBN depletion rate from the amount of fuel sulphur:
Eqn. 39
where: A = 0.35 YFS =.Neutralising effect,and:
Y = Conversion ratio,F = Ratio of fuel to oil consumption,S = Percentage of sulphur in the fuel,r = Ratio of oil consumption to oil charge,t = Time (duration) of test
The Dyson derivation assumes that the oil consumption and replenishment rates areequal and is continuous. Testing this model with the field data obtained, the following
. is found:
TBNt = TBNo -A (1- e-rt)
TBNo - TBNt = A (1 - e-rt )
TBNo - TBNt = 0.35 YF S (1 - e-rt)
y = TBNo -TBN,·0.35 F S (1'; e-rt) Eqn.40
An example calculation based on the averaged 10 hour data, see Table 41, for the 10Oil Hours data, TBN and Oil Consumption data:-
Average fuel consumption = 680 g perhour .Average oil consumption = 26.1 g per hourAverage (sump) oil charge = 1500gFuel sulphur content = 1%New oil TBN (TBNO) = 6.71 mg KOWg by IP 177)Used oil TBN (TBNt) =5.23 mg KOWg
-200-
Substituting these values in the Eqn. 40 above:
Y = TBNo - TBN,0.35 F S (1- e-Tt )
Y = 6.71- 5.230.35 x (26.1/680) x 1x (1- e -(261/1500»
Y = 0.20%
The value obtained for Y, the conversion ratio, lies within the range of values obtainedby Sharma [34] and Dyson [33]. These workers obtained values of Y, typically in therange 0.15 to 0.4%. The value of 0.20% forY obtained from the work carried out atLeicester lies in the middle of the range obtained bySharma and Dyson. This indicatesthat the test engine is behaving in a manner consistent with other engines as regardto oil consumption, blowby and fuel dilution.
A second comparison could be done directly by calculating the theoretical amount ofsulphuric ac'd that can be obtained from the conversion of fuel sulphur. The sulphuricproduced can then be used to calculate the amount ofTBN depleted, assuming all thesulphuric acid reacts with the TBN additives. The sulphur throughput for the engineis in the region of 6.8 g per hour. The amount of sulphur entering the oil wasdetermined for two, ten hour used oils, and a new oil sample. The new oil was foundto contain 1.07% sulphur and the average sulphur content of the two 10hour used oilswas found to be 1.14%. The sulphur content was determined by a x-ray spectroscopictechnique known as X-ray Fluorescence Spectroscopy (XFS). This techniquerevealed that about 15% of the sulphur disappeared during the measurements. Thisindicates that the sulphur must have been trapped as a non-reactive gaseous productwhich was released during the measurements. Ignoring this loss of gaseous sulphur,the amount of sulphur entering the oil through blowby can, conservatively, calculatedto be (a rate of) 0.007% per hour. This data can be used to calculate the TBN depletiontime assuming that only sulphur (as sulphuric acid) neutralises the TBN.
Total TBN = 6.71 x 1500
= 10.06g KOH
= 10.06/56.1
= 0.179 mol KOH
Eqn .41
Sulphur addition = 0.007/100 x 1500
= 0.105 g/hour
= 0.0033 mol/hour
Eqn.42
-201-
The time to completely neutralise KQH, assuming two moles of KQH reacts with onemole of H2S04, is as follows:
Time (TBN .. 0) = 0.179/(2 x 0.0033)
= 27 hours
Eqn.43
The TBN level does not decrease to zero in the time calculated above, due to oilreplenishment and also due to all the sulphur entering the engine not being convertedto sulphuric acid in the lubricant. The presence of acids other than sulphuric acid inthe used oil, however, should in theory, reduce this TBN neutralisation time evenfurther. The TBN neutralisation time of 27 hours obtained suggests that only part ofthe sulphur entering the engine is converted to sulphuric acid of which some fractionenters the lubricating oil and then neutralises the TBN.
The modelling ofTBN depletion has been shown to be meaningless when consideredon its own. The TBN value must be considered together with the associated TANvalues and other oil/engine parameters when using it as a measure of oil life/quality.This is because the TBN and TAN values are the result of reactions occurring over awide kinetic (reactivity) range. The modelling of wear metals, soot, oxidation andviscosity changes during the life of the oil follow simple zero order kinetics. Thebehaviour of these parameters follows the Quasi-Continuous Stirred Tank Reactor(QCSTR)model.
5.3 THE GENERAL QUASI-CONTINUOUS STIRRED TANK REACTOR(OCSIR) MODEL
The changes in mass or concentration of any property of the used oil can be followedby the integrated form of the complete system material balance described below.Consider the stirred tank reactor as depicted in Figure 82, for any component level inthe system:
Initial + Total Make-up = Final + Loss from System + Loss by chemical change
For the oil: Eqn.44
Initial + A1 + A2 +... = Final +L1 + L2 +... + Cl + C2 + ...Eqn.45
where:
-202 -
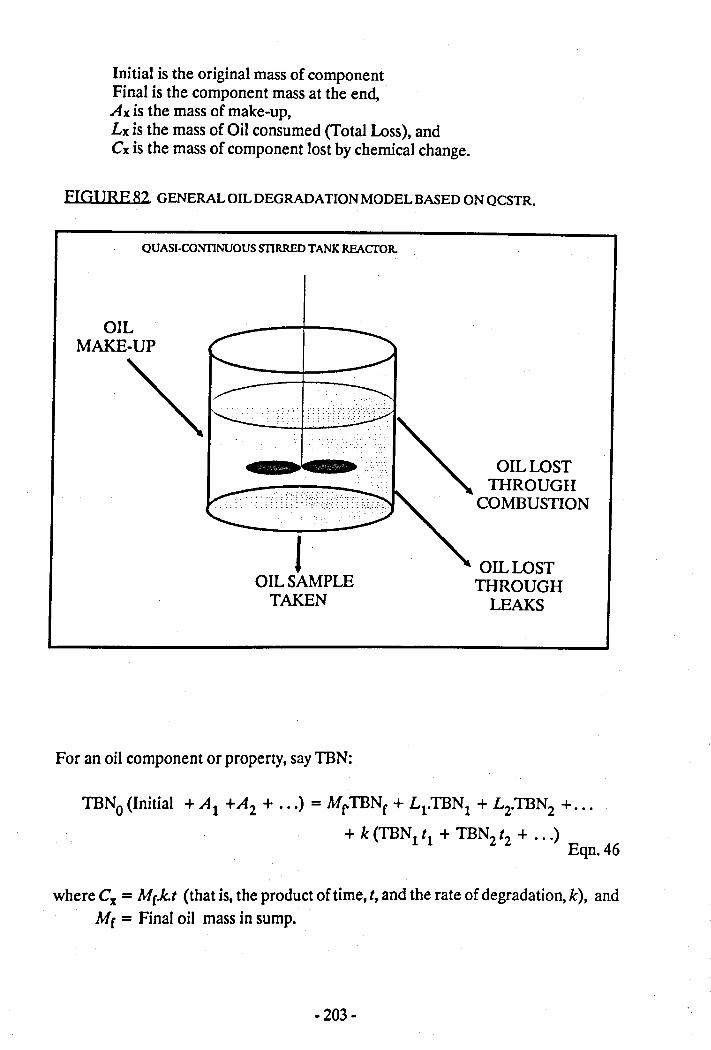
Initial is the original mass of componentFinal is the component mass at the end,Ax is the mass of make-up,Lx is the mass of Oil consumed (Total Loss), andCx is the mass of component lost by chemical change.
FIGl IRE 82. GENERAL OIL DEGRADATION MODEL BASED ON QCSTR.
QUASI-CONTINUOUS rnRRED TANK RFACfOR.
OILMAKE-UP
-,OIL LOST
TIlROUGHCOMBUSTION
IOIL SAMPLETAKEN
OIL LOSTTHROUGHLEAKS
For an oil component or property, sayTBN:
TBNo (Initial + At +A2 + ... ) = MrTBNe + Ll'TBNt + L2·TBN2 +...+ k (TBNl tl + TBN2 t2 + ... )
Eqn.46
where Cx = Me.k.t (that is, the product of time, t, and the rate of degradation, k), andMe = Final oil mass in sump.
-203-
Using the data from the averaged data in Table 41, for the 10Oil Hour TBN data:
6.71(1500 + 2347) = (1535 x 4.73) + 11534 + (k x 664 x 2457)
25813 = 7250 + 11534 + 1631448.k
k = 0.043 mg KOHlglhr
The value of k obtained above, the rate of TBN degradation per hour, is the true oractual rate of degradation ofTBN. The values obtained in Table 43 is the observedrate of TBN degradation. The rate of change of any component in the system can beobtained by a similar treatment which gives:
Rate Accumulation = Ratesupply - RateRemova! + RateFormation· Eqn. 47
From this it can be seen that for a steady state condition where there is no netaccumulation:
Ratesupply = RateRemoval Eqn.48
Consider the Oil in the system in which the purpose of the oil top-up procedure is tomaintain a constant mass in the system:
Rate Accumulation = 0 and so,
RateSupply = RateRemoval (Combustion + Leaks + Sample) Eqn.49
d A = dLdt dt Eqn.50
For a component or property, say TBN
d (M.TBNsl = d fA. TBNo) - d (L.TBNs) + d (C.TBNc)dt dt dt dt
Eqn.51
where M is the system oil mass at any time, t,A is the mass of Make-up oil,L is the mass of component lost through oil consumed,C is the mass of component degraded/produced chemically,
TBNo is the Initial TBN (Fresh Oil),TBNs is the TBN of the used oil at time, t,andTBNc is the average TBN lost by degradation.
-204-
Substituting the averaged TBN, Oil Make-up and Oil Consumption data from Table41, last line:
1376 x 4.67 = 235 x 6.71- 246 x 4.67 -k.TBNc10 10 10
642.6 = 157.7 -114.9 -k (6.71 - 4.67)
-2.04 k = 599.8
k = -294 mg/hr\ \
This value can be checked by noting that C = k.t
The convention used for k is that k is negative for a component or property thatdecreases with time and positive for one that increases with time.
An example calculation based on the averaged 10 hour data, see Table 41, first andlast lines for TBN and Sump Mass data, the average mass of TBN depleted per hourstarting with new oil is:
k = C x IBNt c Eqn.52
= 1376x 2.04 /10
= 280mg/hr
The rest of the data obtained can be treated in a manner similar to that demonstratedfor the oil and TBN shown above. A simpler treatment can be obtained when thesump mass remains constant, in which case the above equations can be simplified to:
Consider an oil parameter X,
Net (Apparent) Change = Added - Loss (Actual) Eqn.53
dXxM =dXxAdt dt
- dX xLdt Eqn.54
For the case where there is no contribution of a parameter due its absence in the freshoil, the above equation is then reduced to the apparent change being the actual changein its level. This would be the case for Total Insoluble Matter, Wear Metals andOxidation parameters.
- 205-
The Quasi-Continuous Stirred Tank Reactor model shown by the above calculationsyields a closer representation of the degradation of the oil and its degradationparameters in real operating engines. This model can be used for a wide range ofengines and operating conditions, as it includes both oil consumption and oil make-upeffects. Simpler models assume that the oil lost and make-up are equal or that theyare close to zero. This model, therefore, be used to model lubricating oil degradationof long, extended test runs covering the life of an engine. The above mentioned modelcan be improved by firstly obtaining oil analysis data continuously from on-linemeasurements, and secondly, by determining the interaction between the small butintense reactor, the top-ring zone, and the relatively benign large reactor, the sump.
5.4 SUMMARY OF CHAPTER 5.
Two different models that had been proposed previously for the rate ofTBN depletionhave been verified. The Quasi-Continuous Stirred Tank Reactor. (QCSTR) modelhas been shown to be a more extensive and representative model of lubricating oildegradation in the engine system under investigation than the model of Dyson,previously considered.
The Quasi-Continuous Stirred Tank Reactor Model takes into account the effect ofboth oil consumption and oil make-up, which ismore representative of real operatingengines. The lubricating oil degradation under real operating conditions can,therefore, be modelled more realistically for extended test. runs over the life of anengine.
-206-
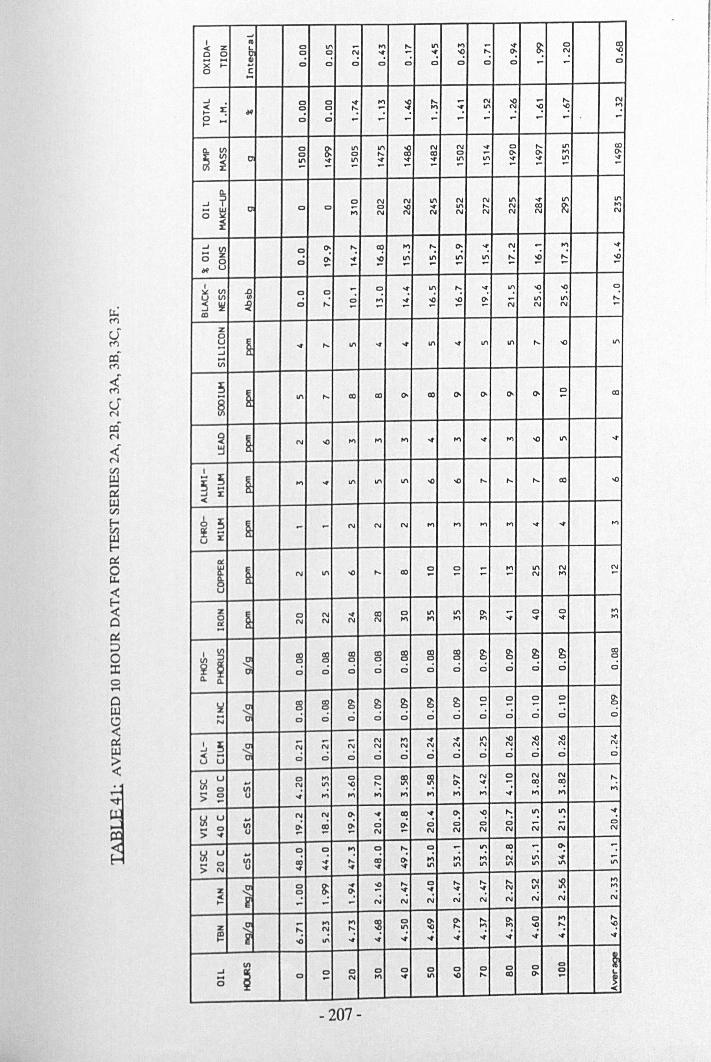
~I III-c Z
~a 1/1 ~ '"
,._ 11\ '" ~ -4' ~ C COC C ~ a N .... ~ .... "! r-, 0- "! "!X ... .; .; .; .; .; .; .;
I- a C ~ ~ 0
0 C.....J 0 0 -4' '" -0 ,._ ~ N -0 - ,._ N-cI- ~ IJlI ~ ~ "': ~ .... '" .... 1/1 N "! "! ""!0 ... 0 a ~ ~ ~ ~ ~ ~ ~ - - ~I-
a. til 0 s II' 1/1 ~ N N .... 0 ,._ 1/1 (IJ
~til C 0 0 ,._ CO 0 - 0- 0- '" 0-
~ 11\ .... 11\ -e .... .... 11\ III .... -4' 11\ -4'~ ~ ~ ~ - ~ ~ ~ ~ - ~ ~
a...J =r
I)a N N 11\ N N 11\ .... 11\ III
0 W c c - c -0 .... 11\ ,._ N CO ~ '":>.: '" N N N N N N N N
~..J til 0: "': CO ""! "': 0: .... N - '" -4'
0 Z ~ ,...:C 0 ~ ~ -0 III 11\ III III ,._ -0 -0
IJlI U - - - - - - ~
I ~:.t til .IJ ~ ~ 0 .... III ,._ ": III -0 ~ ~U til III .; ..; .0 '"< ~ ~ 0 ,._ .... -0 0- - III ,._..J - - - ~ - N N N -Ol
Z0
~U '# ,._ U'I '# -4' 1/1 -4' III U'I
::i,._ -0 III
...til
;~
0
~III ,._ CD CD 0- CO 0- 0- 0- 0- - CO
~ § N -0 '" '" '" -4' '" -4' '" -0 III ....~
I
~5 ; '" '# 11\ 1/1 1/1 -0 -0 ,._ ,._ ,._ CO -0.....J ~<
b ;~
~ - N N N '" .... .... .... ... '# '"~ i:u
CC
~~ N 11\ -0 ,._ CO 0 a ~ '" 11\ N N
a. - - - - N .... -0U
Z
~N ... CO a 11\ 1/1 - 0 0
0 C 0- ....CC N N N N '" M .... .... ... ... .... ......
I ~~
~ CO CO CO CO CO ~ ~ ~ ~ ~ (IJ
til § a ~ ~ ~ ~ ~~ .; C a a 0 c C C C .; .; 0
a. a.
~ ~ ~ gs ~ ~ ~ ~ ~ a c a 0 0-- ~ - - 0
... Cl .; .; .; 0 c c 0 .; c .; .; 0N
I ;~
- - - N .... ... ... 11\ -0 -0 -0 .....J N "! N "! "! N "! "! "! "! "! "!~ ... c cu a 0 a a 0 0 a 0 0 a
u: u ... 0 .... 0 0 CO ~ ,._ N 0 N N "':0 til
N 11\ ~ "': 11'\ 0: ... ~ "! "!:> 0 u ..; ..; .... .... ..; ..; .... ..; .... .... .... ....-u: u ... N "! 0: ~ IX! ~ 0: "! "': ~ ~ ~.. 0 til ~ !!:! ~ 0 0- 0 0 0 0 - - 0
> ... U N - N N N N N N N
u: U .. 0 0 .... 0 ,._ c_.
~ IX!_
0: -:> a til CO .... ,._ CO 0- ..; ..; .... N '" .... ~
N U .... ... ... .... ... 1/1 III 11'\ 11\ 11\ '" '"
1 0~
... ~ ,._ 0 ,._ ,._ ,._ N ~ ....Z 0 0: .... ... ": ~ "! ~ ""!< .,; .,; .,;I-
_ - - N N N N N N
Z i_
.... .... ~ 0 0- 0- ,._ 0- 0 .... ,._
"': "! "': 11\ ~ "': ""! ""! "! "': "?~ -0 '" ... ... ..; .... .... ... .... .... ... ...
til c ~..J
~C 0 0 C 0 0 0 0 c 0... 0 - N .... ... III .0 ,._ CO 0-
_0 ~<
- 207-
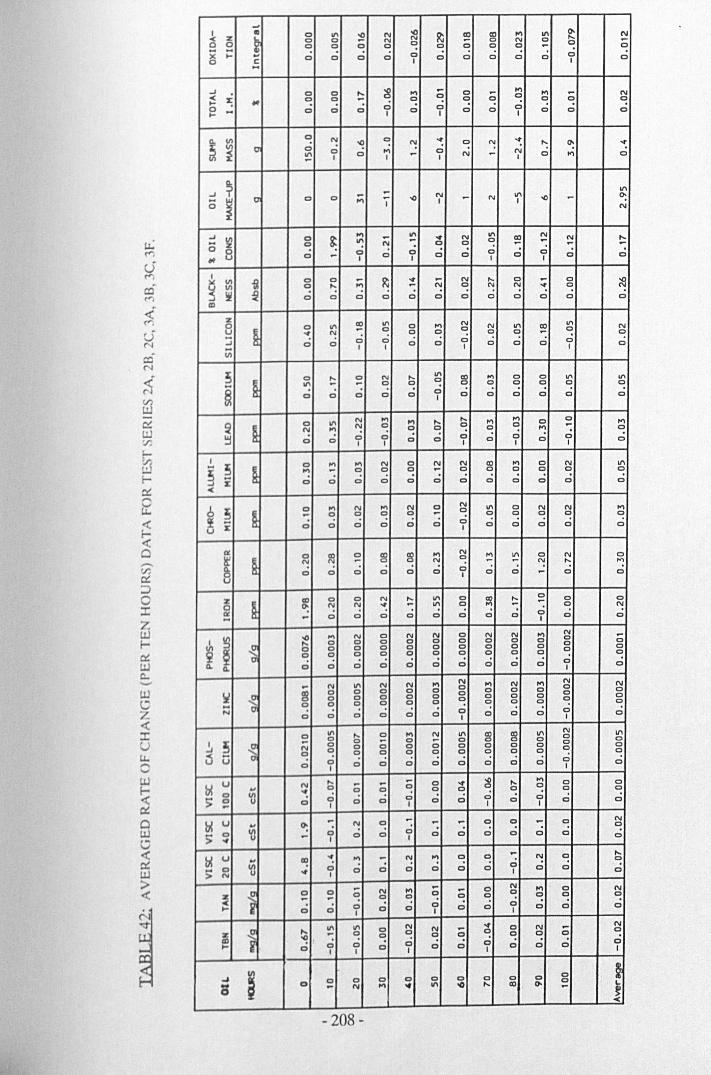
-~~::>c:tZUJf-IXUJ0-.......UJoz<::I:uu..oUJf-~ClUJo;2UJ>«
...I • 0 11'\ s N -0 ~ ~ 115 ." 11'\ 0- N< Z
~c C N N N 0 "- -0 0 ~ ~ ~ 0 ~ C ~ 0 0 - ~ 0- -X I- 0 0 0 0 0 0 0 0 0 0 0 0
0 C I I-J 0 0 ~ s '" - 0 - '" ." - N
~ :.; ~ ~ 0 0 c::: 0 0 0 0 c:::M 0 0 0 0 0 0 0~ - 0 0 I I 0 I 0 0
Cl. III ~ "! 'Q ~ N ~ 0 N ~ "- ~ "';~
III 0-~
0 0 0 ." 0 N N 011'\ - - ." 0- I I I I
J ~ .- N11'\
Cl ;;; II' 0:0 i 0 0 "I 'Q I - N I -0 -N
...~ 0
~.... .- 11\ • N In <Xl N N "-- 0II' "! - ~ ~ 0 .- .- .- .-
0 8 0 0 0 0 0 0 0 0M - I 0 I 0 0 I I
I0 0 - ~ • - N "- 0
"" III i.- 0 -0
~ III 0 "- '" - N 0 N N • 0 N
... !J! ~ 0 0 0 0 0 0 0 0 0 0 0 0III
Z <Xl '" N0
A0 '" 0 '" N II' <Xl II> N
U ~ "! - 0 ~ ~ 0 0 ~ - 0 0::; 0 0 0 0 0 0 0- 0 0 I I 0 0 I 0 IIII
s e 0 "- 0 N "- II' <Xl '" 0 0 '" U'I0
~II' - - 0 0
0 ~ 0 ~ 0 0 0
0 0 0 0 0 I 0 0 0 0 0 0
~ §0 11'1 N .... ." "- "- ." M 0 0 M
"! "! N ~ ~ ~ 0 ~ 0 "'! - ~~ C> 0 0 0 0 0 0 0 0 0 0 0
I I I I I
I
~0 ~ .... N 0 N N IX) '" 0 N '"
~~ M 0 0 0 - 0 0 0 0 0 0
i 0 0 0 0 0 0 0 0 0 0 0 0-<
0 ,; § 0 ." N M N 0 N 11'1 0 N N M- 0 0 0 0 - 0 0 '" '" 0 '"! i 0 0 0 0 0 0 0 0 0 0 0 0U I
~8
0 re 0 <Xl 115 M N ." 11'1 0 N 0
~N - '" N ~ - - N "- M
0 0 0 0 0 0 0 0 0 - 0 0I
Z § CX) 0 0 N "- II' '" ~ "- 0 0 0
~ 0: N "! • - v: '" - - '" N
0 0 0 0 0 0 0 0 0... - 0 '" I
~
-0 ,.., N 0 N N 0 N N ." N -'"~ ~
... 0 0 '" 0 '" 0 0 '" '" 0 C
0 0 0 C 0 0 0 0 0 0 '" C
~ 0 '" ~ c <:> 0 <:> 0 0 0
0 0 0 0 0 0 0 0 00- n. 0 0 0 I
... N U'I N N '"N ." N '" N N0 C
~ 1 ~ Cl '" C 0 0 0 0 '" 0 0 '"0 <:> 0 c <:> ~ '" <:> c c 0<:> C! ~ c C! 0 0 0 '" ~.. 0N 0 0 0 c 0 0 00 0 0 I I 0
0 11\ "- 0 ." N 11\ 115 CX) '" N 11\
§ - '" 0 - 0 (; '" '" '"c '"g ~
N 0 0 c c 0 c '" 0 '" 0
U<:> ~ ~ <:> 0 <:> 0 c c ~ ~ ~
Cl 0 0 Cl Cl 0 0 0 Cl 0 0Cl I I
b! IJ N "- (; - - 0 • ;g ... M 0 0., • 0 0 0 0 c::: 0 ~ '" 00 CC 0 0:; ~ 0 0 0 '" 0 C 0 0 0 0
I I I I
til I.J .. 0: - N 0 - - - 0 ~ .- 0 N
CC 0 0 0 0 0 0 0 C 00
:; 0 .- 0 0"# I I
til u ~ ,.., - "! "'! c::: 0 - "! c:::..... ~ 0 '"... 0 ca • Cl 0 C c 0 0 0 I 0 C C
;> N I
1 - N ." - - C N .". 0 N
~<:> 0 0 ~ c:::
0 0 ~ ~ ~ c::: c:::.- .-... 0 0 C C Cl 0 C Cl 0 0 0 0I I I
111\ 11'1 0 N N - • 0 N - N
Z,... - ~ c:::
0c::: c:::
0 0 C 0 0
~ ~, 0 C 0 0 0 0 00 C 0 00 I I I I I
~ i 0 0 0 C> 0 C> C> 0 C> 0 ~0 0- - N '" of 11'1 -0 ,... CX), 0- .-0 ~
<
~208-
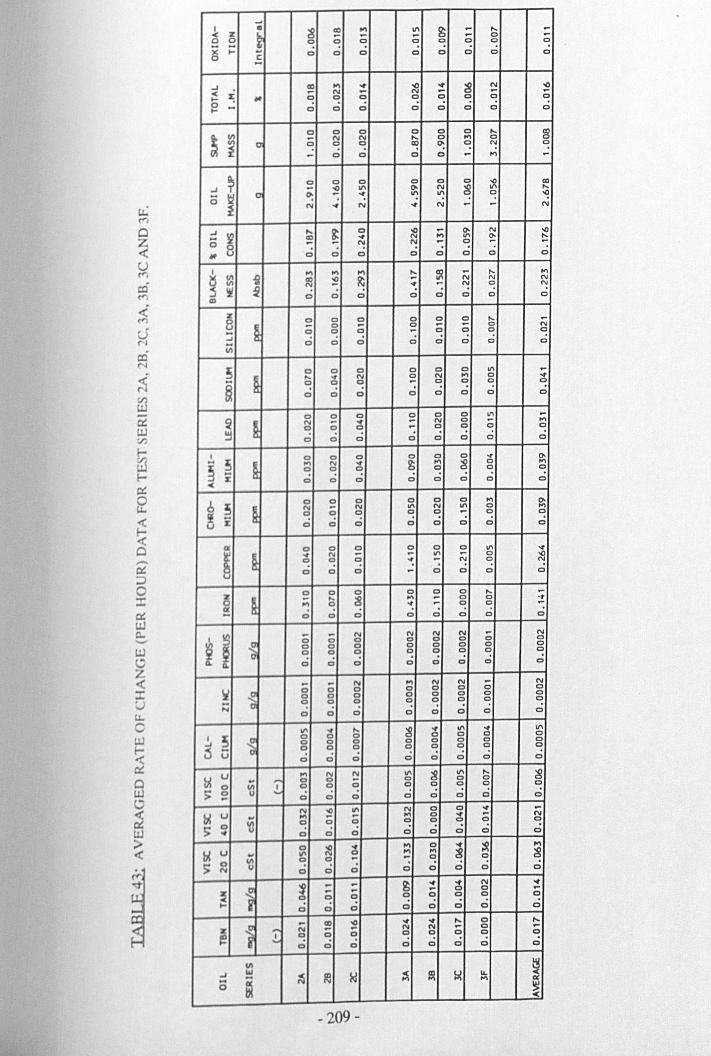
-ex::::>o::.t:
'"UJQ..-
~I • s ~ "" 11\ s ... ,._ ...< z
~... ~ ... 0 ...
0 0 0 0 ~ ~ 0 ~ 0
~ .,; .,; .,;~ c 0 0 0 0 0-oJ Cl) "" ~ 00 ~ s N s< Z;
N - N ... ..... III 0 ~ 0 ~ 0 ~ ~ ~l? - 0 0 0 0 .,; 0 0 0
~~
0 0 0 0 0 0 ,._ Cl)
eN N ,._ 0 "" 0 0
~0 ~ ~ ~ 0: ~ "! ~... 0 0 0 0 ... "" ...
~ 0 0 0 0 0 0 -o Cl)
oJCIl
... :!! 11\ 0- N s 11\ ,._
0 !.'.! 0: ~ 11\ 11\ 0 ~~ N .. N .; N ... .- N
oJ ~,._ s 0 '" ... 0- N '".. ~ .. N "" 11\ ~ ,._
0 0N N .- 0 .-
III U 0 .,; .,; .,; .,; 0 0 .,;
g VI i "" "" "",._ Cl) ... ,._ ""~ :!! ~ - 11\ N N N
11) .. ... N 0 N
~ ~ .,; .,; .,; 0 .,; .,; .; .;ell
Z8 §
0 0 0 0 0 0 ,._ .-.- 0 .- 0 .- .- 0 N.. 0 0 ~ - ~ ~ 0 0... .; 0 0 0
iii 0 0 0 0
;A
0 0 0 0 0 0 '" .-.... ,.. N 0 N "" 0 ,..... 0 0 0 .- 0 0 0 0
~ 0 0 .,; 0 .,; .,; 0 .,;
~ §0 0 0 0 0 0 '" .-N .- .. .- N c - M
0 0 0 - ~ ~ 0 0
~ .,; . .; .,; .; .,;0 0 0
,~ §
0 '" 0 0 0 0 ~ 0-.. "" N .. ~ "" ;g 0 ""~ 0 ~ ~ ~ 0
~ :It 0 c:i 0 c:i 0 .,; 0 .,;
cl, ! ~0 ~ 0 0 (;) (;) "" 0-N N 11\ N 11\ 0 M(;) (;) (;) ~ (;) ... 0 (;)
u i 0 (;) c:i (;) (;) .,; c:i .,;
~~
0 0 (;) (;) (;) (;) 11\ ,..:; N - .- 11\ ... '" '"'" 0 ~ .- N 0 N
.,; 0 .,; - 0 .,; 0 .,;
~ §0 (;) 0 (;) (;) 0 ,._ ...- .... ~ .... ;:: 0 '" .~"" 0 .. 0 0
c:i C .,; 0 0 .,; .; .,;
I i - 0 N N N N ... N
~(;) 0 0 0 0 Cl 0
~0 0 Q (;) (;) 0 (;) (;)
0 0 ~ ~ (;) (;) ~ ~0. c:i c:i 0 0 .,; .,; Cl 0
.. .. N "" N N ;; N
W~
C) C) (;) 0 0 C) C)
0 Cl Q Cl Q Q 0 0... ~ Cl ~ Cl ~ Q ~ 0
N 0 .,; .,;(;) Cl Q 0 Cl
11\ .. ~ ;g .., 11\ .., 11\
.!J ~ ~0 0 Cl Q C (;)
0' Cl 0 Cl 0 0 0 0
i5 0 (;) (;) ~ ~ Q (;) CO (;)
.,; 0 Cl 0 C 0 .; .,;
~ u'i
... N N 11\ ;g 11\ ,._ ~~
CO 0 0 (;) 00 (;) ~ 0 0 ~ ~ 0 ~
$: 5! .:.C) 0 0 c:i 0 0 0 0
N ~ '" N (;) 0 .. ...b! u w ... - '" 0 ~ ... N
ca ~ Q 0 C 0 C 0 ~s- O 0 0 .,; c:i .,; .,;.. Cl0
(;) ~ ~ "" 0 ~ ~ ""bI u ... 11\ "" '" 8 ~
ca 0 0 .. ... 0 ~s: 0 0 0 .; .; .,;N 0 (;) (;)
1 ~... ... g .. ~ N ..
! .. - ... (;) (;) ...(;) 0 (;) (;) (;) (;) (;)
.; (;) Cl 0 .; .; .; .,;
1 - ~ ~ .. .. ,._ (;) ,._
! ~ N N N ... (;) ....!,. C! C! Cl 0 C! 0 ~ 0
(;) 0 Cl 0 Cl (;) Cl (;)
VI ~..J W~ le ~ ~ f!l ~ II.
0 ~"" QC
~
- 209-
CHAPTER6.
6. CONCWSIONS AND IMPUCATIONS FOR FlJRTIIER WORK.
6.1 NEW OIL ANALYTICALIECHNIOUES.
6.1.1 Conclusions.
This work has developed three new oil analytical methods, namely, Total BaseNumber (for both IP 177 and IP 276), Total Insoluble Matter and Water Content.These new techniques have been shown to be superior to the standard methods incurrent use, in that they work well not only for new formulated oils, but also workequally well for used or severely abused oils, which is not the case for the standard oilanalysis methods. The new basic techniques have been proven and shown to giveexcellent repeatability and reproducibility.
6.1.2 Further Work.
The automated oil analyses for Total Base Number, Water Content and TotalInsoluble Matter require further development of the systems and to tidy up thevarious processes of the system. This further development should also encompass asafety review and undertake robust system usage before the complete integratedinstrument system can be considered for commercial production. Procedures forcarrying out sample and solvent preparation along with glassware and instrumentmaintenance require review and documentation before the automated instrument canbe further developed for marketing.
6.2 USED OIL ANALYSIS FROM OPERATING DIESEL ENGINES.
6.2.1 Conclusjons of OU Deiradation.
The analysis of used oils from diesel engines revealed that the TEN and 100°C oilviscosity decrease with the ageing of the oil. The TEN value of the new oil initiallydecreases rapidly followed by a less rapid change, suggesting that TBN is constitutedfrom both fast and slow reacting additive. The oil viscosity at 20°C and 40 °c increasewith the ageing of the oil, together with calcium, oxidation level, wear metals and oilblackness. The trends of the oil analyses indicate that these parameters are beingaccumulated due to the selective removal of the light fractions of the base oil. Thezinc and phosphorus levels have been found to accumulate at a lower rate than the
- 210-
other elements, indicating that they are subject to an additional removal mechanismother than just the total loss method. The linear relationship between the TotalInsoluble Matter (TIM) level and the Oil Make-up Mass level indicates the effect ofoil dilution on TIM and the non-selective loss of TIM from the oil.
6.2.2 Conclusions on Oil De~radation Model.
The oil degradation model previously proposed by Dyson [33] for the depletion ofTBN has been verified. The Quasi-Continuous Stirred Tank Reactor Model has beenshown to be a better model than the previously proposed Dyson model for modellingthe degradation of lubricating oil. The QCSTR model allows the modelling of thelubricating oil degradation over the entire life of an engine as it considers both oilconsumption and oil make-up in its treatment.
6.2.3 Further Work.
The modelling of the lubricating oil degradation by the QCSTR model can be furtherenhanced by obtaining continuous on-line oil analyses and also without dismantlingthe engine at frequent intervals, which causes temporary disruption of the engines'system integrity.
6.2.4 Other Further Work.
The area of great interest for future study is the need for a greater understanding andinsight into top-ring zone chemistry and oil flow rates. This can be achieved bynon-intrusive oil sampling from the top-ring zone. The current work has been limitedby not having undertaken top-ring zone sampling in relation with the tests carried out.The current work does not consider the oil transfer (Maeda, Maeda and Yusotorni,[17] and degradation rates of the top-ring zone oil. The oil is understood to undergosevere degradation within the top-ring zone and such a study could also enable oilconsumption mechanisms to be studied. This could possibly provide a completeunderstanding of oil degradation.
6.3 ornER WORK.
If the characteristics in the top-ring zone could be understood, the task of linkinglubricating oil degradation with engine wear would be more meaningful and a moreaccurate model would then be possible.
-211-
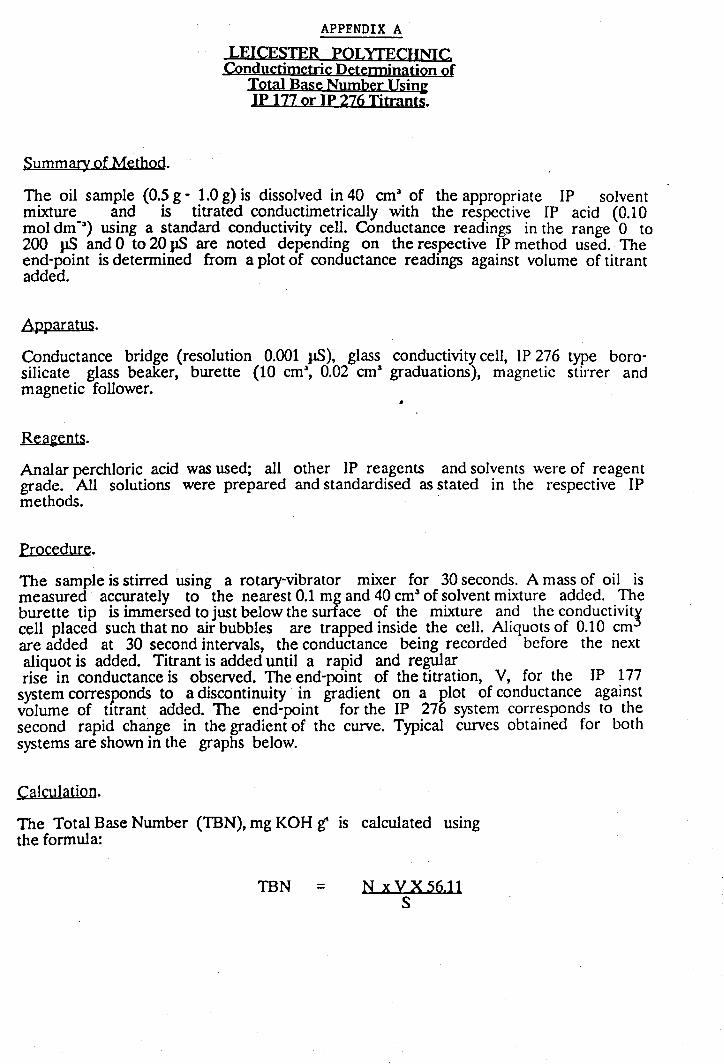
APPENDIX ALEICESTER POLITEOINICConductimetric Detennination of
Total Base Number Usin~JP 177 or JP 276 Titrants.
Summary of Method.
TJ:le oil sample (D.?g - J.O g) is dissolved in.40 cm;,.of the appropriate JP solventmixture and IS titrated conductimetrically WIth the respective JP acid (0.10mol dm-;,) using a standard conductivity cell. Conductance readings in the range 0 to200 pS and 0 to 20 pS are noted depending on the respective JP method used. Theend-point is determined from a plot of conductance readings against volume of titrantadded.
Apparatus.
Conductance bridge (resolution 0.001 pS), glass conductivity cell, IP 276 type boro-silicate glass beaker, burette (10 cm', 0.02 cm" graduations), magnetic stirrer andmagnetic follower.
•
Reagents.
Analar perchloric acid was used; all other JP reagents and solvents were of reagentgrade. All solutions were prepared and standardised as stated in the respective JPmethods.
Procedure.
The sample is stirred using a rotary-vibrator mixer for 30 seconds. A mass of oil ismeasured accurately to the nearest 0.1 mg and 40 cm" of solvent mixture added. Theburette tip is immersed to just below the surface of the mixture and the conductivit_3cell placed such that no air bubbles are trapped inside the cell. Aliquots of 0.10 cmare added at 30 second intervals, the conductance being recorded before the nextaliquot is added. Titrant is added until a rapid and regularrise in conductance is observed. The end-point of the titration, Y, for the JP 177system corresponds to a discontinuity in gradient on a plot of conductance againstvolume of titrant added. The end-point for the JP 276 system corresponds to thesecond rapid change in the gradient of the curve. Typical curves obtained for bothsystems are shown in the graphs below.
Calculation.
The Total Base Number (TBN), mg KOH gotis calculated usingthe formula:
TBN = N xYX56.11S
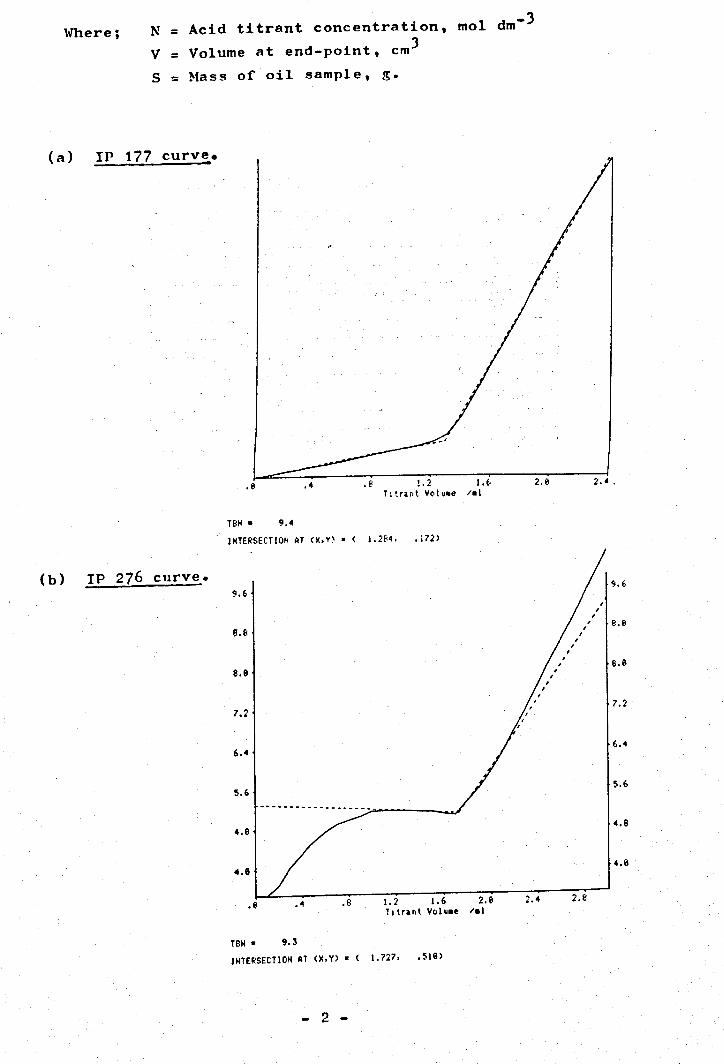
N = Acid titrant concentration, mol dm-JV = Volume at end-point, cm)S = Mass o~ oil sample, g.
•9 .4 .8 1.2 1.(. 2.e 2.•.TI ~ra n t Vol u•• /.1
TB~ • 9.4INTERSECTION AT (X.Y) • ( I.284. .172)
(b) IP 276 curve.~.£ '.E-
8.8e.£<
8.88.9
7.27.2
6 ••6.4
5.65.6
_.- ....... _- --- .. __ ...... - .. _-
4.84.8
4.84.8
.8 .4 .8 1.2 1.6 2.8 2.4 2.8TItrant Volu.e /.1
TBN .. 9.31HTERSECTI OH AT (X.Y) = ( 1.727. .5Ul)
\fuere;
(a) IP 177 curve.
- 2 -
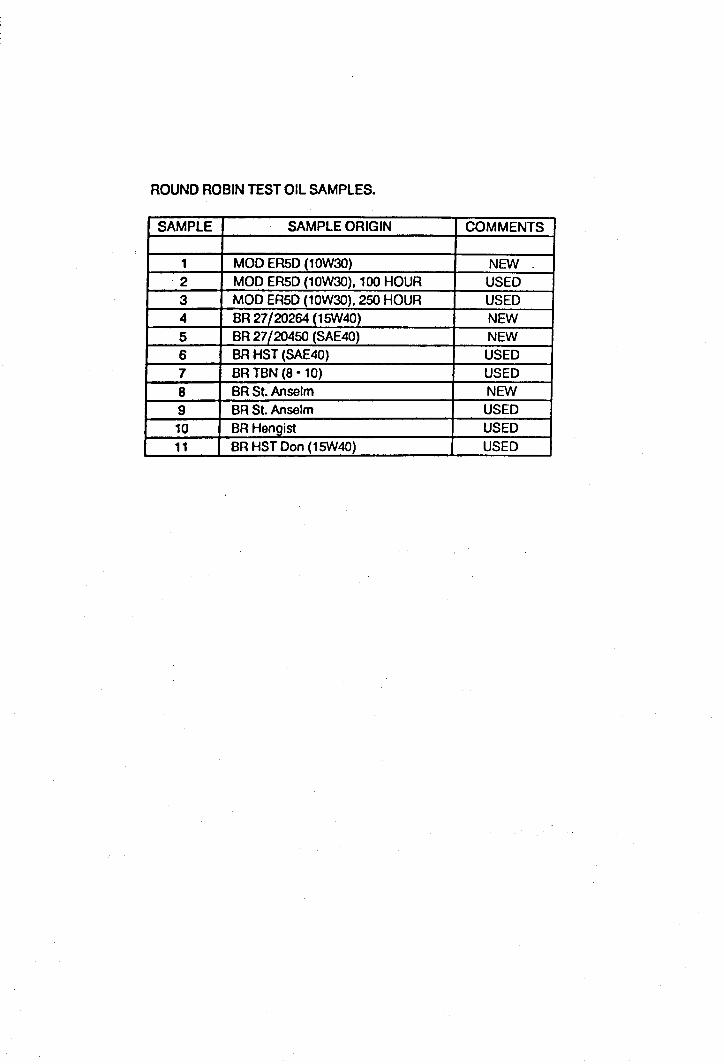
ROUND ROBIN TEST OIL SAMPLES.
SAMPLE SAMPLE ORIGIN COMMENTS
1 MOD ERSD (10W30) NEW2 MOD ER5D (10W30), 100 HOUR USED3 MOD ER5D (10W30), 250 HOUR USED4 BR 27/20264 (15W40) NEW5 BR 27/20450 (SAE40) NEW6 BR HST (SAE40) USED7 BR TBN (8 • 10) USED8 BR St. Anselm NEW9 BR St. Anselm USED10 BR Hengist USED11 BR HST Don (15W40) USED
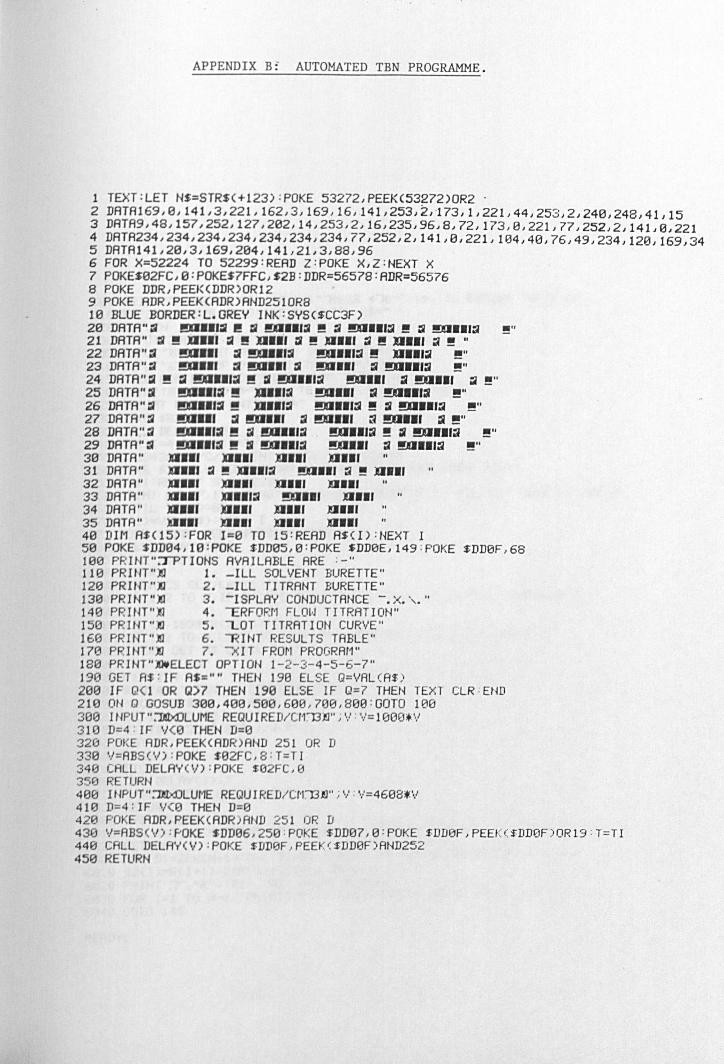
....
APPENDIX B: AUTOMATED TBN PROGRAMME.
1 TEXT:LET NS=STRS(+123):POKE 53272,PEEK(53272)OR2 .2 DATAI69/e,141/3/221/162,3,169,16/J41,253.~.173,l.221,44,253,2,248,248,41.153 DATA9,48,157,252,127,2e2,14,253,2,16,235,96,8,72,173,8,221,77,252,2,141,8,2214 DATA234,234,234,234,234,234,234,77,252,2,141,e,221,104,48,76,49,234,120,169,345 DATA141,2e,3,169,204,141,21,3,88,966 FOR X=52224 TO 52299:READ Z:POKE X,Z:NEXT X7 POKES82Fc,e:POKES7FFC,S2B:DDR=56578:ADR=565768 POKE DDR,PEEK(DDR)ORI29 POKE ADR,PEEK(ADR)AND2510R81a BLUE BORDER: le GREY INK:SYS(SCC3F)213DATA":'J !!II.I.;! I! :ll !!!JII.':2 !! :'J !!DIII:ll !! :ll !!d.II:ll !!"21 DATA" :'J!! JI... ill !! :U... :J !! S •• , :'J II! :U•• , :ll !! "22 DATA":l !!JI." ill !!DIII:2 g.IIWI!! II •• ,WI !!"23 DATA":l !!JI." ill !!JI'.':J !!DIll :'J !!JI •• ':2 !!"24 DATA"12 !! :il !!Q•• ,iII !! III!!JI."" !!Q'.' :ll !!JI'.' WI!!"25 DATA"III !!II•• 'iIl!! JI•• ,12 !!Q•• ' WI!!D•• ';!! !!"26 DATA":Ii m••,:Ii!! :U•. ,::I !!lI.":li!!:Ii !!JI.I.:.! !!"27 DATA":'J !!II." WIm••, .. !!D •• ' ~ !!JI•• ' :ll!!"28 DATA".. !!D."iIl!! WIm••,:2 . !!II•• 'WI!! :ll !DII.':.! !!"29 DATA".. !!II•• ':ll!!:ll !!JI.IIWI !!II•• ' .. !!QI.':.! !!"313DATA" lSIl., D•• , DI., D.II31 DATA" ..III 12 !! D.II:2 !!DIII:'J!! lIll'32 DATA" ..I.. dll" d.11 1I.1133 DATA" U •• , d •• ," !!!!IIII U.II34 DATA" lSI•• ' ••• , D•• ' Dill35 DATA" UI.. .1., •• 11 UIII413DIr1AS(15) :FOR 1=0 TO 15:READ AS(!) :HEXT IS8 POKE SDD04,le:POKE SDDe5,e:POKE SDD0E,149:POKE $DD0F,68lee PRINT":TPTIONS AVAILABLE ARE :-"1H3 PRUIT")!] 1. -ILL SOLVENT BURETTE"128 PRINT"ll 2. -ILL TITRANT BURETTE"138 PRINT"ll 3. -ISPLA'T'CONDUCTANCE -.x.',."140 PRWT")!] 4. RFORr'lFLOt'JTITRATION"158 PRINT")!] 5. OT TITRATION CURVE"168 PR INT")!] 6.. INT RESULTS TABLE"178 PR 1NT")1 7. -xIT FRDrlPROGRAW1813PRINT"lWELECT OPTION 1-2-3-4-5-6-7"190 GET R$; IF AS="" THEN 198 ELSE Q=VAL (A$;\288 IF Q(l OR Q)7 THEN 198 ELSE IF 0=7 THEt~ TEXT CLR:END218 ON 0 GOSUB 3ee,400,508,600.700,800:GOTO 100380 WPUT":-m...:!JLUMEREQUIRED/CW13l1";v:',/=1000*'.,1318 D=4:IF V(0 THEN D=8320 POKE ADR,PEEKCADR)AND 251 OR D338 V=ABS('.,I):POKE S02FC, 8:T=T 1340 CALL DELAY(V):POKE $02FC,B350 RETURN400 HIPUT":-m:.:oLUr-1EREQU1p.ED/cr{'3~";v:-'/=46e8*--/410 D=4:IF V(e THEN D=04213POKE ADR,PEEK(ADR)AND 251 OR D430 V=ABS(V):POKE SDD06.25e:POKE $DD07,8:POKE SDD0F,PEEK(5DD0F)OR19:T=TI448 CALL DELAYCV):POKE $DD0F,PEEK(SDD0F)AND25245'3RETURN
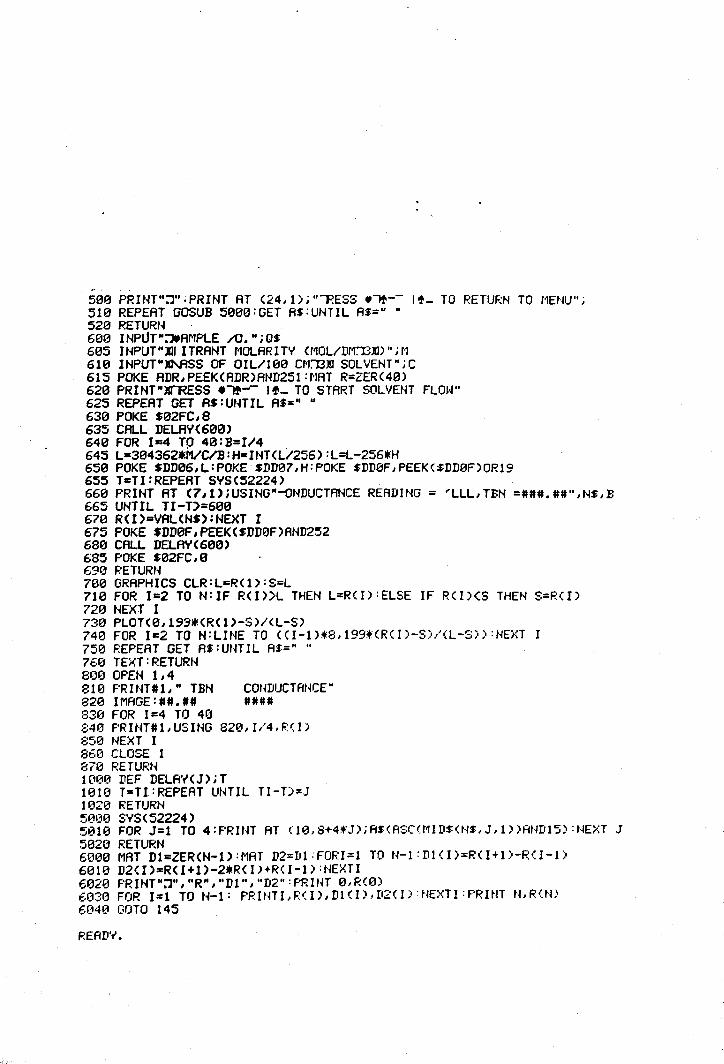
51313PRINT":,)";PRINT AT (24.1) i """HESS 41"'-- I!- TO RETUF:N TO 11ENU"j5113 REPEAT GOSUB 50B0:GET AS:UtHIL AS=" "5213 RETURN61313INPtJT":JfAMPLE /O."jQ$6135 INPUT" IIIITRAI'fTr10LARITY <r10L/DM:'"1311)"j r16113 INPUTN~S OF OIL/leB cr'r1311 SOLVENT" .c615 POKE ADR, PEEK (ADR) AND251 :,.,ATR=ZER (413)6213 PRINT")Sf"'RESS.~-- If- TO START SOLVENT FLOW'625 REPEAT GET AS:UtHIL AS=" "6313 POKE S02FC,8635 CALL DELAY(60B)6413 FOR 1=4 TO 4B:B=I/4645 L=3B4362*ivc/B:H=INHL/256):L=L-256*H6513 POKE SDDB6,L:POKE·SDD07,H:POKE SDDeF,PEEK(SDDeF)OR19655 T=TI:REPEAT SVS(52224)6613 PRINT AT (7,1)iUSING"-ONDUCTANCE READING = 'LLL,TBN =###.##",NS,B665 UNTIL TI-T)=6BB6713 R(I)=VAL(NS):NEXT 1675 POKE SDDBF,PEEK(SDD0F)AND2526813 CALL DELAY(6BB)685 POKE SB2FC,B6913 F.:ETURH7130 GRAPHICS CLR:L=R(l):S=L7113 FOR 1=2 TO N:IF R(I»)L THEN L=R(I):ELSE IF R(I)(S THEN S=RCI)7213 NEXT I730 PLOT(B,l~9*(R(1)-S)/(L-S)7413 FOR 1=2 TO N:LINE TO (CI-l)*8,199*CRCI)-S)/CL-S»:NEXT I7513 REPEAT GET AS:UNTIL AS=" "760 TEXT: RETURt-4Beo OPEN 1,4810 PRINT#I," TBN CONDUCTAt~CE"820 IMAGE:##.## IIII8313 FOR 1=4 TO 408413 PRINT#1,USING 820,I/4,RCI)850 NEXT I8613 CLOSE 18713 RETUF:N10013 DEF DELA'''(J);T113113T=TI:REPEAT UNTIL TI-T)=)11.3213RETURN501313S'y'S(52224)513113FOR J=1 TO 4:PRINT AT (le,8+4*J);AfCASCCMID$(N$,J,I»AND15):NEXT J513213RETURN601313MAT Dl=ZER(N-l):MAT D2=Dl:FORI=1 TO N-l:Dl(I)=RCI+l)-R(I-l)61311.3D2(I)=R(I+I)-2*R(I)+R(I-l):NEXTI613213PRINT":,)","R","Dl","D2":PRINT e,R(13)613313FOR 1=1 TO N-l: PRINTI,R(I),Dl(I),D2(I):NEXTI:PRINT N,R(N)60413 OOTO 145READ'y'•
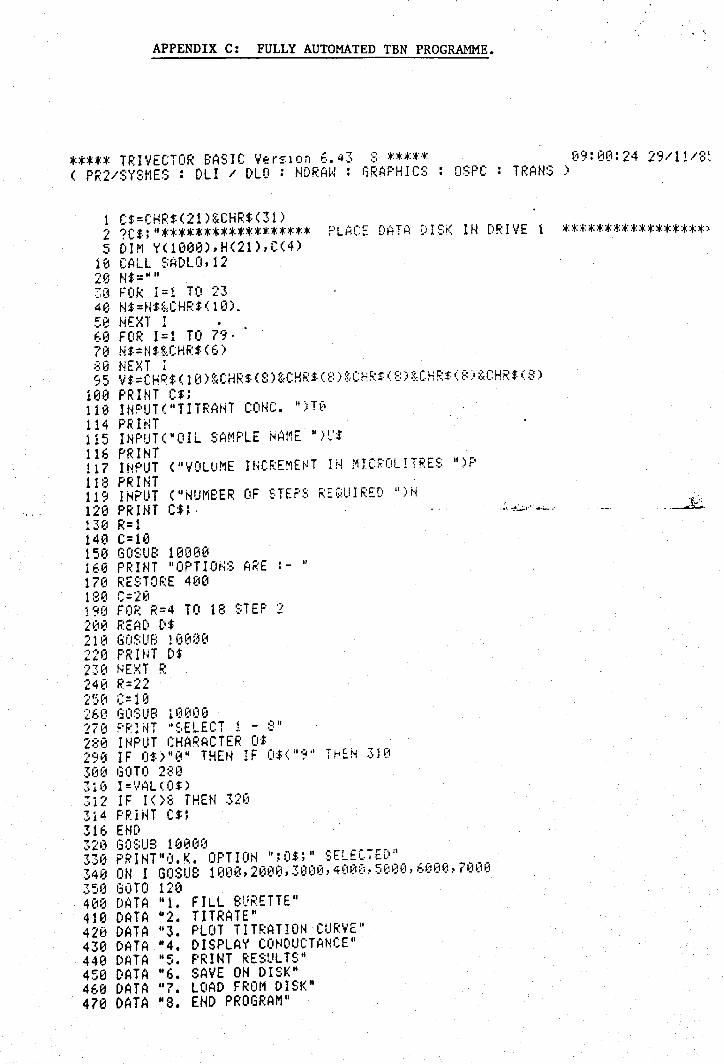
APPENDIX C: FULLY AUTOMATED TBN PROGRAMME.
***** TRIVECTOR BASIC VerSIon 6.43 S ***** 09:00:24 29/1!/8~( PR2/SYSMES : DLI / DLO : HDRAN : GRAPHICS OSPC TRANS)
1 CS=CHRS(21)&CHRS(31)2 ?C$;"****************** PLACE DATA DISK IN DRIYE 1 *****************)5 DIM Y(10ee),H(21),C(4)
1~ CALL SADLO,1220 Nt=""3.) FOr..: 1=1 TO 2348 NS=Ht&CHR$(10).513 HEXT 1 •60 FOR 1=1 TO 79·713 N$=tH·&.CH~:$( 6):::13 NEXT r95 V$=CHR:t(lB)&CHR$(S)&CHRS(8)tCHR$(8)&CHR$(8)&CHR$(S)100 PRINT C$;118 INPUTC"TITRANT CONC. ")TO114 PRHH115 INPUT("OIL SAMPLE NAME ")~$116 PRINT117 INPUT ("VOLUME INCREMENT IN MICROLITRES ")P118 PRINT119 INPUT ("NUM8ER OF STEPS REQUIRED ")N1213 PRINT C$; .~~-.:'':'':'''' ...... , ... ~.130 R=l140 C=10150 GOSUB 1131313131613 PRINT "OPTIO~S ARE :- "1713 RESTO~:E 4091:30 C=2fl199 FOR R=4 TO 18 STEP 22130 READ t\S2113 GOSU8 11312108220 PRINT DS230 ~~E:~TR240 R=22250 C=102E.1jGOSU8 10800270 PR!NT ~SELECT 1 - 8"280 INPUT CHARACTER OS290 IF 0$)"8" THEN IF O$(a9d THEN 3103(H3 GOTO 2:31331(1 I=VAl«(J:t)312 IF 1<>8 THEN 326314 PRiiH C$;316 END32~3 GOSU9 1121130(1330 PRINT"D.K. OPTION ";0$;" SELEC7ED"349 ON I GOSUB 1008,2808,3009,4000,5000,6000,7000350 GOTO 120400 DATA "1. FILL BURETTE"410 DATA H2. TITRATE"420 DATA "3. PLOT TITRATION CURVE"430 DATA ·4. DISPLAV CONDUCTANCE"449 DATA "5. PRINT RESULTS"450 DATA "6. SAVE ON DISK"460 DATA "7. LOAD FROM DISK"470 DATA MS. EHD PROGRAM"
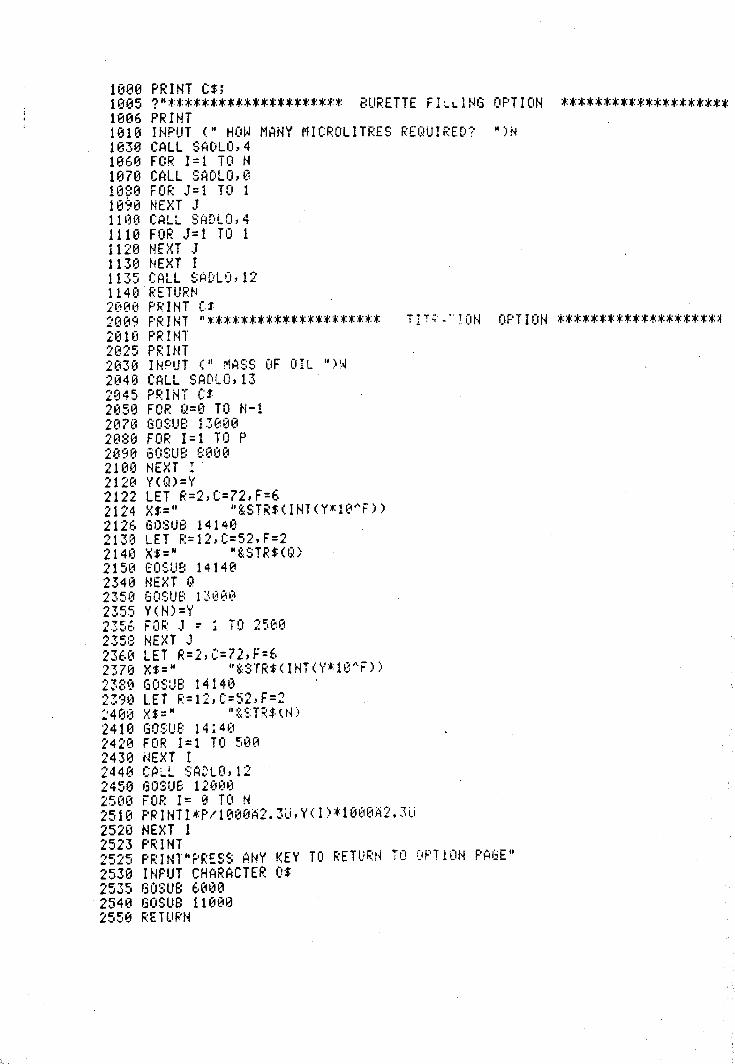
1000 PRINT C$;1005 ?"********************* BURETTE FI~LINS OPTION ***.****t***********1006 PRINT1010 INPUT (H HOW MANY MICROLITRES REQUIRED? ")N1830 CALL SADLO.41060 FOR 1=1 TO H1070 CALL SAOLO,01080 FOR J=1 TO 110~8 NEXT J1190 CALL SADLO,41110 FOR J=l TO 11120 NEXT J1130 NEXT I1135 CALL SADLQ,121148 RETURN2000 PRINT CS2009 PRINT "~******************** TI!;~"!OH OPTION *******************~2010 PRINT2025 PRINT2030 INPUT (~ MASS OF OIL ")W2040 CALL SADLO,132045 PRINT CS2850 FOR Q=0 TO N-!207B GOSUB 130002880 FOR I=1 TO P2090 GOSUB 80002100 NEXT!2120 Y(Q)=Y2122 LET R=2,C=72,F=62124 X$=" "&STR$(INT(Y~10AF»2126 GOSU8 141402130 LET R=12,C=52,F=22140 XI=" "&STR$(Q)2150 eo sue 141482340 NEXT Q2350 GOSUB 13ee@2355 V(N)=Y2356 FOR J ~ : TO 25002358 NEXT J2360 LET R=2,C=72,F=62370 Xf=" "&STR.(INT(V*IBAF»2380 GOSU8 141402390 LET R=12,C=52,F=22400 X$=" "&STR$(N)2410 GOSU8 14:402420 FOR 1=1 TO 5002430 NEXT I2440 C~LL SA0LO,122450 GOSU8 120002500 FOR 1= e TO H2510 PRINTI*P/10e9~2.3J,Y(I)*10e0~2.3U2520 NEXT 12523 PRINT2525 PRINT"PRESS ANY KEY TO RETURN TO DPTlON PAGE"2530 INPUT CHARACTER OS2535 GOSUB 6~002540 SOSUB 110802550 RETURN
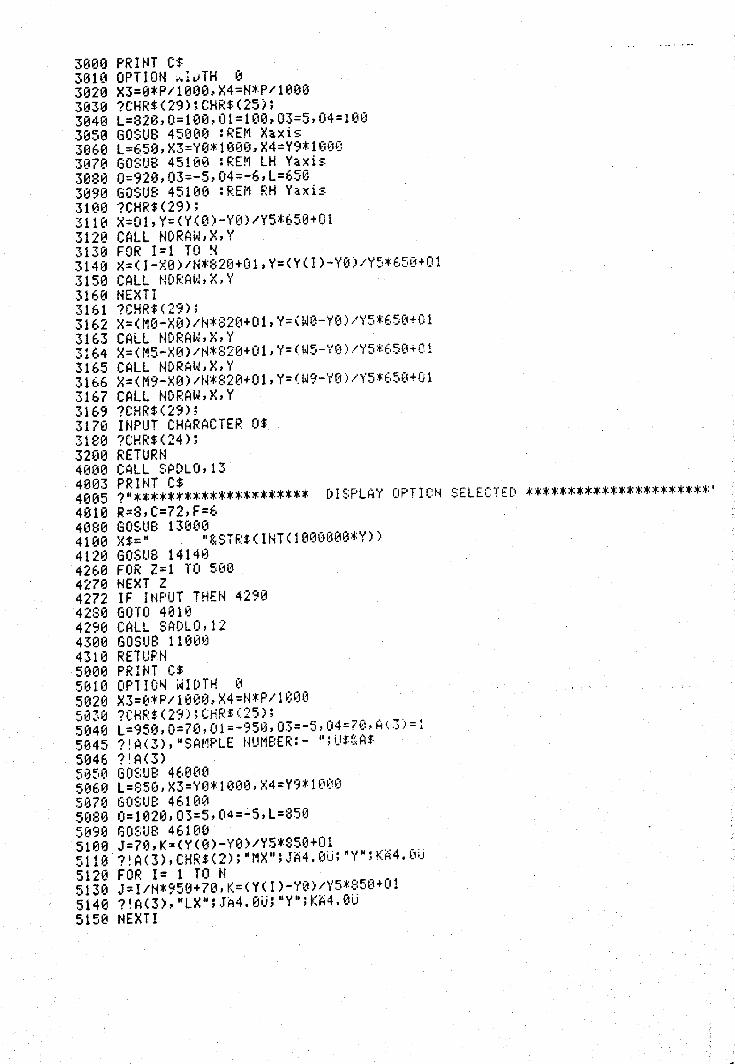
3e09 PRINT Ct3010 OPTION ~IJTH 03020 X3=O*P/1000,X4=N*P/10003030 ?CHRS(29);CHRS(2S);3040 l=B20,O=100,Ol=100,03=5,04=1003050 GOSUB 45009 :REM Xaxis3060 l=650,X3=YS*1000,X4=Y9*100B3870 GOSUB 45109 :REM LH Yaxis3ese O=920,03=-S,04=-6,L=6503090 GOSUB 45100 :REM RH Yaxis3190 ?CHR$(29);3118 X=Ol,Y=(YCO)-YO)/YS*650+013120 CALL HDRAW,X,Y3130 FOR 1=1 TO ~3140 ~=CI-Xe)/N*820+01,Y=(Y(I)-Y0)/Y5*650+013150 CALL NDRAW,X,Y3160 NEXTI3161 ?CHR$(29);3162 X=(M0-XO)/N*S20+01,Y=(W0-YO)/Y5*650+013163 CALL HDRAW,X,Y3164 X=(MS-X0)/H*820+01,y=cW5-Y0)/Y5*650+013165 CALL NDRAW,X,Y3166 X=(M9-XO)/N*S20+01,Y=(W9-YO)/Y5*650+013167 CALL HDRAW,X,Y3169 ?CHR$(29);3170 INPUT CHARACTER OS3189 ?CHR$(24);3200 RETURN4000 CALL SPDLO,134003 PRINT CS4005 ?H**************~****** DISPLAY OPTION SELECTED **********************'4010 R=B,C=72,F=64080 GOSUB 130004100 X$=" "&STRS(INT(10e0000*Y»4120 GOSUB 141484260 FOR 2=1 TO 5eB4279 NEXT Z4272 IF INPUT THEN 42904280 GOTO 40104290 CALL SADLO,124300 GOSU8 1100U4310 RETU~N5000 PRINT C$5810 OPTION ~IDTH 05020 X3=0*P/1000,X4=N*P/10005030 ?CHR$(29);CHR£(25);5040 L=950,O=70,01=-950,03=-5,04=70,A(3)=l5045 ?!A(3),"SAMPLE NUMBER:- ";US&AS5046 ?!A(3)saS0 GOSUB 460005060 L=850,X3=YO*1000.X4=Y9*100e5070 GOSUB 4610050S0 0=1020,03=5,04=-5,L=8505090 GOSUB 461005100 J=7e,K=CY(0)-Y0)/YS*S59+015110 ?!A(3),CHR$(2);"MX";JA4.eU;"Y";K~4.0J5120 FOR 1= 1 TO N5130 J=!/N*95B+7B,K=<Y(!)-Y0)/YS*S50+015140 ?!A(3),"LX";J~4.0U;"Y";K~4.0U5150 NEXT!
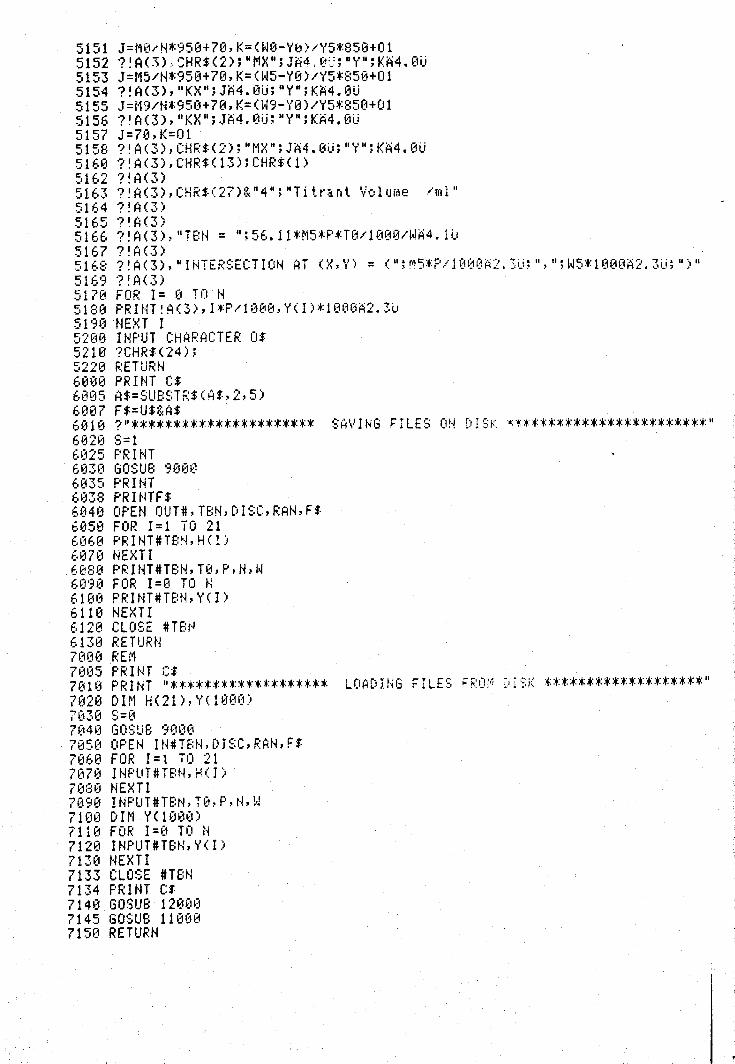
5151 J=M0,H*950+70,K=(WO-Yb)/Y5*850+015152 ?~A(~),SHR$(2);UMxu;J~4.0J;uY";K~4.0U5153 J=M5/N*950+70.K=(W5-VO)/Y5*850+015154 ?!A(3),"KX";J~4.0u;uya;K~4.0U5155 J=M9/N*950+70,K=(W9-Y8)/Y5*S50+015156 ?!A(3),UKxu;J~4.0U;HY";K~4.0U5157 J=70,K=OI5158 ?!A(3),CHR$(2);HMXH;J~4.eU;"Y";K~4.0U5160 ?!A(3),CHR$(13);CHRS(1)5162 ?~A(3)5163 ?!A(3),CHR$(27)&"4A;"Titrant Volume Iml"5164 ?!A(3)5165 ?'A(3)5166 ?~A(3),"TBN = ";56.11*M5*P*T0/1000/W~4.1~5167 ?!A(3)5168 ?!A(3),"INTERSECTION AT (X,Y) = (";~5*P/le00A2.3U;",";W5*1000~2.3U;")"5169 ?~A(3)5170 FOR 1= 0 TO N5180 PRINT!A(3),1*P/100e,Y(!)*1000~2.3U5190 NEXT I5200 INPUT CHARACTER 0$5210 ?CHR$(24);5220 RETURNb~~~ PRINT C$6005 A$=8UBSTR$(A$,2,S)6007 F$=U$&A$6010 ?"********************** SAVING FILES ON DISK ~~**********************"6020 8=16025 PRINT6030 GOSU8 90006035 PRINT6038 PRINTF$6040 OPEN OUT#,T8N,DISC,RAN,F$6050 FOR 1=1 TO 216060 PRINT#TBN,HCI)6070 NEXTI6080 PRINT#TBN,T9,P,N,W6099 FOR 1=0 TO N6100 PRINT#TBN,Y(I)6110 NEXTI6120 CLOSE #T8N6130 RETURN7000 REM7005 PRINT et7010 PRINT "******************* LOADING FILES ;ROM )ISK *******************"7020 DIM H(21),Y(1900)7030 8=07040 GOSU8 90007050 OPEN IN#TBN,DJSC,RAN,FS7060 FOR I=t TO 217670 INPUT#TBN,H(I)7080 NEXTI7090 INPUT#T8N.T0.P.N,W7100 DIM Y(1000)7110 FOR 1=0 TO N7120 INPUT#TBN,Y(I)7130 NEXTI7133 CLOSE #TBN7134 PRINT C$7140 GOSU8 120007145 GOSUe 110007150 RETURN
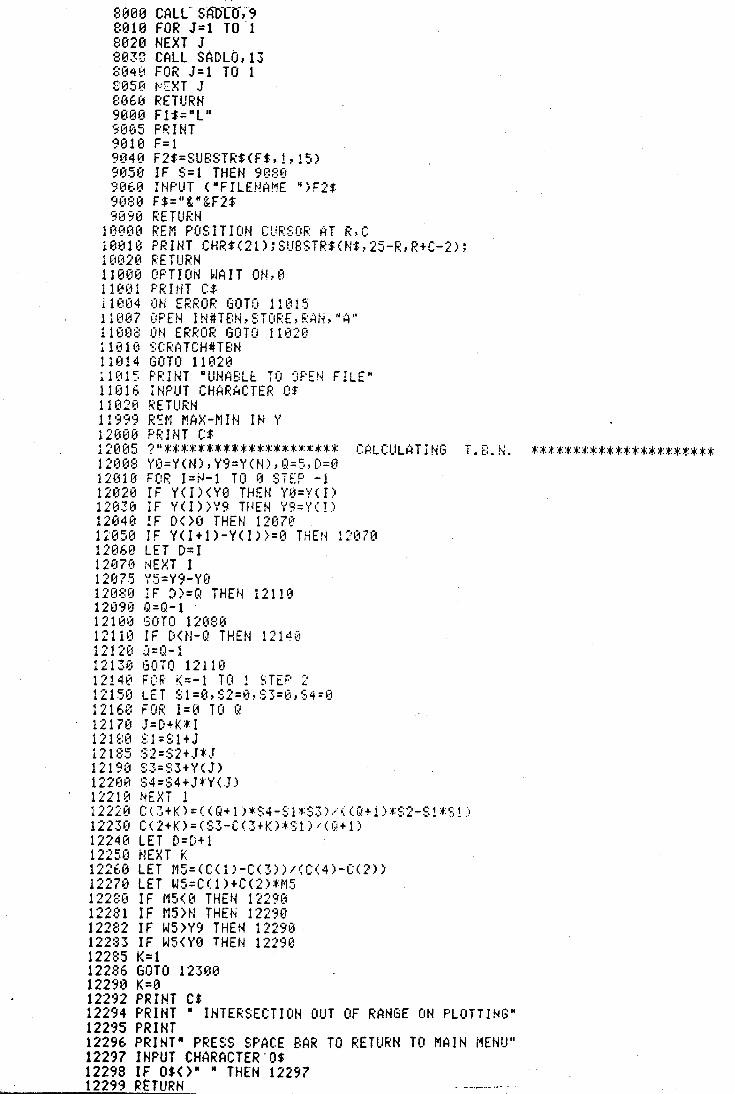
8eea CALL--SADTO-;-98010 FOR J=l TOl8020 NEXT J8030 CALL SADLQ,138040 FOR J=l TO 1805(1 t<::XTJ80E.(;r;:ETURH'30t1l3 Fl$="L II
9005 PRHll'3010 F=l9040 F2$=8UB8TR$(F$,1~15)9050 IF 8=1 THEN 90889960 INPUT (MFILENAME q)F2$9080 F$="&"&F2$9>3913 RETURN
10000 REM POSITION CURSOR AT R,C10019 PRINT CHR$(21);SU8STR$(N$~25-R,R+C-2);1(11)213 ~'ETU~~t~11000 OPTION WAIT ON,B1HH)l F'RIHT (:$11004 ON ERROR GOTO 1101511007 OPEN IN#TBN,STORE,RAN,"A~11008 ON ERROR GOTO 11820i1810 SCRATCH#TBN11014 GO TO 11020i1015 PRINT NUNABLE TO 0PEN FILE"11016 iNPUT CHAR~CTER OS11 i320 ~:ETURH119'39 R~M MAX-MIN IN Y12(1013P~:INT C$12005 ?"**************.*.~*** CALCULATING T.B.N. **********************12008 YO=YCN),Y9=YCN),Q=5,D=O120113 FOR I=N-l TO 0 STEP -112020 IF Y(I)(YO THEN V0=Y(I)12030 IF V(I»V9 THEH V9=Y(!)12040 !F D<>O THEN 1207012950 IF Y(I+l)-Y(I»=0 THEN 1297012(160 LET D= I!2(17(1 t-~EXT I12075 Y5=Y9-YO12080 IF ~)=Q THEN 12110120913 Q=Q-l1210~3 '30TO 120f:012110 IF D(N-Q THEN 1214812120 j=O-l1213(1 60-rO 12111312140 FOP K=-1 TO 1 STEP 212150 LET SI=0,S2=0~S3=6,S4=012160 FOR 1=0 TO Q12170 J=D+K*I121f:~3!:: 1=Sit J12185 82=82+.]:+:J12190 ~;3=::;3+Y(J)1220~ S4=S4+J*V(])li2H1 I~EXT 112220 C(3+K)=«Q+l)*S4-S1~S3)/«Q+l)*S2-S!*Sl)122313 C(2+K)=(S3-C(3+K)*Sl)/(Q+l)1224121LET D=Dtl12250 tlEXT K12260 LET M5=(C(1)-C(3»/(C(4)-C(2»12279 LET W5=C(I)+C(2)*M512280 IF M5(B THEN 1229012281 IF MS>N THEN 1229912282 IF W5>Y9 THEN 1229012283 IF W5<YO THEN 1229912285 K=112286 GOT 0 1230€1122913 K=l312292 PRINT C$12294 PRINT " INTERSECTION OUT OF RANGE ON PLOTTING"122'35 PRINT12296 PRINT· PRESS SPACE BAR TO RETURN TO MAIN MENU"12297 IHPUT CHARACTER·O$12298 IF 0$<>" • THEN 1229712299 RETURN -------__.---------~~~~
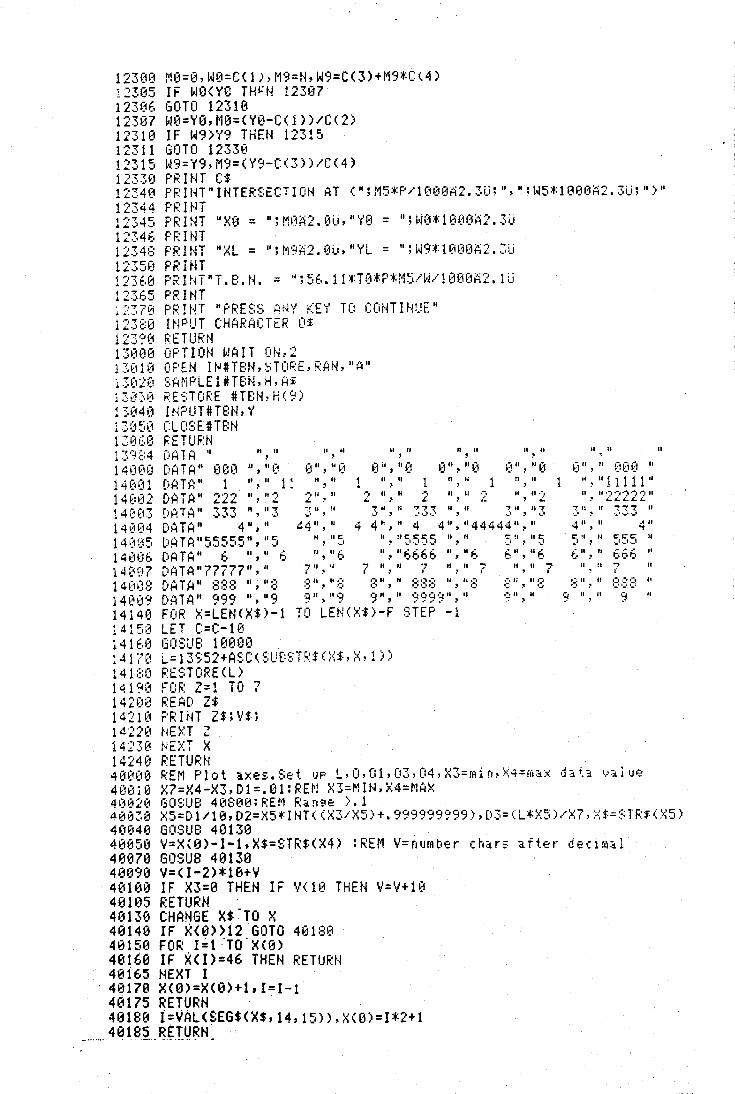
12300223051230E.1230712311:11231112~,1512.33€112341312344
M0=0,W0=C(1),M9=N,W9=C(3)+M9*C(4)IF WO<YO TH~N 12397GOTO 12318W0=YO,M0=(Y0-C(1»/C(2)IF W9>Y9 THEN 12315130TO 1233(1W9=Y9,M9=(Y9-C(3»/C(4)PRINT C$PRIHTwINTERSECTION AT (";M5*P/190e~2.3U;",H;W5*10e0~2.3U;")"P~:Hlj
12345 PRINT "X0 = ";Me~2.0U,"Y0 = ";W0*100e~2.3U12346 PF:INT12348 PRINT "XL = ";M9A2.0U,"YL = ";W9*1000~2.3U12350 PF.:HlT1~13E1012365~;:37tj
123'?131 ::'0130130101.302(11:1t) :',~3!~,04013!)5i3130GO13'?:::41400014001140021400314~:HZ1414C1~;151409614 0~1?1400:31413~)'?141481. 41513141613
PRINT"T.B.N. = ";56.11'TB*P*M5/W/1000~2.1UPRIHTPRINT "PRESS A~Y KEY TO CONTINUE"INPUT CHARACTER os~:ETURtiOPT I OH ~jAIT Cit·;, 2OPEN INtTBN,STORE.RAN,"A"SAt'lPLE 1#TE:t~, H, ~~sRESTORE #TEN,H(9)WPUTUBN, '(CLOSEnBt~F.'ETUF.:t·~iJATA " ","DAiA" 0130 ","(1£:lATA" 1 "," I!DATA" 222 1I~"2[:0 A T A If 333 "," 3DATA" 4","DATAltS5555",U5DATA" .:. "," 6[lATAIf77777","
II II, .. If II II 11 h, , ,(1","(1 ~:l","O (1","0
II If,(111 ~ II f1(1~:1 It
'*:-"11111"II II .').-.,.-_..-}·~t II
!' .... .:..,.~.:..,II " ~-,~ "',', "._' , ,_,._; ._t.. " " 4 "'t ,5 11 " er:c= II, ,_I._i._l
t- " II 666 "," "
.., ", i
::: " " :::88 ",'3 " II '3 II,
:4170 L=13952+ASC(SG8STRS(X$,X,l»141 :::0 F.:E~;TORE (L)141~B FOR 2=1 TO 7142(n3 F:EA(:o Z$14210 PRINT Z$;V$;14:220 t·~En 214:'30 t·JE~:T X14240 F.:ETUF:~~46000 REM Plot axes. Set UP L.O,Ol,03,Cl4.X3=min,\4=max datl value40019 X7=X4-X3,Dl=.Ol:REM X3=MIN,X4=MAX40820 GOSU8 40808:REM Range >.140030 X5=Dl/10,D2=X5*INT«X3/X5)+.999999999),D3=(L*X5)/X7,X$=STR'(X5)40e40 GOSU8 4013940050 V=X(0)-I-l,X$=STR$(X4) :REM V=number chars after deCImal49070 GOSUS 4013840090 V=(I-2)*10+V40100 IF X3=0 THEH IF V<18 THEN V=Y+10401e5 RETURN40130 CHANGE X$-rO X40140 IF ~(e»12GOTO 4018040150 FOR I~l :TO-X(O)40160 IF ~(I)=46 THEN RETURN4€ti65 HEXT I
·40170 X(O)=X(O)+1,I=I-14e175 RETURH .401Se I=VAL(SEG$(X$,14,15».XC0)=I*2+14018~ ..g;I~~H_
II If, .. ", 1.-,i.
II U ... ,, ,;..
II ti, n II,·",11 If~ !'-,f'1I !...;. ,
II, II 2,u " ~~~ "" ,~"~,_I' _,'_'0..",. ,.1 , ....'
.:14", " 4 4"," 4 4","44444","If lie, II UC'C'rr II II
, __I,_! ...1,_1 ,
11,116666 tI,"E.;) 1',11 ? U~1t 7 ff II 7
, I
, ,_Ie ~I II e.s , .J
6","6",1167 II, Ii
DATA" 888 ","8 8","8 8"," 888 ",h8 8","8DATA" 999 ","9 '~",1I'3 '3",11 9',91~tI," ,?fI,UFOR X=LEH(XS)-l TO LEN(X$)-F STEP -1LET (:=(:-113GO:;UE: 1 (1€1I3e
49209 REM Diot x axis40205 Dt ~~/X5*(02-X3)+O.L·_;~40210 ?CHRS(29);40220 CALL NDRAW.O,Ol40240 FOR 1=04 TO L STEP D340250 CALL NORAW.I,Ol40255 01=01-0340260 CALL NDRAW,I,Ol40265 01=01+0340270 CALL NDRAW,I,Ol40280 NEXT I40290 CALL NORAW,L,Ol40295 RETURN40408 REM Plot ~ axis40405 D4=D3/XS*(D2-X3)+Ol,L=L+Ol40410 ?CHRS(29);40420 CALL NDRAW,O.Ol40440 FOR 1=04 TO L STEP 0340450 CALL NORAW,O.r48455 0=0-0340460 CAL~ NDRAW,O,i40465 0=0+0340470 CALL NDRAN,a.!40480 NEXT I40490 CALL NDRAW,O.L48495 RETURN40800 0=D143819 IF X7(=DJ THEh R~TURN40820 Dl=Dl+0.D=0*240839 FOR J=1 TO •40840 IF X7<=Dl THEN RETURN40850 01=Dl+D40360 NEXT J40870 GOrO 4080049899 REM Label x axis40900 02=01-35,D=D240905 IF 02(0 THEN 02=040915 FOR I=D4-50 TO L-50 STEG D340920 ?CHRS(29);40930 CALL NDRAW,I,0240940 ?CHR$(31);DAVU:40950 O=D4X540960 NEXT I40970 ~ETURN41000 REM Label y aXiS41019 02=0-04,D=D241020 IF 02(0 THEN 02=041025 IF 02)1000 THEN 02=100041940 ~OR I=D4 TO L STEP D341050 ?CHRS(29);41060 CALL NDRAW,02,I41B70 ?CHRS(31);D~VU;41080 O=D+X541090 NEXT!41100 RETURN
42999 REM Text to screen45000 eosue 4000045919 GOSUB 4928045020 GOSUe 40990451330 F~ETURH45100 GOSUB 4000845110 GOSUe 4049045120 GOSUe 410004513ij RETI_!F~N46000 GOSUS 400004601B GOSUB 6928046029 GOSlIS-609(1I:t461338 f':ETIJF~H46100 GOSUB 4000046110 GOSU8 6940046120 GOSU8 6100046130 RETu~~t~60200 D4=D3/X5*(D2-X3)+O.L=L+O60229 ?!A(3),CHR$(2);"SMX";O~3.00;uY";01~4.0060240 FOR I=D4 TO L STEP D360260 ?!A(3),"LX";IA4.0U;"Y";OlA4.001"LU0Y";03~2.0U; "LU0V";-03A2.0U6132((' t'~EXT I60280 ?!A(3),"LX";L~4.BU;"Y";OI~4.0U;CHR$(13):CHR$(1)E.i3290~:ETU~:t'l68399 REM Plot y ~xis60400 04=03/X5*(02-X3)+Ol,L=L+Ol60420 ?!A(3),CHR$(2):"MX"~OA4.0U;"Y";Ol~4.0J60440 FOR I=D4 TO L STEP D360460 ?'A(3),ULX";O~4.0U;"Y";1~4.0U;"LU";03A2.0U;"Y0LU"~-03A2.0U;"V0"604?O NE>~T I60480 ?!A(3)J"LX";OA4.eU;"Y";L~4.0060485 ?!A(3),CHR$(1);t.0491?oF:ETUF:N60900 02=01-20,D=D260928 FOR 1=D4-50 TO L-50 STEP D360930 ?!A(3),CHR$(2);"MX";I~4.0U;"Y";02A4.e060940 ?!A(3),C~R$(1);DAVU68950 D=D+X5E.139E.(1 HEXT It.lj970 RETURNEo HI00 F:Et1 La be 1 '.~ "a::o S61010 D2=O-04,D=D261620 IF 02(0 THEN 02=061030 IF 02)1020 THEN 02=102061940 FOR I=D4 TO L STEP D361050 ?!A(3),CHR$(2);"MX";OJ~4.0U;"Y";IA4.00610613 ?!A(3),CHRS(1);0AYU61 €,70 D=D+,:5Eo 1(1:::13HE::<TIt.1 13SII?I ?! A ( 3 ) • CH~:$ ( 2 ) ; 01 r1~~" ; er 2 A4 • (.j t_i; "Y" ; 0 1A 4 • ~)l_'61100 ?!A(3),CHR$(1);E. 11113 RETURt·~
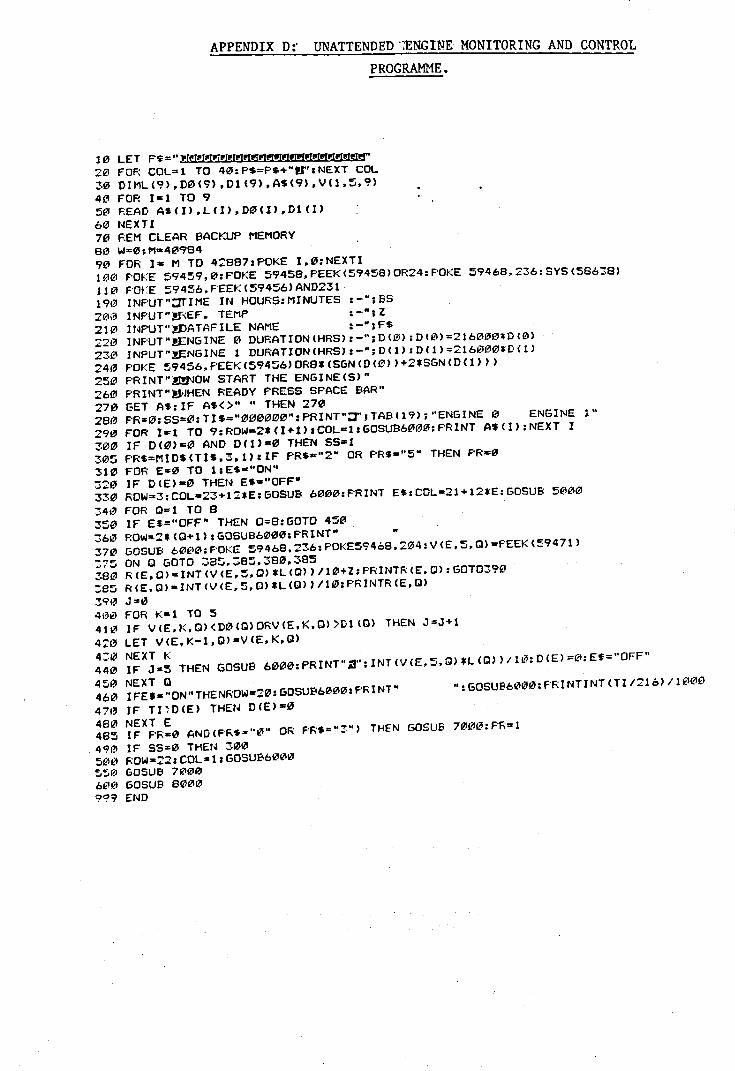
APPENDIX D:' UNATTENDED ';ENGINE MONITORING AND CONTROL
PROGRAMME.
111' LET P$= ''It[I!'!P[IIIPiP[PIt'IPl!IPT!J!IIIIfIPI!II!I!l!!ll2l''20 FOR COL"'1 TO 40:P$=P$+"U",NEXT COL3121DIML(9),DI2I(9),Dl(9),A$(9).V(1.5,9)41.'1FOR 1=1 TO 95121~EAD ASCI),LCI),D@CI).Dl(I)60 NEXTI7121~EM CLEAR BACKUP MEMORY8121 w=e;M=409849121FOR I- M TO 42887:POKE I.I2I:NEXTI1fill?! POKE 59459.121:POKE 59458, PEEK (59458) OR24: POKE 59468. ::36: SYS (58638)110 FOKE 59456.FEEK(59456)AND231190 INFUT"::lTIME IN HOURS:MINUTES :-";BS21313 I NFUT" !J'EF. TEMP :-" ;Z210 INPUT"!J)ATAFILE NAME :-";F$2213 INPUT "!ENGINE 0 DURATION (HRS) :_"; D <I?I) : D (0) =216000*D (111)
230 INPUT"!ENGINE 1 DURATION (HRS): _"; D (1): D( 1)=2161!11?10U)(1>2413 POKE 59456,F·EEKC594::;6)ORS.CSGNCDC0) )+2*SGNC0(1»)250 PRINT"!I!NOW START THE ENGINECS)"260 PRINT"!J'JHEN READY PRESS SPACE BAR"27121GET Af:lF AS<>" " THEN 27121280 F'R=I2I:5S=0: TI $="012112100121":PRINT"::r'J TAB C19) ;"ENGINE 0 ENGINE 1"290 FOR I~l TO 9:ROW=2*(I+l) ICOL-l: GOSUB6000: PRINT A$CI):NEXT I3013 IF D(fZI)-fZ1 AND 0(1)-13 THEN 55=1305 PRS=MIO$(TIS,3,U IIF PRS ....:" OR PR$="5" THEN PR=031121 FOR E=12ITO l:ES·"ON":320 IF 0(E)"0 THEN ES-"OFF·3313 ROW=3:COL-23+12*E:GOSUB 6000:PRINT E.:COL=21+12*E:GOSUB 5012103413 FOR 0=1 TO S350 IF ES="OFF· THEN 0=8:GOTO 45@3613 F:Ow:2* (0+1) :GOSUBb012111hPRINT" "370 GOSUB b00@:POKE 59468.236:POKE59468.2S4:VCE,5,0)=PEEK(59471)375 ON ° GOTO :385,385,380,38538@ RCE,O).INTCV(E.~,O)*L(0»/10+Z:PRINTRCE,0):GOT03ge38::; RCE.O).INT(V(E.5,O)*L(0»/l@:PRINTRCE.0)390 Js:1Zl400 FOR Kal TO 5410 IF VCE,K.O)<OI2l(O)ORVCE.K.O»Dl(Q) THEN J=J+l4:0 LET VCE,K-l,Q)·V(E.K.Q)43121NEXT I(440 IF J ..s THEN GOSUB 6000;PRINT"AI";INT(V(E.5.0HLCQ»/1I/1:DCE)=lil:Ef="OFF"450 NEXT Q460 IFEf.HON"THENROW=20:GOSUB6000:PRINT" ":GOSUB60@@:PRINTINT(TI/216)/l@00470 IF TI)O(E) THEN DCE)s048121NEXT E485 IF PR ..0 ANO(FR$ ..··I2I" OR PRS"'''::'')THEN GOSUB 700l;!:F'R=1490 IF 53=121THEN 3121121500 ROwz22:COL-l,G03UB60005~0 (jOSUS 712100612'0 GOSUB 800121999 END
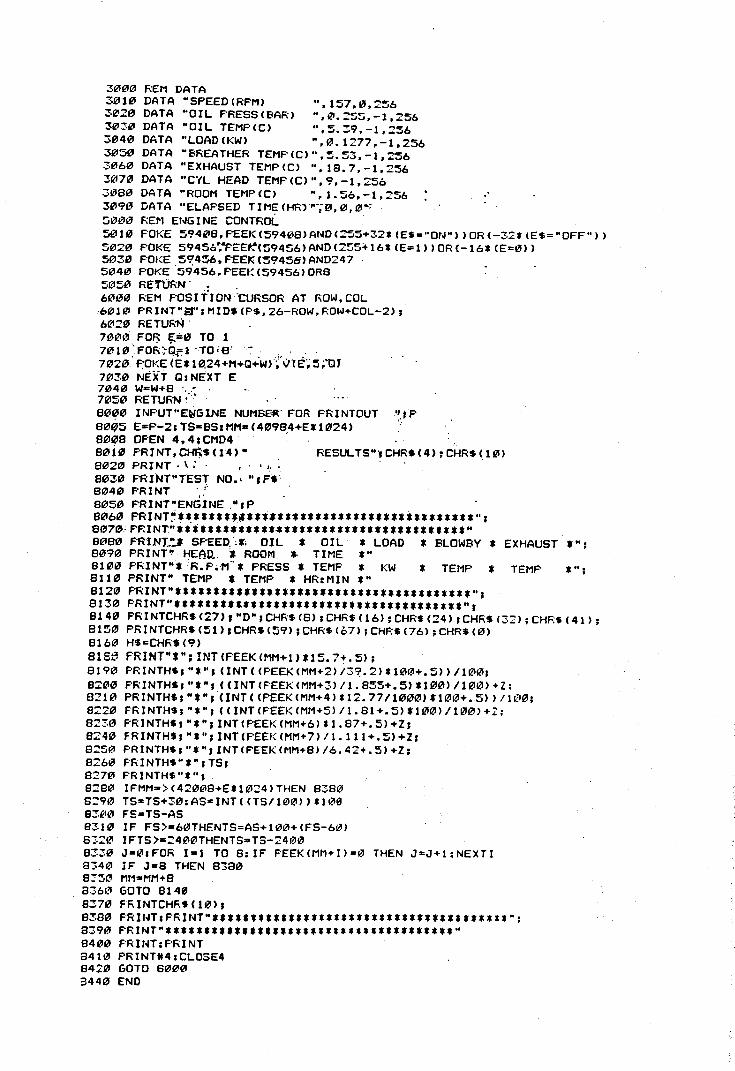
3000 REM DATA301121DATA "SPEED (RFM) ",157,111.256302111DATA "OIL FRESS(BAR) ",0.25~,-1.256311130DATA "OIL TEMP(C) ",5.39.-1,256311140DATA "LOAD(KW) "[email protected],256305121DATA "BREATHER TEMF(C)",5.53,-I,2563060 DATA "EXHAUST TEMP(C) ",18.7,-1.256307111DATA "C'fL HEAD TEMP(C)",9,-I,::563080 DATA "ROOM TEMP(C) ".1.56,-1,256 .'309121DATA "ELAPSED TIME (HR}· ..·;l!I, 0, 0":
~11J0121REl'lENGINE CONTROL .501121POKE 59408, PEEK (59408) AND (255+32* (E$:"ON") )OR (-3::*(E$: "OFF") )502111POKE 59456~~EE~f~94~6)AND(2~5+16'(E=1»OR(-16*(E=0»5030 POKE 594~.PEEK(59458'AND2475040 POKE '59'456.FEE.'(59456) ORBS121SI1IRE'TtJRN" .:61211110REM pOSITION "CURSOR AT ROW, COL6010 PRINT"M' J MIDS (PS, 26-ROW. RDW+COL-2);6020 RETUn"';"711100FO~ ~=0 TO 170 Ut'!: FOf-";O.r=1'TO is'.' . . . .7020' f:OKE(El 10.24+M+O+W"~\.ilE~~;·D17030 NEXT O:NEXT E704121W=W+8 .,.-.7050 F."ETURN..·'8000 INFUT"E~GlNE NUMBEfl;"FOR PRINTOUT .'qp8111~5E=p-2: TSsBS: MM= (4098,4+EI 1024) ,:8008 OPEN 4.4,CMD480iel F·RINT.C~$ (1"4)" RESUL TS"~ CHR$ (4); CHR$ (.10)8021?JPRINT· \: . , I: .
8030 F1UNT"TEST NO.1 "rF$8040 FRINT ./812150PRINT"ENGINE .",P806111PRINT~ IIIU IU,***t~1U I**I** *****IU IU I**** I";91?J70.;PRINT."ii'*'U'UI*I~**UU*U*UU'**U*****H812180F·RtNT~':.ISPEED. ',~;OIL lOlL * LOAD * BLOWSY * EXHAUST *";809121PRINT~ HEAQ. ~ ROOM ~ TIME *"810111PRINT"':R~F·.M-* PRESS * TEMP * KW8110 PRINT" TEMP I TEMP • HR:MIN *"812'" pR INT" *U' *U IIUU *UU U U ***n n ** **** *** *" ;8130 PRINT"*****.*.l*****************************"r8140 PRINTCHR$(27)'''D",CHRS(S),CHR$(16);CHR$(24);CHRS(3:);CHR$(41);8150 PRINTCHRS(~1),CHRSC~9);CHR$Cb7);CHR$(76);CHR$(0)816'" H$~CHR$(,?)8160 FRINT" *": INT(FEEK (~1M+l}lIS. 7+.~) ;819~ PRINTHS,"*"; (INT«PEEK(MM+2)/39.2)*1~0+.5»/100;82121~pRINTHS,"*", «INT(PEEKCMM+3)/l.8S5+.S)*100)/10121)+Z:821121PRINTH$, "."rUNT( (PEEK(MM+4) 112. 77111210121)*10121+•.5» IW0;822121FRINTHS,"*", «INT(FEEKCMM+S)/l.81+.S)*10121)/100'+Z;823121PRINTHS,"*";INT(PEEK(MM+6)*I,87+.S)+Z,824121FRINTHS'"*"JINT(PEEK(MM+7)/l.l11+.S)+Z;8250 PRINTHS,"*",INTCPEEK(MM+8)/6.42+.S)+Z;826121FRINTHS"*",TS,827121pRINTHS"*",828121IFMM->(42008+E*1024)THEN 83808290 TS=TS+30:AS-INT«TS/100»*100830~ FS-TS-AS831~ IF FS>-60THENTS=AS+10~+CFS-60)632121IFTS>=2400THENTS=TS-2400833~ J~I2IJFOR I-I TO 6:IF F'EEK(MM+I)=l~ THEN J=J+l:NEXTI8~40 IF J=8 THEN 838083:;;('1Mr12MM+8a361!!GOTO 814£1837121FRINTCHRt(10),838121FRIHT,PRINT"*****'*********************************";8390 PRINT"**************************************"8400 F'RIHT:F'RINT841121PRINT*4:CLOSE48420 GOTO 6001213440 END
* TEMP * TEMP *";
•••~
'IfBy Appointment to H.R.H. The Duke Of EdmhurghComputer Supplier
Trivcctor System, International Limited Sandy DEDICATED TO AVTOMA TION
CM4000 Automated Oil Analyser
Total Base Total WaterNumber Insoluble ContentHydrochloric or Matter NovelPerchloric Acid Infra-Red VapourConductimetric Absorption Pressure Trivector
Titrations Method LaboratoryTechnique Automation
Systems
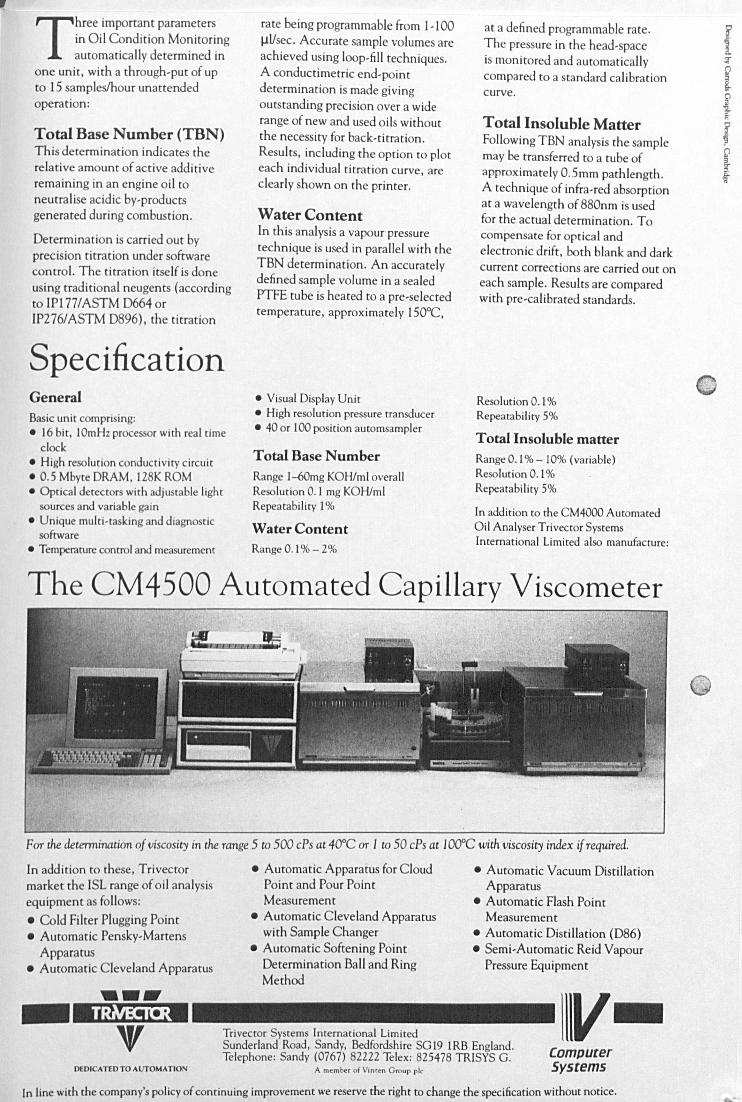
Three important parametersin Oil Condition Monitoringautomatically determined in
one unit, with a through-put of upto 15 samples/hour unattendedoperation:
Total Base Number (TBN)This determination indicates therelative amount of active additiveremaining in an engine oil toneutralise acidic by-productsgenerated during combustion.
Determination is carried out byprecision titration under softwarecontrol. The titration itself is doneusing traditional neugents (accordingto IPI77/ASTM D664 orIP276/ASTM D896), the titration
SpecificationGeneralBasic unit comprising:• 16 bit, 10mHz processor with real time
clock• High resolution conductivity circuit• 0.5 Mbvre DRAM, 128K ROM• Optical detectors with adjustable light
sources and variable gain• Unique multi-tasking and diagnostic
software• Temperature control and measurement
rate being programmable from 1-100ul/sec. Accurate sample volumes areachieved using loop-fill techniques.A conductimetric end-pointdetermination is made givingoutstanding precision over a widerange of new and used oils withoutthe necessity for back-titration.Results, including the option to ploteach individual titration curve, areclearly shown on the printer.
Water ContentIn this analysis a vapour pressuretechnique is used in parallel with theTBN determination. An accuratelydefined sample volume in a sealedPTFE tube is heated to a pre-selectedtemperature, approximately ISOcC,
• Visual Display Unit• High resolution pressure transducer• 40 or 100 position autornsampler
Total Base NumberRange l-60mg KOHlml overallResolution 0.1 mg KOHlmlRepeatability 1%
Water ContentRange 0.1 % - 2%
at a defined programmable rate.The pressure in the head-spaceis monitored and automaticallycompared to a standard calibrationcurve.
Total Insoluble MatterFollowing TBN analysis the samplemay be transferred to a tube ofapproximately O.Smm pathlength.A technique of infra-red absorptionat a wavelength of 880nm is usedfor the actual determination. Tocompensate for optical andelectronic drift, both blank and darkcurrent corrections are carried out oneach sample. Results are comparedwith pre-calibrated standards.
Resolution 0.1%Repeatability 5%
Total Insoluble matterRange 0.1 % - 10% (variable)Resolution 0.1%Repeatability 5%
In addition to the CM4000 AutomatedOil Analyser Trivector SystemsInternational Limited also manufacture:
The CM4500 Automated Capillary Viscometer
For the determination of viscosity in the range 5 to 500 cPs at 40CC or 1 to 50 cPs at 100cCwith viscosity index if required.
In addition to these, Trivectormarket the ISL range of oil analysisequipment as follows:
• Cold Filter Plugging Point• Automatic Penskv-Martens
Apparatus• Automatic Cleveland Apparatus
• Automatic Apparatus for CloudPoint and Pour PointMeasurement
• Automatic Cleveland Apparatuswith Sample Changer
• Automatic Softening PointDetermination Ball and RingMethod
• Automatic Vacuum DistillationApparatus
• Automatic Flash PointMeasurement
• Automatic Distillation (D86)• Semi-Automatic Reid Vapour
Pressure Equipment
- IIV-Trivector Systems International LimitedSunderland Road, Sandy, Bedfordshire SG 19 IRB England.Telephone: Sandy (0767) 82222 Telex: 825478 TRISYS G.
A member of Vinten Group plcDEDICATED TO AUTOMATION
ComputerSystems
In line with the company's policy of continuing improvement we reserve the right to change the specification without notice.
REFERENCES.
1 BOWDEN, F.P. and TABOR, D., "Friction", Heinemann, London, 1974.
2 LEONARDO da VINCI, "The Notebooks", F, 56, V.
3 NEWfON, I., "Philisophiae naturalis principia mathematica", London (1687).
4 AMONTONS, G., "De la resistance causee dans les machines", Acad. Roy. des Sci.,Memoires de mathematiques et de physique. p 259-86 (1699).
5 DESAGULIERS J.T.,"A Course of Experimental Philosophy", London, 1734.
6 COULOMB, CA. de, "Theorie des machines simples", Acad. Roy. des Sci, Memoires demathematiques, et de physique. 10, p 161-332(1785).
7 PHILLIPS, Hcl., "Engineering Chemistry", Crosby Lockwood, London, 1891.
8 REYNOLDS, 0., "On the action of lubricants", "On the friction in Journals", "On the theoryof lubrication", Brit. Assoc. Adv. of Sci. (1883-86).
9 TOWER. B., "First, Second and Third Reports on Friction Experiments" Proc. Inst. Mech.Eng. p 632-59 (1883-1888).
10 PUGH, B., "Practical Lubrication", Butterworths, 1970.
11 DOWSON, D. and HIGGINSON, G.R., "Elastohydrodynamic Lubrication", PergamonPress, 1966.
12 HARDY, W.B., "Boundary Lubrication - The Paraffin Series", Proc. Roy. Soc., lOO,P 550-74 (1922).
13 LANSDOWN, A.R., "Lubrication", Pergamon Press, 1982.
14 BRITISH PETROLEUM, "Lubrication Theory and its Application", BP, 1969.
15 LIVINGSTONE, Cl. and GRUSE, WA., "Piston Deposits, Ring Sticking,Varnishing and Ring Clogging", J. Inst. Pet., 26, Sept. 1940.
16 "Crankcase Oil Specification and Engine Test Manual", Paramins, 1987,Published by ExxonChemical International Inc.
17 YASUTOMI, S., MAEDA, Y and MAEDA, T., "Kinetic Approach to engine Oil. Parts 1 to3", Ind. Eng. Chern., Prod. Res. DEv., 1981,20, P 530·46.
18 MARQUARDT,D.W., J. Soc. Ind. Appl. Math., 1%3, 11,431.
19 DENBIGH, K.G., Trans. Far. Soc., 1944,40, P 352.
20 DOWSON, D. RUDDY, B.L. and ECONOMU, P ,N., "Tribology of Reciprocating Engines",Ninth Leeds-Lyon Symp. on Tribology, Butterworths, 1983.
21 BUSH, G.P ., "An Investigation into Piston Ring Blowby and Its Effect on biogasEngines", Ph.D. Thesis, 1986,Leicester Polytechnic.
22 "Methods for Analysis and Testing", JP Standards for Petroleum and its Products, Institute ofPetroleum, Volumes 1 and 2, Heyden (published annually). .
23 GREENHOW, EJ., Analytica Chern Acta, 109, 129,1979.
24 CAUGHL Y, B.P. and JOBLIN, M.V., Anal. Chern., 41, 1211, 1969.
25 BECKETf, A.H. and TINLEY E.H., "Titration in Non-Aqueous Solvents", 3rd Edition, TheBritish Houses Ltd., London, 1961.
26 LINDBECK, M.R. and FREUND, H., Anal Chern., 37, 1647, 1965.
27 PAWLAK, Z., FOX, M.F. and PICKEN, DJ., "Acid-Base Determination if LubricatingOils", Leicester Polytechnic.
28 HOOKS, R.W., "Recent Analytical Development in the Petroleum Industry", John Wiley &Sons, p. 271,1975.
29 PAWLAK,Z., ChemiaAnal.,p.25, 711 (1980).
JO PAWLAK, Z., FOX, M.F. AND GIERSZ, E., Chemia Anal., (pol), JO' 841 (1985).
( 31 GREENHOW, EJ. and SPENCER, L.E., "Ionic Polymerisation as a means of End-pointIndication in Non-aqueous Thermometric Titrimetry" Analyst 101,777, 1976.
32 FREWING, JJ., "The Significance and Interpretation of Acidity and Basicity in LubricatingOils", Scientific Lubrication, March, 1962.
33 DYSON, A., RICHARDS, L.Z. and WILLIAMS, K.R., "Diesel Engine Lubricants: TheirSelection and Utilisation with Particular Reference to Oil Alkalinity", Proc I Mech E, 17,
1957.
34 SHARMA, G.K., et at, "Total Base Number - Need to Understand", Indian Oil Corp. Ltd.,Conference on Condition Monitoring, Swansea, 1984.
35 DORSEY, E, "Properties of Ordinary Water Substance", Hayner, N.Y., 1968.
36 MITCHELL, J. and SMITH, D.M., "Aquametry Part I, 3",Wtley, 1977.
37 "Lubricant Specification Handbook", Ethyl Petroleum Additives, 1985.
38 ALPHONSE, S., "Motor Oils and Engine Lubrication", Scientific Pub!., 1968.
39 OWEN, K., "Gasoline and Diesel Fuel Additives", J. Wtley Pub!., 1989.
40 COLYER, C.C., "Tailoring oils to engines", Proc Inst Mech Engrs, Vol 198D, 3 p69-75.
41 HARTING, G.L., "NewApproaches to Engine Lubrication", Exxon Research andEngineering Co. Linden, USA.
42 MAHONEY, L.R. et al, "Determination of the Antioxidant Capacity of New and UsedLubricants; Methods and Applications", Ind. Eng. Chem. Prod. Res. Dev., Voll7, 3, 1978,P 250-55.
43 RICHARD, G.P., "Lubricant properties in the diesel engine piston ring zone", 9th Leeds-Lyon Symposium on Tribology, 7-10 September, 1982.
44 HERCAMP, R.D., "Premature loss of oil consumption control in a heavy duty dieselengine", SAE 831720.
45 MORLEY, G.R., "Development of Fuel Efficient multi-grade oils for BR use", "ConditionMonitoring Techniques used on BR Diesel Engines", Condition monitoring, 1984.
46 MONAGHAN, ML., "Engine Friction - A Change in Emphasis", Autotech '87, I Mech ECongress.
47 MILLER, M.S., "World Champion Lubrication", I Mech E Conference at Chester,September,199O.
48 COLEMAN, B., et al., "Oil analysis as a means of investigating oil consumptionmechanisms", I Mech E, C394/056 (1990).
49 THOMPSON, M., "The use of top ring zone sampling and analysis to investigate oilconsumption mechanisms", I Mech E, C394/041 (1990).
50 CAMERON, A., "The Principles of Lubrication" ,Longmans, London, 1966.
51 GUNTHER, R.C., "Lubrication", Bailey Bros., Folkestone, 1972.
52 SHELL ADDITIVES, "APocket Guide to Crankcase Engine Lubricants", 1985.
53 Caterpillar Tractor Company, "Fuel Sulphur - Your Diesels Silent Enemy", Report SEB D0526, Nov. 1979.
54 BOWDEN, F.P. and TABOR, D., "Friction and Lubrication", Methuen,I%7.
55 BURK, R.E., "The Chemical Background for Engine Research", Interscience PublishersInc., 1943.
56 OBERT, E.F., "Internal Combustion Engines", 3rd edition, Int. Textbook Co., 1%0.
57 GooDGER, E.M., "Alternative Fuels, Chemical Energy Resources", Macmillan Press, 1980.
58 PICKEN, D. J. and HASSAAN, HA., "AMethod for Estimating Overhaul Life of InternalCombustion Engines including Engines Operating on Biogas and Methane", JAgrig EngngRes, 28, p. 139,1983.
59 MOORE, J. W., "PhysicalChemistry", Longman, 1972.
60 INOUE, K. and YAMANAKA Y., "Change inPerformance of Engine Oils withDegradation", SAE paper 902122.
61 ABTHOFF, J. and THOM, R. W., "The Influence of Engine Oils and Fuels on theService Life of Internal Combustion Engines", I Mech E paper C394/051,199O.