The catalytic effect of Red Mud on the degradation of poly (vinyl chloride) containing polymer...
12
The catalytic effect of Red Mud on the degradation of poly (vinyl chloride) containing polymer mixture into fuel oil Jale Yanik a, *, Md. Azhar Uddin b , Kazuo Ikeuchi b , Yusaku Sakata b a Department of Chemistry, Ege University, 35100 Izmır, Turkey b Department of Applied Chemistry, Okayama University, Okayama 700-8530, Japan Received 29 November 2000; accepted 23 February 2001 Abstract Thermal and catalytic degradation of poly (vinyl chloride) (PVC) containing polymer mixtures, PVC/PE, PVC/PP and PVC/PS, into fuel oil was investigated. In the catalytic degradations, Red Mud (a waste from alumina production) was tested as both cracking and dechlorination catalyst. For comparison, g-Fe 2 O 3 as a chlorine sorbent and SA-1 (silica alumina) as a solid acid cat- alyst were also used. The effect of degradation conditions, such as nitrogen gas flow, stepwise pyrolysis, catalyst contact mode, on the dechlorination was also investigated. The use of N 2 gas flow suppressed partially the reaction between HCl gas from the degradation of PVC and polymer degradation products. By stepwise pyrolysis, over 90% chlorine in the feed plastic was recovered as HCl gas. SA1 catalyst accelerated the rate of polymer degradation and lowered the boiling point of liquid products, but the chlorine content of oil over SA1 was also the highest. Red Mud (RM) and iron oxides sorbents showed good effect on the fixation of evolved HCl. However, they had no effect on the cracking of polymers. The oils derived from PVC containing pure polymer mixtures by thermal degradation contained a lower amount of chlorine than the oils obtained using RM and other catalysts. From this result we conclude that the formation of some organic chlorine compounds may be promoted by the interaction of the HCl and the catalysts. # 2001 Elsevier Science Ltd. All rights reserved. Keywords: Plastic degradation; Dechlorination; Red Mud 1. Indroduction The pyrolysis of plastic waste into useful fuel oil has been considered to be a promising recycling method. The main problem causes during the pyrolysis of waste plastics are related to Poly (vinyl chloride) (PVC). The pyrolysis products of PVC mixed waste plastics contain both inorganic and organic chlorine compounds [1–4]. The production of fuels having no chlorine content must be a main aim in waste plastics pyrolysis. The degradation mechanisms of PVC are well known. Recently, attempts have focused on the dechlorination of PVC containing polymer mixtures (especially binary mixture). Very little is known about the catalytic degra- dation of PVC containing polymer mixtures. Uddin et al have studied the thermal and catalytic degradation of PE/PVC, PP/PVC and PS/PVC mixtures [5]. Their data showed that by using iron oxides, FeOOH and Fe 3 O 4 , the chlorine compounds in oil could be decreased to a very low level. They suggested that the chlorine removed from the products of degradation of PVC mixed plastics is fixed in the form of iron compounds such as ferrous chloride. They have also reported that the ferrous chloride acts as a catalyst for the dechlor- ination of organic chlorine compounds [6] In this study, the thermal and catalytic degradation of PVC/HDPE, PVC/PP and PVC/PS mixture was carried out by stepwise pyrolysis. In the catalytic degradations, Red Mud (RM) was used as a cracking catalyst and as a sorbent to fix the HCl formed by PVC degradation. RM is a by-product of alumina manufacture process (Bayer process). It contains mainly oxides of iron, aluminium, titanium, silicon, calcium and sodium. It has been used for the liquefaction of coal [7–9] and biomass [10] and in the hydrogenation of anthracene oil [11] as hydrogena- tion catalyst. To our knowledge, there are no published reports on the polymer degradation in the presence of RM. Use of a waste material as a catalyst for the recov- ery of other wastes is an important point of this study. 0141-3910/01/$ - see front matter # 2001 Elsevier Science Ltd. All rights reserved. PII: S0141-3910(01)00095-7 Polymer Degradation and Stability 73 (2001) 335–346 www.elsevier.nl/locate/polydegstab * Corresponding auhtor. Fax: +90-232-388-8264. E-mail address: [email protected] (J. Yanik).
-
Upload
independent -
Category
Documents
-
view
2 -
download
0
Transcript of The catalytic effect of Red Mud on the degradation of poly (vinyl chloride) containing polymer...

The catalytic effect of Red Mud on thedegradation of poly (vinyl chloride) containing
polymer mixture into fuel oil
Jale Yanika,*, Md. Azhar Uddinb, Kazuo Ikeuchib, Yusaku Sakatab
aDepartment of Chemistry, Ege University, 35100 Izmır, TurkeybDepartment of Applied Chemistry, Okayama University, Okayama 700-8530, Japan
Received 29 November 2000; accepted 23 February 2001
Abstract
Thermal and catalytic degradation of poly (vinyl chloride) (PVC) containing polymer mixtures, PVC/PE, PVC/PP and PVC/PS,
into fuel oil was investigated. In the catalytic degradations, Red Mud (a waste from alumina production) was tested as bothcracking and dechlorination catalyst. For comparison, g-Fe2O3 as a chlorine sorbent and SA-1 (silica alumina) as a solid acid cat-alyst were also used. The effect of degradation conditions, such as nitrogen gas flow, stepwise pyrolysis, catalyst contact mode, onthe dechlorination was also investigated. The use of N2 gas flow suppressed partially the reaction between HCl gas from the
degradation of PVC and polymer degradation products. By stepwise pyrolysis, over 90% chlorine in the feed plastic was recoveredas HCl gas. SA1 catalyst accelerated the rate of polymer degradation and lowered the boiling point of liquid products, but thechlorine content of oil over SA1 was also the highest. Red Mud (RM) and iron oxides sorbents showed good effect on the fixation
of evolved HCl. However, they had no effect on the cracking of polymers. The oils derived from PVC containing pure polymermixtures by thermal degradation contained a lower amount of chlorine than the oils obtained using RM and other catalysts. Fromthis result we conclude that the formation of some organic chlorine compounds may be promoted by the interaction of the HCl and
the catalysts. # 2001 Elsevier Science Ltd. All rights reserved.
Keywords: Plastic degradation; Dechlorination; Red Mud
1. Indroduction
The pyrolysis of plastic waste into useful fuel oil hasbeen considered to be a promising recycling method.The main problem causes during the pyrolysis of wasteplastics are related to Poly (vinyl chloride) (PVC). Thepyrolysis products of PVC mixed waste plastics containboth inorganic and organic chlorine compounds [1–4].The production of fuels having no chlorine contentmust be a main aim in waste plastics pyrolysis. Thedegradation mechanisms of PVC are well known.Recently, attempts have focused on the dechlorinationof PVC containing polymer mixtures (especially binarymixture). Very little is known about the catalytic degra-dation of PVC containing polymer mixtures. Uddin etal have studied the thermal and catalytic degradation ofPE/PVC, PP/PVC and PS/PVC mixtures [5]. Their datashowed that by using iron oxides, FeOOH and Fe3O4,
the chlorine compounds in oil could be decreased to avery low level. They suggested that the chlorineremoved from the products of degradation of PVCmixed plastics is fixed in the form of iron compoundssuch as ferrous chloride. They have also reported thatthe ferrous chloride acts as a catalyst for the dechlor-ination of organic chlorine compounds [6]In this study, the thermal and catalytic degradation of
PVC/HDPE, PVC/PP and PVC/PS mixture was carriedout by stepwise pyrolysis. In the catalytic degradations,Red Mud (RM) was used as a cracking catalyst and as asorbent to fix the HCl formed by PVC degradation. RMis a by-product of alumina manufacture process (Bayerprocess). It contains mainly oxides of iron, aluminium,titanium, silicon, calcium and sodium. It has been usedfor the liquefaction of coal [7–9] and biomass [10] and inthe hydrogenation of anthracene oil [11] as hydrogena-tion catalyst. To our knowledge, there are no publishedreports on the polymer degradation in the presence ofRM. Use of a waste material as a catalyst for the recov-ery of other wastes is an important point of this study.
0141-3910/01/$ - see front matter # 2001 Elsevier Science Ltd. All rights reserved.
PI I : S0141-3910(01 )00095-7
Polymer Degradation and Stability 73 (2001) 335–346
www.elsevier.nl/locate/polydegstab
* Corresponding auhtor. Fax: +90-232-388-8264.
E-mail address: [email protected] (J. Yanik).
2. Experimental
2.1. Materials
The Red Mud, as a sludge, was supplied by SeydisehirAluminium Company, Turkey. It was filtered and thendried at 110�C. It was analyzed by classical chemicalanalysis. Surface properties were measured by nitrogenadsorption, BET (Bel Japan, Belsorp 28SP). The surfaceproperties and chemical compositions of RM are shownin Table 1. Polypropylene (PP) was obtained from UBEChemical Industries; polystyrene (PS) from Asahi KaseiIndustries; High-density polyethylene (PE) from MitsuiChemical; and poly(vinyl chloride)(PVC) from GeonChemical. The chlorine content of the PVCwas 52.8 wt.%.
2.2. Methods
The degradation and dechlorination experiments werecarried out in a glass reactor (35 mm i.d. and 350 mm l)under atmospheric pressure at 430�C under N2 flow bysemi-batch operation. A fixed amount of single typeplastic (10 g) or mixed plastics [weight ratio [(PE, PP orPS)/PVC=8/2] and Red Mud (weight ratio: RM/purepolymer=1/10 or RM/mixed polymer=2/10) was loa-ded into the reactor. The reactor was heated to 120�C at3�C/min and held at 120�C for 60 min to remove thephysically absorbed water from the catalyst and theplastic sample. Then the temperature was increased to300 �C at a heating rate of 3�C/min. and the reactor washeld at this temperature for 60 min to evolve the HCl.After the dechlorination, the reactor temperature wasincreased to 430�C at a heating rate of 3�C/min. Thehydrogen chloride evolved from the degradation ofPVC was trapped in a flask containing an aqueoussolution of NaOH and analyzed by ion chromato-graphy. The schematic diagram of experimental set upwas given previously [5]. A few experiments was carriedout without the dechlorination step or without N2stream to compare the effect of RM with other catalystused in previous studies. The products of degradationwere classified into three groups: gases, liquid and residue.
The amount of gaseous products was determined bysubtracting the weight of liquid and residue from theplastic sample feed. The liquid products were analyzedby gas chromatograph with a flame ionization detector(Yanaca: G6800-FID). A gas chromatograph with athermal conductivity detector (Yanaca: G180-TCD)was used to analyze the gases from single type polymers.Organic chlorine compounds in the liquid product wereanalyzed by two gas chromatographs with either anatomic emission detector (HP: G2350A-AED) or a massselective detector (HP: 5973-MSD). Gaseous organicchlorine products were not detected.
3. Results and discussion
3.1. Thermal and catalytic degradation of PE/PVCmixture
In this group of experiments, the dechlorination abil-ity of RM and the effect of its contact mode [liquid-phase contact (LP), vapor-phase contact (VP)] wereinvestigated. Besides RM, TR-99701 (g-Fe2O3) as achlorine sorbent and SA-1 (SiO2.Al2O3) as a solid acidcatalyst were also used. In addition to catalytic effects,the effect of degradation procedure on the dechlorina-tion was also investigated.
3.1.1. Effect of the type of degradation procedureIn order to investigate the effect of degradation pro-
cedure on the dechlorination, three different methods ofdegradation in presence of RM were examined. In thefirst method (method 1), a mixture of PE/PVC wasdegraded under the same conditions used in the pre-vious works [12]. That is, the reactor was heated to120�C at 3�C/min and held at this temperature for 60min in N2 flow. Nitrogen flow was then cut off and thetemperature was increased to 430�C at a heating rate of3�C/min. In the second method (method 2), the reactorcontents were heated to 120�C at 3�C/min and held atthis temperature for 60 min. Then the temperature wasincreased to 300�C (at 3�C/min) and held at that tem-perature for 60 min to dehydrochlorinate the PVC withN2 flow. After the nitrogen flow was cut off, the tem-perature was increased to 430�C. In the third method(method 3); both dechlorination and degradation werecarried out at 430�C in nitrogen flow as described inSection 2.2.Tables 2 and 3 show the product distribution and
chlorine distribution from the degradation of PVC/HDPE mixture for all three degradation methods. Thecomparison of methods 1 and 2 shows that the dechlor-ination step increased the gas yield and decreased theliquid yield. Although gas products have not been ana-lyzed, we can say that this is due to greater HCl evolu-tion. In addition the larger quantity of chlorine (as HCl)
Table 1
Properties of Red Mud
Element Wt.%
Fe2O3 37.72
SiO2 17.10
Al2O3 17.27
TiO2 4.81
CaO 4.54
MgO 0.40
K2O 0.29
Na2O 7.13
Surface area (m2 g�1) 16
336 J. Yanik et al. / Polymer Degradation and Stability 73 (2001) 335–346

adsorbed in traps in method 2 also supports this idea. Itis known that the dechlorination of PVC occurs atlower temperatures than degradation of other polymers.During the dechlorination step, only gas evolution wasobserved, but no liquid products were formed. The useof N2 flow during the whole degradation process(method 3) led to more gas products and less residue.Since degradation products are more easily removedfrom the reactor in presence of N2 flow, secondaryreactions were partially hindered. However, N2 flow waspassed only from the top of the reactor, so some of thevolatile products condensed near the upper parts of thereactor and returned to the reactor to give further sec-ondary reactions. The type of degradation procedurehad no effect on the degradation rate of PVC/HDPEmixture (Fig. 1). In this figure, lapse time was countedfrom beginning of dechlorination in methods 2 and 3and after 120�C in method 1. The dechlorination stephad no effect on the composition of liquid hydrocarbonproducts. However, in case of N2 flow (method 3), C5–C8
hydrocarbons decreased and C16–C20 hydrocarbonsincreased than in the absence of N2 (Fig. 2).The main effect of degradation procedure was on the
amount of chlorine and its distribution in the products.After the dechlorination step, 47% of chlorine in thefeed accumulated in traps as HCl. This amount wasonly 27.6% when the dechlorination step was not car-ried out. Without the dechlorination step, the amountof chlorine in the oil was very high, 4316 ppm. Althoughthe dechlorination takes place quantitatively at lowtemperatures, it did not finish before the degradation ofPE at a heating rate of 3�C/min (in method 1). N2 flowalso affected the amount of chlorine in the oil. Thechlorine contents of oils were 678 and 543 ppm inmethods 2 and 3, respectively. This shows that after thedechlorination step, residual HCl could be removed byN2 flow in method 3.
Table 2
Product yields (wt.%) for degradation of HDPE/PVC mixture at
430�C by different degradation procedure
Catalyst Method Liquid Gas Residue Liquid density
(g cm�3)
Red Mud 1 60.2 15.4 24.4 0.766
Red Mud 2 56.1 18.7 25.2 0.761
Red Mud 3 57.3 21.5 21.2 0.766
Red Mud, VP 3 29.3 22.5 48.3 0.756
TR-99701(g-Fe2O3) 3 56.0 19.6 24.4 0.779
SA-1(SiO2.Al2O3 3 47.0 35.8 17.3 0.761
Table 3
Distribution of Cl in the products obtained from the degradation of
HDPE
Catalyst Method Cl content
in oil (ppm)
Cl distrubition
(wt.%)
Liquid Gas
Red Mud 1 4316 2.40 27.60
Red Mud 2 678 0.35 47.00
Red Mud 3 543 0.29 47.80
Red Mud (vapor phase) 3 940 0.26 23.10
TR-99701 (g-Fe2O3) 3 361 0.20 34.70
SA-1 (SiO2.Al2O3) 3 1591 0.70 82.70
None 3 144 0.10 96.20
Fig. 1. Cumulative volume of liquid products from catalytic degradation using RM of HDPE/PVC mixture at different degradation procedures.
J. Yanik et al. / Polymer Degradation and Stability 73 (2001) 335–346 337

The boiling point distribution of organic chlorinecompounds in oil is called Cl-NP gram [5]. The Cl-NPgram in Fig. 3 was obtained by plotting the Cl contentin the oil against the carbon number of normal paraf-fins. These compounds were mainly distributed in theboiling point range of 36–174�C (equivalent to the bpsof n-C6 to n-C10). The organic chlorine compounds inoil could not be identified by GC–MS. The previousstudy [5] related to the thermal degradation of PVC/HDPE under the same conditions as method 1 showedthat the main organic chlorine compounds were 2-chloro-2-methylpropane and 2-chloro-2-methylpentane.
They suggested that chlorine containing compoundswere formed by the addition of HCl to the tertiary car-bon of the branched olefins.All other degradation experiments were carried out
with the dechlorination step and using N2 flow.
3.1.2. Effect of the catalyst contact modeIn order to investigate the effect of catalytic contact
mode, two kinds of catalyst contact mode, in which thecatalyst (RM) was kept in contact with either meltedpolymer mixtures (liquid phase contact-LP) or degradedhydrocarbon vapors from polymer mixtures (vapor
Fig. 2. C-NP gram of liquid products from catalytic degradation using RM of HDPE/PVC mixture at different degradation procedures.
Fig. 3. Cl-NP gram of liquid products from catalytic degradation using RM of HDPE/PVC mixture at different degradation procedures.
338 J. Yanik et al. / Polymer Degradation and Stability 73 (2001) 335–346

phase contact-VP), were compared. For degradation invapor phase contact, RM was placed on a stainless steelnet located 12 cm from the bottom of reactor where thetemperature was 350�C. Degradation was carried out inmethod 3.As expected, in the case of vapour phase contact the
degradation rate and liquid yield of PVC/HDPE mix-ture were very low (Table 1 and Fig. 1). In the case ofVP contact, the liquid yield was 29.3%, compared to57.3% for LP contact. 74% of residue was adsorbed onthe catalyst bed in liquid form. Since the temperature ofthe catalyst bed was 350�C, lighter liquid hydrocarbonscould leave the reactor. The composition of liquid pro-duct from VP contact (Fig. 2) supports this idea. Liquidcompounds were mainly distributed in the range of C5–C15 (equivalent to hydrocarbons with boiling pointsranging over 36–270�C), whereas they were distributedin a wide range of carbon numbers (n-C5 to n-C25)equivalent to boiling point ranges of 36–405�C in caseof LP-contact. The yield of gaseous products did notdiffer from that of LP contact, but the residue was muchgreater. This shows that RM has no catalytic activity inVP-contact, it hindered the removing of volatiles byadsorption. However previous work [13] showed that inVP contact, thermally degraded hydrocarbons could befurther decomposed into gaseous and lighter liquidproducts over a cracking catalyst. In the same study, theevolved HCl was fixed on the chlorine sorbents such asiron oxides, FeOOH and Fe2O3 and the oil containingless chlorine was obtained in VP-contact than LP-con-tact. In our study, RM in VP-contact adsorbed moreHCl evolved from the degradation of PVC than in LP-contact. 23.1% of the feed chlorine could be removed asHCl, whereas this amount was 47.8% in case of LP-contact. In the dechlorination process, the adsorption of
HCl inside the reactor on the sorbent and/or catalysts isthe main goal. However the higher chlorine amount inthe oil (940 ppm) shows that adsorbed HCl reacted withthe thermal degradation products of HDPE at tem-peratures as low as 350�C. Since RM is a mixture ofseveral metal compounds, one or some of metal com-pounds could catalyze the reaction between fixed HClon catalyst and the degradation products of HDPE.From a consideration of product yields and chlorine
content of oil, we can conclude that LP-contact is moreeffective than VP-contact in the degradation of PVC/HDPE mixture with RM.
3.1.3. Effect of types of catalyst on PVC/HDPEdegradationIn this section, we compare the results of thermal and
catalytic degradation of PVC/HDPE mixture over var-ious types of catalyst such as silica-alumina (SA-1)having a SiO2/Al2O3 mole ratio of 83.3/16.17, g-Fe2O3(TR-99701) and RM. All experiments were carried outin LP-contact mode and in method 3. The previousstudies [5,12–15] showed that the SA1 catalyst acceler-ated the rate of polymer degradation and lowered theboiling point of liquid products, and TR-99701decreased the chlorine content in oil to a very low level.It fixed the chlorine from the products of degradation ofPVC mixed plastics in form of iron compounds such asferrous chloride.Fig. 4 shows the cumulative volume of liquid products
against lapsed time. Lapsed time was counted from thebeginning of the dechlorination step. As expected, theuse of a solid acid catalyst increased the degradationrate, but this increase was not much more than thatof thermal or catalytic degradation with TR-99701 orRM, but it was effective for increasing the gaseous
Fig. 4. Cumulative volume of liquid products from thermal and catalytic degradation of HDPE/PVC mixture at 430�C.
J. Yanik et al. / Polymer Degradation and Stability 73 (2001) 335–346 339

hydrocarbons and for producing liquid hydrocarbonswith lower molecular weight (Fig. 5). SA1 had a morecatalytic effect for the degradation of single PE at 430�C[13]. The amount and composition of the liquid pro-ducts were very similar for both thermal and catalyticdegradation with RM or TR-99701. But in case ofthermal degradation the amount of residue increasedand gas amount decreased.The oil having the lowest amount of chlorine com-
pounds was obtained by thermal degradation (Table 3).96.2% of feed chlorine was in gas, and only 0.1% was inoil. The fact that the distribution of chlorine in gas was47.8% in case of RM and 34.7% in the case of TR-99701 indicating that the HCl from degradation of PVCwas fixed on the RM as well as on the TR-99701. We donot know whether the HCl was only absorbed on RMor was fixed in the form of metal chloride. Since RM isa complex mixture of inorganic materials and is not asynthesized catalyst, it is difficult to suggest anyadsorption mechanism. The chlorine amount in oil fromboth RM and TR-99701 was higher than that of ther-mal degradation. We suggested above that a part of the
fixed HCl could also react with degradation products ofHDPE due to the catalytic effect of metals in RM. Incase of RM, the amount of chlorine in the oil was 543ppm compared to 361 ppm in the case of TR-99701.Thisresult shows that the some of the metals in RM have acatalytic effect.Over SA-1, the HCl amount in gas was greater than
those of the other catalyst, as well as the chlorine con-tent in oil was also the highest (1591 ppm). In previousworks [5,12], chlorine content of oil over SA-1 was les-ser than that of oil from thermal degradation. In ourcase, the dechlorination step seems very effective. Wecan mention that during the dechlorination step, PE wasmolten form and HCl could be easily removed from thepolymer mixture within an hour. However in the pre-sence of a solid material such as a cracking catalyst, partof HCl adsorbed in the reactor and (following thedegradation step) it reacted with the degradation pro-ducts of polymers. Although SA-1 is not a chlorinesorbent or dechlorination catalyst, the HCl amount ingas was lower than that of thermal degradation. Dis-tributions of organic chlorine compounds derived from
Fig. 5. C-NP gram of liquid products from thermal and catalytic degradation of HDPE/PVC mixture at 430�C.
Table 4
Yields of products obtained from the degradation of PS/PVC or PP/PVC at 430�C
Catalyst Liquid (wt.%) Gas (wt.%) Residue (wt.%) Liquid density (g cm�3)
PS/PVC None 67.7 14.9 17.5 0.880
PS/PVC Red Mud 69.1 11.8 19.2 0.891
PP/PVC None 57.4 25.3 17.4 0.740
PP/PVC Red Mud 56.7 22.0 21.4 0.747
340 J. Yanik et al. / Polymer Degradation and Stability 73 (2001) 335–346

the catalytic and thermal degradation of PVC/PE areshown in Fig. 6 as Cl-NP gram. The organic chlorinecompounds were distributed in carbon number range ofn-C6 to n-C11 for the HCl sorbed catalyst (TR-99701and RM) and in the range of n-C6 to n-C10 for SA-1 andthermal process. The types of chlorine compounds weresimilar for all catalyst type, but their contents differed.Briefly, in the absence of a catalyst, we obtained oil
having very little chlorine from the degradation of PVC/PE mixtures with the dechlorination step and N2 flow.The use of a cracking catalyst increased the lighthydrocarbons in the oil, but also increased the chlorinecontent of the oil. RM is as effective as g-Fe2O3 to sor-bed chlorine during degradation of PVC/PE mixtures.
3.2. Thermal and catalytic degradation of PS/PVC andPP/PVC mixture
In the previous study [5], we investigated the degra-dation of PP/PVC mixture at 380�C using differenttypes of catalyst and the degradation of PS/PVC at360�C without a catalyst. In the present work, thedechlorination and cracking behavior of these polymermixtures were investigated. Experiments were carriedout at 430�C with a dechlorination step and in N2 flowwith and without RM. Even if the degradation tem-peratures of PP and PS are lower than that of PE, thedegradation temperature of 430�C was chosen afterconsideration of the fact that all polymers will be trea-ted together as municipal waste plastics.
Table 4 shows the yield of products obtained fromPVC mixed plastics. For both polymer mixtures, liquidyields from catalytic degradation did not differ sig-nificantly from that of thermal degradation, whereas theuse of RM increased the amount of residue anddecreased the amount of gas. This change in the yieldsof residue and gas was not due to the effect of RM onthe polymer degradation mechanism: the adsorption ofHCl gas from the degradation of PVC on the RM led toan increase in residue amount and a decrease in the gasyield. The degradation rate of polymer mixtures as wellas the degradation yields was similar for both thermaland catalytic degradation (Fig. 7). Fig. 8 shows thecomposition of liquid products as a C-NP gram (normalparaffin gram for hydrocarbons). Degradation of PS/PVC mixture both with and without catalyst gave thewell-known PS pyrolysis products containing styrenemonomer,a-methylstyrene, toluene and small quantities
Fig. 6. Cl-NP gram of liquid products from thermal and catalytic degradation of HDPE/PVC mixture at 430�C.
Table 5
Distribution of Cl in the products obtained from the degradation of
PS/PVC or PP/PVC at 430�C
Catalyst Cl content
in oil (ppm)
Cl distribution (wt.%)
Liquid Gas
PS/PVC None 81 0.05 92.3
PS/PVC Red Mud 381 0.25 22.1
PP/PVC Red Mud 764 0.39 29.9
PP/PVC None 365 0.19 98.0
J. Yanik et al. / Polymer Degradation and Stability 73 (2001) 335–346 341

of dimer. The liquid hydrocarbon products from PP/PVC degradation had a carbon number distribution ofn-C5 to n-C25 with a sharp peak at n-C9 (2,4-dimethyl-1-heptene).RM had a big effect on the chlorine content and dis-
tribution in products for both PP/PVC and PS/PVCmixtures as in the case of PE/PVC (Table 5). In theabsence of RM, over 90% of chlorine in PVC recoveredin traps as HCl. In the presence of RM, this amount was
22.1% for PS and 29.9% for PP. Also in this group ofexperiments, the chlorine sorption properties of RMcould be seen clearly. As expected, the amount andcomposition of chlorine compounds in liquid productsdiffered according to the type of degraded plastic. In thepresence of RM, the chlorine content of the oil was 318ppm for PS/PVC and 764 ppm for PP/PVC. In the pre-vious work [5] relating to fixing of HCl to a suitablesorbent (such as a-FeOOH, Fe3O4, calcined a-FeOOH),
Fig. 7. Cumulative volume of liquid products from thermal and catalytic degradation of PS, PP/PVC mixture at 430�C.
Fig. 8. C-NP gram of liquid products from thermal and catalytic degradation of PS, PP/PVC mixture at 430�C.
342 J. Yanik et al. / Polymer Degradation and Stability 73 (2001) 335–346
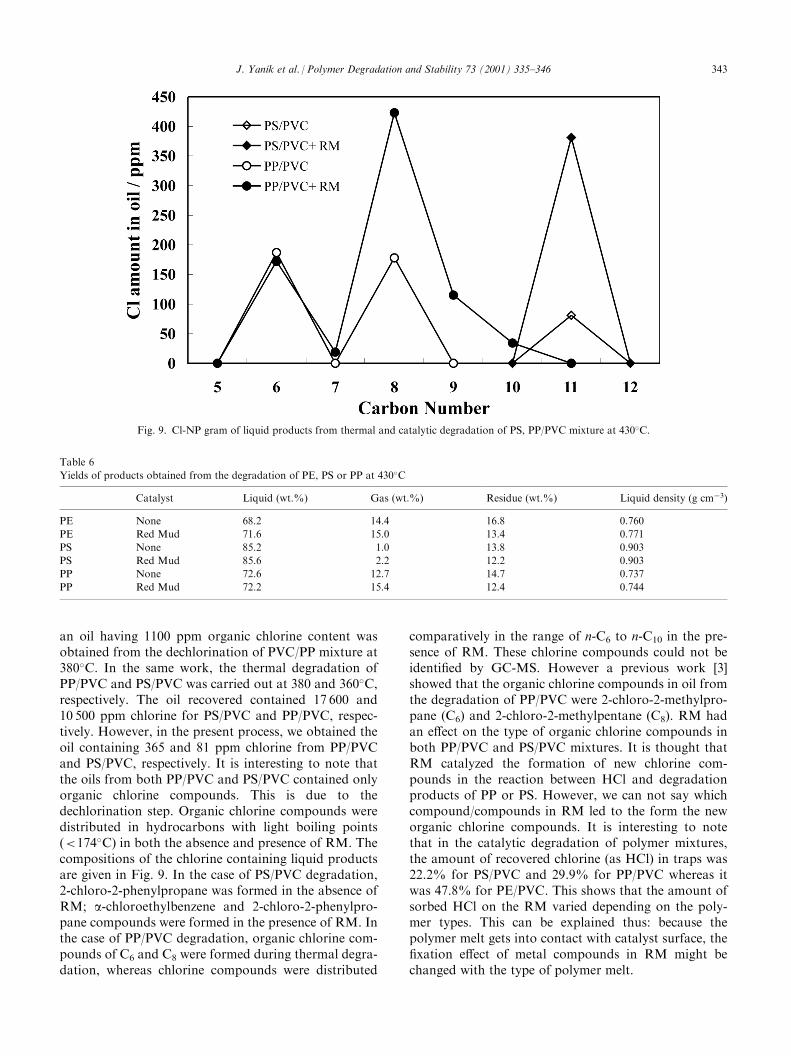
an oil having 1100 ppm organic chlorine content wasobtained from the dechlorination of PVC/PP mixture at380�C. In the same work, the thermal degradation ofPP/PVC and PS/PVC was carried out at 380 and 360�C,respectively. The oil recovered contained 17 600 and10 500 ppm chlorine for PS/PVC and PP/PVC, respec-tively. However, in the present process, we obtained theoil containing 365 and 81 ppm chlorine from PP/PVCand PS/PVC, respectively. It is interesting to note thatthe oils from both PP/PVC and PS/PVC contained onlyorganic chlorine compounds. This is due to thedechlorination step. Organic chlorine compounds weredistributed in hydrocarbons with light boiling points(<174�C) in both the absence and presence of RM. Thecompositions of the chlorine containing liquid productsare given in Fig. 9. In the case of PS/PVC degradation,2-chloro-2-phenylpropane was formed in the absence ofRM; a-chloroethylbenzene and 2-chloro-2-phenylpro-pane compounds were formed in the presence of RM. Inthe case of PP/PVC degradation, organic chlorine com-pounds of C6 and C8 were formed during thermal degra-dation, whereas chlorine compounds were distributed
comparatively in the range of n-C6 to n-C10 in the pre-sence of RM. These chlorine compounds could not beidentified by GC-MS. However a previous work [3]showed that the organic chlorine compounds in oil fromthe degradation of PP/PVC were 2-chloro-2-methylpro-pane (C6) and 2-chloro-2-methylpentane (C8). RM hadan effect on the type of organic chlorine compounds inboth PP/PVC and PS/PVC mixtures. It is thought thatRM catalyzed the formation of new chlorine com-pounds in the reaction between HCl and degradationproducts of PP or PS. However, we can not say whichcompound/compounds in RM led to the form the neworganic chlorine compounds. It is interesting to notethat in the catalytic degradation of polymer mixtures,the amount of recovered chlorine (as HCl) in traps was22.2% for PS/PVC and 29.9% for PP/PVC whereas itwas 47.8% for PE/PVC. This shows that the amount ofsorbed HCl on the RM varied depending on the poly-mer types. This can be explained thus: because thepolymer melt gets into contact with catalyst surface, thefixation effect of metal compounds in RM might bechanged with the type of polymer melt.
Fig. 9. Cl-NP gram of liquid products from thermal and catalytic degradation of PS, PP/PVC mixture at 430�C.
Table 6
Yields of products obtained from the degradation of PE, PS or PP at 430�C
Catalyst Liquid (wt.%) Gas (wt.%) Residue (wt.%) Liquid density (g cm�3)
PE None 68.2 14.4 16.8 0.760
PE Red Mud 71.6 15.0 13.4 0.771
PS None 85.2 1.0 13.8 0.903
PS Red Mud 85.6 2.2 12.2 0.903
PP None 72.6 12.7 14.7 0.737
PP Red Mud 72.2 15.4 12.4 0.744
J. Yanik et al. / Polymer Degradation and Stability 73 (2001) 335–346 343

3.3. Effect of Red Mud on the degradation of singlecompound plastic
In order to investigate the behaviour of RM on thedegradation of single compound plastic, the degrada-tion of PE, PS or PP was carried out with and without
RM at 430�C under nitrogen stream. Table 6 shows theyields of products from thermal and catalytic degrada-tion. For catalytic degradation, the yield of liquids didnot differ significantly from that of thermal degrada-tion. In the cases of PP and PS, RM had effect on theyields of residue and gas. In the presence of RM, the
Fig. 10. Cumulative volume of liquid products from thermal and catalytic degradation of PS, PE and PP at 430�C.
Fig. 11. Composition of gas products from thermal and catalytic degradation of PS, PE and PP at 430�C.
344 J. Yanik et al. / Polymer Degradation and Stability 73 (2001) 335–346

residue amount decreased by 11 and 15%, gas amountincreased by 100 and 21% for PS and PP, respectively.However, these differences are not considerable on thetotal product base. Fig. 10 shows the cumulative volumeof liquid products as a function of lapsed time. The countof lapsed time was started from beginning of 300�C. Asexpected the rate of degradation of PS and PP weremuch faster than that of PE. The degradation rates ofpolymers were same in presence and absence of RM.The composition of gaseous products is shown in
Fig. 11. In both the thermal and catalytic degradationof PP, gaseous products were same. The main gas pro-ducts were C3. In thermal degradation of PS, the gas-eous products were mainly C2, C3, and C4, whereas incatalytic degradation C3 increased and C4 was absence,and also unsaturated hydrocarbons became more. Forthe thermal and catalytic degradation of PE, the gas-eous products were C1, C2 and C3.Composition of the liquid products from catalytic and
thermal degradation of PE, PS and PP is shown in Fig. 12as a Normal Paraffin gram (NP-gram). As shown inFig. 12, RM had no effect on the carbon number dis-tribution of liquid products. In the case of PE, the liquidhydrocarbon products were distributed in a wide rangecarbon numbers (n-C5 to n- C25) equivalent to boilingpoint ranges of 36–405�C, and were composed of linearolefins and paraffins. Similar results for the thermaldegradation of PE at 430�C have been reported in studies(13–15). The liquid hydrocarbon products from PPdegradation also had a carbon number distribution of n-
C5 to C25 with peaks at n-C6, C9, C11, C14, C16 and C18.However, in the case of PS, the liquid hydrocarbons weredistributed sharply in the range of n-C8 to n-C10 with apeak at n-C9 and C18 and composed of styrene, a-methylstyrene and toluene. In the previous study [13]related to the catalytic degradation of PE and PP overvarious types of solid catalysts, such as silica-alumina,zeolite and non-acidic mesoporous silica catalyst, it wasmentioned that the silica-alumina and mesoporous silicacatalysts accelerated the rate of degradation of PE andPP; and they degraded the heavier waxy compounds intolighter liquid hydrocarbons. If we compare our results tothe above literature: in the thermal degradation of PP at430�C, the degradation rate of PP and yields of productswas similar to the results that of silica-alumina, butsilica-alumina catalyst led to lighter hydrocarbons in oil.In the PE degradation over silica-alumina and mesopor-ous silica catalysts, the yield and composition of liquidhydrocarbons and the degradation rate were better thanour results. As a result we concluded that RM had noeffect on the degradation of PE, PP and PS.
4. Conclusion
The results can be summarized as follows.
. During the thermal degradation of the polymermixtures containing PVC, over 90% of feedchlorine was recovered as HCl by dechlorinationstep at 350�C for 1 h.
Fig. 12. C-NP gram of liquid products from thermal and catalytic degradation of PS, PE and PP at 430�C.
J. Yanik et al. / Polymer Degradation and Stability 73 (2001) 335–346 345

. The use of N2 flow during the both dechlorinationand degradation steps decreased the reactionbetween HCl and degradation products of poly-mer due to the effective removal of HCl fromreactor before the degradation of other polymersoccurs.
. Red Mud had a good effect on the fixation ofevolved HCl as well as iron oxides sorbents.
. Red Mud had an effect on the composition oforganic chlorine compounds derived from thedegradation of PS/PVC and PP/PVC mixtures.
. The use of RM in VP contact mode led to moreHCl fixation, but VP-contact mode increased thechlorine amount of oil, because of the reactionbetween fixed HCl and adsorbed degradation pro-ducts on RM.
. Red Mud showed no effect on the cracking ofboth PVC containing polymer mixture and singlepolymer.
. The oils derived from PVC containing polymermixtures by thermal degradation contained loweramount chlorine than the oils obtained by using ofRed Mud.
Unfortunately, we do not suggest any mechanism onthe Red Mud effect, because RM is a complex mixtureof inorganic materials and is not a synthetic catalyst.
Acknowledgements
We would like to thank the Venture BusinessLaboratory of Okayama University, Japan for financialsupport for Dr. Jale Yanik to visit Japan and perform
this work at Okayama University. We would also like tothank Dr. Katsuhide Murata of Japan Eco Environ-ment Products for his suggestions in this work.
References
[1] Blazso M, Zelei B, Jakab E. J Anal Appl Pyrolysis 1995;35:221.
[2] Blazso M. Rapid Commun Mass Spectrometry 1981;12:1.
[3] Sakata Y, Uddin MA, Muto A, Narazaki K, Murata K, Kaji M.
Polym Recycling 1996;2(4):309.
[4] Sakata Y, Uddin MA, Koizumi K, Murata K. Polym Degrad
Stab 1996;53(1):111.
[5] Uddin MdA, Sakata Y, Shiraga Y, Muto A, Murata K. Ind Eng
Chem Res 1999;38:1406.
[6] Uddin Md.A, Shiraga Y, Muto A, Sakata Y, Murata K. Lique-
faction of wasteplastics by catalytic degradation and fixation of
chlorine in waste plastics derived oil with iron oxide sorbents. In:
5th ARAB Int Conf on Polym Sci Technol 18–22 September
1999, Aswan, Egypt.
[7] Eamsiri A, Jackson R, Pratt KC, Chiristov V, Marshall M. Fuel
1992;71:449.
[8] Garg D, Givens EN. Ind Eng Chem Process Des Dev 1985;24:66.
[9] Sato S, Morita M, Hashimoto T, Mitunori I, Chiba K, Tagaya
H. Fuel 1989;68:622.
[10] Klopties B, Hodek W, Bandermann F. Fuel 1990;69:448.
[11] Llano JJ, Rosal R, Sastre H, Diez FV. Fuel 1994;73:688.
[12] Shiraga Y, Uddin MA, Muto A, Narazaki M, Sakata Y. Energy
and Fuels 1999;13:428.
[13] Sakata Y, Uddin MA, Muto A. J Anal Appl Pyrolysis
1999;51:135.
[14] Uddin MA, Sakata Y, Muto A, Shiraga Y, Koizumi K, Kanada
Y, Murata K. Microporous and Mesoporous Materials
1998;21:557.
[15] Sakata Y, Uddin MA, Muto A, Koizumi K, Kanada Y, Murata
K. J Anal Appl Pyrolysis 1997;43:15.
346 J. Yanik et al. / Polymer Degradation and Stability 73 (2001) 335–346