Deciphering The Daily Mud Report
97
Deciphering The Daily Mud Report Rusty Connell April 2015
-
Upload
khangminh22 -
Category
Documents
-
view
0 -
download
0
Transcript of Deciphering The Daily Mud Report

Deciphering The Daily Mud Report
Rusty Connell
April 2015

Contact Information
Oxy Central Drilling Group (CDG)
5 Greenway Plaza - Houston
Rusty Connell – Houston BU Drilling Fluid Specialist
Office 713-840-3006, Rm 21.098
Fred Growcock – Global Drilling Fluid Specialist
Office 713-366-5786, Rm 19.009
2 RC 3_15

Agenda - Objectives
1. Daily Mud Report Contents
2. Drilling Fluid Systems
◦ Water-based Mud (WBM) Systems
◦ Non-aqueous Drilling Fluid (NADF) Systems
3. Mud Properties and Tests
◦ WBM
◦ NADF
4. Effects of Contamination
3 RC 3_15

Drilling Fluid References
API RP 13 B1 – Field Testing Water-based Drilling Fluids
API RP 13 B2 – Field Testing of Oil-based Drilling Fluids
API RP 13C – Mud Processing (Solids Control)
API RP 13D – Rheology and Hydraulics
API RP 13L – Training and Qualification Drilling Fluid Technologists
4 RC 3_15

Daily Mud Report
What is a Daily Drilling Mud Report?
Link between the drilling fluid (mud) company and the Oil and Gas Company (Operator)
Used to evaluate the daily progress of the well and a means of summarizing the drilling operation once a well is completed (recap)
Used as a reference to program future wells
Data used to run hydraulics programs
Used to monitor, identify and treat mud property trends
5 RC 3_15

Daily Mud Report Software
Baroid – DFG Software © with DrillAhead Hydraulics Module ©
MI – OneTrax © with Virtual Hydraulics ©
Baker Hughes – Advantage ©
Newpark – MudPIT © (coming out with update version soon)
NOV FluidControl – Drilling Fluids Engineer ©/Reporting
Software
6 RC 3_15

Daily Mud Report Content

Daily Mud Report - Contents
Report Number and Date
Well Information
Drilling Assembly
Casing Data
Mud Volume
Circulation Data
Mud Properties/Specifications
Mud Products/Inventory
Solids Control Equipment
Treatment Remarks
Activity Remarks
Mud Volume Accounting
Solids Analysis
Rheology/Hydraulics
Cost
Contact Information
8 RC 3_15

Daily Mud Report – Contents - Examples
Report Number, Date, Well Information
9 RC 3_15

Daily Mud Report – Contents - Examples
Drilling Assembly, Casing Data, Mud Volume,
Circulation Data
10 RC 3_15

Daily Mud Report – Contents - Examples Mud Properties and Specifications
11 RC 3_15

Daily Mud Report – Contents - Examples Products and Solids Control
12
RC 3_15
Product Name Units Start Rec Used End Cost
Lime 50 lb 50 0 5 45
Barite 100 lb 200 200 50 350
Caustic Soda 50 lb 50 0 5 45
Bentonite (Bulk) 2000 lb 20 20 10 30
Starch 50 lb 50 0 5 45
Defoamer 5 gal 32 0 6 26
Products Used Last 24 Hrs

Daily Mud Report – Contents - Examples
Treatment and Activity Remarks
Mud property, hole condition and equipment changes
Time, Mud Volume, Solids Analysis, Rheology/Hydraulics
13 RC 3_15

Daily Mud Report – Contents - Examples
Cost and Contact Information
Volume Accounting (More Detail)
14 RC 3_15

Drilling Fluids
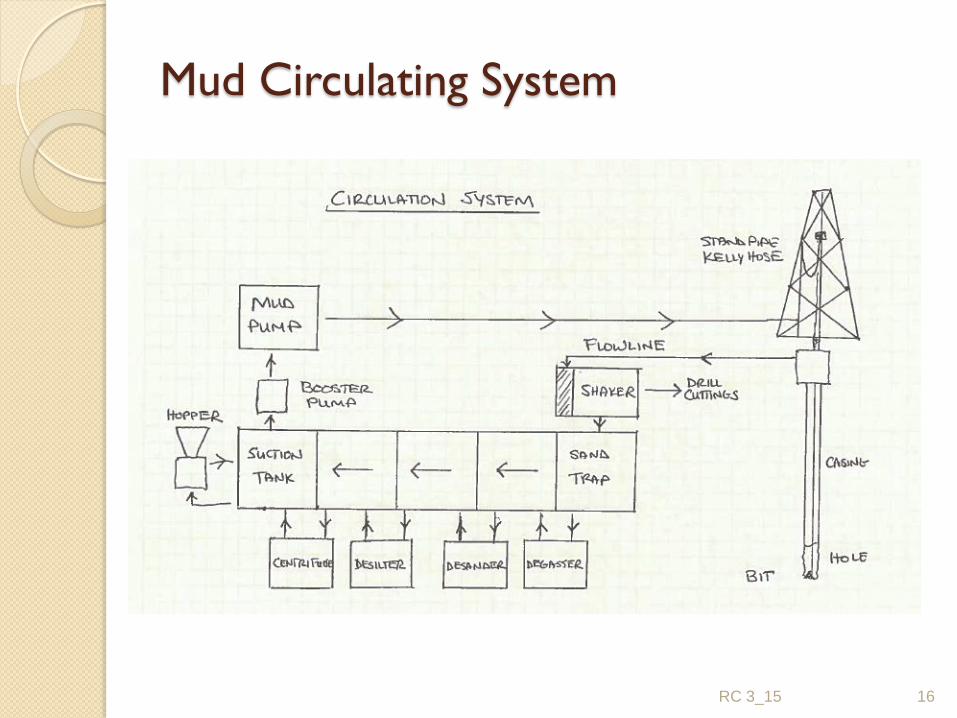
Mud Circulating System
16 RC 3_15

FUNCTIONS OF DRILLING FLUIDS
1. Remove drilled cuttings from the hole
2. Control subsurface pressure
3. Suspend and release cuttings and suspend weight material
4. Seal permeable formations
5. Promote borehole stability
6. Minimize reservoir damage
7. Cool, lubricate and support the bit and drilling assembly
8. Transmit hydraulic energy to tools and bit
9. Ensure adequate formation evaluation
10. Control corrosion
11. Minimize impact on environment
17 RC 3_15

Water-Based Mud
WATER-BASED MUDS
Water
Soluble
Chemicals
Fresh
Water
Sea
Water
Salt Enhanced
Water
Chlorides
Calcium
Magnesium
Chlorides
Calcium
Potassium
Solids
Necessary
Solids
Low Gravity High Gravity
Commercial Clays
Polymers
Chemicals
Weight Material
Drilled
Solids
Reactive Inert
Smectite Clays
Contaminants MISC.

Classification of Water-Based Drilling Fluids
Spud Mud - Un-weighted clay water suspensions
Low Solids Mud (typically < 6 vol% LGS) e.g. fw gel,
polymer, phpa, salt saturated, potassium, designed for
higher ROP
Deflocculated, weighted clay-water suspensions, e.g.
lignosulfonate-based muds
Calcium-treated, weighted deflocculated clay-water
suspensions, e.g. Gyp or Lime muds
HTHP Systems, e.g. lime-clay-extender muds and muds
based on thermally stable synthetic polymers
Salt-water systems, brine based, e.g. using attapulgite clay
Inhibitive mud – Glycol, polyamine, potassium, silicate, etc.
19 RC 3_15

Oil- and Synthetic-Based Mud (NADF)
NAF-BASED MUDS
ExternalPhase
Oil BaseFluid
Diesel Oil Mineral Oil
Refined LP's
Synthetic Fluid
Olef insEsters
Synthetic LP's
Oil SolubleLiquid Additives
SurfactantsRheo. ModifiersLiq. Polymers
Thinners
InternalPhase
25% - 30% CaCl2
Activity = 0.75 - 0.64
Ca2+ and OH-from Lime
Non-ChlorideActivity Reducers
GlycolsCa2+and Mg2+
Acetates
Nitrates
Solids
NecessarySolids
OrganophIlic ClayWeight Material
Salt (CaCl2)
FLC Additives
DrilledSolids
MISC.
20 RC 3_15

Most NADFs are Invert Emulsions
THREE PHASE SYSTEMS - Two immiscible fluids, and the
solids phase
◦ OIL / SYNTHETIC FLUID - continuous - external
phase, lipophilic liquid product additives.
◦ WATER - emulsified droplets (typically CaCl2 brine),
as internal phase, soluble lime.
◦ SOLIDS - barite, organophilic clays, drill solids,
insoluble additives - fluid loss control products, LCM,
etc. (soluble additives)
21 RC 3_15

WBM Properties and Tests

Standard Properties of WBM (API RP13 B1)
PROPERTY UNITS
1. Mud Weight ppg, lb/ft3, SG
2. Funnel Viscosity sec/qt
3. Plastic Viscosity cP
4. Yield Point lb/100 ft2
5. Gel Strengths lb/100 ft2
6. Filtrate (API Fluid Loss) cm3 /30 min
7. HTHP Filtrate cm3 /30 min
8. Filter Cake Thickness 32nd in
9. Solids Content % by vol
10. Liquid Content (Oil / Water) % by vol
11. Sand Content % by vol
12. Methylene Blue Capacity (CEC) eq. ppb
13. pH none
14. Pm cc acid
15. Pf cc acid
16. Mf cc acid
17. Chlorides mg/L
18. Total Hardness as Calcium mg/L
23
Physical
Chemical
RC 3_15

Mud Properties – WBM
24
Rheology
Hole cleaning, barite sag,
suspension, ECD
Filtration
Invasion, cake quality
Retort & MBT
Solids, liquids %, sand,
reactive solids (clay)
Chemical Properties
Chemical Contaminants,
Alkalinity
Misc. Properties
RC 3_15
General Properties:
Mud Weight &
Viscosity
First Warning Signs

Mud Weight / Density
Courtesy of Fann Instrument Company

Mud Weight (Density)
lb/gal (ppg) - pounds / gallon
kg/m3 – kilograms / cubic meter
lb/ft3 - pounds / cubic foot
psi/1000 ft - pounds / square inch per
1000 ft (vertical depth), hydrostatic
pressure gradient
s.g. - specific gravity (no units)
26 RC 3_15

Funnel Viscosity
Courtesy of Fann Instrument Company

Funnel Viscosity
The timed rate of flow in sec / quart or sec / liter through funnel with 3/16” opening:
Begin with ~1.5 qts of mud poured thru a 12-mesh screen
Time the first 1 quart (or liter if metric)
Calibrate the Funnel with water: 26 +/- 0.5 sec/qt
Note: Funnel viscosity is not a quantitative measurement of viscosity. Viscosity of most drilling fluids varies with the shear rate (velocity) of the fluid. The shear rate in a Funnel is not defined and varies with the thickness, temperature and level of fluid in the Funnel.
28 RC 3_15

Viscosity is a function of Shear Rate: Shear Stress
Shear Rate
Bingham Plastic (or Pseudoplastic) has been the preferred Flow Model:
Shear Stress = Yield Point + Shear Rate x Plastic Viscosity
or
t = YP + g x PV
29
Chemical Interactions
• Type of solids and associated
charges
• Concentration of active solids
• Dissolved salts
Mechanical Interactions
• Solids concentration
• Size and shape of the solids
• Viscosity of the fluid phase
RC 3_15

Bingham Plastic Model – 6-Speed Viscometer
30
g (rpm)
t (l
b/1
00 f
t2)
or
(
deg
)
300 600
40
20
10
0
600 = 40
300 = 25
PV = 600 - 300 =15
YP = 300 – PV = 10
Bingham Model
30
t = YP + g PV
Intercept on t axis Slope
RC 3_15

Water-Based Mud Kit
Courtesy of Fann Instrument Company

Viscosity Profile (Rheology)
Fann Model 35 Viscometer
(6 - Speed VG-Meter)
◦ 600 600
◦ 300 - 300
◦ 200 PV
◦ 100
◦ 6 300
◦ 3 - PV
YP
◦ Gel Strengths – 10 s, 10 m, 30 m
Courtesy of Fann Instrument Company

Static Filtration at Ambient Temperature
API Filter Press: Fluid
Loss (Volume of Filtrate
Collected, cc or mL)
100 psi
30 min
7.5 in2 # 50 Whatman
Paper (2.7 micron)
Ambient Temperature
Courtesy of Fann Instrument Company

API Filter Press: Filter Cake Thickness (in increments of 1/32”)
Static Filtration at Ambient Temperature

HTHP Fluid Loss (Static)
Volume (cc) of Filtrate collected X 2
30 min
300°F ( or less - BHST > 175°F)
3.75 sq. in. #50 Whatman paper
500 psi - Differential Pressure
600 psi – TOP
100 psi - BOTTOM (back pressure)
35 RC 3_15
Courtesy of Fann Instrument Company

Retort
Distilled Fractions
% Solids
% NAF (Oil or
Synthetic Fluid
% Water
Courtesy of Fann Instrument Company

Sand Content
% By Volume (% v/v) Sand
Note: These are particles that are “sand-size”: coarser than 200 mesh (74 mm)
Courtesy of Fann Instrument Company
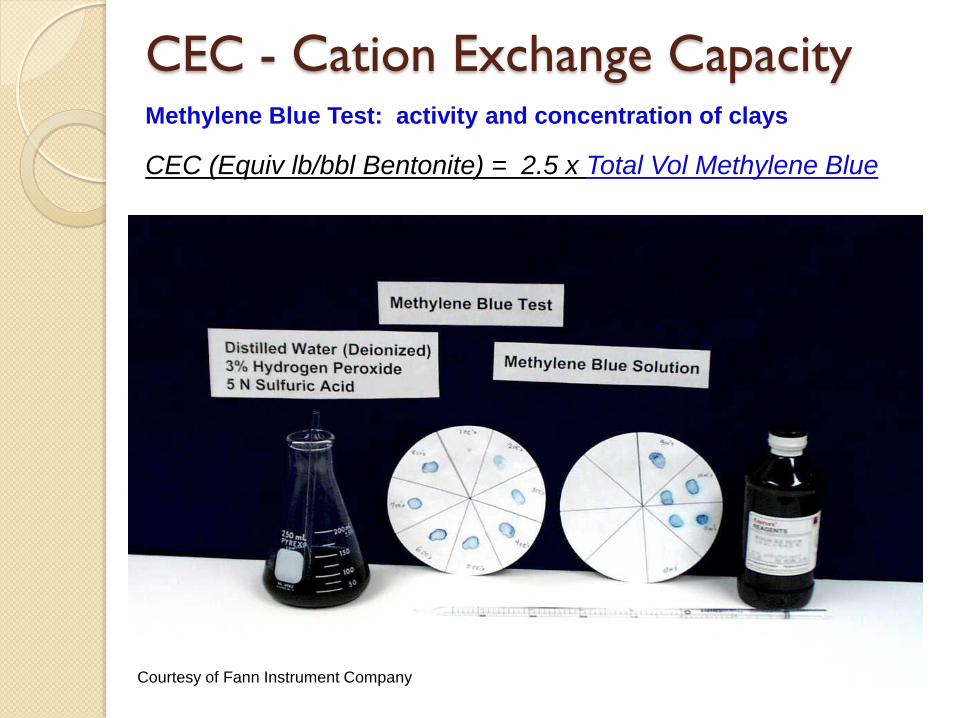
CEC - Cation Exchange Capacity Methylene Blue Test: activity and concentration of clays
CEC (Equiv lb/bbl Bentonite) = 2.5 x Total Vol Methylene Blue
Courtesy of Fann Instrument Company

pH
pH Meter -
Electrometric
(Preferred Method)
pH Strips -
Colorimetric
(General Range)
pH – negative log of H+ ion
Courtesy of Fann Instrument Company

pH & Alkalinity
14 0 7
4.3 8.3 11.7
Most Muds are in this
pH range
Pf
Mf Vol 0.02N
Sulfuric Acid
Vol 0.02N Sulfuric Acid
Pf = OH-, CO32-
Mf = OH-, CO32-, HCO3
-
OH- present when pH > 7.0
HCO3- present when pH is between 4.3 and 11.7
CO32- present when pH > 8.3
Acidic Basic
H+ OH-
Assume the mud
is at this pH
40 RC 3_15
Alkalinity – measure of the quantity of an acid to reduce the pH to a particular value

Carbonate / Bicarbonate Equilibrium
0
20
40
60
80
100
0 2 4 6 8101214
Percent
pH
Percent of various carbonate species at different pH values
CO3=H2CO3
HCO3-
41 RC 3_15

Pm (Phenolphthalein Endpoint of the Mud)
Pm – alkalinity measurement of whole mud – measure lime/cement solids in mud
Courtesy of Fann Instrument Company

Pf (Phenolphthalein Endpoint of the Filtrate)
Courtesy of Fann Instrument Company

Mf (Methyl Orange Endpoint of the Filtrate)
Courtesy of Fann Instrument Company

Cl- (Chlorides)
Courtesy of Fann Instrument Company

Total Hardness ( Ca2+ & Mg2+ )
Courtesy of Fann Instrument Company

Calcium (Ca2+)
Courtesy of Fann Instrument Company

NADF Properties and Tests

Mud Properties – OBM
49
General Properties:
Mud Weight &
Viscosity
(First Warning Signs)
Rheology
Hole cleaning, barite
sag, suspension, ECD
Filtration
Invasion, cake quality
Retort
Solids, liquids %, SWR
Chemical Properties
Salt & Lime Content
Emulsion Stability
Misc. Properties
RC 3_15

Rheology (Viscosity and Gel Strength)
Test at 120° or 150°
Run VG meter at 300 rpm while heating sample
After completing
viscosity profile (600,
300, 200, 100, 6, 3
rpm) and gel strengths
(10 sec, 10 min, 30
min), check the heat
cup for barite settling
Heat Cup
Courtesy of Fann Instrument Company

HTHP Fluid Loss Tester
This is one of several types
of units. Good For 300oF on
a regular basis.
For higher temperatures a
different type unit must be
used, and higher pressures
(top and bottom) should be
used. (Differential pressure
should still be 500 psid)
Courtesy of Fann Instrument Company

HTHP Fluid Loss
This type of unit is used for temperatures above 300 oF.
Usually employs Nitrogen pressurization from a big cylinder.
Courtesy of Fann Instrument Company

Electrical Stability
Electrical stability is a relative value
Electrical stability related to
emulsion stability, wettability,
%water, water droplet size, viscosity,
temperature...
Electrical stability of new mud will
be low until sheared through the bit
Check at 120° or 150 °F (65 °C)
Meters
◦ Operator ramped - (old style) (reading
is doubled)
◦ Self ramping digital - (read directly)
55 RC 3_15
Courtesy of Fann Instrument Company

Retort Analysis
Retort allows us to
determine:
◦ % Solids
◦ % Oil or Synthetic fluid
◦ % Water
◦ Oil (or Synthetic) / Water Ratio
◦ Salt content
Use 50 ml retort for
precision and accuracy since
O/W is critical (10 & 20 ml)
Watch for trends and major
changes
56
RC 3_15
Courtesy of Fann Instrument Company
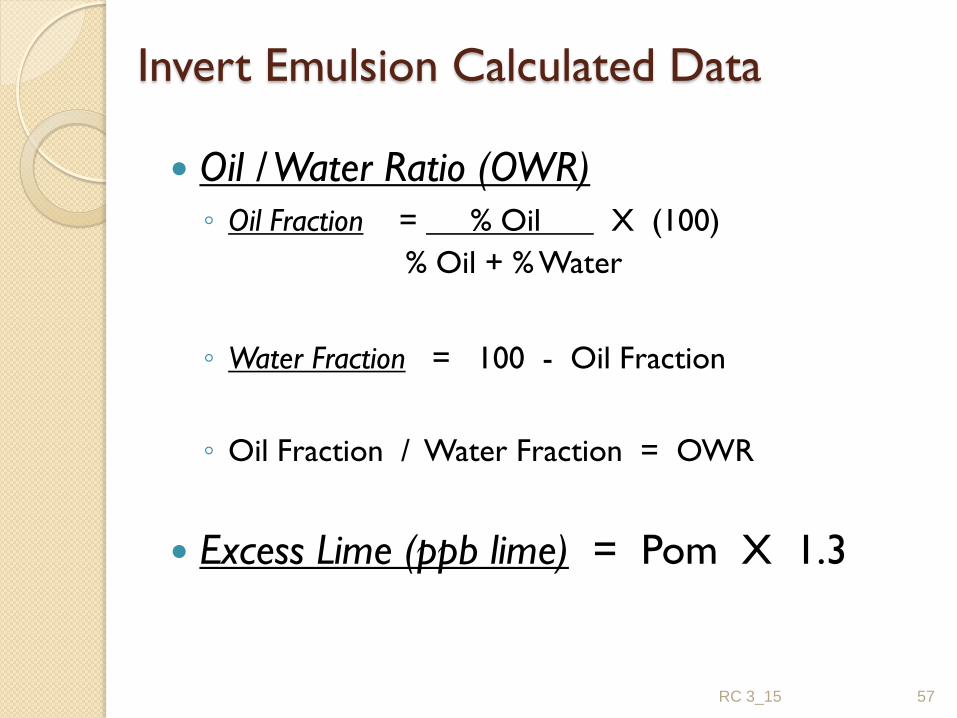
Invert Emulsion Calculated Data
Oil / Water Ratio (OWR)
◦ Oil Fraction = % Oil X (100)
% Oil + % Water
◦ Water Fraction = 100 - Oil Fraction
◦ Oil Fraction / Water Fraction = OWR
Excess Lime (ppb lime) = Pom X 1.3
57 RC 3_15

Titrations
Standard titrations:
◦ Alkalinity – Pom (Psm)
◦ Chlorides - Cl- (whole mud)
Must use whole mud - (2 cc)
(filtrate is Oil/Synthetic fluid)
Mix mud with solvent to break the emulsion
Dilute sample with distilled water and add
indicator.
Titrate!
58 RC 3_15

Pom (Psm) (VSA) - Color change
Courtesy of Fann Instrument Company

Chlorides (whole mud) - Color change
Courtesy of Fann Instrument Company

Calcium (whole mud) - Color change
Courtesy of Fann Instrument Company

Effects of Contaminants
Contaminant – Anything that causes undesirable changes in mud properties

Water-Based Drilling Fluids
Contamination
63 RC 3_15

Major Contaminants of WBM
Solids (Cuttings), especially clays
Bicarbonate (HCO3-)
Carbonate (CO3=)
Sodium Chloride (NaCl)
Cement
Anhydrite (CaSO4)
Hydrogen Sulfide (H2S)
64 RC 3_15

Contamination Examples
65
Solids Contamination
RC 3_15
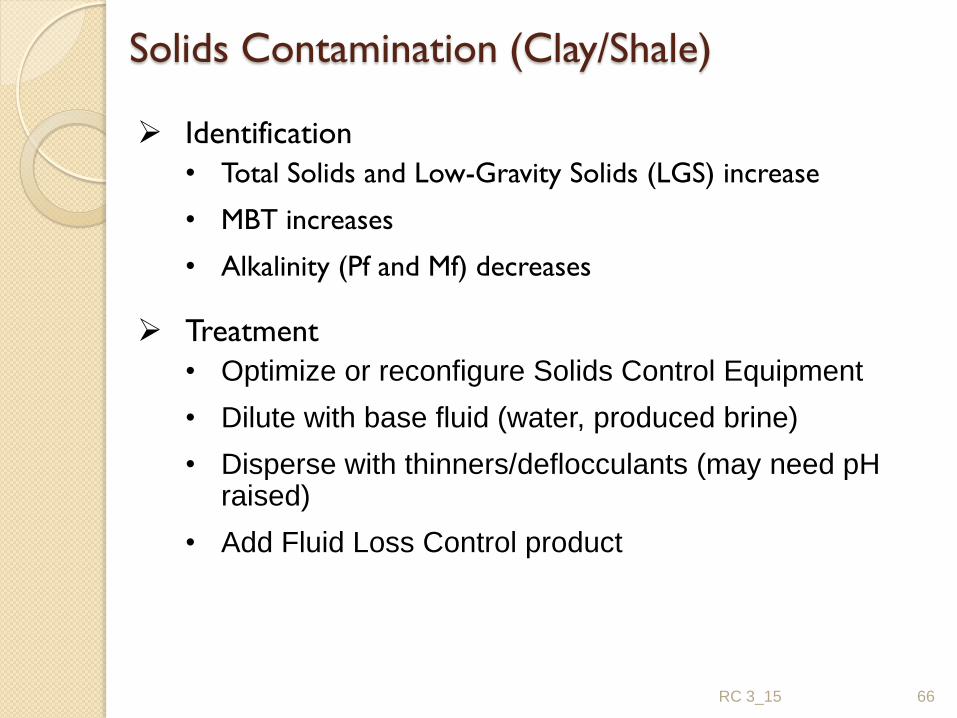
Solids Contamination (Clay/Shale)
Identification
• Total Solids and Low-Gravity Solids (LGS) increase
• MBT increases
• Alkalinity (Pf and Mf) decreases
Treatment
• Optimize or reconfigure Solids Control Equipment
• Dilute with base fluid (water, produced brine)
• Disperse with thinners/deflocculants (may need pH raised)
• Add Fluid Loss Control product
66 RC 3_15

Contamination Examples
67
Bicarbonate Contamination
RC 3_15

Bicarbonate Contamination Identification
• No Calcium (Ca2+)
• Pf is low
• Mf is high
• Fluid Loss increases
• Gel Strength increases
Treatment
• Usually caused by over-treatment with sodium bicarbonate (NaHCO3) prior to drilling cement or influx of CO2
• Maintain 150 to 200 mg/L total hardness in the filtrate to buffer the problem so that it does not reoccur. This is usually easy to obtain with lime treatments, so add lime (Ca(OH)2) to pH 9.5 to 10.0. It may be necessary to supplement the lime with caustic soda (NaOH).
• Add thinners to chemically disperse clays and provide better rheology control
• Add water to offset dehydration
68 RC 3_15

Contamination Examples
69
Carbonate Contamination
RC 3_15

Carbonate Contamination
Identification • Gel strengths are high
• Fluid loss is high
• Alkalinity (Pf and Mf) is high
• No calcium most of the time
Cause • Problem may be induced through addition of excess soda
ash to treat make-up water for removal of hardness
• Avoid over-treatment by controlling total hardness of filtrate between 150 and 200 mg/L
• Do not pre-treat system with large amounts of soda ash
70 RC 3_15

Carbonate Contamination (Cont’d)
Treatment • Add gypsum, or gyp (CaSO4
. 2H2O), to remove carbonate by precipitating it as CaCO3, and adjust pH to 9.5-10.5 with lime or caustic soda
• Monitor total lb/bbl of gyp added to the system. Too much SO4
= in system will cause viscosity problems (see Anhydrite Contamination)
• Add thinners as needed for chemical dispersion
• Add water to offset dehydration
• When acid gas continues to contaminate the fluid, the normal reaction is to add caustic soda (NaOH), thus forming CO3
= and HCO3-, depending on pH
• Lime and gyp can be added together to achieve the proper pH and to precipitate CaCO3 from the system
71 RC 3_15

Contamination Examples
72
Salt Contamination
RC 3_15

Salt (NaCl) Contamination
Identification
• API and HTHP Filtration (fluid loss) increase
• pH drops
• Alkalinity (Pf and Mf) drop
• [Cl-] increases
• Hardness ([Mg2+] and [Ca2+]) also increases if other salts are mixed with the NaCl
Treatment
• Treat with thinners to reduce viscosity, gel strength and yield point
• Adjust pH with caustic soda
• Add polymers for filtration (fluid loss) control
• If the salt concentration is maintained, or the system is broken over to a saturated salt system, pre-hydrated bentonite or polymers must be used to maintain viscosity
• If the clay solids content (LGS) of the fluid is too high, dilution with water may also be necessary.
73 RC 3_15

Contamination Examples
74
Cement Contamination
RC 3_15

Cement Contamination
Identification • API and HTHP fluid loss increase
• pH is high
• Pm and Pf are high
• Calcium is high
Treatment • Add baking soda (sodium bicarbonate, or NaHCO3) to
precipitate calcium. Control total hardness of the filtrate between 150 and 200 mg/L to avoid over-treatment. Note: baking soda will reduce the pH.
• Add thinners for rheology control.
• Add water to offset dehydration, and barite to maintain mud weight.
75 RC 3_15

Contamination Examples
76
Anhydrite Contamination
RC 3_15

Anhydrite Contamination
Identification • API and HTHP fluid loss increase
• pH decreases
• Pm and Pf decrease
• Calcium increases
Treatment • A common method of drilling anhydrite formations is to
adjust the pH to 9.5 and add thinners, while maintaining a low MBT. With this method, a gyp mud can be built and its fluid loss controlled with polymers.
• It is usually uneconomical to treat calcium out of a heavily contaminated system, but it may be controlled by adding soda ash (Na2CO3) if pH < 9.5 or bicarb (NaHCO3) if pH ≥ 9.5. After adding soda ash, a chemical dispersant is usually necessary to reduce viscosity and gel strength.
77 RC 3_15

Contamination Examples
78
H2S Contamination
RC 3_15

H2S Contamination
Identification • H2S gas in filtrate or mud
• API and HTHP fluid loss increase
• All viscosity parameters may increase
• pH decreases
• Alkalinity decreases
• Calcium decreases a little
Treatment • Add Triazine or zinc carbonate (ZnCO3):
ZnCO3 + H2S <=> ZnS + H2CO3
• Add starch or polymers to reduce fluid loss
• Add water for dehydration
• Add lime/caustic soda to adjust pH to > 10 and maintain Pf > 6
79 RC 3_15

WBM Contamination
Did you notice what properties increased in
every example?
Physical properties of the mud increased in all
of these contamination examples
Key to determining what kind of contamination
- analyze the chemical properties of the mud to
narrow down on the specific type of
contamination
MBT level typically has large affect on
contamination severity
80 RC 3_15

Summary of Contaminant Effects & Treatment
81 RC 3_15

Additional Details of Treatments for Contaminants
82 RC 3_15

Non-Aqueous Drilling Fluids
Contamination
83 RC 3_15

Major Contaminants of NADF
Solids
Salt Water
Fresh Water
CO2
84 RC 3_15

Contamination Examples
85
Ultra-Fines Build-up
What contamination caused this?
RC 3_15

Solids Contamination
Identification
• Total Solids increase
• Viscosity parameters increase
• ES changes
Treatment
• Optimize or reconfigure Solids Control Equipment
• Add emulsifier and/or oil-wetting agent
• Dilute with base fluid
86 RC 3_15

Contamination Examples
87
Salt Water Contamination
RC 3_15

Saltwater Contamination
Identification
• O/W ratio decreases
• Chlorides decrease
• Viscosity parameters increase
• ES decreases
• HTHP Fluid Loss increases
• Whole mud alkalinity (Pm) may drop
Treatment
• Add base fluid to adjust O/W ratio back to spec
• Increase concentration of solute – usually CaCl2 – in internal phase to raise Water Phase Salinity (WPS)
• Add lime to adjust Pm upward
• May need to add emulsifier
88 RC 3_15

Contamination Examples
89
Fresh Water Contamination
RC 3_15

Fresh Water Contamination
Identification • O/W ratio decreases
• Chlorides decrease substantially, along with Ca2+ (if CaCl2 is used in internal phase)
• Viscosity parameters increase
• ES decreases
• HTHP Fluid Loss increases
• Whole mud alkalinity (Pm) may drop
Treatment • Add base fluid to adjust O/W ratio back to spec
• Add CaCl2 to raise the Water Phase Salinity (WPS)
• Add lime to increase Pm
• May need to add emulsifier
90 RC 3_15

Contamination Examples
91
CO2 Contamination
RC 3_15

CO2 Contamination
Identification • Whole mud alkalinity (Pom) (excess lime) drops to zero
• ES decreases
• HTHP Fluid Loss increases
Treatment • Add lime to increase Pom
92 RC 3_15

Troubleshooting OBM/SBM (NADF)
93 RC 3_15

Troubleshooting OBM/SBM (NADF)
94 RC 3_15

Troubleshooting OBM/SBM (NADF)
95 RC 3_15

Troubleshooting OBM/SBM (NADF)
96 RC 3_15

Troubleshooting OBM/SBM (NADF)
97 RC 3_15

Troubleshooting OBM/SBM (NADF)
98 RC 3_15

99 RC 3_15