Single-molecule fluorescence study of the inhibition of the oncogenic functionality of STAT3

Protein kinase Cε regulation of translocator protein (18 kDa)Tspo gene expression is mediated through a MAPK pathwaytargeting STAT3 and c-Jun transcription factors†
Amani Batarseh‡,§, Jiehan Li§,#, and Vassilios Papadopoulos‡,§,#,*‡Department of Biochemistry and Molecular and Cell Biology, Georgetown University MedicalCenter, Washington, D.C. 20057, USA§The Research Institute of the McGill University Health Centre and the Departments of Medicine,Biochemistry, 1650 Cedar Avenue, Montreal, Quebec H3G 1A4, Canada#Pharmacology and Therapeutics, McGill University, 1650 Cedar Avenue, Montreal, Quebec H3G1A4, Canada
AbstractTranslocator protein TSPO is an 18 kDa protein implicated in numerous cell functions and is highlyexpressed in secretory and glandular tissues, especially in steroidogenic cells. TSPO expression isaltered in pathological conditions such as certain cancers and neurological diseases. In search of thefactors regulating Tspo expression, we recently showed that high levels of TSPO in steroidogeniccells may be due to high constitutive expression of protein kinase Cε (PKCε), while phorbol-12-myristate 13-acetate (PMA) activation of PKCε drives inducible TSPO expression in non-steroidogenic cells, likely through activator protein 1 (AP1). In this study, we aimed to identify thesignal transduction pathway through which PKCe regulates Tspo gene expression. The MEK1/2specific inhibitor U0126, but not NFκB inhibitors, reduced basal Tspo promoter activity in TSPO-rich steroidogenic cells (MA-10 Leydig), as well as basal and PMA-induced Tspo promoter levelsin TSPO-poor non-steroidogenic cells (NIH-3T3 fibroblasts). AP1 and signal transducer andactivation of transcription 3 (STAT3) have binding sites in the Tspo promoter and are downstreamtargets of PKCε and MAPK (Raf-1 -ERK1/2) pathways. PKCe overexpression induced STAT3phosphorylation in NIH-3T3 cells, while PKCe knockdown reduced STAT3 and c-Junphosphorylation in Leydig cells. MEK1/2, ERK2, c-Jun, and STAT3 knockdown reduced TspomRNA and protein levels in Leydig cells. Additionally, Raf-1 reduced Tspo mRNA levels in thesame cells. MEK1/2, c-Jun, and STAT3 knockdown also reduced basal as well as PMA-inducedTspo mRNA levels in NIH-3T3 cells. Together, these results demonstrate that PKCe regulatesTspo gene expression through a MAPK (Raf-1-MEK1/2-ERK1/2) signal transduction pathway,acting at least in part through c-Jun and STAT3 transcription factors.
Translocator protein (18 kDa) TSPO is a nuclear encoded, primarily mitochondrial, highaffinity cholesterol- and drug-binding protein that has been implicated in numerous cellfunctions, including cholesterol transport and steroidogenesis, cellular respiration, oxidativestress, proliferation, and apoptosis (1;2). Among these functions, the role of TSPO in
†This work was supported by Grant R01 ES07747 from the National Institutes of Health (to V.P.). V.P. was also supported by a CanadaResearch Chair in Biochemical Pharmacology. The Research Institute of MUHC is supported in part by a Center grant from Le Fondsde la recherche en santé du Québec.*All correspondence should be sent to Dr. V. Papadopoulos, The Research Institute of the McGill University Health Center, MontrealGeneral Hospital, 1650 Cedar Avenue, C10-148, Montreal, Quebec H3G 1A4, Canada. Tel: 514-934-1934 ext. 44580. Fax:514-934-8261. [email protected].
NIH Public AccessAuthor ManuscriptBiochemistry. Author manuscript; available in PMC 2011 June 15.
Published in final edited form as:Biochemistry. 2010 June 15; 49(23): 4766–4778. doi:10.1021/bi100020e.
NIH
-PA Author Manuscript
NIH
-PA Author Manuscript
NIH
-PA Author Manuscript
cholesterol transfer across the outer to the inner mitochondrial membrane, the rate-determiningstep in steroidogenesis, is the most well-studied (1;2). TSPO is a ubiquitous protein with diverselevels of expression across the body. Particularly high TSPO levels are found in secretory andglandular tissues, and especially in steroid hormone producing cells, whereas intermediatelevels are observed in renal and myocardial tissues. Lower levels are detected in brain and liver(1-5). TSPO levels are also elevated in cancerous tissues of the breast, ovary, colon, prostate,and brain compared to normal human tissues, suggesting a role for TSPO in carcinogenesis(6-10). A positive correlation between TSPO levels and the metastatic potential of human breastand brain tumors further supports this hypothesis (2;6-8). TSPO expression is also upregulatedin the brain at sites of injury and inflammation, as well as following a number ofneuropathological conditions, including stroke, herpes and HIV encephalitis, andneurodegenerative disorders such as Alzheimer's disease, multiple sclerosis, amyotrophiclateral sclerosis, Parkinson's disease, and Huntington's disease (2;6-8;11).
A number of physiological and pharmacological modulators have been shown to alter TSPOlevels. These include IL-1, TNF-α, serotonin, norepinephrine, dopamine, peroxisomeproliferators, and ginkgolide B (12-14). Despite the numerous studies describing TSPO proteinlevels in various species and tissues, little is known about the mechanisms underlying itstranscriptional regulation. Typical of housekeeping genes, sequence analysis of the mouseTspo promoter revealed that it lacks TATA and CCAAT elements, but contains a series ofproximal GC boxes and several putative binding sites for transcription factors such as v-Etserythroblastosis virus E26 oncogene homolog (Ets), AP1, specificity protein 1/specificityprotein 3 (Sp1/Sp3), AP2, Ik2, GATA, SOX, and SRY (5;15;16). Deletion and mutationalstudies of the Tspo promoter revealed a differential transcriptional regulation of Tspo in TSPO-rich steroidogenic mouse Leydig cells compared to non-steroidogenic mouse NIH-3T3fibroblasts. Two proximal Sp1/Sp3 sites in the 123-15 bp region and members of the Ets familyof transcription factors, as well as an AP1 factor were found to be important for basaltranscriptional activity (5;15;16).
We previously analyzed Tspo transcriptional responses in steroidogenic (MA-10 mouse tumorLeydig cells) and non-steroidogenic cells (NIH-3T3 mouse fibroblasts and SV-40 transformedCOS-7 monkey kidney cells). We found that high levels of endogenous protein kinase C epsilon(PKCε) regulated Tspo expression in TSPO-rich steroidogenic cells, while phorbol-12-myristate 13-acetate (PMA) induced Tspo expression in TSPO-poor nonsteroidogenic cells,with PKCε mediating this effect. Moreover, the PKCε-activated pathway likely targeted theAP1 and Ets transcription factors, whose binding sites are localized to the 805-515-bp regionupstream of the transcription start site (16).
Protein kinase C is a family of serine/threonine-specific protein kinases consisting of at least11 known isoforms (17). PKC isoform expression and distribution is cell-type and condition-specific. A member of the typical group of PKC isoforms, PKCε, has been shown to be involvedin a variety of signaling events involved in cell proliferation, differentiation, apoptosis, nervousfunctions, and secretory vesicle trafficking (18). PKCε is abundant in endocrine, neuronal, andimmune cells (19;20). Moreover, the presence of high levels of PKCε in high-grade tumors,together with studies indicating its participation in tumor development, metastasis, andinvasion, have suggested that PKCε is an oncogene (19). Interestingly, the profile of TSPOexpression in endocrine tissues and various cancers, as well as the role of TSPO in cellproliferation, tumor invasion, and metastasis, parallels that of PKCε (16). PKCε has beenshown to exert its effects through multiple downstream signaling pathways including, but notlimited to, RACK2, NFκB, STAT3, mitogen-activated protein kinase MAPK (Raf-ERK1/2),or MARCKS (18;21;22).
Batarseh et al. Page 2
Biochemistry. Author manuscript; available in PMC 2011 June 15.
NIH
-PA Author Manuscript
NIH
-PA Author Manuscript
NIH
-PA Author Manuscript

Here we used specific pathway inhibitors in steroidogenic (MA-10 mouse tumor Leydig) andnon-steroidogenic (NIH-3T3 mouse fibroblasts) cells to show that the Raf-1 - ERK1/2signaling pathway is the downstream target through which PKCε regulates Tspo genetranscription. In the classic MAPK (Raf-1 -ERK1/2) pathway, Ras activates Raf-1 tophosphorylate MEK1/2, which in turn activates ERK1/2 by phosphorylation. Since AP1 andSTAT3 have binding sites in the Tspo promoter and are downstream targets of the PKCε andMAPK (Raf-1 -ERK1/2) pathways, we also investigated their possible regulation by thesekinases and their participation in regulating TSPO expression. The results obtaineddemonstrate that PKCe regulates Tspo gene expression through a MAPK (Raf-1-MEK1/2-ERK1/2) signal transduction pathway, acting at least in part through c-Jun and STAT3transcription factors.
EXPERIMENTAL PROCEDURESCell Culture
MA-10 cells were a gift from Dr. Mario Ascoli (University of Iowa, Ames, IA). Cells werecultured in T75-cm2 cell culture flasks (Dow Corning Corp., Corning, NY) and grown inDMEM/Ham-F12 nutrient mixture (Sigma Chemical Co., St. Louis, MO) supplemented with5% fetal bovine serum and 2.5% heat-inactivated horse serum (GIBCO, Burlington, ON).NIH-3T3 cells (Lombardi Cancer Center Tissue Culture Facility, Washington, DC) weremaintained in DMEM supplemented with 10% normal calf serum. Before experimentation,MA-10 and NIH-3T3 cells were allowed to recover from plating for 24 h.
Transfection and Luciferase AssaysMA-10 and NIH-3T3 cells were seeded in 6-well plates at a density of 150,000 cells per well.The Tspo promoter construct pGL3-805 (1.5 μg) reporter plasmid was used for transfectionsas described previously (5). In brief, cells were transfected for 24 h using Fugene 6 (Roche,Indianapolis, IN) for MA-10 cells and Polyfect (Qiagen, Valencia, CA) for NIH-3T3 cells. Allcultures received equimolar amounts of experimental constructs, where PUC19 or emptyvector were added where needed to keep the final amount of DNA constant. All cultures wereco-transfected with a Renilla luciferase reporter under the control of the thymidine kinasepromoter (PRLTK, Promega Corp., Madison, WI) to normalize for transfection efficiency.Twenty-four hours after transfection, cells were treated with PMA (Sigma-Aldrich) ordimethylsulfoxide (DMSO, vehicle) (Sigma-Aldrich) or MEK Inhibitors, 1,4-diamino-2,3-dicyano-1,4-bis (2-aminophenylthio)butadiene (U0126) or 2-(2-Amino-3-methoxyphenyl)-4H-1-benzopyran-4-one (PD98059), at indicated doses (Calbiochem,Gibbstown, NJ) for 24 h or as otherwise indicated. Cells were preincubated with inhibitors for1 h before adding PMA. Cellular extracts were collected by incubating cells in 1X passive lysisbuffer (Promega Corp.), followed by processing with the Dual-Luciferase Reporter System(Promega Corp.). Activity was measured using the Victor2 automated plate reader (PerkinElmer, Waltham, MA).
Quantitative Real Time (QRT)-PCRNIH-3T3 cells were seeded in 6-well plates, and after 24 h were treated with DMSO or PMAfor an additional 24 h. In silencing experiments, MA-10 and NIH-3T3 cells were seeded andtreated with siRNA as described below and then cells were collected for QRT-PCR analysis.RNA was extracted using the Rneasy kit (Qiagen) according to the manufacturer's instructions.RNA (1 μg) was reverse transcribed using the TaqMan reverse transcription reagents kit(Roche) according to manufacturer's instructions to a 20 μl final volume. The resulting cDNAwas diluted to 60 μl final volume with RNase free water and used as a template for real timePCR using Tspo specific primers (forward 5′-CACCGCATACATAGTAGTTGAGCA-3′ and
Batarseh et al. Page 3
Biochemistry. Author manuscript; available in PMC 2011 June 15.
NIH
-PA Author Manuscript
NIH
-PA Author Manuscript
NIH
-PA Author Manuscript

reverse 5′-CCCGCTTGCTGTACCCTTACC-3′), and SYBR GREEN dye. Amplification of18s ribosomal RNA served as a control.
MEK and NFκB inhibitorsMA-10 and NIH-3T3 cells were seeded at 150,000 cells per well in 6-well plates. Twenty-fourhours later, cells were transfected with pGL3-805 for 24 h before being preincubated with theMEK inhibitors U0126 (10 μM, or as indicated), PD98059 (10 μM), or with the NFkB SN50Cell-Permeable Inhibitor Peptide (10 and 20 μM) (Calbiochem #481480) or the NFkB SN50MCell-Permeable Inactive Control Peptide (Calbiochem #481486) (10 and 20 μM), for 1 h priorto PMA treatment (50 nM). Twenty-four hours later, cells were lysed and promoter activitywas measured using the dual luciferase assay as described above. Data were normalized toRenilla and presented as fold activity over the untreated control.
ImmunoblottingNIH-3T3 cells were seeded at 150,000 cells per well in 6-well plates for 24 h. Cells werepreincubated with MEK inhibitors U0126 (10 μM) or PD98059 (10 μM) for 1 h before treatingwith PMA for the indicated times. Cells were lysed in 1X cold RIPA buffer (Cell Signaling,Danvers, MA) supplemented with Halt protease inhibitor cocktail 1:100 (Pierce, Rockford,IL). Protein concentration was measured using a standard Bradford assay (Bio-Rad, Hercules,CA), and equal amounts of protein were electrophoresed on 4-20% tris-glycine polyacrylamidegels (Invitrogen), transferred onto PVDF membranes, and probed with antibodies to PKCε(1:800) and c-Jun (1:800) (Santa Cruz, Biotechnology, Santa Cruz, CA), TSPO (1:1000)(28), p-c-Jun (Ser73) (1:1000), ERK1/2 (1:2000) and pERK1/2 (1:2000), STAT3 (1:1000),pSTAT3 (Tyr705) (1:500), pSTAT3 (Ser727) (1:500) (Cell Signaling Technology, Danvers,MA), GAPDH (1:2000) (Trevigen, Gaithersburg, MD), HPRT (1:1000), Tubulin (1:2000),pMEK1 (1:1000) and tMEK (1:1000) (Abcam, Cambridge, MA), and p-Raf-1 (1:500)(Biosource, Camarillo, CA). Immunoreactive proteins were visualized by enhancedchemiluminescence (Amersham, Piscataway, NJ) using a FUJI image reader LAS4000 forcapturing images or film processing. Densitometry of each band was measured using Multi-gauge V3.0 software.
PKCε overexpressionThe pCMV6-XL4 expression plasmid containing Homo sapiens protein kinase C epsilon(PRKCE) was obtained from Origene (Rockville, MD). The plasmid was amplified andpurified, and the PKCε insert was sequenced. pCMV6-XL4 containing PKCε or empty vectorwere then transfected into NIH-3T3 cells as described above. Twenty-four hours later, cellswere treated with DMSO or PMA (50 nM) for an additional 24 h or as indicated. Cells werethen harvested for protein studies as described above.
PKCε, c-Jun, Stat3, and MEK1/2 siRNA treatmentsMA-10 and NIH-3T3 cells were seeded at 150,000 cells per well in 6-well plates. Cells weretransfected 24 h later with 4 or 8 μg of the PKCε siRNA pool, 1 μg Raf-1, 2 μg of the Stat3and MEK1/2 siRNA pool (Dharmacon, Lafayette, CO), or 2 μg c-Jun siRNA (Dharmacon)using X-treme GENE siRNA Transfection Reagent (Roche), as recommended by themanufacturer. For Raf-1 siRNA pool, MA-10 cells were cultured for 72 h before beingharvested for QRT-PCR. MA-10 and NIH-3T3 cells were transfected with Jun siRNA pool,24 h after seeding the cells and 48 h later. Cells were harvested at 72 h for QRT-PCR or 96 hfor immunoblot analysis. Stat3 and MEK1/2 siRNA pools were transfected into MA-10 cellsusing the protocol described above for c-Jun, while NIH-3T3 cells were transfected only onceand 72 h later mRNA was collected for QRT-PCR analysis. NIH-3T3 cells were treated withor without PMA (50 nM) at 48 h for an additional 24 h before being collected for QRT-PCR
Batarseh et al. Page 4
Biochemistry. Author manuscript; available in PMC 2011 June 15.
NIH
-PA Author Manuscript
NIH
-PA Author Manuscript
NIH
-PA Author Manuscript

analysis. Target gene knockdown was verified by QRT-PCR and/or immunoblot analysis ofcell extracts when indicated.
ERK2 shRNA plasmid treatmentMA-10 cells were seeded at 150,000 cells per well in 6-well plates for 24 h before beingtransfected for an additional 72 h with 800 ng of shRNA ERK2 plasmid or pKD-negativecontrol-v1 (Millipore, Lake Placid, NY) using Fugene 6 (Roche), followed by collection forprotein analysis. Target gene knockdown was verified by immunoblot analysis of cell extracts.
c-Jun overexpressionNIH-3T3 cells were seeded in 12 well plates at 10,000 cells/well for 24 h before transfectionwith 10 ng of either pCMV-6/c-Jun containing Homo sapiens c-Jun cDNA (bearing >93%homology with mouse c-Jun; Origene, Rockville, MD), or empty pCMV-6 vector as a controlalong with pGL3-805 or pGL3-805m (containing a double mutation at AP1 and Ets sites) orpGL3- Basic as a control. Cells were treated after 24 h with 50 nM PMA for an additional 24h before being lysed and assayed for luciferase activity as described above.
Preparation of Nuclear Extracts and Electrophoretic Mobility Shift Assay (EMSA)NIH-3T3 cells were transfected with pCMV-6 or pCMV-6 containing PKCε as described abovefor 24 h before treatment with or without 50 nM PMA for an additional 24 h. Nuclear extractswere prepared using NE-PER nuclear and cytosolic extraction reagents (Pierce Chemical Co.,Rockford, IL). For EMSA, double-stranded, 5′-biotinylated oligonucleotides containing wildtype and mutant AP1-binding sequences (Table I) were incubated with 5 μg of NIH/3T3 nuclearextracts. Unlabeled double-stranded AP1 and Ets oligonucleotides were used for competitionexperiments. EMSA was carried out using the LightShift Chemiluminescent EMSA kit (PierceChemical Co.) in the presence of EDTA and Mg2+. The manufacturer's protocol was slightlymodified to optimize protein-DNA interactions in the presence of antibodies. DNA-proteincomplexes were separated on 6% nondenaturing polyacrylamide gels, transferred to nylonmembranes, and processed for visualization. All antibodies used were purchased from SantaCruz Biotechnology (c-Jun: sc-44-x, STAT3: sc-482x and rabbit IgG: sc-2027). DNA-proteinbinding was optimized by including 10 μg BSA and 4 mM DTT in the all reactions.
Chromatin immunoprecipitation (ChIP)ChIP was performed using the Magna ChIP G kit (Millipore) according to the manufacturer'sprotocol. Briefly, MA-10 and NIH-3T3 cells were grown in 150 mm dishes to 80% confluenceand were cross-linked with medium containing 1% formaldehyde for 10 min at roomtemperature. Plates were washed 3 times with ice cold 1X PBS before being scraped andpelleted by centrifugation (800 × g) for 5 minutes at 4°C. Cells were lysed using lysis buffer(provided by manufacturer- Millipore) containing protease inhibitors and nuclei were collectedby centrifugation (800 × g) for 5 minutes at 4°C. Nuclei were suspended in nuclear lysis buffer(provided by manufacturer- Millipore) containing protease inhibitors and kept on ice. NuclearDNA was sheared to an average size of 200-1000 bp with eight 10-sec pulses at 25% powerusing a Vibracell VC 130 sonicator (Sonics and Materials Inc., Newtown, CT) fitted with a 3-mm stepped microtip. After shearing, chromatin was immunoprecipitated with 20 μl STAT3(#9139 Cell Signaling Technology) or 2 μl c-Jun (# SC-44 X, Santa Cruz) antibodies overnightat 4°C with rotation, and complexes were captured using magnetic protein-G beads. Magneticbeads were washed with a low and high salt immune complex wash buffer, LiCl immunecomplex wash buffer and lastly TE buffer following the manufacturer's instructions. Cross-links were reversed by incubating beads in a rotating oven for 4 h at 62°C. DNA was purifiedand diluted 1:10 before being subjected to QRT-PCR using primers specific for the mouseTspo distal promoter (forward 5′- TGGTTAAGAACAGGAAGCCcG-3′ and reverse 5′-
Batarseh et al. Page 5
Biochemistry. Author manuscript; available in PMC 2011 June 15.
NIH
-PA Author Manuscript
NIH
-PA Author Manuscript
NIH
-PA Author Manuscript

TGGTGTCTGCAAGGTAAAGGTGA-3′). Immunoprecipitates obtained with normal 2 μlrabbit IgG (#2729s, Cell Signaling Technology) served as negative controls. NIH-3T3 cellswere grown in 150 mm dishes to 70% confluence before being treated with DMSO or PMAfor an additional 24 h, after which cells were crosslinked and subjected to the same procedureas described above.
Sequence and statistical analysisSequence analysis was performed using Vector NTI software (Informax, Invitrogen).Statistical analysis was performed using Prism version 4.0 (GraphPad Software, San Diego,CA). Group means were compared using the Student's t test or two-way ANOVA. Data arepresented as mean ± SEM, where p < 0.05 was considered significant.
RESULTSPromoter regions 805-515 and 123-15 harbor elements essential for basal Tspo promoteractivity in MA-10 and NIH-3T3 cells
Detailed database motif analysis of the proximal promoter led to identification of multipleputative transcription factor binding sites (Figure 1). Of the multiple sites, three Sp1/Sp3, twoEts and one AP1 sites are dispersed within the first 805 bp of the promoter. Using mutationalanalysis and siRNA technology, we previously demonstrated that Sp1/Sp3 and Ets sites displaydifferential importance for basal transcription in steroidogenic MA-10 Leydig and non-steroidogenic NIH/3T3 fibroblast cells (5;15). Interestingly, analysis of the complimentarystrand revealed a STAT3 binding site that spans the AP1 and Ets sites in the 585-515 region.In this study we aimed to identify any potential role for the STAT3 and AP1 sites in regulatingthe basal and inducible activity of the Tspo gene promoter.
PMA-inducible and basal Tspo promoter activity depends on the MAPK/ERK1/2 signalingpathway
We previously reported that PMA-induced TSPO expression in non-steroidogenic NIH-3T3fibroblasts and the high constitutive expression levels in steroidogenic MA-10 Leydig cells areunder the control of PKCε. Since PMA induced Tspo transcription by activating PKCε inNIH-3T3 cells, which is known to act through multiple signaling pathways, we attempted todetermine the involvement of the MAPK (Raf-ERK1/2) pathway in regulating Tspo promoteractivity. As such, we transfected MA-10 and NIH-3T3 cells with the pGL3-805 promoterconstruct for 24 h before treatment with the MEK1/2 specific inhibitor U0126 for 1 h prior toadding PMA for an additional 24 h. As before, PMA induced Tspo promoter activity inNIH-3T3 (Figure 2A) but not in MA-10 cells (data not shown) (16). To further characterizethe effect of U0126 on Tspo promoter activity, NIH-3T3 and MA-10 cells transfected withpGL3-805 were treated with a broad range of doses of the inhibitor or control DMSO. U0126inhibited the effect of PMA in a dose-dependent manner in NIH-3T3 cells, where 20 μM ofU0126 abolished the stimulatory effect of PMA (Figure 2A). In addition, U0126 reduced basalTspo promoter activity in both NIH-3T3 and MA-10 cells in a dose-dependent manner (Figure2A, B).
To confirm the data obtained with U0126, we next performed a series of experiments usingthe MEK1/2 inhibitor PD98059 (data not shown). In contrast to what we expected, PD98059at 10 μM, a dose commonly used to block MEK 1/ 2 activation, not only failed to inhibit PMA-induced Tspo promoter activity in NIH-3T3 cells, but it enhanced basal transcription in bothNIH-3T3 and MA-10 cells, and the effect of PMA in NIH-3T3 cells. We next investigated thisfinding in detail using QRT-PCR to examine the effect of PD98059 on Tspo mRNA levels.PD98059 at 10 μM induced Tspo mRNA levels significantly after a 48 h treatment. When usedat 100 μM PD98059 reduced Tspo promoter activity. Since PD98059 is a flavone with a
Batarseh et al. Page 6
Biochemistry. Author manuscript; available in PMC 2011 June 15.
NIH
-PA Author Manuscript
NIH
-PA Author Manuscript
NIH
-PA Author Manuscript

possible effect on the antioxidant capacity of cells, resulting from the modulation of antioxidantenzyme activity as well as inhibition of enzymes that generate reactive metabolites, weinvestigated a possible effect on glutathione GSH levels. PD98059 reduced GSH levels onlyat the higher dose (100 μM). To examine whether the low concentrations (10 μM) of PD98059could affect the cellular oxidative machinery we used a mouse oxidative stress and antioxidantdefense profiler PCR array that identified 30 target genes down regulated after the 24 htreatment (data not shown). These findings suggest that PD98059 at low doses (10 μM) actsas a weak inducer of oxidative stress, which is sufficient to drive Tspo expression. At highconcentrations PD98059 is a strong inducer of oxidative stress leading to cytotoxicity andreduction of Tspo levels.
To determine whether the effect of PMA on the Tspo promoter was specific to the MAPKpathway, we next examined the role of the NFκB pathway in this process. NIH-3T3 cellstransfected with pGL3-805 were treated with PMA for an additional 24 h in the presence orabsence of the NFκB inhibitor peptide SN-50, or its mutated inactive negative control. Cellswere preincubated with the inhibitors for 1 h before adding PMA. Figure 2C shows that theNFκB inhibitor did not affect either the stimulatory effect of PMA on the Tspo promoter, orbasal Tspo promoter activity. NIH-3T3 cells were also treated with the small molecule NFkBActivation Inhibitor showing similar negative results (data not shown). Treating MA-10 cellswith either of the NFκB inhibitors did not reduce basal Tspo promoter activity (data not shown).
To investigate if PMA indeed activated the MAPK (Raf-1 -ERK1/2) pathway, NIH-3T3 cellswere seeded for 24 h and treated with PMA for different lengths of time (Figure 2D). PMAphosphorylated MEK1 and ERK1/2 in a time-dependent manner, with ERK2 sustaining higheractivation, up to 10 h, normalized to the HRPT control (Figure 2D). We previously reportedthat PMA induced the up-regulation of c-Jun protein levels, as well as its phosphorylation(16). Data shown in Figure 2D confirm and extend these findings by showing that PMA inducesc-Jun phosphorylation as early as 5 min, and significantly induces c-Jun protein levels startingat 1 h after treatment. In agreement with the promoter data presented above, treatment of thecells with U0126 inhibited ERK1/2 phosphorylation (Figure 2E).
PKCε affects Raf-1, ERK1/2 and STAT3 phosphorylation and prolongs the activation of theERK1/2 pathway
We previously demonstrated that PKCε induced TSPO and c-Jun mRNA and protein levels.To investigate whether PKCε exerts its effect through the MAPK pathway, we transfectedNIH-3T3 cells with either a PKCε-expressing CMV vector or an empty vector for 24 h aspreviously described (16). Cells were then treated with PMA for an additional 24 h beforeharvesting for immunoblot analysis. Immunoblotting with an anti-p-Raf-1 antibody indicatedincreased levels of p-Raf-1, even after treatment with PKCε and PMA for 24 h, compared tocontrols (Figure 3A). In the same samples, ERK1/2 phosphorylation in PKCε-transfected cellswas moderately higher than control where as in PMA treated samples ERK1/2 phosphorylationwas slightly higher by 24 h (Figure 3B&E).
In addition, the PKCε-transfected cells treated with PMA showed higher STAT3phosphorylation levels compared to control cells transfected with the CMV empty vector(Figure 3C). A PMA time-course treatment of NIH-3T3 cells transfected with CMV emptyvector (-PKCε) or PKCε showed a maximized activation of ERK1/2 as well as a prolongedbasal ERK1/2 phosphorylation in PKCε control compared to the CMV control at 24 h inrepresentative blots (Figures 3B&D). A densitometry analysis of three blots indicated asignificantly higher induction of ERK2 in PKCε-transfected samples compared to empty CMVvector alone (Figure 3E).
Batarseh et al. Page 7
Biochemistry. Author manuscript; available in PMC 2011 June 15.
NIH
-PA Author Manuscript
NIH
-PA Author Manuscript
NIH
-PA Author Manuscript

Raf-1, MEK1/2, Stat3, and c-Jun siRNA and ERK2 shRNA significantly reduce TSPOexpression levels in MA-10 cells
To confirm the putative role of the MAPK pathway in the regulation of TSPO expression, apool of Raf-1 and MEK1/2 siRNA and ERK2 shRNA were used to lower Raf-1 and MEK1/2mRNA levels and ERK2 protein levels, in TSPO-rich MA-10 cells. Figure 4A shows that thesiRNA pool significantly reduced c-Jun, Stat3, both MEK1& MEK2 and Raf-1 mRNA levels.Knockdown of both Raf-1 and MEK1/2 significantly reduced Tspo mRNA levels (Figure 4B).ERK2 shRNA significantly reduced ERK2 protein levels compared to the negative control,and knockdown of ERK2 and both MEK1/2 significantly reduced TSPO protein levels (Figure4C&D). We previously linked c-Jun to regulation of TSPO expression through binding to itscorresponding AP1 site on the Tspo promoter (16). siRNA for c-Jun significantly reducedTspo mRNA levels (Figure 4B) as well as TSPO protein levels (Figure 4D). Reducing Stat3mRNA levels also resulted in reduction of Tspo mRNA (Figure 4B) and protein levels inMA-10 cells (Figure 4D).
PKCε regulates TSPO expression as well as c-Jun and STAT3 activity in MA-10 cellsTo determine whether PKCε regulates STAT3, we tested for the phosphorylation status ofSTAT3 in MA-10 cells after knockdown of PKCε. PKCε siRNA was used to lower PKCεprotein levels in TSPO-rich MA-10 cells. Figure 5A shows that the pool of PKCε siRNA usedinhibited PKCε protein expression reaching an 80% inhibition in the presence of 4 μg of siRNA.In agreement with our previous findings, PKCε knockdown reduced TSPO protein levels aswell as p-c-Jun phosphorylation (Figure 5A&B) (16). Under the same conditions, the siRNAused also reduced the levels of STAT3 phosphorylated at Tyr705 (responsible for activationof the protein in the cytosol) as well as Ser727 (responsible for binding to DNA) (Figure 5C&D). Normalizing the levels of phosphorylated STAT3 to Tubulin and dividing them by thetotal STAT3 levels indicates that PKCε significantly reduced the phosphorylation levels of alarge portion of phosphorylated STAT3 at both the Tyr and Ser sites (Figure 5C&D), thusimplicating STAT3 as a downstream target of PKCε in MA-10 cells and adding a new elementto the machinery regulating TSPO expression.
MEK1/2, STAT3, and c-Jun mediate the effect of PMA on Tspo mRNA levels in NIH-3T3 cellsFigure 6A presents mRNA levels of endogenous c-Jun, Stat3, and MEK1/2 following treatmentwith the respective siRNAs. Treating NIH-3T3 cells with a siRNA pool for c-Jun, Stat3, andMEK1/2 for 72 h before QRT-PCR analysis revealed that all were able to slightly reduce basalTspo mRNA levels to a significant level (Figure 6B). Treatment with PMA for an additional24 h following treatment for 48 h with the siRNAs listed above induced Tspo mRNA levels inthe controls (scrambled) as we previously reported (16). We previously demonstrated thatPKCε overexpression induced c-Jun protein levels. Treating NIH-3T3 with a PKCε siRNApool reduced the PMA-induced c-Jun mRNA levels in a dose-dependent manner (Figure 6C).PMA induced c-Jun mRNA levels in the control (scrambled) by 3.5-fold, which was reducedby c-Jun siRNA (Figure 6D). Figure 6E shows a comparative representation of c-Jun mRNAlevels in MA-10 vs. NIH-3T3 cells, were its levels are approximately 1/3 of those found inMA-10 cells. In order to confirm the participation of c-Jun in the regulation of TSPOexpression, NIH-3T3 cells were transfected with pCMV-6/c-Jun cDNA or empty pCMV-6along with Tspo promoter constructs (wt pGL3-805 or pGL3-805-m) or Basic pGL-3 vectoras a control (Figure 6F). After 24 h cells were treated with 50 nM PMA for an additional 24 hbefore luciferase activity was measured. The results obtained showed that PMA inducedpGL3-805 activity by 3.5-fold, as previously reported, an effect that was absent when treatingcells containing pGL3-805m, which harbors a mutation in the AP1 and Ets binding sites (16).Interestingly, c-Jun alone was able to double basal Tspo activity in wt pGL3-805 and furtherpotentiate the PMA effect to 11-fold, an effect which was abolished by the introduced mutations
Batarseh et al. Page 8
Biochemistry. Author manuscript; available in PMC 2011 June 15.
NIH
-PA Author Manuscript
NIH
-PA Author Manuscript
NIH
-PA Author Manuscript

(Figure 6F), further confirming the role of c-Jun and its ability to act on Tspo promoter throughits potential AP1 binding site (Figure 1).
PMA induces binding of c-Jun and STAT3 to Tspo promoter sequencesEMSA was performed to investigate the effect of PMA on protein interactions at the AP1, Etsand the overlapping STAT-3 sites suspected to mediate the PMA effect on Tspo promoterregulation (Figure 7). It is important to note that the AP1 and Ets sites are separated by 3 bpresulting into identical wild-type and labeled probes, referred to as the AP1 oligonucleotide.Incubation of NIH-3T3 nuclear extracts transfected with CMV or PKCε with labeled AP1oligonucleotide (Table I) generated the previously reported two protein-DNA complexes(16); only the more abundant specific complex 1 is visible under the exposure presented herein(Figure 7A, B and C). In Figure 7A, using nuclear extracts from CMV transfected NIH-3T3cells treated with or without PMA, the phorbol ester induced complex 1 formation comparedto control (lanes 4 vs 2); this increased DNA-protein binding was successfully competed usinga c-Jun antibody (lanes 3 and 5). In cells transfected with PKCε, the same complex was formed(lanes 6 & 8), and treatment with PMA further potentiated complex 1 formation compared toPKCε alone; this DNA-protein binding interaction was also competed by c-Jun (lane 7&9). Inorder to investigate whether STAT3 is able to bind to the Tspo promoter, similar experimentswere conducted and the specific complex formed is shown in Figure 7B. Incubation with aSTAT3 antibody reduced the PMA-induced DNA-protein complex 1 formation (Figure 7B,lanes 4 & 8) as well as the DNA-protein binding induced by PKCε. The specificity of theseinteractions in nuclear extracts from transfected and non-transfected cells was confirmed bythe addition of 200-fold excess of an unlabeled AP1 oligonucleotide (wt), which competed theformation of the complexes (Figure 7C, lanes 2 & 7), or an unrelated oligonucleotide (Epstein-Barr virus nuclear antigen recognition site (E) (Figure 7, lane 3). The addition of a 200-foldexcess unlabeled oligonucleotide carrying a mutation on the putative AP1 site decreased theformation of both DNA-protein complexes in CMV and PKCε transfected cells (Figure 7C,lanes 4 & 8). On the other hand, a mutated Ets binding sequence (Figure 7C, lanes 5 & 9)successfully competed with nuclear protein binding to DNA in both complexes. The Etsmutated site was more effective than the AP1 mutated site in decreasing the formation of thesecomplexes.
c-Jun is bound to the endogenous Tspo promoter, and PMA recruits STAT3 binding in NIH/3T3 cells
We next used a ChIP assay to determine whether STAT3 and c-Jun transcription factors arebound to the endogenous Tspo promoter in intact cells. Data shown in Figure 8A and Bdemonstrate that c-Jun binds to the endogenous promoter in both MA-10 and NIH-3T3 cells,whereas the IgG negative control does not. Based on this data and because a STAT3 bindingsite was identified in this sequence, which partially overlaps with the c-Jun and Ets sites thatregulate the Tspo promoter in response to PMA (Figure 1), we examined whether STAT3 bindsto the Tspo promoter by ChIP analysis. Figure 8C shows that PMA induced STAT3 bindingto the Tspo promoter in NIH-3T3 cells, indicating that both STAT3 and c-Jun are importantplayers in regulating Tspo gene expression.
DISCUSSIONThe data presented in this manuscript implicate the MAPK (Raf-1/ERK2) signal transductionpathway as the downstream target of PKCε, responsible for mediating the effect of the kinaseon Tspo gene promoter activity and expression. We also demonstrate that the PKCε-MAPKeffect on TSPO expression is at least in part mediated by the c-Jun and STAT3 transcriptionfactors. In previous studies, functional characterization of the Tspo promoter revealed thepresence of two Sp1/Sp3 sites and two Ets sites in the proximal promoter; variable expression
Batarseh et al. Page 9
Biochemistry. Author manuscript; available in PMC 2011 June 15.
NIH
-PA Author Manuscript
NIH
-PA Author Manuscript
NIH
-PA Author Manuscript
between the cell lines examined, as well as differences in the binding of these transcriptionfactors to the Tspo promoter, were shown to result in differential regulation of the basalTspo promoter activity between steroidogenic and non-steroidogenic cells (5;15). An AP1 site,adjacent to the second Ets site, was also identified in the Tspo promoter, and its role inregulating basal Tspo promoter activity was shown (16). We then investigated the molecularmechanisms governing Tspo regulation by exploring Tspo transcriptional responses to a tumor-promoting agent (PMA) in three cell lines with varying TSPO levels, and showed that onlycell lines expressing low endogenous levels of TSPO were responsive to PMA, and that AP1and the second Ets sites mediated this effect (16). The stimulatory effect of PMA in the low-expressing TSPO non-steroidogenic NIH-3T3 mouse fibroblasts was subsequently shown tobe mediated by PKCε (16). PKCε was also found to be expressed at high levels in thesteroidogenic MA-10 mouse tumor Leydig cells levels, where it maintained the highconstitutive expression of TSPO in these cells (16). Thus, PKCε levels, activity, and targetsseem to be the key drivers of Tspo promoter activity and protein expression.
PKCε signal transduction is complicated, and it is known to act through several cellularpathways such as NFκB, MAPK, p38, or by binding to RACK2. To identify the signalingpathway through which PMA and thus PKCε act on Tspo gene expression, we used pathway-specific inhibitors for the MAPK component MEK1/2, as well as specific inhibitors for theNFκB pathway. The MEK1/2 phosphorylation inhibitor U0126, which exerts its effect byblocking both new and existing MEK phoshophorylation and thus inhibiting MEK's ability tophosphorylate ERK1/2, completely abolished the activation of the Tspo promoter by PMA andreduced basal promoter activity in a dose-dependent manner. In contrast, both peptide andsmall molecule inhibitors of NFκB did not affect PMA-induced Tspo transcription, indicatingthe effect of PMA on Tspo promoter is NFκB-independent and is specific to the MEK1/2signaling pathway.
We obtained contradictory findings using the MEK1/2-specific inhibitor PD898059, whichunlike U0126 blocks only newly phosphorylated MEK, where a low dose (10 μM) inducedTspo promoter activity and mRNA levels and a high dose (100 μM) reduced Tspo mRNAlevels. In search of the mechanisms underlying this biphasic effect of PD898058 we observedthat high concentrations of the compound reduced a glutathione levels. However, although at10 μM PD98059 did not affect glutathione levels, it altered the expression of 30 out of 84 genesinvolved in cellular oxidative stress defense. Taken together these results suggest that PD98059at low doses acts as a weak inducer of oxidative stress altering the homeostasis of the cellantioxidant defense system and generating oxidative stress sufficient to drive Tspo expression(data not shown). This finding could be explained by the fact the PD898059 is a flavonoidpreviously shown to reduce antioxidant molecule levels in various cell types (23). Nevertheless,these data identified reactive oxygen species as a regulator of Tspo expression, a finding thatwill be investigated in detail in future studies.
Raf-1 was significantly phosphorylated at 24 h in NIH-3T3 cells transfected with PKCε andtreated with PMA. On the other hand, PKCε increased ERK1/2 phosphorylation levels at 24h. In these cells, PMA treatment of cells transfected with PKCε also increased STAT3 Tyr705phosphorylation, suggesting that STAT3 may be a member of the transcriptional machineryregulating Tspo expression. Although ERK1/2 phosphorylation levels were induced with PMAin both empty vector- and PKCε-transfected cells, phosphorylation of ERK1/2 wassignificantly higher in PKCε-transfected cells; the presence of increased levels of PKCε werefound to prolong ERK2 activation in agreement with previous findings in PNAC-1 cells (24).It is important to note that aberrant expression and/or activity of PKCε, MAPK/ERK1/2, AP1,STAT3, and TSPO have been linked to many diseases and cancers (21;25;26). Moreover, giventhe fact that STAT3 knockdown in vitro reduces TSPO levels, one could speculate that the
Batarseh et al. Page 10
Biochemistry. Author manuscript; available in PMC 2011 June 15.
NIH
-PA Author Manuscript
NIH
-PA Author Manuscript
NIH
-PA Author Manuscript

STAT3-driven reduction in TSPO levels in vivo could be a contributing factor to the embryoniclethality seen in both STAT3 (27) and TSPO knockout mice (28).
Knockdown of Raf-1 and MEK1/2 with siRNAs significantly reduced TSPO mRNA andprotein expression levels in MA-10 cells. MEK1/2 knockdown significantly reduced both basaland PMA-induced Tspo mRNA levels in NIH-3T3 cells. In addition, ERK2 shRNAsignificantly reduced TSPO levels in MA-10 cells, further confirming the role of the MAPKpathway in the regulation of TSPO expression.
Knockdown of c-Jun levels significantly reduced constitutive TSPO mRNA and protein levelsin MA-10 cells, and both basal and PMA-induced Tspo mRNA levels in NIH-3T3 cells. Thisfinding is in agreement with the previously proposed hypothesis that the effect of PKCε onTSPO expression is mediated at least in part through c-Jun (16). To confirm previous findingsshowing that PMA regulates c-Jun expression, in NIH-3T3 cells, we assessed c-Jun mRNAlevels in cells treated with PMA. Interestingly, PMA induced new c-Jun synthesis in controlcells treated with scrambled siRNA by 3.5-fold, an effect that was reduced in a dose-dependentmanner by c-Jun and PKCε siRNA. Newly synthesized c-Jun may be compensating for thereduced c-Jun levels and thus allowing the induction of Tspo expression. A comparative studyof c-Jun mRNA levels in MA-10 vs. NIH-3T3 cells showed that c-Jun mRNA levels inNIH-3T3 cells were approximately a third of those present in MA-10 cells, an observation thatcorrelates well with the 3.5-fold induction of c-Jun mRNA levels in NIH-3T3 cells followingPMA treatment. We previously reported that basal level of Tspo promoter activity in MA-10cells is double to that found in NIH-3T3 cells. Following PMA treatment of NIH-3T3 cellsTspo promoter activity reach the basal levels found in MA-10 cells, an effect that could bemediated through c-Jun induction. Overexpression of c-Jun in NIH-3T3 cells along withTspo promoter constructs was able to double the basal Tspo promoter activity and furtherpotentiate the effect of PMA only when the AP1 binding site was intact, further confirmingthat this is the site through which c-Jun acts on Tspo promoter.
STAT3 knockdown by siRNA reduced Tspo mRNA and protein levels in MA-10 cells, as wellas basal and PMA-induced Tspo mRNA levels in NIH-3T3 cells. We previously showed thatPKCε levels correlate with TSPO levels, and much higher levels of both PKCε and TSPO arepresent in MA-10 cells compared to NIH-3T3 cells. Since PKCε has been linked to STAT3regulation, and we demonstrated higher activation of STAT3 when overexpressing PKCε inNIH-3T3 cells, we investigated the effect of PKCε knockdown on STAT3 phosphorylation inMA-10 cells. Knockdown of PKCε in MA-10 cells reduced both TSPO expression and p-c-Jun levels at Ser73, a phosphorylation site important for c-Jun binding to DNA, (16) as wellas STAT3 phosphorylation at Tyr705 and Ser727, in agreement with reports that PKCε is aregulator of STAT3 (21;22). To examine whether c-Jun and STAT3 bind to their DNAsequences in cells overexpressing PKCε, we performed EMSAs using NIH-3T3 nuclearextracts from cells transfected with PKCε and CMV, and examined the ability of c-Jun andSTAT3 to shift/deplete the DNA-protein complexes formed. In agreement with previous data,c-Jun was able to efficiently deplete the complexes, while STAT3 was able to decrease complexformation in CMV/PMA treated cells as well as complex formation in PKCε transfected cellsand PKCε/PMA treated cells. These data suggest that PKCε recruits STAT3 to the complex,an effect accomplished by treating with CMV transfected cells with PMA.
The specificity of the DNA-protein complexes formed was confirmed using a 200x abundantwt probe as well as ones containing mutations in the AP1 and Ets sites. The Ets mutated probewas more successful at competing the DNA-protein complex compared to AP1 mutated probe.This finding suggests two possible explanations: i. an intact Ets site is not important for thebinding of proteins while an AP1 site is. ii. Due to the close proximity of the Ets and AP1 sites,an oligo containing a mutated Ets site, harbors an intact AP1 site allowing the binding of factors
Batarseh et al. Page 11
Biochemistry. Author manuscript; available in PMC 2011 June 15.
NIH
-PA Author Manuscript
NIH
-PA Author Manuscript
NIH
-PA Author Manuscript

at the AP1 site and thus competing with the complex formation, whereas an oligonucleotidewith a mutated AP1 site does not allow binding and is not as successful in depleting thecomplex.
To examine whether the effect of c-Jun and STAT3 on Tspo gene expression is direct, throughpromoter binding, or indirect, we performed a ChIP assay using primers spanning a 770 bpregion of the Tspo promoter, where STAT3 and c-Jun factors are expected to bind. Wepreviously identified both AP1 and Ets binding sites in the region of 585-515 bp. Interestingly,the complimentary strand to the two sites harbors a STAT3 binding site. Synergistic bindingbetween c-Jun and STAT3 has been previously reported in the literature (29;30). This suggeststhat STAT3 and c-Jun could bind to the Tspo promoter at the same time, thus keeping thestrands open and more accessible to transcription factors to induce gene expression. c-Jun hasalso been reported to recruit STAT3 to bind to the promoter, where c-Jun has been found tobe present on the promoter before the arrival of phosphorylated STAT3 (31).We used a ChIPassay to test for binding by STAT3 and c-Jun to the Tspo promoter, and found that c-Jun indeedbinds to the Tspo promoter in both MA-10 cells and NIH-3T3 cells. This finding confirms andextends previous data, where gel shift assays of PMA-treated NIH-3T3 cell extracts indicatedincreased binding of c-Jun to the Tspo promoter (16). Additional ChIP assays demonstratedthat PMA induced binding of STAT3 to the Tspo promoter in NIH-3T3 cells. Because the Ras-MAPK pathway is not fully activated in NIH-3T3 cells (32), and this study demonstrated thatPMA activation of Tspo promoter is mediated through a MAPK pathway, which also regulatesSTAT3 activity as a downstream target, we hypothesize that the increased activation of theMAPK pathway induced STAT3 activation and recruitment to the Tspo promoter. Indeed, aRas/ERK1/2/STAT3 Ser727 pathway has been documented in literature (33). It is also possiblethat PMA induces changes of the activity of the Tspo promoter-bound proteins, allowing themto recruit additional factors and modifying the content of the factors binding to the AP-1 andEts sites that span the STAT3 site.
In summary, the data presented herein show that a PKCε-dependent signal transductionpathway activating the MAPK (Raf-1/MEK1/2/ ERK2) pathway acts, at least in part, throughc-Jun and STAT3 transcription factors to drive Tspo transcription and protein expression(Figure 9). This pathway is constitutively activated in steroidogenic MA-10 cells and inducedby PMA in non-steroidogenic NIH-3T3 cells. Because differential expression of TSPO acrossthe body has been associated with numerous physiological functions, ranging fromsteroidogenesis to mitochondrial function and cell proliferation, and changes in TSPOexpression have been linked to various diseases, such as cancer and neurological disorders,understanding how Tspo expression is regulated in health and disease may prove beneficial fordiagnostic, therapeutic, and prognostic purposes. Identifying factors and cofactors participatingin the regulation of TSPO expression, and linking Tspo gene regulation to a specific signaltransduction pathway, not only provides new insights into understanding the TSPO regulationin steroidogenic versus nonsteroidogenic cells, where the focus of our research lies, but alsogives clues regarding the factors and mechanism that could regulate TSPO expression indisease states.
ABBREVIATIONS
AP1 activator protein 1
ChIP chromatin immunoprecipitation
EMSA electrophoretic mobility shift assay
PKCε protein kinase C epsilon
PMA phorbol-12-myristate 13-acetate
Batarseh et al. Page 12
Biochemistry. Author manuscript; available in PMC 2011 June 15.
NIH
-PA Author Manuscript
NIH
-PA Author Manuscript
NIH
-PA Author Manuscript

Sp1 specificity protein 1/Sp1 transcription factor
TSPO translocator protein (18 kDa)
STAT3 signal transducer and activator of transcription 3
REFERENCES1. Casellas P, Galiegue S, Basile AS. Peripheral benzodiazepine receptors and mitochondrial function.
Neurochem. Int 2002;40:475–486. [PubMed: 11850104]2. Papadopoulos V, Baraldi M, Guilarte TR, Knudsen TB, Lacapere JJ, Lindemann P, Norenberg MD,
Nutt D, Weizman A, Zhang MR, Gavish M. Translocator protein (18kDa): new nomenclature for theperipheral-type benzodiazepine receptor based on its structure and molecular function. TrendsPharmacol. Sci 2006;27:402–409. [PubMed: 16822554]
3. Braestrup C, Squires RF. Specific benzodiazepine receptors in rat brain characterized by high-affinity(3H)diazepam binding. Proc. Natl. Acad. Sci. U. S. A 1977;74:3805–3809. [PubMed: 20632]
4. Gavish M, Bachman I, Shoukrun R, Katz Y, Veenman L, Weisinger G, Weizman A. Enigma of theperipheral benzodiazepine receptor. Pharmacol. Rev 1999;51:629–650. [PubMed: 10581326]
5. Giatzakis C, Papadopoulos V. Differential utilization of the promoter of peripheral-typebenzodiazepine receptor by steroidogenic versus nonsteroidogenic cell lines and the role of Sp1 andSp3 in the regulation of basal activity. Endocrinology 2004;145:1113–1123. [PubMed: 14630713]
6. Galiegue S, Casellas P, Kramar A, Tinel N, Simony-Lafontaine J. Immunohistochemical assessmentof the peripheral benzodiazepine receptor in breast cancer and its relationship with survival. Clin.Cancer Res 2004;10:2058–2064. [PubMed: 15041726]
7. Han Z, Slack RS, Li W, Papadopoulos V. Expression of peripheral benzodiazepine receptor (PBR) inhuman tumors: relationship to breast, colorectal, and prostate tumor progression. J. Recept. Signal.Transduct. Res 2003;23:225–238. [PubMed: 14626449]
8. Hardwick M, Fertikh D, Culty M, Li H, Vidic B, Papadopoulos V. Peripheral-type benzodiazepinereceptor (PBR) in human breast cancer: correlation of breast cancer cell aggressive phenotype withPBR expression, nuclear localization, and PBR-mediated cell proliferation and nuclear transport ofcholesterol. Cancer Res 1999;59:831–842. [PubMed: 10029072]
9. Katz Y, Ben-Baruch G, Kloog Y, Menczer J, Gavish M. Increased density of peripheralbenzodiazepine-binding sites in ovarian carcinomas as compared with benign ovarian tumours andnormal ovaries. Clin. Sci. (Lond) 1990;78:155–158. [PubMed: 2155741]
10. Maaser K, Grabowski P, Sutter AP, Hopfner M, Foss HD, Stein H, Berger G, Gavish M, Zeitz M,Scherubl H. Overexpression of the peripheral benzodiazepine receptor is a relevant prognostic factorin stage III colorectal cancer. Clin. Cancer Res 2002;8:3205–3209. [PubMed: 12374690]
11. Papadopoulos V, Lecanu L. Translocator protein (18 kDa) TSPO: an emerging therapeutic target inneurotrauma. Exp. Neurol 2009;219:53–57. [PubMed: 19409385]
12. Amri H, Drieu K, Papadopoulos V. Transcriptional suppression of the adrenal cortical peripheral-type benzodiazepine receptor gene and inhibition of steroid synthesis by ginkgolide B. Biochem.Pharmacol 2003;65:717–729. [PubMed: 12628485]
13. Gazouli M, Yao ZX, Boujrad N, Corton JC, Culty M, Papadopoulos V. Effect of peroxisomeproliferators on Leydig cell peripheral-type benzodiazepine receptor gene expression, hormone-stimulated cholesterol transport, and steroidogenesis: role of the peroxisome proliferator-activatorreceptor alpha. Endocrinology 2002;143:2571–2583. [PubMed: 12072389]
14. Veenman L, Papadopoulos V, Gavish M. Channel-like functions of the 18-kDa translocator protein(TSPO): regulation of apoptosis and steroidogenesis as part of the host-defense response. Curr.Pharm. Des 2007;13:2385–2405. [PubMed: 17692008]
15. Giatzakis C, Batarseh A, Dettin L, Papadopoulos V. The role of Ets transcription factors in the basaltranscription of the translocator protein (18 kDa). Biochemistry 2007;46:4763–4774. [PubMed:17402746]
Batarseh et al. Page 13
Biochemistry. Author manuscript; available in PMC 2011 June 15.
NIH
-PA Author Manuscript
NIH
-PA Author Manuscript
NIH
-PA Author Manuscript

16. Batarseh A, Giatzakis C, Papadopoulos V. Phorbol-12-myristate 13-acetate acting through proteinkinase Cepsilon induces translocator protein (18-kDa) TSPO gene expression. Biochemistry2008;47:12886–12899. [PubMed: 18975922]
17. da Rocha AB, Mans DR, Regner A, Schwartsmann G. Targeting protein kinase C: new therapeuticopportunities against high-grade malignant gliomas? Oncologist 2002;7:17–33. [PubMed:11854544]
18. Garczarczyk D, Toton E, Biedermann V, Rosivatz E, Rechfeld F, Rybczynska M, Hofmann J. Signaltransduction of constitutively active protein kinase C epsilon. Cellular Signalling 2009;21:745–752.[PubMed: 19168130]
19. Griner EM, Kazanietz MG. Protein kinase C and other diacylglycerol effectors in cancer. Nat. Rev.Cancer 2007;7:281–294. [PubMed: 17384583]
20. Ono Y, Fujii T, Ogita K, Kikkawa U, Igarashi K, Nishizuka Y. The structure, expression, andproperties of additional members of the protein kinase C family. J. Biol. Chem 1988;263:6927–6932.[PubMed: 2834397]
21. Aziz MH, Manoharan HT, Church DR, Dreckschmidt NE, Zhong W, Oberley TD, Wilding G, VermaAK. Protein kinase Cepsilon interacts with signal transducers and activators of transcription 3 (Stat3),phosphorylates Stat3Ser727, and regulates its constitutive activation in prostate cancer. Cancer Res2007;67:8828–8838. [PubMed: 17875724]
22. Aziz MH, Manoharan HT, Sand JM, Verma AK. Protein kinase Cepsilon interacts with Stat3 andregulates its activation that is essential for the development of skin cancer. Mol. Carcinog2007;46:646–653. [PubMed: 17583567]
23. Kirkland RA, Franklin JL. Prooxidant Effects of NGF Withdrawal and MEK Inhibition inSympathetic Neurons. Antioxidants & Redox Signaling 2003;5:635–639. [PubMed: 14580320]
24. Racz GZ, Szucs A, Szlavik V, Vag J, Burghardt B, Elliott AC, Varga G. Possible role of duration ofPKC-induced ERK activation in the effects of agonists and phorbol esters on DNA synthesis in Panc-1cells. J. Cell Biochem 2006;98:1667–1680. [PubMed: 16637058]
25. Imler JL, Wasylyk B. AP1, a composite transcription factor implicated in abnormal growth control.Prog. Growth Factor Res 1989;1:69–77. [PubMed: 2518808]
26. Lawrence MC, Jivan A, Shao C, Duan L, Goad D, Zaganjor E, Osborne J, McGlynn K, Stippec S,Earnest S, Chen W, Cobb MH. The roles of MAPKs in disease. Cell Res 18:436–442. 0 AD. [PubMed:18347614]
27. Akira S. Functional roles of STAT family proteins: lessons from knockout mice. Stem Cells1999;17:138–146. [PubMed: 10342556]
28. Papadopoulos V, Amri H, Boujrad N, Cascio C, Culty M, Garnier M, Hardwick M, Li H, Vidic B,Brown AS, Reversa JL, Bernassau JM, Drieu K. Peripheral benzodiazepine receptor in cholesteroltransport and steroidogenesis. Steroids 1997;62:21–28. [PubMed: 9029710]
29. Yoo JY, Wang W, Desiderio S, Nathans D. Synergistic Activity of STAT3 and c-Jun at a SpecificArray of DNA Elements in the +¦2-Macroglobulin Promoter. Journal of Biological Chemistry2001;276:26421–26429. [PubMed: 11319221]
30. Zhang X, Wrzeszczynska MH, Horvath CM, Darnell JE Jr. Interacting Regions in Stat3 and c-JunThat Participate in Cooperative Transcriptional Activation. Mol. Cell. Biol 1999;19:7138–7146.[PubMed: 10490649]
31. Ginsberg M, Czeko E, Muller P, Ren Z, Chen X, Darnell JE Jr. Amino acid residues required forphysical and cooperative transcriptional interaction of STAT3 and AP-1 proteins c-Jun and c-Fos.Mol. Cell Biol 2007;27:6300–6308. [PubMed: 17636030]
32. Ghosh D, Ezashi T, Ostrowski MC, Roberts RM. A central role for Ets-2 in the transcriptionalregulation and cyclic adenosine 5′-monophosphate responsiveness of the human chorionicgonadotropin-beta subunit gene. Mol. Endocrinol 2003;17:11–26. [PubMed: 12511603]
33. Plaza-Menacho I, van der ST, Hollema H, Gimm O, Buys CH, Magee AI, Isacke CM, Hofstra RM,Eggen BJ. Ras/ERK1/2-mediated STAT3 Ser727 phosphorylation by familial medullary thyroidcarcinoma-associated RET mutants induces full activation of STAT3 and is required for c-fospromoter activation, cell mitogenicity, and transformation. J Biol. Chem 2007;282:6415–6424.[PubMed: 17209045]
Batarseh et al. Page 14
Biochemistry. Author manuscript; available in PMC 2011 June 15.
NIH
-PA Author Manuscript
NIH
-PA Author Manuscript
NIH
-PA Author Manuscript

Figure 1. Promoter regions 805-515 and 123-1 harbor elements essential for basal Tspo promoteractivity in MA-10 and NIH-3T3 cellsSchematic representation of the mouse Tspo promoter showing transcription factor bindingsites important for activity. The sequence harboring AP1, Ets and an overlapping STAT3 siteis magnified. Shaded boxes indicate the nucleotide sequences of transcription factor bindingsites.
Batarseh et al. Page 15
Biochemistry. Author manuscript; available in PMC 2011 June 15.
NIH
-PA Author Manuscript
NIH
-PA Author Manuscript
NIH
-PA Author Manuscript

Figure 2. PMA-induced activation of the Tspo promoter is mediated by a MAPK pathway(A) Dose-dependent effect of U0126 on pGL3-805 luciferase activity, alone or with PMA (50nM) or DMSO (control) in NIH-3T3 cells. (B) Dose-dependent effect of U0126 on pGL3-805luciferase activity in MA-10 cells. (C) Dose-dependent effect of NFκB inhibitor peptide or itsinactive peptide incubated in the presence or absence of PMA (50 nM) on NIH-3T3 cells. Cellswere transfected with pGL3-805 for 24 h previous to treating with PMA. Cells werepreincubated with the indicated concentrations of inhibitors or vehicle for 1 h prior to addingPMA up to 24 h after which they were lysed and luciferase activity was measured (D)Immunoblot of phosphorylated (p) and total (t) levels of MEK1, ERK1/2, and c-Jun in NIH-3T3cells treated with or without PMA (50 nM) for the indicated time course. (E) Effect of U0126(UO) on PMA-induced ERK1/2 phosphorylation. Cells were seeded for 24 h previous totreatment with PMA for the indicated time points. When treated with U0126 inhibitor, cellswere preincubated for 1 h before addition of PMA. Blots shown are representative of at leasttwo independent experiments. Results in (A), (B), and (C) are derived from three independentexperiments (n = 9) and presented as fold over untreated control. *p < 0.05 and ***p < 0.001vs. control; ns, non-significant.
Batarseh et al. Page 16
Biochemistry. Author manuscript; available in PMC 2011 June 15.
NIH
-PA Author Manuscript
NIH
-PA Author Manuscript
NIH
-PA Author Manuscript

Figure 3. PKCε affects Raf-1, ERK1/2 and STAT3 phosphorylation and prolongs and maximizesactivation of the ERK1/2 pathwayNIH-3T3 cells were transfected with the PKCε expression vector or empty CMV vector for 24h, then treated with or without PMA for 24 h and examined by immunoblot for the effect onp-Raf-1 (A), pERK1/2 (B), and p-STAT3 Tyr705 (C). (D) Immunoblot analysis of pERK1/2levels in NIH-3T3 cells treated with PMA and overexpressing the PKCε expression vector orempty CMV vector for the indicated times. (E) Densitometry of the data shown in (D), obtainedfrom three independent experiments. In (E), immunoreactive bands were normalized to HPRT,and are expressed as an increase relative to control, (CMV samples were normalized to CMVat time zero (white bars), and PKCε samples were normalized to PKCε time zero (black bars).*p < 0.05, **p < 0.01, and ***p < 0.001 vs. control. Data are representative of at least threeindependent experiments.
Batarseh et al. Page 17
Biochemistry. Author manuscript; available in PMC 2011 June 15.
NIH
-PA Author Manuscript
NIH
-PA Author Manuscript
NIH
-PA Author Manuscript

Figure 4. Raf-1, MEK1/2, Stat3, and c-Jun siRNA and ERK2 shRNA significantly reduce TSPOexpression levels in MA-10 cells(A) Effect of gene-specific siRNA treatment on c-Jun, Stat3, and MEK1/2, Raf-1 mRNA levelscompared to control (scrambled siRNA). (B) Effect of down-regulation of c-Jun, Stat3, andMEK1/2, Raf-1 on Tspo mRNA levels compared to control cells incubated with scrambledsiRNA. (C) Effect of down-regulation of ERK2 by shRNA on TSPO protein levels (top panel)and densitometric analysis of the immunoreactive bands (bottom panel). Cells were transfectedwith shRNA for ERK2 or pKD-negative control for 72 h before immunoblot analysis. (D)Effect of down-regulation of MEK1/2, Stat3, and c-Jun by siRNA on TSPO protein levels (toppanel) and densitometric analysis of the immunoreactive bands (bottom panel). Cells weretreated with the siRNA pool specific for c-Jun, Stat3, and MEK1/2, Raf-1 or scrambledoligonucleotides as described under materials and methods before analysis of Tspo levels usingQRT-PCR and immunoblotting. Immunoreactive bands were normalized to GAPDH, andvalues are expressed as a decrease relative to controls incubated with scrambled siRNA.Immunoblots are representative of at least three independent experiments. Data in (A) werenormalized to control (scrambled siRNA) and are derived from three independent experiments(n = 9) **p < 0.01, and ***p < 0.001 vs. control.
Batarseh et al. Page 18
Biochemistry. Author manuscript; available in PMC 2011 June 15.
NIH
-PA Author Manuscript
NIH
-PA Author Manuscript
NIH
-PA Author Manuscript

Figure 5. PKCε mediates TSPO protein levels and regulates c-Jun and STAT3 activity in MA-10cellsEffect of PKCε knockdown on TSPO expression, phosphorylation levels of c-Jun at Ser73 andSTAT3 at Ser727 and Tyr705. Cells were seeded and treated with the siRNA pool specific forPKCε, or with scrambled siRNA as mentioned in materials and methods. Cells were analyzedfor PKCε, c-Jun pSer73 (A), STATpSer727, STATpTyr705, and STAT3 by immunoblotting 96 hafter siRNA transfection (C). Densitometric analysis of the blots was performed andimmunoreactive bands were normalized to GAPDH (B) or Tubulin (D) controls, and data areexpressed as decrease relative to control. Immunoblots are representative of at least twoindependent experiments. *p < 0.05, **p < 0.01, and ***p < 0.001 vs. control.
Batarseh et al. Page 19
Biochemistry. Author manuscript; available in PMC 2011 June 15.
NIH
-PA Author Manuscript
NIH
-PA Author Manuscript
NIH
-PA Author Manuscript
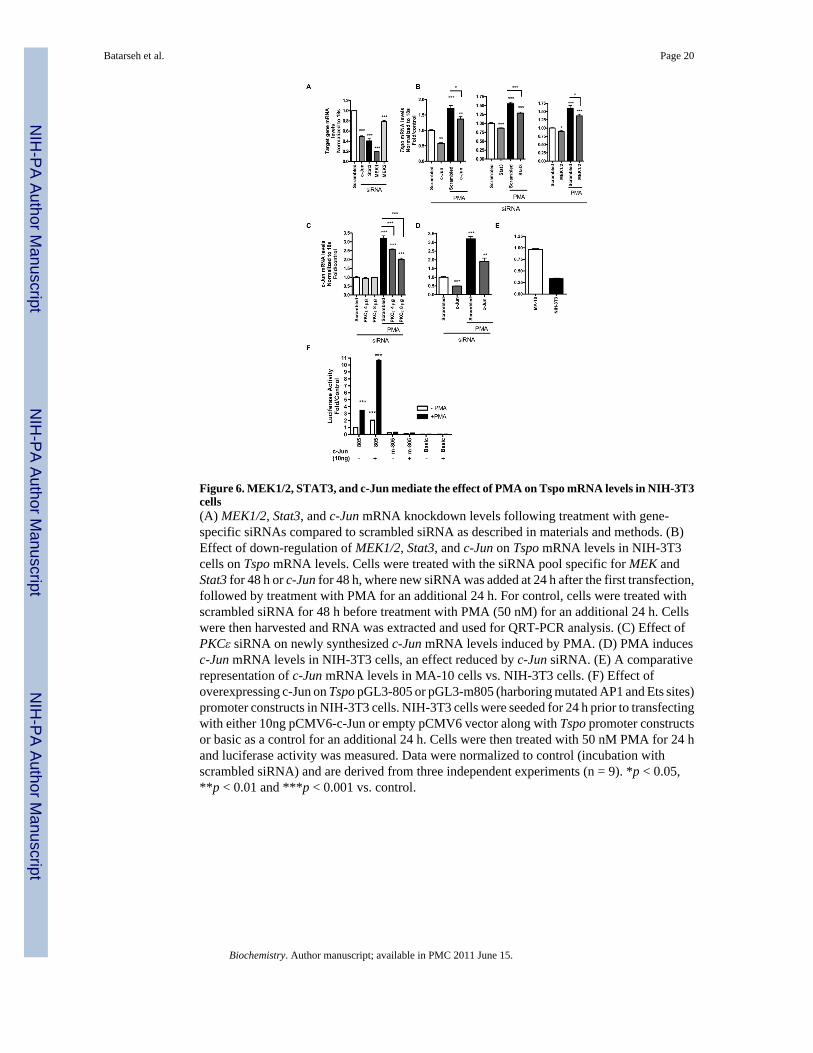
Figure 6. MEK1/2, STAT3, and c-Jun mediate the effect of PMA on Tspo mRNA levels in NIH-3T3cells(A) MEK1/2, Stat3, and c-Jun mRNA knockdown levels following treatment with gene-specific siRNAs compared to scrambled siRNA as described in materials and methods. (B)Effect of down-regulation of MEK1/2, Stat3, and c-Jun on Tspo mRNA levels in NIH-3T3cells on Tspo mRNA levels. Cells were treated with the siRNA pool specific for MEK andStat3 for 48 h or c-Jun for 48 h, where new siRNA was added at 24 h after the first transfection,followed by treatment with PMA for an additional 24 h. For control, cells were treated withscrambled siRNA for 48 h before treatment with PMA (50 nM) for an additional 24 h. Cellswere then harvested and RNA was extracted and used for QRT-PCR analysis. (C) Effect ofPKCε siRNA on newly synthesized c-Jun mRNA levels induced by PMA. (D) PMA inducesc-Jun mRNA levels in NIH-3T3 cells, an effect reduced by c-Jun siRNA. (E) A comparativerepresentation of c-Jun mRNA levels in MA-10 cells vs. NIH-3T3 cells. (F) Effect ofoverexpressing c-Jun on Tspo pGL3-805 or pGL3-m805 (harboring mutated AP1 and Ets sites)promoter constructs in NIH-3T3 cells. NIH-3T3 cells were seeded for 24 h prior to transfectingwith either 10ng pCMV6-c-Jun or empty pCMV6 vector along with Tspo promoter constructsor basic as a control for an additional 24 h. Cells were then treated with 50 nM PMA for 24 hand luciferase activity was measured. Data were normalized to control (incubation withscrambled siRNA) and are derived from three independent experiments (n = 9). *p < 0.05,**p < 0.01 and ***p < 0.001 vs. control.
Batarseh et al. Page 20
Biochemistry. Author manuscript; available in PMC 2011 June 15.
NIH
-PA Author Manuscript
NIH
-PA Author Manuscript
NIH
-PA Author Manuscript

Figure 7. PMA induces c-Jun and STAT3 binding to their putative binding sites on the TspopromoterEMSA of biotinylated AP1 oligonucleotide incubated without (A, lane 1) or with NIH-3T3nuclear extract (N.E.) (all other lanes). EMSAs were performed on nuclear extracts fromNIH-3T3 cells transfected with CMV and treated without (A, lanes 2, 3, 6 and 7) and withPMA (lanes 4, 5, 8 and 9). Supershift/immunodepletion binding reactions were performed inthe presence of IgG (A, lanes 2, 4, 6 and 8) or c-Jun antibody (A, lanes 3, 5, 7 and 9). Smalldotted box in (A) indicates specific DNA-protein complexes. Dotted box on the right indicatesthe same specific DNA-protein complexes formed under different conditions. In (B) EMSAswere performed on nuclear extracts from NIH-3T3 cells transfected with CMV (B, lanes 1-4)or PKCε (B, lanes 5-8) and treated without (B, lanes 1, 2, 5 and 6) and with PMA (lanes 3, 4,7 and 8). Supershift/immunodepletion binding reactions were performed in the presence ofIgG (B, lanes 1, 3, 5 and 7) or STAT3 antibody (B, lanes 2, 4, 6 and 8). Competition experimentswere performed using nuclear extracts from NIH-3T3 cells transfected with CMV (C, lanes1-5) or PKCε (C, lanes 6-9). Nuclear extracts were incubated with unlabeled AP1oligonucleotide (wt) (C, lanes 2 & 7), AP1 mutant oligonucleotide (AP1 mut) (C, lanes 4 &8), Ets mutant oligonucleotide (Ets mut) (C, lanes 5 & 9), or unrelated oligonucleotide (E) (C,lane 3). The free probe is indicated with an arrowhead. DNA-protein binding was optimizedby including 10 μg BSA and 4 mM DTT in the all reactions. Results shown are representativeof three independent experiments.
Batarseh et al. Page 21
Biochemistry. Author manuscript; available in PMC 2011 June 15.
NIH
-PA Author Manuscript
NIH
-PA Author Manuscript
NIH
-PA Author Manuscript

Figure 8. c-Jun is bound to the endogenous Tspo promoter in intact MA-10, and PMA recruitsSTAT3 binding in NIH/3T3 cellsDNA from MA-10 and NIH/3T3 cells was precipitated with antibodies specific for c-Jun (A& B) by ChIP analysis under basal conditions. NIH-3T3 cells were treated with or without 50nM PMA for 24 h and DNA was precipitated with STAT3 specific antibodies (C) by ChIPanalysis as described in materials and methods. DNA was amplified by QRT-PCR usingprimers specific for the distal area of the Tspo promoter spanning the binding sites for AP1,Ets and STAT3 shown in Figure 1. Normal rabbit IgG served as a negative control. Data arepresented as fold enrichment of the ChIP antibody signal versus the negative control IgG usingthe ddCT method, and are derived from three independent experiments (n = 9). *p < 0.05,**p < 0.01 and ***p < 0.001.
Batarseh et al. Page 22
Biochemistry. Author manuscript; available in PMC 2011 June 15.
NIH
-PA Author Manuscript
NIH
-PA Author Manuscript
NIH
-PA Author Manuscript
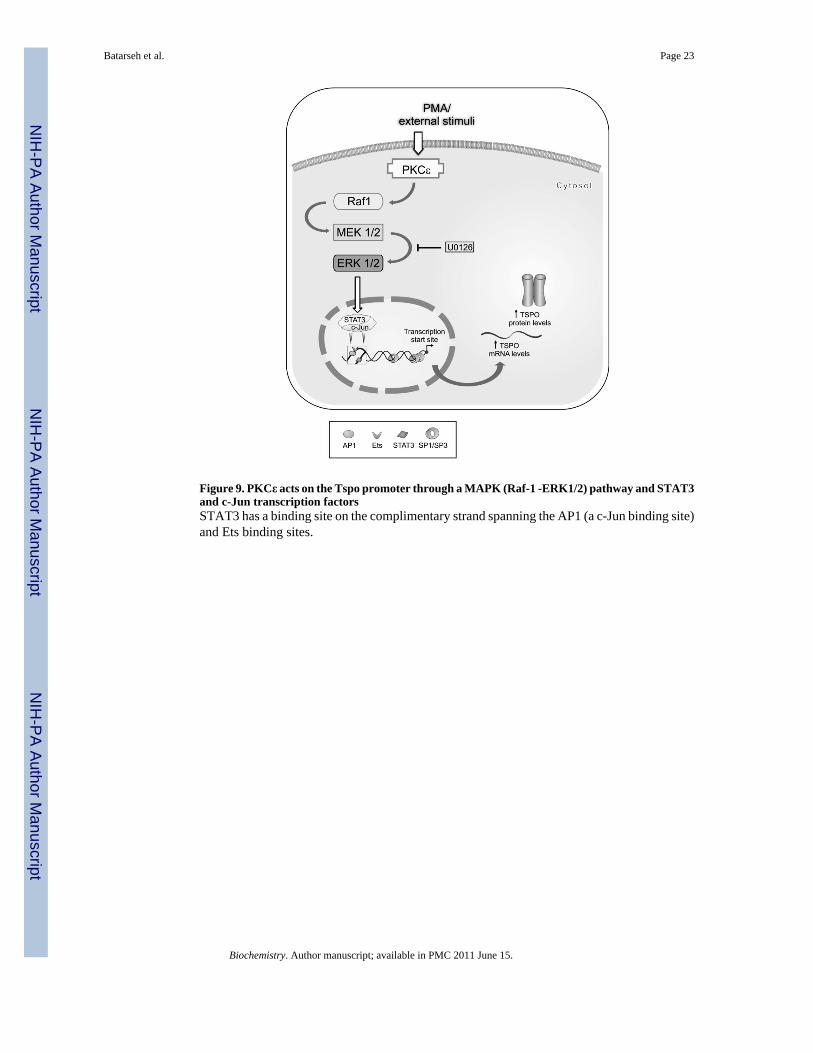
Figure 9. PKCε acts on the Tspo promoter through a MAPK (Raf-1 -ERK1/2) pathway and STAT3and c-Jun transcription factorsSTAT3 has a binding site on the complimentary strand spanning the AP1 (a c-Jun binding site)and Ets binding sites.
Batarseh et al. Page 23
Biochemistry. Author manuscript; available in PMC 2011 June 15.
NIH
-PA Author Manuscript
NIH
-PA Author Manuscript
NIH
-PA Author Manuscript

NIH
-PA Author Manuscript
NIH
-PA Author Manuscript
NIH
-PA Author Manuscript
Batarseh et al. Page 24
Table 1
Oigonucleotide Sequences Used in Electrophoretic Mobility Shift Assays
Oligonucleotide Name Sequence
S-Ap1 wt CTCTAATTGACTCACAGGAAGAGGTT
AS-AP1 wt AACCTCTTCCTGTGAGTCAATTAGAG
S-AP1 WT biotin5 CTCTAATTGACTCACAGGAAGAGGTT
AS-AP1 WT biotin5 AACCTCTTCCTGTGAGTCAATTAGAG
S-Ap1 MUT CTCTAATTCTCTCACAGGAAGAGGTT
AS-Ap1 MUT AACCTCTTCCTGTGAGAGAATTAGAG
S-Ets MUT CTCTAATTGACTCACAGTCAGAGGTT
AS-Ets MUT AACCTCTGACTGTGAGTCAATTAGAG
Biochemistry. Author manuscript; available in PMC 2011 June 15.
Copyright © 2022 FDOKUMEN