Canola/rapeseed protein-functionality and nutrition - EDP Open
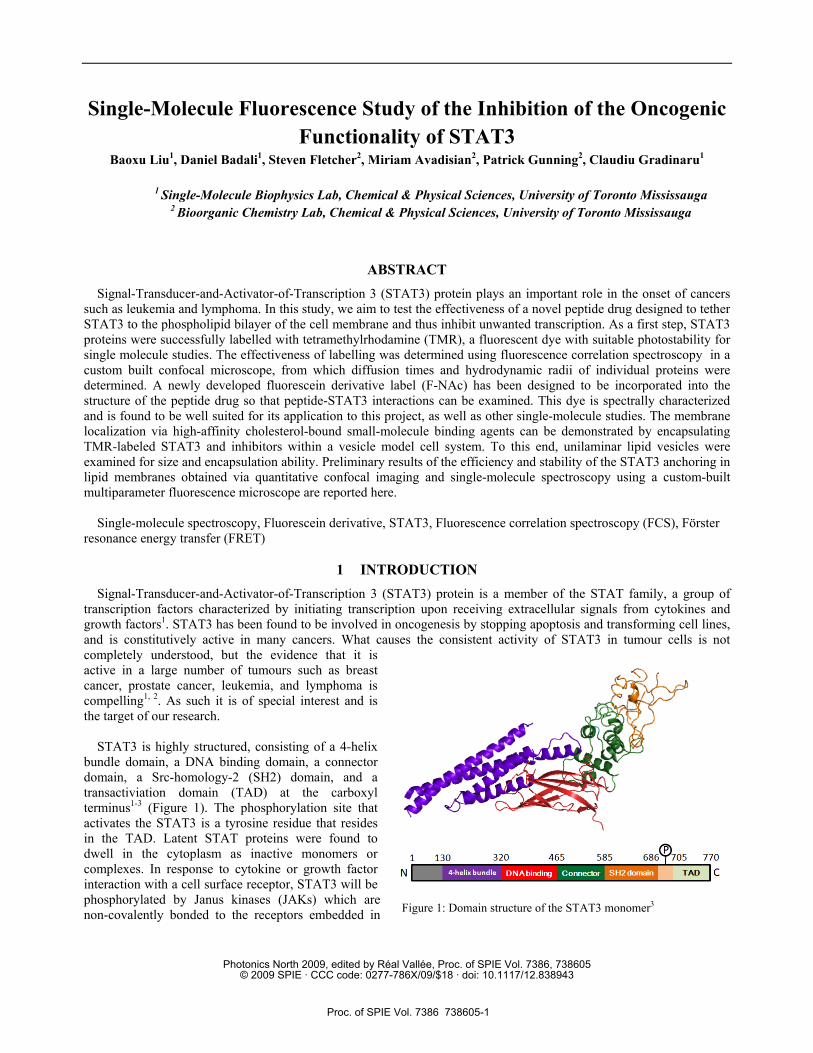
Figure 1: Domain structure of the STAT3 monomer3
Single-Molecule Fluorescence Study of the Inhibition of the Oncogenic Functionality of STAT3
Baoxu Liu1, Daniel Badali1, Steven Fletcher2, Miriam Avadisian2, Patrick Gunning2, Claudiu Gradinaru1
1 Single-Molecule Biophysics Lab, Chemical & Physical Sciences, University of Toronto Mississauga 2 Bioorganic Chemistry Lab, Chemical & Physical Sciences, University of Toronto Mississauga
ABSTRACT Signal-Transducer-and-Activator-of-Transcription 3 (STAT3) protein plays an important role in the onset of cancers
such as leukemia and lymphoma. In this study, we aim to test the effectiveness of a novel peptide drug designed to tether STAT3 to the phospholipid bilayer of the cell membrane and thus inhibit unwanted transcription. As a first step, STAT3 proteins were successfully labelled with tetramethylrhodamine (TMR), a fluorescent dye with suitable photostability for single molecule studies. The effectiveness of labelling was determined using fluorescence correlation spectroscopy in a custom built confocal microscope, from which diffusion times and hydrodynamic radii of individual proteins were determined. A newly developed fluorescein derivative label (F-NAc) has been designed to be incorporated into the structure of the peptide drug so that peptide-STAT3 interactions can be examined. This dye is spectrally characterized and is found to be well suited for its application to this project, as well as other single-molecule studies. The membrane localization via high-affinity cholesterol-bound small-molecule binding agents can be demonstrated by encapsulating TMR-labeled STAT3 and inhibitors within a vesicle model cell system. To this end, unilaminar lipid vesicles were examined for size and encapsulation ability. Preliminary results of the efficiency and stability of the STAT3 anchoring in lipid membranes obtained via quantitative confocal imaging and single-molecule spectroscopy using a custom-built multiparameter fluorescence microscope are reported here.
Single-molecule spectroscopy, Fluorescein derivative, STAT3, Fluorescence correlation spectroscopy (FCS), Förster
resonance energy transfer (FRET)
1 INTRODUCTION Signal-Transducer-and-Activator-of-Transcription 3 (STAT3) protein is a member of the STAT family, a group of
transcription factors characterized by initiating transcription upon receiving extracellular signals from cytokines and growth factors1. STAT3 has been found to be involved in oncogenesis by stopping apoptosis and transforming cell lines, and is constitutively active in many cancers. What causes the consistent activity of STAT3 in tumour cells is not completely understood, but the evidence that it is active in a large number of tumours such as breast cancer, prostate cancer, leukemia, and lymphoma is compelling1, 2. As such it is of special interest and is the target of our research.
STAT3 is highly structured, consisting of a 4-helix
bundle domain, a DNA binding domain, a connector domain, a Src-homology-2 (SH2) domain, and a transactiviation domain (TAD) at the carboxyl terminus1-3 (Figure 1). The phosphorylation site that activates the STAT3 is a tyrosine residue that resides in the TAD. Latent STAT proteins were found to dwell in the cytoplasm as inactive monomers or complexes. In response to cytokine or growth factor interaction with a cell surface receptor, STAT3 will be phosphorylated by Janus kinases (JAKs) which are non-covalently bonded to the receptors embedded in
Photonics North 2009, edited by Réal Vallée, Proc. of SPIE Vol. 7386, 738605© 2009 SPIE · CCC code: 0277-786X/09/$18 · doi: 10.1117/12.838943
Proc. of SPIE Vol. 7386 738605-1
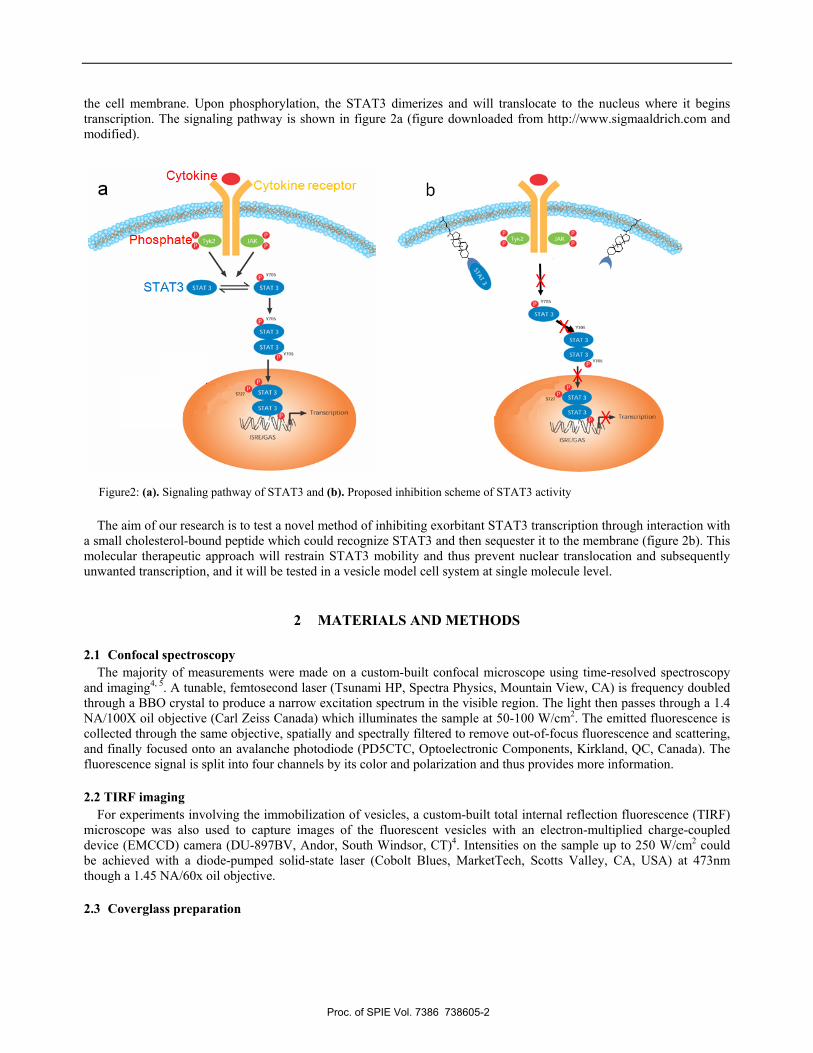
the cell membrane. Upon phosphorylation, the STAT3 dimerizes and will translocate to the nucleus where it begins transcription. The signaling pathway is shown in figure 2a (figure downloaded from http://www.sigmaaldrich.com and modified).
The aim of our research is to test a novel method of inhibiting exorbitant STAT3 transcription through interaction with a small cholesterol-bound peptide which could recognize STAT3 and then sequester it to the membrane (figure 2b). This molecular therapeutic approach will restrain STAT3 mobility and thus prevent nuclear translocation and subsequently unwanted transcription, and it will be tested in a vesicle model cell system at single molecule level.
2 MATERIALS AND METHODS
2.1 Confocal spectroscopy The majority of measurements were made on a custom-built confocal microscope using time-resolved spectroscopy
and imaging4, 5. A tunable, femtosecond laser (Tsunami HP, Spectra Physics, Mountain View, CA) is frequency doubled through a BBO crystal to produce a narrow excitation spectrum in the visible region. The light then passes through a 1.4 NA/100X oil objective (Carl Zeiss Canada) which illuminates the sample at 50-100 W/cm2. The emitted fluorescence is collected through the same objective, spatially and spectrally filtered to remove out-of-focus fluorescence and scattering, and finally focused onto an avalanche photodiode (PD5CTC, Optoelectronic Components, Kirkland, QC, Canada). The fluorescence signal is split into four channels by its color and polarization and thus provides more information.
2.2 TIRF imaging
For experiments involving the immobilization of vesicles, a custom-built total internal reflection fluorescence (TIRF) microscope was also used to capture images of the fluorescent vesicles with an electron-multiplied charge-coupled device (EMCCD) camera (DU-897BV, Andor, South Windsor, CT)4. Intensities on the sample up to 250 W/cm2 could be achieved with a diode-pumped solid-state laser (Cobolt Blues, MarketTech, Scotts Valley, CA, USA) at 473nm though a 1.45 NA/60x oil objective. 2.3 Coverglass preparation
Figure2: (a). Signaling pathway of STAT3 and (b). Proposed inhibition scheme of STAT3 activity
Proc. of SPIE Vol. 7386 738605-2
Microscope coverglass was cleaned of surface fluorescent impurities using a plasma cleaner (PDC-32G, Harrick Plasma, Ithaca, NY, USA). The coverslips were then covered by a mixture of polyethylene glycol (PEG) and PEG-biotin in order to avoid nonspecific adsorption of liposomes, fluorophores and proteins, as well as for specific immobilization of biotinylated vesicles. The PEG/PEG-biotin coverslips were prepared based on the protocol published previously6. A 0.2 mg/ml streptavidin solution was incubated on the biotinylated coverslips for 20 minutes to achieve sparse streptavidin coating. The biotinylated vesicles were then incubated on the coverslips via streptavidin-biotin interactions.
2.4 Protein labeling
STAT3 was successfully labelled with a thiol reactive maleimide form of tetramethylrhodamine (TMR) by targeting exposed cysteine residues. A protein concentration of 20 μM in a volume of 50 μL was used. Disulfide bonds were reduced with tris(2-carboxyethyl)phosphine (TCEP) at 500 times molar excess than the protein, with 5 μL at 100 mM being added. TMR labeling occurred at a 20:1 molar ratio with the protein and was facilitated by rigorous shaking and then purification by centrifugation through a chromatography column (Micro Bio-spin P-30, BIO-RAD, Hercules, CA). Reactions occurred in 50 mM Tris-HCl buffer (pH 7.5) with 150 mM NaCl.
2.5 Artificial cell system
To prepare unilaminar vesicles, egg phosphatidylcholine (PC) phospholipids and biotin-1, 2-dimyristoyl-sn-glycero-3-phosphoethanolamine (DMPE) were dissolved in chloroform in a ratio of 100:2 for immobilization purposes. After being dried with nitrogen, the phospholipids were then hydrated with buffer to create multilaminar vesicles. Molecules to be encapsulated were added to the solution. For encapsulation of F-NAc, 100 molecules per vesicle were desired and so a concentration of 3 μM was used. The solution then underwent three freeze-thaw cycles, altering between liquid nitrogen and a warm water bath to create unilaminar vesicles. To bias the size, the vesicles were extruded (Mini-Extruder, Avanti Polar Lipids, Alabaster, AL, USA) through a 1 μm or 0.1 μm sized porous polycarbonate membrane 11 times.
2.6 Fluorescence correlation spectroscopy
Fluorescence correlation spectroscopy (FCS) analyses the fluctuations of the fluorescence signal emitted by a diffusing molecule by autocorrelating the time-resolved fluorescent intensity7. The intensity-normalized autocorrelation at time t can be expressed as:
( ) ( ) ( )( )
0 02
0
I t t I tG t
I t
δ += (1)
where I(t) is the detected fluorescence intensity as a function of time. Assuming a Gaussian distribution of the intensity of the excitation light, the autocorrelation function of a molecule freely diffusing in three dimensions is7:
( )1 1/ 2
2 2
1 4 41 1xy z
Dt DtG tN ω ω
− −⎛ ⎞ ⎛ ⎞= + +⎜ ⎟ ⎜ ⎟⎜ ⎟ ⎝ ⎠⎝ ⎠
(2)
Where D is the diffusion coefficient and N is the number of fluorescent molecules in the illumination volume characterized by the radii ωxy and ωz in the xy-plane and z-directions respectively. By fitting experimental data with an autocorrelation curve, the parameters in equation (2) can be determined. The number of fluorescent molecules reveals the concentration of fluorophores (since the illumination volume is known), and length of the autocorrelation curve at approximately half its maximum provides the translational diffusion time. By comparing the diffusion time of a fluorophore to a reference molecule with known size and diffusion time, such as fluorescent beads with a uniform size for example, the hydrodynamics radius can also be determined.
3 RESULTS AND DISCUSSION 3.1 Protein labelling
Proc. of SPIE Vol. 7386 738605-3
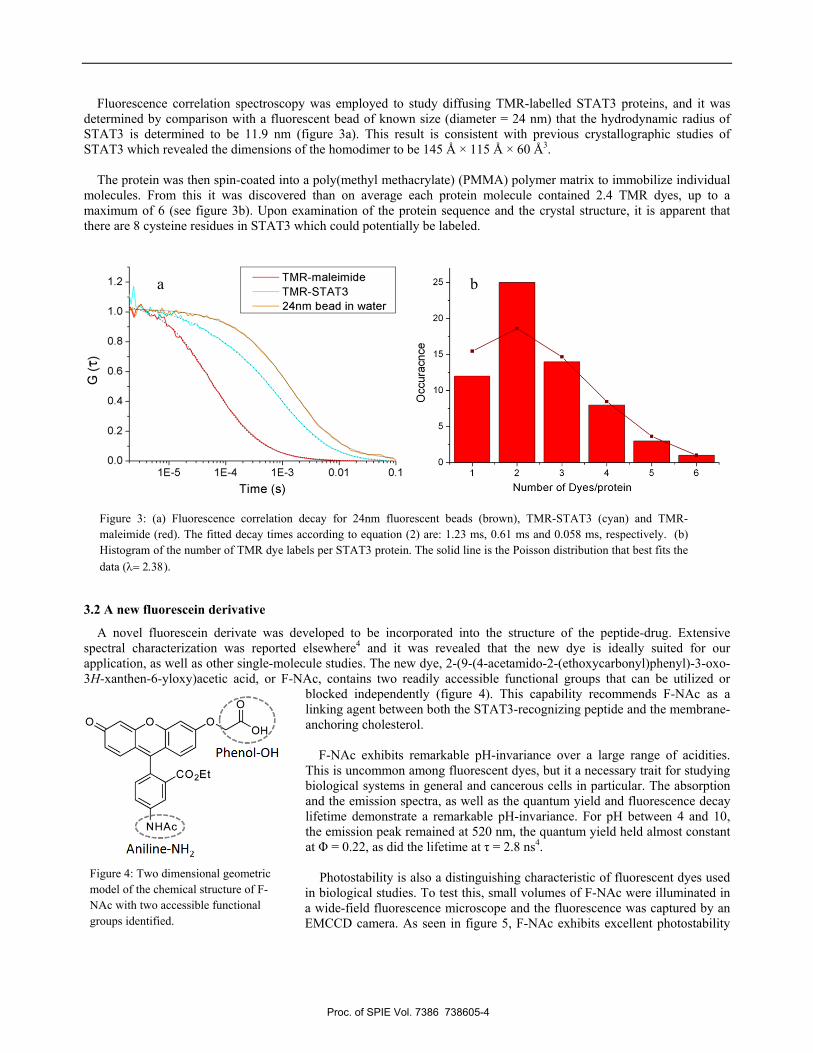
Fluorescence correlation spectroscopy was employed to study diffusing TMR-labelled STAT3 proteins, and it was determined by comparison with a fluorescent bead of known size (diameter = 24 nm) that the hydrodynamic radius of STAT3 is determined to be 11.9 nm (figure 3a). This result is consistent with previous crystallographic studies of STAT3 which revealed the dimensions of the homodimer to be 145 Å × 115 Å × 60 Å3.
The protein was then spin-coated into a poly(methyl methacrylate) (PMMA) polymer matrix to immobilize individual
molecules. From this it was discovered than on average each protein molecule contained 2.4 TMR dyes, up to a maximum of 6 (see figure 3b). Upon examination of the protein sequence and the crystal structure, it is apparent that there are 8 cysteine residues in STAT3 which could potentially be labeled.
3.2 A new fluorescein derivative
A novel fluorescein derivate was developed to be incorporated into the structure of the peptide-drug. Extensive spectral characterization was reported elsewhere4 and it was revealed that the new dye is ideally suited for our application, as well as other single-molecule studies. The new dye, 2-(9-(4-acetamido-2-(ethoxycarbonyl)phenyl)-3-oxo-3H-xanthen-6-yloxy)acetic acid, or F-NAc, contains two readily accessible functional groups that can be utilized or
blocked independently (figure 4). This capability recommends F-NAc as a linking agent between both the STAT3-recognizing peptide and the membrane-anchoring cholesterol.
F-NAc exhibits remarkable pH-invariance over a large range of acidities.
This is uncommon among fluorescent dyes, but it a necessary trait for studying biological systems in general and cancerous cells in particular. The absorption and the emission spectra, as well as the quantum yield and fluorescence decay lifetime demonstrate a remarkable pH-invariance. For pH between 4 and 10, the emission peak remained at 520 nm, the quantum yield held almost constant at Φ = 0.22, as did the lifetime at τ = 2.8 ns4.
Photostability is also a distinguishing characteristic of fluorescent dyes used
in biological studies. To test this, small volumes of F-NAc were illuminated in a wide-field fluorescence microscope and the fluorescence was captured by an EMCCD camera. As seen in figure 5, F-NAc exhibits excellent photostability
Figure 3: (a) Fluorescence correlation decay for 24nm fluorescent beads (brown), TMR-STAT3 (cyan) and TMR-maleimide (red). The fitted decay times according to equation (2) are: 1.23 ms, 0.61 ms and 0.058 ms, respectively. (b) Histogram of the number of TMR dye labels per STAT3 protein. The solid line is the Poisson distribution that best fits the data (λ= 2.38).
Figure 4: Two dimensional geometric model of the chemical structure of F-NAc with two accessible functional groups identified.
a b
Proc. of SPIE Vol. 7386 738605-4
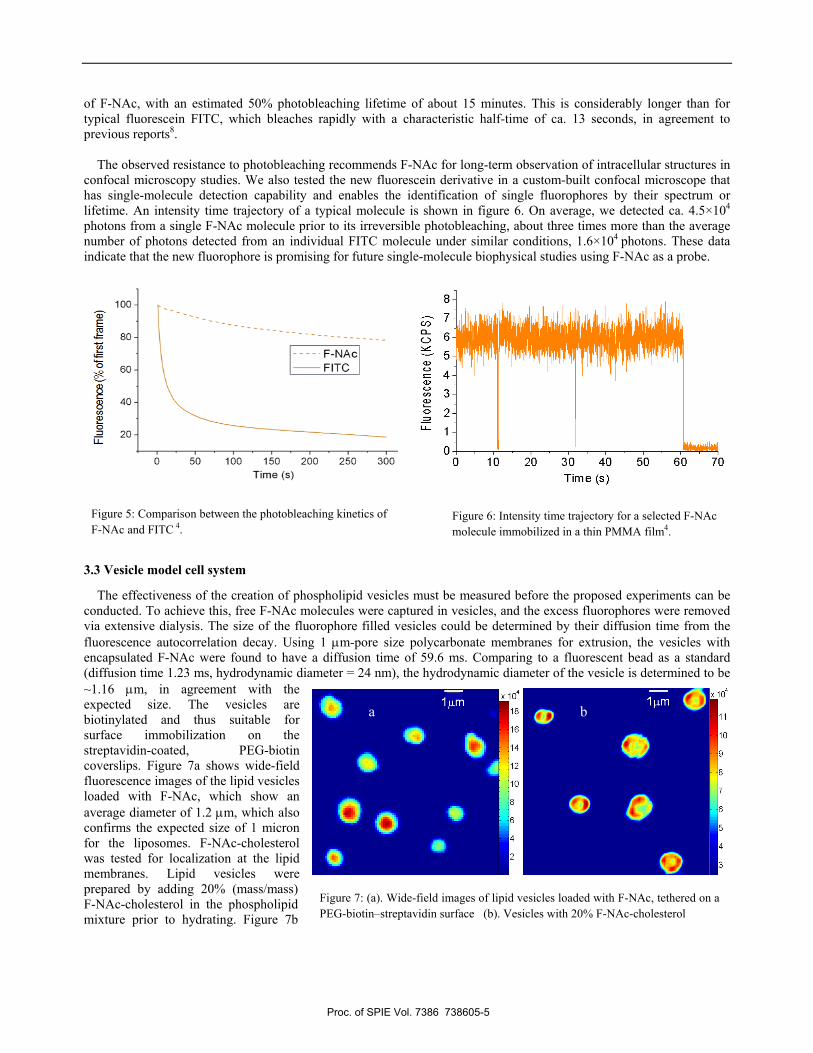
Figure 7: (a). Wide-field images of lipid vesicles loaded with F-NAc, tethered on a PEG-biotin–streptavidin surface (b). Vesicles with 20% F-NAc-cholesterol
of F-NAc, with an estimated 50% photobleaching lifetime of about 15 minutes. This is considerably longer than for typical fluorescein FITC, which bleaches rapidly with a characteristic half-time of ca. 13 seconds, in agreement to previous reports8.
The observed resistance to photobleaching recommends F-NAc for long-term observation of intracellular structures in confocal microscopy studies. We also tested the new fluorescein derivative in a custom-built confocal microscope that has single-molecule detection capability and enables the identification of single fluorophores by their spectrum or lifetime. An intensity time trajectory of a typical molecule is shown in figure 6. On average, we detected ca. 4.5×10⁴
photons from a single F-NAc molecule prior to its irreversible photobleaching, about three times more than the average number of photons detected from an individual FITC molecule under similar conditions, 1.6×10⁴ photons. These data indicate that the new fluorophore is promising for future single-molecule biophysical studies using F-NAc as a probe.
3.3 Vesicle model cell system
The effectiveness of the creation of phospholipid vesicles must be measured before the proposed experiments can be conducted. To achieve this, free F-NAc molecules were captured in vesicles, and the excess fluorophores were removed via extensive dialysis. The size of the fluorophore filled vesicles could be determined by their diffusion time from the fluorescence autocorrelation decay. Using 1 μm-pore size polycarbonate membranes for extrusion, the vesicles with encapsulated F-NAc were found to have a diffusion time of 59.6 ms. Comparing to a fluorescent bead as a standard (diffusion time 1.23 ms, hydrodynamic diameter = 24 nm), the hydrodynamic diameter of the vesicle is determined to be ~1.16 μm, in agreement with the expected size. The vesicles are biotinylated and thus suitable for surface immobilization on the streptavidin-coated, PEG-biotin coverslips. Figure 7a shows wide-field fluorescence images of the lipid vesicles loaded with F-NAc, which show an average diameter of 1.2 μm, which also confirms the expected size of 1 micron for the liposomes. F-NAc-cholesterol was tested for localization at the lipid membranes. Lipid vesicles were prepared by adding 20% (mass/mass) F-NAc-cholesterol in the phospholipid mixture prior to hydrating. Figure 7b
Figure 5: Comparison between the photobleaching kinetics of F-NAc and FITC 4.
Figure 6: Intensity time trajectory for a selected F-NAc molecule immobilized in a thin PMMA film4.
a b
Proc. of SPIE Vol. 7386 738605-5
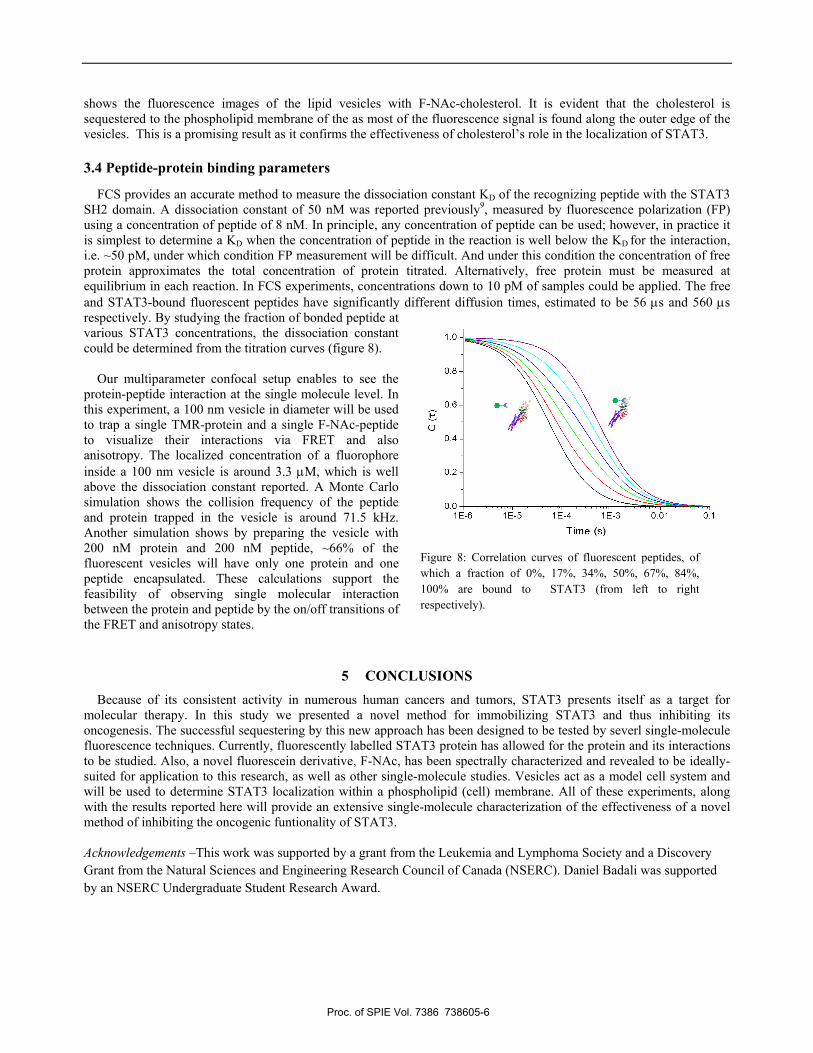
shows the fluorescence images of the lipid vesicles with F-NAc-cholesterol. It is evident that the cholesterol is sequestered to the phospholipid membrane of the as most of the fluorescence signal is found along the outer edge of the vesicles. This is a promising result as it confirms the effectiveness of cholesterol’s role in the localization of STAT3.
3.4 Peptide-protein binding parameters
FCS provides an accurate method to measure the dissociation constant KD of the recognizing peptide with the STAT3 SH2 domain. A dissociation constant of 50 nM was reported previously9, measured by fluorescence polarization (FP) using a concentration of peptide of 8 nM. In principle, any concentration of peptide can be used; however, in practice it is simplest to determine a KD when the concentration of peptide in the reaction is well below the KD for the interaction, i.e. ~50 pM, under which condition FP measurement will be difficult. And under this condition the concentration of free protein approximates the total concentration of protein titrated. Alternatively, free protein must be measured at equilibrium in each reaction. In FCS experiments, concentrations down to 10 pM of samples could be applied. The free and STAT3-bound fluorescent peptides have significantly different diffusion times, estimated to be 56 μs and 560 μs respectively. By studying the fraction of bonded peptide at various STAT3 concentrations, the dissociation constant could be determined from the titration curves (figure 8).
Our multiparameter confocal setup enables to see the
protein-peptide interaction at the single molecule level. In this experiment, a 100 nm vesicle in diameter will be used to trap a single TMR-protein and a single F-NAc-peptide to visualize their interactions via FRET and also anisotropy. The localized concentration of a fluorophore inside a 100 nm vesicle is around 3.3 μM, which is well above the dissociation constant reported. A Monte Carlo simulation shows the collision frequency of the peptide and protein trapped in the vesicle is around 71.5 kHz. Another simulation shows by preparing the vesicle with 200 nM protein and 200 nM peptide, ~66% of the fluorescent vesicles will have only one protein and one peptide encapsulated. These calculations support the feasibility of observing single molecular interaction between the protein and peptide by the on/off transitions of the FRET and anisotropy states.
5 CONCLUSIONS Because of its consistent activity in numerous human cancers and tumors, STAT3 presents itself as a target for
molecular therapy. In this study we presented a novel method for immobilizing STAT3 and thus inhibiting its oncogenesis. The successful sequestering by this new approach has been designed to be tested by severl single-molecule fluorescence techniques. Currently, fluorescently labelled STAT3 protein has allowed for the protein and its interactions to be studied. Also, a novel fluorescein derivative, F-NAc, has been spectrally characterized and revealed to be ideally-suited for application to this research, as well as other single-molecule studies. Vesicles act as a model cell system and will be used to determine STAT3 localization within a phospholipid (cell) membrane. All of these experiments, along with the results reported here will provide an extensive single-molecule characterization of the effectiveness of a novel method of inhibiting the oncogenic funtionality of STAT3. Acknowledgements –This work was supported by a grant from the Leukemia and Lymphoma Society and a Discovery Grant from the Natural Sciences and Engineering Research Council of Canada (NSERC). Daniel Badali was supported by an NSERC Undergraduate Student Research Award.
Figure 8: Correlation curves of fluorescent peptides, of which a fraction of 0%, 17%, 34%, 50%, 67%, 84%, 100% are bound to STAT3 (from left to right respectively).
Proc. of SPIE Vol. 7386 738605-6

References: 1. Aggarwal, B., B., Sethi, G., Ahn, K., S., Sandur, S., K., Pandey, M., K., Kunnumakkara, A., B., Sung, B., and
Ichikawa, H., “Targeting signal-transducer-and-activator-of-transcription-3 for prevention and therapy of cancer: modern target but ancient solution,” Ann N Y Acad Sci 1091, 151-169 (2006).
2. Levy, D., E. and Darnell, J., E., Jr., “Stats: transcriptional control and biological impact,” Nat Rev Mol Cell Biol 3 (9), 651-662 (2002)
3. Becker S., Groner, B. and Muller, C., W., “Three-dimensional structure of the Stat3β homodimer bound to DNA,” Nature 394 (9), 145-151 (1998)
4. Liu, B., Fletcher, S., Avadisian, M. Gunning, P., T. and Gradinaru, C., C., “A Photostable, pH-Invariant Fluorescein Derivative for Single-Molecule Microscopy,” J Fluoresc, 2009
5. Luong, A., K., Gradinaru, C., C., Chandler, D., W. and Hayden, C., C., “Simultaneous time- and wavelength-resolved fluorescence microscopy of single molecules,” J Phys Chem B 109 (33), 15691-8 (2005)
6. Roy, R., Hohng, S. and Ha, T., “A practical guide to single-molecule FRET,” Nat Methods 5 (6), 507-516 (2008) 7. Chen, H., Farkas, E., R. and Webb, W., W., “Chapter 1: In vivo applications of fluorescence correlation
spectroscopy,” Methods Cell Biol 89, 3-35 (2008) 8. Burchak, O., N., Mugherli, L., Chatelain, F. and Balakirev, M., Y., “Fluorescein-based amino acids for solid phase
synthesis of fluorogenic protease substrates,” Bioorg Med Chem 14 (8), 2559-68 (2006) 9. Gunning, P., T., Glenn, M. P., Siddiquee, K., A., Katt, W., P., Masson, E., Sebti, S., M., Turkson, J. and Hamilton,
A., D. , “Targeting protein-protein interactions: suppression of Stat3 dimerization with rationally designed small-molecule, nonpeptidic SH2 domain binders,” Chembiochem 9 (17), 2800-3 (2008)
Proc. of SPIE Vol. 7386 738605-7
Copyright © 2022 FDOKUMEN