Proof of principle for shotgun DNA mapping by unzipping
10
Proof of principle for shotgun DNA mapping by unzipping. Authors (tentative) Lawrence J. Herskowitz, [email protected] Anthony L. Salvagno, [email protected] R. Andy Maloney, [email protected] Linh N. Le, [email protected] Steven J. Koch, [email protected] Affiliation for all: University of New Mexico, Department of Physics and Astronomy and Center for High Technology Materials. Abstract Ability to map polymerases and nucleosomes on chromatin is important for understanding the impact of chromatin remodeling on key cellular processes. Current methods (such as ChIP and ChIP-chip) have produced a wealth of information that demonstrates this importance, but key information is elusive in these ensemble methods. We’re pursuing a new single-molecule chromatin mapping method based on unzipping native chromatin molecules with optical tweezers. The first step we are taking towards this ability is shotgun DNA mapping (SDM). This is the ability to identify the genomic location of a random DNA fragment based on its naked DNA unzipping forces compared with simulated unzipping forces of a published genome. We show that ~32 separate experimental unzipping curves for pBR322 were correctly matched to their simulated unzipping curves hidden in a background of the ~2700 sequences neighboring XhoI sites in the S. cerevisiae (yeast) genome. We describe this method and characterize its robustness as well as discuss future applications. Abbreviations SDM = Shotgun DNA Mapping; SM = single-molecule; ChIP = Chromatin Immunoprecipitation; Pol II = RNA Polymerase II; SCM = shotgun chromatin mapping Introduction (Still need many references, such as (1-6) ) Chromatin remodeling affects the ability of other proteins to access the DNA and has a profound impact on fundamental processes such as DNA repair and gene transcription by RNA polymerase. Understanding of these dynamic remodeling processes requires the ability to characterize with high spatial and temporal resolution the changes to chromatin inside living cells. Techniques such as chromatin Immunoprecipitation (ChIP), ChIP-chip, and other existing techniques have provided a wealth of important information, but have drawbacks in terms of sensitivity to small changes in protein occupancy, spatial resolution, and ensemble averaging. Certain information can only be obtained via Nature Precedings : doi:10.1038/npre.2010.2808.2 : Posted 9 Mar 2010
-
Upload
independent -
Category
Documents
-
view
4 -
download
0
Transcript of Proof of principle for shotgun DNA mapping by unzipping
Proof of principle for shotgun DNA
mapping by unzipping.
Authors (tentative) Lawrence J. Herskowitz, [email protected]
Anthony L. Salvagno, [email protected]
R. Andy Maloney, [email protected]
Linh N. Le, [email protected]
Steven J. Koch, [email protected]
Affiliation for all: University of New Mexico, Department of Physics and Astronomy and Center for High
Technology Materials.
Abstract Ability to map polymerases and nucleosomes on chromatin is important for understanding the impact of
chromatin remodeling on key cellular processes. Current methods (such as ChIP and ChIP-chip) have
produced a wealth of information that demonstrates this importance, but key information is elusive in
these ensemble methods. We’re pursuing a new single-molecule chromatin mapping method based on
unzipping native chromatin molecules with optical tweezers. The first step we are taking towards this
ability is shotgun DNA mapping (SDM). This is the ability to identify the genomic location of a random
DNA fragment based on its naked DNA unzipping forces compared with simulated unzipping forces of a
published genome. We show that ~32 separate experimental unzipping curves for pBR322 were
correctly matched to their simulated unzipping curves hidden in a background of the ~2700 sequences
neighboring XhoI sites in the S. cerevisiae (yeast) genome. We describe this method and characterize its
robustness as well as discuss future applications.
Abbreviations SDM = Shotgun DNA Mapping; SM = single-molecule; ChIP = Chromatin Immunoprecipitation; Pol II =
RNA Polymerase II; SCM = shotgun chromatin mapping
Introduction (Still need many references, such as(1-6)) Chromatin remodeling affects the ability of other proteins to access the DNA and has a profound impact
on fundamental processes such as DNA repair and gene transcription by RNA polymerase.
Understanding of these dynamic remodeling processes requires the ability to characterize with high
spatial and temporal resolution the changes to chromatin inside living cells. Techniques such as
chromatin Immunoprecipitation (ChIP), ChIP-chip, and other existing techniques have provided a wealth
of important information, but have drawbacks in terms of sensitivity to small changes in protein
occupancy, spatial resolution, and ensemble averaging. Certain information can only be obtained via
Nat
ure
Pre
cedi
ngs
: doi
:10.
1038
/npr
e.20
10.2
808.
2 : P
oste
d 9
Mar
201
0
single-molecule (SM) analysis, such as seeing direct correlations between polymerases and nucleosomes
on individual fibers or differentiating between some proposed models of chromatin remodeling(7)
.
To obtain this type of information, we are developing a single-molecule method for mapping
polymerases and nucleosomes on chromatin based on optical tweezers unzipping of native chromatin
molecules. It has been shown that SM DNA unzipping can map the positions of mononucleosomes
assembled in vitro based on a repeatable nucleosome unzipping force profile(8)
. We expect RNA
Polymerase II (Pol II) complexes to also have a repeatable unzipping force profile, but distinguishable
from nucleosomes and perhaps also indicating the sense / antisense orientation of the Pol II. The Pol II
data is not yet available, but if it is as expected, then we anticipate that SM unzipping of native
chromatin fragments (extracted from living cells) will provide high-resolution mapping of nucleosomes
and Pol II molecules (along with orientation) on individual chromatin fibers.
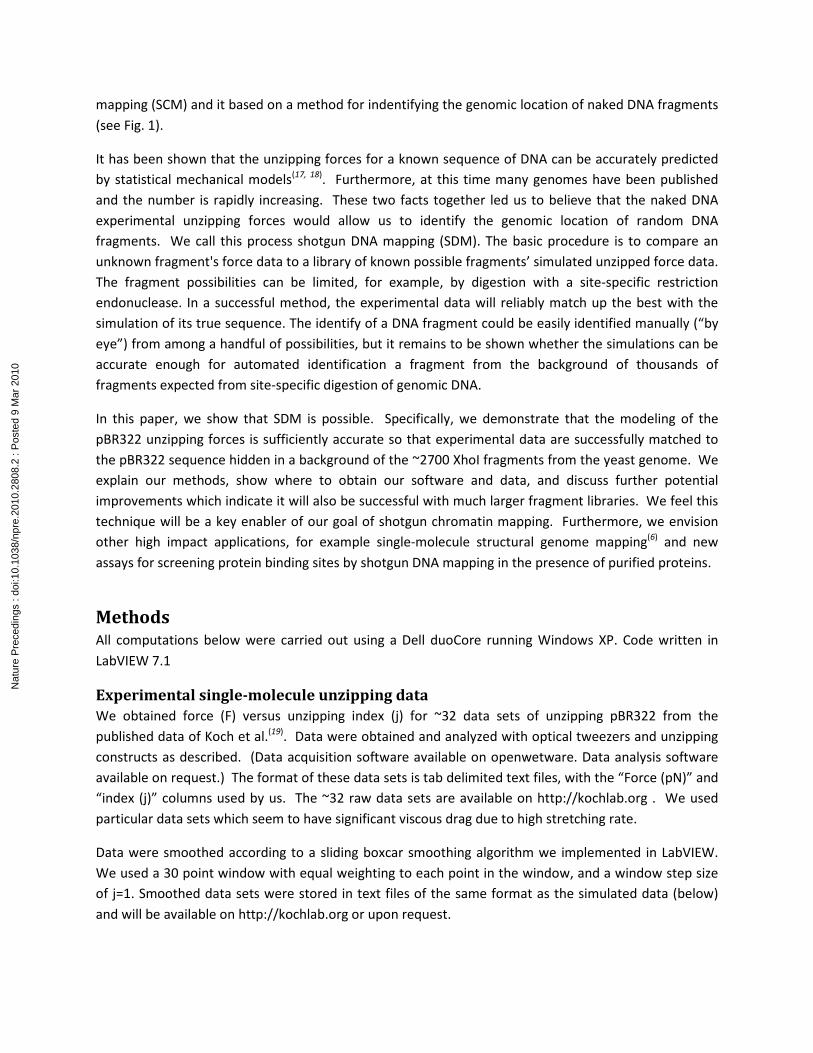
Figure 1
Overview of proposed method for shotgun DNA and chromatin mapping. We have recently achieved proof-of-principle
results important for the “Global Genome Location,” part of the process (lower right).
We may be able to obtain important information from high-resolution SM mapping on individual
fragments, even if their specific location in the genome were unknown. For example, the electron
microscopy analysis of chromatin and RNA transcripts has demonstrated the utility of SM information
even when the identity of the genes was unkown(9)
. However, it would be much more powerful and
thus desirable to obtain high-resolution SM information about specific genes or other sites in the
genome of interest. For example, site-specific SM analysis may provide crucial insight into the issues of
promoter-proximal Pol II pausing and antisense transcription which have recently been shown to be very
important(10-16)
. Thus, we are pursuing methods for site-specific SM analysis of chromatin. The first way
we have tried to do this is by engineering unique restriction sites into the yeast genome (I-SceI) at a
specific site. This has proven difficult, and has the disadvantage of requiring genetic engineering of all
mutant strains and cell types that will be analyzed. Thus, we are now pursuing a second way of
achieving site-specificity which is to unzip random chromatin fragments in a high-throughput fashion,
and then figuring out from which specific site of the genome it came. We call this shotgun chromatin
Nat
ure
Pre
cedi
ngs
: doi
:10.
1038
/npr
e.20
10.2
808.
2 : P
oste
d 9
Mar
201
0
mapping (SCM) and it based on a method for indentifying the genomic location of naked DNA fragments
(see Fig. 1).
It has been shown that the unzipping forces for a known sequence of DNA can be accurately predicted
by statistical mechanical models(17, 18)
. Furthermore, at this time many genomes have been published
and the number is rapidly increasing. These two facts together led us to believe that the naked DNA
experimental unzipping forces would allow us to identify the genomic location of random DNA
fragments. We call this process shotgun DNA mapping (SDM). The basic procedure is to compare an
unknown fragment's force data to a library of known possible fragments’ simulated unzipped force data.
The fragment possibilities can be limited, for example, by digestion with a site-specific restriction
endonuclease. In a successful method, the experimental data will reliably match up the best with the
simulation of its true sequence. The identify of a DNA fragment could be easily identified manually (“by
eye”) from among a handful of possibilities, but it remains to be shown whether the simulations can be
accurate enough for automated identification a fragment from the background of thousands of
fragments expected from site-specific digestion of genomic DNA.
In this paper, we show that SDM is possible. Specifically, we demonstrate that the modeling of the
pBR322 unzipping forces is sufficiently accurate so that experimental data are successfully matched to
the pBR322 sequence hidden in a background of the ~2700 XhoI fragments from the yeast genome. We
explain our methods, show where to obtain our software and data, and discuss further potential
improvements which indicate it will also be successful with much larger fragment libraries. We feel this
technique will be a key enabler of our goal of shotgun chromatin mapping. Furthermore, we envision
other high impact applications, for example single-molecule structural genome mapping(6)
and new
assays for screening protein binding sites by shotgun DNA mapping in the presence of purified proteins.
Methods All computations below were carried out using a Dell duoCore running Windows XP. Code written in
LabVIEW 7.1
Experimental single-molecule unzipping data
We obtained force (F) versus unzipping index (j) for ~32 data sets of unzipping pBR322 from the
published data of Koch et al.(19)
. Data were obtained and analyzed with optical tweezers and unzipping
constructs as described. (Data acquisition software available on openwetware. Data analysis software
available on request.) The format of these data sets is tab delimited text files, with the “Force (pN)” and
“index (j)” columns used by us. The ~32 raw data sets are available on http://kochlab.org . We used
particular data sets which seem to have significant viscous drag due to high stretching rate.
Data were smoothed according to a sliding boxcar smoothing algorithm we implemented in LabVIEW.
We used a 30 point window with equal weighting to each point in the window, and a window step size
of j=1. Smoothed data sets were stored in text files of the same format as the simulated data (below)
and will be available on http://kochlab.org or upon request.
Nat
ure
Pre
cedi
ngs
: doi
:10.
1038
/npr
e.20
10.2
808.
2 : P
oste
d 9
Mar
201
0

Extraction of yeast genome XhoI sites
We obtained the yeast genome (S. Cerevisiae) from yeastgenome.org .We downloaded a text file for
each chromosome of the yeast genome. We wrote a LabVIEW application to do the following:
• Read in a sequence text file
• Eliminate white space and non-DNA base information
• Search for XhoI recognition sites (CTCGAG)
• For each recognition site two fragments were formed, 2000 base pairs before the site and 2000
base pairs after. These were stored as text files sequence only with a naming convention
Chromosome Number/Recognition Site Index, Downstream or Upstream. These files will be
available on http://kochlab.org Upstream fragments are reversed so as to begin with the XhoI
recognition site.
• Additionally the pBR322 sequence used in Koch 2002 was manually added to the sequence
library with a code name to blind it from the data analyzers.
o The pBR322 fragment used for the experimental work was created from EarI digestion
of the plasmid.
Creation of Simulation Library for Yeast XhoI Sites
Methods for simulating unzipping of the above fragments was as in previous work by Bockelmann et al.
with slight modifications(18)
. Our Hamiltonian was:
Formula: E_total = E_DNA + E_FJC
where E_DNA accounts for the energy of the base pairing, and E_FJC is the mechanical energy of the
stretched ssDNA. This is simplified from the work of Bockelmann et al.(18)
by not including the optical
tweezer energy. Further we ignored elastic energy from the dsDNA anchoring fragment used in the
unzipping experiments.(19)
E_DNA for a given j is the sum of E_i where E_i is (1.3 for A-T or 2.9 for G-C).
Values for E_i were obtained from Bockelmann et al.(18)
E_FJC for a given j and l is:
Formula: xF- Integral(x(F’)dF’).
x(F) is the extensible FJC (check ’97 Wang/Block paper for citation). We used FJC values from Koch
2002(19)
. The integral was computed numerically. The F for a given x was found using Newton’s Method.
We wrote an algorithm in LabVIEW to calculate expectation values for F, j, and the variance of each for a
given DNA sequence and end to end length, l. The expectation values were calculated by simple sums
over all possible j values (from 1 to the length of the sequence). Simulated F versus j curves were then
generated by embedding this algorithm in a loop that stepped over varying values for l. An automated
process loaded each sequence and produced F versus j curves for all yeast XhoI fragments in the library.
For this work, the expectation values were calculated in steps of 1 nm from 1 nm to 2200 nm and sums
over j from 1 to 2000. Simulation results were stored in text files, one file for each XhoI fragment and
will be available from http://kochlab.org
Nat
ure
Pre
cedi
ngs
: doi
:10.
1038
/npr
e.20
10.2
808.
2 : P
oste
d 9
Mar
201
0
Matching algorithms
We devised an algorithm that can produce a quantitative measure of the similarity between two force
versus j curves. We call this measure the match score (m), and it is derived from the standard deviation
of the two curves in a given interval. To compute m we used this formula:
Formula m=….
where Fexp
and Fsim
are the experimental and simulated unzipping forces respectively (as a function of j),
kB is the Boltzman constant, T is temperature, and C0 is the single-stranded DNA contour length per
nucleotide.
We wrote a LabVIEW application to calculate the match scores for each experimental data sets against
the entire simulation library. These results were stored in a LabVIEW array with each row being one
experimental data set. For all match scores in this paper we summed from j = 1200 to j = 1700 in steps
of 1. Choice of this window size and location is discussed below and was assisted by a repeatedly
running this matching algorithm for various window sizes and locations.
Robustness Analysis
We created a histogram of all incorrect match scores (noise) . Then the histogram was fit to a Gaussian
using OriginPro (OriginLab, City). A second histogram for all correct match scores was created, and also
fit to a Guassian using the same algorithm. An estimate of the robustness was produced by comparing
the difference of the means of signal to noise relative to the standard deviation of the noise.
Results
Experimental single-molecule unzipping data
We smoothed ~32 data sets for unzipping of an EarI fragment of pBR322. Examination of force versus
unzipping index shows a noticeable increase in the unzipping force for j> 1000. This is due to a
significant increase in the unzipping rate above j=1000, because the original purpose of these data sets
(Koch 2002) was to probe protein occupancy, where an increased unzipping rate is desirable and a
systematic shift in unzipping force is not an issue(19)
.
Extraction of yeast genome XhoI sites
We found ~1350 XhoI sites in the yeast genome, which produced a library of ~2700 upstream and
downstream unzipping fragments. The entire search and extraction took only a few minutes on our
platform. <10 XhoI sites were within 2000 bp from the end of the chromosome, producing fragments
less than the desired 2000 bp. These fragments produced nonsense match scores, which were then
discarded. Also, by chance, some XhoI sites were separated by less than 2000 basepairs, and thus some
fragments included XhoI recognition sequences. In an actual shotgun DNA mapping experiment, these
XhoI sites could produce shortened fragments, depending on the level of completion of digestion. We
did not account for this effect in this paper. The resulting library (will be available on http://kochlab.org)
included the hidden pBR322 fragment.
Nat
ure
Pre
cedi
ngs
: doi
:10.
1038
/npr
e.20
10.2
808.
2 : P
oste
d 9
Mar
201
0
Creation of Simulation Library for Yeast XhoI Sites
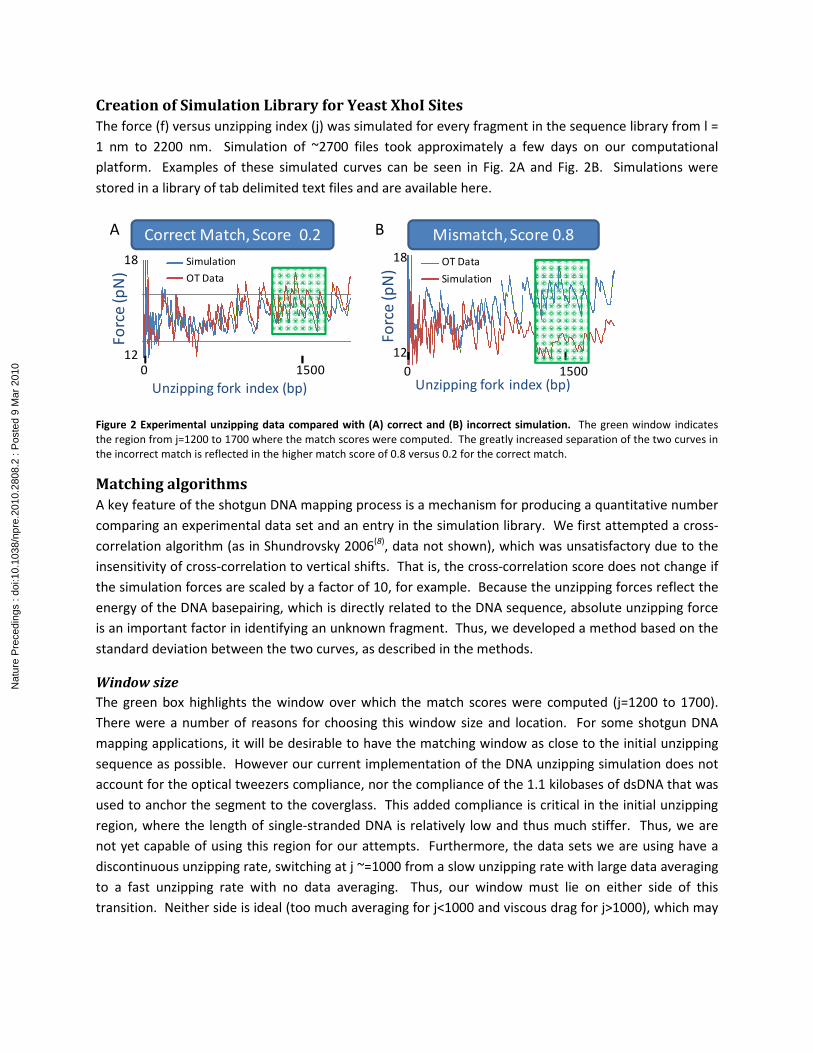
The force (f) versus unzipping index (j) was simulated for every fragment in the sequence library from l =
1 nm to 2200 nm. Simulation of ~2700 files took approximately a few days on our computational
platform. Examples of these simulated curves can be seen in Fig. 2A and Fig. 2B. Simulations were
stored in a library of tab delimited text files and are available here.
12
18
Fo
rce
(p
N)
0 1500
Unzipping fork index (bp)
Simulation
OT Data
Correct Match, Score 0.2
0 1500Unzipping fork index (bp)
OT Data
Simulation
Mismatch, Score 0.8
12
18
Fo
rce
(p
N)
A B
Figure 2 Experimental unzipping data compared with (A) correct and (B) incorrect simulation. The green window indicates
the region from j=1200 to 1700 where the match scores were computed. The greatly increased separation of the two curves in
the incorrect match is reflected in the higher match score of 0.8 versus 0.2 for the correct match.
Matching algorithms
A key feature of the shotgun DNA mapping process is a mechanism for producing a quantitative number
comparing an experimental data set and an entry in the simulation library. We first attempted a cross-
correlation algorithm (as in Shundrovsky 2006(8)
, data not shown), which was unsatisfactory due to the
insensitivity of cross-correlation to vertical shifts. That is, the cross-correlation score does not change if
the simulation forces are scaled by a factor of 10, for example. Because the unzipping forces reflect the
energy of the DNA basepairing, which is directly related to the DNA sequence, absolute unzipping force
is an important factor in identifying an unknown fragment. Thus, we developed a method based on the
standard deviation between the two curves, as described in the methods.
Window size
The green box highlights the window over which the match scores were computed (j=1200 to 1700).
There were a number of reasons for choosing this window size and location. For some shotgun DNA
mapping applications, it will be desirable to have the matching window as close to the initial unzipping
sequence as possible. However our current implementation of the DNA unzipping simulation does not
account for the optical tweezers compliance, nor the compliance of the 1.1 kilobases of dsDNA that was
used to anchor the segment to the coverglass. This added compliance is critical in the initial unzipping
region, where the length of single-stranded DNA is relatively low and thus much stiffer. Thus, we are
not yet capable of using this region for our attempts. Furthermore, the data sets we are using have a
discontinuous unzipping rate, switching at j ~=1000 from a slow unzipping rate with large data averaging
to a fast unzipping rate with no data averaging. Thus, our window must lie on either side of this
transition. Neither side is ideal (too much averaging for j<1000 and viscous drag for j>1000), which may
Nat
ure
Pre
cedi
ngs
: doi
:10.
1038
/npr
e.20
10.2
808.
2 : P
oste
d 9
Mar
201
0
File Number (Arb.)
Ma
tch
Sco
re
Match
demonstrate the robustness of our method. We chose j>1000 due because the large amount of
averaging of the raw data during acquisition made the j<1000 data too unappealing.
The ability to use a smaller window size is also desirable for shotgun mapping applications. We
investigated the results of smaller window sizes and found that smaller windows (for example 100
basepairs wide) produced results that were more dependent on the overall location of the window
(results from poor to just as good as we show here, data not shown). In contrast, the 500 basepair
window was relatively insensitive to location. We chose to use the 500 base pair window so that
window location would not significantly affect our proof-of-principle results.
Shotgun Mapping Results
Fig. 2A and Fig 2B show a comparison of the F versus j curves for
the correct match as well as an incorrect match, respectively. By
eye, it can easily be seen that there is a larger deviation between
the two curves in the Fig 2B. This is reflected by the increased
white space between the curves, and is effectively what our
matching algorithm quantifies, with a score of zero reflecting a
perfect match. For this particular data set, the match score was 0.2,
and the mismatch shown produced a score of 0.8.
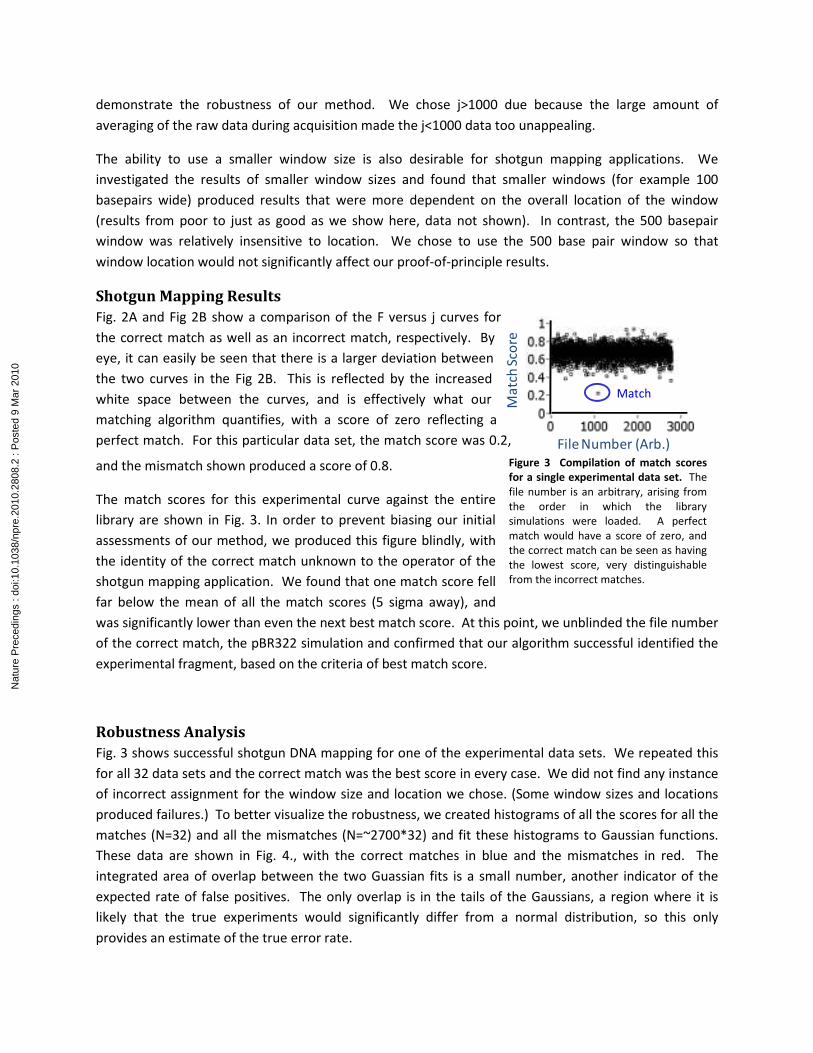
The match scores for this experimental curve against the entire
library are shown in Fig. 3. In order to prevent biasing our initial
assessments of our method, we produced this figure blindly, with
the identity of the correct match unknown to the operator of the
shotgun mapping application. We found that one match score fell
far below the mean of all the match scores (5 sigma away), and
was significantly lower than even the next best match score. At this point, we unblinded the file number
of the correct match, the pBR322 simulation and confirmed that our algorithm successful identified the
experimental fragment, based on the criteria of best match score.
Robustness Analysis
Fig. 3 shows successful shotgun DNA mapping for one of the experimental data sets. We repeated this
for all 32 data sets and the correct match was the best score in every case. We did not find any instance
of incorrect assignment for the window size and location we chose. (Some window sizes and locations
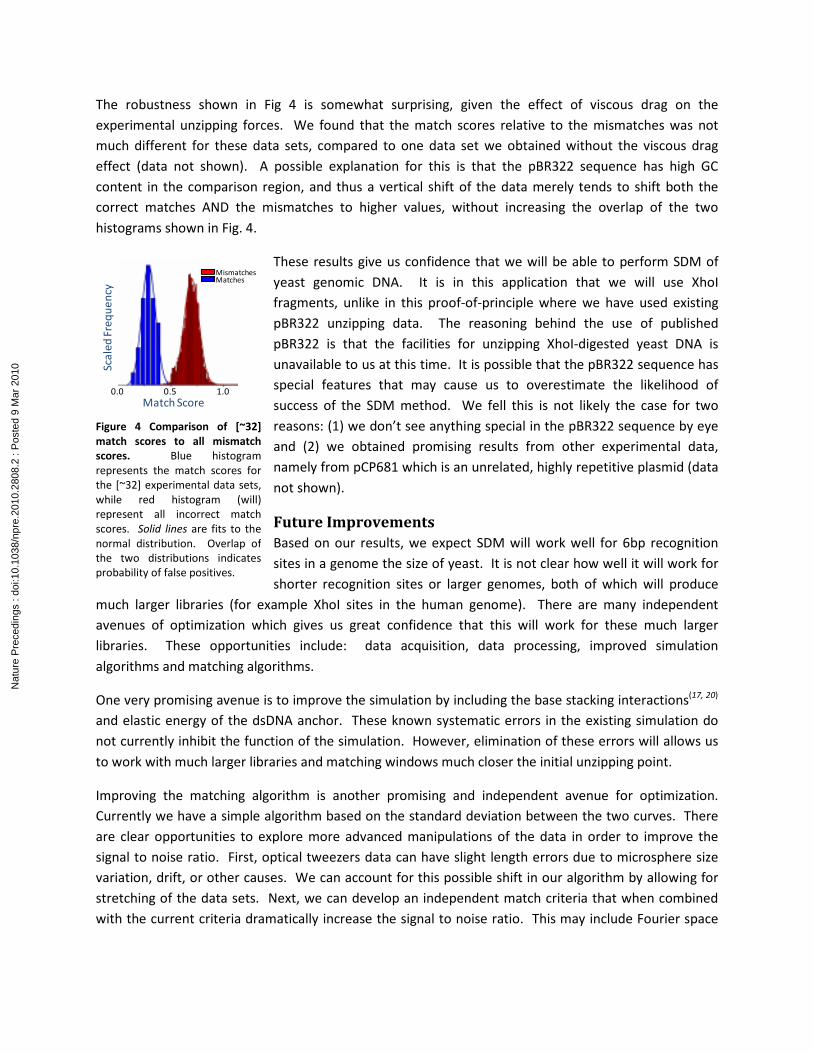
produced failures.) To better visualize the robustness, we created histograms of all the scores for all the
matches (N=32) and all the mismatches (N=~2700*32) and fit these histograms to Gaussian functions.
These data are shown in Fig. 4., with the correct matches in blue and the mismatches in red. The
integrated area of overlap between the two Guassian fits is a small number, another indicator of the
expected rate of false positives. The only overlap is in the tails of the Gaussians, a region where it is
likely that the true experiments would significantly differ from a normal distribution, so this only
provides an estimate of the true error rate.
Figure 3 Compilation of match scores
for a single experimental data set. The
file number is an arbitrary, arising from
the order in which the library
simulations were loaded. A perfect
match would have a score of zero, and
the correct match can be seen as having
the lowest score, very distinguishable
from the incorrect matches.
Nat
ure
Pre
cedi
ngs
: doi
:10.
1038
/npr
e.20
10.2
808.
2 : P
oste
d 9
Mar
201
0
0.0 0.5 1.0
MismatchesMatches
Match Score
Sca
led
Fre
qu
en
cyThe robustness shown in Fig 4 is somewhat surprising, given the effect of viscous drag on the
experimental unzipping forces. We found that the match scores relative to the mismatches was not
much different for these data sets, compared to one data set we obtained without the viscous drag
effect (data not shown). A possible explanation for this is that the pBR322 sequence has high GC
content in the comparison region, and thus a vertical shift of the data merely tends to shift both the
correct matches AND the mismatches to higher values, without increasing the overlap of the two
histograms shown in Fig. 4.
These results give us confidence that we will be able to perform SDM of
yeast genomic DNA. It is in this application that we will use XhoI
fragments, unlike in this proof-of-principle where we have used existing
pBR322 unzipping data. The reasoning behind the use of published
pBR322 is that the facilities for unzipping XhoI-digested yeast DNA is
unavailable to us at this time. It is possible that the pBR322 sequence has
special features that may cause us to overestimate the likelihood of
success of the SDM method. We fell this is not likely the case for two
reasons: (1) we don’t see anything special in the pBR322 sequence by eye
and (2) we obtained promising results from other experimental data,
namely from pCP681 which is an unrelated, highly repetitive plasmid (data
not shown).
Future Improvements
Based on our results, we expect SDM will work well for 6bp recognition
sites in a genome the size of yeast. It is not clear how well it will work for
shorter recognition sites or larger genomes, both of which will produce
much larger libraries (for example XhoI sites in the human genome). There are many independent
avenues of optimization which gives us great confidence that this will work for these much larger
libraries. These opportunities include: data acquisition, data processing, improved simulation
algorithms and matching algorithms.
One very promising avenue is to improve the simulation by including the base stacking interactions(17, 20)
and elastic energy of the dsDNA anchor. These known systematic errors in the existing simulation do
not currently inhibit the function of the simulation. However, elimination of these errors will allows us
to work with much larger libraries and matching windows much closer the initial unzipping point.
Improving the matching algorithm is another promising and independent avenue for optimization.
Currently we have a simple algorithm based on the standard deviation between the two curves. There
are clear opportunities to explore more advanced manipulations of the data in order to improve the
signal to noise ratio. First, optical tweezers data can have slight length errors due to microsphere size
variation, drift, or other causes. We can account for this possible shift in our algorithm by allowing for
stretching of the data sets. Next, we can develop an independent match criteria that when combined
with the current criteria dramatically increase the signal to noise ratio. This may include Fourier space
Figure 4 Comparison of [~32]
match scores to all mismatch
scores. Blue histogram
represents the match scores for
the [~32] experimental data sets,
while red histogram (will)
represent all incorrect match
scores. Solid lines are fits to the
normal distribution. Overlap of
the two distributions indicates
probability of false positives.
Nat
ure
Pre
cedi
ngs
: doi
:10.
1038
/npr
e.20
10.2
808.
2 : P
oste
d 9
Mar
201
0
manipulations such as cross-correlation which we found ineffective on its own but may add value in
combination with the current match criteria.
Missing: comparison with and discussion about optical restriction mapping(1, 3-5, 21)
;
Conclusions and Future Work
• Looks like it works – very promising that shotgun mapping will work with 6 basepair recognition
sequences in yeast DNA.
• We’re pursuing attempts with XhoI digested genomic DNA (purpose of chromatin mapping and
telomeres?)
• High-throughput strategies must be implemented in the future and will enable both shotgun
chromatin mapping and other applications in structural genome mapping etc.
Acknowledgments (please suggest additions / revisions!) The pBR322 experimental unzipping data used in this paper were obtained by SJK in the laboratory of
Michelle D. Wang and were used for equilibrium constant measurements published in 2002(19)
. The
optical tweezers instrumentation and control and analysis software were constructed by authors on that
publication and Richard C. Yeh. We thank the following people for useful discussions, some of whom
may end up being authors on future versions of this paper: Mary Ann Osley, Diego Ramallo Pardo, Kelly
Trujillo, Toyoko Tsukuda, Karen Adelman, David J. Clark, Mike Pikaart, Brandon Beck, and many
anonymous grant reviewers. Diego Ramallo Pardo and Brandon Beck have performed work towards
obtaining native chromatin and DNA constructs for shotgun DNA mapping of yeast genomic DNA. LJH
and ALS were supported by a grant from the American Cancer Society and NSF IGERT Fellowships. RAM
supported by a grant to the CHTM from Emcore corp. SJK and LNL supported by start-up budget from
the CHTM.
References 1. Valouev, A., Schwartz, D., Zhou, S., Waterman, M., "An algorithm for assembly of ordered
restriction maps from single DNA molecules." Proceedings of the National Academy of Sciences
103, 15770 (2006).
2. Lin, J., Qi, R., Aston, C., Jing, J., Anantharaman, T. S., Mishra, B., White, O., Daly, M. J., Minton, K.
W., Venter, J. C., Schwartz, D. C., "Whole-genome shotgun optical mapping of Deinococcus
radiodurans." Science (New York, N.Y.) 285, 1558 (1999).
3. Samad, A., Huff, E. F., Cai, W., Schwartz, D. C., "Optical mapping: a novel, single-molecule
approach to genomic analysis." Genome research 5, 1 (1995).
4. Cai, W., Aburatani, H., Stanton, V. P., Housman, D. E., Wang, Y. K., Schwartz, D. C., "Ordered
restriction endonuclease maps of yeast artificial chromosomes created by optical mapping on
surfaces." PROCEEDINGS OF THE NATIONAL ACADEMY OF SCIENCES OF THE UNITED STATES OF
AMERICA 92, 5164 (1995).
Nat
ure
Pre
cedi
ngs
: doi
:10.
1038
/npr
e.20
10.2
808.
2 : P
oste
d 9
Mar
201
0
5. Schwartz, D. C., Li, X., Hernandez, L. I., Ramnarain, S. P., Huff, E. J., Wang, Y. K., "Ordered
restriction maps of Saccharomyces cerevisiae chromosomes constructed by optical mapping."
Science (New York, N.Y.) 262, 110 (1993).
6. Kidd, J., Cooper, G., Donahue, W. et al., "Mapping and sequencing of structural variation from
eight human genomes." Nature 453, 56.
7. Boeger, H., Griesenbeck, J., Kornberg, R. D., "Nucleosome retention and the stochastic nature of
promoter chromatin remodeling for transcription." Cell 133, 716 (May 16, 2008).
8. Shundrovsky, A., Smith, C. L., Lis, J. T., Peterson, C. L., Wang, M. D., "Probing SWI/SNF
remodeling of the nucleosome by unzipping single DNA molecules." Nature Structural &
Molecular Biology 13, 549 (2006).
9. Osheim, Y. N., Sikes, M. L., Beyer, A. L., "EM visualization of Pol II genes in Drosophila: most
genes terminate without prior 3' end cleavage of nascent transcripts." Chromosoma 111, 1
(2002).
10. He, Y., Vogelstein, B., Velculescu, V., Papadopoulos, N., Kinzler, K., "The Antisense
Transcriptomes of Human Cells." Science, 1163853 (2008).
11. Core, L., Waterfall, J., Lis, J., "Nascent RNA Sequencing Reveals Widespread Pausing and
Divergent Initiation at Human Promoters." Science, 1162228 (2008).
12. Buratowski, S., "TRANSCRIPTION: Gene Expression--Where to Start?" Science 322, 1804 (2008).
13. Margaritis, T., Holstege, F. C., "Poised RNA polymerase II gives pause for thought." Cell 133, 581
(2008).
14. Muse, G., Gilchrist, D., Nechaev, S., Shah, R., Parker, J., Grissom, S., Zeitlinger, J., Adelman, K.,
"RNA polymerase is poised for activation across the genome." Nature Genetics 39, 1507 (2007).
15. Zeitlinger, J., Stark, A., Kellis, M., Hong, J. W., Nechaev, S., Adelman, K., Levine, M., Young, R. A.,
"RNA polymerase stalling at developmental control genes in the Drosophila melanogaster
embryo." Nat Genet 39, 1512 (Dec, 2007).
16. Core, L., Lis, J., "Transcription Regulation Through Promoter-Proximal Pausing of RNA
Polymerase II." Science 319, 1791 (2008).
17. Bockelmann, U., Thomen, P., Essevaz-Roulet, B., Viasnoff, V., Heslot, F., "Unzipping DNA with
optical tweezers: high sequence sensitivity and force flips." BIOPHYSICAL JOURNAL 82, 1537
(2002).
18. Bockelmann, U., EssevazRoulet, B., Heslot, F., "Molecular stick-slip motion revealed by opening
DNA with piconewton forces." PHYSICAL REVIEW LETTERS 79, 4489 (1997).
19. Koch, S. J., Shundrovsky, A., Jantzen, B. C., Wang, M. D., "Probing protein-DNA interactions by
unzipping a single DNA double helix." Biophys J 83, 1098 (Aug, 2002).
20. SantaLucia, J., Jr., "A unified view of polymer, dumbbell, and oligonucleotide DNA nearest-
neighbor thermodynamics." PNAS 95, 1460 (February 17, 1998, 1998).
21. Cai, W., Jing, J., Irvin, B., Ohler, L., Rose, E., Shizuya, H., Kim, U. J., Simon, M., Anantharaman, T.,
Mishra, B., Schwartz, D. C., "High-resolution restriction maps of bacterial artificial chromosomes
constructed by optical mapping." PROCEEDINGS OF THE NATIONAL ACADEMY OF SCIENCES OF
THE UNITED STATES OF AMERICA 95, 3390 (1998).
Nat
ure
Pre
cedi
ngs
: doi
:10.
1038
/npr
e.20
10.2
808.
2 : P
oste
d 9
Mar
201
0