Whole-genome sequencing identifies recurrent mutations in chronic lymphocytic leukaemia
Upload
independentCategory
view
3download
0
Whole-Genome Shotgun Optical Mappingof Rhodobacter sphaeroides strain 2.4.1 and Its Usefor Whole-Genome Shotgun Sequence AssemblyShiguo Zhou,1,4 Erika Kvikstad,1,4 Andrew Kile,1,4 Jessica Severin,1,4 Dan Forrest,1,4
Rod Runnheim,1,4 Chris Churas,1,4 Jason W. Hickman,3 Chris Mackenzie,3
Madhusudan Choudhary,3 Timothy Donohue,2 Samuel Kaplan,3
and David C. Schwartz1,4,51Laboratory for Molecular and Computational Genomics, University of Wisconsin–Madison, UW Biotechnology Center, Madison,Wisconsin 53706, USA; 2Department of Bacteriology, University of Wisconsin–Madison, Madison, Wisconsin 53706, USA;3Department of Microbiology and Molecular Genetics, University of Texas–Houston Medical School, Houston, Texas 77030,USA; 4Department of Chemistry, Laboratory of Genetics, University of Wisconsin–Madison, Madison, Wisconsin 53706, USA
Rhodobacter sphaeroides 2.4.1 is a facultative photoheterotrophic bacterium with tremendous metabolic diversity, whichhas significantly contributed to our understanding of the molecular genetics of photosynthesis, photoheterotrophy,nitrogen fixation, hydrogen metabolism, carbon dioxide fixation, taxis, and tetrapyrrole biosynthesis. To furtherunderstand this remarkable bacterium, and to accelerate an ongoing sequencing project, two whole-genomerestriction maps (EcoRI and HindIII) of R. sphaeroides strain 2.4.1 were constructed using shotgun optical mapping. Theapproach directly mapped genomic DNA by the random mapping of single molecules. The two maps were used tofacilitate sequence assembly by providing an optical scaffold for high-resolution alignment and verification ofsequence contigs. Our results show that such maps facilitated the closure of sequence gaps by the early detection ofnascent sequence contigs during the course of the whole-genome shotgun sequencing process.
Rhodobacter sphaeroides is an �-3, purple, nonsulfur photosyn-thetic eubacterium, which has significantly contributed to ourunderstanding of the molecular genetics of photosynthesis andother important bioenergetic processes. This highly versatile or-ganism can grow aerobically or anaerobically in the presence orabsence of light, while using external electron acceptors such ashydrogen or reduced organic compounds. Furthermore, this bac-terium has tremendous metabolic diversity, as it can oxidize avariety of compounds such as organic acids, sugars, polyols, andmethanol, and toxic compounds such as formaldehyde. It canalso reduce organic or inorganic compounds such as thymine,sulfate, and toxic metal oxides, etc. (Clayton and Sistrom 1978;Moore and Kaplan 1992; Mouncey et al. 1997; Barber and Dono-hue 1998). Besides their bioenergetic versatility and metabolicdiversity, it is believed that this group of bacteria (�-3 subdivisionof the Proteobacteria), and in particular an R. sphaeroides-likeorganism, may have been the ancestor of the primitive mito-chondrion (Yang et al. 1985). Evidence supporting this viewcomes from the findings that this bacterium has two aminolevu-linic acid synthases (Shamin type) and a benzodiazepine-like re-ceptor (Neidle and Kaplan 1993; Yeliseev and Kaplan 1995),which share a high degree of sequence and functional homologywith mammalian mitochondrial proteins.
R. sphaeroides presents a uniquely rich set of metabolic andphylogenetic questions that require detailed answers through aconcerted effort to establish the fundamental genomic underpin-nings for this organism. As such, the sequencing of the R. sphae-roides genome was funded by the U.S. Department of Energy
(DOE), the National Institutes of Health (NIH), and other agen-cies, and was carried out by two sequencing centers, the JointGenome Institute (JGI) and the University of Texas—HoustonMedical School (UT). JGI adopted the whole-genome shotgunapproach (Fleischmann et al. 1995) to sequence the entire ge-nome, while UT focused on chromosome II (Mackenzie et al.2001). Although a large number of microbial genomes have beencompleted using this sequencing strategy, much optimizationremains to be done in terms of reducing the cost and effort re-quired during the finishing stages of any sequencing project. Inthis regard, physical maps guide sequence assembly, characterizegaps, and validate finished sequence, especially when attemptingto assemble genomic regions containing repeated DNA se-quences, as cleavage patterns can frequently discern such se-quence elements. Entire regions of a genome might be excludedfrom “completed” sequence data because of limited budgets andthe absence of physical mapping data (Sensen 1999). Althoughphysical maps had been constructed for R. sphaeroides, whichestablished the existence of a complex genome containing twochromosomes (Suwanto and Kaplan 1989a,b, 1992; Choudharyet al., 1994, 1997), these maps are of modest resolution (theaverage fragment sizes of these maps are >150 kb). Indeed, nearlytwo thirds of chromosome II lacked any physical or genetic mark-ers, thus these maps were minimally useful as a scaffold for se-quence assembly or as a means for assembly validation. There-fore, optical maps (EcoRI and HindIII) were constructed to iden-tify gaps, characterize assembled sequence contigs, and toultimately validate finished sequence.
The optical mapping system is largely automated, and con-structs ordered restriction maps from ensembles of genomic DNAmolecules mounted on the specially derivatized glass surface(Meng et al. 1995; Anantharaman 1997, 1998, 1999; Aston et al.1999a,b; Cai et al. 1998; Jing et al. 1999; Lai et al. 1999; Lim et al.
5Corresponding author.E-MAIL [email protected]; FAX (608) 265-6743.Article and publication are at http://www.genome.org/cgi/doi/10.1101/gr.1128803.
Methods
2142 Genome Research 13:2142–2151 ©2003 by Cold Spring Harbor Laboratory Press ISSN 1088-9051/03 $5.00; www.genome.orgwww.genome.org

2001). DNAmolecules are imaged using fluorescence microscopyafter restriction enzyme digestion, but importantly, restrictionfragments remain ordered. Because DNA molecules are stainedwith a fluorochrome, the mass of each restriction fragment isaccurately determined using integrated fluorescence intensitymeasurements, which obviates the need for uniformly elongatedmolecules required for length-based mass measurements. Gap-free restriction maps of an entire microbial genome are generatedusing a map assembler in a process that is similar to shotgunsequence assembly (Anantharaman 1997, 1998, 1999).
Here, we present two genome-wide optical maps (EcoRI andHindIII) of R. sphaeroides strain 2.4.1 that were used as a scaffoldfor sequence assembly and to validate the finished sequence.Notably, the EcoRI optical map is a very high-resolution mapwith an average fragment size of ∼ 7 kb and represents the highestresolution attained thus far by optical mapping for an entiregenome.
METHODS
DNA PreparationR. sphaeroides strain 2.4.1 genomic DNA gel inserts (Schwartz andCantor 1984) were prepared from a culture grown chemohetero-trophically at 32°C on a shaker using Sistrom’s minimal mediumA and stored in 0.5 M EDTA (pH 8.0) (Lueking et al. 1978). Priorto use, the DNA gel inserts were washed thoroughly overnight inTE (10 mM Tris, 1 mM EDTA; pH 8.0) to remove excess EDTA.The washed inserts were melted at 72°C for 7 min., and themelted agarose was digested at 42°C for 2 h in �-agarase solution(New England Biolabs; 100 µL of TE + 2 µL [1 Unit] �-agarase per20 µL agarose). Suitable DNA dilutions were made from thissample with TE using centrifugation (microfuge; rotor radius 13cm, 6000 rpm, 30 min), to ensure uniform dilution and to mini-mize the presence of supercoiled plasmid DNA on optical map-ping surfaces. Lambda DASH II bacteriophage DNA (Stratagene)was added to the genomic DNA solution (10 pg/µL). Such DNAsamples were mounted onto an optical mapping surface and ex-amined by fluorescence microscopy to check molecular integrityand concentration.
Surface PreparationGlass cover slips (22 � 22 mm, Fisher’s Finest; Fisher Scientific)were cleaned and derivatized as before (Zhou et al., 2002). Surfaceproperties were assayed by digesting � DASH II bacteriophageDNA with 40 units of HindIII and EcoRI diluted in 100 µL ofdigestion buffer with 0.02% Triton X-100 (SIGMA) at 37°C todetermine optimal digestion times, which ranged from 40–120min.
DNA Mounting, Overlay, Digesting and StainingDNA molecules were mounted on derivatized glass surfaces bycapillary action using a microfluidic device (E. Dimalanta andD.C. Schwartz, unpubl.). Then, a thin layer of acrylamide (3.3%containing 0.02% Triton X-100 [SIGMA]) was applied to the sur-face, which upon polymerization was washed with 400 µL TE for2 min, followed by washing with 200 µL digestion buffer foranother 2 min. To set up the digestion, 200 µL of digestion bufferwith enzyme (20 µL NEB [New England Biolabs] Buffer 2, 176 µLhigh purity water, 2 µL 2% Triton X-100 [SIGMA] and 2 µL NEB-HindIII or EcoRI; 2 units/µL) were added to the surface and incu-bated in a humidified chamber at 37°C for 40–120 min. Afterdigestion, the surface was washed twice by adding 400 µL TE andaspirated off, 2–5 min each time. The surface was mounted ontoa glass slide with 12 µL, 0.2 µM YOYO-1 solution {containing 5parts YOYO-1; 1,1�-[1,3-propanediylbis[(dimethyliminio) -3,1-propanediyl]]bis[4–[(3-methyl-2(3H)- benzoxazolylidene)-methyl]]-, tetraiodide [Molecular Probes] and in 95 parts of�-mercaptoethanol in TE 20% v/v}. The sample was sealed withnail polish and incubated (4°C in the dark) for 20 min or over-
night for the staining dye to diffuse before checking under thefluorescence microscope.
Image Acquisition and ProcessingDNA samples were imaged by fluorescence microscopy as previ-ously described using a 63� objective (Zeiss) and a high-resolution digital camera (Princeton Instruments; Lim et al.2001). Images were collected using a fully automated image ac-quisition system developed by our laboratory (Autocollect). Co-mounted � DASH II DNA molecules were used to estimate thedigestion rate and to provide internal fluorescence standards foraccurately sizing the DNA fragments (Anantharaman et al. 1997;Marra et al. 1997; Lin et al. 1999). The image files were processedto create maps using previously described software (Lim et al.2001).
Optical Map AssemblyIndividual molecule restriction maps were overlapped by align-ing restriction sites based on fragment sizes using specially writ-ten software Gentig (Anantharaman 1997, 1998, 1999; Lai et al.1999; Lin et al. 1999; Lim et al. 2001). Briefly, Gentig assemblessingle-molecule restriction maps into a genome-wide map contigusing a greedy algorithm with limited backtracking for findingan almost optimal scoring set of map contigs in order to avoidthe high computational complexity that would occur in attempt-ing to find the optimal assembly. Bayesian inference was used toestimate the probability that two distinct single-molecule restric-tion maps could have been derived from the proposed placementwhile subject to various data errors such as sizing errors, missingrestriction sites (missing cuts), and false cut errors. A Bayesianapproach required fine tuning of these parameters and a knownprior statistical distribution of error sources. These parameters,such as standard deviation, digestion rate, false cut, and falsematch probability, can be reestimated from the data using a lim-ited number of iterations of Bayesian probability density maxi-mization. After these parameters are correctly estimated from thedata, the best offset and alignment between a pair of maps can becomputed by an efficient dynamic programming algorithm.
DNA Sequence AssemblyDNA sequence trace files of the whole-genome were generated bythe DOE microbial genome project and chromosome II-specificfiles were generated by UT. Assembly of the whole-genome dataset by the DOE generated 195 contigs ranging in size from ∼ 0.5–100 kb. Scaffold sequence data (not to be confused with the op-tical scaffold data also described in this work) also supplied by theDOE, indicated sequencing subclones that had insert ends thatassembled into two contigs. This information permitted the de-duction of a tentative contig order and orientation around chro-mosome I and II, which was cross checked by optical mapping.PCR primers were then designed to the contig ends, and PCRproducts spanning the contig gaps were generated then se-quenced and included in subsequent rounds of assembly.
The possession of chromosome II ( ∼ 0.9 Mb)-specific se-quences permitted an initial assembly of this replicon indepen-dently from the whole-genome sequence data set. The in silicomap of chromosome II was then checked against the optical mapfor accuracy. Assembly of chromosome I ( ∼ 3.0 Mb) was thenundertaken as a part of a whole-genome assembly, which in-cluded the now complete chromosome II DNA sequence. Thismethod was used to “encourage” the assembler into aligningtrace files derived from chromosome II with the completed chro-mosome II sequence. In this way, all trace files not assemblingwith the chromosome II sequence must by default be derivedfrom chromosome I or plasmids, which were then closed andfinished in a targeted approach described above. All assemblieswere made using the Phred, Phrap, and Consed package (Gordonet al. 1998). On average, the redundancy of the DNA sequencecoverage of chromosomes I and II was about sevenfold and aboutninefold, respectively. Regions that misassembled, as describedhere, consisted of areas of low sequence coverage (2–3�), thatarose as a consequence of locally high %G+C composition with
R. sphaeroides 2.4.1 Optical Map
Genome Research 2143www.genome.org

strong secondary structure. These regions, which were repeatedat several places in the genome, proved highly recalcitrant to PCRand additional sequencing efforts.
Optical Maps Versus In Silico MapsThe EcoRI and HindIII optical maps of R. sphaeroides 2.4.1 genomechromosome I and chromosome II were aligned separately withthe in silico EcoRI and HindIII maps of chromosome II and sevensequence contigs of chromosome I using Gentig. The possiblemisassembled parts of the chromosome I sequence contigs wereremoved in order to estimate the optical errors compared to thesequence in silico maps. The missing fragments and the false cutsor missing cuts were determined based on these alignments. Therelative error associated with each consensus map fragment inthe optical maps was calculated by the following formula: (| insilico map fragment size) � (optical map fragment size |)/(insilico map fragment size) � 100%, and was plotted against insilico map fragment masses to visualize the relationship betweenfragment size and the relative error.
RESULTS
Acquisition of Data and Construction of Optical MapsWhole-genome shotgun optical mapping (Anantharaman 1997,1998, 1999; Lai et al. 1999; Lin et al. 1999) was used to constructthe restriction maps presented here, a mapping approach thatbears many similarities to whole-genome shotgun sequencing(Fleischmann et al. 1995; Marra et al. 1997; Soderlund et al.1997). The advantages afforded by this approach accrue mainlyfrom the use of genomic DNA as the source of single molecules,which obviates the needs for libraries, PCR, or separations. Aswith shotgun sequencing, a large set of optical maps (vs. “se-quence reads”) is used to multiply cover any given region toestablish continuity and accuracy of the physical maps across agenome.
Genomic DNA molecules were randomly broken into largefragments (200 –1,600 kb) during the course of sample prepara-tion. Such fragments were elongated and bound to optical map-ping surfaces for digestion by two restriction endonucleases(EcoRI and HindIII) in separate experiments and then imaged byfluorescence microscopy using Autocollect (see Methods). Mapsderived from individual DNA molecules were then assembledinto whole-genome consensus maps using the Gentig map as-sembler (Anantharaman 1997, 1998, 1999; Lai et al. 1999).
The EcoRI mapping began with the collection and process-ing of 576 molecules. In total, 256 of these molecules were as-sembled into two circular maps covering two distinct chromo-somes (I and II); a statistical summary is presented in Table 1.Both maps were circularized without gaps and a typical restric-tion fragment reported within the consensus map was computedfrom a number of congruent molecules—37 (chromosome I) or12 (chromosome II). Similar digestion rates were calculated forchromosome I (82.6%) and chromosome II (84.48%). The aver-age fragment size of the EcoRI optical maps was 6.49 kb for chro-
mosome I, and 6.93 kb for chromosome II, which represents thehighest resolution optical maps thus far reported. Figure 1 showsthe finished EcoRI maps (consensus maps) of the R. sphaeroideschromosomes and the underlying single-molecule maps used toconstruct the consensus map.
The precision of the EcoRI whole-genome maps (sizing errorper single restriction fragment) was estimated from the standarddeviation calculated from the sets of like restriction fragmentsused to calculate each position within the consensus maps (thesemaps report the average mass of each fragment set). Accordingly,the average standard deviation about the mean fragment size was1.18 kb for chromosome I and 1.02 kb for chromosome II, basedon the final circularized consensus maps.
The same methodologies and analyses were used to con-struct the HindIII optical map. Here, a total of 464 digested DNAmolecules were imaged and processed to construct two separatemaps (Table 1), with a total mass of 104.87 Mb, representing∼ 26� coverage of the R. sphaeroides 2.4.1 genome. The averagestandard deviation, computed from all of the consensus mapfragments, was 2.21 kb for chromosome I and 3.53 kb for chro-mosome II, based on the finished map contigs. Finally, bothchromosomes were sized at 3.19 Mb and 938 kb, for chromosomeI and II, respectively. These values were based on the summationof all restriction fragments comprising the HindIII consensusmaps.
The correctness of a completed circularized map was statis-tically evaluated by the same Bayesian inference scheme, whichunderlies Gentig (see Methods). In essence, a series of hypoth-esized map alignments supplied by the map data set were statis-tically evaluated with prior probabilities that model commonexperimental error. As such, the false positive probabilities forthe circularization of the maps reported here were 0.02515 and0.00188 for the chromosome I and II EcoRI maps, while similarvalues were obtained for chromosome I (0.02012) and chromo-some II (0.00607) HindIII maps (Table 1). Placing these valuesinto an experimental context—from previous optical maps wehave found that when the false-positive probabilities for the cir-cularization were <0.05, reliable map closure was assured. Finally,the restriction patterns generated by both EcoRI and HindIII wereapparently random, hence no specific restriction patterns orstructural features were discerned.
Assessment of Optical Mapping ErrorsTo assess the errors and accuracy of the EcoRI and HindIII maps,comparisons were made between optical mapping and sequencedata (Fig. 2). The relative sizing error was shown by the plot ofthe optical map fragments against the corresponding in silicomap fragments based on the alignment of optical maps with insilico maps constructed from the available sequence data of chro-mosomes I and II (Fig. 2A–H). The error bars in Figure 2A, C, E,and G indicate the standard deviation about the means of therestriction fragment sizes used to calculate consensus map frag-
Table 1. Optical Mapping Data of R. sphaeroides 2.4.1. Genome
Enzyme Chromosome
Data collection Contigged molecules
Contigrate (%)
Circularcontig
size (kb)
Averagefragmentsize (kb)
Averagefragment
size SD (kb)
Circularizationfalse
probability#
MoleculesMass(Mb)
#Molecules
Mass(Mb)
EcoRI Chr I 576 270.3 232 116.82 47.67 3107 6.49 1.18 0.02515Chr II 1 24 12.05 890 6.93 1.02 0.00188
HindIII Chr I 464 250.5 152 93.10 41.85 3190 17.78 2.21 0.02012Chr II 6 22 11.77 938 24.10 3.53 0.00607
Zhou et al.
2144 Genome Researchwww.genome.org

Figure 1 Whole-genome EcoRI optical map contigs of chromosome I and II of R. sphaeroides 2.4.1. (A) Chromosome I circular map contig. Theoutermost multicolored ring shows the consensus map calculated by Gentig. The consensus map was built from the shown underlying maps, obtainedfrom individual DNA molecules, and represented here as multicolored arcs. Congruent restriction fragments, shown in the consensus map are denotedby common color; the color coding scheme is random to enhance contrast. Missing cuts are displayed as fragments that span across one or more cutsites in the consensus map. (B) Chromosome II circular map contig; display scheme is the same as (A).
R. sphaeroides 2.4.1 Optical Map
Genome Research 2145www.genome.org

Figure 2 Comparisons of the HindIII and EcoRI optical maps of R. sphaeroides chromosome I (CI) and chromosome II (CII) to sequence data. (A) (CIEcoRI), (C) (CII EcoRI), (E) (CI HindIII) and (G) (CII HindIII) are the plots of optical map fragment sizes versus the in silico map fragment sizes from finishedsequence. The error bars represent the standard deviation of optical map fragment size on the means. (B) (CI EcoRI), (D) (CII EcoRI), (F) (CI HindIII), and(H) (CII HindIII) show plots of the absolute error of optical fragment size versus sequence.
Zhou et al.
2146 Genome Researchwww.genome.org

ments shown in Figure 2. The average absolute error was 1.18 kbfor the chromosome I EcoRI map, 1.02 kb for the chromosome IIEcoRI map, 2.10 kb for the chromosome I HindIII map, and 3.53kb for the chromosome II HindIII map, relative to the in silicomaps. Generally, a high degree of correspondence was foundbetween optical map fragment sizes and the in silico map frag-ment sizes, and the trend line is almost identical to the diagonalline.
Scatter plots were done to show details of how the relativefragment sizing error (|optical map fragment size—correspondingin silico map fragment size|/corresponding in silico map frag-ment size � 100%) varied with restriction fragment size (Fig.2B,D,F,H). Overall, relative sizing errors were expectedly found tobe inversely proportional to the restriction fragment size (Menget al. 1995). From this analysis, the average relative sizing errorfor the EcoRI chromosome I optical map was 13.39% for frag-ments <3 kb, 6.46% for fragments 3–5 kb, and 3.38% for frag-ments >5 kb. While the EcoRI chromosome II optical mapshowed a range of average relative sizing errors of 16.34% forfragments <3 kb, 7.81% for fragments 3–5 kb, and 5.71%for fragments >5 kb. A similar assessment of the chromosome IHindIII map showed average relative sizing errors of 6.0% forfragments <5 kb and 1.69% for fragments >5 kb. Likewise, theHindIII map of chromosome II presented the following statistics:7.74% for fragments <5 kb and 3.97% for fragments >5 kb.
Alignments of Optical Maps to In Silico MapsThe above analyses deal solely with the optical fragment sizingerrors, however, it is informative to assess such errors in the con-text of map alignments between optical maps and the in silicomaps (from available sequence data). Such comparisons facilitatesequence assemblies and validate finished sequence. The align-ment of the EcoRI optical map of chromosome I with the corre-sponding in silico maps of seven sequence contigs (Fig. 3A; con-tigs 125 and 103 were graphically combined) produced overlapsbetween the in silico restriction maps that were then carefullycompared with the optical map. This comparison revealed errorsas strings of in silico fragments at the distal ends of four sequencecontigs (Fig. 3A; 103, 125,183, 215, and 217), which sufficientlydiffered (>50%) from each other and the optical map to be noted(Table 2). Accordingly, the putatively errant fragments in thecontig 103 were eliminated to enable its seamless joining withcontig 125 at the 0 position (Fig. 3A). This is represented in Figure3A as a single, continuous sequence contig.
To further confirm these errors we then analyzed the sameset of in silico maps against the HindIII optical map of chromo-some I. If two separate enzyme maps show discrepancies in thesame region, then it is probable that the sequence data is prob-lematic. This analysis showed errors in the in silico map at thesame positions originally flagged by the EcoRI optical map atcontigs 183, 215, and 217 (Table 3). Although sequence contig103 presented no HindIII restriction sites, its size of 19.12 kbspanned the gap between sequence contig 125 and 222. Giventhis finding and the EcoRI data allowed us to confidently insert itat the beginning of sequence contig 222. Further comparisons inthe problematic regions showed that the EcoRI map alignmentsrevealed additional discrepancies, and these problematic regionsare defined as loci 1–4 (L1 to L4) as shown in Tables 2 (EcoRI) and3 (HindIII).
Figure 3A also shows the high-resolution EcoRI optical mapalignments to the same chromosome I sequence data. For thiserror analysis, the putative sequence misassemblies were re-moved, and these filtered data revealed only a single false cut inthe optical map. However, given a high-resolution map, we pre-dicted a larger number of missing fragments. Here, we identified40 missing cuts and 68 missing fragments (out of 565 fragments
in total). Normally, optical maps do not report restriction frag-ments <500 bp and attenuated recording of fragments <1 kb(Meng et al. 1995). Accordingly, further analysis showed thatfour out of five missing fragments for the HindIII optical map,and 42 out of 68 missing fragments for EcoRI optical map ofchromosome I were �1 kb.
The alignment of the HindIII optical map with the corre-sponding chromosome I in silico maps (Fig. 3A) revealed severaldifferences—two false cuts (present in the optical map but not inthe in silico map), four missing cuts (present in the in silico mapbut not in the optical map), and five missing fragments (out of atotal of 186 fragments).
A similar analysis was then performed between the opticalmaps and chromosome II sequence data. Here, the alignment ofthe EcoRI optical map (Fig. 3B) showed three false cuts, ninemissing cuts, and 19 missing fragments (out of a total of 167fragments), while the HindIII optical map (Fig. 3B) showed nofalse cuts, no missing cuts, and one missing fragment (out of atotal of 40 fragments) in the optical map. The only fragmentmissing in the HindIII optical map of chromosome II was 0.49 kb,and 10 out of 19 of the missing fragments in the EcoRI opticalmap were <1 kb.
The Resolution of Locus 4Closure of CI required the joining of three contigs that genomescaffold data suggested were in the order: 125–103–222. The gapsbetween the contigs were thought to be <3 kb; however, PCRacross these gaps had been a consistent failure. The assemblerhad been unable to put these three contigs together but hadsuggested that a region at the 3� end of contig 125 and the 5� endof contig 222 showed strong, high-quality sequence alignmentwith contig 103 (Fig. 4A). Although contigs 125 and 222 hadregions of poor sequence at their 3� and 5� ends respectively, theirin silico maps were overall in agreement (Table 2 and Fig. 4B,C)with their optical maps. This suggested that the PCR failure didnot reside with the primers designed to the ends of these contigs.Why then had PCR been a failure? Contig 103 had two regions ofpoor quality sequence flanked by regions encoding in silico EcoRIsites that were present/absent from the optical map, suggestingmisassembly of contig 103. After paring back the sequences at the3� and 5� ends of contig 103 to EcoRI sites that existed in both thein silico and the optical map, it assembled cleanly with contig125. The subsequent acquisition of new sequences between con-tigs 103 and 222 permitted CI closure. The homology betweencontig 222 and contig 103 represented by the angled grey area inFigure 4A was a “red herring” that fulfilled our preconceptions ofwhat this region “should look like”. The high resolution of theEcoRI optical map suggested that our assumptions were wrongand indicated that a large gap ( ∼ 10 kb) must be reexamined be-fore closure could be achieved. This proved to be the case.
DISCUSSIONTwo whole-genome shotgun optical maps (EcoRI and HindIII)were constructed for the phototrophic bacterium, R. sphaeroides2.4.1 for the purposes of validating sequence assemblies and sim-plification of the gap closure procedures, which were ongoingactivities within the parallel genome sequencing project. Bothmaps were used to check nascent sequence contigs by the align-ment of the in silico maps with the optical data, to assess se-quence assembly errors, to validate, and to orient sequence con-tigs on the optical map scaffold. This process also readily char-acterized gaps between the sequence contigs. Given that our mapand sequence comparisons were performed using unfinished se-quence, a remarkable degree of correspondence was noted. The
R. sphaeroides 2.4.1 Optical Map
Genome Research 2147www.genome.org
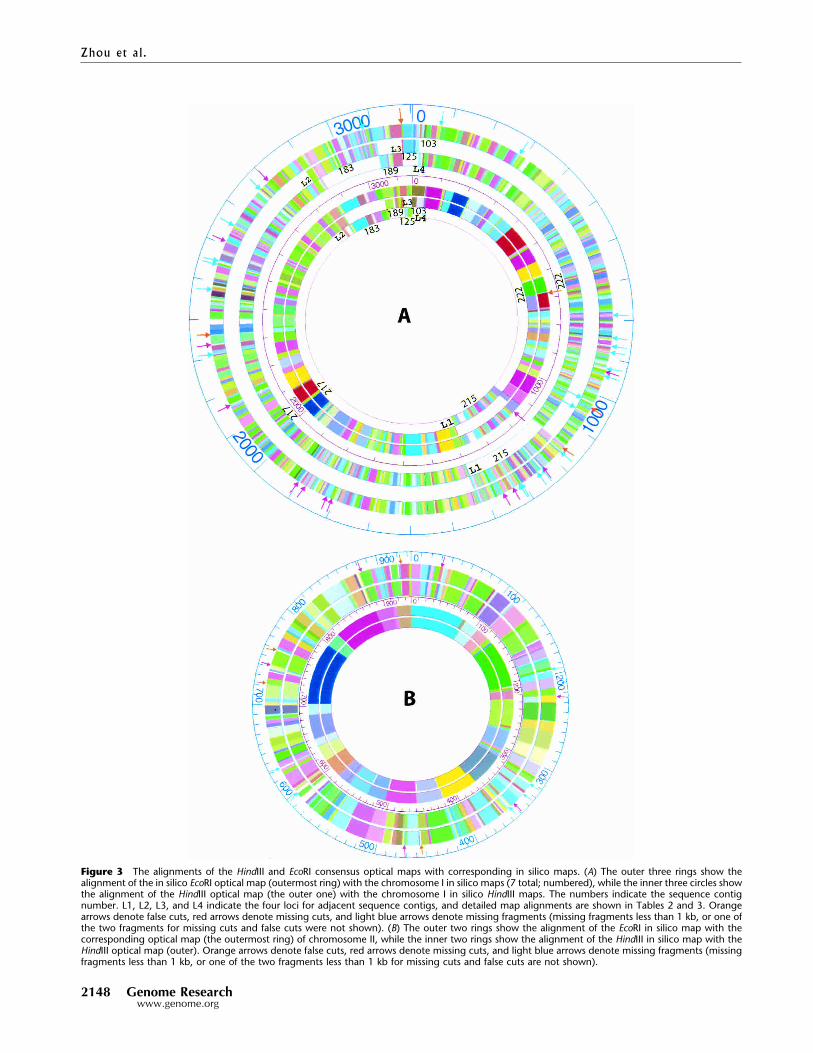
Figure 3 The alignments of the HindIII and EcoRI consensus optical maps with corresponding in silico maps. (A) The outer three rings show thealignment of the in silico EcoRI optical map (outermost ring) with the chromosome I in silico maps (7 total; numbered), while the inner three circles showthe alignment of the HindIII optical map (the outer one) with the chromosome I in silico HindIII maps. The numbers indicate the sequence contignumber. L1, L2, L3, and L4 indicate the four loci for adjacent sequence contigs, and detailed map alignments are shown in Tables 2 and 3. Orangearrows denote false cuts, red arrows denote missing cuts, and light blue arrows denote missing fragments (missing fragments less than 1 kb, or one ofthe two fragments for missing cuts and false cuts were not shown). (B) The outer two rings show the alignment of the EcoRI in silico map with thecorresponding optical map (the outermost ring) of chromosome II, while the inner two rings show the alignment of the HindIII in silico map with theHindIII optical map (outer). Orange arrows denote false cuts, red arrows denote missing cuts, and light blue arrows denote missing fragments (missingfragments less than 1 kb, or one of the two fragments less than 1 kb for missing cuts and false cuts are not shown).
Zhou et al.
2148 Genome Researchwww.genome.org

availability of two independent optical restriction maps enabledus to confidently identify several discrepancies at the distal endsof several chromosome I sequence contigs, and such aberranciesmay often be attributed to sequence assembly errors. As such,assembly efforts involving the garnering of additional reads, PCRanalysis or new assembly schemes can be critically focused onthese sequence loci.
The estimated genome size of R. sphaeroides 2.4.1 strain is4.13Mb (3.19Mb for chromosome I, and 938 kb for chromosomeII) based on the HindIII optical maps, which is very close to thesum of all sequence contigs (4.14 Mb), meaning a mere 0.24%difference or map error. Compared to the genome size estimate ofR. sphaeroides 2.4.1 determined by pulsed field gel electrophoresis(PFGE; 3.05 Mb +/� 95 kb for chromosome I and 914 kb +/� 17kb for chromosome II; Suwanto and Kaplan 1989b), the genomesizing error was smaller for optical mapping than for PFGE(1.5%–4.25% error). The EcoRI optical maps of chromosome Iand II of R. sphaeroides 2.4.1 were also highly congruent withthe in silico EcoRI maps constructed from the sequence data.The genome size estimated from the EcoRI maps was 3.99 Mb (3.1
Mb for chromosome I and 890 kb for chromosome II), which isstill closer (3.62% error) to the size of genome sequence datathan the genome size estimated by PFGE. The differences be-tween the two optical maps stemmedmainly from the absence ofsmall restriction fragments, which are <2 kb in the EcoRI opticalmap.
The final maps showed some variation in contig depth (thenumber of molecules aligned to a given genome locus); both theHindIII and EcoRI optical maps have less coverage for chromo-some II compared to chromosome I. A possible explanation isthat because chromosome I is a much larger circular DNA mol-ecule than chromosome II, it was more frequently sheared toproduce linear molecules, which were mapped; circular mol-ecules may have existed in a supercoiled state, which were im-aged as bright “balls,”—unsuitable for mapping.
Improvements in DNAmounting, image collection, process-ing, and map assembly software have made it possible to gener-ate a high resolution map (the average fragment size <15 kb)using our new optical mapping system as shown before (Zhou etal. 2002). However, when the map resolution approaches 5–7 kb,
Table 2. Problematic Alignments Between the Eco RI Chromosome I Optical and In Silico Maps
Opticalmap
Contig 215 Contig 217Opticalmap
Contig 217 Contig 183Opticalmap
Contig 189 Contig 125 Contig 103 Contig 222
Locus 1 Locus 2 Locus 3 Locus 4
1.08 1.08 – 16.18 15.86 – 3.89 3.53 – – –11.23 10.89 – 10.07 9.71 – 10.16 10.37 – – –1.94 0.48 – 16.83 16.78 – 3.8 3.89 – – –3.7 2.17 – 3.45 3.63 – 30.64 27.45 3.08 – –2.69 1.3 – 2.67 2.42 15.75 1.73 – 1.71 1.14 –2.31 0.77 1.09 8.83 5.32 8.84 24.59 – 25.17 2.01 –2.66 2.4 2.61 15.14 – 14.98 3.06 – 2.83 1.05 –1.56 0.85 0.57 – – 0.8 5.39 – 2.32 6.3 –3.38 – 1.92 2.3 – 1.58 2.83 – – 8.38 –3.04 – 2.01 23.21 – 22.1 9.25 – – – 1.671.29 – 0.79 9.39 – 8.82 5.26 – – – 5.912.87 – 0.94 2.41 – 2.6 6.33 – – – 1.9712.08 – 12.61 5.1 – 5.01 6.5 – – – 5.993.41 – 2.43 1.21 – 1.36 10.99 – – – 10.69
– 1.41 5.17 – 5.03 14.85 – – – 14.3910.21 – 10.33 4.37 – 4.22 2.39 – – – 2.518.26 – 8.44 15.21 – 14.88 5.35 – – – 4.93
Significant differences are bolded.
Table 3. Problematic Alignments of the Chromosome I Hind III Optical and In Silico Maps
Opticalmap
Contig 215 Contig 217Opticalmap
Contig 217 Contig 183Opticalmap
Contig 189 Contig 125 Contig 103 Contig 222
Locus 1 Locus 2 Locus 3 Locus 4
23.07 22.77 – 35.58 36.17 – 10.52 10.62 – – –25.8 25.7 – 21.7 21.51 – 9.87 8.92 – – –19.13 18.94 – 22.55 22.6 – 27.36 11.42 15.31 – –2.92 1.47 – 9.81 9.44 – – – 0.54 – –3.01 0.41 – 34.42 35.04 12.9 7.89 – 7.58 – –3.74 2.18 – 2.61 2.87 2.11 10.34 – 10.14 – –2.19 2.43 – 3.15 3.18 2.88 52.81 – 1.53 19.12 30.333.43 1.13 – 3.14 0.5 3.17 7.8 – – – 7.362.01 0.64 – 8.51 – 8.33 56.29 – – – 56.292.97 0.4 1.49 64.21 – 66.45 9.22 – – – 9.223.77 – 3.29 27.41 – 27.57 4.34 – – – 4.3425.83 – 26.15 13.24 – 12.25 28.49 – – – 28.4953.03 – 54.34 32.14 – 31.94 59.2 – – – 59.2
Significant differences are bolded.
R. sphaeroides 2.4.1 Optical Map
Genome Research 2149www.genome.org

as evidenced by the EcoRI maps presented here, a significant pro-portion of restriction fragments in the map will be <1 kb, andthus poorly represented in the final consensus map using ourcurrent DNA mounting approaches. Although high resolutionmaps have proven utility for validating nascent sequence contigsand guiding whole-genome shotgun sequence assemblies, fur-ther uses for such high-resolution maps are in the realm of com-prehensive genotyping and comparative genomics, as genes arehighly conserved amongst different strains of the same bacterialspecies or even closely related species (Moore and Kaplan 1992;Perna et al. 2000). To meet this challenge, our laboratory is de-veloping newer approaches to address the need for ultra-highresolution maps.
In summary, we have presented here two whole-genomeshotgun optical maps of R. sphaeroides using the optical mappingsystem. These maps were used by the concurrent genome se-
quencing effort for the validation of sequence contigs by thedetection of misassemblies. Such common errors, inherent tomodern whole-genome sequencing approaches are rapidly andconfidently discerned when shotgun sequencing is combinedwith optical mapping.
ACKNOWLEDGMENTSThis work was supported by a grant from the DOE DE-FC02–01ER63175 to D.C.S. and NIH 15590 and DOE DE-FG02–01ER63232 grants to S.K. Special thanks to Thomas Ananthara-man for algorithmic efforts for map assembly.
The publication costs of this article were defrayed in part bypayment of page charges. This article must therefore be herebymarked “advertisement” in accordance with 18 USC section 1734solely to indicate this fact.
Figure 4 The melding of contigs 125, 103 and 222 after the resolution of contig 103 misassembly by optical mapping, see also Locus 3 and 4 in Table2. (A) The three contigs 125, 103 and 222 are shown in the order suggested by sequence scaffold data. Contigs are represented by black horizontallines. In silico EcoRI sites are represented by vertical lines and between them the predicted in silico EcoRI fragment sizes in kb. Green areas indicate regionsof high sequence quality (10–22 -fold coverage), red areas of poor sequence coverage (2–4 fold) and/or poor quality sequence data. Grey block 1indicates a region of high sequence identity between the 3� end of contig 125 and a region lying 4.5 kb from the 5� end of contig 103. The angled greyblock indicated by a question mark (?) shows a region of high sequence identity between the 5� end of contig 222 and a region towards the 3� endof contig 103. This match later proved to be spurious. The 3� region of contig 103 is duplicated internally towards its 5� end. (B) The EcoRI optical mapcovering part of the region for loci 3 and 4. The sizes in this panel are optical map fragment sizes in kb. (C) The solution to the resolution of this region.EcoRI sites considered equivalent on the optical and in silico maps are joined by fine dotted lines. Optical mapping indicated that poor quality regionL had resulted in a misassembly at the 5� end of contig 103. This was concluded from: 1) the presence in a region of high quality sequence of twoadditional EcoRI sites (indicated by + signs); and 2) the absence of a restriction site (indicated by X). These were in conflict with the optical map data.Removal of the sequences 5� of and inclusive of, region L (indicated by a dotted horizontal line) permitted the melding of contig 125 and 103 at greyregion 1. The absence of an EcoRI site 3� of poor quality region R (represented by X) suggested that region R may have given rise to a misassembly ofthe 3� end of contig 103. Removal of this region (also indicated by a dotted line) followed by resequencing in this area resulted in the acquisition ofa missing EcoRI site and permitted the assembly of the new sequence and joining of contigs 103 and 222 at grey regions 2 and 3. Note that contig 222has a 1.97 kb EcoRI fragment; however, optical mapping suggests this fragment should be 6.33 kb (these fragments are marked *). To resolve this sizediscrepancy additional sequencing of this region is currently under way.
Zhou et al.
2150 Genome Researchwww.genome.org
REFERENCESAnantharaman, T.S., Mishra, B., and Schwartz, D.C. 1997. Genomics via
optical mapping 2. Ordered restriction maps. J. Comput. Biol.4: 91–118.
———. 1998. Genomics via optical mapping III: Contiging genomicDNA and variations. In Courant technical report, p. 760. CourantInstitute, New York University, NY.
———. 1999. Genomics via optical mapping III: Contiging genomicDNA and variations. The Seventh International Conference on IntelligentSystems for Molecular Biology 7: 18–27.
Aston, C., Hiort, C., and Schwartz, D.C. 1999a. Optical mapping: Anapproach for fine mapping. Meth. Enzymol. 303: 55–73.
Aston, C., Mishra, B., and Schwartz, D.C. 1999b. Optical mapping andits potential for large-scale sequencing projects. Trends Biotech.17: 297–302.
Barber, R.D. and Donohue, T.J. 1998. Function of aglutothione-dependent formaldehyde dehydrogenase in Rhodobactersphaeroides, formaldehyde oxidation and assimilation. Biochemistry37: 530–537.
Cai, W., Jing, J., Irvin, B., Ohler, L., Rose, E., Shizuya, H., Kim, U.,Simon, M., Anantharaman, T., Mishra, B., et al. 1998.High-resolution restriction maps of bacterial artificial chromosomesconstructed by optical mapping. Proc. Natl. Acad. Sci. 95: 3390–3395.
Choudhary, M., Mackenzie, C., Nereng, K.S., Sodergren, E., Weinstock,G.M., and Kaplan, S. 1994. Multiple chromosomes in bacteria:Structure and function of chromosome II of Rhodobacter sphaeroides2.4.1. J. Bacteriol. 176: 7694–7702.
Choudhary, M., Mackenzie, C., Nereng, K.S., Sodergren, E., Weinstock,G.M., and Kaplan, S. 1997. Low-resolution sequencing of Rhodobactersphaeroides 2.4.1T: Chromosome II is a true chromosome. Microbiol.143: 3085–3099.
Clayton, R.K. and Sistrom, W.R. 1978. The photosynthetic bacteria.Plenum Press, New York.
Fleischmann, R.D., Adams, M.D., White, O., Clayton, R.A., Kirkness,E.F., Kerlavage, A.R., Bult, C.J., Tomb, J.F., Dougherty, B.A., Merrick,J.M., et al. 1995. Whole-genome random sequencing and assemblyof Haemophilus influenzae Rd. Science 269: 496–512.
Gordon, D., Albanian, C., and Green, P. 1998. Consed: a graphical toolfor sequence finishing. Genome Research. 8: 195–202.
Jing, J., Lai, Z., Aston, C., Lin, J., Carucci, D.J., Gardner, M.J., Mishra, B.,Anantharaman, T., Tettelin, H., Cummings, L.M., et al. 1999.Optical mapping of Plasmodium falciparum chromosome 2. GenomeRes. 9: 175–181.
Lai, Z., Jing, J., Aston, C., Clarke, V., Apodaca, J., Dimalanta, E.T.,Carucci, D.J., Gardner, M.J., Mishra, B., Anatharaman, T.S., et al.1999. A shotgun optical map of the entire Plasmodium falciparumgenome. Nat. Genet. 23: 309–313.
Lim, A., Dimalanta, E.T., Potamousis, K.D., Yen, G., Apodoca, J., Tao, C.,Lin, J., Qi, R., Skiadas, J., Ramanathan, A., et al. 2001. Shotgunoptical maps of the whole Escherichia coli O157:H7 Genome. GenomeRes. 11: 1584–1593.
Lin, J., Qi, R., Aston, C., Jing, J., Anatharaman, T.S., Mishra, B., White,O., Daly, M.J., Minton, K.W., Venter, J.C., et al. 1999.Whole-genome shotgun optical mapping of Deinococcus radiodurans.Science 285: 1558–1562.
Lueking, D.R., Fraley, R.T., and Kaplan, S. 1978. Intracytoplasmicmembrane synthesis in synchronous cell populations ofRhodopseudomonas sphaeroides. J. Biol. Chem. 253: 451–457.
Mackenzie, C., Choudhary, M., Larimer, F.W., Predki, P.F., Stilwagen, S.,Armitage, J.P., Barber, R.D., Donohue, T.J., Hosler, J.P., Newman,J.E., et al. 2001. The home stretch, a first analysis of the nearlycompleted genome of Rhodobacter sphaeroides 2.4.1. PhotosynthesisResearch 70: 19–41.
Marra, M.A., Kucaba, T.A., Dietrich, N.L., Green, E.D., Brownstein, B.,Wilson, R.K., McDonald, K.M., Hillier, L.W., McPherson, J.D., andWaterston, R.H. 1997. High throughput fingerprint analysis oflarge-insert clones. Genome Res. 7: 1072–1084.
Meng, X., Benson, K., Chada, K., Huff, J.E., and Schwartz, D.C. 1995.Optical mapping of � bacteriophage clones using restrictionendonucleases. Nat. Genet. 9: 432–438.
Moore, M.D. and Kaplan, S. 1992. Identification of intrinsic high-levelresistance to rare-earth oxides and oxyanions in members of theclass Proteobacteria: Characterization of tellurite, selenite andrhodium sesquioxide reduction in Rhodobacter sphaeroides. J.Bacteriol. 174: 1505–1514.
Mouncey, N.J., Choudhary, M., and Kaplan, S. 1997. Characterization ofgenes encoding dimethylsulfoxide reductase of Rhodobactersphaeroides 2.4.1T: An essential metabolic gene function encoded onchromosome II. J. Bacteriol. 179: 7617–7624.
Neidle, E. and Kaplan, S. 1993. Expression of the Rhodobacter sphaeroides2.4.1 hemA and hemT gebes encoding two aminolevulinic acidsynthase isozymes. J. Bacteriol. 175: 2292–2303.
Perna, N.T., Plunkett III, G., Burland, V., Mau, B., Glasner, J.D., Rose,D.J., Mayhew, G.F., Evans, P.S., Gregor, J., Kirpatrick, H.A., et al.2000. Genome sequence of entrohemorrhagic Escherichia coliO157: H7. Nature 409: 529–533.
Schwartz, D.C. and Cantor, C.R. 1984. Separation of yeastchromosome-sized DNAs by pulsed field gradient gel electrophoresis.Cell 37: 67–75.
Sensen, C.W. 1999. Sequencing microbial genomes. In Organization ofthe prokaryotic genome (ed. R.L. Charlebois), pp. 1–9. ASM Press,Washington, D.C.
Soderlund, C., Longden, I., and Mott, R. 1997. FPC: A system forbuilding contigs from restriction fingerprinted clones. Comput. Appl.Biosci. 13: 523–535.
Suwanto, A. and Kaplan, S. 1989a. Physical and genetic mapping of theRhodobacter sphaeroides 2.4.1 genome: Presence of two uniquecircular chromosomes. J. Bacteriol. 171: 5850–5859.
———. 1989b. Physical and genetic mapping of the Rhodobactersphaeroides 2.4.1 genome: Genome size, fragment identification, andgene localization. J. Bacteriol. 171: 5840–5849.
———. 1992. Chromosome transfer in Rhodobacter sphaeroides: Hfrformation and genetic evidence for two unique circularchromosomes. J. Bacteriol. 174: 1135–1145.
Yang, D., Oyaizu, Y., Oyaizu, H., Olsen, G.J., and Woese, C.R. 1985.Mitochondrial origins. Proc. Nat. Acad. Sci. 82: 4443–4447.
Yeliseev, A.A. and Kaplan, S. 1995. A sensory transducer homologous tothe mammalian peripheral-type benzodiazepine receptor regulatesphotosynthetic membrane complex formation in Rhodobactersphaeroides 2.4.1. J. Biol. Chem. 270: 21167–21175.
Zhou, S., Deng, W., Anatharaman, T.S., Lim, A., Dimalanta, E.T., Wang,J., Wu, T., Tao, C., Creighton, R., Kile, A., et al. 2002. Awhole-genome shotgun optical map of Yersinia pestis strain KIM.Appl. Environ. Microbiol. 68: 6321–6331.
Received December 23, 2002; accepted in revised form June 30, 2003.
R. sphaeroides 2.4.1 Optical Map
Genome Research 2151www.genome.org
Copyright © 2022 FDOKUMEN