Type 2 Diabetes Whole-Genome Association Study in Four Populations: The DiaGen Consortium
8
338 The American Journal of Human Genetics Volume 81 August 2007 www.ajhg.org ARTICLE Type 2 Diabetes Whole-Genome Association Study in Four Populations: The DiaGen Consortium Jukka T. Salonen, Pekka Uimari, Juha-Matti Aalto, Mia Pirskanen, Jari Kaikkonen, Boryana Todorova, Jelena Hyppo ¨nen, Veli-Pekka Korhonen, Janne Asikainen, Christopher Devine, Tomi-Pekka Tuomainen, Jan Luedemann, Matthias Nauck, Wolfgang Kerner, Richard H. Stephens, John P. New, William E. Ollier, J. Martin Gibson, Antony Payton, Michael A. Horan, Neil Pendleton, Walt Mahoney, David Meyre, Jero ˆme Delplanque, Philippe Froguel, Oren Luzzatto, Benjamin Yakir, and Ariel Darvasi Type 2 diabetes (T2D) is a common, polygenic chronic disease with high heritability. The purpose of this whole-genome association study was to discover novel T2D-associated genes. We genotyped 500 familial cases and 497 controls with 1300,000 HapMap-derived tagging single-nucleotide–polymorphism (SNP) markers. When a stringent statistical correction for multiple testing was used, the only significant SNP was at TCF7L2, which has already been discovered and confirmed as a T2D-susceptibility gene. For a replication study, we selected 10 SNPs in six chromosomal regions with the strongest association (singly or as part of a haplotype) for retesting in an independent case-control set including 2,573 T2D cases and 2,776 controls. The most significant replicated result was found at the AHI1-LOC441171 gene region. From Oy Jurilab (J.T.S.; P.U.; J.-M.A.; M.P.; J.K.; B.T.; J.H.; V.-P.K.; J.A.; C.D.) and Research Institute of Public Health and School of PublicHealthand Clinical Nutrition, University of Kuopio (J.T.S.; T.-P.T.), Kuopio, Finland; Institute of Clinical Chemistry and Laboratory Medicine, Ernst MoritzArndt University Greifswald, Greifswald, Germany (J.L.; M.N.); Center of Cardiology and Diabetes, Karlsburg, Germany (W.K.); Vascular Research Group(R.H.S.; J.P.N.; J.M.G.) and Division of Medicine and Neurosciences (M.A.H.; N.P.), University of Manchester, Hope Hospital, Salford, United Kingdom;Centre for Integrated Genomic Medical Research, University of Manchester, Manchester, United Kingdom (W.E.O.; A.P.); Nanogen, San Diego (W.M.); Unite ´ Mixte de Recherche, Centre National de la Recherche Scientifique, Institut Pasteur de Lille, Lille, France (D.M.; J.D.; P.F.); Genomic Medicine,Hammersmith Hospital, Imperial College London, London (P.F.); and Department of Genetics, Institute of Life Sciences (O.L.; A.D.), and Department of Statistics(B.Y.), The Hebrew University of Jerusalem, Jerusalem, Israel Received April 5, 2007; accepted for publication May 7, 2007; electronically published June 26, 2007. Address for correspondence and reprints: Dr. Ariel Darvasi, Department of Genetics, Institute of Life Sciences, The Hebrew University of Jerusalem, Jerusalem 91904, Israel. E-mail: [email protected] Am. J. Hum. Genet. 2007;81:338–345. 2007 by The American Society of Human Genetics. All rights reserved. 0002-9297/2007/8102-0013$15.00 DOI: 10.1086/520599 Type 2 diabetes (T2D [MIM 222100]) is considered a ma- jor medical burden on society. 1 Given the high heritabil- ity and public health importance of the trait, the identi- fication of the underlying genes has been a high-priority mission of the scientific community for many years. 2,3 Nevertheless, only a handful of genes contributing to the predisposition of T2D have been confirmed, including TCF7L2 (MIM 602228), PPARg (MIM 601487), KCNJ11 (MIM 600937), and CAPN10 (MIM 605286). 4–9 These genes, however, account for only a small fraction of the genetic variation of the disease. Although conventional linkage-based studies in affected families have had some success in providing consistent data on linkage peaks in T2D, 3,10–13 it is now believed that linkage analysis may lack the statistical power and mapping resolution to identify genes affecting common complex traits such as T2D. 14 As- sociation studies are the alternative approach and are cur- rently considered the method of choice for the identifi- cation of genes affecting common complex traits. 11 Until recently, association studies have been limited to specific genes or chromosomal regions. As a result of the Human Genome Project, the SNP Consortium, and the HapMap Project, there is today a wealth of knowledge regarding human SNPs and the way they can be used for whole- genome association (WGA) studies. Furthermore, microar- ray technologies now allow genotyping of the genome at the necessary density. A French Canadian consortium 9 recently presented the results of the first WGA study of T2D, indicating sev- eral novel T2D candidate genes. Our study, performed with the same technology, allows a comparison of two independent WGA studies. The genotyping platform used (HumanHap300 [Illumina]) contains 317,000 SNPs, which were selected on the basis of the HapMap data. Material and Methods Subjects The population studied includes 500 cases and 497 controls from four different populations, all white. Specifically, we studied 201 cases and 200 controls from eastern Finland (EF), 200 cases and 197 controls of Ashkenazi Jewish (AJ) origin from Israel, and 99 cases and 100 controls from Germany (GE) and England (UK). The Germans were from the region of Pomerania in northeastern Germany, and the English were from the Manchester region. Two of the populations represent genetically homogenous founder populations (EF and AJ), whereas the Germans and English rep- resent the general European population. Cases and controls were sex matched so that the proportion of each sex was identical in the cases and controls within each population. The controls were selected to be older than the cases, to reduce the chance that some of the controls will develop the disease in the future. Similar
Transcript of Type 2 Diabetes Whole-Genome Association Study in Four Populations: The DiaGen Consortium
338 The American Journal of Human Genetics Volume 81 August 2007 www.ajhg.org
ARTICLE
Type 2 Diabetes Whole-Genome Association Study in FourPopulations: The DiaGen ConsortiumJukka T. Salonen, Pekka Uimari, Juha-Matti Aalto, Mia Pirskanen, Jari Kaikkonen,Boryana Todorova, Jelena Hypponen, Veli-Pekka Korhonen, Janne Asikainen, Christopher Devine,Tomi-Pekka Tuomainen, Jan Luedemann, Matthias Nauck, Wolfgang Kerner, Richard H. Stephens,John P. New, William E. Ollier, J. Martin Gibson, Antony Payton, Michael A. Horan,Neil Pendleton, Walt Mahoney, David Meyre, Jerome Delplanque, Philippe Froguel, Oren Luzzatto,Benjamin Yakir, and Ariel Darvasi
Type 2 diabetes (T2D) is a common, polygenic chronic disease with high heritability. The purpose of this whole-genomeassociation study was to discover novel T2D-associated genes. We genotyped 500 familial cases and 497 controls with1300,000 HapMap-derived tagging single-nucleotide–polymorphism (SNP) markers. When a stringent statistical correctionfor multiple testing was used, the only significant SNP was at TCF7L2, which has already been discovered and confirmedas a T2D-susceptibility gene. For a replication study, we selected 10 SNPs in six chromosomal regions with the strongestassociation (singly or as part of a haplotype) for retesting in an independent case-control set including 2,573 T2D casesand 2,776 controls. The most significant replicated result was found at the AHI1-LOC441171 gene region.
From Oy Jurilab (J.T.S.; P.U.; J.-M.A.; M.P.; J.K.; B.T.; J.H.; V.-P.K.; J.A.; C.D.) and Research Institute of Public Health and School of Public Health andClinical Nutrition, University of Kuopio (J.T.S.; T.-P.T.), Kuopio, Finland; Institute of Clinical Chemistry and Laboratory Medicine, Ernst Moritz ArndtUniversity Greifswald, Greifswald, Germany (J.L.; M.N.); Center of Cardiology and Diabetes, Karlsburg, Germany (W.K.); Vascular Research Group (R.H.S.;J.P.N.; J.M.G.) and Division of Medicine and Neurosciences (M.A.H.; N.P.), University of Manchester, Hope Hospital, Salford, United Kingdom; Centrefor Integrated Genomic Medical Research, University of Manchester, Manchester, United Kingdom (W.E.O.; A.P.); Nanogen, San Diego (W.M.); UniteMixte de Recherche, Centre National de la Recherche Scientifique, Institut Pasteur de Lille, Lille, France (D.M.; J.D.; P.F.); Genomic Medicine,HammersmithHospital, Imperial College London, London (P.F.); and Department of Genetics, Institute of Life Sciences (O.L.; A.D.), and Department of Statistics (B.Y.),The Hebrew University of Jerusalem, Jerusalem, Israel
Received April 5, 2007; accepted for publication May 7, 2007; electronically published June 26, 2007.Address for correspondence and reprints: Dr. Ariel Darvasi, Department of Genetics, Institute of Life Sciences, The Hebrew University of Jerusalem,
Jerusalem 91904, Israel. E-mail: [email protected]. J. Hum. Genet. 2007;81:338–345. � 2007 by The American Society of Human Genetics. All rights reserved. 0002-9297/2007/8102-0013$15.00DOI: 10.1086/520599
Type 2 diabetes (T2D [MIM 222100]) is considered a ma-jor medical burden on society.1 Given the high heritabil-ity and public health importance of the trait, the identi-fication of the underlying genes has been a high-prioritymission of the scientific community for many years.2,3
Nevertheless, only a handful of genes contributing to thepredisposition of T2D have been confirmed, includingTCF7L2 (MIM 602228), PPARg (MIM 601487), KCNJ11(MIM 600937), and CAPN10 (MIM 605286).4–9 Thesegenes, however, account for only a small fraction of thegenetic variation of the disease. Although conventionallinkage-based studies in affected families have had somesuccess in providing consistent data on linkage peaks inT2D,3,10–13 it is now believed that linkage analysis may lackthe statistical power and mapping resolution to identifygenes affecting common complex traits such as T2D.14 As-sociation studies are the alternative approach and are cur-rently considered the method of choice for the identifi-cation of genes affecting common complex traits.11 Untilrecently, association studies have been limited to specificgenes or chromosomal regions. As a result of the HumanGenome Project, the SNP Consortium, and the HapMapProject, there is today a wealth of knowledge regardinghuman SNPs and the way they can be used for whole-genome association (WGA) studies. Furthermore, microar-
ray technologies now allow genotyping of the genome atthe necessary density.
A French Canadian consortium9 recently presentedthe results of the first WGA study of T2D, indicating sev-eral novel T2D candidate genes. Our study, performedwith the same technology, allows a comparison of twoindependent WGA studies. The genotyping platform used(HumanHap300 [Illumina]) contains 317,000 SNPs, whichwere selected on the basis of the HapMap data.
Material and MethodsSubjects
The population studied includes 500 cases and 497 controls fromfour different populations, all white. Specifically, we studied 201cases and 200 controls from eastern Finland (EF), 200 cases and197 controls of Ashkenazi Jewish (AJ) origin from Israel, and 99cases and 100 controls from Germany (GE) and England (UK).The Germans were from the region of Pomerania in northeasternGermany, and the English were from the Manchester region. Twoof the populations represent genetically homogenous founderpopulations (EF and AJ), whereas the Germans and English rep-resent the general European population. Cases and controls weresex matched so that the proportion of each sex was identical inthe cases and controls within each population. The controls wereselected to be older than the cases, to reduce the chance thatsome of the controls will develop the disease in the future. Similar
www.ajhg.org The American Journal of Human Genetics Volume 81 August 2007 339
study protocols and case report forms were used at all sites andwere correspondingly accepted by their ethics committees. In-formed consent forms were signed by all subjects participatingin this study.
T2D Inclusion/Exclusion Criteria
Subjects meeting the following three criteria were defined as pa-tients with T2D: (1) either having regular treatment with an oralhypoglycemic agent (463 of 500 cases used antidiabetic medi-cation) or having treatment only with diet while also havingeither an HbA1c level �7.5% or a fasting blood glucose level atleast 6.7 mmol/liter, (2) with disease manifestation at age 60 yearsor earlier, and (3) with family history of T2D (at least one parentor sibling). Patients given diagnoses of non-T2D were excluded.
Control Inclusion/Exclusion Criteria
Subjects meeting the following two criteria were defined as con-trols for all populations except AJ blood donors: (1) receivingneither insulin treatment nor oral antidiabetic medication andhaving glucose levels !5.5 mmol/liter and (2) having no familyhistory of diabetes (not in grandparents, parents, siblings, or off-spring). Some AJ control samples were obtained from blood do-nors (see below) who declared not having any chronic disease.
Since it is a major risk factor and etiology of T2D, obesity wasnot a selection criterion for either the cases or the controls. Con-sequently, the mean BMI was considerably higher among thecases than the controls.
WGA Sample-Collection Process
Eastern Finland.—The data and sample collection was performedin two places—by the Research Institute of Public Health, Uni-versity of Kuopio (166 cases and 166 controls), and by Oy Food-files (35 cases and 34 controls), Kuopio, Finland. In the universitycollection, the sampling frame was the 17,100 examinees of aquestionnaire survey mailed in 2003 to all households in a smallregion within the founder population, for the “North Savo Pro-ject.” In this survey, information about medical and family his-tory and medical treatments and consent forms for further par-ticipation were collected. The subjects were reexamined in 2004and 2005 at the institute, and blood samples were collected forDNA extraction and other measurements, in accordance with theprotocol. The Foodfiles collection was performed between late2005 and early 2006 with the use of newspaper advertisementsin the surrounding communities of the city of Kuopio, with useof inclusion criteria identical to that of the university collection.On average (including both of these collections), 3.1 of the 4grandparents were of eastern Finnish origin. A total of 201 T2Dcases (99 women and 102 men) and 200 matched nondiabeticcontrols (99 women and 101 men) were included in the study.
Ashkenazi Jews.—Subjects included in the study were collectedin Israel by the patients’ physicians in specialized clinics. Weincluded 200 subjects with T2D (82 men and 118 women, meanage 64 years), each with 3 or more blood relatives of second degreeor closer who had T2D. Two hundred matching nondiabetic con-trol samples (82 men and 118 women, mean age 74 years) werecollected from the Israeli Blood Bank and from elderly patientsvisiting general practitioners’ clinics. All subjects were of AJorigin.
Germany.—Cases were sampled from ∼800 inpatients with T2Dfrom the Clinic for Diabetes and Metabolic Diseases Karlsburg
and from the Department of Internal Medicine of the Ernst MoritzArndt University Greifswald who were examined by a study phy-sician and who fulfilled the inclusion criteria. Correspondingcon-trols (matched by sex and age) were selected from among the3,900 nondiabetic examinees of the population-based “Study ofHealth in Pomerania 1997–2001” cohort.15 Data on family historyof diabetes, medication use, and comorbidity were gathered by astandardized face-to-face interview and measurement of bloodpressure and BMI, and laboratory analyses were performed usingstandardized procedures. For the patients with T2D, additionalinformation was drawn from the patient records. A total of 49cases (24 women and 25 men) and 50 matched healthy controls(24 women and 26 men) from Germany were included in thestudy.
England.—A total of 50 cases (31 women and 19 men) and 50matched nondiabetic controls (31 women and 19 men) were in-cluded in the study. The cases were selected from among 8,300registered patients with T2D in the city of Salford whose baselinecharacteristics matched those of the catchment population withT2D ( ) on the basis of age, sex, and durationn p 8,300/220,000of diabetes. Family history data was gathered via a telephonesurvey with the use of a standardized questionnaire that includedquestions about the patients and their parents, children, siblings,and grandparents. The controls were selected from among theexaminees of the Age and Cognitive Performance Research Cen-tres volunteer panel, a group of 16,000 older adults who havebeen described in detail elsewhere.16 A cohort of ∼2,000 of theseindividuals have DNA archived in the Dyne-Steel DNA bank, and456 of these volunteers, residents of Greater Manchester, hadtaken part in a research study in 2001 that included medicalhistory, including that of T2D, and measurement of HbA1c. Ofthese, subjects were identified to sex match diabetic cases fromManchester.
DNA Samples
At each participating site, DNA was extracted from whole bloodwith the use of standard methods. The quantity and purity ofeach DNA sample was uniformly determined by absorbancemeasurements with a NanoDrop ND-1000 Spectrophotometer(NanoDrop Technologies). A sample was qualified for WGA anal-ysis if the A260:A280 ratio was �1.7 and the DNA concentra-tion was 160 ng/ml. Before WGA analysis, the samples were di-luted to a concentration of 60 ng/ml in reduced Tris EDTA buffer(TEKnova).
Genotyping Platforms and SNPs
The whole-genome genotyping of DNA samples was performedusing Sentrix HumanHap300 BeadChips and Infinium II geno-typing assays (Illumina). The HumanHap300 BeadChip contained317,503 tag SNPs derived from the International HapMap Project.The genotyping reactions were performed according to the Single-Sample BeadChip Manual process described in detail in the In-finium II Assay System Manual (Illumina). In brief, 750 ng ofgenomic DNA was subjected to whole-genome amplification at37�C for 20–24 h. Products were fragmented, precipitated, andresuspended in hybridization buffer. The resuspended sampleswere denatured at 95�C for 20 min, were loaded to BeadChips,and were placed in a hybridization chamber for 16–20 h at 48�C.After hybridization, the mis- and nonhybridized DNA was washedaway from the BeadChips, and an allele-specific single-base ex-

340 The American Journal of Human Genetics Volume 81 August 2007 www.ajhg.org
Figure 1. Distribution of MAFs in 317,503 SNPs
Figure 2. Vertical lines plotted for each SNP analyzed, placedaccording to their chromosomal locations. The height of the linescorrespond to the nominal P value (plotted as �logP) of each SNPas obtained from a single-point analysis with use of a Cochran-Mantel-Haenszel x2 test (see the “Material and Methods” section).The horizontal dashed lines (at , )�7� logP p 6.64 P p 2.3 # 10correspond to the statistical threshold adjusted for multiple test-ing and an overall statistical significance of .05, after 1,000permutations.
tension of the oligonucleotides on the BeadChip was performedin a 48-position Slide Chamber Rack (GenePaint [Tecan]), withthe use of labeled deoxynucleotides and the captured DNA as atemplate. After staining of the extended DNA, BeadChips werewashed and scanned with the BeadArray Reader (Illumina), andgenotypes from samples were called using the BeadStudio 2.0software (Illumina).
The Centaurus genotyping methodology uses standard PCRthat uses primers to produce an amplicon of fewer than a fewhundred residues. Allele-specific probes displaying a fluorescentdye at the 3′ end, a quencher at the 5′ end, and a short enhanceroligonucleotide (∼8–15 residues in length) are hybridized to theamplicon.17 The enhancer oligonucleotide hybridizes to the am-plicon 3′ relative to the allele-specific probes. The uniqueness ofthe assay is derived through a design that produces a single-basegap between the two probes and the enhancer oligonucleotide.This gap creates a synthetic abasic site, which directs the speci-ficity of the enzyme endonuclease IV to this specific location.This enzyme will cleave the dye on the fully complementaryprobe, thus separating the dye from the quencher molecule andproducing a fluorescent signal. The probe that has a mismatchto the target remains uncleaved.
Initial SNP Selection for Statistical Analysis
To check that the same individual was not included twice in thestudy, a set of 23 SNPs (one polymorphic SNP from each chro-mosome) was compared across all subjects before the statisticalanalysis. SNP quality was also assessed on the basis of three cri-teria: the call rate (CR), minor-allele frequency (MAF), and Hardy-Weinberg (H-W) equilibrium. The CR is the proportion of samplesgenotyped successfully, regardless of whether the genotypes arecorrect. The MAF is the frequency of the allele that is less frequentin the study sample. H-W equilibrium was tested for controls withuse of the standard x2 test of goodness of fit with 1 df. A SNP notin H-W equilibrium can be due to genotyping error or to someunknown population dynamics (e.g., random drift or selection).Only the SNPs that had CR 190% and MAF 11% and were in H-W equilibrium (x2 test statistic !27.5 in controls) were used inthe statistical analysis. A total of 315,917 of 317,503 SNPs avail-able in the Illumina HumanHap300 assay fulfilled the above cri-teria and were included in the statistical analysis.
Single-Point Analysis
The single-point analysis was performed using Cochran-Mantel-Haenszel x2 tests to detect association between disease status andthe allele frequency of each SNP, with stratification of the samplesby population. Our sample set consists of four different popu-lations. Cases and controls were carefully matched within eachpopulation by sex and ethnicity, to avoid spurious associations.Accounting for multiple testing, we computed the significancethreshold, using 10,000 permutations. It should be noted thatthe number of permuted P values is SNPs and10,000 # 315,917is thus appropriate for obtaining a very accurate threshold. Thedisease status was randomly reassigned to subjects within eachpopulation, and the same protocol of testing was applied to thepermuted samples. The statistical analysis was performed usingthe R programming environment. We used the specifications ofthe function “mantelhaen.test” in the implementation of thetest.
In addition, the associations of genotypes with T2D were an-alyzed with an adjustment for age, sex, and population by use ofbinary logistic modeling. The population was entered as a cate-gorical variable, so each population had its own correction forthe dependent variable.
Haplotype Analysis
Haplotypes of large chromosomal segments (e.g., 400 SNPs) wereestimated first with the HaploRec program, and then the seg-ments were joined to create fully phased chromosomes.18 TheHaploRec program was used because it has recently been foundto be extremely efficient and powerful compared with popular

www.ajhg.org The American Journal of Human Genetics Volume 81 August 2007 341
Table 1. SNPs with the Strongest Association with T2D in the WGA Study
SNP Markera P Allelic ORb (95% CI)MinorAllele Chromosome Gene
rs7903146 5.52#10�8 1.71 (1.41–2.08) A 10 TCF7L2rs7901695 3.42#10�7 1.66 (1.37–2.01) G 10 TCF7L2rs12255372 5.31#10�7 1.64 (1.35–2.00) A 10 TCF7L2rs6712932 6.25#10�6 .66 (.55–.79) G 2 Noners7910485 1.02#10�5 1.58 (1.29–1.94) A 10 STK32Crs200801 1.78#10�5 1.48 (1.24–1.77) A 21 Noners1535435 1.86#10�5 2.34 (1.58–3.46) A 6 AHI1rs158081 2.36#10�5 .66 (.54–.80) G 21 Noners9494266 2.67#10�5 2.31 (1.56–3.42) A 6 LOC441171rs2254434 3.86#10�5 .68 (.56–.81) A 21 None
a Markers selected for the replication study are highlighted in bold.b ORs presented are for all four populations pooled.
Table 2. Haplotypes with the Strongest Association with T2D in the WGA
Haplotype SNP Markersa P Haplotype ORb (95% CI) Haplotype Chromosome Gene
1 rs7895307, rs7901695, and rs7903146 3.47#10�8 1.76 (1.44–2.16) GGA 10 TCF7L22 rs3936203, rs10933514, and rs4630763 5.02#10�7 1.77 (1.41–2.21) GGC 2 None3 rs2824577 and rs200801 1.28#10�6 .64 (.54–.77) AG 21 None4 rs2288440, rs31299, rs40979, rs173738, and rs1445946 1.30#10�6 1.61 (1.33–1.96) AACGG 5 MYO105 rs1749718, rs1742083, and rs8018904 3.02#10�6 .64 (.53–.77) GAC 14 TTC7B6 rs10491118, rs854685, and rs854692 3.97#10�6 .34 (.21–.55) CAA 17 CCL14-CCL157 rs4495839, rs4466762, rs11596854, rs4128664, and rs925587 4.13#10�6 .46 (.33–.64) AAGAG 10 ANTXRL8 rs1042778, rs237887, rs2268490, rs2268491, and rs237889 5.82#10�6 .04 (.01–.31) AGAAG 3 OXTR9 rs930306, rs13136503, rs7682282, rs13106255, and rs7695711 5.86#10�6 .28 (.16–.50) AGAGG 4 None10 rs6712932 and rs1545122 6.86#10�6 .66 (.54–.79) GG 2 None
a Markers selected for the replication study are highlighted in bold.b OR for the defined haplotype versus all other haplotypes (per increment of the number of copies). Haplotypes 1, 4, 5, 6, and 8 are intragenic.
alternatives.19 Each population was haplotyped separately be-cause population haplotype frequencies differ; thus, estimationof haplotypes within a population is more accurate than use ofthe pooled data. Populations were combined, and haplotype fre-quencies were estimated with the HPM program.20 The programwas used to test haplotypes of length 2, 3, 4, and 5 SNPs. Foreach haplotype, HPM calculates how many times the haplotypeis present in case and control chromosomes and how many timesit is not present in case and control chromosomes. This resultsin a 2#2 table for each single haplotype tested against all otherhaplotypes. To assess statistical significance, 10,000 permutationswere performed similar to the single-point analysis.
Replication Study
The replication study included 2,573 T2D cases and 2,776 nor-moglycemic control subjects given diagnoses in accordance withthe 1997 American Diabetes Association criteria. The T2D caseswere recruited at the Sud Francilien Hospital or at the CentreNational de la Recherche Scientifique UMR8090, Lille. All caseshad family history of T2D (i.e., the proband had at least one first-degree relative with T2D). Individuals with maturity-onset dia-betes of the young or neonatal or mitochondrial diabetes wereexcluded. The control subjects were obtained from a prospectivepopulation-based cohort of middle-aged subjects ( atN p 5,153baseline).21 They had fasting blood glucose level !6.1 mmol/literat baseline and during a 9-year follow-up (measurements at 0, 3,6, and 9 years), and their family histories were free of T2D. Ge-notyping of the 10 SNPs in these samples was performed withthe TaqMan technology (Applied Biosystems).
Results
In the initial WGA study, we genotyped 500 cases and 497controls, producing 1300 million genotype results. Thecases and controls were selected from four populations(EF, AJ, GE, and UK). All populations are of white originbut are distinct, thus allowing the examination of thecommon basis of any finding across different populations.Sex was matched between cases and controls within eachpopulation. The age distribution was higher in controls,to include as few as possible nondiabetic individuals whomay develop the disease in the future.
The average CR for all SNPs was very impressive (99.5%),with only 1,341 (0.42%) of the 317,503 SNPs tested hav-ing a CR !90%. Four subjects chosen randomly were ge-notyped twice for all SNPs. Reproducibility of genotypeswas 199.9%. In addition, to study the validity of the In-finium method, 12 HumanHap300 SNPs were also geno-typed for 393 samples with the Centaurus methodology.17
The concordance of the genotypes was 199.9%. Figure 1presents the distribution of the MAF of all SNPs. As ex-pected, the MAF was found to be quite uniformly distrib-uted between 0.1 and 0.5. Of the 317,503 SNPs availablein the Illumina HumanHap300 assay, 315,917 fulfilled ourcriteria of having CR 190% and MAF 11% and not beingin extreme H-W disequilibrium ( ) and were�7P 1 1.5 # 10included in the statistical analysis.
342 The American Journal of Human Genetics Volume 81 August 2007 www.ajhg.org
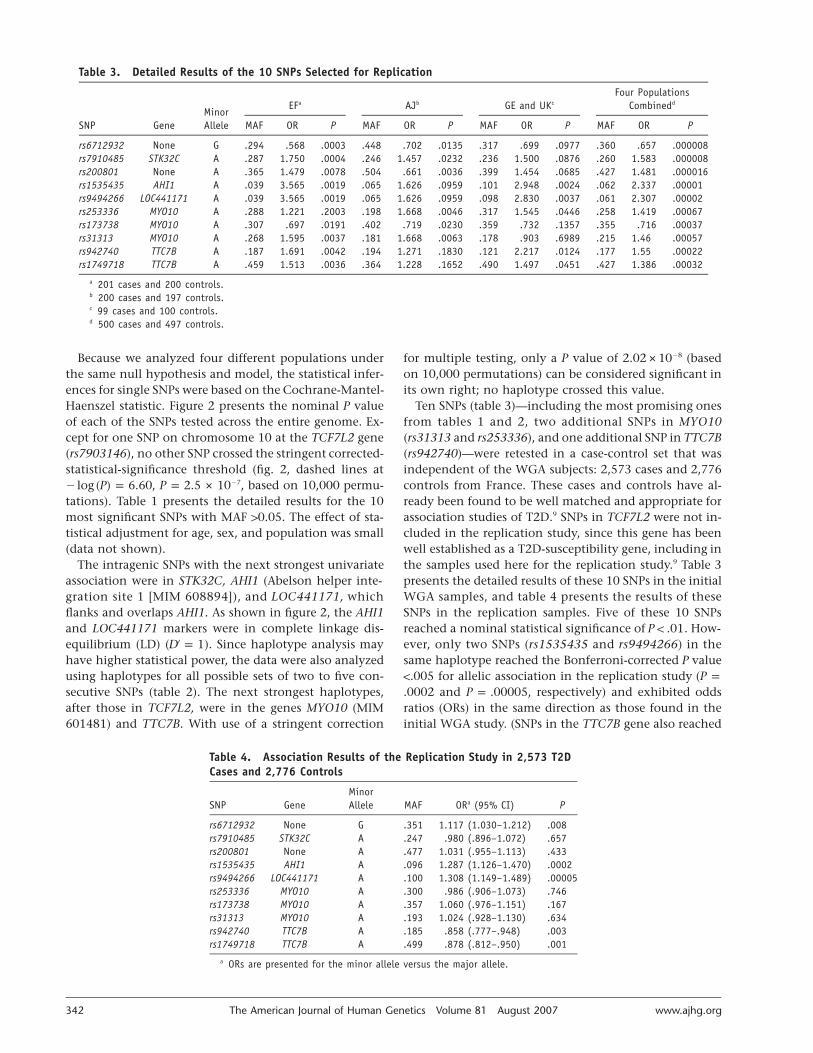
Table 3. Detailed Results of the 10 SNPs Selected for Replication
SNP GeneMinorAllele
EFa AJb GE and UKc
Four PopulationsCombinedd
MAF OR P MAF OR P MAF OR P MAF OR P
rs6712932 None G .294 .568 .0003 .448 .702 .0135 .317 .699 .0977 .360 .657 .000008rs7910485 STK32C A .287 1.750 .0004 .246 1.457 .0232 .236 1.500 .0876 .260 1.583 .000008rs200801 None A .365 1.479 .0078 .504 .661 .0036 .399 1.454 .0685 .427 1.481 .000016rs1535435 AHI1 A .039 3.565 .0019 .065 1.626 .0959 .101 2.948 .0024 .062 2.337 .00001rs9494266 LOC441171 A .039 3.565 .0019 .065 1.626 .0959 .098 2.830 .0037 .061 2.307 .00002rs253336 MYO10 A .288 1.221 .2003 .198 1.668 .0046 .317 1.545 .0446 .258 1.419 .00067rs173738 MYO10 A .307 .697 .0191 .402 .719 .0230 .359 .732 .1357 .355 .716 .00037rs31313 MYO10 A .268 1.595 .0037 .181 1.668 .0063 .178 .903 .6989 .215 1.46 .00057rs942740 TTC7B A .187 1.691 .0042 .194 1.271 .1830 .121 2.217 .0124 .177 1.55 .00022rs1749718 TTC7B A .459 1.513 .0036 .364 1.228 .1652 .490 1.497 .0451 .427 1.386 .00032
a 201 cases and 200 controls.b 200 cases and 197 controls.c 99 cases and 100 controls.d 500 cases and 497 controls.
Table 4. Association Results of the Replication Study in 2,573 T2DCases and 2,776 Controls
SNP GeneMinorAllele MAF ORa (95% CI) P
rs6712932 None G .351 1.117 (1.030–1.212) .008rs7910485 STK32C A .247 .980 (.896–1.072) .657rs200801 None A .477 1.031 (.955–1.113) .433rs1535435 AHI1 A .096 1.287 (1.126–1.470) .0002rs9494266 LOC441171 A .100 1.308 (1.149–1.489) .00005rs253336 MYO10 A .300 .986 (.906–1.073) .746rs173738 MYO10 A .357 1.060 (.976–1.151) .167rs31313 MYO10 A .193 1.024 (.928–1.130) .634rs942740 TTC7B A .185 .858 (.777–.948) .003rs1749718 TTC7B A .499 .878 (.812–.950) .001
a ORs are presented for the minor allele versus the major allele.
Because we analyzed four different populations underthe same null hypothesis and model, the statistical infer-ences for single SNPs were based on the Cochrane-Mantel-Haenszel statistic. Figure 2 presents the nominal P valueof each of the SNPs tested across the entire genome. Ex-cept for one SNP on chromosome 10 at the TCF7L2 gene(rs7903146), no other SNP crossed the stringent corrected-statistical-significance threshold (fig. 2, dashed lines at
, , based on 10,000 permu-�7� log (P) p 6.60 P p 2.5 # 10tations). Table 1 presents the detailed results for the 10most significant SNPs with MAF 10.05. The effect of sta-tistical adjustment for age, sex, and population was small(data not shown).
The intragenic SNPs with the next strongest univariateassociation were in STK32C, AHI1 (Abelson helper inte-gration site 1 [MIM 608894]), and LOC441171, whichflanks and overlaps AHI1. As shown in figure 2, the AHI1and LOC441171 markers were in complete linkage dis-equilibrium (LD) ( ). Since haplotype analysis may′D p 1have higher statistical power, the data were also analyzedusing haplotypes for all possible sets of two to five con-secutive SNPs (table 2). The next strongest haplotypes,after those in TCF7L2, were in the genes MYO10 (MIM601481) and TTC7B. With use of a stringent correction
for multiple testing, only a P value of 2.02#10�8 (basedon 10,000 permutations) can be considered significant inits own right; no haplotype crossed this value.
Ten SNPs (table 3)—including the most promising onesfrom tables 1 and 2, two additional SNPs in MYO10(rs31313 and rs253336), and one additional SNP in TTC7B(rs942740)—were retested in a case-control set that wasindependent of the WGA subjects: 2,573 cases and 2,776controls from France. These cases and controls have al-ready been found to be well matched and appropriate forassociation studies of T2D.9 SNPs in TCF7L2 were not in-cluded in the replication study, since this gene has beenwell established as a T2D-susceptibility gene, including inthe samples used here for the replication study.9 Table 3presents the detailed results of these 10 SNPs in the initialWGA samples, and table 4 presents the results of theseSNPs in the replication samples. Five of these 10 SNPsreached a nominal statistical significance of . How-P ! .01ever, only two SNPs (rs1535435 and rs9494266) in thesame haplotype reached the Bonferroni-corrected P value!.005 for allelic association in the replication study (P p
and , respectively) and exhibited odds.0002 P p .00005ratios (ORs) in the same direction as those found in theinitial WGA study. (SNPs in the TTC7B gene also reached

www.ajhg.org The American Journal of Human Genetics Volume 81 August 2007 343
Figure 3. Pairwise LD diagram for SNPs in the AHI1 gene region. The LD between pairs of SNPs is presented using D′, which wascalculated from the DiaGen genotyping data with Haploview software. The bar graph indicates the negative logarithm of the P valuefor each SNP from single-point analysis.
a P value !.005; however, ORs were in opposite directions.)The respective P values for rs1535435 and rs9494266 in apooled Cochran-Mantel-Haenszel analysis of the WGA to-gether with the replication study were 10�6 and 2.28#10�7. Figure 3 presents the haplotype structure aroundthe significant region. The most significant finding wason chromosome 6, located within an LD block of 178 kbencompassing 19 introns of the AHI1 gene and the non–protein-coding LOC441171 on chromosome 6 (fig. 3). Thisregion has been identified elsewhere as a T2D-suscepti-bility locus in several linkage studies.22,23 LOC441171 (orC6orf217) is a primate-specific gene expressed in brain,pancreas, and liver, and it does not seem to encode a func-tional protein. Therefore, AHI1 might be a preferred can-didate gene, although a functional effect of LOC441171cannot be entirely discarded.
AHI1 encodes a unique AHI1 (Jouberin) protein, theonly known protein containing an SH3 motif, sevenWD40-repeat domains, and multiple SH3-binding do-mains (PXXP motifs).24,25 WD motifs are evolutionarilyconserved across the species and form a stable b-propellerstructure that serves as a platform for protein-protein in-teractions.26 Specific functions of WD-repeat proteinsseem to be determined by other motifs and domains rep-resented in the protein.26 Therefore, the domain structuresuggests that AHI1 is likely to act as a scaffold protein andto participate in a variety of processes such as signal trans-duction, cytoskeleton organization, cell cycle, and cell-cellcommunication.26,27 However, the exact function of AHI1
is not clarified yet, and additional studies will be requiredto determine its possible involvement in T2D.
The SNPs rs1535435 and rs9494266 may directly affectsusceptibility to T2D or may predispose an individual toobesity (MIM 601665) and thus indirectly affect suscep-tibility to T2D. For 1,084 of the cases in the replicationset and 1,084 of the controls, we have BMI information.In this restricted set, the allelic P values of rs1535435 andrs9494266 were .005 and .003, respectively. Analyzingthese SNPs with BMI as a covariate resulted in allelic Pvalues of .019 and .011, respectively. Therefore, althoughthe observed effect on T2D may be partially mediatedthrough obesity, it seems that a direct and independenteffect is also present.
Discussion
In the current study, we aimed to assess the potential valueof WGA studies on the basis of HapMap-derived high-density SNP arrays. To increase statistical power, we pri-marily used samples from homogeneous founder popu-lations (801 of the 997 subjects included in this study).In addition, we included disease cases that have a highfamilial prevalence of the disease—on average, more thantwo affected relatives in addition to the proband. In spiteof our effort to carefully select samples in a manner thatmay increase statistical power and the use of the mostadvanced technology available today, a sample of ∼500cases and ∼500 controls was powerful enough to identify
344 The American Journal of Human Genetics Volume 81 August 2007 www.ajhg.org
only one known gene and to provide suggestive evidenceof the identification of other genes affecting T2D. This issimilar to the findings of another WGA study of T2D.9
Following a genomewide statistical correction, Sladek etal.9 also found only the TCF7L2 gene to be associatedwith T2D. They also performed a replication study inwhich eight additional SNPs were replicated.9 Of theseeight SNPs, five are present in the HumanHap300 mi-croarray that we used. Interestingly, none of these fiveSNPs reached a nominal statistical significance of .01 inour WGA study. It should be noted that the samples usedfor replication by Sladek et al.9 are the same ones used forreplication in the current study.
In the current study, we selected the 10 most promisingSNPs and genotyped them in the replication sample set.The most promising result was found at the AHI1 generegion. The selection of only 10 SNPs is somewhat arbi-trary, and there might be value in testing a significantlylarger number of SNPs. The partial inconsistency of theWGA findings between populations and studies deservesfurther research, since it may suggest either populationspecificity of some of the observed associations, insuffi-cient statistical power, or possible false-positive results ineither study. Population specificity could be due to dif-ferences in LD blocks, population-specific interactions be-tween genes and nongenetic factors, population-specificepigenetic effects, or the different inclusion criteria used(specifically, BMI !30 for the cases in the study by Sladeket al.,9 whereas BMI was not a selection criterion in ourstudy). The possibility of false-positive results should becarefully considered, particularly in light of the unex-pectedly high proportion of SNPs in the replication studythat exhibit a significant effect (5 of 10), 3 of them withORs in a direction opposite to the initial findings. Popu-lation stratification is unlikely to be a source of false-pos-itive results in the initial WGA study, since samples werecarefully matched by ethnicity and sex. More importantly,the only significant result in the initial WGA study wasfound in a gene known to affect T2D, providing strongevidence of the lack of population stratification in thesesamples. Nevertheless, population stratification as a sourceof false-positive results in the replication set cannot beentirely discarded. As in any association study of this kind,further replication is necessary. On the positive side, thereplication of the TCF7L2 finding provides strong evi-dence of the robustness of the WGA-study approach, atleast for the identification of genes with allelic ORs 11.7.Our study also indicates, as has been suggested on a the-oretical basis,28 that larger sample sizes will be necessaryto unequivocally establish the involvement of genes withmodest ORs (i.e., !1.7) across different populations.
Acknowledgments
We thank the personnel of Oy Jurilab, all participating institutes,the former employees and clinical collaborators of IDgene Phar-maceuticals, Stephane Lobbens for technical assistance, and the
subjects who donated samples for this study. This work was par-tially funded by support from the Finnish Funding Agency forTechnology and Innovation (TEKES), to Oy Jurilab. The Study ofHealth in Pomerania is funded by grant 01ZZ96030 from theGerman Ministry for Education and Research and by grants fromthe Ministry for Education, Research, and Cultural Affairs and theMinistry for Social Affairs of the Federal State of Mecklenburg,West Pomerania. The collection of the Dyne-Steel DNA bank forcognitive genetic studies was partially funded by Research IntoAgeing. The materials, anonymized data, and associated protocolsare available on request for the SNPs and haplotypes presentedin this article. Several of the coauthors (J.T.S., P.U., J.-M.A., M.P.,J.K., B.T., and C.D.) are inventors involved in one to four patentapplications (U.S. application numbers 11/325,330, 60/798,706,60/805,522, and 60/863,438) related to the findings of this study.
Web Resources
The URLs for data presented herein are as follows:
HapMap Project and SNP Consortium, http://www.hapmap.org/Human Genome Project, http://www.ornl.gov/sci/techresources/
Human_Genome/home.shtmlOnline Mendelian Inheritance in Man (OMIM), http://www.ncbi
.nlm.nih.gov/Omim/ (for T2D, TCF7L2, PPARg, KCNJ11,CAPN10, AHI1, MYO10, and obesity)
The R Project for Statistical Computing, http://www.r-project.org/
References
1. Narayan KM, Boyle JP, Geiss LS, Saaddine JB, Thompson TJ(2006) Impact of recent increase in incidence on future di-abetes burden: U.S., 2005–2050. Diabetes Care 29:2114–2116
2. Permutt MA, Wasson J, Cox N (2005) Genetic epidemiologyof diabetes. J Clin Invest 115:1431–1439
3. Barroso I (2005) Genetics of type 2 diabetes. Diabet Med 22:517–535
4. Grant SF, Thorleifsson G, Reynisdottir I, Benediktsson R,Manolescu A, Sainz J, Helgason A, Stefansson H, Emilsson V,Helgadottir A, et al (2006) Variant of transcription factor 7-like 2 (TCF7L2) gene confers risk of type 2 diabetes. Nat Genet38:320–232
5. Saxena R, Gianniny L, Burtt NP, Lyssenko V, Giuducci C, Sjo-gren M, Florez C, Almgren P, Isomaa B, Orho-Melander M,et al (2006) Common single nucleotide polymorphisms inTCF7L2 are reproducibly associated with type 2 diabetes andreduce the insulin response to glucose in nondiabetic indi-viduals. Diabetes 55:2890–2895
6. Altshuler D, Hirschhorn JN, Klannemark M, Lindgren CM,Vohl MC, Nemesh J, Lane CR, Schaffner SF, Bolk S, BrewerC, et al (2000) The common PPARg Pro12Ala polymorphismis associated with decreased risk of type 2 diabetes. Nat Genet26:76–80
7. Gloyn AL, Weedon MN, Owen KR, Turner MJ, Knight BA,Hitman G, Walker M, Levy JC, Sampson M, Halford S, et al(2003) Large-scale association studies of variants in genes en-coding the pancreatic b-cell KATP channel subunits Kir6.2(KCNJ11) and SUR1 (ABCC8) confirm that the KCNJ11 E23Kvariant is associated with type 2 diabetes. Diabetes 52:568–572
8. Tsuchiya T, Schwarz PE, Bosque-Plata LD, Geoffrey Hayes M,Dina C, Froguel P, Wayne Towers G, Fischer S, Temelkova-Kurktschiev T, Rietzsch H, et al (2006) Association of the cal-
www.ajhg.org The American Journal of Human Genetics Volume 81 August 2007 345
pain-10 gene with type 2 diabetes in Europeans: results ofpooled and meta-analyses. Mol Genet Metab 89:174–184
9. Sladek R, Rocheleau G, Rung J, Dina C, Shen L, Serre D, BoutinP, Vincent D, Belisle A, Hadjadj S, et al (2007) A genome-wideassociation study identifies novel risk loci for type 2 diabetes.Nature 445:881–885
10. Permutt MA (1991) Use of DNA polymorphisms for geneticanalysis of non-insulin dependent diabetes mellitus. Bailli-eres Clin Endocrinol Metab 5:495–526
11. Laird NM, Lange C (2006) Family-based designs in the ageof large-scale gene-association studies. Nat Rev Genet 7:385–394
12. McCarthy MI (2003) Growing evidence for diabetes suscep-tibility genes from genome scan data. Curr Diab Rep 3:159–167
13. Hansen L, Pedersen O (2005) Genetics of type 2 diabetes mel-litus: status and perspectives. Diabetes Obes Metab 7:122–135
14. Balding DJ (2006) A tutorial on statistical methods for pop-ulation association studies. Nat Rev Genet 7:781–791
15. Luedemann J, Schminke U, Berger K, Piek M, Willich SN,Doring A, John U, Kessler C (2002) The association betweenbehavior dependent cardiovascular risk factors and asymp-tomatic carotid atherosclerosis in a general population.Stroke 33:2929–2935
16. Rabbitt PMA, McInnes L, Diggle P, Holland F, Bent N, AbsonV, Pendleton N, Horan M (2004) The University of Man-chester Longitudinal Study of Cognition in Normal HealthyOld Age, 1983 through 2003. Neuropsychol Dev Cogn B Ag-ing Neuropsychol Cogn 11:245–279
17. Kutyavin IV, Milesi D, Belousov Y, Podyminogin M, VorobievA, Gorn V, Lukhtanov EA, Vermeulen NM, Mahoney W(2006) A novel endonuclease IV post-PCR genotyping system.Nucleic Acids Res 34:e128
18. Eronen L, Geerts F, Toivonen H (2004) A Markov chain ap-proach to reconstruction of long haplotypes. Pac Symp Bio-comput 9:104–115
19. Eronen L, Geerts F, Toivonen H (2006) HaploRec: efficient
and accurate large-scale reconstruction of haplotypes. BMCBioinformatics 7:542
20. Toivonen HT, Onkamo P, Vasko K, Ollikainen V, Sevon P,Mannila H, Herr M, Kere J (2000) Data mining applied tolinkage disequilibrium mapping. Am J Hum Genet 67:133–145
21. Balkau B (1996) An epidemiologic survey from a network ofFrench Health Examination Centres, (D.E.S.I.R.): epidemio-logic data on the insulin resistance syndrome. Rev EpidemiolSante Publique 44:373–375
22. Xiang K, Wang Y, Zheng T, Jia W, Li J, Chen L, Shen K, WuS, Lin X, Zhang G, et al (2004) Genome-wide search for type2 diabetes/impaired glucose homeostasis susceptibility genesin the Chinese: significant linkage to chromosome 6q21-q23and chromosome 1q21-q24. Diabetes 53:228–234
23. Hanson LR, Ehm MG, Pettitt DJ, Prochazka M, ThompsonDB, Timberlake D, Foroud T, Kobes S, Baier L, Burns DK, etal (1998) An autosomal genomic scan for loci linked to typeII diabetes mellitus and body-mass index in Pima Indians.Am J Hum Genet 63:1130–1138
24. Dixon-Salazar T, Silhavy JL, Marsh SE, Louie CM, Scott LC,Gururaj A, Al-Gazali L, Al-Tawari AA, Kayserili H, Sztriha L,et al (2004) Mutations in the AHI1 gene, encoding jouberin,cause Joubert syndrome with cortical polymicrogyria. Am JHum Genet 75:979–987
25. Louie CM, Gleeson JG (2005) Genetic basis of Joubert syn-drome and related disorders of cerebellar development. HumMol Genet 14:R235–R242
26. Li D, Roberts R (2001) WD-repeat proteins: structure char-acteristics, biological function, and their involvement in hu-man diseases. Cell Mol Life Sci 58:2085–2097
27. Mayer BJ (2001) SH3 domains: complexity in moderation. JCell Sci 114:1253–1263
28. Wang WY, Barratt BJ, Clayton DG, Todd JA (2005) Genome-wide association studies: theoretical and practical concerns.Nat Rev Genet 6:109–118