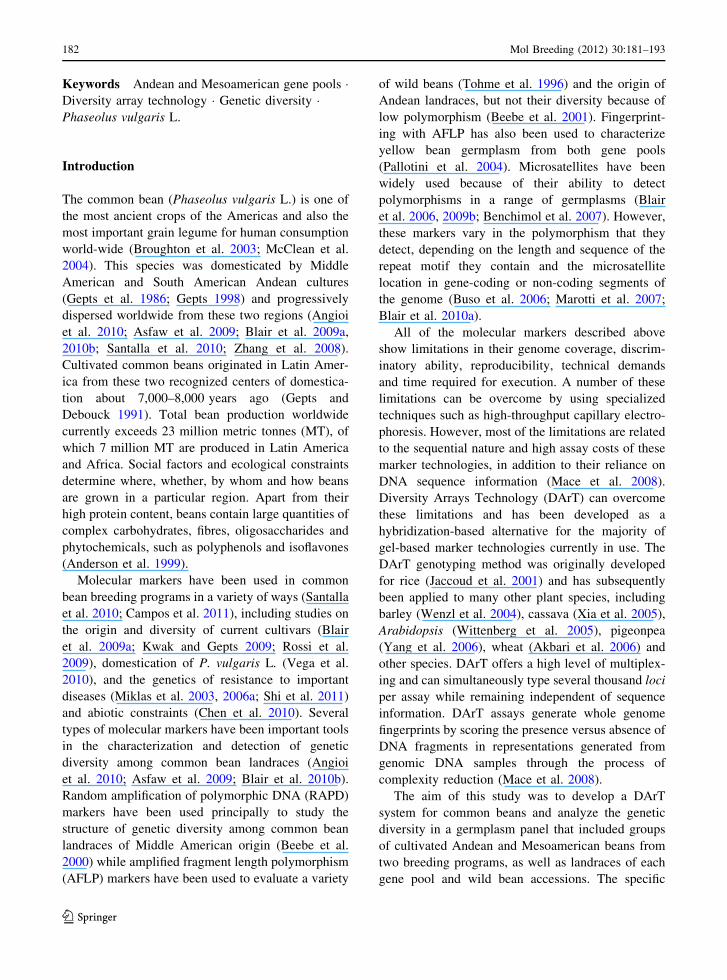
A whole genome DArT assay to assess germplasm collection diversity in common beans
13
A whole genome DArT assay to assess germplasm collection diversity in common beans Boris Brin ˜ez • Matthew W. Blair • Andrzej Kilian • Se ´rgio Augusto Morais Carbonell • Allison Fernando Chiorato • Luciana Benchimol Rubiano Received: 11 February 2011 / Accepted: 24 June 2011 / Published online: 7 July 2011 Ó Springer Science+Business Media B.V. 2011 Abstract A Diversity Arrays Technology (DArT) marker system was applied for the first time to common beans (Phaseolus vulgaris L.) and tested on 89 accessions from the IAC and CIAT common bean breeding programs, as well as on landraces from the FAO collection. Seven frequently used restriction endonucleases were tested in combination with a rare-cutting restriction enzyme, PstI, to evaluate their suitability for DArT technology. Two restriction enzyme combinations (PstI/BstNI and PstI/TaqI) were selected to evaluate polymorphisms and PstI/ BstNI, which yielded the most polymorphisms, was used to construct the final array. Genotyping was done by labelling the genomic representations with the fluorescent nucleotides cy3-dUTP and cy5-dUTP. The poly-linker fragment was labelled with 6-FAM and used as a control treatment and standard to determine the amount of DNA spotted on the array for each clone. DArTsoft version 7.3 software was used to analyse, identify and score polymorphic markers. Arrays containing individual fragments from these representations generated DArT finger- prints with a genotype call rate of 97.1% and a scoring reproducibility of at least 99.9%. A total of 2,501 polymorphic markers were found. Neighbour- joining distance matrices were used to create disper- sion graphs that distinguished the two major gene pools of common beans and classified the accessions as either Andean or Mesoamerican. A principal coordinate analysis of the DArT marker results explained 82% of the total data variation. These results show that the DArT platform was accurate for studying the genetic diversity of the common bean and efficient for the large-scale detection of poly- morphisms. These properties make marker technol- ogy a choice for future experiments. This is the first report to describe the use of DArT technology for genotyping the common bean. Electronic supplementary material The online version of this article (doi:10.1007/s11032-011-9609-3) contains supplementary material, which is available to authorized users. B. Brin ˜ez (&) Department of Genetics, Institute of Biology, State University of Campinas (UNICAMP), PO Box 6109, Campinas, SP, Brazil e-mail: [email protected] M. W. Blair Department of Plant Breeding, Cornell University, Ithaca, NY 14853, USA A. Kilian Diversity Arrays Technology P/L, PO Box 7141, Yarralumla, ACT 2600, Australia S. A. M. Carbonell A. F. Chiorato L. B. Rubiano The Agronomic Institute (IAC), PO Box 28, Campinas, SP, Brazil M. W. Blair International Center for Tropical Agriculture (CIAT), A.A. 6713 Cali, Colombia 123 Mol Breeding (2012) 30:181–193 DOI 10.1007/s11032-011-9609-3
-
Upload
independent -
Category
Documents
-
view
1 -
download
0
Transcript of A whole genome DArT assay to assess germplasm collection diversity in common beans
A whole genome DArT assay to assess germplasm collectiondiversity in common beans
Boris Brinez • Matthew W. Blair • Andrzej Kilian •
Sergio Augusto Morais Carbonell • Allison Fernando Chiorato •
Luciana Benchimol Rubiano
Received: 11 February 2011 / Accepted: 24 June 2011 / Published online: 7 July 2011
� Springer Science+Business Media B.V. 2011
Abstract A Diversity Arrays Technology (DArT)
marker system was applied for the first time to
common beans (Phaseolus vulgaris L.) and tested on
89 accessions from the IAC and CIAT common bean
breeding programs, as well as on landraces from the
FAO collection. Seven frequently used restriction
endonucleases were tested in combination with a
rare-cutting restriction enzyme, PstI, to evaluate their
suitability for DArT technology. Two restriction
enzyme combinations (PstI/BstNI and PstI/TaqI)
were selected to evaluate polymorphisms and PstI/
BstNI, which yielded the most polymorphisms, was
used to construct the final array. Genotyping was
done by labelling the genomic representations with
the fluorescent nucleotides cy3-dUTP and cy5-dUTP.
The poly-linker fragment was labelled with 6-FAM
and used as a control treatment and standard to
determine the amount of DNA spotted on the array
for each clone. DArTsoft version 7.3 software was
used to analyse, identify and score polymorphic
markers. Arrays containing individual fragments
from these representations generated DArT finger-
prints with a genotype call rate of 97.1% and a
scoring reproducibility of at least 99.9%. A total of
2,501 polymorphic markers were found. Neighbour-
joining distance matrices were used to create disper-
sion graphs that distinguished the two major gene
pools of common beans and classified the accessions
as either Andean or Mesoamerican. A principal
coordinate analysis of the DArT marker results
explained 82% of the total data variation. These
results show that the DArT platform was accurate for
studying the genetic diversity of the common bean
and efficient for the large-scale detection of poly-
morphisms. These properties make marker technol-
ogy a choice for future experiments. This is the first
report to describe the use of DArT technology for
genotyping the common bean.
Electronic supplementary material The online version ofthis article (doi:10.1007/s11032-011-9609-3) containssupplementary material, which is available to authorized users.
B. Brinez (&)
Department of Genetics, Institute of Biology, State
University of Campinas (UNICAMP), PO Box 6109,
Campinas, SP, Brazil
e-mail: [email protected]
M. W. Blair
Department of Plant Breeding, Cornell University, Ithaca,
NY 14853, USA
A. Kilian
Diversity Arrays Technology P/L, PO Box 7141,
Yarralumla, ACT 2600, Australia
S. A. M. Carbonell � A. F. Chiorato � L. B. Rubiano
The Agronomic Institute (IAC), PO Box 28, Campinas,
SP, Brazil
M. W. Blair
International Center for Tropical Agriculture (CIAT),
A.A. 6713 Cali, Colombia
123
Mol Breeding (2012) 30:181–193
DOI 10.1007/s11032-011-9609-3
Keywords Andean and Mesoamerican gene pools �Diversity array technology � Genetic diversity �Phaseolus vulgaris L.
Introduction
The common bean (Phaseolus vulgaris L.) is one of
the most ancient crops of the Americas and also the
most important grain legume for human consumption
world-wide (Broughton et al. 2003; McClean et al.
2004). This species was domesticated by Middle
American and South American Andean cultures
(Gepts et al. 1986; Gepts 1998) and progressively
dispersed worldwide from these two regions (Angioi
et al. 2010; Asfaw et al. 2009; Blair et al. 2009a,
2010b; Santalla et al. 2010; Zhang et al. 2008).
Cultivated common beans originated in Latin Amer-
ica from these two recognized centers of domestica-
tion about 7,000–8,000 years ago (Gepts and
Debouck 1991). Total bean production worldwide
currently exceeds 23 million metric tonnes (MT), of
which 7 million MT are produced in Latin America
and Africa. Social factors and ecological constraints
determine where, whether, by whom and how beans
are grown in a particular region. Apart from their
high protein content, beans contain large quantities of
complex carbohydrates, fibres, oligosaccharides and
phytochemicals, such as polyphenols and isoflavones
(Anderson et al. 1999).
Molecular markers have been used in common
bean breeding programs in a variety of ways (Santalla
et al. 2010; Campos et al. 2011), including studies on
the origin and diversity of current cultivars (Blair
et al. 2009a; Kwak and Gepts 2009; Rossi et al.
2009), domestication of P. vulgaris L. (Vega et al.
2010), and the genetics of resistance to important
diseases (Miklas et al. 2003, 2006a; Shi et al. 2011)
and abiotic constraints (Chen et al. 2010). Several
types of molecular markers have been important tools
in the characterization and detection of genetic
diversity among common bean landraces (Angioi
et al. 2010; Asfaw et al. 2009; Blair et al. 2010b).
Random amplification of polymorphic DNA (RAPD)
markers have been used principally to study the
structure of genetic diversity among common bean
landraces of Middle American origin (Beebe et al.
2000) while amplified fragment length polymorphism
(AFLP) markers have been used to evaluate a variety
of wild beans (Tohme et al. 1996) and the origin of
Andean landraces, but not their diversity because of
low polymorphism (Beebe et al. 2001). Fingerprint-
ing with AFLP has also been used to characterize
yellow bean germplasm from both gene pools
(Pallotini et al. 2004). Microsatellites have been
widely used because of their ability to detect
polymorphisms in a range of germplasms (Blair
et al. 2006, 2009b; Benchimol et al. 2007). However,
these markers vary in the polymorphism that they
detect, depending on the length and sequence of the
repeat motif they contain and the microsatellite
location in gene-coding or non-coding segments of
the genome (Buso et al. 2006; Marotti et al. 2007;
Blair et al. 2010a).
All of the molecular markers described above
show limitations in their genome coverage, discrim-
inatory ability, reproducibility, technical demands
and time required for execution. A number of these
limitations can be overcome by using specialized
techniques such as high-throughput capillary electro-
phoresis. However, most of the limitations are related
to the sequential nature and high assay costs of these
marker technologies, in addition to their reliance on
DNA sequence information (Mace et al. 2008).
Diversity Arrays Technology (DArT) can overcome
these limitations and has been developed as a
hybridization-based alternative for the majority of
gel-based marker technologies currently in use. The
DArT genotyping method was originally developed
for rice (Jaccoud et al. 2001) and has subsequently
been applied to many other plant species, including
barley (Wenzl et al. 2004), cassava (Xia et al. 2005),
Arabidopsis (Wittenberg et al. 2005), pigeonpea
(Yang et al. 2006), wheat (Akbari et al. 2006) and
other species. DArT offers a high level of multiplex-
ing and can simultaneously type several thousand loci
per assay while remaining independent of sequence
information. DArT assays generate whole genome
fingerprints by scoring the presence versus absence of
DNA fragments in representations generated from
genomic DNA samples through the process of
complexity reduction (Mace et al. 2008).
The aim of this study was to develop a DArT
system for common beans and analyze the genetic
diversity in a germplasm panel that included groups
of cultivated Andean and Mesoamerican beans from
two breeding programs, as well as landraces of each
gene pool and wild bean accessions. The specific
182 Mol Breeding (2012) 30:181–193
123
objectives involved testing different representations
based on different endonuclease enzymes and com-
paring the genetic diversity found with the resulting
DArT markers in several breeding accessions derived
from different breeding programs and from the two
major common bean gene pools.
Materials and methods
Sample collection and sources of DNA
Diversity panels were generated using DNA from 89
accessions (Table 1) that consisted mainly of samples
from the Agronomic Institute (Instituto Agronomi-
co—IAC, Campinas, SP, Brazil), the Agronomic
Institute of Parana (Instituto Agronomico do
Parana—IAPAR, Londrina, PR, Brazil) and the
International Center for Tropical Agriculture (Centro
Internacional de Agricultura Tropical—CIAT, Cali,
Colombia). In addition, a few samples from the
Federal University of Lavras (Universidade Federal
de Lavras—UFLA, Lavras, MG, Brazil), the Univer-
sity of Sao Paulo (Escola Superior de Agricultura
‘‘Luiz de Queiroz’’—ESALq/USP, Universidade de
Sao Paulo, Piracicaba, SP, Brazil) and the Federal
University of Vicosa (Universidade Federal de Vic-
osa—UFV, Vicosa, MG, Brazil) were also used. The
DNA quality and quantity were checked for each
genotype by incubating 1 ll of DNA with 5 ll of
1 9 loading dye at 37�C for 2 h. After incubation,
the samples were loaded onto 0.8% agarose gels and
run in 1 9 TAE buffer at 80 V. Short or degraded
DNA (\ *4 kb) was eliminated and DNA concen-
trations of 10–100 ng ml-1 were used for the DArT
construction step.
Enzyme digestions for the development
of a common bean DArT system
Combinations of the rare-cutting restriction enzyme
PstI with several restriction endonucleases (PstI/
BstNI, PstI/TaqI, PstI/AluI, PstI/BamII, PstI/MseI,
PstI/HaeIII and PstI/MspI) (New England Biolabs,
Beverly, MA, USA) that cut frequently were initially
tested on DNA from three accessions (CAL 143, IAC
Alvorada and BAT 477) to determine the restriction
enzyme combination that provided the best digestion
of bean DNA. All enzymes were tested at a
concentration of 20 U/ll, except for BstNI that was
used at 10 U/ll. DNA digestion and adaptor ligation
were performed as described by Jaccoud et al. (2001).
Briefly, 100 ng of DNA was digested with 9 ll of the
digestion/ligation mix containing 0.2 ll of restriction
enzymes (except for TaqI and MspI for which 0.1 ll
was used). After analysing the digestion profile and
identifying the best combination for beans, the
restriction product was then ligated to PstI adapters
(50-CACGATGGATCCAGTGCA-3 annealed with
50-CTGGATCCATCGTGCA-30) with 2 U of T4
DNA ligase (New England Biolabs). Subsequently,
1 ll of the restriction/ligation mixture was amplified
in 50 ll of amplification mixture using a primer
(50-GATGGATCCAGTGCAG-30) complementary to
the adapter sequence and the cycling conditions
described by Wenzl et al. (2004): 94�C for 1 min,
followed by 30 cycles at 94�C for 20 s, 58�C for 40 s,
72�C for 1 min and 72�C for 7 min.
Library construction for the DArT array
Once the two best combinations were established,
enzyme digestion, library construction and bacterial
insert amplification were performed as described by
Xie et al. (2006) using a mixture of the 89 accessions.
Briefly, the PCR products of each sample were
combined and ligated into the pCR� 2.1 TOPO vector
using a TOPO cloning kit (Invitrogen Life Technol-
ogies Corporation, Carlsbad, CA, USA). The ligated
insert-vector constructs were transformed into elec-
trocompetent TOP10 Escherichia coli cells (Invitro-
gen), according to the manufacturer’s instructions.
Transformed cells were screened on medium contain-
ing ampicillin (100 lg/ml) and X-gal (40 lg/ml).
The white colonies were picked and transferred to
96-well plates containing 60 ll of LB medium
(50 lg/mg ampicillin) per well followed by incuba-
tion at 37�C for 22 h. The inserts were amplified
directly from 1 ll of the LB stock using the M13
forward and reverse primers, and the PCR products
were precipitated with isopropanol, washed with
ethanol and resuspended in spotting buffer 2 (DArT
Spotter solution). The PCR products were subse-
quently printed onto polylysine-coated slides using a
MicroGrid II arrayer (Genomic Solutions, Lincoln,
NE, USA). After arraying, the slides were placed in a
water bath at 95�C for 2 min to denature the DNA and
then immersed in a solution containing 0.1 mM
Mol Breeding (2012) 30:181–193 183
123
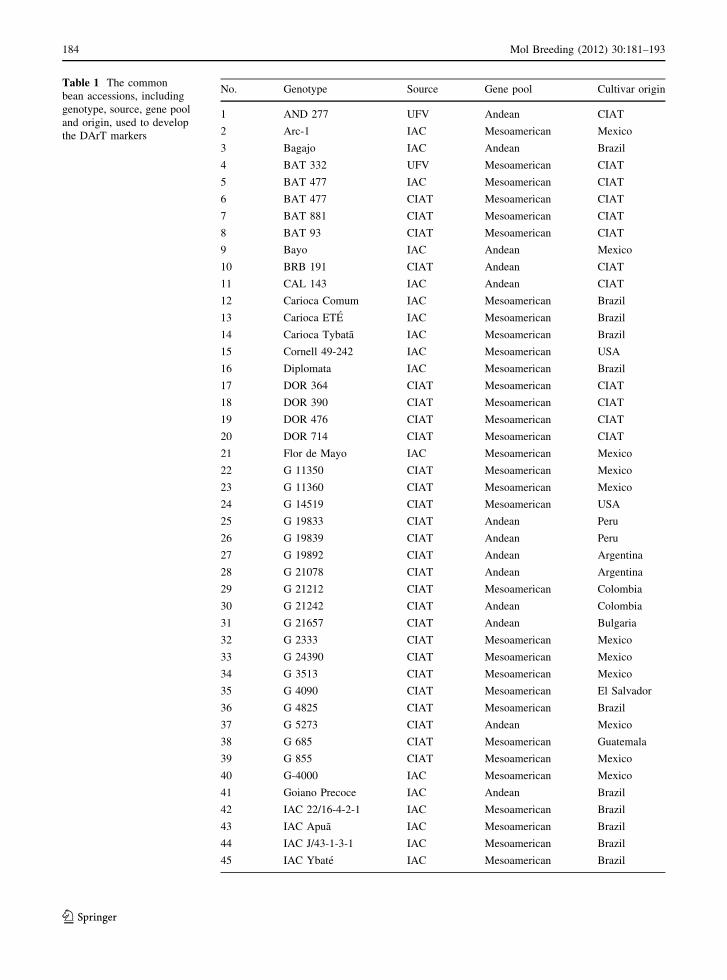
Table 1 The common
bean accessions, including
genotype, source, gene pool
and origin, used to develop
the DArT markers
No. Genotype Source Gene pool Cultivar origin
1 AND 277 UFV Andean CIAT
2 Arc-1 IAC Mesoamerican Mexico
3 Bagajo IAC Andean Brazil
4 BAT 332 UFV Mesoamerican CIAT
5 BAT 477 IAC Mesoamerican CIAT
6 BAT 477 CIAT Mesoamerican CIAT
7 BAT 881 CIAT Mesoamerican CIAT
8 BAT 93 CIAT Mesoamerican CIAT
9 Bayo IAC Andean Mexico
10 BRB 191 CIAT Andean CIAT
11 CAL 143 IAC Andean CIAT
12 Carioca Comum IAC Mesoamerican Brazil
13 Carioca ETE IAC Mesoamerican Brazil
14 Carioca Tybata IAC Mesoamerican Brazil
15 Cornell 49-242 IAC Mesoamerican USA
16 Diplomata IAC Mesoamerican Brazil
17 DOR 364 CIAT Mesoamerican CIAT
18 DOR 390 CIAT Mesoamerican CIAT
19 DOR 476 CIAT Mesoamerican CIAT
20 DOR 714 CIAT Mesoamerican CIAT
21 Flor de Mayo IAC Mesoamerican Mexico
22 G 11350 CIAT Mesoamerican Mexico
23 G 11360 CIAT Mesoamerican Mexico
24 G 14519 CIAT Mesoamerican USA
25 G 19833 CIAT Andean Peru
26 G 19839 CIAT Andean Peru
27 G 19892 CIAT Andean Argentina
28 G 21078 CIAT Andean Argentina
29 G 21212 CIAT Mesoamerican Colombia
30 G 21242 CIAT Andean Colombia
31 G 21657 CIAT Andean Bulgaria
32 G 2333 CIAT Mesoamerican Mexico
33 G 24390 CIAT Mesoamerican Mexico
34 G 3513 CIAT Mesoamerican Mexico
35 G 4090 CIAT Mesoamerican El Salvador
36 G 4825 CIAT Mesoamerican Brazil
37 G 5273 CIAT Andean Mexico
38 G 685 CIAT Mesoamerican Guatemala
39 G 855 CIAT Mesoamerican Mexico
40 G-4000 IAC Mesoamerican Mexico
41 Goiano Precoce IAC Andean Brazil
42 IAC 22/16-4-2-1 IAC Mesoamerican Brazil
43 IAC Apua IAC Mesoamerican Brazil
44 IAC J/43-1-3-1 IAC Mesoamerican Brazil
45 IAC Ybate IAC Mesoamerican Brazil
184 Mol Breeding (2012) 30:181–193
123
Table 1 continuedNo. Genotype Source Gene pool Cultivar origin
46 IAC-Alvorada IAC Mesoamerican Brazil
47 IAC-UNA IAC Mesoamerican Brazil
48 IPR 139 IAPAR Mesoamerican Brazil
49 IAPAR 81 IAC Mesoamerican Brazil
50 IPR Gralha IAPAR Mesoamerican Brazil
51 IPR Grauna IAPAR Mesoamerican Brazil
52 IPR Siriri IAPAR Mesoamerican Brazil
53 IPR Tangara IAC Mesoamerican Brazil
54 IPR Tiziu IAPAR Mesoamerican Brazil
55 IPR Uirapuru IAPAR Mesoamerican Brazil
56 ICA Pijao CIAT Mesoamerican Colombia
57 Jabola IAC Andean Brazil
58 Jalo EEP558 CIAT Andean Brazil
59 Jamapa CIAT Mesoamerican Mexico
60 Kaboon IAC Andean Netherlands
61 MA-IV-18-266 UFLA Mesoamerican Brazil
62 Majestoso UFLA Mesoamerican Brazil
63 MAM 38 CIAT Mesoamerican CIAT
64 MAM 49 CIAT Mesoamerican CIAT
65 MAR 1 CIAT Mesoamerican CIAT
66 MAR 2 IAC Mesoamerican CIAT
67 MD 23-24 CIAT Mesoamerican EAP
68 MEX 54 UFV Mesoamerican CIAT
69 OPNS 331 IAC Mesoamerican Brazil
70 Ouro Negro UFV Mesoamerican Brazil
71 Perola IAC Mesoamerican Brazil
72 BRS Pontal IAC Mesoamerican Brazil
73 Porrillo Sintetico IAC Mesoamerican Mexico
74 BC1 (EXRico 9 VC3) UFLA Mesoamerican Brazil
75 BC2 (M20 9 G122) UFLA Mesoamerican Brazil
76 Red Kidney IAC Andean USA
77 RP2 UFLA Mesoamerican Brazil
78 Ruda UFV Mesoamerican Brazil
79 Sanilac IAC Mesoamerican USA
80 SEA 15 CIAT Mesoamerican CIAT
81 SEA 21 CIAT Mesoamerican CIAT
82 SEA 5 CIAT Mesoamerican CIAT
83 SEL 1309 CIAT Mesoamerican CIAT
84 SEQ 1027 CIAT Andean CIAT
85 Talisma UFLA Mesoamerican Brazil
86 Tio Canela CIAT Mesoamerican EAP
87 VAX 6 CIAT Mesoamerican CIAT
88 VC 16 UFLA Mesoamerican Brazil
89 XAN 159 USP Andean CIAT
Mol Breeding (2012) 30:181–193 185
123

DTT and 0.1 mM EDTA and dried by centrifugation
(500g, 7 min, at room temperature).
DArT genotyping analysis
Genotyping was done by labelling the two best
genomic representations with the fluorescent nucleo-
tides cy3-dUTP and cy5-dUTP, in a primer extension
reaction with random decamers and the exo-Klenow
fragment of E. coli DNA polymerase, respectively.
The poly-linker fragment was labelled with 6-FAM
and used as a reference to determine the amount of
DNA from each clone spotted on the array (Jaccoud
et al. 2001). The hybridization mix was denatured on
a Corbett PCR machine at 95�C for 3 min, followed
by 56�C for 5 min and 55�C indefinitely until
hybridization with the microarray printed with the
DArT clones. The hybridization reaction was then
incubated overnight at 65�C, after which the slides
were washed and scanned using a Tecan LS300
confocal laser scanner (Grodig, Salzburg, Austria).
The resulting TIF images were analysed using
DArTsoft version 7.3, a software package developed
by DArT P/L and available for DArT network
members. This software identifies and scores poly-
morphic markers, with each marker being scored as 0
(absence), 1 (presence) or X (unable to score). The
three principal parameters used for marker selection
were: the quality parameter (Q value) that measured
the fraction of the total variation across all individ-
uals attributable to bimodality, the reproducibility
(R) that derived from replicate individuals that were
supposed to give identical results, and the call rate
(CR) that represented the number of scored spots
versus the maximum number of potential scores. The
polymorphism information content (PIC) was used to
assess how the marker scores were distributed
between the two clusters (scored as 0 or 1) and was
determined according to Anderson et al. (1993). This
value is often used to measure the informativeness of
a genetic marker.
Data analysis
In the analysis of genetic diversity, the marker scores
were analysed with DARwin software (Perrier and
Jacquemoud-Collet 2006) using the Jaccard index.
The diversity tree was built using the neighbour-
joining (NJ) algorithm (Saitou and Nei 1987) that
relaxes the assumption of equal mutation rate in
space and time and produces an unrooted tree. The
confidence interval of the genetic relationships
among the accessions was determined by performing
1,000 bootstraps, with the results being expressed as
percentages at the main nodes of each branch.
Analysis of molecular variance (AMOVA) was used
to partition the genetic variation into within- and
among-gene pool diversity based on Arlequin v3.5
software (Excoffier and Lischer 2010). This analysis
was used to identify and separate the samples into
Mesoamerican and Andean groups based on the
neighbour-joining dendrogram and the results were
compared with those in the literature. A group with
19 accessions was obtained for the Andean gene pool
and one with 70 accessions for the Mesoamerican
gene pool. Statistical significance of the difference
between mean genetic distances was assessed by
Student’s t test. The same software was used to
calculate the average gene diversity over loci (pi) and
the global FST and pairwise FST values that were the
basis for inferring the pattern of population structure.
In the latter analysis we used the Q coefficient from
Weir and Cockerham (1984). Principal component
analysis (PCA) based on genetic dissimilarity was
used to visualize the position of the accessions in
three-dimensional space (as an indication of the
diversity of each pair of accessions). This analysis
was done using the software NTSYSpc 2.1 (Rohlf
2002). The three-dimensional graphs representing the
dispersion of the accessions were drawn using
Statistica software 7.1 (StatSoft Inc. 2005) which
allowed identification of the varieties by origin or
type class.
Results
Selection of the complexity reduction method
and array development
As described above, the rare-cutting restriction
enzyme PstI was used in combination with a
selection of frequently cutting restriction enzymes
in order to determine the most effective combination
for reducing complexity. The best digestion profiles
from the first 51 accessions were generated with the
enzyme combinations PstI/BstNI and PstI/TaqI
(Table 1). Two libraries were produced from
186 Mol Breeding (2012) 30:181–193
123

genomic representations, one containing 1,152 clones
generated with PstI/TaqI and the other with 1,152
clones generated with PstI/BstNI. The polymorphism
information generated by each restriction enzyme
pair was analysed and the criteria for selection of a
given restriction enzyme pair was 100% reproduc-
ibility and a 95% call rate, indicating the usefulness
of DArT markers for analysing genetic diversity in
common bean accessions. Based on the number of
polymorphic markers, the best combination for
complexity reduction was the restriction enzyme pair
PstI/BstNI (Table 2). To develop the full array, the
libraries were extended to a complete set of 15,360
clones from all of the accessions, again using PstI as
the selective primary enzyme and BstNI as the
secondary enzyme. To optimize marker discovery,
the representations were hybridized with all of the
accessions. For this, random replicates were run in a
double-spotted experimental design to ensure few
false positives.
Common bean genetic diversity
A total of 2,501 polymorphic markers were identified
for common beans among the 89 accessions used to
create the array. These accessions were selected as
representative of worldwide (from CIAT) and Bra-
zilian (from the IAC and other institutes) bean
germplasms of the Andean and Mesoamerican gene
pools. The germplasm set included elite lines from
different breeding institutes, as well as a number of
wild accessions and the cultivated germplasm from
both major gene pools. The overall polymorphism
information content rate was 0.31, based on the
full set of 15,360 clones isolated for the array.
The average gene diversity over loci for the
Mesoamerican gene pool was 0.2137 ± 0.1024, and
0.1810 ± 0.0905 for the Andean gene pool. The
quality of the DArT markers based on the scoring
reproducibility computed from the 67 replicated
analyses was 99.9%; the discordance value, which
is complementary to the reproducibility and expresses
the overall variation in scores among replicates, was
0.00 with a consensus of 99.8%. The average call
rate, which expresses the reliability of the final scores
and represents the number of scored slides versus the
maximum number of potential scores, was 97.1%.
This percentage agreed with the values obtained in
other studies, e.g., 97.6% in hop (Howard et al.
2011), 95.0% in barley (Wenzl et al. 2004), 99.2% in
wheat (Akbari et al. 2006), 92.5% in sugarcane
(Heller-Uszynska et al. 2011), 91.6% in banana
(Risterucci et al. 2009) and 96.0% in pigeonpea
(Yang et al. 2006).
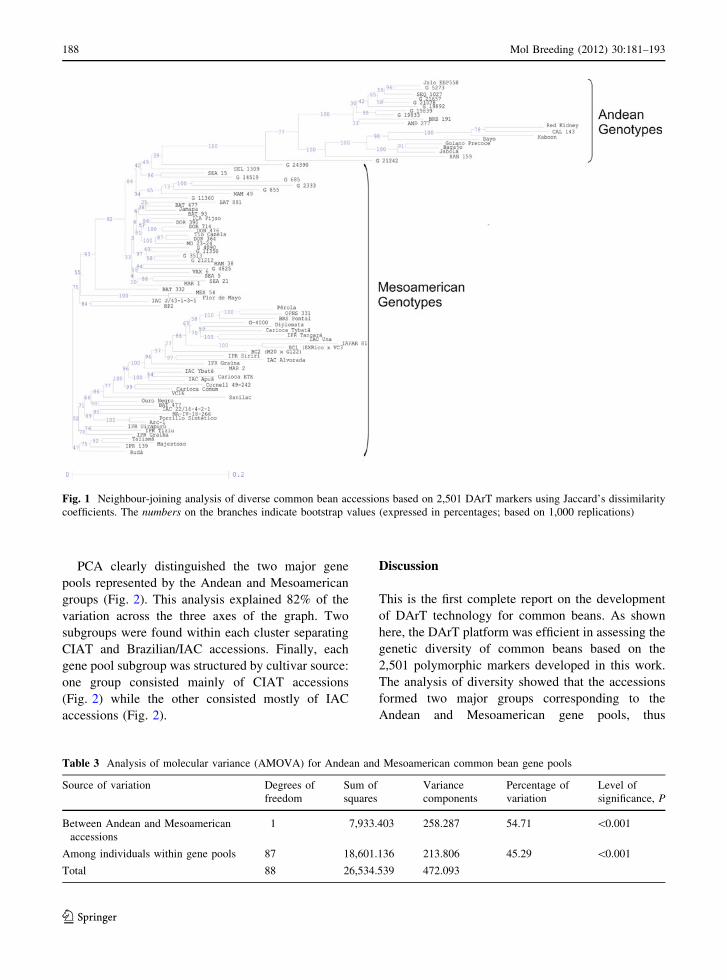
Using the 2,501 polymorphic markers, a dendro-
gram was generated with the 89 accessions (Fig. 1).
The neighbor-joining dendrogram resulted in a tree
with two major clusters, one containing the Andean
samples and the other containing the Mesoamerican
samples. Overall, 19 accessions were classified as
Andean and 70 as Mesoamerican. One of the control
accessions was found in the Mesoamerican group
(DOR 364) and the other in the Andean side of the
tree (G19833). AMOVA was used to determine the
variation explained by the Mesoamerican and Andean
gene pools and to compare the variability between
versus within gene pools. Inter-gene pool differences
were significant (P \ 0.001) and accounted for
54.7% of variability, equivalent to an FST value of
0.5. The remaining variability (45.3%) was attribut-
able to individual variation within each of the two
gene pools (Table 3).
Table 2 Evaluation of
methods for reducing
complexity
Reproducibility: 100%, Call
rate: 95%
Method Spot plate
barcode
Number of PstI/BstNI markers
Average Number of PstI/TaqI markers
Average
PstI/BstNI 1 42 16.93 24 13.87
PstI/BstNI 2 46 18.54 18 10.45
PstI/BstNI 3 47 18.95 27 15.62
PstI/TaqI 4 41 16.53 28 16.18
PstI/TaqI 5 39 15.72 44 25.43
PstI/TaqI 6 33 13.34 32 18.49
Total 6 248 99.97 173 99.97
Mol Breeding (2012) 30:181–193 187
123
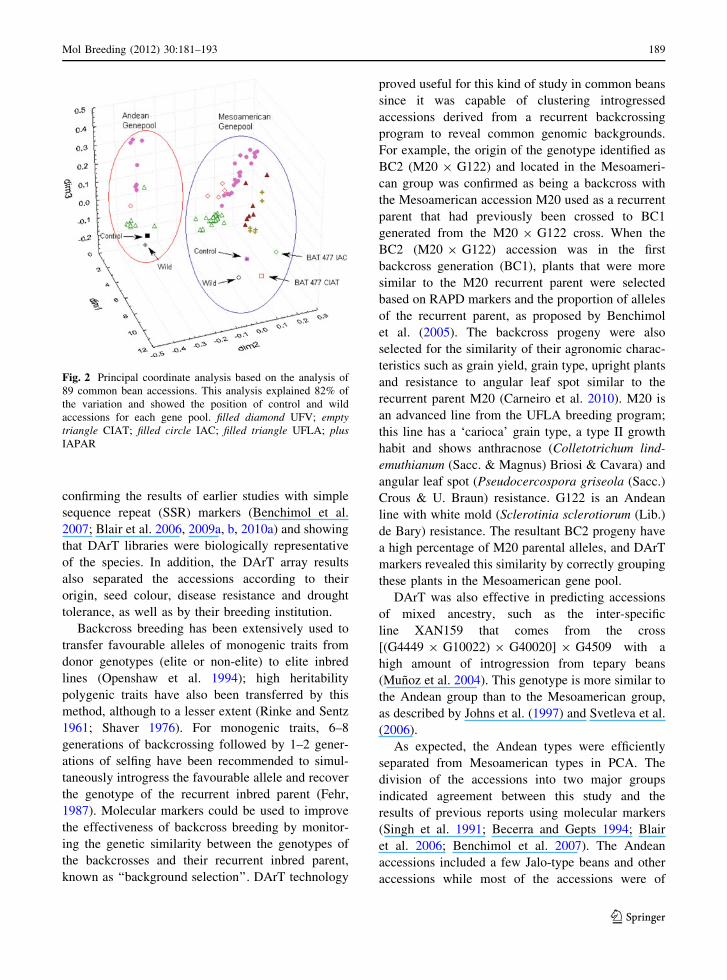
PCA clearly distinguished the two major gene
pools represented by the Andean and Mesoamerican
groups (Fig. 2). This analysis explained 82% of the
variation across the three axes of the graph. Two
subgroups were found within each cluster separating
CIAT and Brazilian/IAC accessions. Finally, each
gene pool subgroup was structured by cultivar source:
one group consisted mainly of CIAT accessions
(Fig. 2) while the other consisted mostly of IAC
accessions (Fig. 2).
Discussion
This is the first complete report on the development
of DArT technology for common beans. As shown
here, the DArT platform was efficient in assessing the
genetic diversity of common beans based on the
2,501 polymorphic markers developed in this work.
The analysis of diversity showed that the accessions
formed two major groups corresponding to the
Andean and Mesoamerican gene pools, thus
Fig. 1 Neighbour-joining analysis of diverse common bean accessions based on 2,501 DArT markers using Jaccard’s dissimilarity
coefficients. The numbers on the branches indicate bootstrap values (expressed in percentages; based on 1,000 replications)
Table 3 Analysis of molecular variance (AMOVA) for Andean and Mesoamerican common bean gene pools
Source of variation Degrees of
freedom
Sum of
squares
Variance
components
Percentage of
variation
Level of
significance, P
Between Andean and Mesoamerican
accessions
1 7,933.403 258.287 54.71 \0.001
Among individuals within gene pools 87 18,601.136 213.806 45.29 \0.001
Total 88 26,534.539 472.093
188 Mol Breeding (2012) 30:181–193
123
confirming the results of earlier studies with simple
sequence repeat (SSR) markers (Benchimol et al.
2007; Blair et al. 2006, 2009a, b, 2010a) and showing
that DArT libraries were biologically representative
of the species. In addition, the DArT array results
also separated the accessions according to their
origin, seed colour, disease resistance and drought
tolerance, as well as by their breeding institution.
Backcross breeding has been extensively used to
transfer favourable alleles of monogenic traits from
donor genotypes (elite or non-elite) to elite inbred
lines (Openshaw et al. 1994); high heritability
polygenic traits have also been transferred by this
method, although to a lesser extent (Rinke and Sentz
1961; Shaver 1976). For monogenic traits, 6–8
generations of backcrossing followed by 1–2 gener-
ations of selfing have been recommended to simul-
taneously introgress the favourable allele and recover
the genotype of the recurrent inbred parent (Fehr,
1987). Molecular markers could be used to improve
the effectiveness of backcross breeding by monitor-
ing the genetic similarity between the genotypes of
the backcrosses and their recurrent inbred parent,
known as ‘‘background selection’’. DArT technology
proved useful for this kind of study in common beans
since it was capable of clustering introgressed
accessions derived from a recurrent backcrossing
program to reveal common genomic backgrounds.
For example, the origin of the genotype identified as
BC2 (M20 9 G122) and located in the Mesoameri-
can group was confirmed as being a backcross with
the Mesoamerican accession M20 used as a recurrent
parent that had previously been crossed to BC1
generated from the M20 9 G122 cross. When the
BC2 (M20 9 G122) accession was in the first
backcross generation (BC1), plants that were more
similar to the M20 recurrent parent were selected
based on RAPD markers and the proportion of alleles
of the recurrent parent, as proposed by Benchimol
et al. (2005). The backcross progeny were also
selected for the similarity of their agronomic charac-
teristics such as grain yield, grain type, upright plants
and resistance to angular leaf spot similar to the
recurrent parent M20 (Carneiro et al. 2010). M20 is
an advanced line from the UFLA breeding program;
this line has a ‘carioca’ grain type, a type II growth
habit and shows anthracnose (Colletotrichum lind-
emuthianum (Sacc. & Magnus) Briosi & Cavara) and
angular leaf spot (Pseudocercospora griseola (Sacc.)
Crous & U. Braun) resistance. G122 is an Andean
line with white mold (Sclerotinia sclerotiorum (Lib.)
de Bary) resistance. The resultant BC2 progeny have
a high percentage of M20 parental alleles, and DArT
markers revealed this similarity by correctly grouping
these plants in the Mesoamerican gene pool.
DArT was also effective in predicting accessions
of mixed ancestry, such as the inter-specific
line XAN159 that comes from the cross
[(G4449 9 G10022) 9 G40020] 9 G4509 with a
high amount of introgression from tepary beans
(Munoz et al. 2004). This genotype is more similar to
the Andean group than to the Mesoamerican group,
as described by Johns et al. (1997) and Svetleva et al.
(2006).
As expected, the Andean types were efficiently
separated from Mesoamerican types in PCA. The
division of the accessions into two major groups
indicated agreement between this study and the
results of previous reports using molecular markers
(Singh et al. 1991; Becerra and Gepts 1994; Blair
et al. 2006; Benchimol et al. 2007). The Andean
accessions included a few Jalo-type beans and other
accessions while most of the accessions were of
Fig. 2 Principal coordinate analysis based on the analysis of
89 common bean accessions. This analysis explained 82% of
the variation and showed the position of control and wild
accessions for each gene pool. filled diamond UFV; emptytriangle CIAT; filled circle IAC; filled triangle UFLA; plusIAPAR
Mol Breeding (2012) 30:181–193 189
123
Mesoamerican origin. Among wild beans, the Mes-
oamerican genotype (G24390) clustered distant from
the wild Andean bean (G19892). The controls
(G19833 for the Andean group and DOR 364 for
the Mesoamerican group) also clustered separately.
These samples were also used as controls by Blair
et al. (2009a, 2010a, b), who confirmed the consis-
tency of the DArT results with SSR analysis.
Another interesting finding was that two BAT 477
accessions occurred in different subgroups within the
Mesoamerican group. This could be explained by the
fact that these accessions came from different breed-
ing institutes (CIAT and IAC) and from different
germplasm banks, respectively. Therefore, some
selection, genetic drift or open fertilization may have
occurred, leading one accession to diverge from the
other at some stage of advanced line development
(CIAT, unpublished). Pedigree analysis showed that
BAT 477 was derived from a multiple cross that
included well-known landraces and successful culti-
vars such as Jamapa and Porrillo Sintetico. Indeed,
the BAT 477 sample that came from CIAT grouped
closer to the Jamapa genotype whereas the other BAT
477 sample, which came from IAC, was located
closer to the Porrillo Sintetico genotype.
Among Mesoamerican beans, the cluster formed
by accessions IAC Ybate, Carioca ETE, IAC Apua,
Cornell 49-242 and Carioca Comum was derived
from the IAC breeding program. The Cornell 49-242
genotype is resistant to anthracnose (Goncalves-
Vidigal et al. 2009) and has been widely used to
incorporate anthracnose resistance into lines from the
IAC breeding program. The Carioca Comum geno-
type was used as a common ancestor of IAC Ybate,
Carioca ETE and IAC Apua to obtain beans with the
carioca type seed coat, which is a cream-striped
Mesoamerican bean preferred in most Brazilian
states. All of the carioca accessions were closely
grouped, showed the typical carioca grain type, and
had high tolerance to diseases such as angular leaf
spot (Phaeoisariopsis griseola), anthracnose caused
by the fungus C. lindemuthianum, bean wilting
caused by Fusarium oxysporum formae specialis
(f. sp.) phaseoli (Fop) and bean common mosaic virus
(BCMV). These diseases can reduce crop productiv-
ity by up to 95%.
Another Mesoamerican subgroup consisted of the
accessions IPR Uirapuru, IPR Tiziu and IPR Gralha
from the IAPAR breeding program. The IPR Gralha
genotype has large grains common to Andean gene
pool accessions. However, this variety clustered with
the Mesoamerican group and may have introgression
from this gene pool. The Talisma and Majestoso
accessions, from the Federal University of Lavras,
clustered together with other varieties from the
Lavras breeding program. Majestoso was derived
from a blend of varieties and was positioned close to
Talisma (Fig. 1). This genotype was subsequently
used to improve OPNS 331 and was later released as
BRSMG-Majestoso. For this reason, these two
accessions may share a high proportion of their
genetic background.
Three other small-seeded carioca-type beans,
including Perola, OPNS 331 and BRS-Pontal,
grouped together as expected. The latter two acces-
sions came from crosses using the Perola genotype as
a common ancestor. Their plant architecture is semi-
erect to prostrate, the seed appearance is carioca-type
and the seed size is relatively small. These accessions
are tolerant to angular leaf spot and have became the
most popular grain in Brazil, hence their importance
as a baseline for this analysis. The IAC Diplomata
and Tybata varieties clustered in the same group and
shared resistance to bean golden mosaic virus
(BGMV) disease. Both of these varieties both have
G4000 as a common ancestor that was used as a
source of disease resistance.
Another group of Mesoamerican beans was
formed by accessions MAM 38, G4825, VAX 6,
SEA 5, SEA 21 and MAR 1, all of which share the
same characteristics (cream-colored grain and resis-
tance to low phosphorus availability). Some of these
advanced lines or accessions are also known for their
drought resistance and have been used in studies of
abiotic stress (Teran and Singh 2002; Kelly 2008;
CIAT 2008). Notably, these CIAT lines were devel-
oped mainly for the tropics rather than for subtropical
regions. The CIAT and IAC Mesoamerican acces-
sions were distinct, possibly because of different
selection pressures in each breeding program and/or
the presence of differing agro-ecological factors in
tropical versus subtropical environments; these fac-
tors probably increased the genetic distance between
the germplasm of each location. The subgroup
clustering pattern was consistent with the experi-
ments, indicating that DArT technology faithfully
detected small differences among accessions, with
excellent bootstrap support.
190 Mol Breeding (2012) 30:181–193
123
The separation of the CIAT and Brazilian (IAC)
accessions in the Andean and Mesoamerican gene
pools probably reflects the selection pressure that
would have permitted beans that were domesticated
in highland or tropical environments to gradually be
moved into lowland or sub-tropical environments,
resulting in genetically distinct subgroups. Beebe
et al. (2001) found that Brazilian germplasm of
Andean origin has several distinct traits such as
indeterminate bush growth, photoperiod insensitivity,
moderate tolerance to a low phosphorus availability,
unique grain colours and a seed striping pattern
known as ‘zebra’. These accessions may be remnants
of the first germplasm adapted to low altitudes that
resulted from exchange between the Andes and
Brazil. More recently, Blair et al. (2009a, b) found
that Jalo-type beans of light yellow colour often have
a mixed or inter-gene pool origin, suggesting another
mechanism for the adaptation of Andean beans to the
lowland environments more typical of Mesoamerican
beans. Finally, carioca types appear to have been
selected from the Mesoamerican gene pool only in
Brazil and are not common in other tropical envi-
ronments. Asfaw et al. (2009) found similar results in
African accessions, where farmers’ preferences dif-
fered in Ethiopia and Kenya and resulted in the
grouping of accessions by country, in accordance
with the ecological adaptation, cooking value and
marketability of each bean type.
AMOVA indicated that the two major gene pools
were strongly separated (FST = 0.5, P \ 0.001) and
that individuals within gene pools showed high
variability, similar to that observed for BAT477
accessions derived from different germplasm banks.
Asfaw et al. (2009) reported that the genetic differ-
entiation (FST) between two Andean control acces-
sions versus two Mesoamerican control accessions
was FST = 0.6.
In summary, DArT profiling proved to be useful in
elucidating the pattern of relatedness among a wide
range of modern bean accessions from the most
important breeding programs and common bean
pools. Though SSR and DArT marker systems are
characterized by different information content on a
per-locus basis, it must be emphasized that the use of
biallelic dominant markers such as DArT markers to
characterize the genetic stocks usually deployed in
genetic analyses does not imply losses of genetic
information. The high number of available DArT
markers, their cost-effectiveness and relatively high
polymorphism content are ideal characteristics for
extensive genome-wide screening for genetic diver-
sity purposes. Additionally, DArT markers in beans
were able to detect similar levels of diversity to SSRs,
mainly because of the possibility of genotyping
thousands of loci without any previous sequence
information. The results obtained with the DArT
markers are in good agreement with those obtained
with highly informative genomic SSR loci, which up
to now have represented the markers of choice to
investigate genetic relationships and to carry out
genetic and/or association mapping studies in com-
mon beans (Benchimol et al. 2007; Campos et al.
2011; Blair et al. 2010c).
In conclusion, a high-throughput genotyping plat-
form based on DArT technology proved very useful for
analysing the genetic diversity in common beans and
may be applied to bean cultivar fingerprinting and/or
germplasm analysis. This approach may be particu-
larly relevant for breeding programs that use marker-
assisted selection systems to monitor breeding
achievements. Since this is the first complete report
of a DArT platform for common beans, the results
described here provide a useful starting point for future
genetic, physical and association mapping studies.
Acknowledgments The authors thank Prof. Dr. Joao Bosco
(UFLA, Lavras, MG, Brazil) for donating germplasm and for
assistance during this work, and Drs. Nelson da Silva (IAPAR,
Londrina, PR., Brazil), Everaldo Barros (UFV, Vicosa, MG,
Brazil) and Maria Lucia Carneiro Vieira (ESALq/USP,
Piracicaba, SP, Brazil) for donating germplasms. This work
was sponsored by Fundag (Fundacao de Apoio a Pesquisa
Agrıcola) and FAPESP (Fundacao de Amparo a Pesquisa do
Estado de Sao Paulo, grants numbers 2009/50275-0 and
2010/51186-9).
References
Akbari M, Wenzl P, Caig V, Carling J, Xia L, Yang S,
Uszynski G, Mohler V, Lehmensiek A, Kuchel H, Hayden
MJ, Howes N, Sharp P, Vaughan P, Rathnell B, Huttner E,
Kilian A (2006) Diversity arrays technology (DArT) for
high-throughput profiling of the hexaploid wheat genome.
Theor Appl Genet 113:1409–1420
Anderson JA, Churchill GA, Autrique JE, Tanksley SD,
Sorrells ME (1993) Optimizing parental selection for
genetic-linkage maps. Genome 36:181–186
Anderson JW, Smith BM, Washnock CS (1999) Cardiovas-
cular and renal benefits of dry bean and soybean intake.
Am J Clin Nutr 70:464S–474S
Mol Breeding (2012) 30:181–193 191
123
Angioi SA, Rau D, Attene G, Nanni L, Bellucci E, Logozzo G,
Negri V, Zeuli PLS, Papa R (2010) Beans in Europe:
origin and structure of the European landraces of Phase-olus vulgaris L. Theor Appl Genet 121:829–843. doi:
10.1007/s00122-010-1353-2
Asfaw A, Blair M, Almekinders C (2009) Genetic diversity and
population structure of common bean (Phaseolus vulgarisL.) landraces from the East African highlands. Theor Appl
Genet 120:1–12
Becerra V, Gepts P (1994) RFLP diversity of common bean
(Phaseolus vulgaris) in its centres of origin. Genome
37:256–263
Beebe S, Skroch PW, Tohme J, Duque MC, Pedraza F,
Nienhuis J (2000) Structure of genetic diversity among
common bean landraces of Middle American origin based
on correspondence analysis of RAPD. Crop Sci 40:264–
273
Beebe S, Rengifo J, Gaitan E, Duque MC, Tohme J (2001)
Diversity and origin of Andean landraces of common
bean. Crop Sci 41:854–862
Benchimol LL, Souza CL, Souza AP (2005) Microsatellite-
assisted backcross selection in maize. Genet Mol Biol
28:789–797
Benchimol LL, Campos T, Carbonell SAM, Colombo CA,
Chioratto AF, Formighieri EF, Gouve LRL, Pereira de
Souza A (2007) Structure of genetic diversity among
common bean (Phaseolus vulgaris L.) varieties of Mes-
oamerican and Andean origins using new developed
microsatellite markers. Genet Resour Crop Evol 54:1747–
1762
Blair MW, Giraldo MC, Buendıa HF, Tovar E, Duque MC,
Beebe SE (2006) Microsatellite marker diversity in
common bean (Phaseolus vulgaris L.). Theor Appl Genet
113:100–109
Blair MW, Dıaz LM, Buendıa HF, Duque MC (2009a) Genetic
diversity, seed size associations and population structure
of a core collection of common beans (Phaseolus vulgarisL.). Theor Appl Genet 119:955–972
Blair MW, Munoz-Torres M, Giraldo MC, Pedraza F (2009b)
Development and diversity assessment of Andean-
derived, gene-based microsatellites for common bean
(Phaseolus vulgaris L.). BMC Plant Biol 9:100
Blair MW, Chaves A, Tofino A, Calderon JF, Palacio JD
(2010a) Extensive diversity and inter-genepool intro-
gression in a world-wide collection of indeterminate snap
bean accessions. Theor Appl Genet 120:1381–1391
Blair MW, Gonzalez LF, Kimani PM, Butare L (2010b)
Genetic diversity, inter-gene pool introgression and
nutritional quality of common beans (Phaseolus vulgarisL.) from Central Africa. Theor Appl Genet 121:237–
248
Blair MW, Prieto S, Dıaz LM, Buendıa HF, Cardona C (2010c)
Linkage disequilibrium at the APA insecticidal seed locusof common bean (Phaseolus vulgaris L.). BMC Plant Biol
10:79. doi:10.1186/1471-2229-10-79
Broughton WJ, Hernandez G, Blair M, Beebe S, Gepts P,
Vanderleyden J (2003) Beans (Phaseolus spp.) model
food legumes. Plant Soil 252:55–128
Buso GSC, Amaral ZPS, Brondani RPV, Ferreira ME (2006)
Microsatellite markers for the common bean Phaseolusvulgari. Mol Ecol Notes 6:252–254
Campos T, Oblessuc PR, Sforc DA, Cardoso JMK, Baroni RM,
De Sousa ACB, Carbonell SAM, Chioratto AF, Garcia
AAF, Rubiano LB, De Souza AP (2011) Inheritance of
growth habit detected by genetic linkage analysis using
microsatellites in the common bean (Phaseolus vulgarisL.). Mol Breed 27:549–560
Carneiro FF, Bosco JS, Leite ME (2010) Marker-assisted
backcrossing using microsatellites and validation of
SCAR Phs marker for resistance to white mold in com-
mon bean. Electron J Biotechnol 13:9–10
Chen J, Zhang X, Jing R, Blair MW, Mao X, Wang S (2010)
Cloning and genetic diversity analysis of a new P5CSgene from common bean (Phaseolus vulgaris L.). Theor
Appl Genet 120:1393–1404
CIAT (2008) Improved beans for the developing world. Annual
Report I-P2. CIAT, Cali
Excoffier L, Lischer HEL (2010) Arlequin suite ver 3.5: a new
series of programs to perform population genetics analy-
ses under Linux and Windows. Mol Ecol Resour
10:564–567
Fehr WR (1987) Principles of cultivars development. Collier
Macmillan Publishers, London, pp 172–192
Gepts P (1998) Origin and evolution of common bean: past
events and recent trends. Hort Sci 33:1124–1130
Gepts P, Debouck D (1991) Origin, domestication and evolu-
tion of the common beans (Phaseolus vulgaris L.). In:
Schoonhoven A, Voysest O (eds) Common beans:
research for crop improvement. CAB International, Wal-
lingford, pp 7–54
Gepts P, Osborne TC, Rashka K, Bliss FA (1986) Phaseolin
protein variability in wild forms and landraces of the
common bean (Phaseolus vulgaris L.): evidence for
multiple centers of domestication. Econ Bot 40:451–468
Goncalves-Vidigal MC, Vidigal Filho PS, Medeiros AF, Pas-
tor-Corrales MA (2009) Common bean landrace Jalo Li-
stras Pretas as the source of a new Andean anthracnose
resistance gene. Crop Sci 49:133–138
Heller-Uszynska K, Uszynski G, Huttner E, Evers M, Carlig J,
Caig V, Aitken K, Jackson P, Piperidis G, Cox M, Gil-
mour R, D0Hont A, Butterfield M, Glaszmann JC, Kilian
A (2011) Diversity arrays technology effectively reveals
DNA polymorphism in a large and complex genome of
sugarcane. Mol Breed. doi:10.1007/s11032-010-9460-y
Howard EL, Whittock SP, Jakse J, Carling J, Matthews PD,
Probasco G, Henning JA, Darby P, Cerenak A, Javornik B,
Killian A, Koutoulis A (2011) High-throughput genotyping
of hop (Humulus lupulus L.) utilising diversity arrays
technology (DArT). Theor Appl Genet 122:1265–1280
Jaccoud D, Peng K, Feinstein D, Kilian A (2001) Diversity
arrays: a solid state technology for sequence information
independent genotyping. Nucleic Acids Res 29:4 e25
Johns MA, Skroch PW, Nienhuis J, Hinrichsen P, Bascur G,
Munoz-Schick C (1997) Gene pool classification of
common bean landraces from Chile based on RAPD and
morphological data. Crop Sci 37:605–613
Kelly J (2008) Annual report of the bean improvement coop-
erative. http://www.css.msu.edu/bic/ reports.cfm. Acces-
sed 08 Nov 2010
Kwak M, Gepts P (2009) Structure of genetic diversity in the
two major gene pools of common bean (Phaseolus vul-garis L., Fabaceae). Theor Appl Genet 118:979–992
192 Mol Breeding (2012) 30:181–193
123
Mace E, Xia L, Jordan Dr, Halloran K, Parh DK, Huttner E,
Wenzl P, Kilian A (2008) DArT markers: diversity analyses
and mapping in Sorghum bicolor. BMC Genomics 9:26
Marotti L, Bonetti A, Minelli M, Catizone P, Dinelli G (2007)
Characterization of some Italian common bean (Phaseolusvulgaris L.) landraces by RAPD, semi-random and ISSR
molecular markers. Genet Resour Crop Evol 54:175–188
McClean P, Kami J, Gepts P (2004) Genomic and genetic
diversity in common bean. In: Wilson RF, Stalker HT,
Brummer EC (eds) Legume crop genomics. AOCS Press,
Champaign, pp 60–82
Miklas PN, Coyne DP, Grafton KF, Mutlu N, Reiser J, Lind-
gren DT, Singh SP (2003) A major QTL for common
bacterial blight resistance derives from the common bean
great northern landrace cultivar Montana No. 5. Euphytica
131:137–146
Miklas PN, Kelly J, Beebe S, Blair M (2006) Common bean
breeding for resistance against biotic and abiotic estresses:
from classical to MAS breeding. Euphytica 147:105–131
Munoz LC, Blair MW, Duque MC, Tohme J, Roca W (2004)
Introgression in common bean x tepary bean interspecific
congruity-backcross lines as measured by AFLP markers.
Crop Sci 44:637–645
Openshaw SJ, Jarboe SG, Beavis WD (1994) Marker-assisted
selection in backcross breeding. In: Proceedings of the
symposium ‘‘Analysis of Molecular Marker Data’’, joint
plant breeding symposia series. American Society for
Horticultural Science/Crop Science of America, Corvallis,
Oregon, pp 41–43
Pallotini L, Garcia E, Kami E, Barcaccia G, Gepts P (2004)
The genetic anatomy of a patented yellow bean. Crop Sci
44:968–977
Perrier X, Jacquemoud-Collet JP (2006) DARwin software.
(http://darwin.cirad.fr/Darwin)
Rinke EH, Sentz JC (1961) Moving corn-belt germplasm
northward. Ann Hybrid Corn Ind Conf 16:53–56
Risterucci AM, Hippolyte I, Perrier X, Xia L, Caig V, Evers M,
Huttner E, Kilian A, Glaszmann JC (2009) Development
and assessment of diversity arrays technology for high-
throughput DNA analyses in musa. Theor Appl Genet
119:1093–1103
Rohlf F (2002) NTSYS pc. Numerical taxonomy system.
Exeter Publishing, Setauket
Rossi M, Bitocchi E, Bellucci E, Nanni L, Rau D, Attene G,
Papa R (2009) Linkage disequilibrium and population
structure in wild and domesticated populations of
Phaseolus vulgaris L. Evol Appl 2:504–522
Saitou N, Nei M (1987) The neighbour-joining method: a new
method for reconstructing phylogenetic trees. Mol Biol
Evol 4:406–425
Santalla M, De Ron AM, De La Fuente M (2010) Integration of
genome and phenotypic scanning gives evidence of
genetic structure in Mesoamerican common bean
(Phaseolus vulgaris L.) landraces from the southwest of
Europe. Theor Appl Genet 120:1635–1651
Shaver DL (1976) Conversations for earliness in maize in-
breds. Maize Genet Coop Newslett 50:20–23
Shi C, Chaudhary S, Yu K, Park SJ, Navabi A, McClean PE
(2011) Identification of candidate genes associated with
CBB resistance in common bean HR45 (Phaseolus vul-garis L.) using cDNA-AFLP. Mol Biol Rep 38:75–81
Singh SP, Nodari R, Gepts P (1991) Genetic diversity in cul-
tivated common bean: I. Allozymes. Crop Sci 31:19–23
StatSoft, Inc (2005) STATISTICA (data analysis software
system) version 7.1. (www.statsoft.com)
Svetleva D, Pereira G, Carlier J, Cabrita L, Leitao J, Genchev
D (2006) Molecular characterization of Phaseolus vul-garis L. Accessions included in Bulgarian collection by
ISSR and AFLP analyses. Sci Hortic 109:198–206
Teran H, Singh SP (2002) Comparison of sources and lines
selected for drought resistance in common bean. Crop Sci
42:64–70
Tohme J, Gonzalez DO, Beebe S, Duque MC (1996) AFLP
analysis of gene pools of a wild bean core collection. Crop
Sci 36:1375–1384
Vega EP, Paneda A, Rodrıguez-Suarez C, Campa A, Giraldez
R, Ferreira JJ (2010) Mapping of QTLs for morpho-
agronomic and seed quality traits in a RIL population of
common bean (Phaseolus vulgaris L.). Theor Appl Genet
120:1367–1380
Weir BS, Cockerham CC (1984) Estimating F-statistics for the
analysis of population structure. Evolution 38:1358–1370
Wenzl P, Carling J, Kudrna D, Jaccoud D, Huttner E, Klein-
hofs A, Kilian A (2004) Diversity arrays technology
(DArT) for whole-genome profiling of barley. Proc Natl
Acad Sci USA 101:9915–9920
Wittenberg AHJ, Van der Lee T, Cayla C, Kilian A, Visser
RGF, Schouten HJ (2005) Validation of the high-
throughput marker technology DArT using the model
plant Arabidopsis thaliana. Mol Genet Genomics
274:30–39
Xia L, Peng K, Yang S, Wenzl P, Carmen de Vicente M,
Fregene M, Kilian A (2005) DArT for high-throughput
genotyping of cassava (Manihot esculenta) and its wild
relatives. Theor Appl Genet 110:1092–1098
Xie Y, McNally K, Li CY, Leung H, Zhu YY (2006) A high-
throughput genomic tool: diversity array technology
complementary for rice genotyping. J Integr Plant Biol
48:1069–1076
Yang S, Pang W, Ash G, Harper J, Carling J, Wenzl P, Huttner
E, Zong X, Kilian A (2006) Low level of genetic diversity
in cultivated pigeonpea compared to its wild relatives is
revealed by diversity arrays technology. Theor Appl
Genet 113:585–595
Zhang X, Blair MW, Wang S (2008) Genetic diversity of
Chinese common bean (Phaseolus vulgaris L.) landraces
assessed with simple sequence repeat markers. Theor
Appl Genet 117:629–640
Mol Breeding (2012) 30:181–193 193
123