Prognostic utility of vitamin d in acute coronary syndrome patients in coastal norway
11
Research Article Prognostic Utility of Vitamin D in Acute Coronary Syndrome Patients in Coastal Norway Patrycja A. Naesgaard, 1,2 Volker Pönitz, 1,2 Hildegunn Aarsetoey, 2,3 Trygve Brügger-Andersen, 1,2 Heidi Grundt, 2,3 William S. Harris, 4 Harry Staines, 5 and Dennis W. T. Nilsen 1,2 1 Department of Cardiology, Stavanger University Hospital, Stavanger, Norway 2 Department of Clinical Science, University of Bergen, Bergen, Norway 3 Department of Medicine, Stavanger University Hospital, Stavanger, Norway 4 Department of Medicine, Sanford School of Medicine, University of South Dakota and OmegaQuant Analytics (LLC), Sioux Falls, SD, USA 5 Sigma Statistical Services, Balmullo, UK Correspondence should be addressed to Patrycja A. Naesgaard; patrycja anna [email protected] Received 20 October 2014; Revised 1 January 2015; Accepted 5 January 2015 Academic Editor: Serge Masson Copyright © 2015 Patrycja A. Naesgaard et al. is is an open access article distributed under the Creative Commons Attribution License, which permits unrestricted use, distribution, and reproduction in any medium, provided the original work is properly cited. Background. An inverse relationship between cardiovascular risk and levels of vitamin D and omega-3 index may exist. Objectives. To evaluate the prognostic utility of serum 25-hydroxyvitamin D [25(OH)D] in 871 patients with suspected acute coronary syndrome (ACS) and to assess the seasonal correlation between 25(OH)D and the omega-3 index in 456 ACS patients from southwestern Norway. Results. In the univariate analysis the hazard ratio (HR) at 2-year follow-up for all-cause mortality in the highest as compared to the lowest quartile of 25(OH)D in the total population was 0.61 (95% confidence interval (CI), 0.37– 1.00), = 0.050. At 7-year follow-up, the corresponding HR for all-cause mortality was 0.66 (95% CI, 0.49–0.90), = 0.008, and for females alone 0.51 (95% CI, 0.32–0.83), = 0.006. Quartile survival did not differ in the multivariable analysis, whereas 25(OH)D < 40 nM (<16ng/mL) was found to be independently related to mortality. Seasonal differences in 25(OH)D, but not for the omega-3 index, were noted, and the two biomarkers were positively correlated, especially during winter-spring; Pearson’s correlation coefficient was 0.358, < 0.001. Conclusion. Vitamin D levels are related to survival, especially in females, and correlate with the omega-3 index. 1. Introduction In observational studies vitamin D and n-3 polyunsaturated fatty acids (PUFA) have been found to be inversely related to cardiovascular disease (CVD) [1, 2]. Whether these factors are causal or are simply markers of a generally lower-risk lifestyle is still unsettled. Low vitamin D levels have been associated with hyperten- sion, obesity, dyslipidemia, and diabetes mellitus, reflecting an increased cardiovascular (CV) risk burden [3]. However, also high levels can be associated with increased total and CV mortality, as described by a U-shape or reverse J-curve [4–6]. N-3 fatty acids may exert beneficial effects on hemo- dynamics, lipid metabolism, inflammation, thrombosis, and ventricular arrhythmias [7]. Fish is the major food source of long-chain n-3 PUFA and includes eicosapentaenoic acid (EPA) and docosahexaenoic acid (DHA) [8]. e omega-3 index is a measure of these fatty acids, given as a percentage of total fatty acids in red blood cell membranes [9]. Vitamin D is mainly synthesized in the skin from 7- dehydrocholesterol under the influence of sun exposure and the remaining 10–20% is ingested in the diet in which fatty fish is a major contributor [10]. e synthesis of vitamin D in response to ultraviolet B (UVB) radiation in sunlight depends Hindawi Publishing Corporation Disease Markers Volume 2015, Article ID 283178, 11 pages http://dx.doi.org/10.1155/2015/283178
-
Upload
independent -
Category
Documents
-
view
1 -
download
0
Transcript of Prognostic utility of vitamin d in acute coronary syndrome patients in coastal norway
Research ArticlePrognostic Utility of Vitamin D in Acute Coronary SyndromePatients in Coastal Norway
Patrycja A. Naesgaard,1,2 Volker Pönitz,1,2 Hildegunn Aarsetoey,2,3
Trygve Brügger-Andersen,1,2 Heidi Grundt,2,3 William S. Harris,4
Harry Staines,5 and Dennis W. T. Nilsen1,2
1Department of Cardiology, Stavanger University Hospital, Stavanger, Norway2Department of Clinical Science, University of Bergen, Bergen, Norway3Department of Medicine, Stavanger University Hospital, Stavanger, Norway4Department of Medicine, Sanford School of Medicine, University of South Dakota and OmegaQuant Analytics (LLC),Sioux Falls, SD, USA5Sigma Statistical Services, Balmullo, UK
Correspondence should be addressed to Patrycja A. Naesgaard; patrycja anna [email protected]
Received 20 October 2014; Revised 1 January 2015; Accepted 5 January 2015
Academic Editor: Serge Masson
Copyright © 2015 Patrycja A. Naesgaard et al. This is an open access article distributed under the Creative Commons AttributionLicense, which permits unrestricted use, distribution, and reproduction in any medium, provided the original work is properlycited.
Background. An inverse relationship between cardiovascular risk and levels of vitamin D and omega-3 index may exist. Objectives.To evaluate the prognostic utility of serum 25-hydroxyvitamin D [25(OH)D] in 871 patients with suspected acute coronarysyndrome (ACS) and to assess the seasonal correlation between 25(OH)D and the omega-3 index in 456 ACS patients fromsouthwestern Norway. Results. In the univariate analysis the hazard ratio (HR) at 2-year follow-up for all-cause mortality in thehighest as compared to the lowest quartile of 25(OH)D in the total population was 0.61 (95% confidence interval (CI), 0.37–1.00), 𝑃 = 0.050. At 7-year follow-up, the corresponding HR for all-cause mortality was 0.66 (95% CI, 0.49–0.90), 𝑃 = 0.008,and for females alone 0.51 (95% CI, 0.32–0.83), 𝑃 = 0.006. Quartile survival did not differ in the multivariable analysis, whereas25(OH)D < 40 nM (<16 ng/mL) was found to be independently related to mortality. Seasonal differences in 25(OH)D, but notfor the omega-3 index, were noted, and the two biomarkers were positively correlated, especially during winter-spring; Pearson’scorrelation coefficient was 0.358, 𝑃 < 0.001. Conclusion.Vitamin D levels are related to survival, especially in females, and correlatewith the omega-3 index.
1. Introduction
In observational studies vitamin D and n-3 polyunsaturatedfatty acids (PUFA) have been found to be inversely relatedto cardiovascular disease (CVD) [1, 2]. Whether these factorsare causal or are simply markers of a generally lower-risklifestyle is still unsettled.
Low vitaminD levels have been associatedwith hyperten-sion, obesity, dyslipidemia, and diabetes mellitus, reflectingan increased cardiovascular (CV) risk burden [3]. However,also high levels can be associated with increased total and CVmortality, as described by a U-shape or reverse J-curve [4–6].
N-3 fatty acids may exert beneficial effects on hemo-dynamics, lipid metabolism, inflammation, thrombosis, andventricular arrhythmias [7]. Fish is the major food sourceof long-chain n-3 PUFA and includes eicosapentaenoic acid(EPA) and docosahexaenoic acid (DHA) [8]. The omega-3index is a measure of these fatty acids, given as a percentageof total fatty acids in red blood cell membranes [9].
Vitamin D is mainly synthesized in the skin from 7-dehydrocholesterol under the influence of sun exposure andthe remaining 10–20% is ingested in the diet in which fattyfish is a major contributor [10]. The synthesis of vitamin D inresponse to ultraviolet B (UVB) radiation in sunlight depends
Hindawi Publishing CorporationDisease MarkersVolume 2015, Article ID 283178, 11 pageshttp://dx.doi.org/10.1155/2015/283178

2 Disease Markers
on factors such as latitude, altitude, time of year and day-time,weather, age, skin pigmentation type, clothing, and sunscreenand is influenced by environment (pollution) and lifestyle[11]. Conditions such as poor nutrition and chronic illness arealso associated with vitamin D deficiency [12].
The prognostic utility of vitamin D in relation to long-term CV outcomes has been evaluated in subjects without ahistory of CVD, as in the Framingham Offspring study [13]and in patients with established CVD [14, 15]. We have previ-ously shown that 2- and 5-year total and cardiac mortality isdecreased in the highest as compared to the lowest quartileof vitamin D in a coronary chest-pain population livingat altitudes exceeding 1000 meters in subtropical northernArgentina [16], and this relationship is stronger in femalesthan in males [17].
The main aim of our study was to evaluate the prognosticutility of vitamin D measured as serum 25-hydroxyvitaminD [25(OH)D] in a Norwegian coastal coronary chest-painpopulation exposed to temperate sun activity at low altitudesand with a high consumption of fish as reflected by theomega-3 index. As a secondary aim, we looked into theseasonal correlation between 25(OH)D and the omega-3index in the subjects with troponin-T (TnT) positive values.
2. Methods
Participants in the present analysis belonged to the RACSstudy (Risk Markers in the Acute Coronary Syndrome)(ClinicalTrials.gov NCT00521976), a single-center prospec-tive observational study designed to evaluate the prognos-tic utility of serum 25(OH)D (D represents D
2and D
3)
status in 871 patients with chest pain and suspected ACSconsecutively admitted to the Stavanger University Hospitalfrom November 2002 to October 2003. The details of theRACS study have been published previously [18].Theprimaryoutcome in the present study was all-cause mortality at 2-and 7-year follow-up and the secondary outcomes includedcardiac death and sudden cardiac death (SCD) at 2-yearfollow-up, as previously defined [16]. Measurements of theomega-3 index at admission were previously investigated in456 of the 471 ACS patients (defined by a peak baselineTnT value > 0.01 ng/mL) [19]. In this subpopulation weperformed a seasonal (summer-autumn defined as June–November and winter-spring defined as December–May)correlation between levels of 25(OH)D and the omega-3index. 25(OH)D as a prognostic marker was evaluated inthe total population, as well as in subgroups including TnTpositive and TnT negative patients, gender, and vitamin Ddeficient subjects (defined as 25(OH)D < 40 nM (16 ng/mL))[20]. Furthermore, seasonal variations in 25(OH)D wereevaluated in the total population. Data were analyzed inquartiles of 25(OH)D and as continuous 25(OH)D valuesapplying univariate and multivariable analyses.
The study was approved by the Regional Board ofResearch Ethics and the Norwegian Health Authorities andconducted in accordance with the Helsinki Declaration of1971, as revised in 1983. Written informed consent wasobtained from all patients.
Blood samples were drawn immediately following admis-sion by direct venipuncture of an antecubital vein, applyinga minimum of stasis. A second blood sample for TnT deter-mination was drawn six hours following the first sample.Baseline laboratory data for this study included measure-ments of 25(OH)D
2, 25(OH)D
3, TnT, high sensitivity C-
reactive protein (hsCRP), glucose, serum lipids, B-type natri-uretic peptide (BNP) measured in EDTA (ethylene diaminetetraacetic acid) plasma, estimated glomerular filtration rate(eGFR) (calculated by modification in diet in renal disease(MDRD) formula), and omega-3 index.
TnT was quantified by a cardiac-specific second-genera-tion troponin T ELISA assay fromRocheDiagnostics, using ahigh-affinity cardiac-specific TnT isoform antibody [21]. Thelower detection limit of the assay used is 0.01 ng/mL.
25(OH)D analysis was carried out at the Department ofMedical Biochemistry at Stavanger University Hospital, aspreviously described [16].
The omega-3 index (EPA + DEA) content was measuredin packed red blood cells, as previously described by Harrisand von Schacky [9] and by Aarsetoey et al. [19].
2.1. Statistical Analysis. Patients were grouped into quartilesaccording to their 25(OH)D levels within the total populationand TnT positive and negative subpopulations as appropriate.As a sensitivity analysis, selected analyses were conductedusing continuous values instead of quartiles. Approximatelynormally distributed variables were given as mean andstandard deviation (SD). The Chi-square test for associationwas applied between the 25(OH)D quartiles and categoricalvariables at baseline. The one way analysis of variance(ANOVA) was used to test for equality of means of scalevariables (e.g., age) amongst 25(OH)D quartiles. The hazardratios (HR) are presented with 95% confidence interval (CI).Separate stepwise Cox multivariable proportional hazardsregression models with total death, cardiac death and SCDas the dependent variable, and 25(OH)D and other variablesas potential independent predictors (listed below) were fitted.To examine the differences in prognosis between subjects inthe upper quartile(s) versus the lowest quartile of 25(OH)D,we adjusted for gender, age, smoking, hypertension, indexdiagnosis, diabetes mellitus, congestive heart failure (CHF)(defined byKillip-Kimball class at admission; patients in class2 to 4 were classified as CHF patients and those in class1 as non-CHF), history of previous coronary heart disease(CHD) (i.e., history of either angina pectoris, myocardialinfarction, percutaneous coronary intervention, or coronaryartery bypass graft), hypercholesterolemia/use of statins, TnT> 0.01 ng/mL, eGFR, hsCRP, BNP, body mass index (kg/m2),and beta-blockers prior to enrolment. The Kaplan-Meierproduct limits were used for plotting times to event with theequality of the 25(OH)D quartile survival curves assessed bythe log-rank test. Hypothesis two-sided 𝑃 values less than0.05 are defined as statistically significant.
3. Results
A total of 871 patients (531 men and 340 women) wereenrolled in the RACS study. Ten samples were not available;
Disease Markers 3
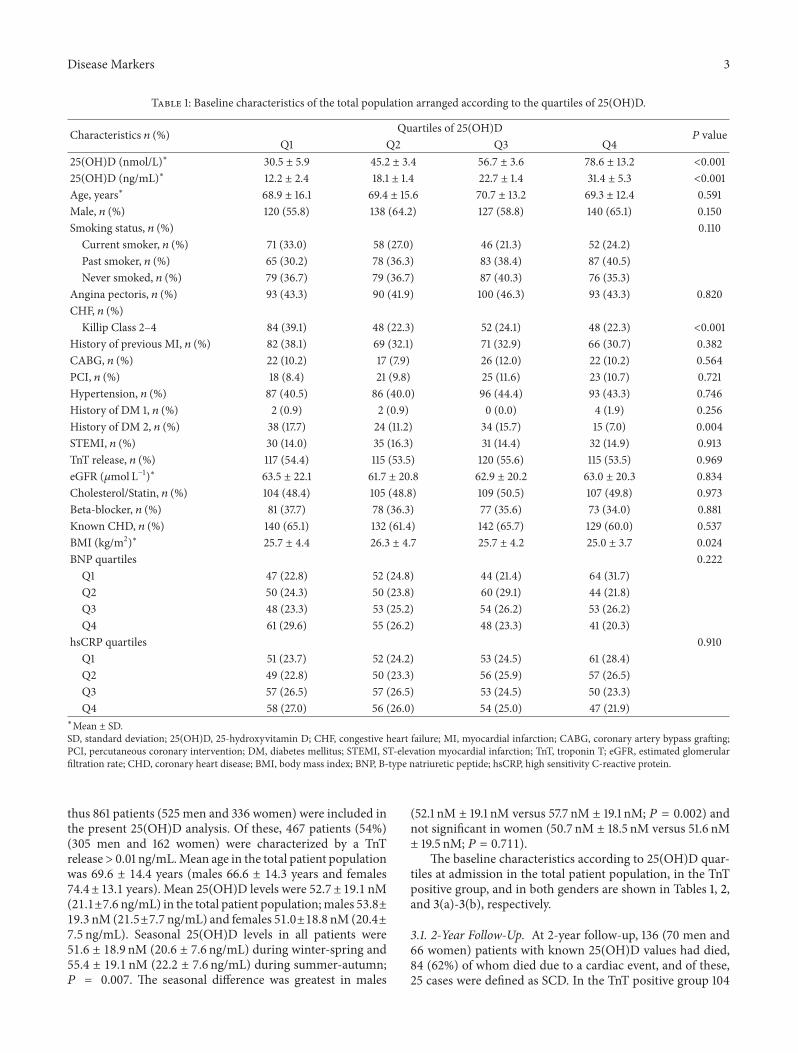
Table 1: Baseline characteristics of the total population arranged according to the quartiles of 25(OH)D.
Characteristics 𝑛 (%) Quartiles of 25(OH)D𝑃 value
Q1 Q2 Q3 Q425(OH)D (nmol/L)∗ 30.5 ± 5.9 45.2 ± 3.4 56.7 ± 3.6 78.6 ± 13.2 <0.00125(OH)D (ng/mL)∗ 12.2 ± 2.4 18.1 ± 1.4 22.7 ± 1.4 31.4 ± 5.3 <0.001Age, years∗ 68.9 ± 16.1 69.4 ± 15.6 70.7 ± 13.2 69.3 ± 12.4 0.591Male, 𝑛 (%) 120 (55.8) 138 (64.2) 127 (58.8) 140 (65.1) 0.150Smoking status, 𝑛 (%) 0.110
Current smoker, 𝑛 (%) 71 (33.0) 58 (27.0) 46 (21.3) 52 (24.2)Past smoker, 𝑛 (%) 65 (30.2) 78 (36.3) 83 (38.4) 87 (40.5)Never smoked, 𝑛 (%) 79 (36.7) 79 (36.7) 87 (40.3) 76 (35.3)
Angina pectoris, 𝑛 (%) 93 (43.3) 90 (41.9) 100 (46.3) 93 (43.3) 0.820CHF, 𝑛 (%)
Killip Class 2–4 84 (39.1) 48 (22.3) 52 (24.1) 48 (22.3) <0.001History of previous MI, 𝑛 (%) 82 (38.1) 69 (32.1) 71 (32.9) 66 (30.7) 0.382CABG, 𝑛 (%) 22 (10.2) 17 (7.9) 26 (12.0) 22 (10.2) 0.564PCI, 𝑛 (%) 18 (8.4) 21 (9.8) 25 (11.6) 23 (10.7) 0.721Hypertension, 𝑛 (%) 87 (40.5) 86 (40.0) 96 (44.4) 93 (43.3) 0.746History of DM 1, 𝑛 (%) 2 (0.9) 2 (0.9) 0 (0.0) 4 (1.9) 0.256History of DM 2, 𝑛 (%) 38 (17.7) 24 (11.2) 34 (15.7) 15 (7.0) 0.004STEMI, 𝑛 (%) 30 (14.0) 35 (16.3) 31 (14.4) 32 (14.9) 0.913TnT release, 𝑛 (%) 117 (54.4) 115 (53.5) 120 (55.6) 115 (53.5) 0.969eGFR (𝜇mol L−1)∗ 63.5 ± 22.1 61.7 ± 20.8 62.9 ± 20.2 63.0 ± 20.3 0.834Cholesterol/Statin, 𝑛 (%) 104 (48.4) 105 (48.8) 109 (50.5) 107 (49.8) 0.973Beta-blocker, 𝑛 (%) 81 (37.7) 78 (36.3) 77 (35.6) 73 (34.0) 0.881Known CHD, 𝑛 (%) 140 (65.1) 132 (61.4) 142 (65.7) 129 (60.0) 0.537BMI (kg/m2)∗ 25.7 ± 4.4 26.3 ± 4.7 25.7 ± 4.2 25.0 ± 3.7 0.024BNP quartiles 0.222
Q1 47 (22.8) 52 (24.8) 44 (21.4) 64 (31.7)Q2 50 (24.3) 50 (23.8) 60 (29.1) 44 (21.8)Q3 48 (23.3) 53 (25.2) 54 (26.2) 53 (26.2)Q4 61 (29.6) 55 (26.2) 48 (23.3) 41 (20.3)
hsCRP quartiles 0.910Q1 51 (23.7) 52 (24.2) 53 (24.5) 61 (28.4)Q2 49 (22.8) 50 (23.3) 56 (25.9) 57 (26.5)Q3 57 (26.5) 57 (26.5) 53 (24.5) 50 (23.3)Q4 58 (27.0) 56 (26.0) 54 (25.0) 47 (21.9)
∗Mean ± SD.SD, standard deviation; 25(OH)D, 25-hydroxyvitamin D; CHF, congestive heart failure; MI, myocardial infarction; CABG, coronary artery bypass grafting;PCI, percutaneous coronary intervention; DM, diabetes mellitus; STEMI, ST-elevation myocardial infarction; TnT, troponin T; eGFR, estimated glomerularfiltration rate; CHD, coronary heart disease; BMI, body mass index; BNP, B-type natriuretic peptide; hsCRP, high sensitivity C-reactive protein.
thus 861 patients (525 men and 336 women) were included inthe present 25(OH)D analysis. Of these, 467 patients (54%)(305 men and 162 women) were characterized by a TnTrelease> 0.01 ng/mL.Mean age in the total patient populationwas 69.6 ± 14.4 years (males 66.6 ± 14.3 years and females74.4 ± 13.1 years). Mean 25(OH)D levels were 52.7 ± 19.1 nM(21.1±7.6 ng/mL) in the total patient population;males 53.8±19.3 nM (21.5±7.7 ng/mL) and females 51.0±18.8 nM (20.4±7.5 ng/mL). Seasonal 25(OH)D levels in all patients were51.6 ± 18.9 nM (20.6 ± 7.6 ng/mL) during winter-spring and55.4 ± 19.1 nM (22.2 ± 7.6 ng/mL) during summer-autumn;𝑃 = 0.007. The seasonal difference was greatest in males
(52.1 nM ± 19.1 nM versus 57.7 nM ± 19.1 nM; 𝑃 = 0.002) andnot significant in women (50.7 nM ± 18.5 nM versus 51.6 nM± 19.5 nM; 𝑃 = 0.711).
The baseline characteristics according to 25(OH)D quar-tiles at admission in the total patient population, in the TnTpositive group, and in both genders are shown in Tables 1, 2,and 3(a)-3(b), respectively.
3.1. 2-Year Follow-Up. At 2-year follow-up, 136 (70 men and66 women) patients with known 25(OH)D values had died,84 (62%) of whom died due to a cardiac event, and of these,25 cases were defined as SCD. In the TnT positive group 104

4 Disease Markers
Table 2: Baseline characteristics of the TnT positive patient population arranged according to the quartiles of 25(OH)D.
Characteristics 𝑛 (%) Quartiles of 25(OH)D𝑃 value
Q1 Q2 Q3 Q425(OH)D (nmol/L)∗ 30.2 ± 6.2 44.9 ± 3.5 56.6 ± 3.6 78.1 ± 13.2 <0.00125(OH)D (ng/mL)∗ 12.1 ± 2.5 18.0 ± 1.4 22.6 ± 1.4 31.2 ± 5.3 <0.001Omega-3 Index∗ 6.1 ± 1.6 6.4 ± 1.6 6.9 ± 1.9 7.5 ± 2.2 <0.001Age, years∗ 72.5 ± 14.8 72.6 ± 13.5 71.5 ± 13.8 71.2 ± 11.0 0.809Male, 𝑛 (%) 64 (55.2) 81 (69.2) 73 (62.4) 86 (74.1) 0.015Smoking status, 𝑛 (%) 0.047
Current smoker, 𝑛 (%) 36 (31.0) 37 (31.6) 35 (29.9) 30 (25.9)Past smoker, 𝑛 (%) 30 (25.9) 42 (35.9) 35 (29.9) 53 (45.7)Never smoked, 𝑛 (%) 50 (43.1) 38 (32.5) 47 (40.2) 33 (28.4)
Angina pectoris, 𝑛 (%) 49 (42.2) 48 (41.0) 52 (44.4) 51 (44.0) 0.949CHF, 𝑛 (%)
Killip Class 2–4 56 (48.3) 27 (23.1) 30 (25.6) 32 (27.6) <0.001History of previous MI, 𝑛 (%) 46 (39.7) 37 (31.6) 35 (29.9) 38 (32.8) 0.413CABG, 𝑛 (%) 11 (9.5) 7 (6.0) 12 (10.3) 12 (10.3) 0.612PCI, 𝑛 (%) 9 (7.8) 9 (7.7) 7 (6.0) 10 (8.6) 0.893Hypertension, 𝑛 (%) 48 (41.4) 47 (40.2) 52 (44.4) 49 (42.2) 0.926History of DM 1, 𝑛 (%) 0 (0.0) 2 (1.7) 0 (0.0) 4 (3.4) 0.058History of DM 2, 𝑛 (%) 26 (22.4) 19 (16.2) 19 (16.2) 9 (7.8) 0.023STEMI, 𝑛 (%) 29 (25.0) 35 (29.9) 30 (25.6) 33 (28.4) 0.813eGFR (𝜇mol L−1)∗ 59.7 ± 23.2 59.8 ± 22.3 62.5 ± 23.3 63.9 ± 23.5 0.418Cholesterol/statin, 𝑛 (%) 53 (45.7) 54 (46.2) 52 (44.4) 50 (43.1) 0.967Beta-blocker, 𝑛 (%) 40 (34.5) 39 (33.3) 35 (29.9) 34 (29.3) 0.793Known CHD, 𝑛 (%) 80 (69.0) 71 (60.7) 76 (65.0) 72 (62.1) 0.566BMI (kg/m2)∗ 25.7 ± 4.5 25.9 ± 4.6 25.6 ± 4.3 25.3 ± 3.9 0.714BNP quartiles 0.778
Q1 15 (13.8) 17 (15.0) 22 (19.5) 23 (21.3)Q2 24 (22.0) 23 (20.4) 25 (22.1) 24 (22.2)Q3 26 (23.9) 34 (30.1) 32 (28.3) 26 (24.1)Q4 44 (40.4) 39 (34.5) 34 (30.1) 35 (32.4)
hsCRP quartiles 0.698Q1 18 (15.5) 22 (18.8) 19 (16.2) 27 (23.3)Q2 24 (20.7) 27 (23.1) 31 (26.5) 27 (23.3)Q3 32 (27.6) 36 (30.8) 36 (30.8) 32 (27.6)Q4 42 (36.2) 32 (27.4) 31 (26.5) 30 (25.9)
∗Mean ± SD.SD, standard deviation; 25(OH)D, 25-hydroxyvitamin D; CHF, congestive heart failure; MI, myocardial infarction; CABG, coronary artery bypass grafting;PCI, percutaneous coronary intervention; DM, diabetes mellitus; STEMI, ST-elevation myocardial infarction; TnT, troponin T; eGFR, estimated glomerularfiltration rate; CHD, coronary heart disease; BMI, body mass index; BNP, B-type natriuretic peptide; hsCRP, high sensitivity C-reactive protein.
patients with known 25(OH)D values died: 71 (68%) due to acardiac event, including 21 sudden cardiac deaths.
In the univariate quartile analysis of all-cause mortalityin the total population and in the TnT positive patientpopulation, theHRs for 25(OH)D in the highest quartile (Q4)as compared to the lowest quartile (Q1) were 0.61 (95% CI,0.37–1.00), 𝑃 = 0.050, and 0.59 (95% CI, 0.33–1.04), 𝑃 =0.067, respectively. No difference in HR was found between25(OH)D quartiles in the TnT negative population, nor for
cardiac death in the total and TnT positive population. Theresults remained statistically nonsignificant in the multi-variable analysis for all groups. The quartile univariate andmultivariable results are presented in Table 4.
In the univariate analysis of continuous 25(OH)D valuesin the total population, the HRs for total mortality andcardiac death were 0.99 (95% CI, 0.98–1.00), 𝑃 = 0.035,and 0.99 (95% CI, 0.98–1.00), 𝑃 = 0.060, respectively. In theunivariate analysis of the TnT positive population, the HRs

Disease Markers 5
Table 3: (a) Baseline characteristics of the female population arranged according to the quartiles of 25(OH)D. (b) Baseline characteristics ofthe male population arranged according to the quartiles of 25(OH)D.
(a)
Characteristics 𝑛 (%) Quartiles of 25(OH)D𝑃 value
Q1 Q2 Q3 Q425(OH)D (nmol/L)∗ 28.8 ± 5.6 43.2 ± 3.9 55.6 ± 3.4 76.1 ± 12.3 <0.00125(OH)D (ng/mL)∗ 11.5 ± 2.2 17.3 ± 1.6 22.2 ± 1.4 30.4 ± 4.9 <0.001Age, years∗ 75.5 ± 14.3 75.8 ± 12.9 75.0 ± 12.1 70.9 ± 12.8 0.058Smoking status, 𝑛 (%) 0.384Current smoker, 𝑛 (%) 18 (21.7) 14 (16.7) 10 (11.9) 17 (20.2)Past smoker, 𝑛 (%) 13 (15.7) 21 (25.0) 17 (20.2) 21 (25.0)Never smoked, 𝑛 (%) 52 (62.7) 49 (58.3) 57 (67.9) 46 (54.8)
Angina pectoris, 𝑛 (%) 44 (53.0) 45 (53.6) 39 (46.3) 39 (46.4) 0.663CHF, 𝑛 (%)Killip class 2–4 43 (51.8) 26 (31.0) 20 (23.8) 17 (20.2) <0.001
History of previous MI, 𝑛 (%) 30 (36.1) 25 (29.8) 25 (29.8) 22 (26.2) 0.567CABG, 𝑛 (%) 6 (7.2) 3 (3.6) 8 (9.5) 3 (3.6) 0.279PCI, 𝑛 (%) 1 (1.2) 2 (2.4) 7 (8.3) 8 (9.5) 0.035Hypertension, 𝑛 (%) 41 (49.4) 39 (46.4) 40 (47.6) 37 (44.4) 0.917History of DM 1, 𝑛 (%) 1 (1.2) 1 (1.2) 0 (0.0) 1 (1.2) 0.798History of DM 2, 𝑛 (%) 11 (13.3) 12 (14.3) 13 (15.5) 9 (10.7) 0.828STEMI, 𝑛 (%) 11 (13.3) 7 (8.3) 3 (3.6) 7 (8.3) 0.164TnT release, 𝑛 (%) 46 (55.4) 40 (47.6) 42 (50.0) 34 (40.5) 0.277eGFR (𝜇mol L−1)∗ 52.3 ± 18.4 54.9 ± 17.4 53.9 ± 17.8 58.9 ± 15.1 0.079Cholesterol/statin, 𝑛 (%) 43 (51.8) 46 (54.8) 45 (53.6) 45 (53.6) 0.985Beta-blocker, 𝑛 (%) 33 (39.8) 32 (38.1) 38 (45.2) 23 (27.4) 0.112Known CHD, 𝑛 (%) 59 (71.1) 56 (66.7) 56 (66.7) 50 (59.5) 0.465BMI (kg/m2)∗ 25.4 ± 4.8 25.5 ± 4.6 25.2 ± 5.2 24.9 ± 4.0 0.886BNP quartiles 0.094Q1 17 (20.7) 20 (25.0) 17 (21.5) 27 (33.8)Q2 19 (23.2) 23 (28.8) 20 (25.3) 19 (23.8)Q3 15 (18.3) 21 (26.3) 23 (29.1) 21 (26.3)Q4 31 (37.8) 16 (20.0) 19 (24.1) 13 (16.3)
hsCRP quartiles 0.995Q1 20 (24.1) 19 (22.6) 21 (25.0) 24 (28.6)Q2 21 (25.3) 20 (23.8) 22 (26.2) 20 (23.8)Q3 21 (25.3) 22 (26.2) 19 (22.6) 22 (26.2)Q4 21 (25.3) 23 (27.4) 22 (26.2) 18 (21.4)
∗Mean ± SD.SD, standard deviation; 25(OH)D, 25-hydroxyvitamin D; CHF, congestive heart failure; MI, myocardial infarction; CABG, coronary artery bypass grafting;PCI, percutaneous coronary intervention; DM, diabetes mellitus; STEMI, ST-elevation myocardial infarction; TnT, troponin T; eGFR, estimated glomerularfiltration rate; CHD, coronary heart disease; BMI, body mass index; BNP, B-type natriuretic peptide; hsCRP, high sensitivity C-reactive protein.
(b)
Characteristics 𝑛 (%) Quartiles of 25(OH)D𝑃 value
Q1 Q2 Q3 Q425(OH)D (nmol/L)∗ 31.7 ± 6.0 46.3 ± 3.0 57.4 ± 3.8 79.9 ± 13.7 <0.00125(OH)D (ng/mL)∗ 12.7 ± 2.4 18.5 ± 1.2 23.0 ± 1.5 32.0 ± 5.5 <0.001Age, years∗ 63.6 ± 15.3 66.0 ± 16.3 67.8 ± 12.9 68.6 ± 12.3 0.024Smoking status, 𝑛 (%) 0.211Current smoker, 𝑛 (%) 53 (40.5) 44 (33.6) 37 (28.0) 34 (26.0)Past smoker, 𝑛 (%) 53 (40.5) 58 (44.3) 67 (50.8) 63 (48.1)Never smoked, 𝑛 (%) 25 (19.1) 29 (22.1) 28 (21.2) 34 (26.0)

6 Disease Markers
(b) Continued.
Characteristics 𝑛 (%) Quartiles of 25(OH)D𝑃 value
Q1 Q2 Q3 Q4Angina pectoris, 𝑛 (%) 46 (35.1) 48 (36.6) 60 (45.5) 54 (41.2) 0.306CHF, 𝑛 (%)Killip Class 2–4 42 (32.1) 21 (16.0) 32 (24.2) 31 (23.7) 0.026
History of previous MI, 𝑛 (%) 50 (38.2) 46 (35.1) 45 (34.1) 44 (33.6) 0.867CABG, 𝑛 (%) 18 (13.7) 14 (10.7) 16 (12.1) 19 (14.5) 0.795PCI, 𝑛 (%) 19 (14.5) 17 (13.0) 18 (13.6) 15 (11.5) 0.903Hypertension, 𝑛 (%) 44 (33.6) 45 (34.4) 56 (42.4) 59 (45.0) 0.141History of DM 1, 𝑛 (%) 1 (0.8) 1 (0.8) 1 (0.8) 2 (1.5) 0.894History of DM 2, 𝑛 (%) 25 (19.1) 14 (10.7) 19 (14.4) 8 (6.1) 0.013STEMI, 𝑛 (%) 21 (16.0) 28 (21.4) 28 (21.2) 23 (17.6) 0.610TnT release, 𝑛 (%) 73 (55.7) 74 (56.5) 76 (57.6) 81 (61.8) 0.754eGFR (𝜇mol L−1)∗ 70.5 ± 21.7 67.0 ± 21.0 68.1 ± 20.6 65.8 ± 21.7 0.312Cholesterol/statin, 𝑛 (%) 57 (43.5) 62 (47.3) 65 (49.2) 61 (46.6) 0.826Beta-blocker, 𝑛 (%) 49 (37.4) 44 (33.6) 44 (33.3) 45 (34.4) 0.894Known CHD, 𝑛 (%) 80 (61.1) 77 (58.8) 85 (64.4) 79 (60.3) 0.817BMI (kg/m2)∗ 26.1 ± 3.9 26.6 ± 4.9 26.0 ± 3.4 25.0 ± 3.5 0.014BNP quartiles 0.545Q1 29 (23.4) 35 (27.3) 27 (21.1) 36 (29.5)Q2 30 (24.2) 30 (23.4) 39 (30.5) 27 (22.1)Q3 30 (24.2) 27 (21.1) 36 (28.1) 31 (25.4)Q4 35 (28.2) 36 (28.1) 26 (20.3) 28 (23.0)
hsCRP Quartiles 0.904Q1 30 (22.9) 33 (25.2) 32 (24.2) 36 (27.5)Q2 28 (21.4) 31 (23.7) 35 (26.5) 36 (27.5)Q3 37 (28.2) 34 (26.0) 35 (26.5) 27 (20.6)Q4 36 (27.5) 33 (25.2) 30 (22.7) 32 (24.4)
∗Mean ± SD.SD, standard deviation; 25(OH)D, 25-hydroxyvitamin D; CHF, congestive heart failure; MI, myocardial infarction; CABG, coronary artery bypass grafting;PCI, percutaneous coronary intervention; DM, diabetes mellitus; STEMI, ST-elevation myocardial infarction; TnT, troponin T; eGFR, estimated glomerularfiltration rate; CHD, coronary heart disease; BMI, body mass index; BNP, B-type natriuretic peptide; hsCRP, high sensitivity C-reactive protein.
for total mortality and cardiac death were 0.99 (95% CI,0.99–1.00), 𝑃 = 0.012, and 0.99 (95% CI, 0.98–1.00), 𝑃 =0.055, respectively. The remaining continuous univariate andmultivariable results are shown in Table 5.
3.2. 2-Year Gender Analysis. In the univariate quartile anal-ysis of total and cardiac mortality in the female population,the HRs for 25(OH)D in Q4 as compared to Q1 were 0.43(95% CI, 0.19–0.94), 𝑃 = 0.035, and 0.35 (95% CI, 0.13–0.98), 𝑃 = 0.046, respectively. No difference in the HRwas found between the 25(OH)D quartiles in males. The25(OH)D quartiles’ HRs for SCD were not significant ineither the univariate or multivariable models. The quartileunivariate and multivariable results are presented in Table 4.
In the univariate analysis of continuous 25(OH)D valuesin the female population, the HRs for total mortality andcardiac death were 0.98 (95% CI, 0.97–1.00), 𝑃 = 0.023,and 0.98 (95% CI, 0.97–1.00), 𝑃 = 0.044, respectively. Thecontinuous univariate andmultivariable results are presentedin Table 5.
3.3. 7-Year Follow-Up. At 7-year follow-up, data collectionwas restricted to total mortality. During this period 327 (180men and 147 women) patients had died. The Kaplan-Meiercurve for survival is shown in Figure 1. In the TnT positivegroup, 216 patients (46%) died, as shown in Figure 2.
In the univariate quartile analysis of all-cause mortalityin the total population and in the TnT positive patient popu-lation, the HRs for 25(OH)D in Q4 as compared to Q1 were0.66 (95% CI, 0.48–0.89), 𝑃 = 0.007, and 0.60 (95% CI, 0.41–0.87), 𝑃 = 0.008, respectively. No difference in mortality wasfound amongst the 25(OH)D quartiles in the TnT negativepopulation.The results were statistically nonsignificant in themultivariable analysis for all groups. The quartile univariateand multivariable results are presented in Table 4.
In the univariate analysis of continuous 25(OH)D valuesin the total population and in the TnT positive patientpopulation, the HRs for total mortality were 0.99 (95%CI, 0.99–1.00), 𝑃 = 0.026, and 0.99 (95% CI, 0.98–1.00),𝑃 = 0.002, respectively. The continuous univariate andmultivariable results are presented in Table 5.

Disease Markers 7
Table 4: The univariate and multivariable HRs (95% CI) for quartiles of 25(OH)D.
2-year follow-up 7-year follow-upUnivariate analysis Multivariable analysis∗ Univariate analysis Multivariable analysis∗
Total population
Total mortality 0.61 (0.37–1.00)𝑃 = 0.05
0.79 (0.45–1.40)𝑃 = 0.40
0.66 (0.48–0.89)𝑃 = 0.008
0.79 (0.57–1.09)𝑃 = 0.15
Cardiac death 0.70 (0.37–1.34)𝑃 = 0.29
0.83 (0.40–1.72)𝑃 = 0.61 NA NA
SCD 0.59 (0.14–2.44)𝑃 = 0.46
1.28 (0.26–6.37)𝑃 = 0.76 NA NA
TnT pos. population
Total mortality 0.59 (0.33–1.04)𝑃 = 0.07
0.82 (0.42–1.61)𝑃 = 0.56
0.60 (0.41–0.87)𝑃 = 0.008
0.74 (0.49–1.12)𝑃 = 0.15
Cardiac death 0.71 (0.36–1.41)𝑃 = 0.33
1.09 (0.49–2.42)𝑃 = 0.84 NA NA
SCD 0.58 (0.14–2.44)𝑃 = 0.46
1.52 (0.30–7.72)𝑃 = 0.61 NA NA
Females
Total mortality 0.43 (0.19–0.94)𝑃 = 0.035
0.65 (0.26–1.62)𝑃 = 0.36
0.51 (0.32–0.83)𝑃 = 0.006
0.64 (0.38–1.10)𝑃 = 0.09
Cardiac death 0.35 (0.13–0.98)𝑃 = 0.046
0.61 (0.19–2.00)𝑃 = 0.41 NA NA
SCD 0.0 (0.00-0.00)𝑃 = 0.96 NA NA NA
Males
Total mortality 0.85 (0.46–1.57)𝑃 = 0.61
0.81 (0.40–1.65)𝑃 = 0.56
0.82 (0.56–1.24)𝑃 = 0.36
0.73 (0.47–1.12)𝑃 = 0.15
Cardiac death 1.09 (0.46–2.56)𝑃 = 0.85
0.89 (0.32–2.46)𝑃 = 0.83 NA NA
SCD 0.99 (0.20–4.88)𝑃 = 0.99
1.92 (0.31–12.1)𝑃 = 0.49 NA NA
SCD, sudden cardiac death.∗Adjusted for gender, age, smoking, hypertension, index diagnosis, diabetes mellitus, CHF (defined by Killip-Kimball class at admission; patients in classes 2to 4 were classified as CHF patients and those in class 1 as non-CHF), history of previous CHD (i.e., history of either angina pectoris, myocardial infarction,percutaneous coronary intervention, or coronary artery bypass graft), hypercholesterolemia/use of statins, TnT >0.01 ng/mL, eGFR, hsCRP, BNP, body massindex (kg/m2), and beta-blockers prior to enrolment.
1.0
0.8
0.6
0.4
0.2
0.0
Cum
surv
ival
0 500 1000 1500 2000 2500 3000
Time to death (days)
Q4
Q2Q3
Q1
Figure 1: Kaplan-Meier plots for seven-year total mortality of25(OH)D quartiles in the total patient population.
0 500 1000 1500 2000 2500 3000
Time to death (days)
1.0
0.8
0.6
0.4
0.2
0.0
Cum
surv
ival Q4
Q2
Q3
Q1
Figure 2: Kaplan-Meier plots for seven-year total mortality of25(OH)D quartiles in the TnT positive patient population.
8 Disease Markers
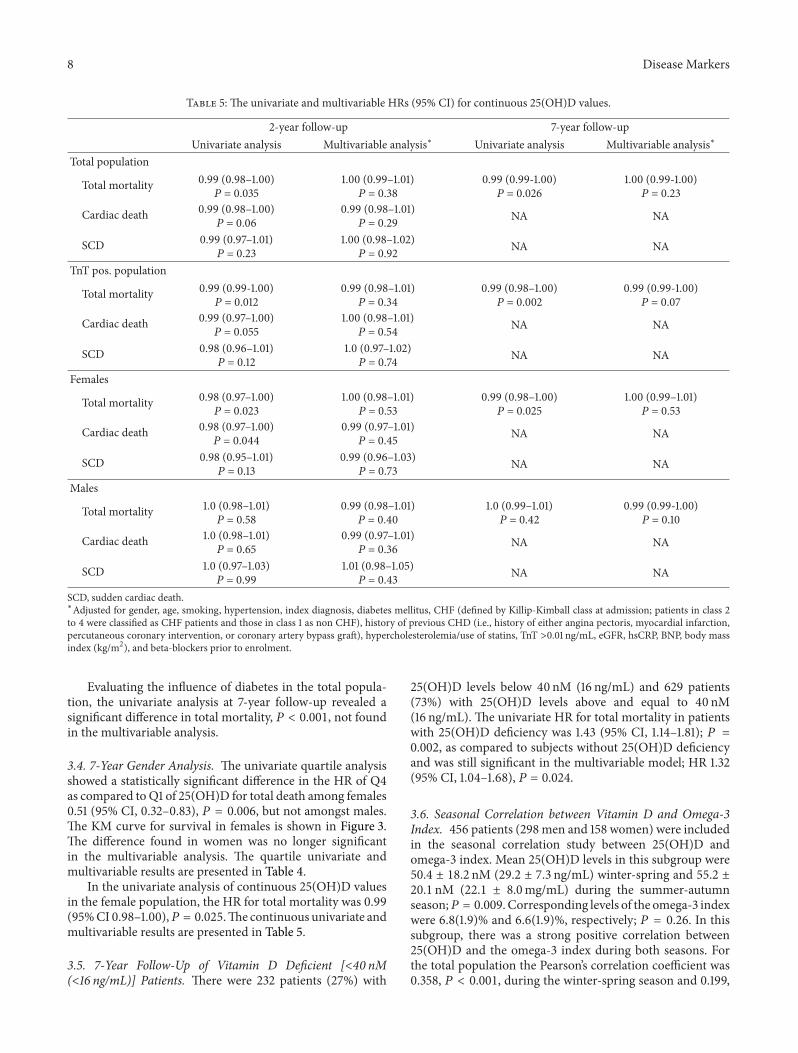
Table 5: The univariate and multivariable HRs (95% CI) for continuous 25(OH)D values.
2-year follow-up 7-year follow-upUnivariate analysis Multivariable analysis∗ Univariate analysis Multivariable analysis∗
Total population
Total mortality 0.99 (0.98–1.00)𝑃 = 0.035
1.00 (0.99–1.01)𝑃 = 0.38
0.99 (0.99-1.00)𝑃 = 0.026
1.00 (0.99-1.00)𝑃 = 0.23
Cardiac death 0.99 (0.98–1.00)𝑃 = 0.06
0.99 (0.98–1.01)𝑃 = 0.29 NA NA
SCD 0.99 (0.97–1.01)𝑃 = 0.23
1.00 (0.98–1.02)𝑃 = 0.92 NA NA
TnT pos. population
Total mortality 0.99 (0.99-1.00)𝑃 = 0.012
0.99 (0.98–1.01)𝑃 = 0.34
0.99 (0.98–1.00)𝑃 = 0.002
0.99 (0.99-1.00)𝑃 = 0.07
Cardiac death 0.99 (0.97–1.00)𝑃 = 0.055
1.00 (0.98–1.01)𝑃 = 0.54 NA NA
SCD 0.98 (0.96–1.01)𝑃 = 0.12
1.0 (0.97–1.02)𝑃 = 0.74 NA NA
Females
Total mortality 0.98 (0.97–1.00)𝑃 = 0.023
1.00 (0.98–1.01)𝑃 = 0.53
0.99 (0.98–1.00)𝑃 = 0.025
1.00 (0.99–1.01)𝑃 = 0.53
Cardiac death 0.98 (0.97–1.00)𝑃 = 0.044
0.99 (0.97–1.01)𝑃 = 0.45 NA NA
SCD 0.98 (0.95–1.01)𝑃 = 0.13
0.99 (0.96–1.03)𝑃 = 0.73 NA NA
Males
Total mortality 1.0 (0.98–1.01)𝑃 = 0.58
0.99 (0.98–1.01)𝑃 = 0.40
1.0 (0.99–1.01)𝑃 = 0.42
0.99 (0.99-1.00)𝑃 = 0.10
Cardiac death 1.0 (0.98–1.01)𝑃 = 0.65
0.99 (0.97–1.01)𝑃 = 0.36 NA NA
SCD 1.0 (0.97–1.03)𝑃 = 0.99
1.01 (0.98–1.05)𝑃 = 0.43 NA NA
SCD, sudden cardiac death.∗Adjusted for gender, age, smoking, hypertension, index diagnosis, diabetes mellitus, CHF (defined by Killip-Kimball class at admission; patients in class 2to 4 were classified as CHF patients and those in class 1 as non CHF), history of previous CHD (i.e., history of either angina pectoris, myocardial infarction,percutaneous coronary intervention, or coronary artery bypass graft), hypercholesterolemia/use of statins, TnT >0.01 ng/mL, eGFR, hsCRP, BNP, body massindex (kg/m2), and beta-blockers prior to enrolment.
Evaluating the influence of diabetes in the total popula-tion, the univariate analysis at 7-year follow-up revealed asignificant difference in total mortality, 𝑃 < 0.001, not foundin the multivariable analysis.
3.4. 7-Year Gender Analysis. The univariate quartile analysisshowed a statistically significant difference in the HR of Q4as compared to Q1 of 25(OH)D for total death among females0.51 (95% CI, 0.32–0.83), 𝑃 = 0.006, but not amongst males.The KM curve for survival in females is shown in Figure 3.The difference found in women was no longer significantin the multivariable analysis. The quartile univariate andmultivariable results are presented in Table 4.
In the univariate analysis of continuous 25(OH)D valuesin the female population, the HR for total mortality was 0.99(95%CI 0.98–1.00),𝑃 = 0.025.The continuous univariate andmultivariable results are presented in Table 5.
3.5. 7-Year Follow-Up of Vitamin D Deficient [<40 nM(<16 ng/mL)] Patients. There were 232 patients (27%) with
25(OH)D levels below 40 nM (16 ng/mL) and 629 patients(73%) with 25(OH)D levels above and equal to 40 nM(16 ng/mL). The univariate HR for total mortality in patientswith 25(OH)D deficiency was 1.43 (95% CI, 1.14–1.81); 𝑃 =0.002, as compared to subjects without 25(OH)D deficiencyand was still significant in the multivariable model; HR 1.32(95% CI, 1.04–1.68), 𝑃 = 0.024.
3.6. Seasonal Correlation between Vitamin D and Omega-3Index. 456 patients (298 men and 158 women) were includedin the seasonal correlation study between 25(OH)D andomega-3 index. Mean 25(OH)D levels in this subgroup were50.4 ± 18.2 nM (29.2 ± 7.3 ng/mL) winter-spring and 55.2 ±20.1 nM (22.1 ± 8.0mg/mL) during the summer-autumnseason;𝑃 = 0.009. Corresponding levels of the omega-3 indexwere 6.8(1.9)% and 6.6(1.9)%, respectively; 𝑃 = 0.26. In thissubgroup, there was a strong positive correlation between25(OH)D and the omega-3 index during both seasons. Forthe total population the Pearson’s correlation coefficient was0.358, 𝑃 < 0.001, during the winter-spring season and 0.199,

Disease Markers 9
0 500 1000 1500 2000 2500 3000
Time to death (days)
1.0
0.8
0.6
0.4
0.2
0.0
Cum
surv
ival
Q4
Q2Q3
Q1
Figure 3: Kaplan-Meier plots for seven-year total mortality of25(OH)D quartiles in females.
𝑃 = 0.006, during the summer-autumn period, respectively.The Pearson’s seasonal correlation coefficient for females was0.380, 𝑃 < 0.001 and 0.183 𝑃 = 0.16, respectively, and formales 0.347, 𝑃 < 0.001 and 0.205, 𝑃 = 0.022, respectively.
4. Discussion
Our chest pain population was recruited from the southwest-ern coast of Norway, at a latitude of 58∘N. At this latitude,the production of cutaneous vitamin D is low in the wintermonths during which vitamin D levels depend on othersources, mainly fish intake.
We divided the population into quartiles of vitamin Dlevels, comparing the higher quartiles to the lowest quartile,and performed univariate and multivariable analyses ofmortality at 2- and 7-year follow-up.
In the univariate quartile analysis at 2-year follow-up ofthe total and TnT positive patient population we observeda trend towards decreased total and cardiac mortality in theupper as compared to the lower quartile of vitamin D. Thesetrends approached significant values when applying contin-uous vitamin D data in the univariate analysis (Table 5). Inthe female population, the reduction in total and cardiacmortality reached statistical significance by both quartile andcontinuous univariate analysis.
At 7-year follow-up, both statistical approaches yieldedsignificant results in the univariate analysis, with reducedtotal and cardiacmortality associatedwith increasing vitaminD levels in the total and TnT positive population, as well as inthe female population, respectively. These and other 7-yearfollow-up data are shown in Table 5.
These associations were not present after adjusting forconfounding variables in ourmultivariablemodel. In contrastto studies in which multivariable models have demonstrateda U-shape or reverse J-shape mortality curve across quintiles[4] and quartiles [5] of vitamin D, the statistically nonsignif-icant results in our multivariable quartile analysis precludeda similar evaluation. However, the univariate quartile hazardratios in our ACS population showed a similar pattern to that
of the above studies [4, 5], in which subjects were enrolledfrom a general elderly population, with the highest age (>75years) in the study by Jia et al. [4] as compared to 69.6 ± 14.4years in our study. In general, the vitamin D values in ourpatients were higher than in the two other studies, with thelowest quartile in our study comparable to that of secondand third quintiles in the study by Jia et al. [4] and to thesecond quartile in the study by Visser et al. [5]. Furthermore,less interquartile differences in morbidity and mortality inour study may be related to a tighter range of vitamin Dvalues.
In a previous report from our group we obtained moredefinitive results investigating a population in NorthernArgentina located at a latitude of 24∘ and at an altitudemore than 1000m above sea level. In the latter population,the prognostic utility of vitamin D in the female populationremained highly significant after correcting for confoundingfactors, which statistically may be due to a larger proportionof females and more events in this subgroup. Similar resultshave been obtained in a German study by Karakas et al. [22].However, in that study they included 1783 healthy middle-aged subjects of both gender with a follow-up of elevenyears during which they identified 298 combined CHD cases,whereas we investigated total and cardiac death in chest painpatients with suspected ACS.
In our Norwegian as compared to our Argentinean study[16] levels of vitamin D were similar in the lowest quartile(30.5 ± 5.9 nM versus 30.7 ± 5.6 nM) of the total populations.Levels were also similar in Q2 andQ3, but higher in Q4 in theNorwegian population (78.6±13.2 nMversus 72.9±11.1 nM).This was an unexpected finding, as the geographic locationsare different with respect to sun exposure.
We have previously [23] published data suggesting thatvitamin D status may be related to socioeconomic factors,implying that low vitamin D levels in that setting maybehave as a secondary risk marker. In our present populationthe quartile levels of vitamin D were clearly related to thedifference in dietary capture of vitamin D, as demonstratedby a monotonic increase in omega-3 values from lowest tohighest quartile of vitamin D, as shown in Table 2.
Based on our observational data, reduced vitamin Dlevels may not only be regarded as a marker of morbidity inwomen as compared to men but may also reflect a genderdifference in serumvitaminDconcentration.Themechanismfor this difference is not obvious, although a female hormonalinteraction has been noted, with levels of vitamin D andprogesterone/estrogen being inversely correlated [24].
Optimal levels of 25(OH)Dare still under debate. Accord-ing to Ross et al. [20], levels of at least 50 nM will meet theneeds of at least 97.5% of the population, whereas the medianvitamin D concentration in the general population will beabove 40 nM. In the present study, we have investigatedthe significance of vitamin D levels < 40 nM in relation tooutcome. Below 40 nM (16 ng/mL), vitamin D behaved as anindependent predictor for total death both in the univariateand multivariable analysis. As vitamin D deficiency wasfound to be an independent risk factor at levels below 40 nM,higher levels may reflect an overall healthier lifestyle andmaynot in themselves be causally related to outcome.

10 Disease Markers
In a subpopulation consisting of TnT positive patients,the correlation between vitamin D and the omega-3 index,including EPA and DHA, was higher during winter-spring(𝑟 = 0.358, 𝑃 < 0.001) as compared to the summer-autumnseason (𝑟 = 0.199, 𝑃 = 0.006). As the omega-3 index wassimilar in both seasons, this finding may be explained byan increased utilization of vitamin D in the diet during thewinter season, and the lower correlation during the summerseason may be due to the increased levels of cutaneousvitamin D production. Our results are in accordance with arecent publication in which the authors compared levels ofvitaminDobtained from sun exposure versus diet at the samealtitude as in the present study [25].
The association between vitamin D and omega-3, espe-cially during the winter-spring season, is of interest, as thediet may be the main source of vitamin D during this period.Furthermore, the correlation was strongest in women inwhom vitamin D showed less seasonal variation. Thus, dueto its prognostic implication, vitamin D may be involved inthe beneficial effects of fish intake. Therefore, the naturalpresence of vitamin D in dietary studies, such as in DART[26] and in the long-term follow-up study by Kromhoutet al. [27], may have beneficially affected outcome in thesestudies, as reflected by the stepwise increase in the omega-3index from lowest to highest quartile of vitamin D in thepresent study. Although reduction in mortality was noted inthe omega-3 arm of the GISSI studies [28, 29], some of theother megatrials also applying a purified omega-3 compoundhave not shown a reduction in mortality, as noted in a meta-analysis by Kwak et al. [30], involving 20485 patients with ahistory of cardiovascular disease from 14 randomized, doubleblind, and placebo controlled studies.
The addition of vitamin D to a purified omega-3 com-pound is being investigated in the VITAL study (ClinicalTri-als.gov Identifier: NCT01169259).
Strengths and Limitations. In comparison to other observa-tional studies enrolling subjects from a general population,the novelty in this study is related to (1) selection of achest pain population with suspected ACS, (2) blood samplesobtained at hospital admission, and (3) categorization ofsubjects with and without myocardial injury. In contrastto many other studies, we have focused not only on totalmortality but also on cardiac death in our selected highrisk population. The strength of our study is mainly relatedto the long-term follow-up and the proportion of femalesaccounting for 39% of the patients. Furthermore, its designis similar to that of our previously published Argentineanreport based on admitted chest pain patients with suspectedACS [16], enabling a comparison of western lifestyle andtraditions to that of a South-American population with othertraditions and dietary habits. A larger number of patientsmayhave contributed to more consistent findings in our Argen-tinean population. However, as power calculations are notapplicable in observational studies, this should be regardedas a limitation. Also, we did not correct for parathyroidhormone (PTH), but we do not regard this to be of greatimportance, as previous data would indicate that only verylow values of vitamin D will influence the level of PTH [31].
As this is an observational study, unknown confounders mayhave been missed.
In conclusion, at long-term follow-up the univariate anal-ysis demonstrated a statistically significant lower mortality inthe highest as compared to the lowest quartile of vitaminD inchest pain patients with suspected ACS, especially in females.Vitamin D was independently related to mortality at levelsbelow the population median. An increase in the omega-3index was noted from lowest to highest quartile of vitamin Dand there was a stronger correlation between vitamin D andthe omega-3 index during winter-spring as compared to thesummer-autumn season.
Conflict of Interests
The analyses of the omega-3 index were performed byWilliam S. Harris who is the President of OmegaQuantAnalytics, LLC, and a Senior Research Scientist at HealthDiagnostic Laboratory, Inc. Both of these laboratories offeromega-3 index testing, the former for researchers/consumersand the latter for clinicians.He is also a consultant toOmtheraPharmaceuticals and Aker Biomarine, companies with inter-ests in omega-3 fatty acids.
References
[1] V. Kunadian, G. A. Ford, B. Bawamia,W. Qiu, and J. E. Manson,“Vitamin D deficiency and coronary artery disease: a review ofthe evidence,” American Heart Journal, vol. 167, no. 3, pp. 283–291, 2014.
[2] P. E. Marik and J. Varon, “Omega-3 dietary supplements andthe risk of cardiovascular events: a systematic review,” ClinicalCardiology, vol. 32, no. 7, pp. 365–372, 2009.
[3] K. Kienreich, A. Tomaschitz, N. Verheyen et al., “VitaminD andcardiovascular disease,” Nutrients, vol. 5, no. 8, pp. 3005–3021,2013.
[4] X. Jia, L. S. Aucott, and G. McNeill, “Nutritional status andsubsequent all-causemortality inmen andwomen aged 75 yearsor over living in the community,” British Journal of Nutrition,vol. 98, no. 3, pp. 593–599, 2007.
[5] M. Visser, D. J. H. Deeg, M. T. E. Puts, J. C. Seidell, and P. Lips,“Low serum concentrations of 25-hydroxyvitamin D in olderpersons and the risk of nursing home admission,”TheAmericanJournal of Clinical Nutrition, vol. 84, no. 3, pp. 616–622, 2006.
[6] T. J. Wang, M. J. Pencina, S. L. Booth et al., “Vitamin Ddeficiency and risk of cardiovascular disease,” Circulation, vol.117, no. 4, pp. 503–511, 2008.
[7] H. Aarsetoey, H. Grundt, O. Nygaard, and D.W. T. Nilsen, “Therole of long-chained marine N-3 polyunsaturated fatty acids incardiovascular disease,” Cardiology Research and Practice, vol.2012, Article ID 303456, 15 pages, 2012.
[8] D. Mozaffarian and J. H. Y. Wu, “Omega-3 fatty acids andcardiovascular disease: effects on risk factors, molecular path-ways, and clinical events,” Journal of the American College ofCardiology, vol. 58, no. 20, pp. 2047–2067, 2011.
[9] W. S. Harris and C. von Schacky, “The Omega-3 Index: a newrisk factor for death from coronary heart disease?” PreventiveMedicine, vol. 39, no. 1, pp. 212–220, 2004.
[10] M. F.Holick, “VitaminD: evolutionary, physiological andhealthperspectives,” Current Drug Targets, vol. 12, no. 1, pp. 4–18, 2011.

Disease Markers 11
[11] A. Mithal, D. A. Wahl, J.-P. Bonjour et al., “Global vitamin Dstatus and determinants of hypovitaminosis D,” OsteoporosisInternational, vol. 20, no. 11, pp. 1807–1820, 2009.
[12] M. F. Holick, “Vitamin D: a D-lightful solution for health,”Journal of InvestigativeMedicine, vol. 59, no. 6, pp. 872–880, 2011.
[13] T. J. Wang, M. J. Pencina, S. L. Booth et al., “Vitamin Ddeficiency and risk of cardiovascular disease,” Circulation, vol.117, no. 4, pp. 503–511, 2008.
[14] H. Dobnig, S. Pilz, H. Scharnagl et al., “Independent associationof low serum 25-hydroxyvitamin D and 1,25-dihydroxyvitaminD levels with all-cause and cardiovascular mortality,” Archivesof Internal Medicine, vol. 168, no. 12, pp. 1340–1349, 2008.
[15] S. Pilz, W. Marz, B. Wellnitz et al., “Association of vitaminD deficiency with heart failure and sudden cardiac death ina large cross-sectional study of patients referred for coronaryangiography,” Journal of Clinical Endocrinology andMetabolism,vol. 93, no. 10, pp. 3927–3935, 2008.
[16] P. A. Naesgaard, R. A. Leon de la Fuente, S. T. Nilsen et al.,“Serum 25(OH)D is a 2-year predictor of all-cause mortality,cardiac death and sudden cardiac death in chest pain patientsfrom Northern Argentina,” PLoS ONE, vol. 7, no. 9, Article IDe43228, 2012.
[17] P. A.Naesgaard, R. A. L. de la Fuente, S. T. Nilsen et al., “VitaminD predicts all-cause and cardiac mortality in females withsuspected acute coronary syndrome: a comparison with brainnatriuretic peptide and high-sensitivity c-reactive protein,”Cardiology Research and Practice, vol. 2013, Article ID 398034,8 pages, 2013.
[18] V. Ponitz, T. Brugger-Andersen, D. Pritchard, H. Grundt, H.Staines, and D. W. T. Nilsen, “Activated factor XII type Apredicts long-term mortality in patients admitted with chestpain,” Journal of Thrombosis and Haemostasis, vol. 7, no. 2, pp.277–287, 2009.
[19] H. Aarsetoey, V. Ponitz, H. Grundt, H. Staines, W. S. Harris,and D. W. T. Nilsen, “(n-3) fatty acid content of red blood cellsdoes not predict risk of future cardiovascular events followingan acute coronary syndrome,”The Journal of Nutrition, vol. 139,no. 3, pp. 507–513, 2009.
[20] A. C. Ross, J. E. Manson, S. A. Abrams et al., “The 2011 reporton dietary reference intakes for calcium and vitaminD from theInstitute of Medicine: what clinicians need to know,” Journal ofClinical Endocrinology andMetabolism, vol. 96, no. 1, pp. 53–58,2011.
[21] M. Muller-Bardorff, K. Hallermayer, A. Schroder et al.,“Improved troponin T ELISA specific for cardiac troponin Tisoform: assay development and analytical and clinical valida-tion,” Clinical Chemistry, vol. 43, no. 3, pp. 458–466, 1997.
[22] M. Karakas, B. Thorand, A. Zierer et al., “Low levels of serum25-hydroxyvitamin D are associated with increased risk ofmyocardial infarction, especially in women: results from theMONICA/KORA Augsburg case-cohort study,” The Journal ofClinical Endocrinology and Metabolism, vol. 98, no. 1, pp. 272–280, 2013.
[23] R. A. Leon de la Fuente, P. A. Naesgaard, S. T. Nilsen et al.,“Socioeconomic assessment and impact of social security onoutcome in patients admitted with suspected coronary chestpain in the city of Salta, Argentina,” Cardiology Research andPractice, vol. 2013, Article ID 807249, 9 pages, 2013.
[24] J. A. Knight, J. Wong, K. M. Blackmore, J. M. Raboud, and R.Vieth, “Vitamin D association with estradiol and progesteronein young women,” Cancer Causes and Control, vol. 21, no. 3, pp.479–483, 2010.
[25] Z. Lagunova, A. C. Porojnicu, L. Aksnes et al., “Effect of vitaminD supplementation and ultraviolet B exposure on serum 25-hydroxyvitamin D concentrations in healthy volunteers: arandomized, crossover clinical trial,” British Journal of Derma-tology, vol. 169, no. 2, pp. 434–440, 2013.
[26] M. L. Burr, A. M. Fehily, J. F. Gilbert et al., “Effects of changes infat, fish, and fibre intakes on death andmyocardial reinfarction:diet and reinfarction trial (DART),”The Lancet, vol. 2, no. 8666,pp. 757–761, 1989.
[27] D. Kromhout, E. B. Bosschieter, and C. De Lezenne Coulander,“The inverse relation between fish consumption and 20-yearmortality from coronary heart disease,” The New EnglandJournal of Medicine, vol. 312, no. 19, pp. 1205–1209, 1985.
[28] R. Marchioli, “Dietary supplementation with N-3 polyunsat-urated fatty acids and vitamin E after myocardial infarction:results of the GISSI-Prevenzione trial,”The Lancet, vol. 354, no.9177, pp. 447–455, 1999.
[29] GISSI-HF Investigators, “Effect of n-3 polyunsaturated fattyacids in patients with chronic heart failure (the GISSI-HFtrial): a randomised, double-blind, placebo-controlled trial,”The Lancet, vol. 372, no. 9645, pp. 1223–1230, 2008.
[30] S. M. Kwak, S.-K. Myung, Y. J. Lee, and H. G. Seo, “Efficacyof omega-3 fatty acid supplements (eicosapentaenoic acid anddocosahexaenoic acid) in the secondary prevention of cardio-vascular disease: a meta-analysis of randomized, double-blind,placebo-controlled trials,”Archives of InternalMedicine, vol. 172,no. 9, pp. 686–694, 2012.
[31] L. Steingrimsdottir, O. Gunnarsson, O. S. Indridason, L. Franz-son, and G. Sigurdsson, “Relationship between serum parathy-roid hormone levels, vitaminD sufficiency, and calcium intake,”Journal of the AmericanMedical Association, vol. 294, no. 18, pp.2336–2341, 2005.