Production of greenhouse gas free hydrogen by thermocatalytic decomposition of methane – A review
36
Production of greenhouse gas free hydrogen by thermocatalytic decomposition of methane – A review U.P.M. Ashik a , W.M.A. Wan Daud a,n , Hazzim F. Abbas b a Department of Chemical Engineering, University of Malaya, 50603 Kuala Lumpur, Malaysia b Department of Chemical Engineering, University of Nizwa, Al Dakulaya, Oman article info Article history: Received 10 June 2014 Received in revised form 1 December 2014 Accepted 12 December 2014 Keywords: Catalytic methane decomposition Hydrogen production Metal-carbon catalysts Methane co-feeding Hydrogen separation membrane abstract Thermocatalytic decomposition of methane (TCD) is a fully green single step technology for producing hydrogen and nano-carbon. This review studying all development in laboratory-scale research on TCD, especially the recent advances like co-feeding effect and catalyst regeneration for augmenting the productivity of the whole process. Although a great success on the laboratory-scale has been fulfilled, TCD for greenhouse gas (GHG) free hydrogen production is still in its infancy. The need for commercialization of TCD is greater than ever in the present situation of huge GHG emission. TCD usually examined over various kind of catalysts, such as monometallic, bimetallic, trimetallic, combina- tion of metal–metal oxide, carbonaceous and/or metal doped carbon catalysts. Deactivation of catalysts is the prime drawback found in TCD process. Catalyst regeneration and co-feeding of methane with other hydrocarbon are the two solutions put forwarded in accordance to overcome deactivation hurdle. Higher amount of co-feed hydrocarbon in situ produce more amount of highly active carbonaceous deposits which assist further methane decomposition to produce additional hydrogen to a great extent. The methane conversion rate increases with increase in the temperature and decreases with the flow rate in the co-feeding process in a similar manner as observed in normal TCD. The presence of co-components in the post-reaction stream is a key challenge tackled in the co-feeding and regeneration. Hence, this review hypothesizing the integration of hydrogen separation membrane in to methane decomposition reactor for online hydrogen separation. & 2014 Elsevier Ltd. All rights reserved. Contents 1. Introduction ........................................................................................................ 222 2. Thermocatalytic decomposition of methane .............................................................................. 223 2.1. Metal catalysts ................................................................................................ 224 2.1.1. Non-supported catalysts ................................................................................. 224 2.1.2. Metal supported catalysts ................................................................................ 225 2.1.3. Metal oxide supported catalysts ........................................................................... 225 2.1.4. Ceramic and red-mud based catalyst ....................................................................... 225 2.1.5. Thin layer catalysts ..................................................................................... 226 2.1.6. Influence of parameters on activity ........................................................................ 226 2.1.7. Catalytic deactivation.................................................................................... 230 2.2. Carbonaceous catalysts ......................................................................................... 231 2.2.1. Carbon catalytic activity boost by metal doping .............................................................. 233 2.2.2. Influence of parameters on activity ........................................................................ 234 2.2.3. Catalytic deactivation.................................................................................... 237 Contents lists available at ScienceDirect journal homepage: www.elsevier.com/locate/rser Renewable and Sustainable Energy Reviews http://dx.doi.org/10.1016/j.rser.2014.12.025 1364-0321/& 2014 Elsevier Ltd. All rights reserved. Abbreviations: TCD, thermocatalytic decomposition of methane; SRM, steam reforming of methane; POX, partial oxidation; DRM, dry reforming of methane; GHG, green- house gas; CNF, carbon nano-fibers; MSI, metal–support interaction; GHSV, gas hourly space velocity; TLC, thin layer catalysts; AC, activated carbon; CB, carbon black; ACPS, activated carbon from palm shell; CNT, carbon nano tube; NCB, nano-sized carbon black; CNF, carbon nano fiber; MWNT, multiwalled nanotube; CLR, coal liquefaction residue; HES, high-energy sites; HPC, hierarchical porous carbon; OSG, oxygen surface group; OCM, oxidative coupling of methane; DFT, density functional theory n Corresponding author. Tel.: þ60 105023818; fax: þ60 379675319. E-mail addresses: [email protected] (U.P.M. Ashik), [email protected] (W.M.A. Wan Daud), [email protected] (H.F. Abbas). Renewable and Sustainable Energy Reviews 44 (2015) 221–256
-
Upload
independent -
Category
Documents
-
view
1 -
download
0
Transcript of Production of greenhouse gas free hydrogen by thermocatalytic decomposition of methane – A review
Production of greenhouse gas free hydrogen by thermocatalyticdecomposition of methane – A review
U.P.M. Ashik a, W.M.A. Wan Daud a,n, Hazzim F. Abbas b
a Department of Chemical Engineering, University of Malaya, 50603 Kuala Lumpur, Malaysiab Department of Chemical Engineering, University of Nizwa, Al Dakulaya, Oman
a r t i c l e i n f o
Article history:Received 10 June 2014Received in revised form1 December 2014Accepted 12 December 2014
Keywords:Catalytic methane decompositionHydrogen productionMetal-carbon catalystsMethane co-feedingHydrogen separation membrane
a b s t r a c t
Thermocatalytic decomposition of methane (TCD) is a fully green single step technology for producinghydrogen and nano-carbon. This review studying all development in laboratory-scale research on TCD,especially the recent advances like co-feeding effect and catalyst regeneration for augmenting theproductivity of the whole process. Although a great success on the laboratory-scale has been fulfilled,TCD for greenhouse gas (GHG) free hydrogen production is still in its infancy. The need forcommercialization of TCD is greater than ever in the present situation of huge GHG emission. TCDusually examined over various kind of catalysts, such as monometallic, bimetallic, trimetallic, combina-tion of metal–metal oxide, carbonaceous and/or metal doped carbon catalysts. Deactivation of catalystsis the prime drawback found in TCD process. Catalyst regeneration and co-feeding of methane with otherhydrocarbon are the two solutions put forwarded in accordance to overcome deactivation hurdle. Higheramount of co-feed hydrocarbon in situ produce more amount of highly active carbonaceous depositswhich assist further methane decomposition to produce additional hydrogen to a great extent. Themethane conversion rate increases with increase in the temperature and decreases with the flow rate inthe co-feeding process in a similar manner as observed in normal TCD. The presence of co-componentsin the post-reaction stream is a key challenge tackled in the co-feeding and regeneration. Hence, thisreview hypothesizing the integration of hydrogen separation membrane in to methane decompositionreactor for online hydrogen separation.
& 2014 Elsevier Ltd. All rights reserved.
Contents
1. Introduction . . . . . . . . . . . . . . . . . . . . . . . . . . . . . . . . . . . . . . . . . . . . . . . . . . . . . . . . . . . . . . . . . . . . . . . . . . . . . . . . . . . . . . . . . . . . . . . . . . . . . . . . 2222. Thermocatalytic decomposition of methane . . . . . . . . . . . . . . . . . . . . . . . . . . . . . . . . . . . . . . . . . . . . . . . . . . . . . . . . . . . . . . . . . . . . . . . . . . . . . . 223
2.1. Metal catalysts . . . . . . . . . . . . . . . . . . . . . . . . . . . . . . . . . . . . . . . . . . . . . . . . . . . . . . . . . . . . . . . . . . . . . . . . . . . . . . . . . . . . . . . . . . . . . . . . 2242.1.1. Non-supported catalysts . . . . . . . . . . . . . . . . . . . . . . . . . . . . . . . . . . . . . . . . . . . . . . . . . . . . . . . . . . . . . . . . . . . . . . . . . . . . . . . . . 2242.1.2. Metal supported catalysts . . . . . . . . . . . . . . . . . . . . . . . . . . . . . . . . . . . . . . . . . . . . . . . . . . . . . . . . . . . . . . . . . . . . . . . . . . . . . . . . 2252.1.3. Metal oxide supported catalysts . . . . . . . . . . . . . . . . . . . . . . . . . . . . . . . . . . . . . . . . . . . . . . . . . . . . . . . . . . . . . . . . . . . . . . . . . . . 2252.1.4. Ceramic and red-mud based catalyst . . . . . . . . . . . . . . . . . . . . . . . . . . . . . . . . . . . . . . . . . . . . . . . . . . . . . . . . . . . . . . . . . . . . . . . 2252.1.5. Thin layer catalysts . . . . . . . . . . . . . . . . . . . . . . . . . . . . . . . . . . . . . . . . . . . . . . . . . . . . . . . . . . . . . . . . . . . . . . . . . . . . . . . . . . . . . 2262.1.6. Influence of parameters on activity . . . . . . . . . . . . . . . . . . . . . . . . . . . . . . . . . . . . . . . . . . . . . . . . . . . . . . . . . . . . . . . . . . . . . . . . 2262.1.7. Catalytic deactivation. . . . . . . . . . . . . . . . . . . . . . . . . . . . . . . . . . . . . . . . . . . . . . . . . . . . . . . . . . . . . . . . . . . . . . . . . . . . . . . . . . . . 230
2.2. Carbonaceous catalysts . . . . . . . . . . . . . . . . . . . . . . . . . . . . . . . . . . . . . . . . . . . . . . . . . . . . . . . . . . . . . . . . . . . . . . . . . . . . . . . . . . . . . . . . . 2312.2.1. Carbon catalytic activity boost by metal doping . . . . . . . . . . . . . . . . . . . . . . . . . . . . . . . . . . . . . . . . . . . . . . . . . . . . . . . . . . . . . . 2332.2.2. Influence of parameters on activity . . . . . . . . . . . . . . . . . . . . . . . . . . . . . . . . . . . . . . . . . . . . . . . . . . . . . . . . . . . . . . . . . . . . . . . . 2342.2.3. Catalytic deactivation. . . . . . . . . . . . . . . . . . . . . . . . . . . . . . . . . . . . . . . . . . . . . . . . . . . . . . . . . . . . . . . . . . . . . . . . . . . . . . . . . . . . 237
Contents lists available at ScienceDirect
journal homepage: www.elsevier.com/locate/rser
Renewable and Sustainable Energy Reviews
http://dx.doi.org/10.1016/j.rser.2014.12.0251364-0321/& 2014 Elsevier Ltd. All rights reserved.
Abbreviations: TCD, thermocatalytic decomposition of methane; SRM, steam reforming of methane; POX, partial oxidation; DRM, dry reforming of methane; GHG, green-house gas; CNF, carbon nano-fibers; MSI, metal–support interaction; GHSV, gas hourly space velocity; TLC, thin layer catalysts; AC, activated carbon; CB, carbon black; ACPS,activated carbon from palm shell; CNT, carbon nano tube; NCB, nano-sized carbon black; CNF, carbon nano fiber; MWNT, multiwalled nanotube; CLR, coal liquefactionresidue; HES, high-energy sites; HPC, hierarchical porous carbon; OSG, oxygen surface group; OCM, oxidative coupling of methane; DFT, density functional theory
n Corresponding author. Tel.: þ60 105023818; fax: þ60 379675319.E-mail addresses: [email protected] (U.P.M. Ashik), [email protected] (W.M.A. Wan Daud), [email protected] (H.F. Abbas).
Renewable and Sustainable Energy Reviews 44 (2015) 221–256
upm ashik
Text Box
Post-print version: Please cite this article as "Ashik UPM, Wan Daud WMA, Abbas HF. Production of greenhouse gas free hydrogen by thermocatalytic decomposition of methane – A review. Renew Sustain Energy Rev. 2015;44:221-56." - http://dx.doi.org/10.1016/j.rser.2014.12.025
3. Comparison between metal and carbonaceous catalysts . . . . . . . . . . . . . . . . . . . . . . . . . . . . . . . . . . . . . . . . . . . . . . . . . . . . . . . . . . . . . . . . . . . . . 2374. Co-feeding: a promising method for enhancing catalyst stability. . . . . . . . . . . . . . . . . . . . . . . . . . . . . . . . . . . . . . . . . . . . . . . . . . . . . . . . . . . . . . 238
4.1. Alkanes as co-feed . . . . . . . . . . . . . . . . . . . . . . . . . . . . . . . . . . . . . . . . . . . . . . . . . . . . . . . . . . . . . . . . . . . . . . . . . . . . . . . . . . . . . . . . . . . . . 2384.2. Ethylene as co-feed . . . . . . . . . . . . . . . . . . . . . . . . . . . . . . . . . . . . . . . . . . . . . . . . . . . . . . . . . . . . . . . . . . . . . . . . . . . . . . . . . . . . . . . . . . . . 2414.3. Ethanol as co-feed . . . . . . . . . . . . . . . . . . . . . . . . . . . . . . . . . . . . . . . . . . . . . . . . . . . . . . . . . . . . . . . . . . . . . . . . . . . . . . . . . . . . . . . . . . . . . 2414.4. Propylene as co-feed . . . . . . . . . . . . . . . . . . . . . . . . . . . . . . . . . . . . . . . . . . . . . . . . . . . . . . . . . . . . . . . . . . . . . . . . . . . . . . . . . . . . . . . . . . . 2444.5. CO2 as co-feed . . . . . . . . . . . . . . . . . . . . . . . . . . . . . . . . . . . . . . . . . . . . . . . . . . . . . . . . . . . . . . . . . . . . . . . . . . . . . . . . . . . . . . . . . . . . . . . . 2444.6. H2S as co-feed . . . . . . . . . . . . . . . . . . . . . . . . . . . . . . . . . . . . . . . . . . . . . . . . . . . . . . . . . . . . . . . . . . . . . . . . . . . . . . . . . . . . . . . . . . . . . . . . 245
5. Catalyst regeneration. . . . . . . . . . . . . . . . . . . . . . . . . . . . . . . . . . . . . . . . . . . . . . . . . . . . . . . . . . . . . . . . . . . . . . . . . . . . . . . . . . . . . . . . . . . . . . . . . 2455.1. Gasification . . . . . . . . . . . . . . . . . . . . . . . . . . . . . . . . . . . . . . . . . . . . . . . . . . . . . . . . . . . . . . . . . . . . . . . . . . . . . . . . . . . . . . . . . . . . . . . . . . 2465.2. Combustion . . . . . . . . . . . . . . . . . . . . . . . . . . . . . . . . . . . . . . . . . . . . . . . . . . . . . . . . . . . . . . . . . . . . . . . . . . . . . . . . . . . . . . . . . . . . . . . . . . 2495.3. Partial regeneration . . . . . . . . . . . . . . . . . . . . . . . . . . . . . . . . . . . . . . . . . . . . . . . . . . . . . . . . . . . . . . . . . . . . . . . . . . . . . . . . . . . . . . . . . . . . 250
6. Separation of pure hydrogen: a hypothesis . . . . . . . . . . . . . . . . . . . . . . . . . . . . . . . . . . . . . . . . . . . . . . . . . . . . . . . . . . . . . . . . . . . . . . . . . . . . . . . 2507. Overall conclusion . . . . . . . . . . . . . . . . . . . . . . . . . . . . . . . . . . . . . . . . . . . . . . . . . . . . . . . . . . . . . . . . . . . . . . . . . . . . . . . . . . . . . . . . . . . . . . . . . . . 252Acknowledgment . . . . . . . . . . . . . . . . . . . . . . . . . . . . . . . . . . . . . . . . . . . . . . . . . . . . . . . . . . . . . . . . . . . . . . . . . . . . . . . . . . . . . . . . . . . . . . . . . . . . . . . 252References . . . . . . . . . . . . . . . . . . . . . . . . . . . . . . . . . . . . . . . . . . . . . . . . . . . . . . . . . . . . . . . . . . . . . . . . . . . . . . . . . . . . . . . . . . . . . . . . . . . . . . . . . . . . . 252
1. Introduction
Hydrogen, the simplest, the lightest and the most abundantelement in the known universe appears to be one of the auspiciousenergy carriers, however, the greenest one if produced fromrenewable resources. This alternative green fuel is indispensablein the contemporary scenario of huge greenhouse gas (GHG)emission from the combustion of fossil fuel. Since, fossil fuelsdominate energy consumption with a market share of 87%, allthe while, renewable energy accounts 2% only [1]. According to theInternational Energy Agency's World Energy Outlook 2012 [2], theglobal energy requirement expected to grow by more than one-third over the period 2035. The rise in energy consumption causesthe elevation in the emission of GHGs like COx, CxHy, NOx, SOx, etc.[3]. Consequently, atmospheric CO2 level hits awful record highs[4]. This increasing CO2 emissions will lead to anthropogenicglobal warming, climate change and ocean acidification, whichwould have severe consequences for ecosystem and for sustain-ability of human society. Moreover, fossil fuel is about to run out ofavailability soon as its limited reserve in earth. Hence, it isessential to place the worldwide energy system onto a moresustainable, secure and environmentally benign path. Unfortu-nately, sources like wind, solar, bio and nuclear are not desirablefor economic energy production, because of their undevelopedtechnology, establishment cost and safety concerns. Hence, hydro-gen being considered as a clean fuel as it produces water only onits combustion [5,6]. Furthermore, H2–O2 fuel cells are environ-mentally benign and highly efficient device which converts che-mical energy of hydrogen directly into electricity. However, itovercomes the limitations imposed by the Carnot efficiency.
Hydrogen produces three times higher quantity of energy(39.4 kWh kg�1) during its combustion than that produced byany other fuel on a mass basis, e.g. liquid hydrocarbons(13.1 kWh kg�1) [7]. Hence, one gallon of gasoline has about thesame energy as one kilogram of hydrogen gas and it is expectedthat the hydrogen can replace all forms of fossil fuels in recentfuture. Approximately 100 times of the present hydrogen produc-tion (more than 3�1012 kg) would have to be produced per yearto fulfill world's demand for fossil fuel. There is no naturalresource of hydrogen and therefore it is not a primary fuel. Hence,hydrogen must be extracted at low cost from other abundantprimary energy sources like coal, natural gas, naphtha, heavy oil,biomass, wastes, solar, wind, or nuclear power, without harmingthe environment [8–10]. Global statistics illustrate that 48% (240Billion cubic meters (Bcm)/yr) of hydrogen is produced fromnatural gas (NG), 30% (150 Bcm/yr) from petroleum, and 18%(90 Bcm/yr) from coal, while only 4% (20 Bcm/yr) is obtained
through water electrolysis [11]. The worldwide contribution ofdifferent sources to overall hydrogen production and its sectorwise-usage are show in Fig. 1. The major contribution of NG forhydrogen production owe to the availability of huge methanereserves in deep ocean bed as well as in industrialized countrieslike United States [12].
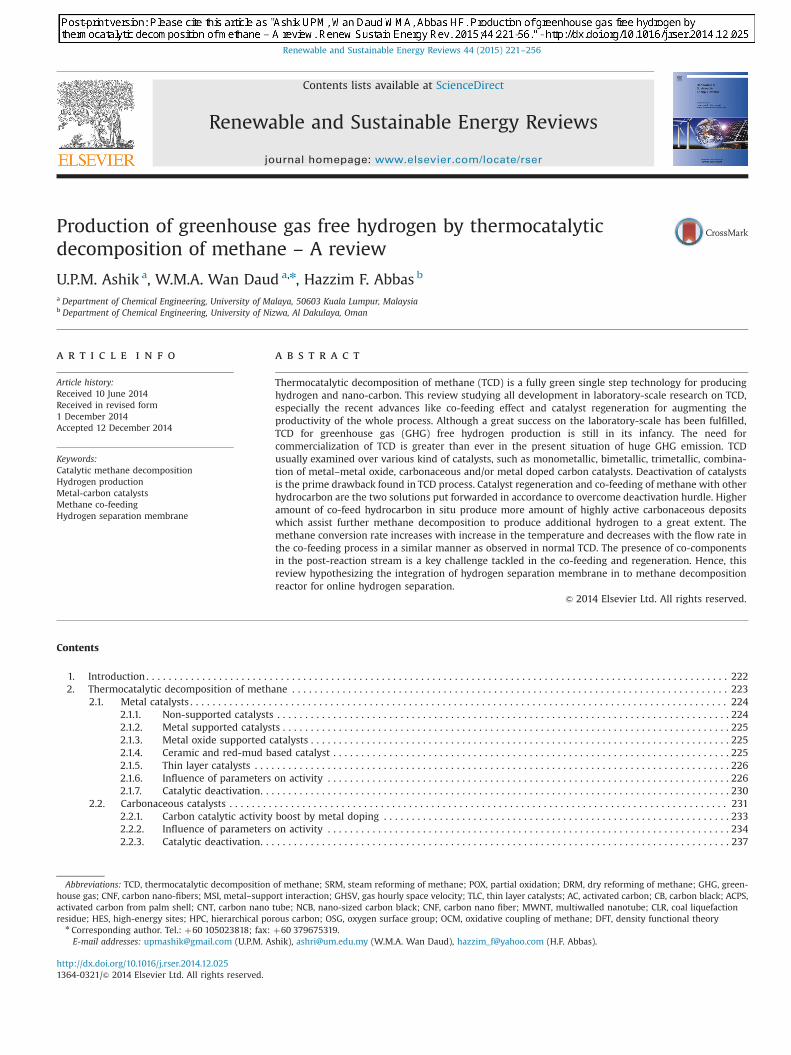
Various hydrogen production method were developed, such asbio-hydrogen production, reviewed elsewhere [13], steam reform-ing of methane (SRM), partial oxidation (POX), coal gasification,water splitting, biomass gasification and thermochemical pro-cesses [14,15]. Water splitting process, consuming renewable solarand wind energy is very fascinating, but not economical because ofits poor efficiency and higher processing cost. Water can bedirectly converted to H2 and O2 with zero CO2 emission by usingphotoelectrodes with sunlight illumination in aqueous electro-lytes. The integration of solar energy concentration systems withsystems capable to split water is of immense value and impact onthe energetics and economics worldwide. For this application, thephotoelectrode materials must have an appropriate band gap,special catalytic properties and needs to be stable in the aqueousenvironment under illumination [16]. Unfortunately, nearly allknown materials today fail to fulfill these conditions [17]. Thehighest reported solar to hydrogen conversion efficiency till 1998was 12.4% [16] for an illuminated area of 0.2 cm2, referring to thelower heat value of hydrogen. Peharz et al. [18], achieved anefficiency of 18% in 2007 for the solar to hydrogen productionunder outdoor conditions. The hydrogen production rate obtainedwith water splitting process is too low due to quick chargerecombination of photo-generated electron/hole pairs, quick back-ward reaction and inability to utilize visible light efficiently [19].Furthermore, the dissociation of water is a reaction not favouredthermodynamically; one has to go up to extremely high tempera-tures (42200 1C) for obtaining some significant dissociationdegree [20]. Moreover, direct one-step water splitting requiresthe energy intensive process of high temperature oxygen–hydro-gen separation coupled with expensive membrane technology andtherefore is considered of little chance for technical and econom-ical viability in the near future. Additionally, gasification andreforming of biomass are extensively explored for producinghydrogen from several biomass resources such as forest residues,wood wastes, crop residues, waste water treatment, biogas, etc.[21]. Nevertheless, the major limitations of these technologies arethe necessity of coupling of further stages like gas separation/purification treatments and the occurrence of further sophisti-cated reactions which reduces hydrogen selectivity [22]. Fig. 2depicting different sources, preparation methods, intensity of GHGemission of each process and utilization of hydrogen.
U.P.M. Ashik et al. / Renewable and Sustainable Energy Reviews 44 (2015) 221–256222
SRM and POX are the current thermochemical processes forhydrogen production from methane, the main constituent of NGhaving highest C:H ratio. SRM has been considered as the one ofthe most common and regularly adopted technique for manyyears. In spite of its high process efficiency (50%) and compara-tively low cost, SRM causes high emissions of COx (at least 1 mol ofCO2/mol of converted methane) and requires more process energy[23]. Moreover, fuel reforming process is multifaceted containingCO elimination by water gas shift reaction together with selectiveCO oxidation. Hence, the post-reaction mixture contains hugequantities of CO even after the purification. Similarly, the POXprocess is also causes GHG emission. Consequently, TCD or so-called methane cracking attracted as a novel technique for eco-friendly hydrogen production. In this moderately endothermicprocess, methane is thermally decomposed to solid carbon andgaseous hydrogen in a technically simple one step process asshown in Eq. (1).
CH4-Cþ2H2 ΔH298 K ¼ 74:52 kJ=mol ð1Þ
2. Thermocatalytic decomposition of methane
Thermocatalytic decomposition of methane (TCD), the mosteconomical hydrogen production method, has been extensivelystudied since 1960s [24–28]. The prime benefit of TCD is the nearelimination of GHG release [12]. Moreover, technically the hydro-gen produced by TCD can directly use as the fuel for H2–O2 fuelcell as well as in internal combustion engine without furtherpurification step, hence produced hydrogen is free from COx [23].Furthermore, nano-carbon, of possible interest for a variety of
potential further applications such as gas (e.g. hydrogen) storage[29], polymer additives [30], catalyst support or direct catalyst[31], is the co-product in TCD process. Despite the fact thathydrogen produced from methane cracking is a pure form ofhydrogen, methane cracking is not used on an industrial scale forproducing hydrogen since the technology is still in laboratorylevel. While, industrially emerged hydrogen production technolo-gies were reviewed elsewhere [32].
Due to its very strong C–H bond (440 kJ/mol) and highsymmetry of the molecular structure, methane is the one of themost inactive hydrocarbons, and its decomposition can only takeplace efficiently at a temperature higher than 1200 1C in theabsence of a catalyst. Various metal and carbonaceous catalystshave been introduced in the interest of reducing decompositiontemperature. In pursuance of producing CO2 free hydrogen,methane decomposition mechanism mainly involves five steps[33] as follows. (i) The chemisorption of methane on the leadingface of a catalyst particle, (ii) detachment of a chemisorbedmethane molecule through progressive breaking of four C–Hbonds as follows:
CH4ð Þg- CH3ð Þaþ Hð Þa ð2Þ
This step is followed by a series of surface stepwise dissociationreactions leading to elemental carbon and hydrogen [34]:
CH3�xð Þa- CH2� xð Þaþ Hð Þa ð3Þwhere 0oxo2; subscripts (a), (c) and (g) denote adsorbed,crystalline and gaseous species, respectively. (iii) Aggregation ofadsorbed atomic hydrogen into molecules, followed by gas phaseemission,
2 Hð Þa- H2ð Þg ð4Þ
(iv) atomic carbon aggregation into encapsulated carbon, lead-ing to progressive catalyst deactivation, or atomic carbon diffusionthrough the bulk catalyst from the leading face to the trailing face,driven by the existing pronounced concentration gradient, and(v) carbon nucleation followed by the formation and growth ofcarbon nano-fibers (CNFs) in the trailing face of the catalystparticle.
Cð Þa-1=n Cnð Þc Carbon crystalline growthð Þ ð5ÞThe kinetic laws (pre-exponential factor, activation energy and
reaction order) of each intermediate elementary reaction step arestill unknown [35]. TCD process has less environmental impactcompared to commercial hydrogen production method likeSRM. Even though, TCD process is facing many challenges asfollows: catalytic deactivation, presence of unreacted methane inout stream, possibility of further components in case of co-feedassisted methane decomposition and formation of COx during
Fig. 1. (a) Worldwide hydrogen production by sources and (b) sector-wise usage of hydrogen.
Fig. 2. Schematic representation of the sources, preparation methods and utiliza-tion of hydrogen.
U.P.M. Ashik et al. / Renewable and Sustainable Energy Reviews 44 (2015) 221–256 223
regeneration of deactivated catalyst. All these titles are discussedin details in this review. This segment of review discusses variousmetal and carbon based catalyst briefly, giving special importanceto the recently developed catalysts.
2.1. Metal catalysts
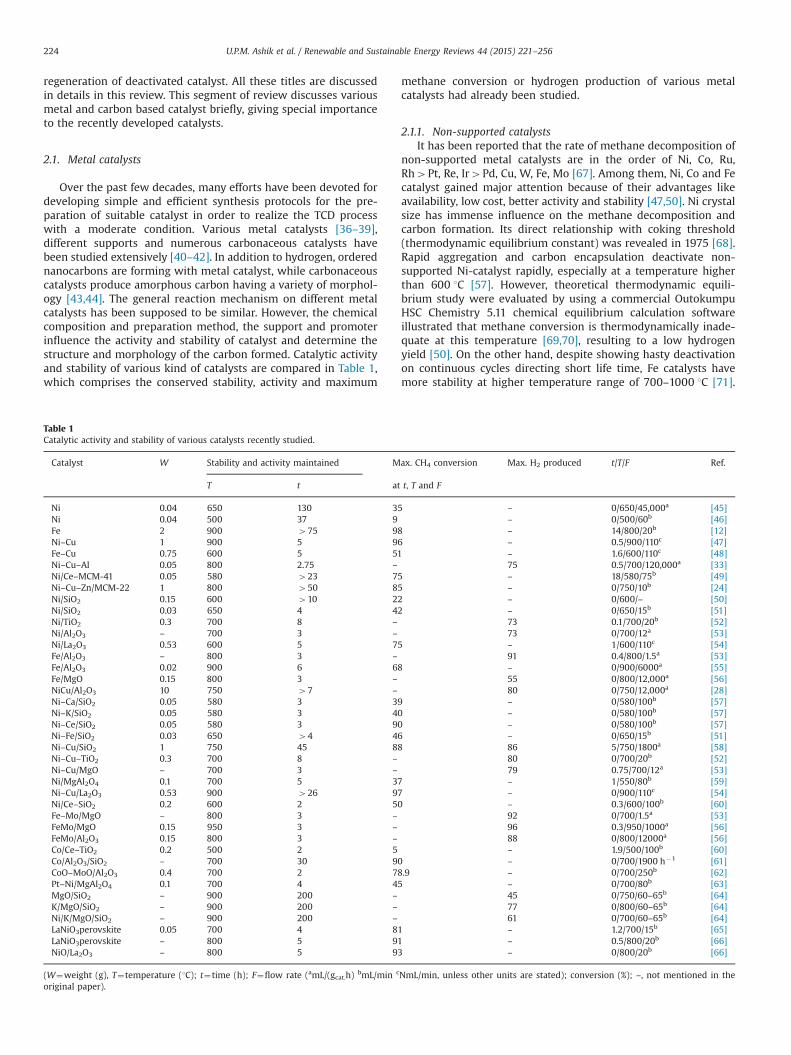
Over the past few decades, many efforts have been devoted fordeveloping simple and efficient synthesis protocols for the pre-paration of suitable catalyst in order to realize the TCD processwith a moderate condition. Various metal catalysts [36–39],different supports and numerous carbonaceous catalysts havebeen studied extensively [40–42]. In addition to hydrogen, orderednanocarbons are forming with metal catalyst, while carbonaceouscatalysts produce amorphous carbon having a variety of morphol-ogy [43,44]. The general reaction mechanism on different metalcatalysts has been supposed to be similar. However, the chemicalcomposition and preparation method, the support and promoterinfluence the activity and stability of catalyst and determine thestructure and morphology of the carbon formed. Catalytic activityand stability of various kind of catalysts are compared in Table 1,which comprises the conserved stability, activity and maximum
methane conversion or hydrogen production of various metalcatalysts had already been studied.
2.1.1. Non-supported catalystsIt has been reported that the rate of methane decomposition of
non-supported metal catalysts are in the order of Ni, Co, Ru,Rh4Pt, Re, Ir4Pd, Cu, W, Fe, Mo [67]. Among them, Ni, Co and Fecatalyst gained major attention because of their advantages likeavailability, low cost, better activity and stability [47,50]. Ni crystalsize has immense influence on the methane decomposition andcarbon formation. Its direct relationship with coking threshold(thermodynamic equilibrium constant) was revealed in 1975 [68].Rapid aggregation and carbon encapsulation deactivate non-supported Ni-catalyst rapidly, especially at a temperature higherthan 600 1C [57]. However, theoretical thermodynamic equili-brium study were evaluated by using a commercial OutokumpuHSC Chemistry 5.11 chemical equilibrium calculation softwareillustrated that methane conversion is thermodynamically inade-quate at this temperature [69,70], resulting to a low hydrogenyield [50]. On the other hand, despite showing hasty deactivationon continuous cycles directing short life time, Fe catalysts havemore stability at higher temperature range of 700–1000 1C [71].
Table 1Catalytic activity and stability of various catalysts recently studied.
Catalyst W Stability and activity maintained Max. CH4 conversion Max. H2 produced t/T/F Ref.
T t at t, T and F
Ni 0.04 650 130 35 – 0/650/45,000a [45]Ni 0.04 500 37 9 – 0/500/60b [46]Fe 2 900 475 98 – 14/800/20b [12]Ni–Cu 1 900 5 96 – 0.5/900/110c [47]Fe–Cu 0.75 600 5 51 – 1.6/600/110c [48]Ni–Cu–Al 0.05 800 2.75 – 75 0.5/700/120,000a [33]Ni/Ce–MCM-41 0.05 580 423 75 – 18/580/75b [49]Ni–Cu–Zn/MCM-22 1 800 450 85 – 0/750/10b [24]Ni/SiO2 0.15 600 410 22 – 0/600/– [50]Ni/SiO2 0.03 650 4 42 – 0/650/15b [51]Ni/TiO2 0.3 700 8 – 73 0.1/700/20b [52]Ni/Al2O3 – 700 3 – 73 0/700/12a [53]Ni/La2O3 0.53 600 5 75 – 1/600/110c [54]Fe/Al2O3 – 800 3 – 91 0.4/800/1.5a [53]Fe/Al2O3 0.02 900 6 68 – 0/900/6000a [55]Fe/MgO 0.15 800 3 – 55 0/800/12,000a [56]NiCu/Al2O3 10 750 47 – 80 0/750/12,000a [28]Ni–Ca/SiO2 0.05 580 3 39 – 0/580/100b [57]Ni–K/SiO2 0.05 580 3 40 – 0/580/100b [57]Ni–Ce/SiO2 0.05 580 3 90 – 0/580/100b [57]Ni–Fe/SiO2 0.03 650 44 46 – 0/650/15b [51]Ni–Cu/SiO2 1 750 45 88 86 5/750/1800a [58]Ni–Cu–TiO2 0.3 700 8 – 80 0/700/20b [52]Ni–Cu/MgO – 700 3 – 79 0.75/700/12a [53]Ni/MgAl2O4 0.1 700 5 37 – 1/550/80b [59]Ni–Cu/La2O3 0.53 900 426 97 – 0/900/110c [54]Ni/Ce–SiO2 0.2 600 2 50 – 0.3/600/100b [60]Fe–Mo/MgO – 800 3 – 92 0/700/1.5a [53]FeMo/MgO 0.15 950 3 – 96 0.3/950/1000a [56]FeMo/Al2O3 0.15 800 3 – 88 0/800/12000a [56]Co/Ce–TiO2 0.2 500 2 5 – 1.9/500/100b [60]Co/Al2O3/SiO2 – 700 30 90 – 0/700/1900 h�1 [61]CoO–MoO/Al2O3 0.4 700 2 78.9 – 0/700/250b [62]Pt–Ni/MgAl2O4 0.1 700 4 45 – 0/700/80b [63]MgO/SiO2 – 900 200 – 45 0/750/60–65b [64]K/MgO/SiO2 – 900 200 – 77 0/800/60–65b [64]Ni/K/MgO/SiO2 – 900 200 – 61 0/700/60–65b [64]LaNiO3perovskite 0.05 700 4 81 – 1.2/700/15b [65]LaNiO3perovskite – 800 5 91 – 0.5/800/20b [66]NiO/La2O3 – 800 5 93 – 0/800/20b [66]
(W¼weight (g), T¼temperature (1C); t¼time (h); F¼flow rate (amL/(gcat.h) bmL/min cNmL/min, unless other units are stated); conversion (%); –, not mentioned in theoriginal paper).
U.P.M. Ashik et al. / Renewable and Sustainable Energy Reviews 44 (2015) 221–256224
Moreover, Fe-based catalysts produce thin wall carbon nanotubesas byproduct, which are invaluable among nanocarbons [72].Hence, most of the Fe-based catalyst work have devoted for theproduction of nanocarbon other than hydrogen production. There-fore, those works are excluded from this review as it is focusing onhydrogen production. While, cobalt catalyst did not get as muchattention as Ni and Fe catalysts. Partially filled 3d orbitals of Fe, Coand Ni facilitate the dissociation of the hydrocarbon moleculesthrough partially accepting electrons. This interaction along with“back-donation” from the metal into the unoccupied orbital in thehydrocarbon molecule changes the electronic structure of theadsorbed molecule so that the dissociation of the molecule occurs[73]. While, copper, a non-transition metal with its 3d shellcompletely filled, was observed to yield very less hydrogen andamorphous carbon. Likewise, noble metals (Rh, Ru and Pt) do notprovide heartening results in terms of methane conversion in TCD[69]. The main advantage of non-supported catalyst is the mag-netic properties associated with those materials which facilitatethe recovery of the catalyst after the reaction, once the latter ismixed with the produced carbon [69,74].
2.1.2. Metal supported catalystsThe metal-supported catalyst belongs to the heterogeneous
catalysis. The metal would be polarized by the influence of chargeenclosed in the support [75], which make changes in their proper-ties. Strong Metal–Support Interaction (MSI) increases the disper-sion of metal by decreasing its mobility. MSI can make changes onthe crystallography and the electronic state of the metal particlesdepending on the intensity of the interaction [76]. The factorsinfluencing the catalytic activity are the electronic state of themetal particles, crystalline size, dispersion of metal particles,textural properties, pore geometry of the support [77], catalystcomposition [28], catalyst preparation method [78], and catalystrinsing solvent [46]. Numbers of efforts have been devoted in favorof improving catalytic activity and stability by bringing changes inthe above mentioned factors.
Various types of metal supported catalysts like Ni–Cu [24,79],Ni–Zn [80], Fe–Pd, Fe–Mo, Fe–Ni [26] and Ni/Cu/Al [81] had beenintroduced in order to improve the activity. Addition of Cu in to Niand Fe by in situ thermal treatment has immense enhancement ontheir catalytic activity and stability. Ni–Cu catalyst shows catalyticstability up to 700–750 1C with a 70–85% methane conversion[47,80]. There is no significant catalytic deactivation occurred for300 min. Cu doped Ni produces octopus and porous CNF with highsurface area. Similarly, Cu addition in to Fe improves with 51%methane conversion with better life span than monometallic Fecatalyst [48]. This higher stability and activity of supportedcatalysts explained in terms of ensemble effect, which decreasesthe rate of formation of encapsulating carbon. Furthermore,Density functional theory (DFT) calculations show that Cu–Wand Cu–Mo composite particles have binding energies in the samerange as Fe, Co and Ni. The addition of a dopant to Cu in anappropriate ratio modifies the binding energy into a certain rangesuitable for C–H bond cleavage formation [82,83]. Moreover, Fegives better results while coupling with Mg, Co, Pd, Ni, and Mothan monometallic Fe at 700–800 1C [26,84,85].
2.1.3. Metal oxide supported catalystsMetal supported on metal oxide catalysts (Co/Mo/Al2O3 [62,86],
Ni–Cu/SiO2 [58], Ni–Cu/Al2O3 [28], Mo–Fe/Al2O3 [87]) have gainedtremendous attention as they exhibit high catalytic activity andstability for TCD process. However, the methodology for selectingthe third component is not systematically illustrated until now. Itis reported that oxide support can alter the surface chemistry ofmetal catalyst particles through epitaxial, spillover, and migration
effects [75]. Lee et al. [62] conduct TCD over CoO–MoO/Al2O3 andfound the initial methane conversions are 50.8, 65.5, 71.6, and78.9% over the catalyst with 10, 20, 30 and 40 wt% CoO–MoOloading, respectively. It shows a gradual increase in initial methaneconversion with metal loading. In a broad-spectrum, the examinedoperating temperatures for Ni-based catalysts are ranged from 500to 900 1C with the highest methane conversion of 85% at 750 1C,while that for Fe-based catalysts are 200–1200 1C with 490%methane conversion at 800 1C [12,53,80]. In 1998, Muradov [88]generated CO2 free hydrogen yield very close to the equilibriumvalue with Fe2O3 catalysts at 850 1C. Fe–Mo/MgO [56] withstandstemperature up to 950 1C with methane conversion of higher than90% for 3 h continuously. Fe/Al2O3 [55] also shows better perfor-mance at higher temperature. In spite of having better stability athigher temperature range, the overall performance of the Fe-basedcatalysts is not as good as that of Ni-based catalysts. It paved theway to introduce Fe incorporated Ni-based catalysts. The additionof Fe in to Ni/SiO2 catalysts boost up its activity by about 3 timeswithout much deactivation [51]. The addition of Cu and Zn in toNi-based catalysts enhance the catalytic stability up to 800 1C with72% methane conversion [24]. Ni–Cu–SiO2 (50:10:40) showshigher activity with a maximum methane conversion of 88%corresponding to a hydrogen yield of 86% at a temperature750 1C and GHSV 1800 mL/h gcat [58]. 10% Cu loading showsmaximum activity, but further addition of Cu lower the activityand stability, especially at high temperature, as the higher amountof Cu make the catalyst particles easily in quasi-liquid state. Theaddition of Ce enhances the stability of both Ni and Fe-basedcatalyst by more than 10 times of that of Ni/SiO2 catalyst[49,60,89]. It is attributed to the conversion of formed carbon toCOx because of Ce4þ/Ce3þ mechanism [49]. Hence, a small amountof COx has been detected throughout the experiments.
2.1.4. Ceramic and red-mud based catalystCeramic materials have high melting point, high resistant to
chemical attack, good mechanical strength, low acidity, goodinteraction with metallic phase [59], and do not form metalcarbide [64]. All these properties are desirable for a catalystsupport. Furthermore, unlike metal catalyst, ceramic catalyst cangovern the reaction for producing specific product is it's additionaladvantage [64]. As expected, Ni/MgAl2O4 illustrate better activitywith 37% methane conversion for 1 h without much deactivation[59]. The contact time of reactant molecules was extremelyimportant for methane decomposition and MgO have the affinityfor sustaining hydrogen which was bonded to methane, in thisway it increased the sustain time of methane on the ceramicsurface, which was responsible for decomposition of methane.However, addition of Pt to the above mentioned ceramic supportdid not favor catalytic result [63]. Addition of K in to MgO/SiO2
ceramic catalyst increases its activity to produce 77% maximumhydrogen yield and stability up to 900 1C even after 200 h [64].Doping of K provides greater active sites and surface area to thecatalyst for better decomposition and higher stability. However, Kaddition inhibited coke formation and carbon deposition duringthe decomposition reaction and hence did not suffer fast deactiva-tion. Silica reacted with potassium oxide to form stable silicateswhich was actually responsible for the stability of ceramic materi-als for better active life [90,91]. Ceramic catalysts produces multi-walled carbon nanotubes which approximately same at optimizetemperatures of Ni catalyst. No impurities were detected innanotubes produced from cracking of methane from ceramics [64].
Red mud is a waste product of the aluminum industry. It iscomposed of iron oxides/oxyhydroxides/hydroxide, aluminumoxide/oxyhydroxide/hydroxide, silica, titania and a range of alkaliand alkaline earth metal compounds such as sodium oxide and
U.P.M. Ashik et al. / Renewable and Sustainable Energy Reviews 44 (2015) 221–256 225
calcium oxide [92]. Of these, the iron compounds are generally themajor phase constituents. Balakrishnan et al. [92] consideredmethane itself as a reductant and conduct methane decompositionover red-mud without any prior reduction step. Red-mud contain-ing relatively high content of titanium seems to have reducedactivity for methane conversion compared to a sample containinga comparable proportion of iron. The maximum hydrogen forma-tion rate observed, 3.80�10�5 molH2/g s, was associated with asample containing the highest proportion of iron and a lowerconcentration of alkali metal [92]. Elsewhere, alkali metals havebeen reported to be very effective poisons for the methanedecomposition reaction [93]. The efficacy of the red mud samplesis variable, which is related to differences in their compositionwhich in turn reflects the purity of the bauxite ores from whichthey are produced. Advanced studies on red mud catalyst has yetto be conducted.
2.1.5. Thin layer catalystsThin layer catalysts (TLCs) are recently attracted the attention
of investigators [61,94]. Frusteri et al. [94] found that the Ni and CoTLC supported on Al2O3 samples suitable for a cyclic dual-stepprocess, which is comprised of TCD and catalyst regeneration byoxygen without damaging the catalyst. Furthermore, both Ni andCo exhibit a strong interaction with Al2O3 support surface and it isnoticed that the formation of encapsulating carbon is depressedand only filamentous carbon forms. Despite of this advantage, Niand Co silica supported catalyst were not found apt for long timecatalysis as their deactivation by time. In fact, Co/Al2O3/Silica TLC isstable up to 700 1C for 32 h and convert more than 80% methaneto hydrogen [61]. Cobalt particles strongly adsorb on Al2O3 supportgiving rise to the formation of CoAl2O4-type structures, whichensure an elevated metal dispersion inhibiting also the occurrenceof sintering phenomena [95,96]. Irrespective of Co loading, initialhydrogen production increases with reaction temperature, whilethe relation between lifetime and activity of TLC catalyst withother operating parameters or catalyst characteristics have yet tobe optimized. It is found that, 20% Co ensures both long lifetimeand high hydrogen productivity.
2.1.6. Influence of parameters on activityCatalyst stability and activity depends on the experimental
parameters such as reaction temperature, partial pressure, spacevelocity, etc. [97]. In general, the hydrogen content in the initialoutput of TCD process with metal catalysts is incredibly high, buttheir activity decreases very fast with time. It is clear from
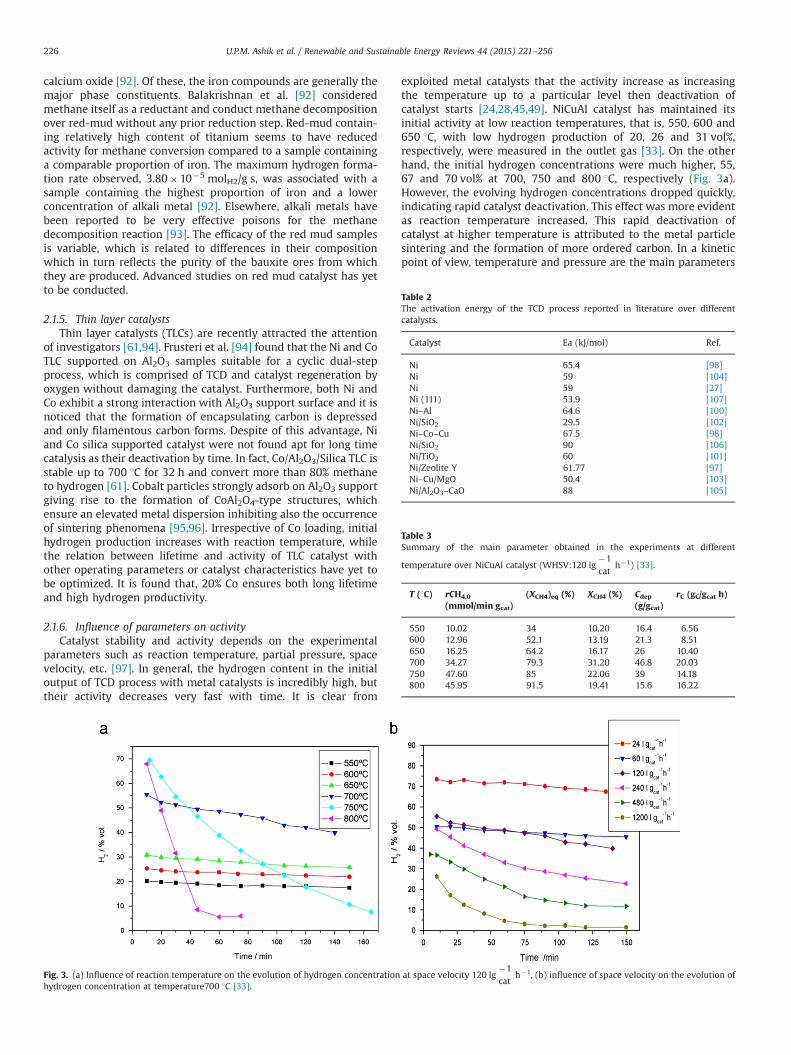
exploited metal catalysts that the activity increase as increasingthe temperature up to a particular level then deactivation ofcatalyst starts [24,28,45,49]. NiCuAl catalyst has maintained itsinitial activity at low reaction temperatures, that is, 550, 600 and650 1C, with low hydrogen production of 20, 26 and 31 vol%,respectively, were measured in the outlet gas [33]. On the otherhand, the initial hydrogen concentrations were much higher, 55,67 and 70 vol% at 700, 750 and 800 1C, respectively (Fig. 3a).However, the evolving hydrogen concentrations dropped quickly,indicating rapid catalyst deactivation. This effect was more evidentas reaction temperature increased. This rapid deactivation ofcatalyst at higher temperature is attributed to the metal particlesintering and the formation of more ordered carbon. In a kineticpoint of view, temperature and pressure are the main parameters
Fig. 3. (a) Influence of reaction temperature on the evolution of hydrogen concentration at space velocity 120 lg�1cat
h�1, (b) influence of space velocity on the evolution ofhydrogen concentration at temperature700 1C [33].
Table 2The activation energy of the TCD process reported in literature over differentcatalysts.
Catalyst Ea (kJ/mol) Ref.
Ni 65.4 [98]Ni 59 [104]Ni 59 [27]Ni (111) 53.9 [107]Ni–Al 64.6 [100]Ni/SiO2 29.5 [102]Ni–Co–Cu 67.5 [98]Ni/SiO2 90 [106]Ni/TiO2 60 [101]Ni/Zeolite Y 61.77 [97]Ni–Cu/MgO 50.4 [103]Ni/Al2O3–CaO 88 [105]
Table 3Summary of the main parameter obtained in the experiments at different
temperature over NiCuAl catalyst (WHSV:120 lg�1cat
h�1) [33].
T (1C) rCH4,0
(mmol/min gcat)(XCH4)eq (%) XCH4 (%) Cdep
(g/gcat)rC (gC/gcat h)
550 10.02 34 10.20 16.4 6.56600 12.96 52.1 13.19 21.3 8.51650 16.25 64.2 16.17 26 10.40700 34.27 79.3 31.20 46.8 20.03750 47.60 85 22.06 39 14.18800 45.95 91.5 19.41 15.6 16.22
U.P.M. Ashik et al. / Renewable and Sustainable Energy Reviews 44 (2015) 221–256226
influencing hydrogen formation rate over time. Kinetic studies arechemical stages conducted for developing a suitable model whichdescribes the rate of reaction and defines the chemical process[98]. Recent studies [99] have shown that the initial C–H bondbreaking of CH4 is the rate determining step over the metal
catalyst at high temperatures, although the activation energy forCH4-bond dissociation decreased from 440 kJ/mol in the gas phaseto 65 kJ/mol on a Ni (100) surface. Wang and Lua [98] were carriedout kinetic studies on methane decomposition over Ni catalyst andfound that the average reaction order and activation energy for themethane decomposition over the unsupported nickel was 0.63 and65.4 kJ/mol, close to those previously published values furnishedin Table 2. The wide range of reported activation energies may bedue to many factors, including the difficulty of collecting truekinetic data and the highly dynamic characteristics of the process[100]. Wang and Lua [98] found that, when PCH4 was increasedfrom 0.2 atm to 1 atm, the hydrogen formation rate significantlyincreased but the catalyst activity decreased. The faster deactiva-tion of the catalyst was subjected to a higher reaction temperature,which accelerated methane dissociation and increased the diffu-sion rate. Generally, increasing reaction temperature increasesmethane dissociation due to the endothermic nature of thereaction while at the same time the diffusion rate also increasesaccordingly. In the case of 2Ni–1Co–1Cu, a faster carbon diffusionrate at a higher temperature would probably speed up the
Table 4Summary of the main parameter obtained in the experiments at different spacevelocity over NiCuAl catalyst (T:700 1C) [33].
WHSV
(lg�1cat
h�1)
r0 (mmol/min.gcat) XCH4 (%) Cdep (g/gcat) rC (gC/gcat.h)
24 10.38 54.61 45.8 7.0260 15.01 31.36 39 15.60
120 34.27 31.2 46.8 20.06240 58.31 20.09 64.6 25.84480 79.95 11.63 84a 33.60
1200 134.74 8.77 141a 56.40
a Catalyst deactivated.
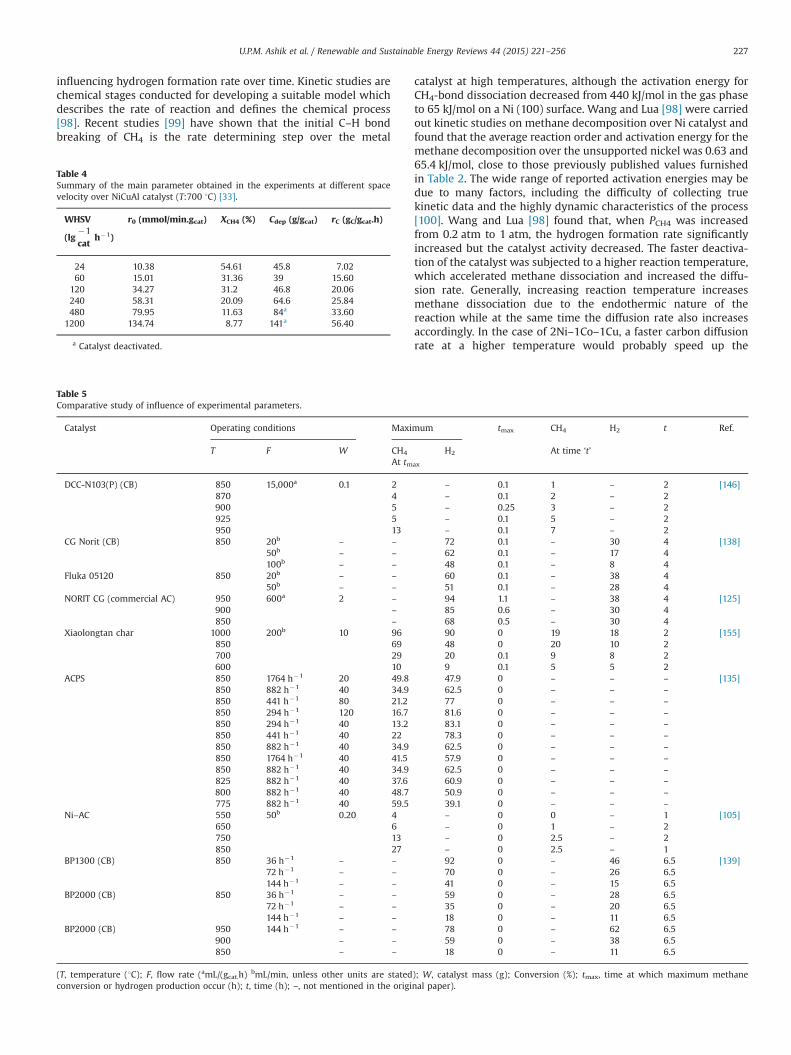
Table 5Comparative study of influence of experimental parameters.
Catalyst Operating conditions Maximum tmax CH4 H2 t Ref.
T F W CH4 H2 At time ‘t’At tmax
DCC-N103(P) (CB) 850 15,000a 0.1 2 – 0.1 1 – 2 [146]870 4 – 0.1 2 – 2900 5 – 0.25 3 – 2925 5 – 0.1 5 – 2950 13 – 0.1 7 – 2
CG Norit (CB) 850 20b – – 72 0.1 – 30 4 [138]50b – – 62 0.1 – 17 4100b – – 48 0.1 – 8 4
Fluka 05120 850 20b – – 60 0.1 – 38 450b – – 51 0.1 – 28 4
NORIT CG (commercial AC) 950 600a 2 – 94 1.1 – 38 4 [125]900 – 85 0.6 – 30 4850 – 68 0.5 – 30 4
Xiaolongtan char 1000 200b 10 96 90 0 19 18 2 [155]850 69 48 0 20 10 2700 29 20 0.1 9 8 2600 10 9 0.1 5 5 2
ACPS 850 1764 h�1 20 49.8 47.9 0 – – – [135]850 882 h�1 40 34.9 62.5 0 – – –
850 441 h�1 80 21.2 77 0 – – –
850 294 h�1 120 16.7 81.6 0 – – –
850 294 h�1 40 13.2 83.1 0 – – –
850 441 h�1 40 22 78.3 0 – – –
850 882 h�1 40 34.9 62.5 0 – – –
850 1764 h�1 40 41.5 57.9 0 – – –
850 882 h�1 40 34.9 62.5 0 – – –
825 882 h�1 40 37.6 60.9 0 – – –
800 882 h�1 40 48.7 50.9 0 – – –
775 882 h�1 40 59.5 39.1 0 – – –
Ni–AC 550 50b 0.20 4 – 0 0 – 1 [105]650 6 – 0 1 – 2750 13 – 0 2.5 – 2850 27 – 0 2.5 – 1
BP1300 (CB) 850 36 h�1 – – 92 0 – 46 6.5 [139]72 h�1 – – 70 0 – 26 6.5144 h�1 – – 41 0 – 15 6.5
BP2000 (CB) 850 36 h�1 – – 59 0 – 28 6.572 h�1 – – 35 0 – 20 6.5144 h�1 – – 18 0 – 11 6.5
BP2000 (CB) 950 144 h�1 – – 78 0 – 62 6.5900 – – 59 0 – 38 6.5850 – – 18 0 – 11 6.5
(T, temperature (1C); F, flow rate (amL/(gcat.h) bmL/min, unless other units are stated); W, catalyst mass (g); Conversion (%); tmax, time at which maximum methaneconversion or hydrogen production occur (h); t, time (h); –, not mentioned in the original paper).
U.P.M. Ashik et al. / Renewable and Sustainable Energy Reviews 44 (2015) 221–256 227
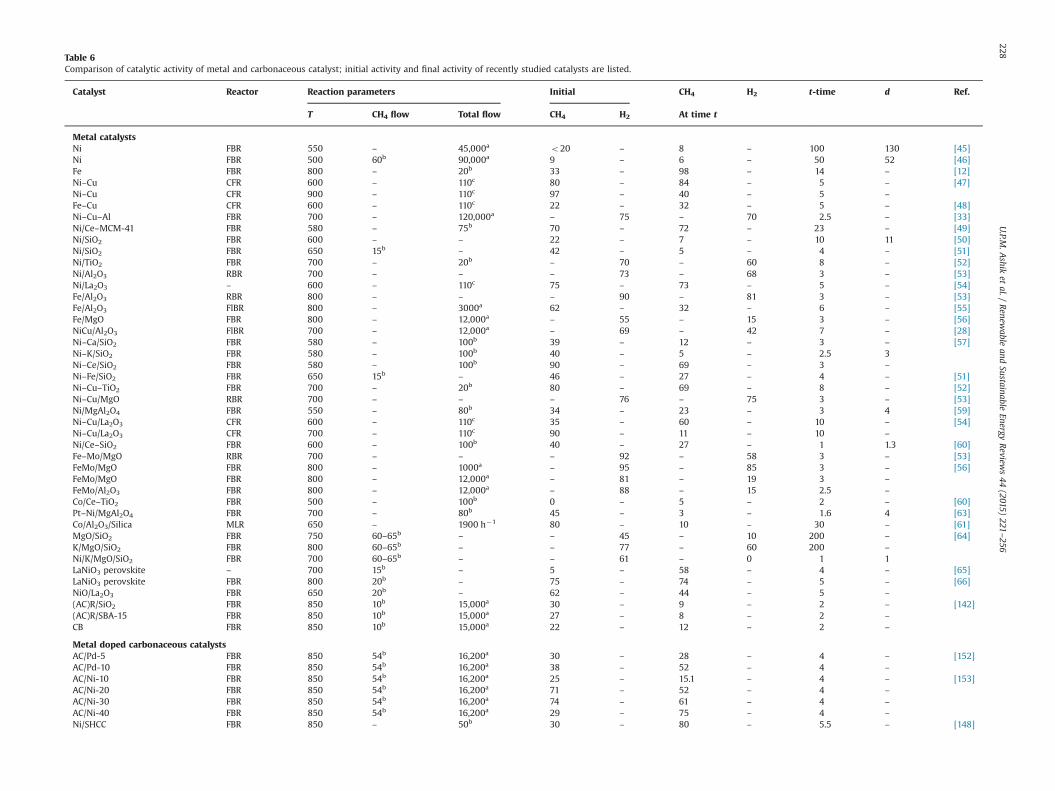
Table 6Comparison of catalytic activity of metal and carbonaceous catalyst; initial activity and final activity of recently studied catalysts are listed.
Catalyst Reactor Reaction parameters Initial CH4 H2 t-time d Ref.
T CH4 flow Total flow CH4 H2 At time t
Metal catalystsNi FBR 550 – 45,000a o20 – 8 – 100 130 [45]Ni FBR 500 60b 90,000a 9 – 6 – 50 52 [46]Fe FBR 800 – 20b 33 – 98 – 14 – [12]Ni–Cu CFR 600 – 110c 80 – 84 – 5 – [47]Ni–Cu CFR 900 – 110c 97 – 40 – 5 –
Fe–Cu CFR 600 – 110c 22 – 32 – 5 – [48]Ni–Cu–Al FBR 700 – 120,000a – 75 – 70 2.5 – [33]Ni/Ce–MCM-41 FBR 580 – 75b 70 – 72 – 23 – [49]Ni/SiO2 FBR 600 – – 22 – 7 – 10 11 [50]Ni/SiO2 FBR 650 15b – 42 – 5 – 4 – [51]Ni/TiO2 FBR 700 – 20b – 70 – 60 8 – [52]Ni/Al2O3 RBR 700 – – – 73 – 68 3 – [53]Ni/La2O3 – 600 – 110c 75 – 73 – 5 – [54]Fe/Al2O3 RBR 800 – – – 90 – 81 3 – [53]Fe/Al2O3 FlBR 800 – 3000a 62 – 32 – 6 – [55]Fe/MgO FBR 800 – 12,000a – 55 – 15 3 – [56]NiCu/Al2O3 FlBR 700 – 12,000a – 69 – 42 7 – [28]Ni–Ca/SiO2 FBR 580 – 100b 39 – 12 – 3 – [57]Ni–K/SiO2 FBR 580 – 100b 40 – 5 – 2.5 3Ni–Ce/SiO2 FBR 580 – 100b 90 – 69 – 3 –
Ni–Fe/SiO2 FBR 650 15b – 46 – 27 – 4 – [51]Ni–Cu–TiO2 FBR 700 – 20b 80 – 69 – 8 – [52]Ni–Cu/MgO RBR 700 – – – 76 – 75 3 – [53]Ni/MgAl2O4 FBR 550 – 80b 34 – 23 – 3 4 [59]Ni–Cu/La2O3 CFR 600 – 110c 35 – 60 – 10 – [54]Ni–Cu/La2O3 CFR 700 – 110c 90 – 11 – 10 –
Ni/Ce–SiO2 FBR 600 – 100b 40 – 27 – 1 1.3 [60]Fe–Mo/MgO RBR 700 – – – 92 – 58 3 – [53]FeMo/MgO FBR 800 – 1000a – 95 – 85 3 – [56]FeMo/MgO FBR 800 – 12,000a – 81 – 19 3 –
FeMo/Al2O3 FBR 800 – 12,000a – 88 – 15 2.5 –
Co/Ce–TiO2 FBR 500 – 100b 0 – 5 – 2 – [60]Pt–Ni/MgAl2O4 FBR 700 – 80b 45 – 3 – 1.6 4 [63]Co/Al2O3/Silica MLR 650 – 1900 h�1 80 – 10 – 30 – [61]MgO/SiO2 FBR 750 60–65b – – 45 – 10 200 – [64]K/MgO/SiO2 FBR 800 60–65b – – 77 – 60 200 –
Ni/K/MgO/SiO2 FBR 700 60–65b – – 61 – 0 1 1LaNiO3 perovskite – 700 15b – 5 – 58 – 4 – [65]LaNiO3 perovskite FBR 800 20b – 75 – 74 – 5 – [66]NiO/La2O3 FBR 650 20b – 62 – 44 – 5 –
(AC)R/SiO2 FBR 850 10b 15,000a 30 – 9 – 2 – [142](AC)R/SBA-15 FBR 850 10b 15,000a 27 – 8 – 2 –
CB FBR 850 10b 15,000a 22 – 12 – 2 –
Metal doped carbonaceous catalystsAC/Pd-5 FBR 850 54b 16,200a 30 – 28 – 4 – [152]AC/Pd-10 FBR 850 54b 16,200a 38 – 52 – 4 –
AC/Ni-10 FBR 850 54b 16,200a 25 – 15.1 – 4 – [153]AC/Ni-20 FBR 850 54b 16,200a 71 – 52 – 4 –
AC/Ni-30 FBR 850 54b 16,200a 74 – 61 – 4 –
AC/Ni-40 FBR 850 54b 16,200a 29 – 75 – 4 –
Ni/SHCC FBR 850 – 50b 30 – 80 – 5.5 – [148]
U.P.M
.Ashik
etal./
Renew
ableand
SustainableEnergy
Review
s44
(2015)221
–256228
Ni/SLCC FBR 850 – 50b 30 – 76 – 5.1 –
Ni/RC FBR 850 – 50b 14 – 59 – 9 –
Al/RC FBR 850 – 50b 29 – 60 – 5 – [154]Si/RC FBR 850 – 50b 23 – 11 – 5 –
AC from coconut FBR 850 – – – 79 – 13 1.5 3.5(AC)R/SiO2 FBR 850 10b 15,000a 30 – 9 – 2 – [142](AC)R/SBA-15 FBR 850 10b 15,000a 27 – 8 – 2 –
Carbonaceous catalystsCB FBR 850 10b 15,000a 22 – 12 – 2 – [142]AC (AX-21) FBR 850 – – – 50 – 21 4 – [88]CB (Vulcan XC-72) FBR 850 – – – 20 – 5 4 –
Graphite FBR 850 – – – 4 – 2 2 3.2RC (AC) FBR 850 3000a 15,000a 31 – 22 – 10 – [160]AC-0 (AC) FBR 850 3000a 15,000a 29 – 3 – 2 –
BP2000 (CB) FBR 850 3000a 15,000a 21 – 3 – 4 –
DCC-N103(p) (CB) FBR 950 25b 15,000a 13 – 7 – 2 – [146]DCC-N220(p) (CB) FBR 950 25b 15,000a 7 – 6 – 2 –
DCC-N550(p) (CB) FBR 950 25b 15,000a 8 – 5 – 2 –
Carbopack B (CB) FBR 850 20b 38 h�1 – 12 – 12 4 – [138]Carbopack C (CB) FBR 850 20b 38 h�1 – 8 – 8 8 –
Fluka 03866 (CB) FBR 850 20b 38 h�1 – 68 – 12 4 –
Fluka 05120 (CB) FBR 850 20b 38 h�1 – 60 – 34 8 –
BP2000 (CB) FBR 850 20b 38 h�1 – 59 – 28 8 –
HS-50 FBR 850 20b 38 h�1 – 29 – 17 8 –
CG Norit FBR 850 20b 38 h�1 – 72 – 8 7.5 –
CG (commercial AC) FBR 850 20b 600a 51 67 18 30 4 – [125]SUPRA (commercial AC) FBR 850 20b 600a 32 49 12 21 4 –
GAC (commercial AC) FBR 850 20b 600a 25 38 16 27 4 –
SCA750 (coal-derived AC) FBR 850 20 b 600a 19 31 3 5 4 –
SCA600 (coal-derived AC) FBR 850 20b 600a 20 32 2 4 4 –
SC800 (coal-derived AC) FBR 850 20b 600a 26 41 2 4 4 –
Shengli lignite char FBR 850 – 200b 87 90 29 38 2 – [155]Xiaolongtan lignite char FBR 850 – 200b 81 82 17 20 2 –
Binxian bituminous char FBR 850 – 200b 70 68 10 13 1 2Jincheng anthracite char FBR 850 – 200b 36 27 3 4 1 2BP1300 (CB) FBR 850 20b 144 h�1 – 42 – 15 6.5 – [139]BP2000(CB) FBR 850 20b 144 h�1 – 17 – 12 6.5 –
(FBR, fixed bed reactor; FlBR, fluidized bed reactor; CFR, continuous flow reactor; RBR, rotary bed reactor; MLR, multilayer reactor; T, temperature (1C); F, flow rate (amL/(gcat.h)bmL/min, cNmL/min, unless other units are stated);Conversion (%); t, time (h); d, complete deactivation (h); –, not mentioned in the original paper).
U.P.M
.Ashik
etal./
Renew
ableand
SustainableEnergy
Review
s44
(2015)221
–256229
fragmentation of the catalyst [98] and leads to deactivation. Uddinet al. [97] reported that Ni/Zeolite Y shows reaction order andactivation energy were 2.65 and 61.77 kJ/mol, respectively formethane decomposition in a fixed bed reactor. The kinetic experi-ment indicates that the optimum temperature range should bemaintained to achieve the highest performance from 30% Ni/Yzeolite in terms of hydrogen formation rate, average hydrogenformation rate, total hydrogen formation, average carbon forma-tion, total carbon formation, and carbon formation rate.
Furthermore, the catalyst deactivation significantly increases asspace velocity goes up [33,51,59]. NiCuAl exhibit high stability
from 20 to 60 lg�1cat
h�1 with 75 vol% of hydrogen in the outlet
stream (Fig. 3b) [33]. While, at the higher space velocity over 120–
1200 lg�1cat
h�1, hydrogen concentration severely decreased to
5 vol% within 60 min due to decrease in contact time betweenmethane molecules and the catalyst surface (Fig.3b). Increasingthe space velocity has two clear effects: the hydrogen concentra-tion in the outlet gases diminishes, and the catalyst deactivationsubstantially increases. Furthermore, Xiong et al. [108] stated thatthe activity of supported catalyst strongly depend on the amountof loaded metal by studying various amount of Ni supported onSiO2. It is due to increasing availability of active sites for reaction.Uddin et al. [97] stated that the carbon deposition is directlyrelated to the metal content of the catalyst. The high distributionof nickel species into the zeolite Y cages and, possibly moresignificantly, the synergistic influence between the microporoussurfaces of zeolite Y and metallic nickel resulted in the highercatalytic performance of 30% Ni/Y zeolite [109]. A greater electrondensity on the surface of metallic nickel and an increase in theretention capacity of hydrogen in the Ni/Y zeolite catalysts werecaused by the synergistic effects, which may include the interac-tions between the higher ionic microporous surface of zeolite Yand the nickel particles.
2.1.7. Catalytic deactivationThe common challenge of TCD of methane process is the
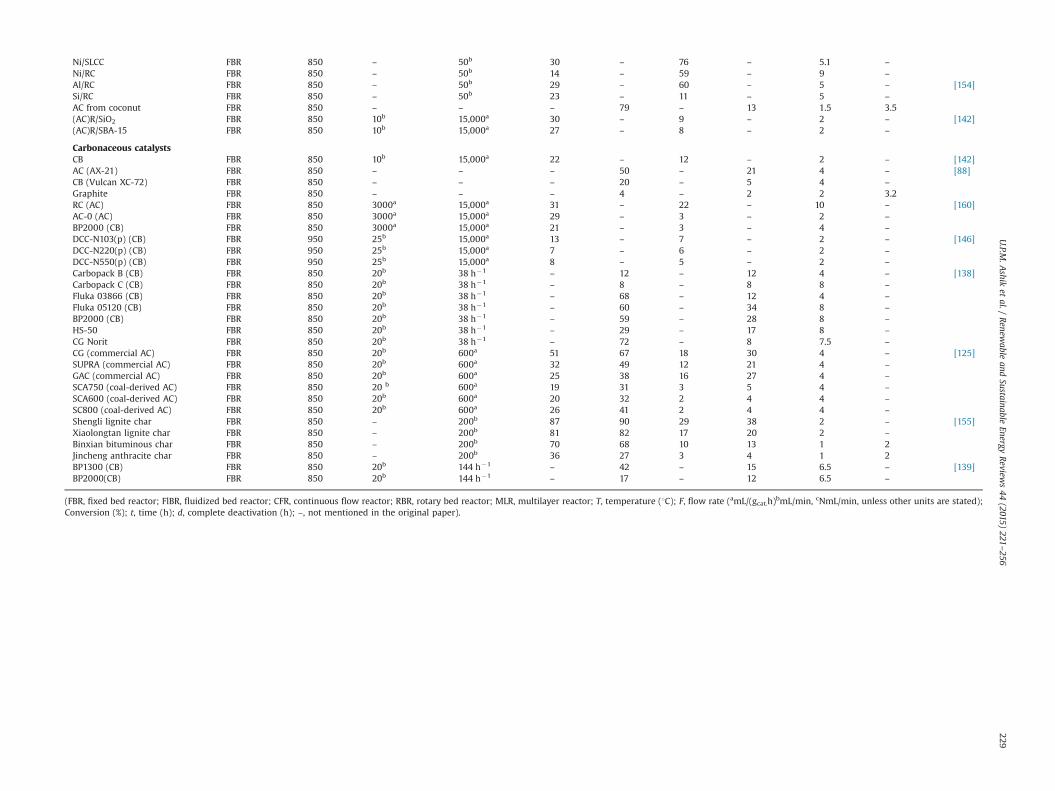
catalytic deactivation. In general catalytic reaction, the catalystdoes not maintain permanent activity and selectivity. Somecatalysts deactivate very rapidly, within seconds, on the otherhand some other catalysts maintain its activity for long time of theorder of months. Poisoning, coking (carbon deposition), mechan-ical degradation and sintering are the main reasons behind thedeactivation of the catalysts [110]. There are number of studiestitled on catalytic deactivation in order to lengthen the catalystlife. Most of the studies focused on parameters affecting deactiva-tion, the period of stable catalytic performance and the completedeactivation time. Table 6 (Metal catalyst) explicitly shows the lossof catalytic activity of various metal catalysts with time during TCDof methane. Table 6 contains initial methane conversion orhydrogen production and those at time t and deactivation time,if any, at particular experimental parameters with which theexamination had conducted. These previously conducted experi-mental results give a clear indication about the catalytic activityloss with time of each catalyst.
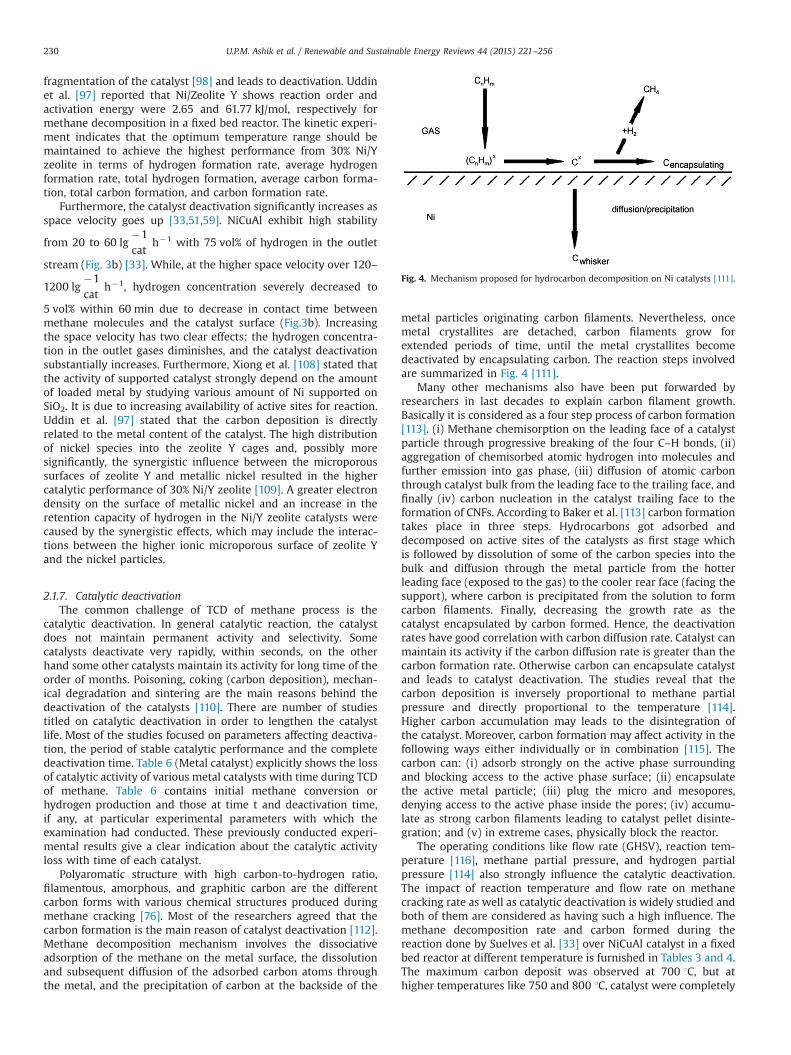
Polyaromatic structure with high carbon-to-hydrogen ratio,filamentous, amorphous, and graphitic carbon are the differentcarbon forms with various chemical structures produced duringmethane cracking [76]. Most of the researchers agreed that thecarbon formation is the main reason of catalyst deactivation [112].Methane decomposition mechanism involves the dissociativeadsorption of the methane on the metal surface, the dissolutionand subsequent diffusion of the adsorbed carbon atoms throughthe metal, and the precipitation of carbon at the backside of the
metal particles originating carbon filaments. Nevertheless, oncemetal crystallites are detached, carbon filaments grow forextended periods of time, until the metal crystallites becomedeactivated by encapsulating carbon. The reaction steps involvedare summarized in Fig. 4 [111].
Many other mechanisms also have been put forwarded byresearchers in last decades to explain carbon filament growth.Basically it is considered as a four step process of carbon formation[113]. (i) Methane chemisorption on the leading face of a catalystparticle through progressive breaking of the four C–H bonds, (ii)aggregation of chemisorbed atomic hydrogen into molecules andfurther emission into gas phase, (iii) diffusion of atomic carbonthrough catalyst bulk from the leading face to the trailing face, andfinally (iv) carbon nucleation in the catalyst trailing face to theformation of CNFs. According to Baker et al. [113] carbon formationtakes place in three steps. Hydrocarbons got adsorbed anddecomposed on active sites of the catalysts as first stage whichis followed by dissolution of some of the carbon species into thebulk and diffusion through the metal particle from the hotterleading face (exposed to the gas) to the cooler rear face (facing thesupport), where carbon is precipitated from the solution to formcarbon filaments. Finally, decreasing the growth rate as thecatalyst encapsulated by carbon formed. Hence, the deactivationrates have good correlation with carbon diffusion rate. Catalyst canmaintain its activity if the carbon diffusion rate is greater than thecarbon formation rate. Otherwise carbon can encapsulate catalystand leads to catalyst deactivation. The studies reveal that thecarbon deposition is inversely proportional to methane partialpressure and directly proportional to the temperature [114].Higher carbon accumulation may leads to the disintegration ofthe catalyst. Moreover, carbon formation may affect activity in thefollowing ways either individually or in combination [115]. Thecarbon can: (i) adsorb strongly on the active phase surroundingand blocking access to the active phase surface; (ii) encapsulatethe active metal particle; (iii) plug the micro and mesopores,denying access to the active phase inside the pores; (iv) accumu-late as strong carbon filaments leading to catalyst pellet disinte-gration; and (v) in extreme cases, physically block the reactor.
The operating conditions like flow rate (GHSV), reaction tem-perature [116], methane partial pressure, and hydrogen partialpressure [114] also strongly influence the catalytic deactivation.The impact of reaction temperature and flow rate on methanecracking rate as well as catalytic deactivation is widely studied andboth of them are considered as having such a high influence. Themethane decomposition rate and carbon formed during thereaction done by Suelves et al. [33] over NiCuAl catalyst in a fixedbed reactor at different temperature is furnished in Tables 3 and 4.The maximum carbon deposit was observed at 700 1C, but athigher temperatures like 750 and 800 1C, catalyst were completely
Fig. 4. Mechanism proposed for hydrocarbon decomposition on Ni catalysts [111].
U.P.M. Ashik et al. / Renewable and Sustainable Energy Reviews 44 (2015) 221–256230
deactivated by producing 39 and 15.6 gC/gcat. In the opinion ofZhang et al. [45], at higher temperature the methane decomposi-tion rate is too high and hence nucleation rate of carbon too.Hence, the diffusion of carbon could not catch up with theincreased nucleation rate; thereby the surfaces of active Ni particlewere covered by the deposited carbon and the catalyst deactivatedrapidly. Table 4 shows that 141 g of carbon deposited per gcat in
60 min at a space velocity of 1200 lg�1cat
h�1. It is observed that
catalyst become completely deactivated at 480 and
1200 lg�1cat
h�1 space velocity quickly comparing with those at
lower space velocities. Moreover, the rate of carbon nucleationwould become quicker at higher space velocities which breaks thecompetitive balance exist between the carbon diffusion andnucleation. Hence, more active site would be covered with theexcess nucleated carbon and the catalyst would deactivate morerapidly. Thus, lower space velocity produce higher hydrogen andcarbon than at higher space velocities. These results clearly revealthe influence of space velocity and reaction temperature oncatalytic deactivation. Higher temperature deactivates catalystrapidly and increase hydrogen content in the post-reaction stream.On the other hand, higher space velocity diminishes hydrogencontent in the outlet gas stream and deactivates catalyst quickly.
According to Suelves et al., [33] thermal sintering of Ni particlesdoes not have any influence on catalytic deactivation. A compar-ison study on the sizes of used catalysts using powder XRDpatterns exhibit comparable sizes at both temperatures of 550and 800 1C [117]. Hence, catalyst deactivation is not the result of Nisintering during the decomposition conducted in the fixed bedreactor indicating the possibility of prevention of Ni sintering byproduced hydrogen. The formation of more ordered carbon is onlyresponsible for deactivation of catalyst at higher temperature [33].While, Ishihara et al. [118] says that the large amount of depositedcarbon is not responsible to catalyst deactivation as their 10%Ni/SiO2 catalyst actively crack methane even after depositing up toa 200-carbon atom/nickel atom ratio. NiCuAl also show lengthenactivity for several more hours even after depositing 46.8 g/gcat at150 min. This extended activity may be attributed to the catalyticactivity of formed carbon. Those observation supports the spacelimitation in the reactor while running reaction results in deacti-vation [23,119].
2.2. Carbonaceous catalysts
The hydrogen content in the initial output of TCD of methaneprocess with metal catalysts is incredibly high, but their activitydecreases very fast with time. It is clear that decrease in activityresults from the blocking of catalyst's active site by the carbonac-eous deposit produced according to Eq. (1). Formation of metalcarbide is the other main challenge of using metal catalysts. Theseproblems have partly overcome by using carbonaceous catalysts.Carbonaceous catalysts are highly stable, relatively cheap andresistant to poisoning by sulfur compounds and other elements,and undergo deactivation to a much lower degree than metalliccatalysts [120]. Carbon has been using as a catalyst [121] as well asa catalyst support [122]. The main advantages of carbon over metalcatalysts are: (1) low cost; (2) high temperature resistance;(3) tolerance to sulfur and other potentially harmful impuritiesin feedstock like amino and tarry compounds; (4) production ofmarketable by-product carbon (which could be substantiallyreduce the net cost of hydrogen production); (5) mitigation ofoverall CO2 emissions from the process; (6) higher fuel flexibility;and (7) no metal carbides formation, hence metal carbide forma-tion can make the metal catalyst regeneration more complicated
[123,124]. In TCD, carbon bears more advantages as follows:(1) produced carbon can catalyze further process, hence externalcatalyst required only for the start-up of the action, avoiding thesupply of external and usually expensive catalyst produced bysophisticated production techniques; and (2) it is not essential toseparate produced carbon from the catalyst.
Activated carbon (AC) [125], carbon black (CB) [126], coal chars[121], glassy carbon [127], MWNT [43] acetylene black [127],soot [127], graphite [43], diamond powder [127], CNT [43], full-erenes [127] and carbon materials with monolithic honeycombdesign [128] are the different carbon materials used as catalyst forTCD process. Most of the researches have been done on AC(contrived from lignocellulosic precursors like coconut, almond,peach, plum, olive, palm and cherry) and CB because of their nobleactivity and better stability [34,127,129]. TCD on carbon catalysts,such as CB, AC, ordered mesoporous carbon, CNF and graphite,needs a high activation energy (143–236 kJ/mol) and has to beoperated at higher temperatures (800–1100 1C) than on metalcatalysts [34,35,126,130–133]. Different factors are associated withactivity of carbonaceous catalyst: pore-size distribution [132,134–137], surface area [138,139], polar surface groups [44,125,140,141],structural disorders, crystallinity [137,142], flow rate [139], reac-tion temperature [143], composition of reaction gas, pressure[144], etc. While, the genuine reason behind its activity andreaction mechanism are not completely elucidated yet. Orderedmesoporous material found exhibiting higher activity because ofits reduced diffusion restriction, studies were reviewed elsewhere[145]. In general, high temperature and low methane spacevelocity favor hydrogen production (Table 5), in a similar manneras metal catalysts done.
It believes that the methane decomposition mechanism overcarbonaceous catalyst initiates with dissociative adsorption ofmethane followed by a sequence of stepwise surface dissociationreactions leading to formation of elemental carbon and hydrogen,as mentioned for metal catalyst [34]. The comprehensive mechan-ism of methane decomposition is yet to be fully elucidated.Initially methane molecules interact with chemically reactivecarbon crystallites (or other energetic abnormalities and/or activesurface radicals) to break C–H bond in order to form new C–Cbonds in a hexagon layer of carbon form. This carbon crystallitegrowth is likely to occur at the periphery of existing crystallites[34]. This is new carbon phase formation is constituted by twoprocesses named carbon nuclei formation and carbon crystallitesgrowth. The rate of carbon nuclei formation is proportional to HESdensity or substrate surface area. The research results among theAC and CB reveals that, CB has highest stability because of ease ofaccessibility for methane molecules, but its catalytic activity iscomparatively low [44,138]. While, AC shows very high initialcatalytic activity, its stability is pitiable because of the presence ofmicropores as well as the prevention of methane diffusion to ACpore by huge carbon deposit formed [5]. The activation energiesfor the activated carbons are in a range from 160 to 201 kJ/mol andthe reaction orders in a range from 0.5 to 0.6 [146]. While, thereported activation energies for the carbon blacks varied in a widerange from 148 to 236 kJ/mol and the reaction orders from 0.5 to1.0. However, these differences among various carbon materialshave not well been elucidated and moreover no definite conclu-sion has yet been made on the mechanism. Serrano et al. [131]suggest CB for short and long term reaction as it providemoderately high rate of hydrogen. On the other hand, AC is farefor short term reaction. The kinetic and deactivation studies revealthat AC undergoes fast deactivation, even having high initial rate.AC produced from coconut shells displayed the highest initialactivity producing hydrogen up to 70–75 vol%. Unfortunately, it isfollowed by dramatic drop in catalytic activity to attain a steadystate of very low hydrogen output within 3 h [88]. Very recently,
U.P.M. Ashik et al. / Renewable and Sustainable Energy Reviews 44 (2015) 221–256 231
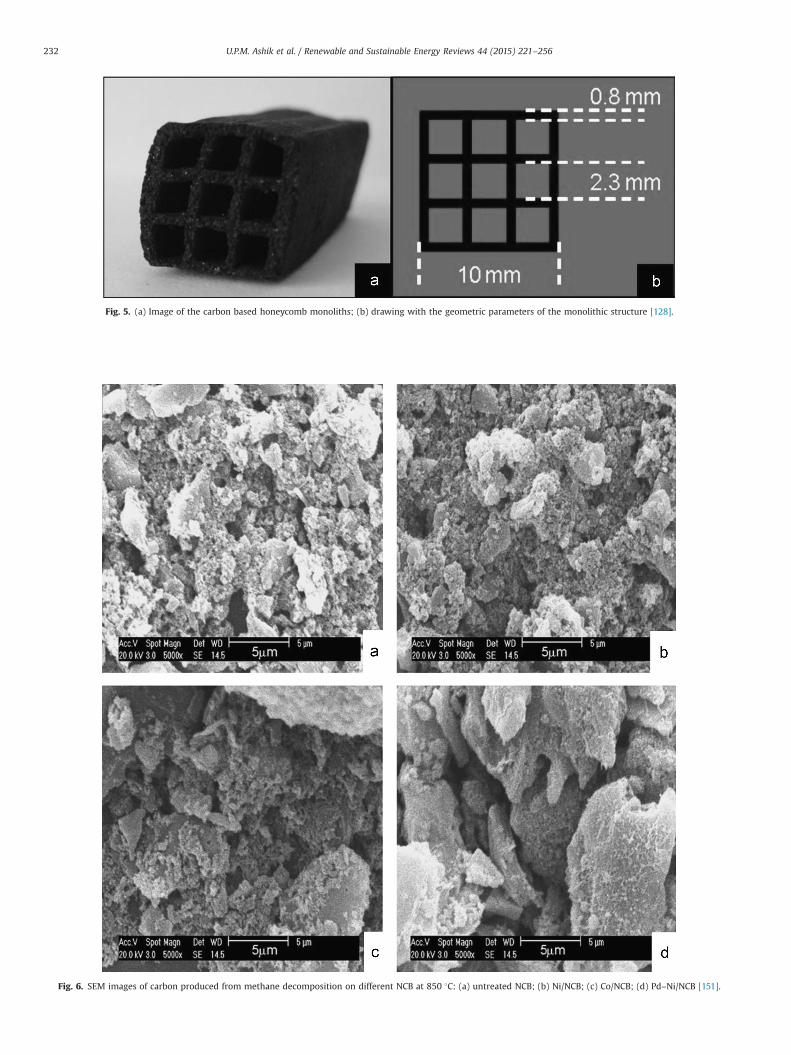
Fig. 5. (a) Image of the carbon based honeycomb monoliths; (b) drawing with the geometric parameters of the monolithic structure [128].
Fig. 6. SEM images of carbon produced from methane decomposition on different NCB at 850 1C: (a) untreated NCB; (b) Ni/NCB; (c) Co/NCB; (d) Pd–Ni/NCB [151].
U.P.M. Ashik et al. / Renewable and Sustainable Energy Reviews 44 (2015) 221–256232
Gatica et al. [128] applied monolithic honeycomb design to carbonmaterial (Fig. 5) for TCD in a mass spectrometer. Similar to othercatalysts, monoliths also undergo activity loss of 35–50%, 50–67%and 50–55% at 750, 800 and 900 1C during 1 h reaction duration,respectively. Eventually, this deactivation is similar or smallercompared to other carbon catalysts. Mass spectrometer signalanalysis reveals that TCD is highly selective towards pure hydro-gen and elemental carbon with similar amount of methanedisappearance and hydrogen production. Furthermore, monolithsshows satisfactory mechanical resistance with no characteristicchanges even after TCD process and possess efficient hydrogenproduction starting at relatively low temperature of 600 1C. Theinfluence of crystallinity and defect concentration of monoliths onits activity and nature of carbon produced frommethane are underinvestigation.
Muradov [127] studied around 30 different carbonaceouscatalysts including samples of elemental carbon, AC, CB, nanos-tructured carbons, glassy carbons, graphite, etc. and concludedthat the disordered forms of carbon (e.g., AC and CB) are cataly-tically more active than the ordered ones (e.g., graphite anddiamond). The order of activity of carbon catalysts for TCDaccording to its structure obeys the following order: amorphous4 turbostratic 4 graphite [34]. Dislocations, low-coordinationsites, vacancies, atoms with free valences, discontinuities andother energetic abnormalities on the surface of amorphous car-bons because of irregular array of carbon bonds have imperativeimpacts on the activity of carbon catalysts. Remarkably, the entiresurfaces of the catalyst do not participate in gas–solid interfacemethane decomposition, but it occurs through a dissociativeadsorption of methane molecules on surface active sites of thecatalyst [130]. This portion is termed as high-energy sites (HES)[134], can be different in each AC. Furthermore, the edges ordefects on the surface of carbon materials are generally acceptedas the active sites for decomposition [138,147].
2.2.1. Carbon catalytic activity boost by metal dopingVery recently, few researchers explored the possibility to amplify
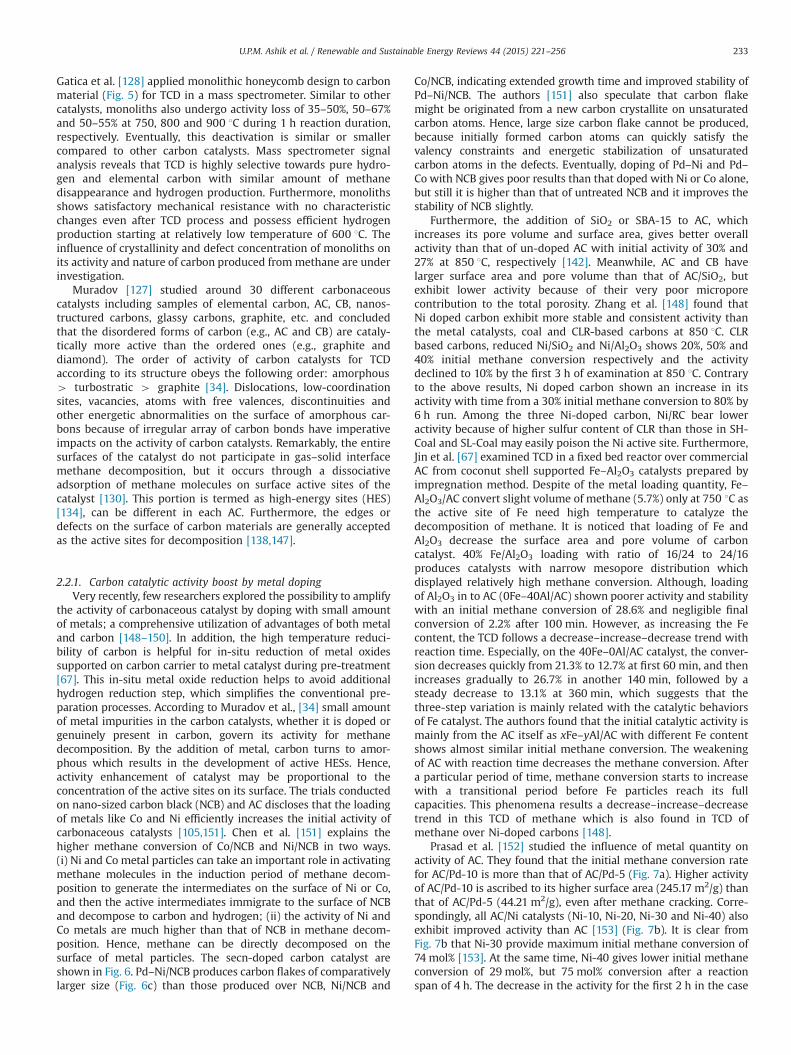
the activity of carbonaceous catalyst by doping with small amountof metals; a comprehensive utilization of advantages of both metaland carbon [148–150]. In addition, the high temperature reduci-bility of carbon is helpful for in-situ reduction of metal oxidessupported on carbon carrier to metal catalyst during pre-treatment[67]. This in-situ metal oxide reduction helps to avoid additionalhydrogen reduction step, which simplifies the conventional pre-paration processes. According to Muradov et al., [34] small amountof metal impurities in the carbon catalysts, whether it is doped orgenuinely present in carbon, govern its activity for methanedecomposition. By the addition of metal, carbon turns to amor-phous which results in the development of active HESs. Hence,activity enhancement of catalyst may be proportional to theconcentration of the active sites on its surface. The trials conductedon nano-sized carbon black (NCB) and AC discloses that the loadingof metals like Co and Ni efficiently increases the initial activity ofcarbonaceous catalysts [105,151]. Chen et al. [151] explains thehigher methane conversion of Co/NCB and Ni/NCB in two ways.(i) Ni and Co metal particles can take an important role in activatingmethane molecules in the induction period of methane decom-position to generate the intermediates on the surface of Ni or Co,and then the active intermediates immigrate to the surface of NCBand decompose to carbon and hydrogen; (ii) the activity of Ni andCo metals are much higher than that of NCB in methane decom-position. Hence, methane can be directly decomposed on thesurface of metal particles. The secn-doped carbon catalyst areshown in Fig. 6. Pd–Ni/NCB produces carbon flakes of comparativelylarger size (Fig. 6c) than those produced over NCB, Ni/NCB and
Co/NCB, indicating extended growth time and improved stability ofPd–Ni/NCB. The authors [151] also speculate that carbon flakemight be originated from a new carbon crystallite on unsaturatedcarbon atoms. Hence, large size carbon flake cannot be produced,because initially formed carbon atoms can quickly satisfy thevalency constraints and energetic stabilization of unsaturatedcarbon atoms in the defects. Eventually, doping of Pd–Ni and Pd–Co with NCB gives poor results than that doped with Ni or Co alone,but still it is higher than that of untreated NCB and it improves thestability of NCB slightly.
Furthermore, the addition of SiO2 or SBA-15 to AC, whichincreases its pore volume and surface area, gives better overallactivity than that of un-doped AC with initial activity of 30% and27% at 850 1C, respectively [142]. Meanwhile, AC and CB havelarger surface area and pore volume than that of AC/SiO2, butexhibit lower activity because of their very poor microporecontribution to the total porosity. Zhang et al. [148] found thatNi doped carbon exhibit more stable and consistent activity thanthe metal catalysts, coal and CLR-based carbons at 850 1C. CLRbased carbons, reduced Ni/SiO2 and Ni/Al2O3 shows 20%, 50% and40% initial methane conversion respectively and the activitydeclined to 10% by the first 3 h of examination at 850 1C. Contraryto the above results, Ni doped carbon shown an increase in itsactivity with time from a 30% initial methane conversion to 80% by6 h run. Among the three Ni-doped carbon, Ni/RC bear loweractivity because of higher sulfur content of CLR than those in SH-Coal and SL-Coal may easily poison the Ni active site. Furthermore,Jin et al. [67] examined TCD in a fixed bed reactor over commercialAC from coconut shell supported Fe–Al2O3 catalysts prepared byimpregnation method. Despite of the metal loading quantity, Fe–Al2O3/AC convert slight volume of methane (5.7%) only at 750 1C asthe active site of Fe need high temperature to catalyze thedecomposition of methane. It is noticed that loading of Fe andAl2O3 decrease the surface area and pore volume of carboncatalyst. 40% Fe/Al2O3 loading with ratio of 16/24 to 24/16produces catalysts with narrow mesopore distribution whichdisplayed relatively high methane conversion. Although, loadingof Al2O3 in to AC (0Fe–40Al/AC) shown poorer activity and stabilitywith an initial methane conversion of 28.6% and negligible finalconversion of 2.2% after 100 min. However, as increasing the Fecontent, the TCD follows a decrease–increase–decrease trend withreaction time. Especially, on the 40Fe–0Al/AC catalyst, the conver-sion decreases quickly from 21.3% to 12.7% at first 60 min, and thenincreases gradually to 26.7% in another 140 min, followed by asteady decrease to 13.1% at 360 min, which suggests that thethree-step variation is mainly related with the catalytic behaviorsof Fe catalyst. The authors found that the initial catalytic activity ismainly from the AC itself as xFe–yAl/AC with different Fe contentshows almost similar initial methane conversion. The weakeningof AC with reaction time decreases the methane conversion. Aftera particular period of time, methane conversion starts to increasewith a transitional period before Fe particles reach its fullcapacities. This phenomena results a decrease–increase–decreasetrend in this TCD of methane which is also found in TCD ofmethane over Ni-doped carbons [148].
Prasad et al. [152] studied the influence of metal quantity onactivity of AC. They found that the initial methane conversion ratefor AC/Pd-10 is more than that of AC/Pd-5 (Fig. 7a). Higher activityof AC/Pd-10 is ascribed to its higher surface area (245.17 m2/g) thanthat of AC/Pd-5 (44.21 m2/g), even after methane cracking. Corre-spondingly, all AC/Ni catalysts (Ni-10, Ni-20, Ni-30 and Ni-40) alsoexhibit improved activity than AC [153] (Fig. 7b). It is clear fromFig. 7b that Ni-30 provide maximum initial methane conversion of74 mol% [153]. At the same time, Ni-40 gives lower initial methaneconversion of 29 mol%, but 75 mol% conversion after a reactionspan of 4 h. The decrease in the activity for the first 2 h in the case
U.P.M. Ashik et al. / Renewable and Sustainable Energy Reviews 44 (2015) 221–256 233
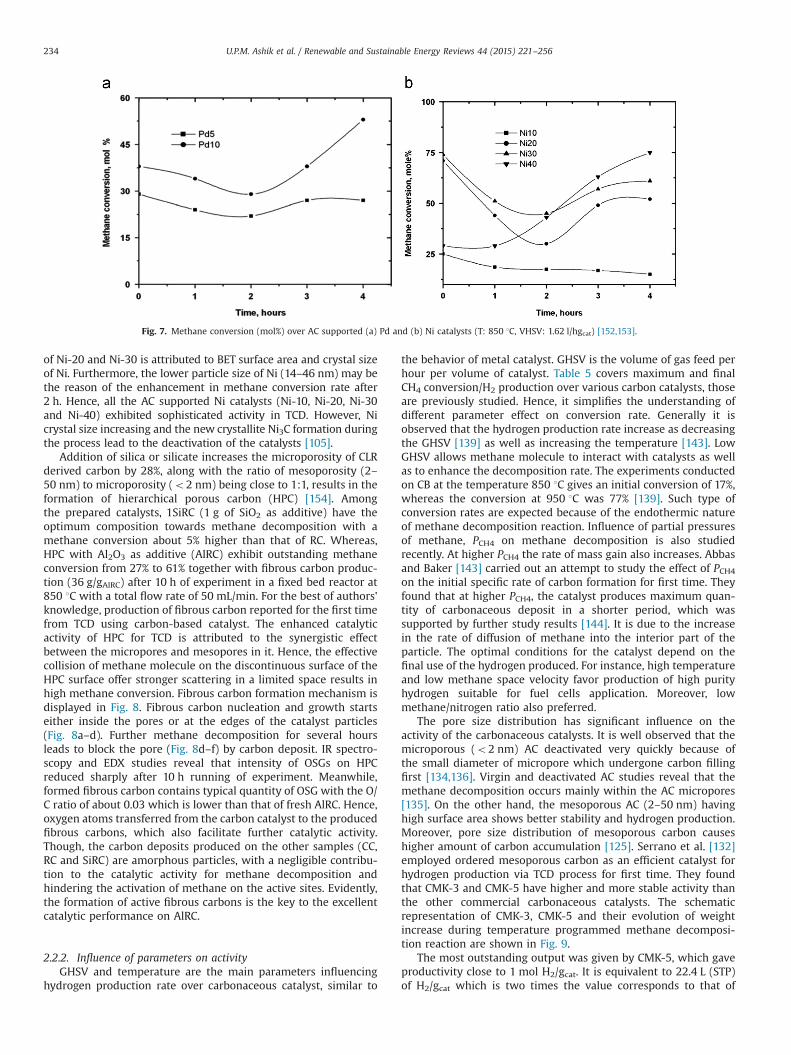
of Ni-20 and Ni-30 is attributed to BET surface area and crystal sizeof Ni. Furthermore, the lower particle size of Ni (14–46 nm) may bethe reason of the enhancement in methane conversion rate after2 h. Hence, all the AC supported Ni catalysts (Ni-10, Ni-20, Ni-30and Ni-40) exhibited sophisticated activity in TCD. However, Nicrystal size increasing and the new crystallite Ni3C formation duringthe process lead to the deactivation of the catalysts [105].
Addition of silica or silicate increases the microporosity of CLRderived carbon by 28%, along with the ratio of mesoporosity (2–50 nm) to microporosity (o2 nm) being close to 1:1, results in theformation of hierarchical porous carbon (HPC) [154]. Amongthe prepared catalysts, 1SiRC (1 g of SiO2 as additive) have theoptimum composition towards methane decomposition with amethane conversion about 5% higher than that of RC. Whereas,HPC with Al2O3 as additive (AlRC) exhibit outstanding methaneconversion from 27% to 61% together with fibrous carbon produc-tion (36 g/gAlRC) after 10 h of experiment in a fixed bed reactor at850 1C with a total flow rate of 50 mL/min. For the best of authors'knowledge, production of fibrous carbon reported for the first timefrom TCD using carbon-based catalyst. The enhanced catalyticactivity of HPC for TCD is attributed to the synergistic effectbetween the micropores and mesopores in it. Hence, the effectivecollision of methane molecule on the discontinuous surface of theHPC surface offer stronger scattering in a limited space results inhigh methane conversion. Fibrous carbon formation mechanism isdisplayed in Fig. 8. Fibrous carbon nucleation and growth startseither inside the pores or at the edges of the catalyst particles(Fig. 8a–d). Further methane decomposition for several hoursleads to block the pore (Fig. 8d–f) by carbon deposit. IR spectro-scopy and EDX studies reveal that intensity of OSGs on HPCreduced sharply after 10 h running of experiment. Meanwhile,formed fibrous carbon contains typical quantity of OSG with the O/C ratio of about 0.03 which is lower than that of fresh AlRC. Hence,oxygen atoms transferred from the carbon catalyst to the producedfibrous carbons, which also facilitate further catalytic activity.Though, the carbon deposits produced on the other samples (CC,RC and SiRC) are amorphous particles, with a negligible contribu-tion to the catalytic activity for methane decomposition andhindering the activation of methane on the active sites. Evidently,the formation of active fibrous carbons is the key to the excellentcatalytic performance on AlRC.
2.2.2. Influence of parameters on activityGHSV and temperature are the main parameters influencing
hydrogen production rate over carbonaceous catalyst, similar to
the behavior of metal catalyst. GHSV is the volume of gas feed perhour per volume of catalyst. Table 5 covers maximum and finalCH4 conversion/H2 production over various carbon catalysts, thoseare previously studied. Hence, it simplifies the understanding ofdifferent parameter effect on conversion rate. Generally it isobserved that the hydrogen production rate increase as decreasingthe GHSV [139] as well as increasing the temperature [143]. LowGHSV allows methane molecule to interact with catalysts as wellas to enhance the decomposition rate. The experiments conductedon CB at the temperature 850 1C gives an initial conversion of 17%,whereas the conversion at 950 1C was 77% [139]. Such type ofconversion rates are expected because of the endothermic natureof methane decomposition reaction. Influence of partial pressuresof methane, PCH4 on methane decomposition is also studiedrecently. At higher PCH4 the rate of mass gain also increases. Abbasand Baker [143] carried out an attempt to study the effect of PCH4on the initial specific rate of carbon formation for first time. Theyfound that at higher PCH4, the catalyst produces maximum quan-tity of carbonaceous deposit in a shorter period, which wassupported by further study results [144]. It is due to the increasein the rate of diffusion of methane into the interior part of theparticle. The optimal conditions for the catalyst depend on thefinal use of the hydrogen produced. For instance, high temperatureand low methane space velocity favor production of high purityhydrogen suitable for fuel cells application. Moreover, lowmethane/nitrogen ratio also preferred.
The pore size distribution has significant influence on theactivity of the carbonaceous catalysts. It is well observed that themicroporous (o2 nm) AC deactivated very quickly because ofthe small diameter of micropore which undergone carbon fillingfirst [134,136]. Virgin and deactivated AC studies reveal that themethane decomposition occurs mainly within the AC micropores[135]. On the other hand, the mesoporous AC (2–50 nm) havinghigh surface area shows better stability and hydrogen production.Moreover, pore size distribution of mesoporous carbon causeshigher amount of carbon accumulation [125]. Serrano et al. [132]employed ordered mesoporous carbon as an efficient catalyst forhydrogen production via TCD process for first time. They foundthat CMK-3 and CMK-5 have higher and more stable activity thanthe other commercial carbonaceous catalysts. The schematicrepresentation of CMK-3, CMK-5 and their evolution of weightincrease during temperature programmed methane decomposi-tion reaction are shown in Fig. 9.
The most outstanding output was given by CMK-5, which gaveproductivity close to 1 mol H2/gcat. It is equivalent to 22.4 L (STP)of H2/gcat which is two times the value corresponds to that of
Fig. 7. Methane conversion (mol%) over AC supported (a) Pd and (b) Ni catalysts (T: 850 1C, VHSV: 1.62 l/hgcat) [152,153].
U.P.M. Ashik et al. / Renewable and Sustainable Energy Reviews 44 (2015) 221–256234
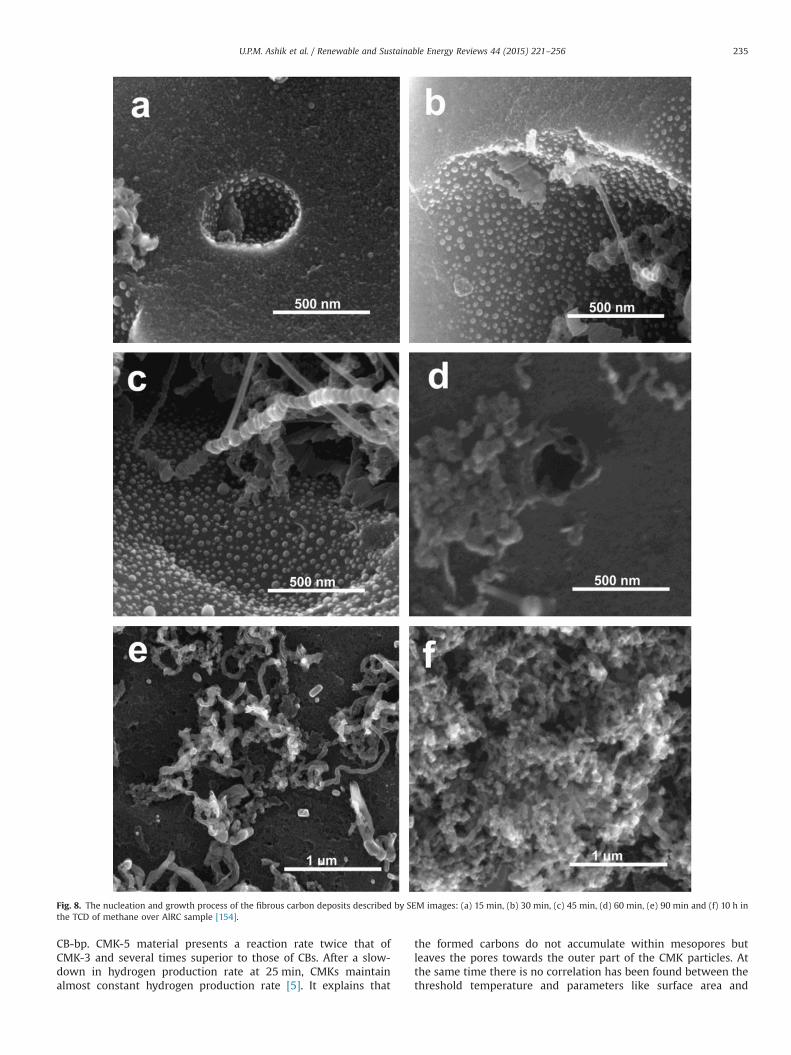
CB-bp. CMK-5 material presents a reaction rate twice that ofCMK-3 and several times superior to those of CBs. After a slow-down in hydrogen production rate at 25 min, CMKs maintainalmost constant hydrogen production rate [5]. It explains that
the formed carbons do not accumulate within mesopores butleaves the pores towards the outer part of the CMK particles. Atthe same time there is no correlation has been found between thethreshold temperature and parameters like surface area and
Fig. 8. The nucleation and growth process of the fibrous carbon deposits described by SEM images: (a) 15 min, (b) 30 min, (c) 45 min, (d) 60 min, (e) 90 min and (f) 10 h inthe TCD of methane over AlRC sample [154].
U.P.M. Ashik et al. / Renewable and Sustainable Energy Reviews 44 (2015) 221–256 235
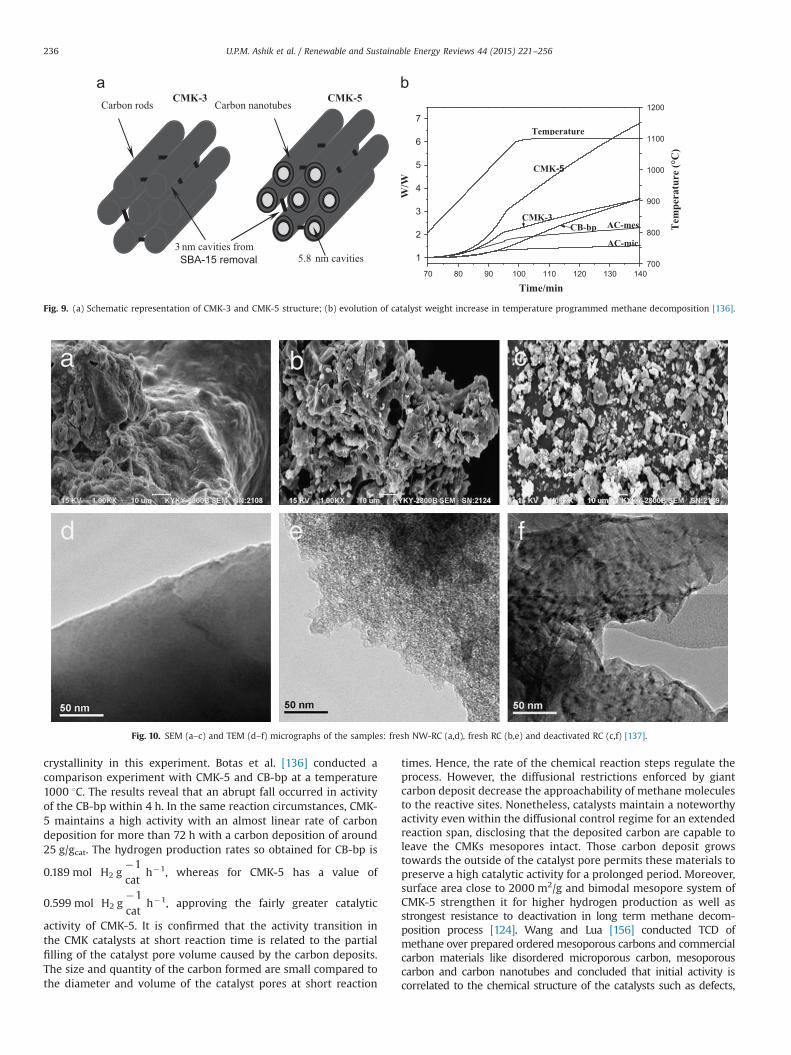
crystallinity in this experiment. Botas et al. [136] conducted acomparison experiment with CMK-5 and CB-bp at a temperature1000 1C. The results reveal that an abrupt fall occurred in activityof the CB-bp within 4 h. In the same reaction circumstances, CMK-5 maintains a high activity with an almost linear rate of carbondeposition for more than 72 h with a carbon deposition of around25 g/gcat. The hydrogen production rates so obtained for CB-bp is
0.189 mol H2 g�1cat
h�1, whereas for CMK-5 has a value of
0.599 mol H2 g�1cat
h�1, approving the fairly greater catalytic
activity of CMK-5. It is confirmed that the activity transition inthe CMK catalysts at short reaction time is related to the partialfilling of the catalyst pore volume caused by the carbon deposits.The size and quantity of the carbon formed are small compared tothe diameter and volume of the catalyst pores at short reaction
times. Hence, the rate of the chemical reaction steps regulate theprocess. However, the diffusional restrictions enforced by giantcarbon deposit decrease the approachability of methane moleculesto the reactive sites. Nonetheless, catalysts maintain a noteworthyactivity even within the diffusional control regime for an extendedreaction span, disclosing that the deposited carbon are capable toleave the CMKs mesopores intact. Those carbon deposit growstowards the outside of the catalyst pore permits these materials topreserve a high catalytic activity for a prolonged period. Moreover,surface area close to 2000 m2/g and bimodal mesopore system ofCMK-5 strengthen it for higher hydrogen production as well asstrongest resistance to deactivation in long term methane decom-position process [124]. Wang and Lua [156] conducted TCD ofmethane over prepared ordered mesoporous carbons and commercialcarbon materials like disordered microporous carbon, mesoporouscarbon and carbon nanotubes and concluded that initial activity iscorrelated to the chemical structure of the catalysts such as defects,
CMK-3 Carbon rods
CMK-5
3 nm cavities from SBA-15 removal
Carbon nanotubes
nm cavities5.890 1301201101008070 140
1
2
3
4
5
6
7
700
800
900
1000
1100
1200
AC-mes
Temperature
AC-mic
CMK-3
CMK-5
CB-bp
W/W
Tem
pera
ture
(°C
)
Time/min
Fig. 9. (a) Schematic representation of CMK-3 and CMK-5 structure; (b) evolution of catalyst weight increase in temperature programmed methane decomposition [136].
Fig. 10. SEM (a–c) and TEM (d–f) micrographs of the samples: fresh NW-RC (a,d), fresh RC (b,e) and deactivated RC (c,f) [137].
U.P.M. Ashik et al. / Renewable and Sustainable Energy Reviews 44 (2015) 221–256236
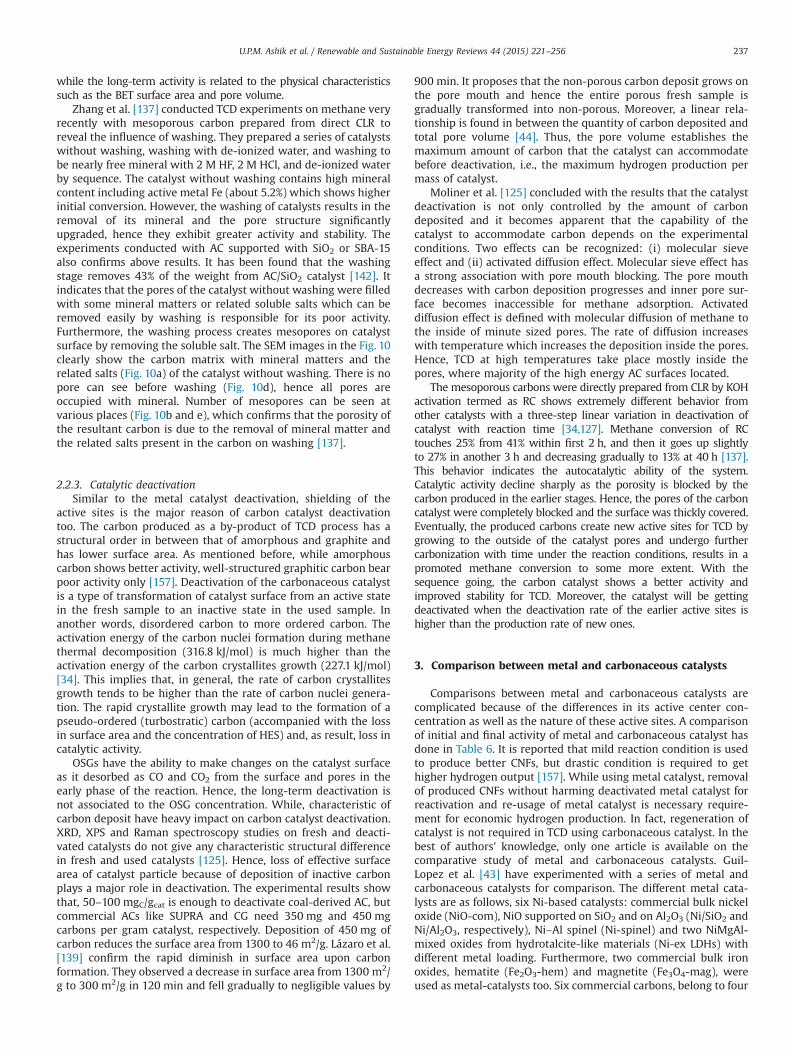
while the long-term activity is related to the physical characteristicssuch as the BET surface area and pore volume.
Zhang et al. [137] conducted TCD experiments on methane veryrecently with mesoporous carbon prepared from direct CLR toreveal the influence of washing. They prepared a series of catalystswithout washing, washing with de-ionized water, and washing tobe nearly free mineral with 2 M HF, 2 M HCl, and de-ionized waterby sequence. The catalyst without washing contains high mineralcontent including active metal Fe (about 5.2%) which shows higherinitial conversion. However, the washing of catalysts results in theremoval of its mineral and the pore structure significantlyupgraded, hence they exhibit greater activity and stability. Theexperiments conducted with AC supported with SiO2 or SBA-15also confirms above results. It has been found that the washingstage removes 43% of the weight from AC/SiO2 catalyst [142]. Itindicates that the pores of the catalyst without washing were filledwith some mineral matters or related soluble salts which can beremoved easily by washing is responsible for its poor activity.Furthermore, the washing process creates mesopores on catalystsurface by removing the soluble salt. The SEM images in the Fig. 10clearly show the carbon matrix with mineral matters and therelated salts (Fig. 10a) of the catalyst without washing. There is nopore can see before washing (Fig. 10d), hence all pores areoccupied with mineral. Number of mesopores can be seen atvarious places (Fig. 10b and e), which confirms that the porosity ofthe resultant carbon is due to the removal of mineral matter andthe related salts present in the carbon on washing [137].
2.2.3. Catalytic deactivationSimilar to the metal catalyst deactivation, shielding of the
active sites is the major reason of carbon catalyst deactivationtoo. The carbon produced as a by-product of TCD process has astructural order in between that of amorphous and graphite andhas lower surface area. As mentioned before, while amorphouscarbon shows better activity, well-structured graphitic carbon bearpoor activity only [157]. Deactivation of the carbonaceous catalystis a type of transformation of catalyst surface from an active statein the fresh sample to an inactive state in the used sample. Inanother words, disordered carbon to more ordered carbon. Theactivation energy of the carbon nuclei formation during methanethermal decomposition (316.8 kJ/mol) is much higher than theactivation energy of the carbon crystallites growth (227.1 kJ/mol)[34]. This implies that, in general, the rate of carbon crystallitesgrowth tends to be higher than the rate of carbon nuclei genera-tion. The rapid crystallite growth may lead to the formation of apseudo-ordered (turbostratic) carbon (accompanied with the lossin surface area and the concentration of HES) and, as result, loss incatalytic activity.
OSGs have the ability to make changes on the catalyst surfaceas it desorbed as CO and CO2 from the surface and pores in theearly phase of the reaction. Hence, the long-term deactivation isnot associated to the OSG concentration. While, characteristic ofcarbon deposit have heavy impact on carbon catalyst deactivation.XRD, XPS and Raman spectroscopy studies on fresh and deacti-vated catalysts do not give any characteristic structural differencein fresh and used catalysts [125]. Hence, loss of effective surfacearea of catalyst particle because of deposition of inactive carbonplays a major role in deactivation. The experimental results showthat, 50–100 mgC/gcat is enough to deactivate coal-derived AC, butcommercial ACs like SUPRA and CG need 350 mg and 450 mgcarbons per gram catalyst, respectively. Deposition of 450 mg ofcarbon reduces the surface area from 1300 to 46 m2/g. Lázaro et al.[139] confirm the rapid diminish in surface area upon carbonformation. They observed a decrease in surface area from 1300 m2/g to 300 m2/g in 120 min and fell gradually to negligible values by
900 min. It proposes that the non-porous carbon deposit grows onthe pore mouth and hence the entire porous fresh sample isgradually transformed into non-porous. Moreover, a linear rela-tionship is found in between the quantity of carbon deposited andtotal pore volume [44]. Thus, the pore volume establishes themaximum amount of carbon that the catalyst can accommodatebefore deactivation, i.e., the maximum hydrogen production permass of catalyst.
Moliner et al. [125] concluded with the results that the catalystdeactivation is not only controlled by the amount of carbondeposited and it becomes apparent that the capability of thecatalyst to accommodate carbon depends on the experimentalconditions. Two effects can be recognized: (i) molecular sieveeffect and (ii) activated diffusion effect. Molecular sieve effect hasa strong association with pore mouth blocking. The pore mouthdecreases with carbon deposition progresses and inner pore sur-face becomes inaccessible for methane adsorption. Activateddiffusion effect is defined with molecular diffusion of methane tothe inside of minute sized pores. The rate of diffusion increaseswith temperature which increases the deposition inside the pores.Hence, TCD at high temperatures take place mostly inside thepores, where majority of the high energy AC surfaces located.
The mesoporous carbons were directly prepared from CLR by KOHactivation termed as RC shows extremely different behavior fromother catalysts with a three-step linear variation in deactivation ofcatalyst with reaction time [34,127]. Methane conversion of RCtouches 25% from 41% within first 2 h, and then it goes up slightlyto 27% in another 3 h and decreasing gradually to 13% at 40 h [137].This behavior indicates the autocatalytic ability of the system.Catalytic activity decline sharply as the porosity is blocked by thecarbon produced in the earlier stages. Hence, the pores of the carboncatalyst were completely blocked and the surface was thickly covered.Eventually, the produced carbons create new active sites for TCD bygrowing to the outside of the catalyst pores and undergo furthercarbonization with time under the reaction conditions, results in apromoted methane conversion to some more extent. With thesequence going, the carbon catalyst shows a better activity andimproved stability for TCD. Moreover, the catalyst will be gettingdeactivated when the deactivation rate of the earlier active sites ishigher than the production rate of new ones.
3. Comparison between metal and carbonaceous catalysts
Comparisons between metal and carbonaceous catalysts arecomplicated because of the differences in its active center con-centration as well as the nature of these active sites. A comparisonof initial and final activity of metal and carbonaceous catalyst hasdone in Table 6. It is reported that mild reaction condition is usedto produce better CNFs, but drastic condition is required to gethigher hydrogen output [157]. While using metal catalyst, removalof produced CNFs without harming deactivated metal catalyst forreactivation and re-usage of metal catalyst is necessary require-ment for economic hydrogen production. In fact, regeneration ofcatalyst is not required in TCD using carbonaceous catalyst. In thebest of authors' knowledge, only one article is available on thecomparative study of metal and carbonaceous catalysts. Guil-Lopez et al. [43] have experimented with a series of metal andcarbonaceous catalysts for comparison. The different metal cata-lysts are as follows, six Ni-based catalysts: commercial bulk nickeloxide (NiO-com), NiO supported on SiO2 and on Al2O3 (Ni/SiO2 andNi/Al2O3, respectively), Ni–Al spinel (Ni-spinel) and two NiMgAl-mixed oxides from hydrotalcite-like materials (Ni-ex LDHs) withdifferent metal loading. Furthermore, two commercial bulk ironoxides, hematite (Fe2O3-hem) and magnetite (Fe3O4-mag), wereused as metal-catalysts too. Six commercial carbons, belong to four
U.P.M. Ashik et al. / Renewable and Sustainable Energy Reviews 44 (2015) 221–256 237
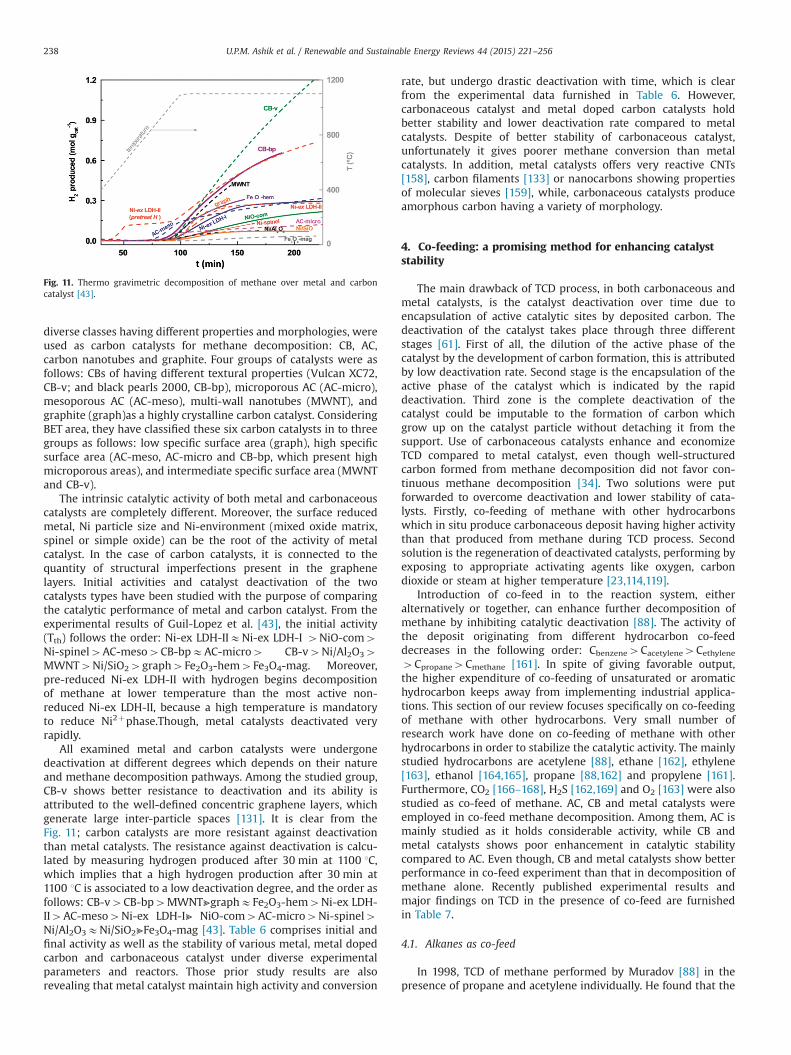
diverse classes having different properties and morphologies, wereused as carbon catalysts for methane decomposition: CB, AC,carbon nanotubes and graphite. Four groups of catalysts were asfollows: CBs of having different textural properties (Vulcan XC72,CB-v; and black pearls 2000, CB-bp), microporous AC (AC-micro),mesoporous AC (AC-meso), multi-wall nanotubes (MWNT), andgraphite (graph)as a highly crystalline carbon catalyst. ConsideringBET area, they have classified these six carbon catalysts in to threegroups as follows: low specific surface area (graph), high specificsurface area (AC-meso, AC-micro and CB-bp, which present highmicroporous areas), and intermediate specific surface area (MWNTand CB-v).
The intrinsic catalytic activity of both metal and carbonaceouscatalysts are completely different. Moreover, the surface reducedmetal, Ni particle size and Ni-environment (mixed oxide matrix,spinel or simple oxide) can be the root of the activity of metalcatalyst. In the case of carbon catalysts, it is connected to thequantity of structural imperfections present in the graphenelayers. Initial activities and catalyst deactivation of the twocatalysts types have been studied with the purpose of comparingthe catalytic performance of metal and carbon catalyst. From theexperimental results of Guil-Lopez et al. [43], the initial activity(Tth) follows the order: Ni-ex LDH-IIENi-ex LDH-I 4NiO-com4Ni-spinel4AC-meso4CB-bpEAC-micro4 CB-v4Ni/Al2O34MWNT4Ni/SiO24graph4Fe2O3-hem4Fe3O4-mag. Moreover,pre-reduced Ni-ex LDH-II with hydrogen begins decompositionof methane at lower temperature than the most active non-reduced Ni-ex LDH-II, because a high temperature is mandatoryto reduce Ni2þphase.Though, metal catalysts deactivated veryrapidly.
All examined metal and carbon catalysts were undergonedeactivation at different degrees which depends on their natureand methane decomposition pathways. Among the studied group,CB-v shows better resistance to deactivation and its ability isattributed to the well-defined concentric graphene layers, whichgenerate large inter-particle spaces [131]. It is clear from theFig. 11; carbon catalysts are more resistant against deactivationthan metal catalysts. The resistance against deactivation is calcu-lated by measuring hydrogen produced after 30 min at 1100 1C,which implies that a high hydrogen production after 30 min at1100 1C is associated to a low deactivation degree, and the order asfollows: CB-v4CB-bp4MWNT⪢graphEFe2O3-hem4Ni-ex LDH-II4AC-meso4Ni-ex LDH-I⪢ NiO-com4AC-micro4Ni-spinel4Ni/Al2O3ENi/SiO2⪢Fe3O4-mag [43]. Table 6 comprises initial andfinal activity as well as the stability of various metal, metal dopedcarbon and carbonaceous catalyst under diverse experimentalparameters and reactors. Those prior study results are alsorevealing that metal catalyst maintain high activity and conversion
rate, but undergo drastic deactivation with time, which is clearfrom the experimental data furnished in Table 6. However,carbonaceous catalyst and metal doped carbon catalysts holdbetter stability and lower deactivation rate compared to metalcatalysts. Despite of better stability of carbonaceous catalyst,unfortunately it gives poorer methane conversion than metalcatalysts. In addition, metal catalysts offers very reactive CNTs[158], carbon filaments [133] or nanocarbons showing propertiesof molecular sieves [159], while, carbonaceous catalysts produceamorphous carbon having a variety of morphology.
4. Co-feeding: a promising method for enhancing catalyststability
The main drawback of TCD process, in both carbonaceous andmetal catalysts, is the catalyst deactivation over time due toencapsulation of active catalytic sites by deposited carbon. Thedeactivation of the catalyst takes place through three differentstages [61]. First of all, the dilution of the active phase of thecatalyst by the development of carbon formation, this is attributedby low deactivation rate. Second stage is the encapsulation of theactive phase of the catalyst which is indicated by the rapiddeactivation. Third zone is the complete deactivation of thecatalyst could be imputable to the formation of carbon whichgrow up on the catalyst particle without detaching it from thesupport. Use of carbonaceous catalysts enhance and economizeTCD compared to metal catalyst, even though well-structuredcarbon formed from methane decomposition did not favor con-tinuous methane decomposition [34]. Two solutions were putforwarded to overcome deactivation and lower stability of cata-lysts. Firstly, co-feeding of methane with other hydrocarbonswhich in situ produce carbonaceous deposit having higher activitythan that produced from methane during TCD process. Secondsolution is the regeneration of deactivated catalysts, performing byexposing to appropriate activating agents like oxygen, carbondioxide or steam at higher temperature [23,114,119].
Introduction of co-feed in to the reaction system, eitheralternatively or together, can enhance further decomposition ofmethane by inhibiting catalytic deactivation [88]. The activity ofthe deposit originating from different hydrocarbon co-feeddecreases in the following order: Cbenzene4Cacetylene4Cethylene
4Cpropane4Cmethane [161]. In spite of giving favorable output,the higher expenditure of co-feeding of unsaturated or aromatichydrocarbon keeps away from implementing industrial applica-tions. This section of our review focuses specifically on co-feedingof methane with other hydrocarbons. Very small number ofresearch work have done on co-feeding of methane with otherhydrocarbons in order to stabilize the catalytic activity. The mainlystudied hydrocarbons are acetylene [88], ethane [162], ethylene[163], ethanol [164,165], propane [88,162] and propylene [161].Furthermore, CO2 [166–168], H2S [162,169] and O2 [163] were alsostudied as co-feed of methane. AC, CB and metal catalysts wereemployed in co-feed methane decomposition. Among them, AC ismainly studied as it holds considerable activity, while CB andmetal catalysts shows poor enhancement in catalytic stabilitycompared to AC. Even though, CB and metal catalysts show betterperformance in co-feed experiment than that in decomposition ofmethane alone. Recently published experimental results andmajor findings on TCD in the presence of co-feed are furnishedin Table 7.
4.1. Alkanes as co-feed
In 1998, TCD of methane performed by Muradov [88] in thepresence of propane and acetylene individually. He found that the
Fig. 11. Thermo gravimetric decomposition of methane over metal and carboncatalyst [43].
U.P.M. Ashik et al. / Renewable and Sustainable Energy Reviews 44 (2015) 221–256238
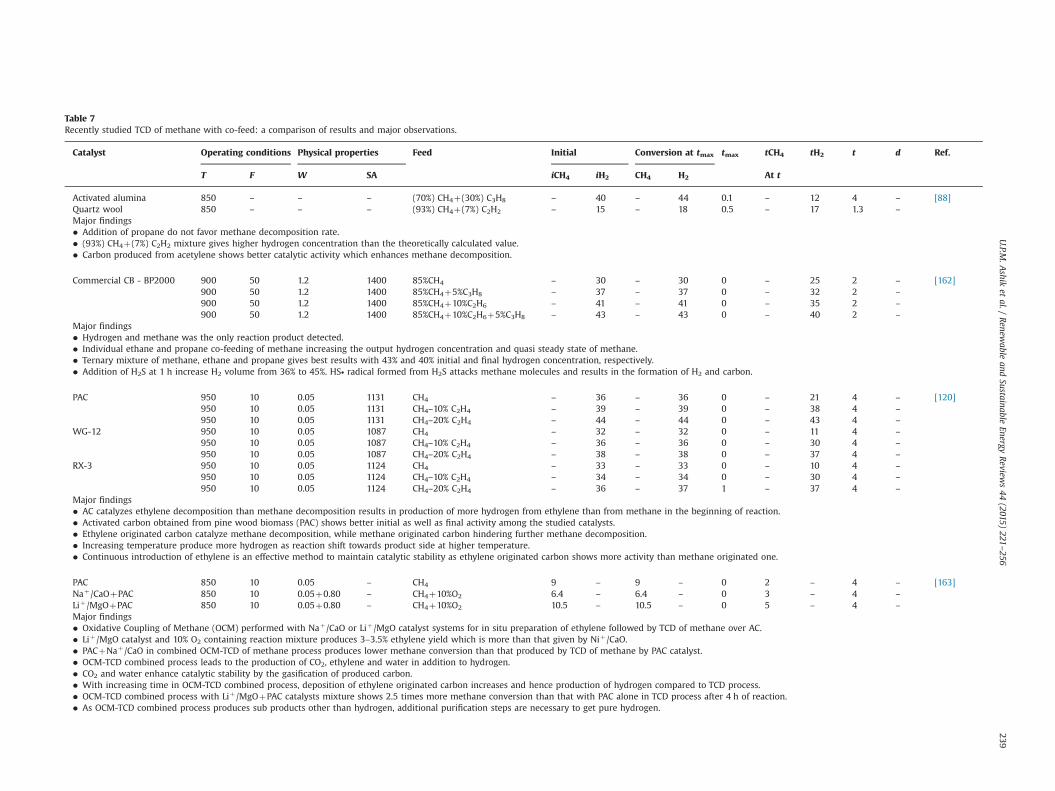
Table 7Recently studied TCD of methane with co-feed: a comparison of results and major observations.
Catalyst Operating conditions Physical properties Feed Initial Conversion at tmax tmax tCH4 tH2 t d Ref.
T F W SA iCH4 iH2 CH4 H2 At t
Activated alumina 850 – – – (70%) CH4þ(30%) C3H8 – 40 – 44 0.1 – 12 4 – [88]Quartz wool 850 – – – (93%) CH4þ(7%) C2H2 – 15 – 18 0.5 – 17 1.3 –
Major findings� Addition of propane do not favor methane decomposition rate.� (93%) CH4þ(7%) C2H2 mixture gives higher hydrogen concentration than the theoretically calculated value.� Carbon produced from acetylene shows better catalytic activity which enhances methane decomposition.
Commercial CB - BP2000 900 50 1.2 1400 85%CH4 – 30 – 30 0 – 25 2 – [162]900 50 1.2 1400 85%CH4þ5%C3H8 – 37 – 37 0 – 32 2 –
900 50 1.2 1400 85%CH4þ10%C2H6 – 41 – 41 0 – 35 2 –
900 50 1.2 1400 85%CH4þ10%C2H6þ5%C3H8 – 43 – 43 0 – 40 2 –
Major findings� Hydrogen and methane was the only reaction product detected.� Individual ethane and propane co-feeding of methane increasing the output hydrogen concentration and quasi steady state of methane.� Ternary mixture of methane, ethane and propane gives best results with 43% and 40% initial and final hydrogen concentration, respectively.� Addition of H2S at 1 h increase H2 volume from 36% to 45%. HS∙ radical formed from H2S attacks methane molecules and results in the formation of H2 and carbon.
PAC 950 10 0.05 1131 CH4 – 36 – 36 0 – 21 4 – [120]950 10 0.05 1131 CH4–10% C2H4 – 39 – 39 0 – 38 4 –
950 10 0.05 1131 CH4–20% C2H4 – 44 – 44 0 – 43 4 –
WG-12 950 10 0.05 1087 CH4 – 32 – 32 0 – 11 4 –
950 10 0.05 1087 CH4–10% C2H4 – 36 – 36 0 – 30 4 –
950 10 0.05 1087 CH4–20% C2H4 – 38 – 38 0 – 37 4 –
RX-3 950 10 0.05 1124 CH4 – 33 – 33 0 – 10 4 –
950 10 0.05 1124 CH4–10% C2H4 – 34 – 34 0 – 30 4 –
950 10 0.05 1124 CH4–20% C2H4 – 36 – 37 1 – 37 4 –
Major findings� AC catalyzes ethylene decomposition than methane decomposition results in production of more hydrogen from ethylene than from methane in the beginning of reaction.� Activated carbon obtained from pine wood biomass (PAC) shows better initial as well as final activity among the studied catalysts.� Ethylene originated carbon catalyze methane decomposition, while methane originated carbon hindering further methane decomposition.� Increasing temperature produce more hydrogen as reaction shift towards product side at higher temperature.� Continuous introduction of ethylene is an effective method to maintain catalytic stability as ethylene originated carbon shows more activity than methane originated one.
PAC 850 10 0.05 – CH4 9 – 9 – 0 2 – 4 – [163]Naþ/CaOþPAC 850 10 0.05þ0.80 – CH4þ10%O2 6.4 – 6.4 – 0 3 – 4 –
Liþ/MgOþPAC 850 10 0.05þ0.80 – CH4þ10%O2 10.5 – 10.5 – 0 5 – 4 –
Major findings� Oxidative Coupling of Methane (OCM) performed with Naþ/CaO or Liþ/MgO catalyst systems for in situ preparation of ethylene followed by TCD of methane over AC.� Liþ/MgO catalyst and 10% O2 containing reaction mixture produces 3–3.5% ethylene yield which is more than that given by Niþ/CaO.� PACþNaþ/CaO in combined OCM-TCD of methane process produces lower methane conversion than that produced by TCD of methane by PAC catalyst.� OCM-TCD combined process leads to the production of CO2, ethylene and water in addition to hydrogen.� CO2 and water enhance catalytic stability by the gasification of produced carbon.� With increasing time in OCM-TCD combined process, deposition of ethylene originated carbon increases and hence production of hydrogen compared to TCD process.� OCM-TCD combined process with Liþ/MgOþPAC catalysts mixture shows 2.5 times more methane conversion than that with PAC alone in TCD process after 4 h of reaction.� As OCM-TCD combined process produces sub products other than hydrogen, additional purification steps are necessary to get pure hydrogen.
U.P.M
.Ashik
etal./
Renew
ableand
SustainableEnergy
Review
s44
(2015)221
–256239
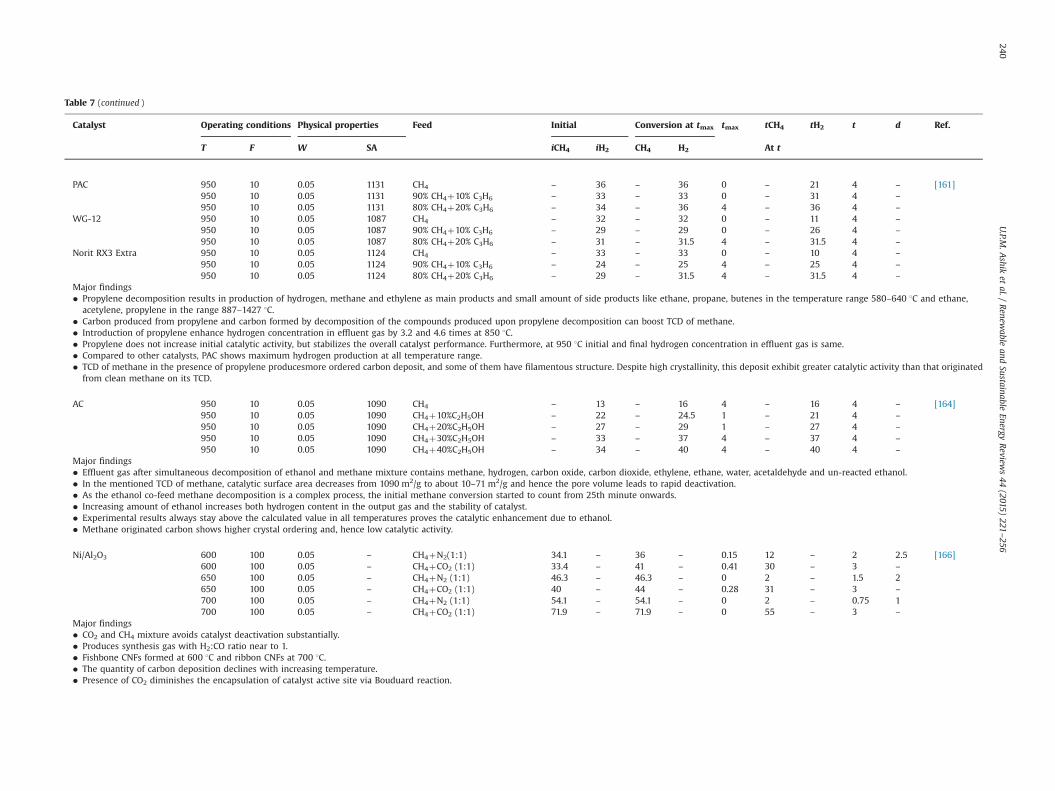
Table 7 (continued )
Catalyst Operating conditions Physical properties Feed Initial Conversion at tmax tmax tCH4 tH2 t d Ref.
T F W SA iCH4 iH2 CH4 H2 At t
PAC 950 10 0.05 1131 CH4 – 36 – 36 0 – 21 4 – [161]950 10 0.05 1131 90% CH4þ10% C3H6 – 33 – 33 0 – 31 4 –
950 10 0.05 1131 80% CH4þ20% C3H6 – 34 – 36 4 – 36 4 –
WG-12 950 10 0.05 1087 CH4 – 32 – 32 0 – 11 4 –
950 10 0.05 1087 90% CH4þ10% C3H6 – 29 – 29 0 – 26 4 –
950 10 0.05 1087 80% CH4þ20% C3H6 – 31 – 31.5 4 – 31.5 4 –
Norit RX3 Extra 950 10 0.05 1124 CH4 – 33 – 33 0 – 10 4 –
950 10 0.05 1124 90% CH4þ10% C3H6 – 24 – 25 4 – 25 4 –
950 10 0.05 1124 80% CH4þ20% C3H6 – 29 – 31.5 4 – 31.5 4 –
Major findings� Propylene decomposition results in production of hydrogen, methane and ethylene as main products and small amount of side products like ethane, propane, butenes in the temperature range 580–640 1C and ethane,
acetylene, propylene in the range 887–1427 1C.� Carbon produced from propylene and carbon formed by decomposition of the compounds produced upon propylene decomposition can boost TCD of methane.� Introduction of propylene enhance hydrogen concentration in effluent gas by 3.2 and 4.6 times at 850 1C.� Propylene does not increase initial catalytic activity, but stabilizes the overall catalyst performance. Furthermore, at 950 1C initial and final hydrogen concentration in effluent gas is same.� Compared to other catalysts, PAC shows maximum hydrogen production at all temperature range.� TCD of methane in the presence of propylene producesmore ordered carbon deposit, and some of them have filamentous structure. Despite high crystallinity, this deposit exhibit greater catalytic activity than that originated
from clean methane on its TCD.
AC 950 10 0.05 1090 CH4 – 13 – 16 4 – 16 4 – [164]950 10 0.05 1090 CH4þ10%C2H5OH – 22 – 24.5 1 – 21 4 –
950 10 0.05 1090 CH4þ20%C2H5OH – 27 – 29 1 – 27 4 –
950 10 0.05 1090 CH4þ30%C2H5OH – 33 – 37 4 – 37 4 –
950 10 0.05 1090 CH4þ40%C2H5OH – 34 – 40 4 – 40 4 –
Major findings� Effluent gas after simultaneous decomposition of ethanol and methane mixture contains methane, hydrogen, carbon oxide, carbon dioxide, ethylene, ethane, water, acetaldehyde and un-reacted ethanol.� In the mentioned TCD of methane, catalytic surface area decreases from 1090 m2/g to about 10–71 m2/g and hence the pore volume leads to rapid deactivation.� As the ethanol co-feed methane decomposition is a complex process, the initial methane conversion started to count from 25th minute onwards.� Increasing amount of ethanol increases both hydrogen content in the output gas and the stability of catalyst.� Experimental results always stay above the calculated value in all temperatures proves the catalytic enhancement due to ethanol.� Methane originated carbon shows higher crystal ordering and, hence low catalytic activity.
Ni/Al2O3 600 100 0.05 – CH4þN2(1:1) 34.1 – 36 – 0.15 12 – 2 2.5 [166]600 100 0.05 – CH4þCO2 (1:1) 33.4 – 41 – 0.41 30 – 3 –
650 100 0.05 – CH4þN2 (1:1) 46.3 – 46.3 – 0 2 – 1.5 2650 100 0.05 – CH4þCO2 (1:1) 40 – 44 – 0.28 31 – 3 –
700 100 0.05 – CH4þN2 (1:1) 54.1 – 54.1 – 0 2 – 0.75 1700 100 0.05 – CH4þCO2 (1:1) 71.9 – 71.9 – 0 55 – 3 –
Major findings� CO2 and CH4 mixture avoids catalyst deactivation substantially.� Produces synthesis gas with H2:CO ratio near to 1.� Fishbone CNFs formed at 600 1C and ribbon CNFs at 700 1C.� The quantity of carbon deposition declines with increasing temperature.� Presence of CO2 diminishes the encapsulation of catalyst active site via Bouduard reaction.
U.P.M
.Ashik
etal./
Renew
ableand
SustainableEnergy
Review
s44
(2015)221
–256240
addition of 30 vol% propane did not give pleasing conversion ofmethane over activated alumina. Moreover, the hydrogen produc-tion is decreased from an initial value of 40 to 12 vol% in 4 h.While, the activity of quartz wool for TCD were maintain almostconsistent for around 1.5 h by the introduction of acetylene tomethane, and it shown better hydrogen content in the final stagethan the initial conversion. This better final catalytic activityattributed to the carbon produced from acetylene. MesoporousCB (BP2000) of having surface area 1400 m2/g has been employedto decompose binary mixture of methane–ethane and methane–propane as well as ternary mixture of methane–ethane–propane[162]. The decomposition of methane–propane mixture margin-ally surges the concentration of hydrogen at the quasi-steady state,reaching 32% from 25% in methane only decomposition. The bestresult was given by ternary mixture with initial hydrogen produc-tion of 43 and 40 vol% after 2 h. Ethane and/or propane introduc-tion to the TCD process using the BP2000 catalyst has a promotingeffect, given that concentration of hydrogen in the post-reactionstream improved primarily because of the contribution of hydro-gen present in those hydrocarbons. Moreover, a stable hydrogenconcentration is observed in the effluent stream of TCD in thepresence of ethane and propane indicating that the carbondeposited from them does not aggravate deactivation of BP2000catalyst.
4.2. Ethylene as co-feed
Ethylene originated carbon shows higher activity towardsmethane decomposition, but less active towards ethylene decom-position [34]. In the initial stage of TCD with ethylene co-feed,major portion of hydrogen originates from ethylene. Hence, highhydrogen and zero ethylene content detected in the initial effluentgas [120]. PAC shows a 41% of activity loss in TCD at 950 1C within4 h, while, ethylene assisted methane decomposition maintain itsinitial hydrogen production of 44 vol% until 4 h without anynoticeable activity loss. The similar tendency was shown by othertwo catalysts, WG-12 and RX-3, at all three temperatures as shownin Fig. 12(a–c).
As ethylene is expensive, Malaika et al. [163] produced it in-situby oxidative coupling of methane (OCM) merged with the TCDprocess in the same reactor. Naþ/CaO or Liþ/MgO catalystsprepared by impregnation method were employed for OCMprocess and AC catalysts for TCD. In the first stage of OCM-TCDcoupled process, methane with admixture of oxygen was flownthrough the OCM oxide catalyst over which ethylene was pro-duced. Then, the un-reacted methane and the post-reaction gaseswere allowed to pass over the bed of the AC catalyst to producemore active carbonaceous catalyst by decomposition of ethylene inorder to maintain catalytic stability. Unfortunately, OCM-TCDprocess is not a favorable method as this process gives lessermethane conversion than the PAC catalyst done. It may be becausethe combined process produces ethane, CO2 and water togetherwhile TCD produce only hydrogen as gas. Even though, in the finalstage of the coupled process, methane conversion rate is 2.5 timesmore than that given by PAC. It is due to the gasification of theactive site blocking carbonaceous deposit by the produced CO2 andH2O.
4.3. Ethanol as co-feed
Concurrent decomposition of methane–ethanol mixture pro-duces the similar products as pure ethanol produces on itsdecomposition. They are methane, hydrogen, carbon monoxide,carbon dioxide, ethylene, ethane, water and acetaldehyde[164,165]. The theoretical decomposition value obtained by theaddition of individual cracking of methane and ethanol were
AC
950
100.05
1131
CH4
23.5
–23
.5–
014
–4
–[167
]95
010
0.05
1131
CH4þ20
%CO
224
.5–
24.5
–0
19.5
–4
–
950
100.05
1131
CH4þ50
%CO
230
–30
–0
10–
4–
Major
findings
�Methan
edecom
positionreaction
conducted
at75
0,85
0an
d95
01C
withCH4/CO2mixture,w
ithva
ryingCO
2co
ntentfrom
5%to
50%.
�Fo
rtheex
perim
entco
nducted
at95
01C,thehighestinitialmethan
eco
nve
rsionan
dfinal
methan
eco
nve
rsionto
hydroge
nis
give
nby
themixturesco
ntaining50
%CO
2an
d20
%CO
2,respe
ctively.
AC-FY
580
020
2–
CH4
28–
34–
0.55
20–
2–
[169
]80
020
2–
CH4þ1%
H2S
38–
38–
024
–2
–
Major
findings
�Influen
ceof
H2Son
methan
edecom
positionan
dCO
2reform
ingwerestudiedon
AC(FY5),aluminasu
pportedNic
atalyst(N
iA)an
dthemixture
ofbo
th(FY5þNiA)separatelyusingco
nve
ntion
alelectric
andmicrowav
ehea
ting
sources.
�Methan
eco
nve
rsionis
higher
under
microwav
ehea
tingthan
that
ofco
nve
ntion
alhea
ting.
�Influen
ceof
H2Son
conve
rsionis
simila
runder
both
hea
tingsources.
�W
hile
H2Sen
han
cecatalyticstab
ility
ofFY
5,itstronglydea
ctivates
metal
NiA
catalyst
because
ofitslack
oftolerance
towardssu
lfurpoisoning.
(W,w
eigh
tof
catalyst
(g);
SA,surfacearea
(m2/g);
T,temperature
(1C);
F,totalflow
rate
(mL/min);
iCH4,initialmethan
eco
nve
rsion(%);
iH2,initialhy
droge
nproduction(%);
t max,tim
eat
whichmax
imum
methan
eco
nve
rsionor
hydroge
nprodu
ctionoc
cur(h);
t,time(h);
d,dea
ctivationtime(h);–,n
otmen
tion
edin
theoriginal
pap
er.N
ote:
allex
perim
ents
wereco
nducted
infixe
dbe
dreactor).
U.P.M. Ashik et al. / Renewable and Sustainable Energy Reviews 44 (2015) 221–256 241
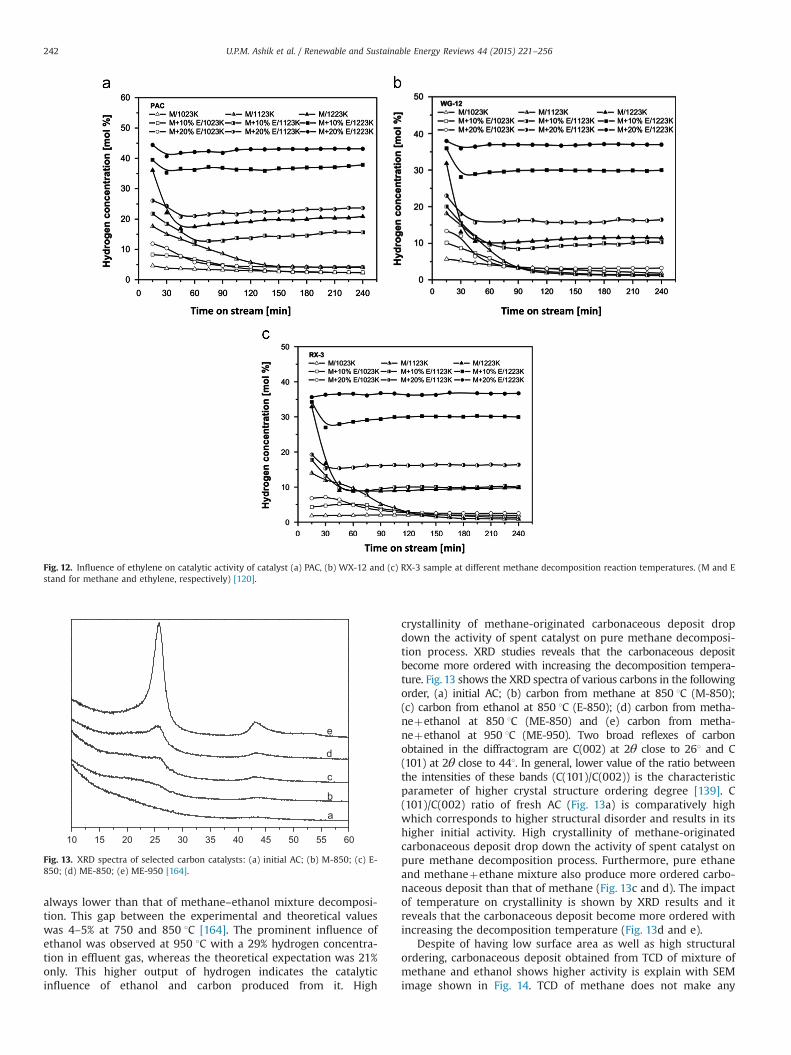
always lower than that of methane–ethanol mixture decomposi-tion. This gap between the experimental and theoretical valueswas 4–5% at 750 and 850 1C [164]. The prominent influence ofethanol was observed at 950 1C with a 29% hydrogen concentra-tion in effluent gas, whereas the theoretical expectation was 21%only. This higher output of hydrogen indicates the catalyticinfluence of ethanol and carbon produced from it. High
crystallinity of methane-originated carbonaceous deposit dropdown the activity of spent catalyst on pure methane decomposi-tion process. XRD studies reveals that the carbonaceous depositbecome more ordered with increasing the decomposition tempera-ture. Fig. 13 shows the XRD spectra of various carbons in the followingorder, (a) initial AC; (b) carbon from methane at 850 1C (M-850);(c) carbon from ethanol at 850 1C (E-850); (d) carbon from metha-neþethanol at 850 1C (ME-850) and (e) carbon from metha-neþethanol at 950 1C (ME-950). Two broad reflexes of carbonobtained in the diffractogram are C(002) at 2θ close to 261 and C(101) at 2θ close to 441. In general, lower value of the ratio betweenthe intensities of these bands (C(101)/C(002)) is the characteristicparameter of higher crystal structure ordering degree [139]. C(101)/C(002) ratio of fresh AC (Fig. 13a) is comparatively highwhich corresponds to higher structural disorder and results in itshigher initial activity. High crystallinity of methane-originatedcarbonaceous deposit drop down the activity of spent catalyst onpure methane decomposition process. Furthermore, pure ethaneand methaneþethane mixture also produce more ordered carbo-naceous deposit than that of methane (Fig. 13c and d). The impactof temperature on crystallinity is shown by XRD results and itreveals that the carbonaceous deposit become more ordered withincreasing the decomposition temperature (Fig. 13d and e).
Despite of having low surface area as well as high structuralordering, carbonaceous deposit obtained from TCD of mixture ofmethane and ethanol shows higher activity is explain with SEMimage shown in Fig. 14. TCD of methane does not make any
Fig. 12. Influence of ethylene on catalytic activity of catalyst (a) PAC, (b) WX-12 and (c) RX-3 sample at different methane decomposition reaction temperatures. (M and Estand for methane and ethylene, respectively) [120].
25 403530 5520 45 501510 60
a
b
c
d
e
Fig. 13. XRD spectra of selected carbon catalysts: (a) initial AC; (b) M-850; (c) E-850; (d) ME-850; (e) ME-950 [164].
U.P.M. Ashik et al. / Renewable and Sustainable Energy Reviews 44 (2015) 221–256242
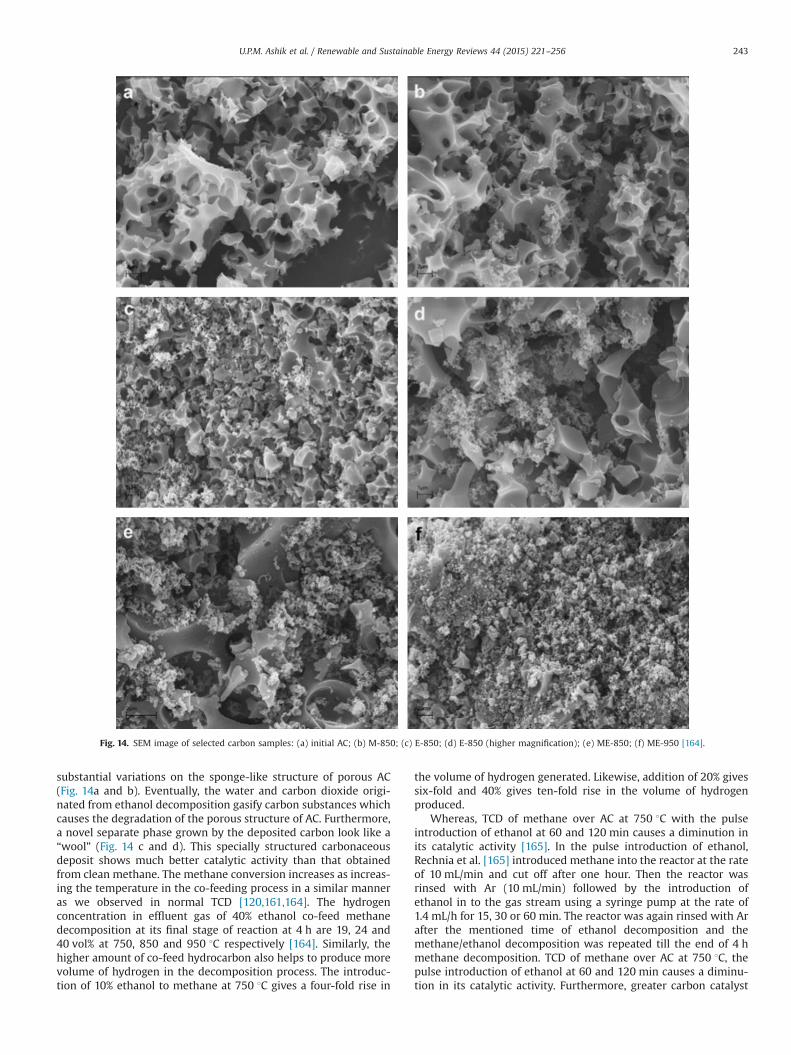
substantial variations on the sponge-like structure of porous AC(Fig. 14a and b). Eventually, the water and carbon dioxide origi-nated from ethanol decomposition gasify carbon substances whichcauses the degradation of the porous structure of AC. Furthermore,a novel separate phase grown by the deposited carbon look like a“wool” (Fig. 14 c and d). This specially structured carbonaceousdeposit shows much better catalytic activity than that obtainedfrom clean methane. The methane conversion increases as increas-ing the temperature in the co-feeding process in a similar manneras we observed in normal TCD [120,161,164]. The hydrogenconcentration in effluent gas of 40% ethanol co-feed methanedecomposition at its final stage of reaction at 4 h are 19, 24 and40 vol% at 750, 850 and 950 1C respectively [164]. Similarly, thehigher amount of co-feed hydrocarbon also helps to produce morevolume of hydrogen in the decomposition process. The introduc-tion of 10% ethanol to methane at 750 1C gives a four-fold rise in
the volume of hydrogen generated. Likewise, addition of 20% givessix-fold and 40% gives ten-fold rise in the volume of hydrogenproduced.
Whereas, TCD of methane over AC at 750 1C with the pulseintroduction of ethanol at 60 and 120 min causes a diminution inits catalytic activity [165]. In the pulse introduction of ethanol,Rechnia et al. [165] introduced methane into the reactor at the rateof 10 mL/min and cut off after one hour. Then the reactor wasrinsed with Ar (10 mL/min) followed by the introduction ofethanol in to the gas stream using a syringe pump at the rate of1.4 mL/h for 15, 30 or 60 min. The reactor was again rinsed with Arafter the mentioned time of ethanol decomposition and themethane/ethanol decomposition was repeated till the end of 4 hmethane decomposition. TCD of methane over AC at 750 1C, thepulse introduction of ethanol at 60 and 120 min causes a diminu-tion in its catalytic activity. Furthermore, greater carbon catalyst
Fig. 14. SEM image of selected carbon samples: (a) initial AC; (b) M-850; (c) E-850; (d) E-850 (higher magnification); (e) ME-850; (f) ME-950 [164].
U.P.M. Ashik et al. / Renewable and Sustainable Energy Reviews 44 (2015) 221–256 243
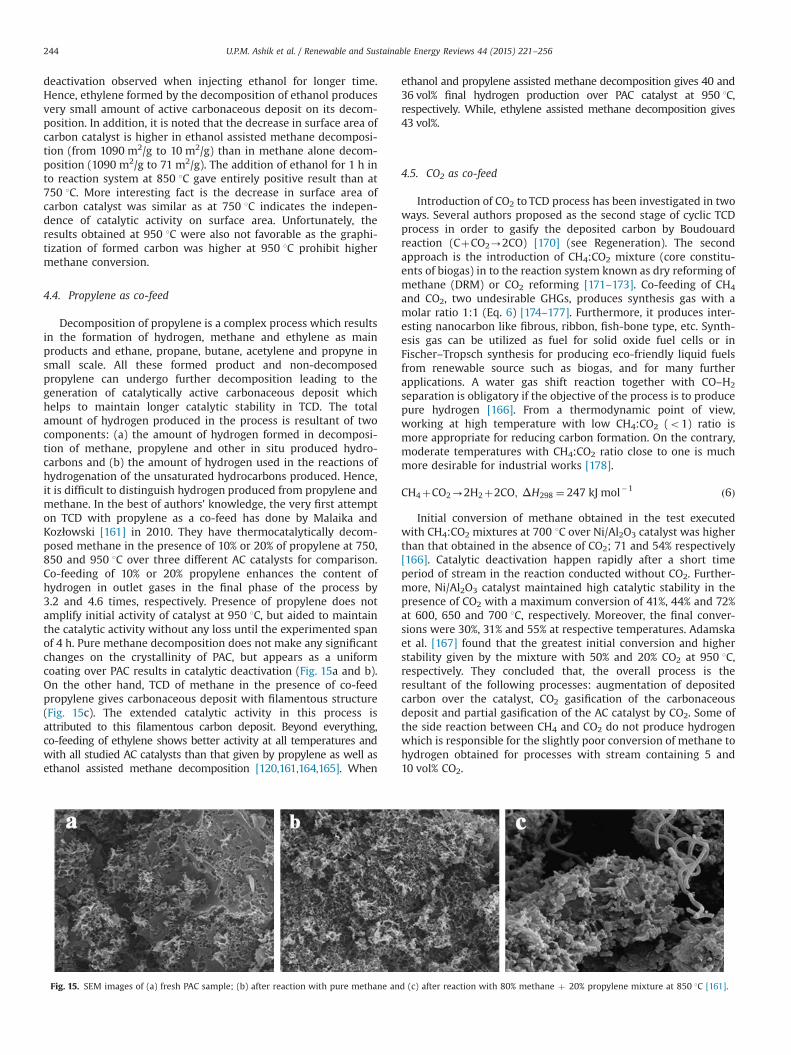
deactivation observed when injecting ethanol for longer time.Hence, ethylene formed by the decomposition of ethanol producesvery small amount of active carbonaceous deposit on its decom-position. In addition, it is noted that the decrease in surface area ofcarbon catalyst is higher in ethanol assisted methane decomposi-tion (from 1090 m2/g to 10 m2/g) than in methane alone decom-position (1090 m2/g to 71 m2/g). The addition of ethanol for 1 h into reaction system at 850 1C gave entirely positive result than at750 1C. More interesting fact is the decrease in surface area ofcarbon catalyst was similar as at 750 1C indicates the indepen-dence of catalytic activity on surface area. Unfortunately, theresults obtained at 950 1C were also not favorable as the graphi-tization of formed carbon was higher at 950 1C prohibit highermethane conversion.
4.4. Propylene as co-feed
Decomposition of propylene is a complex process which resultsin the formation of hydrogen, methane and ethylene as mainproducts and ethane, propane, butane, acetylene and propyne insmall scale. All these formed product and non-decomposedpropylene can undergo further decomposition leading to thegeneration of catalytically active carbonaceous deposit whichhelps to maintain longer catalytic stability in TCD. The totalamount of hydrogen produced in the process is resultant of twocomponents: (a) the amount of hydrogen formed in decomposi-tion of methane, propylene and other in situ produced hydro-carbons and (b) the amount of hydrogen used in the reactions ofhydrogenation of the unsaturated hydrocarbons produced. Hence,it is difficult to distinguish hydrogen produced from propylene andmethane. In the best of authors' knowledge, the very first attempton TCD with propylene as a co-feed has done by Malaika andKozłowski [161] in 2010. They have thermocatalytically decom-posed methane in the presence of 10% or 20% of propylene at 750,850 and 950 1C over three different AC catalysts for comparison.Co-feeding of 10% or 20% propylene enhances the content ofhydrogen in outlet gases in the final phase of the process by3.2 and 4.6 times, respectively. Presence of propylene does notamplify initial activity of catalyst at 950 1C, but aided to maintainthe catalytic activity without any loss until the experimented spanof 4 h. Pure methane decomposition does not make any significantchanges on the crystallinity of PAC, but appears as a uniformcoating over PAC results in catalytic deactivation (Fig. 15a and b).On the other hand, TCD of methane in the presence of co-feedpropylene gives carbonaceous deposit with filamentous structure(Fig. 15c). The extended catalytic activity in this process isattributed to this filamentous carbon deposit. Beyond everything,co-feeding of ethylene shows better activity at all temperatures andwith all studied AC catalysts than that given by propylene as well asethanol assisted methane decomposition [120,161,164,165]. When
ethanol and propylene assisted methane decomposition gives 40 and36 vol% final hydrogen production over PAC catalyst at 950 1C,respectively. While, ethylene assisted methane decomposition gives43 vol%.
4.5. CO2 as co-feed
Introduction of CO2 to TCD process has been investigated in twoways. Several authors proposed as the second stage of cyclic TCDprocess in order to gasify the deposited carbon by Boudouardreaction (CþCO2-2CO) [170] (see Regeneration). The secondapproach is the introduction of CH4:CO2 mixture (core constitu-ents of biogas) in to the reaction system known as dry reforming ofmethane (DRM) or CO2 reforming [171–173]. Co-feeding of CH4
and CO2, two undesirable GHGs, produces synthesis gas with amolar ratio 1:1 (Eq. 6) [174–177]. Furthermore, it produces inter-esting nanocarbon like fibrous, ribbon, fish-bone type, etc. Synth-esis gas can be utilized as fuel for solid oxide fuel cells or inFischer–Tropsch synthesis for producing eco-friendly liquid fuelsfrom renewable source such as biogas, and for many furtherapplications. A water gas shift reaction together with CO–H2
separation is obligatory if the objective of the process is to producepure hydrogen [166]. From a thermodynamic point of view,working at high temperature with low CH4:CO2 (o1) ratio ismore appropriate for reducing carbon formation. On the contrary,moderate temperatures with CH4:CO2 ratio close to one is muchmore desirable for industrial works [178].
CH4þCO2-2H2þ2CO; ΔH298 ¼ 247 kJ mol�1 ð6Þ
Initial conversion of methane obtained in the test executedwith CH4:CO2 mixtures at 700 1C over Ni/Al2O3 catalyst was higherthan that obtained in the absence of CO2; 71 and 54% respectively[166]. Catalytic deactivation happen rapidly after a short timeperiod of stream in the reaction conducted without CO2. Further-more, Ni/Al2O3 catalyst maintained high catalytic stability in thepresence of CO2 with a maximum conversion of 41%, 44% and 72%at 600, 650 and 700 1C, respectively. Moreover, the final conver-sions were 30%, 31% and 55% at respective temperatures. Adamskaet al. [167] found that the greatest initial conversion and higherstability given by the mixture with 50% and 20% CO2 at 950 1C,respectively. They concluded that, the overall process is theresultant of the following processes: augmentation of depositedcarbon over the catalyst, CO2 gasification of the carbonaceousdeposit and partial gasification of the AC catalyst by CO2. Some ofthe side reaction between CH4 and CO2 do not produce hydrogenwhich is responsible for the slightly poor conversion of methane tohydrogen obtained for processes with stream containing 5 and10 vol% CO2.
Fig. 15. SEM images of (a) fresh PAC sample; (b) after reaction with pure methane and (c) after reaction with 80% methane þ 20% propylene mixture at 850 1C [161].
U.P.M. Ashik et al. / Renewable and Sustainable Energy Reviews 44 (2015) 221–256244
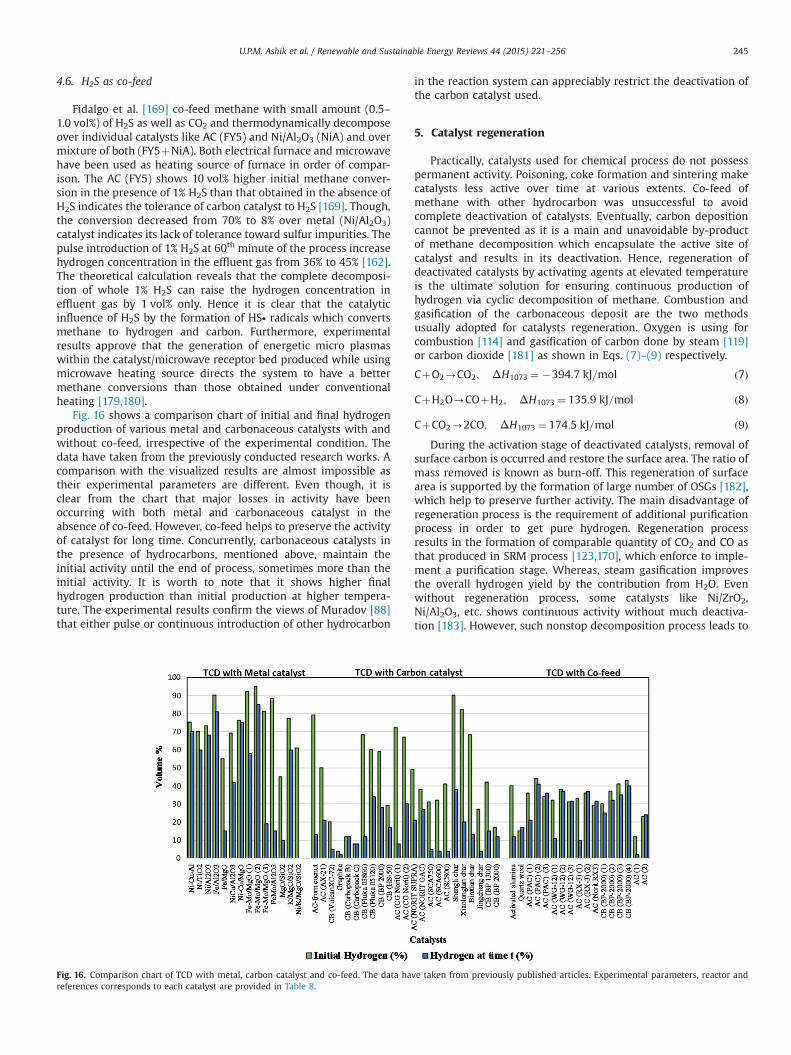
4.6. H2S as co-feed
Fidalgo et al. [169] co-feed methane with small amount (0.5–1.0 vol%) of H2S as well as CO2 and thermodynamically decomposeover individual catalysts like AC (FY5) and Ni/Al2O3 (NiA) and overmixture of both (FY5þNiA). Both electrical furnace and microwavehave been used as heating source of furnace in order of compar-ison. The AC (FY5) shows 10 vol% higher initial methane conver-sion in the presence of 1% H2S than that obtained in the absence ofH2S indicates the tolerance of carbon catalyst to H2S [169]. Though,the conversion decreased from 70% to 8% over metal (Ni/Al2O3)catalyst indicates its lack of tolerance toward sulfur impurities. Thepulse introduction of 1% H2S at 60th minute of the process increasehydrogen concentration in the effluent gas from 36% to 45% [162].The theoretical calculation reveals that the complete decomposi-tion of whole 1% H2S can raise the hydrogen concentration ineffluent gas by 1 vol% only. Hence it is clear that the catalyticinfluence of H2S by the formation of HS∙ radicals which convertsmethane to hydrogen and carbon. Furthermore, experimentalresults approve that the generation of energetic micro plasmaswithin the catalyst/microwave receptor bed produced while usingmicrowave heating source directs the system to have a bettermethane conversions than those obtained under conventionalheating [179,180].
Fig. 16 shows a comparison chart of initial and final hydrogenproduction of various metal and carbonaceous catalysts with andwithout co-feed, irrespective of the experimental condition. Thedata have taken from the previously conducted research works. Acomparison with the visualized results are almost impossible astheir experimental parameters are different. Even though, it isclear from the chart that major losses in activity have beenoccurring with both metal and carbonaceous catalyst in theabsence of co-feed. However, co-feed helps to preserve the activityof catalyst for long time. Concurrently, carbonaceous catalysts inthe presence of hydrocarbons, mentioned above, maintain theinitial activity until the end of process, sometimes more than theinitial activity. It is worth to note that it shows higher finalhydrogen production than initial production at higher tempera-ture. The experimental results confirm the views of Muradov [88]that either pulse or continuous introduction of other hydrocarbon
in the reaction system can appreciably restrict the deactivation ofthe carbon catalyst used.
5. Catalyst regeneration
Practically, catalysts used for chemical process do not possesspermanent activity. Poisoning, coke formation and sintering makecatalysts less active over time at various extents. Co-feed ofmethane with other hydrocarbon was unsuccessful to avoidcomplete deactivation of catalysts. Eventually, carbon depositioncannot be prevented as it is a main and unavoidable by-productof methane decomposition which encapsulate the active site ofcatalyst and results in its deactivation. Hence, regeneration ofdeactivated catalysts by activating agents at elevated temperatureis the ultimate solution for ensuring continuous production ofhydrogen via cyclic decomposition of methane. Combustion andgasification of the carbonaceous deposit are the two methodsusually adopted for catalysts regeneration. Oxygen is using forcombustion [114] and gasification of carbon done by steam [119]or carbon dioxide [181] as shown in Eqs. (7)–(9) respectively.
CþO2-CO2; ΔH1073 ¼ �394:7 kJ=mol ð7Þ
CþH2O-COþH2; ΔH1073 ¼ 135:9 kJ=mol ð8Þ
CþCO2-2CO; ΔH1073 ¼ 174:5 kJ=mol ð9ÞDuring the activation stage of deactivated catalysts, removal of
surface carbon is occurred and restore the surface area. The ratio ofmass removed is known as burn-off. This regeneration of surfacearea is supported by the formation of large number of OSGs [182],which help to preserve further activity. The main disadvantage ofregeneration process is the requirement of additional purificationprocess in order to get pure hydrogen. Regeneration processresults in the formation of comparable quantity of CO2 and CO asthat produced in SRM process [123,170], which enforce to imple-ment a purification stage. Whereas, steam gasification improvesthe overall hydrogen yield by the contribution from H2O. Evenwithout regeneration process, some catalysts like Ni/ZrO2,Ni/Al2O3, etc. shows continuous activity without much deactiva-tion [183]. However, such nonstop decomposition process leads to
Fig. 16. Comparison chart of TCD with metal, carbon catalyst and co-feed. The data have taken from previously published articles. Experimental parameters, reactor andreferences corresponds to each catalyst are provided in Table 8.
U.P.M. Ashik et al. / Renewable and Sustainable Energy Reviews 44 (2015) 221–256 245

deposition of large amount of carbon which causes increase inpressure drop across the catalyst bed from 0.02 to 0.12 atm as wellas physical blockage of the reactor. Therefore, carbon removal isnecessary to avoid such hurdles. Latest catalyst regenerationexperiments and major findings are furnished in Table 9.
5.1. Gasification
Both metal and carbonaceous catalyst can be regenerated bygasification, but the activity of regenerated catalyst varies. Themain advantage of gasification process is the inhibition of catalystre-oxidation and thermal shocks and supplementary hydrogenproduction from steam. Additional 1.4 moles of hydrogen wereproduced during steam gasification results in an overall 3.4 moles
of hydrogen for each mole of methane [23]. Ammendola et al.[194] experimented methane (5%CH4 in N2 flow) decompositionover 25 g of CuAl2O4 catalyst in a fluidized bed reactor. Gasificationof produced carbon performed with 5.5 vol% CO2 in N2 stream and3 vol% steam in N2 stream. They observed that the CO2 regenera-tion rate decreases after 15 min and only 45% of deposited carbonwere gasified after 80 min. Steam also gasified almost similaramount of carbon as CO2 done. Moreover, the quantity of carbonremoved during both gasification processes is lower than thatdeposited in each previous decomposition step. Even the longterm gasification processes were unable to eliminate all carbondeposited on Cu-based catalyst for maintaining a continuousproduction of hydrogen by methane decomposition-catalystregeneration cycle. Whereas, re-dispersion of Ni-particles in
Table 8The experimental parameters, reactor and references of each catalyst mentioned in Fig. 16.
Catalyst Reaction condition (T/F/W/SA/t) Reactor Ref.
1 Ni–Cu–Al 700/120,000a/0.05/80/2.5 FB [33]2 Ni/TiO2 700/20b/0.3/30/8 FB [52]3 Ni/Al2O3 700/12a/–/124/3 RB [53]4 Fe/Al2O3 800/1.5a/–/141/3 RB [53]5 Fe/MgO 800/12,000a/0.15/14.7/3 FB [56]6 NiCu/Al2O3 700/12,000a/10/–/7 FlB [28]7 Ni–Cu/MgO 700/12a/–/14/3 RB [53]8 Fe–Mo/MgO (1) 800/1.5a/–/17/3 RB [53]9 Fe–Mo/MgO (2) 800/1000a/0.15/15.3/3 FB [56]
10 Fe–Mo/MgO (3) 800/12,000a/0.15/15.3/3 FB [56]11 FeMo/Al2O3 800/12,000a/0.15/193.3/1.5 FB [56]12 MgO/SiO2 750/60–65b/–/–/200 FB [64]13 K/MgO/SiO2 800/60–65b/–/–/200 FB [64]14 Ni/K/MgO/SiO2 700/60–65b/–/–/1 FB [64]15 AC-from cocnut 850/–/–/–/3.5 FB [88]16 AC (AX-21) 850/–/–/–/4 FB [88]17 CB (VulcanXC-72) 850/–/–/–/4 FB [88]18 Graphite 850/–/–/–/2 FB [88]19 CB (Carbopack B) 850/38b/–/100/4 FB [138]20 CB (Carbopack C) 850/38b/–/10/8 FB [138]21 CB (Fluka 03866) 850/38b/–/94/4 FB [138]22 CB (Fluka 05120) 850/38b/–/930/8 FB [138]23 CB (BP 2000) 850/38b/–/1337/8 FB [138]24 CB (HS-50) 850/38b/–/40/8 FB [138]25 AC (CG Norit) (1) 850/38b/–/1300/7.5 FB [138]26 AC (CG Norit) (2) 850/600a/2/1100/4 FB [125]27 AC (Norit supra) 850/600a/2/925/4 FB [125]28 AC (Norit GAC) 850/600a/2/1300/4 FB [125]29 AC (SCA750) 850/600a/2/360/4 FB [125]30 AC (SCA600) 850/600a/2/161/4 FB [125]31 AC (SC800) 850/600a/2/52/4 FB [125]32 Shengli char 850/200b/10/–/2 FB [155]33 Xiaolongtan char 850/200b/10/–/2 FB [155]34 Binxian char 850/200b/10/–/1 FB [155]35 Jingcheng char 850/200b/10/–/1 FB [155]36 CB (BP 1300) 850/144 h�1/–/495/6.5 FB [139]37 CB (BP 2000) 850/144 h�1/–/1337/6.5 FB [139]38 Activated alumina 850/–/–/–/4 (C3H8) FB [88]39 Quartz wool 850/–/–/–/1.3 (C2H2) FB [88]40 AC (PAC) (1) 950/10b/0.05/1131/4 (CH4 only) FB [120]41 AC (PAC) (2) 950/10b/0.05/1131/4 (CH4þ20%C2H4) FB [120]42 AC (PAC) (3) 950/10b/0.05/1131/4 (80%CH4þ20%C3H6) FB [161]43 AC (WG-12) (1) 950/10b/0.05/1087/4 (CH4 only) FB [120]44 AC (WG-12) (2) 950/10b/0.05/1087/4 (CH4þ20%C2H4) FB [120]45 AC (WG-12) (3) 950/10b/0.05/1087/4 (80%CH4þ20%C3H6) FB [161]46 AC (RX-3) (1) 950/10b/0.05/1124/4 (CH4 only) FB [120]47 AC (RX-3) (2) 950/10b/0.05/1124/4 (CH4þ20%C2H4) FB [120]48 AC (Norit RX3) 950/10b/0.05/1124/4 (80%CH4þ20%C3H6) FB [161]49 CB (BP-2000) (1) 900/50b/1.2/1400/2 (85%CH4) FB [162]50 CB (BP-2000) (2) 900/50b/1.2/1400/2 (85%CH4þ5%C3H8) FB [162]51 CB (BP-2000) (3) 900/50b/1.2/1400/2 (85%CH4þ10%C2H6) FB [162]52 CB (BP-2000) (4) 900/50b/1.2/1400/2 (85%CH4þ10%C2H6þ5%C3H8) FB [162]53 AC (1) 850/10b/0.05/1090/4 (CH4 only) FB [164]54 AC (2) 850/10b/0.05/1090/4 (CH4þ40%C2H5OH) FB [164]
(T, temperature (1C); F, flow rate (amL/(gcat.h) bmL/min cNmL/min, unless other units are stated); W, weight of catalyst (g); SA, surface area (m2/g); Conversion (%); t¼time(h); FB, Fixed Bed Reactor; FlB, Fluidized Bed Reactor; RB, Rotatory Bed reactor; –, not mentioned in the original paper; and co-feed in bracket, if any).
U.P.M. Ashik et al. / Renewable and Sustainable Energy Reviews 44 (2015) 221–256246
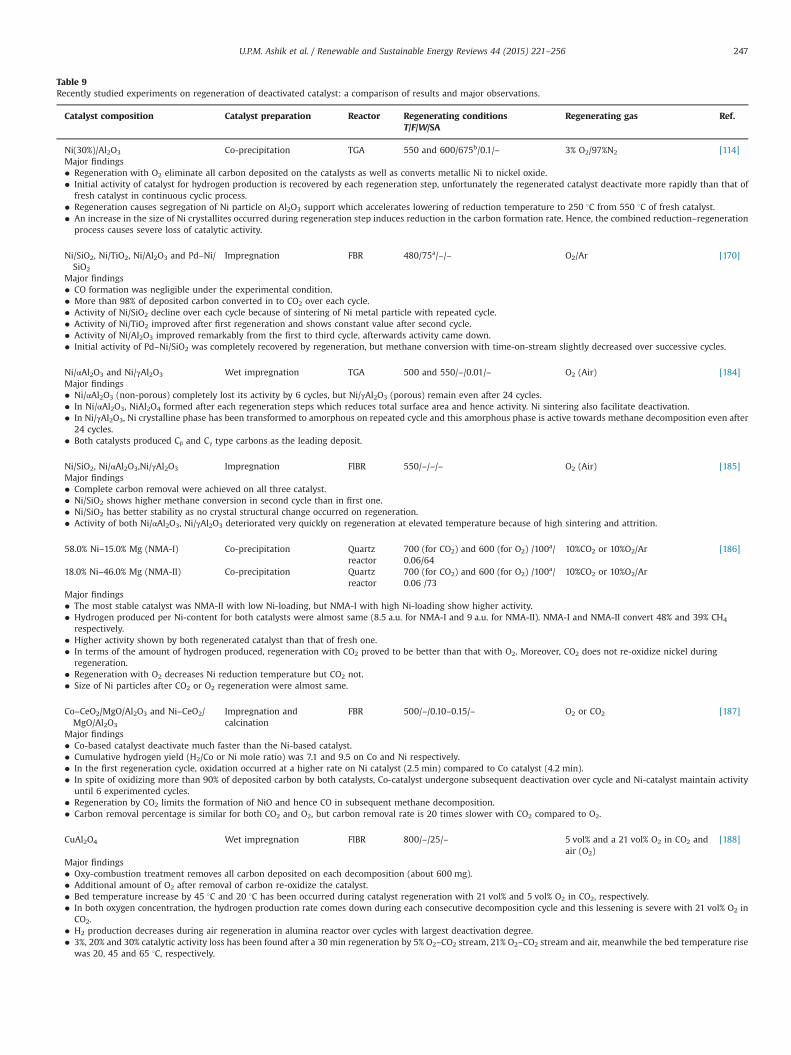
Table 9Recently studied experiments on regeneration of deactivated catalyst: a comparison of results and major observations.
Catalyst composition Catalyst preparation Reactor Regenerating conditions Regenerating gas Ref.T/F/W/SA
Ni(30%)/Al2O3 Co-precipitation TGA 550 and 600/675b/0.1/– 3% O2/97%N2 [114]Major findings� Regeneration with O2 eliminate all carbon deposited on the catalysts as well as converts metallic Ni to nickel oxide.� Initial activity of catalyst for hydrogen production is recovered by each regeneration step, unfortunately the regenerated catalyst deactivate more rapidly than that of
fresh catalyst in continuous cyclic process.� Regeneration causes segregation of Ni particle on Al2O3 support which accelerates lowering of reduction temperature to 250 1C from 550 1C of fresh catalyst.� An increase in the size of Ni crystallites occurred during regeneration step induces reduction in the carbon formation rate. Hence, the combined reduction–regeneration
process causes severe loss of catalytic activity.
Ni/SiO2, Ni/TiO2, Ni/Al2O3 and Pd–Ni/SiO2
Impregnation FBR 480/75a/–/– O2/Ar [170]
Major findings� CO formation was negligible under the experimental condition.� More than 98% of deposited carbon converted in to CO2 over each cycle.� Activity of Ni/SiO2 decline over each cycle because of sintering of Ni metal particle with repeated cycle.� Activity of Ni/TiO2 improved after first regeneration and shows constant value after second cycle.� Activity of Ni/Al2O3 improved remarkably from the first to third cycle, afterwards activity came down.� Initial activity of Pd–Ni/SiO2 was completely recovered by regeneration, but methane conversion with time-on-stream slightly decreased over successive cycles.
Ni/αAl2O3 and Ni/γAl2O3 Wet impregnation TGA 500 and 550/–/0.01/– O2 (Air) [184]Major findings� Ni/αAl2O3 (non-porous) completely lost its activity by 6 cycles, but Ni/γAl2O3 (porous) remain even after 24 cycles.� In Ni/αAl2O3, NiAl2O4 formed after each regeneration steps which reduces total surface area and hence activity. Ni sintering also facilitate deactivation.� In Ni/γAl2O3, Ni crystalline phase has been transformed to amorphous on repeated cycle and this amorphous phase is active towards methane decomposition even after
24 cycles.� Both catalysts produced Cβ and Cγ type carbons as the leading deposit.
Ni/SiO2, Ni/αAl2O3,Ni/γAl2O3 Impregnation FlBR 550/–/–/– O2 (Air) [185]Major findings� Complete carbon removal were achieved on all three catalyst.� Ni/SiO2 shows higher methane conversion in second cycle than in first one.� Ni/SiO2 has better stability as no crystal structural change occurred on regeneration.� Activity of both Ni/αAl2O3, Ni/γAl2O3 deteriorated very quickly on regeneration at elevated temperature because of high sintering and attrition.
58.0% Ni–15.0% Mg (NMA-I) Co-precipitation Quartzreactor
700 (for CO2) and 600 (for O2) /100a/0.06/64
10%CO2 or 10%O2/Ar [186]
18.0% Ni–46.0% Mg (NMA-II) Co-precipitation Quartzreactor
700 (for CO2) and 600 (for O2) /100a/0.06 /73
10%CO2 or 10%O2/Ar
Major findings� The most stable catalyst was NMA-II with low Ni-loading, but NMA-I with high Ni-loading show higher activity.� Hydrogen produced per Ni-content for both catalysts were almost same (8.5 a.u. for NMA-I and 9 a.u. for NMA-II). NMA-I and NMA-II convert 48% and 39% CH4
respectively.� Higher activity shown by both regenerated catalyst than that of fresh one.� In terms of the amount of hydrogen produced, regeneration with CO2 proved to be better than that with O2. Moreover, CO2 does not re-oxidize nickel during
regeneration.� Regeneration with O2 decreases Ni reduction temperature but CO2 not.� Size of Ni particles after CO2 or O2 regeneration were almost same.
Co–CeO2/MgO/Al2O3 and Ni–CeO2/MgO/Al2O3
Impregnation andcalcination
FBR 500/–/0.10–0.15/– O2 or CO2 [187]
Major findings� Co-based catalyst deactivate much faster than the Ni-based catalyst.� Cumulative hydrogen yield (H2/Co or Ni mole ratio) was 7.1 and 9.5 on Co and Ni respectively.� In the first regeneration cycle, oxidation occurred at a higher rate on Ni catalyst (2.5 min) compared to Co catalyst (4.2 min).� In spite of oxidizing more than 90% of deposited carbon by both catalysts, Co-catalyst undergone subsequent deactivation over cycle and Ni-catalyst maintain activity
until 6 experimented cycles.� Regeneration by CO2 limits the formation of NiO and hence CO in subsequent methane decomposition.� Carbon removal percentage is similar for both CO2 and O2, but carbon removal rate is 20 times slower with CO2 compared to O2.
CuAl2O4 Wet impregnation FlBR 800/–/25/– 5 vol% and a 21 vol% O2 in CO2 andair (O2)
[188]
Major findings� Oxy-combustion treatment removes all carbon deposited on each decomposition (about 600 mg).� Additional amount of O2 after removal of carbon re-oxidize the catalyst.� Bed temperature increase by 45 1C and 20 1C has been occurred during catalyst regeneration with 21 vol% and 5 vol% O2 in CO2, respectively.� In both oxygen concentration, the hydrogen production rate comes down during each consecutive decomposition cycle and this lessening is severe with 21 vol% O2 in
CO2.� H2 production decreases during air regeneration in alumina reactor over cycles with largest deactivation degree.� 3%, 20% and 30% catalytic activity loss has been found after a 30 min regeneration by 5% O2–CO2 stream, 21% O2–CO2 stream and air, meanwhile the bed temperature rise
was 20, 45 and 65 1C, respectively.
U.P.M. Ashik et al. / Renewable and Sustainable Energy Reviews 44 (2015) 221–256 247
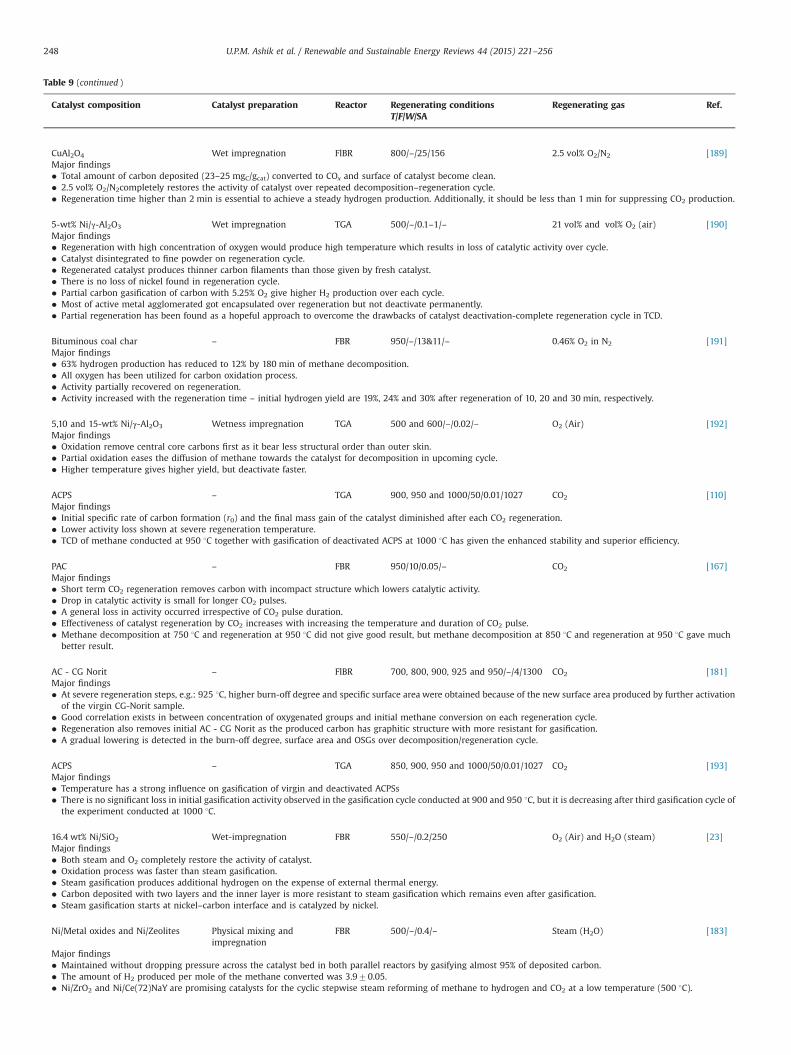
Table 9 (continued )
Catalyst composition Catalyst preparation Reactor Regenerating conditions Regenerating gas Ref.T/F/W/SA
CuAl2O4 Wet impregnation FlBR 800/–/25/156 2.5 vol% O2/N2 [189]Major findings� Total amount of carbon deposited (23–25 mgC/gcat) converted to COx and surface of catalyst become clean.� 2.5 vol% O2/N2completely restores the activity of catalyst over repeated decomposition–regeneration cycle.� Regeneration time higher than 2 min is essential to achieve a steady hydrogen production. Additionally, it should be less than 1 min for suppressing CO2 production.
5-wt% Ni/γ-Al2O3 Wet impregnation TGA 500/–/0.1–1/– 21 vol% and vol% O2 (air) [190]Major findings� Regeneration with high concentration of oxygen would produce high temperature which results in loss of catalytic activity over cycle.� Catalyst disintegrated to fine powder on regeneration cycle.� Regenerated catalyst produces thinner carbon filaments than those given by fresh catalyst.� There is no loss of nickel found in regeneration cycle.� Partial carbon gasification of carbon with 5.25% O2 give higher H2 production over each cycle.� Most of active metal agglomerated got encapsulated over regeneration but not deactivate permanently.� Partial regeneration has been found as a hopeful approach to overcome the drawbacks of catalyst deactivation-complete regeneration cycle in TCD.
Bituminous coal char – FBR 950/–/13&11/– 0.46% O2 in N2 [191]Major findings� 63% hydrogen production has reduced to 12% by 180 min of methane decomposition.� All oxygen has been utilized for carbon oxidation process.� Activity partially recovered on regeneration.� Activity increased with the regeneration time – initial hydrogen yield are 19%, 24% and 30% after regeneration of 10, 20 and 30 min, respectively.
5,10 and 15-wt% Ni/γ-Al2O3 Wetness impregnation TGA 500 and 600/–/0.02/– O2 (Air) [192]Major findings� Oxidation remove central core carbons first as it bear less structural order than outer skin.� Partial oxidation eases the diffusion of methane towards the catalyst for decomposition in upcoming cycle.� Higher temperature gives higher yield, but deactivate faster.
ACPS – TGA 900, 950 and 1000/50/0.01/1027 CO2 [110]Major findings� Initial specific rate of carbon formation (r0) and the final mass gain of the catalyst diminished after each CO2 regeneration.� Lower activity loss shown at severe regeneration temperature.� TCD of methane conducted at 950 1C together with gasification of deactivated ACPS at 1000 1C has given the enhanced stability and superior efficiency.
PAC – FBR 950/10/0.05/– CO2 [167]Major findings� Short term CO2 regeneration removes carbon with incompact structure which lowers catalytic activity.� Drop in catalytic activity is small for longer CO2 pulses.� A general loss in activity occurred irrespective of CO2 pulse duration.� Effectiveness of catalyst regeneration by CO2 increases with increasing the temperature and duration of CO2 pulse.� Methane decomposition at 750 1C and regeneration at 950 1C did not give good result, but methane decomposition at 850 1C and regeneration at 950 1C gave much
better result.
AC - CG Norit – FlBR 700, 800, 900, 925 and 950/–/4/1300 CO2 [181]Major findings� At severe regeneration steps, e.g.: 925 1C, higher burn-off degree and specific surface area were obtained because of the new surface area produced by further activation
of the virgin CG-Norit sample.� Good correlation exists in between concentration of oxygenated groups and initial methane conversion on each regeneration cycle.� Regeneration also removes initial AC - CG Norit as the produced carbon has graphitic structure with more resistant for gasification.� A gradual lowering is detected in the burn-off degree, surface area and OSGs over decomposition/regeneration cycle.
ACPS – TGA 850, 900, 950 and 1000/50/0.01/1027 CO2 [193]Major findings� Temperature has a strong influence on gasification of virgin and deactivated ACPSs� There is no significant loss in initial gasification activity observed in the gasification cycle conducted at 900 and 950 1C, but it is decreasing after third gasification cycle of
the experiment conducted at 1000 1C.
16.4 wt% Ni/SiO2 Wet-impregnation FBR 550/–/0.2/250 O2 (Air) and H2O (steam) [23]Major findings� Both steam and O2 completely restore the activity of catalyst.� Oxidation process was faster than steam gasification.� Steam gasification produces additional hydrogen on the expense of external thermal energy.� Carbon deposited with two layers and the inner layer is more resistant to steam gasification which remains even after gasification.� Steam gasification starts at nickel–carbon interface and is catalyzed by nickel.
Ni/Metal oxides and Ni/Zeolites Physical mixing andimpregnation
FBR 500/–/0.4/– Steam (H2O) [183]
Major findings� Maintained without dropping pressure across the catalyst bed in both parallel reactors by gasifying almost 95% of deposited carbon.� The amount of H2 produced per mole of the methane converted was 3.970.05.� Ni/ZrO2 and Ni/Ce(72)NaY are promising catalysts for the cyclic stepwise steam reforming of methane to hydrogen and CO2 at a low temperature (500 1C).
U.P.M. Ashik et al. / Renewable and Sustainable Energy Reviews 44 (2015) 221–256248
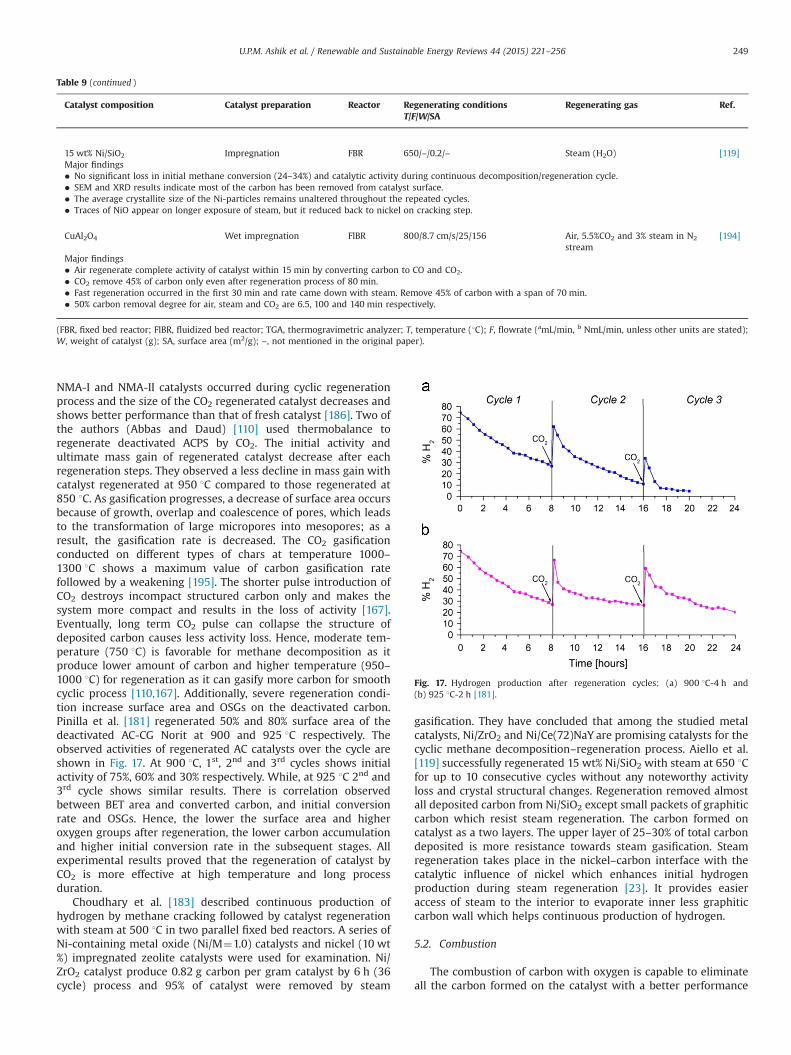
NMA-I and NMA-II catalysts occurred during cyclic regenerationprocess and the size of the CO2 regenerated catalyst decreases andshows better performance than that of fresh catalyst [186]. Two ofthe authors (Abbas and Daud) [110] used thermobalance toregenerate deactivated ACPS by CO2. The initial activity andultimate mass gain of regenerated catalyst decrease after eachregeneration steps. They observed a less decline in mass gain withcatalyst regenerated at 950 1C compared to those regenerated at850 1C. As gasification progresses, a decrease of surface area occursbecause of growth, overlap and coalescence of pores, which leadsto the transformation of large micropores into mesopores; as aresult, the gasification rate is decreased. The CO2 gasificationconducted on different types of chars at temperature 1000–1300 1C shows a maximum value of carbon gasification ratefollowed by a weakening [195]. The shorter pulse introduction ofCO2 destroys incompact structured carbon only and makes thesystem more compact and results in the loss of activity [167].Eventually, long term CO2 pulse can collapse the structure ofdeposited carbon causes less activity loss. Hence, moderate tem-perature (750 1C) is favorable for methane decomposition as itproduce lower amount of carbon and higher temperature (950–1000 1C) for regeneration as it can gasify more carbon for smoothcyclic process [110,167]. Additionally, severe regeneration condi-tion increase surface area and OSGs on the deactivated carbon.Pinilla et al. [181] regenerated 50% and 80% surface area of thedeactivated AC-CG Norit at 900 and 925 1C respectively. Theobserved activities of regenerated AC catalysts over the cycle areshown in Fig. 17. At 900 1C, 1st, 2nd and 3rd cycles shows initialactivity of 75%, 60% and 30% respectively. While, at 925 1C 2nd and3rd cycle shows similar results. There is correlation observedbetween BET area and converted carbon, and initial conversionrate and OSGs. Hence, the lower the surface area and higheroxygen groups after regeneration, the lower carbon accumulationand higher initial conversion rate in the subsequent stages. Allexperimental results proved that the regeneration of catalyst byCO2 is more effective at high temperature and long processduration.
Choudhary et al. [183] described continuous production ofhydrogen by methane cracking followed by catalyst regenerationwith steam at 500 1C in two parallel fixed bed reactors. A series ofNi-containing metal oxide (Ni/M¼1.0) catalysts and nickel (10 wt%) impregnated zeolite catalysts were used for examination. Ni/ZrO2 catalyst produce 0.82 g carbon per gram catalyst by 6 h (36cycle) process and 95% of catalyst were removed by steam
gasification. They have concluded that among the studied metalcatalysts, Ni/ZrO2 and Ni/Ce(72)NaY are promising catalysts for thecyclic methane decomposition–regeneration process. Aiello et al.[119] successfully regenerated 15 wt% Ni/SiO2 with steam at 650 1Cfor up to 10 consecutive cycles without any noteworthy activityloss and crystal structural changes. Regeneration removed almostall deposited carbon from Ni/SiO2 except small packets of graphiticcarbon which resist steam regeneration. The carbon formed oncatalyst as a two layers. The upper layer of 25–30% of total carbondeposited is more resistance towards steam gasification. Steamregeneration takes place in the nickel–carbon interface with thecatalytic influence of nickel which enhances initial hydrogenproduction during steam regeneration [23]. It provides easieraccess of steam to the interior to evaporate inner less graphiticcarbon wall which helps continuous production of hydrogen.
5.2. Combustion
The combustion of carbon with oxygen is capable to eliminateall the carbon formed on the catalyst with a better performance
Table 9 (continued )
Catalyst composition Catalyst preparation Reactor Regenerating conditions Regenerating gas Ref.T/F/W/SA
15 wt% Ni/SiO2 Impregnation FBR 650/–/0.2/– Steam (H2O) [119]Major findings� No significant loss in initial methane conversion (24–34%) and catalytic activity during continuous decomposition/regeneration cycle.� SEM and XRD results indicate most of the carbon has been removed from catalyst surface.� The average crystallite size of the Ni-particles remains unaltered throughout the repeated cycles.� Traces of NiO appear on longer exposure of steam, but it reduced back to nickel on cracking step.
CuAl2O4 Wet impregnation FlBR 800/8.7 cm/s/25/156 Air, 5.5%CO2 and 3% steam in N2
stream[194]
Major findings� Air regenerate complete activity of catalyst within 15 min by converting carbon to CO and CO2.� CO2 remove 45% of carbon only even after regeneration process of 80 min.� Fast regeneration occurred in the first 30 min and rate came down with steam. Remove 45% of carbon with a span of 70 min.� 50% carbon removal degree for air, steam and CO2 are 6.5, 100 and 140 min respectively.
(FBR, fixed bed reactor; FlBR, fluidized bed reactor; TGA, thermogravimetric analyzer; T, temperature (1C); F, flowrate (amL/min, b NmL/min, unless other units are stated);W, weight of catalyst (g); SA, surface area (m2/g); –, not mentioned in the original paper).
Fig. 17. Hydrogen production after regeneration cycles: (a) 900 1C-4 h and(b) 925 1C-2 h [181].
U.P.M. Ashik et al. / Renewable and Sustainable Energy Reviews 44 (2015) 221–256 249
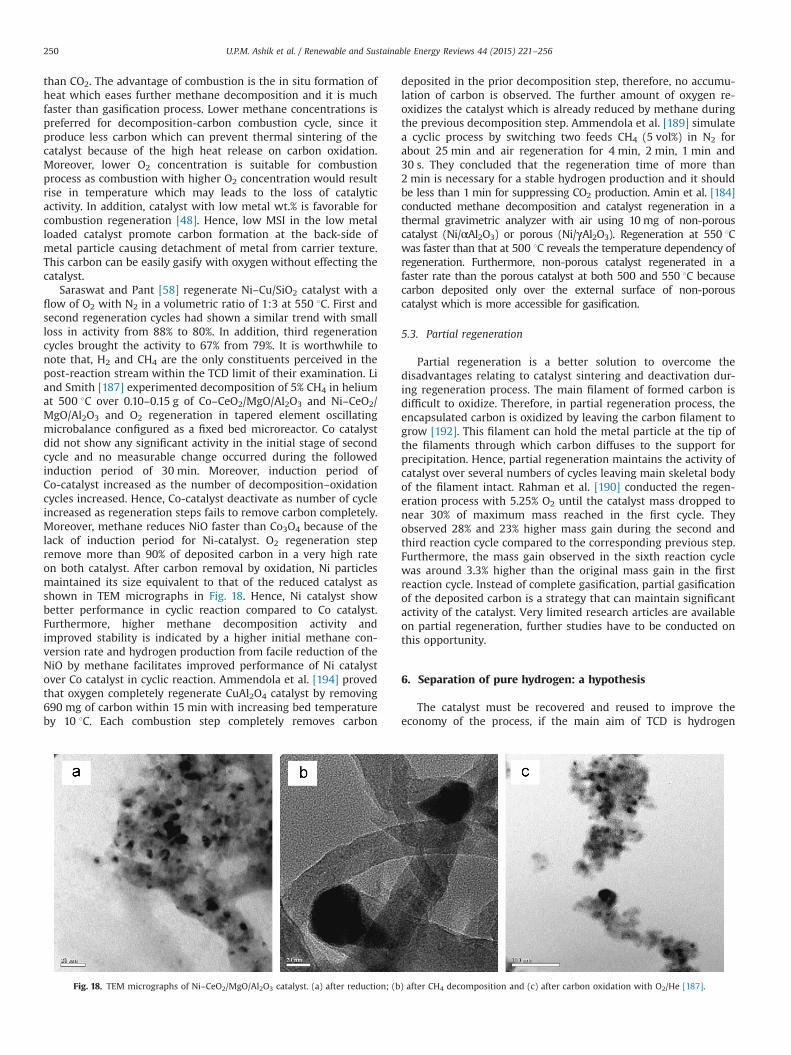
than CO2. The advantage of combustion is the in situ formation ofheat which eases further methane decomposition and it is muchfaster than gasification process. Lower methane concentrations ispreferred for decomposition-carbon combustion cycle, since itproduce less carbon which can prevent thermal sintering of thecatalyst because of the high heat release on carbon oxidation.Moreover, lower O2 concentration is suitable for combustionprocess as combustion with higher O2 concentration would resultrise in temperature which may leads to the loss of catalyticactivity. In addition, catalyst with low metal wt.% is favorable forcombustion regeneration [48]. Hence, low MSI in the low metalloaded catalyst promote carbon formation at the back-side ofmetal particle causing detachment of metal from carrier texture.This carbon can be easily gasify with oxygen without effecting thecatalyst.
Saraswat and Pant [58] regenerate Ni–Cu/SiO2 catalyst with aflow of O2 with N2 in a volumetric ratio of 1:3 at 550 1C. First andsecond regeneration cycles had shown a similar trend with smallloss in activity from 88% to 80%. In addition, third regenerationcycles brought the activity to 67% from 79%. It is worthwhile tonote that, H2 and CH4 are the only constituents perceived in thepost-reaction stream within the TCD limit of their examination. Liand Smith [187] experimented decomposition of 5% CH4 in heliumat 500 1C over 0.10–0.15 g of Co–CeO2/MgO/Al2O3 and Ni–CeO2/MgO/Al2O3 and O2 regeneration in tapered element oscillatingmicrobalance configured as a fixed bed microreactor. Co catalystdid not show any significant activity in the initial stage of secondcycle and no measurable change occurred during the followedinduction period of 30 min. Moreover, induction period ofCo-catalyst increased as the number of decomposition–oxidationcycles increased. Hence, Co-catalyst deactivate as number of cycleincreased as regeneration steps fails to remove carbon completely.Moreover, methane reduces NiO faster than Co3O4 because of thelack of induction period for Ni-catalyst. O2 regeneration stepremove more than 90% of deposited carbon in a very high rateon both catalyst. After carbon removal by oxidation, Ni particlesmaintained its size equivalent to that of the reduced catalyst asshown in TEM micrographs in Fig. 18. Hence, Ni catalyst showbetter performance in cyclic reaction compared to Co catalyst.Furthermore, higher methane decomposition activity andimproved stability is indicated by a higher initial methane con-version rate and hydrogen production from facile reduction of theNiO by methane facilitates improved performance of Ni catalystover Co catalyst in cyclic reaction. Ammendola et al. [194] provedthat oxygen completely regenerate CuAl2O4 catalyst by removing690 mg of carbon within 15 min with increasing bed temperatureby 10 1C. Each combustion step completely removes carbon
deposited in the prior decomposition step, therefore, no accumu-lation of carbon is observed. The further amount of oxygen re-oxidizes the catalyst which is already reduced by methane duringthe previous decomposition step. Ammendola et al. [189] simulatea cyclic process by switching two feeds CH4 (5 vol%) in N2 forabout 25 min and air regeneration for 4 min, 2 min, 1 min and30 s. They concluded that the regeneration time of more than2 min is necessary for a stable hydrogen production and it shouldbe less than 1 min for suppressing CO2 production. Amin et al. [184]conducted methane decomposition and catalyst regeneration in athermal gravimetric analyzer with air using 10 mg of non-porouscatalyst (Ni/αAl2O3) or porous (Ni/γAl2O3). Regeneration at 550 1Cwas faster than that at 500 1C reveals the temperature dependency ofregeneration. Furthermore, non-porous catalyst regenerated in afaster rate than the porous catalyst at both 500 and 550 1C becausecarbon deposited only over the external surface of non-porouscatalyst which is more accessible for gasification.
5.3. Partial regeneration
Partial regeneration is a better solution to overcome thedisadvantages relating to catalyst sintering and deactivation dur-ing regeneration process. The main filament of formed carbon isdifficult to oxidize. Therefore, in partial regeneration process, theencapsulated carbon is oxidized by leaving the carbon filament togrow [192]. This filament can hold the metal particle at the tip ofthe filaments through which carbon diffuses to the support forprecipitation. Hence, partial regeneration maintains the activity ofcatalyst over several numbers of cycles leaving main skeletal bodyof the filament intact. Rahman et al. [190] conducted the regen-eration process with 5.25% O2 until the catalyst mass dropped tonear 30% of maximum mass reached in the first cycle. Theyobserved 28% and 23% higher mass gain during the second andthird reaction cycle compared to the corresponding previous step.Furthermore, the mass gain observed in the sixth reaction cyclewas around 3.3% higher than the original mass gain in the firstreaction cycle. Instead of complete gasification, partial gasificationof the deposited carbon is a strategy that can maintain significantactivity of the catalyst. Very limited research articles are availableon partial regeneration, further studies have to be conducted onthis opportunity.
6. Separation of pure hydrogen: a hypothesis
The catalyst must be recovered and reused to improve theeconomy of the process, if the main aim of TCD is hydrogen
Fig. 18. TEM micrographs of Ni–CeO2/MgO/Al2O3 catalyst. (a) after reduction; (b) after CH4 decomposition and (c) after carbon oxidation with O2/He [187].
U.P.M. Ashik et al. / Renewable and Sustainable Energy Reviews 44 (2015) 221–256250
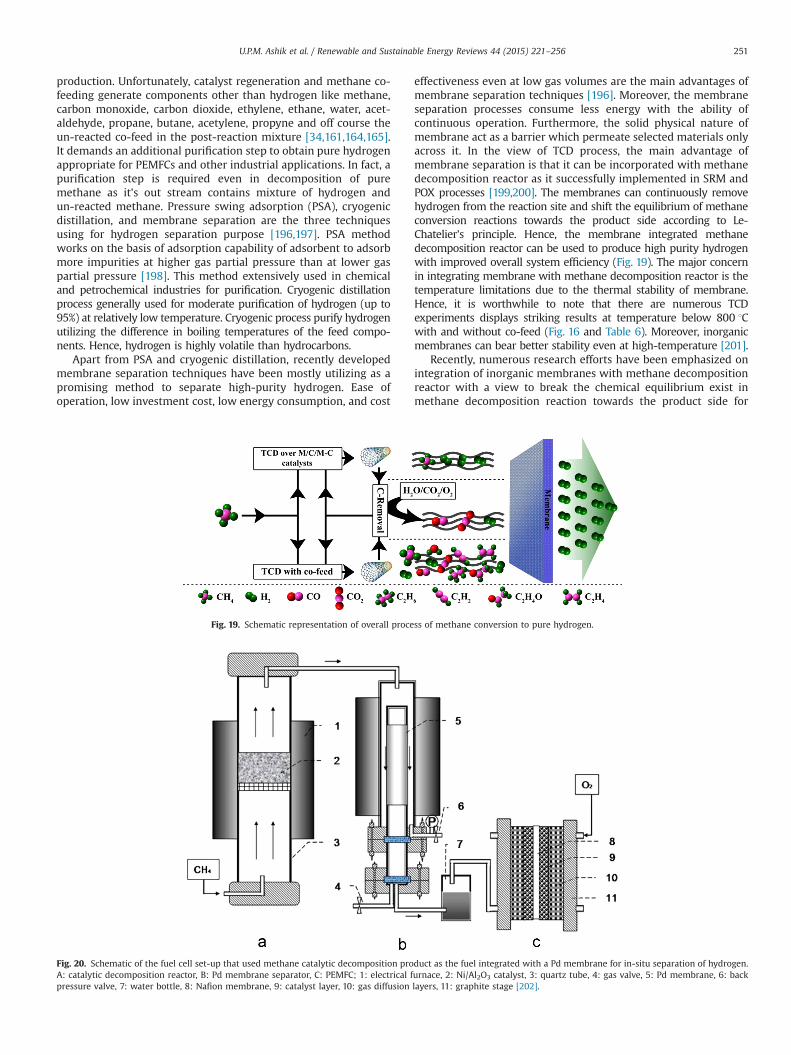
production. Unfortunately, catalyst regeneration and methane co-feeding generate components other than hydrogen like methane,carbon monoxide, carbon dioxide, ethylene, ethane, water, acet-aldehyde, propane, butane, acetylene, propyne and off course theun-reacted co-feed in the post-reaction mixture [34,161,164,165].It demands an additional purification step to obtain pure hydrogenappropriate for PEMFCs and other industrial applications. In fact, apurification step is required even in decomposition of puremethane as it's out stream contains mixture of hydrogen andun-reacted methane. Pressure swing adsorption (PSA), cryogenicdistillation, and membrane separation are the three techniquesusing for hydrogen separation purpose [196,197]. PSA methodworks on the basis of adsorption capability of adsorbent to adsorbmore impurities at higher gas partial pressure than at lower gaspartial pressure [198]. This method extensively used in chemicaland petrochemical industries for purification. Cryogenic distillationprocess generally used for moderate purification of hydrogen (up to95%) at relatively low temperature. Cryogenic process purify hydrogenutilizing the difference in boiling temperatures of the feed compo-nents. Hence, hydrogen is highly volatile than hydrocarbons.
Apart from PSA and cryogenic distillation, recently developedmembrane separation techniques have been mostly utilizing as apromising method to separate high-purity hydrogen. Ease ofoperation, low investment cost, low energy consumption, and cost
effectiveness even at low gas volumes are the main advantages ofmembrane separation techniques [196]. Moreover, the membraneseparation processes consume less energy with the ability ofcontinuous operation. Furthermore, the solid physical nature ofmembrane act as a barrier which permeate selected materials onlyacross it. In the view of TCD process, the main advantage ofmembrane separation is that it can be incorporated with methanedecomposition reactor as it successfully implemented in SRM andPOX processes [199,200]. The membranes can continuously removehydrogen from the reaction site and shift the equilibrium of methaneconversion reactions towards the product side according to Le-Chatelier's principle. Hence, the membrane integrated methanedecomposition reactor can be used to produce high purity hydrogenwith improved overall system efficiency (Fig. 19). The major concernin integrating membrane with methane decomposition reactor is thetemperature limitations due to the thermal stability of membrane.Hence, it is worthwhile to note that there are numerous TCDexperiments displays striking results at temperature below 800 1Cwith and without co-feed (Fig. 16 and Table 6). Moreover, inorganicmembranes can bear better stability even at high-temperature [201].
Recently, numerous research efforts have been emphasized onintegration of inorganic membranes with methane decompositionreactor with a view to break the chemical equilibrium exist inmethane decomposition reaction towards the product side for
Fig. 19. Schematic representation of overall process of methane conversion to pure hydrogen.
Fig. 20. Schematic of the fuel cell set-up that used methane catalytic decomposition product as the fuel integrated with a Pd membrane for in-situ separation of hydrogen.A: catalytic decomposition reactor, B: Pd membrane separator, C: PEMFC; 1: electrical furnace, 2: Ni/Al2O3 catalyst, 3: quartz tube, 4: gas valve, 5: Pd membrane, 6: backpressure valve, 7: water bottle, 8: Nafion membrane, 9: catalyst layer, 10: gas diffusion layers, 11: graphite stage [202].
U.P.M. Ashik et al. / Renewable and Sustainable Energy Reviews 44 (2015) 221–256 251
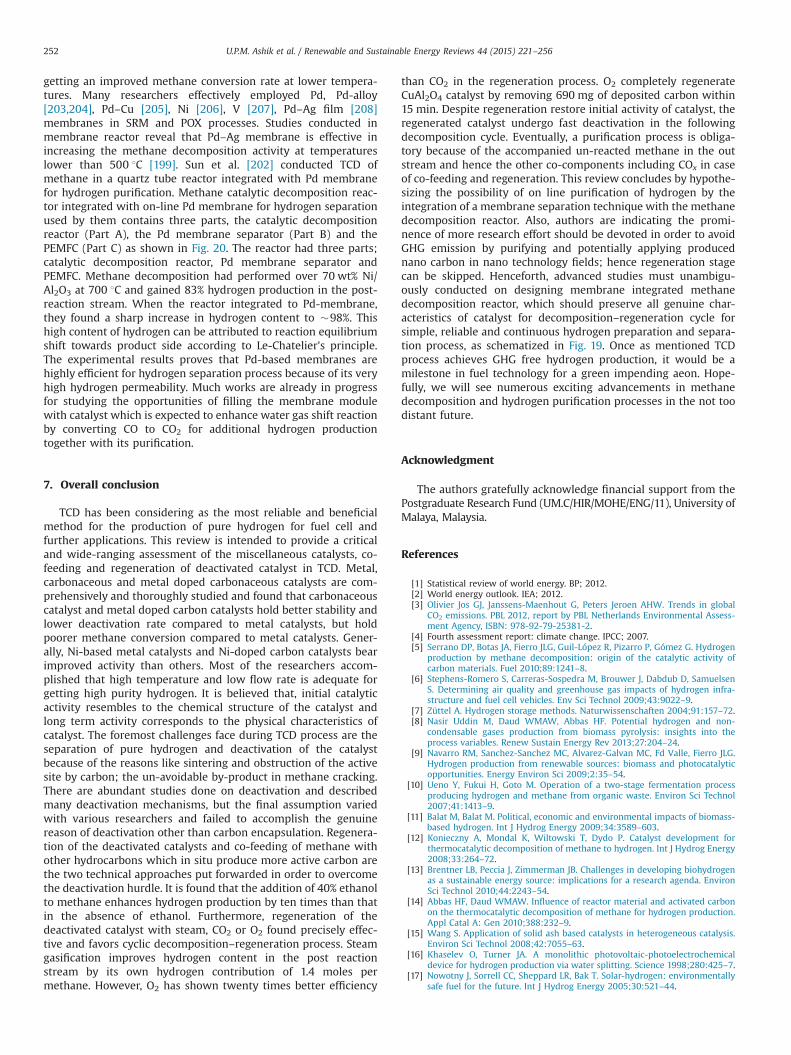
getting an improved methane conversion rate at lower tempera-tures. Many researchers effectively employed Pd, Pd-alloy[203,204], Pd–Cu [205], Ni [206], V [207], Pd–Ag film [208]membranes in SRM and POX processes. Studies conducted inmembrane reactor reveal that Pd–Ag membrane is effective inincreasing the methane decomposition activity at temperatureslower than 500 1C [199]. Sun et al. [202] conducted TCD ofmethane in a quartz tube reactor integrated with Pd membranefor hydrogen purification. Methane catalytic decomposition reac-tor integrated with on-line Pd membrane for hydrogen separationused by them contains three parts, the catalytic decompositionreactor (Part A), the Pd membrane separator (Part B) and thePEMFC (Part C) as shown in Fig. 20. The reactor had three parts;catalytic decomposition reactor, Pd membrane separator andPEMFC. Methane decomposition had performed over 70 wt% Ni/Al2O3 at 700 1C and gained 83% hydrogen production in the post-reaction stream. When the reactor integrated to Pd-membrane,they found a sharp increase in hydrogen content to �98%. Thishigh content of hydrogen can be attributed to reaction equilibriumshift towards product side according to Le-Chatelier's principle.The experimental results proves that Pd-based membranes arehighly efficient for hydrogen separation process because of its veryhigh hydrogen permeability. Much works are already in progressfor studying the opportunities of filling the membrane modulewith catalyst which is expected to enhance water gas shift reactionby converting CO to CO2 for additional hydrogen productiontogether with its purification.
7. Overall conclusion
TCD has been considering as the most reliable and beneficialmethod for the production of pure hydrogen for fuel cell andfurther applications. This review is intended to provide a criticaland wide-ranging assessment of the miscellaneous catalysts, co-feeding and regeneration of deactivated catalyst in TCD. Metal,carbonaceous and metal doped carbonaceous catalysts are com-prehensively and thoroughly studied and found that carbonaceouscatalyst and metal doped carbon catalysts hold better stability andlower deactivation rate compared to metal catalysts, but holdpoorer methane conversion compared to metal catalysts. Gener-ally, Ni-based metal catalysts and Ni-doped carbon catalysts bearimproved activity than others. Most of the researchers accom-plished that high temperature and low flow rate is adequate forgetting high purity hydrogen. It is believed that, initial catalyticactivity resembles to the chemical structure of the catalyst andlong term activity corresponds to the physical characteristics ofcatalyst. The foremost challenges face during TCD process are theseparation of pure hydrogen and deactivation of the catalystbecause of the reasons like sintering and obstruction of the activesite by carbon; the un-avoidable by-product in methane cracking.There are abundant studies done on deactivation and describedmany deactivation mechanisms, but the final assumption variedwith various researchers and failed to accomplish the genuinereason of deactivation other than carbon encapsulation. Regenera-tion of the deactivated catalysts and co-feeding of methane withother hydrocarbons which in situ produce more active carbon arethe two technical approaches put forwarded in order to overcomethe deactivation hurdle. It is found that the addition of 40% ethanolto methane enhances hydrogen production by ten times than thatin the absence of ethanol. Furthermore, regeneration of thedeactivated catalyst with steam, CO2 or O2 found precisely effec-tive and favors cyclic decomposition–regeneration process. Steamgasification improves hydrogen content in the post reactionstream by its own hydrogen contribution of 1.4 moles permethane. However, O2 has shown twenty times better efficiency
than CO2 in the regeneration process. O2 completely regenerateCuAl2O4 catalyst by removing 690 mg of deposited carbon within15 min. Despite regeneration restore initial activity of catalyst, theregenerated catalyst undergo fast deactivation in the followingdecomposition cycle. Eventually, a purification process is obliga-tory because of the accompanied un-reacted methane in the outstream and hence the other co-components including COx in caseof co-feeding and regeneration. This review concludes by hypothe-sizing the possibility of on line purification of hydrogen by theintegration of a membrane separation technique with the methanedecomposition reactor. Also, authors are indicating the promi-nence of more research effort should be devoted in order to avoidGHG emission by purifying and potentially applying producednano carbon in nano technology fields; hence regeneration stagecan be skipped. Henceforth, advanced studies must unambigu-ously conducted on designing membrane integrated methanedecomposition reactor, which should preserve all genuine char-acteristics of catalyst for decomposition–regeneration cycle forsimple, reliable and continuous hydrogen preparation and separa-tion process, as schematized in Fig. 19. Once as mentioned TCDprocess achieves GHG free hydrogen production, it would be amilestone in fuel technology for a green impending aeon. Hope-fully, we will see numerous exciting advancements in methanedecomposition and hydrogen purification processes in the not toodistant future.
Acknowledgment
The authors gratefully acknowledge financial support from thePostgraduate Research Fund (UM.C/HIR/MOHE/ENG/11), University ofMalaya, Malaysia.
References
[1] Statistical review of world energy. BP; 2012.[2] World energy outlook. IEA; 2012.[3] Olivier Jos GJ, Janssens-Maenhout G, Peters Jeroen AHW. Trends in global
CO2 emissions. PBL 2012, report by PBL Netherlands Environmental Assess-ment Agency, ISBN: 978-92-79-25381-2.
[4] Fourth assessment report: climate change. IPCC; 2007.[5] Serrano DP, Botas JA, Fierro JLG, Guil-López R, Pizarro P, Gómez G. Hydrogen
production by methane decomposition: origin of the catalytic activity ofcarbon materials. Fuel 2010;89:1241–8.
[6] Stephens-Romero S, Carreras-Sospedra M, Brouwer J, Dabdub D, SamuelsenS. Determining air quality and greenhouse gas impacts of hydrogen infra-structure and fuel cell vehicles. Env Sci Technol 2009;43:9022–9.
[7] Züttel A. Hydrogen storage methods. Naturwissenschaften 2004;91:157–72.[8] Nasir Uddin M, Daud WMAW, Abbas HF. Potential hydrogen and non-
condensable gases production from biomass pyrolysis: insights into theprocess variables. Renew Sustain Energy Rev 2013;27:204–24.
[9] Navarro RM, Sanchez-Sanchez MC, Alvarez-Galvan MC, Fd Valle, Fierro JLG.Hydrogen production from renewable sources: biomass and photocatalyticopportunities. Energy Environ Sci 2009;2:35–54.
[10] Ueno Y, Fukui H, Goto M. Operation of a two-stage fermentation processproducing hydrogen and methane from organic waste. Environ Sci Technol2007;41:1413–9.
[11] Balat M, Balat M. Political, economic and environmental impacts of biomass-based hydrogen. Int J Hydrog Energy 2009;34:3589–603.
[12] Konieczny A, Mondal K, Wiltowski T, Dydo P. Catalyst development forthermocatalytic decomposition of methane to hydrogen. Int J Hydrog Energy2008;33:264–72.
[13] Brentner LB, Peccia J, Zimmerman JB. Challenges in developing biohydrogenas a sustainable energy source: implications for a research agenda. EnvironSci Technol 2010;44:2243–54.
[14] Abbas HF, Daud WMAW. Influence of reactor material and activated carbonon the thermocatalytic decomposition of methane for hydrogen production.Appl Catal A: Gen 2010;388:232–9.
[15] Wang S. Application of solid ash based catalysts in heterogeneous catalysis.Environ Sci Technol 2008;42:7055–63.
[16] Khaselev O, Turner JA. A monolithic photovoltaic-photoelectrochemicaldevice for hydrogen production via water splitting. Science 1998;280:425–7.
[17] Nowotny J, Sorrell CC, Sheppard LR, Bak T. Solar-hydrogen: environmentallysafe fuel for the future. Int J Hydrog Energy 2005;30:521–44.
U.P.M. Ashik et al. / Renewable and Sustainable Energy Reviews 44 (2015) 221–256252
[18] Peharz G, Dimroth F, Wittstadt U. Solar hydrogen production by watersplitting with a conversion efficiency of 18%. Int J Hydrog Energy 2007;32:3248–52.
[19] Ni M, Leung MKH, Leung DYC, Sumathy K. A review and recent developmentsin photocatalytic water-splitting using for hydrogen production. RenewSustain Energy Rev 2007;11:401–25.
[20] Kodama T. High-temperature solar chemistry for converting solar heat tochemical fuels. Prog Energy Combust Sci 2003;29:567–97.
[21] Westermann P, Jørgensen B, Lange L, Ahring BK, Christensen CH. Maximizingrenewable hydrogen production from biomass in a bio/catalytic refinery. Int JHydrog Energy 2007;32:4135–41.
[22] Jana P, de la Peña O’Shea VA, Coronado JM, Serrano DP. Mild temperaturehydrogen production by methane decomposition over cobalt catalystsprepared with different precipitating agents. Int J Hydrog Energy 2012;37:7034–41.
[23] Zhang T, Amiridis MD. Hydrogen production via the direct cracking ofmethane over silica-supported nickel catalysts. Appl Catal A: Gen 1998;167:161–172.
[24] Saraswat SK, Pant KK. Ni–Cu–Zn/MCM-22 catalysts for simultaneous produc-tion of hydrogen and multiwall carbon nanotubes via thermo-catalyticdecomposition of methane. Int J Hydrog Energy 2011;36:13352–60.
[25] Jang HT, Cha WS. Hydrogen production by the thermocatalytic decomposi-tion of methane in a fluidized bed reactor. Korean J Chem Eng 2007;24:374–7.
[26] Shah N, Panjala D, Huffman GP. Hydrogen production by catalytic decom-position of methane. Energy Fuels 2001;15:1528–34.
[27] Li Y, Chen J, Qin Y, Chang L. Simultaneous production of hydrogen andnanocarbon from decomposition of methane on a nickel-based catalyst.Energy Fuels 2000;14:1188–94.
[28] Pinilla JL, Suelves I, Lázaro MJ, Moliner R, Palacios JM. Parametric study of thedecomposition of methane using a NiCu/Al2O3 catalyst in a fluidized bedreactor. Int J Hydrog Energy 2010;35:9801–9.
[29] Tibbetts GG, Meisner GP, Olk CH. Hydrogen storage capacity of carbonnanotubes, filaments, and vapor-grown fibers. Carbon 2001;39:2291–301.
[30] McAllister P, Wolf EE. Ni-catalyzed carbon infiltration of carbon-fibersubstrates. Carbon 1992;30:189–200.
[31] Toebes ML, Bitter JH, van Dillen AJ, de Jong KP. Impact of the structure andreactivity of nickel particles on the catalytic growth of carbon nanofibers.Catal Today 2002;76:33–42.
[32] Chaubey R, Sahu S, James OO, Maity S. A review on development of industrialprocesses and emerging techniques for production of hydrogen from renew-able and sustainable sources. Renew Sustain Energy Rev 2013;23:443–62.
[33] Suelves I, Pinilla JL, Lázaro MJ, Moliner R, Palacios JM. Effects of reactionconditions on hydrogen production and carbon nanofiber properties gener-ated by methane decomposition in a fixed bed reactor using a NiCuAlcatalyst. J Power Sources 2009;192:35–42.
[34] Muradov N, Smith F, T-Raissi A. Catalytic activity of carbons for methanedecomposition reaction. Catal Today 2005;102–103:225–33.
[35] Dufour A, Celzard A, Ouartassi B, Broust F, Fierro V, Zoulalian A. Effect ofmicropores diffusion on kinetics of CH4 decomposition over a wood-derivedcarbon catalyst. Appl Catal A: Gen 2009;360:120–5.
[36] Trimm DL. The formation and removal of coke from nickel catalyst. Catal Rev1977;16:155–89.
[37] Bartholomew CH. Carbon deposition in steam reforming and methanation.Catal Rev 1982;24:67–112.
[38] Rostrup-Nielsen JR. Coking on nickel catalysts for steam reforming ofhydrocarbons. J Catal 1974;33:184–201.
[39] Takenaka S, Ishida M, Serizawa M, Tanabe E, Otsuka K. Formation of carbonnanofibers and carbon nanotubes through methane decomposition oversupported cobalt catalysts. J Phys Chem B 2004;108:11464–72.
[40] Ashok J, Naveen Kumar S, Subrahmanyam M, Venugopal A. Production ofCOX free hydrogen by catalytic decomposition of methane over Ni/HYcatalysts. Catal Lett 2007;118:139–45.
[41] Ashok J, Kumar SN, Subrahmanyam M, Venugopal A. Pure H2 production bydecomposition of methane over Ni supported on hydroxyapatite catalysts.Catal Lett 2008;121:283–90.
[42] Takenaka S, Ogihara H, Yamanaka I, Otsuka K. Decomposition of methaneover supported-Ni catalysts: effects of the supports on the catalytic lifetime.Appl Catal A: Gen 2001;217:101–10.
[43] Guil-Lopez R, Botas JA, Fierro JLG, Serrano DP. Comparison of metal andcarbon catalysts for hydrogen production by methane decomposition. ApplCatal A: Gen 2011;396:40–51.
[44] Suelves I, Pinilla JL, Lázaro MJ, Moliner R. Carbonaceous materials as catalystsfor decomposition of methane. Chem Eng J 2008;140:432–8.
[45] Zhang W, Ge Q, Xu H. Influences of reaction conditions on methanedecomposition over non-supported Ni catalyst. J Nat Gas Chem 2011;20:339–44.
[46] Zhang W, Ge Q, Xu H. Influences of precipitate rinsing solvents on ni catalystfor methane decomposition to COx-free hydrogen†. J Phys Chem A2009;114:3818–23.
[47] Cunha AF, Órfão JJM, Figueiredo JL. Methane decomposition on Ni–Cu alloyedRaney-type catalysts. Int J Hydrog Energy 2009;34:4763–72.
[48] Cunha AF, Órfão JJM, Figueiredo JL. Methane decomposition on Fe–Cu Raney-type catalysts. Fuel Process Technol. 2009;90:1234–40.
[49] Guevara JC, Wang JA, Chen LF, Valenzuela MA, Salas P, García-Ruiz A, et al.Ni/Ce-MCM-41 mesostructured catalysts for simultaneous production of
hydrogen and nanocarbon via methane decomposition. Int J Hydrog Energy2010;35:3509–21.
[50] Venugopal A, Naveen Kumar S, Ashok J, Hari Prasad D, Durga Kumari V,Prasad KBS, et al. Hydrogen production by catalytic decomposition ofmethane over Ni/SiO2. Int J Hydrog Energy 2007;32:1782–8.
[51] Wang W, Wang H, Yang Y, S. Jiang. Ni–SiO2 and Ni–Fe–SiO2 catalysts formethane decomposition to prepare hydrogen and carbon filaments. Int JHydrog Energy 2012;37:9058–66.
[52] Lázaro MJ, Echegoyen Y, Alegre C, Suelves I, Moliner R, Palacios JM. TiO2 astextural promoter on high loaded Ni catalysts for methane decomposition.Int J Hydrog Energy 2008;33:3320–9.
[53] Pinilla JL, Utrilla R, Lázaro MJ, Moliner R, Suelves I, García AB. Ni- and Fe-based catalysts for hydrogen and carbon nanofilament production bycatalytic decomposition of methane in a rotary bed reactor. Fuel ProcessTechnol 2011;92:1480–8.
[54] Figueiredo JL, Órfão JJM, Cunha AF. Hydrogen production via methanedecomposition on Raney-type catalysts. Int J Hydrog Energy 2010;35:9795–9800.
[55] Torres D, de Llobet S, Pinilla JL, Lázaro MJ, Suelves I, Moliner R. Hydrogenproduction by catalytic decomposition of methane using a Fe-based catalystin a fluidized bed reactor. J Nat Gas Chem 2012;21:367–73.
[56] Pinilla JL, Utrilla R, Karn RK, Suelves I, Lázaro MJ, Moliner R, et al. Hightemperature iron-based catalysts for hydrogen and nanostructured carbonproduction by methane decomposition. Int J Hydrog Energy 2011;36:7832–43.
[57] Zapata B, Valenzuela MA, Palacios J, Torres-Garcia E. Effect of Ca, Ce or Koxide addition on the activity of Ni/SiO2 catalysts for the methane decom-position reaction. Int J Hydrog Energy 2010;35:12091–7.
[58] Saraswat SK, Pant KK. Synthesis of hydrogen and carbon nanotubes overcopper promoted Ni/SiO2 catalyst by thermocatalytic decomposition ofmethane. J Nat Gas Sci Eng 2013;13:52–9.
[59] Nuernberg GDB, Foletto EL, Campos CEM, Fajardo HV, Carreño NLV, ProbstLFD. Direct decomposition of methane over Ni catalyst supported inmagnesium aluminate. J Power Sources 2012;208:409–14.
[60] Tapia-Parada K, Valverde-Aguilar G, Mantilla A, Valenzuela MA, Hernández E.Synthesis and characterization of Ni/Ce–SiO2 and Co/Ce–TiO2 catalysts formethane decomposition. Fuel 2013;110:70–5.
[61] Italiano G, Delia A, Espro C, Bonura G, Frusteri F. Methane decompositionover Co thin layer supported catalysts to produce hydrogen for fuel cell. Int JHydrog Energy 2010;35:11568–75.
[62] Lee K-Y, Yeoh W-M, Chai S-P, Ichikawa S, Mohamed AR. Catalytic decom-position of methane to carbon nanotubes and hydrogen: the effect of metalloading on the activity of CoO-MoO/Al2O3 catalyst. Fuller Nanotub CarbonNanostruct 2012;21:158–70.
[63] Nuernberg GDB, Fajardo HV, Foletto EL, Hickel-Probst SM, Carreño NLV,Probst LFD, et al. Methane conversion to hydrogen and nanotubes on Pt/Nicatalysts supported over spinel MgAl2O4. Catal Today 2011;176:465–9.
[64] Hussain T, Iqbal M. Pyrolysis of methane by catalytic properties exhibited byceramics. J Anal Appl Pyrolysis 2011;90:106–11.
[65] Sierra Gallego G, Barrault J, Batiot-Dupeyrat C, Mondragón F. Production ofhydrogen and MWCNTs by methane decomposition over catalysts originatedfrom LaNiO3 perovskite. Catal Today 2010;149:365–71.
[66] Maneerung T, Hidajat K, Kawi S. LaNiO3 perovskite catalyst precursor forrapid decomposition of methane: influence of temperature and presence ofH2 in feed stream. Catal Today 2011;171:24–35.
[67] Jin L, Si H, Zhang J, Lin P, Hu Z, Qiu B, et al. Preparation of activated carbonsupported Fe–Al2O3 catalyst and its application for hydrogen production bycatalytic methane decomposition. Int J Hydrog Energy 2013;38:1–8.
[68] R-NJ R. Steam reforming catalysts: an investigation of catalysts for tubularsteam reforming of hydrocarbons. Copenhagen: Teknisk Forlag A/S; 1975.
[69] Jana P, de la Peña O’Shea VA, Coronado JM, Serrano DP. Cobalt basedcatalysts prepared by Pechini method for CO2-free hydrogen production bymethane decomposition. Int J Hydrog Energy 2010;35:10285–94.
[70] Roine A. HSC Chemistry 5.11. Outokumpu Research Oy, Pori, Finland; 2002.[71] Takenaka S, Serizawa M, Otsuka K. Formation of filamentous carbons over
supported Fe catalysts through methane decomposition. J Catal 2004;222:520–31.
[72] Ermakova MA, Ermakov DY. Ni/SiO2 and Fe/SiO2 catalysts for production ofhydrogen and filamentous carbon via methane decomposition. Catal Today2002;77:225–35.
[73] Dupuis A-C. The catalyst in the CCVD of carbon nanotubes—a review. ProgMater Sci 2005;50:929–61.
[74] Otsuka K, Ogihara H, Takenaka S. Decomposition of methane over Nicatalysts supported on carbon fibers formed from different hydrocarbons.Carbon 2003;41:223–33.
[75] Chambers A, Nemes T, Rodriguez NM, Baker RTK. Catalytic behavior ofgraphite nanofiber supported nickel particles. 1. Comparison with othersupport media. J Phys Chem B 1998;102:2251–8.
[76] Li Y, Li D, Wang G. Methane decomposition to COx-free hydrogen and nano-carbon material on group 8–10 base metal catalysts: a review. Catal Today2011;162:1–48.
[77] Salmones J, Wang JA, Valenzuela MA, Sánchez E, Garcia A. Pore geometryinfluence on the deactivation behavior of Ni-based catalysts for simultaneousproduction of hydrogen and nanocarbon. Catal Today 2009;148:134–9.
[78] Chen D, Christensen KO, Ochoa-Fernández E, Yu Z, Tøtdal B, Latorre N, et al.Synthesis of carbon nanofibers: effects of Ni crystal size during methanedecomposition. J Catal 2005;229:82–96.
U.P.M. Ashik et al. / Renewable and Sustainable Energy Reviews 44 (2015) 221–256 253
[79] Hornés A, Bera P, Fernández-García M, Guerrero-Ruiz A, Martínez-Arias A.Catalytic and redox properties of bimetallic Cu–Ni systems combined withCeO2 or Gd-doped CeO2 for methane oxidation and decomposition. ApplCatal B: Environ 2012;111–112:96–105.
[80] Lua AC, Wang HY. Decomposition of methane over unsupported porousnickel and alloy catalyst. Appl Catal B: Environ 2013;132–133:469–78.
[81] Suelves I, Lázaro MJ, Moliner R, Echegoyen Y, Palacios JM. Characterization ofNiAl and NiCuAl catalysts prepared by different methods for hydrogenproduction by thermo catalytic decomposition of methane. Catal Today2006;116:271–80.
[82] Li Z, Larsson JA, Larsson P, Ahuja R, Tobin JM, O’Byrne J, et al. Copper/molybdenum nanocomposite particles as catalysts for the growth ofbamboo-structured carbon nanotubes. J Phys Chem C 2008;112:12201–6.
[83] O’Byrne JP, Li Z, Tobin JM, Larsson JA, Larsson P, Ahuja R, et al. Growth ofcarbon nanotubes from heterometallic palladium and copper catalysts. J PhysChem C 2010;114:8115–9.
[84] Shah N, Pattanaik S, Huggins FE, Panjala D, Huffman GP. XAFS andMössbauer spectroscopy characterization of supported binary catalysts fornonoxidative dehydrogenation of methane. Fuel Process Technol 2003;83:163–73.
[85] Punnoose A, Shah N, Huffman GP, Seehra MS. X-ray diffraction and electronmagnetic resonance studies of M/Fe/Al2O3 (M¼Ni, Mo and Pd) catalysts forCH4 to H2 conversion. Fuel Process Technol 2003;83:263–73.
[86] Qian W, Liu T, Wei F, Wang Z, Li Y. Enhanced production of carbonnanotubes: combination of catalyst reduction and methane decomposition.Appl Catal A: Gen 2004;258:121–4.
[87] Shah N, Wang Y, Panjala D, Huffman GP. Production of hydrogen and carbonnanostructures by non-oxidative catalytic dehydrogenation of ethane andpropane. Energy Fuels 2004;18:727–35.
[88] Muradov NZ. CO2-free production of hydrogen by catalytic pyrolysis ofhydrocarbon fuel. Energy Fuels 1998;12:41–8.
[89] Tang L, Yamaguchi D, Burke N, Trimm D, Chiang K. Methane decompositionover ceria modified iron catalysts. Catal Commun 2010;11:1215–9.
[90] Hussain ST, Nadeem MA, Mazhar M. Effect of potassium addition on theproduct selectivity of Ru:Mn/alumina supported catalyst system for Fischer–Tropsch reaction. Catal Commun, 9; 2008. p. 2048–52.
[91] Hussain ST, Gul S, Mazhar M, Anjum DH, Larachi F. Effect of surface structureon the catalytic behavior of Ni:Cu/Al and Ni:Cu:K/Al catalysts for methanedecomposition. J Nat Gas Chem 2008;17:374–82.
[92] Balakrishnan M, Batra VS, Hargreaves JSJ, Monaghan A, Pulford ID, Rico JL,et al. Hydrogen production from methane in the presence of red mud-making mud magnetic. Green Chem 2009;11:42–7.
[93] Ermakova MA, Ermakov DY, Chuvilin AL, Kuvshinov GG. Decomposition ofmethane over iron catalysts at the range of moderate temperatures: theinfluence of structure of the catalytic systems and the reaction conditions onthe yield of carbon and morphology of carbon filaments. J Catal 2001;201:183–97.
[94] Frusteri F, Italiano G, Espro C, Arena F. CH4 decomposition on Ni and Co thinlayer catalysts to produce H2 for fuel cell. Catal Today 2011;171:60–6.
[95] Chai S-P, Zein SHS, Mohamed AR. The effect of reduction temperature on Co-Mo/Al2O3 catalysts for carbon nanotubes formation. Appl Catal A: Gen2007;326:173–9.
[96] Chai S-P, Zein SHS, Mohamed AR. Preparation of carbon nanotubes overcobalt-containing catalysts via catalytic decomposition of methane. ChemPhys Lett 2006;426:345–50.
[97] Nasir Uddin M, Wan Daud WMA, Abbas HF. Kinetics and deactivationmechanisms of the thermal decomposition of methane in hydrogen andcarbon nanofiber Co-production over Ni-supported Y zeolite-based catalysts.Energy Convers Manag 2014;87:796–809.
[98] Wang HY, Lua AC. Deactivation and kinetic studies of unsupported Ni andNi–Co–Cu alloy catalysts used for hydrogen production by methane decom-position. Chem Eng J 2014;243:79–91.
[99] Abbott HL, Harrison I. Methane dissociative chemisorption on Ru(0001) andcomparison to metal nanocatalysts. J Catal 2008;254:27–38.
[100] Kvande I, Chen D, Yu Z, Rønning M, Holmen A. Optimization and scale-up ofCNF production based on intrinsic kinetic data obtained from TEOM. J Catal2008;256:204–14.
[101] Sharif Zein SH, Mohamed AR, Talpa Sai PS. Kinetic studies on catalyticdecomposition of methane to hydrogen and carbon over Ni/TiO2 catalyst. IndEng Chem Res 2004;43:4864–70.
[102] Fukada S, Nakamura N, Monden J, Nishikawa M. Experimental study ofcracking methane by Ni/SiO2 catalyst. J Nucl Mater 2004;329–333(Part B):1365–9.
[103] Borghei M, Karimzadeh R, Rashidi A, Izadi N. Kinetics of methane decom-position to COx-free hydrogen and carbon nanofiber over Ni–Cu/MgOcatalyst. Int J Hydrog Energy 2010;35:9479–88.
[104] Snoeck JW, Froment GF, Fowles M. Kinetic study of the carbon filamentformation by methane cracking on a nickel catalyst. J Catal 1997;169:250–62.
[105] Bai Z, Chen H, Li B, Li W. Methane decomposition over Ni loaded activatedcarbon for hydrogen production and the formation of filamentous carbon. IntJ Hydrog Energy 2007;32:32–7.
[106] Chesnokov VV, Chichkan AS. Production of hydrogen by methane catalyticdecomposition over Ni–Cu–Fe/Al2O3 catalyst. Int J Hydrog Energy 2009;34:2979–85.
[107] Zavarukhin SG, Kuvshinov GG. The kinetic model of formation of nanofibrouscarbon from CH4–H2 mixture over a high-loaded nickel catalyst with
consideration for the catalyst deactivation. Appl Catal A: Gen 2004;272:219–27.
[108] Xiong J, Dong X, Dong Y, Hao X, Hampshire S. Dual-production of nickel foamsupported carbon nanotubes and hydrogen by methane catalytic decom-position. Int J Hydrog Energy 2012;37:12307–16.
[109] de Lucas A, Garrido A, Sánchez P, Romero A, Valverde JL. Growth of carbonnanofibers from Ni/Y zeolite based catalysts: effects of Ni introductionmethod, reaction temperature, and reaction gas composition. Ind Eng ChemRes 2005;44:8225–36.
[110] Abbas HF, Daud WMAW. Thermocatalytic decomposition of methane forhydrogen production using activated carbon catalyst: regeneration andcharacterization studies. Int J Hydrog Energy 2009;34:8034–45.
[111] Figueiredo JL. Carbon formation and gasification on nickel. In: Figueiredo J,editor. Progress in catalyst deactivation. Netherlands: Springer; 1982. p. 45–63.
[112] Zhang Y, Smith K. Carbon formation thresholds and catalyst deactivationduring CH4 decomposition on supported Co and Ni catalysts. Catal Lett2004;95:7–12.
[113] Baker RTK, Barber MA, Harris PS, Feates FS, Waite RJ. Nucleation and growthof carbon deposits from the nickel catalyzed decomposition of acetylene.J Catal 1972;26:51–62.
[114] Villacampa JI, Royo C, Romeo E, Montoya JA, Del Angel P, Monzón A. Catalyticdecomposition of methane over Ni-Al2O3 coprecipitated catalysts: reactionand regeneration studies. Appl Catal A: Gen 2003;252:363–83.
[115] Amin AM, Croiset E, Epling W. Review of methane catalytic cracking forhydrogen production. Int J Hydrog Energy 2011;36:2904–35.
[116] Ermakova MA, Ermakov DY, Kuvshinov GG. Effective catalysts for directcracking of methane to produce hydrogen and filamentous carbon: Part I.Nickel catalysts. Appl Catal A: Gen 2000;201:61–70.
[117] Pinilla JL, Suelves I, Lázaro MJ, Moliner R, Palacios JM. Activity of NiCuAlcatalyst in methane decomposition studied using a thermobalance and thestructural changes in the Ni and the deposited carbon. Int J Hydrog Energy2008;33:2515–24.
[118] Ishihara T, Miyashita Y, Iseda H, Takita Y. Decomposition of Methane over Ni/SiO2 catalysts with membrane reactor for the production of hydrogen. ChemLett 1995;24:93–4.
[119] Aiello R, Fiscus JE, Loye H-Cz, Amiridis MD. Hydrogen production via thedirect cracking of methane over Ni/SiO2: catalyst deactivation and regenera-tion. Appl Catal A: Gen 2000;192:227–34.
[120] Malaika A, Kozłowski M. Influence of ethylene on carbon-catalysed decom-position of methane. Int J Hydrog Energy 2009;34:2600–5.
[121] Dufour A, Celzard A, Fierro V, Martin E, Broust F, Zoulalian A. Catalyticdecomposition of methane over a wood char concurrently activated by apyrolysis gas. Appl Catal A: Gen 2008;346:164–73.
[122] Jüntgen H. Activated carbon as catalyst support: a review of new researchresults. Fuel 1986;65:1436–46.
[123] Muradov N, Chen Z, Smith F. Fossil hydrogen with reduced CO2 emission:modeling thermocatalytic decomposition of methane in a fluidized bed ofcarbon particles. Int J Hydrog Energy 2005;30:1149–58.
[124] Serrano DP, Botas JÁ, Pizarro P, Gómez G. Kinetic and autocatalytic effectsduring the hydrogen production by methane decomposition over carbonac-eous catalysts. Int J Hydrog Energy 2013;38:5671–83.
[125] Moliner R, Suelves I, Lázaro MJ, Moreno O. Thermocatalytic decomposition ofmethane over activated carbons: influence of textural properties and surfacechemistry. Int J Hydrog Energy 2005;30:293–300.
[126] Lee EK, Lee SY, Han GY, Lee BK, Lee T-J, Jun JH, et al. Catalytic decompositionof methane over carbon blacks for CO2-free hydrogen production. Carbon2004;42:2641–8.
[127] Muradov N. Catalysis of methane decomposition over elemental carbon.Catal Commun 2001;2:89–94.
[128] Gatica JM, Gómez DM, Harti S, Vidal H. Monolithic honeycomb designapplied to carbon materials for catalytic methane decomposition. Appl CatalA: Gen 2013;458:21–7.
[129] La ́zaro MJ, Pinilla JL, Utrilla R, Suelves I, Moliner R, Moreno F, et al. H2�CH4
mixtures produced by carbon-catalyzed methane decomposition as a fuel forinternal combustion engines†. Energy Fuels 2010;24:3340–5.
[130] Kim MH, Lee EK, Jun JH, Kong SJ, Han GY, Lee BK, et al. Hydrogen productionby catalytic decomposition of methane over activated carbons: kinetic study.Int J Hydrog Energy 2004;29:187–93.
[131] Serrano DP, Botas JA, Guil-Lopez R. H2 production from methane pyrolysisover commercial carbon catalysts: kinetic and deactivation study. Int JHydrog Energy 2009;34:4488–94.
[132] Serrano DP, Botas JA, Pizarro P, Guil-Lopez R, Gomez G. Ordered mesoporouscarbons as highly active catalysts for hydrogen production by CH4 decom-position. Chem Commun 2008;0:6585–7.
[133] Lee KK, Han GY, Yoon KJ, Lee BK. Thermocatalytic hydrogen production fromthe methane in a fluidized bed with activated carbon catalyst. Catal Today2004;93–95:81–6.
[134] Krzyżyński S, Kozłowski M. Activated carbons as catalysts for hydrogenproduction via methane decomposition. Int J Hydrog Energy 2008;33:6172–7.
[135] Abbas HF, Daud WMAW. Hydrogen production by thermocatalytic decom-position of methane using a fixed bed activated carbon in a pilot scale unit:apparent kinetic, deactivation and diffusional limitation studies. Int J HydrogEnergy 2010;35:12268–76.
[136] Botas JA, Serrano DP, Guil-López R, Pizarro P, Gómez G. Methane catalyticdecomposition over ordered mesoporous carbons: a promising route forhydrogen production. Int J Hydrog Energy 2010;35:9788–94.
U.P.M. Ashik et al. / Renewable and Sustainable Energy Reviews 44 (2015) 221–256254
[137] Zhang J, Jin L, Liu S, Xun Y, Hu H. Mesoporous carbon prepared from directcoal liquefaction residue for methane decomposition. Carbon 2012;50:952–9.
[138] Suelves I, Lázaro MJ, Moliner R, Pinilla JL, Cubero H. Hydrogen production bymethane decarbonization: carbonaceous catalysts. Int J Hydrog Energy2007;32:3320–6.
[139] Lázaro MJ, Pinilla JL, Suelves I, Moliner R. Study of the deactivation mechan-ism of carbon blacks used in methane decomposition. Int J Hydrog Energy2008;33:4104–11.
[140] Zhuang QL, Kyotani T, Tomita A. DRIFT and TK/TPD analyses of surface oxygencomplexes formed during carbon gasification. Energy Fuels 1994;8:714–8.
[141] Bai Z, Li W, Bai J, Li B, Chen H. The effects of textural properties and surfacechemistry of activated carbon on its catalytic performance in methanedecomposition for hydrogen production. Energy Sources Part A: Recovery,Util Environ Eff 2012;34:1145–53.
[142] Zhang J, Jin L, He X, Liu S, Hu H. Catalytic methane decomposition over activatedcarbons prepared from direct coal liquefaction residue by KOH activation withaddition of SiO2 or SBA-15. Int J Hydrog Energy 2011;36:8978–84.
[143] Abbas HF, Baker IF. Thermocatalytic decomposition of methane usingactivated carbon: studying the influence of process parameters usingfactorial design. Int J Hydrog Energy 2011;36:8985–93.
[144] Abbas HF, Daud WMAW. Deactivation of palm shell-based activated carboncatalyst used for hydrogen production by thermocatalytic decomposition ofmethane. Int J Hydrog Energy 2009;34:6231–41.
[145] Serrano DP, Coronado JM, de la Pena O'Shea VA, Pizarro P, Botas JA. Advancesin the design of ordered mesoporous materials for low-carbon catalytichydrogen production. J Mater Chem A 2013;1:12016–27.
[146] Ryu BH, Lee SY, Lee DH, Han GY, Lee T-J, Yoon KJ. Catalytic characteristics ofvarious rubber-reinforcing carbon blacks in decomposition of methane forhydrogen production. Catal Today 2007;123:303–9.
[147] Lee SY, Kwak JH, Han GY, Lee TJ, Yoon KJ. Characterization of active sites formethane decomposition on carbon black through acetylene chemisorption.Carbon 2008;46:342–8.
[148] Zhang J, Jin L, Li Y, Hu H. Ni doped carbons for hydrogen production bycatalytic methane decomposition. Int J Hydrog Energy 2013;38:3937–47.
[149] Morales-Torres S, Silva AMT, Maldonado-Hódar FJ, Machado BF, Pérez-Cadenas AF, Faria JL, et al. Pt-catalysts supported on activated carbons forcatalytic wet air oxidation of aniline: activity and stability. Appl Catal B:Environ 2011;105:86–94.
[150] Li H, Yu D, Hu Y, Sun P, Xia J, Huang H. Effect of preparation method on thestructure and catalytic property of activated carbon supported nickel oxidecatalysts. Carbon 2010;48:4547–55.
[151] Chen J, He M, Wang G, Li Y, Zhu ZJ. Production of hydrogen from methanedecomposition using nanosized carbon black as catalyst in a fluidized-bedreactor. Int J Hydrog Energy 2009;34:9730–6.
[152] Prasad JS, Dhand V, Himabindu V, Anjaneyulu Y, Jain PK, Padya B. Productionof hydrogen and carbon nanofibers through the decomposition of methaneover activated carbon supported Pd catalysts. Int J Hydrog Energy 2010;35:10977–83.
[153] Sarada Prasad J, Dhand V, Himabindu V, Anjaneyulu Y. Production ofhydrogen and carbon nanofibers through the decomposition of methaneover activated carbon supported Ni catalysts. Int J Hydrog Energy 2011;36:11702–11.
[154] Zhang J, Jin L, Li Y, Si H, Qiu B, Hu H. Hierarchical porous carbon catalyst forsimultaneous preparation of hydrogen and fibrous carbon by catalyticmethane decomposition. Int J Hydrog Energy 2013;38:8732–40.
[155] Wei L, Tan Y-s, Han Y-z, Zhao J-t, Wu J, Zhang D. Hydrogen production bymethane cracking over different coal chars. Fuel 2011;90:3473–9.
[156] Wang HY, Lua AC. Hydrogen production by thermocatalytic methanedecomposition. Heat Transf Eng 2012;34:896–903.
[157] Abbas HF, Wan Daud WMA. Hydrogen production by methane decomposi-tion: a review. Int J Hydrog Energy 2010;35:1160–90.
[158] Muradov N, Smith F, Huang C, T-Raissi A. Autothermal catalytic pyrolysis ofmethane as a new route to hydrogen production with reduced CO2 emis-sions. Catal Today 2006;116:281–8.
[159] de la Casa-Lillo MA, Moore BC, Cazorla-Amorós D, Linares-Solano A. Mole-cular sieve properties obtained by cracking of methane on activated carbonfibers. Carbon 2002;40:2489–94.
[160] Zhang J, Jin L, Hu H, Xun Y. Effect of composition in coal liquefaction residueon catalytic activity of the resultant carbon for methane decomposition. Fuel2012;96:462–8.
[161] Malaika A, Kozłowski M. Hydrogen production by propylene-assisted decom-position of methane over activated carbon catalysts. Int J Hydrog Energy2010;35:10302–10.
[162] Pinilla JL, Suelves I, Lázaro MJ, Moliner R. Influence on hydrogen productionof the minor components of natural gas during its decomposition usingcarbonaceous catalysts. J Power Sources 2009;192:100–6.
[163] Malaika A, Krzyżyńska B, Kozłowski M. Catalytic decomposition of methanein the presence of in situ obtained ethylene as a method of hydrogenproduction. Int J Hydrog Energy 2010;35:7470–5.
[164] Rechnia P, Malaika A, Krzyżyńska B, Kozłowski M. Decomposition of methanein the presence of ethanol over activated carbon catalyst. Int J Hydrog Energy2012;37:14178–86.
[165] Rechnia P, Malaika A, Najder-Kozdrowska L, Kozłowski M. The effect ofethanol on carbon-catalysed decomposition of methane. Int J Hydrog Energy2012;37:7512–20.
[166] Pinilla JL, de Llobet S, Suelves I, Utrilla R, Lázaro MJ, Moliner R. Catalyticdecomposition of methane and methane/CO2 mixtures to produce synthesisgas and nanostructured carbonaceous material. Fuel 2011;90:2245–53.
[167] Adamska A, Malaika A, Kozłowski M. Carbon-catalyzed decomposition ofmethane in the presence of carbon dioxide†. Energy Fuels 2010;24:3307–12.
[168] Asai K, Takane K, Nagayasu Y, Iwamoto S, Yagasaki E, Inoue M. Decomposi-tion of methane in the presence of carbon dioxide over Ni catalysts. ChemEng Sci 2008;63:5083–8.
[169] Fidalgo B, Muradov N, Menéndez JA. Effect of H2S on carbon-catalyzedmethane decomposition and CO2 reforming reactions. Int J Hydrog Energy2012;37:14187–94.
[170] Otsuka K, Takenaka S, Ohtsuki H. Production of pure hydrogen by cyclicdecomposition of methane and oxidative elimination of carbon nanofibers onsupported-Ni-based catalysts. Appl Catal A: Gen 2004;273:113–24.
[171] Bachiller-Baeza B, Mateos-Pedrero C, Soria MA, Guerrero-Ruiz A, RodemerckU, Rodríguez-Ramos I. Transient studies of low-temperature dry reforming ofmethane over Ni-CaO/ZrO2-La2O3. Appl Catal B: Environ 2013;129:450–9.
[172] Pino L, Vita A, Cipitì F, Laganà M, Recupero V. Hydrogen production bymethane tri-reforming process over Ni–ceria catalysts: effect of La-doping.Appl Catal B: Environ 2011;104:64–73.
[173] Yan Z-F, Ding R-G, Song L-H, Qian L. Mechanistic study of carbon dioxidereforming with methane over supported nickel catalysts. Energy Fuels1998;12:1114–20.
[174] Zhu X, Huo P, Zhang Y-p, Cheng D-g, Liu C-j. Structure and reactivity ofplasma treated Ni/Al2O3 catalyst for CO2 reforming of methane. Appl Catal B:Environ 2008;81:132–40.
[175] González AR, Asencios YJO, Assaf EM, Assaf JM. Dry reforming of methane onNi–Mg–Al nano-spheroid oxide catalysts prepared by the sol–gel methodfrom hydrotalcite-like precursors. Appl Surf Sci 2013;280:876–87.
[176] Chen W, Zhao G, Xue Q, Chen L, Lu Y. High carbon-resistance Ni/CeAlO3-Al2O3
catalyst for CH4/CO2 reforming. Appl Catal B: Environ 2013;136–137:260–8.
[177] Amin MH, Mantri K, Newnham J, Tardio J, Bhargava SK. Highly stableytterbium promoted Ni/γ-Al2O3 catalysts for carbon dioxide reforming ofmethane. Appl Catal B: Environ 2012;119–120:217–26.
[178] Edwards JH, Maitra AM. The chemistry of methane reforming with carbondioxide and its current and potential applications. Fuel Process Technol1995;42:269–89.
[179] Domínguez A, Fidalgo B, Fernández Y, Pis JJ, Menéndez JA. Microwave-assisted catalytic decomposition of methane over activated carbon for freehydrogen production. Int J Hydrog Energy 2007;32:4792–9.
[180] Fidalgo B, Domínguez A, Pis JJ, Menéndez JA. Microwave-assisted dryreforming of methane. Int J Hydrog Energy 2008;33:4337–44.
[181] Pinilla JL, Suelves I, Utrilla R, Gálvez ME, Lázaro MJ, Moliner R. Hydrogenproduction by thermo-catalytic decomposition of methane: regeneration ofactive carbons using CO2. J Power Sources 2007;169:103–9.
[182] Lázaro MJ, Gálvez ME, Artal S, Palacios JM, Moliner R. Preparation ofsteam-activated carbons as catalyst supports. J Anal Appl Pyrolysis 2007;78:301–15.
[183] Choudhary VR, Banerjee S, Rajput AM. Continuous production of H2 at lowtemperature from methane decomposition over Ni-containing catalyst fol-lowed by gasification by steam of the carbon on the catalyst in two parallelreactors operated in cyclic manner. J Catal 2001;198:136–41.
[184] Amin AM, Croiset E, Constantinou C, Epling W. Methane cracking using Nisupported on porous and non-porous alumina catalysts. Int J Hydrog Energy2012;37:9038–48.
[185] Amin AM, Croiset E, Malaibari Z, Epling W. Hydrogen production by methanecracking using Ni-supported catalysts in a fluidized bed. Int J Hydrog Energy2012;37:10690–701.
[186] Guil-López R, La Parola V, Peña MA, Fierro JLG. Hydrogen production via CH4
pyrolysis: regeneration of ex hydrotalcite oxide catalysts. Catal Today2006;116:289–97.
[187] Li J, Smith KJ. Methane decomposition and catalyst regeneration in a cyclicmode over supported Co and Ni catalysts. Appl Catal A: Gen 2008;349:116–24.
[188] Ammendola P, Chirone R, Ruoppolo G, Russo G. Regeneration of spent catalysts inoxy-combustion atmosphere. Exp Therm Fluid Sci 2010;34:262–8.
[189] Ammendola P, Chirone R, Ruoppolo G, Russo G. Regeneration of deactivatedcatalysts for TCD process by carbon oxidation in a fluidized bed reactor. ThirdEuropean Combustion Meeting ECM, 2007; 2007.
[190] Rahman M, Croiset E, Hudgins R. Catalytic decomposition of methane forhydrogen production. Top Catal 2006;37:137–45.
[191] Sun Z-q, Wu J-h, Haghighi M, Bromly J, Ng E, Wee HL, et al. Methane crackingover a bituminous coal char. Energy Fuels 2007;21:1601–5.
[192] Koc R, Alper E, Croiset E, Elkamel A. Partial regeneration of Ni-based catalystsfor hydrogen production via methane cracking. Turk J Chem 2008;32:157–68.
[193] Abbas HF, Daud WMAW. An experimental investigation into the CO2
gasification of deactivated activated-carbon catalyst used for methanedecomposition to produce hydrogen. Int J Hydrog Energy 2010;35:141–50.
[194] Ammendola P, Chirone R, Ruoppolo G, Russo G. Regeneration strategies ofdeactivated catalysts for thermo-catalytic decomposition process in a flui-dized bed reactor. Combust Sci Technol 2008;180:869–82.
[195] Liu T-f, Fang Y-t, Wang Y. An experimental investigation into the gasificationreactivity of chars prepared at high temperatures. Fuel 2008;87:460–6.
[196] Adhikari S, Fernando S. Hydrogen membrane separation techniques. Ind EngChem Res 2006;45:875–81.
U.P.M. Ashik et al. / Renewable and Sustainable Energy Reviews 44 (2015) 221–256 255

[197] Yu J, Tan M, Liu PKT, Sahimi M, Tsotsis TT. Hydrogen production frombiomass-derived syngas using a membrane reactor based process. Ind EngChem Res 2013;53:819–27.
[198] Sircar S, Golden TC. Purification of hydrogen by pressure swing adsorption.Sep Sci Technol 2000;35:667–87.
[199] Ishihara T, Kawahara A, Fukunaga A, Nishiguchi H, Shinkai H, Miyaki M, et al.CH4 decomposition with a Pd�Ag hydrogen-permeating membrane reactorfor hydrogen production at decreased temperature. Ind Eng Chem Res2002;41:3365–9.
[200] Zhang Y, Li Q, Shen P, Liu Y, Yang Z, Ding W, et al. Hydrogen amplification ofcoke oven gas by reforming of methane in a ceramic membrane reactor. Int JHydrog Energy 2008;33:3311–9.
[201] Tsuru T, Yamaguchi K, Yoshioka T, Asaeda M. Methane steam reforming bymicroporous catalytic membrane reactors. AIChE J 2004;50:2794–805.
[202] Sun L, Liu Y, Wang W, Ran R, Huang Y, Shao Z. Methane catalytic decom-position integrated with on-line Pd membrane hydrogen separation for fuelcell application. Int J Hydrog Energy 2010;35:2958–63.
[203] Uemiya S, Matsuda T, Kikuchi E. Hydrogen permeable palladium–silver alloymembrane supported on porous ceramics. J Membr Sci 1991;56:315–25.
[204] Shigarov AB, Kirillov VA. Modeling of membrane reactor for steam methanereforming: from granular to structured catalysts. Theor Found Chem Eng2012;46:97–107.
[205] Acha E, Requies J, Barrio VL, Cambra JF, Güemez MB, Arias PL, et al. PdCumembrane integration and lifetime in the production of hydrogen frommethane. Int J Hydrog Energy 2013;38:7659–66.
[206] Ryi S-K, Park J-S, Kim D-K, Kim T-H, Kim S-H. Methane steam reformingwith a novel catalytic nickel membrane for effective hydrogen production.J Membr Sci 2009;339:189–94.
[207] Matsuka M, Higashi M, Ishihara T. Hydrogen production from methane usingvanadium-based catalytic membrane reactors. Int J Hydrog Energy2013;38:6673–80.
[208] Borgognoni F, Tosti S, Vadrucci M, Santucci A. Pure hydrogen production in aPd–Ag multi-membranes module by methane steam reforming. Int J HydrogEnergy 2011;36:7550–8.
U.P.M. Ashik et al. / Renewable and Sustainable Energy Reviews 44 (2015) 221–256256