PROCESS ENGINEERING ECONOMICS - E-Library
25
9 Estimate of Profitability In a free enterprise system, companies are in business to make a profit. If profits aren’t maintained, a company’s growth is stifled because retained earnings are derived from profits. A part or all these earnings may be used for new investments to enhance a company’s growth. A company is continually confronted with investment decisions. Management has the responsibility of investing in ventures that are financially attractive by increasing the earnings, providing attractive rates of return, and increasing economic value added. Every viable business has limitations on the capital available for investment purposes; therefore, it will invest in the most economically attractive ventures. The objectives and goals of a company are primary in considering what projects are to be funded. Corporate objectives change as the economy changes. A company that retains static objectives in this rapidly changing world will surely reach economic stagnation. The goal of a company may not be to maximize profit alone, because, if that were the case, then large capital investments might be undertaken that could easily yield a low return on capital. Also, the goal may not be to maximize the return on investment only without considering profit. If this were the case, then only the case that provided the highest return would be selected. In order to determine the worthiness of a venture, certain quantitative and qualitative measures of profitability are used. Although the term profitability is loosely used to measure a project’s value, it may not be a good measure. Peter Drucker [1] has said that “profitability is not a perfect measurement; no one has been able to define it, and yet it is a measurement, despite all its imperfections.” It used to be that only quantitative measures were of paramount importance but industry has taken a more responsible posture as a corporate citizen and
-
Upload
khangminh22 -
Category
Documents
-
view
3 -
download
0
Transcript of PROCESS ENGINEERING ECONOMICS - E-Library

9
Estimate of Profitability
In a free enterprise system, companies are in business to make a profit. If profits
aren’t maintained, a company’s growth is stifled because retained earnings are
derived from profits. A part or all these earnings may be used for new investments
to enhance a company’s growth. A company is continually confronted with
investment decisions. Management has the responsibility of investing in ventures
that are financially attractive by increasing the earnings, providing attractive rates
of return, and increasing economic value added. Every viable business has
limitations on the capital available for investment purposes; therefore, it will
invest in the most economically attractive ventures.
The objectives and goals of a company are primary in considering what
projects are to be funded. Corporate objectives change as the economy changes. A
company that retains static objectives in this rapidly changing world will surely
reach economic stagnation. The goal of a company may not be to maximize profit
alone, because, if that were the case, then large capital investments might be
undertaken that could easily yield a low return on capital. Also, the goalmay not be
to maximize the return on investment only without considering profit. If this were
the case, then only the case that provided the highest return would be selected.
In order to determine the worthiness of a venture, certain quantitative and
qualitative measures of profitability are used. Although the term profitability is
loosely used to measure a project’s value, it may not be a good measure. Peter
Drucker [1] has said that “profitability is not a perfect measurement; no one has
been able to define it, and yet it is a measurement, despite all its imperfections.”
It used to be that only quantitative measures were of paramount importance
but industry has taken a more responsible posture as a corporate citizen and

qualitative factors have become equally important in the decision-making
process. Both these measures will be considered in this chapter.
9.1 CORPORATE OBJECTIVES
Corporate objectives might include one or several of the following:
. Maximize the return on investment.
. Maximize the return on stockholder’s equity.
. Maximize aggregate earnings.
. Maximize common stock prices.
. Find outlets for a maximum of additional investment at returns greater
than the minimum acceptable rate of return.
. Increase market share.
. Increase the economic value added.
. Increase earnings per share of stock.
. Increase the market value added.
These objectives may not be the only ones but they are those that are most
frequently listed by executives.
9.2 PROJECT CLASSIFICATION
Any healthy, growing company has more requests for funding projects than funds
available. In order to consider the requests for funds, a company will establish a
priority or classification system. For example, projects may be classified as
follows:
. Necessity projects
. Product improvement projects
. Process improvement projects
. Expansion projects
. New ventures
Examples of typical necessity projects might be those to meet
environmental, health and safety regulations, legal requirements or possibly to
accomplish intangible but essential needs. Usually these projects do not require
the calculation of a return, but an important economic consideration is the change
in the cash flow that will occur when the project becomes operational. If this type
of project is not funded, operations may be terminated.
Product improvement projects are those that require capital to improve
the quality of a product, like clarity, stability, odor, or purity to meet customer
needs. A small product improvement often yields positive returns and has
small risk.
Chapter 9220
Process improvement projects are concerned with the reduction of
operating expenses, for example, improvement in reaction yields, reduction of
utilities, and labor expenses. The risk associated with these ventures is greater
than product improvement projects but still is relatively low.
Expansion projects often occur to meet increased sales demand for a
product. These projects may require the retrofitting of an existing facility with
associated high expenses and/or the building of a new facility. The risk for this
type project is higher than the previous projects as the sales may not develop as
projected.
New ventures require capital expenditures to introduce new products to the
market. These might also involve joint ventures or alliances with another
company or companies and are the riskiest projects. Problems such as the market
may not have been fully developed, or the share of the market a company can
garner may be questionable. When joint ventures are involved, there may be
differences in philosophies or operational modes among the companies involved
that can cause delays in start-ups and a host of other problems. Therefore, these
projects require a high rate of return initially to consider funding.
In the list above, the least risky projects are listed first, and the required
return when considering funding increases from necessity projects to new
ventures.
A classification system such as the one just described permits management
to consider funding projects according to the purpose of a project and the relative
degree of risk. Projects from various divisions of a company then can be
considered on a similar basis and measured by the same standard of profitability.
Management’s objective is to allocate capital funds for the greatest benefit to the
company. Whatever classification system is used, it should not be so rigid as to
restrict management’s capital budgeting process and decision making.
9.3 MINIMUM ACCEPTABLE RATE OF RETURN
A number of factors affect the minimum acceptable rate of return, barrier or
hurdle return, established by management for a venture to be funded. These
factors are listed in Table 9.1. Proposals of similar risk levels are classified in
each category. Management may increase the rate required for funding a risky
project or if funds are limited, and management establishes a minimum rate for a
project in each of the above categories to be considered for funding.
An important consideration is the cost of capital. It is what it costs a
company to borrow money from all sources, loans, bonds, common and preferred
stock. A company must make a return greater than the cost of capital to pay its
debts and be profitable. In recent years, some firms through creative accounting
have ignored the cost of capital in order to increase the dividends to stockholders.
This means that management is not meeting its obligations to pay off outstanding
Estimate of Profitability 221

debts. A sample calculation of the cost of capital is found in Table 9.2. The
information for this calculation may be found in annual, 10-K, or 10-Q reports.
Another factor affecting the acceptable return is the availability of capital.
This depends on the health of the economy. In timeswhen capital is in short supply,
higher interest rates are charged and capital investment decisions may be delayed.
Competing investments also affect the minimum rate. Management may
adjust this rate to screen from the immediate investment considerations those
ventures that are less attractive.
TABLE 9.1 Factors AffectingMinimum Acceptable Rate of Return
Cost of capitalAvailability of capitalCompeting investmentsDifference in risks of investmentDifference in time to recover capital
TABLE 9.2 Cost of Capital
Balance sheet 12/31/XX Debt, $MMAfter-tax yieldto maturity, %
After-tax weightedaverage cost, %
Long-term debtRevolving account 5.0 4.5 0.02438% debentures 12.0 4.0 0.05
612% debentures 3.4 4.7 0.02
634% debentures 9.4 4.2 0.04
712% debentures 74.5 4.2 0.30
938% loan 125.0 4.4 0.53
Other 23.2 4.4 0.10Total long-term debt 252.5 1.06%Deferred taxes 67.7 0.0 0Reserves 16.1 0.0 0Preferred stock 50.0 8.6 0.42Shareholder’s equity 653.9 15.6 9.80Total debt 1,040.2 11.28%
Each debt item in $M divided by the total debt times the after-tax yield to maturity equals the
after-tax weighted average cost contributing to the cost of capital.
Chapter 9222

The difference in investment risks is also a factor in the planning for
capital investment. The greater the risk, the higher the required return. Lastly,
the length of time to recover the investment in a venture is important.
Management’s objective is to recover the investment as quickly as possible
because the economy is difficult to predict the longer the time frame.
In today’s economy, industry will require a 25–35% return after taxes
for low-risk ventures at the early stages of consideration. As a secondary
guide, a payout period of up to 3 years is considered reasonable.
As a project is evaluated further, refining sales forecasts, capital investment
figures, and operating expenses, the return will usually decline; therefore,
acceptable rates of return at preliminary stages are set at a high value to allow for
return erosion.
9.4 PROFITABILITY MEASURES
9.4.1 Quantitative Measures
There are a number of methods for measuring venture profitability listed in the
literature [2–4], but the most commonly used will be discussed in this section.
9.4.1.1 Return on Investment
The introduction of the return on investment (ROI) was attributed to Du Pont
[5]. From a calculation standpoint, it is the simplest and is used frequently for
quick answers. These results obtained may be related back by the user to
historical decisions, giving the user a sense of confidence in the results. The
equation is
ROðOÞI ¼ annual net profit ðearningsÞ after taxes
total capital investment£ 100 ð9:1Þ
There are several variations of this method; for example, the numerator might
be net earnings before taxes and the denominator could be fixed capital
investment or fixed and working capital. Although this method is simple to use
and relates to accepted accounting methods, it has some serious disadvantages:
. The time value of money is ignored.
. A basic assumption in this method is that all projects are similar in
nature to each other.
. The project will last the estimated life and this is often not true.
. Equal weight is given all income for all years and that is not always
true. The averaging of profits permits laxity in forecasting.
Estimate of Profitability 223
. It does not consider timing of cash flows.
. It does not consider capital recovery.
9.4.1.2 Return on Average Investment
These are methods for measuring the profitability of investments utilizing
accounting data and are based on averaging methods. Racklin [6] presents details
for several averaging methods but only one method also attributed to Du Pont
will be presented.
ROAI ¼ annual net profit ðearningsÞ after taxes
land þ working capital þ FCI=2£ 100 ð9:2Þ
where FCI is the fixed capital investment.
The fixed capital investment is divided by 2, so that over the life of the
investment, the return is earned against the average investment. The justification
for this is that at the beginning of a project the return is earned against the full
investment, and at the end of a project the investment has been fully depreciated
and the capital has been recovered. Therefore, on the average over the life of the
investment, half the fixed capital is involved. This method has all the inherent
disadvantages of the previous method.
9.4.1.3 Payout Period (POP)
The objective of this method is to calculate the amount of time that will be
required to recover the depreciable fixed capital investment from the accrued
cash flow of a project.
Payout period is often used in conjunction with other measures of
profitability. It is defined as
Payout period ðPOPÞ ¼ depreciable fixed capital investment
after-tax cash flowð9:3Þ
The denominator may be the averaged annual cash flows or the individual yearly
cash flows. Consistency in the use of this measure must be maintained to compare
projects against one another.
The method is simple to use and has served as a historical measure of
profitability, comparing POP of proposed projects with those in the past. There
are some disadvantages to using the method, since no consideration is given to
cash flows that occur after the capital is recovered; therefore, this method cannot
be considered as a true measure of profitability. The method makes no provision
for including land or working capital. As presented in Eq. (9.3), the time value of
money is ignored; however, there are provisions for modifying the method to
include discounted cash flows. This will be discussed in the next section.
Chapter 9224
9.4.1.4 Payout Period with Interest (POPI)
The payout period with interest takes into account the time value of money. The
net effect of the interest calculation is to increase the payout time, therefore
reflecting the advantages for projects that earn most of their profits in the early
years. In equation form,
Payout period with interest ¼ ðPOPÞi¼ ðafter-tax cash flowsÞi
ðfixed capital investmentÞI ð9:4Þ
where
ðAfter � tax cash flowsÞi ¼ cash flows discounted to time zero atinterest rate i
ðFixed capital investmentÞi ¼ fixed capital investment compounded totime zero at an interest rate i
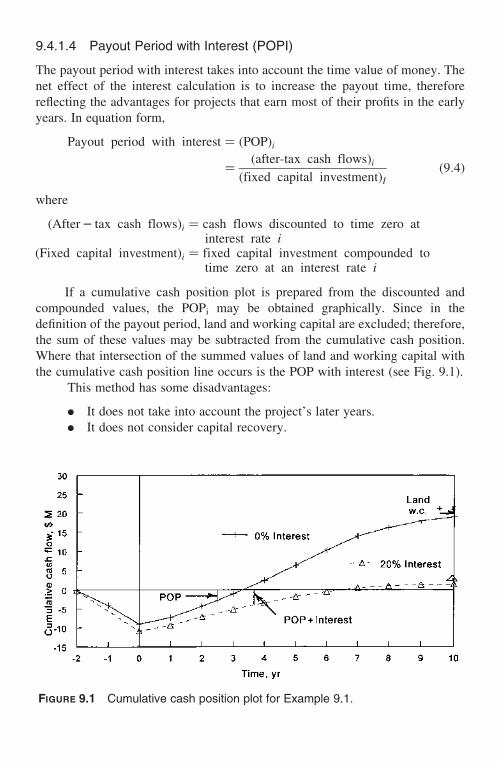
If a cumulative cash position plot is prepared from the discounted and
compounded values, the POPi may be obtained graphically. Since in the
definition of the payout period, land and working capital are excluded; therefore,
the sum of these values may be subtracted from the cumulative cash position.
Where that intersection of the summed values of land and working capital with
the cumulative cash position line occurs is the POP with interest (see Fig. 9.1).
This method has some disadvantages:
. It does not take into account the project’s later years.
. It does not consider capital recovery.
FIGURE 9.1 Cumulative cash position plot for Example 9.1.
Estimate of Profitability 225

9.4.1.5 Net Present Worth (NPW)
As was stated earlier in this chapter, there is no one method for determining
profitability satisfactorily; however, the net present worth (NPW) is the one most
companies use since it has none of the disadvantages of other methods and treats
the time value of money and its effect on project profitability properly. The net
present worth is the algebraic sum of the discounted values of the cash flows each
year during the life of a project [7].
In the net present worth method, an arbitrary time frame, i.e., time zero, is
selected as the basis of calculation. Time zero, the present time, may occur when
the first funds are spent on the project or alternatively when project start-up
commences. If all projects are considered using the same basis, it makes no
difference which time zero is used since the ultimate decision will be the same;
only the dollar values will be different. Since consistency in the use of this
method must be maintained, all projects must be considered on the same basis.
Figure 9.2, a time-net present worth diagram, may be used to discuss the
steps in preparing the net present worth calculations. Lets assume that time zero is
arbitrarily selected at start-up. Prior to time zero, expenditures are made for land,
fixed capital investment, and working capital. Land is allocated instantaneously to
a project sometime before purchase and construction of the plant equipment.
FIGURE 9.2 Cash flow diagram with time zero at start-up.
Chapter 9226

The fixed capital investment is purchased and installed over a period of time prior
to start-up. For the purpose of this discussion, it will be assume that the
construction occurs uniformly over a period of time. Both land and the fixed capital
investment are compounded to time zero using the appropriate compounding
factors. At time zero, working capital is charged into the project. At this point, there
has been no revenue generated and from the figure, the net present worth is
negative. Once the project start-up commences, further expenditures are necessary
to bring the plant on stream that causes the present worth to become more negative,
but at the same time some quality product may be produced and sold. As time
proceeds, salable product in manufactured and the cash flows to the project are
discounted back to time zero. In Figure 9.2, it is assumed that the cash flows
uniformly over the life of the project. This is an ideal model but will suffice to
explain the present worth method. The process continues for the life of the project,
and at the end land and working capital are recovered instantaneously (capital
recovery). One might consider that the land and working capital were “loaned” to
the project by the company. In the above description, the present worths of all cash
inflows are calculated as are the present worths of all investment items. The
difference between these present worths is the net present worth of the project. In
equation form,
Net present worth ðNPWÞ ¼ present worth of all cash inflow
–present worth of all investment
items ð9:5Þ
If the net present worth is positive, the project will earn more than the interest
(discount) rate used in the calculations. If the NPW is negative, then the project
earns less than that rate.
When this method is applied to two or more alternative cases, the project
with the higher NPW will produce a greater future worth to a company and,
therefore, is preferred. Caution must be exercised that projects to be compared
have equal lives or that lives can be adjusted to a common time base.
Humphreys [8] describes how projects of different lives may be made
equivalent for comparison purposes. In Chapter 12, this topic is considered
further.
Management sets the interest (discount) rate for projects based upon the
cost of capital and the project risk, as was discussed earlier in this chapter. The
calculations may be made using discrete or continuous interest. If discrete interest
is used, the cash flows may be discounted to the beginning of a year, end of a year,
or at mid-year depending on company policy. The justification for using
continuous interest is that all cash flows are assumed to occur continuously, and it
is assumed that all cash inflows are continuously reinvested. As long as a basis is
established for making these calculations, all projects should be compared on
Estimate of Profitability 227

the same basis. Example 9.1 presented later in this chapter illustrates how this
method is used for a hypothetical project (Figs. 9.3 and 9.4).
The advantages of this method are that the timing of all cash flows and
capital recovery at the end of a project are considered properly. The major
disadvantage is that the capital investment is hidden in the calculations and needs
to be stated clearly in any report of the results. In order to rank projects using the
NPW method, an indexing method involving the NPW and the investment is
developed and will be discussed in Section 9.4.1.6.
9.4.1.6 Net Present Worth Index (NPWI)
The NPWI method is also known as the profitability index. The index is the ratio
of the present value of the after-tax cash inflows to the present value of the cash
outflows or capital items. An index greater than 1 indicates that a project has
a yield greater than the discount (interest) rate. When more than one project is
considered, that project with the highest net present worth index is to be
preferred, provided it is greater than 1.
9.4.1.7 Internal Rate of Return
The internal rate of return (IRR) is the interest rate that will make the present
worth of the cash proceeds expected from an investment equal to the present
FIGURE 9.3 Cash flow diagram with time zero when first funds spent.
Chapter 9228

worth of the required cash outlays required by the investment [9]. Therefore, it is
discount rate that results when the net present worth is equal to zero. The internal
rate of return is also known as the discounted cash flow rate of return.
In principle, the technique is similar to the NPW method. In the latter
method, the discount rate is set by management based upon factors listed in
Table 9.1, and the NPW is calculated. However, in the IRR method, the result is
the interest rate that will produce an NPW of zero. This is a trial-and-error
calculation and commercial computer programs are available to solve for the
result. The result obtained is then compared with management’s criteria for
funding a project at the level of risk.
FIGURE 9.4 Cumulative cash position plot, showing payout period at 0% interest.
Estimate of Profitability 229
There are many disadvantages to using this method and they will be
discussed in Section 9.4.1.9.
9.4.1.8 Other Measures of Profitability
Ward [2,3] discussed several variations on the NPW and IRR methods such as the
overall rate of return (ORR) and the net rate of return (NRR).
The overall rate of return calculation starts by discounting the investment
cash flows to the present and the revenues to the end of the project. An assumed
discount rate is used in both calculations. The ORR is then computed in another
encounting calculation that relates the discounted cash flow to the encounted
revenue flow at an assumed discount rate.
The net rate of return (NRR) is defined by the following equation:
NRR ¼ net present worth
ðdiscounted investmentÞðproject lifeÞ
£ 100 ð9:6Þ
Ward stated that the cost of capital has been taken care of in the NPW calculation
so that the NRR is then a true net return rate.
9.4.1.9 The NPW–IRR Controversy
For many years, industry used the internal rate of return to measure profitability,
but this method has inherent disadvantages when compared to the net present
worth method. Many critical articles continue to appear in the literature. In this
section, the major points in the controversy will be presented. For more detailed
information, it is recommended that the reader consult Weaver [10], Winston [7],
Ruegg [11], Bingham [12], and Ward [2,3].
The main limitations of the IRR method are:
. Multiple rates for return. Unusual cash flow forecasts can lead to more
than one answer for the IRR
. Reinvestment rate. Inherent in the IRR calculation is the assumption
that funds received during the project can immediately be reinvested at
the same interest rate as the IRR. This is not always possible. The
higher the return, the lower the probability that additional projects are
available for reinvestment at that rate.
. Comparison of two are more projects. When comparing two or more
mutually exclusive projects will not necessarily lead to the correct
choice [9]. One has to select the best from the pair and compare it with
another project, and thus by elimination the best project will be
selected.
. Size of the investment. The IRR method can’t differentiate between
differences in the size of the investment.
Chapter 9230

. Timing of cash flows. Because of the uncertainty in forecasts, the nature
of the cash flow and timing, there is the possibility that the discounted
value of the net cash flows can equal zero at more than one interest rate.
This causes problems in analyzing the meaning of the results.
The net present worth method is superior to the IRR method since it has
none of the above problems. The NPW measures test when a specific investment
meets, beats, or falls short of the return that one should obtain for a proposed
venture. As stated earlier, if the NPW is positive, the project earns more than the
interest (discount) rate. If the NPW is negative, it earns less. An NPW of zero
means the investment produces an interest rate equal to the one used in the
calculation. A rule of thumb is that the best investment is the one with the higher
or highest NPW.
9.4.1.10 New Economy Measures
A firm’s investment portfolio consists of many projects, both ongoing and new.
Each project contributes to the company’s profitability. From the late 1980s to the
present, a “new” management concept, economic value added (EVA) has been
adopted by numerous companies. Far from being new, EVA has been one of the
long-standing pillars of financial theory. EVA is an important financial tool in
addition to the traditional profitability measures. It is the after-tax net operating
profit minus the cost of capital. Until a company posts a profit greater than the cost
of capital, it is not making money for the owners, no matter how good the
accounting looks. It is a company’s wealth predictor [13].
In periods when the economy is strong and sales are growing, the bottom
line, the net profit after taxes, still might not show good results. EVA analysis
helps firms identify waste in operating expenses and in the use of capital. In other
words, EVA is an indicator of how efficient management is at turning investors’
money, namely capital, into profits [14]. It relates the principles in this chapter to
those of the financial concepts in Chapter 3.
Another indicator of company is the market value added (MVA), which is
the difference between what the capital investors put into a company and the
money taken out. Good EVA performance builds MVA and is a gain for investors.
Diversified chemical companies in the late 1980s and early 1990s had
failed to earn the cost of capital [15]. As of the late 1990s, few chemical
companies have implemented EVA, but it is expected that this will change as the
concept is more universally used by industry.
9.4.2 Qualitative Measures
Authors of texts on engineering economics would have the reader believe that
quantitative financial criteria are the sole basis for investment decisions. This
Estimate of Profitability 231
author’s experience has shown that other factors enter into or perhaps control the
decision-making process. There are instances in which major investment
decisions based upon intangible or qualitative factors oppose the results of a
quantitative study; therefore, both must be considered.
9.4.2.1 Intangible Factors
The results of a study of intangible investment criteria was conducted by Perry,
Scott, and Bird [16], based upon responses from selected companies in the
Fortune 500 list. The factors most often listed by the management executives will
be discussed in this section.
9.4.2.1.1 Employee Morale. This factor is directly related to efficiency of
operation. If an employee does not consider that working conditions are
favorable, this will surely affect not only the amount of material produced but
also its quality. Quality circles and other employee input groups have done much
to improve workers’ interests in their immediate jobs, giving them an opportunity
to make constructive comments about the working environment. Management, in
turn, has an obligation to listen, digest and, if possible, put into action employees’
suggestions. Employees who feel that they “belong” to an organization will take
more interest in it, be more content, and display high morale.
9.4.2.1.2 Employee Safety. Safety should be regarded as a joint venture
between labor and management. Unsafe conditions cause accidents to personnel
and equipment that result in increased costs for capital equipment, losses of
production, utilities, and raw materials, as well as associated increased insurance
expenses. Refineries, chemical plants, steel mills, paper mills in recent years have
improved their safety record but constant vigil must be exercised. A plant must be
designed and constructed with safety considerations early in the planning stages
with the result in operating cost savings and increased employee morale.
9.4.2.1.3 Environmental Constraints. Increasingly tight restrictions on water,
air, land, and noise pollution have forced management to reconsider existing
operations, as well as future investments. There are daily examples of plants
being under scrutiny for not complying with environmental standards. Like the
two preceding intangibles, it is impossible to determine dollar effects, that is, cost
versus benefits. While it may be a relatively simple matter to calculate the capital
requirements, operating expenses, and change in cash flow to meet environmental
standards, the benefits are continued operation and recognition that the company
is a good citizen. A return is meaningless but the options are clear.
9.4.2.1.4 Legal Constraints. Local, state, and federal laws must be considered
whenever an investment decision is made. A proposed venture that infringes
upon statutes is doomed. Fines or large capital expenditures to avoid legal action
Chapter 9232
can quantitatively affect the firm’s finances. It is therefore essential to review
existing laws and seek advice on locating a plant. Zoning ordinances, potential
antitrust actions, and potential licensing or patent infringements are examples.
Most firms want to avoid litigation as such proceedings are long, costly, and
damage a firm’s image.
9.4.2.1.5 Product Liability. In recent years this intangible has received
considerable public attention. Consumer advocates and the public demand that a
product, be it a pharmaceutical or a child’s plastic toy, must be safe to use.
Management must consider this intangible early in a project development stage.
It would be a wise decision to forego the installation of a plant until there is a high
probability that the product will meet safety requirements. Management must
take a responsible posture with regard to this intangible.
9.4.2.1.6 Corporate Image. How a company is perceived by the public is an
important factor in capital investment decisions. A poorly maintained plant is an
eyesore to the community and indicates an indifference not only to the locale
around the plant but also to the employees. General housekeeping within the
plant and its immediate environs is indicative of the type of management.
Corporate image also is expressed in howmuch positive interest a company
takes in community affairs. Social responsibility, such as corporate giving,
sponsoring scholarships and programs that benefit society and the community
contribute to a company’s image. Corporate image is considered in any
investment decision because capital expenditures are often required to maintain a
good image. Like the other intangibles, it is difficult to calculate a return since a
benefit cannot be assigned to such an expenditure.
9.4.2.1.7 Management Goals. This is a complex intangible because it involves
not only the corporate goals but subjectively personal goals of individual
managers. Although corporate goals were mentioned earlier in this chapter, it is
advisable to point out that company growth and cash flow are two indicators of
management effectiveness. They are important to the survival of a company.
Managers may make investment decisions on the basis of personal interests
that may not enhance the well-being of the firm. On a personal level, managers
may make decisions that influence job security or as part of “empire” building
that gives them greater visibility within the company. These points promote
personal gain. Although most organizations have checks and balances, it is
doubtful that the personal aspect can be eliminated entirely.
9.4.2.2 Attempts to Quantify Intangible Factors
Numerous methods have been proposed in an attempt to present multiple criteria
in an explicit format. These criteria could include those factors that might be
quantified, such as price, payout period, NPW, but also might include safety,
Estimate of Profitability 233

environmental criteria, and company image. In the 1960s and 1970s, there was a
spate of activity attempting to develop an ordinal or ranking system. Such
methods were complex and often led to subjective judgments. Most of the
methods forced the manager to assign weighting factors to each intangible factor
and thus far have not been successful.
9.5 CONCLUDING COMMENTS
In this chapter, the current measures of profitability were presented. Where
decision conflicts between methodologies occur, rules for resolving the conflicts
were discussed. Consistency in the application of profitability measures is
necessary to prevent incorrect decision being made. Only these measures
involving the time value of money are recommended.
The author has been in company positions where he observed the strong
influence of intangible factors upon the decision-making process. There are no
formulas or cookbook methods for ordering these factors in a value judgment
array. Perhaps in the future, a reliable methodology will be developed, but in the
meantime, the mental exercise of attempting to prioritize intangibles may be
worthy of consideration.
9.6 ILLUSTRATIVE PROBLEM
Example 9.1
Problem Statement:
Acme Chemicals, Inc. is a newly organized company that had formerly
been a division of Triangle Petroleum Company. The petroleum company sold
the division to a group of investors, some of whom were former employees of
Triangle. The new dynamic aggressive management of Apex is seeking new
ventures in the specialty and electronic chemicals business areas. In searching for
new ventures, the manufacture of a liquid intermediate with potential use in the
etching of metals appears to be attractive.
A process to manufacture this new chemical called “ETCHIT” was
developed. A preliminary estimate of the fixed capital investment of $7,500,000
was obtained for a 20MM lb/yr plant capacity. It may be assumed that the fixed
capital investment was purchased and installed uniformly over a 2-year period.
Land valued at $200,000 was charged to the projected instantaneously two years
prior to start-up. Working capital at 15% of the fixed capital investment was
charged to the project instantaneously at time zero. Start-up expenses may be
assumed to be 6% of the fixed capital investment uniformly spread over the first
year of operation. In order to produce the chemical, a proprietary catalyst was
licensed for a one-time charge of $150,000. For the purpose of this analysis, the
cost is charged instantaneously 1 year prior to start-up.
Chapter 9234

The marketing department of Apex provided the following information for
a 10-year project life.
Cash operating expenses for the 10-year period were estimated by the
manufacturing group to be as follows:
For operating expense estimation use 7-year straight-line depreciation,
and for cash flow use the 7-year MACRS depreciation factors.
The company’s after-tax cost of capital is 10.2% and the administration
requires at least a 20% after-tax return for projects of this risk level.
For this proposed project, determine the following:
a. ROI
b. POP
c. Cumulative cash flow analysis and a cumulative cash position plot at
20% continuous interest
Year Sales, MM lb/yr Selling price, $/lb
1 13.0 0.502 17.5 0.483 20.0 0.464 22.0 0.465 25.0 0.476 25.5 0.487 23.0 0.498 21.5 0.439 19.0 0.42
10 16.0 0.40
Year Cash operating expenses, $lb
1 0.272 0.253 0.244 0.245 0.266 0.267 0.278 0.289 0.28
10 0.30
Estimate of Profitability 235

d. POP þ interest
e. PW at 20% continuous interest
f. IRR
What do you recommend to management about this project. Substantiate
your recommendation(s) with numerical results.
Solution:
a. The Total capital investment in:
The definition of the ROI is annual net profit after taxes divided by the total
capital investment expressed as a percentage. When the net profit varies from year
to year, an average annual after-tax net profit may be used in the calculation.
ROI ¼ average annual net profit after taxes
total capital investment£ 100
¼ $20; 803; 00010
$9; 425; 0000£ 100 ¼ 22:2%
Note: The average annual net profit after taxes is found in Table 9.3.
b. Payout period ðPOPÞ ¼ ðfixed capital investmentÞðaverage annual after-tax cash flowÞ
¼ $7; 500; 000
$28; 402; 0000=10¼ 2:6 years:
Note: The average annual after-tax cash flow is found in Table 9.3.
c. Cumulative cash flow analysis is found in Table 9.4, and the
cumulative cash plot is shown in Figure 9.1 (p.225).
d. The payout period plus interest is found in Figure 9.1 and is 3.7 years.
Sum all the capital items except the fixed capital investment. Where this value
intersects the cumulative cash position line on Figure 9.1 is the payout period
plus interest. (For information on the on the construction of a cash position
plot, see Chap. 8.)
Land $200,000Fixed capital investment 7,500,000Working capital 1,125,000Start-up expenses 450,000Catalyst license 150,000Total capital investment $9,425,000
Chapter 9236

TABLE 9.3 Net Income and Cash Flow Analysis for Example 9.1
ITEM/Year 22 22 to 21 21 21 to 0 0 1 2 3 4 5 6 7 8 9 10 Total
Total capital
investment:
Land 2200
Fixed capital
investment
23,750 23,750
Working capital 21,125
Start-up
expense
2450
Catalyst license 2150
Income and
operating data:
Production, MM
lb/yr
13 17.5 20 22 25 25.5 23 21.5 19 16
Sales, $M 6,500 8,400 9,200 10,120 11,750 12,240 11,270 9,245 7,980 6,400
Cash operating
expenses, $M
3,510 4,375 4,800 5,280 6,500 6,630 6,210 6,020 5,320 4,800
Operating
income, $M
2,990 4,025 4,400 4,840 5,250 5,610 5,061 3,225 2,660 1,600
Depreciation, $M 535 1,072 1,072 1,072 1,071 1,071 1,071 535 0 0
Net income
before taxes,
$M
2,455 2,953 3,328 3,768 4,179 4,539 3,990 2,690 2,660 1,600
Federal income
taxes, 35%
859 1,034 1,165 1,319 1,463 1,589 1,397 942 931 560
Net income after
taxes, $M
1,596 1,919 2,163 2,449 2,716 2,950 2,593 1,748 1,729 1,040 20,903
Depreciation, $M 535 1,072 1,072 1,072 1,071 1,071 1,071 535 0 0
Cash flow, $M 2200 23,750 2150 23,750 21,125 1,681 2,991 3,235 3,521 3,787 4,021 3,664 2,283 1,729 1,040 28,402
Cumulative cash
flow, $M
2200 23,950 24,100 27,850 28,975 27,294 24,303 21,068 2,453 6,240 10,261 13,925 16,208 17,937 18,977
Estim
ate
ofProfitability
237
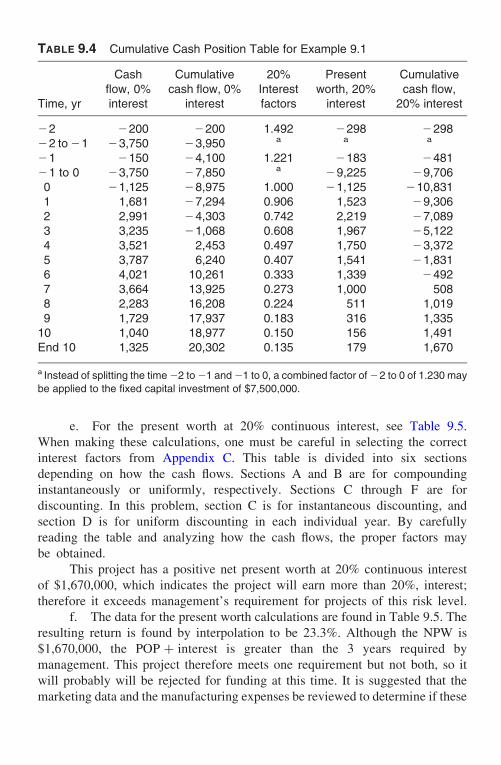
e. For the present worth at 20% continuous interest, see Table 9.5.
When making these calculations, one must be careful in selecting the correct
interest factors from Appendix C. This table is divided into six sections
depending on how the cash flows. Sections A and B are for compounding
instantaneously or uniformly, respectively. Sections C through F are for
discounting. In this problem, section C is for instantaneous discounting, and
section D is for uniform discounting in each individual year. By carefully
reading the table and analyzing how the cash flows, the proper factors may
be obtained.
This project has a positive net present worth at 20% continuous interest
of $1,670,000, which indicates the project will earn more than 20%, interest;
therefore it exceeds management’s requirement for projects of this risk level.
f. The data for the present worth calculations are found in Table 9.5. The
resulting return is found by interpolation to be 23.3%. Although the NPW is
$1,670,000, the POP þ interest is greater than the 3 years required by
management. This project therefore meets one requirement but not both, so it
will probably will be rejected for funding at this time. It is suggested that the
marketing data and the manufacturing expenses be reviewed to determine if these
TABLE 9.4 Cumulative Cash Position Table for Example 9.1
Time, yr
Cashflow, 0%interest
Cumulativecash flow, 0%
interest
20%Interestfactors
Presentworth, 20%interest
Cumulativecash flow,
20% interest
22 2200 2200 1.492 2298 229822 to21 23,750 23,950 a a a
21 2150 24,100 1.221 2183 248121 to 0 23,750 27,850 a 29,225 29,7060 21,125 28,975 1.000 21,125 210,8311 1,681 27,294 0.906 1,523 29,3062 2,991 24,303 0.742 2,219 27,0893 3,235 21,068 0.608 1,967 25,1224 3,521 2,453 0.497 1,750 23,3725 3,787 6,240 0.407 1,541 21,8316 4,021 10,261 0.333 1,339 24927 3,664 13,925 0.273 1,000 5088 2,283 16,208 0.224 511 1,0199 1,729 17,937 0.183 316 1,33510 1,040 18,977 0.150 156 1,491End 10 1,325 20,302 0.135 179 1,670
a Instead of splitting the time22 to21 and21 to 0, a combined factor of22 to 0 of 1.230 may
be applied to the fixed capital investment of $7,500,000.
Chapter 9238
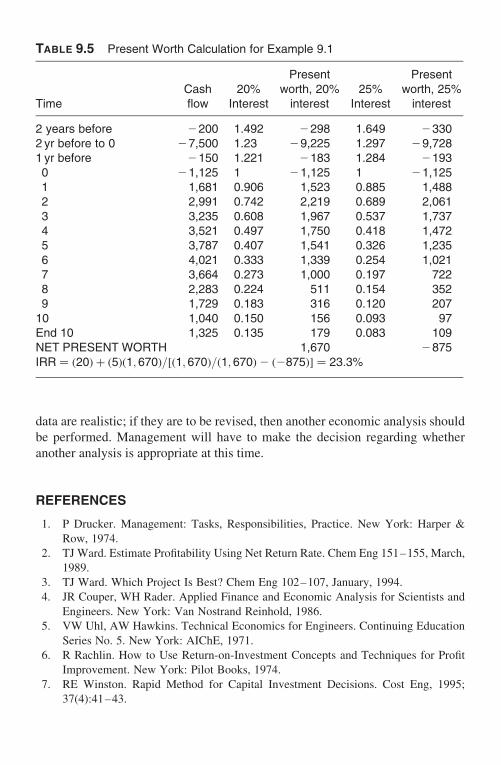
data are realistic; if they are to be revised, then another economic analysis should
be performed. Management will have to make the decision regarding whether
another analysis is appropriate at this time.
REFERENCES
1. P Drucker. Management: Tasks, Responsibilities, Practice. New York: Harper &
Row, 1974.
2. TJ Ward. Estimate Profitability Using Net Return Rate. Chem Eng 151–155, March,
1989.
3. TJ Ward. Which Project Is Best? Chem Eng 102–107, January, 1994.
4. JR Couper, WH Rader. Applied Finance and Economic Analysis for Scientists and
Engineers. New York: Van Nostrand Reinhold, 1986.
5. VW Uhl, AW Hawkins. Technical Economics for Engineers. Continuing Education
Series No. 5. New York: AIChE, 1971.
6. R Rachlin. How to Use Return-on-Investment Concepts and Techniques for Profit
Improvement. New York: Pilot Books, 1974.
7. RE Winston. Rapid Method for Capital Investment Decisions. Cost Eng, 1995;
37(4):41–43.
TABLE 9.5 Present Worth Calculation for Example 9.1
TimeCashflow
20%Interest
Presentworth, 20%interest
25%Interest
Presentworth, 25%interest
2 years before 2200 1.492 2298 1.649 23302 yr before to 0 27,500 1.23 29,225 1.297 29,7281 yr before 2150 1.221 2183 1.284 21930 21,125 1 21,125 1 21,1251 1,681 0.906 1,523 0.885 1,4882 2,991 0.742 2,219 0.689 2,0613 3,235 0.608 1,967 0.537 1,7374 3,521 0.497 1,750 0.418 1,4725 3,787 0.407 1,541 0.326 1,2356 4,021 0.333 1,339 0.254 1,0217 3,664 0.273 1,000 0.197 7228 2,283 0.224 511 0.154 3529 1,729 0.183 316 0.120 20710 1,040 0.150 156 0.093 97End 10 1,325 0.135 179 0.083 109NET PRESENT WORTH 1,670 2875IRR ¼ ð20Þ þ ð5Þð1; 670Þ=½ð1; 670Þ=ð1; 670Þ2 ð2875Þ� ¼ 23:3%
Estimate of Profitability 239

8. K Humphreys, ed. Jelen’s Cost and Optimization Engineering. New York: McGraw-
Hill, 1995.
9. H Bierman, Jr., S Smidt. The Capital Budgeting Decision, 4th ed. New York:
J. Wiley & Sons, 1987.
10. JB Weaver. Persistent Problems in Investment Analysis, Industrial Management.
July–August, 1986, pp. 7–12.
11. RT Ruegg. The Internal Rate of Return and the Reinvestment Rate Controversy.
AIChE Symposium Series, 285. New York: AIChE, 1991.
12. E Brigham. Financial Management: Theory and Practice. 10th ed. Stamford, CT:
Southwestern College Publishing, The Thomson Corporation, 2002.
13. E Brigham. FORTUNE 9:173–174, September, 1996.
14. E Brigham. FORTUNE 10:265–276, November, 1997.
15. E Brigham. Chemical Week 9:31–34, October, 1996.
16. JW Perry, DF Scott, MM Bird. Eng Econ 1975; 20(3):159–172.
PROBLEMS
9.1 You are employed in an economic analysis and planning section of a small
specialty chemical company and are asked to evaluate the following proposed
project:
a. Prepare a cumulative cash position plot.
b. Calculate the payout period without interest.
c. What is the internal rate of return?
d. In today’s economy, is this project likely to be funded? Support your
answer with numerical justifications.
Fixed capital investment $3,600,000Plant capacity 5,000,000 lb/yrConstruction period One year beginning January 2004Land $100,000Working capital $300,000Project life 10 yearsDepreciation life 7 years, straight-linePotential sales 4,000,000 lb/yr in 2004, increasing at 10%
per year for each year of the project lifeSelling price $0.80/lb in the first 2 years, increasing
at 3% per year for the next 5 years andthen decreasing by by 5% per year for thelast 3 years
Cash operating expenses $0.25/lb in 2004, increasing at 5% per yearfor the first 5 years and then increasingat 3% per year the for for the final 5 years
Income tax rate 35%
Chapter 9240

9.2 Your company is considering the installation of a small inert gas generator
to blanket reactions with an unreactive gas. It is possible to lease or purchase the
equipment.
For the purchase case:
The operating income for this venture is expected to $600,000 per year. The
equipment will be purchased and installed over a 2-year period to start-up of the
facility. Depreciation on the capital equipment is based on 7-year straight-line.
The project life is expected to be 10 years at which time the plant will be shut
down. Net proceeds for dismantling and selling the equipment is estimated to be
$50,000 before taxes.
For the lease case:
In order to lease the equipment, a yearly lease charge of $150,000 is
required. This is in addition to the operating expenses in the purchase case. All
other data are the same as in the purchase case.
The company requires a minimum return of 25% after taxes and a payout
period of not more than 3 years to justify capital expenditures at this stage of
evaluation. Your supervisor has asked you to calculate the following for
both cases:a. Total capital investment
b. POP
c. NPW@25%
d. What is your recommendation to management? Be sure to justify your
decision with numerical values. (Note: Be careful when applying
profitability measures to this problem).
9.3 Albrecht, Inc. manufactures a diverse line of specialty products from
pharmaceuticals to health care materials. An executive committee is scheduled to
meet 3 days from now. At that time they will be considering new ventures for the
next year’s budget. Your immediate supervisor has asked you to prepare the
necessary information for both products listed below. Currently, the company
uses the net present worth and the payout period with interest methods for
projects at this stage of consideration. The company’s cost of capital is 11.2%,
so the net present worth calculation is to be based on 25% continuous interest. A
3-year payout period is the maximum that the committee will consider for
the project. Albrecht qualifies for a 7-year MACRS method of depreciation
Fixed capital investment $1,000,000Land 100,000Working capital 100,000
Estimate of Profitability 241

accounting. The expected life of the project is 10 years. A 35% federal income
tax rate is in effect. Capital recovery at the end of the project will include only
land and working capital.
The equipment is to be purchased and installed over a period of 1 12years
prior to start-up.
No-Snooze Decongestant
YearSales,M lb/yr
Selling price,$/lb
Cash operatingexpenses, $/lb
1 15,000 0.38 0.182 17,000 0.40 0.173 19,000 0.41 0.164 20,000 0.41 0.165 22,000 0.42 0.166 20,000 0.37 0.187 18,000 0.37 0.188 17,000 0.35 0.199 15,000 0.33 0.1910 12,000 0.32 0.20
Fixed capital investment ¼ $6,000,000Land ¼ 100,000Working capital ¼ 1,000,000
Vibrahair Growth Stimulant
YearSales,M lb/yr
Selling price,$/lb
Cash operatingexpenses, $/lb
1 6,000 0.86 0.322 6,500 0.87 0.313 7,000 0.87 0.304 8,000 0.89 0.325 10,000 0.90 0.336 11,000 0.88 0.357 10,000 0.87 0.358 9,000 0.86 0.369 7,000 0.86 0.3610 5,500 0.85 0.35
Fixed capital investment ¼ $10,000,000Land ¼ 100,000Working capital ¼ 2,000,000
Chapter 9242

The equipment is to be purchased and installed over a 2-year period prior to
start-up.
Which project would you recommend to management and why? Be sure to
justify your results.
Estimate of Profitability 243