
Proceedings of the Second International Conference on Solar ...
101
Proceedings of the Second International Conference on Solar Energy Solutions for Electricity and Water Supply in Rural Areas 12 th -15 th of October 2016 The American University in Cairo Egypt Editors: Martina Jaskolski, Angela Davis, Daniel Tutwiler
-
Upload
khangminh22 -
Category
Documents
-
view
3 -
download
0
Transcript of Proceedings of the Second International Conference on Solar ...

Proceedings of the Second International Conference on Solar Energy Solutions for Electricity and Water
Supply in Rural Areas
12th-15th of October 2016 The American University in Cairo
Egypt
Editors:
Martina Jaskolski, Angela Davis, Daniel Tutwiler

CONTENTS
Welcome Note……………………………………………………………………………………1
Keynote Speaker Statements……………………………………………………………………..3
Conference Sponsor Statements………………………………………………………………….4
Conference Program……………………………………………………………………………...5
Published Papers Ali, A.
A Novel Approach for Water Treatment Based on the Opto-Genetic Technique…………………………………...…………………...11
Ali, A., & Abozead, A. Effect of Microbial Layers on Wall Shear Stress Measurements for Drinking Water Supply via a Photonic Sensor……………………….…..…19
Ali, A., Taha, H., & Afifi, A. Real Time Data Tracking for Concentrations Measurement of Drinking Water Constituents……………………………………………………32
Elgazzar, K., & Elsharouny, M. Availability, Possibility and Feasibility Studies of Various Water Pumping Systems in Reclamation Lands of Egypt……………...………42
Farag, A., Elhenawy, Y., El-Ghandour, M., Shatat, M., & Moustafa, G. Water Desalination Using Hybrid MED and MD System Driven by Solar Energy for Coastal areas………………………………………...………..60
Fouad, M., Shehata, O., Shihata, L., & Elsayed, M. Repercussions of Urban Growth on Choosing the Most Suitable Renewable Energy Technology: A Comparative Study…………………….….72
Puttinger, M., & Bachhiesl, U. Feasibility of Wind Power in Rural Areas of Egypt Based on the Evaluation of an Existing Wind Atlas…………………………….…………….87
Conference Photos……………………………………………………………………………...96
Conference Excursion Photos…………………………………………………………………..98
Conference Workshop Photos…………………………………………………………………..99

1
Welcome Note
Dear participants, exhibitors and speakers of the Second International Conference on Solar Energy Solutions for Electricity and Water Supply in Rural Areas,
The conference’s Organizing Committee is very pleased that the second event in this new conference series, held at The American University in Cairo (AUC)’s New Cairo Campus between October 12th and 15th 2016 was larger, more interactive and more diverse than the first conference held in October 2015. The event was hosted by the Research Institute for a Sustainable Environment (RISE) at AUC and was organized by Sustainable Concepts, SolarInput, AUTARCON, the Technical University of Berlin (TU) El Gouna Campus, and the German University in Cairo. This year, the conference was attended by a total of over 150 participants, presenters and experts.
One take-away note from the final feedback session at the first conference in 2015 was that the event was lacking rural voices in the discussion about rural problems and solutions. This year, we were very happy to host eight community partners in RISE solar and water projects from very remote areas of Egypt – the oases of Abu Minqar and El Heiz in the Western Desert and the community of Abu Ghusun, located south of Marsa Alam. The representatives of these rural areas in Egypt presented their problems in obtaining reliable water and electricity services, as well discussing some of the solutions they had implemented as part of development initiatives for local communities. The community representatives’ enthusiastic and critical input drove many of the discussions throughout the first two days of the conference and was a valuable and necessary addition to this event.
This year’s conference was attended by participants from Egypt, Germany, Austria, the UK and the USA. The event was opened with special addresses from AUC’s President Francis J. Ricciardone and AUC’s Dean of Sciences and Engineering, Dr. Hassan El Fawal. Keynote addresses from Dr. Hubert Aulich, representing Sustainable Concepts, Dr. Richard Tutwiler and Dr. Martina Jaskolski, both representing RISE, drew links between global sustainable development goals and rural solutions, presented the pressing issues surrounding water scarcity and sustainable electricity provision in Egypt, highlighted the important connections between water and electricity, and emphasized the need to produce participatory, sustainable solutions that can be successfully implemented in rural communities. Over 50 speakers presented in a variety of sessions, workshops and as part of a panel discussion. Among them were speakers invited by the German Science Center, Dr. Martin Bucholz from the Technical University of Berlin and Dr. Markus Spinnler from The Technical University of Munich. Other distinguished speakers included Dr. Kerstin Wydra from Erfurt Polytechnic in Germany, Dr. Abu Bakr Bahaj from the University of Southampton in the UK, Dr. Edwin Rap and Dr. Alvar Closas from the International Water Management Institute (IWMI) in Cairo, Dr. Florian Bauer and Carsten Riechelmann from TU El Gouna, Dr. Amir Ali from GUC, Dr. Lamyaa El Gabry and from AUC, Ann-Katrin Gerlach from the Fraunhofer Institute in Germany, Omar Hosny from KarmSolar and Yaseen AbdelGhaffar from SolarizEgypt. Interesting case studies, new technologies and interesting solutions were presented by speakers from AUC, TU El Gouna, GUC, the Technical University of Graz, Austria, Ain Shams University and KarmSolar. The participants included representatives from all the above-mentioned institutions, as well as from

2
Cairo University, Alexandria University, Ain Shams University, the University of Fayoum and Tanta University. Eleven participants received a scholarship from Sustainable Concepts to attend the conference and the conference workshop. Seven companies presented their products and innovations at exhibition booths at the conference facility.
This year’s conference format contained two days of sessions at AUC’s Conference Center, followed by a one-day excursion and one day of practical workshops held at RISE. The conference excursion was a day trip to El Koraymat Solar Plant in Beni Suef. The interactive workshop gave groups of students a chance to work with representatives from Schneider Electric, SolarizEgypt, AUTARCON, TU El Gouna and RISE on hands-on, practical sessions involving innovative water and electricity solutions. The workshop was attended by students from AUC, Ain Shams University, Cairo University, TU El Gouna, Alexandria, Tanta University, the University of Fayoum, as well as by several young working professionals. The workshop was seen as very beneficial by all participants, as it enabled students to catch a glimpse of technological innovations developed by leading companies working in the field of sustainable solutions. It also presented a platform to network with peers and business representatives in a relaxed, interactive environment.
This conference was generously sponsored by our Gold Sponsor EGBank and our Silver Sponsor SolarizEgypt. We thank both institutions for their kind support in making this event happen. The organizers would also like to thank all attendees for participating in the many lively and constructive discussions, for sharing their experiences with solar energy and drinking water provision in rural areas, and for providing an open forum for hospitality and friendship. Last but not least, the organizers want to thank members of the American University in Cairo and RISE for an excellent organization of all sessions and events as well as friendly support in helping with travel and hotels. The Third International Conference on Solar Energy Solutions for Electricity and Water Supply in Rural Areas is scheduled for October 2018.
Conference Organizers:
Many thanks to our conference supporters:
Gold Sponsor: Silver Sponsor: Other Sponsors:

3
The Research Institute for a Sustainable Environment (RISE) and the American University in Cairo are pleased to host the second annual International Conference on Solar Energy Solutions for Electricity and Water Supply in Rural Areas. With billions of rural people across the globe still without access to electricity, safe water, or both, the need for solutions is pressing. Small scale solar energy technologies offer the possibility of local level solutions where communities themselves can sustainably manage their energy, water, and other precious resources while improving their basic quality of life. The second conference built upon the achievements of the first, and we are delighted to be able to share the knowledge gained in this edited volume of papers presented by the participants.
Dr. Richard Tutwiler Director of the Research Institute for a Sustainable Environment
Dr. Hubert Aulich Chairman of SolarInput and President of Sustainable Concepts
This lively conference presenting technical and practical results about solar electricity and water was a great success. More and more people around the globe understand that renewable energies for electricity and water purification are the most promising ways to substantially increase standard of living, particularly in the rural- and peri-urban areas. The reports at the conference and success stories from the field made this abundantly clear and will be followed-up at next year’s conference.
Dr. Hassan El-Fawal Dean of the School of Sciences and Engineering at the American University of Cairo
The most important aspect of the Second International Conference was to provide an opportunity to humanize issues, like energy, and to empower communities particularly in the eastern and western desert. The conference allowed there to be a human face behind the technology created and developed by scientists. AUC’s role is to empower and engage communities in finding solutions to the challenges they face in terms of energy, water, food, and health.
The second conference of this new series hosted by RISE at AUC was a lively, interactive event attended by students, faculty and researchers from different universities, as well as representatives from development institutions and the business world. A highlight of this year's event was having a number of RISE project partners from rural areas across Egypt present at the conference. Their perspectives and active engagement helped all participants consider the practical side of technical solutions. The discussion among researchers and those implementing and using new technologies is crucial for ensuring that our research has a community focus and that user perspectives drive the development of innovative solutions.
Dr. Martina Jaskolski Associate Director of Research at the Research Institute
for a Sustainable Environment

4
Conference Organizers RESEARCH INSTITUTE FOR A SUSTAINABLE ENVIRONMENT (RISE) RISE is a research institute of the American University in Cairo that aims to advance sustainable resource management in Egypt and the MENA region through research, education and sustainable community development. The institute operates a range of research and teaching facilities on AUC’s New Cairo campus, where the its headquarters are located, including a rooftop garden, a climate control greenhouse operated by solar energy, a water laboratory, an organic garden, as well as hydroponics and aquaponics systems. RISE offers a range of educational programs for AUC students, as well as short training courses for external trainees and environmental education for children. Since 2006, RISE has been implementing a range of research and sustainable community projects across Egypt, including the oases of the Western Desert, the Delta, Upper Egypt and the southern Red Sea coast. These projects aim to improve water conservation and recycling, sustainable farming, and waste management, and include drinking water provision using sustainable technologies and renewable energy solutions. RISE also operates a research station in Sadat City. AUTARCON AUTARCON GmbH is an SME based in Germany. The company focuses on developing and implementing technologically, ecologically and socially sustainable solutions for water supply in remote areas. The mission is to provide safe drinking water for people living in regions of the world with insufficient infrastructure to ensure access to clean and healthy drinking water. The company’s technology, the SuMeWa|SYSTEM, is an intelligent and comprehensive water purification solution that has won several sustainability and innovation prizes in Germany. The AUTARCON system can run on solar energy, requires no addition of chemicals, and no exchange of filters. Through AUTARCON technology, 25,000 people have gained access to safe drinking water in ten countries, among them Egypt, Tanzania, Ghana, Gambia, Haiti, Laos, India and Nepal. The SuMeWa|SYSTEM makes safe water available to schools, hospitals and entire villages. SOLARINPUT SolarInput is a non-profit organization founded in 2003 in Thuringia/Germany devoted to the advancement of photovoltaics and solar thermal energy. The organization manages a network of solar companies, R&D-institutes, universities, municipalities and state organizations to reduce the cost of solar electricity and to work on new applications mainly for the urban environment. In addition to this, SolarInput promotes and maintains international contacts mainly in Africa and South East Asia to disseminate its vast experience in the field of solar electricity and clean water for the application in rural areas world-wide.

5
SC SUSTAINABLE CONCEPTS SC Sustainable Concepts focuses its broad experience and know-how on material sciences, manufacturing and systems application in the field of photovoltaics for designing, financing and installing autonomous solar electricity systems that generate power for village electrification and the disinfection of water for safe drinking purposes. By combining the most advanced solar technology with the latest water disinfection technique, the company can bring electricity and safe drinking water to millions of people living in the rural areas, increasing their quality of life in a sustainable and economic manner. In addition, Sustainable Concepts works with national and international solar energy and water experts to disseminate know-how and technology in order to eliminate electricity and water poverty. TECHNISCHE UNIVERSITÄT BERLIN CAMPUS EL GOUNA Technical University of Berlin Campus El Gouna is working on sustainable solutions regarding water and energy supply and offers teaching and research in those fields. Practical orientated approaches are a central part of the university’s portfolio to face the challenges of water and energy shortages and needs. Small-scale decentralized greywater treatment solutions were part of the workshops held during the conference. These can be a tool to handle wastewater in remote settlements and provides a useful option for water reuse. Therefore, TU Berlin Campus El Gouna was very interested in the scientific support of the Second International Solar Conference at the AUC. EGBANK EGBank was established in 1981 with a vision to become a leading sustainable bank that serves the evolving needs of their customers, as well as to serve and support the developmental projects of Egypt and other Arab countries. The company is constantly trying to improve and develop in three service areas: customer satisfaction, entrepreneurship, and sustainability. The bank strives to contribute to sustainable development in the community and on a global scale. EGBank continually seeks to implement internal sustainability changes that have an effect on both business and society. EGBank was a proud sponsor of the conference, due to its dedication to these important shared values. SOLARIZEGYPT SolarizEgypt is Egypt’s first solar financing company. The company brings Egyptian households and businesses clean energy that is cheaper than the grid, with zero investment. The International Conference on Solar Energy Solutions for Electricity and Water Supply in Rural Areas series brings together all stakeholders on the same table, such as companies, NGO’s, and academia, in a way that creates value for the community. SolarizEgypt was more than happy to be a part of this conference through organizing and funding.

6
Program for the Second International Conference on
SOLAR ENERGY SOLUTIONS FOR ELECTRICITY AND WATER SUPPLY IN RURAL AREAS OCTOBER 12TH – 15TH, 2016
GOLD SPONSOR:
SILVER SPONSOR:
OTHER SPONSORS:
ORGANIZERS:
CONFERENCE SUPPORT:

7
Time Wed, Oct 12
8.30-9 Registration, outside Moataz El Alfi Hall
9-9.30 WELCOME ADDRESSES, Moataz El Alfi Hall Francis J. Ricciardone, President, AUC Hassan El Fawal, Dean of SSE, representing Ehab Abdelrahman, Vice Provost, AUC Conference Gold Sponsor: Nelly Mahmoud, Egyptian Gulf Bank
9.30-10.30 KEYNOTE ADDRESS, Moataz El Alfi Hall Aulich, Hubert, Sustainable Concepts, Germany: Implementation of Solar Electricity to Eliminate Global Poverty in Energy and to Ensure Access to Safe Drinking Water Tutwiler, Richard, RISE: Community-Based Resource Management Jaskolski, Martina, RISE: Drinking Water Supply in Egypt’s Rural Areas
10.30-12 WORKSHOP, P019: (with Coffee Break) Identifying the Water and Energy Needs of Remote Areas Moderation: Martina Jaskolski, Hassan Husseiny and Amira Khalil
12.-13.15 SESSION 1, P022: Implications of Rural and Urban Development Agendas for Renewable Energy and Water Solutions Moderator: Florian Bauer and Martina Jaskolski Fouad, Menna and Shehata, Omar: Repercussions of Urban Growth on Choosing the Most Suitable Renewable Energy Technology Raslan, Hala: Developing an Off-Grid Model for Utilities’ Provision in the 1.5 Million Feddan Project in Egypt Ibrahim, Heba: Wastewater Concept for Elephantine Island, Aswan Rap, Edwin: Pumping Collectives in the Egyptian Delta: Reflections on Water and Energy Use Closas, Alvar: Developing Sustainable Solar Irrigation in the MENA region Rafaat, Laila: A Numerical Backpropagation-Based Technique for Identification of the Single Diode Model Parameters of a PV System
13.15-14 Egyptian Gulf Bank Lunch and Poster Session
14-15.30 SESSION 2, P022: Village Electrification Systems Based on Renewable Energy Moderator: Abu Bakr Bahaj, Hubert Aulich Bahaj, Abu Bakr: Renewable Energy for Development in Africa Puttinger, M.: Feasibility of Wind Power in Rural Areas of Egypt Based on the Evaluation of an Existing Wind Atlas Gerlach, Ann-Katrin: Potential of Wind Energy Modelling Systems for Egypt Husseiny, Hassan: Renewable Energy Models for Electricity in Egypt’s Western Desert Hosny, Omar: Examples of Solar Village Electrification Systems from Different Remote Areas of Egypt Community Representatives: User Perspective of Renewable Energy Solutions in Egyptian Villages
15.30-16 Coffee Break
16-18 SESSION 3, P022: Renewable Energies for Water Pumping, Irrigation Systems and Waste Water Management Moderator: Kerstin Wydra and Omar Hosny Wydra, Kerstin: The Water-Energy-Food Nexus Approach and Reform in Governance as Prerequisite to Achieve the SDGs

8
El Alfy, Sherifa and Husseiny, Hassan: Food for the Future: Sustainable Farming Models for Egypt Based on Renewable Energy Hosny, Omar: The Potential of Larger Scale Solar Pumping Systems for Egyptian Desert Farm Enterprises Abdelrahman, Mamdouh: A Model for Evaluating the Performance of Off-Grid Solar AC Pumping Systems Elgazzar, Kamal and Elsharouny, Mohamed: Availability, Possibilities and Feasibility Studies of Various Water Pumping Systems in Reclamation Lands of Egypt Buchholz, Martin: Greenhouse Based Desalination for Sustainable Agriculture in Desert Climate Riechelmann, Carsten: Green Wall Treatment – Solar Driven Urban Agriculture
18.30-21 Egyptian Gulf Bank Dinner at AUC

9
Time Thurs, Oct 13
9-10.30 SESSION 4, P022: Sustainable Systems for the Supply of Safe Drinking Water Moderator: Alexander Goldmaier and Hassan Husseiny Goldmaier, Alexander: Drinking Water Purification Systems for Different Types of Source Water in Egypt Farag, A. et al.: Water Desalination Using a Hybrid MED and MD System Driven by Solar Energy for Coastal Areas Abuwaly, Abdelrahman: A Study of Solar-Driven Desalination by a Spiral-Wound Air Gap Membrane Distillation Unit Spinnler, Markus: Solar PV Powered Reverse Osmosis for Desalination Presentation of Remote Village Residents: Solar Driven Drinking Water Supply Solutions with Card Controlled User Access
10.30-11 Coffee Break
11-12 SESSION 5, P022: Financing Models and Payment Schemes for Electricity and Water Moderator: Hubert Aulich Village Representation
12-13.30 SESSION 6, P022: Performance and Quality Assurance of Solar Systems and Water Supply Moderator: Amir R. Ali and Carsten Riechelmann Ali, Amir R.: Analyzing Biofilms in DW-Pipes via Photonic Sensors Wilms, Tristan: Biofilm-Hybrid-Processes for Wastewater Treatment in North African Climate-Conventional Carrier vs Recycling Material for Capacity Increase Goldmaier, A.: Iron Filtration in the Oasis of El Heiz, Egypt: History and Performance
13.30-14.30 SolarizEgypt Lunch and Poster Session
14.30-15.30 PANEL DISCUSSION, P019: Towards More Sustainable Water and Energy Agendas for Egypt and Africa – What Needs to Happen to Push Renewable Energies for Electricity and Water Supply? Moderator: Hubert Aulich Ibrahim Motawea, KarmSolar Abdou, Tarek REEF Company Rap, Edwin, International Water Management Institute Yaseen Abdelghaffar, SolarizEgypt Spinnler, Marcus, Technical University of Munich Bauer, Florian, TU El Gouna Bahaj, Abu Bakr, University of Southampton Lamyaa El Gabry, Professor of Mechanical Engineering, AUC Zakariya Mohyeldin, former GIZ and renewable energy volunteer
15.30-17 POSTER SESSION, P020 with Coffee Moderators: Sherifa El Alfy and Zander Pellegrino Otter, Philipp and Benz, Florian.: Electronic Card Systems for the Sustainable Operation of Rural Drinking Water Stations Jaskolski, Martina: A Water Education Center for Egypt’s Western Desert Dessouky, Nermin: Smart Water and Energy Management Solutions for Sustainable Compounds in the Middle East Karty, Tyler, Madkour, Khaled and Sendaaza, Charles: A Solar-Powered Green Wall Greywater Filtration Solution for Egypt

10
Hassan, Kareem: Concepts for Reinventing Sustainability Enterprises Abbas, Ahmed: Building an Economically Viable Mobile Solar Water Pumping Systems for Small Farmers

11
A Novel Approach for Water Treatment Based on the Opto-Genetic Technique
Amir R. Alia,b* aApplied-Science & Robotics Laboratory for Applied-Mechatronics (ARAtronics Lab.); Mechatronics Engineering Department, German University in Cairo, New Cairo, 11835, Egypt bMicro-Sensor Laboratory, Mechanical Engineering Department, Southern Methodist University, Dallas, Texas, 75275, USA
ABSTRACT
Optogenetics is an innovative technique that uses light to control cells in living tissue, typically neurons that have been genetically modified to express light-sensitive ion channels. In this paper, we exploit the use of the optogenetic technique to create a novel approach for water treatment using charged dielectric nano spheres. In this approach, the spheres will be coated with a photosensitive protein called channelrhodopsin. This protein is a subfamily of retinylidene proteins (rhodopsins) that function as light-gated ion channels. They serve as sensory photoreceptors in unicellular green algae, controlling phototoxic movement in response to light. The nano coated spheres are then poled for more than 4hrs under 1 mV/m. When these nano charged spheres mix with turbid water, the spheres start to attract the colloids in the water. Because the spheres are coated with a photosensitive protein, by using a specific wavelength of light we can control the motion of the spheres in the water. Using a pulse width modulation (PWM) algorithm, the nano sphere speeds are easily controlled by switching light on and off. The more intense the cycles are for the PWM, the more the charged spheres make the colloids aggregate together in a very short period of time (couple of minutes). This is called an optical flocculation technique. Experiments were carried out to validate the analysis and to provide an assessment of this concept.
Keywords: Water treatment, micro-optical resonators, channelrhodopsin, opto-genetic approach, whispering gallery mode, turbidity, flocculation approach.
1. NANO CHARGED DIELECTRIC SPHERES
An understanding of the electrostatic properties of dielectric spheres has important consequences for many industrial processes and procedures (Ali, 2012). Prime examples where electrostatic effects can have a significant influence on particle behavior include removal of fine particles and impurities from drinking water. Polymeric spheres are manufactured using a ~5 cm long piece of optical fiber that is first stripped of its plastic cladding using an optical stripper, then heated and stretched to provide a stem end. The tip of this silica fiber is then dipped into a polymer pool (Ali, 2012). Surface tension and the weight of the mixture allow for the formation of a sphere

12
at the end of the stem (Figure 1a). Then, these spheres will be coated with a photosensitive protein called “channelrhodopsin” (Figure 1b).
Figure 1a: Typical micro-sphere; 1b: Coated sphere with a channelrhodopsin
(a)
(b)
To increase the surface charge of the nano spheres, it should be poled for several hours at electric fields of ~ 1 MV/m. The electric field is generated by two brass plates connected to a high-voltage supply. The brass electrodes are shown in Figure 2a and 2b.
Figure 2a: The sphere between brass electrodes; 2b: Poling process for the sphere
(a) (b)
Two metallic parallel-plate electrodes are used to generate the electric field. One plate is connected to the ground and the other is connected to a DC power supply (in the case of high electric field poling). The dielectric sphere is placed in between the two electrodes and is subjected to the uniform E-field. The strength of the field can be adjusted by either changing the gap between the plates or varying the electric potential (Lee, 2013). A schematic and a photograph of this experimental setup are given in Figure 3 to show the segregation of ions.

13
Figure 3: Schematic of dielectric material subjected to the uniform electric field
The poling process is shown in Figure 4a and 4b, where the sphere is subjected to a field of ~1 mV/m. The deflection of the elastic sphere increases over time under this constant external field, indicating that the strength of the electrostriction force (q) increases as the sphere is poled. As shown in Figure 4b, after we impose ~ 10V/m, there is significant change in the morphology of the sphere, indicating that a sphere becomes more likely to attract the fine particles and impurities from the drinking water (Ioppolo, Ayaz, & Otugen, 2009).
Figure 4a: Before; 4b: After, with the sphere subjected to ~10 V/m.
(a) (b)
0 V/m
0 pm
10 V/m
0.3 pm

14
2. WATER TURBIDITY CAUSING DISEASE RISK
Figure 5a shows suspended particles in water that are too light and small to settle, called “colloids.” These colloids cause a state of cloudiness, or haziness, known as “turbidity”. The cloudier a fluid looks, the more turbid it is (Koohestanian, Hosseini, & Abbasian, 2008).
Toxic compound can be absorbed or stick to the surface of the suspended colloids. The more colloids there are, the more toxic the water becomes (Figure 5b). Figure 5a: Turbidity of the water under treatment; 5b: Toxic compounds in the water under treatment
(a)
(b)

15
3. OPTICAL FLOCCULATION APPROACH
Flocculation is the process in which colloids aggregate, or come together, to form larger particles called “flocs” by the addition of a chemical called “flocculant”. In turn, these particles will accumulate in the bottom of the jar (Figure 6). The water becomes clear when all of the larger particles precipitate at the bottom. Figure 6: Typical flocculation process for the water treatment
Figure 7 shows the same process described above, but applies the optical flocculation technique, which uses nano charged spheres coated with the photosensitive protein called “channelrhodopsin”. These spheres will attract impurities in the water, due to the poled spheres repelling one another, which is controlled by light. Once the spheres are under blue light, the channelrhodopsin will be activated and the spheres will move towards the blue wavelength. On

16
the other hand, when an orange wavelength is used, the coated sphere with channelrhodopsin will not move (Figure 8).
Figure 7: Schematic describe the water treatment using the nano poled spheres
(a)
(b)
(c)
(d)
Therefore, the recommended approach in this paper is split into three stages. The first stage involves adding the poled nano spheres to the water we need to treat, using this optical approach. Then, by using a proper wavelength (blue and orange) through the PWM with ~90% duty cycle, we can assign an external force (similar to the centripetal force) on the spheres. Finally, we can see all the colloids precipitated on the bottom and can use the typical whispering gallery modes sensor’s to sense the water impurities (Ali, 2015).

17
Figure 8: The novel optical flocculation technique using the poled nano sphere
4. CONCLUSION
In this paper, a sustainable solution for water treatment is discussed, using an optical flocculation approach for water treatment, consisting of the poled polymeric spheres or powder. The optical approach based on the opto-genetic technique is clearly a favorable approach when beginning a water treatment cycle. The other WGM sensors based on optical resonance could also enhance the feedback for the whole process. Future work could involve the use of more advanced controllers for the PWM, which can enhance the whole process. Finally, one can enhance the filtration process in the future using higher quality factor sensors.
18
REFERENCES
Ali, A.R. (2015). Chemical Impurities Detection in water environment using micro-optical sensors. First International Conference on Solar Energy Solutions for Electricity and Water Supply in Rural Areas. The American University in Cairo, October 2015, Cairo.
Ali, A. R., Ioppolo, T., & Otugen, M.V. (2012). High-resolution Electric Field Sensor Based on Whispering Gallery Modes of a Beam-Coupled Dielectric Resonator. Engineering and Technology (ICET), 2012 International Conference. doi:10.1109/ICEngTechnol.2012.6396117
Ioppolo, T., Ayaz, U.K., & Otugen, M.V. (2009). Tuning of Whispering Gallery Modes of Spherical Resonators Using an External Electric Field. Optics Express, 17(19), 16465-16479. doi:10.1364/OE.17.016465
Koohestanian, A., Hosseini, M., & Abbasian, Z. (2008). The Separation Method for Removing of Colloidal Particles from Raw Water. American-Eurasian J. Agric. & Environ. Sci, 4(2), 266-273.
Lee, E. (2013). Effect of Electrical Field on the Phase Transformation of 0.7Pb(Mg1/3Nb2/3)O3-0.3PbTiO3 Single Crystals. Korean Journal of Materials Research, 23(6), 329-333. doi:10.3740/MRSK.2013.23.6.329

19
Effect of Microbial Layers on Wall Shear Stress Measurements for Drinking Water Supply via a Photonic Sensor
Amir R. Alia,b* and Ahmed Abozeada aApplied-Science & Robotics Laboratory for Applied Mechatronics (ARAtronics Lab.); Mechatronics Engineering Department, German University in Cairo, Cairo, 11835, Egypt bMicro-Sensor Laboratory, Mechanical Engineering Department, Southern Methodist University, Dallas, Texas, 75275, USA
ABSTRACT
Quality assurance of drinking water is an important measurement in any water treatment process. The performance of the pipes used in the drinking water supply system could be affected by factors such as microbial layers, sedimentation, and biofilm growth. The microbial layers determine both the chances of impurities within the drinking water, and their movements. In this paper, a micro-optical wall shear stress sensor concept, based on the optical modes of dielectric resonators, is presented. Based on this, high wall shear stresses will result in denser, stronger biofilms and microbial layers, while low wall shear stresses result in a monolayer of biofilm cells and microbial layers. The sensing element is a dielectric microsphere with a typical diameter around 960 μm. The sensor is essentially afloating element system and measures the shear stress directly. The material of the sphere is polydimethylsiloxane (PDMS). The measurement principle is based on the whispering gallery optical mode (WGM) shifts of the sphere. The wall shear imposes force acting on a movable plate, perturbing it. The plate in turn compresses the sphere, causing a shift in its WGM. The transmission spectrum through the optical fiber is monitored to detect WGM shifts of the one-dimensional wall shear stress. A nanometer can be measured with this optical method for shape perturbations. Prototype sensors using PDMS spheres have been built and validated in a laminar Poiseuille flow and in a plane wave acoustic tube. Measurements are made for a Reynolds number range of 2000–5000 extending to 18 step heights from the step face. The results are in concurrence with those of earlier reports. An analysis is also carried out to evaluate the performance of the WGM sensor, including measurement sensitivity and bandwidth. The results indicated that the wall shear stress increased while increasing the biofilm and microbial layers. Keywords : Wall shear stress, micro-resonators, quality assurance, drinking water supply, whispering gallery mode, photonic sensors, microbial layers.
1. INTRODUCTION
The drinking water quality depends on a number of factors such as microbial layers,sedimentation, and biofilm growth. For human health, water treatment processes must occur regularly for quality assurance of the drinking water. The microbial layers dictate the chance and the movement of impurities in the drinking water environment. Although complete microbial elimination from the water pipes is almost impossible, water suppliers try to control bacterial growth using disinfectants. A large fraction of biomass can be found attached on the pipe walls in most flow conditions (Srinivasan, Harrington, Xagoraraki, &

20
Goel, 2008). To control and monitor the microbial layers and biofilm growth, we will depend on the wall shear stress measurement approach. The measurement of wall shear stress still remains a challenge in fluid mechanics. Most of the currently used sensors are indirect approaches, where the wall shear stress is determined from the measurement of another flow property. These include hot-wire/film-based anemometry (Sturzebecher, Anders, & Nitsche, 2001) or heat flux gages (Huang, Tung, Ho, Liu, & Tai, 1996), surface acoustic wave sensors (Benes & Grschl, 1995), and laser based velocity sensors (Sheng, Malkiel, & Katz, 2009). Another method that has been frequently used is the surface oil film interferometry (Naughton & Liu, 2007; Tanner & Blows, 1976), which provides time-averaged measurements. A new class of MEMS based sensors have been recently proposed, which includes thermal (Liu et al., 1999; Madou, 1997), floating element (Heuer & Marusic, 2005; Padmanabhan, Goldberg, Schmidt, & Breuer, 1996) and an optical wall shear sensor (Fourguette et al., 2001). The micro-optical sensor presented here is based on whispering gallery mode (WGM) resonators, and is capable of registering measurements resolved in time and space with a large dynamic range. It promises to mitigate some of the drawbacks of the current skin friction measurement techniques. The signal output is optical rather than electronic, which makes the sensor essentially immune to electromagnetic interference. The sensor can be applied to a wide range of Reynolds number flows; the measurement resolution, dynamic range and bandwidth can be optimized for a given flow by varying the sensing element size and material. Figure 1: Typical WGM sensor configuration and transmission
2. WGM SENSOR CONCEPT
The sensing is based on tracking the shifts in optical modes (WGM) of a dielectric sphere caused by applied force. The optical modes of the sphere are excited by coupling light from a tunable laser into the sphere using a tapered optical fiber as illustrated in Figure 1. Light from a tunable laser is carried through an optical fiber with a section that is stripped and tapered to
21
about ∼10 μm in diameter. A photodiode placed on the opposite end of the fiber monitors the transmitted light intensity. The tapered section of the fiber serves as an input/output port for the microsphere. When the laser frequency is tuned over a small range, the WGMs are observed as narrow dips in the transmission spectrum through the fiber. The position of each WGM in the transmission spectrum depends on the morphology (i.e. size, shape) of the sphere. The WGM line widths (δλ) can be extremely narrow, thereby allowing for the detection of even very small perturbations of the sphere’s morphology. Thus, any force applied to the sphere that causes a detectable shift in WGM can be measured by monitoring the transmission spectrum through the fiber.
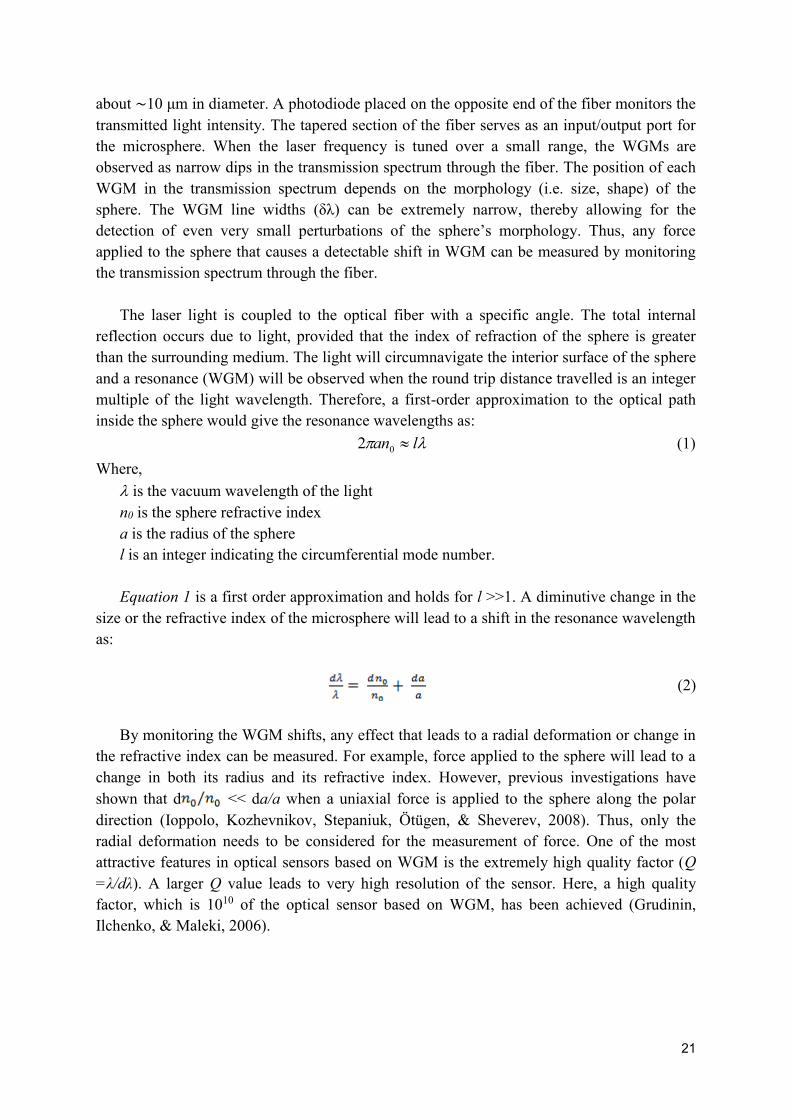
The laser light is coupled to the optical fiber with a specific angle. The total internal reflection occurs due to light, provided that the index of refraction of the sphere is greater than the surrounding medium. The light will circumnavigate the interior surface of the sphere and a resonance (WGM) will be observed when the round trip distance travelled is an integer multiple of the light wavelength. Therefore, a first-order approximation to the optical path inside the sphere would give the resonance wavelengths as:
OS lan |02 (1) Where,
O is the vacuum wavelength of the light n0 is the sphere refractive index a is the radius of the sphere l is an integer indicating the circumferential mode number.
Equation 1 is a first order approximation and holds for l >>1. A diminutive change in the
size or the refractive index of the microsphere will lead to a shift in the resonance wavelength as:
(2)
By monitoring the WGM shifts, any effect that leads to a radial deformation or change in
the refractive index can be measured. For example, force applied to the sphere will lead to a change in both its radius and its refractive index. However, previous investigations have shown that d << da/a when a uniaxial force is applied to the sphere along the polar direction (Ioppolo, Kozhevnikov, Stepaniuk, Ötügen, & Sheverev, 2008). Thus, only the radial deformation needs to be considered for the measurement of force. One of the most attractive features in optical sensors based on WGM is the extremely high quality factor (Q =λ/dλ). A larger Q value leads to very high resolution of the sensor. Here, a high quality factor, which is 1010 of the optical sensor based on WGM, has been achieved (Grudinin, Ilchenko, & Maleki, 2006).

22
(a) Top view
(c) Front view (d) Side view
(b) Bottom view
Silica Beam
Microsphere Pivot
Sensing surface Flow Flow
Pivot Silica Beam
Membrane
Backstop
Figure 2: The shear stress sensor (a) top view photograph, (b) bottom view photograph, (c) side view diagram, (d) front view diagram.
3. SENSOR DESIGN
Photographs and a schematic of the wall shear stress sensor are shown in Figure 2. The cylindrical sensor cavity fits into a hole on the test section wall with its outside surface flush with the wall. The top surface of the cylindrical cavity is made of ∼1 mm thick aluminum. The active components of the sensor cavity are the PDMS microsphere with a 960 μm diameter. A 5 mm silica beam acts as a lever, with a flat plate that serves as the sensing surface. The silica beam is connected to the 0.8 × 0.8 mm square sensing plate on one end and to a back plate (0.4 × 0.4 mm) on the other with loctite epoxy. The back plate compresses the microsphere against the backstop with the force transmitted through the beam. Both plates are made of brass with a nominal thickness of ∼25 μm. The silica beam is attached to the bottom corner of the cavity wall, as shown in Figure 2, using a small amount of 10:1 base-to-curing agent mixing ratio PDMS. The attachment also serves as the pivot point, about which the silica/plate system rotates. The sensing plate is aligned flush with the wind tunnel wall with its outer side exposed to the flow. As the silica/plate system pivots about the attachment point, it transmits the shear force experienced by the plate to the microsphere slightly deforming it (da/a) and causing a shift in the sphere WGM. A latex membrane with 60 μm thickness covers a circular gap to prevent the flow into the cavity.
4. CALIBRATION
Previous studies have shown that for a given sphere material, the sphere size determines the calibration factor relating WGM shift to the immediate applied force to the sphere (Ioppolo et al., 2008; Ioppolo, Ayaz, & Ötügen, 2009). For the shear stress sensor, however, the effect of the additional components (the lever, the polymeric base at the pivoting point, latex membrane, etc) will each have an effect on sensor calibration.

23
Silica Beam
Microsphere Pivot
Sensing surface Membrane
Backstop
Cantilever beam
Translation stage
To Michelson interferometer
Figure 3: Experimental setup for static calibration.
Figure 3 shows a schematic of the static calibration setup. A cantilever beam mounted on
a translational stage is used to exert the force on the sensing surface. The beam is a silica fiber with a length and diameter of 60 mm and 0.125 mm, respectively. One end of the beam is attached to a micro translation stage, while the other end (which is flattened to have a larger surface area) is in contact with the microsphere. A Michelson interferometer is used to measure the deflection of the beam (with a resolution of ∼65 nm). The force exerted on the sensor by the deflected beam can be calculated as:
(3)
where
(4)
Figure 4: Static calibration of the sensor with a 40:1 mixing ratio PDMS sphere of diameter ∼700 μm.

24
Figure 5: Static calibration of the sensor with a 60:1 mixing ratio PDMS sphere of diameter ∼750 μm.
F is the force exerted on the sensor by the beam and u, D, E and L are the tip deflection,
diameter, Young’s modulus and length of the beam, respectively. Figure 4 shows a typical calibration result for a PDMS sphere with 40:1 base-to-curing agent mixing ratio. The sphere diameter for this case is ∼700 μm. The shear stress is obtained by dividing the applied force by the sensing surface area. The plot of Figure 4 is essentially linear in the range of calibration and the sensitivity is simply dλ/dτ . Along with the optical quality factor, sensitivity determines the measurement resolution. If we assume that the minimum measurable WGM shift is δλ =λ/Q, the measurement resolution is:
(5)
For a Q-factor of 107, the resolution for the sensor of Figure 4 is ∼10-2 Pa. The
measurement resolution can be increased by using PDMS spheres with larger base-to-curing agent ratios which yield smaller Young’s moduli. For example, Figure 5 shows the calibration plot of a sensor with a 60:1 base-to-curing agent ratio PDMS sphere of diameter ∼750 μm. As shown, a 15-fold increase in sensitivity is achieved with this sphere. The corresponding shear stress resolution for this sensor is ∼650 μPa.
Although we show here sensor results with only PDMS spheres of 40:1 and 60:1 mixing
ratios, other dielectric spheres with similar optical characteristics (such as silica, PMMA, etc) can also be used for this type of sensor. By changing the sphere diameter and material, a wide range of measurement range and resolution can thus be obtained.

25
Figure 6: Frequency response for the WGM shear stress sensor with a PDMS sphere (60:1 mixing ratio, ∼750 μm diameter)
Figure 7: Results of the frequency response for the WGM shear stress sensor with a PDMS sphere (40:1 mixing ratio, ∼700 μm diameter)
Table 1: Performance characteristics of the presented sensors
Dynamic calibrations have also been carried out to determine the frequency response of the sensors. The setup for dynamic calibrations is a variation of the static setup shown in Figure 3. The long optical fiber beam is replaced by a short, rigid beam that is connected to a piezoelectric actuator. The actuator is driven at a range of frequencies while the displacement amplitude is kept constant. Several measurements (typically 5 to 8) are made at each frequency, and the corresponding WGM shifts are plotted against frequency as shown in

26
Figures 6 and 7 for PDMS spheres of 60:1 and 40:1 mixing ratios, respectively. For the 60:1 mixing ratio sphere, the natural frequency of the sensor is around ∼300 Hz. Therefore, the sensor’s range of linear performance is limited to a bandwidth ∼100 Hz. The sphere with 40:1 mixing ratio, on the other hand, possesses a fairly flat frequency response up to ∼3.5 kHz. Thus, as it is typical of a sensor that has any mechanical components, the present sensor presents a tradeoff between bandwidth and sensitivity. The performance characteristics of the PDMS 40:1 and PDMS 60:1 shear stress sensors are summarized in Table 1.
5. EXPERIMENTS
Tests were carried out to validate the shear stress sensor under steady and unsteady flow conditions. For steady flow tests, a two-dimensional channel (Poiseuille flow) is used, whereas for unsteady flow tests, a plane-wave acoustic tube is designed and built.
A schematic of the two-dimensional wind tunnel is shown in Figure 8. In order to achieve a two-dimensional flow in the mid-section the aspect ratio of AR ~33 is designed. A set of six pressure taps are located inside the wind tunnel at the mid-point to measure the streamwise distribution of the wall pressure. For a fully developed one-dimensional isothermal flow, the shear stress at the wall can be calculated from:
(6)
Where, h is the channel height dp/dx is the streamwise gradient of pressure in the fully developed flow region
Figure 8: Test facility for the steady flow studies

27
The unsteady measurements were carried out in a plane wave acoustic tube that was designed and built in-house as seen in Figure 9. The setup and the experiments are similar to those reported in “Dynamic calibration of a shear stress sensor using stokes-layer excitation” (Sheplak, Padmanabhan, Schmidt, & Breuer, 2001) of shear-stress sensors. Equation 7 shows that the magnitude of the shear stress depends on the amplitude of the acoustic wave and the square root of the excitation frequency. Note that Equation 7 is only applicable when the wave is planar.
� �� � (7)
//)](exp['
0
1
QZQZZQZW
iRJiRJ
cikxtip
���
��
Figure 9: Schematic of the plane wave tube
Figure 10 gives us an indication of the experiment’s simulation, by using a Comsol multi-phsyics experimental model. Figure 10: Experimental model on Comsol multi-physics
Back stop
PDMS sphere
Silica Beam
Sensing element (Latex membrane)
Water flow
Aluminum cylinder

28
6. RESULT AND DISCUSSION
Figure 11 shows the results of a typical experiment where the flow rate is first increased and then decreased over a long period of time (with maximum Reynolds number Re = 4000). The figure presents both the shear stress calculated from Equation 6 and the WGM shifts registered from the optical sensor.
Figure 11: Steady flow test results for the WGM shear stress sensor
The measurements for the plane wave tube is shown in Figure 12, where the solid line indicates the shear stress that is calculated from the microphone output (using Equation 7), and the data points are the output of the WGM sensor.
Figure 12: WGM sensor response in plane wave tube for sensor at 1kHz
For Comsol simulation, after applying a laminar flow with pressure about 30 Pa. a vibration and deformation happened to the sensing surface with value 1.43 mm/s. This vibration directly effects the silica beam to squeeze the sensing element (PDMS sphere), as shown in Figure 13.

29
Figure 13: Result of Comsol simulation
7. CONCLUSION
In this paper, an optical wall shear stress sensor, based on the whispering gallery modes of spherical resonators, has been demonstrated for steady and unsteady flows to measure the one-dimensional, time dependent wall shear stress. In the present design with a sensing surface area of ~650 µm2, a shear stress resolution of 10-2 Pa is obtained when a 700 µm diameter PDMS sphere with 40:1 base-to-curing agent mixing ratio is used. The resolution improves to ~650 PPa if a 60:1 mixing ratio PDMS sphere is used. The results indicated that the wall shear stress increased while increasing the biofilm and microbial layers.

30
REFERENCES Benes, E. & Grschl, M. (1995). Sensor Based on Piezoelectric Resonator. Sensors Actuators A, 48,
1-21. Fourguette, D., Modarress, D., Taugwalder, F., Wilson, D., Koochesfahani, M., & Gharib, M.
(2001). Miniature and MOEMS Flow Sensors. AIAA Paper, 2001-2982. Heuer, W. D. C. & Marusic, I. (2005). Turbulence Wall-Shear Stress Sensor for the Atmospheric
Ssurface Layer. Measurement Science and Technology, 16(8), 1644-9. Huang, J. B., Tung, S., Ho, C., Liu, C., & Tai, Y. (1996). Improved Micro Thermal Shear-Stress
Sensor. IEEE Transactions on Instrumentation and Measurement, 45(2), 570-4. Ioppolo, T., Ayaz, U. K., & Ötügen, M. V. (2009). High-Resolutionforce Sensor Based on
Morphology Dependent Optical Resonances of Polymeric Spheres. Journal of Applied Physics, 105, 013535.
Ioppolo, T., Kozhevnikov, M., Stepaniuk, V., Ötügen, M. V., & Sheverev, V. (2008). A Micro-
Optical Force Sensor Concept Based on Whispering Gallery Mode Resonators. Applied Optics, 47(16), 3009-14.
Grudinin, I. S., Ilchenko, V. S., & Maleki, L. (2006). Ultrahigh Optical Q Factors of Crystalline
Resonators in the Linear Regime. Physical Review A, 74(6), 063806 Liu, C., Huang, C-B., Zhu, Z., Jiang, F., Tung, S., Tai, Y-C., & Ho, C-M. (1999). A Micromachined
Flow Shear-Stress Sensor Based on Thermal Transfer Principles. Journal of Microelectromechanical Systems, 8, 90-9.
Madou, M. (1997). Fundamentals of Microfabrication. New York: CRC Press. Naughton, J. W. & Liu, T. (2007). Photogrammetry in Oil-Film Interferometry. AIAA Journal,
45(7), 1620-9. Padmanabhan, A., Goldberg, H. D., Schmidt, M. A., & Breuer, K. S. (1996). A Wafer-Bonded
Floating-Element Shear-Stress Microsensor with Optical Position Sensing by Photodiodes. Journal of Microelectromechanical Systems, 5(4), 307-15.
Sheng, J., Malkiel, E., & Katz, J. (2009). Buffer Layer Structures Associated with Extreme Wall
Stress Events in a Smooth Wall Turbulent Boundary Layer. Journal of Fluid Mechanics, 633, 17-60.
Sheplak, M., Padmanabhan, A., Schmidt, M.A., & Breuer, S. K. (2001). Dynamic Calibration of a
Shear Stress Sensor Using Stokes-Layer Excitation. AIAA Journal, 39(5), 819-23. Srinivasan, S., Harrington, G. W., Xagoraraki, I., & Goel, R. (2008). Factors Affecting Bulk to
Total Bacteria Ratio in Drinking Water Distribution Systems. Water Research, 42(13), 3393-3404.

31
Sturzebecher, D., Anders, S., & Nitsche, W. (2001). The Surface Hot Wire as a Means of Measuring Mean and Fluctuating Wall Shear Stress. Experiments in Fluids, 31(3), 294-301.
Tanner, L. H. & Blows, L. G. (1976). A Study of the Motion of Oil Films in Surface in Air Flow.
Journal of Physics E: Scientific Instruments, 9(3), 194-20.

32
Real Time Data Tracking for Concentrations Measurement of Drinking Water Constituents
Amir R. Alia,b* , Hazem Tahaa , and Amr Afifia,c
aApplied-Science & Robotics Laboratory for Applied-Mechatronics (ARAtronics Lab.); Mechatronics Engineering Department, German University in Cairo, New Cairo, 11835, Egypt bMicro-Sensor Laboratory, Mechanical Engineering Department, Southern Methodist University, Dallas, Texas, 75275, USA cDipartimento di Ingegneria informatica, automatica e gestionale (DIAG), Sapienza Università di Roma, Roma, Italy ABSTRACT
Water filtration is a critical process requiring continuous monitoring of its phases. Infection due to bacteria, pathogens, and chemicals existent in untreated water causes 1.5 million deaths each year in remote areas without access to safe drinking water (UNICEF and the World Health Organization, 2012). In order to properly monitor the constituents of water during treatment, information about every stage has to be gathered using suitable sensors. The Whispering Gallery Mode (WGM) sensors, with their high quality factor, can be used to measure the slightest changes in the water constituents at every phase of the water treatment process. In the WGM based sensors, the sensing element is a silica microsphere that acts as an optical resonator. The microsphere is placed where measurement data is to be obtained. The data acquired needs to be further processed in order to obtain meaningful sensing information. A real time processing algorithm is needed to detect water contamination, which allows us to act accordingly before water users are harmed. This paper discusses the implementation of WGM sensor data analysis algorithm in real time. The platform chosen for such implementation is the Field Programmable Gate Array (FPGA) due to its parallel nature and reduced latency. The results show that the algorithm used successfully measures the changes in the surroundings of the microsphere. Experiments were carried out to validate the analysis, and to provide an assessment of the WGM sensor concept in real time. The timing achieved by the developed algorithm when compiled on an FPGA is approximately 2.8 microseconds per data set.
Keywords: Real time, micro-resonators, quality assurance, drinking water supply, whispering gallery mode, photonic sensors, FPGA.
1. INTRODUCTION
During recent years, the need for more sensitive detectors for the physical phenomena around us has increased significantly. Lately, a phenomenon, primarily developed to describe the behavior of sound waves in a circular dome, has gained great attention in the photonics and optics fields. This phenomenon is the Whispering Gallery Mode (WGM) which was discovered by Lord Rayleigh in St. Paul’s cathedral in 1878 (Raleigh, 1912). WGM sensors are resonators that can trap laser light inside them for a relatively long period of time due to their high quality factor which

33
can reach values of 1010 (Jonáš, Karadog, Mestre, & Kiraz, 2012). Quality factor is a dimensionless parameter that measures the resolution of a sensor. In comparison, mechanical and electrical sensors typically have quality factors of 103. In other words, the concept of WGM based sensors can be used to measure the slightest changes of a stimulus. These sensors find important applications in the water treatment field. Measuring the amount of water constituents is of utmost importance for the quality assurance of water treatment processes. Concentrations of chemical contaminants such as sodium phosphate, which can cause serious kidney damage and possibly death, were successfully measured using WGM based sensors (Ali, 2015).
2. WGM SENSORS THEORY OF OPERATION
The sensing element in WGM based sensors is a microsphere ranging in size from 50 μm to 1000 μm that is coupled with a tapered optical fiber. Acquiring a proper signal from the microsphere requires a certain equipment setup. Figure 1 shows a schematic of the optoelectronic setup used to obtain sensory signals from the microsphere. The setup consists of a function generator that produces a waveform that tunes the laser. Tuning the laser means that the light wavelength is altered according to the output waveform of the function generator. The tuning waveform often has linear characteristics, such as a saw tooth wave or a triangular wave, but harmonic tuning waveforms can also be used (Ali, Ötügen, & Ioppolo, 2015). The laser beam is then split into 2 components: the signal and the reference. A total of 90% of the light intensity goes into an optical fiber coupled with the microsphere. The reference and signal optical fibers are terminated by photodiodes that detect the light intensity of the waveforms to be analyzed.
Figure 1: Optoelectronic setup

34
Laser light enters the microsphere through a tapered section of the optical fiber (Ali, Ioppolo, & Ötügen, 2012). WGMs occur when light enters the microsphere and circumnavigates it with an integer multiple of the light wavelength, using multiple total internal reflections. These WGMs are observed from the photodiode, as sharp dips in the transmission spectrum. When the sphere experiences changes in its morphology, i.e.: size or refractive index, due to an external stimulus, the location of incidence of WGMs is shifted by an amount proportional to the magnitude of this stimulus as seen in Figure 2. By measuring the amount of spectrum shift, and using proper conversion factors, the magnitude of the stimulus can be obtained.
Figure 2: A detected signal spectrum shifted relative to a previous reference spectrum due to an external stimulus
The resonance condition which governs the phenomenon of WGM occurrence is
2𝜋𝑛𝑜𝑎 ≈ 𝜆𝑙 , 𝑎 ≫ 𝜆 Where,
𝑛𝑜 is the refractive index 𝑎 is the radius of the microsphere 𝜆 is the light wavelength 𝑙 is an integer indicating the mode number ( 𝑙 ≫ 1).
(1)

35
Equation 1 is a first order approximation. Optical sensors possess high quality factors that allow for measurements of the minutest changes in the environment. Detectable stimulus changes are reliant on the quality factor of the sensor as can be seen in Equation 2.
Δ𝜆𝜆 = Δ𝑛𝑜
𝑛𝑜+ Δ𝑎
𝑎
Where the term Δ𝜆𝜆 is the reciprocal of the quality factor.
3. REAL TIME WGM SHIFT TRACKING
The main purpose of this paper is to discuss and show the results of a real time implementation of WGM signals shift measurement. In the literature regarding this process, various methods were used to measure the amount of signal shift. Initial attempts were entirely manual (Ioppolo, Kozhevnikov, Stepaniuk, Ötügen, & Sheverev, 2008). This process starts by choosing a certain dip, and then manually recording its location in subsequent spectrums. The final and initial locations are then subtracted to obtain a shift value. Though this technique was accurate, it was also very time consuming and could not be automated. Another technique used an analog circuit to automatically detect the shift (Ayaz, 2011). Due to the analog nature of the circuit components, the results were unreliable. The most recent shift tracking algorithm used is a technique known as cross correlation (LaPenna, 2013). The algorithm is fully automated; however, it cannot be implemented in real time.
This paper uses the concept of cross correlation and implements it in real time on an FPGA
platform using LabVIEW’s FPGA module. Cross correlation is a mathematical technique that measures the amount of similarity between two waveforms. The cross correlation formula for discrete time domain is
𝑓[𝑛] ⋆ 𝑔[𝑛] = ∑ 𝑓∗[𝑚]𝑔[𝑚 + 𝑛]∞
𝑚=−∞
Where 𝑓[𝑛] and 𝑔[𝑛] are the two waveforms to be correlated and 𝑓∗ is the complex conjugate of 𝑓. For computational efficiency the frequency domain cross correlation equation is used,
ℱ{𝑓[𝑛] ⋆ 𝑔[𝑛]} = (ℱ{𝑓[𝑛]})∗ ∙ ℱ{𝑔[𝑛]}
Where ℱ{𝑓[𝑛]} and ℱ{𝑔[𝑛]} are the Fourier transform of 𝑓 and 𝑔 resepectively. Inverse Fourier transform should be executed after the multiplication in order to obtain a cross correlation result.
The algorithm used in this paper is composed of 3 main processes: preprocessing, cross correlation, and peak detection. To obtain valid results through the cross correlation algorithm, pre-processing operations have to be executed first. There are 4 operations needed: normalization, mean removal, windowing, and zero padding. First, normalization removes the linear trend in the
(2)
(3)
(4)

36
acquired signal by dividing the WGM signal, obtained from the photodiode terminating the optical fiber coupled to the sphere, by the reference signal obtained from an optical fiber with no coupling. Second, the DC component (mean) is removed from the signal in order to avoid large spikes at 0 Hz frequency, which may determine the results when the signal is converted to the frequency domain. Third, a hamming window is applied to the signal to avoid spectral leakage. Finally, the signal is zero padded to increase the frequency resolution of the output signal and enhance the efficiency of the conversion to frequency domain.
The next phases in the algorithm are the cross correlation and peak detection. The acquired
signal is converted to the frequency domain using an algorithm known as the Fast Fourier Transform (FFT), which optimizes the efficiency of conversion. The resulting frequency spectrum is then multiplied by a reference spectrum, which was saved previously, resulting in a cross correlation graph as seen in Figure 3. The location of the highest peak of the cross correlation graph is point of highest similarity between the two signals, and thus is the pursued WGM spectrum shift. A detailed flow chart of processes imposed on each acquired signal spectrum is presented in Figure 4.
Figure 3: Cross correlation result

37
Figure 4: Detailed flowchart of the algorithm processes
An example application of such real time algorithm in water treatment plants is related to the
work of Otter, Jaskolski and Goldmaier (2016, 16-21). Otter et al. contributed in solving off grid water treatment problems by integrating a fully autonomous system capable of pumping and filtering water supplies containing iron oxides and other contaminants. The system is known as SuMeWa (Sun Meets Water) and is shown in Figure 5. The focal point of this technology is a technique known as anodic oxidation that extracts a disinfectant, mainly chlorine, from natural water supplies and uses it to filter the water input. The treated water quality can be autonomously monitored using WGM based sensors in real time. Due to the high sensitivity of WGM sensors, the slightest change in the water components concentration can be detected and acted upon accordingly. The real time implementation of the sensor data analysis diminishes the chance of chemical contamination and allows for an enhanced system in terms of improved pumping speeds. Using real time also reduces the time overhead if data is to be sent to a remote location for monitoring or analysis.

38
Figure 5: SuMeWa|IRON - fully integrated water treatment and supply system for iron removal (Otter, Jaskolski, & Goldmaier, 2016)
4. EXPERIMENTAL VALIDATION AND RESULTS DISCUSSION
The cross correlation algorithm was tested using data available from a previously conducted experiment by LaPenna in 2013. The data was acquired using NI-DAQ, with a sampling rate of 5 MSa/s at a laser tuning frequency of 10 KHz. A piezo stack was used to generate an external force on the microsphere in a sinusoidal pattern with a compression frequency of 1 KHz. Figure 6 shows the shift graph obtained from the real-time algorithm simulation on LabVIEW using the entire data set available.

39
Figure 6: Shift spectrum for the entire length of the simulation
The turbulences seen in the middle section of the shift spectrum in Figure 6 are due to external unwanted disturbances during the experiment itself. The linear trend in the obtained results is due to thermal abnormalities in the optoelectronic setup. The linear trend is removed from an undisturbed section of the results to obtain Figure 7.
Figure 7: Piezo input to be tracked and the resulting WGM shift with linear trend removed
It can be observed from Figure 7 that the cross correlation algorithm follows the sine wave generated by the piezo compression. Concerning the timing results, the code has been compiled and loaded on the NI-MyRIO FPGA target, and the time required by the algorithm to process one signal spectrum is measured. The resultant time is 115 clock ticks per loop which, at clock frequency of 40 MHz, is executed in approximately in 2.8 microseconds. The main cost of having a real-time algorithm on an FPGA is the amount of resources required for its implementation. As shown in Figure 8, the amount of resources required for the final version of the code is 99.7% on

40
the NI-MyRIO device. The algorithm suffers from dependency on the platform’s clock frequency due to its serial nature as inferred from Figure 4. Also, a phenomenon known as peak hopping, which occurs due to thermal abnormalities in the optoelectronic setup, was not handled by this algorithm.
Figure 8: FPGA compilation results
5. CONCLUSION
In this paper, a real time algorithm was presented to detect the WGM shift in optical sensors. The algorithm successfully measures the magnitude of the spectrum shift due to a sinusoidal force input on the microsphere. The timing of the algorithm, when compiled on an NI-MyRIO FPGA platform, is 115 clock ticks which is equivalent to 2.8 microseconds at 40 MHz clock frequency. Furthermore, development of this algorithm is needed in order to enhance the quality of the results and diminish the algorithm’s dependency on the FPGA clock frequency. An example application in the water treatment field is shown along with suggestions for future implementation.

41
REFERENCES Ali, A. R., Ioppolo, T., & Ötügen, V. (2012). High-Resolution Electric Field Sensor Based on
Whispering Gallery Modes of a Beam-Coupled Dielectric Resonator. Engineering and Technology (ICET) 2012 International Conference on IEEE, 1-6.
Ali, A. R., Ötügen, V., & Ioppolo, T. (2015). High Data Rate Transient Sensing Using Dielectric
Micro-Resonator. Applied Optics, 54(23), 7076-7081. Ayaz, U. (2011). An Optical Wall Shear Stress Sensor Based on Whispering Gallery Modes of
Dielectric Microspheres. (Master's thesis). ProQuest Dissertations and Theses, 73, 551-697.
Ioppolo, T., Kozhevnikov, M., Stepaniuk, V., Ötügen, V., & Sheverev, V. (2008). Micro-Optical
Force Sensor Concept Based on Whispering Gallery Mode Resonators. Applied Optics, 47(16), 3009-3014.
Jonáš, A., Karadog, Y., Mestre, M., & Kiraz, A. (2012). Probing of Ultrahigh Optical Q Factors
of Individual Liquid Microdroplets on Superhydrophobic Surfaces Using Tapered Optical Fiber Waveguides. Journal of the Optical Society of America B, 29(12), 3240-3247.
LaPenna, V. G. (2013). Automated Tracking of Optical Resonance Shifts of Dielectric Micro-
Resonators (master’s thesis). Southern Methodist University, Dallas, Texas. Available from ProQuest Dissertations & Theses Global. (1415424339). Retrieved from http://library.aucegypt.edu:2048/login?url=https://search.proquest.com/docview/1415424339?accountid=8423
Otter, P., Jaskolski, M. & Goldmaier, A. (2016). Water Disinfection for Remote Areas – An
Innovative and Sustainable Approach Using Solar Technology and Anodic Oxidation. Proceedings of the First International Conference on Solar Energy Solutions for Electricity and Water Supply in Rural Areas from the Research Institute for a Sustainable Environment, 16-21.
Raleigh, L. (1912). The Problem of the Whispering Gallery. Scientific Papers, 5, 617-620. UNICEF & World Health Organization (2012). Progress on Drinking Water and Sanitation 2012
Update. Retrieved from http://www.unicef.org/media/files/JMPreport2012.pdf

42
Availability, Possibility and Feasibility Studies of Various Water Pumping Systems in Reclamation Lands of Egypt
Kamal O. Elgazzar a, Mohamed R. Elsharouny b
ªResearcher, Master Programme in Groundwater, Institute of Environmental Studies and Researches, Sadat City University, Sadat City, Egypt. bResearcher, Master Programme in Environmental Design & Energy Efficiency, Dept. of Architecture, Cairo University, Giza, Egypt. ABSTRACT
In the last decades, Egypt has suffered from water scarcity across the country, particularly in remote areas. Egypt has a national electricity grid that roughly covers eight percent of its area, and supplies energy to over 90 percent of the population. Unfortunately the grid is concentrated within the Nile Valley and Delta, and hardly takes into account the rural areas in the Western and Eastern Desert that represent most of Egypt's total area. Similar concerns are seen with the water supply. However, the problem here is not only with funding these types of projects, but also the water quantity and quality. Egypt has increasingly depended on groundwater aquifers to supply the needs of rural people, and for the reclamation of desert lands, especially after declaring two mega- projects; the Renaissance Dam in Ethiopia, and the reclamation project of 1.5 million feddan in Egypt. Egypt is currently facing a critical water crisis; in fact, the annual water deficit is around seven billion cubic meters. Additionally, the crisis will be exacerbated by 2040 due to climate change, which will decrease Egypt’s annual per capita share of freshwater from 700 to 350 m3 due to an expected decrease in the Nile discharge (Vishwanath et al., 2015). On the other hand, the Egyptian market is witnessing a boom in the drilling sector and the renewable energy sector, as many are trying to present sufficient and sustainable alternatives for water supply in rural areas to cope with current adverse effects. Also, local and international companies have recently entered the market, which creates healthy competition.
This paper aims to determine the best pumping system at different cases based on different
TDH and locations. It focuses on investigating feasibility studies of the three systems, comprising of mechanical wind water pumping, solar pumping, and diesel pumping systems. The trade-off between these three water pumping systems include (1) system capacity and pumping elevation (2) the working efficiency and limitations (3) a cost estimation and feasibility study according to the Egyptian market. The reclamation project of one million and a half feddan is used as a case study since it covers different promising areas within Egypt. This provides new prospects for sustainable development aimed at agriculture, a pillar of sustainable development that will help fill the information gap.
Key words: GIS application, mechanical wind pump system, solar pump system, diesel pumping, and feasibility studies.

43
1. INTRODUCTION
Egypt has excellent wind resources and an abundance of sunlight, allowing the country to become a leader in terms of installed wind and solar power capacity in Africa and the MENA region. The government has committed itself to an ambitious target of increasing the share of wind energy to 12% by 2020 (Pullen, Sawyer, Teske, & Jones, 2010, 22). The government has also developed a plan for desert reclamation, with the goal of converting 1.5 million feddan of desert into viable agricultural land. Merging these two propositions together, that is to use renewable energy for the desert reclamation process, would be greatly beneficial for Egypt moving forward. An example of this criteria is using renewable energy to power a water distribution network for desert development. This water distribution network would be in the form of a water pumping system, which will be discussed in this paper. The next sections clarify the decision-making stages required to make the right decision in relation to the selection of a pumping system that is appropriate for small to medium scale reclamation projects.
2. METHODOLOGY
The decision-making mechanism in relation to choosing a pumping system (Figure 1) goes through three stages: availability assessment, possibilities (study of alternatives), and a feasibility study. The availability assessment stage aims to assess water and energy resources through revising all of the available data on water potentialities. However, the final conclusion depends on two things: a pump test to estimate the safest yield, as well as camera inspection technology. This technology is defined as one of the best practices to know what exactly is happening beneath the ground and gives the decision maker the information he/she needs to go or stop the process. The energy resources are evaluated through reviewing metrological data and taking measurements on site if necessary. In the case of non-renewable energy, it is necessary to check fuel supply process. The possibilities (study of alternatives) stage includes determining the water requirements for the project, then conducting a sizing calculation for solar, wind, and diesel pumping systems. This identifies the possible pumping methods which cover water requirements within acceptable system limits. Then, a feasibility study is conducted for the selected system in terms of a cost breakdown analysis, in addition to water production unit cost. The next section delves deeper into the decision making framework through assessing the availability of water and energy resources in Egyptian rural and remote areas.

44
Figure 1: Decision making framework in relation to choosing a pumping system (developed by authors)
3. AVAILABILITY OF RESOURCES IN RURAL AND REMOTE AREAS
3.1 Water Aquifers
Egypt has a semi-arid to extremely arid climate and displays the classical features of arid zone hydrology. One of these features is water scarcity, represented in the availability of limited quantities of fresh water. Throughout the history of Egypt, the Nile has been the main source of fresh water in the country. Despite this, there are other resources for water available in Egypt, including underground aquifers, oases, and depressions. Groundwater development in Egypt extends to the desert areas where relatively large reserves are stored but need to be routinely discussed, used and monitored in terms of quantity, quality and feasibility. The hydrology map of Egypt, developed by the Research Institute for Groundwater (RIGW) in 1988 and then updated in 1996, shows that there are eight main hydrological units distributed all over Egypt, varying in their locations and characteristics (Table 1).
Table 1: Aquifers’ characteristics (El Tahlawi et al., 2007)
Aquifers Recharge
Distribution
Productivity
Lithology (rock type)
Surface Sub-
surface Nile Valley and Delta Continuous Continuous Extensive High
Granular rocks
Coastal Aquifers Occasional Limited Local Moderate-high
Nubian Sandstone complex None
Limited Extensive Moderate-high
Mohgra Aquifer Insignificant Locally Extensive Low-moderate Tertiary Aquifers Insignificant Limited Local Low-moderate
45
Carbonates None Locally Extensive Moderate Karstified and fissured rocks Hard Rocks Insignificant Limited Local Low
Aquicludes None None Generally
local None Clay or shale
3.2 Wind Resources
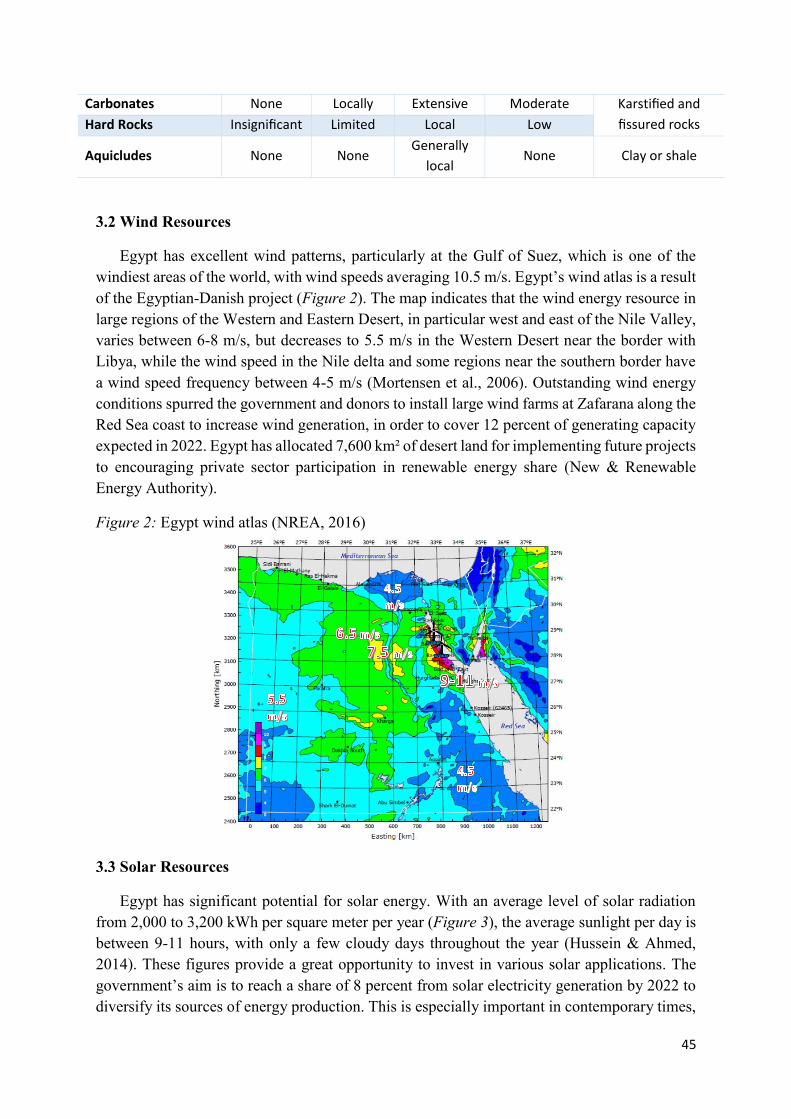
Egypt has excellent wind patterns, particularly at the Gulf of Suez, which is one of the windiest areas of the world, with wind speeds averaging 10.5 m/s. Egypt’s wind atlas is a result of the Egyptian-Danish project (Figure 2). The map indicates that the wind energy resource in large regions of the Western and Eastern Desert, in particular west and east of the Nile Valley, varies between 6-8 m/s, but decreases to 5.5 m/s in the Western Desert near the border with Libya, while the wind speed in the Nile delta and some regions near the southern border have a wind speed frequency between 4-5 m/s (Mortensen et al., 2006). Outstanding wind energy conditions spurred the government and donors to install large wind farms at Zafarana along the Red Sea coast to increase wind generation, in order to cover 12 percent of generating capacity expected in 2022. Egypt has allocated 7,600 km² of desert land for implementing future projects to encouraging private sector participation in renewable energy share (New & Renewable Energy Authority).
Figure 2: Egypt wind atlas (NREA, 2016)
3.3 Solar Resources
Egypt has significant potential for solar energy. With an average level of solar radiation from 2,000 to 3,200 kWh per square meter per year (Figure 3), the average sunlight per day is between 9-11 hours, with only a few cloudy days throughout the year (Hussein & Ahmed, 2014). These figures provide a great opportunity to invest in various solar applications. The government’s aim is to reach a share of 8 percent from solar electricity generation by 2022 to diversify its sources of energy production. This is especially important in contemporary times,

46
as the decline in oil production in Egypt has forced the country to become an oil importer rather than exporter, which it has been since 2012. In September 2014 Egypt launched a feed-in tariff support system for solar PV and wind projects to promote private investment in renewable energy development in Egypt, in an attempt to reach 2300 MW of PV capacity and 2000 MW of wind capacity (Egyptian Electric Utility, 2014).
Figure 3: Egypt solar irradiation map (UNIDO)
3.4 Energy Resources
Egypt is the largest oil producer in Africa outside of the Organization of the Petroleum Exporting Countries (OPEC). That seems promising, but unfortunately Egypt also has the third-largest population in Africa, meaning this resource is insufficient at the per capita level. One of Egypt’s challenges is to satisfy an increasing oil demand amid falling production. Total oil consumption grew by an annual average of 3% over the past 10 years, averaging almost 770,000 bbl/d in 2013. Egypt’s oil consumption has surpassed production since 2010 (Figure 4) (International Business Publications, 2015). The conversion from an oil producer to an oil importer, in addition to enacting energy subsidies, results in an inevitable energy crisis. This has effects on availability and pricing of fuel in Egypt, especially after routine economic deficits since 2011. In order to ease the burden of the budget deficit, the government had to cut energy subsidies. In July 2014, for example, the diesel fuel price/liter rose from 1.10 EGP to 1.80 EGP. Despite this, Egypt is increasing its share of renewable energy to overcome the crisis (Reuters, 2014). The next sections discuss the possibilities of applying a pumping system, and the limitations of each system in order to determine possible pumping methods which cover water requirements within acceptable system limits.

47
Figure 4: Petroleum and other liquids and consumption in Egypt (U.S. EIA)
4. POSSIBILITIES OF APPLICATION IN EGYPT
4.1 PV Solar Water Pumping Systems A solar water pump system is dependent on solar radiation as a source for producing
electricity to power an electrical water pump via photovoltaic panels (Abu-Algah, 2011). The system consists of three main components: solar panels, a controller and a pump. The solar panels generate electricity to power an electric pump. The solar inverter works as a mediator that matches the PV power to the motor and regulates the operation (Figure 5) (Eker, 2005). Figure 5: Solar pumping system components (Lorentz) adopted
There are some factors that affect system efficiency, as the PV array efficiency cannot
exceed 19%. Modern research is developing PV cells that have cell efficiencies approaching 30%, but modules containing these cells are still not easily available in the global market. In regards to the pumps, it is more appropriate to consider both the motor and lift mechanism

48
efficiency (RISE, 2007). Most submersible pumps, designed specifically for solar power, have an overall efficiency of 40 to 70%. The pump wattage requirements are often increased by 25% to cover PV energy losses in peak sun hour (Sinton, Butler, & Winnett, 2004).
The total operational system efficiency;
ηT = ηPV × ηsub = ρghQGA (1)
Where, 𝜌 is water density g is gravitational acceleration h is total dynamic head Q is the discharge rate G is the incident radiation flux (the amount of sunlight that hits the earth’s surface in
W/m2, in another words, the global solar radiation on the tilted PV cell) A is the area of the array collector in m2
There are some limitations to the system, such as size and weather conditions. The system
requires a large area, as size has a positive relationship with overall power output. In arid areas, solar panel efficiency is affected negatively by high temperatures and dust. Heat can reduce output efficiency by 10-25% (Schoder, 2011), while a study revealed that dust accumulation in Egypt caused 33-65% reduction in the performance of solar PV (Mekhilef, Saidur, & Kamalisarvestani, 2012). Water delivery in this system depends greatly on local weather patterns. It relies entirely on exposure to sunlight, and therefore the system suffers during periods when sunlight is minimal. 4.2 Mechanical Wind Pump System (Windmill)
The mechanical wind pump system depends on the intensity of the wind to spin the blades that drive a geared mechanism motion. The motion drives a long sucker rod to lift the water into the piston cylinder. With every move of the piston upward or downward, water enters the pipe through one of the valves then closes to pull water through the second valve. The system consists of a rotor, a gearbox, and tail guides, all of which are attached on a tower to catch the wind to drive motion of the piston cylinder via sucker rod (Figure 6).
The wind systems that exist over the earth’s surface are a result of variations in air pressure. There are also localized wind patterns due the effects of temperature differences between land and seas (topography). The power in the wind is proportional to the area of the windmill rotor being swept by the wind, the cube of the wind speed, the air density, and the cube of the wind speed. The following formula calculates the theoretical power (in watts) available in the wind (Noble, 2008);
PW = ½ ρ A V3 (2)

49
Where, PW is power available in the wind (W) ρ is the air density (kg/m3) A is the swept rotor area (m2) V is the wind speed (m/s)
However, the windmill power differs from the wind power because the efficiency losses
play a vital role as a physical limit to the amount of power that can realistically be extracted from the wind. The factors that control efficiency include the Betz limit, aerodynamic fraction, bearings, gears, power transmutations, pump and fluid friction losses. These hindrances make the maximum amount of energy the windmill can recover from wind only 30-40%. Therefore, by adding efficiency as an aspect in the formula, the windmill power becomes (Conlon);
PM = ½ Cp ρ A V3 (3)
Where, PM is power (in watts) available from the machine Cp is the coefficient of performance of the wind machine
Windmill power should match the power required to lift a certain amount of water to a
certain depth. There are limitations to this system however. These limitations include the inability to control wind patterns, such as overall wind power, fluctuations in wind speeds, and the possible destructiveness of turbulent conditions. Furthermore the system may have a high initial cost of installation, and may not produce adequate levels of water to meet the demand of large cities and industries.

50
Figure 6: Windmill pumping system (Ironman Windmill Co.)
4.3 Diesel System
The US department of trade reported that the Egyptian water pump market is among the largest in the world. Although the Nile Delta is connected to a heavily subsidized national grid pricing scheme of 0.015 US$/Kwh, diesel driven pumps dominate the irrigation market (UNEP, 2003). This is attributed to the unreliable grid and subsidized diesel at 65% which burden the Egyptian government, with 21% of the national budget allocated to energy subsidies (Castel, 2012). Moreover, diesel is among the highest CO2 emitting fuel that drives climate change.
Figure 7 shows portrays a typical diesel system which includes: an AC generator, a control unit, a drop pipe, and a motor. The AC generator supplies the water pump with energy required to lift the water from deep wells. The control unit is used to initiate the pumping, and is installed near the well and generator. Usually, this control unit is supplied with safety units to protect the system from any unexpected hazards like low and over voltage, etc. Finally, the drop pipe is equal to the depth of the water.

51
Figure 7: Diesel system components (Lorentz) adopted
The total efficiency of the diesel pumping system is:
ηT = 𝜂𝑔𝑒𝑛 ∗ 𝜂𝑝𝑢𝑚𝑝= 𝑃ℎ𝑦𝑑𝑃𝑓𝑢𝑒𝑙
* 𝑃𝑔𝑒𝑛𝑃𝑔𝑒𝑛
= 𝜌𝑔ℎ𝑄𝐶𝑉𝑓𝑢𝑒𝑙∗ 𝑚𝑓𝑢𝑒𝑙
(4)
Where, ηgen is the efficiency of the generator ηpump is the efficiency of the pump Pfuel is the power that fuel produces mfuel is the mass of fuel CVfuel is the caloric value of fuel per kg
The diesel system has a short life span and is not environmentally friendly. The system
emits a high percentage of carbon and fumes. Also, the operation cost is high relative to the solar and wind systems.
5. FEASIBILITY
In this study, photovoltaic, wind, and diesel pump systems were economically compared with a conventional energy application for irrigating 5 feddan of land located in various areas. These areas are part of the government’s land reclamation project. Five feddan of land are given to small investors for land reclamation. This land is then used for a feasibility study for a small scale water requirement of no more than 500 m³ /day. The study consists of a cost breakdown analysis to determine the percentage of capital cost and recurring cost according to total cost, to identify the cost breakdown of each system. Additionally, a feasibility analysis for each system was conducted at different workloads to investigate the different costs per

52
cubic meter in nine locations of the 1.5 million feddan project for highlighting the most appropriate and feasible system.
5.1 Overview of the Reclamation of 1.5 Million Feddan in Egypt (Case Study)
The reclamation project of one million and a half feddan by the government is in part to mitigate the extremely high and ever increasing population density in the Nile Valley by relocating individuals and expanding urban space. It provides new prospects for sustainable development, and creates modern and integrated communities dependent on agriculture as a major and essential pillar of development to integrate with other economic parts. This contributes to an increase in inhabited area in Egypt from 6% to 10%, and an increase in the agricultural area of 8 million feddan to 9.5 million feddan, an increase of 20%.
The project has different locations in both the Eastern and Western deserts, where nine out of eleven areas depend on groundwater, representing 89.2% of the targeted area. The biggest capabilities are in the west of Egypt, where the Nubian sandstone aquifer exists in Minya, Farafra, Dakhla, and Siwa Oases (Figure 8). Table 2 lists the nine locations with their resource capabilities.
Figure 8: 1.5 million feddan project locations in green color (based on RIGW, 2013, SIS, 2016)

53
Table 2: Comprehensive data on the 1.5 million project: (State Information Service, 2016)
5.2 Cost Breakdown Analysis
The cost of a pumping system that has a life expectancy of several years is comprised of the capital cost and the future costs, which includes the operating cost, maintenance cost, and replacement cost. In some life cycle costing calculations, a residual value is assumed that will provide a small return for the project again. However, this is often something that is in the distant future and could be quite arbitrary so residual values are not considered in calculation.
Maintenance and operating costs are assumed as a percentage from the capital cost according to mean cost of maintenance (that is estimated within the maintenance schedule). The fuel costs are considered with their escalation rate in the Egyptian market. The replacement schedule is dependent on the ruggedness of the system and the operating environment (water quality, diesel quality, direct exposure to sunlight, excessive temperature).

54
Figure 9: Cost breakdown analysis for pumping systems
Based on this information, the total cost breakdown can be roughly estimated for the three systems, each of which provides a total of 150 m3/day at TDH equal to 100 m. Figure 9 shows that the capital costs for a solar system and windmill system represent 88% and 85 % respectively, while it represents only 40% for the diesel system. A customer may think that the diesel system is more cost-effective and feasible, but this is not true due to a higher percentage of fuel cost that represents 52% of the total lifecycle cost. Despite the high capital cost of two renewable energy systems, especially windmill, the operation and maintenance costs are lower compared to the fuel cost in the diesel system.
5.3 Feasibility Analysis
To study feasibility for such systems, it’s important to revise the previous sections in terms of availability and possibilities. This is one part of making the assessment. The following part is more concerned with cost and economic analyses. The 1.5 million feddan project case study is used to show the feasibility of each system at different workloads, including the differences in costs per cubic meter.
Using this formula,
𝑃𝑟𝑜𝑑𝑢𝑐𝑡𝑖𝑜𝑛 𝐶𝑜𝑠𝑡 (𝑈𝑆𝐷 𝑝𝑒𝑟 𝑚3) = 𝑆𝑢𝑚 𝑜𝑓 𝑎𝑛𝑛𝑢𝑎𝑙 𝑒𝑥𝑝𝑒𝑛𝑠𝑒𝑠𝑎𝑛𝑛𝑢𝑎𝑙 𝑊𝑎𝑡𝑒𝑟 𝑝𝑟𝑜𝑑𝑢𝑐𝑒𝑑 𝑓𝑟𝑜𝑚 𝑡ℎ𝑒 𝑤𝑒𝑙𝑙 (5)
Assumptions are set for each system as:
PV System:
Lifetime period (Yrs)
PSH Operating
hours Efficiency
(𝛈𝐓)
Safety Factor
Water Tanks
Pump Type
20 As shown in Table(2)
6 0.8 1.2 Used AC pump

55
Windmill System:
Lifetime period (Yrs)
Wind Speed Night pumping hrs Efficiency Model
50 As shown in Table(2) 6 40% Iron windmill co.
Diesel System:
Lifetime period (Yrs)
Operating hours
Generator Fuel consumption
(Liter/hr)
Fuel escalation
year Inflation
Safety Factor
Pump Type
10 6 0.24 2% /year 10%/Yr 1.2 AC pump
6. RESULTS
All the calculations were made separately for each region and the disparities between systems has recommended the most appropriate system based on the available resources and feasibility of the system.
According to TDH classification, the windmill system is more feasible than a fuel or solar
system. For the windmill system, the water requirement is low (30 m3/day) and the wind speed ranges from medium (4-6 m/s) to high (> 6 m/s). When water requirement is 70 m3/day and at some depths lower than 100m, the windmill system has recorded better feasible results. However, at higher depths, the solar system is more cost effective. The higher the water requirement increase (till 500 m3/day and TDH = 200), the solar pumping system is more feasible.
According to region classification in Siwa, a windmill system tends to be more feasible at
water requirements ranging from 30 to 250 cubic meters per day. However, the PV system is more feasible at discharges of 500 m3/day. In El Dakhla Oasis, a windmill system tends to be more feasible at medium water requirements, ranging from 30 to 150 meter cube per day. The PV systems gives better results at higher discharges. The diesel system is no longer feasible due to high operational costs and short lifecycle. In El Farafra, West Minya, Tor Sinai, El Moghra and SE of Qattara, the results show that the windmill system is still competitive until the discharge exceeds the limits of 70 m3 per day, then the PV system is more feasible and competitive. In Toshka, West Qena and Kom-Ombo Aswan, the windmill system is only feasible when lifting relatively small quantities of water (30 m3/day). When lifting higher quantities of water, the solar system is more efficient (Figure 10).

56
Figure 10: Production unit cost analysis for different discharge rates in 1.5 project locations

57
7. CONCLUSIONS AND RECOMMENDATIONS
The relationship between total dynamic head and discharge is critical enough to use as an essential factor when choosing a suitable system. The following matrix (Table 3) is concluded from the excessive iterations on different locations in Egypt. The windmill system is more efficient and feasible when the hydraulic workload (daily water volume [m3] × TDH [m]) is less than 9,800 m4/day. On the other hand, the solar system is more feasible at higher workloads. Additionally, the hydraulic workload must be under 100,000 m4 /day. In relation to cost breakdown analysis, capital cost of two renewable energy systems are high, especially windmill, but the operation and maintenance is lower compared to the operation costs of a diesel system.
Table 3: Production unit cost matrix in terms of discharge rates and TDHs for the reclamation project of 1.5 million feddan in Egypt
Location H/Q 30 70 150 250 500
Siwa 20 0.40 0.18 0.17 0.10 0.06
Farafra (New, Old) 40 0.41 0.36 0.20 0.12 0.07
El Dakhla 60 0.41 0.18 0.17 0.13 0.07
El Moghra and SE of Qattara 80 0.11 0.09 0.05 0.04 0.03
El-Tor, Sinai 100 0.20 0.17 0.10 0.08 0.04
Toshka 120 0.30 0.19 0.08 0.06 0.04
West Minya 140 0.38 0.32 0.19 0.14 0.09
West Qena 160 0.40 0.24 0.10 0.10 0.08
Kom Ombo, Aswan 200 0.37 0.32 0.26 0.16 0.08

58
REFERENCES
Abu-Aligah, M. (2011). Design of Photovoltaic Water Pumping System and Compare it with Diesel Powered Pump. Jordan Journal of Mechanical and Industrial Engineering, 5(3), 273-280.
Castel, V. (2012). Reforming Energy Subsidies in Egypt. African Development Bank.
Conlon, T. (n.d.). Water Pumping Windmills. Retrieved from http://www.ironanwindmill.com/engineering.htm IBP, Inc. Egypt Energy Policy Laws and Regulations Handbook Volume 1: Strategic
Information and Laws. (2015). Washington DC: International Business Publications.
El Tahlawi, M. R., Farrag, A. A., & Ahmed, S. S. (2008). Groundwater of Egypt: An Environmental Overview. Environmental Geology, 55, 639-652. doi:10.1007/s00254-007-1014-1
Eker, B. (2005). Solar Powered Water Pumping Systems. Trakia Journal of Sciences, 3(7), 7-11.
Haque, M. M. (2001). Photovoltaic Water Pumping System for Irrigation. 4th International Conference on Mechanical Engineering, 21-26.
Hussein, A. W., & Ahmed, M. W. (2014). Solar Energy: Solution to Fuel Dilemma. IMPACT: International Journal of Research in Engineering & Technology, 2(8), 99-108.
Mekhilef, S., Saidur, R., & Kamalisarvestani, M. (2012). Effect of Dust, Humidity and Air Velocity on Efficiency of Photovoltaic Cells. Renewable and Sustainable Energy Reviews, 16(5), 2920-2925.
Mortensen, N. G., Hansen, J. C., Badger, J., Jorgensen, B. H., Hasager, C. B., Paulsen, U. S., ...Tarad, M. A. (2006). Wind Atlas for Egypt: Measurements, Micro- and Mesoscale Modelling, In Proceedings (online) Brussels: European Wind Energy Association (EWEA).
NASA. (n.d.). Surface Meteorology and Solar Energy. Retrieved September 2016, from https://eosweb.larc.nasa.gov/cgi-bin/sse/grid.cgi?&num=212121&lat=30&submit=Submit&hgt=100&veg=17&sitelev=&[email protected]&p=grid_id&p=swvdwncook&p=swv_dwn&step=2&lon=31
New & Renewable Energy Authority. (n.d.). Retrieved August 8, 2016, from http://www.nrea.gov.eg/english1.html
Noble, N. (2008). Wind Pumping. Technical Brief by Practical Action, United Kingdom. Retrieved from https://answers.practicalaction.org/our-resources/item/wind-pumping
Noble, N. (2010). Solar (Photovoltaic) Water Pumping. Technical Brief by Practical Action, United Kingdom. Retrieved from https://answers.practicalaction.org/our-resources/item/solar-photovoltaic-water-pumping

59
Pullen, A., Sawyer, S., Teske, S., & Jones, J. (Eds.). (2010). Global Wind Energy Outlook 2010 (1-60, Publication). Brussels: Global Wind Energy Council.
Renewable Energy - Feed-in Tariff Projects’ Regulations. (2014). Egyptian Electric Utility for Consumer Protection and Regulatory Agency, 1-12.
Research Institute for Sustainable Energy (RISE). (2007). Solar Water Pumping Module 2. Retrieved from http://www.rise.org.au/info/Education/SPS/swp002.htm
Reuters (2014). Egypt to Raise Fuel Prices by up to 78 Percent from Midnight. July 4. Retrieved from http://www/reuters.com/article/us-egypt-energy/egypt-to-raise-fuel-prices-by-up-to-78-percent-from-midnight-source-idUSKBN0F91YG20140704
Schoder, T. (2011). How Solar Panel Temperature Affects Efficiency. November 6. Retrieved from http://www.civicsolar.com/support/installer/articles/how-solar-panel-temperature-affects-efficiency
Sinton, C. W., Butler, R., & Winnett, R. (2004). Guide to Solar-Powered Water Pumping Systems in New York State. Albany, N.Y: NYSERDA (New York State Energy Research and Development Authority., & New York (State)).
Vishwanath, T., Al-Nashar, S., Carey, K., Al-Dahdah, E., Goldston, J., Ibarra, G. L., & Laursen, T. B. (2015). Promoting Poverty Reduction and Shared Prosperity (Rep.). World Bank Group.
UNEP. (2003). Baseline Survey of the Renewable Energy Sector – Egypt. Cairo, Egypt.
Zarad, A. A. (2016). The Mega National Projects…A Locomotive of Development. April 3. Retreived from http://www.sis.gov.eg/Story/99743?lang=en-us

60
Water Desalination Using Hybrid MED and MD Systems Driven by Solar Energy for Coastal Areas
A. Faraga, Yasser Elhenawyb, M. El-Ghandourb, M. Shatatb, G.H. Moustafab
aResearch assistant and corresponding author. E-mail address: [email protected], Tel.: (+20) 11 586 486 11 bLecturer, 1 Professor, Mechanical Power Department, Faculty of Engineering, Port Said University, Port Fouad, Egypt, Tel.: (+20) 66 3403459
ABSTRACT
This paper introduces a hybrid water desalination system driven by solar energy as a solution to potable water scarcity problem in coastal areas. The system is based on the Multi-Effect Distillation (MED) and Membrane Distillation (MD) techniques. In this system, a two-effect MED unit and an Air Gap Membrane Distillation (AGMD) unit are connected in series. First, saline water is desalinated in the MED unit. Then, the produced brine is introduced to the MD unit for further desalination. The feed water is heated by solar energy using a system of flat-plate and evacuated-tube solar collectors. The performance of the system, estimated by the water productivity as well as the performance ratio (PR), is measured for different days. The preliminary results are taken in a small range of salinities and flowrates. The solar collectors can supply hot water at a maximum temperature of 80°C with a flow rate of 480 L/hr at peak solar intensity of 1100 W/m2. The data suggests that the PR increases with solar radiation intensity. Also, the PR and water productivity of the hybrid system are 50% higher than the MED system alone. Keywords: Water desalination, solar energy, MED, MD, AGMD 1. INTRODUCTION
Humans need fresh, clean water in order to survive on the planet. Water represents 60-75% of the human body (Lawal, 2014). In fact, about 79% of potable water is frozen in icecaps and glaciers, and 20% is stored in groundwater. Both these forms are not easily accessible for human use. The remaining quantity, about 1%, is adequate to support all life on Earth (El-Dessouky & Ettoney, 2002). Unfortunately, freshwater is not evenly distributed throughout the planet, with large regions lacking sufficient access. Globally, due to population rise and human activities, the gap between the demand and supply of potable water has been increasing. In the Middle East and North Africa (MENA) region, there are many arid coastal areas, therefore, desalination of seawater remains a viable solution to close the water gap. Egypt may suffer from a severe water shortage in the future due to climate change, and more recently, by the building of the Renaissance Dam in Ethiopia. The recent trend is to use low operating cost renewable energies for water desalination. Solar energy in Egypt is very intense due to its geographical location. Unfortunately, this energy isn’t fully utilized yet. Many researchers studied hybrid systems for desalination because of the higher efficiencies and water productivities.

61
A combined system made of a single-stage MED, working at atmospheric pressure and an MD module was studied (De Andrés, Doria, Khayet, Pena, & Mengual, 1998). The hot brine rejected from the MED was used as feed in the MD module. It was reported that the production of distilled water was increased by approximately 7.5% and the Gained Output Ratio (GOR) of the whole system was improved by 10%. A hybrid MD-MED system that uses solar energy was designed and tested (Elhenawy, 2016). In this study, the brine exiting MED system was further desalinated in an MD unit. The productivity reached 110 kg/day for a maximum solar intensity of 900 W/m2.
Alklaibi and Lior (2005) theoretically modeled a two-dimensional AGMD process. A
simultaneous numerical solution for the momentum, energy, and diffusion equations of the feed and cold solutions was made. An analysis of the factors affecting the permeate flux was then conducted. It was illustrated that the feed salinity had a relatively small effect on the permeate flux and the thermal efficiency. Increasing the concentration from 20,000 ppm to 50,000 ppm reduced the water productivity by only 16%.
This work introduces a hybrid water desalination system driven by solar energy that may
be suitable for coastal areas with limited access to the potable water network. The system is based on the MED and MD techniques. It proposes to use two effects, an MED unit and an AGMD unit, connected in series. The salinity of the feed is pre-adjusted to simulate seawater on a lab-scale. A preliminary experimental study of the hybrid system performance was conducted during the day. The hybrid system performance is compared with the sole MED system. The influences of feed flowrates and salinities are then reported. The complete package of results and an economic study of the hybrid system will be published in the future.
2. DESCRIPTION OF THE HYBRID SYSTEM
As shown in Figure 1, the cooling medium exiting the MED condenser is used as the coolant in the MD unit. The brine produced from the MED is collected and directed towards the MD unit, where it is used as the feed to increase the amount of distillate from the same amount of feed seawater to the MED system. The components of the hybrid system are illustrated in the figure.
The hybrid system was divided into four subsystems as follows: 1. The solar heating system 2. MED system 3. MD system 4. Data acquisition system and measuring devices
2.1 The Solar Heating System
The solar heating system, composed of multi solar collectors of both flat and evacuated tube types, is shown in Figure 2. Tables 1 and 2 portray the specifications of the solar collectors. Solar energy is used to heat pure water which is then used as a heat source in the first MED evaporator effect of the unit.

62
2.2 The MED System
In the two effects MED system, shown in Figure 3, hot water from the solar system with temperatures of 60 to 80°C is supplied to the MED unit (the first evaporator). Feed water is sprayed in parallel to the evaporator tubes of the two effects. Water vapor is separated and then condensed to produce distilled water. The remaining brine is collected and directed to the MD unit for further desalination.
Figure 1: The flow diagram of the hybrid system
(1) Seawater tank, (2) Condenser, (3) First evaporator, (4) Second evaporator, (5) MED distillate tank, (6) Vacuum tank, (7) Flat plate collector, (8) Evacuated tube collector, (9) MD unit, (10) MD distillate tank.

63
Figure 2a: Flow diagram of the solar heating system; 2b: A photo of the solar collectors
a
b
(1) Four flat plate solar collectors. (2) Three evacuated tube solar collectors. (3) Heat exchanger “excluded”. (4) Circulation pump. (5) Expansion tank.
Table 1: Flat-plate module specifications
Absorber area [m2] 2.10
Aperture area [m2] 2.16
Dimensions [mm] 1892 x 1204 x 99
Gross area [m2] 2.28
Maximum operating pressure [bar] 9
Table 2: Evacuated-tube module specifications
Number of evacuated tubes 30
Grid measurement (length, height) [mm] 2110×1960
Aperture area [m2] 2.84
Efficient solar absorption area [m2] 2.44

64
Figure 3: A photo of the MED system
(1) Seawater tank, (2) Condenser, (3) First evaporator, (4) Second evaporator, (5) MED distillate tank, (6) Vacuum tank, (7) Feed pump, (8) Brine pump, (9) Auxiliary electrical heater
Saline water (seawater) is prepared in the tank (1), which has a capacity of 2,000 L. A
condenser (2) used for condensation of water vapor consists of three tube passes encased in one cylindrical shell. Cold seawater flows inside the tubes, while hot vapor condenses in the shell. The evaporator effect (3 and 4) is a shell and tube heat exchanger which consists of 120 copper tubes in a one-pass design connected between two headers. The shell is perfectly sealed to maintain the vacuum. Sprayers are located above the tubes to spray seawater. The basin is used to collect brine with a drain that passes through the brine pump. Each evaporator is provided with pressure and level gauges.
2.3 The MD System
The MD system consists of an AGMD unit, filters, and other connections. The rejected cold water of the MED condenser is directed through the AGMD as a coolant. The brine of the MED is pumped through the AGMD as the feed. Distilled water with a 99.9% salt rejection factor is obtained. Figure 4 shows the MD system. The Aquastill® (AS14A3.0L) unit is made of Polyethylene (PE) with a membrane surface area of 14 m2. The membrane is a multi-envelope spiral-wound type of 12 envelopes, 3 m in length and 40 cm in height. The membrane has a thickness of 76 µm with 85% porosity, with an air gap width of 1 mm.

65
Figure 4: A photo of the MD system
(1) Coolant tank, (2) Solar collectors, (3) Seawater tank, (4) AGMD unit, (5) Plate heat exchanger, (6) Feed filter, (7) Coolant filter.
2.4 Data Acquisition System and Measuring Devices
The Omega OMB-DAQ-55 system is used for data acquisition. To measure the radiant flux, a pyranometer (KIPP & ZONEN CMP21) is used. To measure the pressure, Dwyer 626-71-GHP9 pressure transmitter is used. Also, the OMEGA type TC-T-1/4NPT-G-120 uses thermocouples to measure temperature. The flowrates are measured using the UV-2112 Dwyer rotameter. Salinity is measured by the Omega CDHSD1, TDS (total dissolved salts) meter.
3. EXPERIMENTAL METHODOLOGY During the day, measurements are taken after the system start-up and when it reaches a
steady state. The pyranometer reads the solar radiation intensity in W/m2. Thermocouples are connected to the data acquisition system. The pressure sensors are used to indicate vacuum and to assure that the liquid entry pressure (LEP) is not exceeded for the MD unit. Salinity of the feed, brine, and distillate are measured every hour. The water productivity and the performance ratio (PR) of the system are measured hourly. The PR (or GOR) represents the system’s thermal efficiency (Khayet & Matsuura, 2011).

66
PR = 𝑚𝑠𝑡. ∗ℎ𝑓𝑔𝑄𝑖𝑛
(1)
Where, 𝑚𝑠𝑡. is the condensed steam (distillated water) mass flowrate (kg/s) ℎ𝑓𝑔 is the latent heat of vaporization (J/kg) 𝑄𝑖𝑛 is the heat input to the system from the solar collectors (W)
4. RESULTS AND DISCUSSION
4.1 Solar Radiation Intensity
Figure 5 illustrates the hourly variation of the solar radiation during different days from 9 A.M. to 5 P.M. The curves are very close because the readings are taken during the same season. The solar radiation increases from about 700 W/m2 at 9 A.M. to its peak of 1100 W/m2 at noon, then decreases to 350 W/m2 at 5 P.M.
Figure 5: The hourly variation of solar radiation along different operating days
4.2 Performance Ratio (PR)
Figure 6 demonstrates the variations of the PR of the hybrid system for different feed salinities, in different days. The distribution shows that the PR decreases with the increase of salinity, which is due to the reduction in water productivity as the salinity increases. In the MED system, the increase in the feed salinity results in an increase in the boiling point of water. This reduces the vapor temperature, which is consequently the driving force for heat and mass transfer. Whereas, in the MD system, the increase in feed salinity results in an increase in the mass transfer resistance and concentration polarization phenomena. Also, the instantaneous PR changes in proportion to the solar radiation intensity. The PR increases with time until 12 P.M., then decreases until the end of the experiment at 5 P.M. For example, on 30/4/2016, when the MED feed salinity was 36,000 ppm and the MD feed salinity was 38,500 ppm, the PR increased
0
100
200
300
400
500
600
700
800
900
1000
1100
1200
8 9 10 11 12 13 14 15 16 17 18
Sola
r rad
iatio
n in
tens
ity ,
W/m
2
Time , hr
28/4/201630/4/20165/5/20164/5/2016

67
from 1.75 at 9 A.M. to 3 at 12 P.M., then decreased to 1.5 at 5 P.M. But on 5/5/2016, when the MED feed salinity was 46,000 ppm and the MD feed salinity was 50,000 ppm, the PR increased from 1.5 at 9 A.M. to 2.2 at 12 P.M., then decreased to 0.8 at 5 P.M.
Figure 6: The variations of the performance ratio for the hybrid system
Figure 7 compares the variations of the PR during 30/4/2016 for both the MED system and the hybrid system. The feed flow rate is 600 L/hr. The maximum PR of the MED system is 2 at midday. On the other hand, the maximum PR of the hybrid system is 3 at midday. As a result, the PR of the hybrid system is higher than that of the MED unit by about 50%.
4.3 Water Productivity
Figure 8 illustrates the variation of the hourly accumulative water productivity during 30/4/2016 for both units and the hybrid system. Overall, the feed flow rate was 600 L/hr with a salinity of 36,000 ppm for the MED. The MED brine salinity was 38,500 ppm for the MD feed. At the end of the experiment, the MED system produced about 120 kg/day, while the MD produced 50 kg/day, with the hybrid system producing a total of 170 kg. The addition of the MD unit in the hybrid system increased the overall water productivity by about 41.67% in comparison with the MED unit alone.

68
Figure 7: The variations of performance ratio during 30/4/2016
Figure 8: The variations of hourly accumulative productivity during 30/4/2016
Figure 9 shows the variation of the hourly accumulative water productivity during 5/5/2016
for the MED, MD, and the hybrid systems. Keeping the feed salinity constant at 36,000 ppm, and reducing the flow by 70%, equal to 180 L/h, the MED system produced about 60 kg whereas the MD produced 20 kg. So, the hybrid system produced a total of 80 kg. The addition of the MD to the MED increased the overall water productivity by about 33.3% in comparison with the MED unit alone, suggesting that the hybrid system is superior. Also, by reducing the flow by 70%, the productivity is reduced by 53%, equal to 80 kg/day. Therefore, the feed flowrate has a major effect on the water productivity.
Figure 10 indicates the variation of the accumulative water productivity of the hybrid system for the 8-hour period in each day of operation. It can be concluded that the productivity is primarily influenced by the feed flow rate. Increasing the feed flowrate from 90 to 600 L/hr increases the productivity from 60 to 70 kg.
0
20
40
60
80
100
120
140
160
180
9 10 11 12 13 14 15 16 17
Acc
um
ula
tive
wat
er
pro
du
ctiv
ity,
kg
Time, hr
MED-MD
MED
MD
30 /4 /2016
mf = 600 l/hrTDS = 36000 ppm _MEDTDS = 38500 ppm _MD
0
0.5
1
1.5
2
2.5
3
3.5
9 10 11 12 13 14 15 16 17 18
Pe
rfo
rma
nce
rat
io
Time, hr
MED _TDS=36000 ppm
MED-MD
30 /4 /2016
mf= 600 l/hr

69
Figure 9: The variations of hourly accumulative water productivity during 5/5/2016
Figure 10: The variations of accumulative water productivity of the hybrid system
4.4 The Effect of Feed Salinity on the Water Productivity
The effect of different TSD on the water productivity of the MED unit is shown in Figure 11 for 8 hours from 9 A.M. to 5 P.M. The feed flow rate was held constant at 400 L/hr during the experiment. On 18/5/2016, the salinity was 38,000 ppm, with a maximum water productivity of 17 kg/hr. On 19/5/2016 the salinity was increased to 47,500 ppm, with a maximum water productivity of 16 kg/hr. Finally, on 20/5/2016, the salinity was increased to 57,500 ppm, with a maximum water productivity of 15 kg/hr at noon.
0
20
40
60
80
100
120
140
160
180
8 9 10 11 12 13 14 15 16 17
Acc
um
ula
tive
wat
er p
rod
uct
ivit
y, k
g
Time, hr
MED-MD_30/4/2016MED-MD_28/4/2016MED-MD_5/5/2016MED-MD_4/5/2016
mf = 600 l/hr, TDS =36000, 38000 ppmmf = 360 l/hr, TDS =38000, 40500 ppmmf =180 l/hr, TDS = 46000, 50000 ppmmf =90 l/hr, TDS =54000, 60000 ppm
0
20
40
60
80
100
120
140
160
180
9 10 11 12 13 14 15 16 17
Acc
um
ula
tive
wat
er
pro
du
ctiv
ity,
kg
Time, hr
MED-MD
MED
MD
5 /5 /2016
mf = 600 l/hrTDS = 46000 ppm _MEDTDS = 50000 ppm _MD
mf= 180 l/hr

70
Figure 11: The effect of TDS on water productivity for MED system
The effect of different TDS on the water productivity for the AGMD unit is shown in Figure 12. The feed flow rate was held constant at 400 L/hr during the three days of the experiment. On 18/5/2016, the salinity was 40,000 ppm, with a maximum water productivity of 12 kg/hr. However, on 19/5/2016 when the salinity was increased to 50,000 ppm, the unit gave a maximum water productivity of 10 kg/hr. Finally, on 20/5/2016, the salinity was increased to 60,000 ppm, with a maximum water productivity of 8 kg/hr at noon. Therefore, the feed salinity has a minor inverse effect on the water productivity.
Figure 12: The effect of TDS on water productivity for the AGMD unit
0
4
8
12
16
20
24
28
32
36
8 9 10 11 12 13 14 15 16 17 18
Wat
er p
rod
uct
ivit
y, k
g/h
r
Time, hr
18/5/2016 _MED, TDS=38000 ppm
19/5/2016 _MED, TDS=47500 ppm
20/5/2016 _MED, TDS=57500 ppm
mf= 400 kg/hr
0
4
8
12
16
20
24
28
32
36
8 9 10 11 12 13 14 15 16 17 18
Wat
er p
rod
uct
ivit
y, k
g/h
r
Time, hr
18/5/2016_MD, TDS=40000 ppm19/5/2016_MD, TDS=50000 ppm20/5/2016_MD, TDS=60000 ppm
mf= 400 l/hr

71
5. CONCLUSION This work experimentally studies a solar-driven hybrid MED-MD water desalination
system to provide potable water to remote coastal areas. The results reveal that the performance ratio (PR) increases with solar radiation intensity, and decreases with increasing feed salinity. Additionally, the PR and water productivity of the hybrid system are higher than the MED system alone by almost 50%. This is because the rejected cold water of the MED condenser is exploited as a coolant to the MD unit. Also, the brine produced from the MED is used as the feed for the MD unit, so that more distillate could be obtained from the same amount of seawater. The influences of feed flowrate and salinity were also studied. It can be concluded that the water productivity decreases as the feed flow is reduced. For the hybrid system, when the feed flow rate decreases by 70%, the productivity reduces by 53%. Furthermore, increasing the feed salinity causes a minor reduction in the water productivity. Finally, when the feed salinity increases to 50%, the MED productivity only reduces by 11.76%, while the MD productivity reduces by 33.3%.
ACKNOWLEDGEMENTS
The authors would like to appreciate and acknowledge the STDF organization in Egypt for fully funding the project No. 5786: “A Novel Hybrid Thermal and Membrane Water Desalination System Driven by Solar Energy”.
REFERENCES
Alklaibi, A. M. & Lior, N. (2005). Transport Analysis of Air-Gap Membrane Distillation. Journal of Membrane Science, 255(1-2), 239–253.
De Andrés, M. C., Doria, J., Khayet, M., Pena, L., & Mengual, J.I. (1998). Coupling of a Membrane Distillation Module to a Multi-Effect Distiller for Pure Water Production. Desalination, 115(1), 71 - 8l.
El-Dessouky, H. T., & Ettouney, H. M. (2002). Fundamentals of Salt Water Desalination. Amsterdam, the Netherlands: Elsevier B.V.
Elhenawy, Y. (2016). Experimental Study and Simulation of Solar Desalination Unit (Thesis). International Journal of Water Resources and Arid Environments, 3, 108-120.
Khalifa, A., Lawal, D., Antar, M., & Khayet, M. (2015). Experimental and Theoretical Investigation on Water Desalination Using Air Gap Membrane Distillation. Desalination, 376, 94 –108.
Khayet, M., & Matsuura, T. (2011). Membrane Distillation Principles and Applications. Amsterdam, the Netherlands: Elsevier B.V.
Lawal, D.U. (2014). Desalination Using Air Gap Membrane Distillation (Thesis from King Fahd University of Petroleum & Minerals).

72
Repercussions of Urban Growth on Choosing the Most Suitable Renewable Energy Technology: A Comparative Study
Menna M. Fouada, Omar M. Shehatab, Lamia A. Shihataa,c , ElSayed I. Morgana
aGerman University in Cairo (GUC), 5th settlement, New Cairo, 11432, Cairo, Egypt, +201119777605 bMutli-Robot Systems (MRS) Research Group, German University in Cairo (GUC), 5th settlement, Cairo, Egypt cAin Shams University (ASU), 11566, Cairo, Egypt
ABSTRACT
More than half of the world’s population is currently living in urban areas and the figure is estimated to exceed 70% by 2050. This high level of urbanization will be the peak of humanity’s increasing energy needs, in which conventional energy sources will not longer suffice to meet them. Thus, renewable energy technologies are championed to have a great potential in providing a sustainable alternative energy source to meet high demands in urban societies. As a result, it is crucial to decide which renewable energy source is most suitable based on the energy consumption, price, area, and other contributing factors. For achieving sustainability, diverse interrelations between several indicators need to be anticipated. Consequently, two different approaches are investigated in this study to convey the inclusive depiction of a reliable decision concerning which source is most applicable in the chosen urban area. A comparative study is proposed between Analytical Hierarchy Process (AHP) MCDM and Genetic Algorithm (GA) optimization approaches. For both, a two-step approach is implemented in which the top alternatives from each of the PV panels as well as top wind turbines are chosen from twenty different commercially available ones based on specific criteria. The second step is concerned with choosing the best renewable energy source between the previously obtained panels and turbines. This will increase the probability of reaching a reliable and sustainable decision in choosing the appropriate renewable energy source that will contribute in improving the economy, especially urban areas in Egypt. MATLAB software is used to code the AHP and GA approaches and results showed that the AHP approach outperformed the optimization one in terms of selecting from an available set of alternatives, while the GA optimization approach is most suitable for the case of designing where it provides the set of values for the decision variables that maximizes the fitness function. Keywords: Urban growth, sustainable renewable energy, multi-criteria decision making (MCDM), analytical hierarchy process (AHP), genetic algorithm (GA)
1. INTRODUCTION
Global energy consumption has been growing and more than half of the world’s population is currently living in urban areas and the figure is estimated to be 66% by 2050 (United Nations, 2015, 1). This is an indication of humans’ increasing energy needs in the areas in which conventional energy sources will not be sufficient to meet them (Kakoi, Tsutsui, Ono, Umezawa, & Kondo, 1988). One of the reliable solutions is the utilization of renewable energy (RE) sources. Two of the most important types of RE sources that are economically feasible are solar energy and wind energy (Jayakumar, 2009). The unlimited availability of sunlight made photovoltaic (PV) panels a promising renewable energy technology, as they directly convert sun radiation into electricity. In

73
addition, the wind turbine is a mechanical system which converts kinetic wind energy to electrical power in a clean and sustainable manner (Yin, Wang, & Karimi, 2014). There are several important criteria related to PV panel choice as well as wind turbine choice which includes: the maximum power, price, size, efficiency and several other factors (Verma & Singhal, 2015). Hence, the choice of the most suitable PV panel and wind turbine involves multiple conflicting criteria and thus requires a procedure that takes into consideration the various criteria and their relative importance. One of the most commonly used ways of selection is the Multiple Criteria Decision Making (MCDM) process.
Multiple-criteria decision-making (MCDM) is a scientific tool that explicitly considers multiple
criteria in decision-making environments by structuring and solving decisions and planning problems involving multiple criteria (Majumder, 2015). Several MCDM techniques are used to determine the best renewable energy alternative in a specific region based on relative weights of the evaluation criteria (Kahraman, Cebeci, & Ulukan, 2003; Kaya & Kahraman, 2010; Sadeghi, Larimian, & Molabashi, 2012). Another crucial approach is the optimization technique which is an organized constructive approach that uses an objective function to reach the best solution (Stadler, 2013). It is widely used in renewable energy applications such as energy planning and alternative selection (Cong, 2013; Ismail, Moghavvemi, & Mahlia, 2014).
Thus, in order to reach a reliable decision concerning which source is most applicable in the
growing urban areas in Egypt, a comparative study is proposed between AHP, MCDM, and GA optimization approaches. The first step is concerned with selecting the top most PV panels and wind turbines while the second step chooses the best renewable energy source among the obtained choices from the first step. This process will help increase the reliability and sustainability of the choice which will contribute in affecting the economy, especially the urban areas under investigation in Egypt. The paper consists of five sections. The next section is a review about the MCDM and optimization techniques used in renewable energy applications. The third section presents the methodology including the AHP and GA optimization techniques. Section four includes a discussion and comparative study between the results obtained from both approaches. Section 5 provides conclusions and recommendations for future work in the field.
2. LITERATURE REVIEW
Several previous studies have been conducted in the MCDM and optimization techniques in renewable energy applications as well as energy planning. As for the MCDM, several techniques were used including AHP, Fuzzy AHP, TOPSIS, VIKOR and many others. Van de Kaa, Rezaei, Kamp, and de Winter (2014) used fuzzy analytic hierarchy process method to analyze factor weights on the proposed five photovoltaic technologies to determine which of them is technology-dominant commercially. The results showed that pricing strategy and technological superiority are the most influential factors in the dominance process. Sindhu, Nehra, and Luthra (2016) used AHP to identify and prioritize the barriers existing in the developmental path of solar power in India which can be further used to formulate strategies that can ease the planning of using solar energy in India. Wu, Hsu, Chang, and Chen (2016) used multi-criteria analysis (MCA) to evaluate environmental impacts among various renewable energy alternatives of wind turbines and

74
photovoltaic (PV) systems. Results indicated that wind turbines are a better choice to use than PV systems in Taiwan especially the 2500-kW offshore wind turbine system.
For the optimization, Suganthi, Iniyan, and Samuel (2015) reviewed the applications of fuzzy
logic based models on renewable energy systems especially solar, wind, bio-energy, micro-grid and hybrid applications. For site assessment, renewable energy installations and tracking in photovoltaic, optimization using fuzzy models was needed to access conflicting criteria. Stadler, Ashouri, and Maréchal (2016) presented a two-step multi-objective optimization approach to define the optimal operation strategy to meet the different comfort and service requirements in Swiss buildings. The optimal design criteria are based on the maximum cost benefits in the view of both the consumer and the distribution network operator. Moreover, Sinha and Chandel (2015) identified the latest promising techniques for the optimization of solar photovoltaic (PV)–wind based hybrid systems considering system sizing. The latest algorithms used are artificial intelligence algorithms. In this study, it was concluded that using more than one algorithm overcomes the limitations of a single algorithm and are thus used in optimization. Based on this literature review, a comparative study was conducted between AHP, MCDM, technique and GA optimization technique, to choose the best renewable energy source among PV panels and wind turbines for urban areas in Egypt.
3. METHODOLOGY
This paper is concerned with applying a comparative study between AHP and GA optimization approaches in a two-step process to determine the most reliable renewable energy source to be used in developing urban areas in Egypt. The first step of the process requries the selection of the most efficient PV panels and wind turbines from a combination of twenty different commercially available panels and turbines. The second step focuses on choosing the best renewable energy source, under some testing criteria, from the choices of panels and turbines obtained from the first step. The same two-step procedure was applied once using AHP and then using GA optimization, which were then compared in the results obtained from both.
a. AHP Approach
The AHP process is applied in this paper 3 times. Once for choosing the top PV panel another for choosing top wind turbine and finally one for choosing the best renewable energy source.
i. AHP for PV Panels
As for the PV panels, the top level goal is to choose the most suitable PV panels from twenty different available ones. The criteria chosen for comparison are: the brand, power output, price, material, size, temperature coefficient and warranty. The brands of the panel were considered as either high-level or low-level brands. The power output is taken from the datasheets as the PMPP
(measured in Watt), the price (in dollars), size (length × width in m2), the temperature coefficient (%/°C) and the warranty (in years). The materials from which the panels were manufactured are chosen as either mono-crystalline silicon or ploy-crystalline silicon. The latter panels chosen are among the most commonly used ones commercially. Figure 1 shows the AHP diagram for choosing the best PV panels among twenty different ones under the previously mentioned seven criteria.

75
Figure 1: AHP diagram for PV panels
A MATLAB code is used to test the above mentioned AHP problem. Three inputs were
required for the code to generate results. The first input is the pairwise comparison matrix for the criteria across each other as shown in Table 1.
Table 1: Pairwise comparison for criteria of PV panels Brand Power Cost Material Size Temp Coefficient Warranty Brand 1.00 0.50 0.50 6.00 3.00 4.00 7.00 Power 2.00 1.00 1.00 7.00 5.00 6.00 8.00 Cost 2.00 1.00 1.00 6.00 3.00 4.00 7.00 Material 0.17 0.14 0.17 1.00 0.20 0.33 3.00 Size 0.33 0.20 0.33 4.00 1.00 2.00 6.00 Temp Coefficient 0.25 0.17 0.25 3.00 0.50 1.00 5.00 Warranty 0.14 0.13 0.14 0.33 0.17 0.25 1.00
The second input is the criteria definition which determines which criteria are to be maximized
and which ones are to be minimized (1: maximization, 0: minimization) as shown in Table 2.
Table 2: Criteria definition for PV panels Brand Power Cost Size Material Temp Coefficient Warranty 1 1 0 0 1 0 1
The third input is the real values obtained from the panels datasheet described as follows: The brand in which the high-level brand takes value of (9) and the low-level brand takes value of (1). The power of the panel in (Watts), the cost in (dollars), and the material in which mono-crystalline takes value of (9) as it has higher efficiency compared to the poly-crystalline which takes value of (1). The size was represented in (m2), the temperature coefficient (%/°C) and warranty in (years) as shown in Table 3.

76
Table 3: Real values for PV panel alternatives
Alternatives Brand (1:Low,9:High)
Power (W)
Price ($)
Size (m2)
Material (1:Poly,9:Mono)
Temp. Coefficient (%/C)
Warranty (Years)
PV1 1 250 137.50 1.627 9 0.43 20 PV2 1 255 140.25 1.627 9 0.43 20 PV3 1 260 143.00 1.627 9 0.43 20 PV4 1 300 198.34 1.934 1 0.44 25 PV5 1 295 195.03 1.934 1 0.44 25 PV6 1 305 201.64 1.934 1 0.44 25 PV7 1 245 147.00 1.627 1 0.44 25 PV8 1 250 150.00 1.627 1 0.44 25 PV9 1 255 153.00 1.627 1 0.44 25 PV10 1 245 161.97 1.934 9 0.44 25 PV11 1 250 165.28 1.934 9 0.44 25 PV12 1 255 168.59 1.934 9 0.44 25 PV13 1 260 171.89 1.934 9 0.44 25 PV14 1 265 175.20 1.934 9 0.44 25 PV15 9 260 363.22 1.637 1 0.41 25 PV16 9 270 424.71 1.627 9 0.44 25 PV17 9 270 487.08 1.634 9 0.42 25 PV18 9 250 379.50 1.634 1 0.42 25 PV19 9 260 374.66 1.650 1 0.4 25 PV20 9 327 744.58 1.630 9 0.38 25
The real values in Table 3 are then converted to pairwise comparisons between the alternatives
across the numerous attributes. Later, priority vectors are obtained for each alternative across every criterion, which was then used to calculate the final score of all alternatives. Finally, the alternatives are ranked from one to twenty where the highest rank is given to the alternative with the highest value in the final priority vector.
ii. AHP for Wind Turbines
Another AHP process is implemented for choosing the best wind turbine among twenty different commercially available turbines based on some chosen criteria which are among the most important selection criteria for wind turbines: Power output (KW), diameter (m), price ($), hub- height (m) and nacelle weight (kg). Figure 2 shows the AHP diagram for choosing the best wind turbine among twenty different ones under the previously mentioned five criteria.

77
Figure 2: AHP diagram for Wind Turbines
The same MATLAB code was used to choose the best wind turbine from the available
alternatives. The pairwise comparison matrix for the criteria across each other is shown in Table 4. While the criteria definition matrix for wind turbines is shown in Table 5.
Table 4: Pairwise comparison for Criteria of Wind turbines
Power Diameter Cost Height Weight
Power 1.00 5.00 1.20 6.00 7.00 Diameter 0.20 1.00 0.25 2.00 4.00 Cost 0.83 4.00 1.00 5.00 7.00 Height 0.17 0.50 0.20 1.00 2.00 Weight 0.14 0.25 0.14 0.50 1.00
Table 5: Criteria definition for wind turbines
Power Diameter Price Hub Height Weight 1 0 0 1 0
The third input is the real values obtained from the turbines datasheets as shown in Table 6. An
empirical formula is proposed (Equation 1) to calculate the price of wind turbines since, according to literature, the prices of wind turbines are not available.
(1) Table 6: Real values for wind turbines alternatives
Alternatives Power (KW)
Diameter (m)
Price($) Maximum hub Height (m)
Weight of Nacelle (Tons)
W.T.1 4200 110 1,654,500.00 124 145 W.T.2 2750 92 1,143,900.00 104 83 W.T.3 3450 136 1,383,000.00 82 70 W.T.4 3450 136 1,458,000.00 132 70 W.T.5 3600 128 1,471,500.00 88 225 W.T.6 3450 126 1,375,500.00 87 70

78
W.T.7 2000 93 911,400.00 100 73 W.T.8 2300 82 972,750.00 90 82.5 W.T.9 2000 110 973,500.00 125 70 W.T.10 1800 76 820,500.00 98 65 W.T.11 2300 100.6 1,011,900.00 99 75 W.T.12 2000 100 951,000.00 120 70 W.T.13 3000 115 1,232,400.00 85 108 W.T.14 2500 118 1,074,960.00 80 93.2 W.T.15 2000 72 873,300.00 95 76 W.T.16 3000 100 1,265,400.00 120 118 W.T.17 3000 132 1,311,300.00 120 111 W.T.18 3000 116 1,259,400.00 100 118 W.T.19 2500 103 1,067,460.00 90 93.2 W.T.20 3500 100 1,344,900.00 75 108
The real values in Table 6 are also converted to pairwise comparisons between the alternatives
across each criterion. The alternatives are ranked from one to twenty according to values obtained in the final priority vector.
iii. AHP for choosing the best renewable energy source
In order to choose the best renewable energy source, an AHP procedure is applied to choose from the alternatives obtained from the results of the AHP PV panel procedure and AHP wind turbine procedure discussed in sections 3.1.1 and 3.1.2, according to certain criteria which are: power output, price and area. The AHP diagram with a goal of choosing the most suitable renewable energy source is shown in Figure 3.
Figure 3: AHP diagram for RE sources
Moreover, Tables 7 and 8 show the pairwise comparison across the three criteria and the criteria
definition, respectively.

79
Table 7: Pairwise comparison for criteria of RE sources
Power Price Area Power 1.00 1.20 4.00 Price 0.83 1.00 4.00 Area 0.25 0.25 1.00
Table 8: Criteria definition for RE sources
Power Price Area 1 0 0
The alternatives that are compared against each other were obtained from the previous AHP
procedures in which the top 3 results from both procedures were considered. Thus, Table 9 shows the 6 alternatives obtained (Top 3 PV panels and top 3 wind turbines). In order to be able to compare the power of PV panels (watts) and wind turbines (mega watts), normalization is done for PV panels by dividing the power, price, area of each panel by the sum of the power, price, area of all panels. The product is then multiplied by half, and same for the wind turbines so that the total normalized power, price, and area column is equal to one. For the area of wind turbines before normalization, it is assumed that the distance between each turbine in the row is 4D (4 times the diameter of the turbine) (Masters, 2013) and the distance between the rows is 6D (6 times the diameter of the turbine) so the total area acquired by each turbine is (6D×4D= 24D2). Table 9: Alternatives for RE sources
Alternatives Normalized Power Normalized Price Normalized Area PV20 0.188581315 0.224762583 0.16663259 PV16 0.155709343 0.128205051 0.166325905 PV17 0.155709343 0.147032366 0.167041505 WT1 0.2625 0.247065675 0.262359063 WT10 0.1125 0.122524863 0.125238508 WT15 0.125 0.130409462 0.112402428
In section 3.1 the AHP methodology for the desired problem is shown and thus, in section 3.2
the methodology for the GA optimization is shown so that results from both sections can be compared in section 4.
b. GA Optimization Approach The Genetic Algorithm (GA) optimization approach is another tool that is studied in this
research in order to assess the different alternatives investigated. The GA is one of the meta-heuristic optimization approaches that are widely used for different optimization problems to search for the optimal or near-optimal solution for the problem. It is extensively used in problems such as vehicle routing, the traveling salesman problem, and task allocation problems. Each GA problem aims at maximizing a fitness function that reflects the objective functions under investigation. In this study, GA is used in order to evaluate the most suitable near-optimal combination of decision variables that best satisfy the problem requirements.

80
i. Fitness Function
The problem is addressed as a maximization problem aiming at finding the highest value for the fitness function. The fitness function is defined as a weighted summation equation of the value of each decision variable. The weight is utilized from the priority vector matrix reflecting the relative importance of each decision variable. For the variables to be maximized, the value is simply multiplied by the weight and added. For the values to be minimized, the reciprocal of the value is multiplied by the weight and added. The fitness function can be reflected by Equation 2. (2) Where,
i is the ith alternative from the list and its corresponding fitness value evaluated using Equation 2 j is the jth decision variable investigated wj is the weight of the jth variable valuei, j is the value of the ith alternative in the jth variable taken as itself if it is to be maximized,
or its reciprocal if it is to be minimized.
ii. Optimal Solution vs. Best Alternative
The GA utilizes the fitness function described in the previous section to evaluate the optimal set of variables that achieve the highest value. However the optimal solution might not necessarily be one of the alternatives available, as a matter of fact it is the expected case. Thus the optimal solution is used in order to determine the best combination of variables that will achieve the best result of the fitness function. This is valid for the case of the designing process, if the selection is still done while in the designing stage, so these set of parameters are used as guidelines for the implementers. The available alternatives are ranked based upon their score in the fitness function, in order to find out the best alternative from the list available.
The two proposed approaches (AHP and GA) are then executed to evaluate the best alternative for each of the PV panels, wind turbines, and selected options. The results achieved from both are presented and compared, as described in the upcoming section.
4. RESULTS AND DISCUSSION
Results obtained from the AHP and optimization approaches concerning choosing the best PV panels, best wind turbines and best renewable energy source are shown in the following sections.
a. AHP Results
Based on the MATLAB code, results are generated by ranking the alternatives based on their final score in the priority vector where the highest score alternative is assigned the highest rank.
i. AHP Results and Discussions For PV Panels
For choosing the top 3 PV panels from the 20 available alternatives, all PV panels are ranked from one to twenty based on the score in the final priority vector. Results are shown in Table 10 below with first column showing the ranks of the panels, the second column representing the final score obtained for each PV panel and the third column showing the panel number. Table 11 shows the priority vector of the criteria from which we can infer which criteria have the highest weight compared to others.

81
Based on the obtained results, panel 20 is the best alternative under the chosen criteria followed
by panel 16 and finally panel 17. From Table 11, the power has highest importance followed by cost, brand, material, temperature coefficient, size and finally warranty. Panel 20 has the highest power among alternatives, as well as the highest cost. It is considered a high brand panel, which is justifiable because of the varying high quality aspects associated with it. Some of these characteristics include high efficiency mono crystalline, the smallest temperature coefficient, one of the smallest sizes and the highest warranty. Therefore, panel 20 has the highest overall score which proved to be reliable and true based on the priority vector of the criteria.
Table 10: Results of PV panels
Rank Final Score Panel number 1 0.125838 20 2 0.061437 16 3 0.061272 17 4 0.058928 15 5 0.056426 19 6 0.055098 18 7 0.052802 1 8 0.046986 2 9 0.04608 3 10 0.045245 10 11 0.04404 11 12 0.041671 12 13 0.039435 14 14 0.037667 13 15 0.036448 7 16 0.035769 8 17 0.035241 9 18 0.034045 6 19 0.033382 4 20 0.033382 5
Table 11: Priority vector for criteria of PV panels
Criteria Priority vector Brand 0.1923 Power 0.3079 Price 0.2603 Size 0.0394 Material 0.1024 Temperature coefficient 0.0730 Warranty 0.0247

82
ii. AHP Results and Discussions For Wind Turbines
Based on the obtained results, turbine 1 is the best alternative under the chosen criteria followed by turbine 10 and finally turbine 15. According to Table 13, the power has highest importance followed by price, then diameter, then height, and finally the weight. Thus, turbine 1 has the highest power among alternatives which is compatible with the highest importance weight of the power; however, it also has the highest price and a moderate diameter. Turbine 1 has the highest overall score which proved to be reliable and true based on the priority vector of the criteria. Table 12: Results of wind turbines
Rank Final Score Turbine number 1 0.05456097 1 2 0.052258397 10 3 0.052194465 15 4 0.051434421 20 5 0.051226042 4 6 0.050824488 6 7 0.050655266 8 8 0.050573124 2 9 0.050207648 3 10 0.050099009 16 11 0.049571055 7 12 0.049090729 5 13 0.049007738 11 14 0.049005948 12 15 0.048628197 13 16 0.048614458 18 17 0.048510029 19 18 0.048143788 17 19 0.048132411 9 20 0.047261816 14
Table 13: Priority vector for criteria of wind turbines
Criteria Priority vector Power 0.4140 Diameter 0.1193 Price 0.3527 Hub Height 0.0711 Weight of Nacelle 0.0431
iii. AHP Results and Discussions For RE Sources
Based on the obtained results, turbine 1 is the best renewable energy source followed by PV panel 16. According to the priority vector of the criteria shown in Table 15, overall power carries the most substantial weight, followed by price, and then area. Table 14 identifies turbine 1 as the

83
RE alternative with the highest power of all. It is compatible with the priority vector of the criteria despite having the highest value for price. The second highest power alternative is still distant in terms of power from turbine 1, although the price is very similar. Therefore, this alternative is nowhere near as effective as the final choice. PV 16 has moderate power and has the lowest price, thus statistically being the second best RE source to be chosen.
Table 14: Final result for RE sources
Rank 1 2 3 4 5 6 Final Score 0.178126 0.174300 0.166689 0.163536 0.163481 0.153864 RE source number 4 2 6 3 5 1
Table 15: Priority vector for criteria of RE sources
Criteria Power Price Area Priority Vector 0.4717 0.4172 0.1111
Based on the performed AHP two-step procedure the top 3 of both the PV and WT were
obtained, and then the best RE source among them was chosen This further helps in choosing the best renewable energy source suitable for a specific urban area according to the specifications, criteria under investigation and alternatives available.
b. GA Optimization Results
The GA approach is used to evaluate the optimal set of parameters of design for each of the cases of the PV panels, wind turbines, and the eventual selection of the leading renewable energy source from the top 3 of each of the two investigated sources. For each of the sources, the optimal set of values from multiple runs of the GA approach is presented, along with the ranking of the alternatives based on their relative scores in the fitness function.
i. GA Results and Discussions For PV Panels
The GA approach for the 20 PV panel alternatives was used in order to evaluate the optimal set of parameters of variables (Table 16). The alternatives available were then ranked based upon their fitness function score yield (Table 17). Table 16: GA optimal results for PV panels
Decision Variable
Brand
Power (W)
Price ($)
Size (m2)
Material
Temp. Coeff. (%/C)
Warranty (Years)
Value 9 327 13705 1.8109 9 0.38 25

84
Table 17: GA results for PV panels Rank 1 2 3 4 5 6 7 8 9 10 Panel number
20 6 4 5 17 16 14 19 15 13
Rank 11 12 13 14 15 16 17 18 19 20 Panel number
3 12 2 9 18 11 1 8 10 7
It is apparent that the results of the score of the PV panels achieved from the GA approach differ
to a great extent from those previously achieved by the AHP approach.
ii. GA Results and Discussions For Wind Turbines
The same GA approach was further implemented on the wind turbines alternatives in order to investigate the optimal set of combinations of variables, presented in Table 18, as well as ranking the available set of wind turbines to evaluate which one is the most suitable in terms of the fitness function score (Table 19). Table 18: GA optimal results for wind turbines
Decision Variable
Power (KW)
Diameter (m)
Price (m$)
Hub height
Weight of Nacelle
Value 4200 72 1 132 95.0511
Table 19: GA results for wind turbines Rank 1 2 3 4 5 6 7 8 9 10 Turbine number
1 5 20 4 6 3 16 17 18 13
Rank 11 12 13 14 15 16 17 18 19 20 Turbine number
2 19 14 11 8 9 12 7 15 10
iii. GA Results and Discussions For RE Sources
The top 3 renewable energy sources from both the PV panels and the wind turbines are selected and then their levels are normalized in order to be able to compare their suitability in the selection process as described previously. The results of the GA approach are reflected in Table 20. Table 20: GA results for RE sources
Rank 1 2 3 4 5 6 RE Source number
4 1 5 3 6 2
RE source ID WT1 PV20 WT5 PV4 WT20 PV6

85
5. CONLUSIONS AND FUTURE WORK This study investigates the problem of selecting the most suitable renewable energy source that
meets the special requirements from a set of alternatives for each renewable energy sources (PV panels and wind turbines). The selection is conducted based on one of two approaches either a Multi-Criteria Decision Making (MCDM) utilizing the AHP approach, or an optimization approach utilizing the Genetic Algorithm (GA) approach.
A set of 20 alternatives from each of the PV panels and the wind turbines are selected and
computed using both approaches to find the most suitable alternative. The alternatives are ranked using the AHP approach to find the most appropriate alternative. The GA is used for two reasons, finding the optimal set of parameters for the designing stage, while the fitness function is used to sort the alternatives from the highest scoring to least. The results reflect that the GA optimization approach incorporated the most suitable combination of parameters if the problem is addressed at the designing stage. While the selection from a set of alternatives is most compatible using the AHP approach, as it considers multiple criteria and their interrelations, and finally how this affects the decision making process.
Recommendations for future work includes considering other unique sustainable energy sources
(such as hydro energy), investigating different MCDM approaches and their suitability to the cases investigated, as well as different optimization techniques for the designing stage. REFERENCES Cong, R. G. (2013). An Optimization Model for Renewable Energy Generation and its Application
in China: A Perspective of Maximum Utilization. Renewable and Sustainable Energy Reviews, 17, 94-103.
Ismail, M. S., Moghavvemi, M., & Mahlia, T. M. I. (2014). Genetic Algorithm Based Optimization
on Modeling and Design of Hybrid Renewable Energy Systems. Energy Conversion and Management, 85, 120-130.
Jayakumar, P. (2009). Resource Assessment Handbook. Asia and Pacific Center for Transfer of
Technology (APCTT). Kahraman, C., Cebeci, U., & Ulukan, Z. (2003). Multi-Criteria Supplier Selection Using Fuzzy
AHP. Logistics Information Management, 16(6), 382-394. Kakoi, Y., Tsutsui, Y., Ono, N., Umezawa, K., & Kondo, N. (1998). Emission Reduction
Technologies Applied to High-Speed Direct Injection Diesel Engine. SAE Paper No. 980173. https://doi.org/10.4271/980173.
Kaya, T., & Kahraman, C. (2010). Multicriteria Renewable Energy Planning Using an Integrated
Fuzzy VIKOR & AHP Methodology: The Case of Istanbul. Energy, 35(6), 2517-2527. Majumder, M. (2015). Impact of Urbanization on Water Shortage in Face of Climatic Aberrations.
Singapore: Springer Verlag Singapore.

86
Masters, G. M. (2013). Renewable and Efficient Electric Power Systems. Hoboken, New Jersey:
John Wiley & Sons. Sadeghi, A., Larimian, T., & Molabashi, A. (2012). Evaluation of Renewable Energy Sources for
Generating Electricity in Province of Yazd: A Fuzzy MCDM Approach. Procedia-Social and Behavioral Sciences, 62, 1095-1099.
Sindhu, S. P., Nehra, V., & Luthra, S. (2016). Recognition and Prioritization of Challenges in
Growth of Solar Energy Using Analytical Hierarchy Process: Indian Outlook. Energy, 100, 332-348.
Sinha, S., & Chandel, S. S. (2015). Review of Recent Trends in Optimization Techniques for Solar
Photovoltaic–Wind Based Hybrid Energy Systems. Renewable and Sustainable Energy Reviews, 50, 755-769.
Stadler, P., Ashouri, A., & Maréchal, F. (2016). Model-Based Optimization of Distributed and
Renewable Energy Systems in Buildings. Energy and Buildings, 120, 103-113. Stadler, W. (2013). Multicriteria Optimization in Engineering and in the Sciences (Vol. 37). New
York: Springer Science & Business Media. Suganthi, L., Iniyan, S., & Samuel, A. A. (2015). Applications of Fuzzy Logic in Renewable
Energy Systems–A Review. Renewable and Sustainable Energy Reviews, 48, 585-607. United Nations Department of Economic and Social Affairs, Population Division (2015). World
Urbanization Prospects: The 2014 Revision. Retrieved from https://esa.un.org/unpd/wup/publications/files/wup2014-report.pdf
Van de Kaa, G., Rezaei, J., Kamp, L., & de Winter (2014). Photovoltaic Technology Selection: A
Fuzzy MCDM Approach. Renewable and Sustainable Energy Reviews, 32, 662-670. Verma, A. & Singhal, S. (2015). Solar PV Performance Parameter and Recommendation for
Optimization of Performance in Large Scale Grid Connected Solar PV Plant. Journal of Energy and Power Sources, 2(1), 40-53.
Wu, W. F., Hsu, Y., Chang, Y. J., & Chen, Y. C. (2016). Selection of Renewable Energy Based on
Life Cycle Assessment and Multi-Criteria Decision Making. Open Journal of Energy Efficiency, 5(01), 1.
Yin, S., Wang, G., & Karimi, H. R. (2014). Data-Driven Design of Robust Fault Detection System
for Wind Turbines. Mechatronics, 24(4), 298-306.

87
Feasibility of Wind Power in Rural Areas of Egypt Based on the Evaluation of an Existing Wind Atlas
Michael Puttinger & Udo Bachhiesl
Graz University of Technology, Institute of Electricity Economics and Energy Innovation, Inffeldgasse 18, 8010 Graz/AUSTRIA ABSTRACT
This paper introduces a holistic approach to investigate the feasibility of wind power in Egypt. One major part of this study questions the existing wind atlas, which is used in many economic driven studies for wind power in Egypt. Due to modern climate data analysis with wind, an abundance of wind data is available. The comparison of the existing data with current measurements offers a sufficient output for an evaluation of chosen sites. Furthermore, the paper describes how this data may be used for calculations of electrical power of wind turbines. Keywords: Wind power, wind atlas Egypt, wind measuring, Fayoum area, thermal wind systems, Weibull calculation, retrospective wind analysis, MERRA
1. INTRODUCTION
The energy crisis in Egypt is influencing all areas of the economy and society. In particular, consumers who use energy based on fossil fuels will need to start thinking about alternative energy possibilities for the future. Egypt offers a huge potential for solar energy, which is well known and has been proven in several studies and projects. Alongside these sun-based technologies, which at the moment still show low efficiencies, the wind sector of Egypt has been largly neglected due to high investment costs and lack of expertise. At the same time, wind power in Europe has been developing rapidly due to the European energy goals and the intensive subsidisation in many European countries. After the subsidisation period, the used wind turbines are often replaced by bigger and more powerful ones. The improved turbines offer a prolonged use of those used wind mills.
This study is about the feasibility of refurbished wind turbines in Egypt. This approach would
result in a minimization of investment costs, while local personal could be trained in the necessary maintenance work. The entire process and future outcomes will help aid local communities. A target for this study is the replacement of existing diesel generators. The price for the operation has doubled in the last two years, and further price increases are expected as a consequence of the reduction of fossil fuel subsidisation in Egypt. The existing wind atlas shows that Egypt offers numerous potential sites with high wind speeds. However, there are also many areas that still need to be investigated in depth, especially local thermal wind systems that exist in the Red Sea area, as well as regions within the Nile Valley. Both of these locations have not been well documented in relation to the wind atlas.
Before the erection of a wind plant at a potential site, it is necessary to measure the wind speed
at a certain height. Within this project, several stations that measure wind speed will be placed at sites with a local wind system. These stations will rely on electricity and the required technical

88
infrastructure. One of these examined areas will be the Fayoum Oasis, which is located 90 km south of Cairo, which is known as “the garden of the capital”. Agriculture is the major economic sector and therefore a substantial amount of energy is needed for irrigation and food production processes.
For measuring the wind at the chosen site, the necessary sensors, data loggers, and softwares
will be prepared with Austrian expertise. Also, a 30 m measuring mast will be built via local welding workshops. A special self-made data logging system allows for stand-alone online data streaming, as well as web-based data analysis.
2. EVALUATION OF THE EXISTING WIND ATLAS OF EGYPT
Wind is the movement of air, which is caused by pressure differences due to the sun irradiation and is influenced by a huge variety of earth surface and atmospheric parameters. Thus wind at a certain site or area is always a product of more than one input effect, depending on the surrounding parameters. Egypt especially is a region where the different wind systems have to be considered. Due to its geographic position on the Earth’s surface (30-degree north of the equator) the atmospheric circulation called “Hadley cell” causes the north-east to north-west Passat trade winds. The north Passat affects Egypt’s climatology throughout the year, from north to south the wind changes direction from north-west to north-east (Craig, 1909). The changing orography of the land between coasts, deserts, small mountains, and cultured landscape has an important influence in accelerating and deflecting these constant trade winds (Rizk, 1986).
The infinite values and input parameters do not allow us to predict or detect the current wind
speed over an area. However, we may use wind analyses which are the product of grid based models of certain observations, combined with meteorological satellite data. For an evaluation of an existing wind atlas it is necessary to follow used data sources and chosen models to compare this data. The valuable combination of these three components will result in a more precise model.
3. THE EGYPTIAN WIND ATLAS
The Egyptian wind atlas is based on two input parameters, an observation based model and numerical long term reanalysis data. The stations for observations were mainly placed on the Mediterranean and the Red Sea coast, with a few placed in highly populated areas. The black dots in Figure 1 show the positions of the meteorological stations used for the wind atlas of Egypt.

89
Figure 1: Elevation map of Egypt showing the meteorological stations used for the wind atlas of Egypt (Mortensen, 2006)
A second approach for wind atlas modelling was a long term reanalysis data model by
NCEP/NCAR1 that offered plenty of climate parameters through a numeric atmospheric model schematic. This 3D-grid of atmospheric states was based on radiosondes and weather satellites. The resolution of this data grid varies, depending on the location between 5 and 7.5 km.
Information about the long-term, large-scale meteorological situation over Egypt was obtained
from the NCEP/NCAR reanalysis data-set (General Authority of Investment, 2010). Time-series data of wind and temperature profiles for the period 1965 to 1998 were used to create around 100 different large-scale wind situations or wind classes. These wind classes form a representative set of wind conditions for the region and represent different wind speeds, wind directions, atmospheric stability or shear (Mortensen, 2006).
1 Based on observings and numerical weather prediction, the NCEP, National Centers for Environmental Prediction, Reanalysis- and the NCAR, National Center for Athmospheric Research, Reanaylses are continually updated data sets representing the athmospheric climatic state of the Earth.

90
Figure 2: Wind atlas of Egypt, mean wind speed 50 m o.g.l. using mesoscale modelling (Mortensen, 2006)
4. NASA’S MODERN-ERA RETROSPECTIVE ANALYSIS FOR RESEARCH AND APPLICATIONS (MERRA)
MERRA is a further development of the previously used NCEP. Like in earlier versions, the provided data is open to use and allows for a wide scope of climate observations (Rienecker, 2011). MERRA has some advantages compared to earlier versions. It has a longer statistical series (1979-2010) with continuous improvement of measure parameters and output quality, and a higher resolution (1×1 km). The online tool called “Global Wind Atlas” allows both an illustrative and numerical portrayal of the data (TU of Denmark, 2010).
Figure 3 shows a graphical output of the available “Global Wind Atlas” for Egypt. The shown
windspeeds, varying in different colors, already display several differences compared to the existing wind atlas. Furthermore, inspections for chosen sights are available.

91
Figure 3: Egyptian mean wind speed MERRA, 50m o.g.l.
An example of the data output for a feasibility analyses, which is described in the following section, for the region of Fayoum is shown in Figure 4. MERRA allows a sector wise analyses of wind direction and speed, and already provides Weibull parameters for further calculations. It is divided in different surface roughness layers and available in three different heights (50m, 100m, 200m o.g.l). For the graphical wind atlas (Figure 3), different orographic models are used to find the right surface roughness. Regarding these models, the most suitable roughness for Fayoum would be 0.030 m.
Figure 4: Mean wind speed and direction in region Fayoum, MERRA data analyses with WAsP
5. WIND MEASURING AT A SPECIAL SITE
As already mentioned, wind is a very complex affair and theoretical models often show uncertainties. Therefore, every wind observation on a particular site needs a wind measuring facility for a certain time frame. Within this study an on-site analyses in the Fayoum region is planned. A

92
30 m mast will be mounted at the desired location. The region was chosen due to the following reasons:
x The geology of this area with hills and lakes leads to a high horizontal gradient of wind speeds caused by the local orology
x Valuable existing meteorological stations are at least 20 km away x No weather stations in the near of this region were considered in the first wind atlas x Fayoum is connected to the national grid and has a high energy demand and therefore would
be a suitable region for wind power utilisation
The time frame for wind measurement is one year. Due to high costs of wind analyses, an internal measuring project is planned within this study. An autonomous data logger on a microcontroller basis is developed which can stream data on a server. The metal mast is fully manufactured in Egypt with local welding workshops. The concept and analysis is based on the Measnet “Evaluation of site specific wind conditions, 2009” (Measnet, 2009). The measured data is shown in Table 1. Table 1: Measured parameters data logger
Parameter Wind speed height 1
Wind speed height 2
Wind direction
Temperature Solar radiation
Sampling rate
1 Hz 1 Hz 1 Hz 0.1 Hz 0.1 Hz
All input data is stored locally with a certain sampling frequency. The mean value for all data is
collected every 10 minute interval, and is calculated and transmitted to a webserver every hour. Additionally, the standard deviation for every 10 minutes’ mean value is calculated and transmitted. A specially developed online tool calculates power density (W/m²). Energy output of the wind turbine and wind rose due to following equations:
The power density, in some sources called specific energy flux is defined by the following equation:
(1) Where,
is air density is mean wind speed
For most valuable energy production calculation of a site it is necessary to calculate the wind
velocity distribution. The most suitable model for wind is the “Weibull distribution” which is defined by the following equation (Hau, 2008):
(2)

93
Where, is the shape parameter of the Weibull function, which defines the curve most suitable to the
measured wind distribution is the scale parameter of the Weibull function is the wind speed
The electrical output power is defined as following:
(3)
is the circular area of the rotor is the power coefficient of a specific wind turbine
6. FOCUS ON FAYOUM REGION
Economic Conditions
The Fayoum Region shows a total area of 6,068 km² and a population of 2.5 million people and can be described as a compact area between the southern deserts and the capital Cairo. The diverse natural resources have been used since ancient times and have provided mainly food and handcrafted products throughout the so called “breadbasket” of the Egyptian capital (General Authority for Investment, 2010).
Figure 5: The Fayoum region (Map: Google Maps 2016, ORION-ME)
Besides some tourist attractions, the local economy is mainly based on agriculture, primarily
food production, and two seperate industry parks. The first industry park focuses on tobacco, while the second focuses on industry and the manufacturing of paper products. Also mineral resources for construction and handcrafted products are located in this region. A third industry park is under construction (Figure 6: Industrial Development in Fayoum Area).

94
Figure 6: Industrial Development in Fayoum Area (Industrial Development Authority, 2011)
Technical Conditions
The Fayoum region is very well connected, because of its location near the Nile. These connections cover road and rail traffic, as well as the electricity connection to the national grid. Nevertheless, this region has to deal with varying problems regarding a stable electricity supply, because it suffers from poorly installed power plant capacities. The biggest energy consumers are the large scale industries (as mentioned above), such as the agricultural sector, including irrigation demand, and the residential sector.
7. RESULTS AND CONCLUSION
The complete evaluation of the current wind atlas will be completed after the measuring data is available and a comparison with the available theoretical data of the site in Fayoum is foreseen. Thus the available data from MERRA data analyses show some differences compared to the existing wind atlas. In particular, the mentioned “high wind” areas near the Red Sea (Zafarana) vary considerably in absolute values. Ongoing large scale wind projects in several regions of Egypt will also produce site evaluations and measurements according to their feasibility studies, as this offers the possibility to evaluate the data quality of the existing wind atlas. From an economic perspective, the potential for wind power is due to the existing feed in tariffs, which is much higher than before. Despite this, the details on the regulations with payment conditions, terms for grid connection, and other economic factors of influence do not make the feed in tariff a catalyst for change. In Egypt, high investment costs face several challenges and therefore a minimisation of initial costs, through the use of refurbished European wind turbines, is part of this study.

95
REFERENCES Craig, J. I. (1909). Types of Weather in Egypt. Cairo Scientific Journal, 3(30).
General Authority for Investment (2010). Dalah, Al-Safwa Tower, Cairo-Fayum Desert Road. Retrieved from http://www.gafinet.org/Lists/Governerates/EnDispForm.aspx?List=e63c6202-8e31-4c68-b6bc-c8dcd2b27bc5&ID=15.
Hau, E. (2008). Windkraftanlagen. Krailing: Springer-Verlag Berlin Heidelberg. Industrial Development Authority (2011). The Industrial Development in Fayoum. Measnet (2009, November). Evaluation of Site- Specific Wind Conditions - Version 1 (Tech.).
Retrieved from https://pdfs.semanticscholar.org/408b/468f6c24684220cf61267afc8d16e4686ca5.pdf
Mortensen, N. G., et al. (2006). Wind Atlas for Egypt: Measurements, Micro- and Mesoscale-
Modelling. In Proceedings (online) Brussels: European Wind Energy Association (EWEA). Rienecker, M. M., et al. (2011). MERRA: NASA’s Modern-Era Retrospective Analysis for
Research. Journal of Climate (MERRA Special Collection), 24, 3624-3648 Rizk, M. (1986). Wind Characteristics and Available Wind Energy in Egypt. Solar & Wind
Technology, 4(4), 491-499. TU of Denmark (2010). Global Wind Atlas. Retrieved from www.globalwindatlas.com.

96

97

98

99