PROCEEDINGS OF THE IRE - World Radio History
148
BOARD OF DIRECTORS, 1955 J. D. Ryder, President Franz Tank, Vice- President W. R. G. Baker, Treasurer Haradan Pratt, Secretary John R. Pierce, Editor J. W. McRae, Senior Past President W. R. Hewlett, Junior Past President 1955 S. L. Bailey A. N. Goldsmith A. V. Loughren C. J. Marshall (RS) L. E. Packard (R1) J. M. Pettit (R7) B. E. Shackelford C. H. Vollum H. W. Wells (R3) 1955-1956 E. M. Boone (R4) J. N. Dyer (R2) J. T. Henderson (R8) A. G. Jensen George Rappaport D. J. Tucker (R6) 1955-1957 J. F. Byrne Ernst Weber • George W. Bailey Executive Secretary • John B. Buckley, Chief Accountant Laurence G. Cumming, Technical Secretary Evelyn Davis, Assistant to the Executive Secretary Emily Sirjane, Office Manager EDITORIAL DEPARTMENT Alfred N. Goldsmith Editor Emeritus John R. Pierce, Editor E. K. Gannett, Managing Editor Manta D. Sands, Production Manager ADVERTISING DEPARTMENT William C. Copp, Advertising Manager Lillian Petranek, Assistant Advertising Manager EDITORIAL BOARD John R. Pierce, Chairman D. G. Fink E. K. Gannett T. A. Hunter W. R. Hewlett J. A. Stratton W. N. Tuttle Responsibility for the contents of papers published in the PRO CEEDINGS of the IRE rests upon the authors. Statements made in papers are not bind- * ig on the IRE or its members. IJOEAU Change of address (with 15 days ad- vance notice) and letters regarding sub- scriptions and payments should be mailed to the Secretary of the IRE, I East 79 Street, New York 21, N. Y. All rights of publication, including foreign language translations are re- served by the IRE. Abstracts of papers with mention of their source may be printed. Requests for republication should be addressed to The Institute of Radio Engineers. PROCEEDINGS OF THE IRE Published Monthly by The Institute of Radio Engineers, I nc. VOLUME 44 January , 1956 NUMBER I CONTENTS Arthur V. Loughren, President, 1956 2 The State of Radio and Electronics in Egypt Professor H. M. Mahmoud 3 5598. A Survey of Application of Ferrites to Inductor Design R. S. Duncan, H. A. Stone, Jr. 4 5599. Electromechanical Filters for 100-Kc Carrier and Sideband Selection... R. IV. George 14 5600. New Microwave Repeater System Using Traveling-Wave Tubes N. Sawazaki and T. Honma 19 5601. Geophysical Prospection of Underground Water in the Desert by Means of Electro- magnetic Interference Fringes W. A. H. El-Said 24 5602. A Transmission Line Taper of Improved Design R IV. Klopfenstein 31 5603. A Precision Resonance Method for Measuring Dielectric Properties of Low-Loss Solid Materials in the Microwave Region S Saito and K. Kurokawa 35 5604. Transistor Amplifiers for Use in a Digital Computer.. Q. W. Simkins, J. H. Vogelsong 43 5605. A Developmental Wide-Band, 100-Watt, 20 DB, S-Band Traveling-Wave Amplifier Utilizing Periodic Permanent Magnets W W. Siekanowicz and F. Slerzer 55 5606. Spurious Modulation of Electron Beams C C. Culler 61 5607. Negative Resistance Regions in the Collector Characteristics of the Point-Contact Transistor L E Miller 65 5608. The Dependence of Transistor Parameters on the Distribution of Base Layer Resis- tivity J L Moll and I. M. Ross 72 5609. Surface Resistance and Reactance of Metals at Infrared Frequencies J R. Beattie and G. K. T. Conn 78 5610. Transverse-Field Traveling-Wave Tubes with Periodic Electrostatic Focusing R. Adkr, O. M. Kromkout, and P. A. Clavier 82 5611. A Simplified Method of Solving Linear and Nonlinear Systems.. . R. Boxer, S. Thaler 89 5612. Multi-Beam Velocity-Type Frequency Multiplier Yukito Matsuo 101 5613. IRE Standards on Terminology for Feedback Control Systems 107 Correction to "Temperature Coefficient of AT Cut Quartz Crystals," by E. A. Gerber 109 Correspondence: 5614. Scattering Matrix Measurements on Nonreciprocal Microwave Devices...J. E. Pippin 110 5615. A New Treatment for Parabolic Reflector Problems B Chatterjee 110 5616. A Method of Launching Surface Waves I D. Lawson Ill 5617. Noise Reduction in CW Magnetrons R L Krulee and J. A. Mullen 111 5618. Russian Vacuum-Tube Terminology G F. Schultz 112 Contributors 112 IRE News and Radio Notes 115-126 5619. Abstracts of IRE Transactions 130 5620. Abstracts and References 134 Annual Index to Convention Record of the IRE Follows Page 148 ADVERTISING SECTION Meetings with Exhibits 6A Notes 32A Membership 72A News—New Products 16A IRE People 44A Positions Open 140A Section Meetings... . 22A Professional Group Positions Wanted 152A Industrial Engineering Meetings 68A Advertising Index.... I97A T HE COVER—If a suspension of tiny iron-oxide particles is poured over the polished surface of a magnetic material and examined through a microscope, an unusual pattern similar to that depicted on this month's cover will be ob- served. The accumulation of the iron powder along well- defined boundary lines indicates the existence of small magnetic "domains" running in various directions within the material. Each domain is magnetized to saturation, but the material as a whole will not reach saturation until all the domains are pointing in the same direction. Interest in magnetic materials has been greatly stimu- lated by the widespread application of ferrites in such de- vices as the control coil shown on the cover. An excellent survey of the use of ferrites in inductors appears in the first paper in this issue. Photo—Bell Telephone Laboratories, Inc.
-
Upload
khangminh22 -
Category
Documents
-
view
1 -
download
0
Transcript of PROCEEDINGS OF THE IRE - World Radio History

BOARD OF DIRECTORS, 1955
J. D. Ryder, President Franz Tank, Vice-President W. R. G. Baker, Treasurer Haradan Pratt, Secretary John R. Pierce, Editor
J. W. McRae, Senior Past President W. R. Hewlett, Junior Past President
1955
S. L. Bailey A. N. Goldsmith A. V. Loughren
C. J. Marshall (RS) L. E. Packard (R1) J. M. Pettit (R7) B. E. Shackelford C. H. Vollum
H. W. Wells (R3)
1955-1956
E. M. Boone (R4) J. N. Dyer (R2)
J. T. Henderson (R8) A. G. Jensen
George Rappaport D. J. Tucker (R6)
1955-1957
J. F. Byrne Ernst Weber
•
George W. Bailey Executive Secretary
• John B. Buckley, Chief Accountant
Laurence G. Cumming, Technical Secretary
Evelyn Davis, Assistant to the Executive Secretary
Emily Sirjane, Office Manager
EDITORIAL DEPARTMENT
Alfred N. Goldsmith Editor Emeritus
John R. Pierce, Editor E. K. Gannett, Managing Editor Manta D. Sands,
Production Manager
ADVERTISING DEPARTMENT
William C. Copp, Advertising Manager Lillian Petranek,
Assistant Advertising Manager
EDITORIAL BOARD
John R. Pierce, Chairman D. G. Fink
E. K. Gannett T. A. Hunter W. R. Hewlett J. A. Stratton W. N. Tuttle
Responsibility for the contents of papers published in the PROCEEDINGS of the IRE rests upon the authors. Statements made in papers are not bind-* ig on the IRE or its members.
IJOEAU
Change of address (with 15 days ad-vance notice) and letters regarding sub-scriptions and payments should be mailed to the Secretary of the IRE, I East 79 Street, New York 21, N. Y.
All rights of publication, including foreign language translations are re-served by the IRE. Abstracts of papers with mention of their source may be printed. Requests for republication should be addressed to The Institute of Radio Engineers.
PROCEEDINGS OF THE IRE Published Monthly by
The Institute of Radio Engineers, I nc.
VOLUME 44 January , 1956 NUMBER I
CONTENTS
Arthur V. Loughren, President, 1956 2 The State of Radio and Electronics in Egypt Professor H. M. Mahmoud 3 5598. A Survey of Application of Ferrites to Inductor Design R. S. Duncan, H. A. Stone, Jr. 4 5599. Electromechanical Filters for 100-Kc Carrier and Sideband Selection... R. IV. George 14 5600. New Microwave Repeater System Using Traveling-Wave Tubes N. Sawazaki and T. Honma 19
5601. Geophysical Prospection of Underground Water in the Desert by Means of Electro-magnetic Interference Fringes W. A. H. El-Said 24
5602. A Transmission Line Taper of Improved Design R IV. Klopfenstein 31 5603. A Precision Resonance Method for Measuring Dielectric Properties of Low-Loss Solid
Materials in the Microwave Region S Saito and K. Kurokawa 35 5604. Transistor Amplifiers for Use in a Digital Computer.. Q. W. Simkins, J. H. Vogelsong 43
5605. A Developmental Wide-Band, 100-Watt, 20 DB, S-Band Traveling-Wave Amplifier Utilizing Periodic Permanent Magnets W W. Siekanowicz and F. Slerzer 55
5606. Spurious Modulation of Electron Beams C C. Culler 61 5607. Negative Resistance Regions in the Collector Characteristics of the Point-Contact
Transistor L E Miller 65 5608. The Dependence of Transistor Parameters on the Distribution of Base Layer Resis-
tivity J L Moll and I. M. Ross 72 5609. Surface Resistance and Reactance of Metals at Infrared Frequencies
J R. Beattie and G. K. T. Conn 78 5610. Transverse-Field Traveling-Wave Tubes with Periodic Electrostatic Focusing R. Adkr, O. M. Kromkout, and P. A. Clavier 82
5611. A Simplified Method of Solving Linear and Nonlinear Systems.. . R. Boxer, S. Thaler 89 5612. Multi-Beam Velocity-Type Frequency Multiplier Yukito Matsuo 101 5613. IRE Standards on Terminology for Feedback Control Systems 107 Correction to "Temperature Coefficient of AT Cut Quartz Crystals," by E. A. Gerber 109
Correspondence:
5614. Scattering Matrix Measurements on Nonreciprocal Microwave Devices...J. E. Pippin 110 5615. A New Treatment for Parabolic Reflector Problems B Chatterjee 110 5616. A Method of Launching Surface Waves I D. Lawson Ill
5617. Noise Reduction in CW Magnetrons R L Krulee and J. A. Mullen 111 5618. Russian Vacuum-Tube Terminology G F. Schultz 112 Contributors 112
IRE News and Radio Notes 115-126 5619. Abstracts of IRE Transactions 130 5620. Abstracts and References 134 Annual Index to Convention Record of the IRE Follows Page 148
ADVERTISING SECTION
Meetings with Exhibits 6A Notes 32A Membership 72A News—New Products 16A IRE People 44A Positions Open 140A Section Meetings... . 22A Professional Group Positions Wanted 152A Industrial Engineering Meetings 68A Advertising Index.... I97A
THE COVER—If a suspension of tiny iron-oxide particles is poured over the polished surface of a magnetic material and examined through a microscope, an unusual pattern similar to that depicted on this month's cover will be ob-served. The accumulation of the iron powder along well-defined boundary lines indicates the existence of small magnetic "domains" running in various directions within the material. Each domain is magnetized to saturation, but the material as a whole will not reach saturation until all the domains are pointing in the same direction.
Interest in magnetic materials has been greatly stimu-lated by the widespread application of ferrites in such de-vices as the control coil shown on the cover. An excellent
survey of the use of ferrites in inductors appears in the first paper in this issue.
Photo—Bell Telephone Laboratories, Inc.

2 PROCEEDINGS OF THE IRE January
Arthur V. Loughren PRESIDENT, 1956
Arthur V. Loughren was born in Rensselaer, New York, on September 15,1902. He received the B.A. and the E.E. degrees from Columbia University in 1923 and 1925, respectively.
Upon graduation, Mr. Loughren spent two years at the Research Laboratory of the General Electric Company con-cerned with problems arising from the adaptation of vacuum tubes to circuits. Then followed two and a half years in the Radio Engineering Department. In 1930 he transferred to the RCA Manufacturing Company at Camden, New Jersey, where, successively, he became responsible for the design of tuned radio-frequency receivers, loudspeakers and phono-graph pickups, as well as all factory tests and inspections. In 1934, he rejoined the General Electric Company at Bridgeport, Connecticut, to work on the design of radio receivers.
In 1936 Mr. Loughren joined the laboratories of Hazeltine Corporation. He then rose to become, successively, engineer in charge of television development, design supervisor for military equipment programs, and director of research. He is currently vice-president in charge of research for Hazeltine Corporation and executive vice-president of Hazeltine Research Inc., a sub-sidiary of Hazeltine Corporation.
During World War II Mr. Loughren received the U. S. Navy, Bureau of Ships, Certificate of Commendation for Out-standing Service to the Navy for contributions to electronic development. During his long career Mr. Loughren has been
awarded thirty U. S. electronics patents. He is a member of Phi Beta Kappa, Sigma Xi, and Tau Beta Pi.
His professional and industrial activities have included membership in Panels 7 and 9 of the first National Television System Committee and Panel 6 of the Radio Technical Plan-ning Board, the chairmanship of the Joint Advisory Commit-tee, and service on RETMA committees. He is currently vice-chairman of the present National Television System Commit-tee and chairman of its Panels 7 and 13. He was awarded the David Sarnoff Gold Medal in 1953 by the Society of Motion Picture and Television Engineers for "meritorious achieve-ment in television engineering," and the 1954 Plaque of the RETMA-IRE Radio Fall Meeting with the citation, "for his contributions to color television circuitry." His outstanding contributions in the formulation of the signal specifications for compatible color television won him the coveted IRE Morris Liebmann Memorial Prize in 1955.
Mr. Loughren joined the IRE as an Associate in 1924. He became a Member in 1929, a Senior Member in 1943 and a Fellow in 1944. He has served on the Papers Procurement, Membership, Finance, Executive, and Editorial Review com-mittees, and as Chairman of the Awards and Policy Advisory Committees. He has also been a member of Radio Receivers, Standards, Television, and Vacuum Tubes committees. He served as Director from 1952-1955.
• "e>

1956 PROCEEDINGS OF THE IRE 3
The State of Radio and Electronics in Egypt
PROFESSOR H. M. MAHMOUD, CAIRO UNIVERSITY
In view of the recent formation of an IRE Section in Egypt, the following report on the recent growth of radio engineering there is of special timeliness and interest.— The Editor.
Egypt's unique geographical juxtaposition to the Mediter-ranean and Red Seas, and the African and Asian continents has since the days of the Pharaohs made Egypt a center of culture, trade and communications—a melting pot where east-ern and western ideas meet and mingle. In recent years Egypt has shown a strong determination to improve her standard of living and develop the land through modern methods. This editorial aims to show this determination in the particular fields of radio and electronics by outlining the history of the development of radio and electronics in Egypt during the past two decades, the present situation, and future plans.
Regular Egyptian broadcasting, which is government-con-trolled, was started in 1933 as a single program from a 20-kw transmitter. From the beginning it was realized that such serv-ice was inadequate, but the advent of World War II inevitably delayed normal expansion. After the war's end, the situation was rectified to such an extent that today Egypt has in opera-tion three medium-wave high-power transmitters with ratings up to 100 kw, six low-power regional transmitters, and three high-power short-wave transmitters with powers of 100 kw, 120 kw and 140 kw. The antenna system serving these trans-mitters occupies a 250-acre area, and the switching of short-wave antennas is carried out by a novel remotely-controlled mechanical switch. As a result, Cairo is now able to broadcast programs in twelve different languages over a total broadcast-ing time of 100 hours per day. The broadcasting station itself, even though it has undergone two major expansions since 1933, is still inadequate. A new station, therefore, is now being erected, including modern programming facilities and tele-vision studios, which will embody the most up-to-date archi-tectural and acoustical designs.
Television broadcasting has not yet begun in Egypt, but the potentialities and value of this medium have not been over-looked. A committee was formed to draft a scheme defining the lines along which television would be introduced to the country. This committee has submitted its report, and steps are now being taken to realize this scheme. In the meantime occasional experimental transmissions are being carried out by the Electronics Laboratory of the Faculty of Engineering, Cairo University.
Wireless telecommunication services are run by a division of the State Telegraph & Telephone. They include maritime, meteorological, and press agencies' teleprinter services.
Public security and police radio services are used now only in the big cities, but a country-wide network will soon be put into operation.
Public radiotelephone and telegraph services have been in operation for a long time. These services are owned and operated by a private company whose contract expires in 1958; at that date the government will assume control. Meanwhile, to meet the increasing demand for radiotelephone and tele-graph services a large transmitting station is being constructed in the vicinity of Cairo. The antenna system of this station will occupy nine hundred acres. A receiving station, with an an-tenna system covering two hundred acres, is also being built. A tremendous expansion in military electronics has oc-
curred in the last decade. The Signal Corps, Artillery, and Air Force now use modern electronic equipment in communica-tions, early warning and fire control radar.
Egyptian radio and electronic industry has just started radio receiver production on an assembly-line basis.
Since 1930 the need for competent engineers to man these projects has been met by giving courses in basic radio, com-munications and electronics to electrical engineers. About a hundred such engineers graduate annually from Cairo, Alex-andria, and Ein Shams Universities. To meet the need for more specialized radio engineers, a more advanced course in radio and electronics was started by the University of Alexandria in 1947, and by the University of Cairo in 1948. The number of graduates each year started at thirty, but it has doubled since. These two universities also offer postgraduate courses which include advanced studies in mathematical communications theories, pulse, television, radar techniques, and microwave theories. A third of the time spent in postgraduate study is allotted to experimental work.
In the past the universities have been responsible for all of the research effort in Egypt. Recently, however, a National Research Council was created, and the nucleus of an Elec-tronics Institute, concerned with problems of research and de-velopment, has been formed. This organization, which has a modern, properly-equipped laboratory operated by a group of qualified scientists and engineers, is presently.investigating the possibility of underground water prospecting by radio methods.
At one time the progress of a nation was measured in terms of the means of communications it possessed; today, however, we feel the state of its radio and electronics is a better criterion.

4 PROCEEDINGS OF THE IRE January
A Survey of the Application of Ferrites to Inductor Design*
R. S. DUNCANt, ASSOCIATE, IRE, AND H. A. STONE, JR•t
The following paper is one of a planned series of invited papers, in which men of recognized standing will review recent developments in, and the present status of, various fields in which noteworthy progress has been made.—The Editor
Summary—Within the last ten years, due to the advent of ferrites important new possibilities in inductor design have materialized. Higher Q's, smaller sizes, and lower costs are among the advantages these new magnetic materials offer. This paper discusses the proper-ties of ferrites and reviews the progress that has been made thus
far in their application to inductors.
INTRODUCTION
IN THE EARLY 1940's the design of high Q mag-netic core inductors might be said to have been in a state of uninspired stability. The molybdenum
permalloy powders [1] had become established as the outstanding core materials for coil usage at frequencies up to at least 100 kc. Silicon iron in laminar form con-tinued to dominate powder applications, but where pre-cision, stability, and high Q were required the "moly" toroids were almost invariably called for. These were available in several sizes and permeabilities and their properties were well characterized; which is to say that the limitations in coil design were well defined.
During the war, as the need developed for electronic gear of improved performance and smaller size, the shortcomings of the available magnetic materials began to become oppressive. Shortly after the war the birth of the transistor added impetus to the clamor for more compact equipment. The need for high quality coils of small size clearly would not be met with molybdenum permalloy or other known metallic alloys.
It was into this sort of situation that the high permea-bility ferrites were introduced. As we review their adaptability to present-day coil needs it will not be sur-prising that they have so rapidly assumed major importance. This survey is concerned primarily with the applica-
tion of ferrites to inductors. Most of the emphasis is on linear or current-stable coils, such as are used in con-ventional filters, equalizers, tuners, etc. Brief attention is also given to a few special nonlinear coil applications. The important contributions of ferrites to other devices such as pulse transformers, antenna rods, gyrators, etc., lie beyond the scope of this paper.
* Original manuscript received by the IRE, September 9, 1955. -I. Bell Telephone Labs., Inc., Murray Hill, N. J.
In metallurgical circles the word ferrite has other con-notations, but in the electronic field it refers simply to iron oxides, or magnetic mixtures of iron oxides with oxides of other metals. The use of ferrites as core materials for inductors is generally considered a recent development and, in a practical sense, this is justified since extensive use is based on the work done by the Philips Company in Holland, and announced in 1946 [2]. As a matter of historical interest, however, ferrites were used in coils, at least as far back as 1935. These first ferrite cores were made from naturally occurring magnetite, Fe304. The ore was ground and impurities removed by magnetic separation [3]. Synthetic mag-netite has also been used. Although inexpensive, mag-netite cores are extremely limited by their low permea-bility, between 2 and 4. Their principal use has been as slugs for high frequency coils and even in this applica-tion they have now been largely replaced by carbonyl iron and permalloy powders. The importance of the Philips' research was in the
establishment on a practicable basis of mixed ferrites with permeabilities in excess of 1,000. High permea-bility combined with the high resistivity of semi con-ductors has opened the door to achievements in induc-tors which, only a few years ago, would have been
considered fantastic.
FERRITE PROPERTIES
Foremost among the desirable characteristics of a core material is permeability, commonly symbolized by ¡I. The improvement in an inductor due to use of a magnetic core whose permeability is significantly greater than unity is effected in two distinct ways. First, the physical size of the coil can be reduced since a winding of fewer turns of smaller wire in a high 11 core will give performance equivalent to a larger winding used without a core. Second, the high permeability core tends to reduce leakage of magnetic flux, thus obviating the need for bulky shielding enclosures frequently re-quired with air core inductor designs. From this one might assume that the highest possible permeability would always be the best. However, in ferromagnetic materials the increase of IA without limit is not desirable

1956 Duncan and Stone: Ferrite Applications in Inductor Design 5
because it entails a sacrifice with respect to core losses which relates to the second important core property, Q. The quality factor, Q, of an inductor is defined as the
ratio of reactance to resistance. It is of major importance as a measure of the purity of the inductance or its relative freedom from the degrading effect of losses which appear as series resistance in the equivalent cir-cuit. For example, since the value of Q of the com-ponents in a filter determines the maximum amount of frequency discrimination which that filter can exhibit, in this large field of inductor application high Q is invariably a desideratum.
As is well-known, alternating current losses in mag-netic materials are a function of permeability, flux density (B„,) and frequency (f) as expressed in Legg's equation for equivalent series resistance [4]:
R„, = egfL apB„.L.
in which e, a, and c are constants and L is inductance. It is seen that an increase in g will inevitably result in increased ac core losses and therefore lower Q. Due to the presence of direct current resistance in addition to core losses, at any given frequency an optimum value of p can be determined for which total coil losses are a minimum (and therefore Q a maximum).
It has been shown [5] that the product p.Q., is a very useful parameter for characterizing ferrite core ma-terials. Here Q„, is the "material Q" and Pm the permea-bility measured on a closed core. The introduction of air gaps in the core structure changes the relative values of ;4 and Q in the product g.Q., where now the subscripts refer to effective values of the two factors in the gapped structure. However, so long as average flux density is maintained constant and if leakage is not excessive, peQ„ will be approximately equal to g„.Q„,. A more im-portant and useful property of the pQ product is that with a given core structure into which various amounts of air gap are introduced, the maximum Q obtainable at the frequency of interest with a given core material and the corresponding value of effective g are each directly proportional to VAQI of that material. Thus the pQ product is a sort of synthetic parameter of special utility in evaluation of the magnetic ferrites as core materials.
A third magnetic core property of importance is the saturation flux density. This value is related to the upper bend of the B—H magnetization characteristic of the material. In this region increases in the magnetizing force produce relatively small increases in flux density. Magnetic nonlinearity sets an upper limit to the current level which can be used in ferromagnetic core inductors for applications requiring a high degree of inductance stability. The mechanical properties of a core material affect
to a large extent its scope of usefulness. Among the qualities desired are high tensile and compressive
strength, good resistance to impact, ability to function unimpaired over a wide range of ambient conditions of temperature and humidity, good dimensional stability, and ability to be formed into complex core shapes at low cost.
The above properties will now be considered with specific reference to modern ferrites. Table I shows
µ Composi-tion
Application Frequency Range
eié2
4,000 NiZn up to 100 kc 50,000 at 10 kc 1,500 MnZn 5 kc to 500 kc 300,000 at 10 kc 500 NiZn 100 kc to 2 mc 20,000 at 500 kc 100 NiZn 1 mc to 15 mc 5,000 at 2 mc 50 NiZn 5 mc to 25 mc 5,000 at 10 mc 15 Ni above 25 mc 500 at 50 mc
permeability and pQ values for a few typical ferrite compositions. It is seen that values of p up to about 4,000 are available which is ample to permit effective inductor miniaturization. The situation with regard to pQ is shown in Fig. 1, a chronological step chart of values available in various materials including ferrite. It is in pQ that ferrite most significantly outperforms previously available materials.
1,000po
100,00
10,000
1,000 lI( 1927 1937 1950
" 4 1 _ t
l - DEVELOPMENT OF HIGH 0 Mn Zn --1 MAGNETIC MATERIALS FERRITE-
( 300,000)-(1 Data cola. for f • 10kc,Bm • 20) 1_
2-81 MOLY. PERMALLOY (27,000)
81 PERMAL (9700)
LOY
— IRON DUST (3100)
._._
Fig. 1—Improvement in µQ related to time of introduction of various magnetic materials.
The saturation flux density of typical ferrite ranges from about 2,000 to 4,000 gausses. This value is rela-tively low and it is this property which definitely limits the applicability of ferrites for high-current level in-ductor cores.
In mechanical properties the ferrites are not far from ideal. Strength, dimensional stability, and producibility
6 PROCEEDINGS OF THE IRE January
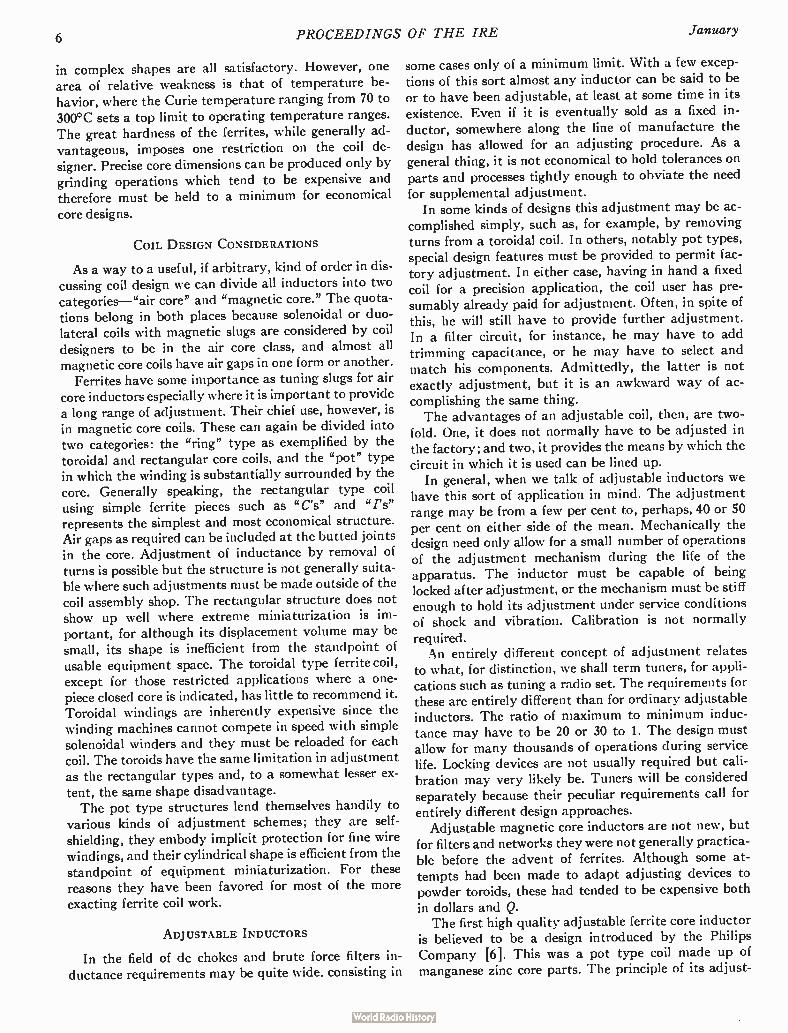
in complex shapes are all satisfactory. However, one area of relative weakness is that of temperature be-havior, where the Curie temperature ranging from 70 to 300°C sets a top limit to operating temperature ranges. The great hardness of the ferrites, while generally ad-vantageous, imposes one restriction on the coil de-signer. Precise core dimensions can be produced only by grinding operations which tend to be expensive and therefore must be held to a minimum for economical
core designs.
COIL DESIGN CONSIDERATIONS
As a way to a useful, if arbitrary, kind of order in dis-cussing coil design we can divide all inductors into two categories—"air core" and "magnetic core." The quota-tions belong in both places because solenoidal or duo-lateral coils with magnetic slugs are considered by coil designers to be in the air core class, and almost all magnetic core coils have air gaps in one form or another.
Ferrites have some importance as tuning slugs for air core inductors especially where it is important to provide a long range of adjustment. Their chief use, however, is in magnetic core coils. These can again be divided into two categories: the "ring" type as exemplified by the toroidal and rectangular core coils, and the "pot" type in which the winding is substantially surrounded by the core. Generally speaking, the rectangular type coil using simple ferrite pieces such as " C's" and "/'s" represents the simplest and most economical structure. Air gaps as required can be included at the butted joints in the core. Adjustment of inductance by removal of turns is possible but the structure is not generally suita-ble where such adjustments must be made outside of the coil assembly shop. The rectangular structure does not show up well where extreme miniaturization is im-portant, for although its displacement volume may be small, its shape is inefficient from the standpoint of usable equipment space. The toroidal type ferrite coil, except for those restricted applications where a one-piece closed core is indicated, has little to recommend it. Toroidal windings are inherently expensive since the winding machines cannot compete in speed with simple solenoidal winders and they must be reloaded for each coil. The toroids have the same limitation in adjustment as the rectangular types and, to a somewhat lesser ex-tent, the same shape disadvantage. The pot type structures lend themselves handily to
various kinds of adjustment schemes; they are self-shielding, they embody implicit protection for fine wire windings, and their cylindrical shape is efficient from the standpoint of equipment miniaturization. For these reasons they have been favored for most of the more exacting ferrite coil work.
ADJUSTABLE INDUCTORS
In the field of dc chokes and brute force filters in-ductance requirements may be quite wide, consisting in
some cases only of a minimum limit. With a few excep-tions of this sort almost any inductor can be said to be or to have been adjustable, at least at some time in its existence. Even if it is eventually sold as a fixed in-ductor, somewhere along the line of manufacture the design has allowed for an adjusting procedure. As a general thing, it is not economical to hold tolerances on parts and processes tightly enough to obviate the need for supplemental adjustment.
In some kinds of designs this adjustment may be ac-complished simply, such as, for example, by removing turns from a toroidal coil. In others, notably pot types, special design features must be provided to permit fac-tory adjustment. In either case, having in hand a fixed coil for a precision application, the coil user has pre-sumably already paid for adjustment. Often, in spite of this, he will still have to provide further adjustment. In a filter circuit, for instance, he may have to add trimming capacitance, or he may have to select and match his components. Admittedly, the latter is not exactly adjustment, but it is an awkward way of ac-complishing the same thing. The advantages of an adjustable coil, then, are two-
fold. One, it does not normally have to be adjusted in the factory; and two, it provides the means by which the circuit in which it is used can be lined up.
In general, when we talk of adjustable inductors we have this sort of application in mind. The adjustment range may be from a few per cent to, perhaps, 40 or 50 per cent on either side of the mean. Mechanically the design need only allow for a small number of operations of the adjustment mechanism during the life of the apparatus. The inductor must be capable of being locked after adjustment, or the mechanism must be stiff enough to hold its adjustment under service conditions of shock and vibration. Calibration is not normally
required. An entirely different concept of adjustment relates
to what, for distinction, we shall term tuners, for appli-cations such as tuning a radio set. The requirements for these are entirely different than for ordinary adjustable inductors. The ratio of maximum to minimum induc-tance may have to be 20 or 30 to 1. The design must allow for many thousands of operations during service life. Locking devices are not usually required but cali-bration may very likely be. Tuners will be considered separately because their peculiar requirements call for entirely different design approaches.
Adjustable magnetic core inductors are not new, but for filters and networks they were not generally practica-ble before the advent of ferrites. Although some at-tempts had been made to adapt adjusting devices to powder toroids, these had tended to be expensive both
in dollars and Q. The first high quality adjustable ferrite core inductor
is believed to be a design introduced by the Philips Company [6]. This was a pot type coil made up of manganese zinc core parts. The principle of its adjust-

1956 Duncan and Stone: Ferrite Applications in Inductor Design 7
ment is shown in Fig. 2. The length of the main gap is controlled by grinding the center post and outside ring to prescribed differential dimensions. Final adjustment is then accomplished by the use of a plastic strip coated with ferrite powder. As shown in the figure, this strip, which is about 0.15 inch wide and 7 or 8 inches long, is threaded through slots in the ring so that it passes through the main air gap. The coating of ferrite on the strip is graded from about 0.001-inch thick at one end
Fig. 2—Inductor using ferrite-coated plastic strip within the air gap for adjustment of inductance.
to anywhere from 0.003- to 0.008-inch at the other. The effective length of the main gap is thus, to a first approx-imation, reduced in proportion to the thickness of ferrite on the strip and this in turn is a function of the length-wise position of the strip in the core. After locating the strip so that the required inductance is met it can be cemented in place and the excess cut off. The range of control of inductance by use of this strip is in the order of 10 per cent.
Fig. 3—Adjustable inductor using auxiliary ferrite slug. ( 1509 type adjustable ferrite core coil for type 0 carrier system.)
In this country there was also early interest in pot type coils with provisions for adjustment. Fig. 3 shows a design created at Bell Laboratories and now in wide use in carrier telephone system filters [7]. This design features a slug which can be inserted, by rotating a screw, into a depression in the center post, providing an essentially linear inductance adjustment range of about +20 per cent. It is mechanically capable of positioning to a precision of about 0.01 per cent and can be locked after adjustment. This coil meets unusually high Q re-quirements; from 500 to 600, depending on inductance value and frequency.
Both of the coils described above permit accurate adjustment, and this means that several conditions have been met:
1 The ratio of inductance change to mechanical dis-
placement is low. It is accomplished in the Philips' coil by the very gradual taper of the thickness of core material on the plastic strip, and in the Bell Laboratories' coil by a fine thread screw. In the latter about seven revolutions of the adjusting screw are required to cover the adjustment range.
2. This ratio always has the same sign. "Waviness" in the adjustment characteristic is always undesirable and if it exists to such a degree that the inductance goes through successive maxima and minima as the coil is being adjusted by null methods, spurious balances will result.
3. Backlash and other phenomena of mechanical looseness have been kept to a minimum.
4. Locking can be accomplished and the hand or ad-justing tools removed without changing the ad-justment.
In both of these designs the approach is to provide a mechanically stable main air gap modified by an extra magnetic detail; in the one case the ferrite coated plastic and in the other a ferrite slug. This approach appeals because it provides rigidity in those core mem-bers that have the greatest effect on inductance. Since in adjusting these coils the differential dimensions in-volved may be fractions of a thousandth of an inch, there is a measure of security in allowing motion only in the relatively small and light supplementary parts.
This security, however, carries economic penalties in two ways. First, directly, since the provision and the assembly of the extra parts cost money. Second, as a result of inflexibility. The range of frequency best served by the two inductors so far described is deter-mined by the mean air gap, which is a fixed parameter of the structure. To adapt them to a different frequency range would involve more changes than are at once ap-parent. Suppose, for instance, in the design shown in Fig. 3 it were desired to change the coil so that the best Q's would be realized at 10 kc instead of 100 kc. The length of the main air gap would have to be materially reduced and this could be accomplished simply by speci-fying a longer center post or a shorter outside ring. But then it would be found that the slug was far less effective in shunting the shortened air gap and the range of adjustment would be reduced. To restore this range the diameter of the slug might be increased. This, however, would introduce a new trouble. Reduced clearance be-tween the slug and the walls of the main core would ag-gravate spurious cyclic changes of inductance, or "wavi-ness," superimposed on the normal adjustment charac-teristic.
Where the need for very precise setting of the induc-tance is not a factor, it becomes possible to use designs

8 PROCEEDINGS OF THE IRE January
in which the effective mechanical motion can be re-stricted to 180°. This is important because it permits the use of very simple structures of the type exemplified by Fig. 4, where one of the cores is rotated with respect to the other. The required air gap spacing can be pro-vided by insertion of a physical spacer or it can be achieved by differential grinding, as illustrated in the figure. The latter has the disadvantage of a more dif-ficult grinding operation but it avoids the problems of strength and dimensional stability that apply to paper or plastic separators. The change in inductance in this type of coil results, not from a change in effective air gap length but from a change in effective cross section of the gap. This is accomplished either by irregularity in the shape of the post, as shown, or by cutaway sec-tions in the periphery of the shell. Both versions have been used and each has its advantages. A somewhat higher Q for a given size structure can be obtained if the shell is cut away because in cores of practical dimensions there tends to be more area in the rim than in the center post. Proportionately more of it can be sacrificed with-out degrading the coil's performance. On the other hand, this method reduces the effective self-shielding of the coil. If the post is shaped, it can be done in such a way as to achieve a variety of desired characteristics of rota-tion vs. inductance, such as, for instance, an approxima-tion of a straight-line frequency characteristic.
AIR GAP
Fig. 4—Inductance adjustment by rotation of core to produce vari-ation in air gap area.
All of the adjustment mechanisms described above have been based on manipulation, in one way or an-other, of the air gap. While this seems to have been the most popular approach, it is not the only one. For example, Fig. 5 shows a pot type coil in which continu-ous adjustment of turns is possible [7].
Adjustment by magnetization of the core with per-manent magnets has been used in connection with permalloy powder toroids [8], but so far as the authors
Fig. 5—Adjustment of inductance based on addition or removal of turns.
are aware, not with ferrites. In using such a method it is necessary to consider modulation and other distortion effects, as well as loss of Q.
TUNERS
The chief distinction between tuners and other ad-justable inductors is in the requirement for long range of adjustment. Since, using a fixed capacitor, resonance frequency is proportional to the square root of induc-tance, it requires a 9 to 1 inductance adjustment range just to cover the 0.5 to 1.5 mc broadcast band. This contrasts with the 11 or 1-1- to 1 kind of performance that we have considered so far.
Success in handling this long range has been achieved by use of a magnetic variometer. Fig. 6 illustrates the principle. The windings on the two cores are so poled that during rotation they pass from a series aiding to a series opposing condition. With a coupling of 90 per cent between cores, which is easily achieved, almost a 20 to 1 variation of inductance is implied. Even though the Q tends to suffer when the windings are directly in op-position, existing designs have permitted practical ranges of this order. A novel variation of the magnetic variometer has been
devised to fill a need for double tuning. This device, illustrated in Fig. 7 has been descriptively dubbed the "twinductor.” Electrically, it can be considered as two variometers, the opposite windings on each core being connected in the same manner as in the single variome-ter. Since the flux patterns in each core due to the two pairs of windings are at right angles to each other, there is no mutual interaction between them. Thus the wind-ings are electrically independent while, at the same time, they are controlled by one simple mechanical motion. Once the coil has been initially balanced, no problem in tracking can occur. The chief weakness of variometer type tuners has
been that the long range of adjustment must be effected in a 180° turning of the cores. This makes them too

1956 Duncan and Stone: Ferrite Applications in Inductor Design 9
sensitive to be usable for some of the more exacting ap-plications. Gear reduction schemes have been partially successful in overcoming this disadvantage but the problem of backlash, as well as expense, limits their practical use.
Where the frequency range of interest is high enough so that Q's obtainable with slug tuned coils are adequate, say above a megacycle, the ferrites can contribute to long range tuning. The two conditions that are needed are high permeability in the core, which the ferrites can provide, and close proximity of the core and the winding, which must be provided by design. In one instance the need for a thin wall between the ferrite core and .the winding was met in the following way. In order to
Fig. 6—Ferrite core variometer.
realize a 10 to 1 range it was determined that the wall thickness should not exceed 0.004 inch. Tubes of this thickness were too fragile to be handled so the inductor was wound on a solid rod of epoxy casting resin. The rod was then recast to envelop and protect the winding, and finally the inside was drilled out leaving the required thin wall. Slug tuned coils can be designed for very sensitive control by use of a fine thread lead screw for the tuning slug.
Fig. 7—The "twinductor." Two electrically independent variometers using common core parts.
MINIATURIZATION
In recent years there has been a growing demand for miniaturized apparatus. The use of improbable numbers of electronic components in aircraft, the need for light and compact equipment for soldiers in the field, the public interest in portable radios and smaller deaf sets, are factors in this trend toward small size. Until recently practical miniaturization was limited by the size and power requirements of electron tubes but new orders in size are now being paced by the transistor. The transis-tor demands passive components of a size comparable with itself so that its own potentials for equipment miniaturization can be realized, and at the same time it provides the possibility of such miniaturization by its very modest demands for power.
Coil designers have been finding in the ferrites the answer to their part of the responsibility for equipment size reduction. The possibility of using high and con-trollable permeabilities and the ability to let the coil parameters determine the form of core rather than de-signing the coil to meet restrictive requirements for core shape have resulted in impressive accomplishments in miniaturization. The permalloy powder cores are not only limited to
such simple forms as the toroid, but they are also re-stricted to a few discrete permeabilities. Since this char-acteristic is a function of the fineness of the powder and the amount of insulation it is commercially impractica-ble to manufacture cores having a great variety of permeabilities. Another restriction is that the highest value of permeability obtainable is only about 125.
Unlike the permalloys, the ferrites are used in bulk form and the effective permeability may be tailored, by inclusion of appropriate air gaps, to fit the individual needs of different coil designs. Effective permeabilities as high as 1,500 can be realized.

10 PROCEEDINGS OF THE IRE January
Some of the ramifications of coil miniaturization might best be reviewed by considering first an inductor, which may be of any shape or size, but whose permea-bility is such as to insure the highest possible Q for the inductance and frequency of interest. It will be assumed that the power level is low enough so that the core loss is not current sensitive. It will also be assumed, for the moment, that ac losses in the wire and losses due to distributed capacitance are small. The remaining losses, then, consist of the ic resistance in the winding, the "residual" loss in tl> core and the eddy current loss in the core [4]. It is of interest that neither of these core losses are dependent on volume, per se. They are, how-ever, directly proportional to permeability.
If the inductor under consideration is reduced in size in such a way that none of the proportions are altered, it will be found that the inductance is reduced directly as the linear dimensions. To make a meaningful compari-son between the reduced size coil and the original it is necessary, then, to restore the inductance. This can be done either by increasing the number of turns, in-creasing the permeability, or both. It can be shown that increasing the permeability and leaving the turns alone will result in the highest Q, and, in fact, that the opti-mum permeability is inversely proportional to the linear dimensions of the coil. Thus, to maintain as high a Q as possible when size is reduced, it is important to have materials, such as the ferrites, where intrinsic perme-ability is high and can be controlled by simple means. The value of Q under the conditions described will
turn out to be proportional to the cube root of the volume; that is, directly proportional to any of the linear dimensions of the coil. Limits to miniaturization by proportional reduction of dimensions, and readjust-ment of coil permeability, may be of four kinds:
1. Q becomes too low to be practicable for the circuit need. If the required size is such that the Q cannot even theoretically be met, the problem reverts back to the circuit designer.
2. The intrinsic permeability of the core material is too low to permit adjustment as size is further reduced. With ferrites this is unlikely to be a prob-lem except at voice frequencies. In such cases, where the permeability can no longer be adjusted upward, the deterioration of Q begins to approach the instead of the power of coil volume.
3. The solution of the mechanical problems attendant on putting smaller pieces together and maintaining closer tolerances becomes economically im-
practical. 4. Temperature stability of the coil, due to the higher
working permeability, fails to meet requirements.
Item (3), obviously, and (4), a little less obviously, are problems for the coil designer. With regard to (4), substantially all of today's ferrites give decided positive
temperature coefficients of inductance. The effect of this instability is approximately in proportion to the effec-tive permeability of the inductor in which the ferrite is used. The inductor designer has, however, the possi-bility of designing temperature compensation into his coils. One simple approach is to have the air gap expand with temperature at such a rate as to maintain constant effective coil permeability as the material permeability increases. This requires careful choice of materials and of design proportions.
Referring to temporary assumptions above, that the ac wire losses and distributed capacitance effects were small, most often such is the case. Where it is not, and these losses are significant, they tend to become less significant as the size of the coil is decreased. The ac wire loss is generally considered to be proportional to the sixth power of the wire diameter [9] and the dis-tributed capacitance is roughly proportional to the linear dimensions of the structure. As a matter of fact, reduction of distributed capacitance can sometimes con-stitute an important bonus in miniaturization. One of the smallest ferrite core inductors so far having
reached manufacture is shown in Fig. 8. This is a fixed
Fig. 8—Details of construction of miniature ferrite core choke.
coil using pot type manganese zinc cores. It is about i-inch in diameter and Ar-inch long, excluding the terminal leads. In spite of its small volume, about 0.015 cubic inch, it is suitable for inductances of up to more than 100 mh, and Q's approaching 100 have been realized. These characteristics, as is generally the case with the smallest coils, are dependent on low level opera-tion. Thus, they are particularly suitable for transistor circuitry.
While fixed miniature coils such as the above have their field of use, adjustability of inductors tends to be-come more important as size is reduced. This is because adjustable air capacitors, or even fixed trimmers, take up an amount of space that is out of all proportion with

1956 Duncan and Stone: Ferrite Applications in Inductor Design 11
the volume of the more miniature assemblies. The in-ductors, then, must assume the burden of adjustability that capacitors could have carried in larger equipments. Some of the same principles of adjustment that have
been described for larger coils are applicable for the miniature ones, even though tolerances become pro-gressively harder to meet as designs are scaled down. The principle illustrated in Fig. 3 has been successfully used for an inductor only I-inch in diameter and about I-inch long. A screw type adjustment was used for a coil of about the same volume and a working Q of almost
300 was realized [10]. A novel scheme of adjustment adapted to a miniature solenoidal coil consisted of a traveling contact that effectively shorted out turns as it was rotated [11]. Adjustment was limited to a few end turns so that the Q of the coil would not be exces-sively degraded. Miniature tuners both of the variome-ter and slug tuned types have been successfully used.
LOADING COILS
One of the largest fields of use for high Q inductors is in the loading of telephone cables. This use differs from many of the filter and network applications in several important respects. First, it is usually required that loading coils carry appreciable direct current for signal-ing. This may, in some cases, approach 100 milliam-peres. Second, modulation requirements are particu-larly severe, especially for carrier telephone circuits where there is danger of modulation products appearing in adjacent talking channels. Third, crosstalk must be kept to a very low level. Crosstalk is a function of balance, leakage, external shielding and relative posi-tioning of adjacent coils.
Toroidal coils of molybdenum permalloy powder, which was originally developed expressly for this appli-cation, are used almost exclusively for low frequency loading in this country. Permalloy powder cores are ideally suited to this use by their ability to carry appre-ciable direct current and their very low leakage. Al-though present ferrites could be used, this is one field where they would not offer outstanding advantages. Their dc carrying characteristics are marginal and the use of discrete air gaps with attendant local leakage ag-gravates the crosstalk problem.
In spite of these facts, and because the main con-stituent of permalloy is nickel, which is a strategic material, some attention has been given to ferrites for loading. Work has been aimed toward creating a ferrite which would be, for all practical purposes, a direct sub-stitute for molydbenum permalloy powder. Such a material, formed into standard sizes of toroidal cores, could be put into use without the delay and expense in-volved in modification of manufacturing plant facilities. So far, experimental work has produced some promising materials but, as of this writing, none suitable for use as a direct replacement for permalloy.
The story in Europe is quite different. There ferrites are used for both voice and carrier frequency loading. Circuit requirements, the state of .raw material supply, present investment in manufacturing equipment, etc., have been just different enough in some cases to have tipped the balance in favor of ferrites. The pot type coils have been generally favored, and ingenious schemes have been devised to insure the required balances. For example, one such scheme, introduced by the Philips Company, involves a mechanism for moving the wind-ings axially within the pot structure, thus modifying the leakage pattern and the resultant self inductances [ 12, 13].
NONLINEAR COIL APPLICATIONS
It has previously been mentioned that the value of ferrites as stable magnetic materials depends on using them at relatively low flux density. Lately there has been an increasing number of applications where the value of the ferrites depends on their instability at higher flux density, and, in fact, increasing attention is being given to development of the so-called square loop ferrites whose permeability is a critical function of their magnetization [14, 15]. These materials are used for modulators, magnetic amplifiers, memory devices, etc. which are generically, but only incidentally, inductors, as well as for control coils, whose design lies directly in the inductor field.
Control coils are simply adjustable inductors whose adjustment is effected by electrical rather than mechani-cal means [16], usually as a function of variations in applied direct current. Magnetic amplifiers represent a specialized use for such coils, but the application of more immediate interest is in frequency control.
In essence a control coil consists of two windings, a signal winding and a control winding, on a common core structure. The signal winding, circuitwise, is to be con-sidered as an inductor, having inductance, inductance range, and Q requirements. It is usually part of a net-work intended for frequency control, as in an oscillator, or for frequency discrimination, as in a filter. The con-trol winding carries a current whose instantaneous mag-nitude determines the permeability of the core structure, and hence the inductance of the signal winding. As in a magnetic amplifier the variations in the control cur-rent must be at a low rate compared to the signal fre-quency.
Direct transfer of energy between the control and signal windings must be avoided. This sometimes can be
done, although somewhat inefficiently, by the use of low pass filtering in the control winding circuit and high pass filtering in the circuit of the signal winding. More com-monly, however, it is done by use of suitable core con-figurations, three of which are shown in Fig. 9. In 9(a), two cores are used and the windings poled so that the net inductive coupling is zero. This sort of structure has

12 PROCEEDINGS OF THE IRE
the advantage of simplicity and can be balanced easily by turns adjustment. Control coils of this type have been on the market for several years. Design parameters can be adjusted for use at audio frequencies or up to 10 mc and higher. At the lower frequencies inductance variations of several hundred to one are possible.
Coils depending on mutually orthogonal flux paths, as shown in Fig. 9(b), have been used experimentally but so far as is known to the authors they have not found commercial application. They tend to be inflexible from the design point of view because of the interde-
pendence between core and winding dimensions. The style of control coil shown in Fig. 9(c), in which
separate structures are used for the control and signal windings, provides the greatest design flexibility. It is possible to choose core materials, and, to some extent, their size and shape independently for the signal and
control windings. The basic requirement for the signal winding core is
that its permeability be sensitive to flux level. This property, and the need for a favorable µQ in the fre-quency range of interest, will be factors in determining which ferrite to use. Size and proportions of the signal coil will be dependent on impedance and frequency re-quirements. The desire, in general, will be to keep the core structure as small as possible so as to increase its
sensitivity to the control flux. At higher frequencies small size in the signal coil may also be advantageous in reducing parasitic capacitance. The requirements for the control winding core are
entirely different. Usually it will operate essentially under de conditions. For sensitive control many ampere turns may be required, necessitating large structures. In the control winding there is little interest in the varia-tion of permeability with flux level, providing the core does not saturate. In some instances the control winding core is a ferrite which may or may not be the same as that in the signal winding. In other instances it has been made up of silicon iron laminations. The chief difficulty in the design of these coils has
been in insuring a high degree of balance of the control winding flux in the signal winding core. This is done by maintaining close symmetry in the latter and locating it with care within the air gap. The long range of inductance adjustment possible in
control coils may be taken advantage of directly for some applications, or the control coil may be used in series with a fixed coil where precise control is essential but the range is not extensive. One such use is in the regeneration of carrier frequency in a carrier telephone television terminal. In this application a ferrite control coil as part of a feedback system keeps a 4 mc carrier generator synchronized with carrier frequency infor-mation derived from the received signal [17].
Experimental control coils have been used at fre-quencies up to 200 mc. With present ferrites, however, both Q and adjustment range become restricted at fre-quencies much over 10 mc.
SIGNAL WINDING
SIGNAL WINDING
SIGNAL WINDING
January
CONTROL
WINDING
CONTROL WINDING
CONTROL WINDING
Fig. 9—Control coil design. Methods of avoiding coupling between control and signal windings. (a) Balanced windings on two cores. (b) Mutually perpendicular flux paths in common core. (c) Use of separate core structures.

1956 Duncan and Stone: Ferrite Applications in Inductor Design 13
CONCLUSION
In the not quite ten years since high permeability fer-rites were announced they have largely usurped the position of permalloy powders as the leading core materials for transmission type inductors. Designers have been quick to take advantage of their structural adaptability and the possibilities they offer for mechani-cal control of permeability. Currently manufactured inductors attest to the improved performance that these new dimensions in design can offer.
It is not unreasonable to suppose that the continuing application of research to improvement of ferrites will result in higher 14 at all frequencies and higher fre-quencies of practical use. Nor should it be assumed that the ultimate in coil design or ingenuity in coil applica-tion has yet been observed. It is not reasonable to predict ferrites for power applications in the near future but in the transmission inductor field, for which they are inherently suited, it is safe to expect a continuing and profitable increase in their use.
BIBLIOGRAPHY [1] Legg, V. E., and Given, F. J., "Compressed Powdered Molyb-
denum Permalloy." Bell System Technical Journal, Vol. 19 (July, 1940), p. 385.
[2] Snoek, J. L., "Non-Metallic Magnetic Materials for High Frequencies." Philips Technical Review, Vol. 8 (December, 1946), p. 353.
[3] Shea, H. G., "Magnetic Powders." Electronic Industries, Vol. 4 (August, 1945), p. 86.
[4] Legg, V. E., "Survey of Magnetic Materials and Applications in the Telephone System." Bell System Technical Journal, Vol. 18 (July, 1939), p. 438.
[5] Owens, C. D., "Analysis of Measurements on Magnetic Fer-rites.» PROCEEDINGS OF THE IRE, Vol. 41 (March, 1953), p. 359.
[6] Latimer, K. E., and MacDonald, H. B., "A Survey of the Pos-sible Applications of Ferrites." Proceedings of the IRE, Vol. 97 (April, 1950), p. 257.
[7] Stone, Jr., H. A., "Ferrite Core Inductors." Bell System Tech-nical Journal, Vol. 32 (March, 1953), p. 265.
[8] Burnell, L. G., "Variable Toroidal Inductors—New Electronic Components." Tele-Tech. Vol. 13 (October, 1954), p. 68.
[9] Wien, M., "On the Transmission of High Frequency Alternating Currents in Stranded Wire." (German) Anren der Physik (4), Vol. 14 (1904), p. 1.
[10] Darnell, P. S., "Miniaturized Components for Transistor Applications.» Telegraph and Telephone Age (August, 1952), p. 8.
[11] ng,. J. W., "Microminiature Variable Inductors for Transis-torization." Tele-Tech, Vol. 12 (August, 1953), p. 74.
[12] Hering, H., and Leichseuring, F., "Modern Loading Coils with Siferrit Pot-cores." (German) Siemens-Zeitschrift, Vol. 27 (Sep-tember, 1953), p. 124.
[13] Six, W., "Some Applications of Ferroxcube." Philips Technical Review, Vol. 13 (May, 1952), p. 301.
[14] Williams, H. J., Sherwood, R. C., Goertz, M., and Schnettler. F. J., "Stressed Ferrites Having Rectangular Hysteresis Loops.'
Transactions of the A IEE, Vol. 72, Part I (November, 1953), p. 531.
[15] Wijn, H. P. J., Gorter, E. W., Esvaldt, C. J., and Gildermans, P., "Conditions for Square Hysteresis Loops in Ferrites." Philips Technical Review, Vol. 16 (August, 1954), p. 49.
[16] Weis, Von A., "Variometers Controlled by Magnetic Fields." (German) Entwicklungs-Berichte der Siemens & Halske Aktienge-sellschaft, Vol. 17, (November, 1954), p. 251).
[17] Rieke, J. W., and Graham, R. S., "The L3 Coaxial System— Television Terminals." Bell System Technical Journal, Vol. 32 (July, 1953), p. 915.
[18] Weis, A. "High Frequency Magnetic Cores of Ferrites." (German) Funk u Ton, Vol. 11 (November, 1948), p. 564.
[19] Landon, V. D., "Use of Ferrite Cored Coils as Converters, Amplifiers and Oscillators." Radio Corporation of America Review, Vol. 10 (September, 1949), p. 387.
[20] Polder, D., "Ferrite Materials." Proceedings of the IRE, Vol. 97 (April, 1950), p. 246.
[21] Kornetzki, M., "Ferrite Cores for High Frequency Coils." (German) Siemens-Zeitschrift, Vol. 25 (April, 1951), p. 94.
[22] Legg, V. E., "Ferrites: New Magnetic Materials for Communi-cation Engineering.» Bell Tekpone Laboratories Record, Vol. 29 (May, 1951), p. 203.
[23] Vanderschmitt, B. V., Obert, M. J., and Stott, H. B., "Ferrite Applications in Electronic Components." Electronics, Vol. 25 (March, 1952), p. 138.
[24] Both, E., "Development and Utilization of Magnetic Ferrites.» Ceramic Age, Vol. 59 (April, 1952), p. 39.
[25] Emmerich, E., and Klaus Jr., S. C., "Evaluation of Electrical Properties of Ferrite Materials for Specific Applications." Ceramic Age, Vol. 59 (May, 1952), p. 26.
[26] Gelbard, E., "Magnetic Properties of Ferrite Materials." Tele-Tech. Vol. 11 (May, 1952), p. 50.
[27] Newhall, E., Gomard, P., and Ainlay, A., "Saturable Reactors as R. F. Tuning Elements." Electronics, Vol. 25 (September, 1952), p. 112.
[28] "Ferrite Core Loading Coil, 80MH." Rundschau, F. and G., (German) No. 35, (October, 1952), p. 123.
[29] Kornetzki, M., Brackmann, J., Frey, J., and Gieseke, W., "Measurements on High Permeability Ferrite Cores." (German) Zeitschrift fits Angewandte Physik, Vol. 4 (October, 1952), p. 371.
[30] Salpeter, J. L., "Developments in Sintered Magnetic Materials." PROCEEDINGS OF THE IRE, (Australia), Vol. 14 (May, 1953), p. 105, and PROCEEDINGS OF THE IRE, Vol. 42 (March, 1954), p. 514.
[31] Kornetzki, M., "Ferrite Cores for Communication Engineering." (German) Siemens Zeitschrift, Vol. 27 (June, 1953), p. 212.
[32] Roberts, W. Van B., "Magnetostriction Devices and Mechanical Filters for Radio Frequencies.' Q.S.T., Vol. 37 (June, 1953), p. 24; (July, 1953), p. 28; and (August, 1953), p. 32.
[33] Kornetzki, M., "Magnetic Constants of Ferrite Cores." (Ger-man) Siemens Entwicklungs Berichte, Vol. 16 (July, 1953), p. 135.
[34] Stiber, S., "Remote Tuning Receiver Has No Moving Parts." Electronics, Vol. 26 (July, 1953), p. 186.
[35] Harvey, R. L., "Ferrites and their Properties at Radio Fre-quencies." Proceedings of the National Electronics Conference Vol. 9 (September, 1953), p. 287.
[36] Hoh, S. R., "Evaluation of High Performance Magnetic Core Materials." Tele-Tech., Vol. 12 (October, 1953), p. 86, and (November, 1953), p. 92.
[37] Geroulo, M., Peck, D. B., and Cushman, N., "Improved Com-ponents Based on Ferrite Materials." Proceedings of the Elec-tronics Components Symposium, (May, 1954), p. 141.
[38] Legg, V. E., and Owens, C. D., "Magnetic Ferrites: New Materials for Modern Applications." Electrical Engineering, Vol. 73 (August, 1954), p. 726.

14 PROCEEDINGS OF THE IRE January
Electromechanical Filters for 100-Kc Carrier and Sideband Selection*
R. W . GEORGEt,
Summary—A general discussion of a torsional type mechanical filter and its termination by mechanical and electrical means is fol-lowed by a detailed description of two 100-kc filters, one 50 cycles
wide and the other 3.1 kc wide. The design, fabrication, and frequency adjustment of one-piece
multiple section filters is described. Frequency stability better than 2 parts per million per degree centigrade is obtained with filters con-
structed of the metal alloy Ni-Span-C. Magnetostrictive ferrite and Ni-Span-C transducers resonant in
the longitudinal mode of vibration are attached tangentially to the
end resonators of the torsion filter. The filter is terminated by con-verting the electrical resistance in low-Q input and output circuits to mechanical damping. Responses due to spurious modes of vibration in the filter are reduced by the use of a pair of transducers in a balanced arrangement at each end of the filter, and by mechanical
damping in the end supports.
SENIOR MEMBER, IRE
INTRODUCTION
itr 1HE electromechanical filter, employing a series
of mechanically resonant elements mechanically coupled together, is of particular interest in the
communications field because of the greatly increased use of single sideband systems. Communications filters must be accurately tuned and must have stable operat-ing characteristics over a wide temperature range. Such filters are rather difficult to make by the commonly used method of assembling pretuned resonators and couplers because of the consequent detuning of the resonators and the mechanical imperfections in the resonator to coupler joints. The one-piece neck type torsional filter with quarter-wave couplers is not only free of these difficulties but is mechanically rugged and
easy to tune. The principles of electromechanical filters have been
fairly well established.i-5 References mentioned here are intended to furnish only a modest background for the described filters. Many articles and books on the
related subject are available. It is convenient to think of electromechanical filters
in terms of the component parts and their functions. The mechanical filter determines the frequency response characteristic. It is designed to have the required
* Original manuscript received by the IRE, June 28, 1955; re-vised manuscript received September 9, 1955. t David Sarnoff Research Center, RCA Labs., Princeton, N. J. 1 R. Adler, "Compact electromechanical filter," Electronics, vol.
20, pp. 100-105; April, 1947. W. van B. Roberts and L. L. Burns, "Mechanical filters for
radio frequencies," RCA Rev., vol. 10, pp. 348-365; September, 1949. 3 L. L. Burns, "A band-pass mechanical filter for 100 kilocycles,"
RCA Rev., vol. 13, pp. 34-46; March, 1952. 4 M. L. Doelz and J. C. Hathaway, "How to use mechanical
filters," Electronics, vol. 26, pp. 138-142; March, 1953. 6 W. van B. Roberts, "Some applications of permanently mag-
netized ferrite magnetostrictive resonators," RCA Rev., vol. 14, pp. 3-16; March, 1953.
number of high-Q mechanical resonators and suitable mechanical coupling elements between the resonators. The design of the mechanical filter also determines the amount of mechanical damping required in the end resonators to properly terminate the filter.
Termination is a matter of introducing the required mechanical loss, or damping, in the end resonators. This is accomplished by the use of mechanically lossy ma-terials, and/or by conversion of electrical damping to mechanical damping in the electromechanical coupling
system. The electromechanical coupling system provides the
means for electrical input and output of the mechanical filter. It can also be made to supply all of the required mechanical termination damping when the electro-mechanical coupling coefficient is sufficiently high. In this case, the output/input voltage ratio approaches unity for equal input and output impedances.
2 2 2 2
(a)
1 2 3 2 I
(b)
Fig. 1—(a) A neck type mechanical filter using half-wave cylindrical resonators, 1, coupled together by quarter-wave necks, 2. The quarter-wave neck extensions and slugs, 3, are for support of the filter. (b) Two resonators coupled together by a multiple coupler to give a very small coupling coefficient.
THE TORSIONAL MECHANICAL FILTER
The neck type mechanical filter shown in Fig. 1(a) is the type used in the carrier and sideband filters. It is most practical when operated in the torsional mode. A brief description including some physical characteristics which contribute to mechanical simplicity, strength, stability, and accurate tuning follows. Each large cylin-der is a half-wave long resonator tuned to the midband
frequency of the filter. Resonator vibration is such that at resonance, one end vibrates in rotation about the axis in the opposite direction to the vibration of the oth-er end. The smaller diameter quarter-wave long sections are the couplers or coupling necks. The coupler length, and the ratio of the coupler neck
diameter to the resonator diameter, determine the frac-tional bandwidth or coefficient of coupling between resonators. A quarter-wave coupler in a given filter has the largest diameter which can be used to obtain the desired coupling coefficient. The length of the quarter-

1956 George: Electromechanical Filters 15
wave coupler is not too critical and therefore requires no adjustment. The coupling coefficient between resona-tors is nearly proportional to the 4th power of the ratio of neck diameter to resonator diameter.
It is a relatively simple matter to tune a resonator to a desired frequency when its resonant frequency can be measured. The frequency is raised by removing material from the ends of the resonator cylinder, and lowered by removing material from a narrow band around the center of the cylinder. The resonator should be resonant at the midband frequency of the filter when it is sup-ported by quarter-wave necks anchored at their far ends. Torsional resonators can be effectively anchored or detuned by clamps. This makes it possible to isolate any resonator in the filter and accurately measure its resonant frequency after clamping the adjacent resona-tors. One-piece construction of a series of torsional res-onators and couplers is thus feasible because the res-onators can be accurately tuned after fabrication. Very small coupling coefficients, such as are required
in the carrier filter, can be obtained by the use of the multiple coupler without making the coupling necks im-practically small in diameter. The multiple coupler Fig. 1(b), in its simplest form, uses two quarter-wave necks separated by a quarter-wave slug. The mechanical filter is made with quarter-wave
neck extensions and end slugs for mounting. The mounting anchors the extreme ends of the necks, thus isolating the filter from its supports.
MECHANICAL FILTER MATERIAL
The iron-nickel-chromium-titanium alloy known as Ni-Span-C6 appears to be one of the most practical materials available7 for use in mechanical filters. It can be processed by heat treatment to have a nearly zero thermoelastic coefficient which imparts an equally low frequency-temperature coefficient to the filter. The most satisfactory results have been obtained by solu-tion-annealing the material before heat treating. The material is sensitive to cold working and this must be avoided after the solution anneal. Heat treatment time and temperature must be determined experimentally for each batch.
Ni-Span-C has good mechanical properties including a mechanicaLQ of about 16,000. As usual with nickel alloys, Ni-Span-C is so difficult to machine that grind-ing is usually preferred to cutting.
Resonators made of Ni-Span-C, can be magnetostric-tively excited. This provides a very convenient aid in measuring the resonant frequency.
ELECTROMECHANICAL TRANSDUCERS
The electromechanical transducers should preferably be the end resonators of the filter and therefore should have good frequency stability. End resonators of Ni-
Ni-Span-C, reg. trade mark of the International Nickel Co. 7 Ni-Span-C can be obtained from The H. A. Wilson Company,
Union, N. J.
Span-C may be used as the magnetostrictive trans-ducers but in general their high eddy current loss re-sults in a low electromechanical coupling coefficient which usually prohibits the use of electrical termination. A composite end-resonator can be made which in-
cludes the original high Q end resonator and an attached electromechanical transducer. One method of doing this is to tune a half-wave longitudinal mode transducer to the midband frequency, and attach one end tangentially to one end of a torsional resonator. Mechanical damping which the transducer derives from the terminal electrical circuits is shared by the composite resonator. Damping to terminate the filter can be obtained in this manner if the electromechanical coupling coefficient is sufficient-ly high. The tuned input and output circuits have relatively low Q and therefore provide a wide-band electrical termination. The magnetostrictive ferrites8 have negligible eddy
current loss and can have an electromechanical coupling coefficient, Ke„„ of 15 per cent to 20 per cent with suita-ble coils. These ferrites can be made to have substantial-ly constant Ke. over a wide temperature range, and a mechanical frequency-temperature coefficient of 20 parts per million per degree centigrade or less. Such ferrites are practical for use as resonant transducers in a wide-band termination system.
The manner in which the transducers are applied to the filter should be such as to minimize the possible excitation of undesired modes of mechanical vibration in the filter. The excitation of bending modes, which are likely to be the most objectionable ones in a torsion filter, can be reduced by the use of a pair of trans-ducers in a balanced arrangement.
MECHANICAL FILTER DESIGN
Methods of calculating the required coupling co-efficients to obtain maximum band-edge attenuation for a given amplitude of ripple in the pass band have been greatly simplified"° and are applicable to the design of a mechanical filter. The coupling coefficients are all different from an end to the center of a symmetrical filter and the differences become smaller near the center. In practice it is necessary to make some compromise of the exact coupling coefficients because of the difficulty and cost of making the coupling neck diameters different and to very close dimensional tolerances. The simplest filter design, sometimes called the Camp-
bell type, has uniform coupling coefficients except at the ends. It is used here because of its mechanical simplicity. One objection to this type of filter is that it is difficult to obtain the proper characteristics in the termination which are required to give flat response in the pass
g R. L. Harvey, "Ferrites and their properties at radio fre-quencies," Proc. NEC, vol. 9, pp. 287-298; February, 1954.
g M. Dishal, "Design of band-pass filters producing desired exact amplitude-frequency characteristics," PROC. IRE, vol. 37, pp. 1050-1069; September, 1949.
10 M. Dishal, "Two new equations for the design of filters," Elec. Commun., vol. 30, pp. 324-337; December, 1953.

16 PROCEEDINGS OF THE IRE January
band. A compromise termination is practical, however, and can give as little as 10 or 15 per cent output varia-tion in pass band with excellent band-edge attenuation. A series of 9 coupled resonators is depicted in Fig. 2.
Ki-a Ices ets-4 Kes Pcs-s 1144 K7-4 Kee
Fig. 2—The general case of a filter having a number of very high-Q resonant elements all tuned to the same frequency and having coupling coefficients, K, between adjacent resonant elements.
The fractional-bandwidth, B, of the filter is equal to twice the coupling coefficient, K, between a pair of
interior resonators.
= K2-3 2
(1)
K1_2 = KI3-9 = —Ay • (2)
The mechanical design of the filter is based on work done at RCA Laboratories.2 The following simplified
formulas have been found satisfactory for general use. The mechanical design to obtain the desired coupling
coefficients using quarter-wave couplers is based on
K —2 4)(1 — ir 2
(3)
When the resonators are a half-wave long and of equal diameter, made of the same material as the coup-ling necks, and are operating in torsion, the value of 4, is simply related to the resonator and neck diameters.
(1)
4
de
D'
de = diameter of coupler
D = diameter of resonator.
A more general expression which can be
the above is
We 4,
-VW1T472
(4)
reduced to
(5)
W. = Kinetic energy of a quarter-wave cou-
pling neck calculated as if rigid.
W1 and W2 = respective kinetic energies of the cou-
pled resonators.
The simple multiple coupler which uses two quarter-wave necks separated by a quarter-wave slug having the same diameter as the resonators, Fig. 1(b), is de-signed from the above equations with the exception of (3), which is replaced by
Kd = (1 — --le ) •
2
2
Ka Coupling coefficient for double coupler.
(6)
The damping, d, required in the end resonators for termination of the Campbell type filter is not a constant value over the pass band. A practical compromise is
used here.
.7B (7)
1 — = Q of end resonator. d
(8)
ELECTRICAL TERMINATION
The mechanical damping required in the end resona-tor of the filter is obtained from the damping in the attached transducer. The transducer in turn receives its damping from the electrical tuned circuit to which it is coupled. The transducer should be large enough so that the required damping can be obtained. The inher-ent mechanical damping in the original end resonator is so small that it can be neglected. The damping, de, required in the transducer, is calcu-
lated as though the transducer were isolated from the
filter.
We di = + 1)d.
We
d = Damping in the original end resonator to termi-
minate the filter
Wr = Kinetic energy of original end resonator
Wt = Kinetic energy of transducer.
The mechanical damping in the transducer, which is obtained from the coupled electrical circuit, is given approximately by
K„„e2Q (10)
Ke„, = Electromechanical coupling coefficient
Q = Q of the input and output circuits.
The most uniform value of damping is had in the
pass band when
K„„,Q 1. (11)
THE NARROW-BAND 100-Kc CARRIER FILTER
An example of a 100-kc carrier filter is shown in Fig. 3. This uses 5 half-wave torsion resonators with double-couplers of quarter-wave elements. The mechani-cal filter was made from a rod of Ni-Span-C on which the coupling necks were ground to the desired diameter. The grinding wheel was dressed in width to cut the
required X/4 neck length. The coupling design is of the Campbell type with B
taken as 0.0005. The measured bandwidth shown in the frequency response curve, Fig. 4, is in good agreement with the design. A bandwidth of less than 25 cycles is equally practical and has been obtained in other experi-
mental models. The following dimensions of the resonators and cou-
plers will be of interest:
(9)

1956 George: Electromechanical Filters 17
Fig. 3-100-kc carrier filter.
Resonator and coupler slug diameter Resonator length, X/2 Coupler neck diameter for K—B/2 Coupler neck diameter for K=Bh/2 Coupler neck and slug length, X/4
0.240 inch ± 0.0002 inch 0.570 inch ± 0.001 inch 0.090 inch ± 0.0005 inch 0.094 inch ± 0.0005 inch 0.285 inch ± 0.001 inch
A small fillet between coupler neck and resonator is not objectionable. The resonators were tuned to 100-kc plus or minus
one cycle. This accuracy is not difficult to achieve but of course does take some care. The resonant frequency of a resonator can be measured accurately with a suit-able signal generator, bridge circuit, and events-per-unit-time counter. The resonator is excited magneto-
strictively in torsion when placed in a coil in one arm of the bridge. Satisfactory residual magnetic bias is had by passing a few amperes axially through the filter for an instant. The resonant frequency is increased 15 to 20 cycles with maximum residual magnetic bias; there-fore, it is necessary to use uniform bias when making frequency measurements. The residual circular bias is subject to partial loss during the tuning operation or when subjected to a strong rf field. Satisfactory results have been had by using the minimum bias which will give a suitable output of the bridge. One way to get this weak bias is to first magnetize with dc, then par-tially demagnetize by passing filter through an ac coil. The small coupling coefficient in the filter makes it
easy to detune the adjacent resonators by clamps in order to isolate the resonator under test. All resonators are tuned before attaching the transducers. The magnetostrictive transducers, which are shown in
the schematic diagram, Fig. 5, were made of 0.015-inch diameter Ni-Span-C wire. The result as shown in Fig. 4 was less electromechanical coupling than required for the best termination of the filter; however, this re-sponse characteristic is considered suitable for carrier separation. The transducers were tuned to within about 50 cycles of 100 kc before being spot-welded to the end resonators of the filter. Final frequency check and tun-ing of end resonators was made after adding transducers.
I. VOLT
.01
.001
-70 -60 -50 -40 -30 -20 -10 0 i0 20 30 At, CYCLES
FREQUENCY • 100 KC f Pf
40 50 60 70
Fig. 4-100-kc carrier filter, output vs frequency for 1 volt input. Dashed curve shows response at 22°C. above room temperature.
Fig. 5—Schematic d agram of carrier filter using multiple couplers and balanced magnetostrictive longitudinal transducers.
The input and output circuits, Fig. 5, are tuned for maximum output at 100 kc. The two coils coupled to a pair of transducers are connected to produce opposing fileds so that with common magnetic bias from the near-by permanent magnet, one transducer becomes longer while the other becomes shorter, thus energizing the torsion resonator with minimum bending. The stray field of a pair of coils connected in this manner is so small that no special shielding is required to keep the the stray input-output coupling to a very low value. The position of the small alnico bias magnet was ad-justed for maximum output. The input circuit is ar-ranged to give some voltage step-up from a 500-ohm source such as a cathode follower. The filter is securely clamped in the end supports with
one end grounded. One or both of these clamps may in-clude a plastic bushing to give some damping of bending modes if necessary. Spurious responses in this filter are few and usually not objectionable.

18 PROCEEDINGS OF THE IRE January
Fig. 6-100-kc upper sideband filter.
The support near the center (Fig. 3) makes the as-sembly better able to withstand shock. It has a nylon bushing with an inner ridge about 1/32 inch wide in close contact with one of the coupler slugs. Coupler slugs can be touched without detuning the filter but a heavily damped slug adds appreciable mechanical transmission loss. These filters have an output impedance of approxi-
mately 5,000 ohms. With an equal input impedance, the input/output voltage ratio is approximately 3. A 500-ohm input source to the circuit shown in Fig. 5 gives an input/output voltage ratio of 1.4. The peak to valley ratio is 1.4 at 28°C. and 1.5 at 50°C. The shape factor is approximately 2.6.
THE SIDEBAND FILTER
One of the sideband filters, electrically terminated with broad-band tuned circuits is shown in Fig. 6. This has 9 torsional resonators with Campbell type coupling coefficients. The filter was designed using a value of 0.031 for B which gave the corresponding band-width shown in Fig. 7. A pair of magnetostrictive ferrite transducers is used on each end resonator. The resona-tors were tuned to the midband frequency of 101,800
cycles plus or minus 10 cycles. Damping is obtained from the end tuned circuits
which, with the added resistors, have a Q of about 5. The electromechanical coupling coefficient to the fer-rites is about 0.19. The pair of tranducers has about I, the kinetic energy of the end resonator and therefore requires a mechanical damping, di, of about 9 times the damping required in the composite end resonator. Two of these filters were made and found to have sub-
stantially identical characteristics. The frequency tern-
VOLT
.001
000190 99 100 101 102 103 104 1
FREQUENCY KILOCYCLES
135
Fig. 7-100-kc sideband filter output vs frequency for 1 volt input.
perature coefficient was less than 2 parts per million per degree centigrade. The input, and output, impe-dance of these filters was approximately 4,500 ohms. The input/output voltage ratio was 1.14 at 24°C. and 1.19 at 74°C. At both temperatures, the maximum to mini-mum amplitude variation in the passband was 1.14 and the shape factor was 1.55. The frequency shift of the band edges was less than 10 cycles. The excellent stability of the electrical termination
at different temperatures was due to the favorable char-acteristics of the magnetostrictive ferrites which were made especially for this purpose. During the develop-ment of these ferrites which were of the equimolar iron-nickel type,8 it was found necessary to reduce the cobalt impurity content to 0.003 per cent or less in order to obtain the desired stability with varying temperature.
ACKNOWLEDGMENT
The author wishes to express his appreciation to Mr. R. L. Harvey, who made the special magnetostric-tive ferrites, and to Mr. J. J. Murphy, who provided the sideband filter elements.

1910 PROCEEDINGS OF THE IRE 19
New Microwave Repeater System Using Traveling-Wave Tubes*
N. SAWAZAKIt, ASSOCIATE MEMBER, IRE, AND T. HONMAt
Summary—This paper describes a new microwave relaying sys-tem using traveling-wave tubes (TWT), and utilizing its large inher-ent frequency bandwidth. In this system, the increased gain is ob-tained by amplifying the input signal through the TWT Amplifier, and reamplifying it in the same TWTA after heterodyning the fre-quency to the second frequency. The signal received could be ampli-fied in the same TWTA more than once simultaneously, and the gain of the TWTA would be increased in proportion to the amplifying times. A 4,000-mc band television repeater using three TWT's, and its
measured results are also described; we obtain the results that the over-all gain is above 100 db and is steady within ± 0.5 db with the frequency bandwidth of 20 mc, and also, the noise figure is below 15 db. The actual test was carried out by putting the equipment in the TV long-distance relay line as a repeater. From this test it was proved that there is no defect of the operation of the amplifier in using TWT as a reflex amplifier. In this new system, the number of TWT's can be reduced one-half to one-third and the cost of a repeater with in-creased reliability can be lowered.
INTRODUCTION
FOR a microwave relay system, the heterodyne type which uses intermediate amplifiers, such as
the TD-2 system in the United States, has chiefly been used up to the present. In Japan, the development of such repeaters has been conducted actively in several places. The authors continued the research of the all-traveling-wave-tubes amplifier-type repeater in cooper-ation with the engineers of the Broadcasting Corpora-tion of Japan (N.H.K.) from 1951 to 1953, after the completion of the heterodyne-type TV relay system, and obtained satisfactory results during practical use at the Hakone TV relay station. This system has many supe-rior characteristics compared with the heterodyne type system: simplification of equipment by decreasing the number of tubes, improved S/N characteristics owing to the progress of the low-noise traveling-wave tube, and ease of maintenance due to eliminating such complicated parts as IF amplifiers, microwave oscillators, and AFC circuits.
It is possible to obtain another relaying system by taking advantage of the wide-band characteristic of the traveling-wave tube (TWT). The authors obtained satisfactory results in experiments applying this prin-ciple. One method is to relay not only one radio channel as conventionally used, but several channels simultane-ously with the same TWT amplifier, and by this prin-ciple a TWT is used commonly for a local oscillator tube and an amplifier tube in a heterodyne type repeater.
In these applications, the repeater which amplifies the east-bound and west-bound channels with the same repeater has been completed by the joint research of
* Original manuscript received by the IRE, June 7, 1955. t Matsuda Research Lab., Tokyo Shibaura Elec. Co., Ltd..
Kawasaki, Japan.
Tokyo Shibaura Electric Co. and N.H.K., for the use of TV relay equipment at the Hakone Relay Sta-tion. The testing of this set could not be performed because of the frequency allocation, though the remark-able results of this two-direction repeater were obtained in the room test. This repeater has practical use as a one-direction repeater. The system mentioned in this paper is a new system
designed for a one-direction, one-channel repeater by applying the wide-band characteristic of the TWT, and reducing the number of TWT's. In previous TWT re-peaters, [1 ] seven stages of TWT's were used in series; in this new system the number of TWT's can be reduced one-half to one-third, which lowers the cost of a repeater, at the same time giving increased reliability. An im-proved version of this new system is also described in this paper.
BASIC PRINCIPLE OF THE NEW SYSTEM [2]
This new system can be called a reflex system which is applied to TWT amplifiers. Its principle is similar to the reflex-type receiver in broadcasting band because the same tubes are commonly used for radio frequency and audio frequency amplifiers. This reflex system util-izes certain special features: the TWT amplifier has a much wider frequency band compared with other types of amplifiers; in microwave systems the sending and re-ceiving carriers are different in frequencies, and signals are frequency-modulated waves. The increased gain is obtained by passing the re-
ceived signal through the TWT amplifier, heterodyned by the crystal mixer to the second frequency, and re-amplifying by the same TWT amplifier. If more gain is necessary, the output signal is heterodyned by the second mixer to the third frequency and reapplied to the input of the same TWT amplifier. Thus the signal is amplified three times by the same TWT amplifier. By using this method, multiplied gain will be two or three times more than that of the straight amplifier with the same TWT's. In Fig. 1, the schematic diagram of the 4,000-mc band reflex-type repeater with three-times amplification by the same TWT amplifier and its equiv-alent circuit is shown.
This repeater was designed on the following basis: Frequency of the input signal 4,045 mc Frequency of the output signal 4,000 mc Frequency bandwidth 20 mc Total gain 100 db.
In Fig. 1, the received 4,045 mc signal is applied through the 4,045-mc band-pass filter, BPF (1), located at the input side of the amplifier through the TWT's No. 1, No. 2, and No. 3. Amplified 4,045-mc signal from

PROCEEDINGS OF THE IRE
404314C (I)
LIJ
-tIP
9oric
4000 tic(.5")
lihrZ
'10 tic
alnid-*4.41-, 404-ric.
FL BP
3vmeic
3V10 tic C 1) 404.5-ric.
1.33-riu
FL-BPg) -1MixIHR-13P 1(2)
135rIc
— 39 /0 nc
(4)
FL-BP
117
Fig. 1—Sematic and equivalent circuit of the reflex amplifier.
the output circuit is applied through the 4,045 mc BPF (2) to the crystal mixer ( 1), where the signal is con-verted to 3,910-mc signal using 135-mc local oscillator, and the 4,000-mc signal is also applied through the BPF (5) to the input of the TWT amplifier. Then the final amplified 4,000-mc signal by the same TWTs is transmitted through the 4,000-mc BPF (6) located at the output side. TWT amplifies the signal three times at three different frequencies; therefore, a total gain pro-portional to the multiple of the amplified times is ob-tained. The over-all gain G in the equivalent circuit may be written as
G = 3(gi g2 g3) — (Ljii+ LM ,)
— (Lip, + LF, • • • -I- L,,) (db),
where gi, g2, gs are gains of TWT's No. 1, No. 2, and No. 3, LA12, LM2 are conversion losses of crystal mixers No. 1 and No. 2. LF2, LF2, • • • , LP& are insertion losses of the BPF (1), (2) • • • (6).
In the case of practical design, conversion loss of a crystal mixer and insertion loss of a band-pass filter composed of three sections are below 15 db. Additional loss in the reflex system as compared with the straight-amplifier system is shown by the sum of the losses of the additional parts for reflex use; these parts are one mixer and three band-pass filters. This loss will be below 20 db, and there are other decreasing factors of gain G caused by the saturation effect of the tubes in high-level input, so that G is nearly equal to that loss of the seven-stages straight amplifier; however, in this three-times reflex system three tubes are used.
Using this technique, many other applications requir-ing high-gain microwave amplifiers can also be made. The case of Fig. 1 is a relay of 100-km span at 4,000 mc. In the case of 50-km span with 80-db over-all gain, for
ooh (6)
, 40 o tic (6)
FL
example, the TD-2 link which is shown in Fig. 2 can be used. Those are examples of a one-time reflex using three tubes and a two-times reflex using two TWT's.
Fig. 2—Examples of the other type reflex amplifier.
THE PRELIMINARY EXPERIMENTS OF THE REFLEX-TYPE AMPLIFIER
The characteristic of very large inherent bandwidth of the TWT is well-known, but the problems of stability, noise, distortion, gain, etc., when two or three signals are applied together to a TWT amplifier simultaneously, have not been clarified. The characteristics of TWT's cannot be calculated simply, so preliminary experiments
have been carried out to learn the characteristics.
Examination of Problems on the TWT Amplifier When Two Signals Are Applied Simultaneously
When reflex amplifying, the signals are applied to the TWT amplifiers in different frequency ranges, are delayed by turns each time, and at the last time are at highest level. On the other hand, the TWT amplifier de-creases its gain at high input level, so that output power

1956 Sawazaki and Honma: Traveling- Wave-Tube Repeater System 21
is constant to some certain input level; then power out-put decreases when input gets too high. The influences of the last-time high-level signal over gain of first- and second-time signal amplification are considered.
‘t) tic,, sviqrn
65
60
55
50
e
0.0 45
4 D
-35
404-5 MC
;-f4t
-50
II:. to
«t 8
6 t-; 4-5
,t
so -30 --to 4000 MC ¡me clb«
(e) ()dirt ciwatteristics of «be eadi ant?. stales
Fig. 3—Gain characteristics of TWTA when two signals are applied simultaneously. (a) Measurine circuit, (b) Gain characteristics of TWTA, (c) Output characteristics of each ampere stage.
-4-0
tb)
-30 -2o 4-0 0 Mc i nine
Gct'm Citar«cierisiics 01 IWTA
-lo o
Fig. 3 shows the gain characteristics of the three-stage TWT amplifier when two signals, differing in am-plitude levels, are applied simultaneously. These char-acteristics are obtained by keeping the low-level 4,045-mc input at — 50 dbm constant and by varying the 4,000-mc input signal from — 50 dbm to — 10 dbm. In these results, gain limitations of the TWT by saturation
begin to appear when the 4,000-mc signal level is about —30 to — 20 dbm, and when the 4,000-mc signal level is more increased, the output power becomes nearly constant; then, the gain of the tubes decreases, as shown in Fig. 3. It also shows that the gain of the 4,045-mc signal varies equally as much as the gain of the 4,000-mc signal. These results prove the wide-range gain-control action in reflex amplifier, due to their power saturation, but, on the other hand, it shows that there is a possibility of oscillation or distortion if the ampli-fier is used under conditions of heavy saturation.
Crosstalk and Noise Due to Amplifying Two Signals Simultaneously
The experimental results of the crosstalk and noise due to amplifying the high-level fm signal and low-level fm signal simultaneously are shown in Fig. 4. This ex-periment has also been done, as similarly described above; that is, the 4,045-mc fm signal was kept constant at — 40 dbm and the added 4,000-mc signal was varied from — 50 to 0 dbm. It seems, as a result, that there were no interactions between signals in the range of weak signal input below — 20 dbm, where there is no satura-tion; however, when the input became above — 10 dbm, both S/N and crosstalk became worse according to the conspicuous tube saturation. In reflex amplification, this crosstalk change is due to signal distortion.
10
>0
50
Cros5 télki •
•
• N
so -40 - -.20 o
4oc,o ric nput db Fig. 4—Crosstalk and S/N when two signals
are applied to the TWTA.
From these results with the reflex system, a good S/N ratio and small distortion like this in the cascade TWT repeater system can be expected, as far as the re-flex amplifier works in the unsaturated region.
REFLEX-TYPE ALL-TWT REPEATER
After preliminary experiments above, reflex-type trial repeater was planned for use of television relay.
Specifications Characteristic requirements for trial repeater were
the same as of television repeaters stationed in span length of 100 km with 40-db gain paraboloids in Tokyo-Nagoya-Osaka links by and specifications were:

22 PROCEEDINGS OF THE IRE January
Input carrier frequency Output carrier frequency Output power
Over-all gain Frequency bandwidth Noise figure
4000MC
F Ise
4,045 mc 4,000 mc above 3 watts (within the input level — 60 to — 30 dbm) above 90 db + 10 mc (3 db down) below 15 db.
39ionc Ft 8+1 15t
—erieellbeeFL-DP
Actc AMP
90 PK
i e4C
1-•••
P. sc
Fig. 5—Block diagram of the reflex-type trial repeater.
Fig. 6—Outside view of the reflex-type repeater.
Outline of the Repeater
As shown in the block diagram, Fig. 5, and photo-graph, Fig. 6, this repeater provides three traveling-wave tubes and the first two tubes VI and V2 act as a
two-time reflex-type amplifier; the last tube, 17 3, is driven by this reflex output. 4W10, especially designed for low-noise TWT, is used for VI, and 4W12, designed for power tubes, is used for V2 and 17 3. The scheme works as follows.
Input 4,045-mc signal is applied to input side 4,045-mc BPF, and the signal amplified in V1 and V2 is ap-plied through a branching circuit and 4,045-mc BPF to the mixer, where the signal is mixed with 135-mc local os-cillator output. The 3,910-mc signal output from this mixer is reapplied through the 3,910-mc BPF, and the branching circuit to the same TWT amplifiers. The sig-nal is amplified again, and the same process is repeated; then, the 3,910-mc signal frequency is shifted to 4,000 mc by mixing with the output of the 90-mc local oscil-lator. Finally the 4,000-mc signal amplified with V1 and V2 is applied through BPF to last tube V2 (4W12). The agc action-reflex amplifier with TWT's has a
good characteristic, but to avoid distortion due to its strong saturation, agc circuit is provided with constant output power for — 60 to — 30 dbm input level range.
135-mc and 90-mc local frequencies are those multi-plied from the main crystal oscillator of 5,625 mc.
For a microwave circuit in the reflex section, wave-guide-type band-pass filters (Q100), Y-type branch-ing waveguides, and phase shifters are used in Fig. 5.
Mors—
Fig. 7—Used traveling-wave tubes.
Traveling- Wave Tubes
Traveling-wave tubes used in this system, and their characteristics, are in Fig. 7 and Table I, p. 23. At the beginning, this system had been designed to use volt-age-amplifier tube 4W11 for the second stage of the re-flex section, but the design was changed to use power-amplifier tube 4W12 in order to decrease a variety of tubes and distortion due to the saturation effect in the reflex section.
Over-all Characteristics
Gain Characteristics: Fig. 8 shows the results of the gain measurements of the TWT amplifier acting as a straight-through amplifier, one-time reflex amplifier, and two-times reflex amplifier. For the gain measure-ments of the straight amplifier, two local oscillators and input side 4,045-mc BPF were removed, and 4,000-mc signal applied to the input. For the gain measurements of the one-time reflex amplifier, 135-mc local oscillator
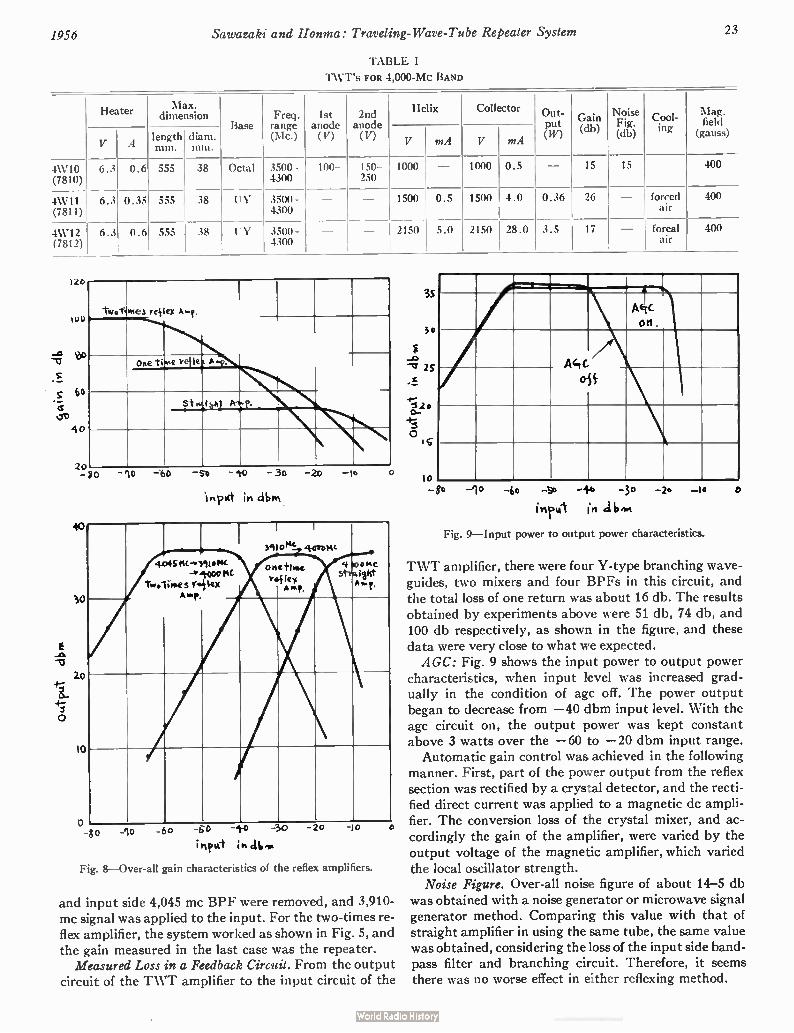
1956 Sawazaki and Honma: Traveling- Wave-Tube Repeater System 23
TABLE 1
TWT's FOR 4,000-Mc BAND
Heater Max.
dimension Base
Freq. range (Mc.)
1st anode (V)
2nd anode (V)
Helix Collector Out- ut ÎW)
m Ga • (db)
Noise • Fig. (db)
Cool-
ing
Mag. field
(gauss) V A
0.6
0.35
length mm.
diam. mm.
V mA
—
V
1000
mA
0.5 4W10 (7810)
6.3 555 38 Octal 3500- 4300
100- 150- 250
1000 — 15 15 400
4W11 (7811)
6.3 555 38
38
UY 3500- 4300
— — 1500 0.5 1500 4.0
28.0
0.36
3.5
26
17
—
—
forced air
foreal air
400
400 4W12 (7812)
6.3 0.6 555 UY 3500- 4300
— — 2150 5.0 2150
120
I00
-o
40
22'
40
30
10
o
11u:times re4 ex A-.1.
I
r ,
ose time retie, A...p.
Site.tslit - - _ • i
-10 -60 -S0 - 14? - 30
rq)ict nabr.\
- lc
4o4S 7 '
_ -
I
i9 I
one
'f'441Eli
sc 0 , 9 trim
-Hobe
Pt c
4000mc sttetiet
fic--.391•14(
-.1-000 MC
_
-8 -10 -60 -6 -
Fig. 8—Over-all gain characteristics of the reflex amplifiers.
and input side 4,045 mc BPF were removed, and 3,910-mc signal was applied to the input. For the two-times re-flex amplifier, the system worked as shown in Fig. 5, and the gain measured in the last case was the repeater.
Measured Loss in a Feedback Circuit. From the output circuit of the TWT amplifier to the input circuit of the
3s
5 0
25
3 2 o o.-
o s
LO -80 -10 -60 -3S0 -I-b -30
ml Fig. 9—Input power to output power characteristics.
-2* —le
TWT amplifier, there were four Y-type branching wave-guides, two mixers and four BPFs in this circuit, and the total loss of one return was about 16 db. The results obtained by experiments above were 51 db, 74 db, and 100 db respectively, as shown in the figure, and these data were very close to what we expected. AGC: Fig. 9 shows the input power to output power
characteristics, when input level was increased grad-ually in the condition of agc off. The power output began to decrease from — 40 dbm input level. With the agc circuit on, the output power was kept constant above 3 watts over the — 60 to — 20 dbm input range. Automatic gain control was achieved in the following
manner. First, part of the power output from the reflex section was rectified by a crystal detector, and the recti-fied direct current was applied to a magnetic dc ampli-fier. The conversion loss of the crystal mixer, and ac-cordingly the gain of the amplifier, were varied by the output voltage of the magnetic amplifier, which varied the local oscillator strength.
Noise Figure. Over-all noise figure of about 14-5 db was obtained with a noise generator or microwave signal generator method. Comparing this value with that of straight amplifier in using the same tube, the same value was obtained, considering the loss of the input side band-pass filter and branching circuit. Therefore, it seems there was no worse effect in either reflexing method.

24 PROCEEDINGS OF THE IRE January
Over-all Frequency Characteristic and the Transient Characteristics: Over-all frequency characteristic may be affected by the characteristics of the branching cir-cuits, band-pass filters, crystal mixers and coupling systems of traveling-wave tubes. But the power gain obtained from the actual equipment was steady within + 0.5 db with the frequency band of 20 mc, as shown in Fig. lo.
403.5 1.45
M MC
Fig. 10—Over-all frequency characteristic.
4055
Concerning the distortion by phase delay, transient response characteristics were tested for signals of rec-tangular frequency-modulated wave with build-up times of about 0.05 microsecond, and there was no perceptible difference in the waveform between the input and the
output of the equipment. Also an actual test was carried out by putting the equipment in the television long-distance relay line as a repeater. The television pictures relayed by it were good and stable. From these experiments, we can conclude that, as for
distortions owing to reflex amplifying, they do not affect the operation of amplifiers to the use of traveling-wave tubes as reflex amplifiers.
CONCLUSION
The main purpose of using traveling-wave tubes as reflex amplifiers is to simplify the construction of re-peaters and, as a result, to decrease maintenance ex-pense without sacrificing operating characteristics of repeaters.
ACKNOWLEDGMENT
The television relay equipment explained herewith was completed by the joint research of the engineers of the Broadcasting Corporation of Japan (N.H.K.), and Tokyo Shibaura Electric Company. The authors wish to express many thanks to T. No-
mura and Dr. K. Suzuki of N.H.K., who made re-searches concerning the possibility of trial repeaters, and M. Mita of the Matsuda Research Laboratory for his advice and suggestions.
BIBLIOGRAPHY I. Sawazaki, N., "Traveling Wave Tube Television Relaying Equip-
ment." Toshiba Review, vol. 9 (January, 1954), pp. 22-31. 2. Sawazaki, N., and Honma, T., "Reflex Type All TWT Relay
System." Convention Record of the E.E. of Japan, Part 3 (Oc-tober, 1954), p. 503.
3. Suzuki, K., Sawazaki, N., and Honma, T., "4,000-Mc Reflex-Amplifier Type TV Relay Equipment." Convention Record of the E.E. of Japan, Part 5 (May, 1955), p. 846.
Geophysical Prospection of Underground Water in the Desert by Means of Electromagnetic
Interference Fringes* M. A. H. EL-SAIDt, SENIOR MEMBER, IRE
Summary—This paper introduces the principles and techniques of underground water prospection in the desert by means of electro-magnetic interference fringes.
Part I formulates the "Variable Frequency Interference Method" while Part II deals with the "Variable Distance Interference Meth-od." Samples of interference patterns obtained at two places in the Egyptian deserts are shown. The water table at one of these places is
known from actual boring. Interpretation of the interference patterns and the proposed
method of calculation of the water table depend upon a knowledge of the average dielectric constant of the propagational medium to-
• Original manuscript received by the IRE, January 14, 1955; revised manuscript received, July 18, 1955. t Assistant Professor of Radio Engineering, Faculty of Engineer-
ing, Cairo University, Egypt.
gether with a single interference pattern determined by either of the methods in Part I or Part II. A good degree of agreement existed between the derived results and the actual water table.
INTRODUCTION
HE METHOD of electromagnetic interference fringes has long been known and was used in the early measurements for the determination of the
he'ght of the ionosphere.' It was proposed2 to the Nation-al Research Council of Egypt for the geophysical pros-pection of underground water in the Egyptian deserts.
1 E. V. Appleton and M. A. S. Barnett, Nature, vol. 115, p. 333; 1925.
2 See Acknowledgments.

1956 El-Said: Underground Water Prospecting 25
The method consists principally of diffusing electro-magnetic energy into the underground medium and the surface by means of a continuous wave transmitter having its antenna laid on the ground surface. A suitable radio receiver is placed at a known distance from the transmitter and has its antenna similarly laid on the ground surface for the measurement of field strength. In the presence of an underground reflecting medium such as a water layer, the wave that has traveled into the ground will be reflected back to the surface. The field strength at any point on the surface will therefore be the resultant of at least two components: one caused by the surface wave, and the other by the underground reflected wave. Owing to the fact that the two waves may travel with different velocities but on the same path length, or on different path lengths but with the same velocities, or a combination of both effects, they arrive at the receiver with a phase retardation difference. Choosing conditions such that the two waves are of the same order of intensity, and the frequency at the trans-mitter is varied slowly through a suitable range, the resultant field strength will undergo maxima and minima at a regular period as shown in Fig. 1(a). Also, if the transmitter frequency is kept fixed while the distance from the transmitter is varied over a suitable range, the resultant field strength at the moving receiver will diminish with increasing distance but will also undergo maxima and minima as shown in Fig. 1(b). In both cases, the maxima and minima will always be present and correspond to the two waves becoming in-phase and out-of-phase. The only question is the useful operating range which makes the two waves of the same order of magnitude, enabling easier detection of interference fringes. These fringes are hereby utilized first, to indi-cate existence of an underground water layer; and sec-ond, to determine its depth from ground surface.
THE VARIABLE FREQUENCY METHOD
Referring to Fig. 1(c), let T be a transmitter and R a receiver, both situated on the ground at a distance d apart. Also, let there be an underground water layer at a depth h from the surface. Assuming that:
1. The receiver and the underground water layer are both in the so-called "far zone" of the transmitter.
2. The ratio of the intensities of the surface wave to the underground reflected wave is independent of fre-quency over some applicable frequency range.
3. The underground medium is homogeneous and the dielectric constant the same throughout.
4. The angle of incidence is greater than the angle of total reflection for various rock couples so that par-tial reflections from any layer other than the desired one are largely suppressed.
5. The underground water surface acts as a perfect reflector and the path length is independent of fre-quency over some applicable frequency range.
6. There are no multiple reflections; i.e., more than one hop.
Considering Fig. 1(c), and noting that the under-ground reflected ray undergoes a 180-degree phase shift
(a)
(L,)
FREQUENCY
n,
d.
— DISTANCE d
+2
nit?
p.
GROUND SURFACE
.9<?- WATER SURFACE
(c)
Fig. 1—Simplified interference patterns: (a) field strength vs fre-quency; (b) field strength vs distance; (c) dimensions in the plane of incidence.
at reflecting surface, interference fringes are given:
D d n
V, 2f where
n=0, 2, 4, • • • , for minima = 1, 3, 5, • • • , for maxima.
D=N/d2+4h2 is the distance traveled by the under-ground wave vo = the velocity of the underground wave
=c/Nfire = c/\/; for a nonmagnetic medium c = velocity of light e = relative dielectric constant of the underground medium va = velocity of surface wave =ac where a is a fraction f= the operating frequency of the transmitter. From Fig. 1(a), when f =f„ n= n1 and when f =f2,we
have n=n2=n1+2. The frequencies fi and h are the frequencies for which consecutive maxima (or minima) will occur. Then, using (1) we find that
(1)
F=f2—f1= D d (-Ve"--
a
(2)
where F has the dimension of frequency and is called delay frequency.
Eq. (2) shows that F depends only on the geometry and dielectric constant and is independent of frequency

26 PROCEEDINGS OF THE IRE January
in as much as e, D, and a are independent of it. Eq. (2) may also be rewritten as:
from which:
h = 1 A/ 1 _c_ d" 2
2 /V E \ F a ) — d2 (3)
Eq. (3) shows that in order to determine the depth h, the values of e, F, d and a must be known. The normal procedure is to perform a variable frequency field ex-periment at an appropriate distance, from which F is obtained. Also, the dielectric constant e is either meas-ured on site' or estimated from laboratorymeasurements on the various types of rock samples that are known to form the site. However, although a knowledge of e is essential for determining h, latter is not critically de-pendent upon it. Value of a may either be assumed from experience or determined by actual measurement on site. But dependence of h on a may be diminished by proper choice of distance d in comparison with h.
For best utilization of the variable frequency field experiment, (2) is further investigated. Values of h are assumed and F is calculated for presumed values of e and a. Fig. 2 shows the F—d—h chart calculated
10 ' too ' '10,000 — DISTANCE d METERS
Fig. 2—Calculated chart relating delay frequency, distance and depth for Vi= 2.5 and a = 0.75; the appropriate frequency range is indicated.
from (2) for Vi = 2.5 and (x=0.75. These curves show that at relatively small distances, the delay frequency is a good identification of depth and becomes reason-ably independent of a. On the other hand, at relatively large distances, the curves become asymptotic and F is almost independent of h. This far-distance condition, in which d>>h is given by:
Fo —
(V; — a)
(4)
3 The method of measurement of e on site will be dealt with in a separate paper pending more field work.
In general, the choice of the appropriate distance for field tests depends on several factors, the most impor-tant of which are:
Far-Zone Condition
In order to apply the simple laws of propagation, both the receiver and the underground reflecting sur-face must be in the far zone of the transmitter. This implies a condition on the minimum value of the dis-tance d relative to the longest wavelength used in the field test. In the far-zone, the field strength is entirely the radiation component Eo. However, in the near far-zone the total tangential component of field strength E0 is the resultant's of three components such that:
E0 = Eo (m2 Jm —1)
where in = X/2ird, from which:
I E0 = I Eo t un.12_ 1)2+m2]112= I E0 I [I. _ m 2+ 10 ] 1/2.
If the distance d is so chosen that m«1, then:
IE0t IEoI(1 __1m2). (5)
Considering the surface ray, the value of X to be used in (5) should be replaced by the surface wavelength
--aX air, and if the minimum distance is greater than half the longest surface wavelength, then • the total tangential component is less than 5 per cent smaller than the radiation component. Similarly, for the under-ground reflected ray, a small discrepancy occurs if the depth h is greater than the longest surface wavelength.
Refraction and Total Reflection
In order to ensure the minimum amount of refraction and to avoid total reflection from the various under-ground strata, the incidence of the underground wave should be as near to normal as possible. This is satisfied practically if d < h.
Received Field Strength
To minimize effects of noise and interfering signals, the received field strength should be as high as possible. This calls for the use of the smallest value of d. From these considerations, the appropriate distance
for field tests is the smallest possible value that falls into the far zone. Thus, the practical relation is:
Ix air ≤ d h. (6)
The appropriate frequency range is indicated on the curves of Fig. 2 for constant depth. Further, the lines d=h and 2d =h are shown. The longest wavelength is deliberately made shorter than that obtained from (6) in order to minimize effects of anomalous dispersion.
In general, effects of anomalous dispersion cause re-sistivity to change with frequency. This causes degree with which weaker ray reinforces or weakens the other ray to vary with frequency; net result being a change in F with frequency. This effect is overcome largely if
J. G. Brainard, "Ultra High Frequency Techniques," D. Van Nostrand Co., Inc., New York, p. 397.

1056 El-Said: Underground Water Prospecting 27
- 300 cr.
- 200
DATE: 23.7.54.
AVERAGE F.= 87 KC
9 8KC--•
T' - 76KC
INTERFERENCE -100 WITH 773 KC E S.13.
—•- MULTIPLY BY 2, K C
260 -
240-
220-
200-
I SO-
160-
400 450 50 50
Fig. 3—Observed and transformed frequency-interference patterns at Baharya Road for d=1,300 meters.
we choose the frequency range such that F is only a small fraction of lowest frequency. Naturally, shorter wavelengths are reserved for smaller depths.
Further, it is found that with a reasonable value of the transmitted power, the received field strength at the appropriate distance is so small that broadcast transmitters often cause a serious amount of inter-ference. The task of the engineer who performs this type of field test consist of employing a specially-built, highly-selective, self-calibrated field strength set, and of utilizing the vacant points of the frequency spectrum. It is particularly important that the radio frequency stage of the field strength set be so designed as to en-sure the least possible amount of tube nonlinearity.
ACTUAL FIELD EXPERIMENTS
The field experiments presented here were made at two places in the Egyptian desert; namely, at Baharya Road, some 20 kilometers from the Pyramids, and at Abu Aweigla, Senai. The experiments at Baharya Road were the first attempt towards obtaining interfer-ence patterns which proved the phenomenon. Acquiring the proper style and technique of the field work was the major objective rather than the determination of the
DATE , 24.7.54.
AVERAGE Fr, 115.5 KC.
- 500 at;
- 400
- 300
00 INTERFERENCE WITH 773 KC (E.S.B.)
L MULTIPLY BY 2, KC
480-
460-
440-
420-
400-
380-
360-
340-
320-
300-
f
o 0 o
400 450 500 550
Fig. 4—Observed and transformed frequency-interference patterns at Baharya Road for d=1,035 meters.
water table which is unknown there. The experiments made at Abu Aweigla were primarily intended for checking the efficacy of the method for the determina-tion of the water table which is known from a nearby boring. In all the tests, both transmitting and receiving antennas were parallel and perpendicular to the plane of incidence.
Experiments at Baharya Road
Figs. 3 and 4 show observed values of the voltage E, induced in the receiving antenna at various frequencies at two different distances. The lower curves are cal-culated in terms of microvolts induced in the receiving antenna per ampere into the center of the transmitting antenna. The general tendency of these curves indicates that E, increases almost with the square of frequency. The upper curves are merely the lower ones multi-
plied by ( 1,000/f)2. This graphical transformation is made only to enable more accurate determination of the maxima and minima. The curves indicate that the delay frequency is not constant. This illustrates clearly effects of anomalous dispersion. Curves also show serious inter-ference caused by the beating action of the relatively strong field strength of the Egyptian State Broadcast

28 PROCEEDINGS OF THE IRE January
.11.0
TRANSMITTING AERIAL . 460+604 M. DATE : 11.9.54. RECEIVING AERIAL 460+604 M
TEST : VARIABLE FREQUENCY.
AVERAGE F = 87 KC
10.5 t
340
o o o
35.0
86 KC 89 KC 84 KC
87 KC , 89 KC
400 450 500
4000«
2000.
o-
Fig. 5—Observed and transformed frequency-interference patterns at Abu Aweigla for d..550 meters.
560
Station at 773 kc with the local signal. Reduction in the output as a result of beat is due to an inherent charac-teristic of converter stage of receiving set.
Considering the average value of the delay frequency F, and using the results of measurements Vic = 2.75 at Baharya Road, and assuming a = 0.75 we get:
At d = 1,035 meters: observed F=115.5 kc, calculated h = 507 meters.
At ¿= 1,300 meters: observed F=87 kc, calculated h= 682 meters.
Average value of his 594 meters. This value could not be checked definitely on water table at this place. Fur-ther, it is not advisable to depend much on these results because of large difference between two values of h, and because of serious variation of F with frequency. More reliable results could have been obtained with cl = 300 meters and f ranging from 1,000 to 1,500 kc.
Experiments at Abu Aweigla
Figs. 5 and 6 give the resulting interference patterns. In these tests, the distances chosen were 550 and 270 meters which are small compared to the expected depth of the water layer. Further, the smaller of these dis-tances is just about half the longest wavelength. It is interesting to note the constancy of the observed delay frequency and the relatively strong field strength. These conditions are favorable for field work.
Using the results of measurements of Nre„ = 2.38 and with a= 0.75, we get:
At ¿= 550 meters: observed F=87 kc, calculated h= 835 meters.
At d= 270 meters: observed F=77 kc, calculated h.= 885 meters.
Average is h = 861 meters. This result agrees with water table borings made by Standard Oil Company at Khabra and Nikhil. Trusted reports of these borings gave depth at which water was first observed as follows:
Khabra Boring: 2,594 ft. or 790 meters Nikhil Boring: 2,872 ft. or 875 meters
450 500 550 . 600 400
Fig. 6—Observed and transformed frequency-interference patterns at Abu Aweigla for (1=270 meters.
The test place at Abu Aweigla is indicated on the drawing of Fig. 7 relative to Khabra and Nikhil borings.
NORTH
•
ABU AWE IGLA
NIKHIL BORING
KHABRA BORING
DATA:
KHABRA BORING1t=790M• 192 M. ABOVE Si— NIKHIL BORING :./kr.875 •'406 • • .•
ABU AWEIGLA :4?‘ =861 " 125 • • SCALE , I CM. =10 KILOMETERS
Fig. 7—Position of Abu Aweigla relative to Khabra and Nikhil borings.
THE VARIABLE DISTANCE INTERFERENCE METHOD
•
Referring to Fig. 1(c), the transmitter T is fixed while the receiver R is moved, the distance d being varied while the frequency f is constant. In addition to the as-sumptions made in the previous section, the variable distance method assumes no change in the surface levels or the water level throughout the test area. Under these conditions, the interference fringes are given by (1).

1956 El-Said: Underground Water Prospecting 29
o
o C-
— FRINGE DISTANCE, METERS
500 10b0 1500 2000 2500
Fig. 8—Calculated chart relating fringe distance and depth for =2.5 and ce = 0.75; the appropriate frequency range is indicated.
From Fig. 1(b) when d=d1, n =n1 and when d -- d2, we have n=n2=n1+2. The distances d1 and do are the dis-tances for which consecutive maxima (or minima) will occur. Then, using ( 1), we find that:
where
1 h = — V(B — 2did2)(B 2did2)
4A
1 [ c 1 A = — + — (d2 — d1)1
N/E f
(7)
(8)
B = d22 + di2 — A' (9)
If in Fig. 1(b), di and do are any two points of suc- 300
cessive maxima and minima, (7) would still hold but:
150C
DATE TEST
Te. AERIAL' (35+35) METERS.
29 630.7.54 Rec . AERIAL (35+35) METERS.
VARIABLE DISTANCE. PLUS 2 METERS TWISTED-LEADS
d METERS:
1 ; I _
. • • • • • "
. . _
250 500 750 1000 1250 1500
Fig. 9—Observed distance-interference patterns at Baharya Road for the frequencies 840, 940 and 1,040 kc.
1 [ c 1 A = — + — (d2 — di)"
Ve 2f a (10)
For best utilization of a variable distance field experi-ment, ( 1) is further investigated by assuming the order of interference n and calculating the distance d at which maxima or minima occur for a given value of h. Values of N/i, a and the appropriate frequency are presumed. Fig. 8 shows fringe distances vs n, for given values of h. These curves are calculated from the relation:
d = nh[0.3 V(0.314 — 25n2)1 (11)
which is derived from ( 1), for NTE = 2.5, a = 0.75, and h= ix air (see (6)). These curves show that the separa-tion between any two consecutive maxima or minima decreases rapidly as the order of interference is in-creased until the separation becomes almost constant when d>>h. This far distance condition is given by:
(da — d1) = — do. (12) f _1 \)
Ve a
500 700 900 1100 1300
Fig. 10—Transformed patterns of Fig. 9.
1500
In general, although the transmitting antenna is laid on the ground surface, a relatively strong vertical com-ponent of the electric field has been observed at the receiver. This makes the variable distance method sensi-tive to small changes in the antenna orientation in the vertical plane. With rough ground the measurement of the electric field is therefore subject to errors. The best utilization of this method is obtained only in fairly level ground for depths less than 500 meters. Greater depths require large fringe distances and these suggest many
field problems.
ACTUAL FIELD EXPERIMENTS
Figs. 9 and 10 show interference patterns obtained at Baharya Road. The curves of Fig. 9 express the re-ceived microvolts per ampere at three fixed transmitter frequencies; namely, 840, 940, and 1,040 kilocycles. The general tendency of the curves indicates that the in-duced voltage decreases inversely with the square of the distance. The curves of Fig. 10 are those of Fig. 9 trans-formed to (d/1,000)2 for accurate graphical determina-tion of the maxima and minima.

30 PROCEEDINGS OF THE IRE January
The curves of Fig. 10 illustrate the errors produced by variations in the antenna orientations in the vertical plane as the receiver is moved from place to place. This effect is most pronounced at distances from 700 to 1,000 meters where the ground surface was rough. The curves also illustrate discontinuities at distances less than 550 meters and greater than 1,350 meters. This indicates a change in the kind of underground material at these places. Apart from the above illustrations, the smoothed
curves of Fig. 10 show definite maixma and minima from which the depth h is calculated. Using the results of measurements Nr€,, = 2.75, and using (7), (8), and (9), with a = 0.75, the following is obtained: When
f= 1,040 kc, d1= 830 meters, d2= 1,185 meters, A= 224,
B= 204 X104, from which h= 591 meters.
When
f = 940 kc, d1=840 meters, d2= 1,205 meters, A = 235,
B = 210.1 X10⁴, from which h= 600 meters
When
f = 840 kc, d1= 850 meters, d2= 1,225 meters, A=246,
B = 216.14 X 10⁴, from which h= 582 meters.
The average value is h = 591 meters..
Altitude measurements at Baharya Road gave the barometer reading at Cairo University = 997.8 millibars; barometer reading at receiver site at Baharya Road = 981.7 millibars. Difference = 16.1 millibars, which is equivalent to a difference in level of 16.1 X8.38 = 135 meters. Adding 10 meters from Nile Level, the height of the test point at Baharya Road is 145 meters above Nile Level during the month of July. These results sug-gest that the water table at this test point is independ-ent of the Nile water. The results, however, agree with those obtained by the variable frequency method men-tioned in the previous section.
A NOTE ON THE MODE OF PROPAGATION
The antenna is perhaps the most important part of this system, due to its complicated behavior and lack of rigorous solution for the resulting mode of propagation. When the antenna is placed on the ground surface,
the latter will act as a lossy dielectric because of the presence of conductivity. This conductivity is also in-homogeneous, being relatively greater at the surface layer than at the bottom layers. This is because of the continuous exposure of the surface layer to the ever-changing climatic conditions. The extra conductivity of the surface layer causes relatively strong surface con-duction currents to flow in the vicinity of the antenna and will produce the following effects:
1. It will absorb energy, thus reflecting a resistive component into the driving point impedance.
2. It will produce a field which opposes the original field of the antenna, and thus reduces the radiation com-ponent and radiation resistance.
3. The reduction in the antenna field in its vicinity will also be accompanied by a change in the reactive component of the driving point impedence. This change, however, may be assumed small in a first order approxi-mation, because most of the energy stored is close to the antenna conductor. Thus the general effect of the presence of ground
surface conductivity is an apparent screening of the power input to the antenna which is thus mainly ab-sorbed instead of being radiated into the appropriate propagation media. However, in this manner, it might appear that the power radiated in air is many times that radiated in the underground medium. Fortunately, the antenna is a more efficient radiator of energy under-ground than in air by virtue of its relative electrical length in each medium.
In general, the effect of the presence of the extra ground surface conductivity may be reached by as-suming an appropriately dimensioned, situated, and resistively loaded image. Owing to the antenna being placed on the boundary, the antenna and its image are almost coincident. Since the image is essentially nega-tive in this case the resulting reduction in the electric field at any point on the ground surface is almost, but not exactly, a complete cancellation. This, perhaps, ac-counts for the weak field which is observed on the ground surface at all points of reception. The equipment employed in the field measurements
consists of a mobile transmitter and a field strength measuring set with its calibrating signal generator. Both the transmitter and the field strength set are of standard construction but special modifications were made locally in the antenna circuits. The tank circuit of the final power amplifier in the transmitter is coupled to the dipole antenna by means of a carefully balanced trans-former in which the degree of balance is controlled and indicated. Similarly, the receiving dipole antenna is coupled to the field strength set by means of a balancing unit and a suitable switching arrangement which en-ables easy comparison of the antenna-induced emf with the calibrated output of the associated signal generator.
ACKNOWLEDGMENT
Entrusted by the National Research Council of Egypt, the author carried out the work which is the subject matter of this paper at the Electronics Labo-ratory, Faculty of Engineering, Cairo University, to which he extends his thanks. The field work was made possible with the kind facilities extended by the Quarter-master General, Egyptian Army. The author wishes also to acknowledge the early work
by Dr. H. Lowy under the supervision of Professor H. M. Mahmoud, Professor of electrical engineering, Cairo University, for the determination of the degree of transparency of desert rocks to electromagnetic waves.

1956 PROCEEDINGS OF THE IRE 31
A Transmission Line Taper of Improved Design* R. W . KLOPFENSTEINt
Summary—The theory of the design of optimal cascaded trans-
former arrangements can be extended to the design of continuous transmission-line tapers. Convenient relationships have been ob-tained from which the characteristic impedance contour for an opti-mal transmission-line taper can be found.
The performance of the Dolph-Tchebycheff transmission-line taper treated here is optimum in the sense that it has minimum reflection coefficient magnitude in the pass band for a specified length of taper, and, likewise, for a specified maximum magnitude reflection coefficient in the pass band, the Dolph-Tchebycheff taper has mini-mum length. A sample design has been carried out for the purposes of illustra-
tion, and its performance has been compared with that of other tapers. In addition, a table of values of a transcendental function used in the design of these tapers is given.
INTRODUCTION
HE ANALYSIS of nonuniform transmission lines has been a subject of interest for a considerable period of time. One of the uses for such nonuni-
form lines is in the matching of unequal resistances over a broadband of frequencies. It has recently been shown that the theory of Fourier transforms is applica-ble to the design of transmission-line tapers.' It is the purpose of this paper to present a transmission-line taper design of improved characteristics. The performance of this taper is optimum in the sense that for a given taper length the input reflection coefficient has mini-mum magnitude throughout the j:$.ss band, and for a specified tolerance of the reflection coefficient magni-tude the taper has minimum length.
For any transmission line system the applicable equa-tions are
dV = — ZI
dx
dl = — VV,
dx (1)
where 'V= the voltage across the transmission line, 1= the current in the transmission line, Z = the series impedance per unit length of line,
and Y= the shunt admittance per unit length of line.
Fig. 1 illustrates the configuration to which the above equations are to be applied.
For nonuniform lines, the quantities Z and Y are known nonconstant functions of position along the line, and the properties of the system are determined through a solution of ( 1) along with the pertinent boundary
• Original manuscript received by the IRE, June 9, 1955. f RCA Labs., Princeton, N. J. I F. Bolinder, "Fourier transforms in the theory of inhomogeneous
transmission lines," PROC. IRE, vol. 38, p. 1354; November, 1950.
conditions. Through use of the waveguide formalism2 (1) is applicable to uniconductor waveguide as well as to transmission line. Strictly speaking, of course, ( 1) is not precisely applicable to any system since it ac-counts for the propagation of a single mode only. It furnishes an excellent description, however, as long as all modes but dominant mode are well below cutoff.
P
x — 2 X
Fig. 1—Tapered transmission-line matching section.
Eq. (1) can be recast in a more directly useful form through the introduction of the quantities
-y = VZY = the propagation constant of the line,
Zo = N/Z/Y = the characteristic impedance of the line,
and
V// — Zo the reflection coefficient at any p = — (2)
V// -F Zo point along the line.
These lead to first order nonlinear differential equation*
dp 1 d(lnZ0) — — hp ± — (1 — p2) — 0. (3)
2 dx dx
This equation has the advantage that it is in terms of the quantity of direct interest in impedance matching prob-lems. Likewise, a very natural approximation for im-pedance matching purposes can be made directly in this equation. If it is assumed that p2«1, (3) becomes
dp — — F(x) = 0, dx
2 N. Marcuvitz, "Waveguide Handbook," McGraw-Hill Book Co., Inc., New York, N. Y., ch. 1, p. 7; 1951.
3 L. R. Walker and N. Wax, "Nonuniform transmission lines and reflection coefficients," Jour. Appl. Ploys., vol. 17, pp. 1043-1045; December, 1946.

32 PROCEEDINGS OF THE IRE January
where
1 d(ln Zo) F(x) —
2 dx (4)
which is a first-order linear differential equation in p.
SOLUTION OF THE DIFFERENTIAL EQUATION
A solution of the differential equation (4) is sought which satisfies the boundary condition p =0 at x = //2. An integrating factor for this equation is
a G(x) = exp [— 2 f •ydt],
a (5)
where the lower limit of the integral is arbitrary. Ap-plying this to (4) it is found that the solution satisfying the boundary condition is given by"
112
p(x) = f F(z) exp [— 2 f (E)dE] dz, (6)
and, hence, the input reflection coefficient is
P = f1/2 F(z) exp [— 2 f 7(t)dt]dz. (7) -1/2 —1/2
The solution given above is subject only to the re-striction that the reflection coefficient is relatively small. It is equally applicable to lossless transmission line, lossy transmission line, and waveguide tapers. The physical interpretation of the solution as given is evi-dent. The incremental reflection at each cross section is given by F(z), and the exponential term expresses the total delay and attenuation of this reflected com-ponent at the input of the tapered section relative to incident input wave.
OPTIMAL DESIGN OF TRANSMISSION-LINE TAPERS
An important special case of the general situation considered above is the lossless transmission-line taper as illustrated in Fig. 1. In this case, the characteristic impedance is a real number and is independent of fre-quency. The wave propagated in the line is essentially TEM in character, and the propagation constant is purely imaginary and proportional to the frequency. Under these conditions the interior integration of ( 7)
can be carried out, and the input reflection coefficient becomes
112
p exp (j,91) = f F(z) exp (—i2OZ)d2. —1/2
(8)
This relationship can be inverted through the theory of Fourier transforms to obtain
F(x) = — f [p exp (j,91) ] exp (j2fix)d13. 1 ie (9)
The analogy between the present problem and the syn-thesis of radiation patterns from line sources is evident.
4 L. R. Ford, " Differential Equations," McGraw-Hill Book Co., Inc., New York, N. Y., ch. 2, pp. 36-39; 1933.
In each case, the quantities of interest are related through the Fourier transform.
In the use of (9) the reflection coefficient is specified so that its value at negative frequencies is equal to the complex conjugate of its value at the corresponding positive frequencies. This is necessary in order that the specified reflection coefficient shall correspond to a physically realizable structure.' This requirement then insures that the transform will be completely real as it must be in order that F(x) have significance in terms of a transmission-line taper.
Collin has recently shown that optimum performance is obtained from a cascaded transformer structure when the power loss ratio is expressed in terms of the Tchebycheff polynomial of degree equal to the number of sections.' This is equivalent to having the input re-flection coefficient proportional to the Tchebycheff polynomial of the same degree, when its square is small relative to one [an assumption already made in the deri-vation of transform pair (8) and (9)]. By allowing the number of sections to increase in-
definitely for a fixed over-all length, the results of Collin can be extended to the case of a continuous transmission-line taper. In the case of a cascaded transformer ar-rangement, a secondary maximum in the reflection co-efficient magnitude occurs at the first and at all succeed-ing frequencies where the individual section lengths be-come equal to a multiple of a half-wavelength. As the number of sections is allowed to increase without limit for a fixed over-all length, the frequency at which this first secondary maximum occurs also increases without limit so that the pass band consists of all frequencies beyond that for which the reflection coefficient first comes within the specified tolerance.
For maximum bandwidth with a fixed maximum magnitude of reflection coefficient then, input reflection coefficient for a continuous taper takes form
p exp (jI31) = Po cosh (A)
cos [V(042 — A21 (10)
which is the limiting form of the Tchebycheff polynomial as its degree increases without limit.' The specification of the parameter A determines the maximum magnitude of reflection coefficient in the pass band which consists of all frequencies such that f3lk A. The reflection co-efficient magnitude takes on its maximum value ! Poi at zero frequency, and it oscillates in the pass band with constant amplitude equal to po/cosh (A). A plot of the function given by ( 10) is shown in Fig. 2 for a number of different values of A. The inversion of the above specified reflection co-
efficient through (9) yields'
O H. W. Bode, "Network Analysis and Feedback Amplifier De-sign," D. Van Nostrand Co., Inc., New York, N. Y., ch. 7, p. 106; 1945. • R. E. Collin, "Theory and design of wide-band multisection
quarter-wave transformers," PROC. IRE, vol. 43, pp. 179-185; Febru-ary, 1955.
7 T. T. Taylor, "Dolph arrays of many elements," Tech. Memo. No. 320, Hughes Aircraft Co., Culver City, Calif.; August 18, 1953.

1956 Klopfenstein: Transmission Line Taper 33
F(x) = Po JA 2 MAO - (2x/1)2] cosh (A)1 1 A-/1 - (2x/1)2
-= 0,
± '215(x - ± (x -4)3, xi 1/2, I xi > 1/2, (11)
where /1 is the first kind of modified Bessel function of the first order, and ô is the unit impulse function. The variation of characteristic impedance along the
taper can be found by direct integration of F(x), and it is given by
1 PO {A20(2x/1, A) In (Zo) = — in (Z1Z2) 2 cosh (A)
+U (x — + Ue(x + —1 ,
2 2
= /n (Z2), /n (Z1),
x > //2, x < — //2.
1 x1 //2,
U is the unit step function defined by,
U(z)=O, z < 0,
U(z) = 1, z 0,
and ck is defined by
(12)
(13)
1'1(A-0 — y2) (1)(z, A) = — ck(— z, = dy,
10 A V1 — y2
I zi 5, 1. (14)
o
Fig. 2—Response of Dolph-Tchebycheff transmission-line tapers.
Eq. ( 12) furnishes the information required for the design of a Dolph-Tchebycheff tapered transition. The quantity po is determined by the two impedances Z2 and Z1 which are to be matched, and A is selected on the basis of the allowed maximum reflection coefficient magnitude in the pass band. One of the interesting as-pects of this design is that the taper has a discontinuous change of characteristic impedance at each end as well as a continuous change along the length of the taper. It is interesting to note that when the tolerated reflection
coefficient approaches the initial reflection coefficient po, the parameter A approaches zero, and the band-width comprises all frequencies from zero to infinity. In this case, the Dolph-Tchebycheff taper design degen-erates into the usual quarter-wavelength transformer design with a discontinuous change of characteristic
impedance at each end and a constant characteristic impedance at intermediate points.
25
20
15
10
5
o
20 1 og, 0 (COSH A ) = 40
35
3
25
20
15 10
Fig. 3 Plot of the function 0(z, A).
The function te(z, A) is not expressible in closed form except for special values of the parameters. Therefore, this function has been computed through standard inte-gration formulas on an IBM CPC digital computer for a suitable range of values of the parameters. Tabulated values of ck(z, A) are given to six decimal places in Table I, p. 34, and the function is shown in Fig. 3. The special closed-form relationships
q5(0, A) = 0,
clo(z, 0) = z/2,
cosh (A) - 1 A2 (15)
are obtained for the end points of the parameter ranges. One more comment should be made in regard to the
application of the preceding design procedure. If one uses the natural value
Z2 - Z1 e PO =
Z2 + Z1 (16)
in entering the equation (12), it will be found that the designed taper does not quite fit the final impedances

34 PROCEEDINGS OF THE IRE
TABLE I
January
VALUES OF THE FUNCTION ct;(z, A) FOR Z=0(0.05)1.00 AND 20 logio (cosh A) = 0(5)40
gz, A)
20 logio (cosh A)
z 0 5 10 15 20 25 30 35 40
0.00 0.000000 0.000000 0.000000 0.000000 0.000000 0.000000 0.000000 0.000000 0.000000
0.05 0.025000 0.029593 0.036848 0.048140 0.065590 0.092539 0.134313 0.199460 0.301772
0.10 0.050000 0.059161 0.073629 0.096137 0.130902 0.184564 0.267698 0.397268 0.600625
0.15 0.075000 0.088681 0.110276 0.143848 0.195661 0.275567 0.399242 0.591802 0.893707
0.20 0.100000 0.118128 0.146721 0.191132 0.259597 0.365055 0.528062 0.781511 1.178306
0.25 0.125000 0.147479 0.182899 0.237850 0.322448 0.452552 0.653321 0.964936 1.451913
0.30 0.150000 0.176708
0.205794
0.218746 0.283869 0.383962 0.537610 0.774237 1.140744 1.712272
0.35
0.40
0.175000 0.254197 0.329059 0.443899 0.619809 0.890101 1.307751 1.957437
2.185803
2.396134
0.200000 0.234711 0.289191 0.373296 0.502035 0.698767 1.000282 1.464942
0.45 0.225000 0.263438 0.323667 0.416460 0.558163 0.774142 1.104238 1.611487
0.50 0.250000 0.291950 0.357568 0.458441 0.612094 0.845635 1.201523 1.746753 2.587582
2.759684 0.55 0.275000 0.320226 0.390837 0.499134 0.663658 0.912994 1.291792 1.870306
0.60 0.300000 0.348244 0.423420 0.538444 0.712709 0.976019 1.374800 1.981918
2.081555
2.912359
3.045886 0.65 0.325000 0.375982 0.455266 0.576284 0.759120 1.034555 1.450409
0.70 0.350000 0.403418 0.486328 0.612574 0.802790 1.088504 1.518582 2.169376 3.160875
0.75 0.375000 0.430533 0.516559 0.647248 0.843641 1.137814 1.579377 2.245710 3.258228
0.80 0.400000 0.457305 0.545918 0.680245 0.881619 1.182484 1.632947 2.311049 3.339098
0.85 0.425000 0.483716 0.574365 0.711518 0.916692 1.222564 1.679531 2.366019 3.404835
0.90 0.450000 , 0.509746 0.601865 0.741027 0.948855 1.258145 1.719443 2.411361 3.456938
0.95 0.475000 0.535377 0.628386 0.768745 0.978123 1.289363 1.753065 2.447905 3.497000
1.00 0.500000 0.560591 0.653899 0.794653 1.004533 1.316391 1.780835 2.476547 3.526658
Z2 and Z1 at the end points. This fact is an evidence of the approximation p2«1 which was made at the outset in differential equation (4). Discrepancy becomes larger as value of magnitude of po increases. This design in-convenience can be eliminated, however, by taking
pp = (Z2/Z1), (17)
as the initial value of the reflection coefficient instead of the true value of ( 16). The two expressions are identical to a second order of approximation for small differences between Z2 and Z1, and the use of the second expression will yield a taper design which exactly fits its end-point impedances for all values of Z2 and Z1. The effect of the approximation p2«1 will then be evidenced by a slight deviation from the performance given by ( 10) in the low-frequency range outside the pass band.
COAXIAL TRANSMISSION-LINE TAPER FROM 50 TO 75 OHMS
As an application of the preceding results, the de-sign of an optimal 50-75 ohm coaxial transmission line taper will be indicated in detail. The taper is to be de-signed so that the input reflection coefficient magnitude does not exceed about one per cent in the pass band.
The initial value of the reflection coefficient in this case is equal to 0.2. The value of po for use in the design of the taper is found from ( 17) to be
Po = In(1.5) = 0.20274. (18)
As observed previously, this value does not differ markedly from the zero frequency reflection coefficient.
It will be required that the maximum reflection co-efficient magnitude in the pass band shall not exceed one-twentieth of po. Thus, from ( 10)
cosh (A) = 20,
so that
A = 3.6887. (19)
The characteristic impedance contour can now be ob-tained directly from ( 12). The resulting Zo curve is illustrated in Fig. 4, and the corresponding coaxial line-conductor contour is shown in Fig. 5.
Characteristic impedance has a discontinuous jump from 50 to 50.52 ohms at left-hand end and a corre-sponding jump from 74.24 to 75 ohms at right-hand end. Characteristic impedance at center of taper is equal to 61.24 ohms, geometric mean between 50 and 75 ohms.

1956 Saito and Kurokawa: Dielectric Measurements at Microwaves 35
1p it 001 FOR 1/I : 0 5E1T Z.
75
70
65
0
55
. - 50 3 .5
Fig. 4-50-75 ohm Dolph-Tchebycheff tapered transition.
MI
5
1p I 5 0.01 F06 e à É 0 587
4
3
- -.3 .2 3 4
Fig. 5—Inner conductor contour for 50-75 ohm Dolph-Tchebycheff coaxial-line transition.
.6
The performance of this taper is plotted in Fig. 6. The pass band consists of all frequencies greater than that for which i3/ = 0.587. For comparison, the perform-ance of an exponential tapers and a hyperbolic tapers has been indicated on the same curve.
C. R. Burrows, "The exponential transmission line," Bell Sys. Tech. _four., vol. 17, pp. 555-573; October, 1938.
9 H. J. Scott, "The hyperbolic transmission line as a matching section," PRoc. IRE, vol. 41, pp. 1654-1657; November, 1953.
1.1
2
15
10
05
O
C
A E XPONENTIAL TAPER
B HYPERBOLIC TAPER
C DOLPH - T CHEBYCHEFF TAPER
et & V
Fig. 6—Performance of 50-75 ohm Dolph-Tchebycheff tapered transition.
CONCLUSION
The theory of the design of optimal cascaded trans-former arrangements can be extended to the design of continuous transmission-line tapers. Convenient rela-tionships have been obtained from which the char-acteristic impedance contour for an optimal transmis-sion-line taper can be found. Alternatively, this imped-ance contour can be thought of as the envelope of the pointwise specified characteristic impedance of a dis-crete cascaded transformer arrangement.
The performance of the Dolph-Tchebycheff transmis-sion-line taper treated here is optimum in the sense that it has minimum reflection coefficient magnitude in the pass band for a specified length of taper, and, likewise, for specified maximum magnitude reflection coefficient in the pass band the Dolph-Tchebycheff taper has minimum length.
A sample design has been carried out for the pur-poses of illustration, and its performance has been com-pared with that of other tapers. In addition, a table of values of a transcendental function used in the design of these tapers is given in Table I.
A Precision Resonance Method for Measuring Dielectric Properties of Low-Loss Solid Materials in the Microwave Region*
S. SAITOt AND K. KUROKAWAt
Summary—A precision resonance method for measuring the di-electric properties of low loss solid materials has been developed in our laboratory. The dielectric sample to be measured is shaped into a cylindrical disk and inserted into a cylindrical cavity resonator
oscillating in the T10, mode. E can be measured from the difference
* Original manuscript received by the IRE, April 2, 1955; revised manuscript received, July 6, 1955.
t Institute of Industrial Science, Univ. of Tokyo, Tokyo, Japan.
between the axial lengths of the cavity tuned to the same frequency with and without the sample, and tan .5 can be found from the differ-
ence between the Q's of the cavity with and without the sample. By making use of a special marker of a resonance point on an oscillo-scope, the measurements accuracy can be improved to yield only 1 per cent error in e and 3 per cent error in tan .5 for various low-loss
samples. Such materials as polystyrol, polyethylene, teflon, and glass for high-frequency use were tested at 4,000 mc, 9,000 mc and 24,000 mc.

36 PROCEEDINGS OF THE IRE January
INTRODUCTION r191 HE METHODS which have been used to measure the dielectric properties of solid materials in the microwave region fall into two classes: standing
wave methods" and resonance methods. The former is suitable for measuring high or medium-loss materi-als, while the latter is preferable for low-loss materials. Many researchers3-4 have already developed several
resonance methods for measuring the dielectric proper-ties of low-loss solid and liquid materials. The authors have extended one of these methods by analyzing a way of eliminating completely all residual losses except for the sample loss, which is the most important and diffi-cult problem for the resonance method. Advantages of this new method compared with the earlier papers are as follows:
1. Tan b of sample can be obtained without any am-biguity from ( 7) or ( 11), by using the measured Q values of cavity with and without sample, and wall losses of empty cavity. Here, it is necessary to locate exciting and pick-up loops or holes at opposite side (No. 1 region of Fig. 1) from movable plunger plate for sample, in order to eliminate coupling losses of external circuits.
t
L
1.1 d
I it III
Fig. 1—Dimensions of the cav'ties with and without the dielectric sample.
2. The accuracy of measurement can be considerably improved by repeating twice measurements at the X1/4 and optimum sample positions as shown in the "typical measuring procedures."
T. W. Dakin and C. N. Works, "Microwave dielectric measure-ments," Jour. Appl. Phys.. vol. 18, pp. 789-796; September, 1947.
W. H. Surber and G. E. Crough, Jr., "Dielectric measurement methods for solids at microwave frequencies," _Tour. Appl. Phys., vol. 19, pp. 1130-1139; December, 1948.
3 C. G. Montgomery, "Technique of Microwave Measurement," McGraw-Hill Book Co., New York, N. Y.; 1947.
4 R. L. Sproull and E. G. Linder, "Resonant-cavity measure-ments," PROC. IRE, vol. 34, pp. 305-312; May, 1946.
5 F. Horner, T. A. Taylor, R. Dunsmuir, J. Lamb, and W. Jack-son, "Resonance methods of dielectric measurement at centimeter wavelengths," Proc. IEE (London), vol. 93, part III, pp. 53-68; January, 1946. ° B. Bleaney, J. H. N. Loubster, and R. P. Penrose, "Cavity
resonators for measurements with centimeter electromagnetic waves," Proc. Phys. Soc. (London), vol. 59, pp. 185-199; March, 1947.
3. The accuracy in Q measurements can be improved by making use of a special frequency marker in the measurements of the resonance and half power points. It has been adopted as the standard for measurements of this kind by the Electrical Communication Laboratory of the Japanese Telephone and Telegraph Corporation and is now used widely in Japan.
Since the new precision method of measuring Q em-ployed in this connection is most suitable for measure-ments involving high values of Q, it is also applicable to measurements of other quantities involving extreme-ly small loss. Measurements of the surface conductivity of metal plates and of the attenuation of waveguide and coaxial line based on the same principle, have been carried out. Their results are briefly described.
PRINCIPLE
Fig. 1 represents a cylindrical cavity resonator which is excited to resonate in the TE 21, mode. A solid dielec-tric sample is formed into a cylindrical disk, whose diameter 2a is the same as that of the cavity, and is then located perpendicularly to the cylinder axis in a certain position in the cavity. The axial length of the partially filled cavity resonant at a certain frequency is less than that of the cavity resonant at the same fre-quency without the sample. Let the thickness of the sample be d, and the distances from the surfaces of the sample to the end plates of the cavity be 1, and /2 respectively (see Fig. 1). The resonant axial length of the cavity with the sample then is (11-1-12±d). The resonant axial length of the cavity at the same fre-quency without the sample is Lo=4±/20, where /1 and /20 are as shown in Fig. 1. Finally, let the difference between the two resonant axial lengths be denoted by shift S. Then the following equation relating these quan-tities is obtained:
n2—n cot thd cot m cot /3,12— cot 13,1 12.— (S-Fd)} = (1)
n cot e2d+cot 1314
Here e„ e2 are the phase constants of the TE01 mode in the axial direction in the air and the dielectric sample, respectively, and n =02/el. The shift S varies with the position of the sample, 11, as shown in Fig. 2 and the condition that gives the maximum value of the shift, S., is given by
cot /Mi=n tan 02d/2, /1= /2± v72X1 (for 132d < ir). (2)
The maximum value S,„„2 satisfies the equation:
cot (31/2 (5.22-1-d) -- 1/n cot thd/2. (3)
Defining .31 and S2 as the shifts corresponding to 11 ( = 2v' -1-1)/4X1, and /2 = v'/2X1 respectively, we have
cot e1(.91 + d) = 1/n cot 132d (4)
cot (31(S2 ± d) = n cot e2d. (5)
Here y' is zero or an integer and Xi is the guide wave-length in the air-filled guide.

1956 Saito and Kurokawa: Dielectric Measurements at Microwaves 37
If S is measured corresponding to a certain value of /2, ,32 can be calculated from ( 1), (3), (4) or (5) and the dielectric constant of the sample, e, is given by
022 ixo\ 2
(2/r/Xo) 2 Xe)
where Xo is the guide wavelength and Xo the cut-off wavelength for the TE ol mode in the air-filled guide.
E =
Fig. 2—Relation between the shift and sample position.
(6)
where R12, R32 are given by
R12 = sin2 vn2 coo eelli)
sin2 • (10) R32 = sin2 /92d (cot 1511/1 + n cot 02d)2
n2 sin' /31/2
In the reactance variation method, when the differ-ences of the axial lengths 2612 and 28/20 at the half-power points of the resonance curves of the cavity with and without the sample, respectively, are obtained by vary-ing the axial length /2, tan ô can be calculated from the equation
tan ô — 1-28/2 — 28/20/R321 [i _ (1 21 (11) L n2dR E Xe
where R is given by
1 coo ei4• tan e2d R = sin2 01/2 [1 +
n' tan' /31/2 n2132d
{ n2 cosec 2 02d
(cot /MI cot fi2d — n) 2 11]. The last term in ( 7) and ( 11) is given by
(12)
21312(R32— 1)+ 2/a(21,-/X0) 2 { (4 +12R32+dR12 Lo) — 1/202(1 — 1/n2)(sin 26111+R32 sin 261/2)1 à = 1.92 -070-,4 10-5 (27r/X0) edRi2+ e/ 2,31(1 /n) 2(sin 2/3111+R32 sin 201/2)1 1 (13)
Next, let us consider the methods for determining tan 6, the loss tangent of the sample. Associated with cavity measurements there is the frequency variation method and the reactance variation method (or axial
length variation method). It is assumed that the cavity in use is of the transmission type and that its exciting and pick-up loops (or holes) are located in the region designated as No. 1 in Fig. 1. When in the frequency variation method 28f and 2Sfo, the half-power band-widths of the resonance curves of the cavity with and without the sample respectively, are measured, tan 6 can be exactly calculated from
WO 2Sfo] [ WI+ Waj tan 6= ruf 1+ _
L fo WI+ W2 ± W3 fo W2
Here Wo corresponds to the energy stored in the cav-ity without the sample; W1, W2 and W3 respectively correspond to the energy stored in regions No. 1, 2 (sample), and 3 of the cavity containing the sample, as shown in Fig. 1. These are obtained as follows:
wo W1 + W2 + W3
1 + W1 + W3
W2
where X0 is the wavelength in free space expressed in cm, and A is attenuation coefficient of metal cavity wall relative to pure copper. When cavity is properly de-signed and manufactured, and value of X0/Xe lies be-tween 0.65 ,,-,0.80, à may be as small as 0.1,-,0.3 X10-4.
It is interesting to note that the proper loss of the sample can not completely be extracted from the measured Q values of the cavity only, with and without
the sample, but another measurement is required to obtain the compensation factor à; i.e., the relative loss factor A. It should be noted that in ( 7),---,(13) cavity wall losses plus coupling losses are taken into account.
For some special cases the above formula may be somewhat simplified. Several cases are listed below.
In the case S= Smax,
/I= 12±v72X1, R12= sin2 sec2 /32d/2, R32 --- 1.00
1 W1+ W3 = 1 + 24 1/ei sin 21314 +
W2 edR12 ± €1131 (1/n) 2 sin 2014 (14)
1 2 R= sin' P1/1 + (1+ 1 \
n2 tan' /3l $2d n tan 1314)
Lo
11+ edRi2 12R32 — 1/202[1 — o(l/n)2] [sin 2i31/2 + R32 sin 2131/2]
+ /2R32 — 1/20i(sin 2/324 + R32 sin 20112) = 1 +
EdR,2 + E/2131(1/n)2(sin 2024 ± R22 sin 201/2)
(8)
(9)

38 PROCEEDINGS OF THE IRE January
In the case /1-= (2V+1)/4Xi(vi = 0, 1, 2, • • •
R12=1.00, R32= cos2 (32d+ n2 sin2 e2d,
W3 11+ 12R32 I 1— sin el/2/201/21 1+ = 1+
W2 Ed 1 1+ sin 202d/2132d 1
R 1+ sin 2e2d/202d =
cos' 02d-1-n2 sin2 02d
In the case /2 = v72)LI (v' = 0, 1, 2, • • • )
(sin 01/1\ R12=
sin i3eil
{sin 01 (S2+1 2 R32 = 71.2R1 2,
sin e2d wi+ W3
1 + 1172
=1+ 1/2(3, sin 2,51(52+d)
edR12—e/201(1/n)2 sin 2ei(S2+d)
(15)
(16)
MEASURING EQUIPMENT
General Installation
A block diagram of the measuring equipment is shown in Fig. 3. The klystron is frequency modulated by means of a sawtooth wave derived from the oscilloscope sweep. The signal from the klystron is transmitted through the main waveguide of the directional coupler and vari-able precision attenuators, and is then fed to the measur-ing cavity resonator through a pick-up antenna (4,000-mc band) or a small hole (6-mm diameter for 9,000-mc
KLYST RON
OSCILLATOR
SAW TOOTH
GENERATOR
DIRECTIONAL
COUPLER
PADDING
AT T(0-30db)
FREQUENCY CALIBRATING CAVITY
1
VARIABLE
Al T(0-55dG)
CRYSTAL
DETECTOR —
PRECISION VARIABLE AT 7(0-I WO
DIFFERENTIA-ING
AMP.
MEASURING
CAVITY
ELECTRONIC
Swl ECK
CRYSTAL
DETECTOR
AMPLIFIER L
AMPLIFIER
VALVE
VOLT METER
Fig. 3—Block diagram of the measuring equipment.
band, 1 X3.5 mm for 24,000-mc band). Part of the signal is attenuated through the directional coupler and the padding attenuator and is fed to the frequency cali-brating cavity. The rectified outputs from both cavities are independently amplified, fed to the electronic switch and displayed simultaneously on the oscilloscope. The
klystron oscillator frequency is frequency modulated to sweep through the resonant frequency of the measur-ing cavity. A typical resonance curve results on the oscilloscope. Since the output of the frequency calibrat-ing cavity is differentiated by an RC circuit and then amplified, the differentiated waveform of the resonance curve appears simultaneously on the screen, as shown in Fig. 3. The (almost) vertical straight line, or more exactly, the point at which this line intersects the abscis-sa, indicates the resonant frequency of the frequency calibrating cavity. Therefore, when the vertical line, described above, coincides with the resonance curve maximum, the resonant frequency of the measuring cavity can be determined accurately from the tuning plunger reading of the frequency calibrating cavity. Also, the width of the resonance curve at half-power, that is, its damping factor, can be determined precisely from the difference between the two tuning-plunger readings necessary to make the vertical line coincide with the upper and lower half-power points of the resonance curve. The half-power points are determined by means of the calibrated precision attenuator as the points at which the curve is 3.01 db below the top of the resonance curve. Alternately the characteristics of the calibrated crystal detector may be used. The foregoing method of determining the half-power
bandwidth is most suitable for measurements involving high Q (such as the loss measurement of high quality dielectric samples), and is more accurate than any other known method. For low Q-measurement, however, (Q < 1,000), its accuracy is decreased by the AM effect of the klystron oscillator, and therefore (for example in the loss measurement of high-loss dielectric samples) the method developed at the Bell Telephone Labora-tories' is preferable in such cases. Even in that method the bright spot induced by the differentiated frequency marker is to be preferred over the usual resonance mark-er because a border point between the bright and dark spots corresponding to the resonant frequency of the calibrating cavity can be observed more clearly on the oscilloscope.
In the reactance variation method of high-Q measure-ments, the same equipment as shown in Fig. 3 is used. In this case, the frequency marker on the oscilloscope is fixed and the resonance curve is varying in accordance with the variation of the axial length of the measuring cavity. The method to obtain the half power points is just the same as described above.
In the reactance variation method for low-Q measure-ments, the klystron oscillator is amplitude modulated by means of a square wave. The rectified cavity output is amplified by the tuned audio-amplifier whose output is measured with a vacuum tube voltmeter as shown (in dotted lines) in Fig. 3.
7 A. C. Beck and R. W. Dawson, "Conductivity measurements at microwave frequencies," PROC. IRE, vol. 38, pp. 1181-1190; October, 1950.

1956 Saito and Kurokawa: Dielectric Measurements at Microwaves 39
Fig. 4 shows the complete measuring setup. It in-volves more than is shown in Fig. 3 so that other meas-urement methods (described below) are possible in the neighborhood of 9,000 mc.
Fig. 4—Complete measuring equipment at 9,000 mc.
Microwave Equipment
The measuring cavities used are cylindrical cavities oscillating in the TE01, modes, specifically, the TEon mode in the 4,000-mc band, the TE 012 mode in the 9,000-mc band, and the TEon and TEam modes in the 24,000-mc band. In order to make the compensation factor, A of ( 13) as small as possible, large diameters, such as 12.5 cm, 5.4 cm and 2.2 cm, are adopted in these frequency bands. Each cavity is provided with a fixed end plate and a movable plunger plate, and the available axial length of the cavity is made long enough to fix sample at the prescribed position and to facilitate tuning over a considerable frequency range. The plunger is advanced with a micrometer screw (one thread per mm), which has a minimum graduation of 1/1,000 mm. All inner dimensions of the cavities are made to within a precision of 3 microns (such an accuracy is not necessarily required for the measuring cavity). The inner surfaces of the cavities are finished by silver plating and their attenua-tion relative to pure copper is 1.4,...,2.0 (the relative attenuation is obtained by comparing the Q values of the TE D', and the TE 0c(,_,) modes). The loaded Q's of the cavities are about 10,000,--45,000. The frequency-calibrating cavities used also oscillate
in the TEou, TEon and TE 014 modes in the respective frequency bands. Their diameters are relatively small (specifically 10.0 cm, 4.4 cm and 1.67 cm) in order to increase the accuracy with which frequency is calibrated. A variation of 1/100 mm in the axial length corresponds to a change in the resonant frequency of about 70 kc, 170 kc and 880 kc at 4,000 mc, 9,100 mc and 24,000 mc, respectively. A variation of 1/1,000 mm in the axial length can be read by means of a double vernier. When a more accurate determination of frequency difference
is required, a small movable rod, attached to the fixed end of the cavity, is inserted into the cavity. For exam-ple, a variation of 1/100 mm in rod insertion corre-sponds to a 2.2-kc change in the resonant frequency at 4,000 mc. The variation in the resonant frequency de-scribed above is calibrated to within a precision of 1.5 kc by the heterodyne method. The variable precision attenuators used are vane-
type dissipative attenuators with a range from 0.5 to 1.0 db. They are calibrated by means of a standard cut-off attenuator and their accuracy is about 0.02 db.
Low- Frequency Equipment
The resonance-curve amplifier used consists of three RC coupled stages. The hum which normally results from ac heated filaments is eliminated by the use of dc power obtained from a selenium rectifier. The response of the amplifier is nearly uniform for frequencies ranging from 10 cps to 60 kc. The output of the klystron and its center frequency
should be constant during the measurement. Since it is also necessary to avoid any residual frequency modu-lation due to hum, battery operation is preferred, but well-stabilized, low hum rectifiers are generally satis-factory sources of klystron cathode and heater voltage. It is necessary to reduce the hum voltage of the klystron repeller source to 0.001 y by adding a decoupling capaci-tor in the repeller circuit, since, for example, in the 4,000-mc band a residual frequency modulation of 1 kc resulting by a 0.001-v hum voltage causes trouble in these precision measurements.
TYPICAL MEASURING PROCEDURES
Typical procedures for measuring the dielectric prop-erties e and tan 8 of low-loss dielectric samples are now briefly described. With the measuring cavity tuned to the measuring
frequency fo, the axial length of the cavity Lo and the half-power bandwidth, 28f0 (frequency variation meth-od) or 28/0 (reactance variation method), are measured. The sample is then inserted at a distance 11=X,/4
from the fixed end of the cavity and the shift of the cav-ity length, SI, as well as the half-power bandwidth, 28fi or 28/1, are measured. Using this value of SI, p is calculated from the following modification of (4):
1 p tan p q tan q,
1 -I- 51/d
where p=132d, d is the thickness of the sample, q --j3i(Si -1-d) and 131 = vr/Lo. The dielectric constant of the sample, e, is then given by (6). When greater precision is required, it is preferable to
make the measurements with the sample inserted at a distance /1max from the end; i.e., at the most sensitive position for both e and tan (3 measurements. To deter-mine /1%ox the shift S'max is calculated from the value p obtained from ( 17), as follows:
(17)

40 PROCEEDINGS OF THE IRE January
tan 0112(S'max d) = 2/ ehd[p/2. tan p/2]. (18)
Then ltfllax is given by
lmax = 1/2 IL O — (S'„. Next, with a sample insertion of /1',..„ as obtained above, the shift S„,„„ and the half-power bandwidth 28f2 or 2812 are measured. Should the measured value .5,,,„x be different from the calculated value S',„„„, the insertion must be adjusted so that 11=12. As the shift varies very slightly with a variation in /1 in the vicinity of 11., as shown in Fig. 2, 4max may be obtained from the above measured value .S„,„x without any serious error by
/I max = 1/2 { Lo — (S,„„„ d)1. (20)
In this case p is calculated by the following formula:
1 p/2 tan p/2 = q„,„„• tan q„,„„,
1 ± Sm.jd
qmax = 01/2(Smax d)
Finally, e is obtained from (6). The value of tan ô can then be calculated from 28f or 281 etc., through ( 7) and ( 11). The procedure described above is suitable for the
measurement of thin, low-loss samples (tan (5 < 20 X10-4, thickness 1.0,-5.0 mm). In the measurement of high loss or thick samples, on the other hand, it is preferable to insert the sample to such a position that /2 = 0 and to measure the shift S2 and 26f. Then, p is given by:
tan p/p = (1 ± 52/d) tan q2/92,
92 = 002 d)
In following this method great caution is required, be-cause slight errors in the measured values seriously affect the final values of e and tan 8. The compensation factor à must also be taken into account, because in some cases it may be impossible to neglect.
Next, the method to determine the exact location of the sample within the cavity is briefly described. As it is somewhat difficult to fix the sample precisely at the prescribed position, especially for lower frequency bands, the following method was adopted. First, the movable plunger plate of the cavity is shifted to the prescribed position where the sample is to be located, and the sample is inserted within the cavity until it makes close contact with the plunger plate. The diame-ter of the sample is made slightly (about 1/10 mm) smaller than that of the cavity. Then a tiny wedge (2 X2 X1 mm--'3X3 X2 mm) made of the same material as the sample is driven between the metal wall of the cavity and the tapered notch of the sample, in order to make the sample stay at the right position and angle within the cavity. The clearance between the cavity wall and the sample can be kept within 1 mm, and there-fore the effect on the results of the measurements can be made negligibly small, because there is no electric
• (21)
(22)
field component of the TEin mode near the metal wal1.8 Finally, the plunger plate is moved away from the sample.
RESULTS
The dielectric properties, e and tan 8, of polystyrol, polyethylene, teflon, ebonite and glass samples were measured both by the frequency variation method and the reactance variation method, in the 4,000-mc, 9,000-mc and 24,000-mc bands. The results obtained are described below. Fig. 5
shows the oscilloscope trace of the resonance curves of the cavity and the frequency marker (the lines in the photograph appear broader than in actual practice because of the long exposure necessary to make the fine frequency marking line more visible).
Fig. 5—Resonance curve and frequency marker on the oscilloscope.
First, the results of the measurement of a 3.55-mm thick polystyrol sample, performed at 3,990 mc are described. The results of e measurements for sample positions 11=L0/2 and /ima, is listed in Table I. From these measured values, e was determined to be 2.570.
TABLE I
MEASURED VALUES OF e FOR POLYSTYROL SAMPLE AT 4,000 mc
fe Le (TEen mode)
28fo
3,990 mc 5.514 cm 0.570 0.428 mc
without sample
SI
e (Calculated) (Calculated)
0.971 cm 0.423 2.571 1.122 cm 2.017 cm
11=1,0/ 2
S. (measured)
S
1.124 cm 0.422 2.568
il ilmitx
Average value of 2.570 ± 0.1 per cent
8 For example, it has been proved, theoretically, that even the air gap 5 mm in the 4,000-mc band cavity may cause only 0.3 per cent error for the e measurement of the sample e = 3.

1956 Saito and Kurokawa: Dielectric Measurements at Microwaves 41
The difference between the values of S calculated from si, 02, e, etc. obtained above, and the measured values of S were found to be within 5 X10⁻²mm for various sample positions. The values of tan o calculated from the meas-ured half-power bandwidths are listed in Table II, where tan (5' and tan (5 respectively neglect and take into account the compensation factor A. The average value of tan (5 is 5.56 X10⁻⁴ and the maximum deviations in the vicinity of limai and 11=L0/2, i.e., in the vicinity of the optimum sample position, are + 1.5 per cent and - 2.3 per cent. It should be noted from Table II that the values of tan (5' increase with the compensation factor, A, which varies from minus to plus value in accordance with the increase of the sample positions /I, but the true value of tan 8 remains nearly constant. Fig. 6 shows the values of S, R12, R32, and 1±Wi+W3/ W2 for various sample positions. The results of measurements for a polyethylene sam-
ple at 3,990 megacycles are listed in Table III. From it, it is noted that the reactance variation method has the same accuracy as the frequency variation method.
Two polyethylene samples whose dielectric proper-ties are expected to be the same were made at 9,000 mc in cavity of TE012 mode. Detailed results are in Table
1.0 2.0 -
0.8 1.6
0.6 1.2
0.4 0.8
0.2 0.4
o tima,
A.
4
3 Le (Cm)
Fig. 6-Relation between the shift S, R12, R.02,14-(Wi+W3/1V2) and the sample position /1.
IV (next page). By this method, e = 2.30, and tan 8=2.80 X10⁻⁴ was obtained with higher accuracy than possible by any other measurement method.
TABLE II
M EASURED VALUES OF tan (5 FOR POLYSTYROL SAMPLE AT 4,000 mc
Rfl+ e4-1-ws
1.2 4.8
1.0 44
0.8 4.0
0.6 3.6
0.4 3.2
0.2 2.8
50 2.4
11 (cm), 1+1T7I-FWa/7I 2,
1.645 1.895 2.017 (1lm«) 2.395 2.757 (Lo/2) 3.145 3.645 4.645
26f (mc), -Fret +TVs • 200(mc),
2.885 2.756 2.740 2.831 3.113 3.682 5.053
21.38
1.274 1.330 1.335 1.264 1.188 1.040 0.927 0.566
tan 6'(10-4), tan 6(10-4)
0.637 0.578 0.550 0.481 0.442 0.417 0.402 0.417
4.62 5.19 5.39 5.56 5.83 5.81 6.61 7.98
-0.548 -0.338 -0.248 +0.0005 +0.195 +0.382 +0.704 +1.99
*5.17 5.53 5.64 5.56 5.63 5.43 *5.90 *5.98
Average value and its max deviation; tan 6=5.61 X10⁻⁴(6.6 per cent, - 7.8 per cent) Average value and its max deviation excluding • values; tan 8=5.56 X10⁻⁴ (1.5 per cent - 2.3 per cent-1
TABLE III
M EASURED VALUES OF tan & FOR POLYETHYLENE SAMPLE AT 4,000 mc L0=5.518 cm (TEou mode), 200=0.348 mc, 26/0=-1.05 X10-3 cm
Sample position li=L0/2 11 nuti
s,
S',..(calculated) S..(measured) E
Average value
0.933 cm 1.108 1.083 cm
2.292
1.108
1.084 cm 2.292
F.V.{wo/rv,+w,+r-v,• 200 tan
R.V.{281 2810/R32 tan
0.815 mc 0.358 mc 3.24X10⁻⁴
1.5 X10⁻³cm 0.68 X 10-km 3.10X10⁻⁴
0.897 mc 0.445 mc 3.02 X10⁻⁴
2.15 X 10⁻³cm 1.05 X 10⁻³cm 3.10X10⁻⁴
3.13 X10⁻⁴ +3.4 per cent
3.10X10⁻⁴
f F.V.; frequency variation methodl 1R.V.; reactance variation methodf
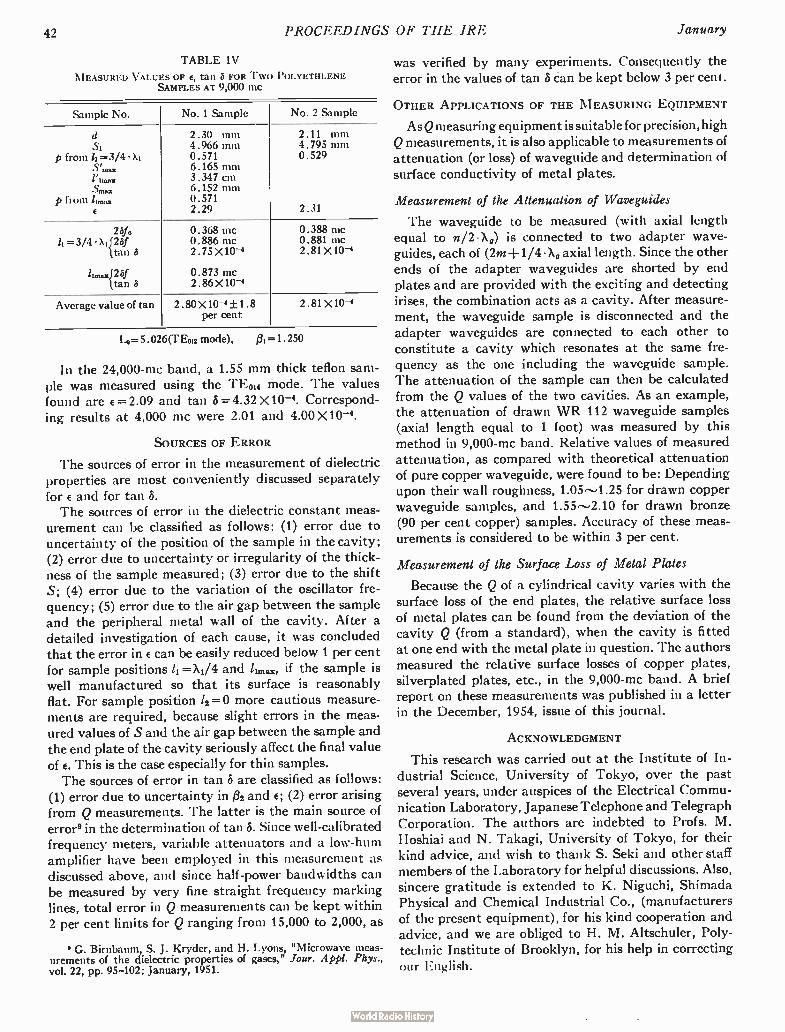
42 PROCEEDINGS OF THE IRE January
TABLE IV
MEASURED VALUES OF e, tan á FOR Two POLYETHLENE SAMPLES AT 9,000 mc
Sample No. No. 1 Sample No. 2 Sample
d .91
p from 11=3/4.X1 S'amx
Sm p from ilmax
E
2.30 mm 4.966 nun 0.571 6.165 nun 3.347cm 6.152 mm 0.571 2.29
2.11 mm 4.795 nun 0.529
2.31
2kfo =3/4 .X152af
Itan
11.420 Itan a
0.368 mc 0.886 mc 2.75X10⁻⁴
0.873 mc 2.86 X10⁻⁴
0.388 mc 0.881 mc 2.81X10-'
Average value of tan 2.80X10⁻⁴ ±1.8 per cent
2.81X10 --4
Lo=5.026(TE0,2 mode), 11=1.250
In the 24,000-mc band, a 1.55 mm thick teflon sam-ple was measured using the TE014 mode. The values found are e= 2.09 and tan S = 4.32 X10⁻⁴. Correspond-ing results at 4,000 mc were 2.01 and 4.00 X10⁻⁴.
SOURCES OF ERROR
The sources of error in the measurement of dielectric properties are most conveniently discussed separately for e and for tan S. The sources of error in the dielectric constant meas-
urement can be classified as follows: ( 1) error due to uncertainty of the position of the sample in the cavity; (2) error due to uncertainty or irregularity of the thick-ness of the sample measured; (3) error due to the shift S; (4) error due to the variation of the oscillator fre-quency; (5) error due to the air gap between the sample and the peripheral metal wall of the cavity. After a detailed investigation of each cause, it was concluded that the error in e can be easily reduced below 1 per cent for sample positions /1= Xi/4 and /1„,.., if the sample is well manufactured so that its surface is reasonably flat. For sample position /2= 0 more cautious measure-ments are required, because slight errors in the meas-ured values of S and the air gap between the sample and the end plate of the cavity seriously affect the final value of E. This is the case especially for thin samples. The sources of error in tan 8 are classified as follows:
(1) error due to uncertainty in 132 and e; (2) error arising from Q measurements. The latter is the main source of error9 in the determination of tan S. Since well-calibrated frequency meters, variable attenuators and a low-hum amplifier have been employed in this measurement as discussed above, and since half-power bandwidths can be measured by very fine straight frequency marking lines, total error in Q measurements can be kept within 2 per cent limits for Q ranging from 15,000 to 2,000, as
9 G. Birnbaum, S. J. Kryder, and H. Lyons, "Microwave meas-urements of the dielectric properties of gases," Jour. Appt. Phys., vol. 22, pp. 95-102; January, 1951.
was verified by many experiments. Consequently the error in the values of tan (5 can be kept below 3 per cent.
OTHER APPLICATIONS OF THE MEASURING EQUIPMENT
As Q measuring equipment is suitable for precision, high Q measurements, it is also applicable to measurements of attenuation (or loss) of waveguide and determination of surface conductivity of metal plates.
Measurement of the Attenuation of Waveguides
The waveguide to be measured (with axial length equal to n/2 - X„) is connected to two adapter wave-guides, each of (2m + 1/4 X, axial length. Since the other ends of the adapter waveguides are shorted by end plates and are provided with the exciting and detecting irises, the combination acts as a cavity. After measure-ment, the waveguide sample is disconnected and the adapter waveguides are connected to each other to constitute a cavity which resonates at the same fre-quency as the one including the waveguide sample. The attenuation of the sample can then be calculated from the Q values of the two cavities. As an example, the attenuation of drawn WR 112 waveguide samples (axial length equal to 1 foot) was measured by this method in 9,000-mc band. Relative values of measured attenuation, as compared with theoretical attenuation of pure copper waveguide, were found to be: Depending upon their wall roughness, 1.05,-4.25 for drawn copper waveguide samples, and 1.55,-4.10 for drawn bronze (90 per cent copper) samples. Accuracy of these meas-urements is considered to be within 3 per cent.
Measurement of the Surface Loss of Metal Plates
Because the Q of a cylindrical cavity varies with the surface loss of the end plates, the relative surface loss of metal plates can be found from the deviation of the cavity Q (from a standard), when the cavity is fitted at one end with the metal plate in question. The authors measured the relative surface losses of copper plates, silverplated plates, etc., in the 9,000-mc band. A brief report on these measurements was published in a letter in the December, 1954, issue of this journal.
ACKNOWLEDGMENT
This research was carried out at the Institute of In-dustrial Science, University of Tokyo, over the past several years, under auspices of the Electrical Commu-nication Laboratory, Japanese Telephone and Telegraph Corporation. The authors are indebted to Profs. M. Hoshiai and N. Takagi, University of Tokyo, for their kind advice, and wish to thank S. Seki and other staff members of the Laboratory for helpful discussions. Also, sincere gratitude is extended to K. Niguchi, Shimada Physical and Chemical Industrial Co., (manufacturers of the present equipment), for his kind cooperation and advice, and we are obliged to H. M. Altschuler, Poly-technic Institute of Brooklyn, for his help in correcting our English.

1956 PROCEEDINGS OF THE IRE 43
Transistor Amplifiers for Use in a Digital Computer* Q. W. SIMKINSt, ASSOCIATE MEMBER, IRE, AND J. H. VOGELSONGt, MEMBER, IRE
Summary—Several transistor pulse-regenerative amplifier cir-cuits suitable for use in a 3 megacycle digital computer are described. These circuits all utilize a type of feedback which is essentially ex-ternal to the transistor. As a consequence, a negative resistance transistor characteristic is not required. Some of these circuits were designed specifically to be relatively tolerant of the slow recovery of
reverse impedance found in many germanium diodes.
INTRODUCTION
ONE of the more important units which has been developed for use in a high speed special pur-pose digital computer is a transistor pulse-re-
generative amplifier with external timing. Various cir-cuit configurations for this application, as well as some general design principles, are described in this paper.
Before proceeding further, it would be well to con-sider the environment of these amplifiers to properly assess their role. The computer for which the amplifiers are intended is synchronous, serial, and binary. The basic pulse rate is 3 megacycles. Storage is provided by delay lines. For delays in the order of word times or less, electrical delay lines are used, while for longer delays requiring larger storage capacities, acoustic delay lines are used. Logical operations such as AND, OR, and INHIBIT are performed by germanium diode circuits. Transformers in the amplifiers provide pulse inversion where necessary for inhibiting.
Pulses are attenuated by the loss in these various passive circuits. In addition, stray capacitance and, in particular, limited bandwidths and nonlinear phase characteristics of delay lines introduce distortion and perturb timing. To offset these effects the regenerative amplifiers are used. At each of these amplifiers, pulses are amplified and reshaped. Under control of a clock signal applied to each amplifier pulses are also retimed.
Different approaches to the design of pulse-regen-erative amplifiers are possible. One type of amplifier utilizing base circuit resistance for feedback has been described in detail.' The performance of such a circuit is based on its ability to switch between two points of stability on a negative resistance emitter characteristic.2 The general type of amplifier to which the scope of this paper will be limited, however, makes use of feedback which is essentially external to the transistor. Fig. 1 shows two logical arrangements for such an amplifier in block form. This principle of external feedback was
* Original manuscript received by the IRE, August 4, 1955. Bell Telephone Labs., Inc., Murray Hill, N. J.
1 J. H. Felker, "Regenerative amplifier for digital computer applications," PROC. IRE, vol. 40, pp. 1584-1597; November, 1952.
2 A. E. Anderson, "Transistors in switching circuits," PROC. IRE, vol. 40, pp. 1541-1558; November, 1952. B. G. Farley, "Dynamics of transistor negative resistance," PROC. IRE, vol. 40, pp. 1497-1508; November, 1952.
applied to vacuum tube circuits by the Bureau of Stand-ards in the SEAC Computer.3
During the course of the investigation to produce a suitable amplifier, various configurations were designed and considered. Initially, a linear amplifier was con-structed for use in an arrangement such as indicated in Fig. 1. To improve the efficiency of operation, the operating range was soon extended so that in all suc-ceeding designs the transistor has been driven from be-low cutoff to some degree of saturation. In the first few models, feedback was used for retiming purposes only.
INPUT
CLOCK
INPUT
AND
AND '
AMPLIFIER
1.4
FEEDBACK
OUTPUT
(a)
FEEDBACK
H OR
CLOCK
AND
(b)
AMPLIFIER OUTPUT
Fig. 1—Logical configurations for a pulse-regenerative amplifier.
Relatively low gain in these models led to the extension of the use of feedback to directly increase the gain. As a beginning in this respect a linear feedback, in which the amount of feedback is directly proportional to the output pulse voltage, was tried. This was found to pro-duce unreliable triggering, since, with the amplifier output load competing with the feedback circuit for current available from the collector, the feedback fre-quently failed to become fully established. Gated feed-back then was produced as a solution to this problem. With this type of feedback, all of the current to be fed back to the emitter becomes available during the first few volts rise at the collector. A back-biased diode can therefore prevent the amplifier load from taking cur-rent until the feedback has been established. Limita-tions in some components presently available, however, cause these circuits to be more complex than would otherwise be necessary. As a consequence of this situa-
3 R. D. Elbourn and R. P. Witt, "Dynamic circuit techniques used in SEAC and DYSEAC," PROC. IRE, vol. 41, pp. 1380-1387; October, 1953.

44
1.5
PROCEEDINGS OF THE IRE
1+20V
January
1.0 —
• 0.5 —
Ui
o
- 0.5
- 1.0
-15
CURRENT, I
Fig. 2—Typical diode characteristic.
tion, a somewhat simpler amplifier has been designed around a semi-gated feedback. In this circuit, an initial gated feedback current is augmented by additional linear feedback current.
DESIGN OBJECTIVES
The over-all design of the computer and the intended role of the regenerative amplifier, as described in the preceding section, served as a guide in setting the ampli-fier design objectives. In the succeeding paragraphs, these objectives are discussed. One of the first considerations in the design of the
amplifier is the rise time required in the output pulses. For 3 mc operation with a fifty per cent duty factor the pulse length will be 0.17 microsecond. To provide time margins and to insure proper operation of the logic cir-cuits and delay lines, the flat portion on top of the pulse should be at least 0.08 to 0.10 microsecond in duration. This means that rise and fall times of the order of 0.04 microsecond or less are required. Since the synchroniza-tion of the computer is maintained by the clock timing wave, the time relation of the amplifier output pulses with the clock must also be held within about 0.04 microsecond or less. Another design requirement, gain, should be de-
fined. With amplifiers of the type to be described, a useful definition is the ratio of peak output pulse power to peak input pulse power. (Peak pulse power is the product of pulse voltage and current during the flat-topped portion of the pulse.) Gain will have this mean-ing in all the material to follow. For a practical com-puter design, it has been decided that a single amplifier should have at least sufficient gain to drive three other similar amplifiers with one intervening stage of logic. This amounts to from six to ten db gain depending on voltage and current levels employed. Additional gain can be used to make computer design more economical.
Several factors influence the choice of operating volt-age and current levels in the amplifier. It is desirable,
INPUT NO.1
INPUT NO.2
5.1K
-20V
5.1K
-20V
6.2K
OUTPUT (TO AMPLIFIER)
-1V
CURRENT, I
Fig. 3—Diode AND circuit and input V-I characteristic.
of course, to keep power dissipation low, so from this standpoint, both voltage and current levels of signal pulses should be low. On the other hand, minimum pulse voltage depends on the threshold voltage deemed necessary to provide adequate margin at the amplifier input. Also, it is also affected by nonlinear character-istic of germanium diode, as seen in Fig. 2. Stray capac-ity, and speed of triggering, limit minimum current. Another important consideration in amplifier design
is the nonlinear voltage-current characteristic of diode logic circuits into which amplifier must be capable of operating. As an example, AND circuit and its voltage-current characteristic with one input pulsed appear in Fig. 3. V-I characteristic is seen to have a low incre-mental impedance region at low voltage and a high incremental impedance region at higher voltages.
COMPONENT LIMITATIONS
Forward and reverse transient effects associated with presently available germanium diodes require special consideration in the design of these regenerative cir-cuits. In practice, the reverse transient has been more troublesome than has the forward transient, solely be-cause in a considerable number of diodes the forward transient effect has been found negligibly small. For this reason, one of the input circuits described in the following section has been designed to have a critical

1956 Simkins and Vogelsong: Transistor Amplifiers for Computers 45
—6Vo —20Voo I o- 3V
(a)
1 — 20VII I-3V 1+3V
(b)
Fig. 4—Transistor output circuits with clipping diodes.
part of the operation depend on changing a diode from the reverse to the forward state, rather than the con-trary. In addition, forward current in diodes in sensitive positions is usually limited to less than 5 milliamperes, since transient effects are more pronounced at the higher current levels.
"Minority carrier storage" in transistors presents another limitation. This effect is characterized by a slow return of the collector to a high impedance following an interval in which the collector has been driven to saturation. As a result, pulses are not terminated im-mediately upon the application of turn-off conditions when the collector is saturated. In the circuits to follow, the combination of a reasonably well controlled emitter current and collector load is used to combat pulse-broadening resulting from hole-storage. Initially, the collector is driven into saturation. As the pulse con-tinues an increasing magnetizing current flows in the mutual inductance of the coupling transformer. This current causes the collector to come out of saturation at approximately the desired time as set by the clock. As a result of differences in transistors and in trans-formers, not all units reside in the saturated condition for the same interval, so some dispersion in pulse widths is present. The variability appears to be acceptable with no further circuit adjuncts. If further evidence should indicate otherwise, improvement can be obtained through use of a clipping diode as in Fig. 4 to modify the collector load so as to prevent driving the collector to saturation. In this case, the clipped portion of the pulse is no longer available to the external load.
CIRCUIT DESCRIPTIONS
Common Features
In the following sections pulse-regenerative amplifiers of three types are described. They differ mainly in the
1+20V
10K
1-20V
Fig. 5—Pulse-regenerative amplifier input circuit.
manner in which the feedback action takes place. The first type uses a feedback circuit for retiming the pulses, but this feedback is not used to increase the amplifier gain. In the second section several amplifiers with gated feedback are described. Here the feedback en-hances the amplifier gain. A gating circuit in the feed-back loop permits operation into loads having nonlinear impedance characteristics and insures positive and fast triggering. The third amplifier type described employs semi-gated feedback. In these circuits a combination of gated and linear feedback is used and a somewhat simpler configuration results.
All of the amplifiers to be described have several fea-tures in common. They all make use of a grounded base point-contact transistor amplifier which is driven from cutoff to saturation. Since these circuits do not depend on a negative resistance input characteristic, junction transistors should be applicable. Junction transistors with the required bandwidth, power handling capability, and breakdown voltages have not been available in quantity, however. In the circuits to be described, the Western Electric GA-52514 point-contact transistor has proved satisfactory in the grounded base connection. It appears that with point-contact transistors operating under the conditions imposed by the pulse-regenerative amplifier requirements, this is the most satisfactory connection, providing more gain than either the grounded emitter or grounded collector arrangement. A second feature the circuits have in common is an
AND circuit with the incoming signal and the clock as the two inputs. One form of this circuit is shown in Fig. 5. The values of the circuit constants are typical values that can be used to explain the circuit operation. The clock is a 3.0 megacycle sine wave with an amplitude of approximately 5.0 volts rms. In the absence of an input signal and with the clock wave sufficiently positive to cut off the clock diode, DI, the potential at the emitter, as set by the voltage divider, is essentially — 1.0 volt. Diode D2 conducts approximately 2.1 milliamperes and the clamp diode, D3, conducts about 0.3 milliampere. The voltage-current characteristic of the transistor,
as seen from the emitter, varies somewhat from tran-sistor to transistor and also depends on the collector

46 PROCEEDINGS OF THE IRE January
2 -
BREAK POINT - -
CURRENT, 1E
I. lg. 6—Typical emitter characteristic for a GA-52514 transistor.
load, but a typical characteristic is shown in Fig. 6. The "break point" is seen to be the point in the characteristic at which the emitter emerges from cutoff, or its high impedance state, to the active region in which the im-pedance seen at the emitter may be a very small posi-tive resistance or a slightly negative resistance. The break point potential for transistors used in any of the amplifiers to be described is usually within several tenths of a volt of ground potential. The current at the break point is usually positive and less than 50 micro-amperes.
In the circuit of Fig. 5, it can be seen that in the ab-sence of an input pulse the emitter will be held below the break point and the transistor will be cut off. A coinci-dence between an input pulse and the positive portion of the clock voltage wave, however, will result in the emitter potential being brought up to the break point and in the circuit of Fig. 5 approximately 2.0 milliam-peres of emitter current will result. In this pulse condi-tion, diodes D3 and D2 will be held cut off by the input pulse and diode DI will be kept back-biased by the posi-tive clock. When the clock swings negative DI will con-duct and the emitter potential will follow the clock sine wave, cutting off the transistor regardless of the poten-tial on the input signal lead. The principal disadvantage of the type of input AND
circuit shown in Fig. 5 is that it imposes fairly rigid re-quirements on the transient behavior of diode DI. If this diode is slow to recover its high back impedance after forward conduction, the amplifier may be trig-gered on every time the clock goes positive. A second type of input AND circuit is shown in Fig.
7. Again, both a positive clock and an input pulse are required to raise the emitter voltage over the break point. With the clock positive and no input pulse pres-ent, the emitter voltage can come up to only about — 1.0 volt and no emitter current will flow. Diode DI clips the clock and therefore limits the flow of current through D2 to approximately 2.0 milliamperes. This leaves D3 conducting about 0.4 milliampere, thus clamp-ing the emitter potential to — 1.0 volt. With an input
INPUT aIGNAL
+4.5 V 14
D31 7 5 I‘
e e -iv 20 V
DI
:CLOCK
t 470
Fig. 7—Pulse-regenerative amplifier input circuit.
pulse present, D2 and D3 are cut off and approximately 1.7 milliamperes flows into the emitter. When the clock goes negative, the current source for the emitter is re-moved, and the transistor turns off. During the negative clock swing, the emitter potential follows the clock.
In this configuration, the reverse transient require-ments on the diodes are not so severe. More clock power is required, however, and the pulse rise is slowed down due to the sinusoidal clock waveshape. Considerable improvement could be effected in the performance of this circuit if a square wave clock source were used, but the advantages do not justify the additional complexity of the clock source and the distribution system. The addition of a dc bias of +2 volts to clock has made cir-cuit somewhat more efficient and improves waveshape. A third feature common to all the amplifier circuits
under discussion is the transformer output coupling circuit. The difference in dc voltage levels at the tran-sistor collector and load circuits makes ac coupling neces-sary. Transformer coupling has several advantages. First, an impedance transformation can be made which results in considerably more usable amplifier gain. Second, with transistor circuits of this type, dc restora-tion can be more readily obtained with transformer, rather than condenser, coupling. This type of output circuit also provides a more efficient means of supplying the dc power to the transistor collector. Still another advantage is that both positive and negative pulses can be made available at the amplifier output.
Several things should be mentioned in connection with the dc restoring features of transformer coupling. Short rise times are required so very tight coupling is used in these transformers and the leakage inductance is small. The transformer equivalent circuit consists then of the parallel combination of the mutual induct-ance, shunt capacity, and an equivalent loss resistance which is normally large. To effect complete dc restora-tion, it is necessary that any energy stored in the mutual inductance and shunt capacity during the pulse interval be dissipated in the interval between pulses. With a 3.0 megacycle pulse repetition frequency, this is 0.17 micro-second. The constants of the transformer and associated circuitry are chosen such that the tuned circuit is slightly less than critically damped and rings at a fre-

1956 Simkins and Vogelsong: Transistor Amplifiers for Computers 47
CLOCK
500
+3
IR
INPUT OUTPUT
'
4.311
1-20V -20V -3V
Fig. 8—Pulse-regenerative amplifier with external feedback for timing only.
quency of about 3.0 megacycles. These conditions pro-vide adequate dc restoration with minimum loss. The loss results primarily from the build-up of energy in the transformer mutual inductance in the form of mag-netizing current during the pulse interval. This is the energy which has to be dissipated in the interval be-tween pulses. The value of the total equivalent shunt resistance in this interval is 'quite important to the prop-er operation of this circuit. If this resistance is too low, the circuit will be overdamped, and the dc restoration will be poor. If the resistance is too high, the overshoot may falsely operate a succeeding amplifier. The tran-sistor collector impedance, which shunts the transformer, is usually of the order of 6 to 15 thousand ohms. To reduce the effect of this large variation and to provide sufficient damping, it is necessary to provide a resistor and a series diode poled, so as to provide a low imped-ance in the interval between pulses. With this arrange-ment, little energy is dissipated in the external resistor during the pulse interval, and the circuit efficiency is not significantly impaired. Most of the amplifiers under discussion require three
or four winding transformers. The turns ratio from pri-mary to one of the secondaries called the feedback winding, is normally 3 to 1, while the turns ratio of pri-mary to output windings is usually 2.25 to 1. The mu-tual inductance of these transformers, as seen from the high or collector side, is nominally 260 microhenries with a maximum variation of ± 20 per cent, while the leakage reactance is only about 1 microhenry. (A reduc-tion in the + 20 per cent tolerance would be highly de-sirable.) Stray shunt capacity contributed by trans-former itself is approximately 3 micromicrofarads. Addi-tional 2 or 3 micromicrofarads of shunt capacity are due to transistor, its socket, and stray wiring capacity.
Retiming-Feedback Amplifiers
The circuits shown in Figs. 8 and 9 are regenerative amplifiers in which the feedback is used for retiming purposes only. Basically, these two are the same, differ-ing only in the input circuit. In either one, output pulses are returned to the input so that they are terminated
+10V 1 1
CLOCK
lvi 11-20V
o
Fig. 9—Pulse-regenerative amplifier with external feedback for timing only.
by the clock rather than the decay of an input pulse. Both circuits are reasonably simple but inherently have rather low pulse gain and require transistors with high pulse current gain to make them useful. Since circuits very similar to these have already been described in some detail,' no further discussion is included here.
CLOCK
INPUT
DI
-IV
03
+8V
I -20V -20V1 1-3 V I a
Fig. 10—Gated feedback amplifier.
R3 910
D5
-IV
D2 D6 OUTPUT
RI 7.5K
Gated Feedback Amplifiers
The circuits to be described in this section all make use of a gated feedback path. This term is most readily understood through consideration of the circuit of Fig. 10. The input AND circuit is similar to that shown in Fig. 5 and previously described. As was indicated, emit-ter current commences at the coincidence of an input pulse and the positive portion of the clock wave. The gated feedback path consists of R3, D3, D2 and the feed-back winding of the transformer. A current of almost 10 milliamperes normally flows from the +8.0 volt source through Rg, Dfi, and the feedback winding of the output transformer to the — 1.0 volt supply. Diode Dg is back-biased by several volts so that the initial col-lector current increment, which flows in response to the emitter current, is in the feedback winding. This winding is poled so that the increment of current opposes the 10
' J. H. Vogelsong, "A transistor pulse amplifier using external regeneration," PROC. IRE, vol., 41, pp. 1444-1450; October, 1953.

48 PROCEEDINGS OF THE IRE January
milliamperes normally flowing, thereby reducing it and raising the potential at the junction of D4 and D5. When the voltage at this point reaches the emitter volt-age, D4 conducts and part of the current in R3 flows back to the emitter. This additional emitter current causes still more collector current to flow, diverting more of the current in the feedback winding to the emitter via D4. The buildup of feedback continues until Dfi is cut off and all the current in R3 flows through D4 into the emit-ter. Throughout this interval, D6 is cut off, thus allow-ing the feedback path to take all the collector current without competition from the output load. When D6 cuts off, however, the feedback winding sees a very high impedance, and the collector voltage rises, overcoming the back-bias on D6, and power is delivered to the load. The term "gated feedback path" can now be defined
as a circuit in which a controlled amount of output cur-rent is fed back to the input through a nonlinear im-pedance. The nonlinear impedance is characterized by a low incremental impedance at currents less than the de-signed feedback current, and a high incremental im-pedance to currents greater than this design current. Such a feedback path around a grounded base transis-tor amplifier, with its emitter biased below cutoff, permits operation as follows:
1. The coincidence of an input pulse and a positive clock raises the transistor emitter potential over the break point and causes a small " trigger" cur-rent to flow into the emitter.
2. The resulting collector current is fed back to the emitter through the low impedance of the gated feedback path.
3. The gain in the feedback loop causes the feedback current to increase rapidly until the design amount is reached and the feedback impedance switches to a high value.
4. The output voltage is then permitted to rise and the load is allowed to take the output current. This operation permits a small " trigger" current to con-trol a large output current, thus providing high pulse gain.
While the circuit of Fig. 10 is useful in explaining gated feedback, it has a serious disadvantage. The nega-tive excursion of the clock and the consequent drop in voltage at the junction of D4 and D5 results in a pulsat-ing current in the feedback winding and a 3.0 megacycle ripple voltage across it. The likelihood of false amplifier operation is consequently increased. Several means of eliminating this difficulty are proposed and the resulting amplifier circuit configurations are presented in the subsequent paragraphs. One method of eliminating the ripple voltage across
the transformer feedback winding makes use of an addi-tional gate circuit in the feedback path. Fig. 11 is a diagram of a circuit of this type with the conventional AND circuit for the clock input. This circuit differs from the previous circuit, shown in Fig. 10, primarily in the addition of /24, Dg, and D7. With this configuration
the gated feedback current normally flows in R3, D5, and R4 when the clock is positive. On the negative por-tion of the clock wave, the current from R3 is diverted through D4 and D3 to the clock. D6 conducts, however, keeping the potential at the junction of D6, Dg, and D7 substantially unchanged, and preventing any current from flowing in the feedback winding.
CLOCK
1+8V 1+8V 1-20V
RI R3 R4 5.6K 910 I.8K
D3 04 05 D7
INPUT D2
DI R2 7.5K
-IV: 1- 20V
D6
—iv
-20V1 e I -3V
Fig. 11—Gated feedback amplifier.
-1.5V
De OUTPUT
D9
R5
In the circuit of Fig. 11, just described, both diodes D3 and D4 are somewhat critical with regard to reverse transient characteristics. These difficulties are elimi-nated in the circuit of Fig. 12 which is similar to Fig. 11,
D3
CLOCK (BIASED A T +2V)
-20V: :-3V
;-20V
-I V -1V
D2 De OUTPUT
D9
R5
Fig. 12—Gated feedback amplifier.
but makes use of the AND circuit input in which the clock acts as the emitter current source. Both these cir-cuits, however, have rather high dc power dissipation and also contain more components than some of the other circuits to be described. The circuit of Fig. 13 illustrates another solution to
the problem of pulsating current in the feedback wind-ing. Here, the ac clock voltage is supplied to both ends

1956 Simkins and Vogelsong: Transistor Amplifiers for Computers 49
of the gated feedback current path with a superimposed dc voltage so that the current through 1?4, D6 and the feedback winding is constant in the absence of an input pulse. The clipping potentials ( — 2.0 volts and +4.5 volts) are so related to the de feedback current that diodes D3 and D7 commence conduction at about the same time, thus maintaining constant the current in the transformer winding.
+4.5V
3 MC CLOCK 5V R MS
BIASED AT +6V
R3 470
R4 03 560 D5
INPUT
el 3 MC CLOCK 5V RMS
BIASED AT D8
3 04 -6V.
02
DI RI 7.5K
07
-2V
I-20V -20V1 -3V
Fig. 13—Gated feedback amplifier.
The following approximate data apply to the ampli-fier circuit of Fig. 13.
Pulse Power Gain Pulse Input Power Clock Power DC Power (Idle Condition)
08 OUTPUT
10 to 12 decibels 7 milliwatts 35 milliwatts 225 milliwatts
No adverse effects due to poor diode transient response were noted in this circuit operation. Principal objection lies in its complexity, particularly in that two clock volt-ages biased at different dc levels are required.
INPUT 02
DI •,RI 7.5K
-IV 1-20V
+8V
1
R2 15. SR3 K 04 05
03 CLOCK
07
J.
06 OUTPUT
-20VII I I-3V
Fig. 14—Gated feedback amplifier with base timing.
Still another circuit employing gated feedback is shown in Fig. 14. This configuration is unique among those presented in that the input AND circuit does not
consist of diodes and resistors alone, but makes use of the transistor as well. It can be seen that the clock is applied to the base through a diode, D3. When the clock is positive, D7 is cut off and D3 conducts, raising the base voltage and consequently keeping the transistor cut off. On the negative portion of the clock wave D3 is back-biased and D7 conducts, holding the base voltage near ground. This permits an input pulse to cause emitter current to flow but keeps the emitter back-biased if no input pulse is present. The feedback circuit is exactly analogous to one previously described and illustrated in Fig. 10. Since the clock is applied on the transistor base rather than at the emitter, there is no difficulty with a pulsating current in the feedback winding of the trans-former.
Semi-Gated Feedback Circuits
The final circuits to be described are those which combine some of the characteristics of gated and linear feedback. Fig. 15 is an example of this type with emitter current derived from the clock source. As in the other circuits in which emitter current is provided in this way, this circuit is moderately insensitive to the reverse trans-
+4.5V DI
CLOCK
(BIASED AT +2V)
RI' 200
O
INPUT 02
R2 3K
R4 1K
04
06 -IV
135
-IVI
R3 7.5K
I -20V
-20V1 I -3V
Fig. 15—Semi-gated feedback amplifier.
ient effect in diodes. In comparison with the preceding gated feedback amplifiers, it is relatively simple with low dc dissipation and comparable gain. On the other hand, the clock power required is relatively high, and the pulse turn-off point is less consistent for different transistors. Typical characteristics for this amplifier are:
Pulse Power Gain Pulse Input Power Clock Power DC Power (Idle Condition)
10 to 12 decibels 7 milliwatts 40 milliwatts 100 milliwatts
As in the previous circuits, the feedback is the dis-tinguishing feature of this amplifier, so the description will be centered primarily on it. Again, it will be helpful to consider first how the feedback circuit works when no input signals are applied, and then note the change in
its functioning when these signals are present.
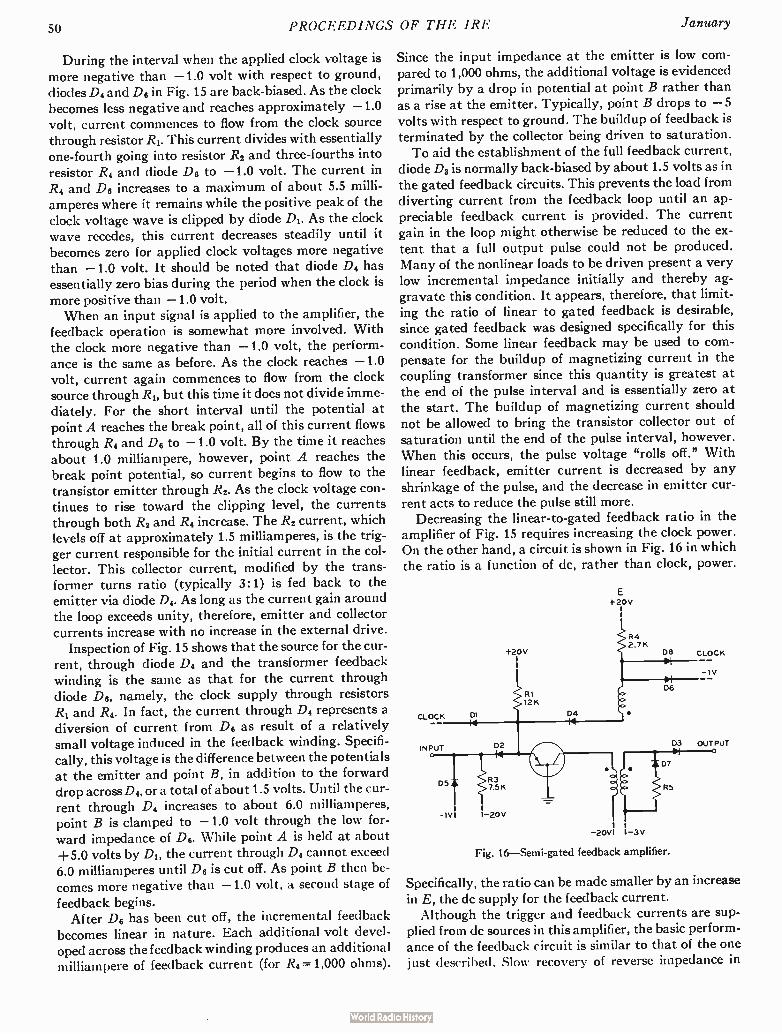
50 PROCEEDINGS OF THE IRE January
During the interval when the applied clock voltage is more negative than — 1.0 volt with respect to ground, diodes D4 and Dg in Fig. 15 are back-biased. As the clock becomes less negative and reaches approximately — 1.0 volt, current commences to flow from the clock source through resistor RI. This current divides with essentially one-fourth going into resistor R2 and three-fourths into resistor R4 and diode Dg to — 1.0 volt. The current in R4 and Dg increases to a maximum of about 5.5 milli-amperes where it remains while the positive peak of the clock voltage wave is clipped by diode DI. As the clock wave recedes, this current decreases steadily until it becomes zero for applied clock voltages more negative than — 1.0 volt. It should be noted that diode D4 has essentially zero bias during the period when the clock is more positive than — 1.0 volt. When an input signal is applied to the amplifier, the
feedback operation is somewhat more involved. With the clock more negative than — 1.0 volt, the perform-ance is the same as before. As the clock reaches — 1.0 volt, current again commences to flow from the clock source through RI, but this time it does not divide imme-diately. For the short interval until the potential at point A reaches the break point, all of this current flows through R4 and Dg to — 1.0 volt. By the time it reaches about 1.0 milliampere, however, point A reaches the break point potential, so current begins to flow to the transistor emitter through R2. As the clock voltage con-tinues to rise toward the clipping level, the currents through both R2 and R4 increase. The R2 current, which levels off at approximately 1.5 milliamperes, is the trig-ger current responsible for the initial current in the col-lector. This collector current, modified by the trans-former turns ratio (typically 3:1) is fed back to the emitter via diode D4. As long as the current gain around the loop exceeds unity, therefore, emitter and collector currents increase with no increase in the external drive.
Inspection of Fig. 15 shows that the source for the cur-rent, through diode D4 and the transformer feedback winding is the same as that for the current through diode Dg, namely, the clock supply through resistors R1 and R4. In fact, the current through D4 represents a diversion of current from Dg as result of a relatively small voltage induced in the feedback winding. Specifi-cally, this voltage is the difference between the potentials at the emitter and point B, in addition to the forward drop across D4, or a total of about 1.5 volts. Until the cur-rent through D4 increases to about 6.0 milliamperes, point B is clamped to — 1.0 volt through the low for-ward impedance of Dg. While point A is held at about +5.0 volts by DI, the current through D4 cannot exceed 6.0 milliamperes until Dg is cut off. As point B then be-comes more negative than — 1.0 volt, a second stage of
feedback begins. After Dg has been cut off, the incremental feedback
becomes linear in nature. Each additional volt devel-oped across the feedback winding produces an additional milliampere of feedback current (for R4= 1,000 ohms).
Since the input impedance at the emitter is low com-pared to 1,000 ohms, the additional voltage is evidenced primarily by a drop in potential at point B rather than as a rise at the emitter. Typically, point B drops to — 5 volts with respect to ground. The buildup of feedback is terminated by the collector being driven to saturation. To aid the establishment of the full feedback current,
diode Da is normally back-biased by about 1.5 volts as in the gated feedback circuits. This prevents the load from diverting current from the feedback loop until an ap-preciable feedback current is provided. The current gain in the loop might otherwise be reduced to the ex-tent that a full output pulse could not be produced. Many of the nonlinear loads to be driven present a very low incremental impedance initially and thereby ag-gravate this condition. It appears, therefore, that limit-ing the ratio of linear to gated feedback is desirable, since gated feedback was designed specifically for this condition. Some linear feedback may be used to com-pensate for the buildup of magnetizing current in the coupling transformer since this quantity is greatest at the end of the pulse interval and is essentially zero at the start. The buildup of magnetizing current should not be allowed to bring the transistor collector out of saturation until the end of the pulse interval, however. When this occurs, the pulse voltage "rolls off." With linear feedback, emitter current is decreased by any shrinkage of the pulse, and the decrease in emitter cur-rent acts to reduce the pulse still more.
Decreasing the linear-to-gated feedback ratio in the amplifier of Fig. 15 requires increasing the clock power. On the other hand, a circuit is shown in Fig. 16 in which the ratio is a function of dc, rather than clock, power.
CLOCK DI
+20V I I
RI 12K
04
E i- 20V 1 i
R4 2.7K
D8 CLOCK
-IV
INPUT D2
05 R3 7.5K
- I -IVI I-20V
.
I I -20VI I-3V
06
03
07
R5
Fig. 16—Semi-gated feedback amplifier.
OUTPUT
Specifically, the ratio can be made smaller by an increase in E, the de supply for the feedback current. Although the trigger and feedback currents are sup-
plied from dc sources in this amplifier, the basic perform-ance of the feedback circuit is similar to that of the one just described. Slow recovery of reverse impedance in

1956 Simkins and Vogelsong: Transistor Amplifiers for Computers 51
diode DI can degrade performance, however, as in the preceding circuits using the input AND circuit of Fig. 5.
TRANSISTOR CHARACTERISTICS
To provide reasonably uniform circuit performance, several requirements have been established for the transistors. These requirements are listed below and in this form should be interpreted algebraically. The con-vention of positive currents flowing into the device ter-minals is used.
1. Ic (I.= 8, 17 = — 3) — 17.0 milliamperes 2. h (I.= 0, V,— — 20) k — 3.0 milliamperes 3. f. (I.=1, 17c= — 20) k 10 megacycles 4. — 0.25 volt Break Point +0.25 volt 5. V. (I.= — 12, Vc= — 10) k — 0.5 volt
The quantities in parentheses specify the biasing con-ditions for the various measurements; all current values are in milliamperes, while voltages are listed in volts. The first requirement, in conjunction with the second,
is to ensure sufficient pulse current gain in the amplifier. In addition, the second requirement also serves to limit the idle condition power dissipation within the tran-sistor. For the third requirement, a lower limit is placed on the alpha cutoff frequency since pulse rise time is re-lated to this quantity, as indicated in the analysis in the Appendix. The range of permissible break points, or emitter cutoff voltages, is limited in the fourth require-ment, so that a maximum input trigger voltage can be specified. The final requirement, a minimum limitation on emitter voltage for a specific operating point, is in-cluded to ensure return of the transistor to cutoff in re-sponse to the clock. Transistors with high base resist-ance and a consequent V(— 12, — 10) considerably more negative than the limit may "lock-up" in a high con-duction state. The following section deals with this con-dition in more detail.
Lock-up
When this anomalous type of operation occurs, the transistor reaches a high current static condition in which excessive power may be dissipated within the unit. In the material to follow, a heuristic explanation of lock-up, based partially on the static characteristics of the transistor, will be given.
In Fig. 17 the collector characteristics of a typical GA-52514 transistor are shown. Drawn on these char-acteristics in solid lines is a load line for the normal amplifier load. In normal operation, the transistor starts at point A with zero emitter current. As the emitter current increases, the operating point follows the load line to point B at which the emitter current has reached its peak value. During the "flat top" portion of the pulse, the emitter current is essentially constant. Mag-netizing current in the output transformer, however, modifies the solid line load line in the drawing by shift-ing it to the left. This, of course, is an over-simplified picture of a transient phenomenon, but for our pur-
poses it is adequate. The load line at several times within the pulse interval is shown by the dotted lines. The "droop" on the back edge of the pulse is seen to be the result of the load line moving out of the saturation re-gion. Now, when the clock swings negative and the emitter current starts to decrease, the operating point on the collector characteristics follows the dotted line vertically downward to point C where the characteristic breaks sharply. The operating point then follows the nearly horizontal load line back to point A.
- 20V
vc
Fig. 17—Typical GA-52514 transistor collector characteristics.
The possibility of lock-up in the high conduction state results from the fact that the emitter current is not supplied from a perfect current source controlled by the clock. Another factor which must be determined, there-fore, is the emitter voltage during the turn-off interval. A consideration of the V.— I. characteristic shows that the emitter voltage reaches its minimum value at the break in the load line. For the transistor to be turned off, the clock voltage must be sufficiently negative to hold the emitter voltage at or below this critical value for sufficient time. The time required depends on the transient response of the transistor and the degree of saturation of the collector. The delay in turn-off caused by minority carrier storage is minimized in these circuits by virtue of the magnetizing current pulling the tran-sistor out of saturation before the end of the pulse in-terval.
If the clock does not turn off the transistor at the end of the pulse interval, the load line in Fig. 17 continues to move to the left. At the time of the next negative ex-cursion of the clock, the break in the load line is still further to the left (higher collector current), and the critical emitter turnoff voltage is still lower. As a result, the transistor never turns off. Ultimately, the load line extends so far to the left that the collector voltage drops to the collector supply voltage (- 20v.) and the tran-sistor is said to be locked up. The condition existing at the emitter when a tran-
sistor is locked up is of interest. In a number of these particular units the emitter potential drops almost to the potential at the collector, indicating a very low

52 PROCEEDINGS OF THE IRE January
emitter-to-collector impedance. When this occurs, the power dissipated in the transistor is approximately the product of base current (in the order of 20 milliamperes) and collector voltage (20 volts).
Transistors which might tend to lock up in the am-plifier circuit are virtually all eliminated through the imposition of the requirement on 17.(— 12, — 10). A more desirable requirement would be the emitter voltage cor-responding to the break in the load line on the collector characteristic (V= 20 volts, ma). Unfortunately, this corresponds to a rather high power dissipation and could not safely be measured statically. The correlation between Ve(— 12, — 10) and lock-up in the amplifier cir-cuit has been excellent, however.
It is significant that most transistors of the type em-ployed in this amplifier do not lock up even when the clock voltage is removed. Since during lock-up the col-lector load is essentially a short circuit, the transistor emitter characteristic (V. vs I.) with the collector short circuited is shown in Fig. 18. Superimposed on this char-acteristic is the emitter load line corresponding to the circuit of Fig. 15. It can be seen that transistors having short circuit emitter characteristics of the type labeled I have no high current point of stability and cannot lock up. Those transistors with characteristics similar to those shown as II and III, however, do have a high cur-rent stable point and might potentially lock up. Ideally, all transistors used in the amplifier circuits described in this paper should be of type I.
• • •
• EMITTER LOAD
• LINE
• • • • • s.
Fig. 18—GA-52514 emitter characteristics.
CONCLUDING REMARKS
Each of the amplifiers described in the preceding sec-tions has been built and tested. Moreover, several hundred semi-gated feedback amplifiers of the type shown in Fig. 15 have been built, and approximately 100 of these have been operating satisfactorily for over 10,000 hours in typical computer circuits. Operating margins of ± 20 per cent or greater, obtained by varying supply voltages independently, have been consistently observed in this equipment.
The performance of the semi-gated feedback ampli-fier of Fig. 15 appears to be satisfactory and comparable to that of the gated feedback amplifiers such as that shown in Fig. 13, while it is a somewhat simpler circuit. As in several of the amplifier circuits described, the effect of diode reverse transients on amplifier performance is minimized in this configuration.
ACKNOWLEDGMENTS
The authors wish to acknowledge the work of Mrs. J. L. G. Landry in making the many computations for the curves presented.
All of the work on these regenerative amplifiers has been done under contract with the Bureau of Ordnance of the U. S. Navy.
APPENDIX
Amplifier Rise-Time Analysis
As indicated in the discussion of operation, various diodes open and close and the transistor is driven to saturation in these amplifiers during the rise-time inter-val. Consequently, the performance is quite nonlinear. In the following analysis, the operation is separated into discrete regions in which linear theory is assumed to ap-ply. Many additional simplifying assumptions are made to make the otherwise cumbersome expressions somewhat more manageable as well as interpretable. In spite of these short-cuts (or perhaps because of them), it is believed that the solutions obtained provide a con-siderable insight into the pulse rise performance of the amplifier. Calculations based on this analysis appear reasonable when compared with experimental results. The specific circuit for which the analysis is made is
the semi-gated feedback amplifier of Fig. 15. With only slight modification, however, the analysis is applicable to the gated feedback amplifiers.
For the semi-gated feedback amplifier, at least five discrete regions can be defined during the pulse rise. The interval of the initial region extends from the in-stant when trigger current first enters the emitter to the time at which the voltage developed across feedback winding of the transformer is just sufficient to overcome the back-bias on diode D4. The duration of this interval is extremely short and is considered negligible in the present analysis. The second interval begins when the first one ends and is terminated when the current through D4 and the feedback winding rises to the value necessary to cut off diode Dg (i.e., when this current be-comes equal to that flowing through resistor R4). This is called region I in the work that follows. A third interval which sometimes exists begins at the end of the second and is terminated when the voltage across the output winding has risen sufficiently to just overcome the back-bias on diode D3. Again this very short time interval has been ignored.

1956 Simkins and Vogelsong: Transistor Amplifiers for Computers 53
Two additional regions exist if it is assumed that the amplifier drives a nonlinear load similar to that char-acterized in Fig. 3. The interval of the first of these load regions commences just as the back-bias of diode D3 is overcome and lasts until the load current rises to the value corresponding to the break in the load character-istic. This is called region II in the following. The other interval called region III begins as region II ends and is terminated when the transistor collector is driven to saturation.
It
Fig. 19—Equivalent circuit for region I.
Fig. 19 shows the equivalent circuit which is assumed for region I in which feedback current through diode D4 rises from zero to the approximately 6 milliamperes necessary to cut off diode Do— in other words, the gated feedback interval. The transformer equivalent circuit includes a leakage inductance L, a shunt capacitance C, and an ideal transformer with an n:1 turns ratio. Addi-tional elements, such as magnetizing inductance or other capacitances are believed less important and are deleted for simplicity. The current I is assumed to be related to the emitter current by the expression,
1 1 dl(t) I(t) = — 1(1) ± —
do ancoc dl
where
Tr, ao = ao (ao — 1) ao
r..
and ao is the dc short-circuit current gain of the tran-sistor. The interpretation of wc is more apparent if the above relation is expressed in terms of the Laplace com-plex frequency operator p.
1 1 p 1 I e(p) = — I(p) — — I(0).
ao ao coc agoc
If initial conditions are zero; i.e., I(0)= 0, then
do
1 (P) = e(P)
WC
and co, is seen to be the angular frequency at which the factor relating I to I. is down 3 db from ao. Since for all practical purposes ao is essentially ao, cue is essentially the angular a-cutoff frequency of the transistor.
Fig. 20—Equivalent circuit for region II.
One final assumption should be noted. The trigger current is considered to be a step function. While this is a very close approximation to the actual conditions in the amplifier of Fig. 16, it is somewhat less realistic when used for the amplifier of Fig. 15 in which the trigger cur-rent is actually derived from a clipped sine wave volt-age operating through a resistor.
Based on these conditions nodal analysis leads to the following characteristic equation for the feedback cur-rent:
1g b2p2 + hip + bo I 17(P) 116 —
p Caps ± C2p2 Cip ± Co p z(P) where
bo = — n2C[1 re(gb
b1= gb gc[1 nregb — n2(1 + r.gb)]
n2co.C[ao — 1 — re(gb g.)]
bo = wc{(nao 1)gb gc[1 — n2(1 ± ra„gb)11
= W(gb
C2 = gbg.L (gb+ gc)co.LC n2C[1+ r .(gb
ci = gb gc(n — 1)2 ± tocLgcgb n2r dcgb
— n'co.C[ao — 1 — r.,(gb
co = cojgb(1 — nao) g.(n — 1) 2+ li2g,r ].
The time solution for such an equation is:
//k Y(0) + Y(pk)ePke
/. Z(0)
C3
k.-s.11 Pb fl (Pb — pi)
j k
where the various pk's are the roots of z(p). Region I ends when If() equals 6 milliamperes, so with this value substituted in the expression above and It set equal to 1.5 milliamperes, the value of t corresponding to the length of the time interval can be determined.
If b np
The equivalent circuit assumed for the next region (II) is shown in Fig. 20. In this region, the amplifier works into the low incremental impedance portion of the load, and in the equivalent circuit the load is as-sumed to be a short circuit. The feedback current es-tablished during the preceding region is shown here as a step function current generator labeled //k/np, since this current remains essentially unchanged during this

54 PROCEEDINGS OF THE IRE January
interval. Similarly, the emitter current is assumed to be a step function current generator labeled -1",/p, and on this basis the emitter resistance is deleted.
For this region the characteristic equation defining the load current is:
d2p2 + dip + dO Jo =
P(P Wc)(h2P2 + hip + ho)
where
d2 = (gb g.)CV 2(0)
d1 = 1(0)go ± (go + g.)[co.CV2(0) — IL(0)]
do = ic(aococgo wcgc) — cuc(go gc)I L(0)
112 = L C(gb + gc)
hi = Lgog.
Ile = gb g.
and
.-ic= It+ IWO) IL(0) is the current through the leakage inductance
at the start of this interval, V2(0) is the voltage across the capacitance at the
start of this interval, and /(0) is the initial condition of the current generator
in the transistor equivalent network.
41240) If b(0)
I (0) L C di°
A time solution can be obtained as before by finding the roots of the denominator of the characteristic equation. By inserting the upper boundary value for /0 (6 milli-amperes), the duration of this region can thus be ob-tained.
Fig. 21—Equivalent circuit for region III.
For the third and final region of the analysis (III) the equivalent circuit of Fig. 21 is assumed. In this region, the amplifier works into the high incremental impedance portion of the load characteristic. The load is therefore assumed to consist of a conductance, GL, referred to the primary side of the transformer, in addition to a step function current generator labeled I r/ p. This latter com-ponent is necessary to account for the load and feedback currents established in the preceding regions. Another step function current generator labeled .f./p is included as in region II to account for the trigger current plus the
gated feedback current established in region I. In addition, the linear feedback current is introduced to the emitter through Gib. Leakage inductance is deleted from the equivalent
circuit, since the incremental load impedance is high. Also, the initial voltage and current of the condenser are assumed to be zero. I,. therefore becomes /(0). The termination of this region is considered to occur
when the pulse voltage rises to 18 volts at the collector, as this is a typical condition existing when the collector reaches saturation. Accordingly, the characteristic equa-tion is written for the pulse voltage developed at the collector and is:
r kip ko V2(p) =
p m2p2 + mi p + tuo
1(0) u2p2 + uip + uo
where
k1 =
ko =
P + co.)(m2P2 + miP + mo)
gc
[ G,1) We — (ao — 1) —
n gc
m2 = — C(Gio gc -± go)
at) go]
= [(ao — 1)cocCG/o — gcGib (1 — —1)2 GLGIb
Gib - geG WeCgc g b (gc GL OcC g
Ito )
mo coc[(ao — 1)GfoOL + gcGfb(1 — —1)2 aogbGfb
G1 b — gcGL, — go (gc + +
n2
Gib 112 = ge —
n
no =
(0.[Gfo (1 ± — cto) 4- 2g. + go]
(0,2[Gfo(1 — ao) gb ge].
While the equations derived are useful, the manner in which rise time is governed by the various parameters is more easily seen from the curves of Figs. 22 and 23, plotted from these equations. In these, the merits of increased transistor cutoff frequency, a, decreased shunt capacitance, and transformer leakage inductance can be noted. For the range of values considered here, leakage inductance appears to have least effect while the other three parameters are somewhat equivalent to one another in influence on the rise time. The total rise times indicated here as ranging from 0.02 to 0.05 micro-second are consistent with measured rise times ranging from 0.03 to 0.05 microsecond.

1956 Siekanowicz and Sterzer: S-Band Traveling- Wave Amplifier 55
Cg=
TOTALS
REGION Kt
....
..... 0
3
2
.....,, '---.7
... REGION .......,..a......
-..'..:±-,..._, Is ,
)
......«.*«.'". 3 — 1
\I
\)
\
N N
°S..... )
••••.... REGION
....>„„....1.......
\s„ 71 ........
"--•-€) 2
5 L =IMICROHENRY C=5 MICRO-MICROFARAOS
..........
....--0 3
5
)
0.050
0.040
0.030
0.020
0.015
3 o.
0.
0.00
0.
0.001
0.001 e 10 12 14 16 16 20 2
cc, CUTOFF FREQUENCY IN MEGACYCLES PER SECOND
Fig. 22—Computed rise times as a function of the transistor parameters.
0.080
0.050
0.040
0.030
0.020
0.010
0.009
e7 0.008
0 0.007
0.006
0.005
0.004
0.003
0.002
L IN MICRO-HENRIES =
5
.wb
PtC'e 5
e
4.
-.4
, ode7-
5
Of =2.5
fc = 15 MEGACYCLES
O 2 3 4 5 6 7 8 9 10
CAPACITANCE IN MICRO- MICROFARADS
Fig. 23—Computed rise times as a function of the transformer parameters.
A Developmental Wide-Band, 100-Watt, 20 DB, S-Band Traveling-Wave Amplifier Utilizing
Periodic Permanent Magnets* W. W. SIEKANOWICZt MEMBER, IRE, AND F. STERZERt
Summary—A developmental, 100-watt, S-band traveling-wave
amplifier utilizing ceramic "periodic" permanent magnets to focus the electron beam is described. The minimum peak power output of the tube is 100 watts at a gain of at least 20 db at frequencies from 2,000 to 3,800 magacycles per second. At lower power levels, a gain of 36 db has been measured in the center of the frequency band. The operating voltages for the amplifier are below 4,000 volts. The use of "periodic" magnets in place of conventional solenoids or permanent magnets producing uniform magnetic fields effects a considerable reduction in the weight and size of the focusing system. Construc-tional features of the tube which permit operation with the "periodic" magnet are discussed. The rf characteristics of this amplifier are evaluated, and the complete "package" assembly is described.
Original manuscript received by the IRE, July 5, 1955; revised manuscript received August 12, 1955. This tube was developed for the U. S. Air Force under Contract No. AF 33(600)-24400, sponsored by the Wright Air Development Center, Dayton. Ohio.
1. Tube Division, RCA, Harrison. N. J
I NTRODUCTION
r 1H IS paper describes a developmental, S-band, 100-watt, 20-db traveling-wave amplifier, shown in Fig. 1, which utilizes "periodic" permanent
magnets for focusing of the electron beam. The tube operates at a beam duty of 100 per cent and rf power-
Fig. 1—View of "packaged" traveling-wave power amplifier including "periodic" permanent magnets for beam focusing. The tube is shown in the lower portion of the figure.

56 PROCEEDINGS OF THE IRE January
BASE
INSULATOR
MAGNETIC SHIELD
ELEC 1 RON GUN
rINPUT COUPLER
-ALuMINUM SHELL
OUTPUT COUPLER
ATTENUATOR COLLECTOR
TUBE AIR-COOLED RADIATOR
RING MAGNETS
META( SHIMS
Fig. 2—Schematic diagram of traveling-wave-amplifier assembly.
output duty of 0.1. In the present design, the rf power-output duty cycle is limited to 10 per cent by rf heating of the helix. This basic design is now being modified so that it will also provide continuous rf power opera-tion at a power-output level of at least 100 watts. The permanent-magnet assembly used in conjunc-
tion with this tube weighs 2.8 pounds and replaces a solenoid which, for this application, would weigh about 50 pounds. The use of the permanent magnet also elimi-nates the power supply required to drive a solenoid. A "packaged assembly" including the tube, the "peri-odic" permanent magnet, and an air-cooled collector is shown in Fig. 1. A schematic diagram of the assembly is shown in Fig. 2.
DESCRIPTION OF COMPONENTS
Permanent Magnet
The design of a light-weight permanent magnet suitable for use in a "packaged" assembly was a major consideration in the development of this traveling-wave amplifier. The required magnetic-field intensity is re-duced by the use of a convergent type of electron gun in which the cathode is shielded from the magnetic field. When purely magnetic means are used for beam focusing, an electron beam launched from a shielded cathode requires a smaller magnetic field for focusing than a beam from a cathode which is partially or totally immersed in a magnetic field.' Calculations and prelimi-nary experiments indicated that a uniform magnetic field of 450 gausses would be required over a cylindri-cal region about inch in diameter and 12 inches long. The weight of a permanent magnet which produced a uniform field of 450 gausses over the required region was considered impractical. However, consideration of the de parameters and of the electron-beam geometry indicated that permanent magnets producing a "peri-
1 C. C. Wang, "Electron beams in axially symmetrical and mag-netic fields," PROC. IRE, vol. 38, pp. 135-147; February, 1950.
odic" magnetic field in the region of electron flow could be built with commercially available materials. The focusing of long electron beams by means of
periodic magnetic fields has been described previously.2-4 The periodic magnet developed for use with the travel-ing-wave amplifier is shown in Fig. 3. This type of struc-
ilIFT111111 itti it w,,,,,„1:,*1.!;\,..typrin
Fig. 3—Sections of "periodic" permanent-magnet assemblies using two different types of magnetic materials. The magnet at the left, made of commercially-available ceramic, weighs 0.510 pound per inch of axial length. The magnet at the right, made of RCA-ceramic ring magnets, weighs 0.200 pound per inch of axial length. Individual ring magnets and shims are shown in the lower portion of Fig. 3.
ture, which consists of a series of ceramic ring magnets separated by metal shims, is considerably lighter in weight than either solenoids, or permanent magnets which produce uniform magnetic fields. The variation of the axial component of the magnetic
field produced by the periodic magnet is very nearly
J. T. Mendel, C. F. Quate, W. H. Yocom, "Electron beam focusing with periodic permanent magnet fields," PROC. IRE, vol. 42, pp. 800-810; May, 1954.
3 Kern K. N. Chang, "Beam focusing by periodic and comple-mentary fields," PROC. IRE, vol. 43, pp. 62-71; January, 1955.
4 A. M. Clogston and H. Heffner, "Focusing of an electron beam by periodic fields," J. Appl. Phys., vol. 25, pp. 436-447; April, 1954.

1956 Siekanowicz and Sterzer: S-Band Traveling-Wave Amplifier 57
sinusoidal, as shown in Fig. 4. For good focusing, it is necessary that the amplitude and period of the magnetic field in the region of the electron beam satisfy certain conditions.2 For operation in the first "pass band" using a magnetically shielded cathode, the following relation-ship must be satisfied:
MAGNETIC SHIELD N 5Ns
MAGNETIC SHIMS
CERAMIC RING MAGNETS
600
400
• 200
C
L.4 ▪ o
o t, -200
400
600
11331111•11111111111MMII111111•1111•11 IMM11111111111111111111111111111111111111111111111 11111111111111 11111111 11111111111 Ill 111111111111ZZ MIIIMM11111111111111111111111111111 1111111111111113 NIIIM11111111111111111111111111111111111111111111M11 Znall111111111111111111111111111111111111111111RIN IIIIIME111111111111111111111111111111111111111111&111 ZMI1111111111111111111111111111111111111111111111111B ZMIIIIM1111111111111111111111111111111111111111111 MIII1111111111111111111111111111111111111111111111M ZNIIIMIII1111111111111111111111111111111111111111111Z IIIIIMM11111111 11111111111111111 1111111111111111BM BRZ1111111111111111111111111111111 1 111181111111111111M -4 -2 0 2 4 6 e 0 12
DISTANCE FROM MODIFIED SHIM-INCHES
Fig. 4—Magnetic field strength of commercial-ceramic magnet, shown in the upper portion of the figure, along the axis of the traveling-wave amplifier.
eBo2L2 < 418 mV
14 16
(1)
where Bo = amplitude of the sinusoidal magnetic field in
webers per square meter, L = period in meters, V= beam (helix) voltage in volts, and
elm = 1.759 X10" coulombs per kilogram. In addition,
Bo = -0 -Bb (2)
where Bb is the uniform magnetic field required to focus the beam (often called the " Brillouin field"). This field can be expressed as follows:5
I"
Bb -= 8.26 X 10⁻⁵ am'
(3)
where I is the beam current in amperes and a is the radi-us of the electron beam in meters. In practice, the mag-netic field required for good focusing of the electron beam is approximately 1.5 to 2 times the theoretical value.' calculated from (3).
5 J. R. Pierce, "Theory and Design of Electron Beams," D. Van Nostrand Co., Inc., New York, N. Y., p. 143; 1949.
Mendel, Quate, and Yocom, op. cit.
Preliminary experiments showed that the uniform magnetic field required for focusing of the beam in this traveling-wave tube is 450 gausses. When this value is substituted in (2), it is determined that the amplitude of the periodic field should be approximately 635 gausses. When this value is used for Bo in ( 1), the value of the period L is calculated to be less than 2 inches. Operation at short periods is desirable because the de-gree of beam "scalloping" is reduced as the period of the magnetic field becomes smaller.7 "Scalloping" is a periodic variation of the beam boundary caused by the periodic nature of the magnetic field. Only a small de-gree of beam scalloping is permissible in this tube be-cause operation at a high beam-to-helix-diameter ratio is necessary for good rf performance. A periodic-magnet assembly built of commercially-
available ceramic (BaFe12019) is shown at the left of Fig. 3. This assembly consists of a series of ring magnets and magnetic shims. The ring magnets, which are axially magnetized, have an outside diameter of 2 inches and are assembled so that their adjoining faces have the same polarity. The cold-rolled steel shims provide a low-permeance path for the flux from the ring magnets to the useful air gap, and also reduce any deviations of the field from axial symmetry. The inside diameter of the shims should be kept small
because the magnetic field strength on the axis increases as the inside diameter of the shims is reduced. With a smaller inside diameter, therefore, the required magnetic field can be obtained with less magnetic material and a lighter structure. Consequently, the radial dimensions of the tube parts and accessories which fit inside the shims are designed to be as small as possible. An inside diameter of the shims of 0.525 inch satisfies both the magnetic and mechanical requirements.
Magnetic materials having a large coercive force make it possible to obtain high field intensities for a de-sign having a small period. Because ceramic magnetic materials have a large coercive force, they are suitable for this application.
Sections of permanent-magnet assemblies built of two different ceramic materials are shown in Fig. 3. The magnet at the left, which is made of commercially avail-able ceramic (BaFei2019), has a total weight of 7.1 pounds for its length of 131 inches. The magnet at the right is made of a new type of magnetic ceramic de-veloped at the RCA Laboratories. This material has a higher energy product at the operating point for this magnetic circuit, and, therefore, permits construction of a smaller and lighter assembly. The total weight of this magnet is 2.8 pounds for a length of 131 inches. It can be seen that both of the structures shown in Fig. 3 effect a considerable reduction in weight as compared with the solenoid which, for this application, weighs over 50 pounds. The period of the assemblies shown in Fig. 3 is 40
per cent of the theoretical limit of 2 inches calculated
7 Ibid.

58 PROCEEDINGS OF THE IRE January
from ( 1). The diagram at the top of Fig. 4 shows the constructional features of the commercial-ceramic assembly. The magnetic-field distribution about the axis of the magnet is also shown in Fig. 4. In the region near the electron-gun end of the tube, the desired "launching field" for the electron beam is obtained by the use of a magnetic shield and by the modification of the first shim of the structure. The construction of the magnet using the RCA developmental ceramic is simi-lar to that shown in Fig. 4 except that the outside diam-eter is 11 inches. Average peak magnetic-field intensity of the periodic magnet using RCA ceramic is 600 g.
Electron Gun
The electron gun used in the traveling-wave tube is a convergent type in which the cathode is shielded from the magnetic field. The gun has a perveances of 1.2 micropervs and a mean cathode-current density of 180 milliamperes per square centimeter at a collector cur-rent of 250 milliamperes. The initial design of the cath-ode and the focusing electrodes was based on information given by Pierce° and Helm, Spangenberg, and Field." Electrode shapes were subsequently modified slightly on the basis of actual dynamic measurements to main-tain the anode interception as low as possible and to obtain the required perveance. Under normal operating conditions, the current intercepted by the anode is less than 0.2 per cent of the cathode current.
Helix
The helix consists of 0.030 inch molybdenum wire wound at a pitch of 0.100 inch. The helix, which has an inner diameter of 0.218 inch, fits into precision glass tubing.
Helix-to- Coaxial-Line Transducers
"Coupled-helix" transducers are used to feed rf energy into and out of the tube. This method of coupling is based on the transfer of electromagnetic energy ob-tained between too oppositely-wound helices when the outside helix is designed to have proper pitch and length with respect to the inside helix."2 Couplers of this type provide a good match over a very wide range of frequencies. The standing-wave ratio of the trans-ducers, measured in the absence of the electron beam, is below 1.7 in the frequency range from 2,000 to 4,000 megacycles per second, as shown in Fig. 5.
For an electron gun operating under space-charge limited con-ditions, the cathode current /c (amps) is related to the anode voltage Va (volts) as follows: =K X10-6 Va312, where K is the perveance in micropervs.
9 Pierce, op. cit. 10 R. Helm, K. Spangenberg and L. M. Field, "Cathode design
procedure for electron beam tubes," Elec. Comm., vol. 24, pp. 101-107; March, 1947. " O. G. Owens, "Coupled helix attenuators for traveling-wave
tubes," Tech. Rept. No. 68, Stanford University, California; August, 1953. '2 R. Kompfner, "Some theory and experiments on coupled
helices"; paper presented at the Conference on Electron Tube Re-search, Palo Alto, Calif.; June 19, 1953.
z 2 o o z - <I-k-
IZ 1.5
Li LJ Z
I r
!* 0 I > 2000 2500 3000
FREQUENCY- Mc 3500 4000
Fig. 5—Voltage standing-wave ratio of "coupled-helix" type of helix-to-coaxial-line transducer as a function of frequency.
The "coupled-helix" tranducer is well-suited for use with a periodic magnet because its radial dimensions can be made small. The mechanical construction of the coupler is shown in Fig. 6. The inner conductor of the coaxial line of the transducer is extended to form the outside helix. The coaxial line is brought out through a slot cut in the magnetic shim of the ceramic magnet and through semicircular holes provided in the adjoining ring magnets. Because these modifications to the mag-netic circuit are very small, they have a negligible effect on the axial component of the magnetic field.
SECTION OF "PERIODIC"' PERMANENT MAGNET
ASSEMBLY
MAGNETIC SHIM
COAXIAL LINE
CONNECTOR
MOM
DIELECTRIC SLEEVE
OUTSIDE HELIX
METAL SLEEVE
6—Coupled-helix type of transducer built into a magnetic shim of "periodic" permanent magnet.
Attenuator
The attenuator used for stabilization of the tube is also of the "coupled-helix"" type, as shown in Fig. 7. The attenuator helix is wound on a thin ceramic sleeve, and carbon is then deposited throughout the volume of the porous ceramic by pyrolysis of methane gas at a temperature of about 1,000 degrees C in a rotating quartz bottle." This attenuator has high power-dissipating capabilities. Attenuation is achieved by the
" Ibid. 14 The application of carbon to the ceramic sleeve was performed
at the Pyrofilm Resistor Co., Morristown, N. J., under the direction of Dr. J. M. Hinkle.

1956 Siekanowicz and Sterzer: S-Band Traveling- Wave Amplifier 59
transfer of energy from the helix of the tube to the at-tenuator helix, and the dissipation of the energy in the carbon. A quadrifilar attenuator helix provides more uniform attenuation over the desired range of frequen-cies. Position of the attenuator along the bulb of the tube is adjusted for best rf performance during prelimi-nary tests; the ceramic sleeve is then sealed to the bulb.
Packaged Design
The packaged design of the developmental traveling-wave amplifier shown in Fig. 1 includes commercial-ceramic ring magnets for focusing of the electron beam and has a total weight of 11 pounds. The use of RCA developmental ceramic permits design of a "package" which is 4.3 pounds lighter. The air-cooled collector is capable of dissipating at least one kilowatt of continu-ous dc power. The input and output terminals of the amplifier use standard coaxial-line bnc connectors. The total length of the assembly is 21 inches.
,L1,1-1-16NU- vvOUNL., OuADRIFILAR OUTSIDE HELIX
-LARSON-IMPREGNATED CERAMIC SLEEVE
RIGHT -HAND-WOUND INSIDE HELIX
I
4 i ,'__.' .- _ . .
1 i
I 1 1 1 i 3000
FREQUENCY-Mc 3500
Fig. 7—Coupled-helix type attenuator and its frequency characteristic.
4000
TUBE CHARACTERISTICS
DC Performance
The dc performance of the traveling-wave tube using "periodic" magnets for focusing of the electron beam is as follows: when the tube is operated at the collector current of 250 milliamperes required to provide the desired rf performance, the current intercepted by the helix is less than one per cent of this value.
RF Performance
The design objectives for this tube were a minimum peak power output of 100 watts at a gain of at least 20 db over the widest possible frequency range centered at 3,000 megacycles per second at electrode voltages below 4,000 volts. When a collector current of 250 milli-amperes is used and the helix voltage is held constant at 3,750 volts, maximum frequency bandwidth is ob-tained for large signal levels. Power output and small-signal gain measured under these conditions are shown as functions of frequency in Fig. 8. The rf peak power output obtained at rf peak power inputs of 1 and 0.5 watts is shown by curves A and B, respectively. A minimum power output of 100 watts at a gain of at
40
z' 30
o
20
200
COLLECTOR MA.250 VOLTS=3750
__-----.
/441, HELIX
SMALL -SIGNAL GAIN C
5F PEAK POWER OUTPUT
Pa K POW R INPUT.14,
'
2500 3000 3500 FREQUENCY - Mc
Fig. 8— RF peak power output and small-signal gain as functions of frequency.
4000
least 20 db is obtained at frequencies from 2,000 to 3,800 megacycles per second. When the rf peak power input is 0.5 watt, the tube operates under "saturated" conditions from 2,800 to 3,200 megacycles per second, but below saturation from 2,000 to 2,800 megacycles per second and from 3,200 to 3,800 mcps. The small-signal gain, measured for an rf peak input
power of about 11 milliwatts, is shown by curve C of Fig. 8. The small-signal gain is 36 db in the center of the frequency band, but drops to lower values at higher and lower frequencies.
1000
6
4
V/ 3 1-F- 2
e
1 1- 100 D 8
— FREQUENCY?tylc)=2/300
I- 6
o
RF PEAK POWER
4
3
:COLLECTOR MA = 250 "HELIX VOLTS=3750
2150
2
3500
4
3
2
.001 4 8 01
RF PEAK 2 34 68 01 2 3 4
POWER INPUT-WATTS
6 81.0
Fig. 9— RF peak power output as a function of rf peak power input.
Peak power output is shown in Fig. 9 as a function of peak power input at three frequencies. Values of helix voltage and collector current are the same as those used in Fig. 8. The tube "saturates" at lower input-power levels in the center of the band than at higher or lower frequencies.

60 PROCEEDINGS OF THE IRE January
EFF=
„ RF PEAK POWER OUTPUT COLLECTOR CURRENT x HELIX VOLTS
L. 15_0
4., ,er C3, 4 2800,
/ 'et
3400 3600 3800 HELIX VOLTS
250
1-
200
O. l 150
CC 4.1 1
151 5 a.
o 4000 3400
RF 'PEAK POWER INPUT
21.5W , .4"«.
I e
C> 4,
4
C.
POWER PEAK INPUT
2800 -
RF PEAK POWER INPUT 'et,
I I I 3600 3800 HELIX VOLTS
4000
Fig. 10—"Saturated" rf peak power output and efficiency as func-tions of helix voltage at a collector current of 250 milliamperes.
1/1 1-4500 O >4000
3 3500
3000
2150
2800
FREQuENcy 0,4c)= 3500
LO:ji < 30 SP I -• = 2800 Mc _ i._20-+=2150 Mc 3500 Mc
1 HELIX VOLTAGE AND RF POWER — 11 Zw 0 INPUT ADJUSTED FOR MAXIMUM RF POWER OUTPUT
kr1-1- 1
L.- o cc
e< D1.5
50
3
10
I ...eb0
Ft 35°C)
HELIX INPUT
VOLTAGE AND RF POWER ADJUSTED FOR MAXIMUM -
POWER OUTPUT
I 1 1 I
RF
100 200 300 COLLECTOR MILLIAMPERES
Fig. 11—"Saturated" rf peak power output and corresponding gain and helix voltages as functions of collector current.
If the tube is required to operate over only part of the band, a power output higher than that shown for broadband conditions can be obtained. The "saturated" rf peak power output and efficiency are shown in Fig. 10 as functions of helix voltage at three frequencies. At low frequencies, a peak power output of 230 watts at an efficiency of 22 per cent can be realized by adjust-ment of the helix voltage to a value favorable for the low-frequency range. This value compares with a power output of 180 watts and an efficiency of 19 per cent when the helix voltage is adjusted for broadband operation.
If the use of a lower power level and gain is desired, the tube can be operated at a reduced collector current. The saturated rf peak power output and corresponding gain and helix voltage are shown in Fig. 11 as functions of collector current.
2150
4000 2800
=3500 3000
__0(mc,)
2000
e fycClUm•
-1 < 5 Z
40
1 3
xr 2
10
2150 2800
rncoueNcra.nc).35°°
lOO ISO 200 250 COLLECTOR MILLIAMPERES
300
Fig. 12—Maximum small-signal gain and corresponding helix voltage as functions of collector current.
FREQUENCY . 3500 Mc COLLECTOR CURRENT = 250 MA. ..„.. I 1H III l I
3800
3800
340C
GAIN OBTA NED WITH HELIX 30
E --. D
......_ VOLTAGE ADJUSTED
MAX. POWER FOR
25 GAIN .......
OBTAINE AT VH=.3750V.
...
20
•-
C HELIX
...,
VOLTS FOR MAX. POWER OUTPUT
!I .01 2 3 4 IS lA 2 3 4 6 IS on 2
RF PEAK POWER INPUT—WATTS
2
l 11111111 o_POWER OUTPUT . OBTAINED= WITH -HE LIX VOLTAGE
ts-_ADJuSTED FOR 4 MAX. POWER
3
2 I OUTPUT
e9,
/
AT MEASURED VH=3750 V
é
is
4
3
2
I .01 2 34 6 • K) 2 34 641.0 2 3 • 6511
RF PEAK POWER INPUT—WATTS
Fig. 13— RF peak power output and gain as functions of rf peak power input at constant and optimized helix voltages at a fre-quency of 3,500 megacycles per second.
The maximum small-signal gain and the correspond-ing helix voltage are shown as functions of collector cur-rent in Fig. 12. The maximum small-signal gain at any value of collector current is 5 to 10 db higher than the gain at "saturation." In addition, the helix voltage re-quired for maximum small-signal gain is lower than the helix voltage for maximum gain at large signal levels. The rf peak power output and gain are shown in Fig. 13 as functions of rf peak power input at constant and op-timized helix voltages at a frequency of 3,500 mega-cycles per second. The curves of Fig. 13 indicate how the linearity of the tube can be improved by proper adjustment of the helix voltage. Curve D of Fig. 13 shows the gain obtained at a constant helix voltage of

1956 Cutler: Spurious Modulation of Electron Beams 61
TABLE I
Voltages
Collector current Helix current DC operation RF operation RF power output at con-
stant helix voltage of 3,750 volts
Small-signal gain
Mechanical features
Total length Total weight of "packaged"
assembly using commer-cial-ceramic magnets
Total weight of "packaged" assembly using RCA-ceramic ring magnets
below 4,000 volts for wide-band opera-tion.
250 milliamperes less than 1 per cent of collector current 100 per cent beam duty 10 per cent duty 15 100 to 170 watts at a gain of at least 20 db from 2,000 to 3,800 mc
36 db at center frequencies, 28 db at 2,000 mc, 25 db at 3,500 mc
"Packaged" design including periodic permanent magnet for electron-beam focusing and air-cooled col-lector
21 inches 11 pounds
(weight of permanent magnet alone =7.1 pounds)
6.7 pounds (weight of permanent magnet alone =2.8 pounds)
15 The present design can be operated at average power-output levels up to 25 watts. The basic design is now being modified so that the tube will also provide continuous rf power operation up to average power outputs of at least 100 watts.
3,750 volts. When the tube is operated under these conditions, the gain is lower than that shown in curve E at small signal levels, but is not affected appreciably at large signals. It is estimated that the helix voltage can be adjusted to give linear operation for power levels up to about 70 per cent of the "saturated" power out-put. A summary of the performance data obtained for this
developmental traveling-wave tube is shown in Table I.
ACKNOWLEDGMENT
The authors wish to thank Dr. I. Gordon of the RCA Laboratories at Princeton, N. J., for supplying the RCA ceramic used in the magnets, Dr. B. B. Brown and W. J. Dodds for their guidance in the course of this work, E. Bliss for helpful cooperation in the design and evalua-tion of the tubes, Miss R. Pekarowitz for measurements, R. Pagano for directing construction of the tubes, and other members of the RCA Tube Division for their contributions to the development of the tube described in this paper.
Spurious Modulation of Electron Beams* C. C. CUTLER'', FELLOW, IRE
Summary—This paper describes spurious modulation effects commonly observed in electron tubes employing high current elec-tron beams. The modulation is caused by positive ions and secondary electrons moving in the beam. It is eliminated by pumping the tube to high vacuum and retarding or deflecting the secondary electrons.
I NTRODUCTION
ADIFFICULTY commonly encountered in ampli-fiers and oscillators employing electron beams is a noise-like modulation of the output at fre-
quencies of around 5 mc and below. Various aspects of this phenomenon have been investigated and explained in part," but the fact that it keeps being rediscov-erec14-6 indicates that a clear description of the phenome-non is needed.
* Original manuscript received by the IRE, May 9, 1955; revised manuscript received, July 13, 1955. t Bell Telephone Labs., Murray Hill, N. J. 1 J. R. Pierce, "Possible fluctuations in electron streams due to
ions," Jour. Appt. Phys., vol. 19, pp. 231-236; March, 1948. 2 E. G. Linder and K. G. Hernqvist, "Space charge effects in
electron beams and their reduction by positive ion trapping," Jour. Appt. Phys., vol. 21, pp. 1088-1097; November, 1950.
3 K. G. Hernqvist, "Space charge and ion-trapping effects in tetrodes," PROC. IRE, vol. 39, pp. 1541-1547; December, 1951.
4 T. Moreno, "Some Anomalous Modulation Effects in Reflex Klystrons," paper presented at 10th IRE Conference on Electron Tubes, Ottawa, Can.; June, 1952.
6 R. L. Jepsen, "Some Beam Instabilities in Klystrons," paper presented at 10th IRE Conference on Electron Tubes, Ottawa, Can.; June, 1952.
T. G. Mihran, "Some Experimental Observations of Positive-Ion Oscillations in Long Electron Beams," 13th Annual Conference on Electron Tube Research, Michigan State College; June, 1955.
The effect usually shows up as a modulation of the radio-frequency output of an amplifier or oscillator em-ploying an electron beam which passes through an elec-tric field free region. The modulation appears as noise having a strongest amplitude in the hundreds of kilo-cycles, but which may have components as low as the audible range and as high as several megacycles. Under some circumstances the modulation is spread out over many octaves, and sometimes will have strong but un-stable discrete frequency components. (See Fig. 2.) The amplitude is often as much as 10 per cent modulation of an rf carrier but under severe conditions is as much as 100 per cent modulation, and in some cases has been reduced to as little as 0.01 per cent. The effect is entirely one of modulation, there being no corresponding high-frequency output in the absence of a signal, and no cor-responding effect on the noise figure of the tube. The study to be described indicates that the effects
come from three related phenomena. The most prom-inent is a plasma oscillation of positive ions attracted by the space charge of the electron beam and excited by secondary electrons returning from the collector region. It is strongest in the hundreds of kilocycles, which is near the natural frequency of transverse oscil-lation of the common positive ions in the normal space-charge field. Another is a relaxation oscillation in the tens of kilocycles, with a period consistent with the time required for electron collisions to produce ions

62 PROCEEDINGS OF THE IRE January
sufficient for space charge neutralization. The third effect is purely electronic, and appears to be a longitud-inal oscillation of secondary electrons in the range of a few megacycles. These effects are strongly influenced by focusing fields, and any and all voltages and currents, even including heater current and cathode temperature.
Both of the ion effects may be eliminated by suffi-ciently hard pumping (which means vacuums of the order of 10-8 mm of Hg in the case of several traveling-wave tube geometries). This leaves a residual modula-tion noise of around 0.01 per cent due to the random fluctuations' in beam current. The third effect is un-common, and its elimination simply calls for electric or magnetic field distributions which eliminate second-ary electrons from the beam.' No practical use has been found for these effects.
NEEDLE VALVE
SOLENOID
TARGET ELECTRODE
,
VACUUM CHAMBER
ELECTRON GUN
,COLLECTOR
DEFLECTING COILS
SOLENOID
TO VACUUM PUMP
Fig. 1—Apparatus used to study spurious modulation in an electron beam (beam operated at 1,000 volts and 5 milliamperes).
EXPERIMENTAL OBSERVATIONS
In order to avoid confusion with microwave fre-quency effects, the beam modulation was studied di-rectly, in a demountable continuously pumped chamber shown in Fig. 1 instead of in a traveling-wave tube where it was discovered. The collected beam current was observed in two ways. First the ac component fre-quencies were measured in a spectrum analyzer, and second, in order to observe the start of the phenomena, the beam was turned on and off with a square wave at a slow rate and observed with an oscilloscope synchro-nized to observe the starting transient of transmitted
Shot noise would be an rias current modulation of V2eB/to where e is electron charge in coulombs, B is the bandwidth in cycles per second and lo is the beam current. Flicker noise would give low frequency components somewhat larger.
8 D. Bohm, E. H. S. Burhop, H. S. W. Massey, and R. M. Wil-liams, "A Study of the Arc Plasma," National Nuclear Energy Ser., McGraw-Hill Book Co., Inc., New York, N. Y., Division I, vol. 5, pp. 173-333; 1949.
R. Rompe and H. Steinbeck, " Der plasmazustand der gase," Erg. exakten Naturwiss., vol. 18, p. 303; 1939.
D. Bohm and E. P. Gross, "Effects of plasma boundaries and plasma oscillations," Physical Rev., vol. 79, pp. 992-1001; September, 1950.
These published works on plasma oscillations lead one to expect an electronic oscillation in the thousands of megacycles. A search was made for such oscillations, but none were found, so we assume they do not exist in the beam geometry and the pressures used.
current." The total current from the cathode under no circumstances showed any significant modulation dur-ing the pulse. Strong modulation was found in the divi-sion of current between the target and the collector, how-ever, and this is the current that is described in the fol-lowing observations. The apparatus was equipped with a gas inlet, so that
the pressure could be varied at will by admitting either hydrogen or nitrogen gas.
RELATIVE AMPLITUDE
(a)
(b)
Fig. 2—Spectrum analy-i spurious modulation appearing on the output of a traveling-wave tube. (Courtesy of M. E. Hines.)
The modulation of the collector current was observed with a spectrum analyzer, and gave patterns similar to Fig. 2.10 The observations were in every particular like those made of the modulation of the microwave energy coming from traveling-wave tubes. This was a good in-dication that we were studying the same phenomenon as previously observed by Pierce and Hines.9"0 The frequencies were generally somewhat lower than in the traveling-wave tube. but this may be explained by the lower-beam currents used.
Fig. 3 shows various oscilloscope patterns of col-lector current. There were evidently three overlapping phenomena which, to avoid confusion, had best be de-
Electron beams in traveling-wave tubes were first studied using this pulse technique by J. R. Pierce early in 1947.
70 These photographs were supplied by M. E. Hines. They were used in his report on spurious modulation effects in traveling-wave tubes at the Fifth Annual Conference on Electron Tubes, at Syracuse University, Syracuse, N. Y., in 1947.

1956 Cutler: Spurious Modulation of Electron Beams 63
scribed separately, although they usually occurred in concert. The main distinguishing feature between them was the frequency constitution.
ION OSCILLATION
The most predominant effect occurred in a broad spectrum from about 100 kc to 2 mc. The amplitude was critically dependent upon pressure, increasing several orders of magnitude as the pressure was increased from 10—i mm Hg to 10-8 mm of Hg. The frequencies in the spectrum increased significantly with increasing electron beam current," or if hydrogen was introduced
(a) 1 o
(b) so% - o
(c)
(d)
"M"REFLEX ELECTRON OSCILLATION
(f)
(9)
L 50 100 150
ANODE VOLTAGE PULSE IN MICROSECONDS
STARTING TRANSIENTS OF QUIET BEAM
iecreiererele.leNti.e.l.eieftWeeetrite$:e.VbWi." .1._
"I" CHARACTERISTIC ION PLASMA OSCILLATION
t...
IrRELAXATION OSCILLATION (ALTERNATE FORMS)
COMBINATION OF I + rr OR I +
I MODULATING U OR BS
Fig. 3-0scillograms of collector current from a pulsed electron beam, showing the three types of modulation.
into the system instead of nitrogen. At the lower pres-sures, the spectrum showed discrete frequencies similar to those in Fig. 2(a), and at higher pressures was more erratic like those in Fig. 2(b) and 2(c). The actual spec-trum shape was kaleidoscopically dependent upon any-thing connected with the tube; i.e., heater power, mag-netic field, voltage, etc., but not in a consistent or re-peatable fashion.
When the beam was pulsed, the oscillations started slowly, as shown in Fig. 3(c), taking from 10 to 100
" Linder and Hernqvist, /oc. cit., also found, and Pierce, /oc. cit., predicted the frequency to be proportional to beam current, but called it "ion density." That it is not the ion density which determines the frequency is evident in the fact that the frequency is not dependent on pressure, and most assuredly at the lower pressures the ion density is affected by the pressure (Bohm and Gross, loc. cit.).
microseconds to reach full amplitude, the starting time varying inversely with pressure. They appeared to be sinusoidal at low pressures, and were hashy, not repeat-ing nicely from pulse-to-pulse at higher pressures. The amplitude was strongly dependent upon the col-
lector-target configuration. When the beam was col-lected with a symmetrical target configuration, with most of the current either striking the target or the collector, the oscillations tended to be small. When the current was more equally divided the oscillations were stronger, and with either the target displaced or the beam steered off center, the oscillations were very much stronger (under some conditions as much as 20-30 db). When the beam was sharply deflected by a magnetic field near the collector, the oscillations were greatly re-duced in amplitude. Maintaining an electric field gradi-ent near the beam also reduced the oscillations by sev-eral orders of magnitude. Biasing the collector-target as-sembly positively usually reduced oscillation amplitude. With sealed-off tubes it was found that these effects
were virtually eliminated at vacuums of the order of 10-8 mm of Hg.
All of this evidence points to positive ions oscillating transversely in the space-charge field of the beam. The calculated orbit of a singly-charged ion with an atomic number in the 10's in the space-charge field of the beam has a frequency in the range observed. The period of such an orbit should vary inversely with the charge density (or beam current), as was observed. The time of build-up of oscillation checks roughly with the cal-culated ionization time based upon the beam current and collision cross section of common atoms. Any large change in the number of positive ions either by electric fields, or by pressure variation gave a corresponding change in the level of oscillation. The mechanism of the oscillation must involve sec-
ondary electrons from the collector, as any reduction in the number of secondaries getting back into the beam reduced the oscillation. It may be that the natural os-cillations of ions in the space-charge field are excited by secondary electrons from the collector region. The secondaries add to the space-charge field, which reacts on the positive ions trapped by the space-charge field, which changes the beam focusing, which in turn influ-ences the distribution of secondaries. As symmetry in the collector-beam relationship would accentuate the
effect, as was observed. Such oscillations would be critically dependent upon beam-focusing pressure and hence on almost any tube parameter, thus explaining the extreme variability of the oscillation. A more sophisti-cated explanation of plasma oscillations'2 has been given by Pierce.'
a There is a lot in the literature on plasma ion oscillations (:\ I ihran, /oc. cit., and Bohm, Burhop, Massey and Williams, /oc. cit.) but the usual gas discharge is quite different from our case and does not directly apply. Our pressures are much lower, we have no reason to expect equal numbers of positive and negative charges, or enough free charge to neutralize any applied field, nor are the fast moving electrons in the beam as free to move as electrons in gas discharge.

64 PROCEEDINGS OF THE IRE January
IONIZATION RELAXATION OSCILLATIONS
Another effect generally mixed with the one men-tioned above appeared with a fundamental component between 10 and 100 kc with harmonics at much higher frequencies. It also depended upon pressure, being strong and common with pressures approaching 10-5 mm of Hg, and weak and uncommon at pressures around 10-7 mm of Hg. Its frequency was critically dependent upon pressure, having a period of the order of the cal-culated time required for electron collisions to produce sufficient positive ions to neutralize the space charge of the electron beam. When the time function was ob-served by pulsing the beam, the oscillation usually started at full amplitude and was obviously a relaxa-tion oscillation, as shown in Fig. 3(d), with a period equal to the time required for normal beam transmission to be established. While this was a long time at very low pressures (the oscillations were sometimes audible), the amplitude became vanishingly small as the pressure was decreased. Sometimes the period described only appeared as a modulation of a higher-frequency com-ponent, as in Fig. 3(g), and it often appeared in com-bination with a higher frequency oscillation, as in Fig. 3(f). When the surrounding cylinder was biased negatively, the oscillations were greatly enchanced, and when the cylinder was positive, the oscillations were sharply reduced. These effects may be explained by the trapping of ions
in the space charge of the beam. The ion density pre-sumably builds up until a critical value is reached, probably the point where ions begin to spill over, in-fluencing the electron focusing near the gun, and thus displacing or sharply defocusing the beam. This quickly releases the trapped ions sufficiently so that at least some of them escape and have to be replaced by new ionization. The process then repeats, giving the relaxa-tion type of oscillation observed.
SECONDARY ELECTRON OSCILLATION
The third effect was almost certainly not an ion ef-fect. It was observed from 1 mc to 15 mc, was strongest with the lowest pressures, and sometimes would start within one or two microseconds of turning on the elec-tron beam, as indicated in Fig. 3(e). It depended strongly upon secondary electrons, and could be increased in frequency and amplitude by elevating the potential of the cylinder surrounding the electron beam, or eliminated by reducing the potential below that of the collector.
This oscillation is presumed to be caused by second-ary electrons oscillating longitudinally between the cathode and collector. Electrons released at the col-lector, returning with a few volts of energy, can in-fluence the focusing at the gun, and thus influence the primary electron beam, thereby changing the second-ary electron distribution. Slow secondaries have the proper velocity to explain the period of the observed oscillations. The variation of the velocity of secondaries with cyclinder potential would explain the electronic tuning, and elimination of secondaries, of course, would stop the oscillation. A cousin to the above is a rather uncommon, single-
frequency, low-amplitude oscillation at 2 or 3 mc, which disappeared with the slightest applied electrical gradi-ent. It is thought to be an oscillation of slow electrons between scallops in the electron beam.
CONCLUSION
The various beam modulation effects described usu-ally occur simultaneously with overlapping spectra, and they intermodulate, the higher-frequency compo-nents often showing sidebands due to the lower-fre-quency oscillations. All three are easily locked in with an ac voltage near the natural frequency of oscillation applied to any electrode. It is not surprising that the spectrum is erratic, since there are many modes of pos-sible oscillation and there are no really stable elements to control the frequencies; the pressure, electron emis-sion, gas constitution, and applied fields all being criti-cally involved. The happy conclusion is that the unwanted effects
are eliminated by simply adequately outgassing the parts and pumping the tube to a good vacuum, and in some cases deflecting the secondary electrons produced at the collector.
Unfortunately, proposed systems which would use ions to help beam focusing2,8,"." are impractical unless one can either show that the oscillations are not harmful in the particular application, or one can invent some way to make the pesky things stand still.
This work was done with the assistance of C. F. Chapman, and was stimulated by J. R. Pierce, M. E. Hines and many other colleagues at the Bell Telephone Laboratories.
u M. E. Hines, G. W. Hoffman, and J. A. Saloom, "Positive ion drainage in magnetically focused electron beams," Jour. Appi. Phys., vol. 26, pp. 1157-1162; September, 1955. u E. L. Ginzton and B. H. Wadia, "Positive-ion trapping in elec-
tron beams," PROC. IRE, vol. 42, pp. 1548-1553; December, 1954.

1956 PROCEEDINGS OF THE IRE 65
Negative Resistance Regions in the Collector Characteristics of the Point-Contact Transistor*
L. E. MILLERt
Summary—The negative resistance regions in the active portion of the point-contact collector characteristics are characterized in terms of three unique types of anomalies in the current multiplica-
tion properties of the device. While the interaction of the a anomalies and the associated circuitry result in a measuring circuit instability, the negative resistances are true device properties which are at-tributable to variations in the collection efficiency of the reverse biased collector junction.
INTRODUCTION
CERTA1N ANOMALIES in the output character-istics of various types of germanium point-con-tact transistors have been noted from time to time
during the testing of experimental and production units. These phenomena appear as negative resistance regions in the active portion of the characteristic. Their incidence varies widely from type to type and is essen-tially zero in a few types presently being manufactured.
It is convenient to examine these phenomena by dis-playing the collector V-I characteristics on an oscillo-scope using emitter current as the other independent parameter. This may be accomplished by applying a sinusoidal voltage to the collector and using the col-lector voltage and current as the ordinate and abscissa respectively. A convenient circuit for this purpose is shown in Fig. 1. In Fig. 2 is shown the typical appear-ance of a number of the more commonly-found types of negative resistance regions when displayed by the cir-cuit of Fig. 1. The general nature of these anomalies has been found to be highly stable. That is, the size and shape of the anomalies do not change appreciably with shelf life or with length of operation at maximum-rated power dissipation. For any given transistor, they appear only in a specified region and the device exhibits normal characteristics at any point outside this region. The anomalies usually appear well within the maximum-rated power dissipation limits of the device. Although individual types of anomalies occur most frequently in separate transistor types, a number of types may occur in the same transistor type.
The seriousness of this situation is obvious if one con-siders the effect of such a negative resistance region in the operating range of some oscillator and amplifier ap-plications.
Although the discussions to follow are confined to n type transistors, similar anomalies are observed in p type point-contact transistors. It appears that if ap-propriate changes in sign are made the same considera-tions will apply.
* Original manuscript received by the IRE, March 7, 1955; re-vised manuscript received July 7, 1955.
Bell Tel. Labs., Inc., Allentown, Pa.
RL
CURRENT
SCOPE CONNECTION
110
60rv ,› OPEN
R,«
VOLTAGE
Re CLOSE AS PHYSICALLY POSSIBLE
TO EMITTER .
L-111
Fig. 1—Transistor output characteristic sweeper.
(-)
Ie6.0
3.0
1.5
( a )
(-)
Cc) 0 (-)
.5
0 1-)
(-)
3.0 2.0
1.5
.5 ( b )
Ie6.0 3.0 1.5
( d )
O (-) (e) (f)
IC
5
O (-
Fig. 2—Some typical transistor negative resistance regions.
CHARACTERIZATION
The multiplicity of the various forms which these negative resistance regions exhibit makes it necessary to characterize them with some care. It has been con-venient to divide them into three major categories be-cause it has been found that there are at least three separate and distinct causes (which, however, may be

66 PROCEEDINGS OF THE IRE January
interdependent) for their occurrence in the output char-acteristics of the point-contact transistor. The other characteristics of the transistor provide a
means of partial characterization of the negative resist-ance regions. All of the transistors with anomalies in the output characteristics exhibit corresponding anom-alies in the feedback and transfer characteristics. How-ever, not all of them show a corresponding anomaly in the input characteristics.
It will also be useful to examine the small signal a ver-sus emitter current characteristic as a part of the char-acterization, since each type of collector characteristic anomaly has associated with it a unique a anomaly. This relation will be discussed in the subsequent sec-tions. The first category of anomaly may be identified as the kind which does not have its counterpart in the input characteristic of the transistor. This category is illustrated by Figs. 2(a) and 2(b) and will be termed a Type 1 negative resistance region.
This type of negative resistance region, which ap-pears as a sudden increase in collector current with a slight increase in collector voltage, is related to a region of operating instability resulting from an abnormally high value of current multiplication in this region. Fig. 3(a) illustrates the appearance of this type of negative resistance region as an oscillographic presentation and Fig. 3(b) depicts the corresponding family of current multiplication vs emitter current curves with collector voltage as the parameter. The peak in the a curve ap-pears at high emitter current for low collector voltage and moves through a maximum to low values of emitter current for increasing collector voltage. Those units which have this type of anomaly exhibit peak values of a, sometimes as high as 100, for collector voltages which correspond to the /c- Vc region where the anomaly oc-curs. The a characteristic has normal peak values of a for all other values of collector .'voltage.
VC
------ - -
o le( to 50 me
Fig. 3—Correlation between /c-Vc negative resistance regions and a vs emitter current anomalies.
Fig. 4 shows the low frequency tee network equivalent circuit of the transistor and the equation which is the criterion for stability' in this circuit. This equation,
r„. R'e R'e <1 —
R0' R'b R'c
1 R. M. Ryder and R. J. Kircher, "Some circuit aspects of the transistor," Bell Sys. Tech. Jour., vol. 28, pp. 367-400; July, 1949.
(1)
where the primed R's include both internal and external resistive elements, predicts that the transistor will ex-hibit a negative resistance region similar to the solid curve in Fig. 4 whenever the inequality does not hold. A normal curve denoted by the dotted line results for the other alternative.
-
vc
(—)
< • k, • rn, rb rc 4- re rc
Fig. 4—Negative resistance output characteristic.
Since the quantity on the left of ( 1) is related to a by
rb Yns a = — (for small rb)
fc+ b re
— (for small external collector resistance) (2) R'c
and the quantities on the right of ( 1) remain relatively constant for any given circuit, the transistor will ex-hibit a negative resistance region whenever a exceeds a certain value which will be determined by the relative magnitude of the collector resistance and the collector load. Therefore, a high, narrow, a peak, which is ex-tremely variable with collector voltage (such as shown on Fig. 3(b)) results in a localized instability as the col-lector is swept through the range of voltages at which it occurs. The occurrence and size of the anomaly and whether circuit changes will affect it may be predicted from the height of the peak, the area under it, and the values of collector voltage for which it occurs. The a emitter current characteristic provides a con-
venient method for additional characterization of the negative resistance regions. The step-back in collector current with an incremental increase in collector voltage such as illustrated in Figs. 2(c) and 2(d) is related to a different type of anomaly in the a emitter current curves and will be termed a Type 2 anomaly. In these cases a secondary peak appears in the a curve at rela-tively low collector voltages and moves to higher values of emitter current with increasing collector voltage. This type of negative resistance region is shown on Fig. 5(a). On Fig. 5(b) is the associated a emitter current character-istic. The size of this secondary a peak with respect to the primary peak and its voltage sensitivity completely determines the characteristics of this type of negative resistance region in the following manner: The collector current at any particular collector volt-
age can be represented as
/e = /.0(Ve) — aI. (3)
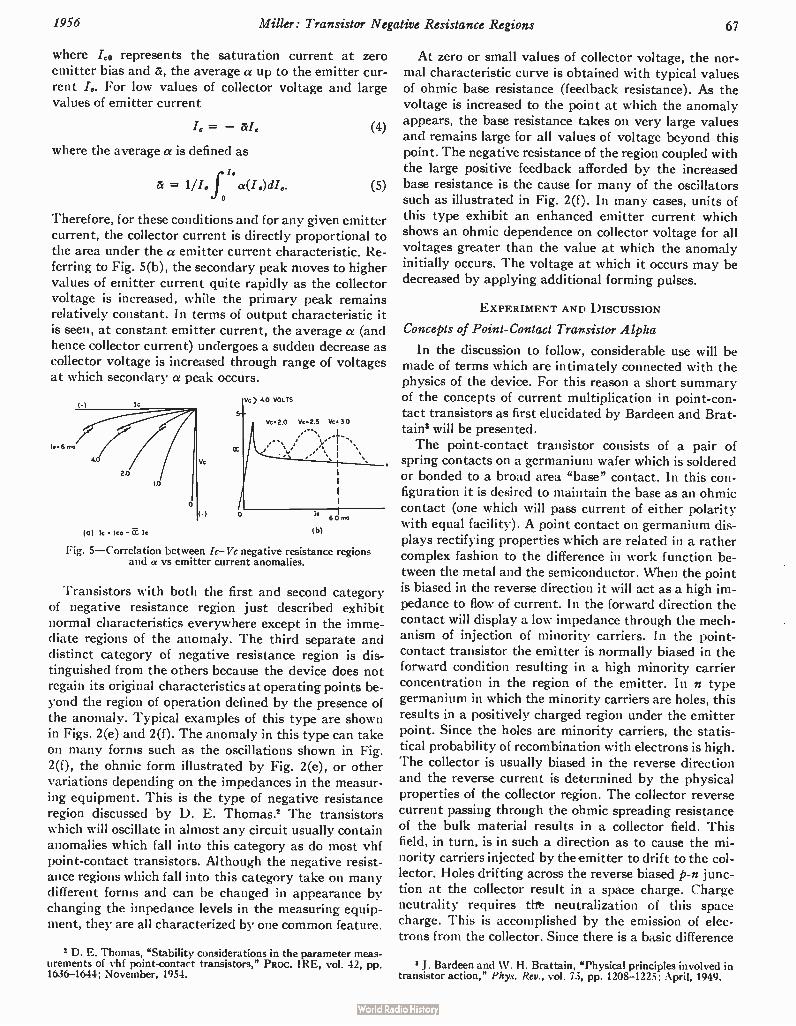
1956 Miller: Transistor Negative Resistance Regions 67
where /co represents the saturation current at zero emitter bias and a, the average a up to the emitter cur-rent I.. For low values of collector voltage and large values of emitter current
/c = —
where the average a is defined as
= 1/I. f a(I.)dIe. o
(4)
(5)
Therefore, for these conditions and for any given emitter current, the collector current is directly proportional to the area under the a emitter current characteristic. Re-ferring to Fig. 5(b), the secondary peak moves to higher values of emitter current quite rapidly as the collector voltage is increased, while the primary peak remains relatively constant. In terms of output characteristic it is seen, at constant emitter current, the average a (and hence collector current) undergoes a sudden decrease as collector voltage is increased through range of voltages at which secondary a peak occurs.
(-1 le
o
Vc
siVe > 4.0 VOLTS
Ve• 2.0 Vc• 2.5 Ve • 30
6 0 mo
(0) le • lee — le (0)
Fig. 5—Correlation between /c— Vc negative resistance regions and a vs emitter current anomalies.
Transistors with both the first and second category of negative resistance region just described exhibit normal characteristics everywhere except in the imme-diate regions of the anomaly. The third separate and distinct category of negative resistance region is dis-tinguished from the others because the device does not regain its original characteristics at operating points be-yond the region of operation defined by the presence of the anomaly. Typical examples of this type are shown in Figs. 2(e) and 2(f). The anomaly in this type can take on many forms such as the oscillations shown in Fig. 2(f), the ohmic form illustrated by Fig. 2(e), or other variations depending on the impedances in the measur-ing equipment. This is the type of negative resistance region discussed by D. E. Thomas.2 The transistors which will oscillate in almost any circuit usually contain anomalies which fall into this category as do most vhf point-contact transistors. Although the negative resist-ance regions which fall into this category take on many different forms and can be changed in appearance by changing the impedance levels in the measuring equip-ment, they are all characterized by one common feature.
2 D. E. Thomas, "Stability considerations in the parameter meas-urements of vhf point-contact transistors," PROC. IRE, vol. 42, pp. 1636-1644; November, 1954.
At zero or small values of collector voltage, the nor-mal characteristic curve is obtained with typical values of ohmic base resistance (feedback resistance). As the voltage is increased to the point at which the anomaly appears, the base resistance takes on very large values and remains large for all values of voltage beyond this point. The negative resistance of the region coupled with the large positive feedback afforded by the increased base resistance is the cause for many of the oscillators such as illustrated in Fig. 2(f). In many cases, units of this type exhibit an enhanced emitter current which shows an ohmic dependence on collector voltage for all voltages greater than the value at which the anomaly initially occurs. The voltage at which it occurs may be decreased by applying additional forming pulses.
EXPERIMENT AND DISCUSSION
Concepts of Point- Contact Transistor Alpha
In the discussion to follow, considerable use will be made of terms which are intimately connected with the physics of the device. For this reason a short summary of the concepts of current multiplication in point-con-tact transistors as first elucidated by Bardeen and Brat-taina will be presented. The point-contact transistor consists of a pair of
spring contacts on a germanium wafer which is soldered or bonded to a broad area "base" contact. In this con-figuration it is desired to maintain the base as an ohmic contact (one which will pass current of either polarity with equal facility). A point contact on germanium dis-plays rectifying properties which are related in a rather complex fashion to the difference in work function be-tween the metal and the semiconductor. When the point is biased in the reverse direction it will act as a high im-pedance to flow of current. In the forward direction the contact will display a low impedance through the mech-anism of injection of minority carriers. In the point-contact transistor the emitter is normally biased in the forward condition resulting in a high minority carrier concentration in the region of the emitter. In n type germanium in which the minority carriers are holes, this results in a positively charged region under the emitter point. Since the holes are minority carriers, the statis-tical probability of recombination with electrons is high. The collector is usually biased in the reverse direction and the reverse current is determined by the physical properties of the collector region. The collector reverse current passing through the ohmic spreading resistance of the bulk material results in a collector field. This field, in turn, is in such a direction as to cause the mi-nority carriers injected by the emitter to drift to the col-lector. Holes drifting across the reverse biased p-n junc-tion at the collector result in a space charge. Charge neutrality requires titt neutralization of this space charge. This is accomplished by the emission of elec-trons from the collector. Since there is a basic difference
3 J. Bardeen and W. H. Brattain, "Physical principles involved in transistor action," Phys. Rev., vol. 75, pp. 1208-1225; April, 1949.
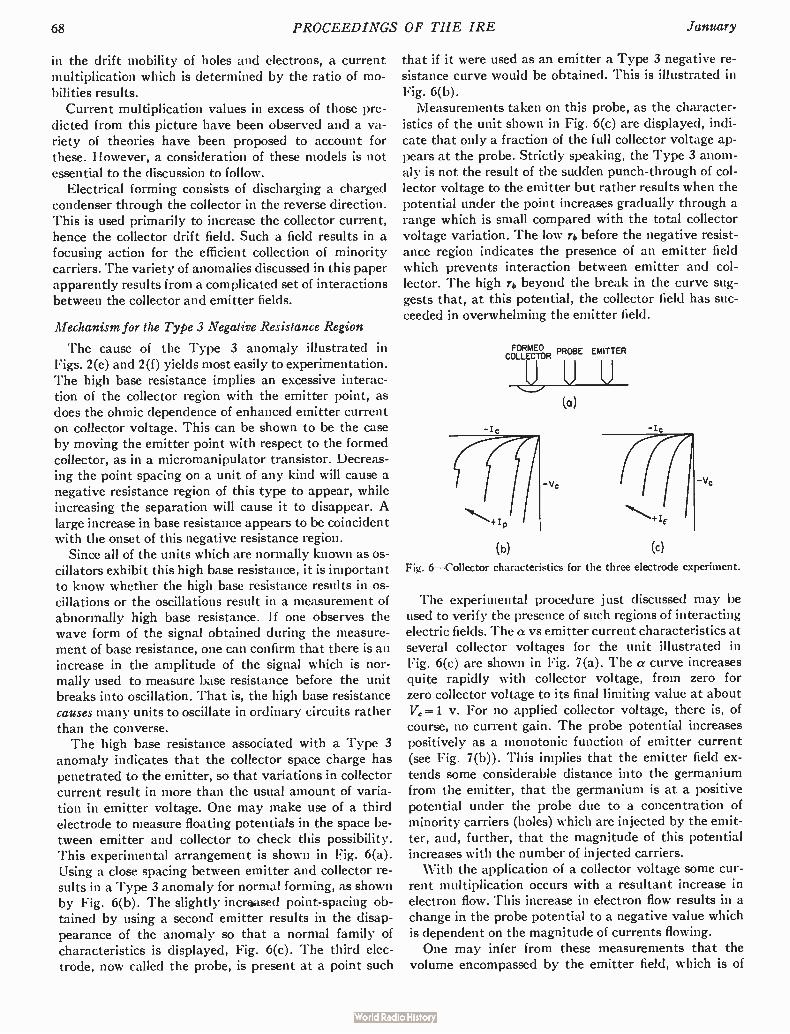
68 PROCEEDINGS OF THE IRE January
in the drift mobility of holes and electrons, a current multiplication which is determined by the ratio of mo-bilities results.
Current multiplication values in excess of those pre-dicted from this picture have been observed and a va-riety of theories have been proposed to account for these. However, a consideration of these models is not essential to the discussion to follow.
Electrical forming consists of discharging a charged condenser through the collector in the reverse direction. This is used primarily to increase the collector current, hence the collector drift field. Such a field results in a focusing action for the efficient collection of minority carriers. The variety of anomalies discussed in this paper apparently results from a complicated set of interactions between the collector and emitter fields.
Mechanism for the Type 3 Negative Resistance Region
The cause of the Type 3 anomaly illustrated in Figs. 2(e) and 2(f) yields most easily to experimentation. The high base resistance implies an excessive interac-tion of the collector region with the emitter point, as does the ohmic dependence of enhanced emitter current on collector voltage. This can be shown to be the case by moving the emitter point with respect to the formed collector, as in a micromanipulator transistor. Decreas-ing the point spacing on a unit of any kind will cause a negative resistance region of this type to appear, while increasing the separation will cause it to disappear. A large increase in base resistance appears to be coincident with the onset of this negative resistance region.
Since all of the units which are normally known as os-cillators exhibit this high base resistance, it is important to know whether the high base resistance results in os-cillations or the oscillations result in a measurement of abnormally high base resistance. If one observes the wave form of the signal obtained during the measure-ment of base resistance, one can confirm that there is an increase in the amplitude of the signal which is nor-mally used to measure base resistance before the unit breaks into oscillation. That is, the high base resistance causes many units to oscillate in ordinary circuits rather than the converse. The high base resistance associated with a Type 3
anomaly indicates that the collector space charge has penetrated to the emitter, so that variations in collector current result in more than the usual amount of varia-tion in emitter voltage. One may make use of a third electrode to measure floating potentials in the space be-tween emitter and collector to check this possibility. This experimental arrangement is shown in Fig. 6(a). Using a close spacing between emitter and collector re-sults in a Type 3 anomaly for normal forming, as shown by Fig. 6(b). The slightly increased point-spacing ob-tained by using a second emitter results in the disap-pearance of the anomaly so that a normal family of characteristics is displayed, Fig. 6(c). The third elec-trode, now called the probe, is present at a point such
(b)
that if it were used as an emitter a Type 3 negative re-sistance curve would be obtained. This is illustrated in Fig. 6(b). Measurements taken on this probe, as the character-
istics of the unit shown in Fig. 6(c) are displayed, indi-cate that only a fraction of the full collector voltage ap-pears at the probe. Strictly speaking, the Type 3 anom-aly is not the result of the sudden punch-through of col-lector voltage to the emitter but rather results when the potential under the point increases gradually through a range which is small compared with the total collector voltage variation. The low rb before the negative resist-ance region indicates the presence of an emitter field which prevents interaction between emitter and col-lector. The high rb beyond the break in the curve sug-gests that, at this potential, the collector field has suc-ceeded in overwhelming the emitter field.
FORMED PROBE EMITTER COLLECTOR
•/
(a)
(c)
v,
Fig. 6—Collector characteristics for the three electrode experiment.
The experimental procedure just discussed may be used to verify the presence of such regions of interacting electric fields. The a vs emitter current characteristics at several collector voltages for the unit illustrated in Fig. 6(c) are shown in Fig. 7(a). The a curve increases quite rapidly with collector voltage, from zero for zero collector voltage to its final limiting value at about = 1 v. For no applied collector voltage, there is, of
course, no current gain. The probe potential increases positively as a monotonic function of emitter current (see Fig. 7(b)). This implies that the emitter field ex-tends some considerable distance into the germanium from the emitter, that the germanium is at a positive potential under the probe due to a concentration of minority carriers (holes) which are injected by the emit-ter, and, further, that the magnitude of this potential increases with the number of injected carriers. With the application of a collector voltage some cur-
rent multiplication occurs with a resultant increase in electron flow. This increase in electron flow results in a change in the probe potential to a negative value which is dependent on the magnitude of currents flowing. One may infer from these measurements that the
volume encompassed by the emitter field, which is of

1956 Miller: Transistor Negative Resistance Regions 69
opposite sign to the collector field, is sharply dependent on the currents flowing through the region. This means that the distance over which no collector drift field ex-ists is extremely variable and dependent on the operat-ing point of the device.
025
PROBE
VOLTAGE
05
(a)
(b)
Vc 1.0 VOLTS AND ABOVE
•-• Ic
V, 0 VOLTS
01
025
05
1.0 VOLT
Fig. 7—Probe potential as a function of ce characteristics.
Since, in the absence of a drift field, the holes injected by the emitter do tend to move by diffusion alone, re-combination processes may become significant. Any sig-nificant recombination results in a change in transport efficiency which in turn affects a. The Type 3 anomaly almost always has associated with it a region of en-hanced a. It is suggested, therefore, that the collector field under the emitter is sufficient, at the voltage at which the Type 3 anomaly occurs, to decrease the size or eliminate completely the positively-charged region under the emitter point where the carriers move by dif-fusion. There are a number of other convincing facts to support this conclusion:
1. The frequency cutoff of a in all regions before the negative resistance region is relatively low and agrees with predictions based on the conductivity modulation model." At all points beyond the negative resistance re-gion the frequency cutoff takes on larger values which coincide closely with calculations based on the drift model.'
2. All hf units, whether they are formed as transmission or switching types, exhibit Type 3 anomalies in some portion of their characteristics.
3. All those hf units which will oscillate in any given circuit, unless special precautions are taken, fall into
' J. E. Thomas, unpublished work. 6 W. Shockley, "Electrons and Holes in Semiconductors," D. Van
Nostrand Co., New York, N. Y., pp. 106-108; 1950.
(a)
the category of the Type 3 anomaly. The oscillations are the result of the negative resistance and the accompany-ing hf response which tends to sustain oscillation.
It appears that the dependence of the frequency re-sponse of any given point-contact unit on electrical forming is based on the necessity of increasing the col-lector field under the emitter to such an extent that the region where the carriers move by diffusion is effectively reduced. The Type 3 anomaly occurs at the biases at which a positively-charged region under the emitter no longer inhibits the drift of holes from emitter to collector. Since at this point the interaction between emitter and collector is increased, causing the base resistance to in-crease to large values, the device loses part of its useful-ness as a small signal amplifier. The conclusion which one is forced to draw is that
there will be an upper frequency limit for any given point-contact structure which will be imposed by the maximum tolerable base resistance, or the negative resistance region, which is a manifestation of this high base resistance.
MECHANISM FOR THE TYPE 2 NEGATIVE RESISTANCE REGION
The explanation for the Type 2 anomaly follows from the discussion of the Type 3. A transistor can have both a Type 2 and a Type 3 anomaly as shown on Fig. 8(a), or it can have a Type 2 which changes into a Type 3 as the biases are changed as illustrated in Fig. 8(b). Often a Type 2 will change to a Type 3 as one observes the characteristics on a curve tracer. This occurs because the sweep measurements are being carried out at biases corresponding to the transition point shown on Fig. 8(b).
-lc
+le
(b) Fig. 8—Collector characteristics containing Types 2 and 3 anomalies.
Both types exhibit high base resistances and both have peculiar peaks in the a vs emitter current characteristic. The difference between the two appears to be one of degree rather than kind, the Type 2 representing a Type 3 which recovers its original characteristics of a and low base resistance. If one measures the base re-sistance of a unit containing a Type 2 anomaly while sweeping collector voltage through the range at which the anomaly occurs, a high value is obtained. It resumes the normal low value at biases beyond this point. This increase in base resistance may be associated with a

70 PROCEEDINGS OF THE IRE January
decrease in the size of the positively-charged region un-der the emitter. This, in turn, results in a more efficient transport factor with the consequent enhanced a. This hypothesis may be checked by repeating the
three-probe experiment described in the previous sec-tion. One may form a transistor such that it contains both Type 2 and Type 3 negative resistance regions. Making use of the wider point-spacing afforded by the third electrode results in the disappearance of the Type 3 but not the Type 2 anomaly. These results are illus-trated in Fig. 9(a), (b), and (c). Fig. 10(a) shows the a emitter current characteristic which is associated with the output characteristics shown in Fig. 9(c). The secondary a peak appears at relatively low collector voltage and moves in a characteristic fashion to higher
emitter currents for increasing collector voltage. The probe potentials for collector voltages which correspond to those for the a curves shown are plotted in Fig. 10(b).
COLLECTOR PROBE EMITTER
\./
(a)
-vc -vc
Fig. 9—Collector characteristics for the three-electrode experiment.
These curves show that the potential between the emit-ter and collector goes to a more negative value as the unit is swept through the region where the a peak occurs and then returns to a more or less "typical" value. This change in probe potential appears to reflect the chang-ing size of the region of positive charge under the emitter point. In the region where the secondary a peak occurs this volume contracts to such an extent that the trans-port efficiency increases with a resultant increase of a. As the emitter current increases still further the in-creased hole density in the region under the point builds up the size of the region of positive charge result-ing in the drop in a. Whether a Type 2 or 3 anomaly will occur depends on
the magnitude and rate of change of collector field with respect to changing bias. If the collector field is expand-ing quite rapidly as the collector voltage is increasing, one might expect a large amount of interaction between the negative collector field and the positive emitter field under the emitter point. This in turn would result in a Type 2 anomaly. This accounts for the fact that the Type 2 anomaly occurs at relatively low voltages while
a is still changing quite rapidly with collector voltage. The Type 3 anomaly, however, almost always occurs at higher voltages than the Type 2. At this voltage, the a has reached its final limiting values.
Finally, one can confirm that this change in drift space potential results in the enhanced a rather than the con-verse. A unit which is formed so that it does not exhibit a secondary a peak can be made to exhibit one by the application of a positive potential to the probe electrode. It is presumed that the resultant increased hole con-centration in the drift space effectively changes the size of the positively-charged region under the emitter re-sulting in changes in transport efficiency.
04
(a)
PROBE 0 VOLTAGE
100 m v
Vc = 2.0 VOLTS AND ABOVE
0.25
Vc 0 VOLTS
0.1
025
(b)
05
.0
te
2.0 VOLTS
Fig. 10—Probe potential as a function of a characteristics.
INVESTIGATION OF THE TYPE 1 NEGATIVE RESISTANCE REGION
In the characterization of the negative resistance regions it was pointed out that the Type 1 anomaly does not have its counterpart in the input characteristic of the transistor. This suggests that the emitter is not basically involved in the formation of this type of anom-aly. This can be verified experimentally by forming a transistor containing a Type 1 anomaly and then re-moving the emitter point. Minority carriers may be supplied by illuminating the germanium surface. If one sweeps out the collector characteristics using light intensity as the parameter, the same negative resistance region in the characteristics is displayed as though a metallic emitter point were used. One may also move the collector point about within the limitations of the formed region or replace the original point used to form the transistor with another without significantly affecting the appearance of the negative resistance region. These facts appear to indicate that the cause of

1956 Miller: Transistor Negative Resistance Regions 71
the negative resistance region is attributable to some anomalous behavior in or near the formed region. This is also suggested by the fact that the anomalies can ap-pear or disappear during a particular forming schedule. All units containing Type 1 negative resistance regions. however, are characterized by reverse currents which are lower than those for the same type of unit contain-ing no anomaly. There is no direct physical explanation for this anomaly but statistical evidence will be pre-sented to suggest that its presence is related to the donor concentration in the formed region of the collector. Hann' has observed that the reverse current for
formed point-contact collectors is dependent on the donor concentration in the collector wire. The data summarized in Fig. 11 represent the results of a care-fully designed experiment in which experimental tran-sistors were made utilizing a series of phosphor bronze wires with increasing phosphorous concentration. These
LEGEND Ic 0,-10/
--x-- PERCENT OF UNITS WITH TYPE 1 ANOMALIES 2.0 100
.05 .1 .5 I 0 2.0
PERCENT PHOSPHOROUS CONCENTRATION
Fig. 11—Variation in transistor parameters with point wire composition.
5.0
75
0 50 cr
a.
25
units were formed to the same large signal forming ob-jective of average a. The figure shows that the fre-quency of occurrence of the Type 1 anomaly, other de-sign variables held constant, is dependent on the donor concentration in the collector wire. More accurately, since matter is transferred from collector to germanium during forming,7 the occurrence of a Type 1 anomaly is dependent on the amount of donor in the formed region as a result of the forming sequence. The graph also shows that a low Lo distribution is probably incompatible with an anomaly free product.
Since the Type 1 anomaly can appear or disappear during any particular forming sequence, and since the absolute amount of donor in the formed regions cannot decrease significantly, one must presume that the rela-tive amount of donor may increase or decrease during the forming sequence. This implies that the transfer and distribution of both acceptor and donor impurities in the germanium during forming is of importance in
8 W. G. Pfann, "Significance of composition of contact-point in rectifying junctions on germanium," Phys. Rev., vol. 81, p. 882; March, 1951.
7 L. B. Valdes, "Transistor forming effects in N-type germanium," PROC. IRE, vol. 40, pp. 445-448; April, 1952.
the determination of the properties of the formed col-lector junction. Copper has been suggested as one of the possible acceptors involved in the forming phenom-enon.° Thermally-induced acceptors have also been suggested.° Both may be involved since Valdes'° reports as high as 102° atoms of Cu/cc have been measured by radioactive techniques in a heavily formed region and has observed damage to the germanium surface in the vicinity of a formed region. In either case, the diffusion coefficients of donor and acceptor" are sufficiently dif-ferent so that we might expect forming efrciency to be time dependent. Table I shows that /a (the reverse cur-
TABLE I
Parameter 0.10 Per cent Phosphorous
Phosphor Bronze
0.9 Per cent Phosphorous
Phosphor Bronze
Time Constant L, (0, — 10) (Average) Percent of Units Contain-
ing Type 1 Anomalies
250p sec 5p sec 0.72 ma 1.00 ma
42 8 per cent per cent
250µ sec Sc sec 0.82 ma 1.10 ma
33 0 per cent per cent
rent of the collector junction) and the a characteristics of the formed collector may be controlled by varying the time constant of the condenser discharge forming pulse. These data were obtained by empirically adjust-ing the amplitudes of the long and short pulses so that each unit could be formed to the same large signal ob-jectives with one forming pulse. Each sub-group repre-sents approximately 25 units. The table shows that one may reduce the incidence of a anomalies by increasing the point wire donor concentration, as was indicated in Fig. 11, but an even more effective way of achieving the same result is to reduce the time constant of the forming pulse. In any event, however, a higher /co is associated with an anomaly free product. The potential measuring techniques described in the
two previous sections were applied also to the study of the Type 1 anomaly. Very pronounced changes in drift potential are observed in the bias regions corresponding to the presence of the high a peaks, and application of potentials to the probe on units containing such anoma-lies enables one to change the properties of the a peak significantly. One may summarize the implications of these experi-
ments as follows:
1. The Type 1 anomaly is a phenomenon which is most closely associated with the properties of the collector junction, appearing most often when reverse currents are low, in turn a property of lightly formed units.
2. The forming process involves the transfer of acceptor and donor atoms into the bulk of the germanium and it
Valdes, ibid. 9 R. C. Longini, "Electric forming of n-germanium transistors
using donor alloy contacts," Phys. Rev., vol. 84, p. 1254, December, 1951.
10 Valdes, op. cit. 11 C. S. Fuller, " Diffusion of donor and acceptor elements into
germanium," Phys. Rev., vol. 86, pp. 136-137; April, 1952.

72 PROCEEDINGS OF THE IRE January
is the distribution of these impurities at or near the collector junction which determines its properties; a rel-atively high donor concentration results in a high re-verse current and normal a characteristics, while a rela-tively low donor concentration results in low reverse cur-rents and anomalous a characteristics.
3. Significant changes in drift potential observed when the transistor is operated at biases in the region of the Type 1 anomaly suggest that this anomaly is a result of variations in collection efficiency of the formed collector point at different operating biases.
CONCLUSIONS
The negative resistance regions in point-contact col-lector characteristics which appear as a measuring cir-cuit instability are the combined result of device proper-ties and the associated circuitry. While the appearance of each type of negative resistance region may vary with the termination impedances of the measuring equipment, the anomalies are the result of true negative resistance regions. Negative resistance regions are pos-sible whenever the current gain of a device is greater than one. Each of the three general types of point-con-tact negative resistance regions has associated with it a unique anomaly in the current gain-emitter current
characteristics which features pronounced variations in current multiplication over relatively short ranges of operating bias. The observed negative resistances are directly attributable to such changes in current gain. The cause of each of the a anomalies in turn is trace-
able to variations in the collector drift potential which exists in the bulk of the germanium between emitter and collector. The additivity of the fields from the re-verse biased collector junction and the forward biased emitter junction provides a continuously varying field (with respect to changing dc bias) through which the minority carriers injected at the emitter are transported to the collector. The efficiency of multiplication (a), therefore, is a function of the relative amount of diffu-sion (near the emitter) and drift, (near the collector) which the injected minority carrier must undergo in its motion from emitter to collector.
Other device properties such as base resistance and the frequency cutoff of a are also related to such varia-tions in drift potential.
ACKNOWLEDGMENT
The author is indebted to N. J. Herbert for many helpful suggestions and constant encouragement, and has profited greatly from many discussions with J. H. Forster.
The Dependence of Transistor Parameters on the Distribution of Base Layer Resistivity*
J. L. MOLLt, ASSOCIATE MEMBER, IRE, AND I. M . ROSSt
Summary—This paper presents a method of analyzing transistor behavior for any base-layer impurity distribution. In particular,
expressions are derived for emitter efficiency 7, transverse sheet resistance R, transit time r, and frequency cut-off fa. The parameters -y and R are functions only of the total number of impurities in the
base layer. The analysis is used to derive -y, R, r and f,,, for four differ-ent distributions—uniform, linear, exponential, and complementary error function. For each of these distributions a transistor base-layer design equivalent in R and f,,, is obtained. Comparison shows that for equivalent parameters the nonuniform distributions permit the use
of wider base layers, but require greater maximum impurity concen-trations and must be operated at high current densities.
INTRODUCTION
TI-1 E DEPENDENCE of transistor parameters on geometry and conducting characteristics of emit-
ter, base, and collector has been discussed for the case of minority carrier transport across the base layer
* Original manuscript received by the IRE, July 22, 1955; revised manuscript received September 20, 1955.
t Bell Telephone Labs. Inc., Murray Hill, N. J.
by pure diffusion.' ,2 This case is realized physically by having a base layer of uniform resistivity throughout. The dependence of frequency response on base layer thickness for transistors with uniform base layer resis-tivity is well known. High frequencies require thin base layers, making the fabrication of high frequency tran-sistors difficult.
If the resistivity varies across the base layer from emitter to collector the change in equilibrium majority carrier concentration results in "built in" fields which may aid or retard the flow of minority carriers across the base layer. In particular, if the donor concentration (for p-n-p) decreases from the emitter to collector the resultant fields will aid the flow of minority carriers across the base layer with a resultant decrease in transit
W. Shockley, M. Sparks, and G. K. Teal, "P-n junction transis-tors," Phys. Rev., vol. 83, pp. 151-162; July, 1951.
2 J. M. Early, "PNIP and NPIN junction transistor triodes," Bell Sys. Tech. Jour., vol. 33, pp. 517-533; May, 1954.

1956 Moll and Ross: Transistor Base Layer Resistivity 73
time and increase in the frequency cut-off of the trans-port factor as compared to the case of pure diffusion. The enhancement of frequency cut-off by an ap-
propriate resistivity gradient eases the fabrication problem somewhat, and a quantitative calculation of the effects of the resistivity gradient on frequency and transit time as well as the effects on other transistor parameters was desired.
In addition to effects on the frequency behavior of the transport factor, the distribution of base layer im-purities can effect the behavior with frequency of the emitter efficiency, 7. The total number of impurities as well as geometry determine the low frequency emit-ter efficiency and the base resistance rb. Some of the effects of an exponential distribution of impurities have been discussed. 8,4 This paper presents a method of an-alyzing transistor behavior for any base layer impurity distribution. The analysis is used to give a simple com-
parison of the properties resulting from four different distributions.
THEORY FOR A GENERAL DISTRIBUTION
Assumptions
a) A one-dimensional geometry will be analyzed. b) The base layer thickness is large compared to a
mean free path for charge carriers. Hence the motion of carriers can be represented by a diffusion plus drift equation.
e) The mobility of carriers is constant. This is not true for impurity densities greater than about 1016/cc, but the assumption of constancy does not radically alter the final results.
d) The density of "minority" carriers is small com-pared to the density of "majority" carriers; i.e., no con-ductivity modulation effects. Also the density of "majority" carriers is small enough that Maxwell-Boltzman statistics apply; i.e., nondegenerate semi-conductors.
e) Recombination in the base layer is negligible. This assumption implies that the dc transport factor e is unity. Hence the component of current carried by minority carriers is constant (in the dc case) across the base layer. Actually, this is not an unduly restrictive assumption since the effect of a finite minority carrier lifetime in the base layer can be calculated from the relation
(1)
where
r = average minority carrier transit time r„= minority carrier lifetime in the base layer = fraction of emitted holes (for p-n-p) that reach the collector.
3 H. Kromer, "Der drifttransistor,"Naturwiss., vol. 40, pp. 578-579 ; November, 1953.
4 H. Kromer, "Zur theorie des diffusions- und des drifttransistors" Arc'. deck. übertragung, vol. 8, pp. 223-228, 363-369, 499-504; 1954.
Basic Equations
Fig. 1 illustrates the general configuration that will be considered. The theory will be obtained for an n type base region. The zero of the spatial coordinate x will be taken at
the emitter-base junction and it will be assumed that the holes are collected at x=w. There may be space-charge widening effects on the base layer in some of the configurations that will be considered. In such cases w will vary with collector voltage but these effects will be neglected in this analysis.
Let N(x)— excess donor density in the base layer (see Fig. 1).
1
1
1
1
DISTANCE FROM EMITTER JUNCTION, X
EMITTER REGION
BASE REGION
X*IN
1 1 1 1
COLLECTOR REGION
Fig. 1—General distribution of donors and acceptors in structures to be analyzed.
Then if N>>ni it is approximately true" that
n _ 0)1kr (2)
where n = electron density, ni the intrinsic value of electron density. ct• is the Fermi potential and tfr is the electrostatic potential.
From (2) we obtain
di/ kT 1 d.N. E= — — = — —
dx q .V dx
= "built in field."
Also the hole current density I„ is given by7
dp r „ = qiippE — qD„— •
dx
(3)
(4)
Where I„ is the hole current, z,, and D„ are mobility and diffusion constants for holes in n type material, and p is hole density. Substituting (3) into (4) we obtain
rp dN dpi
P= gDP L dx dxj • (5)
The steady state solution to (5) with the boundary con-dition that p= 0 at x = w is
5 The condition /V>>ni limits the accuracy of calculation to n > 5 X 10° for Ge at room temperature.
W. Shockley, "Electrons and Holes in Semiconductors," New York, D. Van Nostrand, 1950, p. 304.
7 Ibid., p. 299.

74 PROCEEDINGS OF THE IRE January
1
qD, X(x) f P = Ndx. (6)
The hole concentration, po, in the base layer adjacent to the emitter junction can be obtained from (6), and is of interest since this quantity is related to the emitter voltage by the boundary condition8
r,
Po = pooeqVgikT (7)
where No= thermal equilibrium value for hole concen-tration in the base layer at the emitter junction and Vs =emitter voltage. The hole concentration po is
qD,No f o Po — Ndx. (8)
where No is defined as the excess donor concentration
in the base layer adjacent to the emitter junction.
Derivation of Fundamental Transistor Parameters
The transverse sheet resistance R of the base layer is given as the reciprocal of the integrated transverse con-ductance9 and is very nearly
1 —R = i.inJ Ndx (9)
where R = resistance/square and j.t„= electron mobility. For any fixed geometry, the ohmic base resistance is directly proportional to R. Thus, for circular geometry the ohmic base resistance for the active region between emitter and collector'0 is
1 r = = (10)
8/r 87rqµ„Nw
for uniform base layer. The dc emitter efficiency is defined as
where I,, and I„ are the electron and hole currents re-spectively crossing the emitter junction. The electron current I„ is" (for uniform resistivity in
the emitter)
qD„ In
Ln
2
(egVE/kT _ Po
1) (12)
where Po is the acceptor concentration in the emitter region, L. is the diffusion length for electrons in the emitter" and D„ is the diffusion constant for electrons
in the emitter region. From (7), (8) and (9) we obtain
8 Ibid., p. 312. 9 Ibid., p. 16. '° Early, op. cit. " Shockley, op. cit. p. 314. 12 For emitter regions less than a diffusion distance thick,
must be replaced by a distance dependent on the emitter geometry and recombination velocity at the emitter surfaces.
/*„ = q2DienRni2eqvgikr. (13)
For VE>>kT/q (12) and (13) give
(14) 1f —
R+ 1
qmpL.Po
This expression neglects possible differences in mobility between emitter and base regions but does give the general form of the dependence of 7 on the geometrical parameters. Note that the second term in the denom-inator of ( 14), which arises from electron current into the emitter, could be written as the transverse sheet resistance of a slice of the emitter which is one electron diffusion length thick. Eq. (14) shows that the dc emit-ter efficiency is a function only of the sheet resistance of the base layer and the conducting properties of the emitter region. Also, for a given emitter region, 7 ap-proaches 1 as R is increased. This places a lower limit on R consistent with high dc ^y. This requirement con-flicts with the general objective of low ohmic base re-
sistance. The average transit time for holes, r, is given by
f w dx T =
V
(15)
where u is the average velocity at position x. The veloc-ity is related to the current I„ by the relation
ip = Pqte• (16)
A substitution for p from (6) gives
hence,
1 1 r. D,N(x)
N(x)dx, (17)
r = r 1 r, fo LD„N(x) N(x)dx]dx. (18)
The alpha of a transistor, defined as the ratio of change in collector current to corresponding change in emitter current can be written as the product of •y, (3, and a* where 7 is the emitter efficiency, fi is the trans-port factor and a* is the ratio of total collector current to minority carrier current at the collector junction. For the purposes of this paper, we assume that a* is unity. Both 7 and 0 decrease in magnitude as frequency is increased so that the frequency cut-off of alpha is determined by a combination of the frequency behavior of 7 and 0. We will consider the frequency cut-off of 7 and p separately.
In the transistor of Fig. 1, a drift-field exists in the base layer which forces the holes in the base layer to drift towards the collector junction. In this case, as dis-tinguished from that of the uniform base layer, the fre-quency cut-off of the transport factor is not proportional

1956 Moll and Ross: Transistor Base Layer Resistivity 75
to the reciprocal of transit time. hi fact we will have a phase shift in i3 without the corresponding fall off in amplitude. A general relation between transit time r and fre-
quency cut-off can be obtained from the following con-sideration: The frequency cut-off of (defined as the frequency where the magnitude of e has fallen to 1/./2 of its low frequency value) is proportional to the fre-quency with which infinitely narrow spikes of holes can be emitted at the emitter and still be distinguishable when they have reached the collector. The spike of cur-rent will start as a very narrow bunch of holes which simultaneously drifts and diffuses towards the col-lector." To a first order, the effec..ts of drift and diffusion
can be considered separately so that we can say that in time r (transit time) the bunch has spread in space to a width of
d VD,r. (19)
If we take d as the closest spacing of the bunches that are still distinguishable, the spacing in time of the spikes must then be
or
-VD,1-312
(20)
(21)
fo = frequency cut-off of 0.
The values of transit time and frequency cut-off for the uniform case have been calculated." From these results (25), (26) the relationship of (21) can be reduced to,
1
ir-VD„ (2r)3/2 (22)
The nature of the assumptions used in obtaining (22) limits its accuracy to within about 20 or 30 per cent. However, the direction of error should be the same for all distributions.
SPECIFIC DISTRIBUTIONS
The quantities R, r, and fo will be discussed for four specific donor distributions in the base layer. The excess donor distributions will be taken as a) Uniform, b) Linear, e) Exponential, and d) Complementary error function. In cases b), e) and d) it will be assumed that the concentration decreases from emitter to collector. As before, the collector junction will be taken at x=w. The uniform case has been extensively discussed and will
•
13 W. Shockley, "Transistor electronics: imperfections, unipolar and analog transistors," PROC. IRE, vol. 40, pp. 1289-1313; Novem-ber, 1952 gives a more comprehensive dicussion of simultaneous drift and diffusion of a bunch of carriers.
14 Shockley, et al., op. cit.
be taken as the basis of comparison for all of the other distributions. The subscripts 0, lin, exp, erfc will be used to designate cases a, b, c, and d respectively to facilitate the comparison.
Uniform
From (9)
From ( 10)
N(x) = constant = No. (23)
1 — = einwNo. Ro
To =
w-
2D,
Also, the frequency cut-off for the uniform case is
Linear
D, fo .
rzu 2
x N(x) = No (1 — —
w
Tlin 4D,
and from (22) and (26)
D, = — = 2•Vifo. (30)
7r
Exponential
1 ',Vow = —
2R0
(24)
(25)
(26)
N(x) = Noe—ziL —
Collector junction is at x=w where N(x) =0; hence
(27)
(28)
(29)
No — = In — •
N,
(31)
(32)
(Actually, in the examples considered here, collection occurs at a place in the base region where the concen-tration of donors is at least as high, or higher, than the concentration of acceptors in the collector region. However, for purposes of comparison, the same con-ditions are assumed for all distributions.)
1 1 t 1 NI r 1 + 1 (33)
Ro No No No in — In —
1‘11 NI
Fig. 2 shows a plot of as a function of No/No
Texp
2D In No - ( N0 \'
In )
w2 2 2 rzeliNo In U du
1 — u (34)

76 PROCEEDINGS OF THE IRE January
JO
8
o
FE 6 cr
4
2
EXP
ERF
LINEAR
UNIFORM
Ice 10 3
No/N,
Fig. 2—Effect of various impurity distributions, on base layer resistance.
,o 4 105
In (34), the dimensionless parameter u is introduced to demonstrate the dependence of transit time only on No/Ni. We can rewrite (34) as
Tam, = rof No \
(35)
NI
where f(No/Ni) is the multiplier of w2/2D„ in (34). Fig. 3 shows a plot of roxp/ro as function of No/Ni,
1.2
1.0
08
0.6
0.4
0.2
))-312 fexp = fo (f(-- •
Ni
UNIFORM
LINEAR
ERR
EXP
102 io iO 05
N O/N I
(36)
Fig. 3—Effect of various impurity distributions on transit time.
Fig. 4 has a plot of fe„p/fo as a function of No/Ni.
Complementary Error Function
N(x) = No erfc — - (37)
16
14
12
10
4
o
LINEAR
‘ERF
UNIFORM
'04
No/N,
10 5
Fig. 4—Effect of various impurity distributions on frequency cut-off of /3.
and it will be assumed that N(x)= 0 at x=w or
106
No erfc — = NI (38)
= qµ„Now —=_- ( 1 — e—w41e) 1 (
) (39) Rer fc coVir
1 1 L = — - (1 - e-w211.2)). (40)
Rer f e R 0 11, 'VW
Fig. 2 also shows a plot of Rorio/R0 as a function of No/NI. Also,
(erfc 271w_ _ W2 1 L No de. (41) n, J o zw NI
erfc — - — L No
In (41), the dimensionless parameters have been in-troduced so that integral is a function only of Ni/No and 2v/L which is a function of Ni/No. We may write
where
Ter ic = rog(—) AT0
1 (erfc -1-71v-L - -VN j dn
/ NI\ ri
g---N0)=2 .1 0 Ew N, erfc - — -
L No
(42)
(43)
Fig. 3 shows a plot of reao/ro as a function of No/NI.

1956 Moll and Ross: Transistor Base Layer Resistivity
Also, 10
77
N \\-312 feet° = f0 •
Ni
Fig. 4 has a plot of ferfo/fo as a function of No/Ni.
(44)
DISCUSSION
We have obtained formulas relating some of the fundamental transistor parameters to the distribution of impurities in the base layer. A direct comparison between the attainable transistor parameters is desir-able however. The essential transistor parameters which affect the behavior of transistors include base resistance, frequency cut-off of 0, low frequency "y, fre-quency cut-off of ^y, collector capacitance, low fre-quency collector-emitter voltage feedback, space charge layer widening effects on a.
In order to reduce collector capacitance and mitigate "punch through limitations" it has been proposed that a high resistivity layer be included between the base and collector.0 This has the effect of forcing the space charge region to extend towards the collector rather than in the direction of the base layer. In this case, the number of base layer donor atoms which are included within the space charge region is essentially independ-ent of the distribution of donors in the base layer, and is a function only of collector voltage. Thus, the effect of collector voltage on transverse base layer sheet re-sistivity does not depend on the distribution of donors in the base layer. The effects of collector voltage on collector-emitter feedback and low frequency -y are also independent of the distribution of carriers in the base layer, but are a function of the total number of impurity centers. The requirements of high dc -y and low re make it necessary to compromise the value of R (base layer sheet resistivity) and this compromise is in-dependent of donor distribution. The parameters that are a function of donor dis-
tribution in the transistor structure that we have hypothecated are fa, the frequency cut-off, and No, the density of donors in the base at the emitter junction. The density No is a large factor in determining the be-havior of the emitter junction at high frequencies. For thin base layers and low resistivity emitter regions, the high frequency behavior of the emitter junction may be approximated by the parallel combination of an emitter resistance rio and emitter transition region ca-pacitance CTE. On a unit area basis, and for a junction approximating a step'.
CrE e%e N/No (45)
1 r e /V •
IE (46)
'8 Early, op. cit. 18 W. Shockley, "The theory of p-n junctions in semiconductors
and p-n junction transistors," Bell Syst. Tech. Jour., vol. 28, pp. 435-489; July, 1949.
DENSITY X 10-16
B
6
4
EXP
o
UNIFORM
LINEAR ERF REACHES
10 t4 HERE-\
2 4
WIDTH X 10-4DIA
6
EXP REACHES
ICCHERE
Fig. 5—Equivalent base layer designs.
The current which flows into CTB does not contribute to hole flow so that the emitter has a frequency cut-off (frequency cut-off of -y) proportional to the reciprocal of the time constant.
but
IE = TECTE• (47)
../NO/JE. (48)
Hence, if the ratio VAT0//E remains constant, the emit-ter cut-off frequency remains constant. (Actually, CTB is a function of the forward voltage, but this variation is slow compared to the variation of IE with voltage.)
In practice, the relation in (48) means that in order to attain higher frequencies it will be necessary to oper-ate transistors at higher current densities. Also, to attain a given cut-off frequency in the emitter, the operating current density is a function of the base layer donor distribution.
In particular, distributions with high No require higher emitter current densities than those with low No to attain the same 7 frequency cut-off. However, it will now be shown that, for equal base resistances and the required higher current density consistent with high ^y frequency cut-off, the distributions with high No actually operate at lower hole concentration. Eq. (8) shows that, if the total number of impurities in the base layer is fixed, the maximum hole density po is given by
p oc . No
Furthermore, if /ph/No is constant, then
1 PO °C —
VNO
To present a concrete comparison of the base layer designs, four Ge base layers equivalent in R and f6, were obtained by a cut and try process from Figs. 2, 3, and 4. These base layer designs are shown in Fig. 5. It is
(49)
(50)

78 PROCEEDINGS OF THE IRE January
assumed for this comparison that the density of ac-ceptors in the collector is 10" and for the uniform case the density of donors is 4 X 10¹⁹/cm3 and W= 2 X10⁻⁴ cm.'" It is seen from Fig. 5 that the nonuniform dis-tributions require greater maximum donor concentra-tions than does the uniform case. Thus for equal -y cut-off frequency the nonuniform distributions must operate at higher current (and power) density than does the uniform distribution, but at a lower hole density. Also, the uniform case requires a narrower base region than do the nonuniform cases. We have not attempted to account for variation of
mobility across the base layer in the analysis. In the
17 This example is essentially the 200 mcps fa transistor given by J. M. Early in reference 2.
examples of Fig. 5, this would certainly have an effect since at N = 4 X 10" the hole drift mobility" in Ge is only 1,100 while at 1019 (roughly the last third of the transit for the exponential case) the mobility is approxi-mately 1,800. The increased mobility at the end of the transit would be at least partially compensated by the lower mobility at the beginning of the transit so that exact estimation of this effect is difficult.
ACKNOWLEDGMENT
The authors are indebted to R. W. Hamming who was of great assistance in the computing of transit times, and to the reviewer who pointed out an error in the treatment of the exponential case.
18 M. B. Prince, "Drift mobilities in semiconductors, I. Germani-um," Phys. Rev., vol. 92, pp. 681-687; November 1, 1953.
Surface Resistance and Reactance of Metals at Infrared Frequencies*
J. R. BEATTIEt AND G. K. T. CONNt
INTRODUCTION
/N A METAL the electrical current density and the field strength decay exponentially at high frequen-cies as the distance z from the surface increases.
Thus
J = Jo exp (-0), (1)
where J is the current density and 8 is the skin depth. By Maxwell's theory #3 is related to u, the direct current conductivity, so that
o = (2e-cocr); (2)
co is the angular frequency. At 109 cycles per second, is of the order of microns in metals of high conductivity. The ratio R of the electric field gradient to the current per unit square at the surface is a convenient definition of resistance at high frequencies, and
R = 1/ (u(3) = 027rcebrc2). (3)
At high radio-frequencies R may be obtained by meas-uring the Q of resonators made of the material under
• Original manuscript received by the IRE, May 31, 1955; revised manuscript received August 11, 1955. t Dept. of Physics, ITniversity of Sheffield, Sheffield, England.
study.1-4 Measured values usually exceed those cal-culated from (3) but good electro-polished surfaces give close agreement. The discrepancies are almost certainly caused by surface roughness; the presence of strain or impurity in the surface layers appears to be of less practical importance. At infrared frequencies, greater than 101' cycles per
second, (3) is inadequate. Writing CZ/47r as the ratio of the electric to the magnetic field strengths at the sur-face of the meta1,9.6 we define the real and imaginary components of the surface impedance, Z respectively as the surface resistance R and the surface reactance X. R may be determined from measurements of the inten-sity of reflected radiation. If Ro' is the ratio of reflected to incident intensity, then to a close approximation
1 — R02 = CR/7r. (4)
F. A. Benson, "Wave-guide attenuation and its correlation with surface roughness," Proc. IEE, vol. 100, pp. 85, 213; 1953.
I F. A. Benson, "Attenuation in nickel and mild-steel waveguides at 9375 Mc/s," Proc. IEE, vol. 101, pp. 38; 1954.
3 A. C. Beck and R. W. Dawson, Correction to "Speed of elec-tronic switching circuits," PROC. IRE, vol. 38, p. 1181; October, 1950.
4 R. C. Chambers and A. B. Pippard, " Properties of Metallic Surfaces," Institute of Metals, p. 28; 1952.
3 J. A. Stratton, "Electromagnetic Theory," McGraw-Hill Book Co., Inc., New York, N. Y.; 1941.
G. E. H. Reuter and E. H. Sondheimer, "Theory of the anoma-lous skin effect in metals," Proc. Roy. Soc. A, vol. 195, p. 336; 1948.

1954 Beattie and Conn: Surface Resistance at Infrared Frequency 79
Rubens and Hagen7 measured Ro° for many metals and this early work was taken to vindicate (3) at infrared frequencies. Recently, considerable doubt has been cast on this view which is in conflict with modern theories." Though R and X are related," both must be measured if investigation is limited to a particular frequency range. This work shows that X is much larger than R so that measurements of Ro° alone are of limited value. The experimental methods used in the infrared are
essentially optical and it is natural to describe the be-havior of materials studied in terms of a complex refrac-tive index n—jk. Save under special theoretical condi-tions (Reuter and Sondheimer) this refractive index is equivalent to reciprocal of surface impedance and
Z = R jX 471-/c(n — jk). (5)
R and X have a more direct practical significance for the present purpose and will be used to describe the experimental results. The simple theory of electron relaxation gives°,"."
2 R = ( r2co\
C
X = V(2irco --) • N/ {tor + 1/( 1 C')27-2) } • C20 (7)
4- V(1 w2r2) , (6)
r is the relaxation time, that is the interval between electron collisions. In each expression the factor which forms (3) is multiplied by a function of r. The behavior of a number of specimens of silver,
aluminum, copper, and nickel is discussed below; these have been studied in the range 2.5 to 15 X10" cycles per second. Suitable values of r and co- have been chosen to fit these results. The consequent values of o do not in general agree with accepted figures of the direct current conductivity and the origin of this is discussed. In some cases the temperature coefficient of o has been measured. Nickel specimens show undoubted departure from (6) and (7); probable explanation that this is caused by in-ternal photoelectric transitions between d- and s-bands.
EXPERIMENTAL METHOD
The only measurements of the optical constants of metals in the infrared region, y less than 10" cycles per second, from which both R and X may be deduced, are
7 H. Rubens and E. Hagen, "On some relations between the opti-cal and electrical qualities of metals," Phil. Mag., vol. 7, P. 162; 1904.
8 N. F. Mott and C. Zener, "Optical properties of metals," Proc. Camb. Phil. Soc., vol. 30, p. 249; 1934. The dispersion of free or metallic electrons in terms of optical constants n and /c is discussed in this paper. ° R. B. Dingle, "The anomalous skin effect and the reflectivity of
metals," Physica, vol. 19, p. 348; 1953. 1° T. S. Robinson, "Optical constants by reflection," Proc. Phys.
Soc. B, vol. 65, p. 910; 1952. 11 N. F. Mott and H. Jones, "Properties of Metals and Alloys,"
1936. 12 O. O. Wolfe, Proc. Phys. Soc. B, vol. 65, p. 910; 1952.
those of F6rsterling and Fréedericksz." Opaque films of silver, copper, gold, iridium, and platinum were exam-ined over the limited range of 5.9 X10" to 5 X 10" cycles per second. In studies of relaxation it is important to ex-tend measurements to frequencies at least as low as 3X10'8 cycles per second. The experimental methods which have been developed"." are applicable over the whole range of infrared frequencies but attention has so far been limited to frequencies larger than 2.5 X 10" cycles per second since ample radiant flux is available, relaxation effects can be measured and there is no reason to suppose that, with metals, information is lost by this limitation.
Plane polarized radiation falls at an oblique angle on a specimen and the elliptically polarized light which is reflected is analyzed by a second plane polar. At a given angle of incidence ck, two parameters p and A are measured; p is the amplitude ratio of the two reflection coefficients and à is the relative phase of these two com-ponents polarized parallel and perpendicular to the plane of incidence. Then, to a close approximation,"
4r 1 — p exp ( ià) R + jX = (8)
c tan (j) sin e 1 p exp (Pk) R and X are usually determined with an accuracy of 1 or 2 per cent.
SPECIMENS
The depth to which radiation of wavelength X pene-trates an absorbing medium is X/47rk or crnok;hl in most metals it is of the order of 10-° cm. Roughness or con-tamination of the surface may therefore seriously in-fluence Z though the defects are small compared with a wavelength of visible light and therefore not obvious to microscopic examination. Since such defects cannot be eliminated entirely it is important to examine, in the case of each metal, a number of surfaces prepared in different ways. Specimens of bulk material have been prepared by buffing, by mechanical polishing, by chem-ical etching, and by electropolishing of annealed ma-terial. Opaque metal films have been made by condens-ing the metal vapor on glass at room temperatures; these were deposited at pressures lower than 10-5 mm Hg. It is well-known that the electrical conductivity of thin films is significantly lower than that of bulk ma-terial; using the technique of multiple-beam inter-ferometry to determine the thickness, the direct current conductivity was measured .'7
n V. Fiirsterling and Fréedericksz, "Optical constants of certain metals in the infrared," Ann. Phys., vol. 40, p. 201; 1913.
14 J. R. Beattie and G. K. T. Conn, "Optical constants of metals in the infrared principles of measurement," Phil. Mag., vol. 46, p. 222; 1955. " J. R. Beattie, "Optical constants of metals in the infrared-ex-
perimental methods," Phil. Mag., vol. 46, p. 235; 1955. te If co«lir so that there is no reactive term, this reduces to ( 1). 17 S. Tolansky, "Multiple-Beam Interferometry," Clarendon
Press, Oxford, England; 1948.

80 PROCEEDINGS OF THE IRE Januar v
Rond X ohms
132 133 13 4 135 136 13.7 138 139 14 0 141 14 2
Log.:
Fig. 1—Surface resistance R and reactance X of evaporated silver as a function of frequency.
30
1 RondX ohms
10
--n—ThectetKal —0—Experimental
R -o--- — 0— -e----°
133 134 13 5 136 137 138 139 140 141 142
Fig. 2—Surface resistance R and reactance X of evaporated aluminum as a function of frequency.
30
20
Rand ohms
10
Theoretical
o- - - - -0 Experiment
X (calculated chspersor theay
o'
xoe0 o
X (Expeimentop
oR 9
133 134 13 5 13 13-7 138 13-9 140 141 2 KU
loq
Fig. 3—Surface resistance R and reactance X of a copper surface, mechanically polished, plotted against frequency.
EXPERIMENTAL RESULTS
Results which are typical of silver, aluminum, and copper are shown in Figs. 1, 2 and 3 in which R and X
60
t50
Rand X 40 ohms
3
20
10
Experiment X X x Theoretical
133 13-5 137 13.9 141 143 Ioq V2
Fig. 4—Surface resistance R and reactance X of annealed electro-polished nickel plotted against frequency. At higher frequencies the experimental points depart significantly from the calculated dispersion curve.
are plotted as functions of frequency. The curves drawn are calculated from (6) and (7). The values of cr and r used for this purpose were chosen to fit the experimental results at low frequencies since there is evidence that the dispersion of metallic electrons, described by (6) and (7), is the only significant influence at such frequencies." u and r are given by the equations
u = 2ircil(RXc2) and r = — (10 — X2)/(2RX(o). (9)
These follow immediately from (6) and (7). The simple theory of electron relaxation is vindicated by the close correspondence between the experimental points and the theoretical curves. The importance of the reactive component X is obvious. It may be noted that in all cases investigated the value of u which is deduced is considerably less than that measured with direct cur-rents.
Fig. 4 is representative of specimens of nickel. Clearly (6) and (7) are not adequate; the significant influence of absorption other than by conduction electrons is briefly discussed elsewhere." At low frequencies this absorption is trivial and (9) has been used in this re-gion to calculate r and cr; the latter is again much less than that measured with direct currents. A summary of many experimental measurements is
given in Table I. r and « are listed with the effective number of "free" electrons per unit volume which is calculated from the simple expression"
'8 J. R. Beattie and G. K. T. Conn, "Optical constants of metals in the infrared-silver, copper, and nickle," Phil. Mag., in press.
19 J. R. Beattie and G. K. T. Conn, "Resonance absorption of nickle in the infrared region," Phil. Mag., in press.
•

1956 Beattie and Conn: Surface Resistance at Infrared Frequency 81
TABLE I
SUMMARY OF EXPERIMENTAL RESULTS*
Metal Preparation rrE.S.U.
Silver
Aluminum
Copper
Nickel
r secs. 7/atom cru.c./cr aD.C./a Evaporated Mechanically polished Metal-polish Etched
Evaporated
Evaporated Mechanically polished Electrolytically polished Scratched
Evaporated Mechanically polished Electrolytically polished Etched
23.4 X10¹⁶ 19.5 X10 16 12 X1014 6.9 X 10¹⁶
11.6 X10¹⁴
12.4 X10¹⁶ 13.5 X10¹⁴ 9.1 X 10" 4.9 X10¹⁶
3.16 X10¹⁶ 2.68X 10¹⁴ 3.93 X10¹⁶ 1.47 X 10¹⁶
1.75 X 10-" 1.61 X 10-u 2.05 X10⁻¹⁴ 3.3 X10⁻¹⁴
6A X10-14
1.41 X10⁻¹⁴ 1.80 X10⁻¹⁴ 1.41 X10⁻¹⁴ 1.06 X10⁻¹⁴
1.02 X10⁻¹⁴ 0.81 X10⁻¹⁴ 1.24X 1.32 X10-14
0.90 1.4 0.81 2.9 0.39 4.8 0.14 8.4
1.28 1.3
0.41 2.0 0.35 3.9 0.30 5.7 0.21 10.6
0.14 1.5 0.14 4.3 0.14 2.9 0.05 7.8
4
5.5 20 4.6
• With evaporated films «D.C. is that of the film not the bulk value. ado is the temperature coefficient of the direct current conductivity of bulk material and a the temperature coefficient of cr measured at infrared frequencies.
o. = yetrim. (m denotes the mass of an electron).
Figures for the conductivity of each metal vary con-siderably with treatment of the surface. The general, and obvious, conclusion may be drawn that rougher surfaces show lower value of o• but even the most bril-liant mirror finish, however obtained, yields figures which fall short of those measured with direct currents. Such discrepancies may be caused by surface irregularities of the order of 10-6 cm, an interpretation which finds some support in the behavior of liquid metals. Color is also lent to this view by the temperature coefficients listed. These were obtained by measuring the R and X of speci-mens at 250° C and were very much smaller than the figures commonly accepted. Elimination of the influ-ence of surface roughness may eventually permit a more
satisfactory explanation in terms of "anomalous skin effect" ;6.9 a discussion on such lines is premature at this stage. For normal metals at room temperature Reuter and Sondheimer showed that, assuming specular re-flection of electrons at the surface of the metal, the anomalous skin effect is not important. Dingle discusses in detail the influence of diffuse electron reflection and it appears not impossible that a theoretical treatment on these lines may account for the low values of uo re-ported. Dingle's theory, however, predicts a departure from the form of classical dispersion contrary to these results for silver, copper, and aluminum.
ACKNOWLEDGMENT We must acknowledge grants for apparatus from the
Research Fund of the University of Sheffield and from the Royal Society.

82 PROCEEDINGS OF THE IRE January
Transverse-Field Traveling-Wave Tubes with Periodic Electrostatic Focusing*
R. ADLERt, FELLOW, ME, O. M . KROMHOUTt, AND P. A. CLAVIERt, MEMBER, IRE
Summary—Traveling-wave tubes are described in which the wave-propagating structure constitutes a smooth, balanced trans-mission line for radio frequency signals while at the same time pro-viding a space-periodic focusing field at zero frequency. Experimental structures for the 500-900 mc band have wave velocities of 1 to 2 per cent of light and characteristic impedances of about 500 ohms. A simplified theoretical analysis is given, based on the readily
visualized concept of transverse electron waves in a focusing field. In order to get gain, the electron stream must travel faster than the circuit wave by a substantial margin which is determined by the strength of the focusing field. The gain is proportional to the square
root of the beam current. Experimental data are presented concerning the relation between
focusing field and effective beam velocity, and between beam current and gain. They are in good agreement with the theory.
Noise figures as low as 6 db have been measured.
THIS PAPER deals with traveling-wave tubes in which the high-frequency signal fields and the periodic electron motions which correspond to
these fields are perpendicular to the direction of wave propagation and of electron flow. The electron stream in these tubes is shaped like a thin, flat ribbon; it originates at a long, narrow, cathode, passes through focusing and collimating slits and enters the interac-tion space, where it is kept thin by a chain of electro-
static lenses. The experimental tubes described in the following
were designed for the uhf band, 500 to 900 mc. The principles of their operation, however, are not restricted to any particular band and same type of structure or a similar one may be used on other frequency ranges.
THE TUBE STRUCTURE
The Slow- Wave Circuit
The wave-propagating structure, shown schematically in Fig. 1, is symmetrical about a center plane which is also the mid-plane of the thin electron stream. On each side of the center plane there is a helical winding which has the cross-sectional shape of a thin rectangle. High frequency signals are applied to this balanced structure from a push-pull source and the amplified signals are delivered to a push-pull load. In the center plane the electric field is purely transverse for reasons of sym-metry; longitudinal components exist outside the center plane but for the dimensions employed these compo-nents are small enough to remain negligible throughout the region of electron flow. The helices used in the experimental tubes were
wound on rail-shaped ceramic bars having a cross sec-tion of 0.550 inch X0.63 inch. Each helix was bifilar, being made up of two interlaced windings, each of 44 turns per inch. The spacing between the two helices
* Original manuscript received by the IRE, August 10, 1955; re-vised manuscript received, September 19, 1955.
Research Dept., Zenith Radio Corp., Chicago 39, Ill.
was varied from 0.064 inch to as little as 0.010 inch. Propagation velocities of the transverse field wave on
such structures were measured over the range of fre-quencies from a few mc up to 1,000 mc by observing the length of standing waves along the helices. For this purpose the two interlaced windings of each helix were
ELECTRON SHEET
BALANCED FLAT HELICES
Fig. 1—Balanced wave propagating structure, with electron stream along center plane.
connected together at both ends. At the lower frequen-cies the standing waves were measured by shorting the helices together at one end and observing the frequen-cies for which the impedance is zero at the other end; above 400 mc, where end effects were no longer negli-gible, the field pattern along the helices was explored with the aid of a small movable inductive probe.
CIRCUIT WAVE VELOCITY
02C
oo
HELIX SPACING
.064"
030" -
010"
500
FREQUENCY ( MC.)
Fig. 2—Phase velocity of balanced flat helices (in terms of light velocity c) vs frequency for three values of spacing between helices. Spacing of 0.030 inch is used in present tubes.
1000
Fig. 2 shows some of the results of these measure-ments. For the widest spacing, the propagation velocity is more than 2 per cent of light at low frequencies but falls off rapidly toward higher frequencies. For the narrowest spacing, low frequency propagation is slower than 1 per cent of light and after an initial drop, a

1956 Adler, Kromhout, and Clavier: Transverse Field Traveling- Wave Tubes 83
slight increase of velocity occurs toward the higher frequencies. At 0.030 inch spacing, the velocity in the range from 500 to 900 mc is practically constant at
. 1.5 per cent of light. Thus, the circuit wavelength X is 0.365 inch at 500 mc and 0.197 inch at 900 mc. The corresponding propagation constants (7 = 27r/X) are 17.2 per inch at 500 mc and 31.7 per inch at 900 mc. With a spacing D = 0.030 inch between the helix sur-faces, the product -y• D becomes 0.52 at 500 mc and 0.95 at 900 mc. These figures are of interest with respect to the theoretical analysis which follows later.
In addition to the transverse field wave, the structure shown in Fig. 1 can also propagate a longitudinal wave.
It is of interest to know the velocity of this wave be-cause if it accidentally coincided with the velocity of electron flow, traveling-wave amplification of the con-ventional kind would occur. Measurements show that the longitudinal mode on this structure is 90 per cent faster than the transverse mode at 500 mc and 40 per cent faster at 900 mc.
Returning now to the transverse field, the character-istic impedance of such a structure can be defined like that of a two-wire transmission line, as the square of
the voltage between corresponding points on the two helices divided by the power flow. The transverse field in the center plane is generated by that same voltage.
A known perturbation of the transverse field, produced for instance by inserting a sheet of mica between the two helices, causes a drop in phase velocity from which the characteristic impedance can be computed. For 0.030-inch spacing, the structure described above meas-ures several thousand ohms at very low frequency, about 600 ohms at 500 mc and 400 ohms at 900 mc. The 0.030 inch spacing was used in all experimental
tubes. A phase velocity of 1.5 per cent of light corre-sponds to the speed of electron flow at 57 volts; this
illustrates the magnitude of the voltages employed in such tubes.
Beam Forming and Focusing
Fig. 3 illustrates the electron gun which was used. The first slot following the cathode is held at negative potential; it serves to control the total current and to confine the active portion of the cathode to a narrow strip of high density. The following accelerator slot is held at about 400 volts to produce the required field at the cathode. After passing the accelerator the beam enters a retarding field and diverges; a small slice,
about 10 to 15 per cent of the total cathode current in the present tubes, is selected by the third slot which is only 0.005 inch wide. This slot, together with the metallic mounting brackets for the ceramic bars and with the helices themselves, forms an entrance lens which projects the collimated beam into the interac-tion space.
The two centering wires shown in Fig. 3—one electri-cally connected to the third slot, the other brought out
separately—make it possible to start beam along the center plane in spite of accidental asymmetries in the gun, and study effects of incorrect beam centering.
Space charge forces, if left to themselves, would make the thin beam grow rapidly thicker; periodic electro-static focusing is used to prevent this. In a recent paper' it was pointed out that the spatial period of such a focusing system must be of a certain minimum size if orderly beam flow is important; unless the thickness of the beam is small compared to the spatial period, trans-verse motions impressed upon the beam at one point along its travel soon turn into turbulence. The pitch of the windings used in these tubes (0.023 inch) is not
nearly large enough to serve as spatial period; thus it
CENTERING
GUN ENTRANCE
LENS GOLLI MATOR
Fig. 3—Profile of electron gun, showing small slice of beam selected by narrow third slot.
is not possible to obtain suitable focusing by applying two different dc potentials to two interlaced uniform windings in the manner described by Tien2 without changing some important parameter by a large factor. This did not appear practical. What is required here is a structure which combines
the uniformly distributed high frequency properties of a smooth transmission line with the space-periodic dc field needed for focusing. Several alternatives which combine these properties were studied. The structure finally chosen is shown in Fig. 4. This is still a bifilar
PERIODIC FOCUSING
Fig. 4—Edgewise view of bifilar winding arrangement for electro-static focusing. Shaded areas represent the notched ceramic forms; the two separate windings on each form, shown in white and black, are held at separate dc potentials VI and VI.
helix pair, with the two windings on each bar operated at two different dc potentials VI and 172. But the turns are no longer of uniform cross section; instead, one winding is exposed to the electron stream while the
R. Adler, O. M. Kromhout, and P. A. Clavier, "Resonant be-havior of electron beams in periodically focused tubes for transverse signal fields," PROC. IRE, vol. 43, pp. 339-341; March, 1955. 2 P. K. Tien, "Bifilar helix for backward-wave oscillators," PROC.
IRE, vol. 42, pp. 1137-1143; July, 1954.

84 PROCEEDINGS OF THE IRE January
other is recessed into grooves cut into the ceramic form, thus shielded from the electron stream by the first winding. At regular intervals, the recessed and the ex-posed windings interchange their roles. This is ac-complished by arranging the grooves in such a pattern that a winding of constant pitch alternately drops into one group of grooves and rides between the grooves of the next group. A bifilar winding of constant pitch is thus made to form a periodic focusing structure with a spatial period which may be made as long as desired. In the experimental tubes, this period equals 0.20 inch or nine times the pitch. The depth of the recesses is only 0.015 inch, a little
less than one-quarter of the minor cross-sectional di-mension of the winding. This is not enough to cause any substantial change in the propagation properties of the structure; each bar still acts essentially like a uniform
bifilar helix. The over-all length of the bars is 2.25 inches, and the
wound length a little less than two inches. This is rather short for a traveling-wave tube, but not too short to provide useful gain, and it simplifies the task of putting windings on the fragile ceramic bars.
Terminations
In the frequency range between 500 and 900 mc, the characteristic impedance of the helix pair is not very much higher than the 300 ohms commonly used in balanced transmission lines for this range. To obtain a reasonably good match to such lines, quarter-wave sec-tions of intermediate impedance are provided at both ends of the structure. This is done by increasing the distributed capacity of the last three bifilar turns.
Fig. 5—Transverse-field traveling-wave tube. Flat helix surfaces are perpendicular to plane of photograph. Electron gun at left; two of the wires at left and two of the base pins at right form the 300-ohm balanced input and output lines.
At each end of each helix, the two bifilar windings are connected together through small barium titanate discs which constitute short circuits for signal frequencies. This makes it possible to save four external connections: only the two low-voltage windings are brought out through one end of the tube, and only the two high-voltage windings through the other.
Fig. 5 shows a complete tube, photographed to give the effect of a cross-sectional view. Fig. 6 shows the tube parts including an assembled helix pair (spaced somewhat farther apart than in the experimental
tubes) and a single, partly wound ceramic bar.
ELEMENTARY ANALYSIS OF THE TRANSVERSE FIELD TUBE
Transverse Electron Waves
A general theory of the transverse field traveling wave tube has long been available in the literature.' It treats the interaction between slow-wave circuits and electron streams throughout the range of relative velocities and
focusing fields. Elementary considerations regarding the mechanism
of interaction in transverse fields teach us that sub-stantial effects will occur only if a certain numerical relation exists between velocities, focusing field and signal frequency. Since practical tubes must obey this relation, we might reasonably ask whether a simplified analysis might not be made for this special case. It turns out that the resulting simplification is consider-able, and that the analysis correctly predicts the per-formance of practical tubes.
Fig. 6—Components of tube, from left to right: bracket for support-ing helices, slots for electron gun, and cathode; pair of helices in position as mounted in tube; partially wound helix showing bifilar winding; collector and capacity-loading element for matching.
Consider a slow-wave circuit on which waves, excited by a generator of angular frequency co, travel in the +z direction at a velocity u. An observer at a fixed point anywhere along the circuit notes an electric field which alternates at the frequency co. A moving observer finds a different frequency, because of the Doppler effect; if his speed of motion us coincided with u, he would observe zero frequency. Generally, the frequency WA which he observes is
WA
UE
CO (1 — —u). (1)
If the observer travels faster than the wave (us >u), (.0A becomes negative; as in the familiar case of a beat note passing through zero, the minus sign merely signi-fies a reversal of phase rotation.
3 J. R. Pierce, "Traveling-Wave Tubes," D. Van Nostrand Co., Inc., New York, N. Y., ch. XIII; 1950.

1956 Adler, Kromhout, and Clavier: Transverse Field Traveling- Wave Tubes 85
In some instances the sense of phase rotation is not important. For these we can write
uE (04 — 1 + (2) u w
A case in point is the excitation of a resonator by a driving force of appropriate frequency. If the observer carries such a resonator, tuned to some fixed frequency WE which he wishes to be excited by the field, he can accomplish this even though wE0w, by traveling at one of the two suitable speeds uE given by (2). An electron in a focusing field represents this kind of
an observer. In a homogeneous magnetic field, elec-trons may easily be thrown into large transverse motion if the driving force acts at the cyclotron frequency; a periodic electrostatic focusing field, on the other hand, exerts upon each electron an elastic restoring force and thus again renders it resonant at a well-defined fre-quency.'
An electron stream of velocity uE in a focusing field, which establishes a transverse resonant frequency coE, will therefore react strongly to a circuit wave whose velocity u and signal frequency co are properly related. We may use (2) to obtain the two suitable wave veloci-ties:
UE
u12 = (3) WE
1 + — co
and the propagation constants Yi = w/ui, = co/u2:
± WE
712 - +
uE 14E (4)
where yE = wE/uE. Once an electron stream has been exposed, even for
a short portion of its travel, to one of the two signal fields described by (3), its electrons will keep on oscil-lating at their resonant frequency WE while they move forward. Thus (3) and (4) describe the velocities and propagation constants not only of two kinds of slow-wave circuits capable of influencing the stream, but also of two free transverse electron waves which may exist on the stream. These waves—one faster and one slower than the stream—are evidently similar to the familiar longitudinal space-charge waves first described by Hahn and Ramo;4 the analogy between transverse field traveling-wave tubes operated with a focusing field and velocity-modulating traveling-wave tubes working under high space charge conditions was pointed out by Pierce.6 It is important, however, to remember the dif-ferences. The two transverse electron waves are sepa-rated not because of space charge but only because of the focusing field; their separation remains the same regardless of current density as long as the focusing
4 Simon Ramo, "The electronic-wave theory of velocity-modulated tubes," PROC. IRE, vol. 27, pp. 757-763; December, 1939.
6 Pierre, op. cit., p. 169.
field is not changed, and generally they are quite far apart in velocity: a separation of less than ± 10 per cent is rare, and ± 25 per cent is common in practical tubes.
If the two electron waves exist at the same time, they beat with each other and form a standing wave. Since the difference between the two propagation con-stants [from (4)] is 27E, the length of a standing wave is
27r Ir UE Az = = = .
27E 'YE WE (5)
A simple physical interpretation of this standing-wave picture is given in Fig. 7. Here, an electron stream guided by a focusing field passes between a pair of short deflectors. Electrons which receive a transverse im-pulse while passing the deflectors oscillate transversely at the frequency WE and thus cross the center plane at time intervals separated by half cycles, or r/coE; during each of these intervals they cover a distance Az = uE(r/coE), the length of one standing wave. It might be noted that the experiment illustrated in Fig. 7 is easily performed; there is no restriction on the signal frequency to be applied to the deflectors, and any con-venient signal down to zero frequency may be used. Since the forward velocity uE is generally known rather accurately, direct observation of the trajectories, for instance by means of off-center targets, is a convenient means for measuring the transverse resonant frequency WE in periodically focused structures.
Fig. 7—Electron trajectories in focusing field. Electrons pass a short deflection field before entering. The results of two opposite de-flections are shown for a pictorial representation of the standing-wave analogy . Electrons strike one or the other collector depend-ing on number of center-plane crossings. This number can be determined by varying the focusing field.
The Interaction Process
Having now established the relations between veloci-ties and frequencies associated with transverse electron waves on a stream which flows in a focusing field, we proceed to examine the interaction process between such a stream and a slow-wave circuit capable of carrying a transverse electric field. We will assume that the un-disturbed propagation velocity of the slow-wave circuit has been made equal to the velocity of one of the two unmodified electron waves; the other electron wave must then have an entirely different velocity and its propagation constant will remain relatively unaffected by the presence of the slow-wave circuit. We shall limit study to interaction between the circuit wave and that electron wave which travels at the same velocity.

86 PROCEEDINGS OF THE IRE January
Each of these two waves, originally, has the same propagation constant 7. As a result of their interection, we expect -y to be perturbed, so that the field will be
E = Eoexp [j(cot — 7z) -I- az] (6)
To an electron moving at the speed uE this appears as if it were a field
EE = E0 exp [jcoA Eli (7)
where
E = a • tin. (8)
The sign of WA (7) may be positive or negative, de-pending on whether we have chosen the faster or the
slower electron wave. Under the influence of EE, the electron moves
transversely with an excursion
y = yo exp [jcoA 4- 0]t (9)
a velocity
= [jcoit 4- Ely (10)
and an acceleration
= [jwit e]2y = — [WA2 — E 2] y 2jwAey. (11)
The first term on the right side of (11) represents an acceleration j) proportional to the excursion y but of opposite sign; this is characteristic of periodic motion, and it is taken care of by the elastic force which the focusing field exerts. Let us now assume that €<< lcoAl ; if we then adjust the focusing field so that we —(042—€2, we find that to a good approximation
e'e WAI • (12)
The condition e«laui, stated in physical terms, means that each electron performs primarily a harmonic mo-tion at the frequency coal; growth, decay or phase change are insufficient to overshadow the harmonic character of this motion. As will be shown later, the condition €<<lco,41 is more easily met than infringed in practice. The second term on the right side of ( 11) calls for
an external driving force. A transverse field E produces
an acceleration j)= (e/m)E; thus
2jcoey = E (13)
and
e E Y
m 2jwAE (14)
Eq. (14) relates the transverse excursion y of an electron at any point in the tube to the transverse signal E at the same point. It thus describes the electron wave as a function of the circuit wave. Let us now turn to the current which the electron wave induces in the
circuit. This circuit contains two metallic surfaces, spaced by
a distance D, between which the electron stream flows.
We may simplify the analysis by assuming that D is smaller than the circuit wavelength divided by 27r, or -yD <1. Under this restriction the field changes only gradually with z and y and it becomes permissible to consider each increment dz of the slow-wave circuit a small lumped condenser in which the transverse field is homogeneous. The current induced in such an incremental condenser
at a point z is determined by the transverse motion of the stream ay/at at that point, not by the transverse velocity j, of the individual electrons. All electrons, however, which start at the same time travel through the same signal field and all are subject to the same elastic force. Thus all electrons arriving at a point z at a given instant have acquired the same excursion y from the signal. Hence the excursion of the entire stream at point z, at any instant, is determined by ( 14). The field E when measured at a fixed point has the
frequency co; therefore the transverse excursion of the electron stream at a point z is given by
e E(z) Y(3) — exp jcot. (15)
m 2:74me
The transversely moving stream, with a charge density p per unit length, induces in the adjacent slow-wave circuit a current per unit length
aY 1
= p -- •
at D
From ( 15) and (16),
e p E = . m D 2e Wit
(16)
(17)
Substituting the voltage on the circuit y and the spacing D for the field E, and dividing by the voltage,
e p 1 w = .
y m D2 2e WA (18)
Now when an external current —i (amperes per unit length) is injected, current flowing outward would be counted positive, into a transmission line of charac-teristic impedance Z, it splits up into the two parallel halves of the line and produces a voltage increment ay/az = —4iZ. Since the voltage along the line varies as y yo exp az, av/az = ay; hence — liZ = ay and
2« (19)
Combining now (18) and ( 19), and replacing e by a • uE according to (8), we find
2a e p 1 w — = Z m D2 2aup, WA
or
lepZco «2 — (20)
4 In D2 uE WA

1956 Adler, Kromhout, and Clavier: Transverse Field Traveling- Wave Tubes 87
We may now use some well-known relations: u E • p = I (the dc beam current) and m • uE2= 2e • I' (where V is the dc beam voltage). With their help. (20) becomes:
Zho a 2 = (21)
8 VD2wA
a corresponds to the perturbation in the propagation constant in (6). If WA is negative (stream faster than wave), +a represents the gain or loss per unit length of two waves, both having the original velocity u; with a voltage th applied to the input end, the voltage along the slow-wave circuit becomes
y = v1 cosh az. (22)
If, on the other hand, WA is positive (stream slower than wave), an input signal splits up into two waves of unchanging amplitude but modified velocity (propaga-
tion constants 7+a) and the combined voltage on the slow-wave circuit is
= vi cos az. (23)
Eqs. (22) and (23) describe what happens when the input signal is applied to the slow-wave circuit. For this simple and important case, the two resulting waves have equal starting fields which add up to match the input field, and equal but opposite electron motions which cancel each other initially. Eq. (10) shows that this cannot be quite correct: if the initial excursions yi and y2 of the two waves are equal and opposite, the two transverse velocities jh and 5,2 are equal but not exactly opposite, because of the factor [jwA-1-e] in one and [jc.dA — e] in the other. But at least for E«1 WA1 , the approximation is good and no third wave is needed to satisfy the boundary conditions at the input.
It was stated previously that the condition €«! coA I is more easily met than infringed. Inspection of (21) might lead one to believe that reducing co,' would in-crease a and thus quickly lead to an infringement. But if one wants to reduce Wit he must also reduce WE, which means weakening the focusing field. This leads to a very rapid drop in the maximum possible dc current which the tube can carry.' In practice it appears to be quite difficult to build a tube which violates the rule.
EXPERIMENTAL RESULTS
Velocity and Gain
Eq. (3) predicts that if the signal frequency co is kept constant and WE is varied, beam velocity uE must be varied in a certain way to maintain maximum gain. This was tested in an experimental tube at three signal
frequencies; the potential difference between high and low dc voltages was varied in steps, and each time aver-age beam velocity was adjusted for maximum gain. The transverse electron resonant frequency WE as a
function of the two dc voltages was determined by the method illustrated in Fig. 7, using zero frequency de-flection. For this purpose a separate tube was built in
Adler, Kromhout, and Clavier, op. cit.; eq. (25).
which the helix windings were replaced by a series of flat plates; the spatial period of the focusing field formed by these plates corresponded to that in the traveling-wave tube. Upon leaving the focusing field the beam was collected by a pair of target anodes, so that its final direction could be determined. The effective elec-tron velocity uE was computed by totaling the transit times for the high and low voltage sections. The circuit wave velocity u was measured by the method described in connection with Fig. 2; it corresponded to 55 volts at the highest frequency and to 60 volts at the lowest. Fig. 8 shows the experimental points; the dashed line represents the theoretical relation.
1.6
1.5
1.4 UE
U 1,3
1.2
1.0
uE =. WEI , • U I C4)
/ 0 • / w d 211
• 470 MC.
0710 MC.
X 860 MC.
0 2 3 .4 5 .6 WE (À.)
Fig. 8—Ratio of electron velocity to phase velocity in function of the ratio of transverse resonant frequency to signal frequency, for maximum gain.
Experimental tubes are normally operated at a ratio coE/co of 0.1 to 0.2 5 ; thus the effective beam voltage is normally 20 to 60 per cent above the voltage which would correspond to the circuit wave velocity. It might be noted that these beam voltages are too low for any accidental interaction with the longitudinal mode.
If the tube is operated at an effective electron ve-locity lower than the circuit wave velocity, the ratio caA/co becomes positive. The de voltages can then be adjusted so that co E = WA, and the combined signal volt-age on the helix becomes a cosine function of distance according to (23). Under these conditions, for a helix of length L, there exists a value of beam current I for which a •L =ir/2. From (23) one would expect a null in the output signal at this particular adjustment, similar to the Kompfner dip in more conventional traveling-wave tubes.' This has been observed experimentally for several values of WE; the information so obtained is useful in calculating tube parameters. For example, with an effective electron velocity corresponding to 45 volts, and an coE/27r of 123 mc, a null was observed for
7 R. Kompfner, "On the operation of the traveling-wave tube at low level," Jour. Brit. IRE, vol. 10, pp 283-289; August—September, 1950.

88 PROCEEDINGS OF THE IRE January
1=81 microamperes. The signal frequency was 710 mc and L=1.93 inches. With a = 7r/2L, the characteristic impedance Z can be calculated from (21); it is found to be 460 ohms. This is in reasonable agreement with the value found by inserting a dielectric between the helices and measuring the change in phase velocity.
Fig. 9 is a plot of gain-over-cold against beam current, for three different signal frequencies: 470 mc, 710 mc, and 860 mc. Two curves are shown for 710 mc, for two different values of WE. As one would expect from (21), the gain for a given beam current is higher for the smaller coE; however, with the stronger focusing field one can get more beam current through the tube, and the maximum gain is higher than for the weaker
focusing field. The dashed line on Fig. 9 represents the theoretical gain-over-cold for 710 mc with an WE/27r of of 123 mc; it includes a small correction for the 2.6 db
distributed cold loss at this frequency.
GAIN OVER COLD (DB)
00 200 300
COLLECTOR CURRENT ( MICROAMPERES)
Fig. 9—Gain vs collector current for various signal and resonant frequencies. The potentials from which the resonant frequencies were calculated are listed next to the signal frequency.
No attenuator was used in the tube on which these measurements were made. With helices only about two inches long, the gain was not high enough to render an attenuator necessary; leaving it off made it much easier
to compare theory and experiment. The value of Z used in the calculation was the one ob-
tained by the null method described earlier. The experi-mental curve follows the theoretical curve closely for the lower beam currents but begins to fall short of the theoretical gain for the higher currents. This is probably due to the fact that at these currents a considerable part of the beam is lost to the helices. For example, at de
voltages of 95 and 62 volts, the helices intercept 8
µa for 100 on the collector, 32 µa for 200 on the collector, and 83 µa for 260 on the collector.
As mentioned previously, there is little dispersion in these helices over the frequency range of interest. As a result, if WE is left approximately constant, the effective electron velocity must be adjusted as the signal fre-quency is varied in order to maintain maximum gain according to (3). This was done in taking the data for Fig. 9; the average beam voltage decreases as co in-creases. If the beam voltage is not readjusted but left at the optimum setting for 710 mc, and the current is adjusted to give a gain-over-cold of 10.5 db at that fre-quency, the gain is down to 9.5 db at 570 mc and to 9.0 db at 860 mc. It should be pointed out that no voltage adjustment with frequency would be necessary if the helices were designed to have the proper positive dis-persion. This was verified on the present tube by ob-serving that the voltage did not need to be readjusted as the signal frequency was varied between 850 and 1,300 mc; in this region the helices have a slight amount of positive dispersion.
Overload effects are observed at unusually low signal levels. Electrons move transversely in response to the signal and because of the small spacing D, they cannot go very far without striking a winding. An increase of helix current at the expense of collector current is readily
observed at output voltages of the order of 100 milli-volts; this is in good agreement with the relation be-tween field and electron excursion given in ( 15).
Noise Figure
The noise figure of the tube ranged from 6 to 8 db over the frequency ra nge 470 to 860 mc. This was found by measuring the improvement in noise figure of a television receiver, obtained when the traveling-wave tube was placed in front of it. Table I shows the im-provement at three signal frequencies.
TABLE I
Signal frequency
Noise figure, receiver alone
Noise figure, receiver
with TWT
Insertion gain of TWT
470 mc 710 mc 860 mc
16.1 db 15.0 db 16.4 db
11.1 db 10.2 db 10.1 db
6.2 db 7.5 db 8.4 db
The best noise figures which can currently be obtained with special triodes range from 4 to 7 db at 500 mc and from 6 to 9 db at 1,000 mc. The receiver used in measur-ing the traveling-wave tube was, of course, not equipped
with such triodes. The noise figure of the transverse-field traveling-wave
tube depends critically on the accuracy with which the beam is positioned in the center plane. This can be demonstrated by using the small centering electrode in the gun to deflect the beam in the y direction at the
start of the interaction space. As the beam is swept through the centered position, the noise output of the tube goes through a distinct minimum, while the gain goes through a maximum.

1956 Boxer and Thaler: Solving Linear and Nonlinear Systems 89
It has been pointed outs that the noise figure of a transverse-field traveling-wave tube has no theoretical minimum and depends primarily upon the width of the limiting apertures in the gun: the smaller the aperture width, the better the noise figure. The current through the aperture, however, decreases when the aperture is narrowed. Therefore, a compromise must be made. The experimental tubes described in this paper probably do not represent an optimum choice from the standpoint of noise figure.
It is interesting to note that as far as noise is con-cerned, electrostatic focusing has a definite advantage over magnetic focusing. The tube is not affected by transverse fluctuations in the beam parallel to the
8 G. Wade, K. Amo, and D. A. Watkins, "Noise in transverse-field traveling-wave tubes," Jour. Appt. Phys., vol. 25, pp. 1514-1520; December, 1954.
center plane of the flat helices. In the case of magnetic focusing, such fluctuations are rotated by the magnetic field and converted into transverse fluctuations per-pendicular to the center plane which the tube can amplify. With electrostatic focusing, on the other hand, no such rotation occurs.
CONCLUSION
The results of measurements on experimental tubes show good agreement with the theory. Gains of useful magnitude are readily obtained. Noise figures as low as 6 db have been measured and the chances for further improvement look promising. It appears that the transverse-field traveling-wave tube with periodic electrostatic focusing is well suited for low noise high frequency amplification.
A Simplified Method of Solving Linear and Nonlinear Systems*
R. BOXERt, MEMBER, IRE, AND S. THALERt
Summary—A simplified method for obtaining the response of linear and nonlinear systems, without knowledge of the roots of the system characteristic equation, is described. The solutions are given as time series representing the values of the response at equally spaced instants of time. Initial conditions are introduced easily through the use of the Laplace transform. It is shown that the Laplace transform of a linear system may be approximated by a z-transform, allowing the time series to be obtained by synthetic division. Two examples for linear constant coefficient systems are worked out including the solution of a third-order system and a first-order differential equation. The results are compared with the exact solutions obtained by analytic means.
The same methods are then extended to the solution of time-varying, nonlinear, and time-lag systems. An example of each type is worked out in detail to illustrate the wide applicability of the tech-nique. A discussion of error considerations is included.
INTRODUCTION
r iHE RESPONSE of a network to an applied sig-nal is usually initially defined implicitly by an
integro-differential equation. The methods for ob-ta'ning an explicit solution fall into two broad classes— analytic methods which yield a solution in functional form, and numerical methods which yield a solution as a sequence of numerical values. In the more simple problems, the analytic methods have the advantage of permitting one to obtain a functional solution which contains the original network parameters in explicit
* Original manuscript received by the IRE, June 9, 1955; revised manuscript received, August 18, 1955. j- Rome Air Development Center, Griffiths AF Base, Rome, N. Y.
form. As the order of the differential equation increases, this advantage is lost and numerical methods may pro-vide a solution with less labor. Recently, methods have been published which endeavor to systematize the numerical approach into easily used disciplines of wide applicability. 1-6 These methods are based upon a num-ber series expansion, the coefficients of which are the values of the desired time function at times that corre-spond to the particular term of the number series ex-pansion. Madwed extends Tustin's method of deriving number series utilizing the time domain only.' Unfor-tunately Madwed's method utilizes cumbersome nota-tion and manipulation.
Cruickshank utilizes jump functions in approximating the solution of continuous linear systems.4 The method
A. Madwed, "Number Series Method of Solving Linear and Nonlinear Differential Equations," Rep. No. 6445-T-26, Instrumen-tation Lab., MIT; April, 1950.
2 J. R. Ragazzini, and A. R. Bergen, "A mathematical technique for the analysis of linear systems," PROC. IRE, vol. 42, pp. 1645-1651; November, 1954.
3 A. Tustin, "A method of analysing the behavior of linear sys-tems in terms of time series," "A method of analysing the effects of certain kinds of nonlinearity in closed-cycle control systems," Jour. IEE, Proceedings at the Convention on Automatic Regulators and Servomechanisms, vol. 94, Part II-A, pp. 13Off ; May, 1947.
4 A. J. O. Cruickshank, "A note on time series and the use of jump functions in approximate analysis," Proc. IEE, vol. 102, Part C, pp. 81-87; March, 1955.
6 J. Oswald, "Filtres en echelle dementaires," Cables and Trans., vol. 7, pp. 325-358; October, 1953.
6 J. G. Truxal, "Numerical analysis for network design," TRANS. IRE, vol. CT- 1, pp. 49-60; September, 1954.

90 PROCEEDINGS OF THE IRE January
requires knowledge of the zeros of the characteristic equation for each of the individual transfer functions in the system.
Ragazzini and Bergen have applied z-transform theory, which was developed for the analysis of sampled data systems, to the solution of continuous linear sys-tems with successful results. In a typical system, the method requires that the Laplace transform of the indi-vidual network blocks be known in factored form; i.e., the roots of the characteristic equations of the individ-ual blocks must be known. In addition, a fictitious net-work block known as a "triangle generator" must be in-serted in the network loop. This entails considerable complication to the equations, especially when the loop itself is of any complexity.
In this paper, a method will be described which uti-lizes the z-transform directly to obtain the responses of linear and nonlinear continuous systems. A knowledge of the roots of the characteristic equation will not be re-quired nor will a "triangle generator" be necessary. The simplicity of obtaining the result by the process of long division when dealing with linear systems by the other methods will be retained and extended to the solution of time varying and nonlinear differential equations.
Before describing the theory, it is advantageous to summarize the procedure to be used. This should em-phasize the simplicity of the method. Assume that one has the Laplace transform of an output response. This could have been obtained by taking the Laplace trans-form of a differential equation including initial condi-tions, or by manipulation of Laplace transfer functions. The Laplace transform of the response will usually be available in the following form:
ao alS a2S2 ± • • • akSk • • • ± anS" F(S) =
b0 biS b2S2 ± • • • bek • • • +
The steps to obtain the time response are: 1. Express the function F(S) as a rational fraction in
powers of S-1 by dividing the numerator and denomi-nator by Sni.
2. Substitute for S-K a rational fraction in powers of z-1 obtained from Table I and rearrange F(S) as a ra-tional fraction in powers of z-1.
3. Divide the resulting expression by T, where T is the time interval between points at which the solution
is desired. 4. Expand the fraction by synthetic division into a
series of the form
Do + D2z-2 + • • • + Dnz-n + • • • ,
(1)
(2)
where Dn, the coefficient of Z— n, is the approximate value of the time response at t=nT.
LINEAR SYSTEMS
Assume an arbitrary function of time f(t) as shown in Fig. 1(a). The Laplace transform of f(t) is defined by
F(S) = f (3) o
while the inverse Laplace transform is given by
1 C-14.0
1(1) = — f F(S)estrIS. 27d -J.
Fig. 1(b) indicates symbolically the result of sampling the function f(t) utilizing shifted unit impulses. The re-sult is a series of impulses at times t = nT. The areas of the impulses are equal to the amplitudes of the function .f(t) at corresponding times t = n T.' The Laplace trans-form of the sampled function is given by'
6-
(4)
e(esT) = E Anne-see. (5)
f(n T)
f ( o)
I ( T)
I
O T 21 (n-I)T nT (nrOT
TIME
Areo f ( nI)
T 2T (n- 1)T nT (n+1)T
TIME
(a) (&)
Fig. 1—(a) Arbitrary function of time; (b) Sampled function of time (symbolic).
If the substitution
z = eST (6)
is made in (5), the result is the shorthand notation known as the z-transform;
(7) F*(z) = E ". n 0
The inverse z-transform is given by
f(riT) = F*(z)e-idz, (8)
where the contour is taken around a circle centered at the origin in the z-plane and including all the singulari-ties of F*(z)." The relationship (6) conformally maps the Jce axis of the s-plane into a unit circle about the origin in the z-plane.
Although the z-transform defined by (7) is given in series form, it can usually be expressed in closed form for the functions of time arising in engineering practice.' A simplified method for accomplishing this has been reported.'" The result will appear as
7 J. R. Ragazzini and L. A. Zadeh, "The analysis of sampled data systems," Trans. AIEE, vol. 71, Part II, pp. 225-232; Novem-ber, 1952.
8 E. I. Jury, "Analysis and synthesis of sampled data control systems." AIEE Commun. and Elec., vol. 73, pp. 332-346; Septem-ber, 1954. ° C. Holtsmith, D. F. Lawden, and A. E. Bailey, "Characteristics
of sampling servo systems," Automatic and Manual Control; Butter-worth's Scientific Publications; London, pp. 377-407; 1952. '0 R. Boxer, "Frequency analysis of computer systems," PROC.
IRE, vol. 43, pp. 228-229; February, 1955.

1956 Boxer and Thaler: Solving Linear and Nonlinear Systems 91
ao alz-1 oar' ± • • • ± anr"" F*(z) = (9)
bo biz-1 b2z-2 . . .
An advantage of the z-transform is evident in that divi-sion of the numerator by the denominator will yield the coefficients f(nT) as defined by (7) directly, without re-sorting to the inversion integral of (8).2
It would be desirable to utilize this characteristic of z-transform theory in the analysis of nonsampled sys-tems. To do this, one uses the Inverse Laplace Integral of (4),
1 C+.1«,
1(1) = f F(S)estdS, (10) 2rJ c_jea
which can be expressed for a contour on the Jo) axis of the s-plane as
1 f frIT
f (t) = F(S)es'cIS
[F(s)ess 27rJ jr
Fig. 2 illustrates the manner in which the contour on the Jco axis is divided into two sections in ( 11). The part of the contour shown between — (r/T)≤co≤(r/T) is given by the first integral of ( 11). The second integral is for the remaining portion of the contour co > (7r/ T), < — (ir/T).
Jwt
0<
Fig. 2—Contour taken in complex frequency plane S for approximate solution.
If F(S) has poles on the real frequency axis between —(r/T) and r/T, the path of integration is modified to pass to the right of such poles. If 1/T is chosen suffi-ciently large, the first integral of ( 11) will yield a good approximation of f(t) and the second integral may be discarded. The error is then given by
e(t) — 1 r [F(S)es' + F(—S)e—sek1S. (12) 27r./ JTIT
Further considerations regarding the error will be dis-cussed in the error consideration section. The approximation to f(t) is given by fA(t) as
1 JTIT
fA(i) f F(S)essdS. ( 13)
Letting t = nT,
1 f n JrIT
fA(nT) = — F(S)esrdS'. (14) 2rJ —JaIT
Eq. (6) can be solved for S:
1 S = — In z, (15)
which is substituted into ( 14)
1 rJrIT ( 1 1 MO') = F — In z) 6"T(11T) In z) ( 16)
2rJ J _j „IT T
1 • 1 F (1 fA(nr) = In z) zn-ldz, (17)
2irJf T T
where the contour is a unit circle in the z-plane. Two aspects of ( 17) should be pointed out. The substi-
tution S= (1/T) In z given by (15) is exact for principal values of the logarithm as can be seen by"
1 S = — ln eST
S = ( 1 —)(ST).
(18)
(19)
Thus, the term F[(1/T) In z] is exactly equal to F(S) for — (r/T)≤w≤(r/T). Furthermore, if equation ( 17) is compared with equation (8), it is seen that it has the form of an inverse z-transform except for the constant multiplier 1/T. However, since F[(1/T) In z] is a tran-scendental function instead of a ratio of polynomials in z-', it is not directly expandable, by synthetic division, into a series of powers of z--1. This relatively simple procedure, synthetic division, is applicable only if a suitable approximation can be found. It is well known that if F(S) is expanded in a series of decending powers of S
F(S) = alS-1 + a2S-2 + • • • ,
a functional solution of the form
t2
f(1) = a ± a21 + a3— + • • • 2!
(20)
(20a)
can be obtained. However, an attempt to expand F(S) in ascending powers of S is usually not valid. We are, therefore, led to rearrange F[(1/T)/In z] as a rational fraction of two polynomials in powers of S-'= T/ln z.
Polynomial approximations for the function of T/In z can be obtained from a number of definitions of ln z. The definition selected was
where:
ln z = 2[u +.4 3 + • • • 1,
1 — =
(21)
u F. H. Raymond, "Analyse du functionment des systèmes phy-siques discontinus," Ann. Tele. Commun., vol. 4, pp. 8-9; July, 1949; pp. 250-256; September, 1949; p. 307; pp. 347-357; October, 1949.

92 PROCEEDINGS OF THE IRE January
This definition was selected because the series converges relatively rapidly and further, when this series is used to approximate 1/S= T/ln z the result has the same phase as 1/S for S= Jw. Using this definition, we obtain
1 T T/2
S In z u + ¡u2 + ¡u' + • • •
Then by synthetic division we obtain a Laurent series,
1 T =
S lnz
(22)
T [ 1 1 4 44 = — — - — u - — u3 - — u6 • • • 1. (23) 2 u 3 45 945
Series expansions for S-K can be obtained by raising both sides of (23) to the Kth power. Table I was con-structed by retaining the principal part and the constant term of the Laurent series. This yields a result of the form
NK(Z-1) S K eze =
(1 _ z—i)K
where NK is a polynomial in powers of z-1. The right-hand side of (24) is called the "z-form" for S-K.
Since z = esT, both sides of (24) have a pole of order K at S=0. The right-hand side has additional poles and zeros but these occur sufficiently far out on the real fre-quency axis so as not to introduce appreciable errors where T is chosen so that r/T is greater than the highest frequency of interest.
It might appear that the inclusion of additional terms from the series definition of .9.—K would improve ac-curacy. However, an attempt to do this introduces additional poles in the z-form leading to increased rather than smaller errors. The z-forms obtained by this procedure are given in
Table I for K=1, 2, 3, 4, 5. Column 4 of Table I gives the frequency spectrum of
the z-form obtained by substituting the expression z= e-"T into the forms of column three. As noted earlier, there is no phase shift between the actual spec-trum of column two and the derived z-forms.
00A*(z) (12 + 6T + T2) _ (36 + 6T _ 9T2)z-.1 (36 - 6T - 9T2)z-2 - ( 12 - 6T + T2)z-3
.2
o re o
I I 1 CURVES PLOTTED ARE IFL e-eLe 11— I ti777.
k .2
-2
- 3
3 2.1
Fig. 3—Spectrum amplitude error between z-forms and exact Laplace forms.
It
WT
Fig. 3 plots the error between the z-form spectrum and the actual spectrum for the various values of K.
(24) Example 1—Third Order System
The first example will be based upon the third-order system shown in Fig. 4. With a step input as shown, the Laplace transform of the output is given by
1 MS) =
S' + S
§9-An—S
(25)
Fig. 4—Typical feedback system used in example.
Following the step-by-step procedure outlined in the introduction, the transform is expressed in powers of S-1:
S-3 00(S) = (26)
1 + 5-1 + S-2
Substituting the corresponding forms from Table I and dividing the result by T,
6 T2(z-1 z-2)
To note the effect of using only a finite number of terms of the inverse log expansions, the frequency spectrum of the z-forms may be expanded into the series shown in column 5 of Table I. The first term of each series is identical to the exact frequency spectrum of column 2. The magnitude of the coefficients indicates that the z-form approximation improves as K becomes larger. In all cases, the series reduces to the exact spectrum in the limit as T becomes zero.
(27)
The solution is obtained by choosing T and dividing the denominator of (27) into the numerator. A discussion of the choice of T will be given in the section on error analysis. At this point, assume T=1.0, causing the out-put to be expressed as
0oA*(z) = 19 - 33z-1 + 21z-2 - 7z-3
Carrying out the long division process,
6z-1. ± 6z-2
(28)
.316z-1 + .864z-2 + 1.15z-6 + 1.16z-4 + 1.06z-' + .987z-6 + • • •
19 - 33z-1 -I- 21z-2 - 7z-3)6z-1 + 6z-2 (29)

1956 Boxer and Thaler: Solving Linear and Nonlinear Systems 93
12
lo
2
o
E % ACT SOLUTION
L• APPROXIMATE T. 10 • APPROXIMATE T. 05
4
TIME ( SEC)
6 7
Fig. 5-Exact and approximate solution to third-order system.
These points are plotted in Fig. 5, together with the exact solution.
The accuracy improves if smaller values of T are taken. This will be indicated by letting T=0.5 in the example just considered. Substituting T=0.5 into (27).
1.5z-4 + 1.5z-2 00A*(z) = (30)
15.25 - 36.75z-4 ± 30.75z-2 - 9.25z-3
Carrying out the long division process,
The methods described previously may be used to ob-tain the solution to (33). Alternatively, the high-fre-quency component can first be removed by dividing the denominator of (33) into the numerator once. This yields a quotient u/S and remainder (1 - u). Thus
u 1 - u Y(S) - - +
S S2 + S
In this procedure, the step function of amplitude u is added to the result obtained after operating upon (1 - u)/S2+S.
In general, the following rules can be stated:
1. If the degree of the denominator of the Laplace transform is higher than the degree of the numera-tor by two or more, proceed directly.
2. If the degree of the numerator is one less, equal to, or greater than the degree of the denominator, divide until the remainder meets the criterion of Rule 1.
(34)
In the example under consideration, let u = . 1. Ex-pressing the second term of (34) in powers of S-1,
0.9S-2 Vi(s) = (35)
1 ± S-'
.0984z-2 ± .335z-2 ± .610z-3 ± .853z-4 ± • • •
15.25 - 36.75z-' 30.75z-2 - 9.25z-01.5z-' ± 1.5z-2
The points obtained in this case are plotted on Fig. 5.
Example 2-Solution of Differential Equation
The method described in this paper is applicable to the solution of integro-differential equations. To do this,
(31)
Substituting the z-forms of Table I and dividing by T,
0.9T(1 10z-1 ± z-2) l'iA*(z) = (36)
(12 + 6T) - 24z-' + ( 12 - 6T)z-2
Letting T=0.1 and carrying out the long division,
.00714 ± .085z-2 ± . 163z-2 ± .233z-3 ± .296z-4 + .354z-4 ± • • •
12.6 - 11.4z-2-).09 .09z-2
one takes the Laplace transform of the equation includ-ing any initial conditions in the usual way, and then proceeds exactly as above. If the numerator of F(S) is only one degree less than the denominator, the solution
as a function of time will exhibit an instantaneous rise to an initial value at time t= 0. It is usually worthwhile in such cases to eliminate from F(S) the high frequencies implied by the instantaneous rise. This is very readily done by using synthetic division to reduce the degree of
the numerator. This is best illustrated by a simple ex-ample; namely
dY
-di + 1 (32)
Assuming an initial condition Y(0) = u, the Laplace transform Y(S) is
yol
(37)
6 I
-dy
dt
I
+y=1;
I
y(o)=.I
I I
5
4
3
2
- 0
EXACT
APPPDX SOLUTION MATE SOLUTION T 0 1 I _
"I
Fig. 6-Exact
5 4
TIME SEC / 6 7 e
and approximate solution of first-order differential equation having initial condition.
Y(S) - 1 + Su Su + 1
S(.9 + 1) S' + S (33) This result is plotted in Fig. 6 after adding the step
function of amplitude 0.1.

94 PROCEEDINGS OF THE IRE January
TABLE I
Z-FORMS
S-K (..1(0)-K
S-, T
z-Form-= F K (Z— I)
2 1—z-1
F ( e—.1€ T
T (or —J
2 2
J JwT2 Jw3T4 -F
w 12 720
S-3
S-3
—07 T2 1+10r-'+r2
12 (1—z-e)' ri 12 csc2 ) \ 4 2
WI
z-'+z-I
2 (1—z-53
wT
T3 cos 2
8 sinew/.
2
1 Jr weTe
we 240 6048
J JwT4 Jw8T6
WI 240 3024
S-1
S-0
WI
WI
Te Te
6 (1—z-e)e 720
T4(2-Fcos wT 1 \
48‘ sine wT 15i
2
1 Jr were
we 3024 -F 34560
71 Z-1-1- 118-2-1- 11Z-3-1-Z-4
24
T cos le OJ +11 cos —2 2
wT sine-2
J JwT3 Jw3T8
e+ 6048 + 34560+
TIME-VARYING SYSTEMS
The general form of a linear differential equation with time-varying coefficients may be expressed as
d. d"-1 (It" [QM -F — [(f.-1(1)171 4- • • • fo(1)17 = f(1), (38) dt"-1
where f(t), f.--i(t) • • • , fo(t) are functions of the inde-pendent variable t. This type of differential equation can be solved using the z-forms of Table I by the follow-ing procedure:
1. Obtain the Laplace transform of (38) in the usual manner including initial conditions.
2. Proceed as in the constant coefficient case dis-cussed above. In performing the long division process, however, change the values of C., • • • Co at each step in the division process to the values at the corresponding times of the functions
C. = f„(1)
Co =
In general
(39)
C = fi(t). (40)
The justification for the above procedure is outlined in the Appendix. To illustrate the procedure, a simple time-varying
equation, the exact solution of which is easily available, will be used. Let
dY — ti- = t. dt
The exact solution, assuming y(0) = 0, is
Y =- 1 - e--'212.
Following the procedure outlined, (41) is
dY — CV = I. dt
(41)
(41)
rewritten
(43)
Taking the Laplace transform, considering C constant, and Y(0) = 0,
Y(S) = 1
S3 + CS'
Expressing as powers of S-',
(44)
s-a V(S) = (45)
1 ± CS-1
Substituting the z-forms of Table I and dividing by T,
YA*(z) = (2 ± .4C) - (6 + .4C)z-t + (6 - .4C)z--2 - (2 - .4C)z-3
z -
(2 ± CT) - (6 ± CT)z-1 + (6 - CT)z-2 - (2 - CT)z-3
Letting T=0.4,
.16z-' . 16z-'
(46)
(47)

1956 Boxer and Thaler: Solving Linear and Nonlinear Systems 95
The long division process is carried out letting C= 0.4 during the first step of the division, 0.8 during the sec-ond step, and 1.2 during the third step, and so forth, yielding
Since n cannot be taken outside the summation sign, the equivalent z-form for -dF(S)/dS can be expressed as
E nTf(nT)z-nT. (53) n=.0
.0741z-' -I- . 266z-2 ± .503z-3 + . 714z-4 + • • •
(2 + .4C) - (6 .4C)z-i + (6 - .4C)z-2 - (2 - .4C)z-0.16z-1 + . 16z-2 (48)
The solution obtained is plotted on Fig. 7 together with The factor nT is identically equivalent to the factor C the exact solution. of (43).
t
0
I dy F t +
I
ty=t
..................__,— • -
•
B
6
4
SOLUTION SOLUTION 140.4
2
• — EXACT 0 APPROXIMATE
- I 3 .7 20 2.4 2.8 3.2 36 TIME ( SEC.)
Fig. 7—Exact and approximate solution of differential equation with time-varying coefficient.
The limitations upon the form of the time varying coefficients have not been fully examined. Difficulties are encountered if these coefficients become infinite at a value t in the range of interest. It is believed however, that the method is applicable to the type of equations that arise from physical systems. It appears that a minimum limitation upon the form of the coefficients is that they be Laplace transformable.
In addition to the derivation shown in the Appendix, the time-varying situation can be related to the Laplace transform by making use of an approximation to the Laplace integral definition. This will be illustrated for the case in which the coefficients fn(t), f.-4(1) • • • fo(t) are polynomials in t. A well-known relation from Laplace transform theory is
d L[tf(t)] = - — F(S).
SS (49)
For the methods of this paper, the Laplace transform definition
F(S)• = f(t)e-sgdt f' o can be approximated by
F(S) = E f(nT)e-snTT. n=0
Differentiating with respect to S,
dF(S)
SS E nTf(nT)e-surT. (52)
(50)
NONLINEAR SYSTEMS
Nonlinear differential equations may be solved in a manner similar to that for the time varying linear equa-tion. The regression equation is arrived at through the long division process as in the time varying case. The factors such as C., C.-1, • • • Co, however, must now represent functions of the dependent variable.
In general, a nonlinear differential equation can be expressed in the following form:
d » r dY (17' • • ') Y] (117 dt di» n-1 dl • • •) y]
\ • • fo V,— 17,---dt • • • ) Y = 1((), (54)
for which the rules of procedure are 1. Obtain the Laplace transform of (54) in the usual
manner including initial conditions. 2. Proceed as in the constant coefficient case. In per-
forming the long division process, however, change the values of C. • • • Co at each step in the division process to the most recent values available for
In general
dY C. = 1„(17,— • • • )
dt
dY = — • • • ).
dt
dY \
C° = j° U7'•Tit- • • • ) •
Ci-fi V'Tt • • • ).
(55)
(56)
In other words, in the first step, values of C., Co-1, • Co are obtained from the initial conditions for Y, dY/dt • • • . The result of the first division is a new
(51) value of Y to be used in calculating Co, C,,_1 • CO for the second step in the division. New values to be used for the derivatives of Y with respect to t are calculated from the new values of the dependent variables. The process is awkward to describe in words, but is simple in concept.

96 PROCEEDINGS OF THE IRE January
As an illustration, let
dY (57)
The exact solution of (57) obtained by standard means, assuming Y(o) = 0, is
Y =- tanht. (58)
In carrying out the procedure outlined above, (57) is written
dY ± CV = 1.
dt (59)
used in calculating Y at t=(n+1)T is based upon the value of Y one is seeking. This is unavailable, obvi-ously, necessitating the use of the previous value of Y as described above. An improvement in accuracy would result, if each step of the division were iterated. For the same degree of accuracy as obtained in the above example, iteration would permit a larger value of T to be used. Whether the amount of labor saved in the reduction in the number of basic division steps is appreciable compared with the labor involved in the iteration process has not been fully explored. The au-thors believe that it is advantageous to improve the accuracy by choosing a smaller value of T.
The Laplace transform, assuming C to be constant ex- SYSTEMS CONTAINING TIME LAGS
pressed in powers of S-1 is Systems that contain time lags are readily manipu-s-2 lated through the use of the z-forms. One requirement
Y(S) = 1 (60) must be met; namely, the choosing of the sampling CS-'
interval T must be such that T is an integral submulti-Substituting the z-forms of Table I and dividing by T pie of the time-delay. The trivial system of Fig. 9, con-yields
YA*(z) - T(1 ± 10z-' z-2)
(12 + 6CT) — 24z-2 ± ( 12 — 6CT)z-2
Letting T=0.1,
. (61)
0.1(1 + 1Oz-' -I- Z-2) YA*(Z) = . (62)
(12 + 0.6C) — 24z-1 + (12 — 0.6C)z-2
e- r* ee(e) •
Fig. 9—Feedback system containing time lag.
sisting of a delay line with a unity feedback path, will Carrying out the long division procedure yields serve as an illustration of the procedure. For a step
.00833 ± 0.100z-' ± . 199z-2 + . 295z-3 ± .390z-4 ± • • •
(12 ± 0.6C) — ± (12 — 0.6C)z-2)0.1 ± 1.0 z-2 0.1 Z-2 (63)
The solution obtained in plotted on Fig. 8 together input the Laplace transform of the output is with the exact solution. e -rS
00(S) — S(1 ± e-sT)
where r is the time lag. Expressing (64) in powers of S-1,
yft
I e B
6
4
SOLUTION SOLUTION 1.0.1
II --
2.,.......„.....„.„,.... -EXACT 0 APPROXIMATE
• I
2 .3 .4 .5 .6 .7 e .9 TIME ( SEC.)
Fig. 8—Exact and approximate solution of nonlinear differential equation.
In the above example, the value of the dependent variable at t=nT was utilized in calculating the value of the dependent variable at t=(n+1)T. The derivation in the Appendix indicates that the proper value to be
(64)
e-sTS-1 00(S) = (65)
1 ± e-8?
Substituting the z-form and dividing by T,
e-Sr(1 z-1)
00,4* (Z) = (66) 2(1 — z-1) 2e-sr(1 — z-1)
Assuming a sampling period T such that r =3T causes
e-Sr = e-3ST = z-3 .
Substituting (67) into (66)
Z-3 ± Z-4
eoA*(z) — 2 — 2z-1 -I- 2z-3 — 2z-4
(67)
(68)

1956 Boxer and Thaler: Solving Linear and Nonlinear Systems 97
Carrying out the long division process,
0 + 0 + 0 + 0.5z-3 + z-4 z-5 0.5z-° + 0 + 0 + 0.53-9 + • • •
2 — 2z-1 + 2z-3 — 2z-4)0 + 0 -I- O ± z-3 -I- Z-4
The result is shown in Fig. 10 together with the exact solution.
eoi
.0 •
I
•
I -
G EXACT APPROXIMATE
SOLUTION SOLUTION T. 1 T
.5 I
1
• 0 ,. ,, e e
• •
• •
TIME ( SEC.) lOT IIT 121
Fig. 10—Exact and approximate solution to system containing time lag.
ERROR CONSIDERATIONS
Contributions to the total error that result through the use of the method are based upon two factors. The error is due in part to the use of truncated series for the inverse logarithms, and to the fact that the contour of (13) is the finite path along the imaginary axis in the s-plane from — Jr/T to -1-Jr/T. As T—>0, the error goes
to zero because the contour then becomes infinite and the z-forms become exact, as can be seen from column 5 of Table I, where all the terms of the series except the first go to zero. Thus, the smaller the value of T chosen, the more accurate the result.
The z-forms were derived using the maximum number of terms compatible with realizing a denominator of the form ( 1 —z-1)K. Since a more accurate approximation to the logarithm results when more terms of the series are included, an explanation of the limitation on the number of terms is in order. To deal with a specific case, the inverse logarithm series for K=1 will be used. Re-peating the series for convenience,
1 T + z- 1 — z-1) 4(1 — z-)3
S 2 1 — z-1 3 1 ± z-1 45 1 + z-1
44 (1 — z-1)5
945 1 ± z-1 +... 1. (70)
Following the rules outlined, only the first term is taken, yielding
1 T 1 ± z-- ee S 2
(71)
The expression indicates that there is a single order pole at z-1 = 1 in the z-plane. This is equivalent to a single order pole in the s-plane at S=0. This is shown in
Figs. 1 la and 11b. The location of the pole indicates
(69)
that the time response should be a constant. Carrying out the long division in terms of z-1 for ( 71) after dividing by T yields
z-1 z-2 z-3 z-4 . . .
2 — 2z-1)1 + z-1
J It) POLE OF
c•C__
(a)
(72)
Z-1 PLANE POLE OF
T /(— 2 e
Fig. 11 (a) Pole of Laplace forms; ( 3) Pole of z-form.
The result (with the exception of the point at t= 0) is
a sampled unit step. Fig. 12 plots this response. If the second term of the series given by (70) is
included, the result would be
1.0
y(t)
05
1 T
S 3 1 — Z-2
1
e
7' 1 + 4z-l-Ez et,
3 ( 1 — z-1)(1 z-1)
e e o
(73)
(74)
0 2 3 4 TIME ( SEC)
Fig. 12—Time domain solution of first- order z-form using one term of inverse log series.
T=1.0
5
This indicates that there are single order poles at z-1= 1 and z-1 = — 1. The response due to the pole at z-1= 1 yields the constant, while the pole at z-1= 1 causes an oscillation at half the sampling frequency. Carrying out the division indicated by (73) after dividing by T leads to
fz-1 4Z-3 + • • • (75) 3 ± 0 — 3z-2)1 -I- 4z-1 ± z-2

98 PROCEEDINGS OF THE IRE January
The result is plotted in Fig. 13. The desired value of unity is obtained between the sampling points. Exclud-ing the first point, the average of any two succeeding values of (75) is the correct result between the times at which the two values are taken. With this understand-ing, the method of this paper can be applied to the solu-tion of a Laplace transform that does not contain other
than S--' terms. Thus, if
1.0
y (t)
F(S) = s 1
+ 1 I ±
I \
A
/ \
A / / \ \
/11 /
I I
I I \
\
/ I
/ V
\
\ 1i
/ / /
\
\
/I
/
i / T.1.0
if
2 3 TIME ( SEC.)
(76)
Fig. 13—Time domain solution of first-order z-form using two terms of inverse log series.
one may substitute (73) into (76) obtaining after division by T:
FA * (Z) = 1 ± 4z-' z-2
(3 ± T) 4T z-1 (T — 3)z-2
Choose a value for T in (77) and carry out the long division procedure. Then average succeeding values which will yield the result midway between the sampling points to greater accuracy than that obtained using the z-form of Table I for a given choice of T.
If the third term of the series of (70) is included, there results
(77)
Table I do not introduce undesirable responses and can be made as accurate as desired by choosing smaller values of T, it is recommended that those forms be used.
In theory, the error due to the use of the finite contour in the s-plane can be obtained by evaluating (12). In practice, the evaluation is diff cult to perform, and is not recommended as standard procedure. Until simplified procedures for calculating the error are evolved, the successful use of the method is based upon the judicious choice of the value T. The choice of T can be made in
a number of ways. In solving a typical feedback prob-lem, one can always choose a highest frequency of inter-est and then base the choice of T upon the highest fre-quency of interest being down a specified number of db at some subharmonic of the sampling frequency.
In any event, one can always choose a value of T,
obtain a solution, and then compare results with that obtained for a smaller value of T until the change in the least significant figure of interest is negligible.
DISCUSSION
The paper has presented a systematic procedure for the approximate solution of linear, time-varying and nonlinear systems, including those containing time lags. An advantage of the method other than the technical advantages described in the introduction is that the z-forms of Table I are substituted into standard Laplace transforms. The Laplace transform method is well known, allowing one to couple the methods of this paper with other knowledge readily available; i.e., initial and final theorems, Nyquist criteria, frequency response and the convenient method the Laplace transform affords for the introduction of initial conditions.
Further research should extend the applicability of the method. Among the fields that should be investi-
1 T 13 + -I- 236z-2 + 236z-2 A- 111z-4 + — S 45 (1 — z-') ( 1 ± z-') 4
This form contains the pole at z-1 = 1, but has a multiple order pole at z'= — 1, causing an unstable response. Rules for obtaining the correct response could be worked in a manner similar to the discussion associated with Fig. 13, but they would he fairly complicated. Possibly the rules for removing the undesirable oscilla-tions could be obtained using the suggestions made by Huggins in relation to a similar problem.'2 This may merit further investigation.
In general, therefore, taking more terms of the inverse logarithm series introduces unwanted poles, compli-cating the methods for obtaining the desired result. The difficulties are enhanced when the Laplace trans-form forms one is working with contain various powers of S--1 as is usually the case. Since the forms given in
(78)
gated are better methods of choosing T, a simple way of obtaining a quantitative value for the error and utiliza-tion of the technique for synthesis.
In conclusion, it should be pointed out that a definite relationship exists, to an extent not yet determined, to the methods of numerical analysis. This is indicated by the fact that (71) is the z-transform for the trapezoidal rule of integration, while (73) is the z-transform of Simpson's rule. Summation of the first two terms of the series given in (21) is the z-transform of Simpson's -a rule. The z-transforms of these integration formulas have been derived by Salzer, using the numerical analysis relations directly, in connection with integra-tion programming for digital computers."
12 \V. 1-1. Huggins, "A low pass transformation for z-transforms," TRANS. IRE, vol. CT- 1, pp. 69-70; September, 1954.
" J. M. Salzer, "Frequency analysis of digital computers oper-ating in real time," PROC. IRE, pp. 457-466; February, 1954.

1956 Boxer and Thaler: Solving Linear and Nonlinear Systems 99
APPENDIX: JUSTIFICATION OF PROCEDURES A differential equation with functional coefficients
may, in general, be written in either of two forms. The first is
dn
dl" (f n-1 .17) + — (f.-110 -F • • • -I- foY = At), (79)
dt
where the fi are functions of the independent variable t, the dependent variable y and its derivatives. The second form is:
d"Y d" g.— g,-, Y + • • • + goY = g(t), (80)
dt" dt
where the g, are similarly functions of t, y and the derivatives of y. A differential equation having the form of (80) may
be expressed in the form of (79) through the use of the following relation :
d" — goY = E Ckn gn
di" dtk k
dk )( dn-k
Y),
where the Ckn are the binomial coefficients. One can justify the application of the procedures
given in the body of the paper to equations of the form of (79). The procedures are applicable to the form (80) if the functions of g. are slowly varying, otherwise the conversion to form (79) must be accomplished. To illustrate this point, consider
d'Y dY — + + go(t)Y = j(t). dt2 dt
After conversion to the form (79),
(12 d d — Y + — [gi(t)Y] [go(1) - — Mt)] Y = f(t). dt2 dt dt
If gi (t) is slowly varying so that
d d go(t)>> —dt g,(1); —dt
Hi(S) = f hi(t)e-sldi o
F(S) = f j(t)e-sedt o
Rearranging (86),
S'112(S) Si/1(S) Ho(S)
= F(S) + Sh2 (0) + h2'(0) h,(0). (87)
If F(S) is available as a rational function of S, the procedure is somewhat different than instances in which F(S) is not so available. The procedure for F(S) not rational will be discussed subsequently.
Needless complication in this discussion is avoided, without loss in generality, by choosing a particular func-tion F(S). Let F(S)=1/S, in which case (87) becomes
1 1 112(S) + — Hi(S) + — Ho(S)
S S2
(81) = + —1 h2(0) ± —1 [h2'(0) MO)].
Utilizing the z-forms of Table I, one obtains
T 1 H2(s) +
9 1
(88)
z-1 T2 1 + 10z-' z-2 Hi(S) Ho(S) _ z-1 12 (1 - z-1)2
7'' z-' ± Z-2 T 1 + z-1 2 ( 1 - z-53 + 2 1 - z-1 hs (0)
T2 1 ± + Z-2 [112' (0) + h1(0)]. (89)
(82) 12 (1 - z-1)2
It should be noted that (89) reduces to (88) in the limit as T->0. The difference equation that will be obtained from (89) represents an approximation to the original
(83) differential equation. Clearing fractions in (89)
may be neglected and it is not necessary to perform the conversion.
In (79), let hi-fi Y, obtaining
d" d" — ho —1h,,,+ • • • + ho f(l). (84)
To simplify the discussion, without loss of generality, let (84) be of the second order.
d2 d hi -I- ho = f(t). (85)
(112 dt
The Laplace transform is given by
S2112(S) - Sh2(0) - h2'(0) Slii(S) - /11(0)
Ho(S) = F(S), (86)
where
12(1 - z-53H2(S) 6T(1 - z- - Z-2 ± Z-3)III(S)
± T2(1 ± 9z-I ___ 9z-2 z-3)110(S)
6T3(z-1 z-2) 6T(1 - z- - z-2 z-3)h2(0)
± 7'2(1 ± 9z-' - 9z-2 - z-3) [h2'(0) ki(()) J. (90)
Dividing both sides of (90) by T yields the z-transform of proper difference equation. Difference equation is ob-tained by taking inverse z-transform, which leads to
12h2 (t) - 36112 (1 - T) + 36112 (t - 2T) - 12h, (t - 3T)
+6Thi(t) - 6Thi(t - T) - 6Thi(t - 2T)
+ 6Thi(t - 3T) + T2h0(1)+9T2h0(t - T)
- 9T2h0(t - 2T) - T2ho(t - 3T)
= 61nui + 6T2u2+ (6u0 - ( u, - 6u2 ± 6142)112 (0)
T(uo 9u1 - 9u2 - u2) [h2'(0) iiI(0)1, (91)
where t takes on the values nT; n=0, 1, 2 • • • , and
un = 1 for i
un = 0 for i nT.

100 PROCEEDINGS OF THE IRE January
If the numeric values of MO), h2(0) and h2'(0) are in-serted in the right-hand side of (91), and if the usual
17 A* (Z)
The methods given in the body of the paper would yield for (92) the following z-transform expression:
T2(z-1 z-2)
(2 + TC) - (6 + TC)z-1 + (6 - TC)z-2 - (2 - TC)z-2
Performing the synthetic division indicated by (98),
T2 [ T2 T2(6 + T) 0 +
2 T 2 + 2T + (2 T)(2 + 2T)J
(2 + TC) - (6 + TC) + (6 - TC) - (2 - TC))0 T2
O T2
+ T2
T2(6 + T)
2 + T
+ T2(6 + T)
2 + T
assumption is made that ho(t), Mt), and h2(1) are zero for negative arguments, then the solution of the above difference equation is found to give exactly the same results as are obtained by the synthetic division process described in the body of the paper. A simple example will serve to clarify this. Given the differential equation
d'Y d — + — (tY) = 1, dt2 dt
(98)
(99)
It is seen that the sequence of values obtained by the synthetic division propagates in the same way as the results given by (97).
Considering the case in which F(S) is not available as a rational function of S in (87) one may express the equation as
1 1 (92) WS) —s II1(S) + — Ho(S)
S2
the Laplace transform assuming zero initial conditions is
1 S2Y(S) + SL[tY] =
Y(S) + 1 1 L[tY] = Sa •
1 1 1 = — F(S)+— h2(0) — [h2'(0) 112(0)].
S S' S' (100)
(93) Using the z-forms of Table I, dividing by T to obtain the z-transform, and then taking the inverse z-transform yields the following difference equation:
12h2(1)+24122(1-T)+12h2(1-2T)+6Thi(1)-6Thi(1-T) (94)
Substituting the z-forms of Table I to obtain the ap-proximate Laplace transform
T 1+z 1 T2 z-1 + z-2 VA(S) nY] 2 1 - z--2L 2 (1 - z-1)2 e (95)
where Cn=t=nT; for n=0, 1, 2 • • •. Dividing by T to obtain a z-transform and then taking the inverse transform yields
(2 + TC.)Y.- (6 + + (6 - TC,2)Y.-2
- (2 -I- TC.-3)17.-3 = T2u. T2u2. (96)
Solving this difference equation, assuming
y(I) = 0; t < 0
C. = 0; 1 < 0.
The first three values are
y(0) =
y(1) -
y(2) =
T2
2 + T
T2 T2(6 ± n
2 + 2T + (2 -F 2T)(2 T)
+Pho(t)+10T2h0(t- T)+T2h0(t- 2T)
=T2f(1)± 10T2f(1-n -FT2A -2 T)+6h2(0)(140- 142)
T[112'(0) -F h1(0) [uo+ lOui+ua (101)
The synthetic division process equivalent to this differ-ence equation is derived in the following manner. The original differential equation is
d2 d
di2 — (.1.210+f1(Y) .1.0( 17) = (102)
Obtain the Laplace transform in accordance with the rules outlined for variable coefficients (time-varying or nonlinear):
S2C2Y(S) - Sf2(0)y(0) - f2'(0) Y(0) - f2(0) Y'(0)
SCIY(S) - MO) Y(0) -I- CoY(S) = F(S). (103)
Rearranging and solving for Y(S),
1 1 1 —F(S) + — f2(0) Y(0) — q(0) S2 S S2
Y(S) = (104) 1 1
(97) C2 + — C1 + — Co 5 S'

1956 Motsuo: Velocity- Type Frequency Multiplier 101
Where
q(0) = f2'(0) Y(0) + MO) Y'(0) MO) Y(0).
Utilizing the z-forms of Table I, and dividing by T, the following z-transform is obtained:
But
YA*(z) —
lim Y(nT) = 4Y(0) for n =
lim Y(nT) = Y(0) for n
where Y(0) is the exact solution at t = 0.
(106)
T 2 1 + 10Z-1 + Z-2 T 1 ± 10z-1 ± z-2 1 1 + z-1 F*(z) q(0) U2 (0)Y(0)]
12 (1 — z—')2 12 (1 — z-1)' 2 1 — z-1
CO
F(z) = E f(nnz--.-0
T 1 + z-1 T2 1 ± 10z-1 ± z-2 co C2 + +
2 1 — z—' 12 (1 —
which can be inserted in ( 105). After clearing fractions one then can proceed with the synthetic division leading to the same results that are obtained from the solution of (101).
Two further comments are appropriate in this Appendix. First, it can be shown that the procedures of this paper yield values of y(n T) such that
(105)
Second, if initial conditions are neglected in taking the Laplace transform, the method yields a difference equation approximating the system with considerably less algebraic manipulation. This difference equation can be used for computation after the first values of the solution are calculated by any means whatever.
ACKNOWLEDGMENT
The authors wish to express their appreciation to D. L. Ashcroft for his helpful suggestions made during the development of the technique covered by this paper.
Multi-Beam Velocity-Type Frequency Multiplier* YUKITO MATSUOt
Summary— One of the limitations imposed upon a conventional frequency multiplier using a double-cavity klystron is the restriction of rf output caused by the mutual repulsion of electrons. To overcome this difficulty a multibeam velocity-type frequency multiplier was proposed by the author, and theoretical and experimental investiga-tions were made.
Another type of multibeam frequency multiplier has been pro-posed by R. Kompfner, but as far as the author is aware, this tube has not yet been fully examined experimentally nor theoretically be-cause of the complexity of the physical structure.
Experiments made on a tentative model of the proposed frequency
multiplier with two electron beams disclosed that much higher output power compared with conventional klystron multipliers could be derived. It is believed that the new tube is promising in providing a novel means of generating microwave signals of multiplied fre-quencies.
INTRODUCTION
AT THE PRESENT time, crystal detectors are used as frequency multipliers in the generation of millimeter waves, but the multiplied power ob-
tainable therefrom is very small. This is the primary drawback of such frequency multipliers. On the other hand, beam current in double-cavity klystrons contain
* Original manuscript received by the IRE, May 21, 1955; revised manuscript received, June 16, 1955. I. Dept. of Physics, Osaka University, Osaka, Japan.
large quantities of higher-order harmonics and are used as frequency multipliers in the centimeter regions. Drawbacks experienced with double-cavity klystrons, however, are in the debunching force in the electron beam, which increase with large beam current. If the debunching force is reduced to some extent by some sort of way, the multiplied power will be greater. Herein lies the possibility of an effective method of generating millimeter waves by extracting powerful harmonic power from the beam.
Hereupon, in 1951, the author proposed a new type of multibeam velocity-type frequency Jmultiplier con-sisting of several individual beams, thus providing an increased total beam current without serious debunch-ing effect inherent to all high beam density.' This multi-plier tube is provided with a single input and an output cavity common to all the beams. These electron beams, with different dc velocities, are velocity-modulated in common by the input cavity, while the energy of the harmonics generated in each beam are picked up by the output cavity. This type of frequency multiplier will be termed the velocity-type, hereafter.
Y. Matsuo "On the new type of frequency multiplier," The Record of the General Meeting of the Kansai Branches of I.E.E. and I.E.C.E. of Japan, October, 1951.

102 PROCEEDINGS OF THE IRE January
R. Kompfner proposed another type of multibeam frequency multiplier, employing the same number of input cavities with the number of electron beams, in which the driving high-frequency voltages are impressed on each input cavity at different phases.* This method is pretty troublesome, if not impossible, in maintaining definite phase difference between the driving voltages, and it also involves added difficult procedure in the mechanical arrangement. For convenience, this type will be termed the phase-type frequency multiplier. The authors have carried out theoretical studies on
the multibeam velocity-type multiplier as well as the phase-type multibeam frequency multiplier. For sim-plicity, two-beam velocity-type frequency multipliers have been constructed and tested in the centimeter region; i.e., 8 cm,--,3 cm, whose results will be dealt with in the present paper.
OPERATION OF THE TUBE
The operation of the multi-beam velocity-type multi-
plier is outlined as follows. The current components at the mth harmonic of the
klystron, 1„„ are given by
= 2/0./„,(mX) cos m(wt — Bo), (I)
here,
X = ( VI2 Vo) (w//u0) = bunching parameter, I o = accelerating voltage, 1 = drifting length, 00 cot/no = dc transit angle, = driving rf voltage,
/0 = beam current, no = dc velocity.
Transverse debunching results in the reduction of the beam current that passes through the output gap caused by the loss of current collected at the circumference of the cavity gap. Hence, the reduction of rf current caused by transverse debunching is affected approxi-mately by a factor,'
here,
uo = —
1 — (h1) 2, 6
6010 (ha) 2 —
fiv0
a = beam radius, c = light velocity.
(2)
By the effect of transverse debunching, neglecting the effect of longitudinal debunching which is equivalent to
2 R. Kompf tier, "Velocity modulation results of further considera-t ion," Wireless Engr., vol. 17, pp. 478-488; November, 1940.
D. R. Hamilton, J. K. Knipp, and J. B. H. Kuper. "Klystrons and Microwave Triodes," McGraw-Hill Book Company, New York, N. Y., pp. 209 -217, 285-293: 1948.
assuming a constant Bessel function independent of the beam current, the rf power is proportional to
X 2
/02 - (hi) 2 = /0" .
6
This is to say that the rf power is not proportional to the square of the beam current as indicated in the simple klystron theory. Since this transverse debunching effect is based upon the assumption of X < 1, it is not rigor-ously true for X >1, however, it may serve to explain the general behavior of this type of tube. From (2), it follows that the effect of transverse debunching is pro-portional to /0, and inverse proportional to Vos. On the other hand, longitudinal debunching causes a
reduction in the value of bunching parameter at the output gap. In this case the bunching parameter is ex-
pressed as follows,'
sin hl X' = X
hl (3)
Increase of beam current affects X' in such a way as to reduce the maximum value of J.,(mX'). However, the longitudinal debunching effect caused by the increase of beam current may be compensated by adjusting the accelerating voltage. The optimum voltage in the actual adjustment is achieved by maximizing the amplitude of 1m as expressed by (1), wherein /0', as well as J„,(mX') is also a function of Vo. In a beam of finite cross section with a conducting wall, however, there is no longitudinal debunching at the outer edge of the beam, and it should be noted that there is a variation in the bunching parameter with different radial position within the beam. Hereupon, there is an effective bunching parame-ter which must be taken equal to the mean bunching parameter. This effect decreases the rf current of the mth harmonic, since the mean bunching parameter necessarily reduces the value of the Bessel function J„,(mX') from its maximum value determined by the optimum X'. Though it was found experimentally that the wall effect did not extend so far into the beam,* it must be remembered that the wall effect might play an important role as the harmonic order, m, is taken large. At any rate, it may be concluded that the rf power is
not proportional to the square of the beam current caused by such debunching effects. There certainly is a maximum value to the rf power at some value of beam current, say, /0. Therefore, instead of increasing the beam current /0 to increase the rf power which cannot exceed the maximum power, a number of beams, whose beam currents are /0, are adopted, and their bunches may be made to pass through the output gap succes-sively with the definite time intervals by changing their dc velocities (see Fig. 1). If mOo= 27rn (n= integer) is set for each beam by adjusting each velocity, ( 1) is written for N beams as follows:

1956 Matsuo: Velocity-Type Frequency Multiplier 103
= 21 /0V,.(m,(11) io"J,,,(mX2') + • • •
/o (N)J„,(mXN')1 cos nue (4)
Primes show the bunching effects. As the velocities of each beam are different, each bunching parameter has a different value.
In the phase-type, Xi' = X2' • • • =X N ', ancl /0' = /0"= • • • =/0(N), so the rf power of the mth harmonic is proportional to I Nio'f,„(mX1')1 2, which is N' times the rf power of one beam. But in the velocity-type, if J„,(mX1') is adjusted to its maximum value, the values of other Bessel functions become smaller than J„,(mXi'). Also, the beam currents /0', /0", /on • • •, and /o(s') are not equal, because their beam velocities are different. Consequently, the rf power of the mth harmonic is smaller than that of the phase-type. How-ever, if the "B-type arrangement" which will be stated later is adopted, the rf power of the mth harmonic will approach that of the phase-type fairly closely.
ANI Ala A27 A32
N T — N
-•-• T
Ae2 Aot
— TIME
Fig. 1—A-type arrangement of the bunching centers (N -= Number of beams).
THE ARRANGEMENT OF THE BUNCHING CENTERS OF THE BEAMS
Fig. 1 shows the general order of the bunching centers of N beams that arrive successively at the output gap. In Fig. 1, N is the beam number, T is the period of the driving voltage, A11, Al2, • • • , A21, A22, • • • , and AM,
A N2, • • • are the bunching centers of the first, second, and the Nth beam, respectively. In this notation, the first subscript represents the beam number and the second represents the successive bunching centers of the beam specified by N. This arrangement of the order of beam bunches will be termed the "A-type," and it contains the nNth harmonics (n= integer). However, it does not necessarily require that the time intervals be-tween each bunching center are TIN. Another arrange-ment, wherein, for instance, N= 2, is shown in Fig. 2(a). In this case, the 4nth harmonic is predominant among the rest of the harmonics. This arrangement will be called the "B-type." Large difference of velocity be-tween each beam leads to large difference of the bunch-ing parameters, X', of each beam. Therefore, when one beam is adjusted to its optimum bunching, it follows that the others will depart from their optimum bunch-ing. Hence, the B-type arrangement, Fig. 2(a), is richer in the 4nth harmonic than the A-type arrange-
ment, Fig. 2 (b). In general, we assume that there are N beams. One of the beams, say the first beam, will be adjusted to its optimum bunching. The beam the bunch-ing center of which arrives at the output gap next to the bunching center of the first beam will be called the sec-ond beam, and so forth. In order to get the mth har-monic (in general, m /V), one should take the time dif-ference between the bunching centers of the first and
(a.) Au .t?21
(b)
T
Au Azz
T.
- - — TIME
A21
T
2 2
Al2
-r
22
— TIME
Fig. 2—(a) An example of the B-type arrangement of the bunching centers (Number of beams: 2, m=4). (b) A-type arrangement (Number of beams: 2).
the (b+l)th beam as bT/m (b = 1, 2, 3, • • • , N-1). For large m, the values of the bunching parameters of each beam approach each other closely, whereby the multi-plied rf power of the velocity-type approaches fairly close to that of the phase-type. However, when the successive bunching centers are made too close to each other, overlapping of bunches occurs which gives rise to undesirable debunching. Cut-and-try means of adjust-ment seem to be the only way of overcoming this effect.
J.0
.9
.8
.7 4 6 8 10
t(CM)
Fig. 3—Relation between .74(4X1) and drifting space length t, when N = 2, X=20 cm and Va2 = 500 volts (A -type arrangement).
For example, when N= 2, X = 20 cm and the accelerat-ing voltage of one beam, 17 02, is kept constant at 500 volts ( Voo meaning Vo in Fig. 7), the Bessel function ./4(4X1) of the other beam is calculated for the drifting space length l and is shown in Fig. 3, maintaining the
-14(4 XI)
12 14

104 PROCEEDINGS OF THE IRE January
X,
1.3
1.2
1.0
9
8
V.30/OLT)
600
V
50 500
40
30
20
I 0
400
300
200
1 0 0
Vo, a, 4x.)
1.(4X2)
.5
4
3
2
0 0 4 6 8 10 12 14 16
2(CPI)
Fig. 4—The relation between J4(4X1) and the drifting space length /, when N=2, X=20 cm and Vo2 =500 volts. (The time difference of the flight of both beams to output gap is T/4).
Bessel function J4(4X2) to its maximum value by ad-justing the high frequency driving voltage for each drifting space length. As these Bessel functions are in proportion to the magnitudes of the 4th harmonic con-tents of each beam, the multiplied power is proportional to { J4(4X1) -I-J4(4X2) j 2, neglecting the debunching
5MM
1 29MM
IOMM
Fig. 5—Cross section of the two-beam velocity-type frequency multiplier.
effects of electrons. In Fig. 3, the arrangement of bunch-ing centers belongs to the A-type.
Fig. 4 shows the case in which the bunching centers of both beams are arranged as in Fig. 2(a). From Fig. 3 and Fig. 4, the rate of increase of the value of Bessel function, J4(4X1), for the B-type arrangement is found.
In these figures, V represents the high-frequency driving voltage, and Vol represents the accelerating voltages of the other beam ( Vol meaning Vo+Vd in Fig. 7).
Fig. 6—Appearance of the two-beam velocity-type frequency multiplier.
CONSTRUCTION OF TUBE AND EXPERIMENTAL SETUP
The internal construction and external appearance of the velocity-type frequency multiplier are illustrated in Figs. 5 and 6, respectively. Each of the two electron guns is given an inclination to the center axis to facilitate the passage of the electron beams through the aperture of the output cavity. The connection diagram of this tube is shown in Fig. 7. The velocity of the first beam, "1," which is faster than that of the second beam "2," is varied by the voltage Vd. Unbalance of both beams due to different grid potentials relative to each cathode is very small if beam 2 is operated in the vicinity of the temperature limited condition. This condition may be the cause of instability by fluctuation in cathode tem-perature, and therefore this condition is not the best one. Methods of overcoming this point are being considered, but the objections did not prevent obtaining the de-sired results. Electron paths of both beams are affected little by adjusting the difference voltage Vd. Therefore the ratio of the collector current to the total current is almost invariable for the difference of voltage applied between the two beams. The wavelength of the driving high frequency voltage was about 22.5 cm. As the out-put was detected by a crystal detector having a square

1956 Matsuo: Velocity- Type Frequency Multiplier 1(15
Va
law character, the detected crystal current may be con-sidered proportional to the output power, which is designated by Po with an arbitrary unit. Experiments were carried out up to the harmonic order of m = 7.
1
Fig. 7—Connection diagram.
EXPERIMENTAL RESULTS
Effect Due to Velocity Difference
The 4th harmonic power Po and the collector current /c vs the difference voltage Vd are shown in Fig. 8. At V d= 0, the accelerating voltage is adjusted for maximum harmonic power Po, while maintaining constant the driving voltage and the filament voltage. The difference in the time of arrival of the bunching centers of both beams at the output gap for extremum points of Po is calculated from the experimental results of Fig. 8 and is shown in Fig. 9. Here, A21 and A22 are the bunching centers of beam 2 in Fig. 7. At Po = 0 and Vde,;50 volts in Fig. 8, the bunching centers of beam 2 lag about T/8 from those of beam 1, wherein 4th harmonic powers induced by the bunching centers of both beams are out of phase as shown in Fig. 9. In Fig. 9, the sinus-oidal wave represents the 4th harmonic induced by the bunching center A21 in the output cavity. Points of maximum power are explained in the same way. From this figure, the power at Vdr,-.390 volts is seen to be smaller than that at Vez-J150 volts. This is due to the reduction of the harmonic content of beam 1 for large difference voltages. In Figs. 8 and 9, it is clear that con-dition at Voee- 150 volts corresponds to B-type arrange-ment of Fig. 2(a), and that condition at Vde--:390 volts corresponds to A-type arrangement of Fig. 2(b).
Effect Due to Current Density
If the parameters are adjusted in favor of the mth harmonic, which is proportional to the Bessel function
160
I 40
1 20
100
80
60
40
20
P,
• •••.•
100 200 300
Nict (VOL T)
Fig. 8—The 4th harmonic power vs the difference voltage (X4=5.64 cm).
400 500
I 6
I 4
8 6
4
2
O 600
J„,(mX2) of beam 2, the velocity of which is less than that of beam 1, the condition that maximizes the slow beam power output does not simultaneously satisfy the optimum condition of J„,(mXi) of beam 1. Nevertheless, the reduction of J„;(mXi) is compensated to some extent by the decreased transverse debunching effect of beam 1 caused by the larger accelerating voltage.
A2. BUNCHING CENTERS OF .2SEAM A22
BUNCHING CENTERS OF 'I BEAM AT Vd 150V
(51 01
(.>4
Fig. 9—Time relation between the bunching centers of beam 1 and beam 2 at the output gap (calculated from the result of Fig. 8).
Fig. 10 shows a typical relation between the collector current and the third harmonic power. Here, the output is adjusted so as to be at its maximum for each collector current, maintaining constant the driving voltage. Curve C shows the case where there is no velocity dif-ference between both beams; curve D shows the case when the time difference of the flight of both beams to the output gap is T/3. In Fig. 10, the maximum power of curve D is about twice as large as that of curve C. If both beams have equal current densities, and if the debunching effects are not considered for simplicity, the maximum power ratio of both cases, I[Ja(3,(1)
J3(3X2)]/J3(3X2)1 2, is calculated only from the values of Bessel functions. Therefore, the maximum power for curve D is about 2.9 times that of curve C, which is slightly different according to the operating voltage. The reason why the experimental result is smaller than 2.9 is due to the electron path of both beams. This will be explained later.

106 PROCEEDINGS OF THE IRE January
In the region of small collector currents, the power for curve C is little affected by the debunching forces and follows the square law character, as expected theoreti-cally. Hence the power for curve C is larger than that for curve D.
100
R
1 0
D
</
/.. co
V= CON ST.
2 I(MA)
4 7 10
Fig. 10—The 3rd harmonic power vs the collector current. Curve C: without velocity difference between both beams. Curve D: with velocity difference between both beams.
Fig. 11 shows the 3rd harmonic power for the various values of collector current. In this figure, curves A and B are results obtained for beam 1 and beam 2, separately. Curve C is the superposed result of both beams without velocity difference, and curve D is that with velocity difference. If electron paths of both beams coincide with each other, although it is impossible to realize such an electron gun, curves A, B and C will fall on the same curve. In this ideal case, the maximum power ratio of curve D to curve C and therefore the maximum power ratio of curve D to curves A or B is about 2.9, in accord with the above statement. If the paths of both beams
miss the center of the output gap, the ratio of the former becomes smaller, but the ratio of the latter stays almost invariable. In Fig. 11, the maximum power of curve D is more than 2.9 times the maximum power of curve A or B. That the ratio is greater than 2.9 may be due to the fact that the transverse debunching effect is smaller in beam 1, since the velocity of beam 1 is faster than that of beam 2.
100
P
1
„
co ..*'• G
r.e. (../;A
V=CONST. B
i i I i 2 .4
Ic( MA)
7 10
Fig. 11—The third harmonic power versus the collector current. Curve A and Curve B: Curves for beam 1 and beam 2.
In these above experiments, wave interaction be-tween two beams of different velocity is not considered in the present case, owing to the fact that two beams are far apart from each other along their entire path except at output gap. Results of Fig. 8 and Fig. 9 are in good accord with the discussions, neglecting effects of wave interaction. Therefore, it is justified to assume that wave interaction, in construction of the tube as em-ployed here, is of the second-order phenomena.
ACKNOWLEDGMENT The author wishes to thank heartily Professor K.
Okabe of Osaka University, Dr. T. Hayashi, and Prof. S. Mito of the Osaka City University who kindly di-rected the author, and Dr. S. Nakajima, Mr. Y. Yasuoka, Mr. K. Shiozawa, and Mr. C. Shibata of J. R. C. and Mr. K. Takashima and Mr. T. Misugi of Kobe Kogyo Electric Co., Ltd. who helped fabricate the testing tubes. The author is also much indebted to Dr. T. Hatano, Tokyo Shibaura Electric Co. Ltd., for his useful discussion and to Mr. Y. Yamane for his valuable assistance in carrying out the experiment.
G"'"C"

PROCEEDINGS OF THE IRE 107
M. R. Aaron G. R. Arthur V. Azgapetian
1\1. R. Aaron G. S. Axelby G. A. Biernson V. B. Haas, Jr. R. J. Kochenburger
IRE Standards on Terminology for Feedback Control Systems, 1955*
COMMITTEE PERSONNEL
Subcommittee on Terminology for Feedback Control Systems
M. R. AARON, Chairman 1954-55 J. C. LOZIER, Chairman 1952-54
M. Cooperstein J. O. Edson T. Flynn
C. F. Rehberg F. Zweig
Committee on Feedback Control Systems 1954-55
J. E. WARD, Chairman
D. P. Lindorff W. K. Linvill D. L. Lippitt J. C. Lozier T. Kemp Maples W. M. Pease
M. W. BALDWIN, JR., Vice- Chairman
J. Avins W. R. Bennett J. G. Brainerd P. S. Carter P. S. Christaldi A. G. Clavier J. E. Eiselein A. W. Friend V. M. Graham R. A. Hackbusch H. C. Hardy
Standards Committee 1955-56
E. W EBER, Chairman
R. F. SHEA, Vice- Chairman
P. J. Herbst Hans Jaffe Henry Jasik A. G. Jensen J. L. Jones J. G. Kreer, Jr. E. A. Laport A. A. Macdonald Wayne Mason D. E. Maxwell K. R. McConnell
Definitions Coordinator
M. W. BALDWIN, JR.
1. INTRODUCTION
1.1. Prior to the preparation of this standard, no com-plete and self-consistent set of terminology appeared to fulfill the requirements of the IRE. Because of a wide variation in the terminology used by different industries
L. Goldman J. C. Lozier L. H. O'Neill
E. A. Sabin P. Travers R. B. Wilcox S. B. Williams F. R. Zatlin
L. G. CUMMING, Vice- Chairman
H. R. Mimno M. G. Morgan G. A. Morton H. L. Owens P. A. Redhead C. H. Page R. Serrel I R. M. Showers H. R. Terhune J. E. Ward
W. T. Wintringham
and professional societies it was difficult to choose a ter-
minology acceptable to all fiekls. Therefore, a compro-mise has been made among existing terminologies used in the electrical field.
Reprints of this standard, 55 IRE 26.S2 may be purchased while available from the Institute of Radio Engineers, 1 East 79 Street, New York, N. Y., at $0.50 per copy. A 20 per cent discount will be allowed for 100 or more copies mailed to one address.

108 PROCEEDINGS OF THE IRE January
2. DEFINITIONS
2.1 Signals
2.1.1. Loop Input Signal. An external signal applied to
a feedback control loop.
2.1.2. Loop Output Signal. The controlled signal ex-tracted from a feedback control loop.
2.1.3. Loop Feedback Signal. The signal derived as a function of the loop output signal and fed back to the mixing point for control purposes.
2.1.4. Loop Actuating Signal. The signal derived by mixing the loop input signal and the loop feedback
signal.
2.1.5. Loop Error Signal. The loop actuating signal in those cases in which it is the loop error (See 2.4.10).
2.1.6. Loop Return Signal. The signal returned via a feedback control loop to a summing point, in response to a loop input signal applied to that summing point, and subtracting from the loop input signal.
Note: The loop return signal is a specific type of loop input signal.
2.1.7. Loop Difference Signal. The output signal from a summing point of a feedback control loop produced by a particular loop input signal applied to that sum-ming point.
Note: The loop difference signal is a specific type of
loop actuating signal.
2.2. Points and Paths
2.2.1. Mixing Point. In a block diagram of a feedback control loop, a symbol indicating the relationship of one output to two or more inputs, such that the value of the output at any instant is a function of the values
of the inputs at that instant. Note: If a mixing device in practice contains dynamic
elements, these shall be considered as transfer elements in one or more of the signal paths entering or leaving
the mixing point.
2.2.2. Summing Point. A mixing point whose output is obtained by addition, with prescribed signs, of its
inputs.
2.2.3. Multiplication Point. A mixing point whose out-put is obtained by multiplication of its inputs.
2.2.4. Forward Path. In a feedback control loop, the transmission path from the loop actuating signal to the
loop output signal.
2.2.5. Feedback Path. ln a feedback control loop, the transmission path from the loop output signal to the
loop feedback signal.
2.2.6. Through Path. In a feedback control loop, the
transmission path from the loop input signal to the loop output signal.
2.3. Transfer Functions
2.3.1. Transfer Function. A relationship between one system variable and another that enables the second variable to be determined from the first.
2.3.2. Transfer Ratio. The transfer function from one system variable to another in a linear system, expressed as the ratio of the Laplace transform of the second variable to the Laplace transform of the first variable, assuming zero initial conditions.
2.3.3. Loop Transfer Function. The transfer function of the transmission path formed by opening and proper-ly terminating a feedback loop.
Note: One example of proper termination is a zero impedance generator driving the opened loop, and an output termination for the opened loop equal to the impedance facing the generator.
2.3.4. Loop Transfer Ratio. The transfer ratio of a loop return signal to the corresponding loop difference signal.
2.3.5. Forward Transfer Function. In a feedback con-trol loop, the transfer function of the forward path.
2.3.6. Feedback Transfer Function. In a feedback control loop, the transfer function of the feedback path.
2.3.7. Return Transfer Function. In a feedback control loop, the transfer function which relates a loop return signal to the corresponding loop input signal.
2.3.8. Difference Transfer Function. In a feedback control loop, the transfer function which relates a loop difference signal to the corresponding loop input sigm.l.
2.3.9. Through Transfer Function. In a feedback con-trol loop, the transfer function of the through path.
2.3.10. Actuating Transfer Function. In a feedback control loop, the transfer function which relates a loop actuating signal to the corresponding loop input signal.
2.4. General
2.4.1. Feedback Control Loop. A closed transmission path, which includes an active transducer and which consists of a forward path, a feedback path, and one or more mixing points arranged to maintain a prescribed relationship between the loop input signal and the loop output signal.
2.4.2. Feedback Control System. A control system, comprising one or more feedback control loops, which combines functions of the controlled signals with func-tions of the commands to tend to maintain prescribed relationships between the commands and the controlled signals.
2.4.3. Feedback Control System, Linear. A feedback control system in which the relationships between the pertinent measures of the system signals are linear.

1956 IRE Standards on Feedback Terms 109
2.4.4. Feedback Control System, Nonlinear. A feedback control system in which the relationships between the pertinent measures of the system input and output sig-nals cannot be adequately described by linear means.
Note: A system can be either quasi-linear or nonlinear, depending upon operating conditions and performance requirements.
2.4.5. Feedback Control System, Quasi-Linear. A feed-back control system in which the relationships between the pertinent measures of the system input and output signals are substantially linear despite the existence of nonlinear elements.
Note: A system can be either quasi-linear or non-linear, depending upon operating conditions and per-formance requirements.
2.4.6. Feedback Regulator. A feedback control system which tends to maintain a prescribed relationship be-tween certain system signals and other pre-determined quantities.
Note I: This definition is intended to point out the fact that some of the system signals in a regulator are adjustable reference signals.
Note 2: It should be noted that servomechanism and regulator are not mutually exclusive terms; their applica-tion to a particular system will depend on the method of operation of that system.
2.4.7. Servomechanism. A feedback control system in which one or more of the system signals represent me-chanical motion.
Note: It should be noted that servomechanism and regulator are not mutually exclusive terms; their applica-tion to a particular system will depend on the method of operation of that system.
2.4.8. Command. An independent signal from which the dependent signals are controlled according to the pre-scribed system relationships.
2.4.9. Disturbance. An undesired command.
2.4.10. Loop Error. The desired value minus the actual value of the loop output signal.
LOOP INPUT SIGNAL IMIXING
POINT
LOOP FEEDBACK SIGNAL
LOOP ACTUATING SIGNAL FORWARD
TRANSFER FUNCTION
FORWARD PATH
FEEDBACK TRANSFER
LOOP OUTPUT SIGNAL
• le.
FUNCTION FEEDBACK PATH Fig. 1
3. EXAMPLE
3.1. Application of the standard terminology to a typi-cal block diagram is shown in Fig. 1.
CORRECTION
E. A. Gerber, author of the correspondence "Tem-perature Coefficient of AT Cut Quartz Crystals," which appeared on page 1529 of the October, 1955, issue of the PROCEEDINGS OF THE IRE, has brought the following
correction to the attention of the editors. In the first column, twelfth line from the bottom of
the page, the term feet should be replaced by the term minutes.

110 PROCEEDINGS OF THE IRE January
Correspondence
Scattering Matrix Measurements
on Nonreciprocal Microwave De-
vices*
I read with considerable interest the let-ter by A. C. MacPherson' describing a method of measuring the scattering matrix elements of nonreciprocal microwave four-pole. We have worked out a strikingly similar technique early this year and have been using it in our laboratory.2 Since our method gives a somewhat more rapid meas-urement of the scattering matrix parameters, we believe it warrants description. A two-port microwave device (Fig. 1) is
described by
ri = Sod' Si2d2
T2 = S2idi S22d2,
where d1 and cis represent the waves incident on the device, and r1 and r2 represent the outgoing waves.
di
r,
d2
Fig. 1—Two-port microwave device.
Then
= = S, -I- Suds/di
r2
r, = r2/d2 = S22 + S21(11/(12,
where we have denoted ri/d, and r2/d2 by ri and 1'2; these complex reflection coeffi-cients are measurable by slotted lines. In particular, if I d2I = I di I , so that d2/d, =e0, then
= Si, + sue
= S24 ±
If the angle O is adjusted to be first zero (with respect to some reference plane) and then Ir, we have
ri(-) = + si2 (0 = 0)
IV) = S11 - S12 (0 = 7r)•
Therefore,
Sil - 2
_ r1(b)
+ rio)
S12 - 2
(1)
(2)
• Received by the IRE. August 26, 1955. Work carried out under AF Contract No. 19(604)-1084. while the writer was a General Communications Company Fellow in Applied Physics.
1 *Measurement of microwave nomeciprocal four-poles,* PROC. IRE. vol. 43. p. 1017; August, 1955.
Cruft Lab., Harvard University, Prog. Rep. No. 34. Contract N5 ORI-76, p. 8; Jan., 1955. Ibid.. No. 35, p. 7; April, 1955. A complete description with a discussion of errors is given in Gordon McKay Lab-oratory. Harvard University, Pros. Rep. No. I, Con-tract AF 19(604)-1084; July. 1955.
A similar set of equations holds for S22 and S21. Thus, if two measurements of Fi (r.(-, and rim) are made, Su and Su are determined by (2); similarly, S2, and S22 are determined from two measurements of rz.
The measurement setup is illustrated in Fig. 2. The device under test is to be inserted at plane a-b. The procedure is as follows:
MATCHED CLOTTED PAD .1NE
MAGIC
MATCHED PHASE MATCHED PAD SHrFtER vAR4AEILE
AT TENuATDR MATC.ED ,OAD
SPDNAL 50UnCE
Fig. 2—Test set-up.
1. With a straight section of waveguide inserted at plane a-b, adjust the variable (uncalibrated) attenuator until an infinite vswr is observed in the slotted line. Then d2I = I dd. Set the phase shifter so that a minimum in the standing wave occurs at the desired reference plane; the setting on the phase shifter corresponds to 6=-7r. If the phase shifter is uncalibrated, it may be calibrated at this point by adjusting it until a maximum in the standing wave appears at the previously selected reference plane, at which time the phase shifter is set for 0 =0. This completes the calibration adjust-ments and takes the place of the measure-ment of Bgi/Bg2 suggested by MacPherson.
2. Insert the unknown at plane a-b and measure Fiw) and I'l(5) for the two positions of the phase shifter. Su and S12 are then determined.
3. Turn the device end-for-end and re-peat step 2, measuring i'21°) and no', thus determining S22 and Se.
If a second slotted line is used at the right of the plane a-b, as suggested in Mac-Pherson's Fig. 2, the whole measurement described above is carried out without re-moving the device, once the calibration ad-justments of step 1 are made.
This procedure is somewhat more con-venient than that described by MacPherson although it is obvious that his procedure will give a more accurate measurement of Su and S22.
Finally, a consideration of errors shows that for reasonable accuracy the pads (or Unilines) must be well-matched, as em-phasized by MacPherson. The commercial Unilines with which we are familiar are not sufficiently well-matched to use without additional matching devices. On the other hand commercial pads have proven ade-quate of themselves for our purposes.
Professors C. L. Hogan, J. E. Storer, and Dr. E. G. Fubini gave valuable suggestions in connection with this problem.
J. E. PIPPIN Gordon McKay Lab. Harvard University Cambridge, Mass.
A New Treatment for Parabolic Re-
flector Problems*
Parabolic reflectors are often used at microwave frequencies to obtain a high directivity and large antenna gain. The ordinary procedure is to calculate the re-flected field strength at a point by the ordi-nary ray treatment—considering the reflec-tion at the parabolic reflector. A slight modi-fication of this procedure is to consider it on the image basis.
Suppose 0 is a line source at the focus of the parabolic cylinder reflector PQV shown in Fig. 1. Considering only the trans verse section in the plane of the paper, the field strength due to the reflected wave at any point on the right of the reflector can be calculated on the assumption that the radiation is coming from a line source LL' (the directrix of the parabolic reflector) which emits a parallel beam of radiation. Thus the problem of calculating the reflected field strength at any point is simplified. The actual field strength is the superposition of the direct field strength due to the source proper over this reflected field strength.
Fig. 1
In order to calculate the field strength we should also know the intensity distribution along the image. If the ray OQ makes an angle 20 with the axis OV, then (from the properties of the parabolic cylinder) the im-age of 0 in the reflector element near Q will be the point B on the directrix, and LQ0B = LQB0. Also, as QB is parallel to OD, LQB0= LBOD. Therefore, LBOD is half LQ0D or ZBOD = O. Similarly, if a por-tion PQ of the parabola makes an angle2 #50 at 0, then its image AB will make an angle 60 at the same point. Now,
* Received by the IRE March 18. 1955. Revision received, August IS, 1955.

1956 Correspondence 111
AB = (0B)• 60 sec 0 = (0D)• 60 sect O.
The power radiated by the source 0 is proportional to 2 60, and, since OD is con-stant, the intensity I at the point B of the image (directrix) is proportional to cost where 0= ZDOB.
The above treatment can be easily ex-tended to the three-dimensional case in which the image will be a plane sheet per-pendicular to the axis.
B. CHATTERJEE Indian Institute of Technology
Kharagpur, India
A Method of Launching Surface Waves*
In order to launch surface waves effi-ciently the field pattern of the launching de-vice should be matched as closely as possible to the pattern of the wave. A very good match can be obtained with the systems shown in Fig. 1. The principle of the method is to maintain the phase velocity of the wave constant throughout the system.
I. E. DIELECTRIC GUIDE..
T.14 DIELECTFUC GUIDE-.
I \cosh ex.p
ININIIP1111 1,H111111111111111111111 11111111111111
coikeuGarco
Fig. 1
In the diagrams the vertical amplitude variation of the component of field per-pendicular to the paper, and the wave nor-mal of the elementary criss-crossing plane waves in the dielectric are shown. The phase velocity in the dielectric guides is given by c/n sin 0, where c is the velocity of light, n is the refractive index of the dielectric, and
is the angle between the wave normal of the elementary plane waves in the dielectric and the vertical. In the corrugated guide the angle of the elementary wave is complex, and the phase velocity is given by c/sin where sin =sec 22-d/X, d being the depth of the slots outside the horn.
Experiments with the first system showed that if the horn was tapered gradually the radiation loss was very small indeed.
• Received by the IRE, September 7, 1955.
This letter is based on work done at the Telecommunications Research Establish-ment, Malvern, England, in 1946
J. D. LAWSON Atomic Energy Res. Establishment,
Harwell, England.
Noise Reduction in CW Magnetrons*
In two-way microwave systems operat-ing in both directions simultaneously, the noise voltage in the receiver due to the local transmitter may well be as large as the re-ceived signal. The reduction of noise in transmitting tubes is thus highly desirable.
The rf output of self-excited oscillators in general, and of magnetrons in particular, is a function of the parameters of the power supply. Experiments have shown that this is usually true for the noise output too, specifically, that the fluctuations in anode current are usually correlated with the rf noise, which appears as modulation of a sinusoidal carrier wave.i Thus one expects that increasing the impedance of the power supply will reduce the noise output by re-ducing the anode current fluctuation.
The AM and fm noise modulations of the magnetron have been measured using a crystal video receiver; for fm detection, an off-tune resonant cavity acting as a micro-wave discriminator is included.2 Several types of S- and X-band magnetrons have been tested; the figures illustrate the meas-urements on a typical RK5609, a 100-watt cw S-band tube, in which the carrier to noise ratio in theAM measurements is about 70 db.
Fig. 1 shows the power in the anode cur-rent fluctuations in the frequency band from 2 kc to a variable upper frequency limit
Ao
20
t,0
«C
I ANODE CURRENT FLUCTUATIONS
9 %).L‘W11161
/90 •0 ,OA
Z. • IAA IL
I R05609 50.00351F
50FC I00 AC 50000 INC 5 hic «950 10 -.•
Fig. 1—Anode current fluctuations,
which appears as abscissa with either zero or twelve thousand ohms in the anode line. The unregulated noise output rises at 3 db per octave which is characteristic of white noise. The increased impedance reduces the amount of noise present by 15 to 18 db at low frequencies. Above 1 mc the regulation
* Received by the IRE. September 26, 1955. D. Middleton, W . M . Gottschalk, and I. B.
Wiesner. "Noise in cw magnetrons,' -tour. A ppt. Plays,. vol. 24, pp. 1065-1066; August, 1953.
2 W . M. Gottschalk, ' Direct detection measure-ments of noise in cw magnetrons." TRANS. IRE„ PGED, vol. 1, no. 4, pp. 91-98; December, 1954.
becomes less effective and the noise again increases at 3 db per octave.
Fig. 2 shows the corresponding measure-ments on the AM noise. The noise reduction here follows that in the anode current as re-gards both amplitude and frequency. The narrow bandwidth of the microwave com-ponents eliminates the noise above a few megacycles per second.
ANI NOISE RORER'
111o) 1:61/101
- I. • 0.10
e
Z.:I2 Oft
}
R05609 NO 0035/F
sœc 1006C 5000C INC
Fig. 2—AM noise power.
!MC IO.AC
The fm measurements are shown in Fig 3. The cavity which acts as discriminator is tuned above the frequency of the magnetron, which gives a noise output about 6 db greater than when the cavity is tuned below the magnetron. The frequency dependence of the regulated output is the same as for the anode current, but the maximum noise re-duction is about 6 db less, for the high peak shown in the figure and about 12 db less for the low peak (not shown). In one tube type, no reduction of fm noise was possible, al-though the AM noise was reduced as usual.
40
FIA NOISE NIGH AEA'«
PI 1,1e1911 / 61
1. • 010à
• ZeD11.
Ze.20 A
000C i0OAC 5000C
5609 NO. 003511
MC 5OG
Fig. 3—FM noise high peak.
OJO
Correlation measurements showed that for these tubes the fm noise voltage was uncor-related with the anode current fluctuations.
On approximately a dozen cw mag-netrons, we have found that the AM noise output can be reduced by as much as 25 db and the fm noise output by 15 db by adding impedance in the anode line in order to re-duce the anode current fluctuations?'
R. L. KRULEE RCA Aviation Systems Lab.
Waltham, Mass. J. A. MULLEN
Res. Div. Raytheon Mfg. Co. Waltham, Mass
This work was done entirely under the auspices of Research Division, Raytheon Manufacturing Cu., Waltham. Mass.

112 PROCEEDINGS OF THE IRE January
J. R. BEATTIE
Russian Vacuum-Tube Terminol-
ogy*
The list of Russian terms given below is a continuation of several such lists of radio terms and circuit notations already pub-lished in these columns primarily for the benefit of engineers engaged in foreign-equipment evaluation.
As noted in a previous article the ordi-nary Russian word for tube is namna (lampa) with Tpy6xa (trubka) reserved for special-
all-metal tube amplifier tube cathode-ray tube cold-cathode tube detector tube dissector tube gas tube gas-filled tube general-purpose tube glass tube high-vacuum tube hot-cathode tube klystron magnetron mercury-vapor tube metal-glass tube
purpose tubes. In the present list of tube terms, it may be seen that two methods of noun modification are used in Russian: (1) an adjective, (2) a prepositional phrase introduced by the preposition c or co (with). For example, "glass tube" is expressed by (1) crewman:ma aamna or (2) amnia co crexananum 6aanonom (tube with glass envelope). Other examples of (2) are cold-cathode tube and hot-cathode tube which in Russian are literally "lamp with cold cathode" and "lamp with preheated cath-
neabxomeTaaanneexan .namna ycx.nirreabnan mama icaTontwayttexaa Tpy6x.a .namna C xoaomium xamogom neTexmomiaa aamna nxeceicropllan Tpy6xa tutu:max amnia (Tpy6xa) rasorianoaHeimaa namna yxxxepcaarrman aamna eTexantman aamna nueoRoBaxyyman aamna amnia e nonorpexumm xaTonom HJIHCTI)OH
MarlieTp0H
pTexan namna meTaa.nkmeexo-emeRanliHan nana
mixer tube multielectrode tube multiple-unit tube oscillator tube oscillating tube phototube power tube receiving tube rectifier tube thermionic tube transmitting tube thyratron twin-diode tube variable-mu tube water-cooled tube X-ray tube
ode," respectively. Russian has no word for oscillator, using simply "generator"; thus, oscillator tube is literally "generator tube." X-ray is rendered in Russian by "Rentgen," a transliteration from the German "Roentgen."
G. F. SCHULTZ Indiana University Bloomington, Ind.
* Received by the IRE, October 3, 1955,
emeeirreabilaa namna
mHoroanewrpoxtua amnia MHOPORpanian aamna rexepaTopkiaa amnia rexepllpytornan aamna cicurroTpy6xa monnan TIMM npliemilaa nana
Bunpamwreabliasi amnia
Tepalmoimag namna
nepenatoman na na TnpaTpon CHBOeHHHH HHOHHan aamna amnia "Bapn-mio" .namna C BOHR/ISM oxaagennem penTrenosexaa Tpy6xa
Contributors For a biography and photograph of R.
Adler, see p. 345 of the March, 1955 issue of PROCEEDINGS OF THE IRE.
J. R. Beattie was born in British Hon-duras in 1922. He was educated in Montrose, Scotland, and studied at St. Andrews Uni-
versity. He received a
commission in the radar branch of the R.A.F. in 1942, and served in the United Kingdom and later with a mobile radar unit on the Conti-nent.
At present, Mr. Beattie is a lecturer in the physics depart-ment of the Univer-
sity of Sheffield. His research studies are concerned mainly with the infra-red and the solid state.
Mr. Beattie is a member of the Physical Society of London.
R. Boxer was born on August 6, 1927, in New York, N. Y. He received the B.E.E. degree in 1949 from the Cooper Union and
the M.E.E. degree from Syracuse University in February, 1955.
From 1949 to 1950, Mr. Boxer was em-ployed as a project engineer at the \Vright Air Develop-ment Center, Day-ton, Ohio.
Since 1950, he has been with the Rome Air Development Center, Rome, N. Y., engaged in the de-velopment of control systems involving aircraft and guided missiles. He is the
author of several publications concerned with the analysis of air traffic control, fuel and aerodynamic characteristics, sampled data systems, and digital computers.
Mr. Boxer is an associate member of Sigma Xi.
R. BOXER
For a biography and photograph of P. A. Clavier, see p. 345 of the March, 1955 issue of PROCEEDINGS OF THE IRE.
G. K. T. Conn was educated in Canada and at the Universities of Aberdeen and Cambridge in Great Britain.
G. K. T. CONN
He is presently a reader in the depart-ment of physics in the University of Shef-field.
In his research work, Dr. Conn has been investigating the application of optical techniques to the study of the solid state. He is also studying the mecha-nism of conduction in thin films and vacuum physics.
He is a fellow of the Physical Society of London, and the
Cambridge Philosophical Society, and a member of the Faraday Society.
For a photograph and biography of C. C. Cut!er, see page 231 of the February, 1955 issue of the PROCEEDINGS OF THE IRE
R. S. Duncan was born in New York City, N. Y. on October 19, 1911. He received the E.E. degree from Cornell University in

1956 Contributors 113
R. W. GEORGE
R. S. DUNCAN
1933 and the S.M. in E.E. from Massa-chusetts Institute of Technology in 1935.
Since 1936 he has been a member of the technical staff of Bell Telephone Labora-tories. He worked with a special group on the design of filters and networks until 1950. Since then he has been con-cerned with the de-sign and develop-ment of inductors.
Mr. Duncan is a member of Tau Beta Pi, Eta Kappa Nu,
and Phi Kappa Phi.
M. A. H. El-Said (SM'48) was born in Aga, Egypt, in May, 1916. He was gradu-ated from Fouad University in Cairo in
1938, and was ap-pointed to the facul-ty of engineering. In 1943, he received the M.Sc. degree and in 1944, the Ph.D.
Dr. El-Said was engaged in an engi-neering mission to England and the United States for the Egyptian government through a fellowship from 1945 to 1948.
This project was sponsored by the Marconi Wireless Telegraph Co. in England, and the General Radio Co. in the United States.
Since 1949, he has occupied the post of assistant professor of radio engineering at Cairo University, and was recently assigned by the National Research Council to investi-gate the geophysical prospection of under-ground water by radio methods.
M. A. H. EL-SAID
R. W. George (A'31-SM'44) was born in Jamestown, N. D., on July 19, 1905. He re-ceived the B.S. degree in electrical engineer-
ing from Kansas State College in 1928. Since that time he has been with RCA.
At Riverhead, N. Y. he worked in the fields of high fre-quency propagation, measuring equipment radio relays, and other phases of communications. He transferred to the David Sarnoff Re-
search Center at Princeton, N. J. in 1951 where he has been concerned mostly with the development of electromechanical filters.
He is a member of Sigma Xi.
T. Honma was born in 1923 in Yama-gata-ken, Japan. He received his degree from Yamagata University in 1942 and
K. KURONAWA
T. HONMA
served in the armed forces during World War II.
After the war, Mr. Honma was a mem-ber of the research staff of the Matsuda Research Laboratory of Tokyo Shibaura Electric Co. His ma-jor field of work has been the study of microwave measure-ment and microwave relay systems.
Mr. Honma is a member of the Insti-tute of Electrical Communication En-
gineers of Japan.
C.
R. W. Klopfenstein (S'44-A'46-M'50-SM'54) was born on June 3, 1923, in Aber-deen, S. D. He received the B.S. in E.E. de-
gree from the Uni-versity of Washing-ton in 1944 and the M.S. and Ph.D. degrees in applied mathematics from Iowa State College in 1951 and 1954.
From 1945 to 1946, he was a radio materiel officer in the U. S. Naval Reserve. He became an in-structor in the mathe-
matics department of South Dakota School of Mines and Technology in 1946. In 1948, he joined RCA Victor in Camden, N. J., where he worked on the advanced develop-ment of television and fm transmitting antennas and filters. After three years as an instructor in mathematics at Iowa State, from 1950 to 1953, he returned to RCA Laboratories Division in Princeton, N. J. where he is now a member of the research staff.
Dr. Klopfenstein is a member of Sigma Xi, Phi Kappa Phi, and the Mathematical Association of America.
R. KLOPFENSTEIN
For a biography and photograph of O. M. Kromhout, see p. 346 of the March, 1955 issue of PROCEEDINGS OF THE IRE.
K. Kurokawa was born on August 14, 1928, in Tokyo, Japan. He received the B.S. degree in electrical engineering from the
University of Tokyo in 1951.
Since then, as a graduate student at the university, he has been engaged in re-search on microwave measurements. He was a participant in the Foreign Student Summer Project at the Massachusetts Institute of Technol-ogy in 1954.
L. E. MILLER
Mr. Kurokawa is a member of the In-stitute of Electrical Engineers of Japan, and a member of the Institute of Electrical Communications Engineers of Japan.
•:*
Y. Matsuo was born on July 12, 1919, in Osaka, Japan. He was graduated from the electrical engineering department of
Yonezawa Technical College in 1940, and joined Tokyo Shi-baura Electric Co., Ltd.
From 1943 to 1945 he was engaged in the development of uhf tubes and radar techniques at the Naval Technical In-stitute. In 1945, Mr. Matsuo joined the physics department
of Osaka University where he is presently concerned with research in the development of uhf tubes.
Mr. Matsuo is a member of the Institute of Electrical Engineering and Electrical Communication of Japan.
Y. MATSIJO
L. E. Miller was born on September 30, 1923. He received his B.S. degree in engi-neering physics from Lafayette College in
1949. He was a mem-ber of the technical staff of the Central Research Laboratory of General Aniline and Film Corp. from 1949 to 1952. During this period, his work was concerned pri-marily with the theo-ry of the photograph-ic process. His major efforts were physical-electronic instrumen-
tation and measurements, and a considera-tion of solid-state physics in relation to formation of photographic latent image.
Mr. Miller became a member of the technical staff of Bell Telephone Labora-tories in July, 1952, and has been concerned with the final development of semiconduc-for devices. He is a member of the American Physical Society.
9
For a biography and photograph of J. L. Moll, see p. 1978 of the December, 1955 issue of PROCEEDINGS OF THE IRE.
I M. Ross was born in Southport, Eng-land, on August 15, 1927. He received the B.A. and M.A. degrees in engineering from

114 PROCEEDINGS OF THE IRE January
N. SAWAZAKI
S. SAITO
IAN M. Ross
the University of Cambridge in 1948 and 1952. He received the Ph.D. degree from Cambridge in 1952 for an investigation of
low-frequency noise in vacuum tubes and semiconductors.
Dr. Ross became a member of the tech-nical research staff of Bell Telephone Lab-oratories in Febru-ary, 1952, and since that time has worked in transistor physics and development.
S. Saito waiborn on September 17, 1919, in Tokyo, Japan. He graduated from the electrical engineering department of the
University of Tokyo in 1941. During World War II he was engaged in research on microwave radar for the Naval Tech-nical Research Insti-tute in Tokyo.
He returned to the University of Tokyo after the war, and was appointed as an assistant pro-fessor in 1947. In
1951, he received the Ph.D. degree from the University of Tokyo.
For his research on microwave measure-ments at the Institute of Industrial Science of the University, he was awarded the Aki-yama and Shida Memorial Prize by the Institute of Electrical Communication En-gineers of Japan, and the Hattori Hoko Prize from the Hattori Hoko Kai Founda-tion in 1953.
During the present academic year, he is studying at the Research Laboratory of Electronics of M.I.T. as a Fulbright research scholar. He is a member of the Institute of Electrical Engineers of Japan, and of the Institute of Electrical Communication En-gineers of Japan.
N. Sawazaki was born in Wakayama-ken, Japan, on April 16, 1913. He graduated from Waseda University in 1938, and re-
ceived the Ph.D. in engineering in 1952.
During the war he designed and de-veloped radio altim-eter and radar equip-ment in the Tokyo Shibaura Electric Co. Since the war, Dr. Sawazaki has en-gaged in studies con-nected with micro-wave measurement and microwave re-
lays systems at the Matsuda Research Lab-oratory of Tokyo Shibaura Electric Co., in Kawasaki, where he is chief of research in communication.
F. STERZER
Q. W . SIMKINS
Dr. Sawazaki is secretary of the Institute of Electrical Communication Engineers of Japan, and a member of the Institute of Electrical Engineers of Japan.
W. \V. Siekanowicz (A'49—M'55) was born on January 3, 1928, in Poland. He re-ceived the B.S. degree in electrical engineer-
ing from the Imperial -11 College of Science
Y and Technology, London University, England, in 1948, and the M.S. degree in electrical engineering from Columbia Uni-versity in 1950.
He has been em-ployed in the Tube Division of RCA at Harrison, New Jer-sey since July of 1950
and has specialized in the development of traveling-wave tubes.
Mr. Siekanowicz holds membership in Sigma Xi.
W . SIEKANOWICZ
Q. W. Simkins (S'49—A'50) was born on May 4, 1926, in Camden, N. J. He received the B.S.E.E. degree from Cornell University
in 1949. Since his gradua-
tion, Mr. Simkins has been a member of the technical staff of Bell Telephone Labora-tories, where he has been engaged in the design of transistor and magnetic core digital computer cir-cuits. He has also done research studies concerned with tele-
phone switching systems and circuits. Mr. Simkins is a member of Eta Kappa
Nu, and Tau Beta Pi.
F. Sterzer was born in Vienna, Austria, on November 18, 1929. He received the B.S. degree in physics from the City College of
New York in 1951, and the M.S. and Ph.D. degrees in physics from New York University in 1952 and 1955, re-spectively.
He worked for the Allied Control Co. in New york City from 1952 to 1953. During the school year of 1953 to 1954 he was an instructor in phys-
ics at the Newark College of Engineering in Newark, N. J., and a research assistant
J. H. VOGELSONG
S. THALER
H. A. STONE, JR.
at New York University working on micro-wave spectroscopy. He joined the Tube Division of RCA in Harrison, N. J., in October, 1954. His work with the micro-wave tube advanced development activity is concerned primarily with traveling-wave tubes and backward-wave oscillators.
Dr. Sterzer is a member of Phi Beta Kappa, Sigma Xi, and the American Phys-
ical Society.
•
H. A. Stone, Jr. (A'54) was born in New York City, N. Y. on July 7, 1909. He re-ceived the B.S. degree in physics from Yale
in 1933. Mr. Stone joined
the Bell Telephone Laboratories in 1936. Until 1953, he was engaged in the design of inductors. From 1953 to the present he has been compo-nents development engineer for Bell Tele-phone Laboratories in charge of an or-ganization devoted to
the development of inductors, capacitors, and resistors. He is a member of AIEE.
•
S. Thaler was born on June 17, 1917, in New York, N. Y. He received the B.E.E. from the College of the City of New York in
1940. From 1940 to 1948, he was with the Signal Corps.
Since 1948, Mr. Thaler has been at the Rome Air De-velopment Center in Rome, N. Y. where he has engaged in the development of digi-tal tracking devices.
He is an associate member of the Amer-ican Institute of
Electrical Engineers, as well as IRE.
•
J. H. Vogelsong (M'54) was born on October 30, 1925, in York, Pa. In 1949, he received the B.S. degree in electrical engi-
neering from Lehigh University.
Since his gradua-tion, he has been a member of the tech-nical staff of Bell Telephone Labora-tories. He has been engaged in the de-sign of digital com-puter circuits, and is currently working on a military communi-cations study.
Mr. Vogelsong is a member of Phi Beta Kappa, Tau Beta Pi, and Eta Kappa Nu.

1956 PROCEEDINGS OF THE IRE 115
IRE News and Radio Notes
ANNUAL AWARDS FOR 1956 ARE ANNOUNCED BY THE IRE
F. J. Bingley, color television research engineer of the Philco Corp., has been named to receive the Vladimir K. Zworykin Tele-vision Prize Award for 1956 for his contribu-tions to colorimetric science as applied to television. The award is made annually for outstanding contributions to electronic tele-vision.
The Browder J. Thompson Memorial Prize for 1956 was awarded to J. E. Bridges, research engineer of the Zenith Radio Corp., for his paper entitled "Detection of Television Signals in Thermal Noise," which appeared on page 1396 of the September, 1954 issue of the PROCEEDINGS OF THE IRE. The award is made annually to an author under thirty years of age at date of submis-sion of manuscript for a paper recently pub-lished by the IRE which constitutes the best combination of technical contribution and presentation of the subject.
The awards will be presented during the IRE National Convention in New York City, March 19-22.
IRE NATIONAL CONVENTION SET FOR MARCH 19-22
On Monday, March 19, New York City will be the focal point of the engineering world when the 1956 IRE National Conven-tion gets underway. Over 40,000 engineers and scientists are expected to be on hand as a full four-day program of sessions, exhibits, and social events unfolds at the Waldorf-Astoria Hotel and Kingsbridge Armory.
The convention will start at 10:30 Mon-day morning with the Annual Meeting in the Waldorf's Grand Ballroom. This meeting is held especially for members to meet their of-ficers and hear them discuss current plans and activities of the IRE. The program will feature a well-known speaker who will dis-cuss a subject of interest to all engineers. A comprehensive program of fifty-five
technical sessions and professional group symposia is being prepared by the Technical Program Committee with the assistance of all twenty-four professional groups. The ses-sions will be held at the Waldorf-Astoria, nearby Belmont-Plaza, and at the Kings-bridge Armory. The highlight of the program will be a special Tuesday evening session de-voted to Space Satellites. Full details of the program will be announced in the March is-sue of the PROCEEDINGS.
Plans are being made to publish again the IRE Convention Record. It will contain all available papers presented at the convention.
The Radio Engineering Show this year will comprise over 700 exhibits, covering al-most every conceivable new development in radio and electronic equipment, materials, and techniques. To accommodate this dis-play, approximately 100 exhibits will be lo-cated in the Klageridge Palace, just a block
and a half from the Kingsbridge Armory. Free and continuous bus service will be pro-vided between the Armory and Waldorf-As-toria for the convenience of convention regis-trants.
The social activities will get underway Monday evening with a "get-together" cock-tail party in the Grand Ballroom of the Wal-dorf. Climax of the convention will be the Annual Banquet, which this year will feature a speaker of national importance. Also on the program will be presentation of the IRE Awards for 1956 by A. V. Loughren, Presi-dent.
An attractive and entertaining program is being planned for the wives of members. Visits to a famous art gallery, a leading de-partment store, and West Point are includ-ed, as well as a luncheon-fashion show, mat-inees at Broadway plays, and a sightseeing tour of New York. The center for women's activities will be located in the Regency Suite on the fourth floor of the Waldorf-Astoria.
NEW IRE MILITARY ELECTRONICS PROFESSIONAL GROUP FORMS
The Professional Group on Military Electronics recently formed an active new group.
IRE members interested in joining it should contact J. Q. Brantley, Jr., Mem-bership Committee Chairman, Cornell Aeronautical Laboratory, Buffalo Airport, New York. Any persons interested in start-ing chapters in their area should contact E. A. Speakman, Guided Missiles Division, Fairchild Engine and Aircraft Corporation, Wyandanch, L. I., New York.
OFFICERS ELECTED FOR 1956
At its meeting on November 2, 1955, the Board of Directors announced the election of the following IRE officers and directors:
President, 1956: Arthur V. Loughren, Hazeltine Corporation, Little Neck, Long Island.
Vice-President, 1956: Herre Rinia, Philips Research Laboratories, Eindhoven, Holland.
Directors-Elected-at-Large, 1956-1958: E. W. Herold, Radio Corporation of America, Princeton, New Jersey; J. R. Whinnery, University of California, Berkeley, California.
Regional Directors, 1956-1957: Region One, C. R. Burrows, Cornell Univer-sity, Ithaca, New York; Region Three, J. G. Brainerd, University of Penn-sylvania, Philadelphia, Pennsylvania; Region Five, J. J. Gershon, DeVry Technical Institute, Chicago, Illinois; Region Seven, C. F. Wolcott, Gilfillan Brothers, Inc„ Los Angeles, Çali-fornia,
Calendar of Coming Events
IRE-ASQC Second National Sym-posium on Reliability and Quality Control, Hotel Statler, Washing-ton, D. C., Jan. 9-10
IRE National Simulation Symposium, Dallas, Tex., Jan. 19-21
AIEE Winter General Meeting, Hotel Statler, New York City, Jan. 30-Feb. 3
IRE Symposium on Microwave The-ory and Techniques, U. of Penn-sylvania, Philadelphia, Pa., Feb. 2-3
Western Computer Conference, Fair-mont Hotel, San Francisco, Calif., Feb. 8-10
IRE Annual Southwestern Confer-ence, Oklahoma City, Okla., Feb. 9-11
Annual Banquet of Washington Sec-tion, Hotel Statler, Washington, D. C., Feb. 11
IRE-AIEE-U. of P. Conference on Transistor Circuits, U. of Penn-sylvania, Philadelphia, Pa., Feb. 16-17
IRE-AIEE Scintillation Counter Sym-posium, Shoreham Hotel, Wash-ington, D. C., Feb. 28-29
IRE National Convention and Radio Engineering Show, Waldorf-As-toria Hotel and Kingsbridge Arm-ory, New York City, Mar. 19-22
PGIE-AIEE-ISA Conference on Mag-netic Amplifiers, Syracuse, N. Y., Apr. 5-6
Seventh Regional Technical Confer-ence and Trade Show, Hotel Utah, Salt Lake City, Utah, Apr. 11-13
Tenth Annual Spring Television Con-ference of the Cincinnati Section, Engineering Society of Cincinnati Building, Cincinnati, Ohio, Apr. 13-14
New England Radio Engineering Meeting, Sheraton Plaza Hotel, Boston, Mass., Apr. 23-24
PGCT-PIB Symposium on Non-linear Network Theory, Engi-neering Society Building, New York City, Apr. 25-27
URSI Spring Meeting, National Bureau of Standards, Washington, D. C., Apr. 30-May 3
IRE-RETMA-AIEE-WCEMA Elec-tronic Components Symposium, U. S. Department of Interior, Washington, D. C., May 1-3
National Aeronautical and Naviga-tional Conference, Hotel Biltmore, Dayton, Ohio, May 14-16

116 PROCEEDINGS OF THE IRE January
JOHN V. N. GRANGER WINS 1955 REGIONAL AWARD
John V. N. Granger, a Senior Member of IRE, was presented recently with the 1955 Regional Electronics Achievement Award at WESCON in San Francisco. Joseph M. Pettit, Director of IRE Region 7, presented this annual regional award for recognition of contributions to electronics to Dr. Granger.
Dr. Granger is assistant chairman of the Engineering Department and head of the Aircraft Radiation Systems Laboratory at Stanford Research Institute, Palo Alto, California. He is also a civilian member of the Panel on Antennas and Propagation, Committee on Electronics, Research and Development Board, and since 1951 he has been Chairman of the Subpanel on Airborne Antennas.
J. M. Pettit (right), Director of IRE Region Seven, congratulates J. V. N. Granger, award recipient.
Prior to 1949 and his coming to SRI, Dr. Granger was a Research Fellow in elec-tronics and group leader of the Antenna Group at the Electronics Research Labora-tory, Harvard University. He obtained the A.B. degree in mathematics from Cornell College, the M.S. degree in communications engineering, and the Ph.D. degree in applied physics from Harvard University.
Dr. Granger is retiring Chairman of the Palo Alto Subsection and Editor of the IRE Transactions on Aeronautical and Navi-gational Electronics. In 1951 he was Chair-man of the Technical Program Committee at the IRE West Coast Convention. He is a member of Sigma Xi, the American Physical Society, and Commission VI of the U. S. National Committee of the International Scientific Radio Union.
TENTH SPRING TELEVISION CONFERENCE W ILL BE IN APRIL
The Tenth Annual Spring Television Conference, sponsored by the Cincinnati Section of the IRE, will be held on Friday and Saturday, April 13 and 14, at the Engi-neering Society of Cincinnati Building, 1349 East McMillan St., Cincinnati, Ohio.
Requests for advertising and exhibition privileges should be referred to Arthur B. Ashman, Cincinnati and Suburban Bell
Telephone Company, 225 East Fourth Street, Cincinnati 2, Ohio. Information con-cerning advance registration or hotel reser-vations may be obtained from Reuben Nathan, Crosley Division, Avco Mfg. Corporation, Glendale-Milford Road, Even-dale, Ohio. Information on other matters may be obtained from Stanley M. Stuhl-barg, Chairman of Publicity Committee, Crosley Division, Avco Mfg. Corporation, 4890 Spring Grove Avenue, Cincinnati 32, Ohio.
SOUTHWESTERN CONFERENCE AND SHOW MEETS AT OKLAHOMA CITY
Oklahoma City, with its central location and proximity to the Air Force's largest procurement, supply, and maintenance depot, the Civil Aeronautic Authority's world-wide training center, the educational plants of the University of Oklahoma and Oklahoma City University, and the pe-troleum industry, is the site of this year's Southwestern Regional Conference and Electronics Show which will be held Feb-ruary 9-11.
At Oklahoma City's Municipal Audi-torium the Zebra Room has been engaged for the Electronics Show with space for over 100 exhibit booths. Adjoining wings will be fitted and fixtured to provide an appropriate atmosphere for presentation of the technical program. At the Skirvin Tower Hotel space and facilities are being arranged for special meetings and gatherings. The Persian Room has been reserved for the banquet which will feature the social side of the conference. This hotel and others in the vicinity will be hold-ing a large number of rooms open for reserva-tion by out of town guests.
This event, representative of the South-west's interest in the field of electronics, now goes into its eighth consecutive year. Insti-tuted in 1949 by the Dallas-Fort Worth Section, it has since gained greater regional import through a policy of rotating showings among major cities of the Southwest.
Technical papers will be presented Thursday afternoon, Friday morning and afternoon, and Saturday morning and after-noon. Paper subjects will be grouped ac-cording to the technical group divisions, and papers have been received to give a comparatively complete coverage. A partial list of titles and authors of papers which have been accepted follows.
Characteristics of Reflex Klystrons in Communications Systems, Marion P. Hob-good, Philco Corporation; Multi-Megawatt Klystron Radar Transmitters, John Bushy, Sperry Gyroscope Company; Color Telecast-ing, J. L. Hathaway, National Broadcasting Company; High Stability LC Oscillator for Use with a Capacitive Sensing Element, A. J. Eldridge, Sandia Corporation; Precision Voltage Calibrator Circuit, R. E. McCallum, Sandia Corporation; The Omniguide An-tenna: an Omnidirectional Waveguide Array for UHF-TV Broadcasting, O. M. Wood-ward, Jr. and James Gibson, RCA Labora-tories; The Use of Transmission Line Charts in Circuit Analysis, H. F. Mathis, Goodyear Aircraft Corporation; A Directional Glide Path System, Lawrence Spinner, CAA; Use of Finite Difference Operators to Determine the Poles and Zeros of a Network, J. P. Lind-
sey, Phillips Petroleum Company; Semicon-ductors Devices, K. D. Smith, Bell Tele-phone Laboratories; Forward Scattering, TA CA N Air Navigation System, Federal Telecommunication Laboratories; Engi-neers and Cornputors, W. B. Lewis, Boeing Airplane Company; Application of Flying Spot Scanners in Television, by R. Deichert, DuMont Laboratories; Correlation and Power Spectrum Analysis Techniques, F. E. Brooks, Jr. and H. W. Smith, University of Texas; Electronics Logistics, Col. D. B. Yount, Tinker Air Force Base; Technique for the Simple Measurement of Extremely Small Amounts of FM on a Microwave Sig-nal, Hewlett-Packard Company.
Thursday morning sessions will be de-voted to opening procedures and introduc-tions, with registration desks operating con-tinuously during the three days. A special address has been planned for Friday, en-titled "Current Status of Color Television," by William B. Logde of CBS Television, New York. Mr. Logde will present, in con-nection with his address, a colored movie on television at CBS. The University of Okla-homa AIEE-IRE Joint Student Branch, under the leadership of Fritz Villines, plans to have one complete half day in which stu-dent papers may be presented by student branches in the region.
PGA COMMITTEE MEETS The mid-year meeting of the Administra-
tive Committee of the Professional Group on Audio was held coincidentally with the National Electronics Conference in Chicago, on October 4, 1955. Considerable attention was given to the question of increasing interest in Audio among IRE student members. A. B. Bereskin, of the University of Cincinnati, Editor of the IRE Transac-tions on Audio, was asked to study the various proposals made in this connection and to make recommendations to the Ad-ministrative Committee. The matter of establishing a PGA Student Award for out-standing papers on Audio by IRE student members was also discussed. This proposal was assigned for study to D. W. Martin, of Baldwin Piano Company, Chairman of the PGA Awards Committee.
Considerable attention was given to the question of standardization of systems and concepts dealing with "high fidelity" repro-duction systems. After much discussion, the Administrative Committee agreed that the PGA is not in a position to promote stand-ardization in this field. However, it was pointed out that a number of IRE standards exist which deal with measurement, termin-ology, and techniques of audio and these may be useful in the measurement of per-formance of various audio systems.
The Administrative Committee heard and approved the reports of A. B. Jacobsen, Motorola, Tapescripts Committee Chair-man; Marvin Camras, Armour Research Foundation, Nominating Committee Chair-man; D. W. Martin, Baldwin Piano Com-pany, Awards Committee Chairman; and P. B. Williams, Jensen Mfg. Co., Program Committee Chairman. Committee budgets were approved.
Consideration was given to the participa-tion of the PGA on the contemplated Acous-tical Standards Board.

1956 IRE News and Radio Notes 117
KANSAS CITY SECTION PLAYS HOST TO IRE BOARD OF DIRECTORS AT ANNUAL ELECTRONICS CONFERENCE
Right—(left to right): D. J. Tucker, Director of Region Six, G. W. Bailey. IRE Executive Sec-retary, and A. W. Graf, former Director of Re-gion Five, were among those attending a recep-tion for the IRE Board of Directors at the Kan-sas City Section IRE Conference.
e
Below—Incoming IRE President, A. V. Lough-ren (left) and his predecessor. J. D. Ryder (right) are shown chatting with Arthur B. Eisenhower, Kansas City bank official and brother of Presi-dent Eisenhower. during the Kansas City Section IRE Conference.
Below—High point of the conference was a banquet held at the Towne House Hotel in Kansas City, Kansas. Shown at the banquet head table are (left to right): Conference Vice-Chairman W. H. Ashley, Jr., Wilcox Electric Co.; Mrs. W. H. Ashley, Jr.; 1956 IRE President. A. V. Loughren, Hazeltine Corp.; 1955 IRE Presi-dent. J. D. Ryder, Michigan State University; and the guest speaker, H. W. Wells, Carnegie Institution c: Washington, D. C., whose address to the conference was entitled " Radio Astronomy."
Below—Toastmaster R. W. Fetter, Aeromotive Equipment Corp., and Chairman of the IRE Kansas City Section, was host to IRE officers and directors at the banquet. Seated with Mr. Fetter are (left to right): Mrs. R. W. Fetter, Mrs. V. M. Math-ew, and V. M. Mathews, chairman of the conference.

1118 UM BS
ACTIVITIES OF IRE SECTIONS AND PROFESSIONAL GROUPS
Above--PGAP co-sponsored a re-tent Symposium on Radio As-zonomy at Chicago, Partici-pants in the panel discussion "Radio Astronomy Enlarges the Observable Universe, at the National Electronics Conference, Chicago. were (left tb right): H. J. Ewen, Harvard University; R. C. Spencer, Air Force Cam-bridge Research Center; L. Berkner, Chairman, Associated Universities. Inc.; H. W. Dodson. Mc-Math-Hulbert Observa-tory, Univ. of Michigan. and F. T. Haddock. Jr., Naval Research Laboratory.
(Above. left)—Lt. Col. H. C. Williams (10). Program Chair-man, and R. O. Burns (right), Chairman of the Fort Hua-chuca Subsection, chat with T. L. Martin. Jr., University of Arizona, after he addressed the subsection at a fall meet-ing on the effects of cosmic rays and atmospheric electric-ity upon the human body.
Above—On a recent visit to Akron, Ohio, to address the cal IRE Section. J. D. Ryder (second from left), past presi-dent of the IRE, examines L-3 GEDA computes at Good-year Aircraft as C. O. Lambert (left), H. L. Flowers (second from right), and H. F. Lanier (right) of the Akron Section watch.
Below—At a recent dinner the North Carolina-Virginia Section installed Piedmont Subsection Officers. (left to right) E. W. Johnson, Subsection Secretary-Treasurer; C. M. Smith, Jr., Subsection Vice-Chairman; W. A. Welsh. Subsection Chairman; M. J. Minor, Section Vice-Chairman; G. B. Hoadley, Past Section Chairman, and A. L. Corn-
This is the first of a new series of picture pages in our new program of reporting more fully the activities of the Professional Groups and Sections. With this expansion of the IRE NEWS AND RADIO NOTES section comes an opportunity for all Professional Groups and Sections to publicize activities of special national interest. News of IRE officers' visits, conferences, banquets, award ceremonies, and publications serve to keep the general membership informed of current activities.
Below—A. V. Loughren (right). 1954 award winner. con-gratulates L. M. Clement, 1955 recipient of the RETMA Radio Fall Meeting plaque "for his effective initiation and conduct of important activities in the field of reliability of electronic equipment and for his long time contributions to the work of the RETMA Engineering Department."
stock. Section Secretary-Treasurer. The dinner, in Burlington, N. C, featured a tour-demonstration and a talk by A. A. Currie of Bell Tel. Labe, on the M33 Anti-Aircraft Fire Control System. Mr. Currie was a member of a special committee that made a study of postwar fire control equipment.

OVER 1000 ATTEND PGANE ANNUAL CONFERENCE
The Second Annual East Coast Con-ference on Aeronautical and Navigational Electronics, sponsored jointly by the Balti-more Section of the IRE and the Professional Group on Aeronautical and Navigational Electronics, was held at the Lord Baltimore Hotel, Baltimore, Maryland, October 31 and November 1. A highlight of the conference was a panel
discussion of the design features required for military and civilian airborne equipment. Panel members were: Norman Caplan, Bendix Radio Division, Bendix Aviation Corporation; J. C. McElroy, Collins Radio Corporation; A. R. Applegarth, National Aeronautical Corporation; W. F. Carnes, Jr., Aeronautical Radio, Inc.; Ludlow Hall-man, Wright Air Development Center; Max Karant, Aircraft Owners and Pilots As-sociation; A. B. Winick, Bureau of Aero-
nautics; G. W. Church, Bendix Radio Divi-sion, Bendix Aviation Corporation; and Lt. Col. J. L. Wilson, Jr., Signal Corps.
F. W. Godsey, manager of the Baltimore Division of Westinghouse Electric Corpora-tion, served as toastmaster at the con-ference banquet. Gustave Eckstein, physiol-ogist and author, gave an address entitled "At Arm's Length," on the importance and significance of the human hand.
Responsible for the success of the Second Annual East Coast Conference on Aeronau-tical and Navigational Electronics were C. F. Miller, Chairman of the Baltimore Section; E. A. Post, Chairman of the Pro-fessional Group on Aeronautical and Navi-gational Electronics; C. D. Pierson, Confer-ence Chairman; J. General, Conference Vice-Chairman; and S. Hershfield, Public-ity Chairman.
Above—Scientists and engineers from military and civil organizations appearing as panel members were (le lo right): Norman Caplan. Moderator, J. C. Mc-Elroy, G. W. Church, Max ICarant, A. Rufus Apple-garth, William F. Carnes, Jr., Ludlow Hallman, Alexander E. Winick. and Lt. Col. John L. Wilson.
Above: A modern exhibit. More than a thou-sand engineers and scientists registered at the conference. Thirty-eight papers cover-ing a variety of subjects were presented and forty-two exhibitors showed their products.
Below: The Administrative Com-mittee of PGANE. Left to right: T. C. Rives, J. F. Morrison. K. C. Black. R. C. Newhouse, G. W. Brown, J. M. Dennis, E. A. Post, Chairman of PGANE, L. G. Cumming, G. Haller, J. General, and C. D. Pierson. Conference Chairman.
At conference banquet were (below, let to right): C. F. Miller. Chairman of Baltimore Section; J. General, Conference Vice-Chairman; Capt. A. C. Packard. Bureau of Aero-nautics; K. C. Black; C. D. Pierson; G. Eckstein, Speaker; F. W. Godsey, Jr., Westing-
house Electric Corp., Toastmaster; Col. G. J. Urban, Signal Corps; E. A. Post; Lt. C T. IC. Trigg, Signal Corps; N. Caplan; Lt. Col. J. L. Wilson, Jr., Signal Conn; and Hallman, Wright Air Development Center, Wright-Patterson Air Force Base.
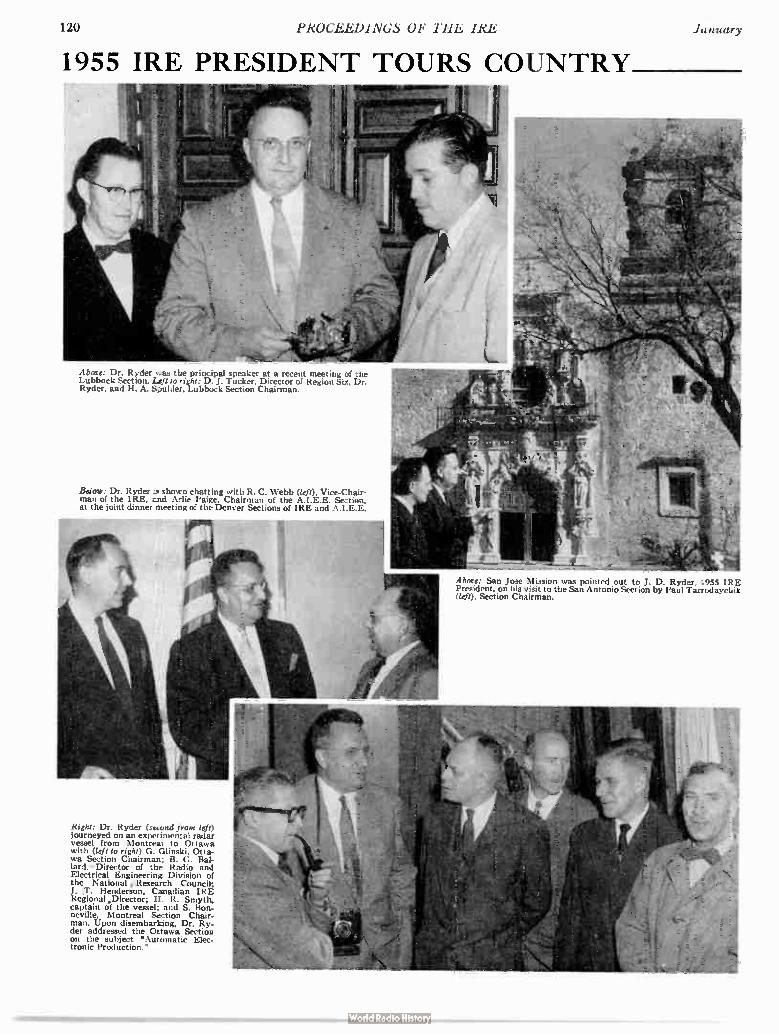
I 20 PROCEEDINGS OF THE IRE January
1955 IRE PRESIDENT TOURS COUNTRY
Above: Dr. Ryder was the principal speaker at a recent meeting of the Lubbock Section. Left to right: D. J. Tucker, Director of Region Six, Dr. Ryder, and H. A. Spuhler. Lubbock Section Chairman.
Belau,: Dr. Ryder is shown chatting with R. C. Webb (WO, Vice-Chair-man of the IRE, and Arlie Paige, Chairman of the A.I.E.E. Section, at the joint dinner meeting of the Denver Sections of IRE and A.I.E.E.
Above: San Jose Mission was pointed out to J. D. Ryder. 1955 IRE President, on his visit to the San Antonio Section by Paul Tarrodaychik (left), Section Chairman.
Right: Dr. Ryder (seirmd from 14t) journeyed on an ewer imental radar vessel from Montreal to Ottawa with (left to right) G. Glinski, Otta-wa Section Chairman; B. G. Bal-lard," Director of the Radio and Electrical Engineering Division of the National eResearch Council J. Z. Henderson. Canadian IRE ReigionalDirector; H. R. Smyth. captain of the vessel: and S. Bon-neville. Montreal Section Chair-man. Upon disembarking, Dr. Ry-der addressed the Ottawa Section on the subject "Automatic Elec-tronic Production."

/9i75 IRE News and Radio Notes 121
NEWFOUNDLAND-LABRADOR SECTION GREETS RYDE
The Newfoundland-Labrador Section, which was officially recognized by the IRE on September 8, 1955, was visited by J. D. Ryder, former president of the IRE, on Sep-tember 26, 1955. The Section has grown from a nucleus of Canadian and American engineers in September, 1953, when the first
meeting was held, into a full Section. When Dr. Ryder arrived by plane, he
was met by E. D. Witherstone, Section Chairman, and Colonel J. A. MacDavid, Northeast Air Command. The following
morning Dr. Ryder took part in a round table discussion at Armed Forces Radio Sta-tion VOUS which was recorded for later re-lease on September 29. The formation of the new Section, the problem of the lack of engi-neers, and the impact of the IRE on the military were topics discussed. A luncheon followed, attended by members of the Executive Committee of the new Section. An informal discussion of the aims, struc-ture, and organization of the IRE was held.
Dr. Ryder then visited Signal Hill, site of Marconi's first transatlantic radio com-munication.
He was guest of honor at a dinner in the Officers' Mess at Pepperrell Air Force Base on the evening of September 27. Civil and military officials attended the dinner, and the Newfoundland Minister of Mines and Resources brought greetings to the new Section from the Premier. Immediately after
the dinner, Dr. Ryder presented the Charter of the Newfoundland-Labrador Section to its chairman, E. D. Witherstone. He also gave a short talk called "Automation in Printed Circuitry," and showed slides of IRE headquarters.
Above: J. D. Ryder (left), former president of the IRE, J. A. MacDavid (center), Northeast Air Command, and F. J. Schryer (right), Section Secretary, take part in a round table forum at Armed Forces Radio Station VOUS.
Above: D. B. Nowakoski (left), Section Vice-Chairman, and It D. Witherstone (right), Section Chairman, are presented with the Charter of the Newfoundland-Labradca- Section by 1955 IRE President J. D. Ryder.
Officers of the Newfoundland-Labrador Section honor Dr. Ryder at a dinner. Shown are (left ta right): R. H. Bunt, Publicity; E. H. Schwarze, Meetings and Papers; E. D. Witherstone, Chairman; Dr. Ryder; D. B. Nowakoski, Vice-Chairman; J. B. Austin, Membership; F. J. ScIrryer. Secretary, and A. Jarrette, Meetings and Papers.

Above: The luncheon speaker was D G. Fink, who assessed the role of transistors and vacuum tubes today.
Right: L. M. Field described what has been done and what may come in the development of microwave tubes.
Below: (L.) Another speaker was J. A. Morton, whose topic was semiconductor devices. (R.) L. S. Nergaard gave an ad-dles on thermionic cathodes.
GUEST SPEAKERS ADDRESS PGED TECHNICAL MEETING AT WASHINGTON
The Professional Group on Electron Devices held its first annual Technical Meeting at the Shoreham Hotel, Washington, D. C., October 24-25. Nearly nine hundred engineers attended the meeting at which more than fifty technical papers were presented, covering developments in microwave tubes, semiconductor devices, and non-micro-wave tubes.
The first day's program began with a general survey of trends in the development of electron devices. Three in-vited speakers, J. A. Morton of Bell Telephone Labora-tories, L. S. Nergaard of RCA Laboratories, and L. M. Field of Hughes Aircraft Company presented papers on semiconductor devices, thermionic cathodes, and micro-wave tubes, respectively. At the luncheon which followed, D. G. Fink, Director of Research, Philco Corporation, spoke on the subject "Transistors vs. Vacuum Tubes," and told of the promise of a million-hour transistor. For the rest of the meeting, the engineers separated to hold simul-taneous sessions on microwave tubes, semiconductor de-vices, and non-microwave tubes.
Chairman of the General Committee was G. D. O'Neill. The rest of the committee was composed of G. A. Esperson, Vice-Chairman; R. R. Law, Technical Program; H. L. Thorson, Secretary; G. W. Griffin, Jr., Public Relations; and J. S. Saby, Publication. The Local Arrangements Com-mittee was headed by T. M. Liimatainen. Others on his committee were J. H. Wright, Vice-Chairman; R. I. Cole, Treasurer; A. L. Milk, Publicity; C. R. Knight, Hotel; H. D. Arnett, Registration; R. R. Grantham, Local Pro-gram; and H. J. Peake, Audio-Visual.
Papers presented at this meeting and available for pub-lication will be published in a forthcoming issue of Trans-actions of the IRE, Professional Group on Electron De-vices.
3eloz.: Scientists and engineers gathered for luncheon at Shoreham Hotel, Washington, D. C., during the two-day Technical Meeting of the Professional Group on Electron Devices

7500 ATTEND 1955 NATIONAL ELECTRONICS CONFERENCE
Approximately 7,500 registrants partici-pated in the eleventh National Electronics Conference held recently in Chicago, Illinois.
The conference was sponsored by the American Institute of Electrical Engineers, Illinois Institute of Technology, the IRE, Northwestern University and University of Illinois, with Michigan State University, Purdue University, University of Michigan, University of Wisconsin, Radio-Electronics-Television-Manufacturers Association, and Society of Motion Picture and Television Engineers participating.
The conference presented a diversified technical program with over 100 papers and 186 exhibit booths. All papers presented at the conference are being published in Volume 11 of the Proceedings of the National Elec-tronics Conference.
A. V. Astin, Director, National Bureau of Standards, Washington, D. C. was the speaker at the first day's luncheon with his talk "Standards for Electronics." At this luncheon the second National Electronics Conference Award was made to A. W. Friend for his contribution to the electronics field through his comprehensive paper "The Use of Powered Iron in Television Deflecting Circuits" presented at the 1946 conference. At the second day's luncheon J. M. Robson, Research Physicist, Atomic Energy of Can-ada, Ltd., Chalk River, Ontario, Canada discussed "The Canadian Nuclear Reactor Accident." The last day's luncheon address "Uniform Confusion or Diverse Regimenta-tion" was given by Ernst Weber, Director. Microwave Research Institute, Polytechnic Institute of Brooklyn, Brooklyn, N. Y. Another feature of this luncheon was the honoring of H. H. Beverage, Director of Radio Research of the RCA Laboratories, and L. N. McClellan, Assistant Commis-sioner, and Chief Engineer of U. S. Bureau of Reclamation as Eminent Members of Eta Kappa Nu.
Officers of the 1955 National Electron-
Below: H. H. Beverage. Director of Radio Research at RCA, was honored as an Emi-nent Member of Eta Kappa Nu. an honor-ary engineering organization.
ics Conference were: President, O. I. Thomp-son, DeVry Technical Institute; Executive Vice-President, R. R. Jenness, Northwestern University; Chairman of the Board of Direc-tors, G. E. Anner, University of Illinois; Executive Secretary, J. S. Powers, Bell and Howell Company; Secretary, C. G. Miller, Weston Electrical Instrument Company; Treasurer, J. H. Enenbach, Illinois Bell Tele-phone Company; Assistant Treasurer, H. H. Brauer, Bell and Howell Company; Arrange-ments Committee Chairman, J. J. Walovich, General Transformer Company; Awards Committee Chairman, J. D. Ryder, Michigan State University; Exhibits Committee Chair-man, G. J. Argall, DeVry Technical Insti-tute; Housing Committee Chairman, A. J. Hoehn, Armour Research Foundation; Party Committee Chairman, W. R. Brock, Columbia Broadcasting System; Procedures Committee Chairman, G. T. Flesher, Illinois Institute of Technology; "Proceedings" Committee Chairman, G. E. Happell, Pur-due University; Program Committee Chair-man, G. Hok, University of Michigan; and Publicity Committee Chairman, J. Kocik, Il-linois Bell Telephone Co.
Directors of the conference were: Chair-man, G. E. Anner, University of Illinois, Urbana, Ill.; A. D. Bailey, University of Il-linois, Urbana, Ill.; C. E. Barthel, Jr., Arm-our Research Foundation, Chicago, Ill.; R. R. Batcher, Hudson Wire Company, New York, N. Y.; H. H. Brauer, Bell and Howell Company, Chicago, Ill.; J. M. Cage, Purdue University, Lafayette, Ind.; M. H. Crothers, University of Illinois, Urbana, Ill.; J. H. Enenbach, Illinois Bell Telephone Co., Chicago, Ill.; G. T. Flesher, Illinois Insti-tute of Technology, Chicago, Ill.; G. W. Goelz, Northwestern University, Evanston, Ill.; A. W. Graf, Patent Lawyer, Chicago, Ill.; A. J. Hoehn, Armour Research Founda-tion, Chicago, Ill.; Gunnar Hok, University of Michigan, Ann Arbor, Mich.; R. R. Jen-ness. Northwestern University, Evanston,
Below: L. N. McClellan. Assistant Commis-sioner and Chief Engineer of the U. S. Bu-reau of Reclamation, was also honored as an Eminent Member of Eta Kappa Nu.
Above: O. I. Thompson of DeVry Technical Institute, Chicago, Illinois. presided over the 1955 National Electron-ics Conference.
Ill.; C. W. McMullen, Northwestern Uni-versity, Evanston, Ill.; H. L. Messerschmidt, Western Electric Co., Inc., Chicago, Ill.. C. G. Miller, Weston Electrical Instrument Co., Chicago, Ill.; J. S. Powers. Bell and Howell Company, Chicago, Ill.; E. A. Rob-erts, Armour Research Foundation, Chi-cago, Ill.; K. E. Rollefson, The Muter Com-pany, Chicago, Ill.; J. D. Ryder, Michigan State University, East Lansing, Mich.: E. H. Scheibe, University of Wisconsin, Madison, Wis.; J. C. Schuder, Purdue Uni-versity, Lafayette, Ind.; R. M. Soria, Ameri-can Phenolic Corporation, Chicago, Ill.; G. W. Swenson, Jr., Michigan State Uni-versity, East Lansing, Mich.; O. I. Thomp-son, DeVry Technical Institute, Chicago,
Below: The second National Electronics Conference award went to A. W. Friend for his contribution to the electronics field through a paper presented at a previous conference.

124 PROCEEDINGS OF THE IRE January
Lrft to right: W. D. Lewis, Bell Tel. Labs.. Treasurer; J. G. Brainerd, Univ. of Penna.. General Committee Chair-man; J. Forrester. Digital Computation Lab.. M.I.T: and F. M. Verzuh, M.I.T.. Local Arrangements Com-mittee Chairman.
HOTEL STATLER, BOSTON WAS SCENE OF FIFTH EASTERN JOINT COMPUTERS CONFERENCE
The theme of the Fifth Eastern Joint Computers Conference, held November 7-9. was "Computers in Business and Industrial Systems." Computers in Basic Business Ap-plications by F. J. Porter, Operations Con-trol with an Electronic Computer by B. F. Butler, The Place of the Special Purpose Electronic Data Processing Systems by R. E. Sprague, Electronics in Financial Accounting by B. J. Bennett, K. E. Eldridge, T. H. Mor-rin, J. D. Noe, and O. W. Whitby, Manual Use of Automatic Records by Anthony Oet-tinger, Evaluation of Sorting Methods by J. C. Hosken, Documents Processing by R. H. Gregory, Original Documents in Re-tail Accounts Receivable by V. H. Roman, The Computer and Its Peripheral Equipment by N. Rochester, Computers with Remote Data Input by E. L. Fitzgerald, Develop-ments in Programming Research by C. W. Adams, Storage and Retrieval of Information by L. N. Ridenour, The Role of Communica-tions Networks in Digital Data Systems by R. C. Matlack, and Standardization of Com-puter Intercommunication by H. R. J. Grosch were presented at the conference.
Guided inspection trips were made to see the Mark I and Mark IV computers at Har-vard Computation Laboratory, the Whirl-wind Computer at M.I.T. Computation Laboratory, and several high speed printers at ANeleac Corporation.
On the general committee in charge of the conference were .1. G. Brainerd, Chair-man; H. Mitchell, Jr., Secretary; W. D. Lewis, Treasurer; Irven Travis, Program; and N. P. Edwards, Publications. Members of the local arrangements committee include F. M. Verzuh, Chairman and Secretary; R. H. Gregory, and W. J. Oliphant, Finance; W. A. Johnson and Carl Reynolds, Registra-tion; F. E. Heart and P. R. Bagley, Hotel Arrangements; R. C. Kelner and A. Oet-tinger, Inspection Trips; H. I. Cohen, and M. A. Meyer, Exhibits; J. C. Hosken and Laurence Rosenfeld, Publicity; and D. T. Ross. Robert Kramer and Robert Leonard, Printing.
Copies of the proceedings of the confer-
TREVOR GARDNER
ence are being sent to full-fee registrants. Non-registrants may obtain copies of the proceedings from the headquarters of the IRE, the American Institute of Electrical Engineers, or the Association for Computing Machinery.
SECOND SYMPOSIUM ON RELIA-BILITY & QUALITY CONTROL W AS HELD EARLY THIS MONTH
The Second National Symposium on Re-liability and Quality Control in Electronics was held at the Hotel Statler, Washington,
D. C., January 9-10. The symposium was sponsored by the Pro-fessional Group on Reliability and Qual-ity Control. The Elec-tronics Division of the American Society for Quality Control and the Staff Com-mittee on Acceptance Procedures of the Radio-Electronics-Tel-evision Manufactur-
ers' Association were co-sponsors. A feature of the symposium was the
luncheon on January 10th, at which Trevor Gardner, Assistant Secretary of the Air Force, spoke on "Security and Progress in National Defense."
Seventeen papers were presented. A joint Symposium on Precision Resistors was held with the Washington, D. C. Section. A mo-vie.entitled "The Priceless Component" was alsó shown. On the following day there was a panel discussion, sponsored by the RETMA Quality Acceptance Procedures Committee, on "Acceptance Procedures—The Design, Specifications, and Standards Problem Fac-ing the Industry." Participants in the dis-cussion were: L. J. Jacobson, Chairman of the Quality Acceptance Procedures Com-mittee; G. Bowler, Chairman of the Inspec-tion Bulletin Subcommittee; A. Warsher, Chairman of the Inspection and Acceptance Practices Subcommittee; and E. Torkleson, Chairman of the Technical Liaison Subcom-mittee.
On the last day of the symposium a tour
was made of the wind tunnels, magnetic re-search area, and technical shop at the Naval Ordnance Laboratory, White Oaks, Mary-land.
PGCT INVITES PAPERS ON SIGNAL THEORY
The IRE Professional Group on Circuit Theory is planning to devote the September, 1956 issue of its Transactions to the subject of signal theory. Papers on this subject, as outlined below, are invited for consideration.
Signal theory is defined as being con-cerned with developing useful descriptions for (a) dynamical observables (such as sig-nals, messages, noise and disturbances) in physical systems, and (b) the transforming effects of system elements on the significant characteristics of observables.
The purpose of the issue is to explore the suggestion that signal theory provides (a) a unifying basis for the analysis and design of diverse physical systems found in communi-cations, process control and other fields of modern technology, and (b) an extended content for circuit theory.
Contributions are invited which present new theoretical results in any branch of sig-nal theory or examples of the application of any branch of signal theory to the solution of a specific practical problem. Manuscripts giving new theoretical results should identify clearly the underlying problem of signal the-ory that is being attacked. Manuscripts giv-ing specific applications of signal theory should but briefly identify the underlying theoretical problem before describing the practical application.
Authors planning to submit manuscripts should contact the guest editor, Professor J. M. Ham, Department of Electrical Engi-neering, University of Toronto, Toronto 5, Ontario, Canada. The deadline for all manu-scripts is June 1.
CONVENTION MARKS THIRTIETH ANNIVERSARY OF IRE IN CANADA
The Canadian IRE Convention and Exposition will be held October 1-3, 1956, in the Automotive Building, Canadian Na-tional Exhibition Park, Toronto. The build-ing is equipped with all facilities for conven-tion and exhibition purposes and has un-limited parking space. A brochure giving complete details including floor plans and space rates will be mailed to prospective exhibitors. Copies are available from the convention manager, Grant Smedmor, 745 Mt. Pleasant Road, Toronto, Canada.
The exhibition will include a variety of products of industry and of allied fields such as instrumentation, laboratory apparatus, materials, and packaging. There will be displays of electronic equipment as used by all branches of the Canadian Armed Forces, and it is also expected that equipment re-lating to the industrial applications of atomic energy will be shown.
George Sinclair of the Department of Electrical Engineering, University of To-ronto, Chairman of the Technical Papers Committee, has invited authors to submit titles and abstracts of 100-200 words on papers offered for presentation. The dead-line for receiving titles and abstracts is May 31, 1956. The papers may be on any subject pertaining to radio or any allied field of in-terest to members of the IRE.

1956 IRE News and Radio Notes 125
PARIS, FRANCE IS SITE OF
INTERNATIONAL CONGRESS
ON M ICROWAVE TUBES
The International Congress on Micro-wave Tubes, organized by the Societe des Radioelectriciens and the Societe Francaise des Ingenieurs Techniciens du Vide, will be held at the Conservatoire National des Arts et Metiers, Paris, May 29—June 2.
The purpose of this congress is to exam-ine and discuss recent results in the field of microwave tubes. The term "microwave tubes" referred to here is used to mean radio tubes operating at frequencies above 500 mc; however, problems of special interest relat-ing to tubes operating at lower frequencies may also be discussed. Due to the close analogy existing between certain particle accelerators and microwave tubes, questions concerning accelerators operating on frequencies above 500 mc will also be open to discussion. Pa-pers presented will consist either of exposi-tory reports concerning developments, or of original work on specific problems. Each pa-per will be open to discussion.
Persons wishing to attend or to present papers should inform the Congres Interna-tional Tubes Hyperfrequences, S.F.I.T.V., 44 rue de Rennes, Paris 6, France, of their in-tention at an early date. Prospective authors should provide a summary, to be typewrit-ten in either French or English and limited to thirty lines, containing the main points of the paper.
OBITUARY
Alva B. Clark (SM'46—F'56) died re-cently. He had retired last February as vice-president of Bell Telephone Laboratories after more than forty-three years with the Bell System. Since then he had been director of research and development in a sector of the United States Department of Defense.
During his career, Mr. Clark received forty-four patents for telephone devices and was an early leader in the development of basic communications systems, such as long-distance transmission of telephone, television and radio.
He directed the planning and engineering of the transcontinental coaxial cable and microwave radio relay systems for telephone and television transmission and earlier sys-tems using the carrier principle of moving many messages simultaneously over one electrical pathway.
More recently he directed the develop-ment of the direct dialing system for long-distance calls. He also guided the develop-ment of the automatic message accounting system, now used throughout the Bell system.
During World War II, he served as con-sultant or member of various divisions of the Office of Scientific Research and Develop-ment. In 1944, he was named consultant to the Secretary of War and made several trips to the Mediterranean and European zones of operation.
After graduation from the University of Michigan, he joined the American Tele-phone and Telegraph Company in 1911.
He worked in the engineering and then the development and research departments until 1934 when the latter division was con-solidated with Bell Laboratories. With Bell, he was toll transmission development direc-tor and then director of transmission de-velopment.
In 1940, he assumed general direction of the laboratory work in telephone switching transmission and equipment development.
He became vice-president in 1944. From 1951 until his retirement, he was in charge of coordinating research between the labora-tories, the American Telephone and Tele-graph Company and Western Electric Co.
From 1938 to 1955, Mr. Clark was Bell System chairman of the Joint Subcommittee on Development and Research of the Edison Electric Institute and the Bell System.
He was a Fellow of A.I.E.E. and Acous-tical Society of America, and a member of the American Association for Advancement of Science.
•
Arnot P. Foster (A'41—M'45), President of the Foster Transformer Company in Cin-cinnati, Ohio, died recently after several months' illness at his home. Mr. Foster had attended Bethany College and the Uni-versity of Cincinnati Evening College, re-ceiving a degree in electrical engineering. After working briefly for the government, he joined the Crosley Radio Corporation in 1930 as a transformer design engineer. He continued at Crosley until 1940, when the transformer business which he had started in 1938 began to occupy his full attention.
Mr. Foster was an active supporter of the Spring Technical Conference on Televi-sion, sponsored by the Cincinnati Section of the IRE, from its beginning. He was also an active member of the Engineering Society of Cincinnati.
TECHNICAL COMMITTEE NOTES
The Navigation Aids Committee met at IRE Headquarters on October 21 with Chairman H. R. Mimno presiding. The com-mittee continued a discussion led by F. Moskowitz on the Proposed Standards on VHF Omni-Directional Radio Range (VOR). Discussion was directed primarily toward clarification of the purpose and recom-mended procedures. Numerous notes on the discussion were made for the guidance of an editorial group.
Chairman R. Serrell presided at a meet-ing of the Electronic Computers Committee on October 19. The major part of the meet-ing was devoted to discussing and amending the Proposed Standards on Electronic Com-puters: Definitions of Electronic Computers Terms. Following approval by Committee 8 of the Proposed Standards, a consolidated
list of the approved definitions to be desig-nated as 55 IRE 8. PSI will be prepared by L. C. Hobbs as soon as possible and sub-mitted to the Definitions Coordinator of the Standards Committee.
Two new subcommittees were appointed. One of these subcommittees will be desig-nated as "Subcommittee 8.7 on Computer Block Diagrams and Logical Symbols:" the other subcommittee, 8.8, will handle analog computer definitions and symbols.
The Circuits Committee convened on October 28 under the chairmanship of W. R. Bennett. The chairman conveyed word from T. R. Finch and V. G. Linvill that the technical discussion held at the University of Connecticut, October 20 and 21 had been highly successful. However, some difficulties over terminology as applied to transistor circuits had appeared.
W. A. Lynch prepared a proposal for standardizing terminology and definitions on linear signal flow graphs. This field has become very important in feedback systems. The committee endorsed Prof. Lynch's sug-gestion that he ask E. J. Angelo to formulate a list of defined terms in this field with the help of W. A. Lynch, R. M. Foster and J. G. Truxal. A revised list of feedback terms, 55 IRE
4.7 PS2, was presented by Chairman Lynch of Subcommittee 4.7, Linear Active Circuits and the remainder of the meeting was de-voted to discussion of these terms.
The Radio Frequency Interference Com-mittee met at IRE Headquarters on October 10 with Chairman R. M. Showers presiding. The chairman announced that RETMA Proposal S. P. 437 "Limits of Radiation from TV Broadcast Receivers between the Frequencies of 15 KC and 50 MC" was approved by the RETMA Standards Com-mittee. M. S. Corrington, Chairman of Sub-committee 27.1, reported that the subcom-mittee, as requested by the main committee, reviewed the ASA C63.4 document in-formally. There are a number of items which require further consideration, and the sub-committee did not feel it was in a position to comment at the present time. The sub-committee is still working on the manual of good engineering practices. Dr. Showers requested Mr. Corrington to discuss the manual of good engineering practice with E. O. Johnson, chairman of the task force, and report to the committee a tentative date on which a draft of the document would be available. It was suggested that an outline of the manual be submitted as soon as possible. A. B. Glenn, Chairman of Sub-committee 27.3, reported that there is a task force of Subcommittee 27.3 investigat-ing the problem of extending the range of measurement to 25 megacycles and rewriting where necessary the 1954 Standards. This task was assigned to Subcommittee 27.3. J. Minter, Chairman of Subcommittee 27.10, reported that there has been no activity on the part of his subcommittee. Dr. Showers suggested that a major item for the consider-ation of this subcommittee was the review of the ASA C63.4 proposal. This will be undertaken. H. E. Dinger, Chairman of Subcommittee 27.11, reported that there has been no activity in his subcommittee. The remainder of the meeting was devoted to a review of the revision of Standards on Television: Methods of Testing Television Receivers prepared by the Radio Receivers Committee.

1 )6 PROCEEDINGS OF THE IRE January
Professional Groupst
Aeronautical & Navigational Electronics— James L. Dennis, General Technical Films, 3005 Shroyer, Dayton, Ohio.
Antennas It Propagation—Delmer C. Ports, Jansky & Bailey, 1339 Wisconsin Ave., N.W., Washington 7, D. C.
Audio—W. E. Kock, Bell Tel. Labs., Murray Hill, N. J.
Automatic Control—Robert B. Wilcox, Ray-theon Manufacturing Co., 148 California St., Newton 58, Mass.
Broadcast & Television Receivers—L. R. Fink, Research Lab., General Electric Company, Schenectady, N. Y.
Broadcast Transmission Systems—O. W. B. Reed, Jr., Jansky & Bailey, 1735 DeSales St., N.W., Washington, D. C.
Circuit Theory—H. J. Carlin, Microwave Res. Inst., Polytechnic Inst. of Brooklyn, 55 Johnson St., Brooklyn 1, N. Y.
t Names listed are Group Chairmen.
Communications Systems—A. C. Peterson, Jr., Bell Labs., 463 West St., New York 14, N. Y.
Component Parts—A. W. Rogers, Comp. & Materials Branch, Squier Signal Lab., Ft. Monmouth, N. J.
Electron Devices—J. S. Saby, Electronics Laboratory, G.E. Co., Syracuse, N. Y.
Electronic Computers—J. H. Felker, Bell Labs., Whippany, N. J.
Engineering Management—Max Batsel, Engineering Products Dept., RCA Victor Div. Bldg. 10-7, Camden, N. J.
Industrial Electronics—George P. Bosom-worth, Engrg. Lab., Firestone Tire & Rubber Co., Akron 17, Ohio
Information Theory—Louis A. DeRosa, Federal Telecommunications Lab., Inc., 500 Washington Avenue, Nutley, N. J.
Instrumentation—F. G. Marble, Boonton Radio Corporation, Intervale Road, Boonton, N. J.
Medical Electronics—V. K. Zworykin, RCA Labs., Princeton, N. J.
Microwave Theory and Techniques—A. C. Beck, Box 107, Red Bank, N. J.
Military Electronics—C. L. Engleman, 2480 16 St., N.W., Washington 9, D. C.
Nuclear Science—M. A. Schultz, Westing-house Elec. Corp., Commercial Air Power, P.O. Box 355, Pittsburgh 30, Pa.
Reliability and Quality Control—Victor Wouk, Beta Electric Corp., 333 E. 103rd St., New York 29, N. Y.
Production Techniques—R. R. Batcher, 240-02-42nd Ave., Douglaston, L. I., N. Y.
Telemetry and Remote Control—C. H. Hoeppner, Stavid Engineering, Plain-field, N. J.
Ultrasonics Engineering—M. D. Fagen, Bell Labs., Whippany, N. J.
Vehicular Communication—Newton Monk, Bell Labs., 463 West St., N. Y., N. Y.
Sections*
Akron (4)—H. L. Flowers, 2029-19 St., Cuyahoga Falls, Ohio; H. F. Lanier, 49 West Lowell Ave., Akron, Ohio.
Alberta (8)—J. W. Porteous, Alberta Univ., Edmonton, Alta., Canada; J. G. Leitch, 13024-123A Ave., Edmonton, Alta., Canada.
Albuquerque-Los Alamos (7)—T. G. Banks, Jr., 1124 Monroe St., S.E., Albuquerque, N. Mex.; G. A. Fowler, 3333-49 Loop, Sandia Base, Albuquerque, N. Mex.
Atlanta (3)—D. L. Finn, School of Elec. Engr'g., Georgia Inst. of Tech., Atlanta, Ga.; P. C. Toole, 605 Morningside Dr., Marietta, Ga.
Baltimore (3)—C. F. Miller, Johns Hopkins University, 307 Ames Hall, Baltimore 18, Md.; H. R. Hyder, 3rd, Route 2, Owings Mills, Md.
Bay of Quinte (8)—J. C. R. Punchard, Elec. Div., Northern Elec. Co. Ltd., Sydney St., Belleville, Ont., Canada; M. J. Wal-ler, R.R. I, Foxboro, Ont., Canada
Beaumont-Port Arthur (6)—W. W. Eckles, Jr., Sun Oil Company, Prod. Laboratory, 1096 Calder Ave., Beaumont, Tex.; E. D. Coburn, Box 1527, Beaumont, Tex.
Binghamton (4)-0. T. Ling, 100 Henry Street, Binghamton, N. Y.; Arthur Ham-burgen, 926 Glendale Dr., Endicott, N. Y.
Boston (1)—T. P. Cheatham, Jr., Hosmer St., Marlborough, Mass.; R. A. Waters, IRE Boston Section Office, 73 Tremont St., Room 1006, Boston 8, Mass.
Buenos Aires—J. M. Rubio, Ayachucho 1147, Buenos Aires, Argentina; J. L. Blon, Transradio Internacional, San Mar-tin 379, Buenos Aires, Argentina.
Buffalo-Niagara (1)—D. P. Welch, 859 Highland Ave., Buffalo 23, N. Y.; W. S. Holmes, 1961 Ellicot Rd., West Falls, N. Y.
Cedar Rapids (5)—Ernest Pappenfus, 1101
• Numerals in parentheses following Section desig-nate Region number. First name designates Chair-man, second name, Secretary.
—20 St., S.E., Cedar Rapids, Iowa; E. L. Martin, 3821 Vine Ave., S.E., Cedar Rap-ids, Iowa.
Central Florida (3)—Hans Scharla-Nielsen, Radiation Inc., P.O. Drawer 'Q', Mel-bourne, Fla.; G. F. Anderson, Radiation Inc.. P.O. Box 'Q', Melbourne, Fla.
Chicago (5)—J. S. Brown, 9829 S. Hoyne Ave., Chicago 43, Ill.; D. G. Haines, 17 West 121 Oak Lane, Bensenville, Ill.
China Lake (7)—G. D. Warr, 213-A Wasp Rd., China Lake, Calif.; B. B. Jackson, 54-B Rowe St., China Lake, Calif.
Cincinnati (4)—D. W. Martin, The Bald-win Company, 1801 Gilbert, Cincinnati 2, Ohio; F. L. Wedig, Jr., 3819 Davenant Ave., Cincinnati 13, Ohio.
Cleveland (4)—R. H. DeLany, 5000 Euclid Ave., Cleveland 3, Ohio; J. F. Keithley, 22775 Douglas Rd., Shaker Heights 22, Ohio.
Columbus (4)—W. E. Rife, 6762 Rings Rd., Amlin, Ohio; R. L. Cosgriff, 2200 Home-stead Dr., Columbus, Ohio.
Connecticut Valley (1)—P. F. Ordung, Dun-ham Laboratory, Yale University, New Haven, Conn.; H. M. Lucal, Box U-37, University of Connecticut, Storrs, Conn.
Dallas-Fort Worth (6)—M. W. Bullock, 6805 Northwood Rd., Dallas 25, Texas; C. F. Seay, Jr., Collins Radio Company, 1930 Hi-Line Dr., Dallas, Texas
Dayton (5)—W. W. McLennan, 304 Schenck Ave., Dayton 9, Ohio; N. A. Nelson, 310 Lewiston Rd., Dayton 9, Ohio.
Denver (6)—J. W. Herbstreit, 2000 E. Ninth Ave., Boulder, Colo; R. S. Kirby, 455 Hawthorne Ave., Boulder, Colo.
Des-Moines-Ames (5)—A. D. Parrott, Northwestern Bell Telephone Company, Des Moines, Iowa; W. L. Hughes, E.E. Department, Iowa State College, Ames, Iowa
Detroit (4)—N. D. Saigeon, 611 Nightingale, Dearborn, Michigan; A. L. Coates, 1022 E. Sixth St., Royal Oak., Mich.
Egypt—H. M. Mahmoud, 24 Falaki St.,
Cairo, Egypt; E. I. Elkashlan, Egyptian State Broadcasting, Cairo, Egypt
Elmira-Corning (1)—R. A. White, 920 Grand Central Ave., Horseheads, N. Y.; R. G. Larson, 220 Lynhurst Ave., Wind-sor Gardens, Horseheads, N. Y.
El Paso (6)—J. C. Nook, 1126 Cimarron St., El Paso, Texas; J. H. Maury, 3519 Fort Blvd., El Paso, Texas.
Emporium (4)—E. H. Boden, R.D. 1, Em-porium, Pa.; H. S. Hench, Jr., R.D. 2. Emporium, Pa.
Evansville-Owensboro (5)—E. C. Gregory, 1120 S.E. First St., Apt. B-2, Evansville, Ind.; A. K. Miegl, 904 Kelsey Ave., Evansville, Ind.
Fort Wayne (5)—C. L. Hardwick, 2905 Chestnut St., Fort Wayne 4, Ind.; Paul Rudnick, Farnsworth Electronics Com-pany, Fort Wayne 1, Ind.
Hamilton (8)—G. F. Beaumont, 6 Tallman Ave., Burlington, Ont., Canada; C. N. Chapman, 40 Dundas St., Waterdown, Ont., Canada.
Hawaii (7)—H. E. Turner, 44-271 Mikiola Dr., Kaneohe, Hawaii; G. H. Hunter, Box 265, Lanikai, Oahu, T. H.
Houston (6)—L. W. Erath, 2831 Post Oak Rd., Houston, Texas; R. W. Olson, Box 6027, Houston 6, Texas.
Huntsville (3)—A. L. Bratcher, 308 E. Holmes St., Huntsville, Ala.; W. O. Frost, Box 694, Huntsville, Ala
Indianapolis (5)—A. J. Schultz, 908 E. Michigan St., Indianapolis, Ind.; H. L. Wisner, 5418 Rosslyn Ave., Indianapolis 20, Ind.
Israel—Franz 011endorf, Box 910, Hebrew Inst. of Tech., Haifa, Israel; J. H. Halber-stein, P.O.B. 1, Kiriath Mozkin, Israel
Ithaca (1)—Benjamin Nichols, School of Electrical Engineering, Cornell Univer-sity, Ithaca, N. Y.; H. L. Heydt, General Electric Advanced Electronics Center, Cornell University Airport, Ithaca, N. Y.
(Coned on next page)

1956 IRE News and Radio Notes 127
(Sections cont'd) Kansas City (6)—Richard W. Fetter, 8111 W. 87 St., Overland Park, Kan.; Mrs. G. L. Curtis, Radio Industries, Inc., 1307 Central Ave., Kansas City 2, Kan.
Little Rock (6)—J. E. Wylie, 2701 N. Pierce, Little Rock, Ark.; Jim Spilman, A. R. & T. Electronics, P.O. Box 370, North Little Rock, Ark.
London (8)—C. F. MacDonald, 328 St. James St., London, Ont., Canada; J. D. B. Moore, 27 McClary Ave., London, Ont., Canada.
Long Island (2)—Paul G. Hansel, Addison Lane, Greenvale, L. I., N. Y.; W. P. Frantz, Sperry Gyroscope Co., Great Neck, L. L, N. Y.
Los Angeles (7)—Walter E. Peterson, 4016 Via Cardelina, Palos Verdes Estates, Calif.; John K. Gossland, 318 E. Cal-averas St., Altadena, Calif.
Louisville (5)-0. W. Towner, WHAS Inc., 525 W. Broadway, Louisville 2, Ky.; L. A. Miller, 314 Republic Bldg., Louisville 2, Ky.
Lubbock (6)—H. A. Spuhler, Electrical En-gineering Department, Texas Technologi-cal College, Lubbock, Texas; J. W. Dean, 1903-49 St., Lubbock, Texas.
Miami (3)—C. S. Clemans, Station WSWN, Belle Glad, Fla.; H. F. Bernard, 1641 S.W. 82 Place, Miami, Fla.
Milwaukee (5)—Alex Paalu, 1334 N. 29 St., Milwaukee 8, Wis.; J. E. Jacobs, 6230 S. 116 St., Hales Corner, Wis.
Montreal (8)—Sydney Bonneville, Room 1427, 1050 Beaver Hall Hill, Montreal, Que., Canada; R. E. Penton, 2090 Clare-mont Ave., N.D.G., Montreal, Que., Canada.
Newfoundland (8)—E. D. Witherstone, 6 Cornell Heights, St. John's, Newfound-land, Canada; R. H. Bunt, Box H-182, St. John's, Newfoundland, Canada.
New Orleans (6)—J. A. Cronvich, Dept. of Electrical Engineering, Tulane Univer-sity, New Orleans 18, La.; N. R. Landry, 620 Carol Dr., New Orleans 21, La.
New York (2)—A. C. Beck, Box 107, Red Bank, N. J.; J. S. Smith, 506 East 24 St., Brooklyn 10, N. Y.
North-Carolina-Virginia (3)—J. C. Mace, 1616 Jefferson Park Ave., Charlottes-
ville, Va.; Allen L. Comstock, 1404 Hamp-ton Drive, Newport News, Va.
Northern New Jersey (2)—P. S. Christaldi, Box 111, Clifton, N. J.; W. Cullen Moore, 130 Laurel Hill Rd., Mountain Lakes. N. J.
Northwest Florida (3)—B. H. Overton, Box 115, Shalimar, Fla.; G. C. Fleming, 579 E. Gardner Dr., Ft. Walton Beach, Fla.
Oklahoma City (6)—A. P. Challenner, Uni-versity of Oklahoma, Norman, Okla-homa; Frank Herrmann, 1913 N.W. 21 St., Oklahoma City, Okla.
Omaha-Lincoln (5)—M. L. McGowan, 5544 Mason St., Omaha 6, Neb.; C. W. Rook, Dept. of Electrical Engineering, Uni-versity of Nebraska, Lincoln 8, Neb.
Ottawa (8)—George Glinski, 36 Granville Ave., Ottawa, Ont., Canada; C. F. Pat-tenson, 3 Braemar, Ottawa 2, Ont., Canada.
Philadelphia (3)—C. R. Kraus, Bell Tele-phone Co. of Pa., 1835 Arch St., 16 Floor, Philadelphia 3, Pa.; Nels Johnson, Philco Corp., 4700 Wissahickon Ave., Philadel-phia 44, Pa.
Phoenix (7)—William R. Saxon, 641 E. Missouri, Phoenix, Ariz.; G. L. McClana-than, 509 East San Juan Cove, Phoenix, Ariz.
Pittsburgh (4)—J. N. Grace, 112 Heather Dr., Pittsburgh 34, Pa.; J. B. Woodford, Jr., Box 369, Carnegie Tech. P.O., Pitts-burgh 13, Pa.
Portland (7)—J. M. Roberts, 4325 N.E. 77, Portland 13, Ore.; D. C. Strain, 7325 S. W. 35 Ave., Portland 19, Ore.
Princeton (2)—G. C. Sziklai, Box 3, Prince-ton, N. J.; L. L. Burns, Jr., R.C.A. Labs., Princeton, N. J.
Rochester (1)—G. H. Haupt, 48 Van Voor-his Ave., Rochester 17, N. Y.; B. L. Mc-Ardle, Box 54, Brighton Sta., Rochester 10, N. Y.
Rome-Utica (1)—H. F. Mayer, 60 Fountain St., Clinton, N. Y.; R. S. Grisetti, 67 Root St., New Hartford, N. Y.
Sacramento (7)—R. C. Bennett, 3401 Chenu Ave., Sacramento 21, Calif.; R. A. Poucher, Jr., 3021 Mountain View Ave., Sacramento 21, Calif.
St. Louis (6)—F. A. Fillmore, 5758 Itaska St., St. Louis 9, Mo.; Christopher Efthim, 1016 Louisville Ave., St. Louis 10, Mo.
Salt Lake City (7)—A. L. Gunderson, 3906 Parkview Dr., Salt Lake City, Utah; S. B. Hammond, Engineering Hall, Univ. of Utah, Salt Lake City 1, Utah.
San Antonio (6)—Paul Tarrodaychik, 215 Christine Dr., San Antonio 10, Texas; J. B. Porter, 647 McIlvaine St., San An-tonio 1, Texas.
San Diego (7)—F. X. Brynes, 1759 Beryl St., San Diego 9, Calif.; R. T. Silberman, 4274 Middlesex Dr., San Diego, Calif.
San Francisco (7)—B. M. Oliver, 275 Page Mill Rd., Palo Alto, Calif.; Wilson Pritchett, Div. of Electrical Engineering, University of California, Berkeley 4, Calif.
Schenectady (1)—C. C. Allen, 2064 Baker Ave., Schenectady 9, N. Y.; A. E. Rankin, 833 Whitney Dr., Schenectady, N. Y.
Seattle (7)—W. C. Galloway, 5215 Pritchard St., Seattle 6, Wash.; J. M. Scovill, 7347-58 Ave., N.E., Seattle 15, Wash.
Syracuse (1)—G. M. Glasford, Electrical Engineering Dept., Syracuse University, Syracuse 10, N. Y. (Secretary).
Toledo (4)—L. R. Klopfenstein, Portage, Ohio; D. F. Cameron, 1619 Milburn Ave., Toledo 6, Ohio.
Toronto (8)—A. P. H. Barclay, 2 Pine Ridge Dr., Toronto 13, Ont., Canada; H. W. Jackson, 352 Laird Dr., Toronto 17, Ont., Canada
Tulsa (6)—Glen Peterson, 502 S. 83 East Ave., Tulsa, Okla.; D. G. Egan, Research Laboratory, Carter Oil Company, Box 801, Tulsa 2, Okla.
Twin Cities (5)—N. B. Coil, 1664 Thomas Ave., St. Paul 4, Minn.; A. W. Sear, 5801 York Ave. S., Minneapolis 10, Minn.
Vancouver (8)—J. E. Breeze, 5591 Toronto Rd., Vancouver 8, B. C., Canada; R. A. Marsh, 3873 W. 23 Ave., Vancouver, B. C., Canada.
Washington (3)—H. I. Metz, U. S. Govern-ment Dept. of Commerce, CAA, Room 2076, T-4 Bldg., Washington 25, D. C.; A. H. Schooley, 3940 First St., S.W., Washington 24, D. C.
Williamsport (4)—G. B. Amey, 968 N. Market St., Williamsport, Pa.; W. H. Bresee, 818 Park Ave., Williamsport, Pa.
Winnipeg (8)—R. M. Simister, 179 Renfrew St., Winnipeg, Man., Canada; G. R. Wal-lace, 400 Smithfield Ave., Winnipeg, Man., Canada
Subsections Berkshire (1)—Gilbert Devey, Sprague
Electric Company, Marshall St., Bldg. 1, North Adams, Mass.; R. P. Sheehan, Ballou Lane, Williamstown, Mass.
Buenaventura (7)—W. O. Bradford, 301 East Elm St., Oxnard, Calif.; M. H. Fields, 430 Roderick St., Oxnard, Calif.
Centre County (4)—W. L. Baker, 1184 Omeida St., State College, Pa.; W. J. Leiss, 1173 S. Atherton St., State College, Pa.
Charleston (3)—W. L. Schachte, 152 Grove St., Charleston 22, S. C.; Arthur Jonas, 21 Madden Dr., Dorchester Terr., Charleston Heights, S. C.
East Bay (7)—J. M. Rosenberg, 1134 Nor-wood Ave., Oakland 10, Cal.; C. W. Park, 6035 Chabolyn Terrace, Oakland, Cal.
Erie (1)—R. S. Page, 1224 Idaho Ave., Erie 10, Pa.; R. H. Tuznik, 905 E. 25 St., Erie, Pa.
Fort Huachuca (7)—R. O. Burns, Army Electronic Proving Ground, Ft. Huachu-
ca, Ariz.; J. H. Homsy, Box 123, San Jose Branch, Bisbee, Ariz.
Lancaster (3)—R. B. Janes, Radio Corpora-tion of America, Tube Dept., Lancaster, Pa.; H. F. Kazanowski, 108 Mackin Ave., Lancaster, Pa.
Mid-Hudson (2)—R. E. Merwin, 13 S. Ran-dolph Ave., Poughkeepsie, N. Y.; P. A. Bunyar, 10 Morris St., Saugerties, N. Y.
Monmouth (2)—G. F. Senn, Orchard Rd.-River Plaza, Red Bank, N. J.; C. A. Borgeson, 82 Garden Rd., Little Silver, N. J.
Orange Belt (7)—F. D. Craig, 215 San Rafael, Pomona, Calif.; W. F. Meggers, Jr., 6844 De Anza Ave., Riverside, Calif.
Palo Alto (7)—W. W. Harman, Electronics Research Laboratory, Stanford Univer-sity, Stanford, Calif.; W. G. Abraham, 611 Hansen Way, c/o Varian Associates, Palo Alto, Calif.
Pasadena (7)—Jennings David, 585 Rim Rd., Pasadena 8, Calif. (Secretary).
Piedmont—Officers to be elected. Quebec (8)—Officers to be elected. Richland (7)—R. G. Clark, 1732 Howell
Richland, Washington; R. E. Connally, 515 Cottonwood Dr., Richland, Wis.
Tucson (7)—R. C. Eddy, 1511 E. 20 St., Tucson, Ariz.; P. E. Russell, Elect. Eng. Dept., Univ. Ariz., Tucson, Ariz.
USAFIT (5)—J. J. Gallagher, Box 3482 USAFIT, Wright-Patterson AFB, Ohio (Secretary).
Westchester County (2)—Joseph Reed, 52 Hillcrest Ave., New Rochelle, N. Y.; D. S. Kellogg, 9 Bradley Farms, Chappaqua, N. Y.
Wichita (6)—M. E. Dunlap, 548 S. Lor-raine Ave., Wichita 16, Kan.; English Piper, 1838 S. Parkwood Lane, Wichita, Kan.
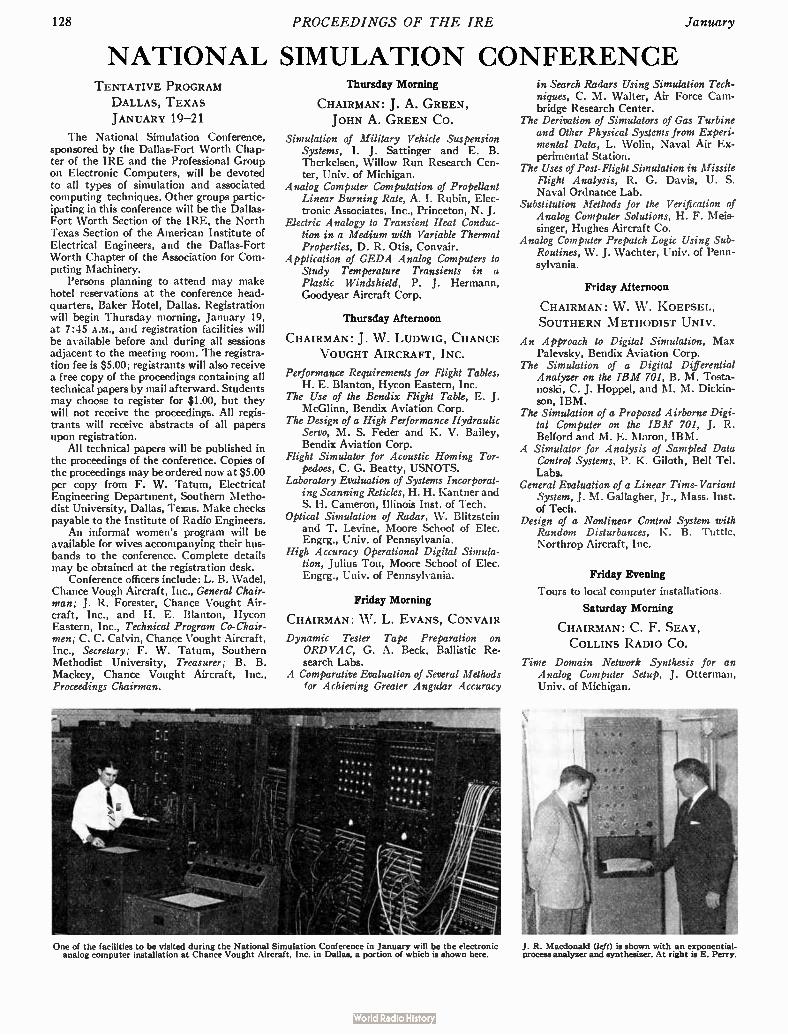
128 PROCEEDINGS OF THE IRE January
NATIONAL SIMULATION CONFERENCE TENTATIVE PROGRAM
DALLAS, TEXAS
JANUARY 19-21
The National Simulation Conference, sponsored by the Dallas-Fort Worth Chap-ter of the IRE and the Professional Group on Electronic Computers, will be devoted to all types of simulation and associated computing techniques. Other groups partic-ipating in this conference will be the Dallas-Fort Worth Section of the IRE, the North Texas Section of the American Institute of Electrical Engineers, and the Dallas-Fort Worth Chapter of the Association for Com-puting Machinery.
Persons planning to attend may make hotel reservations at the conference head-quarters, Baker Hotel, Dallas. Registration will begin Thursday morning, January 19, at 7:45 A.M., and registration facilities will be available before and during all sessions adjacent to the meeting room. The registra-tion fee is $5.00; registrants will also receive a free copy of the proceedings containing all technical papers by mail afterward. Students may choose to register for $1.00, but they will not receive the proceedings. All regis-trants will receive abstracts of all papers upon registration.
All technical papers will be published in the proceedings of the conference. Copies of the proceedings may be ordered now at $5.00 per copy from F. W. Tatum, Electrical Engineering Department, Southern Metho-dist University, Dallas, Texas. Make checks payable to the Institute of Radio Engineers.
An informal women's program will be available for wives accompanying their hus-bands to the conference. Complete details may be obtained at the registration desk.
Conference officers include: L. B. Wadel, Chance Vough Aircraft, Inc., General Chair-man; J. R. Forester, Chance Vought Air-craft, Inc., and H. E. Blanton, Hycon Eastern, Inc., Technical Program Co-Chair-men; C. C. Calvin, Chance Vought Aircraft, Inc., Secretary; F. W. Tatum, Southern Methodist University, Treasurer; B. B. Mackey, Chance Vought Aircraft, Inc., Proceedings Chairman.
Thursday Morning
CHAIRMAN: J. A. GREEN,
JOHN A. GREEN CO.
Simulation of Military Vehicle Suspension Systems, I. J. Sattinger and E. B. Therkelsen, Willow Run Research Cen-ter, Univ. of Michigan.
Analog Computer Computation of Propellant Linear Burning Rate, A. I. Rubin, Elec-tronic Associates, Inc., Princeton, N. J.
Electric Analogy to Transient Heat Conduc-tion in a Medium with Variable Thermal Properties, D. R. Otis, Convair.
Application of GEDA Analog Computers to Study Temperature Transients in a Plastic Windshield, P. J. Hermann, Goodyear Aircraft Corp.
Thursday Afternoon
CHAIRMAN: J. W . LUDWIG, CHANCE
VOUGHT AIRCRAFT, INC.
Performance Requirements for Flight Tables, H. E. Blanton, Hycon Eastern, Inc.
The Use of the Bendix Flight Table, E. J. McGlinn, Bendix Aviation Corp.
The Design of a High Performance Hydraulic Servo, M. S. Feder and K. V. Bailey, Bendix Aviation Corp.
Flight Simulator for Acoustic Homing Tor-pedoes, C. G. Beatty, USNOTS.
Laboratory Evaluation of Systems Incorporat-ing Scanning Reticles, H. H. Kantner and S. H. Cameron, Illinois Inst. of Tech.
Optical Simulation of Radar, W. Blitzstein and T. Levine, Moore School of Elec. Engrg., Univ. of Pennsylvania.
High Accuracy Operational Digital Simula-tion, Julius Tou, Moore School of Elec. Engrg., Univ. of Pennsylvania.
Friday Morning
CHAIRMAN: W . L. EVANS, CONVAIR
Dynamic Tester Tape Preparation on ORDVAC, G. A. Beck, Ballistic Re-search Labs.
A Comparative Evaluation of Several Methods for Achieving Greater Angular Accuracy
in Search Radars Using Simulation Tech-niques, C. M. Walter, Air Force Cam-bridge Research Center.
The Derivation of Simulators of Gas Turbine and Other Physical Systems from Experi-mental Data, L. Wolin, Naval Air Ex-perimental Station.
The Uses of Post-Flight Simulation in Missile Flight Analysis, R. G. Davis, U. S. Naval Ordnance Lab.
Substitution Methods for the Verification of Analog Computer Solutions, H. F. Meis-singer, Hughes Aircraft Co.
Analog Computer Prepatch Logic Using Sub-Routines, W. J. Wachter, Univ. of Penn-sylvania.
Friday Afternoon
CHAIRMAN: W . W . KOEPSEL,
SOUTHERN M ETHODIST UNIV.
An Approach to Digital Simulation, Max Palevsky, Bendix Aviation Corp.
The Simulation of a Digital Differential Analyzer on the IBM 701, B. M. Tosta-noskiI,BC..J. Hoppel, and M. M. Dickin-son, IBM.
The Simulation of a Proposed Airborne Digi-tal Computer on the IBM 701, J. R. Belford and M. E. Maron, IBM.
A Simulator for Analysis of Sampled Data Control Systems, P. K. Giloth, Bell Tel. Labs.
General Evaluation of a Linear Time- Variant System, J. M. Gallagher, Jr., Mass. Inst. of Tech.
Design of a Nonlinear Control System with Random Disturbances, K. B. Tuttle, Northrop Aircraft, Inc.
Friday Evening
Tours to local computer installations.
Saturday Morning
CHAIRMAN: C. F. SEAY,
COLLINS RADIO CO.
Time Domain Network Synthesis for an Analog Computer Setup, J. Otterman, Univ. of Michigan.
One of the facilities to be visited during the National Simulation Conference in January will be the electronic analog computer installation at Chance Vought Aircraft, Inc. in Dallas, a portion of which is shown here.
J. R. Macdonald (left) is shown with an exponential-process analyzer and synthesizer. At right is E. Perry.

1956 IRE News and Radio Notes 129
Simulation of Dead Time, N. L. Irvine, Aero-ject-General Corp.
A Simulation System for the Study of Human Dynamics, J. M. Stroud, U. S. Navy Electronics Lab.
The Applied Systems Development and Evaluation Center at the Navy Electronics Laboratory, R. Coburn, U. S. Navy Electronics Lab.
An Analog Computer for Radioactive Fallout Prediction, H. K. Skramstad and J. H. Wright, National Bureau of Standards.
An Exponential-Process Analyzer and Syn-
thesizer, J. R. Macdonald, Texas Instru-ments, Inc.
Saturday Afternoon
CHAIRMAN: J. R. M ACDONALD, TEXAS INSTRUMENTS, INC.
The Gated Amplifier Computer Technique, Sidney Godet, Reeves Instrument Corp.
A Wide-Band Direct-Coupled Operational Amplifier, C. S. Deering, Convair.
An Improved Diode Function Generator for
Analog Computers, R. A. Bruns, Calif. Inst. of Tech.
Use of Semi-Conducting Surfaces in Analog Function Generation, V. L. Larrowe and M. Spencer, Willow Run Research Cen-ter, Univ. of Michigan.
Repeatable Generation of Noise with a Masked Cathode Ray Tube, L. B. Wadel, C. C. Calvin, and J. W. Atkins, Jr., Chance Vought Aircraft, Inc.
A Comparison of Diode Switching Methods for Analog Function Generators, O. L. Up-dike and J. H. McLeod, Jr., USNAMTC
NATIONAL SYMPOSIUM ON MICROWAVE TECHNIQUES
UNIVERSITY OF PENNSYLVANIA PHILADELPHIA, PENNSYLVANIA
FEBRUARY 2-3
A National Symposium on Microwave Techniques will be held at the University of Pennsylvania, Philadelphia, Pennsyl-vania, on Thursday and Friday, February 2 and 3. The Moore School of Electrical Engineering, University of Pennsylvania, is host to this symposium. The symposium is sponsored jointly by the Professional Group on Antennas and Propagation, the Profes-sional Group on Microwave Theory and Techniques, and the Philadelphia Section of the IRE.
The technical program arranged for this symposium has been designed to present the most significant advances in the field of microwave engineering. Sessions will be de-voted to microwave components, antennas, guided microwave transmission, scatter propagation and radiation, and ferrite theory and devices. Inspection of several laboratories and facilities of the new Physi-cal Sciences building on the campus of the University of Pennsylvania will be possible during the symposium.
The symposium will be held in the new Physical Sciences building of the University of Pennsylvania. The registration fee is $2.50 for advance registrants and $3.50 for those registering at the door. Advance registrations should be sent by January 15 to Charles Polk, Chairman of the Arrange-ments Committee, Moore School of Electri-cal Engineering, University of Pennsylvania. Philadelphia 4, Pennsylvania. Checks should be made payable to I. L. Auerbach, Treas-urer. A cocktail party for those attending the
symposium will be held at the Penn-Sherwood Hotel, 39th and Chestnut Streets, Philadelphia, February 2 at 5:30 P.M.
Tickets at $2.00 apiece will be required for admission.
Of interest to those attending the Sym-posium on Microwave Techniques is the regularly scheduled meeting of the Phila-delphia Section of the IRE, Wednesday
evening, February 1, 8:00 P.M., at the Franklin Institute. D. G. Fink will speak on the topic "Danger! The Radio Spectrum is Bursting at the Seams." Those arriving in Philadelphia in time are invited to attend.
The Symposium on Microwave Tech-niques has been planned and organized by the Steering Committee under the chairman-ship of R. F. Schwartz. Members of the Steering Committee are: R. F. Schwartz, Chairman, Moore School of Electrical Engi-neering, University of Pennsylvania; S. M. King, Secretary and Publicity, I-T-E Circuit Breaker Company; J. B. Williams, Finance, Philco Corporation; D. R. Crosby, Techni-cal Program, Radio Corporation of America; Charles Polk, Arrangements, Moore School of Electrical Engineering, University of Pennsylvania; D. D. King, Johns Hopkins University; W. M. Sharpless, Bell Telephone Laboratories, Inc.; Ben Warriner, IV, Gen-eral Electric Company; Sanford Hershfield, Glenn L. Martin Company; and N. I. Kor-man, Radio Corporation of America.
The Technical Program Committee who assembled the program for this symposium consists of the following members: D. R. Crosby, Chairman, Radio Corporation of America; S. E. Benson, Philco Corpora-tion; Sanford Hershfield, Glenn L. Martin Company; R. W. Klopfenstein, Radio Corporation of America; P. P. Lombardini, Moore School of Electrical Engineering, University of Pennsylvania; Milton Nuss-baum, American Electronic Laboratories, Inc.; A. A. Oliner, Polytechnic Institute of Brooklyn; T. S. Saad, Sage Laboratories, Inc.; and W. M. Sharpless, Bell Telephone Laboratories, Inc.
The Local Arrangements Committee re-sponsible for the nontechnical phase of this symposium is composed of the following members: Charles Polk, Chairman, Moore School of Electrical Engineering, University of Pennsylvania; Robert Scudder, Radio Corporation of America; Ernest Jacobs, American Electronic Laboratories, Inc.; Sterling Wright, Philco Corporation; and P. J. Kelly, Moore School of Electrical Engineering, University of Pennsylvania.
Thursday, February 2
9:30 a.m.
Auditorium A
MICROWAVE COMPONENTS
Session Chairman: B. F. Wheeler, R.C.A. "Recent Advances in Waveguide Hy-
brid Junctions," P. A. Loth, Wheeler Lab. "A Traveling-Wave Ring Filter," F. S.
Coale, Stanford Research Institute. "Printed Microwave Bandpass Filters
with an Application in the X-Band," J. H. Wenzel, Philco Corporation.
"Miniaturization of Microwave As-semblies," L. Lewin, Standard Telecom-munication Laboratories Limited, England.
"Very Narrow Passband Waveguide Filters in Toll-Ticket Waveguide," David Proctor and G. W. Wolfe, Convair.
Auditorium B
ANTENNAS
Session Chairman: L. H. Hendrixson, Bell Telephone Company of Pennsylvania.
"A Broadband Receiving Antenna for Horizontal and Vertical Polarization," W. H. Clark and Werner Koppl, Radio Frequency and Antenna Consultants.
"Techniques for Controlling the Radia-tion from a Dielectric Rod Waveguide," J. W. Duncan and R. H. DuHamel, U. of Ill.
"Microwave Interferometer Studies in Dielectric Media and Parallel Wire Grids in Free Space and Waveguide," D. B. Medved and F. M. Millican, Convair.
"The Excitation of Surface Waveguides and Radiating Slots by Strip-Circuit Trans-mission Lines," A. D. Frost, C. R. McGeoch, and C. R. Mingins, Tufts University.
"New Method of Antenna Array Syn-thesis Applied to Generation of Double-step Patterns," C. J. Sletten, Air Force Cam-bridge Research Center.
2:00 p.m.
University Museum Auditorium
"Welcoming Remarks," C. C. Chambers, Vice-Pres. Engineering Affairs, U. of Penna.

130 PROCEEDINGS OF THE IRE January
PANEL ON GUIDED MICROWAVE
TRANSMISSION
Moderator: Dr. W. L. Barrow, Sperry Gyroscope Company.
Members: R. W. Klopfenstein, Coaxial, Spiral and Dielectric Guides, RCA. George Goubau, Open Wire Lines, U.S.A. Signal Corps consultant; E. G. Fubini, Strip Lines, Airborne Instruments Laboratory, Inc.; T. N. Anderson, Rectangular and Ridge Waveguide, Airtron Inc.; S. E. Miller, Round Guide, Multimode Guide, Bell Tele-phone Laboratories, Inc.
Thursday evening, February 2
Cocktail party
Friday, February 3
9:30 a.m.
Auditorium A
SCATTER PROPAGATION AND
RADIATION
Session Chairman: J. B. Williams, Philco Corporation.
"Summary of Scatter Propagation," W. E. Gordon, Cornell University.
"A Scatter Propagation Test at 400, 2250 and 2820 MC," S. P. Brown, Signal Corps, and H. R. Mathwich, RCA.
"On the Simulation of Fraunhofer Radia-tion Patterns in the Fresnel Region," D. K. Cheng, Syracuse University.
"Near-Zone Gain of Rectangular Aper-
tures," Charles Polk, Moore School of Elec-trical Engineering, University of Pa.
"Diffraction Zone SHF Antenna Pattern Range," J. O. Stenoien, Boeing Airplane Company.
Auditorium B
FERRITE THEORY
Session Chairman: N. C. Colby, Radio Corporation of America.
"Ferrites in the Region Below 3,000 MC," C. L. Hogan, Harvard University.
"Representation of Non-Reciprocal Two-Parts via the Modified Wheeler Network," H. M. Altschuler and W. K. Kahn, Poly-technic Institute of Brooklyn.
"Non-Linear Propagation in Ferrite-Loaded Waveguide," N. G. Sakiotis, H. N. Chait and M. L. Kales, Naval Research Laboratory.
"Evaluation of Non-Reciprocal Micro-wave Circuits for Radar Applications," D. A. Caswell, Cascade Research Corp.
"Power Conservation in Waveguide Sys-tems," A. G. Fox, Bell Telephone Labora-tories, Inc.
2:00 p.m.
Auditorium A
MICROWAVE COMPONENTS
Session Chairman: E. I. Hawthorne, Moore School of Electrical Engineering, University of Pennsylvania.
"Criteria for Design of Loop Type Di-rectional Couplers for the L-Band," P. P.
Abstracts of IRE Transactions
The following issues of "Transactions" have recently been published, and are now available from the Institute of Radio Engineers, Inc., 1 East 79th Street, New York 21, N. Y. at the following prices. The contents of each issue and, where available, abstracts of technical papers are given below.
Group IRE Non-Sponsoring Group Publication Members Members Members*
Information Theory Vol. IT-1, No. 2 Instrumentation Vol. PGI-4 Medical
Electronics PGME-2 Telemetry and Remote
$1.90 $2.70
$0.85
$2.85 $5.70 $4.05 $8.10
$1.25 $2.55
Control $1.05 $2.10 Vol. TRC-1, No. 3 $0.70
* Public libraries and colleges may purchase copies at IRE Member rates.
Information Theory
Vol,. 1T-1, No. 2, SEPTEMBER, 1955
On Optimum Multiple-Alternative Detec-tion of Signals in Noise—D. Middleton and D. Van Meter
The problem of the optimum detection of signals in noise, when a possible signal can arise from more than one class of signal types, is con-sidered from the point of view of decision theory. Specifically, optimization here consists of minimizing the average risk for preassigned costs appropriate to the possible correct and
Lombardini, R. F. Schwartz and P. J. Kelly, Moore School of Electrical Engineering, University of Pennsylvania.
"Recent Advances in Finline Circuits," S. D. Robertson, Bell Telephone Labora-tories, Inc.
"Broadband Waveguide Series Switching T," J. W. E. Griemsmann and G. S. Kasai, Polytechnic Institute of Brooklyn.
"A Coaxial Balanced Duplexer," John Reed and Gershon Wheeler, Raytheon Manufacturing Company.
"Image Rejection Converter," W. H. Horton, and F. Schnurer, General Electric Company.
Auditorium B
FERRITE DEVICES
Session Chairman: A. A. Oliner, Poly-technic Institute of Brooklyn.
"The Turnstile Circulator," P. J. Allen, Naval Research Laboratory.
"A Broad-Band Microwave Circulator," E. A. Ohm, Bell Telephone Laboratories, Inc.
"Optimum Design Parameters for Ferri-magnetic Resonance Absorption Isolators," L. A. Blasberg, L. J. Laden and R. A. Young, Hughes Weapon Systems Development Laboratories.
"Improved Rectangular Waveguide Resonance Isolators," M. T. Weiss, Bell Telephone Laboratories, Inc.
"An Automatic Gain Control System for Microwaves," J. P. Vindling, Cascade Research Corporation.
incorrect decisions, when only a single signal, of class k, may occur out of N+1 mutually ex-clusive signal classes. The analysis is a generali-zation of the authors' earlier work on binary, or single alternative detection systems. The pres-ent treatment outlines the optimization pro-cedure for additive signals and noise, indicates the general structure of the detector, and gives expressions for the probabilities of error and minimum average (or Bayes) risk. Some explicit results for normal statistics are included, and an example—coherent detection of similar sig-nals, differing only in amplitude—illustrates the general approach. A Note on the Envelope and Phase-
Modulated Components of Narrow-Band Gaus-sian Noise—Robert Price
The autocorrelation function and power spectrum of the phase-modulated portion of narrow-band gaussian noise is studied and specific computations are carried out for the case of a rectangular noise spectrum. Related results are given for the noise envelope. Gen-eral asymptotic expressions for the spectra are obtained, together with experimental verifica-tion.
Error Bounds in Noisy Channels Without Memory—Amiel Feinstein
It is shown that for any noisy channel with-out memory having only a finite number of re-ceived signals, the error in transmitting in-formation at a rate H <C and using uniformly

1956 IRE News and Radio Notes 131
good codes of length n is bounded by an expres-sion Fe-egc-ins where F and B are constants depending upon the channel parameters but not upon H or n.
A Bibliography on Noise—P. L. Chessin Supplement to A Bibliography of Informa-
tion Theory (Communication Theory—Cyber-netics)—F. L. Stumpers
Correspondence PGIT News
Instrumentation
VOL. PGI-4, OCTOBER, 1955
(Fourth Conference on High Frequency Meas-urements—IRE, AIEE, NBS, and URSI,
Washington, D. C., January 17-19, 1955)
Measurements and Components for Rec-tangular Multimode Waveguides—D. J. Ange-lakos
This paper is divided into four sections: (1) measurement techniques as applied to rectangular guides in which TEui, TE20, and combinations of these modes may exist, (2) scattering by, and field distributions in, slots cut in multimode guides, (3) directional coup-lers used as mode selectors for guides containing both TEli) and TE20, and (4) multimode guides partially filled with dielectrics (propagation constants and measurement techniques). A Comparison Method for Tuning Wide-
band TR Tubes—H. H. Rickert The method consists of comparing each pro-
duction TR tube with a specially constructed and adjusted standard, in a microwave circuit which yields the differences in reflection and transmission. The test signal is swept con-tinuously across the X-band at a rapid rate, while the difference outputs are displayed on an oscilloscope. The production tubes are tuned to best agreement with the standard; limit lines drawn on the scope face indicate whether the tuned tube is acceptable. The method has made it possible to maintain un-usual tolerance of uniformity among TR tubes.
Radio Interference Measurement Tech-niques—L. W. Thomas
The importance of using proper techniques for the measurement of radio interference can-not be overemphasized. The amount of radio interference produced by many commercial items determines to a great extent the accep-tability of that item to the user. Manufacturers of many items have formulated voluntary codes recommending minimum interference values which current manufacturers attempt to meet. The desired technique for the assessment of radio interference is one that will produce significant and uniform indications of the in-terference potentialities of the item in ques-tion. It has been found, however, that meter in-dications of interference can vary by factors of as much as one hundred to one when variations are made in the measurement technique. Many technical groups are actively prosecuting the development of standards for radio interfer-ence measurements.
Pattern Measurements of Large Fixed An-tennas—J. P. Shanklin
The measurement of the pattern of large fixed antennas poses many problems if good quantitative results are desired. A method has been devised for obtaining the pattern and power gain of large antennas in the vhf range using an airborne receiver. A discussion of the problems involved in making such tests is given, followed by a description of the details of tests recently performed on some very large rhombic antennas. The lecture is illustrated with slides showing various aspects of the technique together with samples of the re-corded data. Comparisons with theoretical characteristics of the antenna are made wherein it is shown that good agreement with theory is obtained.
Accurate Radar Attenuation Measurements Achieved by In-Flight Calibration—F. J. Janza and R. E. West
To achieve accurate inflight loop attenua-tion measurements with a pulse radar, in-stabilities inherent in the active networks (mixers, IF amplifiers, etc.) necessitate obtain-ing complete input-output calibration curves in flight at frequent intervals. By this tech-nique, receiver calibration accuracy can be held within ± 1 db. Slightly less accurate results may be obtained by calibrating in the air at only one point on the input-output curve, pro-vided that laboratory calibrations are made immediately before and after each flight. Com-parisons shown between laboratory and various inflight calibrations demonstrate beyond ques-tion the need for the latter. Variations recorded in environmental testing on the ground were much less than those found in the air, even though the vibration, pressure, and tempera-ture variations were nominally more severe in the testing laboratory on the ground.
Use of Distribution Curves in Evaluating Microwave Path Clearance—B. F. Wheeler and H. R. Mathwich
It has been found that distribution curves of the fading expel ienced on paths in a microwave relay system can assist in evaluating whether or not the paths have adequate clearance above intervening obstacles. Several months' propa-gation data must be taken on each path, re-cording the depth of each fade and its duration at each of several chosen reference signal levels. These data are then plotted in two fashions. The first is to plot as the abscissa "the per cent of fades for which the duration is equal to or exceeds the ordinate" and as the ordinate "the fade duration in minutes. » The second type curve is to plot as the abscissa "the per cent of total outage time contributed by fades of dura-tion equal to or exceeding the ordinate" and again the ordinate is "the fade duration in minutes. » The shape of these curves has been found to differ significantly between paths whose clearance is adequate and those whose clearance is not adequate. Data from a number of paths of various lengths, clearances, and fre-quencies will be used to illustrate these points. 6 KMC Sweep Oscillator—D. A. Alsberg An external cavity klystron sweep oscillator
has been developed for use in the 6 kmc com-mon carrier band. The oscillator has a useful output over the frequency range of 5.4-7.2 kmc. A power output of more than 300 mw can be realized constant over more than 650 mc within our ability to measure (.2 db). The sweep width may be adjusted continuously from 10-800 mc. The center of the sweep fre-quency may be set conveniently anywhere in the band and may be read directly on a cali-brated dial. The oscillator is frequency modu-lated mechanically at a rate of 53 cycles per second with almost complete suppression of ex-ternal vibration. Oscilloscope sweep voltage, optional blanking and measure-reference switching are provided. Discussed in some de-tail are microwave cavity, tuner and iris design, mechanical vibration and fatigue problems and electromechanical considerations. The design practices developed for the 6 kmc oscillator have been found applicable in other microwave frequency ranges with comparable results.
Data on Temperature Dependence of X-Band Fluorescent Lamp Noise Sources— W. W. M umford and R. L. Schafersman
This paper is concerned primarily with the performance of fluorescent lamps as microwave noise sources at 9,000 mc. In particular, it deals with the temperature dependence of the excess noise ratio of an eight-watt lamp running at a lamp current of 150 milliamps in a 10 de-gree E plane holder. It was found that (a) the bulb temperature is much higher than that with a lamp of 75 milliamps encountered in the 90 degree H plane circuit investigated pre-viously at 4,000 mc—hence, the temperature
coefficient of excess noise waveguide tempera-ture obtained in the 4,000 mc circuit does not apply; (b) anomalous and unreproducible in-versions in the temperature coefficient at these higher bulb temperatures have been observed; and (c) these anomalies can be avoided by operating the bulb at lower temperatures, 40 to 50 degrees C, where the lamps appear to be just as uniform and stable and probably just as noisy as they are at 4,000 mc.
Broadband UHF and VHF Noise Genera-tors—W. H. Spencer and P. D. Strum
This paper discusses the application of slow-wave structures to noise generator design and describes in detail the design of a uhf and a vhf generator. The uhf generator has a uniform spectrum from 200 to 3,000 mc. The vhf genera-tor has a uniform spectrum from 80 to 300 mc. Reduced output can be obtained from either at lower frequencies with the aid of a calibrated chart. The UHF generator utilizes a helical transmission line to provide coupling to a gas-discharge tube, while the vhf generator utilizes a lumped-constant transmission line. The out-put impedance of the uhf generator is 50 ohms and that of the vhf generator is 350 ohms. De-sign criteria and families of design curves will be presented. Limitations on the upper and lower frequencies will be discussed. A brief dis-cussion of measurement precautions is given.
A Noise Figure Meter Having Large Dy-namic Range—P. D. Strum
This paper describes a continuous-reading noise figure meter having a range of 0 to 35 db. The meter incorporates a gas-discharge tube as a standard source of noise power. To provide continuous reading over a large dynamic range, the noise generator is modulated and a coherent detector is used to compare noise outputs dur-ing the on and off periods. The output reading is presented on a direct-reading meter in such a manner that an accuracy of ± 0.3 db is ob-tained over most of the range. It is possible to use a wide variety of gas-discharge noise sources covering continuously the frequency band from tens of megacycles to tens of thousands of megacycles.
Precise Insertion Loss Measurements Using Imperfect Square Law Detectors and Accuracy Limitations Due to Noise—G. Sorger and B. O. Weinschel
The theory showing inaccuracies of inser-tion loss measurements as a function of the deviation of the square law detector from square law and as a function of the insertion loss is discussed. Experimental data are given showing good agreement with the theory. In-sertion loss test sets are described which meas-ure 10 db with an accuracy of 0.02 db. General precautions are mentioned necessary for precise loss measurements. This principle has been reduced to practice in the range of 30 to 10,000 mc; however, it can be used wherever a trans-mission system can be properly terminated in a bolometer. The behavior of square law and synchronous detectors in the presence of noise is reviewed. Graphs are given showing the rms meter fluctuation as a function of the ratio of input to output bandwidth with signal to noise at the input as a parameter.
Microwave Peak Power Measurement Techniques—R. E. Henning
The theory, advantages, and disadvantages of several peak power measurement techniques will be discussed. These include the barretter integration-differentiation, "notch," and aver-age power measurement techniques. The ex-treme simplicity and, therefore, field and pro-duction testing application of the barretter in-tegration-differentiation technique will be covered in detail. An analysis of error sources and magnitudes is included.
Application of UHF Impedance Measuring Techniques in Biophysics—H. P. Schwan
A summary is presented of important ap-plications of uhf impedance measuring tech-niques in biophysics and medicine. These ap-

132 PROCEEDINGS OF THE IRE January
plications are partly of fundamental interest and partly of practical importance. Of practical importance is the knowledge of the dielectric data of various body tissues up to 10,000 mc in order to evaluate the potential health haz-ards associated with the use of powerful radar equipment. Furthermore, of practical use is the understanding of the mechanism of absorption of electromagnetic energy in tissue in order to promote better equipment in the field of dia-thermy. These applications are demonstrated by results which show how such quantities as the complex reflection coefficient of the body surface varies with parameters such as skin, amount of subcutaneous fat, and muscular tis-sue. Standards for good performance of radia-tion diathermy equipment can be formulated now and lead to proposals for more advanced equipment than presently available. From a basic point of view, the relationship of observed dielectric data from such tissue components as water, salt content, and protein material is of interest. Techniques are proposed for measur-ing the amount of " bound" water, absorbed by protein molecules, by the determination of di-electric parameters of protein solutions at uhf. Recent advances with regard to this important contribution to uhf-measuring techniques are discussed. Finally, technical requirements for impedance measuring equipment, useful for biophysical work, are formulated, and pres-ently-used equipment which fulfills these re-quirements is described.
Representation and Measurement of a Dis-sipative Four-Pole by Means of a Modified Wheeler Network—H. M. Altschuler A specific network representation (of a pas-
sive, reciprocal, but otherwise general four-pole), consisting of only lossless transmission lines, ideal transformers, and a single dissipa-tive attenuator element, is described. The net work is derived from a prototype given by H. A. Wheeler, and the manner in which it transforms the reflection coefficient locus is in-dicated. Several desirable features and some limitations of the network are pointed out. The modified Wheeler network is particularly suited for application in the measurement of symmetric dissipative four-poles. A semi-precision measurement method to be followed in such cases is sketched.
The Use of Concentric-Line Transformers in UHF Measurements—W. A. Harris and J. J. Thompson
Concentric lines fitted with movable, ad-justable stubs have been designed for use in measurements within the range from 500 to 1,000 megacycles per second. The lines are used as calibrated transformers connected to the input and output terminals of a tube. The design and calibration of the lines are discussed, and the results of measurements on several tube types are presented. The data obtained with calibrated lines and associated equipment are used to determine input, output, forward, and feedback admittance, and for the analysis of triode noise.
Figure of Merit of Probes as Standing Wave Detectors—S. W. Rubin
In the measurement of standing-wave ratio and phase, errors arise due to the interaction of the detector probe with the terminations of the line. Present knowledge of these effects suffers in some important cases from gaps in information and, in other cases, from discourag-ing mathematical complexities. Equally im-portant, the need exists for a systematic corre-lation and interpretation of such knowledge. This paper partly fills the gap in error formulae and correlates a group of existing formulae which apply to the bulk of practical cases. Further, a simple consistency is observed which permits defining a figure of merit of probes which is inversely proportional to the error in the particular types of measurement, and which may be measured readily for a given
probe. This viewpoint is developed analytically to yield a concise figure of merit for the entire measuring system showing the effect of the probe parameters of tuning, efficiency, and re-flection coefficient, and the external parameters of available source power and minimum de-tectable signal. For comparing two given probes, the formula simplifies to just the probe parameters. Application of these results permits the prediction of maximum measurement error, the rating of the merits of given probes, and partial design criteria for probes. Some ex-perimental verifications are included.
Characteristics of Microwave Compara-tors—E. W. Matthews
An analysis is made of the characteristics of hybrid junctions with regard to their use as microwave comparators. The effects of such factors as unbalance, asymmetry, cross-coup-ling, and condition of match on the perform-ance of comparators are discussed. These quantities are represented analytically in terms of the scattering coefficients of the junction. An attempt is made to determine the origin of these factors, and techniques are outlined for the measurement of their magnitudes. A Comparison Method for Measuring
Cavity Q—E. B. Mullen and P. M. Pan To facilitate measuring the microwave
permeability tensor of ferrites, a bridge has been built whereby the "Q" and resonant fre-quency of a cavity containing the ferrite can be found by comparison with those of a cavity with calibrated controls. The reflections from the two cavities are combined in the difference arm of a magic T and the resulting signal dis-played on an oscilloscope. A teflon plunger in the cavity provides sensitive tuning from 9,100 to 9,375 mcps. Changes in "Q" are ob-tained through the variable loading presented to the fixed TEm mode pattern of the cavity by a rotatable coupling arm containing a re-sistive termination. In this way, the "Q" of the comparator cavity can be varied in the range from 750 to 5,000.
A Portable Frequency Standard for Naviga-tion—P. Antonucci, J. O. Israel, E. B. Mech-ling. and F. G. Merrill
Precision in a modern, single site, long dis-tance, navigation system, called Navarho, requires an extremely accurate and stable reference frequency standard that can be car-ried in a plane. The oscillator described in this paper will provide such a standard stable to one part per billion under extreme changes of ambient conditions such as temperature, humidity, vibration, and supply voltage. This precision compares favorably with that of the best ground stations and makes possible the measurement of distance with an accuracy bet-ter than one per cent during flight periods as long as eight hours. This paper describes the use of the oscillator as part of a navigational distance measuring instrument, together with a description of three important phases of the oscillator development: the, oscillator circuit with high phase stability, the crystal oven maintaining the crystal temperature to ± 0.01 degree C, and the method of comparing the oscillator frequency with the Bell System Standard of Frequency to one part per ten billion.
Locked Oscillators in Frequency Standards and Frequency Measurements—J. K. Clapp
Locked oscillators can be used as frequency multipliers, dividers, and selectors. Different methods of locking an oscillator are briefly de-scribed with representative applications. An oscillator of extreme frequency stability and of precisely variable frequency is described. Such an oscillator is useful in studying very sharply resonant systems such as quartz crystal filters. A standard frequency multiplier, multiplying 0.1 mc to 1,000 mc, is described.
Measurement of the Carrier Frequency of RF Pulses—A. Bagley and D. Hartke
The problem of accurate determination of carrier frequency during short rf pulses is dis-cussed. Several methods are described for making measurements from uhf to X-band, and typical results are given. By one method, a carrier frequency in the vicinity of 1,000 mc, which is modulated by 2.5 microsecond pulses at a 30-cycle repetition rate, is measured with an accuracy of ± 10 kc.
An Instrument for Precision Range Meas-urements—D. H. Beck A calibrator for time delays, such as radar
range, with a precision not heretofore obtained is described. The spacing accuracy of the generated reference pulse pairs is of the order of 10-, seconds, over a range to 10,000 micro-seconds. A crystal oscillator provides several marker chains and synchronizes the repetition frequency generator. Gating circuits select a fixed and a variable pulse from the 10 micro-second chain. A three-decade electronic counter indicates the selected course delay in multiples of 10 microseconds. A vernier delay of up to 10 microseconds may be added which is produced by a directly calibrated phantastron. The de-vice operates with triggered fast-writing oscil-loscopes. Other applications are listed. 6 KMC Phase Measurement System for
Traveling Wave Tubes—C. F. Augustine and A. Slocum
A method is presented for measuring phase shift at a frequency of six kilomegacycles with a precision of one-tenth degree. The technique of measurement is based on comparing the un-known phase shift with a precisely calibrated phase shifter. The talk covers the problems solved in designing the phase comparator and the calibrated adjustable phase standard. An application is presented which incorporates this method of measuring phase shift to detect level to phase conversion of traveling-wave tubes.
A New Precision X-Band Phase Shifter— E. F. Barnett
This paper describes a waveguide phase shifter of the rotary type which operates over the entire X-band guide range from 8,200 to 12,400 mc with a maximum error of about +2 degrees. The 90 and 180 degree differential phase sections consist of dielectric slabs to-gether with cavities and grooves in the guide wall. Strips of resistive material are used to suppress resonances due to higher-order wave-guide modes. The method used to calibrate this instrument is discussed, and curves showing the overall performance are given. A Molecular Microwave Spectrometer, Os-
cillator and Amplifier—J. P. Gordon An experimental device has been developed
which can be used as a very high resolution microwave spectrometer, a microwave ampli-fier, or a very stable oscillator. It utilizes a beam of molecules, electrostatic focussing of certain states of these molecules, and a cavity in which radiation can occur and can be de-tected. The device amplifies microwaves as a result of interaction between radiation and the beam of molecules. As an amplifier, it has very narrow bandwidth and can give noise figures very close to unity. Sustained oscillations powered by induced emission from the mole-cules may be produced when the beam is sufficiently intense. Comparison of two such oscillators shows that they have a spectral purity of better than one part in 10" and that frequency stabilities on the order of one part in 109 or 101, can be fairly readily achieved.
Insertion Loss Test Sets Using Square Law Detectors—B. O. Weinschel
This paper discusses theory and errors, when measuring radio frequency attenuation, using imperfect square law detectors. The audio modulation of a radio frequency source is detected by the resistance modulation of a bolometer producing an audio frequency vol-tage. For ideal square law detectors, the varia-

1956 IRE News and Radio Notes 133
tion of the audio frequency level in decibels, using a constant current source, is twice the decibel change of the radio frequency level. A theoretical analysis of the error due to devia-tion from square law is given. Experimental data regarding this error based on the static characteristic and independent experimental data relying upon differential rf measurements are furnished and are in agreement with the theory. Applying this error analysis to typical barretters. accuracies of .01 db are feasible for a measurement of a 20 db loss. A simple test set which has been reduced to practice is discussed. It permits rf loss measurements of 30 db with an accuracy of . 1 db.
The Thermal Time Constant of a Bolometer —G. U. Sorger A convenient method for measuring r-f
power ratios with audio frequency techniques is the following: r-f power is modulated with audio frequency and dissipated in a bolometer. The resistance of the bolometer changes then with the audio frequency and by feeding the bolometer with a constant dc current an ac
voltage across the bolometer is produced which is amplified and detected. The bolometer must be able to change its resistance sufficiently fast so it can follow the modulated power. This ability is limited by the thermal time constant of the bolometer. The first part of this paper deals with the theory of the time constant of bolometers, the second part discusses two methods of measurement and the third part treats a theory of multiple time constants in-cluding their distribution.
Medical Electronics
VOL. PGME-2, OCTOBER, 1955
Panel Discussion on Medical Electron-ics, Session XLI at the 1955 IRE National Convention
Telemetry and Remote Control
VOL. TRC-1, No. 3, AUGUST, 1955
A Message from the Chairman—C. H. Hoeppner
Problems in Ultra-High-Speed Flight— H. L. Dryden
An Automatic Self-Verifying, Self-Correct-ing Data Transmission System—Ivan Flores
Function Generation on the Differential Analyzer Extended to the Analog Computer— D. F. Rearick
This paper discusses the technique of "gen-erating" certain analytically-defined mathe-matical functions by continuously solving a differential equation having the desired func-tion as solution. This principle was first applied to the mechanical differential analyzer, de-scribed in the first section. The characteristics of the differential analyzer and the electrical analog computer are compared, and extension of this function generating scheme to the latter machine is discussed. Methods are described for determining a differential equation yielding a given function as its solution. Finally, experi-mental results obtained on an analog computer are described_

1 . 4 PROCEEDINGS OF THE IRE January
Abstracts and References Compiled by the Radio Research Organization of the Department of Scientific and Industrial Research,
London, England, and Published by Arrangement with that Department and the Wireless Engineer, London, England
NOTE: The Institute of Radio Engineers does not have available copies of the publications mentioned in these pages, nor does it have reprints of the articles abstracted. Correspondence regarding these articles and requests for their
procurement should be addressed to the individual publications, not to the IRE.
Acoustics and Audio Frequencies Antennas and Transmission Lines Automatic Computers Circuits and Circuit Elements General Physics Geophysical and Extraterrestrial Phe-nomena
Location and Aids to Navigation Materials and Subsidiary Techniques Mathematics Measurements and Test Gear Other Applications of Radio and Elec-
tronics Propagation of Waves Reception Stations and Communication Systems. Subsidiary Apparatus Television and Phototelegraphy Transmission Tubes and Thermionics Miscellaneous
134 134 135 135 137
139 140 140 142 143
144 144 145 145 145 145 146 146 148
The number in heavy type at the upper left of each Abstract is its Universal Decimal Classification number and is not to be confused with the Decimal Classification used by the United States National Bureau of Standards. The number in heavy type at the top right is the serial number of the Abstract. DC numbers marked with a dagger ( f) must he regarded as provisional.
ACOUSTICS AND AUDIO FREQUENCIES
534.2+1538.566:535.43 3464 On the Scattering of Spherical Waves by a
Cylindrical Object—Wait. (See 3582.)
534.2 3465 Sound Scattering and Transmission by Thin
Elastic Rectangular Plates—J. Martinek and G. C. K. Yeh. (Quart. J. Mech. appi. Math., vol. 8, Part 2, pp. 179-190; June, 1955.) Analysis is given for the case where the plate separates two fluid media and is excited to forced vibra-tions by the incident wave. The pressure in the scattered and transmitted waves is determined in terms of the characteristic parameters of the plate and of the two media.
534.2 3466 The Attenuation of Sound in a Turbulent
Atmosphere over a Desert Terrain—M. M okh-tar and M. A. Mahrous. (Acusiica, vol. 5, pp. 179-181; 1955.)
534.213.4 3467 Attenuation of the ( 1, 0) and (2, 0) Modes
in Rectangular Ducts—A. M. Ghabrial. (Acustica, vol. 5, pp. 187-192; 1955.) Report of an experimental investigation using sound in the frequency range 1.18-3.4 kc. The values found for the attenuation constants are in agreement with values deduced from Beatty's theory ( 1045 of 1951).
534.23-14-8 3468 Sound Absorption in Liquids in Relation
to their Specific Heats—S. Parthasarathy and D. S. Guruswamy. (Ann. Phys., Lpz., vol. 16, pp. 31-42; June 15, 1955. In English.) A for-mula is derived relating the absorption to the specific heats for a frequency of 3 mc.
The Index to the Abstracts and References published in the PROC. IRE from February, 1954 through January, 1955 is published by the PROC. IRE, April, 1955, Part II. It is also published by Wireless Engineer and included in the March, 1955 issue of that journal. Included with the Index is a selected list of journals scanned for abstracting with publishers' addresses.
534.232 3469 Directivity and Mechanical-Impedance
Characteristics of Cylindrical Acoustic Sources —M. Federici. (Ricerca sci., vol 25. pp. 1423-1430; June, 1955.) Analysis is given for a cylinder executing radial vibrations. The direc-tivity characteristic is expressed as the product of a trigonometric function of cylinder height and a Bessel function of the radius. For cylinders long with respect to X the mechanical impedance is expressed as the ratio between two Bessel functions of the radius. Results are shown graphically.
534.232-8 : 621.318.134 3470 Use of Ferrites in Ultrasonic Generators—
U. Enz. (Tech. Mitt. schweiz. Telegr.-Teleph-Verw., vol. 33, pp. 209-212; June 1, 1955. In German.) The suitability of various ferrites as magnetostrictive generators is discussed in relation to measurements of their magnetic properties. Generators of various shapes are illustrated; the highest efficiency attained is 94 per cent. A radiated output as high as 1 kw/cm' is attainable in theory; in practice, limitations arise due to the inadequate me-chanical strength of the ferrite and other causes. The strength can be increased by addition of Pb0 during preparation, or by pre-stressing. Possible applications are discussed.
534.3/.4 3471 The Physical Structure of the Musical
Signal—A. Moles. (Rev. sci., Paris, vol. 91, pp. 277-303; July/December, 1953.)
534.32:621.395.625 3472 The Subjective Discrimination of Pitch and
Amplitude Fluctuations in Recording Systems —A. Stott and P. E. Axon. (Proc. Insta, elect. Engrs., Part B, vol. 102, pp. 643-656; Septem-ber, 1955.) Technique and equipment de-veloped by the B.B.C. are described for making controlled tests of the threshold of perception of pitch and amplitude fluctuations, using musical or other program signals. The results enable frequency weighting characteristics to be defined which can be incorporated into instruments for measuring the magnitude of unwanted fluctuations in any kind of recording equipment.
534.613 3473 Use of a Bifilar Device as a Balance for
measuring Acoustic Radiation Pressure—G. Laville. (C. R. Acad. Sci., Paris, vol. 241, pp. 465-467; August 1, 1955.)
534.84:534.6 3474 Measurements of the Reflection of Flexural
Waves at Sudden Changes of Cross-Section of Rods—Mugiono. (Acuslica, vol. 5, pp. 182-186; 1955. In German.) Report of a theoretical and practical investigation relevant to the propaga-tion of flexural waves in building structures.
534.844 3475 Normal Modes and Reverberation—N. B.
Bhatt. (J. Insta. Telecommun. Engrs., India, vol. 1, pp. 61-68; June, 1955.) Analysis is pre-sented for reverberation in rooms with nonuni-form distribution of absorption over the walls. For a room with one absorbing wall and the other walls perfectly reflecting, there exist two reverberation times corresponding respectively to sound propagated normal to and parallel to the absorbing wall, giving rise to a disconti-nuity in the decay characteristic.
534.86: 621.396.712.3 : 621.395.625.3 3476 Artificial Reverberation—P. E. Axon,
C. L. S. Gilford, and D. E. L. Shorter. (Proc. Insta, elect. Engrs., Part B, vol. 102, pp. 624-640; September, 1955. Discussion, pp. 640-642.) The characteristics of artificial-reverbera-tion apparatus using delay channels with overall feedback are discussed and illustrated by the results of early experiments with acous-tic-delay tubes. Details are given of a magnetic-recording delay system used by the B.B.C.: the effective number of delay paths is greatly increased by use of a double recording track. Flutter effects associated with impulsive signals are reduced by use of a small auxiliary reverber-ation chamber.
621.395.616 3477 Stable Laboratory-Standard Capacitor Mi-
crophone—J. F. Houdek, Jr. (Elect. Commun., vol. 32, pp. 75-81; June, 1955; J. audio Engng. Soc., vol. 2, pp. 234-238; October, 1954.) A detailed description is given of a precision microphone of rugged construction, with a spring-loaded rear-electrode assembly, pro-viding constant diaphragm tension.
621.395.616 3478 The Electrostatic Microphone—( TSF et
TV, vol. 31, pp. 194-197; July/August, 1955.) Description of the French Type-515C high--quality capacitor microphone.
621.395.625.3:771.53 3479 Recent Developments in Magnetic Striping
by the Lamination Process—R. F. Dubbe. (J. Soc. Mot. Pict. Telev. Engrs., vol. 64, pp. 378-379; July, 1955.) Commercial equipment suitable for 8-mm and 16-mm films and operat-ing at film speeds up to 125 ft/min is briefly described.
ANTENNAS AND TRANSMISSION LINES
621.315.21:621.372.2 3480 Scattering of Electrical Waves in Slightly
Nonuniform Transmission Lines—M. Did-laukis. (Arch. elekt. Übertragung, vol. 9, pp. 269-271; June, 1955.) The form of the correla-tion function of the random deviations of the characteristic impedance is discussed and a Fourier-transformation method is developed

1956 Abstracts and References 135
for deducing the function from the measurable spectrum of the mean-square deviations of the input impedance.
621.315.212.1:621.372.21 3481 Comparative Study of Pulse Echoes due to
Irregularities in Coaxial Cables—G. Comte, F. de Carfort, and A. Ponthus. (Câbles Transm., vol. 9, pp. 202-227; July, 1955.) An expression is given for the waveforms of echoes caused by sudden and by gradual im-pedance changes along the line. Testing equip-ment and typical test results are discussed; the importance of the test-pulse shape is indicated
621.315.28:621.395.44 3482 A Transatlantic Telephone Cable—M. J.
Kelly, G. Radley, G. W. Gilman and R. J. Halsey. (Proc. Instil. elect. Engrs., Part B, vol. 102, pp. 717-719; September, 1955.) Discussion on 1547 of June.
621.372 : 621.317.336 3483 Transmission-Line Termination—J. M. C.
Dukes. (Wireless Engr., vol. 32, pp. 266-271; October, 1955.) The concepts presented previ-ously ( 1255 of May) are extended and applied to the determination of the impedance of a line termination when measured through a mis-matched junction between two dissimilar transmission lines.
621.372.8+621.372.413 3484 Theory of Imperfect Waveguides: the
Effect of Wall Impedance—A. E. Karbowiak. (Proc. Instn. elect. Engrs., Part B, vol. 102, pp. 698-708; September, 1955.) Analysis shows that although with circular waveguides all E and H modes are stable, with rectangular guides all E modes and higher-order H modes are unstable, only Ho modes propagating without change of form. Formulas are derived for calculating the propagation coefficients of waveguides with wall impedance and the band-width and resonance frequency of cavities with wall impedance.
621.372.8 3485 Irregular Waveguides with Slowly Varying
Parameters---B Z. Katsenelenbaum. (C. R. Acad. Sci. U.R.S.S., vol. 102, pp. 711-714; June 1, 1955. In Russian.) The irregular wave-guide is considered as a stepped waveguide made up of short sections of regular waveguides of different constant cross sections. The coeffi-cients of the functions describing the field are connected by a system of linear differential equations of the first order. A method of solving the problem is developed for the simple case when H waves only are propagated, as in a conical junction in a circular waveguide.
621.372.8 3486 On the Theory of Disc-Loaded Waveguide
—H. Derfler. (Z. angew. Math. Phys., vol. 6, pp. 190-206; May 25, 1955. In English.) Theory based on the difference equation discussed pre-viously (3438 of November) is presented.
621.372.8 3487 Note on the Properties of Two Functions
appearing in the Theory of TM Wave Propaga-tion through Periodically Iris-Loaded Guides— C. C. Grosjean. (Nuovo Cim., vol. 1, pp. 1264-1266; June 1, 1955. In English.) Functions introduced previously (2832 of October) are discussed in detail.
621.372.8(083.74) 3488 IRE Standards on Antennas and Wave-
guides: Definitions for Waveguide Compo-nents, 1955—(Paoc. IRE, vol. 43, pp. 1073-1074; September, 1955.) Standard 55 IRE 2.S1.
621.372.8: 621.318.134 3489 Unusual Waveguide Characteristics associ-
ated with the Apparent Negative Permeability obtainable in Ferrites— G. H. B. Thompson.
(Nature, London, vol. 175, pp. 1135-1136; June 25, 1955.) With the ferrite magnetized in the same direction as that in which a right-handed circularly polarized plane wave of fre-quency 10 kmc is propagated, the effective permeability associated with the transverse field components may be negative, the wave then being evanescent. In a waveguide, this effect occurs for guide dimensions above a critical value; below this value the wave is propagated, but with negative group velocity. Experimental results are shown graphically for two circular waveguides with diameters respectively above and below the critical value.
621.372.8: 621.318.134: 538.6 3490 Figure of Merit for Microwave Ferrites at
Low and High Frequencies—B. Lax. (J. appl. Phys., vol. 26, p. 919; July, 1955.) The figure of merit for Faraday rotators comprising wave-guides containing ferrites is defined as the ratio of rotation to attenuation and is equal to coT, where T is the relaxation time constant of the ferrite. Theoretical estimates are made of losses at frequencies below about 3 kmc, and the fig-ure of merit and low-frequency limits of opera-tion are hence deduced. For a device with an insertion loss of 0.5 db this limit is about 1 kmc, and for a 1-db insertion loss about 500 mc. At 9 kmc the figure of merit of 120 for single crystals may define the upper limit.
621.396.67 3491 Multipoles and Schelkunoff Waves. The
General Case—I. Ferrari. (R.C. Accad. nos. Lincei, vol. 18, pp. 623-630; June, 1955.) The analysis presented previously (27 of January and 2838 of October) is extended to deal with systems with more marked asymmetry.
621.396.67:621.317.3 3492 Measurements on Receiving Aerials: Part 1
—I. Grosskopf. (Arch. tech. Messen., no. 233, pp. 121-124; June, 1955.)
621.396.67:621.396.712 3493 F.M. Antenna Inside the A.M. Tower—
M. W. Scheldorf and G. Klink, Jr. (Elec-tronics, vol. 28, pp. 130-131; August, 1955.) A note describing the antenna arrangements at station WTOP.
621.396.67:621.396.81 3494 The Limits of Communication Reception
using Antennas with Losses—M. Didlaukis. (Fernmeldetech. Z., vol. 8, pp. 384-386; July. 1955.) An evaluation is made of the lowest value of field strength capable of being received in some telegraphy and df systems.
621.396.674.3:621.397.6 3495 V.H.F. Antennas for Television Broadcast-
ing—G. J. Phillips. (Proc. Instn. elect. Engrs., Part B, vol. 102, pp. 687-688; September, 1955.) Antennas have been designed by the B. B. C. using batwing elements in conjunction with masts of thickness comparable with X; arrangements suitable for (a) horizontal and (b) vertical polarization are described, for bands I and III. Antennas using systems split into an upper and lower half are also men-tioned: the two halves are fed separately, thus avoiding the need for a reserve antenna.
621.396.677.3.029.63 3496 Metal-Foil "Fir-Tree" Antenna [dipole
array] for Decimeter Wavelengths—H. Schneider. (Fernmeldetech. Z., vol. 8, pp. 312-315; June, 1955.) Microstrip construction is used, the dipoles, feeders and reflectors being of copper foil stuck between two insulating sheets. For an array area 120 X 90 cm including 144 dipoles, half-power beam widths of 6 de-grees and 9 degrees have been obtained at 13.6 cm X. Dipole arrays produced by such methods may be economically comparable with mirror-and lens-type antennas.
621.396.677.43 3497 Radiation Resistance and Gain of Rhombic
Antennas, will Damping due to Radiation taken into Account Approximately—H. Zuhrt. (Arch ele/el. übertragung, vol. 9, pp. 255-258; June, 1955.) The formulas derived are suffi-ciently accurate for most practical applica-tions. Design curves are also given.
621.396.677.85 3498 Dielectric Lens for Microwaves—K. S.
Kelleher and C. Goatley. (Electronics, vol. 28, pp. 142-145; August, 1955.) By varying the size and spacing of holes in laminated disks of dielectric material, a controlled variation of re-fractive index is obtained across the lens thus built up.
AUTOMATIC COMPUTERS
681.142 3499 High-Speed Electronic-Analogue Comput-
ing Techniques—D. M. MacKay. (Proc. Instn. elect. Engrs., Part B, vol. 102, pp. 609-620; September, 1955. Discussion, pp. 620-623.) An investigation has been made of the upper limits of speed conveniently attainable in various basic operations performed with a par-ticular differential analyzer. With multidi-mensional displays and electronic program-ming a very large increase in information ca-pacity is attainable in problems requiring systematic search processes for their solution.
681.142 3500 A Mercury Delay Line Storage Unit—R. D.
Ryan. (J. Brit. Instn. Radio Engrs., vol. 15, pp. 419-427; August, 1955.) Reprint. See 2578 of 1954.
681.142 3501 Magnetic Memory Device for Business
Machines—S. J. Begun. (Elect. Engng., N.Y., vol. 74, pp. 466-468; June, 1955.) Description of a device combining the short access time of a magnetic drum and the large storage capacity of the tape record.
681.142 3502 Synchronizing Magnetic Drum Storage
Speed—E. W. Bivans. (Electronics, vol. 28, pp. 140-141; August, 1955.) Synchronization to an acoustic delay line is obtained by a time-difference discriminator which controls the drum speed. An accuracy within ± 0.5 ;Is is achieved with a 10 per cent line-voltage vari-ation.
681.142 3503 Square-Law Circuit—K. S. Lion and R. H.
Davis. (Electronics, vol. 28, pp. 192, 202; Sep-tember, 1955.) A device for use as a multiplier in analog computers consists of a source pro-ducing a negative-going triangular waveform which is superposed on a positive-going input signal applied to a diode. The average value of the output voltage is proportional to the square of the input voltage.
681.142:621.383.2 3504 Photoelectric Transformation of Mathe-
matical Functions. Solution of Equations— G. Blet. (Bull. Soc. franc. Elect., vol. 5, pp. 341-344; June, 1955.) An arrangement comprising a mirror galvanometer in combination with an appropriately shaped diaphragm and a photo-cell is used to generate a current j(x) when the current x flows through the galvanometer. Elaboration of the arrangement to generate complex functions is discussed.
681.142 : 621.385.5 3505 Binary Adder Tube for High-Speed Com-
puters—Maynard. (See 3805.)
CIRCUITS AND CIRCUIT ELEMENTS
621.3:061.4 3506 Interesting New Developments in the Com-
ponents Industry at the Hanover Exhibition— (Funk-Techtiik, Berlin, vol. 10, pp. 294-297; June, 1955.)

136 PROCEEDINGS OF THE IRE January
621.314.22.011.23 3507 Stray Reactances in Power and Instrument
Transformers—W. Knaack. (Electrotech. u. Maschinenb., vol. 72, pp. 269-279, 291-298; June 15, and July I, 1955.)
621.318.435:621.373.443 3508 Saturating Reactor Magnetic Pulser Design
—E. M. Williams and R. A. Mathias. (Elect. Engng., N.Y., vol. 74, p. 525; June, 1955.) Digest of paper to be published in Trans. Amer. IEE, Part I, Communication and Electronics, vol. 74, pp. 185-207; 1955. See also 2362 of 1951 (Melville).
621.318.57:621.3.042 3509 The Transfluxor—a Magnetic Gate with
Stored Variable Setting—J. A. Rajchman and A. W. Lo. (RCA Rev., vol. 16, pp. 303-311; June, 1955.) The transfluxor is a device com-prising a magnetic core with two or more aper-tures, the core material having a nearly rec-tangular hysteresis loop. Switching and storage operations are performed by controlled transfer of the flux from leg to leg of the core. The opera-tion of a two-aperture device is described in detail.
621.318.57: 621.374.3: 621.314.7 3510 [Junction-I Transistor Binary-Number
Store for Pulse Operations—E. Munk and P. Batz. (Fernmeldetech. Z., vol. 8, pp. 379-381; July, 1955.)
621.318.57: 621.374.32 3511 The Design of Hard-Valve Binary Counters
—D. M. Taub. (Electronic Engng., vol. 27, pp. 386-392; September, 1955.) The method of de-sign takes account of tolerances on component values, tube characteristics and supply volt-ages, and indicates modifications necessary when Se diodes are used in place of hot-cathode diodes for interstage coupling; it is valid at counting speeds up to several kc.
621.37 3512 The Relation between Standing-Wave
Ratio and Bandwidth in Wide-Band Compensa-tion of a Reactance—R. Merten. (Fernmelde-tech. Z., vol. 8, pp. 387-393; July, 1955.) Calculations are made for two different equiva-lent circuits representing a resistance ac-companied by inherent reactance. The swr obtained when the compensated resistance is connected to a loss-free line with purely resis-tive characteristic impedance is used as a cri-terion of the compensation. The results are expressed as irrational algebraic functions which are presented as bandwidth curves. Simple relations are derived between the permissible swr and the bandwidth.
621.37: 621.318.57 3513 The Folded Tree—A. W. Burks, R. Mc-
Naughton, C. H. Pollmar, D. W. Warren, and J. B. Wright. (J. Franklin Inst., vol. 260, pp. 9-24, 115-126; July/August, 1955.) The prob-lem of constructing circuits to perform certain functions, such as switching functions, is treated by representing the circuits by "vertex diagrams," of which the "folded tree" is a par-ticular form.
621.372.029.64:538.569.4 3514 Revolutionary New Oscillator-Amplifier—
Shunaman. (See 3583.)
621.372.412:549.514.51 3515 Effects of Impurities on Resonator Proper-
ties of Quartz—A. R. Chi, D. L. Hammond and E. A. Gerber. (PRoc. IRE, vol. 43, pp. 1137; September, 1955.)
621.372.412: 621.314.7 3516 Calculation of the Oscillation Frequency of
a Quartz Crystal maintained by a Transistor— G. Briffod. (C. R. Acad. Sci., (Paris), vol. 241, pp. 159-161, 458-459; July 11/August 1, 1955.) The calculation presented previously
(1895 of July) is extended to the general case where it is required to determine both the influ-ence of the maintaining system on the fre-quency and the possibility of aligning this frequency with a given reference frequency. Formulas are derived based on the use of ca-pacitors in series and in parallel with the crys-tal.
621.372.413+621.372.8 3517 Theory of Imperfect Waveguides: the
Effect of Wall Impedance—Karbowiak. (See 3484.)
621.372.413 3518 Wide-Range Electronic Tuning of Micro-
wave Cavities—F. R. Arams and H. K. Jenny. (Pnoc. IRE, vol. 43, pp. 1102-1110; Septem-ber, 1955.) Analysis is presented for tuning by introducing into the cavity an electrom beam with its direction parallel to the magnetic field, so that spiralling of the beam is produced. Measurements are reported indicating that the tuning range is much greater for a cavity con-taining a gas at low pressure than for an evacuated cavity.
621.372.44 3519 Series Resonance with Nonlinear Capacitor
—J. C. Hoff mann. (C. R. A cad. Sci., (Paris), vol. 241, pp. 180-182; July 11, 1955.) A graphical method is used to explain multiple resonance and hysteresis in a circuit tuned by a capacitor with a BaTiO3 dielectric.
621.372.5 3520 Unambiguous Choice of Arrow Direction for
Currents and Voltages in Quadripoles with Applications to Directional Quadripoles and Gyrators—M. J. O. Strutt. (Arch. Elektrotech., vol. 42, pp. 1-5; June 20, 1955.) It is recom-mended that the positive direction of the volt-age arrow should always point from positive to negative charge; with quadripole diagrams, the output-current arrow should point away from the quadripole. Simplifications of network analysis resulting from adoption of this con-vention are indicated.
621.372.5 3521 Conditions for Aperiodicity in Linear Sys-
tems—A. T. Fuller. (Brit. J. appl. Phys., vol. 6, pp. 195-198; June, 1955.) The necessary and sufficient conditions are derived; when ex-pressed in terms of the coefficients of the char-acteristic equation they take the form of a num-ber of simple determinantal inequalities which are closely analogous to the Routh-Hurwitz stability criteria.
621.372.5 3522 Definition of the Ideal Transformer and the
Ideal Gyrator by their Impedance-Transform-ing Properties—F. A. Fischer. (Fernmeldetech. Z., vol. 8, pp. 309-311; June, 1955.) The fun-damental difference between the two networks is that the input impedance of the ideal trans-former is directly proportional to the load impedance, while for the ideal gyrator the proportionality is inverse. The ideal gyrator can be completely defined as a passive linear loss-f ree quadripole with frequency-independent transforming properties.
621.372.5 3523 A New Method for investigating Linear
Quadripoles: Part 2—J. de Buhr. (Fernmelde-tech. Z., vol. 8, pp. 335-340; June, 1955.) Con-tinuation of work abstracted in 2864 of Oc-tober. A distinction is made between elliptic. hyperbolic, parabolic and loxodromic quad-ripoles.
621.372.5 3524 Two Network Theorems for Analytical
Determination of Optimum-Response Physi-cally Realizable Network Characteristics— S. S. L. Chang. (Pnoc. IRE, vol 43, pp. 1128-1135; September, 1955.)
621.372.512.3:621.314.7 3525 How to Design I.F. Transistor Transform-
ers—R. R. Webster. (Electronics, vol. 28, pp. 156-158, 160; August, 1955.) Design curves are given for single- and double-tuned units providing matching of collector and base impedances while meeting bandwidth and minimum-insertion-loss requirements.
621.372.54 3526 Symmetrical Lattice Filters—J. Oswald
and J. Dubos. (Câbles ér Transm., vol. 9, pp. 177-201; July, 1955.) The calculation and field of utility of standard types of lattice filter are discussed and permissible approximations are indicated. Classification based on image pa-rameters is proposed, on the lines of the system used in a previous paper on ladder filters [ 1710 of 1954 (Oswald)].
621.372.54 3527 Note on Antimetrical Lattice Filters with
Successive Reactances of Alternate Sign—R. Leroy. (Câbles fs* Transm., vol. 9, pp. 246-247; July, 1955.) A simplification of the treatment given by Oswald (64 of January).
621.372.543.3 3528 Notch Network Design—C. J. Savant. Jr.,
and C. A. Savant. (Electronics, vol. 28, p. 172; September, 1955.) Curves are given facilitating the design of bridged- T band-stop filters operating between equal impedances.
621.373 3529 The Period and Amplitude of the van der
Pol Limit Cycle—E. Fisher. (J. appl. Phys., vol. 25, pp. 273-274; March, 1954.) "The am-plitude and period of the limit cycle of the van der Pol equation, 9-1-Y =vY(1— y2), are found for all values of a by joining graphically the re-sults of solutions about v = 0 and v
621.373 3530 Limit-Cycle Period of Nonlinear Oscillation
—J. Groszkowski. (Bull. Acad. polon. Sci., Classe 4, vol. 3, pp. 85-91; 1955. In English.) The problem is discussed with reference to previous work on the solution of the van der Pol equation v(1 = O. A formula is derived for the limit-cycle period which is appli-cable both for small and large values of a, corresponding respectively to quasi-sinusoidal and relaxation oscillations. Results obtained from various formulas are compared in a table.
621.373.42.029.42 3531 The Design and Performance of a Simple
V.L.F. Oscillator—R. A. Seymour and J. S. Smith. (Electronic Engng., vol. 27, pp. 380-384; September, 1955.) Using a Wien RC network for frequency control, the oscillator covers the range 0.01-100 cis in finite steps, with a maxi-mum output of 6 y rms into a 6-kD load.
621.373.43:621.385.15 3532 Secondary-Emission-Valve Pulse Genera-
tor with Cathode Output—R. Favre. (Helv. phys. Acta, vol. 28, pp. 167-171; May 31, 1955. In French.) A positive-feedback circuit giving a very low output impedance is used, capable of producing pulses of amplitude 50-60 a with rise time about 20 mps. By using a pentode as cathode load it is possible to obtain a wide variety of pulse waveforms. The arrangement gives a better performance than the ordinary blocking oscillator.
621.373.431.1:621.373.44 3533 Investigation of the Time Delay in the
Triggering of a Pulse in a Monostable Multi-vibrator—G. Haas. (Arch. elekt. übertragung, vol. 9, pp. 272-276; June, 1955.) Results of experiments indicate that a monostable multi-vibrator may be used as a pulse amplifier in applications where waveform distortion is unimportant. With pulse voltages above 100 mv the multivibrator used showed time delays of less than 10-8 sec and these were independ-

1956 Abstracts and References 137
ent of pulse width over a wide range. The ga:n obtainable is about 500. Time delays in a free-running multivibrator are of the order of 10's to 10-4 seconds; this is shown theoretically to be due to the stray capacitances present.
621.373.444 3534 Triggered Microsecond Sweep Generators
—D. P. C. Thackeray. (Electronic Engng., vol. 27, pp. 397-401; September, 1955.) Hard-tube balanced-output and single-ended sweep gener-ators are described using Miller integrator feedback for linearization; both are capable of providing a 450-v sweep in 1 rhs. Applications in high-speed photography are indicated.
621.374.3:621.314.7:621.318.57 3535 A Time-Delay Device using Transistors—
G. F. Pittman, Jr. (Elect. Engng., N.Y., vol. 74, pp. 498-501; June, 1955.) Pulse shaping and counting circuits are described in which junction transistors are used for switching, in conjunction with magnetic cores with rec-tangular hysteresis loops. The number of pulses required to saturate the core is such that long time delays can be produced. Pub-lished also in Trans. Amer. IEE, Part I, Communication and Electronics, vol. 74, pp. 54-58; March, 1955.
621.374.32 3536 High-Frequency Pulse Counter—R. Favre.
(Hell,. phys. Acta, vol. 28, pp. 179-184; May 31, 1955. In French.) A circuit based on the secondary-emission-tube pulse generator de-scribed in 3532 above.
621.374.4: 621.375.3.029.3 : 621.395.2 3537 All-Magnetic Audio Amplifier—J. J. Suozzi
and E. T. Hooper. (Electronics, vol. 28, pp. 122-125; September, 1955.) Three cascaded magnetic frequency tripiers are used to provide a 10.8-kc carrier from a 400-c/s line frequency. Used with a carbon microphone and a two-stage magnetic amplifier, the system gives an audio output power of 2.5 w, with linear operation over the range 90-3,000 c/s.
621.374.44:621.385.15 3538 Wide-Band Frequency Divider—R. Favre.
(Helv. phys. Ada, vol. 28, pp. 172-178; May 31, 1955. In French. Addendum, ibid., vol. 28, pp. 343-344; August 31, 1955.) A circuit for operation at frequencies up to 25 mc, based on the secondary-emission-tube pulse generator described in 3532 above.
621.375.121:621.372.542.2 3539 Design of Low-Pass Amplifiers for Fast
Transients—G. Thirup. (Phillips Res. Rep., vol. 10, pp. 216-230; June, 1955.) The pro-posed synthesis of an interstage coupling net-work for wide-band low-pass amplifiers is based on Darlington's design method (2742 of 1952). Some practical details are given of a 50-mc amplifier; experimentally determined phase and amplitude characteristics are pre-sented graphically; oscillograms of the transient response are shown. Details are also given of the design of a phase-correction network.
621.375.13.018.3 3540 The Mechanism of Subharmonic Genera-
tion in a Feedback System—J. C. West and J. L. Douce. (Proc. I EE, Part B, vol. 102, pp. 569-574; September, 1955. Discussion, pp. 594-595.) Analysis is given for nonlinear feed-back systems, using the description-function method. Subharmonics are produced as a result of modification of the response of the nonlinear element by the input signal. Conditions are derived for the absence of subharmonic oscilla-tions. Theoretical and experimental results for a particular unit with an approximately cubic characteristic are in agreement.
621.375.2+621.373.4+621.317.31.029.6 3541 Disc-Seal Circuit Techniques—J. Swift.
(Proc. IRE (Australia). vol. 16, pp. 205-217,
247-260, 295-307; July/September, 1955.) A survey of amplifiers and oscillators using disk-seal tubes, and of associated microwave meas-urement methods.
621.375.221.2 3542 On Distributed Amplification—D. G.
Sarma. (Proc. IEE, Part B, vol. 102, pp. 689-697; September, 1955.) The response charac-teristics of a distributed amplifier can be im-proved by making the delay characteristics of the anode and grid lines different, this tech-nique being termed "staggering." The improve-ment is illustrated by photographic records of the responses of experimental amplifiers.
621.375.223:621.372.543.2 3543 Filters with Very Narrow Pass Band vari-
able on the Principle of the Fabry-Pérot Interferometer—G. Raoult and J. C. Pecker. (C. R. Acad. Sci., (Paris), vol. 241, pp. 25-27; July 4, 1955.) Analysis is given for a narrow-band rf amplifier with n equal stages each comprising a tube and a three-mesh CR phase-shift network. Maximum gain is obtained at a frequency slightly different from that for which the phase shift is 21rn. A relative bandwidth of 2 X 10⁻⁴ is attainable with 10 stages.
621.375.232 3544 Note on the Design of Wide-Band Low-
Noise Amplifiers—D. Weighton. (Pooe. IRE, vol. 43, pp. 1096-1101; September, 1955.) Methods of reconciling the design requirements for minimum noise factor and those for ade-quate bandwidth are discussed. The problem can be solved by equalization using either feed-back or complementary networks. Some meas-urements on an experimental grounded-cathode amplifier with feedback are reported; satisfac-tory performance with bandwidths up to about 20 mc appears possible.
621.375.3 3545 Figure of Merit in Magnetic Amplifiers—
J. T. Carleton and W. F. Horton. (Tele-Tech Electronic Ind., vol. 14, pp. 96-97, 170; June, 1955.) The figure of merit discussed is the ratio of power amplification to amplifier re-sponse time. It is useful as a basis for the com-parison of amplifiers which are linear over the working range and have equal rated output powers.
621.375.4:621.314.7 3546 Transistor Operating Points—R. E.
Skipper. (Tele-Tech ar Electronic Ind., vol. 14, pp. 104-105, 182; June, 1955.) A theoretical and experimental investigation is reported of the relation between the junction-transistor noise and gain and the collector-to-base voltage; the results are used in the design of a high-gain low-noise amplifier.
621.375.4:621.314.7 3547 Automatic Gain Control of Transistor Am-
plifiers—W. F. Chow and A. P. Stern. (Pooe. IRE, vol. 43, pp. 1119-1127; September, 1955.) Satisfactory agc circuits can be designed based on variation of either emitter current I. or collector voltage V. The required control power is very low if the variation of I. or V. is produced by varying the base current. Dis-tortion may become a serious problem.
621.375.4:621.314.7 3548 Transistor Equivalent Circuits—Cocking.
(See 3780.)
621.375.4.029.3 3549 Transistor-Equipped Light-Weight Pro-
gramme-Input Amplifier Type V79—H. H. Lammers. (Tech. Hausmitt. NordwDtsch. Rdfunks, vol. 7, pp. 94-100; 1955.) An ampli-fier for a portable sound recorder is described. In the pre-amplifier the microphone is matched to the first transistor via a transformer. By use of current feedback in the first stage it is possi-ble to connect without attenuation capacitance
microphones with terminal resistance > lira The second stage includes a feedback circuit providing equalization up to 15 kc. The final stage is designed for an output of 32 mw. Shifting of the working point due to internal heating is reduced by use of a special stabilizing circuit.
621.374.3 3550 Millimicrosecond Pulse Techniques. [Book
Reviewl—I. A. D. Lewis and F. H. Wells. Publishers: McGraw-Hill, New York, and Pergamon Press, London, 1954, 310 pp., 40s. (Science, vol. 121, p. 826; June 10, 1955.) A sur-vey with an excellent bibliography.
GENERAL PHYSICS
53.05 3551 Note on Carpet Graphs—J. R. Ellis. (Engi-
neer, (London), vol. 199, pp. 869-870; June 24, 1955.) Description of a method developed at the National Physical Laboratory for present-ing information concerning three variables in a single combined graph.
535.376 35 Theory of Electroluminescence—W.W52.
Piper and F. E. Williams. (Phys. Rev., vol. 98, pp. 1809-1813; June 15, 1955.) On the basis of the threshold value of the field necessary to excite luminescence, the following three possible mechanisms are discussed: (a) direct ionization of impurity systems by the field; (b) accelera-tion of conduction electrons or valence-band holes to velocities sufficient to produce excita-tion by inelastic collisions; (c) injection of charge carriers.
535.6 3553 Empirical Relationships with the Munsell
Value Scale—J. H. Ladd and J. E. Pinney. (PRoc. IRE, vol. 43, p. 1137; September, 1955.) A discussion relevant to the establish-ment in color television of an equal-step grey scale.
535.6.08 3554 The Specification of Colours based on Meas-
urements with the Trichromatic Colorimeter— F. Blottiau. (Cah. Phys., No. 54, pp. 37-52; February, 1955.)
537.22 3555 A General Mathematical Treatment applic-
able to certain Electrode Systems—G. Power. (Brit. J. appl. Phys., vol. 6, pp. 245-247; July, 1955.) Formulas are developed for a basic sys-tem of two coaxial dielectric cylinders of dif-ferent homogeneous and isotropic media con-taining an embedded line charge. These are applied to determine the fields in a circular-cylinder electrode system, the results being ex-pressed as series converging reasonably rapidly. Other electrode systems considered are a semi-infinite strip, an elliptic cylinder, and a para-bolic cylinder.
537 311.1 3556 On the Theory of Plasma Oscillations in
Metals—H. Kanazawa. (Progr. them.. Phys., Osaka, vol. 13, pp. 227-242; March, 1955.) The effect of the crystal lattice on plasma oscil-lations is investigated on the basis of quantum mechanics. See also 1023 of 1954 (Wolff) and 1613 of June (Hubbard).
537.311.33:535.35 3557 Application of the Method of Generating
Function to Radiative and Nonradiative Transitions of a Trapped Electron in a Crystal— R. Kubo and Y. Toyozawa. (Progr. theor. Phys., Osaka, vol. 13, pp. 160-182; February, 1955.) See also 3449 of 1952 (Kubo).
537.52 3558 Measurement of the Statistical Time Lag of
Breakdown in Gases and Liquids—R. F. Saxe and T. J. Lewis. (Brit. J. appl. Phys., vol. 6, pp. 211-216; June, 1955.)

138 PROCEEDINGS OF THE IRE January
537.525:538.56.029.6 3559 The Direct Current associated with Micro-
wave Gas Discharge between Coaxial Cylin-ders: Part 4--K. Mitani. (J. phys. Soc. (Japan), vol. 10, pp. 391-397; May, 1955.) Measure-ments made by a double-probe method give results in good agreement with theory. Part 3: ibid., vol. 8, pp. 642-645; September/October, 1953.
537.525:538.56.029.6 3560 Investigation of High-Frequency Discharge
by Method of Probes—Kh. A. Dzherpetov and G. M. Pateyuk. (Zh. eksp. icor. Fis., vol. 28, pp. 343-351; March, 1955.) The methods used by Banerji and Ganguli (Phil. Meg., vol. 11, pp. 410-422; February, 1931) and by Beck (Z. Phys., pp. 355-375; October 18, 1935) were compared experimentally; the results obtained in the two cases were similar. A study was also made of the temperature, concentration of electrons and potential along the axis of the discharge tube at various pressures between about 0.1 and 1 mm Hg of 112, Ar, and Ne at frequencies of the order of 100 mc; the distri-bution was found to depend on the gas pres-sure, the diameter of the tube and the Id field strength. Results are presented graphi-cally.
537.525.5 3561 Retrograde Motion in Gas Discharge
Plasmas—K. G. Hernqvist and E. O. Johnson. (Phys. Rev., vol. 98, pp. 1576-1583; June 15, 1955.) A phenomenon observed in cylindrical diodes operating in the ball-of-fire mode [959 of 1952 (Malter et al.)] is discussed.
537.525.8 3562 Diffusion in Moving Striations—V. D.
Farris. (Proc. phys. Soc., vol. 68, pp. 383-385; June 1, 1955.) A digest is presented of a thesis developing a diffusion theory of striations and testing the theory with experimental results reported by Pupp (Phys. Z., vol. 36, pp. 61-69; January 15, 1935.)
537.525.8 3563 Field Measurements in Glow Discharges
with a Refined Electron-Beam Probe and Auto-matic Recording—R. Warren. (Phys. Rev., vol. 98, pp. 1650-1658; June 15, 1955.)
537.525.8 3564 Interpretation of Field Measurements in
the Cathode Region of Glow Discharges— R. Warren. (Phys. Rev., vol. 98, pp. 1658-1664; June 15, 1955.)
537.533/.534 3565 Self-Focusing Streams—W. H. Bennett.
(Phys. Rev., vol. 98, pp. 1584-1593; June 15, 1955.) A restatement of the theory of magnetic self-focusing of streams comprising a mixture of ions and electrons. See also 126 of January (Bennett and Hulburt).
537.533/.534:538.691 3566 The Theoretical Possibility of separating
Beams of Charged Particles having Different Polarizations in a Magnetic Field—V. V. Vladimirski. (C.R. Acad. Sci. U.R.S.S., vol. 102, pp. 1099-1100; June 21, 1955. In Russian.) It is shown that a separation of beams such as is obtained in the Stern-Gerlach experiment can theoretically be obtained also in the case of charged particles.
537.533:539.211 3567 Electron Emission and Other Phenomena
on Freshly Disturbed Metal Surfaces—L. Grunberg. (Research, (London), vol. 8, pp. 210-214; June, 1955.) A general account of the effects and methods of observing them using an open-ended Geiger counter or a photo-graphic plate. See also 2301 of 1953 (Kramer).
537.533.7 3568 A Note on the Diffusion in a Gas of Elec-
trons from a Small Source—L. G. H. Huxley
and R. W. Crompton. (Proc. phys. Soc., vol. 68, pp. 381-383; June 1, 1955.)
537.533.7:538.63 3569 Experimental Investigation of the Motions
of Electrons in a Gas in the Presence of a Mag-netic Field—B. I. H. Hall. (Proc. phys. Soc., vol. 68, pp. 334-341; June 1, 1955.) The aim of this investigation was to verify the theory given by Huxley and Zaazou (Proc. roy. Soc. A, vol. 196, pp. 402-426; April 7, 1949.)
537.533.8 3570 Secondary Electron Emission—S. Rodda.
(Nature, (London), vol. 175, pp. 1112-1114; June 25, 1955.) Report of colloquium held at the Institute of Physics in March, 1955.
537.533.8 3571 Secondary Electron Emission by Primary
Electrons in the Energy Range of 20 keV to 1.3 MeV— B. L. Miller and W. C. Porter. (J. Franklin Inst., vol. 260, pp. 31-39; July, 1955.) Experiments were made using a primary beam from a small linear accelerator, after passage through a magnetic analyzer, and targets of various metals. The secondaries comprised two groups, one with energy mainly < 30 ev and the other, possibly elastically scattered, with high energies. Curves show both the total secondary emission and the high-energy component as functions of primary voltage for various target metals; for a gold target the energy spectrum of the low-velocity secondaries is investigated. Another graph shows the high-energy compo-nents plotted against the atomic number of the target metal. Some experiments with insulator targets are briefly reported.
537.533.8:621.38.032.11 3572 A Demountable Vacuum System for Sec-
ondary-Emission Studies—A. Lempicki. (J. sci. Instrum., vol. 32, pp. 221-223; June, 1955.)
537.56 3573 The Growth of an Electron Avalanche re-
tarded by its Own Space Charge—G. Francis. (Proc. phys. Soc., vol. 68, pp. 369-380; June 1, 1955.) The calculation presented shows how the ionization coefficient a and the total multipli-cation in the avalanche vary with the distance traveled when the positive ions formed have an appreciable effect. The time taken for an avalanche to develop is also calculated. The cases of (a) constant field at electrodes, and (b) constant potential between them are consid-ered, assuming plane parallel geometry.
537.56 3574 Passage of Charged Particles through
Plasma—J. Neufeld and R. H. Ritchie. (Phys. Rev., vol. 98, pp. 1632-1642; June 15, 1955.) A phenomenological approach is used to exam-ine the behavior of a dispersive plasma and determine its response to an external disturb-ance, in particular that created by a moving point charge. The validity of this approach is discussed. An analysis is made of the field and the polarization charge density produced by an incident particle and the effectiveness of the plasma in stopping the particle.
537.56 3575 Microwave Study of Positive-Ion Collec-
tion by Probes—G. J. Schulz and S. C. Brown. (Phys. Rev., vol. 98, pp. 1642-1649; June 15, 1955.) The electron density in a plasma is de-termined from the shift in resonance frequency of a cavity in which a discharge is maintained. The results are used to verify theory of positive-ion collection by negatively biased or double probes. Experiments were performed in H, Ar and He at pressures from 0.05 to 6 mm Hg. Agreement between experimental and theoreti-cal results is good at the lower pressures; at high pressures the probe collected about twice the current predicted by theory.
538.3 3576 A Short Modern Review of Fundamental
Electromagnetic Theory—P. Hammond. (Proc. IEE, Part B, vol. 102, pp. 716-717; Septem-ber, 1955.) Further discussion on 97 of January.
538.3:52 3577 Magneto-Hydrodynamics—V. C. A. Fer-
raro. (Nature, (London), vol. 176, pp. 234-237; August 6, 1955.) Report of a Royal Society discussion held in May, 1955.
538.3:538.6 3578 Electromagnetic Field Equations for a Mov-
ing Medium with Hall Conductivity—J. H. Piddington. (Mon. Not. R. asir. Soc., vol. 114, pp 638-650; 1954.) The well known equation representing the electromagnetic field in a moving isotropic conductor is adapted to treat the case of an anisotropic conductor, such as an ionized gas moving in a strong magnetic field, by introducing a tensor conductivity. The modified equation is used to analyze astro-physical problems, including the propagation of magnetohydrodynamic waves.
538.56:538.6 3579 The Motion of Ionized Gas in Combined
Magnetic, Electric and Mechanical Fields of Force—J. H. Piddington. (Mon. Not. R. ash-. Soc., vol. 114, pp. 651-663; 1954.) "Transient electric and mechanical forces uniform in space are applied to a gas in the presence of a steady magnetic field. The current transport equation for the anisotropically conducting medium is used to determine the subsequent motion of the gas, the internal electric field and the current density. These are damped oscillatory functions leading to a steady state. There is a close con-nection between the effects of the electric and mechanical forces: a steady internal electric field perpendicular to the magnetic field cannot exist unless accompanied by a mechanical force. The relationship between the two is examined."
538.56.029.6 3580 éerenkov Radiation and its Applications—
J. V. Jelley. (Brit. J. appl. Phys., vol. 6, pp. 227-232; July, 1955.)
538.566 3581 Reflection at Arbitrary Incidence from a
Parallel Wire Grid—J. R. Wait. (Appt. sci. Res., vol. B4, pp. 393-400; 1955.) The analysis presented is valid for any direction of polariza-tion, angle of incidence or value of wire con-ductivity. •
538.566:535.431+534.2 3582 On the Scattering of Spherical Waves by a
Cylindrical Object—J. R. Wait. (Ape sci. Res., vol. B4, pp. 464-468; 1955.) Analysis indicates that the ratio of the amplitude of the scattered field for a spherical incident wave to that for a plane wave is equal to [po/(pol-p)] 1, where pc is the distance of the source and p that of the observer from the cylinder axis.
538.569.4:621.372.029.64 3583 Revolutionary New Oscillator-Amplifier—
F. Shunaman. (Radio-Electronics, vol. 26, pp. 56-57; June, 1955.) Short simplified description of the "maser" (name derived from "microwave amplification by stimulated emission of radi-ation"). See also 100 of January (Gordon et at.).
538.569.4.029.6:535.33.08 3584 A Microwave Spectrometer and its Appli-
cations to some Organic Molecules—G. Erlandsson. (Ark. Fys., vol. 9, pp. 399-434; May 13, 1955.) A Stark-modulated microwave spectrometer operating in the frequency range 12-25 kmc is described in detail; circuit dia-grams are given. Spectra of several asym-metric-top molecules have been investigated.
538.569.4.029.6: 538.61 3585 Some Magneto-optical Phenomena con-
nected with the Molecular Resonance of Gases

1956 Abstracts and References 139
at Microwave Frequencies—A. Gozzini. (J. Phys. Radium, vol. 16, pp. 357-359; May, 1955.) The production of birefringence and Faraday rotation is discussed quantitatively with particular reference to NH3.
GEOPHYSICAL AND EXTRATER-RESTRIAL PHENOMENA
52:538.3 3586 Magneto-Hydrodynamics—Ferraro. (See
3577.)
523.16 3587 New Science of Radio Astronomy—B. J.
Bok. (Sci. Mon., vol. 80, pp. 333-345; June, 1955.) A review of research methods and re-sults, based on an address delivered to the American Association for the Advancement of Science.
523.16 3588 The Spatial Distribution and the Nature of
Radio Stars—M. Ryle and P. A. G. Scheuer. (Proc. roy. Soc. A, vol. 230, pp. 448-462; July 12, 1955.) Data obtained from a survey of ra-dio stars by Shakeshaft et al. (to be published in Mem. R. ash'. Soc.) are analyzed. The results indicate an apparent increase in the spatial dis-tribution density with distance in all directions. A reasonable interpretation of the results can-not be provided unless most of the stars are as-sumed to be outside the galaxy.
523.16 3589 An Alternative Identification of the Radio
Source in the Direction of the Galactic Cen-tre—R. D. Davies and D. R. W. Williams. (Nature, Land., vol. 175, pp. 1079-1081; June 18, 1955.) An attempt has been made to determine the distance of the radio source ob-served e.g., by McGee and Bolton (2932 of 1954) from the absorption by interstellar hy-drogen at 1.42 kmc. The results suggest that this source is considerably closer than the galactic nucleus.
523.16 3590 Radio Emission from Jupiter— Nature,
Land., vol. 175, p. 1074; June 18, 1955.) Brief report of reception at Seneca, Mary-land, of radiation on 22 mc; a large cross an-tenna was used of the type developed by Mills [see e.g., 633 of 1954 (Mills and Little)]. The ef-fect in a broadcast receiver was similar to that with thunderstorm interference. See also 2933 of October (Burke and Franklin).
523.16 3591 Radio Waves from the Planet Jupiter and
a Cosmogonic Hypothesis—Q. Majorana. (R.C. Accad. nez. Lincei, vol. 18, pp. 577-580; June, 1955.) The reported observation of ra-diation at about 22 mc [2933 of October (Burke and Franklin)] is discussed in relation to theo-ries concerning physical conditions on Jupiter. It is suggested that Saturn may also emit radio waves, but with lower intensity. Theoretical considerations indicate that astral heat and light may be a direct effect of the gravitational force.
523.5:537.56 3592 Meteor Radiation, Ionization and Atomic
Luminous Efficiency—E. J. erpik. (Proc. roy. Soc. A, vol. 230, pp. 463-501; July 12, 1955.) A theoretical paper; empirically constructed tables are presented for calculating the radia-tion from meteors.
523.72:550.385 3593 Corpuscular Streams—R. C. Jennison. (Ob-
servatory, vol. 75, pp. 125-126; June, 1955.) Solar emission of particles giving rise to varia-tions of the geomagnetic field [2494 of 1952 (Kiepenheuer)] is discussed. If the stream of particles is borne in the wake of a shock wave with a velocity of the order of 1500 km, com-plete transport of material from the sun to the
earth need not be postulated. The steep nature of the shock front is consistent with the sudden commencement of magnetic storms
523.746 3594 Provisional Determination of the Mean
Length of the 80-Year Sunspot Cycle— W. Gleissberg. (Naturwiss., vol. 42, p. 410; July, 1955.) Analysis of available data shows that during the past 16 centuries the duration of the 80-year cycle has fluctuated between five and eleven 11-year cycles, the mean being (7.1 ± 0.3) 11-year cycles; taking the mean dura-tion of the 11-year cycle as 11.1 years, this cor-responds to a range 75.5-82.1 and a mean value 78.8 years.
523.75:550.385:537.591 3595 Solar Flare and Magnetic Storm Effects in
Cosmic-Ray Intensity near the Geomagnetic N Pole—J. W. Graham and S. E. Forbush. (Phys. Rev., vol. 98, pp. 1348-1349; June 1, 1955.) Phenomena observed during and fol-lowing the solar flare of July 25, 1946 are dis-cussed. If the observed increase in cosmic-ray intensity was due to charged particles from the sun, the trajectories must have been strongly affected by factors other than the geomagnetic field.
550.372 3596 Measurement of Soil Conductivity by the
Wave-Tilt Method—S. C. Mazumdar. (J. 'man. Telecommun. Engrs., India, vol. 1, pp. 76-83; June, 1955.) Description of the experi-mental arrangement and report of results ob-tained in the vicinity of Delhi.
550.38 3597 Geomagnetism—(Indian J. Met. Geophys.,
vol. 5, Special Number, pp. 1-242; December, 1954.) This special number commemorates the golden jubilee of the Alibag observatory. The 30 papers presented include the following: The Contrast between Geomagnetic S and L
at Huancayo— J. Bartels (pp 69-74). Characteristics of Polar Magnetic Storms—
T. Nagata and N. Fukushima (pp. 75-88)• Ionospheric Magnetic Fields during Marked
Decreases in Cosmic Rays—S. E. Forbush and E. H. Vestine (pp. 113-116).
Magnetohydrodynamic Waves and Solar Prom-inences—H. Alfvén (pp. 133-136).
Auroral Activity at Medium Latitudes—A. Vassy and E. Vassy (pp. 137-140). In French.
Solar Radiation in the Far Ultraviolet and some Related Geophysical Phenomena—A. K. Das (pp. 141-152).
On the Emission of Electric Currents from the Sun—V. C. A. Ferraro (pp. 157-160).
Sunspots and Geomagnetic Variation—S. K. Pramanik and M. K. Ganguli (pp. 161-178).
Magnetic Storms and Solar M Regions—P. K. Sen Gupta (pp. 179-188).
The Dynamo Action of the Diurnal Atmos-pheric Oscillation—R. Pratap. (pp. 189-194).
Recurrence Tendency of Geomagnetic Activ-ity during the Current Sunspot Minimum— A. M. Naqvi and B.e. Bhargava (pp. 195-202)
Some Remarks on the Equatorial Electrojet, as revealed by the Analysis of Solar Flare Ef-fects—J. Veldkamp and J. G. Scholte (pp. 203-212).
Geomagnetic Records at Colaba and Alibag on Days of Solar Eclipse—S. L. Malurkar. (pp. 213-220).
Some others are abstracted individually.
550.380.8 3598 Apparatus for Measurement of the Inten-
sity of the Terrestrial Magnetic Field—R. Bire-bent. (C.R. Acad. Sci., Paris, vol. 241, pp. 368-369; July 25, 1955.) An adaptation of the de-vice described previously (2367 of August).
550.385 3599 Notes on the Theory of Magnetic Storms—
S. Chapman. (Indian J. Met. Geophys., vol. 5, Special Number, pp. 33-40; December, 1954.) «A non-mathematical account is given of the model problems and their solutions, by which Chapman and Ferraro have sought to illustrate some aspects of the theory of magnetic storms. These problems are here used to develop a qual-itative solution of the motion of an infinite neu-tral ionized plane sheet of gas (or of a succession of such sheets) towards a unidirectional mag-netic field whose intensity decreases as an in-verse power of the distance from an axis to which the sheet is parallel. The gas in the cen-ter approaches to a minimum distance from the axis and then recedes again. The gas far to either side moves onward with little distortion. Between these central and outer parts there are two strips of the sheet whose ions and electrons separate from each other, under the influence of the magnetic field; partly because these strips become much extended and reduced to low den-sity. Some charges are deviated away to infin-ity, others are captured by the field and build up a 'westward' electric current to which is ascribed the main phase of a magnetic storm."
550.385:551.510.535 3600 The Relation between the Geomagnetic
Field and Range Disturbance in Various Lati-tudes—R. P. W. Lewis and D. H. McIntosh. (Indian J. Mel. Geophys., vol. 5, Special Num-ber, pp. 51-62; December, 1954.) Analysis of observations leads to a theory of the mecha-nism of magnetic disturbances intermediate be-tween the classical theory and that advanced by Nikolsky (3897 of 1947). The true storm-time effect is greatest at the equator; an addi-tional effect comprising instantaneous re-sponse to and recovery from the disturbance is greatest in the auroral zone. The effect on the ionosphere at high latitudes is briefly consid-ered.
551.51:061.3 3601 Assembly of the International Union for
Geodesy and Geophysics, Rome 1954—(Ann. Géophys., vol. 11, pp. 115-248; April/June, 1955.) The text is given of 11 papers, most of them in English, dealing with the structure of the atmosphere and especially with research by means of rockets since 1946.
551.510.53 3602 Dissociation of Oxygen in the Upper Atmos-
phere—E. T. Byram, T. A. Chubb, and H. Friedman. (Phys. Rev., vol. 98, pp. 1594-1597; June 15, 1955.) The 02 content of the atmos-phere at heights between 110 and 130 km was determined by measuring the transmission of solar radiation in the wavelength band from 1425 to 1500 A, using an ultraviolet photon counter in a rocket. At 130 km the 01 concen-tration was 10,0/cm*, indicating that 12 per cent of the atmospheric oxygen was still undis-sociated.
551.510.535 3603 Determination of the True Distribution of
Electron Density in the Ionosphere: Part 1—W. Becker. (Arch. elekt. übertragung, vol. 9, pp. 277-284; June, 1955.) A survey leads to the conclusion that existing methods of investi-gating the electron-density distribution are either too inaccurate or too complicated for routine use. 51 references.
551.510.535 3604 Resonance Absorption of Sunlight in Twi-
light Layers—T. M. Donahue and R. Resnick. (Phys. Rev., vol. 98, pp. 1622-1625; June 15, 1955.) Calculations are made relevant to the determination of the thickness of the atmos-pheric sodium layer, which appears to be lo-cated at a height between 70 and 115 km.

140 PROCEEDINGS OF THE IRE January
551.510.535 3605 New Representation of the Longitude Ef-
fect in the Ionosphere F2 Layer—F. Delobeau. (C.R. Acad. Sci., Paris, vol. 241, pp. 439-441; July 25, 1955.) The representation is based on a chart with geographic latitude as abscissa and magnetic latitude as ordinate. On plotting the positions of existing ionospheric stations the need for stations in certain regions is demon-strated, particularly for stations with south geographic and north magnetic latitude.
551.510.535 3606 Simultaneous Fluctuations of the F2-Layer
Ionization at Two Widely Spaced Observation Stations—O. Burkard. (eist. Z. Telegr. Teleph. Funk Fernsehtech., vol. 9, pp. 57-59; May /June, 1955.) Observations of short-term varia-tions of foF2 at Graz in Austria and at Cape-town in S. Africa during January, 1953 are com-pared. Correlation factors up to 0.725 were ob-tained for values observed at the same univer-sal time, but the correlation decreases rapidly as the time difference between the measure-ments increases. The results support the view that the ionizing radiation itself undergoes short-term fluctuations.
551.510.535 3607 The Ionospheric F2 Layer over India in
Minimum Sunspot Year 1953—K. R. Rama-nathan and K. M. Kotadia. (Indian J. Met. Geophys., vol. 5, Special Number, pp. 117-122; December, 1954.) A summary of observations made at various stations in India.
551.510.535 3608 A Singular Echo Trace observed in Iono-
grams from the Kerguelen Islands Station— R. Busch and A. Luchet. (C.R. Acad. Sci., Paris, vol. 241, pp. 507-509; August 1, 1955.) Traces have been obtained indicating reflec-tions from a layer at a height of 48-55 km in summer and 55-65 km in winter, corresponding to the temperature-maximum region at the up-per boundary of the ozone layer. The results are in agreement with those of Major (3252 of November).
551.510.535:621.396.812.3.029.55 3609 Investigation of Vertical Movements of the
F2 Layer—N. V. G. Sarma. (Curr. Sci.. vol. 24, pp. 190-191; June, 1955.) Calculations based on observations of the rate of fading of 4.92-mc signals and simultaneous independent determi-nations of E layer vertical movements confirm that the vertical drift velocity of the F2 layer at morning and evening is greater than that of the E layer.
551.594.5 3610 Diurnal Variation in Auroral Activity—
N. C. Gerson. (Proc. phys. Soc., vol. 68, pp. 408-414; July 1, 1955.) An analysis of amateur-radio contacts during the period 1949-1951, using vhf transmissions incident obliquely to the ionized aurora, is compared with results obtained by radio soundings at normal inci-dence. Auroral activity shows a strong maxi-mum at 2100 hours local time, with 86 per cent of the total occurrences between 1700 and 2400 hours.
523.16 3611 Radio Astronomy. [Book Reviewf-J. L.
Pawsey and R. N. Bracewell. Publishers: Geoffrey Cumberlege, Clarendon Press, Oxford, 1955, 354 pp., 55s. (J. Brit. Insta. Radio Engrs., vol. 15, p. 11; August, 1955.) Intended pri-marily for physicists and astronomers.
523.5:621.396.96 3612 Meteor Astronomy. [Book Reviewl—
A. C. B. Lovell. Publishers: Clarendon Press, Oxford; Oxford University Press, London, 1954, 463 pp., 60s. (Nature (London), vol. 176, pp. 135-136; July 23, 1955.) A comprehensive up-to-date survey indicating the importance of radio techniques.
523.7 3613 The Sun (The Solar System - Vol. 1). [Book
Review)—G. P. Kuiper (Ed.). Publishers: University of Chicago Press, Chicago, and Cambridge University Press, London, 1953, 745 pp., 94 s. (Nature (London), vol. 176, p. 5; July 2, 1955.) Chapters on the various aspects of the subject are contributed by ac-knowledged leaders in the field, to produce a reference book for the specialist and a useful survey for the nonspecialist.
551.510.535:621.396.11 3614 The Physics of the Ionosphere. [Book
Notice[—Publishers: The Physical Society, London, 1955, 406 pp., 40s. (J. Brit. I.R.E., vol. 15, p. 11; August, 1955.) A collection of 50 papers presented at the Physical Society Con-ference held at Cambridge, England, in Sep-tember, 1954.
LOCATION AND AIDS TO NAVIGATION
621.396.96: 535.37: 551.46 3615 Radar and Phosphorescence at Sea—B.
Hilder. (Nature (London), vol. 176, pp. 174-175; July 23, 1955.) Mariners' observations of phosphorescence apparently stimulated by radar are reported and discussed.
621.396.96:621.374.3 3616 Target Discriminator for Countermeasures
—M. Weiss and S. R. Sixbey. (Electronics, vol. 28, pp. 118-120; August, 1955.) A voltage-difference discriminator driven by the output from a logarithmic amplifier provides a device capable of discriminating between input volt-age pulses of amplitudes in the ratio of 5 to 4, and independent of pulse width, repetition rate and absolute pulse amplitude.
621.396.96.029.65:551.578 3617 Measurements of the Effect of Rain, Snow
and Fogs on 8.6-mm Radar Echoes—N. P. Robinson. (Proc. I EE, Part B, vol. 102, pp. 709-714; September, 1955.) Measurements of the attenuation caused by rain and of the back-scattered radiation agreed well with predictions from theory. The echo intensity from fogs was too low to be detected, but measurements of the attenuation of echoes from a corner reflec-tor in fogs of different thicknesses were of the same order as the predicted values. The attenu-ation caused by moist snow was 21 times that caused by rain with a similar precipitation rate. The echo intensity from the »radar bright band» composed of melting snow was 14-19 db greater than that from the dry snow above and 2-8 db greater than that from the rain below.
MATERIALS AND SUBSIDIARY TECHNIQUES
533.56 3618 The Final Vacua of Oil Diffusion Pumps—
R. F. Coe and L. Riddiford. (J. sci. Instrum., vol. 32, pp. 207-213; June. 1955.) Measure-ments of the vapor pressures of apiezon C, octoil S, DC 703 and some other oils by various methods are compared with final pressures measured with both ionization and Knudsen gauges. The residual liolecules are decomposi-tion products of the oil and vary with the type of oil; their average molecular weight is less than that of the oil.
535.215:546.482.21:539.231 3619 Production of Light-Sensitive Cadmium-
Sulphide Films by Cathode Sputtering—G. Helwig and H. Ktinig. (Z. angew. Phys., vol. 7, pp. 323-325; July, 1955.) The deposition of photoconductive CdS films on glass by sputter-ing Cd in an atmosphere of H2S and an inert gas is described. The ratio of current at an illumination of 1000 lux to the dark current is of the order of 104 to 105.
535.37:546.472.21 3620 Laws of Decay of Afterglow in Zinc-
Sulphide Phosphors in Region of Temperature Quenching—F. I. Vergunas and N. L. Gasting. (Zh. eksp. Icor. Fis., vol. 28, pp. 352-360; March, 1955.) An experimental investigation is reported on ZnS-Cu, ZnS-(Cu, Co), and ZnS-Zn phosphors. In all cases the decay of afterglow varied with temperature up to quenching temperature and with the intensity of the exciting light. As the temperature increased, the hyperbolic curve representing the early stages of the characteristic changed into an exponential curve; simultaneously, the hyper-bolic curve representing the later stages of the decay shrank, so that at high temperatures the whole of the decay curve was approximately exponential. Corresponding results were ob-tained for the effect of intensity and duration of excitation. Results are presented graphically.
535.376 3621 Alternative Explanation of the Waymouth-
Bitter Experiments—L. Burns. (Phys. Rev., vol. 98, p. 1863; June 15, 1955.) An alternative explanation is advanced of electroluminescence observations reported by Waymouth and Bitter (441 of February).
535.376:546.472.21 3622 Light Patterns in Electroluminescent ZnS
Single Crystals activated by Diffusion of Cu— G. Diemer. (Philips Res. Rep., vol. 10, pp. 194-204; June, 1955.)
535.376:546.472.21 3623 Some Aspects of the Voltage and Frequency
Dependence of Electroluminescent Zinc Sul-phide—P. Zalm, G. Diemer, and H. A. Klasens. (Philips Res. Rep., vol. 10, pp. 205-215; June, 1955.) "Experiment shows that the relation between the luminous emittance H of an elec-troluminescent cell and the applied r.m.s. voltage V is given by H = Ho exp ( -c/ VD. A mechanism is proposed that may explain both the well-known linear frequency dependence at a constant rms voltage of the emittance and the observed voltage dependence."
537.221:546.48 3624 Work Function of Cadmium—P. A. Ander-
son. (Phys. Rev., vol. 98, pp. 1739-1740; June 15, 1955.) Continuation of work reported previ-ously (993 of 1953).
537.226: 538.221 3625 Model for Magnetization Process in
Ferrodielectrics—M. N. Grigorev and I. M. Kirko. (C. R. Acad. Sci. U.R.S.S., vol. 102, pp. 733-736; June 1, 1955. In Russian.) The mag-netic properties of materials composed of steel spheres embedded in a quartz-sand insulating medium were investigated experimentally; results were compared with theory. Conclu-sions indicate that the effective permeability in a constant field and the dispersion in an alternating field can be determined if the follow-ing are known: (a) the permeability and dis-persion of the steel, (b) its conductivity, and (c) the permeability of the ferrodielectric at one frequency in the dispersion region.
537.226:621.315.6 3626 Physics, Chemistry and Insulation—C. G.
Garton. (J. Instn. elect. Engrs., vol. 1, pp. 576-580; September, 1955.) A short review with particular reference to von Hippel's two books, Dielectrics and Waves (2045 of July) and Di-electric Materials and Applications (3030 of October)
537.226.2:537.224 3627 Abnormal Increase in the Dielectric Con-
stant of an Electret-Forming Material—S. D. Chatterjee and T. C. Bhadra. (Phys. Rev., vol. 98, pp. 1728-1729; June 15, 1955.) "An electret with its two surfaces covered by plates which are connected together presents a situation in which the average (zero) field between the plates is composed of two equal and opposite parts, one due to the polarization and the

1956 Abstracts and References 141
other due to the charges on or adjacent to the plates. These opposing fields can be very large (,,,106 volts/cm) and as a result, large fluctua-tions may be expected in the vicinities of indi-vidual molecules For these reasons it is sur-mised that the dielectric constant of the ma-terial of an electret may show an abnormal value, depending upon "strength" of the electret. The experiments described verify the existence of such an abnormality."
537.227 3628 A Neutron-Diffraction Study of the Ferro-
electric Transition of Potassium Dihydrogen Phosphate—G. E. Bacon and R. S. Pease. (Proc. roy. Soc. A, vol. 230, pp. 359-381; June 21, 1955.)
537.227:546.431.824-31:621.396.822 3629 Noise Generation in Crystals and in
Ceramic Forms of Barium Titanate when Sub-jected to Electric Stress—A. C. Kibblewhite. (Proc. IEE, Part B, vol. 102, pp. 683-684; September, 1955.) Discussion on 1347 of May.
537.311.3:546.73.281 3630 The Crystal Structure of CO2Si—S. Geller
and V. M. Wolontis. (Acta Cryst., vol. 8, pp. 83-87; February, 1955.)
537.311.3:546.97.289 3631 The Rhodium-Germanium System: Part 1
—The Crystal Structures of Rh2Ge, RhbGe3 and RhGe—S. Geller. (Acta Cryst., vol. 8, pp. 15-21; January 10, 1955.)
537.311.31 : 546.87: 538.63 3632 Effect of Hydrostatic Pressure on the Gal-
vanomagnetic Effects in Bi and its Alloys: Part 1—N. E. Alekseevski and N. B. Brandt. (Zh. eksp. teor. Fiz., vol. 28, pp. 379-383; March, 1955.) Brief report of an experimental investigation at a pressure of 1500 atm and at temperatures in most cases equal to or not much above that of liquid He. Results are presented graphically.
537.311.33 3633 Semiconductors: No Man's Land between
Metals and Insulators—R. W. Douglas. (Nature, Loud., vol. 175, pp. 1059-1061; June 18, 1955.) A simple introduction to the subject.
537.311.33 3634 Intermetallic Semiconductors—I. M. Ross.
(Nature, Load., vol. 176, pp. 341-343; August 20, 1955.) Report of a symposium held in April, 1955 at the Services Electronics Research Laboratory, Baldock, Herts. Emphasis was on compounds of the zinc-blende type, particu-larly InSb.
537.311.33 3635 Ionic and Homopolar Bonds in Semicon-
ductors—I. M. Tsidil'kovski. (CR. Acad. Sci. U.R.S.S., vol. 102, pp. 737-740; June, 1, 1955. In Russian.) A discussion relating to semicon-ductors such as oxides, sulphides, and selenides.
537.311.33:538.63 3636 Galvanomagnetic Effects in Semiconduc-
tors—O. Madelung. (Naturwiss., vol. 42, pp. 406-410; July, 1955.) A survey with particular reference to Hall effect and resistance variation due to the magnetic field.
537.311.33:538.63 3637 Theory of the Hall and Nernst-Ettings-
hausen Effects in Semiconductors with Mixed Conductivity—F. G. Bass and I. M. Tsidil'kov-ski. (Zh. eksp. icor. Fis., vol. 28, pp. 312-320; March, 1955.) The theoretical discussion pre-sented is based on the assumption of a law for the mean free path 1 of the form 1=4,(T)0, where 41(T) is a function of temperature, y is the velocity of the charge carriers and n has the same value for electrons and holes.
537.311.33: 539.15 3638 Overhauser Effect in Nonmetals- -\ Abra-
gam. (Phys. Rev., vol. 98, pp. 1729-1735; June 15, 1955.) A survey is made of different ways in which nuclear spins can relax through their interaction with electronic spins. The case of a paramagnetic ion is examined in detail with reference to Honig's experiment on As-doped Si (753 of March).
537.311.33:54 3639 Chemical Aspects of Semiconductos—F. S.
Stone. (Nature, Lond., vol. 176, pp. 153-155; July 23, 1955.) Brief report of symposium held at Reading in March, 1955.
537.311.33:546.26-1 3640 Semiconductivity of a Type lib Diamond—
J. F. H. Custers. (Nature, Loud., vol. 176, pp. 173-174; July 23, 1955.) The semiconductor properties of this class of diamond are thought to be due to crystal imperfections. The tem-perature variation of conductivity obeys an exponential law. In a particular specimen the energy gap was 0.70 ev. Rectification is ob-tainable. All blue diamonds are of this type, though not all of this type are blue.
537.311.33: [546.28+546.289 3641 Optical and Impact Recombination in Im-
purity Photoconductivity in Germanium and Silicon—N. Sclar and E. Burstein. (Phys. Rev., vol. 98, pp. 1757-1760; June 15, 1955.) Factors affecting the time taken to restore charge-carrier equilibrium are investigated by com-paring the nonradiative, radiative and three-body recombination coefficients calculated on the basis of a simple model with hydrogen-like impurity centers. None of the mechanisms con-sidered is consistent with time constants as short as those observed.
537.311.33: [546.28+546.289 3642 Electron Voltaic Study of Electron Bom-
bardment Damage and its Thresholds in Ge and Si—J. J. Loferski and P. Rapaport. (Phys. Rev., vol. 98, pp. 1861-1863; June 15, 1955.)
537.311.33:546.28 3643 Solution of the Hartree-Fock-Slater Equa-
tions for Silicon Crystal by the Method of Orthogonalized Plane Waves—T. O. Wood-ruff. (Phys. Rev., vol. 98, pp. 1741-1742; June 15, 1955.)
537.311.33:546.28 3644 Pressure Dependence of the Resistivity
of Silicon—W. Paul and G. L. Pearson. (Phys. Rev., vol. 98, pp. 1755-1757; June 15, 1955.) Measurements made on high-purity single crystals of Si in the intrinsic range indicate that the energy gap narrows as the applied pressure increases.
537.311.33:546.28 3645 Interpretation of Donor-State Absorption
Lines in Silicon—W. Kohn. (Phys. Rev., vol. 98, pp. 1856-1857; June 15, 1955.)
537.311.33:546.28 3646 Infrared Absorption of Silicon near the
Lattice Edge—G. G. Macfarlane and V. Rob-erts. (Phys. Rev., vol. 98, pp. 1865-1866; June 15, 1955.) Report of measurements over the temperature range 20-3330 degrees K.
537.311.33:546.289 3647 Fast-Neutron Bombardment of n-Type Ge
—J. W. Cleland, J. H. Crawford, Jr., and J. C. Pigg. (Phys. Rev., vol. 98, pp. 1742-1750; June 15, 1955.) Report of an extensive experimental study. The results indicate that the neutron bombardment produces two vacant states in the energy gap, one deep and one shallow. Mobility studies indicate that scattering associ-ated with bombardment-induced lattice dis-order is more complex than that due to charged impurities. Appreciable photoconductivity as-sociated with minority-carrier trapping is pro-duced.
537.311.33:546.289 3648 Microwave Determination of the Average
Masses of Electrons and Holes in Germanium —J. M. Goldey and S. C. Brown. (Phys. Rev., vol. 98, pp. 1761-1763; June 15, 1955.) A de-termination of the dielectric constant was made by measuring the complex transmission coeffi-cient at 24.15 kmc through a thin slab of Ge at several temperatures. Values of the effective masses of electrons and holes thus determined are (0.09 ± 0.05)mo and (0.30 ± 0.05)mo re-spectively.
537.311.33:546.289 3649 Water-Vapor-Induced n-Type Surface Con-
ductivity on P-Type Germanium—R. H. Kingston. (Phys. Rev., vol. 98, pp. 1766-1775; June 15, 1955.) Measurements have been made of the n-type surface conductance of the p-type region in an n-p-n transistor, using a direct-reading instrument in contrast to the bridge measurements made by Brown ( 166 of 1954). From the results it is deduced that the density and type of carrier at the surface of an etched Ge crystal depend on the surface treatment and surrounding gas rather than on the carrier concentration in the bulk material. See also 1951 of 1954.
537.311.33:546.289 3650 Electrical Breakdown in Germanium at
Low Temperatures—F. J. Darnell and S. A. Friedberg. (Phys. Rev., vol. 98, pp. 1860-1861; June 15, 1955.) Report of an investigation of current/elect ric-field characteristics at different values of temperature and transverse magnetic field. Values of carrier mean free time and path are deduced.
537.311.33:546.289 3651 New Radiation resulting from Recombina-
tion of Holes and Electrons in Germanium— J. R. Haynes. (Phys. Rev., vol. 98, pp. 1866-1868; June 15, 1955.) In addition to a previ-ously reported radiation maximum at about 1.8 la wavelength, evidence has been found for a second radiation maximum at about 1.5 µ.
537.311.33:546.289 3652 Surface Recombination in Germanium in
the Presence of Strong Electric Fields—H. K. Henisch and W. N. Reynolds. (Proc. phys. Soc., vol. 68, pp. 353-356; June 1, 1955.) The effect on the surface recombination velocity of a field normal to the crystal surface was investigated experimentally using Many's method (2129 of 1954) to determine the minority-carrier life-time. The n- and p-type specimens were about 0.05 cm thick, 0.4 cm wide, and 1.5-3 cm long; the resistivities varied between 5 and 12 G. cm. The surface-recombination-velocity/applied-voltage curves obtained had similar slopes for both types of specimen. A possible theoretical explanation of the results is discussed.
537.311.33:546.289 3653 A Pulse Method for measuring the Injec-
tion Ratio of Metal-Semiconductor Contacts —G. G. E. Low. (Proc. phys. Soc., vol. 68, pp. 447-452; July 1, 1955.) A tungsten point con-tact connected to a constant-current pulse generator divides a filamentary specimen of n or p-type Ge so as to form two arms of a bridge circuit. The change in conductance of the specimen with time after injection of a current pulse is measured. Curves of injection ratio against emitter current are given for various conditions.
537.311.33:546.289 3654 On the Behavior of Rapidly Diffusing Ac-
ceptors in Germanium—F. van der Maesen and J. A. Brenkman. (J. electrochem. Soc., vol. 102, pp.229-234; May, 1955.) Experiments on the acceptor activity and diffusion of Cu and Ni in Ge are reported. The results are inter-preted as indicating that these impurities may occur both substitutionally and interstitially in

142 PROCEEDINGS OF THE IRE January
the lattice, different diffusion constants being appropriate for the two cases
537.311.33:546.289 3655 Magnetic Susceptibility of Germanium—
G. Busch and N. Helfer. (Helv. phys. Ada, vol. 27, pp. 201-204; June 30, 1954. In Ger-man.) Measurements on single crystals were made over the temperature range 56-1180 de-grees K. The susceptibility passes through a maximum value at about 800 degrees K. The effect of thermally produced holes is discussed.
537.311.33:546.289 3656 Charge-Carrier Susceptibility and Cyclotron
Resonance of Germanium—C. Enz. (Helv. phys. Ada, vol. 28, pp. 158-166; May 31, 1955.) In German.) On the basis of energy-band theory, the carrier susceptibility in the intrinsic range is calculated and compared with experi-mental results obtained by Busch and Helfer (3655 above). The agreement between theoreti-cal and experimental results is much better if the number of families of ellipsoids in the con-duction band is taken to be 4 rather than 8.
537.311.33:546.289 3657 Germanium in Some of the Waste-Products
from Coal—K. V. Aubrey. (Nature, Lond., vol. 176, pp. 128-129; July 16, 1955.) Experimental investigations are reported leading to conclu-sions differing in some respects from those of Forrest et al. (2659 of September). Possible reasons are discussed for the lower concentra-tions of Ge encountered in power- station boiler deposits as compared with deposits from the waste-gas flues of producer-gas plant.
537.311.33:546.289:539.32 3658 Elastic Constants of Germanium between
1.7° and 80°K—M. E. Fine. (J. appl. Phys., vol. 26, pp. 862-863; July, 1955.)
537.311.33:621.314.632.1 3659 The Effect of Field-Dependent Mobilities
on the Diffusion Theory of Rectification—P. T. Landsberg. (Proc. phys. Soc., vol. 68, pp. 366-368; June 1, 1955.) A note on the theoretical part of Lees' work (462 of 1954) showing that if the mobility and diffusion coefficient of the current carriers are subjected to a much smaller fractional change, as a function of position in the barrier layer, than is the electric field, then many results of the general theory of barrier-layer rectifiers remain essentially unchanged.
537.311.33:621.314.7 3660 Semiconductors and Transistors: some
Current Problems—J. R. Tillman. (Nature, Load., vol. 176, pp. 9-11; July 2, 1955.) A con-cise survey of the existing state of knowledge.
537.311.33:621.396.822 3661 Electronic Fluctuations in Semiconductors
—R. E. Burgess. (Brit. J. appl. Phys., vol. 6, pp. 185-190; June, 1955.) Various types of electrical fluctuations which occur in a semi-conductor are compared with the corresponding processes in a vacuum tube. The types consid-ered include thermal, shot, partition, ava-lanche, and modulation noise, the last-mentioned being conspicuous at low frequen-cies, especially when current-carrying contacts or barriers occur.
537.311.33:669.046.54 3662 Zone Melting Apparatus—( Tech. News
Bull. nat. Bur. Stand., vol. 39, p. 81; June, 1955.) Automatic apparatus for producing high-purity semiconductors uses a water-cooled rf heating coil concentric with a vycor tube which surrounds the boat holding a bar of the semi-conductor. The coil is motor-driven along the tube.
537.311.33:669.046.54:546.289 3663 Zone Melting—W. G. Pfann and K. M
Olsen. (Bell. Lab. Rec., vol. 33, pp. 201-205;
June, 1955.) A short illustrated description of the method of purifying Ge crystals, or pro-ducing a desired constituent distribution, by repeated crystallization, the Ge ingot in a graphite boat being traversed through a series of induction heating coils.
538.22 3664 Tentative Interpretation of the Magnetic
Properties at High Temperature of the Rhom-bohedral Sesquioxides of Titanium, Vanadium, Chromium, and Iron (Ti203, V203, Cr2O3 and Fe2O3)—J. Wucher. (C.R. Acad. Sci., Paris, vol. 241; pp. 288-290; July 18, 1955.1
538.22: 621.318.134 3665 A Review of the Structure and some Mag-
netic Properties of Ferrites— L. C. F. Black-man. (J. Electronics, vol. 1, pp. 64-77; July, 1955.)
538.221 3666 Density of States of Conduction Electrons
in Ferromagnetics—A. V. Sokolov and S. M. Tsipis. (Zh. eksp. Icor. Fis., vol. 28, pp. 321-325; March, 1955.) The calculation presented is based on a model with s-d electron interac-tion.
538.221 3667 Some Magnetic Properties of Dilute Ferro-
magnetic Alloys: Part 1—G. Bate, D. Scho-field, and W. Sucksmith. (Phil. Meg., vol. 46, pp. 621-631; June, 1955.) An account is given of an investigation into the variation with heat treatment of the magnetic properties of Cu-Co and Cu-Fe alloys containing small percentages of ferromagnetic component. A maximum in the coercivity is found which is thought to be associated with single-domain precipitates; the characteristics of the hys-teresis loops at this stage indicate coercivities >1,000 oersted.
538.221 3668 The Influence of Temperature on Magnetic
Viscosity—J. H. Phillips, J. C. Woolley, and R. Street. (Proc. phys. Soc., vol. 68, pp. 345-352; June 1, 1955.) Extension of earlier work (3272 of 1954). Measurements were made to demonstrate the influence of temperature on irreversible magnetic viscosity in different types of precipitation alloys: Pt-Co. Ni3Au, and alnico in an undeveloped state.
538.221 3669 The Absence of Block Walls in Certain
Ferromagnetic Materials—P. M. Prache. (Cables Transm., vol. 9, p. 228; July, 1955.) Corrections to paper abstracted in 3018 of Oc-tober.
538.221 3670 Low-Temperature Evolution of the Coercive
Force of Finely Divided Nickel—L. Weil. (C.R. Acad. Sci., Paris, vol. 241, pp. 470-472: August 1, 1955.) Measurements of the coercive force were made at progressively lower tem-peratures on Ni powders prepared by reduction. The results are not affected by applied mag-netic fields, but are strongly affected by the thermal history of the specimens. Transforma-tions effected at low temperature persist on reheating.
538.221:539.23 ' 3671 Magnetization Reversal in Thin Films—
R. L. Conger. (Phys. Rev., vol. 98, pp. 1752-1754; June 15, 1955.) "An experiment has been performed which indicates that mag-netization reversal in evaporated films of 80 per cent Ni, 20 per cent Fe, 2X 1Œ' cm thick takes place by domain rotation rather than by the motion of 180 degree domain walls."
538.221:669.24 3672 Nickel Alloys made by Powder Metallurgy
Techniques—(Metta/urgia, Manchr., vol. 51, pp. 215-217; May 1955.) The close control
in the production of Ni and Ni alloys by the technique described resulted in high-purity ma-terials particularly suitable for use in tubes. A magnetic alloy of composition Ni 77 per cent, Fe 14 per cent, Mo 4 per cent, Cu 5 per cent, was also developed; this can be annealed in pure or wet hydrogen without detriment to its magnetic properties. Initial permeabilities >25,000 have been obtained in strip material of thickness down to 0.0005 inch; by suitable heat treatment, the details of which are not given, this may be increased to 60,000-100,000. Tables are given of the electrical resistivity of various samples of high-purity Ni, of the mean coefficient of expansion of Ni-Fe alloys, and of the chemical composition of the materials dis-cussed.
539.23:537.311.3 3673 Experimental Investigation of the Electrical
Conductivity of Complex Metal/Dielectric Films produced by Evaporation—C. Feldman. (Ann. Phys., Paris, vol. 10, pp. 435-478; May/June, 1955.) A study was made of films produced by (a) evaporating metal on to a previously deposited salt film, (b) evaporating metal and salt simultaneously, and (c) evapo-rating a salt on to a previously deposited metal film. The variation of conductivity with tem-perature and electric field is expressed by a formula of the same type as that for simple metal films, with different values of the con-stants. Theoretical discussion is based on the presence of very low potential barriers due to extremely close spacing between the grains. Complex films can be produced with either linear or nonlinear resistance characteristics. 49 references.
• 546.681 3674 Magnetic Susceptibilities of Crystal and of
Liquid Gallium—A. Marchand. (C. R. Acad. Sci., Paris, vol. 241, pp. 468-470; August 1, 1955.) Experimental results are reported.
548.5 3675 On the Distribution of Impurity in Crystals
Grown from Impure Unstirred Melts—K. F. Hulme. (Proc. phys. Soc., vol. 68, pp. 393-399; July 1, 1955.)
621.315.61:546.287 3676 Silicones as Engineering Materials—L. P.
Smith. (Engineering, Load., vol. 179, pp. 789-792, June 24, 1955.) The physical and chemical
operties of silicones are briefly described and various applications are indicated.
621.318.2 3677 Impulse Magnetizer for Permanent Mag-
nets—G. M. Moore. (Electronics, vol. 28, pp. 121-123; August, 1955.) A 200-ka pulse is ob-tained by discharging a capacitor through a current step-up transformer. Reversal of the magnetizing pulse is prevented by use of a thyratron-controlled ignitron shunting the magnetizing loop. Application is to magnetron magnets.
666.1/.2 3678 The Devitrification Behaviour of Glasses
Used in Vacuum Techniques—O. Knapp. (Acta tech. Acad. Sci. hungaricae, vol. 8, pp. 67-78; 1954. Glass Ind., vol. 36, pp. 262-264, 285; May, 1955. Experimental results indicate lower liquidus temperatures and higher rates of crys-tal growth for lime and lead glasses than were reported by Kalsing et al. (Glastechn. Ber., vol. 21, p. 66; 1943.) The liquidus temperatures for both types is about 825-830 degrees C.
MATHEMATICS
512 3679 A Direct Iterative Method for the Hurwitz
Expansion of a Polynomial—F. L. Bauer. (Arch. elekt. übertragung, vol. 9, pp. 285-290; June, 1955.)
to 5 a Abstracts and References 143
517 3680 The Evaluation of Integrals containing a
Parameter—R. B. Dingle. (Appt. sci. Res., vol. B4, pp. 401-410; 1955.) The problem consid-ered is that of finding suitable expressions for the integral (a) for small and (b) for large values of a parameter. Methods based on (a) the Taylor expansion, (b) integration by parts, (c) Mellin transforms, and (d) the differential equation are expounded by evaluating the same function, Ei.(x)= fi'n'e'du. The van-ous expansions developed for Ei,,(x) are used in two following papers (not abstracted) on the functions Ci.(x), Si(x), C/.(x) and Sin(x)•
519.2 3681 A Sequential Two-Sample Life Test—
B. Epstein. (J. Franklin last, vol. 260, pp. 25-29; July, 1955.) Analysis is presented rele-vant to the problem of determining, from tests on samples, which of two lots of components has the greater mean life.
519.2 3682 An Introduction to Stochastic Processes,
with Special Reference to Methods and Appli-cations. [Book Review[—M. S. Bartlett. Pub-lishers: University Press, Cambridge, 1955, 312 pp., 35s. (Nature, Land., vol. 176, p. 275; August 13, 1955.) Has application to communi-cation theory.
MEASUREMENTS AND TEST GEAR
529.7 3683 Precision Measurement of Time—H. M.
Smith. (J. sci. Instrum., vol. 32, pp. 199-204; June, 1955.) A brief survey is given of methods and instruments used; the construction of chronometers is described and the applica-tion of standard-frequency transmissions is discussed.
53.082.7:535.22:538.56.029.6 3684 The Velocity of Propagation of Electromag-
netic Waves—J. T. Henderson and A. G. Mungall. (Canad. J. Phys., vol. 33, pp. 265-274; June, 1955.) Measurements were made by a coaxial-cavity-resonator method using a fre-quency of 400 mc which is close to that used for geodetic surveying in Canada. Consistent re-sults were obtained giving a value of 299 780 km for c. This value is believed to be low owing to an indeterminate systematic error intro-duced by discontinuities at junctions in the cavity; coaxial-cavity methods are not con-sidered capable of giving the desired degree of accuracy at this frequency.
53.082.7: 535.22: 621.396.11.029.62 3685 A Measurement of the Velocity of Propaga-
tion of Very-High-Frequency Radio Waves at the Surface of the Earth—E. F. Florman. (J. Res. not. Bur. Stand., vol. 54, pp. 335-345; June, 1955.) An interferometer method was used, operating at a frequency of 172.8 mc to avoid skywave interference and ground effects and to keep the size of the measuring system within convenient limits. The value derived for the free-space velocity was 299795.1 ± 3.1 km; this uncertainty includes a 95 per cent confidence interval for the mean and an esti-mated limit of ± 0.7 km for the systematic error. The accuracy of the result is limited by the accuracy with which the refractive index of the air path is known. (See also Tech. News. Bull. Nat. Bur. Stand., vol. 39, pp. 1-3; Janu-ary, 1955.)
621.3.018.41(083.74)+529.786 3686 An Atomic Standard of Frequency and
Time Interval—L. Essen and J. V. L. Parry: E. C. Bullard. (Nature, Land., vol. 176, pp. 280-282; August 13, 1955.) Description of a frequency standard constructed at the National Physical Laboratory, based on a natural reso-nance of the Cs atom and using the atomic-beam magnetic-resonance technique. Using
this standard, quartz clocks car be calibrated with an accuracy within ± 1 part in 10,, cor-responding to 0.0001 sec/day. Tile value of the frequency btandardized is 9192632050 ± 10 c/s. A note by Bullard is appended, discussing the desirability of abandoning the astronomical second in favor of a physically defined second.
621.3.018.41(083.74)+529.786 3687 Frequency and Time Standards—F. D.
Lewis. (Paoc. IRE., vol. 43, pp. 1046-1068; September, 1955.) A review paper. Quartz-crystal resonators and stable oscillators includ-ing them are described. A discussion of the present status of atomic and molecular fre-quency standards includes the ammonia ab-sorption cell and the ammonia- and caesium-beam oscillators. Instrumentation for precision frequency measurement is outlined and a cur-rent list of standard-frequency broadcasting stations is given.
621.317.3:621.385.2/.31.029.63 3688 Conductance and Slope Measurements on
Transit-Time Diodes and Triodes—F. W. Gundlach and H. Lonsdorfer. (Fernmeldelech. Z., vol. 8, pp. 305-309; June, 1955.) Theory is given and methods are described for measur-ing the conductance of disk-seal diodes and the input conductance and transconductance of disk-seal triodes at about 50 cm and 12 cm X. Some results are reported.
621.317.3 + 621.375.2 +621.373.41.029.6 3689 Disc-Seal Circuit Techniques—Swift. (See
3541.)
621.317.3.029.6 3690 Microwave Measurements—G. Pircher.
(Rev. an. Elect., vol. 64, pp. 301-311; June, 1955.) A survey of up-to-date methods and equipment including standing-wave detectors, wavemeters, bolometers, attenuators and turntable apparatus for measurements on an-tennas.
621.317.335(083.7) 3691 The Measurement of the Dielectric Con-
stant of Standard Liquids—L. Hartshorn, J. V. L. Parry, and L. Essen. (Proc. phys. Soc., vol. 68, pp. 422-446; July 1, 1955.) Methods are described and results are pre-sented for measurements on benzene, cyclo-hexane, dichlorethane and nitrobenzene, made with the object of providing dielectric-constant values of improved accuracy. Both audio and microwave frequencies were used.
621.317.336 3692 Rapid Measurement of Impedance and
Admittance—B. Salzberg and J. W. Marini. (Elect. Engng., N.Y., vol. 74, p. 503; June, 1955.) Digest of paper to be published in Trans. Amer. IEE, Part I, Communication and Electronics, vol. 74, 1955. A method of determining the driving-point impedance of linear networks over the frequency range 50 kc-5mc involves measuring the resistive and reactive components by means of mixers whose local-oscillator voltage is derived from the cur-rent through the impedance while the voltage across the impedance is used as the signal volt-
age.
621.317.336:621.372 3693 Transmission-Line Termination—Dukes.
(See 3483.)
621.317.341:621.372.56 3694 Resistance Attenuator Circuits for Attenu-
ation Measurements up to 20 Nepers—R. Dallemagne. (Câbles & Transm., vol. 9, pp. 229-245; July, 1955.) Details are given of the construction and use of equipment for measure-ment of attenuation and crosstalk over the fre-quency band 5-800 kc. Correction of the effects of parasitic impedances due to wiring etc., in the attenuator used is simplified by representing them as T, 11, or lattice networks.
621.317.36:621.373.1.029.64 3695 Ammonia Absorption Line (3, 3) as Stand-
ard for Measurement of Frequencies in the 5-20-Mcls Band with Accuracy of D. Osipov and A. M. Prokhorov. (C.R. Acad. Sel. U.R.S.S., vol. 102, pp. 933-934; June 11, 1955. In Russian.) Equipment using a Stark-modulated microwave spectroscope was used, the signal being suitably frequency-multiplied, to bring it into the 24-kmc band. A block diagram of the equipment is given.
621.317.382:621.396.61.029.62 3696 Measurement of Transmitter Power of the
order of Tens of Watts at Metre Wavelengths —R. Bryssinck and A. G. Tellier. (Rev. HF, Brussels, vol. 3, pp. 71-82; 1955.) Calorimetric, directional-coupler, peak-voltmeter and photo-metric methods of measurement are discussed and some results are reported. With these four methods the attainable accuracies are respectively within 2 per cent, 5 per cent, 8 per cent and 10 per cent, or 30 per cent in the last case for low powers. With correctly designed loads the last three methods can be used satis-factorily.
621.317.44:537.311.33:546.682.86:538.632 3697
Indium Antimonide as a Flumneter Material —E. W. Saker, F. A. Cunnell, and J. T. Edmond. (Brit. J. appl. Phys., vol. 6, pp. 217-220; June, 1955.) The principles of measure-ment of magnetic fields by use of the Hall effect are considered. The efficiency of Hall-voltage generators is proportional to the square of the carrier mobility in the material used. The mo-bility for InSb is 60,000 cm/s per v/cm, com-pared with 3600 cm/s per v/cm for Ge; the theoretically attainable output power of an InSb generator is therefore about 280 times that of a Ge generator. The construction of suitable probes is described and sensitivity, linearity, and temperature compensation are discussed.
621.317.7 3698 The Damping of Moving-Coil Vibrating
Systems by means of Quadripole Resonant Circuits—E. G. Schlosser. (Arch. Elektrotech., vol. 42, pp. 42-47; June 20, 1955.) An arrange-ment of two resonant circuits is described, capable of providing optimum damping for recording instruments.
621.317.7.029.53/.55 3699 Broad-Band Reflectometers at High Fre-
quencies—R. T. Adams and A. Horvath. (Elect. Commun., vol. 32, pp. 118-125; June, 1955.) A directional coupler using resistive rather than reactive coupling elements has constant sensitivity over the frequency range 300 kc-30 mc.
621.317.725.029.42:621.383.2 3700 A Photoelectric Relay for measuring Volt-
ages of Low Frequency—J. M. W. Milatz, H. J. J. van Boort, J. van Laar, and C. T. J. Alkemade. (Ape sci. Res., vol. B4, pp. 447-456; 1955.) The instrument described is de-signed for amplifying and measuring signals such as bolometer outputs varying at a fre-quency of the order of 1 c/a, and comprises primary dc galvanometer, rotating-disk light chopper, and photo-cell coupled to 50-c/a amplifier, with ac galvanometer as indicator. The sensitivity is limited only by the Johnson noise of the input circuit; drift effects are very low.
621.317.729 3701 A Microwave Phase Contour Plotter—J. S.
Ajioka. (Paoc. IRE, vol. 43, pp. 1088-1090; September, 1955.) A simple arrangement is de-scribed, using two field-sampling probes, one of which provides the reference signal.
621.317.733 3702 Measurement of Inductances, Capacitances
and Frequencies—W. Herzog and E. Frisdl.

144 PROCEEDINGS OF THE IRE January
(Fernmeldetech. Z., vol. 8, pp. 325-328; June, 1955.) Descriptions are given of a bridge con-nected as oscillator, for measurement of in-ductances, and a passive bridge for measure-ment of capacitances and frequencies. Adjust-ment of a capacitance over a range 1:10 enables capacitances and inductances over a range 1:1000 and frequencies over a range 1:30 to be measured. See also 1117 of April (Herzog).
621.317.755 3703 Towards the Universal Oscillograph—J.
Croizier. (Électronique, Paris, pp. 48-51; July/August, 1955.) Design principles are dis-cussed for equipment for studying phenomena over a wide frequency range, having inter-changeable timebase units together with a com-mon unit comprising cr tube, output amplifiers and calibrating voltage.
621.317.755 3704 A Rapid and Simple Method for obtaining
Permanent Records from Cathode-Ray Oscillo-scopes—H. D. Rathgeber. (J. sci. Instrum., vol. 32, pp. 232; June, 1955.) The cro image is traced with a ball-point pen on a removable strip of transparent plastic tape stuck on the screen.
621.317.755: 778.6 3705 Colour Photography of Oscillograms—G. H.
Hille. (Elektronik. vol. 4, pp. 129-130; June, 1955.) Technique is described for photograph-ing in different colors curves displayed simul-taneously on the cro screen.
621.317.784.029.6 3706 A Milliwattmeter for Centimetre Wave-
lengths—A. C. Gordon-Smith. (Proc. I EE, Part B, vol. 102, pp. 685-686; September, 1955.) "The instrument is in the form of a differential air thermometer, and consists of two similar glass cells connected by a glass capillary tube. A carbon-coated strip is placed in each of the two cells; one of these strips absorbs the radio-frequency power to be meas-ured and the other is heated by direct current. A liquit pellet in the capillary tube is displaced as a result of the differential expansion of the air in the two cells arising from the heat dissi-pated in the carbon-coated strips. After balancing the system by adjustment of the dc cell the radio-frequency power is finally de-termined by the measurement of the dc power which must be substituted for the radio-fre-quency power in the same cell in order to main-tain the state of balance. The instrument has been used to measure powers of 10 to 100 mw at a wavelength of 3 cm with a discrimination of about 0.2 mw."
621.317.794.029.64 3707 An Improved Method of measuring Effi-
ciencies of Ultra-high-Frequency and Micro-wave Bolometer Mounts—R. W. Beatty and F. Reggia. (J. Res. not. Bur. Stand., vol. 54, pp. 321-327; June, 1955.) A method is de-scribed based on that of Kerns (3471 of 1949) but modified so as to avoid direct measurement of impedance.
621.396.62.001.4(083.7) 3708 IRE Standards on Radio Receivers:
Method of Testing Receivers employing Ferrite Core Loop Antennas, 1955—(Paoc. IRE, vol. 43, pp. 1086-1088; September. 1955.) Standard 55 IRE 17.S1.
621.397.6.001.4:535.623 3709 Differential Gain tests TV Color—Schroe-
der. (See 3758.)
621.397.8.001.4 3710 Method for the Assessment and Charac-
terization of the Distortion of the Sawtooth Test Signal in Tests on Television Transmis-sion Lines—Redeker. (See 3767.)
OTHER APPLICATIONS OF RADIO AND ELECTRONICS
621.317.39: 534.13 3711 Use of X/4 Coaxial Line for Measurement
of Mechanical Oscillations—E. Lob. (Arch. Elektrotech., vol. 42, pp. 5-13; June 20, 1955.) The amplitude of vibration is determined by arranging the vibrating object near the open end of the line, so as to vary its electrical length periodically, and observing the corre-sponding periodic variations of tuning. Vibra-tions of nonmetallic as well as metallic objects can be investigated.
621.365.5(083.74) 3712 IRE Standards on Industrial Electronics:
Definitions of Industrial Electronics Terms, 1955—(Paoc. IRE, vol. 43, pp. 1069-1072; September, 1955.) Standard 55 IRE 10.S1 on induction and dielectric heating.
621.384.6 3713 Strong Focusing in [particle] Accelerators—
W. Dâllenbach. (Z. angew. Phys., vol. 7, pp. 344-360; July, 1955.) Full text of paper ab-stracted in 3059 of October.
621.384.611/.612 3714 The 156-in. Cyclotron at Liverpool—M. J.
Moore. (Nature, Lond., vol. 175, pp. 1012-1015; June 11, 1955.) The machine described is a synchro-cyclotron producing protons of energy about 400 mev.
621.384.611 3715 General Purpose X-Band Laboratory Mi-
crotron with Facilities for Electron Extraction— H. F. Kaiser and W. T. Mayes. (Rev. sci. Instrum., vol. 26, pp. 565-567; June, 1955.)
621.384.612 3716 The Synchrotron and Problems relating to
it—E. Persico. (J. Phys. Radium, vol. 16, pp. 360-365; May, 1955.) A short survey.
621.384.612 3717 Betatron Oscillations in the Synchrotron—
C. L. Hammer, R. W. Pidd, and K. M. Ter-williger. (Rev. sci. Instrum., vol. 26, pp. 555-556; June, 1955.) Experimental results indicate that a transverse rf electric field will excite the betatron oscillations at several frequencies, the spacing of which is equal to the synchrotron-frequency. The effect is believed to be due to frequency modulation of the betatron oscilla-tions by the synchrotron oscillations.
621.384.612 3718 Experimental Characteristics of the Proton
Synchrotron—P. B. Moon, L. Riddiford, and J. L. Symonds. (Proc. roy. Soc. A, vol. 230, pp. 204-215; June 21, 1955.) Features of the Birmingham proton synchrotron which are im-portant in relation to the experimental use of the machine are described.
621.384.612 3719 Some Proton Synchrotron Beam Studies
with the Induction Electrode—L. Riddiford, H. B. van der Raay, and R. F. Coe. (Proc. phys. Soc., vol. 68, pp. 489-502; June 1, 1955.)
621.384.622.2 3720 The Linear Accelerator—(E/eci. Rev., Load.,
vol. 156, pp. 1144-1146; June 24, 1955.) A simplified explanation of the mode of operation.
621.385.833 3721 Third-Order Aberrations of a Typical
Electrostatic Unipotential Lens—W. Glaser and P. Schiske. (Optik, Stuttgart, vol. 12, pp. 233-245; 1955.)
621.387.424 3722 Sensitive Volume of External-Cathode
Geiger-Müller Counters—D. Blanc. (Nuovo Cim., vol. 1, pp. 1280-1281; June 1, 1955. In French.)
621.389:539.155.082.7 3723 Recent Research with an Experimental
Mass Spectrometer—G. P. Barnard. (J. Electronics, vol. I, pp. 78-102; July, 1955.) De-scription of a precision all-metal instrument constructed at the National Physical Labora-tory; it is a 60 degree sector type, first-order, single-focusing, with 4 inch radius of curvature in the magnetic analyzer.
PROPAGATION OF WAVES
538.566.2 3724 Reflection of a Plane Electromagnetic
Wave by an Ionized Medium—P. Poincelot. (C.R. Acad. Sci., Paris, vol. 241, pp. 186-188; July 11, 1955.) Expressions involving Hankel functions are derived for the strength of the electric and magnetic fields in a medium where the refractive index varies with altitude accord-ing to a stated law.
538.566.2 3725 Reflection of a Plane Electromagnetic
Wave by an Ionized Gas with a Given Dis-tribution Law—P. Poincelot. (C. R. Acad. Sci., Paris, vol. 241, pp. 290-292; July 18, 1955.) Continuation of 3724 above. See also note of correction ibid., vol. 241, pp. 649-651; August 29, 1955.
621.396.11: 551.510.535 3726 Ionospheric-Absorption Equivalence Theo-
rems—É. Argence, K. Rawer, and K. Suchy. (C.R. Acad. Sci., Paris, vol. 241, pp. 505-507; August 1, 1955.) A more general analysis is presented than that of Appleton and Beynon (2400 of August); partial reflections and elec-tron collisions are taken into account. The case of strong absorption is investigated using theory of dispersive media and metallic reflec-tion.
621.396.11.029.55 3727 Simplification of the "Spanish Method"
[for ionospheric prediction of m.u.f.1—R. Gea Sacasa. (Rev. Telecommunicación, Madrid, vol. 9, pp. 31-51; March, 1955. In Spanish and English.) The monthly predictions published by the Commonwealth Observatory of Aus-tralia for the months of December and June, 1953 and 1954, are compared with those com-puted by the author's method. The results are similar, but in nearly all cases, and particularly in summer, the Spanish method predicts higher mufs than the Australian. By the use of a set of abacs developed by the author, predic-tions for any period of the year and for any locality and range may be very simply ob-tained.
621.396.11.029.6 3728 V.H.F. and U.H.F. Signals in Central
Canada—D. R. Hay and R. C. Langille. (PRoc. IRE, vol. 43, p. 1136; September, 1955.) Measurements are reported of signals at fre-quencies of 49, 91, 173 and 495 mc, at ranges be-tween 20 and 235 miles. The results are close to those predicted from theory of propagation round a smooth spherical earth [802 of 1948 (Buffington)] for ranges up to 30-40 miles. At ranges > 80 miles the deviations from the pre-dicted value increase with increasing fre-quency. Assuming that at ranges > 80 miles the signals are propagated by scatter from atmospheric turbulence, the results are con-sistent with the scatter formula proposed by Gordon ( 1136 of April).
621.396.11.029.62/.63 3729 Factors affecting Radio Propagation in the
TV and F. M. Bands—W. E. Utlaut. (Tele-Tech ér Electronic Ind., vol. 14, pp. 98-101, 378; June, 1955.) An account is presented of the effects at frequencies up to about 1 kmc of (a) diffraction by the earth and by obstacles, (b) atmospheric refraction, (c) atmospheric reflection, (d) scattering, and (e) the sporadic E layer, with particular reference to recent

1956 Abstracts and References 145
theoretical and experimental work mainly by the Central Radio Propagation Laboratory.
621.396.11.029.62 3730 Long-Distance V.H.F. Fields: Part 1—
Partial Reflections from a Standard Atmos-phere. Part 2—Refractivity Profiles containing "Sharp Layers." Part 3—The Case of Two Elevated Layers—F. H. Northover. (Cenad. J. Phys., vol. 33, pp. 241-256, 316-349; May /June, 1955.) Various explanations are dis-cussed for the high field strengths of vhf radio signals which have been consistently observed beyond the horizon. Detailed analysis indicates that the phenomenon cannot be explained solely in terms of partial internal reflections when the propagation takes place in a standard atmosphere, characterized by a continuous slow decrease of refractive index with height. While the phenomenon could be due to this cause when high-level inversion layers are present, scattering from atmospheric turbu-lence is considered a more probable cause. The general theory is used to derive an equation for the eigenvalues of the propagation for the case of two sharply defined atmospheric layers.
621.396.11.029.62:53.082.7: 535.22 3731 A Measurement of the Velocity of Propaga-
ion of Very-High-Frequency Radio Waves at the Surface of the Earth—Florman. (See 3685.)
621.396.81.029.62 3732 Note on the Diurnal Variation of Field
Strength in the U. S. W. Band—L. Klinker. (Z. Met., vol. 9, pp. 178-191; June, 1955.) Diurnal variations are discussed associated with the night-time formation of low-level inversion and its disappearance during the day. For trans-mission distances up to twice the optical path length the effect can be accounted for by vari-ations of atmospheric refraction. Using meas-urements of the vertical gradients of tempera-ture and water vapor pressure, a calculation is made of the daily variation from the known formula for field strength. For average condi-tions, the calculated value is brought into agreement with observations by taking account of the temperature gradient only. For longer distances the observed and calculated values differ by an amount which increases with the path length, since the effect of refraction de-creases relative to that of other factors notably scattering due to turbulence.
621.396.812.3 3733 Distribution-in-Speed of Fading of 150-kcis
Waves—R. B. Banerji. (Nature, Lond., vol. 176, p. 131; July 16, 1955.) Fading observations were made at the Pennsylvania State Univer-sity, using time intervals much longer than those used e.g., by Mitra at Cambridge working with frequencies of 2-6 mc (442 of 1950). No significant deviation from a Gaussian distribu-tion of speed of fading was found; this supports the theoretical prediction that such a deviation should be less readily evident at low than at high frequencies.
551.510.535: 621.396.11 3734 The Physics of the Ionosphere. (Book
Notice]—(See 3614.)
RECEPTION
621.396.62 3735 Cross-Section of the Technical Novelties
of [West German] 1955/56 Broadcast Re-ceivers—W. W. Diefenbach. (Funk-Technik, Berlin, vol. 10, pp. 352-356; July, 1955.) The principal trends include developments in usw/fm and If stages, use of rotatable ferrite-rod built-in antennas and use of several loud-speakers of both moving-coil and es types in the larger table models. Further details are given in a supplement and in subsequent issues of the journal.
621.396.62.001.4(083.74) 3736 IRE Standards on Radio Receivers:
Method of Testing Receivers employing Ferrite Core Loop Antennas, 1955—(Paoc. IRE, vol. 43. pp. 1086-1088; September, 1955.) Standard 55 IRE 17.S1.
621.396.621:621.396.822 3737 The Resolution of Signals in White,
Gaussian Noise—C. W. Helstrom. (Prtoc. IRE, vol. 43, pp. 1111-1118; September, 1955.) "The resolution of two signals of known shapes FM) and F2(t) in white Gaussian noise is treated as a problem in statistical decision theory. The observer must decide which of the signals is present with a minimum probability of error. The optimum system for this decision is specified in terms of filters matched to the two signals, the outputs of which are compared. The error probability is exhibited as a function of the cross-correlation of the two signals and of the signal-to-noise ratio. If the phases of the two signals are unknown, as in radar, and if the signals are of equal strength and equal a priori probability, the optimum system con-sists of filters matched to each of the signals, each followed by a detector. The observer then bases his decision upon which of the detectors has the larger output. The probability of error is computed for this case also."
621.396.621.54: 621.319.43 : 537.227 3738 The Aplication of Dielectric Tuning to
Panoramic Receiver Design—T. W. Butler, Jr., W. J. Lindsay, and L. W. Orr. (Paoc. IRE, vol. 43, pp. 1091-1096; September, 1955.) Con-tinuous tuning over a 2:1 frequency band is obtained at frequencies up to 110 mc by using ferroelectric tuning capacitors with nonlinear characteristics.
621.396.81:621.396.67 3739 The Limits of Communication Reception
using Aerials with Losses—Didlaukis. (See 3494.)
STATIONS AND COMMUNICATION SYSTEMS
621.376.5:621.39 3740 Quantitative Noise Reduction in Pulse
Time Modulation—J. Das. (Electronic Engng., vol. 27, pp. 406-409; September, 1955.) Rigorous analysis of typical systems, based on the principles proposed by Deloraine and Labin (1947 of 1945), gives results for improvement of signal/noise ratio in agreement with experi-ment.
621.39.001.11:519.2 3741 On the Average Uncertainty of a Continuous
Probability Distribution—A. D. du Mosch. (Appt. sci. Res., vol. B4, pp. 469-473; 1955.) Discussion of importance in communication theory.
621.395.2:621.374.4:621.375.3.029.3 3742 All-Magnetic Audio Amplifier—Suozzi and
Hooper. (See 3537.)
621.395.44:621.315.28 3743 A Transatlantic Telephone Cable—M. J.
Kelly, G. Radley, G. W. Gillman, and R. J. Halsey. (Proc. IEE, Part B, vol. 102, pp. 717-719; September, 1955.) Discussion on 1547 of June.
621.396 3744 The Argentine Telecommunications Net-
works—H. B. R. Boosman. (Tijdschr. ned. Radiogenool., vol. 20, pp. 115-135; May, 1955. In English.) See 2745 of September.
621.396.3 3745 The T.O.R. [teletype on radio] Circuits for
The Argentine Radio Links—W. Six. (Commun. News, vol. 15, pp. 108-119; August, 1955; Tijdschr. ned. Radiogenoot, vol. 20, pp. 137-159; May, 1955. In English.) Application of the error-reducing system described by van Duuren
(2837 of 1951) to the Argentine radiotelegraph system (3744 above). Most of the switching is performed by means of cold-cathode tubes Types Z500T and Z501T. A radio teat on a circuit between Hilversum and Eindhoven showed that introduction of the TOR system reduced the number of mutilated characters by a factor of 2000.
621.396.65.029.64 3746 Radio Link Operating in 4000 Mc/s Band,
for Television and Multichannel Telephony— H. C. B. Evertsz. (Tijdschr. ned. Radiogenoot., vol. 20, pp. 183-193; May, 1955. In English.) Description of link equipment using Type-EC56 triodes for mixing and amplifying at fre-quencies in the 3.8-4.2-kmc band. Heterodyne repeater stations are used. Some details are given of the antenna system, which comprises a parabolic reflector illuminated by a square waveguide continued as a pair of rectangular waveguides. one leading to the transmitter and the other to the receiver and each containing a "uniline" control device operated by ferromag-netic resonance in a small sheet of ferrite.
SUBSIDIARY APPARATUS
621-526 3747 The Response of Remote-Position-Control
Systems with Hard-Spring Nonlinear Charac-teristics to Step-Function and Random Inputs —J. C. West and P. N. Nikiforuk. (Proc. IEE, Part B, val. 102, pp. 575-593; September, 1955. Discussion, pp. 594-595.)
621-526 3748 The Adjustment of Control Systems for
Quick Transient Response—A. T. Fuller. (Proc. I EE, Part B, vol. 102, pp. 596-601; September, 1955.) A theoretical investigation indicates that for a large class of linear systems the error due to a transient disturbance is de-pendent on only one system parameter, the "settling time-constant," and that the quickest approach to correction is obtained when the system is adjusted so as to be quasicritically damped. The adoption of quasicritical damping as a design criterion for stability is recom-mended.
621-526 3749 The Integral-of-Error-Squared Criterion for
Servo Mechanisms—H. H. Rosenbrock. (Proc. IEE, Part B, vol. 102, pp. 602-607; September, 1955.)
621.314.63: 621.311.6 3750 Silicon Alloy Junction Diodes for Power
Supply Applications—J. Shields. (Engineer, Loud., vol. 199, pp. 801-803; June 10, 1955. B.T.-H. Activ., vol. 26, pp. 102-107; July /August, 1955.) Characteristics of low-power and high-power Si diodes are presented and various applications indicated.
TELEVISION AND PHOTOTELEGRAPHY
621.397.24:621.397.6 3751 An Unconventional Wired Television Dis-
tribution System—E. J. Gargini. (J. Telco. Soc., vol. 7, pp. 403-427; April/June, 1955.) The advantages and disadvantages of radio and wired television systems are compared. Tests of the suitability of various types of cable for for multichannel operation are mentioned. Various distribution-network arrangements are considered; good area coverage is obtained by use of a network comprising spiral main feeder sections with short spurs. A detailed description is given of a wired system in which receiver design is simplified by transferring as much circuitry as possible to the sending end. See also 1173 of April.
621.397.26 3752 Long-Range Television Reception—( Wire-
less World, vol. 61, pp. 504-505; October, 1955. Correction, ibid., vol. 61, p. 530; Novem-ber, 1955.) Good reception has been recorded

146 PROCEEDINGS OF THE IRE January
in Sweden of television broadcasts on 48, 55 and 62 mc from Russia, Italy, etc.
621.397.26:621.396.65 3753 The Roving Eye—T. Worswick and
G. W. H. Larkby. (J. Telev Soc., vol. 7, pp. 397-400; April/June, 1955.) Description of the B.B.C. mobile television-camera unit. A fre-quency of about 200 mc is used for the vision-signal radio link to base; four-element Vagi antenna arrays are used both on the vehicle and at the base; arrangements for keeping the vehicle antenna on the correct bearing are de-scribed. Positive modulation is used, the trans-mitter power being about 12 w on peak white. In open country the range is of the order of two miles, the limit being set by man-made interference. In built-up areas the range may be anything up to a mile, depending entirely on topography.
621.397.26:621.396.65.029.64 3754 The Manchester-Kirk o'Shotts Television
Radio-Relay System—G. Dawson, L. L. Hall, K. G. Hodgson, R. A. Meers, and J. H. H. Merriman. (Proc. I EE, Part B, vol. 102, pp. 607-608; September, 1955.) Discussion on 2784 of 1954.
621.397.5 3755 Television Technique—A. Karolus. (Tech.
Milt. schweiz. Telegr.-TelephVerw., vol. 33, pp. 169-186; May 1, 1955. In German.) An account, intended for nonspecialists, of the historical development of television.
621.397.5 3756 Limits of Quality with Intercarrier Sound
Reception—H. J. Grieve. (Fernmeldelech. Z., vol. 8, pp. 374-378; July, 1955.) Sources of noise on the intercarrier system are examined. Transmitter tests necessary for investigating interference phase modulation are discussed. Most of the audio interference observed origi-nates in the receiver rather than the trans-mitter. The less stringent requirements as regards oscillator-frequency constancy and avoidance of microphony with the intercarrier system make this system greatly preferable for operation in bands III and IV.
621.397.6.001.4 3757 Determination of the Characteristic Pa-
rameters of a Television F.M. Link by Meas-urements between Video Input and Video Out-put—G. Brühl. (Fernmeldetech. Z., vol. 8, pp. 362-366; July, 1955.) Methods of measurement foi both video and rf parts of the system are discussed. In order to ascertain which part is responsible for observed imperfections of repro-duction, the amplitude and frequency of the test signals should be appropriately chosen, and the sequence of the operations should be: (a) linearity measurement of the video stages, using very low frequencies, and any necessary corrections; (b) measurement and adjustment of the frequency characteristic of the rf stages; (c) measurement of overall frequency and delay characteristics.
621.397.6.001.4:535.623 3758 Differential Gain testa TV Color—J. O.
Schroeder. (Electronics, vol. 28, pp. 114-117; August, 1955.) A composite signal, consisting of a small-amplitude 3.5-mc sine wave mixed with a large-amplitude 120-c/s rectangular wave of variable duty cycle, is used to check the linearity of the transfer characteristic of video equipment.
621.397.61+ [621.396.61:621.376.3 3759 General Outline of the Development of
Transmitters for Television and Frequency Modulation [in the Netherlands1—P. W. L. v. Iterson and H. A. Teunissen. (Tijdschr. ned. Radiogenoot., vol. 20, pp. 207-222; May, 1955. In English.)
621.397.61:621.372.55 3760 Application of Differential Equalization in
Television—R. Theile. (Arch. elekt. übertra-gung, vol. 9, pp. 247-254; June, 1955.) A de-velopment of Gouriet's equalization method (1936 of 1953) is described. A simple equalizer circuit is used; its performance is shown by oscillograms and photographs of a test pattern.
621.397.61:621.372.55 3761 Circuits for Aperture Compensation in
Television Cameras—W. Dillenburger. (Fre-quenz, vol. 9, pp. 181-188; June, 1955.) Phase-linear amplitude equalizers permitting 100 per cent modulation of the video signal at frequen-cies up to 5 mc are discussed, including various differentiating equalizers and the "cosine" equalizer. Use of aperture compensation is scarcely worth while if the uncompensated camera gives a modulation depth of 50 per cent or more at 5 mc. See also 3104 of October.
621.397.611.2 3762 Limiting Resolution due to Charge Leakage
in the Scenioscope, a New Television-Camera Tube—P. Schagen. (Philips Res. Rep., vol. 10, pp. 231-238; June, 1955.) The loss of modula-tion depth in the picture signal due to charge leakage is calculated as a function of the re-sistivity and thickness of the glass target. Estimates show that for practical applications the resistivity should be > 2.3 X 10u 11 cm. In a 625-line system the diameter of a picture element is about 75 As with a scanned target area of 45 X60 mm2; in order to obtain satis-factory resolution the target thickness must not exceed l00j.
621.397.62(94) 3763 Television Channels, Standard Intermedi-
ate Frequencies and Standards for Limits of Radiation from Receivers—Proc. IRE A ust., vol. 16, pp. 173-175; June, 1955.) A statement prepared by the Australian Broadcasting Con-trol Board for the information of television-receiver manufacturers. Ten vhf and 50 uhf channels, each of 7 mc, have been allocated. Sound if should be 30.5 mc ± 0.25 mc, vision if should be 36 mc ± 0.25 mc. Limits are stated for radiation due to beat oscillators; it has not yet been found practicable to recommend limits for radiation due to sweep circuits.
621.397.62+778.51:535.6 3764 Color Television vs. Color Motion Pictures
—D. G. Fink. (J. Soc. Mot. Pict. Telev. Engrs., vol. 64, pp. 281-290; June, 1955.) The technical capabilities and limitations of the two systems are compared under five headings: (a) the viewing situation, (b) image photometry, (c) colorimetry, (d) structure, and (e) continuity. The results of a survey of 8-mm, 16-mm, and 35-mm film practice are tabulated and com-pared with the contemporary performance of 21-inch color television receivers. The conclu-sions are also tabulated.
621.397.62:621.385.3.029.62/.63 3765 A U.H.F.-V.H.F. Television Tuner using
Pencil Tubes—W. A. Harris and J. J. Thomp-son. (RCA Rev., vol. 16, pp. 281-292; June, 1955.) The resonance frequencies of the experi-mental pencil-type triodes used are high enough to permit use of shunt-tuned circuits, and the feedback inductance is low enough to ensure stability. Advantages of shunt-tuning are the small overall dimensions and the moderate number of switching components required.
621.397.62.029.62 3766 A Survey of Tuner Designs for Multi-
channel Television Reception—D. J. Fewings and S. L. Fife. (J. Brit. IRE, vol. 15. pp 379-404; August, 1955.) The survey includes de-signs of British, U.S., and European origin; a rotary-coil-turret design developed in the U.S. appears to be most generally suitable. Noise considerations are discussed; calculations indi-cate that optimum conditions are obtained with
a receiver noise factor of 22 db at 40 mc de-creasing to 3 db at 220 mc; the importance of these considerations for fringe-area reception is emphasized. Arrangements enabling existing single-channel receivers to operate for multi-channel reception without use of double heterodyning are described. Future require-ments for uhf reception in the U.K. are dis-cussed and tuner designs incorporating lumped and distributed tuning elements are examined.
621.397.8.001.4 3767 Method for the Assessment and Characteri-
zation of the Distortion of the Sawtooth Test Signal in Tests on Television Transmission Lines—H. Bikleker. (Fernmeldetech. Z., vol. 8. pp. 323-324; June, 1955.) The fidelity with which the sawtooth level-setting signal is transmitted is tested by comparing the re-ceived sawtooth signal as displayed on a cro screen with engraved markings on a transparent template arranged just in front of the screen.
TRANSMISSION
621.396.61 : 621.376.31+ 621.397.61 3768 General Outline of the Development of
Transmitters for Television and Frequency Modulation [in the Netherland:31—P. W. L. v. Iterson and H. A. Teunissen. (Tijdschr. ned. Radiogenoot., vol. 20, pp. 207-222; May, 1955.
In English.)
621.396.61:621.396.662 3769 Automatic Tuning of Transmitters—W. L.
Vervest. (Tijdschr. ned. Radiogenoot., vol. 20, pp. 195-206; May, 1955. In English.) De-scription of the instantuner system. Automatic changing from one pre-set frequency to another is accomplished in 1-3 seconds for small transmitters and in 2-10 seconds for large transmitters.
621.396.61.029.63:621.385.4 3770 A Novel Ultra-high-Frequency High-
Power-Amplifier System—L. L. Koros. (RCA Rev., vol. 16, pp. 251-280; June, 1955.) The amplifier was developed for television trans-mitters and uses grid-driven 15-kw beam power tetrodes Type 6448 described by Bennett in TRANS. IRE, pp. 11-17; March, 1955, de-veloped from the Type 6181 described previ-ously by Bennett and Kazanowski (1206 of 1953). The anode cavity resonator is of trans-mission-line type, consisting essentially of one high-impedance and one low-impedance X/4 section; it acts as a step-down transformer between tube and load.
TUBES AND THERMIONICS
621.314.63 3771 The Determination of the Dynamic Proper-
ties of Crystal Diodes—G. Stuart-Monteith. (Brit. J. appl. Phys., vol. 6, pp. 254-256; July, 1955.) The ac characteristics of a forward-biased crystal diode depend on the frequency and the amplitude of the applied voltage. A method is given for determining the dynamic resistance for low values of bias current.
621.314.632:546.289:621.374 3772 Germanium Positive-Gap Diode: New Tool
for Pulse Techniques—A. H. Reeves and R. B. W. Cooke. (Elect. Commun.. vol. 32, pp. 112-117; June, 1055.) English version of 2257 of 1954 (Reeves).
621.314.7 3773 A Simple Explanation of Transistor "h"
Parameters—L. B. Johnson. (Mallard tech. Commun., vol. 2, pp. 58-63; July, 1955.) The small-signal performance of transistors can be calculated from hybrid or "h" parameters which are given by the slopes of the character-istic curves at the working point. This mode of assessment is likely to be used extensively in manufacturers' published data. An indication is given of the use of these parameters for calcu-lations on complex circuits.

1956 Abstracts and References 147
621.314.7 3774 High-Frequency Power Gain of Junction
Transistors—R. L. Pritchard. (Paoc. IRE, vol. 43, pp. 1075-1085; September, 1955.) Different ways of defining power gain at high frequencies are discussed. An equation is presented for calculating the gain in terms of the quadripole parameters of the transistor driven by a genera-tor with purely resistive impedance. Secondly, an expression is derived relating the gain to the fundamental device parameters for transistors in which the base impedance is frequency de-pendent, as in grown-junction transistors. Measurements on about 60 grown-junction transistors on the whole confirm the theory. Thirdly, the gain of an idealized model of a grown-junction transistor is calculated from the physical parameters. The results indicate that it should be possible to obtain a gain of 30 db at 5 mc and that these transistors should oscillate at frequencies up to several hundred mc.
621.314.7 3775 Emitter Efficiency of Junction Transistor—
T. Misawa. (J. phys. Soc. Japan, vol. 10, pp. 362-367; May, 1955.) The efficiency is calcu-lated on the basis of the quasi-Fermi-level concept, by introducing modified boundary conditions appropriate to the case of moder-ately high injection level. The results are com-pared with those of Webster (2798 of 1954) and of Rittner (3390 of 1954).
621.314.7 3776 A Germanium Point-Contact Transistor to
operate at High Ambient Temperatures—A. F. Gibson, J. W. Granville, and W. Bardsley. (Brit. J. appl. Phys., vol. 6, pp. 251-254; July, 1955.) The process of carrier exclusion, previously termed "carrier extraction" [2017 of July (Arthur et al.)I, is applied in specially constructed transistors to suppress the normal increase of minority carriers with temperature, thereby increasing the upper temperature limit of the transistor by about 30 degrees C and improving the speed of operation. The sweep current required has no effect on the noise factor. The technique may be applied to junction diodes, but not to junction transistors.
621.314.7(47) 3777 Technical Data on Russian Transistors—
(Radio Moscow, p. 30, June, 1955.) Data are tabulated for eight point-contact and seven junction-type transistors.
621.314.7:537.311.33 3778 Semiconductors and Transistors: Some
Current Problems—J. R. Tillman. ( Nature, Lond., vol. 176, pp. 9-11; July 2, 1955.) A concise survey of the existing stage of knowl-edge.
621.314.7:546.28 3779 Forming Procedures for Silicon Point-
Contact Transistors—J. W. Granville, W. Bardsley, and A. F. Gibson. (Brit. J. appl. Phys., vol. 6, pp. 206-210; June, 1955.) Suit-able whisker materials for use as emitters and collectors on n- and p-type Si and the pulsing techniques used in forming are described. Si transistors have been made with power gains not markedly inferior to those of Ge point-contact transistors. Experimentally determined characteristics are given. For a different method of forming, see 1195 of April (Jacobs et al.).
621.314.7: 621.375.4 3780 Transistor Equivalent Circuits—W. T.
Cocking. (Wireless World, vol. 61, pp. 331-334, 388-392, 444-448, and 499-502; July/October, 1955.) The principles for developing equivalent circuits of the thermionic tube are described and applied to the directly analogous n-p-n transistor with earthed emitter, leading on to the case of the earthed-base transistor. Equivalent circuits for transistor amplifiers are
discussed, and formulas defining performance are deduced.
621.314 7:621.396.822 3781 Experimental Investigation and Separation
of Noise Sources in Junction Transistors—W. Guggenbilhl and M. J. O. Strutt. (Arch. ate übertragung, vol. 9, pp. 259-269; June, 1955.) Analysis of equivalent quadripoles shows that in the frequency-independent range the noise of a p-n-p transistor can be completely ac-counted for by (a) emitter-junction shot noise, (b) base-resistance noise. (c) collector saturation noise, and (d) current partition noise. The noise factors for the three basic transistor cir-cuits are nearly equal. Results show that the noise factors of modern junction transistors are of the same order as those in good triode tubes operating under comparable conditions. The noise factors of transistors Type 0070, 0071. and 00601, determined experimentally by a method described previously (2778 of Septem-ber) are presented graphically as a function of frequency.
621.385:621.317.723 3782 Receiving Tubes with Very Small Grid Cur-
rent—H. Takayama and K. Shimoda. (J. phys. Soc. Japan, vol. 10, pp. 387-391; May, 1955.) The use of miniature tubes for electrometer pur-poses is discussed. Types 6AK5 and 3S4 are found to be appropriate. The grid current of the latter has been reduced to about 10-16 A by appropriate silicone treatment, a voltage gain of 20-40 being obtained.
621.385.002.2 3783 Materials for Radio Valves—R. L. Smith-
Rose. (Nature, Lond., vol. 175, pp. 1029-1030; June 11, 1955.) Report of a discussion at the Institution of Electrical Engineers.
621.385.013.78.71 3784 The Thermally Conducting Valve Screen—
N. G. Webb. (Marconi Instrumentation, vol. 5, pp. 38-41; June, 1955.) A toroidal coil spring is fitted inside a screening can so that it en-circles and makes contact with the hottest part of the tube envelope. The can screws on to a threaded metal bush on the tube holder or a metal screening box. A helical compression spring in the top of the can retains the tube in its holder. A bulb temperature of 220 degrees C in free air was reduced to 130 degrees C by this means.
621.385.029.6 3785 On the Initial Space-Charge Distribution in
a Cylindrical Magnetron Diode—R. Q. Twiss. (J. Electronics, vol. 1, pp. 1-7; July, 1955.) Calculations are made taking account of thermal emission velocities but neglecting electron-electron interactions. The space-charge distribution is of double-stream type even when the ratio of the radius of the space-charge cloud to the cathode radius is less than 2. Comparison of the results with experimental data (3786 below) indicates that the stream theory does not describe the steady-state dis-tribution.
621.385.029.6 3786 The Space Charge Distribution in the Pre-
oscillation Magnetron—L. E. S. Mathias. (J. Electronics, vol. 1, pp. 8-24; July, 1955.) An experimental study has been made of smooth-anode cylindrical magnetrons with anode-radius/cathode-radius ratios of 2-2.5. using molecular-beam technique. The space-charge density falls off with increasing distance from the cathode, at first smoothly and then in a series of small steps beyond the cloud radius predicted by stream theories. The space charge has no definite edge. Increasing the anode voltage increases the radius of the cloud and the density at each point in the space charge. Discrepancies between these results and those given by theory are discussed by Twigs (3785 above).
621.385.029.6 3787 Theory of the Pre-oscillating Magnetron:
Part 1—D. Gabor and G. D. Sims. (J. Elec-tronics, vol. 1, pp. 25-34; July, 1955.) A dis-cussion is presented which may be of interest for a general understanding though not neces-sarily for a quantitative explanation of pre-oscillations in the cylindrical magnetron.
621.385.029.6 3788 The Effect of Initial Noise Current and
Velocity Correlation on the Noise Figure of Traveling-Wave Tubes—S. Bloom. (RCA Res., vol. 16, pp. 179-196; June, 1955.) The effect of correlation between fluctuation due to shot noise and that due to electron-velocity distri-bution is to introduce a further noise-current space-charge wave. Neither the degree of initial correlation nor the individual values of the shot-noise and velocity-distribution fluctua-tions affect the conditions for minimizing the noise figure of the tube, which depends only on the standing-wave ratio of the resultant noise-current wave and the position of the helix with respect to this wave.
621.385.029.6 3789 The 4-cm-X Travelling-Wave Valve de-
veloped at the Centre National d'Études des Télécommunications—Bobenrieth, Cahen, Lestel, and Picquendar. (Électronique, Paris, pp. 15-23; May, 1955.) Details are given of the Type-S47 tube developed by the French Post Office for use in radio links branching from the main 8-cm-X links. Output is > 1w and practi-cally independent of frequency over the band 6-8.5 kmc; gain is of the order of 40 db, and operating voltage is 1350± 30 v.
621.385.029.6:537.533 3790 Some Experiments on a Cylindrical Electron
Beam Constrained by a Magnetic Field—J. D. Lawson. (J. Electronics, vol. 1, pp. 43-52; July, 1955.) Measurements were made of longitudinal variations of beam cross section and radial current distribution, using a movable intercepting screen. The influence of angle of entry into the constraining axial magnetic field was studied. Operating parameters giving the smallest beam-diameter variations were: beam voltage 500 v, beam current 12 ma, beam radius about 1.2 mm, magnetic field 140 oersted. Discrepancies between the results and predictions from theory are discussed.
621.381029.63 3791 Factors in the Design of Power Amplifiers
for Ultra-high Frequencies—J. Dain. (J. Elec. tronics, vol. 1, pp. 35-42; July, 1955.) Amplifier tubes for the frequency range 400-900 mc with outputs > 10 kw and power gains not much less than 10 are discussed. The relative merits of triodes, tetrodes, klystrons and traveling-wave tubes are compared.
621.385.029.64 3792 High-Grain Travelling-Wave Output Valve
with Permanent Magnet—W. Eichin, P. Meyerer, W. Veith, and O. Zinke. (Fernmelde-tech. Z., vol. 8, pp. 369-373; July, 1955.) De-scription of the Type-V503 tube, which gives linear operation with gain > 30 db at a power output >3 w over the frequency range 3.6-4.2 kmc. The reflection factor at the input is < 10 per cent and at the output <5 per cent over a 30-mc band. Helix voltage is 1.3 kv and beam current about 35 ma. The cathode has a diame-ter of 8 mm, and the gun focusing is assisted by a permanent magnet, the resulting concen-tration being such that < I ma is intercepted by the helix.
621.385.032.213.2 3793 The Bolt Cathode: an Indirectly Heated
Tungsten Cathode for Electron Guns—E. B. Bag. (Z. angew. Phys., vol. 7, pp. 337-344; July, 1955.) The heavy-duty cathode described comprises a tungsten rod with a coaxial external

148 PROCEEDINGS OF THE IRE January
helical heater. One of the end faces of the rod is the emitter surface. Additional heating of the rod is obtained by electron bombardment from the heater. A magnetically stabilized heating circuit is used. Operating conditions were in-vestigated experimentally. Results are pre-sented graphically and discussed.
621.385.032.216 3794 The Resistance of the Oxide-Coated Cath-
ode at Ultra-high Frequencies—L. J. Herbst and J. E. Houldin. (Brit. J. appl. Phys, vol. 6, pp. 236-238; July, 1955.) Measurements were made on disk-seal triodes over the frequency range 730 mc-2.360 kmc with cathode temper-atures from 1250 to 1400 degrees K. The ca-thode behavior can be represented by the equivalent circuit comprising the grid-cathode capacitance in series with the coating resist-ance. Accurate determination of the dc coating resistance is not possible; the results agree approximately with those at rf. Determinations correspond to specific conductivities between 0.3 and 0.4 fr2m-2, at a temperature of 1250 degrees K. Heater resistance decreases with increasing cathode temperature and this effect can be used to measure power loss in the coat-ing under oscillatory conditions.
621.385.032.216 3795 Mass-Spectrometer Investigation of Gases
in Electronic Apparatus with Oxide Cathodes--N. D. Morgulis and G. Ya. Pikus. (C.R. Acad. Sel. U.R.S.S., vol. 102, pp 1103-1106; June 21, 1955. In Russian.) The gas in an evacuated tube containing a heated oxide cathode was analyzed at intervals up to 300 hours, and at the end of the subsequent period of about 330 hours. The latter analysis showed a large increase in the H2 and He content. This was probably due to a diffusion of these gases through the molybdenum-glass envelope. Other gases observed were H20, 0, 02 and N2-1- CO. Results are presented graphically.
621.385.032.216 3796 A Study of the Long-Term Emission Be-
haviour of an Oxide-Cathode Valve—G. H. Metson. (Proc. LEE, Part B, vol. 102, pp. 657-675; September, 1955. Discussion, pp. 675-677.) Conditions for maintaining emission over a long period are discussed; it is assumed that emission is maintained as long as there is a suffi-ciency of metallic Ba in the oxide matrix. Fac-tors causing loss or gain of the Ba metal are examined. The tentative conclusion is that a cathode working under a current load in gas-free surroundings will continue to emit until the BaO matrix is exhausted by electrolysis and evaporation.
621.385.032.216:621.315.612.8 3797 Some Experiments on the Breakdown of
Heater-Cathode Insulation in Oxide-Cathode Receiving Valves—G. H. Meson, E. F. Rickard, and F. M. Hewlett. (Proc. IEE, Part B, vol. 102, pp. 678-683; September, 1955.) The sintered alumina used for insulating the tungsten-wire heater is more liable to failure when the heater is run positive with respect to the cathode than when it is run negative, due to enhanced transfer of the tungsten across the alumina. The effect is attributed to production of positive tungsten ions under electron bom-bardment from the cathode, and is retarded when the alumina contains a pore-free layer.
621.385.032.24.002.2 3798 Frame-Grid Technique and its Significance
in the Construction of Modern Amplifier Valves
—O. Pfetscher. (Elektronik. vol. 4, pp. 139-143; June, 1955.)
621.385.15 3799 Anode-Dynode Beam Deflection Amplifier
—H. J. Wolkstein and A. W. Kaiser. (Elec-tronics, vol. 28, pp. 132-136; August, 1955.) The tube described has a composite output element such that in the absence of an applied signal the anode and dynode currents are out of phase and cancel. Signal variations produce currents in each element which are in phase, resulting in a linear input-voltage/output-current characteristic. Linear negative or positive transconductance can be produced. Applications to gating circuits, difference amplifiers, binary storage circuits etc., are de-scribed.
621.385.15:621.373.4.029.6 3800 Transit-Time Functions of a Dynatron
Oscillator—G. Diemer. (Ape sel. Res., vol. B4, pp. 457-463; 1955.) A new type of dyna-tron tube is discussed in which the primary electrons are directed obliquely towards the secondary-emission electrode. High values of the negative dynode admittance are attained by using a primary-electron voltage such that the secondary-emission factor has its maximum value. Analysis of high-frequency operation shows that oscillations can be produced at cm X.
621.385.2/.3).029.63:621.317.3 3801 Conductance and Slope Measurements on
Transient-Time Diodes and Triodes—Gund-lach and Lonsdorfer. (See 3688.)
621.385.3.029.62/.63:621.397.62 3802 A U.H.F.-V.H.F. Television Tuner using
Pencil Tubes—Harris and Thompson. (See 3765.)
621.385.3.029.63 3803 Development of the Premium Ultra-high-
Frequency Triode 6J4-WA—G. W. Barclay. (RCA Rev., vol. 16, pp. 293-302; June, 1955.) This tube is a version of the Type-6J4 for military applications. Modifications leading to improvement of interelectrode insulation, re-duction of heater-to-cathode leakage and re-duction of grid-to-cathode shorts are indicated, and the manufacture of the close-wound grid is described. The importance of quality control is
emphasized.
621.385.4:621.396.61.029.63 3804 A Novel Ultra-high-Frequency High-Power-
Amplifier System— Koros. (See 3770.)
621.385.5:681.142 3805 Binary Adder Tube for High-Speed Com-
puters—F. B. Maynard. (Electronics, vol. 28, pp. 161-163; September, 1955.) The composite tube described replaces a typical binary adder circuit employing eleven tubes. It may also be used as a coincidence detector etc.
621.385.83 3806 Electrode Shapes for a Cylindrical Electron
Beam—P. N. Daykin. (Brit. J. appl. Phys., vol. 6, pp. 248-250; July, 1955.) A new ap-proximate analytical solution of Laplace's equation for the es potential outside the space-charge region is derived and numerical tables are developed for applying the appropriate boundary conditions to give the required elec-trode shapes. A plot of the electrode shapes, applicable to both solid and hollow beams, is presented.
621.385.832 3807 A New Method for magnifying Electron
Beam Images—W. R. Beam. (RCA Rev., vol. 16, pp. 242-250; June, 1955.) A magnified spot is obtained in a Cr tube by deflecting the beam across a small aperture and again deflecting the transmitted beam and tracing the image on a fluorescent screen. The procedure is useful in electron-gun design work.
MISCELLANEOUS
061.4:621.39 3808 Radio Show Review—(Wireless World, vol.
61, pp. 476-491; October, 1955.) A trend to-wards basic circuit standardization in television receivers was noted; more sets were fitted with age in the vision channel, the majority making use of the mean bias voltage developed on the grid of the synchronizing-signal separator; true gated age systems were rare. On the sound channel age was practically universal. For sta-tion selection many sets had turret tuners with separate coils for each channel. Incremental-inductance tuning was also common. Con-vertors were available for most band I sets to enable them to be used on band III. Antennas for television reception were very varied. Printed circuits were common for filters and crossover networks. In vhf fm sound receivers precautions were taken to prevent oscillator radiation. Progress in transistor design is shown both for af and hf amplification and for power rectification. For dc conversion, efficiencies as high as 80 per cent are attained. For another account see Wireless Engr., vol. 32, pp. 280-285; October, 1955.
061.4: 621.39 3809 British Aircraft Radio—(Wireless World,
vol. 61, pp. 491-494; October, 1955.) Appa-ratus shown at Farnborough in 1955 reflected the continuous progress in reducing the size and weight of airborn gear. Navigational aids included new direction-finding and position-finding systems. Other exhibits included com-munication equipment for use on the 225-400-mc band and sets with tubes entirely replaced by transistors.
061.4:621.39 3810 German Radio Show—(Wireless World,
vol 61, pp. 468-470; October, 1955.) In Ger-man vhf receivers emphasis is placed on free-dom from radiation likely to cause interfer-ence. Television receivers for bands I and III have in many cases provision for conversion to band IV. Test and measuring gear was shown by several manufacturers.
621.3.002.2 3811 Mechanized Production of Electronic
Equipment—J. Markus. (Electronics, vol. 28, pp. 137-160; September, 1955.) Present and projected practice in the U.S.A. involves mechanical preparation of components for in-sertion in etched wiring circuits, followed by automatic assembly, dip soldering, and auto-matic testing of completed circuits. Illustra-tions of the various processes are given.
413.164:621.396/.397 3812 Elsevier's Dictionary of Television, Radar
and Antennas in Six Languages. [Book Review] —W. E. Clason. Publishers: Elsevier, London and New York etc., 1955, 760 pp., 120s. (J. Brit. Instn. Radio Engrs., vol. 15, p. 11; August, 1955.) The languages included are English, French, Spanish, Italian, Dutch, and German.