PROCEEDINGS OF THE 44th ANNUAL MEETING ...
170
PROCEEDINGS OF THE 44th ANNUAL MEETING FERTILIZER INDUSTRY ROUNDTABLE 1994 1951 s November 7, 8, and 9, 1994 Grosvenor Resort Hotel Lake Buena Vista, Florida
-
Upload
khangminh22 -
Category
Documents
-
view
2 -
download
0
Transcript of PROCEEDINGS OF THE 44th ANNUAL MEETING ...
PROCEEDINGS OF THE
44th ANNUAL MEETING FERTILIZER INDUSTRY
ROUNDTABLE 1994
1951
s
November 7, 8, and 9, 1994 Grosvenor Resort Hotel
Lake Buena Vista, Florida

Table of Contents Monday, November 7, 1994
Morning Session I Moderator:
PatrickE. Peterson
Page Keynote Address - James D. Speir .. . . . . . . .. 1 Outlook For Nitrogen
Glen Buckley . . . . . . . . . . . . . . . . . . . . . . . . . . 4 Outlook For Phosphates
Ken Nyiri . . . . . . . . . . . . . . . . . . . . . . . . . . . .. 15 Outlook For Potash
Rick Brasnett ......................... 18 Outlook For Sulphur
Robert Zwerneman. .................... 30
Monday, November 7,1994 Mternoon Session II
Moderator: Frank P. Achorn
Fertilizer in the Environment Charlotte Sine. . . . . . . . . . . . . . . . . . . . . . . . .. 39
Control Release Mechanisms Dr. Gary Smith ........................ , 43
Size Requirements for Lawn & Garden Fertilizers Frans H. Jager .......................... 49
A Blender's Tool for Quick SGN Determination James C. Brown & Jean L. Cheval ......... 52
How Important Are Micronutrients in Modern Farming
Roy M. Stephen. . . . . . . . . . . . . . . . . . . . . . .. 62
Thesday, November 8,1994 Morning Session III
Moderator: EdHuber,Jr.
Status of Fertilizer Consumption in the USA
Janice T. Berry& Norman L. Hargett ....... 67 AAPFCO Report Teresa A. Crenshaw .................... 71
Analytical Standardization in a Larger Arena CEN AOAC International & You Peter Kane. . . . . . . . . . . . . . . . . . . . . . . . . . .. 77
New Techniques for Obtaining Rapid Page Analytical Measurements of Fertilizer Elements Harrison Cooper & Joseph E. Gliksman .... 81
Process Safety Management (PSM) Jerry Hawthorne & Wm. G. Kramer ........ 93
Thesday, November 8, 1994 Mternoon Session IV
Moderator: Dale Dubberly
Global Positioning Application Dr. Sam Kincheloe ..................... 99
Modern Placement and Tillage Practices Dr. Paul Fixen ......................... 102
Current Trends in Organic Fertilizer Mark Nuzum .....•.................. 109
Best Management Practices for Prevention of Nitrates in Groundwater for Florida Growers
Ken Kuhl ............................ 114 Performance of a Closed Gypsum Stack
Ozzie Morris & Dr. John Garlanger ........ 116
Wednesday, November 9, 1994 Session V
Moderator: RichardF. McFarlin
The Effectiveness of Created Wetlands on Phosphate Mined Lands
Ronnie G. Best ........................ 127 The Georgia Iron Works / Stapel Land Dredge Story
Graeme R. Addie, T. Hagler & R. Hagler. . . . 133 The PECO Fluorine Recovery Process
Wm. R. Erickson & Leif E. Bouffard. . . . .. 138 Public Perception of the Fertilizer Industry: The Effect of Risk Communications
P. Whitney Yelverton. . . . . . . . . . . . . . . . . .. 146 Overview of Phosphorite Deposits in the Sirhan-Turayf Basin, Kingdom of Saudi Arabia
James R. Herring ....................... 151 Financial Report ........................ 159

INDEX OF PARTICIPANTS
Grame R. Addie Paul E. Fixen Ozzie Morris GIW INDUSTRIES, INC. PPI CARGILL, INC. 5000 Rightsboro Road 305 5th Street 8813 U.S. 41 S Grovetown, GA 30813 Brookings, SO 57006 Riverview, FL 33569
Frank P. Achorn John Garlanger Mark Nuzum SE-ME ARDAMAN & ASSOC HARMONY PRODUCTS, INC P.O. Box 493 8008 S. Orange Ave 2121 Old Greenbrier Rd Florence, AL 35631 Orlando, Fl 32809 Chesapeake, VA 23320
Janice T. Berry Joe E. Glicksman Patrick E. Peterson TN VALLEY AUTHORITY IMC AGRICO CO CF INDUSTRIES, INC. P.O. Box 1010 P.O. Box 2000 Salem Lake Drive Muscle Shoals, AL 35674 Mulberry, Fl33860 Long Grove, Il60047
Ronnie G. Best Jerry Hawthorne Ken Nyiri UNIV. OF FLORIDA FARMLAND HYDRO LTD TEXASGULF, INC. Wetland & Water Resea. P.O. Box 9600 3101 Glen Wood Ave Gainsville, FL 32611 Bartow, FL 33836 Raleigh, NC 27622
Rick Brasnett James Herring Charlotte Sine PCS SALES US Geological Survey FARM CHEMICALS 122 1 st Ave., Sasakatoon, Denver Federal Center 37733 Euclid Avenue Saskatchewan, S7K7G3 Denver, CO 80225 Willoughby, OH 44094
James C. Brown Ed Huber Gary Smith SYLVITE SALES, INC. TFI VIGORO INDUSTRIES P.O. Box 929 6615 Pheasant Drive P.O. Box 512 Lebanon, PA 17042 Elkridge, MD 21227 Winter Haven, Fl33882
Glen Buckley Franz Jager James D. Speir CF INDUSTRIES, INC. lESCO, INC. IMC FERTILIZER, INC. One Salem Lake Dr. 20005 lake Road 2100 Sanders Road Long Grove, Il60047 Rockey River, OH 44116 North Brook, IL 60062
Jean Cheval Peter Kane Roy M. Stephen SYLVITE SALES, INC. IN STATE CHEMIST ARISE RESEARCH & DISCOVERY, INC 374 Main St.,Suite 200 1154 Biochemistry Bldg Rt. 3, Box 34 Hamilton, Ontario Lap1 K2 W. Lafayette, IN 47907 Martinsville, IL 62442
Harrison Cooper Sam Kincheloe P. Whitney Yelverton COOPER SYSTEMS IMC FERTILIZER, INC THE FERTILIZER INSTITUTE 106 W. 2nd N One Nelson C. White 501 Second St, NE Bouniful, UT 84010 Mundelein, IL 60060 Washington, DC 20002
Teresa A. Crenshaw Bill Kramer Robert Zwerneman DE DEPT. OF AGRI. FARMLAND HYDRO LTD FREEPORT MCMORAN 2320 S. DuPont Hwy P.O. Box 9600 1615 Poydras Dover, DE 19901 Bartow, FL 33836 New Orleans, LA 70112
Dale Dubberly Ken Kuhl FL DEPT. OF AGRI Fl DEPT OF AGRr 3125 Conner Blvd 3125 Conner Blvd Tallahassa, Fl 32399 Tallahassa, FL 32399
Bill Erickson Richard F.McFarlin PECO FL INSTITUTE OF 2940 Dranefield Rd PHOSPHATE RESEARCH Lakeland, FL 33811 1855 W. Main St
Bartow, FL 33836
ii
1994 BOARD OF DIRECTORS
FRANK P. ACHORN JEAN L. CHEVAL KEN HEATON SE-ME SYLVITE SALES, INC. MOBILE MINING AND MINERALS P.O. P.O. BOX 493 374 MAIN STREET W,STE.200 BOX 26683 FLORENCE, AL 35631 HAMILTON, ONTARIO RICHMOND, VA 23261
CANADA Lap 1 K2 B.E. ADAMS ED HUBER, JR. CONSULTANT KURT CONSTANT 6615 PHEASANT DRIVE 3509 WOODLAWN STREET THE WORLD BANK ELKRIDGE, MD 21227 HOPEWELL, VA 23860 1818 'H' STREET NW
WASHINGTON, DC 20433 K.C. KNUDSEN THOMAS B. ATHEY KEMIRA DENMARK, A/S 219 HERON POINT DAVID CRERAR POSTBOKS 100 CHESTERTOWN, MD 21620 HYDRO AGRIINTERNATIONAL DK-2950 VEDBAEK
6, WESTMORLAND ROAD DENMARK LEO BEWER FELlXSTOWE, SUFFOLK IP119TB PCS SALES ENGLAND JAMES J. KUHLE 1221ST AVE. S. LEBANON CHEMICAL CORP. SASAKATOON,SASKATCHEWAN MR. DONALD P. DAY P.O. BOX 180 S7K 7G3 CANADA TEXASGULF, INC. LEBANON, PA 17042
P.O. BOX 30321 HAROLD D. BLENKHORN RALEIGH, NC 27622 DAVID W. LEYSHON 525 BEACONSFIELD JACOBS/DORRCO DIV BEACONSFIELD, QUEBEC JOE S. DREWRY, JR. P.O. BOX 2008 CANADA H9W 4C8 DREWRY & ASSOC •• INC. LAKELAND, FL 33803
6640 WILLIAMSON DR F. ZANE BLEVINS ATLANTA, GA 30328 OLE H. LIE ALLIED SIGNAL, INC. NORSK HYDRO A.S. 700 S. 6TH STREET DALE DUBBERLY P.O. BOX 2594 SOLLI HOPEWelL, VA 23860 FL DEPT OF AGRICULTURE N-OSLO 2 NORWAY
3125 CONNER BLVD G. CAMERON BOWEN TAlLAHASSA, FL 32399-1650 BYRON MCCARVER CAMERON CHEMICALS, INC. ARCADIAN CORP 1316 SMITH DOUGLAS JOHN M. FRENCH P.O. BOX 307 CHESAPEAKE, VA 23320 BRITISH SULPHUR CORP. LTD. GEISMAN, LA 70734
31 MOUNT PLEASANT scon BRANSCOMBE LONDON WCIX OAD JIM MICKUS CENTRAL CANADA POTASH ENGLAND CARGILL, INC. P.O. BOX1500,COLONSAY BOX 9300 SASK. SOK OZO JAMES GREENE MINNEAPOLIS, MN 55440 CANADA SOUTHERN STATES COOP
2582 SALISBURY HWY. RICHARD F. MCFARLIN JAMES C. BROWN STATESVILLE, NC 28677 FL INSTITUTE PHOSPHATE RESEACH SYLVITE SALES (USA),INC 1855 WEST MAIN ST. P.O. BOX 929 MICHAEL HANCOCK BARTOW, FL 33836 LEBANON, PA 17042 OISC PURDUE UNIVERSITY
1154 BIOCHEMISTRY BLDG. PATRICK E. PETERSON DOUGLAS CAINE W LAFAymE, IN 47907 CF INDUSTRIES, INC. CONSULTANT SALEM LAKE DRIVE P.O. BOX 491 MABRY M. HANDLEY LONG GROVE, IL 60047 WHITING, IN 46394 IMC fERTILIZER INC.
ONE NELSON C. WHITE GARRY PIGG VERNON C. CARLTON MUNDELEIN, Il 60060 c/o FREEPORT-MCMORAN MFG. WINSTON-WEAVER FERT. CO. 1615 POYDRAS STREET P.O. BOX 7366 G. CONRAD HARDIE, JR. NEW ORLEANS, LA 70112 WINSTON-SALEM, NC 27109 LYKES AGRI SALES
P.O. BOX 13989 FT. PIERCE, FL 34979
iii
PAULJ.PROSSER,JR THE PROSSER COMPANY P.O. BOX 5036 GLEN ARM, MD 21057
JOHN RENNEBURG CONSULTANT 6 MIDVALE ROAD BALTIMORE, MD 21210
JOSEPH E. REYNOLDS, JR. CONSULTANT 5518 SOUTHWOOD DR. MEMPHIS, TN 38119
ROBERT E. ROBINSON ROBERT E. ROBINSON & ASSOC 111 MAPLEWOOD DRIVE BEAVER, PA 15009
WALTER J. SACKETT, JR. THE A.J. SACKETT & SONS COMPANY 1701 SOUTH HIGHLAND BALTIMORE, MD 21224
JAMES J. SCHULTZ INTERNATIONAL FERTILZER DEV.CTR P.O. BOX 2040 MUSCLE SHOALS, AL 35662
WILLIAM F. SHELDRICK THE WORLD BANK 38 RAVINE ROAD CANFORD CLIFFS POOLE, BH13 7HY DORSET UNITED KINGDOM
SR. ADOLFO SISTO ADIFAL MESETA 200, DEL A. OBREGON 01900 MEXICO, D.F.
iv
RODGER C. SMITH FERTILIZER MARKET. & TECHNOLOGY 1206 W CAMINO DEL PATO GREEN VALLEY, AZ 85622
GLEN H. WESENBERG, P.E. FEECO INTERNATIONAL, INC. 3913 ALGOMA ROAD GREEN BAY, WI 54311
JAMES C. WILSON CHILEAN NITRATE 150 BOUSH ST., SUITE 701 NORFOLK,VA 23510
PHILLIP W. (WHIT) YELVERTON THE FERTILIZER INSTITUTE 501 SECOND STREET WASHINGTON, DC 20002
OFFICERS
David W. Leyshon Walter J. Sackett, Jr. Paul J. Prosser, Jr.
Chairman Vice Chairman Secretary-Treasurer
ACTIVE PAST CHAIRMEN
Joseph E. Reynolds, Jr. Rodger C. Smith Frank P. Achorn Harold D. Blenkhorn John L. Medbery William F. Sheldrick Paul J. Prosser, Jr.
Past Chairman Past Chairman Past Chairman Past Chairman Past Chairman Past Chairman Past Chairman
COMMITTEE CHAIRMEN
Entertainment Meeting Dates & Places Finances Program-Annual Meeting Nominating Public Relations International Relations
v
Thomas B. Athey Thomas B. Athey Paul J. Prosser, Jr. Harold D. Blenkhorn Joseph E. Reynolds, Jr. Walter J. Sackett, Jr. William F. Sheldrick


Opening Remarks
David W. Leyshon, Chairman
I am David Leyshon of Jacobs Engineering Group Inc. I am serving my second and final year as chairman of this, the 44th Annual Meeting of the Fertilizer Industry Round Table.
I represent some 45 volunteer directors of the Round Table who meet twice a year to put together what is primarily a technical program for the many facets of our industry.
On behalf of the directors, I want to welcome you all to Orlando. We hope you derive important information from our meeting and make or renew personal contacts that will help you in these rough times.
Last year at New Orleans we presented Mr. Paul Prosser with the Fertilizer Industry Award of Merit. Mr. Paul, as I'm sure most of us here know, has been the back bone of this organization, serving as Secretary-Treasurer for over 20 years. We are sorry to report that Paul will miss the Round Table meeting for the first time since the early 60's. He has undergone surgery for an intestinal problem. He's been in intensive care but we believe
he'll be OK, and we'll provide an update as soon as news is available. We extend to Paul best wishes for a speedy recovery.
Yesterday many of the directors gave up several hours of Sunday discussing the future of this organization. I want to personally thank them for their time. We hope we can continue to have a healthy and vital Fertilizer Round Table. As Frank Achorn said, if we didn't have a Fertilizer Industry Round Table, he or someone would have to reinvent it.
Next, I'd like to introduce our key note speaker for this meeting. We see here evidence of the fast moving changes in the industry. In our initial announcement we had the title wrong and now even the latest listing gives the wrong company title.
James Speir is President of IMC Global, and is a graduate of the University of Georgia. In 32 years with IMC he has risen through the ranks to become President. We are pleased and flattered to have Mr. Speir as our Key Noter this year.

Monday, Noventber 7, 1994 Session I
Moderator:
Patrick E. Peterson
Keynote Address James D. Speir
Florida Phosphate Council
Good morning and thank you Dave for that kind introduction. It's truly a pleasure for me to join you here at this beautiful setting in Florida. With our Chicago weather starting to take its annual turn toward winter, and my daughter and her family residing in nearby Orlando, I didn't have to be asked twice to come and be your keynote speaker. Besides, it is indeed an honor to be asked to address such a distinguished assembly, particularly during a period of significant change within our industry.
Accordingly, during the next few minutes I'd like to share with you some of my thoughts about our business - both in terms of where we are today ... and where I believe we're headed. I will use my Company - IMC Global - as a vehicle for illustrating my observations and demonstrating that we are, in my view, an industry in transition.
Some of you are familiar with IMC. However, for those of you who are not, let me quickly review our operations before discussing the global factors that are changing the fertilizer business.
IMC's core business is the manufacture and sale of phosphate rock, concentrated phosphates and potash.
Our potash comes from three mines. One is located in Carlsbad, New Mexico and produces muriate of potash, sulphate of potash and our premium potash material- Sul-Po-Mag.
Our larger operation is in Canada, where we operate two mines to produce muriate of potash.
1
Our total annual capacity at the three mines exceeds 5 million tons, making IMC one of the world's largest private enterprise potash producers.
In the Southeastern United States we operate four ammoniation granulation plants and market specialized high-value crop nutrients through our Rainbow division.
Our phosphate rock and concentrated phosphate operations are conducted through the jointventure company IMC-Agrico, which began operating July 1, 1993. Through IMC-Agrico, we are North America's largest miner of phosphate rock, the basic raw material for concentrated phosphates. Our concentrated phosphate operations consists of six plants: three located in central Florida and three in Louisiana along the Mississippi River. Our extensive reserves, low-cost mining operations and highly efficient plants will allow us to remain a low-cost DAP producer in the long term.
And fimilly, we also hold a 25% interest in the Main Pass Sulphur mine located offshore Louisiana in the Gulf of Mexico.
Let's move on now and examine the fundamental supply/demand dynamics of the fertilizer industry.
World grain consumption is tied directly to world population, which is increasing at a rate of more than 90 million people per year. This means 30 million more tons of grain are needed annually just to maintain per capita consumption levels.
This output must come from the world '8 leading grain producing regions: North America, China and Europe. Not surprisingly, the profile of world fertilizer consumption very closely matches the profile of world grain production.
Given this profile, it is critical to recognize that a review of the North American fertilizer supply/
demand situation must take a global view. This is certainly born out by the fact that the U.S. phosphate industry exports more than half of its total production. Moreover, fertilizer consumption in the rapidly growing Asian market, driven by China, India and Pakistan, represented nearly 50% of U.S. DAP/MAP shipments last year.
Looking at world demand, fertilizer consumption over the past five years is down. The world picture, however, masks two important trends.
The first is rapid demand growth in developing countries where fertilizer consumption has nearly doubled since 1980 in line with growth in food production.
The second is a steep decline in demand in Eastern Europe and the Former Soviet Union, where total nutrient consumption over the past 5 years has declined by an amount equivalent to annual fertilizer use in the United States.
The decline in demand in Easterrr Europe and the Former Soviet Union simply cannot continue for a number of reasons.
First, no political system is stable if its people are hungry. Second, it is much cheaper and more efficient for these countries to maintain food supplies through proper fertilization than to import grains. Third, while foregoing fertilizer for a few years may not dramatically affect crop yields in the short term, ultimately the productive capability of the soil is reduced for many years to come. As a result, we fully expect demand in this region to turn around over the next couple of years.
It is noteworthy that the fall-off in demand experienced by this region also had a major effect on the pattern of world trade in fertilizers - particularly concentrated phosphates.
The most dramatic change in fertilizer demand, however, was the transformation of the Former Soviet Union from a net importer of phosphates to an aggressive net exporter. Clearly, efforts to generate hard currency contributed to the switch. But rising production costs associated with the gradual movement toward a more market based economy has curtailed fertilizer production there and slowed the flow of phosphate exports.
Potash exports from the Former Soviet Union have been affected by the same factors, but have been held in the range of 3 to 3.5 million tonnes K20 by transportation and export bottlenecks.
2
However, the destinations for these cargoes have changed markedly.
Soviet exports to Eastern Europe approached 2 million tonnes KzO in the late 1980's, but dropped to almost nothing following the collapse of the region's centrally planned economies. With their domestic and export markets collapsing, producers in Russia and Belarus sought new markets for their potash.
Although exports to Western Europe, North America and South America did increase, the major shift was into Asia. From about 300,000 tonnes KzO in the mid 1980's exports to Asia jumped to a peak of 1.4 million tonnes in 1991. However, over the last couple of years, as consumption has begun to recover in their traditional markets in Eastern Europe, exports to Asia by former Soviet producers have started to recede.
Compounding the problems emanating from the former Eastern Bloc countries was a substantial cutback in fertilizer imports by the two largest buyers - China and India. These two countries account for almost a third of world fertilizer use.
China is the largest consumer of fertilizer products in the world with approximately 23% of total demand.
Normally, China consumes approximately a third of U.S. D AP exports, with their share in some years approaching half. China also accounts for over 20% of North America's potash exports.
U.S. DAP exports to China were off 50% in 1993. This was the result of a large cut in exchange rate subsidies and the elimination of fertilizer subsidies to farmers. These negatives were partially offset by increases in government support prices for grains and other crops.
China returned to the market during the last three months of calendar 1993 as local demand exhausted the in-market phosphate inventories. China's purchasing has continued to be strong in 1994. The result was a 54 percent rebound in U.S. DAP exports to China in 1993/94.
North American potash shipments to China dropped sharply in fiscal 1992, but have recovered over the last two years. For the fiscal year that ended last June, exports to China were up almost 20 percent from the previous year. Shipments have remained strong through the first half of 1994/ 95.
Long term, as consumption moves towards goals recognized by most experts, the potential demand for phosphate and potash in China is huge. The current use of phosphate and potash is about half of what's needed to balance current nitrogen use, given China's soils and cropping patterns. Stated another way, Chinese farmers should be using the equivalent of 7 1/2 million more tons of DAP and 5 million more tons of potash this year to optimize the productivity of their current nitrogen use.
India is also a significant purchaser of fertilizer products, representing approximately 10% of world demand. Like China, India's phosphate imports from the U.S. also tumbled 50% during 1992/ 93. Fertilizer subsidies to both farmers and local fertilizer producers were reduced. Recently, however, the government ofIndia announced new policies to support the use of fertilizer. This year's budget allocates $1.3 billion in fertilizer subsidies for the current year.
Recovering exports and more stable conditions in Eastern Europe and the Former Soviet Union are clearly important to the fertilizer industry. However, we can't overlook conditions in our domestic market. The U.S. is the world's second largest consumer of fertilizer products, representing approximately 15% of total world demand.
Corn accounts for about 45% of U.S. fertilizer consumption.
U.S. ending stocks of corn dropped sharply last year. The tight stocks can be attributed to 1993's difficult weather and low yields. Low stocks and improved prices combined to raise corn plantings almost 6 million acres this past spring.
With prospective yields this year well above trend line - in fact at record levels - the carryout of corn at the end of the 94/95 marketing year will increase substantially. The increased stocks and a recently announced 7.5 % Acreage Reduction Program suggest that corn plantings in 1995 will be reduced from the high 1994 levels.
Overall, we see relatively little change in projected crop acreage in 1995. However, a number of shifts among crops are likely to occur.
The most significant change expected is a reduction in corn acreage of about 3 million acres. In addition, ample world supplies of oilseeds and
3
this year's huge U.S. crop will put pressure on U.S. soybean plantings. On the plus side, relatively tight supplies of wheat will increase plantings by about 1 1/2 million acres. Cotton acreage should remain unchanged at about 14 million.
We estimate that U.S. fertilizer consumption rose 3% during 93/94. Looking to 1995, we expect demand to remain near today's high levels with about a 1 % drop in use at the farm level in 94/95.
Now, let's look down the road at some of the dynamics that will impact the U.S. and world fertilizer business.
Although concentrated phosphate prices have increased significantly over the past year, they are not at levels that encourage construction of new production capacity. This chart illustrates the capacity of the seven leading producing countries that account for two-thirds of world capacity. There are no capacity expansion plans scheduled in any of these countries.
With no capacity increases planned for either concentrated phosphates or potash, rising demand is being met by higher operating rates at existing facilities. This chart illustrates the increase in operating rates by U.S. phosphate producers throughout the 93/94 year with production continuing at record setting levels so far in 94/95. Strong demand in both domestic and export markets has absorbed all of this production increase.
Given these conditions, I am confident the near-term outlook for our industry is positive. World demand for our products will remain robust with increased consumption in Eastern Europe, Latin America, Africa and Asia. In fact, fertilizer consumption in these regions is expected to rise five percent in 1994/95, with most of the increased demand coming from Asia.
It is in the long-term view, however, where the transition within our industry clearly manifests itself. Let me explain.
Less than three weeks ago I was President of IMC Fertilizer Group. Today, however, I am President ofIMC Global- the same company but with a new name. Why, you may wonder, did we change our corporate nameplate?
The reason lies in the litany of overseas markets I mentioned a moment ago. They are increas-
ingly important to IMC and to you. Consider the following:
Fifty-six percent of the world's population resides in Asia. In addition, the Far East is also home to the world's most rapidly expanding economies and has one of the highest birth rates. The opportunities for our industry in this part of the world alone are enormous, and an expanded presence there is essential.
At least that's what we firmly believe at IMC, where 20 percent of our total shipments in 1994 went to China. In fact, following a careful evaluation of my Company's resources and market potential earlier this year, we determined that our future prosperity lies in an expanded presence and more aggressive role in global agriculture.
Consistent with this belief is a new strategic focus, accompanied by changes in several areas which support our more aggressive long-term objectives.
It was with our new strategic course in mind that we sought -and received-shareholder approval to change our name. We believe the name "IMC Global" more accurately defines our present and future course, and promotes a new corporate identity that will aid our globalization process.
I suspect that some, perhaps even many of you, have recognized our industry's need to become more global in its approach to market opportunities. That's why I wanted you to know about one company that's taken its globalization process off the drawing board and put it to work. And, I should add, none to soon.
Thank you for your kind attention. If you have any questions, I will be happy to try to answer them.
Outlook For Nitrogen Glen Buckley
CF Industries, Inc.
After a dismal year in 1993, fertilizer year '94 proved to be a relatively positive year for most nitrogen producers. Strong domestic demand combined with a tight world supply situation, allowed the U.S. industry to operate at close to 100 percent of capacity.
4
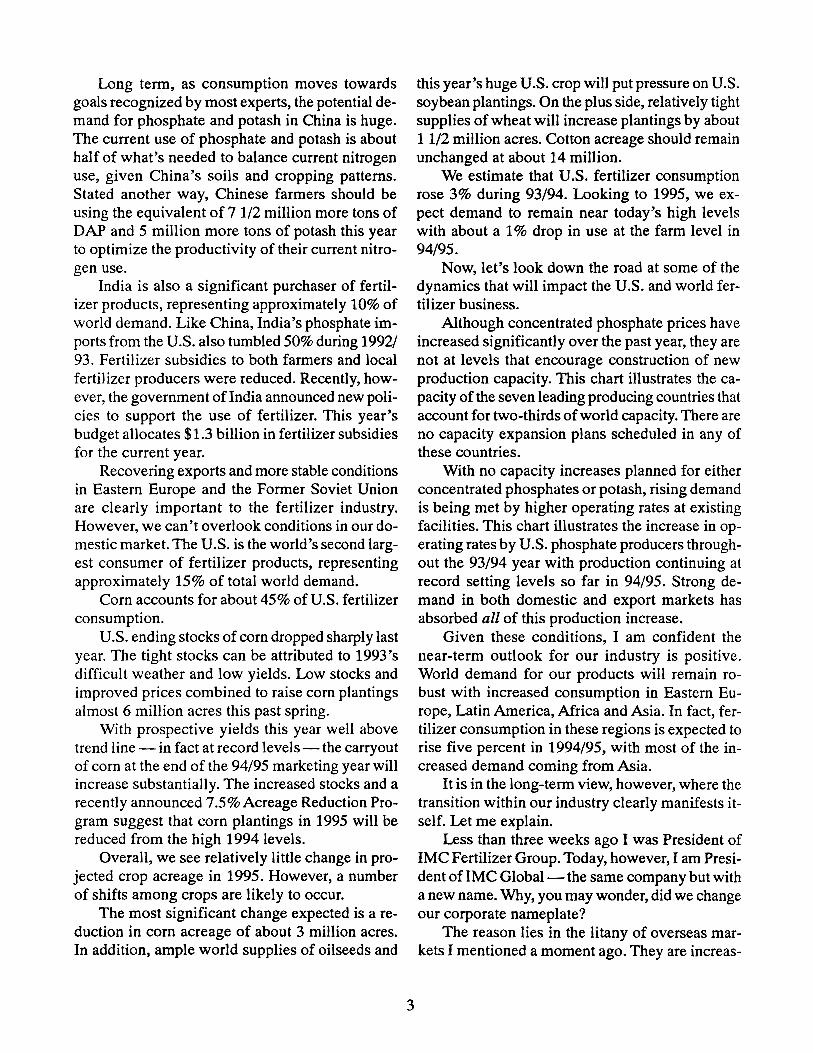
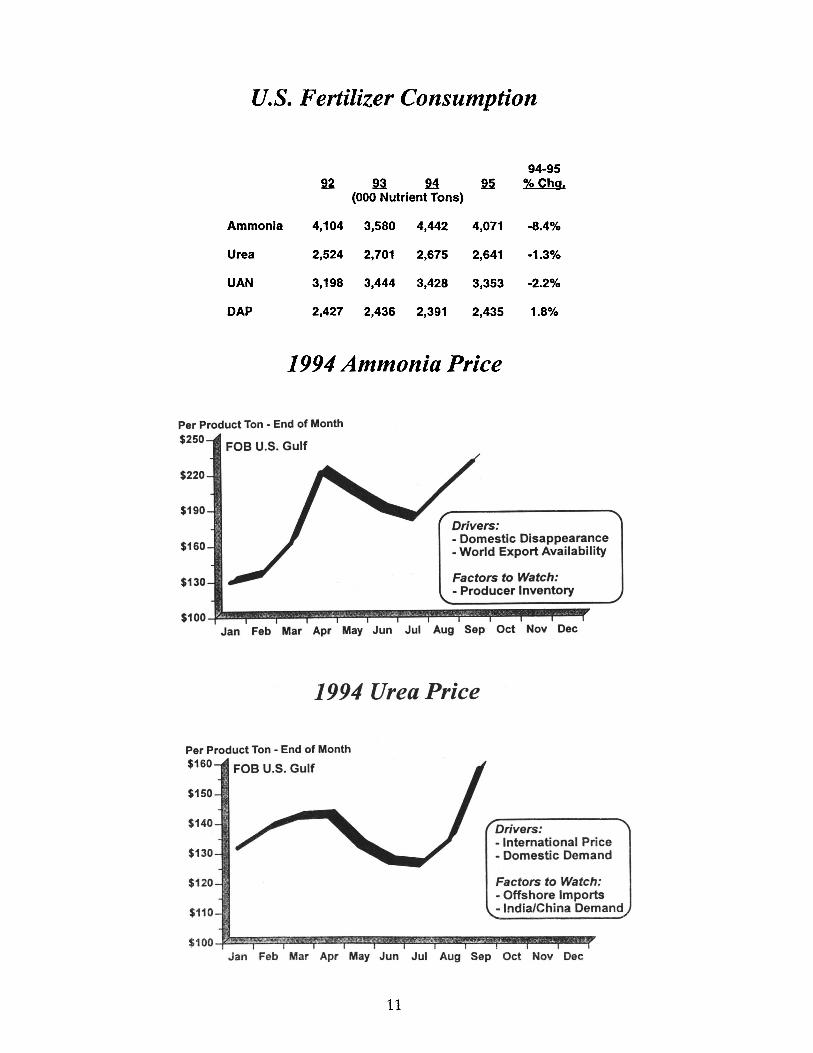
The most significant change was inthe ammonia market. U.S. Gulf ammonia prices, which dropped to below $90 per ton at the beginning of fertilizer year '94, climbed to $ 130 per ton in January and by April jumped to over $220 per ton.
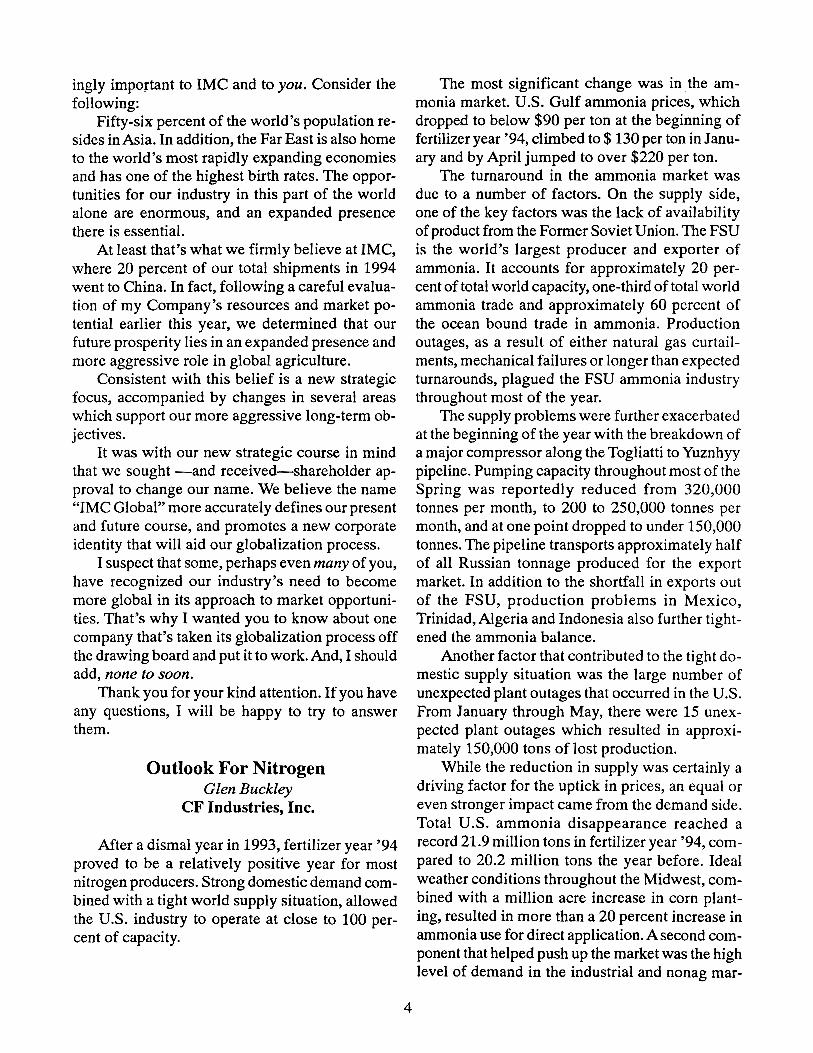
The turnaround in the ammonia market was due to a number of factors. On the supply side, one of the key factors was the lack of availability of product from the Former Soviet Union. The FSU is the world's largest producer and exporter of ammonia. It accounts for approximately 20 percent of total world capacity, one-third of total world ammonia trade and approximately 60 percent of the ocean bound trade in ammonia. Production outages, as a result of either natural gas curtailments, mechanical failures or longer than expected turnarounds, plagued the FSU ammonia industry throughout most of the year.
The supply problems were further exacerbated at the beginning of the year with the breakdown of a major compressor along the Togliatti to Yuznhyy pipeline. Pumping capacity throughout most of the Spring was reportedly reduced from 320,000 tonnes per month, to 200 to 250,000 tonnes per month, and at one point dropped to under 150,000 tonnes. The pipeline transports approximately half of all Russian tonnage produced for the export market. In addition to the shortfall in exports out of the FSU, production problems in Mexico, Trinidad, Algeria and Indonesia also further tightened the ammonia balance.
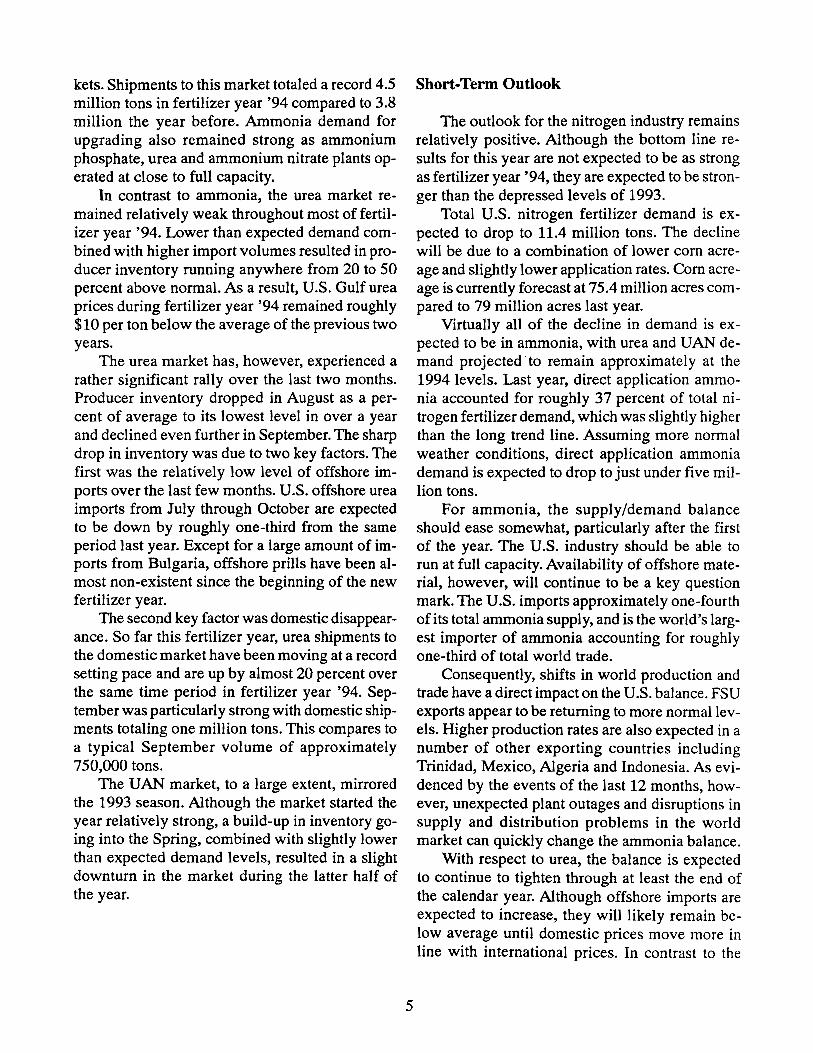
Another factor that contributed to the tight domestic supply situation was the large number of unexpected plant outages that occurred in the U.S. From January through May, there were 15 unexpected plant outages which resulted in approximately 150,000 tons of lost production.
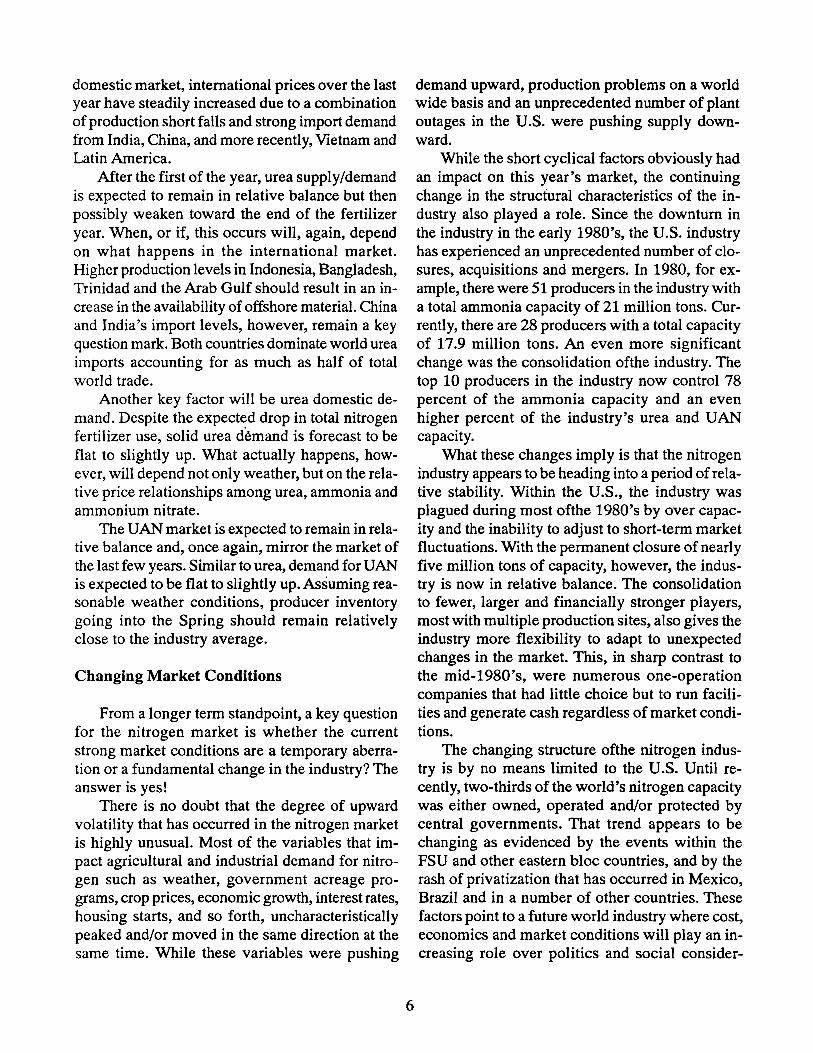
While the reduction in supply was certainly a driving factor for the uptick in prices, an equal or even stronger impact came from the demand side. Total U.S. ammonia disappearance reached a record 21.9 million tons in fertilizer year '94, compared to 20.2 million tons the year before. Ideal weather conditions throughout the Midwest, combined with a million acre increase in corn planting, resulted in more than a 20 percent increase in ammonia use for direct application. A second component that helped push up the market was the high level of demand in the industrial and nonag mar-
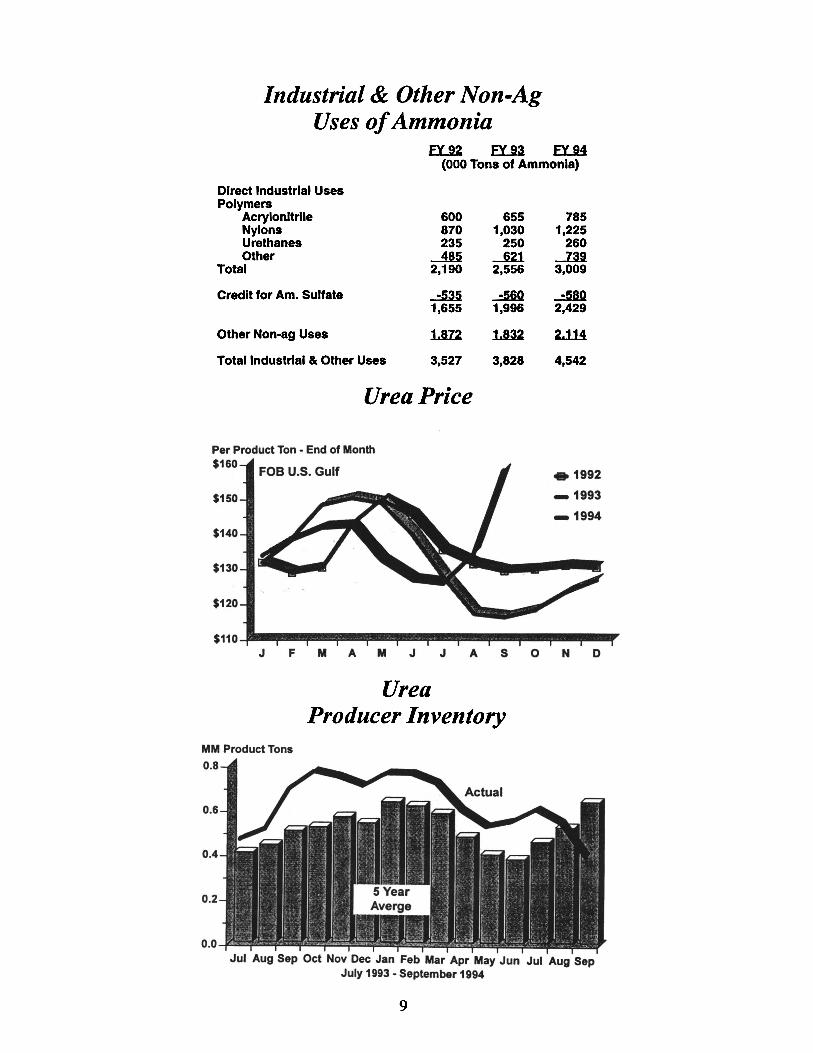
kets. Shipments to this market totaled a record 4.5 million tons in fertilizer year '94 compared to 3.8 million the year before. Ammonia demand for upgrading also remained strong as ammonium phosphate, urea and ammonium nitrate plants operated at close to full capacity.
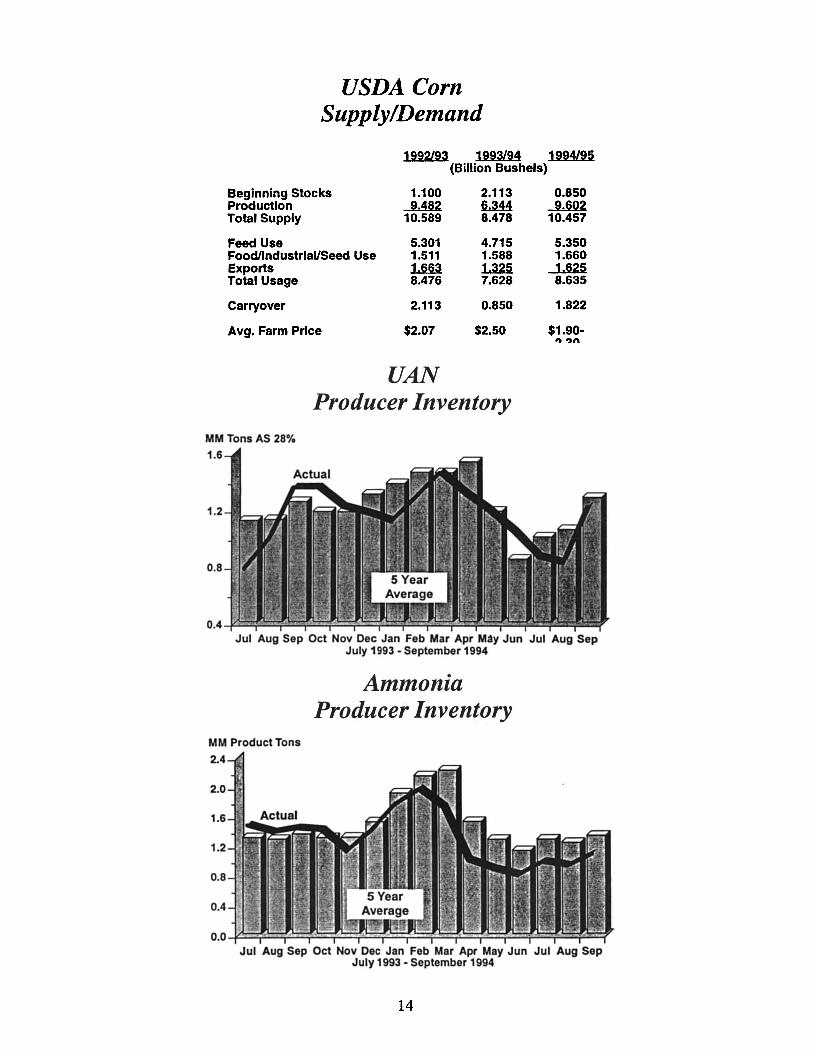
In contrast to ammonia, the urea market remained relatively weak throughout most of fertilizer year '94. Lower than expected demand combined with higher import volumes resulted in producer inventory running anywhere from 20 to 50 percent above normal. As a result, U.S. Gulf urea prices during fertilizer year '94 remained roughly $10 per ton below the average of the previous two years.
The urea market has, however, experienced a rather significant rally over the last two months. Producer inventory dropped in August as a percent of average to its lowest level in over a year and declined even further in September. The sharp drop in inventory was due to two key factors. The first was the relatively low level of offshore imports over the last few months. U.S. offshore urea imports from July through October are expected to be down by roughly one-third from the same period last year. Except for a large amount of imports from Bulgaria, offshore prills have been almost non-existent since the beginning of the new fertilizer year.
The second key factor was domestic disappearance. So far this fertilizer year, urea shipments to the domestic market have been moving at a record setting pace and are up by almost 20 percent over the same time period in fertilizer year '94. September was particularly strong with domestic shipments totaling one million tons. This compares to a typical September volume of approximately 750,000 tons.
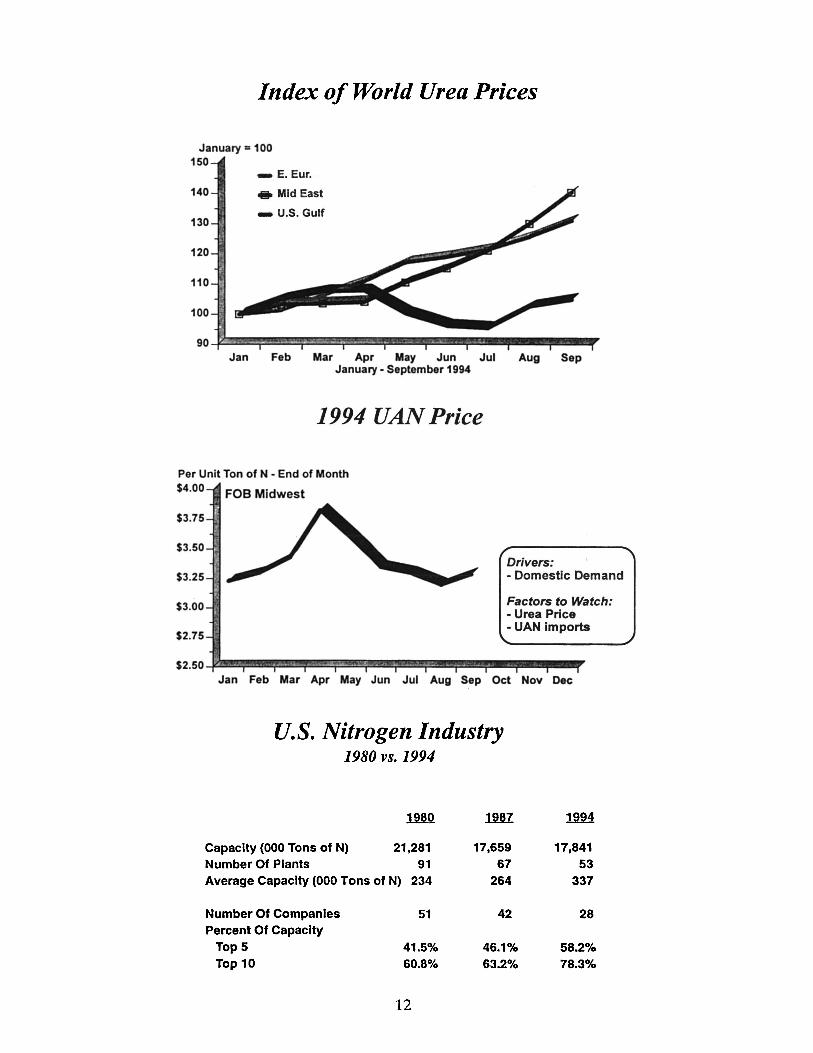
The UAN market, to a large extent, mirrored the 1993 season. Although the market started the year relatively strong, a build-up in inventory going into the Spring, combined with slightly lower than expected demand levels, resulted in a slight downturn in the market during the latter half of the year.
5
Short-Tenn Outlook
The outlook for the nitrogen industry remains relatively positive. Although the bottom line results for this year are not expected to be as strong as fertilizer year '94, they are expected to be stronger than the depressed levels of 1993.
Total U.S. nitrogen fertilizer demand is expected to drop to 11.4 million tons. The decline will be due to a combination of lower corn acreage and slightly lower application rates. Corn acreage is currently forecast at 75.4 million acres compared to 79 million acres last year.
Virtually all of the decline in demand is expected to be in ammonia, with urea and UAN demand projected to remain approximately at the 1994 levels. Last year, direct application ammonia accounted for roughly 37 percent of total nitrogen fertilizer demand, which was slightly higher than the long trend line. Assuming more normal weather conditions, direct application ammonia demand is expected to drop to just under five million tons.
For ammonia, the supply/demand balance should ease somewhat, particularly after the first of the year. The U.S. industry should be able to run at full capacity. Availability of offshore material, however, will continue to be a key question mark. The U.S. imports approximately one-fourth of its total ammonia supply, and is the world's largest importer of ammonia accounting for roughly one-third of total world trade.
Consequently, shifts in world production and trade have a direct impact on the U.S. balance. FSU exports appear to be returning to more normal levels. Higher production rates are also expected in a number of other exporting countries including Trinidad, Mexico, Algeria and Indonesia. As evidenced by the events of the last 12 months, however, unexpected plant outages and disruptions in supply and distribution problems in the world market can quickly change the ammonia balance.
With respect to urea, the balance is expected to continue to tighten through at least the end of the calendar year. Although offshore imports are expected to increase, they will likely remain below average until domestic prices move more in line with international prices. In contrast to the
domestic market, international prices over the last year have steadily increased due to a combination of production short falls and strong import demand from India, China, and more recently, Vietnam and Latin America.
After the first of the year, urea supply/demand is expected to remain in relative balance but then possibly weaken toward the end of the fertilizer year. When, or if, this occurs will, again, depend on what happens in the international market. Higher production levels in Indonesia, Bangladesh, Trinidad and the Arab Gulf should result in an increase in the availability of offshore material. China and India's import levels, however, remain a key question mark. Both countries dominate world urea imports accounting for as much as half of total world trade.
Another key factor will be urea domestic demand. Despite the expected drop in total nitrogen fertilizer use, solid urea d~mand is forecast to be flat to slightly up. What actually happens, however, will depend not only weather, but on the relative price relationships among urea, ammonia and ammonium nitrate.
The VAN market is expected to remain in relative balance and, once again, mirror the market of the last few years. Similar to urea, demand for VAN is expected to be flat to slightly up. Assuming reasonable weather conditions, producer inventory going into the Spring should remain relatively close to the industry average.
Changing Market Conditions
From a longer term standpoint, a key question for the nitrogen market is whether the current strong market conditions are a temporary aberration or a fundamental change in the industry? The answer is yes!
There is no doubt that the degree of upward volatility that has occurred in the nitrogen market is highly unusual. Most of the variables that impact agricultural and industrial demand for nitrogen such as weather, government acreage programs, crop prices, economic growth, interest rates, housing starts, and so forth, uncharacteristically peaked and/or moved in the same direction at the same time. While these variables were pushing
6
demand upward, production problems on a world wide basis and an unprecedented number of plant outages in the U.S. were pushing supply downward.
While the short cyclical factors obviously had an impact on this year's market, the continuing change in the structural characteristics of the industry also played a role. Since the downturn in the industry in the early 1980's, the U.S. industry has experienced an unprecedented number of closures, acquisitions and mergers. In 1980, for example, there were 51 producers in the industry with a total ammonia capacity of 21 million tons. Currently, there are 28 producers with a total capacity of 17.9 million tons. An even more significant change was the consolidation ofthe industry. The top 10 producers in the industry now control 78 percent of the ammonia capacity and an even higher percent of the industry's urea and VAN capacity.
What these changes imply is that the nitrogen industry appears to be heading into a period of relative stability. Within the U.S., the industry was plagued during most ofthe 1980's by over capacity and the inability to adjust to short-term market fluctuations. With the permanent closure of nearly five million tons of capacity, however, the industry is now in relative balance. The consolidation to fewer, larger and financially stronger players, most with multiple production sites, also gives the industry more flexibility to adapt to unexpected changes in the market. This, in sharp contrast to the mid-1980's, were numerous one-operation companies that had little choice but to run facilities and generate cash regardless of market conditions.
The changing structure of the nitrogen industry is by no means limited to the V.S. Until recently, two-thirds of the world's nitrogen capacity was either owned, operated and/or protected by central governments. That trend appears to be changing as evidenced by the events within the FSV and other eastern bloc countries, and by the rash of privatization that has occurred in Mexico, Brazil and in a number of other countries. These factors point to a future world industry where cost, economics and market conditions will play an increasing role over politics and social consider-

ations. Assuming these trends continue, this will not only impact the long-term decisions to close existing plants or to construct new capacity, but
also the day-to-day operations of existing facilities.
Ammonia Price
Per Product Ton· End of Month $250
$225
$200
$175
$150 .Jjt~iiIiiii~
$125
$100
$75 J:' ..... ~
$50--f2l~~~~~~~~i!EF'i~~~~~~~~ JFMAMJJASONDJFMAMJJASONDJFMAMJJAS
1992 1993 1994
World Ammonia Exports
FSU Exports Exporters - 1994
5
4
3
2
1
0 90 91 92 93 94
Est W. Europe
7

FSU Ammonia Exports By Country
m.2 lJn 1.9U (MIllion Tonnes Product)
Russia 2.82 3.06 2.50 Ukraine 1.16 1.04 0.90 Belarus 0.16 0.05 0.05 Baltic States DJ.2 ~ ~
Total 4.25 4.20 3.50
Unscheduled Ammonia Plant Closures - January - June 1994
Company
Air Producta Miss. Chern. DUPONT TRIAD Arcadian Comlnco Koch Monsanto Allied Signel Farmland Farmland AMC CYTEC Farmland FIrst Miss. Saskferco
Pace,FL Yazoo City, MS Beaumont, TX D'vllle, LA Augusta,GA Borger, TX Sterlington, LA Lullng,LA Hopewell. VA Dodge City, KS Lawrence, KS Verdigris, OK Fortier, LA Pollock, LA D'vllle,LA Selle Plaine, SK
Dec.Jan Jan Feb Feb
Feb-Mar Feb-Mar Feb-Mar Feb-Mar
Mar Mar Mar
Mar-Apr Apr
Mar-Apr Mar-Apr Apr-May
Loet DIn
10 2-3 10 4-5 22 4-5
9-10 4-5 2-3 1-2 3-4 2-3 7
5-6 3-4
7-10
Ammonia Domestic Disappearance
MM Product Tons 25
20
15
10
5
o
8
production (Tons)
1,300 3,500
12,200 5,800
35,200 5,500
13,150 6,300 3,100 1,100 4,400 4,400 8,700 7,800 4,800
J3.!IQIl 130,250
Industrial & Other Non-Ag Uses of Ammonia
EU2 fY..U fUM (000 Tons of Ammonia)
Direct Industrial Uses Polymers
Acrylonitrile 600 Nylons 870 Urethanes 235 Other ~
Total 2,190
Credit for Am. Sulfate ...=5a5 1,655
Other Non-ag Uses 1..m
Total Industrial & Other Uses 3,527
Urea Price
Per Product Ton - End of Month
$160 FOB U.S. Gulf
$150
$140
$130
$120
655 1,030
250 J21 2,556
~ 1,996
1.8U
3,828
785 1,225
260 ...J3i 3,009
-=5.8.Q 2,429
U1.4
4,542
.. 1992
_1993
_1994
$110-JII~~ .. -~ .. - ..... -.-..... - ..... -1If' J F M A M J J A SON 0
Urea Producer Inventory
MM Product Tons
0.8
0.6
0.4
0.2
0.0
Jut Aug Sep Oct Nov Dec Jan Feb Mar Apr May Jun Jut Aug Sep July 1993 - September 1994
9

u.s. Urea Imports July - October
000 Product Tons 900
750
600
450
300
150
Offshore
Canada
O ~BL ____________ ~paL-____________ ~
FY94 FY95
UANPrice
Per Unit of N - End of Month
$4.00 FOB Midwest
$3.60
$3.00
...,1992
_1993
_1994
J F M A M J ' J A SON 0
Corn
Wheat
Soybeans
Cotton
Other
8 MaJor Crops
Planted Acres
1m 19.1M (MM)
73.3 78.8
72.2 70.5
59.4 61 .8
13.4 14.1
-..2U -2Li
247.5 252.6
~
75.4
71.8
59.4
13.2
...2U
248.1
Fertilizer Consumption
Esl % Change EY...U En! ~ ~
(MM Nutrient Tons)
N 11.4 11.9 11 .5 -3.3%
P.O. 4.3 4.3 4.2 -2.7%
1<.0 5.1 5.2 5.1 -2.8%
10
u.s. Fertilizer Consumption
94-95 92 ~ SJ ti 0i2 Qhg.
(000 Nutrient Tons)
Ammonia 4,104 3,580 4,442 4,071 -8.4%
Urea 2,524 2,701 2,675 2,641 -1.3%
UAN 3,198 3,444 3,428 3,353 -2.2%
DAP 2,427 2,436 2,391 2,435 1.8%
1994 Ammonia Price
Per Product Ton· End of Month
$250 FOB U.S. Gulf
$220
$190
$160
$130
Drivers: • Domestic Disappearance - World Export Availability
Factors to Watch: - Producer Inventory
Jan Feb Mar Apr May Jun Jut Aug Sep Oct Nov Dec
1994 Urea Price
Per Product Ton· End of Month
$160 FOB U.S. Gulf
$150
$140
$130
$120
$110 '
Drivers: - International Price - Domestic Demand
Factors to Watch: • Offshore Imports - India/China Demand
Jan Feb Mar Apr May Jun Jut Aug Sep Oct Nov Dec
11
Index of World Urea Prices
January .. 100 150
_ E. Eur.
140 .. Mid East
_ U.S. Gulf 130
120
110
Jan Feb Mar Apr May Jun Jul Aug Sep January - September 1994
1994 UAN Price
Per Unit Ton of N - End of Month
$4.00 FOB Midwest
$3.75
$3.50
$3.25
$3.00
$2.75
Drivers: - Domestic Demand
Factors to Watch: - Urea Price - UAN imports
Jan Feb Mar Apr May Jun Jul Aug Sep Oct Nov Dec
U.s. Nitrogen Industry 1980 VS. 1994
mQ lnZ
Capacity (000 Tons of N) 21,281 17,659 Number Of Plants 91 67 Average Capacity (000 Tons of N) 234 264
Number Of Companies 51 42 Percent Of Capacity
TopS 41.5% 46.1% Top 10 60.8% 63.2%
12
~
17,841 53
337
28
58.2% 78.3%

"Free" Ammonia Demand vs. Availability
MM Product Tons 14
12
10
8
6
4
78 79 80 81 82 83 84 85 86 87 88 89 90 91 92 93 94 95 96 97 98 99 00
Changing Structure of World Nitrogen Market
~--
u.S. Ammonia Operating Rate
JASONDJFMAMJJASONDJFMAMJJAS 1992 1993 1994
13
USDA Corn Supply/Demand
1992/93 1993194 1994195 (Billion Bushels)
Beginning Stocks 1.100 2.113 Production ..JMU ~ Total Supply 10.589 8.478
Feed Use 5.301 4.715 FoodllndustriaVSeed Use 1.511 1.588 Exports 1.&U l..3.25 Total Usage 8.476 7.628
Carryover 2.113 0.850
Avg. Farm Price $2.07 $2.50
UAN Producer Inventory
0.850 ~ 10.457
5.350 1.660
J.ill 8.635
1.822
$1.90· " 'lift
MM Tons AS 280/.
1.6
1.2
0.8
0.4 Jul Aug Sep Oct Nov Dec Jan Feb Mar Apr May Jun Jul Aug Sep
July 1993 - September 1994
Ammonia Producer Inventory
MM Product Tons
2.4
2.0
1.2
0.8
0.4
Jul Aug Sep Oct Nov Dec Jan Feb Mar Apr May Jun Jul Aug Sep July 1993 - September 1994
14
The Phosphate Outlook Kenneth F. Nyiri Texasgulf Inc.
Comparing calendar year 1994 to 1993, you might come to the conclusion that the U.S. phosphate industry is having a very good year, and you would be correct. Overall, phosphate demand is expected to be up 5%, phosphate production should grow 11 % and average prices are forecast to be about 35% higher than last year's level. Indeed, 1994 has been a good year, particularly when compared to last year.
THE U.S. PHOSPHATE INDUSTRY IS HAVING A GOOD YEAR •••
Figure 1.
But least we forget, calendar year 1993 was a disaster for the U.S. phosphate industry, maybe the worst year in nearly two decades. The gains in 1994 are indeed positive, but they represent a recovery from a very depressed period the year before.
Nevertheless, the recovery that began in 1994 appears ready to continue into 1995. The growth certainly won't be as dramatic as this year's but it should be positive just the same.
The China Syndrome
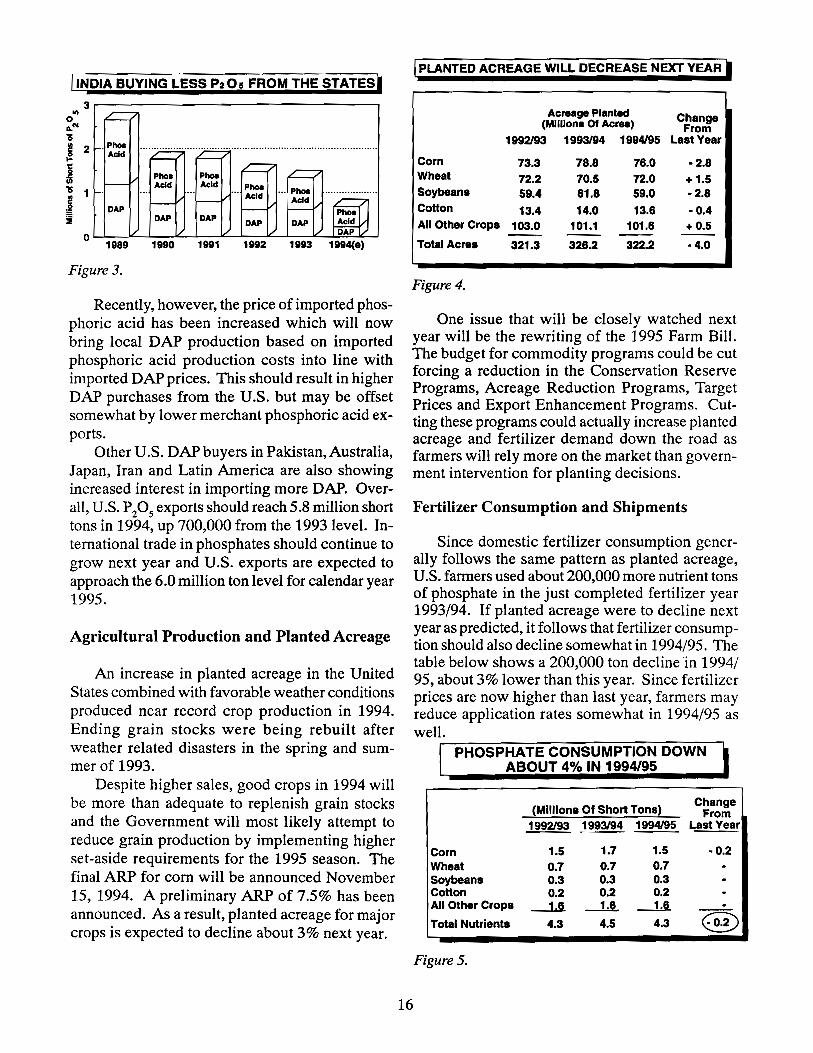
While a number of factors can influence the phosphate marketplace; Chinese DAP purchases have probably had the most dramatic impact on the U.S. market in recent years. The chart below demonstrates the volatility of Chinese buying over the last five years, including my 1994 estimates.
I CHINESE DAP IMPORTS IMPACT THE MARKET I 6~----------------------------~
! s '15 I 4 ~
j 3
'15 2 I u.I.
I 1
u.I. u.s. u.s.
o 1989 1990 1991 1992 1993 1994(8)
Figure 2.
Traditionally, the United States has supplied between 90-95% of China's DAP imports. In 1994, about half of all U.S. DAP exports will be shipped to China. It's obvious that any significant fluctuation in Chinese DAP purchases will immediately be felt back in the U.S.A. After falling over 40% in 1993, the Chinese returned to the market again in 1994 and are expected to buy about 4.8 million short tons of DAP from the States, 2 million tons more than the 1993 level.
The Chinese should continue to be a major buyer of U.S. DAP in 1995 and beyond. Recent history suggests that some of the 1994 purchases may have been to refill local stocks drawn down from the previous year. However, at this time, it appears that the Chinese will buy about the same or slightly less DAP in 1995.
15
India EtAI
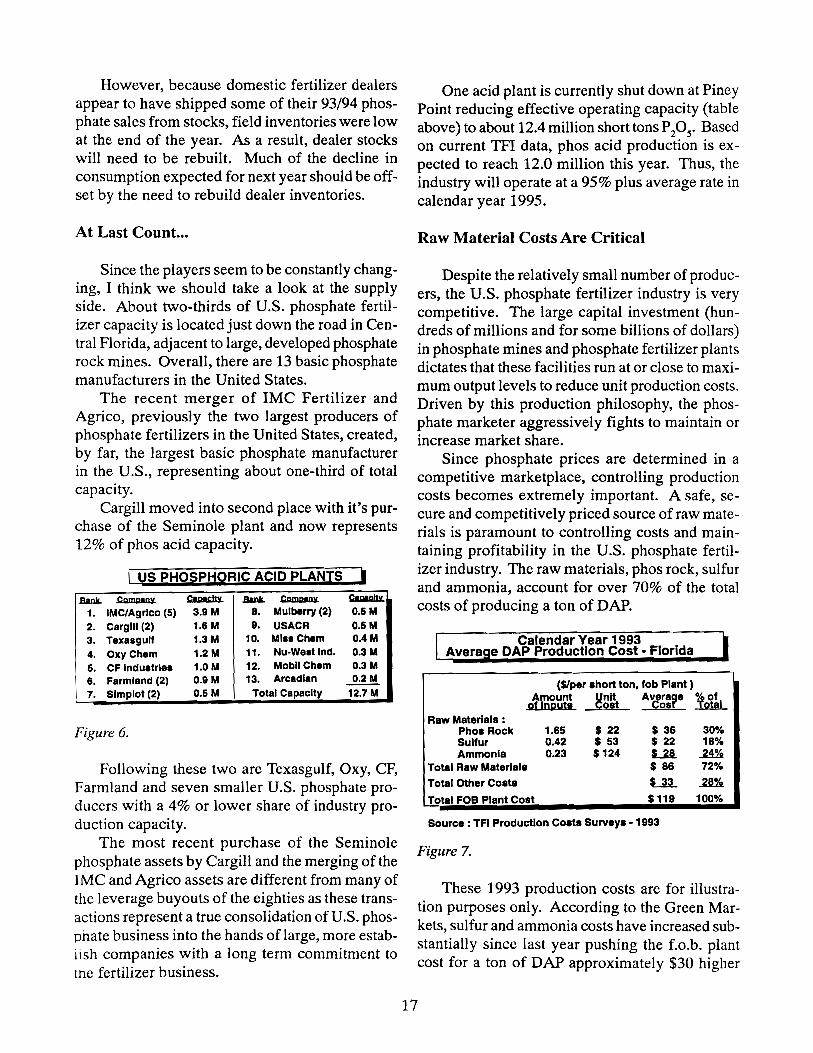
The real potential for growth in 1995 appears to be outside of China. India, in particular, has been buying less and less PzOs from the States. Deregulation of phosphate prices in India caused a sharp decline in phosphate use beginning in 1993. In addition, subsidies for local DAP manufacturers in India favored phosphoric acid imports over U.S. DAP. The combination of these two events resulted in lower purchases from U.S. DAP suppliers in 1993 and again in 1994.
[INDIA BUYING LESS P20, FROM THE STATES.
... o e.N ,.
3r-------------------------------,
§ 2 .-. PhOs
AcId
I ,. 1
I DAP ::Ii
o 1989 1990 1991 1992 1993
Figure 3.
Recently, however, the price of imported phosphoric acid has been increased which will now bring local DAP production based on imported phosphoric acid production costs into line with imported DAP prices. This should result in higher DAP purchases from the U.S. but may be offset somewhat by lower merchant phosphoric acid exports.
Other U.S. DAP buyers in Pakistan, Australia, Japan, Iran and Latin America are also showing increased interest in importing more DAP. Overall, U.S. P 20
5 exports should reach 5.8 million short
tons in 1994, up 700,000 from the 1993 level. International trade in phosphates should continue to grow next year and U.S. exports are expected to approach the 6.0 million ton level for calendar year 1995.
Agricultural Production and Planted Acreage
An increase in planted acreage in the United States combined with favorable weather conditions produced near record crop production in 1994. Ending grain stocks were being rebuilt after weather related disasters in the spring and summer of 1993.
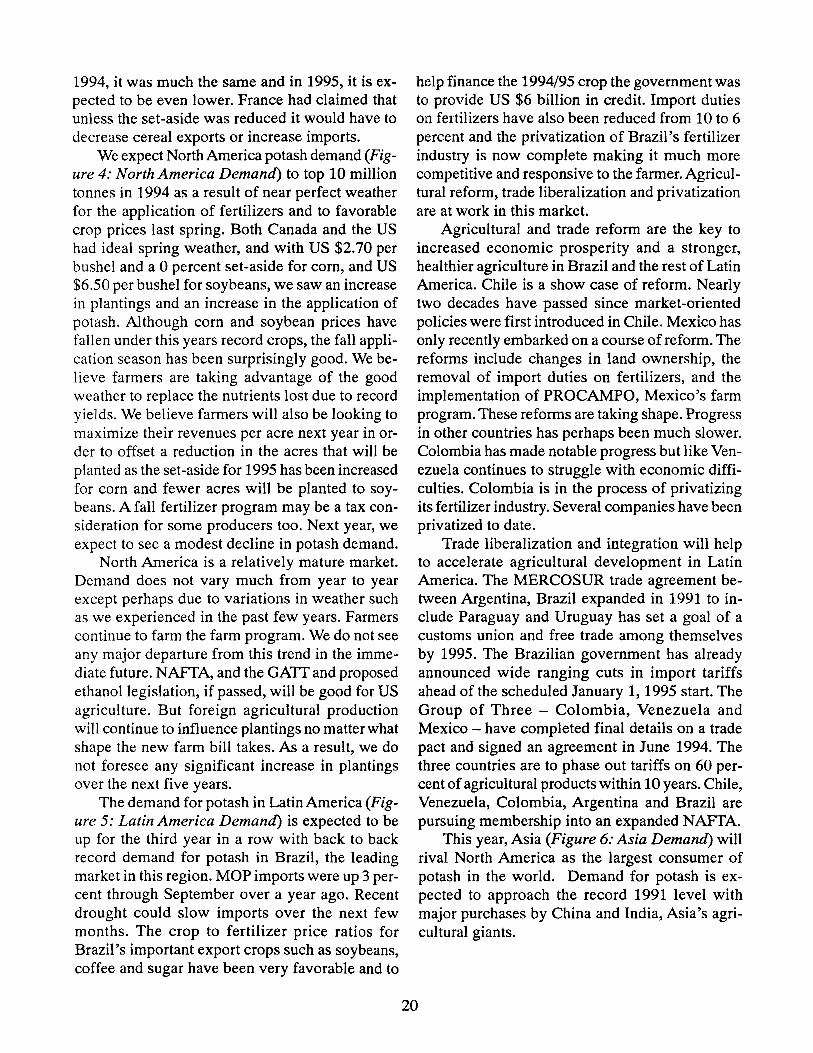
Despite higher sales, good crops in 1994 will be more than adequate to replenish grain stocks and the Government will most likely attempt to reduce grain production by implementing higher set-aside requirements for the 1995 season. The final ARP for corn will be announced November 15, 1994. A preliminary ARP of 7.5% has been announced. As a result, planted acreage for major crops is expected to decline about 3% next year.
I PLANTED ACREAGE WILL DECREASE NEXT YEAR.
Acreage Planted Change (Millions Of Acres) From 1992193 1993194 1994195 LaatYear
Corn 73.3 78.8 76.0 -2.8 Wheat 72.2 70.5 72.0 + 1.5 Soybeans 59.4 61.8 59.0 -2.8 Cotton 13.4 14.0 13.6 - 0.4 All O1her Crops 103.0 101.1 101.6 +0.5 -- -- --Total Acres 321.3 326.2 322.2 -4.0
Figure 4.
One issue that will be closely watched next year will be the rewriting of the 1995 Farm Bill. The budget for commodity programs could be cut forcing a reduction in the Conservation Reserve Programs, Acreage Reduction Programs, Target Prices and Export Enhancement Programs. Cutting these programs could actually increase planted acreage and fertilizer demand down the road as farmers will rely more on the market than government intervention for planting decisions.
Fertilizer Consumption and Shipments
16
Since domestic fertilizer consumption generally follows the same pattern as planted acreage, U.S. farmers used about 200,000 more nutrient tons of phosphate in the just completed fertilizer year 1993/94. If planted acreage were to decline next year as predicted, it follows that fertilizer consumption should also decline somewhat in 1994/95. The table below shows a 200,000 ton decline in 1994/ 95, about 3% lower than this year. Since fertilizer prices are now higher than last year, farmers may reduce application rates somewhat in 1994/95 as well.
r--P-H-O~S--:P-:-H:-:A~T:-=E:-::C::-::O:-:N-:-:S::-::U"':':M:-::P=T=IO-=-=-=N-::D:-:::O::-W::-:::N:-:---1
ABOUT 4% IN 1994/95
Change (Millions Of Short Ton8) From
1992193 1993194 1994195 Last Year
Corn 1.5 1.7 1.5 - 0.2 Wheat 0.7 0.7 0.7 Soybeans 0.3 0.3 0.3 Cotton 0.2 0.2 0.2 All Other Crops --U -1&. ---Ll Total Nutrients 4.3 4.5 4.3
Figure 5.
However, because domestic fertilizer dealers appear to have shipped some of their 93/94 phosphate sales from stocks, field inventories were low at the end of the year. As a result, dealer stocks will need to be rebuilt. Much of the decline in consumption expected for next year should be offset by the need to rebuild dealer inventories.
At Last Count ••.
Since the players seem to be constantly changing, I think we should take a look at the supply side. About two-thirds of U.S. phosphate fertilizer capacity is located just down the road in Central Florida, adjacent to large, developed phosphate rock mines. Overall, there are 13 basic phosphate manufacturers in the United States.
The recent merger of IMC Fertilizer and Agrico, previously the two largest producers of phosphate fertilizers in the United States, created, by far, the largest basic phosphate manufacturer in the U.S., representing about one-third of total capacity.
Cargill moved into second place with it's purchase of the Seminole plant and now represents 12% of phos acid capacity.
I US PHOSPHORIC ACID PLANTS •
.BaIl.IL ~ CIIIGllx. .BaIl.IL ~ ~
1. IMC/Agrlco (5) 3.9M 8. Mulberry (2) O.15M 2. Cargill (2) 1.6M 9. USACR O.15M 3. Texasgulf 1.3 M 10. MlaaChem 0.4M
4. OxyChem 1.2M 11. Nu-Weat Ind. 0.3M
5. CF Induatrles 1.0M 12. MobliChem 0.3M
6. Farmland (2) O.9M 13. Arcadian .J!:!!! 7. Simplot (2) O.SM Total Capacity 12.7M
Figure 6.
Following these two are Texasgulf, Oxy, CF, Farmland and seven smaller U.S. phosphate producers with a 4% or lower share of industry production capacity.
The most recent purchase of the Seminole phosphate assets by Cargill and the merging of the IMC and Agrico assets are different from many of the leverage buyouts of the eighties as these transactions represent a true consolidation of U.S. phosphate business into the hands of large, more establish companies with a long term commitment to the fertilizer business.
One acid plant is currently shut down at Piney Point reducing effective operating capacity (table above) to about 12.4 million short tons P 205' Based on current TFI data, ph os acid production is expected to reach 12.0 million this year. Thus, t~e industry will operate at a 95% plus average rate In
calendar year 1995.
Raw Material Costs Are Critical
Despite the relatively small number of producers, the U.S. phosphate fertilizer industry is very competitive. The large capital investment (hundreds of millions and for some billions of dollars) in phosphate mines and phosphate fertilizer plants dictates that these facilities run at or close to maximum output levels to reduce unit production costs. Driven by this production philosophy, the phosphate marketer aggressively fights to maintain or increase market share.
Since phosphate prices are determined in a competitive marketplace, controlling production costs becomes extremely important. A safe, secure and competitively priced source of raw materials is paramount to controlling costs and maintaining profitability in the U.S. phosphate fertilizer industry. The raw materials, phos rock, sulfur and ammonia, account for over 70% of the total costs of producing a ton of DAP.
Calendar Year 1993 . e DAP Production Cost· Flonda
($Iper short ton, fob Plant ) Amount Hnlt A~rage 100t~1 of Inputl OltOlr
Raw Materlall : Phol Rock 1.65 $22 $ 36 30% Sulfur 0.42 $ 53 $ 22 18% Ammonia 0.23 $124 l...2§. ..2D
Total Raw Materlall $86 72%
Total Other COlta ~ ..2§%.
Total FOB Plant COlt $119 100%
Source: TFI Productlon Co.w SurveYI • 1993
Figure 7.
These 1993 production costs are for illustration purposes only. According to the Green Markets, sulfur and ammonia costs have increased substantially since last year pushing the f.o.b. plant cost for a ton of DAP approximately $30 higher
17

than the 1993 average. However, the underlying message does not change that raw material costs represent a substantial portion of overall production costs.
Long Term
It is critical that the phosphate producer control raw material costs not only in the short term, but also in the long term as well. Most U.S. phosphate producers purchase their sulfur and ammonia on the merchant market. While prices of these two raw materials will fluctuate based on the supply/demand balance within their market, the long term outlook for supply for these two raw materials appears to be adequate.
However, future phos rock supply may be a more serious problem. Dwindling U.S. phosphate rock reserves will force many phosphate fertilizer producers to make major investments (in the hundreds of millions of dollars) in new phos rock production capacity in the near future or consider alternative sources of supply.
I U.S. PHOS ROCK SUPPLY &. DEMAND i 70
(Millions of Tons of Rock)
r- ...................... ...... Pbol.RQl::k.CaPAlc:lty ..... · ....... ··· .. ······ .. ······ .... -Domestic ROC,!-R="UI~~ I" I" I" - ~ I'" I" r-. 40
30
20
10
Figure 8.
This graph shows Tg's estimate of production from existing phos rock mining capacity compared to an estimate of domestic ph os rock demand. While the timing of the mine-outs can vary by several years on either side of this estimate, the message is still pretty clear.
Additionally, new U.s. phos rock capacity is neither guaranteed nor quickly added. The lengthy permitting process for new mines - up to 10 years - and strong resistance by local environmental groups trying to block any new mining venture will make it extremely difficult to develop a new phos-
18
phate rock mine in the future. For these reasons. few, if any, new phosphate rock mines may be developed in the United States.
The phosphate fertilizer producer with a safe. secure and long term source of phosphate rock wlll have an advantage in the phosphate fertilizer marketplace of tomorrow. Purchasing imported rock may be an alternative, but it may be an expensive and even risky option. Two u.s. phosphate manufacturers are currently importing their phosphate rock requirements from Morocco. Others could follow.
The Bottom Line
Monthly, weekly or even daily variations in buying patterns in the phosphate market are expected. The U.S. phosphate fertilizer business is both seasonal and dependent on international trade. A down year in 1993 was followed by an up year in 1994. The U.S. industry must also consider the impact oflonger term trends, particularly the availability and price of important inputs.
To summarize the current outlook for phosphate supply and demand from the States, the overall market should remain in relative balance - demand should continue to grow, particularly in the offshore markets. At this time, the outlook for 1995 is positive.
Outlook For Potash Rick Brasnett pes Sales
I thank you for this opportunity to speak to you today on the outlook for potash. Let me begin first by looking back at what has happened to our industry since 1988.
Looking Back
Five years ago, no one would have (Figure 1: World Potash Supply and Demand) predicted that we would loose one-third of our market leaving the industry in a tremendous state of over capacity. The decline in world potash demand was du::, to the collapse of Communism in East Europe ana the FSU, and CAP reform in West Europe as de·

mand for the most part held its own in the Rest of the World.
Times were tough and producers were faced with difficult decisions. There were mine closures, mergers and buyouts. Horizon Potash closed its mine in April 1993. The German industry was merged and by year-end eight out of 10 mines in former East Germany were closed. And in 1993, PCS acquired the potash assets of the Potash Company of America from Rio Algom. The mines that operated during this period operated at very low and unacceptable rates. In 1993, the industry operated at less than 60 percent of its nominal or listed capacity, or at roughly two-thirds of its real capacity.
Thrning the Corner in 1994 - Looking Ahead
Today, we believe (Figure 2: World Potash Demand) the industry has turned the corner. The outlook for the potash industry is much brighter than a year ago. We are forecasting an increase in world demand in 1994 inspite of reports that FSU demand continues to decline. 1995 looks good too.
World wheat and coarse grain consumption is expected to exceed production for the second year in a row, even with this years bountiful harvest in the US, resulting in the lowest stock levels as a percent of consumption in 20 years. Rice stocks are headed in the same direction. All major soft commodity prices from palm oil to sugar and coffee are up over a year ago. Coffee prices tripled on the New York Commodity Exchange following Brazil's worst frost since 1981.
We believe that world potash demand has bottomed and that we are now on an upswing in demand. In fact, we believe 1994 marks the beginning of perhaps a period of more steady but not necessarily uninterrupted growth in world potash demand.
Let me explain why we believe this.
In Europe, we expect (Figure 3: Europe Potash Demand) to see perhaps a slight increase in potash demand this year.
We expect to see an increase in potash use in Eastern Europe as a result of more favorable spring weather and an increase to some extent in the avail-
ability of government assistance for agriculture. A system of cheap credit was introduced in Hungary this spring to purchase much needed fertilizers as application rates had fallen to a fraction of the former levels. Romania has earmarked US $285 million in credit for farmers to buy seed and fertilizer for this year's crop. Something has to be done. East European farmers have been mining the soils heavily for four year and the effects on crop yields are beginning to show. Demand for potash last year was only 15 percent of the 1988 level.
The transition from state farms to newly privatized farms in East Europe has been difficult. The privatization of land is complete in Romania and is underway in Bulgaria. Agriculture in Hungary and the former Czechoslovakia is dominated by large scale transformed cooperatives. The new breed of farmers have much to learn but as the free market system evolves more fertilizer will be used. We expect to see further increases next year and the year after but we do not know whether application rates will ever reach the previous high levels. Some experts believe fertilizers were overused under the Communist state-planning system.
In Western Europe, we expect to see about the same level of demand for potash this year. And we expect an increase next year. CAP reform and dry weather has impacted plantings and fertilizer application in Western Europe over the past few years. 1994 was no exception. But the set-aside area has stabilized and former East German farmers are slowly getting back on their feet. European Union figures show a less than one percent decrease in the area planted in 1994 and due to pressure from its members, fewer acres are to be set-aside next year. The European Union Commission just recently approved a reduction in the set-aside to 12 percent for 1995.
We believe demand has bottomed for potash in Western Europe. We do not expect to see any significant increase in the set-aside area in the near future. It is unlikely the set-aside will ever reach the 15 percent target. Many experts believe this target is not achievable and that the true figure is perhaps 10 or 11 percent as small producers are exempt from the program. In 1993, the set-aside program was responsible for taking 4.7 million hectares or nearly 10 percent of the arable land base area (mostly in cereals) out of production. In
19
1994, it was much the same and in 1995, it is expected to be even lower. France had claimed that unless the set-aside was reduced it would have to decrease cereal exports or increase imports.
We expect North America potash demand (Figure 4: North America Demand) to top 10 million tonnes in 1994 as a result of near perfect weather for the application of fertilizers and to favorable crop prices last spring. Both Canada and the US had ideal spring weather, and with US $2.70 per bushel and a 0 percent set-aside for corn, and US $6.50 per bushel for soybeans, we saw an increase in plantings and an increase in the application of potash. Although corn and soybean prices have fallen under this years record crops, the fall application season has been surprisingly good. We believe farmers are taking advantage of the good weather to replace the nutrients lost due to record yields. We believe farmers will also be looking to maximize their revenues per acre next year in order to offset a reduction in the acres that will be planted as the set-aside for 1995 has been increased for corn and fewer acres will be planted to soybeans. A fall fertilizer program may be a tax consideration for some producers too. Next year, we expect to see a modest decline in potash demand.
North America is a relatively mature market. Demand does not vary much from year to year except perhaps due to variations in weather such as we experienced in the past few years. Farmers continue to farm the farm program. We do not see any major departure from this trend in the immediate future. NAFTA, and the GAIT and proposed ethanol legislation, if passed, will be good for US agriculture. But foreign agricultural production will continue to influence plantings no matter what shape the new farm bill takes. As a result, we do not foresee any significant increase in plantings over the next five years.
The demand for potash in Latin America (Figure 5: Latin America Demand) is expected to be up for the third year in a row with back to back record demand for potash in Brazil, the leading market in this region. MOP imports were up 3 percent through September over a year ago. Recent drought could slow imports over the next few months. The crop to fertilizer price ratios for Brazil's important export crops such as soybeans, coffee and sugar have been very favorable and to
help finance the 1994/95 crop the government was to provide US $6 billion in credit. Import duties on fertilizers have also been reduced from 10 to 6 percent and the privatization of Brazil's fertilizer industry is now complete making it much more competitive and responsive to the farmer. Agricultural reform, trade liberalization and privatization are at work in this market.
Agricultural and trade reform are the key to increased economic prosperity and a stronger, healthier agriculture in Brazil and the rest of Latin America. Chile is a show case of reform. Nearly two decades have passed since market-oriented policies were first introduced in Chile. Mexico has only recently embarked on a course of reform. The reforms include changes in land ownership, the removal of import duties on fertilizers, and the implementation of PROCAMPO, Mexico's farm program. These reforms are taking shape. Progress in other countries has perhaps been much slower. Colombia has made notable progress but like Venezuela continues to struggle with economic difficulties. Colombia is in the process of privatizing its fertilizer industry. Several companies have been privatized to date.
Trade liberalization and integration will help to accelerate agricultural development in Latin America. The MERCOSUR trade agreement between Argentina, Brazil expanded in 1991 to include Paraguay and Uruguay has set a goal of a customs union and free trade among themselves by 1995. The Brazilian government has already announced wide ranging cuts in import tariffs ahead of the scheduled January 1, 1995 start. The Group of Three - Colombia, Venezuela and Mexico - have completed final details on a trade pact and signed an agreement in June 1994. The three countries are to phase out tariffs on 60 percent of agricultural products within 10 years. Chile, Venezuela, Colombia, Argentina and Brazil are pursuing membership into an expanded NAFTA.
20
This year, Asia (Figure 6: Asia Demand) will rival North America as the largest consumer of potash in the world. Demand for potash is expected to approach the record 1991 level with major purchases by China and India, Asia's agricultural giants.
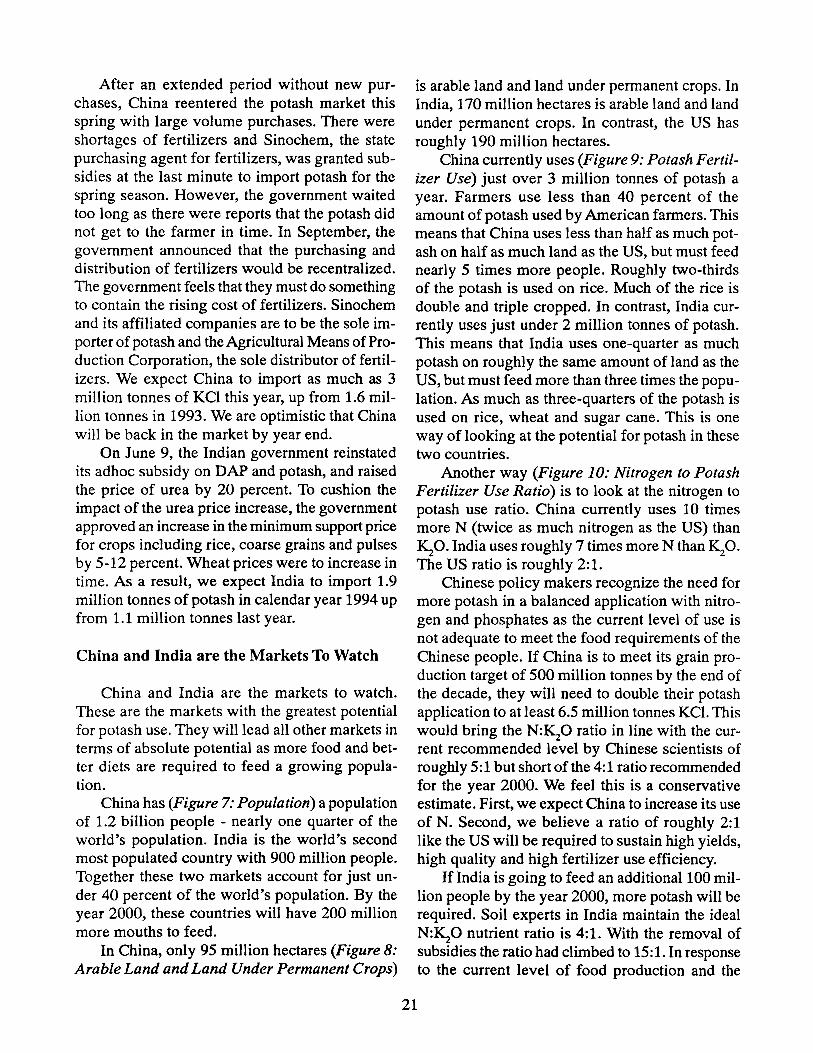
After an extended period without new purchases, China reentered the potash market this spring with large volume purchases. There were shortages of fertilizers and Sinochem, the state purchasing agent for fertilizers, was granted subsidies at the last minute to import potash for the spring season. However, the government waited too long as there were reports that the potash did not get to the farmer in time. In September, the government announced that the purchasing and distribution of fertilizers would be recentralized. The government feels that they must do something to contain the rising cost of fertilizers. Sinochem and its affiliated companies are to be the sale importer of potash and the Agricultural Means of Production Corporation, the sale distributor of fertilizers. We expect China to import as much as 3 million tonnes of KCI this year, up from 1.6 million tonnes in 1993. We are optimistic that China will be back in the market by year end.
On June 9, the Indian government reinstated its adhoc subsidy on DAP and potash, and raised the price of urea by 20 percent. To cushion the impact of the urea price increase, the government approved an increase in the minimum support price for crops including rice, coarse grains and pulses by 5-12 percent. Wheat prices were to increase in time. As a result, we expect India to import 1.9 million tonnes of potash in calendar year 1994 up from 1.1 million tonnes last year.
China and India are the Markets To Watch
China and India are the markets to watch. These are the markets with the greatest potential for potash use. They will lead all other markets in terms of absolute potential as more food and better diets are required to feed a growing population.
China has (Figure 7: Population) a population of 1.2 billion people - nearly one quarter of the world's population. India is the world's second most populated country with 900 million people. Together these two markets account for just under 40 percent of the world's population. By the year 2000, these countries will have 200 million more mouths to feed.
In China, only 95 million hectares (Figure 8: Arable Land and Land Under Permanent Crops)
is arable land and land under permanent crops. In India, 170 million hectares is arable land and land under permanent crops. In contrast, the US has roughly 190 million hectares.
China currently uses (Figure 9: Potash Fertilizer Use) just over 3 million tonnes of potash a year. Farmers use less than 40 percent of the amount of potash used by American farmers. This means that China uses less than half as much potash on half as much land as the US, but must feed nearly 5 times more people. Roughly two-thirds of the potash is used on rice. Much of the rice is double and triple cropped. In contrast, India currently uses just under 2 million tonnes of potash. This means that India uses one-quarter as much potash on roughly the same amount of land as the US, but must feed more than three times the population. As much as three-quarters of the potash is used on rice, wheat and sugar cane. This is one way of looking at the potential for potash in these two countries.
Another way (Figure 10: Nitrogen to Potash Fertilizer Use Ratio) is to look at the nitrogen to potash use ratio. China currently uses 10 times more N (twice as much nitrogen as the US) than ~O. India uses roughly 7 times more N than ~O. The US ratio is roughly 2:1.
Chinese policy makers recognize the need for more potash in a balanced application with nitrogen and phosphates as the current level of use is not adequate to meet the food requirements of the Chinese people. If China is to meet its grain production target of 500 million tonnes by the end of the decade, they will need to double their potash application to at least 6.5 million tonnes KCl. This would bring the N:~O ratio in line with the current recommended level by Chinese scientists of roughly 5: 1 but short of the 4: 1 ratio recommended for the year 2000. We feel this is a conservative estimate. First, we expect China to increase its use of N. Second, we believe a ratio of roughly 2:1 like the US will be required to sustain high yields, high quality and high fertilizer use efficiency.
If India is going to feed an additional 100 million people by the year 2000, more potash will be required. Soil experts in India maintain the ideal N:~O nutrient ratio is 4:1. With the removal of subsidies the ratio had climbed to 15:1. In response to the current level of food production and the
21
growing imbalance in fertilizer usage, the government reinstated the adhoc subsidy for DAP and potash for the 1994/95 season. This will help this year. But, next year and the year after, we do not know what action India will take to help agriculture. Nevertheless, we remain confident that some form of assistance will be given the farmer while agriculture and the fertilizer industry is transformed, as the government is certainly aware of the danger of not having enough fertilizers.
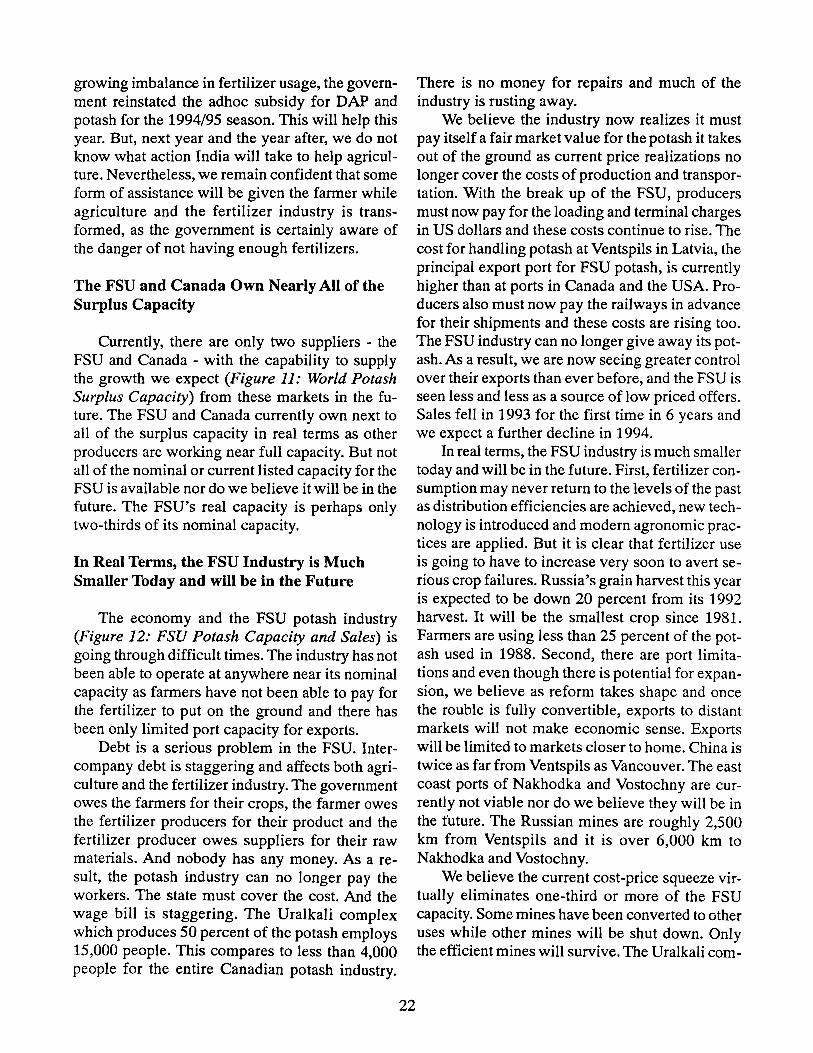
The FSU and Canada Own Nearly All of the Surplus Capacity
Currently, there are only two suppliers - the FSU and Canada - with the capability to supply the growth we expect (Figure 11 .. World Potash Surplus Capacity) from these markets in the future. The FSU and Canada currently own next to all of the surplus capacity in real terms as other producers are working near full capacity. But not all of the nominal or current listed capacity for the FSU is available nor do we believe it will be in the future. The FSU's real capacity is perhaps only two-thirds of its nominal capacity.
In Real Terms, the FSU Industry is Much Smaller Today and will be in the Future
The economy and the FSU potash industry (Figure 12: FSU Potash Capacity and Sales) is going through difficult times. The industry has not been able to operate at anywhere near its nominal capacity as farmers have not been able to pay for the fertilizer to put on the ground and there has been only limited port capacity for exports.
Debt is a serious problem in the FSU. Intercompany debt is staggering and affects both agriculture and the fertilizer industry. The government owes the farmers for their crops, the farmer owes the fertilizer producers for their product and the fertilizer producer owes suppliers for their raw materials. And nobody has any money. As a result, the potash industry can no longer pay the workers. The state must cover the cost. And the wage bill is staggering. The Uralkali complex which produces 50 percent of the potash employs 15,000 people. This compares to less than 4,000 people for the entire Canadian potash industry.
22
There is no money for repairs and much of the industry is rusting away.
We believe the industry now realizes it must pay itself a fair market value for the potash it takes out of the ground as current price realizations no longer cover the costs of production and transportation. With the break up of the FSU, producers must now pay for the loading and terminal charges in US dollars and these costs continue to rise. The cost for handling potash at Ventspils in Latvia, the principal export port for FSU potash, is currently higher than at ports in Canada and the USA. Producers also must now pay the railways in advance for their shipments and these costs are rising too. The FSU industry can no longer give away its potash. As a result, we are now seeing greater control over their exports than ever before, and the FSU is seen less and less as a source of low priced offers. Sales fell in 1993 for the first time in 6 years and we expect a further decline in 1994.
In real terms, the FSU industry is much smaller today and will be in the future. First, fertilizer consumption may never return to the levels of the past as distribution efficiencies are achieved, new technology is introduced and modern agronomic practices are applied. But it is clear that fertilizer use is going to have to increase very soon to avert serious crop failures. Russia's grain harvest this year is expected to be down 20 percent from its 1992 harvest. It will be the smallest crop since 198!. Farmers are using less than 25 percent of the potash used in 1988. Second, there are port limitations and even though there is potential for expansion, we believe as reform takes shape and once the rouble is fully convertible, exports to distant markets will not make economic sense. Exports will be limited to markets closer to home. China is twice as far from Ventspils as Vancouver. The east coast ports of Nakhodka and Vostochny are currently not viable nor do we believe they will be in the future. The Russian mines are roughly 2,500 km from Ventspils and it is over 6,000 km to Nakhodka and Vostochny.
We believe the current cost-price squeeze virtually eliminates one-third or more of the FSU capacity. Some mines have been converted to other uses while other mines will be shut down. Only the efficient mines will survive. The Uralkali com-

plex in Russia is to be privatized and the the oldest mine in this group could be the first to close.
The Canadian Industry Should Benefit the Most from these Developments
The Canadian industry (Figure 13: Canadian Potash Capacity and Sales) should benefit the most from these developments. Canada is the only other producer with any real surplus capacity as we do not expect any major new production over the next 3-5 years. It takes 5 years and a lot of capital to develop a new potash mine. The only new developments we see in the near future is a further expansion in Jordan, a small project in Chile and possibly some production from projects in Thailand and China towards the turn of the century. There could be some loss of production from shutdowns in the US and France during this period.
Canadian producers will benefit from the increase in export sales. We do not know exactly by how much or how quickly these sales will materi-
alize but we are confident they will as we look to China and India and, of course, other markets in Asia and Latin America for new opportunities. The challenge for us as the largest producer of potash in the world with 20 percent of the world's capacity in real terms and 40 percent of the surplus capacity and the one to gain the most is how to manage through this period of over capacity. We will continue to supply the market as needed in order to achieve a reasonable return on our investment for our shareholders. Our goals are no different from the farmer who wants to earn a living and profit from his labor and capital.
No doubt the industry will be different as we enter the 21st century. We can expect a more productive agriculture and an even more efficient potash industry. But perhaps when we look back at the late 1980's and early 1990's, the most striking change will be the return to modest profitability after an era of tremendous economic upheaval due mostly to the collapse of Communism in East Europe and the former Soviet Union.
FIGURE 1: WORLD POTASH SUPPLY AND DEMAND IN REAL TERMS
Million Tonnes KCI 70
60
50
40
30
20
10
o 1988 1989 1990 1991 1992 1993
Calendar Years
23
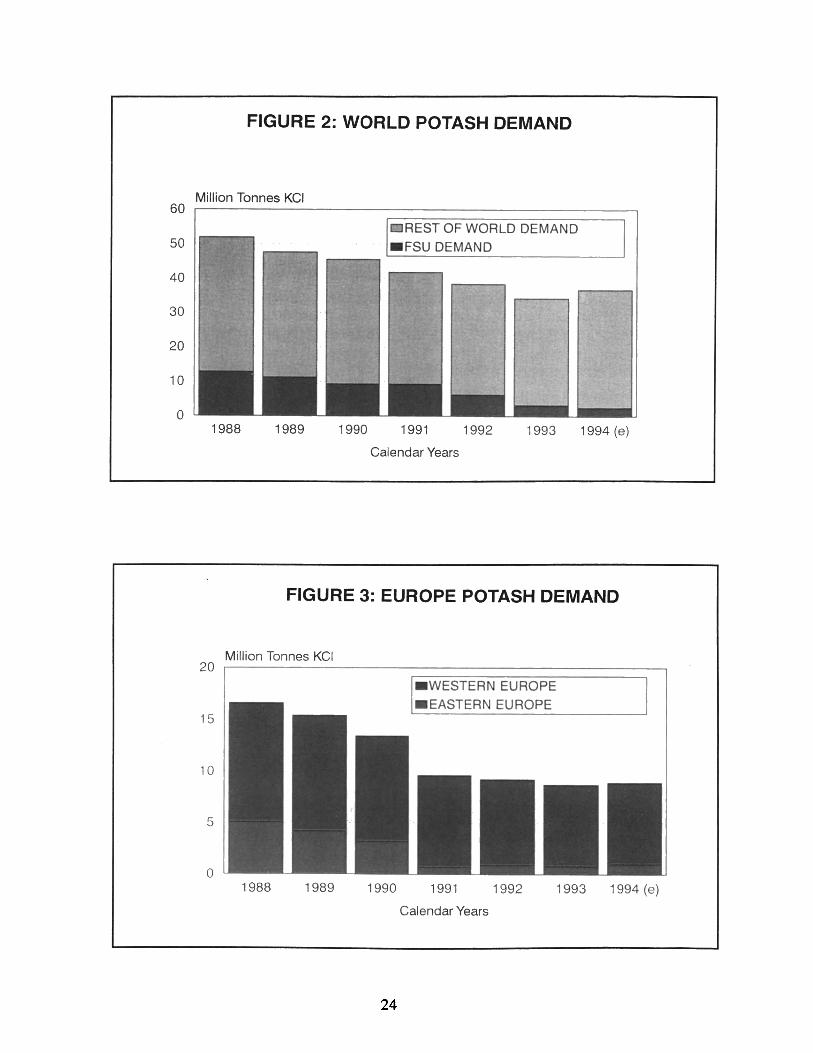
FIGURE 2: WORLD POTASH DEMAND
Million Tonnes KCI 60 ,-------------------------------------------,
50
40
30
20
10
o
REST OF WORLD DEMAND
1988 1989 1990 1991 1992 1993 1994 (e)
Calendar Years
FIGURE 3: EUROPE POTASH DEMAND
Million Tonnes KCI 20 ,-------------------------------------------,
15
10
5
o 1988 1989 1990
24
_WESTERN EUROPE _EASTERN EUROPE
1991 1992
Calendar Years
1993 1994 (e)
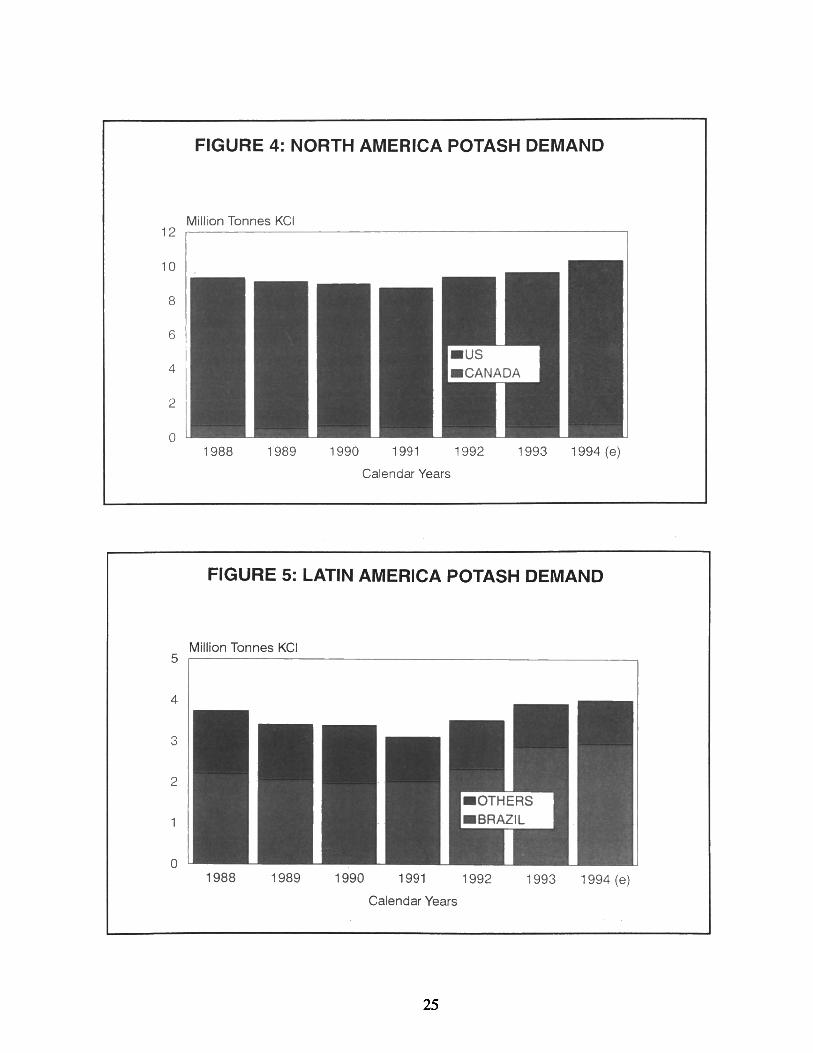
FIGURE 4: NORTH AMERICA POTASH DEMAND
Million Tonnes KCI 12 ~------------------------------------------.
10
8
6
4
2
o 1988 1989 1990 1991 1992 1993 1994 (e)
Calendar Years
FIGURE 5: LATIN AMERICA POTASH DEMAND
Million Tonnes KCI 5
4
3
2
o 1988 1989 1990 1991 1992 1993 1994 (e)
Calendar Years
25
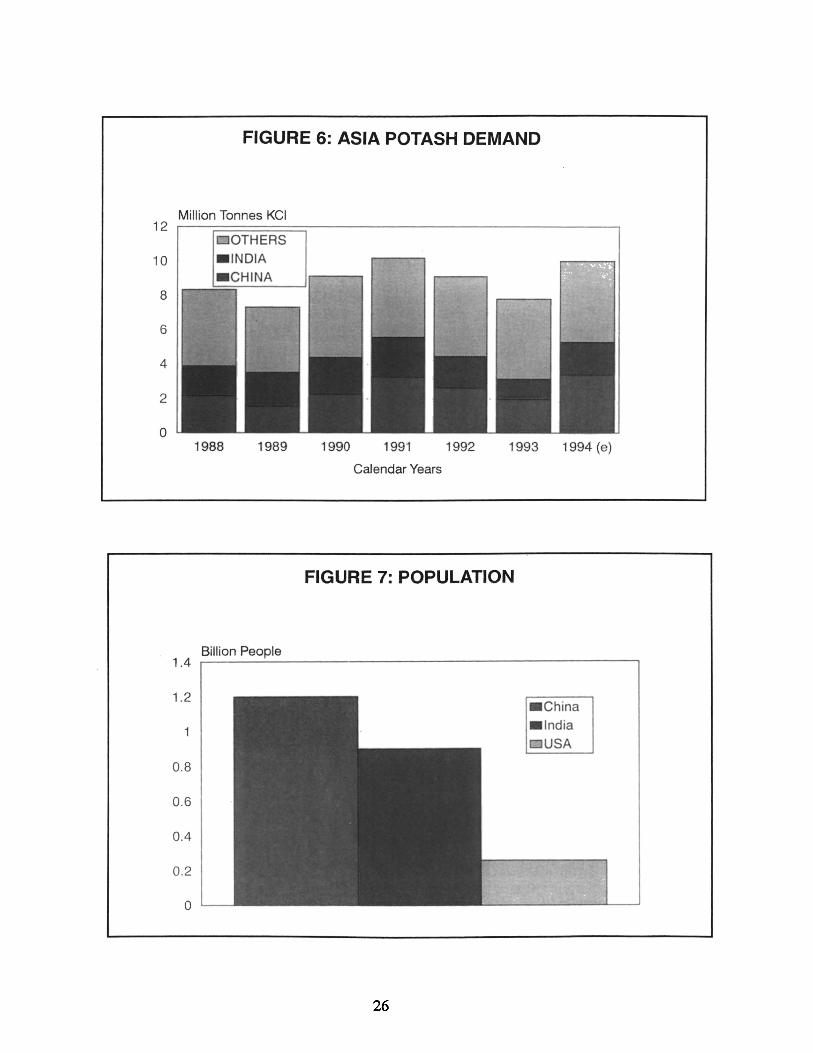
FIGURE 6: ASIA POTASH DEMAND
Million Tonnes KCI 12 r--'========~----------------------------~
10
8
6
4
2
a 1988 1989 1990 1991 1992 1993 1994 (e)
Calendar Years
FIGURE 7: POPULATION
Billion People 1.4 .------~----------------------------------__,
1.2
0 .8
0.6
0.4
0.2
a
26
.China
. India USA

FIGURE 8: 'ARABLE LAND & LAND UNDER PERMANENT CROPS
Million Hectares 250 ~----------------------------------------,
.China 200 .India
DUSA
150
100
50
o
FIGURE 9: ·POTASH FERTILIZER USE
Million Tonnes KCI 10 ,------------------------------------------
8
6
4
2
o
.China
. India
USA
27
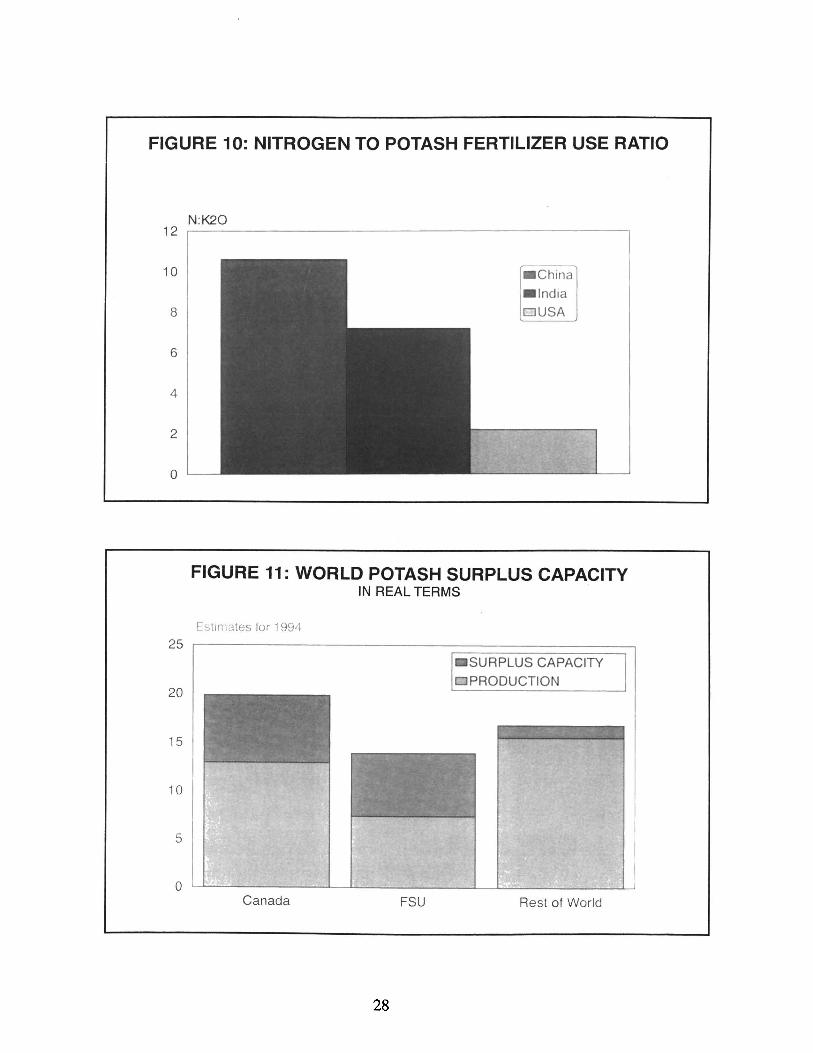
FIGURE 10: NITROGEN TO POTASH FERTILIZER USE RATIO
N:K20 12 ~----------------------------------------~
10
8
6
4
2
o
.China
. India DUSA
FIGURE 11: WORLD POTASH SURPLUS CAPACITY IN REAL TERMS
Estimates for 1994
25 ~--------------------~==============~
20
15
10
5
. SURPLUS CAPACITY DPRODUCTION
o ~----------~~--________ ~~L-__________ ~
Canada FSU Rest of World
28
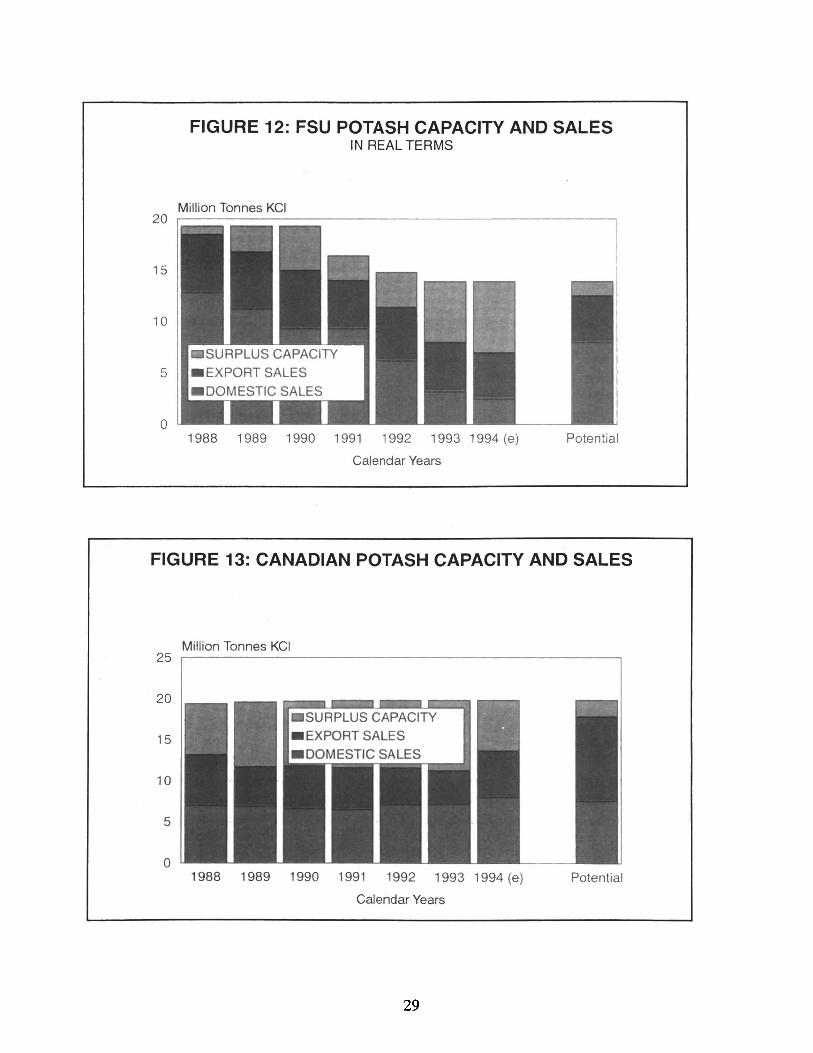
FIGURE 12: FSU POTASH CAPACITY AND SALES IN REAL TERMS
Million Tonnes KCI 20 ,-------------------------------------------,
15
10
5
o 1988 1989 1990 1991 1992 1993 1994 (e)
Calendar Years
Potential
FIGURE 13: CANADIAN POTASH CAPACITY AND SALES
Million Tonnes KCI 25 ~------------------------------------------.
20
15
10
5
o 1988 1989 1990 1991 1992 1993 1994 (e)
Calendar Years
29
Potential

The Outlook For Sulphur Robert C. Zwerneman Freeport MeMo Ran
It's a pleasure to be here this morning with such a fine group of speakers and panelists. I would like to thank David Leyshon and the members of the Round Table planning committee for giving us the opportunity to present the sulphur situation in North America.
My intent this morning is to look forward and provide you with a glimpse of the future so you can appreciate how uniquely challenging it is to be not only in the sulphur business, but in the sulphur mining business today. While a thorough presentation on the overall sulphur supply/demand outlook should only take about five minutes, I'm going to spend the remaining time explaining why there are fewer and fewer sulphur producers at fertilizer industry meetings such as this one. In the process, I hope you'll gain some insight into what has caused the tremendous drop in sulphur values, why no one can tell you what truly lies ahead, such that you should believe them, and how unsuspecting the world's sulphur consumers are today. The consultantS' tell consumers they should have no trouble lining up supplies through the balance of the decade. I don't challenge their methods or conclusions, and they are certainly not to blame for the tremendous fall in sulphur prices, so I'll just blame the Canadians.
In the beginning ... someone found a need for this stuff. Once used by pagan priests nearly 4,000 years ago as a medicine, fumigant or in religious rites, sulphur has transcended time to become one of the key ingredients in the production of fertilisers, pulp and paper, titanium dioxide, hydrofluoric acid, caprolactam and carbon disulphide and on and on. You couldn't imagine a world without sulphur; life would be completely different. And the uses are broadening. Some people, even outside of Canada, put it on the ground as the fourth major plant nutrient and it's becoming increasingly popular in copper oxide ore leaching; something I won't cover in detail this morning.
30
u.s. Sulphur Demand By End-Use Segment - 1993
Agricultural Uses 72%
Suiphur-in-All-Forms 12.3 Million Tons
Agricultural uses of sulphur dominate other endmarket segments comprising nearly three-fourths of U.S. sulphur consumption last year. As all of us know, phosphate fertilizer manufacturing heads the list accounting for two-thirds of U.S. suiphur-in-all-forms consumption. And from what we can see, U.S. sulphur demand for fertilizers this year will gain even more ground with the improvements in U.S. phosphate exports and the higher industry operating rates.
The direct link is almost obvious when we compare derived U.S. elemental sulphur consumption versus U.S. phosphoric acid operating rates as shown in this slide. Admittedly, the picture has become more blurred in the last several years with the establishment of the Boliden and SATCO sulphuric acid terminals in Florida. These facilities have permitted phosphate producers to maintain high phos acid production through the importation of smelter acid and excess sulphuric output in Bone Valley during sulphuric acid unit maintenance turnarounds at certain plants. However, with very high copper prices brought on by decreased copper production and sharply higher global demand, heap leaching of copper oxide wastes has created a very tight global sulphuric acid market at the present; a sharp contrast from earlier this year. For those would-be sulphur demand experts out there, simply figure out, if, when and how much DAP China will buy, and you hold the magic key to understanding U.S. sulphur demand. Outside of the U.S., one has to wait a year or so to see what happened.
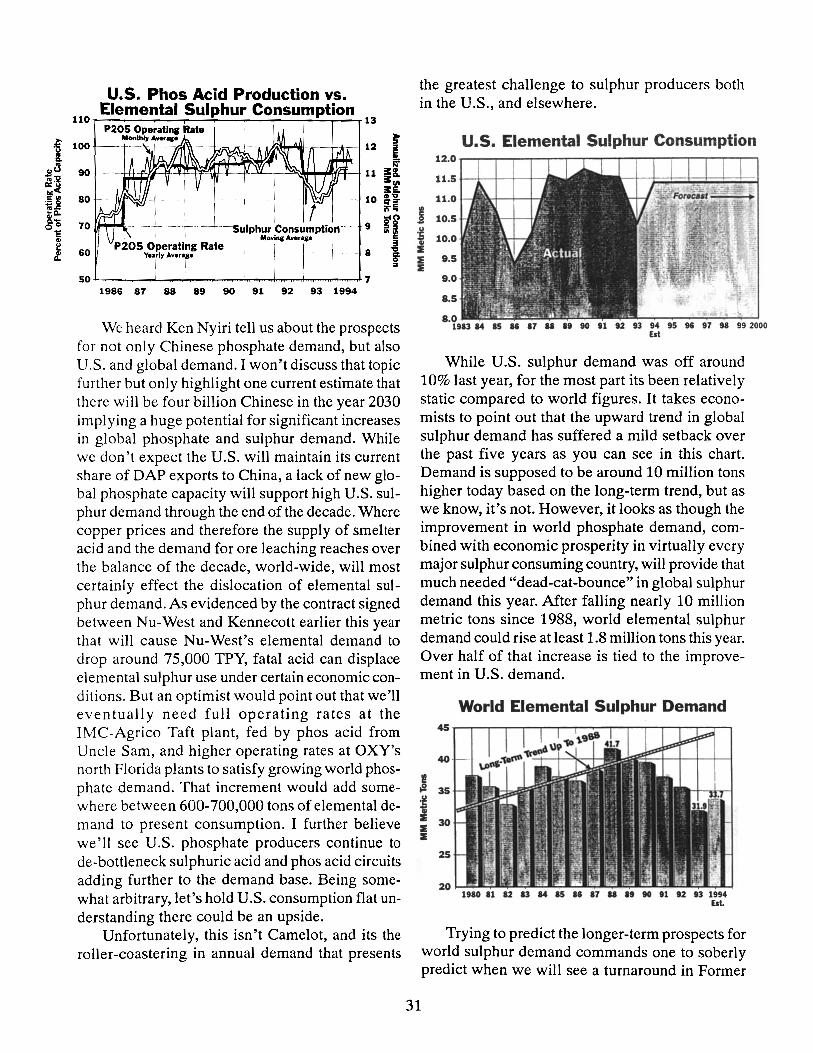
u.s. Phos Acid Production vs. Elemental Sulphur Consumption
110 13
t 12 i
I __ ~~~~~~~~~~~~~~~ ~ 90 t- 11 3I:s, 31:(1) 31:5-
80 - -
70
60
--, --JJ--\,':iR-- -I- 10 a. 'go
I I! 9 ill i .. -f!i ----sulphur Consumption- -
Movin&: Av.r ... P20S Operating Rate I ,I ~
Vu'l} ..... '.i. - r- 8 go I I ..
1986 87 88 89 90 91 92 93 1994
We heard Ken Nyiri tell us about the prospects for not only Chinese phosphate demand, but also U.S. and global demand. I won't discuss that topic further but only highlight one current estimate that there will be four billion Chinese in the year 2030 implying a huge potential for significant increases in global phosphate and sulphur demand. While we don't expect the U.S. will maintain its current share of DAP exports to China, a lack of new global phosphate capacity will support high U.S. sulphur demand through the end of the decade. Where copper prices and therefore the supply of smelter acid and the demand for ore leaching reaches over the balance of the decade, world-wide, will most certainly effect the dislocation of elemental sulphur demand. As evidenced by the contract signed between Nu-West and Kennecott earlier this year that will cause Nu-West's elemental demand to drop around 75,000 TPY, fatal acid can displace elemental sulphur use under certain economic conditions. But an optimist would point out that we'll eventually need full operating rates at the IMC-Agrico Taft plant, fed by phos acid from Uncle Sam, and higher operating rates at OXY's north Florida plants to satisfy growing world phosphate demand. That increment would add somewhere between 600-700,000 tons of elemental demand to present consumption. I further believe we'll see U.S. phosphate producers continue to de-bottleneck sulphuric acid and phos acid circuits adding further to the demand base. Being somewhat arbitrary, let's hold U.S. consumption flat understanding there could be an upside.
Unfortunately, this isn't Camelot, and its the roller-coastering in annual demand that presents
the greatest challenge to sulphur producers both in the U.S., and elsewhere.
u.s. Elemental Sulphur Consumption 12.0 -r--:---:--..,.........,.........,......."""""""--'---'--"""-"""-"""-""-""--'---'--'
11.5 +--+-+-+-+-
11.0
1 10.5
~ 10.0 .. :E :E 9.5 :E
9.0
8.5
Est
While U.S. sulphur demand was off around 10% last year, for the most part its been relatively static compared to world figures. It takes economists to point out that the upward trend in global sulphur demand has suffered a mild setback over the past five years as you can see in this chart. Demand is supposed to be around 10 million tons higher today based on the long-term trend, but as we know, it's not. However, it looks as though the improvement in world phosphate demand, combined with economic prosperity in virtually every major sulphur consuming country, will provide that much needed "dead-cat-bounce" in global sulphur demand this year. After falling nearly 10 million metric tons since 1988, world elemental sulphur demand could rise at least 1.8 million tons this year. Over half of that increase is tied to the improvement in U.S. demand.
31
World Elemental Sulphur Demand
40
25
20~~~~~~~~~~~~~ ~~ 1910 11 12 13 14 15 II 17 U It 10 81 82 83 1994
Est
Trying to predict the longer-term prospects for world sulphur demand commands one to soberly predict when we will see a turnaround in Former
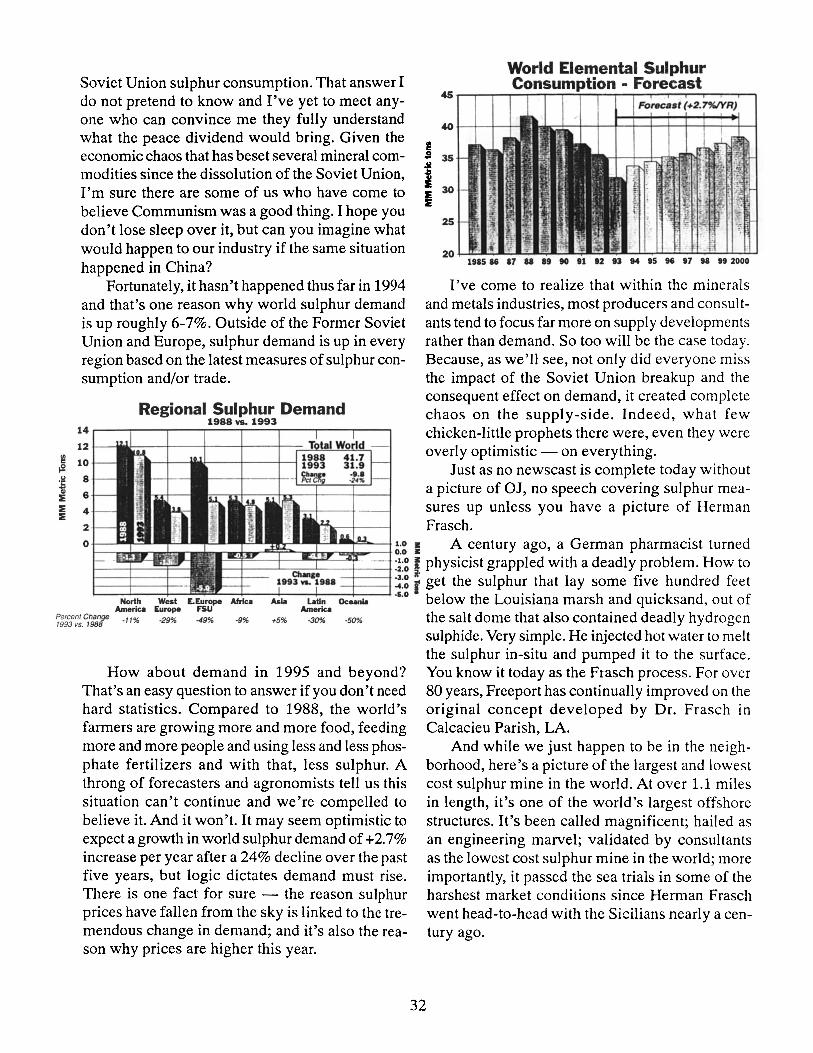
~ ~
:5 G> :E :E :E
Soviet Union sulphur consumption. That answer I do not pretend to know and I've yet to meet anyone who can convince me they fully understand what the peace dividend would bring. Given the economic chaos that has beset several mineral commodities since the dissolution of the Soviet Union, I'm sure there are some of us who have come to believe Communism was a good thing. I hope you don't lose sleep over it, but can you imagine what would happen to our industry if the same situation happened in China?
Fortunately, it hasn't happened thus far in 1994 and that's one reason why world sulphur demand is up roughly 6-7%. Outside of the Former Soviet Union and Europe, sulphur demand is up in every region based on the latest measures of sulphur consumption and/or trade.
Regional Sulphur Demand 1988 \'S. 1993
14
12
10
8
6
4
2
World Elemental Sulphur Consumption • Forecast
~r-~~~~~~~~-r~~~~-'~~~
40 -I--I-t-I-
J 35
i J: 30 IE
2S
20~~~~~~~~~~L-~~~~~~~
1985 86 17 88 .9 90 91 92 93 94 95 9G 97 98 99 2000
I've come to realize that within the minerals and metals industries, most producers and consultants tend to focus far more on supply developments rather than demand. So too will be the case today. Because, as we'll see, not only did everyone miss the impact of the Soviet Union breakup and the consequent effect on demand, it created complete chaos on the supply-side. Indeed, what few chicken-little prophets there were, even they were overly optimistic - on everything.
Just as no newscast is complete today without a picture of OJ, no speech covering sulphur measures up unless you have a picture of Herman Frasch.
~-t-=--4 1.0 !Ii A century ago, a German pharmacist turned g-.:~~~~::'$~~-::=t 0'o -
0
-+---..I.......:;;;:-..l--+---t :!:~ i physicist grappled with a deadly problem. How to -+--t~:~ f get the sulphur that lay some five hundred feet
!---N ..... ort-h-w--el-sl~'l:::Ii= ........ -I----I----I----+-----4·s.o below the Louisiana marsh and quicksand, out of Arnerl"" Europa
~~~"i~~.~~"f' -11% -29% -49% -9% +5% -50% the salt dome that also contained deadly hydrogen
How about demand in 1995 and beyond? That's an easy question to answer if you don't need hard statistics. Compared to 1988, the world's farmers are growing more and more food, feeding more and more people and using less and less phosphate fertilizers and with that, less sulphur. A throng of forecasters and agronomists tell us this situation can't continue and we're compelled to believe it. And it won't. It may seem optimistic to expect a growth in world sulphur demand of +2.7% increase per year after a 24% decline over the past five years, but logic dictates demand must rise. There is one fact for sure - the reason sulphur prices have fallen from the sky is linked to the tremendous change in demand; and it's also the reason why prices are higher this year.
sulphide. Very simple. He injected hot water to melt the sulphur in-situ and pumped it to the surface. You know it today as the Frasch process. For over 80 years, Freeport has continually improved on the original concept developed by Dr. Frasch in Calcacieu Parish, LA.
32
And while we just happen to be in the neighborhood, here's a picture of the largest and lowest cost sulphur mine in the world. At over 1.1 miles in length, it's one of the world's largest offshore structures. It's been called magnificent; hailed as an engineering marvel; validated by consultants as the lowest cost sulphur mine in the world; more importantly, it passed the sea trials in some of the harshest market conditions since Herman Frasch went head-to-head with the Sicilians nearly a centuryago.
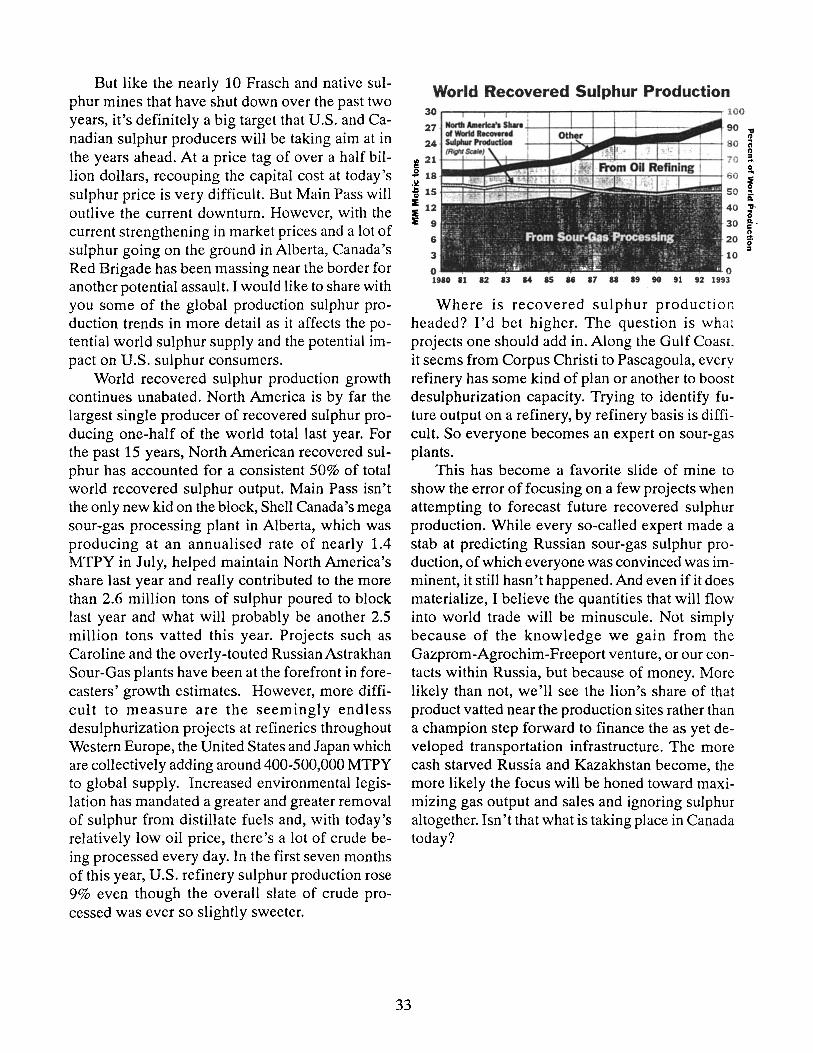
But like the nearly 10 Frasch and native sulphur mines that have shut down over the past two years, it's definitely a big target that U.S. and Canadian sulphur producers will be taking aim at in the years ahead. At a price tag of over a half billion dollars, recouping the capital cost at today's sulphur price is very difficult. But Main Pass will outlive the current downturn. However, with the current strengthening in market prices and a lot of sulphur going on the ground in Alberta, Canada's Red Brigade has been massing near the border for another potential assault. I would like to share with you some of the global production sulphur production trends in more detail as it affects the potential world sulphur supply and the potential impact on U.S. sulphur consumers.
World recovered sulphur production growth continues unabated. North America is by far the largest single producer of recovered sulphur producing one-half of the world total last year. For the past 15 years, North American recovered sulphur has accounted for a consistent 50% of total world recovered sulphur output. Main Pass isn't the only new kid on the block, Shell Canada's mega sour-gas processing plant in Alberta, which was producing at an annualised rate of nearly 1.4 MTPY in July, helped maintain North America's share last year and really contributed to the more than 2.6 million tons of sulphur poured to block last year and what will probably be another 2.5 million tons vatted this year. Projects such as Caroline and the overly-touted Russian Astrakhan Sour-Gas plants have been at the forefront in forecasters' growth estimates. However, more difficult to measure are the seemingly endless desulphurization projects at refineries throughout Western Europe, the United States and Japan which are collectively adding around 400-500,000 MTPY to global supply. Increased environmental legislation has mandated a greater and greater removal of sulphur from distillate fuels and, with today's relatively low oil price, there's a lot of crude being processed every day. In the first seven months of this year, U.S. refinery sulphur production rose 9% even though the overall slate of crude processed was ever so slightly sweeter.
World Recovered Sulphur Production 30r-'-~~--~'--.-'r-.-.---------~
27
24
8 21~~~~~~tE~~~tt - 18)l1li
~ IS~~~~~~$S :l; 12 :l; :l; 9
6
3
o 19.0.1 12 .3 14 as II .7 II .9 to 91
00
Where is recovered sulphur production headed? I'd bet higher. The question is whar projects one should add in. Along the Gulf Coast. it seems from Corpus Christi to Pascagoula, every refinery has some kind of plan or another to boost desulphurization capacity. Trying to identify future output on a refinery, by refinery basis is difficult. So everyone becomes an expert on sour-gas plants.
This has become a favorite slide of mine to show the error of focusing on a few projects when attempting to forecast future recovered sulphur production. While every so-called expert made a stab at predicting Russian sour-gas sulphur production, of which everyone was convinced was imminent, it still hasn't happened. And even if it does materialize, I believe the quantities that will flow into world trade will be minuscule. Not simply because of the knowledge we gain from the Gazprom-Agrochim-Freeport venture, or our contacts within Russia, but because of money. More likely than not, we'll see the lion's share of that product vatted near the production sites rather than a champion step forward to finance the as yet developed transportation infrastructure. The more cash starved Russia and Kazakhstan become, the more likely the focus will be honed toward maximizing gas output and sales and ignoring sulphur altogether. Isn't that what is taking place in Canada today?
33
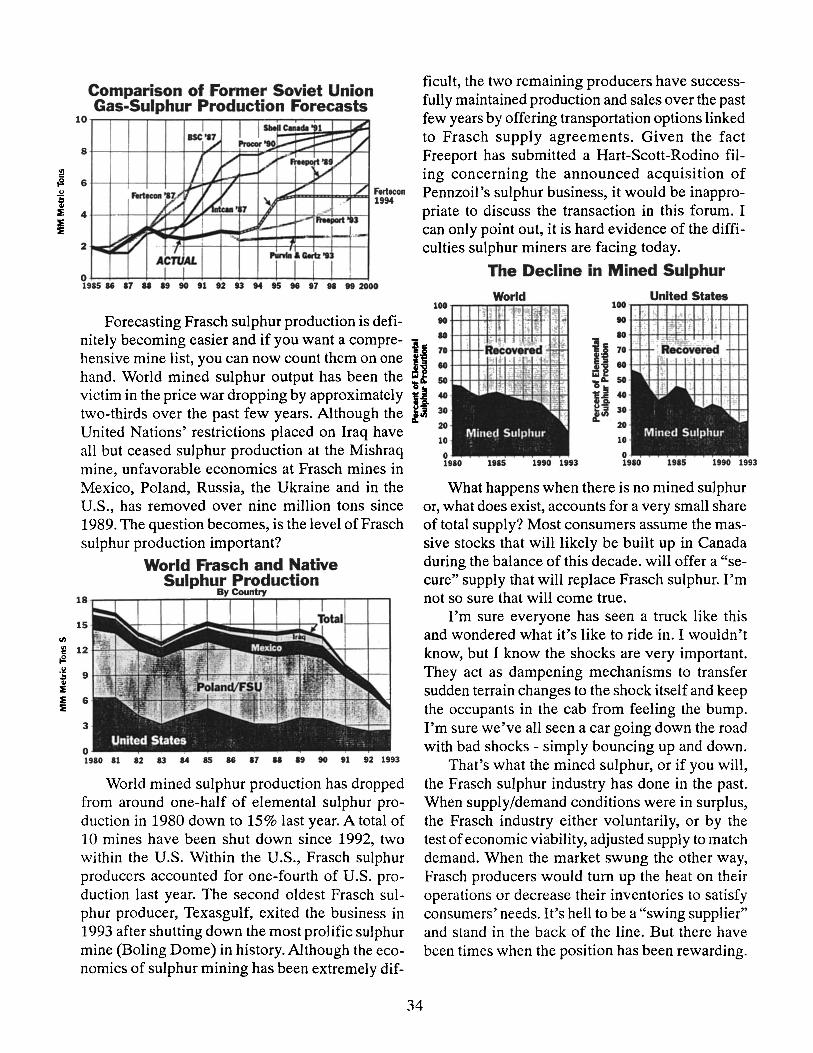
<I)
Comparison of Former Soviet Union Gas-Sulphur Production Forecasts
Forecasting Frasch sulphur production is definitely becoming easier and if you want a comprehensive mine list, you can now count them on one hand. World mined sulphur output has been the victim in the price war dropping by approximately two-thirds over the past few years. Although the United Nations' restrictions placed on Iraq have all but ceased sulphur production at the Mishraq mine, unfavorable economics at Frasch mines in Mexico, Poland, Russia, the Ukraine and in the U.S., has removed over nine million tons since 1989. The question becomes, is the level of Frasch sulphur production important?
World Frasch and Native Sulphur Pr4t)dllctiion
15
~ 12 +'-':?-t-{!.
:E 9 t--=;;~::i+"i!iil .. :E :E 6 :E
3
o 1980 11 82 83 84 as " 17 II 89 90 91 92 1993
World mined sulphur production has dropped from around one-half of elemental sulphur production in 1980 down to 15% last year. A total of 10 mines have been shut down since 1992, two within the U.S. Within the U.S., Frasch sulphur producers accounted for one-fourth of U.S. production last year. The second oldest Frasch sulphur producer, Texasgulf, exited the business in 1993 after shutting down the most prolific sulphur mine (Boling Dome) in history. Al though the economics of sulphur mining has been extremely dif-
ficult, the two remaining producers have successfully maintained production and sales over the past few years by offering transportation options linked to Frasch supply agreements. Given the fact Freeport has submitted a Hart-Scott-Rodino filing concerning the announced acquisition of Pennzoil's sulphur business, it would be inappropriate to discuss the transaction in this forum. I can only point out, it is hard evidence of the difficulties sulphur miners are facing today.
100
90
10
The Decline in Mined Sulphur
United States 100
90
11 Jl
70
10 )1 : wI : 50 "\5 .. "\5 It 40 it 40
30 i;i 30 l!'"
34
20 20
10 10
1915 1990 1993
What happens when there is no mined sulphur or, what does exist, accounts for a very small share of total supply? Most consumers assume the massive stocks that will likely be built up in Canada during the balance of this decade. will offer a "secure" supply that will replace Frasch sulphur. I'm not so sure that will come true.
I'm sure everyone has seen a truck like this and wondered what it 's like to ride in. I wouldn't know, but I know the shocks are very important. They act as dampening mechanisms to transfer sudden terrain changes to the shock itself and keep the occupants in the cab from feeling the bump. I'm sure we've all seen a car going down the road with bad shocks - simply bouncing up and down.
That's what the mined sulphur, or if you will, the Frasch sulphur industry has done in the past. When supply/demand conditions were in surplus, the Frasch industry either voluntarily, or by the test of economic viability, adjusted supply to match demand. When the market swung the other way, Frasch producers would turn up the heat on their operations or decrease their inventories to satisfy consumers ' needs. It's hell to be a "swing supplier" and stand in the back of the line. But there have been times when the position has been rewarding.
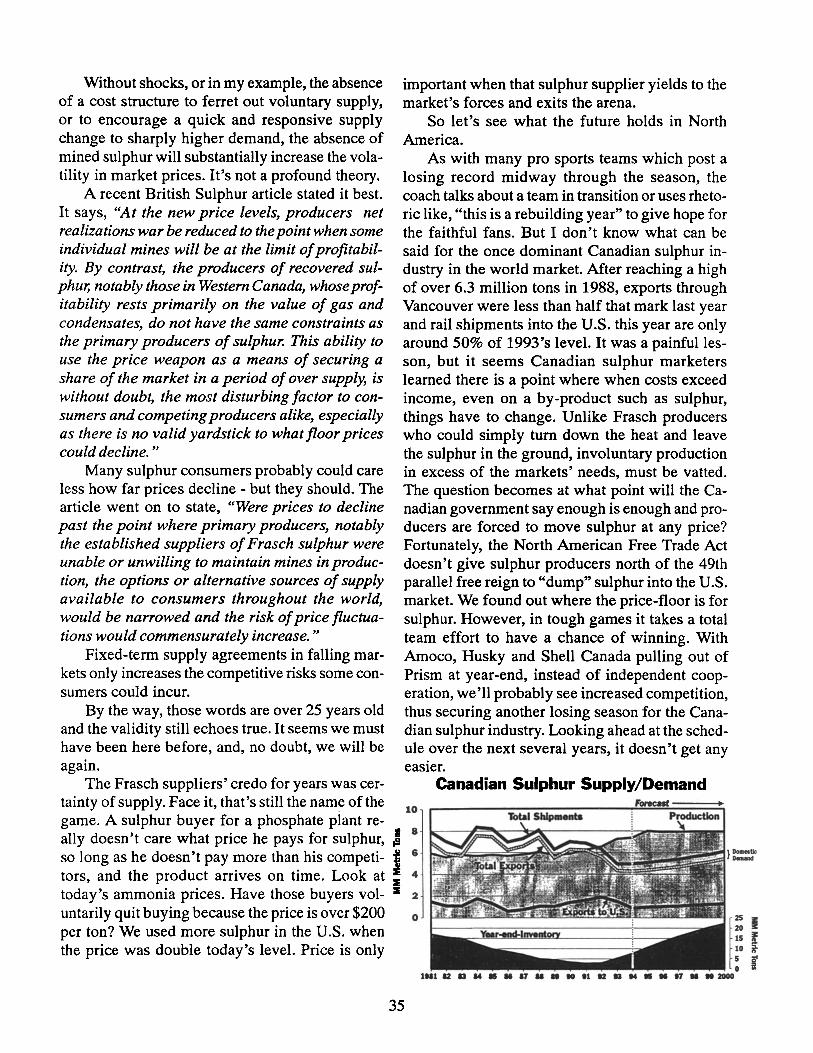
Without shocks, or in my example, the absence of a cost structure to ferret out voluntary supply, or to encourage a quick and responsive supply change to sharply higher demand, the absence of mined sulphur will substantially increase the volatility in market prices. It's not a profound theory.
A recent British Sulphur article stated it best. It says, "At the new price levels, producers net realizations war be reduced to the point when some individual mines will be at the limit of profitability. By contrast, the producers of recovered sulphur, notably those in Western Canada, whose profitability rests primarily on the value of gas and condensates, do not have the same constraints as the primary producers of sulphUr. This ability to use the price weapon as a means of securing a share of the market in a period of over supply, is without doubt, the most disturbing factor to consumers and competing producers alike, especially as there is no valid yardstick to what floor prices could decline. "
Many sulphur consumers probably could care less how far prices decline - but they should. The article went on to state, "Were prices to decline past the point where primary producers, notably the established suppliers of Frasch sulphur were unable or unwilling to maintain mines in production, the options or alternative sources of supply available to consumers throughout the world, would be narrowed and the risk of price fluctuations would commensurately increase. "
Fixed-term supply agreements in falling markets only increases the competitive risks some consumers could incur.
By the way, those words are over 25 years old and the validity still echoes true. It seems we must have been here before, and, no doubt, we will be again.
important when that sulphur supplier yields to the market's forces and exits the arena.
So let's see what the future holds in North America.
As with many pro sports teams which post a losing record midway through the season, the coach talks about a team in transition or uses rhetoric like, "this is a rebuilding year" to give hope for the faithful fans. But I don't know what can be said for the once dominant Canadian sulphur industry in the world market. Mter reaching a high of over 6.3 million tons in 1988, exports through Vancouver were less than half that mark last year and rail shipments into the U.S. this year are only around 50% of 1993's level. It was a painfullesson, but it seems Canadian sulphur marketers learned there is a point where when costs exceed income, even on a by-product such as sulphur, things have to change. Unlike Frasch producers who could simply turn down the heat and leave the sulphur in the ground, involuntary production in excess of the markets' needs, must be vatted. The question becomes at what point will the Canadian government say enough is enough and producers are forced to move sulphur at any price? Fortunately, the North American Free Trade Act doesn't give sulphur producers north of the 49th parallel free reign to "dump" sulphur into the U.S. market. We found out where the price-floor is for sulphur. However, in tough games it takes a total team effort to have a chance of winning. With Amoco, Husky and Shell Canada pulling out of Prism at year-end, instead of independent cooperation, we'll probably see increased competition, thus securing another losing season for the Canadian sulphur industry. Looking ahead at the schedule over the next several years, it doesn't get any easier.
The Frasch suppliers' credo for years was certainty of suppl y. Face it, that's still the name of the 10
game. A sulphur buyer for a phosphate plant re-I 8 ally doesn't care what price he pays for sulphur, {J
Canadian Sulphur Supply/Demand
so long as he doesn't pay more than his competi- i 6
tors, and the product arrives on time. Look at :E 4
today's ammonia prices. Have those buyers vol- :E 2
untarily quit buying because the price is over $200 0
per ton? We used more sulphur in the U.S. when the price was double today's level. Price is only
35
~ I 15 f 10 If 5 r

r! ~
; i : :E i :E
:E
14
12
10
8
6
4
2
0
Turning to the U.S., even, allowing for the modest increase in sulphur imports from Canada, Mexico, and Venezuela, which makes little sense given Venezuela's proximity to Brazil, under a flat demand scenario, the market available to the swing supplier, i.e., the U.S. Frasch industry, continues to contract. That is if one assumes the Frasch industry gets what left over. But in this day of a changing international market structure, it's get- ~ ting harder to identify the swing supplier solely as :E
Frasch. Along with the downturn in prices, there J has been a reduction in capital expenditures by re- I covered sulphur producers for transportation as- v.
sets. One survey taken by an industry consultant in the past few months, reportedly indicates the North American railcar fleet of molten sulphur tankcars declined by 10% last year. I doubt prices have improved to the point where anyone intends to order a couple of hundred cars or so. Are there enough taxis to handle the stocks in Canada all the way to Florida? I doubt it.
u.s. Sulphur Supply/Demand
since the start of the year, although for some reason those sources give Morocco a $ 10/MT break over the rest of the market. Where are prices headed?
Sulphur Prices "nImpa Uquld Terminal Contract and Vancouver Solid Spot
so ~-l----f-
25~-l----f---4---+---+---+--~~~~ I ,
o Not.: Tampa price is S per long ton. Vancouver is S per metric ron.
19&. 1t17 1tll 1tlt litO 1191 1192 1993 1994
The warning signs are clearly visible with the imminent downsizing of Prism. The chicken little choir tells us it's only a matter of time. However, like in any sport, if you concede the game before it starts, you're sure to lose. Admittedly, the move is up to the Canadian industry.
As you can see from past exercises, you can have all the puzzle pieces fit and still have no clear picture of the future. I read all these studies and was amazed at the persuasiveness of the conclusions. By the way, for those of you straining to see the current Fertecon forecast, it's centered around their trend range of $5570/ LT, although I'm sure if prices go higher, they will update the forecast, if they haven't done so already.
Includes inventory changes. An Exact Science: /
Sulphur Price Forecastfng The real question is what happens when de
mand drops over a million tons as we saw last year? Fortunately, I've given a flat consumption forecast and don't have to answer that one. But I suspect if the price gets too low, the marginal cost supplier exits the arena. This year, the marginal cost supplier was Canadian.
As far as price is concerned, another economic oddity has taken place thus far in 1994 with world prices firmly higher in the face of a surplus which has required the Canadians to pour another 2.0 million tons to block (through September). Since the start of the year, Tampa prices have increased around 30% to approximately $65/LT. The trade press has Vancouver prices up as much as double
Uquld Price, FOB "nImpa Ter "" 350.---------~--~----~~~--------~
300
250 8ritIs~ Sulphur 119851 ,." "
II . .", .. .. ;" .",
J 200 ~",_",_",,,,,,tt'
... __ .".".. MaIn .....
I 150 ~~~_''';';'';'''.'' . .:..:.Fe·sIIIIIHlS~I18~~! •...... ,.. •• • ••••• ••• 11 ••• •••••
100
so
0 1975 1980 1985 1990
r-t.- (19941 .. ... ----..... 1995 2000
No18: sse /orecasl origltulOy 8xpr8sud in cooslanl 1994 S'S FOB~, &trapolalion based on in"alion and a ... ,.~ ratnp&lVancouvef ditfentntiaJ.
36
Despite what empirical evidence I may have shown you today, I would be remiss ifl didn't tell you what we already know. With Mother Nature and not so steadfast government policies holding

the rudder of world agriculture, and therefore our industry's fate, we've learned to cope with adversity. When it's bad, it's really bad and when it's good, it's only going to get better. The bottom-line is the fertilizer business is cyclical. Along with it, so too is the sulphur business. I've read those words of Santyana so often, I've come to believe them.
He said, "those who cannot remember the past, are condemned to repeat it". In 1970, after four years of oversupply, rising inventories, a sharp cutback in Frasch production and a 50% drop in price, the sulphur market turned around. I believe, we could already be re-living the past.
37

Monday, NovelDber 7, 1994 Session II
Moderator:
Frank P. Achorn
Fertilizer In The Environment By Charlotte Sine
FARM CHEMICALS Magazine
Thank you, Frank. To address the Fertilizer Industry Round Table is a honor I never anticipated when I attended my first Round Table in the early 1960s. I remember the meeting as if it were yesterday. It was held at the Mayflower Hotel in Washington, DC - four days packed solid with talks on ammoniation-granulation, preneutralization, wet process phosphoric acid, bulk blending, fluid mixing. Travis Hignett was on the program, as were the industry's leading experts on all phases of production.
There were probably 600-700 people at the meeting, and unlike most of fertilizer meetings in those days - and today - the meeting room was more crowded than the hallways and the lobby. The men attending were there to learn, and more importantly, to share their knowledge.
That first Round Table was a real learning experience for this editor. I came home with two shorthand notebooks completely filled, plus all the papers I could scrounge. What an indoctrination into fertilizer production for a English major and a journalism minor who to that point had been inside a fertilizer plant only once - a AAC superphosphate plant built around 1910. It was so old they still used Georgia buggies in the eady 1960s.
Dr. Vincent Sauchelli and the early leaders of the Round Table provided a real service to the fertilizer industry Doc Marshall, Joe Whittington, AI Spillman, Wayne King, and Joe Reynolds and many others devoted countless hours developing programs and getting out proceedings.
After nearly 50 years the Round Table continues to be the industry's most important open forum. But there have been significant changes in the topics covered. The astute leadership of the Round Table recognizes that the challenge facing the fertilizer industry today is not how to produce quality fertilizer materials, but to produce, handle, and apply them in an environmentally responsible way.
Today, I would like to focus my remarks more on the end use of fertilizers.
In September 1994, FARM CHEMICALS published a special issue celebrating our lOOth Anniversary. Theme of the issue was "The Foundation For A Fantastic Tomorrow." In developing the issue, I spent many hours reviewing old copies of the magazine, known in its early days as American Fertilizer. And it brought a true appreciation of the achievements of the fertilizer industry in developing the products we know today.
Just think about the materials used back in "the good old days" as described by Walt Sackett Jr. and Larry Taylor of A. J. Sackett in the lOOth Anniversary Issue:
"The major raw materials were potash, shipped infrom Germany; 'acid phosphates' from phosphate rock mines in South Carolina and Tennessee. In order to get the maximum P205 content, the acid phosphates were put into storage to "cure" for 3 to 5 weeks. The end result was a hard, sticky mess that was extremely difficult to handle. Nitrogen came from such items as animal and garbage tankage, oilseed meals, fish meals, manures, dried blood, and bone. In the nitrogen storage end of a fertilizer plant, the piles literally tmoved.' "
In his "History of the U.S. Fertilizer Industry," the late Lewis B. Nelson writes of fish scrap, an
39

important fertilizer in the middle and late 1800s. Did you know that in 1880, over 50,000 tons of fish scrap was used as fertilizer. Fish scrap plants were built in Rhode Island, New York, Connecticut, and Maine. Nelson gives this vivid description:
"Odors from decaying fish and fish scrap were overwhelming. Observers traveling on Long Island where whole fish had been applied on the fields by farmers noted that the stench of Long Island was intolerable. Men were often overcome by the fumes when loading and unloading fish scrap. One sea captain said, 'Should I haul fish scrap, it would be impossible for me to mingle with shoremen or call on my friends in the city. The odor of fish scrap is obnoxious and it clings to a person with bulldog tenacity.'"
I doubt even the most ardent environmentalist would cling with "bulldog tenacity" to this organic fertilizer!
One environmentalist who displayed the tendencies of a bulldog in the 1970s was Dr. Barry Commoner, who created headlines in the early '70s with charges that fertilizers were polluting drinking water. Like Rachel Carson, he was the first to sound a warning that overuse and improper timing of application could create undesirable environmental results. Commoner used as the basis of much of his attack what were soon proven to be faulty figures on the nitrite content in rivers in Illinois resulting from nitrogen fertilizer application. But this should not be too surprising. In his book, "The Closing Circle," the former director of the Center for Biology of Natural Systems at Washington University, stated:
"The way scientists get at the truth is not so much by avoiding mistakes or personal bias as by displaying them in public, where they can be corrected"
Although Dr. Commoner created a fury, most environmentalists in the 1970s and 80s were focusing more on the use of agricultural chemicals than plant nutrients. This didn't go unnoticed by some short-sighted fertilizer people who tried to divorce fertilizers and pesticides, regardless of the fact that most dealers handled both or that feedand-weed was a popular method of application.
Today, nutrients share the environmental spotlight.
Almost every water quality initiative includes regulation of fertilizers. The MidwestAgricultural Chemicals Association has established a Regional Water Issues Team tracking initiatives in place or under proposal. I'd like to mention four that could have a very significant impact.
Coastal Zone Management Act
Many of you probably are familiar with the Coastal Zone Management Act. This measure calls for development and implementation of comprehensive nutrient management plans, including a nutrient budget for the crop. identification of the types and amounts of nutrients necessary to produce a crop based on realistic crop yield expectations. and an identification of the environmental hazards of the site. Other items called for in the measure include soil tests and other tests to determine crop nutrient needs, and proper calibration of nutrient equipment. Under the Coastal Zone Management Act, each state must develop NPS or non-point source control programs - systems of approved best management practices. This act impacts 29 states and territories.
Great Lakes Initiative
An initiative just evolving is the Great Lakes Initiative. Final guidelines are due March 1995, following which the Great Lake states must adopt standards, procedures, and policy for all waters, consistent with the final guidance within two years or be subject to EPA promulgation.
The proposed guidelines includes:
40
1) derivation of criteria for the protection of aquatic life, human health, and wildlife;
2) use of bioaccumulation factors in calculating criteria;
3) protection of current water quality; and 4) implementation.
If finalized as proposed, the Great Lakes Initiative could be the most stringent water quality standard on earth. It has been extensively criticized

by industry, municipalities, and EPA's own Science Advisory Board.
Added regulation of the Great Lakes Initiative would be triggered by the presence in water of 138 different pollutants, some at limits thousands of times smaller than current laboratory detectable limits.
Gulf of Mexico Program
Still another evolving program covers the Gulf of Mexico. Sixty-six percent of the area of the contiguous U. S. drains into the Gulf. One of the aims is to reduce the input of nutrients, pesticides, and toxic substances into the Gulf. It is likely that the Clean Water Act and the Coastal Zone Management Act will be coordinated in the Gulf states under the Gulf of Mexico program. There is a technical subcommittee on nutrient enrichment.
This is an intergovernmental program established in 1988 by EPA Regions 4 and 6 as a forum for addressing Gulf-wide problems and solutions.
Upper Mississippi River Water Quality Initiative
One of the least known initiatives is the Upper Mississippi River Water Quality Initiative. The Upper Mississippi River Water Quality Association was formed in 1984 by governors of Illinois, Iowa, Minnesota, Missouri and Wisconsin to coordinate river resource management. Concerns voiced by the governors include the buildup of sedimentation, toxic pollutants (including pesticides), and nutrients.
The Initiative is in development stage only, and to date has no formalized structure or authority. However, if the Upper Mississippi River Initiative is formalized, it could unite with the Great Lakes Initiative and the Gulf of Mexico program to form a Canada-to-the-Gulf regulatory structure.
At the federal level: the Clean Water Act and the Safe Drinking Water Act now being revised in Congress.
What all this means is that the adoption of the Best Management Practices and improving fertilizer efficiency must be given the highest priority.
41
Exciting developments are allowing precise fertilization never dreamed of when I attended my first Round Table in 1963. Tomorrow Dr. Sam Kinchloe will be talking about global positioning application, and Dr. Paul Fixen of PPI will be discussing modern placement and tillage practices.
Let me give you a little preview of global position or GPS.
Using positioning satellites and receivers, applicators can determine their positions within a dozen feet. By comparing the exact position with a soil conditions computer database in the vehicle, applicators can customize fertilizer and pesticide use for that site.
GPS is real and being used on more acres every season. Ron Olson of Top Soil Testing Service in Illinois used GPS to grid and map 120,000 acres in 1994. The cooperative Illini FS used the technology on 175,000 acres and in Missouri, a group of farmers pooled 10,000 acres for GPS grid sampIing.
Grid sampling gives an accurate picture of nutrient variations within the field. This allows farmers to apply fertilizer only where it is needed and in exactly the right amount. Even lime can be applied at variable rates throughout the field to correct pH.
Farmers are using GPS to generate yield maps so precise they can go back into the field to check out why variance in yield from row to row or even part of a row. These maps can be used in conjunction with soil maps to apply variable rates of fertilizer. When the soil map information is incorporated with the precision timing of application rigs equipped with on-board computers, precision placement and rate of fertilizer inputs are possible.
Coming is DGPS - that stands for differential global positioning system. By using a receiver in a known position, DGPS can reduce position error from the current 100 yards down to less than 1 yard.
Another system uses a soil probe mounted on the front of the applicator unit to analyze soil organic matter on the go. Information from the sensor is analyzed by a computer, and fertilizer rates are adjusted immediately to meet field needs.
We've gone from farming by the field to farming by the acre to farming by the foot to farming
by the inch. All made possible by the computer age.
Farmers are taking to the field, computer in hand. Shown is Infielder, a programmed, hand-held Newton Message Pad. It can read and interpret handwritten notes and process data in the field, or download data to a Windows-based PC. Introduced this summer, Infielder is a collaboration between computer experts from Apple, software experts from Pharos Technologies, agronomists from the Potash and Phosphate Institute, and researchers from Monsanto.
Infielder is programmed specifically for Midwest farmers and contains more than 3000 soil types, hundreds of com hybrids, dozens of soybean varieties, and the latest formats for recording environmental data and compliance records. -represented with pinpoint precision in the form of maps, tables, charts, and reports.
All this is taking place at the same time farmers are making dramatic changes in tillage practices. This slide shows the percentage of total U. S. acres planted to no-till, ridge-till, and mulchtill, and 15% to 30% residue cover left after planting has grown by 11 % in five short years.
Improved efficiency and more environmentally sound. Yes, we're making Paul Bunyan steps today in precision application. But Lilliputian steps in development of new processes for producing fertilizer materials and baby Lilliputian steps in the development of new plant nutrient products. With the National Fertilizer Development Center reshaped into the Environmental Research Center, who will conduct the research to keep fertilizer development in step with these new technologies? Isn't it time to pool resources for the future of the industry? The Round Table has proven for 50 years that knowledge can be shared without compromising competitive advantage.
Can you name any recent development that has had the impact of DAP? DAP revolutionized the mixed fertilizer business and made possible bulk blending of quality fertilizer mixes on a prescription basis. From 1955 to 1970, it is estimated that there was one new bulk blend plant built every day over the entire 15-year period. Fluid plants were also being installed, and we're starting producing
clear liquids and suspensions. Together, they revolutionized the distribution system for not only fertilizers but agricultural chemicals, and created the fertilizer/ag chemical dealer network as we know it today.
Never has that dealer network been more important to U.S. agriculture than today And never have fertilizer and ag chemical dealers been more challenged than today. While being called upon to expand the delivery of products and services to farmers, dealers must upgrade and improve production facilities, product workers, address environmental concerns, and communicate with their local communities as never before.
With its centennial issue, FARM CHEMICALS launched a new industry-wide initiative designed to foster professional dealer development and industry excellence called PACE.
PACE is an acronym for:
Protect Our Environment. Advance the State of Crop Protection. Commit to Excellence. Enhance Our Communities.
When taken as a whole, managing these four issues will form the foundation of all successful dealerships in the 21st Century. Stewardship to customers, employees, community, and environment are all encompassed within PACE.
The PACE program is still evolving, and we enlist your support and input and ask you to join us in the PACE Pledge:
42
We Pledge to Set The PACE. ... By upholding the public trust of preserving and
protecting our God-given environmental resources.
By improving our business to: • Enhance customer services. • Offer greater opportunities for employees. • Expand environmental stewardship.
By actively helping our community understand the integral role our business (industry) plays in the responsible production of food and fiber.
By placing the welfare of people, other businesses, and the environment over personal gain.
Our commitment to excellence is more than a slogan. It is our solemn pledge to:
Our Customers! Our Community! Our Environment!
PACE dealers will be those dealers promoting best management practices and employing the latest technology to precisely deliver fertilizer to the crop.
Over the last 100 years, there have been exciting time, down times, and periods of rapid development, and cycle after cycle of oversupply and underdemand. FARM CHEMICALS has chronicled it all. Yet never have both challenges and opportunities been greater.
The fertilizer industry has helped lay the foundation for what we truly believe will be a fantastic tomorrow. But progress must continue. The industry and the Round Table must foster a strong return to research and development of new materials and processes.
Kinetics of Controlled Release Fertilizer Nutrients
Gary L. Smith Vigoro Industries
Introduction
A principal goal in fertilizer science is to grow better plants through effective nutrition. To accomplish this goal efficiently, one must know the nutritional requirements of the plant, and the release characteristics of the fertilizer nutrients to be used.
The nutritional requirement of plants change over time. These are due to changes in the seasons, growth stages, and other factors. To help visualise these profiles, one can look at them as differential nutrient demand plots over time (dN/ dt vs t). Data of this nature is limited but there are some examples that show the diversity involved.
In a similar manner it is helpful to visualize the differential nature of fertilizer nutrient release over time, to understand what the various technologies offer. To date, most fertilizer release can
be represented by one or a combination of three kinetic orders; 1) first order, 2) square root of time (SROT) order and 3) zero order.
Effectively matching the shape of a target plant system (cool season grass) with a fertilizer technology release profile, is the challenge that must be met to provide good plant nutrition.
Discussion
A kinetic approach to classification of fertilizer release - release order and rate constants.
Since the development of UF based fertilizer technology, there have been a number of different controlled release nutrient materials commercialized. Most attempts to classify these technologies revolved around their chemistry:
• Oligomers; urea formaldehydes (UF) and methylene ureas (MU).
• Compounds; isobutylidene diurea (IBU) and crotonylidene diurea.
• Shell coatings: sulfur coated ureas (SCU). • Film coatings; plastic coated urea (PCU). • Combinations of the above.
A problem with this classification was, it did not tell anything about the release characteristics of the technology or their products. This paper is an attempt to provide a more definitive classification and description of these materials.
The analytical technique used to examine the test materials was a leach procedure that maximized the concentration potential between the nutrient particles and the leachate. Kinetic analysis consisted of soaking 5 grams of sample in 500 ml of distilled water at 20°C and/or 40°C. The water was changed at specific intervals (2 hr, I day, 3 day, 7 day, & once every week) by removing all the leachate and replacing it with 500 ml of distilled water. The leachates were analyzed for nitrogen (or potassium), and the results accumulated. The data was plotted [logC vs t, C vs t and C vs v t] and analyzed to seek out linearity (First order, Zero order & SROT order).
43
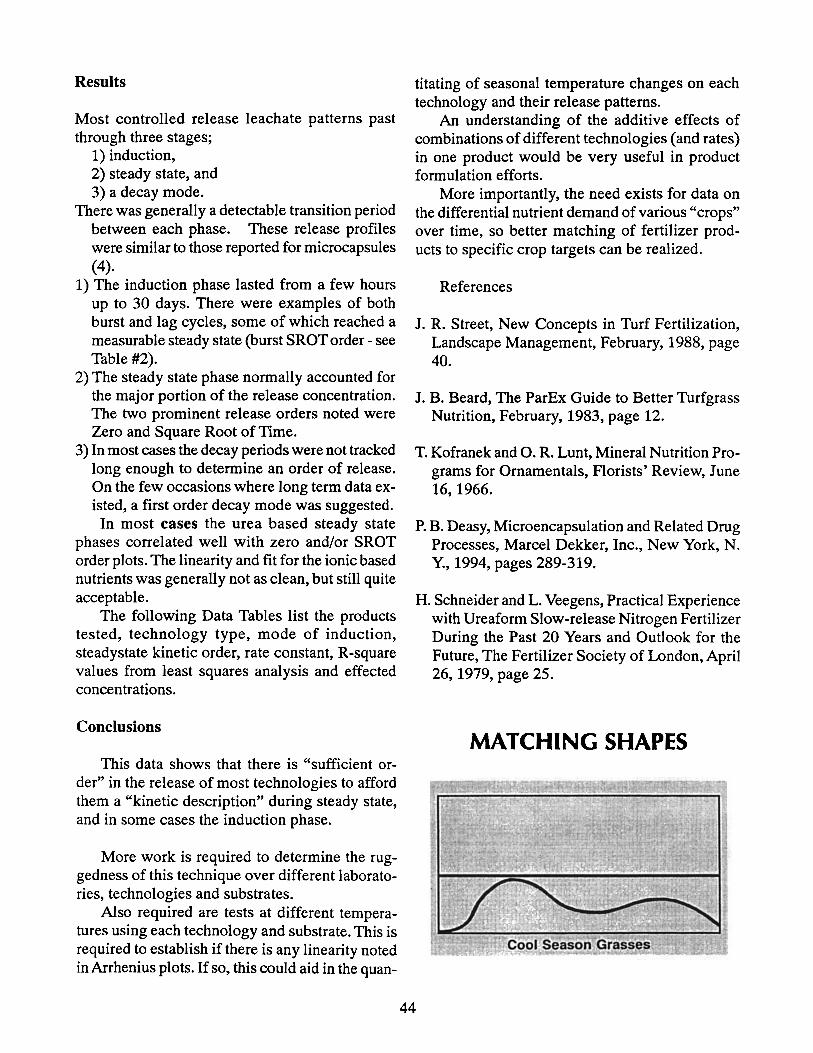
Results
Most controlled release leachate patterns past through three stages;
1) induction, 2) steady state, and 3) a decay mode.
There was generally a detectable transition period between each phase. These release profiles were similar to those reported for microcapsules (4).
1) The induction phase lasted from a few hours up to 30 days. There were examples of both burst and lag cycles, some of which reached a measurable steady state (burst SROT order - see Table #2).
2) The steady state phase normally accounted for the major portion of the release concentration. The two prominent release orders noted were Zero and Square Root of Time.
3) In most cases the decay periods were not tracked long enough to determine an order of release. On the few occasions where long term data existed, a first order decay mode was suggested.
In most cases the urea based steady state phases correlated well with zero and/or SROT order plots. The linearity and fit for the ionic based nutrients was generally not as clean, but still quite acceptable.
The following Data Tables list the products tested, technology type, mode of induction, steadystate kinetic order, rate constant, R-square values from least squares analysis and effected concentrations.
Conclusions
This data shows that there is "sufficient order" in the release of most technologies to afford them a "kinetic description" during steady state, and in some cases the induction phase.
More work is required to determine the ruggedness of this technique over different laboratories, technologies and substrates.
Also required are tests at different temperatures using each technology and substrate. This is required to establish if there is any linearity noted in Arrhenius plots. If so, this could aid in the quan-
titating of seasonal temperature changes on each technology and their release patterns.
An understanding of the additive effects of combinations of different technologies ( and rates) in one product would be very useful in product formulation efforts.
More importantly, the need exists for data on the differential nutrient demand of various "crops" over time, so better matching of fertilizer products to specific crop targets can be realized.
References
J. R. Street, New Concepts in Turf Fertilization, Landscape Management, February, 1988, page 40.
J. B. Beard, The ParEx Guide to Better Turfgrass Nutrition, February, 1983, page 12.
T. Kofranek and O. R. Lunt, Mineral Nutrition Programs for Ornamentals, Florists' Review, June 16, 1966.
P. B. Deasy, Microencapsulation and Related Drug Processes, Marcel Dekker, Inc., New York, N. Y., 1994, pages 289-319.
H. Schneider and L. Veegens, Practical Experience with Ureaform Slow-release Nitrogen Fertilizer During the Past 20 Years and Outlook for the Future, The Fertilizer Society of London, April 26, 1979, page 25.
MATCHING SHAPES
44
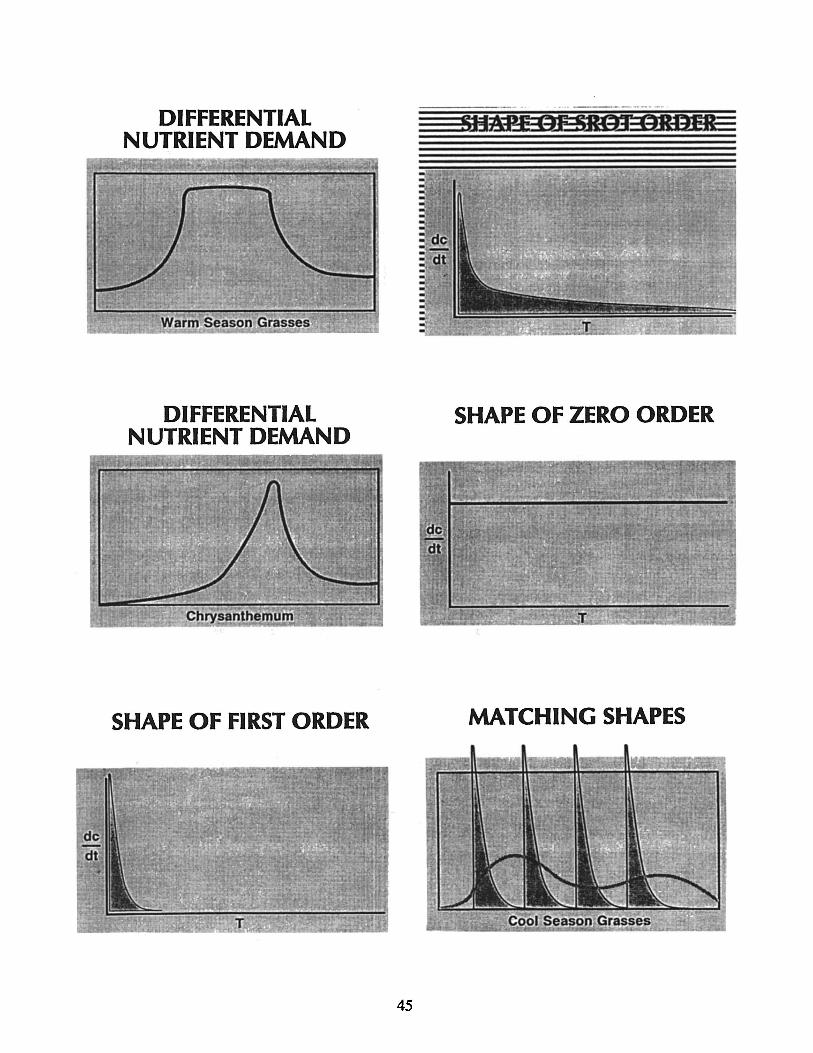
DIFFERENTIAL NUTRIENT DEMAND
DIFFERENTIAL NUTRIENT DEMAND
SHAPE OF FIRST ORDER
45
- , .. _--_ .. _- _ .. su_
SHAPE OF ZERO ORDER
MATCHING SHAPES
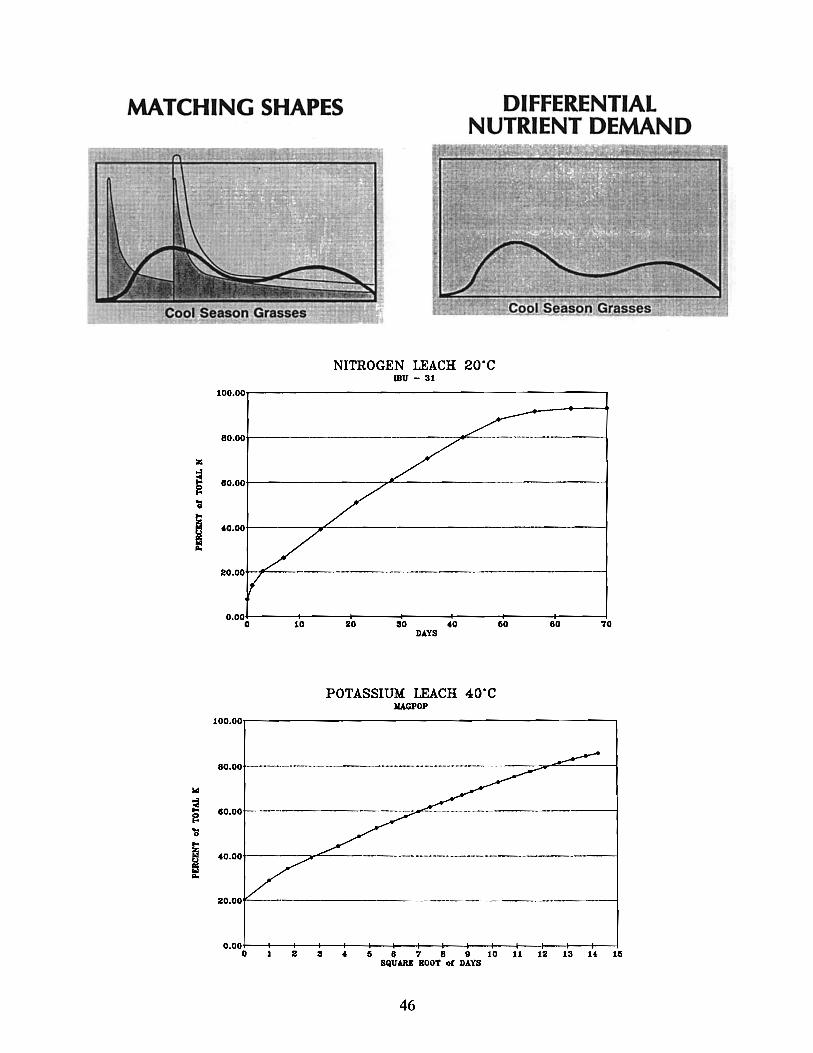
MATCHING SHAPES DIFFERENTIAL NUTRIENT DEMAND
Z
~ ~ "a
I
... ~ ~ ... 0
'"' ~ w ""
100.00
80.00
80.00
.0.00
20.00
II 0.00
o
/ 10
NITROGEN LEACH 20·C mtT - 31
~
/ /
20 30 CiO 80 70 DAYS
POTASSIUM LEACH 40·C KAGPOP
100.00r-----------------------.
80.00
40.00
20.00
0.00 0 2 3 4 Ci 8 7 8 II 10 11 12 13 H IIi
SQtTARB ROOT 01 DAYS
46
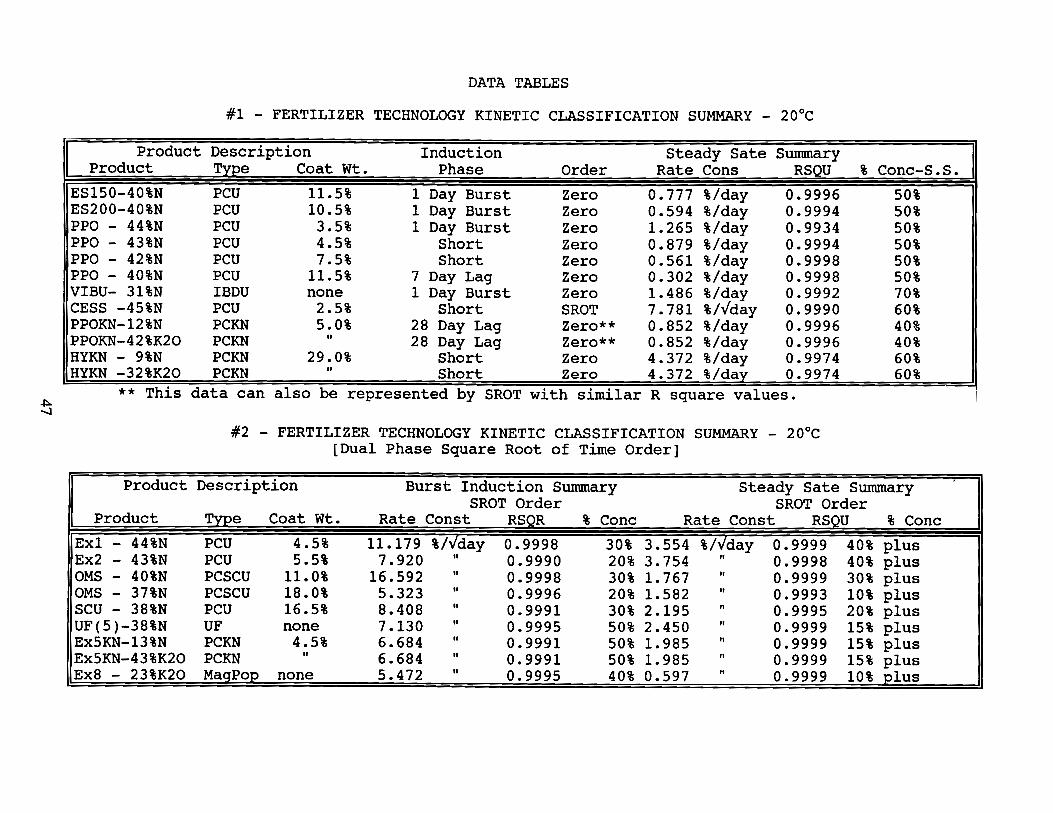
~
DATA TABLES
#1 - FERTILIZER TECHNOLOGY KINETIC CLASSIFICATION SUMMARY - 20°C -
Product Description Induction Steady Sate Summary Product
ES150-40%N ES200-40%N PPO - 44%N PPO - 43%N PPO - 42%N PPO - 40%N VIBU- 31%N CESS -45%N PPOKN-12%N PPOKN-42%K20 HYKN - 9%N HYKN -32%K20
- .
Type Coat Wt. Phase Order Rate Cons RSQU
PCU 11.5% 1 Day Burst Zero 0.777 %/day 0.9996 PCU 10.5% 1 Day Burst Zero 0.594 %/day 0.9994 PCU 3.5% 1 Day Burst Zero 1. 265 %/day 0.9934 PCU 4.5% Short Zero 0.879 %/day 0.9994 PCU 7.5% Short Zero 0.561 %/day 0.9998 PCU 11.5% 7 Day Lag Zero 0.302 %/day 0.9998 IBDU none 1 Day Burst Zero 1.486 %/day 0.9992 PCU 2.5% Short SROT 7.781 %/...fday 0.9990 PCKN 5.0% 28 Day Lag Zero** 0.852 %/day 0.9996 PCKN " 28 Day Lag Zero** 0.852 %/day 0.9996 PCKN 29.0% Short Zero 4.372 %/day 0.9974 PCKN .. Short Zero 4.372 %/day 0.9974
. -p y
#2 - FERTILIZER TECHNOLOGY KINETIC CLASSIFICATION SUMMARY - 20°C [Dual Phase Square Root of Time Order]
--.............. - ........... ~.- .. -- -_ ...... __ .......... _._ ....... __ ...... __ ... - -
% Conc-S.S.
50% 50% 50% 50% 50% 50% 70% 60% 40% 40% 60% 60%
Product Description Burst Induction Summary Steady Sate Summary SROT Order SROT Order
Product T~e Coat Wt. Rate Const RSQR % Cone Rate Const RSQU % Cone
Ex1 - 44%N PCU 4.5% 11.179 %/Vday 0.9998 30% 3.554 %/vday 0.9999 40% plus IEx2 - 43%N PCU 5.5% 7.920 II 0.9990 20% 3.754 " 0.9998 40% plus iOMS - 40%N PCSCU 11.0% 16.592 II 0.9998 30% 1.767 " 0.9999 30% plus ·OMS - 37%N PCSCU 18.0% 5.323 It 0.9996 20% 1.582 If 0.9993 10% plus SCU - 38%N PCU 16.5% 8.408 II 0.9991 30% 2.195 If 0.9995 20% plus UF(5)-38%N UF none 7.130 .. 0.9995 50% 2.450 " 0.9999 15% plus Ex5KN-13%N PCKN 4.5% 6.684 II 0.9991 50% 1.985 " 0.9999 15% plus Ex5KN-43%K20 PCKN II 6.684 " 0.9991 50% 1.985 If 0.9999 15% plus Ex8 - 23%K20 MaqPop none 5.472 11 0.9995 40% 0.597 If 0.9999 10% plus
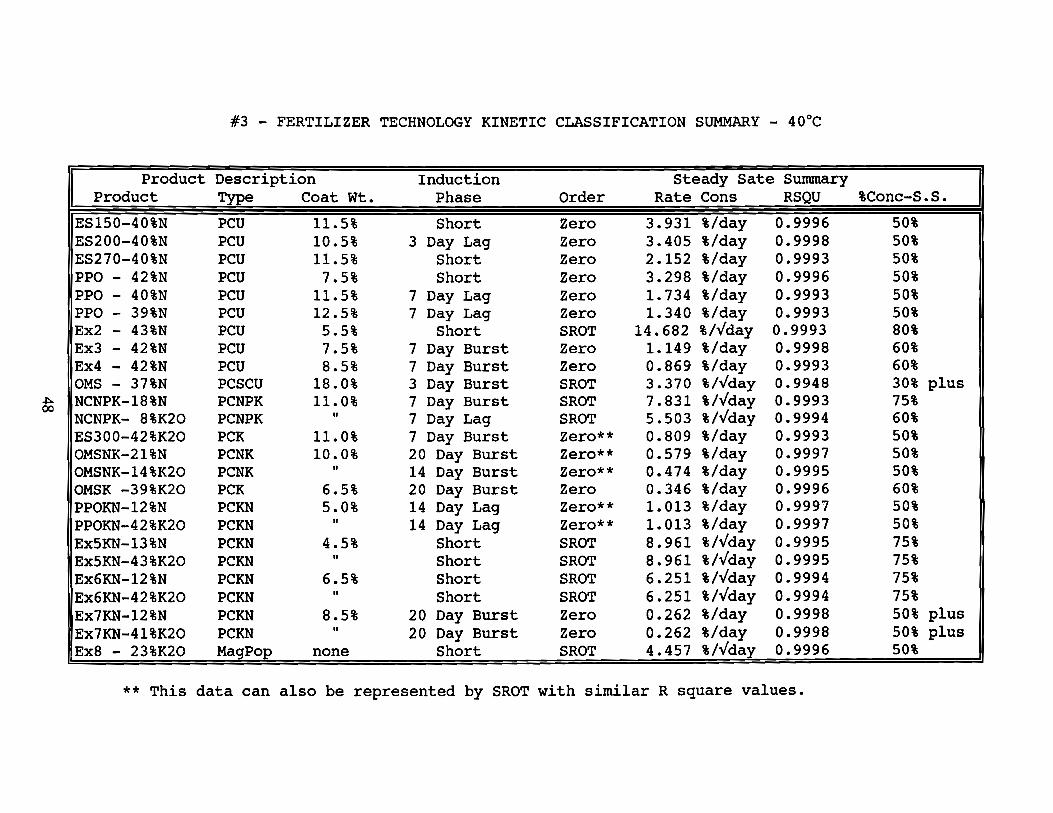
#3 - FERTILIZER TECHNOLOGY KINETIC CLASSIFICATION SUMMARY - 40°C
_ ..................... _ .......... _._ .. _-
Product Description Induction Steady Sate Summary Product Type Coat Wt. Phase Order Rate Cons RSQU %Conc-S.S.
ES150-40%N PCU 11.5% Short Zero 3.931 %/day 0.9996 50% ES200-40%N PCU 10.5% 3 Day Lag Zero 3.405 %/day 0.9998 50% ES270-40%N PCU 11.5% Short Zero 2.152 %/day 0.9993 50% PPO - 42%N PCU 7.5% Short Zero 3.298 %/day 0.9996 50% PPO - 40%N PCU 11.5% 7 Day Lag Zero 1. 734 %/day 0.9993 50% PPO - 39%N PCU 12.5% 7 Day Lag Zero 1.340 %/day 0.9993 50% Ex2 - 43%N PCU 5.5% Short SROT 14.682 %/";day 0.9993 80% Ex3 - 42%N PCU 7.5% 7 Day Burst Zero 1.149 %/day 0.9998 60% Ex4 - 42%N PCU 8.5% 7 Day Burst Zero 0.869 %/day 0.9993 60% OMS - 37%N PCSCU 18.0% 3 Day Burst SROT 3.370 %/";day 0.9948 30% plus
~ NCNPK-18%N PCNPK 11.0% 7 Day Burst SROT 7.831 %/";day 0.9993 75% NCNPK- 8%K20 PCNPK II 7 Day Lag SROT 5.503 %/";day 0.9994 60% ES300-42%K20 PCK 11.0% 7 Day Burst Zero** 0.809 %/day 0.9993 50% OMSNK-21%N PCNK 10.0% 20 Day Burst Zero** 0.579 %/day 0.9997 50% OMSNK-14%K20 PCNK II 14 Day Burst Zero** 0.474 %/day 0.9995 50% OMSK -39%K20 PCK 6.5% 20 Day Burst Zero 0.346 %/day 0.9996 60% PPOKN-12%N PCKN 5.0% 14 Day Lag Zero** 1.013 %/day 0.9997 50% PPOKN-42%K20 PCKN II 14 Day Lag Zero** 1.013 %/day 0.9997 50% Ex5KN-13%N PCKN 4.5% Short SROT 8.961 %/";day 0.9995 75% Ex5KN-43%K20 PCKN tI Short SROT 8.961 %/";day 0.9995 75% Ex6KN-12%N PCKN 6.5% Short SROT 6.251 %/";day 0.9994 75% Ex6KN-42%K20 PCKN II Short SROT 6.251 %/";day 0.9994 75% Ex7KN-12%N PCKN 8.5% 20 Day Burst Zero 0.262 %/day 0.9998 50% plus Ex7KN-41%K20 PCKN II 20 Day Burst Zero 0.262 %/day 0.9998 50% plus Ex8 - 23%K20 MagPop none Short SROT 4.457 %/";day 0.9996 50%
** This data can also be represented by SROT with similar R square values.
Size Requirements for Lawn and Garden Fertilizers
FransH.Jager LESCO, Inc.
My presentation today is the continuation of what has almost become a crusade, which I started shortly after joining LESCO at the February 1993 TFI, to try to get the Basic Fertilizer Manufacturers to pay attention to the specific requirements of the Turf Fertilizer Industry.
The issue is very simple: As the Basic Fertilizer Industry improves and
standardizes the quality of agricultural fertilizers and makes more sophisticated measurements such as SGN, and Uniformity Index part of the specification for its products, it has found itself confronted with the need to redefine the optimum particle size for its standard production and, as a result, has almost without exception gravitated towards a somewhat larger particle size, frequently defined as 2x4 mm.
This product may be very blend able, ideal for precision application on row crops and it may offer the production managers stable and efficient operating rates, but it is not what would obtain optimum performance if put on your lawn or on your ornamentals.
Many of you in the audience today, represent Basic Fertilizer Manufacturers and that is why I have accepted, without hesitation, the Round Table's invitation to speak to you today about the size requirements of the Lawn & Garden Fertilizer Industry.
Unfortunately, I cannot claim that there is such a thing as an industry standard for the sizing of materials that go into the manufacturing of lawn & garden fertilizers, but I can state categorically that in our business "smaller is better," which is a clear divergence from the path that agricultural fertilizers have taken over the last couple of years.
At LESCO we have, over time, established three grades of turf fertilizer that are distinguished by particle size alone. We have chosen to call these sizes: "Standard"; "Mini"; and "Elite®." Our "Elite" size is sometimes in the Industry known as "Micro" size or as "Greens" size.
The rationale for three size grades in the Turf Fertilizer business is directly related to the type of turf the product is applied on and the prevalent cutting height.
Greens and tees are mowed to 1/8" height (3.2 mm) and it is obvious that fertilizer particles that would be in the 2x4mm range would literally stick out! But fairways are being cut today to 1/2" as a regular practise and that is only 12.7mm. Homelawns are generally cut at 2-3" height and are therefore less sensitive to the sizing of the fertilizer particles.
The other reason for differentiating the size of turf fertilizer has to do with the sensitivity of the turf to stress and disease and the degree of protection that the caretaker of the turf requires. This gets us into the issue of particle distribution across the turf surface, which I will address in some detail later on in my presentation.
We have chosen to define "Standard" product to fall within a screen analysis range of Tyler 6+ 16; "Mini" product as to fall within a screen analysis of Tyler -10+20; and "Elite" product as to fall within a screen analysis of Tyler -14+28.
Clearly, when we are making an issue of particle size for raw materials going into lawn & garden fertilizers, we are addressing the requirements of that segment of the Turf Fertilizer Industry that supplies its customers with dry blended finished product. We do not have reliable statistics of the marketshare represented by blends in the total turf fertilizer market, but we do believe that it is substantially more than 50% of the total market.
The questions that I want to address here this morning are:
• "Why can the Turf Fertilizer Industry not live with the size of raw material used in the agricultural market for blended product?"
• "Why would the basic manufacturer have to concern himself with this issue?"
Before I do that, let's look at the marketplace for lawn & garden fertilizer to give us a feel for what we are dealing with.
If you think that reliable consumption statistics for agricultural fertilizers in the USA are hard
49

to come by , then think twice before you undertake a commitment to talk or write about consumption of fertilizers in the Lawn & Garden Fertilizer Industry. If it was not for the good work done by Kline & Company, who, in the absence of government or industry produced data, has found a commercial opportunity to compile and publish survey results pertaining to the Consumer Markets and the Professional Markets for Pesticides and Fertilizers, I would not have known what to tell you. Relying, however, on their analyses, which go back to 1992 and 1993, I can serve up the following data on the scope of the Market that we are interested in.
The Kline study reports:
Fertilizer business in the markets covered by its study to be in excess of $ 1.1 Billion, broken down as follows:
• Horticultural fertilizer business $ BO.B MM (1993)
• Professional fertilizer business $ 466.5 MM (1992)
• Consumer fertilizer business $ 623.9 MM (1993)
• A growth rate of 5.3% per annum in the horticultural fertilizer business
• A growth rate of 4.9% per annum in the professional fertilizer business
• A growth rate of 2.9% per annum in the consumer fertilizer business
• N represents 66% of the consumer fertilizer business
• K represents 22% of the consumer fertilizer business
• P represents 12 % of the consumer fertilizer business
50
If we take these data and focus, for the benefit of our investigation, only on the fertilizers applied to turf and then use the Kline growth projections to bring the '92 and '93 data to estimated 1994 levels, we see that:
• 1994 professional turf fertilizer business is estimated at $ 513 MM
• 1994 consumer turf fertilizer business is estimated at $ 413 MM
• These projections include the value of "combination products," fertilizer/pesticide combinations.
LESCO believes that this total volume of bus iness in turf fertilizers of $ 926 MM, measured at the end-user level, equals a total tonnage in excess of 1.7 MM tons of product per annum.
If, for a moment, we assume, that the N-P-K distribution in the professional market is the same as Kline found for the consumer market - 66%-12%-22%- then it would follow that the Turf Fertilizer Industry consumes annually 1.1 MM tons of nitrogen materials, 0.2 MM tons of phosphate materials and 0.375 MM tons of potash materials.
These numbers may not be 100% accurate, but they are good enough to give you a feel for the size of the turf fertilizer market in the USA. And this market is growing by an average of 4 % per year.
Now that we all have a feel for the importance of the market that we are addressing here, let's get to the meat of the matter and ask ourselves again:
"Why can the Turf Fertilizer Industry not live with the size of raw material used in the agricultural market for blended product?"
Here are my answers:
• Because a grass plant in size and nutrient absorption is very different from a corn stalk
• Because combination products, which represent a sizeable portion of the turf fertilizer business, work on the basis of uniform distribution with particles in close proximity or with particles remaining in contact with the foliage.
• Because modern cutting practices on the Golf Course represent the risk of cutting up, smearing or picking up larger particles that do not penetrate down into the turf.
• Because smaller particle size allows for better distribution of the nutrients over the turf surface, eliminating streaking and spotting patterns on lawns, fairways and greens.
To illustrate this last point, we took samples ofLESCO Poly Plus® Sulfur Coated Urea in Standard, Mini and Elite size and counted the number of particles contained in just 1 gram of each of these materials and found the following:
• 1 gram of LESCO standard size SCU contains approx. 100 particles
• 1 gram of LESCO mini size SCU contains approx. 230 particles
• 1 gram of LESCO micro size SCU contains approx. 800 particles
In contrast, we took a random sample of agricultural grade granular urea and counted 42 particles in a gram of product.
We are of the opinion that these differences have a material impact on the efficacy of fertilizer nutrients and control product active ingredients on turf and we are committed to offering our customers the best possible products they can buy for the protection and maintenance of their turf.
The other question is:
"Why would the basic manufacturer have to concern himself with meeting the size requirements for turf fertilizer applications?"
My answers to that question are:
• Can the fertilizer industry afford to turn its back to the requirements of a domestic customer segment that represents 1.7 MM tons of business, takes product year around and is growing?
• Sizing can be controlled by the granulation process or by screening. In both instances it can be most cost effectively done at the production site.
• Turf sizing represents an opportunity to create a specialty market for a premium product, somewhat isolated from the agricultural commodity market.
• Because the fertilizer industry wants to be responsive to genuine customer demands.
Let me be clear at this point. I can name a few fertilizer manufacturers that are offering specific "turf grade" or "greens grade" fertilizers. But, it seems to me, these are isolated efforts and do not necessarily signal a lasting Industry commitment to the turf fertilizer business. Availability is not always secured and quantities are mostly limited.
What is missing is an industry-wide recognition that there is a specialty market opportunity right at the producers' doorstep, that has largely been ignored. It is a sizeable market. It is consistently growing. It is pretty much active year around . It is not subject to the vagaries of the export markets. And it can afford to be operating without the sometimes wildly fluctuating seasonal pricing of the agricultural commodity business.
The concept of offering a specialized product to a specialty market is not without precedent in the fertilizer industry. Fertilizer plants in the USA produce, store and ship large quantities of "Feed Grade," "Industrial Grade" and "Explosives Grade" materials. So why not add "Turf Grade" products?
Somewhere at the start of my remarks, I commented on the fact that the Lawn & Garden Fertilizer Manufacturers have, so far, not attempted to formulate sizing standards for the materials they require. Our Industry is a fiercely competitive bunch and in many organizations the sizing of raw materials is somewhat of a trade secret. And everyone seems to have a slightly different definition of what the size requirements for different applications are.
51
I suggest, that this situation calls for the creation of a small task force of representatives of the Basic Fertilizer Manufacturers of N, P, and K and representatives of the Lawn & Garden Fertilizer Industry. Maybe this is an initiative that can be worked out right here by the Fertilizer Industry Round Table. If that is not the right platform, I

suggest that members of the TFI Committee on Turf Fertilizers take the initiative to create such task force. I can promise you that LESCO will be an active and constructive participant to such dialogue.
In my crusade, that started in February of 1993, I have met with a good number of Fertilizer Industry Executives, who each have, pretty much without exception, pledged to pay attention to the requirements of the Turf Fertilizer Industry. But, as Lou Holtz so comprehensively stated, "when all is said and done, a lot more is said than done."
My presence here, this morning, signals a new commitment on the part of LESCO and, I am confident, on the part of the seriously customer interested Turf Fertilizer Industry to develop, in conjunction with the Basic Fertilizer Industry, a plan for the creation of a supply system for the ingredients that we need in order to be able to give our customers the best possible products for the maintenance of their turf. We believe that doing business in the nineties is all about "exceeding customers' expectations." Our definition of a "loyal" customer is one who has not found a better alternative, yet! The Basic Fertilizer Manufacturers and the Lawn & Garden Fertilizer Manufacturers should realize that they share a huge customer base, consisting of, in large part, all of us homeowners who like to keep their turf green and free of weeds and insects, with environmentally acceptable products and practices. Let's give them what they want!
If we don't do it, someone else will. This brings me back to where we started with
the words of John McDonnell. I trust it is clear to you now, why I chose his
words to introduce to you my topic for this session of the Fertilizer Industry Round Table.
A Blender's Tool For Quick SGN Determination
James C. Brown JeanL. Checal
Sylvite Sales Inc.
Introduction
The Canadian Fertilizer Institute introduced the Size Guide Number (SGN) method of particle size
identification more than a decade ago. The method has contributed to quality improvements of blended fertilizers and has become popular with the fertilizer industry in North America. Sylvite Sales, dedicated to quality and service, supported the "SGN Movement" from the beginning. Sylvite also recognized that a simple tool was needed to give a quick answer to the customer's question: "what is the SGN of this sample?".
The SGN Scale
The idea for such an instrument originated with George Hoffmeister's histograms in the paper he presented to the 1962 Round Table(l). It was then visualized as a small plexiglass box, fitted with 5 standard sieves to produce the size histogram and balanced on a scale beam for direct reading of the average particle dimension. We present here a simplified (no scale beam) version of the concept. The "SGN Scale", as we call it, comes in two sizes:
• The pocket size, for samples up to 30 mL. Outside dimensions are 130 mm x 80 mm x 40 mm, or about 5" x 3" X 11/2".
• The desk size (figure 1), for samples up to 210 mL. Outside dimensions are 250 mm x 165 mm x 60 mm, or about 10" x 61/2" X 21/4". These dimensions were chosen to fit the pieces of wire cloth measuring 6" x 2" exactly.
To use the SGN Scale you would:
52
• Fill the right end compartment (next to the 400 mark) 3/4 full with the fertilizer to be tested.
• Close the SGN Scale, holding the cover tight against the box.
• Rotate 90° to bring the sample in the top position.
• Shake until sifting is completed.
• Return the box to the horizontal position, to view the level in each compartment and to estimate the value of SGN (SGN is that point on the scale that divides the total sample mass in two equal parts).

Size Analysis - Some Comments
Testing for particle size is normally a tedious and onerous operation. The IFDC S-107 method of size analysis(2) is a good example of the procedure.
Testing sieves have not changed much since 1910 when W.S. Tyler offered a series in which the sieve openings increased in the ratio of the fourth root of two, or 1.189(3). The American Society For Testing Materials (A.S.T.M) has, in the last 25 years, adjusted the openings of both the Tyler Scale and the U.S.A. standard scale to harmonize with the series adopted by the International Organization for Standardization (ISO). The ISO series is based on the fortieth root of ten, or 1.059. The screen scales of North America, based on mesh numbers can be confusing. For example, a 2 mm opening is 9 mesh in the Tyler scale and 10 mesh in the U.S.A. scale. Similar problems were common in the rest of the world until ISO insisted that testing sieves be designated by the metric dimension of their openings or "nominal size of aperture"(4) In this paper, we will make reference to the Tyler Scale when appropriate, since this scale is still commonly used by the North American Fertilizer Industry.
The sieve shaker, Tyler Ro-Tap or equivalent, can handle only six full-height sieves at one time. To make the size analysis in one pass you would stack 5 sieves on top of the fine sieve (such as 150 micrometer or Tyler 100) required to measure dust. Depending on the type of product, you could use one of the following sieve selections:
• For a product which is 90% between 2 and 4 mm.
4.00mm, 3.35 mm, 2.80mm, 2.36mm, 2.00mm,
Tyler 5 Tyler 6 Tyler 7 Tyler 8 Tyler 9
• For a product which is 90% between 1 and 4 mm.
4.00mm, 2.80mm, 2.00mm,
Tyler 5 Tyler 7 Tyler 9
1.40mm, 1.00 mm,
Tyler 12 Tyler 16
• For a product which is 90% -6+16 Tyler 3.35 mm, Tyler 6 2.36 mm, Tyler 8 1.70 mm, Tyler 10 1.18 mm, Tyler 14 0.85 mm, Tyler 20
The first selection uses consecutive sieves of the A.S.T.M. E-ll series (Table 1) and consequently gives the best accuracy possible with the standard sieves available in North America. Using every second standard sieve, as we suggest in the other two selections, is a practical way to test most fertilizers in one pass, although accuracy may suffer. This is clearly illustrated in the Particle Size Report - Test 1 (Exhibit 1) and Test 2 (Exhibit 2). The "s" shape of the cumulative distribution curve is better tracked when consecutive sieves are used, as in Test 2. Incidentally, you may have noticed that we accumulate from the pan up, rather than the traditional "from the top sieve down". The reason is simply that we prefer to place the zero particle dimension at the origin of the graph. The traditional method would yield exactly the same curve, only upside down, so to speak.
SGN-UI Calculations
The Size Guide Number method of particle dimension identification reduces the results of test sieving to two parameters:
• The Size Guide Number (SGN),
• The Uniformity Index (VI).
The Size Guide Number is that particle dimension which corresponds to the 50% level of the cumulative curve. SGN is calculated by interpolation with the general formula in which k = 50.
53
a(CRA- k) + b CRA-CRB

The expression CRA stands for "Cumulative Retained Above k". The expression CRB stands for Cumulative Retained Below k". The values for CRA and CRB can be found in the testing data. The coefficient b is the opening dimension for the sieve on which the value CRA was obtained. The coefficient a is the dimension difference for the sieves on which CRAand CRB were obtained. The coefficients a and b are expressed in SGN units, that is millimetre times 100.
The Uniformity Index is the ratio of particle dimensions at the level of 95% cumulative retained, and 10% cumulative retained. The small (S) and large (L) dimensions are calculated with the same interpolation formula. The value k is 95 for Sand 10 for L.
Methods of determinations, with examples, can be found in tables available from the authors and dealing with:
• Consecutive Standard Sieves
• ISO 8397 Standard Sieves(5)
• 'TYler Principal Sieves
• Old 'TYler Sieves
Testing The SGN Scale - Desk Size
Comparative tests were made with four different material samples. Each sample was first run through the SGN Scale, with the height of product in each compartment measured and recorded (Test 1).
The same sample was then tested with the "Standard" IFDC S-107 method, using Standard Sieves 4.00 mm, 2.80 mm, 2.00 mm, 1,40 mm and 1.00 mm. Product collected on each sieve was weighed and a record made (standard method).
The sample was again run through the SGN Scale (Test 2).
The usual calculations were then carried out to calculate SGN and VI from the findings of the standard method.
Our SGN Scale-Desk Size is fitted with one standard opening sieve at the 140 mark (1.40 mm). The other four (non-standard) sieves have 1.01, 2.03, 2.82 and 4,45 mm openings. With the coef-
54
ficients a and b reflecting the actual dimensions, these discrepancies were of little or no conse-quence. The coefficients a and b, for the SGN Scale-Desk Size, are:
It k is between II. .k
400 mark (4.45 mm) & 280 mark (2.82 mm) 163 282
280 " 200" (2.03 mm) 79 203
200 " 140" (1.40 mm) 63 140
140 " 100" (1.01 mm) 39 101
The results of these tests were:
~ SGN/UI l'm.l Ie.&tZ. Standard
MitlhQd
Prilled SGN 177 178 174 Urea UI 48 45 43
Granular SGN 243 240 248 Potash UI 38 42 43
Granular SGN 271 271 275 MAP UI 50 50 54
European SGN 363 363 350 CAN UI 67 67 66
Applications
Our principal objective has been to provide a tool which, in one minute or less, by inspection gives the blender operator a quick answer to the question "what is the SGN of tbis sample? We did this ourselves for the four samples used in the comparative tests (Test 2):
• The prilled urea was estimated at 170-180. The standard method had found 174.
• The potash was estimated at 240-250. The standard method had found 248.
• The MAP was estimated at 270. The standard method had found 275.
• The European CAN was estimated at 360. The standard method had found 350.
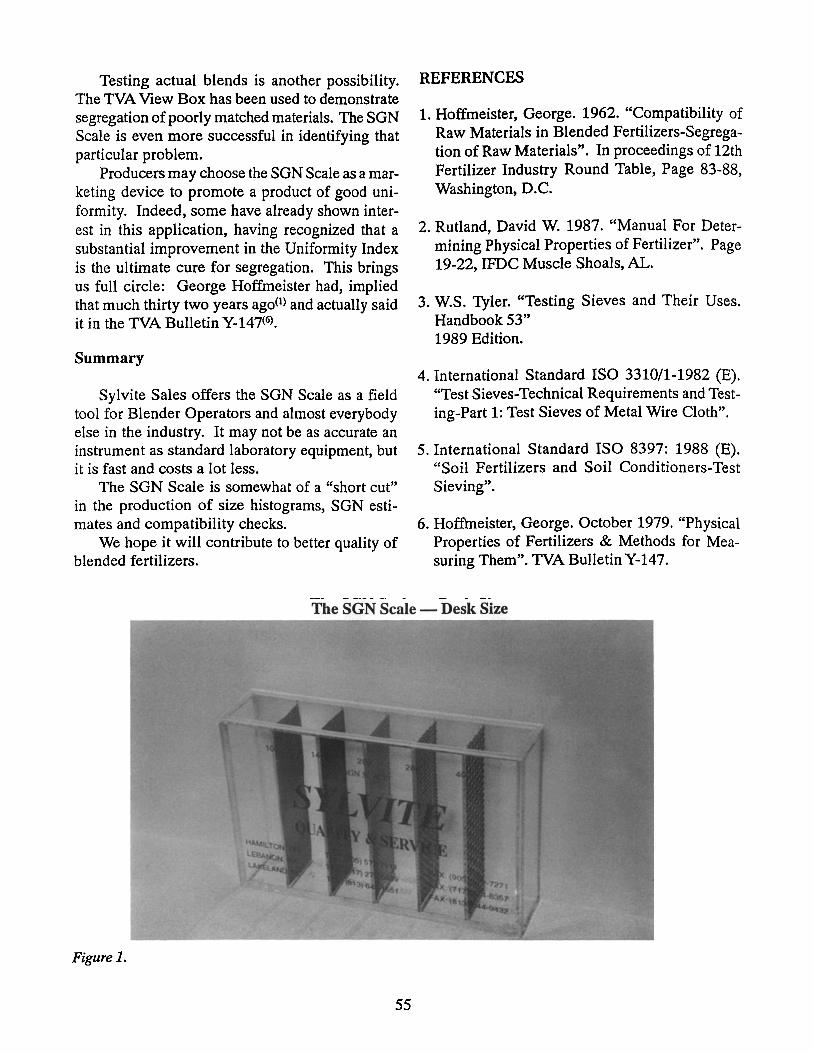
Testing actual blends is another possibility. The TVA View Box has been used to demonstrate segregation of poorly matched materials. The SGN Scale is even more successful in identifying that particular problem.
Producers may choose the SGN Scale as a marketing device to promote a product of good uniformity. Indeed, some have already shown interest in this application, having recognized that a substantial improvement in the Uniformity Index is the ultimate cure for segregation. This brings us full circle: George Hoffmeister had, implied that much thirty two years ago(!) and actually said it in the TVA Bulletin Y-147(6).
Summary
Sylvite Sales offers the SGN Scale as a field tool for Blender Operators and almost everybody else in the industry. It may not be as accurate an instrument as standard laboratory equipment, but it is fast and costs a lot less.
The SGN Scale is somewhat of a "short cut" in the production of size histograms, SGN estimates and compatibility checks.
We hope it will contribute to better quality of blended fertilizers.
REFERENCES
1. Hoffmeister, George. 1962. "Compatibility of Raw Materials in Blended Fertilizers-Segregation of Raw Materials". In proceedings of 12th Fertilizer Industry Round Table, Page 83-88, Washington, D.C.
2. Rutland, David W. 1987. "Manual For Determining Physical Properties of Fertilizer". Page 19-22, IFDC Muscle Shoals, AL.
3. W.S. Tyler. "Testing Sieves and Their Uses. Handbook 53" 1989 Edition.
4. International Standard ISO 3310/1-1982 (E). "Test Sieves-Technical Requirements and Testing-Part 1: Test Sieves of Metal Wire Cloth".
5. International Standard ISO 8397: 1988 (E). "Soil Fertilizers and Soil Conditioners-Test Sieving".
6. Hoffmeister, George. October 1979. "Physical Properties of Fertilizers & Methods for Measuring Them". TVA Bulletin Y-147.
-
The SGN Scale - Desk Size
Figure 1.
55
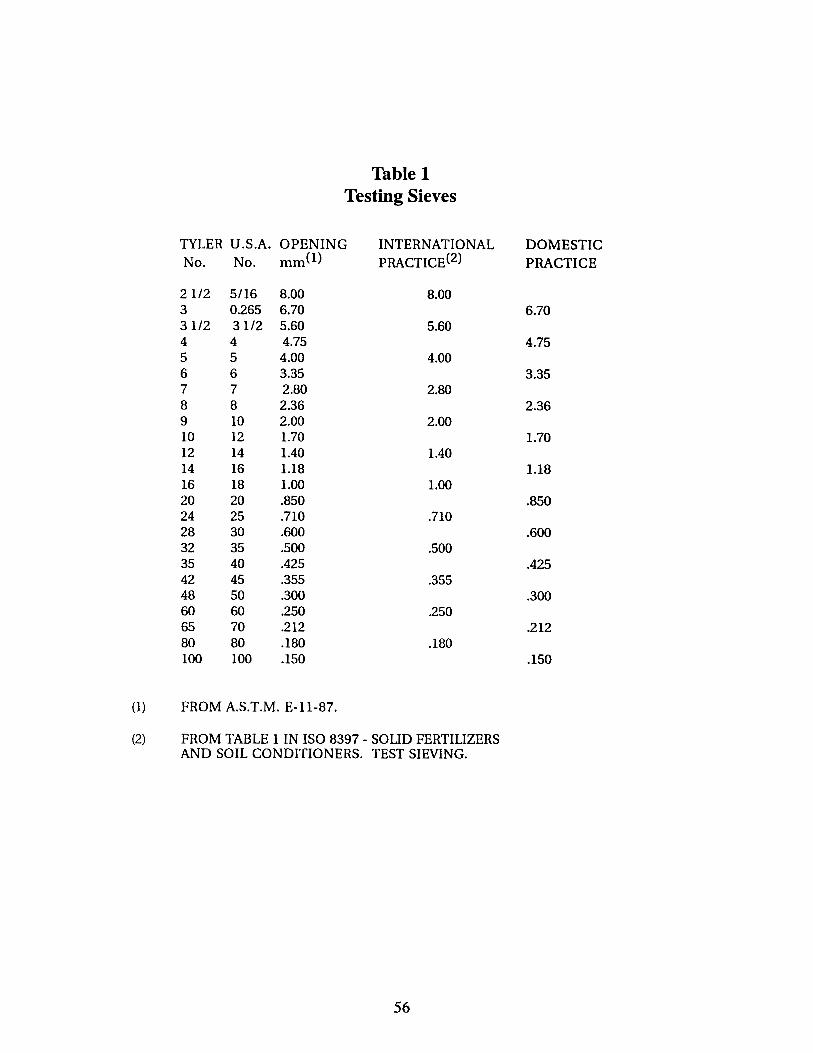
Table 1 Testing Sieves
TYLER U.S.A. OPENING INTERNATIONAL DOMESTIC No. No. mm(l) PRACTICE(2) PRACTICE
2112 5/16 8.00 8.00 3 0.265 6.70 6.70 3112 3112 5.60 5.60 4 4 4.75 4.75 5 5 4.00 4.00 6 6 3.35 3.35 7 7 2.80 2.80 8 8 2.36 2.36 9 10 2.00 2.00 10 12 1.70 1.70 12 14 1.40 1.40 14 16 1.18 1.18 16 18 1.00 1.00 20 20 .850 .850 24 25 .710 .710 28 30 .600 .600 32 35 .500 .500 35 40 .425 .425 42 45 .355 .355 48 50 .300 .300 60 60 .250 250 65 70 .212 .212 80 80 .180 .180 100 100 .150 .150
(1) FROM A.S.T.M. E-11-87.
(2) FROM TABLE 1 IN ISO 8397 - SOUD FERTIUZERS AND SOIL CONDITIONERS. TEST SIEVING.
56

VI -....}
~ 314 Main SItae! West. Sui,e 200 Hamilton. Ontario LBP 1 K2
SYLVITE PARTICLE SIZE WOlT OU! __________ _ 1II0l1
tMIII.\1 mm If ________ _
SWIl lim _____ _ SWIlDAf __________ __
SWIl 5i1£ _____ _ LOt sm _________ __
ACTUAL ..... un .. l cmmt t
I ·1.25 u O.n \ 0.01 s,~ '2..40
.1S • 1.11 0.0'1. O. \0
I.II·~ UI 5S/,;'
...... ·1.11 Q.~o \.01)
1.11 • ..." 0.'0. ~ FlIES
.... -1.11 't.GO .s.oo 0.0\ A DUST 1.11 - __
~·1.81 "0.00 65.00 H KK '\0 %
l.Il -,,;.:;;
4;,Ii' - 1.11 'l.0.00 <\5.00 1-4 KK 0.4-.'1 % ---
EXHIBIT 1
!I)--------
l'ZSTiIl __ ....L __ _
SIII?il:iIl. ______ _
fiDOOcr ____ _
SP2CIFICATIOf/S
~ 37.! Main S;:reel West. SUI~e 200 HamiltOn, Omana l8P lK2
SYLVITE PARTICLE SIZE REPORT UPOU DUl ______ _ 1'lI0lI
Tm DUE mmu ______ _
S!.!!l'L! DAr! _________ _ illIl'IlD!T __________ _
illIl'Lf sm ________ _ LOt sm _________ _
ACTIJAL 'I': l'l' B.!JLtS I "..",. \
J ~ •• 15 U 0·01 0.01 S6K 2{'5 .15 - 1.1/ 0.0'\ 0·10
1.11 - 1.1& O.t,.() 0.50 UI t.o%
1.11 • 1.1/ 0.50 Lao
IAI - 1.71 \.00 2.00 FIKES 0.0'\
1.71 1.11 :'.00 5.00
1.11 1.1£ 1".00 2.1.oq_ DUST __ 0- 0 \
1.1. - 1.11 44-.00 "5.00 H KK ~% Lil - UI 25.00 '\0.00
1.15 - 1.11 5.00 '15.00 I I 1-4 IX 'i~.'i %
EXHIBIT 2
!I)------
ttSl'iO '2.
SiII!'!l iIl. ______ _
1'lIIlIlrl ____ _
SPECIFICATIONS

~ I
METHOD OF DETERMINATION OF SGN & UI WITH CONSECUTIVE STANDARD SIEVES
Test results, expressed in percent of sample mass, are accumulated from the largest size all the way down to the pan. The general interpolation formula is:
a (eRA - kl + b CRA - CRa
Where k k k
50 for SGN (Size Guide Number - 50\ level) 10 for L (Large Particles - 10% level) 95 for S (Small Particles - 95% level)
a = difference, in rom times 100, of the opening dimensions for the sieves on both sides of k
b = opening dimension, in rom times 100, of the sieve retaining a proportion greater than k
CRA Cumulative Retained Above % retained greater than k
eRB : Cumulative Retained Below : % retained smaller than k
IF k IS BETWEEN l1l _ a __ _b _
8.SS rom & 6.70 rom (2 1/2 & 3) 130 679 6.7S rom & 5.60 rom (3 & 3 1/2) 110 560 5.60 rom & 4.75 rom (3 1/2 & 4) 85 475 4.75 rom & 4.00 rom (4 & 5) 75 40 iii 4.00 rom & 3.35 rom (5 & 6) 65 335 3.35 rom & 2.89 rom (6 & 7) 55 280 2.89 rom & 2.36 rom (7 & 8) 44 236 2.36 rom & 2.S8 rom (8 & 9) 36 200 2.11 rom & 1.71i1 rom 19 & 10) 30 179 1.70 rom & 1.41 rom (11 & 12) 30 148 1.4S rom & 1.18 rom (12 & 14) 22 118 1.18 rom & 1.8S rom (14 & 16) 18 100 1.IS rom & 1.851 rom (16 & 2S) 15 85 8.858 rom & 1.710 rom (21 & 24) 14 71 0.719 rom & 9.689 rom (24 & 28) 11 60 1.619 rom & 1.511 rom (28 & 32) 19 51 1.5S" rom & S.425 rom (32 & 35) 7.5 42.5 8.425 rom & 1.355 rom (35 & 42) 7.0 35.5 0.355 rom & 0.300 rom (42 & 48) 5.5 30.0 S.300 rom & 1iI.2S1 rom (48 & 6 iii I 5.0 25.0 8.250 rom & 0.212 rom (60 & 65) 3.8 21.2 8.212 mm & 8.181 rom (65 & 81i1) 3.2 18.0 8.189 rom & 9.150 rom (88 & 1S0) 3.S 15.1i1
(1) The numbers between brackets refer to Tyler Mesh numbers for the specified opening dimensions.
EXAMPLE OF DETERMINATION OF SGN & UI WITH CONSECUTIVE STANDARD SIEVES
The SCreen test results are:
CUMULATIVE % RETAINED ON
5 4.00 rom (Tyler 5) 10 3.35 rom (Tyler 6) 35 2.80 rom (Tyler 7) 80 2.36 rom (Tyler 8) 95 2.00 rom (Tyler 9)
Calculate SGN (Size Guide Number - 50\ level)
k= 50 eRA 80 CRB 35 b 236 a = 44
SGN 44(89 - 50) + 236 265.3 -- 265 89 - 35
Calculate L (Large Particles - 19\ level)
k =: 10 eRA 10 eRB 5 b 335 a = 65
L 65(111 - 10) + 335 335 10 - 5
Calculate S (Small Particles - 95\ level)
s
Calculate U1:
k = 95 CRA 95 CRB 80 b 200 a = 36
36(95 - 95) + 200 95 - 80
U1 ll.LS. 180 X 290 335 L
200
59.71:1% -- 611

VI
'"
METHOD OF DETERMINATION OF SGN & DI WITH THE ISO 8397 STANDARD SIEVES
Test results, expressed in percent of sample mass, are accumulated from the largest size all the way down to the pan. The general interpolation formula is:
a (eRA - kl + b eRA - CRB
Where k k k
'" 59 for SGN (Size Guide Number - 59% level) 10 for L (Large Particles - 1S% level)
'" 95 for S (Small Particles - 95% level) a '" difference, in mm times 19S, of the opening
dimensions for the sieves on both sides of k b .. opening dimension, in mm times 1S9, of the sieve
retaining a proportion greater than k eRA = Cumulative Retained Above
'" % retained greater than k eRB cumulative Retained Below
.. \ retained smaller than k
IF k IS BETWEEN'" ~ -.lL-
8.S" mm & 5.6" mm (2 1/2 & 3 1/2) 240 569
5.69 mm & 4.99 mm (3 1/2 & 5) 160 499
4.88 rom & 2.88 rom (5 & 7) 129 289
2.89 mm & 2.9" mm (7 & 9) 80 2"11
2.09 rom & 1.49 rom (9 & 12) 60 1411
1.40 mm & 1.B9 rom (12 & 16) 40 HI 11
l.U rom & .718 rom (16 & 24) 29 71
.719 rom & .500 mm (24 & 32) 21 58
.580 mm & .355 rom (32 & 42) 14.5 35.5
.355 rom & .258 rom (42 & 60) 10.5 25
.259 mm & .18B mm (68 & 88) 1 18
(1) The numbers between brackets refer to Tyler Mesh numbers for the specified openin9 dimensions.
EXAMPLE OF DETERMINATION OF SGN & ur WITH THE ISO 8397 STANDARD SIEVES
The screen test results are:
CUMULATIVE '- RETAINED ON
9 4.99 mm (Tyler 5) 20 2.8S mm (Tyler 7) 80 2.90 mm (Tyler 9) 92 1.49 mm (Tyler 12) 98 1.99 mm (Tyler 16)
Calculate SGN (Size Guide Number - 59\ level)
k= 59 eRA 89 eRB 2" b 2"0 a = 89
SGN 8"(8" - 59) + 2"" 24" 8" - 2S
Calculate L (Large Particles - 19% level)
k= 111 eRA 29 eRB 0 b 289 a '" 120
L = 120(29 - 10l + 280 340 29 - 9
Calculate S (Small Particles - 95\ level)
k = 95 eRA '" 98 eRB 92 b = 199 a == 40
S 49(98 - 95) 98 _ 92 + UJS
Calculate UI:
UI .il.L.S. us X 129 349 L
129
35.29\ -- 35

0\ 0
METHOD OF DETERMINATION OF SGN & UI WITH THE TYLER PRINCIPAL SIEVES
Test results, expressed in percent of sample mass, are accumulated from the largest size all the way down to the pan. The general interpolation formula is:
a (eRA - k) ... b CRA - CRa
Where k k k
59 for SGN (Size Guide Number - 59% level) 19 for L (Large Particles - 19% level)
a = b
95 for S (Small Particles - 95% level) difference, in rom times 19S, of the opening dimensions for the sieves on both sides of k opening dimension, in rom times 19S, of the sieve retaining a proportion greater than k
eRA
CRB
Cumulative Retained Above % retained greater than k Cumulative Retained Below % retained smaller than k
IF k IS BETWEEN'"
6.79 rom & 4.75 rom (3 & 4)
4.75 rom & 3.35 rom (4 & 6)
3.35 rom & 2.36 rom (6 & 8)
2.36 rom & 1.79 rom (8 & 19)
1.79 rom & 1.18 rom (19 & 14)
1.18 rom & 9.859 rom (14 & 29)
9.859 rom & 9.699 rom (29 & 28)
9.699 rom & 9.425 rom (28 & 35)
9.425 rom & 9.399 rom (35 & 48)
9.399 rom & 9.212 rom (48 & 65)
9.212 rom & 9.159 rom (65 & 199)
~ ~
195 475
149 335
99 236
66 179
52 118
33 85
25 69
17.5 42.5
12.5 39
8.8 21.2
6.2 15
(1) The numbers between brackets refer to Tyler Mesh numbers for the specified opening dimensions.
EXAMPLE OF DETERMINATION OF SGN & UI WITH THE TYLER PRINCIPAL SIEVES
The screen test results are:
CUMULATIVE % RETAINED ON
" 29 80 91 97
3.35 2.36 1. 70 1.18 0.85
(Tyler (Tyler (Tyler (Tyler (Tyler
6) 8) HI) 14) 29)
Calculate SGN (Size Guide Number - 5S\ level)
k = 50 CRA = 89 CRB = 20 b 179 a = 66
SGN = ~6 (89 - 59) ... 170 293 89 - 29
Calculate L (Large Particles - 10% level)
k = 10 CRA 20 CRB 9 b = 236 a = 99
L 99 (29 - Ie) + 236 285.5 29 - 9
Calculate S (Small Particles - 95\ level)
k = 95 eRA 97 CRB 91 b = 85 a = 33
s = 33 (97 - 95) ... 85 96
Calculate U1:
01 ll.LS. L
97 - 91
In x 96 285.5
33.63 - 34
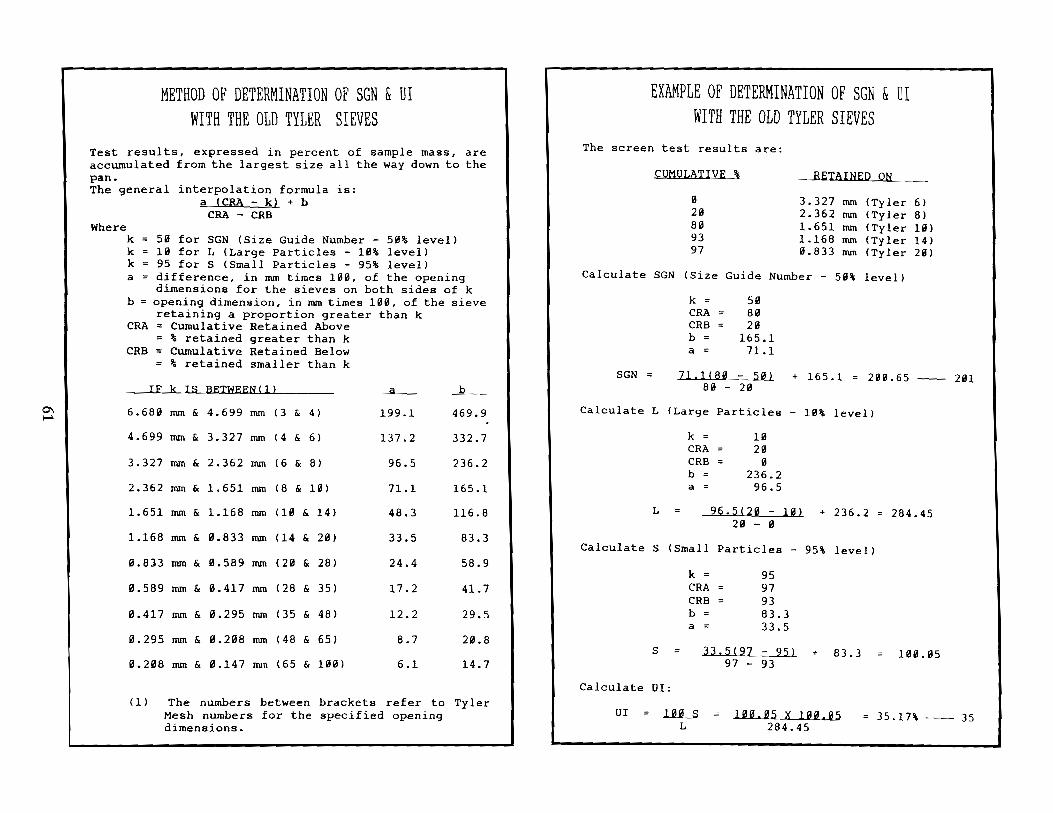
0\ ~
METHOD OF DETERMINATION OF SGN & Ul WITH THE OLD TYLER SIEVES
Test results, expressed in percent of sample mass, are accumulated from the largest size all the way down to the pan. The general interpolation formula is:
a (CRA - k) + b CRA - CRB
Where k k k
58 for SGN (Size Guide Number - 59% level) 10 for L (Large Particles - 10% level) 95 for S (Small Particles - 95% level)
a = difference, in rom times 199, of the opening dimensions for the sieves on both sides of k
b opening dimension, in rom times 199, of the sieve retaining a proportion greater than k
Cumulative Retained Above CRA = % retained greater than k
CRB Cumulative Retained Below % retained smaller than k
IF k IS BETWEENCl) ~ _b __
6.6811 rom & 4.699 rom C3 & 4) 199.1 469.9
4.699 rom & 3.327 rom 14 & 6) 137.2 332.7
3.327 rom & 2.362 rom (6 & 8) 96.5 236.2
2.362 rom & 1.651 rom (8 & IS) 71.1 165.1
1.651 rom & 1.168 rom (18 & 14) 48.3 116.8
1.168 rom & 0.833 rom (14 & 20) 33.5 83.3
8.8J3 rom & 0.589 rom (20 & 28) 24.4 58.9
0.589 rom & 0.417 rom (28 & 35) 17.2 41.7
8.417 rom & 0.295 rom (35 & 48) 12.2 29.5
9.295 rom & 8.208 rom (48 & 65) 8.7 20.8
S.208 rom & 8.147 rom (65 & 180) 6.1 14.7
(1) The numbers between brackets refer to Tyler Mesh numbers for the specified opening dimensions.
EXAMPLE OF DETERMINATION OF SGN & WITH THE OLD TYLER SIEVES
The screen test results are:
CUMULATIVE'
8 29 89 93 97
RETAINED ON
3.327 rom (Tyler 6) 2.362 rom (Tyler 8) 1.651 rom (Tyler 19) 1.168 rom (Tyler 14) 9.833 rom (Tyler 29)
Calculate SGN (Size Guide Number - 59\ level)
SGN
k '" 50 eRA 80 CRB 20 b 165.1 a = 71.1
71.1(89 - 58) + 165.1 21111.65 -- 2i!l 80 - 20
Calculate L (Large Particles - 10% level)
k '" 10 CRA 20 CRB 8 b 236.2 a '" 96.5
L 96.5(20 - 10) + 236.2 264.45 20 - 8
Calculate S (Small Particles - 95% level)
k = 95 CRA 97 CRB 93 b 83.3 a = 33.5
s 33.5(97 - 95) 97 _ 93 + 83.3
Calculate 01:
01 ll.LS L
HI I" 05 X 11;"".05 284.45
1fi1i!.05
35.17% -- 35
Micronutrient Focus In Modern Farming
Roy M. Stephen Arise Research and Discovery, Inc.
Continued growth of the Micronutrient Industry has brought new focus to the use of micronutrient formulas in Modern Farming and Precision Agriculture. Balanced fertility has long been a discussion point with universities, fertilizer companies, private consultants, farm management companies and growers. Nutrients improperly balanced are not. cost effective or environmentally friendly.
Soil sample collection and testing for chemical analysis has been and is still being used as a guide for fertilization. Without such information economical recommendations cannot be made for balancing nutrients. Soil testing labs, fertilizer dealers, universities and crop consultants all make a varied type of recommendations for balancing nutrients.
" The process of making fertilizer recommendations should consider both the technical aspect of soil chemistry and nutrient response, and also the economic and personal concerns of the farmer."l Micronutrients are small "but mighty" in the recommendation process. New technology focuses on small grids in the field with the potential to make prescription fertilization for a particular grid.
Introduction
Arise Research and Discovery, Inc. in conjunction with Cameron Chemicals and Sims Ag set ebout the task to enforce the validity of micronutrients and the role of micronutrient formulations with Modern Farming Techniques and Precision Agriculture. The five year study encompasses a number of crops with specific fertility requirements during a growing season. The selected verification crops were Field Corn, Soybeans, Soft Winter Wheat, Alfalfa and Pumpkins. Each crop has nu-
I Mengel, Purdue University, Fertilizer Recommendations Fact or Fiction, p.75, Proceedings of the TWenty Fourth North Central Extension-Industry Soil Fertility Conference. October 26-27, 1994.
62
trient requirements of a different physiological metabolic process and need nutrient assessment (NNA) during different periods of time in their respective growing season.
Methodology
The procedure used to test for validity and evaluate the role of micronutrient formulations in Modern Farming and Precision Agriculture was as follows:
1. Define the relationship between yield increase (ie. the yield with micronutrient formulas minu~ the yield without micronutrient formulas), SOlI test, and rate of fertilizer applied. for the case of zero spatial variability. The relationship must give actual yield increases and not just relative increases. The equation used does not have to be 100 percent accurate, since the purpose is to determine how the relationship (equation) changes as the variability of the soil test within the plots change.
2. The plot site at the station is an Illinois Glaciated Soil in the Cisne Association. Cisne soils are highly weathered, old soils, with a low CEC of ten or less, very poorly internally drained but good surface drainage with slight slope. High fertility test plots were selected for this trial to limit focus to other nutrients. All soil tests in this trial were well above the economic levels to apply maintenance fertilizer in accordance to the University of Illinois Agronomy Handbook. The high soil tests allows for an inverse view of the micronutrient formulations.
3. Four test controls were used for measuring actual yield response.
Control 1: No Fertilizer Control. Verification 1: No Fertilizer Control Plus
Micronutrient Formulation.
Control 2: Nitrogen only Soil Productivity Rating
Verification 2: Nitrogen only Soil Productivity Rating plus Micronutrient For mulation.

Control 3: University of Illinois N,P,K. and Results and Discussion Pelletized Lime Recommenda-tions.
Verification 3: University of Illinois N,P,K, and Pelletized Lime plus Micronutrient Formulation.
Control 4: University of Illinois N,P,K, and Pelletized Lime Recommendations at 25 bushel/corn increments.
Verification 4: University of Illinois N,P,K, and Pelletized Lime Recommendations at 25 bushel/corn increments plus Micronutrient For mulation.
4. Crops: The verification crops encompass the complete growing season. Field Corn was planted April 30, 1994, Soybeans were drilled May 20th, 1994, Soft Winter Wheat was drilled October 15th, 1993, Alfalfa was seeded July 1993, Pumpkins were free dropped May 21st 1994.
5. Weather: All crops were seeded under optimum conditions. The growing season was near normal with short periods of moisture stress. Weather stress is not considered as a factor in this experiment.
6. Soil: Soil was not compacted, very friable and generated an excellent seedbed. Soil conditions are not considered as a factor in this experiment.
7. Product Sources: Micronutrient Formulations were acquired from Sims Ag in Mt. Gilead, Ohio. The pelleted lime was acquired from Allerton Supply Company, Allerton, lllinois. All other nutrients were acquired from a local fertilizer dealer.
8. Data: Data was collected and generated into a per acre 'basis. Units were set at bushels per acre, tons per acres and cwt per acre. All crops were harvested in a timely fashion.
Table 1 shows the average range of the soil tests taken in the plot area. These tests are excellent with all soil tests above current critical levels with the exception of pH. By using an area of high tests in the experiment no response to P or K would be expected with any of the crops in the trial. This eliminates the masking of symptoms of other nutrients and brings focus to the micronutrient formula used. The micronutrient formula differed per crop.
Table 2 gives the yield data for the controls and the verification experiments. The results indicate little influence from other elements in the trial. Economic responses were noted with pelleted lime and the micronutrient formula used. A combination of the two indicate a strong economic advantage by a "bundling of the two" for soils with high fertility tests.
Table 3 examines the economic gross return per acre of each control and verification crop. Data indicates a higher gross margin with the verification studies. Put to a cost basis micronutrient formulations and pelletized lime are key players for Maximum Economic Yield.
Observations of the five control crops during the growing season.
Field Corn: A near normal growing year with very limited environmental stresses. Corn yields were superior for the geographical area of the trial. A Pioneer number was selected with a second ear characteristic noted to be actively involved yield. The second ear was noted throughout the growing season being more developed in the verification studies than the controls. Root masses were examined during the growing season numerous time. Root mass was more prevalent in the verification trials than the control. Visual differences were noted with the verification studies. Early stages of corn growth presented a taller and leaf advancement stage plant. Extended leaf height favored the verification studies.
Soybeans: An indeterminate soybean variety for narrow rows was .selected. The growing season was excellent and few environmental stresses were noted. No visual differences were noted in this trial as to height, pod count etc.
63

Wheat: The soft winter wheat variety selected was Cardinal. Few stresses were noted during the growing season. No visual differences were noted until boot stage of the wheat. Verification studies excelled in growth during this period of time. At the time of harvest, lodging was occurring in the verification studies. No harvesting lost was noted.
Alfalfa: The variety selected was oriented to protein rather than yield. Yields however were excellent with some stress occurring before the last two cuttings. This did decrease overall yield. The verification studies exhibited visual plant health and regrowth following each cutting.
Pumpkins: Accelerated users of nutrients with rapid plant growth. This crop produced prominent visual observations during the growing season. The crop did not come under any moisture stress. Verification study pumpkins noted a deep color with excellent weight and stem qualities.
Summary
The Micronutrient Industry has increased in size and production dramatically since 1978. Industries contacted openly state a 10 per cent increase in sales each year for the last ten years. Since the development of fertilizer recommendations, grower management schemes have evolutionized every seven years because of new technology, the end product being: BMPS>MEY>Sustainable Agriculture.
Factual data, as determined in the first year of this experiment aborts some philosophical recommendations by governings not associated to the Micronutrient and Pelletized Lime Industry.
Global Positioning and Variable Rate Technology begins with a grower's library for (a) field(s). Nutrient recommendations will address the Nutrient Needs Assessment Approach sometimes called the Nutrient Sufficiency Approach. The recom-
mendation must be correlated to the technical aspects of soil chemistry and nutrient response, and also the economic and personal concerns of the grower. Different goals and objectives should be reflected with the micronutrient approach. Soil test sustainability and correlated yields lead to nutrient efficacy.
Equipment controllers will bring about higher levels of grower management within a field. Once a field library is developed, economic status of grids and nutrients will be analyzed and precision applications made. This management scheme proves to be environmentally friendly as well as a relief to societal pressures.
Balanced micronutrient formulation along with other elements will produce the most efficient use of $ inputs ever seen in Modem Agriculture.
Micronutrients now will focus to the soil environment with narrower rowed crops, higher plant populations changing organic matter and increased economic environmentally sound yields.
Presenter Note:
Legality prevents the disclosure of the micronutrient formulations being used in the study. Disclosure of such information must be given by Sims Ag.
Sawyer, J. E. 1994, Grid Sampling: The Worth of Information. Proceedings of the 'I\venty Fourth North Central Extension Industry Soil Fertility Conference
Webster,R. and M.A. Oliver, 1990. Statistical methods in soil and land resource survey. Oxford University Press. New York, NY.
64
Mengel, D. and Hawkins,S, 1994, Fertilizer Recommendations, Fact or Fiction. Proceedings of the 'I\venty Fourth North Central Extension Industry Soil Fertility Conference.
Jones, J Benton, Wolf Benjamin, Mills Harry, Plant Analysis Handbook, 1994. Micro-Macro Publishing, INC. Athens, Georgia.
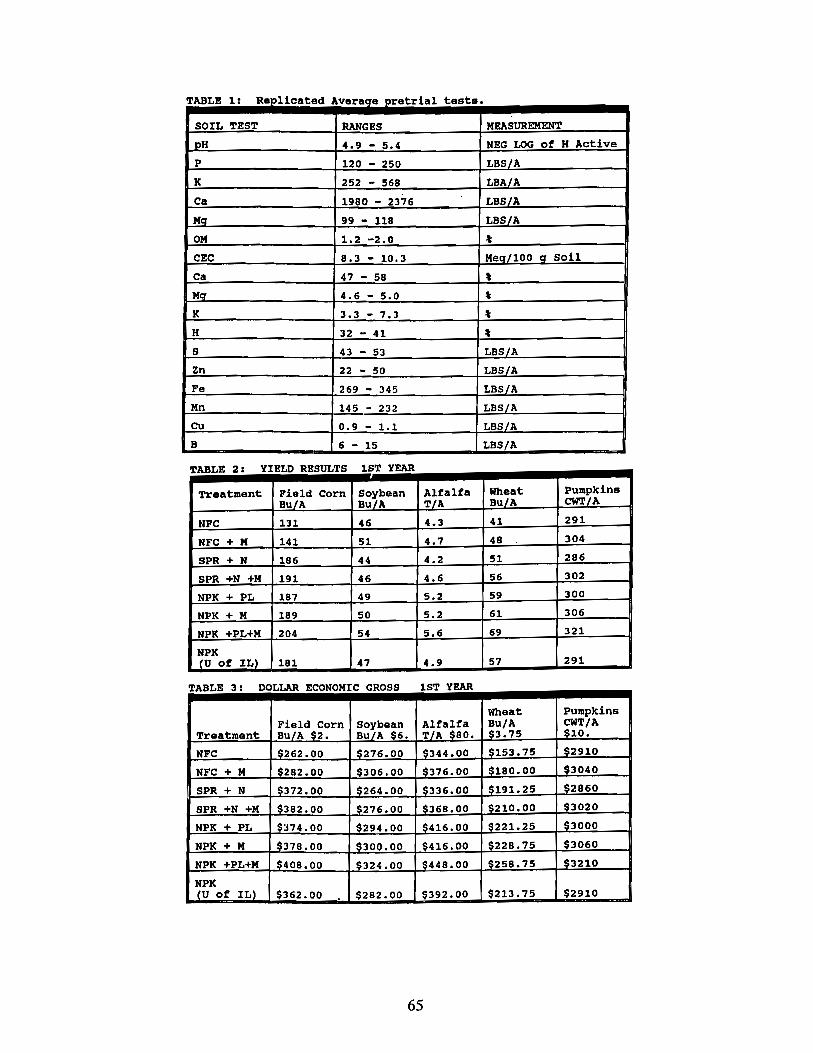
TABLB 1: Repl i cated Averaqe pretrial tests.
SOIL TBST RANGES MEASUREMENT
pH 4.9 - 5.4 NEG LOG of H Active
P 120 - 250 LBS/A
K 252 - 568 LBA/A
Ca 1980 - 2376 LBS/A
JIg 99 - 118 LBS/A
OM 1.2 -2.0 t
CBC 8.3 - 10.3 Meq/100 q soil
Ca 47 - 58 t Mq 4.6 - 5.0 t
K 3.3 - 7.3 t
H 32 - 41 , S 43 - 53 LBS/A
Zn 22 - 50 LBS/A
Fe 269 - 345 LBS/A
Mn 145 ~ 232 LBS/A
CU 0.9 - 1.1 LBS/A
B 6 - 15 LBS/A
TABLE 2 : YIELD RESULTS 1ST YEAR
Treatment Field Corn Soybean ~~.talfa Wheat PUmpkins Bu/A BuiA T A aulA cwrriA
NYC 131 46 4.3 41 291
NYC + M 141 51 4.7 4B 304
SPR + N 186 44 4.2 51 286
SPR +N +M 191 46 4.6 56 302
NPK + PL 187 49 5.2 59 300
NPK + M 189 50 5.2 61 306
NPK +PL+M 204 54 5.6 69 321
NPK -(U of IL) 181 47 4.9 57 291
TABLE 3' DOLLAR ECONOMIC GROSS 1ST YEAR . Wheat PUmpkins
Field Corn SOYbesn Alfalfa aulA CWT/A Treatment Bu/A $2. auiA 6. TIA $80. $3.75 $10.
NFC $262.00 $276.00 $344.00 $153.75 $2910
NFC + M $282.00 $306.00 $376.00 $180.00 $3040
SPR + N $372.00 $264.00 9336.00 $191.25 $2860
SPR +N +M $382.00 $276.00 S368.00 9210.00 $3020
NPK + PL S374.00 $294.00 $416.00 $221.25 $3000
NPK + M $378.00 $300.00 $416.00 $228.75 $3060
NPK +PL+M $408.00 $324.00 $448.00 $258.75 $3210
NPK -CU of IL) $362.00 $282.00 $392.00 $213.75 $2910
65

Thesday, November 8, 1994 Session III Moderator:
Ed Huber, Jr.
Status of Fertilizer Consumption in the USA
Janice T. Berry Tennessee Valley Authority
Norman L. Hargett
1991 Survey of the U.S. Retail Fertilizer Industry
Introduction
The United States has more than 13,000 bulk blenders, fluid mixers, ammoniation-granulation plants, and retail stores. These outlets receive materials from basic producers of ammonia, phosphoric acid, diammonium phosphate, urea, triple superphosphate, and potash which they mix, blend, suspend, or granulate, often adding micronutrients and pesticides. The final product, 47 million tons of fertilizer (1) valued at $7 billion (2), is sold to about 2.1 million farmers (3), either directly or through other retail outlets or distributors.
This marketing pattern contrasts sharply with that of 35 years ago when basic producers supplied materials to regional wholesale granulation plants. Relatively few grades were manufactured for distribution through retail outlets. Today, hundreds of grades are prepared by bulk blenders and fluid mixers to meet individual farmer requests. In contrast to the estimated 160 ammoniationgranulation plants operating in 1973, fewer than 40 plants are in operation today.
Historically, the Tennessee Valley Authority (TVA). cooperating with the Association of American Plant Food Control Officials (AAPFCO), has surveyed the retail segment of the U.S. fertilizer
market. Information from the survey has been used in publishing the Directory of Fertilizer Plants in the United States and in creating a profile of the retail market.
In this report, data describing each type of plant were compiled from those firms indicating exclusive operation for a particular system--bulk blend, liquid, suspension, or fluid (liquid and/or suspension).
1. Presented at the Annual Meeting of the Fertilizer Industry Round Table, Lake Buena Vista, Florida, November 8, 1994.
Survey of the Fertilizer IndustrySummary
Since 1973-74, AAPFCO and TVA have conducted six surveys of U.S. retail fertilizer distributors. The 1991 survey provides the background information for this paper.
Results of the 1991 survey are based on 5,651 responses from bulk blenders, fluid mixers, granulation plants, retail stores, and a few basic producers. Responses included 4,191 plants with mixing capability. The remaining 1,460 units were retail or specialty outlets. Of the 4,191 plants, 82 percent had bulk blending facilities, 29 percent had liquid, 12 percent had suspension, and 32 percent had liquid and/or suspension.
The total number of fertilizer registrants and licensed dealers reported for all states was 13,078, a slight increase over the 13,044 reported in 1988.
Sixty-two percent of fertilizer plants responding to the survey were in the East North Central and West North Central States. Based on U.S. fertilizer consumption data compiled by TVA, these states accounted for 47 percent of all fertilizer dis-
67

tributed in the fertilizer year ending June 30, 1991 (1).
Results indicated that 45.9 percent of all fertilizers distributed were dry bulk or bagged blends. Fluid fertilizers (including mixtures, anhydrous ammonia, nitrogen solutions, and other direct application materials) accounted for 37.3 percent. Granulated materials accounted for only 4.2 percent, a decline from the 10.5 percent reported in 1984. The remaining 12.6 percent reported in 1992 consisted of dry materials, such as ammonium nitrate (34-0-0) and diammonium phosphate (18-46-0).
Extrapolating percentages of material distributed by all plants to the 46.8 million tons of fertilizer consumed in fertilizer year 1991 (1) suggests that 21.5 million tons of dry blends (both bulk and bagged), 7.0 million tons of fluid mixtures, and 2.0 million tons of granular NPK mixtures were distributed in the United States.
Bulk Blend Patterns
Dry bulk blending is the largest component of the fertilizer manufacturing and distribution system. Bulk blending's growth accelerated when diammonium phosphate was introduced during the middle 1950s. With the simplicity and adaptability of the process, bulk blending grew rapidly, gaining distribution and economic advantages over the then-dominant ammoniation-granulation segment. Bulk blending enabled dealers to provide services such as custom mixing at competitive prices.
Bulk blending works best with well-granulated, closely-sized, dry materials that do not react or deteriorate in storage. Bulk blending and granulating have complemented each other. Blenders material was applied by farmers (53.5 percent) than was custom applied by blenders, although this percentage was down slightly from the 57.2 percent shown in the previous survey. Dealers often rent application equipment to farmers.
Complementary services continue to be a vital part of the bulk blender's fertilizer marketing program. The 1991 survey revealed that 85.1 percent of the bulk blenders reporting provided custom application services. Almost 81 percent added micronutrients, 62.2 percent added herbicides, 37.3
percent added insecticides, 67.7 percent added seeds to their dry bulk blends, 87.3 assisted in soil testing, and 13.9 percent had bagging facilities.
Data reported on type of business revealed that 32 percent of bulk blend plants were privately owned, 51.7 percent were cooperatives, and 16.3 percent were corporations.
Fluid Fertilizer Plants
The fluid (liquid and/or suspension) industry grew dramatically during the 1960s and 1970s as technology was introduced and advanced. The 1980s, however, witnessed a maturing of the fluid segment. In 1960, fluid consumption (excluding anhydrous ammonia) was 1.7 million short tons of material. This tonnage increased each year up to 13.2 million tons in 1981, then fluctuated, and peaked at 13.7 million tons in 1984 (4).
Fluid consumption in 1991 was 12.7 million tons, down from the 12.9 million tons distributed in 1990; however, the market share increased slightly from 28 percent in 1990 to 29 percent in 1991 (1). As with bulk blend systems, fluid mix fertilizer systems can economically combine intermediate fertilizer materials produced at widely dispersed production points. Both types of plants also serve as storage facilities in the market area.
68
Base materials for fluid mixtures are derived by neutralizing superphosphoric acid with ammonia to produce a liquid 11-37-0 or 10-34-0. Today, liquid ammonium polyphosphate 10-34-0 is the primary base material used in the fluid industry. High nitrogen, nonpressure urea-ammonium nitrate solutions are combined with soluble potash and 10-34-0 to produce fluid mixtures. Each of these components can also be used as a direct application material.
Attractive characteristics of fluid systems include ease of mixing, ease of incorporating additives while achieving mixture homogeneity, handling convenience, and high reliability of fluid application systems.
Suspension fertilizers are fluids in which salts are suspended by incorporating a suspending agent. Complete solubility of phosphate is not required in suspensions, allowing a wide range of possible phosphate sources. Monoammonium phosphate
(MAP) is a primary source of P205 in suspensions. Higher analysis grades can be mixed as suspensions than can be produced with conventionalliquids.
Consumption of all fluid multiple-nutrient materials in fertilizer year 1991 was estimated at 9.2 million tons. Seven states--Califomia, Florida, Illinois, Indiana, Iowa, Nebraska, and Texas--accounted for 60 percent of all fluid multiple nutrients used (1). Based on TVA estimates suspensions comprised about 24 percent of all fluid multiple nutrients used in 1991 compared with 30 percent in 1984 and 29 percent in 1988.
The 1991 AAPFCO survey revealed an average throughput of 4,551 tons for the 287 plants listing only liquid mix facilities. For plants reporting each of the following materials, the average distribution was 3,079 tons of liquid mixtures, 982 tons of anhydrous ammonia, 1,409 tons of nitrogen solutions, and 735 tons of liquid direct application materials such as 10-34-0 and 8-24-0.
The ten leading liquid grades reported were 7-21-7,4-10-10,20-10-0,7-22-5,2-6-12,6-18-6, 24-8-0, 5-10-10, 10-30-0, and 18-18-0. These grades have an average 30.6 percent nutrient content. The fluid plants also distributed significant tonnages of bulk and bagged mixtures and materials such as ammonium nitrate and diammonium phosphate.
Comparable data from 63 suspension-only plants showed an average annual throughput of 3,198 tons. Average distribution for plants reporting each of the following materials was 1,970 tons of suspension mixtures, 806 tons of nitrogen solutions, 672 tons of anhydrous ammonia, and 675 tons of liquid direct application materials.
The ten leading suspension grades produced by the plants reporting were 3-10-30, 10-30-0, 4-12-24, 2-6-35, 3-9-27, 3-9-18, 13-13-13, 6-18-18, 8-24-0, and 2-6-30. Average analysis for these grades was 38.6 percent, compared with 30.6 percent for liquids and 50.2 percent for bulk blends.
Similar to liquid plants, reporting suspension plants also distributed significant tonnages of dry direct application materials and dry complete mixtures. A frequency distribution for fluid plants (liquids and/or suspensions only) indicated that the greatest number of plants distributed 1,000 tons
or less. The average annual throughput of fluid plants was less than that of bulk blend plants, with the median tonnage for fluid plants being 2,373 and the median for bulk blend plants being 3,156.
Average storage capacity for liquid fertilizer plants, as with suspension plants, amounted to 26.2 percent of total annual distribution. Both systems appeared to enjoy greater supply flexibility and enhanced inventory management options than did bulk blend operations. Plants with liquid and/or suspension capabilities showed storage capacity at 30.8 percent of total annual distribution.
A total of 34.1 percent of liquid fertilizer tonnage was custom applied--28.9 percent by dealers and 5.2 percent by application contractors. As with bulk blends, more liquid fertilizer is applied by farmers than is custom applied by dealers. However, 30 percent of the fertilizer applied by farmers was applied with equipment rented from dealers; farmers applied 35.8 percent using their own equipment.
The percentage of custom-applied suspension fertilizer was higher than that for bulk blends and liquids combined. Eighty-two percent of suspension mixes were custom applied, primarily by suspension dealers rather than by custom applicators. Suspensions require more sophisticated application equipment than do dry blends or liquids.
As with bulk blending operations, an increasing percentage of the fluid plants reporting offered complementary services. Of liquid plants reporting, 66.1 percent added herbicides, 48.8 percent added insecticides, 79.9 percent added micronutrients, and 21.9 percent added seeds to mixtures. Of suspension plants reporting, 88.2 percent reported adding herbicides, 51.5 percent insecticides, 82.4 percent micronutrients, and 39.7 percent seeds.
Ownership data relating to fluid fertilizer plants reporting indicated that 56.9 percent were privately owned, 10.6 percent were cooperatives, and 32.5 percent were corporations.
National Market Patterns
The 1991 survey also provided a composite description of the U.S. fertilizer retail market system. Of the 5,651 respondents, 4,191 had manu-
69
facturing facilities, such as bulk blending, liquid mixing, suspension mixing, or granulation, or had basic production units. Thirty-four percent of the plants offered anhydrous ammonia, 43.1 percent added insecticides to their fertilizer mixtures, 67.5 percent added herbicides, and 82.8 percent added micronutrients. Consulting was offered by 60.2 percent and soil testing assistance was offered by 87.1 percent Eighty-four percent provided custom application.
Non-Farm Use--Eleven percent of the total tonnage distributed for all respondents was for non-farm use. Granulators reported selling 48.5 percent of their annual tonnage for non-farm use; bulk blenders,5.2 percent; and fluid mixers, 5 percent.
Types of Plants--Eighty-two percent of all plants reporting had bulk blend facilities, and 32.2 percent had fluid mix facilities. Sixty-five percent of the plants had bulk blending only facilities, and 14.7 percent had fluid mix only (liquid and/or suspension).
Ownership Patterns--Forty-three percent of all reporting plants indicated their form of business to be a cooperative (a slight increase over the 1988 survey data). The remaining 57 percent consisted of sole proprietorships and public and private corporations.
Directory of Fertilizer Manufacturers
The 1992 edition of Directory of Fertilizer Plants in the United States also includes names and addresses of Canadian firms and is available through the Association of American Plant Food Control Officials (AAPFCO).
Directory entries list plant location, mailing address, plant owner's or manager's name, telephone number, storage capacity, plant type, and related services offered. Orders should include prepayment of $25 per copy for U.S. mailing addresses or $35 for addresses outside the United States. Payment should be made to AAPFCO and orders directed to:
Joel M. Padmore Food and Drug Protection Division North Carolina Department of Agriculture
4000 Reedy Creek Road Raleigh, North Carolina 27611
References
1. Hargett, Norman L., Janice T. Berry and Melanie H. Montgomery, Commercial Fertilizers. 1991. The Tennessee Valley Authority Environmental Research Center, Muscle Shoals, Alabama, pp. 7,34, and 3637.
2. Economic Indicators of the Farm Sector: National Financial Summary, 1990. Agricultural and Rural Economy Division, Economic Research Service, U.S. Department of Agriculture, Washington, D.C., p. 10.
3. Agricultural Statistics 1991. Agricultural Statistics Board, National Agricultural Statistics Service, U.S. Department of Agriculture, Washingtonr D.C., p. 354.
4. Hargett, Norman L., and Janice T. Berry.Fertilizer Summary Data, biennial series. The Tennessee Valley Authority Environmental Research Center, Muscle Shoals, Alabama.
Fertilizer Consumption Patterns Since 1970
Fertilizer use varies with geographic regions. Agriculture in the Northeast has been steadily declining. However, this region has a relatively large non-farm fertilizer market. The South Atlantic States have experienced a decline in market share of fertilizer consumption, while the East North Central and West North Central States have enjoyed a significant increase in market share. The East South Central and West South Central region has had a slight increase in market share. Major crops in this region are corn, cotton, wheat, and soybeans. The Mountain and Pacific States region has high-value crops grown under special cropping conditions as well as most of the nation's rangeland.
70

U.S. fertilizer consumption hit an all-time high of 54 million tons in 1981 before dipping to an ll-year low of 41.8 million tons in 1983. Since that time fertilizer use has fluctuated, with the last three years (1991-1993) showing increases. Total consumption for 1993 was 49.1 million tons, a 2.7 percent increase over 1992. Tonnage used in 1994 is expected to increase 3 to 5 percent over 1993.
The percentage of mixtures compared to total fertilizer use has steadily decreased from 52.3 percent in 1970 to 37.4 percent in 1993.
Average analysis of all fertilizers ranged from 40.6 percent in 1970 to a high of 44.7 percent in 1986. Since 1990, the average analysis has remained steady at about 43 percent.
U.S. nitrogen consumption increased at an average annual rate of 1.8 percent between 1970 and 1993. However, since 1980, use has slightly decreased (an average of 0.03 percent per year). In 1993, U.S. nitrogen consumption was 11.4 million tons.
Nitrogen markets are dominated by fluid single-nutrient materials. Anhydrous ammonia and nitrogen solutions accounted for 54 percent of all nitrogen consumed in 1993, while urea and ammonium nitrate, dominant solids, accounted for 22 percent.
Phosphate use in 1993 was 4.5 million tons, a reduction of almost a million tons from the 5.4 tons consumed in 1980. This represents an average 1.51-percent decrease in use per year since 1980. Consumption in 1970 was 4.6 million tons.
Ninety-two percent of all phosphate consumed in 1993 was in multiple-nutrient grades, primarily diammonium phosphate.
Potash use in 1993 was 5.1 million tons, more than 1.2 million tons below the record 6.3 million tons consumed in 1981. Potash consumption patterns showed an average annual growth rate of 1.03 percent from 1970 to 1993; however, an average annual decline of 1.53 percent is seen from 1980 to 1993.
Potash markets are dominated by the use of potassium chloride; reported consumption (before blending) shows that its market share was 64 percent in 1993. Multiple-nutrient grades accounted for 33 percent of ~O consumption in 1993.
71
Considering fertilizer use by class, since 1970, market shares for dry bulk blends and fluids have steadily increased, while bagged materials have decreased drastically. In 1993, 52.5 percent was fluid, and 9.2 percent was bagged.
References
1970-1984 (years ended June 30). Commercial Fertilizers (consumption for year ended June 30). Annual Reports of Crop Reporting Board, Statistical Reporting Services; U.S. Department of Agriculture, Washington, D.C.)
1985-1993 (years ended June 30). Commercial Fertilizers (consumption for year ended June 30). Annual Reports of the National Fertilizer and Environmental Research Center; Tennessee Valley Authority, Muscle Shoals, Alabama.
AAPFCO Report Teresa A. Crenshaw
Association of American Plant Food Control Officials, Inc.
As President of the Association of American Plant Food Control Officials, I am pleased to speak to you this morning with a report of our Association's activities. Please allow me to introduce myself and my responsibilities with AAPFCO and how those responsibilities relate to my position as a fertilizer control official. With the Delaware Department of Agriculture, I am the Agriculture Compliance Officer, which is just another name for the fertilizer control official, and the Delaware State Chemist. In addition to feeds, pet foods, limes, frozen desserts, and the commercial dairies, I have the legal authority to regulate plant foods and soil conditioners for the State of Delaware.
During this time, I will discuss the purpose and functions of AAPFCO. I will then discuss the changes presented this past August at theAAPFCO Annual Meeting, and how these changes may affect your product labeling. And finally, I will in-
troduce the new issues which we hope to tackle this coming year.
What is AAPFCO?
AAPFCO, the "Association of American Plant Food Control Officials", is made up of members charged to execute state, territory, dominion, province, federal, or other governmental laws in North America, Hawaii, and Puerto Rico regulating the production, storage, labeling, distribution, sale or use offertilizers. Membership is also open to heads or chiefs of experimental stations, departments of agriculture, bureaus, and laboratories charged by law with the examination of fertilizers, and also to research workers charged by law in the investigation of fertilizers and their component parts.
The Association's purpose is to provide a forum through which members may unite to:
1. promote uniform and effective legislation, definitions, rulings, and enforcement practices;
2. encourage and sponsor the adoption of the most effective and adequate analytical methods for fertilizer by all member agencies;
3. develop high standards of fertilizer inspection techniques and procedures;
4. promote adequate labeling and safe use of fertilizer;
5. provide facilities and opportunities for the free exchange of information, discussion, and cooperative study of problems confronting members of the Association; and
6. cooperate with members of industry in order to promote the usefulness and effectiveness of fertilizer products and the protection of soil and water resources.
AAPFCO is not a legal or legislative body with enforcement authority. AAPFCO does not certify, approve, or endorse fertilizers or fertilizer manufacturers. Fertilizer companies are not required to first seek AAPFCO approval to begin distribution
of their products. Only the states may require product registration or licensing approval to begin fertilizer distribution. Only the states may mandate a revision in labeling or remove products from the marketplace.
Uniformity
Instead, AAPFCO strives for uniformity in fertilizer laws across the states by maintaining and continually improving the one mechanism for sound regulatory authority - The AAPFCO Uniform State Fertilizer Bill, which includes the Official Rules and Regulations, Terms and Definitions, and Statements of Uniform Interpretation and Policy. All states are encouraged to adopt the language agreed upon by the AAPFCO membership. Uniformity provides the industry with a clear understanding of the labeling requirements for selling or distributing fertilizer products in any region of the country.
Nothing can be more frustrating to a company than to spend thousands of dollars in label revisions for one state, only to find that label unacceptable in another. Or perhaps the reverse scenario has occurred: every state finds the label acceptable, yet one "Lone Ranger" state demands a change in the label if the company wishes to distribute in their state.
These types of situations occur all to often. As a result, AAPFCO is becoming more involved by encouraging states with conflicting labeling requirements to follow the uniform models. If the concern is valid, fertilizer manufacturers may have an intermediary that can intervene in cases of conflicting or non-uniform labeling or analytical requirements.
Committees
72
The work of the Association is performed primarily through a committee system. The committees meet during the regularly scheduled sessions of AAPFCO and may conduct business through mailed or faxed correspondence. All committees report to the Board of Directors for any recommendations or changes that may affect the officially adopted documents approved by the Asso-
ciation. Any changes to these documents must first be submitted to the Board of Directors. These changes are considered during the Mid-Year Meeting usually held in the month of February. Our upcoming Mid-Year Meeting will be held in San Antonio, Texas on February 21,1995.
If approved by the Board, the recommendatio~s are presented to the AAPFCO membership dunng the Annual Meeting always held during the first full week of August. Our next Annual Meeting will be held in San Juan, Puerto Rico. Industry members are encouraged and welcomed to attend. . Any change to an officially adopted document, If approved by the AAPFCO membership, becomes "tentative" for a minimum of 1 year. In tentative status, needed corrections may be considered if problems arise. After the first year, the committee may recommend that the change be moved to "official" status. If concerns have been noted, or if additional corrections are necessary, the sponsoring committee may recommend that the change remain in tentative status.
Many fertilizer companies will revise their labels as soon as a change has been approved by the Association. Some state control officials may not immediately change their law or regulations, but may prefer to make several changes only once every 5 or 10 years. Dealing with state legislatures can be time-consuming and somewhat risky. However, most states will abide by the changes approved by AAPFCO and permit certain labeling formats even before their own law or regulations have been updated. Newsletters prepared by our AAPFCO Secretary, Dr. David L. Terry, ensure that each control official is notified of any changes to the officially adopted documents in case the state was not in attendance at the Annual Meeting.
Since some changes to the official AAPFCO Terms and Definitions may have been approved by the Association, industry representatives should keep themselves informed of the AAPFCO proceedings. States often have the legal authority to adopt AAPFCO officially approved Terms and Definitions by reference. Any official change approved by AAPFCO immediately becomes enforceable by the state.
73
Official Changes Approved in August 1994
So just what were these changes to the officially adopted documents that were approved by theAAPFCO membership this past August? I will present each of these changes since your product labeling may be affected.
Available Phosphate (Pl0J
As Chair of the Uniform Bills Committee I • will begin with changes approved to the Uniform State Fertilizer Bill. First, I would like to mention a revision that was approved in 1993. Last year, the Association approved a change in the guaranteed analysis of fertilizer labels to include a guarantee for Available Phosphate (P 0 ) replacing Available Phosphoric Acid (P20S).2 Although the terms have changed, the numerical grade of the fertilizer will not change since the guarantees will continue to be expressed as (P 20S)'
This change was considered as a result of the public's perception to the term "phosphoric acid". Manufacturers began having difficulty in the transport of fertilizers since transportation officials confused the fertilizer ingredient with the hazardous chemical, phosphoric acid. Currently, no state has refused a label with a guarantee for Available Phosphate (P20 S)' although changes may not yet have been approved in the state's commercial fertilizer law or regulations.
If labels have not been changed to list guarant:es for ",?-vailable Phosphate (P20 S)' please conSIder havmg new labels printed soon since some states have already incorporated this requirement into their state's law. These states will no longer accept the term "Available Phosphoric Add" after the time limit for depleting old label inventories has expired. Again I will note. all states have accepted guarantees for Available Phosphate. I have requ~~ted any fertilizer company that has difficulty recelvmg approval from a state for Available Phosphate guarantees to please notify me so that AAPFCO may contact the state official. AAPFCO supports this change and will strive for uniform acceptance across the states.
Available "Phosphorus" and "Potassium"
With the emphasis on uniform acceptance of Available Phosphate (P 20S) in the guaranteed analysis, the Association approved a change this past August to delete the option in the Uniform State Fertilizer Bill to allow guarantees for "Available Phosphorus" and "Soluble Potassium" expressed in the elemental form. Since no state requires "P" and "K" to be guaranteed on a fertilizer label and no manufacturer lists these guarantees, this change should cause no one alarm. Several references to the elemental guarantees for phosphorus and potassium throughout the officially adopted documents were also deleted as "housekeeping". Again, these changes should not affect any manufacturer's labels, but only maintain the uniform format of the guaranteed analysis.
Adulteration
The Uniform Bills Committee recommended a change to the AAPFCO membership this past August to update the authority of the fertilizer law to identify adulterated fertilizers. Problems became apparent when a study revealed that certain plants could absorb heavy metals from recycled materials which were being applied to the land as fertilizer nutrients. The plants were thriving even though they could pose a threat to humans or livestock if consumed. Since the current law defines adulterated fertilizers only as materials which may injure the plant, the Committee recommended a revision to expand the section to include injury to humans, animals or aquatic life, and also injury to the soil or water.
Similar revisions to the adulteration chapters have been recommended to the Model Agricultural Liming Materials Bill and the Uniform Soil Amendment Bill. Since these recommendations are tentative for this year, we need to verify that these changes can not be misinterpreted to consider any or all types of fertilizers, liming materials or soil conditioners as adulterated, but only those materials that pose a serious threat. Comments would be appreciated.
Use and Application
The Uniform Bills Committee also recommended a change in the Uniform State Fertilizer Bill allowing the state to adopt and enforce rules and regulations relating to the use and application of fertilizers. This tentative revision is intended to allow the fertilizer control official the authority to prescribe best management practices for fertilizer nutrient management. Regulating the use and application of fertilizers is not an area that the Uniform State Fertilizer Bill was intended; however, with the current trend toward stricter environmental regulations, the fertilizer control official with a regulatory program in place, is the most appropriate regulator. Hopefully, AAPFCO can provide guidance and uniformity to the State Departments of Agriculture for becoming the primary enforcement agency for reguhlting the use and application of fertilizers.
Environmental Affairs Committee
Although the Subcommittee on Nutrient Management of the Environmental Affairs Committee recommended no changes to the AAPFCO officially adopted documents, the Subcommittee is considering the development of a model nutrient management plan; however, until there is a clear idea of what the plan should contain, the Subcommittee has decided that tracking the successes or failures of state programs would be more valuable for the current time. Amodel nutrient mangagement plan must take into account the activity at the national level for nutrient management, such as the Clean Water Act or the Coastal Zone Act Reauthorization Amendments of 1990.
74
Containment
AAPFCO maintains a model document for the requirements for primary and secondary containment of fertilizers. The Subcommittee on Containment of the Environmental Affairs Committee has recommended several changes to the Containment Rules. This model document which became "official" in 1993, has and will continue to be revised as individual states share their experiences
after implementing these rules and as technology develops in the field of fertilizer storage and containment.
Labeling/Terms and Definitions Committee
Perhaps the most popular committees of the Association are the Labeling Committee and the Official Terms and Definitions Committee which always meet jointly during the AAPFCO sessions. These committees submitted several changes to the Association this past August. A summary of these changes is presented.
Labeling
The Labeling Committee presented changes to the Fertilizer Rules and Regulations as follows:
1. Fertilizer Rule 1 was moved to official which exempts potting soils containing a fertilizer charge from being required to meet the minimum percentages for the secondary and micro plant nutrient guarantees. Without an exemption from this requirement, potting soil manufacturers had no way to inform the consumer that the product contained a fertilizer charge. The fertilizer charge was added only to provide a boost to the plant, not to sustain the plant over a long period of time.
2. Fertilizer Rules 3 and 9 were also recommended to be moved to official status. These sections deal with the labeling requirements for slowly released plant nutrients. Rule 3(c), which requires the water insoluble or slow release nitrogen to be not less than 60% if the nitrogen is claimed to be organic, was being misinterpreted as written. For clarity, Rule 3(c) was simply renamed Rule 9. No change was made to the intent of the regulation with this revision.
3. The new Rule 3(c) was approved as official which designates the AOAC Internationallaboratory methods which are to be used to confirm guarantees for coated and occluded slow release
nutrients and water insoluble nitrogen for organic materials.
Official Terms and Definitions
Several new terms were approved by the Association in August. These terms are summarized as follows:
1. Term T-13 Natural Organic Fertilizer was approved as official with a minor revision from the tentative definition to remove "ashing" as an acceptable manipulation of the material.
2. Terms T-40 Nitrogen Stabilizer and T-41 Stabilized Nitrogen Fertilizer were approved as official with no changes from the tentative definitions.
3. Definition N-19 Process Tankage was also approved as official with no changes.
4. A new term, T-42 Sphagnum Peat Moss, was approved as tentative for 1994.
75
5. Through a request by an industry representative, two new definitions were approved as tentative for 1994. These definitions are for P-23 Magnesium Ammonium Phosphate and P-24 Magnesium Potassium Phosphate.
Education and Information
Although no revisions were required to the officially adopted documents, the Education and Information Committee has published two brochures entitled "Uniformity By Consensus" and "The Standard Label". This committee has been given the task to inform the public, industry and governmental officials of the existence and purpose of AAPFCO. "Uniformity by Consensus" provides an introduction to the Association that is short, to the point and easy to read. Other topics are planned to provide educational information to the industry, with the first brochure just released about designing an accurate fertilizer label. A brochure is currently being developed which explains
each of the officially adopted documents of the Association. These brochures could not have been produced without the cooperative efforts of the industry, especially Mr. Daniel Paradiso, Jr. of The Andersons. Copies of any of these brochures may be obtained by contacting our Association's Secretary, Dr. David L. Terry.
TVA
One of the most pressing issues which AAPFCO must consider is the continuation of the Fertilizer Plant Directory and the publication of national fertilizer tonnage data. With the decision by TVA to discontinue these projects, AAPFCO and The Fertilizer Institute must decide if these publications can be financially feasible and if the compilation of the reports is possible.
Dr. David Terry has graciously offered the services of the computers at the University of Kentucky to prepare the 1995 fertilizer tonnage reports. State fertilizer tonnage is of great value to the fertilizer industry as well as to officials who must provide nutrient data for federally mandated nutrient management plans. No other state office compiles this fertilizer information. Recent changes to the software allowing the reporting of nutrient breakdown data makes the tonnage reports even more valuable.
The fertilizer industry will be called upon to bear with us as we begin this project next year. You will also be called on to support the state collection of tonnage data since some states may prefer to discontinue the program as budgets continue to be cut. Mr. Dale Dubberly of the Florida Department of Agriculture and Consumer Services has agreed to chair the AAPFCO Uniform Reports Committee which plans to take an active role in continuing the collection and reporting of fertilizer tonnage data.
The fate of the Fertilizer Plant Directory has not yet been decided. The AAPFCO Plant Directory Committee is currently looking at all possibilities for continuing the publication, contracting out to independent publishing firms, or discontinuing our involvement with the Plant Directory. Your input is vital if you wish to continue receiving this information.
New Issues
During our last Mid-Year meeting, Mr. Whitney Yelverton, Vice President, TFI, and AAPFCO President Dr. David Terry, appointed the joint TFI/AAPFCO Slow (Controlled) Release Task Force. The purpose of the Task Force is to:
1. Evaluate the current labeling requirements for slow release fertilizers;
2. Summarize current and new slow release fertilizer technology;
3. Evaluate the current analytical methodology for determining the slow release properties of fertilizers.
The Task Force has organized into five subcommittees, each dealing with labeling, methodology, new product/concepts, enforcement and policy. While the Task Force is not destined to rewrite the book, current regulations simply are not adequate to address the changing technologies for slow and controlled release fertilizers. New policies and regulations must be considered that will be appropriate for the products available now and in the future.
Industry Concerns - Non Uniformity
I have received so many calls with concerns about the labeling requirements and enforcement practices of other states. If you pay your registration fees or your licensing fees, you have a right and a responsibility to expect the control official to enforce whatever regulations are adopted by that state. Only by your support of state regulatory programs, can you have a say in how fertilizer regulations should be enforced. When the industry supports a state regulatory program, you can be a powerful force. The fertilizer industry saved the fertilizer regulatory program in New Jersey marked as a budget cut for fiscal year 1995.
76
AAPFCO strives for uniformity among the states, but does so with constant participation by the industry that we regulate. Your comments,
ideas, concerns, and information are as valued and welcomed at the Association's table as is the controlofficial. As President of AAPFCO, I appreciate the expertise received from the industry members with whom we have worked. I hope to continue encouraging your participation to make sound, effective, and fair regulations that benefit the industry, the control official, and most importantly, the consumer, who buys your products.
Unfortunately, we can get so caught up in the regulatory game that we often forget about the consumer. And usually, you, the industry, have to remind us of the ever important question, "Is the consumer really going to benefit from what is being presented here?" And for that, I thank you for your often well-timed reality checks, for your support of uniform fertilizer regulations, and for your interest and valued participation with the Association of American Plant Food Control Officials.
Analytical Standardization in a Larger Arena: CEN, AOAC International and
You Peter F. Kane
Office of the Indiana State Chemist
My wife is a school librarian, who once a year travels from Kokomo Indiana to Indianapolis, at her own expense, to attend a library conference. So as usual, before I left home to head for the airport, I found myself trying to explain to her that, besides the fact that it is getting cold up in Indiana, the other reason I wanted to come here is because I want you to know something about fertilizer standardization activity in Europe.
I do hope that by my sharing some of what is currently going on in CEN, The Joint European Standards Institution, some of you will discover that you have common points of interest with those activities. And I hope that some of you can find reason to cooperate with, and contribute to the European standardization efforts, in ways which would be of benefit to everyone involved.
First in need to make a few disclaimers. I am a laboratory chemist in a state regulatory setting.
My credentials are that I have been active in the AOAC in fertilizer methods development chemistry. I do not have an industry perspective. I am not familiar with trade issues and international fertilizer politics. And as the AOAC Internationalliaison representative to CEN TC260, I have only observer status. And I should also be careful to emphasize that my function is to represent AOAC International, not the US or the US fertilizer industry.
Having said what I am not, lerme also say there are good and talented people in CEN TC260 who are trying to make fertilizer regulation and trade more orderly. And I believe I have built the beginnings of a positive relationship with the European experts participating in this work. When I was appointed liaison, I was told that I would have to be very careful because those involved in European standardization would be very pro Europe, and resist any influence from this side of the ocean. Wrong! I can say for sure that the European experts involved in this effort disagree with each other way too much to worry about disagreeing with nonEuropeans. And after a heated discussion, of which there are many, some of the experts have taken to breaking the tension by asking "Well Peter, what do you think of Fortress Europe now?" So I guess I have been accepted. And more important, I can see that the AOAC is very much accepted and respected for its experience with collaborative studies. There is an open door here. And the question is can we figure out ways to make the openness work for everyone.
Let me begin by telling you just a bit about CEN and how it works, though again I do not claim to be an expert on the inner workings CEN and the EC bureaucracies, and there may well be a number of people here more knowledgeable than I am.
On the one hand CEN often functions very much like ISO, the International Standards Organization. Some of the same people who were active in ISO TC134, fertilizers, a few years ago, have switched over and are now working in CEN. As in ISO, chemistry tends to get done by committee compromise. The bureaucratic structures, the method validation, and the document approval process, are very much like ISO. Only the end
77
product is a European, rather than an international standard.
On the other hand, unlike the International Standards Organization, a CEN technical committee can be given an EC mandate, and then things work a little differently. A mandate is a formal agreement for which CEN is paid by the EC, and agrees to accept and complete a defined project in a specified amount of time. And also at the end of this process the standard produced becomes a part of the legal code of all the EC countries. All this of course is designed to bring down trade barriers between European nations, but the laws and regulations apply equally to anyone outside the EC wishing to conduct business with EC countries.
CEN has a Technical Committee to deal specifically with Fertilizers and Liming Materials, TC 260. The TC has 5 Working Groups and several Task Forces, which meet regularly on their own, and submit reports to TC meetings. The TC meets about twice a year, and its next meeting will be in February in Berlin. I have attended the last 2 TC meetings, in London last fall, and Paris this past spring.
The TC has a formally established program of work, and I have made some copies of the most recent version of the work item summary table. They are available with the copies of this talk. To give you an idea briefly, there are currently 33 work items. First there is a group of items relating to liming materials. There is an item on liming product definitions and specifications. Methods for moisture, sieving, neutralizing value, magnesium by atomic absorption, and calcium and magnesium by complexometry, are at the stage of formal draft methods.
There is a current strong point of contention concerning the fineness of liming materials. Sweden is very much resisting linking particle size with quality of liming material, because there are Swedish interests that maintain their country has a courser product, but that it is physically softer, and breaks down more rapidly in the soil. This has generated a search for a method which would somehow measure actual "reactivity" of the liming material on the soil.
Turning to fertilizers, there is a subcommittee concerned with product definitions, classification,
and vocabulary. A number of methods for physical testing of fertilizers are in various stages of development. These would include such procedures as determining dust content, bulk density, crushing strength, flowability. More recently the Technical Committee has begun to deal more with chemical methods, and I will use the rest of my time to talk about several of these in a little more detail.
The first that I want to mention is the area of slow release products. As you are aware, the topic of slow release is currently receiving a lot of attention in North America. We heard a presentation yesterday about the mechanisms of slow release. There is a newly created Task Force of US control officials and industry representatives, charged with the task of rethinking slow release definitions and regulations in the light of developing technology, and reworking the chemical methodology. This US task force met here at the hotel this past Sunday.
Bill Hall from that task force will be working on chemical methodology. I have asked if Bill would be the AOAC associate referee for Slow Release, and the paperwork to make that official is in process.
78
CEN is also quite interested in Slow Release definitions and methodology. It's one of their higher priority activities. TC 260 has a Slow Release Task Force chaired by a German, Bernard Kloth. The CEN task force has been in existence a bit longer than the US task force, and is farther along in the process of formulating definitions. The CEN task force defines Slow release as follows. No more than 15 % released 24 hours. No more than 75 % released 30 days. At least about 75% released at stated release life.
The chemical method to quantify this definition of slow release is yet to be determined. The way the Task Force is approaching method development is typically European, I guess. The task force has access to 5 in-house slow release methods from 5 companies, Aglukon, Fisons, ICI, Scott, and Sierra. The plan is to combine these, distill them down to the lowest common denominator method, and then try it out in the lab to see how it works.
The CEN task force distinguishes between slow release and controlled release, and is working on a controlled release definition which is a bit more involved than the definition of slow release. No more than 15 % released in 24 hours. No more than 25% released within 10% of stated release life. No more than 75 % released in 30 days. At least 15 % and no more than 50% released at 75% of stated release life. At least 75% released at stated release life. If this were the accepted final definition, it looks like you would have to have a calculator in hand to figure out the label on the bag. The last report I have is that this definition is not very settled, and is still under a lot of discussion.
I would think it fair to say that the US task force is taking a little more fresh, new look at slow release. But both task forces have expressed a willingness to work with the other, and my intention is to keep the communication flowing as much as possible. There are philosophical as well as chemical methodology differences involved at the moment, but I would really like to see some common international direction emerge. The opportunity is now. If we wait too long, divergent paths will get set in concrete.
The next topic I want to spend a little time on is chelated micronutrients. This is a new area for TC260. But it is a work item that has a mandate from the EC Commission. Remember, that means that CEN is contracted to do the work, and the Commission expects the project to be completed in a fixed amount of time. Also, it ends up as law in all the member states once it is accepted by the Commission.
The analytical methods to be developed include methods for the qualitative and quantitative determination of the chelating agent itself, as well as methods for the amount of the chelated micronutrient.
Working Group 5 of TC260 will be the group that develops these methods. We are at the earliest stage of this work. The core group of experts has been gathered, but the mandate agreement with the EC has yet to be formalized. I have just received, and not yet had time to look at, a collection of methods and journal articles which have been gathered to serve as a starting point for de-
veloping official tests. A Working Group 5 meeting was scheduled for October 12 in Brussels to review the methods, and I have not as yet received the minutes of the meeting.
Politically, Working Group 5 has gotten off to a rather shaky start. Prior to creating WG5, there were long discussions about the internal restructuring TC260 to create a Working Group devoted to chemical methodology and collaborative testing. Then several possible chairs of the Working Group first accepted, then declined the position, partially due to the difficulty of developing chelate methodology, and partially due to worries about the amount of work required to conduct collaborative studies.
When word came that a chelate mandate was coming from the EC, everybody got quite excited, but at the same time TC members remained concerned about the amount of work to be done. The idea of conducting collaborative studies is imposing to a number of the members of TC260. They don't quite know how to go about it, and the amount of work worries them.
I would say that the Working Group is at the very beginning of a large task, and it is a bit overwhelmed with the task and the deadlines the mandate will impose. This is an opening for you. If anybody has an interest and technical expertise to contribute, it would more than likely be quite welcome at this point.
Another topic I would like to bring up is the subject of heavy metals. CEN uses the term nonnutritive trace elements. The elements mentioned as of first interest to TC260 are Cadmium, Fluorine, Mercury, Lead, Chromium, and Nickel.
Cadmium in phosphate rock is a obvious bell ringer. Also, many members of TC260 are alert to the problems of undesirable trace elements in waste materials and sludges, and movement of this kind of product across national boundaries is cause for concern. Unfortunately there is a general lack of regulatory methods dealing with this topic, and TC260 would like to support work leading to the development of suitable methods.
Sweden in particular has pressed for progress in this area, and has a submitted a formal proposal for the addition of a work item to the agenda. The problem is that the TC feels a bit overwhelmed by
79
the difficulty of collaborative studies, as I mentioned before. And also, Working Group 5, chemical methodology and collaborative studies, is now totally focused on the chelate mandate, where the money and the deadlines are involved.
As the General Referee for fertilizer, it seems to me that AOAC International is deficient in the area of trace analysis as well. We have atomic absorption methods for micronutrient elements, but no ICP methods. And we have neither atomic absorption or ICP methods for non-nutritive elements.
On the other hand, I know that there are inhouse methods out there. I know that IMC-Agrico, New Wales, has a lot of experience analyzing these elements, in the past by atomic absorption, and now by ICP. I know that the Office of the Texas State Chemist has recently developed ICP methodology in this area. The bottom line is, I think there is enough CEN interest, and if there were several US groups willing to cooperate and communicate with the Europeans, there would be enough critical mass to get the job done, and we could have matching CEN and AOAC methods for non-nutritive trace elements.
I want to mention one more area of CEN activity. TC260 has a task force for organic and organo-mineral fertilizers, which has been quite active. To date the task force has looked at existing European national legislation in various countries concerning organic fertilizer products, and it has developed a table of definitions and specifications for individual products. In order to be sold in trade as a fertilizer, a product must be defined in the EC.
The product definitions are quite a bit more elaborate than what you would find in the Control Officials Manual. To give you one example of a typical organic product definition, take bone. CEN proposes to derme bone as: The Product obtained by drying, heating and finally grinding bones of warm-blooded land animals from which fat has been largely extracted or physically removed. The product must be substantially free of hooves, horn, bristle, hair, and feathers, as well as digestive tract content.
Next, having defined bone, a minimum content of fertilizer nutrient is specified as follows:
80
Total ofN and PlOS at least20%. Organic N at least 4%. Total PlOS at least 16%. CarbonI nitrogen ratio not greater than 6. The organic nitrogen content shall be at least 90% of the total nitrogen. Total N, organic N, and total P ° must be declared on the label.
1 5 In addition to the specific definitions for each kind of organic fertilizer product, there are general criteria that apply to all organic products: Maximum 12 % moisture. Free of pathogens and weed seeds. Maximum levels ofnon-nutrient elements will be specified. A product can be designated "meal" if 85 % passes through a 2mm sieve.
Each organic product has specifications like this. I have some copies of the complete table of definitions as current in the CEN task force for anyone who is interested in detail. The EC is currently in the process of reviewing them, and with some modification and adjustment they will end up in the legal code. Work on a similar table of definitions for organo-mineral products will soon be underway.
Once all these definitions and specifications are set, I should also make the point that methodology will also need to be forthcoming to support the labeling requirements. There will need to be a method for organic nitrogen, and a method for carbon. Organic nitrogen will probably be worked out as total nitrogen minus all other known nitrogen forms. It remains to be seen how carbon will be determined.
So, those are some of the current fertilizer standardization activities in CEN TC260. There are other activities, and there is the prospect of new topics in the future. I expect TC260 will gradually focus more on methodology.
My point in all of this, is that I believe there is an opportunity for AOAC International, and interested parties working through the AOAC, to have a relationship with CEN. The reason I think there is an open door is because first of all TC260 is under a good deal of pressure from the EC and various national standards bodies to become more efficient and productive. Second, TC260 is at a point where it needs people who understand the process of methods validation by collaborative study. Collaborative studies seem very imposing
to TC260 right now, and help would be welcomed. Third, I have found the people who make up the committee to be open. I haven't seen much of a fortress Europe mentality.
So, if you have a common area of interest wi th something I have mentioned today, please let me know. My aim is to communicate mutual self interest, promote the AOAC in the process, and maybe chip away and make the world just a little bit smaller at the same time.
New Techniques for Obtaining Rapid Analytical Measurements of Fertilizer
Elements Harrison R. Cooper
Cooper Systems
Introduction
There has been a redoubled effort in recent years to improve the speed and accuracy of analytical measurements in fertilizer raw material plants, both for product quality control and plant process control. With increasing emphasis on computer control of operations by means of artificial intelligence, expert systems and other advancing technologies, the need for automatic and rapid feedback of process measurements is becoming more critical.
Nitrogen facilities - ammonia, urea, and nitric acid plants - have been on "auto-pilot" for many years, because the uniform gaseous streams are amenable to existing technologies for rapid analysis and computer control. Applying rapid analytical measurement techniques to phosphate and potash plants (dealing with solids and slurries) has been more difficult to accomplish. I would like to discuss some recent promising developments for automating fertilizer plant analytical technology, with particular emphasis on phosphate raw material plants.
81
Recent Technology Advances
It is convenient to discuss recent advances in analytical technology in terms of two main requirements:
1. Automation of process control measurements to minimize time delays for data needed to control the processes. This includes instruments and devices installed in the process to present composition measurement data almost immediately ("on-line" or "on-stream" analysis); and alternatively, means to process manually obtained samples rapidly by laboratory methods to provide operating personnel with results on a quick turn-around basis so that operators can make timely process control decisions.
2. Automation of laboratory procedures with innovative samplers, robotic devices, advanced technology instrumentation, etc., to speed up data production and improve the accuracy of results. More efficient use of manpower and potentially fewer human errors are further benefits.
Phosphate Beneficiation On-Stream Composition Measurement
It is axiomatic that for maximum yields, energy optimization and overall economic results, chemical and beneficiation processes should run as smoothly as possible in face of the inevitable changes in feed composition and other upsets. Excursions outside limits of process control parameters are to be minimized. The sooner the operator knows that a given process control variable has trended outside a narrow band, the sooner he can make corrections to return operations within control limits.
Data analysis is the key to determining those process conditions necessary to maintain economically optimum operations. Rapid on-stream analysis thus becomes the ideal data source for control. On-stream analytical measurements need not be as precise as laboratory data as standard of reference, because a more important consideration is that the data are obtained quickly and repeti-

tively with internal consistency to show process trends. If good precision of measurement can also be attained by on-line analysis along with speed and reliability, so much the better.
Processing phosphate rock not only involves natural geologic variations in ore quality, but ore variability occurs at most Florida phosphate operations also from several different draglines feeding a single beneficiation plant. Random variability in raw material (unlike nitrogen and potash processes) inevitably makes reagent dosing in the flotation plant sub-optimal. Conventional time-delayed sampling and testing under these conditions is futile for controlling the process. By the time a sample is collected, transported to a laboratory, chemically analyzed, and the results returned to the operator, rock matrix from the process representing the original sample has long since been discharged.
Need for immediate and automatic data acquisition for flotation control has long been recognized, but until quite recently no effective methods have been available to fill the need. However, in recent years several newly introduced high technology measurement methods have been developed for use in phosphate beneficiation process control:
•
•
•
•
magnetic resonance for phosphorus.
prompt gamma neutron activation (PGNA) applicable to most or all elements, depending on the specific instrument design and measurement technique.
X-ray crystal diffraction (XRD) to measure phosphorus apatite mineral and also silica (as quartz) by quantitative determination of crystalline forms of mineral.
optical imaging by light absorption or reflection.
• flow injection analysis (colorimetric). Each of these methods has unique applications,
and they vary considerably as to cost, speed of analysis, accuracy, and convenience of use as well as capability for specific elements. The sampling
82
statistics associated with each method are critical. For example, a phosphate reading using magnetic resonance measures the average phosphorus content from several gallons of slurry flowing through the instrument during a one minute interval. Phosphorus analysis of phosphate feed or tails, considering the coarse particulates of variable mineral content being processed, will be more reliable statistically the larger the volume of sample being used.
The available on-stream analysis methods are summarized in Table 1. A list of bibliography references is given along with brief outlines of the technologies and their applications.
The magnetic resonance on-stream slurry analyzer (the "Phospholyzer") is the only on-line slurry analyzer currently in routine use for beneficiation plant process control in Florida's phosphate industry. The technology was developed in Florida over several years in conjunction with Occidental Chemical, where the method is employed for beneficiation plant control. The Florida Institute of Phosphate Research (FIPR) funded a study in 1990-91 to evaluate losses in phosphate matrix flotation using a magnetic resonance on-stream slurry analyzer to compile data through frequent automatic measurements. Conclusions were that productivity losses in phosphate beneficiation can be substantial, and that clear economic benefits can be achieved using advanced process control for productivity improvements (see bibliography).
XRD (automatic on-line crystal diffraction measurement) on-stream slurry analyzer systems have been employed in South Africa and Finland, and a unit is currently being evaluated in Florida with financial help of the Institute of Phosphate Research. Neutron activation (PGNA) is an established on-line analysis method practiced in several industries (iron ore beneficiation, coal quality, cement blending, etc.). APGNAanalyzer will be shortly installed in Florida and also in an Idaho phosphate fertilizer operation. BRGM in France has adapted bore-hole neutron activation analysis of phosphorus to an on-stream slurry analyzer design, and the technology has been investigated in Florida, again under sponsorship of FIPR and the University of Florida.

FIPR most recently supported study of techniques for elemental composition analysis through automated optical inspection of phosphate minerals. Such an analyzer for rapid sample testing is assisting TexasGulf in North Carolina with operating control of insoluble minerals (silica) in concentrates. The computer operated instrument was developed by the Virginia Polytechnic Institute. An independently developed optical sensor for insol in phosphate product is also in use at IMCAgrico, Inc., in Florida.
"Flow injection analysis" refers to the technology of on-line analysis employing chemical treatment of process control samples to obtain an automatic measurement. "FIA" technology is regularly used with many industrial processes to generate analysis data for process control, and is implemented by designing a robotic system of sample extraction, treatment, and sensing of elemental contents by colorimetric or other means. Essentially, the method emulates laboratory manual andlor instrument techniques.
The presentation by J. E. Gliksman of IMCAgrico, Inc., given in these proceedings describes advances made in automation of phosphate sample processing in a phosphate fertilizer laboratory. The report is centered on results using improved instrumental FIA-type laboratory units. FIA technology for on-line phosphate beneficiation has been evaluated by IMC-Agrico, Inc., at the Kingsford plant 1989-90. Whereas the on-line plant system was ultimately replaced, laboratory FIA and related automatic analysis systems have allowed rapid processing of plant samples on a timely basis for process control, as outlined in the presentation by Gliksman.
Analysis Methods for Process Control in Phosphoric Acid Digestors
Automatic analytical measurements for phosphoric acid reactor process control have been focused on two principle measurements: first, the free sulfate (excess sulfuric acid) content of attack slurries; and second, the free P205 content of phosphogypsum from the filters. Other phosphate measurements of interest include monitoring key streams from the filter (as no. 4 filtrate),
and detecting changes in the phosphoric acid content of washlflush water entering the process and being discharged with phosphogypsum slurry.
Adaptation of "expert system" control for phosphoric acid reactors has recently been achieved by IMC-Agrico (see bibliography for reference to Stana and Clements) resulting in significantly increased recovery. Introduction of expert systems to phos-acid reactor operation, and its extension to other stages of the phosphate fertilizer process, has also been supported by the Florida Institute of Phosphate Research through the Florida Institute of Technology and IMCAgrico over the past several years. Use of expert systems has emphasized the need for automatic measurements of the key flow streams.
Automatic free sulfate measurement has been a long-standing goal of technologists in the phosphoric acid industry (see bibliography, reference to Baumann). The well-established Marchant technique for the turbidometric sensing of barium sulfate is an example. Free sulfate analyzers are beset with scaling and sample presentation problems. In the case ofIMC-Agrico's reactor expert system control, hourly manual tests on reactor samples for free sulfate are providing satisfactory results.
Measurement of phosphoric acid in the water phase (wash, filtrates, etc.) can be effectively handled by precise determination of solution density (analogous to gravity). A nuclear density unit with careful solution pretreatment can measure phosphoric acid with a standard error of 0.01 per cent (Stana and Clements, loco cit.). This precision is accurate enough for expert system control.
83
Measurement of the phosphorus content of phosphogypsum filter cake is being evaluated using the magnetic resonance on-stream analyzer technology by Occidental Chemical. The first phase of the work, determining feasibility of measuring phosphorus low levels (1.0 to 2.0 per cent PzOs in phosphogypsum solids) with sufficient accuracy to have practical value, has been concluded. A 0.1 per cent standard error objective for magnetic resonance phosphorus measurement in phosphogypsum was achieved and work is continuing.
Phosphate Fertilizer Production Control
Quality control measurements on shipments of DAP, MAP, and other products are now more accurate than those available with on-line analyzers. Production quality controls necessitate the use of accurate bulk sampling procedures and precise laboratory techniques. These must be carried out promptly to provide data to operations as needed to maintain production quality standards.
IMC-Agrico, Inc., have installed laboratory procedures to transfer samples from the field by means of carriers sent through pneumatic tubes, processing through precision analysis devices, and immediate I automatic routing of the results by a computer data transfer network to operating plants. The high sample volumes (several hundred per shift) are managed by bar code printing and automatic monitoring to integrate measurement data into reports transmitted back to the plant locations where the samples originated (R. E. Gliksman, see bibliography).
Gliksman describes both improved sample processing rates and more accurate measurements when processing samples for simultaneous phosphate, calcium, and nitrogen by means of the advanced Flow Segmented Flow Analyzer technique now being used by IMC-Agrico (next chapter of these proceedings). In addition to accuracy and processing capacity improvements, minimum down-time is being experienced while processing laboratory samples at a high rate.
Applications of Flow Segmented Flow Analyzer technology are being extended to other fields of fertilizer elemental analysis. A project at the University of Kentucky for simultaneous analysis of phosphate and potassium (potash) analysis is an example.
Laboratory application of prompt gamma neutron activation (pGNA) is also possible. A recent report describes an initial plant test program for phosphate rock product quality control (Klatt, see bibliography). PGNA analysis techniques show promise in dealing with the measurement of magnesium, which would resolve a significant problem in Florida phosphate processing.
New Developments in Potash Production On-Sream Analysis
Potash industry process control has benefited by a quirk of nature - the presence of the potassium K40 natural radioisotope - making it possible to monitor potassium concentration in flowing material by installing a gamma radiation sensor for readout of that isotope. The Saskatchewan potash industry has been using the method since the 1960's. This led to prompt installation of effective process control systems, and most recently to the use of expert process control.
A further technique improving process control in potash plants is the use of magnetic resonance on-stream analysis for monitoring sodium levels in crystallization liquors. This method is also promising for maintaining sodium control in the final product.
The Future of Laboratory and Process Automation
Industry throughout the world is devoting great effort to utilizing all practical and available methods to increase productivity in manufacturing, process control, and general management. Development and use of on-line analysis, expert process control systems, and automation oflaboratory processes are all parts of this trend.
As in all endeavors, pace setters have come forward. Examples of completely unmanned minerals laboratory operations have recently been revealed. One example is the robotic gold assay laboratory operated by Newmont Gold in Nevada. Another is the fully automated robotic laboratory recently installed in Australia by Hammersley Iron Mines. These examples portend the future in the fertilizer industries where demand for increased productivity will drive industry to increasing levels of automation.
84
Bibliography
1. Cooper, H. R., "Process Control in Florida Phosphate Matrix Beneficiation", proc. Eng. Foundation ConI. Palm Coast, Fla. (Dec. 1993),

"Beneficiation of Phosphate: Theory and Practice", eds. H. EI-Shall, B. Moudgil, and R. Wiegel; publ. Soc. Mining Engineers, Littleton, Colo. (1993).
2. Cooper, H. R., "An Investigation of Potential for Improved Efficiencies in Phosphate Rougher Flotation through On-Line BPL Measurements", Final Report of Research Contract No. 86-04-32, Florida Institute of Phosphate Research, Bartow, Fla. (1990).
3. Cooper, H. R., and Vedova, R., "Phosphate Beneficiation Control with On-Stream Slurry Analysis", Mintech '91, pp. 167-9; publ. Sterling Publications International, London, U. K. (1991).
4. Grove, R. D., and Wiegel, R. L., "On-Stream Phosphorus and Acid Insoluble Analysis for Phosphate Rock Flotation Control", Proc. 21st APCOM Conference, Las Vegas, Nev., Feb. 1989, ch. 76, pp. 841-9; pub!, Soc. Mining Engineers, Littleton, Colo. (1989).
5. Jamsa-Juonel, S. K., and Karki, E. K., "Expert Control System for Rougher Flotation of Phosphate", Proc. Intern. Fed. Automatic Control, 11th World Congress, Talinn, Estonia (1990).
6. Englebrecht, J. P., de Bruyn, S. W., and de Villiers, J. P. R., "An Automated On-Stream Analyser for Process Control in the Phosphate Industry", pub!, Mineralogy and Process Chemistry Div., MINTEK, Randsburg, Rep. South Africa (1991).
7. King, J. D. and Cooper, H. R., "Development of Nuclear Magnetic Resonance Slurry Analyzer for Phosphate Mineral Beneficiation Process", in "Proceedings of Control '90 Symposium", eds. J. R. Herbst and K. Rajamani, publ. Soc. Mining Eng. AIME, Littleton, Colo. USA (199O).
8. Shoniker, J., "On-Line BPL Analysis at OxyChem Conversion of the Phospholyzer System from Prototype to Production Unit", presented 9th Ann. AIME Phosphate Conf., Lake-
85
land, Fla., Oct. 1994 (to be pub!, in Engineering & Mining J., 1995).
9. Grove, R. D., Elliott, M. F., and Wiegel, R. L., "Phosphate Process Stream Composition Measurement by an Image Analysis Technique", proc. Eng. Foundation Conf. Palm Coast, Fla. Dec. 1993, "Beneficiation of Phosphate: Theory and Practice", eds. H. EI-Shall, B. Moudgil, and R. Wiegel; publ. Soc. Mining Engineers, Littleton, Colo. (1993).
10. Moudgil, B.M., "On-Stream Analysis of Ph os phate Rock by Prompt Neutron Activation Probe", Final Report of Research Contract No. 88-02-080, Florida Institute of Phosphate Research, Bartow, Fla. (1992). Also "The Application of Prompt Neutron Activation Technique for the On-line Analysis of Phosphate Rock Slurry", proc.Eng. Foundation Conf. Palm Coast, Fla., Dec. 1993, "Beneficiation of Phosphate: Theory and Practice", eds H. EI-Shall, B. Moudgil, and R. Wiegel; pub!, Soc. Mining Engineers, Littleton, Colo. (1993).
11. Yoon, R-H., "An Optical Sensor for On-Line Analysis of Phosphate Minerals", Final Report of Research Contract No. 90-04-045, Florida Institute of Phosphate Research, Bartow, Fla. (1993).
12. Adel, G. T., Chandler, M. A., Yoon R-H., Gutierrez, E. C., and Richardson, J. N., "Phosphate Analysis by Optical Image Processing: Sensor Development and In-Plant Testing", presented Soc. Mining Engineers Ann. Meeting, Reno, Nevada, Feb. 1993.
13. Baumann, A. N. and Roberts, H. H., "Automatic Sampling and Analysis of Wet Process Phosphoric Acid Digestion", proc. ofTechnicon Symposium "Automation in Analytical Chemistry", publ. Mediad, Inc., White Plains, N. Y. (1967).
14. Stana, R. R. and Clements, J. R., "Back to Future III", pres. at A. I. Ch. E. Regional Phosphate Industry ann. meeting, Clearwater, Fla., May 1994.
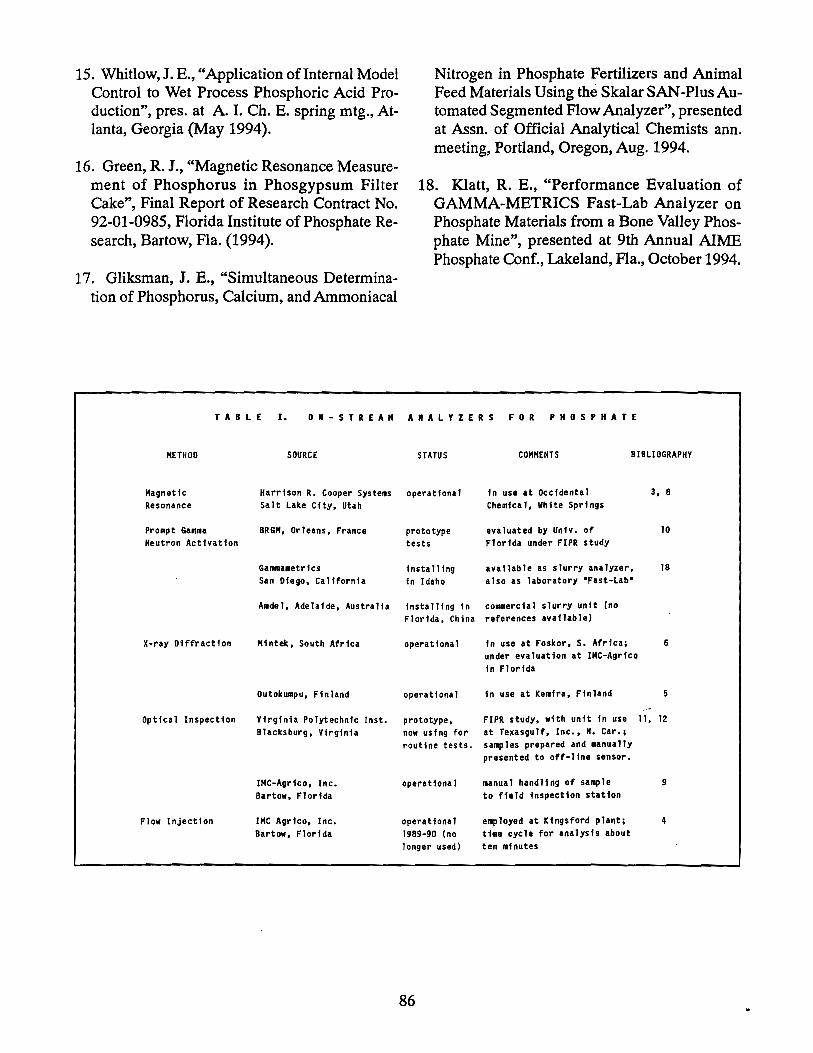
15. Whitlow, J. E., "Application of Internal Model Control to Wet Process Phosphoric Acid Production", pres. at A. I. Ch. E. spring mtg., Atlanta, Georgia (May 1994).
16. Green, R. J., "Magnetic Resonance Measurement of Phosphorus in Phosgypsum Filter Cake", Final Report of Research Contract No. 92-01-0985, Florida Institute of Phosphate Research, Bartow, Fla. (1994).
17. Gliksman, J. E., "Simultaneous Determination of Phosphorus, Calcium, and Ammoniacal
Nitrogen in Phosphate Fertilizers and Animal Feed Materials Using the Skalar SAN-Plus Automated Segmented Flow Analyzer", presented at Assn. of Official Analytical Chemists ann. meeting, Portland, Oregon, Aug. 1994.
18. Klatt, R. E., "Performance Evaluation of GAMMA-METRICS Fast-Lab Analyzer on Phosphate Materials from a Bone Valley Phosphate Mine", presented at 9th Annual AIME Phosphate Conf., Lakeland, Fla., October 1994.
TAB LEt. 0 • - S T REA" A. A L Y Z E R S FOR PliO S P II ATE
METHOD SOURCE STATUS COMMENTS BIBLIOGRAPHY
Magnetic Harrison R. Cooper Syste~s operational In use at Occidental 3, 8 Resonance Salt lake City. Utah Chemical, White Springs
Prompt Gam~a 8RGM, Orleans, France prototype eva luated by Unfv. of 10 Neutron Activation tests Florida under FIPR study
X-ray Diffraction
Ganuaa~trfcs
San Diego, California installing in Idaho
available as slurry analyzer. also as laboratory "Fast-lab"
Amdel. Adelaide, Australia Installing 1n commerCial slurry unit (no Florida, China references available)
Mintek. South Africa operational
operational
in use at Foskor. S. Africa; under evaluation at IMC-Agrico in Florida
in use at Ke~ira, Finland
18
6
5
Optical Inspection Virginia PolytechniC Inst. prototYpe, FIPR study, with unit in use II, 12
Flow Injection
Blacksburg, Virginia now using for at Texasgulf. Inc., N. Car.;
IMC-Agrico. Inc. Bartow, Florida
IMC Agrico. Inc. Bartow, Florida
routine tests. samples prepared and manually presented to off-line sensor.
operational
operational 1989-90 (no
manual handling of sample to field inspection station
employed at Kingsford plant; time cycle for analysis about
longer used) ten mfnutes
86
9
4
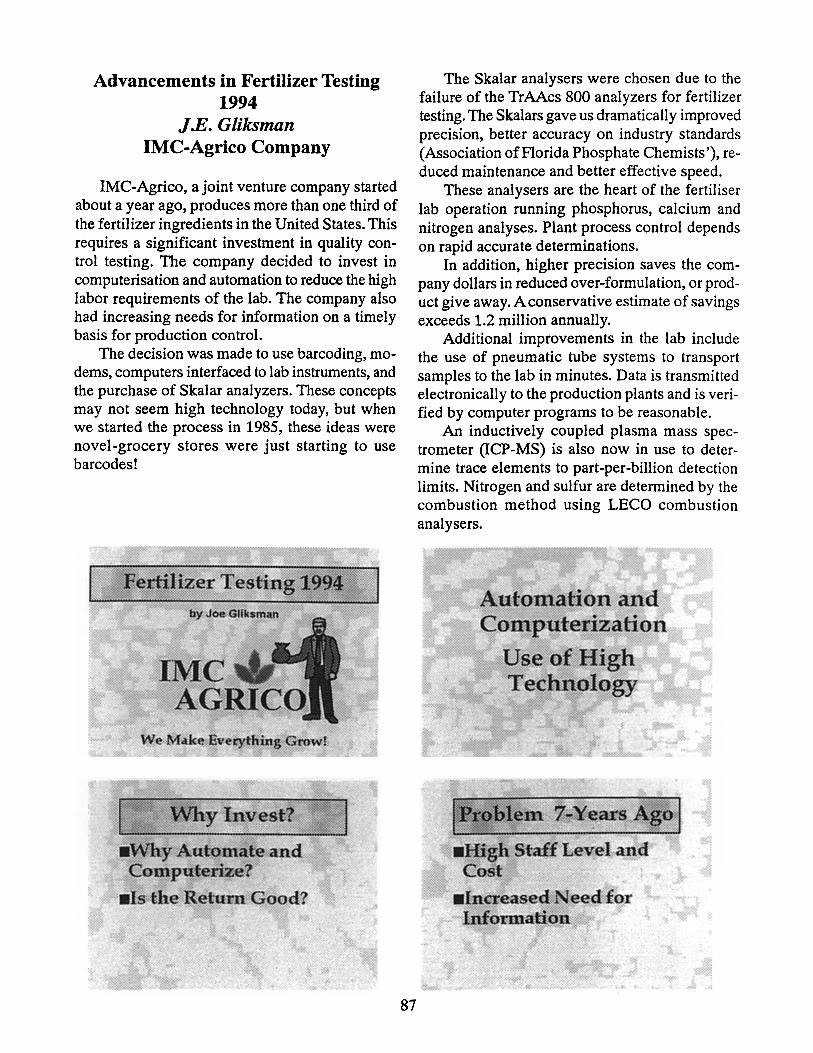
Advancements in Fertilizer Testing 1994
J.E. Gliksman IMC-Agrico Company
IMC-Agrico, a joint venture company started about a year ago, produces more than one third of the fertilizer ingredients in the United States. This requires a significant investment in quality control testing. The company decided to invest in computerisation and automation to reduce the high labor requirements of the lab. The company also had increasing needs for information on a tirnely basis for production control.
The decision was made to use barcoding, rnodems, computers interfaced to lab instruments, and the purchase of Skalar analyzers. These concepts may not seern high technology today, but when we started the process in 1985, these ideas were novel-grocery stores were just starting to use barcodes!
Fertilizer Testing 199'4 s
by Joe,Gllksman
We-Make Ev.e.:ytfting Growf
Why-Invest?
.Why Automate and Computerize?
.Isthe RetumGood?
87
The Skalar analysers were chosen due to the failure of the TrAAcs 800 analyzers for fertilizer testing. The Skalars gave us drarnatically improved precision, better accuracy on industry standards (Association of Florida Phosphate Chemists'), reduced maintenance and better effective speed.
These analysers are the heart of the fertiliser lab operation running phosphorus, calcium and nitrogen analyses. Plant process control depends on rapid accurate determinations.
In addition, higher precision saves the company dollars in reduced over-formulation, or product give away. A conservative estimate of savings exceeds 1.2 million annually.
Additional improvements in the lab include the use of pneumatic tube systems to transport samples to the lab in minutes. Data is transmitted electronically to the production plants and is verified by computer programs to be reasonable.
An inductively coupled plasma mass spectrometer (ICP-MS) is also now in use to determine trace elements to part-per-billion detection limits. Nitrogen and sulfur are determined by the combustion method using LECO combustion analysers.
Automation and Computerization
Use of High Technology
·liHigh Staff Level·and Cost
.Increased eedfor Information

~at We Decide~
• ntedace Lab Instruments
.Purchase a Skalar Analyzer
( Precision and Accuracy I .ADramatic Impro-vement in Precision
.Accuracy Was Better on Industry Standards
.100 Samples per Hour
88
lIN'ew Modem. Instrument
I Maintenance ~~ Costs )
• Bullet-Proof Reliable
Speed 11100 Samples per HCllU

Speed moo Samples per Hour
.Effective Speed
Improvements
.Accuracy
.Precision
.Reliability
.Cost Effeeti veness
.Efficiency
Audit . Salllples
89
Reputation .Heart of the Operation
.Plant Process Oontrol
0.7 cu O.!I
Accuracy
• ~ u ! ~.3 8 o .~
0 .1
Methods

90

91
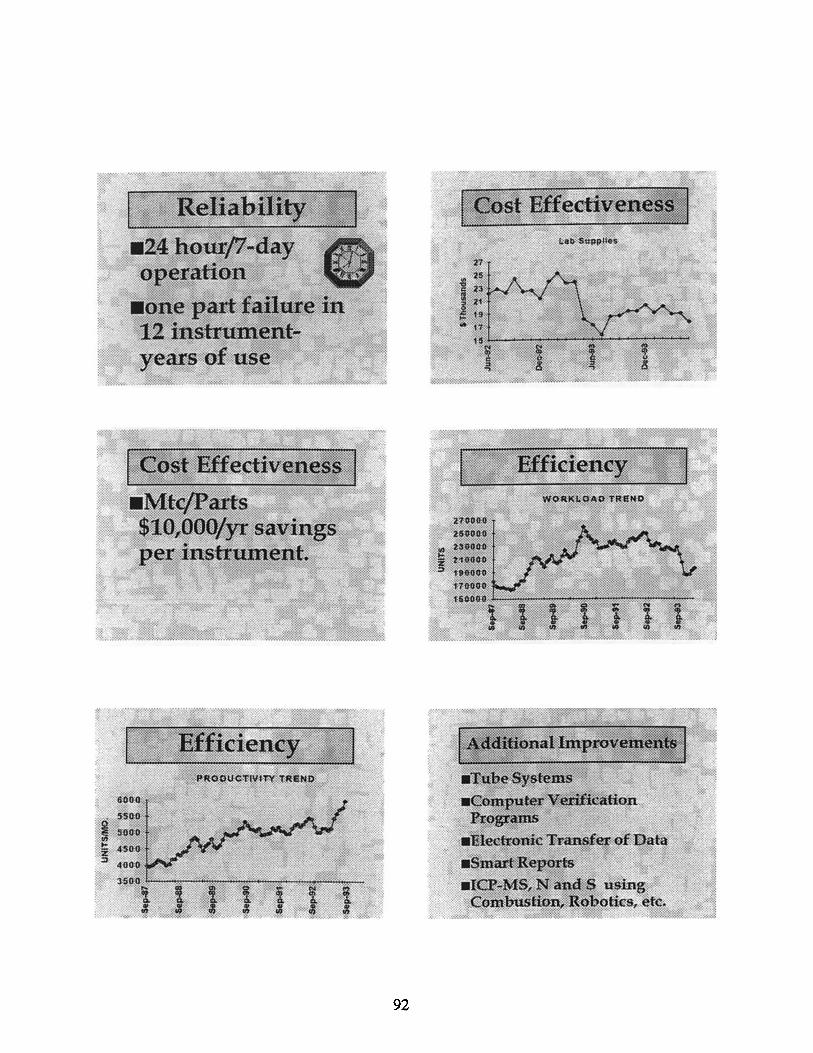
92
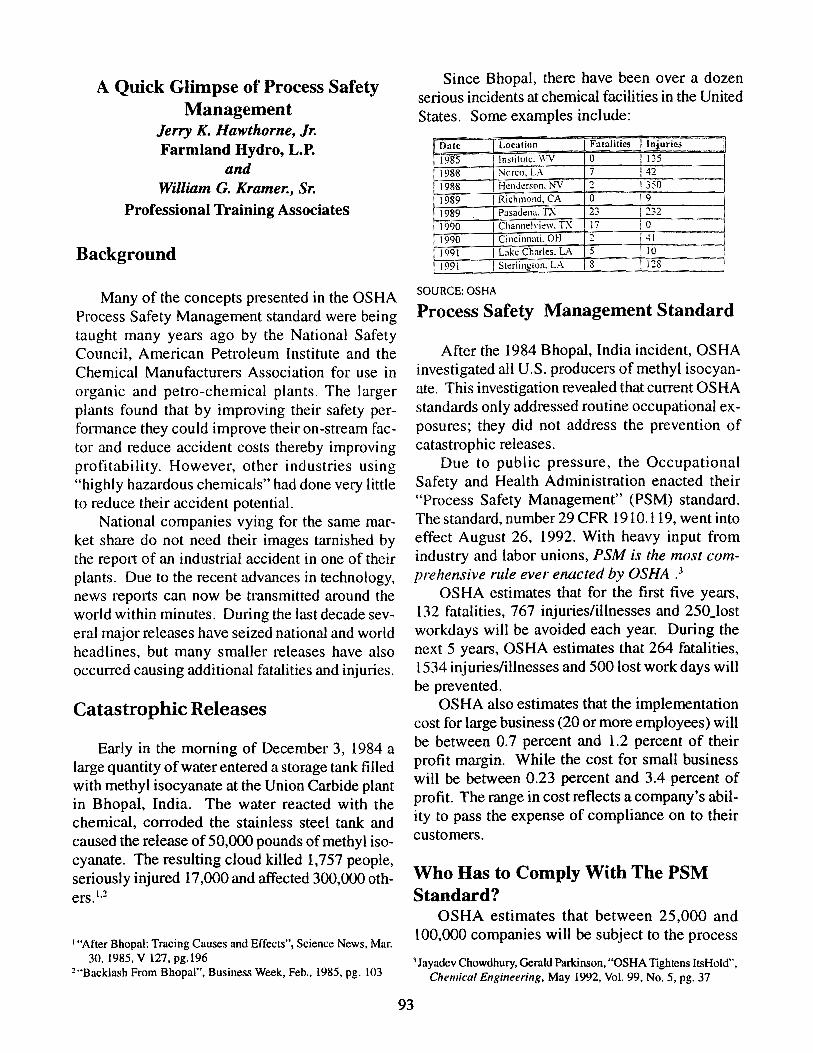
A Quick Glimpse of Process Safety Management
Jerry K. Hawthorne, Jr. Farmland Hydro, L.P.
and William G. Kramer., Sr.
Professional Training Associates
Background
Many of the concepts presented in the OSHA Process Safety Management standard were being taught many years ago by the National Safety Council, American Petroleum Institute and the Chemical Manufacturers Association for use in organic and petro-chemical plants. The larger plants found that by improving their safety performance they could improve their on-stream factor and reduce accident costs thereby improving profitability. However, other industries using "highly hazardous chemicals" had done very little to reduce their accident potential.
National companies vying for the same market share do not need their images tarnished by the repOlt of an industrial accident in one of their plants. Due to the recent advances in technology, news reports can now be transmitted around the world within minutes. During the last decade several major releases have seized national and world headlines, but many smaller releases have also occurred causing additional fatalities and injuries.
Catastrophic Releases
Early in the morning of December 3, 1984 a large quantity of water entered a storage tank filled with methyl isocyanate at the Union Carbide plant in Bhopal, India. The water reacted with the chemical, corroded the stainless steel tank and caused the release of 50,000 pounds of methyl isocyanate. The resulting cloud killed 1,757 people, seriously injured 17,000 and affected 300,000 others. I•2
t"After Bhopal: Tracing Causes and Effects", Science News, Mar. 30,1985, V 127, pg.196
2 "Backlash From Bhopal". Business Week, Feb., 1985, pg. 103
Since Bhopal, there have been over a dozen serious incidents at chemical facilities in the United States. Some examples include:
, !laic I Location FUlalities Ilnjllries
J9l.tS I Institute. v..'V 0 1135 1988 I ?-JoreD, LA 7 142
~ I Henderson. NV :; 350
r 1989 I Richmond, CA 0 9
1989 I Pasad"IU1. TX J~ ..,--, -.)
__ "It-
i 1990 I Channelview. TX 17 0
1990 I Cincinnati. OH !2 4\
1991 I Lake Charles. LA 5 110 1991 I Sterlington. LA Is 1m I
SOURCE: OSHA
Process Safety Management Standard
After the 1984 Bhopal. India incident, OSHA investigated all U.S. producers of methyl isocyanate. This investigation revealed that current OSHA standards only addressed routine occupational exposures; they did not address the prevention of catastrophic releases.
Due to public pressure, the Occupational Safety and Health Administration enacted their "Process Safety Management" (PSM) standard. The standard, number 29 CFR 1910.119, went into effect August-26, 1992. With heavy input from industry and labor unions, PSM is the most comprehensive rule ever enacted by OSHA .3
OSHA estimates that for the first five years, 132 fatalities, 767 injuries/illnesses and 250Jost workdays will be avoided each year. During the next 5 years, OSHA estimates that 264 fatalities, 1534 injuries/illnesses and 500 lost work days will be prevented.
OSHA also estimates that the implementation cost for large business (20 or more employees) will be between 0.7 percent and l.2 percent of their profit margin. While the cost for small business will be between 0.23 percent and 3.4 percent of profit. The range in cost reflects a company's ability to pass the expense of compliance on to their customers.
Who Has to Comply With The PSM Standard?
OSHA estimates that between 25,000 and 100,000 companies will be subject to the process
3 Jayadev Chowdhury, Gerald Parkinson, "OSHA Tightens It~Hold", Chemical Engineering, May 1992, Vol. 99, No.5, pg. 37
93

safety management standard. The first question the facility operator should ask is, will my facility be required to comply with the Process Safety Management standard?
Section (a )(i) of the standard identifies two (2) types of facilities that are subject to the requirements of this standard. OSHA considers facilities with processes involving highly hazardous chemicals and facilities with processes involving flammable liquids or gasses to pose the greatest danger to public safety in the event of a catastrophic event.
Facilities That Manufacture or Store Highly Hazardous Chemicals
Appendix A of the standard contains a list of 137 chemicals entitled "List of Highly Hazardous Chemicals, Toxies and Reactives". Facilities manufacturing or storing any of these listed chemicals at or above the Threshold Quantity (TQ) are covered by the Process Safety Management Standard. The processes in which these materials are used are referred to as covered processes. Of the 137 Highly Hazardous Chemicals, ammonia, chlorine, nitric acid (394.5%) and sulfur dioxide (gas) are generally the ones found in fertilizer plants. Sulfur dioxide liquid is listed but is not a concern in sulfuric acid plants.
Some plants have chosen to include all process involving these four chemicals in the process safety management compliance program. Some, however, have chosen to make precise calculations of S03 gas contained in the sulfuric acid plant in order to eliminate S03 if the volume is below the threshold quantity.
Facilities That Store Flammable Liquids or Gasses
Facilities storing 10,000 pounds or more of flammable liquids or gasses, on site in one location, must also comply with the Process Safety Management Standard. OSHA defines a flammable liquid as a liquid with a flashpoint below 100 oF.
Exceptions
1. Hydrocarbon fuels used for comfort heating or vehicle refueling are exempt from this standard.
2. Flammable liquids stored in atmospheric tanks or transferred which are kept below their normal boiling point with chilling or refrigeration are exempt from this standard.
Who Does Not Have to Comply With PSM?
Facilities that would otherwise be subject to the standard but have one of the following classifications are exempt from complying with the PSM standard.
94
1. Retail facilities - Facilities that obtain more than half of their income from sales to the end user.
2. Oil or gas well drilling or servicing operations. 3. Normally unoccupied facilities.
PSM Requirements OSHA 1910.119 (paragraph)
Employee Participation (c) Employees must be involved at the elemental level of the PSM program.
Process Safety Information (d) Complete, accurate, information concerning the process must exist before conducting a process hazard analysis.
Process Hazard Analysis (e) Employers must develop a thorough, orderly, systematic approach for identifying, evaluating and controlling processes involving highly hazardous chemicals.
Operating Procedures (I) Clear instructions for conducting activities involved in the process must be provided.
Training (g) Every employee must be trained in an overview of the process and the operating procedures. This must be done before a person is assigned to the job, and at least every three years.
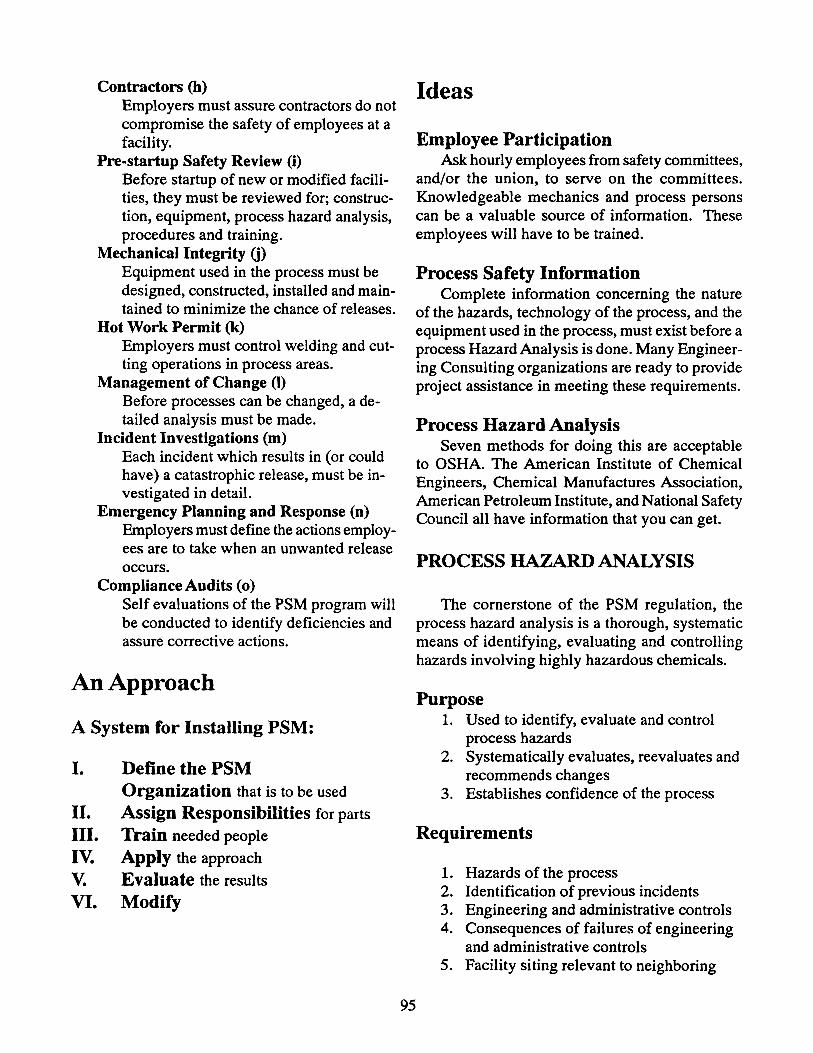
Contractors (h) Employers must assure contractors do not compromise the safety of employees at a facility.
Pre-startup Safety Review (i) Before startup of new or modified facilities, they must be reviewed for; construction, equipment, process hazard analysis, procedures and training.
Mechanical Integrity 0) Equipment used in the process must be designed, constructed, installed and maintained to minimize the chance of releases.
Hot Work Permit (k) Employers must control welding and cutting operations in process areas.
Management of Change (I) Before processes can be changed, a detailed analysis must be made.
Incident Investigations (m) Each incident which results in (or could have) a catastrophic release, must be investigated in detail.
Emergency Planning and Response (n) Employers must define the actions employees are to take when an unwanted release occurs.
Compliance Audits (0) Self evaluations of the PSM program will be conducted to identify deficiencies and assure corrective actions.
An Approach
A System for Installing PSM:
I. Define the PSM Organization that is to be used
II. Assign Responsibilities for parts III. Train needed people IV. Apply the approach
V. Evaluate the results VI. Modify
95
Ideas
Employee Participation Ask hourly employees from safety committees,
and/or the union, to serve on the committees. Knowledgeable mechanics and process persons can be a valuable source of information. These employees will have to be trained.
Process Safety Information Complete information concerning the nature
of the hazards, technology of the process, and the equipment used in the process, must exist before a process Hazard Analysis is done. Many Engineering Consulting organizations are ready to provide project assistance in meeting these requirements.
Process Hazard Analysis Seven methods for doing this are acceptable
to OSHA. The American Institute of Chemical Engineers, Chemical Manufactures Association, American Petroleum Institute, and National Safety Council all have information that you can get.
PROCESS HAZARD ANALYSIS
The cornerstone of the PSM regulation, the process hazard analysis is a thorough, systematic means of identifying, evaluating and controlling hazards involving highly hazardous chemicals.
Purpose 1. Used to identify, evaluate and control
process hazards 2. Systematically evaluates, reevaluates and
recommends changes 3. Establishes confidence of the process
Requirements
1. Hazards of the process 2. Identification of previous incidents 3. Engineering and administrative controls 4. Consequences of failures of engineering
and administrative controls 5. Facility siting relevant to neighboring
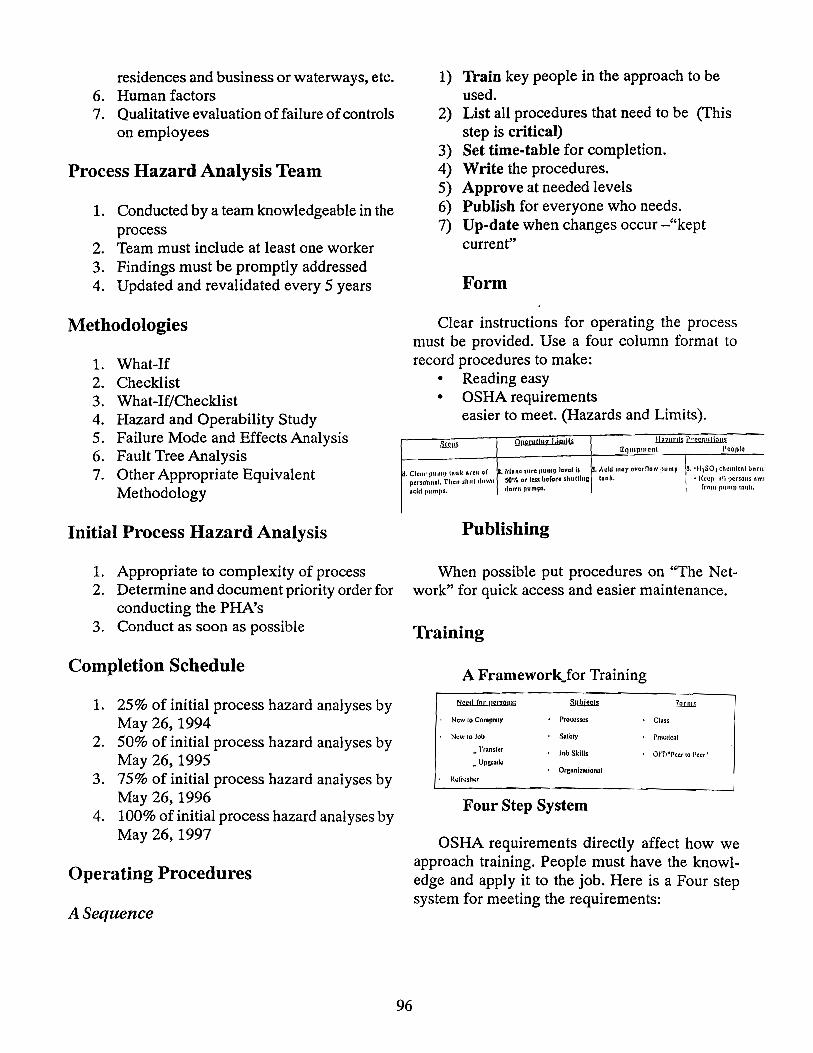
residences and business or waterways, etc. 6. Human factors 7. Qualitative evaluation of failure of controls
on employees
Process Hazard Analysis Team
1. Conducted by a team knowledgeable in the process
2. Team must include at least one worker 3. Findings must be promptly addressed 4. Updated and revalidated every 5 years
Methodologies
1. What-If 2. Checklist 3. What-If/Checklist 4. Hazard and Operability Study 5. Failure Mode and Effects Analysis 6. Fault Tree Analysis 7. Other Appropriate Equivalent
Methodology
Initial Process Hazard Analysis
1. Appropriate to complexity of process 2. Determine and document priority order for
conducting the PHA's 3. Conduct as soon as possible
Completion Schedule
1. 25% of initial process hazard analyses by May 26,1994
2. 50% of initial process hazard analyses by May 26,1995
3. 75% of initial process hazard analyses by May 26,1996
4. 100% of initial process hazard analyses by May 26,1997
Operating Procedures
A Sequence
1) 1rain key people in the approach to be used.
2) List all procedures that need to be (This step is critical)
3) Set time-table for completion. 4) Write the procedures. 5) Approve at needed levels 6) Publish for everyone who needs. 7) Up-date when changes occur -"kept
current"
Form
Clear instructions for operating the process must be provided. Use a four column format to record procedures to make:
• Reading easy • OSHA requirements
easier to meet. (Hazards and Limits).
OIl£tQlinr I,imits 1J.n:LnJ:!l.I~ Equipment lteople SJ~I!.\
CI I ", ',., o( ,l\'lol.c Slire puml.levul is ~. ,\(id IIlfl)' allerOnw {mUll' r' 'H,SO,I chemlcnl burn , CUi' ptlllf,} nUn I I • 1\ ~
IUU'$O)Ulol. Tltelt sltut IIIIWIl SO!v. or 'cS~ bafore sbuttinG toni(, • Keell lin persons I'WI ndt! IHlntlu, down tlUlnps. rrQUI PlHn11 tnul!,
96
Publishing
When possible put procedures on "The Network" for quick access and easier maintenance.
Training
A Framework_for Training
~= Sl~ .1!lU:m.I
New to Cmnptttly PrOl:CsSC$ Chls$
New to !IJb SafclY Pflu:ticnl
Trnnsfcr Jub Skill. OJT'''PCt:f 10 Peer" _ UI)gr!ld\!
Orgllnizmiol1o' Ildh:slu:r
Four Step System
OSHA requirements directly affect how we approach training. People must have the knowledge and apply it to the job. Here is a Four step system for meeting the requirements:
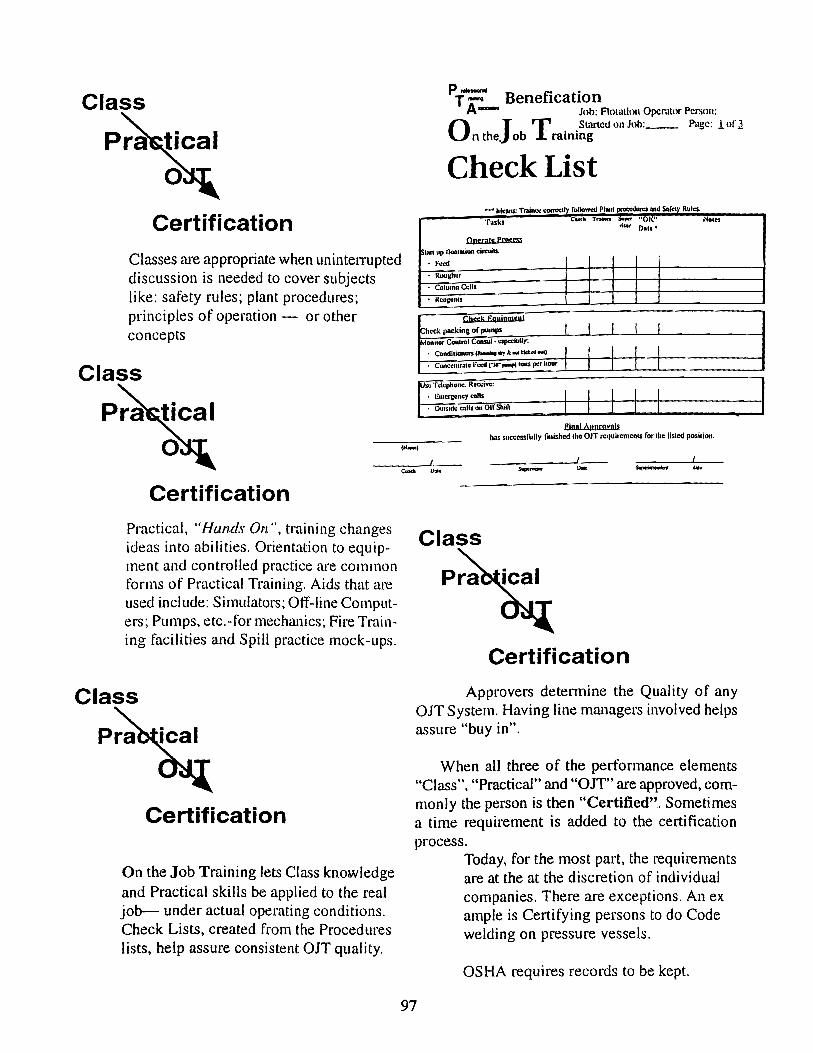
Class
Certification
Classes are appropriate when uninterrupted disclission is needed to cover subjects like: safety rules; plant procedures; principles of operation - or other concepts
Class
Pi"'=: Benefication A - Job: Flnlatiun Opcrulnr Pcrson:
O J T · .StarlcdoIlJllb: __ Pugc: lnrl n the. ob rammg
CheckList -,- M<Iru: T ....... _Iy IbIIowcd 'hW ~ wi Sa"'!), Rol<>-
Taskt c_ ,- -, "OK" Noees ,,- nata ..
OUI:I:alll!m.c:w tint up Iluatalion cifcvil$.
• 1'..:.1 • R.,.,ghet
• Column Cclts ~ I(cqcul$
~1lIIWII
1 J J J 1 ~'<ck packing of putnl'" . IM"";IO< COl","' Consul· ......,ially:
I I .1 1 1 • COndilioncrSC ..... ..,.t .. kidlaI ... '
• Cunecntf'aht Fa:d ("'56" ..... tant pt:f hour I ~ ~
sc 'r clephone. Receiw:
· E",o"'.'.r col .. I I I J 1 L . Oltuiidc calfs on OlTSbifi ~ ~ J ~L
l!lw!I.AIllltlWlll has SI",c<s,'blly r •• ishcd 1110 OJT roquirelllcu!1 ror Ih.Usted position.
(Na.c)
Certification Practical. "Hunds On", training changes ideas into abilities. Orientation to equipment and controlled practice are common forms of Practical Training. Aids that are used include: Simulators; Off-line Computers; Pumps, etC.-for mechanics; Fire Training facilities and Spill practice mock-ups.
Class
Certification
On the Job Training lets Class knowledge and Practical skills be applied to the real job- under actual operating conditions. Check Lists. created from the Procedures lists. help assure consistent OJT quality.
.J
Class
Certification Approvers determine the Quality of any
OJT System. Having line managers involved helps assure "buy in".
When all three of the performance elements "Class", "Practical" and "OJT" are approved, commonly the person is then "CertifiedH
. Sometimes a time requirement is added to the certification process.
97
Today, for the most part, the requirements are at the at the discretion of individual companies. There are exceptions. An ex ample is Certifying persons to do Code welding on pressure vessels.
OSHA requires records to be kept.
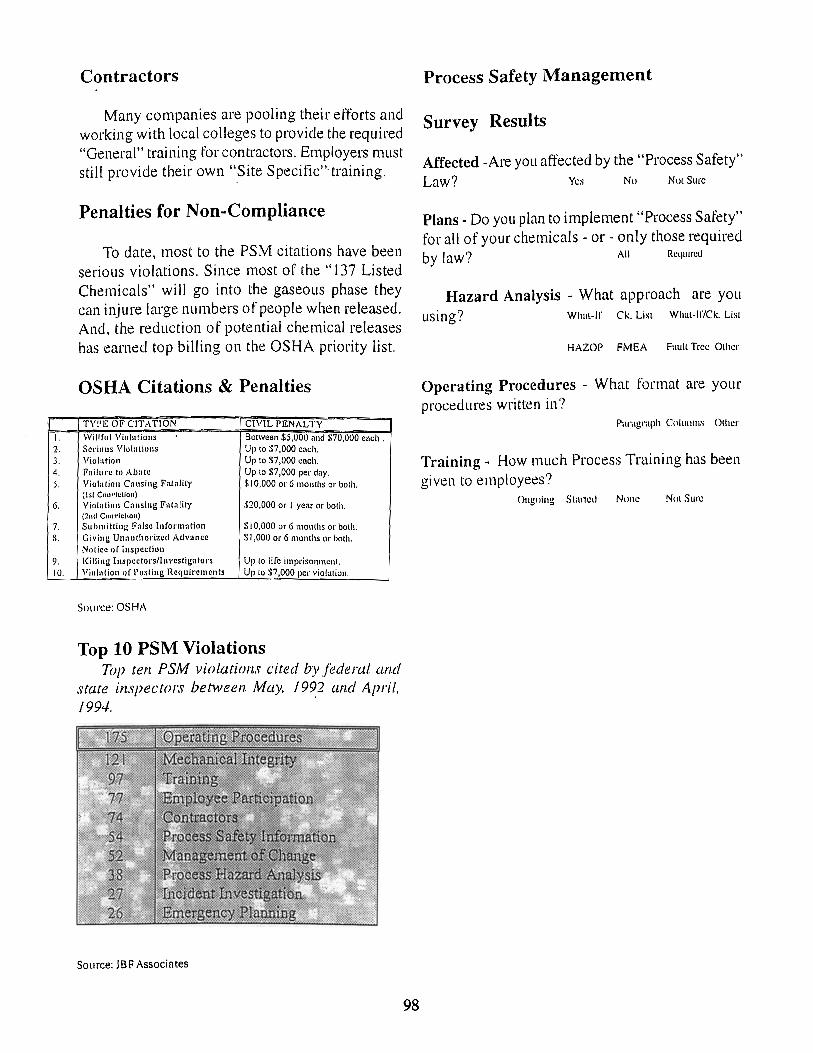
I. 2. 3. 4 . S.
6.
7. S.
9. 10.
Contractors
Many companies are pooling their efforts and working with local colleges to provide the required "General" training for contractors, Employers must still provide their own ".Site Specitic"training,
Penalties for Non-Compliance
To date, most to the PSM citations have been serious violations, Since most of the" 137 Listed Chemicals" will go into the gaseous phase they can injure large numbers of people when released, And. the reduction 0 f potential chemical releases has earned top billing on the OSHA priority list.
OSHA Citations & Penalties
TYI'I~ OF CITATION CIVIL PENALTY
Willful Violations Betweon $5,000 ancl $70,000 each . Serious Viulations Up to $7,000 each. Violation Up to $7,000 each. l~ailnrc to Abate Up to $7,000 per day. Violation Causing F:ualil)' $10,000 01' 6 months 01' both. (1st CUII\'ic(fnll)
Villiation Causing Falality $20,00001' I year or both . (211d CUI1\' ichon)
Suhlllittin!: False Informatilln :Ii I 0,000 01' 6 months or both. Giving Ulwuthodzcu Advance :iiI ,000 or 6 months 01' both . Nlllice Ill' Inspection Killing Inspectors/Investigators Up 10 lile imprisonment. Villialion of l'ostinl1Requirelllents Up to :£7,000 per violation.
Source: OSHA
Top 10 PSM Violations Top ten PSM violations cited by federal and
state inspectors between. May, 19~2 an.d April. 199-+,
Source: JBF Associates
98
Process Safety lVlanagement
Survey Results
Affected -Are you affected by the "Process Safety" Law? Yes Nt) Nol Sure
Plans - Do you plan to implement "Process Safety" for all of your chemicals - or - only those required by law? All Rcquircli
Hazard Analysis - What approach are you . ?
llSll1g, WlliIl- l f Ck. List What-IrICk. List
HAZOP FI'vIEA Fuull Tree Olher
Operating Procedures - What format are your procedures written in?
Paragraph COIUIlIl1S Other
Training - How much Process Training has been given to employees?
Ollguillg Slarled None Nol Sure

Thesday, NovelDber 8, 1994 Session IV
Moderator:
Dale Dubberly
Global Positioning Application Dr. Sam Kincheloe
IMC Global
Site Specific Management ... A BMP
Best Management Practices (BMPs). Maximum Economic Yield (MEY) and sustainable agriculture are terms that should be part of our vocabulary when discussing agricultural issues. In the proper context, BMPs, MEY and sustainability are not terms in conflict. Quite to the contrary. BMPs lead to MEY and MEY leads to sustainability ... both environmentally and economically.
Put another way, the primary objective of a sustainable, efficient agricultural system is to provide an economical, safe supply of high quality food and fiber, with adequate and responsible protection of the environment. It is this combination of productivity and responsibility that most accurately describes the term, "sustainable agriculture."
What are Best Management Practices? Best Management Practices are those practices that have been proven in research and tested through farmer implementation to give optimum production potential, input efficiency and environmental protection. A BMP for one location is not necessarily the same at another - they can vary for various crops, soils and climates. BMPs are very site specific.
Past research, farmer experience and knowledge of the uncontrollable factors, such as soil and climate, are valuable tools in arriving at the BMP recommendation for each particular site.
BMPs involve both soil conservation and agronomic practices. It is the combination of these BMPs that assures a highly efficient and produc-
tive cropping system and one that preserves the soil for future generations.
The idea is to simply maximize the efficiency of all inputs and manage steps to produce the highest yield at maximum profit ... which in turn ... enhances environmental stewardship.
One of the BMPs that is generally recognized as being environmentally sound is soil testing. It will continue to be extremely important that farmers base their fertility programs on a good soil testing program.
Recent applications of technology have offered some rather profound progress in achieving MEY and sustainability. Through the integration of off-the-shelf innovations, the implementation of MEY can be enhanced. Some of these innovations, although not particularly new, are computers, radio receivers, global positioning satellites, and intensive soil testing.
The integration of these components, and others, into a BMP production system for greater efficiency has evolved in a number of different terms to describe it. Some of the terminology is: precision farming, computer aided farming, variable rate technology, farming by the foot and site specific management. The following discussion should provide a summary of this management process called ... site specific management.
"Research has documented that wide yield variations routinely occur in fields that have always received the same inputs. Much of the variability is due to differing soil types. However, significant variability is found within soil types. This is true because man's activities have had a more profound effect on nutrient level variability than the natural, inherent variability due to soil type.
99

Growing economic and environmental concerns are also causing some farmers and researchers to take a closer look between the boundaries of individual fields when applying inputs.
Recent production developments have focused on the benefit of dividing a field into small units for more intensive or site specific management. This procedure is called the grid sampling approach. The field is sub-divided into small cells of about one hectare. Soil sample cores are collected within the cell and consolidated for analysis. The soil samples are summarized and nutrient management maps created. With this approach, it is recognized that nutrients such as nitrogen, phosphorus and potassium vary independently of soil type, map units and, of each other. Fertilizer rates and chemicals are then varied based on the nutrient management maps developed.
The major advantage of the grid system is that it considers both the soil type and field history differences. Another advantage of the grid system is that the intensive soil sampling provides the best soil testing program most farmers have ever had.
Intensive soil testing is at the heart of this system. Individual soil samples are taken from each grid of approximately one hectare or two and a half acres. The soil test results are entered into computer mapping software. Therefore, the computer is used to develop digitized field maps by combining grids with similar nutrient levels. At this point, fertility management is possible on a more site specific basis.
The fertilizer rate can be varied according to the nutrient maps using the manual methods ... such as spot spreading, double spreading, and manually manipulating the controls on spreaders.
Even more important today are the pressures being placed on the agricultural community to develop high-tech, innovative procedures to replace more traditional farming techniques.
The concept of site specific management, variable rate technology, computer aided farming, precision farming, or whatever the term or phrase used to describe the concept .. .it does address these current issues of the day in a comprehensive manner. By understanding the characteristics of a field in detail and relating these features by geographic location, the farmer can focus on areas that need
att~mtioll itnd treat them according to yield potential. Yield potential is reflected through soil types and the nutrient grid maps.
Successful implementation of site specific management relies on the farmer treating each soil type or each grid area individually instead of treating the entire field as a single management unit. Obviously this shift in management approach can lead to increased productivity because a field is farmed according to the potential of each small grid area.
With the increasing cost of land and demands on its associated resources, higher expectations are being placed on farmers to better manage these commodities. Wise management must be based upon complete, accurate and timely information.
Innovative farmers are beginning to break away from the traditional methods that have long shaped their production practices. Space-age ideas and equipment, and off-the-shelf computer and communication systems are helping farmers move into these high-tech methods of crop production, achieving maximum economic yield and reducing potential environmental impact.
Dead reckoning and radar gun systems mounted on field equipment have been particularly useful in establishing the sampling grids. Likewise, they have been helpful in positioning equipment in the field.
However, even more sophisticated technology is available and is being used. It is called global positioning satellite systems. Global positioning satellite systems have the greatest potential for use in positioning fertilizer spreaders and other farm equipment in the field ... at exactly the same location, time after time. The other unique feature is that exact geographic locations can be determined at any time as the equipment moves across the field ... on the go.
Global Positioning Systems are a 24-hour, worldwide, all-weather network providing precise navigation information to its earth-based computer system within meters of its target. GPS, as it is called, is a United States government navigation system operating from a constellation of 24 satellites. Used primarily for governmental activities, this highly accurate positioning system is now open to civilian use.
100
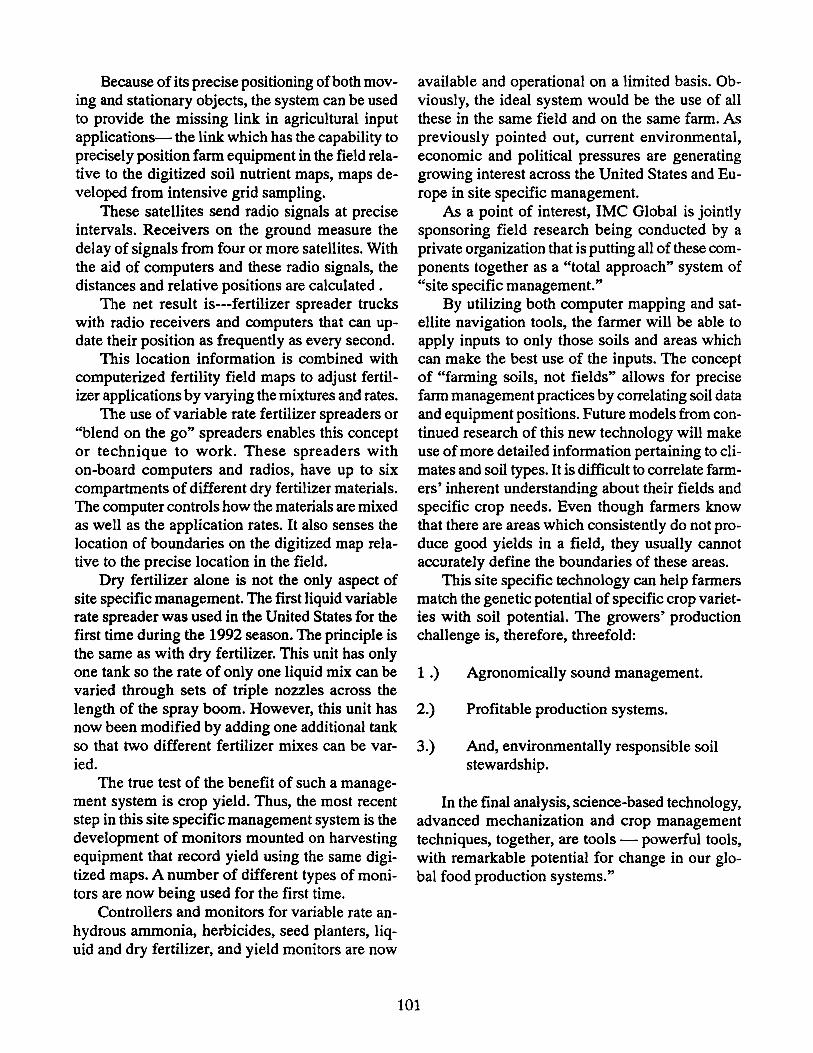
Because of its precise positioning of both moving and stationary objects, the system can be used to provide the missing link in agricultural input applications- the link which has the capability to precisely position farm equipment in the field relative to the digitized soil nutrient maps, maps developed from intensive grid sampling.
These satellites send radio signals at precise intervals. Receivers on the ground measure the delay of signals from four or more satellites. With the aid of computers and these radio signals, the distances and relative positions are calculated.
The net result is---fertilizer spreader trucks with radio receivers and computers that can update their position as frequently as every second.
This location information is combined with computerized fertility field maps to adjust fertilizer applications by varying the mixtures and rates.
The use of variable rate fertilizer spreaders or "blend on the go" spreaders enables this concept or technique to work. These spreaders with on-board computers and radios, have up to six compartments of different dry fertilizer materials. The computer controls how the materials are mixed as well as the application rates. It also senses the location of boundaries on the digitized map relative to the precise location in the field.
Dry fertilizer alone is not the only aspect of site specific management. The first liquid variable rate spreader was used in the United States for the first time during the 1992 season. The principle is the same as with dry fertilizer. This unit has only one tank so the rate of only one liquid mix can be varied through sets of triple nozzles across the length of the spray boom. However, this unit has now been modified by adding one additional tank so that two different fertilizer mixes can be varied.
The true test of the benefit of such a management system is crop yield. Thus, the most recent step in this site specific management system is the development of monitors mounted on harvesting equipment that record yield using the same digitized maps. A number of different types of monitors are now being used for the first time.
Controllers and monitors for variable rate anhydrous ammonia, herbicides, seed planters, liquid and dry fertilizer, and yield monitors are now
available and operational on a limited basis. Obviously, the ideal system would be the use of all these in the same field and on the same farm. As previously pointed out, current environmental, economic and political pressures are generating growing interest across the United States and Europe in site specific management.
As a point of interest, IMC Global is jointly sponsoring field research being conducted by a private organization that is putting all of these components together as a "total approach" system of "site specific management."
By utilizing both computer mapping and satellite navigation tools, the farmer will be able to apply inputs to only those soils and areas which can make the best use of the inputs. The concept of "farming soils, not fields" allows for precise farm management practices by correlating soil data and equipment positions. Future models from continued research of this new technology will make use of more detailed information pertaining to climates and soil types. It is difficult to correlate farmers' inherent understanding about their fields and specific crop needs. Even though farmers know that there are areas which consistently do not produce good yields in a field, they usually cannot accurately define the boundaries of these areas.
This site specific technology can help farmers match the genetic potential of specific crop varieties with soil potential. The growers' production challenge is, therefore, threefold:
1.} Agronomically sound management.
2.} Profitable production systems.
3.) And, environmentally responsible soil stewardship.
In the final analysis, science-based technology, advanced mechanization and crop management techniques, together, are tools - powerful tools, with remarkable potential for change in our global food production systems."
101
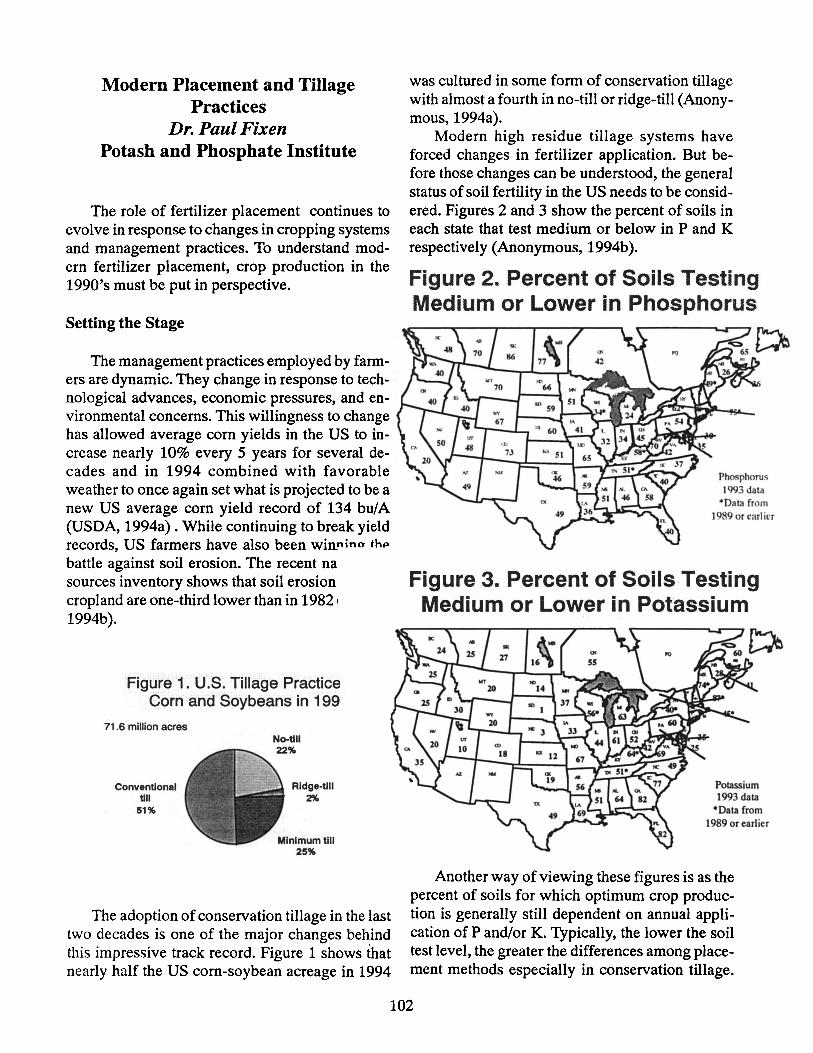
Modern Placement and Tillage Practices
Dr. Paul Fixen Potash and Phosphate Institute
The role of fertilizer placement continues to evolve in response to changes in cropping systems and management practices. To understand modern fertilizer placement, crop production in the 1990's must be put in perspective.
Setting the Stage
The management practices employed by farmers are dynamic. They change in response to technological advances, economic pressures, and environmental concerns. This willingness to change has allowed average corn yields in the US to increase nearly 10% every 5 years for several decades and in 1994 combined with favorable weather to once again set what is projected to be a new US average corn yield record of 134 bu/A (USDA, 1994a) . While continuing to break yield records, US farmers have also been winr'lno thp
battle against soil erosion. The recent na sources inventory shows that soil erosion cropland are one-third lower than in 1982 I 1994b).
Figure 1. U.S. Tillage Practice Corn and Soybeans in 199
71 .6 million acres
Conventional till
51%
Rldge.tIIl 2%
The adoption of conservation tillage in the last two decades is one of the major changes behind this impressive track record. Figure 1 shows that nearly half the US corn-soybean acreage in 1994
was cultured in some form of conservation tillage with almost a fourth in no-till or ridge-till (Anonymous, 1994a).
Modern high residue tillage systems have forced changes in fertilizer application. But before those changes can be understood, the general status of soil fertility in the US needs to be considered. Figures 2 and 3 show the percent of soils in each state that test medium or below in P and K respectively (Anonymous, 1994b).
Figure 2. Percent of Soils Testing Medium or Lower in Phosphorus
Phosphorus 1<>93 data
·Data from ]989 or earlier
Figure 3. Percent of Soils Testing Medium or Lower in Potassium
Potassium 1993 data
-Data from 1989 or earlier
Another way of viewing these figures is as the percent of soils for which optimum crop production is generally still dependent on annual application of P and/or K. Typically, the lower the soil test level, the greater the differences among placement methods especially in conservation tillage.
102

The soil test results show that fertilizer placement will likely be critical for many of today's farmers utilizing conservation tillage methods on soils that cannot meet crop nutrient needs without supplementation.
Residue cover is another factor that farmers in the 90's consider when management decisions are made. The simple process of knifing in anhydrous ammonia may bury too much residue to be practical for land requiring 30% residue cover if any other tillage is being done (Table 1). Such concerns have increased interest in placement tools that minimize disturbance.
Concerns for surface water quality may also impact placement decisions. Placing P sources below the surface of vulnerable sites reduces the potential for significant P contribution to surface water. The SCS is currently testing a Phosphorus Index (SCS, 1994). This is a matrix intended for use by field staff for identifying fields with the greatest potential to contribute P to surface water. Fields with ratings equal to or greater than 15 are defined as having a high potential for·P losses. One of the eight factors considered in the index is fertilizer placement. As Table 2 shows, an unincorporated surface application of P fertilizer made more than 3 months before the crop is planted contributes 4 points to the index on a scale where 15 points is high. In the index matrix, manure placement has twice the effect of fertilizer placement due to the greater potential for manure P to leave the field in runoff when surface applied (Table 2).
Undoubtedly, the importance of understanding fertilizer placement in crop production has increased. Lets review:
•
•
•
Conservation tillage is rapidly becoming dominant with 1/4 of the com and soybeans produced in no-till or ridge-till systems. Placement is more important in these high residue systems.
Optimum crop production in many fields is still dependent on annual application of P and/or K.
Government programs and erosion control have increased the importance of limiting residue burial during application. This be
comes another challenge for placement equipment and application timing.
• Concerns about the impact of P management on surface water quality have increased. Subsurface placement is viewed as a means of reducing potential impacts.
Nitrogen Placement
Numerous N placement studies have shown that subsurface application of N fertilizer below the residue mat of conservation tillage is superior to surface application. The data summarized in Table 3 from several states are typical. Subsurface application eliminates the potential for volatilization losses, reduces denitrification and immobilization potential, and protects against stranding of the fertilizer N at the soil surface during dry periods. The Kansas study showed that increasing N rate did not increase yield of the less effective placement methods to that of the knife treatments.
A relatively new approach to subsurface application is point injection. Point injection uses a spoked wheel to place liquid fertilizer in concentrated pockets at points about 8 inches apart to a soil depth of about 4 inches. The potential advantages include minimal residue disturbance, placement near plants without root pruning, and lower energy requirements compared to other subsurface methods. Research indicates that point injection is at least as effective as knifing in reduced till systems (Fixen, 1990).
Starter Fertilizer
Early season nutrient insufficiencies are quite common in today's conservation tillage systems. A survey of 80 com fields in the Midwest in 1992 showed that 75% of the fields tested insufficient in at least one nutrient (Fixen, 1993). In this survey, no-till and ridge-till systems did not differ in nutrient relationships but both were more likely to have insufficient levels of Nand K than minimum till systems (Figure 4). Agronomic principles suggest that starter fertilization should be the most effective means of correcting these insufficiencies.
103
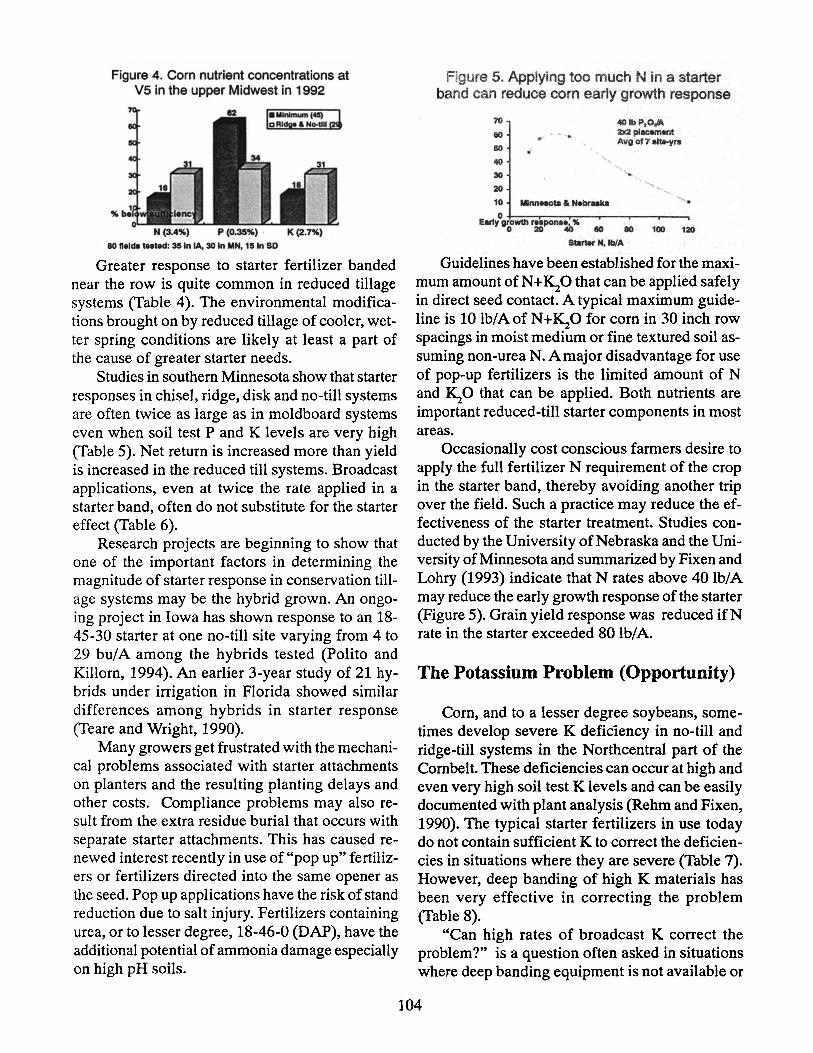
Figure 4. Corn nutrient concentrations at V5 in the upper Midwest in 1992
N (3.4%) P (0.35%) . K(2.7%)
80 nelda t •• ted: 35 In IA, 30 In MN, 15 In SO
Greater response to starter fertilizer banded near the row is quite common in reduced tillage systems (Table 4). The environmental modifications brought on by reduced tillage of cooler, wetter spring conditions are likely at least a part of the cause of greater starter needs.
Studies in southern Minnesota show that starter responses in chisel, ridge, disk and no-till systems are often twice as large as in moldboard systems even when soil test P and K levels are very high (Table 5). Net return is increased more than yield is increased in the reduced till systems. Broadcast applications, even at twice the rate applied in a starter band, often do not substitute for the starter effect (Table 6).
Research projects are beginning to show that one of the important factors in determining the magnitude of starter response in conservation tillage systems may be the hybrid grown. An ongoing project in Iowa has shown response to an 18-45-30 starter at one no-till site varying from 4 to 29 bu/A among the hybrids tested (Polito and Killom, 1994). An earlier 3-year study of 21 hybrids under irrigation in Florida showed similar differences among hybrids in starter response (Teare and Wright, 1990).
Many growers get frustrated with the mechanical problems associated with starter attachments on planters and the resulting planting delays and other costs. Compliance problems may also result from the extra residue burial that occurs with separate starter attachments. This has caused renewed interest recently in use of "pop up" fertilizers or fertilizers directed into the same opener as the seed. Pop up applications have the risk of stand reduction due to salt injury. Fertilizers containing urea, or to lesser degree, 18-46-0 (DAP), have the additional potential of ammonia damage especially on high pH soils.
Figure 5. Applying too much Nin a starter band can reduce corn early growth response
70
80
IiO . ' 40
30
20
40 Ib P,O,JA 2lC2p1acement AvO 0' 7 alt.yra
10 Mlnnnota & NebrMka ..... .
o~~~~~~--~~--~ Early o~owth r=ponat," 80 80 100 120
Starter N, IbiA
Guidelines have been established for the maximum amount ofN+~O that can be applied safely in direct seed contact. A typical maximum guideline is 10 Ibl A of N + ~O for corn in 30 inch row spacings in moist medium or fine textured soil assuming non-urea N. A major disadvantage for use of pop-up fertilizers is the limited amount of N and KzO that can be applied. Both nutrients are important reduced-till starter components in most areas.
Occasionally cost conscious farmers desire to apply the full fertilizer N requirement of the crop in the starter band, thereby avoiding another trip over the field. Such a practice may reduce the effectiveness of the starter treatment. Studies conducted by the University of Nebraska and the University of Minnesota and summarized by Fixen and Lohry (1993) indicate that N rates above 40 Ib/A may reduce the early growth response of the starter (Figure 5). Grain yield response was reduced if N rate in the starter exceeded 80 Ibl A.
The Potassium Problem (Opportunity)
Corn, and to a lesser degree soybeans, sometimes develop severe K deficiency in no-till and ridge-till systems in the Northcentral part of the Combelt. These deficiencies can occur at high and even very high soil test K levels and can be easily documented with plant analysis (Rehm and Fixen, 1990). The typical starter fertilizers in use today do not contain sufficient K to correct the deficiencies in situations where they are severe (Table 7). However, deep banding of high K materials has been very effective in correcting the problem (Table 8).
"Can high rates of broadcast K correct the problem?" is a question often asked in situations where deep banding equipment is not available or
104

where additional residue disturbance is not desirable. Studies where deep band and broadcast applications have been compared at the same rate indicate that broadcast applications are ineffective in the short term. However, raising soil test K to some optimum level (higher level than with conventional tillage) with broadcast applications may be successful in the long term.
The 1992 plant analysis survey of corn fields in Iowa, Minnesota and South Dakota mentioned earlier (Fixen, 1993) was used to determine what soil test' K levels were required to get a sufficient level of K in the plant at the 5-leaf growth stage (2.7% K). Caution is required in applying these results since no yield data were collected from these fields. Rather, the interpretation is based solely on plant analysis. Soil test K levels of 142 and 182 ppm in the corn row were required for chisel and no-till or ridge-till systems respectively. In other words, no-till and ridge-till needed 40 ppm higher soil test K levels to reach sufficiency. Typically, approximately 8 pounds of fertilizer K20 is required to change soil test K levels by 1 ppm in Midwestern medium or fine textured soils. Thus, these data suggest that no-till or ridge-till systems require an additional 320 pound of fertilizer K20 compared to chisel systems to correct for reduced K availability if K is broadcast. Annual applications of only 40 to 50 Ib K20lA in a subsurface band below the row have been sufficient, illustrating the marked difference in short term effectiveness of broadcast and band K applications in these systems (Rehm, 1993b).
The cause of increased K requirements in notill or ridge-till systems has not been conclusively demonstrated. However, it is likely related to the nutrient stratification that occurs when soils are not plowed (Table 9). Positional unavailability of nutrients near the surface may occur due to the frequent drying out of the surface soil layers which impedes root development and nutrient uptake. Also, corn hybrids differ in their sensitivity to reduced-till induced K deficiency (Table 10) and root system characteristics appear to be responsible for the differences (Allan et aI., 1993). Sensitive hybrids early in the season have lower root densities near the soil surface where the K is concentrated. This hybrid interaction supports the theory that the K deficiency is at least in part caused by the stratification.
Site-specific Applications
Developments in variable rate application equipment and advances in positioning capability have lead to tremendous growth in the potential for site-specific management. These developments have in turn lead to an exponential rate of growth in the amount of grid soil sampling being done where the end result is usually a map of soil test levels. Grid sampling generally reveals more soil test variability within fields than people expect (Table 11) which intensifies the interest in managing the variability. With on-the-go yield monitors becoming readily available, this interest will continue to escalate.
In the past, site specific management or "precision farming" has been tied primarily to broadcast fertilizer application. However, some early innovators are merging conservation tillage, fertilizer placement and site-specific management technologies. The Bott Brothers no-till farm in southwestern Minnesota near the town of Cottonwood. They use grid sampling to generate fertilizer application maps and variable rate technology to vary anhydrous ammonia rates, turn N-serve on or off depending on the N loss potential of the soil, and vary banded dry P and K rates. They inject the N, P and K below next year's corn rows (22.5" spacing), ammonia at a depth of 6-8" and P and K at a depth of 4-6". Since their fields cause iron chlorosis on soybeans they also vary soybean variety across their fields, planting tolerant varieties in the high pH areas, and higher yield potential but sensitive varieties in the normal parts of the fields. They have effectively merged placement, conservation tillage, and site-specific technologies.
What about dealer application? The Botts do it themselves with home-built rigs but dealers like Sam Kitzman of Keswick, IA already apply ammonia and band liquid P and K for their customers in one pass using a Terra-Gator pulling a toolbar and ammonia tank. It would seem that variable rate technology and other parts of the site specific management package would be a natural fit with such a program. Other dealers are currently custom applying ammonia with variable rate equipment.
105
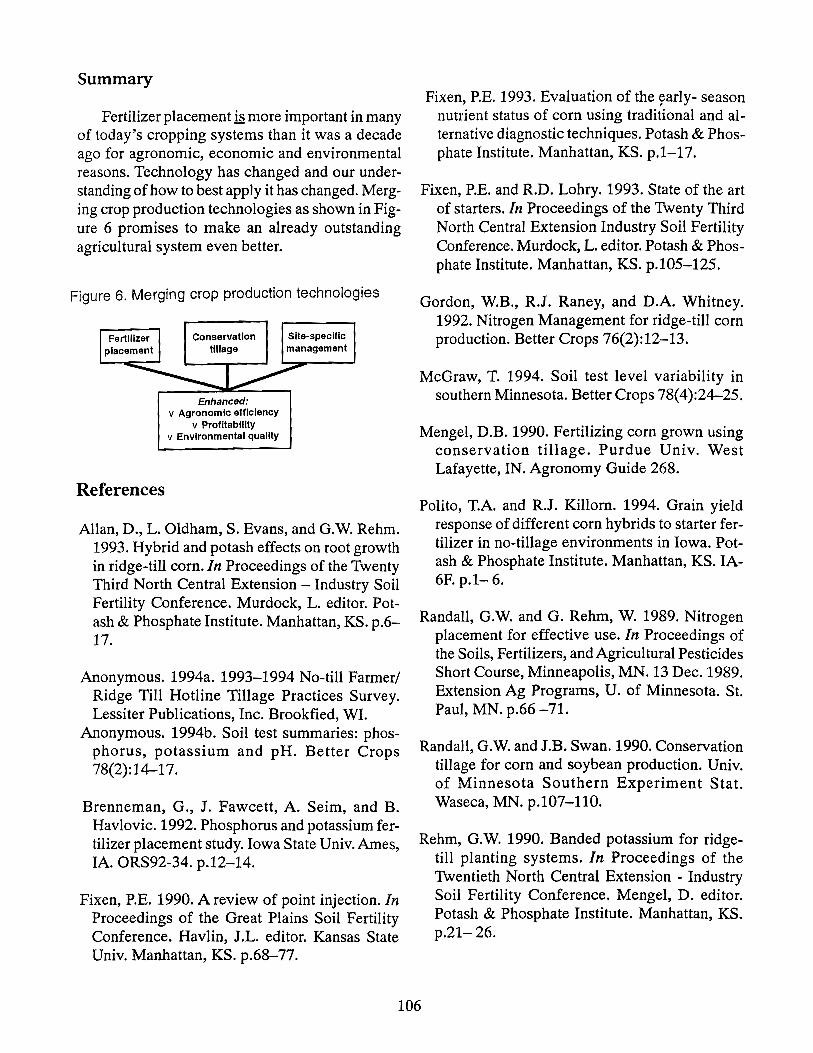
Summary
Fertilizer placement is more important in many of today's cropping systems than it was a decade ago for agronomic, economic and environmental reasons. Technology has changed and our understanding of how to best apply it has changed. Merging crop production technologies as shown in Figure 6 promises to make an already outstanding agricultural system even better.
Figure 6. Merging crop production technologies
References
Enhanced: v Agronomic efficiency
v Profitability v Environmental quality
Site-specific management
Allan, D., L. Oldham, S. Evans, and G.W. Rehm. 1993. Hybrid and potash effects on root growth in ridge-till corn. In Proceedings of the 'lWenty Third North Central Extension - Industry Soil Fertility Conference. Murdock, L. editor. Potash & Phosphate Institute. Manhattan, KS. p.6-17.
Anonymous. 1994a. 1993-1994 No-till Farmerl Ridge Till Hotline Tillage Practices Survey. Lessiter Publications, Inc. Brookfied, WI.
Anonymous. 1994b. Soil test summaries: phosphorus, potassium and pH. Better Crops 78(2):14-17.
Brenneman, G., J. Fawcett, A. Seim, and B. Havlovic. 1992. Phosphorus and potassium fertilizer placement study. Iowa State U niv. Ames, IA. ORS92-34. p.12-14.
Fixen, P.E. 1990. A review of point injection. In Proceedings of the Great Plains Soil Fertility Conference. Havlin, J.L. editor. Kansas State Univ. Manhattan, KS. p.68-77.
Fixen, P.E. 1993. Evaluation of the ~arly- season nutrient status of corn using traditional and alternative diagnostic techniques. Potash & Phosphate Institute. Manhattan, KS. p.1-17.
Fixen, P.E. and R.D. Lohry. 1993. State of the art of starters. In Proceedings of the Twenty Third North Central Extension Industry Soil Fertility Conference. Murdock, L. editor. Potash & Phosphate Institute. Manhattan, KS. p.105-125.
Gordon, W.B., R.J. Raney, and D.A. Whitney. 1992. Nitrogen Management for ridge-till corn production. Better Crops 76(2):12-13.
McGraw, T. 1994. Soil test level variability in southern Minnesota. Better Crops 78(4):24-25.
Mengel, D.B. 1990. Fertilizing corn grown using conservation tillage. Purdue Univ. West Lafayette, IN. Agronomy Guide 268.
Polito, T.A. and R.J. Killorn. 1994. Grain yield response of different corn hybrids to starter fertilizer in no-tillage environments in Iowa. Potash & Phosphate Institute. Manhattan, KS. IA-6F. p.1- 6.
Randall, G.W. and G. Rehm, W. 1989. Nitrogen placement for effective use. In Proceedings of the Soils, Fertilizers, and Agricultural Pesticides Short Course, Minneapolis, MN. 13 Dec. 1989. Extension Ag Programs, U. of Minnesota. St. Paul, MN. p.66 -71.
Randall, G.W. and J.B. Swan. 1990. Conservation tillage for corn and soybean production. Univ. of Minnesota Southern Experiment Stat. Waseca, MN. p.107-110.
Rehm, G.W. 1990. Banded potassium for ridgetill planting systems. In Proceedings of the Twentieth North Central Extension - Industry Soil Fertility Conference. Mengel, D. editor. Potash & Phosphate Institute. Manhattan, KS. p.21- 26.
106

Rehm, G.W. 1993a. Personal communication. Soil Science Dept., Univ. of Minnesota.
Rehm, G.W. 1993b. Change a necessity when switching to ridge-till, no-till. Fluid Journal 1(1):23-24.
Rehm, G.W. and P.E. Fixen. 1990. Potassium deficiency in corn - A common ridge-till problem. Better Crops 74(3):6-9.
SCS. 1992. Crop Residue Management. Soil Conservation Service. St. Paul, MN. 1992-657-002. p.1-4.
SCS. 1994. Conservation planning for water quality concerns, phosphorus loading. Soil Conservation Service. Washington, DC. WQ Ser. No. 460-LI-1. p.1-8.
Teare, I.D. and D.L. Wright. 1990. Corn hybridstarter fertilizer interaction for yield and lodging. Crop Sci 30:1298-1303.
USDA. 1994a. October Crop Report. National Agricultural Statistics Service. Washington, DC.
USDA. 1994b. Summary Report 1992 National Resources Inventory. Soil Conservation Service. Wahington, DC.
Varsa, E.C., K.E. Keller, J.M. Jemison, M.W. Osborn,A.K. Leis, and S.W. Hnetkovsky. 1994. Nitrogen placement in no-till corn. In Proceedings of the 1\venty Fourth North Central Extension-Industry Soil Fertility Conference. Vitosh, M. editor. Potash & Phosphate Institute. Manhattan, KS. p.69-74.
Voss, R. 1984. Fertilizer placement and tillage. Iowa State Univ. Ames, IA. CE-2081x. p.1-6.
Table 1. Residue burial during fertilizer aEEUcation is a concern. Soybeans Closing disks Corn or small grain
% residue remaining No 75-85 45-70 Yes 60-75 30-50
Anhydrous knife. SCS, 1992.
Table 2. Placement factors in the SCS PhosEhorus Index. P source
Practice Fertilizer Organic P Weighted rating
Surface applied> 3 months before crop 4 8 Surface applied < 3 months before crop 2 4
Incorporated> 3 months before crop 2 4 Incorporated immediately before crop 1 2
Placed deeEer than 2" .5 1 Total index with all 8 factors 2. 15 is high; > 32 is very high.
Table 3. Subsurface N applications perform better than surface applications in no-till and ridge-till systems.
UAN MN 3-year average KS 5- year average IL 7-year average application corn-soy. ridge- Irrig. corn, ridge- Corn, no-till
method till till Randall & Rehm, Gordon, 92 Varsa et aI.. 94
89 bulA
Broadcast 145 143 104 Surface band --- 145 107
Knifed or 155 156 122 injected
107
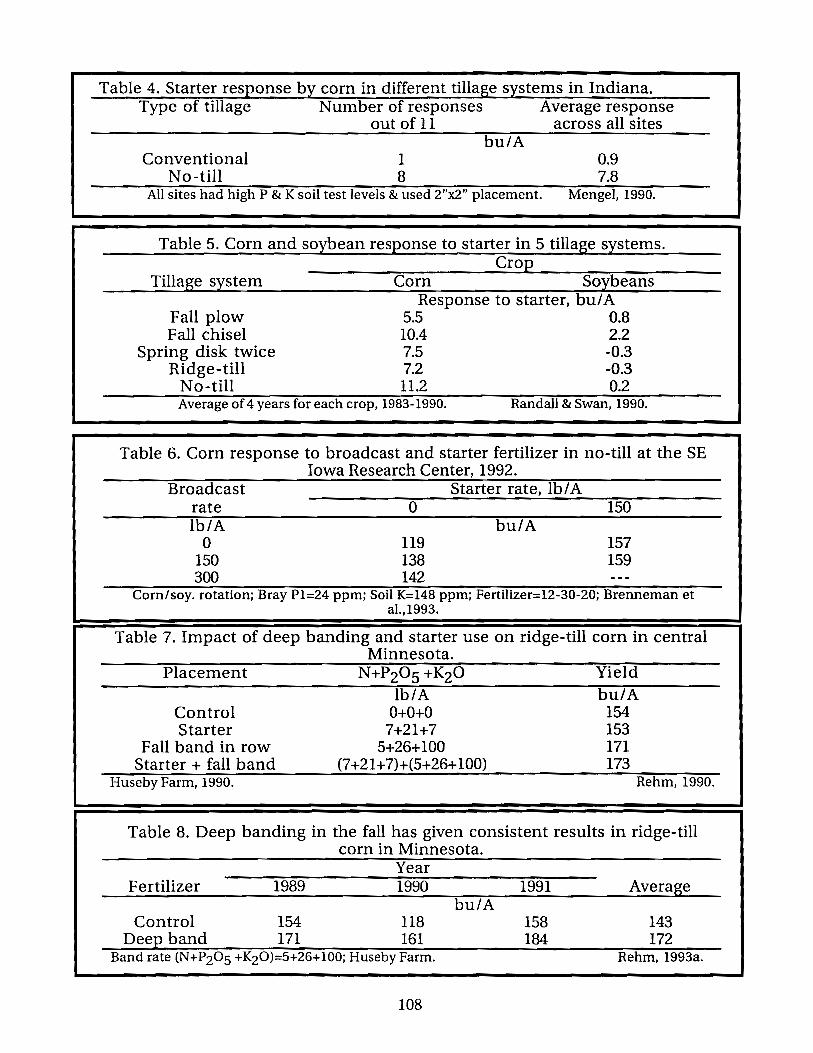
Table 4. Starter response by corn in different tillage systems in Indiana. Type of tillage Number of responses Average response
Conventional No-till
out of 11 across all sites
1 8
bulA 0.9 7.8
All sites had high P & K soil test levels & used 2"x2" placement. Mengel. 1990.
Table 5. Corn and soybean response to starter in 5 tillage systems.
Tillage system
Fall plow Fall chisel
Spring disk twice Ridge-till
No-till
Crop Corn Soybeans
Response to starter, bul A 5.5 0.8 10.4 2.2 7.5 -0.3 ~2 ~3 11.2 0.2
Average of 4 years for each crop. 1983-1990. Randall & Swan. 1990.
Table 6. Corn response to broadcast and starter fertilizer in no-till at the SE Iowa Research Center, 1992.
Broadcast Starter rate, IblA rate 0 150 IblA bulA
0 119 157 150 138 159 300 142 ---
Corn/soy. rotation; Bray P1=24 ppm; Soil K=148 ppm; Fertilizer=12-30-20; Brenneman et aI..1993.
Table 7. Impact of deep banding and starter use on ridge-till corn in central Minnesota.
Placement N+P205+K20 Yield Ib/A bulA
Control 0+0+0 154 Starter 7+21+7 153
Fall band in row 5+26+100 171 Starter + fall band (7+21 +7)+(5+26+ 100) 173
Huseby Farm, 1990. Rehm, 1990.
Table 8. Deep banding in the fall has given consistent results in ridge-till corn in Minnesota.
Year Fertilizer 1989 1990 1991 Average
bulA Control 154 U8 158 143
Deep band 171 161 184 172 Band rate (N+P20S +K20)=S+26+100; Huseby Farm. Rehm, 1993a.
108

Table 9. Stratification of P and K. PhQ~QhQru~ Poti!s~illm
De2th Plow Chisel No-till Plow Chisel No-till Inches ppm ppm
0-2 28 57 69 135 265 300 2-4 29 52 43 125 195 175 4-6 32 38 22 135 135 105 6-9 35 18 17 130 95 95 9-12 22 9 12 125 90 100
After 8 years. Randall (1980) summarized by Voss, 1984.
Table 10. Hybrids can differ in response to banded K in ridge-till.
Hybrid
A B
1
10 21
Site
Response, bul A 2
34 53
Rehm, 1993a. Table 11. Soil test variability in 392 southern Minnesota fields.
Soil Acres in the field All test 35-80 80-160 > 160 fields
% of fields with 4 or 5 soil test classes 1 P 75 89 96 86 K 48 62 78 61
Zn 63 77 91 75 ISoil test classes were very low, low, medium, high, and very high. McGraw, 1994.
Current Trends in Organic Fertilizer J. Mark Nuzum
Harmony Products, Inc.
The organic fertilizer market is a very diverse market that covers all areas of fertilizer sales. What I will speak to you about today is not only what is happening within our industry but more importantly what is happening outside our industry that could and probably will result in significant changes for us in the future.
From row crops to specialty retail markets, organic fertilizers utilize materials from a wider range of sources than the chemical fertilizer industry does. The importance of organics in the fertilizer industry has ranged from complete dominance in the 1800s and early 1900s to being almost non-existent in some parts of the country today. Some organic products that were important to farming in the past are not significant today, and those products that are important today did not exist 20 years ago. Since organics cover such a broad range of materials that vary tremendously in value and applications, it is important that we group various organic materials into categories and
109
speak about them individually to avoid any mis~ understandings.
I categorize organics into four categories -(insert list of them). This may seem like a lot of ground to cover in the next 20 minutes, but it is important that we take a brief look at all of these categories to get a feel for the history of organics, and more importantly to look at trends in our current society. Because these are the trends that will ultimately affect the future of our industry.
I would first like to look at the rendered products, the original fertilizers: bonemeal and bloodmeal, along with imported guano. Natural, organic materials once accounted for 90% of the fertilizer nitrogen consumed in the United States. This number declined to 34% in 1920 and 3.4% by 1950. Much of the decline after 1920 was due to the growing competition of chemical nitrogen materials derived from synthetic ammonia. While rendered products might have been the organic materials of the early days, they have nothing to do with modern day agriculture and probably never will again. When you think of organics and their use in agriculture today, or how they may fit into fertilizer programs today, don't be thinking of these rendered materials of yesteryear. Organics will come back in the years to come, but not as the high protein meals and guano. The organic of the future is derived from waste. Let's take a look at the organics generated from waste.
Municipal Solid Waste
Municipal solid waste, or MSW, is becoming more of a management problem with each generation. Landfill space is constantly an issue and the trend to recycle reusable products rather than bury them is becoming the norm. Due to decreasing landfill space and the growing expense for using it, the organic portion of garbage, especially that which can easily be separated - such as grass clippings and yard debris - is being composted. Although this does not affect the fertilizer market because of the low analysis and physical form of the products, it does show a dramatic change or shift in the attitude of our society. To recycle, to reuse, and not to waste.
Animal Manure
This brings us to the number one mismanaged waste, or what I would like to call a resource, in the U.S. - animal manure. Agricultural waste products are growing at an alarming rate each year. The big problem with tracking manure use or its impact on the fertilizer industry is that most is not reported. For our discussion today, I will focus on poultry manure because of its merits as a fertilizer and also because of its high concentration.
To give an example, there were 4 billion pounds of poultry manure generated in 1992. That is 20,500,000 tons. The Tennessee Valley Authority reported that 180,000 tons of compost and dried manure were used as fertilizer nationwide. I think it is safe to assume that the majority that was not reported as fertilizer use was applied in some form to agricultural land. Animal manure applied in its raw form is not an acceptable fertilizer and has no doubt been a big part of what has given agriculture the title of the number one source of non-point pollution in the United States. Animal manures are the number one mismanaged resource in the U.S. Increasing governmental pressure to manage this waste stream and track its disposal or use will place this resource in the fertilizer industry. This is the current trend in poultry manure management today. Composting to stabilize and dry and then granulating by some means such as pan or pellet mill.
The latest technOlogy upgrades poultry manures into premium fertilizers by adding synthetic nutrients prior to granulation. In this form they become an excellent plant nutrient. How big could this market be? Currently, poultry manure production is at the 20,500,000 ton level, assuming an average nitrogen content of 3%, this would be equal to 1,336,000 tons of Urea or 614,560 tons of elemental nitrogen or 5% of total agricultural consumption of elemental nitrogen in the U.S. at the 10.63 million ton level. The current expansion rate of pOUltry and other manure producing industries and increasing environmental pressures to manage these waste, are forcing new, more and better technologies to process it into desirable fertilizer products. This organic source could be a significant contributor to our industry in the next 10 years.
110
Although not as large in sheer volume, another waste stream is growing more and more rapidly. Municipal Sludge or Biosolids will impact the fertilizer industry more significantly than any other organic in the years to come due to the environmental impact and need to find a disposal or use for it. A biosolid is the solid matter recovered from waste water treatment after it has been aerated in the presence of microorganisms. The precipitated solid matter recovered can be dewatered, resulting in a cake, and then if desired, further dried and granulated. In a dried, granulated form, a biosolid takes on a profile that begins to look attractive. Not exactly the best material to come down the pike, but definitely usable as a fertilizer. I mean it does have value. Based on today's cost of nitrogen and phosphorus, a dried biosolid with 4-2-0 analysis has a nutrient value of more than $20.00. Many sludges are 6-2-0 or even higher, increasing their nutrient values. Another value that can be put on this material is as a filler. A typical filler such as limestone can be $20.00 a ton, giving the biosolid a total value of over $40.00, not including the value of the secondary and minor elements or organic matter. Let's keep that $40 value in mind.
So why has the heat dried biosolid not been such a big success in the fertilizer industry? There are many good reasons, but none of them are ones we can't overcome.
The physical characteristics of heat dried sludge have varied greatly in the past. I have heard some real horror stories about surprises encountered when sludge material has been delivered, but with the new technologies coming on today, the improvements have been remarkable. Heavy metal contents and pathogens are now monitored in all heat dried sludges sold. The new 503 regulations insure that biosolid products are safer both from excessive heavy metals and pathogens. In fact sludges must pass much higher standards than conventional fertilizers. Sludges passing the most stringent quality standards are labeled exceptional quality sludges and have absolutely no limitations on their use. They can be used on crops for human consumption.
Perception of human waste will always be a factor that needs to be addressed but necessity
breeds acceptance. Therefore in time, I believe this factor will play less of a role in a sludge's use.
Price of sludges in the past have been much higher than could be justified. This is changing and will be discussed later.
So what is the current trend with municipal sewage sludge. The United States produces roughly 5 million tons of sewage sludge per year. It has been used and disposed of about every way imaginable in the past. With environmental policies tightening, alternatives for use and disposal are now becoming more limited. Ocean dumping has been banned. Permitting for new incinerators has become increasingly difficult and expensive. And land filling it is becoming too expensive due to the downward trend in landfill space. At the same time, sludges that have previously not been regulated are now being regulated.
Dried biosolid actually makes up a small percentage of the sewage sludge total, but it has been and is continuing to increase yearly due to the limitations being placed on its disposal. In fact, dried biosolid production is increasing faster than demand for it, causing downward pressure on its pricing. Just in the past 12 to 15 months with more and more exceptional quality sludge entering the market prices have plummeted. Prices have decreased to the point where the value of sludge is beginning to match its price. I'll make a prediction and say they will come down even more in the near future.
I think we are going to see a lot more organics coming back into the fertilizer picture in all areas from specialty to row crop. Not as we saw them in the early years, but rather as resources management of the 21 st century. It's coming, and it's coming fast. It's not what is currently happening inside our industry but rather outside that's important. So as you plan for the future, you may give some thought to what I reported here today and ask yourself: How can I take advantage of this upward trend of organics in the future?
111
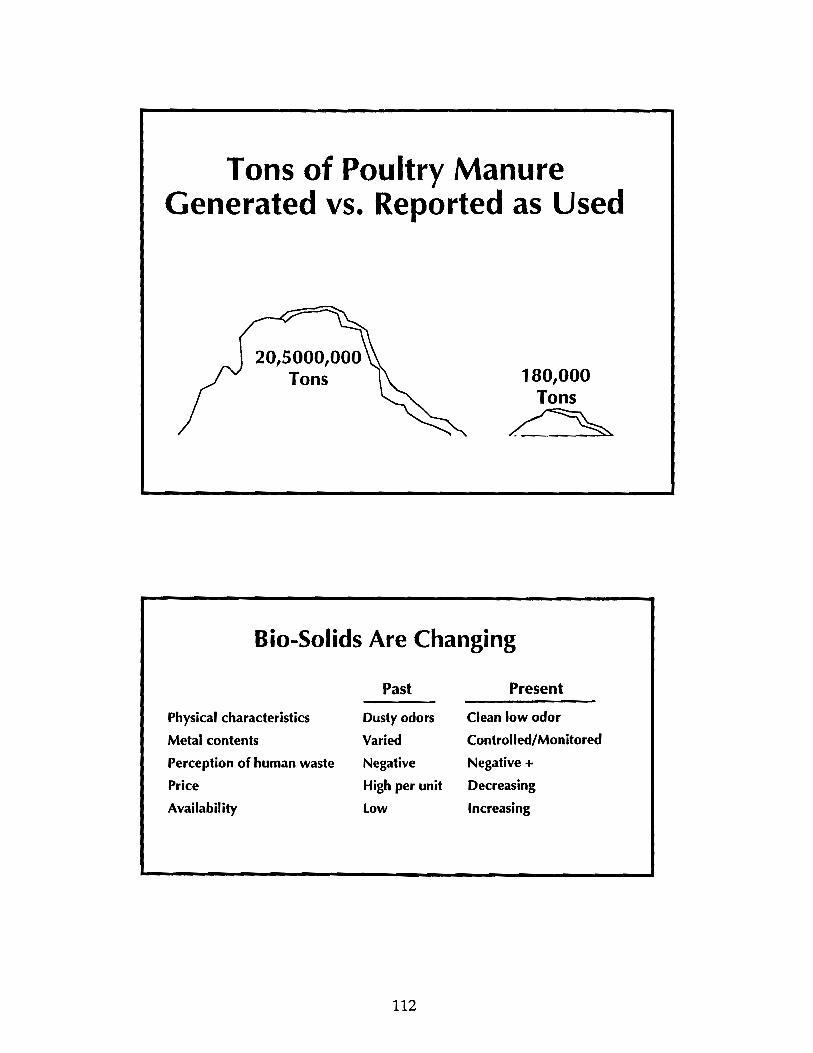
Tons of Poultry Manure Generated vs. Reported as Used
20,5000,000 Tons 180,000
Tons
~
Bio-Solids Are Changing
Past Present
Physical characteristics Dusty odors Clean low odor
Metal contents Varied Controlled/Monitored
Perception of human waste Negative Negative +
Price High per unit Decreasing
Availability Low Increasing
112

Dried Bio-Solid Sludge Production
:.I
~ ~!J!J,!J!J!J ...
J !J!J,!J!J!J U-J ~~!J J ~£j!J J ~~!J J ~~2 J ~~~l J ~~~ 2!J!JU
Sludge Disposal
Disposal Practice
Incineration
Land Application
Surface Disposal
Not Regulated
Unknown
Total
113
Dry Metric Tons
736,000
1,570,000
471,000
1,549,000
285,000
4,561,000

Best Management Practices for Prevention of Nitrates in Groundwater
for Florida Growers Ken Kuhl
Florida Department of Agriculture
Background
The 1993 Florida Legislature recognized "that nitrate residues have been found in ground water and drinking water in various areas throughout the state at levels in excess of established water quality standards". The Legislature recognized further "that some fertilization practices could be a source of nitrate contamination. It is the intent of the Legislature to improve fertilizer-management practices as soon as practicable in a way that protects the state's water resources and preserves a viable agricultural industry. This goal is to be accomplished through research concerning best-management practices and education and incentives for the agricultural industry and other major users of fertilizer".
The key components of this program are the words "research", "education", "incentives", and "best management practices". Too often regulatory initiatives are implemented via the traditional enforcement approach. This program offers our industry the opportunity to change its behavior willfully based on scientific data and correct a serious resource problem.
The term best management practices (BMPs) is familiar to all of us and has been utilized for years by our industry and various levels of government. The term "best management practices" has a unique meaning in this particular legislation. BMPs adopted by the Florida Department of Agriculture and Consumer Services (Department) pursuant to this program must be research-based and shown to be "the most effective and practicable methods of fertilization designed to meet nitrate ground water quality standards".
The BMP development process must also consider economic and technological feasibility. Obviously, the successful implementation of this program will require considerable input from the state's agricultural industry.
Authority to Impose A(lditional Fees on Fertilizer
The nitrate legislation authorizes the Department to impose additional fees on the license to distribute fertilizer ($100.00), the registration for each ofthe first five specialty fertilizers ($100.00) and for each additional specialty fertilizer ($25.00), and a tonnage fee ($0.50 per ton) on all fertilizer sold in the state containing nitrogen. The fee collection provision of the legislation is authorized for ten years pending ratification by the Florida Legislature.
The main purpose of the fees is to fund research to develop BMPs for those commodities and regions where ground water data indicates that nitrates from fertilizer are a problem. Collected fees must also be utilized to fund the adoption and distribution of BMPs, and to reimburse the Department of Environmental Protection's (DEP) Water Quality Assurance Trust Fund (WQATF) for costs incurred by DEP related to the restoration of drinking water wells contaminated by fertilizers containing nitrogen. Currently, the DEP spends approximately one million dollars a year from the WQATF to remediate drinking water wells contaminated by fertilizers and pesticides. State law requires DEP to recover remediation costs from the responsible parties when water quality standards are exceeded.
Waiver of Liability
This is where the "incentive" component of the program comes into play. This bill releases landowners who implement the adopted research-based BMPs from the cost recovery provisions in state law [so 376.307(5) F.S.] described above. Therefore, in exchange for the industry's willingness to pay additional fees to fund BMP research and DEP's remediation costs, and to implement adopted BMPs, the individual landowner is released from the cost recovery provisions of state law. The Legislature is wagering that the desired change in fertiIizer·management behavior and in ground water quality will more likely be achieved by this approach than the traditional approach of enforcement on and cost recovery from individual landowners.
114
Interim Measures
The term "interim measures" is defined as practices intended to provide a reasonable expectation of reducing nitrate levels entering ground water, based on currently available knowledge. The Legislature realized that the research to develop BMPs would take time, yet growers should be encouraged to begin changing fertilization practices to the extent possible. As a result, the Department is authorized to adopt interim measures which afford landowners with the same liability waiver as BMPs. These practices may be the existing fertilizer recommendations published by the land grant universities which were not typically developed with the protection of ground water in mind. However, it is recognized that landowners who follow such guidelines may be less likely to apply excessive quantities of nitrate or other plant nutrients. The Department will contract with the appropriate institutions to extract the nitrogen management components of current bulletins for adoption as interim measures by the Department. When BMPs are adopted growers must implement them in accordance with the schedules specified by rule to maintain the liability waiver.
Priority of BMP Research Projects
The funding of BMP research projects shall be based on the following ranked priorities to the extent of available funds:
a. The highest priority shall be for commodities and/or regions where exceedance of nitrate ground water standards is documented by monitoring data collected by state agencies.
b. The second priority shall be areas and their included commodities where DEP has implemented new potable water well per mitting, location, construction, testing, and clearance requirements as set forth in s. 373.309 F.S., due to ground water contamination by nitrate or to vulnerability to nitrate contamination resulting from the application of fertilizers containing nitrogen.
c. The third priority shall be commodities and/or regions for which the Department receives requests from the industry to fund BMP research where agricultural trends or other factors indicate the potential for nitrate contamination problems.
Rulemaking
Rule making will occur throughout the life of the bill as BMPs are developed and adopted. The first phase of the Department's rule making is to adopt procedures for landowners to submit the Notice of Intent to comply with adopted interim measures or BMPs. Priority will be given to the development of BMPs for the fern industry in Vol usia, Putnam, and Lake counties, and of interim measures for citrus fertilization for the "ridge" area of Florida. State agencies have considerable monitoring data to indicate that nitrates from the application of fertilizers exceed ground water quality standards in these areas.
Verification Monitoring of BMPS
Once BMPs are adopted by Department rule and implemented, representative sites will be selected for verification monitoring. If the BMPs which were successful in the research phase continue to perform in a commercial setting, the BMP will become verified. This determination gives landowners within the same region assurance that implementation of the verified BMP establishes a "presumption of compliance with water quality standards". This has practical significance for landowners because the presumption means they would not be required to pay for expensive ground water monitoring to demonstrate compliance with standards as long as their records indicate that the verified BMP has been implemented.
If a particular BMP does not stand up in a commercial setting, then additional research may be required to refine the adopted BMP. Landowners who implemented the failed BMP in good faith, would still be protected by the liability waiver.
115
Summary
In summary, this legislation offers our industry a mechanism to address either existing or future ground water/nitrate problems via a more palatable approach. It allows the industry to develop research-based BMPs for the application of fertilizers containing nitrogen consistent with water quality standards. Growers who implement the adopted BMPs are protected from the cost recovery provisions of state law in the event a contaminated drinking water well is discovered offsite which resulted from the application of fertilizers containing nitrogen. The goal is to improve ground water quality and to maintain the beneficial uses of fertilizers.
If the implementation of this program is successful and the benefits to the resource are realized, this incentive-based approach may be used to address other water quality issues in Florida.
Performance of a Closed Gypsum Stack
Edgar O. Morris Cargill Fertilizer, Inc.
and John E. Garlanger
Ardaman and Associates
Introduction
Cargill Fertilizer, has a long history for not just providing fertilizer needed to boost our agricultural productivity, but also innovating new products and processes that have become industry standards. Cargill Fertilizer's East Tampa facility opened in 1924 as the U.S. Export Chemical Company and quickly established itself as a pioneer in the fertilizer industry. The company was the first producer of phosphoric acid and triple super phosphate. Production technologies used by U.S. Export Chemical Company later known as Gardinier, Inc. still serve as standards for modern fertilizer production. Today, that pioneering spirit still guides the new company, Cargill Fertilizer, Inc.
Cargill Incorporated, owner of Cargill Fertilizer, Inc. (formerly Gardinier, Inc.) since 1986, has invested more than $150 million in capital improvements to the Tampa facility designed to improve operation and reinforce its environmental safeguards. This same commitment and capital is being invested in their new sister facility in Bartow, FL (formerly Seminole Fertilizer, Inc.). Cargill Fertilizer today has the same commitment to performance, innovation and customer satisfaction that built its past success. It also has a renewed commitment to quality, and the responsible corporate citizenship that will enable them to build an even stronger performance record in the future.
In the,1980's the company was committed to the construction of a new state-of-the-art gypsum field that would allow the storage and stacking of gypsum, protection of the environment, and meet the concerns of the surrounding community. This environmental innovation at the time set a new standard for the fertilizer industry's gypsum storage areas.
One of the more noteworthy environmental achievements has been the closure and transformation of a 60-year old gypsum stack. Closing and capping the 350-acre fertilizer byproduct storage area made Cargill Fertilizer the first company to close an existing gypsum stack of this size. This project prevents rainfall from leaching pollutants into the groundwater and provides control of storm water run-off. Cargill Fertilizer, Inc.'s closed gypsum stack is located approximately seven miles south of Tampa, Florida adjacent to Hillsborough Bay, near the mouth of the Alafia River.
The data contained in this paper are extracted from "Area Information and Closure Plan, Existing Gypsum Storage Area" prepared by Ardaman & Associates, Inc., 1989 and new data collected and analyzed by Ardaman over the past five years. This firm conducted the field exploration, analyses and prepared the closure plan documents. They also prepared the contract drawings and specifications for the closure construction work and provided support for monitoring the closure performance. Additional information was extracted from "Phosphogypsum Stack Closure" a paper by Mr. Dean Kleinschmidt.
116

Background
The base of the stack occupied approximately 340 acres with an operational top area of approximately 100 acres. The stack height is 210 feet at the south (slurry discharge) end and 200 feet at the north end. The side slopes below elevation 115 feet are 4.0 horizontal to 1.0 vertical (4:1) or flatter. Above elevation 120 feet, the slopes range from 3.0 to 3.2:1. Typically, fresh gypsum placed at the exterior of the outer dike was sloped at 2: 1 but consolidation and settlement flattened the slope as additional lifts of fresh gypsum were placed on the dikes. The side slopes of the stack were covered with six inches of top soil and grassed. Underdrains are located beneath the slope surface to intercept leachate water and reduce seepage breakouts at the side slope surface. The stack is surrounded by a buried toe drain which consists of two (2) 18 inch diameter perforated pipes. The pipes are embedded in a filter sand drain. The pipe gradient is approximately 1 foot vertical per 1,000 feet horizontal (1:1000) with the average pipe invert elevation at -0.16 feet (NGVD).
Geologic and Hydrogeologic Setting
The geology and hydrogeology summary is from a groundwater monitoring plan report (Ardaman & Associates, 1983). The stack lies within the Pamlico Terrace which is a Quarternary Age erosional surface about two miles wide paralleling the east shore of Hillsborough Bay. The terrace terminates inland at a low topographic bluff marking the transition from this terrace to an older slightly higher one to the east.
The site is underlain by approximately 8,000 feet of sedimentary rock. The upper 700 feet consists of, from youngest to oldest, undifferentiated Pleistocene deposits, the Hawthorne formation of Miocene Age, the Tampa limestone, also of Miocene Age, Suwannee limestone of Oligocene Age, Ocala group limestone and Avon Park limestone , both of Eocene Age. This stratigraphy, as well as that of the entire peninsula of Florida, is a typical sedimentary domain resulting from sea level transgressions and regressions. The strata were deposited in horizontal layers with little subsequent distortions or warping.
The base of the Avon Park limestone is considered the base of the Floridan Aquifer; however, at this site groundwater in the Avon Park and Ocala group limestone is saline. The Suwannee limestone and Tampa formation are, therefore, the deepest formations of interest as they form the top section ofthe Floridan aquifer and have the least mineralized waters within it. The Suwannee limestone , described by (Yon and Hendry, 1972) is a hard crystalline limestone with a pale orange color. According to the report "Evaluation of Gypsum Field Stability", Volume 1, by (Woodward-Clyde Consultants, October, 1974) the Suwannee formation at the site is between 230 and 280 feet thick.
The Tampa formation below the site consists of creamy white, gray and tan, fairly hard, porous to dense, sandy limestone which is fossiliferous and silicified in part. Based on various well logs contained in the Woodward-Clyde report, and at least two holes documented by USGS with lithologic logs, the Tampa formation below the site is estimated to be about 60 to 67 feet thick.
The Tampa formation is overlain by the Hawthorne formation of Miocene Age which exhibits great variation in composition and properties. Included are gray, greenish-gray, or blue-gray, sandy phosphatic clays, sandy limestones, sands, silts and shells. The thickness varies from a few feet to about 60 feet.
The surficial soils form a part of the Pamlico sands and consist of an undifferentiated Pleistocene (Quarternary) deposit of organics, sands, shells, clays and calcareous clays. The thickness ranges from several feet to about 30 feet.
The groundwater regime underlying the site consists of three aquifer systems: the surficial, the intermediate and the Floridan aquifer. The surficial aquifer is unconfined and consists of the Pleistocene deposits which are predominantly fine sands with some clays. Based on the (Woodward-Clyde reports, September 23,1976 and March 28,1977) the average permeability is estimated at 0.7 to 2.2 feet per day. This layer is sufficiently porous and permeable to permit infiltration and storage of groundwater. Recharge to this surficial water table aquifer is by local rainfall. Discharge is mainly by evapotranspiration and flow to the west toward Hillsborough Bay. The gradient is locally altered
117
by the man-made gypsum stack, ditches, cooling ponds and other seepage sources. The depth to the water table is quite variable depending mostly on local rainfall but also dependent on water levels in ditches. Numerous test borings within the site indicate the water table to be at an average depth of about five feet below natural ground surface. During the wet season, the water table may rise close to the ground surface. Generally, water from this aquifer is not available in desirable quality or quantity for potable supply and is, therefore, not a source of water supply in the area (Menke, et aI., 1961).
The intermediate aquifer system is found in the sand and limestone beds of the Hawthorne formation and in isolated cases can produce significant quantities of highly mineralized water. According to Woodward-Clyde Consultants (report of March 28, 1987) the coefficient of permeability in the limestone layers of the Hawthorne formation ranges from 0.25 to 0.9 feet per day. The intermediate aquifer is not a major water producing aquifer on this site because of its variable thickness and area combined with brackish water in wells near Tampa Bay and the Alafia River.
The upper Floridan aquifer is beneath the Hawthorne formation and is separated from it by a stiff greenish clay near the top of the Tampa formation. At this site the clay layer is typically 10 to 20 feet thick; however, the layer is absent in more than half of the Gardinier well logs. The Floridan aquifer which underlies the site includes the Avon Park limestone, Ocala group limestone, Suwannee limestone and Tampa formation limestone. Numerous wells on the Gardinier property have been drilled 800 to 1200 feet into limestone and yield highly mineralized water most of which comes from the Avon park limestone. Various field permeability tests, indicate a wide variation within the Floridan aquifer ranging from 0.05 to 22 feet per day. (Stewart, 1980) places this site in an area of very low recharge to the Floridan aquifer. It is estimated to be less than two inches per year.
For this site the elevation of the potentiometric surface was approximately +3.0 feet (NGVD). Generally, water within the aquifer flows west toward Hillsborough Bay, but it is also affected by cones of depression. Based on an average head dif-
ference between the surficial and Floridan aquifer of 12 feet and a specific flow through the confining layer at 5.0 X 10⁻⁴ GPD/FT3 (West Coast Regional Water Supply Authority, 1978), this corresponds to a vertical permeability for a 20 foot thick confining layer of approximately 0.001 feet per day.
Groundwater Quality
Groundwater data west of U.S. Highway 41, from the Groundwater Monitoring Plan (Ardaman, 1983) and subsequent monitoring. indicate G-III and G-IVaquifer classifications. The Floridan and intermediate aquifer systems are Class G-IV because the total dissolved solids (TDS) in the aquifers exceed 10,000 mg/l and the aquifer are confined. The aquifer become increasingly non-potable with depth. Along Hillsborough Bay, the deeper portions of the aquifers contain dissolved solids content similar to sea water. Thus, deep wells in this area yield brackish to saline water.
The surficial aquifer system west ofU. S. Highway 41 is Class G-III. The site is surrounded on three sides by brackish water. The land surface for natural ground beneath the gypsum stack ranges from ° to 5 feet (NGVD). High tides are +2 feet (NGVD) approximately. The sands are relatively permeable, therefore, allowing brackish surface water to freely enter the groundwater system. The aquifer is unconfined.
Stack Closure Plan
The following information was extracted from the paper "Phosphogypsum Stack Closure" by Mr. De~n Kleinschmidt at the Third International SympOslU~ ~n Phosphogypsum. Decommissioning of the eXIstmg gypsum stack coincided with start-up of the new gypsum disposal field. In general, the Closure Plan include the following five major tasks:
Fill Top Cavity and Complete Initial Dewatering
A water clarification pond existed on top of the stack with a total volume of approximately 90
118
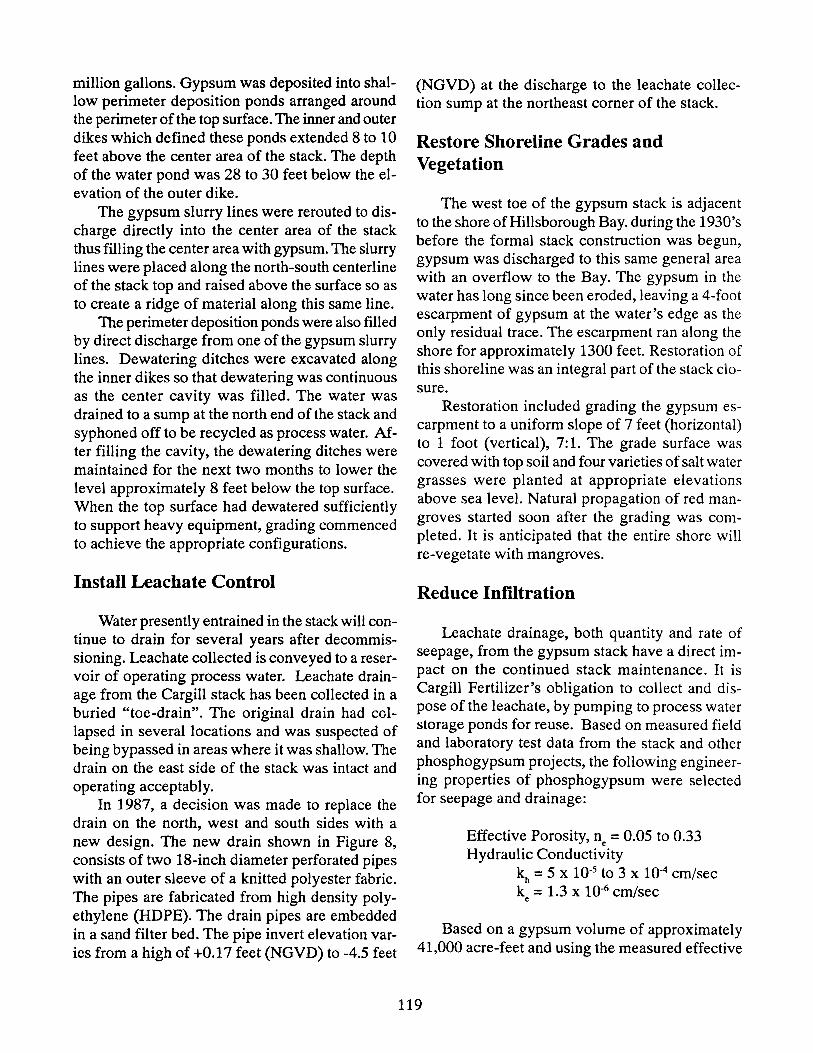
million gallons. Gypsum was deposited into shallow perimeter deposition ponds arranged around the perimeter of the top surface. The inner and outer dikes which defined these ponds extended 8 to 10 feet above the center area of the stack. The depth of the water pond was 28 to 30 feet below the elevation of the outer dike.
The gypsum slurry lines were rerouted to discharge directly into the center area of the stack t~us filling the center area with gypsum. The slurry hnes were placed along the north-south centerline of the stack top and raised above the surface so as to create a ridge of material along this same line.
The perimeter deposition ponds were also filled by direct discharge from one of the gypsum slurry lines. Dewatering ditches were excavated along the inner dikes so that dewatering was continuous as the center cavity was filled. The water was drained to a sump at the north end of the stack and syphoned off to be recycled as process water. After filling the cavity, the dewatering ditches were maintained for the next two months to lower the level approximately 8 feet below the top surface. When the top surface had dewatered sufficiently to support heavy equipment, grading commenced to achieve the appropriate configurations.
Install Leachate Control
Water presently entrained in the stack will continue to drain for several years after decommissioning. Leachate collected is conveyed to a reservoir of operating process water. Leachate drainage from the Cargill stack has been collected in a buried "toe-drain". The original drain had collapsed in several locations and was suspected of being bypassed in areas where it was shallow. The drain on the east side of the stack was intact and operating acceptably.
In 1987, a decision was made to replace the drain on the north, west and south sides with a new design. The new drain shown in Figure 8, c~nsists of two 18-inch diameter perforated pipes wlth an outer sleeve of a knitted polyester fabric. The pipes are fabricated from high density polyethylene (HDPE). The drain pipes are embedded in a sand filter bed. The pipe invert elevation varies from a high of +0.17 feet (NGVD) to -4.5 feet
(NGVD) at the discharge to the leachate collection sump at the northeast comer of the stack.
Restore Shoreline Grades and Vegetation
The west toe of the gypsum stack is adjacent to the shore of Hillsborough Bay. during the 1930's before the formal stack construction was begun, gypsum was discharged to this same general area with an overflow to the Bay. The gypsum in the water has long since been eroded, leaving a 4-foot escarpment of gypsum at the water's edge as the only residual trace. The escarpment ran along the shore for approximately 1300 feet. Restoration of this shoreline was an integral part of the stack closure.
Restoration included grading the gypsum escarpment to a uniform slope of 7 feet (horizontal) to 1 foot (vertical), 7:1. The grade surface was covered with top soil and four varieties of salt water grasses were planted at appropriate elevations above sea level. Natural propagation of red mangroves started soon after the grading was completed. It is anticipated that the entire shore will re-vegetate with mangroves.
Reduce Infiltration
Leachate drainage, both quantity and rate of seepage, from the gypsum stack have a direct impact on the continued stack maintenance. It is Cargill Fertilizer's obligation to collect and dispose of the leachate, by pumping to process water storage ponds for reuse. Based on measured field and laboratory test data from the stack and other ~hosphogy~sum projects, the following engineermg propertIes of phosphogypsum were selected for seepage and drainage:
Effective Porosity, ne = 0.05 to 0.33 Hydraulic Conductivity
kh = 5 X 10⁻⁵ to 3 X 10⁻⁴ cmlsec ke = 1.3 X 10⁻⁶ em/sec
Based on a gypsum volume of approximately 41,000 acre-feet and using the measured effective
119
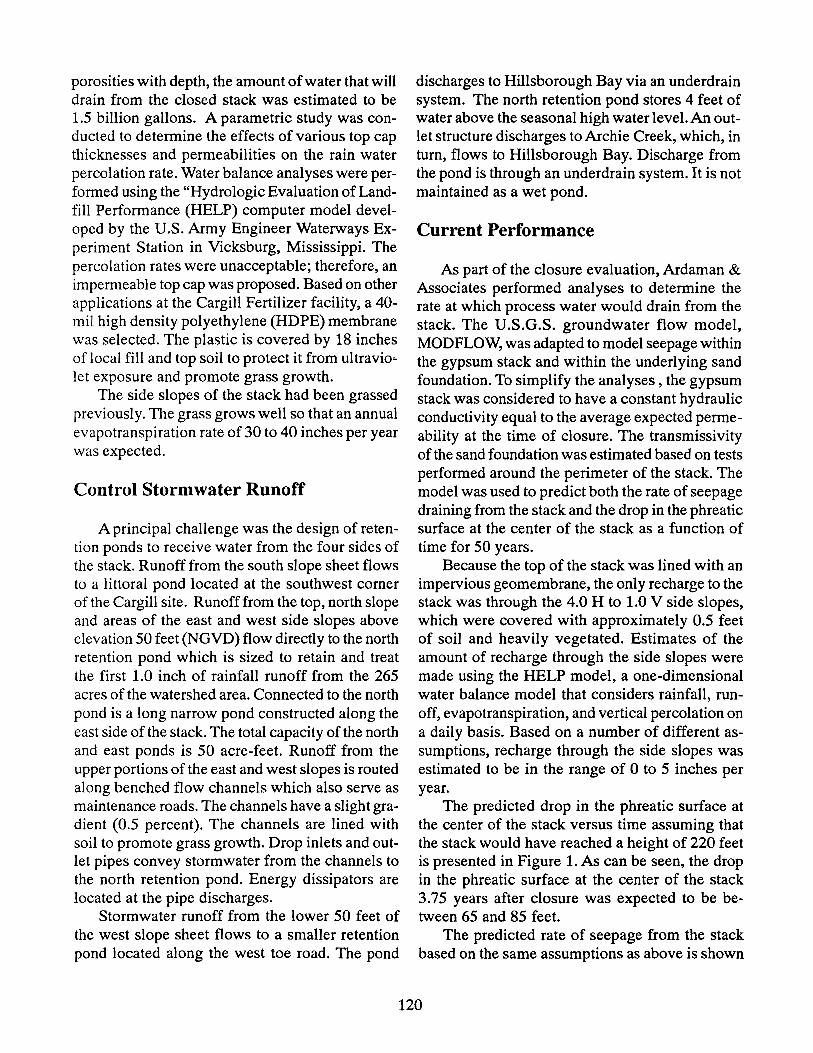
porosities with depth, the amount of water that will drain from the closed stack was estimated to be 1.5 billion gallons. A parametric study was conducted to determine the effects of various top cap thicknesses and permeabilities on the rain water percolation rate. Water balance analyses were performed using the "Hydrologic Evaluation of Landfill Performance (HELP) computer model developed by the U.S. Army Engineer Waterways Experiment Station in Vicksburg, Mississippi. The percolation rates were unacceptable; therefore, an impermeable top cap was proposed. Based on other applications at the Cargill Fertilizer facility, a 40-mil high density polyethylene (HDPE) membrane was selected. The plastic is covered by 18 inches of local fill and top soil to protect it from ultraviolet exposure and promote grass growth.
The side slopes of the stack had been grassed previously. The grass grows well so that an annual evapotranspiration rate of 30 to 40 inches per year was expected.
Control Stormwater Runoff
A principal challenge was the design of retention ponds to receive water from the four sides of the stack. Runoff from the south slope sheet flows to a littoral pond located at the southwest corner of the Cargill site. Runoff from the top, north slope and areas of the east and west side slopes above elevation 50 feet (NOVD) flow directly to the north retention pond which is sized to retain and treat the first 1.0 inch of rainfall runoff from the 265 acres of the watershed area. Connected to the north pond is a long narrow pond constructed along the east side of the stack. The total capacity of the north and east ponds is 50 acre-feet. Runoff from the upper portions of the east and west slopes is routed along benched flow channels which also serve as maintenance roads. The channels have a slight gradient (0.5 percent). The channels are lined with soil to promote grass growth. Drop inlets and outlet pipes convey stormwater from the channels to the north retention pond. Energy dissipators are located at the pipe discharges.
Stormwater runoff from the lower 50 feet of the west slope sheet flows to a smaller retention pond located along the west toe road. The pond
discharges to Hillsborough Bay via an underdrain system. The north retention pond stores 4 feet of water above the seasonal high water level. An outlet structure discharges to Archie Creek, which, in turn, flows to Hillsborough Bay. Discharge from the pond is through an underdrain system. It is not maintained as a wet pond.
Current Performance
As part of the closure evaluation, Ardaman & Associates performed analyses to determine the rate at which process water would drain from the stack. The U.S.O.S. groundwater flow model, MOD FLOW, was adapted to model seepage within the gypsum stack and within the underlying sand foundation. To simplify the analyses, the gypsum stack was considered to have a constant hydraulic conductivity equal to the average expected permeability at the time of closure. The transmissivity of the sand foundation was estimated based on tests performed around the perimeter of the stack. The model was used to predict both the rate of seepage draining from the stack and the drop in the phreatic surface at the center of the stack as a function of time for 50 years.
Because the top of the stack was lined with an impervious geomembrane, the only recharge to the stack was through the 4.0 H to 1.0 V side slopes, which were covered with approximately 0.5 feet of soil and heavily vegetated. Estimates of the amount of recharge through the side slopes were made using the HELP model, a one-dimensional water balance model that considers rainfall, runoff, evapotranspiration, and vertical percolation on a daily basis. Based on a number of different assumptions, recharge through the side slopes was estimated to be in the range of 0 to 5 inches per year.
The predicted drop in the phreatic surface at the center of the stack versus time assuming that the stack would have reached a height of 220 feet is presented in Figure 1. As can be seen, the drop in the phreatic surface at the center of the stack 3.75 years after closure was expected to be be· tween 65 and 85 feet.
The predicted rate of seepage from the stack based on the same assumptions as above is shown
120
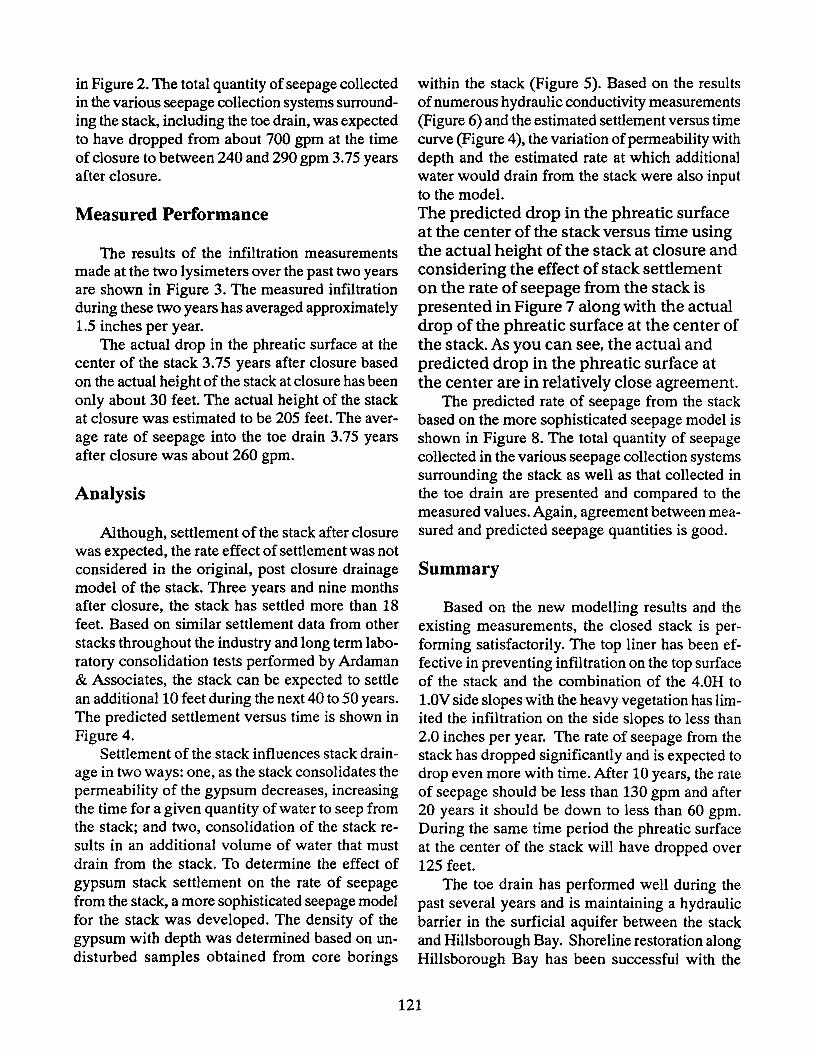
in Figure 2. The total quantity of seepage collected in the various seepage collection systems surrounding the stack, including the toe drain, was expected to have dropped from about 700 gpm at the time of closure to between 240 and 290 gpm 3.75 years after closure.
Measured Performance
The results of the infiltration measurements made at the two lysimeters over the past two years are shown in Figure 3. The measured infiltration during these two years has averaged approximately 1.5 inches per year.
The actual drop in the phreatic surface at the center of the stack 3.75 years after closure based on the actual height of the stack at closure has been only about 30 feet. The actual height of the stack at closure was estimated to be 205 feet. The average rate of seepage into the toe drain 3.75 years after closure was about 260 gpm.
Analysis
Although, settlement of the stack after closure was expected, the rate effect of settlement was not considered in the original, post closure drainage model of the stack. Three years and nine months after closure, the stack has settled more than 18 feet. Based on similar settlement data from other stacks throughout the industry and long term laboratory consolidation tests performed by Ardaman & Associates, the stack can be expected to settle an additional 10 feet during the next 40 to 50 years. The predicted settlement versus time is shown in Figure 4.
Settlement of the stack influences stack drainage in two ways: one, as the stack consolidates the permeability of the gypsum decreases, increasing the time for a given quantity of water to seep from the stack; and two, consolidation of the stack results in an additional volume of water that must drain from the stack. To determine the effect of gypsum stack settlement on the rate of seepage from the stack, a more sophisticated seepage model for the stack was developed. The density of the gypsum with depth was determined based on undisturbed samples obtained from core borings
within the stack (Figure 5). Based on the results of numerous hydraulic conductivity measurements (Figure 6) and the estimated settlement versus time curve (Figure 4), the variation of permeability with depth and the estimated rate at which additional water would drain from the stack were also input to the model. The predicted drop in the phreatic surface at the center of the stack versus time using the actual height of the stack at closure and conSidering the effect of stack settlement on the rate of seepage from the stack is presented in Figure 7 along with the actual drop of the phreatic surface at the center of the stack. As you can see, the actual and predicted drop in the phreatic surface at the center are in relatively close agreement.
The predicted rate of seepage from the stack based on the more sophisticated seepage model is shown in Figure 8. The total quantity of seepage collected in the various seepage collection systems surrounding the stack as well as that collected in the toe drain are presented and compared to the measured values. Again, agreement between measured and predicted seepage quantities is good.
Summary
Based on the new modelling results and the existing measurements, the closed stack is performing satisfactorily. The top liner has been effective in preventing infiltration on the top surface of the stack and the combination of the 4.0H to 1.0V side slopes with the heavy vegetation has limited the infiltration on the side slopes to less than 2.0 inches per year. The rate of seepage from the stack has dropped significantly and is expected to drop even more with time. After 10 years, the rate of seepage should be less than 130 gpm and after 20 years it should be down to less than 60 gpm. During the same time period the phreatic surface at the center of the stack will have dropped over 125 feet.
The toe drain has performed well during the past several years and is maintaining a hydraulic barrier in the surficial aquifer between the stack and Hillsborough Bay. Shoreline restoration along Hillsborough Bay has been successful with the
121
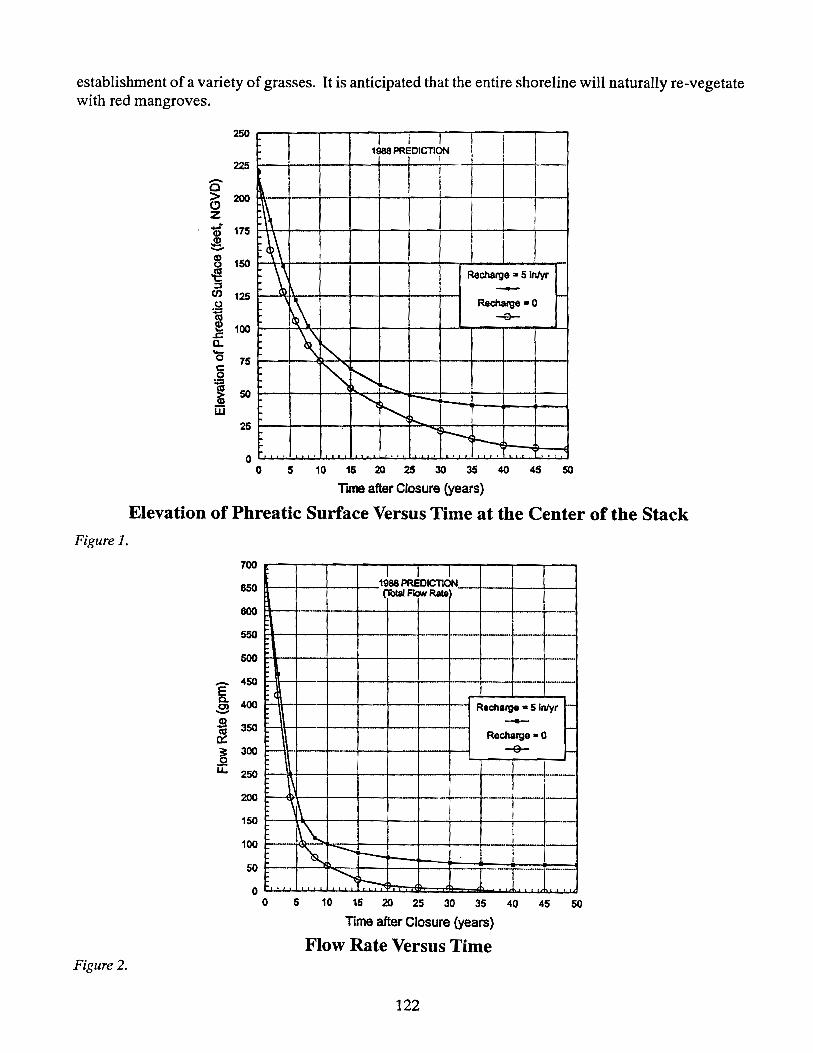
establishment of a variety of grasses. It is anticipated that the entire shoreline will naturally re-vegetate with red mangroves.
250
225 -0 i; 200
Z J 175 <D .a -8 150 ~ :l Cf) 125 <.> ~ <II e 100 .s::; Q.
'0 75 c 0 ~
~ 50
W 25
1!ae ~OICTI~ I
! I I
~ I I 1-\
I ,~
~\ j I
I I I ~ I
Recharge" 5ln/yr -~
Rechalge -0 r-
I -e-
'\ t'. 1\ ~ r---.. I
........,
~ r-- !
II--.
~ ~ o . .... ....
o 5 10 15 20 25 30 35 40 45 50
TIne after Closure (years)
Elevation of Phreatic Surface Versus Time at the Center of the Stack Figure 1.
700
650 1~~ICTI~ (Tolal Flow Rate
600
560
500 -
- 450 E 0. 400 C) -S 350 ~
. Redlarge .. 5ln/yr -I -Recharge-o -~ 300
u: 250
-€I- -I --
200
150
100
50
-1---\.
~\.. I
"' --.... I
l.. I
~ t--l -,-- --~ .. 1 o o 5 10 15 20 25 30 35 40 45 50
Time after Closure (years)
Flow Rate Versus Time Figure 2.
122
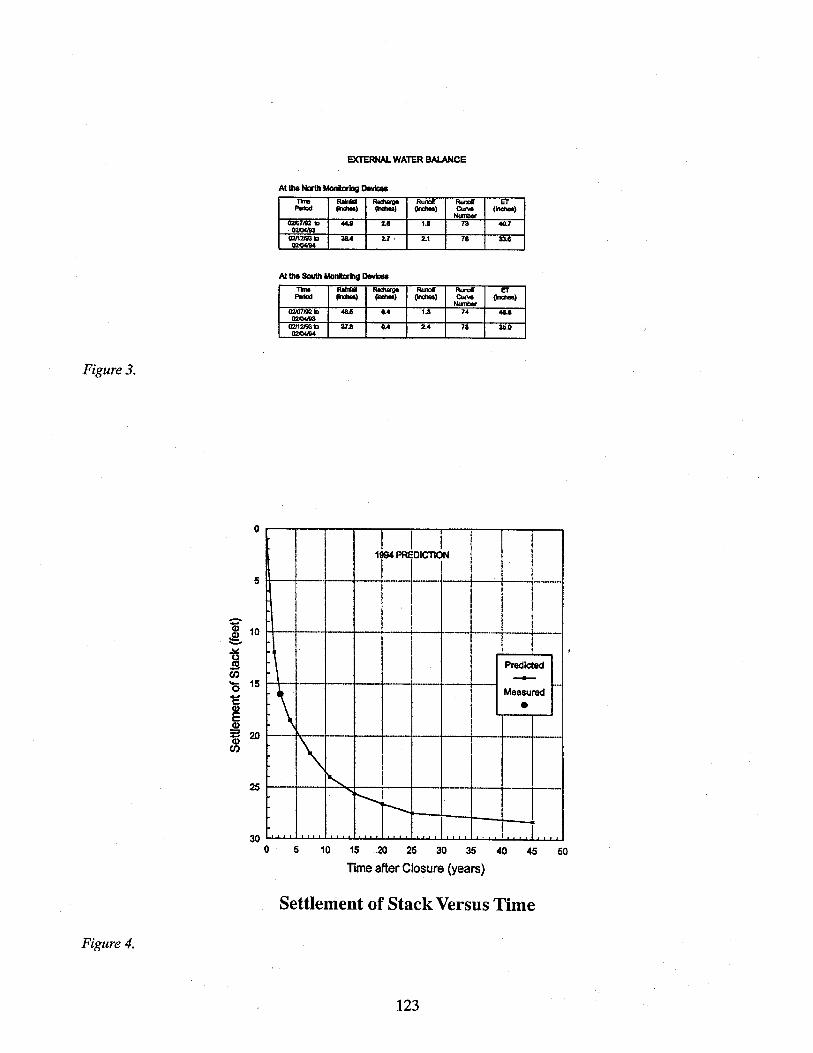
Figure 3.
o
5
~ 10 ~ .lII:
~ f/J ..... 15 0 .... c:
~ Q)
E 20 Q) f/J
25
30
Figure 4.
EXTERNAL WATER BALANCE
no. - Aod1arge RuncIf RuncIf ET - (inohIoI ~I (Inchool CUM! <-I -~7J92 a 40UI u 1.1 73 40.7 .. 02lO4I93 02/12J93 a 38A 2.1 2.1 78 33.1
02lO4I94
At the South MonllDrlng DevbIa
no. - -- RlInar RlI...,. ET - (inohIoI ~I (Inchool C ....... <-I -.. ~7J92a ~ 0.4 1.3 74 48.8
02J04JU3 1l2J12193a 37.8 Q.4 2.4 78 35.0
02I04IIl4
+tJ- I I
I
-I '1--j 1 I ! I
i ----.f--
I i I .
Predicted I I
~ -----t-- Measured
~-
I • I
o 5
\ I I
I "'-
"i- T 10 15 20 25 30 35 40 45 50
Tame after Closure (years)
Settlement of Stack Versus Time
123
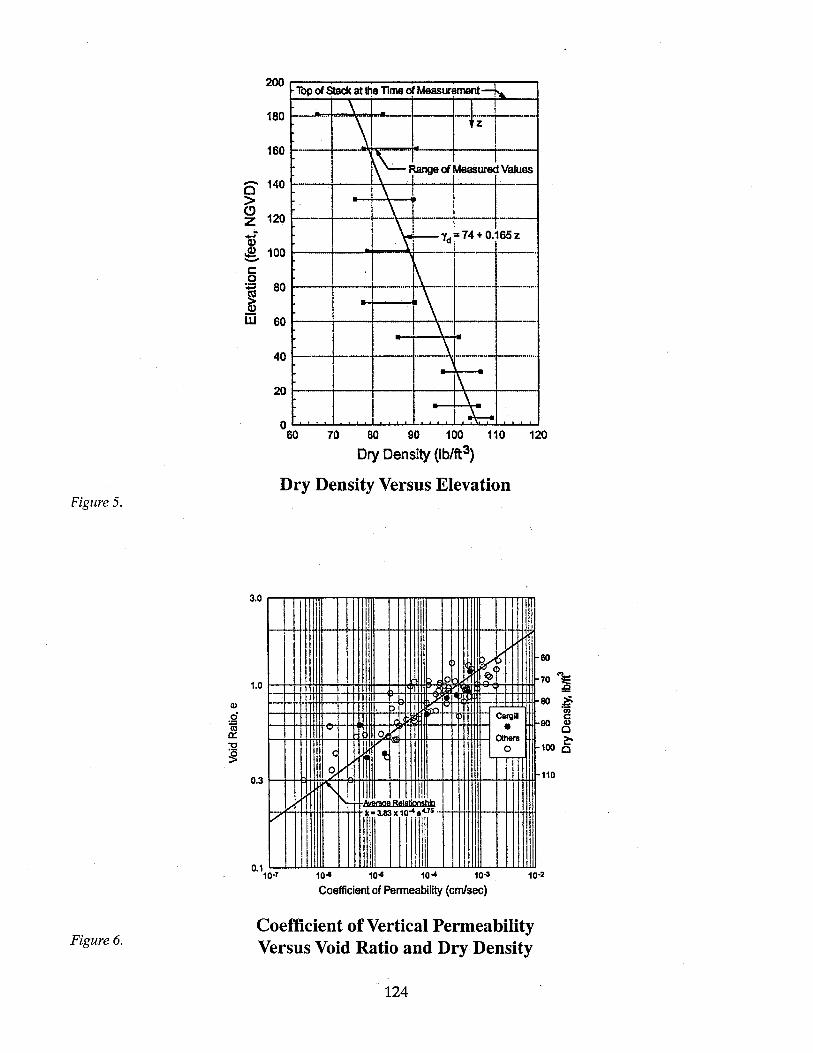
Figure 5.
Q)
~ a:: :s! ~
Figure 6.
200~--------------------~--~
180
160
Q 140 > ~ 120
Qf g. 100 ---t--..... -.....tJ. c: o ~ 801---+--~ Q)
W 60
40
20 I---.-t---+-
o~~~~~~~~~~~~~~
60 70 80 90 100 110 120
Dry Density (lb/ft3)
Dry Density Versus Elevation
3.0
Llil ! III I
111
m
~ S'
II b 0
-+-'-t ii' ___ .1.. I " , --
j ,
~ -~. 1-- T Cargil
1.0
'oJ OV • , 0tIlars (
m t 0
11 01/ I
f' II I I j
1\ Av9nIaA BlIlllliwmill
0.3
.. - k-3.83x10 ... 4.15 . V-
I ill I l" ! I I
I III I Ii
60
70 '"'E :9
80 J!.
90 ~ o 100 5' 110
0.1 10.1 10'- 10-6 10" 10-3
Coefficient of Permeability (cm/sec) 10.2
Coefficient of Vertical Permeability Versus Void Ratio and Dry Density
124
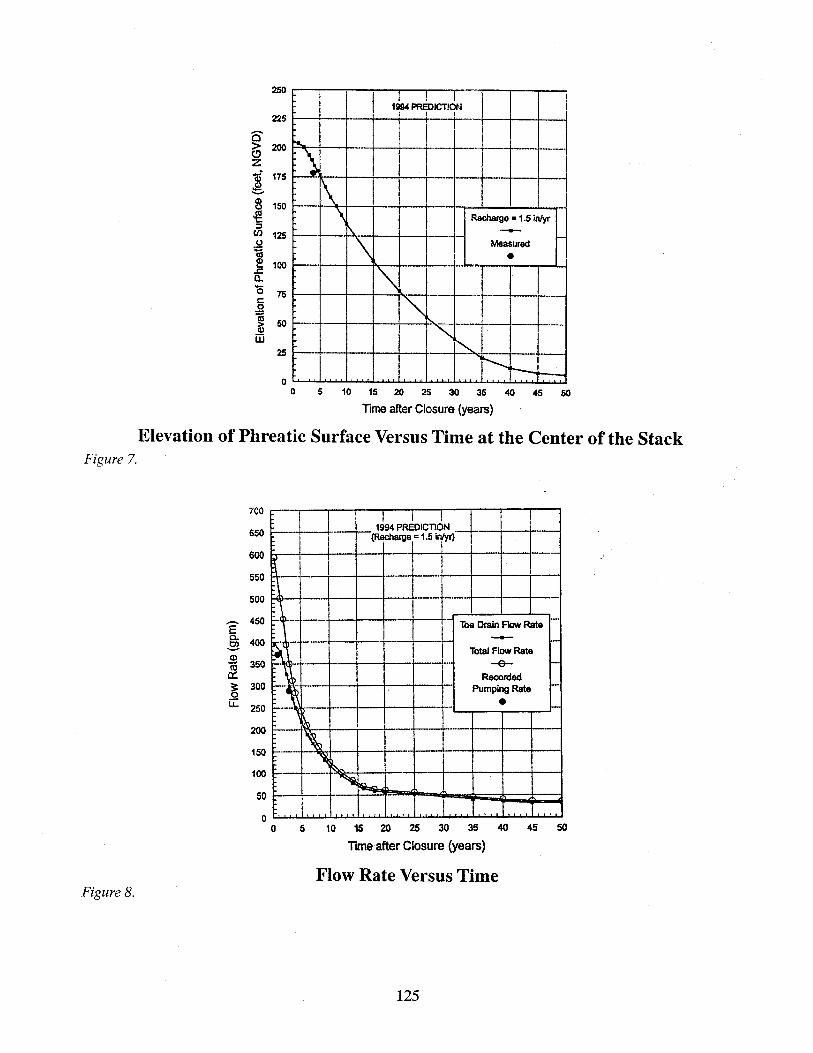
250 "'---"""'I--:-I-"""1-1""T'"tla..-PREQ""T'-IC-n"'""Jr-'I\I-"'-\-""'---""--'
I : r--"'),.-\I--+--i---+4_J-+-/--+-I-+I---l··_·
.~ 150 1--__ "'I-I\-1\\"+-t-I--I---i--+r-.....I..-~--J.--.-I "t: I Recharge = 1.5 inlyr
~ 125 r--"I---+>r--.. .. -I---+-+---i- - I-o \ I Measured ~ . e 100 r--I--+--:p.'l-+--+-.-I-IL.......,~.....,..-..-L.l ~ ~ I ~ 75~~-+--~--~.~.-~+.--~-4 ___ 1
:;::I
~ 50 ·--.-t---l--+---Ic----P-~-.:--+--+-·-t--I-_-I W ,,~
25 I---+--t---l--I---+_ .. _I.....::::.... ~'-I ~_-J
O~~~~~~~~~~~~~~~~ o 5 10 15 20 2S 30 3S 40 so
Time after Closure (years)
Elevation of Phreatic Surface Versus Time at the Center of the Stack Figure 7.
700 !
650 ,
600
550
500
E 450
Q.. 400 8 $ 350 i}. ~ 300 .2 u.. 250
200
150
100
50 1---"1 I o ~~~~~~~I~~~~~~~~~~
a 5 10 15 20 25 30 35 40 45 so Time after Closure (years)
Flow Rate Versus Time Figure 8.
125


Wednesday, Nove:mber 9, 1994 Session V
Moderator:
Richard F. McFarlin
The Effectivness of Created Wetlands on Phosphate Mined Lands
Ronnie G.Rest University of Florida Center for Wetlands
Introduction
Historically, the importance of our wetlands has been overlooked. As recently as 20 years ago they were considered expendable. However, wetlands are very productive and valuable ecosystems. Their importance lies not only in the traditional perceived values of biological diversity offish and wildlife, but wetlands also provide a multitude of additional functions including their ability to retain nutrients, sediments, and toxins; protect shorelines; attenuate peak flows of surface water; recharge groundwater aquifers; and provide an important link in atmospheric gaseous exchange.
Florida has lost approximately 9.3 million acres of wetlands (Dahl 1990). It has been estimated that Florida once had approximately 20.3 million acres~ of wetlands which covered 54.2 percent of the state's surface area. By the 1980s Florida's wetland acreage had been reduced by 46 percent to 11 million acres (FDNR 1988, Shaw
1 This is a preliminary report of a project funded by the Florida
Institute of Phosphate Research. Much of the text is abstracted
from a lengthy preliminary report prepared by the principal inves
tigators (manuscript authors) and their staff. A debt of gratitude is
extended to the many participants in this project without whose
help this task could not have been undertaken, and to the phos
phate industry which has assisted greatly in providing access to
their wealth of information regarding mined and reclaimed sites.
and Fredine 1956, and TschinkeI1984). Based on current U.S. Fish and Wildlife Service National Wetlands inventory estimates of past wetland losses, an estimated 400,000 acres of wetlands are lost nationally while approximately 25,000 acres are gained on an annual basis.
Since 1975 the State of Florida has permitted the loss of thousands of acres of wetlands. From 1985 to 1990 the Florida Department of Environmental Regulation (DER) issued over 1,200 permits that included creation, enhancement or preservation of wetlands as mitigation. The permits authorized the loss of over 3,300 acres of wetlands and required as mitigation that approximately 3,300 acres be created, 7,300 acres be enhanced and 7,500 acres be preserved (DER 1991). From 1975 to 1991 the Florida phosphate industry has mined approximately 15,000 acres of wetlands and as mitigation has constructed over 6,700 acres of wetlands in approximately 100 projects.
The differences between constructed wetlands on phosphate mined lands and wetlands constructed in other landscapes and land uses is significant. Surface mining for phosphate causes considerable alternations of landscape, soils, and ground and surface hydrology atypical of other wetland construction projects. It is estimated that the size of wetlands constructed in mine reclamation projects are normally an order of magnitude larger than wetlands constructed in residential or commercial developments. Mine reclamation projects involve large (200 to 500+ acre) landscapes that often include a diversity of reclaimed and preserved habitats connected to the constructed wetland systems. Although for Florida in general most created wetlands are three years or less in age, many wetlands constructed on phosphate
127
mined lands are over six years old with a few exceeding ten-plus years (Erwin 1991).
This research project addresses six important wetland reclamation research issues identified by government regulatory agencies, environmental organizations, the scientific community, and industry:
•
•
•
•
•
•
To what extent are these constructed wet lands persistent functioning systems? What are appropriate functions and "val ues" provided by these wetlands? How should success criteria be applied to these projects? Investigate project design criteria and determine elements required for goal attain ment. Provide a database to guide operational or policy changes required to achieve a higher degree of success. What are the future research needs of government and industry?
Specific research goals of this project are:
• To determine to what extent currently constructed wetlands are persistent, functioning ecosystems.
• To determine what wetland functions are provided by these constructed wetlands, identify appropriate indicators of the various functions and then develop quantitative methods of measuring those indicators.
• To determine how success criteria should be applied to evaluating the constructed wetlands attainment of goals or trend to ward that end.
• To determine how the design criteria and state and federal regulations affect the attainment of the primary objectives of the constructed wetland projects.
• To provide a database to guide operational or policy changes required to achieve a higher degree of success.
• To identify future research needs of the industry and regulatory agencies.
HYDROLOGY-All types of wetlands occur in nature because of the hydrologic conditions
that allow the successful growth of specific plant communities. Although the subsurface geology and soil conditions are important in the initial establishment of a wetland environment, the fundamental factor influencing the longevity and health of any wetland environment is its hydrologic regime. The hydrologic regime of any given plant community influences the type and composition of plant species and significant change in the hydroperiod normally causes a change in the composition of the community, succession of the community' or the failure of the community (Ewel, 1991). Therefore, all of the hydrologic factors affecting the hydroperiod bear great significance to the continued success of a wetland community.
Afundamental question revolves around what are the hydrologic factors within the hydrologic cycle most important to continued success of wetland environments. The water balance is governed by· the simple principle that the balance between inflow and outflow factors causes a change in quantity of water stored in any system, whether it be a wetland, a stream or some part of the aquifer sys-tem.
. . . h . Wetland plant commumtles occupy mc .• es m the natural system controlled primarily by the hydrology of the specific location. Without a sufficient supply of water over a significant part of the year, any given type of wetland could not develop or remain in a healthy condition. The hydrologic regimes of a wetland, including timing of flooding event, depth and duration that the area is flooded or saturated, are critical elements providing for plant community development as well as influence and significance offire. The flooded condition also allows wetland plants to survive potential competition from upland plant communities, which are not adapted to the soil types and flooded conditions within typical wetland sites.
The location of areas having the natural hydrologic regime necessary to allow the successful growth of wetland plants is solely dependent on the water balance of the location. The water balance at any location is controlled by the physical framework of the shallow aquifer system, the altitude and general topographic characteristics of the landscape, and the basinwide climatic conditions. Once wetland plant communities become estab-
128
lished, they can actually modify the soil conditions by deposition of organic detritus over a period of many years to change the type of plant community with time or allow an increase in size of the feature. Wetlands and hydrology cannot be separated because they are fully and totally interrelated based on physical occurrence and continued success.
The following preliminary conclusions/recommendations are made regarding hydrology:
• Use post-mining rather than pre-mining landscape to locate created wetlands.
• Acquire pre-mining hydrogeologic data to assist in developing post-mining landscape.
• Coordinate mining methods with reclamation plan to facilitate establishing proper watershed flow characteristics.
• Assure proper position of wetlands in landscape; establish sufficient upland-to-wetland ratio.
• Create wetlands within proper hydro geomorphic setting.
• Properly integrate wetland reclamation with upstream (or up watershed) activities.
SOILS-Soils-related criteria such as compaction, organic matter and nutrient accumulation can be used to evaluate the progression of wetland development in constructed wetlands. A review of project reports dealing with existing phosphatemined reclaimed wetlands found minimal information related to the development of wetlands soils at the these sites. Therefore, an effort was made to carefully observe soil profile development of the recreated wetlands toured on this project. In addition, soil samples (184 total) were taken at selected sites to determine criteria which may be used to determine successful wetland progression.
Criteria selected for evaluation included compaction, bulk density, organic matter (carbon) and nitrogen content, C/N ratio, available and total nutrient content, and cation-exchange capacity. Analysis of these samples suggested that many of the wetland soils had characteristics indicating progression toward mature wetland soils. Sites at which poor vegetative growth was observed were
generally those with high bulk density values and low organic matter contents.
Soil sampling in this project was done on a synoptic basis at a variety of wetland sites. However, definite conclusions regarding correlation of soil parameters with wetland progression could not be made due to the lack of systematic and detailed sampling. Asystematic evaluation of wetland progression should be done by careful selection of sites and sampling locations within sites to correlate vegetative growth and stand establishment with soil parameters.
Plants growing in wetland soils have unique features in adapting to the anaerobic environment: (i) transport of molecular oxygen from the aerial parts through the stem and to the roots (Armstrong, 1964), and (ii) anaerobic respiration. These mechanisms enable wetland plants to ward off toxic reduction products, accumulate nutrients, and survive in an oxygen-free medium (Armstrong, 1964; 1967). Oxidation of the rhizosphere serves as a protective mechanism in preventing high concentrations of reduced substances from coming in contact with the root surface. Oxygen diffusing from the root surface to the adjacent soil layer also enhances the development of a predominantly aerobic microflora in the rhizosphere. Accumulation and/or decomposition of organic matter in wetland soils is a function of pH, C:N ratio of plant residue, available nutrients in the soil, and other soil conditions such as particle size distribution and structure.
In conclusion, only a limited amount of information was found on soil/sediment characteristics and physicochemical properties in existing reports on evaluation of phosphate-mined reclaimed wetlands. However, with the limited data coupled with our "pilot-scale" sampling, the following trends appear evident:
129
• Organic matter accumulation, one of the indicators of a productive wetland, in creased across transects going from uplands toward the center of the wetlands. Organic matter content also increased with wetland age. The reclaimed wetlands are slowly developing into a "typical" wetland
based on soils criteria. • Soil bulk density decreased with increas
ing organic matter content in the wetland soils studied. Areas that had lower bulk density and higher organic matter content appeared to support better vegetative growth.
• The C:N ratio decreased with wetland age and approached values commonly found in wetland soils (20-25).
• Results suggest that penetrometer readings will be a useful parameter for relating compaction to vegetative growth.
• Soil-related criteria needed to adequately evaluate wetland performance and soil profile development should include: compaction, organic matter content, C:N ratio, available nutrients, and CEC.
To complement this preliminary work, a systematic evaluation of wetland progression should be done by careful selection of sites and sampling locations within sites to correlate vegetative growth and stand establishment with compaction, bulk densitv and orQ:anic matter content: substrate tvoe
.; fW1 - - , - "' ...
(overburden, sand tailings, clay); mucking vs. no mucking. In addition, vegetation nutrient concentrations need to be correlated with soil parameters to establish recommendations for soil-amendments.
WATER QUALITY-The main question being addressed regarding water quality is does the water chemistry in constructed wetlands reach levels similar to those found in natural wetlands and if they do how long does it take? The current database consists of water quality data from approximately fifteen constructed wetlands. This is a very low percentage of the total number of constructed wetlands. Data from these constructed wetlands have been compared both with each other and with water chemistry from natural wetlands. The relatively low number of wetlands examined must be taken into account when regarding these preliminary results and conclusions.
. Water chemistry parameters analyzed are a combination of potential nutrients and pollutants. These parameters include pH, specific conductance, total phosphorous, total nitrogen, dissolved oxygen and biological oxygen demand. Prelimi-
nary results indicate that most parameters seem to peak in the first few years after construction. Between the fourth and fifth years these parameters appear to level out towards an equilibrium range. This equilibrium range for each parameter analyzed does appear to be similar to the values found in natural systems. It is our conclusion that the water chemistry in constructed wetlands does reach a stable endpoint that appears to mimic the water chemistry of natural wetlands. In order to verify these conclusions there should be an effort to monitor more constructed wetlands for water quality. This will improve the current database and possibly verify these preliminary conclusions:
• Limited "meaningful" information; low number of wetlands monitored for water quality.
• Need to be selective in choosing parameters; much variability in existing data.
• Need to establish standard list of parameters and standardize approach to sampling.
• Even with limited data, trends are for "water quality in constructed wetland becomes similar to water quality in [reference] wet lands about 4-5 years post-reclamation."
AQUATIC FAUNA-Preliminary analysis indicate that for nearly every taxonomic level examined there seems to be an evident trend of an increase in macroinvertebrates during the first two to three years after construction, followed by a gradual decrease in density/abundance after the third year to a level endpoint. It also appears that this endpoint is approximately similar to macroinvertebrate density/ abundance levels found in natural wetlands. A preliminary conclusion is that a successful trend appears evident within constructed wetlands. With the limited data available we can conclude that by the fourth to fifth year after construction macro invertebrate communities are similar to those found in natural wetlands. These conclusions, however, must be considered tentative. There a several factors that may affect reliability of these preliminary conclusions. The relatively low number of wetlands sampled must be taken into account. There are also several problems with sampling methodologyspecifically, sampling methods used by the industry
130

was not consistent and standardized - that could affect our conclusions. Future monitoring for macroinvertebrates and standardization of sampling techniques would improve the database and allow for a more conclusive evaluation of the data. Preliminary conclusions are as follows:
Trend for most taxa examined: • Initial increase in populations first 2-3 yr • Gradual decrease after 3rd year • Trend towards density levels similar to reference wetlands
• Obvious population successional trend Conclusions are very tentative and need much additional "standardized" sampling
VEGETATION-In this section, the vegetation component of constructed wetlands is evaluated. Site visits to over 164 reclaimed and natural wetlands in the central and northern Florida phosphate mining regions were made. In addition, data were compiled and synthesized from numerous sources, and trends in wetland plant community establishment and persistence were examined to determine present plant community structure and how it may be changing over time.
There are several types of wetlands occurring within the central and north Florida phosphate regions. In general, community structure of wetlands is controlled primarily by hydrologic parameters (hydroperiod and depth of inundation) and also by other factors such as nutrient availability, soils, recent fire history, and logging activities. The types of wetlands occurring within the region are as follows: Bay swamps (bayheads), cypress domes/strands/sloughs, mixed hardwood swamps, hydric hammocks, wet prairies, shallow marshes, and deepwater marshes. In general, the phosphate industry is creating numerous types of wetlands emulating at a broad scale the types of wetlands found in the region.
Mean percent cover by the herbaceous strata for all wetland sites evaluated increased from about 80% in year one to about 130% in year five. The one site having nine years of data exhibited an increase from 60% in the sixth year to about 140% in the ninth year. Mean species richness for all sites over all years appears to be about 50 species. The most frequently used herbaceous species in
marsh plantings were Sagitta ria lancifolia and Pontedaria cordata, Juncus efftisus and Thalia geniculata. The most common naturally occurring species were Juncus effusus, Panicum hemitomon, Pontedaria cordata. The relative importance of shrub species planted in marsh wetlands was minor; 10% of the marsh sites were planted in shrub species. Average survival of planted tree seedlings in the first year was about 60%. In the second year it was about 55%, and continued to decline to about 50% in the fifth year. Tree crown width increased almost 140% in five years and 400% in seven years. Tree height increased by about 200% in five-seven years.
The following are conclusions of this preliminary analysis:
Data are limited to a small subset of monitored sites; need to expand and standardize sampling; Marshes
• Plant cover trended toward 90% cover w/ in 3-5 years
• Species richness initially higher than natural wetlands with decreasing numbers towards natural wetlands
• Mulching "appears" to help • Control on nuisance species beneficial
Swamps • Survival 50-60% after 5 years with low
(1-3%) year-to-year mortality once established
• Planted species richness higher in constructed wetlands
• No apparent effect of mulching on seedling survival
WILDLIFE-Objectives of the wildlife component of this study are to elucidate both the desirability and the feasibility of incorporating wildlife considerations into the criteria for "success" in the creation of wetlands. There is, in reality, a paucity of data regarding wildlife populations on reclaimed wetlands. However, there are some general conclusions that can be drawn from the field visits and limited data:
• Very limited information on wildlife! However, note the following were observed
131

•
•
•
or potentially occur on reclaimed phos phate lands:
• Mammals - 19 species • Birds - over 170 species • Reptiles & amphibians - over 50
species. Diversity of wildlife need a diversity of habitats. Wildlife need corridors through which to pass from system-to-system as well as from natural-to-created areas. Much research needed on recovery and successional pattern for various fauna in reclaimed wetlands.
lANDSCAPES-Wetlands reclamation is not only a question of developing a lasting and functional assemblage of wetland flora and fauna, but an ecological community that is integrated into a larger context, sometimes referred to as landscape setting. The landscape setting of a created wetland community determines functionality, not from inter-community perspective, but from an intracommunity one. The intra-community perspective seeks to evaluate ho\v the Greated \Xlet-Ia-nd re-lates to surrounding areas ... how it affects and is affected by these areas. Through use of pre- and post-mining plans and reclamation plans coupled with regional maps, a GIS was used to evaluate landscape trends. The following are preliminary conclusions:
•
•
•
•
Ecological Connectedness Thirty-one percent of surveyed wetland reclamation projects are connected directly to natural forested lands, however, the connection is often weak. Forty-eight percent of projects are connected to relatively mature reclaimed lands. 1Wenty-four percent of wetland reclamation projects are integrated into a regional habitat system by having forested connections to core habitat reserves.
Hydrological Connectedness Less than 10% of wetland reclamation projects are within the smallest drainage basins.
132
•
•
•
•
•
•
•
•
•
•
The largest percentage, 60%, of reclamation projects are constructed in large drain age basins and 31 % are constructed in very large basins (Peace River scale).
Community Fitness The most common land cover type in wet lands reclamation projects is agriculture (primarily pasture land). Landscape heterogeneity of wetlands reclamation projects is relatively high, especially when compared to the native Florida landscape, however, often the increased heterogeneity is at the expense of patch size. Average upland/wetland ratios for wetland reclamation projects appear to be some what lower than those found for native Florida landscapes. Low wetland/upland ratios combined with the relatively small amount of uplands that are planted in forests (on average about 10%) translates into lowered overall carrying capacity for faunal species.
Overall, preliminary analysis has revealed:
There is little standardization in the way site plans are produced, annotated, and documented, making comparisons between projects difficult and the job of organizing coherent landscapes a hit and miss proposition. There appears to be no larger scale (beyond the scale of the individual reclamation project) organizational principles driving the reclamation of phosphate mined lands. Wetland reclamation projects are constructed close to existing native forested communities about 1/3 of the time, but ecological connectedness is often not maximized because of the minimal area of planted upland forests. Landscapes that are created on individual reclamation projects tend to maximize heterogeneity but at the expense of patch size. Hydrology of constructed wetlands may be problematic, while many constructed wet-
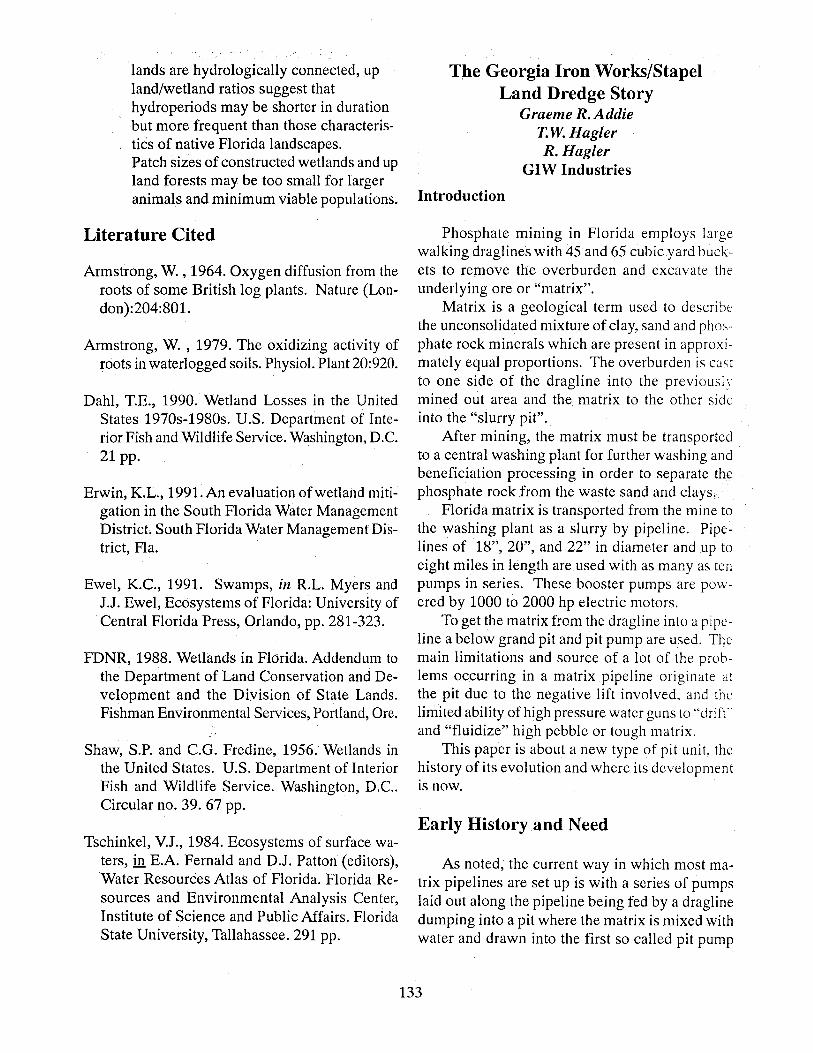
lands are hydrologically connected, up land/wetland ratios suggest that hydroperiods may be shorter in duration but more frequent than those characteristics of native Florida landscapes. Patch sizes of constructed wetlands and up land forests may be too small for larger animals and minimum viable populations.
Literature Cited
Armstrong, W. , 1964. Oxygen diffusion from the roots of some British log plants. Nature (London):204:801.
Armstrong, W. , 1979. The oxidizing activity of roots in waterlogged soils. Physiol. Plant 20:920.
Dahl, T.E., 1990. Wetland Losses in the United States 1970s-1980s. U.S. Department of Interior Fish and Wildlife Service. Washington, D.C. 21 pp.
Erwin, K.L., 1991. An evaluation of wetland mitigation in the South Florida Water Management District. South Florida Water Management District, Fla.
Ewel, K.C, 1991. Swamps, in R.L. Myers and 1.1. Ewel, Ecosystems of Florida: University of Central Florida Press, Orlando, pp. 281-323.
FDNR, 1988. Wetlands in Florida. Addendum to the Department of Land Conservation and Development and the Division of State Lands. Fishman Environmental Services, Portland, Ore.
Shaw, S.P. and CG. Fredine, 1956. Wetlands in the United States. U.S. Department of Interior Fish and Wildlife Service. Washington, D.C.. Circular no. 39. 67 pp.
Tschinkel, V.I., 1984. Ecosystems of surface waters, in E.A. Fernald and DJ. Patton (editors), Water Resources Atlas of Florida. Florida Resources and Environmental Analysis Center, Institute of Science and Public Affairs. Florida State University, Tallahassee. 291 pp.
The Georgia IronWorks/Stapel Land Dredge Story
Graeme R. Addie T.w. Hagler R.Hagler
GIW Industries
Introduction
Phosphate mining in Florida employs large walking draglines with 45 and 65 cubic yard buckets to remove the overburden and excavate the underlying ore or "matrix".
Matrix is a geological term used to describe the unconsolidated mixture of clay, sand and phosphate rock minerals which are present in approximately equal proportions. The overburden is cast to one side of the dragline into the previously mined out area and the matrix to the other side into the "slurry pit".
After mining, the matrix must be transported to a central washing plant for further washing and beneficiation processing in order to separate the phosphate rock from the waste sand and clays.
Florida matrix is transported from the mine to the washing plant as a slurry by pipeline. Pipelines of 18", 20", and 22" in diameter and up to eight miles in length are used with as many as ten pumps in series. These booster pumps are powered by 1000 to 2000 hp electric motors.
To get the matrix from the dragline into a pipeline a below grand pit and pit pump are used. The main limitations and source of a lot of the problems occurring in a matrix pipeline originate at the pit due to the negative lift involved, and thc limited ability of high pressure water guns to "drift" and "fluidize" high pebble or tough matrix.
This paper is about a new type of pit unit, the history of its evolution and where its development is now.
Early History and Need
As noted, the current way in which most matrix pipelines are set up is with a series of pumps laid out along the pipeline being fed by a dragline dumping into a pit where the matrix is mixed with water and drawn into the first so called pit pump
133

and then pumped along the pipeline. Adiagrammatic representation of this is shown in Figure 1.
""","~-..r..- m):x :n\·'S.s.:v-l~~ ~i-,\:::E~.;~
FTGlJRE L
The dragline normally dumps semi-dry matrix on one side of the pit ahead of a 6" bar screen grizzly from where it is slurried and moved into the pit by high pressure water guns.
The matrix cannot be dumped directly into the pit because the pump is not able handle the surges in conce-ntr-alion and-some \v-a-ter i-s ne-eded to cre~ ate a slurry. From where it is dumped on the side of the pump, high pressure water is therefore needed to break up the solids, move the matrix through the screen into the pit and form a slurry of a SG that can be handled by the pump.
In any centrifugal pump system under steady conditions the head produced by the pump(s) must be in equilibrium with the pipeline system as shown in Figure 2 where in the case of multiple pumps in series the heads of identical pumps are additive. Where the liquid being pumped is a slurry then the equivalent feet of liquid less some solids effect applies and the exact flow (or velocity) at which the pipeline operates is important in that if it is below a certain flow or velocity deposit or plugging of the line might occur and at high velocities excessive wear in the pump and pipeline occurs and higher energy is required.
Control of the system is usually effected by having variable speed capability on the first and last booster pumps in the line. The pit high pressure gun and low pressure supplemental water is usually fixed. Apart from startup and shutdown,
control usually amounts to maintaining the pit liquid level.
Total Head Ft of Slurry
Row
Figure 2.
This in effect means that the pit water sets the base line pipeline velocity and that as solids are added,· the pipeline velocity increases·in that proportion. An ammeter is usually the only instrument monitored at the pit. In some cases there are flowmeters and density meters located at the wash plant. The density meter helps but is of limited value because of its location and the ammeter is a good guide of how high the concentration is and the level of production.
The pit that the dragline dumps into is usually created by bulldozers to a depth of 10 feet or more beneath the regular land level and the pit pump sits on a sled on the side overlooking the pit with its suction pipe hanging down into the pit and beneath the slurry liquid level.
Of necessity there is usually a level distance of 6 to 10 feet or more between the pit pump centerline and the liquid level in the pit with the bottom of the suction pipe being some ten feet or more below that.
A centrifugal pump will only operate when the NPSH available from the system is equal or greater to that required by the pump. The NPSH required is a function of the pump design and its operating conditions. For a typical matrix pump it is as shown on Figure 3.
The NPSH available(A) referenced to the pump centerline is a function of the liquid level, the suction piping, the suction pipe entrance conditions and the slurry specific gravity. For a typical installation this is as shown in Figure 3 also.
134
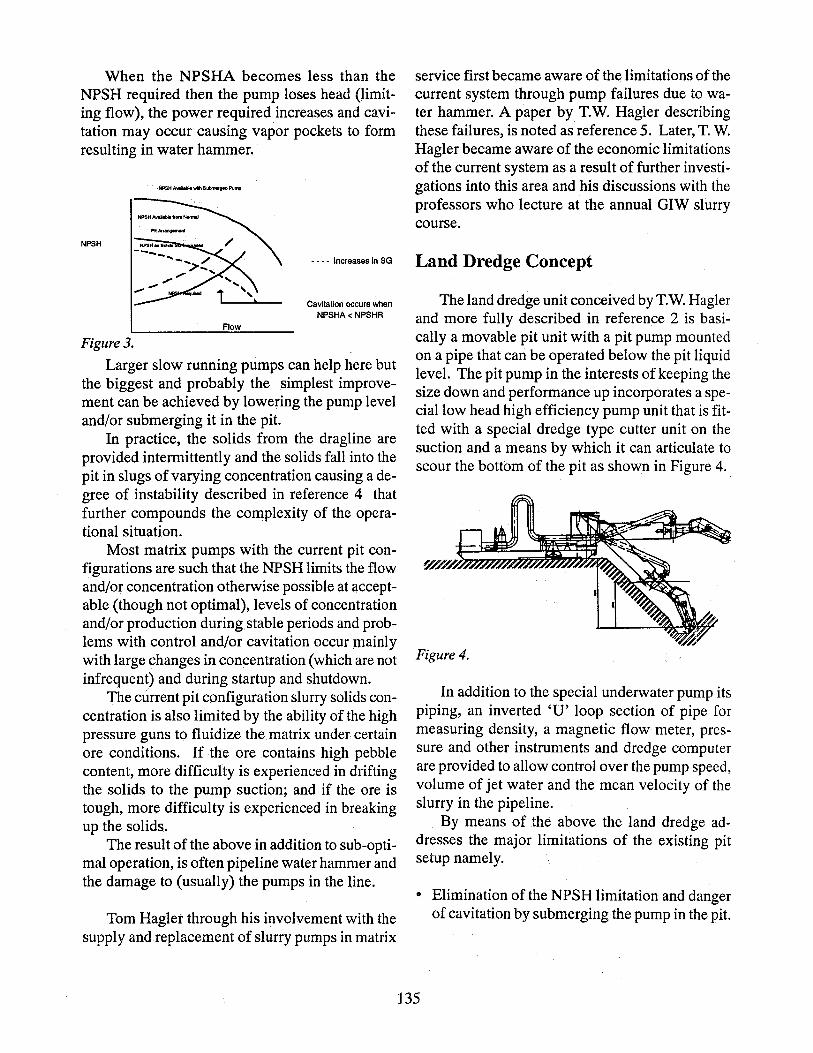
When the NPSHA becomes less than the NPSH required then the pump loses head (limiting flow), the power required increases and cavitation may occur causing vapor pockets to form resulting in water hammer.
NPSH Available wIh Submlfged PIIfIlP
NPSH
Flow
Figure 3.
- - - - Increases in SG
Cavitation occurs when NPSHA < NPSHR
Larger slow running pumps can help here but the biggest and probably the simplest improvement can be achieved by lowering the pump level and/or submerging it in the pit.
In practice, the solids from the dragline are provided intermittently and the solids fall into the pit in slugs of varying concentration causing a degree of instability described in reference 4 that further compounds the complexity of the operational situation.
Most matrix pumps with the current pit configurations are such that the NPSH limits the flow and/or concentration otherwise possible at acceptable (though not optimal), levels of concentration and/or production during stable periods and problems with control and/or cavitation occur mainly with large changes in concentration (which are not infrequent) and during startup and shutdown.
The current pit configuration slurry solids concentration is also limited by the ability of the high pressure guns to fluidize the matrix under certain ore conditions. If the ore contains high pebble content, more difficulty is experienced in drifting the solids to the pump suction; and if the ore is tough, more difficulty is experienced in breaking up the solids.
The result of the above in addition to sub-optimal operation, is often pipeline water hammer and the damage to (usually) the pumps in the line.
Tom Hagler through his involvement with the supply and replacement of slurry pumps in matrix
service first became aware of the limitations of the current system through pump failures due to water hammer. A paper by T.W. Hagler describing these failures, is noted as reference 5. Later, T. W. Hagler became aware of the economic limitations of the current system as a result of further investigations into this area and his discussions with the professors who lecture at the annual GIW slurry course.
Land Dredge Concept
The land dredge unit conceived by T.W. Hagler and more fully described in reference 2 is basically a movable pit unit with a pit pump mounted on a pipe that can be operated below the pit liquid level. The pit pump in the interests of keeping the size down and performance up incorporates a speciallow head high efficiency pump unit that is fitted with a special dredge type cutter unit on the suction and a means by which it can articulate to scour the bottom of the pit as shown in Figure 4.
Figure 4.
In addition to the special underwater pump its piping, an inverted 'U' loop section of pipe for measuring density, a magnetic flow meter, pressure and other instruments and dredge computer are provided to allow control over the pump speed, volume of jet water and the mean velocity of the slurry in the pipeline.
By means of the above the land dredge addresses the major limitations of the existing pit setup namely.
• Elimination of the NPSH limitation and danger of cavitation by submerging the pump in the pit.
135
• Allowing higher and more consistent SG's to be pumped by means of the better NPSH and the available cutter head.
• Allowing more efficient operation as a result of reduced line velocities, higher SG's and reduced quantities of gun water.
• Reducing the quantity of high pressure gun water required as a result of the use of a cutter unit and better NPSH.
• Lowering wear in the pumps as a result of the lower line velocities.
• Making the system less sensitive to changes in concentration.
• Allows the use of a deeper pit that makes for a . better drift of slurry to pump.
• Eliminates the need for the current grizzly.
• Eliminating the production limitations associated with ore "drift" bv automated movement ---- _ .. ---- -- - J
of pump suction entrance.
• Improved ability to break up tough matrix with the cutter head rather than high pressure gun water.
Phosphate Matrix Tests
While it is obvious that reduced line velocities and higher operating concentrations make for economies of operation up until the late eighties, there was no satisfactory data on what minimum velocities and actual head loss values to expect for the different phosphate matrix types being used around the central Florida area.
In August of 1987, however, FIPR let a contract No. 87-04-037R for the comprehensive testing in the GIW Hydraulic Testing Laboratory and in the field of several different types of phosphate matrix in a number of different diameters of pipelines.
The results of this work is covered in reference 1 and 3 and provided for the first time a set of comprehensive and accurate data on a number of
phosphate matrix types that could be used for evaluations and comparisons.
In addition to the matrix data collection and evaluation, FIPR contract No. 87-04-037R included for the development of characteristic algorithms and an easy to use computer program called "PAPES" for the design and evaluation of phosphate matrix pipelines.
Using this data and the computer program, a study was made of the potential operating cost improvements was made and reported as reference 4.
Economic Justification for Land Dredge
The study carried out in reference 4, investigated the head gradient, minimum pumping velocity, the effed of pipeline diameter,pipeline stability and economic factors.
This paper showed that pumping velocities lower than now used were possible, and that for a 17-1/4" pipe, ignoring for the moment the effect of stability, (and associated safety margins), etc., that velocities as i6w as 12 ft/sec were possibie.
Figure 8 from the paper reproduced here as Figure 5 in particular shows the unit energy in units of HP HR/TON MILE units at different tons per hour dry solids transport rates for a 17-1/4" diameter inside dimension pipe along with the slurry concentrations and pipeline mean velocities at those conditions while pumping a high pebble matrix slurry.
This shows the enormous increase in energy associated with higher line velocities and lower concentrations and in particular where operation along a constant 10,000 Usgpm from water supply would be compared for example against operation along a lower constant velocity line.
From the above graph, and from the paper, it can be seen that in the case of a 1504 tons per hour transportation rate in the same 17-1/4" diameter pipeline, if we control water to the pit and go from a 36.4% by weight concentration to only 45% by weight, then the savings in electricity alone are about $466,000 in a normal year. Savings due to reduced wear and less failures would be on top of this.
136
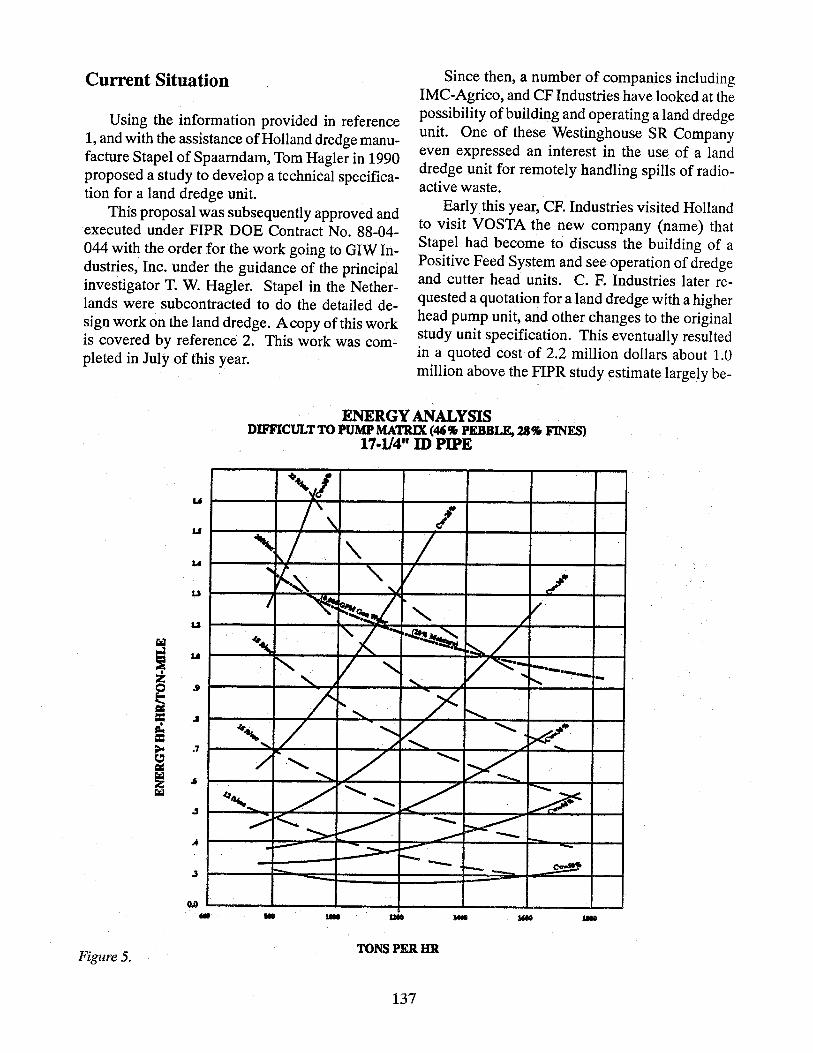
Current Situation
Using the information provided in reference 1, and with the assistance of Holland dredge manufacture Stapel of Spaamdam, Tom Hagler in 1990 proposed a study to develop a technical specification for a land dredge unit.
This proposal was subsequently approved and executed under FIPR DOE Contract No. 88-04-044 with the order for the work going to GIW In?ustri:s, Inc. under the guidance of the principal Investigator T. W. Hagler. Stapel in the Netherlands were subcontracted to do the detailed de~ign work on the land dredge. Acopy of this work IS covered by reference 2. This work was completed in July of this year.
Since then, a number of companies including IMC-Agrico, and CF Industries have looked at the po~sibi1ity of building and operating a land dredge umt. One of these Westinghouse SR Company even expressed an interest in the use of a land dredge unit for remotely handling spills of radioactive waste.
Early this year, CF. Industries visited Holland to visit VaSTA the new company (name) that Sta~~l had become to discuss the building of a POSItive Feed System and see operation of dredge and cutter head units. C. F. Industries later requested a quotation for a land dredge with a higher head pump unit, and other changes to the original ~tudy unit specification. This eventually resulted In a quoted cost of 2.2 million dollars about 1.0 million above the FIPR study estimate largely be-
ENERGY ANALYSIS DIFFICULT TO PUMP MATRIX (46.., PEBBLE, 2SfJi FINES)
17·114" m PIPE
+'J /', ~i' , / " /
---~~ ", V / I ~ ~~./
I-/1/ "-
~" ";( ... ~~ ~/
"'-, V ........ V~·-: --.-..... t'--. - -/ 1', >< r--....
~, 7 ......... l( .......... ~. ...... /
/ ...
/ .......... V-............ ........
4, / .......... / ~ .... ............
./ t<'-..""">-~ -- b-:<:. ---
u
u
u
u
u
CiI;'I
~ u
• Z
~ .I
= .a t1. = ~ .7 r,:, ~
~ "' ~
" ~ ...- - .. - ---- 1'-_ '-
r- _ ~
...
.3
0.0 - -Figure 5.
TONSPERHR
137

cause of changes to the specification by CF, higher than expected initial costs, additional freight costs and exchange rate variations.
In August of this year, VOSTA re-quoted the Land Dredge according to the original FIPR study specifications. Final price for the first unit was about 1.8 million. units manufactured after the initial were estimated at approximately 1.4 million.
Currently, the firm of Carolina Industrial Pumps headed up by Robert Hagler continues to market the use of the so called land dredge unit to potential users in Florida and elsewhere.
References
1. Florida Institute of Phosphate Research (1989). Phosphate Matrix Pipeline Design Data and Tools for Efficiency Improvement: Publication No. 04-037-078.
2. Florida Institute of Phosphate Research (1991). Development of a Positive Feed System for Matrix Transportation: Publication No. 04-044-096.
3. Duckworth, R. Alan, Addie, Graeme R., and Maffett, J. R., (1988). Full Scale Experimental Study of the Pipeline Transport of Phosphate Matrix Slurries, Proc. Hydrotransport 11, BHRA Fluid Engineering, Cranfield, UK.
4. Addie, Graeme R. and Hagler, T. W. (1989). Potential Operating Cost Improvements in Florida Matrix Transportation, 4th Annual AlME Regional Phosphate Conference.
5. Carstens, M.R., ASCE, M. and Hagler, T. W. (1964). Water Hammer Resulting from Cavitating Pumps. Proc. of the American Society of Civil Engineers, Vol. 90, No. HY6.
The PECO Fluorine Recovery Process Wm R. Erickson Leif E. Bouffard
PEeo Introduction
Phosphate Engineering & Construct ion Company, Inc. (PECO), incorporated in 1973 in Lakeland, Florida, USA, is a process and product development organization for the phosphate and chemical industries striving to assist them in becoming more efficient, productive, and environmentally safe. Since its inception PECO has been concerned with the environmental issues surrounding the phosphate industry, as indicated by the areas of its research and resulting patents.
PECD has a well-eguipped, Florida state certified, analytical laboratory, pilot plant, and process engineering group to perform research programs which have resulted in the development of several processes being offered to the industry on an exclusive worldwide basis. These processes include, but are not limited to, a patented closed loop system for the elimination of fluGrine pollution from phosphoric acid plants by eliminating cooling ponds, and a patented P 20/HF Process for the production of phosphoric acid and hydrogen fluoride from fluosilicic acid and phosphate rock.
Background Information
Approximately 600,000 tons per year of fluorine are contained in the twenty million tons per year of phosphate rock consumed in the state of Florida for the production of phosphate fertilizers. Approximately 400,000 tons of this material could be recovered as fluosilicic acid; however, the present market for fluosilicic acid is only about 60,000 tons per year.
Amarket does exist for fluoride products; however, except for the PECO P 0 /HF Process no 2 S economical process is presently available to con-vert the total amount of fluorine evolved during the manufacture of phosphate products into these finished saleable products. This newly developed PECO P20 s/HF Process could provide a significant additional profit to the phosphate producers.
138
A limited number of phosphoric acid producers recover fluorine as fluosilicic acid. This is due to the relativel y small market demand for fluosilicic acid or its products such as sodium silicofluoride, cryolite, and aluminum fluoride.
Because of this small demand, the bulk of the fluorine evolved during the manufacture of wet process phosphoric acid is absorbed into the cooling pond water.
The concentration of fluorine in cooling ponds can build up to levels of about 4,000 ppm (0.4%) for producers who recover fluosilicic acid and to about 12,000 ppm (1.2%) for producers who do not. Producers who have lined their cooling ponds and do not recover fluosilicic acid have encountered fluorine levels over 25,000 ppm (2.5%).
A sizeable market of 400,000 tons per year exists for fluorine in the United States and this market is predicted to increase to 500,000 tons per year by 1994. Historically this market has not been available to the phosphate industry since its fluorine is tied up with silica and therefore not acceptable to the higher value fluoride consumers. The PECO P20/HF Process separates the silica from the fluorine aIld opens up the fluoride chemical market to the phosphate industry.
Fluorine Chemistry
The field of fluorine chemistry is very complicated and one of the more complex subjects in the field of inorganic chemistry. It is not necessary to totally understand the complex reactions of the molecule fluorine, however a brief discussion of this area of chemistry is presented below to assist the reader in following the logic in some of the basic designs used by the practicing chemical engineer.
Fluorine is obtained from the mineral fluorapatite. In most cases phosphate rock contains approximately 3% to 3.5% fluorine. When the phosphate rock is reacted with sulfuric acid in the production of phosphoric acid, the calcium fluoride present in the phosphate rock produces hydrogen fluoride according to the following eguation:
CaF 2 + H 2SO 4-> CaS04 + 2HF (Equation 1)
As soon as the hydrogen fluoride is formed it attacks the silica present in the phosphate rock. Although the amount of silica in phosphate rocks varies, there is normally an excess of silica available to react with all the hydrogen fluoride generated by eguation 1. The attack by the hydrogen fluoride of the silica follows the equation given below.
4HF + Si02-> SiF4 + 2H20
(Equation 2)
The product from this reaction is silicon tetrafluoride which is a gas at normal room temperature and pressure.
Since most phosphoric acid processes are conducted in an aqueous phase, the silicon tetrafluoride, as soon as it is produced, forms fluosilicic acid and silicon dioxide according to the followmg:
3SiF4 + 2H20 -> 2H
2SiF
6 + Si0
2
(Equation 3)
This is significant because when the fluosilicic acid is formed, insoluble silica is generated as a gelatinous material having the characteristic of plugging up fume· scrubbers, fluosilicic acid recovery towers, and anything else that it comes in contact with. In some cases it makes many processes for the recovery of fluorine inoperable because of the large deposits of the silica gel in the operating equipment.
This probl~m can be avoided by using an aqueous solution of hydrogen fluoride to react with the silicon tetrafluoride producing fluosilicic acid, according to equation 4.
SiF4 + 2HF -> H2SiF 6 (Equation 4)
Fluosilicic acid (H2SiF J can only exist in the aqueous phase; that is to say it exists only when it is in a water solution. As soon as the fluosilicic acid is vaporized from the water solution, it turns into SiF4 and hydrogen fluoride according to equation 5.
H2SiF6(AQ~>2HF + SiF4
(Equation 5)
139
It has been noted that silicon tetrafluoride is normally released earlier than hydrogen fluoride. In most cases the vapors coming from phosphoric acid at concentrations below 40% are very rich in silicon tetrafluoride (SiF J and lean in hydrogen fluoride. Therefore when this vapor is scrubbed with water the silicon tetrafluoride reacts with the water in accordance with equation 3 producing fluosilicic acid, as well as generating the silica gel, again creating the problem of clinging to any surface and plugging up almost all equipment.
When the concentration of phosphoric acid is much over 40%, the vapors coming from that evaporator are generally rich in hydrogen fluoride and lean in silicon tetrafluoride. No silica is deposited when the vapors are scrubbed since the excess hydrogen fluoride reacts with Si02 in accordance with equations 2 and 4 producing H2SiF6
in water rather than precipitating the silica gel. The chemical engineer, in designing his
fluosilicic acid unit, will use a counter current operation so as to have a vapor rich in hydrogen fluoride scrubbed first and then use that liquor to scrub the SiF from lower concentration evaporators. This
4 keeps the mole ratio proper and prevents the for-mation of silica. The only alternative to this is to scrub the vapors rich in SiF4 and add a pure stream of hydrofluoric acid to it so as to keep the mole ratio correct and thereby eliminate the precipitation of silica. However hydrofluoric acid is very expensive making it not economical to use as a regulator in a fluosilicic acid recovery system to keep the mole ratio constant.
The above explanation also illustrates why it is necessary to concentrate phosphoric acid to the higher concentration so as to obtain a hydrogen fluoride rich solution to be used in scrubbing the vapors from the lower P Ps evaporator concentration stages. When a manufacturer is producing only 40% phosphoric acid, the vapors from that system do not contain enough hydrogen fluoride to be in equilibrium with the excess silicon tetrafluoride coming from the lower evaporators. Therefore it is extremely difficult to put in fluosilicic acid recovery units which will not precipitate silica, when evaporating phosphoric acid only to 40% P20S'
PEeo p 20 /HF Process
The objective of the research program was to develop a process which would produce phosphoric acid by reacting fluosilicic acid and phosphate rock and convert the fluorine into a nonvolatile compound.
The process worked quite well producing phosphoric acid without using sulfuric acid, however, it had one drawback: while separating the phosphoric acid from the acid insolubles and precipitated solids, the silica associated with the fluosilicic acid reported to the solids as expected, the fluorine associated with the fluosilicic acid stayed with the phosphoric acid unexpectedly.
The dilemma proved to be short lived when PECO found that the fluorine is readily converted to hydrogen fluoride and easily liberated from the add. The hydrogen fluoride vapors are then recoverable as a concentrated solution or as aluminum fluoride. The market demands for hydrogen fluoride and aluminum fluoride are sufficient to absorb most of the hydrogen fluoride that could be produced by the phosphCite indllstry.
-The initial invention of the PECOJP 20 s HF Process occurred in August of 1989. This invention was registered with PECO's patent attorney of Dowell and Dowell in Washington DC. Mr. Ralph Dowell did a preliminary patent search and determined that this was definitely new technology and would not infringe on existing or past patents. The process then moved to a bench scale evaluation of the various chemical reactions and data obtained to design a continuous pilot plant. A continuous pilot plant was installed at PECO's research headquarters in Lakeland, Florida, and operated for some six months to verify the process on a pilot plant scale and to obtain data for design of a commercial unit. Samples of the material were obtained at the various stages throughout the operation and analyzed by third parties who indicated that the process chemistry was correct and the process technology viable.The bench scale testing and pilot plant operation of the P20/calcium fluoride portion of the PECO P 20/HF Process was conducted under a loan provided by the Florida Institute for Phosphate Research.
140
On July 20, 1992, the United States Department of Commerce Patent and Trademark Office issued a Notice of Allowance to PECO for thirtythree claims of the thirty-eight claims requested. The patent was formally issued on January 19, 1993. Based on this United States patent, foreign patents have been obtained in several critical countries throughout the world.
PECO has completed a Process Engineering Design Package (Front End Engineering) and a definitive capital cost for the first commercial installation of the PECO P 20/HF Process to be built and operated by PECO. The design basis for this facility is summarized in Table 3.
TABLE 3 Design Basics
FSA Consumed (100% Basis) 18,000
Plant Utility 7,440
P2OsProduced 15,635
CaF2 Produced 24,830
HF Produced (100% Basis) 11,250
Process Description
STPY HRSjYR
STPY
STPY
STPY
The PECO P ° /HF Process produces wet pro-2 S cess phosphoric acid by reacting phosphate rock and fluosilicic acid and subsequently recovering the fluorine as hydrogen fluoride is shown in Figure 3.
In the first step phosphate rock and fluosilicic acid are reacted and the resulting reaction slurry is filtered or centrifuged to separate the phosphoric acid and calcium fluoride, with a fluoride concentration of 12% to 15%, from the undigested rock and silica (Phosphoric Acid/Calcium Fluoride Production Area). In the final step hydrogen fluoride vapors are recovered from the silica free phosphoric acid and calcium fluoride. The vapors from this step are condensed to form a water solution of concentrated hydrogen fluoride (Hydrogen Fluoride Production Area). The phosphoric acid, having been separated from the hydrogen fluoride, is returned to the phosphoric acid plant for further processing. The concentrated hydrofluoric acid can either be sold directly or processed further using existing technologies to produce saleable fluoride salts.
The following description is of the first commercial PECO P20 s/HF Process currently under design.
Phosphoric Acid/Calcium Fluoride Production Area
The Phosphoric Acid/Calcium Fluoride Production Area for the PECO P20s/HF Process includes the following:
P20/CaF2Reaction System CaF 2 Separation and Concentration System
The process produces three times the quantity of P ° per unit of fluosilicic acid as compared to
2 S fl' d '1' other processes. In addition the uonne an Sl lca in the fluosilicic acid are precipitated as two different insoluble compounds which can be mechanically separated. Once the silicon dioxide has been removed from the phosphoric acid and calcium fluorIde, this stream is further processed into two product streams. Two thirds of the product phosphoric acid containing 19% P 20S on a solids free basis is exported to the wet process Phosphoric Acid Plant for further processing. The analysis of this product is give in Table 4. The second product stream, calcium fluoride/phosphoric acid slurry containing approximately 50% CaF 2 by weight with a fluorine to silica ratio of 100 to 1, is transferred to the Hydrogen Fluoride Production Area for conversion to hydrogen fluoride.
TABLE 4 Phosphoric Acid Typical Analysis
(Solids Free
P20 S CaO Al20 3 Fe20 3 MgO F S04 S102
Basis) %bywt 18.7 0.23 0.012 0.26 0.20 0.47 0.15 0.24
141
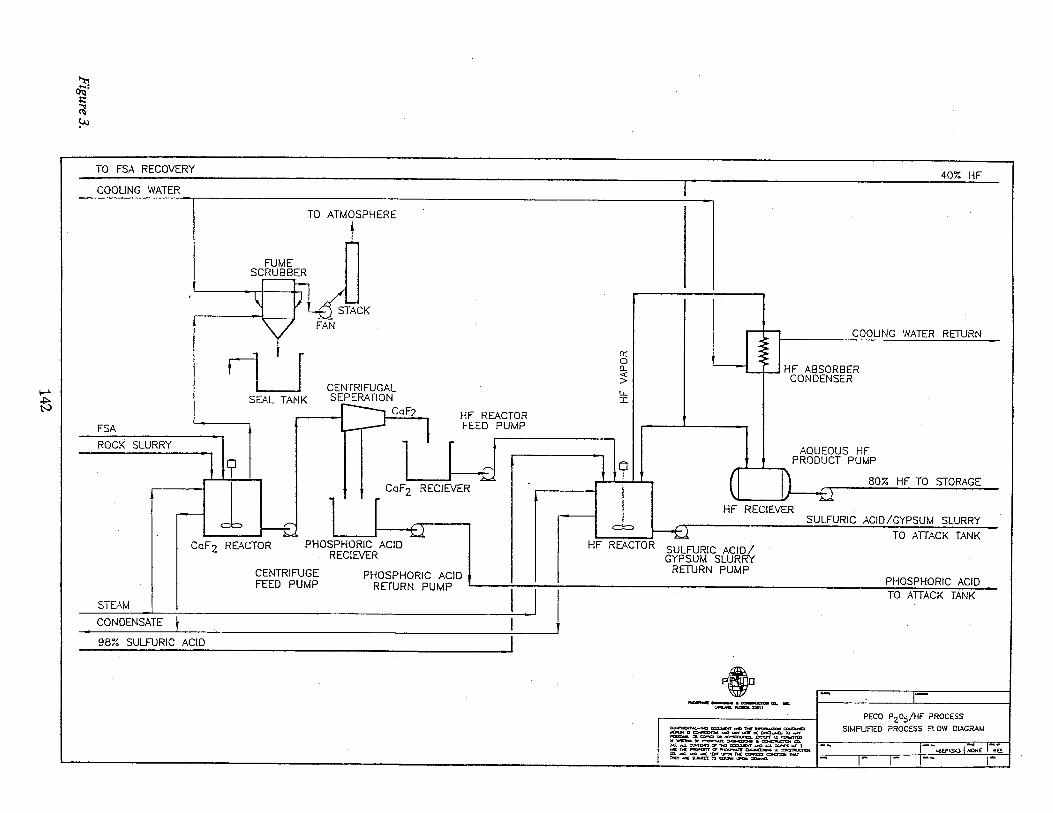
I-""
t3
~ ()Q" I:: ~ ~
TO FSA RECOVERY
COOUNG WATER
FUME SCRUBBER
TO ATMOSPHERE
.---__ " O14~cK
FSA
ROCK SLURRY
FAN
rLJ SEAL TANK
CENTRIFUGAL SEPERATION
lie
~ CaF 2 REACTOR
L-CaF2 HF REACTOR'
FEED PUMP
U-Jr CaF2 RECIEVER
r
-fI PHOSPHORIC ACID
RECIEVER
-
0:: o 0...
~ u.. :c
1 ~?
L
40% HF
rn COOUNG ':VATER RETURN
L-.I I- I HF ABSORBER '---f--I CONDENSER
AQUEOUS HF PRODUCT PUMP
~~ 80% HF TO STORAGE
HF RECIEVER SULFURIC ACID/GYPSUM SLURRY
TO ATTACK TANK HF REACTOR SULFURIC ACIO/
GYPSUM SLURRY RETURN PUMP
CENTRIFUGE PHOSPHORIC ACID t , PHOSPHORIC ACID
FEED PUMP RETURN PUMP I ~ TO ATTACK TANK
STE~M ,
CONDENSATE _I _
98% SULFURIC ACID
• ..... --.~QL, .. ~""-Jo»I'
~-nQ t:IXUooIDlI' _ ~ ~ c:otCUCD
otOIOta~.otG_'I~-=~TO",," ~=-c::rc::llt~D:::I:PT.u~
PECO P205/HF PROCESS
SIMPUflED PROCESS fLOW DIAGRAM
~~~~,,=!.,~~=, 1-' ,-- 1- . [--• ..... lit(~r1~~.~ .&.6E?'-GO NQf.lE at:! ~~~:.gr.-=~~ctNr.Dtnw _ 1_ 1- 1-- 1-

Phosphoric acid and calcium fluoride are produced by reacting phosphate rock and fluosilicic acid in a medium of phosphoric acid and calcium fluoride. The basic raw materials are 68 BPL (Bone Phosphate of Lime) ground phosphate rock slurry and 23% fluosilicic acid.
Phosphate rock is a complex material, the principal mineral constituent, fluorapatite, contains calcium, phosphate, fluoride, carbonate, and other elements or groups bound together in the crystal lattice. Secondary mineral constituents are organic matter and sand (silicon dioxide). When the rock is treated with a strong mineral acid, the apatite lattice is destroyed and the phosphate constituent is solubilized as orthophosphoric acid (HlO~. The overall chemical equation of the principal reaction between the phosphate constituent (CaiP04)J and fluosilicic acid (H2SiF
6) is as follows:
CaiPO~2+ H2SiF6 + 2H20 + Heat-> 2H3P04 + 3CaF2+ Si02
Additional side reactions are represented by the following equations:
CaC03 + 2Hl04-> Ca(HlO~2+ CO2+ H20 CaiPO~2+ 4H3P04-> 3Ca(Hl04)2 CaiPO~2+ 3H2SiF6-> 2H3P04+ 3CaSiF6
CaSiF6 + 2Ca(H2P04)2+ 2H20-> 4Hl04+ 3CaF2+ Si02
Normally 97% of the fluorine in the feed acid is converted to calcium fluoride and 90% of the P 205 in the rock feed is converted from a citrate insoluble form to a water soluble form. The reaction yields 1.83 pounds of calcium fluoride per pound of fluosilicic acid (100% basis) and 0.28 pounds of water soluble P 205 per pound of phosphate rock (dry basis) or 0.87 pounds of water soluble P 205 per pound of fluosilicic acid (100% basis).
After mechanically separating the phosphoric acid and calcium fluoride produced by the process from the silicon dioxide and undigested portions of the phosphate rock, over 85 percent by weight of the P 20 5 in the rock feed is recovered in the product phosphoric acid and calcium fluoride/ phosphoric acid slurry in a water soluble form.
Approximately 85.8% of the fluorine in the fluosilicic acid is recovered in the calcium fluoride/phosphoric acid slurry as calcium fluoride.
PECO P20/CaF2 Reaction System
The PECO P20./CaF2 Reaction System consists basically of a single reaction vessel with suitable agitation, heat exchanger, fume ventilation, raw material feed systems, and a reaction product surge and transfer system.
Calcium Fluoride Separation and Concentration
In the PECO P 20/HF Process the recovery of phosphoric acid and calcium fluoride is achieved through a two stage centrifugation step followed by a clarification step. The products having been separated from the waste products are further processed into phosphoric acid and calcium fluoride/ phosphoric acid slurry by centrifugal separation. The phosphoric acid is returned to the fertilizer complex for conventional processing while the calcium fluoride/phosphoric acid slurry is transferred to the Hydrogen Fluoride Production Area.
Hydrogen Fluoride Production Area
The calcium fluoride/phosphoric acid slurry produced in the phosphoric acid/calcium fluoride production area is further processed into a concentrated solution of hydrogen fluoride.
The Hydrofluoric Fluoride Production Area for the PECO P 20/HF Process includes the following:
HF Reaction System HF Absorption System
This facility is designed to produce 11,250 short tons per year of hydrogen fluoride (100% basis) operating 7,440 hours per year. The facility produces a concentrated solution of hydrofluoric acid containing 80% HF which is transferred to the Aqueous HF Storage and Shipping Area. The analysis of this product stream is given in Table 5.
143
TABLES Product by Typical Analysis
%bywt HF 80 pps 0.24 S04 0.24 Si02 0.94
Hydrogen fluoride is produced by reacting the calcium fluoride/phosphoric acid slurry with concentrated sulfuric acid (93% to 98% H
2SO J in a
medium of sulfuric acid/phosphoric acid and calcium sulfate. In the PECO P20/HF Process only 2.0 tons of sulfuric acid (100% basis) is consumed per ton of P 2 Os produced.
The overall chemical equation of the principal reaction between the fluoride constituent (CaF~ and sulfuric acid (H2SO J is as follows:
Additional side reactions are represented by the following equations:
Ca(Hl04)2 + H2S04 -> 2H3P04 + CaS04 CaSiF6 + H2S04-> SiF4 + 2HF + CaS04
Si02 + 4HF -> SiF4 + 2H20
In order to convert 95% of the calcium fluoride to hydrogen fluoride a stoichiometric excess of sulfuric acid is reacted with the calcium fluoride. Additional sulfuric acid is added to increase the sulfuric acid content of the liquid portion of the hydrogen fluoride reactor slurry. This results in an increase in the evolution of the hydrogen fluoride and a higher concentration of hydrogen fluoride in the vapors exiting the reactor. Approximately 0.63 tons of HF (100% basis) is produced per ton of FSA (100% basis). The excess sulfuric acid containing phosphoric acid and calcium sulfate is exported to the Phosphoric Acid Plant reactor for utilization of the sulfuric acid and recovery of the phosphoric acid. The PECO P20/HF Process requires only 4.65 tons of sulfuric acid (100% basis) per ton of HF (100% basis) be returned to the attack system.
PECO HF Reaction System
The PECO hydrogen fluoride reactor system consists basically of a single reaction vessel with suitable agitation, heat exchanger, vapor transfer, raw material feed systems, and a reactor product surge and transfer system.
Hydrogen Fluoride Absorption System
Hydrogen fluoride vapors produced in the HF Reactor are recovered in the absorption system by circulating a stream of aqueous hydrogen fluoride solution containing 80% hydrogen fluoride. The absorption system which consists of a falling film condenser, circulating tank, circulating pump, and a tail gas scrubber, is housed in a totally enclosed building which is vented to a fume scrubber.
40 % HF Utilization
A high purity aqueous hydrogen fluoride product containing 80% HF is exported from the facility. This material can be distilled to produce an anhydrous hydrofluoride suitable for conversion to high value fluoride products. The distillation process produces a 40% HF aqueous hydrogen fluoride solution containing the water and impurities present in the original 80% product. This dilute HF solution is returned to the PEeO P
20/HF
Process Plant for recovery. Alternatively, this material is available for use
in the fluosilicic acid recovery process within the phosphoric acid plant. Every pound of hydrogen fluoride contained in the 40% HF solution utilized for the recovery of fluosilicic acid results in a net recovery of 2.4 pounds offluosilicic acid (H2SiF
6,
100% basis). The utilization of the 40% HF solution allows the fluosilicic acid recovery process to be operated with sufficient excess of hydrogen fluoride to maintain the silicon dioxide in solution. The availability of this material allows for the recovery of concentrated fluosilicic acid from previously unavailable sources such as the phosphoric acid attack tank, flash cooler circuit, and fume scrubber. Heretofore these sources have been unavailable due to the precipitation of silicon dioxide.
144
The 40% HF solution available from the commercial installation can be used to eliminate the silicon dioxide precipitation problem and recover an additional 4,650 STPY of fluosilicic acid (100% basis) as a concentrated commercially valuable material. The use of this 40% HF solution results in a net increase in fluosilicic acid recovery of 25%.
Advantages of the PECO P205/HF Process to the Phosphoric Acid Complex Operation
Acid Quality
The PECO P20/HF Process provides an incremental increase in the production of phosphoric acid by profitably converting fluorine, a contaminant in acid water streams into a low impurity phosphoric acid.
Since this phosphoric acid produced by the PECO P 0 /HF Process is lower in impurities than normal 2phosphoric acid, the effect of blending them makes it easier to produce DAP of acceptable quality.
It is speculated that because of the rejection of impurities by the PECO P20/HF Process phosphate rock with very high impurity levels can be used in the PECO P20 s/HF Process.
Operating Factor
Amajor benefit of the PECO P 20S/HF Process to the phosphoric acid production facilities is that it is not an integral part of the overall production of phosphoric acid. Hence, the operation of the PECO P ° /HF Process is dependent on the op-2 S eration of the phosphoric acid plant while the phos-phoric acid plant operation is essentially independent of the operation of the PECD P 20 /HF Process.
Summary of Process Results
Fluosilicic acid can be reacted with phosphate rock to produce a nominal 19% P20sPhosphoric acid. Since phosphoric acid is produced by this process, relatively high levels of P 20S in the
fluosilicic acid raw material are acceptable. Consequently, the evaporators in the phosphoric acid plant can be operated in the same manner as when fluorine is not being recovered. In fact, P 20 S currently lost during the evaporation step would be recovered in the fluosilicic acid scrubbers and returned to the phosphoric acid plant in the acid produced by the PECO P20 s/HF Process.
Over 0.S7 tons of phosphoric acid is produced for each ton of fluosilicic acid fed to the system. The quality of the phosphoric acid produced has an impurities to P20 S ratio one-fourth of the current levels with a typical analysis of: 18.7% P
20
S'
0.23% CaO, 0.012% Al203, 0.26% Fe20 3, 0.20%
MgO, 0.47% F,0.15% S04' and 0.24% Si02. The PECO P20 s/HF Process consumes only
2.0 tons of sulfuric acid per ton of P20 sproduced as compared to 2.75 normally consumed by wet process phosphoric acid plants and returns only 4.65 tons of sulfuric acid per ton of HF produced.
Silica is separated from the fluorine such that the fluorine to silica ratio in the calcium fluoride/ phosphoric acid slurry is 100.
An overall recovery of 75% ofthe fluorine fed to the process as fluosilicic acid is recovered as an SO% hydrogen fluoride solution.
The hydrogen fluoride is produced as an 80% solution. Since this concentrated hydrofluoric acid is well above the 37% azeotrope, anhydrous hydrogen fluoride can be produced by distillation.
Existing technology currently practiced on a commercial basis can be used to produce anhydrous hydrogen fluoride, aluminum fluoride, and other fluoride salts from the concentrated hydrofluoric acid produced by the PECO P20/HF Process.
A 40% HF solution from the distillation process is available to be returned directly to the phosphate complex providing for a 25% increase in commercial strength fluosilicic acid recovery.
145
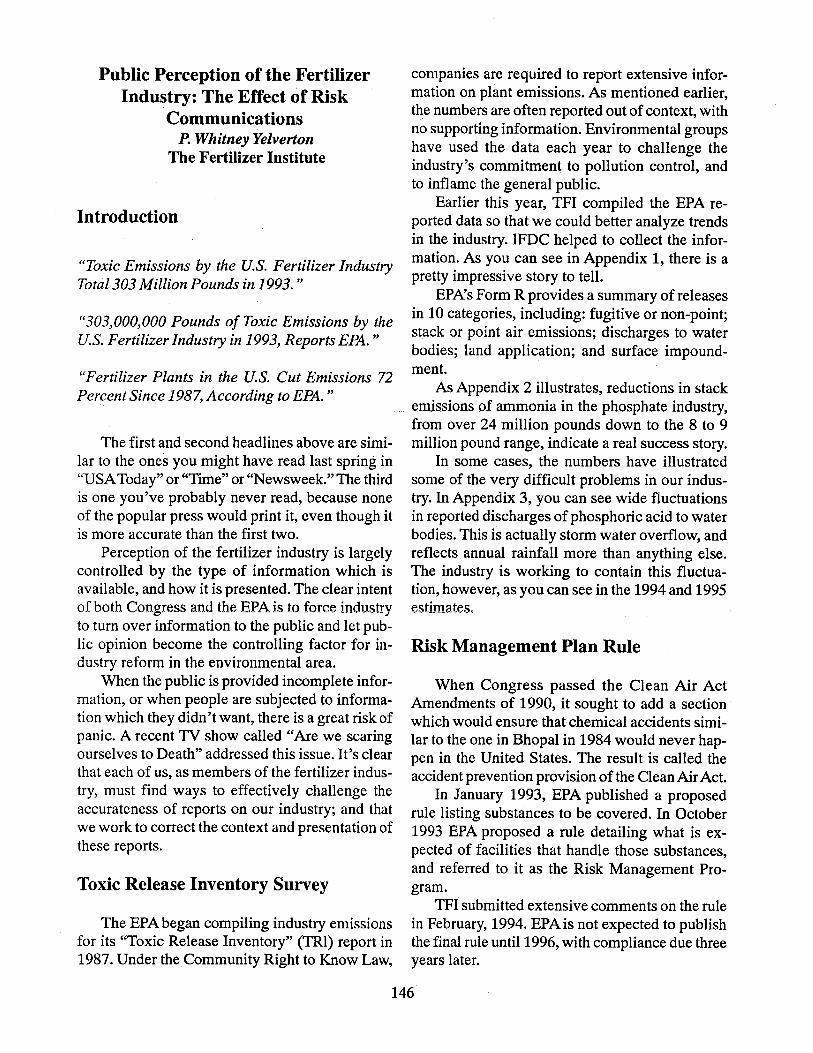
Public Perception of the Fertilizer Industry: The Effect of Risk
Communications P. Whitney Yelverton
The Fertilizer Institute
Introduction
"Toxic Emissions by the u.s. Fertilizer Industry Total 303 Million Pounds in 1993. "
"303,000,000 Pounds of Toxic Emissions by the u.s. Fertilizer Industry in 1993, Reports EPA."
"Fertilizer Plants in the u.s. Cut Emissions 72 Percent Since 1987, According to EPA. "
The first and second headlines above are similar to the ones you might have read last spring in "USA Today" or "Time" or "Newsweek." The third is one you've probably never read, because none n:f t'h~ 'I"'\{"\1"'\111.f] .... 1"\ .... ~ClC' ,'111"'\111,.11"\ .... ;nt;t A-":T.:::t.n thn1"1nh;t V..L LJ,...l'-' PVPU.l.u..I. y.l."""~~ .. V """"'.JoY Y.I..I.U, .. "'1., ,",Y,"".l.l UJ.V'"'5J..I..I.1.
is more accurate than the first two. Perception of the fertilizer industry is largely
controlled by the type of information which is available, and how it is presented. The clear intent of both Congress and the EPA is to force industry to turn over information to the public and let public opinion become the controlling factor for industry reform in the environmental area.
When the public is provided incomplete information, or when people are subjected to information which they didn't want, there is a great risk of panic. A recent TV show called "Are we scaring ourselves to Death" addressed this issue. It's clear that each of us, as members of the fertilizer industry, must find ways to effectively challenge the accurateness of reports on our industry; and that we work to correct the context and presentation of these reports.
Toxic Release Inventory Survey
The EPA began compiling industry emissions for its "Toxic Release Inventory" (TRI) report in 1987. Under the Community Right to Know Law,
companies are required to report extensive information on plant emissions. As mentioned earlier, the numbers are often reported out of context, with no supporting information. Environmental groups have used the data each year to challenge the industry's commitment to pollution control, and to inflame the general public.
Earlier this year, TFI compiled the EPA reported data so that we could better analyze trends in the industry. IFDC helped to collect the information. As you can see in Appendix 1, there is a pretty impressive story to tell.
EPA's Form R provides a summary of releases in 10 categories, including: fugitive or non-point; stack or point air emissions; discharges to water bodies; land application; and surface impoundment.
As Appendix 2 illustrates, reductions in stack emissions of ammonia in the phosphate industry, from over 24 million pounds down to the 8 to 9 million pound range, indicate a real success story.
In some cases, the numbers have illustrated some of the very difficult problems in our industry. In Appendix 3, you can see wide fluctuations ;n .,..~nl""\ .... tAr1 rI;C"r'thn. .... rroC'l 1""\.f''I''\h,......C'I_h_ ... ~_ ..... _!~ f-_ , .... J' ........ ~ .. .1..1.1. .l""pVJ. .. ""'" ,.u..:>\".r.lJUJ.5"".:t VL l'.lJ.V\:t,PJIV.l.lv a""'.lU LV vva .. ~.l
bodies. This is actually storm water overflow, and reflects annual rainfall more than anything else. The industry is working to contain this fluctuation, however, as you can see in the 1994 and 1995 estimates.
Risk Management Plan Rule
When Congress passed the Clean Air Act Amendments of 1990, it sought to add a section which would ensure that chemical accidents similar to the one in Bhopal in 1984 would never happen in the United States. The result is called the accident prevention provision of the Clean Air Act.
In January 1993, EPA published a proposed rule listing substances to be covered. In October 1993 EPA proposed a rule detailing what is expected of facilities that handle those substances, and referred to it as the Risk Management Program.
TFI submitted extensive comments on the rule in February, 1994. EPA is not expected to publish the final rule until 1996, with compliance due three years later.
146

The rule will affect all facilities which handle anyone of 140 regulated chemicals in quantities above threshold amounts. Anhydrous ammonia and aqua ammonia are on the list. The threshold quantity for ammonia is 10,000 pounds - just 5 tons.
The rule requires each covered facility to prepare a risk management program containing three major components.
1. A hazard assessment for each chemical, to determine the off-site consequences of an accidental release. The hazard assessment must determine a worst-case scenario, and provide a fiveyear history of accidental releases at the facility.
2. A program outlining how to prevent an accident. Many of the requirements for this section are similar to OSHA's process safety management rule. The section will include a process hazard analysis, process safety information, and audits of maintenance, safety and training programs.
3. An emergency response program. The program will include writing an emergency response plan, conducting training and drills, and coordinating with local emergency response agencies.
These components will then be combined and filed with the EPA, the local emergency planning commission, and the state emergency planning council.
TFI's Board of Directors has recognized the widespread impact the risk management rule will have on our industry. A task force has been formed with the objective of developing a framework which will assist fertilizer companies with RMP compliance. We hope to publish a manual next summer which will contain extensive information about RMP compliance.
Risk Communications and Public Image
Perhaps the most critical aspect of EPA's risk management plan is the challenge of risk commu-
nications to local communities. It's clear that the RMP will result in a flood of information abut release scenarios, hazard assessments, etc. The challenge of how to manage this information flow to the public without crippling our industry is a daunting one.
TFI has begun to collect some information about how we are viewed by the general public, as a part of the RMP program and other programs. Through the use of focus groups, we are analyzing how people feel about fertilizer use and manufacturing. This information will be useful in RMP, to help make risk information more understandable to the general public. We also hope the focus group analysis will help us in positioning other TFI programs.
Early results from two focus group, one in Milwaukee and one in Fairfax, Virginia have yielded some interesting observations, though no real surprises.
1. Few people have a detailed understanding of modern farming practices. With only a small portion of the population of our country involved in farming today, there is very little understanding of farming. Public image may'be driven more by "nostalgia" created from Grampa's stories or even from TV.
2. There is general anxiety about the health effects of current American eating habits. The groups articulated a concern for the cumulative effects of eating over-processed food, for example, as much as any concerns over chemical use in food production.
3. The terms "organic" and "natural" are viewed with great skepticism, and are seen as primarily marketing ploys.
4. Most people distrust the media, government, elected officials, politics, agribusiness, and big business.
Conclusion
Public image affects every aspect of our business today, from how we make the product, to how
147
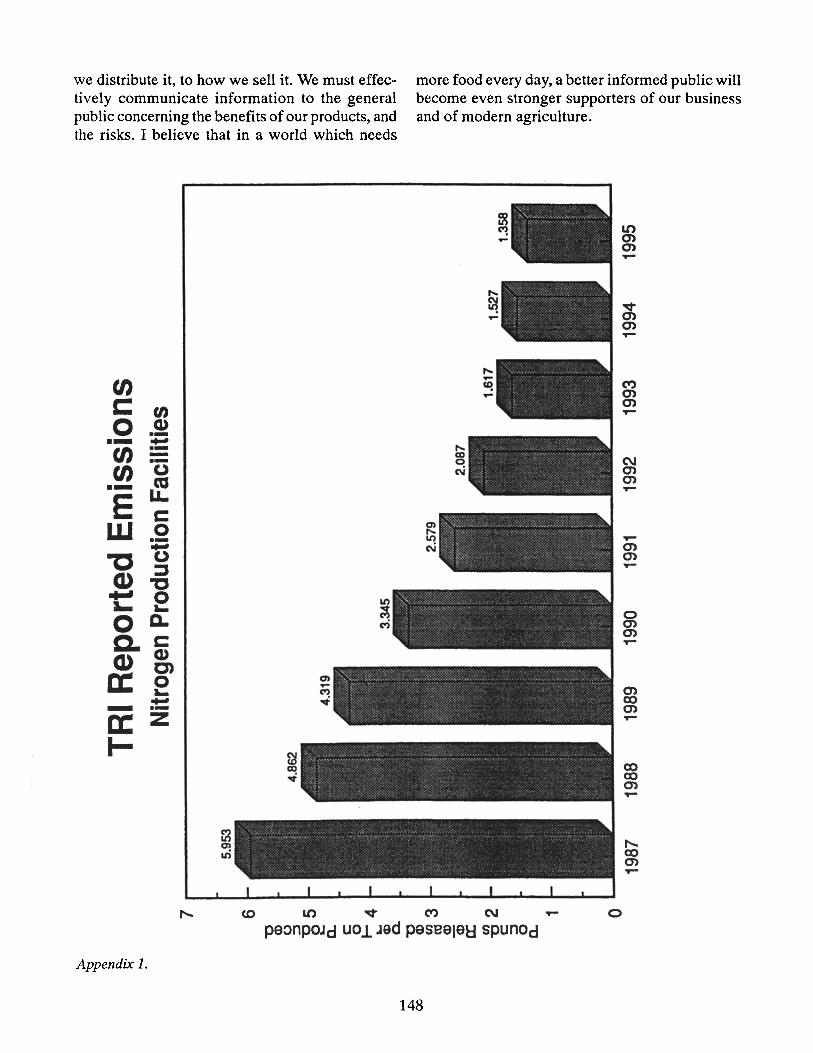
we distribute it, to how we sell it. We must effectively communicate information to the general public concerning the benefits of our products, and the risks. I believe that in a world which needs
en c: tJ)
0 CD ---- ... en -----en u CO --
E LL C
W 0 --... -C u
:::s Cl) " ... 0 ~ .. 0 D-
C. c Cl) CD
C) a: 0 .. ... - --a: z I-
more food every day, a better informed public will become even stronger supporters of our business and of modern agriculture.
C') 0) 0) ,...
C\I 0) 0) ,...
,... 0) 0) ,...
0 O) 0) ,...
0) eo 0) ,...
eo eo 0) ,...
it) v C') C\I ,...
paonpOJd U0.l Jed pasealaH spunOd
Appendix 1.
148
..... ~ \D
).
:g ~ ::: ~ ~ .
!'-J
30
25
{g 20 c:: ::l 0 0. 15 C 0 .--== 10 E
5
o
TRI Reported Emissions Phosphate Production Facilities
Stack Emissions of Ammonia
1987 1988 1989 1990 1991 1992 1993 1994 1995

~ VI 0
~ '15 ~ ;:s ~ ~.
~
en u c ::J a
TRI Reported Emissions Phosphate Production Facilities
Discharges to Water Bodies, Phos Acid 200-· -------=:::===~~--------------------------I
175.8
150
0.100 c a
:.= 0-
E 50
o 1987 1988 1989 1990 1991 1992 1993 1994 1995

Overview of Phosphorite Deposits in the Sirhan-Thrayf Basin, Kingdom of
Saudi Arabia James R. Herring
U.S. Geological Survey
Abstract
The Sirhan-Turayf Basin, which lies in the northernmost part of the Kingdom of Saudi Arabia, contains multiple deposits of phosphorite with resources estimated to be at least several billion tons. Phosphorite beds occur as the members of three formations ranging in age from late Cretaceous through Eocene. Recently, preliminary pre-qualification bids have been requested as one of the last steps prior to possible mining of the phosphorite deposit at Al Jalamid. According to recent feasibility studies, this deposit is able to sustain production of 4.5 Mt (megatons) of rock per year. Minable reserves of phosphate rock are estimated to be about 200 Mt. Phosphatic ore concentrate, after transport by truck or slurry pipeline toAl Jubayl, a port city on the Persian Gulf, would be processed into phosphoric acid then into diammonium phosphate fertilizer. The markets for product would include both domestic agricultural ~eed an.d export, ~ith the latter occurring principally mto AsIan countries. Several other phosphorite deposits exist in the Sirhan-Turayf Basin. In addition to the deposit at Al Jalamid, significant other deposits occur at Thaniyat, Sanam, and Umm Wual. These other deposits are undergoing preliminary characterization for resource tonnage and grade.
Introduction
There is a global need for continued supply of phosphate rock. Availability of the major agromineral phosphate, which supplies the bioessential mineral phosphorus, has a direct connection to world food supply. Phosphate rock is mined to produce the phosphatic fertilizers that are used to grow food needed by humans in the world today and in the future. Modeling the depletion of the known reserves and reserve base of phosphate rock based on various scenarios for increas-
ing population and future demand for phosphate shows that the presently known reserves and reserve base of phosphate rock will be depleted within the next 100 years (Herring and Fantel, 1993). The models use a 1.0 to 2.0 percent annual growth of demand for phosphate rock. These demand growth rates are possibly conservativeother studies forecast much higher demand growth rates, and the 3D-year record of phosphate rock production shows an exponential, annual demand growth of 4.2 percent. Using the present rate of population growth combined with a stasis scenario (1. 7 percent growth; global population stabilization by 2040; phosphate demand stabilization in 2050). known reserves are depleted within 42 years and reserve base within 84 years from present. These results do not forecast the exhaustion of global phosphate resources; new discoveries or ~own, lower-grade deposits can be used but likely WIth greater development or production costs. Nonetheless, the ineluctable conclusion in a world of continuing phosphate demand is that society, in order to extend phosphate rock reserves and res~rve base beyond the approximate 100 year depletion date, must find additional reserves and/or reduce the rate of growth of phosphate demand in the future. Society must: (1) increase the efficiency of use of known resources of easily minable phosphate rock; (2) discover new, economically-minable resources; or (3) develop the technology to economically mine the vast but currently uneconomic resources of phosphate rock that exist in the world. Otherwise, the future availability of present-cost phosphate, and the cost or availability of world food will be compromised, perhaps substantially. Toward this end, the phosphatic rocks in Saudi Arabia may play an important role in the near future supply of phosphate rock.
Phosphatic sedimentary rocks of the SirhanTurayf Basin, located in the northernmost part of the Kingdom of Saudi Arabia (figure 1), are part of a belt of similar-age, phosphatic rocks that occur across the northern part of Africa from Morocc? to the ~iddle east. This complex of phosphatic rocks IS part of the depositional system that occurred at the southern margin of the Tethys O~ean from latest Cretaceous through early Eocene (fIgure 2). The phosphatic units of this system are
151

generally thought to have occurred as shelf to slope, marine clastic deposits that were enriched in phosphate because of local- to regional-scale upwelling of nutrient-rich waters along the ocean margin. Phosphatic depositional episodes coincide with major oceanic transgressions during this time interval. Depositional analogs in Jordan and Egypt are discussed, respectively, by Abed and Fakhouri (1990) and by Glenn (1990).
The history of discovery and exploration of the phosphatic deposits in Saudi Arabia stems from extrapolation of the occurrence of similar units in Jordan and Iraq to the north. Phosphorite has been mined for several decades in Jordan, about 200 km west of the A! Jalamid area. In 1965, Sheldon (1965) suggested and demonstrated the continuance of similar phosphatic units in the SirhanTurayf Basin.
Geology of Deposits
Stratigraphy of the deposits and the general geology of the part of the basin are described by Meissner and others (1989, 1990). TheA! Jalamid phosphorite deposit occurs in a barren, featureless section of the northernmost part of the basin, about 20 to 40 km south of the border with Iraq. At the Al Jalamid deposit, phosphorite occurs in the Thaniyat member of the Jalamid Formation (figure 2). The member averages about 17 m in thickness throughout the deposit. The Thaniyat member also occurs in the southwest part of the basin (Berge and Jack, 1990).
The phosphatic Ghinah member of the Mira Formation overlies the Thaniyat member. The Ghinah member comes to the surface of the basin--or effectively to the surface but remains covered by a Quaternary duricrust of a few m thickness-about 10 km west of the A! Jalamid area. The unit can be seen directly in drill cores, but in the field it can only be mapped by inference based on the occurrence of phosphatic float on the duricrust surface. The Ginah member also is exposed in the central (A! Amud area) and southwest parts of the basin.
The youngest phosphatic unit in the basin is the Arqah member of the Umm Wual Formation. It occurs, for example, on both flanks of the Umm
Wual graben, about 100 km west of the A! Jalamid area. West of this area the unit thickens to 40 m but underlies 100 m of other strata (Meissner and others, 1989). The unit also occurs in the Wadi Rushayda area in the center of the basin. Exposures here are minor, however; it only occurs at the edges of or in windows through the regional basalt cover.
Geologic structure plays only a minor role in the disposition of phosphatic units in the basin. The A! Jalamid area lies near the axis of a 100 km-wide, southeast and gently plunging structure known as the Ha'il Arch. Phosphatic beds occur only on the west flank of this arch; on the east flank these same beds, if they ever existed, have been eroded as the present ground surface uniformly and gradually declines toward the Persian Gulf. On the west flank of the arch, there is little structure, and the rock units appear as if in a monocline with a nearly flat but slight southwest dip of only 0.5°. The Arqah member in the northern part of the basin is interrupted by the Umm Wual graben, which a northwest-trending structure about 10 km in width. Extent of downdropping in the graben center is uncertain. However, this structure does not appear to have affected the placement of the Arqah member other than to have imposed a discontinuity in the unit. In the Thaniyat and Sanam areas of the southwest part of the basin, northwest trending local faulting breaks up depositional units of the Thaniyat and Arqah members. In the Thaniyat area, these units occur on the elevated part of a regional plateau bounded on the south by the Thaniyat escarpment. There is no phosphorite south of this escarpment, and the units are only Mesozoic or older. In the Sanam area, the phosphatic units occur at or near tops of erosional remnant hills in the Wadi A! Fayha region.
Subsequent Alteration
Post-depositional alteration of the deposits, during diagenesis or lithification or from other external factors such as weathering, has had an important but varied influence on the lithologic composition of these phosphatic deposits. The deposit at A! Jalamid serves as a useful example. The upper part of the Thaniyat member, which is
152
the stratal unit that is considered for mining, has 1-3 m of friable phosphorite without appreciable carbonate in the matrix overlying 3-5m of indurated phosphorite with a carbonate-rich matrix. The friable phosphorite has a higher grade of P 20 5'
Underlying the indurated phosphorite is the lower part of the phosphorite of the Thaniyat member. This lower phosphorite is enriched in MgO and, for this reason, is not being considered for mining at this time. The friable phosphorite portion has resulted from solution weathering by groundwater and is perhaps a geologically recent phenomenon. The upper indurated phosphorite is thought to originally have contained dolomite that subsequently has been removed through processes of weathering and dedolomitization. This latter process results from an oxidation of sulfur, either from organically-bound material or sulfide minerals in the sediment, to sulfate ion in the pore water, which then corrodes and leaches Mg-containing mineral. Without Mg, the matrix recrystallizes as reasonably pure calcium carbonate. In contrast, the lowermost phosphorite has been little affected by these processes. The different compositions of these three parts of the Thaniyat member illustrate important different processes of diagenesis and lithification and, especially of post depositional alteration from weathering and ground water interaction with the phosphate rock. How these processes have affected phosphatic units in other parts of the basin will determine in large part the ore nature and quality of the phosphorite and whether the resources might be mined.
Commodity Estimates
Total phosphate rock resources for the SirhanTurayf basin may well exceed 10 Ot (billion tons) of phosphate rock with a bulk, average P 205 content of ~19 percent. However, all but about 2 Ot of these may occur in deposits that, because of remoteness, grade, thickness, or localized extent, are unlikely to be mined in any present to immediately foreseeable economic climate. Resources inventoried by Riddler and others (1990) for the remaining areas, AI Jalamid, Umm Wual, and Thaniyat, are shown in Table 1. The indicated resources for the Umm Wual region include 23 per-
cent of those resources in the north part of the region with an average P20 S grade of21 percent and an overburden ratio of 10:1, whereas the remainder of the resources has a lower average P 205 grade of 18 percent but also has a shallower, more economically favorable strip ratio of 2.5: 1. The other phosphatic area of interest in the southwest part of basin, Sanam, lies about 75 km southwest of the Thaniyat area and contains exposures of Thaniyat member phosphorite at or near the tops of several erosional remnant hills that are immediately south of the Thaniyat Escarpment. Bed thickness of the phosphatic portion of the Thaniyat member are up to 12 m and overburden ratios are generally small, usually <2:1. This area may contain 40 Mt ofP20 5 as inferred resources may exist here assuming an area of 10 x 10 km, a remnant coverage of the landscape of 10 percent, an average thickness of 8 m, and an average P20 S grade of 20 percent. Davis and others (1991) suggest a similar number for the phosphatic resources in the area. The shallow overburden thickness provides a considerable advantage to mining of these latter resources in that they easily could be exposed and mined using a bulldozer to scrape off the overburden and work the phosphatic strata.
Recommendations for Further Characterization
Much resource information is lacking for proper resource of the phosphate rock deposits in the Sirhan-Turayf Basin. Further exploration and drilling characterization of the type used at the deposit at AI Jalamid would definitely benefit understanding of the resources of the phosphate deposits in the basin. Unfortunately, this scale of exploration, especially of an extensive drilling and coring effort, has an accompanying relatively high cost. However, there are less expensive alternative exploration techniques that would still provide useful information if a more extensive effort cannot be mobilized. Trenching and auguring provide inexpensive field characterization techniques and alternatives to expensive drilling and coring. Use of a bulldozer or backhoe with an auguring attachment would be suitable for characterizing many of these areas. These exploration and char-
153
acterization techniques have minimal personnel support requirement and preclude a drill crew with required support vehicles and facilities. In most cases outcrop location and bed thickness would be revealed by these techniques even when there is a duricrust cover of a few m thick over the strata.
There are several provinces within the basin that would benefit from further exploration and field sampling to characterize phosphate rock resources. There are localities in the center part of the basin, notably the area referred to as Al Amud, that, while they often contain deposits several m thick and are sometimes composed of excellent P20S grade, are unfortunately localized in extent. They would benefit from further exploration characterization only in a climate of greater interest in phosphatic deposits. Riddler and others (1990) estimate these resources to be 800 Mt of phosphate rock but with an overall average grade of <20 percent. Furthermore, the phosphatic units often are buried under thick overburden, which can include basalt cover of several tens of m thickness. Average strip ratio for these deposits is 14:1 (table 1).
The obvious deposits for immediate further characterization are, in order of priority: extensions of the known deposit at Al Jalamid, the deposits on both sides of the Umm Wual graben, deposits in the Sanam area, and deposits in the Thaniyat area. In the case of the deposit at Al Jalamid, the search for additional Thaniyat deposits should be continued to north and northwest of the deposit proposed to be mined. The occurrence of phosphatic float on the surface and favorable phosphate shows in existing drilling records and core indicate the presence of additional resources in the immediate area. The relative absence of dense drilling patterns in these outlier areas allows for the existence of possible deposits of similar size to the known deposit. Initial exploration could be done by inexpensive trenching if soil and overburden rock thicknesses do not exceed 2 m. Auguring would be able to sample units to 20 or 30 m depth, well within the economically recoverable range. Alternatively, an infilling and exploration drilling plan should be carried out up to 40 km northwest of the main deposit. Sampling of the material should include P20 S content for assessment of grade and tonnage, overburden ratios, and
major element characterization of the phosphatic units for Mg, Fe, and Al.
In addition to exploration for new deposits of extensive, thick phosphatic units, further study also should include sampling of these deposits to characterize chemistry and concentrations of elements that might compromise mining, processing, or phosphoric acid manufacture. Lithologic characterization should include bulk mineralogy, especially carbonate, silicate, carbonate cement, and clay type and concentration. Chemical characterization should include Fe, Mg, Al, and the trace element suite of U and Cd.
There are additional phosphatic resources at the Al Jalamid deposit. Specifically, the lower phosphatic unit of the Thaniyat member should be extensively resampled in the area of the proposed mine where it is relatively rich in MgO. One or more of the existing shafts into the Thaniyat member in the area of the proposed mine could be deepened for this project. The purpose of this sampling would be to obtain several tons of material that could be used for various bench scale beneficiation tests for MgO-rich phosphorite. The ultimate goal would be the development of a beneficiation technique that would economically process MgO-rich phosphate rock. Development and availability of such a technique in the near future would add considerably to the reserves of the proposed Al Jalamid deposit and could alter the proposed mine plan of this main deposit in a way to better extract all phosphatic resources.
A thick sequence of the phosphatic part of the Thaniyat member, averaging 6 m but ranging upward to 12 m, exists in the Sanam area, especially at localities in the southern part of the Wadi AlFayha area. The area had a series of trenches dug by hand (Farasani and others, 1991) followed by excavation of the unit in 6 localities by bulldozer. Understanding of the phosphorite unit in this area would benefit from an e"tension of this relatively low-cost exposure technique. Re-sampling of the existing trenches recently provided composite samples of about 10 to 15 kg of the phosphatic sediment, excluding interlayered chert units. These samples presently are being analyzed for PO,
. d' I 2 5 major, an mmor e ements including trace ele-ments of concern. In addition, sufficient material
154
was obtained to run small-scale beneficiation tests on the samples to resolve considerations of mineralogy and cementation that would be important to subsequent mining and processing of the phosphate resources. Finally, these samples are intended for paleontologic investigations that might resolve biostratigraphic age questions and help understand possible differences in depositional environment for the Thaniyat member between localities at A! Jalamid and the southwest portion of the Sirhan-Turayf basin.
Aspects of Ore Quality
In most cases uranium is not likely to be of concern in the production of phosphoric acid from the phosphatic rocks of the Sirhan-Turayf Basin. There are some localized enrichments of uranium to 400 ppm in the phosphorite and some isolated occurrences of visible uraniferous-vanadiferous minerals within the phosphate-enriched units, but analytical values for uranium in most units are not large enough to indicate concern. 1Ypical uranium concentration values for the Thaniyat member are s100 ppm. Within the Thaniyat member, there is a slight vertical trend in uranium concentration with smaller concentration values occurring toward the top of the member. This likely reflects leaching from post-depositional weathering that has left the rock more friable by removing carbonate and simultaneously leached some of the soluble uranium from the ore.
Production Considerations
Transportation to processing facilities of mined phosphate rock concentrate in the Sirhan-Turayf basin will be a major logistic consideration. The deposit at A! Jalamid lies approximately 1300 km from the port city of A! Jubayl on the Persian Gulf where the phosphate fertilizer plant complex is to be located. Options being examined for the transport of phosphate ore concentrate to this complex are slurry pipeline and truck transport along the Trans Arabian Pipeline highway. Other deposits in the basin are even more remote from the proposed fertilizer manufacturing complex. One pos-
sible solution to for these other deposits in the basin is to explore cooperative joint projects with Jordan, which might facilitate development and processing of remote deposits, especially those in the western portion of "the basin. In the Sanam and Thaniyat areas, phosphate rock processing facilities in Jordan are much closer by nearly a thousand km than any fertilizer manufacturing facilities that are being considered for development in Saudi Arabia.
There are ore considerations of production for the phosphorite deposits of the Sirhan-Turayf Basin that need to be pursued. These include ways to economically beneficiate the phosphate pellets from a variety of enclosing matrices, including calcite and/or chert matrix. Processes currently considered for this beneficiation include crushing and flotation. Another difficulty is MgO content. Conventional processing techniques in the phosphoric acid industry encounter difficulty when MgO content of the concentrate are exceeds more than about one-half percent. Further processing experimentation will have to be conducted to develop ways to beneficiate the high MgO portion of the Thaniyat member if it is to be mined.
Overview/Summary/Conclusion
Sufficient deposits of phosphorite occur within the Sirhan-Turayf Basin to allow the kingdom to become a producer of phosphate rock at a level of at least several million tons per year. Preliminary feasibility studies have been completed for the deposit at A! Jalamid, which is estimated to be able to sustain production of 4.5 Mt per year of phosphate rock with an average grade of 20 percent P20 S' Phosphatic concentrate, after transport by truck or slurry pipeline to A! Jubayl, a port city on the Persian Gulf, would be processed into phosphoric acid then into diammonium phosphate fertilizer. The markets for product would include both domestic agricultural need and to export, with the latter occurring principally into Asian countries. Other phosphorite deposits within the basin are potentially minable, especially those at Umm Wual.
155
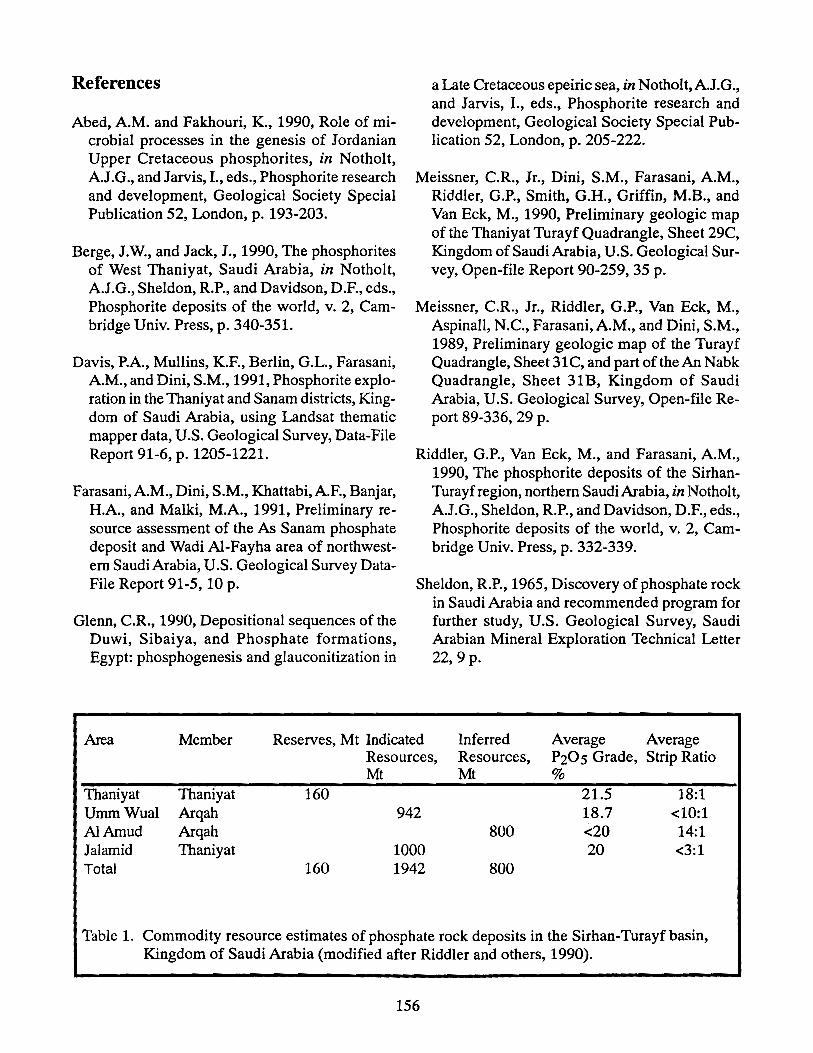
References
Abed, A.M. and Fakhouri, K., 1990, Role of microbial processes in the genesis of Jordanian Upper Cretaceous phosphorites, in Notholt, A.J.G., and Jarvis, I., eds., Phosphorite research and development, Geological Society Special Publication 52, London, p. 193-203.
Berge, J.W., and Jack, J., 1990, The phosphorites of West Thaniyat, Saudi Arabia, in Notholt, A.J.G., Sheldon, R.P., and Davidson, D.F., eds., Phosphorite deposits of the world, v. 2, Cambridge Univ. Press, p. 340-351.
Davis, P.A., Mullins, K.F., Berlin, G.L., Farasani, A.M., and Dini, S.M., 1991, Phosphorite exploration in the Thaniyat and Sanam districts, Kingdom of Saudi Arabia, using Landsat thematic mapper data, U.S. Geological Survey, Data-File Report 91-6, p. 1205-1221.
Farasani, A.M., Dini, S.M., Khattabi, A.F., Banjar, H.A., and Malki, M.A., 1991, Preliminary resource assessment of the As Sanam phosphate deposit and Wadi Al-Fayha area of northwestern Saudi Arabia, U.S. Geological Survey DataFile Report 91-5, 10 p.
Glenn, C.R., 1990, Depositional sequences of the Duwi, Sibaiya, and Phosphate formations, Egypt: phosphogenesis and glauconitization in
a Late Cretaceous epeiric sea, in Notholt, A.J.G., and Jarvis, 1., eds., Phosphorite research and development, Geological Society Special Publication 52, London, p. 205-222.
Meissner, C.R., Jr., Dini, S.M., Farasani, A.M., Riddler, G.P., Smith, G.H., Griffin, M.B., and Van Eck, M., 1990, Preliminary geologic map of the Thaniyat Turayf Quadrangle, Sheet 29C, Kingdom of Saudi Arabia, U.S. Geological Survey, Open-file Report 90-259, 35 p.
Meissner, C.R., Jr., Riddler, G.P., Van Bek, M., Aspinall, N.C., Farasani, A.M., and Dini, S.M., 1989, Preliminary geologic map of the Turayf Quadrangle, Sheet 31 C, and part of the An Nabk Quadrangle, Sheet 3IB, Kingdom of Saudi Arabia, U.S. Geological Survey, Open-file Report 89-336, 29 p.
Riddler, G.P., Van Eck, M., and Farasani, A.M., 1990, The phosphorite deposits of the SirhanTurayf region, northern Saudi Arabia, in Notholt, A.J.G., Sheldon, R.P., and Davidson, D.F., eds., Phosphorite deposits of the world, v. 2, Cambridge Univ. Press, p. 332-339.
Sheldon, R.P., 1965, Discovery of phosphate rock in Saudi Arabia and recommended program for further study, U.S. Geological Survey, Saudi Arabian Mineral Exploration Technical Letter 22,9 p.
Area Member Reserves, Mt Indicated Inferred Average Average Resources, Resources, P20S Grade, Strip Ratio Mt Mt %
Thaniyat Thaniyat 160 21.5 18:1 UmmWual Arqah 942 18.7 <10:1 AlAmud Arqah 800 <20 14:1 Jalamid Thaniyat 1000 20 <3:1 Total 160 1942 800
Table 1. Commodity resource estimates of phosphate rock deposits in the Sirhan-Turayf basin, Kingdom of Saudi Arabia (modified after Riddler and others, 1990).
156
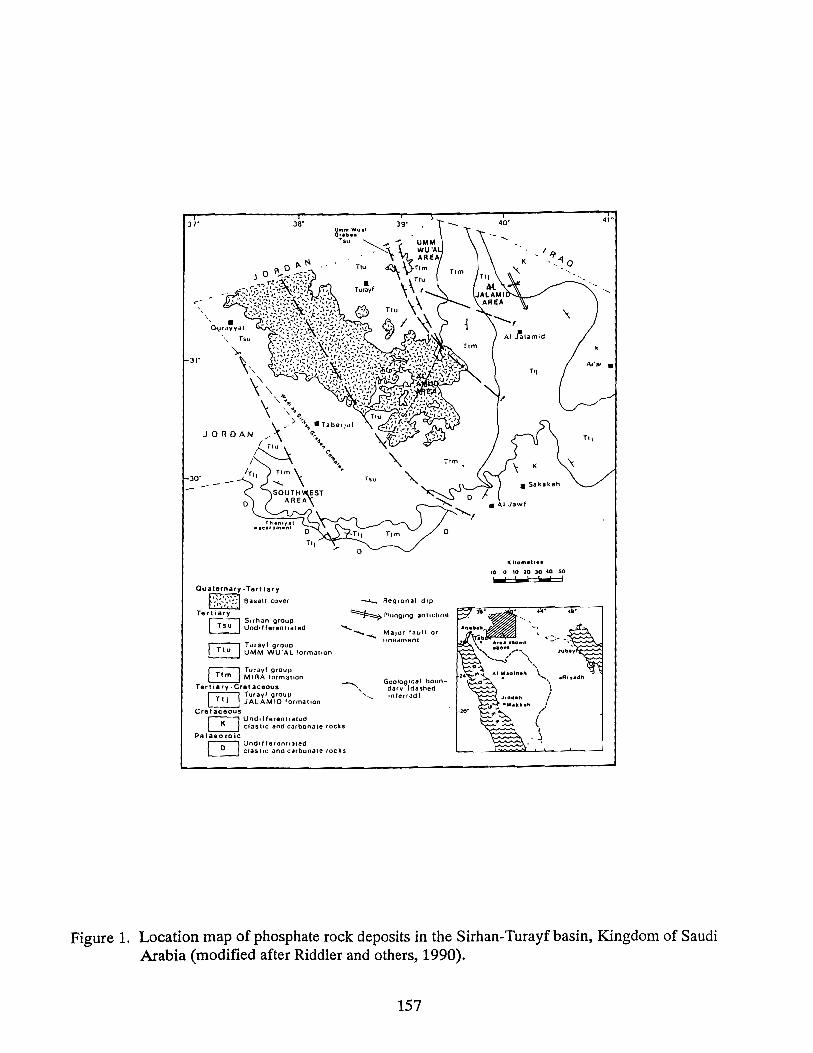
31' la'
31'
30' --
Ouaternary ·Tertiary
r.'~"(";;"·1 BaSilI1 cover :" ...... -~ Tertiary
r-:;:::-] Sirhan group ~ Und.ffetenl,atad
r:;;::-,- Turayf group ~ UMM WU·Al 'ormatIon
r:;::-::; Tu:ayf group ~ MIRA formation
TerU.ry. Cret aC80US
~ Turay' 9tOuJ,J ~ JALAMID formation
Cret aeeous
Urnm WUI' Gra.b."
T$U
o
39'
~ Regl()nal dip
~P!lIoglOg JntlclUl$
'-... ........ Malor fault or lineament
Geological boundary tdas;,ed Inferred I
r-;;--, Undl fferenllated ~ clastic and carbonate rocks
Palaeozoic r-;::;--, undl t ferBnflaled ~ CfaSlic and carl)Qnate (ocks
40'
• Sakakah
.4.1 Jawf
I(llom.".'
'0010 2Q 30 40 .so low! low! .... -j
4'"
Til
Figure 1. Location map of phosphate rock deposits in the Sirhan-Turayf basin, Kingdom of Saudi Arabia (modified after Riddler and others, 1990).
157

TIME INFORMAL NOMENCLATURE
MEMBER seD
SHIHIYjlH "-15+m
MUOANNA COQUINA
u .... INU 'At.
TIU TARaAH t.S-1Im
HAMAD 2o.5_eo*'m
Z RUSHAYDA COQUINA
~ ALAMUD MA'DA COOUINA I- S-.. ;J1.$m w I-
W 3 AAOAH Z , PHOSPHORITE ~ 2 .. 21m
53
SIB 8O .. 1.s+m ..
~ -... --,. MIRA ...
Tim ,. ~ TURAYF MINDASSAH
fi 0 .. .48m
I!! LEGEND,
.... 1 .. , HAWSA ~ DotomlHe limestone
~ '0 .. "_
~ LImestone
l: GHINAH
~ Fisslhll Shale ... PHOSPHORITE 5-20.5m
ARUS t:-=i Clavston•
fL..~ Shale
GHUZAV CJ S01ndttono
w + + + + Calcite·Coarse M'SSf'i8
~ KUWAYKA8AH + +.
0-80m <- - + ... II II Calcite- Vem :3 • ~ J>\t.AMtO ... Calc.te.VYQ
T'I OUTAYFAH - -Chert .. 8eOded - Cheft· Nodular
•• 000 Pellet,. Phosphaltc rock tiP·,/, • THANIYAT (J (J BIoclastic· BIValve
PHOSPHORITE (J (J q(J Gastropod « O .... Om
Nummulite
Q Geode
Phosphate
Figure 2. Stratigraphy of strata including phosphatic members in the Sirhan-Turayf basin, Kingdom of Saudi Arabia (modified after Riddler and others, 1990).
158
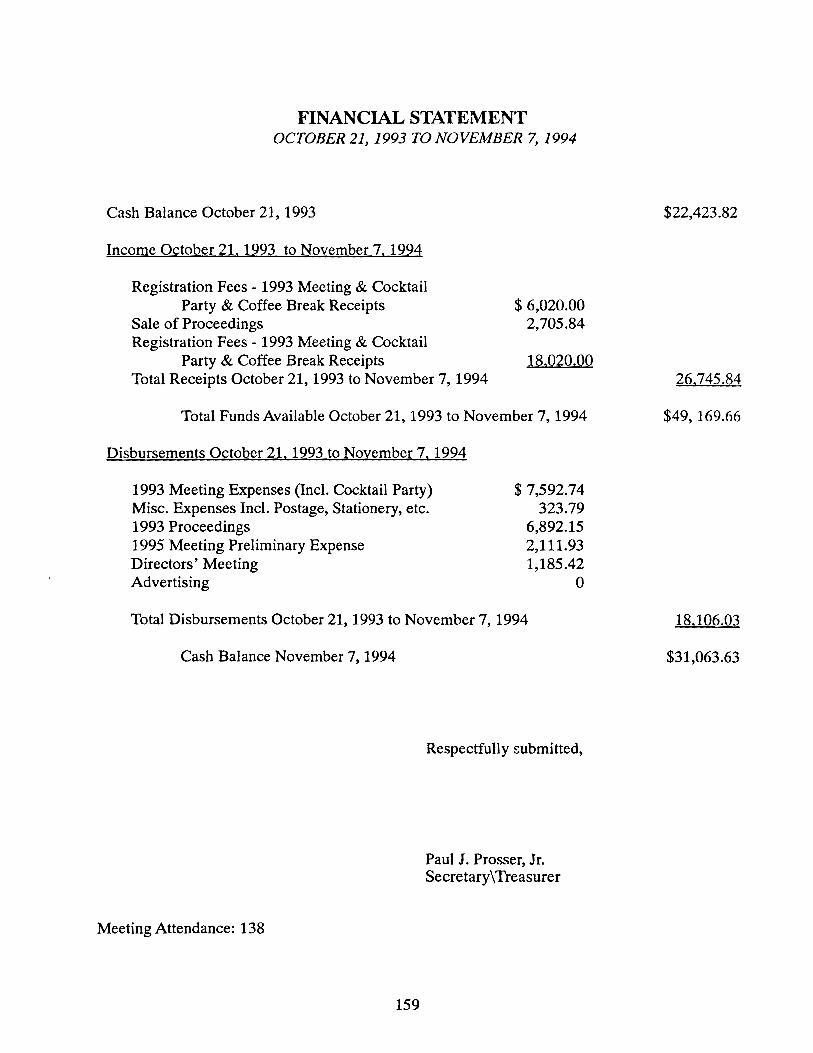
FINANCIAL STATEMENT OCTOBER 21,1993 TO NOVEMBER 7, 1994
Cash Balance October 21, 1993
Income October 21. 1993 to November 7.1994
Registration Fees - 1993 Meeting & Cocktail Party & Coffee Break Receipts
Sale of Proceedings Registration Fees - 1993 Meeting & Cocktail
Party & Coffee Break Receipts Total Receipts October 21,1993 to November 7, 1994
$ 6,020.00 2,705.84
18.020.00
Total Funds Available October 21,1993 to November 7,1994
Disbursements October 21.1993 to November 7,1994
1993 Meeting Expenses (IncI. Cocktail Party) Misc. Expenses Incl. Postage, Stationery, etc. 1993 Proceedings 1995 Meeting Preliminary Expense Directors' Meeting Advertising
$ 7,592.74 323.79
6,892.15 2,111.93 1,185.42
o
Total Disbursements October 21,1993 to November 7, 1994
Cash Balance November 7,1994
Meeting Attendance: 138
159
Respectfully submitted,
Paul J. Prosser, Jr. Secretary\ Treasurer
$22,423.82
26,745.84
$49,169.66
18.106.03
$31,063.63