
Proceedings of 2012 Annual Meeting of the Academy of ...
311
Sacred Heart University DigitalCommons@SHU SHU Conference Publications 2012 Proceedings of 2012 Annual Meeting of the Academy of International Business-US North East Chapter: Business Without Borders Academy of International Business. US North East Chapter Jing'an Tang, ed. Sacred Heart University, [email protected] Follow this and additional works at: hp://digitalcommons.sacredheart.edu/conferences Part of the Economics Commons , and the International Business Commons is Conference Proceeding is brought to you for free and open access by DigitalCommons@SHU. It has been accepted for inclusion in SHU Conference Publications by an authorized administrator of DigitalCommons@SHU. For more information, please contact [email protected]. Recommended Citation Academy of International Business. US North East Chapter and Tang,, Jing'an ed., "Proceedings of 2012 Annual Meeting of the Academy of International Business-US North East Chapter: Business Without Borders" (2012). SHU Conference Publications. Paper 1. hp://digitalcommons.sacredheart.edu/conferences/1
-
Upload
khangminh22 -
Category
Documents
-
view
3 -
download
0
Transcript of Proceedings of 2012 Annual Meeting of the Academy of ...
Sacred Heart UniversityDigitalCommons@SHU
SHU Conference Publications
2012
Proceedings of 2012 Annual Meeting of theAcademy of International Business-US North EastChapter: Business Without BordersAcademy of International Business. US North East Chapter
Jing'an Tang, ed.Sacred Heart University, [email protected]
Follow this and additional works at: http://digitalcommons.sacredheart.edu/conferences
Part of the Economics Commons, and the International Business Commons
This Conference Proceeding is brought to you for free and open access by DigitalCommons@SHU. It has been accepted for inclusion in SHUConference Publications by an authorized administrator of DigitalCommons@SHU. For more information, please contact [email protected].
Recommended CitationAcademy of International Business. US North East Chapter and Tang,, Jing'an ed., "Proceedings of 2012 Annual Meeting of theAcademy of International Business-US North East Chapter: Business Without Borders" (2012). SHU Conference Publications. Paper 1.http://digitalcommons.sacredheart.edu/conferences/1
Proceedings of
2012 Annual Meeting of the
Academy of International Business-US North East Chapter October 11 – 13, 2012 Fairfield, Connecticut
Business without Borders
Host John F. Welch College of Business
Sacred Heart University
Conference Co-Chairs
Khawaja Mamun, Ph.D. Jing’an Tang, Ph.D.
Sponsors Temple CIBER UConn CIBER

ii
2012 ANNUAL MEETING OF THE ACADEMY OF INTERNATIONAL BUSINESS-US NORTH EAST CHAPTER Proceedings of the 2012 Academy of International Business-US North East Chapter Fairfield, Connecticut, October 11-13, 2012. Editor: Jing’an Tang, Sacred Heart University Copyright 2012 © Sacred Heart University The proceedings were prepared from materials supplied by the authors. In case of errors and omissions, please contact the respective author.
iii
FOREWORD
The expression used to be, “if America sneezes, the world catches a cold,” to indicate America’s place in the world economy. But changes in the global environment have been so dramatic that the expression could go “if any country sneezes, the world catches a cold.” A relatively small country like Greece can suffer financial problems and the world economy is shaken for over a year. A tsunami in Japan, an earthquake in China, or floods in Thailand can disrupt well-crafted supply chains and create havoc in companies all over the world, not just the areas impacted. Restraints on credit in one area of the world can cripple demand and lead to a recession that shakes the planet. The disruptions that every business and every country faces are now more quickly and pervasively felt. We are indeed experiencing Business without Borders. In the meantime, echoing with Dr. Ghemawat’s (2008, 2011) seminal research on international business, we also observe that while business and commerce is more closely connected and efficiently executed around the world than at any time, the playground where international businesses take place is far from “flat” yet, which makes “managing differences across national borders” one of the core challenges faced by international business scholars as well as managers. With the call to enhance our understanding of this disconcerted phenomenon: Borderless Business in a Bordered World (fragmented playground), the 2012 Annual Conference of the Academy of International Business–US Northeast Chapter (AIB-NE) brings together scholars as well as practitioners around the world to Fairfield, Connecticut from October 11-13, 2012. Organized by the John F. Welch College of Business of the Sacred Heart University, the conference centers on the presentation of the newest ideas and work in progress in the field to an international audience. The conference will host 75 competitive papers from 12 countries with majority of them being focused on the opportunities and challenges to global business environment. The conference program includes twenty-three sessions, five plenary sessions, three panel discussions and two keynote speeches. We wish to thank President Dr. John Petillo at Sacred Heart University, Provost and Vice-President of Academic Affairs Dr. Laura Niesen de Abruna at Sacred Heart University, Member of the Board of Trustee Murray Martin, Dean of John F. Welch College of Business Dr. John Chalykoff, Associate Dean of John F. Welch College of Business Dr. Rupendra Paliwal for their unconditional support in organizing this Conference. We are also indebted to Academy of International Business – Northeast chapter president Prof. Mohamad Elahee at Quinnipiac University for his guidance, patience and support. Special thanks to Prof. Yasin Ozcelik at Fairfield University for the website support. We also like to thank Vice President for Marketing and Communications Michael Iannazzi, Director of Special Events and Community Relations Ann Miron, Executive Director of Public Relations Funda Alp, Registrar Assistant Joe Beleznay and Assistant to the WCOB Associate Dean, Deb Lauria for their logistical support. A very special thank-you to the Director of Student Experience Sean Heffron, at John F. Welch College of Business for always doing the heavy-lifting with a big smile on his face. Graduate assistants Olivia Kiraly and Amanda Remy and all the other students who helped us with this event deserve our special appreciation. Our special thanks to the UConn CIBER and Temple CIBER for their support as the co-sponsors of this event. We also extend our thanks to Northwestern Mutual for their generous support. Finally, our gratitude to all the contributors, invited speakers, the track

iv
chairs, discussants, and the reviewers. This conference wouldn’t have been possible without their help. We hope that you will enjoy the 2012 AIB-NE conference as well as the crisp fall air and the colorful foliage. Khawaja Mamun, Ph.D. & Jing’an Tang, Ph.D. Conference Co-chairs, 2012 AIB-NE John F. Welch College of Business Sacred Heart University
v
PROGRAM TRACKS & CHAIRS
• Accounting Challenges in Global Economy Karen Cascini, Sacred Heart University
• Business Ethics, Corporate Governance & Social Responsibility
Andra Gumbus, Sacred Heart University
• Doing Business in China Zhen Pan, Nanjing Normal University
• Emerging Markets
Steven Chang, Long Island University
• Entrepreneurship & Business Innovations Vishal Gupta, Binghamton University
• Global Supply Chain and Operations Management
Omar Salgado, ITESM, Mexico
• International Economics and Economic Development Hiranya Nath, Sam Houston State University
• International Finance, Financial Services and Financial Markets
Abu Amin, Sacred Heart University
• Management of Global Workforce Carrie Picardi, Sacred Heart University
• Marketing in Digital Age
Iryna Pentina, University of Toledo
• The Network Organization and Information System Kittipong Laosethakul, Sacred Heart University
• Organizational Behavior and Leading Across Cultures
Michael Zhang, Sacred Heart University
• Pedagogical Challenges in Teaching International Business Saeb Al Ganideh, Al Zaytoona University, Jordan
• Strategic Issues in Global Business
Crystal Jiang, Bryant University

vi
REVIEWERS
• Thomas Abbott, Post University
• Mohamad Asgari Ghods, University of Tehran
• Narendra Bhandari, Pace University
• David Borker, Manhattanville College
• Chen-ho (Mike) Chao, City University of New York
• Olga Chapa, University of Houston
• Valerie Christian, Sacred Heart University
• John Christie, Southern New Hampshire University
• James Clarke, University of Queensland
• Cheryl Crespi, Central Connecticut State University
• Roberto Curci, Butler University
• Jay Dahya, Baruch College - The City University of New York (CUNY)
• Izzet Darendeli, Temple University
• Mohinder DUGAL, Western Connecticut State University
• Kwamie Dunbar, Sacred Heart University and
• Monique Durant, Central Connecticut State University
• Joseph Farhat, Central Connecticut State University
• Margaret Goralski, Quinnipiac University
• Alka Gupta, Binghamton University
• Andy Hao, University of Hartford
• David Hartman, Quinnipiac University and
• Suthikorn Kingkaew, Thammasat Business School
• Mark Lennon, Frostburg State University and
• Lirong Liu, Sam Houston State University
• Christopher Marquette, Central Connecticut State University
• Carmen Martinez-Lopez, City University of New York
• Raymond Mataloni Jr., Bureau of Economic Analysis
• Hiranya Nath, Sam Houston State University and
vii
• A Ben Oumlil, Western Connecticut State University
• Hedda Pahlson-Moller, Sacred Heart University
• Rupendra Paliwal, Sacred Heart University
• Richard Pate, Sacred Heart University
• Christopher Richter, Southern New Hampshire University
• Christopher Robertson, Northeastern University
• Isabel Ruiz, University of Oxford
• Seyed mohammad, hossein sadr
• Omar Salgado, Tecnologico de Monterrey
• Wenguo Shen, Sun Yat-sen University
• David Taylor, Sacred Heart University
• Carlos Vargas-Silva, University of Oxford
• Yingjing Wang, Nanjing University of Science and Technology and
• Mike Wilman, Southampton Solent University
viii
AWARDS
Best Paper Award
“Job Satisfaction Determinants: A study across 48 nations”, by Jeanine Andreassi, Sacred Heart University; Leanna Lawter, Sacred Heart University; Martin Brockerhoff and Peter Rutigliano, Sirota Consulting
Best Student Paper Award
“The Impact of Social Ties on Mutual Fund Proxy Voting”, by Paul Vincent Calluzzo, Rutgers Business School
Best Reviewer Award Hiranya Nath, Sam Houston State University
ix
TABLE OF CONTENTS
“ The Path of Measuring Moral Courage in the Workplace” Olga Chapa, University of Houston – Victoria; Rebecca Gonzalez, University of North Carolina at Pembroke and Donna Stringer, University of Houston - Victoria
1
“Globalization Effects on Business Relationships of BRIC Based Firms” Christopher Lawrence Richter, Southern New Hampshire University and John Philip Christie, Southern New Hampshire University
10
“Do U.S. Students Cheat More or Less Than Their Counterparts Around The World? A Multicultural Inquiry” Sameer Vaidya, Texas Wesleyan University; Jason B. MacDonald, Boise State University
25
“Antecedents of Problem-solving Cross-cultural Negotiation Style: Some Preliminary Evidence” Robert L Engle, Quinnipiac University; Mohammad N. Elahee, Quinnipiac University and Ekrem Tatoglu, Bahcesehir University
33
“National Culture and leadership Style in a Multi-cultural Environment: the Luxembourg Case” Petra Garnjost, University of Applied Science, Germany ; Stephen M. Brown, Sacred Heart University Jeanine K. Andreassi, Sacred Heart University
49
“Silicon Valley Index and its Significance for Modernization Demonstration Area Planning in Southern Jiangsu” Xiaoran Hu, Southeast University and Chengyang Xie, Southeast University
74
“Interactive pedagogical techniques: Effective teaching tools in varied learning modalities” Thomas Abbott, Post University
80

x
“The cultural Path Dependence in the Process of Chinese SOEs’ “Going out”--On the basis of the discussion of some typical cases” Yingjing Wang, Nanjing University of Science and Technology and Hanhui Hu, Southeast University
87
“The Spring Festival Effect: Evidence from Chinese Shares Traded in the U.S.” Congsheng Wu, University of Bridgeport; Ji Zhang, University of Bridgeport; Zhen Cong, University of Bridgeport and Pei Zhang, University of Bridgeport
95
“The Impact of Interest Rate Future on the Underlying Interest Rate Market in India” Manish Sinha, Symbiosis Centre for Management and Human Resource Development
101
“An Alternative Resource-Based View of New Product Development: the case of IC Industry” Shiu-Wan Hung, National Central University Daw Ma, Chung-Hua Institution for Economic Research
112
“Global Public Private Partnership: Analogical Reasoning Model between the Food and Beverage Industry and the Pharmaceutical Industry” Hyuk Kim, Lourdes University
125
“Characteristics and Performance of Foreign Direct Investment in Retails Trade: The Case of Japanese Firms” Jianping Liang, Sun Yat-sen University; Jing’an Tang, Sacred Heart University;d Ben Shaw-Ching Liu, Quinnipiac University
143
“Don't Forget The Non - Plateaed! Some Insights on Stress, Organizational Citizenship Behaviors and Coping” Carrie S. Hurst, Tennessee State University; Kenneth Kungu, Tennessee State University and Phyllis Flott, Tennessee State University
163
“A Strategic Approach to International Training: A Contingency Based Global Training Model” David Ole Hartman, Quinnipiac University and Mohammad Elahee, Quinnipiac University
177
xi
“Job Satisfaction Determinants: A study across 48 nations” Jeanine Andreassi, Sacred Heart University; Leanna Lawter, Sacred Heart University; Martin Brockerhoff and Peter Rutigliano, Sirota Consulting
193
“Human Resource Development in Macao: Exploring Regional Policy and Strategy” Zenon Arthur Siloran Udani, University of Macau
216
“Development of intercultural skills in workers involved in technology transfer teams” Omar Salgado, EGADE Business School, Tecnológico de Monterrey; Jose Carlos Ramírez-Sanchez, Volkswagen de Mexico; Jerry Banks,
Engineering School, Tecnológico de Monterrey; Yongjiang, Shi and Helen, Zhang, Institute for Manufacturing, University of Cambridge
234
“Survive In The Price War: Growth Strategy For Online Individual Entrepreneurship In China” Wei Zhao, Business School of Nankai University and Hao Yu, Business School of Nankai University
257
“Relationship between Students’ Grades and School Year and their Intention for Entrepreneurship: Some Pioneering Findings” Narendra C. Bhandari, Pace University
268
“IPOs’ Earnings Quality in Emerging Capital Markets” Alireza Daneshfar, University of New Haven; Bita Mashayekhi, Tehran University and Elham Hasani-Azar, Tehran University
277
“Invisible Discrimination: Employers & Social Media Sites” Richard Pate, Sacred Heart University
286
1
THE PATH OF MEASURING MORAL COURAGE IN THE WORKPLACE
Olga Chapa
University of Houston – Victoria [email protected]
Rebecca Gonzalez
University of North Carolina Pembroke Country [email protected]
Donna Stringer
University of Houston – Victoria [email protected]
ABSTRACT The purpose of this study is to conduct the third validation and purification of a bravery scale to be included as part of a larger study, the development of a scale used to measure moral courage. Given the significance of bravery within the construct of courage and by extension moral courage, a study of this kind is necessary since there are no valid and reliable scales developed to date to measure the construct. We report the findings of each step, including two prior data collections. Furthermore, the second and third data collection stages include participants that require courage every day to fulfill their job responsibilities and duties, fire fighters.
Keywords: scale development, bravery, courage, moral courage, firefighters
INTRODUCTION
Ethics scholars have renewed our interest to explore theoretical underpinnings and measures in the construct of courage (Sekerka, Bagozzi & Charmigo, 2009). The problem with studying courage is the fact that there is no consensus of the definition. Rate, Clarke, Lindsay and Sternber (2007) alone cite 29 different definitions demonstrating the lack of overall agreement. Common among the definitions is the appearance of fear, which must be experienced when taking physical, psychological or moral risks (Lopez, O’Byrne & Petersen, 2003; Pury, Kowalski & Spearman, 2007; Putman, 1997). The individual motivated by purpose overcomes or copes with the fear and is able to perform a heroic or difficult task thereby presumed courageous (Hannah, Sweeney & Lester, 2007; Rate et al., 2007).
Attempts to create and validate instruments to measure courage in various contexts are not new in the literature (Larsen & Giles, 1976; Peterson & Seligman, 2004; Pury, Kowalski & Spearman, 2007; Schmidt & Koselka, 2000; Woodard, 2004). As for moral courage, Sekerka et al. (2009) measured moral courage in military organizations and summarized other previous attempts to measure courage. Alas, there is a lack of reliable and valid measures; however,
2
earlier studies have produced certain potential correlates (i.e., risk-taking), which have contributed to the study of courage (Peterson & Seligman, 2004).
Beyond the psychological breakthroughs the measurement of courage may facilitate, organizations may want to measure courage for ethical purposes (Sekerka et al., 2009). Moral courage would enable an individual to act ethically, despite the fear of others’ opinions. This type of courage exceeds physical heroic deeds and exists in the development of true self-respect mirroring higher values (Peterson & Seligman, 2004). Measuring courage as a pre-employment evaluation can help organizations in the selection process by ascertaining whether the applicant demonstrates the courage, and by extension, the moral courage, to deal with ethical decisions (Maddi, 2007; Sekerka et al., 2009).
This manuscript answers calls for research into the construct of courage in an occupational context (Barrett, Palomsky & McDaniel, 1999; Cooper, 1995, Lusa, Häkkänen, Luukkonen & Viikari-Juntura, 2002; Moran 2001; Weick, 1996) and the scale development literature (Churchill, 1979; DeVillis, 1991; Spector, 1992). We describe the attempts to continue the validation and purification of a scale intended to measure bravery as part of a larger construct, moral courage. The scale has undergone three stages of validation and purification with findings suggesting that self-sacrificing and risk taking behavior as measured by the bravery construct may play a role in the construct of moral courage.
THE STUDY
Participants
The uniqueness of the studies has been the sample of participants, comprised of a large number of fire fighters. It is not the intention of the authors to make firefighters a proxy for courage. However, firefighting has been correlated with courage since the nineteenth century, and before, in one form of literature or another (Cooper, 1995; Pury et al., 2007). Courage evolves where conditions of threats or danger are present, a constant in the firefighting occupation (Fingfeld, 1999). We take an explicit theoretical approach to the measurement of the construct measuring those people performing tasks presumed to measure courage (Peterson & Seligman, 2004; Rate et al., 2007).
Moreover, consider the three main types of risks cited in the literature: physical, psychological and moral. Emergency responder literature is filled with empirical data and studies detailing the physical and psychological risks firefighters may experience. Occupational characteristics include risking their lives and limbs, and experiencing extreme levels of physiological anxiety and stress given the horrific scenes they are exposed to when performing their duties (Beaton & Murphy, 1995; Burke, 1998; Lusa et al., 2002; Moran, 1998; Regehr, LeBlanc, Jelly & Barath, 2008; Regehr, LeBlanc, Jelly, Barath & Daciuk, 2007; Smith, Manning & Petruzzello, 2001). As per moral risks, firefighters live within a strict code of conduct requiring moral courage (Cooper, 1995; Putman, 1997).
3
Procedure
This study took place in four phases: 1) a literature review and qualitative study of fire fighter focus groups to generate the items; 2) first quantitative collection of data from firefighters and laypeople; 3) second quantitative purification from a sample comprised of volunteer and paid firefighters and 4) third purification from samples of firefighters. Procedures as described by DeVillis (1991) and Spector (1992), and Churchill’s (1979) basic steps of developing self-reported measures guided this study. The steps are: (1) specify the domain of the construct; (2) generate a sample of items from surveys, insight, and literature search; (3) collect the initial data; (4) purify the measure and assess reliability; (5) collect new data; (6) repeat steps 4-7; (7) collect new data; and, (8) repeat steps 4-7.
Stage 1: Focus Groups and Generation of Items Step 1: Specify Domain. To insure proper sampling of the construct domain and improved scale development, focus group informants were selected based on their profession as firefighters. One of the authors interviewed two focus groups (males). These interviews were filmed to ensure no loss of valuable data. The participants were asked to discuss their profession, beginning with the reason they aspired to become fire fighters in the first place. In both sessions (lasting up to 5 hours), the other firefighters would further the discussions (although not asked to) by speaking of their experiences. These discussions resulted in repeated comments and enough data to proceed to the next stage of item generation. Stage 2: Item Generation. The initial item construction is necessary to ensure the validity of the measurement scale (Nunnally, 1978). The primary concern in item generation is the assessment of content validity, adequately reflecting a content domain of interest using deductive or inductive approaches (Churchill, 1979; DeVillis, 1991; Hinkin, 1995). The items used in this study were generated using both approaches. Although scales have not been fully developed to measure bravery within the context of this study, a deductive approach is followed by drawing from the literature and the vast array of definitions for bravery. The theoretical definition of the construct for this study is: performing an act or task without regard to one’s physical or psychological safety in spite of the dangers and risks it poses. Through inductive logic, a researcher focuses on the respondents’ perceptions of their experiences and arrives at a unified theory (Strauss & Corbin, 1990). The systematically developed categories derived from the participants’ statements form a theoretical framework, which helps explain the phenomena of interest (Strauss & Corbin, 1990). Ensuring rigor in qualitative research is done with a different set of criteria than quantitative research (Shah & Corley, 2006). Whereas quantitative research has criteria regarding Construct validity, internal and external validity and reliability, qualitative research uses criteria for construct validity, credibility, transferability and dependability. Further, qualitative research addresses concerns about the interview by issuing protocols related to interview, task, and respondent effects. The qualitative data analysis from focus groups comprised of firefighters generated items based on individual responses (Hinkin, 1995). Griffin and Hauser (1993) suggest stopping the interview process for item generation after repetitive ideas or statements. This occurred during the second focus group interview. Twenty-two bravery items, plus three questions from Templer’s (1970) Death Anxiety scale and six questions from Parker and DeCotiis’ (1983) Job
4
Stress scale (included for construct validity purposes) comprised the entire instrument. Additional demographic questions were included. Special care was placed on the wording of the scale items (i.e., reverse-score items) to avoid an area of increasing concern in the literature. Although negatively worded items do not reveal major problems, item loadings for reverse-scored items tend to be lower (Hinkin, 1995). The item generation process resulted in a pool of 31 items used in additional analyses. A concern reported in the scale validation process is the number of items. Too many items may cause a hesitance to complete the survey and too few, albeit internal consistency can be obtained with a very small sample, may lack content and construct validity (Hinkin, 1995). Analyses report Cronbach α = 0.65, above the 0.60 recommended by Nunnally (1978). The final step in this stage was to seek the advice of experts to determine the content validity of the initial items as recommended by Churchill (1979). An Assistant Fire Chief, an eight-year volunteer firefighter, and a research design academician were recruited. In addition to their expertise in their respective fields, they were given the definition of courage used for the study and asked to check the relevancy of each item in relation to what it was intended to measure. If any item is determined not to be an appropriate measure of courage by the experts, it would not be included in the initial data collection. However, the initial item pool was deemed appropriate for further exploratory research and this step was not necessary. Stage 2: First Data Collection. Step 3: Collect initial data. Participants. Participants for the first phase of the study were recruited from fire stations and from the general adult population resulting in 155 surveys used in further analyses. One of the authors and university students, who were recruited to collect data, were the primary data collectors in this stage. Extra credit was used as an incentive. Interviewers were instructed to request firefighters’ participation and to stop the collection and leave immediately in the event of an emergency call. No emergency calls occurred during the interviews. None of the interviewers reported non-responsive locations. Both methods required some form of identification on the surveys and randomly selected for verification purposes. The same procedure was followed for the data collection of the general public. Participants were relatively young, 75% under the age of 35, reporting marital status of 60/40, single and married, respectively. The number of surveys collected surpassed the one-to-four ratio (participants - number of items) considered suitable for multivariate analysis in scale development procedures (Hinkin, 1995). Twenty-seven items remained in the final instrument. Step 4: Purify the measure and assess reliability. Exploratory Factor Analysis. An exploratory factor analysis using Maximum Likelihood and Oblimin rotation (assuming correlations) as suggested by Gerbing and Anderson (1988) and Spector (1992) was performed on the data collected from both firefighters and the general adult public. Since this is an exploratory study, items loading above 0.35 were selected for further analysis (Costello & Osborne, 2005). The initial 22 bravery items were reduced to 14 items with factor loadings ranging from 0.36 to - 0.66 forming a three factor structure (Fearless, Self-Sacrifice and Risk Taking Behavior) with acceptable reliability coefficients: 0.76, 0.61, and 0.73, respectively. Using the Kaiser-Guttman approach, eigenvalues of one were deemed acceptable. Furthermore, the scree plot confirmed the three factor structure. The three factors explain helped explain 46% of the total variability in bravery in this analysis. Reliability for the three factor structures was reported as 0.72 suggesting redundancy and that the scale can be utilized for further refinement (Nunnally, 1978; Peterson, 1994). Goodness of fit statistic is significant (p = < 0.000) with a X2 = 129.735. Examples of the items loading into the three factors follow:
5
Factor 1: “I would not hesitate to stop and help people even though there may be dangerous flames at any moment”, “A scene involving dead, decomposing bodies will not bother me if I have a job to do”, and “I will finish a task regardless of the danger if that is what I get paid to do” (6 items: α = 0.76).
Factor 2: “I would be willing to experience horrific things if it meant I could help someone”, “I will risk my life if it meant saving someone I cherish”, and “People should avoid situations that may be dangerous” (4 items: α = 0.61).
Factor 3: “Even though bungee jumping is dangerous, I would like to participate in the sport”, “I sometimes like to do things that are frightening”, and “I would like to try thrilling activities like sky diving” (4 items: α = 0.73).
Stage 3: Second Collection of Data Step 5: Collect new data. In order to further test for unidimensionality, a confirmatory factor analysis was performed (Gerbing & Anderson, 1988). The evaluation of the data can confirm the proposed structure of the bravery scale as determined by the exploratory analysis (Ohanian, 1990). The second set of data resulted in 174 usable questionnaires. The population was predominately male (88%) and single (63%), all having at least a high school education, with reported incomes ranging from less than $12,000. Step 6: Confirmatory Factor Analysis and Internal Consistency. The second data set was utilized to evaluate whether the new data would confirm the proposed structure of courage as determined in the exploratory stage (Ohanian, 1990). We explored a confirmatory factor analysis (LISREL 8) to verify the proposed model (Jöreskog, 1993). All of the items were included in the survey. The number of participants (n = 174) and item ratios were found to be in order in this analysis as well (Hinkey, 1995). Fifteen of the original 22 items with loadings from 0.33 to – 0.77, α = 0.69 resulting in two factors, with reliabilities of 0.69 and 0.62, respectively. The original 14 items from the Phase I results were present, with one additional item labeled “Trust”. KMO results were significant at 0.71; goodness of fit was significant accounting for 45% of the variability in bravery explained by the two factors. Similar scales developed to measure courage report similar variances. Woodard’s (2004) four factor solution explained 39% of the variance in courage. The identified model produced a two construct model: Self-Sacrificing (α = 0.77) and Risk Taking Behavior (α = 0 .80). Eight factors loaded on the factor Self-Sacrificing and five factors loaded on the Risk Taking factor, with loadings ranging from 0.39 to -0.94. The model, without constraints, improved the model fit: X2 = 61.93, p= < 0.00, X2/df = 1.99, well below the par of <3, recommended by Kline (1998). Other indices were: Steiger-Lind RMSEA Index of 0.076, Bentler-Bonet Non-Normed Fit Index of 0 .88, a Jöreskog Adjusted Good of Fit Index (AGFI) of 0.88 and a CFI of 0.93. Step 7: Assess validity 7a) Content/face validity. A series of validation studies were conducted to verify that the scale behaved as predicted and measures what it is designed to measure as reported in the item generation section. 7b) Criterion validity. An important part of construct validity refers to the fact that hypothesized constructs such as courage should be related to other constructs, forming the nomological net for that set of constructs (Churchill, 1979; DeVillis, 1991; Newell & Goldsmith, 1997). Based on logical theory, we derived three hypothesized relationships between courage and other hypothesized variables, which should be related.
H1: Bravery will be positively correlated with the willingness to sacrifice one’s life to risk their lives for someone they cherish. (0.61)

6
H2: Bravery will be positively correlated with the willingness to risk one’s life and not hesitate to help regardless of dangerous flames. (0.77)
H3: Bravery will be positively correlated with the enjoyment of thrilling and dangerous activities (0.74).
Predictive validity. In predictive validity, we assess the degree to which a test can predict the success of the individual in a future situation (Gay & Diebl, 1992). We theorize that a measure of bravery should be able to predict how a person feels about spending large amounts of time away from the responsibilities of other roles in order to fulfill their duties (job stress). An ANOVA statistical analysis showed predictive validity at a significant level (p = < 0.000), R = - 0.29, R2 = - 0.08. The hypothesized relationship was supported.
Convergent validity. In convergent validity, we examined the degree to which the factors correlated with each other. It is hypothesized that they will converge at a significant level. The results showed a positive correlation between the two factors (r = 0.37: p = < 0.01)
Concurrent validity. Gay and Diebl (1992) state that utilizing the discrimination method of establishing concurrent validity involves determining whether the scores can be used to discriminate between persons who possess a certain characteristic and those who posses the characteristic to a greater degree. For instance, an item is included that measures whether the respondents believe that volunteering is stupid (-0.154, p = < 0.05) and that they want to help in risky situations but cannot (-0.178, p= < -0.01). As hypothesized both correlated in a negative direction with establishing concurrent validity.
Discriminant validity. Discriminant validity was assessed for the Courage scale by running a structural equation model and constraining the correlation between the two constructs to 1 (Anderson & Gerbing 1988, Fornell & Larcker, 1981). The model fit increased the chi-square to 84.71 and the RMSEA to 0.095. The model without the constraints improved the model fit substantially (X2= 61.93, p = < 0.001, RMSEA = 0.076, NFI = 0.88, GFI = 0.93, AGFI = 0.88, CFI = 0.93, and IFI = 0.94).
Reliability. Overall, the model accounts for 77% of the variance in Self-Sacrificing and 80% of the variance in Risk Taking Behavior, well above the suggested levels of 0.70 and above (Fornell & Larcher, 1981). For the variance-extracted measures, Self-sacrificing has a value of 0.70 and Risk Taking Behavior has a value of 0.60 exceeding the recommended levels of 0.50. The levels of the two constructs indicate that 0.30 and 0.40 of the specified indicators are not accounted for in these two sub-constructs. Stage 4 Final Purification Participants Participants were recruited from two large fire departments in Texas and one in Maryland for the final purification of the bravery scale that evolved from the previous stages (n = 272). The model fit increased to X2 = 91.53, RMSEA = 0.05, NFI = 0.83, GFI = 0.95, AGFI = 0.92 and CFI = 0.93 for the two factor solution: Self-Sacrificing (0.42 – 0.69) and Risk Taking Behavior (0.27 – 0.53). Although the scale is not improved by much, we can come to the conclusion that these items can be used to begin the validation and purification of the moral courage scale.
7
DISCUSSION
Some individuals are attracted by the excitement or the thrill and adventurous descriptions of the job and others simply identify themselves as death defying (Fender, 2003). Correlations between certain traits, such as self-sacrificing and risk taking behavior accompanied by the desire to perform in dangerous occupations is common among individuals in the fire fighter occupation (Piliavin & Charng, 1990; Schwartz, 1970; VanMaanen, 1975). This study along with previous studies and intentions to develop scales to measure courage validate this perception. We propose using the same items and add additional items to the existing scale (i.e., leadership, need for power) as well as those intended to measure moral courage lead us to the next stage of a moral courage scale. In the next data collection, we intend to add at least two items from each of the dimensions as proposed by Sekerka et al. (2009) to measure professional moral courage (PAC). The dimensions are: moral agency, multiple values, endurance of threats, going beyond compliance and moral goals in future research.
Acknowledgement: We would like to thank Dr. Martin Feinberg for his help in earlier manuscripts. References Barrett, G. V., Palomsky, M. D., & McDaniel, M. A. (1999). Selection tests for firefighters: A
comprehensive review and meta-analysis. Journal of Business and Psychology, 13, 507-514.
Beaton, R., & Murphy, S. A. (1995). Secondary traumatic stress of crisis workers: Research implications. In C. Figley (Ed.), Compassion Fatigue: Coping with secondary traumatic stress disorder in those who treat the traumatized. (pp. 51-81). New York: Brunner/Mazel.
Burke, R. J. (1998). Work and non-work stressors and well-being among police officers: The role of coping. Anxiety, Stress and Coping, 11, 345-362.
Carmine, E. G., & Zeller, R. (1979). Reliability and validity assessment. Newbury Park, CA: Sage Publications.
Churchill, G. A. (1979). A paradigm for developing better measures of marketing constructs. Journal of Marketing Research, 16, 64-73.
Cooper, R. (1995). The fireman: Immaculate manhood. Journal of Poplar Culture, 28 (4), 139-170.
Costello, A. B., & Osborne, J. (2005). Best practices in exploratory factor analysis: four recommendations for getting the most from your analysis. Practical Assessment Research & Evaluation, 10 (7). Available online: http://pareonline.net/getvn.asp?v=10&n=7
DeVillis, R. F. (1991). Scale development: Theory and application. Newbury Park, CA: Sage Publications.
Fender, D. L. (2003). Controlling risk taking among firefighters. Professional Safety, July, 14-18. Finfgeld, D. L. (1999). Courage as a process of pushing beyond the struggle. Qualitative Health
Issues, 9 (6), 803-814.
8
Fornell, C., & Larcker, D. F. (1981). Evaluating structural equation models with unobservable variables and measurement error. Journal of Marketing Research, 18, 39-50.
Gay, L. R., & Diehl, P. L. (1992). Research methods for business research. New York: Macmillan Publishing Company.
Gerbing, D. W., & Anderson, J. C. (1988). An updated paradigm for scale development incorporating unidimensionality and its assessment, Journal of Marketing Research, 25, 186-192.
Grifin, A., & Hauser, J. R. (1993). The Voice of the Customer, Marketing Science, 12 (1), 1-27. Hannah, S. T., Sweeney, P. J., & Lester, P. B. (2007). Toward a courageous mindset: The
subjective act and experience of courage. Journal of Positive Psychology, 2 (2), 129-135. Hinkin, T. R. (1995). A review of scale development practices in the study of organizations.
Journal of Management, 21 (5), 967-988. Jöreskog, K. G. (1993). LISREL VIII: Analysis of linear structural relations by the method of
maximum likelihood. Chicago, ILL: National Education Resources. Larsen, K., & Giles, H. (1976). Survival or courage as human motivation: Development of an
attitude scale. Psychological Reports, 39 (1), 299–302. Lopez, S. J., O’Byrne, K. K., & Petersen, S. (2003). Profiling courage. In S. J. Lopez & C. R.
Snyder (Eds.), Positive psychological assessment: A handbook of models and measures. (pp: 185-198). Washington, DC: American Psychological Association.
Lusa, S., Häkkänen, M., Luukkonen, R., & Viikari-Juntura, E. (2002). Perceived physical work capacity, stress, sleep disturbance and occupational accidents among firefighters working during a strike, Work & Stress, 16 (3), 264-274.
Maddi, S. R. (2007). Relevance of hardiness assessment and training to the military context. Military Psychology, 19 (1), 61–70.
Marshall, C., & Rossman, G. B. (1999). Designing qualitative research. Thousand Oaks, CA, Sage Publications.
Moran, C. C. (1998). Stress and emergency work experience: A non-linear relationship. Disaster Prevention and Management, 7 (1), 38-46.
Moran, C. C. (2001). Personal predictions of stress and stress reactions in firefighter recruits. Disaster Prevention and Management, 10 (5), 356-365.
Newell, S. J., & Goldsmith, R. E. (2001). The development of a scale to measure corporate credibility. Journal of Business Research, 52 (3), 235-248.
Nunnally, J. C. (1978). Psychometric theory, New York: McGraw Hill. Ohanian, R. (1990). Construction and validation of a scale to measure celebrity endorser’s
perceived expertise, trustworthiness and attractiveness. Journal of Advertising, 19, 39-52. Parker, D. F., & DeCotiis, T. A. (1983). Organization determinants of job stress: Organizational
and Human Performance, 32 (2), 160-178. Peterson, C., & Seligman, M. E. P. (2004). Bravery [Valor]. In Character strengths and virtues:
A handbook and classification, (pp. 213-228). Washington, DC: American Psychological Association.
Peterson, R. A. (1994). A meta-analysis of Cronbach’s coefficient alpha, Journal of Consumer Research, 21, 381-391.
Piliavin, J. A., & Charng, H. (1990). Altruism: A review of recent theory and research, Annual Review of Sociology, 16, 27-65.
Pury, C., Kowalski, R. M., & Spearman, J. (2007). Distinctions between general and personal courage. The Journal of Positive Psychology, 2 (2), 99-114.
Putman, D. (1997). Psychological courage. Philosophy, Psychiatry, and Psychology, 4, 1-11.

9
Rate, C. R., Clarke, J. A., Lindsay, D. R., & Sternber, R. J. (2007). Implicit theories of courage. Journal of Positive Psychology, 2, 80-98.
Regehr, C., LeBlanc, V., Jelly, R. B., & Barath, I. (2008). Acute stress and performance in police recruits. Stress and Health, 24, 295-303.
Regehr, C., LeBlanc, V., Jelly, R. B., Barath, I, & Daciuk, J. (2007). Previous trauma exposure and PTSD symptoms as predictors of subjective and biological response to stress. The Canadian Journal of Psychiatry, 52 (10), 675-683.
Schmidt, N. B., & Koselka, M. (2000). Gender differences in patients with panic disorder: Evaluating cognitive mediation of phobic avoidance. Cognitive Therapy and Research, 24 (5), 531-548.
Schwartz, S. H. (1970). Elicitation of moral obligation and self-sacrificing behavior: An experimental study of volunteering to be a bone marrow donor. Journal of Social Psychology, 37, 283-293.
Sekerkra, L. E., Bagozzi, R. P., & Charmigo, R. (2009). Facing ethical challenges in the workplace: Conceptualizing and measuring professional moral courage. Journal of Business Ethics, 89, 565-579.
Smith, D. L., Manning, T. S., & Petruzzello, S. J. (2001). Effect of strenuous live-fire drills on cardiovascular and psychological responses of recruit firefighters, Ergonomics, 44 (3), 244-254.
Spector, P. E. (1992). Summated rating scale construction: An introduction. Newbury Park, CA: Sage Publications.
Strauss, A., & Corbin, J. (1990). Basics of qualitative research: Grounded theory procedures and techniques. Newbury Park, CA: Sage.
Templer, D. I. (1994). Templer Death Anxiety Scale (TDAS). In J. Fischer & K. Corcoran (Eds.), Measures for clinical practice. (pp. 656-657). New York: The Free Press.
Van Maanen, J. (1975). Police socialization: A longitudinal examination of job attitudes in an urban police department. Administrative Science Quarterly, 20 (2), 207-228.
Weick, K. E. (1996). The collapse of sense making in organizations: The Mann Gulch disaster. Administrative Science Quarterly, 38 (4), 628-652.
Woodard, C. R. (2004). Hardiness and the concept of courage. Consulting Psychology Journal: Practice and Research, 56, 173-185.

10
GLOBALIZATION EFFECTS ON BUSINESS RELATIONSHIPS OF BRIC BASED FIRMS
Christopher Lawrence Richter
Southern New Hampshire University
John Philip Christie Southern New Hampshire University
ABSTRACT
This paper attempts to answer three questions: first, has globalization increased the
number of partnerships with BRIC based firms after 1990; second, do the nine years preceding 1990 or following 1990 have the highest number of partnerships with BRIC based firms; third, which type of partnerships have had the highest number during that period of time? Using database information on international mergers and acquisitions and joint ventures over a period of 30 years, the results of this study indicate support for questions 1 and 3, but do not support question 2.
INTRODUCTION
While the consensus among scholars has been that a connection exists between globalization and emerging markets exists, there have been questions that have yet to be answered about the particulars and the degree of such a connection. This paper attempts to answer three questions: first, has globalization increased the number of partnerships with BRIC based firms after 1990; second, do the nine years preceding 1990 or following 1990 have the highest number of partnerships with BRIC based firms; third, which type of partnerships have had the highest number during that period of time? In order to answer these three questions, this paper will be composed of five sections. First, a literature review will be done looking at the influence globalization has had on the firms of BRIC based countries and also the role that partnerships (alliances and acquisitions/mergers) of BRIC have had on this influence. Second, the theory development will look into the research question and the hypotheses used to answer that question. Third, the methodology will be outlined for how the hypotheses will be tested. Fourth, the results will be shown. Fifth and last, the conclusion will either accept or reject the hypothesis presented.
LITERATURE REVIEW Globalization & BRICs
Globalization “refers to the integration of world economies through the reduction of barriers to the movement of trade, capital, technology, and people.” (Daniels, Radebaugh, & Sullivan, 2011) The ability to capitalize on such a wide market leaves seemingly unlimited potential for growth and maximization of profit.
When looking at the BRIC countries in terms of GDP growth, income per capita, and currency movements with a focus through the year 2050 (Wilson & Purushothaman, 2003) first assessed current conditions of economic size, growth, incomes and demographics, demand patterns, and currency movements. Generally the results indicate that these economies are
11
growing and growing fast, despite that much of the populations in these countries tend to remain poor, the demand from the BRICs is growing and is predicted to be as high as quadruple the G6 demand, the growth patterns are believed to account for 2/3 of the currency movement in these countries. To identify individual differences (Wilson & Purushothaman, 2003) then looked at the countries individually. For example the amount of working age people in India and Brazil is seen to be increasing while in Russia it is decreasing, this result in the GDP per capita projections to show large growth in the countries, except Russia at a less substantial rate, even though GDP should increase substantially in all of them.
In another industry report five years later, (Merrill Lynch, 2008) given economic events since, their account of the BRICs is less enthusiastic yet still positive. The growth seen previously had slowed down somewhat, indicating the projections of extreme growth by (Wilson & Purushothaman, 2003) had been affected by the credit crisis and the poor outlook for exports. However, the BRIC economies while slowing are still growing and thanks to the proper policies and monetary strategies they can help in supporting the global economy during the credit crisis. Next, (Merrill Lynch, 2008) much like (Wilson & Purushothaman, 2003), delves into a country by country overview of how each has been performing. First is Brazil; monetary policy has helped to take advantage of external conditions, and the large domestic demand has helped drive GDP growth. Brazil also has low unemployment and a relatively high income. For Russia; political risk is still seen as a turn off for some foreign investors, yet the highly commodity based economy has kept it stable and steadily growing, again depopulation is still a problem but the government has been making investments in ‘natural resources’ other than oil to diversify, which has helped the economy as well. While still mostly poor, India has remained a strong growth economy and urbanization is expanding as well to give places for the newly highly educated workers to live and work. China is seen to have hits its peak of radical growth at the time of publishing and is expected to level off over the next decade while still a healthy growth rate around 8% annually. The strong government, large population for consumption, and controlled credit lending are positives for helping China hedge against the credit crisis that is affecting it in some ways
Based on the period prior to the 90’s and restructuring, (Fleury & Fleury, 2009) show that Brazilians companies are 12% of the top 100 BRIC companies and have over 40 international firms and they are truly global in terms of manufacturing. While having good management skills , the production talent is even more impressive. The state has become less involved and many companies are no longer dependent on the government directly. The FSAs stand out in many of the cases presented and the idea of having products available close to the markets that buy them, instead of a central manufacturing place resulting in high shipping costs.
According to (Ramamurti & Singh, 2009), some characteristics that make India unique are a large economy, technical and managerial talent, strong institutions, and entrepreneurship. The authors go on to reveal two waves of FDI. In the first waves of the 70’s and 80’s there was much of the FDI going to developing countries focused on manufacturing, and done by a small group of companies. Wave 2 after the mid 90’s saw FDI going mostly to other developed countries and less to manufacturing, acquisitions were more common and new players appeared to be participating. The second wave is attributed to be different due to changes in policy and regulations, exchange rates, and international policy for trade. In terms of turning country specific advantages into firm specific ones (Williamson & Zeng, 2009) looked at some of the top Chinese MNEs. The strategies of these companies were compared with some from India and the gateways to entry into the global marketplace were

12
addressed. The Chinese firms “dragons” have turned CSAs into FSAs through cost innovation and it is suggested that this is done through 3 dimensions: organizational strategies and routines allow these firms to offer high tech for low cost, using processes that offer large variety of products at price competitive with no-variety, and strategies that reduce breakeven point of specialty products through low costs.
The second focus is comparing the Chinese strategies to those used by Indian firms. As a “Local Optimizer”, the advantage comes from being able to produce products for emerging markets. When acting as a “Low-Cost Partner”, one can exploit factor cost arbitrage more effectively than competitors because local knowledge minimizes factor costs. If performing as a “Global Consolidator”, the advantage is in operations excellence with restructuring capabilities. Finally, as a “Global First-Mover”, an EMC becomes global innovator, leveraging a low-cost home base and home demand.
In terms of the new gateways for entry into the global marketplace, the trends for this include factors like; increased use of outsourcing, modularization of products and services, the drive to codify more of global knowledge, concentration/globalizing retail, more fluid market for talent, and open market for corporate control which allows Chinese acquisitions (Williamson & Zeng, 2009).
Business Relationship Modes Partnerships. In 1976, Andrew J. Van De Ven looked into why businesses partner with other
businesses, thus forming strategic alliances. He noted that up until this point, “no generally accepted framework, theory, or methods have emerged from research or practice” (Ven, 1976). He began by defining a strategic alliance, also known as an IR (inter-organizational relationship) as, “when two or more organizations transact resources (money, physical facilities and materials, customer or client referrals, technical staff services) among each other” (Ven, 1976). Ven mentioned that such an alliance can be short or long term but if done over the long term, unique roles are taken upon by members of the IR in terms of their rights and responsibilities within the group. The overall objective for each member of the IR rests with attaining the goals and objectives that they otherwise would not be able to attain without belonging to the IR. Ven explored this relationship in terms of four different areas: situational factors, process dimensions, structural dimensions, and outcome dimensions. From there, Ven outlined nine hypotheses, which he suggested should be followed-up in the future. These hypotheses come from three models (resource dependent model, system change model, and the emergence and structure of inter-agency relationships). In 1988, J. Carlos Jarillo looeds at answering a basic question, how can a network (strategic alliance) and sustained? He began by referring to the work done by C.I Barnard in 1968s work, The Functions of the Executive (Jarillo, 1988) (Barnard, 1968). Barnard outlined two characteristics necessary for the creation and sustainability of organizations: first, that it must be effective; second, it must be efficient. He defined effective as when the desired result has been achieved and he defined efficient as when more emerges from the organization than the amount that is put into the organization (e.g. raw materials or labor). Jarillo describes these as the “basic conditions of existence of networks” (Jarillo, 1988). In 1989, Gary Hamel, Yves L. Doz, and C.K. Prahalad, examined the benefits
13
surrounding strategic alliances using more than five years of studying 15 strategic alliances (Hamel, Doz, & Prahalad, Collaborate with Your Competitors and Win, 1989). They summed up their research by noting four ideas: first, collaboration is competition in a different form; second, harmony is not the most important measure of success; third, cooperation has limits; fourth, learning from partners is paramount. In short, the point they made was that any business has to look out for itself first. Therefore, when businesses enter into a strategic alliance, their only concern is on the benefits that that alliance will create for them. When that is understood, businesses in a strategic alliance have a better understanding of what they can receive out of the alliance and what to watch out for.
Mergers and Acquisitions. In 1983, Ronald W. Melicher, Johannes Ledolter, and Louis J. D’Antonio looked at the
history of mergers through a time series analysis, attempting to understand the reasons behind the phases in which mergers have taken place. By understanding the reasons, it was hoped that more insight would be given into predicting future waves of mergers, in particular the economic situation needed to be to be present for mergers. They began by giving the history of the previous waves of mergers that have taken place: first, during the start of the 20th century; second, during the 1920s; third starting after World War II and currently taking place during the 1980s (Melicher, Ledolter, & D'Antonio, 1983). Using time series analysis, they made two conclusions. First, that between 1947 and 1977, there was a “weak relationship between merger activity and economic conditions with changes in industrial production and business failures lagging behind changes in merger activity” (Melicher, Ledolter, & D'Antonio, 1983). In other words, economic changes because of industrial production showed a weak correlation with merger activity. In addition, industrial production and business failures were a lagging indicator of merger activity – instead of a forward indicator, thus not being able to show when merger activity will happen – but instead when it had already happened. Second, that stock prices and bond yields actually were a forward indicator of merger activity, typically about 2 quarters ahead of the mergers. In 1991, James P. Walsh and John W. Ellwood, explored how mergers and acquisitions affect managers. In particular, they looked at the effect on managers who were entrenched and inefficient. Citing W.T. Grimm and Company, from 1963 to 1989, more than 76,000 mergers and acquisitions had been announced – Walsh and Ellwood cited these numbers in support of calling this time period the fourth wave of mergers and acquisitions (Grimm & Company, 1989) (Walsh & Ellwood, 1991). Using data from 240 companies over five years, they examined the turnover rate of managers and correlation to announced mergers during this time period. In their analysis, they looked at the following three types of companies: control, parent, and target. Grimm and Company observed, “the parent company cumulative turnover rate is not significantly different from the control company rate in any year but the fifth, when it is higher” (Grimm & Company, 1989). They also noted that the relationship between the parent and target companies followed the same pattern as that observed of the parent and control company. The inefficient management hypothesis posits that if a firm is doing poorly (as can be shown through stock price performance), top management is released from power (either through firing or the management quitting on their own). The study completed by Grimm and Company did not support this hypothesis. However, in 2005, Krug and Aguilera explored the stress level that mergers have on executives. They discovered that, “target firm executives experience considerable acculturative stress and, on average, almost 70% depart in the five years following completion” (Krug &

14
Aguilera, 2005). These results support the inefficient management hypothesis. From 2000 through 2006, several authors explored the financial gains or losses for shareholders of businesses going through a merger or acquisition. In 2001, Anov Agrawal and Jeffrey F. Jaffe compared the returns gained from target firms to those gained from bidding firms during acquisitions. Their analysis concluded, “While target firm shareholders generally enjoy positive short-term returns, investors in bidding firms frequently experience share price underperformance in the months following acquisition, with negligible overall wealth gains for portfolio holders” (Agrawal & Jaffe, 2000). However, in 2001, Charlie Conn, Andy Cosh, Paul Guest, and Alan Hughes determined that 35 - 45% of bidding firms took two to three years following the acquisition to achieve a positive return (Conn, Cosh, Guest, & Hughes). While the previous authors only looked at the months following an acquisition, the authors in 2001 completed a longer study and attained different results.
METHODOLOGY
The scope and limitation of this study involves the firms based in four emerging markets: Brazil, Russia, India, and China (BRIC). There are two types of partnership transactions that are looked into: first are alliances and second are those involving mergers and acquisitions. The years of interest are from 1980 to 2009, which are then categorized into three categories comprising of nine-year intervals: 1980 – 1989 1990 – 1999 2000 – 2009 The transactions are classified by the year the announcement was made by the firm. Only completed transactions were used in this study. By using this data, three hypotheses were explored: Hypothesis 1: Globalization has increased the number of partnerships (alliances and
mergers/acquisitions) with BRIC based firms after 1990. a. Before 1990, this study looks at data from 1980 – 1989
b. After 1990, this study looks at data from 1991 - 2009
The belief here is that because of the decline of command economies throughout the
world, BRIC based firms have been able to increase their level of economic activity with other countries after the early 1990’s. This time period serves as the start of, what were previously known as command economies, transitioning into free market economies (such as with the Soviet Union collapsing and the increase in economic freedom found in China). From 1980 – 1989, firms based in these command economies could not capitalize on the innovation that they had. Hypothesis 2: The period from 1990 – 1999 has had the highest number of partnerships
(alliances and mergers/acquisitions) with BRIC based firms when compared to both the nine years preceding this period and the nine years following this period.
15
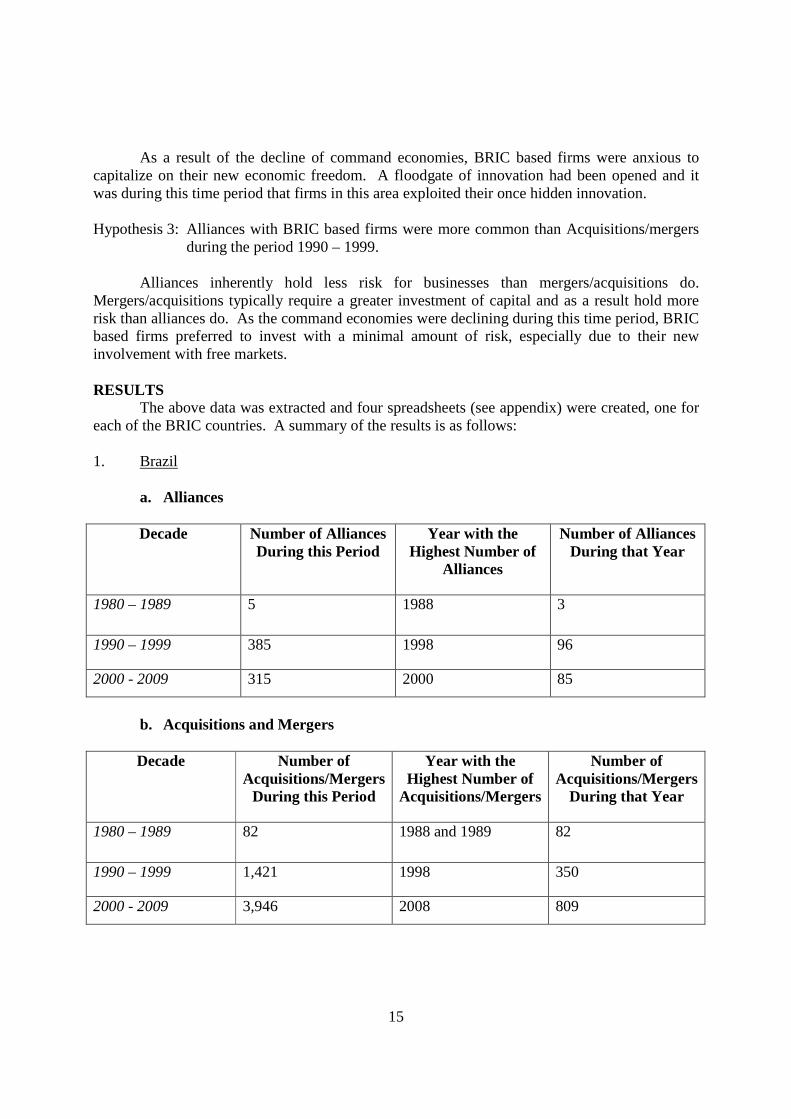
As a result of the decline of command economies, BRIC based firms were anxious to
capitalize on their new economic freedom. A floodgate of innovation had been opened and it was during this time period that firms in this area exploited their once hidden innovation. Hypothesis 3: Alliances with BRIC based firms were more common than Acquisitions/mergers
during the period 1990 – 1999.
Alliances inherently hold less risk for businesses than mergers/acquisitions do. Mergers/acquisitions typically require a greater investment of capital and as a result hold more risk than alliances do. As the command economies were declining during this time period, BRIC based firms preferred to invest with a minimal amount of risk, especially due to their new involvement with free markets. RESULTS The above data was extracted and four spreadsheets (see appendix) were created, one for each of the BRIC countries. A summary of the results is as follows: 1. Brazil
a. Alliances
Decade Number of Alliances During this Period
Year with the Highest Number of
Alliances
Number of Alliances During that Year
1980 – 1989 5 1988 3
1990 – 1999 385 1998 96
2000 - 2009 315 2000 85
b. Acquisitions and Mergers
Decade Number of Acquisitions/Mergers
During this Period
Year with the Highest Number of
Acquisitions/Mergers
Number of Acquisitions/Mergers
During that Year
1980 – 1989 82 1988 and 1989 82
1990 – 1999 1,421 1998 350
2000 - 2009 3,946 2008 809

16
2. Russia
a. Alliances
Decade Number of Alliances During this Period
Year with the Highest Number of
Alliances
Number of Alliances During that Year
1980 – 1989 0 n/a 0
1990 – 1999 860 1995 165
2000 - 2009 494 2007 104
b. Acquisitions and Mergers
Decade Number of Acquisitions/Mergers
During this Period
Year with the Highest Number of
Acquisitions/Mergers
Number of Acquisitions/Mergers
During that Year
1980 – 1989 4 1984 2
1990 – 1999 683 1999 164
2000 - 2009 8,181 2009 2,956
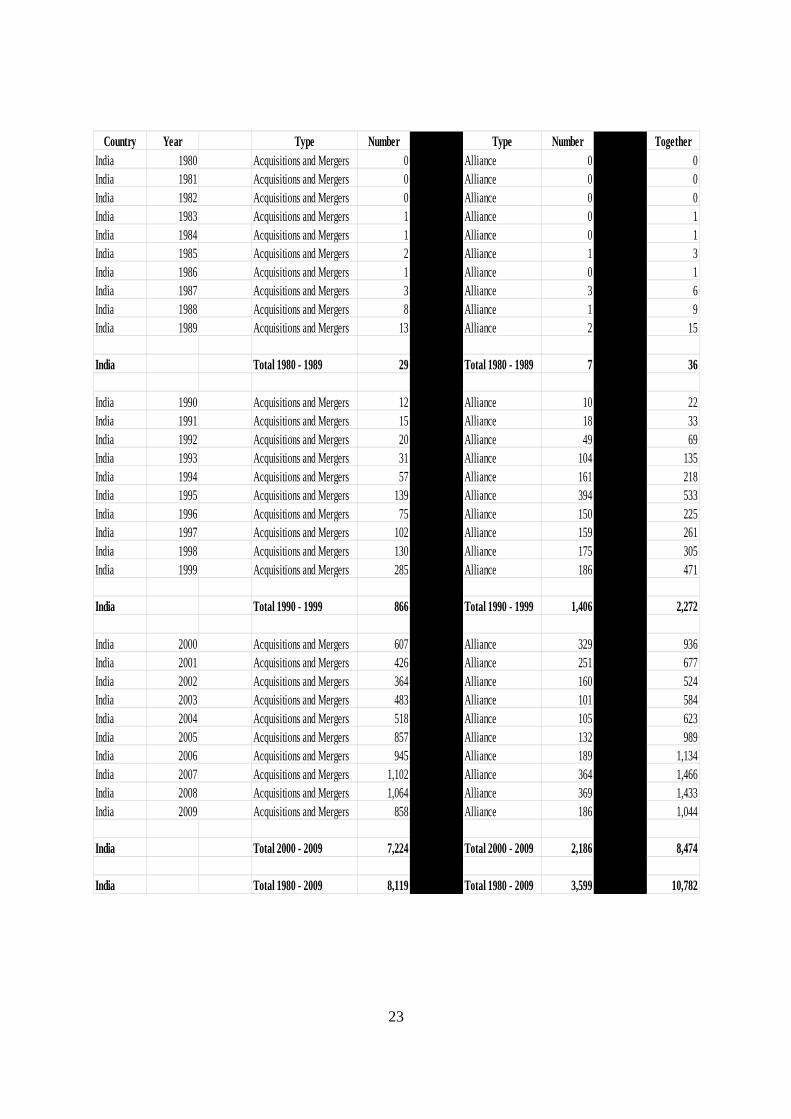
3. India
a. Alliances
Decade Number of Alliances During this Period
Year with the Highest Number of
Alliances
Number of Alliances During that Year
1980 – 1989 7 1987 3

17
1990 – 1999 1,406 1995 394
2000 - 2009 2,186 2008 369
b. Acquisitions and Mergers
Decade Number of Acquisitions/Mergers
During this Period
Year with the Highest Number of
Acquisitions/Mergers
Number of Acquisitions/Mergers
During that Year
1980 – 1989 29 1989 13
1990 – 1999 866 1999 285
2000 - 2009 7,224 2007 1,102
4. China
a. Alliances
Decade Number of Alliances During this Period
Year with the Highest Number of
Alliances
Number of Alliances During that Year
1980 – 1989 41 19888 14
1990 – 1999 4,316 1994 987
2000 - 2009 4,268 2002 707
b. Acquisitions and Mergers
Decade Number of Acquisitions/Mergers
During this Period
Year with the Highest Number of
Acquisitions/Mergers
Number of Acquisitions/Mergers
During that Year
1980 – 1989 30 1989 12
18
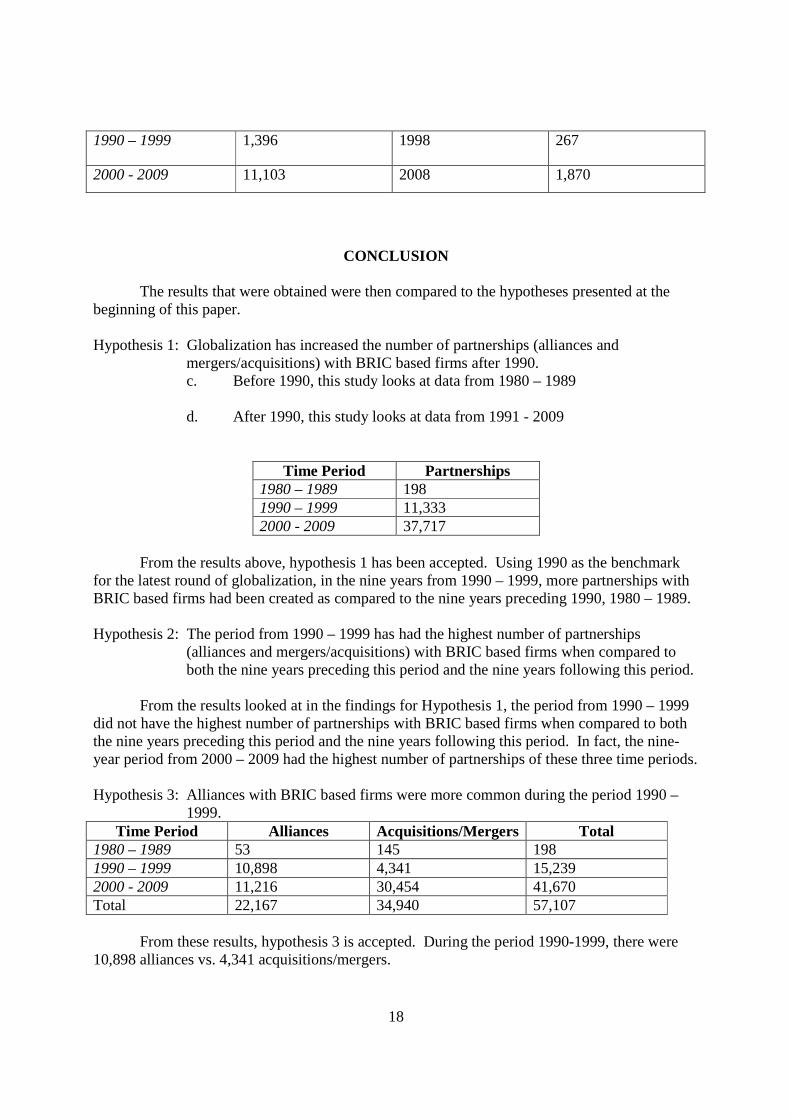
1990 – 1999 1,396 1998 267
2000 - 2009 11,103 2008 1,870
CONCLUSION
The results that were obtained were then compared to the hypotheses presented at the beginning of this paper. Hypothesis 1: Globalization has increased the number of partnerships (alliances and
mergers/acquisitions) with BRIC based firms after 1990. c. Before 1990, this study looks at data from 1980 – 1989
d. After 1990, this study looks at data from 1991 - 2009
Time Period Partnerships
1980 – 1989 198 1990 – 1999 11,333 2000 - 2009 37,717
From the results above, hypothesis 1 has been accepted. Using 1990 as the benchmark
for the latest round of globalization, in the nine years from 1990 – 1999, more partnerships with BRIC based firms had been created as compared to the nine years preceding 1990, 1980 – 1989. Hypothesis 2: The period from 1990 – 1999 has had the highest number of partnerships
(alliances and mergers/acquisitions) with BRIC based firms when compared to both the nine years preceding this period and the nine years following this period.
From the results looked at in the findings for Hypothesis 1, the period from 1990 – 1999 did not have the highest number of partnerships with BRIC based firms when compared to both the nine years preceding this period and the nine years following this period. In fact, the nine-year period from 2000 – 2009 had the highest number of partnerships of these three time periods. Hypothesis 3: Alliances with BRIC based firms were more common during the period 1990 –
1999. Time Period Alliances Acquisitions/Mergers Total
1980 – 1989 53 145 198 1990 – 1999 10,898 4,341 15,239 2000 - 2009 11,216 30,454 41,670 Total 22,167 34,940 57,107 From these results, hypothesis 3 is accepted. During the period 1990-1999, there were 10,898 alliances vs. 4,341 acquisitions/mergers.

19
REFERENCES
Agrawal, A., & Jaffe, J. F. (2000). The post merger performance puzzle. Advances in Mergers
and Acquisitions, 1, 119 - 156.
Barnard, C. (1968). The Functions of the Executive.
Conn, C., Cosh, A., Guest, P., & Hughes, A. (n.d.). Long Run Share Performance of UK firms
engaging in cross border acquisitions. Working Paper No. 214, University of Cambridge,
Centre for Business Related Research .
Daniels, Radebaugh, & Sullivan. (2011). International Business (13 ed.). Pearson/Prentice Hall.
Fleury, A., & Fleury, M. (2009). Brazilian Multinationals: Surfing the waves of
internationalization. In R. Ramamurti, & S. J., Emerging Multinationals in Emerging
Markets (pp. 200-243). Cambridge (UK): Cambridge University Press.
Grimm, W., & Company. (1989). Mergerstat Review. Chicago, IL, USA: Grimm and Company.
Hamel, G., Doz, Y. L., & Prahalad, C. (1989, January - February 133 - 139). Collaborate with
Your Competitors and Win. Harvard Business Review.
Jarillo, J. C. (1988). On Strategic Networks. Strategic Management Journal, 9, 31 - 41.
Krug, J., & Aguilera, R. (2005). Top Management team turnover in mergers and acquisitions.
Advances in Mergers and Acquisitions, 4, 121 - 149.
Melicher, R. W., Ledolter, J., & D'Antonio, L. J. (1983, August). A Time Series Analysis of
Aggregate Merger Activity. The Review of Economics and Statistics, 65(3), 423 - 430.
Merrill Lynch. (2008). The BRIC wall. London: Merrill Lynch.
Ramamurti, R., & Singh, J. (2009). Indian Multinationals: Generic internationalization strategies.
In R. Ramamurti, & J. Singh, Emerging Multinationals in Emerging Markets (pp. 110-
165). Cambridge (UK): Cambridge University Press.
20
Ven, A. H. (1976, October). On the Nature, Formation, and Maintenance of Relations Among
Organizations. Academy of Management Review, 24 - 36.
Walsh, J. P., & Ellwood, J. W. (1991). Mergers, Acquisitions, and the Pruning of Managerial
Deadwood. Strategic Management Journal, 12, 201 - 217.
Williamson, P. J., & Zeng, M. (2009). Chinese multinationals: Emerging through new global
gateways. In R. Ramamurti, & J. Singh, Emerging Multinationals in Emerging Markets
(pp. 81-109). Cambridge (UK): Cambridge University Press.
Wilson, D., & Purushothaman, R. (2003). Dreaming with BRICs: The Path to 2050. New York:
Goldman Sachs.

21
Appendix
Country Year Type Number Type Number TogetherBrazil 1980 Acquistions and Mergers 0 Alliance 0 0Brazil 1981 Acquistions and Mergers 0 Alliance 0 0Brazil 1982 Acquistions and Mergers 2 Alliance 0 2Brazil 1983 Acquistions and Mergers 0 Alliance 0 0Brazil 1984 Acquistions and Mergers 0 Alliance 0 0Brazil 1985 Acquistions and Mergers 8 Alliance 0 8Brazil 1986 Acquistions and Mergers 16 Alliance 0 16Brazil 1987 Acquistions and Mergers 14 Alliance 1 15Brazil 1988 Acquistions and Mergers 21 Alliance 3 24Brazil 1989 Acquistions and Mergers 21 Alliance 1 22
Brazil Total 1980 - 1989 82 Total 1980 - 1989 5 87
Brazil 1990 Acquistions and Mergers 16 Alliance 3 19Brazil 1991 Acquistions and Mergers 38 Alliance 16 54Brazil 1992 Acquistions and Mergers 56 Alliance 17 73Brazil 1993 Acquistions and Mergers 65 Alliance 22 87Brazil 1994 Acquistions and Mergers 94 Alliance 34 128Brazil 1995 Acquistions and Mergers 129 Alliance 47 176Brazil 1996 Acquistions and Mergers 162 Alliance 30 192Brazil 1997 Acquistions and Mergers 198 Alliance 45 243Brazil 1998 Acquistions and Mergers 350 Alliance 96 446Brazil 1999 Acquistions and Mergers 313 Alliance 75 388
Brazil Total 1990 - 1999 1,421 Total 1990 - 1999 385 1,806
Brazil 2000 Acquistions and Mergers 470 Alliance 85 555Brazil 2001 Acquistions and Mergers 347 Alliance 20 367Brazil 2002 Acquistions and Mergers 224 Alliance 12 236Brazil 2003 Acquistions and Mergers 183 Alliance 10 193Brazil 2004 Acquistions and Mergers 255 Alliance 17 272Brazil 2005 Acquistions and Mergers 243 Alliance 16 259Brazil 2006 Acquistions and Mergers 310 Alliance 28 338Brazil 2007 Acquistions and Mergers 727 Alliance 56 783Brazil 2008 Acquistions and Mergers 809 Alliance 51 860Brazil 2009 Acquistions and Mergers 378 Alliance 20 398
Brazil Total 2000 - 2009 3,946 Total 2000 - 2009 315 4,261
Brazil Total 1980- 2009 5,449 Total 1980 - 2009 705 6,154

22
Country Year Type Number Type Number TogetherRussia 1980 Acquistions and Mergers 0 Alliance 0 0Russia 1981 Acquistions and Mergers 1 Alliance 0 1Russia 1982 Acquistions and Mergers 0 Alliance 0 0Russia 1983 Acquistions and Mergers 0 Alliance 0 0Russia 1984 Acquistions and Mergers 2 Alliance 0 2Russia 1985 Acquistions and Mergers 0 Alliance 0 0Russia 1986 Acquistions and Mergers 0 Alliance 0 0Russia 1987 Acquistions and Mergers 1 Alliance 0 1Russia 1988 Acquistions and Mergers 0 Alliance 0 0Russia 1989 Acquistions and Mergers 0 Alliance 0 0
Russia Total 1980 - 1989 4 Total 1980 - 1989 0 4
Russia 1990 Acquistions and Mergers 1 Alliance 6 7Russia 1991 Acquistions and Mergers 5 Alliance 8 13Russia 1992 Acquistions and Mergers 14 Alliance 94 108Russia 1993 Acquistions and Mergers 32 Alliance 141 173Russia 1994 Acquistions and Mergers 69 Alliance 149 218Russia 1995 Acquistions and Mergers 136 Alliance 165 301Russia 1996 Acquistions and Mergers 116 Alliance 50 166Russia 1997 Acquistions and Mergers 78 Alliance 78 156Russia 1998 Acquistions and Mergers 68 Alliance 101 169Russia 1999 Acquistions and Mergers 164 Alliance 68 232
Russia Total 1990 - 1999 683 Total 1990 - 1999 860 1,543
Russia 2000 Acquistions and Mergers 374 Alliance 24 398Russia 2001 Acquistions and Mergers 365 Alliance 19 384Russia 2002 Acquistions and Mergers 376 Alliance 43 419Russia 2003 Acquistions and Mergers 409 Alliance 32 441Russia 2004 Acquistions and Mergers 335 Alliance 17 352Russia 2005 Acquistions and Mergers 414 Alliance 40 454Russia 2006 Acquistions and Mergers 582 Alliance 57 639Russia 2007 Acquistions and Mergers 817 Alliance 104 921Russia 2008 Acquistions and Mergers 1,553 Alliance 96 1,649Russia 2009 Acquistions and Mergers 2,956 Alliance 62 3,018
Russia Total 2000 - 2009 8,181 Total 2000 - 2009 494 8,675
Russia Total 1980 - 2009 8,868 Total 1980 - 2009 1,354 10,222
23
Country Year Type Number Type Number TogetherIndia 1980 Acquisitions and Mergers 0 Alliance 0 0India 1981 Acquisitions and Mergers 0 Alliance 0 0India 1982 Acquisitions and Mergers 0 Alliance 0 0India 1983 Acquisitions and Mergers 1 Alliance 0 1India 1984 Acquisitions and Mergers 1 Alliance 0 1India 1985 Acquisitions and Mergers 2 Alliance 1 3India 1986 Acquisitions and Mergers 1 Alliance 0 1India 1987 Acquisitions and Mergers 3 Alliance 3 6India 1988 Acquisitions and Mergers 8 Alliance 1 9India 1989 Acquisitions and Mergers 13 Alliance 2 15
India Total 1980 - 1989 29 Total 1980 - 1989 7 36
India 1990 Acquisitions and Mergers 12 Alliance 10 22India 1991 Acquisitions and Mergers 15 Alliance 18 33India 1992 Acquisitions and Mergers 20 Alliance 49 69India 1993 Acquisitions and Mergers 31 Alliance 104 135India 1994 Acquisitions and Mergers 57 Alliance 161 218India 1995 Acquisitions and Mergers 139 Alliance 394 533India 1996 Acquisitions and Mergers 75 Alliance 150 225India 1997 Acquisitions and Mergers 102 Alliance 159 261India 1998 Acquisitions and Mergers 130 Alliance 175 305India 1999 Acquisitions and Mergers 285 Alliance 186 471
India Total 1990 - 1999 866 Total 1990 - 1999 1,406 2,272
India 2000 Acquisitions and Mergers 607 Alliance 329 936India 2001 Acquisitions and Mergers 426 Alliance 251 677India 2002 Acquisitions and Mergers 364 Alliance 160 524India 2003 Acquisitions and Mergers 483 Alliance 101 584India 2004 Acquisitions and Mergers 518 Alliance 105 623India 2005 Acquisitions and Mergers 857 Alliance 132 989India 2006 Acquisitions and Mergers 945 Alliance 189 1,134India 2007 Acquisitions and Mergers 1,102 Alliance 364 1,466India 2008 Acquisitions and Mergers 1,064 Alliance 369 1,433India 2009 Acquisitions and Mergers 858 Alliance 186 1,044
India Total 2000 - 2009 7,224 Total 2000 - 2009 2,186 8,474
India Total 1980 - 2009 8,119 Total 1980 - 2009 3,599 10,782

24
Country Year Type Number Type Number TogetherChina 1980 Acquisitions and Mergers 0 Alliance 0 0China 1981 Acquisitions and Mergers 0 Alliance 0 0China 1982 Acquisitions and Mergers 1 Alliance 1 2China 1983 Acquisitions and Mergers 1 Alliance 1 2China 1984 Acquisitions and Mergers 0 Alliance 0 0China 1985 Acquisitions and Mergers 2 Alliance 6 8China 1986 Acquisitions and Mergers 3 Alliance 5 8China 1987 Acquisitions and Mergers 5 Alliance 10 15China 1988 Acquisitions and Mergers 6 Alliance 14 20China 1989 Acquisitions and Mergers 12 Alliance 4 16
China Total 1980 - 1989 30 Total 1980 - 1989 41 71
China 1990 Acquisitions and Mergers 7 Alliance 37 44China 1991 Acquisitions and Mergers 25 Alliance 87 112China 1992 Acquisitions and Mergers 32 Alliance 208 240China 1993 Acquisitions and Mergers 114 Alliance 656 770China 1994 Acquisitions and Mergers 126 Alliance 987 1,113China 1995 Acquisitions and Mergers 136 Alliance 771 907China 1996 Acquisitions and Mergers 175 Alliance 445 620China 1997 Acquisitions and Mergers 259 Alliance 361 620China 1998 Acquisitions and Mergers 267 Alliance 458 725China 1999 Acquisitions and Mergers 255 Alliance 306 561
China Total 1990 - 1999 1,396 Total 1990 - 1999 4,316 5,712
China 2000 Acquisitions and Mergers 368 Alliance 353 721China 2001 Acquisitions and Mergers 406 Alliance 616 1,022China 2002 Acquisitions and Mergers 749 Alliance 707 1,456China 2003 Acquisitions and Mergers 1,055 Alliance 306 1,361China 2004 Acquisitions and Mergers 1,358 Alliance 313 1,671China 2005 Acquisitions and Mergers 1,234 Alliance 386 1,620China 2006 Acquisitions and Mergers 1,241 Alliance 323 1,564China 2007 Acquisitions and Mergers 1,650 Alliance 460 2,110China 2008 Acquisitions and Mergers 1,870 Alliance 490 2,360China 2009 Acquisitions and Mergers 1,172 Alliance 314 1,486
China Total 2000 - 2009 11,103 Total 2000 - 2009 4,268 14,650
China Total 1980 - 2009 12,529 Total 1980 - 2009 8,625 20,433
25
DO U.S. STUDENTS CHEAT MORE OR LESS THAN THEIR COUNTERPARTS AROUND THE WORLD? A
MULTICULTURAL INQUIRY
Sameer Vaidya Texas Wesleyan University
Jason B. MacDonald Boise State University
ABSTRACT
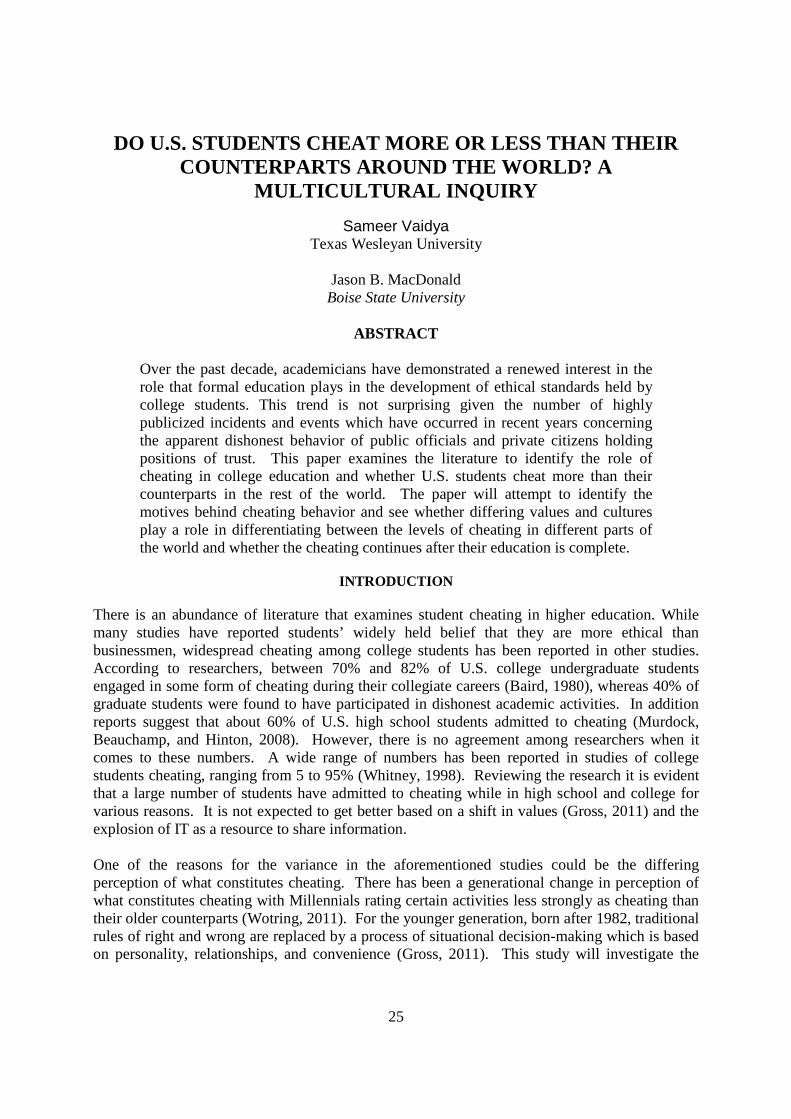
Over the past decade, academicians have demonstrated a renewed interest in the role that formal education plays in the development of ethical standards held by college students. This trend is not surprising given the number of highly publicized incidents and events which have occurred in recent years concerning the apparent dishonest behavior of public officials and private citizens holding positions of trust. This paper examines the literature to identify the role of cheating in college education and whether U.S. students cheat more than their counterparts in the rest of the world. The paper will attempt to identify the motives behind cheating behavior and see whether differing values and cultures play a role in differentiating between the levels of cheating in different parts of the world and whether the cheating continues after their education is complete.
INTRODUCTION
There is an abundance of literature that examines student cheating in higher education. While many studies have reported students’ widely held belief that they are more ethical than businessmen, widespread cheating among college students has been reported in other studies. According to researchers, between 70% and 82% of U.S. college undergraduate students engaged in some form of cheating during their collegiate careers (Baird, 1980), whereas 40% of graduate students were found to have participated in dishonest academic activities. In addition reports suggest that about 60% of U.S. high school students admitted to cheating (Murdock, Beauchamp, and Hinton, 2008). However, there is no agreement among researchers when it comes to these numbers. A wide range of numbers has been reported in studies of college students cheating, ranging from 5 to 95% (Whitney, 1998). Reviewing the research it is evident that a large number of students have admitted to cheating while in high school and college for various reasons. It is not expected to get better based on a shift in values (Gross, 2011) and the explosion of IT as a resource to share information. One of the reasons for the variance in the aforementioned studies could be the differing perception of what constitutes cheating. There has been a generational change in perception of what constitutes cheating with Millennials rating certain activities less strongly as cheating than their older counterparts (Wotring, 2011). For the younger generation, born after 1982, traditional rules of right and wrong are replaced by a process of situational decision-making which is based on personality, relationships, and convenience (Gross, 2011). This study will investigate the
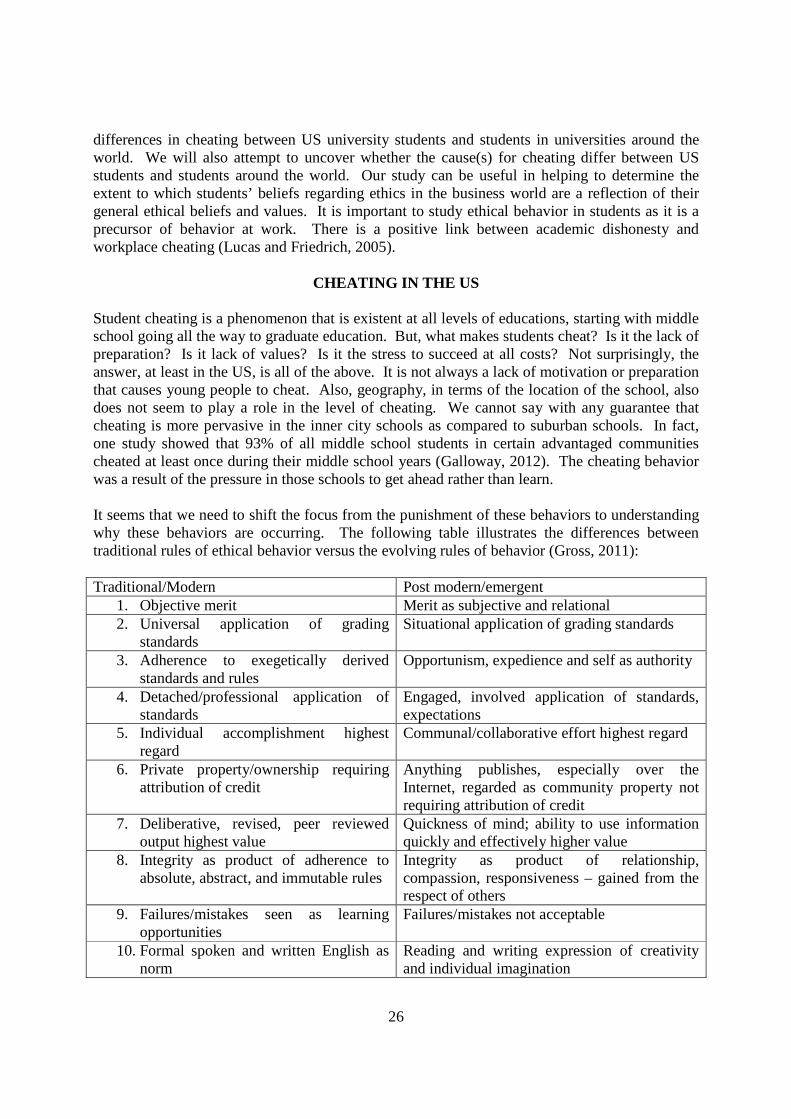
26
differences in cheating between US university students and students in universities around the world. We will also attempt to uncover whether the cause(s) for cheating differ between US students and students around the world. Our study can be useful in helping to determine the extent to which students’ beliefs regarding ethics in the business world are a reflection of their general ethical beliefs and values. It is important to study ethical behavior in students as it is a precursor of behavior at work. There is a positive link between academic dishonesty and workplace cheating (Lucas and Friedrich, 2005).
CHEATING IN THE US Student cheating is a phenomenon that is existent at all levels of educations, starting with middle school going all the way to graduate education. But, what makes students cheat? Is it the lack of preparation? Is it lack of values? Is it the stress to succeed at all costs? Not surprisingly, the answer, at least in the US, is all of the above. It is not always a lack of motivation or preparation that causes young people to cheat. Also, geography, in terms of the location of the school, also does not seem to play a role in the level of cheating. We cannot say with any guarantee that cheating is more pervasive in the inner city schools as compared to suburban schools. In fact, one study showed that 93% of all middle school students in certain advantaged communities cheated at least once during their middle school years (Galloway, 2012). The cheating behavior was a result of the pressure in those schools to get ahead rather than learn. It seems that we need to shift the focus from the punishment of these behaviors to understanding why these behaviors are occurring. The following table illustrates the differences between traditional rules of ethical behavior versus the evolving rules of behavior (Gross, 2011): Traditional/Modern Post modern/emergent
1. Objective merit Merit as subjective and relational 2. Universal application of grading
standards Situational application of grading standards
3. Adherence to exegetically derived standards and rules
Opportunism, expedience and self as authority
4. Detached/professional application of standards
Engaged, involved application of standards, expectations
5. Individual accomplishment highest regard
Communal/collaborative effort highest regard
6. Private property/ownership requiring attribution of credit
Anything publishes, especially over the Internet, regarded as community property not requiring attribution of credit
7. Deliberative, revised, peer reviewed output highest value
Quickness of mind; ability to use information quickly and effectively higher value
8. Integrity as product of adherence to absolute, abstract, and immutable rules
Integrity as product of relationship, compassion, responsiveness – gained from the respect of others
9. Failures/mistakes seen as learning opportunities
Failures/mistakes not acceptable
10. Formal spoken and written English as norm
Reading and writing expression of creativity and individual imagination
27
Source: Gross, Emma R., 2011. Clashing Values: Contemporary Views about Cheating and Plagiarism Compared to Traditional Beliefs and Practices. Education, Vol. 132 (2), pg. 436
A cultural shift in the tolerance for cheating is making it more difficult to reinforce the traditional/modern view of ethical behavior. Students in general, but especially college students, attribute neutralizing techniques to justify their cheating behavior. These neutralizers include things such as disorganized, unclear instruction, poor presentation skills of the instructor, and too much work assigned by the instructor (Haines, Diekhoff, LaBeff, and Clark, 1986). Similar to Wotring’s (2011) finding, Anderman (2007) also found that high schools and colleges that emphasized performance over learning the material experienced a higher level of cheating among students. In a study conducted by Akeley (2012), college students’ cheating-related attitudes were tested using the instructor fear appeal and morals appeal conditions. In other words, students in one group were told that if caught cheating, they would be subject to substantial punishment (fear appeal) and students in the other group were told that they should refrain from cheating as it was morally wrong to cheat. The authors found that there was a stronger relationship between cheating and neutralizing attitudes when presented with the moral appeal condition than with the fear appeal condition. In other words, students tend to rationalize cheating with more emphasis if the appeal not to cheat is based on a moral argument. However, Miller, Shoptaugh, and Wooldridge (2011) found that students were less likely to cheat if presented with a moral argument against cheating and helping students internalize that argument. In their study, Miller et al (2011) discovered that students are more likely to cheat when presented with punishment as a consequence of the behavior. It makes sense, then, that students will rationalize cheating with more emphasis if presented with a moral argument. Once a student internalizes the moral argument, they feel the need to rationalize the cheating behavior as it conflicts with their value system. College students cheat for various reasons. Among the list of common reasons identified by researchers are neutralizing attitudes, learning vs. performance, observation of peers involved in cheating, etc. Students tend to cheat more when the focus is on performance (Rettinger and Kramer, 2009) and when they can readily present neutralizing attitudes to justify their cheating (Sykes and Matza, 1957). However, research has also shown that cheating is related to locus of control, specifically external locus of control (Murdock and Stephens, 2007). Using the attribution theory, we can posit that students with an external causal attribution would likely cheat more than students with an internal causal attribution. In one study, 82% of respondents who were alumni reported cheating while completing their undergraduate education (Yardley, Rodriguez, Bates, and Nelson, 2009). However, there were no significant differences between males and females when it came to cheating in their major courses. But for some reason, males reported higher levels of cheating on their non-major courses than females did. The most commonly cited reasons for cheating were “lack of time” and to “help a friend”. In another study, gender was found to be significantly related to cheating, with males more likely to cheat than females (Saulsbury, Brown, Heyliger, and Beale, 2011). The same study also found a positive link between the trait of Machiavellianism and cheating. It

28
would be safe to assume that males would tend to score higher than females on Machiavellianism. Interestingly age, GPA, race, and income and marital status did not link positively to cheating. However, upper level students were found to be more ethical than lower division students and business majors were found to be more likely to cheat than non-business majors (Smyth, Kroncke, and Davis, 2009). Their study also found that females, in general, are more ethical than males. The finding of business students being more likely to cheat was confirmed by another study (Simha, 2012), who found that business students were more likely to cheat than leadership students. One of the major causes of cheating is observation of peer behavior. It is easy to rationalize cheating when one observes his/her peers cheating and feel that it must be acceptable to cheat in that particular setting. Students with a high cheating valence are more likely to cheat if they observe other students cheating (O’Rourke, Barnes, Deaton, Fulks, Ryan, and Rettinger, 2010). In other words, students that were already predisposed to cheating would be encouraged by the presence of other cheaters. But what about the students that observe the behavior and are not predisposed to cheating? Will they report the behavior to their instructors? Overwhelmingly, observers are hesitant to report observed cheating behaviors (Hendricks, Young-Jones, and Foutch, 2011). A way to improve peer reporting would be to ensure a reward for reporting or a punishment for lack of reporting (McCabe, Trevino, and Butterfield, 2001). Although, there is a certain level of reluctance to report observed cheating behavior, the emotional response of the observer ranges from hostility to anxiety to empathy (Firmin, Burger, and Blosser, 2009). There are other factors that increase or decrease the likelihood of cheating. Intrinsic motivation to perform well in college was linked to lower levels of cheating (Hendricks, Young-Jones, and Foutch, 2011) as was the competence of the students as well as interest in the class. This presents an opportunity for professors and administrators to discover how to lessen cheating in college. Spending resources to improve the quality of instruction would increase the likelihood of student interest in the course. Also, ensuring that students have the appropriate level of competence (or prerequisite knowledge) will increase the likelihood of honest behavior.
CHEATING OVERSEAS While we have discussed some of the elements of cheating behavior by US students, it is also imperative that we try to understand similar behavior in students outside the US. The business world has shrunk dramatically over the last two decades with the advancements in information technology as well as a philosophical shift by governments in allowing access to their markets. With globalization, organizations and businesses have to realize that their pool of employees will be diverse, in many aspects, including culturally. As discussed earlier, there is a significant relationship between cheating as a student and cheating at the workplace. A study with Taiwanese students revealed that their unethical beliefs related to the workplace have an impact on their intention to cheat at school (Hsiao and Yang, 2011). In other words, the relationship between academic cheating and workplace cheating is not just a one-way relationship as previously suggested.
29
In a study comparing Australian, Chinese, Irish, and US students, the authors found that the highest percentage of students cheating on a major exam was Chinese students followed by the Australian students (Bernardi, Baca, Landers, and Witek, 2008). Chinese students, similar to students in the US, felt that the virtues offered by education were not related to success in the real world (Yang, 2012). The Irish students were the lowest among the groups that reported cheating on a major exam. However, the Irish were the highest in reporting that they considered cheating to be a result of competition in grades and were also the highest in reporting that cheating was wrong, dishonest, or unethical. It is interesting to note that a majority of Indian medical students, in another study, did not feel that cheating in examinations will have a significant effect on their future performance (Monica, Ankola, Ashokkumar, and Hebbal, 2010). Australian students were the lowest reporters of cheating as a result of grade competition (Bernardi et a., 2008), yet in another study grade orientation was found to be a significant predictor of cheating (Marsden, Carroll, and Neill, 2005). A comprehensive study by Teixeira and Rocha (2010) investigated cheating among university students from 21 countries. In that study the authors discovered that within Europe the likelihood of cheating varies widely, with Scandinavian nations reporting propensity to cheat below 5% to Eastern European countries with an average propensity to cheat at 88%. The Latin American nations are similar in that respect to Southern European nations with an average propensity to cheat for both regions at around 67%. A study by Bazoukis and Dimoliatis (2011) confirmed that Greek students believed that around 72% had passed an examination by cheating. Although the Teixeira and Rocha (2010) study was conducted by surveying business students and the Greek study was conducted by surveying medical students, the percentage of students that believed cheating was present is surprisingly close. (67% vs. 72%). Another study conducted in Romania also displayed that around 85% of students reported that cheating was prevalent at their institution (Teodorescu and Andrei, 2009). So far, among all the reasons we have reviewed, the concept of IT usage to aid in cheating has not come up. In a study of British students, researchers found that IT capabilities are not linked to higher likelihood of cheating (Trushell, Bryne, and Simpson, 2012). In other words, the researchers had the right idea in their mind. Students that possess high IT capabilities are probably more likely to have greater access to data and information to aid them in cheating.
CONCLUSION After reviewing the literature it is evident that there is great deal of variability in the level of cheating in the US versus throughout the rest of the world. Some of the reasons discussed earlier to understand cheating in the US also apply to students in other nations. Students respond to incentives. In nations where the penalty for cheating is severe, students are less likely to cheat. Nations in Eastern Europe, certain Latin American nations, and in Asia, the consequences of cheating are not severe, which increases its likelihood. Further research needs to be conducted to study the link between academic cheating and the incidences of workplace dishonesty. Also, more international studies looking at cultural variables and their propensity to cheat should be researched.
30
References Akeley Spear, J. 2012. The Effects of Instructor Fear Appeals and Moral Appeals on Cheating-Related Attitudes and Behavior of University Students. Ethics & Behavior, 22(3), 196-207. Anderman, E. M. 2007. The Effects of Personal, Classroom, and School Goal Structures on Academic Cheating. In E. M. Anderman and T. B. Murdock, (Eds.), Psychological Perspectives on Academic Cheating. San Diego, CA: Elsevier. Baird, J. 1980. Current trends in college cheating. Psychology in the Schools, 17, 515–522. Bazoukis, G. and Dimoliatis, I. D. K. 2011. Cheating in Medical Schools in Greece: Quantitative Evaluation and Recommendations for Resolving the Problem. Archives of Hellenic Medicine, 28(3), 390-399. Bernardi, R. A., Baca, A. V., Landers, K. S., and Witek, M. B. 2008. Methods of Cheating and Deterrents to Classroom Cheating: An International Study. Ethics & Behavior, 18(4), 373-391. Firmin, M. W., Burger, A., and Blosser, M. 2009. Affective Responses of Students Who Witness Classroom Cheating. Educational Research Quarterly. 32(3), 3-15. Galloway, M. K. 2012. Cheating in Advantaged High Schools: Prevalence, Justifications, and Possibilities for Change. Ethics & Behavior. 22(5), 378-399. Gross, Emma R., 2011. Clashing Values: Contemporary Views about Cheating and Plagiarism Compared to Traditional Beliefs and Practices. Education, 132 (2), 435-440. Haines, V. J., Diekhoff, G. M., LaBeff, E. E., and Clark, R. E. 1986. College Cheating: Immaturity, lack of commitment, and the neutralizing attitude. Research in Higher Education, 25, 342-354. Hendricks, E., Young-Jones, A., and Foutch, J. 2011. To Cheat or Not to Cheat: Acedemic Dishonesty in the College Classroom. LOGOS: A Journal of Undergraduate Research. Fall, 68-75. Hsiao, C. and Yang, C. 2011. The Impact of Professional Unethical Beliefs on Cheating Intention, Ethics & Behavior, 21(4), 301-316. Lucas, G. M. and Friedrich, J. 2005. Individual Differences in Workplace Deviance and Integrity as Predictors of Academic Dishonesty, Ethics & Behavior, 15(1), 15-35. Marsden, H., Carroll, M., and Neill, J. T. 2005. Who Cheats at University? A Self-Report Study of Dishonest Behaviours in a Sample of Australian Students. Australian Journal of Psychology, 57(1), 1-10.
31
McCabe, D. L., Trevino, L. K., and Butterfield, K. D. 2001. Dishonesty in Academic Environments: The Influence of Peer Reporting Requirements. The Journal of Higher Education, 72, 29-45. Miller, A., Shoptaugh, C., and Wooldridge, J. 2011. Reasons Not to Cheat, Academic-Integrity Responsibility, and Frequency of Cheating. The Journal of Experimental Education. 79, 169-184. Monica, M., Ankola, A. V., Ashokkumar, B. R., and Hebbal, I. 2010. Attitude and Tendency of Cheating Behaviours Amongst Undergraduate Students in a Dental Institution of India. European Journal of Dental Education, 14(2), 79-83. Murdock, T. B., Beauchamp, A. S., and Hinton, A. M. 2008. Predictors of Cheating and Cheating Attributions: Does Classroom Context Influence Cheating and Blame for Cheating? European Journal of Psychology of Education, 23(4), 477-492. Murdock, T. B. and Stephens, J. B. 2007. Is Cheating Wrong? Students’ Reasoning about Academic Dishonesty. In E. M. Anderman and T. B. Murdock, (Eds.), Psychological Perspectives on Academic Cheating. San Diego, CA: Elsevier. O’Rourke, J., Barnes, J., Deaton, A., Fulks, K., Ryan, K., and Rettinger D. A. 2010. Imitation is the Sincerest Form of Cheating: The Influence of Direct Knowledge and Attitudes on Academic Dishonesty. Ethics & Behavior, 20(1), 47-64. Rettinger, D. A. and Kramer, Y. 2009. Situational and Personal Causes of Student Cheating. Research in Higher Education, 50, 293-313. Saulsbury, M. D., Brown III, U. J., Heyliger, S. O., and Beale, R. L. 2011. Effect of Dispositional Traits on Pharmacy Students’ Attitude Toward Cheating. American Journal of Pharmaceutical Education. 75(4), 1-8. Simha, A. 2012. Who Leads and Who Lags? A Comparison of Cheating Attitudes and Behaviors Among Leadership and Business Students, Journal of Education for Business, 87(6), 316-324. Smyth, L. S., Kroncke, C. O., and Davis, J. R. 2009. Students’ Perceptions of Business Ethics: Using Cheating as a Surrogate for Business Situations, Journal of Education for Business, March/April, 229-238. Sykes, G. M. and Matza, D. 1957. Techniques of Neutralization: A Theory of Delinquency. American Sociological Review, 22(6), 664-670. Teixeira, A. C. and Rocha, M. F. 2010. Cheating by Economic and Business Undergraduate Students: An Exploratory International Assessment. Higher Education, 59, 663-701. Teodorescu, D. and Andrei, T. 2009. Faculty and Peer Influences on Academic Integrity: College Cheating in Romania. Higher Education, 57, 267-282.

32
Trushell, J., Byrne, K., and Simpson, R. 2012. Cheating Behaviours, the Internet, and Education Undergraduate Students. Journal of Computer Assisted Learning, 28(2), 136-145. Whitney, B. E. 1998. Factors Associated with Cheating Among College Students: A Review. Research in Higher Education, 39, 235-274. Wotring, K. E. 2011. Generational Differences among Community College Students in their Evaluation of Academic Cheating. Community College Journal of Research & Practice, 35(9), 724-735. Yang, J. 2012. Predicting Cheating Behavior: A Longitudinal Study with Chinese Business Students. Social Behavior and Personality, 40(6), 933-944. Yardley, J., Rodriguez, M. D., Bates, S. C., and Nelson, J. 2009. True Confessions?: Alumni’s Retrospective Reports on Undergraduate Cheating Behaviors. Ethics & Behavior, 19(1), 1-14.
33
ANTECEDENTS OF PROBLEM-SOLVING CROSS-CULTURAL NEGOTIATION STYLE: SOME PRELIMINARY EVIDENCE
Robert L Engle and
Mohammad N. Elahee Quinnipiac University
Ekrem Tatoglu
Bahcesehir University “While economics seems well-represented in dyadic bargaining research, and our understanding of cognition in this enterprise is clearly on the rise, the social side of dyadic bargaining remains largely ignored.”
-Neale Northcraft (1991, p. 182)
ABSTRACT
This paper postulates a model identifying the antecedent factors such as cultural intelligence and several personality traits that lead negotiators to adopt problem-solving style in international business negotiations. The paper also proffers a series of hypotheses drawn from the model and empirically tests the hypotheses. A hierarchical regression model analyzing self-reported data collected from Turkey and the US provides support for the proposed model. The findings further indicate that a higher level of cultural intelligence and relationship orientation will result in the adoption of problem solving negotiation style by negotiators. The paper concludes with a discussion on the implications of the findings and directions for future research.
INTRODUCTION Negotiation is one of the most widely practiced human activities in business as well as in real life. We engage in negotiation on a daily basis for creating, maintaining, strengthening, and even terminating relationships. In fact, no business transaction can occur without some form of negotiations. Because of its omnipresence in our everyday life, negotiation is one of the most widely studied human phenomena, as can be evidenced by the prevalence of a voluminous literature on negotiation. Negotiation has been studied from various disciplinary perspectives such as business, communications, conflict resolution, diplomacy, law, world peace, etc. We also find different traditions in the study of negotiations. Perhaps the earliest tradition began with writing of books on the topic, which had been commonplace throughout history. In ancient India, Chanakya wrote extensively on negotiation (Sen, 2010). We also find implicit reference to negotiations in many
34
ancient Chinese texts (e.g., ‘The Art of War’ by Sun Tzu). In more modern times, an important piece of work was written by a French Diplomat named de Callieres in 1716 (Encyclopedia Britannica, 2012). A second tradition started in the early part of the 20th century when various publishing houses and scholars started publishing case studies on negotiations that were often based on real situations. The third tradition upholding rigorous, scientific research on negotiation started in the middle of the 20th century when the study of negotiation emerged as an academic discipline. We find two distinct genres within the realm of scientific research on negotiation: a rational approach using game theoretic models and a behavioral approach describing various factors that affect negotiation context, situation, behavior, as well as outcome, among others. This paper belongs to this last genre and seeks to identify that factors that may influence adoption of a particular behavior by the negotiation parties. The extant literature identifies two principal type of negotiation behavior: competitive or win-lose and cooperative or win-win negotiation, which is also known as problem-solving behavior (e.g., Lewicki et al., 2008). While we find a plethora of deductive and inductive work on these two types of negotiation behavior, there is hardly any empirical work that investigates what leads or influences such behavior. This paper seeks to partially bridge this gap in the literature by identifying the antecedents to problem solving behavior in cross-cultural negotiations. Specifically, we focus on cultural intelligence and various personality factors. Based on the premise that our negotiation behavior is influenced to a significant extent by our level of cultural intelligence and personality factors, this paper attempts to link various dimensions of cultural intelligence with negotiation style adopted during a negotiation. Drawing from the extant literature on psychology, cross-cultural communication, and conflict resolution, this paper presents a model depicting the relationship between cultural intelligence and cooperative negotiation behavior. The paper also proposes hypotheses drawn from the proposed model and empirically tests the hypotheses by analyzing data collected from Turkey and the US. It should be clarified here that there are different types of negotiation involving two or more parties. The antecedents to negotiation behavior in a multi-party negotiation could be quite different from that in a dyadic (i.e., two party) negotiations. This paper is delimited to identifying the antecedent variables to problem solving behavior in the context of dyadic negotiations only. Any discussion involving multiple parties or negotiation process is thus beyond the scope of this study.
THEORETICAL FOUNDATIONS
Cross-cultural Negotiation Since this paper examines data collected from two very different national cultures located in two continents, it is pertinent to discuss the cross-cultural dimensions of negotiations. Negotiation, by nature, is a very complex process as people from different cultural backgrounds may perceive and interpret reality differently. In a cross-national context, negotiation is even more difficult since the negotiator, in addition to all the complexities of domestic negotiations, encounters the added component of cultural diversity (Adler, 1997). The impact of culture on negotiations is well documented (e.g., Hofstede 1989; Elahee, Kirby and Nasif, 2002; Adler and Graham 1989). Culture has been found to have influenced our negotiation behavior in myriad ways such as the exercise of power, the pattern of concession
35
making (Herbig and Herbig 2001), the propensity to engage in unethical behavior (Volkema, 1999). While commenting on the influence of culture on negotiations, (Janosik 1987) identified four distinct possibilities. First, culture as a learned behavior affects negotiation in that it shapes one’s notion of reciprocity and justice, attitude about acceptable outcomes, or concepts about the appropriate timing for certain bargaining behaviors. Second, culture as “shared values” produces a common bargaining style among the people of a particular culture. Third, culture, in addition to representing “shared values” also represents dialectic (i.e., the tensions that exist among values embedded in a given culture). Culture as a dialectic may cause seemingly incompatible negotiation behavior among the people within the same culture (e.g., “harmonious cooperation” versus “warrior-like ethics” among the Japanese). Finally, culture as a carrier of dominant social and contextual factors affects the negotiation style and outcome of the people of a given culture in a particular situation. However, the thrust of this study is not highlighting the cultural differences between the negotiators from the US and Turkey, but to test a conceptual model with data from disparate cultural groups to identify the factors that lead to problem solving behavior in negotiations. A secondary objective is to uncover the differences, if any, between Turkish and US negotiators. It may be mentioned here that there are different approaches to the study of negotiations such as a normative or prescriptive approach, based on rational models of bargaining (e.g., Bazerman and Neale, 1992), an individual differences approach focusing on personality factors (Greenhalgh, Neslin and Gilkey, 1985), a structural approach grounded in game theory (e.g., Raiffa, 1982), a social contextualist approach (e.g., Kramer, Pommerenke, and Newton, 1993), just to name a few. In this study, we have incorporated both culture and personality factors to identify what may lead negotiators to behave in a certain way in a business negotiation. Cultural Intelligence Cultural intelligence (CQ) is defined as a multidimensional construct that encompasses an individual’s capability to function and manage effectively in culturally diverse settings (Early & Ang, 2003). This definition can be seen to be consistent with Schmidt and Hunter’s (1998) definition of general intelligence “the ability to grasp and reason correctly with abstractions (concepts) and solve problems”(p. 3). It also can be seen as fitting the more global approach to intelligence as suggested by theories of practical and multiple intelligences (Sternberg & Wagner, 1986). Cultural intelligence is seen as one of these “multiple intelligences”, it is also seen as conceptually and measurably distinct from others such as general or analytical intelligence (IQ), social intelligence (SI), and emotional intelligence (EQ) (Elenkov and Pimentel, 2008) with a distinguishing characteristic that cultural intelligence applies to multiple cultural settings while social and emotional intelligence may not apply in another cultural setting (Thomas, 2006). As conceived by Earley and Ang (2003) and developed by Van Dyne, Ang, and Koh (2008), the factors that make up the discrete construct of cultural intelligence (Total Cultural Intelligence or TCQ) include Metacognitive CQ; Cognitive CQ; Motivational CQ; and Behavioral CQ. Metacognitive CQ refers to the conscious awareness which an individual has regarding cultural interactions. Cognitive CQ is seen to reflect the knowledge of a group’s values, beliefs, and norms. Motivational CQ reflects the capability to direct energy to learning about cultural differences. Finally, behavioral CQ reflects the capability to choose appropriate verbal and physical actions when interacting with people of different cultures.

36
Such a construct would seem to be particularly appropriate to apply to the process of conducting cross-cultural business negotiations. Cellich and Jain (2004) argue that while negotiations can be difficult in any business setting, cross-cultural business negotiations are especially difficult due to cultural differences between the parties involved. Bernard (2009) suggested that cultural intelligence should be one of the foundations on which successful international business negotiations is based and Huang (2010) reinforces this view by addressing the need to have the cultural intelligence necessary to address the many cross-cultural communication factors that are critical for successful cross-cultural negotiations. As suggested by Van Dyne, Ang, and Koh (2008), the dimension of meta-cognitive cultural intelligence may be seen as a critical dimension of CQ as being aware or conscious of differences and using different approaches based on cultural difference is virtually always required in successful cross-cultural negotiations where a true problem-solving approach is used (Cellich & Jain, 2004). Therefore our first hypothesis is: H1: Higher meta-cognitive CQ scores will result in higher problem solving cross-cultural negotiation style score. Relationship and Task Management Styles Blake and Mouton (1964, 1985) argued that relationship orientation and task orientation are critical components in identifying management and leadership styles. In its most simple form, they saw relationship orientation as a concern for others and task management as concern for results or productivity. Blake and Mouton argue that an exclusive concern for production at the expense of the needs of those engaged in production leads to dissatisfaction and conflict, thus adversely affecting performance; but that, on the other hand, an excessive concern to avoid conflict and maintain good relationships is also detrimental to the achievement of goals and objectives. Based on Blake and Moutons’ initial work (1964), researchers have classified these two concepts as personality factors (Dunham, 1984) that have been found to play important roles in management and leadership effectiveness (Blake & Mouton, 1964, 1985), team building (Sulaiman, Mahbob, & Hassan, 2012), coaching behaviors (Curtis, 2002), negotiation of public contracts (DeCaro, DeCaro & Bowen-Thompson, 2010), and international negotiations (Naoko & Tanner, 1992; Martin, Herbig, Howard & Borstorff, 1999). In the latter case of international negotiations, both papers suggest the importance of building relationships first followed by an effective focus on exchanging task-related information in a persuasive manner. Thus, it can be argued that both relationship-orientation and task-orientation are of importance in the negotiation process. This may be similar to what Blake and Mouton (1964) labeled on their “managerial grid” as “9.9” suggesting that this high score in both orientations result in a manager with a concern for people as well as the task to be performed. Curtis (2002) saw the “9.9” manager as being skilled in promoting participation, involvement, and commitment among the people with whom he or she is working as well as confronting others in a constructive and sensitive manner in order to solve conflicts that might develop – a situation that is not uncommon in business negotiations. In cross-cultural business negotiations where a problem-solving approach is seen as the most effective approach to a successful negotiation, it can be hypothesized that both relationship and
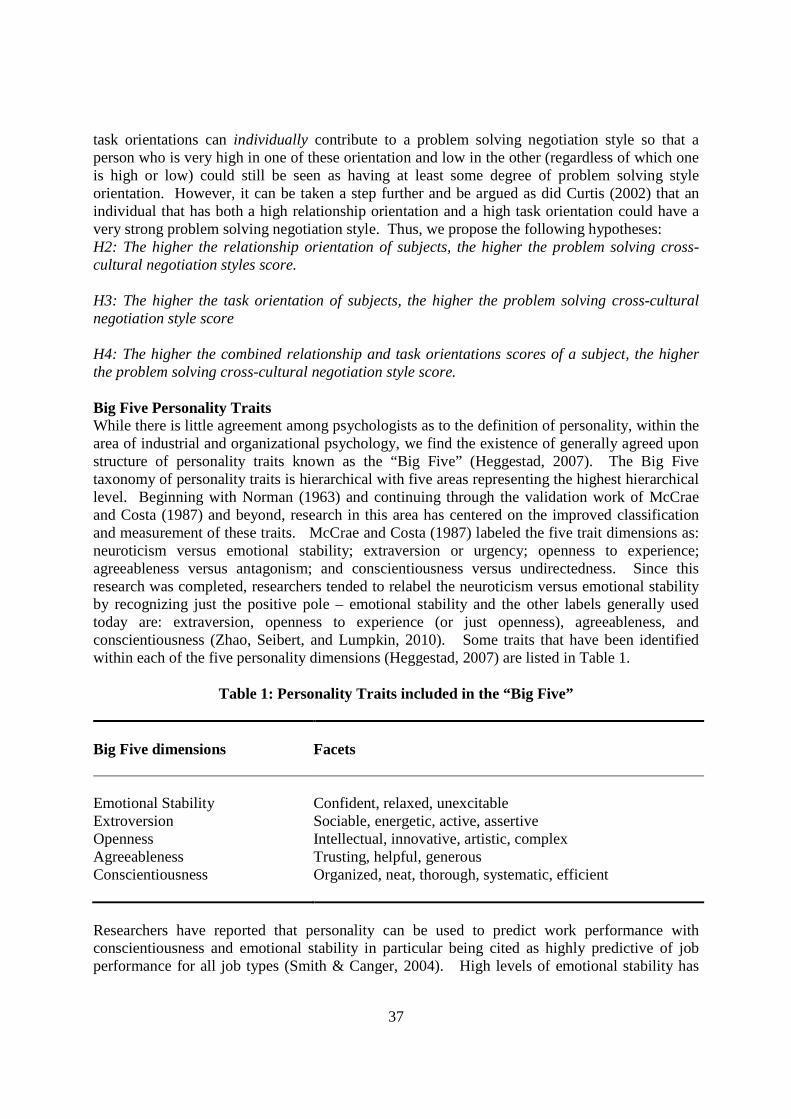
37
task orientations can individually contribute to a problem solving negotiation style so that a person who is very high in one of these orientation and low in the other (regardless of which one is high or low) could still be seen as having at least some degree of problem solving style orientation. However, it can be taken a step further and be argued as did Curtis (2002) that an individual that has both a high relationship orientation and a high task orientation could have a very strong problem solving negotiation style. Thus, we propose the following hypotheses: H2: The higher the relationship orientation of subjects, the higher the problem solving cross-cultural negotiation styles score. H3: The higher the task orientation of subjects, the higher the problem solving cross-cultural negotiation style score H4: The higher the combined relationship and task orientations scores of a subject, the higher the problem solving cross-cultural negotiation style score. Big Five Personality Traits While there is little agreement among psychologists as to the definition of personality, within the area of industrial and organizational psychology, we find the existence of generally agreed upon structure of personality traits known as the “Big Five” (Heggestad, 2007). The Big Five taxonomy of personality traits is hierarchical with five areas representing the highest hierarchical level. Beginning with Norman (1963) and continuing through the validation work of McCrae and Costa (1987) and beyond, research in this area has centered on the improved classification and measurement of these traits. McCrae and Costa (1987) labeled the five trait dimensions as: neuroticism versus emotional stability; extraversion or urgency; openness to experience; agreeableness versus antagonism; and conscientiousness versus undirectedness. Since this research was completed, researchers tended to relabel the neuroticism versus emotional stability by recognizing just the positive pole – emotional stability and the other labels generally used today are: extraversion, openness to experience (or just openness), agreeableness, and conscientiousness (Zhao, Seibert, and Lumpkin, 2010). Some traits that have been identified within each of the five personality dimensions (Heggestad, 2007) are listed in Table 1.
Table 1: Personality Traits included in the “Big Five”
Big Five dimensions Facets Emotional Stability Confident, relaxed, unexcitable Extroversion Sociable, energetic, active, assertive Openness Intellectual, innovative, artistic, complex Agreeableness Trusting, helpful, generous Conscientiousness Organized, neat, thorough, systematic, efficient Researchers have reported that personality can be used to predict work performance with conscientiousness and emotional stability in particular being cited as highly predictive of job performance for all job types (Smith & Canger, 2004). High levels of emotional stability has

38
been related to such adjectives as relaxed, calm, even tempered, unemotional, secure, and patient, while low levels of emotional stability (neuroticism) is described as emotional, nervous, impulsive, jealous, impatient, and insecure (McCrae & Costa, 1987). Ward and Fischer (2008) found a significant positive relationship between emotional stability and the ability of business person to generally adapt when working in a foreign country, and Smith and Canger (2004) suggest that those individual with low levels of emotional stability will tend to have problems developing personal relationships. This leads us to propose the following hypotheses: H5a: Emotional stability will moderate the relationship orientation impact on problem solving style with higher levels of emotional maturity positively contributing to the problem solving cross-cultural negotiation style score. H5b: Emotional stability will moderate the task orientation impact on problem solving style with higher levels of emotional maturity positively contributing to the problem solving cross-cultural negotiation style score. H5c: Emotional stability will moderate the impact of combined score of relationship and task orientation on problem solving style with higher levels of emotional stability positively contributing to the problem solving cross-cultural negotiation style score. These hypotheses can be visualized most clearly in the following model relationships:
Figure 1 Study Model
Methodology The sample for the study consisted of 233 university business students from the United States and Turkey. As this was a pilot study to examine the instruments used and the viability of the proposed model relationships, these two countries were chosen due to the cultural distance between the countries. Cultural distance (CD) was calculated using the formula described by Morosini, Shane, and Singh (1998). Hofstede’s (2001) power distance, uncertainty avoidance, masculinity, and individualism dimensions were used to create the CD score:
39
CDj = �∑ ����−������
where: CDj: is the cultural difference for the jth country. Iij: Hofstede’s score: ith cultural dimension and jth country. l: Indicates USA The results indicated a cultural distance score between the U.S. and Turkey of 18.4 with the average for the Hofstede’s 67 countries and regions being 17.0. It was felt this country that was slightly greater than the 67 country mean would be appropriate to examine the proposed model relationships in two very different cultures. In each country the questionnaire was administered in classroom environments and participation was voluntary. All students were either natives of each country and/or were citizens. In the United States a total of 106 usable questionnaires were generated representing a response rate of greater than 90% of those who had the opportunity to participate. In Turkey 127 usable questionnaires were obtained also with greater than 90% response rate. Questionnaires in Turkey were translated from English to Turkish and back translated with corrections made and checked. Cross-cultural problem solving negotiation orientation was measured using questions developed by Cellich and Jain (2004). However, since there is no report in the literature that these questions were evaluated for validity and reliability factor analysis and Cronbach alphas were calculated with the result being that the 7 questions suggested by Cellich and Jain were reduced to four questions. For the Turkey these four questions had factor loadings ranging from .496 to .687 and for U.S. they ranged from .409 to .600. Cronbach alphas however were weak with Turkey being .69 and the U.S. at .61. The four questions used were in the form of “I would try to learn the real needs of the other party before making a concession.” measured using a Likert scale with “1” being “Strongly Disagree” and with “5” being “Strongly Agree”. In order to frame these questions the following brief scenario and directions preceded these questions:
“Imagine you are working for a global telecom firm. You are being sent to Turkey as a lead negotiator to sell some telecom equipment manufactured by your firm. Your boss has given you wide latitude to make decisions on the spot. You have been thoroughly briefed about the positions, goals, and interests of your firm. However, as is common in most negotiations, you do not know much about your Turkish counterpart’s position, interests and priorities. Being able to close a deal would be very important for your firm and for your own career advancement. Please indicate to what extent the following statements reflect your likely negotiation behavior with your Turkish counterpart.”
Relationship orientation and task orientation questions came from Northouse (2004) and both consisted of 10 questions each. Since no documentation on validity and reliability were available, factor analysis and Cronbach alphas were done with the result that 4 questions were identified for each construct with factor loadings ranging from .455 to .792 for the U.S. and from .448 to .735 for Turkey. Cronbach alphas tended to be weak however with relationship

40
orientation being .67 for the U.S. and .70 for Turkey and task orientation having alphas of .68 for the U.S. and .67 for Turkey. The subject was asked to consider “how often you tend to engage in the described behavior when working in a group or team situation” and the questions were in the form of “Help others feel comfortable in the group” and measured using a Likert scale with “1” being “Never” and “5” being “Always”. Emotional Stability was measured using a Big Five personality scale developed by Gosling, Rentfrow, and Swan (2003) who point out, the Big Five structure enjoys considerable support among international psychologists whose research have resulted in a range of instruments. These instruments have as many as 240 item scales and as few as 5 item scales that can be used depending on a number of factors including the purpose or objective of administering the instrument (diagnoses of a suspected psychological illness or general employment selection process), and the need for very high levels of psychometric preciseness, and the concern of the researcher over the length of the questionnaire being administered and possible subject concentration and fatigue given a large number of questions. Gosling et al. (2003) developed and tested the 10 item measurement used in this study and found satisfactory convergence validity with the often used and highly regarded Big Five Inventory (BFI) of John and Srivastava (1999). They point out the BFI in-turn shows high convergent validity with other self-report scales and peer rating scales of the Big Five. They also found the 10-item scale (TIPI) to have test-retest reliability, satisfactory patterns of predicted external correlations, and convergence between self-rated and observer ratings. Meta-cognitive cultural intelligence was measured using the self-report instrument developed and validated by Van Dyne, Ang, and Koh (2008). During their validation process they identified the 20 items with the strongest psychometric properties. Nested model comparisons demonstrated the superiority of the hypothesized four-factor CQ model. The instrument was then tested for generalizability across samples and analysis using structured equation modeling (SEM) demonstrated good fit also finding acceptable Cronbach alphas. They also completed an analysis of generalizability across time, generalizeability across countries, generalizability across methods (observer report and self-report), as well as discriminant validity, incremental validity, and predictive validity (with cultural decision-making, interactional adjustment, and mental well-being as dependent variables). The study concluded that the construct appears to have a clear, robust, and meaningful structure. Shannon and Begley (2008) confirmed that the psychometric properties of the Van Dyne, Ang, and Koh (2008) model were stable. The meta-cognitive dimension consisted of four questions of the form “I am conscious of the cultural knowledge I use when interacting with people with different cultural backgrounds” being measured using a Likert scale with “1” being “Strongly Disagree” and “7” being “Strongly Agree.”
RESULTS
As indicated in Table 2, the sample consisted of 233 university business students consisting of 133 men and 100 women from the United States and Turkey. The average age was approximately 21.5 years with a mean of 3 years of university completed. This sample came from one university in each of the selected countries.

41
Table 2 Study Sample
USA Turkey Total Subjects 106 127 Men 65 68 Women 41 59 Age 20.3 22.4 Education* 2.8 3.2
*Number of years in university The means of problem solving negotiation style (ProbSol), meta-cognitive cultural intelligence (Meta CQ), relationship management style (Relation), and task management style (Task) ranged from 4.10 to 4.78 for the USA and from 3.85 to 4.65 for Turkey (see Table 3). The combination scores of relationship plus task management styles (RelTsk) were 8.47 and 7.85 for the USA and Turkey respectively. The combination relationship and task management style interaction with emotional stability (RelTsk*ES) scores were 44.55 and 34.18 for the USA and Turkey respectively. With all variables, except Meta CQ with no difference, were the USA mean scores significantly higher than Turkey (p<.001).
Table 3 Descriptive Statistics
* Significance p<.001 The correlations for the entire sample population between variables are seen in table 4. All correlations except Meta CQ and Emotional Stability, and Task and Emotional Stability were significant (p<.05) with the highest correlation being .595 between relation and task management styles.
Table 4 Correlations: Core Model Variables
All Subjects (233) Meta CQ Relation Task Emotional
Stability Problem Solving
Meta Cognitive CQ 1 Relation .243 1 Task .291 .595 1 Emotional Stability .052 .170 .075 1
Variables USA Mean/SD
Turkey Mean/SD
ProbSol 4.18* 3.85 Meta CQ 4.78 4.65 Relation 4.38* 4.00
Task 4.10* 3.86 RelTsk 8.47* 7.85
RelTskT*ES 44.55* 34.18
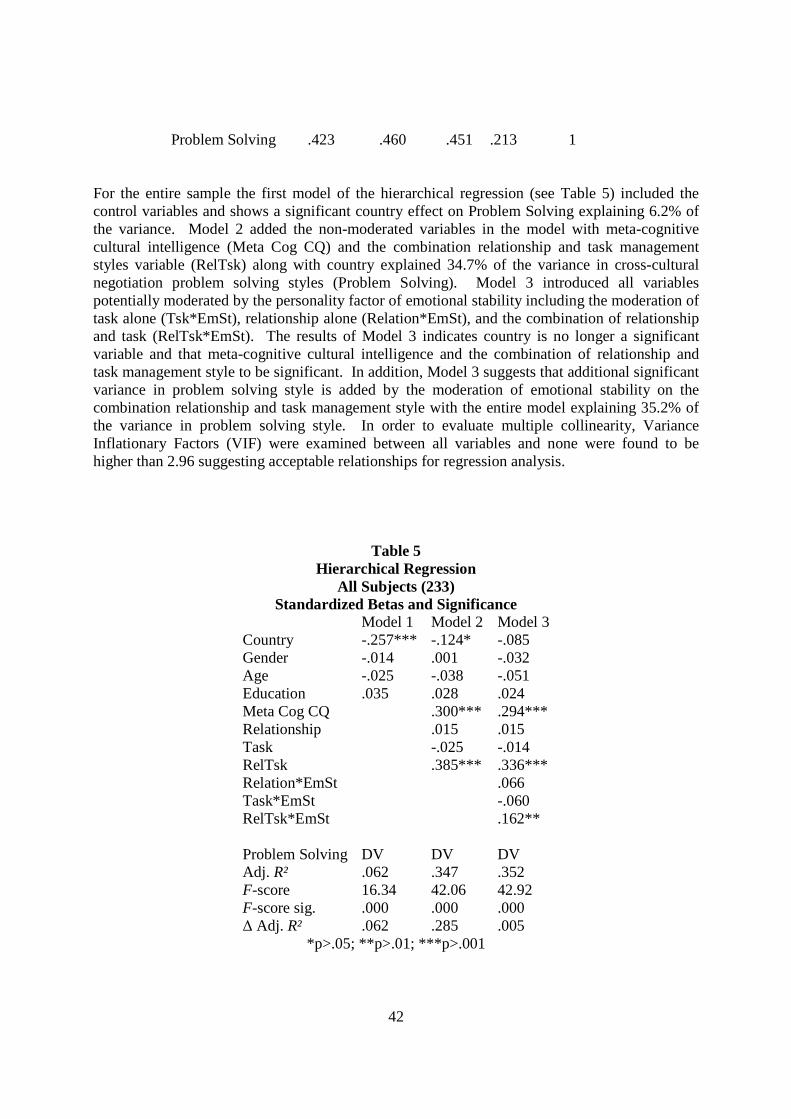
42
Problem Solving .423 .460 .451 .213 1 For the entire sample the first model of the hierarchical regression (see Table 5) included the control variables and shows a significant country effect on Problem Solving explaining 6.2% of the variance. Model 2 added the non-moderated variables in the model with meta-cognitive cultural intelligence (Meta Cog CQ) and the combination relationship and task management styles variable (RelTsk) along with country explained 34.7% of the variance in cross-cultural negotiation problem solving styles (Problem Solving). Model 3 introduced all variables potentially moderated by the personality factor of emotional stability including the moderation of task alone (Tsk*EmSt), relationship alone (Relation*EmSt), and the combination of relationship and task (RelTsk*EmSt). The results of Model 3 indicates country is no longer a significant variable and that meta-cognitive cultural intelligence and the combination of relationship and task management style to be significant. In addition, Model 3 suggests that additional significant variance in problem solving style is added by the moderation of emotional stability on the combination relationship and task management style with the entire model explaining 35.2% of the variance in problem solving style. In order to evaluate multiple collinearity, Variance Inflationary Factors (VIF) were examined between all variables and none were found to be higher than 2.96 suggesting acceptable relationships for regression analysis.
Table 5 Hierarchical Regression
All Subjects (233) Standardized Betas and Significance
Model 1 Model 2 Model 3 Country -.257*** -.124* -.085 Gender -.014 .001 -.032 Age -.025 -.038 -.051 Education .035 .028 .024 Meta Cog CQ .300*** .294*** Relationship .015 .015 Task -.025 -.014 RelTsk .385*** .336*** Relation*EmSt .066 Task*EmSt -.060 RelTsk*EmSt .162** Problem Solving DV DV DV Adj. R² .062 .347 .352 F-score 16.34 42.06 42.92 F-score sig. .000 .000 .000 ∆ Adj. R² .062 .285 .005
*p>.05; **p>.01; ***p>.001
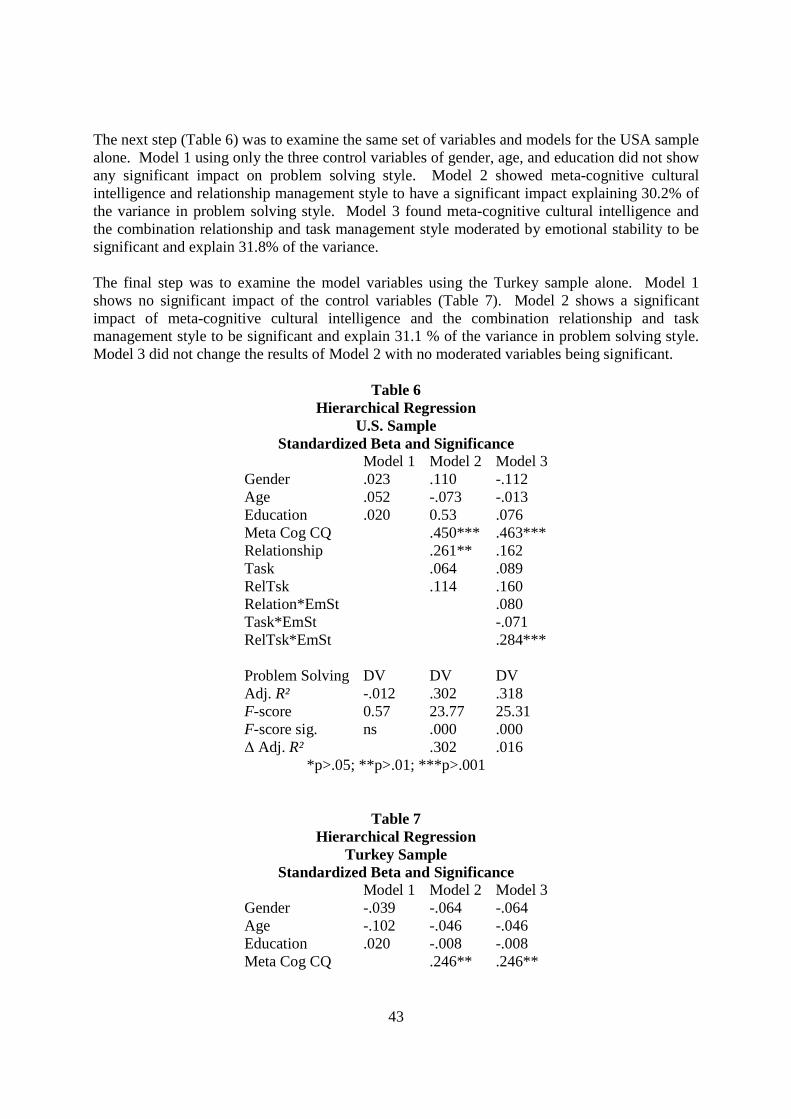
43
The next step (Table 6) was to examine the same set of variables and models for the USA sample alone. Model 1 using only the three control variables of gender, age, and education did not show any significant impact on problem solving style. Model 2 showed meta-cognitive cultural intelligence and relationship management style to have a significant impact explaining 30.2% of the variance in problem solving style. Model 3 found meta-cognitive cultural intelligence and the combination relationship and task management style moderated by emotional stability to be significant and explain 31.8% of the variance. The final step was to examine the model variables using the Turkey sample alone. Model 1 shows no significant impact of the control variables (Table 7). Model 2 shows a significant impact of meta-cognitive cultural intelligence and the combination relationship and task management style to be significant and explain 31.1 % of the variance in problem solving style. Model 3 did not change the results of Model 2 with no moderated variables being significant.
Table 6 Hierarchical Regression
U.S. Sample Standardized Beta and Significance
Model 1 Model 2 Model 3 Gender .023 .110 -.112 Age .052 -.073 -.013 Education .020 0.53 .076 Meta Cog CQ .450*** .463*** Relationship .261** .162 Task .064 .089 RelTsk .114 .160 Relation*EmSt .080 Task*EmSt -.071 RelTsk*EmSt .284*** Problem Solving DV DV DV Adj. R² -.012 .302 .318 F-score 0.57 23.77 25.31 F-score sig. ns .000 .000 ∆ Adj. R² .302 .016
*p>.05; **p>.01; ***p>.001
Table 7 Hierarchical Regression
Turkey Sample Standardized Beta and Significance
Model 1 Model 2 Model 3 Gender -.039 -.064 -.064 Age -.102 -.046 -.046 Education .020 -.008 -.008 Meta Cog CQ .246** .246**
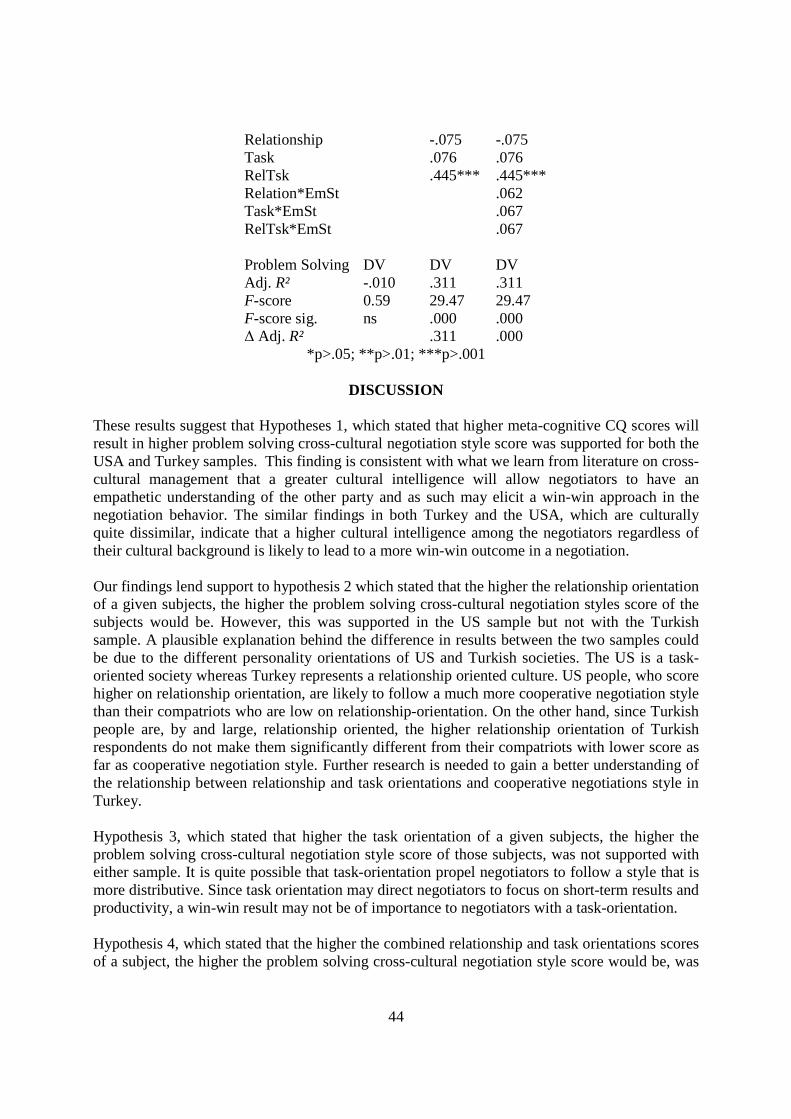
44
Relationship -.075 -.075 Task .076 .076 RelTsk .445*** .445*** Relation*EmSt .062 Task*EmSt .067 RelTsk*EmSt .067 Problem Solving DV DV DV Adj. R² -.010 .311 .311 F-score 0.59 29.47 29.47 F-score sig. ns .000 .000 ∆ Adj. R² .311 .000
*p>.05; **p>.01; ***p>.001
DISCUSSION
These results suggest that Hypotheses 1, which stated that higher meta-cognitive CQ scores will result in higher problem solving cross-cultural negotiation style score was supported for both the USA and Turkey samples. This finding is consistent with what we learn from literature on cross-cultural management that a greater cultural intelligence will allow negotiators to have an empathetic understanding of the other party and as such may elicit a win-win approach in the negotiation behavior. The similar findings in both Turkey and the USA, which are culturally quite dissimilar, indicate that a higher cultural intelligence among the negotiators regardless of their cultural background is likely to lead to a more win-win outcome in a negotiation. Our findings lend support to hypothesis 2 which stated that the higher the relationship orientation of a given subjects, the higher the problem solving cross-cultural negotiation styles score of the subjects would be. However, this was supported in the US sample but not with the Turkish sample. A plausible explanation behind the difference in results between the two samples could be due to the different personality orientations of US and Turkish societies. The US is a task-oriented society whereas Turkey represents a relationship oriented culture. US people, who score higher on relationship orientation, are likely to follow a much more cooperative negotiation style than their compatriots who are low on relationship-orientation. On the other hand, since Turkish people are, by and large, relationship oriented, the higher relationship orientation of Turkish respondents do not make them significantly different from their compatriots with lower score as far as cooperative negotiation style. Further research is needed to gain a better understanding of the relationship between relationship and task orientations and cooperative negotiations style in Turkey. Hypothesis 3, which stated that higher the task orientation of a given subjects, the higher the problem solving cross-cultural negotiation style score of those subjects, was not supported with either sample. It is quite possible that task-orientation propel negotiators to follow a style that is more distributive. Since task orientation may direct negotiators to focus on short-term results and productivity, a win-win result may not be of importance to negotiators with a task-orientation. Hypothesis 4, which stated that the higher the combined relationship and task orientations scores of a subject, the higher the problem solving cross-cultural negotiation style score would be, was
45
supported with the Turkish sample but not supported with the US sample. This finding is somewhat unexpected given what we found with respect to Hypotheses 1. We have earlier found a positive relationship between relationship orientation and problem solving negotiation style in the US, but not in Turkey and no direct relationship between task orientation and problem solving negotiation style in either country. However, we find a different picture when we look at the combined score of relationship and task orientation in the two focal countries. It is quite possible that the interaction effect of these two orientations is moderated by some other factors which is not captured in our model. Further research is thus needed in this area. Another possible explanation behind this divergence in the result could be attributed to some cultural factors that need to be identified. It is also conceivable that the role of combined relationship- and task-orientations is more prominent in an individualistic society such as the US as compared to a collectivistic society like Turkey. Both Hypotheses 5a and 5b which stated that emotional stability will moderate the relationship orientation (5a) and task orientation (5b) impact on problem solving style with higher levels of emotional maturity positively contributing to the problem solving cross-cultural negotiation style score were not supported. However, Hypothesis 5c which stated that emotional stability will moderate combined score of relationship and task orientation impact on problem solving style with higher levels of emotional stability positively contributing to the problem solving cross-cultural negotiation style score, was supported in the USA sample but not in the Turkish sample. This finding raises more question than it answers. The analysis of data which shows a greater coefficient for combined score of Relationship and Task orientation for the Turkish responses, but not for the US responses, despite the added boost given by emotional stability indicate that some other factors may be playing a role which is not captured by the model. It is also quite possible that the moderating effect of stability may vary from culture to culture, this showing a higher score for the US data as compared to the Turkish data, and yet this impact of relationship orientation and emotional stability is more than offset in Turkish culture by the presence of some other yet to be identified factor(s) when combined with task orientation. The findings have significant implications for selection of negotiators as well as for designing training program for negotiators. Our findings confirm the existence of a positive relationship between cultural intelligence and problem solving negotiation style. If a firm is thus interested in achieving win-win outcomes, it should design its managerial training in a way that would help managers hone their cultural intelligence. Our analysis also provide support, although somewhat limited, for the hypothesized relationship between relationship orientation and problem solving style as well as validates the mediating role of emotional stability in the case of US respondents. These findings call for focused training of managers to enhance their relationship orientation and emotional stability for ensuring the adoption of problem solving style, and consequently, maximizing joint benefits from negotiations. As stated earlier, the findings also give rise to new questions. Further research needs to be conducted to ascertain why, with respect to problem solving negotiation style, relationship orientation and emotional stability play a higher role in the US than in Turkey. Future researchers also need to study why this role reverses and becomes more important in Turkey than in the US when task orientation is combined with relationship orientation. Future researchers should also study if other personality factors impact our style in international negotiations.
46
Future researchers should also identify other mediating and moderating variables that impact the adoption of a particular negotiation style. While much work lies ahead, it is expected that this paper would generate further interest among researchers to identify the other antecedent factors not captured in our model that impact the adoption of a particular negotiation style. While the proposed model is not be an all-inclusive model, it is hoped that it would provide the basis for furthering our understanding of the complex and multi-faceted relationship between cultural intelligence and negotiation style as well as between various personality factors and negotiation style.
REFERENCES Adler, Nancy J. (Ed). (1997). International Dimensions of Organizational Behavior, Cincinnati, OH: Southwestern.
_______ Graham, J.L. (1989). Cross-cultural interaction: The international comparison fallacy? Journal of International Business Studies, 20 (2): 515-537. Bazerman, M.H. and Neale, M.A. (1982). Negotiating Rationally. New York: Free Press. Blake, R.; Mouton, J. (1964). The Managerial Grid: The Key to Leadership Excellence. Houston: Gulf Publishing Co. Blake, R.; Mouton, J. (1985). The Managerial Grid III: The Key to Leadership Excellence. Houston: Gulf Publishing Co. Cellich, C., and Jain, S. (2004). Global Business Negotiations. Mason, OH: Thomson-South-Western. Curtis, B. (2002). Analysis of the Blake/Mouton leadership styles and their relationship to effective coaching behaviors. Dissertation, Pepperdine University. DeCaro, F., DeCaro, N., and Bowen-Thompson, F. (2010). An examination of leadership styles of minority business entrepreeneurs: A case study of public contracts. Journal of Business & Economic Studies, 16(2), 72-79. Dunham, R. (1984). Organizational Behavior. Homewood, IL: Richard D. Irwin Press Earley, P., and Ang, S. (2003), Cultural Intelligence: Individual Interactions Across Cultures, Palo Alto: Stamford University Press. Elahee, Mohammad N., Kirby, Susan and Nasif, Ercan. (2002). National culture, trust, and perceptions about ethical behavior in intra- and cross-cultural negotiations: An analysis of NAFTA countries. Thunderbird International Business Review, 44 (6): 799-818.

47
Elenkov, D., and Pimentel, J. (2008). Social Intelligence, Emotional Intelligence, and Cultural Intelligence: An integrative perspective, in Ang and Van Dyne (Eds) Handbook of Cultural Intelligence, Armonk, NY: M.E. Sharpe, 289-305. Encyclopedia Britannica. "Francois de Callieres". Encyclopedia Britannica Online. Encyclopædia Britannica Inc., 2012. Web. 07 Jul. 2012. Gosling, S., Rentfrow, P., and Swann, W. (2003). A very brief measure of the Big Five personality domains. Journal of Research in Personality, 37, 504-528. Greenhalgh, Leonard, Neslin, Scott A. and Gilkey, Roderick W. (1985). The effects of negotiator Preferences, situational power, and negotiator personality on outcomes of business negotiations. The Academy of Management Journal, 28 (1): 9-33 Heggestad, E. 2007. Personality, in Ed. S. Rogelberg Encyclopedia of Industrial and Organizational Psychology, Thousand Oaks: Sage, 607-611. Hofstede, G. (2001), Culture’s Consequences (2nd Ed.), Newberry Park, CA: Sage Publications Janosik, R.J. (1987). Rethinking the culture negotiation link. Negotiation Journal, 3: 385-95. Lewicki, Roy. J., Barry, Bruce, and Saunders, David M. (20080. Negotiations. 6th ed. Boston: McGraw Hill-Irwin. Martin, D., Herbig, P., Howard, C., and Borstorff, P. (1999). At the table: Observations on Japanese negotiation styles. American Business Review, 17(1), 65-74. McCrae, R., and Costa, P. 1987. Validation of the five-factor model of personality across instruments and observers. Journal of Personality and Social Psychology, 52(1), 81-90. Morosini, P., Shane, S., and Singh, S. (1998). National cultural distance and cross-border acquisition performance, Journal of International Business Studies, 29, 137-158. Norman, W. T. 1963. Toward an adequate taxonomy of personality attributes: Replicated factor structure in peer nomination personality ratings. Journal of Abnormal and Social Psychology, 66, 574–583. Northouse, P. (2004). Leadership: Theory and practice. Thousand Oaks: Sage Publications Raiffa, Howard (1982). The art and science of negotiations. Cambridge, MA: Belknap Press of Harvard University Press. Schmidt, Frank L, & Hunter, John E. (1998). The validity and utility of selection methods in personnel psychology: Practical and theoretical implications of 85 years of research findings. Psychological Bulletin, 124(2), 262-274. Sen, Amartya. (2005). The Argumentative Indian. London, UK: Penguin.

48
Shannon, L. and Begley, T. (2008). Antecedents of the four-factor model of cultural intelligence, in Ang & Van Dynes (Eds.) Handbook of Cultural Intelligence: Theory, Measurements, and Applications, London: M.E.Sharpe, 41-55. Smith, M., and Canger, J. (2004). Effects of Supervisor "Big Five" Personality on Subordinate Attitudes. Journal of Business and Psychology , Vol. 18(4), 465-481. Sternberg, R., and Wagner, R. (Eds.) (1986). Practical Intelligence. Cambridge: Cambridge University Press. Sulaiman, W., Mahbob, M., and Hassan, B. (2012). An analysis on the effectiveness of team building: The impact on Human Resources. Asian Social Science, 8(5), 29-34. Oikawa, N., and Tanner, J. (1992). The influence of Japanese culture on business relationships and negotiations. The Journal of Services Marketing, 6(3), 67-75. Thomas, D. (2006), Domain development of cultural intelligence: The importance of mindfulness. Group and Organization Management, 31, 78-99. Van Dyne, L. Ang, S., and Koh, C. (2008), Development and validation of the CQS, in Ang & Van Dynes (Eds.) Handbook of Cultural Intelligence: Theory, Measurements, and Applications, London: M.E.Sharpe, 16-38. Volkema, Rojer J. (1999). Ethicality in negotiations: Analysis of perceptual differences between Brazil and the United States. Journal of Business Research, 45 (1): 59-67. Zhao, H., Seibert, S., and Lumpkin, G. 2010. The relation of personality to entrepreneurial intentions and performance: A meta-analytical review. Journal of Management. 36, 361 – 404.
49
NATIONAL CULTURE AND LEADERSHIP STYLE IN A MULTI-CULTURAL ENVIRONMENT: THE LUXEMBOURG
CASE
Petra Garnjost University of Applied Science
Waldhausweg 114 D- 66123 Saarbruecken Germany
Stephen M. Brown Welch College of Business Sacred Heart University
5151 Park Ave. Fairfield, CT 06825-1000 [email protected]
Jeanine Andreassi
Welch College of Business Sacred Heart University
5151 Park Ave. Fairfield, CT 06825-1000
[email protected] ABSTRACT
Hofstede´s research on cultural differences and its implication for management style has been reviewed and acknowledged for decades. His findings suggest cultural dimensions have strong impact on expected behavior of supervisors and subordinates. The Globe survey identified leadership styles that work in any cultural environment. There is a strong indicator that in addition to cultural specific leadership styles there is also a universal one. The leadership categories identified by GLOBE as universally effective, were very similar to the dimensions of transformational leadership. This paper analyzes nationality as a predictor of Transformational Leadership style with a sample of 250 managers from Luxembourg; an EU country with a highly international workforce comprised of 69.5% foreigners. The results based on regression show, that there is no prediction of national culture regarding preferred leadership style. This finding is of high implication for a multicultural business environment as it is in Luxembourg. This research suggests a diminishing influence of national culture in such a multicultural business environment. Keywords: Culture, Management Style, Leadership, Transformational Leadership
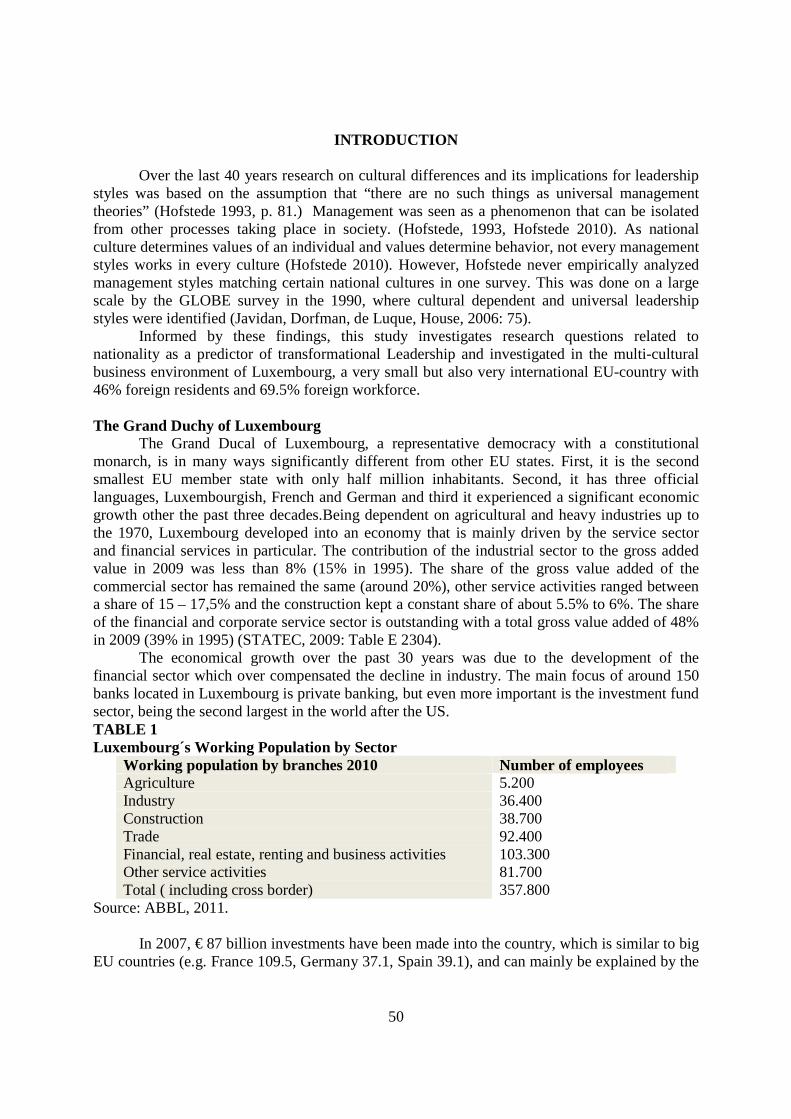
50
INTRODUCTION
Over the last 40 years research on cultural differences and its implications for leadership styles was based on the assumption that “there are no such things as universal management theories” (Hofstede 1993, p. 81.) Management was seen as a phenomenon that can be isolated from other processes taking place in society. (Hofstede, 1993, Hofstede 2010). As national culture determines values of an individual and values determine behavior, not every management styles works in every culture (Hofstede 2010). However, Hofstede never empirically analyzed management styles matching certain national cultures in one survey. This was done on a large scale by the GLOBE survey in the 1990, where cultural dependent and universal leadership styles were identified (Javidan, Dorfman, de Luque, House, 2006: 75).
Informed by these findings, this study investigates research questions related to nationality as a predictor of transformational Leadership and investigated in the multi-cultural business environment of Luxembourg, a very small but also very international EU-country with 46% foreign residents and 69.5% foreign workforce.
The Grand Duchy of Luxembourg
The Grand Ducal of Luxembourg, a representative democracy with a constitutional monarch, is in many ways significantly different from other EU states. First, it is the second smallest EU member state with only half million inhabitants. Second, it has three official languages, Luxembourgish, French and German and third it experienced a significant economic growth other the past three decades.Being dependent on agricultural and heavy industries up to the 1970, Luxembourg developed into an economy that is mainly driven by the service sector and financial services in particular. The contribution of the industrial sector to the gross added value in 2009 was less than 8% (15% in 1995). The share of the gross value added of the commercial sector has remained the same (around 20%), other service activities ranged between a share of 15 – 17,5% and the construction kept a constant share of about 5.5% to 6%. The share of the financial and corporate service sector is outstanding with a total gross value added of 48% in 2009 (39% in 1995) (STATEC, 2009: Table E 2304).
The economical growth over the past 30 years was due to the development of the financial sector which over compensated the decline in industry. The main focus of around 150 banks located in Luxembourg is private banking, but even more important is the investment fund sector, being the second largest in the world after the US. TABLE 1 Luxembourg´s Working Population by Sector
Working population by branches 2010 Number of employees Agriculture 5.200 Industry 36.400 Construction 38.700 Trade 92.400 Financial, real estate, renting and business activities 103.300 Other service activities 81.700 Total ( including cross border) 357.800
Source: ABBL, 2011.
In 2007, € 87 billion investments have been made into the country, which is similar to big EU countries (e.g. France 109.5, Germany 37.1, Spain 39.1), and can mainly be explained by the
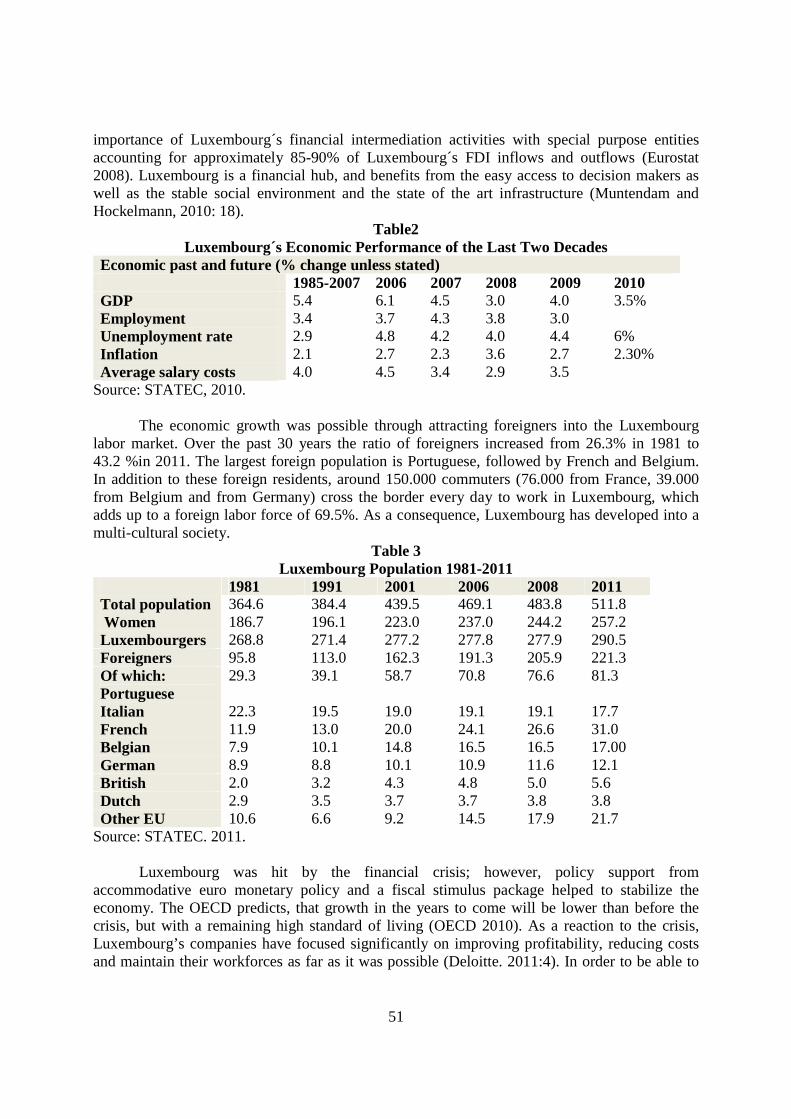
51
importance of Luxembourg´s financial intermediation activities with special purpose entities accounting for approximately 85-90% of Luxembourg´s FDI inflows and outflows (Eurostat 2008). Luxembourg is a financial hub, and benefits from the easy access to decision makers as well as the stable social environment and the state of the art infrastructure (Muntendam and Hockelmann, 2010: 18).
Table2 Luxembourg´s Economic Performance of the Last Two Decades
Economic past and future (% change unless stated) 1985-2007 2006 2007 2008 2009 2010 GDP 5.4 6.1 4.5 3.0 4.0 3.5% Employment 3.4 3.7 4.3 3.8 3.0 Unemployment rate 2.9 4.8 4.2 4.0 4.4 6% Inflation 2.1 2.7 2.3 3.6 2.7 2.30% Average salary costs 4.0 4.5 3.4 2.9 3.5
Source: STATEC, 2010.
The economic growth was possible through attracting foreigners into the Luxembourg labor market. Over the past 30 years the ratio of foreigners increased from 26.3% in 1981 to 43.2 %in 2011. The largest foreign population is Portuguese, followed by French and Belgium. In addition to these foreign residents, around 150.000 commuters (76.000 from France, 39.000 from Belgium and from Germany) cross the border every day to work in Luxembourg, which adds up to a foreign labor force of 69.5%. As a consequence, Luxembourg has developed into a multi-cultural society.
Table 3 Luxembourg Population 1981-2011
1981 1991 2001 2006 2008 2011 Total population 364.6 384.4 439.5 469.1 483.8 511.8 Women 186.7 196.1 223.0 237.0 244.2 257.2 Luxembourgers 268.8 271.4 277.2 277.8 277.9 290.5 Foreigners 95.8 113.0 162.3 191.3 205.9 221.3 Of which: Portuguese
29.3 39.1 58.7 70.8 76.6 81.3
Italian 22.3 19.5 19.0 19.1 19.1 17.7 French 11.9 13.0 20.0 24.1 26.6 31.0 Belgian 7.9 10.1 14.8 16.5 16.5 17.00 German 8.9 8.8 10.1 10.9 11.6 12.1 British 2.0 3.2 4.3 4.8 5.0 5.6 Dutch 2.9 3.5 3.7 3.7 3.8 3.8 Other EU 10.6 6.6 9.2 14.5 17.9 21.7
Source: STATEC. 2011.
Luxembourg was hit by the financial crisis; however, policy support from accommodative euro monetary policy and a fiscal stimulus package helped to stabilize the economy. The OECD predicts, that growth in the years to come will be lower than before the crisis, but with a remaining high standard of living (OECD 2010). As a reaction to the crisis, Luxembourg’s companies have focused significantly on improving profitability, reducing costs and maintain their workforces as far as it was possible (Deloitte. 2011:4). In order to be able to
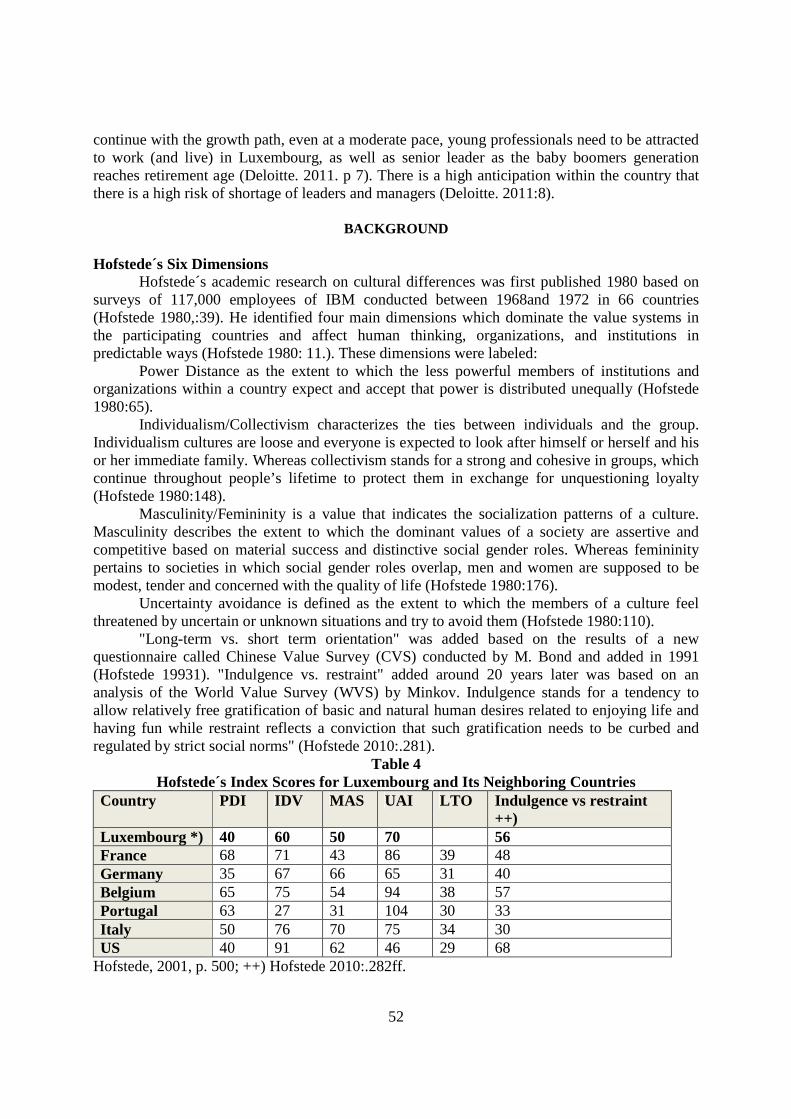
52
continue with the growth path, even at a moderate pace, young professionals need to be attracted to work (and live) in Luxembourg, as well as senior leader as the baby boomers generation reaches retirement age (Deloitte. 2011. p 7). There is a high anticipation within the country that there is a high risk of shortage of leaders and managers (Deloitte. 2011:8).
BACKGROUND
Hofstede´s Six Dimensions Hofstede´s academic research on cultural differences was first published 1980 based on
surveys of 117,000 employees of IBM conducted between 1968and 1972 in 66 countries (Hofstede 1980,:39). He identified four main dimensions which dominate the value systems in the participating countries and affect human thinking, organizations, and institutions in predictable ways (Hofstede 1980: 11.). These dimensions were labeled:
Power Distance as the extent to which the less powerful members of institutions and organizations within a country expect and accept that power is distributed unequally (Hofstede 1980:65).
Individualism/Collectivism characterizes the ties between individuals and the group. Individualism cultures are loose and everyone is expected to look after himself or herself and his or her immediate family. Whereas collectivism stands for a strong and cohesive in groups, which continue throughout people’s lifetime to protect them in exchange for unquestioning loyalty (Hofstede 1980:148).
Masculinity/Femininity is a value that indicates the socialization patterns of a culture. Masculinity describes the extent to which the dominant values of a society are assertive and competitive based on material success and distinctive social gender roles. Whereas femininity pertains to societies in which social gender roles overlap, men and women are supposed to be modest, tender and concerned with the quality of life (Hofstede 1980:176).
Uncertainty avoidance is defined as the extent to which the members of a culture feel threatened by uncertain or unknown situations and try to avoid them (Hofstede 1980:110).
"Long-term vs. short term orientation" was added based on the results of a new questionnaire called Chinese Value Survey (CVS) conducted by M. Bond and added in 1991 (Hofstede 19931). "Indulgence vs. restraint" added around 20 years later was based on an analysis of the World Value Survey (WVS) by Minkov. Indulgence stands for a tendency to allow relatively free gratification of basic and natural human desires related to enjoying life and having fun while restraint reflects a conviction that such gratification needs to be curbed and regulated by strict social norms" (Hofstede 2010:.281).
Table 4 Hofstede´s Index Scores for Luxembourg and Its Neighboring Countries
Country PDI IDV MAS UAI LTO Indulgence vs restraint ++)
Luxembourg *) 40 60 50 70 56 France 68 71 43 86 39 48 Germany 35 67 66 65 31 40 Belgium 65 75 54 94 38 57 Portugal 63 27 31 104 30 33 Italy 50 76 70 75 34 30 US 40 91 62 46 29 68
Hofstede, 2001, p. 500; ++) Hofstede 2010:.282ff.

53
*) Luxembourg was not in the original IBM set, however, there are estimations available based on observation and clustering in European Union (Hofstede, 2001: 502).
Looking at the different scores of the six dimensions for Luxembourg and its foreign workforce the scores for Power distance, Individualism, and Uncertainty Avoidance have the highest variation. "Managers and leaders, as well as the people they work with, are part of national societies. If we want to understand their behavior, we have to understand their societies." (Hofstede 2010:25) Therefore, Hofstede relates certain scores or combinations of scores of his cultural dimensions to country specific management/ leadership behavior. For example, values about appropriate power distance are present among superiors and subordinates in a specific country, both share a country specific expectation regarding appropriate behavior in the workplace (Hofstede 1980: 258.)
Table 5 Expected Management Practices
Dimension Low Score High Score PDI Hofstede, 1980: 107, 2001: 107f
Hierarchy in organizations means an inequality of roles, established for convenience Decentralization is popular Narrow salary range between top and bottom of organization. Subordinates expect to be consulted The ideal boss is a resourceful democrat Privileges and status symbols are frowned upon
Hierarchy in organizations reflects the existential inequality between higher-ups and lower-downs Centralization is popular Wide salary range between top and bottom of organization Subordinates expect to be told what to do The ideal boss is a benevolent autocrat or good father Privileges and status symbols for managers are both expected and popular
IDV/COL Hofstede, 1980: 173f, 2001:236
Collectivist Relationship employer-employee is perceived in moral terms, like a family link Hiring and promotion decisions take employees' in-group into account Management is management of groups Relationship prevails over task
Individualist Relationship employer-employee is a contract supposed to be based on mutual advantage Hiring and promotion decisions are supposed to be based on skills and rules only Management is management of individuals Task prevails over relationship
MAS /FEM Hofstede, 1980:207f, 2001: 311ff
Feminine Managers use intuition and strive for consensus Stress on equality, solidarity, and quality of work life Resolution of conflicts by compromise and negotiation
Masculine Managers expected to be decisive and assertive, stress on equity, competition among colleagues, and performance Resolution of conflicts by fighting them out
UAI Hofstede
There should not be more rules than is strictly necessary
Emotional need for rules, even if these will never work
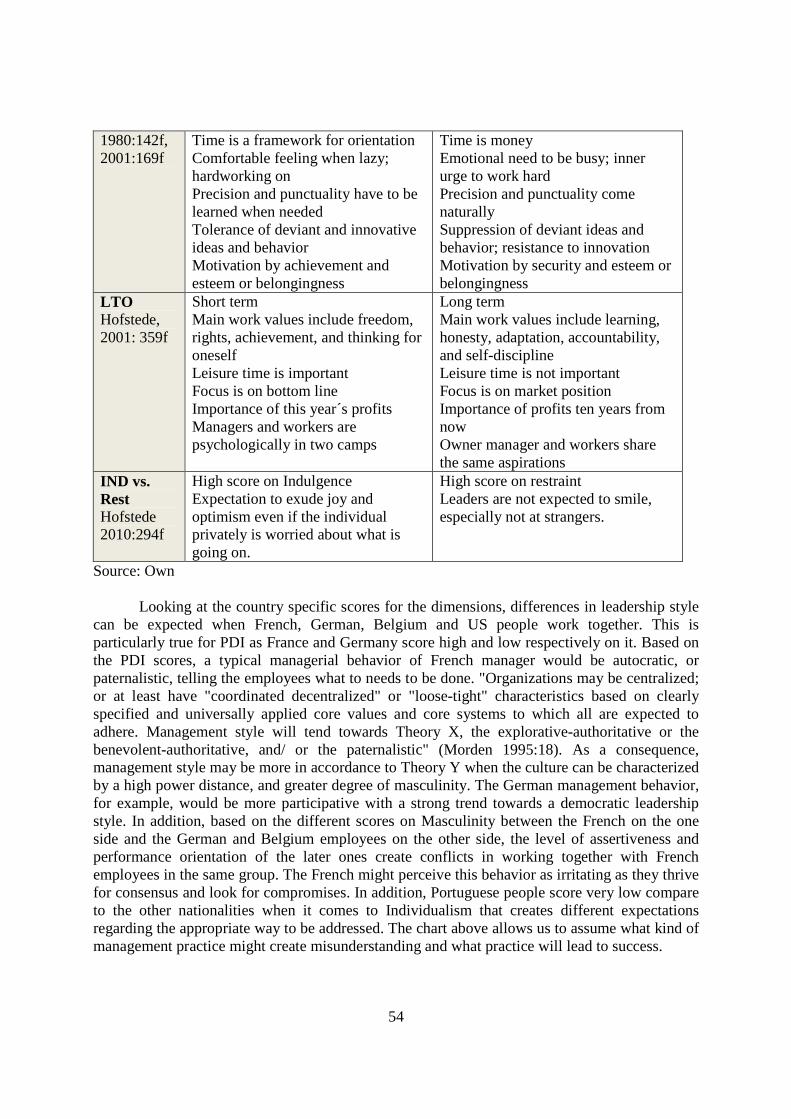
54
1980:142f, 2001:169f
Time is a framework for orientation Comfortable feeling when lazy; hardworking on Precision and punctuality have to be learned when needed Tolerance of deviant and innovative ideas and behavior Motivation by achievement and esteem or belongingness
Time is money Emotional need to be busy; inner urge to work hard Precision and punctuality come naturally Suppression of deviant ideas and behavior; resistance to innovation Motivation by security and esteem or belongingness
LTO Hofstede, 2001: 359f
Short term Main work values include freedom, rights, achievement, and thinking for oneself Leisure time is important Focus is on bottom line Importance of this year´s profits Managers and workers are psychologically in two camps
Long term Main work values include learning, honesty, adaptation, accountability, and self-discipline Leisure time is not important Focus is on market position Importance of profits ten years from now Owner manager and workers share the same aspirations
IND vs. Rest Hofstede 2010:294f
High score on Indulgence Expectation to exude joy and optimism even if the individual privately is worried about what is going on.
High score on restraint Leaders are not expected to smile, especially not at strangers.
Source: Own
Looking at the country specific scores for the dimensions, differences in leadership style can be expected when French, German, Belgium and US people work together. This is particularly true for PDI as France and Germany score high and low respectively on it. Based on the PDI scores, a typical managerial behavior of French manager would be autocratic, or paternalistic, telling the employees what to needs to be done. "Organizations may be centralized; or at least have "coordinated decentralized" or "loose-tight" characteristics based on clearly specified and universally applied core values and core systems to which all are expected to adhere. Management style will tend towards Theory X, the explorative-authoritative or the benevolent-authoritative, and/ or the paternalistic" (Morden 1995:18). As a consequence, management style may be more in accordance to Theory Y when the culture can be characterized by a high power distance, and greater degree of masculinity. The German management behavior, for example, would be more participative with a strong trend towards a democratic leadership style. In addition, based on the different scores on Masculinity between the French on the one side and the German and Belgium employees on the other side, the level of assertiveness and performance orientation of the later ones create conflicts in working together with French employees in the same group. The French might perceive this behavior as irritating as they thrive for consensus and look for compromises. In addition, Portuguese people score very low compare to the other nationalities when it comes to Individualism that creates different expectations regarding the appropriate way to be addressed. The chart above allows us to assume what kind of management practice might create misunderstanding and what practice will lead to success.

55
Hofstede´s cultural framework has been accepted as important and reasonable for describing differences among nations, but little empirical research has used the Hofstede dimensions to investigate the efficacy of different management practices on performance in different culture groups (Newman, 1996: 756) Newman closed that gap by conducting a survey which tested 176 work units of one large U.S. based corporation. The work units were located in eighteen European and Asian countries including all nationalities represented in the Luxembourg workforce except for Luxembourg itself, and nearly all participants were citizens of the country which the entity was located at (Newman 1996:759). For three dimensions the cultural score and certain management practices had a clear implication for performance:
• In low power distance countries, more participative work units performed higher, and the contrary was evident for high power distance countries.
• Individualistic countries prefer the emphasis on individual responsibility whereas it is the opposite for collectivist countries.
• Masculine countries perform better with merit-based reward for pay and promotion and vice versa.
• Long-term-orientated countries work better with longer-term outlook.
Only for uncertainty avoidance, was there no clear evidence. Only high uncertainty avoidance cultures perform better if they have a clear sense of direction whereas there is no such interdependence for low uncertainty avoidance with a particular management practice (Newman 1996: 761f.). Newman concludes, "that management practices should be adopted to the local culture to be most effective" (Newman 1996:762). However, this conclusion is based on work-units employing a workforce that shares the same cultural background as the location of the entity. The GLOBE Survey
The GLOBE survey was an initiative of 170 researchers working together for 10 years to answer the question of universal and culture specific aspects of leadership. The driving force of that endeavor was their assumption, that business people in today's global business environment find plenty of general advice how to perform in foreign settings, however that this information lacks of scientifically complied information, is not detailed enough, and not context-specific (Javidan, Dorfman, Sully de Luque, House 2006: 68).
As Hofstede, the GLOBE team started off with the basic assumption that there is "... substantial empirical evidence (which) indicates that leader attributes, behavior, status, and influence vary considerably as a result of culturally unique forces in the countries or regions in which the leaders function" (Javidan, Dorfman, de Luque, House 2006:72). The group conducted a large-scale survey that included 17,300 middle managers working in 951 organizations, located in 62 societies. The data collection was conducted between 1993 and 2003 with a focus on the food processing, the financial services and telecommunications industries which are present in all countries of the world. In order to identify universal and culture specific aspects of leadership, they conceptualized and developed measures of cultural dimensions based on a review of the work of Hofstede, Trompenaars, Kluckhohn and Strodtbeck. They extracted 9 cultural dimensions, listed in the Chart below in comparison with the 5 Hofstede dimensions.

56
Table 6 Comparison of Hofstede and GLOBE Dimension
GLOBE dimension Definition Hofstede`s dimension
Power Distance expect power to be distributed equally Same label*) Uncertainty Avoidance
relies on social norms, rules and procedures to avoid unpredictability of future events
Same label*)
Future Orientation enables people to delay gratification, and invest in future
Rename of Long-Term orientation*)
Institutional Collectivism
encourage and rewards collective distribution of resources and collective actions
Individualism-Collectivism*)
In-Group Collectivism expressing pride, loyalty and cohesiveness in their organizations and families
Performance Orientation
encourages and rewards performance improvement and excellence
Masculinity-Femininity*)
Assertiveness results in assertive, confrontational and aggressive relationships with others
Humane Orientation encourages being fair, altruistic, generous and caring
Gender Egalitarianism
minimized gender inequality
Hofstede 2010b: 1339 Based on these 9 cultural dimensions, GLOBE was able to empirically identify 10 cultural clusters out of the 62 participating cultures. Those relevant to this study are listed in the chart below.
Table 7 Cultural Cluster of the GLOBE Survey
Cluster Countries belonging to this cluster Eastern Europe Hungary, Russia, Greece, Albania, Georgia, Kazakhstan, Poland,
Slovenia, Romania, Czech Republic, Lithuania, Latvia, Estonia, Serbia
Anglo Australia, England, Ireland, New Zealand, South Africa, USA, Canada
Germanic Europe Austria, Netherlands, Switzerland, Germany, Belgium Latin Europe France, Italy, Portugal, Spain, Swiss (French and Italian speaking) Nordic Europe Finland, Sweden, Denmark Norway
Javidan, Dorfman, de Luque, House 2006:87.
In order to be able to identify a match between certain cultural clusters and leadership style, the GLOBE looked at "implicit leadership theory where individuals hold a set of beliefs about the kinds of attributes, personality characteristics, skills, and behavior that contributes to or impede outstanding leadership" (Javidan, Dorfman, Sully de Luque, House, 2006: 72). They argued that structure and content of these belief systems would be shared among individuals in a common culture. GLOBE empirically identified six global leadership dimensions that
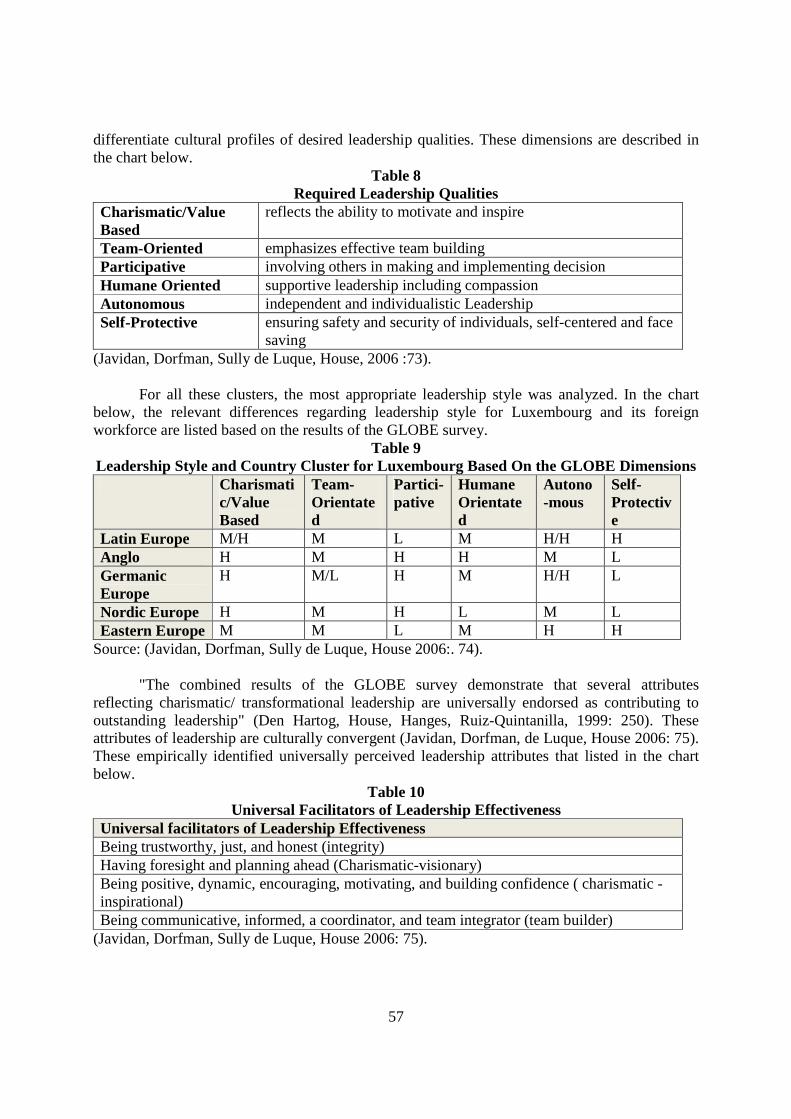
57
differentiate cultural profiles of desired leadership qualities. These dimensions are described in the chart below.
Table 8 Required Leadership Qualities
Charismatic/Value Based
reflects the ability to motivate and inspire
Team-Oriented emphasizes effective team building Participative involving others in making and implementing decision Humane Oriented supportive leadership including compassion Autonomous independent and individualistic Leadership Self-Protective ensuring safety and security of individuals, self-centered and face
saving (Javidan, Dorfman, Sully de Luque, House, 2006 :73).
For all these clusters, the most appropriate leadership style was analyzed. In the chart below, the relevant differences regarding leadership style for Luxembourg and its foreign workforce are listed based on the results of the GLOBE survey.
Table 9 Leadership Style and Country Cluster for Luxembourg Based On the GLOBE Dimensions Charismati
c/Value Based
Team-Orientated
Partici-pative
Humane Orientated
Autono-mous
Self-Protective
Latin Europe M/H M L M H/H H Anglo H M H H M L Germanic Europe
H M/L H M H/H L
Nordic Europe H M H L M L Eastern Europe M M L M H H
Source: (Javidan, Dorfman, Sully de Luque, House 2006:. 74).
"The combined results of the GLOBE survey demonstrate that several attributes reflecting charismatic/ transformational leadership are universally endorsed as contributing to outstanding leadership" (Den Hartog, House, Hanges, Ruiz-Quintanilla, 1999: 250). These attributes of leadership are culturally convergent (Javidan, Dorfman, de Luque, House 2006: 75). These empirically identified universally perceived leadership attributes that listed in the chart below.
Table 10 Universal Facilitators of Leadership Effectiveness
Universal facilitators of Leadership Effectiveness Being trustworthy, just, and honest (integrity) Having foresight and planning ahead (Charismatic-visionary) Being positive, dynamic, encouraging, motivating, and building confidence ( charismatic - inspirational) Being communicative, informed, a coordinator, and team integrator (team builder)
(Javidan, Dorfman, Sully de Luque, House 2006: 75).
58
Transformational Leadership Transformational Leadership is a group of leadership theories that stress the charismatic
attributes, vision, longer-term goals, group member rewards beyond individual rewards, and change or transformation of the organization. The transformational leader inspires the followers by connecting to their values and calls upon them to act upon higher values for the good of the group.
Transformational leadership first appeared in the literature in the book Leadership (1978) by Burns. In the book Burns not only described Transformational leadership but put it at as the extreme at the end of the continuum with the construct of transactional leadership at the opposite end of the continuum and independent of each other (Avolio, B.J., Bass,B.M. and Jung,D.I. 1999). This dichotomy of transformational and transactional leadership being opposites existing in the literature for around twenty years, and still is in the theory in use in the practice field.
Burns differentiated between the two theories through what the leader and followers offered each other. Burns saw transactional leadership as less effective especially in bringing about significant change, and appealing to pure self-interest of the followers by using conventional rewards and punishment. Burns’ work built upon earlier humanistic works that described individual characteristics of transformational leaders. These include Weber ‘s (1924) concept of the charismatic authority and leadership. Burns also built on the ethical and motivational concepts of Abraham Maslow (1954). The Transformational leader appeals to the higher ideals and values of the followers. These being self-esteem and self-actualization in motivation and in values the Beta values found in Maslow’s work.
Bass developed the theory of his Full Range Leadership Model (Bass 1985) and the Multifactor Leadership Questionnaire (Bass and Aolio 1994). He conceptualized Transformational and Transactional Leadership as not being opposites but different parts of the full repertoire a leader can use. Additionally, he added a third leadership type of leadership in his model, that of the Laissez Faire Leader. This is a leader who demonstrates a lack of leadership behavior, avoidance of interventions, and no attempt to make agreements, motivate, set standards, give feedback or use authority.
Bass and his co-researchers found that four behavioral factors associated with transformational leadership. They are:
1. Idealized Influence or Charisma is associated with leaders with vision and the ability to motivate others toward the vision. Through his trait the leader gains the trust and confidence of the followers and is seen as a role model.
2. Inspirational Leadership is the ability of the leader to motivate the followers to believe they can achieve more than thought possible. The leader provides a clear strategy that often is a novel answer to the problem.
3. Individualized Consideration is the respect and treated as an important individual. The leader builds trust with the followers and helps to develop them.
4. Intellectual Stimulation is the leaders ability to communicate with the followers and help them see old problems in new ways and to conceive of new solutions. The leader encourages the followers to rethink their conventional practices.
Bass added to these four transformational leader behaviors two behaviors that are associated with transactional leadership. In his view, transactional leaders try to control followers through rational or economic means. (Bass, B. M. and Avolio, B. J. 1990) The two factors are related to exchange in this economic means. The behaviors are:
59
Contingent Rewards in which leaders reward continual efforts of the followers through rewards such as pay, raises and promotions. The leader communicates how to gain rewards, and punishes undesired behavior of the followers.
The second is Management by Active or Passive Exception is when the leader intervenes only when followers deviate from expectations. The leader gives negative feedback after expectations are not met which is passive management by exception. The leader can anticipate mistakes or problems, which is active management by exception.
The full range theory of leadership was developed to separate the behaviors of effective and ineffective leaders. The full range consists of the four transformational behaviors, the two transactional behaviors and the lassiez faire behavior.
Bass in his model does not have transformation and transactional leadership as the extreme opposites but part of the full range of behaviors that a leader may exhibit. Bass wanted to find the most effective leadership behavior.
Kouzes and Posner (Kouzes,J.M. and Posner,B.Z. 2002) have developed a conceptual model for exemplary leadership synonymous with transformational leadership. Since 1983, they have conducted research with over 75,000 leaders in various organizational settings, countries and cultures. They started by asking, “What values or traits (personal traits or characteristics) do you look for and admire in your leader?” (KouzesJ.M. and Posner ,B.Z. 202: 24) The results over time, country and position were incredibly consistent. The four attributes that consistently receive the vast majority of votes are: Honest, Forward-looking, Competent, and Inspiring. They also found that “more than anything, people want leaders that are credible. Credibility is the foundation of leadership.” Above all else we must be able to believe in our leaders. We must believe that their word can be trusted, that they’ll do what they say, that they’re personally excited and enthusiastic about the direction in which we’re headed”.(Kouzes, J. M. and Posner, B .Z. 2002: 32)
Based on further investigation using subjects’ stories about their personal best leadership experience, Kouzes and Posner developed a framework for designed to provide guidance to leaders “to get extraordinary things done.” (Kouzes, J. M. and Posner, B. Z. 2007: 17) This framework has some assumptions worth making explicit. Kouzes and Posner believe leadership is not a position, but a set of behaviors and character tests. Leadership can be taught assuming the leader has credibility and personal character to lead. The five practices which they identify are an interrelated set of practices which a leader must follow all of them. A leader cannot pick and chose individual components of the model. In agreement with Burns, they acknowledge that leadership has a ethical component.
The framework consists of five practices that incorporate ten commitments of leaders. The practices are described below with the commitments. Practice 1-Modeling the Way
In this practice the leader becomes a role model for the group. The leader becomes the model for the idealized values of the group, and affirms the values by acting on the values. The first commitment is Find Your Voice. Leaders find their voice by clarifying their values, and expressing themselves. Kouzes and Posner (2002) further explain there is an assumption of competence in the practice. , “ Having a clear and authentic message is a necessary first step, yet the ability to consistently deliver the message and act on it takes a high degree of skill. Before you can do the right things, you have to know how to do them.” (Kouzes, J. M. and Posner, B. Z. 2002: 33). Since Kouzes and Posner developed their framework there has been considerable

60
writing on the topics in the first practice. Most notably is George and Sims (2007 ) on the power of credibility and “telling your own story”. Practice 2- Inspire a Shared Vision
There are two commitments that comprise this practice. They are Envision a Future by Imagining Exciting and Ennobling Possibilities and Enlist Others in a common Vision by Appealing to Shared Aspirations. Exemplary leaders are forward looking and are able to imagine a future for the common good. The vision symbolizes the highest ideals of the group and the followers can see a better future through the vision. Most importantly is the leaders ability to communicate the vision to all levels of the followers. As Kouzes and Posner say,” make use of this human longing by communicating the meaning of the organization’s work so that people understand their important role in creating it.” Kouzes and Posner (2007: 61) Practice 3- Challenge the Process
The leader is the facilitator of change and innovation. “ the opportunity to change the business-as usual-environment is fertile soil for leadership. The challenge of creating a new way of life is intrinsically motivating to leaders and constituents alike.” (Kouzes and Posner 2002: 186) The commitments with in this practice are Search for Opportunities by Seeking Innovative Ways to Change, Grow and Improve and Experiment and Take Risks by Constantly Generating Small Wins and Learning From Mistakes. Practice 4- Enable Others to Act
The two commitments in this practice are Foster Collaboration by Promoting Cooperative Goals and Building Trust, and Strengthen Others by Sharing Power and Discretion. “Strengthening others by increasing self-determination and developing competence , exemplary leaders accept and act according to the paradox of power; they become more powerful when they gave their power away, instead of hoarding it.” (Kouzes and Posner 2007: 227). Practice 5- Encouraging the Heart
This practice is achieved by the two commitments of Recognize Contributions Showing Appreciation for Individual Excellence and Celebrate the Values and Victories by Creating a Spirit of the Community. Kouzes and Posner are the epitome of transformational leadership. They rely on Charismatic leaders who give novel visions. The leaders are idealized versions of the followers, and they enforce the best of the values of the group. The leaders encourage innovation and change and empower followers and build community based on the group’s values.
Transformational leadership has been tied to positive benefits in organizations (Ackfeldt and Leonard 2005) (Bolino, Turnley and Bloodgood 2002), selfless behavior by individuals in organizations (Barksdale and Werner2001) and Nguni, Sleegers and Denessen 2006) and most importantly to positive effect on employee performance (MacKenzie, Podsakoff and Ahearne 1998). Posner, Kouzes and Schmidt (1998) found Transformational leadership impacts commitment, performance and motivation. Hatter and Bass (1988) and House and Shamir (1993) also found a relationship between transformational leadership and followers motivation.
There was an assumption that transformational leadership would be more effective than transformational leadership (Wright and Pandey 2009). However, some research findings suggest leaders are more successful in obtaining maximum follower performance and satisfaction through the augmentation of transformational leadership with contingent rewards.( Bass and Riggio 2009, Avolio, Bass, and Jung 1999, Howell and Avolio 1989). The more successful leaders display behaviors of both transformational and transactional leadership models.
Early in the research in leadership, there was mounting evidence for the effectiveness for transformational leadership, and it being more effective than transactional leadership.(Bass 1985; Bass 1990a; Burns 1978; House 1977; Shamir, House, and Arthur 1993; Yukl 1998) Fiol, Harris,
61
and House (1999) did an analysis of research studies that in over 100 studies of charismatic leadership. They found positive effects on their organizations and followers, and the charismatic leaders were seen as effective leaders. However, these early studies were often conducted in U.S., Canadian, and Western Europe (Yukl 1998).
It was postulated that characteristics of effective leaders may vary due to different cultural profiles of the countries.(Bass 1990; Hofstede 1993). The Globe study original thought that culture would be an “influencer and inhibitor as belief systems and values are determinates of leadership style.” ( Den Hartog et al 1999: 72) However, the Globe study did find that there were six universally perceived attributes of effective leaders. They are: Charismatic/value-based, Team-oriented, Participative, Humane-oriented, Autonomous and Self-protective. The first four line up with transformational behaviors/values.
In a follow-up to the GLOBE study (Den Hartog et al 1999), universally endorsed leadership attributes were found. Theses attributes were: 1) integrity, charismatic,2) inspirational visionary leadership, 3) team-oriented, and 4) excellence oriented. Den Hartog et al summarize the findings. “In summary, the results presented here support the idea that many charismatic/transformational leadership attributes are universally endorsed as contributors to outstanding leadership by an international sample of middle managers.” (1999: 240)
The authors go on to say, ”a shared preference for transformational/charismatic attributes will be enacted in exactly the same manner across cultures or that similar meaning would be attached to all exhibited behaviors across all cultures.” (1999: 242) RESEARCH QUESTIONS Based on the literature and the changing dynamics of business evidenced in Luxembourg, the following research questions were the focus of this research.
1. Is Nationality a Predictor of Transformational Leadership? 2. Is nationality predictive of one’s preferred transformational leadership style? 3. Is nationality predictive of one’s perceived transactional leadership style?
METHOD
A survey was administered through Zoomerang, an online survey tool in 2010. The
survey link was distributed to potential responders via announcement of the Chamber of Commerce Luxembourg, the American Chamber of Commerce AMCHAM, EU-Institutions located in Luxembourg, Luxembourg Ministries and a student alumni network of a private University in Luxembourg. The target group of the survey was individuals working in a company or institution located in Luxembourg. Within a period of three month (January to March 2010), 250 completed questionnaires were collected. The data was imported into SPSS, where variables were computed, coded and analyzed. Sample
Our resulting sample was 28% female and 72% male. The majority had a master’s level education (55%), followed by a bachelor’s degree (17%), a high school diploma (10%), a Phd (8%) or a professional qualification (2%). The highest percentage of the respondents were in the 35-44 age bracket (39%), followed by 45-54 (34%), 25-34 (13%), 55-64 (12%) and 65+ (2%). Most of the sample consisted either of middle managers (25%) or senior managers (25%), followed by CEO/general managers (15%), first level managers (10%), independents (10%),

62
professionals (8%) and board members (5%). There was a relatively even distribution among industries with Education/training/HR/Healthcare the largest percentage (17%), followed by finance and accounting (14%), telecommunications/IT (13%), Legal/consulting (13%), Banking/Insurance (13%), Other (12%), customer service (11%) and industry (9%). The breakdown of nationalities in the sample is shown in the chart below.
Table 11 Breakdown of Nationalities in the Sample.
Country of Origin (Nationality) Percentage Anglo 19% Luxembourg 17% France 16% Germany 14% Belgium 12% Others 10% Dutch 6% Missing 5%
Measures
Transformational Leadership. A transformational Leadership scale was constructed by two researchers of this study, who wrote items based on the transformational and transactional conceptualizations by Kouzes and Posner (2002) .After the items were constructed, four leadership experts rated the items as transformational or transactional. Only items where all four agreed were kept, resulting in 18 items from five dimensions: Model the way (three items, for example, “I clarify priorities and direction”), inspire shared vision (two items, for example “I define corporate social responsibility goals”), Challenge process (three items, for example “I value learning in the team”), enable others (six items, for example, “I do not interfere in the way people manage their unit”), and encourage heart (four items, for example, “I listen to personal problems”). The cronbach alpha for this study was .85.Each question’s sub-items reflects at least one facet of one of Kouzes & Posner’s Practices.
Transformational Leadership sub dimensions The same method was used to determine items for the transformational leadership subscales. There are five sub dimensions of transformational leadership: model the way, inspire a shared vision, challenge the process, enable others to act and encourage the heart. Model the way was measured with three items. Reliability analysis revealed an increase in the cronbach alpha with the deletion of one item. Therefore the resulting scale was two items with reliability of .51. Inspire shared vision was measured with two items, and had a cronbach alpha of .54. Challenge Process was originally measured with three items. Reliability analysis revealed an increase in the reliability with the deletion of one item. The resulting scale was two items, with a cronbach alpha of .61. Enable others was measured with six items. One item was deleted to increase the reliability of the scale. The resulting scale was five items, with a cronbach alpha of .64. Encourage heart was measured with five items. One item was deleted to increase the reliability of the scale. The resulting scale was four items, with a cronbach alpha of .56.
Transformational Leadership preferred style. Questions from the transformational leadership style were reworded in order to determine one’s preference for being led in a
63
transformational way. An example is “I like to speak up and present my own ideas.” Eight items comprised this scale, with a cronbach alpha coefficient of .682.
Transactional Leadership. The transactional leadership scale was developed using the same method as the transformational leadership scale. Transactional leadership was measured with five items. The reliability increased when one item was deleted. The resulting scale was four items with a cronbach alpha of .67. An example of an item is “I often feel like I have to tell people what to do.” Control Variables.
Control variables age, education, gender, managerial status, profession, linguistic identity, and organizational size were used in the study to control for demographic variables and organizational size, variables that have an effect on the leadership style. Variables were assigned dummy variables for the purposes of the regression analysis: Gender (1 = male, 2 = female), Age (1=25-34, 2=35-44, 3=45-54, 4=55-64, 5=65+), Education (1=high school, 2=professional qualification, 3=bachelor degree, 4=master degree, 5=PhD/Doctorate), Linguistic Identity (1=Anglo, 2=French, 3=German, 4=Multi, 5=Latin/med, 6=Dutch & Scan, 7=other), Corporation Size (1=<50, 2=50-249, 3=250-499, 3=500-999, 4=1000-4999, 5=>5000), Management level: (1=First Level, 2=Independent, 3=Professional, 4=Middle Management, 5=Senior Management, 6=CEO/General manager, 7=Board Member), Profession: (1=Industry, 2=Telecomm/IT, 3=Cust Service, 4=Banks/Insurance, 5=Fin/Accounting, 6=Legal/Consulting, 7=Educ/Train/HR/Health, 8=other), Nationality (1=Lux, 2=France, 3=Germany, 4=Belgium, 5=Anglo, 6=Dutch, 7=Others).
RESULTS
Table 12

64
Basic Statistics and Correlations Variables Mean SD N 1 2 3 4 5 6 7 8 9 10 11 12 13 14 15
1. Age 2.51 .94 248 - 2. Education 3.41 1.10 247 -.125 - 3. Gender 1.28 .45 248 -.06 .041 - 4. Linguistic identity 2.95 1.95 248 .055 .121 -.021 - 5. Corp size 3.05 1.14 196 -.107 -.134 .060 -.026 - 6. Mgmt level 4.14 1.66 244.271*** -.200** -.101 .052 -.028 - 7. Profession 4.75 2.22 248 .097 .008 .152* .013 -.213** .034 - 8. Nationality 3.85 2.13 248 .053 -.070 -.057 .013 .054 -.055 .070 - 9. Transf Lead 3.30 .32 248 .205** -.060 .053 -.050 -.137 .126 .174** -.057 (.85) 10.Transf _model way 3.34 .53 248 .218** -.123 .015 -.043 -.159* .214** .227*** -.049 .690*** (.51) 11.Transf _shared vision2.91 .57 246.260*** -.023 .085 -.035 -.150* .159* .180** -.100 .614*** .517*** (.54) 12. Transf _challenge 3.58 .45 247 .017 .029 .074 -.015 -.046 -.028 .064 -.060 .703*** .368*** .260*** (.61) 13. Transf _enable others3.38 .37 248 .178** -.045 .043 .024 -.095 .087 .100 -.094 .867*** .473*** .412*** .618*** (.64) 14. Transf _encourage 3.28 .42 248 .119 -.085 .110 -.138* -.053 .051 .152* .056 .801** .479** .348*** .522*** .592*** (.56) 15.Transf _preferred 3.30 .34 245 .107 -.001 .017 .013 -.086 .018 .110 .020 .452*** .252*** .203** .285*** .338*** .438*** (.68)Note: Categorical variables: Gender (1 = male, 2 = female); Age (1=25-34, 2=35-44, 3=45-54, 4=55-64, 5=65+) Education (1=high school, 2=professional qualification, 3=bachelor degree, 4=master degree, 5=PhD/Doctorate) Linguistic Identity (1=Anglo, 2=French, 3=German, 4=Multi, 5=Latin/med, 6=Dutch & Scan, 7=other) Corporation Size (1=<50, 2=50-249, 3=250-499, 3=500-999, 4=1000-4999, 5=>5000); Management level: (1=First Level, 2=Independent, 3=Professional, 4=Middle Management, 5=Senior Management, 6=CEO/General
manager, 7=Board Member); Profession: (1=Industry, 2=Telecomm/IT, 3=Cust Service, 4=Banks/Insurance, 5=Fin/Accounting,
6=Legal/Consulting, 7=Educ/Train/HR/Health, 8=other); Nationality (1=Lux, 2=France, 3=Germany, 4=Belgium, 5=Anglo, 6=Dutch, 7=Others) Reliability estimates are reported in parentheses along the diagonal. * p < .05, two-tailed; ** p < .01, two-tailed, *** p < .001, two-tailed

65
Research question 1: Is country of origin related to a leader’s perceived transformational leadership style (overall and at the dimension level)? The research question was tested using hierarchical linear regression analysis, with the control variables (age, education, gender, profession, management level, linguistic identity, and organizational size) entered in the first step of the regression, and the independent variable country of origin entered in the second stage of the model. There were six separate regression analyses computed, one with overall transformational leadership style as the dependent variable, and the other five represented each of the sub dimensions of transformational leadership. Tables II and III indicate the results of this analysis. Research question 1 revealed that nationality did not predict overall transformational leadership style above and beyond the effect of the control variables. As can be seen in Table III, nationality was positively related to the transformational leadership dimension “encourage heart” (β = -.144, p < .05).
Table 13 Hierarchical Regression: Is Nationality a Predictor of Transformational Leadership
Nationality IV Model 1 Model 2 Age .133* .138* Education -.011 -.013 Gender .061 .057 Mgr Status .074 .066 Profession .154** .149** Linguistic Identity
-.049 -.044
Corp Size -.092 -.089 Nationality -.070 R2 .046 .046 ∆R2 .081 .005 ∆F 2.328 .950 DF’S 186 186
Note: * p < .10, two-tailed; ** p < .05, two-tailed; ***p<.01
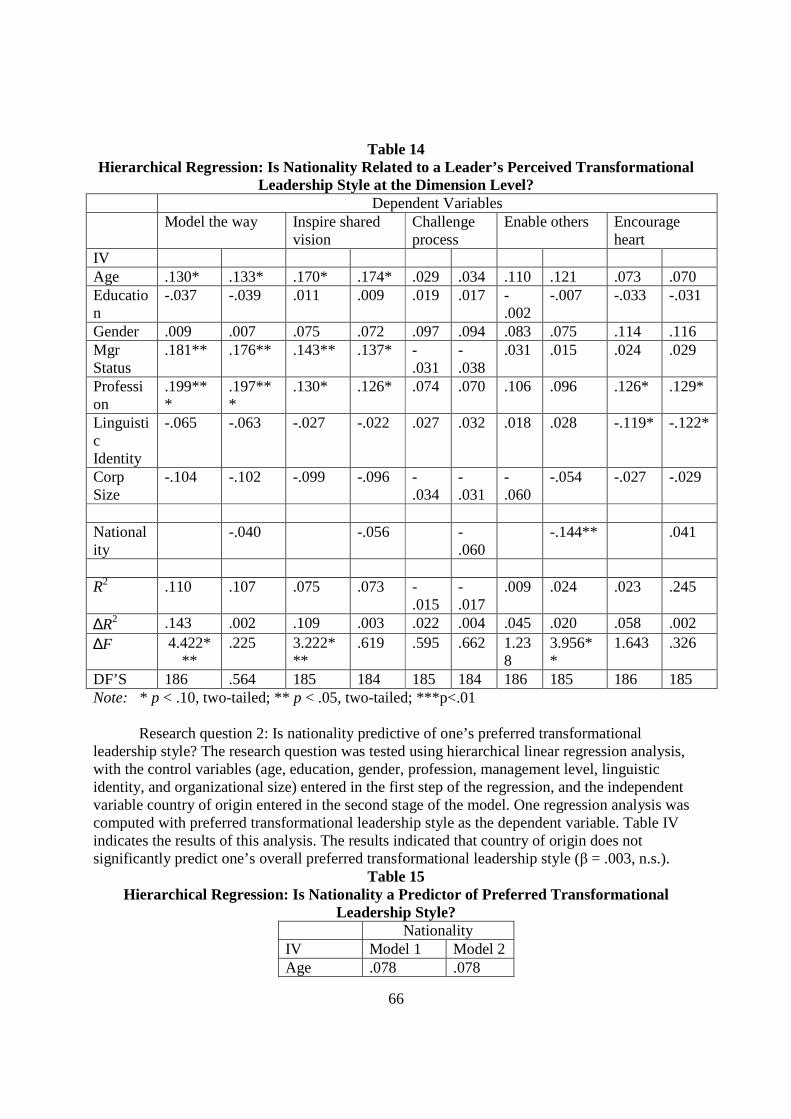
66
Table 14 Hierarchical Regression: Is Nationality Related to a Leader’s Perceived Transformational
Leadership Style at the Dimension Level? Dependent Variables Model the way Inspire shared
vision Challenge process
Enable others Encourage heart
IV Age .130* .133* .170* .174* .029 .034 .110 .121 .073 .070 Education
-.037 -.039 .011 .009 .019 .017 -.002
-.007 -.033 -.031
Gender .009 .007 .075 .072 .097 .094 .083 .075 .114 .116 Mgr Status
.181** .176** .143** .137* -.031
-.038
.031 .015 .024 .029
Profession
.199***
.197***
.130* .126* .074 .070 .106 .096 .126* .129*
Linguistic Identity
-.065 -.063 -.027 -.022 .027 .032 .018 .028 -.119* -.122*
Corp Size
-.104 -.102 -.099 -.096 -.034
-.031
-.060
-.054 -.027 -.029
Nationality
-.040 -.056 -.060
-.144** .041
R2 .110 .107 .075 .073 -
.015 -.017
.009 .024 .023 .245
∆R2 .143 .002 .109 .003 .022 .004 .045 .020 .058 .002 ∆F 4.422*
** .225 3.222*
** .619 .595 .662 1.23
8 3.956**
1.643 .326
DF’S 186 .564 185 184 185 184 186 185 186 185 Note: * p < .10, two-tailed; ** p < .05, two-tailed; ***p<.01
Research question 2: Is nationality predictive of one’s preferred transformational leadership style? The research question was tested using hierarchical linear regression analysis, with the control variables (age, education, gender, profession, management level, linguistic identity, and organizational size) entered in the first step of the regression, and the independent variable country of origin entered in the second stage of the model. One regression analysis was computed with preferred transformational leadership style as the dependent variable. Table IV indicates the results of this analysis. The results indicated that country of origin does not significantly predict one’s overall preferred transformational leadership style (β = .003, n.s.).
Table 15 Hierarchical Regression: Is Nationality a Predictor of Preferred Transformational
Leadership Style? Nationality IV Model 1 Model 2 Age .078 .078
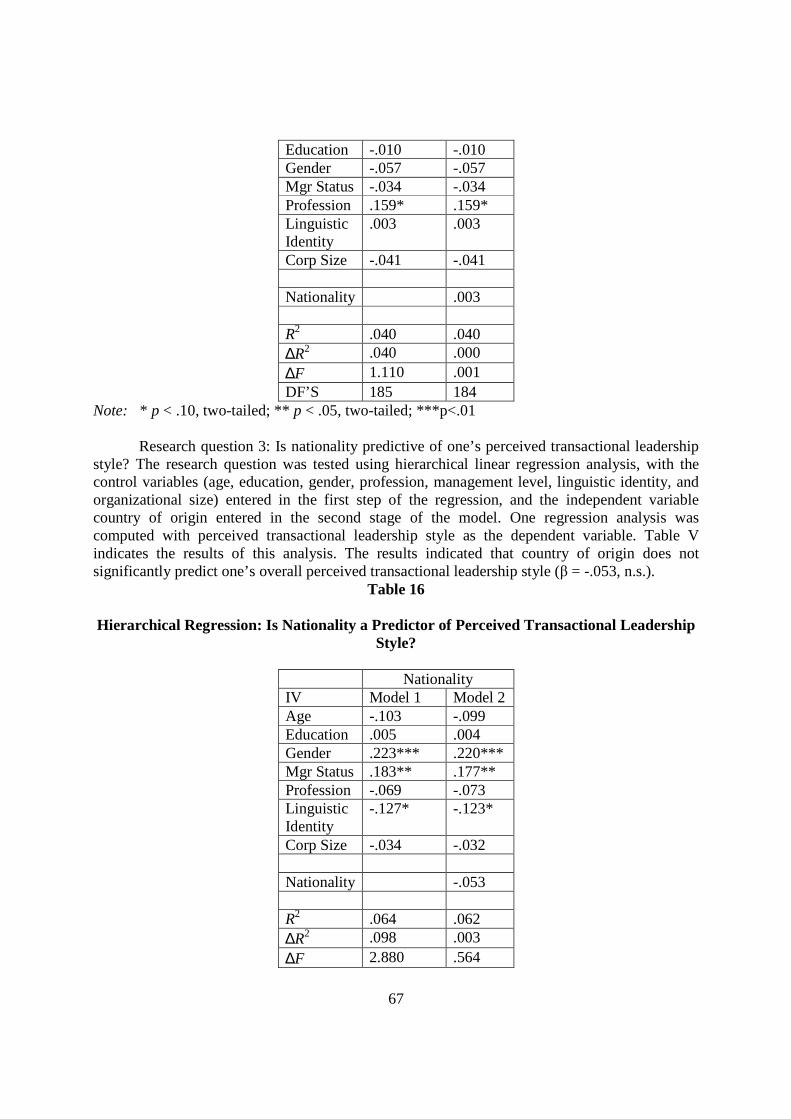
67
Education -.010 -.010 Gender -.057 -.057 Mgr Status -.034 -.034 Profession .159* .159* Linguistic Identity
.003 .003
Corp Size -.041 -.041 Nationality .003 R2 .040 .040 ∆R2 .040 .000 ∆F 1.110 .001 DF’S 185 184
Note: * p < .10, two-tailed; ** p < .05, two-tailed; ***p<.01
Research question 3: Is nationality predictive of one’s perceived transactional leadership style? The research question was tested using hierarchical linear regression analysis, with the control variables (age, education, gender, profession, management level, linguistic identity, and organizational size) entered in the first step of the regression, and the independent variable country of origin entered in the second stage of the model. One regression analysis was computed with perceived transactional leadership style as the dependent variable. Table V indicates the results of this analysis. The results indicated that country of origin does not significantly predict one’s overall perceived transactional leadership style (β = -.053, n.s.).
Table 16
Hierarchical Regression: Is Nationality a Predictor of Perceived Transactional Leadership Style?
Nationality IV Model 1 Model 2 Age -.103 -.099 Education .005 .004 Gender .223*** .220*** Mgr Status .183** .177** Profession -.069 -.073 Linguistic Identity
-.127* -.123*
Corp Size -.034 -.032 Nationality -.053 R2 .064 .062 ∆R2 .098 .003 ∆F 2.880 .564

68
DF’S 185 184 Note: * p < .10, two-tailed; ** p < .05, two-tailed; ***p<.01
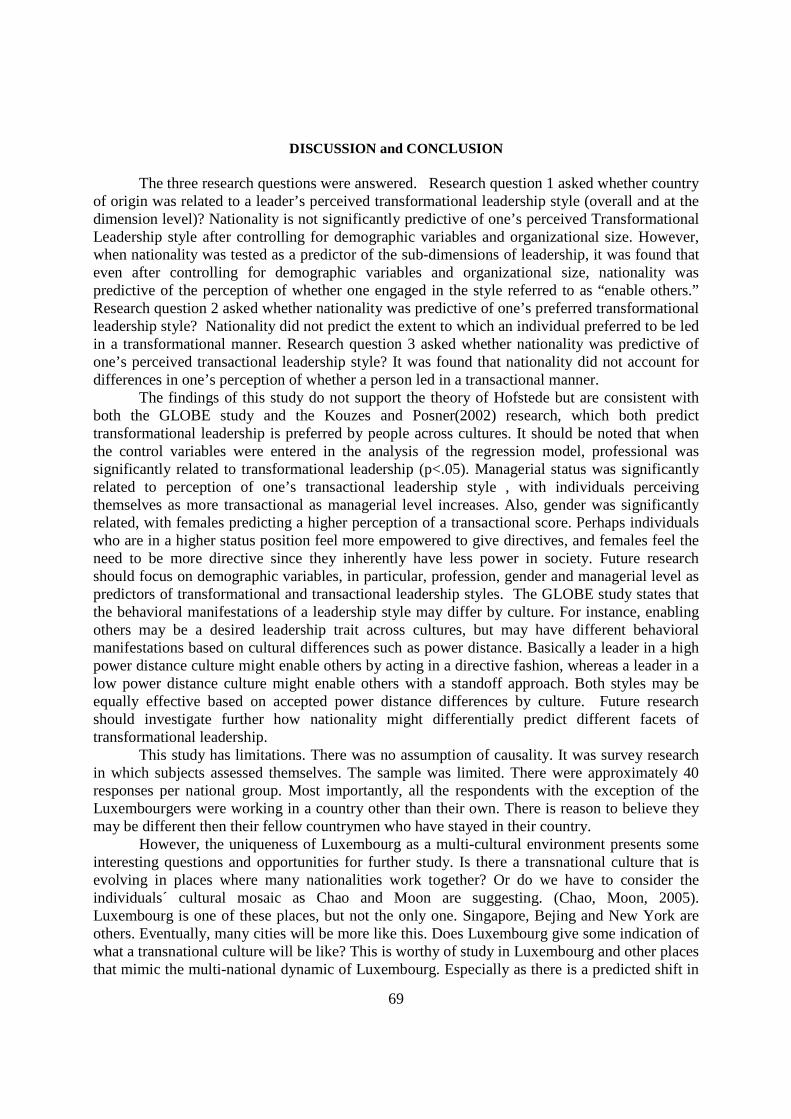
69
DISCUSSION and CONCLUSION
The three research questions were answered. Research question 1 asked whether country of origin was related to a leader’s perceived transformational leadership style (overall and at the dimension level)? Nationality is not significantly predictive of one’s perceived Transformational Leadership style after controlling for demographic variables and organizational size. However, when nationality was tested as a predictor of the sub-dimensions of leadership, it was found that even after controlling for demographic variables and organizational size, nationality was predictive of the perception of whether one engaged in the style referred to as “enable others.” Research question 2 asked whether nationality was predictive of one’s preferred transformational leadership style? Nationality did not predict the extent to which an individual preferred to be led in a transformational manner. Research question 3 asked whether nationality was predictive of one’s perceived transactional leadership style? It was found that nationality did not account for differences in one’s perception of whether a person led in a transactional manner.
The findings of this study do not support the theory of Hofstede but are consistent with both the GLOBE study and the Kouzes and Posner(2002) research, which both predict transformational leadership is preferred by people across cultures. It should be noted that when the control variables were entered in the analysis of the regression model, professional was significantly related to transformational leadership (p<.05). Managerial status was significantly related to perception of one’s transactional leadership style , with individuals perceiving themselves as more transactional as managerial level increases. Also, gender was significantly related, with females predicting a higher perception of a transactional score. Perhaps individuals who are in a higher status position feel more empowered to give directives, and females feel the need to be more directive since they inherently have less power in society. Future research should focus on demographic variables, in particular, profession, gender and managerial level as predictors of transformational and transactional leadership styles. The GLOBE study states that the behavioral manifestations of a leadership style may differ by culture. For instance, enabling others may be a desired leadership trait across cultures, but may have different behavioral manifestations based on cultural differences such as power distance. Basically a leader in a high power distance culture might enable others by acting in a directive fashion, whereas a leader in a low power distance culture might enable others with a standoff approach. Both styles may be equally effective based on accepted power distance differences by culture. Future research should investigate further how nationality might differentially predict different facets of transformational leadership.
This study has limitations. There was no assumption of causality. It was survey research in which subjects assessed themselves. The sample was limited. There were approximately 40 responses per national group. Most importantly, all the respondents with the exception of the Luxembourgers were working in a country other than their own. There is reason to believe they may be different then their fellow countrymen who have stayed in their country.
However, the uniqueness of Luxembourg as a multi-cultural environment presents some interesting questions and opportunities for further study. Is there a transnational culture that is evolving in places where many nationalities work together? Or do we have to consider the individuals´ cultural mosaic as Chao and Moon are suggesting. (Chao, Moon, 2005). Luxembourg is one of these places, but not the only one. Singapore, Bejing and New York are others. Eventually, many cities will be more like this. Does Luxembourg give some indication of what a transnational culture will be like? This is worthy of study in Luxembourg and other places that mimic the multi-national dynamic of Luxembourg. Especially as there is a predicted shift in
70
talent mobility from a intra-continental pattern valid for the period of 1990 – 2010 to a fluid mobility of talents world-wide in 2020 (PwC Talent Mobility 2020, pp. 18,19). This, obviously, begs for further research as the truly global workforce develops further. REFERENCES
Association des Banques et Banquiers, Luxembourg (ABBL) 2011. ABBL Facts & Figures, Luxembourg, from http://www.abbl.lu/
Avolio, B. J., Bass, B. M. , and Jung, D. I. 1999. Re-examining the components of transformational and transactional leadership using the Multifactor Leadership. Journal of Occupational and Organizational Psychology, 72, 441–462.
Barbuto, J. E., and Brown, L. L. 2000 Full Range Leadership. University of Nebraska-Lincoln Extension. D-27, Retrieved from: http://www.advisor.unl.edu/wanttoknowmore/Full-Range-Leadership/
Barksdale, K., and Werner ,J. M. 2001. Managerial Ratings of in-role behaviors, organizational citizenship, and overall performance: testing different models of their relationship. Journal of Business Research Feb., 51, 2, 145-155.
Bass, B. M. 1985. Leadership and performance beyond expectations. New York: Free Press.
Bass, B. M. 1988. The inspirational process of leadership. Journal of Management Development, 7, 21-32.
Bass, B. M., and Avolio, B. J. 1990. Transformational leadership development: Manual for the Multifactor Leadership Questionnaire. Palo Alto, CA: Consulting Psychologist Press.
Bass, B. M., and Avolio, B. J. (993. Transformational leadership: A response to critiques. M. M. Chemers & R. Ayman (Eds.), Leadership, theory and research. San Diego, CA: Academic Press, 49-88.
Bass, B. M., and Avolio, B. J. 1994. Improving organizational effectiveness through transformational leadership. Thousand Oaks, CA: Sage Publications.
Bass, B. M., and Riggio, R. E. 2006. Transformational leadership (2nd ed.). Mahwah, NJ: Lawrence Erlbaum Associates. Mahwah, NJ: Lawrence Erlbaum Associates.
Boehnke, K., Bontis, N., DiStefano, J.J., and DiStefano, A.C. 2003. Transformational Leadership: An Examination of Cross-national Differences and Similarities. Leadership and Organization Development Journal, 24, 5–15.
Bolino, M. C., Turney, W. H., and Boodgood, J. M. 2002. Citizenship behavior and the creation of social capital. Academy of Management Review, Oct.,27, 4, 505-522.
Burns, J. M. 1978. Leadership. New York: Harper & Row.
71
Chamber of Commerce Luxembourg 2009. Living and working in Luxembourg, from http://www.cc.lu/
Chao, G.T; and Moon, H. 2005. The cultural mosaic: A metatheory for understanding the complexity of culture. Journal of Applied Psychology, 90, 6, 1128-1140.
Deloitte 2011. HR survey. The global trend remains defensive. Luxembourg, from http://www.deloitte.com/lu/hrsurvey2011
Den Hartog, D. N. 1999. Culturally specific and cross cultural generalizable implicit Leadership Theories: are attributes of charismatic/transformational leadership universally endorsed? Leadership Quarterly 10, 2, 219- 256.
Eagly, A. H., Johannesen-Schmidt, M., and van Engen, M. L. 2003. Transformational, Transactional, and Laissez-Faire Leadership Styles: A Meta-analysis Comparing Women and Men. Psychological Bulletin, 129, P. 569–91.
Eurostat 2008. Foreign direct investment, from http://epp.eurostat.ec.europa.eu/portal/
Evans, S. 2008. Promises, promises. Businessreview Luxembourg, June, 14-15.
Feld, T. 2009. 2008 - Banken unter Schock. Luxembourger Wort, Spécial Économie & Finance, 5.
Fiol, C. M., Harris, D., and House, R. J. 1999. Charismatic leadership: strategies for effecting social change. Leadership Quarterly, 10, 449-482.
George, W. and Sims, P. 2007. True North: Discovering your Authentic Leadership. Wiley: New York.
Givens, R.J. 2008. Transformational Leadership: The Impact on Organizational and Personal Outcomes. Emerging Leadership Journeys, 1 (I), 4-24.
Hatter, J. J. and Bass, B. M. 1988. Superiors’ evaluations and subordinates’ perceptions of transformational and transactional leadership. Journal of Applied Psychology. 73, 695-702.
Hofstede, G. 1980. Culture`s consequences: international difference in work-related values. Sage Publication, Newbury Park.
Hofstede, G. 1993. Cultural constraints in management theories. Academy of Management Executive, 7, 1, 81-94.
Hofstede, G. (2001). Culture´s consequences: comparing values, behaviors, institutions, and organizations across nations, 2nd edition, Thousand Oaks, CA: Sage.
Hofstede, G. 2010b. The GLOBE debate: Back to relevance, Journal of International Business Studies, 41, 1339-1346.
Hofstede, G., Hofstede, G.J., and Minkov, M. 2010. Cultures and organizations: software of the mind, McGraw-Hill, New York.

72
House, R. J. 1977. A 1976 theory of charismatic leadership. In Hunt, J. G. and Larson, L. L. (Eds.) Leadership: The Cutting Edge (189-204) Carbondale,Il: Southern Illinois University Press.
House, R. J. and Shamir, B. 1993. Toward the integration of transformational, charismatic and visionary theories. In Chemmers, M. M. and Ayman, R.(Eds.) Leadership theory and research: perspectives and directions. (81-107). New York: Academic.
Howell, J. M. and Avolio, B. J.1993 Transformational leadership, transactional leadership locus of control and support for innovation. Journal of Applied Psychology. 78. 891-902.
Javidan, M., Dorfman, P.W., Sully de Luque, M., and House, R.J., 2006. In the eye of the beholder: Cross cultural lessons, leadership from the project GLOBE, Academy of Management Perspectives, February, 67-90.
Kearney, E., and Geber, D. 2009. Managing diversity and enhancing team outcomes: the promise of transformational leadership. Journal of Applied Psychology, 94, 1, 77-89.
Kluckholm, C. 1962. Culture and behavior. Free Press: New York.
Kouzes, J. M., and Posner, B. Z. 2002. The leadership challenge. 3rd ed. Jossey-Bass. San Francisco, C.A.
Kouzes, J. M., and Posner, B. Z. 2007. .The leadership challenge. 4th ed. Jossey-Bass. San Francisco, C.A.
Lomeli, L. C. 2007. Culture, sex, and gender role attitudes In relation to transformational leadership. San Diego State University. San Diego.
Mancheno-Smoak, L. et al. 2009. The individual cultural values and job satisfaction of the transformational leader. Organization Development Journal, 27,3, 9-21.
Maslow, A.H. 1954 Motivation and personality. New York: Harper.
Mercer Quality of Living Survey-Worldwide Rankings, 2011, from http://www.mercer.com/press-releases/quality-of-living-report.
Minkov, M. 2007. What makes us different and similar: A new interpretation of the world value system and other cross-cultural data. Sofia: Klasika i Stil.
Morden, T. 1995. International culture and management. Management Decision, 33, 2, 16-21.
Muntendam, F., Hockelmann, D. 2010. What will the future bring for Luxembourg? North American Business in Luxembourg, Luxembourg Wort, Special Edition October, 18.
Newman, K. L. 1996. Culture and congruence: The fit between management practices and national culture. Journal of International Business Studies, 27,4,753-780.
OECD. 2010. Economic survey of Luxembourg, chapter 1; from http://www.oecd.org/document/
73
Posner, B. Z., and Kouzes, J.M., and Schmidt, W.H. 1985 Shared values make a difference: an empirical test of corporate culture. Human Resources Management, 24, 3, 293-309.
PriceWaterhouseCoopers 2010. Talent mobility 2020. The next generation of international assignments, from http://www.pwc.com/gx/en/managing-tomorrows-people/
Shamir, B., House, R.J., and Arthur, M. B. 1993. The motivational effects of charismatic leadership: A self-concept based theory. Organizational Science, 4, 1-17.
STATEC, 2010. Statistical yearbook 2010, from http://www.statistiques.public.lu/
STATEC, 2009. Statistical yearbook 2009, from http://www.statistiques.public.lu/
STATEC, 2012. Indicateur rapides série L, from http://www.statistiques.public.lu/
Van Engen, M. L., and Willemsen, T. M. 2004. Sex and Leadership Styles: A Meta-analysis of Research, Psychological Reports, 94, P. 3–18.
Weber, M. 1947. Theory of social and economic organization. Chapter: "the nature of charismatic authority and its routinization", translated by A. R. Anderson and Talcott Parsons. New York: Oxfort University Press. Originally published in 1922 in German under the title Wirtschaft und gesellschaft Chapter III, § 10.
Wolf, T. 2006. Culture, leadership and organizations. The Journal of Applied Christian Leadership, Summer, 55-71.
Wright, B. E., and Pandey, S. K. 2009. Transformational leadership in the public sector: does structure matter? Journal of Public Administration Research and Theory, P. 75-89.
Yukl, G. 1998. Leadership in organizations. (4th ed.). Upper SaddleRiver, NJ: Prentice-Hall.
74
SILICON VALLEY INDEX AND ITS SIGNIFICANCE FOR MODERNIZATION DEMONSTRATION AREA PLANNING IN
SOUTHERN JIANGSU
Xiaoran Hu (School of Economics and Management, Southeast University, email:
Chengyang Xie (School of Economics and Management, Southeast University, email:
ABSTRACT
Amidst the leading development of Jiangsu Province, it’s of great theoretic and practical importance to summarize the development model of regional and industrial collaboration innovation through practice, stamped with Jiangsu and even Chinese characteristics. This paper introduces the design background and main content of Silicon Valley development index in California. It sums up the development experience of Silicon Valley as an innovation-pioneering area, which integrates technical innovation, industrial development and social progress. Therefore, in the process of planning modernization demonstration area in Southern Jiangsu, the institutional and organizational innovation of Silicon Valley requires our close attention. Based on that, by reviewing and analyzing the staged development path under the guidance of innovation in Suzhou Industrial Park, this paper proposes that Silicon Valley can provide a reference model to realize the pioneering development in Jiangsu Province.
Keywords: collaborative innovation, Silicon Valley development index, innovation-pioneering area, modernization demonstration area
I. BACKGROUND OF THE RESEARCH QUESTION
Along with the leading development of Jiangsu and the planning of modernization
demonstration area in Southern Jiangsu, it's of great significance to realize the transition of development model in Southern Jiangsu and lead the progress of late-developing areas. For that purpose, we need to summarize the development model of regional and industrial innovation through practice, stamped with Jiangsu and even Chinese characteristics.
Jiangsu province does not lack models of regional development (Hu, Cao, & Huang, 2011). Some of the models imitate Silicon Valley in the southern part of the San Francisco Bay Area in California, the United States. Since Chinese national expectation has been raised very high for the leading development of Jiangsu, how can we learn from Silicon Valley and promote it as one of the ideal development models for regional and industrial innovation? To answer this question, it's of vital importance for us to figure out the representative characteristics of Silicon Valley model.

75
There always exist various viewpoints of Silicon Valley's characteristics (Honjo & Oliva, 1991; Bae, 2000; Glaeser, 2011). In some regions outside the United States, people merely view it as a myth of technical innovation (Honjo & Oliva, 1991; Bae, 2000). For them, it seems that the combination of venture capital and high-tech industries will typically result in technical patents; wherever there are universities and university science parks, Silicon Valley can be duplicated; if they plan an industrial park (frequently tens of square kilometers), and introduce some high-tech firms, most of which are actually labor-intensive while high-tech, they can build a Silicon Valley.
As a matter of fact, even in the United States- the birthplace of Silicon Valley, the interpretation of Silicon Valley model varies from person to person (Berliant and Wang, 2008). Many scholars simply regard it as a representative of regional innovation, which features the synergy between technological innovation, industrial development and social progress. Therefore, besides Silicon Valley, there are similar replica such as the North Carolina Research Triangle Park and Massachusetts Route 128. Today there is still a Development Project of New York Roosevelt Island, a joint bid by Cornell University and Technion-Israel Institute of Technology, which is to extend Silicon Valley with "Silicon Route."
Silicon Valley takes the lead in sustainable industrial technology innovation, whose typical characteristics can be represented by the Silicon Valley Index.
II. CONTENT OF SILICON VALLEY INDEX AND ITS IMPLICA TIONS
In the early 1990s, to push Silicon Valley towards a more glorious future, Joint Venture-
Silicon Valley Network and Silicon Valley Community Foundation jointly commenced preparing the Silicon Valley Index. Since 1995, they have published Silicon Valley Index almost on an annual basis. They hold that the indicators are to measure the changes in Silicon Valley, according to which it can be judged whether the economy in the region of Silicon Valley is going up or down, and whether the society is going forward or backward. The index acts as a lens through which the economic advantages and social desirability can be observed, and provides an analytical foundation for related research and decision making.
The current Silicon Valley Index (Index for short) is mainly composed of five groups of indicators, which can objectively represent the demographic situation, economic development, social progress, space allocation and regional governance. We can clearly find that these indicators are comprehensive measurements of social development, resident life and industry growth. For example, the indicators group of demographic situation focuses on the attraction of Silicon Valley to talents from other places of the U.S. and other countries, among others, the inflow and outflow persons, the academic degrees and ethnic distribution of inflow ones. The indicators group of economic development is particularly about the growth of employment, venture capital and patents, as well as the changes of income and cost of living. The indicators group of social progress focuses on the changes in the health of residents, secondary education, primary education, ethnic disparity, juvenile delinquency, cultural and artistic life, and community safety. The indicators group of space allocation is particularly about environmental quality, land use conditions, residential living habits, energy recycling, cost of housing and space congestion of business district. The indicators group of regional governance attaches great importance to the investment in public goods, citizen participation and tax revenue. Among these five groups of indicators, innovation and entrepreneurship, venture capital, research and development investment, which we believe are the typical characteristics of Silicon Valley, are
76
not on the list of the first-tier indicators. On the contrary, they have permeated throughout society and are embodied by social development and the comfortable environment for residential living and working. In other words, Silicon Valley is not like what we see in some “Chinese Valleys”. It's not a place bustling during the day but dark and inanimate at night, and; it's not a place for entrepreneurs to turn knowledge and innovation into money during the day but live elsewhere to spend the money at night. Silicon Valley is the unity of innovation and life, a livable place providing an entrepreneurial lifestyle.
When taking a closer look at the Silicon Valley Index, we will naturally find that the local residents expect Silicon Valley to produce synergy between social development, utilization of environment and industrial innovation, rather than a place merely of technological innovation. The innovative business organizations and industrial organizations are viewed as the foundations for the innovative and entrepreneurial way of life and social structure in Silicon Valley, where innovative urban and rural structure are integrated effectively with innovative business organizations. Without the regional collaborative innovation system, it is difficult to push forward social progress and realize the innovative and entrepreneurial way of life in Silicon Valley.
Silicon Valley Index indicates that success and sustainability of Silicon Valley depend on the synergy between regional social innovation, cultural innovation and industrial innovation, based on institutional and organizational innovation. Therefore, when emulating Silicon Valley, we should steer ourselves towards the synergy between a variety of innovations, including innovations for regional social development, cultural development and industrial development.
In addition, Silicon Valley Index also implies that the foundation for Silicon Valley's development is the capability of development and innovation. In a sense, the Index centers on capability enhancement and institution development. The core issue to emulate Silicon Valley is to build sustainable innovation capability.
III. DEVELOPMENT OF CHINA-SINGAPORE SUZHOU INDUSTRIAL PA RK AND
ITS SIGNIFICANCE
In China, Jiangsu province takes the lead in “attaining a well-off society and basically realizing modernization”. China-Singapore Suzhou Industrial Park is a typical case in point.
Thinking about the significance of Silicon Valley for the development of modern China, we should reflect upon it from the perspective of the synergy between society, culture, science and technology as well as an innovative lifestyle, not just from the aspect of technological innovation and industrial development. Meanwhile, we should also keep in mind that scientific and technological innovations in Silicon Valley are largely achieved through institutional and organizational innovations. In this way, we will truly realize that if the introduction of products and technological innovations is not combined with corresponding institutional innovations, regional social transformations, organizational changes and lifestyle changes (entrepreneurial way of life), it will be difficult to develop a demonstration area with Chinese characteristics.
Since its establishment in 1994, notably over the latest nine years, Suzhou Industrial Park has gone through three exploration stages: industrial development, scientific and educational development, and social development. Its regional innovative development is people-oriented with Southern Jiangsu characteristics, which to a certain extent manifests itself as gradual and interconnected processes: quantity growth, capacity building and sustainable development.
77
Driven by foreign direct investment, Suzhou Industrial Park proactively undertakes industrial transfer and participates in industrial division of labor all over the world. At the beginning of this century, Suzhou Industrial Park has basically formed a distinctive industrial structure. It concentrates on some leading industries, including industries of electronic information, bio-pharmaceuticals, precision manufacturing and new materials (new energy). In addition, the government has greatly improved macro-control of economy and investment invitations. All these are typical features of the world's manufacturing base.
With the development of high technology and the advent of the era of knowledge-based economy, the Yangtze River Delta has developed on a full scale and China's economy is taking off, while Suzhou Industrial Park is under the increasing pressure of changing economic growth pattern and optimizing and upgrading industrial structure. At this point, it's urgent to figure out how to reinforce the position of enterprises as the main body of innovation and improve institutions to facilitate innovations. With its size increased/As its size increases, Suzhou Industrial Park has selected Silicon Valley as a key reference model.
In order to further integrate scientific and technological resources and strengthen innovation capabilities, as a milestone, Suzhou Industrial Park commenced building Dushu Lake Science, Education and Innovation District in 2002. In this way, the Industrial Park can maintain its sustainable development by developing intellectual innovation area based on knowledge-intensive products. With the relentless efforts over the last decade, Dushu Lake District has been preliminarily developed into a functional area for innovation and development, which integrates higher education, research and development, industrial development, residential life, health care, and general education. It has provided “Silicon Valley-style” innovation support and development experience not only for the Industrial Park, but also for Suzhou and the Yangtze River Delta.
Keeping an eye on the breakthroughs of world-class general-purpose technologies, Dushu Lake District has successfully invited settlement of Institute of Nanotechnology Applications, Chinese Academy of Sciences. Furthermore, in order to gather the capacity of developing general-purpose technologies, Dushu Lake District has introduced research institutes or sub-campuses from national famous universities, including Nanjing University, Southeast University, Xi'an Jiaotong University, China University of Science and Technology, and Renmin University of China. Besides, some colleges and universities have entirely moved there, like Suzhou University (new campus), Xi'an Jiaotong - Liverpool University. The District also have areas for innovative enterprises such as nano and creative industrial parks. At the same time, urban and industrial infrastructures have been gradually improved, and life services and high-end services are developing at a rapid speed. The institutional innovations are combined with market-oriented operation, which has laid industrial and social foundation for developing innovation capability.
In the future, Suzhou Industrial Park will further promote the development of surrounding areas and make full use of its intellectual capital with high efficiency. Along with the development of the Yangcheng Lake area, the innovation community worthy of the title of “Suzhou Silicon Valley” will be built in a larger area, and will further achieve the sustainability and harmony among human, social and industrial development.
Therefore, life in Suzhou of modern times, which has been known as “paradise on earth”, can be best described in a way that is easily understood: “doing business beside the Jinji Lake, reading books by the Dushu Lake and enjoying life along the Yangcheng Lake.”
78
IV. CONCLUSIONS AND PROSPECTS
Today the regional development in China is linked with a new round of urbanization. As a uniquely urbanized region, Silicon Valley, in the first place, is a natural area. Then, it is a collaborative innovation system of society, economy and industry, which is composed of the subsystems of industrial and technological innovation. As a result, if we merely observe the evolution of the industrial innovation system without involving social development, we will not comprehend the law of Silicon Valley's development. The development of Silicon Valley has shown the following in an explicit manner. Firstly, without the comprehensive and coordinated development of society, environment, culture and people as well as structural changes, it would have been difficult for Silicon Valley to possess collaborative institutional and organizational innovations. Secondly, lacking collaborative institutional and organizational innovations, Silicon Valley would have hardly produced influential and continuous innovations of technology and industry. Thirdly, in the absence of influential and continuous innovations of technology and industry, it would have been hard for Silicon Valley to make breakthroughs on general-purpose technologies, let alone set an example to lead the industrial development in a particular region, even around the world.
Thereby, this paper has reached three primary conclusions. To begin with, Silicon Valley is one of the effective models for the innovative development of regions and industries. Furthermore, the success and sustainability of Silicon Valley rely on the synergy between regional social innovation, cultural innovation, technological innovation and industrial innovation, based on systematic innovations of institutions and organizations. Hence in a relatively isolated industrial park (even a high-tech industrial park), it’s impossible to build an “Innovation Valley”, due to lack of an environment for synergy between a variety of innovations. Finally, Silicon Valley in the United States can be and also should be a reference model to plan modernization demonstration area in Southern Jiangsu. Silicon Valley Index can be used as a reference index for the demonstration area.
These conclusions have the following implications. The "Innovation Valleys" in China are bound to develop with Chinese characteristics, and some of China’s technological valleys currently need to adjust its development strategy and stage-specific missions. That is to say, we should not only attach great importance to building regional technological innovation system, but also focus on constructing the incentive system for original scientific and technological innovations and reorganizing social innovation structure. A case in point is the construction of industrial cultural system of innovation and entrepreneurship, which shows the significance of the development and prosperity of advanced culture advocated by the central government. Otherwise, some of the industrial valleys in China may fall into the trap of “the world’s high-tech factories”, which are actually labor-intensive and “high-tech” (not equivalent to intelligence-intensive areas). The good news is that some places in China have taken actions to keep pace with the times, such as Suzhou Industrial Park, whose achievements in innovation and demonstration should be recognized.
Silicon Valley in the United States is an ideal benchmark for planning and developing modernization demonstration areas in Southern Jiangsu, and can also provide us with a wide range of enlightenments. Nowadays, China has become a large manufacturing power, and has given first priority to “technological innovation” in economic development. We are now embracing a new era when we stress on changes in development model and coordinated development of economy, society and environment. It's an objective perspective to view Silicon

79
Valley as a fundamental industrial innovation structure of effective organizations for social development. From the development of Silicon Valley, we will find out a way to achieve the coordinated development of society, industry and environment, rather than a way to separate them and a way resulting in the rise of a single industry. If the industrial innovation is isolated from social development, it will not be able to support industrial “Innovation Valleys” with Chinese Characteristics.
ACKNOWLEDGEMENT
The authors owe their thanks to the financial support provided by National Natural
Science Foundation of China (Project Name: “An Analysis of International Transfer of Industrial Clusters and the Chain Effect of Industrial Clusters in Chinese Enterprises' foreign direct investment”, Project No. 70873019).
References [1] Bae, Z.T. (2000). Overcoming the barriers in creating and managing high-tech ventures:
A case study of Korean start-ups in Silicon Valley. Paper presented at A/PARC Seminar, Stanford University.
[2] Glaeser, E. L. (2011). Triumph of the city. New York: Penguin Press, [3] Berliant, M. and Wang, P. (2008). Urban growth and subcenter formation: A trolley ride
from the Staples Center to Disneyland and the Rose Bowl. Journal of Urban Economics, 63, 679-693.
[4] Ohe, T., Honjo, S., Oliva, M. and Macmillan, I. C. (1991). Entrepreneurs in Japan and Silicon Valley: a study of perceived differences. Journal of Business Venturing, 6, 135-144.
[5] Hu, H. H., Cao, L. B., & Huang, X. (2011). Knowledge clusters and the upgrade of China’s manufacturing clusters. Jianghai Academic Journal, 5, 95-100.

80
INTERACTIVE PEDAGOGICAL TECHNIQUES: EFFECTIVE TEACHING TOOLS IN VARIED LEARNING MODALITIES
Thomas M. Abbott
The Malcolm Baldrige School of Business Post University
ABSTRACT
Global business education demands that learning take place in ways that mirror the actual conduct of international business. Students today are learning in methods ranging from traditional classrooms to online distance learning mimicking the context of global business. Effective teaching tools and methods in varied learning delivery modes and across cultures can help. This paper examines the effectiveness of blended-class formats, simulations, case studies, collaborative experiences, knowledge transfer and the concept of “flipped learning” in direct comparison with traditional classroom and online teaching. Also discussed are formative and summative learning assessments.
Keywords: flipped classroom, student engagement, interaction
INTRODUCTION
More than ever before, educators in all fields are faced with the challenge of communicating an ever growing body of knowledge to diverse student groups in multiple delivery modes. Particularly challenging in this situation is that these diverse groups are often separated by space, time and distance. The proliferation of technical information as well as interpretive works can seem overwhelming. The traditional conveyor of this information, the university, is faced with competition from a variety of sources in this traditional role. The availability of information on the internet makes it possible for individuals and organizations to educate themselves in ways previously impossible without an effective intermediary. Even within the academic community, schools face this competition within their own boundaries as the academic community struggles to keep pace with the changing methods of “doing education.” In no field is this pressure felt more than in the teaching of international business. This field of study, by its very nature, encourages the rapid consumption and processing of vast quantities of information in a global setting, crossing cultures, languages, political systems, etc. just like the subject matter of global commerce. Yet, we know the value of deliberate and deep study and understanding in truly developing the individual and corporate body of knowledge that will enhance the practice of global business. So, as educators we are faced with a dilemma: How can we deliver this vast and varied body of knowledge to diverse student groups in what they perceive to be an acceptable manner while allowing for this deep and deliberative study? How can we assure the effectiveness of this delivery and the true understanding and learning that is desired? One of the answers is to develop methods of content delivery that will suit different learning styles and requirements in different learning modalities in order to address this concern. Another consideration is the fact that online learning is no longer a new concept or practice,
81
having been in use and in a process of constant refinement for a number of years. Technological advances and particularly the advent of improved instructional design tools have changed the online education world. Better understanding of how to use these tools has moved education to a new generation of online learning. This paper is directed at examining three different learning modalities/environments: traditional “face-to-face” classes, online classes and blended (combined online and face-to-face) classes. Many institutions now offer instruction in all three of the modes. These institutions face some interesting problems among them:
• Understanding the differences between student populations in the differing modes • Ensuring consistent content delivery across modes in satisfaction of institutional
educational requirements (outcomes achievement, etc.) • Ensuring consistency across modes for accreditation standards • Achieving effective levels of student engagement and success across modes of delivery
The body of this paper will examine these issues from the perspective of a small, business-oriented university with long experience in all three of the learning modalities described above. Common Elements in International Business Education
It is important to recognize that business education in the 21st century has a set of common requirements. First, business education is indeed global in nature, mirroring the realities of commerce and organizations. Second, effective business education needs to simulate the demands of the business environment. Third, business education needs to be cross-cultural, but not only in the commonly used sense of accommodating students of different ethnic, linguistic and cultural background. It must cross the differences between student groups in each of the different modalities examined in this paper. But perhaps most importantly, business education needs to provide students with those skills demanded by the marketplace. Increasingly these are becoming known as the “Four C’s": Creativity, Collaboration, Communication, and Critical thinking. These skills are difficult enough to address in traditional educational settings and the methods of blended learning and online learning and new challenges to old problems. This paper will address some of the issues involved incorporating these tools into different learning environments. Particularly important is the attention paid to the issues around incorporating the four C's coursework that contains a large non-classroom component. Understanding why students choose specific learning modes.
In an earlier era, the opportunities for learning delivery outside the traditional classroom were limited. The thinking of the traditional classroom had developed over time and was well entrenched within the minds of educators. The classroom was where information was conveyed, outside the classroom was where "homework" was performed. The classroom was the space for lecture and was the province of the professor. The space was occupied by students as well as teacher but clearly the students were there for one purpose and that was to absorb knowledge which would then be practiced in exercises outside the classroom space. Students seeking that knowledge had little choice but to attend class in that traditional setting. With the advent of online education, the space moved. Now, we have information being conveyed in space that was not the province of the professor and that could actually be and frequently is in the student's own home. Therefore, students now have a choice of learning spaces. The choices are more often than not driven by personal convenience preferences and/or learning style preferences. In either case the choice of the learning space dictates the techniques of effective teaching that must be employed. The next sections of this paper will focus on two critical areas in educational success; student engagement and interaction.
82
STUDENT ENGAGEMENT
Beer, Clark & Jones (2010) acknowledge the fact that term “engagement” is difficult to define simply but that the concept includes active and collaborative learning, interaction with instructors as a real factor in formative learning and developing a feeling of community between the offering institution and the student. They also point out (p.82) that student engagement is often related to instructor engagement. Many educators will report that they intuitively understand that relationship but are accustomed to reporting that from qualitative observations only. Those of us who have done most of our teaching in classroom settings can readily identify an engaged student and we often presume that an engaged student will enjoy superior learning outcomes. Jones (2008) effectively points out some of these identifiable traits but goes on to emphasize that effective engagement is an outgrowth of building an effective relationship between student and instructor. Understanding this premise, the question then becomes how to accomplish this in different learning modes? Some direct discussion of practical methods to accomplish relationship building will take place later in this paper.
Another issue to be considered is that if engagement is to be considered as an important factor then how is it to be measured? One suggested technique is offered by Beer, Clark & Jones (2010) who studied data gathered using the capabilities of learning management systems (LMS). The study described measured the number of “clicks” generated in online courses by students and instructors in those courses. Not surprisingly, in courses where there were high numbers of clicks from both students and the instructor, student performance (as measured by grades earned) was higher. This seems to uphold the long-held conventional thought in traditional face-to-face classes that attendance is an indicator of engagement and that if a student’s attendance falters, that is an indicator that the student will struggle in that particular class. It may be difficult to document this similarity because in many situations, use of the LMS in the classroom itself is not considered in the same way as it is in online classes. In face-to-face class, engagement is often still measured in a subjective way, similar to the descriptions of gauging the depth of relationships reported above. However, if the concept of gathering data online can be extended to the classroom then we may be able to measure engagement across the board more objectively and use that data to make adjustments in course delivery methods. This is only one example of how transfer of methods can move between the traditional and online classrooms.
INTERACTION
The next factor we need to consider, one that builds engagement and relationships is the
critical component of interaction. While many educators attempt to utilize clever and innovative instructional design tools, programs and technology based solutions, both research and my own experience suggest that there is no substitute for instructor involvement. In this section I will briefly discuss the activities that comprise effective instructor interaction and their collective impacts on learning.
Arbaugh (2001) studied instructor behaviors in web-based MBA classes. This research suggests that immediacy behaviors such as rapid response, discussion participation, etc. can go far in reducing social distance between instructors and learners. This is corroborated by Swan (2002) and Zhu (2006) as well as by the authors own experience. A summary of this would be that instructors need to be “present” in the class (Abbott & Abbott, 2012) and that this presence adds to the potential for positive outcomes. Chepya (n.d.) refers to this presence as “e-personality”
83
and offers reinforcement to these ideas. An unscientific review of student course evaluations at the author’s institution reveals that the most commonly noted immediacy behavior is timely feedback and response to student questions. As our institutional experience has shown, many students in online classes have attended multiple schools and exhibit a tendency to “shop around” for the program and coursework that offers them the best fit for their needs as perceived by the individual student. Students often report the most negative experiences as being when the instructor had no or limited interaction with them, to the point where this is often cited as a reason to switch to another institution. Despite some the suggestions to be made later, the research and anecdotal evidence supports the observation that the insertion of an interactive tool such as a web-based simulation or inclusion of video content versus traditional reading assignments does not substitute well for active instructor participation. A key factor to remember is that there is a balance to be struck between quality and quantity of interaction. Discussion board participation is an area for illustrating some of these points. As reported by Zhu (2006), cognitive engagement may be linked to the instructor’s questions. The instructor must not only be interactive but should be guiding the student to a deeper level of understanding. Simply asking personally for information retrieval that could be equally well performed by an anonymous “check the box” exercise is not perceived by the student as interaction. In the author’s experience, a critical component is the ability of the instructor to craft an intelligent leading question to every discussion, using that question to stimulate critical thought and participation. The idea is to use the discussion board as a formative learning tool, not as an reporting forum for students to display information retrieval skills.
MODALITIES, VENUES AND FLIPPED CLASSROOMS
The reader has seemed to concentrate on online learning while offering less attention to
the traditional classroom or what has been termed “blended” learning environments. Nevertheless, upon further examination this is a logical progression for this discussion. Recall that in the introduction, it was identified that students now have a variety of choices in learning environments, are increasingly aware of their own learning preferences and needs and are surrounded by myriad sources of information and educational materials. As educators, we have become increasingly aware of these realities and the requirements for adaption of our pedagogical methods. I will argue that the three modalities listed above have now become two. The traditional classroom and the accompanying models of lecture, note taking, recall, examination and writing no longer exists. The two modes in which we operate are the blended (combining online and face-to-face components in a prescribed balance) and wholly online. The technological nature of most information delivery, the increased use of learning management systems in the classroom, the growing acceptance of online education and the expectations and technological acculturation of most students dictates this new reality.
Another reality to be considered is the “flipped classroom” concept. This concept is related to the previous comments in that in the flipped classroom model, information delivery and retrieval is considered preparatory to the critical thinking and application stages of the learning process and is accomplished outside the classroom. The critical thinking, discussion, collaboration, etc. activities are performed in the classroom in the presence of classmates and instructors. This divide is rather easily envisioned in the blended mode as the actual in-class face-to-face time is clearly different from online time. In the wholly-online mode, the course (in most cases the LMS) is both information source and interactive space.
84
Further, educators must be aware of the realities of the environment in which we and our students reside. Because students are accustomed to the use of technological means to access and retrieve data and information, the level of comfort with that means should be at the forefront of the educator’s awareness. This is particularly important for instruction in business and international business. The information delivery simulates the realities of conducting business a global environment. The need for interactivity across time and distance simulates those realities. Furthermore, in a discipline such as international business education more students are entering the educational arena with significant exposure to similar technological methods of learning/information delivery. If as instructors we do not match their expectations then our chances at successful outcomes are diminished.
AUTHOR’S SUGGESTIONS FOR PRACTICAL APPLICATIONS
The preceding body of this paper has discussed some of the contextual and theoretical
issue surrounding the need to improve/adapt interactive pedagogical techniques in order to achieve student success. In this section, I will offer from my own experience and that of my colleagues’ suggestions for use of some simple tools that can have a beneficial effect upon student learning outcomes. Embedded in this discussion will be some cautionary words about the pitfalls that can be encountered and hopefully avoided. The Engagement Progression: Student engagement, as variously defined, is suggested by many as one of the most powerful factors in student success. Engagement is built by developing effective relationships with the instructor, the material, or the institution or the class itself. Building an engaging class is a process that involves awareness of all previously discussed factors. The reader has been exposed to some suggestions for measuring engagement quantitatively but the conclusion is that for the moment it remains a more qualitative measure. Surveys and interviews remain the most effective way to gather indications of student engagement and satisfaction. Use those surveys as valuable tools to adjust course content. There are only two venues: Technology has come to the classroom to stay. Integrate the tools and information delivery of the online learning world in any classroom format, blended or what may still be billed as traditional face-to-face. Students are not accustomed to sitting in a classroom and listening to a lecture for prolonged periods. By bringing interactive tools into the classroom itself, the instructor allows for the introduction of complementary/competing perspectives, stimulation of critical thinking and rapid application of concepts and information. Use the principles of the flipped classroom. Interaction means you: Merely incorporating a video, a simulation game, an interactive quiz tool is not effective interaction when considered in the context of developing engagement. Studies and experience have strongly suggested that effective interaction is timely, authentic to the particular course and personal. As an observation born of my experience, the inclusion of video presentations specifically by the course instructor for that particular iteration of the course are highly effective tools that fit this paper’s definitions of interaction. Created easily by using even the simplest of webcam technology, the combination of visual instructor “presence” is often commented upon extremely favorably by students. The key is authenticity. Even commonly available technology for “lecture capture” (while preferable to mere written lectures) does not receive the same positive reaction from students as a timely, direct response from an instructor. Every communication from an instructor should attempt to be as personal and authentic to the student/course as possible. Also, explore the use of commercially available tools to develop
85
interactive answers to student questions (such as Jing, Camtasia, YouTube, SnagIt, tools embedded in PowerPoint). The ability of the instructor to quickly and simply produce audio/visual answers to student questions cannot be underestimated. But perhaps most importantly of all is the timeliness of your response. If an instructor does not respond rapidly to a student inquiry, the perception will exist that the instructor is not engaged and the attendant consequences are invariably negative. The quality of the question cannot be underestimated: In order to effectively implement flipped learning concepts, the quality of the discussion question whether delivered in person or in an online discussion board sets the tone for the discussion learning experience. Quantity of instructor participation can never be substituted for quality. In my experience, a frequent mistake of instructors is to participate too early and too often in online discussion as well as in face to face discussion. The pitfalls should be obvious, the opportunities for the instructor’s perspective to dominate the thinking and discussion of the class being the most readily apparent. Even more dangerous is the overly active instructor participation in online courses/online sections of blended courses. Try to avoid the impression of creating extra work for the student for all that extra reading of continuous discussion response will be interpreted as extra “work.” Enlist accomplices: An effective tool for stimulating interaction and engagement is to enlist a student collaborator. As students of international business often tend to be an older, more experienced group, try to identify a student early in the course who can serve as your accomplice. Ask that student to ask questions in discussion. Have the student suggest a link to an outside source. While seemingly an act of favoritism, in my experience this has proven highly effective in engaging the leading students as well as other class participants. Relevancy and perceptions of applicability matter: Simulations and collaborative projects are easily incorporated into online and blended classes. Again, the principles of the flipped classroom are to be embraced, the collaborative nature of such exercises such as teams performing simulations, group projects to solve case study, etc. can prove highly effective and can act as formative learning experiences while the comprehensive nature of the project or simulation serves as a summative experience as well. Particularly important is that we can draw direct parallels to the conduct of international business in a global setting and that our coursework mimics the effort student s will use in the workplace upon completion of the course. The more coursework is seen as having immediate applicability in career settings, engagement levels tend to increase. Remember to incorporate the Four C’s: Creativity, Collaboration, Communication, Critical thinking. These four critical areas of competency are what employers demand in today’s business graduate. Hopefully, the preceding allows for stimulating thought on what works for you and areas where all international business educators can explore possibilities for improving student learning outcomes.

86
REFERENCES
Abbott, C. B., & Abbott, T. M. (2012). Being Present Online: Increasing student engagement
using rapid authoring & audio visual content. Shaping the Future: Driving Innovtion in
Online Higher Education. Waterbury, Connecticut: Post University.
Arbaugh, J. (2001, December). How Instructor Immediacy Behaviors Affect Student Satisfaction
and Learningin Web-based Courses. Business Communication Quarterly, 64(4).
Beer, C., Clark, K., & Jones, D. (2010). Indicators of engagement. In C.H. Steel, M.J. Keppell,
P. Gerbic & S. Housego (Eds.) Curriculum, technology & transformation for an unknown
future.Proceedings ascilite 2010 Sydney(pp.75-86).
Chepya, P. (n.d.). E-Personality:The Fusion of IT and Pedagogical technique. Educause
Quarterly, 28(3).
Jones, R. D. (2008). Strengthening Student Engagement. Rexford, New York: International
Center for Leadership in Education.
Swan, K. (2002). Building learning Communities in Online Courses:the importance of
interaction. Education, Communication & Information, 2(1).
Zhu, E. (2006). Interactionand cognitive engagement: An analysis of four asynchronous online
discussions. Instructional Science.
87
THE CULTURAL PATH DEPENDENCE IN THE PROCESS OF CHINESE SOES’ “GOING OUT” -ON THE BASIS OF THE
DISCUSSION OF SOME TYPICAL CASES
Yingjing Wang Nanjing University of Science and Technology
Hanhui Hu Southeast University
ABSTRACT In recent years, with the “Going out” strategy the outward direct investment (ODI) and contracted overseas project and labor cooperation of Chinese SOEs, is forging ahead at a great speed. Though there may not be lacking in successful cases, there are quite a few failures either, which should call for deep thought. This paper mainly discusses the cause of the failure of Chinese SOEs' ODI from the aspect of cultural path dependence. The result indicates that the cultural path dependence on different levels will bring various negative impacts on the enterprises’ performance in the host countries. Keywords- Cultural path dependence, Chinese SOEs, Outward Direct Investment (ODI)
ⅠⅠⅠⅠ. INTRODUCTION
After 30 years’ reform and opening-up, Chinese open economy has changed from initial merely “Bringing in” to “Going out” and “Bringing in” together. In recent years, the outward direct investment (ODI) and contracted overseas projects and labor cooperation of Chinese enterprises is forging ahead at a great speed. A few days ago, Hucheng Gao, Vice Minister of of the Ministry of Commerce in China introduced that up to the end of 2011, the ODI of Chinese enterprises has totally reached to 380 billion dollars, and there have been more than 18 thousand Chinese enterprises abroad, which are located in 178 countries and areas globally, and have made almost 1.6 trillion overseas assets. And according to the data from the Ministry of Commerce of China, in 2011 the Chinese contracted overseas projects have finished a turnover of 103.42 billion dollars, up 12.2% over the same period of last year, and the volume involved in newly signed contracts came to 142.33 billion dollars, up 5.9% over the same period of last year; in 2011 there are 452 thousand of all kinds of labor service personnel sent by foreign labor cooperation, a rise of 41 thousand personnel on last year's same period, including 243 thousand personnel under contracted overseas project.
And the report from American Asia Society (Daniel H. Rosen & Thilo Hanemann, 2011) shows that “FDI from China to the United States is now more than doubling annually.” The report from the Wall Street Journal in Feb. 2012 shows that businesses from China have established operations and created jobs in 38 of the 50 U.S. states. The American Asia Society's report (Daniel H. Rosen & Thilo Hanemann, 2011) holds that “If China follows the pattern of other emerging nations, more than $1 trillion in direct Chinese investment will flow worldwide

88
by 2020, a significant share of which will be destined for advanced markets such as the United States.”
Among the Chinese enterprises' ODI and contracted overseas projects and labor cooperation in these years, the SOEs always play a vital role. According to the data from the Ministry of Commerce of China, in 2009 70% of Chinese global outward direct investment was derived from SOEs. And from 2003 to 2010, in the 230 Chinese investments in the U.S. there are 170 investments, which are about 74%, from private enterprises. But, in the case of the total investment value, just the opposite is true: the SOEs account for 65% (Daniel H. Rosen & Thilo Hanemann, 2011).
Though there may not lacking in successful cases of Chinese SOEs’ “Going out”, there are quite a few failures either, such as the Polish A2 highway project by China Overseas Engineering Group Co. (COVEC), up to June 30, 2011, the confirmed losses of this project had been 0.55 billion yuan RMB; the M&A of TCL Group and France's Thomson SA, the loss was 70 million euros in 2005; the falling of the merger of China National Offshore Oil Corporation (CNOOC) Ltd and Unocal; a series of large loss of the overseas investment by China Investment Corporation (CIC), etc.
Though the scholars and experts have discussed various factors making impacts on the failures of Chinese SOEs’ ODI, such as institutional, social & economic factors, etc., the cultural path dependence is still a very influential factor. “Every culture attempts to create a ‘universe of discourse’ for its members, a way in which people can interpret their experience and convey it to one another (Dean Barnlund, 1998).”
In this paper, the theory of path-dependence would be used to study the cause of Chinese SOEs' ODI failures, and the cultural path dependence would be discussed mainly.
The rest of this paper is organized as follows: the second part introduces some researches of path dependence, cultural path dependence and Chinese SOEs’ “Going out”; the third part explains the connotation of Chinese enterprises “Going out” and introduce three typical cases of SOE’s “Going out” failure briefly; the fourth part mainly analyses the cultural path dependence in the process of Chinese SOEs’ “Going out” on the basis of the cases introduced before, and their negative impacts are discussed in this part; finally, some conclusions are given.
II. PATH DEPENDENCE AND CULTURAL PATH DEPENDENCE
The path dependence hypothesis in economics has mainly been applied to discussing
technological development, and there are many literatures about this topic (Arthur, 1989; Puffert, 1991; David, 1992; Cowan & Hultén, 1996; Liebowitz & Margolis, 1999). The main effect of path dependence has been described in terms of restrictions or as something that is hindering the development of new innovations and new products (Arthur, 1989). Furthermore the path dependence due to the institutional factor is also very important to the economic performance through time (North, 1992).
Culture is the collective programming of the mind which distinguishes the members of one group or category of people from another, the core element in culture is values, management is subject to cultural values (Hofstede, 2007). Or culture is a catchall term, which includes but is not limited to belief systems, behavioral repertoires, causal mappings, status hierarchies, trust relationships, and social capital, and culture determines how we interpret and process information, how we act, and how we expect others to act (Page, 2006-1)

89
The cultural path dependency could be traced with respect to the natural sciences and tooled knowledge. That means the first is arguably the dominant knowledge domain; the second, the dominant force active on the planet today (Chartrand, 2007).
With regard to the culture research, the cultural values do have a significant effect on differences in entrepreneurial behavior, with some cultures producing more innovation and entrepreneurship than others (Shane, 1993) and national culture plays an important role in entrepreneurship (Holt, 1997). Scott et al. (Page, 2006-2) develop a model of institutional and cultural path dependence, which captures institutional externalities transmitted through culture.
III. “GOING OUT”STRATEGY AND SOME SOE’S FAILURES
Chinese “Going Out” Strategy
“Going out” is the overseas investment strategy which Chinese government supports strongly at present. In 2001 the “Going out” strategy has been raised to the level of country strategy. And in 2001 it has been written in the China’s “The national economic and social development of the tenth five-year program outline”. In the outline “implementing the strategy of ‘Going out’” was described as follows: “Encourage the outward investments which could develop our relative advantages, enlarge the fields, approaches and methods of international economic and technological cooperation; further expand contracted projects overseas as well as labor-export services, encourage the enterprises with competitive advantage to develop overseas processing and assembling trade in order to drive the import of product, service and technology.
Therefore the “Going out” strategy means not only the outward direct investment (ODI) of the enterprises, but also the contracted overseas projects and labor cooperation of them. Brief Introduction Of Some SOE’s Failures
In the Chinese enterprises’ “Going out” experiences, the SOEs have been always as the pioneer and play a vital role.
Though there may not lacking in successful cases of Chinese SOEs’ “Going out”, there are quite a few failures either. Here are some typical cases from them. a. COVEC’s Project in Poland
China Overseas Engineering Group (COVEC) is a subsidiary of China Railway Engineering Corp (CREC), one of Asia's largest construction and engineering companies. The Beijing-based company won the bid to build two sections of Poland's A2 highway, which will stretch 49 kilometers and run from Warsaw to the German border, in 2009.
In June 2011, COVEC withdrew from a $447 million highway construction project in Poland after incurring heavy losses. The cancellation comes just two years after the company became the first Chinese enterprise to win a large European highway contract. The Polish road agency demanded compensation of 741 million zlotys ($271.1 million) from COVEC, and COVEC also claimed compensation from its Polish partner (China Daily, June 2011). The once-happy relationship between the Polish government and a Chinese builder ended in a lose-lose situation. b. TCL’s overseas M&A

90
Founded in 1981, TCL is one of the largest consumer electronics enterprises in China with a global presence. TCL Corporation has three listed companies: TCL Corporation (SZ.000100), TCL Multimedia (HK.1070) and TCL Communication (HK.2618).
From October 2002 to September 2004 for two years, TCL Group had made a series of mergers and acquisitions in Germany Schneider, the French Thomson company's TV business, as well as France's Alcatel's mobile phone business and embarked on a one by cross-border mergers and acquisitions to achieve scale expansion of the international road.
But the typical characteristic of these three M&A is that they all brought very serious loss to the group: in the first half of 2003 the TCL’s Schneider Electronic Co., Ltd. had a loss of 20 million HK$; TCL-Thomson-Electronics Corporation (TTE) had a loss of 70 million euros in 2005; TCL Alcatel Mobile Phones Limited (TAMP) had a HK$ 258 million loss in four months, which brought the dissolution of the joint venture finally. c. CIC’s Overseas Investment
China Investment Corporation (CIC) is a sovereign wealth fund responsible for managing part of the People's Republic of China's foreign exchange reserves. CIC was established in 2007 with approximately US$200 billion of assets under management, making it one of the largest sovereign wealth funds.
CIC bought a US $3 billion stake of Blackstone Group in June 2007, and since Blackstone's shares have dropped about 64% in June 2009, leaving CIC with a loss of about $1.9 billion; bought a 9.9 per cent stake of Morgan Stanley worth US$ 5 billion on December 19, 2007 whose value later plunged, and early June 2009 CIC plowed an additional $1.2 billion into Morgan Stanley, the transactions brought a floating loss of 0.91 billion dollars after two years; and due to the bankruptcy of Lehman Brothers the Reserve Primary monetary market fund fell below par, which made the CIC investment more loss.
V. CULTURAL PATH DEPENDENCE IN THE PROCESS OF SOE’S “GOING OUT”
The culture of a community may be an important influence on the level of
entrepreneurship (Cassen, 1990), and culture has a determining impact on business systems (Zutshi & Tan, 2008).The other study (Zapalska, 2001) also found that as one of the main factors culture influences the evolution of China’s entrepreneurial ventures. “Zhong-Yi-Qing-Li” & “San-Gang-Wu-Chang”
“Zhong-yi-qing-li” means to value righteousness and belittle profit, which came from the Confucianism in the Spring and Autumn period (770-476 B. C.), and have made a very notable impact on Chinese social moral standards’ establishment in later years. Confucius said in the Analects, that “Junzi yu yu yi, xiaoren yu yu li” (The gentleman knows what is right; the small man knows what is profitable.), which embodies a hierarchical economic ethics characteristic (Liu, 1997). Among Confucius sayings, there is “Yu su, ze bu da, jian xiaoli, ze dashi bu cheng.”(You cannot reach your goal if you want to be quick, and you cannot accomplish great things if you seek petty gains), which reflects an important characteristic in Confucian economic ethics of valuing the entirety and neglecting an individual; and the characteristic of overemphasizing national and collective interests, ignoring individual interest, requiring personal interests to be subordinated to national and collective ones.

91
“San-gang-wu-chang” are the main principles of social order in ancient China, which are the three cardinal guides (ruler guides subject, father guides son and husband guides wife) and the five constant virtues (benevolence; righteousness, propriety, wisdom and fidelity) as specified in the feudal ethical code (Li, 2010). Those principles reflect the hierarchical severity in Chinese ancient society, and the suppression of individual consciousness from objective social thinking and cultural background, also the suppressions of equality consciousness, and the suppressions of right consciousness, which would be bound to lead to individual frustration of enthusiastically fighting for personal right and material interests.
The representations of cultural path dependence on SOEs’ “Going out”: 1) Have made a social culture of “Strong government weak people” Contrary to
American “small government powerful people”, that is the reason why the CIC could spend so large amount of money but bear no responsibility, and that is the reason why 26% from SOEs’ investments in the U.S. from 2003 to 2010 could have 65% of the total investment value.
2) Have brought SOEs, especially the centrally-administered SOEs' special privileges. And because of these cultural path dependences, even after 30 years’ reform and opening up, there is always lacking in social atmosphere to encourage the development private-run economy. And SOEs could always get the commercial banks’ loan more easily, or to get the investment approval more early, and more easily to get the rare resources than the other enterprises.
3) Always lack in supervision of SOEs overseas investment. When the private-run enterprises get the investment loss, they could only eat their own bitter fruit, but when the SOEs have loss, they will be called as simple “pay the tuition”, and finally the huge loss would be paid by the government and the people. Take the example of CIC, the foreign exchange reserves belong to the people's hard-earned money, and CIC make investment in the government's name, in the Nation's interest, but the people just could not supervise their activities. When CIC repeatedly fought and lost, they gave no response about that, and they have no explanation of the huge investment loss.
4) Always ignore the individual interest. After the merger of TCL and Alcatel, the entrepreneur Dongsheng Li had been in France in the weekend to convene a meeting of the Middle-level executives, and he found nobody. But in China it is very normal to be called in the weekend to have a meeting. In the case of COVEC’s A2 Project in Poland, under the Polish labor law, the overseas workers should be paid according to the local salary level, but when COVEC stopped their construction, COVEC tried to pay the workers under Chinese domestic labor law. Because the individual interest should always be subordinated to the interests of the group in China. And the France labor union also made Dongsheng Li also pay much tuition, but the labor union in China is just an organization to mainly manage the workers. “Zhong-Shu-Qing-Fa” & “Guan-Benwei”
“Zhong-shu-qing-fa” means to value manipulation and belittle law. And there is a saying in China that “Shang you zhengce, xia you duice” (Those above have policies while those below have their own ways of getting around them.), which is just the reflection of this thought. Tracing back the Chinese traditional thought and culture, the Legalist's thought in fact, valued “Run the country according to law” . “Guan zi” said, “Fa zhe, tianxia zhi chengxu ye, wanshi zhi yibiao ye (What is Law? It is the rule of the world and regulates everything).”
From Han Dynasty to premodern times, due to the rise of Confucianism, Legalists of Pre-Qin Period had been denounced and criticized for a long time, in order to meet the predilection
92
of Confucianism of all through the ruling classes many kinds of statecraft tended to become value manipulation and belittle law, which made all the rulers in their national control measures pay attention to the political trickery and stratagem, etc. And in contemporary society, this “Shu (manipulation)” in the enterprises’ business operations is just the emphasis on the “Guan xi (relationship)”, especially the necessity to develop the relationship with VIP persons in government key sectors. Therefore because of the preference difference of higher leadership or the difference of enterprise operator’s communication and management ability there could result in the phenomenon of more powerful “rule of man” than “rule of law”(Yin, 1994).
So called “Guan-benwei” regards the official as the foundation of the society, the officials are noble and the people are humble, and many times the government official even surpasses the law (Hai, 2004). There is also a certain logic between Confucianism and “Guan-benwei”, because Confucianism told the people to respect the official and try to be an official, which leads to the value direction, e.g. the slogan of “Xue er you ze shi (he who excels in study can follow an official career)” is just from the Analects of Confucius; the Imperial Examination system is just a system teaching people to be an official by the way of learning, and “Wan ban jie xia pin, wei you du shu gao (Learning is the noblest of human pursuits.)” is just because learning could help people to be an official, and official could be placed above the others.
The representations of cultural path dependence on SOEs’ “Going out”: 1) Have special market entry mode. For COVEC’s management for a long time they are
used to apply the unspoken rule in Chinese infrastructure industry, that is at first by providing a competitive very low quote to obtain the contract, and then afterwards by changing the engineering in the construction process to enter a claim, that is “project secondary operation”, therefore the low-price engineering changes to high-price engineering (21 century business herald, June 2011).
2) Have special method to deal with the problem. The Chinese SOEs are all familiar with the “Guan xi xue (favoritism through connections)”, and they are all very good at communicating with the government, and they even brought the style into their overseas investment. In the overseas market, the Chinese SOEs always confuse the relation of “politic” and “Commerce”. Before COVEC bids for the Polish A2 project, the General Manager of COVEC, Yuanming Fang, had met the Poland Ambassador Witold Prandota. And after COVEC began to find some difficulty in the Polish market, Manager Fang came to Warsaw and visit Radoslaw Stepien, the vice Minister of Polish Ministry of Infrastructure with Tengxuan Fu, the A2 project manager in Poland at that time together. They had an enthusiastic reception, though Radoslaw Stepien promised nothing related to the project, but his enthusiasm made Manager Fu think that the Poland side would try their best to provide the China side the convenience, and afterwards Manager Fu always would like to say publicly that “The polish government welcomes us very much, and we have a very good relation with them.”
3) Have disorganized management. When COVEC met the big problem and had to stop the construction, they just changed their leader from Manager Fu to Manager Kun Wang, and it was said that the working ability of Wang was generally accepted, and he was hoped to sort out the mess. And some of the suppliers told the reporter that they could not get the public response of their quote, but afterwards by the telephone of the COVEC internal staff, who would like to “talk about the business privately”, and always had subtext of “sales commission”. Those phenomena reflect the “rule of man” but not “rule of law”.
93
V CONCLUSION
This paper mainly studied the negative affects of cultural path dependences in the process of Chinese SOEs’ “Going out”. The analysis indicates that some old cultural thoughts, such as “Zhong-li-qing-yi”, “San-gang-wu-cahng”, “Zhong-shu-qing-fa” and “Guan-benwei”, etc., have affected the performance of Chinese SOEs’ “Going out”. Facing the international market competition Chinese SOEs should only realize these negative impacts from cultural path dependence, and try to break through the cultural path dependence, could they carry out the management innovation and institutional innovation, and gain the competitive advantage and win the market in the future.
ACKNOWLEDGEMENT
The work in this paper was supported by grants from National Science Foundation of China (Projects No. 70873019 and No. 71272164)
REFERENCES
Rosen, Daniel H. & Hanemann, Thilo (2011 March). An American Open Door? Maximizing the benefits of Chinese Foreign Direct Investment, Special Report of American Asia Society
Barnlund, Dean (1998). Communication in a Global Village. In Milton J. Bennett (Ed.), Basic Concepts of Intercultural Communications. (pp35-42). Intercultural Press.
Arthur, W. B. (1989). Competing Technologies, Increasing Returns, and Lock-In by Historical Events, Economic Journal, vol.99, 16–131.
Puffert, D. J. (1991). The Economics of Spatial Network Externalities and the Dynamics of Railway Gauge Standardization. Ph.D. dissertation, Stanford University.
David, P. A. (1992). Heros, Herds and Hysteresis in Technological History: Thomas Edison and The Battle of the Systems Reconsidered. Industrial and Corporate Change, vol.1, no.1, 129-180.
Cowan, R. & Hultén, S. (1996). Escaping Lock-In: The Case of the Electric Vehicle. Technological Forecasting and Social Change, vol.53, no.1, 61-80.
Liebowitz, S. J. & Margolis, S. E. (1999). Winners, Losers, and Microsoft: How Technology Markets Choose Products, published by the Independent Institute.
North, D. C. (1992). Institutions Ideology and Economics Performance. Cato Journal, no.3, 477-488.
Hofstede,Geert. (2007). Asian management in the 21st century, Asia Pacific Journal of Management, vol.24, 411–420.
Page, S. E. & Bednar, J. (2006). Culture, Institutional Performance, and Path Dependence, eScholarship Repository, Institute of Governmental Studies, University of California, Berkeley. Retrieved May 20, 2012 from http://repositories.cdlib.org/igs/WP2006-6
Chartrand, H. H. (2007). The Competitiveness of Nations in a Global Knowledge-Based Economy – Ideological Evolution, Saarbrücken, Germany: VDM Verlag Dr Muller.
Shane, S. (1993). Cultural influences on national rates of innovation. Journal of Business Venturing, no.3, 59-73.
94
Holt D. H. (1997). A comparative study of values among Chinese and U.S. entrepreneurs: Pragmatic convergence between contrasting cultures. Journal of Business Venturing, vol.12, no.6, 483-505.
Page, Scott E.(2006). Path Dependence, Quarterly Journal of Political Science, no.1, 87-115. China Daily (2011, June 18). COVEC stops Polish highway construction. Casson, Mark C. (1990). ed. Entrepreneurship. Vol. 13, International Library of Critical
Writings in Economics. Zutshi, Ravinder K. & Tan, Wee Liang (2009). Impact of culture on ‘partner selection criteria’ in
East Asian international joint ventures. International Entrepreneurship and Management Journal, vol.5, no.4, 369-393
Zapalska, A. M. & Edwards, W. (2001). Chinese entrepreneurship in a cultural and economic perspective. Journal of Small Business Management, vol.39, no.3, 286–292.
Liu, Y. (1997). History of Ancient Management Philosophies in China (in Chinese). Shanxi People Press, Xi’an, China
Li, Huijun (2010) Discussion on the formation and function of “San-gang-wu-chang”, Journal of Literature and History, no.3, 22-25
Yin, J. (1994). The problem of market economy in Chinese history, Economic Review, no.1, 7-18 Hai. D. (2004, June 7). The historical root of “Guan-benwei”. [Online]. Retrieved Nov. 20 2005
from http://www.21red.net Zhu, Lan (2005). The Cultural Root of Chinese Traditional Officialdom Standard Thought,
Theory Journal, no.11, 115-118+131 21 Century Business Herald (2011, Sep.19). COVEC Polish Trap, ,
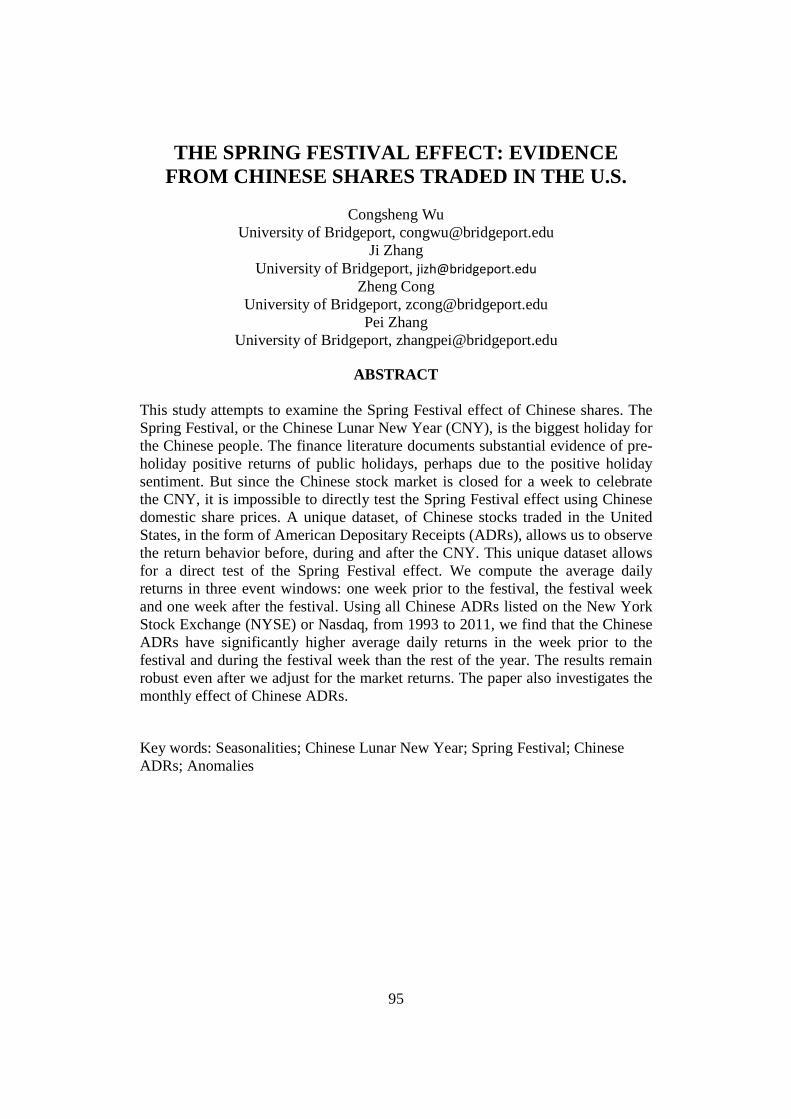
95
THE SPRING FESTIVAL EFFECT: EVIDENCE FROM CHINESE SHARES TRADED IN THE U.S.
Congsheng Wu
University of Bridgeport, [email protected] Ji Zhang
University of Bridgeport, [email protected] Zheng Cong
University of Bridgeport, [email protected] Pei Zhang
University of Bridgeport, [email protected]
ABSTRACT
This study attempts to examine the Spring Festival effect of Chinese shares. The Spring Festival, or the Chinese Lunar New Year (CNY), is the biggest holiday for the Chinese people. The finance literature documents substantial evidence of pre-holiday positive returns of public holidays, perhaps due to the positive holiday sentiment. But since the Chinese stock market is closed for a week to celebrate the CNY, it is impossible to directly test the Spring Festival effect using Chinese domestic share prices. A unique dataset, of Chinese stocks traded in the United States, in the form of American Depositary Receipts (ADRs), allows us to observe the return behavior before, during and after the CNY. This unique dataset allows for a direct test of the Spring Festival effect. We compute the average daily returns in three event windows: one week prior to the festival, the festival week and one week after the festival. Using all Chinese ADRs listed on the New York Stock Exchange (NYSE) or Nasdaq, from 1993 to 2011, we find that the Chinese ADRs have significantly higher average daily returns in the week prior to the festival and during the festival week than the rest of the year. The results remain robust even after we adjust for the market returns. The paper also investigates the monthly effect of Chinese ADRs. Key words: Seasonalities; Chinese Lunar New Year; Spring Festival; Chinese ADRs; Anomalies
96
INTRODUCTION
The efficient market hypothesis (EMH) postulates that all publicly available information has been fully incorporated in stock prices. One of the implications of the EMH is that the stock market follows a random walk and hence displays no predictable patterns that can be explored reliably for abnormal returns. Basically, the EMH argues that shares prices are inherently unpredictable. The EMH has long been contested by academics as well as practitioners.
Among the various financial anomalies that have been documented in the literature are the abnormal returns around public holidays. This phenomenon, known as the holiday effect, has been uncovered in the U.S. and other developed markets. Lakonishok and Smidt (1988), for instance, examine returns around public holidays in the U.S. and find significant abnormal returns before holidays. They find that roughly half of the gain in the Dow Jones Industrial Average occurs during the 10 pre-holiday trading days in each year. Post-holiday returns are insignificant until 1952 and positive and significant from 1952 to 1986. Ariel (1990) examines intraday market returns and documents a significant preholiday effect. Over the pre-holiday period stock prices increase and have a much higher frequency of positive returns, particularly in the last hour. Abnormal pre-holiday returns are also documented in other developed markets such as UK and Japan (Kim and Park, 1994), Hong Kong (McGuiness, 2005) and Spain (Menue and Pardo, 2004). Unlike some other anomalies, the pre-holiday effect seems to be persistent over time (Lakonishok and Smidt, 1988).
Studies on emerging markets provide consistent results of the holiday effect. A number of studies have examined the holiday effect of the Chinese stock markets. For instance, McGuinness and Harris (2011) examine the Chinese Lunar New Year (hereinafter referred to as CNY) return effects within the context of the mainland Chinese (Shanghai and Shenzhen) and Hong Kong market places. The CNY, or the Spring Festival, is the biggest holiday for the Chinese people. They find positive returns in the three days prior to and one day after the CNY holiday. Moreover, the effect is common to all major sectors of the Hong Kong market as well as to the Shanghai and Shenzhen markets in mainland China.
The finance literature has provided two possible explanations for the holiday effect. The first one, as presented by Fabozzi, Ma and Briley (1994), is that the effect may be part of the other seasonalities that have already been documented. This is pertinent in situations where holidays occur primarily on specific days of the week or in specific periods such as the beginning or end of the month. This means that a vital part of ascertaining whether there is truly a holiday anomaly is to eliminate the possibility that the holiday is capturing other calendar effects.
Another possible explanation of the holiday effect is based on behavior finance (e.g., Thaler, 1999). The behavior argument is consistent with the notion that happier people tend to believe in more positive outcomes (Kavanagh and Bower, 1985). According to this argument, the higher pre-holiday returns are a result of a positive holiday sentiment. This occurs when people look forward to the holiday period, are optimistic and focused on non-work activities, and hence
97
are reluctant to trade or close out positions on stock that they hold. This argument is supported by Hirshleifer and Shumway (2003) who suggest that the weather may have a psychological effect on investors’ mood and how they perceive information. In their empirical investigation of the link between the weather and stock market returns, they document returns of 24.8% and 8.7% on sunny and cloudy days respectively. This behavioral trait of investors may also explain the existence of the holiday effect, as investors’ outlook can become more positive around public holidays.
Chan, Khanthavit and Thomas (1996) consider the holiday effect within a cultural context for the stock exchanges of Malaysia, Singapore, India and Thailand. They find a stronger holiday effect around cultural holidays, compared to state holidays with no cultural origin. Notably, the Kuala Lumpur, Singapore and Bombay stock exchanges all show significant, positive abnormal returns around cultural holidays. Cadsby and Ratner (1992) and Yen and Shyy (1993) find that cultural holidays, such as the CNY, are related to economically significant abnormal returns in Hong Kong, Japan, Malaysia, Singapore, Korea and Taiwan Province of China. Their findings point to the existence of a “cultural effect” within the holiday effect, at least in Asian stock markets.
The drawback of previous studies on the CNY effect of the Chinese stocks is that the Chinese stock market is closed for a week to celebrate the holiday. As a result, it is impossible to directly observe the return behavior during the holiday. To overcome this drawback, we use Chinese stocks traded in the United States, in the form of American Depositary Receipts (ADRs), which continue to be traded during the CNY. We are able to obtain data for all Chinese ADRs listed on the New York Stock Exchange (NYSE) or Nasdaq since 1993. This unique data set allows for a direct test of the CNY effect.
We compute the average daily returns in three event windows: one week prior to the festival, the festival week, and one week afterwards. The average daily returns for the three windows are, respectively, 0.226%, 0.238% and -0.032%. In comparison, the average daily return for the entire year excluding the festival week is 0.053%. Regression analyses suggest that the Chinese ADRs have significantly higher average daily returns in the week prior to the festival and during the festival week than the rest of the year. The results remain robust even after we adjust for the U.S. market returns.
This paper also investigates the monthly return patterns of Chinese ADRs. The results indicate that the monthly returns in April and July are significantly positive, while the returns in August, November, September and June are significantly negative.
DATA AND RESULTS
Many Chinese stocks are now traded in the United States, in the form of American Depositary Receipts (ADRs), and they continue to be traded during the Chinese New Year. ADRs are negotiable certificates (denominated in U.S. dollars) that are issued by a U.S. bank to represent the underlying shares of a foreign stock, which are held in trust at a foreign custodian bank. ADRs are sold,
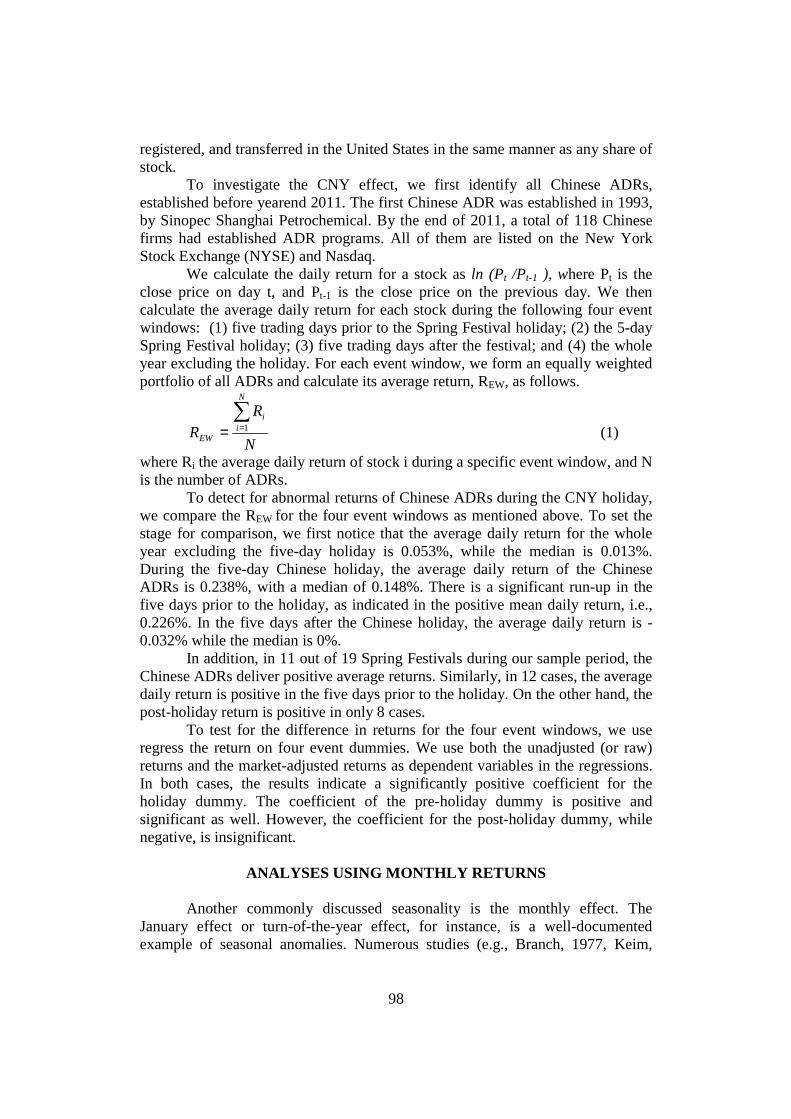
98
registered, and transferred in the United States in the same manner as any share of stock.
To investigate the CNY effect, we first identify all Chinese ADRs, established before yearend 2011. The first Chinese ADR was established in 1993, by Sinopec Shanghai Petrochemical. By the end of 2011, a total of 118 Chinese firms had established ADR programs. All of them are listed on the New York Stock Exchange (NYSE) and Nasdaq. We calculate the daily return for a stock as ln (Pt /Pt-1 ), where Pt is the close price on day t, and Pt-1 is the close price on the previous day. We then calculate the average daily return for each stock during the following four event windows: (1) five trading days prior to the Spring Festival holiday; (2) the 5-day Spring Festival holiday; (3) five trading days after the festival; and (4) the whole year excluding the holiday. For each event window, we form an equally weighted portfolio of all ADRs and calculate its average return, REW, as follows.
N
RR
N
ii
EW
∑== 1 (1)
where Ri the average daily return of stock i during a specific event window, and N is the number of ADRs.
To detect for abnormal returns of Chinese ADRs during the CNY holiday, we compare the REW for the four event windows as mentioned above. To set the stage for comparison, we first notice that the average daily return for the whole year excluding the five-day holiday is 0.053%, while the median is 0.013%. During the five-day Chinese holiday, the average daily return of the Chinese ADRs is 0.238%, with a median of 0.148%. There is a significant run-up in the five days prior to the holiday, as indicated in the positive mean daily return, i.e., 0.226%. In the five days after the Chinese holiday, the average daily return is -0.032% while the median is 0%.
In addition, in 11 out of 19 Spring Festivals during our sample period, the Chinese ADRs deliver positive average returns. Similarly, in 12 cases, the average daily return is positive in the five days prior to the holiday. On the other hand, the post-holiday return is positive in only 8 cases.
To test for the difference in returns for the four event windows, we use regress the return on four event dummies. We use both the unadjusted (or raw) returns and the market-adjusted returns as dependent variables in the regressions. In both cases, the results indicate a significantly positive coefficient for the holiday dummy. The coefficient of the pre-holiday dummy is positive and significant as well. However, the coefficient for the post-holiday dummy, while negative, is insignificant.
ANALYSES USING MONTHLY RETURNS Another commonly discussed seasonality is the monthly effect. The
January effect or turn-of-the-year effect, for instance, is a well-documented example of seasonal anomalies. Numerous studies (e.g., Branch, 1977, Keim,
99
1983, and Roll, 1983) have found that the average return in January is significantly higher than other months of the year.
We investigate this issue with Chinese ADRs by forming an equally weighted portfolio and computing its return for each calendar month for the years 1993-2011. The month that delivers the highest returns is April, and the mean return in this month is 4.54% with a median of 2.51%. Another good month is July, in which the mean return is 1.714% and the median is 2.075%. On the other hand, August, November, September and June are the months that are associated with substantial negative returns. The mean returns for these four months are, respectively, -5.717%, -4.007%, -3.689% and -3.567%.
In order to determine the statistical significance, we run a regression of the monthly returns on the twelve monthly dummies. The results confirm that the monthly returns in April and July are significantly positive, while the returns in August, November, September and June are significantly negative.
SUMMARY AND CONCLUSIONS
This study attempts to examine the Spring Festival effect of Chinese shares. The Spring Festival, or the Chinese Lunar New Year (CNY), is the biggest holiday for the Chinese people. The finance literature documents substantial evidence of pre-holiday positive returns of public holidays, perhaps due to positive holiday sentiment.
A unique dataset, of Chinese stocks traded in the United States, in the form of American Depositary Receipts (ADRs), allows us to observe the return behavior before, during and after the CNY. This unique data set allows for a direct test of the Spring Festival effect. We compute the average daily returns in three event windows: one week prior to the festival, the festival week and one week after the festival. Using all Chinese ADRs listed on the New York Stock Exchange (NYSE) or Nasdaq, from 1993 to 2011, we find that the average daily returns for the three windows are, respectively, 0.226%, 0.238% and -0.032%. In comparison, the average daily return for the entire year excluding the festival week is 0.053%. Statistical analyses suggest that the Chinese ADRs have significantly higher average daily returns in the week prior to the festival and during the festival week than the rest of the year. The results remain robust even after we adjust for the market returns.
This paper also investigates the monthly effect of Chinese ADRs. The results indicate that the monthly returns in April and July are significantly positive, while the returns in August, November, September and June are significantly negative.
REFERENCES
Ariel, Robert A. (1987). A monthly effect in stock returns. Journal of Financial
Economics, 18, 161–74. Ariel, R.A. (1990). High stock returns before holidays: existence and evidence on

100
possible causes, The Journal of Finance, 45 (5), 1611-1626. Branch, Ben S. (1977). A tax loss trading rule. Journal of Business, 50, 198–207. Cadsby, Charles Bram, and Mitchell Ratner (1992). Turn-of-the-month and pre-
holiday effects in stock returns. Journal of Banking and Finance, 16, 497– 509.
Chan, M.W.L., Khanthavit. R & Thomas, H. (1996). Seasonality and cultural influences on four Asian stock markets, Asia Pacific Journal of Management, 13 (2), 1-24.
Fabozzi, Frank J., Christopher K. Ma, and Jeffrey E. Briley (1994). Holiday trading in futures markets. Journal of Finance, 49, 307–24.
Hirshleifer, D. & Shumway, T. (2003). Good day sunshine: stock returns and the weather, The Journal of Finance, 58 (3), 1009-1032.
Kavanagh, D.J. & Bower, G.H. (1985). Mood and self-efficacy: Impact of joy and sadness on Perceived Capabilities, Cognitive Therapy and Research, 9 (5), 507-525.
Keim, Donald B. (1983). Size-related anomalies and stock return seasonality: Further empirical evidence,” Journal of Financial Economics, 12, 13–32.
Kim, C.W. & Park, J. (1994). Holiday effect and stock returns: further evidence, Journal of Financial and Quantitative Analysis, 29 (1), pp. 145-157.
Lakonishok, J. & Smidt, S. (1988). Are seasonal anomalies real? A ninety-year perspective, The Review of Financial Studies, 1 (4), 403-425.
McGuinness, P.B., and R. D. Harris (2011). Comparison of the ‘turn-of-the- month’ and lunar new year return effects in three Chinese markets: Hong Kong, Shanghai and Shenzhen. Applied Financial Economics, 21 (13), 917-929.
Meneu, V. & Pardo, A. (2004). Pre-holiday effect, large trades and small investor behavior, Journal of Empirical Finance, 11, 231-246.
Mitchell J.D., and Ong, L. (2006). Seasonalities in China`s Stock Markets: Cultural or Structural? International Monetary Fund Working paper.
Roll, Richard (1983). Vas is Dat? The turn-of-the-year effect and the return premia of small firms. Journal of Portfolio Management, 9, 18–28.
Thaler, R.H. (1999). The end of behavioural finance, Financial Analyst Journal, 55 (6), 12-17.
Tonchev, D. & Kim, T. (2004). Calendar effects in Eastern European financial markets: evidence from the Czech Republic, Slovakia and Slovenia, Applied Financial Economics, 14, 1035-1043.
Yen, Gili, and Gang Shyy (1993). Chinese New Year effect in Asian stock markets. NTU Management Review, 4, 417–36.

101
THE IMPACT OF INTEREST RATE FUTURES ON THE UNDERLYING INTEREST RATE MARKETS IN INDIA
Manish Sinha
Email: [email protected]
ABSTRACT
If the market is perfect and complete, ideally, the introduction of derivatives should not in any way affect the equilibrium conditions in the underlying market. However, the presence of information asymmetry in the market ensures that introduction of a derivative alters the speed with which equilibrium is attained. This may generally affect the underlying asset’s price level and also its volatility. A study of a similar phenomenon is done in the case of the Indian bond market. The Indian Bond market which is predominantly G-sec saw the introduction of the interest rate futures recently. The 10 year Interest rate futures contract based on a 10 year notional coupon bearing Government of India security, the 91 day T Bill futures which is based on 91 day T bills issued by the Government of India and the 2 and 5 year Interest rate Futures based on 2 and 5 year notional Gsec. The purpose of this paper is to understand their impact on the underlying market. The developments in the interest rate futures market can be attributed to the novelty of this market in India. In this paper we will try and understand whether there has been any change in the behavior of the markets for the underlying post the introduction of these derivatives. It is seen that both the short term interest rate and long term interest rate markets gets impacted on their turnover post the introduction of these derivatives. However, when it comes to volatility, it is only the short term interest rates which gets significantly impacted.
INTRODUCTION
The idea that financial markets are imperfect is more or less accepted with the theorists rejecting the possibility of a Walrasian type equilibrium in this market. Also, the assertion by Modigliani and Miller that there should be indifference between debt and equity has also not been found to be true in the case of financial market. If the market is perfect and complete, ideally, the introduction of derivatives should not in any way affect the equilibrium conditions in the underlying market. However, the presence of information asymmetry in the market ensures that introduction of a derivative alters the speed with which equilibrium is attained. This may generally affect the underlying asset’s price level and also its volatility. The Indian Bond market which is predominantly G-sec saw the introduction of the following interest rate futures recently. The 10 year Interest rate futures contract based on a 10 year notional coupon bearing Government of India security. The notional coupon shall be 7% per annum with semi annual compounding and the contract shall be settled by physical delivery of deliverable grade securities. The 91 day T Bill futures which is
102
based on 91 day T bills issued by the Government of India. The contract would be cash settled and the final settlement price of the contract shall be based on the weighted average price/yield obtained in the weekly auction of the 91 day Treasury Bills on the date of expiry of the contract. It was also proposed to have the 2 and 5 year Interest rate Futures based on 2 and 5 year notional Gsec with semiannually compounded coupon of 7%. These would also be cash settled and the final settlement price shall be based on the yields on basket of securities for each Interest rate Futures contract specified by the respective stock exchange. Interest rate derivatives, as we can see are very new to the Indian financial market and one is obviously intrigued to know as to how they are affecting the market for the underlying. Before analyzing their impact on the underlying, a look at the current trend in the futures market in India does not present a very encouraging picture. The interest rate futures based on 10 year notional bond initially picked up momentum but it gradually lost steam. In September 2009, the total trading volume was Rs 1473 which by December 2009 dropped to Rs 215 crores and further to a meager 57 crores in February 2010. Similarly, the market for interest rate futures based on notional 91 days T bill has shown a very identical trend. At its launch by NSE on July 4 2011, it saw a turnover in excess of Rs 730 crore. By August 4, the volume dropped to Rs 14 crores. There is a wide potential for the 91 days futures in India. Corporate houses dealing in floating rate bonds, mutual funds and banks which park a substantial amount in T bills of this duration are expected to use this instrument for hedging purposes. This market, as can be seen is far away from its potential. The purpose, however, of this paper is not to analyze the causes of the declining turnover in the interest rate futures market but to understand their impact on the underlying market. The developments in the interest rate futures market can be attributed to the novelty of this market in India. In this paper we will try and understand whether there has been any change in the behavior of the markets for the underlying post the introduction of these derivatives. In particular, we would like to explore the effects on the volatility of the underlying assets.
REVIEW OF LITERATURE
World over studies have been done in this regard and data overwhelmingly support the theory that derivatives in general have affected the volatility of the underlying asset prices. While the impact of option contracts on the underlying is more or less clearly established through numerous empirical research, the impact of futures contracts on asset price volatility is more debated and controversial. However, this uncertainty is more visible in financial futures and their relationship to the price of the underlying. When it comes to futures on commodities, there is an overwhelming body of support to assert that they seem to reduce the price volatility of the underlying. Futures on stocks were analyzed by Stoll and Whaley (1987) who found an increase in the market volatility of stocks included in the index basket on the day of contract expiration. Damodaran (1990) using S&P 500 index future also report that stocks included in the index have a significantly higher volatility than those not included. The effect of the introduction of stock index futures on volatility of the Italian stock exchange

103
was examined by Bologna and Cavallo(2002). They concluded that the introduction of the stock index futures had led to a decline in the stock market volatility. They attributed this to the increased impact of recent news and diminishing effect of the uncertainty arising from the old news. Whereas, in yet another study of KOSPI 200 futures on Korean stock market, Ryoo and Graham Smith (2003) argue that introduction of index futures have increased the volatility of the stock markets. Their results show that futures trading increases the speed at which information is impounded into the spot market prices, reduces the persistence of the information and increases the spot market volatility. The role of futures on stock under Indian conditions also does not present a very unambiguous picture. In a study done by Bandivadekar and Ghosh (2003), the results shows that while the future effects play important role in reduction of volatility in S&P CNX Nifty, in case of BSE Sensex, its role seemed ambiguous. Unlike futures on stock, futures on bonds, especially treasury bonds, seem to be associated with some volatility reduction. This is explained by the limited relevance of information asymmetry in this market. Futures market in bond seems to increase the market liquidity. Esposito and Giraldi (1994) studied the Italian Treasury Bond market and found that the introduction of futures trading on the BTP contract reduced the volatility of the underlying market. Studies on the US government and mortgage bond market (Froewiss(1978), Simpson and Ireland(1982) and Edwards (1988)) found that futures trading either has no effect or stabilizes the underlying markets. Another effort to detect the impact of futures contract on Treasury bond was made by Citanna and Rovelli (1991), who analyzed the French market and found a reduction of term premia in the yield curve after the listing of the futures on OAT. Preliminary evidence of the lead lag relationship between futures and spot prices on the bond market is provided by Angeloni, Drudi and Majnoni (1994) who analyze the intraday price behavior for the Italian market in the period 1992-94. They found clear evidence of futures leading the spot market. Some studies have been done to ascertain the impact of futures on volume of trade in the underlying market. As of now, these studies do not reveal a significant effect on volumes. Bansal, Pruitt and Wei (1989) find that trading volumes increase after option listing but only for a short period around the listing date. Damodaran and Lim (1991) find a small effect on market adjusted volumes. Skinner (1989) reports the disappearance of volume effects after the seventies. Damodaran and Subrmanyam (1992) interpret this evidence as a sign that the introduction of derivatives was not able to attract speculators into the underlying markets. While no specific study has been done regards the interest rate derivates market, one would expect something similar in them as well.
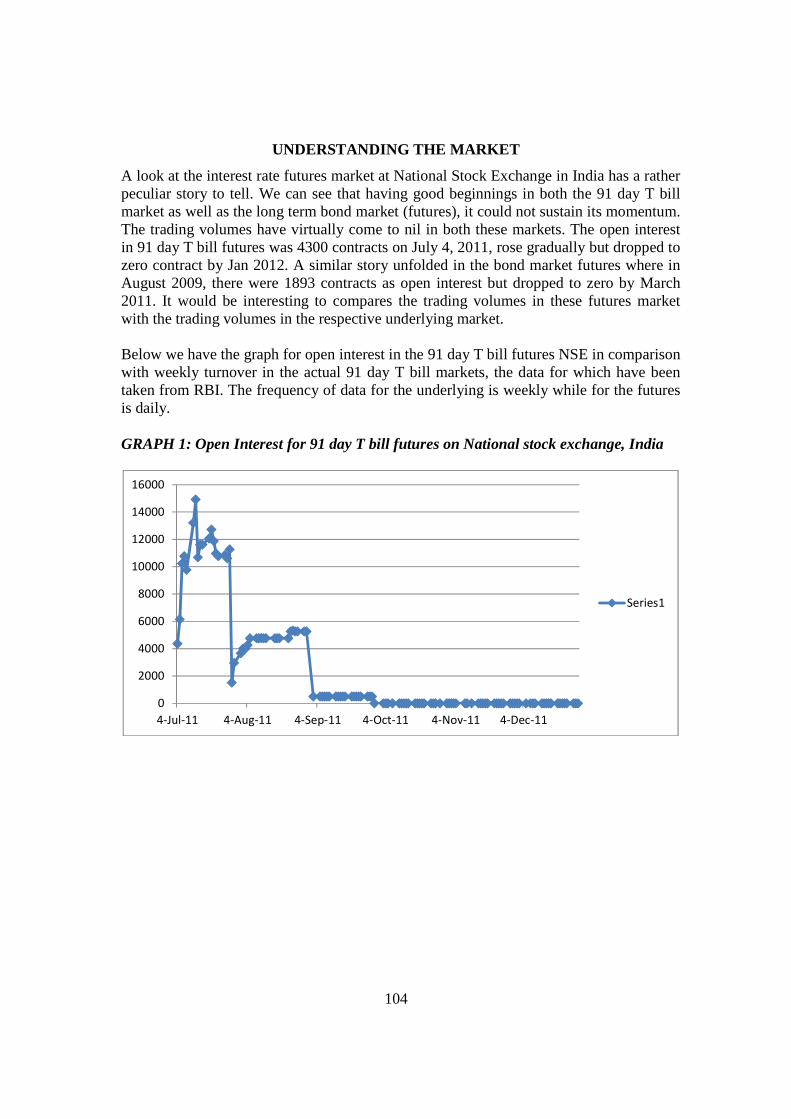
104
UNDERSTANDING THE MARKET
A look at the interest rate futures market at National Stock Exchange in India has a rather peculiar story to tell. We can see that having good beginnings in both the 91 day T bill market as well as the long term bond market (futures), it could not sustain its momentum. The trading volumes have virtually come to nil in both these markets. The open interest in 91 day T bill futures was 4300 contracts on July 4, 2011, rose gradually but dropped to zero contract by Jan 2012. A similar story unfolded in the bond market futures where in August 2009, there were 1893 contracts as open interest but dropped to zero by March 2011. It would be interesting to compares the trading volumes in these futures market with the trading volumes in the respective underlying market. Below we have the graph for open interest in the 91 day T bill futures NSE in comparison with weekly turnover in the actual 91 day T bill markets, the data for which have been taken from RBI. The frequency of data for the underlying is weekly while for the futures is daily. GRAPH 1: Open Interest for 91 day T bill futures on National stock exchange, India
0
2000
4000
6000
8000
10000
12000
14000
16000
4-Jul-11 4-Aug-11 4-Sep-11 4-Oct-11 4-Nov-11 4-Dec-11
Series1

105
GRAPH 2: Daily Turnover of 91 days Treasury bill
The volumes in the futures market for 91 day T bill seems to be driving the underlying market as well. As we can see since the time of the introduction of futures on 4th July 2011, uptil December 2011, volumes in both the markets seem to move together. Let us see if there is any such relationship in the futures for long term bonds. Graph 3: Futures daily open interest on Long term bonds
0
5000
10000
15000
20000
25000
30000
01-Jul-2011 01-Aug-2011 01-Sep-2011 01-Oct-2011 01-Nov-2011 01-Dec-2011
0
1000
2000
3000
4000
5000
6000
7000
8000
31
-Au
g-0
9
30
-Se
p-0
9
31
-Oct
-09
30
-No
v-0
9
31
-De
c-0
9
31
-Ja
n-1
0
28
-Fe
b-1
0
31
-Ma
r-1
0
30
-Ap
r-1
0
31
-Ma
y-1
0
30
-Ju
n-1
0
31
-Ju
l-1
0
31
-Au
g-1
0
30
-Se
p-1
0
31
-Oct
-10
30
-No
v-1
0
31
-De
c-1
0
31
-Ja
n-1
1
28
-Fe
b-1
1
31
-Ma
r-1
1
Series1
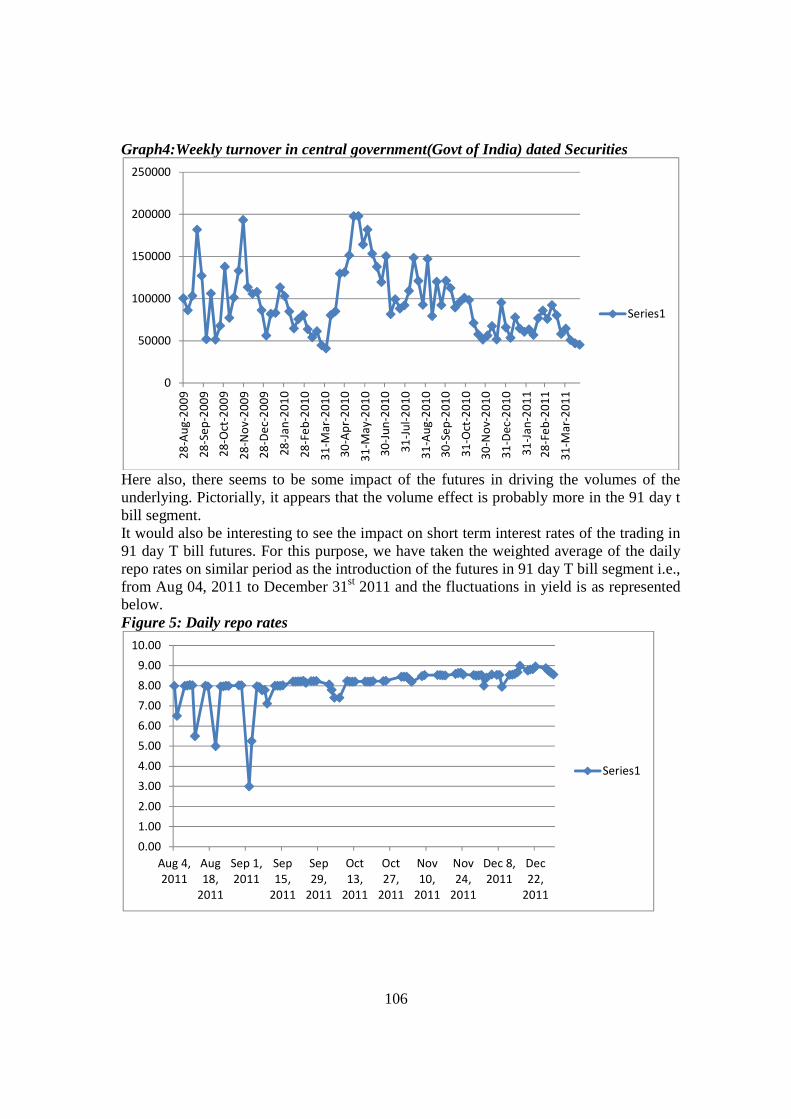
106
Graph4:Weekly turnover in central government(Govt of India) dated Securities
Here also, there seems to be some impact of the futures in driving the volumes of the underlying. Pictorially, it appears that the volume effect is probably more in the 91 day t bill segment. It would also be interesting to see the impact on short term interest rates of the trading in 91 day T bill futures. For this purpose, we have taken the weighted average of the daily repo rates on similar period as the introduction of the futures in 91 day T bill segment i.e., from Aug 04, 2011 to December 31st 2011 and the fluctuations in yield is as represented below. Figure 5: Daily repo rates
0
50000
100000
150000
200000
2500002
8-A
ug
-20
09
28
-Se
p-2
00
9
28
-Oct
-20
09
28
-No
v-2
00
9
28
-De
c-2
00
9
28
-Ja
n-2
01
0
28
-Fe
b-2
01
0
31
-Ma
r-2
01
0
30
-Ap
r-2
01
0
31
-Ma
y-2
01
0
30
-Ju
n-2
01
0
31
-Ju
l-2
01
0
31
-Au
g-2
01
0
30
-Se
p-2
01
0
31
-Oct
-20
10
30
-No
v-2
01
0
31
-De
c-2
01
0
31
-Ja
n-2
01
1
28
-Fe
b-2
01
1
31
-Ma
r-2
01
1
Series1
0.00
1.00
2.00
3.00
4.00
5.00
6.00
7.00
8.00
9.00
10.00
Aug 4,
2011
Aug
18,
2011
Sep 1,
2011
Sep
15,
2011
Sep
29,
2011
Oct
13,
2011
Oct
27,
2011
Nov
10,
2011
Nov
24,
2011
Dec 8,
2011
Dec
22,
2011
Series1
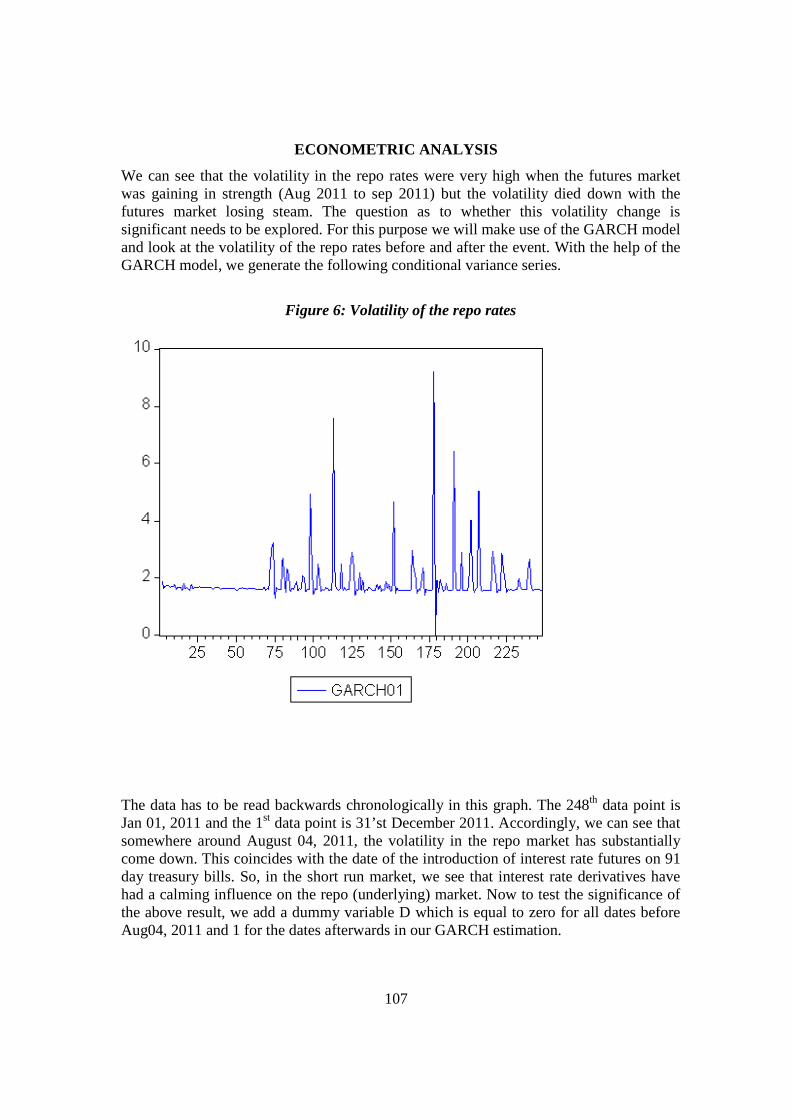
107
ECONOMETRIC ANALYSIS
We can see that the volatility in the repo rates were very high when the futures market was gaining in strength (Aug 2011 to sep 2011) but the volatility died down with the futures market losing steam. The question as to whether this volatility change is significant needs to be explored. For this purpose we will make use of the GARCH model and look at the volatility of the repo rates before and after the event. With the help of the GARCH model, we generate the following conditional variance series.
Figure 6: Volatility of the repo rates
The data has to be read backwards chronologically in this graph. The 248th data point is Jan 01, 2011 and the 1st data point is 31’st December 2011. Accordingly, we can see that somewhere around August 04, 2011, the volatility in the repo market has substantially come down. This coincides with the date of the introduction of interest rate futures on 91 day treasury bills. So, in the short run market, we see that interest rate derivatives have had a calming influence on the repo (underlying) market. Now to test the significance of the above result, we add a dummy variable D which is equal to zero for all dates before Aug04, 2011 and 1 for the dates afterwards in our GARCH estimation.
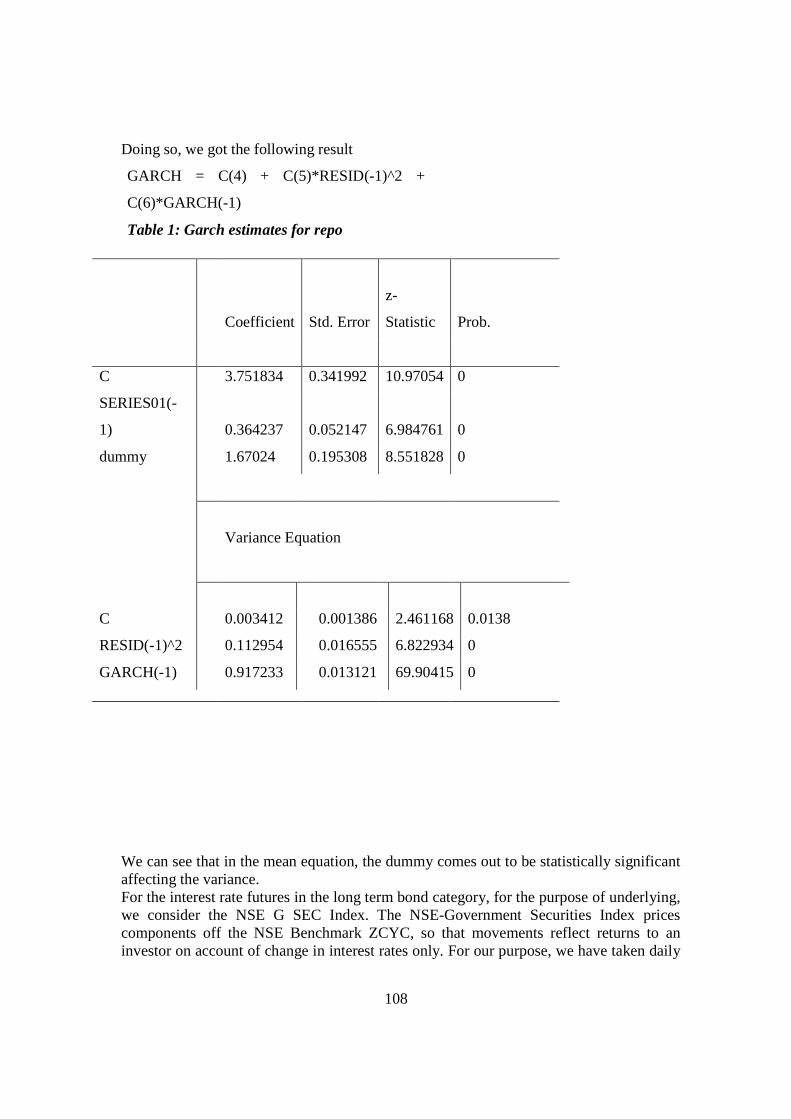
108
Doing so, we got the following result
GARCH = C(4) + C(5)*RESID(-1)^2 +
C(6)*GARCH(-1)
Table 1: Garch estimates for repo
Coefficient Std. Error
z-
Statistic Prob.
C 3.751834 0.341992 10.97054 0
SERIES01(-
1) 0.364237 0.052147 6.984761 0
dummy 1.67024 0.195308 8.551828 0
Variance Equation
C 0.003412 0.001386 2.461168 0.0138
RESID(-1)^2 0.112954 0.016555 6.822934 0
GARCH(-1) 0.917233 0.013121 69.90415 0
We can see that in the mean equation, the dummy comes out to be statistically significant affecting the variance. For the interest rate futures in the long term bond category, for the purpose of underlying, we consider the NSE G SEC Index. The NSE-Government Securities Index prices components off the NSE Benchmark ZCYC, so that movements reflect returns to an investor on account of change in interest rates only. For our purpose, we have taken daily

109
data from November 2008 to June 2010. With the help of GARCH model, we have generated a conditional volatility series for this data. Figure 6: Volatility for NSE G SEC Index
The volatility trend is not definitive. Around the observation 200, futures were introduced. But it does not seem to affect volatility in a significant manner. In order to test this, we run a GARCH with a dummy D taking values of 1 after the IRF introduction and 0 before that. We get the following result. GARCH = C(4) + C(5)*RESID(-1)^2 + C(6)*GARCH(-1)
Table 2: Garch values for before and after event
Coefficient Std. Error z-Statistic Prob.
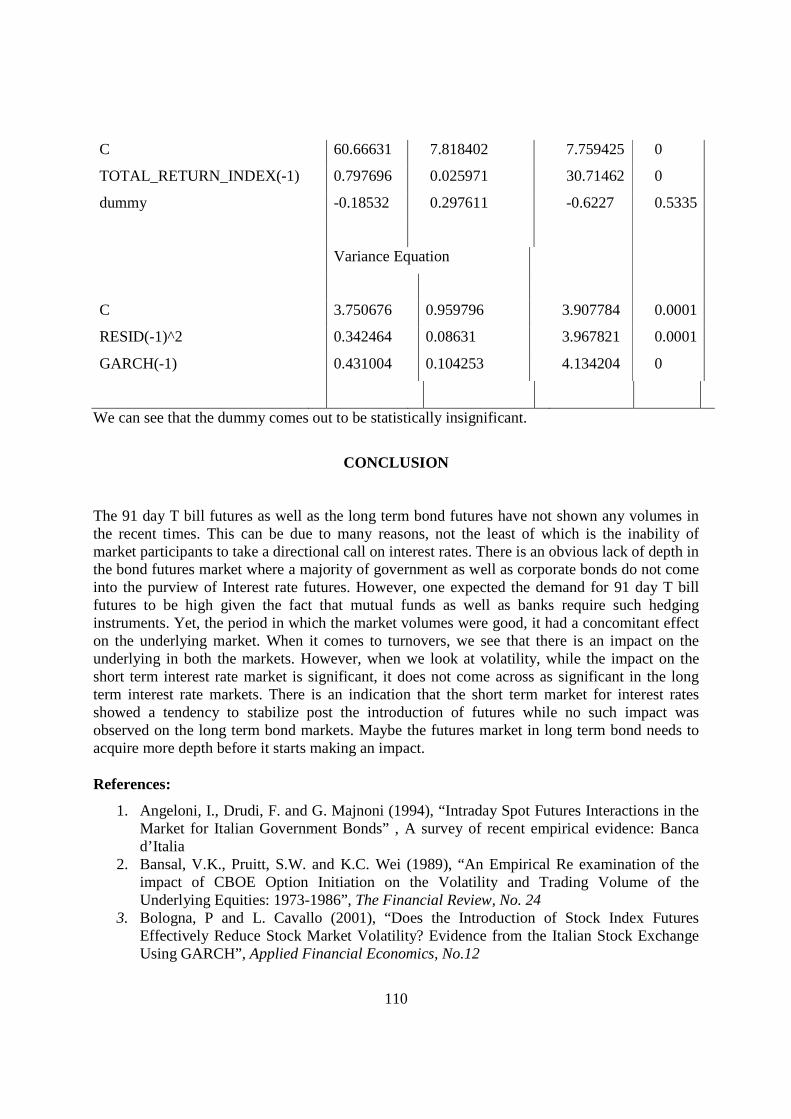
110
C 60.66631 7.818402 7.759425 0
TOTAL_RETURN_INDEX(-1) 0.797696 0.025971 30.71462 0
dummy -0.18532 0.297611 -0.6227 0.5335
Variance Equation
C 3.750676 0.959796 3.907784 0.0001
RESID(-1)^2 0.342464 0.08631 3.967821 0.0001
GARCH(-1) 0.431004 0.104253 4.134204 0
We can see that the dummy comes out to be statistically insignificant.
CONCLUSION
The 91 day T bill futures as well as the long term bond futures have not shown any volumes in the recent times. This can be due to many reasons, not the least of which is the inability of market participants to take a directional call on interest rates. There is an obvious lack of depth in the bond futures market where a majority of government as well as corporate bonds do not come into the purview of Interest rate futures. However, one expected the demand for 91 day T bill futures to be high given the fact that mutual funds as well as banks require such hedging instruments. Yet, the period in which the market volumes were good, it had a concomitant effect on the underlying market. When it comes to turnovers, we see that there is an impact on the underlying in both the markets. However, when we look at volatility, while the impact on the short term interest rate market is significant, it does not come across as significant in the long term interest rate markets. There is an indication that the short term market for interest rates showed a tendency to stabilize post the introduction of futures while no such impact was observed on the long term bond markets. Maybe the futures market in long term bond needs to acquire more depth before it starts making an impact. References:
1. Angeloni, I., Drudi, F. and G. Majnoni (1994), “Intraday Spot Futures Interactions in the Market for Italian Government Bonds” , A survey of recent empirical evidence: Banca d’Italia
2. Bansal, V.K., Pruitt, S.W. and K.C. Wei (1989), “An Empirical Re examination of the impact of CBOE Option Initiation on the Volatility and Trading Volume of the Underlying Equities: 1973-1986”, The Financial Review, No. 24
3. Bologna, P and L. Cavallo (2001), “Does the Introduction of Stock Index Futures Effectively Reduce Stock Market Volatility? Evidence from the Italian Stock Exchange Using GARCH”, Applied Financial Economics, No.12
111
4. Bollerslev, T.(1986), “Generalized Autoregressive Conditional Heteroscedasticity”, Journal of Econometrics, No.31
5. Damodaran, A. and M.G. Subrahmanyan (1993) “The Effects of Derivative Securities on the Markets for the Underlying Assets in the United States”, Financial Markets, Institutions and Instruments, Vol. 1, No.5
6. Damodarn, A.(1990), “Index Futures and Stock Market Volatility”, Review of Futures Markets, No.9
7. Damodaran, A. and J. Lim (1991), “The Effects of Option Listing on the Underlying Stock’s Return Processes”, Journal of Banking and Finance, No.15.
8. Edwards, R.F. (1988), “Futures Trading and Cash Market Volatility: Stock Index and Interest Rate Futures, Journal of Futures Markets, No.8
9. Esposito, M. and C. Giraldi (1994), “Preliminary Evidence on a New Market: Futures on the Italian Treasury Bonds”, Journal of Futures Markets
10. Froewiss, K. (1978), “GNMA Futures: Stabilising or Destabilising?”, Federal Reserve Bank of San Fransisco Economic Review.
11. Hyun Jung Ryoo and Smith,Graham (1999), “The Impact of Stock Index Futures on Korean Stock Markets”, Department of Economics, School of Oriental and African Studies”
12. Kawaller, I.G., Koch, P.D. and T.W. Koch (1990), “Intraday Relationship Between Volatility in the S&P 500 Futures Prices and Volatility in the S&P 500 Index”, Journal of Banking and Finance, No. 14.
13. Simpson, W. and T. Ireland (1982), “The effect of futures trading on the price volatility of GNMA Securities”, Journal of Futures Markets.
14. Snehal Bandivadekar and Saurav Ghosh (2003), “Derivatives and Volatility on Indian Stock Markets”, Reserve Bank of India Occasional Papers, Vol.24, No.3
15. Stoll, H.R. and R.E. Whaley (1990), “Intraday Price Change and Trading Volume Relations in the Stock and Stock Options Markets”, Journal of Finance, No.45

112
AN ALTERNATIVE RESOURCE-BASED VIEW OF NEW PRODUCT DEVELOPMENT: THE CASE OF IC INDUSTRY
Shiu-Wan Hung
Department of Business Administration
National Central University
No. 300, Jung-Da Road, Jung-Li city, Tao-Yuan 320, Taiwan
Tel: 886-3-4269903 Fax: 886-3-2118558
E-mail: [email protected]
Daw Ma*
Chung-Hua Institution for Economic Research
75 Chang-Hsing St. Taipei, Taiwan
Tel: 886-2-27356006 Fax: 886-2-2739-615
E-mail: [email protected]
ABSTRACT
Successful new product development (NPD) is the foundation of corporate survival and growth. NPD is a process of recombining resources. Scholars who discussed NPD based on the resource-based view (RBV) mostly focused on improving the process efficiency and product effectiveness, neglecting the value created during resources recombination and the concept of complementary assets extended from the RBV. Through integrating product characteristics from the RBV, this study intends to conduct a multi-criteria evaluation of the new product development. This study uses the IC industry in Taiwan as a case study. Fuzzy analytic hierarchy process (FAHP) is applied to simultaneously consider the perspectives of the industry, educational institutions, and research communities. The results showed that the two new products of the IC industry in Taiwan that are suitable for development are “cloud computing tablets/handheld devices” and “flexible transparent display.” The industry and research communities tend to prioritize the more technologically mature “cloud computing tablets/handheld devices,” whereas academic experts prefer the “flexible transparent display,” which is not yet sufficiently developed for mass production.
Keywords: New product development, resource-based view, Fuzzy AHP, complementary asset
113
I. INTRODUCTION
For most industries, successful NPD is the key to corporate survival and growth (Calantone, Schmidt, & Song, 1996). It is also a potential source of competitive advantage (Song & Montoya-Weiss, 2001). However, empirical studies have reported that the success rate for NPD projects is only 14 to 20% (Rothaermel, 2001). NPD is a process of resources recombination. According to the resource-based view (RBV), corporations possess various tangible and intangible resources, which can become unique capabilities. However, capabilities do not flow between companies and are difficult to replicate. These unique resources and capabilities are the foundation of continued competitive advantage (Barney, 1991). However, researchers who explored NPD from a RBV perspective typically focused on improving resource recombination efficiency and product effectiveness (Iansiti & Clark, 1994; Verona, 1999), instead of creating value during resource recombination (Ardichvili, Cardozo, & Ray, 2003) and conceptually extending complementary assets from a RBV perspective (Teece, 1986). The high-tech industry in Taiwan has long excelled in developing manufacturing process technology, demonstrating its excellent performance through industrial clusters and work specialization. However, IC manufacturing and assembly are the sections that provide the lowest value in the IC industry, which is technologically mature and has minimal barriers to entry. Companies easily decline into having only “razor-thin profit margins.” Application developments in Taiwan’s semiconductor industry primarily focus on the computing, communications, and consumer electronics (3C) industries. High product homogeneity results in fierce competition over price, which is easily influenced by international economic fluctuation, making the future development of Taiwan’s IC industry extremely uncertain. Besides developing toward the direction of R&D and intellectual property, an alternative method for addressing the low added value, high uncertainty, and fiercely competitive business environment is to develop new product applications. This enables firms to address current problems, increase corporate profit, and gain a sustainable competitive advantage. When using RBV to consider the decision issue of NPD projects, the evaluation of NPD projects becomes a multi-criteria decision-making problem. Thus, when evaluating NPD projects, this study considers the dimensions residing both inside and outside the organizational boundaries, including the organizational heterogeneous resources/capabilities, the potential risks from the dynamic environment, and whether the attributes of new product meet the market demand. Fuzzy analytic hierarchy process (FAHP) is employed in this study as a multiple attribute decision-making (MADM) technique to ensure that all the evaluations are objective and comprehensive. A survey from industry, educational institutions, and research communities are simultaneously analyzed to obtain an overall view of the industrial level NPD in Taiwan’s IC industry. The procedures and results of this study could be used as a reference for NPD decision-making. The constructs and index used to evaluate NPD in Taiwan’s IC industry were obtained from a review of literature and expert interviews. The six NPD options which were used to construct a NPD evaluation model for the IC industry in Taiwan were provided through the experts’ initial identification based on IC product development trends. FAHP models were used to analyze the expert questionnaires for confirmation. The second section of this study describes the evaluation constructs. The third section of this study introduces the IC industry and discusses future applications of new products. The fourth section presents the FAHP analysis model. The

114
empirical results are provided in section five. In the sixth section, the conclusion and recommendations are provided.
II. RESEARCH DESIGN
1. Data source
This study applied fuzzy AHP to explore the development of new products in the IC industry in Taiwan. We conducted interviews among experts of various fields within the IC industry in Taiwan and reviewed related literature to classify the products by their applications. We also used quantified fuzzy AHP methods to verify projects developing product applications.
We then developed the questionnaire content according to the operational definitions of each construct. Because the objective is to evaluate the future product development projects of the IC industry in Taiwan, the questionnaire respondents included experts from the industry, educational institutions, and research communities who are experienced in IC technology or production processes. They were contacted by phone, e-mail, or visited in person and invited to participate in this study. We distributed 106 questionnaires and received 68 valid responses. To ensure equal sampling, 20 valid questionnaires were chosen from each category, that is, industry, education, and research communities, for a total of 60 questionnaires.
2. Evaluation process
This study developed a structural hierarchical survey questionnaire on “IC industry level NPD evaluation” from expert interviews and relevant literature. Because traditional AHP cannot avoid the disadvantages of subjectivity, imprecision, and vagueness, this study adopted the fuzzy AHP developed by Buckley (1985) and developed traditional AHP with fuzzy set theory. A triangular fuzzy number was introduced into a pairwise comparison matrix to process fuzzy questions when making decisions. This study extended the choice of actual technology project types, which are rarely discussed in literature, to construct a complete model for IC industry level NPD evaluation.
3. Questionnaire design
After reviewing literature regarding the related constructs of NPD projects development, we determined that the three constructs “Organizational heterogeneous resource/capabilities,” “product attributes,” and “environmental uncertainty” should be emphasized when evaluating and developing industry-level NPD projects. The evaluation criteria for Organizational heterogeneous resource/capabilities include capability to commercialize technology, capability to innovate, capability to integrate technology, complementary manufacturing capabilities, and capability to control the establishment of industrial standards. Evaluation items for product attributes include product compatibility, novelty, and functionality. Evaluation items for environmental uncertainty include stability of supplier, global market competition, and environmental policies. Thus, the three constructs comprise 11 evaluation criteria.
This study also uses a literature review to compile the four demands for future emerging markets proposed by the Department of Industrial Technology of the Ministry of Economic Affairs and ITRI. Finally, we considered the top six end-user IC applications/ products, namely
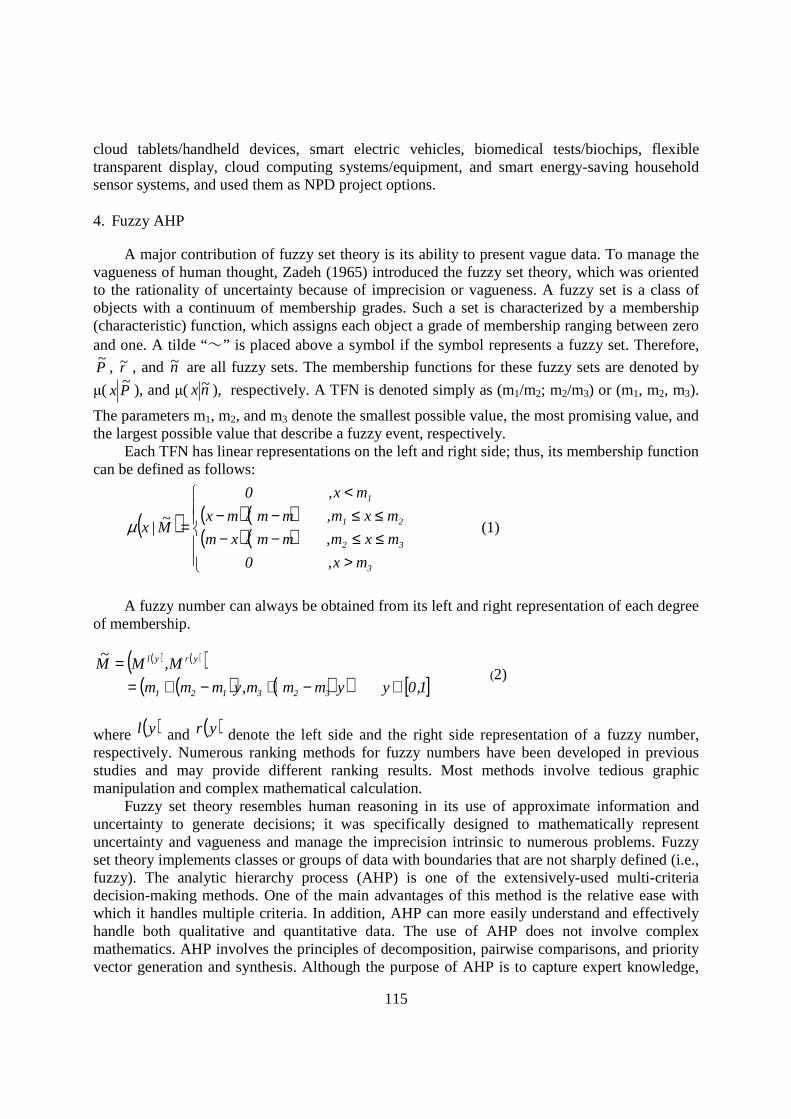
115
cloud tablets/handheld devices, smart electric vehicles, biomedical tests/biochips, flexible transparent display, cloud computing systems/equipment, and smart energy-saving household sensor systems, and used them as NPD project options.
4. Fuzzy AHP
A major contribution of fuzzy set theory is its ability to present vague data. To manage the vagueness of human thought, Zadeh (1965) introduced the fuzzy set theory, which was oriented to the rationality of uncertainty because of imprecision or vagueness. A fuzzy set is a class of objects with a continuum of membership grades. Such a set is characterized by a membership (characteristic) function, which assigns each object a grade of membership ranging between zero and one. A tilde “~” is placed above a symbol if the symbol represents a fuzzy set. Therefore,
P~
, r~ , and n~ are all fuzzy sets. The membership functions for these fuzzy sets are denoted by
µ( P~
x ), and µ( n~x ), respectively. A TFN is denoted simply as (m1/m2; m2/m3) or (m1, m2, m3).
The parameters m1, m2, and m3 denote the smallest possible value, the most promising value, and the largest possible value that describe a fuzzy event, respectively.
Each TFN has linear representations on the left and right side; thus, its membership function can be defined as follows:
( ) ( ) ( )( ) ( )
−−−−
=
0
mm/xm
mm/mx
0
M~
|xµ
3
32
21
1
mx,
mxm,
mxm,
mx,
>≤≤≤≤
<
(1)
A fuzzy number can always be obtained from its left and right representation of each degree of membership.
( ) ( )( )( ) ( )( ) [ ]1,0yymmm,ymmm
M,MM~
323121
yryl
∈−+−+==
(2)
where ( )yl and ( )yr denote the left side and the right side representation of a fuzzy number, respectively. Numerous ranking methods for fuzzy numbers have been developed in previous studies and may provide different ranking results. Most methods involve tedious graphic manipulation and complex mathematical calculation.
Fuzzy set theory resembles human reasoning in its use of approximate information and uncertainty to generate decisions; it was specifically designed to mathematically represent uncertainty and vagueness and manage the imprecision intrinsic to numerous problems. Fuzzy set theory implements classes or groups of data with boundaries that are not sharply defined (i.e., fuzzy). The analytic hierarchy process (AHP) is one of the extensively-used multi-criteria decision-making methods. One of the main advantages of this method is the relative ease with which it handles multiple criteria. In addition, AHP can more easily understand and effectively handle both qualitative and quantitative data. The use of AHP does not involve complex mathematics. AHP involves the principles of decomposition, pairwise comparisons, and priority vector generation and synthesis. Although the purpose of AHP is to capture expert knowledge,
116
conventional AHP still cannot reflect the human thinking style (Kahraman et al., 2003). Therefore, fuzzy AHP, a fuzzy extension of AHP, was developed to solve hierarchical fuzzy problems.
III. RESULTS
1. Weighting and ranking of NPD evaluation criteria
This study initiates a bidirectional link between the NPD evaluation criterion and industry level products that have potential. The analysis result for the main constructs (Table 1) by the experts show that whether the product attribute is accepted at the consumer end is the most important factor during analysis, followed by organizational heterogeneous resource/capabilities. Experts mainly believed that the NPD is a series of decision-making processes. Long-term competition can only be sustained by focusing on the industry advantages and matching available heterogeneous resource/capabilities with needs from the consumer end.
When evaluating criteria, we can determine the main factors influencing the experts by their ranking of constructs and cross-construct relative importance. The product attribute construct is expressed in Table 2. Product novelty is the most important evaluation criterion for most experts, followed by product functionality. This means that experts consider novelty to be the primary factor influencing the purchasing decision of consumers. If the developed products can pique the interest of consumers and generate a sense of novelty, the product attractiveness and competitive advantage may increase significantly. This means that manufacturers must create products that match the requirements and have new application features. An example would be early computers that are mainly used for word processing. Nowadays, because mobile networking is required, a product can only attract consumers by being lightweight and thin, easy to carry, and enabling instant data retrieval. Compared to the above two, product compatibility does not make any notable difference to the selection of products. Because product market competition is globalized, the cultural and habitual factors and user experiences in different country always differ. Compatible design that considers all idiosyncrasies increase production costs and limit the market potential, increasing the development risk. Because most firms in Taiwan are small to medium sized, they are not well equipped to handle excessive costs and risks; this explains the low importance of product compatibility.
Regarding the technology/resource capability construct, the results are shown in Table 2. Capability for innovation is considered the most important. The least important construct is the complementary manufacturing capabilities. Experts commented that in an environment where changes are excessive, industrial competition is fierce, consumer demands are continuously shifting, and product life cycles are shorter, the key to NPD in Taiwan’s IC industry is whether it can address the product markets’ needs and provide innovative solution across the supply chain and whether it can continue providing new products. Additionally, to meet customers' actual needs, suppliers must assess product innovations while considering the real benefits. Converting ideas into products or services with market value, integrating organizational resources, and converting technical research results into company wealth all require “capability to integrate technologies” and “capability to commercialize technology.” Some industry experts have stated that when developing new-user products (i.e. NPD projects), Taiwan must aggressively design products’ technical standards. When standards are established by suppliers in other countries,
117
Taiwanese businesses’ ability to understand the market and establish new product life cycles will be limited. Experts also stated that because Taiwan’s semiconductor industry achieved global dominance through its unique vertical division of labor, this is a competitive advantage of Taiwan. The upstream and downstream industrial chain is now complete and professionally specialized, strengthening and reinforcing each segment and creating a strong industrial cluster effect with well-rounded supporting industries nearby. In the long term, this is the easiest advantage to maintain, which explains the lowest weight assigned to the complementary production capability.
Regarding the environmental uncertainty construct shown in Table 2, the evaluation criterion “competition from the global market” was emphasized more by the experts during the evaluations. According to the results of the survey and the interview, the consumption power of countries such as China and India are increasing. Because of market globalization and the spread of capitalism, these regions are considered emerging markets with substantial potential and require swift and forceful entry by transnational corporations (TNCs). When discussing the competitive marketing strategy of global end-user products, the TNCs or global market perspective is typically adopted. These discussions frequently focus on how TNCs and other corporations from the Western world enter foreign markets and expand their operation range. Overall, experts do not know how local corporations (LCs) should compete domestically and in foreign markets with TNCs. Thus, the competition from the global market is a substantial influence on environmental uncertainties.
Cross-construct relative importance ranking is shown in Table 2. The three evaluation criteria for “product attributes” are in the top three when ranked according to importance. This shows that during product development, whether the product attributes satisfy demands for novelty and functions remains the most significant aspect. “Capability to innovate” and “global market competition” are the two most important evaluation criteria besides the product attribute construct. This shows that in addition to considering the acceptance of products by consumers, the organizational innovative capability and the competitivity of the product globally are also factors considered important by experts in this industry.
<< Table 1 goes about here >>
<< Table 2 goes about here >>
2. NPD evaluation results for the IC industry
Results of this study are shown in Table 3. Experts believe that based on Taiwan’s existing IC industry, the more suitable NPD projects are cloud computing tablets/handheld devices (5.104) and flexible transparent displays (4.773), followed by cloud computing systems/equipment (4.770), smart energy-saving household sensor systems (4.556), and biomedical tests/biochips “(4.367). According to the interview results, the experts stated that the reason cloud computing tablets/handheld devices and flexible transparent displays were ranked the highest was that the product attributes have substantial potential for development, wide range of applications, future market demand, and clear and strong demand growth. According to studies by the market research institute HIS iSuppli, shipments of tablet PCs and tablet devices is set to reach 242.3 million, which, compared to the 19.7 million items shipped in 2010, is a 12-

118
fold growth. The analysis institute Gartner also predicted that the total tablet computer market size is set to reach 77.4 billion USD in 2015, when 294 million devices will be sold. With the existing internal industrial advantage of Taiwan’s IC industry and the external demand opportunity, a significant change making cloud computing tablets/handheld devices an excellent product belonging to Taiwan only is anticipated. Academia believes that industries such optics, which are involved in flexible transparent displays, have received two trillion NTD in government investments. The industry, academia, and research communities have experienced multiple rounds of cooperative development. Thus, with continued support from the government, product development breakthroughs are achievable, which indirectly increases the demand for display components in the upstream semiconductor industry.
“Cloud computing systems/equipment” were ranked third in the evaluation, with only a minimal difference from the second place flexible transparent displays. By analyzing the evaluation process, experts believe that there are two reasons for it to become an industry-level NPD projects. First, with the constantly upgrading network environment, the convenience and speed of cloud computing is much improved. Cloud computing also reduces the front end lead time for companies or organizations to build data centers and reduce systematic risk. This also conforms to the energy-saving/carbon reduction trend and is the mainstream application in the next wave of information technology. With the global positioning of domestic information technology, relevant businesses must not avoid cloud computing development to maintain survival. The government should promote the “cloud industry supply chain,” and gain a foothold for Taiwan in this field. Additionally, creating an industry-level end-user product. A matching “cloud” is required to fully utilize its functions and value. In developing cloud computing tablets/handheld devices and flexible transparent displays, we must also consider establishing and developing cloud computing systems/equipment to enhance product functionality and value by providing a comprehensive service with both hardware and software to the consumer.
IV. CONCLUSION AND SUGGESTIONS
This section summarizes the empirical and analysis results, states the research conclusions, explains the limitations of this study, and provides suggestions for future studies.
1. Conclusions
(1) Establishing industry-level NPD projects evaluation architecture This study referenced related theories and literature from domestic and international sources,
summarized opinions and interview results from many experts from the industry, academia, and research communities with practical experiences. The results are three major constructs, 11 evaluation criteria, and six potential options for the IC industry. These were used to construct industry-level NPD projects evaluation architecture for the IC industry. This product evaluation architecture combined academic theory with the practical perspective of the industry.
The results can also be used as a reference by the IC industry in Taiwan. Regarding the main constructs, experts believe that to evaluate the suitable industry-level NPD projects, whether the product attribute is acceptable to the consumer must first be considered. Next, we must consider whether organizational heterogeneous resource/capabilities are sufficient for obtaining and maintaining an advantage. The final consideration is environmental uncertainty.
119
Regarding the evaluation criteria under the main constructs, “product novelty” is the most important criteria to experts. Among organizational heterogeneous resource/capabilities, the capability to innovate is the most important, followed by capability to establish and control industrial standards. Regarding environmental uncertainty, global market competition is the most important to experts. For the industry-level NPD projects, the results show that two more suitable NPD projects in the IC industry of Taiwan are “cloud computing tablets/handheld devices” and “flexible transparent display.”
(2) Management implications of the NPD evaluation model
According to the results of this study, the NPD options most suitable for the Taiwan’s IC industry to develop are “cloud computing tablets/ handheld devices” and “flexible transparent display.” From the weighting ranks in the main evaluation constructs (Table 1), the product attributes of the new products were the reason these two new products were selected. This indicates the influences from “market pull” are strongly dominant. This also indirectly suggests that if new products cannot attract consumer demand and desire to purchase, regardless of how advanced the technology is, or the technology push, the product will be discarded by the market.
Thus, companies must learn to control the contextual changes from the consumer side. Developing a product attribute demanded by the consumer side contributes to a NPD project success. According to the analysis and evaluation of the experts in this study, most of them agree that “cloud computing tablets/handheld devices” will become the next mainstream 3C application product. Thus, companies in Taiwan should strive to establish appropriate links between internal IC manufacturing advantage and external market demand opportunities to facilitate growth of this industry in the next one to five years. They should also aggressively build the cloud computing tablets/handheld devices into a dedicated NPD option. Regarding flexible transparent display, because it possesses superb product attributes, such as being thin and light, bendable, and not restricted by space and occasions, this key component has deep developmental potentials in the display industry, mobile communications devices, and illumination devices. This flat display has the most developmental potential in the next generation. The applications all show substantial market potential.
With continued support from the government, product development breakthroughs are achievable and can increase demand for display components in the upstream semiconductor industry. Currently, the flexible transparent display is still in initial stages of development. Although applied devices are entering the market, they are still some distance away from mass production. In the medium and long term, developing the flexible transparent display product as an industry-level NPD project for the IC industry in Taiwan has substantial market opportunity and expectations.
NPD is a highly uncertain endeavor with high risks. For the company, even with the potential opportunities to develop and earn profit, the potential failures can cause the company massive losses, even result in failure. This is why most companies are very cautious toward new product developments. To reduce the potential risks involved in NPD, this study adopted RBV and considered the five evaluation criteria of the “organizational heterogeneous resource/capabilities” construct. For example, “capability to establish and control industrial standards” uses the existing IC production chain as a foundation to limit the risks of new product development. This makes the company realize its advantages and use more efficient product development methods to create its own end-user technology product.
120
2. Suggestions
Considering business strategies, the results indicate that the most important criteria and constructs are “product novelty” under the “product attributes” construct and “capability of innovation” under the “organizational heterogeneous resource/capabilities.” Thus, by linking these two criteria we determined that to create NPD options that are available only in Taiwan, organizations must pay attention to the development of innovative energy to avoid only mimicking others. Only this can create added value from the demand side to open markets and avoid intensive competition among the IC end-user products.
Regarding a short-term strategy for NPD projects, “cloud computing tablets/handheld devices” have entered a fierce race because all notable manufacturers already have products reaching the market. To succeed, Taiwanese companies must obtain breakthrough innovations in product attributes. Regarding the long-term strategy, because the “flexible transparent display” is not yet technically mature, companies in Taiwan should strengthen the technical inadequacies in flexible transparent displays with research and related patents, such as base plate material, upstream ingredient control, and drive backboard applications. By rapidly amending this gap, Taiwan can enhance its future competiveness regarding this technological product and avoid being surpassed by Japanese and Korean manufacturers in the technology race and locked out by patents.
The data used in this study was obtained from expert interviews and literature in journals. Despite ensuring to consider both the theories and practices, the following limitations to this study remain: (1) when establishing evaluation constructs, if more complete information is gathered without errors, adopting the FAHP theory restricts the comparison factors in the same layer to seven. Thus, the factors cannot be presented comprehensively. Considering the evaluation of the IC industry NPD options, from the RBV, the criteria provided in this study should be acceptable. (2) Because of the numerous IC industry downstream end-user product applications, researchers, manufacturers, and educational experts usually focus on a single field during their research. This is reflected in the unavoidable errors when evaluating products from fields outside their specialty area. (3) Different characteristics of each industry can lead to different weightings for considerations. The product evaluation model used in this study may be limited when applied to other industries.

121
REGERENCE 1. Ardichvili, A., Cardozo, R., & Ray, S. (2003). “A theory of entrepreneurial opportunity
identification and development” Journal of Business Venturing, 18 (1): 105-23.
2. Barney, J. (1991). “Firm resources and sustained competitive advantage.” Journal of Management, 17 (1): 99.
3. Buckley, J. J. (1985). “Fuzzy hierarchical analysis.” Fuzzy Sets and Systems, 17: 233-47.
4. Calantone, R. J., Schmidt, J. B. & Song, X. M. (1996). “Controllable factors of new product success: a cross-national comparison.” Marketing Science, 15 (4): 341-58.
5. Kahraman, C., Cebeci, U. & Ulukan, Z. (2003). “Multi-criteria supplier selection using fuzzy AHP” Logistics Information Management, 16: 382-94.
6. Iansiti, M., & Clark, K. 1994. “Integration and dynamic capability: evidence from product development in automobiles and mainframe computers.” Industrial and Corporate Change, 3 (3): 557-605.
7. Rothaermel, F. T. (2001). “Incumbent's advantage through exploiting complementary assets via interfirm cooperation.” Strategic Management Journal, 22 (6-7): 687-99.
8. Song, M., & Montoya-Weiss, M. M. (2001). “The effect of perceived technological uncertainty on Japanese new product development.” Academy of Management Journal: 61-80.
9. Teece, D. J. (1986). “Profiting from technological innovation: implications for integration, collaboration, licensing and public policy.” Research Policy, 15 (6): 283-305.
10. Verona, G. A. (1999). “Resource-based view of product development.” Academy of Management Review, 24 (1): 132-42. Successful
11. Zadeh, LA. (1965). “Fuzzy sets.” Information and Control, 8: 338-53.
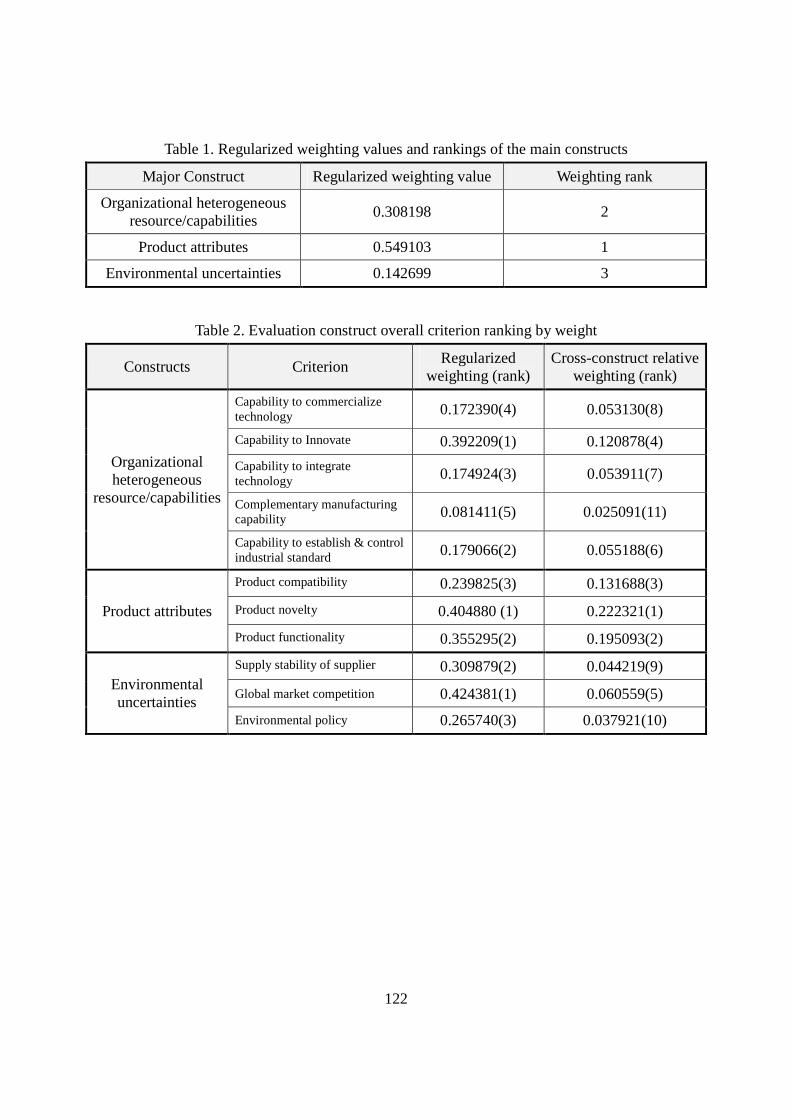
122
Table 1. Regularized weighting values and rankings of the main constructs
Major Construct Regularized weighting value Weighting rank
Organizational heterogeneous resource/capabilities
0.308198 2
Product attributes 0.549103 1
Environmental uncertainties 0.142699 3
Table 2. Evaluation construct overall criterion ranking by weight
Constructs Criterion Regularized
weighting (rank) Cross-construct relative
weighting (rank)
Organizational heterogeneous
resource/capabilities
Capability to commercialize technology 0.172390(4) 0.053130(8)
Capability to Innovate 0.392209(1) 0.120878(4)
Capability to integrate technology 0.174924(3) 0.053911(7)
Complementary manufacturing capability 0.081411(5) 0.025091(11)
Capability to establish & control industrial standard 0.179066(2) 0.055188(6)
Product attributes
Product compatibility 0.239825(3) 0.131688(3)
Product novelty 0.404880 (1) 0.222321(1)
Product functionality 0.355295(2) 0.195093(2)
Environmental uncertainties
Supply stability of supplier 0.309879(2) 0.044219(9)
Global market competition 0.424381(1) 0.060559(5)
Environmental policy 0.265740(3) 0.037921(10)
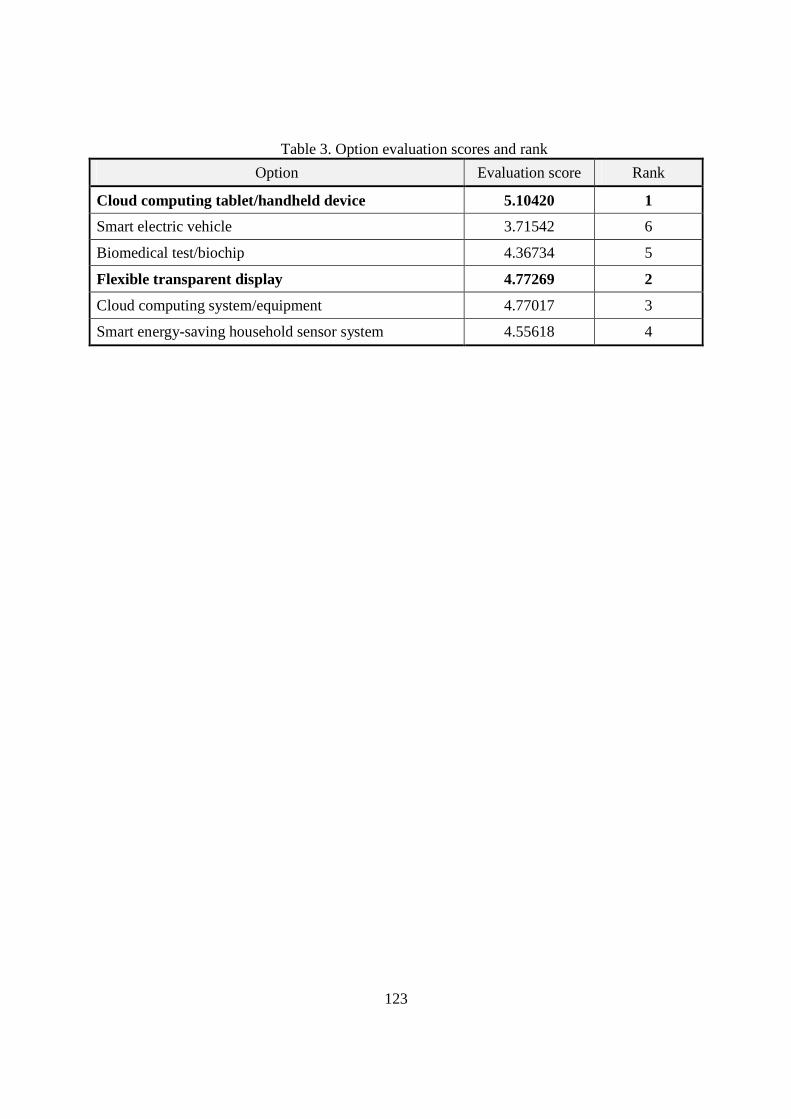
123
Table 3. Option evaluation scores and rank
Option Evaluation score Rank
Cloud computing tablet/handheld device 5.10420 1
Smart electric vehicle 3.71542 6
Biomedical test/biochip 4.36734 5
Flexible transparent display 4.77269 2
Cloud computing system/equipment 4.77017 3
Smart energy-saving household sensor system 4.55618 4
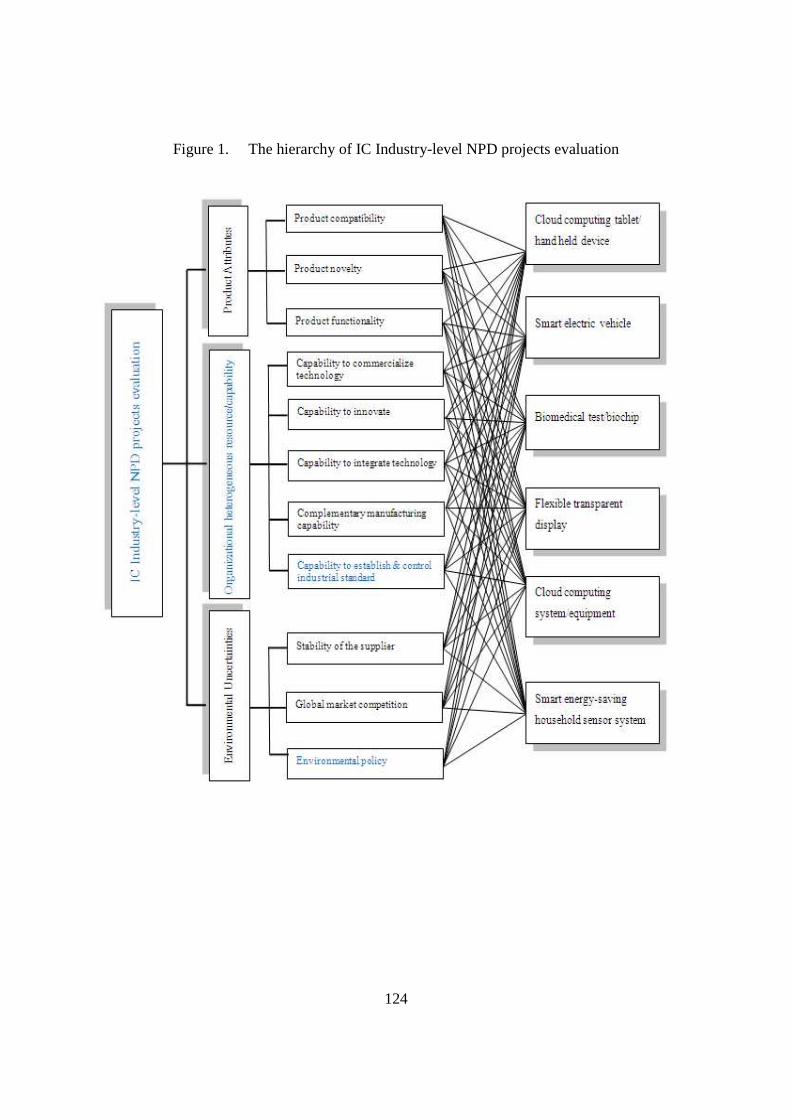
124
Figure 1. The hierarchy of IC Industry-level NPD projects evaluation

125
GLOBAL PUBLIC PRIVATE PARTNERSHIP: ANALOGICAL REASONING MODEL BETWEEN THE FOOD AND BEVERAGE
INDUSTRY AND THE PHARMACEUTICAL INDUSTRY
Hyuk Kim Lourdes University [email protected]
ABSTRACT
The pharmaceutical industry has been criticized in perspective of the global public health because the industry’s business model, particularly the stringent patent protection on the pharmaceutical products, is considered to be a huge impediment to improving the access to essential, life-saving medicines. It is imperative for the pharmaceutical industry to develop strategies that can balance the access to essential, lifesaving medicines with its R&D-intensive, expensive business. The main objective of this paper is to develop organizational strategies, in the stakeholder management terms, for the multinational pharmaceutical companies, adopting an analogical reasoning model (ARM). An ARM is adopted to propose a way which can improve the access to essential, life-saving medicines by those who need them most, as well as which can develop strategies for the pharmaceutical companies in the stakeholder management terms. In essence, the ARM helps develop practical strategies that can realize a win-win situation for both the multinational pharmaceutical companies and their stakeholders. The ARM for the pharmaceutical industry is developed, analyzing the food and beverage industry as a source environment. The ARM suggests the comprehensive, industry-wide, multi-stakeholder public-private partnership, particularly led by the pharmaceutical industry. Keywords: Pharmaceutical Industry; Food and Beverage Industry; Analogical Reasoning Model; Organizational Strategy; Stakeholder Management.
ANALOGICAL REASONING MODEL IN TERMS OF THE ORGANIZA TIONAL
STRATEGY DEVELOPMENT FOR THE MULTINALTIONAL PHARMAC EUTICAL COMPANIES
To improve the access to essential, life-saving medicines, particularly in conjunction with the HIV/AIDS pandemic in the developing world, several strategic options have been proposed by scholars and practitioners. For instance, the strategic options that have been proposed include the drug pricing strategy using the stakeholder management model as a guide (Kennedy et al., 2004), the differential pricing strategy (Danzon, 1997; Danzon & Towse, 2003), the socially responsible drug pricing strategy (Vachani & Smith, 2004), the compulsory licensing strategy (Ashcroft, 2001), the free market-driven pricing strategy (Calfee et al., 2004), and the strategic option of voluntary licensing. Nevertheless, it is argued that, as Mascarenhas et al. (2005) comment, each of these strategic solutions for the pharmaceutical companies in the light of the desire to bring about an increase in the global distribution of essential, life-saving medicines at affordable prices is ideological, very general and fraught with a bevy of other problems.
126
In this respect, the main objective of this paper is to develop organizational strategies, in the stakeholder management terms, for the multinational pharmaceutical companies, adopting an analogical reasoning model (ARM). An ARM can be seen as an alternative analogical model independent of the approaches mentioned above through which strategies are developed for the multinational pharmaceutical companies. Specifically, an ARM is adopted for this paper to propose a way which can improve the access to essential, life-saving medicines by those who need them most, as well as which can develop strategies for the pharmaceutical companies in the stakeholder management terms. It is argued that an ARM of this paper helps to develop any practical strategies that can realize a win-win situation for both the multinational pharmaceutical companies and its stakeholders. However, an ARM has also some weaknesses, as discussed below, as an analytical method. To compensate for the possible weaknesses of an ARM, it is better to combine other alternative approaches with an ARM. In other words, if an ARM is combined with or complemented by another analytical method, such as a qualitative comparative analysis, it can be a very useful analytical tool to generate strategic options. Gavetti et al. (2005) suggest the way in which cases or analogies can be used in framing and implementing business strategies, that is, an ARM. An ARM “makes efficient use of information, but does not pretend to detail every market issue of the problem at hand” (Mascarenhas et al., 2005, p. 405). That is, an ARM “pays attention to select features of the information, sees patterns in it, and applies the patterns to the present market challenges” (Mascarenhas et al, 2005, p. 405). In essence, an ARM solves “a ‘target problem’ by seeking and evaluating ‘candidate solutions’ from a ‘source industry’ that bears close resemblance to the target industry” (Mascarenhas et al., 2005, p. 404). In this respect, an ARM developed by Gavetti et al. (2005) is particularly useful for the strategy development for the multinational pharmaceutical companies, because it can facilitate the pharmaceutical companies to develop any realizable, effective strategies of their own, in the stakeholder management terms, based on the strategies of other industry sectors that have been under similar circumstances. In essence, in an ARM, a previous solution may be transferred to solve a present problem. Mascarenhas et al. (2005) assert that the value of applying the precedent to the present is fully recognized in an ARM. It is noted that an ARM tries to find “a bilateral case-by-case solution” (Mascarenhas et al., 2005, p. 404) to the target problems. In specific, an ARM is a bilateral, market-by-market, brand-by-brand, or even corporate-by-customer approach (Mascarenhas et al., 2005). In this respect, an ARM is a more appropriate approach for the multinational pharmaceutical companies to develop strategies in the stakeholder management terms than those that have been adopted, for the pharmaceutical companies, in the extent studies. In other words, the approaches that have been taken by the extent studies to address the issue of the access to essential, life-saving medicines are multilateral, general, and ideological models and, thus, they have been failed to solve the issue of the global public health. It is argued that the approaches that have been taken to address the issue of the global public health do not produce any effective solution. Therefore, it is needed to explore and adopt an alternative model, such as an ARM, to generate any viable remedies for both the multinational pharmaceutical companies and the people who need the essential, life-saving medicines. An ARM, a simple adaptation of a familiar experience to a new setting, can be a powerful source for firms in terms of discovering effective and competitive positions, developing their business strategies. Gavetti et al. (2005) argue that an ARM, a prevalent strategy-making process
127
relatively untapped in research, can be a potentially important source of novel strategies for firms. The authors further contend that, in complex and novel contexts, an ARM may be superior to other strategy-making models. It is noted that the advocates of an ARM also discuss the danger in applying an ARM. Namely, Gavetti et al. (2005) point out that, although an ARM is a powerful and prevalent tool, it is extremely easy to reason poorly through analogies and, thus, strategy makers rarely consider how to use them wisely. Especially, problems arise when the strategists draw an analogy on the basis of ‘superficial similarity’, not deep causal traits. In this respect, Gavetti et al. (2005) illustrate a dilemma posed by reasoning by analogy. That is, on the one hand, reasoning by analogy is a powerful tool, well suited to the challenges of making strategy in novel, complex settings sparkling breakthrough ideas, and, then, fuelling successful implementation of strategies. On the other hand, it raises the specter of superficiality. Gavetti et al. (2005) emphasize that it is impossible to make analogies 100% safe. In general, since the strategists use an ARM under unfamiliar, ambiguous circumstances where other methods of strategy development are unavailable, it must be very hard for the strategists to distinguish the deep traits and the superficial similarity. Thus, Gavetti et al. (2005) argue that it is often difficult to tell whether similarities between a familiar and an unfamiliar problem are deep or superficial. In this respect, for the strategists facing strategic choices, Gavetti et al. (2005) propose four straightforward steps which can improve the strategists’ odds of using analogies skillfully avoiding superficial analogies. In the next section, these four steps of an ARM are explained and applied to the strategy development for the pharmaceutical companies.
FOUR-STEPS OF THE ANALOGICAL REASONING MODEL (ARM)
This paper follows four steps of the ARM presented by Gavetti et al. (2005) to develop organizational strategies for the multinational pharmaceutical companies in the stakeholder management terms. Gavetti et al. (2005) acknowledge that these straightforward steps, which can improve the strategists’ odds of using analogies skillfully avoiding superficial analogies, are rooted in the political science. The authors mention that “we must acknowledge our debt to political scientists, especially Harvard’s Ernest May and Richard Neustadt, who found that analogical reasoning often leads policy makers astray” (Gavetti et al., 2005, p. 9). The first step of the ARM is to articulate the analogy, that is, to recognize the analogy and to identify its purpose. In other words, to defend against flawed analogies, a strategist, first, must recognize the analogies he or she is using. Sometimes, the analogies are obvious, however, in other cases, the influential analogies remain hidden. Gavetti et al. (2005) point out that the analogies often come from executives’ backgrounds. It is also important to identify how a company is using any analogies it recognizes. For instance, although the ARM is used as a tool for choosing among possible solutions to the strategic problems that the pharmaceutical companies face for this paper, the ARM can be used for a variety of other purposes (e.g. brainstorming, communicating complexity, and motivating employees) in other cases. In the light of the purpose of using the ARM for this paper (i.e. developing organizational strategies for the multinational pharmaceutical companies in the stakeholder management terms), as Gavetti et al. (2005) suggest, it might be useful to break the process of analogical reasoning into three further steps to analyze the chains of cause and effect. The second step of the ARM aims at identifying and understanding the source. Also, through the second step, how and why the source strategies worked in the source context should be

128
examined. In other words, the ‘source industries’ and ‘source problems’ that might offer solutions to the target problems are explored. In essence, the second step of the ARM can be defined as a process in which the source is understood. This second step can be begun by examining why the strategies worked in the source industry from which the analogy is drawn. Gavetti et al. (2005) suggest that the classic tools of strategy analysis are extremely useful at this stage, maintaining that “indeed, the key is to lay out in-depth analyses that are familiar to strategists, particularly analyses of the source environment, the solution or strategy that worked well (or that failed) in the original context, and the link between the source environment and the winning (or losing) strategy” (Gavetti et al., 2005, p. 9). In short, during the second step of the ARM, a strategist lay out a chain of cause and effect that explains why the original strategy worked in the source environment. Then, the strategist’s goal should be to figure out whether the causal logic identified in the source environment is supported in the target environment. Gavetti et al. (2005) argue that “in preparing to make that analysis, the strategy maker will find it useful to compile two lists of industry features: those that play a crucial role in the causal logic and those that don’t” (p. 9). The third step of the ARM aims at assessing actively the similarities and differences between the source and the target setting, and, then, presenting feasible ‘candidate solutions’ to the target problems. In other words, Gavetti et al. (2005) suggest that a strategist maps the similarities between the source and the target setting, and, then, determines whether the resemblance between the two settings is more than ‘superficial’. The understanding of the source that a strategist has built up through the second step is crucial in this third step. In addition, rather than wrestling with the entire target problems, which are much less familiar with the source, the strategist can focus on the key features of the causal logic. That is, the basic question for the third step is whether the source and the target are similar or different along these key features. It is noted that not only the similarities but also the differences between the source and the target setting should be considered. The strategist must search actively the differences between the source and target setting, seeking evidence that each essential feature of the source problem is absent in the target setting. The list of industry features that are not crucial in the causal logic is very useful in this step. Namely, if many of the similarities between the source and the target are on this list of not crucial in the causal logic rather than crucial correspondences, the analogy may be based on superficial similarity. The last step of the ARM aims at evaluating the ‘target solutions’. In other words, the last step aims at translating, deciding, and adapting the original strategies to the new setting. In essence, the final step is to decide whether the original strategies, properly translated, will work for the target industry. According to Gavetti et al. (2005), this step requires, first, that a strategist can say clearly what the strategy would look like in the new setting, and this requires some adjustment. The authors comment that even the best analogies involve some differences between the source and the target setting. For this step, Gavetti et al. (2005) ask a critical question to strategists: how much should a company translate the candidate solution, based on the forethought alone, before launching it in the marketplace? The authors suggest that it makes sense to adjust a candidate solution beforehand to account for the glaring differences between the source and the target. However, the authors also stress that, in novel and uncertain environments, where strategists rely the most on analogies, it is often wise to hold off on fine-tuning the solution until the market can give its guidance. In essence, although the majority of analogies are imperfect, they are useful in terms of strategy development. In this respect, Gavetti et al. (2005) maintain that the analogies of an
129
ARM lie on a spectrum. That is, at the one end of the spectrum, there are perfect analogies, where the source and target setting are truly alike on the dimensions that drive economic performance. In contrast, at the opposite end of the spectrum, there are profoundly problematic analogies that are based on superficial similarities yet plagued by underlying differences. It is argued that the vast majority of the analogies of ARMs fall somewhere in between, thus, they are imperfect but useful. Gavetti et al. (2005) emphasize that “the challenge is to get the most out of them” (p.13), and, to get the most out of them, “managers who wish to tap the great power of analogy and sidestep its pitfalls must master multiple modes of thoughts” (p. 13).
APPLYING FOUR-STEPS OF THE ANALOGICAL REASONING MOD EL TO THE PHARMACEUTICAL INDUSTRY IN THE STAKLEHPLDER MANAGEM ENT
TERMS
As explained earlier, the first step of the ARM tries to recognize the analogy and identify its purpose. Thus, through the first step, the ‘target problems’ of the pharmaceutical industry in connection with its stakeholders are examined. The second step tries to identify how and why the source strategies worked. In other words, the ‘source industries’ and ‘source problems’ that might offer solutions for the pharmaceutical industry are examined. The third step tries to assess the similarities and the differences between the source and the target setting and, then, to present feasible ‘candidate solutions’ to the target problems of the pharmaceutical industry. The last step tries to evaluate the ‘candidate solutions’. In other words, the last step tries to translate, decide, and adapt the original strategies to the new setting (i.e. the pharmaceutical industry which is under severe pressure in connection with the access to essential, life-saving medicines). In essence, given the target problem of the pharmaceutical industry (i.e. improving the access to essential, life-saving medicines to deal with the risks posed by its stakeholders), the ARM examines other comparable industries that tackled similar problems that the pharmaceutical industry encounters. These source industries and source problems can offer candidate solutions to the target problem of the pharmaceutical industry. Then, the ‘target solutions’ (i.e. what the pharmaceutical industry can learn from the candidate solutions in relation to producing and marketing essential, life-saving medicines) for the pharmaceutical industry are developed and suggested. Step One: Recognize the Analogy and Identify its Purpose For the first step, it is important to identify the target problem of the pharmaceutical industry. In a broad sense, the target problem of the pharmaceutical industry is how to deal with the risks/challenges posed by its various stakeholders. More specifically, the target problem can be defined as how to improve the global public health through enhancing the access to essential, life-saving medicines on the part of the pharmaceutical industry, balancing its R&D-intensive, expensive business, to cope with the risks/challenges posed by its various stakeholders. The pharmaceutical industry has been under severe pressure posed by its stakeholders. The industry has been criticized in perspective of the global public health because the industry’s business model, particularly the stringent patent protection on the pharmaceutical products, is considered to be a huge impediment to improving the access to essential, life-saving medicines. The access to essential, life-saving medicines is a critical issue not only for the developing world but also for the developed world, although the specific circumstances of each world are different. In addition,
130
although the HIV/AIDS pandemic, especially in the least-developed countries, has been the major issue in connection with the access to essential, life-saving medicines, other diseases are also becoming more problematic. Under these circumstances, it is imperative for the pharmaceutical industry to develop strategies that can balance the issue of the access to essential, lifesaving medicines with its R&D-intensive, expensive business. Although many diseases are in connection with the issue of the access to essential, life-saving medicines, the HIV/AIDS pandemic, as Mascarenhas et al. (2005) illustrate, has been the worst global public health crisis since the Black Plague in the fourteenth century. HIV/AIDS now kills more people worldwide than any other infectious diseases. The medicines that can suppress HIV/AIDS are called antiretrovirals (ARVs) and Burroughs Welcome introduced Retrovir (i.e. AZT), the first ARV drug, in 1987. However, since Burroughs Welcome introduced the first antiretroviral drug, there has been huge controversy over the prices of the HIV/AIDS medicines, and the pharmaceutical industry has been on the center of the controversy. In sum, the target problem of the ARM is how to improve the state of the access to essential, life-saving medicines (i.e. how to rapidly produce and effectively distribute the essential, life-saving medicines) on the part of the pharmaceutical industry to deal with the risks/challenges posed by its stakeholders. In particular, how the pharmaceutical industry can produce and market the essential, life-saving medicines in the developing world that need them most at affordable prices is the main point of the target problem, although the developed world is also in connection with the issue of the access to essential, life-saving medicines. Step Two: Understand the Source (The Food and Beverage Industry) Based upon the target problem of the ARM of this paper, a source industry to examine source problems should be chosen among the industries which have effectively and profitably resolved the problems of marketing and distributing critically needed products or services, at affordable prices, especially in the developing world. In other words, the analysis of source problems should show how a comparable industry has marketed and distributed vitally needed products or services particularly to the developing world that has needed them most. In this respect, the food and beverage industry was chosen as a source industry. For an ARM, a researcher borrows related choices from one industry (i.e. a source industry) and applies the system to a new industry (i.e. a target industry). In essence, a source industry should show similarities to some crucial dimensions of the representation of a target industry and the observable characteristics of a target industry may constitute the crucial dimensions of the representation of the target setting (Gavetti et al., 2005). Gavetti et al. (2005) emphasize that a researcher should develop a crucial dimensions of the representation of a target problem in terms of capturing the salient characteristics of the situation. Then, the researcher can identify a setting that displays the similar salient characteristics. This setting serves as a source of a candidate solution. The following crucial dimensions of the representation of the pharmaceutical industry were developed, reflecting the salient characteristics of the target setting. That is, to avoid a superficial analogy, a source industry must: (1) relate to marketing and distributing critically needed (i.e. life-saving) products or services; (2) relate to the developing world in terms of the production, distribution, prices, and access; (3) relate to the issues of economic growth, productivity, and poverty reduction especially in the developing world; (4) relate to lack of coherent leadership on the part of public sector that can help incentivize, monitor, and coordinate programs and policies

131
in connection with private sector industry; (5) relate to political instability and social unrest; (6) relate to multiple stakeholders, such as consumers, national governments, NGOs, inter-governmental organizations, and shareholders; (7) relate to the uncertainty of the best practices to tackle problems; and (8) relate to R&D costs/IPRs protection. For this paper, the source industry was selected based on these crucial dimensions of the representation of the target setting. In essence, the food and beverage industry satisfies seven dimensions of the target setting except the dimension of R&D costs/IPRs protection. It is noted that other industry sectors were also tested for a source industry. For instance, infrastructure industries such as energy/electricity, transportation, and high tech sectors (e.g. telecommunications) were examined for a source industry. As Gasmi et al. (2006) indicate, the last two decades have witnessed a worldwide wave of reforms that have significantly affected the infrastructure industries to improve the functioning of the industries. However, on the dimensions of the target setting of the pharmaceutical industry, there is a significant difference between the target setting and the infrastructure industries. That is, the infrastructure industries relate to life-enhancing products or services, while the target industry is focused on life-saving products or services. It is noted that the food and beverage industry relates to life-saving products or services. In addition, the infrastructure industries have related to the issues of liberalization, privatization, and regulatory governance on performance (Cubbin et al., 2005), not to the issue of R&D costs/IPRs protection. However, these differences do not necessary bar an infrastructure industry from a source industry for the pharmaceutical industry. Since the energy/electricity and the transportation industry reveals significant similarities to the dimensions of the target setting, a careful “adjustment” (Gavetti, 2005) in the process of an ARM might produce useful solutions for the pharmaceutical industry. It is clear that proper nutrition is a foundation for the overall health. However, global under-nutrition (or malnutrition) persists at unacceptable levels. Under-nutrition can be defined as “a diet that does not provide adequate calories and/or micronutrients for growth and maintenance (Bradley, 2008, p. 171). Under-nutrition remains one of the world’s most serious health problems. For example, malnutrition is the single, biggest contributor to child mortality, with over 50% of all the deaths of children under the age of five is attributed to underlying under-nutrition (Nelson, 2006) . In addition, more than 2 billion people, about 30% of population in the developing world, suffer from the micronutrient deficiencies (Nelson, 2006). It is estimated that 32% of the global burden of disease would be removed by eliminating malnutrition, including micronutrient deficiency (Nelson, 2006). It is noted that, as Nelson (2006) points out, under-nutrition is “linked to the HIV/AIDS pandemic in that it makes adults more susceptible to the virus, inadequate infant feeding aggravates its transmission from mother to child, and there is evidence to suggest that it makes antiretroviral drugs less effective” (p. 4). Under-nutrition is also a serious problem in terms of economy, costing the developing countries (especially, the least-developed countries) billions of dollars annually. That is, under-nutrition is an impediment to productivity, economic growth, and poverty reduction. The scale of the under-nutrition problem, in the economic terms, is large and extensive. If the problem is not significantly reduced, the under-nutrition could cost the global economy about $180-250 billion over the next ten years, and yet the total public investments to address the problem are estimated to be only about $4-5 billion (Nelson, 2006). Today, with a challenge so significant, there is broad acceptance that the future success of the global public health depends, to a large extent, on sound nutrition. Nevertheless, as Bradley (2008) comments, still “obtaining food for survival far outweighs obtaining optimal nutrition in

132
countries where the economic reality is harsh…in an unstable financial atmosphere, making sound and affordable nutritional decisions is a luxury many cannot afford” (p. 171). The Center for Health and Aging of the National Bureau of Asian Research (NBR) addresses a few of the key challenges related to the global under-nutrition (“Food for Thought”). First, in the field of nutrition, there is lack of coherent leadership. The diversity of topics and corresponding organizations in the field of nutrition make it difficult to identify a clear leading body of organizations that can help incentivize, monitor, and coordinate the global nutrition programs and policies. Second, despite renewed momentum in the nutrition field, under-nutrition (or malnutrition) is not perceived to be an urgent issue in comparison with infectious diseases such as HIV/AIDS. Although nutrition is related to the major health issues, it seems that nutrition still remains abstract, low-priority issue for many decision makers. Third, in terms of nutrition, many developing countries face health inequities and a dual burden of disease. Economic growth with large economic disparities between the rural and urban populations in the countries such as Brazil, India, South Africa, and China under-nutrition and obesity coexists at relatively high rates. However, it is also noted that, in the least developed world such as sub-Saharan African countries, still, obtaining food for survival far outweighs obtaining optimal nutrition. Fourth, the prices for grains, sugars, and oils have doubled or tripled in recent years. This food crisis has caused political instability and social unrest. Fifth, although some significant, proven, cost-efficient global nutrition intervention strategies have been developed and implemented, they still remain fragmented and miss out the opportunities to reach more people. In other words, there exists uncertainty about the best practices in the nutrition interventions. Public policies that incentivize more positive private sector engagement in the nutrition field would motivate the private companies to tackle the issues related to nutrition, leveraging their distribution systems, and share their valuable knowledge about consumer behavior. Sixth, although many countries have put comprehensive nutrition strategies into practice in recent years, the implementation remains weak. Also, numerous governments, in terms of nutrition, still lack comprehensive strategies as well as specific policies. In other words, at the state level, there is lack of nutrition-related strategies and policies which are clear, enforceable, and flexible. Lastly, it is criticized that the private sector engagement in the nutrition field has been insufficient. While some companies have successfully developed and marketed fortified foods for lower-income groups, those initiatives have been limited and most have not yet been scaled up. The problem of global malnutrition is extensive and growing in many countries. However, Nelson (2006) argues that “proven and cost-effective interventions exist – especially in the areas of under-nutrition and micronutrient deficiencies” (p. 4). A report produced by the World Bank (2006) points out that there is now unequivocal evidence in connection with the workable solutions to the malnutrition problem, and they are the excellent economic investments. It is noted that the returns of investing in the micronutrient programs are the second only to the returns of the fighting HIV/AIDS among a lengthy list of ways to meet the world’s development challenges. In essence, the World Bank report (2006) made a strong case that the investments in proven technologies and interventions to tackle under-nutrition (or malnutrition) offer potentially very high economic returns. The World Bank, UNICEF, WHO and others contend that the most critical ‘window of opportunity’ for addressing under-nutrition is from before pregnancy through to a child’s the first two years of life (Nelson, 2006). It is highly noted that, as Nelson (2006) comments, the investments and interventions are likely to have their greatest impact in terms of both the improved health outcomes and the high economic returns during this short periods of
133
time. The workable solutions to the under-nutrition problem, considering the proven, cost-effective interventions, are needed to be dramatically scaled up. Individual state governments should take the lead in tackling the under-nutrition (or malnutrition) problem. However, the international development community can help the individual countries do more on the problem. The international community of the development partners “must use their combined resources of analysis, advocacy, and capacity-building to encourage and influence governments to move nutrition higher on the agenda…This role can be fulfilled only if the development partners share a common view of malnutrition problem and broad strategies to address it, and if they speak with common voice” (“Repositioning nutrition”, 2006, p.14). It is argued that without the coordinated and focused action between the individual governments and international development partners, no significant progress in the nutrition field can be expected. In terms of the coordinated and focused action between the individual governments and international development partners, how can the private sector, specifically the food and beverage industry, share their business resources and expertise in conjunction with the under-nutrition problem? In other words, how can the private and the public sector join forces to develop and implement programs that resolve the under-nutrition problem? As Nelson (2006) illustrates, the ‘business case’ for companies to engage in hunger-reduction efforts varies by industry and by company. Nevertheless, every step in the food production and consumption process is related to some type of private sector involvement. The contribution that an industry (or a company) can make in overcoming the under-nutrition problem in connection with the public private partnership may vary depending on the kind of the industry sector and the type of intervention it pursues. Also, it would be influenced by the capacities and abilities of other actors related to the under-nutrition problem, such as national governments, NGOs, inter-governmental organizations, and the research institutions. It is noted that whether the companies act individually, or act on a collective industry-wide basis, or act in collaboration with other industry sectors can affect the results of the public private partnership to address the under-nutrition problem. Nevertheless, it is clear that the under-nutrition and other forms of malnutrition problems cannot be solved without the strong, effective partnerships, and the most powerful untapped opportunities for partnerships in connection with the under-nutrition problem involve the public private interaction. Step Three: Access the Similarity between the Source and the Target In this step, the similarities between the food and beverage industry and the pharmaceutical industry are mapped, and whether the resemblance is more than superficial is determined. Gavetti et al. (2005) emphasize that a strategist must search actively not only the similarities but also the differences between the source and the target setting, seeking evidence that each essential feature of the source problem is absent in the target setting. Therefore, for this paper, whether the key features of the food and beverage industry are exit or absent in the pharmaceutical industry in conjunction with its target problem, i.e., how to improve the global public health through enhancing the access to essential, life-saving medicines on the part of the pharmaceutical industry, balancing its R&D-intensive, expensive business, to cope with the risks/challenges posed by its various stakeholders. The similarities between the source and the target setting of the ARM are summarized as follows. That is, both the source (the food and beverage) and the target (the pharmaceutical)

134
industry problems (1) relate to the issue of the global public health, i.e., they supply the essential products/services for the overall public health; (2) relate to the developing world (particularly, the least-developed world) in terms of the production, distribution, prices, and access; (3) relate to the issues of economic growth, productivity, and poverty reduction especially in the developing world; (4) relate to lack of coherent leadership that can help incentivize, monitor, and coordinate the global public health programs and policies in connection with the industries; (5) can relate to political instability and social unrest; (6) relate to multiple stakeholders, such as consumers/patients, national governments, NGOs, inter-governmental organizations, and the shareholders of the industries; and (7) relate to uncertainty in that the best practices to tackle the problems are still unclear. Lastly and the most importantly, for both the source and the target problem, the proven, effective, workable solutions have been found and scaled up dramatically through the partnerships between the public and the private sectors. In contrast, the differences between the source and the target setting of the ARM can be summarized as follows. First, while the access to essential, life-saving medicines has been perceived to be an urgent issue in terms of the global public health, the under-nutrition (or malnutrition) has not been perceived to be an urgent issue. Although the under-nutrition problem is related to other major health issues, infectious diseases such as HIV/AIDS have attracted the majority of policy attention and funding. Second, thus, the food and beverage industry has not been pressed severely by its multiple stakeholders in comparison with the pharmaceutical industry. The under-nutrition problem still remains low-priority issue for many decision makers. Third, in the case of the access to essential, life-saving medicines, the R&D cost incurred by the pharmaceutical industry is one of the major issues in explaining the conflicts between the industry and its stakeholders. That is, the pharmaceutical companies have emphasized the stringent patent protection on the pharmaceutical products to recoup the expensive R&D cost (for the future R&D investment), and, in contrast, the critics have criticized the pharmaceutical companies on the ground that the strong patent protection impedes the access to essential, life-saving medicines, particularly, in the developing world. However, in the case of the under-nutrition problem, the R&D cost incurred by the food and beverage industry (including the R&D cost-related patent protection) is not as important issue as in the case of the access to essential, life-saving medicines. Lastly, there has been lack of clear, enforceable, and flexible policies to address the under-nutrition problem at the state level. In contrast, as witnessed in Brazil, Thailand, and South Africa, there have been effective policies at the state level to address the issue of the access to essential, life-saving medicines forcing the pharmaceutical industry make concessions. The original strategy of the food and beverage industry for the source problem of the under-nutrition is the public private partnership. Yach (2008) argues that the most powerful untapped opportunities for partnerships involve public-corporate interaction and any significant supports for change will not come from traditional sources of health development finance such as government development agencies or the major private foundations. These partnerships needed to be embedded in new business models that promote better health and are profitable. Step Four: Translate, Decide, and Adapt the Original Strategy The last step of the ARM is to evaluate whether the original strategy of the public private partnerships that has been adopted by the food and beverage industry to address the global under-nutrition problem would work, when it is translated properly, for the target problem (i.e.
135
how to improve the global public health through enhancing the access to essential, life-saving medicines on the part of the pharmaceutical industry, balancing its R&D-intensive, expensive business, to cope with the risks/challenges posed by its various stakeholders) of the target industry, i.e., the pharmaceutical industry. Since even the best analogies involve some differences between the source and the target setting, in translating the original strategy, some adjustments that deal with the differences should be made. In addition, if the analogy is chosen to be pursued for the target setting, another round of adjustment – adapting in the marketplace in response to the feedback from the customers, rivals, suppliers, and others – should be made (Gavetti et al., 2005). Therefore, to decide whether the public private partnership strategy that has been adopted by the food and beverage industry to deal with the global under-nutrition problem would work for the pharmaceutical industry in terms of the access to essential, life-saving medicines, the original strategy of the food and beverage industry is tried to be translated properly as much as possible, adjusting the differences between the two industry settings. Private sector (here, the food and beverage industry) can play a vital role in the systems that sustain healthy communities, reduce poverty, and prevent hunger. A report produced by the World Economic Forum (2006) points out the following: “It is no coincidence that areas with widespread chronic hunger often have little private sector activity” (p. 11). The food and beverage companies can play innovative roles in tackling the global under-nutrition problem on the individual firm basis. Several food and beverage companies, such as Heinz, Nestlé, Group DANONE, The Coca-Cola Company, Unilever, and PepsiCo Inc., have undertaken initiatives that could harness their core competences, products, services, and business networks to help overcome under-nutrition (Nelson, 2006). However, one of the most important contributions to tackling the global under-nutrition problem by the food and beverage industry, as the World Bank report describes (2006), has been implemented on a collective basis particularly through the partnership with the public sector. On the part of the national governments, in addition to working with the private sector, they are also increasingly working through the partnerships that use the institutional capacity of NGOs for growth promotion as well as micronutrient programs (“Repositioning nutrition”, 2006). In essence, the public sector, normally, is responsible for addressing the essential underlying issues of the under-nutrition problem. Nevertheless, it often has neither the capacity nor the resources to do so effectively (“Harnessing private sector”, 2006). Thus, the private sector can take part in the public private partnerships to compensate for the weaknesses of the public sector, applying its core competences to strengthen the public institutions. The public private partnerships are collaborative capacity building efforts among companies, national governments or public agencies, and/or NGOs to tackle the global under-nutrition problem. It is noted that “the application of private sector technical and managerial skills to strengthen the capacity of public agencies and NGOs can often bring greater long-term value than cash or in-kind donations” (“Harnessing private sector”, 2006, p. 19). The Global Alliance for Improved Nutrition (GAIN) presents a proven, effective model of the public-private partnership for the under-nutrition problem. GAIN was founded in 2002 at the United Nations General Assembly’s Special Session on Children as a public-private network to reduce malnutrition through the use of food fortification and other strategies aimed at improving the health and nutrition of populations at risk (Ameringen et al., 2008). In specific, GAIN was launched as “a multi-sector alliance, grant-giving and technical assistance body, and advocacy network with a core purpose to tackle micronutrient deficiency primarily through food

136
fortification” (Nelson, 2006, p. 11). That is, GAIN is a public-private partnership launched to help create cost-effective food fortification programs in a bid to improve health, cognitive development, and productivity in the developing world (“GAIN to improve”, 2002). GAIN has set clear, measurable targets for itself. The major targets of GAIN include: (1) Reduce the prevalence of vitamins and mineral deficiencies by 30% in the areas where GAIN supports projects; (2) Reach 1 billion people with food that has been fortified with vitamins and minerals; (3) Ensure that 500 million of the people most in need, such as children and the pregnant women, regularly consume the fortified foods; and (4) Achieve these results at a cost of less than 25 U.S. cents per person, per year (Nelson, 2006). Although GAIN is a Swiss Foundation funded by the Bill and Melinda Gates Foundation, the United States Agency for International Development (USAID) and the Canadian International Development Agency (CIDA), it builds the partnerships between the public and the private sector. In other words, GAIN is composed of diverse groups including foundations, the U.N., the developing country governments, the private sector companies, NGOs, and the academic institutions (“GAIN to improve”, 2002). The supporters of GAIN include UNICEF, THE World Bank, WHO, the World Food Programme, the Helen Keller International, the U.S. Center for Disease Control and Prevention, A2Z (the USAID Micronutrient Program), and the Micronutrient Initiative. Particularly, GAIN is partnering with the private sector companies such as Group DANONE, Unilever, and Cargill. GAIN delivers its funding and technical assistance through the multi-sector National Fortification Alliances in about 17 countries, and each has its own targets. At the global level, GAIN has a multi-sector Board of Directors and a multi-sector Reference Group (Nelson, 2006). GAIN advocates for better nutrition worldwide as a cost-effective way to make people and economies stronger, healthier, and more productive (Ameringen et al., 2008). GAIN has tried to enable innovative solutions to improve nutrition at a large scale by providing financial and technical support. GAIN has set itself the target of reaching 1 billion people of whom 500 million are in target groups most vulnerable to under-nutrition (Ameringen et al., 2008). In sum, the most distinctive and essential feature of GAIN is its partnership with the private sector companies in order to use the companies’ know-how in product development, marketing, and distribution. This distinctive and essential feature of GAIN enabled it to launch a business alliance. That is, GAIN established the GAIN Business Alliance for Improved Nutrition in Beijing in 2005. In specific, the GAIN Business Alliance is a jointly funded initiative of GAIN and the World Bank Institute to bring together the global food companies committed to furthering food fortification around the world (“Business action”). Namely, the GAIN Business Alliance was launched to support the GAIN’s commitment to finding the market-based solutions through spearheading active business-led initiatives in a number of regions around the world (Ameringen et al., 2008). In addition, GAIN has made a strategic commitment to systematically increase its dialogue and engagement with the business community, increasing the number of companies with which it has significant interaction (Nelson, 2006). The establishment of the GAIN Business Alliance has been central to this strategic commitment. The GAIN Business Alliance “operates globally, regionally, and nationally in countries such as China and India, as well as through regional networks in the Americas and in Africa” (Nelson, 2006, p. 11). The GAIN Business Alliance is chaired by Unilever and it focuses on: (1) Mobilizing companies in developing countries to promote the food fortification through providing technical assistance, recognition, and other support; (2) Creating media attention and visibility for the food fortification; and (3) Creating a clear and rigorous progress for engaging the private sector in a

137
manner that makes clear business sense to the companies and offers clear development benefits in terms of results (Nelson, 2006). The private sector companies involved in the GAIN Business Alliance include Unilever, Heinz, Group DANONE, Cargill, DSM, BASF, Tetra Pak, and Coca-Cola. In conclusion, the GAIN’s global partnership model is an innovative one, building programs with the private sector, and, thus, providing the partnerships between the public and the private sector. The GAIN Business Alliance is the key part of the GAIN’s strategy and it was launched “as a platform to extend the production and distribution of affordable fortified foods around the world, in particular to poor and at-risk populations” (“Memorandum”, 2006). GAIN and the GAIN Business Alliance aim at effective regulatory change to improve diets, working with the national governments, consumers, and the private sector companies. In particular, the GAIN Business Alliance’s mission is to develop innovative and new approaches for dealing with the barriers that have traditionally kept affordable fortified products outside of the market place (World Bank Institution [“Business Action”]). It is argued that the GAIN’s global partnership model is an innovative example of how to make markets work better for the poor people by facilitating a more active partnerships between the public and the private sector in the area of health and nutrition. Another example of the public-private partnership, a business-led alliance, to tackle the under-nutrition problem is the Business Alliance Against Chronic Hunger (BAACH). “In 2006, the World Economic Forum and some of its member companies jointly launched an innovative new initiative with the mission to form a network of businesses committed to taking action to reduce chronic hunger in Africa, in cooperation with the public sector, civil society and community partners” (Nelson, 2006, p. 12). Namely, BAACH is a cross-industry, multi-stakeholder initiative working with a broad array of companies to promote business models that contribute to sustainable food production and raise incomes in poor regions (“Food sustainability”, 2008). BAACH enables businesses leverage their expertise and capabilities to improve value chains from production, processing, and packaging to retailing and marketing to increase food supply, nutrition, and incomes in hungry regions (“Food sustainability”, 2008). For example, BAACH works to reduce hunger in Africa by strengthening specific food value chains through the business development and the market linkages. The private sector companies implement the solutions in partnership with the national governments, NGOs, the inter-governmental organizations, and the communities (“Food sustainability”, 2008). It is noted that BAACH is looking at the partnership opportunities between the public and the private at the every stage of the value chain. That is, the strategy of BAACH is “to take an integrated approach to solving hunger by focusing on using business expertise and market power to strengthen food value chains and build more sustainable and equitable market systems through multi-stakeholder partnership, testing these new approaches in a specific region, and disseminating lessons globally” (Nelson, 2006, p. 12). In essence, BAACH strengthens, globally, commitment to action on hunger by promoting effective business models to reduce hunger, facilitating dialogue and engaging in the global partnerships (“Food sustainability”, 2008). Bradley (2008) argues that “creating trust and building relationships are at the heart of good business…Partnerships built on a foundation of trust, shared values and common aspirations seem to be the most productive way to reach realistic, measurable goals” (p. 171). Each of the possible partners in the public-private initiatives (i.e. the private sector companies, NGOs, the national governments, inter-governmental organizations, and the academia) can provide specific and unique expertise of its own, working together to tackle the global issues such as the under-
138
nutrition and the access to essential, life-saving medicines, and can be the most effective way to deal with the issues, providing the highest rate of success. In addition, a successful public-private partnership is based on a strong understanding, among the partners, of the challenges to be overcome in the target community. Thus, facilitating dialogue, concerning the capabilities and the shared values, among the partners can maximize the potential of a public-private partnership, enabling a strong understanding to be formed. In terms of the public-private partnership, both the public and the private sector must discard the traditional way of thinking and try to invent strategies or programs that can effectively tackle the global issues such as the under-nutrition and the access to essential, life-saving medicines. To deal effectively with the pressure posed by their stakeholders, the private sector industries (e.g. the food and beverage industry, the pharmaceutical industry) should actively incorporate the public-private partnership into their business model - preferably on a industry-wide, collective business basis – and should develop innovative strategies that utilize and share business know-how with their partners such as the national governments, NGOs, international agencies, and the academia. DISCUSSIONS AND CONCLUSIONS: THE ANALOGICAL TARGET SOLUTION FOR
THE PHARMACEUTICAL INDUSTRY, PUBLIC-PRIVATE PARTNER SHIP
In the third step of the ARM above, whether the key features of the food and beverage industry are exist or absent in the pharmaceutical industry in connection with its target problem (i.e. how to improve the global public health through enhancing the access to essential, life-saving medicines on the part of the pharmaceutical industry to deal with the risks posed by its various stakeholders) was examined. The similarities between two industries suggest the application of the proven, cost-effective candidate solution to the source problem of the food industry to the target problem of the pharmaceutical industry. Moreover, the first two differences between two industries even reinforce the potential for applying the candidate solution to the target problem. That is, although the under-nutrition has not been perceived to be an urgent issue in comparison with the issue of the access to essential, life-saving medicines in terms of the global public health and, thus, the food industry has not been pressed severely by its stakeholders as compared with the pharmaceutical industry, the food industry has developed a proven, cost-effective strategy to deal with the global under-nutrition problem. In other words, the pharmaceutical industry, which has been severely pressed by its stakeholders in connection with the access to essential, life-saving medicines (which has been perceived to be an urgent issue in terms of the global public health), should also develop an effective strategy to improve the access to essential, life-saving medicines. Although it should be adjusted for the target setting, the proven, cost-effective solution to the source problem of the food industry can be an effective target solution to the target problem of the pharmaceutical industry. However, before introducing and applying the candidate solution to the target problem, the third difference between two industries (regarding the stringent patent protection to recoup the R&D cost for the future investment) should be considered. This difference requires some adjustment in adapting the original strategy (i.e. the candidate solution) of the food industry to the target problem of the pharmaceutical industry. In the case of the access to essential, life-saving medicines, the R&D cost incurred by the pharmaceutical industry is one of the major issues in explaining the conflicts between the industry and its stakeholders. In contrast, in the
139
case of the under-nutrition problem, the R&D cost and patent protection are not as important as in the case of the access to essential, life-saving medicines. Therefore, the pharmaceutical industry needs to develop strategies which can balance the access to essential, life-saving medicines with its expensive, R&D-intensive business. However, although the difference exists between two industries in terms of the patent protection, there is no need for the candidate solution of the food industry (i.e. the comprehensive, industry-wide, multi-stakeholder public-private partnership) to be significantly adjusted to the target setting/target problem of the pharmaceutical industry. That is, without making any significant adjustment, the candidate solution can be applied to the target problem of the pharmaceutical industry. The suggested analogical target solution (i.e. target strategy) for the pharmaceutical industry in connection with the access to essential, life-saving medicines is implementing the candidate solution of the food industry. That is, this type of public-private partnership can help the pharmaceutical industry to deal with the pressure posed by various stakeholders in connection with the access to essential, life-saving medicines, balancing its R&D-intensive, expensive business with the enlarged corporate social responsibility. Although the pharmaceutical companies have engaged in several public-private initiatives in conjunction with the access to essential, life-saving medicines, there has been no comprehensive, industry-wide, multi-stakeholder public-private partnership. Moreover, except the Merck’s Mectizan Donation Program, the public-private initiatives which have a connection with the pharmaceutical industry have always been initiated by the public sector institutions, not by the private sector pharmaceutical companies. Therefore, the public-private partnerships which have been implemented between the public sector institutions and the pharmaceutical companies should be examined and evaluated in terms of the proven, cost-effective public-private partnerships, such as the GAIN Business Alliance and the Business Alliance Against Chronic Hunger, which have been implemented between the public sector institutions and the food companies, in order to develop the public-private partnership strategy for the pharmaceutical industry. GAIN (particularly, the GAIN Business Alliance) and BAACH have important implications for the pharmaceutical companies in terms of the public-private partnership. That is, the GAIN Business Alliance and BAACH present how the pharmaceutical industry can form the comprehensive, industry-wide, multi-stakeholder, cost-effective public-private partnership in relation to the access to essential, life-saving medicines. GAIN’s global partnership model is an innovative example of how to make markets work better for the poor people by facilitating a more active partnership between the public and the private sector in the area of the global public health. Namely, GAIN’s global partnership model is an innovative one in that it builds programs with the private sector and, thus, provides partnership between the public and the private sector. In particular, the GAIN Business Alliance is the key part of the GAIN’s strategy and the business alliance has formed the business-led public-private partnerships. GAIN’s global partnership model can be applied to the strategy development for the pharmaceutical industry in terms of the access to essential, life-saving medicines. In essence, the GAIN Business Alliance presents how the public-private partnership can be led by the private sector companies, not by the public sector institutions, benefiting both the public and the private sector. BAACH is another proven, effective model of the public-private partnership (a business-led alliance) in the field of the global public health, taking an integrated approach to hunger through the multi-stakeholder partnership. The pharmaceutical industry should do something to deal with the risks posed by its stakeholders. However, the pharmaceutical industry alone cannot resolve the problem of the
140
access to essential, life-saving medicines, particularly in the long-term. That is, with regard to the access to essential, life-saving medicines, the pharmaceutical industry needs a comprehensive, industry-wide, multi-stakeholder public-private partnership to secure the cooperation from its various stakeholders. One of the most important contributions to tackling the global under-nutrition problem by the food industry has been implemented on a collective basis particularly through the partnership with the public sector. In this respect, the strategy of the public-private partnership must be a useful solution to improving the access to essential, life-saving medicines on the part of the pharmaceutical companies, particularly in overcoming the obstacle of a lack of infrastructure in connection with marketing and distributing medicines and related products particularly in the developing world. In addition, the pharmaceutical industry should initiate (or lead) the public-private partnership, promoting effective business models and facilitating the dialogue between the industry and its stakeholders. That is, the pharmaceutical industry should actively incorporate the public-private partnership into its business model - preferably on an industry-wide, collective business basis – and should develop innovative strategies that utilize and share business know-how with its partners such as the national governments, NGOs, international agencies, and the academia. It should be noted that a successful public-private partnership is based on a strong understanding of the challenges to be overcome among the partners in the target community. The strong understanding among the partners in relation to the global public health enables a comprehensive, cost-effective, multi-stakeholder public-private partnership in terms of the access to essential, life-saving medicines. Facilitating dialogue among the partners concerning the capabilities and the shared values can maximize the potential of a public-private partnership, enabling a strong understanding to be formed. In this respect, for an effective public-private partnership, both the public and the private sector must discard the traditional way of thinking and try to invent strategies or programs that can effectively tackle the issues in connection with the access to essential, life-saving medicines.
REFERENCES Ameringen, M. V., Magarinos, B., & Jarvis, M. (2008). Business and malnutrition: Opportunities
and challenges for the food industry in reaching the poor. The World Bank Group [Electronic
Version]. Retrieved December 8, 2008, from
http://www1.worldbank.org/devoutreach/june08/article.asp?id=494
Ashcroft, R. E. (2001). Affordable access to essential medication in developing countries: Conflicts between ethical and economic imperatives. Journal of Medicine and Philosophy, 27, 179-195. Bradley, D. (2008). Beyond product: The private sectors drive to perform with the purpose of
alleviating global under-nutrition. Global Forum Update on Research on Health Volume 5
[Electronic Version]. Retrieved December 4, 2008, from
http://www.globalforumhealth.org/filesupld/global_update5/art/Update5_BeyondProduct_
Bradley.pdf
Business action to combat malnutrition (n.d.). The World Bank Institution [Electronic Version].
Retrieved September 5, 2008, from
http://web.worldbank.org/WBSITE/EXTERNAL/WBI/WBIPROGRAMS/CGCSRLP/0,,contentMD
K:20649737~pagePK:64156158~piPK:64152884~theSitePK:460861,00.html
Calfee, J. E., & Bate, R. (2004). Pharmaceuticals and the Worldwide HIV Epidemic: Can a
141
Stakeholder Model Work? Journal of Public Policy & Marketing, 23, 140-152. Cubbin, J. & Stern, J. (2005). Regulatory effectiveness: The impact of regulation and regulatory
governance arrangements on electricity industry outcomes. World Bank Policy Research
Paper 3536.
Danzon, P. M. (1997). Price discrimination for pharmaceuticals: Welfare effects in the US and
the EU. International Journal of the Economics of Business, 4, 301-321.
Danzon, P. M., & Towse, A. (2003). Differential pricing for pharmaceuticals: Reconciling access, R&D and patents. International Journal of Healthcare Finance and Economics, 3, 183-205. Food for Thought: Challenges for Global Nutrition (n.d.). The National Bureau of Asian
Research, Center for Health and Aging [Electronic Version]. Retrieved December 5, 2008,
from http://pacifichealthsummit.org/downloads/nutrition/nutrition_challenges.pdf
Food sustainability: A guide to private sector action (2008). The United Nations Global Compact
[Electronic Version]. Retrieved December 10, 2008, from
http://www.unglobalcompact.org/docs/news_events/9.1_news_archives/2008_09_24/foods
ustainability.pdf
GAIN to improve global nutrition (2002, May 14). Foodnavigator.com [Electronic Version].
Retrieved July 1, 2008, from http://www.foodnavigator.com/content/view/print/98759
Gasmi, F., Noumba, P., & Virto, L. R. (2006). Political accountability and regulatory performance in infrastructure industries: An Empirical Analysis [Electronic Version]. Retrieved September 10, 2010, from http://www-
wds.worldbank.org/external/default/WDSContentServer/IW3P/IB/2006/12/29/000016406_20061229104357/Rendered/PDF/wps4101.pdf
Gavetti, G., Levinthal, D. A., & Rivkin, J. W. (2005). Strategy making in novel and complex worlds: The power of analogy. Strategic Management Journal, 26, 691-712. Gavetti, G., & Rivkin, J. W. (2005, April). How strategies really think: Tapping the power of
analogy [Electronic Version]. Harvard Business Review. Retrieved March, 2008, from http://www.eleganthack.com/homepage/archives/How%20Strategists%20Really%20Think.pdf.
Harnessing private sector capabilities to meet public needs: The potential of partnerships to
advance progress on hunger, Malaria and basic education (January 2006). The World
Economic Forum.
Kennedy, C. R., Harris, F. H., & Lord, M. (2004). Integrating public policy and public affairs in a pharmaceutical marketing program: The AIDS pandemic. Journal of Public Policy and Marketing, 23, 128-139. Mascarenhas, O. A., Kesavan, R., & Bernacchi, M. (2005). Global marketing of lifesaving drugs: an analogical mode. Journal of Consumer Marketing, 22, 404-411. Memorandum submitted by GAIN – THE Global Alliance for Improved Nutrition (2006). The
United Kingdom Parliament [Electronic Version]. Retrieved September1, 2008, from
http://www.parliament.the-stationery-
office.co.uk/pa/cm200506/cmselect/cmintdev/921/921we16.htm
Nelson, J. (2006). Business as a partner in overcoming malnutrition. An agenda for action. Harvard University Kennedy School of Government [Electronic Version]. Retrieved

142
December 5, 2008, from http://www.hks.harvard.edu/mrcbg/CSRI/publications/report_14_NUTRITION%20FINAL.pdf
Repositioning nutrition as central to development: A strategy for large-scale action (2006). The
World Bank [Electronic Version]. Retrieved November 10, 2008 from
http://siteresources.worldbank.org/NUTRITION/Resources/281846-
1131636806329/NutritionStrategy.pdf
Vachani, S., & Smith, C. N. (2004). Socially responsible pricing: Lessons from the pricing of the
AIDS drugs in developing countries. California Management Review, 47, 117-145.
Yach, D. (2008). Invited editorial: a personal view. Food and nutrition for better health. Public
Health Nutrition, 11, 109-111.

143
CHARACTERISTICS AND PERFORMANCE OF FOREIGN DIRECT I NVESTMENT IN RETAIL TRADE: THE CASE OF JAPANESE FIRMS
Jianping Liang
Assistant Professor of Marketing Sun Yat-sen Business School
Sun Yat-sen University 135 Xingang Xi Road, Haizhu
Guangzhou, Guangdong, China, 510275 Tel: 86-20-84112557 Fax: 86-20-84036924
E-mail: [email protected]
Jing’an Tang Assistant Professor of Strategy and International Business
John F. Welch College of Business Sacred Heart University
5151 Park Ave., Fairfield, CT06825 Tel: (203)371-7960 Fax: (203)365-7538
E-mail: [email protected]
Ben Shaw-Ching Liu Professor of Marketing
Lender School of Business Quinnipiac University
275 Mt. Carmel Avenue Hamden, CT 06518 USA
Tel: (203)582-3772 Fax: (203)582-8664
E-mail: [email protected]

144
ABSTRACT
In the international business development, foreign direct investment (FDI) as a general
phenomenon has been extensively studied, yet the understanding of particular characteristics of FDI in the retail industry remain limited. The success of international retail trade relies heavily on the understanding of consumers in the host countries. Therefore, this paper analyzed the characteristics and performance of foreign direct investment (FDI) in retail trade using the Japanese FDI data (JFDI) from 1986-2001 as a case. We found (1) an overall trend for JFDI to move from the developed countries to developing countries; (2) a modest correlation between subsidiary size and performance; (3) in certain countries/regions, a positive and significant correlation between entry mode and performance; and (4) a focus of JFDI on the USA and the Greater-China area. The results of this paper provide important implications for countries which want the FDI in retail trade and for companies which want to invest in international retail trade. KEYWORDS: Retail Trade, Foreign Direct Investment, Foreign Entry Performance, Entry Mode, Subsidiary Size, International Consumer Behavior, Japanese Firms
145
INTRODUCTION
With rapid globalization, more and more countries have witnessed the expansion of foreign direct investment (FDI) across numerous industries, from manufacturing to retailing. In addition, consumers from different countries have benefited from worldwide economic development, especially in emerging markets in Asia and Latin America. As consumers in different countries have more spending power, they develop different tastes and desire better lifestyles. Therefore, we should expect to see a fast growing retail industry, both domestically and internationally. Kuipers (1999) observed that a significant proportion of sales in many prominent retailers were derived from international operations. However, as Mooij & Hofstede (2002) pointed out, a number of additional new realities such as mega-mergers and new communication capabilities are changing the rules of the game in international retailing, leading to, for example, a focus on understanding differences rather than similarities among consumers across borders. Moreover, Goldman (2001) indicated that the pattern of internationalization activities by international retailers is changing from largely involving moves among developed economies to moves from developed economies to developing economies that provide opportunities such as high growth rates, growing middle-class, and weak competition from local retailers (see also Barth et al., 1996; Hentzepeter, 1999; Reuling, 1998; Stores, 1998). Countries Which Want the FDI in Retail Trade Nitsch, Beamish, & Makino (1995) argued that public policy makers and government officials can learn a lot from examining the characteristics and performance of foreign subsidiaries, such as job creation and investment stimulation. As Drabek & Payne (2001) pointed out, FDI is very important to the national economy in any country (see also Brewer, 1993; Boddewyn, Halbrich & Perry, 1986; Makino, Beamish & Zhao, 2004). Although it is possible for a country to generate funds by itself, many negative effects on the national economy may result from such isolationism, such as slow domestic economic development. Nitsch et al. (1995) found evidence that one significant effect of having trade barriers at the country level is to stimulate investment in another country in the region. Those countries that have trade barriers provide opportunities for others’ economic development rather than their own. Nowadays, many developing countries realize the negative effects of having trade barriers and most of them actively encourage international behavior (Takagi, 2006), such as the FDI (Fan & Lu, 2011). For example, after opening the domestic market for more than 30 years, China has become a country that is in the 3rd place on purchasing power parity GDP in the world (after European Union and United States) by measuring economic output on the prices of a bundle of goods and services in local currencies (The World Fact Book, 2011), and is in the 4th place on gross national income (GNI) measured by valuing each country’s goods and services in dollars, using three year average exchange rates (Atlas of Global Development, 2007). Therefore, the study of the characteristics and performance of FDI can provide very important insights for countries to make related public policies (Pan, 1998; Park, 2003; Gao & Tisdell, 2008; Liu & Pearson 2010). Companies Which Want to Invest in International Retail Trade
For companies that want to invest in international retail trade, there are many factors to be considered. For example, Anand & Delios (1997) found that depending on the required capabilities and location-specific resources, different entry mode choices (i.e., acquisitions, joint ventures and greenfield establishments) in FDI in wholesale and retail industries could significantly influence the performance of the foreign subsidiaries. Bouquet, Hébert & Delios (2004) found that the choice of foreign entry mode and expatriate staffing decisions in three
146
service industries including retail trade have important consequences for a subsidiary’s competitive advantage in new international markets (see also Edstrom & Galbraith, 1977; Hill et al., 1990). While most of the previous research on international retail trade focused on the internationalization activities among developed countries, a growing number of international retailers shifted attention to developing countries (Shiu & Dawson, 2002; Kim, 2008; Cao and Dupuis, 2010). Goldman (2001) investigated the transfer of retail formats (e.g., supermarkets, hypermarkets, specialty stores, department stores, wholesale-clubs and shopping centers) to developing economies, in particular China, and found that differences in economic conditions between China and the home countries, and the target market segments in China, determine the extent of transfer change of retail formats. Moreover, Mooij & Hofstede (2002) examined the convergence and divergence in consumer behavior across countries by using Hofstede’s (1997, 2005) five-dimension model of national culture and found that retailing strategies cannot be extended from one country to other countries without adaptation. This study attempted to provide guidance for international retailers to make better decision on those important issues.
METHOD
In order to investigate the characteristics and performance of JFDI in retailing, we used the TK (Toyo Keizai) database covering the years of 1986-2003. It has been compiled from Japanese Overseas Investment: a Complete Listing by Firms and Countries. Data was collected from publicly-available market data from the three major Japanese stock exchanges and from a survey sent to top Japanese managers in each subsidiary of those listed Japanese parent companies (Nitsch et al., 1995). This database had been tested for reliability and validity (Beamish & Nitsch, 1999) and had been used in over 100 refereed journal publications.
In this study, we first selected 853 Japanese subsidiaries that were categorized in retail trade according to the Standard Industrial Classification (SIC) code for subsidiaries established during 1986-2003. The further selection of the sample for data analysis followed the criteria outlined in Nitsch et al (1995). First, we excluded cases from countries/regions with less than five Japanese subsidiaries in order to identify patterns across countries/regions. Second, cases with incomplete data and unclear definition of entry mode were excluded. Third, we deleted those subsidiaries less than three years old due to evidence from other studies (e.g., Woodcock, Beamish, & Makino, 1994) that most subsidiaries need two years after establishment to stabilize their performance. Therefore, we had a sample of 743 of the original 853 cases.
Moreover, because we attempted to describe the characteristics of the JFDI subsidiaries, and to link those observations to subsidiary performance, we wanted to have a sample that had a measure of performance. According to Nitsch et al. (1995), incommensurable national accounting conventions and the difficulty of obtaining non-consolidated data led to few studies that made such a connection between the characteristics and performance of subsidiaries. In the TK database, the performance measure was one of the three possible performance (i.e., “Gain”, “Breakeven”, or “Loss”) ranked by the top Japanese managers in the subsidiary. However, in any given year that had the performance measure from 1986 to 2003, out of the 743 cases, only 20 to 137 subsidiaries had the data for the performance measure. We decided to choose the performance data from the year 2001, because only 39 subsidiaries had performance data in 2003 but 120 subsidiaries had in 2001. Following the above changes, we again ruled out the
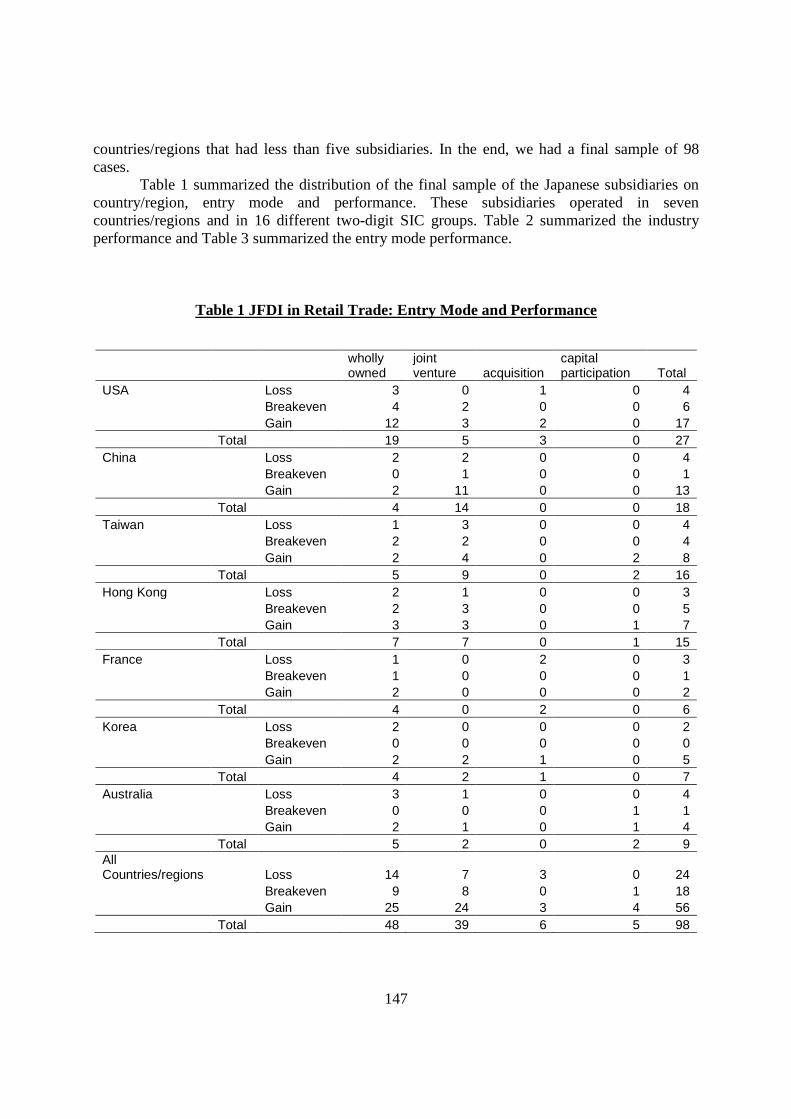
147
countries/regions that had less than five subsidiaries. In the end, we had a final sample of 98 cases.
Table 1 summarized the distribution of the final sample of the Japanese subsidiaries on country/region, entry mode and performance. These subsidiaries operated in seven countries/regions and in 16 different two-digit SIC groups. Table 2 summarized the industry performance and Table 3 summarized the entry mode performance.
Table 1 JFDI in Retail Trade: Entry Mode and Performance
wholly owned
joint venture acquisition
capital participation Total
USA Loss 3 0 1 0 4 Breakeven 4 2 0 0 6 Gain 12 3 2 0 17 Total 19 5 3 0 27 China Loss 2 2 0 0 4 Breakeven 0 1 0 0 1 Gain 2 11 0 0 13 Total 4 14 0 0 18 Taiwan Loss 1 3 0 0 4 Breakeven 2 2 0 0 4 Gain 2 4 0 2 8 Total 5 9 0 2 16 Hong Kong Loss 2 1 0 0 3 Breakeven 2 3 0 0 5 Gain 3 3 0 1 7 Total 7 7 0 1 15 France Loss 1 0 2 0 3 Breakeven 1 0 0 0 1 Gain 2 0 0 0 2 Total 4 0 2 0 6 Korea Loss 2 0 0 0 2 Breakeven 0 0 0 0 0 Gain 2 2 1 0 5 Total 4 2 1 0 7 Australia Loss 3 1 0 0 4 Breakeven 0 0 0 1 1 Gain 2 1 0 1 4 Total 5 2 0 2 9 All Countries/regions Loss 14 7 3 0 24 Breakeven 9 8 0 1 18 Gain 25 24 3 4 56 Total 48 39 6 5 98

148
Table 2 JFDI in Retail Trade: Industry Performance
USA China Taiwan Hong Kong France Korea Australia
Wholesale Trade - Durable 1.33 -- 2.00 3.00 -- 1.00* 1.00* General Merchandise Stores 2.33 3.00 3.00 3.00 2.50 -- 1.00 Apparel and Accessory Stores 2.75 1.00* 2.00 2.00 3.00* -- 3.00 Eating and Drinking Places 2.57 2.90 1.50 2.25 1.00* -- 3.00 Miscellaneous Retail -- -- 3.00* 2.50 1.00* 2.50 1.50 Other Retail 3.00 1.50 2.60 1.33 1.00 3.00 3.00 Country/region Means (All Industries) 2.48 2.50 2.25 2.27 1.83 2.43 2.00 (*, single case) Averages were based on the following coding of questionnaire responses 1="Loss"; 2="Breakeven"; 3="Gain"
Table 3 JFDI in Retail Trade: Entry Mode Performance
USA China Taiwan Hong Kong France Korea Australia
Wholly Owned Subsidiary 2.47 2.00 2.20 2.14 2.25 2.00 1.80 Joint Venture 2.60 2.64 2.11 2.29 -- 3.00 2.00 Acquisition 2.33 -- -- -- 1.00 3.00* 2.50 Capital Participation -- -- 3.00 3.00* -- -- -- (*, single case) Averages were based on the following coding of questionnaire responses 1="Loss"; 2="Breakeven"; 3="Gain"
JFDI IN RETAIL TRADE: INDUSTRY DISTRIBUTION Although the JFDI in retail trade distributed widely in the entire spectrum of the available
SIC codes, about 80% of the subsidiaries could be categorized into five two-digit industrial classifications: • SIC 50 – wholesale trade-durable (9% of the cases): Subsidiaries in this category operated in
the retail trade as the subsidiary’s second, third, or fourth industry. For example, Kaga (Korea) Electronics Co. Ltd., Tasaki Shinyu (Hong Kong) Ltd., and Honolulu Optical Co. Inc.
• SIC 53 – General Merchandise Stores (14% of the cases): For example, Mitsukoshi (U.S.A) Inc., Takashimaya Retailing Australia Pty. Ltd, and JUSCO Stores (Hong Kong) Co., Ltd.
• SIC 56 – Apparel and Accessory Store (10% of the cases): For example, Issey Miyake Europe S.A., Fashion Force (HK) Ltd, and Yoshinoya Taiwan Co. Ltd.
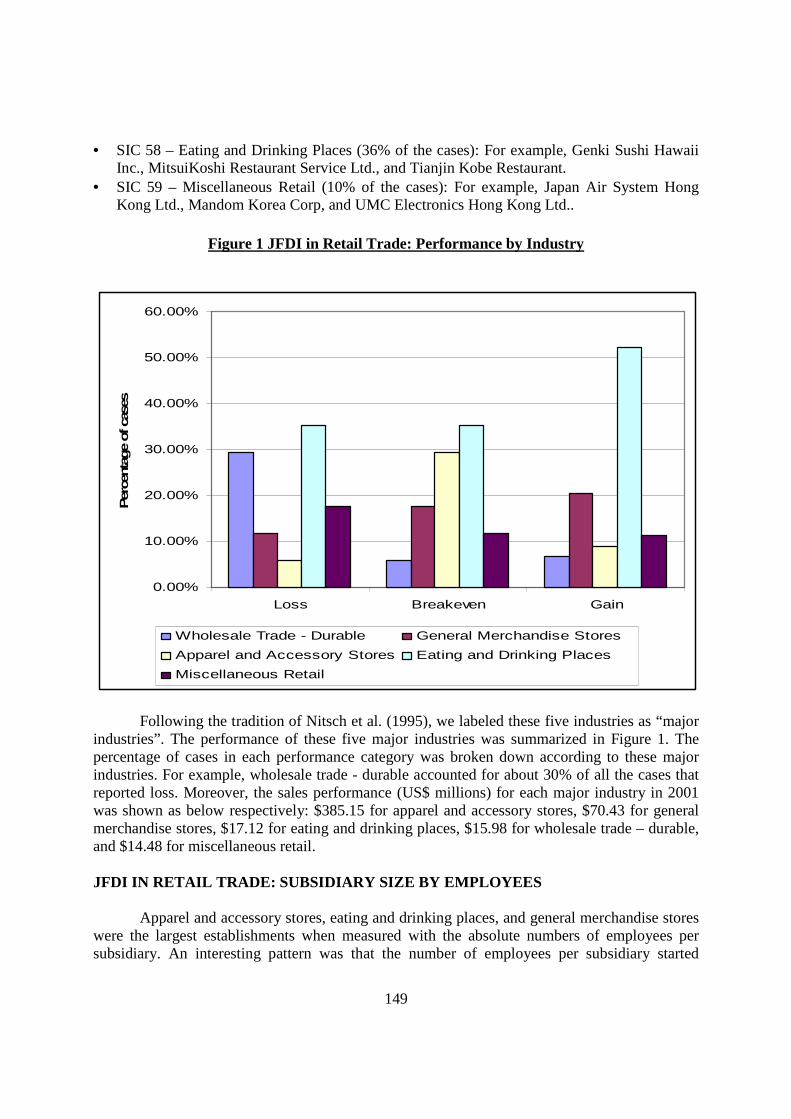
149
• SIC 58 – Eating and Drinking Places (36% of the cases): For example, Genki Sushi Hawaii Inc., MitsuiKoshi Restaurant Service Ltd., and Tianjin Kobe Restaurant.
• SIC 59 – Miscellaneous Retail (10% of the cases): For example, Japan Air System Hong Kong Ltd., Mandom Korea Corp, and UMC Electronics Hong Kong Ltd..
Figure 1 JFDI in Retail Trade: Performance by Industry
Following the tradition of Nitsch et al. (1995), we labeled these five industries as “major industries”. The performance of these five major industries was summarized in Figure 1. The percentage of cases in each performance category was broken down according to these major industries. For example, wholesale trade - durable accounted for about 30% of all the cases that reported loss. Moreover, the sales performance (US$ millions) for each major industry in 2001 was shown as below respectively: $385.15 for apparel and accessory stores, $70.43 for general merchandise stores, $17.12 for eating and drinking places, $15.98 for wholesale trade – durable, and $14.48 for miscellaneous retail.
JFDI IN RETAIL TRADE: SUBSIDIARY SIZE BY EMPLOYEES
Apparel and accessory stores, eating and drinking places, and general merchandise stores
were the largest establishments when measured with the absolute numbers of employees per subsidiary. An interesting pattern was that the number of employees per subsidiary started
0.00%
10.00%
20.00%
30.00%
40.00%
50.00%
60.00%
Loss Breakeven Gain
Per
centa
ge
of ca
ses
Wholesale Trade - Durable General Merchandise Stores
Apparel and Accessory Stores Eating and Drinking Places
Miscellaneous Retail
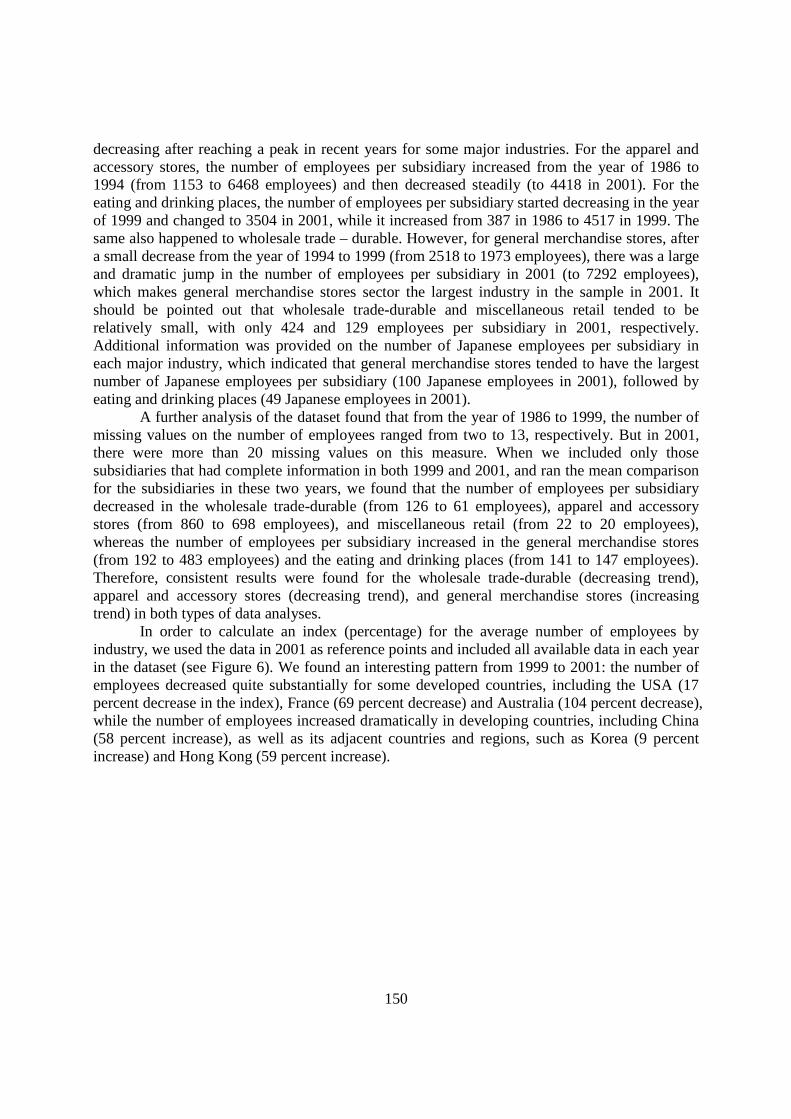
150
decreasing after reaching a peak in recent years for some major industries. For the apparel and accessory stores, the number of employees per subsidiary increased from the year of 1986 to 1994 (from 1153 to 6468 employees) and then decreased steadily (to 4418 in 2001). For the eating and drinking places, the number of employees per subsidiary started decreasing in the year of 1999 and changed to 3504 in 2001, while it increased from 387 in 1986 to 4517 in 1999. The same also happened to wholesale trade – durable. However, for general merchandise stores, after a small decrease from the year of 1994 to 1999 (from 2518 to 1973 employees), there was a large and dramatic jump in the number of employees per subsidiary in 2001 (to 7292 employees), which makes general merchandise stores sector the largest industry in the sample in 2001. It should be pointed out that wholesale trade-durable and miscellaneous retail tended to be relatively small, with only 424 and 129 employees per subsidiary in 2001, respectively. Additional information was provided on the number of Japanese employees per subsidiary in each major industry, which indicated that general merchandise stores tended to have the largest number of Japanese employees per subsidiary (100 Japanese employees in 2001), followed by eating and drinking places (49 Japanese employees in 2001).
A further analysis of the dataset found that from the year of 1986 to 1999, the number of missing values on the number of employees ranged from two to 13, respectively. But in 2001, there were more than 20 missing values on this measure. When we included only those subsidiaries that had complete information in both 1999 and 2001, and ran the mean comparison for the subsidiaries in these two years, we found that the number of employees per subsidiary decreased in the wholesale trade-durable (from 126 to 61 employees), apparel and accessory stores (from 860 to 698 employees), and miscellaneous retail (from 22 to 20 employees), whereas the number of employees per subsidiary increased in the general merchandise stores (from 192 to 483 employees) and the eating and drinking places (from 141 to 147 employees). Therefore, consistent results were found for the wholesale trade-durable (decreasing trend), apparel and accessory stores (decreasing trend), and general merchandise stores (increasing trend) in both types of data analyses.
In order to calculate an index (percentage) for the average number of employees by industry, we used the data in 2001 as reference points and included all available data in each year in the dataset (see Figure 6). We found an interesting pattern from 1999 to 2001: the number of employees decreased quite substantially for some developed countries, including the USA (17 percent decrease in the index), France (69 percent decrease) and Australia (104 percent decrease), while the number of employees increased dramatically in developing countries, including China (58 percent increase), as well as its adjacent countries and regions, such as Korea (9 percent increase) and Hong Kong (59 percent increase).
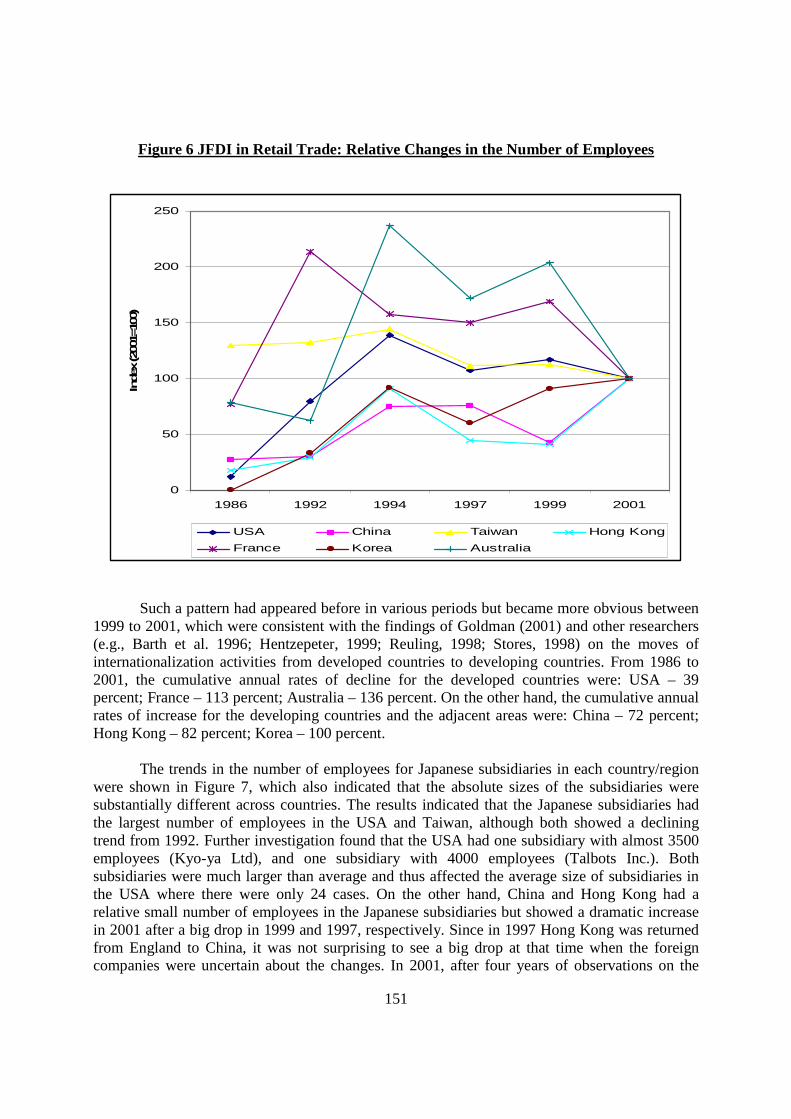
151
Figure 6 JFDI in Retail Trade: Relative Changes in the Number of Employees
Such a pattern had appeared before in various periods but became more obvious between
1999 to 2001, which were consistent with the findings of Goldman (2001) and other researchers (e.g., Barth et al. 1996; Hentzepeter, 1999; Reuling, 1998; Stores, 1998) on the moves of internationalization activities from developed countries to developing countries. From 1986 to 2001, the cumulative annual rates of decline for the developed countries were: USA – 39 percent; France – 113 percent; Australia – 136 percent. On the other hand, the cumulative annual rates of increase for the developing countries and the adjacent areas were: China – 72 percent; Hong Kong – 82 percent; Korea – 100 percent.
The trends in the number of employees for Japanese subsidiaries in each country/region
were shown in Figure 7, which also indicated that the absolute sizes of the subsidiaries were substantially different across countries. The results indicated that the Japanese subsidiaries had the largest number of employees in the USA and Taiwan, although both showed a declining trend from 1992. Further investigation found that the USA had one subsidiary with almost 3500 employees (Kyo-ya Ltd), and one subsidiary with 4000 employees (Talbots Inc.). Both subsidiaries were much larger than average and thus affected the average size of subsidiaries in the USA where there were only 24 cases. On the other hand, China and Hong Kong had a relative small number of employees in the Japanese subsidiaries but showed a dramatic increase in 2001 after a big drop in 1999 and 1997, respectively. Since in 1997 Hong Kong was returned from England to China, it was not surprising to see a big drop at that time when the foreign companies were uncertain about the changes. In 2001, after four years of observations on the
0
50
100
150
200
250
1986 1992 1994 1997 1999 2001
Index
(20
01=10
0)
USA China Taiwan Hong Kong
France Korea Australia

152
development of Hong Kong and rapid growth in China, Japanese firms became optimistic about the future of this emerging market and thus increased employment dramatically.
We summarized the relationships between the changes of the subsidiaries’ total number of employees from 1986 to 2001 and their performance in Table 4. We found: (1) highly significant positive correlations of the number of total employees between one period and the corresponding ones in different periods. This indicated that the size of Japanese subsidiaries tended to be stable; (2) highly significant positive correlations of the performance between one period and the corresponding ones in different periods. This indicated that the performance of Japanese subsidiaries also tended to be stable; and (3) there was no significant correlations between the number of total employees and the performance of the subsidiaries in the same period or across periods. This indicated that the size of Japanese subsidiaries was only a modest predictor of the performance of the subsidiaries, as the signs of the coefficients were positive.
Figure 7 JFDI in Retail Trade: The Number of Employees by Country/Region
Since the capital investment could be considered as another illustration of subsidiaries
size, we summarized the capital investment by countries in Table 5 and the relationships between
0
100
200
300
400
500
600
700
USA
China
Taiw
an
Hong
Kong
Fran
ce
Korea
Austra
lia
All Cou
ntrie
s
Mea
n N
o. o
f E
mp
loye
es
1986 1992 1994 1997 1999 2001

153
subsidiaries’ capital investment from 1986 to 2001 and their performance in those years in Table 6. We found similar conclusions to the above ones made by using the number of total employees as a measure of the subsidiary size.
154
Table 4 JFDI in Retail Trade: Employee – Performance Correlations
Performance - 1986
Employees - 1986
Performance - 1992
Employees - 1992
Performance - 1994
Employees - 1994
Performance - 1997
Employees - 1997
Performance - 1999
Employees - 1999
Performance - 2001
Employees - 1986
0.33
Performance -1992
0.67 0.35
Employees - 1992
0.37 .936(**) 0.16
Performance -1994
0.33 0.37 .770(**) 0.22
Employees - 1994
0.36 .989(**) 0.16 .945(**) 0.19
Performance - 1997
0.00 0.18 .623(**) 0.15 .640(**) 0.14
Employees - 1997
0.35 .937(**) 0.17 .995(**) 0.16 .953(**) 0.12
Performance - 1999
-0.04 0.20 .484(**) 0.18 .476(**) 0.19 .717(**) 0.15
Employees - 1999
0.34 .981(**) 0.17 .960(**) 0.18 .949(**) 0.11 .973(**) 0.15
Performance - 2001
0.06 -0.08 .401(*) 0.11 .400(*) 0.13 .616(**) 0.09 .897(**) 0.09
Employees - 2001
0.18 0.08 0.18 .894(**) 0.27 .849(**) 0.19 .826(**) 0.19 .880(**) 0.20
** Correlation is significant at the 0.01 level (2-tailed).
* Correlation is significant at the 0.05 level (2-tailed).
Table 5 JFDI in Retail Trade: Capital Investment by Countries/regions
Nation in which subsidiary was established
Capital invested in subsidiary (US$) - 1986
Capital invested in subsidiary (US$) - 1992
Capital invested in subsidiary (US$) - 1994
Capital invested in subsidiary (US$) - 1997
Capital invested in subsidiary (US$) - 1999
Capital invested in subsidiary (US$) - 2001
USA Mean 3476000 10994561 8762876 21369310 20237083 19752978 % change 216.30% -20.30% 143.86% -5.30% -2.39% China Mean 2750000 2225752 14333333 8141108 5148920 31443205 % change -19.06% 543.98% -43.20% -36.75% 510.68% Taiwan Mean 3256941 9955426 221382393 43852893 48173794 20056337
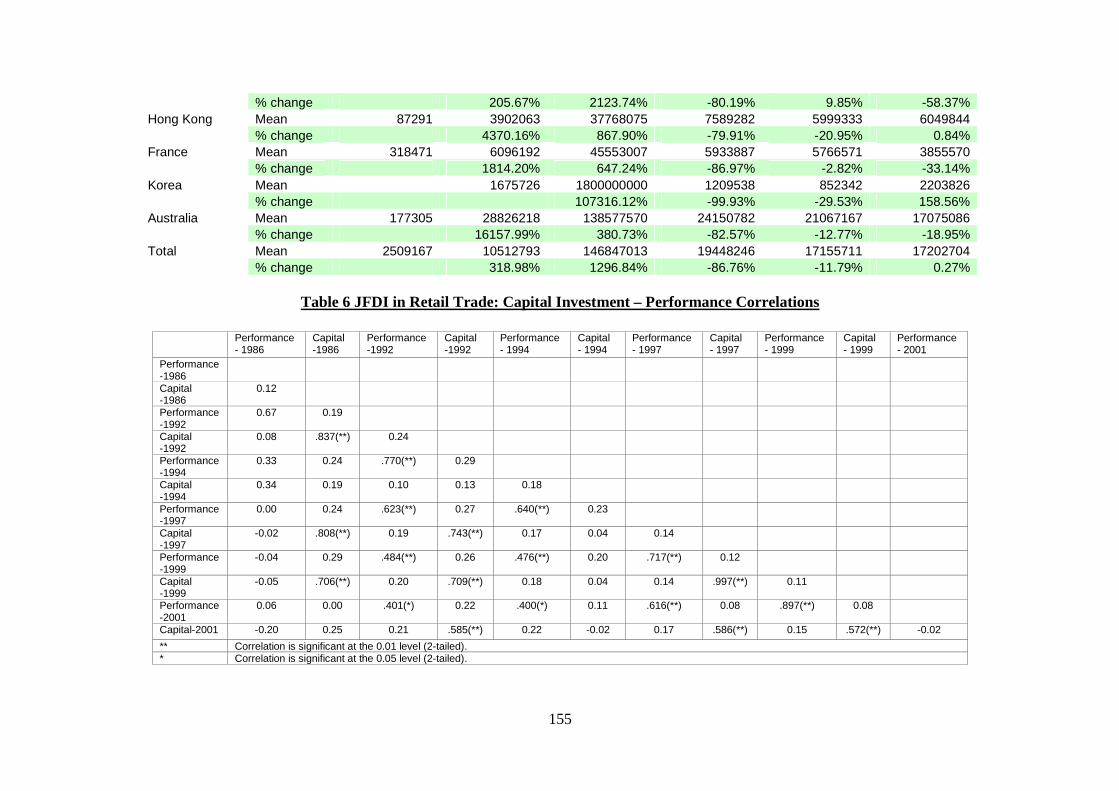
155
% change 205.67% 2123.74% -80.19% 9.85% -58.37% Hong Kong Mean 87291 3902063 37768075 7589282 5999333 6049844 % change 4370.16% 867.90% -79.91% -20.95% 0.84% France Mean 318471 6096192 45553007 5933887 5766571 3855570 % change 1814.20% 647.24% -86.97% -2.82% -33.14% Korea Mean 1675726 1800000000 1209538 852342 2203826 % change 107316.12% -99.93% -29.53% 158.56% Australia Mean 177305 28826218 138577570 24150782 21067167 17075086 % change 16157.99% 380.73% -82.57% -12.77% -18.95% Total Mean 2509167 10512793 146847013 19448246 17155711 17202704 % change 318.98% 1296.84% -86.76% -11.79% 0.27%
Table 6 JFDI in Retail Trade: Capital Investment – Performance Correlations
Performance
- 1986 Capital -1986
Performance -1992
Capital -1992
Performance - 1994
Capital - 1994
Performance - 1997
Capital - 1997
Performance - 1999
Capital - 1999
Performance - 2001
Performance -1986
Capital -1986
0.12
Performance -1992
0.67 0.19
Capital -1992
0.08 .837(**) 0.24
Performance -1994
0.33 0.24 .770(**) 0.29
Capital -1994
0.34 0.19 0.10 0.13 0.18
Performance -1997
0.00 0.24 .623(**) 0.27 .640(**) 0.23
Capital -1997
-0.02 .808(**) 0.19 .743(**) 0.17 0.04 0.14
Performance -1999
-0.04 0.29 .484(**) 0.26 .476(**) 0.20 .717(**) 0.12
Capital -1999
-0.05 .706(**) 0.20 .709(**) 0.18 0.04 0.14 .997(**) 0.11
Performance -2001
0.06 0.00 .401(*) 0.22 .400(*) 0.11 .616(**) 0.08 .897(**) 0.08
Capital-2001 -0.20 0.25 0.21 .585(**) 0.22 -0.02 0.17 .586(**) 0.15 .572(**) -0.02
** Correlation is significant at the 0.01 level (2-tailed). * Correlation is significant at the 0.05 level (2-tailed).
156
JFDI IN RETAIL TRADE: MAJOR COUNTRY/REGION COMPARISO NS BY ENTRY MODE, INDUSTRY AND PERFORMANCE
Four major countries/regions (i.e., the USA, China, Taiwan, and Hong Kong) accounted
for 78 percent of the subsidiaries in the sample. Although China, Taiwan and Hong Kong could be considered together as the Greater-China area, they were quite different in terms of economic development, political and social environment, etc. Therefore, we deemed it more appropriate to have in-depth observations into all four of these countries/regions and compared the similarities and differences on the entry mode, industry and performance of the JFDI in retail trade in these places.
United States of America (USA)
Subsidiaries in the USA represented the largest portion (28%) of JFDI in retail trade in our sample. Overall reported performance put the US subsidiaries in the top-ranked group on the country/region basis in terms of the highest absolute number of subsidiaries (17 subsidiaries) that made profits (i.e., Gain as performance), the highest overall percentage of the number of subsidiaries who were at least breakeven (85%), or the lowest overall percentage of the number of subsidiaries who lost money (15%). The eating and drinking places sector (SIC 58) had the largest number of subsidiaries (14 cases) and also had the largest number of subsidiaries who reported gain in 2001 (10 out of 14 cases, 71%). Wholly owned subsidiary was the dominant entry mode in this industry (11 out of 14 cases, 79%).
Compared with the entry mode in the overall dataset (wholly owned subsidiary: 48 cases, 49% of total cases vs. joint venture: 39 cases, 40% of total cases), JFDI in retail trade in the USA displayed a definite preference for wholly owned subsidiary, with 19 (70%) of the total 27 cases in this mode (vs. five joint ventures and three acquisitions). Nevertheless, as indicated before, eating and drinking places represented 52 per cent of the USA subsidiaries in our sample (14 out of 27 cases), which accounted for the strong preference for wholly owned subsidiary overall. The distribution among entry modes became even after excluding the eating and drinking places from the USA data and became similar to the overall distribution across countries/regions in the sample. No other country displayed such a skewed preference for wholly owned subsidiaries in the eating and drinking places sector. China (Mainland)
The number of subsidiaries in mainland China (18 cases) was the second largest to the number in the USA in our sample. The China subsidiaries reported performance that was also comparable to that reported by the US subsidiaries. In particular, 13 (72%) subsidiaries reported gain in performance, which was even higher than the percentage of the USA subsidiaries (63%) which reported gain. Four subsidiaries (22%) reported loss in performance and one (6%) reported breakeven. Interestingly, similar to the US subsidiaries, the eating and drinking places sector (SIC 58) had the largest number of subsidiaries (10 cases) and also had the largest number of best performers who reported gain in 2001 (9 out of 10 cases, 90%). However, contrary to the pattern

157
of entry mode in the US subsidiaries in this industry, joint venture (9 out of 10 cases, 90%) rather than wholly owned subsidiary (one case, 10%) was the dominant entry mode in this industry. In the eating and drinking places sector, the only one wholly owned subsidiary reported gain in performance, while eight joint ventures reported gain and one reported breakeven. Such observations indicated that seeking Chinese joint venture partners could be worthwhile for Japanese parent companies. Moreover, there was no other reported entry mode in the JFDI in retail trade in China in our sample.
Compared with the entry mode in the overall dataset, JFDI in retail trade in China displayed a definite preference for joint ventures, with 14 of the total 18 cases in this mode (vs. four wholly owned subsidiaries). However, such a preference may be explained by the large percentage (56%) of the eating and drinking places in the sample of China subsidiaries. The distribution among entry modes became even after excluding the eating and drinking places from the China data, similar to the overall distribution across countries/regions in the sample. No other country/region displayed such a skewed preference for joint ventures in the industry of eating and drinking places.
Hong Kong
The performance reported by the Hong Kong subsidiaries was lower than the other major countries/regions in the sample. In particular, only seven of 15 cases (47%) reported gain in performance, which was the smallest number of subsidiaries (either the absolute number or the percentage) reporting gain compared with the other three countries/regions, whereas five (33%) and three (20%) subsidiaries reported breakeven and loss, respectively. The average performance for the 15 Hong Kong subsidiaries was the second lowest (2.27) among the four major countries/regions. The industries with the best performance in 2001 in Hong Kong were wholesale trade-durable, general merchandise stores, and eating and drinking places (eight out of 15 cases, 53%). Their average performance was 2.63.
The distribution of entry mode in this region may not explain the relative poor performance of the subsidiaries. JFDI in retail trade in Hong Kong showed a strong propensity to use wholly owned subsidiaries and joint ventures but no preference between these two modes (both have the same number of subsidiaries – seven cases each). Such a pattern of entry mode is comparable to the overall pattern of distribution in the overall dataset. Moreover, in the overall dataset, the average performance of the wholly owned subsidiary (2.23, n=48) is slightly lower than that of the joint venture (2.44, n=39). For the Hong Kong subsidiaries, a similar pattern was also found between wholly owned subsidiary (2.14, n=7) and joint venture (2.29, n=7). However, the average performance of Hong Kong subsidiaries was slightly below the mean in each of these two modes.
Further investigation indicated that the poor performance may be explained by the performance in the industries of food products, apparel and accessory stores, and furniture stores, which had 33% of the total number of subsidiaries but an average performance only at 1.60 (i.e., not even at a breakeven level). The average performance of apparel and accessory stores (2.00)
158
and furniture stores (1.00) in Hong Kong were substantially lower than the corresponding performance (2.30 and 2.33, respectively) in the overall dataset. Taiwan
The average performance reported by the Taiwan subsidiaries was the lowest (2.25) among the four major countries/regions in our sample, although the number of subsidiaries reported gain in performance (8 out of 16 cases, 50%) was slightly more than that in Hong Kong (7 cases, 47%). The industries with the best performance were industrial machinery, general merchandise stores, automotive dealers and service, and miscellaneous retail, which had a total of seven subsidiaries (44%) and all reported gain in performance.
The distribution of entry mode in the Taiwan subsidiaries, where there were five wholly owned subsidiaries (33%), nine joint ventures (56%), and two capital participation (13%), was comparable to that in the overall dataset. The average performance of these three entry modes were 2.20, 2.11, and 3.00, respectively, the former two of which were both lower than the overall average performance in the overall dataset (2.23 and 2.44, respectively).
Further investigation indicated that the poor performance may be explained by the performance in the industries of wholesale trade-durable, food stores, apparel and accessory stores, and eating and drinking places, which had 56% of the total number of subsidiaries but an average performance of only 1.67 (i.e., not even able to breakeven). The average performance of apparel and accessory stores (2.00) and eating and drinking places (1.50) in Taiwan were substantially lower than the corresponding performance (2.30 and 2.49, respectively) in the overall dataset.
CONCLUSION
The characteristics and performance of JFDI in retail trade as presented in this paper provided insights for countries that want to capture JFDI or other FDI in retail trade and also for companies that want to invest in international retail trade. The patterns of JFDI in retail trade not only varied over time but also varied across countries and/or regions in the performance, entry mode, and industry. Several major conclusions could be drawn from our observations in the data analyses.
First, there was an overall trend for the JFDI in retail trade to move from the developed countries to developing countries. Such an observation was consistent with the pattern proposed in previous research (e.g., Goldman, 2001; Barth et al., 1996; Hentzepeter, 1999; Reuling, 1998; Stores, 1998). Moreover, the observations on performance also provided encouraging prospects of investing in the developing countries/regions, such as China, which had the highest proportion of subsidiaries that reported gain in performance.
Second, there was a modest correlation between subsidiary size and performance, no matter whether the sizes were measured with the number of employees or the amount of capital investment. There were also positive and significant correlations on subsidiary size itself and on
159
performance itself over time. In certain countries/regions, there was a positive and significant correlation between entry mode and performance in certain industries. For example, eating and drinking places performed very well in both the USA and China, but the subsidiaries in the USA were mainly wholly owned and those in China were mainly joint ventures. Therefore, we concluded that there was a positive and significant correlation between wholly owned (joint venture) subsidiaries and good performance in the eating and drinking places in the USA (China).
Third, broadly speaking, JFDI in retail trade mainly focused on the USA and the Greater-China area, the latter of which included China, Hong Kong and Taiwan. For their best interests, these countries and regions should investigate further the characteristics and performance of the JFDI and other FDI in retail trade. Interesting patterns and findings had been observed in this study and provided a starting point for future research. Future research should also investigate why the characteristics and performance varied across these countries/regions and determine what factors led to those different characteristics and performance.
Finally, for companies that want to make FDI in retail trade, this study provided useful information, for example, on the relationship between entry mode, industry and performance in different countries/regions, especially in the USA and the Greater-China area. The USA is still the largest economy entity and the Greater-China area is the fastest growing market in the world. Therefore, these two markets represent the two most important business territories, especially for the international retailers.
160
REFERENCES
Anand, Jaideep & Delios, Andrew (1997). Location specificity and the transferability of downstream assets to foreign subsidiaries. Journal of International Business Studies, Vol. 28, No.3, 579-603.
Barth, Karen, Karch, Nancy J., McLaughlin, Kathleen & Shi, Christiana Smith (1996). Global
retailing. The McKinsey Quarterly, 1, 116-125. Beamish, Paul & Nitsch, D. (1999). A longitudinal analysis of entry mode and performance of
Japanese investments in Europe. In Engelhard, J. and WA. Oechsler (eds), International management: Effects of global changes on competition, Corporate Strategies and Labor Markets (pp. 156-171), Gabler Verlag.
Boddewyn, J.J., Halbrich, M.B. & Perry, A. C. (1986). Service multinationals: Conceptualization,
measurement and theory. Journal of International Business Studies, 17(3), 41-57. Bouquet, Cyril, Hébert, Louis, & Delios, Andrew (2004). Foreign expansion in service industries:
Separability and human capital intensity. Journal of Business Research, 57, 35-46. Brewer, T.L. (1993). Government policies, market imperfections, and foreign direct investments.
Journal of International Business Studies, 24(1), 101-120. Cao, Lanlan & Dupuis, Marc (2010). Strategy and Sustainable Competitive Advantage of
International Retailers in China. Journal of Asia-Pacific Business, 11:6-27, 6-27. Drabek, Z. & Payne, W. (2001). The impact of transparency on foreign direct investment.
Working Paper ERAD-99-02, World Trade Organization, Geneva, Switzerland. Edstrom, A & Galbraith, JR. (1977). Transfer of managers as a coordination and control strategy
in multinational organizations. Administrative Science Quarterly, 22, 248-261. Fan, C. Cindy & Lu, Jiantao (2011). Foreign Direct Investment, Migration and Locational
Factors in China, 1985-1997. Asian Geographer, Special Issue: Regional Development in China, 79-99.
161
Gao, Zhicun & Tisdell, Clem (2008). Foreign Investment and Asia’s, Particulary China’s, Rise in the Televeision Industry: The International Product Life Cycle Reconsidered. Journal of Aisa-Pacific Business, 6:3, 37-61.
Goldman, Arieh (2001). The transfer of retail formats into developing economies: The example
of China. Journal of Retailing, 77, 221-242. Hentzepeter, Vincent (1999). Central Europe: The battlefield of food retail. Elsevier Food
International, 4 (October), 46-55. Hill C.W., Hwang P, & Kim W.C. (1990). An eclectic theory of the choice of international entry
mode. Strategic Management Journal, 11, 117-128. Hofstede, Geert (1997). Cultures and organizations: Software of the mind. New York: McGraw
Hill. Hofstede, Geert (2001). Culture’s consequences (2nd ed.). Thousand Oaks, CA: Sage. Kim, Renee B. (2008). Wal-Mart Korea: Challenges of Entering a Foreign Market. Journal of
Asia-Pacific Business, 9:4, 344-357. Kuipers, Pascal (1994). Top Retailers. Elsevier Food International, 4 (October), 15-23. Liu, Yi & Pearson, Cecil (2010). An Empirial Study of the Determinants of Foreign Investment
in China: A Western Australian Perspective. Journal of Asia-Pacific Business, 11:2, 99-120.
Makino, Shige, Beamish, Paul W. & Zhao, Natalie Bin (2004). The characteristics and
performance of Japanese FDI in less developed and developed countries. Journal of World Business, 39, 377-392.
Mooij, Marieke de & Hofstede, Geert (2002). Convergence and divergence in consumer
behavior: Implications for international retailing. Journal of Retailing, 78, 61-69. Nitsch, Detlev, Beamish, Paul W. & Makino, Shige (1995). Characteristics and performance of
Japanese foreign direct investment in Europe. European Management Journal, Vol. 13, No. 3, September, 276-285.
Pan, Yigang (1998). Environmental Risk and Foreign Equity Ownership in Joint Ventures in
China. Journal of Asia-Pacific Business, 2:2, 23-42.

162
Park, Kang H. (2003). Patterns and Strategies of Foreign Direct Investment: the Case of Japanese Firms. Applied Economics, 35:16, 1739-1746.
Reuling, Eddy (1998). Global retailers conquer emerging markets. Elsevier Food International, 3
(May), 21-24. Shiu, Eric Chi-Chung & Dawson, John A. (2002). The Applicability of Cyclical and Conflict
models of Retail Change to Taiwan – A Preliminary Exploration. Journal of Asia-Pacific Business, 4:1, 67-81.
Stores (1998). Global powers of retailing. Section 3, January. Takagi, Seiichiro (2006). China’s Economic and Social Development and the International Scene,
Asia-Pacific Review, 13:2, 27-37. The World Fact Book (2011). Central Intelligent Agency.
https://www.cia.gov/library/publications/the-world-factbook/geos/ch.html. [October, 2011].
Atlas of Global Development (2007). World Bank Publications. Woodcock, C. Patrick, Beamish, Paul W. & Makino, Shige (1994). Ownership-based entry mode
strategies and international performance. Journal of International Business Studies, 25(2), 253-273.

163
DON’T FORGET THE NON-PLATEAED! SOME INSIGHTS ON STRESS, ORGANIZATIONAL CITIZENSHIP BEHAVIORS, AND
COPING
Carrie S. Hurst Tennessee State University
[email protected] Kenneth Kungu
Tennessee State University [email protected]
Phyllis Flott Tennessee State University
ABSTRACT Results of this study extend research on the outcomes of hierarchical and job content plateaus by considering stress and organizational citizenship behaviors (OCBs). Plateaus were positively related to stress and negatively related to OCBs. We also examined differences in coping strategies by incorporating responses from non-plateaued as well as three groups of plateaued employees. Non-plateaued employees reporting higher usage of non-work coping strategies compared to double plateaued employees, shedding some light on how these employees might be successfully avoiding becoming plateaued in their careers. In addition, job involvement and non-work coping strategies were negatively related to stress. Implications of these results for research and practice are also discussed.
INTRODUCTION
The U.S. unemployment rate in March 2012 was 8.3% (www.bls.gov) and it remains unclear when the labor market will improve in any substantial way, leaving many employees who have lost their jobs still searching for employment. In addition to the unemployed, many individuals are also under-employed. For example, marginally attached workers are those who have searched for a job over the past year but not in the preceding 4 weeks and are therefore not included in unemployment figures. The number of marginally attached individuals (2.4 million) increased from 2010-2011, and many of any of these individuals report they are not looking for work because they believe no work is available (www.bls.gov). Another indicator of under-employment involves individuals experiencing plateaus in their careers, which may also be on the rise as a result of the current economic climate.
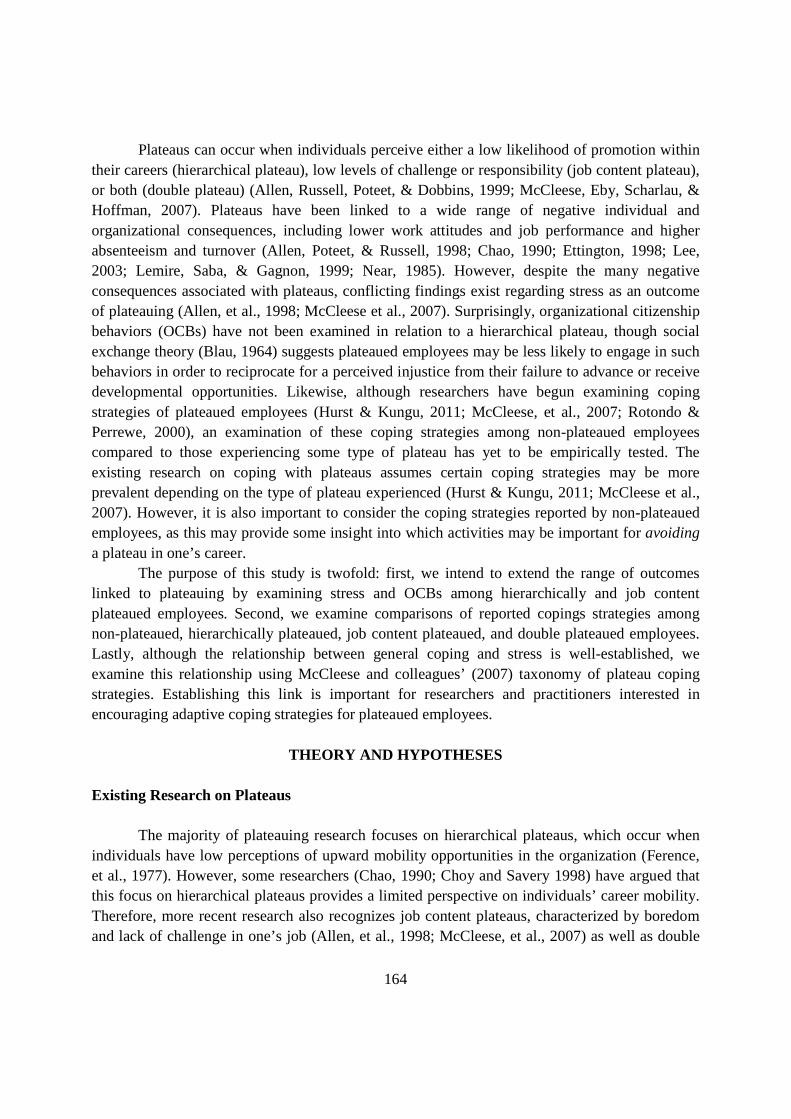
164
Plateaus can occur when individuals perceive either a low likelihood of promotion within their careers (hierarchical plateau), low levels of challenge or responsibility (job content plateau), or both (double plateau) (Allen, Russell, Poteet, & Dobbins, 1999; McCleese, Eby, Scharlau, & Hoffman, 2007). Plateaus have been linked to a wide range of negative individual and organizational consequences, including lower work attitudes and job performance and higher absenteeism and turnover (Allen, Poteet, & Russell, 1998; Chao, 1990; Ettington, 1998; Lee, 2003; Lemire, Saba, & Gagnon, 1999; Near, 1985). However, despite the many negative consequences associated with plateaus, conflicting findings exist regarding stress as an outcome of plateauing (Allen, et al., 1998; McCleese et al., 2007). Surprisingly, organizational citizenship behaviors (OCBs) have not been examined in relation to a hierarchical plateau, though social exchange theory (Blau, 1964) suggests plateaued employees may be less likely to engage in such behaviors in order to reciprocate for a perceived injustice from their failure to advance or receive developmental opportunities. Likewise, although researchers have begun examining coping strategies of plateaued employees (Hurst & Kungu, 2011; McCleese, et al., 2007; Rotondo & Perrewe, 2000), an examination of these coping strategies among non-plateaued employees compared to those experiencing some type of plateau has yet to be empirically tested. The existing research on coping with plateaus assumes certain coping strategies may be more prevalent depending on the type of plateau experienced (Hurst & Kungu, 2011; McCleese et al., 2007). However, it is also important to consider the coping strategies reported by non-plateaued employees, as this may provide some insight into which activities may be important for avoiding a plateau in one’s career.
The purpose of this study is twofold: first, we intend to extend the range of outcomes linked to plateauing by examining stress and OCBs among hierarchically and job content plateaued employees. Second, we examine comparisons of reported copings strategies among non-plateaued, hierarchically plateaued, job content plateaued, and double plateaued employees. Lastly, although the relationship between general coping and stress is well-established, we examine this relationship using McCleese and colleagues’ (2007) taxonomy of plateau coping strategies. Establishing this link is important for researchers and practitioners interested in encouraging adaptive coping strategies for plateaued employees.
THEORY AND HYPOTHESES
Existing Research on Plateaus
The majority of plateauing research focuses on hierarchical plateaus, which occur when
individuals have low perceptions of upward mobility opportunities in the organization (Ference, et al., 1977). However, some researchers (Chao, 1990; Choy and Savery 1998) have argued that this focus on hierarchical plateaus provides a limited perspective on individuals’ career mobility. Therefore, more recent research also recognizes job content plateaus, characterized by boredom and lack of challenge in one’s job (Allen, et al., 1998; McCleese, et al., 2007) as well as double
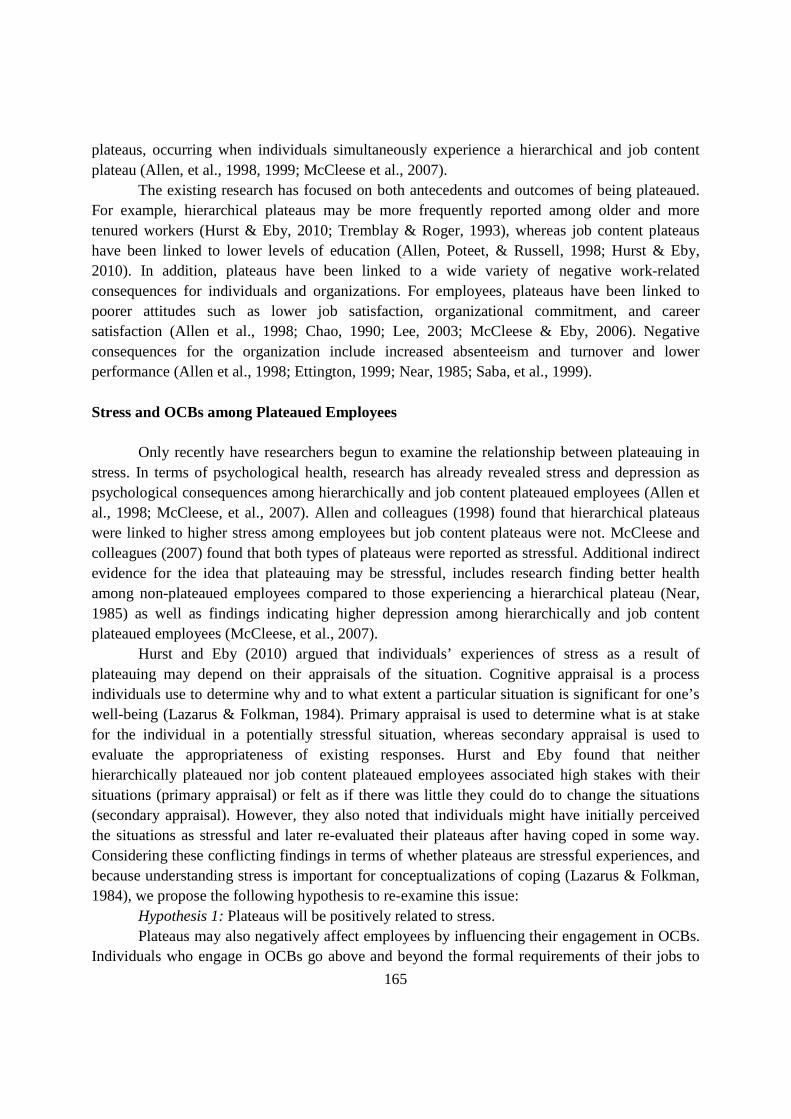
165
plateaus, occurring when individuals simultaneously experience a hierarchical and job content plateau (Allen, et al., 1998, 1999; McCleese et al., 2007).
The existing research has focused on both antecedents and outcomes of being plateaued. For example, hierarchical plateaus may be more frequently reported among older and more tenured workers (Hurst & Eby, 2010; Tremblay & Roger, 1993), whereas job content plateaus have been linked to lower levels of education (Allen, Poteet, & Russell, 1998; Hurst & Eby, 2010). In addition, plateaus have been linked to a wide variety of negative work-related consequences for individuals and organizations. For employees, plateaus have been linked to poorer attitudes such as lower job satisfaction, organizational commitment, and career satisfaction (Allen et al., 1998; Chao, 1990; Lee, 2003; McCleese & Eby, 2006). Negative consequences for the organization include increased absenteeism and turnover and lower performance (Allen et al., 1998; Ettington, 1999; Near, 1985; Saba, et al., 1999). Stress and OCBs among Plateaued Employees
Only recently have researchers begun to examine the relationship between plateauing in
stress. In terms of psychological health, research has already revealed stress and depression as psychological consequences among hierarchically and job content plateaued employees (Allen et al., 1998; McCleese, et al., 2007). Allen and colleagues (1998) found that hierarchical plateaus were linked to higher stress among employees but job content plateaus were not. McCleese and colleagues (2007) found that both types of plateaus were reported as stressful. Additional indirect evidence for the idea that plateauing may be stressful, includes research finding better health among non-plateaued employees compared to those experiencing a hierarchical plateau (Near, 1985) as well as findings indicating higher depression among hierarchically and job content plateaued employees (McCleese, et al., 2007).
Hurst and Eby (2010) argued that individuals’ experiences of stress as a result of plateauing may depend on their appraisals of the situation. Cognitive appraisal is a process individuals use to determine why and to what extent a particular situation is significant for one’s well-being (Lazarus & Folkman, 1984). Primary appraisal is used to determine what is at stake for the individual in a potentially stressful situation, whereas secondary appraisal is used to evaluate the appropriateness of existing responses. Hurst and Eby found that neither hierarchically plateaued nor job content plateaued employees associated high stakes with their situations (primary appraisal) or felt as if there was little they could do to change the situations (secondary appraisal). However, they also noted that individuals might have initially perceived the situations as stressful and later re-evaluated their plateaus after having coped in some way. Considering these conflicting findings in terms of whether plateaus are stressful experiences, and because understanding stress is important for conceptualizations of coping (Lazarus & Folkman, 1984), we propose the following hypothesis to re-examine this issue:
Hypothesis 1: Plateaus will be positively related to stress. Plateaus may also negatively affect employees by influencing their engagement in OCBs.
Individuals who engage in OCBs go above and beyond the formal requirements of their jobs to

166
help the organization (Podsakoff, MacKenzie, Paine, and Bachrach, 2000). OCBs have not been examined to date in relation to plateauing but the negative relationships observed between plateaus and job performance (Allen, et al., 1998; Ettington, 1998; Lemire et al., 1999) indicates employees may reduce their job performance when they feel stifled in their careers. It seems plausible that if plateaued employees are willing to reduce effort for their mandatory tasks at work, they may also be less willing to engage in extra-role behaviors such as OCBs. Career advancement is an important source of motivation (Chay, Aryee, & Chew, 1995; Tremblay, Roger, & Toulouse, 1995) and plateaued employees may not be motivated to exert any extra effort if they do not believe it will be recognized or rewarded. Further, social exchange theory (Blau, 1964), suggests individuals who perceive high-quality relationships with their employers may feel obligated to reciprocate in positive ways. In contrast, if being plateaued is an undesirable career situation and individuals hold their employing organizations at least partly responsible for their career advancement status, they might withhold OCBs as a way to retaliate for some perceived injustice. Based on this logic and rationale, the following hypothesis is proposed:
Hypothesis 2: Plateaus will be negatively related to organizational citizenship behaviors. Coping with Plateaus
Some research has begun to examine coping strategies employees use to deal with the
experience of being plateaued. Rotondo and Perrewe (2000) examined a number of “positive” (e.g., project or team involvement) and “negative denial” coping strategies (e.g., blaming one’s supervisor or organization) among hierarchically plateaued employees. McCleese and colleagues (2007) examined coping by asking employees open-ended questions about their coping strategies and proposed a taxonomy of seven major coping strategies plateaued employees reported using to deal with job content and hierarchical plateaus. These included discussing the problem, job involvement, non-work activities, mental coping, and side work, with some employees reporting doing “nothing” to cope. Results revealed differences in the reported frequency of certain coping strategies based on the type of plateau experienced only for mental coping strategies (e.g., controlling emotions, accepting or ignoring the plateau), with hierarchically plateaued employees reporting greater use of mental coping strategies than job content or double plateaued. However, McCleese and colleagues only reported differences in coping if the difference in reported frequency was greater than 5% using a relatively small sample. We are aware of only one other study to empirically examine coping differences based on the type of plateau experienced. Lentz and Allen’s (2009) study also provided some empirical support for the idea that the effectiveness of coping may depend on the type of plateau experienced. For example, their results revealed that mentoring (a “non-work activity” in McCleese et al.’s taxonomy) may help in coping with a job content plateau but not a hierarchical plateau.
Examining differences in coping strategies based on the type of plateau experienced is important for understanding the activities in which plateaued employees are engaging to manage their unique career experiences. However, considering experiences of those employees who are

167
not plateaued might also shed light on the effectiveness of coping strategies. That is, these employees may hold the key to understanding what might be done to avoid plateaus (Hurst & Kungu, 2011). Plateauing research has considered the experiences of non-plateaued employees in order to draw comparisons on predictors of plateauing as a way to highlight certain demographic characteristics (e.g., age, gender, tenure) that may be helpful for avoiding plateaus (Allen et al., 1998; 1999), but we are aware of no research to date that considers the coping strategies of non-plateaued employees. Therefore, we pose the following exploratory research question:
Research Question 1: Do plateaued and non-plateaued employees differ in their use of coping strategies? Effective coping should eliminate or reduce the negative consequences associated with
plateauing (Hurst & Kungu, 2011). Folkman and Lazarus (1980) defined coping as the thoughts and actions individuals use to manage stressful events. Although it is generally well-accepted that coping should reduce stress, many of the specific coping strategies outlined in McCleese and colleagues’ (2007) taxonomy have not been examined in relation to stress. As the authors note, some of the plateau coping strategies identified by the plateaued participants (e.g., discuss problem, mental coping) may be similar to items on existing coping inventories, other more career-specific forms of coping are not (e.g., job withdrawal, job involvement).
Establishing the relationships between these categories of coping and stress is important in order to shed light on which coping strategies may be most effective for managing plateaus. Job withdrawal includes coping behaviors such as reducing the number of hours worked and avoiding more responsibility (McCleese, et al., 2007). For some plateaued employees, job withdrawal may be the only viable alternative left for dealing with their plateaus. That is, if an employee fails to advance or perceive challenge in their position over an extended period of time, they might cease exerting extra effort or seeking additional responsibilities to reduce the stress experienced from being plateaued. Job involvement includes activities such as training, lateral moves, and increasing job knowledge (McCleese, et al., 2007). This category of coping is consistent with problem-focused coping in that it might be aimed at directly reducing the stressor, itself, rather than emotion-focused forms of coping that reduce the negative emotions resulting from the stressor (Folkman & Lazarus, 1980) and should also be associated with lower stress. Lastly, in addition to the more “novel” categories highlighted by McCleese and colleagues, we also examine non-work activities, as it includes a career-specific coping behavior (mentoring), in addition to more general activities such as exercise and leisure activities (McCleese, et al., 2007). Following this logic and rationale, we make the following prediction:
Hypothesis 3: Plateau coping will be negatively related to stress.
METHOD Participants and Procedure Participants Participants included graduate students from selected programs in two universities in the
168
South-East United States. Participation was solicited from graduate students in Business (MBA), Public Administration (MPA), Psychology (MS, PhD), and Social Work (MSW) in one university and Human Resource Education (MS, PhD) in the other. The graduate programs targeted tend to have a preponderance of their students working full-time. The survey focused on their experiences as employees, not necessarily as students, hence the decision to target a variety of disciplines/fields which may mirror the occupational diversity of employees in any organization. Data was collected via an online survey. Voluntary participation was solicited via an email containing a link to the online survey which was distributed to all graduate students enrolled in the various programs by their respective program coordinators/chairs. To increase the response rate, several reminders were sent to respondents.
A total of one hundred and twenty-three completed surveys were considered usable for this study. The highest proportion of respondents were young adults, 21% of them falling between 25-29 years, and about half (50%) between 25-39 years. Majority reported being female (69%), married (48%), had worked full-time for fifteen or more years (40%), and occupied junior or entry-level positions (52%). Majority also reported having worked in their current position for less than five years (52%) and worked for large organizations or ones with more than two hundred and fifty employees (57%). Measures Hierarchical plateau was assessed using Milliman’s (1992) 6-item scale designed to measure the likelihood of future vertical advancement. The instrument returned a high internal consistency (α. = .94). The measure was anchored on a 5-point Likert-type scale ranging from 1 (strongly disagree) to 5 (strongly agree) such that higher scores indicated greater perceptions of plateauing. Those with scale averages of 4 or above on the hierarchical plateau measure were considered to be hierarchically plateaued, and were coded as thus. Fifty-four percent of the respondents were hierarchically plateaued. Job content plateau was measured using Milliman’s (1992) 6-item scale designed to measure employees perceptions of the likelihood of future challenges and responsibilities in their jobs. The instrument had a high internal consistency (α. = .91). The measure was anchored on a 5-point Likert-type scale ranging from 1 (strongly disagree) to 5 (strongly agree) such that higher scores indicated greater perceptions of plateauing. Those with scale averages of 4 or above on the hierarchical plateau measure were considered to be job-content plateaued, and were coded as thus. Thirty-seven percent of the respondents were job-content plateaued. Double Plateau was considered to be those who had scale averages of 4 or above on both the hierarchical plateau and job content plateau. Thirty-one percent of the respondents were double plateaued. Stress was measured using Cohen, Kamarck, and Mermelstein’s (1983) 4-item Perceived Stress Scale, with modifications in the instructions to capture stress associated with plateaus. Respondents were asked to “keep their career situation in mind” while indicating how often they felt a certain way (e.g., ‘‘In the last month, how often have you felt that you were unable to control the situation’’, α. = .69). Items were measured on a 4-point Likert-type scale ranging from 1 (never) to 4 (very often) such that a higher score indicated greater stress.

169
Organization Citizenship Behaviors (OCB1 & OCBO) were assessed using the 14-item scale developed by William and Anderson (1991). Seven of these items assessed OCBO (e.g., "I take action to protect the organization from potential problems", α. = .71) while the remaining seven assessed OCBI (e.g., "I help others who have been absent", α. = .76). Respondents indicated their level of agreement with each statement on a 5-point Likert-type scale ranging from 1 (strongly disagree) to 5 (strongly agree), with higher scores representing higher incidence of organization citizenship behaviors. Coping Behaviors were assessed by way of a scale developed by the researchers based on the work of McCleese et al., (2007) and Hurst and Kungu (2011). McCleese et al.’s (2007) study on career plateaus invited respondents to report in an open-ended question the strategies they employed to cope with both hierarchical and job content plateaus. A content analysis of those responses revealed seven categories of coping (discuss problem, job withdrawal, job involvement, non-work activities, mental coping, nothing, and side work). Questions were developed to capture each dimension of coping. The questions were subjected to a face and content validity examination by experts in Management and Organization Behavior fields. The experts reviewed the questions for readability and clarity, and they rated how important each coping strategy was for the dimension of coping it was listed under. A total of twenty-five questions were retained in the final scale to assess the seven coping strategies. In this study, only three dimensions of coping were retained for analysis (Job involvement, job withdrawal, and non-work activities) while the rest were dropped due to very low reliabilities. Items within each dimension were dropped if such an action improved the reliability estimate. Whereas the generally accepted lower limit for Cronbach alpha is .70, in exploratory research it may drop to .60 (Hair, Anderson, Tatham, & Black, 1998). This study being an exploratory study, and being the initial use of the scale, dimensions which had an alpha of above .60 or were close to it were used for analysis. Non-work activities coping strategies was measured using a 6-item scale which captured activities pursued outside of the workplace (e.g. “Engaged in physical exercise”, α. = .63). Job involvement was assessed using a 4-item scale which covered coping strategies involving attempts to get more involved at work (e.g. “Increased my job knowledge”, α. = .59). Job withdrawal was measured using two items assessing strategies involving withdrawing from work (e.g. “Avoided taking on more responsibility at work”, α. = .54). Respondents rated how often they used listed strategies on a four-point Likert-type scale ranging from 1 (never) to 5 (almost always). Respondents were also asked to provide demographic information including age, gender, marital status, years of full-time work experience, length in current position, size of the organization and job type.
RESULTS
The means, standard deviations, reliabilities and correlations among variables in this study are shown in Table 1. Hypothesis 1 which suggested that plateaus will be positively related to stress was assessed by correlating both hierarchical plateaus and job content plateau with stress. Hypothesis 1 was only partially supported, as the correlation between stress and hierarchical
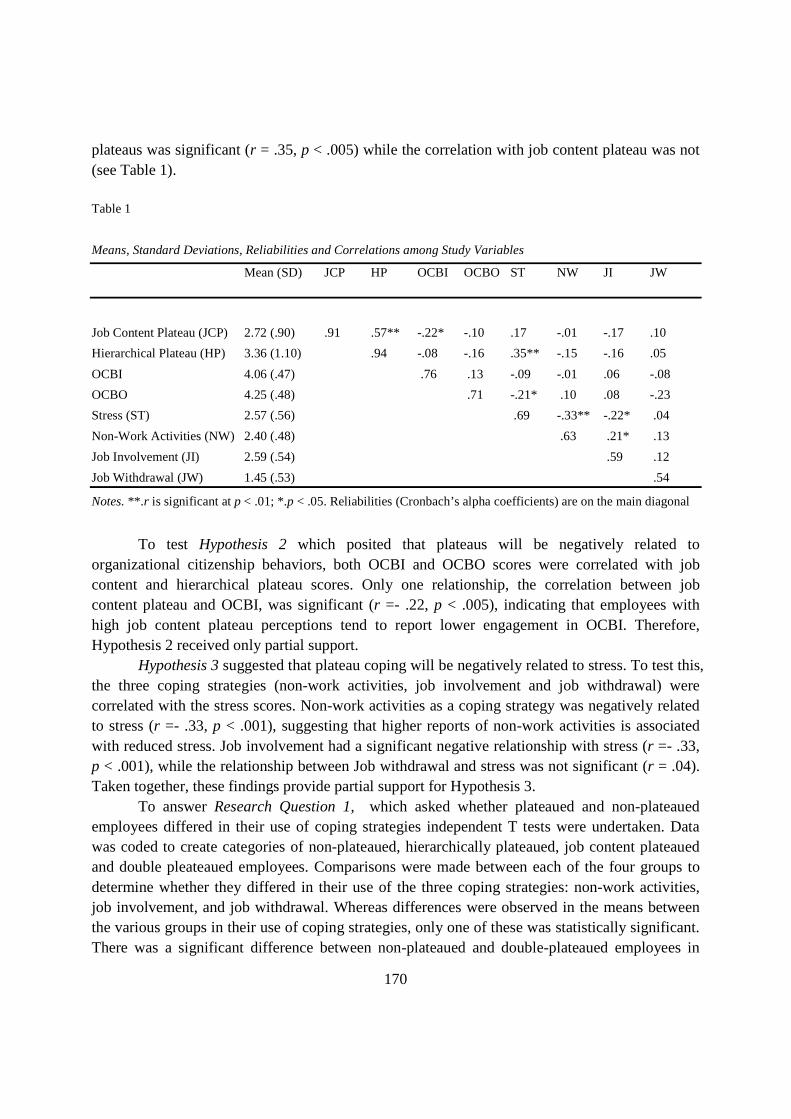
170
plateaus was significant (r = .35, p < .005) while the correlation with job content plateau was not (see Table 1).
Table 1
Means, Standard Deviations, Reliabilities and Correlations among Study Variables
Mean (SD) JCP HP OCBI OCBO ST NW JI JW
Job Content Plateau (JCP) 2.72 (.90) .91 .57** -.22* -.10 .17 -.01 -.17 .10
Hierarchical Plateau (HP) 3.36 (1.10) .94 -.08 -.16 .35** -.15 -.16 .05
OCBI 4.06 (.47) .76 .13 -.09 -.01 .06 -.08
OCBO 4.25 (.48) .71 -.21* .10 .08 -.23
Stress (ST) 2.57 (.56) .69 -.33** -.22* .04
Non-Work Activities (NW) 2.40 (.48) .63 .21* .13
Job Involvement (JI) 2.59 (.54) .59 .12
Job Withdrawal (JW) 1.45 (.53) .54
Notes. **. r is significant at p < .01; *.p < .05. Reliabilities (Cronbach’s alpha coefficients) are on the main diagonal
To test Hypothesis 2 which posited that plateaus will be negatively related to
organizational citizenship behaviors, both OCBI and OCBO scores were correlated with job content and hierarchical plateau scores. Only one relationship, the correlation between job content plateau and OCBI, was significant (r =- .22, p < .005), indicating that employees with high job content plateau perceptions tend to report lower engagement in OCBI. Therefore, Hypothesis 2 received only partial support.
Hypothesis 3 suggested that plateau coping will be negatively related to stress. To test this, the three coping strategies (non-work activities, job involvement and job withdrawal) were correlated with the stress scores. Non-work activities as a coping strategy was negatively related to stress (r =- .33, p < .001), suggesting that higher reports of non-work activities is associated with reduced stress. Job involvement had a significant negative relationship with stress (r =- .33, p < .001), while the relationship between Job withdrawal and stress was not significant (r = .04). Taken together, these findings provide partial support for Hypothesis 3.
To answer Research Question 1, which asked whether plateaued and non-plateaued employees differed in their use of coping strategies independent T tests were undertaken. Data was coded to create categories of non-plateaued, hierarchically plateaued, job content plateaued and double pleateaued employees. Comparisons were made between each of the four groups to determine whether they differed in their use of the three coping strategies: non-work activities, job involvement, and job withdrawal. Whereas differences were observed in the means between the various groups in their use of coping strategies, only one of these was statistically significant. There was a significant difference between non-plateaued and double-plateaued employees in

171
their use of non-work coping strategies. Non-plateaued employees reporting higher usage of non-work coping strategies (M = 2.51, SD = .46) compared to double plateaued employees (M = 2.31, SD = .46), t(86) = 2.10, p < .039.
DISCUSSION Results of this study reveal four important findings. First, hierarchical plateaus, but not
job content, are associated with higher stress. Second, this study expands the outcomes associated with plateauing by revealing a negative relationship between job content plateaus and individually-focused OCBs. Third, differences in coping were noted, with non-plateaued employees reporting more use of non-work coping strategies than double plateaued employees. Lastly, two plateau coping strategies (job involvement and non-work coping) are associated with lower stress. In contrast to McCleese and colleagues’ (2007), the results of the present study found that hierarchical plateaus were positively related to stress but job content plateaus were not. However, our findings are consistent with the results of Allen et al.’s (1998) study, which also found that hierarchical plateaus may be more stressful than job content. One possible explanation for McCleese et al.’s conflicting findings is that because their sample focused solely on plateaued employees, they compared plateaued employees’ stress to normative data on stress experienced by working adults. While their research indicated that job content plateaued employees’ stress was higher than that experienced in the general population, it might not be high enough to warrant concern for employers. On the other hand, it is also possible that job content plateaued employees are finding other ways to cope and reduce stress beyond the strategies examined here. In order to address this possibility, future research should also explore coping strategies such as discussing the problem and mental coping (McCleese et al., 2007) in relation to job content plateaus. In addition, longitudinal work is warranted to address the causal relationships among plateaus, stress, and coping. In terms of OCBs, the finding that job content plateaus were negatively related to individually-focused forms of OCBs is consistent with research revealing a negative relationship between plateauing and job performance (Allen, et al., 1998; Ettington, 1998; Lemire et al., 1999). Interestingly, hierarchical plateaus were not significantly related to OCBs. While speculative, it may be that individuals who are bored with and unchallenged by their jobs (i.e., job content plateaued) intentionally withhold helping behaviors aimed at assisting their coworkers as a way to retaliate for their boredom. Alternatively, it is possible that individual-focused forms of OCB are a cause, rather than a consequence, of job content plateaus. In other words, it could be that by assisting coworkers, some employees are able to avoid becoming job content plateaued. Perhaps doing so adds to the level of challenge or responsibility experienced in their careers. The findings of the present study add to the literature by identifying a link between OCBs and job content plateaus. However, because we are unable to draw conclusions about causality, future models of plateauing should incorporate OCBs to further explore their role in the experiences of job content plateaued employees.

172
Non-plateaued employees reported more use of non-work coping strategies than double-plateaued employees. This finding is important because, to date, the literature has only included a focus on how plateaued employees cope with their career stagnation. However, understanding the actions of non-plateaued employees may provide a more complete picture of stress and coping in relation to career advancement, as this group of employees have been successfully able to avoid a plateau. In this case, non-plateaued employees endorsed engaging in activities such as engaging in physical exercise or leisure activities, spending time with friends and family, relaxing, pursuing stress management education, and mentoring others. Overall, these activities reflect very general forms of coping aimed at helping employees decompress away from their work lives. On the other hand, mentoring others might help employees with their career development in a more career-oriented way. In McCleese and colleagues’ (2007) study, employees who reported use of this coping strategy mentioned mentoring relationships undertaken informally and outside of the workplace. Though this might not be considered a “job-involvement” form of coping, the leadership skills gained from such a relationship could still transfer back to the workplace, potentially reducing the likelihood of hierarchical plateauing. Likewise, mentoring a young adult in one’s free time could add to an individual’s perceptions of challenge and responsibility, reducing the likelihood of experiencing job content plateaus. Moreover, in addition to extending the scope of plateauing research by incorporating non-plateaued employees’ coping responses, the finding that non-work activities were associated with less stress suggests the need for further studies to investigate the reasons behind this dynamic and also investigate its potential as an effective coping strategy. The finding that job involvement and non-work coping strategies were associated with lower stress is consistent with decades of research on the role of coping in reducing stress (e.g., Folkman & Lazarus, 1980; Judge, Thoresen, Pucik, & Welbourne, 1999; Lazarus & Folkman, 1984; Pearlin & Schooler, 1978). It is also consistent with the small but growing body of research indicating that coping may help reduce negative consequences among plateaued employees. For example, Rotondo and Perrewe (2000) found that positive activities coping strategies were associated with more positive attitudes and higher perceived job performance than negative denial coping responses. However, stress was not examined in their study. We encourage future research to explore the full range of plateau coping strategies in relation to stress in order to assist researchers and practitioners in their efforts to recommend adaptive coping strategies for plateaued employees. Implications for Practice and Research
Coping workshops (e.g., Rowe, 1999) addressing job involvement and non-work coping strategies could be developed to aid employees in understanding the options available both within and outside the work environment. This could assist in encouraging constructive forms of coping since Elsass and Ralston (1989) describe a number of negative coping strategies that could have serious consequences for organizations if frustrated employees select them. For example, the authors argue that plateaued employees might lower their performance or abuse alcohol or drugs if they see no other positive alternatives for dealing with their plateau. Increasing the awareness and availability of positive forms of coping may help prevent negative coping.

173
In addition, the present study highlights the importance for future research on coping with plateaus to consider the experiences of not just those who are plateaued, but also non-plateaued employees. These employees have successfully avoided plateaus and their experiences may provide valuable insight into the full range of coping strategies available to employees. Therefore, researchers should continue to maintain distinctions between hierarchical, job content, and double plateaus, but also incorporate experiences of non-plateaued employees. Areas for Future Research In order to fully understand why hierarchical plateaus are associated with higher stress than job content plateaus, future research should identify the information plateaued employees use to appraise a plateau as stressful (Hurst & Eby, 2010). In other words, for those who do find the experience stressful, are their appraisals based on their own personal career image, external pressures, concerns about future earning potential and external marketability, etc.?
Some researchers have argued that plateaus are not always a negative experience for employees. For example, McCleese and Eby (2006) found that job content plateaued employees were less negatively impacted by plateauing when role ambiguity was low. Additional research is needed examining the boundary conditions of plateauing. There may be other characteristics of individuals work or home environment that lessen the negative impact of plateauing. For example, individuals experiencing plateaus early in their careers might report higher stress than those who plateau later in their careers. Likewise, individuals caring for young children or aging parents might view a plateau in a positive light if it allows them the opportunity to focus more on family responsibilities. Limitations and Conclusion Several limitations to the findings of this study are worth noting. First, the sample in the present study was comprised of individuals pursuing graduate education, which may raise concerns regarding the generalizability of findings. However, the fact that slightly less than half had worked full-time for more than fifteen years makes their perspectives important for anyone studying career plateaus. That said, future research should still attempt to confirm findings of this study among a group of employees representing a wider range of occupations.
A second set of limitations involves the research design, which relied on cross sectional data and the self-report measures. This type of design leads to concerns about common method bias and reverse causality. The contrasting relationships between stress and OCBs for hierarchical and job content plateaued employees provide some evidence that the observed relationships were not simply a function of common method bias, but as noted earlier, additional research is warranted before drawing any firm conclusions about causality.
Thirdly, measures for coping strategies reported less than ideal reliability estimates. Hence the results from that section of the study should be interpreted with caution. While this study is the first undertaking to develop theoretically-driven items derived from the literature on employees own accounts of coping, future research should focus on developing more robust measures of the coping strategies among a large, diverse sample of plateaued employees.
Despite these limitations, the findings of this study address important gaps in the literature by expanding the range nomological network of variables considered in relation to experiencing a

174
plateau and by considering non-plateaued employees’ experiences with respect to coping. This is important for both researchers and managers who are interested in assisting employees in dealing with their unique career experiences and understanding the role coping may play in either coping with or preventing plateauing.

175
REFERENCES Allen, T. D., Russell, J. E. A., Poteet, M. L., & Dobbins, G. H. (1999). Learning and
development factors related to perceptions of job content and hierarchical plateauing. Journal of Organizational Behavior, 20: 1113-1137.
Allen, T. D., Poteet, M. L., & Russell, J. E. A. (1998). Attitudes of managers who are more or less career plateaued. Career Development Quarterly, 47: 159-172.
Arthur, M. B., & Rousseau, D. M. (1996). The boundaryless career: A new employment principle for a new organizational era (pp. 237-255). New York: Oxford University Press.
Blau, P. M. (1964), Exchange and Power in Social Life. New York: John Wiley. Bureau of Labor Statistics (2011). http://www.bls.gov/ Retrieved from web 4/4/2012. Chao, G. T. (1990). Exploration of the conceptualization and measurement of career plateau: A
comparative analysis. Journal of Management, 16: 181-193. Chay, Y. W., Aryee, S., & Chew, I. (1995). Career plateauing: Reactions and moderators among
managerial and professional employees. The International Journal of Human Resource Management, 6: 61-78.
Choy, M. R. & Savery, L. K. (1998). Employee plateauing: Some workplace attitudes. Journal of Management Development, 17: 392-401. Cohen, S., Kamarck, T., & Mermelstein, R. (1983). A global measure of perceived stress.
Journal of Health and Social Behavior, 24: 386-396. Ettington, D. R. (1998). Successful career plateauing. Journal of Vocational Behavior: 52, 72-88. Ference, T. P., Stoner, J. A., & Warren, E. K. (1977). Managing the career plateau.
Academy of Management Review, 602-612. Folkman, S., & Lazarus, R. (1980). An analysis of coping in a middle-aged community sample.
Journal of Health & Social Behavior, 21: 219-239. Hurst, C. S., & Eby, L. T. (2010). Plateaus and appraisal: Characteristics and experiences of
plateaued employees. Journal of Knowledge & Human Resource Management, 2: 10-19. Hurst, C. S., & Kungu, K. (2011). Coping effectiveness: Differential predictions for plateaued
employees. Journal of Knowledge & Human Resource Management, 3: 38-46. Judge, T. A., Thoresen, C. J., Pucik, V., & Welbourne, T. M. (1999). Managerial coping with
organizational change: A dispositional perspective. Journal of Applied Psychology, 84: 107-122.
Lazarus, R. & Folkman S. (1984). Stress, appraisal, and coping. New York: Springer Publishing Company.
Lemire, L., Sada, T., & Gagnon, Y. C. (1999). Managing career plateauing in the Quebec public sector. Public Personnel Management, 28: 375-391.
Lee P. C. B. (2003). Going beyond career plateau. Journal of Management Development, 22: 538-551.
McCleese, C. S., & Eby, L. T. (2006). Reactions to job content plateaus: Examining role ambiguity and hierarchical plateaus as moderators. Career Development Quarterly, 55(1): 64-76.

176
McCleese, C. S., Eby, L. T., Scharlau, E. A., & Hoffman, B. H. (2007). Hierarchical, job content, and double plateaus: A mixed-method study of stress, depression, and coping responses. Journal of Vocational Behavior, 71: 282-299.
Milliman, J. F. (1992). Causes, consequences, and moderating factors of career plateauing. Unpublished doctoral dissertation. University of Southern California.
Near, J. P. (1985). A discriminant analysis of plateaued versus nonplateaued managers. Journal of Vocational Behavior, 26: 177-188.
Pearlin, L., & Schooler, C. (1978). The structure of coping. Journal of Health and Social Behavior, 19: 2-21.
Podsakoff, P. M., MacKenzie, S. B., Paine, J. B., & Bachrach, D. G. (2000). Organizational citizenship behaviors: A critical review of the theoretical and empirical literature and suggestions for future research. Journal of Management, 26: 513-563.
Rotondo, D. M., & Perrewe, P. L. (2000). Coping with a career plateau: An empirical examination of what works and what doesn’t. Journal of Applied Social Psychology, 30: 2622-2646.
Rowe, M. M. (1999). Teaching health-care providers coping: Results of a two-year study. Journal of Behavioral Medicine, 22: 511-527.
Tremblay, M., & Roger, A. (1993). Individual, familial, and organizational determinants of career plateau: An empirical study of the determinants of objective and subjective career plateau in a population of Canadian managers. Group & Organization Management, 18: 411-435.
Tremblay, M., Roger, A., & Toulouse, J. (1995). Career plateau and work attitudes: An empirical study of man. Human Relations, 48: 221-236.
177
A STRATEGIC APPROACH TO INTERNATIONAL TRAINING: A CONTINGENCY BASED GLOBAL TRAINING MODEL
David O. Hartman
Quinnipiac University [email protected]
Mohammad N. Elahee Quinnipiac University
ABSTRACT
Training issues are complex regardless of the size or location of the actors involved. As firms make their way up the ladder of internationalization, the contextual nature of training as well as the limitations of its generalizability can inhibit its effectiveness in sharing between the various organizational sub-units, particularly those with different national cultures. In light of this, a model matching appropriately designed training regimens with the suitable type of international business operation is proposed in this paper. A number of propositions are also drawn from the model. The paper concludes with a discussion of the implications of the model and possible future research.
Key words: training, international business, strategy
1. INTRODUCTION
Concurrent with globalization and technological advancements, business firms all over the world, and particularly in the US, have been experiencing increased challenges emanating from radical changes in their organizational structure and operations. Notable among these changes are increased outsourcing, and consequently, transfer of US jobs to other countries; greater reliance on sub-contractors; shorter product life cycle requiring continuous development of new products and ideas; higher and more frequent use of temporary workers than before; emergence of flexible work hours etc., just to name a few. Such changes call for a critical examination of how business firms manage their human resource management (HRM) policies and practices, which are considered key to ensuring competitive advantages of a firm (Bartlett &Ghoshal, 1989).
178
While HRM constitutes a number of inter-related activities that have been widely studied over the past 50 years, this paper is concerned with training, which is one of the most important HRM functions. Over the past few decades, US based multinational enterprises (MNEs) have made significant changes in their HRM practices partly to respond to the aforementioned challenges and also to remain viable and ahead of the curve in the face of stiff competition from firms in other countries. As a key component of HRM, managerial training has received a great deal of attention from researchers as well as practitioners. Indeed, following Taylor, Beechler and Napier (1996), it can be argued that MNEs can enhance their international competitiveness by developing a proper training method that would enable transferring their organizational competencies across their global operations. We further argue that training, in addition to being an effective tool for sharpening managerial skillsets, is also a vehicle for instilling corporate culture among the workforce scattered around the globe. Moreover, increased regulations on various issues ranging from employment discrimination to workplace safety require training on a constant basis to keep managers and employees informed about new statutes and regulations in the home as well host countries. Last, but not least, in this age of job-hopping and off-shoring, training can be an enticing means for attracting, developing and retaining an effective workforce. It is generally believed that HRM practices are quickly diffused and widely accepted by MNE subsidiaries located around the globe. Subramony (2006) however challenges this traditional wisdom and shows that HRM practices do not enjoy a high rate of adoption. Parry, Dickmann and Morley (2008) also report that US MNEs often fail to transfer their HRM practices to their subsidiaries. Given such evidence of the low success rate of transfer of HRM practices across subsidiaries coupled with the emergence of a fast changing work environment characterized by uncertainties, a crucial question for MNEs is how to design and deliver effective training than can enhance the competitiveness of the firm. While the nature and effectiveness of different types of corporate training programs in raising employee morale motivation and satisfaction have been widely studied for the past 50 years (Delaney & Huselid, 1996; Huselid, 1995), not much is known about whether the advent of global business may have changed the context in which training is viewed and discussed. The quality of HRM in the international arena is, in many cases, considered even more important than in domestic operations (Tung, 1984). Existing literature documents a direct link between training and financial performance (Guest, Michie, Conway & Sheehan, 2003; Wood & de Menezes, 1998) as well as organizational performance (Heery & Noon, 2001; Pfeffer & Salancik, 1978). Training, therefore, should also be examined from the viewpoint of corporate strategy. Given the nature of the current business environment characterized by constant change and unpredictability, this paper argues for a contingency approach to training. Utilizing a strategic role model of international subsidiaries in MNEs proposed by Bartlett and Ghoshal (1986) along with a model of Strategic International Human Resource Management (SIHRM) devised by Taylor et al. (1996) as a proxy for training complexity, this paper offers a new model which features a contingency approach to international training. The proposed approach is based on the premise that the type of training employed by a particular MNE subsidiary unit should be
179
based upon the strategic position which the unit occupies within the range of the MNEs international operations. This paper links various concepts of international human resource management (IHRM) propagated by Schuler, Dowling & DeCieri, (1993) and Taylor et al., (1996) as well as strategic human resource management (SHRM) with training. It should be noted here that an IHRM system is a set of distinct activities, functions and processes that are directed at attracting, developing and maintaining an MNE’s human resources- it manages people both at home and overseas (Lado & Wilson, 1994; Schuler et al., 1993). SHRM on the other hand, explicitly links HRM with the strategic management processes of the organization and emphasizes coordination or congruence among the various HRM practices (Schuler & Jackson, 1987). The remainder of the paper is organized as follows. In Section 2, a review of the relevant IHRM literature is presented to set the context for the discussion of training, which is the main thrust of this paper. This is followed by a critique of the current models in Section 3. This is followed by a comparison of different models with the proposed model. In section 4, a new contingency approach based model is presented from which a series of propositions are drawn and proposed. In the concluding section, managerial and research implications of the model as well as its limitations are discussed.
2. LITERATURE REVIEW
Managerial training is a widely researched topic within the field of human resource management as evidenced by a large body of literature available on the topic. We find three traditions within this area: writing of text and trade books, usually written with a normative approach; case studies, which are usually descriptive in nature, illustrating the challenges of training by highlighting a particular firm or situation; and finally, research papers published in academic journals. Several strands can also be found within the tradition of research papers such as conceptual work, prescriptive models, empirical analysis of extant frameworks, etc. Since the current paper belongs to the third tradition, this section mainly reviews the seminal work published in academic journals. A review of relevant literature reveals two recurring schools of thought in the study of IHRM practices: the Rationalist School of thought and the Institutional School of thought. While documenting the various facets of these two schools of thought, Adeleye (2011) emphasizes the need for combining various approaches found within these schools of thought by MNEs. MNEs and Training Within the IHRM literature, we find a large body of work on training. In their seminal work, Schuler et al. (1993) identified four factors endogenous to MNEs which influence SIHRM and hence training:
1) organizational competitive strategy ( Dowling/Schuler, 1990; Schuler/Jackson, 1987)

180
2) headquarters international orientation (Heenan/Perlmutter, 1979) 3) organizational structure (Dowling, 1989; Brewster/Hegewisch, 1994) 4) experience in international business (Dowling, 1989)
Previous researchers (Heskett, Jones, Loveman, Sasser & Schlesinger, 1994; Goldstein, 2003) have provided a theoretical framework which links training, as a part of SHRM, with employee development, as well as the employees’ and the firm’s performance. Since SIHRM attempts to squarely place IHRM in a strategic context (Schuler et al., 1993), this paper links international training systems with strategy. Specifically, this paper links the international training aspect of SIHRM as presented by Taylor et al. (1996), with the typology model of the strategic roles of MNE subsidiary units of Bartlett and Ghoshal (1986) in order to highlight the varying needs and abilities which these units have regarding training needs and capacities. This linkage will highlight the varying training needs and capacities of the international presence of an MNE and will support the case for a contingent approach when devising and providing training throughout an international organization. Training Issues and Functions in MNEs De Cieri & Dowling (1997) presented a typology of training types for MNEs at various stages of their international business development which is presented below as Table I. Table I – Functions and HRM (Training) Issues in Multinational Enterprises Structural Forms and Modes of HRM (Training) Issues and Internationalization Functions Export Limited Training Roles or Issues Establishment of sales subsidiaries Major issue: Staffing with foreign branch offices PCNs or HCNs Establishment of foreign production Major issue: Technology & Management knowledge Transfer to HCNs Global product or area division by Major issue: Fully product standardization or developed training diversification in subsidiaries Transnational (matrix or mixed Complex issues including Structure) the use of TCNs Cooperative ventures Major issues: Evaluation
181
& promotion of managers; Corporate loyalty Inter-organizational networks Major issues: Increased Complexity; Equity issues The benefit of this typology is that it matches HRM (training) behaviors with strategic activities associated with varying degrees of sophistication with regard to international business. When a firm is only involved in exporting to foreign markets, these business issues do not require much in the way of HRM beyond what is provided for the purely domestic business of the firm. When the firm begins to establish foreign operations, then the HRM issues change and can be thought of as IHRM issues. For example, should the firm staff the foreign operation with parent company nationals (PCN) or host country nationals (HCN)? A transnational approach typically involves a multidimensional, matrix structure, although clumsiness and bureaucracy associated with matrix structures has led to an emphasis on inter-unit networking (Ghoshal & Bartlett, 1990). It requires complex IHRM strategies and practices, particularly with regard to staffing international operations. Cooperative ventures, including licensing agreements, strategic alliances and joint ventures, involve issues such as management of corporate loyalty (Hendry 1994). De Cieri & Dowling’s (1997) typology is a useful matching of function with training from an international business perspective. However, it does seem to lack specificity regarding the manner in which different foreign operations interact with head office (and each other) in terms of their HRM or training needs. For example, a particular subsidiary may have in fact reached the status of a Global Product Manager and will require a fully developed HRM. A question that may be fairly asked at this juncture is should the HRM be a stand-alone variety or should it be developed in an interdependent fashion with other strategically important subsidiaries and head office? It would seem that a globally important sub-unit should provide organizational learning to other locations of the organization if the organization is really to gain the greatest advantages of its global presence. Thus, there is a latent need for a more appropriate strategic role-training model, which this paper proffers in a later section. International Training Systems- Convergence or Divergence? At the present time, many aspects of training are based on a convergence toward the US model since written training materials are expensive to produce locally for relatively small markets (Han-Sui Chow, 1995). A consequence of this convergence is that there is a trend toward instructional programs being developed and presented by individuals who are not members of the target culture. These instructional programs and techniques, however, may not be effective cross-culturally because every culture has its own specific expectations about appropriate instructor behaviors and delivery methods (Burba, Petrosko & Boyle, 2001). Han-Sui Chow (1995) and Thornhill (1993) among others, have found that when a training program is

182
written or delivered by someone who is not a member of the population that will receive it, the program must be adapted to the target audiences and their cultures. The adaptation has to be made to conform to the client’s culture and not the other way round (Burba et al., 2001). Viewed from this point-of-view, it would seem that basic cultural differences exist globally that have sufficient strength to prevent training convergence to any single type anytime in the near future. If the international business goal of an organization is to reach the transnational business model, where it is the quality of the idea which is paramount and not the country of origin, then it would be reasonable to assume that trans-national training should also be governed by these strictures. That is, training elements should be utilized from the breadth of a firm’s international operations which would then ultimately combine in a kind of universal training manual. However, although training elements from different locations may be used throughout a firm’s international operations, this does not mean that every subsidiary is in a strategic position to offer training to every other subsidiary. Certain subsidiaries may have roles which are highly interdependent with the head office in a technology developing role while other operations occupy the role of low cost manufacturer and do not have the human resources to become involved at a more strategic level (Bartlett & Ghoshal, 1986). Indeed, it would seem reasonable to expect subsidiaries which have similar technological or strategic levels would have similar training needs and could benefit the most by some sort of interchange. If competitive strategies depend upon similar behaviors regardless of location of operation, then units pursuing similar strategies are likely to benefit by exchanging information on their HR (training) policies and practices (Schuler et al., 1993). In this situation, having some units serve as creators of knowledge, thus becoming benchmarks for the other units in specific practices, may serve to benefit all units (Pucik, 1992). As a consequence, there would be certain training leaders which would create training practices for other units with similar strategic interests. However, units which are closely involved in developing particular technologies or marketing programs together will be involved in sharing information on an interdependent basis. Units of MNEs that are pursuing the same competitive strategy will have more mechanisms to share and transfer their learning across units than those which are pursuing different competitive strategies (Schuler et al. 1993). Thus, it should not be surprising to see a situation where interdependent units jointly develop training protocols to benefit their shared business strategy even though they cross national or cultural boundaries. At the same time, it is possible that some units are more passive in their strategic position in the MNE and their principal focus is to produce products efficiently which are devised by some other unit (Bartlett & Ghoshal, 1986). These units would be more likely to accept training devised at head-quarters and provide it to its employees with limited or even little adaptation to its national and cultural circumstance. Although, this type of training may not be the most suitable for the intended employees, strategic concerns with costs may be the primary factor regarding this approach. Thus, it is not necessarily the national or cultural circumstance which primarily influences the type of training system which a MNE may adopt, but it may instead be a particular unit’s

183
strategic role which will influence the type of training which it adopts or has influence over. This is not to negate that cultural differences between BUs may significantly impact SIHRM or training practices. Indeed, a number of scholars have studied this issue (Black, Gregersen & Mendenhall, 1992; Brewster & Hegewisch, 1994) and have come to the conclusion that culture is an important issue when devising SIHRM or training practices. This paper, however, argues that the prime motivating factor for the types of training provided by an organization should be based on the organization’s strategic goals and the manner in which it utilizes its global operations to achieve these goals and not the ease or expense incurred in devising and providing said training. Therefore, if two BUs are interdependent with one another, their training regimens, regardless of their cultural differences, should be created jointly by them so that both sub-units may work in the most effective manner possible for the benefit of the entire firm. This would require greater efforts and costs in the near term in order to create a joint program that would include elements from both contributors, but this should be viewed as an investment which will provide a substantial return in the future. Home Office/Host Country Cultural Issues Taylor et al. (1996) extended Schuler’s model by incorporating Barney’s (1991) RBV of the firm as well as the Resource Dependency theory of Pfeffer and Salancik (1978). Utilizing SIHRM as a resource which can confer sustainable competitive advantage, Taylor et al. (1996) devised a SIHRM model system which could be based on one of three basic premises as follows:
1) an adaptive SIHRM- HRM in each affiliate is somewhat independent and is constructed to serve local market;
2) an exportative SIHRM- top management of an MNC prefers a wholesale transfer of the parent firm’s HRM system to overseas affiliates;
3) an integrative SIHRM- this attempts to take “the best” approaches from the various international locations and use them throughout the organization in the creation of a worldwide system. Transfers can go in any direction and affiliate practices can be transferred to the parent company or vice versa.
The Taylor et al. (1996) model offers interesting material for consideration when considering an international training model. This model will form the basis of the theoretical framework for the analysis of international training in this paper. Adaptive, Exportative or Integrative Training Taylor et al.’s (1996) formulation presents a typology of SIHRM along with the appropriate international business type. This is one of the first examples of a formal attempt to link the type of international business strategy with a SIHRM type. The Taylor et al. model (1996) is described in Table II below. Table II

184
Global Training Model (Taylor, Beechler and Napier, 1996) SIHRM Type International Business Type Adaptive Multi-Domestic Strategy Integrative Global Other Conditions Exportative/ Integrative If Management perceives HRM
competence as a generalizable resource.
This model considers what the appropriate SIHRM type may be to link to a multi-domestic strategy (Porter, 1986). A multi-domestic strategy indicates that a MNE manages its overseas affiliates as independent businesses. In such a case the local market demands a high degree of adaptation of a firm’s products and processes. According to Taylor et al. (1996), this type of strategy should use an adaptive SHIRM, or training style since the adaptive style is meant to provide the local firm with maximum independence with which to serve the local market. SIHRM or Training- A Force for Change? Taylor et al.’s typology of SIHRM (training) is quite a useful model in pointing management toward matching an appropriate level of training with a particular type of international business strategy. However, if management is interested in developing its international operations towards a more integrated approach, then this typology may be somewhat lacking in detail. For example, a multi-domestic strategy does contend that international subsidiaries basically address their own national markets. However, in large MNEs, not all international operations are equal and some may be more integrated with the home-office than others. In this case an adaptive SIHRM or training type may not serve well these more advanced operations even though it suits other subsidiaries reasonably well. Similarly, a global business approach most likely includes many country operations which are more or less developed than others and which are able, to a greater or lesser extent, to contribute technological or marketing ideas to advance the home country business level. It would seem that groupings of subsidiaries would naturally occur based on the foregoing which would have similar types of information interchange. Bartlett and Ghoshal’s International Subsidiary Typology Therefore, in thinking of the circumstances which would render one of these training modes more appropriate than another, it may be useful to recall Bartlett and Ghoshal’s (1986)
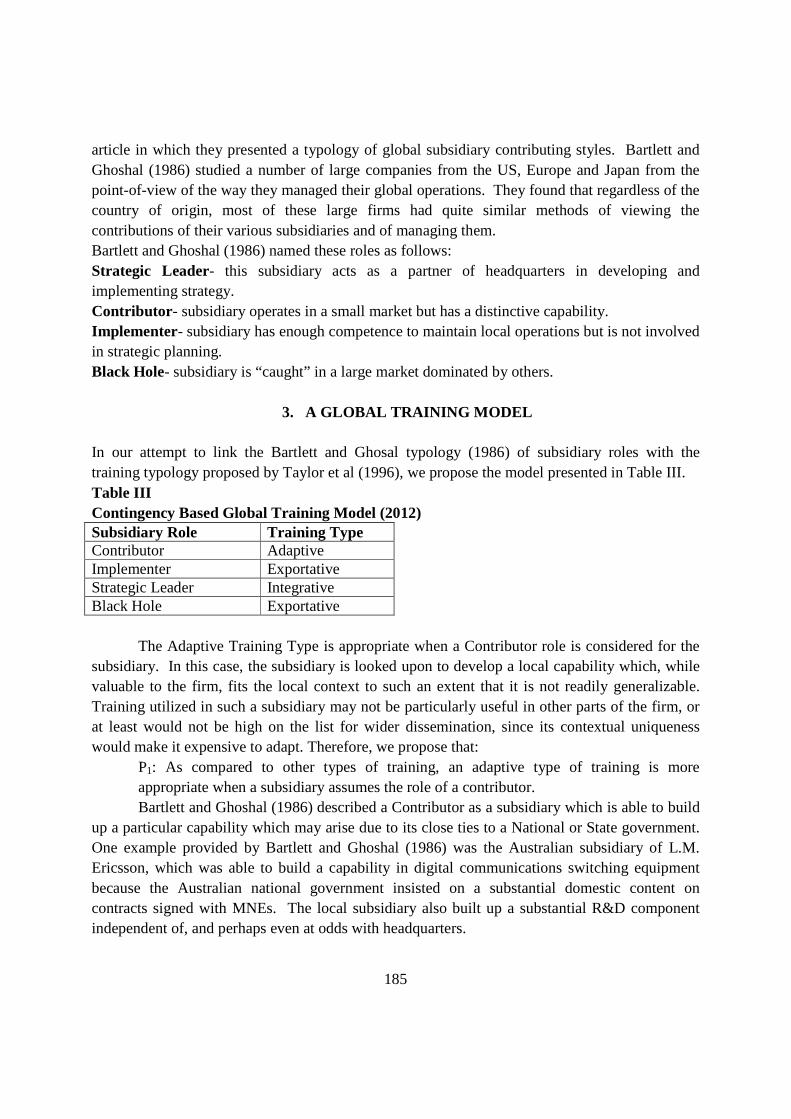
185
article in which they presented a typology of global subsidiary contributing styles. Bartlett and Ghoshal (1986) studied a number of large companies from the US, Europe and Japan from the point-of-view of the way they managed their global operations. They found that regardless of the country of origin, most of these large firms had quite similar methods of viewing the contributions of their various subsidiaries and of managing them. Bartlett and Ghoshal (1986) named these roles as follows: Strategic Leader- this subsidiary acts as a partner of headquarters in developing and implementing strategy. Contributor - subsidiary operates in a small market but has a distinctive capability. Implementer- subsidiary has enough competence to maintain local operations but is not involved in strategic planning. Black Hole- subsidiary is “caught” in a large market dominated by others.
3. A GLOBAL TRAINING MODEL In our attempt to link the Bartlett and Ghosal typology (1986) of subsidiary roles with the training typology proposed by Taylor et al (1996), we propose the model presented in Table III. Table III Contingency Based Global Training Model (2012) Subsidiary Role Training Type Contributor Adaptive Implementer Exportative Strategic Leader Integrative Black Hole Exportative The Adaptive Training Type is appropriate when a Contributor role is considered for the subsidiary. In this case, the subsidiary is looked upon to develop a local capability which, while valuable to the firm, fits the local context to such an extent that it is not readily generalizable. Training utilized in such a subsidiary may not be particularly useful in other parts of the firm, or at least would not be high on the list for wider dissemination, since its contextual uniqueness would make it expensive to adapt. Therefore, we propose that:
P1: As compared to other types of training, an adaptive type of training is more appropriate when a subsidiary assumes the role of a contributor.
Bartlett and Ghoshal (1986) described a Contributor as a subsidiary which is able to build up a particular capability which may arise due to its close ties to a National or State government. One example provided by Bartlett and Ghoshal (1986) was the Australian subsidiary of L.M. Ericsson, which was able to build a capability in digital communications switching equipment because the Australian national government insisted on a substantial domestic content on contracts signed with MNEs. The local subsidiary also built up a substantial R&D component independent of, and perhaps even at odds with headquarters.
186
In this case, since the technical expertise that was developed in the Business Unit was, at least to some extent, independent of the headquarters approach, it would likely not lend itself to easy integration with the headquarters sanctioned technology. Because of this, it would not be expected that these organizational routines would be transmitted through integrative training devised in conjunction with other BUs or headquarters, but rather would be of a type adapted from headquarters style and intended for the exclusive use of the subsidiary. An organization with a Polycentric organization design would utilize this type of training (Perlmutter, 1965). Noble (1997) indicated that although USA headquartered MNEs were ethnocentric regarding their competitive strategies, they were polycentric regarding training and development (Parry, Dickmann and Morley, 2008). An Exportative Training type is appropriate when considering a global business system which is made up of a large number of Implementers. In this case, the Implementers role is to deliver value in the most efficient manner possible and it would seem reasonable to presume that with a training system exported from headquarters, cost could be reduced and operations streamlined. We could consider such a training type to reflect an Ethnocentric view towards these subsidiaries (Perlmutter, 1965). Therefore, we hypothesize:
P2: As compared to other types of training, an exportative type of training is more appropriate when a subsidiary assumes the role of an implementer.
Implementers are typically found in smaller markets, such as smaller European or Latin American countries for example, where the market potential is limited and the corporate resource commitment is similarly limited. Since these subsidiaries typically do not get involved in strategy creation they likely do not require the same total level of training as headquarters. However, they do need to be efficient and thus would be good candidates for receiving Exportative Training developed at head-office or by a strategic leader. The Implementers purpose in the global strategy is to provide economies of scale and thus they must keep costs down in order to fulfill this role satisfactorily. It is quite common, for example, that HRM practices are transferred from the USA to subsidiaries via a sort of Anglo-saxonization to subsidiaries in Europe (Egan & Bendick, 2003; Poutsma, Ligthart & Schouten, 2005). There can be situations, however, in which implementers may be found in large, developed countries like the US. For example, German headquartered MNEs such as Volkswagen, Siemens and BMW, to name a few, have found it necessary to export elements of the German training system to the US in order to train machinists and other highly skilled factory workers for their US plants (Fuhrmann, 2012). Thus, even though the US is home to many strategically important MNEs, it also serves as an implementer in some industries, such as the auto industry, and it is in fact receiving Exportative training since the operations in the US for some MNEs are not at the strategic leader stage. Since subsidiaries that function as Strategic Leaders are very important for the future direction of the firm, it would be reasonable to expect that training regimens be developed and shared in an Integrative manner, in concert with headquarters and other subsidiaries which are strategically involved at a similar level. In this circumstance, the firm would attempt to create a geocentric training system (Perlmutter, 1965) and would adopt, and adapt, training aspects which
187
seem to provide both home office and host country operations with competitive advantage. Therefore, we hypothesize,
P3: As compared to other types of training, an integrative type of training is more appropriate when a subsidiary assumes the role of a strategic leader.
In this case, MNEs would realize that there are particular technologies or approaches which are possessed by many domestic firms in the countries that they compete in and which can be well utilized in other markets. For example, miniaturization is a set of technologies which are well developed in many Japanese electronic firms and varied and creative marketing and advertising approaches are a particular strength in the US across a range of industries. MNEs with strategic operations in these or other countries may wish to develop training with the integrative involvement of such subsidiaries and would, as a result, develop training which could be quite different than if they chose a solely head office approach. Training, as a part of the larger HRM set of practices, can also be influenced by micro-political forces at the level of the subsidiary. For example, Edwards, Colling and Ferner (2007) described an un-named American MNE which they called ‘Engineering, Inc.’, that experienced a reverse transfer of approach concerning international HR policy creation. The ‘revolt’ of one European HR manager, supported by other non-US managers, was sustained by the argument that in order for Engineering, Inc. to truly pursue its global business aspirations, it would need to have greater international input in the formulation of HRM policy (Edwards et al., 2007). In this case, the agency of subsidiary managers created the opportunity for the subsidiaries to bargain their way to greater formal responsibility and to create a circumstance whereby an integrative approach to HRM was formed. This example suggests that since an Integrative HRM may develop in a reactive manner in a MNE in time anyway, a proactive, headquarters driven Integrative training program could be beneficial since it enlists subsidiary mangers in a positive and creative pooling of interests approach. The Black Hole is certainly a drain on the firm’s resources and might be considered a solution seeking a problem to solve. That is, the parent may be a successful MNE, but a particular subsidiary, Philips in Japan or Matsushita in Germany, for example (Bartlett & Ghoshal, 1986) may be so irrelevant in those respective markets that they don’t even merit having a training regimen be provided to those employees. It may be thought, however, that although the subsidiary may not be contributing very much to the organization overall, and may even be a drain of resources, it still may make sense to provide training, if for no other reason than to maintain the firm’s reputation. Therefore, we hypothesize that
P4: As compared to other types of training, an exportative type of training is more appropriate when a subsidiary assumes the role of a black hole.
For the longer term future of the subsidiary, Bartlett and Ghoshal (1986) suggest that perhaps a strategic alliance, such as a joint venture, may be the best solution. In that case, the Black Hole could be considered as an opportunity for organizational learning but from an external point of view (Kogut, 1988). The subsidiary’s interest would then be to learn about market developments without an independent training approach as discussed with the other

188
subsidiary types, since it serves primarily as a conduit to head-office of new technological or marketing ideas. Comparison of Models The Taylor et al. (1996) model is a good one for highlighting the flexibility required by a MNE in utilizing its SIHRM (training) system as core competence. Its primary weakness is that it tends to treat all parts of a MNE similarly and assumes that there is minimal information sharing between units unless the firm is global in its approach. That is, although a MNE may have a basic multinational approach, for example, there are likely quite substantial differences between the collaborative efforts of some of the larger units and the smaller ones, and simply conceding that this type of international strategy should have an adaptive training system may limit its creativity and growth. Similarly, the Taylor et al. (1986) model suggests that a global international strategy should be supported by an integrative training system. Subsidiary units of the same MNE in different countries, and different industries usually have different training systems, and the effort and expense required to obtain even a limited degree of similarity can be quite great. Thus, while it sounds quite efficient to develop similar training programs across many national borders and industries, it is in fact quite inefficient and probably unnecessary. However, what is efficient and necessary is to have subsidiary units which function together on the same projects ensure that their training, and their SIHRM, is harmonized, so that they can jointly develop their important facets of the MNEs overall international strategy. It is in this regard that the CBGTM 2012 makes a contribution. The CBGTM 2012 utilizes Bartlett and Ghoshal’s (1986) classic typology of subsidiary roles in a MNEs organizational structure and utilizes the strategic role of the subsidiary as the basis for its training type. In this way, important resources of time and money are channeled in the most effective way to this activity on an internationally strategic basis. The CBGTM 2012 also includes differences in technological sophistication and market potential to be assumed under the mantle of organizational strategy. Thus, the CBGTM 2012 adopts a contingency approach to the subject of training. It views the type of interconnectedness that international subsidiaries have with head office as the chief criterion for the type of training which is to be provided by particular subsidiaries. In the language of Perlmutter (1965), it views each subsidiary from the point-of-view of its role in executing the organization’s global strategy. Thus, it may view one subsidiary from a polycentric point of view; for example a Contributor with an Adaptive Training System. Another subsidiary may function as an Implementer utilizing an Exportative Training System and Home Office could be considered to be ethnocentric in its view of this particular subsidiary. Finally, Home Office would be considered to have a geocentric view of its Strategic Leader subsidiaries with which it jointly develops an Integrative Training System.
189
Should a particular market begin to assume greater importance in the strategic operation of the MNE, then there will be greater resources placed into this market and the CBGTM 2012 will indicate that greater training interdependence should be made between this unit and the other Strategic Leaders. Although this model does not do much to bring up the level of Contributor or Implementer type units, it is not intended as prescriptive in intent. It is meant to be descriptive in nature and to provide a theoretical basis for what may be already taking place in many MNEs.
4. MANAGERIAL IMPLICATIONS
One implication of this model is that if particular sub-units wish to move up higher in the strategic decision making of the MNE, they may not find a great deal of support to accomplish this from Head Office. This is because the CBGTM 2012 takes at face value the strategic position of the various sub-units and seeks to provide the most efficient training system relative to the existing strategic framework. It would seem that if a sub-unit wished to advance itself then it might look to local and national governments for tax or education support. Greater national capabilities in terms of technical or engineering talent would also benefit the various governmental entities in the form of increased tax revenues which generally accrue from an increased strategic position and higher value-added products or services. It goes without saying that developing and implementing an effective training program requires a substantial expenditure of resources. This paper proposes a model that can be implemented by MNEs with different types of management philosophies (e.g., ethnocentric, polycentric, geocentric, etc.). This model also offers the flexibility for a MNE to design different types of training programs for its various subsidiaires based on the specific roles played by a given subsidiary. By proposing a simple, structured yet flexible and inclusive training system, this model offers the hope that MNEs, by adopting this training model, can save limited resources and time currently devoted to developing different training regimens and spend them more wisely in other areas where they are needed.
5. CONCLUSIONS Although simple in design, the proposed model brings some needed clarity to a somewhat murky topic. Even though at the first glance the model’s reliance on the strategic role, as described by Bartlett and Ghoshal (1986), may seem excessive, it does point to a logical screening method for determining how to manage the business of training. This paper sets the stage for further work in the area of training programs by MNEs facing intense international competition. The next logical step should be to empirically test the propositions presented in this paper. Future researchers should also look at unique micro-level and macro-level issues of a given location that may require modification in their training modules. In particular, future researchers should examine the link between different types of isomorphism identified by DiMaggio and Powell (1983) and corporate training programs. Future researchers should also examine if the proposed model would apply to international organizations and NGOs
190
that are increasingly becoming international. Finally, researchers should also examine how this model can be adapted to fit the needs of newer forms of organizations such as virtual organizations or firms that rely largely on outsourcing and subcontracting. While much work lies ahead, this paper is presented as a prelude to further studies on training from a corporate strategy point of view. It is hoped that this study will spur further research interest in this area and help managers and researchers alike in gaining a better understanding of how training programs can be designed so as to achieve the desired results. References: Adeleye, Ifedapo. (2011). Theorizing the diffusion of human resource practices: Toward an integrated conceptual approach. International Journal of Business and Management, 6 (12), 254 – 269. Barney, J. (1991) Firm resources and sustained competitive advantage. Journal of Management, 17, 99-120 Bartlett, C. & Ghoshal, S. (1986) Tap your subsidiaries for global reach. Harvard Business Review, November/December Bartlett, C. & Ghoshal, S. (1989) Managing across borders: The transnational solution. Boston: Harvard Business School Press. Black, J.S., Gregersen, H.B. & Mendenhall, M.E. (1992) Global assignments. San Francisco, CA: Jossey-Bass Brewster, C. & Hegewisch, A. (Eds.) (1994) Policy and practice in European human resource management. London: Routledge Burba, F.J., Petrosko, J.M. & Boyle, M.A. (2001) Appropriate and inappropriate instructional behaviors for international training. Human Resource Development Quarterly, 12 (3), 267-283 De Cieri, H. & Dowling, P.J. (1997) Strategic international human resource management: An Asia-Pacific perspective. Management International Review, 37, 21-43 Delaney, J.T & M.A. Huselid (1996) The impact of human resource management practices on perceptions of organizational performance. Academy of Management Journal, 39 (4), 949-969 Dimaggio, P. & Powell, W. (1983). The iron cage revisited: Institutional isomorphism and collective rationality in organizational fields. American Sociological Review, 48, 147- 160. Dowling, P.J. (1989) Hot issues overseas. Personnel Administrator, 34 (1), 66-72 Dowling, P.J. & Schuler, R. (1990) Comparative labour law and industrial relations in industrial market economies. R. Blanpain (Ed.) Deventer: Kluwer Edwards, T, Colling, T. & Ferner, A. (2007) Conceptual approaches to the transfer of employment practices in multinational companies: An integrated approach. Human Resource Management Journal, 17 (3), 201-217 Egan, M-L. & Bendick, M. (2003) Workforce diversity initiatives of US multinational corporations in Europe. Thunderbird International Review, 45 (6), 701-727
191
Fuhrmann, V. (2012, June 14) Germany’s new export: Jobs training. Wall Street Journal, pp. B1, B2. Ghoshal, S. & Bartlett, C.A. (1990) The multinational corporation as an interorganizational network. Academy of Management Review, 15, 603-625 Goldstein, S.M. (2003) Employee development: An examination of service strategy in a high- contact service environment. Production and Operations Management, 12 (2), 18-34 Guest, D., Michie, J., Conway, N. & Sheehan, M. (2003) Human resource management and corporate performance in the UK. British Journal of Industrial Relations. 41, 291-314 Han-Sui Chow, I. (1995) Management education in Hong Kong: Needs and challenges. International Journal of Educational Management, 9 (5), 10-15 Heenan, D.A & Perlmutter, H. (1979) Multinational organization development: A social architectural perspective. Reading, MA: Addison-Wesley Heery. E. & Noon, M. (2001) A dictionary of human resource management. Oxford: Oxford University Press. Hendry, C. (1994) Human resource strategies for international growth. London: Routledge Heskett, J.L., Jones, T.O., Loveman, G.W., Sasser Jr., W.E. & Schlesinger, L.A. (1994) Putting the service-profit chain to work. Harvard Business Review, March-April, 164-170 Huselid, M.A. (1995) The impact of human resource management practices on turnover, productivity and corporate financial performance. Academy of Management Journal, 38 ( 3), 635-672 Kogut, B. (1988) Joint ventures: Theoretical and empirical perspectives. Strategic Management Journal, 9 (4), 319-332 Lado, A. & Wilson, M. (1994) Human resource systems and sustained competitive advantage: A competency – based perspective. Academy of Management Review, 19, 699-727 Noble. C (1997) The management of training in multinational corporations: Comparative case studies. Journal of European Industrial Training, 21, (Feb/March), 102-110 Parry, E., Dickmann, M. & Morley, M. (2008) North American MNCs and their HR policies in liberal and coordinated market economies. The International Journal of Human Resource Management, 19 (11), 2024-2040 Perlmutter, H.V. (1965) Three conceptions of a world enterprise. Revue Economique & Social, May Pfeffer, J. & Salancik, G. (1978) The external control of organizations: A resource dependence perspective. New York: Harper & Row. Porter, M.E. (1986) Competition in global industries: A conceptual framework. In M. Porter (Ed.), Competition in global industries. Boston, MA: Harvard Business School Press. Poutsma, E., Ligthart, P. & Schouteten, R. (2005) Employee share schemes in Europe: The influence of US multinationals. Management Revue, 16 (1), 99-122 Pucik, V. (1992) Globalization and human resource management. In V. Pucik, N.Tichy & C. Barnett (Eds.) Globalizing management: Creating and leading the competitive organization (pp. 61-84) New York, NY: Wiley
192
Schuler, R.S., Dowling, P.J. & DeCieri, H. (1993) An integrative framework of strategic international human resource management. International Journal of Human Resource Management, 4 (4), 717-64 Schuler, R.S., Budhwar, P.S. & Florkowski, G.W. (2002) International human resource management: Review and critique. International Journal of Management Reviews, 4 (1), 41-70 Schuler, R.S & Jackson, S.E. (1987) Linking competitive strategies with human resource management practices. Academy of Management Executive, 1, 207-219 Subramony, Mahesh (2006). Why organizations adopt some human resource practices and reject others: An exploration of rationales. Human Resource Management, 45(2): 195-200 Taylor, S., Beechler, S. & Napier, N. (1996) Toward an integrative model of strategic international human resource management. Academy of Management Review, 21 (4), 959-985 Thornhill, A.R. (1993) Management training across cultures: The challenge for trainers. Journal of European Industrial Trainer, 17 (7), 43-51 Tung, R.L. (1984) Strategic management of human resources in multinational enterprises. Human Resource Management, 23 (2), 129-143 Wood, S. & de Menezes, L. (1998) High commitment management in the UK: Evidence from the Workplace Industrial Relations Survey and Employers Manpower and Skills Survey. Human Relations, 51 (4), 485-515

193
JOB SATISFACTION DETERMINANTS: A GLOBAL STUDY ACROSS 48 COUNTRIES
Jeanine Andreassi
& Leanna Lawter
Sacred Heart University
Martin Brockerhoff Independent Consultant
Peter J. Rutigliano
Sirota Survey Intelligence
ABSTRACT
This paper examines the drivers of job satisfaction across four cultural regions—Asia, Europe, North America, and Latin America. Using Hofstede’s theory, determinants were used to predict job satisfaction for each region and then compared to determine significant differences. Data was collected from a proprietary industry survey on employee work attitudes. The sample consisted of over 70,000 employees from 4 large multinational organizations. Data was analyzed using regression analysis and comparison testing across models. There are significant relationships between job characteristics and job satisfaction across all regions of the world, with a sense of achievement universally the most important driver. Although job characteristics impact job satisfaction across all regions, there are significant differences in the relative importance of job characteristics on job satisfaction, consistent with Hofstede’s cultural dimensions. The findings have implications for tailoring human resource management practices across locations within multinationals.This research is believed to be the first cross-cultural study of the job determinants affecting job satisfaction using multiple organizations and industries.
Keywords – Job satisfaction, culture, job characteristics, employee attitudes

194
INTRODUCTION
In the past few decades, there has been an explosion of businesses moving operations overseas, setting up international joint ventures, and establishing multinational enterprises. This trend has led organizational researchers and corporations to explore the implications of cultural differences in managing a workforce. An important question is whether Western management practices can be used as effectively with employees in Asia, Europe, and Latin America, as in North America, and whether the application of Western management principles affects satisfaction in non-Western countries. The prevailing view, largely inspired by the work of Hofstede (1980), is that differences in national cultures and value systems call for different management practices (Newman and Nollen, 1996). Similarly, the GLOBE Study of 62 societies (House, 2004) found that cultural differences strongly influence how employees view their leaders and organizations (Grove, 2005).
This study examines employee attitudinal survey responses across 48 countries in four global regions: Asia, North America, Europe, and Latin America. Specifically, we examined proprietary survey data from three large multinational companies, each of which had a physical location in all four global regions. The three companies represented three major industries: financial services, manufacturing, and oil & gas production. The current research compares the relative importance of seven job characteristics on overall job satisfaction across four global regions. The current study posits that significant differences exist across global regions with regard to how employee attitudes on job characteristics influence job satisfaction. The basis of the hypothesized differences are Hofstede’s four primary cultural dimensions: power distance (social inequality), individualism/collectivism (relationship between the individual and the group), masculinity/femininity (social implications of gender roles) and uncertainty avoidance (extent to which cultural members are threatened by ambiguity).
The implications for the current study are significant for practitioners. This information can help multinational organizations better understand how key job characteristics considered important in North American culture influence job satisfaction differently among other global regions. In particular, this information can be used by managers to tailor job practices based on cultural differences. Additionally, the size of the database used in the current research and the broad cross section of corporations across the four global regions increases the generalizability and relevance of the current findings.
LITERATURE REVIEW
Determinants of Job Satisfaction
A number of different theories have been used to explain job satisfaction. One of the most prominent explanations of job satisfaction is the job characteristics model (Hackman & Lawler, 1971), which suggests that task identity, task significance, skill variety, autonomy and feedback relate to job satisfaction. Need theories have also been used to predict job satisfaction.
195
Maslow (1943) maintains that people are motivated by unfulfilled needs, which include physiological (thirst, hunger), safety (shelter), social (sense of belonging), esteem (achievement, recognition) and self-actualization (reaching one’s fullest potential). Similarly McClelland (1961) posits that all people have a need for achievement, power and affiliation, which differ depending on the individual. Herzberg’s Two-Factor Theory (1987, 1959) characterizes work factors as either motivating factors, which can increase job satisfaction, or hygiene factors, which can increase dissatisfaction. Factors which are associated with job satisfaction are achievement, recognition, characteristics of the job, level of responsibility, and growth opportunities. Likert (1961) and McGregor (1960) were among the first researchers to theorize that employee satisfaction has important implications for organizational productivity and effectiveness. They expressed that job satisfaction influences the extent to which one works to their fullest potential towards organizational goals and cooperates with colleagues. A number of studies have examined the relationship between job characteristics and job satisfaction (Blegen, 1993; Brown & Peterson, 1993; Loher, Noe, Moeller, & Fitzgerald, 1985), and have shown that job satisfaction is related to job performance (Harrison, Newman, & Roth, 2006; Judge, Thoresen, Bono, & Patton, 2001; Riketta, 2008), retention (Tett & Meyer, 1993), and organizational commitment (Riketta, 2002). For the purposes of the current study, seven job characteristics were selected as possible determinants of job satisfaction—perception of equal opportunities in the workplace, feeling of personal accomplishment, perception of teamwork and cooperation within one’s work team, level of training received, communication from management on key issues, recognition for good performance, and work-life balance. These seven job determinants were chosen as predictors in the analysis because for each there is a theoretical reason why they would be related to job satisfaction. Another criterion used to analyze these seven was that data needed to be available for the dimension for each of the regions in the comparison analysis in the proprietary databases used in the study.
There is little research on job satisfaction across cultures, and the authors know of no study which uses data from multiple countries in multiple regions to investigate job satisfaction and its determinants across different cultures. Based on differences among cultures and societies in terms of what is valued it is likely in the workplace (Hofstede, 1980; House, 2004), we posit that the determinants of job satisfaction will not be universal across cultures, but, instead will vary in their level of importance based on differences in Hofstede’s cultural dimensions. We have used Hofstede’s theoretical model to hypothesize how cultural dimensions will influence the degree to which the job characteristics-- teamwork, work-life balance, communication from management, training received, recognition, feeling a sense of accomplishment, and perceptions of equal opportunity in the workplace—drive job satisfaction. In the literature review below, we will describe theory and past research as it relates to Hofstede’s cultural dimensions, and propose how culture might influence the relationship between workplace variables and job satisfaction.
Hofstede’s Cultural Dimensions
196
Individualism/Collectivism . Cultures with lower levels of collectivism (and higher levels of individualism) are less likely to value working together as a team and more likely to prefer working independently. On the other hand, cultures with higher levels of collectivism are more likely to prefer close working relationships with co-workers. Kirkman and Shapiro (2001) studied the impact of cultural values on job satisfaction among 461 self-managing teams in four countries (Belgium, Finland, Philippines and the United States). They found that higher levels of collectivism are associated with higher levels of job satisfaction and commitment within teams. Loh, Restubog, and Gallois (2010) found that eastern cultures (higher in collectivism) have a higher level of work-group identification than western cultures (higher in individualism). Therefore, it is expected that the degree to which cultures are more collectivistic will affect the extent to which teamwork is an important driver of job satisfaction such that:
Hypothesis 1: Teamwork will be a more important determinant of job satisfaction in collectivistic cultures than individualistic cultures. Recent models on cross cultural differences in work-family posit that both cultural and
sociocontextual factors impact the experience of work-family conflict (Joplin, Schafer, Francesco, & Lau, 2003; Korabik, Lero & Ayman, 2003). A cultural factor is individualism/collectivism, described previously, as the extent to which there is a focus on the individual versus the group (Hofstede, 1984). Work-family conflict is less likely in collectivistic cultures because hard work is seen as a means to increase the well-being of the family (Aryee, Luk, Lueng, & Lo, 1999; Grzywacz, Arcury, Marin, Carillo, Burke, Coates & Quandt, 2007; Yang, Chen, Choi and Zou, 2000). Because hard work is seen as integral to family well-being, experiencing work-family conflict is less likely to be perceived as stressful (Hassan, Dollard, and Winefield, 2010; Spector, Cooper, Poelmans and Allen, 2004). Research studies have supported the notion that in collectivistic societies, females perceive that work activities are in support of family activities leading to less conflict. For example, Thein, Auste, Currie and Lewin (2010) found that women in Hong Kong and Singapore perceived the domains of work and family as interdependent whereas Westerners conceptualized the two domains as separate and therefore in opposition to one another. Yang et al. (2000) found that in collectivistic China, sacrificing time with one’s family was viewed as a self-sacrifice; whereas, American women with an individualistic orientation perceived time spent at work away from one’s family as a failure to care for significant others. Because individuals from collectivistic societies view work activities as enhancing the family, and therefore do not see work as an impediment to family life, it is predicted that:
Hypothesis 2: The ability to balance one’s work and personal lives will be a more important determinant of job satisfaction in individualistic cultures than in collectivistic cultures.

197
Uncertainty Avoidance
Uncertainty avoidance refers to the degree to which a culture tolerates uncertainty concerning the future. Cultures high in uncertainty avoidance have a low tolerance for uncertainty and attempt to plan for and predict the future. Cultures high in uncertainty avoidance, desire to follow rules and have strict codes of behavior (Hofstede, 1984), and therefore, often have organizations marked by a high degree of formalization (Shackleton & Ali, 1990). A high degree of formalization has been observed to be related to communication inflexibility in organizations leading to a reduced interdependency between a manager and subordinate (Crozier, 1964). It has been found that in highly formalized work groups, managers rely more on procedures and rules to exert control as opposed to using tools such as open communication (Huang & Van de Vliert, 2006). Open communication from management is perceived as undermining formalization in the organization and increasing the degree of uncertainty and ambiguity and by increasing information flow between management and employees (Sriussadaporn, 2006). Therefore, based on a theoretical understanding of uncertainty avoidance and past research it is hypothesized that:
Hypothesis 3: Communication from management on key issues will be less important in cultures that are high on uncertainty avoidance than those low on uncertainty avoidance. High uncertainty avoidance cultures also value security, so that individuals within these
cultures likely have a tendency to prefer jobs that offer stability. Because training increases the flexibility and adaptability of the workforce, it would serve to increase uncertainty and has a low level of desirability or worth in high uncertainty avoidance cultures. Burke, Chan-Serafin, Salvador, Smith and Sarpy (2008) argued that in an effort to avoid ambiguity in workforce training, trainers in a high uncertainty avoidance culture would focus more on providing a highly structured training session and be less interested in engaging the participants. They also argued that attempting to decrease ambiguity in training would lead to standardized structured educational approaches such as use of lecturing in high uncertainty avoidance cultures and greater usage of experiential methods that are more engaging in low uncertainty avoidance cultures. In support of their theoretical suppositions, they found that higher uncertainty avoidance reduced the effectiveness of safety training and was related to lower levels of engagement in training, suggesting usage of less engaging training methods in high uncertainty avoidance cultures (Burke et al., 2008). In high uncertainty avoidance culture, we would expect that training would be deemed to be less important because people would like stability as opposed to having to change jobs or engage in new types of skills. Training in high uncertainty avoidance cultures would also be less engaging, and therefore, not impact job satisfaction to the same extent as in a low uncertainty avoidance culture. Therefore, it is expected that in high uncertainty avoidance cultures, level of training will be less important as a driver of job satisfaction than in low uncertainty avoidance cultures such that:
Hypothesis 4: Level of training received will be a more important determinant of job satisfaction in low uncertainty avoidance cultures than in high uncertainty avoidance cultures.

198
Masculinity / Femininity
Masculinity/femininity refers to how well established gender roles are within a culture. These roles directly relate to how males and females are perceived within the culture. Another facet of the masculinity/femininity dimension is how a culture generalizes concepts of success. Cultures which are characterized as masculine measures success in terms of personal success as measured by material wealth and financial rewards, as compared to feminine cultures which place less emphasis on material success and place more value on personal relationships and quality of life (Hofstede, 1980b).
Level of personal recognition is an externally focused event which involves an interchange between two people where one person acknowledges another’s performance. This type of extrinsic reward is relationship dependent and can be characterized as a socioemotional career satisfier. Feminine gender-based self-schemas place more importance on socioemotional career satisfiers, such as recognition (Eddleston, Veiga, & Powell, 2006). Feminine cultures place more emphasis an individual’s contribution to society and value other’s recognition of work well done (Arrindell & Veenhoven, 2002). As individuals in a feminine culture are more concerned with their relationships with their managers in the organization (Hofstede, 1991), and would value recognition, it is predicted that:
Hypothesis 5: Level of recognition received for doing a good job will be a more important determinant of job satisfaction in feminine cultures than in masculine cultures.
Sense of accomplishment is internally focused and closely aligned with an individual’s need for achievement (Maslow, 1943). Masculine cultures place an emphasis on personal drive and ambition (Hofstede 1980b), both also internally focused. Schuler & Rogovsky (1998) found that high masculinity was associated with greater use of an individual bonus system. In Japan, Jakofsky and Slocum (1988) found that high masculinity was reflected in a great interest in work and achievement. Because masculinity is related to competitiveness and individual achievement, it is expected that countries that are higher in masculinity place more value on achievement needs being met than those that are lower in masculinity. Therefore it is expected that:
Hypothesis 6: Work leading to a sense of accomplishment will be a more important determinant of job satisfaction in masculine cultures than in feminine cultures.
Power Distance
Power distance is the degree to which members of a society without power accept the inequality in power (Hofstede, 1980a). In high power distance cultures, such as Latin American cultures, inequality among social classes is accepted by both the higher social levels and the lower social levels with an underlying expectation that wealth and social status are fairly static within the culture (Varela et al., 2010). On the other hand, cultures in low power distant countries are generally considered to be equals regardless of inequities in characteristics such as wealth and an underlying assumption is that there is mobility to levels of wealth and status within the culture (Hofstede 1980b). In high power distance societies, subordinates expect superiors to behave in an

199
autocratic, non-consultative manner and seek more guidance from supervisors (Agarwal, 1993). Western cultures (low power distance) espouse egalitarianism as a key cultural value in the workplace; eastern cultures (high power distance) expect a high degree of hierarchy and vertical distance among managerial levels (Pan et al., 2010). One could argue that within high power distance cultures, inequality is expected to be part of all organizational structures, such that if an employee is accustomed to experiencing social inequality in general, but experiences a perception of equality in the workplace, they will be more likely to value that equality, which, in turn, will increase job satisfaction. Conversely, if equality in an underlying assumption in a culture, the impact of equality in the workforce will not be a motivating factor to increasing job satisfaction.
Therefore, it is expected that: Hypothesis 7: Perception of equal opportunities in the workplace will be a more important determinant of job satisfaction in high power distance cultures than in low power distance cultures.
METHODOLOGY
Sample
Employees from three large multinational companies in financial services, manufacturing, and oil & gas production participated in a proprietary industry survey on job attitudes/characteristics and job satisfaction. Each company had physical locations in at least four countries in each of the four global regions: Asia, Europe, North America, and Latin America. There were ten or more full-time employees in each location. A total of 75,813 employees participated in the survey.
Five demographic characteristics—gender, age, race, tenure, and job function—were also collected. These were used as control variables in the regional regression models. Table 1 Demographic Characteristics of Participants
Number of Respondents 75813
Gender Female 45.6% Male 54.4%
Race White 68.7% Black 8.0% Hispanic 6.6% Asian 9.3%
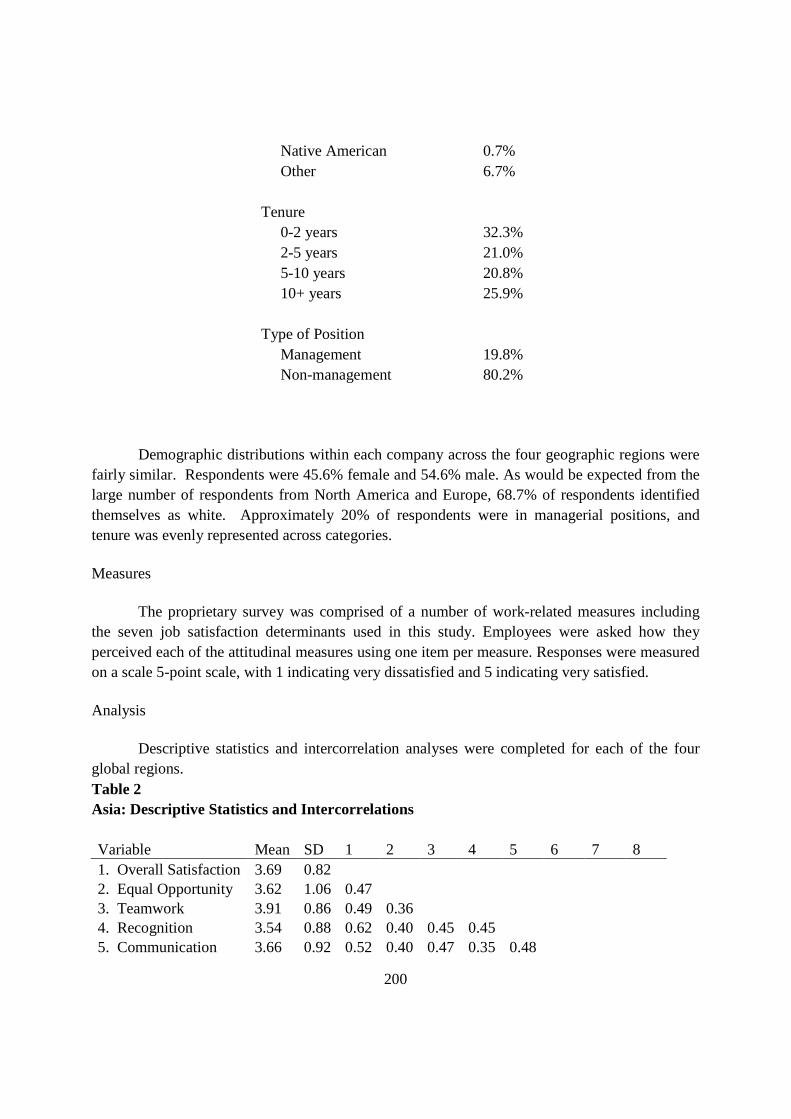
200
Native American 0.7% Other 6.7%
Tenure 0-2 years 32.3% 2-5 years 21.0% 5-10 years 20.8% 10+ years 25.9%
Type of Position Management 19.8% Non-management 80.2%
Demographic distributions within each company across the four geographic regions were
fairly similar. Respondents were 45.6% female and 54.6% male. As would be expected from the large number of respondents from North America and Europe, 68.7% of respondents identified themselves as white. Approximately 20% of respondents were in managerial positions, and tenure was evenly represented across categories.
Measures
The proprietary survey was comprised of a number of work-related measures including the seven job satisfaction determinants used in this study. Employees were asked how they perceived each of the attitudinal measures using one item per measure. Responses were measured on a scale 5-point scale, with 1 indicating very dissatisfied and 5 indicating very satisfied.
Analysis
Descriptive statistics and intercorrelation analyses were completed for each of the four global regions. Table 2 Asia: Descriptive Statistics and Intercorrelations Variable Mean SD 1 2 3 4 5 6 7 8 1. Overall Satisfaction 3.69 0.82 2. Equal Opportunity 3.62 1.06 0.47 3. Teamwork 3.91 0.86 0.49 0.36 4. Recognition 3.54 0.88 0.62 0.40 0.45 0.45 5. Communication 3.66 0.92 0.52 0.40 0.47 0.35 0.48

201
6. Accomplishment 3.82 0.87 0.48 0.37 0.42 0.30 0.41 0.43 0.37 7. Training 3.42 0.93 0.46 0.36 0.38 0.45 0.46 0.39 0.37 0.35 8. Work-Life Balance 3.62 0.99 0.38 0.27 0.26 0.30 0.31 0.26 0.27 0.26 All correlations significant at p<.0001
Table 3 North America: Descriptive Statistics and Intercorrelations Variable Mean SD 1 2 3 4 5 6 7 8 1. Overall Satisfaction 3.77 0.90 2. Equal Opportunity 3.58 1.13 0.46 3. Teamwork 3.94 0.99 0.45 0.34 4. Recognition 3.52 1.02 0.59 0.39 0.48 0.43 5. Communication 3.60 1.04 0.50 0.38 0.47 0.28 0.50 6. Accomplishment 3.91 0.94 0.51 0.35 0.40 0.24 0.42 0.38 0.38 7. Training 3.57 0.94 0.40 0.31 0.30 0.38 0.40 0.35 0.28 0.33 8. Work-Life Balance 3.62 1.07 0.38 0.21 0.23 0.24 0.29 0.26 0.28 0.25 All correlations significant at p<.0001
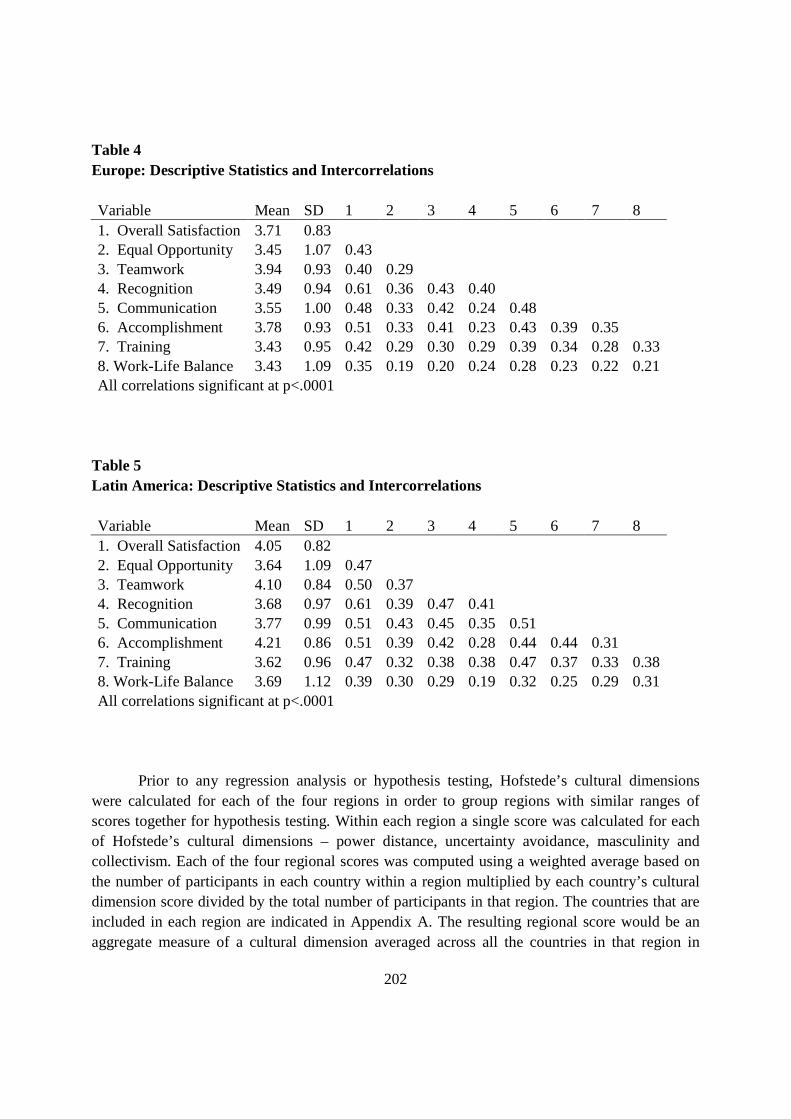
202
Table 4 Europe: Descriptive Statistics and Intercorrelations Variable Mean SD 1 2 3 4 5 6 7 8 1. Overall Satisfaction 3.71 0.83 2. Equal Opportunity 3.45 1.07 0.43 3. Teamwork 3.94 0.93 0.40 0.29 4. Recognition 3.49 0.94 0.61 0.36 0.43 0.40 5. Communication 3.55 1.00 0.48 0.33 0.42 0.24 0.48 6. Accomplishment 3.78 0.93 0.51 0.33 0.41 0.23 0.43 0.39 0.35 7. Training 3.43 0.95 0.42 0.29 0.30 0.29 0.39 0.34 0.28 0.33 8. Work-Life Balance 3.43 1.09 0.35 0.19 0.20 0.24 0.28 0.23 0.22 0.21 All correlations significant at p<.0001
Table 5 Latin America: Descriptive Statistics and Intercorrelations Variable Mean SD 1 2 3 4 5 6 7 8 1. Overall Satisfaction 4.05 0.82 2. Equal Opportunity 3.64 1.09 0.47 3. Teamwork 4.10 0.84 0.50 0.37 4. Recognition 3.68 0.97 0.61 0.39 0.47 0.41 5. Communication 3.77 0.99 0.51 0.43 0.45 0.35 0.51 6. Accomplishment 4.21 0.86 0.51 0.39 0.42 0.28 0.44 0.44 0.31 7. Training 3.62 0.96 0.47 0.32 0.38 0.38 0.47 0.37 0.33 0.38 8. Work-Life Balance 3.69 1.12 0.39 0.30 0.29 0.19 0.32 0.25 0.29 0.31 All correlations significant at p<.0001
Prior to any regression analysis or hypothesis testing, Hofstede’s cultural dimensions
were calculated for each of the four regions in order to group regions with similar ranges of scores together for hypothesis testing. Within each region a single score was calculated for each of Hofstede’s cultural dimensions – power distance, uncertainty avoidance, masculinity and collectivism. Each of the four regional scores was computed using a weighted average based on the number of participants in each country within a region multiplied by each country’s cultural dimension score divided by the total number of participants in that region. The countries that are included in each region are indicated in Appendix A. The resulting regional score would be an aggregate measure of a cultural dimension averaged across all the countries in that region in
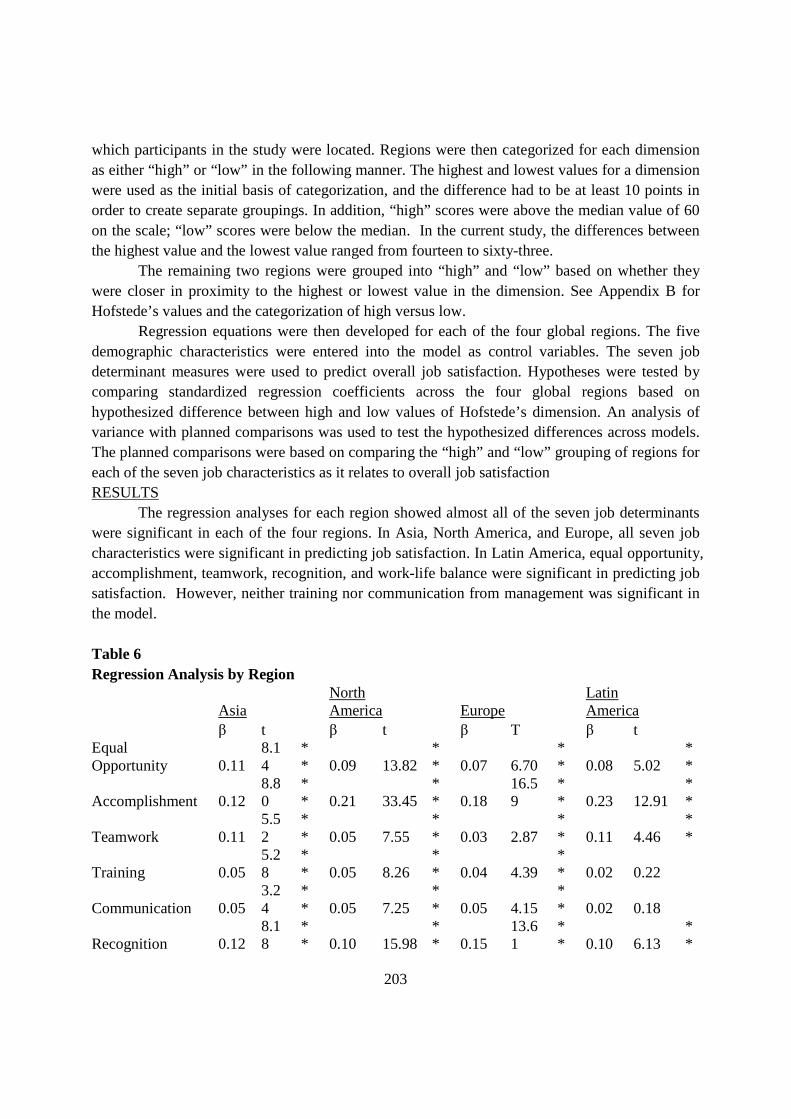
203
which participants in the study were located. Regions were then categorized for each dimension as either “high” or “low” in the following manner. The highest and lowest values for a dimension were used as the initial basis of categorization, and the difference had to be at least 10 points in order to create separate groupings. In addition, “high” scores were above the median value of 60 on the scale; “low” scores were below the median. In the current study, the differences between the highest value and the lowest value ranged from fourteen to sixty-three.
The remaining two regions were grouped into “high” and “low” based on whether they were closer in proximity to the highest or lowest value in the dimension. See Appendix B for Hofstede’s values and the categorization of high versus low.
Regression equations were then developed for each of the four global regions. The five demographic characteristics were entered into the model as control variables. The seven job determinant measures were used to predict overall job satisfaction. Hypotheses were tested by comparing standardized regression coefficients across the four global regions based on hypothesized difference between high and low values of Hofstede’s dimension. An analysis of variance with planned comparisons was used to test the hypothesized differences across models. The planned comparisons were based on comparing the “high” and “low” grouping of regions for each of the seven job characteristics as it relates to overall job satisfaction RESULTS
The regression analyses for each region showed almost all of the seven job determinants were significant in each of the four regions. In Asia, North America, and Europe, all seven job characteristics were significant in predicting job satisfaction. In Latin America, equal opportunity, accomplishment, teamwork, recognition, and work-life balance were significant in predicting job satisfaction. However, neither training nor communication from management was significant in the model.
Table 6 Regression Analysis by Region
Asia North America Europe
Latin America
β t β t β T β t Equal Opportunity 0.11
8.14
** 0.09 13.82
** 0.07 6.70
** 0.08 5.02
**
Accomplishment 0.12 8.80
** 0.21 33.45
** 0.18
16.59
** 0.23 12.91
**
Teamwork 0.11 5.52
** 0.05 7.55
** 0.03 2.87
** 0.11 4.46
**
Training 0.05 5.28
** 0.05 8.26
** 0.04 4.39
** 0.02 0.22
Communication 0.05 3.24
** 0.05 7.25
** 0.05 4.15
** 0.02 0.18
Recognition 0.12 8.18
** 0.10 15.98
** 0.15
13.61
** 0.10 6.13
**

204
Work-Life Balance 0.04
2.90 * 0.11 18.16
** 0.11
11.89
** 0.04 2.45 *
N 5348 45933
15063 5348
* p < .01 ** p < .001
When comparing the standardized regression coefficients within each region, there were notable differences in what had the strongest effect in each of the regional models. For Asia, accomplishment (β= 0.12), personal recognition (β=0.12), and equal opportunity (β=0.11) were the strongest predictors of job satisfaction. For North America, accomplishment (β=.21) was the strongest predictor of job satisfaction, followed by work-life balance (β=0.11). For Europe, accomplishment (β=0.18) and personal recognition (β=0.15) were the strongest predictors of job satisfaction. For Latin America, accomplishment (β=0.23) was the strongest predictor of job satisfaction, followed by teamwork (β=0.11).
Table 7 Hypothesis Testing by Hofstede’s Dimensions
Collective Individualistic Asia Latin America Europe North America
H1: Teamwork β 0.11 0.11 0.03 0.05 **
H2: Work Life Balance
β 0.04 0.04 0.11 0.11 **
High Uncertainty Avoidance Low Uncertainty Avoidance Latin America Asia North America Europe
H3: Communication β 0.11 0.05 0.05 0.03 **
H4: Training β 0.04 0.05 0.11 0.11 **
Masculine Feminine
North America Latin America Asia Europe
H5: Recognition β 0.10 0.10 0.12 0.15 **

205
H6: Accomplishment
β 0.21 0.23 0.12 0.18 **
High Power Distance Low Power Distance Asia Latin America North America Europe
H7: Equal Opportunity β 0.11 0.08 0.09 0.07
* p < .01 ** p < .001
The standardized regression coefficients can then be compared across regions: Equal
opportunity was most important in Asia (β=0.11). Accomplishment was most important in Latin America (β= 0.23) and North America (β=0.21). Teamwork was most important in Asia (β=0.11) and Latin America (β=0.11). Training and communication were least important in Latin America (β=0.02 for both). Personal recognition was most important in Europe (0.15). Work-life balance was most important in North America (β=0.11) and Europe (β=0.11). Six of the seven hypotheses tested were significant at p < 0.001. For hypotheses 1 and 2, Asia (individual/collective = 27) and Latin America (individual/collective = 32), which both are highly collective cultures, were compared to Europe (individual/collective = 76) and North America (individual/collective =90), which are both highly individualistic cultures. Hypothesis 1 which hypothesized that teamwork is a more important determinant of job satisfaction in collectivistic cultures than individualistic cultures was significant. Hypothesis 2 which predicted that the ability to balance one’s work and personal lives is a more important determinant of job satisfaction in individualistic cultures than in collectivistic cultures was also significant. For hypotheses 3 and 4, Latin American (uncertainty= 80), which is considered high on uncertainty avoidance, was compared to Asia (uncertainty= 40), North America (uncertainty= 46), and Europe (uncertainty= 52), which have relatively low values on uncertainty avoidance. Both hypotheses were supported. Hypothesis 3 predicted that communication from management on key issues is less important in cultures that are high on uncertainty avoidance than those low on uncertainty avoidance was significant. Hypothesis 4 which predicted that level of training received is a more important determinant of job satisfaction in low uncertainty avoidance cultures than in high uncertainty avoidance cultures was also significant. For hypotheses 5 and 6, North America (masculinity= 61) and Latin America (masculinity = 61), which have higher values of masculinity, were compared to Asia (masculinity = 50) and Europe (masculinity = 47), which had lower values of masculinity. Hypothesis 5 which predicted that level of recognition received for doing a good job will be a more important determinant of
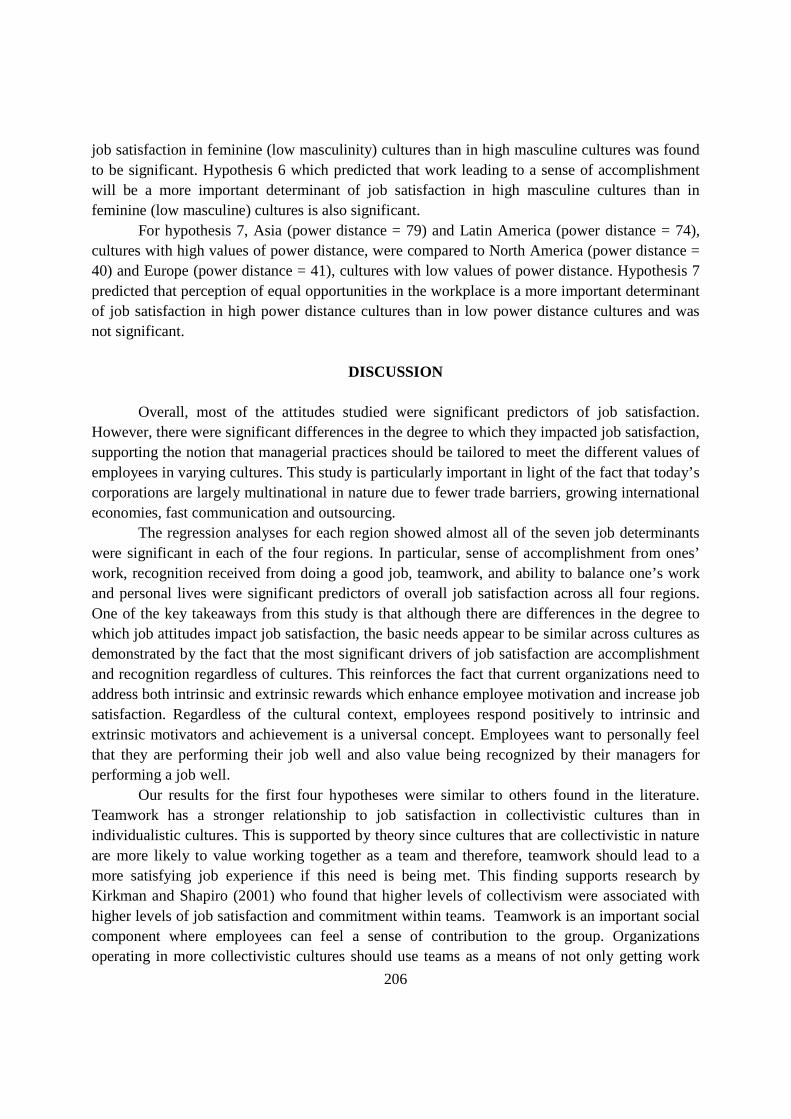
206
job satisfaction in feminine (low masculinity) cultures than in high masculine cultures was found to be significant. Hypothesis 6 which predicted that work leading to a sense of accomplishment will be a more important determinant of job satisfaction in high masculine cultures than in feminine (low masculine) cultures is also significant. For hypothesis 7, Asia (power distance = 79) and Latin America (power distance = 74), cultures with high values of power distance, were compared to North America (power distance = 40) and Europe (power distance = 41), cultures with low values of power distance. Hypothesis 7 predicted that perception of equal opportunities in the workplace is a more important determinant of job satisfaction in high power distance cultures than in low power distance cultures and was not significant.
DISCUSSION
Overall, most of the attitudes studied were significant predictors of job satisfaction. However, there were significant differences in the degree to which they impacted job satisfaction, supporting the notion that managerial practices should be tailored to meet the different values of employees in varying cultures. This study is particularly important in light of the fact that today’s corporations are largely multinational in nature due to fewer trade barriers, growing international economies, fast communication and outsourcing.
The regression analyses for each region showed almost all of the seven job determinants were significant in each of the four regions. In particular, sense of accomplishment from ones’ work, recognition received from doing a good job, teamwork, and ability to balance one’s work and personal lives were significant predictors of overall job satisfaction across all four regions. One of the key takeaways from this study is that although there are differences in the degree to which job attitudes impact job satisfaction, the basic needs appear to be similar across cultures as demonstrated by the fact that the most significant drivers of job satisfaction are accomplishment and recognition regardless of cultures. This reinforces the fact that current organizations need to address both intrinsic and extrinsic rewards which enhance employee motivation and increase job satisfaction. Regardless of the cultural context, employees respond positively to intrinsic and extrinsic motivators and achievement is a universal concept. Employees want to personally feel that they are performing their job well and also value being recognized by their managers for performing a job well.
Our results for the first four hypotheses were similar to others found in the literature. Teamwork has a stronger relationship to job satisfaction in collectivistic cultures than in individualistic cultures. This is supported by theory since cultures that are collectivistic in nature are more likely to value working together as a team and therefore, teamwork should lead to a more satisfying job experience if this need is being met. This finding supports research by Kirkman and Shapiro (2001) who found that higher levels of collectivism were associated with higher levels of job satisfaction and commitment within teams. Teamwork is an important social component where employees can feel a sense of contribution to the group. Organizations operating in more collectivistic cultures should use teams as a means of not only getting work

207
done, but of also increasing employees’ sense of job satisfaction through their feeling that they are contributing to the organization.
The ability to balance one’s work and family lives is a more important determinant of job satisfaction in individualistic cultures than in collectivistic cultures. This is consistent with prior literature which has posited that work-family conflict is less likely in collectivistic cultures because hard work is seen as a means to increase the well-being of the family (Aryee et al., 1999; Grzywacz, et al., 2007; Yang et al., 2000). Because hard work is seen as integral to family well-being, experiencing work-family conflict is less likely to be perceived as stressful (Spector et al., 2004). Research studies have supported the notion that in collectivistic societies, females perceive that work activities are in support of family activities leading to less conflict. Individuals in individualistic cultures might benefit from this knowledge. In particular, if individuals are able to alter their own perceptions of work-life balance and instead adopt a more collectivistic approach to work-family conflict by viewing work as contributing to the well-being of the family, it may reduce the incidence of work-family conflict. In addition, organizations operating in highly individualistic countries, like the United States, could use a more collective approach to help American workers better manage work-family conflict. For instance, corporations could have workshops where men and women are asked to examine what their work means in terms of supporting and assisting their family. If men and women come to realize that their work is indeed helping their families, they might experience less guilt, especially in the case of working mothers, a common phenomenon in North America.
Communication from management on key issues is less important in cultures high on uncertainty avoidance than those low on uncertainty avoidance. Cultures high in uncertainty avoidance often adopt rules and strict codes of behavior in the workplace (Hofstede, 1984), leading to greater formalization (Shackleton & Ali, 1990) and less communication flexibility (Crozier, 1964). Our finding that communication was less important in high uncertainty avoidance cultures is supported by Huang & van de Vliert (2006), who found that, in highly formalized work groups, managers rely more on procedures and rules to exert control as opposed to using tools such as open communication (Huang & Van de Vliert, 2006). Managers who are in low uncertainty avoidance cultures such as Asia, North America and Europe should emphasize communication with their employees. Communications can be viewed as providing information about the organization, but also making employees feel that they are part of the decision making process, whereas formalized rules and procedures do not allow for employee decision making outside of the established guidelines. These findings are important for managers who are accustomed to engaging in open communication with employees, but are working in a high uncertainty avoidance culture. Open communication policies in high uncertainty avoidance cultures can actually negatively impact overall job satisfaction. A better tactic would be to make sure there are clear rules and policies in place to increase employees comfort levels in these cultures. Recent research conducted in the United States found that managers who communicate with employees through multiple media channels get projects completed more quickly (Neeley, Leonardi, & Gerber, 2011). This type of communication would likely be less effective in a high uncertainty avoidance cultures.
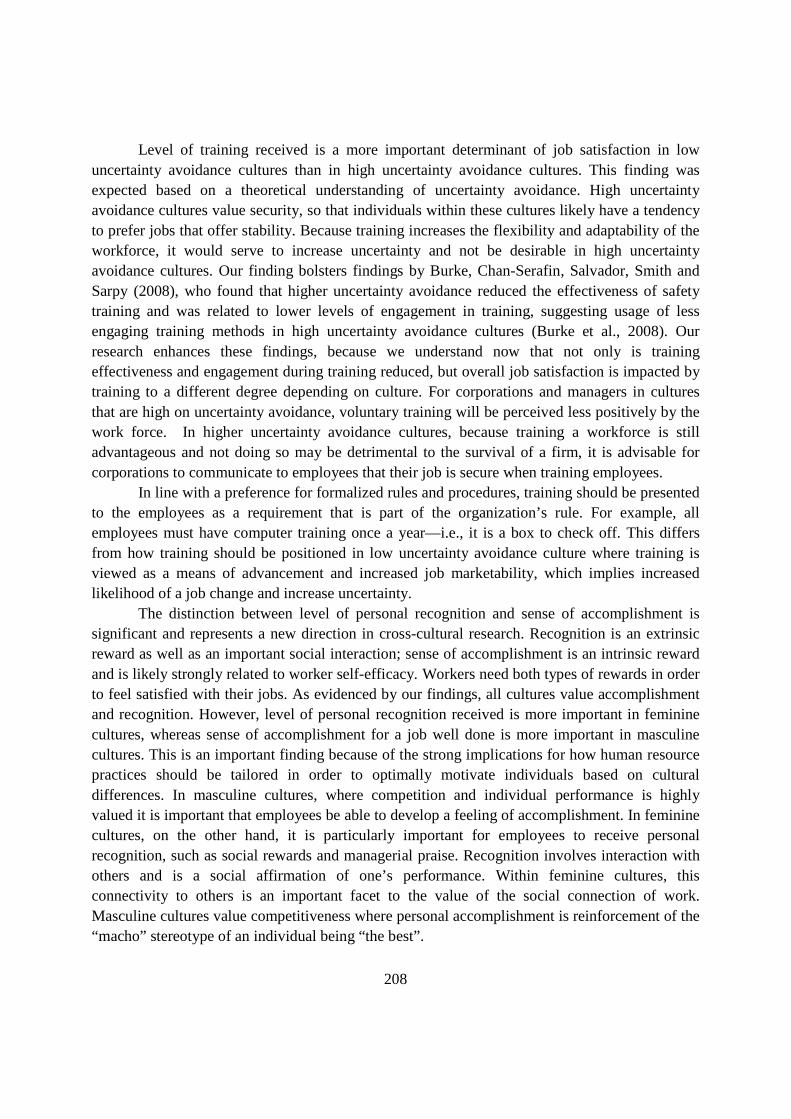
208
Level of training received is a more important determinant of job satisfaction in low uncertainty avoidance cultures than in high uncertainty avoidance cultures. This finding was expected based on a theoretical understanding of uncertainty avoidance. High uncertainty avoidance cultures value security, so that individuals within these cultures likely have a tendency to prefer jobs that offer stability. Because training increases the flexibility and adaptability of the workforce, it would serve to increase uncertainty and not be desirable in high uncertainty avoidance cultures. Our finding bolsters findings by Burke, Chan-Serafin, Salvador, Smith and Sarpy (2008), who found that higher uncertainty avoidance reduced the effectiveness of safety training and was related to lower levels of engagement in training, suggesting usage of less engaging training methods in high uncertainty avoidance cultures (Burke et al., 2008). Our research enhances these findings, because we understand now that not only is training effectiveness and engagement during training reduced, but overall job satisfaction is impacted by training to a different degree depending on culture. For corporations and managers in cultures that are high on uncertainty avoidance, voluntary training will be perceived less positively by the work force. In higher uncertainty avoidance cultures, because training a workforce is still advantageous and not doing so may be detrimental to the survival of a firm, it is advisable for corporations to communicate to employees that their job is secure when training employees.
In line with a preference for formalized rules and procedures, training should be presented to the employees as a requirement that is part of the organization’s rule. For example, all employees must have computer training once a year—i.e., it is a box to check off. This differs from how training should be positioned in low uncertainty avoidance culture where training is viewed as a means of advancement and increased job marketability, which implies increased likelihood of a job change and increase uncertainty.
The distinction between level of personal recognition and sense of accomplishment is significant and represents a new direction in cross-cultural research. Recognition is an extrinsic reward as well as an important social interaction; sense of accomplishment is an intrinsic reward and is likely strongly related to worker self-efficacy. Workers need both types of rewards in order to feel satisfied with their jobs. As evidenced by our findings, all cultures value accomplishment and recognition. However, level of personal recognition received is more important in feminine cultures, whereas sense of accomplishment for a job well done is more important in masculine cultures. This is an important finding because of the strong implications for how human resource practices should be tailored in order to optimally motivate individuals based on cultural differences. In masculine cultures, where competition and individual performance is highly valued it is important that employees be able to develop a feeling of accomplishment. In feminine cultures, on the other hand, it is particularly important for employees to receive personal recognition, such as social rewards and managerial praise. Recognition involves interaction with others and is a social affirmation of one’s performance. Within feminine cultures, this connectivity to others is an important facet to the value of the social connection of work. Masculine cultures value competitiveness where personal accomplishment is reinforcement of the “macho” stereotype of an individual being “the best”.
209
Hypothesis 7 was the only prediction not supported. Perception of equal opportunities in the workplace is not a more important determinant of job satisfaction in high power distance cultures than in low power distance cultures. It was posited that if an employee is accustomed to experiencing social inequality in general, but experiences a perception of equality in the workplace, they will be more likely to value that equality, which, in turn, will increase job satisfaction. When looking at the results, perceptions of equality opportunity in North America, Europe, and Latin America are significantly related to job satisfaction and do not differ in terms of importance. Yet, in comparison to the other job determinants, they were not the most important determinant of overall job satisfaction. On the other hand, in Asia, one’s perception of equal opportunity is a more important determinant of job satisfaction than in the other regions of the world and overall for Asia is one of the most important determinants of job satisfaction. We attribute this to the recently changing social structure in China and other countries in Asia, which has received an enormous amount of press. Within the last 10 years, many Asian countries have seen the rise of a middle class due to rapid economic growth. Social mobility as a result of education and new wealth is more accepted (Goodman & Robinson, 1996). Asian organizations which embrace this new social mobility and offer equal opportunities for advancement may have more satisfied employees.
CONTRIBUTIONS AND IMPLICATIONS
The primary contribution of this study is the breadth of countries and cultures which are
included in the study. This is the only study on cross-cultural job satisfaction that the authors know of which includes over 70,000 employees in the study, and represents 48 countries and four geographical regions giving greater weight to the significant findings of this study. In addition, the generalizability of the findings is extremely strong due to the number of physical locations of the multinational corporations across three different industries.
The implications for this study are significant for theory and practice. From a theoretical perspective, this study furthers our understanding of how job characteristics impact job satisfaction differently across regional cultures. The degree to which the seven job characteristics are determinants of employee job satisfaction is not universal across cultures. There are significant differences across cultures in the relative importance of each of these job characteristics as relates to job satisfaction. Secondly, the findings of the current study reinforce that a sense of achievement is universal and is a vital component of work across all cultures.
The practical implication is that multinational organizations need to help managers address employee needs with cultural sensitivity. The results of this study strongly show that different job characteristics are valued differently for each culture, and the successful manager will be able to recognize that one’s own culture is not directly transferable to another culture in the workplace. Another implication for organizations is that within a cultural context, both extrinsic rewards (recognition) and intrinsic rewards (accomplishment) need to be incorporated into the organization’s reward systems to increase employee motivation and employee job satisfaction.

210
Limitations No research is without limitations including the current research. The largest limitation of the current research is that the cross-sectional nature of the data prevents any conclusions about causality. There is also the possibility of common-method bias because of the self-report nature of the study. However, because the survey was administered in different locations and at different points in time, the threat is minimized. Future Research
Future research needs to examine how the social changes in Asian countries, such as China and India, are changing the value systems within the culture and how these changes in values directly relate to work. As the social fabric of the Asian countries change, we as researchers have a unique opportunity to study the relationship between cultural values and work values and how changes in culture possibly lead to a change in work values. Another interesting direction for future research would be to investigate achievement needs as they relate to organizational rewards across different cultures. This study has shown that while achievement and reward are an important determinant in job satisfaction, cultural differences exists in the types of rewards which are important to employees.

211
Appendix A
Countries Included in the Study by Region Asia China Hong Kong India Indonesia Japan Korea Malaysia Philippines Singapore Taiwan Thailand Vietnam North America Canada USA Latin America Argentina Brazil Chile Colombia Costa Rica Ecuador Mexico Peru Uruguay Venezuela
Europe Austria Belgium Bulgaria Czech Republic Denmark Eire Finland France Germany Greece Hungary Italy Luxembourg Norway Poland Portugal Romania Russia Spain Sweden Switzerland The Netherlands Turkey United Kingdom

212
Appendix B
Hofstede’s Cultural Dimensions
Weighted Values by Region* Power
Distance Individualism/ Collectivisim
Masculinity/ Femininity
Uncertainty Avoidance
Asia 79 27 50 40
North America 40 90 61 46
Europe 41 76 47 52
Latin America 74 32 61 80
*Values are weighted averages calculated by multiplying the number of employees in each country by the
country’s cultural dimension score and dividing by total number of employees in that region
Hofstede’s Cultural Dimensions
Categorized by High/Low
High Low
Power Distance Asia Latin America Europe North America
79 74
41 40
Individualism/ Collectivism North America Europe
Latin America Asia
90 76 32 27
Masculinity/ Femininity North America Latin America
Asia Europe
61 61 50 47
Uncertainty Avoidance Latin America Europe North America Asia
80 52 46 40

213
REFERENCES
Agarwal, S. (1993), " Influence of formalization on role stress, organizational commitment, and work
alienation of salespersons: A cross-national comparative study", Journal of International Business
Studies, Vol. 24, pp. 715-735.
Arrindell, W. A. and Veenhoven, R. (2002), "Feminine values and happy life-expectancy in nations",
Personality and Individual Differences, Vol. 33, pp. 803-813.
Aryee, S., Luk, V., Leung, A., and Lo, S. (1999), "Role stressors, inter-role conflict, and well-being: The
moderating influence of spousal support and coping behaviors among employed parents in Hong
Kong", Journal of Vocational Behavior, Vol. 54, pp. 259-278.
Brown, S. P. and Peterson, R. A. (1993), "Antecedents and consequences of salesperson job satisfaction:
Meta-analysis and assessment of causal effects", Journal of Marketing Research, Vol. 30, pp. 63-
77.
Burke, M. J., Salvador, R., Smith-Crowe, K., Chan-Serafin, S., Smith, A. N., and Sonesh, S. C. (2011),
"The dread factor: How hazards and safety training influence learning and performance", Journal
of Applied Psychology, Vol. 96, pp. 46-70.
Crozier, M. (1964), The Bureaucratic Phenomenon, University of Chicago Press, Chicago.
Eddleston, K. A., Veiga, J. F., and Powell, G. N. (2006), "Explaining sex differences in managerial career
satisfier preferences: The role of gender self-schema", Journal of Applied Psychology, Vol. 91,
pp. 437-445.
Goodman, D. S. G. and Robinson, R. (1996), The new rich in Asia: Mobile phones, McDonalds, and a
middle class revolution, Routledge, New York.
Grove, C. N. (2005), Introduction to the GLOBE Research Project on Leadership Worldwide [Online].
Available: www.grovewell.com/pub-GLOBE-intro.html [Accessed 2011].
Grzywacz, J. G., Arcury, T. A., Marin, A., Carillo, L., Burke, B., Coates, M. L., and Quandt, S. A. (2007),
"Work-family conflict: Experiences and health implications among immigrant Latinos", Journal of
Applied Psychology, Vol. 92, pp. 1119-1130.
Hackman, J. R. and Lawler, E. E. (1971), "Employee reactions to job characteristics", Journal of Applied
Psychology, Vol. 55, pp. 259-286.
Harrison, D. A., Newman, D. A., and Roth, P. L. (2006), "How important are job attitudes? Meta-analytic
comparisons of integrative outcomes and time sequences", Academy of Management Journal,
Vol. 49, pp. 305-325.
Hassan, Z., Dollard, M. F., and Winefield, A. H. (2010), "Work-family conflict in East vs Western
countries", Cross Cultural Management, Vol. 17, pp. 30.
Herzberg, F. (1959), The Motivation to Work, John Wiley and Sons, New York.
Herzberg, F. I. (1987), "One more time: How do you motivate employees?", Harvard Business Review,
Vol. 65, pp. 109-120.
Hofstede, G. National Cultural Dimensions [Online]. Available: http: geert-hofstede.com/national-
culture.html [Accessed 2011].
Hofstede, G. (1980a), Culture’s consequences: International differences in work-related values, Sage,
London.
214
Hofstede, G. (1980b), "Motivation, leadership, and organization: Do American theories apply abroad?",
Organizational Dynamics, Vol. 5, pp. 42-63.
Hofstede, G. (1984), "The cultural relativity of the quality of life concept", The Academy of Management
Review, Vol. 9, pp. 389-398.
Hofstede, G. (1991), Cultures and Organizations: Software of the Mind, McGraw-Hill, London, U.K.
Hofstede, G. (1999), "Problems remain, but theories will change: The universal and the specific in 21st-
century global management", Organizational Dynamics, Vol. 24, pp. 34-44.
Huang, X. and Van De Vliert, E. (2006), "Job Formalization and Cultural Individualism as Barriers to
Trust in Management", International Journal of Cross Cultural Management, Vol. 6, pp. 221-242.
Hundley, G. and Kim, J. (1997), "National culture and the factors affecting perceptions of pay fairness in
Korea and the United States", The International Journal of Organizational Analysis, Vol. 5, pp.
325-341.
Jakofsky, E. F. and Slocum, J. W., Jr. (1988), CEO roles across cultures. In The executive effect:
Concepts and methods for studying top managers, JAI Press, Greenwich, CT.
Joplin, J. R. W., Shaffer, M. A., Francesco, A. M., and Lau, T. (2003), "The macro-environment and
work-family conflict.", International Journal of Cross Cultural Management, Vol. 3, pp. 305-328.
Judge, T. A., Thoresen, C. J., Bono, J. E., and Patton, G. K. (2001), "The job satisfaction-job performance
relationship: A qualitative and quantitative review", Psychological Bulletin, Vol. 127, pp. 376-407.
Karasek, R. A. and Theorell, T. (1990), Healthy work: Stress, productivity and the reconstruction of
working life, Basic Books, New York.
Kirkman, B. I. and Shapiro, D. L. (2001), "The impact of cultural values on job satisfaction and
organizational commitment in self-managing work teams: the mediating role of employee
resistance", Academy of Management Journal, Vol. 44, pp. 557-589.
Korabik, K., Lero, D., and Ayman, R. (2003), "A multi-level approach to cross-cultural work-family
research: A micro- and macro-level perspective", International Journal of Cross Cultural
Management, Vol. 3, pp. 289-303.
Likert, R. (1961), New patterns of management, McGraw Hill, New York.
Loh, J., Restubog, S. L. D., and Gallois, C. (2010), "Attitudinal outcomes of boundary permeability",
Cross Cultural Management, Vol. 17, pp. 118.
Loher, B. T., Noe, R. A., Moeller, N. L., and Fitzgerald, M. P. (1985), "A meta-analysis of the relation of
job characteristics to job satisfaction", Journal of Applied Psychology, Vol. 70, pp. 280-289.
Maslow, A. H. (1943), "A theory of human motivation", Psychological Bulletin, Vol. 50, pp. 370-396.
McClelland, D. C. (1961), The Achieving Society, Van Nostrand, Princeton, NJ.
McGregor, D. (1960), The human side of enterprise, McGraw Hill, New York.
Neeley, T. B., Leonardi, P. M., and Gerber, E. M. (2011), "It’s not nagging: Why persistent, redundant
communication works", Harvard Business School Working Knowledge Newsletter.
Newman, K. L. and Nollen, S. D. (1996), "Culture and congruence: The fit between management practices
and national culture", Journal of International Business Studies, Vol. 27, pp. 753-779.
Pan, Y., Song, X., Goldschmidt, A., and French, W. (2010), "A cross-cultural investigation of work values
among young executives in China and the USA", Cross Cultural Management, Vol. 17, pp. 283.
215
Ramamoorthy, N., and Carroll, S. (1998), "Individualism/collectivism orientations and reactions toward
alternative human resource management practices", Human Relations, Vol. 51, pp. 571-588.
Riketta, M. (2002), "Attitudinal organizational commitment and job performance: A meta-analysis",
Journal of Organizational Behavior, Vol. 23, pp. 257-266.
Riketta, M. (2008), "The causal relation between job attitudes and performance: A meta-analysis of panel
studies", Journal of Applied Psychology, Vol. 93, pp. 472-481.
Schuler, R. and Rogovsky, N. (1998), "Understanding compensation practice variations across firms: The
impact of national culture", Journal of International Business Studies, Vol. 29, pp. 159-177.
Shacketon, V. J. and Ali, A. H. (1990), "Work-related values of managers: A test of the Hofstede model",
Journal of Cross Cultural Psychology, Vol. 21, pp. 109-119.
Sirota, D. and Greenwood, M. J. (1971), "Understanding your overseas work force", Harvard Business
Review, Vol. 49, pp. 53-60.
Sparrow, P. and Wu, P. (1998), "Does national culture really matter? Predicting HRM preferences of
Taiwanese employees", Employee Relations, Vol. 20, pp. 26-40.
Spector, P. E., Cooper, C. L., Poelmans, S., and Allen, T.D. (2004), "A cross-national comparative study
of work-family stressors, working hours, and well-being: China and Latin America versus the
Anglo world", Personnel Psychology, Vol. 57, pp. 119-142.
Sriussadaporn, R. (2006), "Managing international business communication problems at work: a pilot
study in foreign companies in Thailand", Cross Cultural Management, Vol. 13, pp. 330.
Tett, R. P. and Meyer, J. P. (1993), "Job satisfaction, organizational commitment, turnover intention, and
turnover: Path analysis based on meta-analytic findings", Personnel Psychology, Vol. 46, pp. 259-
293.
Thein, H. H., Auste, S., Currie, J., and Lewin, E. (2010), "The impact of cultural context on the perception
of work-family balance by professional women in Singapore and Hong Kong", International
Journal of Cross Cultural Management, Vol. 10, pp. 303-320.
Varela, O. E., Salgado, E. I., and Lasio, M. V. (2010), "The meaning of job performance in collectivistic
and high power distance cultures", Cross Cultural Management, Vol. 17, pp. 407.
Yang, N., Chen, C., Choi, J., and Zou, Y. (2000), "Sources of work-family conflict: A sino-U.S.
comparison of the effects of work and family demands", Academy of Management Journal, Vol.
43, pp. 113-123.
216
HUMAN RESOURCE DEVELOPMENT IN MACAO: EXPLORING REGIONAL POLICY AND STRATEGY
Zenon Arthur Siloran Udani
Faculty of Business Administration, University of Macau Email: [email protected]
ABSTRACT
Human resource development (HRD) is a strategic issue in a small region with no natural resources like Macao. It is a critical element for sustainable socio-economic development amid pressing concerns on manpower shortages, an aging population and low birth rates. More talents will be needed by the growing service and hospitality industries as the region positions itself as a world tourism and leisure center. Small and big businesses need to hire more foreign workers to fill up manpower needs which cannot be supplied by local residents. But government labor policies have remained very restrictive toward migrant labor. During the past five years, the government has also advocated a more aggressive the localization of various jobs and positions especially in the hospitality and gaming industries. This paper explores HRD issues and challenges of Macao, employing a SWOT analysis of the region’s HRD, and recommends policies and strategies to sustain the development of human resources in the region.
Key words: human resource development, strategy, Macao
INTRODUCTION
Macao’s population stood at 562,900 at the end of the first quarter of 2012, with more than half constituting the labor force. Developing local human resources has been a big challenge in the region where highly-skilled locals are direly needed and hiring foreign talents has been constrained by the government (Coutinho, 2011). This restrictive policy has hampered the growth particularly of the small and medium-size enterprises (SMEs). Moreover, this move is disadvantageous for Macao’s growing services sector which depends on the experience and geniality of qualified foreign workers.
The growth of human resource development (HRD) in Macao has been both spurred and hampered by an economy that is excessively reliant on the gaming industry. HRD initiatives and

217
activities have increased since the liberalization of the gaming industry in 2002. The presence of more foreign companies in the region has given a big boost to HRD in the private sector. Moreover the expansion of the tourism industry has propelled the demand for better customer and frontline services (Lages, 2010), managerial and leadership competence, technical skills and language proficiency among employees. At the same time, a limiting factor on the economy has been the shortage of qualified people (Chan & Cheong, 2012; Cavaliere, 2011). This is especially the case in the service and hospitality industries. Government restraint on hiring foreign workers and the lack of essential skills and experience among local workers have adversely affected the quality of service in the hospitality industry (Cavaliere, 2011).
Macao’s human resources and employment
The region’s shift from a garments manufacturing-dependent enclave into a gaming-dependent economy has accentuated the need for service-orientation and better HRD (Kuan, 2011). The match between the supply of local human resources and industry demand has been far from ideal. For instance, local residents who previously worked in the virtually extinct textile and garment manufacturing industry had difficulties finding jobs in the service and tourism sectors. This has been a serious concern among community associations in Macao (Ng, 2011). Likewise, another major concern is creating a room for job specialization and promotion for the younger generations of the 1980’s and 1990’s (Ng, 2011). The Macao Statistics and Census Bureau’s (Direcção dos Serviços de Estatística e Censos or DSEC) employment data for the fourth quarter of 2011 recorded the labor force at 347,000, with 340,000 people employed. Unemployment rate was at 2.1 percent, and underemployment rate at 0.9 percent. Among the 7,000 unemployed, 12.4 percent were new to the job market.
The percentage of Macao’s employed population with tertiary education has grown from 11.4% in 1999 to 23.5% in the first quarter of 2011 (See Table 1). This could be explained by the additional jobs filled up by qualified foreign and local workers in the liberalized gaming industry. A university degree for a local resident is almost always a guarantee of finding a job with a monthly salary of at least MOP 10,000 (USD 1,250).
The presence of number of less-educated people among the working population who have attained at most primary education is a big concern for HRD in Macao. The number of unskilled workers has grown from 32,000 in 1999 to 60,800 in the first quarter of 2011. This reflects the problem of human resource quality in the region (Siu, 2011).
Employed unskilled workers earned a median monthly salary of MOP 5,000 (USD 625) in the first quarter of 2011, while professionals earned an average of MOP 25,000 (USD 3,125). Unskilled workers are undoubtedly a potential target for both government and private HRD providers. Enhanced knowledge and skills improve their chances of getting better jobs and salaries.
The growth of the services sector is indicated by the increase in the number of service and sales employees, from 39,200 in 1999 to 74,600 in the first quarter of 2011. On the other hand,
218
the shrinking manufacturing sector has led to structural unemployment. The skills of the displaced workers do not match the requirements of job vacancies. Retraining and upgrading among the unemployed or underemployed are needed to prepare them for jobs in the service industry. But even then, there will be some positions which can be on filled adequately by foreign workers.
The government spurs over-aged residents to earn their secondary school diploma through its recurrent education program. This crucial to improving the quality of human resources in the region and promoting lifelong learning. But there are hurdles to overcome. Low (1998: 37) notes that the “ageing of the labour force also imposes problems of retraining and reskilling older workers. This clearly more difficult, with a possibly lower rate of return. Motivating older workers to retrain themselves as skills and jobs change is a challenge requiring tripartite collaboration between government, management and labour.”
There were more than 94,000 non-resident workers in Macao by the end of 2011 (peaked at 104,281 in September 2008). Most of the workers were from mainland China, followed by the Philippines, and Hong Kong. More than 20 percent of these non-residents worked in hotels and restaurants and a good number are employed in the construction industry. The growing localization of manpower, especially in the gaming and hospitality industries, continue to restrict the number of foreign labor in the region.
The recent Macao Law on Imported Labor, which took effect in April 2010, stipulates that priority should be given to local residents in being hired for available jobs and retained when downsizing happens. It also affords more protection to non-resident workers especially in regards to working conditions. Education in Macau
Education plays a crucial role in the development of Macao and its scarce human resources (UNESCO, 2008). Higher education, in particular, can contribute in “creating a new generation of professionals and experts; upgrading its local workforce; creating linkages, cooperation and networks inside and outside Macao; promote lifelong and life-wide learning” (UNESCO, 2008: 5).
Macao’s modern tertiary education is two decades old (MY 2010: 340). Currently there are 10 tertiary education institutions (TEIs), four are public and six private. Public TEIs are directly subsidized by the government. The government also provides scholarships for qualified recipients studying locally and abroad. These TEIs have around 5,000 graduates every year. On the other hand, dropouts in higher education are a problem especially for an economy in need of a highly skilled manpower (Morrison, 2011a: 31).
The Education and Youth Affairs Bureau (DSEJ) manages non-tertiary education (NTE) in the region, covering 80 schools (of which 69 private) and 4,984 teachers. NTE is guided by the Education Council and receives funding from the Educational Development Fund through the School Development Scheme and Continuing Education Subsidy Scheme (CESS) (MY 2010: 330). In 2009, the CESS provided a total of MOP 13 million subsidies to 1546 training programs

219
with 23,000 participants. Courses included computer applications, finance, business/administrative management, fine arts and sports. In a bid to keep students in school, the Macau government implemented a 15-year free education system in 2007, covering pre-primary up to senior secondary education. Education is compulsory for minors from 5 to 15 years old.
Lifelong learning is promoted by the government through continuing education subsidies for residents as well as through recurrent education whereby learning opportunities are offered to those who are beyond school age. Teachers may also avail of subsidies for professional development through the Educational Development Fund. HRD and Regional Development
HRD is critical to the effective performance of jobs and attainment of goals and objectives. Swanson and Holton (2009: 4) defines HRD as “a process of developing and unleashing expertise for the purpose of improving individual, team, work process, and organizational system, performance.” Gilley et al. (2002: 6) identifies four components of HRD: individual development, performance management, career development and organization development.
HRD has implications on individuals, organizations, and nations (McLean, 2004; Yang et al., 2004). Effective HRD induces economic growth and development (Rangel, 2004; Yang et al., 2004; Low, 1998). The availability of skilled employees at the right place and right time are essential to the growth and sustainability of any business.
HRD is also critical to the retention to valued talents in a company. “HRD needs to be at the center of creating an organizational environment that stimulates and values workers, that meets their needs such that it retains them in a marketplace where workplace benefits – as mundane as working with a nice supervisor – can outweigh the lure of a higher wage” (Lee, 2007: 106). Moreover, HRD has a strategic role in the company. “HRD also needs to become a central part of an organization’s strategy if it is to play a crucial balancing role in meeting the needs of the organization and employees in the uncertain and flexible world” (Lee, 2007: 106). And by extension, an HRD policy for the region or nation is necessary (Lutta-Mukhebi, 2004; McLean, 2004; Rangel, 2004). Human Resource Development in Macao
Macao’s Human Resource Development Committee was established on September 2002 to formulate policies and promote HRD. This came at the time when the gaming industry was liberalized, allowing competition.
Training and development (T&D) of people is crucial for effective work performance and job retention (Taylor, 2005). At the beginning of 2010, there were close to 22,000 civil servants in Macao, with about half having tertiary education qualifications. The Training Division of the Public Administration and Civil Service Bureau manages the T&D programs for civil servants which includes specialized training based on public administration needs, project and job demands, language courses, and vocational training courses (MY 2010: 149). Macao’s Labor
220
Affairs Bureau (Direcção dos Serviços para os Assuntos Laborais or DSAL) promotes vocational training among citizens and collaborates with other government departments in this endeavor. The DSAL also launched the “Internship Program in Mainland China for University Graduates” in 2009. The program provides Macao graduates the experience of working in mainland companies for six to 12 months, hoping to improve their chances of landing better jobs in the workplace.
The government has teamed up with the Macao Federation of Trade Unions on a program called “On-job Training and Employment Scheme” focusing on the unemployed. The scheme is linked with enterprises in the hotel and restaurant industries and six gaming concessionaries who provide on-job training (OJT) for the non-skilled and hire directly those who are qualified.
The government has also commissioned the services of Singapore's Civil Service College (CSC) to provide training services to Macau's Public Administration and Civil Service Bureau (SAFP) and assist the latter to establish a new Central Training. To date, CSC has trained more than 3,000 senior, middle and junior officers from Macau under the Executive Management Development (EMD) Programme for Directors and middle level managers, the Executive Management Skills (EMS) Programme for high potential junior officers and the Public Policy Development (PPD) Programme for senior officers within the Macao Civil Service.
The Macao Productivity and Technology Transfer Center (Centro de Produtividade e Transferencia de Tecnologia de Macau or CPTTM ) was set up in 1996 to enhance the competitiveness and productivity of businesses. It has also played an active role in corporate training. Moreover, CPTTM has initiated skill building courses for secondary and primary students to prepare them for future studies and jobs.
There are more than 132 adult education providers in Macao offering various courses covering soft skills, technical skills, language proficiency and many others. The University of Macau’s Center for Continuing Education (CCE), for instance, is dedicated to adult and lifelong education in the region. It has organized more than 100 courses over the past five years attended by more than 9,000 people. The CCE has been strengthening its links with international and local professional organizations in order to address the T&D needs of Macao and provide relevant, world-class training programs.
The Institute for Tourism Studies (IFT, 2009) is the region’s leading training provider for the hospitality and tourism industry. It is a public tertiary education institution established in 1995 and funded by the government. It offers degree and diploma courses, various vocational training, and short courses on hospitality and catering, heritage and tourism, and foreign languages. More than 45,000 people have attended its continuing education courses over the past five years. IFT is also actively engaged in training and development partnerships with top hotels in Macao (MSS, 2010). In July 2010, IFT signed an 18-month culinary arts practicum program agreement with 11 hotels in Macao to attract young local students to be future chefs in Western food (Li, 2010).
The Macao Polytechnic Institute (IPM, 2009), through its training arm -- the Centre of Continuing Education and Special Projects – organizes continuing and vocational training in different fields for both civil servants and the public. Its programs on casino career, tourism and

221
hotel, and convention and exhibition are popular among residents. Language courses, public administration and business management also attract a good number of participants. Corporate HRD
Companies in Macao face a shortage of qualified local human resources, government restriction on hiring foreign employees, and possible job cuts due to the economic downturn. In this context, HRD plays a crucial role in helping companies derive better performance and productivity from employees, and retain the best talents.
Traditionally, the major utility companies in Macao like the CEM (Companhia de Electricidade de Macau) electric company and Macao Water, and organizations like the Banco Nacional Ultramarino (BNU), Air Macau, the CTM (Companhia de Telecomunicacoes de Macau) telecom company, and Lisboa Hotel were at the forefront of corporate training and development in the region. The entry of major foreign corporations in the hospitality and gaming industries over the past seven years have increased the both quantity and quality of T&D initiatives and activities in Macao (MSS 2010). T&D investment in customer service related programs have increased with more tourists expecting better service from hotels, restaurants, retail shops, and other businesses.
Five-star hotels offer a wider range of T&D courses for their employees (MSS 2010). Venetian Macao Resort Hotel, MGM Grand Hotel, StarWorld Hotel, Wynn Macau, and Altira Macau are at the forefront of T&D activities. Customer service, job skills training, management and supervisory development, leadership skills, trainers’ training, language courses, and occupational health and safety are popular programs in these organizations. Growing cultural diversity in the workplace requires employees to acquire better relational and team building skills in order to ensure work harmony and collaborative performance. Harmonious and familial workplaces contribute positively to organizational loyalty and employee retention.
The localization of more job positions in the gaming and food and beverage industries has also increased the demand for training Macao residents. Hotel and gaming companies have been requested by the government to craft a promotion plan for local talents. Bigger companies in Macao have taken seriously their management training programs with the aim of preparing talented local residents to occupy managerial and senior positions in the organization (MSS 2010).
Macao’s fledgling MICE (meetings, incentives, conventions, exhibitions) industry, which got a big boost with the opening of Venetian Macau’s 1.1 million square feet of convention space, foreshadow more T&D activities in the future. A MICE training center would be needed to enhance the development of local talents with the appropriate knowledge, skills and attitudes. This will also facilitate Macao’s diversification process outside the gaming industry which will require a lot of qualified professionals. HRD Challenges in the Region

222
The European Commission’s 2010 report on Macau cites limited human resources as “a bottleneck to sustainable economic development” (EC, 2011). The lack of qualified manpower is a major concern among industries, especially in the gaming, hotel and service sectors (Kim-Ieng and Woo, 2010). High turnover rate, filling up vacant technical positions and retaining young staff members are among major concerns of the local market (MSS 2010).
Hiring foreign workers are a good solution to Macao’s urgent manpower needs, especially in jobs disliked by the locals (Coutinho, 2011a; Kim-Ieng and Woo, 2010). Besides filling up unpreferred jobs, foreign workers also make up for technical expertise and experience needed in the industries (Siu, 2011; Leong, 2007). But residents are not too keen in having more foreign workers due to job concerns. Moreover, the government is overly cautious in granting import labor quotas to companies. In this regard, more transparency and accountability are needed in the approval process of labor quotas (Coutinho, 2011a).
A highly restrictive import labor policy is detrimental to Macao’s transition into a “world travel and leisure hub” and a world-class city (Yip & Lages, 2011). Quality of services would stagnate, prices go up and the enclave’s image deteriorates (Yip & Lages, 2011). Despite government restrictions on the hiring of imported labor, industries will need to hire foreigners with the right experience and expertise in order to grow and survive (Shamadasani, 2008).
The scarcity of manpower especially in the construction industry has driven some companies to hire illegal labor. Two main factors explain to this practice. One is that illegal workers cost cheaper than the locals. And companies are willing to take the risk of hiring them. Another factor is that illegal workers are desperate for jobs and are willing to do any type of work even in adverse conditions. Despite the government’s unrelenting campaign against hiring illegal workers, the practice continues especially with the resurgence of construction projects in the region.
Retaining valuable talents has been a major challenge even among the bigger companies in Macau (Cou, 2012; Yu, 2012). At times, it is not just a matter of keeping employees happy on the job but also reaching out to their families (Cou, 2012; Yu, 2012). Moreover, executives have to devote more time communicating effectively with their frontline staff (Tam, 2012). Having a good boss is critical to employee retention. Education Background of Local Labor
In 2011, 65,800 people of Macao’s employed population had a primary education background or less, 182,400 had secondary education, while 79,400 had tertiary education (DSAL 2012). Low education background limits the job possibilities and career mobility of people. Casino dealers, for instance, usually experience serious difficulties in finding jobs outside the industry. On the other hand, companies have little choice when hiring people for jobs mandated as for-residents-only. Even some big companies accede to lowering job specification requirements to be able to fill up vacancies. Small and medium enterprises (SMEs) are usually in the losing end because they count among the least-preferred employers for local employees.

223
Among the 8,700 jobless people in 2011, 7,200 had secondary education or less, while the rest had tertiary education (DSAL 2012). During the same period, there were nearly 8,000 job vacancies in various industries – wholesale and retail trade had 4,137; the gaming industry had 2,274; transport storage and communications, 666; investigation and security services, 838. The local workers were either unwilling to take available jobs or they did not have the training and experience to fill up the vacant positions (Trigger, 2010). Research Objectives and Methodology
This exploratory study examines the current status of HRD in Macao, and relevant public policy and strategies in the region. Employing the SWOT analysis, it determines the key areas of improvement of HRD in Macao in order to effectively address persistent human resource problems and harness opportunities for development. The research addressed the following questions:
1) What are the HRD challenges and problems faced by the region? 2) What policy reforms and HRD strategies should be adopted by the Macao government in
order to effectively address present human resource problems? Invitations for research interview were sent to various stakeholders including HR executives, legislators, academics, professional and labor association officers. Primary data were gathered from those who agreed to be interviewed. Semi-structured interview questions were developed with the aid of relevant HRD literature. The questions were designed to elicit the interviewees’ expert opinion on the research theme. The respondents were also given the opportunity to discuss issues not addressed by the questions, but relevant to the research. Interview transcripts were analyzed, noting the concurrence and divergence of opinions among the various experts as regards the strengths, weaknesses, opportunities and threats of HRD in Macao. Secondary data from published reports and related literature were also used to corroborate research findings. Lastly, HRD policies and strategies for Macao are proposed to conclude the study.
SWOT ANALYSIS Strengths
Macao has the Chinese central government’s approval to retain gaming in the enclave, ensuring hefty revenues from gaming taxes and, thus, adequate resources for education and HRD in the region. Educational funds and subsidies for residents are available, although public expenditure for education is still less than 3 percent of GDP (OECD, 2012). Big businesses, such as hotels and casinos, also have considerable resources and various training and development programs for employees (Carreiro, 2012; Cou, 2012; Yu, 2012).
Last year, the government launched a three-year continuing education program estimated to cost 500 million patacas, offering each resident aged at least 15 a course enrolment subsidy of up to 5,000 patacas (USD 625). Government financial support is also given to continuing
224
professional education providers, who in turn offer subsidies or tuition fee rebates to residents completing various training and development programs (Lei, 2011).
Local labor’s strength includes their familiarity with the environment and culture of Macao, minimizing the problems related to social and work adjustment (Carreiro, 2012; Cou, 2012; Yu, 2012; Lei, 2011; Siu, 2011). They also enjoy more flexibility in terms of job mobility (Pun, 2011). Moreover, the younger population has a relatively higher educational attainment and better skills compared to older generations (Ng, 2011). Weaknesses
Macao’s rapid economic growth over the past decade, given its limited human resources, has put big and small companies in a difficult situation. The region’s labor policies and human resource plan have been inadequate in responding to the needs of business. The labor market has been very tight especially with the expansion of the services sector, constraining sustainable economic development in the region (EC, 2011). The lack of executive, managerial and technical talents and the restrictions on hiring foreign workers have beleaguered many employers especially in the gaming and hospitality industries (Tam, 2012; Yu, 2012; Coutinho, 2011). In the accounting field there is an urgent need for managerial talents (Lok, 2012). But potential candidates for certain positions lack the relevant experience, training, and at times the inclination to work in a very demanding profession (Chan & Cheong, 2012). Even some higher education institutions face difficulties in attracting top international talents due to less competitive compensation packages and statutory restrictions on employment contracts (Lei, 2012).
The tight labor market coupled the government’s restrictive policy on hiring foreign labor usually breeds a vicious cycle where a horde of casino or hotel employees resign from their current employer to join a newly-opened business (Tam, 2012). The ease that residents have in shifting jobs makes organizational commitment and job specialization difficult to grow. This condition usually leads to higher recruitment and training costs and a drop in the service quality. Small and medium enterprises in the service industry are usually on the losing end as they are faced with the problem of retaining talents and recruiting local staff members (Chan & Cheong, 2012).
Macao’s policy on human resources has been unable to address effectively and decisively chronic labor problems, especially skills shortages (Morrison, 2011). “Labor law seems to undermine large industries and construction businesses; [there is] lack of transparency and comprehensibility in the rules governing non-local hiring” (Morrison, 2011: 57). The government does not have a long-term HR plan and adequate strategies to promote HRD in the region (Siu, 2011). The government needs greater efficiency in addressing human resource issues in the region (Lei, 2012). For instance, the guidelines regarding the quota of imported labor for various industries are unclear (Lei, 2011). The Macao government established the Human Resources Office to deal with requests for imported labor but it was not able to engage in serious research about HR issues in the region (Ng, 2011). Moreover, lifelong learning among the residents has not been effectively implemented.

225
The need for imported labor is especially urgent in the hotel, food & beverage and transport industries (Yip & Lages, 2011). One hospitality industry expert avers: “Since there are not enough qualified residents to fill vacancies and importing labour is hard, hotel employees have become a commodity. They are no longer regarded as qualified workers with a career ahead of them” (Cavaliere, 2011). Continuous restrictions on hiring of talented foreign workers will hurt Macao’s image as a world-class city (Yip and Lages, 2011) and impede its transformation into a world tourism and leisure center. Also part of the difficulty in hiring foreign workers is the long processing time of applications for imported labor by the government (Chang & Cheong, 2012). By the time a foreign employee begins his first day on the job, at least four months would have transpired since the application’s submission.
Deficient quality and quantity of local human resources often vex many organizations (Coutinho, 2011a ; Lei, 2011; Pun, 2011; Siu, 2011; Yip & Lages, 2011). The stability of business operations and quality of services are adversely affected especially when employees leave in hordes for newly opened properties.
Issues regarding the quality of local employees are often traced to the region’s educational system (Coutinho, 2011a). Critical thinking and language skills, for instance, are not adequately learned in the schools (Coutinho, 2011a). Moreover, a good number local appear to be less competitive because they are more passive, conservative, and parochial in their viewpoint (Fong, 2011). There is also the school dropout problem which has to be addressed more firmly (Morrison, 2011a). Related to matters concerning Macao’s youth, a local professional commented: “I think that contemporary young generation doesn’t have a strong mental quality and determination to struggle for their life because of the stable and comfortable life style and status in Macau. While the economic environment is stable, they are not able to conquer failures. They prefer a comfortable and easy life to live instead of struggling hard” (Luk, 2102). Moreover, younger employees who just focus on earning money miss the long-term need for continuing personal and professional development (Cavaliere, 2011).
Despite the government’s policy to alleviate manpower needs of SMEs, they continue to experience serious human resource challenges and cannot compete with the gaming companies in hiring professionals (Coutinho, 2011a; Lok, 2012; Tam, 2012). One legislator puts it this way: “If there is no change to the existing situation, then eventually there will only be two employers in Macau - the government and the gaming companies, and also those companies that are related and dependent on the gaming industry.” (Coutinho, 2011a).
Lastly, the region also faces the issues of an aging population and low fertility rate (1.1 births per woman in 2010) which will have debilitating effects on future labor supply. Opportunities
The Closer Economic Partnership Arrangement (CEPA) between the Macao government and the mainland Chinese central government grants the former preferential access to the Chinese market, fostering trade and investment in both sides. Macao’s economic integration with China will intensify through the closer links in trade and economic cooperation with the governments of

226
Zhuhai municipality and the Guangdong province (EC, 2011). For competitive Macao SMEs, this is an opportunity to grow their business and profits, enabling them to hire talented employees and invest in HRD.
Macao’s inclusion as a potential location for international conventions and exhibitions among various trades continues to drive it toward internationalization. This diversification offers more job options for the local population (Lei, 2011; Pun, 2011). It also provides motives for more private investment in HRD.
Alongside Macao’s development as a global tourism and leisure destination, its progress as a haven for shopping and family entertainment will draw more diverse tourists (Yip & Lages, 2011). This will spur the need for better customer service and, thus, enhanced training and development for the local workforce. Frederick Yip, head of the Retailers and Tourism Services Association of Macao states: “We need to focus on families that are coming to Macau and take advantage of that to diversify our tourism sector. We need to become a big entertainment centre. We must consider that there are other exciting destinations in Asia that are offering the same as Macau, like Singapore…. So we have to put more efforts to further develop Macau as a global tourism centre.” (Yip & Lages, 2011).
The presence of foreign workers in various industries provides opportunities for the transfer of learning among residents who can gain knowledge and expertise from the foreigners (Pun, 2011). Mentoring programs can be carefully designed in companies in order to facilitate and ensure knowledge transfer.
Threats
The opening of new properties in Macao’s gaming, hospitality and food & beverage (F&B) industries means potentially losing valuable talents to new businesses (Cou, 2012; Tam, 2012; Yu, 2012). This situation usually translates to additional work and costs to recruitment, training and development among affected companies. With restrictions to hiring foreign workers, labor demand for new facilities is filled by attracting those already employed through better salaries and benefits. This pushes labor costs upward, severely affecting the SME employers’ effort to attract better talents.
The growing presence of foreign workers with higher educational attainment and better collective experience in the gaming and hospitality industries are also seen as a threat by Macao residents (Siu, 2011). This feeling will remain for as long as residents fail to take charge of their own personal growth and development and rely continually on government support and protection. Residents may also miss the opportunities for growth when they come and, thus, fail to improve and broaden their horizons (Fong, 2011).
China’s recent five-year plan (2011-2015) includes the drive to increase minimum wages by 13 percent and household incomes by about 7 percent in an effort to improve social inequality (Li & Woetzel, 2011). This means some mainland workers would decide working in their provinces rather than finding jobs in Macao. The region’s neighbor, Guangdong province, has
227
already been experiencing labor shortages. Thus, Macao needs to relax quotas for qualified workers from other regions in order to fill chronic job vacancies.
DISCUSSION AND RECOMMENDATIONS
The government needs a five-year and ten-year HRD plan, similar to the Tourism Master Plan proposed by the Pacific Asia Travel Association (Segui, 2012), which will support the region’s vision as a world tourism and leisure center. Such plan should solicit inputs from the residents, the business sector, labor associations, the academe, non- government organizations and other stakeholders in society. It should address the quality and quantity of human resources needed by the region, the standardization and quality of education, jobs and careers for people, and the quality of life of families in the region. Moreover, the support and services of trade and professional associations, and bigger corporations should be engaged in enhancing the skills and expertise of residents through structured and long-term training and development and career development.
The government should give top priority to developing human resources in Macao and attract locals to work in crucial professions such us nursing and social work (Pun, 2011). A recent Pacific Asia Travel Association (PATA) report on Macao also recommended a “migration policy for skilled workers” and “developing capacities working with local universities” towards a comprehensive “workforce development strategy” (Segui, 2012: 6). A steady supply of well-trained locals is crucial to the sustainable development of Macao. Thus, there is need for long-term HRD strategy which includes continuing professional education (Tam, 2012; Lages, 2010). A Macao-based educationist suggests that, “Macau needs sustained investment in training, education and lifelong learning at all levels and fields, the incubation of creativity, research and development laboratories for business and enterprise, and business parks that will attract and serve business development. Macau must cultivate high-level expertise in business and management, and solve persistent problems with labour and related legislation.” (Morrison, 2011: 57)
Macao’s current policy on imported labor dissatisfies both employers and labor associations. Employers consider it very restrictive and labor groups consider it loose. Labor groups are firm on maintaining a zero non-local workers for certain jobs such as casino dealers (Lei, 2011). Moreover, they demand a more transparent procedure to determine which industries can import labor, what ratio they should adopt between local and imported workers, and how soon foreigners should leave when their contracts expire (Lei, 2011). They are also wary about the presence of illegal labor. Likewise, they want more government support in enhancing the potentials and the quality of local labor, and providing them career planning and development (Lei, 2011).
On the other hand, a Macao-legislator proffers a more open view toward foreign workers. He suggests that the government should “create more dynamic and flexible immigration and labour systems, whereby companies would be allowed to import foreign workers provided that they also train local staff” (Coutinho, 2011: 32). Government should “loosen restrictions on
228
foreign recruitment, while maximizing the opportunities for training of local workers” (Coutinho, 2011: 32).
An academic recommends that “the city must create more high-grade employment opportunities and diversify the economy much more, so that the highly qualified can find employment that matches their qualifications.” He says “the city also needs to expand and diversify higher education to serve a diversified economy, and to give high-level employment training,” (Morrison, 2012: 105). Educational Reforms
Macao’s human resource predicament is partly explained by the absence of a standard system for primary and secondary education (Vong and Leitao, 2012; Siu, 2011). The quality of education could be compromised in the absence of measurable standards and students are not adequately prepared for the rigor of tertiary education and possibly their future jobs. Educational reforms should strategically support the government’s vision for its citizens and its own goal as world tourism and leisure center. Moreover, judicious investment in teacher training and student scholarships should be increased besides the additional infrastructure that will facilitate the environment of higher learning (Ng, 2011).
The hospitality courses offered by local universities have to be reviewed and configured to match industry standards. In this regard, collaboration between the schools and industry will be very useful in providing courses, training and work experience needed to form graduates suited for the companies. Some of the institutions in Macao are already working toward this direction. But even then, the number of graduates in their programs still falls short of what the hotel, gaming and service industries demand. Kim-Ieng and Woo (2009) recommend the enhancement of higher education hospitality programs in the region, a stronger drive to increase enrollment in the programs, and coordination among tourism and hospitality education providers. These strategies will especially contribute to the managerial development of local talents.
Formal education and continuing education subsidies are available from the government. Instead of being a short-term intervention, this support should be studied carefully and designed as a long-term strategy aligned to a sound HRD vision for the region. Moreover, the government should increase its sponsorship of college students from its current level of 40 percent of the number of students. (Fong, 2011) Suggested Policy Reforms and HRD Strategies
In order to provide the local employed population with better and suitable qualifications, the Macao government should invest more in upgrading the service of higher education institutes (HEIs) of the region. Government support for HEIs was announced recently by the chief executive (MDT 2010). By providing more resources and funds to these institutes, they can hire more qualified teaching staff and offer more programs and courses that are suitable to needs of industry and the labor market. Moreover, centers of excellence on specific fields or
229
specializations should be established in these institutes in order to give more focus and consolidate resources for effective HRD programs in the region. One good example that needs urgent attention is the setting up of a school or institute focusing on the training and development of current and future professionals in the MICE industry of the region.
The government should continue to be open to offering residency to highly qualified and needed foreigners who are willing to contribute to the development of Macao. The expertise of these foreigners should be tapped in transferring their knowledge and skills to Macao residents who are working in related fields. Moreover, the government should also consider giving priority for residency to highly qualified graduates of Macao’s higher education institutions who come from mainland China and other countries.
Also, the Macao government can try to attract overseas graduates who are local residents, or provide more subsidies to local secondary students to encourage them to obtain qualifications required by the labor market overseas and then return to work in Macao. Very attractive incentives should be given to those who have acquired excellent work experience abroad for them to decide to settle back in Macao. This measure can help to increase the number of highly qualified local professionals.
The government has to promote the courses and job trainings that it offers to residents to encourage continuing professional development and lifelong learning. Also, the government can make these courses more attractive by providing more subsidies to workers who have completed their training programs. In addition, it can offer more opportunities for paid internships among residents who are fresh university graduates. All the above can help to improve the competitiveness of local labor by increasing their qualifications.
The government should work hard to eliminate any illegal labor. Through giving sudden checks to construction sites or other working places, and to impose harsh punishments on the use of illegal labor, the amount of illegal workers can be greatly reduced.
There is one more strategy to solve the HRD challenges which is already in place – limiting the quota for imported labor. However, this should be used as the last resort and applied judiciously as Macao nowadays really lacks professionals in many fields. What the government can do is to help the companies to look for local professionals, and only when none can be found, then it can approve the employment of imported labor. In this regard, companies should find adequate support in the government and not a stumbling block to their growth and development.
Macao cannot depend on the gaming industry forever. The gaming industry nowadays in Macao relies very much on gamblers from mainland China. But it is not guaranteed that the central government will not further constrict or tighten the number of mainlanders that enter Macao. Macao should attract tourists who would be interested in its heritage. In order to do this, Macao should become more diversified and develop more family-friendly leisure facilities. Since Macao has a special history background consisting both Chinese and Western cultures and there are many valuable world heritage sites, the government should see it as an advantage to develop ancillary industries. The government should make use of this golden chance to develop special attractions to increase its competitiveness. Or else Macao may be overshadowed by its neighbors such as Singapore and Taiwan, as they are also developing their gaming industries.

230
CONCLUSION
The rapid growth of Macao given an inadequate local workforce underscores the urgent
need for HRD as a regional strategy. HRD in the region is at its growth stage, driven by current manpower demands, and short and medium-term training needs. The region’s highly restrictive labor migration policy has adversely affected the growth of SMEs and big businesses, hampered the quality of services and forced some businesses to resort to illegal workers. It is time to adopt a less restrictive labor policy and a more long-term HRD strategy to develop local talents and harness the strengths of foreign labor.
HRD’s trajectory in Macao has been both encouraged and hampered by an economy that is overly dependent on the gaming industry. The presence of more multinational companies in the region has given a big boost to HRD in the private sector. They are also in a better position to provide a definite career path for their employees and not just jobs for long-term employment. The next five years should see more HRD programs for small and medium-size businesses and non-gaming companies. This would need support and guidance from the government, as well as expertise from the bigger companies in the private sector.
The government needs to adopt an integrated HRD policy and strategy that would effectively address the HRD needs of local human resources, identify and promote effective training interventions, and provide better job opportunities for locals. The quality of government-sponsored or initiated training programs should also be enhanced by ensuring that program design and implementation match the expectations of potential employers. Moreover, greater attention should be given to empowering the unskilled segment of the employed population. While providing more jobs to local residents is a meritorious goal, people, nonetheless, have to be equipped with the requisite knowledge, skills and attitudes in order to work productively.
Best HRD practices among the multinational companies in Macao should be shared to local companies. This may be done by tapping HRD professionals from these foreign companies as resource persons for public or in-house training programs. Moreover, setting up an association of HRD professionals in the region could facilitate the exchange of experiences and foster professional development among HRD practitioners. An HRD academy for public servants will also be strategically useful in upgrading and enhancing civil service expertise.
Serious attempts to diversify into the MICE (meetings, incentives, conventions and exhibitions) sector have opened more possibilities for the HRD profession. Existing tie-ups between companies and the academe, such as IFT, to train and develop MICE professionals are highly commendable. MICE professionals in Macao definitely need continuing professional development (He, 2010) in order to grow their profession and careers.
Better coordination and synergy must also be formed among the existing centers of continuing education. Identifying centers of excellence for public training programs and more government funding could further enhance the growth and effectiveness of HRD in the region. Lastly, companies especially the SMEs should be encouraged to invest more in their people by giving them appropriate government incentives that could facilitate this endeavor.
231
REFERENCES
Carreiro, E. (2012). Interview with Ms. Elsa Carreiro (Recruitment Manager of Grand Lisboa
Hotel & Casino), March 14. Cavaliere, G. (2011). To young hospitality worker. Macau Business, June: 112. Chan, C. & Cheong, C. (2012). Interview with Mr. Chan Chak Mo (Managing Director, Future
Bright Holdings Ltd.) and Ms. Cristine Cheong (Director of Human Resources, Future Bright Holdings Ltd.), August 7.
Cou, F. (2012). Interview with Ms. Fatima Cou (Director, Staffing, MGM Macau), February 22. Coutinho, J.P. (2011). Great Expectations. Macau Business, May: 32. Coutinho, J.P. (2011a). Interview with Macao Legislator José Maria Pereira Coutinho, September
12. EC (European Commission) (2011). Macao Special Administrative Region: Annual Report 2010.
http://eeas.europa.eu/macao/docs/com_205_11_en.pdf. Accessed 29 July 2011. Fong, D. (2011). Interview with Dr. Davis Fong (Director of the Institute for the Study of
Commercial Gaming, University of Macau) on 19 August 2011. Gilley, J., Eggland, S., & Gilley, A. (2002). Principles of Human Resource Development. 2e.
New York: Basic Books. Institute for Tourism Studies (IFT) (2009). Website:
http://www.ift.edu.mo/en/Home/Default.aspx Kuan, V.M. (2011). Interview with Mr. Victor Manuel Kuan, Director General of CPTTM,
October 18. Lages, A. (2010). Fanny Vong, president of IFT: ‘Local residents have to work harder’.
Macau Daily Times. t http://www.macaudailytimes.com.mo/macau/14504-Fanny-Vong-president-IFT-Local-residents-have-work-harder.html. Accessed 15 July 2010.
Lee, M. (2007). Human resource development from a holistic perspective. Advances in Developing Human Resources, 9(1): 97-110.
Lei, E. (2011). Interview with Ella Lei (Vice-Chairperson, Macau Federation of Trade Unions) on 24 June 2011.
Lei, H. (2012). Interview with Prof. Lei Heong Iok (President of Macao Polytechnic Institute), July 19.
Leong, A, (2007). Macau MICE Tourism with a Closer Review of the Las Vegas and Atlantic City Experiences.” Journal of Macau University Science and Technology, 1(2): 55-70.
Li, G. and Woetzel, J. (2011). “What China’s Five-year Plan Means for Business”. McKinsey Quarterly, July: 1-6.
Lim-Ieng, L. and Woo, G. (2010). “Macao’s Casino Industry: Reinventing Las Vegas in Asia.” Cornell Hospitality Quarterly. 51. (2). 268-283.
Lok, S. (2012). Interview with Ms. Stella Lok (President, Macau Society of Registered Accountants) on March 17.
232
Luk, A. (2012). Interview with Ms. Alice Luk (Founder & Chairperson, Macau Society of Registered Accountants) on March 17.
Low, L. (1998). Human resource development in the Asia-Pacific. Asian-Pacific Economic Literature, 12(1): 27-40.
Macao Economic Services (DSE) (2007). Website: http://www.economia.gov.mo/web/DSE/public?_nfpb=true&_pageLabel=Bk_SME&locale=en_US
Macao Labor Affairs Bureau (DSAL) (2012). Website: http://www.dsal.gov.mo/english/tel.htm Macao Polytechnic Institute (IPM) (2009). Website: http://www.ipm.edu.mo/cfcpe/ Macao Statistics and Census Bureau (DSEC) (2010). Website:
http://www.dsec.gov.mo/Home.aspx?lang=en-US Macao Statistics and Census Bureau (DSEC) (2011). Survey of Manpower Needs and Wages,
Available at: http://www.dsec.gov.mo/getAttachment/3e65f69e-bf1f-41c5-9de5-8fca14608fa4/E_NECI_FR_2011_Q1.aspx (Accessed on July 28, 2011)
McLean, G.N. (2004). National human resource development: What in the world is it? Advances in Developing Human Resources, 6(3): 269-275.
Macau Daily Times (MDT) (2010). Continuing education to get more support. http://www.macaudailytimes.com.mo/macau/15082-Continuing-education-get-more-support.html. Accessed on 31 July 2010.
Macau Business (MB) (2010). Good news, bad news. Macau Business, June: 37. Morrison, K. (2012). Feed the mind, mind the belly. Macau Business, June: 104-105. Morrison, K. (2011). Macau’s signature dish. Macau Business, May: 57. Morrison, K. (2011a). Zombie sex stereotypes. Macau Business, June: 31. Morrison, K. (2010). The frog economy. Macau Business, June: 32. MSS Recruitment (2010). Macau Job Marker 2010: Leading employers talk about opportunities
in their companies. Macau: MSS Recruitment. Macao Social Welfare Bureau (MSWB) (2008). Practical Tips for Living in Macao. Macao Yearbook (MY) (2009). Government Information Bureau of the Macao Special
Administrative Region. Ng, K.C. (2011). Interview with Macao Legislator Ng Kuok Cheong, August 23. Organization for Economic Cooperation and Development (OECD) (2012). Society at a Glance -
Asia/Pacific Edition 2011. http://www.oecd.org/document/2/0,3746,en_2649_201185_49233154_1_1_1_1,00.html. Accessed 14 June 2012.
Pun, P. (2011). Interview with Mr. Paul Pun (President, Caritas) July 11. Rangel, E. (2004). Policies for employment and higher education in Mexico: An approach to
human resource development as policy. Advances in Developing Human Resources, 6(3), 374-381.
Segui, V. (2012). Report argues for a ‘Tourism Master Plan’ in order to make ‘Macau accessible to the world’. Macau Daily Times. June 20: 6.
233
Shamadasani, A. (2008). When the Chips are Down. Macau Today. Hong Kong: SCMP. October 30: 6-10.
Siu, R. (2011). Interview with Prof. Ricardo Siu (Associate Professor in Economics), August 31. Swanson, R. & Holton, E. (2009). Foundations of Human Resource Development. 2e. San
Francisco: Berrett-Koehler. Tam, S. (2012). Interview with Ms. Shirley Tam (Assistant Vice President, Casino Marketing,
Galaxy Macau), February 24. Taylor, R. (2005). “China’s Human Resource Management Strategies: The Role of Enterprise
and Government.” Asian Business and Management, (4), 5-21. Trigger, R. (2010). “Imported labor law ‘could hurt SMEs’”. The Macau Post Daily. June 25: 2. UNESCO (2008). Higher Education in Macau: Country Report to UNCESCO. University of Macau (UM) (2009). Website: http://www.umac.mo/ Vong, T. and Leitao, L. (2012). Education’s ‘cruel reality’. MBusiness Daily, 18 June: 4-5. Yang, B., Zhang, D., & Zhang, M. (2004). National human resource development in the People’s
Republic of China. Advances in Developing Human Resources, 6(3): 297-306. Yip, F. and Lages, A. (2011). Several industries are lacking labour force. Interview with Mr.
Frederick Yip, president of the Executive Committee of the Association of Retailers and Tourism Services. Macau Daily Times. October 10: 2-3.
Yu, W. (2012). Interview with Ms. Wendy Yu (Vice President, Strategic Planning, MGM Macau), February 22.

234
DEVELOPMENT OF INTERCULTURAL SKILLS IN WORKERS INVOLVED IN TECHNOLOGY TRANSFER TEAMS
Omar Salgado
EGADE Business School, Tecnológico de Monterrey; Jose Carlos Ramírez-Sanchez
Volkswagen de Mexico Jerry Banks, Engineering School, Tecnológico de Monterrey
Yongjiang, Shi and Helen, Zhang Institute for Manufacturing, University of Cambridge
ABSTRACT
The speed of changes in the global business environment has pushed European multinationals to employ staff from its foreign subsidiaries, to take over some corporate activities in a third country. This is the case with Latin American executives working in China, that face not only the culture shock, but are immersed in a complex chain of command between headquarters, subsidiary and host market. This article is part of a wider research on decoding the business environment in China for Latin American executives, based on three areas: communication patterns, negotiation patterns and cultural/interpersonal development. A pilot sample was built of Mexican executives that currently manage business in China, and it offers initial assumptions of the study about leadership values such as in-group collectivism, future orientation and power distance. Interviewees also provided insights about differences in working conditions between Mexico & China, the way managers either overcome or fought such difference and the changes that executives would like to see in the Chinese business environment in order to facilitate the adaptation of expatriates from Latin America.
Keywords: international business communication, corporate communication, expatriate communication, subsidiary coordination and control
INTRODUCTION
The speed of changes in the global business environment has pushed European multinationals to employ staff, from its foreign subsidiaries, to take over some corporate activities in a third country. This is specially the case of German manufacturers such as VW that after the most recent 2008 crisis, the company has started to rely on human resources throughout the corporate network and not only from the ones centralized in its home county. This phenomenon is caused mainly by two factors; on the one hand, the steady growth of the Chinese automobile market
235
(Automotive News, 2010) (Automotive News, 2010), (Automotive News, 2012) in which VW operates based on ‘parallel organizational hierarchies’, demands expatriates to share the control of company’s activities in China with Chinese business partners; and on the other, the company experienced an increase in demand in Europe (Automotive News, 2012) which hardened the availability of executives. The company made its way out of this problem by setting up an internationalization strategy for its executives worldwide following four principles: (1) designing formal processes for talent scout worldwide, (2) build a pool of internationally trained executives with an international career plan, (3) building a chain of mentors that helps to develop international managers, (4) setting up a formal plan of successors. This article is part of a wider research which aims to decode the business environment in China based on three areas: communication patterns, negotiation patterns and cultural/interpersonal development. The article reports on a pilot sample of Mexican executives that are currently managing operations in China; the sample aims to explore research tools for the wider sample, but it also provides peculiar insights about differences in working conditions between Mexico & China, the way managers either overcome or fought such difference and the changes that executives would like to see in the Chinese business environment in order to facilitate the adaptation of expatriates from Latin America.
The Complexity of the phenomenon
The traditional approach towards foreign markets is via a central planning trough in which subsidiaries ‘replicate the corporate knowledge that has been proven successful in the home market’ (Birkinshaw, 1996). No adaptation is pursued unless local conditions endanger the feasibility of the venture. If it does, then Multinational Enterprises (MNE) looks for achieving a local responsiveness but making the most of the global coordination efficiency in terms of standardization (Bartlett & Ghoshal, 2001).
The above paragraph exemplifies much of the phenomenon that has been explained in the introduction. VW entered the Chinese market, by playing a specific role of technology provider for the strategic alliance it makes with Chinese manufacturers; whereas, Chinese partners deal mainly with the adaptation of the VW’s corporate knowledge to the local conditions. The adaptation involves several issues such as local market and human resources development. In consequence, two parallel organizational structures have been built in most of the executive positions. Thereby, VW´s expatriates have a Chinese partner with the same hierarchy level, degree of responsibilities and authority. All decisions to be made either at operational or strategic level need to be communicated and negotiated. This scenario becomes significantly complex if the players are considered as follows: (1) VW’s HQ in Germany dictates product mandates to be developed; (2) VW’s subsidiary in China replicates given mandates; (3) Chinese partners adapt product mandates and absorb technology and knowledge. Issues such as: what to adapt and how to adapt it becomes a regular game of communication and negotiation processes. At the end of the day, two general goals have to be accomplished: (1) Ensure that products are built according
236
to technological specifications and quality standards; (2) achieve efficiencies based on local resources.
The above explanation describes the phenomenon along ‘company’ as the unit of analysis; however, this articles aims to describe how this phenomenon increases in complexity if it is analyzed along ‘individuals’ as the unit of analysis. The increment in complexity comes from cultural perceptions and attitudes that individuals may follow during the communication and negotiation processes. Consequently, VW sends expatriates to China expecting that they are able to transfer technology, know-how, product and process compliance and project management techniques. A Chinese counterpart expects that expatriates are fully aware of what corporations negotiated and that they are capable to transfer the corporate knowledge. Hence, expatriates expect that Chinese partners agreed with what the corporation negotiated and that they are receptive and eager to adopt corporate practices. Until now, the increment in complexity comes from two sources: (1) the inclusion of the word ‘expect’ brings to the discussion individuals’ perception of the reality, (2) expatriates and Chinese individual’s activities are never what corporations negotiated or what corporate knowledge is but, a ‘proxy’ for reality.
Finally, the complexity increases even further due to the fact that individuals’ perceptions are significantly based on cultural values. Therefore, VW pulls executives from its foreign subsidiaries according to the internationalization plan explained earlier in this article. In consequence, HQ expects that the expatriate from a 3rd country is not only capable to replicate the corporate knowledge but also, he/she has the needed networking in Headquarters (HQ). Figure 1 shows the complexity of the phenomenon along a three axis chart. The ‘y’ axis exemplifies the unit of analysis in which the low-end refers to individuals and the high-end to companies. The ‘x’ axis shows the corporate hierarchy position on which the left side stands for subsidiary and right side for HQ. Lastly, the ‘z’ axis refers to the position in the corporate network which just stands for peers such as: other plants, sales representatives, etc. There are three proxies in the system: (1) German expats performance for ‘corporate knowledge’, (2) Chinese managers’ performance for ‘compliances with agreements’. (3) Mexican expats’ performance for ‘emulating HQ-from expats’. Individual performance is the generic proxy which is shaped by communications, negotiations, perceptions and attitudes. Finally, the focus of this article represented by a two-dimension triangle: German expats, Chinese Managers and Mexican expats.
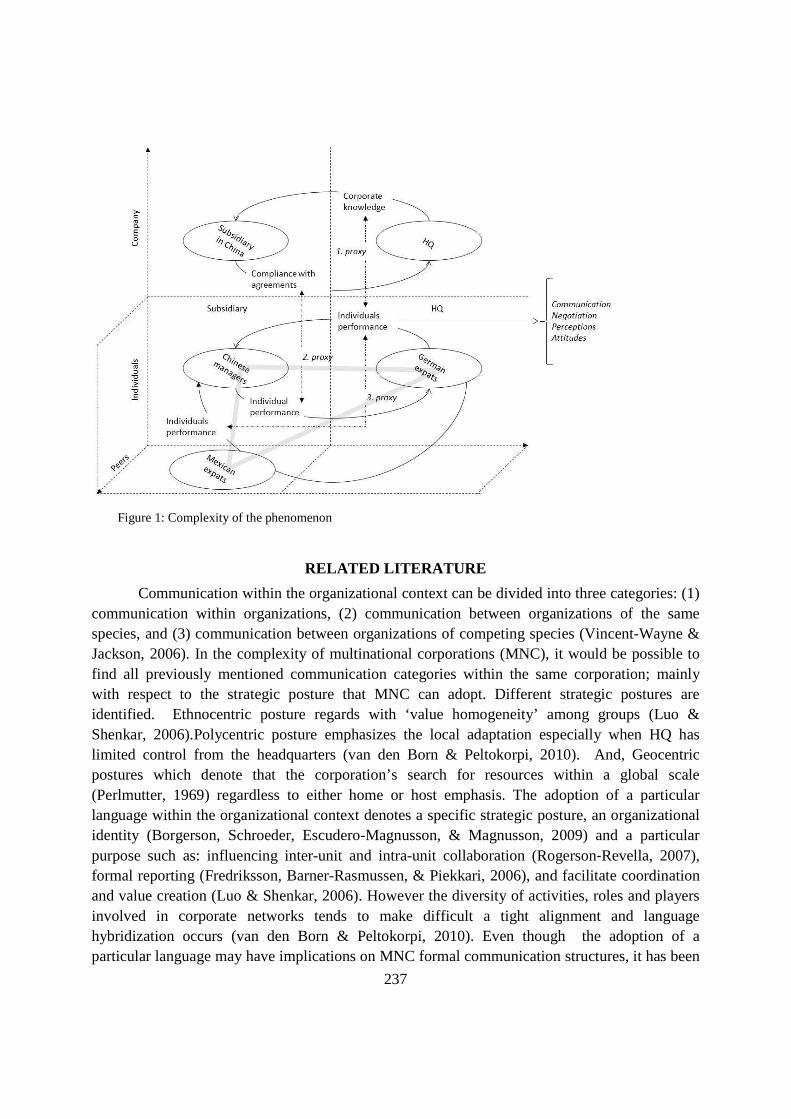
237
Figure 1: Complexity of the phenomenon
RELATED LITERATURE
Communication within the organizational context can be divided into three categories: (1) communication within organizations, (2) communication between organizations of the same species, and (3) communication between organizations of competing species (Vincent-Wayne & Jackson, 2006). In the complexity of multinational corporations (MNC), it would be possible to find all previously mentioned communication categories within the same corporation; mainly with respect to the strategic posture that MNC can adopt. Different strategic postures are identified. Ethnocentric posture regards with ‘value homogeneity’ among groups (Luo & Shenkar, 2006).Polycentric posture emphasizes the local adaptation especially when HQ has limited control from the headquarters (van den Born & Peltokorpi, 2010). And, Geocentric postures which denote that the corporation’s search for resources within a global scale (Perlmutter, 1969) regardless to either home or host emphasis. The adoption of a particular language within the organizational context denotes a specific strategic posture, an organizational identity (Borgerson, Schroeder, Escudero-Magnusson, & Magnusson, 2009) and a particular purpose such as: influencing inter-unit and intra-unit collaboration (Rogerson‐Revella, 2007), formal reporting (Fredriksson, Barner-Rasmussen, & Piekkari, 2006), and facilitate coordination and value creation (Luo & Shenkar, 2006). However the diversity of activities, roles and players involved in corporate networks tends to make difficult a tight alignment and language hybridization occurs (van den Born & Peltokorpi, 2010). Even though the adoption of a particular language may have implications on MNC formal communication structures, it has been
238
reported that interpersonal networking makes a larger contribution to communication performance (Ghoshal, Korine, & Szulanski, 1994), this finding put emphasis on how individuals make use of communication techniques and methods in order to impact positively on his/her own managerial performance. In consequence, the universe of languages to choose from and individuals’ expertise in a particular language, make a complex system of languages zones (Babcock & Du-Babcock, 2001). Expats usually switch from one language zone to another according to the specific situation and receiver. Furthermore, managers employ so called ‘linchpins’ that are individuals with bilingual capabilities and comprehension of the local business environment. Linchpins assist expatriates during the communication process customizing both ways messages with the aim of improving and speeding up the communication (Du-Babcock & Babcock, 1996), (Babcock & Du-Babcock, 2001). Another important characteristic of international communication is the identification of ‘genre patters’ such as: professional, commercial and relational genre (Du-Babcock & Babcock, 2007); to which the level of proficiency and the importance of the comprehension of the message vary. Communication assertiveness has been claimed especially important within subsidiary – HQ context; miscommunication between expats and local managers leads to underperformance and an increasing anxiety in local managers that triggers conflict and cognitive distortion of the strategic intent (Harzing & Feely, 2008). Consequently, negotiation is another important capability within cross-border management context. Four dimensions have been identified for negotiation in an international context: (1) concept of negotiation which refers to a negotiators’ initial intentions such as win-win agreements; (2) most significant issue which refers to a particular emphasis negotiators put on the process, these are either task-related or relationship-based; (3) basis of trust which refers to whether or not negotiators rely on written or spoken plans; (4) form of agreement which refers to whether negotiators request explicit contracts or implicit agreements (Metcalf, Bird, Peterson, Shankarmahesh, & Lituchy, 2007).
As mentioned previously, the phenomenon implies the perception and attitudes of individuals that are heavily influenced by their cultural values. In organizational studies, perhaps one of the most well-known works involving culture is the one developed by Geert Hofstede during the 1970’s (Hofstede G. , 1980). Hofstede defined four components of national cultures; power distance, individualism vs. collectivism, masculinity vs. femininity, and uncertainty avoidance with the intention of claiming that work-related values, beliefs, norms, and self-descriptions vary from cultures. Definitions of the dimension are as follows (Minkov & Hofstede, 2011): Power distance is a social inequality, including the relationship with authority; Individualism vs. collectivism is the relationship between the individual and the group; Masculinity vs. femininity is the social implications of having been born as a boy or a girl; Uncertainty avoidance are ways of dealing with uncertainty, relating to the control of aggression and the expression of emotions. In a later work, Hofstede included a fifth dimension: long vs. short term orientation (Hofstede G. , 1991) to address if the focus of people’s efforts is on the future, present or past. The implication of Hofstede’s research has brought a significant amount of related studies such as the GLOBE Project (Global Leadership and Organizational Behavior Effectiveness) in which it was introduced other dimensions as well as reframing Hofstede ones.
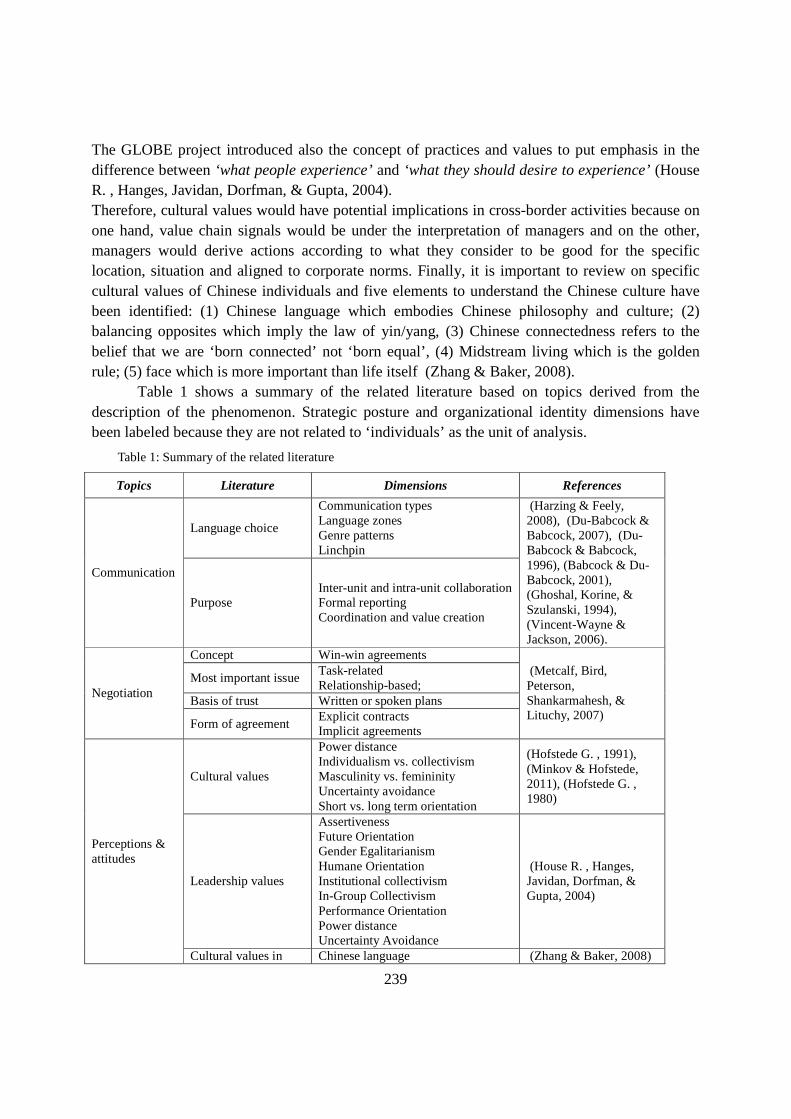
239
The GLOBE project introduced also the concept of practices and values to put emphasis in the difference between ‘what people experience’ and ‘what they should desire to experience’ (House R. , Hanges, Javidan, Dorfman, & Gupta, 2004). Therefore, cultural values would have potential implications in cross-border activities because on one hand, value chain signals would be under the interpretation of managers and on the other, managers would derive actions according to what they consider to be good for the specific location, situation and aligned to corporate norms. Finally, it is important to review on specific cultural values of Chinese individuals and five elements to understand the Chinese culture have been identified: (1) Chinese language which embodies Chinese philosophy and culture; (2) balancing opposites which imply the law of yin/yang, (3) Chinese connectedness refers to the belief that we are ‘born connected’ not ‘born equal’, (4) Midstream living which is the golden rule; (5) face which is more important than life itself (Zhang & Baker, 2008).
Table 1 shows a summary of the related literature based on topics derived from the description of the phenomenon. Strategic posture and organizational identity dimensions have been labeled because they are not related to ‘individuals’ as the unit of analysis.
Table 1: Summary of the related literature
Topics Literature Dimensions References
Communication
Language choice
Communication types Language zones Genre patterns Linchpin
(Harzing & Feely, 2008), (Du-Babcock & Babcock, 2007), (Du-Babcock & Babcock, 1996), (Babcock & Du-Babcock, 2001), (Ghoshal, Korine, & Szulanski, 1994), (Vincent-Wayne & Jackson, 2006).
Purpose Inter-unit and intra-unit collaboration Formal reporting Coordination and value creation
Negotiation
Concept Win-win agreements (Metcalf, Bird, Peterson, Shankarmahesh, & Lituchy, 2007)
Most important issue Task-related Relationship-based;
Basis of trust Written or spoken plans
Form of agreement Explicit contracts Implicit agreements
Perceptions & attitudes
Cultural values
Power distance Individualism vs. collectivism Masculinity vs. femininity Uncertainty avoidance Short vs. long term orientation
(Hofstede G. , 1991), (Minkov & Hofstede, 2011), (Hofstede G. , 1980)
Leadership values
Assertiveness Future Orientation Gender Egalitarianism Humane Orientation Institutional collectivism In-Group Collectivism Performance Orientation Power distance Uncertainty Avoidance
(House R. , Hanges, Javidan, Dorfman, & Gupta, 2004)
Cultural values in Chinese language (Zhang & Baker, 2008)
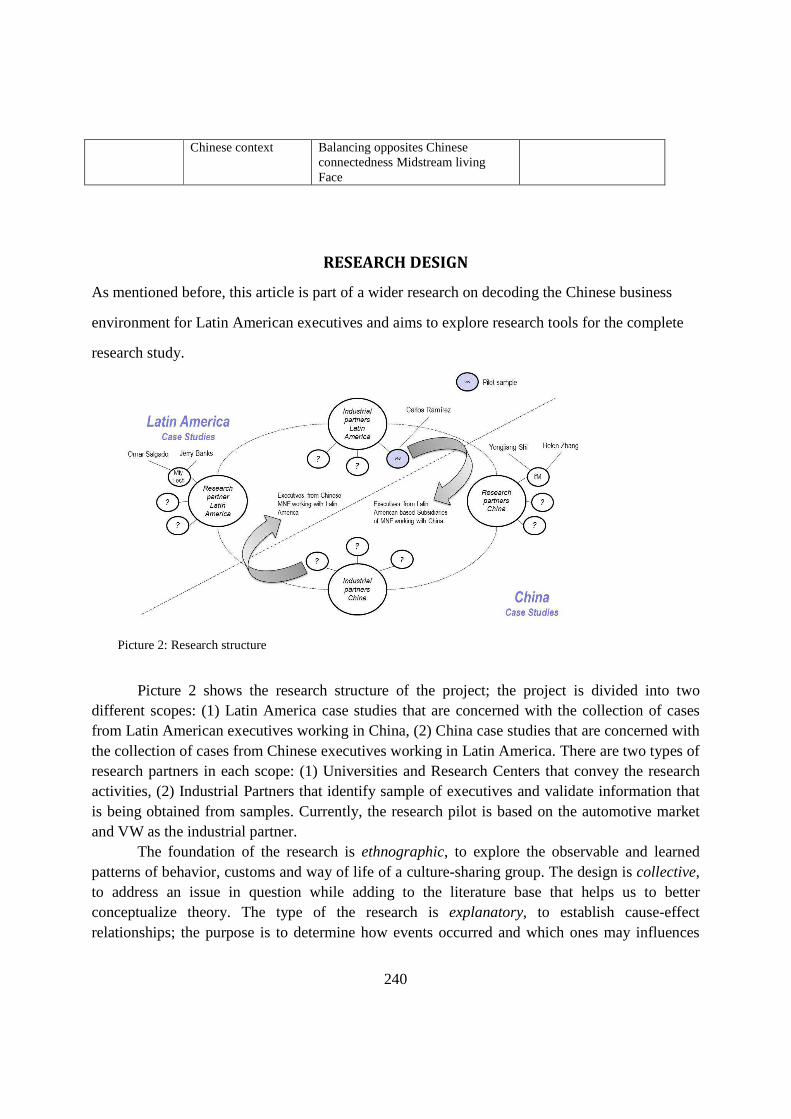
240
Chinese context Balancing opposites Chinese connectedness Midstream living Face
RESEARCH DESIGN
As mentioned before, this article is part of a wider research on decoding the Chinese business
environment for Latin American executives and aims to explore research tools for the complete
research study.
Picture 2: Research structure
Picture 2 shows the research structure of the project; the project is divided into two
different scopes: (1) Latin America case studies that are concerned with the collection of cases from Latin American executives working in China, (2) China case studies that are concerned with the collection of cases from Chinese executives working in Latin America. There are two types of research partners in each scope: (1) Universities and Research Centers that convey the research activities, (2) Industrial Partners that identify sample of executives and validate information that is being obtained from samples. Currently, the research pilot is based on the automotive market and VW as the industrial partner.
The foundation of the research is ethnographic, to explore the observable and learned patterns of behavior, customs and way of life of a culture-sharing group. The design is collective, to address an issue in question while adding to the literature base that helps us to better conceptualize theory. The type of the research is explanatory, to establish cause-effect relationships; the purpose is to determine how events occurred and which ones may influences
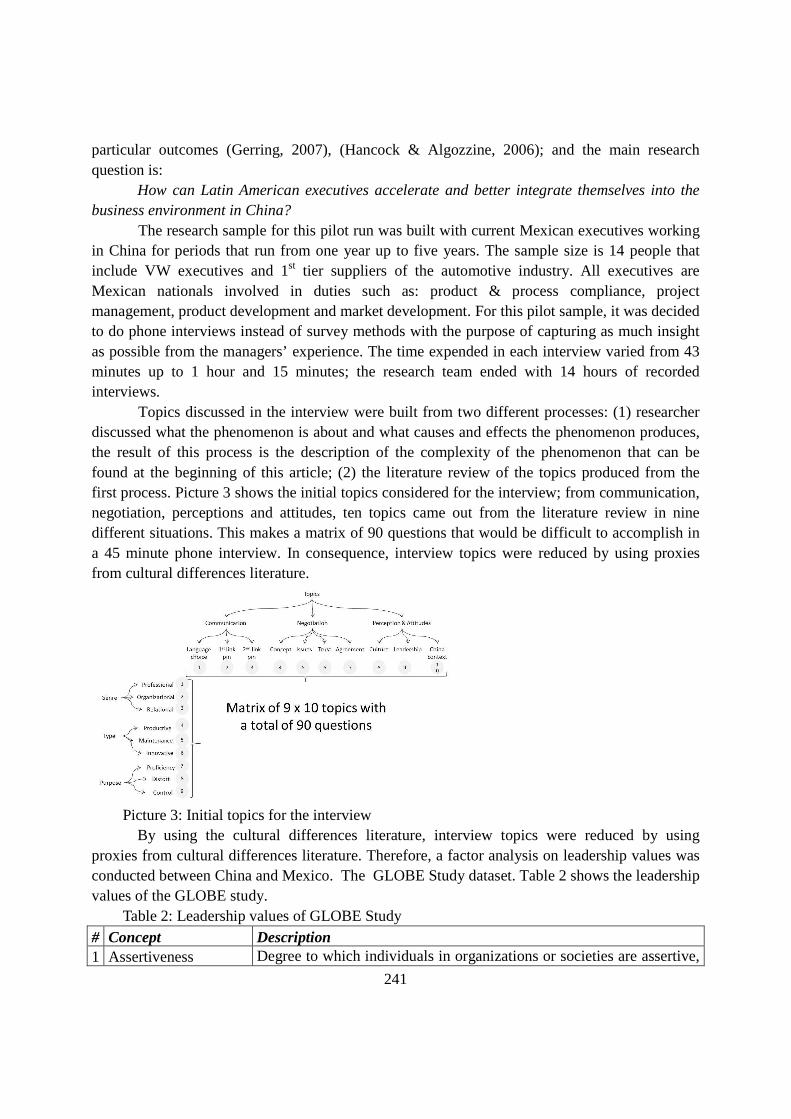
241
particular outcomes (Gerring, 2007), (Hancock & Algozzine, 2006); and the main research question is:
How can Latin American executives accelerate and better integrate themselves into the business environment in China? The research sample for this pilot run was built with current Mexican executives working in China for periods that run from one year up to five years. The sample size is 14 people that include VW executives and 1st tier suppliers of the automotive industry. All executives are Mexican nationals involved in duties such as: product & process compliance, project management, product development and market development. For this pilot sample, it was decided to do phone interviews instead of survey methods with the purpose of capturing as much insight as possible from the managers’ experience. The time expended in each interview varied from 43 minutes up to 1 hour and 15 minutes; the research team ended with 14 hours of recorded interviews. Topics discussed in the interview were built from two different processes: (1) researcher discussed what the phenomenon is about and what causes and effects the phenomenon produces, the result of this process is the description of the complexity of the phenomenon that can be found at the beginning of this article; (2) the literature review of the topics produced from the first process. Picture 3 shows the initial topics considered for the interview; from communication, negotiation, perceptions and attitudes, ten topics came out from the literature review in nine different situations. This makes a matrix of 90 questions that would be difficult to accomplish in a 45 minute phone interview. In consequence, interview topics were reduced by using proxies from cultural differences literature.
Picture 3: Initial topics for the interview
By using the cultural differences literature, interview topics were reduced by using proxies from cultural differences literature. Therefore, a factor analysis on leadership values was conducted between China and Mexico. The GLOBE Study dataset. Table 2 shows the leadership values of the GLOBE study.
Table 2: Leadership values of GLOBE Study # Concept Description 1 Assertiveness Degree to which individuals in organizations or societies are assertive,

242
confrontational and aggressive in social relationships.
2 Future Orientation
Degree to which individuals in organizations or societies engage in future-oriented behavior such as: planning, investing in the future, and delaying individual or collective gratification.
3 Gender Egalitarianism
Extent to which an organization or a society minimizes gender role differences while promoting gender equity and the equality of genders.
4 Humane Orientation
Degree to which individuals in organizations or societies encourages and reward individuals for being fair, altruistic, friendly, generous, caring, kind to others, and exhibiting and promoting altruistic ideals.
5
Institutional collectivism (Collectivism I)
Reflects the degree to which organizational and societal institutional practices encourage and reward collective distribution of resources and collective action.
6
In-Group Collectivism (Collectivism II)
Reflects the degree to which individuals express pride, loyalty and cohesiveness in their organizations or families.
7 Performance Orientation
Refers to the extent to which an organization or society encourages and rewards group members for performance improvement and excellence.
8 Power distance Degree to which members of an organization or society expect and agree that power should be unequally shared.
9 Uncertainty Avoidance
Extent to which members of an organization or society strive to avoid uncertainty by reliance on social norms, rituals, and bureaucratic practices to alleviate the unpredictability of future events.
The analysis showed that three leadership values (Practice collectiveness in-group,
Practice Future Orientation, Practice Power Distance) explain the 78% of differences between Mexican and Chinese nationals.
Table 3 shows communalities which explain the amount of variance in each factor. Table 3: Communalities
Table 4 shows the variance explained; it is possible to see that the first 3 factors explain
up to 78.3% the variability of the initial nine factors.
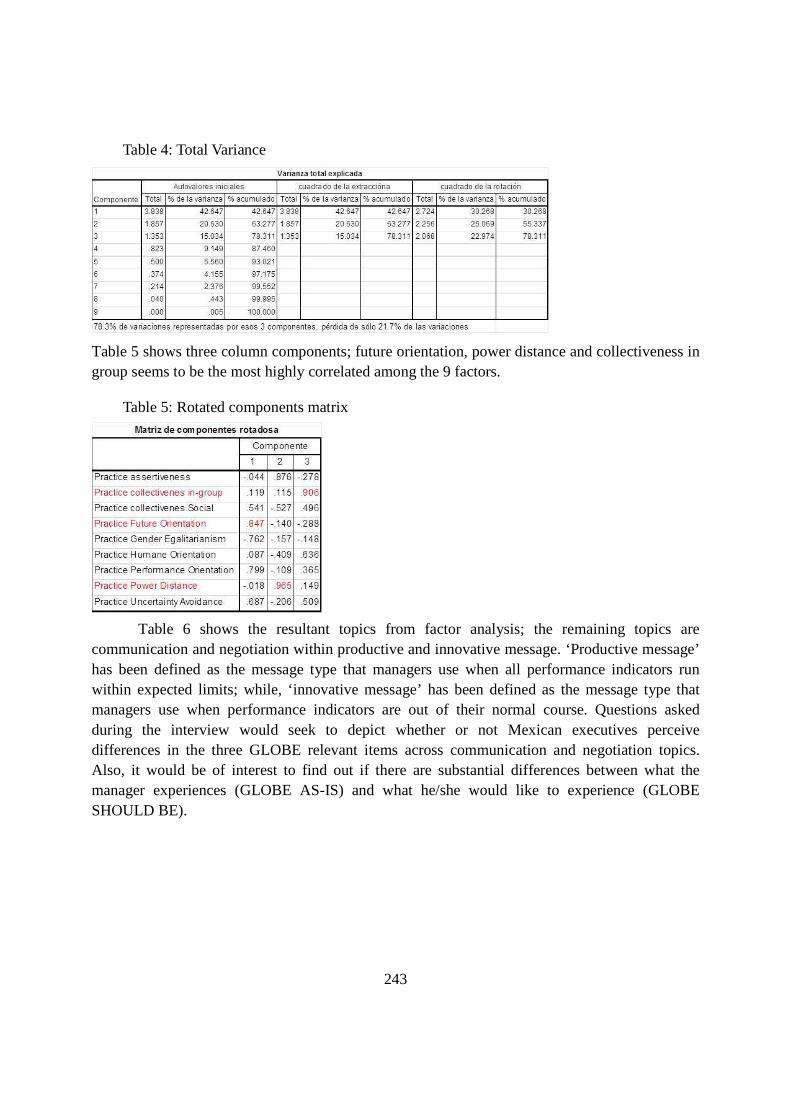
243
Table 4: Total Variance
Table 5 shows three column components; future orientation, power distance and collectiveness in group seems to be the most highly correlated among the 9 factors.
Table 5: Rotated components matrix
Table 6 shows the resultant topics from factor analysis; the remaining topics are communication and negotiation within productive and innovative message. ‘Productive message’ has been defined as the message type that managers use when all performance indicators run within expected limits; while, ‘innovative message’ has been defined as the message type that managers use when performance indicators are out of their normal course. Questions asked during the interview would seek to depict whether or not Mexican executives perceive differences in the three GLOBE relevant items across communication and negotiation topics. Also, it would be of interest to find out if there are substantial differences between what the manager experiences (GLOBE AS-IS) and what he/she would like to experience (GLOBE SHOULD BE).
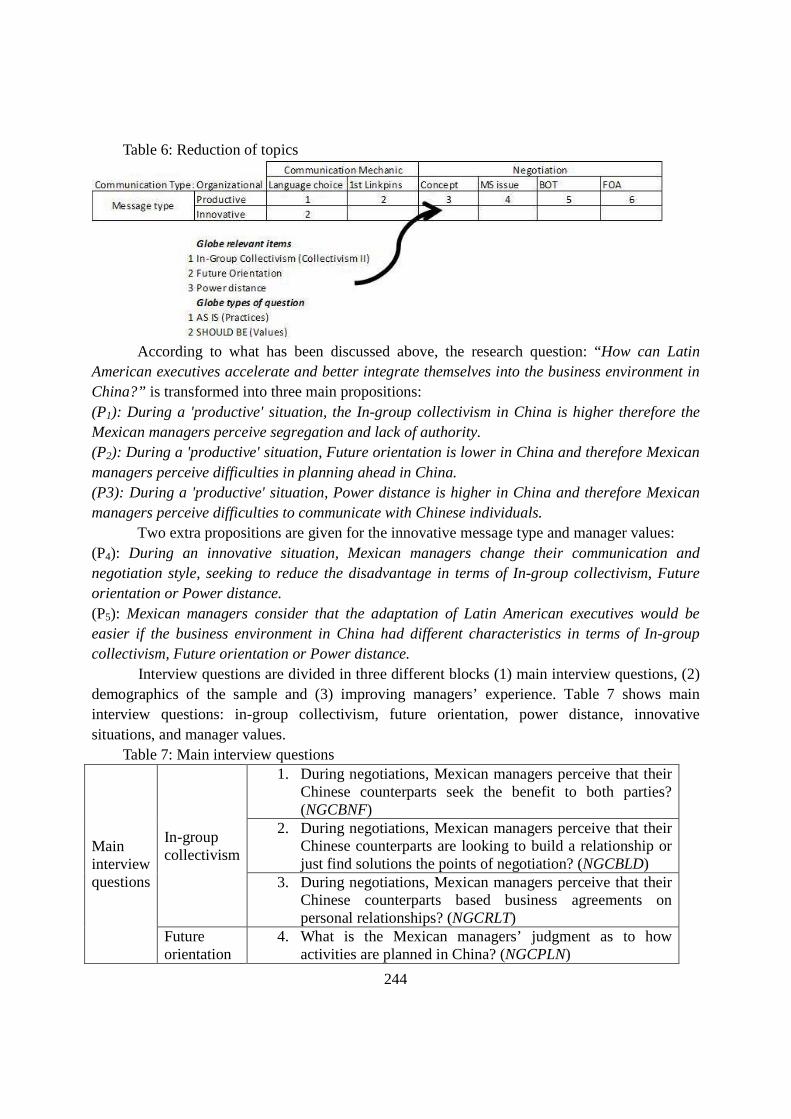
244
Table 6: Reduction of topics
According to what has been discussed above, the research question: “How can Latin
American executives accelerate and better integrate themselves into the business environment in China?” is transformed into three main propositions: (P1): During a 'productive' situation, the In-group collectivism in China is higher therefore the Mexican managers perceive segregation and lack of authority. (P2): During a 'productive' situation, Future orientation is lower in China and therefore Mexican managers perceive difficulties in planning ahead in China. (P3): During a 'productive' situation, Power distance is higher in China and therefore Mexican managers perceive difficulties to communicate with Chinese individuals.
Two extra propositions are given for the innovative message type and manager values: (P4): During an innovative situation, Mexican managers change their communication and negotiation style, seeking to reduce the disadvantage in terms of In-group collectivism, Future orientation or Power distance. (P5): Mexican managers consider that the adaptation of Latin American executives would be easier if the business environment in China had different characteristics in terms of In-group collectivism, Future orientation or Power distance. Interview questions are divided in three different blocks (1) main interview questions, (2) demographics of the sample and (3) improving managers’ experience. Table 7 shows main interview questions: in-group collectivism, future orientation, power distance, innovative situations, and manager values.
Table 7: Main interview questions
Main interview questions
In-group collectivism
1. During negotiations, Mexican managers perceive that their Chinese counterparts seek the benefit to both parties? (NGCBNF)
2. During negotiations, Mexican managers perceive that their Chinese counterparts are looking to build a relationship or just find solutions the points of negotiation? (NGCBLD)
3. During negotiations, Mexican managers perceive that their Chinese counterparts based business agreements on personal relationships? (NGCRLT)
Future orientation
4. What is the Mexican managers’ judgment as to how activities are planned in China? (NGCPLN)
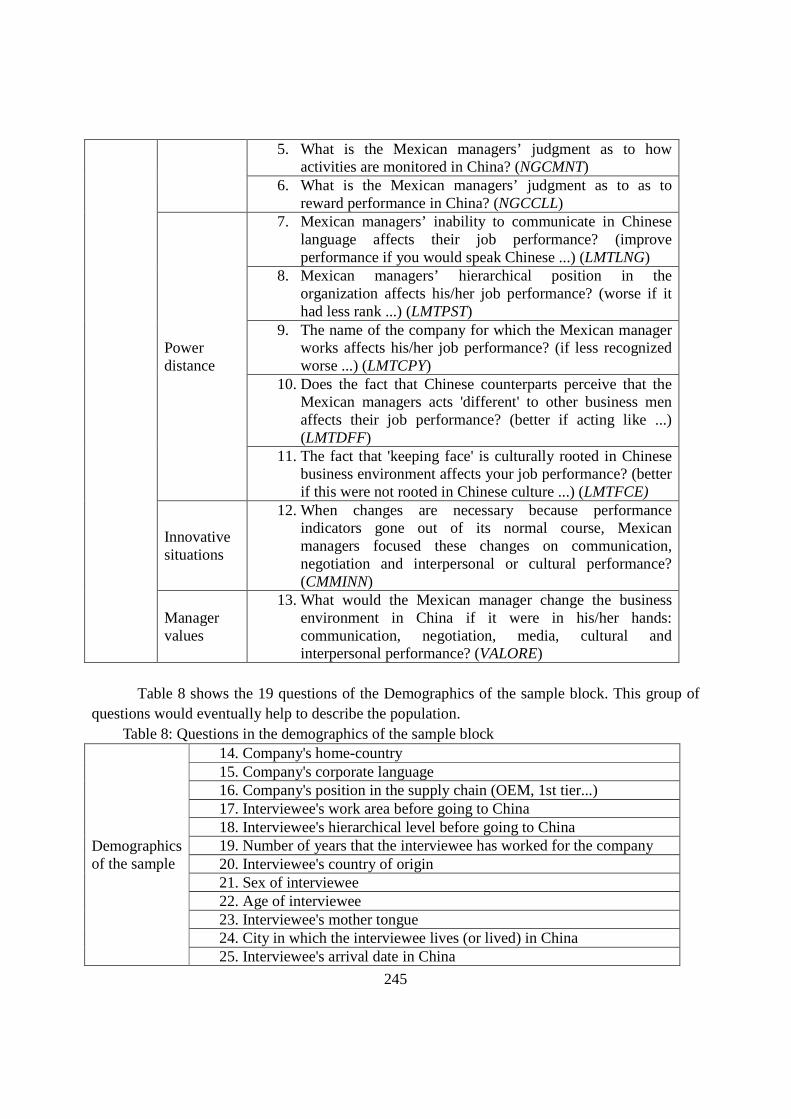
245
5. What is the Mexican managers’ judgment as to how activities are monitored in China? (NGCMNT)
6. What is the Mexican managers’ judgment as to as to reward performance in China? (NGCCLL)
Power distance
7. Mexican managers’ inability to communicate in Chinese language affects their job performance? (improve performance if you would speak Chinese ...) (LMTLNG)
8. Mexican managers’ hierarchical position in the organization affects his/her job performance? (worse if it had less rank ...) (LMTPST)
9. The name of the company for which the Mexican manager works affects his/her job performance? (if less recognized worse ...) (LMTCPY)
10. Does the fact that Chinese counterparts perceive that the Mexican managers acts 'different' to other business men affects their job performance? (better if acting like ...) (LMTDFF)
11. The fact that 'keeping face' is culturally rooted in Chinese business environment affects your job performance? (better if this were not rooted in Chinese culture ...) (LMTFCE)
Innovative situations
12. When changes are necessary because performance indicators gone out of its normal course, Mexican managers focused these changes on communication, negotiation and interpersonal or cultural performance? (CMMINN)
Manager values
13. What would the Mexican manager change the business environment in China if it were in his/her hands: communication, negotiation, media, cultural and interpersonal performance? (VALORE)
Table 8 shows the 19 questions of the Demographics of the sample block. This group of
questions would eventually help to describe the population. Table 8: Questions in the demographics of the sample block
Demographics of the sample
14. Company's home-country 15. Company's corporate language 16. Company's position in the supply chain (OEM, 1st tier...) 17. Interviewee's work area before going to China 18. Interviewee's hierarchical level before going to China 19. Number of years that the interviewee has worked for the company 20. Interviewee's country of origin 21. Sex of interviewee 22. Age of interviewee 23. Interviewee's mother tongue 24. City in which the interviewee lives (or lived) in China 25. Interviewee's arrival date in China

246
26. Date that the interviewee will leave China (real or prospected) 27. Day of the interview 28. Interviewee's work area in China 29. Interviewee's hierarchical level in China 30. Hierarchical level of the interviewee's communication assistant
(linchpin) 31. Interviewee’s marital status 32. Does the interviewee have children?
Table 9 shows questions in the improving managers’ experience block. Questions in this block give more insight about how is the living experience in China.
Table 9: Questions in the improving managers' experience block
Improving Managers experience
33. Does the interviewee have a prior experience as an expatriate? 34. In what country was the interviewee working before being sent to
China? 35. Does the interviewee have prior work experience in China? 36. Does the interviewee have to work with a Chinese partner in decision-
making? (2 hierarchical structure) 37. What is the language that the interviewee uses most of the time at
work? 38. Does the interviewee have a translator or communication assistant? 39. In what language the interviewee is communicating with his translator
and communication assistant? 40. Is (or was) the interviewee with his family in China? 41. How supportive was the interviewee’s family during his/her stay in
China? 42. What is the experience of the interviewee in a matter of housing in
China? 43. What is the interviewee's experience within schooling in China? 44. What is the experience of the interviewee in a matter of city services in
China? 45. What is the experience of the interviewee in a matter of informal
networks (clubs, neighbors, sports, etc.) in China? 46. What is the experience of the interviewed in a matter of health services
in China? 47. Who the interviewee receives more support for his/her professional
development? 48. Who does the interviewee receive more often support from? 49. What is the impact of the expatriate experience in China on the
interviewee’s professional development? 50. What is the impact of the expatriate experience in China on the
interviewee’s personal development? 51. What is the impact of the expatriate experience in China on the
interviewee’s family development? 52. What is the impact of the expatriate experience in China on the

247
interviewee’s company? 53. What is the impact of the expatriate experience in China on the
interviewee’s country of origin?
Fifty three questions were provided,, very challenging for an interview lasting 45 minutes on the average. Therefore, researchers focused the interview on main questions in order to let managers freely express themselves as much as the time allowed. Interviews were reordered and transcribed afterwards; researchers coded interviewees’ responses on likert scales. Time after, interviewees received an excel file with the interviewer’s questions, so that they were able to see how his/her responses were codified. Researchers requested interviewees to check if the codification matched with what they wanted to express during the interview and if it does not, they were able to change their responses directly on the likert scale. A database of codified answers was built with returning excel files and a statistical analysis was derived from such source. Table 10 shows likert scales of main responses.
Table 10: Liker scales of main responses In-group collectivism
5: Always beneficial for both, 4: Often benefits both 3: Neutral (depends on the case), 2: Often benefits them, 1: Always benefits for them 5: Always build a relationship, 4: Often build a relationship, 3: Neutral (depends on the case), 2: Rarely build a relationship, 1: Never build a relationship 5: Always based on personal agreements, 4: Often based on personal agreements, 3: Neutral (depends on the case), 2: Rarely based on personal agreements, 1: Never agreements based on personal
Future orientation
5: Much better than expected, 4: Better than expected, 3: As expected, 2: Worse than expected, 1: Much worse than expected, 0: I cannot judge
Power distance
4: Definitely yes, 3: Yes to some extent, 2: Not substantially, 1: Definitely No, 0: I cannot judge
Innovative situation
1: Communication, 2: Negotiation, 3: Support, 4: Cultural performance and interpersonal
Manager values
1: Communication, 2: Negotiation, 3: Support, 4: Cultural performance and interpersonal
Interviews in numbers
As mentioned previously, this article presents a pilot study that aims to build a research methodology, questions and research sample characteristics for the wider study of the project‘ Decoding China for Latin America’ . In consequence, the numbers shown in this section are not to be taken as population statistics sincethe sample size is limited. Table 11 shows the MNC participating in the pilot sample, their country of origin and location in China.
Table 11: MNC included in the sample MNC Home Country Subsidiary Host Location VW Germany SAIC-VW Shanghai VW Germany FAW-VW Changchun, Beijing, Cheng Du Continental Germany Continental Changchun

248
Johnsons Controls
US Johnsons Controls Changchun
Grammer Germany Grammer Changchun Hella Germany Hella Changchun
Figure 1 shows boxplots for in-group collectivism, future orientation and power distance.
Figure 1: Boxplot analysis for in-group collectivism, future orientation and power distance
In-group collectivism
With no significant shift in means, the perception of Mexican expatriates is that in-group collectivism depends on specific cases, and a large overlap of boxplot boxes indicates that the majority of interviewees tend to think similarly. However for the question of ‘…Chinese counterparts would either seek for their own benefits or the benefit for both parties?’ Interviewees indicated that if the negotiation is about short term agreements, Chinese managers tend to look for their own benefit. But, in negotiations on long term agreements, the consensus is around seeking benefits for both parties. Interviewees highlighted the positive experience they had while negotiating further investment with the central government; contrary to what the expected, executives from government never push or rush the negotiation. A similar situation is with the question of whether ‘…Chinese counterparts seek to build a relationship?’; managers expressed that it is difficult to build a relationship with Chinese nationals mainly because of the
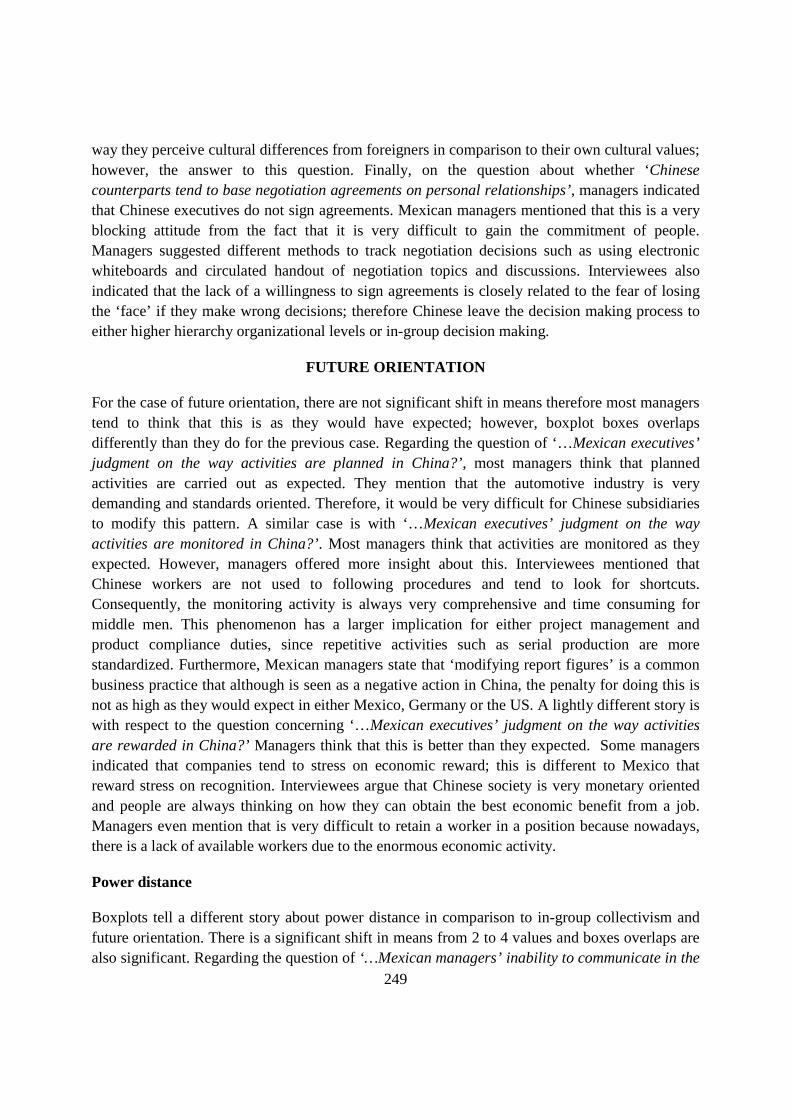
249
way they perceive cultural differences from foreigners in comparison to their own cultural values; however, the answer to this question. Finally, on the question about whether ‘Chinese counterparts tend to base negotiation agreements on personal relationships’, managers indicated that Chinese executives do not sign agreements. Mexican managers mentioned that this is a very blocking attitude from the fact that it is very difficult to gain the commitment of people. Managers suggested different methods to track negotiation decisions such as using electronic whiteboards and circulated handout of negotiation topics and discussions. Interviewees also indicated that the lack of a willingness to sign agreements is closely related to the fear of losing the ‘face’ if they make wrong decisions; therefore Chinese leave the decision making process to either higher hierarchy organizational levels or in-group decision making.
FUTURE ORIENTATION
For the case of future orientation, there are not significant shift in means therefore most managers tend to think that this is as they would have expected; however, boxplot boxes overlaps differently than they do for the previous case. Regarding the question of ‘…Mexican executives’ judgment on the way activities are planned in China?’, most managers think that planned activities are carried out as expected. They mention that the automotive industry is very demanding and standards oriented. Therefore, it would be very difficult for Chinese subsidiaries to modify this pattern. A similar case is with ‘…Mexican executives’ judgment on the way activities are monitored in China?’. Most managers think that activities are monitored as they expected. However, managers offered more insight about this. Interviewees mentioned that Chinese workers are not used to following procedures and tend to look for shortcuts. Consequently, the monitoring activity is always very comprehensive and time consuming for middle men. This phenomenon has a larger implication for either project management and product compliance duties, since repetitive activities such as serial production are more standardized. Furthermore, Mexican managers state that ‘modifying report figures’ is a common business practice that although is seen as a negative action in China, the penalty for doing this is not as high as they would expect in either Mexico, Germany or the US. A lightly different story is with respect to the question concerning ‘…Mexican executives’ judgment on the way activities are rewarded in China?’ Managers think that this is better than they expected. Some managers indicated that companies tend to stress on economic reward; this is different to Mexico that reward stress on recognition. Interviewees argue that Chinese society is very monetary oriented and people are always thinking on how they can obtain the best economic benefit from a job. Managers even mention that is very difficult to retain a worker in a position because nowadays, there is a lack of available workers due to the enormous economic activity.
Power distance
Boxplots tell a different story about power distance in comparison to in-group collectivism and future orientation. There is a significant shift in means from 2 to 4 values and boxes overlaps are also significant. Regarding the question of ‘…Mexican managers’ inability to communicate in the

250
Chinese language affects their job performance?’ most managers tend to express that this affects their performance and obviously, executives with activities directly related to managing people, stress in this issue. Most of the arguments of managers denote the anxiety on doubting whether Chinese counterparts understand or not what they want to express. Interviewees state that even though most companies hire communication assistants (linchpins) to translate or help with the day by day communication, linchpins do not solve the anxiety on this matter. Furthermore, some of the interviewed managers mentioned that they dispensed with linchpins because they do not tacitly translate what they want to say, mainly because of the fact that linchpins tend to adapt the message to their business culture. Another important issue expressed by Mexican managers is the use of body language; Chinese workers tend to assent when they are listening but that does not mean that they agreed what they have been told but simply saying ‘I am listening’. Anxiety rises when Mexican managers raise their voices to the level of being considered rude. The practice of pointing out the defects of someone in public decreases the authority of the one who does it. Managers also state that as a foreigner, speaking Chinese may lead to more confusion because Chinese workers could think that the foreigner knows the culture surrounding the conversation. Regarding the question of ‘…Mexican managers’ hierarchical position in the organization affects his/her job performance?’ most managers indicate that organizational hierarchy impacts job performance. They state that decisions are made by top management; furthermore, if immediate action is needed, the most reliable way is that top management communicates it by a top-down command. Managers mentioned that organizational hierarchy is a big issue in a business context because it impacts substantially on the effectiveness of meetings. Meetings becomes an ‘ informational show’ in which there is not discussion of issues or the opportunity to change the course of decisions, decisions are made before meetings. Regarding the question of ‘…The name of the company for which the Mexican manager works affects his/her job performance?’ most managers consider this to be true; however as explained previously, the Chinese living style is very monetized and workers would not prefer to stay in a well-known company if the salary is low. Regarding the question of ‘…The fact that Chinese counterparts perceive that the Mexican managers acts 'different' to other business persons affects their job performance?’ most managers disagree with this statement, since they do not perceive that acting differently affects his/her performance. Some of them even argue that being a foreigner is an advantage; people know that you are there because of the knowledge and technology so they seek to quickly gain the most of your knowledge. With respect to the question of ‘The fact that 'keeping face' is culturally rooted in Chinese business environment affects your job performance’, most managers consider this to be true. ‘Keeping face’ causes lack of commitment and lack of willingness to take a risk. Managers mentioned that when they have found fault with somebody, it is not possible to blame them immediately. Managers need to find ways to point out mistakes without exposing people; respondents mentioned that when someone has been exposed in public, Chinese are in solidarity with their compatriots and are no longer willing to participate.
Figure 2 shows the boxplot analysis for the dimension of manager’s perception, attitudes and cultural values. As mentioned before, levels represent how managers would choose to
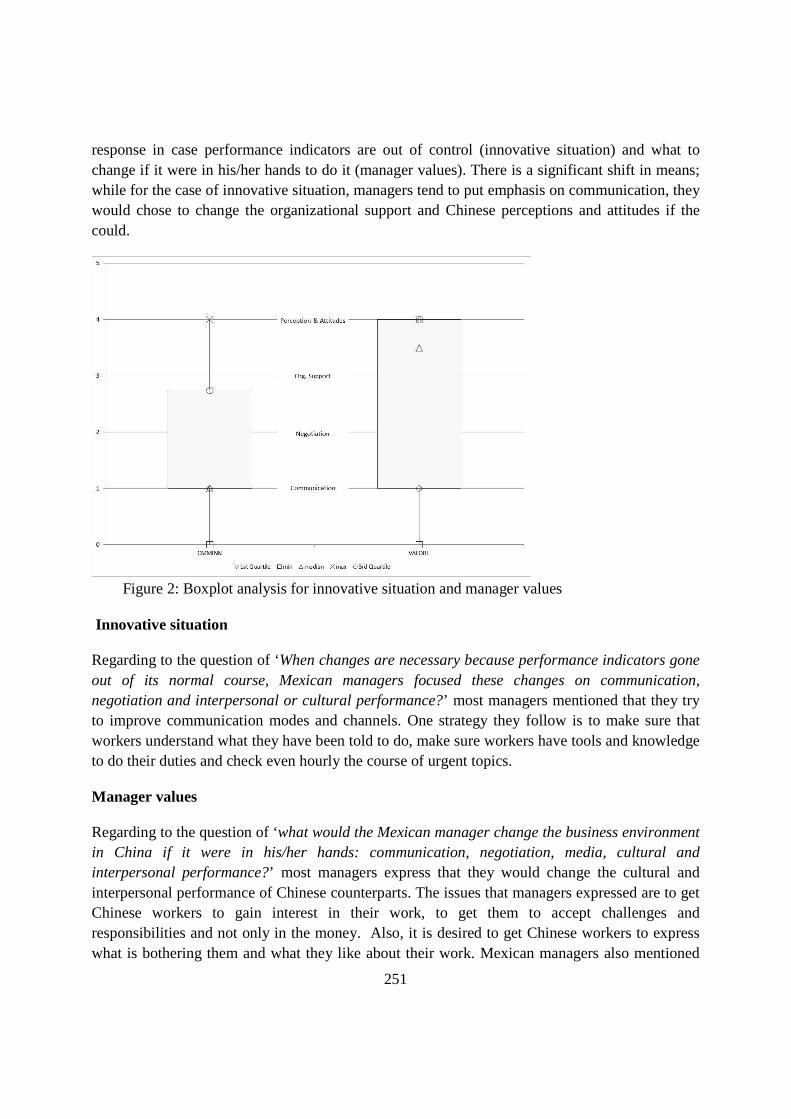
251
response in case performance indicators are out of control (innovative situation) and what to change if it were in his/her hands to do it (manager values). There is a significant shift in means; while for the case of innovative situation, managers tend to put emphasis on communication, they would chose to change the organizational support and Chinese perceptions and attitudes if the could.
Figure 2: Boxplot analysis for innovative situation and manager values
Innovative situation
Regarding to the question of ‘When changes are necessary because performance indicators gone out of its normal course, Mexican managers focused these changes on communication, negotiation and interpersonal or cultural performance?’ most managers mentioned that they try to improve communication modes and channels. One strategy they follow is to make sure that workers understand what they have been told to do, make sure workers have tools and knowledge to do their duties and check even hourly the course of urgent topics.
Manager values
Regarding to the question of ‘what would the Mexican manager change the business environment in China if it were in his/her hands: communication, negotiation, media, cultural and interpersonal performance?’ most managers express that they would change the cultural and interpersonal performance of Chinese counterparts. The issues that managers expressed are to get Chinese workers to gain interest in their work, to get them to accept challenges and responsibilities and not only in the money. Also, it is desired to get Chinese workers to express what is bothering them and what they like about their work. Mexican managers also mentioned
252
that Mexican managers should change their mind-set about China; the old stereotype of poor, humble and handicapped Chinese people that was widely publicized by movies is no longer valid. China has gone ahead quickly to many western countries in different economic activities.
Other factors: language choice, linchpins and double organizational hierarchy
Other important information obtained from interviews is how expatriates’ performance is affected by the use of a specific language, linchpins or double organizational hierarchies (Chinese pair). It seems that linchpins do not have an important impact on expats’ performance. Managers expressed that even if linchpins can be a ‘bridge’ to the Chinese culture, they do not really offer much advantage; especially if linchpins are young workers with low experience and little organizational knowledge. Some managers stated that linchpins can be an advantage if their ‘in-situ’ is high. Another important factor to discuss is the choice of language to communicate; it seems that the choice of German as a communication language has a negative impact on expats’ performance. The organizational communication literature discusses the advantages of adopting a common organizational language that in many cases is not the MNC home country language. Finally, the double organizational hierarchy seems to have a relative positive impact on expats performance. Although Mexican managers would find it difficult to couple with Chinese managers, they offer a reliable ‘bridge’ to the local business culture.
Thumb rules for adaptation
It is not possible to derive a statistical conclusion to the above proposed research statements because the sample size is too small but, tentative findings can be proposed to the reader as a summary of what is being discussed:
1. Before embarking in any negotiation, foresee players’ roles, aims and horizons. If possible express goals in a medium to long term period.
2. Try to find out what role can you play in already established Chinese teams, play for the team and not for yourself. In this way, you increase the chances to build a relationship with your hosts.
3. Locate the decision maker, communicate your ideas to him/her in a face-to-face meeting, and let him/her convey the ideas to the team. Do not pretend that your ideas would be better accepted if you push or rush your Chinese hosts.
4. Do not make a direct judgment on somebody else’s work. Express your points in terms of overall performance. Base your judgment on facts (indicators, written processes, etc.). If needed, call the worker in a face-to-face meeting to point out his/her mistakes.
5. Be aware about the volatile job market in which implications might be different from what you have seen in your country. Workers would be looking for today’s reward rather that a job career.
6. Find a common communication language which might be different from a corporate language. Use linchpins but do not rely on them to assertively communicate your ideas.

253
Even with his/her help, double check if the message has gone through (ask questions, monitor developments frequently, etc.)
7. Understand and accept the fact about the importance of hierarchies; rather than fight against them. Use the system to advance your ideas and improve performance.
8. Seek support whenever is needed starting from your pairs. Use your organizational networking to bring solutions to the problems you are facing daily.
9. Remember that you are not there to take a Chinese position, but to take the position that a Chinese worker cannot have yet because of the lack of knowledge. Therefore, teach them to do it.
10. Get rid of any stereotype you have about China, you will be surprised how advanced and fast growing it is in comparison to your own country.
CURRENT LIMITATIONS OF THE STUDY
It is important to mention that the sample size presented in this paper limits any possible statistical assumptions. Anyhow, the purpose of this paper is to pilot the research questions, variables and statements for increasing the sample size and sample heterogeneity by including other Latin American nationals. With respect to this issue, there are several topics that can be discharged such as: the use of linchpins and the whole perception of managers about how activities are planned, monitored, and rewarded in China. On one hand, managers did not stress the value of communication assistants for their performance. On the other hand, this study is framed in the automotive industry which its competition dynamic permeates business practices to the local environment and little differences are found. However, there are several topics which it would be important to concentrate on for the wider research; one is the impact that the double organizational hierarchy has on expats’ performance and the other, is the support that expats need to have in order to improve the benefits from his/her experience in China. The first topic is important to research not only from the MNC point of view but also, from the local perspective; since fast adaptation of expats and the fast transference of knowledge would have a positive impact on the subsidiary performance. The second topic has a potential to contribute to the corporate network configuration and coordination literature, since having peer subsidiaries to contribute to the success of another subsidiary is a valuable research gap to discuss.
Another important limitation is the current study’s perspective and approach taken; the GLOBE framework is that an “either/or” (linear, Western), rather than “and/and” (Chinese, holistic) perspective is adopted to assess cultural differences in the context of China. Some scholars have also been challenging the controversy surrounding Project GLOBE and what it has measured: unfounded national stereotypes (misleadingly called "practices") and norms (misleadingly called "values"); while clear differences are shown if compared between mainland China, Hong Kong and Taiwan. Following Hofstede’s value orientation framework, tend to bound Chinese people in their high power distance, low individualism, low uncertainty avoidance and medium masculinity ratings (Bond, 1996; Chong et al., 1983; Shenkar and Ronen, 1987:
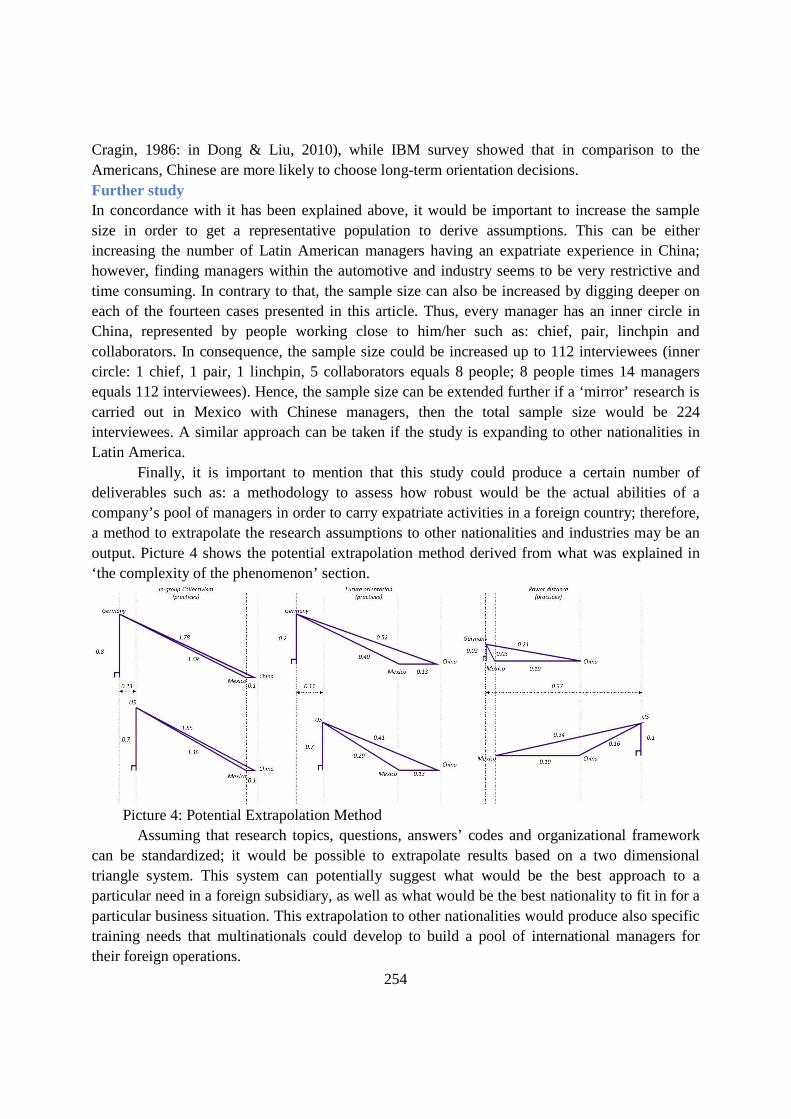
254
Cragin, 1986: in Dong & Liu, 2010), while IBM survey showed that in comparison to the Americans, Chinese are more likely to choose long-term orientation decisions. Further study In concordance with it has been explained above, it would be important to increase the sample size in order to get a representative population to derive assumptions. This can be either increasing the number of Latin American managers having an expatriate experience in China; however, finding managers within the automotive and industry seems to be very restrictive and time consuming. In contrary to that, the sample size can also be increased by digging deeper on each of the fourteen cases presented in this article. Thus, every manager has an inner circle in China, represented by people working close to him/her such as: chief, pair, linchpin and collaborators. In consequence, the sample size could be increased up to 112 interviewees (inner circle: 1 chief, 1 pair, 1 linchpin, 5 collaborators equals 8 people; 8 people times 14 managers equals 112 interviewees). Hence, the sample size can be extended further if a ‘mirror’ research is carried out in Mexico with Chinese managers, then the total sample size would be 224 interviewees. A similar approach can be taken if the study is expanding to other nationalities in Latin America.
Finally, it is important to mention that this study could produce a certain number of deliverables such as: a methodology to assess how robust would be the actual abilities of a company’s pool of managers in order to carry expatriate activities in a foreign country; therefore, a method to extrapolate the research assumptions to other nationalities and industries may be an output. Picture 4 shows the potential extrapolation method derived from what was explained in ‘the complexity of the phenomenon’ section.
Picture 4: Potential Extrapolation Method
Assuming that research topics, questions, answers’ codes and organizational framework can be standardized; it would be possible to extrapolate results based on a two dimensional triangle system. This system can potentially suggest what would be the best approach to a particular need in a foreign subsidiary, as well as what would be the best nationality to fit in for a particular business situation. This extrapolation to other nationalities would produce also specific training needs that multinationals could develop to build a pool of international managers for their foreign operations.
255
References Automotive News. (2010, November 29). China's auto sales could top 18 million units in 2010.
Automotive News. (2010, Octubre 12). VW says 9-month China sales surpassed full-year 2009.
Automotive News. (2012). Data Center.
Automotive News. (2012, January 13). VW's 2011 China sales rise 18% to record.
Babcock, R., & Du-Babcock, B. (2001). Language-Based Communication Zones in International Business Communication. Journal of Business Communication, 38(4), 372-412.
Bartlett, C. A., & Ghoshal, S. (2001). Managing Across Borders: The Transnational Solution. Harvard Business School Press Books.
Birkinshaw, J. (1996). How Multinational Subsidiary Mandates Are Gained And Lost. Journal of International Business Studies, 27(3), 467-495.
Borgerson, J. L., Schroeder, J. E., Escudero-Magnusson, M., & Magnusson, F. (2009). Corporate communication, ethics, and operational identity: a case study of Benetton. Business Ethics: A European Review, 18(3), 209-223.
Cavinato, J. (2004). Supply chain logistics risks; from the back room to the board room. International Journal of Physical Distribution & Logistics Management, 34(5), 383-387.
Craighead, C. W., Blackhurst, J., Rungtusanatham, M. J., & Handfield, R. B. (2007). The Severity of Supply Chain Disruptions: Design Characteristics and Mitigation Capabilities. Decision Sciences, 38(1), 131.
Du-Babcock, B., & Babcock, R. (1996). Patterns of Expatriate-Local Personnel Communication in Multinational Corporations. Journal of Business Communication, 33(2), 141-164.
Du-Babcock, B., & Babcock, R. D. (2007). Genre Patterns In Language-Based Communication Zones. Journal of Business Communication, 44(4), 340-373.
Fredriksson, R., Barner-Rasmussen, W., & Piekkari, R. (2006). The multinational corporation as a multilingual organization. Corporate Communications, 406-423.
Gerring, J. (2007). Case Study Research: Principles and Practices. Cambridge University Press.
Ghoshal, S., Korine, H., & Szulanski, G. (1994). Interunit Communication in Multinational Corporations. Management Science, 40(1), 96-110.
Habermann, M. (2009). ProQuest Dissertations and Theses.
Hancock, D. R., & Algozzine, B. (2006). Doing Case Study Research: A practical Guide for Beginning Researchers. Teachers College Press.
256
Harzing, A.-W., & Feely, A. J. (2008). The language barrier and its implications for HQ-subsidiary relations. Cross Cultural Management, 15(1), 49-61.
Hofstede, G. (1980). Culture’s Consequences: International Differences in Work-related Values. Beverly Hills, CA: Sage.
Hofstede, G. (1991). Cultures and Organizations - Software of the Mind. New York, NY: McGraw-Hill.
House, R., Hanges, P., Javidan, M., Dorfman, P., & Gupta, V. (. (2004). Culture, Leadership, and Organizations: The GLOBE Study of 62 Societies. Thousand Oaks, CA: Sage.
Luo, Y., & Shenkar, O. (2006). The multinational corporation as a multilingual community: Language and organization in a global context. Journal of International Business Studies, 37(3), 321-339.
Metcalf, L., Bird, A., Peterson, M., Shankarmahesh, M., & Lituchy, T. (2007). Cultural Influences in Negotiations: A Four Country Comparative Analysis. International Journal of Cross Cultural Management, 7(2), 147.
Minkov, M., & Hofstede, G. (2011). The evolution of hofstedes doctrine. Cross Cultural Management, 18(1), 10-20.
Perlmutter, H. (1969). Some management problems in spaceship earth: The megafirm and the global industrial estate. Academy of Management Journal, 12, 59.
Rogerson‐Revella, P. (2007). Directions in e‐learning tools and technologies and their relevance to online distance language education. Open Learning, 22(1).
van den Born, F., & Peltokorpi, V. (2010). Language Policies And Communication In Multinational Companies. Journal of Business Communication, 47(2), 97-118.
Vincent-Wayne, M., & Jackson, P. (2006). The nature of corporate communication. European Business Forum, 26(1), 37-39,41-42.
Zhang, H., & Baker, G. (2008). Think Like Chinese. The Federation Press.
257
SURVIVE IN THE PRICE WAR: GROWTH STRATEGY FOR ONLINE INDIVIDUAL
ENTREPRENEURSHIP IN CHINA
Wei Zhao Business School of Nankai University
[email protected] Hao Yu
Business School of Nankai University [email protected]
ABSTRACT
With information technology and network entering into people’s life, to sell and buy on the Internet becomes more and more popular in China. Accordingly, individual entrepreneurship on the Internet in China, which generally acts as intermediate business, has been growing rapidly. The information technology changes the transactions a lot by offering clearer information at a lower cost. The effect of asymmetric information and price discrimination, which used to bring profits for intermediate business, has been weakened and this impels the intermediate economy on the Internet into an operating predicament. Near-zero profitability, caused by excess price competitions, poor qualities and evil reputations, supply channel bonding and innovation difficulties together with platform websites’ restrictions, has been harassing China’s online individual business. This paper has analyzed these issues and summarized Chinese online entrepreneurs’ survival tactics to refrain from clumsy price competitions, and put forward a model of growth path as well as a growing strategy combination for online individual entrepreneurship in China.
KEYWORDS: Individual Entrepreneurship; Online Business; Growth Strategy; China
258
The rapidly-developing Internet has changed the sellers and buyers a lot, both in the trading methods and trading concept. Information technology (IT) has made the searching cost of price information much lower and declined the degree of price discrimination. In China, online individual entrepreneurship is thriving since the Internet has been mature and popular. And numbers of vendors and consumers choose to sell and buy on the World Wide Web. But the life of doing business on the Internet is not seemingly glamorous for most of the Chinese small vendors and the competitions among them integrate the market structure and change online transactions in many aspects. As a matter of fact, a lot of individual entrepreneurship on the Internet has failed. Chinese online small vendors, who just buy at a low price and sell at a high price, face the dilemma of zero profitability. What changes does the Internet have brought to Chinese individual entrepreneurship? What makes online individual entrepreneurship activities blooming and glomming? What is the trend of Chinese individual entrepreneurship on the Internet? And what are the solutions to overcome those failure-leading factors? These issues deserve researchers’ attention.
CHINESE INDIVIDUAL ENTREPRENEURSHIP’S THRIVING ON T HE INTERNET
To cope with the lasting negative effects of the international financial crisis in recent years,Chinese government has published a series of policies about stimulating domestic investment and social consumption. And small-scale private entrepreneurship and business activities are also encouraged and advocated. The prominent small/micro businesses are generally based on two types: innovation-oriented and job-oriented. The former refers to the entrepreneurial activities based on a technical or service innovation, some of which can obtain a few of loans, investments or grants. While the latter aims at handling unemployment. Chinese government encourages college graduates and young people to create their own enterprises to reduce social employment pressure by lower taxing and applying supporting tools such as enterprise incubators. And the popularization of the Internet has opened up a new world for entrepreneurship, especially for Chinese young generations.
With the advent of the Internet into people's life, doing small business on the Internet as an off-work money-making activity also becomes popular in today’s China, which usually takes the form of individual entrepreneurial activities as the opportunity entrepreneurship. And the accordant C2C websites and the huge demand in the e-market have provided conditions and possibilities for them.
Online shopping has realized more and more Internet users’ daily consumption. During the period of economic transformation, Chinese government entitles people to have more freedom in choosing a favorite business, fixing a price, and selling in a proper way allowed by law. And so far, Chinese government has provided a relatively favorable environment for individual entrepreneurship by publishing related policies and laws. According to the 30th Chinese Internet Development Report published by China Internet Network Information Center (CNNIC), by the end of June 2012, the number of Chinese Internet users has reached to 538 million (http://www.cnnic.net.cn/hlwfzyj/hlwxzbg/hlwtjbg/201207/t20120723_32497.htm). And the number of online shopping users has reached to 209.892 million with the utilization rates up to 39% (http://www.cnnic.cn/hlwfzyj/hlwxzbg/hlwtjbg/201207/P020120723477451202474.pdf). Meanwhile IT and network have made the information, especially the price information, much more transparent than ever before, and the consequent low prices based on price battle have attracted a lot of people shopping online. Many C2C websites have also grown up rapidly by attracting more and more registered buyers and sellers.
259
However, the individual entrepreneurs on the Internet in China generally play the role of intermediate businessmen or retailers. Usually these people neither produce products themselves nor implement any of the key production processes. Thus they are not the main forces of breakthrough innovation and cannot achieve the inimitable and irreplaceable innovation for profits. Once customers are extremely price-sensitive, and supported by sufficient and convenient technology for comparing the prices (based on an absolutely same product), B2C as well as C2C businesses will enter into a stage of fierce price war (Chen, 2010).
THE CHANGES THE INTERNET BRINGS TO THE PROFITABILIT Y
Since online intermediate business seldom produces any products directly, the price difference between buying and selling generates the profits. In ancient China, merchants had quite low status because people believed that they almost produced nothing but just to buy at a low price and sell at a high price. And this kind of behavior was taken for roguery, cheat and dishonesty. In fact, the merchants did produce some values in trading processes before IT era since they had played the delivery role, contributed to the different needs in different regions, and cut down the huge single transaction cost. Therefore merchants produced scale economy.
The emergence of IT and express delivery services can solve the problem of the regional limitation at a lower cost. With them, people don’t have to go distantly to buy commodities themselves saving much money and time. Instead people can gain almost all the information of what they need and pay on the Internet and get the goods in convenient places. For the same product, the primary causes of the much smaller price difference in different places are usually not the middle men’s profits but the differences in postage or delivery fees.
Nowadays IT and online network have made the business world nearly an information-complete world. And the complete information (especially price information) about homogeneous products brings about a perfectly competitive market. It is very convenient and efficient to utilize a searching engine and other searching tools such as Youdao shopping assistant for Chinese online customers to find out the lowest price of a product. Small online sellers suffer it a lot since these searching tools have triggered the fierce price wars among them. Individual entrepreneurs generally choose C2C websites to publish their products at a near-zero rent with secure paying and withdrawing such as Taobao.com and Paipai.com. In the early time before these websites became popular, small online sellers had been creating large number of registered users for them by low price attraction. Now these websites have a tremendous amount of clicks everyday and work like large virtual malls in which many vendors and stores have settled with huge number of customers’ visiting. These C2C trading platforms have their own ranking functions such as to rank by price, volume of sales, publishing time, clicks and sellers’ reputation scores, which also intensify the price battles on homogenous products.
IT has also weakened the price discrimination to a certain extent. Price discrimination means to charge different people different prices for the same product to gain the biggest profits. This behavior is likely to be viewed as unfair and easily outrages the customers once they found that they had been extracted for more money (Elegido, 2011). For the first-degree price discrimination, the price of a product will be viewed by all customers once it is published on the web by eliminating spatial difference. Hence it is impossible to implement the first-degree price discrimination if the privacy information of the viewers such as cookies is not gained by applying software to confirm different customers’ consumption habits. As to the second-degree price discrimination, many websites offer group purchase which enable individual buyers to enjoy a lower price based on bulk purchases.
260
The third-degree price discrimination has defined the different prices to people who consume in different areas. If there was no IT in our life, merchants would get more profits by taking advantage of asymmetric information in different areas. But IT has made the information of products much more transparent, and people of different areas within a specific region, such as the same country or state, will face different postages but not differentiated price of product. On average the postage adds much less cost to a purchase than price discrimination does, which makes a real cost but not an unfair treatment. People like to choose the lowest-priced goods but not the instant ones if they are not urgently needed. Therefore the third-degree price discrimination is weakened in a certain region. Here we use “weakened” instead of “eliminated”, because the third-degree price discrimination still exists for great distance area difference and IT can’t eliminate the time effect differences caused by spatial differences. This is particularly common in China since it has a vast territory and frequent super-long-distance transportation will surely add the expenses. For low-value products, regional economies of scale still exit if single logistics fee is too large compared with the product’s price and consumers are able to gain the products at a lower total cost in the local. And the virtual interface makes people reluctant to consume high-value products online in case of high uncertainty caused by real spatial difference such as inaccurate information and fraud. In this sense, virtual malls cannot completely replace the real stores. As Chinese credit system and Internet security measures are getting improved and the logistics costs become lower, the third-degree price discrimination continues to be weakened.
In all, IT has put most of the online businesses into a nearly completely competitive market and shrinks the online entrepreneurs’ profits.
THE PRICE BATTLE MODELS AMONG ONLINE SELLERS
Businesses live on profits, but severe price competition will cut down the profitability and impel entrepreneurship to depression or even death. The traditional method of reaping huge profits by asymmetric information is ended by the prevalence of IT.
Chinese individual entrepreneurs on the Internet are generally tied to a C2C website, which charges them less fees and rents than an entity store does. The most popular Chinese C2C websites are Taobao.com and Paipai.com. They have almost all the functions and services like eBay.com. And Taobao.com has been known as “Chinese eBay”. Taobao's registered users reached 370 million in 2010 and Taobao led China's online B2C and C2C shopping market with a 75.3 percent share by transaction volume as of the end of September 2009, according to Chinese Internet consultancy Analysys International (Interfax, China Business Newswire, 2011). To buy and sell on Taobao.com has been the first choice for most Internet users in China. And if the sellers’ commodities are homogeneous ones (and usually they are), which means the products someone is selling can be searched out in other sellers’ online shops and he/she is not able to monopolize those products’ supply channel, the online individual entrepreneurs playing the role of intermediate businessmen or retailers will inevitably fall into intense price battles.
Sellers are entitled to two methods of publishing their products on both Taobao.com and Paipai.com, by fixed price (namely “buy it now” on eBay) or auction. Here we’ll discuss three kinds of price battles that Chinese online sellers generally face. And our discussions are based on specific homogeneous products supposing that all the sellers have the same qualifications to purchase their stocks at the same wholesale price from manufacturers. And we also suppose that buyers have mastered the whole market information.
261
Fixed Price Of One Product
New entrants with zero information about their reputations and scores who are selling incumbent homogenous products are likely to choose penetration price strategy to increase customers’ clicks and sales. Customers rank the products by price, and the lowest-priced seller will generally win the order, supposed that the customers are economic rational and have mastered the whole information of the products such as qualities and prices. Some sellers even sell some products for minus profits in exchange for positive remarks, which are expected to bring more sales and profits. Profits but not losses are what the tradesmen pursue, and eventually they will enhance the price someday and are likely to lose their customers to newer entrants who also follow the low price strategy. (The sale records including the transaction price can be viewed by new potential customers, and if customers find that the current price is higher than before, the purchase will generally be postponed or cancelled since customers are expecting the promotion price’s publishing or they will search other sellers’ lower prices. The change of prices will affect both incumbent products’ and new ones’ sales, and this topic is beyond this paper’s theme.) A low price is an entry barrier. New competitors are not interested in an incumbent market with little profits or demands. Once a seller enhances the price for normal or big profits, new entrants will be attracted to enter into it before the markets is saturated. Analogically, to win the consumers, new entrants will begin hot contesting and set lower and lower prices until the profits shrink to zero or even minus. So the advantage of the first mover in intermediate business disappears very soon. (However first mover will accumulate more remarks, which are an important way for new customers to get the products’ real information, and the positive remarks will win new customers who don’t have the whole real information about the products such as fake products’ features. These customers usually reckon the low-priced products as fake ones or inferior goods with low quality. And trust means a lot to purchasing online. This will be discussed later.) Moreover the first mover may face the disadvantage of higher costs and bigger risks, as delineated in strategic management theories. In this model for one specific homogenous product, the price battle is fiercest.
Fixed Prices Of Multiple Products
Some smart sellers have changed the above model into a mild form by selling one or several varieties of their products at the lowest prices for customers who are likely to buy more than one category. The products with the lowest prices are generally best-selling, and they can attract customers to view their listing pages of all products and buy the lowest-priced products as well as other products which they may gain normal profits. Since the postage within a constant weight is a sunk constant cost, customers are willing to buy the lowest-priced products combination to dilute every product’s average postage. There are still other sellers who give gifts to promote sales. But the price-sensitive customers will count it carefully how much the gifts cost and whether the main products they need take a large proportion in the whole order and are sold at the lowest prices. And this price battle leads to the products’ being sold at the lowest-priced homogenous combination.
Auction
In auction model sellers may set a threshold price and a minimum bid interval to a product. This model still leads to price competition among sellers but not buyers for

262
homogeneous products. Suppose a seller set the threshold price at a penetrative one like ¥0.01. Before the product is bidden above the lowest fixed price submitted by other sellers, the competition is among the buyers. If the lowest fixed price offered by other sellers equals the seller’s cost, the seller will risk a loss in case the buyers don’t bid at a higher price than the lowest fixed price. (And usually the buyers won’t.) It will be worse that other sellers have got a supply channel at a competitive price and set a fixed price below the former seller’s cost. And more and more manufacturers also appear on a C2C website and retail at wholesale price which makes the price competition fiery. To avoid potential losses, sellers may make the threshold price equal the cost to reach breakeven at least. However this pricing has actually abandoned the stimulation of buyers’ bids and returned to the first model. Some sly sellers even play tricks in the bidding process to raise the price, but smart buyers will not buy it and give up the bids to other lower-priced products. Cheating in the bidding benefits neither the sellers nor the buyers and made the auctions on Chinese C2C websites notorious at one time. Though these websites have taken measures to punish the tricksters, less and less Chinese online buyers trust the auction model and fewer sellers adopt it.
To sum up, online entrepreneurs who sell homogenous products will fell into price battles whatever the sale pattern is.
PRODUCT QUALITY AND REPUTATION
Sellers, who are engaged in cutting down cost and attracting customers by low prices, often neglect products’ qualities. Cheap shoddy commodities disguised with refined pictures are harmful to online buyers’ interests and sellers’ reputation scores, and will give the buyers the feeling of being deceived. Before Chinese government and C2C websites draw up policies to guarantee secure online transactions, online fraud cases and phishing are very common in China. Generally a product’s new customer is not capable of get acquainted with the product only by lingual description and image expression since the knowledge of some products has to be gained by practicing. For example, a new hair clipper consumer can’t gain all the product’s true performance and functional information by the picture of its appearance. Some C2C websites offer video show service for charge but most Chinese small sellers are reluctant to use it in case of extra costs. The disputations caused by products’ being inconsistent with their descriptions bring about customer dissatisfaction, negative feedbacks, refunds, complaints, penalties, and even online stores’ shutdown. In light of the costs added by returning unqualified or unsatisfied goods, buyers possibly would rather keep the goods and publish negative feedbacks on the Internet, which can be viewed by potential buyers. And this will damage the sellers’ reputation and reduce the sales. Ironically, the lack of trust and credibility has made buyers panic-stricken and suspicious about low-priced products even if they are really bargains. According to consumer behavior theories, price may be the indicator of a product’s quality especially when the consumer is uncertain about product quality (Martin, 1986). Shopping online is very different from that in a real store because buyers can’t touch and examine the target product on the scene to get its exact quality information. Frustrating online shopping experiences, such as the products’ failing to live up to the buyers’ expectations that are generated by online sellers’ descriptions, may strengthen consumers’ cognition that cheapest is the dearest and the things on the Internet are not trustworthy. So the competitive advantage based on lowest price will not benefit online sellers all the time not only for the reason of low profits.
Furthermore, the reputation scores of sellers may not be true. As a matter of fact, many online sellers cheat in their reputation scores. Fake online transactions and fake positive scores
263
can be created by software or sock puppets. Another cheating method often used is to publish a product at a very low price to attract buyers but the product is not in stock. Before the rules of publishing items online have been improved recently by C2C websites in China, some sellers marked a very low fixed price such as ¥0.01 while added the real price into the postage to occupy the first position in the low-to-high price rank. And now there are still many sellers who publish prices lower than the costs and declare on the web pages that the real priced products’ links are others but not the ones being viewed. These tricks have wasted the buyers’ searching time, added extra cost to transactions and led to price information malfunction, information redundancy as well as losses in efficiency. These will also bring online buyers with cognition about prices that there is no cheap lunch in this world. In the past, many online sellers made their fortune by false pretenses. Buyers used to bear the return postage themselves while the commodities they bought had quality problems or were inconsistent with the sellers’ descriptions, which was the sellers’ fault. There is so much speculative product information flooding on the Internet and confusing consumers that there are still quite a lot of Chinese consumers reject shopping online.
CHANNEL BONDING AND INNOVATION HANDICAP
As intermediate business, Chinese individual entrepreneurship on the Internet lives on external supply chains to buy in bulk and sell at retail. Along with the competitions growing, some first-tier suppliers begin their B2C business on C2C websites and retail at wholesale price. Retailers who bulk buy from them have fallen into the awkward position of price-comparison setoffs. Moreover the suppliers’ disadvantage of first mover will simultaneously bring disaster to the first-moving retailers.
More and more online retailers have realized the trouble of competing for homogenous products and begin to innovate to be new, special and unique. But these innovations are very simple and can be easily copied. Online individual entrepreneurs generally don’t have the qualifications or abilities to implement vitally important innovation, since they don’t have much money, enough equipment, or any interest in breakthrough technical innovation. A mild change in formats, which is easy to be replicated, is not adequate to bring them with long-term competitive advantage. In this situation, price battles will surely come back soon. What’s more, China’s online intellectual property protection is not perfect to solve the problems of infringement.
PLATFORM RESTRICTION
Being bonded to a C2C website is not always a good and sound settlement for online entrepreneurs. When small sellers are enjoying the toll-free online platforms to do business, they are inclined to be locked in and controlled by the C2C website. For example, after massive small sellers settled in Taobao and contributed to the large number of registered users by their owns’ low prices and little profits in fierce competitions, Taobao has been pushing out new rules that are benefit to itself and its B2C users (sellers) who are capable of offering big rents but harmful to great numbers of free users (sellers). Taobao is apparently aiming at abandoning the cost-adding free users (sellers) and turning to be a profit-making B2C platform. The notorious “Taobao’s Sieged Incident in October 2011” verifies this. According to the report (Chen, Wang & Xiao, 2011, http://news.qq.com/a/20111102/000768.htm), on 10th Oct., 2011, Taobao Mall, namely Taobao’s B2C platform, decided to raise up its technical service fees from ¥6,000 per

264
year to two levels of ¥30,000 and ¥60,000 per year, and the deposit from ¥10,000 to three levels of ¥50,000, ¥100,000 and ¥150,000. Taobao Mall offers B2C platforms only for registered companies, and some of them are derived from individual enterprises, which still have the characteristics of weak financial abilities. And these skimming pricing policies based on users’ lock-in enraged Taobao Mall’s small sellers. On 13th Oct., thousands of online small vendors attacked Taobao Mall on the Internet by utilizing Taobao’s policies of “Return for No Reasons”. Furthermore, hundreds of victims even demonstrated in the street carrying protesting placards, which caught the government’s attention. In the end, Taobao had to make a concession. Moreover there are still many tricks for C2C websites to create other difficulties for free incumbent users. What’s more, being bonded to a third party will accumulate huge conversion cost such as reputation scores, virtual stores’ construction and maintenance.
THE TREND OF C2C’S LOSING TO B2C
It is reported by Modern Business (China) that B2C businesses got more capital input than C2C in 2011 and B2C businesses strongly rallied, and meanwhile the C2C’s leading role was declining for the past decade. This is because with the flourishing of online shopping, more and more Chinese online consumers have given up low prices and turned to pursue genuine articles with much value, famous brands, good qualities, and guaranteed after-sale services. And many people agree that B2C businesses, which can meet these new needs well, are the mainstream of future online markets (Modern Business, 2011; Fu, 2011). Zhang (2010) also pointed out that counterfeit products had ruined the C2C businesses and B2C businesses would realize their prosperity. Hence the living space of small sellers on the Internet in China is getting narrower. Being dependent on price battles and lack of innovation as mentioned above adds to the collapse of the old model of Chinese online individual entrepreneurship.
SURVIVAL STRATEGIES
It’s obvious that Chinese online entrepreneurship is inevitably squeezed by fierce price battles in the process of striving for survival. To eliminate the fatal effects of price battles and leave them as far as possible, online entrepreneurs may probably adopt the following strategies:
Select A Diversified Industry With Numerous Heterogeneous Categories
Some industries such as apparel industry include many ordinary brands and product varieties for buyers to select. This market is a high-degree differentiation market full of information, while buyers as bounded rationality people are not capable of making the best decision by finding out all the information about all the products. This means that one keyword may be related to so many products that customers are impossible to view and compare all of them and leaves much space for retailers to live. Therefore to obtain benefits by implementing asymmetric information is possible for the sellers. Buyers will make transactions when they feel the products can meet their needs at the most reasonable prices they confirm. And the selected prices are different for different buyers according to their price knowledge by experience. Some researchers have also pointed out that “the reason why Internet sites provide extraneous information well beyond that provided by storefronts has been obscure because providing it bears at least some cost but seemingly gains no benefit for the input supplier if users can surf the Web, collect information, and then buy elsewhere at the lowest price” (Just & Just, 2006: 882).
265
On one hand, in some industries there are many kinds of products related to one searching keyword. This market has the nature of diversification. On the other hand, the same product can be named by different descriptions to be differentiated. Some sellers rename (or redefine) a homogenous product differently to make consumers feel that it is absolutely new. In this way, though the consumers try to rank the products by price, by using the new names as keywords they will find that the products are in a blue ocean.
Add Value Based On Know-How Knowledge To The Products
Chinese online individual entrepreneurs shouldn’t settle for their conventional roles. Though they are not the main body to implement breakthrough technological innovation to make a fortune, they may play a positive role in a succinct but not simple improvement to make each one’s products different from the others’. To add know-how technique into a product will well protect the profits by making inimitable differences. For example, some handicraft products will gain unique taste and higher perceptive quality by skillful redecoration, masterly assemblage and distinctive packaging.
Monopolize A Product
It is difficult for a small seller to monopolize a supply channel because of weak financial ability. However it is possible for someone to monopolize a typical product in some industries. For example, some special unique products made of non-renewable resources are good options, and this is very common in collection industry which has been growing explosively in China today. In addition to luxurious collection business, cheaper and smaller collection business is also prosperous. Unique means absolutely different and highest differential. And valuable products with this nature will yield great profits.
Seek A Profitable Market Niche Or Enter A Segment Market
To operate a market niche means to monopolize a segment market to obtain great benefits. Sellers may explore new needs and meet them or go in for a professional market and cut down the costs to achieve scale economy.
Develop Positive Reputation And Get Registered
A product with a famous registered brand can be identified by people easily since the brand strategy belongs to the differentiation strategy. A well-known brand has accumulated much and will provide more reputation information about quality, taste, performance, after-sale services and so on, which will cut down buyers’ transaction cost. It can draw online sellers out from the hot water of competing for homogeneous products at a very low price without profits. In recent years, some Chinese online sellers began to pay attention to their own brands, and some small remarkable brands have been emerging online.
FROM SURVIVAL TO GROWTH
Most of the Chinese online entrepreneurs, who survived in the continuing price wars, have occasionally or deliberately adopted one or two strategies mentioned above. Actually these survival strategies can be combined into a practical package for the continuous growth of

266
Chinese online entrepreneurs. Figure 1 shows a 4-stage growing process that is supposed to help Chinese online individual entrepreneurship get through price wars and keep growing: entry, establishment, extension and consolidation. In entry stage, entrepreneurs can take the strategies of heterogeneous industry and/or market niche to begin their online businesses. In establishment stage, knowledge innovation strategies of redesign, reassembly and redefinition are available. In extension stage, it is necessary to integrate forward and monopoly the supply channel to a certain degree. In consolidation stage, brand strategy is the main method to maintain and promote the business.
Figure 1
Growing Process Of Individual Entrepreneurship On The Internet In China To sum up, Chinese individual entrepreneurship on the Internet has to keep growing to
get out of the low-leveled price battles thoroughly. Baptized by painful price competitions, some individual online enterprises in China have begun higher levels of their lifecycle and operate more meticulously. With the fast development and extensive use of cloud computing system, intelligent information terminals as well as the Internet of Things (IOT), it can be expected that Chinese individual entrepreneurship on the Internet will gain much more living space, and will play more active roles contributing to China’s developing into the “Innovation-oriented Society”.
REFERENCES
Chen, B., Wang, R. H., & Xiao S. (2011, November 12). The whole story of the "Taobao’s sieged incident in October 2011" triggered by the new regulations. Retrieved September 1, 2012, from http://news.qq.com/a/20111102/000768.htm.
Chen, Y. A. (2010). Location: The key to profitability of B2C/C2C. China Marketing, 5, 24-26. China Internet Network Information Center (CNNIC). (2012, July 23). The 30th China Internet
development statistics report. Retrieved September 1, 2012, from http://www.cnnic.net.cn/hlwfzyj/hlwxzbg/hlwtjbg/201207/t20120723_32497.htm
Elegido, J. M. (2011). The ethics of price discrimination. Business Ethics Quarterly, 21(4), 633-660.
Interfax, China Business Newswire. (2011, January 7). Taobao's registered users reach 370 mln in 2010. Retrieved September 1, 2012, from http://www.interfax.com/newsinf.asp?id=213734.
Fu, Z. X. (2011). B2C vs C2C: Who have the last laugh? China Chain Store, 8, 67.
Stage1 Entry
Stage 2 Establishment
Stage 3 Extension
Stage 4 Consolidatio
n
Price War Zone
Price War Zone

267
Just, D. R., & Just, R. E. (2006). Information exchange and distributional implications of price discrimination with Internet marketing in agriculture. American Journal of Agricultural Economics, 88(4), 882–899.
Martin, R. E. (1986). On judging quality by price: Price dependent expectations, not price dependent preferences. Southern Economic Journal, 52(3), 665-672.
Modern Business. (2011). The turning point of 10-year-war between two E-business models appeared: The decline of C2C emerges. Modern Business, 4, 10.
Zhang, S. L. (2010). The mishap of C2C online shopping. FAREN Magazine, 7, 44-45.
268
RELATIONSHIP BETWEEN STUDENTS’ GRADES AND SCHOOL YEAR AND THEIR INTENTION FOR
ENTREPRENEURSHIP: SOME PIONEERING FINDINGS
Narendra C. Bhandari Pace University
ABSTRACT
This article studies if there is a relationship between the Lubin School students’ current year of education and their cumulative grade point average—and their intention to starting a business once they have completed their undergraduate studies? The research showed that there is no statistical relationship between these students’ current year of education—and their intention to starting a business once they have completed their undergraduate studies. The analysis also showed that there is no statistical relationship between these students’ cumulative grade point average—and their intention to starting a business once they have completed their undergraduate studies. This is the first study of its kind that explored the relationship between (a) students’ year of education and their intention to start a business once they have completed their undergraduate studies and (b) students’ cumulative grade point average and their intention to start a business once they have completed their undergraduate studies. My claim about these pioneering findings is based upon an extensive title review (including their summaries) of hundreds of articles related to these factors listed in EBSCO.
RESEARCH METHODOLOGY i
A 6-page questionnaire containing 91 questions (variables) was designed for this study for distribution among selected undergraduate students at the Lubin School of Business, Pace University, New York during December 2004 – December 2005 period.ii Copies of the questionnaire were sent to the author’s faculty colleagues who agreed to allow their students to participate in the study. Of the 435 responses completed by the students, 390 were included for further analysis in this study. Forty-five of these were found unusable for the study for various reasons.
PURPOSE OF RESEARCH
The overall purpose of this continuing research is to find if there is a statistical relationship between a number of independent variables and the Lubin School of Business students’ intention to become entrepreneurs after they have completed their undergraduate education. The objective of this article is limited to analyzing selected variables as stated in the following hypotheses:

269
1. Null Hypothesis: There is no statistical difference between the Lubin students’
current year of undergraduate education (first year, second year, third year, or fourth year)—and their intention to starting a business once they have completed their undergraduate studies.
� Alternate Hypothesis: There is such a statistical difference. 2. Null Hypothesis: There is no statistical difference between the Lubin students’
cumulative grade point average as of the preceding semester (A’s, B’s, C’s, or lower than C’s)—and their intention to starting a business once they have completed their undergraduate studies.
� Alternate Hypothesis: There is such a statistical difference. The independent variables (students’ year of education and students’ cumulative grade point average) were tested against the dependent variable (intention to become entrepreneur). Exhibit 1 lists the exact questions related to these variables as included in the questionnaire.
LIMITATIONS OF STUDY
This is a study of the Lubin students who were taking undergraduate business courses (accounting, information system, management, or marketing) at different class levels (first, second, third, or fourth year) during the study period. The 390 students chosen for the study were all different individuals. This is not a study of the same individuals as they progressed from their first year of study through to their fourth year.
DEFINITION, REQUIREMENTS, AND EDUCATION
Let me first present a brief overview of the definition, requirements, and educational aspects of entrepreneurship. Entrepreneurship Definition According to the Wikipedia, the free Encyclopedia, the term first appeared in the French Dictionary "Dictionnaire Universal de Commerce" of Jacques des Bruslons published in 1723. Entrepreneur in English is a term applied to a person who is willing to help launch a new venture or enterprise and accept full responsibility for the outcome (Wikipedia 2012). Here are some other definitions: 1. 1934: Schumpeter: According to him entrepreneurs are innovators who use a process of
shattering the status quo of the existing products and services, to set up new products, new services (Wikipedia 2012).
2. 1961: David McClleland: An entrepreneur is a person with a high need for achievement [N-Ach]. He is energetic and a moderate risk taker (Wikipedia 2012).

270
3. 1964: Peter Drucker: An entrepreneur searches for change, responds to it and exploits opportunities. Innovation is a specific tool of an entrepreneur hence an effective entrepreneur converts a source into a resource (Wikipedia 2012).
4. According to a European Commission report (2008), “entrepreneurship refers to an individual’s ability to turn ideas into action. It includes creativity, innovation, and risk taking, as well as the ability to plan and manage projects in order to achieve objectives.”
Entrepreneurs: Born or Made Like the traits theory of leadership that argues that the leaders are born and cannot be made, there are people who contend that entrepreneurs are also born and cannot be educated and trained to become one. Birch once said that if you want to teach people to be entrepreneurs, you can’t. To them, entrepreneurship, like leadership, is a function of some invisible personality attributes (in Aronson 2004). According to Thompson (2004; quoted in Alain Fayolle 2008), talent and temperament cannot be taught. On the other hand, Peter Drucker once said that “It is becoming clear that entrepreneurship, or certain facets of it, can be taught. Business educators and professionals have evolved beyond the myth that entrepreneurs are born not made.” The entrepreneurship is not magic, it’s not mysterious, and it has nothing to do with the genes. It’s a discipline. And, like any discipline, it can be learned” (Drucker 1985, in Kuratko 2005). I am one of those many other writers who maintain that entrepreneurship, like leadership, is a function of certain skills and attitudes which can be acquired and improved upon through education and experience. If one can learn to become a medical doctor, he/she can also learn to become an entrepreneur. Actually, it is sometimes easier to become an entrepreneur than to be qualified as a physician or physicist. If Birch were opining today, I am sure he will have entirely different thoughts. Entrepreneurship Education The merits of entrepreneurial education have been cited by several people. Entrepreneurship education could help students establish and manage a business properly. It could also help them prepare for working for someone else. According to Muster (2009), if the engineers want to attain their goals (either by creating a firm, or by being creative within an existing firm), they have to create connections, form partnerships outside established fields, organize the distribution of tasks, and receive financial support, among others. The Innovation and Entrepreneurship specialization aims to provide them with this type of competency. The significance of the entrepreneurship education is evidenced by the fact that a growing number of institutions, other than the business schools, are offering courses and programs in the various fields of entrepreneurship. These include, among others, the schools of arts, engineering, medicine, nursing, and sciences. In i t s March 2008 reports, the European Commission recommended that teaching of entrepreneurship should be integrated in more curricula, not just in the curricula of business or economic studies.
271
RESEARCH FINDINGS & DISCUSSION
Several statistical techniques, such as chi-square, regression analysis, and t-test, are available to test the validity of a set of data. All the same, only the chi-square technique has been used to test the validity of data used in this research, because the data gathered amply satisfy the following four primary assumptions of the Pearson's chi-squared test: (a) Independence of observations, (b) large enough expected cell counts, (c) randomness of data, and (d) sufficient sample size (Yates, Moore & McCabe, 1999). Research Findings A summary of the statistical analysis of data related to the two hypotheses stated above is presented in Exhibit 2. It also shows the decisions reached based on this analysis. This analysis endorses the acceptance of the Null Hypothesis 1: That there is no statistical difference between these students’ current year of education (1st/2nd/3rd/4th year)—and these students’ intention to starting a business once they have completed their undergraduate studies. The calculated value of X2, 1.61729, is smaller than the tabulated value of X2, 9.49, with 3 degrees of freedom with alpha=.05. This analysis also endorses the acceptance of the Null Hypothesis 2: That there is no statistical difference between these students’ cumulative grade point average—and these students’ intention to starting a business once they have completed their undergraduate studies. The calculated value of X2, 2.18879, is smaller than the tabulated value of X2, 7.82, with 3 degrees of freedom with alpha=.05. Discussion This is the first study of its kind that explored the relationship between (a) students’ year of education and their intention to start a business once they have completed their undergraduate studies and (b) students’ cumulative grade point average and their intention to start a business once they have completed their undergraduate studies. My claim about these pioneering findings is based upon an extensive title review (including their summaries) of hundreds of articles related to these factors listed in EBSCO. Due to the lack of similar studies to review and compare, the survey of literature presented below is limited to a study of some other variables that reflect upon the students’ intention for entrepreneurship. Bhandari (2006) in his study of students at a university in India found that “luck” and “to lead other people” have a statistical relationship with the intention to start their own business after completing education. In another study of students at Pace University’s Lubin School of Business, Bhandari (2012) found that there is no statistical difference between these students’ gender—and their intention to start a business once they have completed their undergraduate studies. A research by Wilson et al. (2004; in Shinnar, Pruett, and Toney) also concluded that men expressed higher entrepreneurial interest than did women, a relation that was consistent across Hispanic, Black, and White youth (Wilson et al). In a study of secondary school students enrolled in the Young Achievement Australia (YAA) enterprise program, Peterman and Kennedy (2003) found that the participants, after completing the enterprise program, reported significantly higher perceptions of both desirability and feasibility of starting a business.

272
According to Crispeels (2008), the drive towards (or away from) entrepreneurship comes from the potential entrepreneur’s perception towards own skills and the environment. The more confident the potential entrepreneur is about these factors, the more likely the step towards nascent entrepreneurship becomes.
SUGGESTIONS FOR RESEARCH
This research shows that the Lubin School of Business students’ intention to become entrepreneurs is not related to their year of education (first year, second year, third year, or fourth year of undergraduate education. Likewise, their cumulative grade point average has no statistical relationship with their intention to become entrepreneurs. I make the following suggestions for further research: 1. Relationship between grades and intention for entrepreneurship among graduate level
students by their majors in the area of business: accounting, economics, finance, management, marketing, etc.
2. Relationship between grades and the discipline of arts: English, geography, history, law, mathematics, philosophy, etc.
3. Relationship between grades and the disciplines of science: engineering, information systems, medicine, nursing, etc.

273
Exhibit 1 List of Independent and Dependent Variables Used for Research
(With their Original Question Numbers) Independent Variables 9. What is your current year of education (check one): (a) 1st year of undergraduate study _____; (b) 2nd year of undergraduate study _____; (c) 3rd year of undergraduate study _____; (d) 4th year of undergraduate study _____; (e) 1st year of graduate study _____; (f) 2nd year of graduate study_____ 12. What is your cumulative grade point average as of the preceding semester/term (check one): (a) A+, A, A- _____ (b) B+, B, B- _____; (c) C+, C, C- _____; (d) Lower than C _____; Dependent Variable 15. After you have finished your education (whether you have attained a degree or not), what do you intend to do (check one): a. Start my own business _____; b. Work for a business owned by an immediate family member (spouse, parent, brother and/or
sister) _____; c. Work for someone else ______

274
Exhibit 2 Relationship between Selected Variables and Students’ Intention for Entrepreneurship
Null Hypothesis Total No.
of Respon-
dents
No. of Respondents Who Wants
to be Entrepreneurs
X2
Calculated Value
X2
Critical Value
Degree of
Freedom, a=.05
Decision on Null
Hypothesis
There is no relationship between Students' Current year of education (1st year to 4th year) and Their Intention for Entrepreneurship
391 177 1.61729 9.49 3 Accept
There is no relationship between Students' Cumulative GPA and Their Intention to Become Entrepreneurs
380 169 2.18879 7.82 3 Accept
275
REFERENCES Aronsson, Magnus (2004). “Education Matters—But Does Entrepreneurship Education? An interview with David Birch,” Academy of Management Learning and Education, 2004, Vol. 3, No. 3, pages 289-292. Bhandari, Narendra C. (2006). “Intention for Entrepreneurship among Students in India,” Journal of Entrepreneurship, July-December, 2006. Bhandari, Narendra C. (2012). Relationship between Students’ Gender, Their Own Employment, Their Parents’ Employment, and the Students’ Intention for Entrepreneurship, Journal of Entrepreneurship Education, Volume 15, 2012, Pages 133-144. Published online. Crispeels, Thomas; Oliver Uecke, Oliver; Goldstein, Marc; and Schefczyk, Michael (2008). “Best Practices for Developing University Bio-Entrepreneurship Education Programmes,” Journal of Commercial Biotechnology Volume 15, pages 136–150. Published online. Kuratko, Donald F. (2005). “The Emergence of Entrepreneurship Education: Development, Trends, and Challenges,” Entrepreneurship Theory & Practice, pages 586-597. Drucker, P.F. (1985). Innovation and Entrepreneurship. New York: Harper & Row. European Commission (March 2008). Entrepreneurship in Higher Education, Especially in Non-Business Studies, page 10. Fayolle, Alain (2008). “Entrepreneurship Education at a Crossroads: Towards a More Mature Teaching Field,” Journal of Enterprising Culture, Vol. 16, No. 4, December 2008, pages 325–337. Mustar, Philippe (2009). “Technology Management Education: Innovation and Entrepreneurship at Mines ParisTech, a Leading French Engineering School,” Academy of Management Learning & Education, 2009, Vol. 8, No. 3, pages 418-425. Peterman, Nicole E; and Kennedy, Jessica (2003). “Enterprise Education: Influencing Students' Perceptions of Entrepreneurship,” Entrepreneurship Theory & Practice. Shinnar, Rachel; Pruett, Mark; and Toney, Bryan (2009). “Entrepreneurship Education: Attitudes Across Campus,” Journal of Education for Business, January/February 2009, Volume 84, Issue 2, pages 151-159. Thompson, John. L. (2004). The facets of the entrepreneur: Identifying entrepreneurial potential. Management Decision, Vol. 42, Issue 2, pages: 243-258. Wikipedia, the free Encyclopedia, copied from online on August 19, 2012.

276
Wilson, F.; Marlino, D.; & Kickul, J. (2004). “Our Entrepreneurial Future: Examining the Diverse Attitudes and Motivations of Teens across Gender and Ethnic Identity,” Journal of Developmental Entrepreneurship, 9, 177–197. Yates, Daniel; Moore, David: and McCabe, George (1999). The Practice of Statistics. W. H. Freeman.
277
IPOS’ EARNINGS QUALITY IN EMERGING CAPITAL MARKETS
Alireza Daneshfar, Ph.D. University of New Haven
Bita Mashayekhi Tehran University
Elham Hasani-Azar
Tehran University
ABSTRACT
In recent years, Initial Public Offerings (IPOs) have increased vastly. IPOs provide an easy way to increase initial investors’ wealth and to raise cash for future expansion of the company. Accrual accounting provides management with discretion in the reporting of earnings, and thus provides opportunity for managers to engage in earnings management in an IPO. This paper presents the first study of earnings management by initial public offering (IPO) firms in Iran. Besides, this paper seeks to determine whether Iranian managers exercise discretionary accruals to reach earnings forecast targets they voluntarily specify in conjunction with initial public offerings (IPOs). We examine a sample of 90 Iranian firms that issue voluntary management earnings forecasts in connection with IPOs that occur between 1993 and 2006. We investigate the pattern of discretionary current accruals (DCA) over time. We show that IPO firms choice to accruals-based earnings management in the year before the IPO and in the first year as a public company. The results show that pre-IPO earnings management by issuers is positively related to subsequent firm performance. The evidence strongly suggests that Iranian IPO firms engage in accruals management to reach their voluntary earnings forecast targets. KEYWORDS: Initial public offering (IPO); Earnings management; Financial reporting; voluntary earnings forecast.
278
INTRODUCTION In recent years, Initial Public Offerings (IPOs) have increased vastly. An IPO is the first sale
of stock by a private company to the public. IPOs are often issued by smaller, younger companies seeking capital to expand, but can also be done by large privately owned companies looking to become publicly traded. IPOs provide an easy way to increase initial investors’ wealth and to raise cash for future expansion of the company. In other words, going public is a major corporate event for a company to raise additional capital to fund its growth and enhance the entrepreneur's personal wealth, where an offering prospectus including externally audited financial statements for up to a certain period (different among different jurisdictions) is needed to be prepared in the IPO process.
When a company lists its shares on a public exchange, it will almost invariably look to issue additional new shares in order to raise extra capital at the same time. The money paid by investors for the newly-issued shares goes directly to the company (in contrast to a later trade of shares on the exchange, where the money passes between investors). An IPO, therefore, allows a company to tap a wide pool of stock market investors to provide it with large volumes of capital for future growth. The company is never required to repay the capital, but instead the new shareholders have a right to future profits distributed by the company.
The case of IPOs is a little different from seasoned issues. For new issues there is no settled value and a shortage of information, therefore investors were rely more heavily on financial statements information (Friedlan, 1994; Neill et al, 1995). Accrual accounting provides management with discretion in the reporting of earnings, and thus provides opportunity for managers to engage in earnings management in an IPO. According to Healy and Wahlen (1999), "Earnings Management" occurs when managers use judgment in financial reporting and in structuring transactions to alter financial reports to either mislead some stakeholders about the underlying economic performance of a company or to influence contractual outcomes that depend on reported accounting numbers. Earnings management in general and earnings management in the IPO process in particular, have attracted growing attention in the accounting research.
Earnings management in the IPO process is of particular concern for several reasons. First, management has incentives to engage in income increasing earnings management to ensure that the issue is fully subscribed and/or priced higher to earn greater proceeds, because their compensation and/or status depend on the success of the IPO. Second, at the issuing stage, earnings management is found to be negatively related to post issue earnings performance (Teoh et al., 1998b) and post issue stock returns (Teoh et al., 1998a). As a result, at the issuing stage, earnings management has significant resource allocation implication. Third, APB 20 allows IPO firms to change accounting principles in the prospectus as long as financial statements of previous years are restated. This may give management an opportunity to engage in earnings management (Chen et al. 2005). Fourth, there is significant information asymmetry between the owners-managers and investors (Leland and Pyle, 1977), and between informed and uninformed investors (Rock, 1986; Beatty and Ritter, 1986).
Many previous researches suggest that earnings are managed even in relatively highly-regulated US environment (Friedlan, 1994; Teoh et al., 1998a; Teoh et al., 1998b; Burgstahler and Eames, 1998), so there is a high possibility of observing earnings management in less-regulated stock markets, as exist in developing countries. In addition, because of different environments across countries and regions, we decided to conduct an earnings management
279
study for IPO firms in Iran. The current study is motivated by two previous studies. The first is a study by Roosenboom et al (2003) which finds that IPO firms, which managers tend to over-report earnings in the first year as a public company, subsequently suffer poor returns; and, the second is a study by Gramlich and Sorensen (2003) which found Danish IPO firms engage in accruals management to reach their voluntary earnings forecast targets.
We have focused on the case of Iranian IPOs and Tehran Stock Exchange, as an emerging capital market. Tehran Stock Exchange has grown rapidly and it lists all major firms in Iran. We examined the managers’ behavior for reporting of earnings in the period before the IPO and in the first year as a public company, as Roosenboom et al (2003) did in their research. Then, Like Teoh et al. (1998b) and Roosenboom et al. (2003), we studied the long-term stock price performance for the IPO firms that were engaged in earnings management experience in comparison to the performance of those firms that do not appear to engage in that activity in order to assess the long-term effects facing the decision to increase short-run earnings. Next, we examined if discretionary accruals are related to a possible incentive to reach mandatory specified earnings forecasts1.
IRANIAN GENERALLY ACCEPTED ACCOUNTING STANDARDS (GA AP) Prior to 1979, financial reporting in Iran was influenced heavily by Anglo-American practices
(Mirshekari and Sudagaran, 2005). There were no national accounting standards and disclosure requirements were based on tax law, corporate law, and stock exchange regulations. The tax law required firms to prepare a balance sheet, income statement, and a list of shareholders (with their holdings).
The tax law also prescribed a set format for reporting tax-deductible expenses, computing depreciation, and accounting policies related to certain expenses. The main disclosure requirements of the corporate law were contained in Section X of the 1969 Amendment to the Commercial Code with Articles 232–242 specifying the rules for preparing financial statements, disclosing any changes in accounting methods, contingent expenditure and the required methods of depreciation. In 1970, the tax law decreed the Iranian Official Accountants Institute, and Official Accountants were in charge of verifying the tax liability reported in financial statements.
From 1966 to 1978, there were requirements for corporate financial statements to be audited. For example, the regulations of the Tehran Stock Exchange required that publicly traded companies have their financial statements audited by Official Accountants. Therefore, all the Big Eight international auditing firms in Iran had Official Accountants as their employees. In the 1960s and 1970s, the Big Eight dominated the public accounting profession in Iran. While there was an emerging cadre of local and Western trained Iranian accountants, the Big Eight tended to be dominated by expatriates from the United Kingdom, United States, and South Africa. This contributed to accounting and auditing in Iran being influenced by foreign practices. However, these developments were ad hoc and there was no systematic structure in place either for setting national accounting standards or for adopting International Accounting Standards.
1 Gramlich and Sorensen (2003) in their study, seek to determine whether Danish managers exercise discretionary accruals to reach earnings forecast targets they voluntarily specify in conjunction with initial public offerings (IPOs). Because earnings forecasting for IPO firms in Iran is mandatory, we examined earnings management in the case of mandatory earnings forecasts for IPO firms.

280
Following the Iranian revolution, in 1980, an amendment to the Direct Tax Law disbanded the Official Accountants Institute. The public sector’s control and ownership of previously private enterprises made necessary the establishment of audit enterprises for managing business entities expropriated by the government. Therefore, during 1980–1982, the government established audit enterprises and Budget, Planning and National Industries Organization. These new organizations recruited a large number of accountants who were previously employed with private auditing firms. In 1987, following the merger of the public sector audit entities, the Audit Organization was established as the sole auditor of organizations with public ownership and as the only regulatory body for national accounting and auditing standards. Audit organization is responsible for compiling and determining principles and rules of audit and accounting in Iran. The audit reports and financial statements in which, the determined principles and rules are not observed not allowed to be used in any of governmental offices.
During the last two decades, Audit Organization has taken various measures to enhance accounting profession in Iran. It has harmonized Iranian profession with global practices via translation of International Accounting Standards (IAS), preparation and publication of a number of textbooks complying with developed countries’ accounting and auditing standards, issuance sets of accounting and auditing manuals for special topics, and accounting and auditing guidelines that are published at a superior level. In continuation of these efforts, the Audit Organization has prepared and issued the accounting and auditing standards and code of ethics.
3. Stock market and IPO process in Iran One of the major tasks of capital market is to provide a proper condition in order to determine
the fair prices of the capital assets, provide money for the stock owned by the investors, and specify optimum budget to the departments, which are qualified enough for increasing values. When the market cannot function properly and efficiently, it causes major disorders in the capital market, and its effects will be perceived in the layers of national and foreign economies.
Because of infirmities in their statutory systems and regulative mechanisms, most emerging markets usually face many different forms of manipulation, which cause in their turn deficiencies in their capital market and also account for the loss of public credence to these markets. Short and drastic swings, and short-time investment with little role in economic growth are undesirable consequences resulted from investor's lack of long term presence, and are widely reflected in the large economy of these countries.
The idea of having a stock exchange to speed up the process of industrialization in Iran dates back to 1936, when Bank Melli Iran completed a report working out the details for the formation of a stock market and laid down the preliminary foundations. The outbreak of the World War II and subsequent economic and political events delayed the establishment of the stock exchange until 1967 when the Stock Exchange Act was ratified. The Tehran Stock Exchange (TSE) opened in April 1968. Initially only Government Bonds and certain State-backed certificates were traded in the market. During 1970's the demand for capital increased the demand for stocks. At the same time institutional changes like the transfer of shares of public companies and large private firms owned by families, to the employees and the private sector led to the expansion of the stock market activity. The restructuring of the economy following the Islamic Revolution in 1979 expanded public sector control over the economy and reduced the need for private capital. At the same time, the abolishment of interest-bearing bonds terminated their presence in the stock market. Because of these events, the TSE started a period of standstill. This came to an end in 1989 with the revitalization of the private sector through privatization of state-owned
281
enterprises and promotion of private sector economic activity based on the First Five-year Development Plan of the country. Since then the Stock Exchange has expanded continuously.
In Iran, companies use IPO in order to attract financial resources. In other countries the firms are first shaped into joint stock (or public company) and then enter the stock exchange whereas in Iran the first offer is made along with the company's entering into the stock exchange. In fact the conversion of companies into joint stock is considered as a second market for them. In the IPO process in Iran, some controlling mechanisms (such as investment banks, periods of stock bargain banning in order to fix the market prices, and controlling the preliminary offering) are not being applied.
Determining the access or deny of the companies' stock in the stock exchange, is the responsibility of stock admission board. According to the rules if the admitted companies do not observe the exchange regulations and manuals or if after working for a while in the stock market they be distinguished as unqualified, the admission board can eliminate the company from admitted firms' list.After admitting the applicant, the company must annually pay an amount as the registration charge.
In short, we can summarize the process of admitting companies in Tehran Stock Exchange (TSE), as the most important Iranian stock market as follows:
1- Application- If the applicant is qualified, he/she must provide the required documents
and send them to the TSE Admission Board and the TSE council to get the application examined. The applicant must forward a letter from one of the official brokers of TSE, which serves as an introduction of the applicant to be admitted in the TSE. The applicant must pay the TSE Admission Board a sum of money as the investigation fee.
2- The phases of examining the admission- The examination starts with receiving the
introductory letter from the official brokers of TSE, which contains the applicants request for being accepted in the stock market. The applicant's required documents are taken for examining the request. The sent documents are examined at the TSE Admission Board and the TSE council to make sure of the completeness of documents. In case of their completeness, a basic report is made in this department. A general schema of the firm's general status is given in this report. When the first examinations are carried out, the applicant's request and the documents are sent to the TSE Admission Board’s secretariat after the chief secretary permits. After doing further investigations and preparing critical reports, the applicant's application is rendered to the TSE Admission Board for making a decision upon.
The TSE Admission Board is responsible to check the request and announce his decision stating either acceptance or rejection of it within 2 months. In case the stocks are accepted, the TSE Admission Board will inform the TSE board of directors, the official brokers of TSE who has sent the introductory letter and the applicant him/herself immediately.
In case the stocks are not accepted, the TSE Admission Board is obliged to announce the result and give reasons for making such a decision in a written statement to the official brokers of TSE who has sent the introductory letter, the applicant and finally to the TSE council supervisor and the TSE board of directors.
The decisions of the TSE Admission Board can be revised by the TSE council at most until 10 days after the results have been announced to the TSE board of directors; this is only possible if the TSE council supervisor or the people whose requests have been denied have
282
any objection to the results. The TSE council will consider the revision request and give its verdict within 20 days after getting the objection. The verdict of the TSE council is definite.
In case the request is denied, the applicant cannot require again for admission of the same stocks before a period of 12 months is completed. By accepting applicant's request, he/she will be told about the terms of admission, and the time needed for it to be carried out. If the admission terms are agreed upon, the TSE Admission Board will perform the ultimate phase for registering the name of the firm in the registered firms' list.
DISCUSSION AND CONCLUSION
This study examined the function of discretionary accruals in the Iranian IPO market. We show that IPO firms choice to accruals-based earnings management in the year before the IPO and in the first year as a public company. Our results strongly support the expected use of income-increasing DCA during the year prior to going public and the IPO year. These results are consistent with earlier findings such as Roosenboom et al. (2003), Aharony et al. (1993), and Teoh et al. (1998b). In contrary to Roosenboom et al. (2003), the results show that pre-IPO earnings management by issuers is positively related to subsequent firm performance. Besides, the evidence strongly suggests that Iranian IPO firms engage in accruals management to reach their voluntary earnings forecast targets. The direction and extent of the accrual management depends on how pre-managed earnings differ from forecast level. Firms reduce (increase) reported earnings through earnings management depending on whether pre-managed earnings are higher (lower) than forecast level. This result is similar to Gramlich and Sorensen (2003). In summary, in an environment without high potential litigation costs, Iranian firms undergoing IPOs often voluntarily forecast post-IPO earnings. Discretionary accruals (or ‘earnings management’) appear to be used to narrow the gap between forecast and reported earnings, and this suggests that managers view voluntary earnings forecasts as terms of an implicit contract with stakeholders. Thus, Iranian managers typically provide more earnings forecasts, and they appear to possess the flexibility to manage earnings to reach the forecasts.
REFERENCES
Aggarwal, R., R. Leal, and L. Hernandez (1993). The aftermarket performance of initial public offerings in Latin America. Financial Management, 22 (42-53).
Aharony, J., Lin, C. -J., & Loeb, M. P. (1993). Initial public offerings, accounting choices and earnings management. Contemporary Accounting Research, 10(1), 61–83.
Alexander, J.C. (1991). Do the Merits Matter? A Study of Settlement in Securities Class Actions. Stanford Law Review 43:497-598.
Ball, R. J. and Brown, P. (1968). An empirical evaluation of accounting income numbers, Journal of Accounting Research, 6, pp. 159–178.
Barberis, N., Shleifer, A., and Vishny, R. (1998). A model of investor sentiment. Journal of Finance, 49(3), 307–343.

283
Beatty, R., Ritter, J. (1986). Investment banking, reputation, and the underpricing of initial public offerings. Journal of Financial Economics, Vol. 15 No.1/2, pp.213-32.
Beaver, W. H. (1968). The information content of annual earnings announcements, Journal of Accounting Research, 6 (Supplement), pp. 67–92.
Bernard, V. L., and J. K. Thomas. (1990). Evidence that Stock Prices Do Not Fully Reflect the Implications of Current Earrings for Future Earrings. Journal of Accounting and Economics. 13- 304-340.
Burgstahler, D. and Eames, M. (1998). Management of earnings and analysts’ forecasts. Working Paper, University of Washington, DC.
Chaney, P. K., & Lewis, C. M. (1995). Earnings management and firm valuation under asymmetric information. Journal of Corporate Finance, 1(3/4), 319–345.
Chen, K., Lin, K., and Zhou, J. (2005). Audit quality and earnings management for Taiwan IPO firms Managerial Auditing Journal. Vol. 20, No. 1, 86-104.
Datar, S.M., Feltham, G.A., Hughes, J.S., 1991. The role of audits and audit quality in valuing new issues. Journal of Accounting and Economics 14 (1), 3–49.
DeAngelo, L. E. (1986). Accounting numbers as market valuation substitution: A study of management buyouts of public stockholders. Accounting Review, 61(3), 400–420.
Dechow, P. M. (1994). Accounting earnings and cash flows as measures of firm performance: The role of accounting accruals. Journal of Accounting and Economics, 18(1), 3–42.
Dechow, P. M., Sloan, R. G., & Sweeney, A. P. (1995). Detecting earnings management. Accounting Review, 70(2), 193–225.
Degeorge,F. , J.Patel and R.Zeckhauser(1999), Earning Management to exceed thresholds, Journal of Business. 72(1).
DuCharme L., Malatesta P. and Sefcik S. (2002), Earnings Management: IPO Valuation and Subsequent Performance, Journal of Accounting, Auditing & Finance, pp.369-396.
Dye, R. (1988). Earnings management in an overlapping generations model. Journal of Accounting Research 26: 195-235.
Eije, V., Witte, M., and Zwaan, V. (2003). IPO-related organizational change and long-term performance: Considerations of Dutch corporate officers. Managerial Finance, 29(11/12).
Fama, E., (1980), Agency Problem and the Theory of the Firm, Journal of Political Economy 88: 288-308
Fern , R.H. , B.Brown & S.W. Dickey. (1994), An emperical test of politically-motivated income smoothing in the oil refining industry, Journal of Applied Research, 92.
Firth, M. (1998) IPO profit forecasts and their role in signaling firm value and explaining post-listing returns, Applied Financial Economics, 8, pp. 29–39.
Friedlan, J. M. (1994). Accounting choices of issuers of initial public offerings. Contemporary Accounting Research, 11(1), 1–31.
Gounopoulos, D. (2003), Accuracy of management earning forecast in IPO prospectuses. Working paper. School of Management – University of Surrey).

284
Healy, P. M., & Wahlen, J. M. (1999). A review of the earnings management literature and its implications for standard setting. Accounting Horizons, 13(4), 365–384.
J. D. Gramlich and O. Sørensen. (2004). Voluntary Management Earnings Forecasts and Discretionary Accruals: Evidence from Danish IPOs. European Accounting Review, Vol. 13, No. 2, 235–259, 2004
Jones, J. J. (1991). The effect of foreign trade regulation on accounting choices. Journal of Accounting Literature, 29(2), 193–228.
Kasznik, R. (1999). On the association between voluntary disclosure and earnings management, Journal of Accounting Research, 37, pp. 57–81.
Kellog, I. and L.B. Kellog, (1991), "Fraud, window dressing and negligence in financil statements", McGrow Hill, Colorado Springs.
La Porta, R., F. Lopez-de-Silanes, A. Shleifer, and R. Vishny (1997), Legal determinants of external finance, Journal of Finance, 52, 1132-50.
Magnan, M., & Cormier, D. (1997). The impact of forward-looking financial data in IPOs on the quality of financial reporting. Journal of Financial Statement Analysis, 2(3), 6–17.
Mirshekari, S. and Saudagaran, S. (2005). Perceptions and characteristics of financial statement users in developing countries: Evidence from Iran, Journal of International Accounting, Auditing and Taxation, 14, 33–54.
Neill, J. D., Pourciau, S. G., & Schaefer, T. F. (1995). Accounting method choice and IPO valuation. Accounting Horizons, 9(3), 68–80.
Richardson, V. (2000), Information asymmetry and earnings management: some evidence, Review of Quantitative Finance and Accounting, Vol. 15 No.4, pp.325-47.
Rock, K. (1986), Why new issues are underpriced, Journal of Financial Economics, Vol. 15 No.1/2, pp.187-212.
Roosenboom, P., Goot, T., and Mertens. G. (2003). Earnings management and initial public offerings: Evidence from the Netherlands. The International Journal of Accounting, 38. 243–266
Scott B. Jackson. (2004). Earnings Management by Initial Public Offering Firms: A Reexamination. Journal of Forensic Accounting, Vol.V, pp. 67-90
Stolowy, H., & Bereton, G.(2004),"A Framework for the Classification of Accounts Manipulations", International Journal of Accounting ,June.
Teoh, S. H., Welch, I. and Wong, T. J. (1998a) Earnings management and the post-issue performance of seasoned equity offerings, Journal of Financial Economics, 50, pp. 63–99.
Teoh, S. H., Welch, I., & Wong, T. J. (1998b). Earnings management and the long-run market performance of initial public offerings. Journal of Finance, 53(6), 1935–1974.
The electronic official site of Audit Organization , www.audit.org
The electronic official site of Tehran Stock Exchange (TSE) , www.irbourse.ir
Titman, S., and B. Trueman, (1986), Information quality and the valuation of new issues, Journal of Accounting and Economics 8, 159-172.

285
Trueman, B., Titman, S. (1988), "An explanation for accounting income smoothing", Journal of Accounting Research, Supplement, Vol. 26 pp.127-32.
Verrecchia, R. (1983), "Discretionary Disclosure," Journal of accounting and economics, 5, 179-94.
286
INVISIBLE DISCRIMINATION: EMPLOYERS & SOCIAL MEDIA SITES
Richard Pate
John F. Welch College of Business Sacred Heart University
INTRODUCTION
With the advent and popularity of social networks sites, the boundaries of the relationship between the employer-employee/prospective employee have stretched well beyond the work-place and work-hours. Predictably, this relationship expansion has led to unchartered adversarial scenarios between the respective parties.
Ensuing legal disputes necessitate an expansion of the law’s applicability (or new legislation) to this new world. The respective parties, employers especially, require a level of predictability regarding their respective rights and duties. While this predictability can only be offered by a body of well settled law, unfortunately, in this new, vibrant cyber world, traditional employment law considerations are struggling for deference and rumination.
Notwithstanding this ostensible indifference, each phase of the relationship is heavily impacted by social network media. Applicant recruitment, information gathering and applicant selection stand to be impacted by the social network communications made by employees or prospective employees. While Facebook users are projected to shortly reach1Billion, no legislation exists specifically regulating the employer’s access to and use of social network information for hiring and firing purposes.
This article examines whether present and proposed law protects employees’ and prospective employees’ rights from potential, unlawful discrimination resulting from the employer’s use of social media in its applicant recruitment, information gathering and applicant selections processes. iii
I. The Competing Interestsiv A. The Employer’s Interests
The employer’s desire to obtain and digest all possible information regarding a job applicant before selection is a logical business interest. A preliminary study finds a strong correlation between job performance and Facebook profiles.v In a study published in the Journal of Applied Social Psychology, raters were asked to rate university students by personality related questions, such as “[I]s this person dependable?” after viewing the student’s Facebook page only.vi Raters were, in essence, asked to “form impressions” of an applicant based solely on viewing the publicly available material (photos, status updates, and conversations) on the applicant’s Facebook page.vii
The raters then assigned a grade to each applicant for the attributes of a good employee; a degree of emotionally stability, conscientiousness, extroversion, intellectual curiosity and agreeableness.viii Such findings were subsequently (six months later) matched to the student’s job performance evaluation completed by the students’ respective employers. The study found a clear and strong relationship between “good” Facebook scores and job performance. Generally,

287
the raters gave positive grades to students who traveled, had lots of friends and a variety of interests or hobbies.
Such indications suggest that a reasonable employer should review job applicants’ social media communications. In its recruiting and selection process, it is, of course, in the employer’s interest to distinguish between a poor applicant and a good applicant.
Under some circumstances, a review of an applicant’s profile page may be more than a logical business decision, but may also constitute a legal necessity. Employer responsibility for the actions of an employee can potentially be based on two different theories. Firstly, under the doctrine of respondeat superior, when the employee commits a tort while in the course of his employment duties, the employer is rendered liable to the victim of the tort.ix While it is true that this type of vicarious liability, generally, does not create an affirmative duty to peruse an applicant’s profile page prior to offering the position,x a prudent employer would be better served to conduct such review in search evidence for propensity towards tortious conduct. xi
Secondly, unlike vicarious liability, which is based on the indirect liability of the employer, direct liability may also be imposed on the employer for the eventual tortious acts of the employee.xii An employer may be directly liable based on the theory of negligent hiring. This doctrine stems from pure negligence concepts, that is, an employer must exercise reasonable care when hiring a person to perform specific duties.xiii For example, an employer may be deemed to be acting unreasonably, i.e., negligently, when it employs a person, previously convicted of child abuse, to work in a position entailing direct contact with children, if harm to the children ensues. Most states’ law holds employers liable for the tortious acts of the employee when the employees’ tortious acts were reasonably foreseeable at the time of hiring.xiv Negligent hiring is based on the fact that it was negligent for an employer to hire the employee given what the employer knew or should have known about the employee at the time of hiring. Using Connecticut as an example, “[t]he ultimate test of the existence of the duty to use care is found in the foreseeability that harm may result if it is not exercised.”xv “It is well settled that defendants cannot be held liable for their alleged negligent hiring[…] of an employee accused of wrongful conduct unless they had notice of said employee's propensity for the type of behavior causing the plaintiff's harm.”xvi
Since foreseeability is the basis of this tort, the inevitable question is whether employers must perform a perfunctory investigation of an applicant’s profile page (especially given the relative ease of doing so) prior to employing the candidate. No case has explicitly found that a failure to review online information before hiring an employee who later commits a tort, constitutes negligence hiring. Other than statutorily required background checks in connection to sensitive positions such as teachers and law enforcement personnel,xvii current law is not clear on this point.xviii Some courts have imputed to employers the obligation to investigate an applicant's background.xix While in other jurisdictions the existence of the duty may depend on the nature of the position sought, the hazardous nature of the employee’s tasks, the level of interaction of employee with public and the correlation between the employee’s prior misconduct and the nature of the position sought.xx Notwithstanding this lack of clarity, seemingly, it is in the interest of the employer to conduct a review of an applicant’s profile before hiring the applicant.xxi
In fact, employers do conduct reviews of applicants’ profile page. According to a study conducted for CareerBuilder.com by Harris Interactive,xxii 45% of employers surveyed are using social networks to select applicants.xxiii Just one year earlier, a similar study found that 22% of
288
employers were using social networks sites like Facebook, MySpace, Twitter and LinkedIn to review applicants.xxiv The study found that 35% of employers based their decision to deny applicants jobs on the content viewed on the respective applicant’s social networking site.xxv In the study, Facebook proved to be the most popular social media site for employers to conduct their applicant screening (followed by LinkedIn, MySpace and Twitter). xxvi Over 50% the employers who participated in the survey stated that provocative photos played the biggest role in a decision not to hire an applicant, while 44% of employers used applicants’ references to drinking and drug use as red flags as a contributor to not employing applicant.xxvii A survey commissioned by Microsoft in 2010, also showed that 79% of the U.S. employers which participated in study use the Internet to screen applicants and that 70% employers rejected applicants based on the search results.xxviii
Not only have employer s demonstrated their willingness to search profiles, recently, they have also demanded applicants’ passwords to respective social media sites as a condition of employment. xxix The practice first came to attention when the Maryland Division of Corrections (DOC) policy required that job applicants for employment with the DOC provide the government with their social media account usernames and personal passwords for use in employee background checks.xxx As consequence, corrections officer Robert Collins was required to provide his Facebook login and password to the DOC. During the interview the interviewer logged on to Collins’ social media site and read the latter’s postings and those of his family and friends.
The above conclusions demonstrate that the employer (1) should review profiles, (2) at times may need to review profiles, (3) most times will review the profiles, and (4) that it will use the information contained in profile to deny a position. How are these legitimate business and legal concerns contrary to the interests of the applicant?
B. The Applicant’s Interests
When viewing unbridled media site profiles, an employer may potentially view and discern, among other things, the age, religion, color, race, gender, disability, sexual orientation, military status, or the nationality of an applicant. This information gives the employer the ability to go beyond legitimate applicant recruitment and selection. The employer is afforded the opportunity to enter the realm of unlawful discrimination. Typically, other than an applicant’s gender (most time discoverable from a name on application) the applicant’s attributes are likely to be revealed only after an interview, in fact, some characteristics may never be discovered. However, a pre-interview review of a profile is likely to show the above mentioned classifications before the applicant meets with employer.
Accordingly, the employer’s ability to discriminate is greatly facilitated. The employer can discriminate based on one or more of the above classifications without the applicant knowledge. That is, in absence of an interview, and therefore without the knowledge of the employer’s review of her profile page, an applicant is likely to never know if she was denied the position because of, for example, her color.
It is the applicant’s interest to participate in the world of social media sites without giving up the opportunity to gain employment because of her merit, or be denied a position because of her race, color, religion, gender, national origin, age or disability, for example.
The legal (and social ) issues are then formulated: How can the law avoid interfering with the prudent employer’s need to review content that clearly aids in its recruitment and selection process, and simultaneously prevent the employer the opportunity to view and weigh factors
289
which may potentially lead to unlawfully discriminate? And, how can the law achieve this without the applicant’s notice of the unlawful discrimination?
THE ADVERSARIAL SYSTEM
A. Litigation
The U.S. legal system is based on the adversarial system.xxxi As opposed to the inquisitorial systems where a judge or other public decision maker is the proponent of the facts and legal evaluation,xxxii “an adversary system relies upon the parties to produce the facts and legal arguments that will be forwarded on their behalf, for such a system to function properly, the parties must be somewhat equally capable of producing their cases. xxxiii “[The] accepted virtue of the common law, adversarial system of justice is that it leaves more control in the parties…By placing control in the individual over the state the adversary system reflects deeper values of liberalism and even natural justice.” xxxiv Our decision to resolve legal disputes in this manner, however, triggers equality concerns.xxxv “ If one side in adversarial adjudication is ill-equipped--it cannot afford access to the system, or has less time and money to pursue evidence, or less skill in developing legal claims--then what emerges as the stronger case might not necessarily be the better case…[T]he parties must be given relatively equal opportunities to present their case.”xxxvi The adversarial system hinges on party control of the investigation and presentation of evidence.xxxvii
The anticipatory use of social media information by employers does not simply trigger such concerns, it eradicates the adversarial system. More specifically, when an employer views the content of an applicant’s profile prior to an interview, it gains an overwhelming competitive edge over the applicant and the law in the adversarial setting. As stated above, this preliminary view of the profile allows the employer to make the hiring decision without the applicant’s knowledge that he or she is even under consideration. If an employer discerns an applicant’s color, for example, and bases its decision not to hire on such factor, it is essentially free to unlawfully discriminate effortlessly and without much consequence; the applicant will simply never know that this misconduct has occurred.xxxviii Without notice of the wrongdoing the applicant will not seek redress, hence she will not investigate the matter, file a charge of discrimination or litigate the case; no adversarial setting will ever be triggered into play. That is no enforcement of the anti-discrimination law will occur.
As stated above, in an adversarial system, the parties must be put on equal footing to present their case.xxxix The adversarial system rests on party’s ability to investigate and present the evidence.xl The above described applicant is clearly not on equal footing with the employer. In fact, she is likely to never become one of the adversaries. In essence, social media sites remove possible discriminatory conduct from the purview of justice by temporally moving such conduct outside reality and into the cyber world, rendering unlawful discrimination invisible.
B. Agency Enforcement
The Equal Employment Opportunity Commission (“EEOC”) has the authority under Title VII and the ADA to file a Commissioner’s charge independently of an employee or applicant’s charge,xli arguably, lessening the harm caused by the lack of an adversarial system. The EEOC Compliance Manual states as follows: “While the principal means for implementing Commission policy is the investigation of individual charges, EEOC-initiated investigations are a
290
necessary part of the enforcement process. Discrimination victims are often unaware of their rights or unaware of discriminatory practices. While this is typically so in cases of systemic discrimination, it is also true in cases where discrimination is less pervasive. Field offices should not hesitate to recommend Commissioner charges or initiate directed investigations when such action will fulfill EEOC's law enforcement mission.”xlii
The EEOC has a special interest in pattern or practice of discrimination cases because “‘it has access to the most current statistical computations and analyses regarding employment patterns' [and] was thought to be in the best position ‘to determine where “pattern or practice” litigation is warranted’ and to pursue it.”xliii
However, notwithstanding this mandate, in the end, the EEOC’s authority to initiate its own litigation is rarely used. In 2011, only 47 Commissioner’s charges were filed, while 99,947 charges were filed by individuals against their employer. The EEOC’s reliance on the adversarial system is evident. xliv Given this heavy reliance, ostensibly, the EEOC is as powerless as the individual applicant as means of discovering and redressing discriminatory conduct. After all, with the possible exception of pattern and practice cases (where statistics play a major role), the EEOC is in no better position than the applicant when it comes to discovering invisible discriminatory conduct. In the end, the EEOC’s own enforcement of anti-discrimination law is also rendered less than efficacious.
CURRENT LEGISLATION: DOES IT PROTECT APPLICANT? xlv
A. The Password Trend
The analysis beings with the most recent trend in the employer-employee/applicant relationship, that is, the employer’s practice of demanding applicants’ social media sites passwords as a condition of employment or as a part of the hiring (see Maryland Division of Corrections matter described above). Although new, the practice may be short lived. Maryland itself became the first state to pass legislation prohibit employers from requiring applicants and employees to disclose their passwords (the law takes effect on October 1, 2012).xlvi On August 1, 2012 Illinois signed into law (effective January 1, 2013) amendments to the Right to Privacy in the Workplace Act,xlvii thereby prohibiting, among other things, employers from asking applicants and employees to provide passwords and log-in information to personal social networking sites. Similar legislation has been introduced in California, Illinois, Maryland, Michigan, Minnesota, Missouri, New York, South Carolina and Washington.
Congress is currently considering two related bills. In April 2012, Reps. Eliot Engel and Jan Schakowsky introduced the Social Networking Online Protection Act,xlviii and in May 2012, Sen. Richard Blumenthal and Rep. Martin Heinrich introduced the Password Protection Act of 2012.xlix Both proposed laws would prohibit employers from, among other things, requiring or asking an employee or applicant to provide a password for access to personal social media account. Law makers’ reaction to this latest practice indicates that employees will not be subject to the password requirement. However, the legislative reaction does not protect the employees from the use of information that is openly available on the Internet.
B. The Fair Credit Reporting Act
291
The Fair Credit Reporting Act (FCRA),l among other things, regulates employment background checks performed by third parties on behalf of employer.li The Act requires that when a third party prepares a background check of an employee or applicant, the latter two must be notified of the investigation; given the opportunity to give or refuse consent; and notified if information from the report if used to make an adverse hiring decision.lii The FCRA requires an employer to “clearly and accurately notify applicants in writing if they will be the subject of a consumer credit report prepared by a consumer reporting agency.”liii
Unfortunately, the FCRA and its protections do not apply when an employer performs its own profile search. Accordingly, the FCRA would be of no aid to the aforementioned applicant.
C. Stored Communications Statutes
As stated above, this note’s analysis is based on applicants’ whose profile is public. In instances where the applicant’s media site is not public but is nevertheless accessed by employer without the applicant’s consent, a violation of the Stored Communications Act may be found. The Electronic Communications Privacy Act (ECPA)liv includes federal wiretapping laws and federal laws prohibiting unauthorized access to communications in electronic storage.
Title II of the ECPA created the Stored Communications Act (SCA)lv, intended to “address access to stored wire and electronic communications and transactional records.” The SCA makes it a federal crime for anyone to “access” without “authorization”, or in excess of authorization, a “facility providing electronic communication services and thereby obtaining access to a wire or electronic communication while it is in electronic storage.” The SCA would be of no help to an applicant with a public profile.lvi
D. Federal Computer Fraud and Abuse Act
Although this Act is often used by employers to pursue claims against their employees, arguably, an employer who exceeds its authorized access to a profile or the social network’s server, may be in violation of the Computer Fraud and Abuse Act (CFAA).lvii Again, however, the CFAA would be of no help to an applicant with a public profile.
E. Title VII, The ADA and the ADEA
An array of antidiscrimination statutes exists if we consider state and federal law. The most fundamental federal statutes, however, are listed below. Under Title VII of the 1964 Civil Rights Act,lviii an employer shall not “fail or refuse to hire or to discharge any individual, or otherwise to discriminate against any individual with respect to his compensation, terms, conditions, or privileges of employment, because of such individual's race, color, religion, sex, or national origin.”lix Under the Americans with Disabilities Act (ADA)lx an employer cannot make an adverse employment decisions against “an individual with a disability who, with or without reasonable accommodation, can perform the essential functions of the employment position that such individual holds or desires.” Pursuant the Age Discrimination in Employment Act (ADEA), it is against the law for an employer “to fail or refuse to hire or to discharge any individual or otherwise discriminate against any individual . . . because of such individual's age.”lxi

292
As a consequence of this legislation and disparate treatment and disparate impact principles, employers are prohibited from making inquiries such as the following examples, in response to an applicant’s application.lxii Are you Hispanic? What is your ethnicity? What is your race? What is your national origin? Are you a citizen of this country? Where were you born? What is your religion? Do you attend church? How old are you? When were you born? Are you disabled? Are you an addict?lxiii
Additionally, as a consequence of this legislation and especially disparate impact principles employers are strongly discouraged from making inquiries such as the following examples, in response to an applicant’s application. Are you married? Do you have children? Do you plan to have children? Are you pregnant or planning to become pregnant? Have you ever been charged with a crime? Have you ever bounced a check? Have you ever failed to make a payment on a loan? Were you honorably discharged from the military? How tall are you? How much do you weigh? Are you a citizen? Where were you born? What is your religion? Can you work on Sunday? What organizations do you belong to?lxiv The introduction of social media sites into this paradigm demonstrates the growing irrelevance of employment law in the cyber-world. A profile or even simply a posted photo of an applicant may give the employer the answer to most of these inquiries, without the need to pose a single unlawful question. And, as stated above, the employer can collect and consume such responses without the applicant’s knowledge that she is unknowingly responding to unlawful inquiries. To a great extent, this represents the demise of antidiscrimination protection at the employee recruiting and selection phase. The more the employer looks, the more it sees, the more it sees, the greater the potential of discrimination.

293
In the end, no federal statute specifically prohibits employers from obtaining or utilizing information gathered from profile searches.
CONCLUSIONS & RECOMMENDATIONS
The preliminary findings of this note are as follows: (1) The employer should review profiles, (2) the employer, at times, must review profiles, (3) the employer most times will review profiles, (4) the employer will most times use information contained in profile to make a hiring decision. Lastly, it is also clear that (5) the employer’s review of social media sites takes any potential discriminatory conduct outside the temporal parameters contemplated by current anti-discrimination statutes, and, consequently, (6) the applicant and the EEOC are unlikely to discover the discriminatory conduct. Without notice of the misconduct, the adversarial system stops functioning and with it the enforcement of anti-discrimination law.
Based on these conclusions, to remain consequential in this new world, anti-discrimination protection must find a presence in that pre-interview slice of time. Two avenues seem most apt towards achieving this end. The first option is to steer away from the reasoning reflected in the current “password related legislation” discussed above. That is, given the absence of an adversarial system to enforce the law, a categorical prohibition of employer’s use of social media content in hiring decisions would be less than a weak warning. Since it seems clear that employers are actually using the online content to make decisions, the first clear choice is to require employers to report to the EEOC and the applicant every instance of social media site review (in the context of making hiring related decision). As a result, the applicant and the EEOC would have notice of the review and the option to re-enter the adversarial system should discriminatory conduct be suspected.
The reporting system currently required by the FCRA should be expanded.lxv As stated above, among other things, this law regulates employment background checks performed by third parties on behalf of employer.lxvi The Act requires that when a third party prepares a background check of an employee or applicant, the employer must “clearly and accurately notify applicants in writing if they will be the subject of a consumer credit report prepared by a consumer reporting agency.”lxvii The FCRA ‘s protections have not been expanded to cover employer conducts its own background check. Amending the law to make it applicable to employer’s own searches would, as stated above, reactivate the adversarial system by giving notice to the applicant and the EEOC. Of course, we remain with traces of the problem: How can one ascertain if the self-regulated reporting is a true reflection of the employer’s searches; for unscrupulous employers, the ones more likely to discriminate, the searches and the discrimination would remain invisible. The second option consists of applying a rebuttable presumption element to discrimination cases. In discrimination related cases, employers would have the burden of rebutting the presumption that they did view social media sites when they made their hiring decision. Of course, this would be quasi irrefutable in instances where an employer has an actual declared internet screening policy. Obviously, the employer's burden of rebutting the presumption would be onerous. However, placing this burden on the employer in order to rescue the adversarial system is a burned worth imposing. In the end, such a presumption does not create any greater burden than that of a small business owner operating in a small town where everybody knows everybody.
294
i i A good amount of the text-material included under “Research Methodology”
section of this article is identical to the text-material that was written under “Research Methodology” section of the first article that was based on the same data published in the 2012 online issue of the Journal of Entrepreneurship Education.
ii The author is very thankful to his faculty colleagues who helped collect students’ responses for this research and to Dr. Vasantha K. Bhat who helped in the statistical analysis of the data. Thanks are also due to Mr. Mihir Trivedi and to Mr. Pratik Shinde for their research assistance; and to Pace University for its support in this study.
iii The focus of this note is on the effects of social media sites/profiles on discriminatory practices in the workplace. However, it should be mentioned that the growth of such communications has also impacted employee privacy, discipline and discharge, and has also not left unscathed union protected employees. Several cases have seen the application of tort based legal theories such as defamation, invasion of privacy, wrongful disclosure of confidential information or trade secrets. Cases against public employers may also rely on the U.S. Constitution, arguing that certain aspects of profile searches constitute an unreasonable search and seizure. Other cases have raised exceptions to the general at-will doctrine, such as violation of public policy and statutory protections such as anti-retaliation statutes based on protected activities such as free speech. For examples of cases dealing with discipline and discharge of employees due to social media sites posts, see Simonetti v. Delta Airlines, No. 1:05-CV-2321, 2005 WL 2407621 (N.D. Ga. Sept. 7, 2005) in which a flight attendant posted a suggestive photo of herself on MySpace page and was later discharged for the same; Pietrylo v. Hillstone Rest. Grp., No. 06-5754 (FSH), 2008 U.S. Dist. LEXIS 108834 (D.N.J. July 25, 2008), where an employee was discharged after staring a MySpace page and posting numerous comments about management. See also, http://www.higheredmorning.com/professor-suspended-for-facebook-posts (last visited September 1, 2012), (professor was suspended after a student reported humorous comments on her Facebook page, about “not wanting to kill” any students that day. Facebook: Professor Suspended for Posts, HigherEdMorning.com; see also Ayla Webley, How One Teacher's Angry Blog Sparked a Viral Classroom Debate, Time/CNN, Feb. 18, 2011, http://www.time.com/time/nation/article/0,8599,2052123,00.html#ixzz1Fx9Ba0fz (last visited September 1, 2012.)
Social media sites’ popularity has also impacted union protected employees. On May 30, 2012, the National Labor Relations Board (NLRB), through its Acting General Counsel (GC), issued a third Operations Management Memo on social media cases in less than a year. https://www.nlrb.gov/news/acting-general-counsel-releases-report-employer-social-media-policies (last visited July 8, 2012).
See also the 2011NLRB survey which indicates that the NLRB has reviewed more than 129 cases involving social media sites. The central issues of cases regard discharge or discipline of employees based on their social media posts and whether the posts are a protected activity under the National Labor Relations Act.
295
http://www.uschamber.com/sites/default/files/reports/NLRB%20Social%20Media%20Survey%20-%20FINAL.pdf (last visited August 28, 2012).
iv Throughout this note, the terms “social media site” and “profile” are used synonymously and are defined as follows: A form of electronic communication (as Web sites for social networking and microblogging) through which users create online communities to share information, ideas, personal messages, and other content (as videos). See Social Media, Merriam-Webster, http://www.merriam-webster.com/dictionary/social%20media (last visited Sept. 23, 2012)(last visited September 23, 2012). Popular examples include Facebook, Twitter, Linked-In, and YouTube.
Throughout this note it presumed that an applicant’s social media site/profile (such as a Facebook profile) is public and not protected by privacy settings.
v Donald H. Kluemper et al., Social Networking Websites, Personality Ratings, and the Organizational Context: More Than Meets the Eye? 42 Journal of Applied Social Psychology, Volume 42, Issue 5, pp. 1143–1172 (2012).
vi Id. vii Id. viii Id. ix Richard A. Epstein, Cases and Materials on Torts 432 (9th ed. 2008). x Restatement (Second) of Agency § 219(1) (1958). xi Daniel E. Mooney, Comment, Employer on the Web Wire: Balancing the Legal Pros and
Cons of Online Employee Screening, 46 Idaho L. Rev. 733, 758 (2010). xii Restatement (Second) of Agency § 213 (1958). xiii Id. xiv Lex K. Larson, State-by-State Analysis, Employment Screening (MB) pt. 1, ch. 11
(2010).
xv Perodeau v. Hartford, 259 Conn. 729, 754, 792 A .2d 752 (2002). xvi Knicrumah v. Albany City School District, 241 F.Sup.2d 199, 211 (N.D.N.Y.2003). xvii For example, Connecticut law requires all public school employees hired on or after July
1, 1994, to submit to state and national criminal history record checks when they are hired. According to a survey by Education Week, 42 states require criminal background checks for teacher certification. The states that do not have background check requirements for teachers are Illinois, Indiana, Massachusetts, North Carolina, Ohio, Pennsylvania, Tennessee, and Wisconsin. See “State Policies on Sexual Misconduct Between Educators and Students,” Education Week, April 30, 2003.
xix See, e.g., Kendall v. Gore Props, Inc., 236 F.2d 673 (D.C. 1956); Weiss v. Furniture in
the Raw, 306 N.Y.S.2d 253 (N.Y. Civ. Ct. 1969); Robertson v. Church of God Int'l, 978 S.W.2d

296
120, 125 (Tex. App. 1997) (“One who retains the services of another has a duty to investigate the background of that individual for fitness for the position....”). xx “Liability of the employer is predicated on the employer's antecedent ability to recognize a potential employee's ‘attribute[s] of character or prior conduct’ which would create an undue risk of harm to those with whom the employee came in contact in executing his employment responsibilities.... The scope of the employer's duty in exercising reasonable care in a hiring decision depends on the employee's anticipated degree of contact with other persons in carrying out the duties of employment. The requisite degree of care increases, and may require expanded inquiry into the employee's background, when the employer expects the employee to have frequent contact with the public or when the nature of the employment fosters close contact and a special relationship between particular persons and the employee.” Moses v. Diocese of Colorado, 863 P.2d 310, 323-324 at 327-328 (Colo.1993), cert. denied, 511 U.S. 1137, 114 S.Ct. 2153, 128 L.Ed.2d 880 (1994) (citations omitted), quoting Connes v. Molalla Transport System, Inc., 831 P.2d 1316, 1321 (Colo.1992).
For example, in Ponticas v. K.M.S. Invs., 331 N.W.2d 907, 911 (Minn. 1983), “the apartment manager had access to tenants' homes, his employer had a duty to conduct a reasonable investigation to explore whether the manager posed a high risk of injury to the apartment complex's residents. The employee in question had a criminal history of armed robbery and other felonies that a cursory criminal background check would have revealed. Additionally, the employee had listed his mother and sister as his employment references. Due to the ease with which the employer could have discovered that the employee had committed violent crimes and had provided sham employment references, the court upheld the jury's finding that the employer was liable for negligent hiring.” Katherine A. Peebles, Negligent Hiring And The Information Age: How State Legislatures Can Save Employers From Inevitable Liability, 53 Wm. & Mary L. Rev. 1397, 2012. See also Proceed with Caution: Social Networking Websites and Blogs, Labor Law Reports, May 27, 2009, at 1, available at http:// www.bicklaw.com/Publications/LAWFULMININGOFSOCIALNETWORKS.htm (last visited June 1, 2012); and Jonathan Bick, Lawful Mining of Social Networks, N.J. Law J., Feb. 16, 2009.
xxi In jurisdictions where the duty clearly does not exist, an argument could be made that if an employer may only be liable for what is reasonably foreseeable, it behooves him not to review any profiles and argue ignorance of any of the applicant’s propensities. However, as can be learned from the statistics below, the employer is likely to deem the benefits of a search to outweigh the possible consequences of the review.
xxii http://www.careerbuilder.com/share/aboutus/pressreleasesdetail.aspx?id=pr519&sd=8/19/2009&ed=12/31/2009 (last visited June 30, 2012).
xxiii Id. xxiv Id. xxv Id. xxvi Id. xxvii Id. xxviii Cross-Tab, Online Reputation in a Connected World 5-6 (2010), available at

297
http://www.microsoft.com/privacy/dpd/research.aspx (follow hyperlink labeled “Online reputation research overview PDF) (last visited September 8, 2012).
xxix This trend has been met with opposition, as discussed below. xxx 02/18/ Want A Job? Password, Please! By Meredith Curtis, ACLU of Maryland at
2:04pm http://www.aclu.org/blog/technology-and-liberty/want-job-password-please (last visited July 8, 2012).
xxxi See, e.g., Lassiter v. Dep't of Soc. Servs., 452 U.S. 18, 28 (1981) (“[O]ur adversary system presupposes [that] accurate and just results are most likely to be obtained through the equal contest of opposed interests... “);
See McNeil v. Wisconsin, 501 U.S. 171, 181 n.2 (1991) (“What makes a system adversarial rather than inquisitorial is...the presence of a judge who does not (as an inquisitor does) conduct the factual and legal investigation himself, but instead decides on the basis of facts and arguments pro and con adduced by the parties.”).
xxxii As is the case in most of Europe. See John H. Langbein, The German Advantage in Civil Procedure, 52 U. Chi. L. Rev. 823 (1985).
xxxiii William B. Rubenstein, The Concept Of Equality In Civil Procedure, 23 Cardozo L. Rev. 1865 (2002).
xxxiv Martin E.P. Seligman, et al., Why Lawyers Are Unhappy, 23 Cardozo L. Rev. 33 Cardozo Law Review (2001).
xxxv Rubenstein, supra note 31, at 1874.
xxxvi Id. See also Alan Wertheimer, The Equalization of Legal Resources, 17 Phil. & Pub. Affairs 303 (1988).
xxxvii Judith Resnik, Managerial Judges, 96 Harv. L. Rev. 374, 380 n.23 (1982); See also Judith Resnik, Money Matters: Judicial Market Interventions Creating Subsidies and Awarding Fees and Costs in Individual and Aggregate Litigation, 148 U. Pa. L. Rev. 2119, 2136 (2000) (“Equipage for civil litigants--from filing fees to investigation to counsel for experts--is generally left either to the legislature or to the market.”).
xxxviii Arguably, an applicant could hire an expert to find an online trail left by an employer's search. However, without some notice of the employer’s search or suspicion thereof, the applicant’s curiosity is unlikely to be sufficiently aroused to take such steps. And, in the cases where the suspicion or notice is present, the cost of such steps may be prohibitive.
Title VII of the Civil Rights Act, the Americans with Disabilities Act and the Age Discrimination in Employment Act (all discussed below) do require employers to retain applications and other personnel records relating to hiring process. One could argue that such records could be used to trigger investigations, etc. However, the unscrupulous employer, the one most likely to discriminate, is unlikely to abide by this law if it knows the chances of being found out are minimal. Moreover, the applicant is not automatically entitled to a copy of such records, thus, who would review such innumerable documents?
298
xxxix Rubenstein, supra note 31, at 1874. xl Resnik, supra note 35, at 379. xli See 42 U.S.C. § 2000e-6(e) (2008); 29 C.F.R. §§ 1601.7-11; § 2000e-5(b);
1 EEOC Compliance Manual (BNA) 8:0001 (2001)(Hereinafter referred to as “EEOC Intake”)(“Under Title VII/ADA, EEOC must have a basis to investigate possible violations and must obtain a Commissioner charge and notify the respondent of such basis by specifying the date, place and circumstances to be covered by the investigation. Under ADEA/EPA, there are no prerequisites which must be met to investigate.”
No commissioner’s charge provisions are found in the ADEA and the EPA, however, the EEOC may investigate into violations of these two statues. EEOC Intake.
xlii Id. xliii Equal Employment Opportunity Comm'n v. Shell Oil Co., 466 U.S. 54, 69 (1984). xliv http://www.eeoc.gov/eeoc/plan/upload/2011par.pdf (last visited September 18, 2012) xlv With some exceptions, the ensuing discussion does not examine state (U.S.) anti-
discrimination law, but focuses on pertinent federal law. xlvi To be codified at Md. Code Ann., Lab. & Empl. § 3-712. xlvii Illinois HB 3782 amends the state’s Right to Privacy in the Workplace Act xlviii H.R. 5050, 112th Cong., 2d Sess. (Apr. 27, 2012). xlix S. 3074, 112th Cong., 2d Sess. (May 9, 2012). l 15 U.S.C. §§ 1681-1681t (2000 & Supp. 2003). li Id. lii Id. liii Id. liv 18 U.S.C. §§ 2510–2522 lv 18 U.S.C. Chapter 121 §§ 2701–2712.
lvi In Crispin v. Christian Audigier Inc. ,717 F. Supp. 2d 965 (C.D. Cal. 2010), a federal district court decided that the SCA applies to social media posts, provided that a posting had established privacy settings was content electronically stored within the meaning of the SCA and thus could not be accessed without authorization. See also, Pietrylo v. Hillstone Rest. Group, 2008 WL 6085437; and Konop v. Hawaiian Airlines, Inc., 236 F.3d 1035 (2001) (D.N.J. July 24, 2008), making it clear that under some circumstances unconsented access to private media sites may constitute a violation if the SCA.
lvii 18 U.S.C. § 1030. lviii 42 U.S.C. §§ 2000e-2 (2000). lix 42 U.S.C. §§ 2000e-2(a)(1). lx 42 U.S.C. §§ 12101-12213 (2000). lxi 29 U.S.C. §§ 621-634 (2000).
lxii Many of such questions are not explicitly prohibited by the language of the
aforementioned antidiscrimination laws (except for the ADA), but in some cases have been de

299
facto made unlawful by federal regulations and EEOC guidance. It is beyond the scope of this article to discuss specific federal regulations and EEOC guidance regulating such inquiries.
lxiii
http://www.peopleclick.com/resources/wpaper/Social_Networks_Employment_Law_eBook.pdf (last visited September 29, 2012)
lxiv Id. lxv 15 U.S.C. §§ 1681-1681t (2000 & Supp. 2003). lxvi Id.


![Proceedings [of the] annual meeting. - AgEcon Search](https://static.fdokumen.com/doc/165x107/6333d7934e43a4bcd80cf484/proceedings-of-the-annual-meeting-agecon-search.jpg)