Optimized Electroless Silver Coating for Optical and Plasmonic Applications
Probing a Century Old Prediction OnePlasmonic Particle at a TimeA. Tcherniak,† J. W. Ha,† S. Dominguez-Medina,† L. S. Slaughter,† and S. Link*,†,‡
†Department of Chemistry, and , ‡Department of Electrical and Computer Engineering, , and Rice University,Houston, Texas 77005
ABSTRACT In 1908, Gustav Mie solved Maxwell’s equations to account for the absorption and scattering of spherical plasmonicparticles. Since then much attention has been devoted to the size dependent optical properties of metallic nanoparticles. However,ensemble measurements of colloidal solutions generally only yield the total extinction cross sections of the nanoparticles. Here, weshow how Mie’s prediction on the size dependence of the surface absorption and scattering can be probed separately for the samegold nanoparticle by using two single particle spectroscopy techniques, (1) dark-field scattering and (2) photothermal imaging, whichselectively only measure scattering and absorption, respectively. Combining the optical measurements with correlated scanningelectron microscopy furthermore allowed us to measure the size of the spherical gold nanoparticles, which ranged from 43 to 274nm in diameter. We found that even though the trend predicted by Mie theory is followed well by the experimental data over a largerange of nanoparticle diameters, for small size variations changes in scattering and absorption intensities are dominated by factorsother than those considered by Mie theory. In particular, spectral shifts of the plasmon resonance due to deviations from a sphericalparticle shape alone cannot explain the observed variation in absorption and scattering intensities.
KEYWORDS Surface plasmon resonance, Mie theory, single particle spectroscopy
Plasmonic nanoparticles (NPs) have attracted signifi-cant attention in various fields because of their sizeand shape tunable optical properties. Possible ap-
plications of metallic NPs range from subwavelength opticaldevices,1–3 catalysis,4 biological sensing5–8 and imaging,9–12
to disease diagnostics and treatment.13–15 In contrast tosmaller molecules, the surface plasmon oscillation of NPsgives rise to both strong absorption and scattering of theincident light.16,17 The fourth century Roman Lycurgus Cuppresents a fascinating example of absorption versus scat-tering by gold NPs;18,19 it appears red due to absorption andgreen due to scattering when the cup is illuminated atdifferent angles relative to the observer.
Similarly, many modern applications of plasmonic NPsrely on either their absorption or scattering properties. Thus,it is useful to obtain experimental information about howthese properties evolve with NP size and shape so that theoptimal plasmonic NPs can be designed for a particular use.For example, the sensitivity of plasmonic sensors that arebased on spectral shifts of the surface plasmon scatteringspectrum6,7 benefits from increasing the NP size and hencescattering intensity. However, this is usually accompaniedby an increase in absorption efficiency and hence photo-thermal heating of the environment as well. Because DNAbound to the surface of gold NPs is very sensitive to the localtemperature,20,21 for studies that rely on biomolecularrecognition7,22 it is important to minimize absorptive pho-tothermal heating and hence to compromise with respect
to the magnitude of the scattering signal. On the other hand,photothermal cancer therapy with plasmonic NPs relies onboth absorption for heat delivery and scattering for imag-ing.13 It is therefore vital to know the ratio between absorp-tion and scattering cross sections in order to correctlyestimate the NP coverage and temperature change from thescattering images.23,24
The size dependent absorption and scattering cross sec-tions of spherical metallic NPs were solved analytically byGustav Mie in 1908.25 His theory predicts that the absorptionand scattering cross sections as well as the scattering-to-absorption ratio increase with increasing NP size.16,17,25,26
Although many studies have shown excellent agreementbetween UV-vis spectra and Mie theory,10,16,17,27 typicalensemble measurements yield the total extinction only, thatis, the sum of absorption and scattering. Experimentallyseparating the contributions of absorption and scattering tothe spectra of plasmonic NPs is more difficult, but can beaccomplished by combining extinction measurements withoff-axis scattering28 or photoacoustic spectroscopy.29 Nev-ertheless, size and shape inhomogeneities of typical colloidalNP samples remain a major disadvantage in ensembleopticalmeasurementsasonlyaveragevaluescanbeobtained.
Ensemble averaging of optical properties due to inhomo-geneous NP size distributions is eliminated using differentsingle particle spectroscopy techniques.26,30–37 Furthermore,it is possible to separately measure either surface plasmonabsorption32,33,38,39 or scattering.34–36,40,41 Surface plasmonscattering from individual NPs is most commonly detectedby dark-field microscopy, which has been used to determinethe plasmon resonances and line widths of single NPs with
* To whom correspondence should be addressed. E-mail: [email protected] for review: 01/19/2010Published on Web: 03/02/2010
pubs.acs.org/NanoLett
© 2010 American Chemical Society 1398 DOI: 10.1021/nl100199h | Nano Lett. 2010, 10, 1398–1404

different sizes and shapes34,35,41–43 including spherical goldNPs with diameters between 20 and 150 nm.44 However,the magnitude of the scattering intensity is often neglectedin these single particle studies. On the other hand, singleparticle absorption spectra of gold NPs with mean diametersof 5, 10, 20, and 33 nm have been recorded independentlyusing photothermal imaging.39 In addition, the size depen-dence of the photothermal signal intensity at 532 nm hasbeen determined for NPs with average diameters up to 75nm.30,33
Although single particle spectroscopy yields the homo-geneous line width, the spectra can vary greatly among theindividual NPs even for the same sample. This arises fromsmall inhomogeneities in NP size and shape, including thepresence of small aggregates, different orientation of the NPswith respect to the incident radiation, variations in the localdielectric function of the surroundings, and interactions ofthe NP with the substrate.35,39,43–48 Because optical andstructural characterizations of metallic NPs have mostly beenperformed separately, only the mean values and theirstandard deviations for the plasmonic response and the NPdimensions could be correlated with each other. To circum-vent some of these issues, optical studies have to be carriedout on the same individual NPs that are also characterizedby a structural imaging technique such as transmission orscanning electron microscopy (TEM or SEM). This can beachieved using substrates with registration marks that allowfor identification of the same areas in optical and electronmicroscopes. Such an approach, although tedious, has beentaken more recently especially for correlating the scatteringspectra with the shapes of nonspherical NPs.35,41–43,45,48–50
To directly probe Mie’s prediction for the size dependenceof the absorption and scattering of spherical metallic NPsover a large range of diameters with single particle resolu-tion, we measured both absorption and scattering intensitiesof the same individual NPs that were also characterized bySEM. This was accomplished using single particle photother-mal imaging and laser dark-field scattering, both carried outusing 532 nm as the exciting wavelength for five samplesof spherical gold NPs with average diameters d varying from51 to 237 nm. We found good general agreement with thesize dependence predicted by Mie theory considering theentire size range. In particular, for the largest NPs weobserved the departure from the simple scaling laws ofd3 and d6 for the absorption and scattering intensities,respectively.16,17,26 However, our results also show thatfactors other than the NP size lead to strong fluctuations inthe often less analyzed absorption and scattering intensitieseven for NPs with comparable diameters.
We selected five gold NP samples with average diametersranging from 51 to 237 nm so that the relative contributionsfrom absorption and scattering change from absorption-dominated for the smaller NPs to scattering-dominated forthe larger NPs. Each sample was first characterized byensemble extinction spectroscopy and SEM. In Figure 1 the
extinction spectra are compared to Mie theory calculationscarried out for the mean NP sizes for each sample. Consider-ing that the average experimental size distributions of 15%were not included in these calculations, the agreementbetween theory and experiment is excellent even for thelarger 155 and 237 nm NPs, which show higher orderplasmon resonances in addition to the dipole mode due tophase retardation effects.16,17 For the three smallest NPsamples with average diameters of 51, 76, and 88 nm theline widths of the dipole plasmon resonance are in goodagreement with the values obtained from the theoreticalspectra. The line widths defined as the full width at half-maximum were computed by fitting a single Lorentziancurve to each spectrum giving 0.24, 0.29, and 0.38 eV for
FIGURE 1. Experimental ensemble extinction (left column) and Mietheory spectra (right) for spherical gold NPs with different meansizes: A, B, 51 nm; C, D, 76 nm; E, F, 88 nm; G, H, 155 nm; and I, J,237 nm. The Mie theory extinction spectra (solid lines) can beseparated into contributions from scattering (open circles) andabsorption (dashed lines).
© 2010 American Chemical Society 1399 DOI: 10.1021/nl100199h | Nano Lett. 2010, 10, 1398-–1404
the experimental spectra of the 51, 76, and 88 nm NPs,respectively. The corresponding theoretical values are slightlynarrower with 0.23, 0.28, and 0.36 eV. However, this iscommonly found for ensemble measurements, in which thebroadening can be attributed to the size and shape inhomo-geneity of the NPs.35,39,48 Because of the multiple overlap-ping peaks for the two largest NP samples with diametersof 155 and 237 nm, we were not able to determine the linewidths of their dipole plasmon resonances.
Mie theory allows one to separately calculate the pureabsorption and scattering spectra,16,17,25 while ensembleUV-vis spectroscopy yields the sum of both processes.Figure 1B,D shows that absorption (dashed line) dominatesfor the 51 and 76 nm NPs. However with increasing NPdiameter, scattering (open circles) increases more steeplyand becomes about equal in strength compared to absorp-tion for 88 nm NPs (Figure 1F). For 155 and 237 nm NPsscattering is much stronger than absorption and dominatesthe overall extinction spectrum (Figure 1H,J). Furthermore,it is evident from the spectra in Figure 1 that the ratiobetween absorption and scattering is not constant for allwavelengths, but depends strongly on the spectral depen-dence of the absorption and scattering as a function of NPsize. A quantitative comparison between absorption andscattering for different NP sizes is therefore best accom-plished either by defining integrated spectral densities or ata particular wavelength.
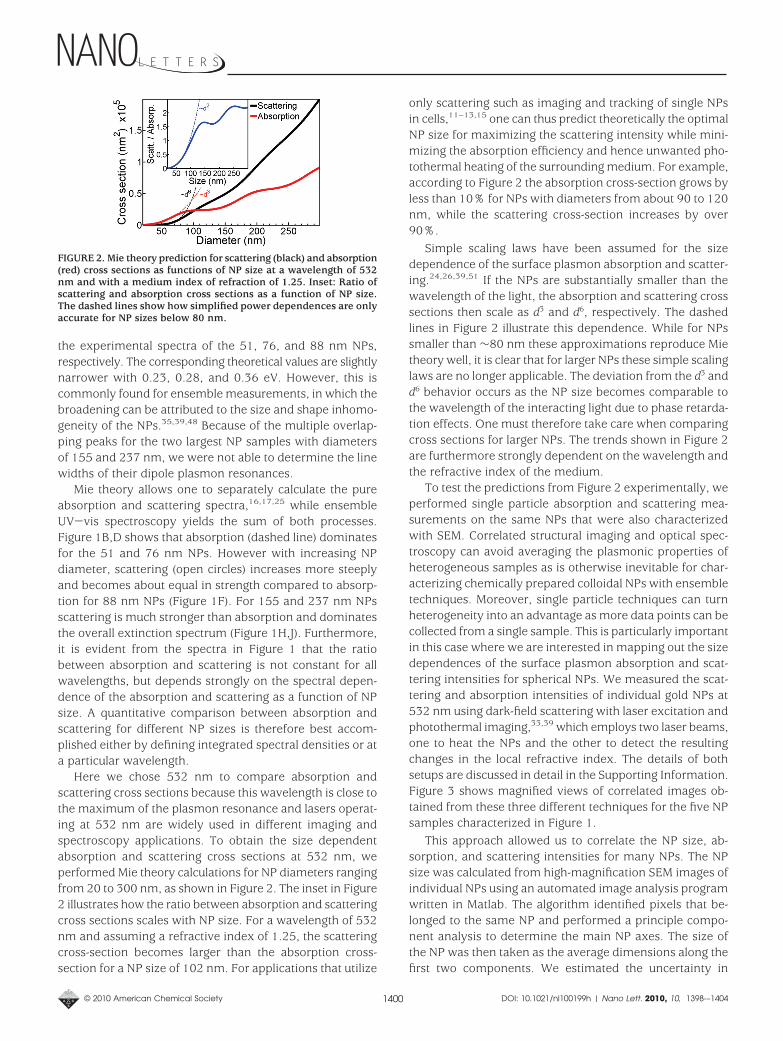
Here we chose 532 nm to compare absorption andscattering cross sections because this wavelength is close tothe maximum of the plasmon resonance and lasers operat-ing at 532 nm are widely used in different imaging andspectroscopy applications. To obtain the size dependentabsorption and scattering cross sections at 532 nm, weperformed Mie theory calculations for NP diameters rangingfrom 20 to 300 nm, as shown in Figure 2. The inset in Figure2 illustrates how the ratio between absorption and scatteringcross sections scales with NP size. For a wavelength of 532nm and assuming a refractive index of 1.25, the scatteringcross-section becomes larger than the absorption cross-section for a NP size of 102 nm. For applications that utilize
only scattering such as imaging and tracking of single NPsin cells,11–13,15 one can thus predict theoretically the optimalNP size for maximizing the scattering intensity while mini-mizing the absorption efficiency and hence unwanted pho-tothermal heating of the surrounding medium. For example,according to Figure 2 the absorption cross-section grows byless than 10% for NPs with diameters from about 90 to 120nm, while the scattering cross-section increases by over90%.
Simple scaling laws have been assumed for the sizedependence of the surface plasmon absorption and scatter-ing.24,26,39,51 If the NPs are substantially smaller than thewavelength of the light, the absorption and scattering crosssections then scale as d3 and d6, respectively. The dashedlines in Figure 2 illustrate this dependence. While for NPssmaller than ∼80 nm these approximations reproduce Mietheory well, it is clear that for larger NPs these simple scalinglaws are no longer applicable. The deviation from the d3 andd6 behavior occurs as the NP size becomes comparable tothe wavelength of the interacting light due to phase retarda-tion effects. One must therefore take care when comparingcross sections for larger NPs. The trends shown in Figure 2are furthermore strongly dependent on the wavelength andthe refractive index of the medium.
To test the predictions from Figure 2 experimentally, weperformed single particle absorption and scattering mea-surements on the same NPs that were also characterizedwith SEM. Correlated structural imaging and optical spec-troscopy can avoid averaging the plasmonic properties ofheterogeneous samples as is otherwise inevitable for char-acterizing chemically prepared colloidal NPs with ensembletechniques. Moreover, single particle techniques can turnheterogeneity into an advantage as more data points can becollected from a single sample. This is particularly importantin this case where we are interested in mapping out the sizedependences of the surface plasmon absorption and scat-tering intensities for spherical NPs. We measured the scat-tering and absorption intensities of individual gold NPs at532 nm using dark-field scattering with laser excitation andphotothermal imaging,33,39 which employs two laser beams,one to heat the NPs and the other to detect the resultingchanges in the local refractive index. The details of bothsetups are discussed in detail in the Supporting Information.Figure 3 shows magnified views of correlated images ob-tained from these three different techniques for the five NPsamples characterized in Figure 1.
This approach allowed us to correlate the NP size, ab-sorption, and scattering intensities for many NPs. The NPsize was calculated from high-magnification SEM images ofindividual NPs using an automated image analysis programwritten in Matlab. The algorithm identified pixels that be-longed to the same NP and performed a principle compo-nent analysis to determine the main NP axes. The size ofthe NP was then taken as the average dimensions along thefirst two components. We estimated the uncertainty in
FIGURE 2. Mie theory prediction for scattering (black) and absorption(red) cross sections as functions of NP size at a wavelength of 532nm and with a medium index of refraction of 1.25. Inset: Ratio ofscattering and absorption cross sections as a function of NP size.The dashed lines show how simplified power dependences are onlyaccurate for NP sizes below 80 nm.
© 2010 American Chemical Society 1400 DOI: 10.1021/nl100199h | Nano Lett. 2010, 10, 1398-–1404
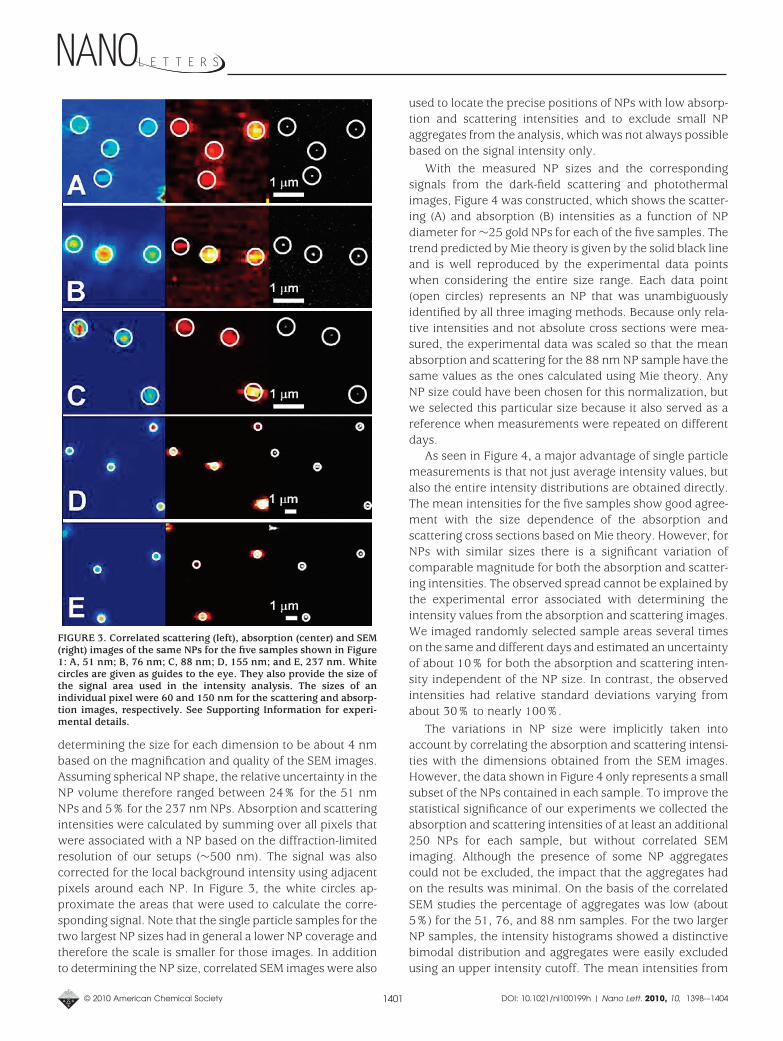
determining the size for each dimension to be about 4 nmbased on the magnification and quality of the SEM images.Assuming spherical NP shape, the relative uncertainty in theNP volume therefore ranged between 24% for the 51 nmNPs and 5% for the 237 nm NPs. Absorption and scatteringintensities were calculated by summing over all pixels thatwere associated with a NP based on the diffraction-limitedresolution of our setups (∼500 nm). The signal was alsocorrected for the local background intensity using adjacentpixels around each NP. In Figure 3, the white circles ap-proximate the areas that were used to calculate the corre-sponding signal. Note that the single particle samples for thetwo largest NP sizes had in general a lower NP coverage andtherefore the scale is smaller for those images. In additionto determining the NP size, correlated SEM images were also
used to locate the precise positions of NPs with low absorp-tion and scattering intensities and to exclude small NPaggregates from the analysis, which was not always possiblebased on the signal intensity only.
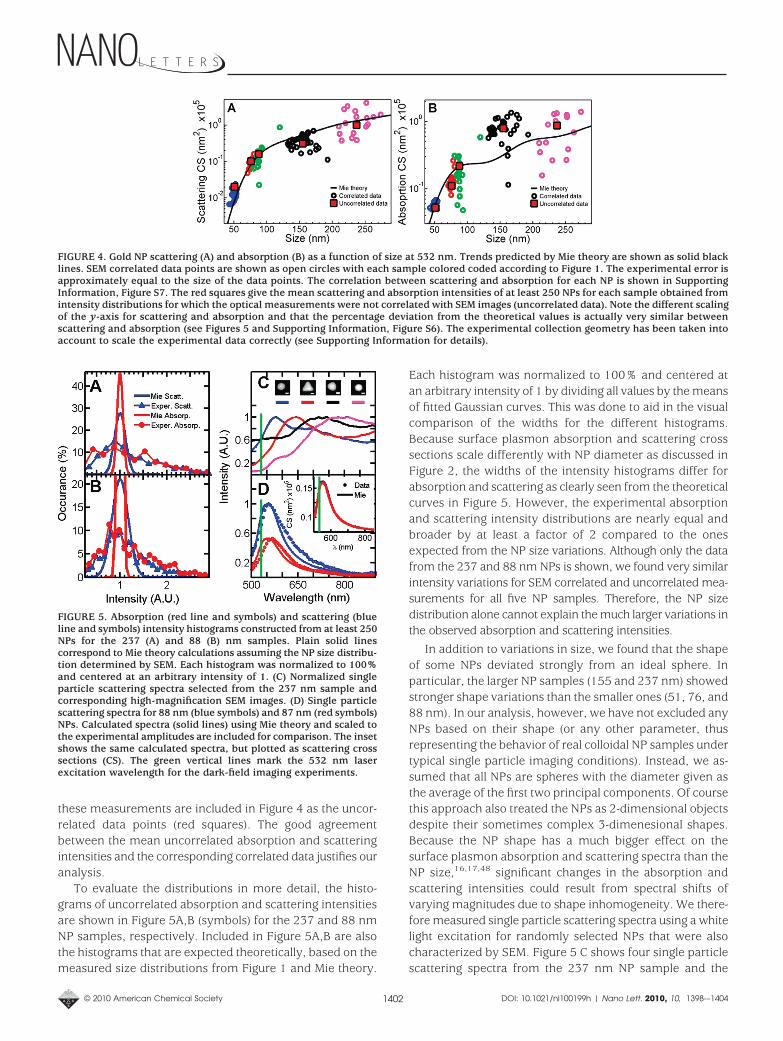
With the measured NP sizes and the correspondingsignals from the dark-field scattering and photothermalimages, Figure 4 was constructed, which shows the scatter-ing (A) and absorption (B) intensities as a function of NPdiameter for ∼25 gold NPs for each of the five samples. Thetrend predicted by Mie theory is given by the solid black lineand is well reproduced by the experimental data pointswhen considering the entire size range. Each data point(open circles) represents an NP that was unambiguouslyidentified by all three imaging methods. Because only rela-tive intensities and not absolute cross sections were mea-sured, the experimental data was scaled so that the meanabsorption and scattering for the 88 nm NP sample have thesame values as the ones calculated using Mie theory. AnyNP size could have been chosen for this normalization, butwe selected this particular size because it also served as areference when measurements were repeated on differentdays.
As seen in Figure 4, a major advantage of single particlemeasurements is that not just average intensity values, butalso the entire intensity distributions are obtained directly.The mean intensities for the five samples show good agree-ment with the size dependence of the absorption andscattering cross sections based on Mie theory. However, forNPs with similar sizes there is a significant variation ofcomparable magnitude for both the absorption and scatter-ing intensities. The observed spread cannot be explained bythe experimental error associated with determining theintensity values from the absorption and scattering images.We imaged randomly selected sample areas several timeson the same and different days and estimated an uncertaintyof about 10% for both the absorption and scattering inten-sity independent of the NP size. In contrast, the observedintensities had relative standard deviations varying fromabout 30% to nearly 100%.
The variations in NP size were implicitly taken intoaccount by correlating the absorption and scattering intensi-ties with the dimensions obtained from the SEM images.However, the data shown in Figure 4 only represents a smallsubset of the NPs contained in each sample. To improve thestatistical significance of our experiments we collected theabsorption and scattering intensities of at least an additional250 NPs for each sample, but without correlated SEMimaging. Although the presence of some NP aggregatescould not be excluded, the impact that the aggregates hadon the results was minimal. On the basis of the correlatedSEM studies the percentage of aggregates was low (about5%) for the 51, 76, and 88 nm samples. For the two largerNP samples, the intensity histograms showed a distinctivebimodal distribution and aggregates were easily excludedusing an upper intensity cutoff. The mean intensities from
FIGURE 3. Correlated scattering (left), absorption (center) and SEM(right) images of the same NPs for the five samples shown in Figure1: A, 51 nm; B, 76 nm; C, 88 nm; D, 155 nm; and E, 237 nm. Whitecircles are given as guides to the eye. They also provide the size ofthe signal area used in the intensity analysis. The sizes of anindividual pixel were 60 and 150 nm for the scattering and absorp-tion images, respectively. See Supporting Information for experi-mental details.
© 2010 American Chemical Society 1401 DOI: 10.1021/nl100199h | Nano Lett. 2010, 10, 1398-–1404
these measurements are included in Figure 4 as the uncor-related data points (red squares). The good agreementbetween the mean uncorrelated absorption and scatteringintensities and the corresponding correlated data justifies ouranalysis.
To evaluate the distributions in more detail, the histo-grams of uncorrelated absorption and scattering intensitiesare shown in Figure 5A,B (symbols) for the 237 and 88 nmNP samples, respectively. Included in Figure 5A,B are alsothe histograms that are expected theoretically, based on themeasured size distributions from Figure 1 and Mie theory.
Each histogram was normalized to 100% and centered atan arbitrary intensity of 1 by dividing all values by the meansof fitted Gaussian curves. This was done to aid in the visualcomparison of the widths for the different histograms.Because surface plasmon absorption and scattering crosssections scale differently with NP diameter as discussed inFigure 2, the widths of the intensity histograms differ forabsorption and scattering as clearly seen from the theoreticalcurves in Figure 5. However, the experimental absorptionand scattering intensity distributions are nearly equal andbroader by at least a factor of 2 compared to the onesexpected from the NP size variations. Although only the datafrom the 237 and 88 nm NPs is shown, we found very similarintensity variations for SEM correlated and uncorrelated mea-surements for all five NP samples. Therefore, the NP sizedistribution alone cannot explain the much larger variations inthe observed absorption and scattering intensities.
In addition to variations in size, we found that the shapeof some NPs deviated strongly from an ideal sphere. Inparticular, the larger NP samples (155 and 237 nm) showedstronger shape variations than the smaller ones (51, 76, and88 nm). In our analysis, however, we have not excluded anyNPs based on their shape (or any other parameter, thusrepresenting the behavior of real colloidal NP samples undertypical single particle imaging conditions). Instead, we as-sumed that all NPs are spheres with the diameter given asthe average of the first two principal components. Of coursethis approach also treated the NPs as 2-dimensional objectsdespite their sometimes complex 3-dimenesional shapes.Because the NP shape has a much bigger effect on thesurface plasmon absorption and scattering spectra than theNP size,16,17,48 significant changes in the absorption andscattering intensities could result from spectral shifts ofvarying magnitudes due to shape inhomogeneity. We there-fore measured single particle scattering spectra using a whitelight excitation for randomly selected NPs that were alsocharacterized by SEM. Figure 5 C shows four single particlescattering spectra from the 237 nm NP sample and the
FIGURE 4. Gold NP scattering (A) and absorption (B) as a function of size at 532 nm. Trends predicted by Mie theory are shown as solid blacklines. SEM correlated data points are shown as open circles with each sample colored coded according to Figure 1. The experimental error isapproximately equal to the size of the data points. The correlation between scattering and absorption for each NP is shown in SupportingInformation, Figure S7. The red squares give the mean scattering and absorption intensities of at least 250 NPs for each sample obtained fromintensity distributions for which the optical measurements were not correlated with SEM images (uncorrelated data). Note the different scalingof the y-axis for scattering and absorption and that the percentage deviation from the theoretical values is actually very similar betweenscattering and absorption (see Figures 5 and Supporting Information, Figure S6). The experimental collection geometry has been taken intoaccount to scale the experimental data correctly (see Supporting Information for details).
FIGURE 5. Absorption (red line and symbols) and scattering (blueline and symbols) intensity histograms constructed from at least 250NPs for the 237 (A) and 88 (B) nm samples. Plain solid linescorrespond to Mie theory calculations assuming the NP size distribu-tion determined by SEM. Each histogram was normalized to 100%and centered at an arbitrary intensity of 1. (C) Normalized singleparticle scattering spectra selected from the 237 nm sample andcorresponding high-magnification SEM images. (D) Single particlescattering spectra for 88 nm (blue symbols) and 87 nm (red symbols)NPs. Calculated spectra (solid lines) using Mie theory and scaled tothe experimental amplitudes are included for comparison. The insetshows the same calculated spectra, but plotted as scattering crosssections (CS). The green vertical lines mark the 532 nm laserexcitation wavelength for the dark-field imaging experiments.
© 2010 American Chemical Society 1402 DOI: 10.1021/nl100199h | Nano Lett. 2010, 10, 1398-–1404
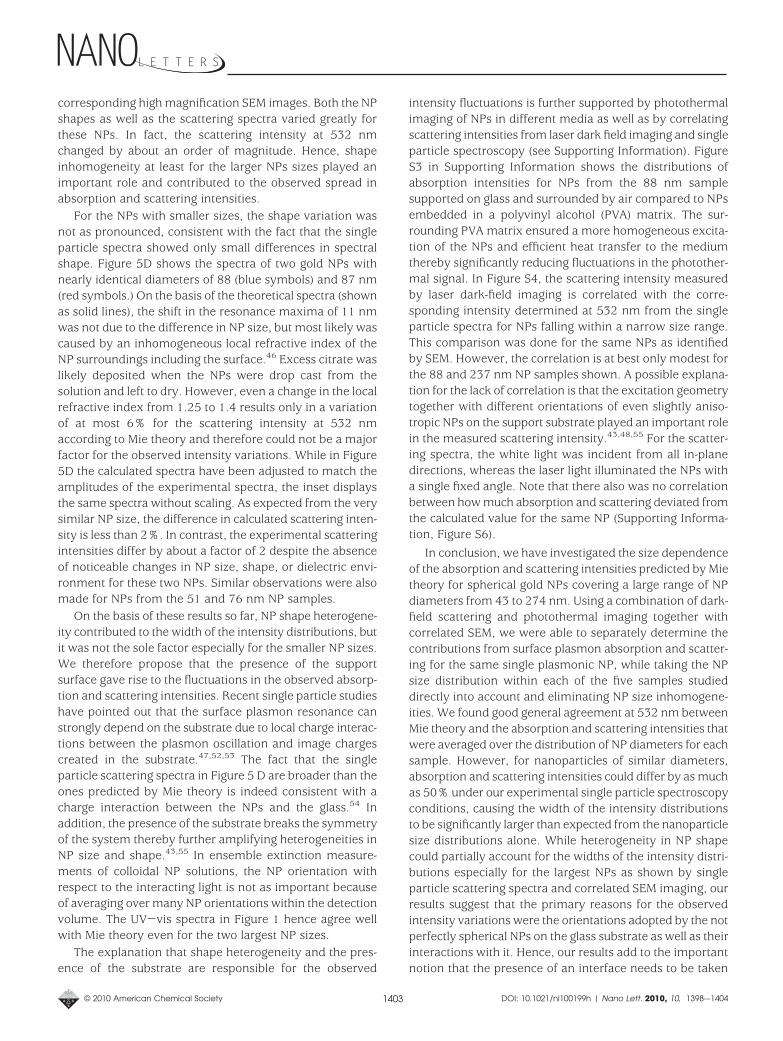
corresponding high magnification SEM images. Both the NPshapes as well as the scattering spectra varied greatly forthese NPs. In fact, the scattering intensity at 532 nmchanged by about an order of magnitude. Hence, shapeinhomogeneity at least for the larger NPs sizes played animportant role and contributed to the observed spread inabsorption and scattering intensities.
For the NPs with smaller sizes, the shape variation wasnot as pronounced, consistent with the fact that the singleparticle spectra showed only small differences in spectralshape. Figure 5D shows the spectra of two gold NPs withnearly identical diameters of 88 (blue symbols) and 87 nm(red symbols.) On the basis of the theoretical spectra (shownas solid lines), the shift in the resonance maxima of 11 nmwas not due to the difference in NP size, but most likely wascaused by an inhomogeneous local refractive index of theNP surroundings including the surface.46 Excess citrate waslikely deposited when the NPs were drop cast from thesolution and left to dry. However, even a change in the localrefractive index from 1.25 to 1.4 results only in a variationof at most 6% for the scattering intensity at 532 nmaccording to Mie theory and therefore could not be a majorfactor for the observed intensity variations. While in Figure5D the calculated spectra have been adjusted to match theamplitudes of the experimental spectra, the inset displaysthe same spectra without scaling. As expected from the verysimilar NP size, the difference in calculated scattering inten-sity is less than 2%. In contrast, the experimental scatteringintensities differ by about a factor of 2 despite the absenceof noticeable changes in NP size, shape, or dielectric envi-ronment for these two NPs. Similar observations were alsomade for NPs from the 51 and 76 nm NP samples.
On the basis of these results so far, NP shape heterogene-ity contributed to the width of the intensity distributions, butit was not the sole factor especially for the smaller NP sizes.We therefore propose that the presence of the supportsurface gave rise to the fluctuations in the observed absorp-tion and scattering intensities. Recent single particle studieshave pointed out that the surface plasmon resonance canstrongly depend on the substrate due to local charge interac-tions between the plasmon oscillation and image chargescreated in the substrate.47,52,53 The fact that the singleparticle scattering spectra in Figure 5 D are broader than theones predicted by Mie theory is indeed consistent with acharge interaction between the NPs and the glass.54 Inaddition, the presence of the substrate breaks the symmetryof the system thereby further amplifying heterogeneities inNP size and shape.43,55 In ensemble extinction measure-ments of colloidal NP solutions, the NP orientation withrespect to the interacting light is not as important becauseof averaging over many NP orientations within the detectionvolume. The UV-vis spectra in Figure 1 hence agree wellwith Mie theory even for the two largest NP sizes.
The explanation that shape heterogeneity and the pres-ence of the substrate are responsible for the observed
intensity fluctuations is further supported by photothermalimaging of NPs in different media as well as by correlatingscattering intensities from laser dark field imaging and singleparticle spectroscopy (see Supporting Information). FigureS3 in Supporting Information shows the distributions ofabsorption intensities for NPs from the 88 nm samplesupported on glass and surrounded by air compared to NPsembedded in a polyvinyl alcohol (PVA) matrix. The sur-rounding PVA matrix ensured a more homogeneous excita-tion of the NPs and efficient heat transfer to the mediumthereby significantly reducing fluctuations in the photother-mal signal. In Figure S4, the scattering intensity measuredby laser dark-field imaging is correlated with the corre-sponding intensity determined at 532 nm from the singleparticle spectra for NPs falling within a narrow size range.This comparison was done for the same NPs as identifiedby SEM. However, the correlation is at best only modest forthe 88 and 237 nm NP samples shown. A possible explana-tion for the lack of correlation is that the excitation geometrytogether with different orientations of even slightly aniso-tropic NPs on the support substrate played an important rolein the measured scattering intensity.43,48,55 For the scatter-ing spectra, the white light was incident from all in-planedirections, whereas the laser light illuminated the NPs witha single fixed angle. Note that there also was no correlationbetween how much absorption and scattering deviated fromthe calculated value for the same NP (Supporting Informa-tion, Figure S6).
In conclusion, we have investigated the size dependenceof the absorption and scattering intensities predicted by Mietheory for spherical gold NPs covering a large range of NPdiameters from 43 to 274 nm. Using a combination of dark-field scattering and photothermal imaging together withcorrelated SEM, we were able to separately determine thecontributions from surface plasmon absorption and scatter-ing for the same single plasmonic NP, while taking the NPsize distribution within each of the five samples studieddirectly into account and eliminating NP size inhomogene-ities. We found good general agreement at 532 nm betweenMie theory and the absorption and scattering intensities thatwere averaged over the distribution of NP diameters for eachsample. However, for nanoparticles of similar diameters,absorption and scattering intensities could differ by as muchas 50% under our experimental single particle spectroscopyconditions, causing the width of the intensity distributionsto be significantly larger than expected from the nanoparticlesize distributions alone. While heterogeneity in NP shapecould partially account for the widths of the intensity distri-butions especially for the largest NPs as shown by singleparticle scattering spectra and correlated SEM imaging, ourresults suggest that the primary reasons for the observedintensity variations were the orientations adopted by the notperfectly spherical NPs on the glass substrate as well as theirinteractions with it. Hence, our results add to the importantnotion that the presence of an interface needs to be taken
© 2010 American Chemical Society 1403 DOI: 10.1021/nl100199h | Nano Lett. 2010, 10, 1398-–1404

into account for applications that involve supported plas-monic NPs. Our findings are important for applications thatrely on the absorption and scattering intensities of single NPinstead of spectral shifts of the plasmon resonance.
Acknowledgment. This work was supported by the Nano-scale Science and Engineering Initiative of the NationalScience Foundation under NSF Award Number EEC-0647452.S.L. acknowledges support from the Robert A. Welch Foun-dation (Grant C-1664) and 3M for a Nontenured FacultyGrant. S.D.M. was supported by the Howard Hughes MedicalInstitute for the 2006 Professors Grant 52005732. L.S.S. wassupported by the NSF IGERT Nanophotonics fellowshipprogram. We thank Dr. Christy Landes for tremendous helppreparing this manuscript, Dr. Jason Hafner for insightfuldiscussions, Britain Willingham for providing the sourcecode for the Mie theory calculations, and SaumyakantiKhatua for help with acquiring the single particle spectra.
Supporting Information Available. Experimental meth-ods, Mie theory calculations, photothermal imaging of goldNPs in a PVA matrix, correlation of scattering intensitiesrecorded by laser dark-field imaging and determined fromsingle particle spectra, and correlation between the devia-tions from the calculated values for absorption and scatter-ing. This material is available free of charge via the Internetat http://pubs.acs.org.
REFERENCES AND NOTES(1) Engheta, N. Science 2007, 317, 1698.(2) Ozbay, E. Science 2006, 311, 189.(3) Dionne, J. A.; Diest, K.; Sweatlock, L. A.; Atwater, H. A. Nano Lett.
2009, 9, 897.(4) Valden, M.; Lai, X.; Goodman, D. W. Science 1998, 281, 1647.(5) Rosi, N. L.; Mirkin, C. A. Chem. Rev. 2005, 105, 1547.(6) McFarland, A. D.; Van Duyne, R. P. Nano Lett. 2003, 3, 1057.(7) Raschke, G.; Kowarik, S.; Franzl, T.; Sonnichsen, C.; Klar, T. A.;
Feldmann, J.; Nichtl, A.; Kurzinger, K. Nano Lett. 2003, 3, 935.(8) Soennichsen, C.; Reinhard, B. M.; Liphardt, J.; Alivisatos, A. P.
Nat. Biotechnol. 2005, 23, 741.(9) Schultz, S.; Smith, D. R.; Mock, J. J.; Schultz, D. A. Proc. Natl. Acad.
Sci. U.S.A. 2000, 97, 996.(10) Yguerabide, J.; Yguerabide, E. E. Anal. Biochem. 1998, 262, 157.(11) Lasne, D.; Blab, G. A.; Berciaud, S.; Heine, M.; Groc, L.; Choquet,
D.; Cognet, L.; Lounis, B. Biophys. J. 2006, 91, 4598.(12) Murphy, C. J.; Gole, A. M.; Stone, J. W.; Sisco, P. N.; Alkilany, A. M.;
Goldsmith, E. C.; Baxter, S. C. Acc. Chem. Res. 2008, 41, 1721.(13) Loo, C.; Lowery, A.; Halas, N.; West, J.; Drezek, R. Nano Lett. 2005,
5, 709.(14) O’Neal, D. P.; Hirsch, L. R.; Halas, N. J.; Payne, J. D.; West, J. L.
Cancer Lett. 2004, 209, 171.(15) Huang, X.; El-Sayed, I. H.; Qian, W.; El-Sayed, M. A. J. Am. Chem.
Soc. 2006, 128, 2115.(16) Kreibig, U.; Vollmer, M. Optical Properties of Metal Clusters;
Springer: Berlin, 1995.(17) Bohren, C. F.; Huffman, D. R. Absorption and Scattering of Light
by Small Particles; Wiley: New York, 1983.(18) Freestone, I.; Meeks, N.; Sax, M.; Higgitt, C. Gold Bull. 2007, 40,
270.(19) Hornyak, G. L.; Patrissi, C. J.; Oberhauser, E. B.; Martin, C. R.;
Valmalette, J. C.; Lemaire, L.; Dutta, J.; Hofmann, H. Nanostruct.Mater. 1997, 9, 571.
(20) Barhoumi, A.; Huschka, R.; Bardhan, R.; Knight, M. W.; Halas,N. J. Chem. Phys. Lett. 2009, 482, 171.
(21) Reismann, M.; Bretschneider, J. C.; Plessen, G. v.; Simon, U. Small2008, 4, 607.
(22) Taton, T. A.; Lu, G.; Mirkin, C. A. J. Am. Chem. Soc. 2001, 123, 5164.(23) Khlebtsov, B.; Zharov, V.; Melnikov, A.; Tuchin, V.; Khlebtsov, N.
Nanotechnology 2006, 17, 5167.(24) Jain, P. K.; Lee, K. S.; El-Sayed, I. H.; El-Sayed, M. A. J. Phys. Chem.
B 2006, 110, 7238.(25) Mie, G. Ann. Phys. 1908, 25, 377.(26) van Dijk, M. A.; Tchebotareva, A. L.; Orrit, M.; Lippitz, M.;
Berciaud, S.; Lasne, D.; Cognet, L.; Lounis, B. Phys. Chem. Chem.Phys. 2006, 8, 3486.
(27) Khlebtsov, N. G. Quantum Electron. 2008, 38, 504.(28) Bogatyrev, V. A.; Dykman, L. A.; Khlebtsov, B. N.; Khlebtsov, N. G.
Opt. Spectrosc. 2004, 96, 128.(29) Kreibig, U.; Schmitz, B.; Breuer, H. D. Phys. Rev. A 1987, 36, 5027.(30) Arbouet, A.; Christofilos, D.; Del Fatti, N.; Vallee, F.; Huntzinger,
J. R.; Arnaud, L.; Billaud, P.; Broyer, M. Phys. Rev. Lett. 2004, 93.(31) Ignatovich, F. V.; Novotny, L. Phys. Rev. Lett. 2006, 96, 4.(32) Boyer, D.; Tamarat, P.; Maali, A.; Lounis, B.; Orrit, M. Science
2002, 297, 1160.(33) Berciaud, S.; Cognet, L.; Blab, G. A.; Lounis, B. Phys. Rev. Lett.
2004, 93, 257402.(34) Sonnichsen, C.; Franzl, T.; Wilk, T.; von Plessen, G.; Feldmann,
J.; Wilson, O.; Mulvaney, P. Phys. Rev. Lett. 2002, 88, No. 077402.(35) Nehl, C. L.; Grady, N. K.; Goodrich, G. P.; Tam, F.; Halas, N. J.;
Hafner, J. H. Nano Lett. 2004, 4, 2355.(36) Mock, J. J.; Barbic, M.; Smith, D. R.; Schultz, D. A.; Schultz, S.
J. Chem. Phys. 2002, 116, 6755.(37) Lindfors, K.; Kalkbrenner, T.; Stoller, P.; Sandoghdar, V. Phys. Rev.
Lett. 2004, 93, No. 037401.(38) Chang, W. S.; Ha, J. W.; Slaughter, L. S.; Link, S. Proc. Natl. Acad.
Sci. U.S.A. 2010, 107, 2781.(39) Berciaud, S.; Cognet, L.; Tamarat, P.; Lounis, B. Nano Lett. 2005,
5, 515.(40) Sherry, L. J.; Jin, R.; Mirkin, C. A.; Schatz, G. C.; VanDuyne, R. P.
Nano Lett. 2006, 6, 2060.(41) Novo, C.; Gomez, D.; Perez-Juste, J.; Zhang, Z. Y.; Petrova, H.;
Reismann, M.; Mulvaney, P.; Hartland, G. V. Phys. Chem. Chem.Phys. 2006, 8, 3540.
(42) Munechika, K.; Smith, J. M.; Chen, Y.; Ginger, D. S. J. Phys. Chem.C 2007, 111, 18906.
(43) Hu, M.; Chen, J.; Marquez, M.; Xia, Y.; Hartland, G. V. J. Phys.Chem. C 2007, 111, 12558.
(44) Soennichsen, C.; Franzl, T.; Wilk, T.; von Plessen, G.; Feldmann,J. New J. Phys. 2002, 4, 93.1.
(45) Tchebotareva, A. L.; van Dijk, M. A.; Ruijgrok, P. V.; Fokkema,V.; Hesselberth, M. H. S.; Lippitz, M.; Orrit, M. ChemPhysChem2009, 10, 111.
(46) Novo, C.; Funston, A. M.; Pastoriza-Santos, I.; Liz-Marzan, L. M.;Mulvaney, P. J. Phys. Chem. C 2008, 112, 3.
(47) Mock, J. J.; Hill, R. T.; Degiron, A.; Zauscher, S.; Chilkoti, A.; Smith,D. R. Nano Lett. 2008, 8, 2245.
(48) Rodriguez-Fernandez, J.; Novo, C.; Myroshnychenko, V.; Funston,A. M.; Sanchez-Iglesias, A.; Pastoriza-Santos, I.; Perez-Juste, J.; deAbajo, F. J. G.; Liz-Marzan, L. M.; Mulvaney, P. J. Phys. Chem. C2009, 113, 18623.
(49) McMahon, J. M.; Wang, Y.; Sherry, L. J.; Van Duyne, R. P.; Marks,L. D.; Gray, S. K.; Schatz, G. C. J. Phys. Chem. C 2009, 113, 2731.
(50) Jin, R.; Jureller, J. E.; Kim, H. Y.; Scherer, N. F. J. Am. Chem. Soc.2005, 127, 12482.
(51) Jain, P. K.; Huang, X.; El-Sayed, I. H.; El-Sayed, M. A. Acc. Chem.Res. 2008, 41, 1578.
(52) Sherry, L. J.; Chang, S.-H.; Schatz, G. C,; Van Duyne, R. P.; Wiley,B. J.; Xia, Y. Nano Lett. 2005, 5, 2034.
(53) Knight, M. W.; Wu, Y. P.; Lassiter, J. B.; Nordlander, P.; Halas,N. J. Nano Lett. 2009, 9, 2188.
(54) Hoevel, H.; Fritz, S.; Hilger, A.; Kreibig, U.; Vollmer, M. Phys. Rev.A 1993, 48, 18178.
(55) Hasan, W.; Lee, J.; Henzie, J.; Odom, T. W. J. Phys. Chem. C 2007,111, 17176.
© 2010 American Chemical Society 1404 DOI: 10.1021/nl100199h | Nano Lett. 2010, 10, 1398-–1404
Copyright © 2022 FDOKUMEN