Primary production by phytoplankton along the Kenyan coast during the SE monsoon and November...
18
Pergamon Deep&w Research II. Vol. 44, No. 617, pp. 119S-1212, 1997 0 1997 Elsevier Science Ltd Pn: So!%7-0645(~15-5 All rights reserved. Printed in Great Britain 0967-0645/97 S17.00+0.00 Primary production by phytoplankton along the Kenyan coast during the SE monsoon and November intermonsoon 1992, and the occurrence of Trichodesmium JACCO KROMKAMP,* MONIQUE DE BIE,* NICO GOOSEN,* JAN PEENE,* PIETER VAN RIJSWIJK,* JAN SINKE* and GERARD C. A. DUINEVELDT (Accepted 15 January 1997) Abstract-Phytoplanktonic primary production was measured during the SE monsoon in JuneJuly and during the intermonsoon period in November-December 1992. Primary production was highest on the northernmost transect during the SE monsoon, whereas during the intermonsoon it was highest on the southernmost transect. In general primary production was higher during the intermonsoon, and highest productivity was measured along the southern coast of Kenya. The more stable hydrodynamical conditions during the intermonsoon period promoted the occurrence of the nitrogen-fixing cyanobacterium Trichodesmium, primarily at the shallower stations. Nitrogen fixation assays suggested that this cyanobacterium was responsible for most of the new production. Comparison between net primary productivity, bacterial productivity and benthic respiration suggests that rates of primary production should be higher than measured, implying that primary production can be as high as that in tropical upwelling systems, despite the fact that a regular and well-developed upwelling period does not always seem to occur. 0 1997 Elsevier Science Ltd INTRODUCTION The South Equatorial Current (SEC) at 6”s to 20”s flows continuously westwards, dividing the Indian Ocean into a northern and a southern sector. When the SEC approaches the east coast of Africa it splits to form two coastal currents: the Mozambique Current to the south and the East African Coastal Current (EACC) to the north. The Indian Ocean is subjected to a complex system of surface currents, driven by the monsoon winds. During the southeast monsoon, from May to September, the winds accelerate the EACC to speeds exceeding 200 cm s-l. This coastal current pushes large amounts of open ocean water northwards towards the Arabian peninsula, where it causes strong upwelling along the Somali coast, promoting massive algal blooms (e.g. Nair et al., 1989; Owens et al., 1993). The winds reverse in November, and from November to March the NE monsoon blows. Along the Somali coast the EACC disappears, biological productivity declines, and conditions akin to “marine deserts” are expected. Because of the NE monsoon winds the water will eventually flow southwards along the Somali coast. Off the coast of northern Kenya it meets the remainder of the EACC, and both currents are deflected eastwards, sometimes causing upwelling. *Netherlands Institute of Ecology, Centre for Estuarine Ecology, P.O. Box 140, NL-44OOAC Yerseke, The Netherlands. t Netherlands Institute for Sea Research, P.O. Box 59, NL 1790 AB Den Burg, The Netherlands. 1195
Transcript of Primary production by phytoplankton along the Kenyan coast during the SE monsoon and November...
Pergamon Deep&w Research II. Vol. 44, No. 617, pp. 119S-1212, 1997
0 1997 Elsevier Science Ltd
Pn: So!%7-0645(~15-5 All rights reserved. Printed in Great Britain
0967-0645/97 S17.00+0.00
Primary production by phytoplankton along the Kenyan coast during the SE monsoon and November intermonsoon 1992, and the
occurrence of Trichodesmium
JACCO KROMKAMP,* MONIQUE DE BIE,* NICO GOOSEN,* JAN PEENE,* PIETER VAN RIJSWIJK,* JAN SINKE* and
GERARD C. A. DUINEVELDT
(Accepted 15 January 1997)
Abstract-Phytoplanktonic primary production was measured during the SE monsoon in JuneJuly and during the intermonsoon period in November-December 1992. Primary production was highest on the northernmost transect during the SE monsoon, whereas during the intermonsoon it was highest on the southernmost transect. In general primary production was higher during the intermonsoon, and highest productivity was measured along the southern coast of Kenya. The more stable hydrodynamical conditions during the intermonsoon period promoted the occurrence of the nitrogen-fixing cyanobacterium Trichodesmium, primarily at the shallower stations. Nitrogen fixation assays suggested that this cyanobacterium was responsible for most of the new production. Comparison between net primary productivity, bacterial productivity and benthic respiration suggests that rates of primary production should be higher than measured, implying that primary production can be as high as that in tropical upwelling systems, despite the fact that a regular and well-developed upwelling period does not always seem to occur. 0 1997 Elsevier Science Ltd
INTRODUCTION
The South Equatorial Current (SEC) at 6”s to 20”s flows continuously westwards, dividing the Indian Ocean into a northern and a southern sector. When the SEC approaches the east coast of Africa it splits to form two coastal currents: the Mozambique Current to the south and the East African Coastal Current (EACC) to the north. The Indian Ocean is subjected to a complex system of surface currents, driven by the monsoon winds. During the southeast monsoon, from May to September, the winds accelerate the EACC to speeds exceeding 200 cm s-l. This coastal current pushes large amounts of open ocean water northwards towards the Arabian peninsula, where it causes strong upwelling along the Somali coast, promoting massive algal blooms (e.g. Nair et al., 1989; Owens et al., 1993). The winds reverse in November, and from November to March the NE monsoon blows. Along the Somali coast the EACC disappears, biological productivity declines, and conditions akin to “marine deserts” are expected. Because of the NE monsoon winds the water will eventually flow southwards along the Somali coast. Off the coast of northern Kenya it meets the remainder of the EACC, and both currents are deflected eastwards, sometimes causing upwelling.
*Netherlands Institute of Ecology, Centre for Estuarine Ecology, P.O. Box 140, NL-44OOAC Yerseke, The Netherlands.
t Netherlands Institute for Sea Research, P.O. Box 59, NL 1790 AB Den Burg, The Netherlands.
1195

1196 J. Kromkamp et al.
The continental shelf of Kenya is narrow, and thus the ocean is very deep close to the coast. Fringing coral reefs can be found along the entire coast. Two rivers cause freshwater input along the Kenyan coast, the river Tana in the north and the river Galana-Sabaki in the central region. Both rivers originate in the volcanic highlands near Mount Kenya, but whereas the catchment of the river Tana is mainly agricultural, the Sabaki also carries waste from the capital Nairobi. River discharge is largest during the SE monsoon (April-May), but there is also a smaller “rain season” during the changing of the monsoon winds in November and December. Increased river discharge may have a positive effect on phytoplankton productivity along the coast.
There is very little information on phytoplankton biomass and production along the Kenyan coast. Earlier Indian Ocean expeditions mainly visited the northwestern sector of the Indian Ocean (Burkill et al., 1990; Banse, 1994) and the Dutch Snellius II expedition visited the Banda Sea near Indonesia (Gieskes et al., 1990; Wetsteyn et al., 1990). The (irregular) occurrence of upwelling in the northern coastal area might promote algal blooms, as CZCS images suggest maximum chlorophyll concentrations there in January. These blooms in the NE monsoon, however, might also be associated with increased river runoff.
Some nutrient and biological data are presented in the Atlas of the International Indian Ocean Expedition (Krey and Babenerd, 1976). Estimated phosphate concentrations are less than 0.2 uM year round. Silicate is estimated to range between less than 3 uM and 5 PM. Nitrate is less than 0.5 PM, but may be as high as 1.0 uM in coastal areas exposed to river input. During the SE monsoon, surface chlorophyll concentrations show a very sharp gradient offshore, ranging from values greater than 0.5 mg me3 to less than 0.2 mg me3 more offshore. The IIOP atlas reports similar concentrations during the NE monsoon. For the SE monsoon, no estimate of daily primary production is available, but production rates of 250 mg C m-* day- ’ to greater than 500 mg C m-* day-’ are reported in the IIOP atlas for the NE monsoon.
The aim of this research was to investigate the effects of two different monsoon periods and varying river discharge on phytoplankton productivity along the Kenyan coast. It will be shown that the hydrodynamic regime controls both total primary production and new production, and that total phytoplanktonic primary production can be as high as that measured in the Arabian Sea upwelling areas.
METHODS AND SAMPLING SITES
Study sites
During the A 1 SE monsoon cruise (18 June-8 July) in the SE monsoon four transects were sampled: the Kiwayuu transect in the north (2”3’S), the Tana transect (2”43’S), the Sabaki transect (3”lO’S) and the Gazi transect (4”25’S; see Fig. 1). During the A2 intermonsoon cruise (18 November-6 December) the Tana transect was skipped. Sampling stations were at water depths of 20,50,500, 1000 and 2000 m (no 20 m station for the Gazi transect). For the Al cruise the station number was preceded by a 1 (i.e. station 19 becomes 119), and for the A2 cruise the number was preceded by a 5.

Primary production along the Kenyan coast 1197
Fig. 1. Map showing the location of the transects. From north to south: Kiwayuu transect, Tana transect, Sabaki transect and Gazi transect. The Al cruise station numbers had a prefix 1 (i.e. stations
103-133) and the A2 cruise had a prefix 5 (502533).
Primary production
At each station depth profiles were carried out by CTD-GoFlo rosette casts. Using temperature and fluorescence data obtained during the downcast, GoFlo samples were collected just below the surface, near the base of the mixed layer and in the deep chlorophyll maximum. Most samples for primary production studies were collected in the morning, and only data from morning samples are presented here. Duplicate samples were incubated in 70 ml acid cleaned polycarbonate bottles in an rotating incubator (simulated in situ production) for approximately 3 h at eight different light intensities varying from 0 to 750 uE rn-’ s-l; 500 u1 of 925 kBq ml -’ [‘4C]NaHC03 (Amersham) was added. During leg A2 we had to use the spare lamp (Philips HPIT 400 W, daylight colour) because electrical problems prevented use of the original lamp, and light intensities were just enough to saturate rates of photosynthesis. For the Al leg, light intensities were sufficiently high. After the 3 h incubation the samples were gently filtered onto 0.45 urn nitrocellulose filters (Schleicher & Schuell BA23). For size fractionated primary production, nitrocellulose filters

1198 J. Kromkamp et al
were used with pore diameters of 0.2, 3 and 12 urn. Filters were placed in a fume of HCI for 30 min, air dried, and counted in a LKB RackBeta scintillation counter. As a scintillation cocktail, 0.5% (w/v) PPO (2,5-diphenyloxazol, p.a. Merck) in toluene (Baker, technical grade) was used. External quench correction took place using a quench curve. Photosynthesis light curves were fitted by the Eilers and Peeters (1988) method:
P = Z/(a? + hl + c)
where I is the irradiance, and a, b and c are fit constants. PgaX, the maximum rate of photosynthesis [mg C (mg chl.))’ hh’] can be calculated as l/[b+ 2,/(ac)] and aB, the photosynthetic efficiency [mg C (mg chl.)-’ hh’ (uE rnp2 s-‘)-‘1 as l/c. The light saturation parameter Zk = PL,,/aB. The superscript B denotes that rates are expressed as per unit chlorophyll-a. We subtracted the dark bottle values from the light bottles values to avoid overestimates of primary production by phytoplankton as a result of chemosynthetic processes (Banse, 1993).
For calculation of area1 rates of production, we used an hourly averaged irradiance value from a representative, sunny day to facilitate comparison with other days. Irradiance was measured and logged every 10 min using a MACAM SD 1OlQ cosine-corrected photosynthetically active radiation (PAR) sensor connected to a Keithley multimeter. The depth to which 1% of the surface irradiance penetrated was taken as the depth of the euphotic zone. Underwater light attenuation was measured with a cosine-corrected light sensor mounted on the rosette-frame.
Chemical analyses
Water samples were analysed with TRAACS 800 Autoanalyzers according to the manufacturer’s instructions. For low nitrate and nitrite analyses an AA1 1 analyser was used. For the presentation of the surface nutrient concentrations the average concentrations (n = 3-5) of the surface mixed layer to 25 m depth are given. Photosynthetic pigments were analysed using reversed-phase HPLC (Gieskes et al., 1988).
Total suspended matter was collected onto acetone-treated and 250°C dried glass fibre filters (GF/C, Whatman) and determined gravimetrically. Particulate organic carbon (POC) was determined using the same filter with a Carlo Erba NA 1500 nitrogen/carbon analyser as described by Nieuwenhuize et al. (1984).
Nitrogen fixation
Colonies of the nitrogen-fixing diazotroph Trichodesmium taken from the GoFlo bottles were filtered onto 12.0 urn membrane filters for counting using a dissection microscope. For nitrogen fixation assays, colonies of Trichodesmium were collected at the surface using a hand-towed net with a 55 urn mesh size. Nitrogenase activity was assayed by means of the acetylene reduction technique as described by Stal(1988). Colonies were suspended in 2 ml seawater and incubated in 12 ml gas-tight glass tubes. Acetylene (1.5 ml) was injected through a rubber septum into the tubes. The samples, while being shaken gently using a Thermolyne Speci-mix Model 26120/26, were incubated at an irradiance of 45 uE me2 s-‘. It was assumed that eight electrons were necessary to reduce molecular nitrogen to ammonia (Stal, 1988).
Primary production along the Kenyan coast
temperature (“C) temperature CC)
16 18 20 22 24 26 28 14 16 18 20 22 24 26 28 30 I I I I I I I I I l I I I I I I
1199
40 -
E 60-
5 80-
% m loo-
120 -
160 ,( t I I I I I I
-2.0 -1.5 -1 .o -0.5 0.0 0 2 4 6 8 10 12
fluorescence (r.u.) fluorescence (r.u.)
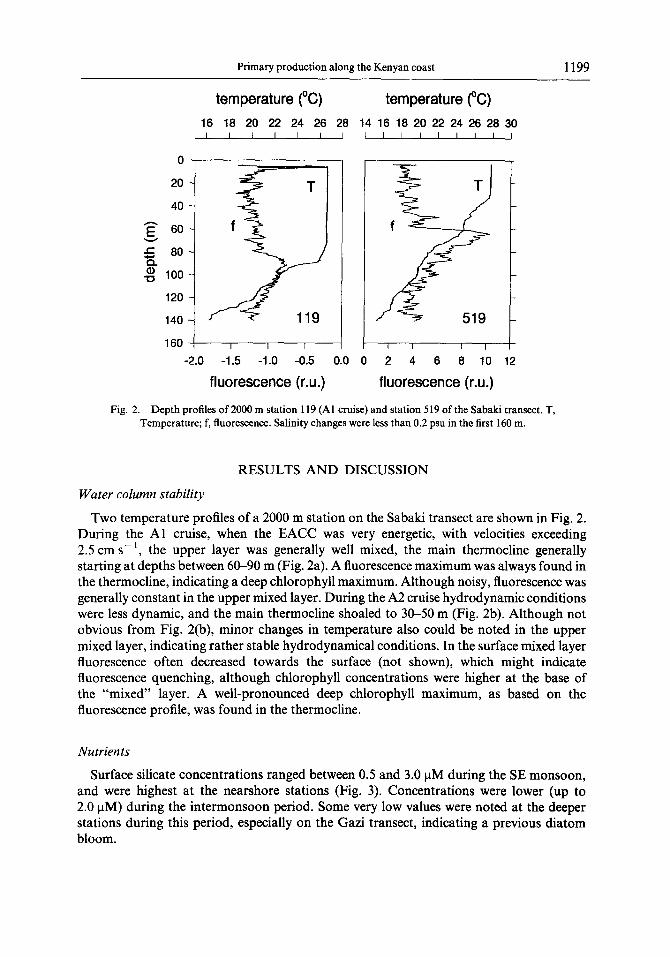
Fig. 2. Depth profiles of 2000 m station 119 (Al cruise) and station 519 of the Sabaki transect. T, Temperature; f, fluorescence. Salinity changes were less than 0.2 psu in the first 160 m.
RESULTS AND DISCUSSION
Water column stability
Two temperature profiles of a 2000 m station on the Sabaki transect are shown in Fig. 2. During the Al cruise, when the EACC was very energetic, with velocities exceeding 2.5 cm s-l, the upper layer was generally well mixed, the main thermocline generally starting at depths between 60-90 m (Fig. 2a). A fluorescence maximum was always found in the thermocline, indicating a deep chlorophyll maximum. Although noisy, fluorescence was generally constant in the upper mixed layer. During the A2 cruise hydrodynamic conditions were less dynamic, and the main thermocline shoaled to 30-50 m (Fig. 2b). Although not obvious from Fig. 2(b), minor changes in temperature also could be noted in the upper mixed layer, indicating rather stable hydrodynamical conditions. In the surface mixed layer fluorescence often decreased towards the surface (not shown), which might indicate fluorescence quenching, although chlorophyll concentrations were higher at the base of the “mixed” layer. A well-pronounced deep chlorophyll maximum, as based on the fluorescence profile, was found in the thermocline.
Nutrients
Surface silicate concentrations ranged between 0.5 and 3.0 uM during the SE monsoon, and were highest at the nearshore stations (Fig. 3). Concentrations were lower (up to 2.0 PM) during the inter-monsoon period. Some very low values were noted at the deeper stations during this period, especially on the Gazi transect, indicating a previous diatom bloom.

1200 J. Kromkamp et al.
A2
c
Si PO4 NO3 NH4 Si PO4 NO3 NH4
Fig. 3. Box plots of average nutrient concentrations in the upper mixed layer of all stations during the Al (left panel) and A2 (right panel) cruises. The box gives the 25th and 75th percentiles, the line inside is the 50th percentile. The bars indicate the 10th and 90th percentiles, whereas the open circles
mark the 5th and 95th percentiles or data outside this range.
Surface phosphate concentrations showed the opposite: they were higher during the intermonsoon period in November-December and varied between 0.20 and 0.35 pM, whereas during the SE monsoon concentrations varied between 0.10 and 0.20 uM (Fig. 3). No well-developed spatial pattern was observed, although concentrations were slightly lower at the deeper stations of the Sabaki transect during both transects.
Surface nitrate and nitrite concentrations were close to or below the detection limit, especially during the intermonsoon cruise, where nearly all concentrations were below 100 nM. Although surface ammonium concentrations were significantly higher during the SE monsoon, they were generally below 0.5 uM (Fig. 3). Highest concentrations were found on the Gazi transect.
Nutrient depth profiles for both cruises at the 2000 m station on the Sabaki transect (Fig. 4) are very similar. Phosphate increased slightly with depth to approximately 2 PM. Surface concentrations of silicate and nitrate show the expected increase with depth, whereas nitrate and phosphate remained constant below 800-1000 m as a result of regeneration. Silicate is normally mineralized at greater depths and in seafloor sediments (Murray, 1992). The chemocline had risen during the intermonsoon, as might be expected from the shoaling thermocline.
During the Al cruise, nutrient SijP ratios varied between 9 and 16, i.e. close to the Redfield ratio for diatoms. Si/N ratios were generally higher than three, suggesting an Si surplus or an N shortage. Median N/P ratios were less than five, which is far below the Redfield ratio of 16, indicating a relative surplus of phosphate. All these ratios point to a nitrogen limitation of phytoplankton. Although we did not measure micronutrients such as iron, we think they were in surplus so close to the coast (Martin, 1992).
During the A2 cruise nutrient concentrations were still low. The Si/P ratio was about six for surface waters of the Kiwayuu and Sabaki transect, but two for the southern Gazi transect. Si/N ratios were slightly higher, except along the Gazi transect where the median value dropped from 7.5 to two. N/P ratios were significantly lower during the second cruise, generally lower than two. These ratios indicate again nitrogen was the most likely limiting

Primary production along the Kenyan coast 1201
NH4 (WV NH, (PM) 0.30 0.35 0.40 0.45 0.50
L I I I 0.00 0.04 0.06 0.12 0.16
LI I I I I 0 10 20 30 40 50
PO4 or F 403 (FM) 0
500
E c, 1000
& D
1500
2000 I 1 , 3, I I,+ 0 30 60 90 120
SiO4 (IJW
PO, or NO, (FM)
I\ I I I I
0 30 60 90 120
W, WI
,O
500
1000
1500
2000
Fig. 4. Depth profiles of phosphate (a), silicate (A), nitrate (M) and ammonia (0) at the 2000 m Sabaki station 119 (a, Al leg) or station 519 (b, A2 leg).
factor. Our measured nutrient concentrations corroborate the values presented in the IIOP atlas (Krey and Babenerd, 1976), with the exception of silicate, which we found to be significantly lower.
The Al cruise was undertaken after the main rainy season. Because of the SE monsoon, nutrient-poor ocean waters occurred close to the coastline. Only when we took a surface sample close the mouth of the Sabaki-Galana river were higher nutrient concentrations measured. Probably most of the river-derived nutrients remained landward of the coral reef. During the intermonsoon period with its small “rain period”, we did not measure any increased nutrient concentration as a result of river input of nutrients.
Chlorophyll
For both cruises, the highest surface chlorophyll-a contents were found at the shallow stations, decreasing offshore. Concentrations ranged between 0.05 and 1.1 ug 1-l. Highest concentrations were found at the shallow stations of the northern Kiwayuu transect during the Al cruise (Fig. 5a). The situation was more complex at the end of the SE monsoon during the A2 cruise, when highest values were found in the shallow waters of the Gazi transect and in the shallow waters of the northern Kiwayuu transect (Fig. 5b). Slightly higher chlorophyll concentrations were observed in the very shallow waters at the Sabaki transect (3.1 “S, 40.1 “E), perhaps owing to fluvial input of algae or nutrients.
Picoplankton chlorophyll, defined here as less than 3 urn, constituted between 40 and 60% of the total chlorophyll-a. Only at the 20 m Kiwayuu and 500 m Gazi stations was the

1202 J. Kromkamp et al.
-2.5
-3.c
-3.5
-4.0 0.8
0.7
-4.5-r- T-m 39.5 40.0 4d.5 41 .o 41.5
degrees east
Fig. 5. Contour plots of surface chlorophyll-a concentrations (kg I-‘). Top: Al cruise; bottom, A2 cruise.
picoplankton fraction substantially less. Differences in chlorophyll concentration between surface samples and the bottom of the mixed layer (beginning of the thermocline) were small during the Al cruise, again demonstrating mixing; but concentrations were generally higher at the bottom of the mixed layer during the inter-monsoon (Table 1). During the Al cruise,
Primary production along the Kenyan coast 1203
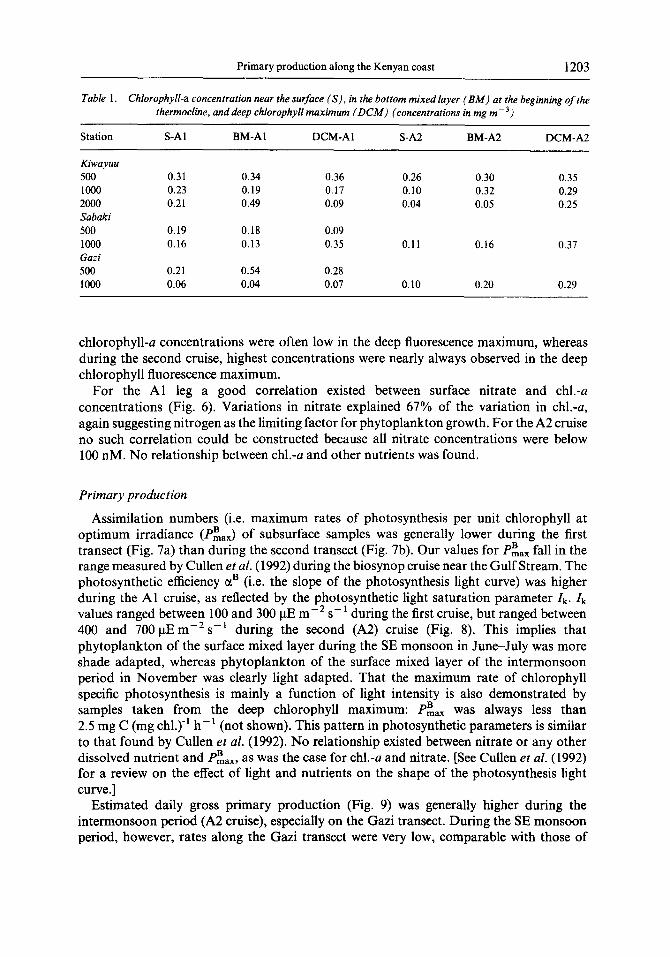
Table 1. Chlorophyll-a concentration near the surface (S), in the bottom mixed layer (BM) at the beginning of the thermocline. and deep chlorophyll maximum (DC&f) (concentrations in mg m-‘)
Station S-Al BM-AI DCM-Al S-A2 BM-A2 DCM-A2
Kiwayuu 500 1000 2000 Sabaki 500 1000 Gazi 500 1000
0.31 0.34 0.36 0.26 0.30 0.35 0.23 0.19 0.17 0.10 0.32 0.29 0.21 0.49 0.09 0.04 0.05 0.25
0.19 0.18 0.09 0.16 0.13 0.35 0.11 0.16 0.37
0.21 0.54 0.28 0.06 0.04 0.07 0.10 0.20 0.29
chlorophyll-u concentrations were often low in the deep fluorescence maximum, whereas during the second cruise, highest concentrations were nearly always observed in the deep chlorophyll fluorescence maximum.
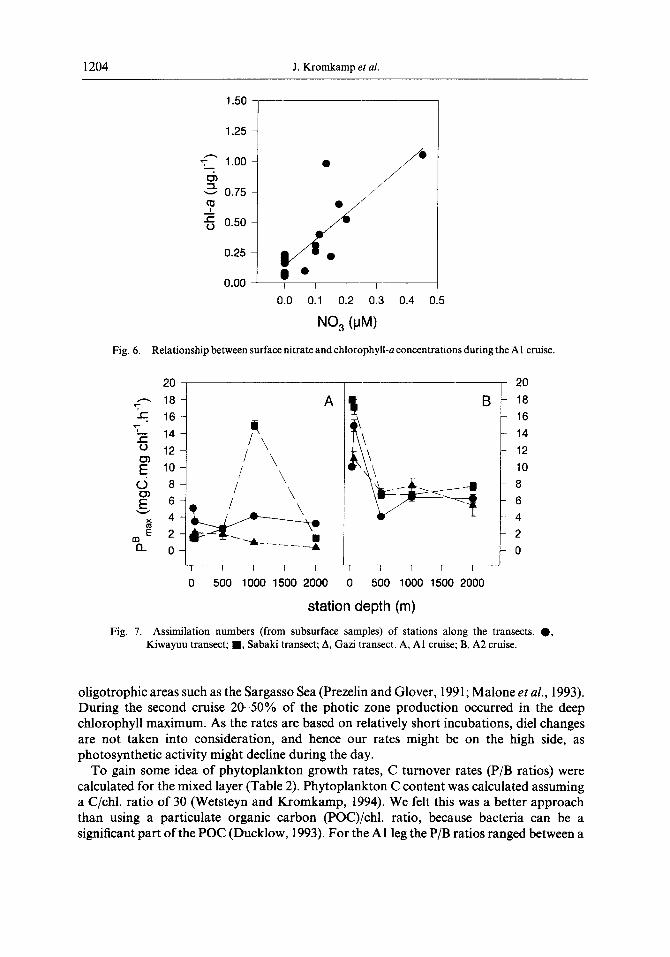
For the Al leg a good correlation existed between surface nitrate and chl.-a concentrations (Fig. 6). Variations in nitrate explained 67% of the variation in chl.-a, again suggesting nitrogen as the limiting factor for phytoplankton growth. For the A2 cruise no such correlation could be constructed because all nitrate concentrations were below 100 nM. No relationship between chl.-a and other nutrients was found.
Primary production
Assimilation numbers (i.e. maximum rates of photosynthesis per unit chlorophyll at optimum irradiance (Pz,,) of subsurface samples was generally lower during the first transect (Fig. 7a) than during the second transect (Fig. 7b). Our values for Pi,, fall in the range measured by Cullen et al. (1992) during the biosynop cruise near the Gulf Stream. The photosynthetic efficiency ~1~ (i.e. the slope of the photosynthesis light curve) was higher during the Al cruise, as reflected by the photosynthetic light saturation parameter Zk. Zk values ranged between 100 and 300 pE rn-’ s-’ during the first cruise, but ranged between 400 and 700 pErnm2 s-’ during the second (A2) cruise (Fig. 8). This implies that phytoplankton of the surface mixed layer during the SE monsoon in June-July was more shade adapted, whereas phytoplankton of the surface mixed layer of the intermonsoon period in November was clearly light adapted. That the maximum rate of chlorophyll specific photosynthesis is mainly a function of light intensity is also demonstrated by samples taken from the deep chlorophyll maximum: Pi, was always less than 2.5 mg C (mg chl.)’ h-’ (not shown). This pattern in photosynthetic parameters is similar to that found by Cullen et al. (1992). No relationship existed between nitrate or any other dissolved nutrient and PB max, as was the case for chl.-a and nitrate. [See Cullen et al. (1992) for a review on the effect of light and nutrients on the shape of the photosynthesis light curve.]
Estimated daily gross primary production (Fig. 9) was generally higher during the intermonsoon period (A2 cruise), especially on the Gazi transect. During the SE monsoon period, however, rates along the Gazi transect were very low, comparable with those of
1204 J. Kromkamp et al
-7 1.00
-:
z u 0.75 (0
6 0.50
I 0.25
0.00
0 0 /
0 ’ k d 0
0 ??I I I I I
0.0 0.1 0.2 0.3 0.4 0.5
NO, (PM)
Fig. 6. Relationship between surface nitrate and chlorophyll-a concentrations during the Al cruise.
20
18
16
14
12
10
8
6
4
2
0
0 500 1000 1500 2000 0 500 1000 1500 2000
station depth (m)
Fig. 7. Assimilation numbers (from subsurface samples) of stations along the transects. 0, Kiwayuu transect; ??, Sabaki transect; A, Gazi transect. A, Al cruise; B, A2 cruise.
oligotrophic areas such as the Sargasso Sea (Prezelin and Glover, 1991; Malone et al., 1993). During the second cruise 20-50% of the photic zone production occurred in the deep chlorophyll maximum. As the rates are based on relatively short incubations, die1 changes are not taken into consideration, and hence our rates might be on the high side, as photosynthetic activity might decline during the day.
To gain some idea of phytoplankton growth rates, C turnover rates (P/B ratios) were calculated for the mixed layer (Table 2). Phytoplankton C content was calculated assuming a C/chl. ratio of 30 (Wetsteyn and Kromkamp, 1994). We felt this was a better approach than using a particulate organic carbon (POC)/chl. ratio, because bacteria can be a significant part of the POC (Ducklow, 1993). For the Al leg the P/B ratios ranged between a

Primary production along the Kenyan coast 1205
1000 1000
800 - h
‘; cn
0 , I I I I I I I I I 0
0 500 1000 1500 2000 0 500 1000 1500 2000
station depth (m)
Fig. 8. Photosynthesis saturation values (Zk) during the Al and A2 cruises. Symbols as in Fig. 9.
station depth (m) Fig. 9. Daily photic zone gross primary production during the Al and A2 cruises. K, S and G:
Kiwayuu, Sabaki and Gaza transect, respectively.
very low 0.09 day- ’ for the 2000 m station on the Gazi transect to 1.2 day-’ at the shallow 20 m station of the Kiwayuu transect. The 3.3 day -t measured at the 1000 m Sabaki station is probably an outlier. During the inter-monsoon period in November-December phytoplankton was much more active, and P/B ratios were generally above 1 day-‘. Our values are on average considerably higher than those reported for the Arabian Sea by Jochem et al. (1993), who used POC/chl. ratio, but similar to those reported by Malone et al. (1993), who used 14C-labelled chlorophyll. The phytoplankton-C accounted for 2-10% of the POC (assuming a C/chl. ratio of 30). The higher turnover of phytoplankton suggests an

1206 J. Kromkamp et al.
Table 2. P/B ratios (C turnover day-‘) in the mixed layer during the SE monsoon (Al) and intermonsoon (A2)
Depth (m)
P/B-Al Kiwayuu
P/B-A2 Kiwayuu
P/B-A 1 Sabaki
P/B-A2 Sabaki
P/B-Al Gazi
P/B-A2 Gazi
20 1.2 1.7 50 0.5 1,s 500 0.7 0.9 1000 1.0 1.7 2000 0.6 I .3
0.5 3.0 0.1 1.6 0.4 1.4 3.3 2.2 nd 2.2
nd nd 0.6 2.3 0.3 0.8 0.2 0.2 0.1 1.0
To calculate cell carbon, a C/chl. ratio of 30 was assumed. nd, Not determined
increased carbon (and nutrient) flux through the microbial loop, as has been observed by us (see Goosen et al., 1997).
Net primary production and (calculated) respiratory losses
To compare our production data with other data published for the Indian Ocean we converted our gross primary production rates to net rates, as we carried out short-term incubations and had no 24 h incubations. Net production is normally calculated from gross production by assuming that the rate of respiration (R) is a fixed percentage of P,,, (e.g. Cole et al., 1992). It is probably better to divide respiration into a constant maintenance respiration, needed for cell integrity, osmotic balance, etc., and a variable respiration dependent on the growth rate (Laws and Bannister, 1980; Falkowski et al., 1985; Geider and Osborne, 1986). Using these data, Langdon (1993) developed a two-component model of algal respiration, which also allowed respiration in the light to be different from respiration in the dark, as was shown to be the case for several algae by Grande et al. (1989) and Weger et al. (1989). The respiration over the entire water column (R,,) can be modelled as
Rzt = BZ[24DRo + (24 - D)RDP,B, + DRDRLP,B,]
where P,,B is P,,/(DBZ). B is the biomass (mg chl. ms3), D the daylength, P,, is the primary production in the water column (mg C m-* maintenance respiration [mg 02 (mg chl.)-’
day- ‘), DRo is the biomass specific h-l], Z the mixing depth, RD growth rate (or
better: photosynthesis) dependent linear coefficient of dark respiration [mg Oz(mg chl.)- ’ h- ‘1, and RL the ratio of light to dark respiration (Langdon, 1993). We took values for the coefficients from Langdon; RO was 0.096 mg O2 (mg chl.)- ’ h-l, RD was 0.064 and the PQ ratio (photosynthetic quotient-02/C02) was taken as 1.2. We assumed that mitochondrial respiration in the light was equal to that in the dark. This approach was shown to be more realistic than the assumption that respiration is a fixed percentage of P,,, (Kromkamp and Peene, 1995). The calculated rates of net primary production are given in Table 4 (below). As can be seen, phytoplankton respiratory losses were generally higher during the SE monsoon, especially in the more offshore stations. When P/B ratios were very low, calculated respiration was even larger than gross production, indicating collapse of phytoplankton populations. In general, rates of primary production were very low during the SE monsoon, and comparable with those in other oligotrophic areas. During the intermonsoon period, respiratory losses were approximately 15% of gross production.

Primary production along the Kenyan coast
col0nies.Q 0 2 4 6 6 10 12 14 16
1207
Fig. 10. Depth distribution of Trichodesmium colonies at station 511 (a). Heavy winds (Beaufort 6) mixed the water column. Despite the mixed conditions, Trichodesmium was able to regulate its
vertical position the next day (m).
Trichodesmium: buoyancy
As noted above, microstratification indicated that the upper water layer above the thermocline was physically rather stable. This is the ideal type of physical environment for colony-forming algal species, which can regulate their buoyancy and vertical migration. Although some diatoms have been observed to regulate their buoyancy, the diazotrophic cyanobacteria Trichodesmium is well known for this (Walsby, 1978; Villareal and Carpenter, 1990). Because Trichodesmium can fix molecular nitrogen, this organism can be responsible, at least theoretically, for a substantial input of nitrogen in the photic zone and thus for the formation of new production. We did not find any Trichodesmium colonies during the SE monsoon, but during the calmer inter-monsoon period Trichodesmium was observed, mainly in the shallower stations (up to 500 m water depth). Based on colony shape and cell morphology, we think that we encountered populations of T. thiebautii (Carpenter et al., 1993), but as we are not certain about the correct species we use only the genus name. At the 1000 and 2000 m stations Trichodesmium was nearly absent. Surface scums were noticed, especially around noon or later in the afternoon. Figure 10 shows a strong positive buoyancy of most colonies at station 511 on 29 November, resulting in a marked vertical distribution with a maximum at the surface. That night wind speeds rose (Beaufort 6), causing a more homogeneous distribution of Trichodesmium colonies. However, despite the fact that no temperature differences were found during the first 25 m the next day, the colonies had partly resisted entrainment by turbulent mixing. Because of the patchy distribution of the colonies, quantifying the total number of Trichodesmium filaments is very difficult (Table 3). At station 505 a massive bloom was encountered in the afternoon, whereas the morning cast only sampled three colonies per litre. This bloom seemed to be associated with a front (a deepening of the mixed layer to 100 m). Large streaks with colonies were floating at the surface (we measured more than 99% floating colonies) in which more than 220 colonies per millilitre (!) were counted.
1208 J. Kromkamp et al.
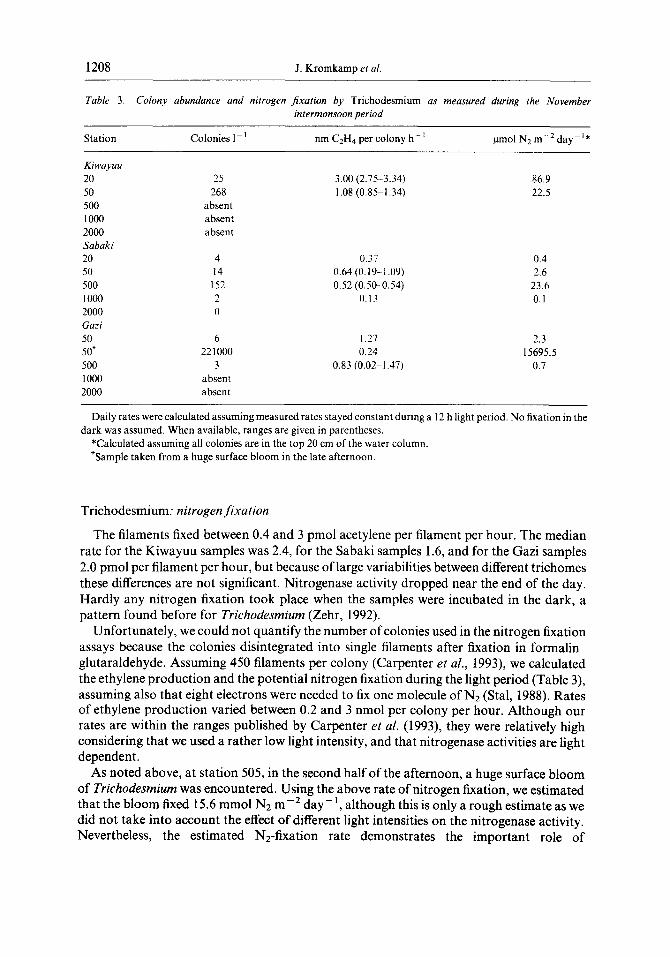
Table 3. Colony abundance and nitrogen jixation by Trichodesmium as measured during the November intermonsoon period
Station Colonies I- ’ nm CzH4 per colony h- ’ pmol N2 m-‘day-‘*
Kiwayuu 20 50 500 1000 2000 Sabaki 20 50 500 1000 2000 Gazi 50 507 500 1000 2000
25 268
absent
3.00 (2.75-3.34) 86.9 I .08 (0.85-I .34) 22.5
4 14
152 2 0
6 22 1000
3 absent absent
0.37 0.4 0.64 (0.19--1.09) 2.6 0.52 (0.500.54) 23.6
0.13 0.1
1.27 2.3 0.24 15695.5
0.83 (0.02-1.47) 0.7
Daily rates were calculated assuming measured rates stayed constant during a I2 h light period. No fixation in the dark was assumed. When available, ranges are given in parentheses.
*Calculated assuming all colonies are in the top 20 cm of the water column. tSample taken from a huge surface bloom in the late afternoon.
Trichodesmium: nitrogen fixation
The filaments fixed between 0.4 and 3 pmol acetylene per filament per hour. The median rate for the Kiwayuu samples was 2.4, for the Sabaki samples 1.6, and for the Gazi samples 2.0 pmol per filament per hour, but because of large variabilities between different trichomes these differences are not significant. Nitrogenase activity dropped near the end of the day. Hardly any nitrogen fixation took place when the samples were incubated in the dark, a pattern found before for Trichodesmium (Zehr, 1992).
Unfortunately, we could not quantify the number of colonies used in the nitrogen fixation assays because the colonies disintegrated into single filaments after fixation in formalin- glutaraldehyde. Assuming 4.50 filaments per colony (Carpenter et al., 1993), we calculated the ethylene production and the potential nitrogen fixation during the light period (Table 3), assuming also that eight electrons were needed to fix one molecule of N2 (Stal, 1988). Rates of ethylene production varied between 0.2 and 3 nmol per colony per hour. Although our rates are within the ranges published by Carpenter et al. (1993), they were relatively high considering that we used a rather low light intensity, and that nitrogenase activities are light dependent.
As noted above, at station 505, in the second half of the afternoon, a huge surface bloom of Trichodesmium was encountered. Using the above rate of nitrogen fixation, we estimated that the bloom fixed 15.6 mmol N2 me2 day-‘, although this is only a rough estimate as we did not take into account the effect of different light intensities on the nitrogenase activity. Nevertheless, the estimated Nz-fixation rate demonstrates the important role of

Primary production along the Kenyan coast 1209
Trichodesmium in the Kenyan coastal ecosystem with regard to new production during this part of the monsoon period. Glibert and Bronk (1994) demonstrated that approximately 50% of the Nz fixed by Trichodesmium can be released as dissolved inorganic nitrogen (DON). This DON release is likely to stimulate microbial activity and phytoplankton primary production.
It is clear from the results above that the physical environment dominated phytoplankton activity. Because of the SE monsoon winds, the EACC induces a rather deep, well-mixed layer in which nitrogen is probably limiting for phytoplankton growth. Despite the possible nutrient limitation, the phytoplankton adopted shade-adapted characteristics in its photosynthetic physiology, owing to relatively deep mixing.
During the intermonsoon, the water column was more stable, and the mixed layer was less deep. Nitrogen still seemed in short supply, but the phytoplankton now showed high light- adapted characteristics. The physical environment promoted the occurrence of the cyanobacterium Trichodesmium, which was not observed during the SE monsoon. The contribution to the primary production by Trichodesmium is probably underestimated: we incubated only 70 ml in the primary productivity assay, and it is likely that we underestimated the true phytoplankton biomass, as most of the Trichodesmium biomass is contained in the colonies.
Comparison between net primary production, bacterial growth and benthic metabolism
According to Duineveld et al. (1997), the sediments of the Kenyan shelf are of marine origin; pigment profiles indicate no traces from terrestrial or mangrove origin. As there were no signs of microphytobenthos populations, this implies that most of the organic matter in the shelf sediments originates from pelagic production. To determine whether primary production could sustain both benthic metabolism and bacterial production, net primary production rates were expressed as percentages of benthic respiration and bacterial production (Table 4). As mentioned in Section 2, we subtracted 14C incorporation in the dark bottle from that in the light bottles to avoid any contribution of chemosynthetic bacteria in phytoplankton production estimates. During the Al leg, calculated rates of net primary production were very low (even negative for the two outer stations on the Gazi transect). Rates of bacterial production differed little between the two legs (see also Goosen et al., 1997). Only at the shallow stations was primary production (barely) enough to sustain bacterial production. Because of the increased primary production during the A2 leg, bacterial production ranged between 6 and 35% of net primary production at most stations, but the bacterial demand was higher at the deepest stations. The values found during the A2 cruise are similar to those reported by Ducklow (1993) for the NW Arabian sea. Benthic respiration was also similar for the two cruises. Highest values were found close to the shore, and benthic respiration rates were highest at the Kiwayuu transect (Table 4). During the SE monsoon period in June-July, primary production was insufficient to feed the benthic C demand. During the intermonsoon period, in the A2 leg, primary production was sufficient. Benthic metabolism will be the result of POC deposition averaged out over a certain time span. This means that the C demand at times can be higher than the C produced by phytoplankton. This has also been found for the NW Arabian Sea by Ducklow (1993), and has been discussed in more detail by Goosen et al. (1997). What is clear from Table 4, however, is that primary production is insufficient to supply the C for both bacterial production and benthic metabolism at the peak of the SE monsoon. In the calculations net

1210 J. Kromkamp et al.
Table 4. Relation between netprimaryproduction in thephotic zone (PN),* bacterial Cproduction in thephotic zone (BP) and benthic respiration (BR)
Cruise
Station PNiPG
Al
BPIPN WPN PNiPG
A2
BPIPN BWPN
Kiwayuu 20 50 500 1000 2000 Sabaki 20 50 500 1000 2000 Gazi 50 500 1000 2000
85 81 69 69 59
71 97 nd 87 6 nd 54 316 1264 86 23 29 49 483 231 84 32 21 76 171 51 83 34 8 9 2597 649 84 48 18
II 17 45 36 10 <o <o <o
16 110 118 245
nd 86 13 nd 74 86 35 49 74 82 32 19 21 83 53 8 122 83 79 23
I15 477 <o
86 8 5 84 12 4 84 28 4 82 65 21
‘For calculation of net primary production coefficients were taken from Langdon (1993). For the maintenance respiration coefficient (&) a value of 0.096 mg 02 (mg chl.)- ’ h - ’ was chosen. RD = 0.064 and it was assumed that mitochondrial respiration in the dark was similar to that in the light. A PQ of 1.2 was assumed. Data on benthic respiration were taken from Duineveld et al. (1997). Bacterial production rates were from Goosen et al. (1997).
bacterial production rates were used. When the efficiency with which C is incorporated into bacterial biomass is taken into consideration, net primary production is still high enough during the intermonsoon period to meet the bacterial C demand for primary production, but at the deeper stations it was insufficient to feed the C demand of both the bacteria and the sediments. This implies that there is no direct coupling between the pelagic processes and the benthic processes. Hence, POC is imported into the system, or primary production is even higher during some periods than measured during the A2 leg. If the latter is true, it implies that tropical coastal systems can be very productive in the absence of well-developed upwelling processes, and as these types of coastal systems are more abundant than coastal upwelling systems, they deserve more attention than they have received previously. Periods of high production of the Kenyan coastal system might be expected when the thermocline deepens again (entrainment of nutrients in the upper mixed layer) and when rivers discharge more nutrients into the coastal system. Discharge rates were low before and during the two cruises. Alternatively, it can be that the upwelling, which is reported to occur irregularly during the phase of the NE monsoon, might be better developed than assumed.
Acknowledgements-We would like to thank the crew and the technicians of R.V. Tyro for their assistance, and Jan van Ooyen for the nutrient analyses and the “bodemlab” for the SPM-POC measurements. This is Communication 2214 of the NIOO-CEMO.

Primary production along the Kenyan coast 1211
REFERENCES
Banse, K. (1993) On the dark bottle in the 14C method for measuring marine phytoplankton production. ICES MSS, 197, 132-140.
Banse, K. (1994) On the coupling of hydrography, phytoplankton, zooplankton, and settling organic particles offshore in the Arabian Sea. In Biogeochemistry of the Arabian Sea, D. La1 (ed.), pp. 274. Indian Academy of Sciences, Bangalore.
Burkill, P. H., Mantoura, R. F. C. and Owens, N. J. P. (1990) Biogeochemical cycling in the northwestern Indian Ocean: a brief overview. Deep-Sea Research, 40, 643-649.
Carpenter, E. J., O’Neil, J. M., Dawson, R., Capone, D. C., Siddiqui, P. J. A., Roenneberg, T. and Bergman, B. (1993) The tropical diazotrophic phytoplankter Trichodesmium: biological characteristics of two common species. Marine Ecology Progress Series, 95, 295-304.
Cole, J. J., Caraco, N. F. and Peierls, B. J. (1992) Can phytoplankton maintain a positive carbon balance in a turbid, freshwater, tidal estuary? Limnology and Oceanography, 37, 1608-1617.
Cullen, J. J., Yang, X. and MacIntyre, H. L. (1992) Nutrient limitation of marine photosynthesis. In Primary Productivity and Biogeochemical Cycles in the Sea, Environmental Science Research, Vol. 43, P. G. Falkowski and A. D. Woodhead (eds), pp. 69-88. Plenum, New York.
Ducklow, H. W. (1993) Bacterial biomass in warm core Gulf Stream ring 82B: mesoscale distribution, temporal changes, and production. Deep-Sea Research, 33, 1789-1812.
Duineveld, G. C. A., Tahey, T. M., de Wilde, P. A. W. J., Berghuis, E. M., Kok, A. and Kromkamp, J. (1997) Benthic respiration, biomass and phytodetritus on two contrasting continental margins in the Western Indian Ocean: the Yemen/Somalia upwelling region and the margin of Kenya. Deep-Sea Research, 0, OOO- 000.
Eilers, P. and Peeters, J. C. H. (1988) A model for the relationship between light intensity and the rate of photosynthesis in phytoplankton. Ecological ModeRing, 42, 199-215.
Falkowski, P. G., Dubinsky, Z. and Wyman, K. (1985) Growth-irradiance relationships in phytoplankton. Limnology and Oceanography, 30, 31 l-321.
Geider, R. J. and Osborne, B. A. (1986) Light absorption, photosynthesis and growth of Nannochloris atomus in nutrient-saturated cultures. Marine Biology, 93, 351-360.
Gieskes, W. W. C., Kraay, G. W., Nontji, A., Setiapennana, D. and Sutomo, (1988) Monsoonal alternation of a mixed and layered structure in the phytoplankton of the euphotic zone of the Banda Sea (Indonesia), a mathematical analysis of algal pigment fingerprints. Netherlands Journal of Sea Research, 22, 123-137.
Gieskes, W. W. C., Kraay, G. W., Nontji, A., Setiapermana, D. and Sutomo, (1990) Monsoonal differences in primary production in the eastern Banda Sea (Indonesia). Netherlands Journal of Sea Research, 25,473-483.
Glibert, P. M. and Bronk, D. A. (1994) Release of dissolved organic nitrogen by marine diazotrophic cyanobacteria, Trichodesmium spp. Applied and Environmental Microbiology, 60, 39964000.
Goosen, N. K., van Rijswijk, P., de Bie, M., Peene, J. and Kromkamp, J. (1997) Bacterioplankton and nanozooplankton abundance and production in coastal waters of Kenya. Deep-Sea Research, 0, OOO- 000.
Grande, K. D., Marra, J., Langdon, C., Heinemann, K. R. and Bender, M. L. (1989) Rates of respiration in the light measured in marine phytoplankton using an “0 isotope labelling technique. Journal of Experimental Marine Biology and Ecology, 129, 95-120.
Jochem, F. J., Pollehne, F. and Zeitschel, B. (1993) Productivity regime and phytoplankton size structure in the Arabian Sea. Deep-Sea Research, 40, 71 l-735.
Krey, J. and Babenerd, B. (1976) Phytoplankton production. In Atlas of the International Indian Ocean Expedition. Universitat Kiel, Institut fiir Meereskunde, 70 pp.
Kromkamp, J. and Peene, J. (1995) Possibility of net phytoplankton primary production in the turbid Schelde Estuary (SW Netherlands). Marine Ecology Progress Series, 121, 249-259.
Langdon, C. (1993) The significance of respiration production measurements based on both carbon and oxygen. ICES MSS, 197, 69-78.
Laws, E. A. and Bannister, T. T. (1980) Nutrient- and light-limited growth of Thalassiosira jhkatilis in continuous culture, with implications for phytoplankton growth in the ocean. Limnology and Oceanography, 25, 457473.
Malone, T. C., Pike, S. E. and Conley, D. J. (1993) Transient variation in phytoplankton productivity at the JGOFS Bermuda time series station. Deep-Sea Research, 40, 903-924.
Martin, J. H. (1992) Iron as a limiting factor in oceanic productivity. In Primary Productivity and Biogeochemical
1212 J. Kromkamp et al
Cycles in the Sea, Environmental Science Research, Vol. 43, P. G. Falkowski and A. D. Woodhead (eds), pp. 123-l 37. Plenum, New York.
Murray, J. W. (1992) The oceans. In Global Biogeochemicul Cycles, S. S. Butcher, R. J. Charlson, Cl. H. Orians and G. V. Wolve (eds), pp. 175-211. Academic Press, London.
Nair, R. R., Ittekot, V., Manganin, S. J., Ramaswamy, V., Haake, B., Degens, E. T., Desai, B. N. and Honjo, S. (1989) Increased particle flux to the deep ocean related to monsoons. Nature, 338, 749-751.
Nieuwenhuize, J., Maas, Y. E. M. and Middelburg, J. J. (1984) Rapid analysis of organic carbon and nitrogen in particulate materials. Marine Chemistry, 45, 217-224.
Owens, N. J. P., Burkill, P. H., Mantoura, R. F., Woodward, E. M. S., Bellan, I. E., Aiken, J., Howland, R. J. M. and Llewellyn, C. A. (1993) Size fractionated primary production and nitrogen assimilation in the northwestern Indian Ocean. Deep-Sea Research, 40, 697-709.
Prezelin, B. B. and Glover, H. E. (1991) Variability in time/space estimates of phytoplankton, biomass and productivity in the Sargasso Sea. Journal of Plankton Research, 13, 45-67.
Stal, L. J. (1988) Nitrogen fixation in cyanobacterial mats. In Methods in Enzymology, Vol. 167, Cyanobacteriu, L. Packer and A. N. Glazer (eds), pp. 474484. Academic Press, New York.
Villareal, T. A. and Carpenter, E. J. (1990) Die1 buoyancy regulation in the marine diazotrophic cyanobacterium Trichodesmium thiebautii. Limnology and Oceanography, 35, 1832-1837.
Walsby, A. E. (1978) The properties and buoyancy providing role of gas vesicles in Trichodesmium Ehrenberg. British Phycological Journal, 13, 103-l 16.
Weger, H. G., Herzig, R., Falkowski, P. G. and Turpin, D. H. (1989) Respiratory losses in the light in a marine diatom: measurements by short-term mass-spectrometry. Limnology and Oceanography, 34, 1153-l 161.
Wetsteyn, L. M. P. J. and Kromkamp, J. C. (1994) Turbidity, nutrients and phytoplankton primary production in the Oosterschelde (The Netherlands) before, during and after a large-scale coastal engineering project (198s 1990). Hydrobiologia, 282-283, 61-78.
Wetsteyn, F. J., Ilahude, A. G. and Baars, M. A. (1990) Nutrient distribution in the upper 300 m of the eastern Banda Sea and northern Arafura Sea during and after the upwelling season, August 1984 and February 1985. Netherlands Journal of Sea Research, 25, 449464.
Zehr, J. P. (1992) Molecular biology of nitrogen fixation in natural populations of marine cyanobacteria. In Marine Pelagic Cyanobacteria: Trichodesmium and other diazotrophs, NATO ASI Series C, Vol. 362, E. J. Carpenter, D. G. Capone and J. G. Rueter (eds), pp. 2499264. Kluwer, Dordrecht.