STRUCTURAL REFORM OF THE KENYAN HEALTH CARE ...
295
STRUCTURAL REFORM OF THE KENYAN HEALTH CARE SYSTEM by Benjamin Musembi Nganda A dissertation submitted in fulfilment of the requirements for the degree of Doctor of Phi- losophy of the Department of Economics and Related Studies, University of York, England. November, 1994
-
Upload
khangminh22 -
Category
Documents
-
view
0 -
download
0
Transcript of STRUCTURAL REFORM OF THE KENYAN HEALTH CARE ...

STRUCTURAL REFORM OF THE KENYAN HEALTH CARE SYSTEM
by
Benjamin Musembi Nganda
A dissertation submitted in fulfilment of the requirements for the degree of Doctor of Phi
losophy of the Department of Economics and Related Studies, University of York, England.
November, 1994

-CONTENTS-
LIST OF FIGURES ............................................................................. viii
LIST OF TABLES .............................................................................. x
ACKNOWLEDGEl\1ENTS ..................................................................... xii
ABSTRACT .................................................................................... xiii
CHAP'IER ONE ............................................. '" .................... " ..... " .... 1
1. INTRODUCTION: SCOPE AND PURPOSE OF THE STUDY .................................. 1
1.0 Introduction ............................................................. 1
1.1 Pressures for Reform of the Health Care System .......................... 4
1.2 The Initial Response: Reforms in the Financing Arrangements ............. 5
l.3 The Need for 'Broader Structural Reforms' .............................. 6
1.4 Purpose and Scope of the Present Study .................................. 6
1.5 Organisation of the Dissertation .......................................... 7
CHAPTER TWO ................................................................................. 9
2. THE SETTING OF THE PROBLEM-I: THE HEALTH STATUS SITUATION IN KENYA ... 9 AND THE DISTRIBUTION OF HEALTH RESOURCES ............................... .
2.0 Introduction ............................................................. 9
2.1 Demographic Characteristics and Implications for the Health Services .... 10
2.1.1 General demographic trends ......................................... 10
2.1.2 Structure of the population .......................................... 11
2.l.3 Life expectancy: ..................................................... 12
2.1.4 Distribution of the total population and urbanisation .................. 16
2.1. 5 Conclusion .......................................................... 17
2.2 Trends in public health expenditures in the 1980's and regional resource distribution ................................................... 17
2.2.1 Financial resources .................................................. 17
Trends in public health expenditures in the 1980 's ..................... 17
The regional allocation of financial resources in relation regional population shares .................................................. 20
2.2.2 Physical resources .................................................. 21
Trends in physical resources ........ . . . . . . . . . . . . . . . . . . . . . . . . . . . . . . . . . . . 21
Facility distribution and access measures ............................. . 23
2.2.3 Trends in and distribution of human health resources ................. 26
Trends in medical and health personnel ............................... 26
-n-

The regional distribution of human health resources ................... 31
2.3 Morbidity and Mortality Patterns ....................................... 33
2.3.0 Overall patterns ..................................................... 33
2.3.1 Regional out-patient morbidity patterns .............................. 36
2.3.2 Regional mortality patterns according to hospital based information .. 37
2.3.3 The distribution of health resources and health status-implications for policy ................................................... " ......... 39
2.3.4 Conclusion .......................................................... 41
2.4 Some International Comparisons ........................................ 43
2.4.0 Some caveats about international comparisons ....................... 43
2.4.1 Performance of Kenya's health sector viewed in relation to other developing countries ................................................... 44
2.4.2 Conclusion .......................................................... 50
2.5 Conclusions ............................................................. 52
CHAP1ER TIlREE ............................................................................. 55
3. TIlE SETTING OF THE PROBLEM-I!: TIlE PRESENT HEALTH CARE SYSTEM IN KENYA-ITS ORGANISATION AND BACKGROUND TO PRESENT PROBLEMS .... 55
3.0 Introduction ............................................................ 55
3.1 Organisation of Health Services in Kenya ................................ 55
3.1.1 Organisation of the public health sector .............................. 56
3.1.2 The private sector of the health services in Kenya .................... 58
3.1.3 Relationship between the public and private sub-sectors .............. 59
3.2 A Synoptic Diagnosis of Problems and Their Causes in the Current . 60 System ................................................................ .
3.2.0 Introduction ......................................................... 60
3.2.1 The resource allocation process in Kenya's public health services system ................................................................ 60
The budget setting and resource allocation process in the public sector ............................................................. 61
Some weaknesses in the budget setting and resource allocation process ........... ................................................. 63
The need for change ................................................... 66
3.2.2 The private sector ................................................... 67
3.3 The Overall Picture and Implications for Policy .......................... 69
3.4 A Review of Related Previous Works on the Kenyan Health Care . 71 System ................................................................ .
Assessment and ConclUSions ... . . . . . . . . . . . . . . . . . . . . . . . . . . . . . . . . . . . . . . .. 81
3.5 Summary of Key Problems Faced by the Current System that Need Redressing ............................................................... 85
3.5. 1 Problems within the public sector .................................... 85
--111-

3.5.2 Problems within the private sector ................................... 85 3 5 3 Cl' d I' . I' . .. onc USIons an po ICY Imp IcatlOns .................................. 86
3.6 Conclusions ........................................................... 86
CHAPTER FOUR .............................................................................. 88
4. ASPECTS OF INEFFICIENCY IN THE KENYAN HEALTH CARE SYSTEM: DEFINITIONS, SOURCES AND IMPLICATIONS FOR HEALTH POLICY ............. 88
4.0 Introduction ............................................................ 88
4.1 The Objective Function in the Kenyan Health Sector and Efficiency ...... 88
4.2 Efficiency in Health Care: Some Theoretical Considerations .............. 94
4.2.1 What should efficiency in health care mean? ......................... 95
Providing only medically effective services ............................ 97
Providing services that are cost-effective ............................. 100
EffiCiency also demands concentrating on health services that offer the highest pay-offs in terms of health ............................ 100
Efficiency also means providing appropriate scales of the medicalIy-and cost-effective services ........................................ 102
4.2.2 Quality of care ...................................................... 104
4.2.3 Consumer choice ................................................... 104
4.2.4 The private sector .................................................. 105
4.2.5 The question of incentives .......................................... 106
4.3 Potential for Efficiency Improvement in the Kenyan Health Sector ...... 106
4.3.1 Some evidence of resource mis-use in the Kenyan public health care system ............................................................... 107
4.3.2 The MOH resource allocation is not geared to the country's health problems ............................................................. 110
4.3.3 An alternative 'closer' look at the distribution of recurrent curative expenditures ......................................................... 114
4.4 A Framework for Analysing Health Sector Problems in Kenya .......... 116
4.5 Summary and Conclusions ............................................. 125
CHAPIER FIVE ........... . . . . . . . . . . . . . . . . . . . . . . . . . . . . . . . . . . . . . . . . . . . . . . . . . . . . . . . . . . . . . . . . . .. 127
S. TIlE EQUITY OBJECTIVE IN KENYAN HEALTH POLICY ............................... 127
5.0Introduction ............................................................ 127
5. 1 Equity in Kenyan Health Policy and Health Care ........................ 128
5. 1. 1 The basis for equity concern-health care as an individual's 'right' ., 128
5.1.2 The approach adopted by government to realise the equity objective . 132
Development of health services before independence .................. 132
Prevailing equity conceptions and changes implemented since independence .................... 134
•••• ••••••• 10 •••••••••••••••••••••
-i\l-

(i) Equity and the public health services after Independence ....... 135
Why the waiver system is ineffective ............................... 138
(ii) Equity in the private sector ................................... 139
5.1.3 Conclusions ........................................................ 139
5.2 Philosophical and Health Economics Bases of Equity and Their Implications for Kenyan Health Policy ................. " ....... '" ...... 143
5.2.1 Utilitarianism ....................................................... 144
5.2.2 The difference principle ............................................. 145
5.2.3 Equality of opportunity ............................................. 147
5.2.4 Sen's capabilities approach ......................................... 148
5.2.5 Theory of entitlements .............................................. 150
5.2.6 The decent minimum ............................................... 151
5.2.7 The non-envy criterion .............................................. 152
5.2.8 The health maximisation principle (extra-welfarism) ................. 153
5.2.9 Conclusions ........................................................ 159
5.3 Equity and Access to Health Care: Towards Operational Measures ..... 159
5.3.1 What constitutes equity in health and health care? ................... 160
5.3.2 'Need' and equity in health care .......... '" ............... " ...... , 161
5.3.3 Need, equity and efficiency ......................................... 164
5.3.4 Equality ofwhat?-Possible 'candidates' for equitable distribution .. 166
5.4 Policy Implications for Kenya .......................................... 170
5.4.1 Underlying policy guidelines ........................................ 171
5.4.2 Targeting resources to specific groups .............................. 171
5.4.3 Implications for informational requirements ......................... 172
5.4.4 The need for further research ....................................... 172
CHAPTER SIX ............................................................................... 174
6. THE AGENCY RELATIONSHIP AND ITS RELEVANCE TO MODELLING A REFORM STRATEGY FOR THE KENYAN HEAL TII CARE SYSTEM .......................... 174
6.0 Introduction ........................................................... 174
6.1 Theoretical Approaches to Explaining Variable Efficiency in the Health Sector ................................................................. 175
6.1.1 Non-allocative inefficiencies that may sustain X-inefficiency in the health sector .......................................................... 175
6.1.2 Budget restraint as tool for dealing with non-allocative inefficiencies in the health sector and its deficiencies ................................ 177
6.1.3. Budget restraint and the 'proximate' behaviour of providers ........ 180
6.1.4 A model of hospital behaviour suited to Kenyan public hospitals ..... 181
6.2 Towards an Alternative Policy Model for the Kenyan Health Sector ..... 186
6.2.1 The appropriate setting-Some factors to consider ......... " ....... 186
-v-

6.2.2 Funding and performance incentives under the agency relationship ... 189
Optimal reward structure in a single agency relationship ............. 190
6.2.3 An application to centrally-funded health care facilities .............. 192
6.2.4 Implications for improving incentive compatibility in the health sector 195
6.3 Costs, Outputs and Competition ........................................ 198
6.3.1 Competitive reforms, regulation and managed care ................. 203
Competitive reforms and managed care ............................... 203
Prospective payment systems ......................................... 204
Competitive contracting .............................................. 206
Global budgeting ..................................................... 208
6.3.2 Incentives and system performance under competition: What empirical evidence reveals ............................................ 209
6.3.3 Conclusions ........................................................ 214
6.4 Summary and Conclusions: Implications for Health Policy Formulation in Kenya ................................................................ 215
CHAP1'ER SEVEN ............................................................................ 217
7. PROPOSALS FOR RESTRUCTURING TIfE KENYAN PUBLIC HEAL rn CARE SYSTEM 217
7.0 Introduction ........................................................... 217
7.1 The Criteria for Option Evaluation ..................................... 218
7.1.1 Equity .............................................................. 218
7.1.2 Efficiency .......................................................... 219
7.1. 3 Easel difficulty of implementation ................................... 219
7.1.4 Adequacy .......................................................... 220
7.2 Proposals for Restructuring the Delivery of Public Health Care Services in Kenya ................................................................ 220
7.2.1 Option 1: The current system with internal changes .................. 221
Assessment in terms of the evaluation criteria ......................... 222
7.2.2 Option 2: Introduction of reimbursement using 'global budgets' ..... 223
A. Introduction of reimbursement using a resource allocation formula 223
(a) The setting of institutional recurrent budgetary needs ......... 223
(b) Setting capital budgets ........................................ 226
(c) Some difficulties in the use of aformula to allocate resources . 227
(d) Assessment in terms of the evaluation criteria ................. 229
B. An alternative methodology for estimating institutional budgetary requirements ..................................................... 230
(a) Setting recurrent budgets ..................................... 230
(b) Capital budgets ............................................... 234
(c) Assessment according to the evaluation criteria ............... 234
-Vi-

7.2.3 Option 3: Introducing publicly financed competition in the health services through prospective reimbursement budgets .................. 235
(a) Use of DRG information to set prospective budgets ............... 235
(b) Use of population and utilisation based standards ................. 236
(c) Assessment in light of the set criteria .............................. 239
7.2.4 Option 4: Introducing publicly financed competition in the health services through the separation of the financing and provider roles ..... 239
(a) Restructuring the system through giving prominence to primary health care ....................................................... 241
(b) Other necessary changes in the organisational structure of public hospital services .................................................. 242
(i) Changes in the status of public hospitals ....................... 242
(ii) Changes in the way the National Hospital Insurance Fund operates ...................................................... 242
(c) How competition can be injected into the new system .............. 245
(i) Tackling equity and efficiency in the new system ............... 245
How the overall budget would be split ............................ 245
Districts as budget holders: How they'll allocate resources to ensure efficiency .............................................. 246
Allocating the curative services budget resources ................. 246
Allocating resources for primary care at the district level ......... 247
(H) The process of contracting .................................... 249
(Ui) Implementing the change-the time framework ............... 250
(d) Some issues to be addressed in the future ......................... 252
7.2.5 An assessment of the proposals-a summary ........................ 253
7.3 Some 'Observations' about the Private Sector .......................... 254
7.4 Summary and Conclusions ............................................. 256
CHAPTER EIGHT 259
8. CONCLUSIONS 259
8.0 Summary .............................................................. 259
8.1 ConclusionslRecommendation .......................................... 264
8.2 Weaknesses and Strengths of the Thesis: An Overall Assessment ........ 265
8.3 Research Implications of the Suggested Structural Reform .............. 266
REFERENCES ................................................................................ 268
-w-

- LIST OF FIGURES -
FIGURE 2.1: VITAL POPULATION STATISTICS: 1950-1990 ................................ 12
FIGURE 2.2: PUBLIC EXPENDITURE ON HEALTH, EDUCATION, DEFENCE AND OTHER SOCIAL SERVICES, 1980/81-1990/91 ........................................ 18
FIGURE 2.3: RELATIONSHIP BETWEEN GNP, GOVERNMENT BUDGET AND VARIOUS FORMS OF GOVERNMENT EXPENDITURES, 1980/81-1990/91 ..................... 19
FIGURE 2.4: PER CAPITA PUBLIC SPENDING ON SELECTED SERVICES TRENDS: 1980/81-1990/91 ......................................................................... 19
FIGURE 2.5: TRENDS IN HEALTH FACILITY STOCK BY TYPE, (1978-1990): .............. 22
FIGURE 2.6: TRENDS IN HOSPITAL BEDS BY TYPE OF OPERATING AGENCY, 1964-1989 ............................................................................... 23
FIGURE 2.7: TRENDS IN SELECTED CADRES OF HUMAN RESOURCES EMPLOYED IN THE HEAL 1H SECTOR OF KENYA: 1960-1990 ...................................... 27
FIGURE 2.8: SURPLUSESIDEFICIENCIES IN VARIOUS CATEGORIES OF PERSONNEL: 1991/91 ................................................................................. 30
FIGURE 2.9: PERCENTUAL DEVIATIONS FROM THE NATIONAL MEAN POPULATION (KENYA) PER UNIT OF SELECTED HEALTH PERSONNEL, 1991192 ................. 32
FIGURE 2.10: PER CENT OF GOVERNMENT SPENDING ON HEALTH AND GNP PER CAPITA IN DEVELOPING COUNTRIES: 1987-1990 .................................. 45
FIGURE 2.11: PER CAPITA HEAL 1H SPENDING AND GNP PER CAPITA IN DEVELOPING COUNTRIES: 1986-1990 .............................................. 46
FIGURE 2.12: LIFE EXPECTANCY AT BIRTH (YEARS) AND GNP PER CAPITA IN DEVELOPING COUNTRIES: 1989 ...................................................... 48
FIGURE 2.13: UNDER 5 MORTALITY RATE AND GNP PER CAPITA IN DEVELOPING COUNTRIES, 1989 ...................................................................... 49
FIGURE 2.14: PER CAPITA PUBLIC SPENDING ON HEALTH AND LIFE EXPECTANCY IN DEVELOPING COUNTRIES, 1989 .................................................. 51
FIGURE 4.1: THE OBJECTIVE OF HEALTH POLICY AND POLICY ALTERNATIVES ...... 91
FIGURE 4.2: HEALTH IMPROVEMENT BETWEEN TO AND Tl DUE TO 'EFFECTIVE CARE' .................................................................................. 98
FIGURE 4.3: DETERMINING THE OPTIMAL SIZE OF THE HEAL1H SECTOR .............. 103
FIGURE 4.4: COMPARISON OF COSTS AND QUALITY AMONG MOH HOSPITALS, HEALTH CENTRE AND DISPENSARY AND AN NGO HOSPITAL, 1988/89 .......... 108
FIGURE 4.5: FLOW OF FUNDS AND INTER-RELATIONSHIPS AMONG PARTICIPANTS IN THE KENYAN HEALTH CARE SYSTEM ........................................... 117
FIGURE 4.6:A MATRIX OF HEALTH CARE FINANCING AND PROVISION IN KENYA .... 121
-W}-

FIGURE 5.1: THE CHAIN FROM GOODS TO UTILITY ....................................... 149
FIGURE 5.2: DIFFERENCES IN ACCESS COSTSIDEMANDS CAUSE DIFFERENCES IN UTILISATION .......................................................................... 167
FIGURE 6.1: THE OUTPUT ·MAXIMISING HOSPITAL UNDER DIFFERENT CONDITIONS . 200
FIGURE 7.1: TOWARDS A RESOURCE DISTRIBUTION FORMULA: A DIAGRAMMATIC REPRESENTATION .................................................................... 225
FIGURE 7.2: THE DETERMINATION OF FACILITY COST PER CAPITA .................... 237
FIGURE 7.3: CALCULATION OF HOSPITAL COST-COMPONENTS TO CONSIDER ....... 238
--IX-

- LIST OF TABLES-
TABLE 1.1: TRENDS IN SOME ECONOMIC INDICATORS, 1970-1990 ....................... 3
TABLE 2.1 POPULATION AGE STRUCTURE, 1962-1979 (FIGURES IN 'OOO'S AND PER CENT) .................................................................................. 11
TABLE 2.2 LIFE EXPECTANCY AT BIRTH BY SEX: 1950-1990 ............................ 13
TABLE 2.3 POPULATION DISTRIBUTION BY PROVINCE, 1989: PERCENT OF POPULATION BY SEX, SEX RATIO AND PROPORTION OF POPULATION UNDER 15 YEARS BY PROVINCE. ............................................................. 14
TABLE 2.4 PROPORTION OF POPULATION UNDER 15 IN RELATION TO FERTILITY RATE, INFANT, UNDER FIVE AND CHILDHOOD MORTALITY RATES ............. 15
TABLE 2.5: PERCENTAGE DISTRIBUTION OF URBAN AND RURAL POPULATION BY PROVINCE, 1969 AND 1979. ........................................................... 16
TABLE 2.6: REGIONAL DISTRIBUTION OF RECURRENT PUBLIC HEALTH EXPENDITURE BY THE MINISTRY OF HEALTH: 1989/90 (pERCENTAGES) ........ 21
TABLE 2.7: PHYSICAL RESOURCES AND ASSOCIATED MEASURES OF ACCESS BY PROVINCE, 1989 ....................................................................... 25
TABLE 2.8: FUNCTIONAL DISTRIBUTION OF MINISTRY OF HEALTH PERSONNEL, 1991/92 .................................................................................. 28
TABLE 2.9: POPULATION PER UNIT OF SOME SELECTED CATEGORIES OF HEALTH PERSONNEL BY PROVINCE-1991/92 ................................................ 32
TABLE 2.10: PATTERNS IN OPD MORBIDITY BY TYPE OF DISEASE CATEGORY: VARIOUS YEARS BETWEEN 1964 AND 1991 ......................................... 34
TABLE 2.11: DISTRIBUTION BY ICD CLASSIFICATION OF THE TOP 20 LEADING CAUSES OF ADMISSIONS AND DEATHS IN MOH HOSPITALS IN 1990 ............. 35
TABLE 2.12: OPD MORBIDITY PA ITERNS BY DISEASE GROUP AND BY PROVINCE, KENYA: 1984 AND 1991-PERCENT AND NUMBERS ............................... 36
TABLE 2.13: ADMISSIONS AND DEATHS BY SEX IN REPORTING GOVERNMENT HOSPITALS 1968 AND 1990 BY PROVINCE ........................................... 38
TABLE 2.14: SIMPLE CORRELATION BETWEEN IMR, U5M, CMR. AND DIFFERENT CATEGORIES OF HEALTH PERSONNEL IN KENYA AROUND THE PERIOD 40 1991/2 .................................................................................. .
TABLE 2.15: DISTRIBUTION OF A SAMPLE OF DEVELOPING COUNTRIES BY PER CENT OF GOVERNMENT EXPENDITURE ON SOCIAL SERVICES .................. 44
TABLE 2.16: DATA USED FOR INTERNATIONAL COMPARISONS ......................... 54
-x-

TABLE 3.1: COMPARATIVE CLINICAL EFFICIENCY INDICATORS, KNH AND AKH, 1986 ..................................................................................... 73
TABLE 3.2: ANNUAL FINANCING GAPS BY RESOURCE CATEGORY, PIPHC SERVICES, 1990 ..................................................................................... 75
TABLE 3.3: GAPS IN RURAL HEALTH FACILITIES AND HOSPITAL Ol.ITPATIENT DEPARTMENTS ........................................................................ 76
TABLE 4.1: FUNCTIONAL DISTRIBUTION OF RECURRENT HEALTH CARE EXPENDITURES: 1972/3-1990/91 (VARIOUS YEARS-PER CENT) ................ 110
TABLE 4.2: DISTRIBUTION OF CURATIVE SERVICES EXPENDITURES, 1991192 .......... 111
TABLE 4.3: BURDEN OF DISEASE BY SEX, CAUSE AND TYPE OF LOSS, 1990 ............ 114
TABLE 4.4: RECURRENT EXPENDITURE ALLOCATIONS BY INPUTS, 1982/3-91/92: (PERCENTAGES) ....................................................................... 115
TABLE 4.5 ESTIMATES OF FINANCING OF RECURRENT HEALTH EXPENDITURE BY SOURCE OF FINANCE, 1983/84 (KS MN) .............................................. 118
TABLE 4.6: TOTAL GROSS RECURRENT EXPENDITURE BY TYPE OF HEALTH CARE PROVIDER, 1983/84 (KS MILLIONS) .................................................. 122
TABLE 7.1: SETTING HOSPITAL BUDGETS USING DRG INFORMATION: AN ILLUSTRATION ........................................................................ 235
TABLE 7.2: PUBLIC HEALTH SECTOR REFORM PROPOSALS ASSESSMENT MATRIX ... 253
-Xi-

- ACKNOWLEDGEMENTS-
I am indebted to Professor A 1. Culyer, under whose wisdom, tutelage and unreserved guidance I was able to write this dissertation at the University of York I thank him not only for the academic nourishment he imparted through the critiques of all my drafts (some of which I often look at and wonder why I ever passed them to him!), but also for the patience and the speed at
which he read all of them. I also wish to thank the other members of my thesis advisory grouJr-Mr 1. Suckling and Mr M Wheeler-for the many useful comments they made of my drafts. I also have many others to thank, all of whom cannot be listed by name. I came to York without any background on health economics. I am grateful to all my MSc. (Health Economics) tutors who introduced me to the subject, particularly Or A Jones who supervised my MSc. dissertation and Or 1. Posnett, the Director and tutor of the health economics course in 1990/91.
Financial support from the International Development Research Centre (IDRC) of Canada
made it poSSlble for me to come to York, and not only paid all my fees, but also gave me other allowances. The University of Nairobi granted me study leave to pursue this course. The East
Afiican Research Consortium provided supplementary field-work financial support. The
Department of Economics and Related Studies at York helped with computer memory chips when I got stuck with masses of data that had to be reduced to meaningful statistics. The Leche Trust made a contnbution to my upkeep at York when I had financial difficulties. I am indeed grateful to all.
I wish to thank James Mnsinga and Mercy Reuben who were my principal field-support stafffor patiently coping with (my) arduous wode for about five months; Messrs S. Muchiri and D. Nzoya who assisted with most information sources at the Ministry of Health; and Ben Obonyo of Sheria House who provided (with permission) most of the unpublished information compiled by
the Registrar -General's department. I am also grateful to George Masila Musyoka and Wnil.y and Joses Kirigia and other
Kenyans--both at York and elsewhere in the UK who made my stay at York less lonely at one point or another. Non-Kenyans also contributed similarly-Professor Culyer and family (UK),
John Kudjoe (Ghana), Or James Flolu (Ghana), Or (and Mrs Meena) J. Pokharel (Nepal),
Hoffinan Aipira (Malawi), and R Mangalore (India). Fmally but not /east, I wish to record my gratitude to Elizabeth, who has not only patiently
endured my long absence but also has taken care of the f&nily, given me hope, moral support and encouragement through constant mail and occasional phone calls. This work is dedicated to her; our children---Esther Mwithi, Mercy Ndinda and Nancy Mwende for their perseverance and
understanding; and my parents, Mr Julius Nganda and Mrs Lydia Nganda, for the sacrifices they
made in order to educate me. Last, the usual disclaimer applies. None of the individuals or institutions named above bear
any responsibility, by association or any other way, for any errors that may remain in this work. All such errors are solely mine. A similar disca1imer applies to the ideas ecpressed herein----eccep where works of others are used, in which case the source is duly cited.
-~-

-ABSTRACT-
Practically all health care systems are in flux. Regardless of whether they are public or
private, health systems have begun to re-examine their resource utilisation, cost-efficiency and the
effectiveness of services, service provision, adequacy and accessIbility, and equity. Kenya is no
exception to this world-wide trend. In 1989 the refonn process in the health care system was
started by implementing some changes in the public health services sector. These appear to have
been geared more to increasing the amount of resources available to the public health services
sector than to tackling the afore-mentioned. Out-patient user-fees were re-introduced for the first
time since their abolition about 25 year earlier, while contributions to the National Hospital
Insurance Fund were revised into a progressively sliding-scale according to personal incomes.
This thesis views these changes as inadequate to transform the health system into one that
can serve the rising population efficiently and equitably now and in the future (and shows how this
is so), and proceeds to develop a framework of what efficiency and equity in health and health CMe
mean. On efficiency, it is suggested that the health care system should aim to provide only services
that are medically effective, cost-effective, offer the highest payoffs in tenns ofhealth gains, and are
provided at appropriate scales. On equity, after reviewing the basis for equity concern in the
system, and the approach used by the government to realise this objective, a review of various
philosophical and health economics approaches to equity indicates that equity is more than the
mere provision of 'equal opportunity of access', which appears to be the underlying conception of
equity in Kenya. Specificilly, and particularly if efficiency is also taken into account, equity in
health care demands that patients who are 'alike' in 'relevant respects' ought to be 'treated in a
'like' filshion, and those who are 'un1ike' in relevant respects treated in appropriately 'unlike' ways
in a manner similar to the notions of'horimntal' and 'vertical' equity in public finance economics.
A model that can be used as the basis for proposals for health care refonn of the public health care
system is then developed.
Fonowing this frameworlc, several refonn proposals are presented-{l)' the aurent system
with 'modest' internal changes, (ii). the adoption of 'global budgets', (m). the implementation of
prospective reUnbu.rsement, and , (iv). the separation of the purchasing and provision roles through
the implementation of provider markets. These V3l}' both in tenns of content and effect. Following
their assessment in tenns of set criteria (efficiency, equity, ease of implementation/pragmatism, and
adequacy-meet:ing the government's long-term health policy objectives) it has been found that in the long-run the separation of purchaser/provider roles is the most promising proposal for
restructuring the system. This would separate organisationally the funding and provision of health
care. The provision of health care would largely be privatised, but not the demand for it. The
advantage of this separation is that competition and efficiency gains would be aeated combined
with the intrinsic equity of a 'central allocation' system.
-xm-

-CHAPfERONE-
1. INTRODUcnON: SCOPE AND PURPOSE OF THE STUDY
1.0 Introduction
Kenya operates a 'mixed economy of health care' that is largely an outgrowth of the pm
independence patterns of provision It consists of a heterogeneous mixture of government and
non-government activities. Service providers consist of both modem and traditional practitioners.
The government services are more varied in terms of population coverage and the comprehensive
ness of services. The private sector activities are largely biased to curative services. At independ
ence in 1963 the country inherited a health care system that was considered (by the new
government) to have many defects (see chapter two) including an 'unacceptable' distnbution of
health (e.g., in tenns of crude measures such mortality and morbidity-see chapter two), and dif
ferentials in access to health care services. To 'redress' these defects, the new government adopted
a policy of providing free or low cost curative and preventive care services to increase the popula
tion's access to health care servicesl. The system adopted was based on a teclmical or rational
planning model designed to provide uniform services in a'Stalinist-type' framework-a centralised
command and control decision making framework. The decision-making process was vested in
politicians and civil servants at national, regional (provincial and district), and municipal (or some
times county) levels, while the day-to-day operating authority was the responstbility of government
appointed administrators and 'suitably qualified' medical personnel at those levels. This top-down
planning model was deemed a publicly accountable arrangement that would ensure the provision
of necessary services in a universal and cost effective fashion
Available aggregate statistics since independence indicate that the system has generally been
able to partly achieve the objectives it was designed for. 2 At independence there were 148 hospi
tals. By 1989, the lUlInber was 183 (MOHlGOK, 1993). Increased training and career develop
ment opportunities for health persormel have substantially lowered the population-health personnel
ratios. Census statistics show that Kenya's population growth rate rose from 2.5% in 1948 to
3.34% in 1989, having peaked at 3.8% in 1979. This was mainly due to declines in infimt and child
mortality, higher fertility among women in their child bearing ages and improved medical services
I Medical se~ces we~ declared free only for outpatients and all children, though. Inpatients continued to pay, albeIt low, vanous charges.
2 It would not be entirely correct to attribute all the improvements described hereafter to the health services alone. Other factors played their role too, e.g. education, rise in the standard of living, and so on. as indicated.
-1-

that helped reduce still births and generally lowered morbidity and mortality. The crude death rate
declined steadily from 25 per thousand in 1948, to 12 per thousand in 1990. The crude birth rate
on the other hand remained almost unchanged at around 50 per thousand (see Figure 2.1 and the
expJanation thereofin chapter 2). Infant deaths (per thousand live births) declined steadily from an
estimated 184 in 1948 to around 70 by 1990 (although results from a demographic household sur
vey indicate that these 'impressive' overall figures conceal severe regional disparities, with infimt
mortality varying from 107 per thousand in Coast province to as little as 35 per cent in Rift Valley
proviD:e (K~ 1989».
Life expectancy at birth has also increased. The 1991 figure of 59 years compares favoura
bly with 50 years for 'least developed countries' in general. 51 years for sub-Saharan Africa, but
unfavourably with 61 and 74 years at birth for developing and developed countries respectively
(see UNICEF, 1993, Table 1, p. 68). Total fertility-<iefined as the number of live births a woman
gets by the end ofher productive life-bas declined slightly from 6.7 in 1948 to 6.4 by 1991, al
though in 1979 it was 7.9. Despite this decline, the total fertility rate in Kenya is still higher than the
6.0 and 3.7 for developing and developed countries respectively, although lower than that of other
sub-Saharan countries (6.5). The proportion of infdnts with low birth weight in 1990 was esti
mated at 16%, which was lower than the 24% and 15)010 for least developed and developing coun
tries respectively, and at par with that of sub-Saharan Afiica.
But although food availability has grown considerably and has almost kept pace with popu
lation growth, acute malnutrition and other nutrition deficiency disorders prevalent at independ
ence--though no longer considered a national problem--still persist (Kenya, 1992, chapter 6). In
the period 1980-91, the proportion of children of ages 0-4 years suffering from moderate and se
vere underweight was 14% and 3% respectively. That of children aged 12-23 months suffering
from wasting was 5% while the proportion of children aged 24-59 months suffering from stunting
was 32%. Although these proportions are lower than the corresponding proportions in the least
developed, developing or even sub-Saharan countries, there are wide variations between provinces
and districts. For eoounple, the 1987188 rural child nutrition swvey (Kenya, 1992, Ioc. cit.) found
that aD the districts in Coast and Nyanza provinces had stunting rates higher than the national
prevalence rate (which was 19.6%). In the Coast province, Kilifi and KwaIe districts had the high
est proportions of stunting, while Siaya district in Nyanza province held this ignoble trait. Other
ctistricts with higher than average prevalence rates were Machakos and Meru in Eastern, Nyan
darua in Central, and Narok, Kericho and Nakuru in Rift Valley. The swvey also observed that be
sides food intake, rrutritionaI stunting was closely associated with access to clean water and
-2-

sanitation, and literacy rates. In 1990 the proportion of population with access to safe drinking wa
ter was only 21 % in the rural areas and 61 % in the urban areas, and the national average was 300/0.
The proportion of population with access to adequate sanitation was 190/0, 890/0, and 34% res~
tively for rural, urban and the country as a whole.
Overall, Kenya has perfonned comparatively well (particularly in terms of health status) in
relation to the sub-Saharan and other 'least developed' countries (see chapter 2). Substantial
achievements in economic and social development enabled the country to make good progress in
spite of various constraints--both internal and external. The economy grew at an average rate of
5.2% per amrum in real terms between 1964 and 1990 although the growth was not unifonn.
Terms ofttade Balanre of External debt (1982=100) GovellblM
GnMth Growth 01. Pdyments Public IntJation service budget deficit of GDP GDP per Deficit debt rate charges as a All Non oil as a perten1
("/0) ~ta("/o) (K£m) (K£m) ("/0) %ofexpons items itfms <1"GDP
1970 6.4 4 16.8 - 3 3.5· - - -1975 33 03 (16.9) 311.6 18 2.8 - - (8.1)
1980 4.0 (0.8) (722) 941.9 13 5.6 122 121 (73)
1985 4.8 1.4 94.2 2,565.9 11 15.3 92 ~ (43)
1986 5.5 l.9 (73.0) 2,846.5 6 15.6 103 93 (8.6)
1987 4.8 12 104.4 3,209.6 7 18.5 85 75 (4.0)
1988 52 1.6 67.7 3,353.8 11 17.1 88 79 (4.5)
1989 5.0 1.4 ~.5 4,1Ol.6 11 18.5 79 70 (6.3)
1990 4.5 l.0 (168.9) 4,758.1 13 14.72 71 62 (6.8)
• 1972 figure 2 Provisional.
Soorce: CompIed from StatistiaIl AhstIacts and Eoonomic Surveys, varioos years, 1970-1990.
Table 1.1: Trends in some economic indicators, 1970--1990.
Several filctors combined to account for fluctuations in the rate growth, including oil
shocks, deteriorating terms of trade, adverse fluctuations in exchange rates of currencies of
Kenya's major trading partners, especially the (British) pound and the (US) dollar, increased inter
est rates on intemationalloans, increased debt burden, general global economic recessions in the
late 19705 and early 19805, droughts, structural rigidities in some sectors of the economy, and the
effects of expansionary fiscal and monetary policies in the post-oil crises periods, also external se
curity problems. Besides, the 19705 and early 19805 saw a growing participation of govenunent in
-3-

the economy in the provision of social services and in other economic activities through parasta
ta1s. 3 This participation increased government spending and resulted in unsustainable budgetary
deficits. The effect of these crises was reduced growth rates of gross domestic product (GDP) and
income per capita, increased balance of payments deficits, increased public debt and high inflation
ary pressures (see Table 1.1 above). Overall economic perfonnance fhltered.
Government-with backing from the World Bank and the International Monetary Fund
(IMF)-responded to these crises by implementing policy initiatives designed to restructure the
economy. These policies (respectively associated with the institution that backed them) were
structural adjustment and economic stabilisation programmes. Structural adjustment policies were
meant to correct economic imbalances through (social and political) institutional and economic re
fonns so as to achieve sustainable and balanced growth and were of a medium to long term nature.
Stabilisation policies on the other hand were of short-term nature, primarily aimed at correcting
balance of payments dis-equihbria and internal (or sectoral) imbalances. Devaluation, reduction of
direct participation of government in economic activities, decontrol of prices, hberalisation of the
economy, creation of export incentives, and budget rationalisation were some of the
conditionalities imposed for the loan fucilities offered by the two institutions. The programmes
placed stringent controls on the economy, resulting in a gradual run-down of state subsidies and
price inflation Personal incomes fiilled to keep up. The public health care system-which in
1991192 employed some 45,000 people or about six per cent of the total civil service workforce-
was particuJarly adversely affected. A striking fhllout has been a gradual decline in nominal and real
ten:ns of the proportion of the government budget allocated to the health sector. The public health
budget nominally fell from 8% to 5% of total government expenditure between 1964 and 1992,
the decline having accelerated under the programmes. In 1991/92, the total health sector (nominal)
expenditure amounted to K£213.05 millions, equivalent to Ks. 185 per head and 4.9110 of the
GDP.
1.1 Pressures for Refonn of the Health Care System
Despite this 'good' perfonnance at the overall system level, due to the problems alluded to
above, in the eighties the public health services came under critical stress. The govenunent revemle
J This tenn refers to a business entity in which the government has a share-holding, i.e. of joint ownership between the government and private enterprise. This is the equivalent of 'quangos' in the UK. The government need .not. be directly involved in the management of such a corporation, although it has the prerogative to appomt Its own board of management should it desire to do so.
-4-

base shrunk, leading to cuts in public revenues allocated to various components of government
spending. The health sector, being in a rather weak position in the government's list of priority
spending (e.g. as compared with education and defence-see the appendix) among others, was
particularly adversely affected. As a consequence, service provision fiWed to expand as anticipated.
Equipment to deliver services, personnel to staff fucilities, and other inputs (financial and physical)
became increasingly inadequate. At the same time the population was increasing and patient expec
tations were rising. Other contnbutory factors also played their part-though they were not explic
itly recognised, as we show in this dissertation---such as the consequences of the fixed (and almost
guaranteed) institutional budgets and 'assured' personnel salaries, both with strong disincentives
for higher productivity, creating additional disincentives for efficient utilisation of resources.
Against this background, it became imperative to review the structure and organisation of the pub
lic health services, with a view to redefining the role of government in the health sector. In line with
the thrust of the then World Bank policy towards developing countries health care systems (Akin
et al., 1987t, which was still supporting structural reform in the economy, the government, in the
Sessional Paper number 1 of 1986 (Kenya, 1986) contemplated a health policy reform that fOaJsed
on four main areas:
• finding alternative sources of finance, particularly making the 'beneficiaries' of these
services bear a part or all) of the cost of provision, whilst simultaneously making the poor
the major beneficiaries of the expanded resources for and improved efficiency in the
government sector through appropriate subsidy schemes;
• Increased use ofinsurance or other risk coverage schemes;
• Supplementation of government effort by the non-government sector,
• Decentralisation of the public services-in areas of planning, budgeting and purchasing
to increasingly make use of market incentives to guide decisions where appropriate.
1.2 The Initial Response: Refonns in the Financing Arrangements
Following the above, in 1989, outpatient user-fees were reintroduced in public health facili
ties at all levels above the dispensary (since their abolition almost 25 years earlier) and most
4 whose main contentions were that there was: - Insufficient allocations of government spending on cost-effective health activities; - Internal inefficiency of public programs due to under-funding in critical areas, adversely af-
fecting the performance of the sector-reduced effectiveness of personnel, under-utilisation of lower level facilities co-existing with overcrowding in central outpatient clinics and hospitals;
- Inequity in the distribution of benefits from health services due to a bias in investment in the expensive modem technologies that serve a few, mainly urban based clients (who also have better access to non-governmental services), while low cost interventions for the (mainly rural based) masses are under-funded.
- need to mobilise additional resources from other sources, including encouragement of the private sector.
-5-

inpatient charges were revised upwards, while the contributions to the National Hospital Insurance
Fund (NHIF}-previously pegged at Ks 20 for all qualifYing contnbutors (those earning incomes
of Ks. 1,000 and over per month)--were revised into a more progressive schedule in which
contnbutions varied with income.
1.3 The Need for 'Broader Structural Refonns'
But these changes have not brought substantial revenues to the public health system (as an
ticipated-see chapter two) mainly because the user charges are only nominal, and do not cover a
substantial cost of the actual cost of public health services, while the greatest proportion of the in
crease in the NHIF contnbutions gets siphoned to the private sector facilities where most benefici
aries of this Fund seek care. Therefore, the public sector will continue to have inadequate and
poSSlbly even greater declines in the real resources available to fund public health care activities.
Given the government's long term objective of ensuring all Kenyans (in need ofhea1th care serv
ices) have access to such services-and also that the government itselfis the single largest financier
and provider of health care services in the countIy-this trend will make it even more difficult to
achieve the objectives of the public health care sector (see chapter five) unless corrective action is
taken swiftly. If the situation gets worse, it is conceivable that some of the gains achieved so far
may be compromised. In this changed envirorunent, health sector activities can no longer be justi
fied on their ability to provide universal services and to enhance social justice only. Productivity
and efficiency issues have to be important criteria for judging the performance ofhea1th services.
1.4 Purpose and Scope of the Present Study
This thesis is concerned with the design of a basic institutional framework/system for the de
livery and financing of personal services as well as preventive medicine in Kenya in this changed
environment. The framework developed encompasses hospital and clinic based services, training
institutions for doctors, nurses and other paramedical professionals, the role of research in
supporting health services, and the role of various public agencies concerned with preventive pr0-
grams. The aim of the thesis is to provide a sound framework on the basis of which issues such as
the following can be addressed: What kinds of health services should exist in Kenya? Who will get
them and on what basis? Who will deliver them? How are the burdens of financing them to be dis
tnbuted? and, How is the power for the control of these services (between the public and the pri_
-6---

vate sectors) to be distnbuted? The way these questions are resolved in the Kenyan health care
system will determine the level and distnbution of he&th risks in the population, the actions taken
to deal with them, and the degree to which people are helped to regain good health. Macro as well
as micro decisions should be made on the basis ofprinciples--moral (about justice) and economic
(efficiency}-that serve as a public and final basis about how the health care system should be
designed/operate. In this thesis a framework within which he&th planners and legislators can make
more specific and infonned policy decisions is developed The framework provides principled
mechanisms to resolve the often conflicting claims advanced by different groups on the health sys
tem---conflicts that reflect the fundamental differences that ecist between providers and consumers
ofhea1th care, between different groups of providers or consumers, or between different economic
classes, who bear the benefits and burdens of policy decisions differently.
Specifically, the thesis proposes (among others) a refonn strategy based on the use of in
creased competition through contracting in the public sector. The questions raised above are
answered iOOirectly by searching answers for five related questions:
• What seIVices should be provided, now and in the future?-what criteria should be used
to determine what should be provided? and what monitorinWcontroVregulatory
mechanisms should be adopted?
• The system does not generate the relevant infonnation for the most part, so what system
would do this over time if established now?-i.e. what type of infonnation and support
would the 'purchasers' and 'providers' need?
• For whom should these services be provided, and why?
• Who should pay for these services, and how? In other words, what funding
arrangements should be adopted?
• What incentives for efficient behaviour-for providers, patients, and fund~d de
usedfmtroduced? Related to this are other questions: What would be the role of
competition in the 'new' system? What role would the central government play? What
about the private sector? And finally, what would be the role of training, research and
education in the system?
1.5 Organisation of the Dissertation
The rest of the dissertation is organised as follows. The next two chapters provide some
background infonnation on the Kenyan health care system, giving a snap-shot of the
-7-

settinglenvironment under which inefficiency has been cultured. Chapter two describes the demo
graphic characteristics of the Kenyan population and the implications for health services demand in
the future. The trends and distnbution of health resources are then discussed and related to the dis
tnbution of the population The epidemiological situation is then discussed and also related to the
distribution of the health resources. The chapter ends with a discussion of the Kenyan health situa
tion in relation to other developing countries. Chapter three provides a description of the
administrative and organisational structure of the system followed by a review of some studies
done prior to, and during the two financing changes mentioned above. Chapters four and five are
about the theoretical developments and literature reviews. In chapter four we review the concept
of efficiency in the health care system. In chapter five, theoretical issues of equity- focusing on the
various approaches--both philosophical and non-philosophical, and contnbutions from economics,
proposed to shed light on the meaning of equity, are reviewed briefly, and it is shown how effi
ciency and equity can be incorporated in the health policy. Chapter six considers the issue ofincen
tives in the health care system. Theoretical approaches to improving incentive structure (as well as
raising incentive compatIbility) are disaJssed and a model for incorporating incentive structures in
the system is developed. Chapter seven discusses four proposals for health care reform in the pub
lic health sector and looks at their implications. Some suggestions concerning the private sector are
also given. Given the objectives of government policy and reality, the chapter outlines what can be
done to make the Kenyan health care delivery system more efficient and equitable, given the exist
ing constraints. Chapter eight concludes the thesis.
-8-

-CHAPTERlWO-
2. THE SETIING OF THE PROBLEM-I: THE HEALm STATUS SITUATION IN KENYA AND THE DISTRIBUTION OFHEALm RESOURCES
2.0 Introduction
At independence in 1963, Kenya inherited a health care system that was uneven-largely bi
ased towards the hospital sector (curative seIVices), and favowing certain groups (the middle and
higher income) and the urban areas. For example, Nairobi was better provided in terms of medical
seIVices/facilities because this was where most people with high incomes and the head offices of
most philanthropic organisations were located, and also because most doctors and other trained
medical personnel preferred to work there since most either were trained there or in similar envi
ronments and did not want to leave. Thus the environment from the onset provided no incentive
for physicians or facilities to relocate towards the geographical areas with greatest medical
need-mainly the rural areas. Therefore the distnbution and location of facilities were largely influ
enced by the benef3ctors, beneficiaries and providers. Moreover, the practice of case selection that
emphasised the development of techniques for curable or potentially curable patients led to a health
care system that favoured cUrative seIVices. Thus the service mix was also biased in favour of cura
tive medicine. As a result, as we show below, health care resources were unevenly distnbut
ed-between seIVices, areas, and social groups, and generally ineffectively used, given the
country's health problems. This trend has persisted for over 30 years now. The survival to a great
extent of the unequal pattern of regional provision per head ofcrude population (see below) after
more than 30 years of public direction by a government which recognised this problem at the time
it ascended to power-among others---is the issue addressed in the present and the next chapter.
This chapter provides an overview of the epidemiological situation and looks at the distnbu
tion of health resources in relation to the epidemiological profile. The chapter is organised as fol
lows. Section 2.1 provides a surnmaIY of the major demographic characteristics and their
implications for the health services. Section 2.2 discusses trends in various types of health re
sources, both over time as well as their distnbution between regions. Section 2.3 then discusses the
epidemiological situation, both over time as well as across geographic regions within the country
and attempts a link. of this with the distnbution of health resources. Section 2.4 provides some in
ternational comparisons. Section 2.5 concludes the chapter.
-9-

2.1 Demographic Characteristics and ImpUcations for the Health Services
To study the patterns of morbidity and mortality it is essential to know the demographic
backgrOlUld of the COWltIy under study, because, among other factors, the frequency of disease
and death is related to the age and the sex structure of that popu1ation, its geographical distribution
and the migration processes, and the level and distribution of health resources. This section exam
ines the major demographic characteristics of the Kenyan population The focus is on the broader
features of Kenya's demographic situation that may provide information about the qua1ity ofIife in
reIation to the available health resources.
2.1.1 General demographic trends
The demographic data used in this study comes from the 1979 and 1989 popu1ation census
reports, supplemented with infonnation from other sources such as the earlier census reports, sta
tistical abstracts and various fertility and health surveys conducted by the Central Bureau of Statis.
tics (CBS) and the Kenya Population Council (KPC).
The recorded population of Kenya at the time of the first national census in 1948 was 5.4
millions. The 1969 census returns showed the population had grown to 10.943 millions, indicating
the population had doubled in approximately 21 years. The 1979 census recorded a total popula
tion of 15.327 millions, showing a trebling of the population in approximately 30 years. The 1989
census on the other hand indicated that the total population in that year was 21.469 millions-an
intercensal growth rate of approximately 3.34 per cent between 1979 and 198~ -indicating the
population had nearly quadrupled in approximately 40 years. Such a high rate of population
growth (as compared to the growth rates in developed countries for example) has grave implica
tions on the ability of the govennnent to provide essential services such as health care, education,
and other social services over the long tenD, besides the retarding effects it has on the capital for
mation capacity of the economy as a whole. Let us examine some aspects of the demographic
situation that have a bearing on 'health needs', such as the structure and the distnbution of the
population
, Due to organisational inadequacies in the census exercise, the CBS considers this figure an underestimate and estimated the actual population to have been about 23 millions [Kenya, (1991), CBS, p. 33].
-10-
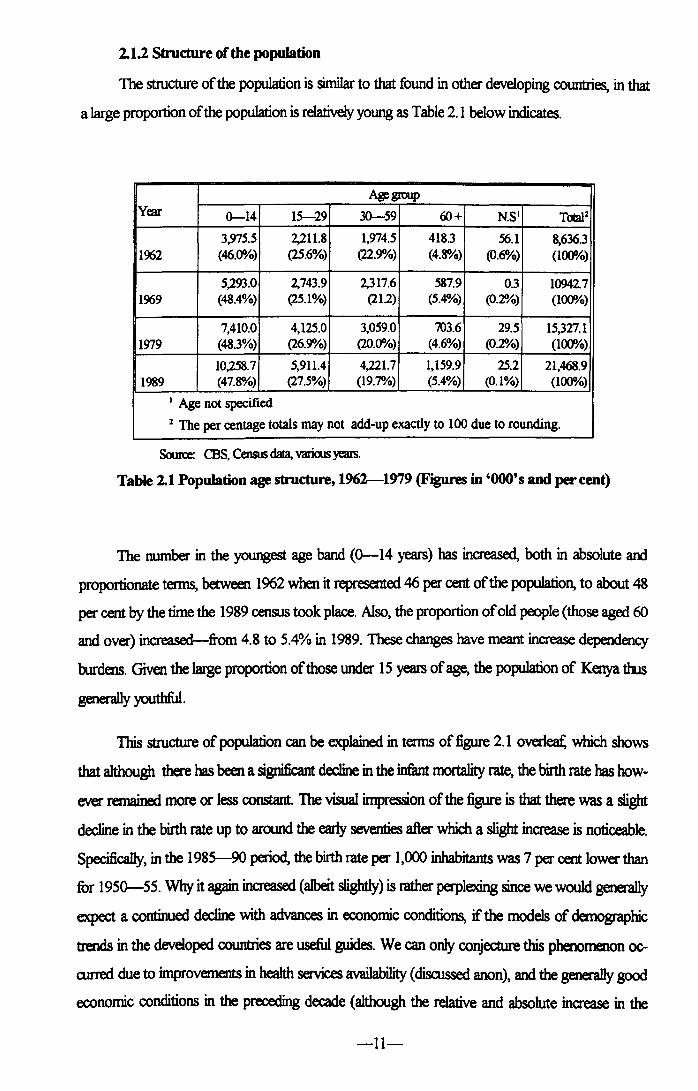
2.1.2 Structure of the population
The structure of the population is similar to that found in other developing countries, in that
a large proportion of the population is relatively young as Table 2.1 below indicates.
AiJ!group Year 0-14 15-29 30-59 60+ N.S· TcAaJl
3,975.5 2,211.8 1,974.5 418.3 .56.1 8,636.3 1962 (46.0010) (25.6%) (22.91110) (4.8%) (0.6%) (100010)
5,293.0 2,743.9 2,317.6 587.9 0.3 10942.7 1969 (48.4%) (25.1%) (212) (5.4%) (0.2%) (100010)
7,410.0 4,125.0 3,059.0 703.6 29.5 15,327.1 1979 (48.3%) (26.91110) (20.0010) (4.6%) (02%) (100010)
10,258.7 5,911.4 4,221.7 1,159.9 25.2 21,468.9 1989 (47.8%) (27.5%) (19.7%) (5.4%) (0.1%) (100010)
• Age not specified
1 The per centage totals may not add-up exactly to 100 due to rounding.
Source: CBS, Cemus data, various years.
Table 2.1 Population age structure, 1962-1979 (Figures in '000' 5 and per cent)
The number in the youngest age band (0--14 years) has increased, both in absolute and
proportionate terms, between 1962 when it represented 46 per cent of the population, to about 48
per cent by the time the 1989 census took place. Also, the proportion of old people (those aged 60
and over) increased-from 4.8 to 5.4% in 1989. These changes have meant increase dependency
burdens. Given the laIge proportion of those under 15 years of age, the population of Kenya thus
generally youthful.
This structure of population can be explained in terms of figure 2.1 overleat: which shows
that although there has been a significant decline in the infant mortality rate, the birth rate has how
ever remained more or less constant. The visual impression of the figure is that there was a slight
decline in the birth rate up to around the early seventies after which a slight increase is noticeable.
Specifically, in the 1985-90 period, the birth rate per 1,000 inhabitants was 7 per cent lower than
for 1950--55. Why it again increased (albeit slightly) is rather perplexing since we would generally
expect a continued decline with advances in economic conditions, if the models of demographic
trends in the developed countries are useful guides. We can only conjecture this phenomenon 0c
curred due to improvements in health services availability (disalssed anon), and the generally good
economic conditions in the preceding decade (although the relative and absolute increase in the
-11-

proportion of females in the population might also be an important contributory filctor---5ee the
next sub-section). Infimt mortality rate over the same period fell by just over one half The death
~ by comparison, also declined, albeit slightly over this period. The decline in mortality rate can
be attnbuted to improved health services situation in the country and the increased emphasis during
the late 196Os, the 1970s and 1980s on immunisation, particularly .immunisation for childhood dis
eases. The impact of these is particularly evident in the decline in infant mortality. The unchanged
birth rate might be attnbuted to the 'delayed response effect' whereby, given the previous high in
fimt mortality levels, it takes a while for people to adjust to the new lower levels and adjust their
fiunily sizes accordingly. The overall result has been an increase in the population in the lower age
brackets-notice (from table 2.1) the proportion of those under 30 has increased during the
period.
160 .......................................... .
60 •..•.••....•.•......•......................
40 ...................•.......................
Crude death rate 20 •.••••••••• . •.•
1950-55 1955-60 1960-65 1965-70 1970-75 1975-80 1980·85 1985-90 Period
Period 19'0-" 19"-60 1960-6' 1963-70 1970-7' 197s-80 1980-8' 198' ·90 Crude birth rate 33.3 ,1.1 49.9 48.2 48 48.3 49.7 49.7 Crude death rate 26.9 24.7 22., 20.3 18.1 1'.9 14 12.4
li1tid~rate 1'.0 13.0 11.8 10.8 93 88 III 72
Figure 2.1: VItal population statistics: 1950-1990
2.1.3 Life expectancy
Life expectancy at birth improved from 39 yE"MS in the 1950-55 period to just over 55
years in the 1985-90 period. The life expectancy for females has been higher than that of men
-12-

(fable 2.2). The result was an increase in the proportion of females in the population The propor
tion offemales in the 1989 census was 50.4 per cent.
Period
1950-5 1955-6 l~ 1965-7 197(}'-75 1975-8 1980-8 1985-9 5 0 5 0 0 5 0
Life~ iat tirth nyears
Ma1es 37.1 39.1 41.4 43.8 46.3 48.9 51.2 53.5
Females 40.2 42.3 44.6 47 49.6 52.3 54.7 57.1
An 38.6 40.7 43 45.4 47.5 SO.5 529 55.3
Table 2.2 Life expectancy at birth by sex: 1~1990
The population age and sex structure are dominated by the (almost non-discriminatin) ef
fect of mortality as it affects different cohorts, and cannot reveal the significant difference that exist
between the wban and rural populations. The wban type of age and sex structure is illustrated by
the Nairobi pattern that differs widely from that of the rest of the provinces, as shown by the
census data, shown for two census years in Table 2.3 below. The pattern shown in the table arises
out of in- and out-migration of people that results in the influx of people (mostly those over 15
years) into the wban areas, and this trend seems to become more evident over time as the intercen.
sal changes indicate. In the 1989 census, the percentage of under age 15 population was 47.8 per
cent. A similar situation existed in the 1979 and 1969 population censuses.
In general, whereas in the rural areas the proportion of under-age popu1ation (under 15
years) for both sexes is well over 48 per cent, in the main wban areas it is lower. Provinces that
have a tendency of gaining migrants-such as Nairob~ Coast and the Coast province have a low
proportion of children, and a higher proportion of adults (particularly ages 15-44), whereas those
losing migrants, e.g., Central, Eastern and Western have a high proportion of children. The Nairobi
figure of 31 per cent in 1989 is less than the national average due to this influence of in- and out
migration Also, there is a tendency for out-migration areas (mainly rural districts) to show a defi
ciency of the male population In the wban areas, therefore, there is a tendency for the males to
dominate the migration streams. However, in some of the smaller wban centres, the proportion of
the under -age population and sex ratios are closer to those of the rura1 areas.
-13-
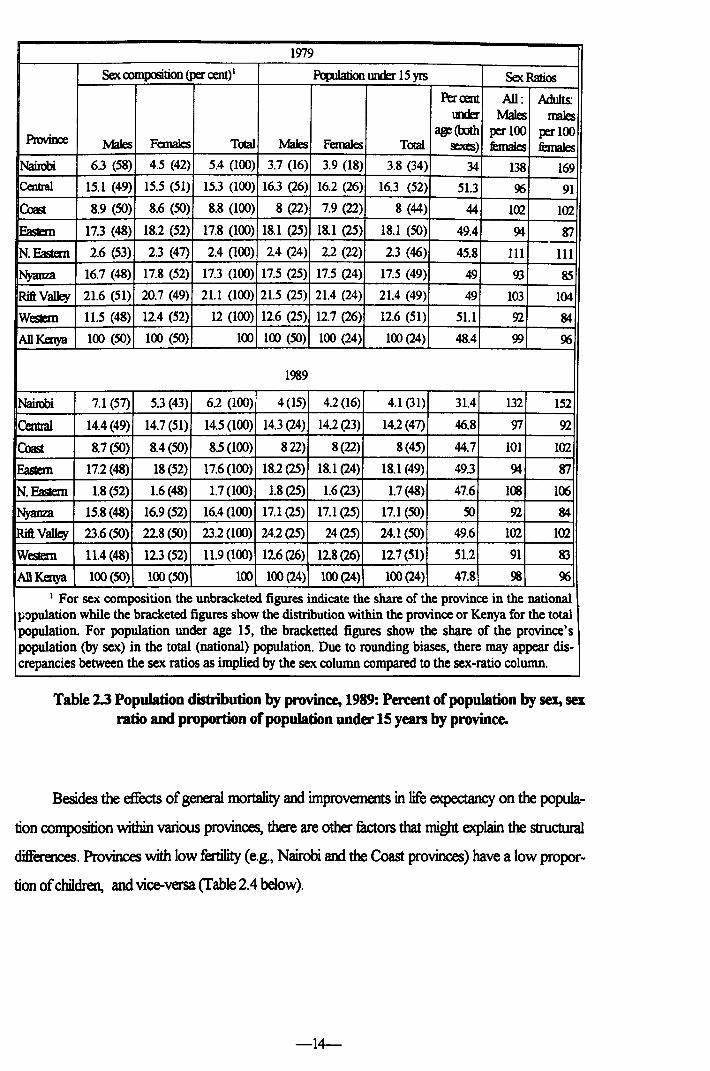
1979
Sex composition (per cent) 1 PopJIation tmder 15 yrs Sex Ratios
Percent All: Adults: \DJer Males males
Provioce age(OOth per 100 per 100
Males Females Total Males Females Total sexes) remaIes bnales Nairobi 6.3 (58) 4.5 (42) 5.4 (100) 3.7 (16) 3.9 (18) 3.8 (34) 34 138 169 Central 15.1 (49) 15.5 (51) 15.3 (100) 16.3 (26) 16.2 (26) 16.3 (52) 51.3 % 91
Coast 8.9 (SO) 8.6 (SO) 8.8 (100) 8 (22) 7.9 (22) 8 (44) 44 102 102
~ 17.3 (48) 18.2 (52) 17.8 (100) 18.1 (25) 18.1 (25) 18.1 (SO) 49.4 94 ~
N.Eastem 2.6 (53) 2.3 (47) 2.4 (100) 2.4 (24) 2.2 (22) 23 (46) 45.8 III 111
Ny.mza 16.7 (48) 17.8 (52) 17.3 (100) 17.5 (25) 17.5 (24) 17.5 (49) 49 93 85
RiftVa1ley 21.6 (51) 20.7 (49) 21.1 (100) 21.5 (25) 21.4 (24) 21.4 (49) 49 103 104
WesIiem 11.5 (48) 124 (52) 12 (100) 12.6 (25) 12.7 (26) 12.6 (51) 51.1 92 84
ADKenya 100 (SO) 100 (SO) 100 100 (SO) 100 (24) 100 (24) 48.4 99 %
1989
Nairobi 7.1 (57) 5.3 (43) 62 (100) 4(15) 4.2 (16) 4.1 (31) 31.4 132 152
Central 14.4 (49) 14.7 (51) 14.5 (100) 14.3 (24) 14.2 (23) 14.2 (47) 46.8 97 92
Coast 8.7 (SO) 8.4 (SO) 8.5 (100) 822) 8(22) 8(45) 44.7 101 102
~ 17.2 (48) 18 (52) 17.6 (100) 18.2 (25) 18.1 (24) 18.1 (49) 49.3 94 ~
N.Eastem 1.8 (52) 1.6 (48) 1.7 (lOO) 1.8 (25) 1.6 (23) 1.7 (48) 47.6 1<lJ 106
NyarrlJl 15.8(48) 16.9 (52) 16.4 (100) 17.1 (25) 17.1 (25) 17.1 (SO) 50 92 84
RiftValley 23.6 (SO) 22.8 (SO) 23.2(100) 24.2 (25) 24(25) 24.1 (SO) 49.6 102 102
WesIem 11.4 (48) 12.3 (52) 11.9 (100) 12.6 (26) 128(26) 12.7 (SI) S1.2 91 83
ADKenya 100 (SO) 100 (SO) 100 100 (24) 100(24) 100 (24) 47.8 98 96
1 For sex composition the unbracketed figures indicate the share of the province in the national population while the bracketed figures show the distribution within the province or Kenya for the total population. For population under age IS, the bracketted figures show the share of the province's population (by sex) in the total (national) population. Due to rounding biases, there may appear dis-crepancies between the sex ratios as implied by the sex column compared to the sex-ratio column.
Table 1.3 Population distribution by province, 1989: Percent of population by sex, sex ratio and proportion of population unda' 15 yean by province.
Besides the effects of general mortality and improvements in life expectancy on the popula
tion composition within various provinces, there are other mctors that might explain the structural
differences. Provinces with low fertility (e.g., Nairobi and the Coast provinces) have a low propor
tion of children, and vice-versa (Table 2.4 below).
-14-

PopJIation Under Infimt mortality Under five mor- Childhood mor-Province! 15 years (1989) Fertility Rate2 rate2 tality~ talitymte2
Nairobi 31.4 4.6 46.3 ro.4 35.7
Central 46.8 6 37.4 47 10
Coast 44.7 5.5 107.3 156 54.5
Eastern 49.3 7 43.1 64.3 22.2
Nyarrza 47.6 7.1 94.2 148.5 ro Rift Valley 50 7 34.6 50.9 16.9
WesIem 49.6 8.1 74.6 132.8 62.9
Kenya 51.2 6.7 58.6 90.9 34.3
! Data on mortality and fertility is not available for North Eastern province.
2 According to 1989 Kenya demographic and Health survey. Mortality rates are for the period 1979-1989.
Table 2.4 Proportion of population under 15 in relation to fertility rate, infan~ under fIVe and childhood mortality rates
Except for coast and Central provinces, areas with high i.nfunt mortality (i.e., tmder age 1
mortaIity), childhood mortality (i.e., tmder age 15 mortality) and under-five mortality portray high
proportions of children--poSSlbly due to replacement and precautionary childbearing behaviour. It
is difficult to explain why Central province has the highest proportion of children using this ap
proach, since it not only has a lower than the national average rate of fertility, but also has the low
est rates of childhood and under five mortality. A poSSlble explanation is that Central province,
being close to Nairob~ besides having a well educated (and therefore mobile population), loses
most of its adult population to the City and other urban areas. On the other hand, the Coast prov
ince is different in that it not only has a low proportion of children to adults, it also has the highest
rate ofinfimt and tmder five mortality. It is diffirult to reconcile these tw06 but it should be noted
that the province contains Kenya's second largest city-Mombasa, and we may be getting the ef
fect of that city's popuIation structure reflected in the overall provincial population structure. The
Eastern, Western and Nyanza provinces have high proportions of young populations and coJn}o
spondingly high fertility and child mortality rates. Western province, with the highest overall child
hood mortality also has the highest fertility rate. Similarly, Eastern province, with the lowest
(among these three only) childhood mortaIity also has the lowest fertility (again, among the three
only).
6 That is, unless we assume the infant and under five mortality is so high as to contribute to this outcome-a questionable assumption since we would expect a decline in the population over time-a result not supported by the facts.
-15-

2.1.4 Dinribution of the total population and urbanisation
The total population of Kenya is unevenly distnbuted, with a nation-wide density of 37
persons per square kilometre in 1989. The distribution of the rural population closely follows the
pattern of rainfiill in the country. Most of the rural population is concentrated in three areas in the
country. The first cluster is around the lake region, with a broad base on the Lake Victoria basin.
This chJster stretches unevenly into some parts of the Rift Valley, and across onto the eastern side
in the Central and Eastern Provinces. These areas experience precipitation levels of more than soo mm. annually. The second major cluster lies to the East of the central Rift Valley and extends
roughly from north of Nairobi to Mount Kenya and down to the Mua hills in Machakos District.
The third major population cluster is along the coastal region, besides the major wban centres
there. The rest of the country is sparsely populated.
Environmental conditions play a vital role in the health of the population of any country. The
distnbution of the population between the urban and rural envirorunent is one important environ
mental consideration. Table 2.5 shows the wban and rural population by province for the 1969 and
1979 censuses respectively7.
1969 1979
% afto1al' %oftDlal' Province UIbm Rural Taal' pqWtion UIbm Rural TOlaI' pq1IIaion
Nairobi 100 0 100 4.7 100 0 100 '5.4
Central 2.7 fJ7.3 100 15.3 5.5 94.5 100 15.3
Coast 30.1 iQ 100 8.6 30.3 69.7 100 8.8
EasIern 2 98 100 17.4 8.6 91.4 100 17.8
N.Eastern 0 100 100 23 17 83 100 24
Ny.mza 21.).7 79.3 100 19.4 7.9 92.1 100 17.3
rutlValley 6.7 93.3 100 20.2 10.5 89.S 100 21.1
Western 0.8 99.2 100 121 5.8 94.2 100 12
Kenya 13.5 86.5 100 100 15.1 84.9 100 100
, Some totals may not add up to 100 due to rounding.
Table 2.5: Percentage distribution of urban and rural population by province, 1969 and 1979.
By international standards, the level ofwbanisation in Kenya is low. The urban population is
concentrated in the two major cities-Nairobi and Mombasa and other upcoming urban ar-
1 Similar information from the 1989 population census was not available at the time of writing.
-16-
eas-Kisumu, Nakuru, and Eldoret, etc. Although in the inter-census years some wban bounda
ries changed, the ruunber ofwban centres with populations more than 2,000 persons increased.
Nairobi's share of the total wban population declined with the advent of other wban centres. 100
rate of increase of the wban population is generally well above that of the rest of the countIy. This
trend continued between 1979 and 1989 censuses. Initial analytical results of the 1989 census data
revealed the wban population had increased to about 3.8 million by 1989, giving an intercensal
growth rate of 4.8 per cent per amrurn and a 19 per cent proportionate share of the total popula
tion compared to 15 per cent in 1979.
2.1.5 Condusion
In conclusion, it is therefore notable that the Kenyan population is not only generally youth
ful, but its sex composition shows there are more females one average. Besides, the population is
growing at a fairly fast rate. Moreover, most of this population resides in the rural areas where the
provision of health services is a demanding task, particularly given its uneven distnbution and the
differences in ecological conditions that lead to differential disease patterns across regions. The
concerns for the future health of such a population and the ensuing demands upon the heath serv
ices are undoubtedly real ones.
2.2 Trends in public health expenditures in the 1980's and regional resource distribution
2.2.1 Financial resources Trends in public heoJth expendiJures in the 1980's
Figure 2.2 below shows public expenditure on health, education, defence and other social
services in the 1980's in constant (1982) prices. The nominal figures have been deBated using a
simple index of government spending which is deJived by dividing nominal government spending
with constant price government spending as given in the national income accounting marruals. Ideo :~
ally, sectoral indices should be used but these are not available for Kenya The figure shows both
health and other social services took a small (and almost constant) proportion of the government
budget. Education and defence, on the other hand, took comparatively 1arge and inaeasing pr0-
portions. Owing the period, the economy as a whole did not perfonn well and health and other s0-
cial services bore the brunt of this poor economic performance.
-17-

£~o r-------------------------------------------~
m~--~----~--~--~--~--~--~--~--~--~~
1980/81 198112 198213 1983/4 198415 1985/6 198617 1987/8 1988/9 1989/90 1990191
Year (fiscal) ... Total health care expenditure * Recurrent health care expenditure .. Education
e Defence .. Other Social Services
Figure 2.2: Public expenditure on health, education, defence and other social services, 1980/81-1990/91
There is a general reIationship, though not very strong, between real GNP changes and vari
ous fonns of government spending in real tenns (see Figure 2.3, below). The government budget
appears to follow the trend of GNP with roughly a one year Jag. The expenditures themselves in
turn appear to relate to the government budget with a short time Jag. But education and health ex
penditure appear to rise and fall more or less in line with trends in real GNP than with the govern
ment budget. But the expenditures show greater variance than GNP. The biggest variance is
displayed by defence expenditures which on average take a while longer to respond to the changes
in real GNP. The government budget swings are less pronounced compared to specific expendi
ture changes.
Figure 2.4 below shows there has been a general decline in the per capita spending on
health, but the rate decelerated in the second half of the 1980s. Per head (public) expenditure on
education continued to ~. In many countries, the shares of resources devoted education and
health tend to be nearly the same, with health taking a lightly lower share (see below). The share of
the GNP devoted to health has fallen over time. In tenns of the overall financing of the health serv
ices, between 1980/1 and 1990/1 fiscal years8 the public expenditure on health as a percentage of
Gross National Product (GNP) declined throughout.
I The fiscal year of the Kenya Government runs from July 1 through June 30.
-18-

50r-------------------------------------------------.
30 - - - - - - - - - - - - - - - - - - - - - - - - - - - - - - - - - - - - - - - - - - - -
J 10 ~ ~ 0 ~ 8. -10
-30~----~----~----~--~----~----~--~----~----~
1980/81 198112 1982/3 1983/4 1984/5 198516 198617 1987/8 1988/9 1989/90 Year (fiscal)
& Changes in health care expenditure + Changes in GNP '* Changes in education expenditure .... Changes in defence expenditure + Changes in government budget
s
FIgUre 2.3: Relationship between GNP, government budget and various fonns of government expenditures, 1980/81-1990/91
£20~------------------------------------------------,
8' £15
ro~----~--~----~--~--~----~--~--~----~--~~
1980/81 198112 198213 1983/4 1984/5 198516 1986n 1987/8 1988/9 1989/90 1990/91 Year (fiscal)
~ Total health care expenditure .. Recurrent health care expenditure ... Education '* Defence .. Other Social Services
Figure 2.4: Per capita public spending on selected services trends: 1980/81-1990/91
This analysis (of trends in the levels of public health expenditures) reveals two major prob
lems relating to them. FU'St is the low level of GNP which leads to low levels of spending on health
care. Second, in recent times there has been a decIine in the proportion of GNP devoted to health
care. Since we have no reason to suppose that there will be any significant changes in the propor
tion of GNP resources being allocated to the health sector, and in the worst scenario, this propor-
-19-

tion will contiIDJe to decline, both in nominal and real tenns, any major improvements in the sector
nrust in the main come from better use of the currently available resources--rnainly through im
proved efficiency in the use of resources.
The regionoJ aJIocoIion 0/ jinanciaI resources in reJotion regionoJ population shares
The regional distribution of the Ministry of Health resources by provinces is shown in Table
2.6 (below) for the year 1989. The table shows there are disparities in the allocation ofMinistIy of
Health recurrent financial resources between provinces. Colunm 1 shows the overall share of each
province in the MOH budget. Colunm 9 shows the share of each province's total population. The
Coast province, which accommodated only 9 per cent of the total population, received about 15
per cent of the MOH budget. The North Eastern province, which housed less than 2 per cent of
the total population received over 4 per cent of the MOH resources, and so on Colunm 10 shows
the overall implications of such disparities in the allocation--differences in per capita spending on
health. This disparity ranges from K£119 per capita in North Eastern province to less than K£4 per
capita in Rift Valley and Nyanza Provinces (K£3.52 and K£3.60 respectively). The national per
capita spending on health in 1989190 was K£4.77. Four out of eight provinces had per capita ex
penditures lower than this average (i.e., Nairob~ Eastern, Nyanza, and the Rift Valley). North East
ern province had more than double the national average. Whether there is any justification for such
disaepancies will be assessed- in section 2.3 below-after we have discussed the patterns of
motbidity and mortality. Other columns (2-8 ) show there are variations in allocations of specific
budgets.
Thus there are wide per capita regional variations in the allocation of public health care ex
penditures among the regions in the country, variations that at this point we cannot tell whether
they are justifiable until we have examined the clistnbution of the ill-health burden in the country.
This will be necessmy since to achieve a balanced and rational distnbution ofhea1th resotU'CeS, it is
necessary to relate the inputs (resources) to the outcomes (health status). But before we attempt
such a comparison, let us further examine the trends in other health related resources-the stocks
of physical resources.
9 K£1=Ks20.
-20-

All Prom' Rural Shared Per MoH I Admin1 Prov. 4 Dist. 6 PfevB Health Train 11 i3cilit12 Capita &p2 &p2 Hosp.' Hosp.' ~9 SeM;10 ServsIO SeM;10 Pq>13 RHCEI4
% % % % % % % % % K£
Cohmm~ 1 2 3 4 5 6 7 8 9 10
NaiIOOi 6 11 7 - 9 - 44 7 6 4.34 Central 15 11 11 19 10 19 10 11 15 4.85 Coast 15 13 16 16 19 10 9 16 9 8.42
EasIem 16 13 14 19 13 19 9 14 17 4.38 N.Eastem 4 12 6 3 5 2 2 6 2 10.79 Nyanza 13 13 14 9 14 17 12 14 17 3.60 Rift Valley 17 16 18 18 17 14 10 18 23 3.52
WesIem 15 11 13 17 13 20 4 13 12 5.98
All Kenya 100 100 100 100 100 100 100 100 100 4.n I Ministry of Health; 1 Expenditure; 1 Administrative; 4 Provincial; , Hospitals; 6 District; 7
Promotive; 8 Preventive; 9 Medicine; 10 Services; 11 Training; 12 Facilities; 13 Population; 14 RHCE: Recurrent health care expenditure.
Table 2.6: Regional distribution of recurrent public health expenditure by the Ministry of Health: 1989190 (percentages)
2.2.2 Physical resources
Trends in physicol resources
The stock of health filcilities in the country grew substantially since the 1960' s. Available
data shows in 1967 there were 199 hospitals in the Republic, 76 of them (38 per cent) being public
hospitals, catering for a total population of about 9 million. In 1970, the munbers for health centres
and dispensaries were 195 and 603 respectively. Of the 195 health centres, 173 were operated by
the central government, 18 by numicipalities and only 4 by missions. Of the 603 dispensaries in the
country then (1970),378 were nul by the central government, 152 by missions, 59 by private com
panies, and the rest (14) by nnmicipaJities. By 1978, the proportion of government hospitals (118)
had risen to 52 per cent. Figure 2.5 below shows the trends in health tacilities in the country for the
period 1978-1990. The largest increase during the period occurred in the stock of health centres
(49 per cent) while dispensaries increased by 42 per cent Hospitals increased by about 20 per cent
during the period.
The public hospitals vary considerably in size and tacilities10• The national referral hospital,
Kenyatta National hospital, and most provincial hospitals are categorised as grade 1 while most
district hospitals are graded 2. There are also what are called grade 3 hospitals or cottage hospitals
10 This is also true of the private and mission hospitals.
-21-

-usually without a permanent resident doctor. Grade 1 hospitals are usually well staffed and
equipped. Available figures on government hospital size (by bed capacity) show that in 1989, Ken
yatta National Hospital was the largest of the grade 1 hospitals, with a total of 1,662 beds. The sec
ond largest was Mathare Mental Hospital (1,13 8 beds). The average size of the provincial hospitals
was 460 beds. The largest maternity hospital, Pumwani, had 329 beds. District and sub-district (or
cottage) hospitals varied in size from as few beds as 9 (Othaya hospital) to 352 beds (Eldoret Hos
pital) with an average of 134 beds.
1600
1500
1400
1300
1200 --------------------
1100 -
1000 -
900
800
700
600 -
500 -
400
300
200
100
1978 1979 1980 1981 1982 1983 1984 1985 1986 1987 1988 1989 1990
11 Dispensaries fII Health Centres _ Hospitals
1978 1979 1980 1981 1982 1983 1984 1985 1986 1987 1988 1989 1990
Ha;pitals 225 226 216 221 220 216 213 243 249 254 260 264 268
WCmIrcs 201 233 241 262 7:76 288 299 269 7:76 282 294 294 299
Dispensaries' 1,103 1,088 1,087 1,130 1,13S 1,213 1,273 1,173 1,424 1,s3S I,sS) 1,s5S 1,s64
1 Includes sub-health centres; Data for each type of facility are for both private and public sector.
Figure 2.5: Trends in health facility stock by typ~ (1978-1990):
-22-
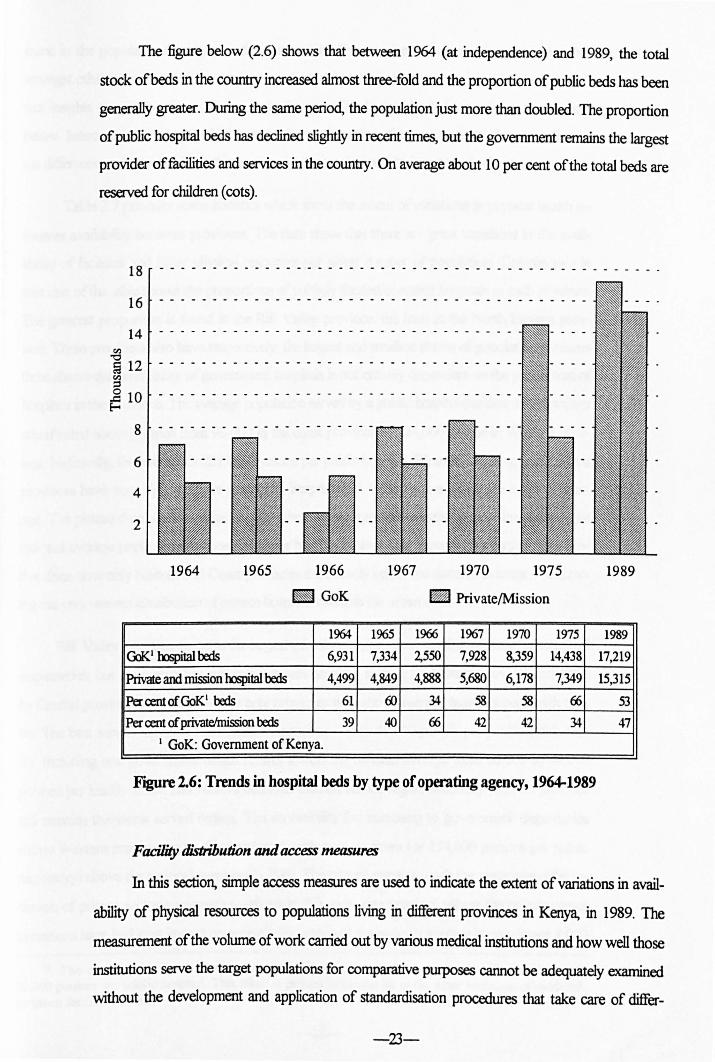
The figure below (2.6) shows that between 1964 (at independence) and 1989, the total
stock ofbeds in the countIy increased almost three-fold and the proportion of public beds has been
generally greater. During the same period, the population just more than doubled. The proportion
of public hospital beds has declined slightly in recent times, but the government remains the largest
provider of facilities and services in the country. On average about 10 per cent of the total beds are
reserved for children (cots).
18 - - - - - - - - - - - - - - - - - - - - - - - - - - - - - - - - - - - - - - - - - - - - - - - .
16 - - - - - - - - - - - - - - - - - - - - - - - - - - - - - - - - - - - - - - - - -
14 - - - - - - - - - - - - - - - - - - - - - - - - - - - - - - - - - -
~ fa 12 ~ °10 ~
8
6
4
2
1964 1965 1967 1970 1975 1966
~ GoK • Private/Mission
1%4 1965 1966 1967 1970 1975
GoK I OOspital beds 6,931 7,334 2,550 7,928 8,359 14,438
Private and mission OOspital beds 4,499 4,849 4,888 5,680 6,178 7,349
Per cent of GoK1 beds 61 ro 34 58 58 66
Per cent of privatelmission beds 39 40 66 42 42 34
I GoK: Government of Kenya.
Figure 2.6: Trends in hospital beds by type of operating agency, 1964-1989
Facility distribution and access measures
1989
1989
17,219
15,315
53
47
In this section, simple access measures are used to indicate the extent of variations in avail
ability of physical resources to populations living in different provinces in Kenya, in 1989. The
measurement of the volume of work carried out by various medical institutions and how well those
institutions serve the target populations for comparative purposes carmot be adequately examined
without the development and application of standardisation procedures that take care of differ-
-23-

ences in the populations being seIVed--oornposition by sex, age, incomes, education, etc., and,
amongst others, the complexity of patient conditions that the institutions receive. However, impor
tant insigbts can still be discovered without the use of such complicated procedures as we show
below. Inaccuracies are inevitable, because of cross-boundary flows of patients, for example, and
the c:fi1Fenn:es mentioned above. Consequently, the resuIts must be interpreted with caution
Table 2.7 provides some statistics which show the extent of variations in physical health re
sources availability between provinces. The data show that there are great variations in the avail
ability of fBcilities and other physical resources per given number of population. Column two in
part one of the table shows the proportions of publicly funded/operated hospitals in each province.
The greatest proportion is found in the Rift Valley province, the least in the North Eastern prov
m. These provinces also have respectively, the largest and smallest shares of population Colwnn
three shows that availability of government hospitals is not entirely dependent on the proportion of
hospitals in the province. The average population served by a public hospital (subject shortcomings
adumbrated above), varies from 93,000 in the coast province to 424,000 people in Western prov
ince. Nationally, the average is 221,000 persons per public hospital. Western, Nyanza, and Eastern
provinces have very high munbers per public hospital. Rift Valley is just above the national aver
age. The picture changes somewhat slightly when we incorporate non-government hospitals- the
national average population per hospital drops by 50 per cent. This average is nevertheless decep
tive since now only Nairobi and Coast provinces are actually below the national average -indicat
ing the Vf!rj Wleven distribution of private hospitals towards the urban areas 11.
Rift Valley province contains the largest (absolute and relative) munber of health centres and
dispensaries, but the population per public health centre is highest for Eastern province, followed
by Central province and Nyanza--the only provinces with above average numbers per health cen
tre. The best served region is North Eastern provin~with 41,000 people per public health cen
tre. Including non-government health centres lowers the national average from 56,000 to 44,000
persons per health centre, and Nairobi becomes the best served region nationally. Eastern province
still remains the worst served region The accessIbility (by numbers) to government dispensaries
shows Western province to be disadvantaged, with over six times (or 134,000 persons per public
dispensary) above the national average (21,000). The picture remains IIUlch the same even after in
clusion of private sector dispensaries--5howing this to be one province where the private sector
operations have had least impact on accessability, although the national average is now lower 8, ()()()
11 The average for Coast province, excluding Mombasa-the second largest city in Kenya, is 92,000 persons. per p~blic hospital. This effect is present in almost all of the other measures of availability given for this proVInce.
-24-

persons per dispensary, and Western province's access figure improves substantially (now 46,000
only}--but still remains about 6 times above the national average! Nevertheless, there has been an
improvement since the 1970-75 Development Plan, when the (public) ratio varied from
1:100,000 to 1:50,000, with an average of 1:65,000. In 1989, the dispersion was between
1:41,000 and 1:70,000, with an average of 1:56,000. (Remember, on paper health centres are de
signed for catchment popuJations of around 30,000)
PART ONE
1 2 3 4 5 6 7 8 Shareof' Share of Share of
GOK PopJIation GOK Popi1atioo GOK HOIIpitaIs PopJIation per H/a:drcI Pop11ation per Dispensaries
in the perOOK HOIIpita1- in the perOOK H/a:nIre- inthc Province HOIpital All Province H/cenIres All Province
% ('OOO's) ('OOO's) % ('000'8) ('OOO'S\ %
Nairobi 7 192 64 8 45 33 4 Centrnl 15 'Ml 115 11 71 57 16
~ 21 93 (f) 10 47 43 15
~ 15 248 133 12 81 59 17 N.Eastem 3 124 124 2 41 41 3
Nyanza 9 395 148 15 61 46 U
Rift Valley 23 222 117 25 51 37 32
WesIem 6 424 121 16 42 37 2
Kenya 100 221 111 100 56 44 100 PART 1WO
ShIre of PopIIItim ShIre of l'oplIation PopuIItioo Popul- Population 0Ihtr perOlhtr GOK per per
ationper perDispen- GOKfaci- faci1ity Beds GOK Bed OOKDis- Brj- lilies in the type in the in the Bodinthe AlI-
pcnsary All types Province Province Province Province Beds ('000'5) ('OOO'5) % ('000'5' % (1IImber (Nwnber)
Nairobi 35 18 frl 30 21 379 236
Centrnl 19 15 2 3,110 16 1,149 949
~ 12 9 6 617 11 956 3~
EasIr:m 21 12 0 Mi1 15 1,474 785
N.Eastem 12 11 0 rVa 5 448 448
Nyanza 29 23 0 nla 8 2,679 835 Rift Valley 15 9 2 4,894 ~ 1,419 m WesIfm 134 46 4 1,272 5 2,frlO 913 Kenya 21 13 100 411 100 1,243 6S8
I Not applicable-this means the province has no 'other facility type'.
Source: Compiled from data provided by the MOH Information Services and the 1989 Population Census Reports.
Table 2.7: Physical resources and associated measures of access by province, 1989
-25-

The distnbution of 'other health care fucilities' included in the table shows a big bias towards
Nairobi province. This is because these others include mainly specialised cIinics---rnost of them lo
cated at the national referral hospital (Kenyatta) in Nairob~ medical centres and nursing homes
(private and public)-also concentrated in major urban area.s-especially in Nairobi and Mombasa
(Coast). Finally, the table also shows the distnbution and availability of hospital beds to populations
by regions in 1989, both for public sector and combined. Nairobi had the highest number, although
this figure includes beds at Kenyatta National Hospital-which are available nation-wide (this be
ing a national referral hospital). Nairobi also had the least number of people per public hospital bed
(376), followed by North Eastern (448), and Central (956) and Coast province (1,149). The other
provinces had bed-ratios that were above the national average (1,243), the worst being Western
province (2,870 persons per public hospital bed), Nyanza (2,679) and Eastern (1,476).
Overall, using a simple average of all the rankings according to the measures given in Table
2.7, the emerging conclusion is that the Coast province comes out best overall, followed by Nai
robi, then the Rift Valley, Central, N. Eastern, Eastern, Western and Nyanza provinces in that or
der. We soon shall examine whether this distnbution of physical resources is correlated with the
health situation in the regions. However, before that, something about trends and the distribution
of another important parameter of the health system-health manpower.
2.2.3 Trends in and distribution of human health resources Trends in medical and hslJth personnel
There also occurred substantial in~ in medical and health personnel in the country. Fig
ure 2.7 shows the changes in the stocks of some selected trained manpower over the period
1960-1990. In 1960, there were only 713 registered doctors in the country. By 1990, the figure
was nearly 3,400, an increase of nearly 500 per cent. A more dramatic increase occurred in the
munber of dentists, though in absolute numbers it was small (see the data accompanying the fig
ure). But these statistics should be interpreted with caution as there is no annual licensing of regis
tered medical personnel in the country. The data therefore may overstate the numbers of those
actuaI1y practising in the country. Some may be dead (or may have migrated out of the country).
-26-

18 - - - - - - - - - - - - - - - - - - - - - - - - - - - - - - - - - - - - - - - - - - - - - - - .
16
14
~ 12
----------- - ------- - --- - ------------------- - - -
-------------- --- - ---- ------------ - --- ..
a J 10
8 - - - - - - - - -
6 - - - - - - - - -
4 -----
2
1960 1971 1980 1981 1982 1983 1984 1985 1986 1987 1988 1989 1990
Doctors
Dentists
Phannacists • Clinical officers·
Registered nurses2
Emol1ed nurses
Doctors .. Dentists _ Phannacists _ Clinical Officers
-.J Registered Nurses Iiiiil Enrolled Nurses
1960 1971 1980 1981 1982 19&3 1984 1985 1986 1987 1988 1989
713 1,405 1,691 2,057 2,151 1,514 2,752 2,847 2,980 3,071 3,176 3,266
52 87 162 197 239 289 331 384 441 492 527 561
170 148 60 84 86 113 427 231 - 362 .588 413
- - 1,!i34 1,681 1,821 1,921 2,001 2,107 2,224 2,3.5.5 2,464 2,!i34
1,354 3,789 6p92 6,892 7,675 8,!i47 9,16.5 9,377 9,627 9,862 10,009 10,289
1,865 4,612 8,722 9,191 9,!i18 10,168 10,650 11,248 12,452 13,202 14,078 15,200
I Blanks indicate missing data; 2 1990 data doubtful
1990
3,357
5%
443
2,630
5,441
17,724
Figure 2.7: Trends in selected cadres of human resources employed in the health sector of Kenya: 1960-1990
The growth of the various categories of medical personnel has been uneven Notice the phe
nomenal growth in nursing personnel as compared to other categories. Even within the nursing
category, the increase in the stock of community nurses is far greater than that of registered nurses.
However, it is not clear why the later declined after 1989.
The effectiveness of health care system's manpower also depends to a large extent on how it
is deployed across the various functions performed by the system. The distribution of Kenya's
health sector manpower by function in 1991/92 is shown in Table 2.8 (below). In 1991/92, the
Ministry of health had a labour force of 43,522 personnel of diverse cadres as shown, with a total
wage bill ofK£75,51 0, 120. From the last row in the table, 69.2 per cent of all the MOH personnel
were deployed in the curative services sector, and only 11.7 and 11 per cent in the promotive, and
preventive, and rural health services respectively. This bias towards the curative care services is re-
-27-
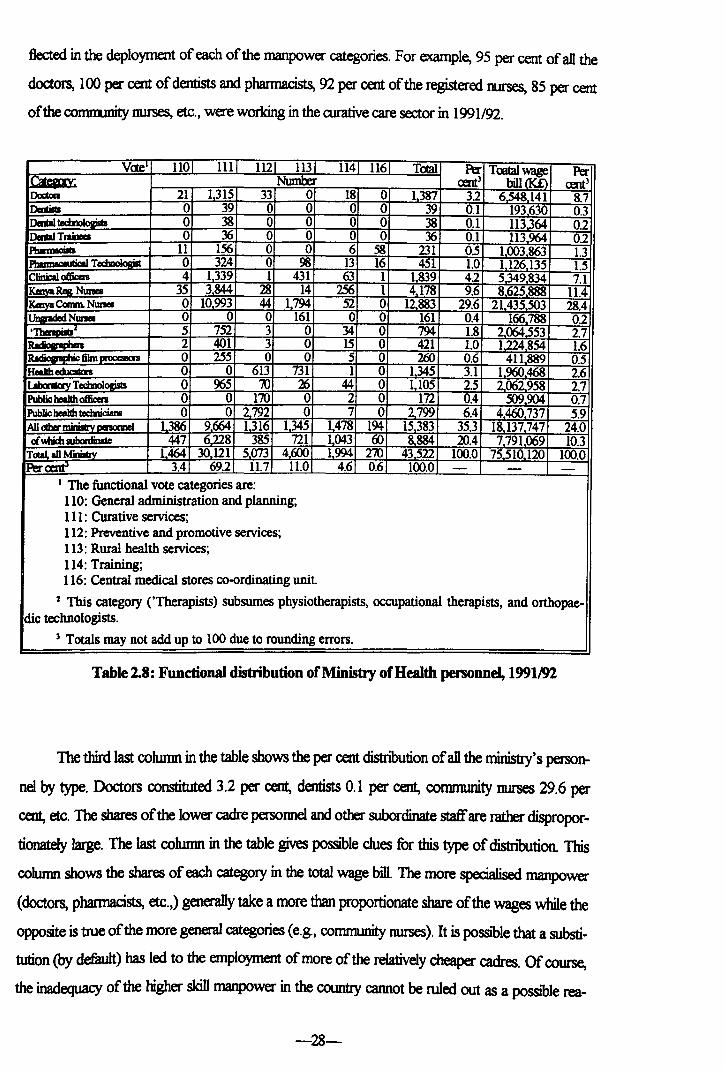
flected in the deployment of each of the manpower categories. For example, 95 per cent of all the
doctors, 100 per cent of dentists and phannacists, 92 per cent of the registered nurses, 85 per cent
of the corrm.mity nurses, etc., were working in the rurative care sector in 1991/92.
V<te 110 HI lU 113 H4 116 TOIal Per Toot.al wage Per ~ Number an) bill a<£> an)
Doc:ton 21 1315 33 0 18 0 1387 32 6548141 8.7 DmtiIII 0 39 0 0 0 0 39 0.1 193630 0.3 DaUI 0 38 0 0 0 0 38 0.1 113364 0.2 DaaI TraineeI 0 36 0 0 0 0 36 0.1 113964 02 PbInnaciIIa 11 156 0 0 6 58 231 0.5 1003863 1.3 I'tIIImIceuIica T 0 324 0 98 13 16 451 1.0 1126135 1.5 Clinical officen 4 1339 1 431 63 1 1839 42 5.349834 7.1 rkmYaR.e& Nunea 35 3844 28 14 2S6 1 4178 9.6 8625888 11.4 IKlayaConm Nunea 0 10993 44 1794 52 0 12883 29.6 21435503 28.4 r"'-WI Nunea 0 0 0 161 0 0 161 0.4 166788 02 . 5 752 3 0 34 0 794 1.8 2064,553 2.7
2 401 3 0 15 0 421 1.0 1.224854 1.6 . fihn 0 255 0 0 5 0 260 0.6 411889 0.5
Hedb educItas 0 0 613 731 1 0 1345 3.1 1960468 2.6 1'~Tdmlogjsls 0 965 iO 26 44 0 1105 2.5 2062958 2.7 Public beaIIh officen 0 0 170 0 2 0 172 0.4 509904 0.7 Public beaIIh tecmicians 0 o 2.792 0 7 0 2799 6.4 4460737 5.9 All cdw minisIrv oenomeI 1,386 9664 1316 1345 1478 194 15383 35.3 18,137747 24.0 ofWlich aJbordinate 447 6.228 385 721 1043 ro 8.884 20.4 7791069 10.3
TotaL all MiDiITry 1464- 30 121 5073 4000 1994 270 43522 100.0 75510 120 100.0 Per~ 3.4 69.2 11.7 11.0 4.6 0.6 100.0 - - -
I The functional vote categories are: 110: General administration and planning; Ill: Curative services; 112: Preventive and promotive services; 113: Rural health services; 114: Training; 116: Central medical stores co-ordinating unit.
2 This category (,Therapists) subsumes physiotherapists, occupational therapists, and orthopae-dic technologists.
) Totals may not add up to 100 due to rounding errors.
Table 2.8: Functional distribution of Ministry of Health personnel, 1991192
The third last column in the table shows the per cent distnbution of all the ministry's person
nel by type. Doctors constituted 3.2 per cent, dentists 0.1 per cent, community nurses 29.6 per
cent, etc. The shares of the lower cadre persormel and other subordinate staffare rather dispropor
tionately large. The last column in the table gives poSSIble clues for this type of distnbution This
cohunn shows the shares of each category in the total wage bill. The more specialised manpower
(doctors, phannacists, etc.,) generally take a more than proportionate share of the wages while the
opposite is true of the more general categories (e.g., comnumity nurses). It is poSSIble that a substi
tution (by defiwlt) has led to the employment of more of the relatively cheaper cadres. Of course,
the inadequacy of the higher skill manpower in the country cannot be ruled out as a poSSIble rea-
-28-

son However, the ministry does not have a clear manpower deployment policy to guide recruit
ment 12. Some guidelines on deployment within the ministry exist, but are not designed to determine
appropriate staffing ratios. They are rather arbitrary and deficient for this purpose. Though they
specifY the authorised munbers of personnel of different cadres that should be deployed in each
functional seIVice or facility, but it appears they are not strictly adhered to, nor do they seem to be
related to workloads in various types of institutions. That two hospitals are classified in the same
grade, that they have say, equal floor are, number ofbeds, or even equipment does not mean they
should similarly staffed. The staffing needs, and indeed for many other 'inputs, the quantities de
ployed there should take into account the workloads that each facility handles. This means it does
not make much sense to insist on constructing 'standard' types of hospitals or other health care mcilities. Moreover, even with currently established 'staffing norms' appear to change from year to
year, not because of changes in the parameters that ought to be used to set the mrms, but purely
to filcilitate the retention of the existing number of personnel in a particular service or filcility. Con
sequently, analysing the manpower deployment in the ministry, one gets the impression these
guidelines are cosmetic. Facilities would appear in year 0, for example, as over-staffed (according
to the oorms), only to appear the following year as having the required personnel--without alQI
apparent change in the status quo--5ince the Ministry officials in charge of staffing decide that
that be the 'required staff munbers for institution
These shortcomings notwithstanding, we have analysed the data using the 'established
guidelines' to detennine which categories of manpower are in short supply and which are not, (r
eording to the Ministry of Health s norms. We have only done this at the macro level since at the
micro level there are the constant changes described previously which abrogate their intended ef
fects. The analysis shows the ministry was generally understaffed in 1991192 by only 2 per cent,
and the problem is more pronounced for the higher skill categories, for example, dentists, and less
pronounced for the lower skill cadres as shown in the figure below. The figure reveals that the min
istry needed only 2 per cent more doctors in that year (relative to the establishment then) to achieve
its required staffing norm for doctors in the system. This appears to be an under-estimation of
manpower requirements by the ministry, traceable to the nature of guidelines in use. The same is
true of most other categories of skilled cadres. It appears inconsistent that while the national plans
advocate for increased doctor-population ratio, while the ministry's planning indicates the targets
are nearly achieved.
12 Like all other ministries in the country. most manpower recruiUUent is done on its behalf by the Public Service Commission.
-29-

Total, All Ministry of which Surbordinate staff
All Other Ministry personnel Public Health Technicians
Public Health Officicers Laboratory Technologists
Health Educators Radigraphic Film Processors
Radigraphers 'Therapists
Ungraded Nurses Kenya Enrol. Comm. nurses
Kenya Registered Nurses Clinical Officers
Pharmaceutical Technologists Phannacists
Dental Trainees Dental Technologist
Dentists Doctors
-60 -so -40 -30 -20 -10 o
Per cent under (-)/over-(+) staffed
10 20
Figure 2.8: Surpluses/deficiencies in various categories of personnel: 1991/91
30
There is therefore need to establish proper manpower deployment guidelines based on fu.cil
ity and service needs. The ministry has recognised this deficiency [personal communication
MOH officers], but has yet to device and implement them. Besides establishing such guidelines,
there is the question of their application. There are structural and practical difficulties in redeploy
ing manpower (due to various political and social impediments), but, if guidelines are to be useful,
it is inevitable that some sections will be adversely affected. To minimise the obstacles to imple
mentation, factors likely to cause adverse effects should be carefully considered and where possible
minimised if not eliminated. One possible starting point for such a process should be a change in
the ministry's prioriti~ from curative based care towards preventive, promotive and rural health
services. The country has got its priorities mixed up. The bulk of the health system's workload is
handled by the lower level faciliti~ especially dispensaries and health centres, yet these account for
only a small proportion of the total labour force. The staffing requirements of these facilities should
be reconsidered. Besides the current staffing norms, the ministry should consider the possibility of
gradually deploying more qualified personnel to these facilities---such as registered nurses, com
munity nurses and more clinical officers, to be in-charge of their operations. And this should start
with the more experienced of these categories so that the need for supervision by higher skill per
sonnel is minimised. Such a move would have two desirable effects. First, it would lead to im
proved services in the lower level facilities and better utilisation of the labour that is so expensive to
be under-utilised. Improved services in the lower level facilities would mean less referrals to the
-30--

higher level filcilities. Consequently, the higher level facilities would not be adversely affected by
such a change. Secondly, the morale of the redeployed staff would be boosted by the feeling that
they have decision making roles in the system-rather than the present situation where they have
limited opportunities to apply their skills on their own-rnost of them operate under instructions
from the doctor in charge of a ward, clinic, etc.
In the longer term, the ministry should consider poSSIbilities of having doctors in these lower
level filcilities. For a start, arrangements could be made for a doctor---either from the sub-district
or district hospital-to visit, say, at least once a week, a health centre where he reviews all the
cases seen by the clinician or the registered nurse during the week, and decide on those cases the
latter could not handle effectively. This would reinforce the effects described above, besides in
creasing the overall efficiency of the system. In the long term, there will be less demand for the
more expensive curative oriented filcilities, and those that would eKist would be capable of deliver
ing high quality and efficient care since the cases they receive would already have been adequately
screened and diagnosed at the lower levels of the system. These reflections call for a well thought
manpower training and deployment scheme, as will be discussed in the main text under various
proposals in chapter seven.
The regional distribution ofhuman heoIth resources
The distribution of health personnel is usually reflected either in the number of a specified
category per unit (thousand or 100,(00) popuIation, or alternatively, the population per unit (of
that category). The table below (fable 2.9) shows the population per unit of some selected catego
ries of health personnel by region.
The table shows the availability of health personnel is closely correlated with that of the fa
cilities, as would be expected. Coast and North Eastern are the only provinces having population
per unit of the selected categories ofhealth personnel that exceed the national averages. Although
the North Eastern province is vast and sparsely populated so that the figures may not necessarily
represent an accurate picture of availability, the population of this province is increasingly urban
ised. The urbanisation clusters are located near main amenity centres and on this account we can
accept the hunch that the province has become better served in terms of health resources than
many others in recent times.
-31-

REGION
North
Health Personnel Nairobi Central Coast Eastern Eastern Nyanza Rift Valley Western Kenya
Category: Population per unit of respective health personnel category
Doctors 4,748 17,415 10,608 21,463 12,352 29,180 20,484 27,696 16,475
Dentists 151 ,869 703,058 420,977 964,806 266,594 883,845 825,057 731,218 585,902
Pharmacists 33,078 101,455 69,876 129,698 46,423 168,710 118,395 135,707 98,919
Clinical Officers 22,510 12,231 6,984 11,444 5,638 20,098 10,207 26,285 12,425
Registered Nurses 6,908 4,386 3,009 4,625 2,775 10,065 5,581 11,108 5,469
Corrununity Nurses 4,074 1,528 1,111 1,554 874 2,961 1,554 2,903 1,774
Source: Compiled from infotmation printed in the MOH Recurrent Expenditure Estimates 1991192 (the section on manpower budgets), and population projections based on the 1989 Census district population growth rates.
Table 2.9: Population per unit of some selected categories of health personnel by province-1991192
A better perspective of the overall distribution of manpower resources between the prov
inces can be gleaned from figure 2.9 below which shows the percentual deviations of population
per unit of the selected categories of the health personnel from the (national) mean.
Western
Rift Valley
Nyanza I Community Nurses
N. Eastern I Registered Nurses
(]]]] Clinical Officers
Eastern I Phannacists
Coast • Dentists
Central 0 Doctors
-150 -100 -50 o 50 100
Per cent of Deviation from Kenyan Mean
Figure 2.9: Percentual deviations from the national mean population (Kenya) per unit of selected health personnel, 1991192
-32-

Nairobi shows a mixed picture, but is generally well served in tenns of the higher skill cate
gories of health persomtel (doctors, dentists and phannacists). Central, Eastern and Rift Valley
provinces have below-average availability for the higher skill categories and generally above
average availability for the lower cadres ofhealth persormel. However, the Central province is bet
ter off compared to the Rift Valley, which itself is in turn better off than Eastern province. The
other two provinces, that is, Nyanza and Western, appear to be equally disadvantaged in all re
spects and their availability measures are below the national average for all categories of health
persomtel.
It is also clear from the distribution of human health resources that the two provinces, i. e.
Nyanza and Western, are also disadvantaged in tenns of the quantity of the health personnel de
ployed there. The important question at this point is: is there a corresponding disadvantage in tenns
of the health health in these provinces? Let us now look at the health situation in the country to see
whether we can answer this question-i.e., to see whether the regional health status is any way re
lated to the health resowce distnbution.
2.3 Morbidity and Mortality Patterns
2.3.0 Overall patterns
The table below shows the distnbution of morbidity cases for out-patients presenting in the
outpatient departments (OPDs) of government filcilities-shown for selected years for the period
arowtd independence (19605) and more recently (late 1980s and early 1990s). The data shows the
leading causes of morbidity in government hospitals have not changed much since independence.
Around independence, the four leading causes of out-patient moIbidity were infectious and para
sitic diseases, respiratory system diseases, alimentaIy system diseases, and, skin and musculo
skeletal diseases. 13
In the early 1990s, the leading causes were infectious and parasitic diseases, respiratory sys
tern diseases, and, skin and musculo-skeletal dise&es. These four categories of diseases accounted
for over three quarters of all OPD cases. In the parasitic and infectious diseases group, the leading
awses of moIbidity have been malaria, diarrhoeal diseases and early childhood ~ such as
measles, whooping cough, etc. In the respiratory tract diseaes group, pneumonia is the single larg
est cause of morbidity. In 1991 about 88 per cent ofall OPD visits were caused by infectious and
13 We exclude diseases of the nervous system and sensory organs whose prominence waned off almost immediately on the assumption that this might have been a result of traumas of the fight for independence. Also excluded is the general category of ill-defined diseases and accidents.
-33-

parasitic diseases: respiratory system diseases: skin and musculo-skeletal diseases, and, ill-defined
diseaes, fractures and injuries. Thus close to 90 per cent of the health problems that are handled by
curative services are problems that are largely preventable and possibly at low cost (see chapter 4,
section 4.3.2 for a discussion of this aspect of the health services).
1963 1964 1984 1985 1986 1987 1991
Infedioos and puasitic dia-ases 17.4 26 42.1 4O.S 36.2 37.8 38.S
Malignant growths'neoplasms O.l 0.2 0 0 0.1 0 0
Allelgic, endocrine system and metabolic diseases 1.7 22 1.6 1.7 1.6 1.4 S.7
Diseases dthe nervoos sysICm'sensory organs 24.2 s.s S 4.9 S2 4.S 4.l
CiIaJIatoIy system dia-ases 02 0.4 0.3 0.4 1 0.3 0.7
RfsPratD1y system dia-ases 16.S 20.5 20.3 23.4 23.1 22.4 23.3
AlimDaly system diseases 124 13.4 0.4 0.9 1.3 0.9 1.1
Genito-urinaIy system diseases 2.3 3.1 0.3 0.4 0.3 0.3 02
Skin and IIJUSCUIo..skeI diseases 9.4 l.6 8.1 7.7 8.3 9.4 10.3
m defined diseases, accidents, ftacIures and iqjuries 15.8 20 21.9 20 22.8 23.2 16
Total 100 100 100 100 100 100 100
Soort:e: Compiled from varDJs MOH Amrual Reports
Table 2.10: Patterns in OPD morbidity by type of disease category: Various yean between 1964 and 1991
Data on hospital admissions and deaths also reveal a pattern of largely avoidable problems
that is no less disconcerting than outpatient data. The table below shows the 20 leading causes of
admissions and deaths in MOH hospitals in 1990. Between them, the top 20 diseases accounted
for 63 per cent of all admissions, and 54 per cent of all hospital deaths. Concerning admissions, of
the 63 per cent, infectious and parasitic diseases; and diseases of the respiratory system, respec
tively, accounted for 25 and 13-i.e. 38 per cent of all the admissions due to these top 20 diseases
(which translates to 40 and 20 per cent respectively fur admissions due to all causes).
In a 1990 Provincial and District Health Services Study (REACHlMOH, 1990), a sample of
patient records reviewed in a sample off8cilities revealed that in 1989, bums, uyuries and wounds,
fractures and malaria accounted for 26 per cent of all inpatient admissions into the Nakuru Provin
cial General Hospital. At Naivasha District hospital, bronchial pneumonia, abortion, malaria, and
burns accounted for 34 per cent of the inpatient admissions. In the private sector f3cility in the sam
ple (Mercy Hospital), malaria, pneumonia, abortion, and measles accounted for 47 per cent of ad-
-34-

missions. In Naivasha and Mercy hospitals, malaria and abortion accounted for 37 and 42 per cent
of admissions to the female wards, respectively; malaria, wounds, injuries and traffic accidents ac
counted for 52 and 27 per cent of the admissions into the male wards. In the paediatric wards,
bronchial pnewnonia and malaria accounted for 34 and 44 per cent of admissions respectively.
Admissions Deaths I(DI Grrup ~ (percent)2 (percent»)
1 Infeaioos and Parasitic diseases 24.94 15.91
2 NcopIagns 0 8.05
3 Endocrine, nutritional., metabolic diseases. 1.55 7.89
4 Disrases ofblood and blood Conning organs 6.46 6.l8
5 Menral dUmders 0.22 3.13
6 Diseases. afthe nervoos sysffm/sense organs 0.48 22
7 Diseases cithe ciIaJIatmy ~ 0.42 l.7
8 Diseases afthe respiratory ~ 12.45 l.45
9 Diseases of the di.grstive system 0.l7 1.31
10 Diseases of the genitoorinary system 0.32 124
11 eompications of pregnancy, childbirth and puperium 13.73 121
12 Diseases of skin and subcumneous tissue 0.16 l.06
13 Diseases of IIlIBlJlo.ske1e system and c:onnedive tissue 0 0.73
14 Congenital anomalies 0 0.49
15 Certain cmfitions <liginating aroum perinatal O.oI 0.39
16 SymptooIS, signs and ill defined amditions 0.54 0.36
17 Injwy and poimng 1.5 023
Total 62.96 53.54
I International Classification of Diseases. Entries with zeroes should be interpreted to mean that no disease(s) from the group featured among the top 20 causes of admissions or deaths in 1990.
2 As per cent of total (nation-wide admissions due to all causes).
3 As per cent of total deaths due to all causes.
Soura:: eompled from data suwJied by the Health Informati:m System afthe Minisby afHealth.
Table 2.11: Dimibution by ICD classification of the top 20 leading causa of admissions and deaths in MOH hospitals in 1990.
These data suggest that a Iarge fraction of inpatient cases----by far the most expensive level
oftreatmen1 in the system-are preventable through other interventions. Concerning mortality, the
table also shows the single largest cause of mortality was infectious and parasitic diseases---these
are also preventable. Ifwe add together all causes of mortality that are preventable (e.g. infectious
and parasitic diseases, diseases of the respiratory system, and (most) diseases of the skin, musculo-
-35-

skeletal system and connective tissue), preventable deaths rise to at least 25 per cent. It is our inten
tion to propose a refonn strategy that will create effective mechanisms for tackling these essentially
'public goods' type health problems (as well as the less public ones that today gobble up the lion's
share ofhealth resources).
2.3.1 Regional out-patient morbidity patterns
Data on morbidity by region (provinces) for 1984 and 1991 (the only two years where an
indication of the response rates of surveyed institutions is given) is shown in Table 2.12 belowl4.
1984 Ncrth Rift
Nairobi CtntraI Coast Eastern Eastan Nyanza Valley WesIan Kmya b8ctioua and pnaitic diseas5 26 24 45 39 48 54 40 so 38
MaJianant lasms 0 0 0 0 0 0 0 0 0
I Allergic, axIocrine syIIem & mefaboIic diseases 2 1 2 1 3 2 3 1 6
0-.. IXtbe ncrwus S)IIcm'IICQIOI)' organs s S 4 S S 4 4 3 4
, sYIfIm diseas5 0 0 0 0 0 0 0 0 1 diseases 22 28 17 21 24 18 25 20 23 diseases 1 0 0 1 1 1 1 1 1
I~ • , systan diaea8ea 0 0 0 0 0 0 0 0 0
Skinand~ diIeaaeI 7 8 10 8 8 10 9 9 10
m cWined c:IiIeaaeI, aocidaD, fiaaura & ~urics 37 33 20 24 10 11 17 l' 16
TcDI 100 100 100 100 100 100 100 100 lOO ('llxumfI) 1,049 2,697 1,573 3,176 372 3,061 3,96' 2,1'3 18,046
Share IXtotaI . I (pQ" cent) 6 l' 9 18 2 17 22 12 100
ShIre of total morbiditv (oer cent) 1 14 10 15 1 28 26 17 lOO
1991 Ncrth Rift
Nairobi Ca1Ira1 Coast Eastan Eastan Nyanza Valley WesIan Kmya lnic:tious and paruitic: diseases 35 27 46 22 48 54 40 so 38
MaIipd 0 0 0 0 0 0 0 0 0
I AlIcrgic, axIocrine syIIem & mdaboIic diseases 1 0 2 43 3 2 3 1 6
0iIeueI. cCtbe IWVOUI , 4 5 3 5 4 4 3 4
circulataly mtan diseases 0 2 0 0 0 0 0 0 1 , mtan diseases 28 30 21 14 24 18 25 20 23
diseases 1 2 1 1 1 1 1 1 1 .~ .. , I)'ItaII diaea8ea 0 0 0 0 0 0 0 0 0
Skinand~ diseases 10 13 11 7 8 10 9 9 10
m dafined diIeIIeI., ~ b:tures & iqjurics 19 22 13 10 10 11 17 15 16
TcDI 100 lOO 100 100 100 100 100 100 lOO PopulIIioa ('lboI-a) 1,480 3,289 1,971 3,962 372 3,m 5,306 2,712 22,863
Share of total (pQ"cent) 6 14 9 17 2 17 23 12 lOO Share cCtotaI morbidity (pQ" cent) 2 22 12 8 1 19 26 9 lOO
Source: Compiled from data published in Statistical Abstracts, various years.
Table 2.12: OPD morbidity patterns by disease group and by province, Kenya: 1984 and 1991-per cent and numbers
14 The data for 1987 give similar infonnation but the total for Nyanza province appears inconsistent with the published figures. The 1991 data are provisional.
-36-

The table shows in 1984 the outpatient department (OPD) regional pattern was similar to
the national average as discussed above, with the exception of Central province where diseases of
the respiratory tract are predominant. This difference is explained by the high altitude of the prov
ince, which makes the climate different from that of the rest of the country. Nairob~ which is also
high altitude, has above the national average cases for respiratory diseases too. Over 50 per cent of
all the OPD cases in each ofNyanza and Western provinces in that year were due to infectious and
parasitic diseases, reflecting another ecological variation-low lying mosquito infested areas,
where malaria accounted for a substantial proportion of these cases.
The table also shows the proportions of population residing in each province and the corre
sponding burden of total morbidity as a per cent of the national totals. Nyanza, Western and the
Coast provinces had a higher share of morbidity than their shares of the population in 1984, al
though the situation was more pronounced in the first two provinces. The analysis of section 2.2
above showed these two provinces had below average shares of most categories of health re
sources. It therefore appears that the relatively high share of morbidity in them (the provinces)
owes its origin partly to this distribution At least this is true for Nyanza province. After all, neither
province has more of the private sector resources than others.
2.3.2 Regional mortality patterns according to hospital based infonnation
A comparison of the pattern of hospital mortality between regions is given in Table 2.13 be-
low for 1968 and 1990. The 1968 data is extracted from Bonte (1974). The following points
should be taken into account when interpreting the data. FtrSt, the 1968 data combines Nairobi and
Central provinces. Second, the 1990 data is only for the top twenty leading filtality diseases in the
country as at then. Third, the disease classification procedure used differs between the periods
the fonner is more aggregative as compared to the latter. Despite these differences however, it is
poSSIble to get an idea about the trend pattern between the two years.
The table shows that in 1968 at the national level aIthough only 86 males got admitted for
every 100 females, there was a higher casualty for the males---124 males died for every 100
women who died. Only Nyanza and the North Eastern provinces had death-sex ratios ofless than
100, posstbly on account of the small absolute numbers. On the other hand in 1990, the sex ratio of
deaths increased slightly to 127, and Nyanza and Western provinces this time have lower ratios
-37-

than the rest of the country. The Western province ratio is very low-again possibly due to the low
absolute nwnbers. The sex ratio for Central province, including Nairobi in 1968 is low probably
due to the low sex ratio of Nairobi, which is evident in the 1990 figures.
1968
Admissions' Deaths' SexratilB' Clinical morta1it'
lUgioo Males Females All Males Females All Adm. Deaths Males Females All
CenIraI. including Nairobi 22,143 26,040 48,183 1,818 1,563 3,381 85 116 8 6 7
CaaIt 10,552 8,573 19,125 602 345 947 123 175 6 4 5
EasIan 7,884 12,089 19,973 749 658 1,407 65 114 10 5 7
NonbEastem 1,489 993 2,482 24 35 59 ISO 69 2 4 2
N)'IIIZI 5,266 5,447 10,713 194 235 429 97 83 4 4 4
Riivalley 20,415 25,060 45,475 1,570 1,163 2,733 82 135 8 5 6
WCIII.an 5,137 6,430 11,567 290 247 537 80 117 6 4 5
Kmya 72,886 84,632 157,518 5,248 4,246 9,494 86 124 7 5 6
1990
Admissions' Deaths' SexratilB' Clinical morta1ity'
lUgioo Males Females All Males Females All Adm. Deaths Males Females All
NGobi 86 535 621 13 91 104 16 14 15 17 17
CtIIIral 13,520 25,930 39,4SO 926 546 1,472 52 170 7 2 4
CoIIl 17,818 18,734 36,552 858 528 1,386 95 163 5 3 4
EasIan 11,385 14,143 25,528 662 357 1,019 80 185 6 3 4
NonbEastem 1,528 1,381 2,909 128 106 234 111 121 8 8 8
Nyanza 10,247 13,070 23,317 386 624 1,010 78 62 4 5 4
Riiva1ley 12,627 22,072 34,699 896 611 1,507 57 147 7 3 4
WCIII.an 1,281 9,098 10,379 93 257 350 14 36 7 3 3
Kmya 68,492 104,963 173,455 3,962 3,120 7,082 35 127 6 3 4
I Absolute numbers~ 2 (Males/Females)xlOO~ 3 (DeathslInpatients)xlOO~
Compiled from data by Bonte (1974) and other data from the MOH Infonnation Services.
Table 2.13: Admissions and deaths by sex in reporting government hospitals 1968 and 1990 by province
There is no discernible pattern between the two periods since some areas such as Coast,
Nyanza and Western provinces have registered declines, while Eastern, North Eastern and the Rift
Valley recorded rises in the inpatient sex ratios. It is not clear whether such changes are linked to
the health situation with respect the sexes in the respective areas, and there is need for further in
vestigation to detennine what factors most likely contnbuted to these trends. But it is also notable
that the change in inpatient death sex-ratios is closely related to the changes in admission sex-ratios,
which have similarly changed.
-38-

In 1968, as in 1990, males had a higher clinical mortality than womenlS, that is, for a given
rrumber of both sexes each admitted, males suffered greater filtal casualties than females, as de
picted in the last 3 columns of table. This pattern exists in all regions except in Nyanza province in
the two years. Regionally, the worst clinical mortality ratios were recorded in the central province,
including the Nairobi area and the Eastern province in 1968-whose average exceeded the na
tional figure. The Central province figure during that year is probably exercebatecl by the adverse
Nairobi figure that is evident from the 1990 figure. There occurred an improvement in all regions
between the two years except in North Eastern province (excluding Nairobi area). The high Nai
robi figure for 1990 can poSSlbly be explained by the complexity of the cases received by the na
tional referral hospital (Kenyatta National Hospital) and other specialised institutions there--cases
whose survival chances are low. POSSlbly there are other exp1anations---such as the presence of a
large teaching hospital there, or the lack of a district hospital, to help ease the burden of admission
for Nairobi residents, etc. But there does not appear to exist any discenuble correlation between
the distribution of health resources (as discussed previously) and the pattern of hospital inpatient
mortality. Western and Nyanza provinces, which were shown to be relatively disadvantaged in
terms of health resources' distnbution, do not possess significantly worse records of mortality in
this case. Similarly, areas shown to be favoured by the resource distnbution (e.g., Coast province)
have more or less the same patterns of mortality as the disadvantaged areas, some are even worse
(e.g., North Eastern).
2.3.3 The distribution ofbadth resources and health status-implications for policy
11n.Js fiu" we have analysed the distributions ofhE-alth. resources and 'health' in the country.
The available data, though scanty and probably unreliable, generally suggest that regions with more
health resources are better -off in terms ofhE-alth. status. This is as would be expected. TheoI)' pre
dicts a strong relationship between the health inputs and the health status, i.e., areas with more
health inputs (resources) will tend to have better health status (e.g., lower mortality or morbidity,
and so on), and vice-versa. This type of analysis is best approached through the health production
function However, the absence of reliable data on the health situation at district levels (the avail
ability of which would have given us adequate degrees of freedom to estimate a health production
function for the country or even regions) precludes this type of analysis. But it is still poSSlble to
U Why this is so is hard to rationalise, but it is possible that women, being from the very beginning the target of most health awareness campaigns, consult early enough before their health situations deteriorate too much. May be men engage in more 'risky' jobs.
-39-

show the same relationship (between inputs and outcomes) holds for Kenya, albeit using crude and
rather highly aggregated (provincial) data.
Ib:tors Clinical officers Registen:d nurses Enrolled nurses Inmnt mortaJity mte -.5448 -.3376 -.4020 -.4030)
(.103) (.229) (.186) .185)
Urm 5 mortality mte -.5659 -.4588 -.5510 -.5211 (.093) (.ISO) (.100) (.115)
Chi1d1xxxl mortality mte -.5576 -.5845 -7083 -.6375 (.097) (.084) (.037) (.062)
Table 2.14: Simple correlation between IMR, U5M, CMR and different categories of health personnel in Kenya around the period 19911l
The table above shows the simple correlation between various definitions of under age 15
mortality (usually a better measure of overall health status in a given region than total mortality)
and various categories of health personnel. calculated using data on mortality and health personnel
for Kenya's provinces around 199112. The correlation are negative as would be expected. The fig
ures below the coefficients (and in brackets) show the calculated (probability) levels at which, for a
one tailed test they can be accepted as significant. Although these (significance) probabilities are
rather high, the important thing to note here is that there exists an inverse relationship between
mortality and these health care inputs. This is true for most health inputs and has implications for
the redistribution of health resources in the country. First, if all the regions were resow-ced on the
same per alpita basis as the best resourced province (e.g., the Coast or North Eastern provinces),
we can expect an improvement in the overall health situation in the countty, although this conclu
sion is subject to whether those areas receiving the ertra resources are capable of converting them
into increased health (see chapter row- for more on this). But this situation may be highly hypotheti
cal since we have seen the actual situation is one of declining resomces to the health sector. Sec
ond, if instead we were to redistribute the existing resources 'equally' across the provinces, two
outcomes may be the case. One, if the losing provinces were already having an 'excess' of re
sources over their actual needs (which is highly doubtful1 we can expect an overall incmJSe in the
overall health status. If otherwise, the overall outcome depend on a comparison between the gains
and losses. If the gaining areas are able to generate more 'health' out of those resources than the
losing ones, then on balance the overall health situation would improve. If not, there will be a net
loss of 'health'. Indeed, given the heterogeneity of the epidemiological situation across regions, it is
-40-

not possible to tell a priori, the outcome of such a redistnbution of resources. It would be neces
sary to develop a needs based fonnula for redistnbuting resources, one which makes use of all the
available infonnation on inputs and outputs for the different areas, which leads to the same conclu
sion arrived at above-we need to know the relationship between the inputs and outputs in the
health sector.
2.3.4 Conclusion
The analysis of morbidity and mortality data from various sources given above gives a gen
eral perspective on the "demand" for health services in Kenya and helps us to approach the prob
lem of those who are most at risk in tenns of the socio-economic characteristics of the population
But it is not very revealing on some important questions that are important for the fonnulation of
health policies, such as the kinds of risks that are unequally distnbuted. The only truly satisfactory
way of approaching these matters is by means of exhaustive health and morbidity surveys such as
those undertaken in the developed countries (and some developing countries). Nevertheless, the
analysis done so fur helps us at least to begin to approximate the extent of inequality of risk, both
by types (groups) of individuals or by region. Unfortunately, most of the available (published) sta
tistics are not really very helpful for an analysis concerned with the distnbution of health and the
differential impact of sickness and death, at least not in the fonn they are currently published. We
have in mind data such as those on mortality through notification of deaths, or the type published in
the statistical abstracts on outpatient morbidity, for example. Unless one is able to do a consider
able amount of work with the semi-processed data available at the Registrar-Generals andIor the
MinistIy of Health 'archives', there is no alternative but to use broad classifications - e.g., by re
gions, to approximate the more meaningful socio-economic distinctions such as urbanIrural,
highllow income, etc. Such an approach is obviously fraught with biases/errors. The data by prov
inces are of course indirectly related to such distinctions, as the provinces have unequal rates of ur
banisation or education, and vary in gross products per capita, as well as in disease ecology. But
the comparison of average data per province leaves us ignorant of these differences within each
province (and these may paint a totally different picture}-despite favourable values for health indi
cators, extreme inequalities may exist (as is apparent from the implications of the data on the Coast
province in this and the previous chapter). With these caveats in mind, the following main conclu
sions follow.
-41-

Mortality, and infant mortality in partiruIar, which is still high by international standards, has
been declining over the past 40 years or so, and appears to be on a downward trend yet, although
the rate of decline has somewhat slowed since the early seventies---the filstest rate of decline 0c
curred in the period inunediately after independence, poSSIbly because at the time medical services
were availed to groups hitherto then missing that "right" under the colonial administration Infant
mortality is nruch influenced by 'exogenous' causes deriving mainly from the environment-infec
tious diseases for example, which can be related to medical services availability, the nature OfllOUS
ing sanitation, etc. It has not been poSSIble to demonstrate changes in mortality through time due to
data unavailability, particularly on mortality itself: but the scanty data that is available indicate there
are substantial differences in infant mortality rates as between provinces. WIthout data on provin
cial GNPs, it would not be poSSIble to explain adequately why any variations occur over time.
Nevertheless, it pays to Point that the more economically advanced provinces (e.g., Nairob~ Cen
tral and some parts of the Rift valley province) have generally lower infimt mortality rates. The
same is true of fertility rates. There does not appear to exist a correlation between wbanisation and
infant mortality - Nairobi, wholly urban, has a higher infant mortality than Centra1, Eastern, and Rift
valley provinces. However, it nrust be realised random fluctuations occur from year to year and re
liable comparisons can only be made on the basis of a long time series data (using moving averages
for example).
The data on overall mortality might give a better picture since it is available at more than one
point in time, is more broadly based and includes cause of death, but is deficient in accuracy. This
shortfiill notwithstanding, it reveals substantial di1ferentials in the distnbution of different kinds of
health risks in Kenya. Deaths due respiratory and infectious/parasitic diseases are widespread in
the country. These deaths (especially those due to infectious'parasitic diseases) are usually associ
ated with low health standards-the result of poor environmental conditions andIor poor health fa
cilities. But the fonner vary more with geographic and climatic condition
The evidence of the unequa1 spreld of health risks between Kenya's provinces discussed
above is in addition to other, probably great inequalities that can be expected to exist within each
province-e.g., between rural and urban dwellers, higher and lower income groups, etc. This une
qual spread will obviously be related to broad f3ctors of socio-economic nature and to inequalities
and in the avaiJability and efficiency of the health services to the different areas anellor groups. The
next chapter will review the organisation and development of the health setVices sector and assess
policies that have been implemented to rectifY the unequal distnbution of health risks (if any) in
-42-

Kenya. But before then, let us first look at how Kenya's health situation compares with that of
other developing countries.
2.4 Some International Comparisons
2.4.0 Some caveats about international comparisons
Data bases for different countries are seldom truly comparable, but cross-country compari
sons can sometimes be indicative of deficiencies in one country's practices as compared with oth
ers. Some studies have examined whether countries with the same per capita spend the same
fraction of their health. care resources on hospital services. The evidence, subject to (poSSIbly large)
data imperfections, suggests the allocation varies greatly from country to another (see for example
Mills, 199Oa, b). The general hypothesis emerging is that most countries currently allocate health
resources sub-optirnally. However, cross country analyses can be highly deceptive because of a
munber offactors (De Ferranti, 1983a). First, the data rarely reflect real differences across coun
tries due to disparities in the quality and definitional conventions used. Second, in some cases the
published data may cover only the expenditure by the ministry of health, in others, other public and
private providers are included. The way the health sector is defined also is important-in some in
stances it may simply mean medical care to individuals, mass immunisations and control of vector
borne diseases~ or it may be more comprehensive--also encompassing environmental sanitation,
fiunily planning, public health. education and promotion, mrtrition programm~ solid waste dis
posal, etc. Differences also occur depending on whether only recurrent expenditures are given, or
development expenditures are also included. The conventions used to determine what counts as
recurrentldevelopment expenditure also differ.
The data can also be misleading since it may fiill to account for differences in purchasing
power of the various countries' CWTencies (t.e. purchasing power parity). Also, figures on cwrent
(average) spending elsewhere are not necessarily a reasonable guide to how much any particular
country ought to spend. That average may be too high or too low. Moreover, cross-country statis
tics do not reflect complementarity between the health and other sectors, and in other ~ they
simply do not allow for differences in population structure and composition, the country's health
profil~ and the costs of appropriate technologies for prevention and cure. While some studies
have attempted to rectifY for some of these deficienciesl6, in general, their approaches do not re-
16 For example, the studies by Tait and Helier (1981), and Golladay and Liese (1980).
--43-

solve the problem since if the current allocation is sub-optirnal, any infonnation based on such data
will serve to perpetuate the existing inefficiencies and inequalities.
What follows adds some perspective to the development of health expenditure in Kenya set
in an international perspective, subject to the foregoing caveats.
2.4.1 Perfonnance of Kenya's health sector viewed in relation to other developing countries
By invoking exchange rates, it is poSSlble to relate health expenditure per head for different
countries to the per capita incomes in those countries. This has been done in the present work. Ta
ble 2.15 shows the distnbution of a sample of 60 developing countries for which data on govern
ment expenditure on health, education, defence and other social services and GNP per capita was
avai1able.
Per cent of government Other Social expenditure spent on various services H:aJthl 1&b:ation1 I:Jetmcel Services·
Lc:5s than 5 % 25 S 7 21
SC'lObJt<I001O 26 10 21 12
IS%tu<lO% 6 35 ~ IS
20% and more 2 9 8 9
ToIaI Numbec of coontries S9 59 .56 57
, Mode: 6 per cent; average: 7 percent.
1 Mode: 19-20 per cent; average: IS per cent.
3 Mode: spread almost evenly between 4 and 14 per cent, with a hunch around 8- 9 per cent.
4 There is no clear distribution pattern across countries but the mean was 12 per cent.
Source: Compiled frcm infonnation contained in Table 2.16 at the end of this chapter.
Table 2.15: Distribution of a sample of developing countries by per cent of government expenditure on social services 17
The table shows most developing countries allocate about half as much of government re
SOW"CeS to health as to education or defence. In general, the health sector receives less than 10 per
cent of the budget (the sample average was 7 per cent) while education, defence and other social
services l ' receive about 15, 13, and 12 per cent respectively (with sample modes of 19-20 per
11 The data used in the table are for the period 1987-1990, derived from two main various sources -UN Government Finance Statistics Yearbooks and UNICEF, 1993.
'I Other social service expenditures are those on social security and housing, among others.
44
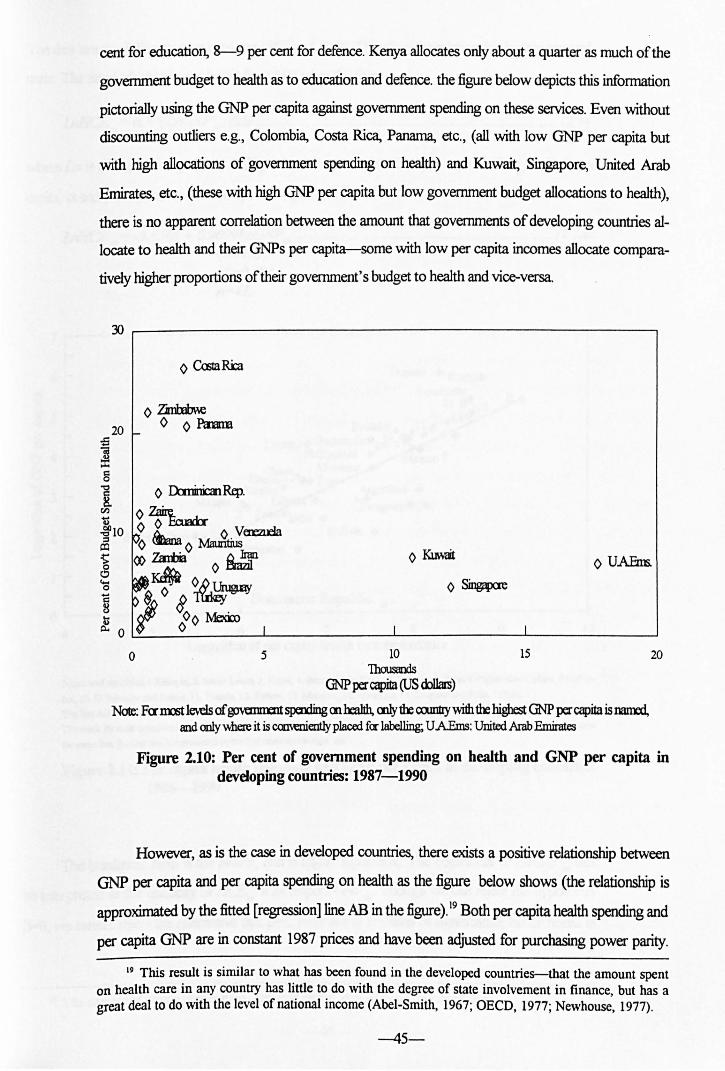
cent for education, 8-9 per cent for defence. Kenya allocates only about a quarter as much of the
govenunent budget to health as to education and defence. the figure below depicts this information
pictorially using the GNP per capita against government spending on these services. Even without
discounting outliers e.g., Colombia, Costa Rica, Panama, etc., (all with low GNP per capita but
with high allocations of goverrunent spending on health) and Kuwait, Singapore, United Arab
Emirates, etc., (these with high GNP per capita but low government budget allocations to health),
there is no apparent correlation between the amount that governments of developing countries al
locate to health and their GNPs per capita-some with low per capita incomes allocate compara
tively higher proportions of their goverrunent's budget to health and vice-versa.
~ ~----------------------------------------------------.
o 5
I I
10 1housaOOs
GNP per capita (US <k>1.Im)
15
o U.AEm;.
20
Note: Fannrt levels of ~ sperxting cnheallh, cnlyth: co.mtty with thehigbest GNP per capita is named, and only \\here it is caM:Dien1ly placed fer labelling; U AEms: United Arab Emirates
Figure 2.10: Per cent of government spending on health and GNP per capita in devdoping countries: 1987-1990
However, as is the case in developed countries, there exists a positive relationship between
GNP per capita and per capita spending on health as the figure below shows (the relationship is
approximated by the fitted [regression] line AB in the figure). 19 Both per capita health spending and
per capita GNP are in constant 1987 prices and have been adjusted for purchasing power parity.
19 This result is similar to what has been found in the developed countries--that the amount spent on health care in any country has little to do with the degree of state involvement in finance, but has a great deal to do with the level of national income (Abel-Smith, 1967; OECD, 1977; Newhouse, 1977).
-45-

The data are for different years between 1986 and 1990. Therefore the relationship is only approxi
mate. The fitted (double-logarithmic) line (AB) takes the form
LnllCEpc = <X + f3L1CNP pc' ~ ...................................................................................... (2.1)
where ill is the naturallogaritlun, HCEpc is health care expenditure per capita, GNP pc is GNP per
capita, <X and ~ are parameters. The specific equation is:!)
LnIfCEpc = -3.6568 + 0.9699l1J(]NP pc ......................................................................... (2.1a) (6.0498) If =0. 484, n=41.
7.---------------------------------------------------~
Dominican Republic • OL-------~--------~------~----~--~------~------~
4 5 6 7 8 9 10 Logarithm of per capita health care expenditure
Numbered CXlII1Iries: 1 EdDopia, 2. Siara Leone, 3. Nepal, 4. Jndonesia, ,. Thailand, 6. Emt, 7. Peru, 8. Papua New Guinea, 9 Colan
bia, 10. El SaivIKb" and Jordan, 11. Tunisia, 12. Turkey. 13. MaIa)1lia. 14. Mauritius, 1'. Uruguay and 8)ria. • awe. The line AB is fitted OIl the basis of equation 2.1a in the main text
The mark for IJIOIIt coomies is immediately to the rigid. ~ for Togo. and Mauritius (14). Where t\W er mn 00UIIIries are named at
the same line, the first one is represented by the first mark on the rist-. de.
Figure 211: Per capita health spending and GNP per capita in developing countries: 1986-1990
The bracketed term is the t-ratio, and is highly significant. The coefficient of ll1GNP can pc
be interpreted as the elasticity of HCEpc with respect GNP pc' Though we can reject the hypothesis
~, we cannot reject the alternative that ~ 1, even at the 1% level of significance. hence health is
20 The sample of usable observations dropped due to gaps in some countries' data.

a nonnal good in developing countries (if only for those in the current sample, which represent all
levels of development in the developing world).
The observed variations in health care expenditure per capita (public and private) in devel
oping countries shows a very wide variation---a fuct:or of over 30 in conservative estimates (see
the column on health care expenditure per capita in Table 2.16 at the end of this chapter) unlike in
the developed countries where the variation fuctor is only about five (see e.g., Culyer, 1987,
1988b). Another difference is that whereas variations in the developed cowrtries' national income
almost entirely accounts for all the variations in HCEp:. in the developing countries it only explains
just over 50 per cent of the variations. 21
The above result has important implications for health expenditure policy in developing
countries. Since the income elasticity is positive, it means the consumption of health care services,
made possible by available disposable income, will be directly or indirectly influenced by the distri
bution ofincome-any reduction in disposable income will reduce people's (or a cowrtry's) ability
to consume health care services. Specifically, any increase in the inequity of the distnbution of dis
posable income will increase inequalities in the access to health care services, thereby aggravating
any existing inequalities in health. For Kenya, this has the following implications. Available income
distnbution information shows that Kenya, a low income cowrtry according to UN classifications,
has an inequitable income distribution, favouring the high income groups (UN, World Develop
ment Report, 1986}-the lowest 20 per cent were earning a mere 2.6 per cent of the total income
in 1976 (the most recent year on which Kenya's income distnbution data is available), while the
richest top 20 per cent earned 60.4 per cent of the income. The adoption of a regressive payment
(for health services) structure e.g., flat fee schedules, under these circumstances will adversely af
fect the poor and merely serve to worsen health inequalities between the rich and the poor-and it
will be shown such inequalities already exist.
Thus although on average the proportion of government budget allocated to health in
Kenya is less than (the sample) average, the per capita spending (when we take into account pri-
21 A simple linear function shows HCEpc = -15.8899 + 0.0349GNPpc
(6.704) R'=0.535, n=41.
meaning that an increase of GNPpc by $1 will increase health spending by 3 cents only. This conforms with the general trends in these countries-where as a whole the average spending on health care is about 3% of their GDP. In the developed countries, the corresponding figure is about eight cents or 8 per cent of the GDP (Culyer, 1988b). This as shown by the equation 2.1a implies the demand for health care is income elastic-a rise in income always generates a rise in health expenditure. [What factors account for the remaining 50% of the variations in health care spending per capita in the above equations?]
-47-

vate health expenditures and purchasing power parity), given her capita income, is above the aver
age--the line AB in Figure 2.11 above. But this does not tell us whether or not the health of the
population is on average better. The per capita income is an inadequate measure of the welfitre of
the population as it ignores distnbutional aspects and says very little about the living conditions of
the people. Per capita income is only but one aspect ofwelfitre (some others being security, free
dom, longevity, health status, literacy and nutrition Health status is the most frequently used of the
non-monetary indicators of a country' s developm~ perfonnance. It can be approximated by vari
ous measures such as life expectancy at birth, or infant mortality. These measures show how the
country has made use of the available resources to provide the basic necessities oflife for its popu
lation (e.g., food, safe drinking water, sanitation, housing, etc.), including health care services.
4.4 ,...-----------------------------,
~ B
'" -, ~ 4.2 'ot
I Kmya. • Iner
i 4
Pakistan •• _______ - - - - - 20 7_ • Jogo - - - - •• .Papua N_OuiDea. - - - - - - - - - - - - - -
19.10 Bolivia
J _ .. Elhiopia- - - - - - - - - - - - - - - - - - - - - - - - - - - - - - - - - • - - - -
• SiClTll Leone
3.6 L-____ ....I.-____ -.1.. ____ -.l. _____ .L..-___ ---'
S 6 7 8 9 10 Logariiun of GNP per Capita (US dollars)
Numbered CCUI1Iries: 1. ArFiina. 2. &icina Fao, 3. CIiIe, 4. Colombia, ,. Dtminican Republic, 6. F..aIadcr, 7. Ghana. 8. 0uatemaIa, 9. Indooesia 10. Libaia, 11. Malaysia, 12. PmIma, 13. Pmguay, 14. PbilippineI, H. Thailand, 16. Tunisia, 17. TIJrkcy, 18. Vmezucla, 19.ZaUe,20.~
Figure 1.11: Life expectancy at birth (years) and GNP per capita in developing countries: 1989
In Figure 2.12, each COuntry'S GNP per capita is plotted against the corresponding life ex
pectancy at birth. It is evident that countries with a high GNP per capita also are associated with a
high lire expectancy (for their citizens of course) at birth.
-48-

The line AB in the figure above is drawn on the same principles as equation 2.1 above and is
based on the equation
llzLEY89 =3.1179-0.J314illGNPpc ............................................................................. (2.1b) (12.240) /f9).793, n=41.
where LEY 89 is life expectancy in years at birth in 1989. The equation indicates that for every per
centage increase in GNP pc' life expectancy rises by 0.13%. An alternative comparative approach
with similar conclusions is also evident from an examination of the relationship between the GNP
per capita and the infimt mortality rate--shown in Figure 2.13 and equation 2.1 c below.
~ -I
7~--------------------------------------------------.
6
~ s
! ! 4
f e 3 ....
~ 2 B
1 L-________ ~ ________ ~ ________ ~ __________ ~ ______ ~
S 6 7 8 9 10 Logarithm of GNP per capita
NumbInd counIries: 1 ArgaIIina 2 BurIcina Fuo, 3. CoIanbia, 4. DaniniaIn republic, S. El Salvador, 6. Ghana, 7. 0u8IanaIa, 8. India,9.Indoncsia, 10. Jadao, 11. Ma&.itiua, 12 PIkiIIan, 13. Pm8ma, 14. PapuaNewGuima,IS. Plnpy, 16. Sierra Leone, 17. ThIiIInd, 18. Togo, 19. limisia, 20. Turby, 21. Uruguay, 22 Zambia, 23. Zaire.
Figure 2.13: Under 5 mortality rate and GNP per capita in developing countries, 1989
The line AB is also fitted on the basis of a double logarithmic function of the form of equa
tion 2.1. The equation used is
LnU5MR89 = 12. 7237-J.1657LnGNPpc ...................................................................... (2.1c) (-9.341) /f=O.691, n=41,
-49-

where U5MR89 is the 1989 under-five (years) mortality rate. Both equations 2.1h and 2.1c and the
corresponding figures indicate there is a strong correlation between longevity and mortality on the
one hand and the GNP per capita, on the other. Moreover, the health status improves with im
proved GNP per capita. Equation 2.1 c shows that a unitary increase in GNP per capita causes a
more than proportionate decline in under five mortality ~ which perhaps explains why some of
these countries experienced unpreceded rates of population growth. Figure 2.13 shows Kenya lies
below the line AB which means given her GNP per capita, she has a lower than average under five
mortality rate. The figure shows most countries with high incomes per capita lying above the aver
age, which might indicate that it becomes increasingly difficult to lower the mortality rate as in
come per capita increases in these countries-but lower levels have been achieved in the developed
countries-which either suggests there is something the developing countries are not getting right.
But the diagrams also show there are differences even between countries with similar GNP per
capita, e.g., between the Philippines and Indonesia
The foregoing shows there is no simple/single relationship between income growth and im
proved health status. The latter largely depends on the policies (directly or indirectly) affecting
health pursued by individual countries. The importance ofhealth status as a measure of a countIy's
health policies drives most govenunents to play a prominent role in providing health care services
andIor in the financing it. In a half of the countries in the sample used above, the government is the
largest participant in the health care sector. This is because of a desire to provide a health care sys
tem that can ensure there is equal access for the citizens.
2.4.2 Condusion
The general conclusion from the analysis presented in this sub-section is that whereas the
proportion of state governments' budgets allocated to the health sector are not correlated with the
level of GNP per capita, the amounts of health spending per capita themselves are correlated with
health. In terms of the proportion of public resources allocated to health by the government, Kenya
is not significantly different from most other developing countries, but in terms of the expenditure
per capita, it is above average. The data shows a positive relation between the per capita health
spending and the general health of the population (reflected in Figures 2.12 and 2.13, and explicitly
depicted in Figure 2.14 below by the line labelled AB). This figure shows the countries with a
higher GNP per capita at each level generally perform better-most of them lie above the line AB.
In other words, high per capita health expenditure per se does not necessarily result in higher gains
-50-

in longevity---rome countries spending less than Kenya have higher life expectancy for their popu
lations, because they have a higher GNP. This suggests that the increase in GNP is a necessary (b.rt
not sufficient) condition for improvements in the health sector outcomes, as it is likely to lead to in
creased public (and private) health expenditures. However, as adumbrated above, the increase in
the amowrt of resources going to the health sector is uncertain, given the low level of GNP and the
poor performance of the economy in recent times.
It therefore appears that although Kenya has performed relatively well in relation to other
developing countries in similar stages of development, the implementation of structural refonns (in
addition to other adverse external fuctors) and the generally poor economic performance are likely
to lead to a constant or declining real resources to the public health sector. Therefore, future in
creases in the output of the health sector have to come, in the main, from efficiency gains in the
health sector itself Consequently, it is imperative that means be sought of increasing the efficient
use of the available public sector resources in order to attain the same objective, that is, improved
health situation for the population How this is to be done is the substance of this Thesis.
4.4 r----------------------------,
~---p
• Dominican Rep.
Burlcina Faso • • Malawi
3.8 • E1biopia
• Sicua Leone
3.6 L....-_____ -'-_____ ---' ______ -'-_____ ---J
o 2 4 6 8 Logari1bm ofheal1h care expenditure per capita
Numbered CounIries: 1. El Salvador 2. Malaysia, 3. Mauritius, 4. PeN, ~. Tunisia, 6. Zaire.
Figure 2.14: Per capita public spending on health and life expectancy in developing countries, 1989
-51-

2.5 Conclusions
This chapter has analysed the current Kenyan health care system in tenns of trends and the
distribution of resources in relation to the countIy's health problems. A number of problems have
been identified in relation to the public health care expenditures. Most notable among them are (1)
the low level of GNP which results in low allocations to the health sector, and (ii) variations in the
regional per capita allocations of public health care resources. Two tentative conclusions can be
drawn from the analysis of this chapter. FII'St, although Kenya has perfonned relatively well in rela
tion to other developing countries in similar stages of development, the implementation of struc
tural reforms (m addition to other adverse ectemal factors) and the generally poor economic
perfonnance are likely to lead to a constant or declining real resources to the public health sector.
In this enviromnent, future increases in the 'output' of the health sector have to come, in the main,
from efficiency gains in the health sector itself rather than from freshly ~ected resources. Second,
as the analysis of the resource distribution in relation to regional health status shows, there is need
to study the impact of public health expenditures upon health (m more detail than has been done in
this work) as one issue for policy evaluation (this should fonn a priority area for future research in
the Kenyan health sector). For in order to allOOlte public money among different regions or tacili
ties (hospitals, health centres, and so on), it is not only the knowledge of output which may prove
useful, but also knowledge regarding the productivity of different inputs as well as the interrela
tionships between them (e.g., substitutability). This would enable policy makers and resource anocators to identifY the optimal combination of inputs and enable them to evaluate the extend to
which increases in these inputs (through the expenditures on them) would increase the health
status. Thus an analysis of the interplay between the health status (outcome) and health resources is
an important link that nrust guide the allocation of public health expenditures amonWbetween dif
ferent programs. An alternative but essentially similar approach to achieving similar results will be
presented in chapter four after we have looked at the factors that have poSSIbly shaped the present
distribution ofhealth resources in the next chapter.
-52-

The following table presents the data used in section 2.4 for international comparisons.
Pt:pJl- HeaIth Education Defence Otrer Life Under Year atim: GDPl care auper experxIi- !OCial Per expoct- five
data mid- per cqxni- a:ntof tureas servic- capita ancy IroJ1al-
refers ~ capita itmeas govemm- percent ices as HCE2 at birth ~rate
i> figures USS percent entexpe- d %of $ 1,989 1,989
CrunIIy (mi11im) dGE3 lXIi1ure GE GE
AIgentina 1989 31.93 1,887 1 10 10 40 2 71 36
BbuIan 1990 1.52 154 5 10 n.a 9 3 49 193
BoIMa 1990 7.4 748 2 18 14 18 3 54 165
Botswana 1990 1.3 2,!l>3 5 21 13 18 SO 64 frI
Bra7j} 1990 15037 3,150 7 3 4 26 72 6S 85
Burkina Faso 1987 7.89 132 5 14 18 2 1 48 232
Cameroon 1989 11.54 na 3 12 7 10 7 53 ISO 0Ule 1988 12.75 1,732 6 10 8 35 30 72 1:7
ColonDia 1989 29.19 1,197 21 42 n.a4 5 10 69 SO
CairaRica 1990 2.99 1,907 26 14 n.a 16 128 75 22
Dm1inicanRep. 1990 7.17 m 14 10 5 21 1 64 85
EaJador 1990 10.78 986 11 18 13 3 16 66 8)
E&YIt 1989 51.8 1,~ 3 13 13 26 18 8) 94
E1Salwdor 1990 525 1,142 10 18 25 7 11 64 ex>
Ethiq>ia 1988 48.59 119 3 11 37 12 1 45 226
GaIxm 1985 0.99 3,700 n.a n.a n.a n.a n.a 52 167
Ghana 1988 14.13 368 9 26 3 12 5 55 143
GuaIemala 1989 8.94 939 10 ~ 13 8 11 63 97
Guinea-Bissau 1989 na n.a 5 5 4 17 n.a n.a n.a
India 1990 827.1 338 2 2 17 7 1 5} 145
JJx:Ionesia 1990 179.3 610 2 9 8 2 3 61 100
IIan 1990 J4.61 3,751 8 22 10 ~ n.a 67 64
10Idan 1990 4 1,091 n.a 15 21 19 ~ 67 55
Kenya 1990 24.03 351 5 al 10 6 5 5'} 111
I<o"ea (Dem Rep) 1990 42.87 569 2 19 23 11 19 ~ 31
Kuwait 1988 1.96 10,696 8 14 14 22 n.a 73 l)
LeDho 1990 l.n 329 11 18 7 7 19 57 132
Ubezia 1988 2.43 483 5 11 9 3 6 53 209
MadaglB3r 1990 11.2 na 8 ~ 9 2 3 54 179
Malawi 1989 8.02 205 7 9 5 3 4 48 258
Mala)m 1990 17.76 2,390 5 19 9 11 37 ~ 30
Mali 1988 7.83 n.a 2 9 8 3 2 45 287
Mauritius 1990 1.07 2,135 9 14 1 l) 47 ~ 29
Mcxioo 1989 84.49 2,376 2 12 2 10 9 69 51
Morocx:o 1987 23.2 816 3 17 15 8 7 61 116
-53-

Table 2.16 (cootinued)
I\)pul- lblth Education ~ Oth:r Life Under Year atim: GDP care as a per ecperdi- !Ilcial Per ecped- five data mid- per ecpend- cr:nto£ tureas servic- capita aocy mortal-
refers }t'8l' capita itureas gD\'eIl1l11- percr:nt ices as HCE at birth ~mte
b figures US$ percr:nt entexpe- d %0£ $ 1,989 1,989
Counby (million) dGE nditlJre GE GE
Myannnar 1988 39.97 1:75 5 14 19 15 2 61 91
Pdkistan 1986 99.16 322 1 3 29 10 1 57 162
Panama 1990 2.42 2,045 21 17 5 24 116 71. 33
PapJa N. Guinea 1988 3.56 1,023 9 15 5 5 1:7 55 &3
~ 1990 428 1,230 4 13 13 15 5 67 61
Peru 1986 19.84 1,299 6 21 18 0 13 62 119
Pbi1ippnes 1990 61.48 603 4 16 11 3 6 64 71.
Sierra I..eol1e 1990 4.15 175 10 13 10 3 2 42 261
Sin&aJme 1990 3 U,I77 5 ~ 24 9 na 74 12
SriLanka 1990 16.99 473 5 10 7 15 109 71 36
Syria 1990 U.12 2,048 2 7 32 5 8 66 62
Thailand 1990 56.08 1,372 6 19 18 6 1 66 35
Togo 1987 322 384 5 ~ 11 11 6 54 ISO Trinidad & Tobago 1989 121 3,540 na na na na na 71 18
'fuoiga 1990 8.07 1,548 6 17 6 18 32 66 66
'I'mkey 1990 56.1 1,935 4 19 12 4 17 65 !Xl
U.A.Emirates 1989 1.55 17,755 7 15 44 4 na ~ 31
Uruguay 1990 3.1 2,671 4 7 9 51 31 71. 1:7
Venezuda 1990 17.53 3,474 10 ~ 6 13 74 ~ 44
Yemen 1987 7.31 576 3 19 23 2 6 51 192
Zaire 1988 33.46 265 12 25 56 19 2 53 132
Zantia 1988 7.53 361 7 7 na 4 10 54 125
~ 1987 8.64 583 22 3 3 na 3 59 !Xl
1 Gross Domestic Product
2 Health care expenditure
3 Government expenditure
4 n.a: means data not available.
Table 2.16: Data used for international comparisons
-54-

-CHAPTER THREE--
3. THE SE1TING OF THE PROBLEM-ll: THE PRESENT REALm CARE SYSlEM IN KENYA-ITS ORGANISATION AND BACKGROUND TO PRESENT
PROBLEMS
3.0 Introduction
This chapter descnbes the administrative and organisational structure of the health care sys
tem and shows that a logical outcome of it is inefficiency and inequity in mobilisation and use of
available health resources. The rest of the chapter is organised as follows. Section 3.1 outlines the
administrative and organisational set-up of the public health services and its relationship with the
private sector. Some stylised f3ct0rs that ecplain the observed variations in perfonnance within the
system are then discussed in section 3.2. Since our interest is in the reform of the public health care
system, we focus on the effects of the financial budget practice on efficiency motivation and its dif
ferential effect on institutional perfonnance, according to some basic behavioural postulates be
cause we believe (and we will illustrate this) this is one of the biggest sources of problems in the
present system. Section 3.3 summarises the main implications for policy. Section 3.4 reviews previ
ous (related) works on the Kenyan health sector with a view to identifying the main concerns iden
tified, and assessing whether the (identified) concerns and the recommendations proffered have
really been the fundamental ones and or whether they have been incentive compatible. Section 3.5
summarises the key problems filced by the current system that need redressing. Section 3.6 sum
marises the chapter.
3.1 Organisation of Health Services in Kenya
Kenya is divided into eight (civiVpoJitical) administrative units called provinces-Nairobi (an
urban-extra provincial district), Central, Coast, Eastern, North Eastern, Nyanza, Rift Valley and
Western. Each province is further subdivided into units called districts. Some provinces have more
districts than others. In 1990, there were a total of 42 districts. Each district is divided into smaller
political and administrative units called divisions (sometimes sub-districts). The divisions constitute
the smallest political units (constituencies). For administrative purposes, however, the divisions are
further subdivided into locations, the locations themselves in turn divided into the smallest adminis
trative units called sub-Iocations.
-55-

The health sector has a fiIirly Iarge public sector that is funded and run by the govennnent,
and a small but not insignificant private sector. The Ministry of Health (MOH) is responsible for
designing and implementing national health policy. It has a supervisary role over the conduct of the
private sector, besides its own general responsIbility for health matters in Kenya
3.1.1 Organisation of the public health sector
The activities of the MOH are organised on a central basis with four levels according to the
politicaVadrninistrative set-up descnbed above. The four levels are central, provincial, district and
rural. However, with the advent of District Focus for Rural Development, the district is increas
ingly becoming the focal point for co-ordinating health activities within each district.
The central level is the headquarters from which political, administrative and professional
matters are directed and co-ordinated and policies and decisions made. The minister for health is
the political head. The pennanent secretary in the MOH is the head of the administrative activities
of the ministry. The professional head bears the label of the Director of Medical Services (DMS).
The central government, through the MOH, is responsIble for organising and administering
govermnent hospitals, which together with the health centres and dispensaries fonn the core of
clinical fucilities in Kenya The hospital service is based on an integrated system of sub-district and
district hospitals, provincial hospitals and the central consultative hospital in Nairobi-Kenyatta
National Hospital-with a full range of modem fiicilities, including a cardiology cIinic, a kidney
transplant unit, a cancer research centre, a medical and a dental training school (parts of the Uni
versity of Nairobi) for training medical doctors and dentists respectively. A medical college at
tached to the hospital trains high rank IRlfSes. In Nairobi (the capital city), besides the headquarters
of the Ministty ofHea1th and the national referral hospital, there are other specialist institutions in
cluding the main mental hospital, an infectious diseases hospital with poliomyelitis and respiratory
wings, an orthopaedic rehabilitation centre, medical research laboratories, an insect-bome diseBses
research institute and radiological department. The expertise focused in Nairobi is available to re
ceive difficult or infectious cases referred there by supporting hospitals-both nationally and inter
nationally in the eastern and central African region The Central Medical Stores are also located in
Nairobi. These supply phannaceutical and laboratory equipment to the whole coW11Iy, including a
range ofvaccines. some of which are exported.
-56-

There are eight provincial hospitals at Embu, Garissa. Kakamega. Kisunru, Machakos,
Mombasa, Nakuru and Nyeri. These are administered by a Provincial Medical Officer of Health,
and have bed capacities of between 300 and 800. These institutions are the general hospitals for
thek districts but also serve some specialist needs of the district and mission hospitals and private
clinics. They have fully qualified medical officers of health on their staffs, and provide specialist as
well general services, clinical laboratory and diagnostic X-ray services.
Below the provincial level are district and sub-district hospitals. The District Medical Officer
of Health is responstble for the management of the district hospital, besides their other functions
concerning the local health services. The sub-district hospitals are under the charge of a hospital as
sistant They provide simple medical care.
Below the district and sub-district hospitals are health centres and dispensaries. Much of am
bulatory health services are provided through a network of health centres. These are under the di
rect supervision of a District Medical Officer of Health, supported by a Health Inspector, a Public
Health Nurse and a Clinical Officer. Their aim is to bring medical aid and forces of preventive hy
giene to local people, especially those in rural villages. The health centres are mostly located in
Jarge villages or small towns. They are ordinarily designed for catchment populations of around
30,000. Health centres generally offer various services-preventive and curative--mostly adapted
to local needs. Primary emphasis is directed toward the preventive and promotive aspects of
health, but now there are pressures on curative services in these filcilities. This pressure has been
temporarily met in most areas though the construction of dispensaries.
The dispensaries, besides relieving the pressure off the health centres, fulfil an important role
in providing a wide coverage for preventive health measures, which is a primary goal of the health
policy. They are nul by qualified nurses, although some are still under 'graded dressers' who can
make elernentBIy diagnosis and give treatments. Sometimes, mobile health units, operated by
health centre staff pay regular visits to areas beyond the health centre and dispensaries' innnediate
sphere. Such mobile units are especially suitable for serving the nomadic peoples-the Maasai, the
Twicana and the West Suk, for example. Mobile clinics are also used to take services to the people
where the local population, though sedentary, is widely scattered, making it difficult for some pe0-
ple, given their low incomes and the poor transport network, to reach the site facilities.
In addition, Local Government AutOOrities, especially the Nairobi City Council and several
JTDJI1icipal councils operate filcilities at the health centre and dispensary equivalents in their respec-
-57-
tive areas of jurisdiction, to supplement the MOH fucilities. They are also in charge of sanitation,
public and environmental health in their localities.
The public health system, as is evident from the above, is a hierarchical referral health care
system. The dispensaries are the system's line offirst contact with patients (although in some areas
health centres and even hospital outpatient departments are first points of such contact). A perva
sive characteristic of a hierarchical referral health care system is a pyramid-like structure of health
institutions, through which basic and tertiary health services are provided, in principle, to everyone.
The apeK of the system in Kenya is the Kenyatta National Hospital. The system permits movement
of patients from the base of the national health system to its aJ)e'C and vice-versa. The movement of
the patients in the referral system is intended to be initiated by the health professionals who manage
the public health care system.
3.1.21be private sector of the health senices in Kenya
The government health service is supplemented by privately owned/operated hospitals and
clinics, mission hospitals and clinics (operated mainly by the Protestant and Catholic Missions, but
a few by the Islamic community and other religious organisations). Except for the mission fitcilities
and a few scattered private clinics, the bu1k of the private sector health fBcilities are located in urban
areas (for reasons already disrussed). These consist mainly of private hospitals, private dental serv
ices, private medical and nursing services and private pharmaceutical services. Some employees
also operate 'on site' clinics for their employees' needs. Occasionally, Kenyans go abroad for spe
ciatised treatments such as heart transplants (although successful transplants have been done in the
oountry--in both private and public fitcilities) and brain twnour swgeries.
In the main towns there are private general hospitals that vary in size. Nairobi alone has six
large private hospitals and several private maternity homes. In the rural areas, hospitals have been
built by various agricultural and commercial enterprises for their employees. There were 50 private
hospitals in Kenya in 1989. In addition there are other smaller institutions that provide in patient
medical fiIcilities
There were 34 mission hospitals in Kenya in 1989. They have qualified personnel-although
most have been 'poached' from public sector, where salaries are generally low. Missions played an
important part in introducing medical services to rural populations. But much of their services are
mainly curative oriented. The standards of services in these fiIcilities are usually high, sometimes
-58-

comparable to those of the purely for profit hospitals (often reputed for their high quality of care
-slthough see chapter six why this interpretation need not be correct).
The number of medical doctors and other medical personnel in the private sector is not well
known. It is difficult to estimate the number of doctors working in the private sector in Kenya
because doctors working in the government sector engage in private practice on a considerable
scale as consultants or are employed again in the private sector as consultants. Similar problems
exist for other medical personnel. Long serving clinicians with considerable experience, previously
barred from private practice were allowed to enter practice in 1990. This must make it even more
difficult to detennine the personnel in the private sector.
3.1.3 Relationship between the public and private sub-sedon
As shown above, the public and private sectors CCHMst in the Kenyan health care system.
The public semce sector is strongly centralised, but is not supported by an efficient hierarchical
network for its management-rules are executed at provincial, district and institutional levels by
politically responstble bureaucrats, under a hierarchical set of formal authorisations and innocuous
controls. Ftmding and provision are not separated (more of which below). On the other hand, the
private sector is generally independent and non-integrated-with diverse providers operating al
most independently, subject to (some) control by the Ministry of Health. One remarkable behav
iowal feature of this structure of the health system has been the 'dual practice' phenomenon
-where some Kenyan physicians hold appointments sinrultaneously in the public and private sec
tors-especiaI1y those in urban areas. For ewnple, a 1988 study on the health services situation in
the Nairobi Area (REACHIKNH, 1988) found that about 22 per cent of doctors in private practice
in Nairobi had employment outside their clinics. This phenomenon has never been fully challenged
by the public health authorities and whether it is an outcome of the relative importance of the pri
vate sector or a consequence of its existence is open to debate. However, using simple economic
concepts, its implications in the system can be shown to work to the disadvantage of the public
health services, given the present structure. In addition to this behavioural aspect of the health care
system, some other aspects of the organisation and funding of the different sectors of the system
need to be considered when assessing the incentives structure in the system as a whole, before gen
eral postulates about the system incentive structure can be drawn. Focusing mainly on the funding
arrangements, and taking into account the organisational structures and funding arrangements in
the different sub-sectors of the system, the next section examines the incentives prevalent in the
-59-

current system, and concludes there is need for a more co-ordinated effort if the objectives of the
system are to be attained.
3.2 A Synoptic Diagnosis of Problems and Their Causes in the Current System
3~O Introduction
In addition to the behavioural f3ct:ors alluded to above, the nature of funding of the public
sector has generally not encouraged a more cost-conscious management of the resources in Ken
ya's public health sector. In filet:, as we show below, the method presently used by the Ministry of
Health (and the National Hospital Insurance Fund (NHIF) to allocate resources to the provider
units (to reimburse providers in case of the NHIF) has not provided an explicit and objective finan
cial constraint within which questions of operational efficiency in the sector can in principle be
supported.
3.2.1 The resource aDocation process in Kenya's public health services system
In countries with a certain degree of decentralisation, an initial distribution in mvour of re
gional health authorities usually precedes the final alloaltion although the criteria for allocation is
detennined in principle in a fBshion consistent with the implementation of globally-set planning
policies. DemJgraphic variables-such as population in the region, morbidity and mortality metors,
and so on, are mostly considered at this intennediate stage with account taken of some territorial
or social inequality f3ct:ors (e.g. see DHSS, 1976). However, in practice, other implicit criteria may
also be present, such as those based on pure inaementalistic patterns, political lobbies, or some
other amorphous criteria such as those offering a generous one-time treatment to some areas for
one year and none the next.
Whenever no explicit criteria are set for the latter redistribution (i.e. allocation to regions and
mcilities), the previous year's expenditure, or what has already been actually spent in the CUIrent
year takes on a systematic nature--one which in reality leads to some form of cost-based mmbursement. This may fdil to translate the financial environment ofresource limitation (scarcity) into
the internal behaviour of the health providers in order to induce incentives for improving perform
ance Ovtr time. Most of these features are found in the system of budget coverage for expenses in
the Kenyan public and private segments of the health sector, particularly in the fonner.
The budget setting and restJIUCe allocation process in the public sector
In the Kenyan public health services sector, the roles of purchasing agent and provider are
combined tmder one agency-the Ministry of Health (MOH). The central government provides
funds from general tax revenues. The Ministry of Health, through the organisational framework al
ready descnbed, is responsIble for allocating funds to the various functions and facilities. The
budget is usually the main instrument by which decision makers plan the activities of the public
health sector. The budgets of various public providers have in the past not been drawn up in a way
that related resources to specific objectives-<>r outputs-that are to be achieved. Instead, they are
designed for administrative purposes: to ensure appropriations are used in canying out specific
tasks. The rurrent budgets are 'item' budgets---appropriations are allocated according to catego
ries or items of eKpenditure. There are columns for actual amounts spent on major categories and
the corresponding items of expenditure within each, for the previous year (called approved appro
priations), and what is 'estimated' to be the requirements for the present year. The only innovation
introduced in the plarming process recently was that of a 'forward rolling' budget where an attempt
to 'look forward into the future' is made. In spite of this, the impression one gets is that it merely
compares the present year with the previous because even the forecast budget is based on the pre
vious year's budget out-turn. TIros the budget is one of budget by 'items' of expenditure by cate
gories rather than by objectives.
The items of expenditure are broken down according to various functional divisions of the
MmistIy of Health. The main functional categories are: General administration and planning Cura
tive health, Preventive medicine and promotive health; Rural health services; Health training; Na
tional health insurance; and Medical supplies co-ordinating unit. These are further broken down
into sub-divisions. For example, Administrative and plarming expenditure is broken down into vari
ous components: MmistIy of Health headquarters administrative services; Ministry of health head
quarters professional administrative services; Provincial professional administrative services
(further broken down by province); Medical legal services; and Plarming and feaslbility studies.
Similarly, the Curative Health category is broken down into Kenyatta National Hospital, Provincial
hospitals (further broken down by province); District hospitals (up to 1989, this appeared as a sin
gle expenditure category but presently it is broken down by district and by hospital); Psychiatric
services (by institution); Non-Govemmenta1 Organisations (grants to); Spinal injury hospital (only
one); Biomedical and hospital engineering; and Dental services. Within these sub-categories of ex
penditure the budget lists the particular items of expenditure, for example, the amount allocated for
personal emoluments, different types of utilities, maintenance of buildings, purchase of equipment,
-61-
and so on. Apart from expenditures, there are entries under each category and or sub-category
showing 'appropriations in aid' -income receipts that arise as a result of service 'sales', and so on.
For example, under each curative health f3cility--say a district or a provincial hospital-appropria
tions in aid (m the form of ' sales and fees for services rendered', 'boarding fees', and 'other miscel
laneous receipts') are indicated. This type of budget by function and expenditure item
categorisation is used for both the recurrent and capital development budgets.
The available resources are not shared between regions and or f3cilities according to any
systematic basis. Although the Ministry of Health has recognised the need for allocating resources
on the basis of fBctors such as size, demography, sex, mortality and morbidity factors (MOH,
1992), it has yet to incorporate such considerations into the budgeting process. The revcrue allo
cation process is usually on the basis of expected workloads implied by filcilities' work plans, the
swn of which detennines the overall allocation to any region---not the filctors mentioned above,
i.e., the Kenyan public sector operates under a system of revenue allocation based on a retrospec.
tive spending. The mechanism of revenue allocation to the decentralised health care units proceeds
throogh three main stages:
• detennination of the global sum of expenditure available to the health sector. This
decision is 13ced at the central government level and involves negotiation between the
MOH and The Treasury.
• the distnbution of the funds to the health care sub-sectors (such as curative versus
preventive medicine, hospital versus ambulatory care, inpatient versus outpatient
treatment, etc.). This type of decision is f3ced at the MOH and to a certain extent reflects
govennnent objectives although political interference is not urusual.
• finally, in relation to the distnbution amongst the specific units charged with the provision
of that particular type ofhealth care. This type of decision is also fuced at the MOH level.
In general, there are no decentralised stages for planning and allocation of health resources
regionally, although in recent times, with introduction of District Focus for Rural Development, the
MOH is also contemplating decentralisation. The decentralised facility network is managed under a
type of bureauCratic network in a hierarchical filshion. In general, there are no ecplicit aiteria set
for the distribution of resources between hospitals. There has been reliance on the previous year's
expenditure-Or what has actually been spend---as the basis for current allocation. Such an alloca
tion procedure may fail to instil the financial discipline necessary to provide incentives for improv
ing efficiency over time into the internal behaviour of hospitals. This is because such an allocation,
based on retrQSPeCtive spending as it is, is nothing more than a cost-based reimbursement-where
-62-

the reimbursement is based on actual (self) reported expenses. Thus, one can argue, it ultimately
results in already inrurred expenditure being reimbursed.
The process of resource allocation of revenues generally begins with requests put forward
by each department or filcility, e.g. a hospital, in advance to the MOH These budget forecasts are
statutorily based on the probable expenditure in the current year, adjusted for cost increases antici
pated from expected filcility activity-in reality they are little more than 'guesstimates.' For each
item, the forecast figure has to be accompanied by the probable expenditure in the present year.
Thus, the current amounts are obviously used as the basis for an incrementalistic pattern (of the
budget) in lia! of a full expenditure appraisal. In general, the forecasting exercise consists of two
parts-one for the current expenditure, the other for capital expenditure. Standardised procedures
for presentation of infonnation are used, constructed according to certain administrative fonnali
ties, rather than from a specific functional design for budget evaluation principles. A set of guide
lines is provided annually for this purpose, providing codes, definitions, and delimiting the scope of
items included, often with an indication of priority areas, particularly in investments and equipment
acquisition Manpower expenses are determined according to staffing levels as approved by the
Ministry of Health. The rest of the budgetary iterns--medical and non-medical inputs--are often
left to the institution's discretion. In the hospital sector, there is no fonnal separation of outpatient
and inpatient services-this is also left to the institutions to establish the relative sizes. Conse
quently, little is hardly known about the use of resources in the respective activities since there is a
lot of resource sharing. Besides, budgets are often not linked to global growth of the economy and
are rarely adjusted for inflation (see section 3.4 below). The resulting 'bids' fOnD the basis for in
crementalistic pattern of aIl00ttion instead of a full expenditure reappraisal. The rural health serv
ices' budgets are residually detennined--i.e., receive whatever is left after curative, administrative
budgets, etc. have been completed.
Some 'H1t!Ilknesses in the budget setJing and resource aJ/ocation prot:DS
The type of budgeting process described above, as a tool of planning, cannot in its present
form assist the ministry official& in deciding how to allocate scarce resources efficiently and equita
bly (these concepts are discussed in the following chapters) among the various goals and or activi
ties. The budgeting process has various shortcomings. Flfst, it is not output oriented. There is
hardly any economic or epidemiological appraisal. Each sub-category (of aIl00ttion) is limited to
pointing out the differences between, say, this year's requests as compared with the previous year's

amount. This shows the budget requests are done mainly on an incremental basis--Iast year plus a
bit more. This has the implicit assumption that the current level of ecpenditure (say, for a particular
&ci1ity or even on an input) is 'the correct' level of expenditure and what is needed are only mar
ginal changes to incorporate cost f3ctors that are likely to affect either the demand for or supply of
health care services, such as expected increase in caseloads, inflation, or medical advances and
teclmological changes that have cost implications, and so on. Moreover, the allocation is generally
on the basis of the existing health sector infrastructure. This may also fail to account for inequality
in the current distnbution of resources. While the total requirements o( say, the hospitals are given,
there is no indication of why a particular level of doctors, nurses, and so on should be employed in
a partirular institution-because the technical relationship between inputs and outputs is hardly
known. The setting of staffing nonns is therefore an arbitrary exercise, more based on convenience
than technical considerations.
Second, under the c::wrent budgeting procedures, institutions are simply reimbursed all ex
penses at full cost, irrespective of their contnbution or otherwise to the objectives of the health care
system. Moreover, since reimbursement is on the basis of past costs, and given that any savings
made by an institution during the budget period revert to The Treasury-any unspend allocations
at the end of the accounting period are automatically retumed-institutions (filcilit.ies) have incen
tives to spent all the allocated appropriations. To do this may involve encouraging activity as nruch
as possible just to ensure all allocations are fully accounted for. This may have adverse effects on
efficiency since most activities Wldertaken have not been evaluated for their worth-neither to the
patient nor to the objectives of the system as a whole. ThIs the present budget practices penalise
f3cilities for being efficient and 'reward' inefficient filcilities.
Another confounding f3ct0r is that doctors and other health personnel are paid a salary that
is tmrelated to perfonnance, one instead determined mainly by grade, length of service, and so on.
Such wages are in principle 'attached to jobs rather than workers' without account to the e.xtemal
earnings levels in the private sector22, or the worker's actuaI level of performance. A complex set
of administrative procedures-such as 'job-groups' that are mostly dependent on seniority and ex
perience in the bureaua"atic hierarchy, together with some consideration offonna1 qualifications
determine the level of wages. Ifwe assume significant job-skills are acquired simply by experience
on the job, this (wage hierarchy set-up) in theory reduces potential bargaining costs, particularly in
22 The Weekly Review (June 3, 1994), reporting on a dispute between the government employed doctors and their employer, states that in the private sector doctors earn four times as much as their counterparts in the public sector (Weelcly Review, June 3, 1994, The Medical Profession: Doctors Issue Strike Threat, pp. 19-20).

sectors with high infonnational asymmetries (as in the health sector). But this provides a constant
perverse incentive environment, since it is actually based on job promotion for life-which can
conceivably be achieved simply by giving a 'modest effort' while the passage of time guarantees
promotion into the next rung up the wage ladder. In such cases, problems of 'shirking' could be
expected to abound, and thus inefficiency. This perhaps explains the general lack of incentives for
efficient perfonnance over time, and the continued haemorrhage of the public sector health person
neI-aspects rrruch decried by the authorities in the Kenyan public health care sector. The govern
ment has not recognised the need to provide incentives (monetaIy and non-monetary) for doctors
--and other health persormel-to be efficient in their resource allocation The financial and non
financial incentives that exist are not meant to encourage efficient behaviour (but are given as in
ducements to instead serve in isolated, usually small urban towns in arid areas---but the distrIbution
of health persormel still shows these are the areas with the greatest number of unfilled vacancies ac
cording the to the Ministry of Health's own staffing nonns).
Another important outcome of the allocation process discussed above is that instead of cor
recting inefficiencies in resource distribution, it serves to entrench them since the (present) alloca
tion is tied to existing institutional capital infrastructure. Consequently, rrruch reliance has been
made of the capital budget to improve health infrastructure capital distnbution, but it appears the
reverrue budget dominates the process, since capital projects can be postponed. As noted else
where, even this approach has been prone to errors, e.g.., when the government constructed a mci1ity in an area alm1dy served either by purely for profit or non-governmental filcilities.
Fmally, the absence of a more complete budget appraisal and expenditure evaluation policy
on which to link those restraints has led to problems of inefficiency and inequity in the health sector
since often the allocations may dependent on irrelevant filctors such as the negotiating abilities of
fiIcility managers. Personal cormections may also play a role in determining the outcomes ofbudget
allocations. Moreover, the approval of the budget is not necessarily the final constraint according
to which activities are to be camed out. Budget overruns are common23. No specific pattern can be
demonstrated to exist in the sequential process ofbudget submission, approval and execution, with
respect to their initial and final outcomes, in terms of the level of reduction, degree of overrun, and
the future use of any of the former budget bases for new planned expenditure. It appears there is an
23 Sometimes the MOH resorts to arbitrary 'across-the-board' sweeping cuts in the budget proposals. This seems an exercise in futility because before the year is over, most hospital managers (or heads of other public health departments/facilities) will be back in the MOH corridors presenting requests for supplementary funding to defray deficits and, unfortunately or fortunately, most requests are fulfilled -even if only partially. Thus, in general, the approval of the budget is not, strictly speaking, the final expression of the financial constraint according to which activity has to carried out.
--65-
implicit assumption that financial restraint policies can encourage efficiency. This appears to stem
from the assumption that the resulting imposed cost-savings imply parallel improvements in re
source utilisation Whether such policies can achieve improvements in efficiency is a debatable mat
tee. YU'St, what is to be understood by efficiency in this conted is not clear. If it translates into
'doing the same but cheaper', it needs to be proven that the same outcome is actually achieved and
it would be necessary to account for variations in circumstances from which this result can plausi
bly be eKpeCted. If the same refers to what someone else does, it needs to be proven that similar
ciraunstanceS prevail in the comparison, especially if from the alternative providers we expect
identical performance. Second, the expenditure restraint just serves to validate past levels of ecpen
ditures, since they (the past levels) are used as bases for future projections. We have seen that those
bases are the result of the fBctors such as the budget revenue allocation grounded in the current ret
rospective system. Therefore, this is a weak basis for expenditure rationalisation, since it incorpo
rates the consequences of a perverse set of institutional arrangements. Past levels of expenditure
cannot provide a sound basis for an expenditure rationalisation projected into the future. Third, the
implementation of general cash limits with across-the-board increase&'ruts tend to deal with poten
tial 'unequa]s' as 'equals'. In this case, for example, the haphazard increases penalise previously
cost-<x>nscious spenders but rewards past profligacy--l~ the latter (higher spenders) relatively
better-off after implementation of the policy, given the indifferent basis of application of these gen
eral increases. As a result, the policy introduces questions of comparative justice and certain dislo
cation effects that encow-age some gaming strategic behaviour (on the part of providers) in
budgeting in order that the initially prospective financial constraints can be evaded.
Thus, neither the reimbursement nor the expenditure restraint policies provide any effective
incentive motivation for cost-conscious management of health resources. 'Across-the-board' in
aeases based on self-reported costs in a context of inadequate monitoring and expenditure evalua
tion cannot intrinsically contribute to the expenditure rationalisation targets required if a serious
and constant effort for improvements in the allocation of public resources is to be pursued in the
health sector. Moreover, this policy introduces a set of distortion against a more rational basis for
development ofhealth sector activity.
The nesl/OI' change
The short list of some of the major problems inherent within the mechanism of resource allo
cation in the public health services discussed above shows the system, in its present form, carmot
-66---

substantially assist officials in deciding how to allocate scarce resources to meet the objectives of
efficiency and equity in the health care systenr-there is a lack of appropriate incentives. In short,
there is need for establishing a more solid basis on which a consistent and rational evaluation of
policy should be pennanently grounded. In the absence of a complete reform of the budgeting
methods, system budget ovenuns are connnon, and under the influence of filci1ity administrators
(particularly hospital administrators) current levels of expenditure are often used to adjust budgets
where such overruns have occurred. In theory, in order to prevent such outcomes, facility adminis
trators are ordered to follow budget execution rules strictly (with resources being released in
tranches periodically). But it: under 'exceptional circumstances' problems of over-spending arise,
facilities are allowed to request for additional funding. Though theoretically no preswnption exists
for automatic approval, the process is nearly a formality for dealing with budget ovemms without
appearing to make the exercise simple. Lobbies and political pressures may be exerted for the full
coverage of the overruns, but the final outcome often depends on &Jbjective elements such as per
sonal abilities offacility administrators to achieve additional funds, and so on
In conclusion, the system operates in practice as a retrospective reimbursement. In this con
text, we cannot expect any general motivation for a cost-conscious management other than that
which is ad hoc. The question now is: what alternative system or framework or modifications of
the present system can be put in place to ensure that health care resources are used efficiently with
out at the same time abandoning that cherished concept of equity? The efficiency implications of
the process of resource allocation, and the enviromnent of their application, will be analysed in the
next chapter. According to the theory to be developed in chapter six, there are a rrumber of alterna
tives that night be tried/adopted. These alternatives will be discussed in chapter seven
3.2.2 The private sector
Growth of the private sector has both positive and negative consequences for the health sys
tem. It is for example claimed that the better-off patients will use private hospitals and thus free
public resources to serve the poor (Akin et al., 1987). On the other hand, it widens the gap ofine
quality. Given that the state aims towards equitable health care services provision, but the private
sector providers are often driven by the desire to maximise profits, there may a divergence between
the objectives of the state and those of the private sector providers. Private physicians may for ex
ample over-prescribe care in order to generate higher incomes for themselves or their organisa
tions, which is costly both to the individual and society, and may have adverse effects on state
-67-

objective of increased access to care. The concern with profits may lead the private sector private
sector providers to behave in ways considered unethical. In 1992, there was a general public up
roar when one private hospital was reported in the local media to be refusing treatment to accident
victims because payment was not assured. There has also been report of another hospital that re
fused to put a renal patient on dialysis because 'enough' deposit had not been paid. Private provid
ers may also promote expensive treatments and high cost procedures or high teclmology
equipment even in the absence of evidence about their effectiveness. Besides an absence of concern
for public health services, the private sector providers, particularly those in poorer areas, may cut
costs by providing low qua1ity care, or by relying on unqualified, less costly personnel. In other
cases, the motivation for profits also may mean that the private sector providers are unlikely to en
gage in public health care activities (as shown in chapter four). This meBllS they fiill to promote
preventive practices which reduce morbidity and the resultant number of consultations. Private sec
tor providers could play an increased role in the early detection of disease and prevention if en
~ to use screening procedures for groups at risk of specific diseases (where efficacy has
been demonstrated), and to engage in immunisations.
The growth of the private sector also attracts trained personnel from the public sector, often
at a considerable social cost and may thus undermine the public services. This problem is particu
larly acute in Kenya. The large differences of earnings that exist between the public and private sec
tor encourages trained to leave the public sector to work full time in the private sector, so creating
skilled personnel shortages in the government fiIcilities. For eaunple, the Nairobi Area Study
(REACH/KNH, 1988) survey data showed that about 68 per cent of privately practising doctors
in Nairobi were previously public sector employees. In particular, 52 per cent ofthern were previ
ously working for the Ministry of Health, 10 per cent from the University and 7 per cent from the
Nairobi City Council. Some private sector doctors also work in public institutions (mainly as con
sultants). It is conceivable that their private practice receives priority over government sector work
(again due to remuneration differences), in addition to giving them an opportunity to solicit for pa
tients from the public sector. The study quoted above concluded that
There is need to determine the effect that the rapid expansion of the private sector in Nairobi since independence has had on the structure of the sector. It is important to determine, for example, whether expansion has made the private sector more competitive and what has happened to the costs. Twenty years from now a large proportion of the private doctors will be nearing retirement. Government should have a policy of replacing retired doctors in the private sector to ensure that medical care in this sector is not disrupted by the natural retirement of private sector doctors (page 56).

The wisdom of this advice is questionable. While it is a stated government objective to en
courage private sector expansion in order to ease the burden on the public services, it is not entirely
up to the government to provide training for all private sector requirements. Besides, if the compe
tition mentioned is a reality, the problem of skilled personnel haemorrhage to the private sector will
continue and there would be no need for such a policy. The important issue is how this affects the
effectiveness of the public health services.
As the state has a role in ensuring safe and appropriate health service provision to the popu
lation, it nrust have mechanisms through which to liaise with private sector providers. In consider
ing ways to improve service provision to the whole population, there is need to analyse the
interrelationships between the government and the private sector, in particular, the actual and p0-
tential mechanisms for improving this relationship. A conceptual framework to assist towards this
end will be developed in chapter six, where an attempt will be made to outline the key areas of in
teraction, the concerns and relationships between them, after development of a theoretical frame
work that will place this relationship in conted.
3.3 The OveraD Picture and Implications for Policy
The analysis up to this point was an overview of the Kenyan health care system----its organi
sation, administration, and the distribution of financial and physical resources and personnel-and
the general health situation It is now apparent that Kenya inherited an inherently inefficient and in
equitable system The survival, to a great extent, of the unequal pattern of regional provision per
head of crude popuJation-and the persistent unequal burden ofhealth risk-after more than 30
years of public intervention can however be heuristically explained.
The separate development of the different segments of the health care system that had cc
a.ured before independence persisted after independence largely because of an absence of c0-
ordinated or explicit nationallalth services planning policy. Two filctors were largely respoIlSlble
for the apparent lack of any coherent planning even in the face of a government that was conunit
ted to etimination of inequalities as early as 1965. The first is the quality and the distribution of ex
isting capital stock at independence, and the second is the revenue costs of the previous systems.
The hospital capital existing at independence was largely unevenly distrIbuted, some of it
aged. Despite the effort by the government to alter the distnbution, substantial capital was required
-both for improvement and construction Taken together, these would have required a large
-f£)-
capital budget to remedy them. But even more noteworthy, there was no explicit criteria for provi
sion and this led to duplication of effort. It has not been unusual to find a government, private or
mission :t3cility being constructed in an area where another f3cility of a similar type exists due to
this WlCO()I"(tination in the system.
Moreover, this uncoordinated planning also extended to the financing side. While private
health insurance was not widespread and that which existed catered only for specific groups of the
population, the introduction of public sector insurance (the National Hospital Insurance Fund) put
a check to its growth. But the legal imposition of a flat contribution rate restricted the development
of this particular public institution and no attempt was made to cater for those in the rural areas
largely because the scheme, like the private sector insurance-focused on the working group, most
of them based in urban areas. Consequently, capital development on any broad scale was pre
cluded by unavailability of adequate funds. Moreover, for a newly independent country, there were
many other equally pressing areas requiring wgent capital inftrastructure-e.g. industrial and social
capital was necessary-and the development of the health care infrastructure had to compete with
other sectors. Those sectors politically favoured, e.g. education, naturally won Besides inefficien
cies in resource allocation, a number of other fuctors further impeded the development of the
health sector. Notable among them is the efficiency in resource use in the public sector. Usually,
the allocation is not related to expected health status improvements-because as shown in the de
saiption of hospital sector resource allocation, no systematic methodology is used. The productiv
ity of resources is therefore hardly known There is an absence of specific norms for provision of
various types of services and consequently, the concentration of capital continues to be wban bi
ased Thus there is need to study the impact of these public expenditures upon health as one basic
issue for policy evaluation The fiillure of the ministry ofhea1th to drive any substantial inroads into
the pattern of inequality eKist:ing at independence largely derives from the method of funding used
to allocate budgets. Facilities and regions (districts and provinces) receive a budget: based on the
previous annual budget with allowances for new capital or services anticipated in the coming year
and for inflation and growth-when ruts were necessary, frequently the 'victims' have been capital
projects. The other main problem, as hinted above, has been poor economic performance.
Another problem has emanated from reliance on donors-who mostly constructed f8cilities
but did not equip or staff them. In most cases the MOH fiWed to incorporate the effects of such fa
cility developments in its budget-50 the budget: provision for these new facilities was inadequate
-this further constrained their efficiency and the effectiveness of the health care services they pr0-
vided. The reliance on 'harambee,:14 effort had similar efforts---f3cilities were constructed under
-70-

communal efforts that could not be operated effective1y/effeciently. Lack of policy guidelines on
the donor community/harambee meant there was failure to apply new capital wholly to the benefit
of the worst-off regions. This continued to perpetuate inequalities, besides compromising effi
ciency. In order to allocate budgets for public money among different regions and or filcilities (hos
pitals, health centres and so on), it is not only the knowledge of the output that may prove useful,
but also the knowledge about the productivity of various inputs as well as the interrelationships be
tween them (substitutability) enables us to identifY the optimal combination ofinputs and enables
us to evaluate the extent to which increases in these inputs would increase the health status. There
has to be criteria for allocating resources that takes into accowlt the inter-relationships between the
health status, health resources and technology ifwe are to achieve an effective and equally efficient
health care system. This is the main task this thesis undertakes--the development of mainly the0-
retic constructs for optimal resource allocation We subsequently examine the theoretically appro
priate patterns of regional provision and policy attempts to redistribute resources. However, the
filet that there is ooequal per capita provision does not of itself demonstrate an inappropriate distri
bution-such an asswnption would beg the question of what comprises an appropriate distribu
tion These issues are taken up in Chapter five. But we first review some works on the Kenyan
health sector in order to outline what are anrently thought as the problems that need redressing.
3.4 A Review of Related Previous Works on the Kenyan Health Care System
Studies done prior to (and dwing) the implementation of the initial financing reforms looked
at various aspects of the Kenyan health care system, including (1) issues of efficiency, principally
from a managerial point of view, i.e., identifYing how more output could be achieved from the re
sources available to the Ministry of Health, (0) estimating the level of additional resources needed
to supplement the allocations to the public services from The Treasury, (iii) identiJYing options for
mobilising resources in the private sector towards this end, and (iv) simu1ating the likely impact of
introducing cost-sharing in the public sector. The pwpose of this review is to collate these studies
so as to identify the main concerns raised, the recommendations proffered and assess whether
those issues were really the fundamental ones and whether the changes/reforms proffered were in
centive compatible.
24 'Harambee' is a Kiswahili word for an informal 'communal effort' directed at pooling resources for a common goal-where members contribute according to their self-assessed abilities. The system has successfully been used to raise funds for construction of health facilities, particularly dispensaries and health centres; to finance medical expenses for catastrophic illnesses for some individuals; assist bereaved families; to sponsor students for studies; and so on.
-71-

The studies carried out on Kenyatta National Hospital (REACHIKNH, 1988), the Nairobi
Aral Study (REACHlMOH, 1988) and the Provincial and District Health Services (pADS) Study
(REACHlMOH. 1990) focused on management efficiency improvements. In 1987, Kenyatta Na
tional Hospital (KNH), through a presidential order of April 1987 was granted independent status,
governed by a Board of Directors. This order and the empowering act of parliament gave KNH
the freedom to adjust its operations in order to achieve greater efficiency in service provision and
raise funds from SOW'CeS other than the Ministry of Health (MOH). The hospital initiated a consul
tancy study (REACHIKNH, 1988) to identifY ways to improve management and efficiency, and
consider cost-sharing for selected services. The study analysed virtually every aspect of the hospi
tal' s operations in order to prepare it for the new status. One of the main findings of this report was
that management was too over-centralised to achieve effective contro~ with most departmental
managers reporting directly to the Director, although there existed a layer of senior management to
whom these managers should have been reporting. The established lines of authority were thus not
bemg followed. The resulting organisational structure-where appropriate lines of authority are
not followed-'sIx>rt-cirt:uits' the 'established' decision making framework, often overloading the
top Jayer of management (the Director) with 'trivial issues' rather than concentrating on 'strategic
issues'. Other major problems identified included lack of proper financial and physical pJarming in
many spheres of operations that often led to increased costs, lack of service co-ordination resulting
in shortages of essential supplies and tmder-utilisation of costly services of operations, lack of ade,
quate infonnation to cany out the above, and general under-funding. Some selected 'low level' in
efficitnles identified based on comparisons are summarised in the Table 3.1 below.
The study made several recommendations, including charging for drugs and diagnostic serv
~ introducing fees for inpatient and outpatient services, and strategies for generating additional
revenues besides fees, such as seeking contracts with employers or making arrangements with in
surers and other third party payers to provide services to their clients, and to raise additional reve
nues through establishment of an 'amenity' ward where doctors would pay 'rent' for using the
hospital' s highly specia1isetf f3cilities to treat their private patients. Following the findings of this
study, the World Bank proposed and co-funded a project designed to introduce a series of changes
covaing strategic plarming, changes in organisational management, including changes accounting,
financial, materials, pharmaceuticals and maintenance protocols that would increase efficienq and
quality of services provided in every department of the hospital.
-72-

AlxIominal Smgery Ma1aria Pmmmia Normal
Discharges Discharges Discharges Deliveries KNH1 AKHI KNH AKH KNH AKH KNH AKH
Average Ieogth of slay (days) 8.7 7 3.9 3.4 52 4.6 2.4 2.9 Range of slay (days) 147 147 1-15 1-8 141 2-12 1-26 1-5 ILaboIatoly requestS (per pttient) 1.8 5 29 6.5 1.2 32 0.3 1.9
Per cent rL 08' ip1eted laIxratOJy requestS 68 100 67 100 19 SS
Radiology requestS (per patient) 0.4 0.6 0.04 - OJ 1 OJ 2.1 Cornplded radiology request (per patient) SS 94- 0 - 100 93 - -Other procedures requested (per patient)l 22 25 0.7 - 0.3 - 0.6 0.9
Percent oompletfd of other proa:dures ~ (per patient) SS 100 86 - 67 100 71 82
medications ples:ribed (tDIal») 31 (f) 39 32 Z7 ~ 13 31
Mediadion.'i (per patient) 4.9 10.3 3.4 4.8 3 4 1.4 4
I KNH: Kenyatta national Hospital; AKH: Aga Khan Hospital. For each condition, random samples were selected from the hospital records. These varied in size between hospitals and conditions.
1 These vary from blood transfusions, parasitic cultures, and so on.
1 Number of different medications prescribed.
Source: Compikrl ftom REAOJIKNH, 1988, ExhiIXts Ill.B.l-l - Ill.B.1-4.
Table 3.1: Comparative dinical eft"lCiency indicators, KNH and AKH, 1986
The Nairobi Area Study (REACH/MOH, 1988) was launched mainly to ~ ways of
strengthening services provision in the City of Nairobi in view of the changed status of the Ken
yatta National Hospital which was previously available to most City residents, and partly to exam
ine efficiency of services provision within the city public fiscilities in order to reconnnend ways of
reducing the costs of producing them and devise ways of expanding both the public and private
sector Clp8City to cope with workload diverted from Kenyatta as well as with future levels of de
mand. The study analysed the Nairobi health delivery system, the cost and utilisation of services'
both in private and public fiscilities, the scope for efficiency improvements and general policy, plan
ning and management issues. The Study concentrated on three areas (I) outpatient services, (ii)
preventive and promotive services, and (m) maternity and mental health services. The study identi
fies twelve problem areas which were classified into priority levels:
(i) Fm priority group:
• tmeVen distnbution of utilisation, • inappropriatefmadequate financing mechanisms, • inefficient use of resources, • inadequate supply of resources, • inadequate policy guidelines for operation and co-operation,
-73-
• lack of mission clarity for fucilities and systems, • inadequate conununicationlcoordination,
(n) Second priority group:
• inappropriate'mequitable distribution of resources, • lack of management skills, • lack of evaluation ofinputs and outputs, • Iirnited infonnation for planning, • non-operational infonnation reporting systems.
The study used a random sampling design and the sample (154 filcilities) indicated that
roughly 64 per cent of the facilities in 1987 belonged to the public sector-Nairobi City Council,
the MOH and parastataIs, while 13 per cent were mission fdcilities and the rest private. This high
proportion of public facilities is indicative of the general situation in the country, but, in Nairobi it
should have been lower-had private clinics and surgeries been included. The study foWld consid
erable unexploited potential for increasing efficiency and the effectiveness of curative services. The
most acute problems related to inefficient use existing physical capacity, ineffective deployment of
staft: unco-ordinated flow of patients between service levels, inadequate administrative and man
agement systems, and lack of accountability to organise and co-ordinate City-wide health services.
Among some notable findings was the low inpatient bed occupancy rates for all types of fdcilities
-public as well as private-genera11y under 90 per cent, except for two public filcilities, the spinal
qwy hospital, which had a 92 per cent occupancy rate, and the main maternity hospital, with a
107 per cent ocrupancy rate. The private fdcilities had gmerally higher occupancy rates. However,
for maternity beds, the opposite was true , with occupancy rates generally higher for public f3cili
ties. The public sector operated over 80 per cent of all beds in the city but handled approximately
70 per cent of all admissions, while. For maternity beds, the rates varied from 26 to 129 per cent.
Most of the public facilities had rates arOWld 100 per cent or more-probably indicative of a pric
ing structure which makes private sector facilities unavailable for maternity cases. But this could
mainly be attributed to the filet that maternity cases are not covered by private insurance, as most
private sector patients use this means of reimbursement. In terms of outpatient workload distribu
tion between the sectors, the public sector handled respectively 84 per cent of all maternity cases
and outpatient services. In terms of service deJivery efficiency, large variations existed not only be
tween the sectors, but also between various units within each sector. There were more broken
equipment in the public service filcilities also. Personnel appeared more under-utilised in the public
sector, and so on The Ministry's response to these problems was to develop a planning process
that would result in a strategic plan for providing health services in the Nairobi area. Later it was
decided to produce such a plan for the whole country. Consequently, the Provincial and District
-74-

Health Services Study, PADS, (REACHlMOH, 1990), a series of sub-studies, was launched, to
examine preventive and primary health care, user fees implementation and district health services.
Government considers primary and preventive services an efficient and cost-effective means
of providing health care to the population Shortages of drugs, supplies, transport, insufficient staH:
and other key resources are the main f3ctors constraining the fitciJities providing these services. The
objective of the PADS preventive and primaIy health care (PIPHC) gap study (MOH, 1990) was
estimate the additional financial resources required to operate the PIPHC system at full capacity.
The study ecamined the efficiency of ecisting operations, asswning location, mix of PIPHC serv
ices to be optimal. This is a major weakness of the study since access f3ctors differ significantly be
tween regions (see below), indicating that the current locational matrix offucilities is not optimal.
There is need to take into account di1ferences in supply and demand f3ctors. The study surveyed
approximately five per cent of the MOH filcilities and identified two major constraining gaps--<>ne
in recurrent expenditures needed to provide services at full capacity, and the other a one-time in
vestment expenditure required to bring the a1ready ecisting &cilities to full capacity. A SUIl1JIUU)' of
the amrua1 financing gap by resource category is shown in Table 3.2 below.
Category Cwreot expeoditJue &penctinre gap Gap as a per cent of (Ksm) (Ksm) expendibue
Drugs 275.5 79.1 29
Equipment 63 72 114
Tmnsport 19.3 17.3 ro Training 42.2 5.1 12
Supplies 41.1 61.3 149
Patient 1bod 1.7 6.0 352
Maintellance 33 83.3 2,524
Staff 765.5 170.5 22
Total 1,156.8 429.8 37
SooItx:: Compiled from daIa exIIaCtfd fnm varioos tables, in MOH, 1990.
Table 3.2: Annual financing gaps by resource category, PIPHC Services, 1990
The total annual recurrent expenditure gap was estimated at approximately Ks 430 million
(then Ks 23=US $1) or 37 per cent of the recurrent expenditures for PIPHC. In terms of catego
ries, the largest (absolute) gaps were for persormel and drugs, though they are re1atively small in
percentage tenns. Building maintenance and patient food expenditure gaps, though small in moIW-
-75-

tary terms, were the most under-funded items, as shown by the large percentage gaps. These gaps
cannot be viewed in isolation as one item acts as a constraint on one or more others. For example,
transport deficiency constraints personnel movement, food, drug and patient transport, and so on
The one-time investment gap, showing the level of investment expenditure required to up
grade equipment, vehicles, staff and space to the full capacity requirements was estimated at Ks
37Sm (US $16.3 m), which was an under-estimate as it eccluded building and equipment rehabili
tation costs.
Table 3.3 below indicates that rural health filciIities had larger gaps in most resource catego
ries, eccept drugs. These facilities therefore experienced relatively larger expenditure deficits than
hospital out-patient departments (OPD). If account is taken of voIumes of workloads, the rural
health facilities are in a worse situation since, since although hospital OPDs provided about 10,000
consultations per month, while the health centres' and dispensaries' averages were 3,000 and
2,000 respectively, the large number of health centres and dispensaries means dispensaries and
health centres provided more than 60 and 30 per cent ofaD out-patient consultations, respectively.
Hospital OPDs provide less than 10 per cent of the consultations.
Type c:LfiK:ility/categmy c:L expendinrre Omatt Exp:ndinrre
RURAL HEALTIlFAcnmES expenditure (Ks m) gap(l<s. m)
Drugs 196.7 43.9
maintenm:e 21 73
Per!Oud 309 81
Supplies 13.3 J1
TOIal 521.1 234.9
Gap as per cent cH aun:nt &pe! Kting 44
HOSPITAL our-PATIENT DEPARTMENTS
Drugs 79 35
mainlenanre 12 10.3
Perl!Oud 456.5 89.5
Supplies 14.6 13.7
T<Xal 551.3 158.5
Gap as per cent c:L rumnt speI Kting 29
&uce: ~ from Vlll'iwiti>les in MOH, 1990.
Table 3.3: Gaps in rural health facilities and hospital outpatient departments
-76-

TIrus there is evidence here, though based on a study whose methodology is shaky, that the
MOH should refonn its budget allocation from hospital based curative services in favour of rural
based health services. However, there is need for better a designed study to establish marginal pro
ductivity of resources in order to put resources in those areas with greatest returns, taking into ac
count factors such as local population structure, health needs, as well as other sources of service
provision in the localities. Other implications of the study are that Govermnent should not ap
proach the problem piece-wise. This will not solve the underlying (complex) relationships between
the various categories.
Another PADS study, the PADS Nakuru District Health Services Study (REACHlMOH,
1990), attempted a comparison of private and public providers in a sample of District f3ci1ities. The
Study does not explain why or how Nakuru District was chosen as the study area and it is not clear
whether the study results could be generalised. Moreover, there is no explanation of the sampling
design used for identifYing f3cilities and patients included in samples. These are major flaws which
should be bome in mind as we disruss the study.
The study identified four problem areas in the delivery of public health services: planning and
budgeting inadequacies, production inefficiencies, lack of cost contaimnent measures, and inade
quate attention to quality of care. In public facilities, there were inadequate allocations of financial
and physical resources to areas with chronic shortages such as drugs, supplies, transport, equip
ment and building maintenance, and so on This study also found the public filcilities had a worse
record of equipment maintenance, which lead to increased service costs as it led to referrals to
higher cost filcilities, or increased lengths of stay. Patients were often admitted seveml days prior to
operations, leading to longer stays, and inefficient use of staff time, in addition to other resources.
In addition, there were no standard t:remment protocols for common conditions, which results in
large variations in costs for similar conditions in comparable facilities. The study also suggested
charges would induce patients to leave hospital sooner than Iater-cases were doaunented of pa
tients remaining in public hospitals for several days after being officially discharged and the need for
cost-monitoring. It also suggested the MOH should invest in more capital, labour and medical and
other supplies in lower level filcilities in order to ease the burden on the higher level (that are also
higher cost) 13ciJities. Concerning quality of care, it was noted that most patients were dissatisfied.
In addition, it was found that the vohune of out-patient services as well as the number of new cura
tive cases had declined over the previous two years, prompting the study to conclude that a smaller
proportion of the population was receiving MOH services than two years previously, a phenome-
-n-

non interpreted to mean that unless the overall health of the people had improved substantially (un
likely), people were receiving services from other providers, probably paying to obtain them.
The decision to implement cost sharing in the health sector was a logical reaction to pres
ues from many concerns as noted above. From govenunertt's policy statements, the main objec
tive of cost sharing was to generate additional resources, although other desirable objectives were
also in sight. The introduction of cost sharing was based on an agreement between the Kenya Gov
enunent and the World Bank that the revenues so generated were in addition to, and not substitu
tion for government funding to the MOH Such reverrue, if unspent at the end of the year was not
to be returned to The Treasuzy as Government accounting procedures required. TIrus cost-sharing
revenue was not to feature in the MOH Appropriation-in-Aid account. Now, whether cost-sharing
would lead to higher revenues depended on several &ctors, including the response of consumers to
the clJarges (prices), the cost of the collection system, and incentives for collection. In addition to
all the studies reviewed above which included surveys of patient willingness to pay and perceived
quality of services in public facilities, there were also other studies on the likely effects of fees
(Mwabu, et al., 1989; Kirigia, et al. 1989; Ellis et al., 1990). These studies indicated patients were
generally willing to pay for services if that would improve their quality.
An aJ-hoc study by ministry officials (MOH, 1991) evaluated the problems likely to con
front cost-sharing implementation-fees administration, revenue collection procedures, incentive
suuc;ture and impact on utilisation. It turned out that institutional and management systems were
not quickly restructured to acconunodate the implementation ofuser fees. The ecisting accounting,
security and receipting mechanisms were inadequate to handle the volume of anticipated revenues.
Moreover, many aspects of the fee program were not fully understood by patients and staff-in
eluding the waiver fees, which services fees were to be paid for, and so on. The process of intr0-
ducing the user-fees itself was fraught with dif1ia.dties and (political) uncertainties, and
consequently it was a stop-go introduction-but despite the negative attitude towards cost sharing
within the administration, Kenya introduced charges for public health services beginning Novem
ber 1989, although the take-offwas never smooth (Dahlgren, 1990). There was evidence after
user-fees implementation that attendance declined and the revenues collected were not as much as
previously anticipated (Mwabu, et al., 1991; MOH, 1991). Data indicated there was about 38 per
cent drop in the utilisation of services. Mwabu et al., (op. cit) summarise the outcome for the pe
riod between November 1, 1989 and September 1990 when. fees were operational2S , tIllS:
U Concerns about the effect of the new fees on specific patient groups first led to reductions in maternity fees on January 23, .1990, exemption of civil servants on April 17, 1990, and finally to suspension of outpatient consultauon fee on September 1, 1990, but other fees, e.g., inpatient fees, maternity
-78-

The outpatient services are highly inelastic with respect to user charges. Nonetheless, cost-sharing led to a reduction of up to 38 per cent in demand for outpatient services as a result of the large percentage increase by which outpatient fees were adjusted. Consistent with this finding, suspension of registration fees is associated with a remarkable i.ncrease in service use. This increase occurred despite the retention of some other fees like the laboratory and X-ray fees. By March 1991, eight months after the removal of registration fees, service demand had recovered substantially and was only 8.5 per cent below its original level. Patients are more sensitive to laboratory fees than to registration fees; lab0-ratory fee elasticity of demand is about 5 times larger than that of the registration fees. User charges compress h~ care demand. Their implementation or upward adjustment therefore should be preceded by investments that compensate for this shortcoming.
The result, taken in context of the pre-user fee situation shows what patients perceive as
poSSIble benefits of fees chmges when confronted with actual fee demands. As a result of this un
anticipated bellaviour, the revenues generated were fur less than previously projected. Between
December 1, 1989 and June 30, 1990, only Ks 92 million had been collected, representing approxi
mately 2 per cent of the recurrent budget (adjusted for the period) of the MOH hospitals and
health centres, and only one per cent of the total recurrent budget of the MOH This was far less
than the expected figure of 5 per cent. The Ministry had anticipated collections would amount to
20 per cent of the total recurrent budget by the year 2000. This now looks an ambitious goal. To
ensure revenue collection was maximised, fee expenditure guidelines were prepared according to
which 100 per cent of all the funds collected are retained in the collecting district, 75 per cent to be
used by the collecting f3cility while the 25 per cent is redistnbuted for coIIlIIUlIlity preventive health
care in the district. The amount remaining in the facility would be used for facility and service reha
bilitation, improvement of management and service delivery, and improvements in quality of care.
Public hospitals, were encouraged to claim remIDursement from the National Hospital Insurance
Fund (NHIF). It turned out that they had only managed to recoup 15 to 40 per cent of the poten
tially claimable reverue from NHIF.
Some of the problems listed above are largely because in the past there did not exist a clear
health policy that defined national health care goals and the strategies of realising them, delineating
the specific roles of various providers and institutional framework to synchronise the activities of
the different participants in the sector. In March 1993 the Ministry of Health produced the 'Strate
gic Plan of Action for Fmancing Health Care in Kenya', (MOHlGOK, 1993) whose objectives., be
sides evaluating the then 'current' situation fiIcing the health sector, were to
• develop a public policy role of the Ministry ofhealth. • provide a sharper focus of the Ministry ofH~ activities in the health sector. • find ways of targeting public subsidies for curative care to the poor.
feeS, X-ray and laboratory fees continued to be in force.
-79-

• explore means of encouraging increased role of the private sector in the financing and provision of curative care services.
• explore how alternatives to tax and out-of-pocket spending on health care through a diversification of social financing mechanisms could be strengthened.
This plan specified for the first time some important elements that a national health policy
should contain, including
• some strategies for achieving the 'specified' goals, e.g., by • improving resource allocation within the public sector and mobilisation of
resources through cost sharing and better use of private sector resources. • increasing efficiency, effectiveness and equity. • improving quality and quality assurance.
• delineation of the expected roles of the private sector in relation to the provision and financing of services--to assume increasing importance in the provision and financing of curative care services (services that have 'private good' characteristics).
• specifYing the role of the MinistIy of Health in tenns of the extent of involvement in the provision of care, by devolving itself from the provision of curative care services and concentrating only on services that have 'public good' characteristics, mainly health preventive and promotive care services, and in extreme circumstances, providing all care in certain disadvantaged areas or Districts where the operation of the private market is adjudged insufficient.
Among (many) other recommendations (nruch of the plan is nothing else but a SUIIUnaIy of
all the recommendations proffered in the studies swmnarised above), the strategic plan recom
mended the following strategic goals and options for action in the health care sector as policy initia
tives likely to have greatest impact (these have been selected on account of their relevance to the
objectives of this thesis):
• directing public spending on curative care to target groups with specific health needs, including tmder-served areas, poor popuJations, comnwnialhle disease patients, and patients with chronic illnesses.
• Improving quality of services at MOH f3cilities, and encouraging the use of nearby low-oost filcilities.
• creating an enabling enviromnent and reducing government imposed costs of providing health care services through the private sector, particularly with respect to target
popuJations, using appropriate incentives such as reducing unnecessary burdens through reduced bureaucracy, simplified licensing fees (e.g., by abolishing double license fees as often required of a provider who sets up activity in a Municipality or Local County Council area, where they pay a license fee to the central government and another to the nnmicipality or local council authority) and tax structures, encouraging rural location and relocation through selected reduction of duties on medical equipment, setting aside of free land for private health fiIcilities, provision of targeted subsidies for those operating in underserved areas, and so on
• enhancing private sector role in publicly supported curative care by engaging in gradual privatisation of selected MOH curative services, departments, and filcilities through pilot projects.
• strengthening the role of the National Hospital Insurance Fund (NHIF) as a social jnsurance scheme by, among others, developing a role of NIDF as a financier of new health development.
-80-

• Improving efficiency in allocation of scarce budgetaIy resources, through: allocation of resources using a formula built on the need for resources under consideration; redeploying from over-staffed f3cilities to under-served filcilities that are in need of similar skills; allocating physical resources across administrative boundaries and f3cilities on the basis of assessed needs; and developing capital budgets budgeting plan based on target group priorities and actual demand for services.
• lowering the cost per unit of output of the MOH health services (i.e. achieving acceptable quality of services with mininrum cost) through: increased use of budgeting not only as a tool for planning but also to pursue efficiency goals at different decision-making levels; giving different level decision makers budgets and respoIlSlbility to manage them; allowing decision makers to retain the whole or part of cost-savings within the filcility at the end of the financial year, encouraging the use of economic efficiency/evaluation criteria in the choice ofleast cost intervention policies; and training decision makers at different levels on economic appraisal methods.
• managing MOH staff to achieve maximum productivity from available staff by: improving the working environment; reducing bureaucracy involved in making decisions at filcility levels; improving the procedures for the procurement and distnbution of drugs and medical supplies; and encouraging the use of (effective) treatment protocols.
• managing resources for drugs and supplies to achieve maximwn benefit for patients through: strengthening the medical supplies co-ordinating unit (MSCU) management through the implementation of internationally approved phannaceutical and equipment procurement protocols and workload based on estimation of need and allocation of supplies; finalisation and implementation of clinical guidelines; and so on
This thesis provides some of the 'nuts and bohs' required to achievel'unplement some of the
above objectives/strategies.
Assessment and Con.clusions
In collating these studies, we should ask: did they ~ address the fimdamental issues? Were
they incentive-a>mpatlble in their proposed changeslreforms? Were they evidence based-are
there reasons for believing them to have the effects hoped for from them? In short: (a) did they ask
the right questions? (b) if they did, did they come up with plauslble answers?
The administrative and organisational arrangements within which the Kenyan public health
services sector providers operate make it inherently inefficient compared to private providers. The
budget allocation process is the single most important factor. The PADS study (REACHlMOH,
1990) collaborates this view. Reviewing the budgeting process within a sample of public facilities,
this study observed that in 1988189 fiscal year, the treaswy allowed the MOH a general increase of
4 per cent in recurrent expenditure over the previous year (while the rate of inflation was 10 per
cent). Most fiIcilities received only a fraction of their requests. (An interesting observation made by
this study was that 9C)01o of the increase [m recurrent allocations allowed by The Treasury to the fa
cilities in the sample] went to salaries, leaving only 1% to cover all other categories of expendi_
-81-

ture.} As ~ result, many facilities cannot function efficiently and most have aca.unulated bills, which .'
are curled over from year to another. This is contrary to official govermnent policy since fdcilities
are not allowed to inaJr expenses for which no financial commitment has been allowed when funds
are insufficient, except in exceptional cira.unstances, and then only for 'essential services'. This
study however found the most under-funded items of expenditure were patients' food; electricity;
telephone; drugs and dressings; purchase of stationery; unifonns and clothing; and personal allow
ance ~. That filciIity managers have a discretion in deciding 'what is essential' is apparent
from the list. Moreover, some facilities did not have any allocations for buildings and equipment re
pairs. TIrus, as shown above, the worst affected areas from this type of budget process have been
non-personnel costs. This, combined with the practice of paying outstanding bills first when new
allocations are made, leave many fucilities in a perpetual viscous cycle of shortages, leading to a
munber of problems. This study observed that
It is difficult to establish the precise budgetary gaps of govennnent health facilities due to the methods used to make budgetaIy estimates and the final allocations by the Ministry of Health ... The methods used in making budget estimates and actual allocations lead to inappropriate estimates of the actual needs of health facilities. Budget allocations do not take into account changes in utilisation levels of health filcilities that result from population growth or changes in demand for services. (p. 41).
The private filcility included in the sample did not have as big a problem of financial short
fiills (with pending bills being only 3.2%, of total budget allocations). One of the main outcomes of
this type of budgeting process has been the non-functioning of the referral system. The Nairobi
Area Study observed that many services that could be provided at lower level facilities were being
reft:rred to higher level facilities due to lack of equipment and personnel in the lower level facilities
(of the public health seIvice). This suggests there has not been proper plarming that places empha
sis on costs of treatment at appropriate levels. Consequently, upper level facilities become con
gested with patients who would have been served at a lower level (and at lower cost) f3ci1ity. This
not only increases the cost of providing medical care in the public sector, but also affects the quality
of services as perceived by patients since the result is (probably unnecessmy) increased travel and
waiting times for all patients. Second, although all facilities, public as well as private experience
shortages of trained personnel, the situation is worse in the public sector, but the major difference is
that comparable f3cilities within the public and private sector use different personnel ratios. For ex
ample, the study cited above found that the doctor f3ci1ity ratio in private, mission and parastatal
facilities was generally smaller than in the public services, yet patients perceived the quality of serv
ice in the funner to be better (although it was also observed that the workload of the private sector
is generally lower). The private sector was observed to make more use of part-time staff as a
--82-

method of alleviating staff shortage, a rare occurrence in the public sector. Another significant ob
servation was in the deployment of skilled health personnel in administrative responsibilities-the
public services tend to deploy more of the higher level personnel in these activities compared to
private and NGO sector providers.
In the Provincial and District Health Services Study considerable variations in the health sec
tor were also found to exist. The average cost (to the hospital) per outpatient visit was found to be
lower for private hospitals than for public hospitals, but the cost of the drugs per outpatient cura
tive visit was much higher in the private sector. Cost per inpatient day was lower for the private
sector. Similarly, the average length of stay was lower for private providers. Workloads reveal a
different pattern. The highest workloads was for the private sector (m terms of volumes of work in
relation to staff rn.unbers)---in general, private providers manage more workloads with lesser staff.
The considerable variations which can be observed in the perfonnance of comparable ftIcili
ties as indicated above between the public and private sector may indicate that such variations can
not explained by the single notion of 'f3ciIity uniqueness' and therefore there is need to examine
how the perfonnance of filcilities in the public sector can be brought to par with that of their pri
vate sector counterparts. The main drawback of the studies cited above is that there was TV effort
to define the output of facilities-say in terms of patients' health states. However, in general,
these studies are indicative of the general situation, although their results are not entirely suitable
for comparison purposes because their methodology did not control for factors such as the peculi
arities of f3ciIities, or outcomes. More research is needed to clarifY the issue of productivity differ
entials between the public and the private sector.
Moreover, efficiency comparisons in the above sense might not be revealing since we are ac
tually not comparing like with likes. The public sector providers have different targets and not just
efficiency, although it is important. Second, the sources of income and the way they are committed
to activities also is different. Third, the public providers operate within an environment in which
conditions are imposed on them by an outside regulator (the government) who specifies mininrum
standards, extent of geographical and social coverage, and so on. This commutes the comparison
(Lindsay, 1976). The private sector operates more in line with the postulates of the competitive
market (and the pareto criterion) while the public providers operate within a bureaucratic public
administrative environment. The actual production characteristics, and the intemaI policies and or
regulations that govern their operations may make it hard for them to operate more or less like the
private providers. Since the eKisting data, in spite of inadequacy in terms of comparability, show

the private sector providers to be rather efficient, it is our intention to examine how the public pro
viders in the system can be made to operate in an environment which, while not losing touch of the
social obligations, promotes competition Substantial attention has been devoted to the examina
tion of methods of encouraging public providers to be more competitive. The literature bearing on
these aspects will be presented in chapter five after a definitions of efficiency and equity in chapters
two and three.
Generally, the studies sununarised above (excluding the strategic plan) have used ap
proaches that have facilitated the identification of the many weaknesses of the public health care
system and have offered suggestions and proposed methods of how to solve them. The main
weaknesses of the studies are that they had a narrow forus and did not offer incentive-compabble
recommendations--either on a single facility or a group of them or in some cases on only a single
topio---iUld concentrated a lot on managerial inefficiencies. In general, the issue of efficiency has
not been treated as a systematic problem that am only be solved through a combination of techni
cal and a/Jocative concerns, sinrultaneously interacting, either at system-wide or sectorallevel. Ig
noring aIlocative efficiency considerations may result in prescriptions that improve the particular
area of spending but this does not necessarily lead to optimal use of resources in the whole system.
Second, focusing on costs, while appropriate, ignores other aspects in the environment that interact
to affect the level of costs, such as the demand for seIVices, marginal cost of alternatives ways of
providing the service, the general environment within which activities take place, and so on
From the above review of the efforts towards a better health care system we can summarise
what appears to be the main issues in the Kenyan health system today as follows:
• resource allocation,
• cost-sharing,
• role of the private sector,
• role of social financing mechanisms,
• incentives for efficiency.
This thesis departs from the methodology adopted in previous studies on the Kenyan health
care system in that we draw on economic principles and lessons from other health care systems in
order to develop a refonn strategy within whose framework teclmical and economic efficiency, eq
uity. and incentive compatibility, both at micro and rnaao levels become focal issues of the health
sector activities. The basic framework of analysis is developed in the nect two chapters. We start
by looking at the concept of efficiency in health care in the next chapter.
3.5 Summary of Key Problems Faced by the Current System that Need Redressing
3.5.1 Problems within the public sector
The major problems identified in this sector include:
• lack of adequate financial resources to continuefunprove on past levels of support.
• inappropriate distnbution of public expenditures between functions-which makes them
less effective.
• inequitable distnbution of public expenditures, which leaves most of the rural populations
without adequate services.
• inappropriate use of fi1cilities due to breakdown of the referral system as well absence of
appropriate 'incentives' for consumers to use levels off3.cilities commensurate with their
'need', due to lack of prices that reflect the true opportunity cost of services in tenns of
local market conditions.
• inefficiency in service delivery-occasioned by inadequate supportive resources in most
areas due to poor planning, lack of incentives for staff to use resources judiciously and
lack of cost contaimnent measures.
• Poor quality services due to shortages of necessary complementaIy inputs. Due to poor
capital investment planning, the recurrent cost implications of many tacilities were not
properly budgeted for.
3.5.2 Problems within the private sector
The major problems identified in this sector include:
• financial crunch affecting mission fi1cilities which have provided services SInce
independence in areas Wlderserved by both the public and purely private or 'for profit'
providers.
• geographical disparity with a bias oflocation towards urban areas.
• little is known about the range of services provided by this sector, and the efficiency ofits
operations (other than that the services are mostly curative), although given its
'competitive' nature, one may assume away the efficiency concern.
• lack of co-ordination of activities of this sector and those of the public sector, that often
leads to duplication and therefore waste of resources.
--85-

3.5.3 Conclusions and policy implications
From these observations, the following immediate broad (policy) proposals appear plaustble:
• there is urgent need to focus explicitly on setting strategic direction and objectives that at
the same time still makes the organisation of operating activities the respollSlbility of
professionaIs;
• In the public sector, production should be decentralised and decisions delegated;
• evaluation and feedback should be a regular feature of all production;
• patients should have the opportunity to choose between alternative types and or
providers of care;
• the responsibility for finance and production in the public sector should be separated,
with more frequent use of external purchases where these promise better service than
public provision;
• Need to change the engagement contracts of the public health sector employees if any
incentive related gains are to be extorted out of them.
Beyond these (unplicit) structural shifts at the system level, there is need for substantial
changes in the decision making processes inside individual provider organisations. The major impe
tus to effectiveness should come from improved social dynamics (incentives and comnrunication).
Connnand and control relationships should be replaced by incentive-driven interactive relation
ships. Issuing instructions (that are expected to be implemented) should be replaced by dialogue
-by a marlret style exchange between producers and consumers by participatory discussion
among employees inside organisations, and an emphatic and respectful discourse with patients. In
short, there is need to change the ecisting structural arrangements within the public health service.
The rest of this thesis is concerned with developing the ftamewotk for such a structural
change. In the following two chapters we first develop the basic ingredients of the conceptual
framework focusing, respectively, on efficiency and equity. In chapter six we shall then present a
framewotk which can be adopted to replace the present command and control relationships.
3.6 Conclusions
The account of the organisation and structure of the Kenyan health care given in this chapter
remforces the conclusions of the previous chapter and identifies fiuther problems concerning the
public health care expenditures. Significant among these is that usually allocation is not related to
eKpeCted health status improvements-because no systematic methodology is used. Second, the
-86-

productivity of resources is hardly known or even evaluated. The general conclusion that may be
drawn from the previous two chapters' analyses is that, whatever proposals for policy and reor
ganisation of the institutional and organisational framework for providing health care in Kenya,
there are two principal areas upon which research interest should be focused. The first concerns the
relationship between the inputs and output. The second concerns the equitable distnbution of those
resources so that there is maximum impact of them on the health of the population
The rest of this thesis focuses on these issues. In the noo chapter, we develop the theoretical
and conceptual framework for assessing the relationship between the inputs and outputs which
also takes into account the efficiency with which resources are used, either within the regions or in
services.
-87-

-CHAPfERFOUR-
4. ASPECfS OF INEFFICIENCY IN THE KENYAN REALm CARE SYSTEM: DEFINTI10NS, SOURCES AND IMPUCATIONS FORBEALm POliCY
4.0 Introduction
This chapter discusses efficiency in health care, presents some prima facie evidence of ineffi
ciency in the Kenyan health care system, and provides a framework for examining aspects of effi
ciency in the system, pointing areas where some refonns are poSSlblelnecesscuy. The rest of the
chapter is organised as follows. The next section establishes the objective function that should fOIm
the basis for efficiency in the Kenyan health care sector, viz, the quality of care, consumer choice,
how the private sector is to be treated in the scheme ofhealth services, and the notion of incentives
needed to encourage both efficient and equitable use of the available resources. What constitutes
the efficient use of resource resources is then discussed in section 4.2, together with other related
evaluative concepts of the health care sector. Section 4.3 then presents some evidence which sug
gests there is inefficiency in the system. In section 4.4 a snap-shot framework for analysing the is
sue of inefficiency in the health sector is outlined. Section 4.5 summarises the main arguments of
the cl1apter.
4.11be Objective Function in the Kenyan Health Sector and Efficiency
In the last chapter we outlined the general setting of inefficiency in the Kenyan health care
system. To discuss efficiency in the health care system, we need some basis for evaluating it. This is
provided by the system's objective. The rurrent national development plan ~ 1994a) simply
states that 'The long-term objective of the health sector is the achievement of Health for An by the
year 2000' (p. 229). This is a rather amorphous statement for which it is difficult to give content
and intelpretation The first national development plan (Kenya, 1966) appears to provide a better
statement of the objective ofhealth services, in the conteKt of efficiency:
In drawing up the health programme for the period 1965nO, the Govenunent has kept in mind the filet that an improvement in the health of the nation is.fundamental .... Thus, expenditure on health services must be accepted as an essential investment even though the returnS may not be easy to calculate .... Following the precepts of African Socialism as set forth in Sessional Paper No. 10, it is the Government's long-term objective to pr0-
vide an adequate level of free basic services to all its citizens. The cwnto'does not have the QnqnciaI resources to provide all these free services at once· Therefore. the lonztmn oQjective must be reached thror@ q series efsteps tu resourcespermjt. The intr0-duction of free medical services for out-patients and all children in 1965 was an important step in this process .... A determined attempt will be made to bring health services
-88-

increasingly within reach of all people in order to promote improvement in the level and stardard of national health. (Kenya, 1966, p. 314, aided emPhasis.).
It appears from the passage that government considered 'free' care an 'end' rather than a
'means'-but providing free services is not necessarily an effective means of maximising health
gains as we shall demonstrate below. But the context of this passage is best interpreted in light of
the Kenyan constitution which guarantees 'equality' before the law, regardless of economic condi
tion, political affiliation, religion, and so on, recapitulated in the Sessional Paper Number 10 men
tioned in the passage above (Kenya 1965) to be 'in the sense of equal opportunities to receive
certain services and other benefits, among them, health care' (pp. 1-2H equity is the aspect im
plied here and it is discussed in the next chapter as an objective of health services in Kenya). How
ever, the assurance of such a principle has to be interpreted within existing resource constraints
since, although it is ethically desirable that every Kenyan achieve the best level of health the avail
able resources can provide, there are resource constraints that impose the need for choice between
competing ends. This crucial constraint is recognised by policy makers, as the underlined section in
the passage indicates. This immediately suggests that whatever resources are used for the purposes
of promoting health have to be used in such a filshion as to maximise their impact on the nation's
health (Culyer, 1992}-see the first paragraph on page 94 below. We shall see in the next section
this requires an evaluation of the contnbution of those resources to health in various uses to which
they may be put in the sector and that sometimes hard choices have to be made.
In the health sector, a nruItitude of choices has to be made with regard to production, provi
sion, and the distnbution of the health services such as what should be produced, how nruch
should be produced, how the production of the health services should be organised, i.e. which sec
tor-public, Non-Governmental Organisations (NGOs), or p~ould provide what services
as well as how they should be distributed regionally and between individuals. It is therefore neces
S8lY to identifY who, within the system, makes/should be making these choices/decisions. This is
important because it enables us to interpret the context in which the objective function is translated
into quantifiable/measurable outcomes in the health sector. Knowing the people (or groups ofpeo
pIe) making decisions, the environment in which they make them, and so on, can enable us to
evaluate these decisions appropriately and where necessary, design appropriate mechanisms to in
fluence these decision makers to make decisions in ways likely to lead to realisation of the health
system's objective. In so doing, we can be able to deteImine how maximwn effectiveness and effi
ciency in use of those resources can be achieved.

A discussion of the health policy framework in Kenya appears to be a good starting point.
FIgure 4.1 is a schematic depiction of health policy and various levels of resource allocation in
Kenya. The objective of health policy is in health per-se, placed at the top in the diagram. Health
policy, which is directly concerned with the pursuit of this objective is placed next below. The next
row shows that there are several alternatives of producing health and public health policy (in the
diagram directly related to health policy) is only one of them. Other policies are put at par with
public health policy because, though not directly concerned with health per-se, do nevertheless
have impacts (mostly indirect), on it. Therefore health policy competes for scarce resources with
other policies (we can think of this as a decision of determining the sectoral shares in the national
cake--et what we call the 'pre-strategic' level, and this is outside the scope of our analysis). Health
policy is composed of programs. The programs consist of a set of projects that in twn consist of
activities, these in twn being broken down to treatments, techniques or services. Each of the pro
grams can be expanded all the way down to activities. In the diagram, we have only expanded two
of them, and these are discussed only in relation to the public health services. Moreover, the expan
sion is not exhaustive. The diagram therefore is not an in depth representation of all elements of
health policy, but the expanded branches will serve to illustrate the major issues.
The levels where resource allocation decisions are made are indicated by circled and mm
bered nodes. The first level of decisions are what we call here 'strategic level', the circle munbered
1, determines shares to these programs. In Kenya most decisions affecting the health of the popula
tion at this level are made by planners and politicians, although in recent times, with the decentraIi
sation of govenunent administrative activities and the introduction of the District Focus for Rural
Development strategy, the planning for the health needs of the population is being done often with
coUaboration of the local people in order to get a better matching of resources with local needs.
This development notwithstanding strategic decisions of allocating the total funds available to the
health sector between its various activities are still made by planners at the MOH Such decisions
detennine the potential output mix of the health sector, i.e. how large each of the programs would
be in the MOH budget. This level of allocation results in determining allocations that will go to
various geographic regions. Decision makers at this level can be ecpected to be interested in allo
cating resources so as to maximise their impact on outcome&-i.e. health, or some other proxies of
it such as mortality and motbidity. The question is, partiaJlarly for the public services, have they
been doing so? We show below that it is doubtful, and will argue the resource allocation should be
reJated to the patterns of morbidity and mortality. In later chapters we shall outline the procedure
for incorporating such filctors when making decisions at this level.
-90-

~ .cl e • ~ i
l' 1J4.r-----.--.....- a ~
~~ f ~~~ ~
--~~~~~~--------~----Treatments, Services, etc.
•• --------------------~~~--------------+. Figure 4.1: The objective of health policy and policy alternatives
The second level of decision making in the system allocates resources between the various
proj~ outpatient services, inpatient care, preventive care, and so on. Thus for example,
when a hospital (an example of a pro~for providing hospital services in a certain area) has
received its allocation from the MOH, it decides how much of them it will allocate for outpatient,
inpatient, maintenance services, and so orr". We show below that because of lack of focus in the
budget, a m.unber of items get WldeIfunded, mainIy due to constraints imposed by level 1 decision
makers, and propose a simple way of rearranging the accounts in order to be able to detect areas
where underfunding is likely to make severe constraints with the program activity.
The third and last decision-making level in the system concerns allocating project resources
to consumers i.e. at the case level (e.g., at facility level) by medical specialists working within the
budget allocated to them or the f3ciIity, These decide how to treat patients-whether to hospitalise
or treat them as outpatients, and so on. These decisions are not only about the effectiveness of the
treatments they offer, but also their efficiency. Most of the studies reviewed in the previous chapter
have concentrated their effort on this level, mostly on efficiency (see chapter 3, section 3.4). From
the definitions of efficiency and effectiveness (given in the section below), it will become clear that
26 In reality this decision is made before the funds are allocated to it for program heads or managers produce activity budgets to back their budget requests.
-91-

this piece-meal treatment of problems in the health sector goes only a part of the way in solving
problems of resource allocation in the system. Another aspect of resource allocation decision, la
beJled as 3a, is that by individuals. Although in the diagram this comes under preventive care, it
may appear under any of the activity branches. This shows individuals affect resource allocations
by the decisions they make about their health care seeking behaviour. We show below (section
4.3) that when individuals seek health care at levels not commensurate with their health states, this
affects the efficiency with which health resources are used in the system. This aspect and what can
be done about it will also be discussed in this study, mainly by examining the methods used in other
systems to cause individuals to seek health care at 'appropriate' 13cility levels and compare this
with the course taken in Kenya.
But, although on some occasions we will consider choices made by individuals themselves
(node 3a), we shall in the main asswne that the 'output' of the health sector is allocated between
individuals by doctors and other health personnel, both administrative and professional, who worlc
in various facilities within the ministry (as well as others in the private sector). For ease of exposi
tion, we shall refer to such an individual (or groups of same) as the 'policy maker'. The questions
we nrust consider are what criteria should these (POlicy makers) use and to what effect? How can
they make decisions that ensure the output from the 'limited' resources is maximised, i.e. in a fash
ion so as to maximise the impact on the nation's health of whatever resources are availed to this
end? We start on the premise that, since budgets (synonymous with resources) are, and will al
ways be limited, it is desirable to attempt to get the most out of them. That involves making for
mal, weIl-considered judgements about how best to allocate those budgets and the services they
will be used to produce. What should be the basis of such considered judgements?
The pareto optirnality condition appears to provide the most comprehensive theoretic con
struct for assessing a system's efficiency since it takes into account the way resources are allocated,
the way production is organised and the distribution of the goods and services to consumers---all
wmm issues in the Kenyan health care system. The principle says that a change is desirable if it
makes some individuals better-off' without making any others worse-off. This is the main value
judgement on which the pareto optimality condition is based. The impact of changes is usually ana
lysed by use of the social weJmre function (SWF), which relates different allocations of resources
to different levels of social weIJ3re. In this worlc, the objective of health policy as identified above
can be recast as the maxirnisation ofhealth, subject to the condition that it also is equitably distrib
uted. This rider means health policy in Kenya should take distnbutional issues directly into account.
Specifically, resources benefiting the poor are given more weight than those benefiting the rich. 7:1
-92-

The 'we!f3re' or the maxirnand is interpreted as the individual's health status or some proxy of it,
which depends on the inputs of health care, and other health enhancing inputs (mcluding intra- and
extra-personal f3ctors), available to the individuals, adjusted to take into account the f3ctors such
as ertemalities, uncertainty (about the timing and effects of illness on the side of consumers, and
about the outcomes of various diagnostic regimens on the side of the providers), merit good argu
ment and monopoly nature of health services production Only then can the available options (of
allocating health resources between individuals) be ranked on a scale of better or worse, depending
on their overall impact on the SWF.
The use of the pareto improvement criterion to choose among ways of committing scarce
resources presupposes that the securing of potential pareto improvements is the social objective.
There may be difficulties of interpretation of who makes such decisions in society. But we want all
players-from top policy makers through managers, professionals, to patients-who commit re
sources to various uses at various levels in the system to behave appropriately. In the literature,
two broad interpretations (of the decision maker) can be distinguished. These are the decision
making approach and the paretian approach (Sugden and Williams, 1978). The decision making
approach presumes that the social objective is an objective pursued by a social decision maker who
makes decisions in the interest of the public. The decision makers in this case will normally be ex
pected to choose an objective corresponding to the pareto improvement because they know that,
with the backing of the government, with its powers to convert potential pareto improvements into
actual pareto improvements, it is poSSIble to translate the theoretical potential pareto improvements
into a practical policy. Hence, projects satisfYing the potential pareto improvement criterion can be
implemented, with appropriate tax changes, etc., to make everyone better-off. In this approach
therefore the selection of the objective function is at the discretion of the decision maker. If the de
cision maker errs in funning judgements about the objectives, it may turn out that a better alterna
tive is omitted. Second, the decision maker may, by design or error, choose a course of action and
stick to it without looking at alternatives, because they believe 'it is the correct' one.
'l1 But it need not be so. Given the potential enormous costs (e.g., informational and administrative) of the application of distributional weights (Harberger, 1978), and follOwing Ng, 1990, it is only necessary to concentrate on efficiency, with an understanding that the result is subject to distributional qualifications. Such an approach may be based on a premise such as
For any alternative (A) using a system (a) of purely equality-type preferential treatment between the rich and the poor, there exists an alternative, B, which does not use preferential treatment, that makes no one worse off and achieves the same degree of equality (of, say, the health status, access to health care, or welfare, etc.) and raises more government revenue which could be used to make everyone better-off. (Cf. Ng, 1990, p. 248). This means the pursuit of equity in health policy be limited to consideration of incentives, on
both the producer and provider sides. In this fonnulation, irrespective of the recipient, a shilling spent on health would be treated as a shilling, if efficiency is to be achieved. Then, any desired level of equality can be achieved by use of redistributive mechanisms.
-93-

The paretian approach, on the other hand, presumes that the objectives of social decision
makers are 'distilled from a consensus of value judgements of the individuals who make up the s0-
ciety, and they should be propositions which command universal, or, at least very wide assent'
(Sugden and Williams, 1978, p. 91). The value judgements derive from welfare economics and are
concerned with economic efficiency and distributive justice. In the health domain, economic effi
ciency would be about the overall health of the comnrunity. It also could be viewed from the input
side-as pertaining to the size of the total care resources available to the community, since the pa
reto optimal distnbution of inputs should serve the ultimate objective (outcomes). The distnbu
tional justice issues are about the way this (health or health resources) Ware shared amongst the
people. The potential pareto improvement criterion identifies changes in economic efficiency: a
change that produces a potential pareto improvement is one that increases economic efficiency.
But potential pareto improvement and increases in economic efficiency mean precisely the same
thing. The basic premise of the paretian approach is that, ceteris paribus, an increase in economic
efficiency is a good thing. If social welfare is measured by the level of economic efficiency and dis
tributive justice, then an increase in economic efficiency is desirable, provided no corresponding de
crease in distnbutional justice occurs. However, if there are other dimensions of social welf3re, as
some writen have argued there are (Sen, 1982; Culyer, 1990), then the pareto improvement crite
rion goes only a part of the way to satisfying increases in social welfare. The decision making ap
proach appears closest to the framework in which resource allocation decisions are made in Kenya
and will therefore be adopted as the basis for identifying changes with potential pareto
improvement.
4.2 Efficiency in Health Care: Some Theoretical Considerations
In order to avoid confusion in interpretinWevaluating the alternative refOIll1 strategies pro
posed for the Kenyan health care system later on in this thesis, we have to first clarify a number of
issues at the outset. This includes giving appropriate meanings to evaluative terms like 'efficiency'
and 'equity'; laying down the criteria for assessing the desirability of making greater use of one sys
tem of provision rather than another (e.g. the NGO private sector as opposed to the private for
profit providers); and the use of professional and financial incentive5 (such as peer group review or
pay-related incentives), and the relative desirability of increasing consumer choice. Alternatives
might be judged in terms of how they address the issues of efficiency, equity, quality of care and
consumer choice. The alternatives are instrumental to achieving these ends. Except the issue of eq
uity, which is addressed separately in the next chapter, this section discusses these issues.
-94-

Efficiency is the maximisation of the size of the total health of all members of the commu
nity, achieved by evaluating in temtS of opportunity costs, the contnbution to it of alternative ways
of committing scarce resources and choosing those alternatives that minimise the opportunity
costs. One method, which appears to have been the basis for analysing efficiency issues by previ
ous studies on the Kenyan hemth sector, is the estimation ofunit costs (or average costs) of deliv
ering services, and choosing the method with the lowest unit cost per unit of output. Focus on the
average is fundamentally wrong for efficiency considerations. We have used the term 'appears' de
hberately since in previous studies all that was done was to compare the unit costs by cJi1fo'ent pro
ducers, therefore, there was no evaluation of alt~. It is usually preferable to do this
comparison only for one unit (or similar units) of production, since in such a case, 'other extrane
ous' f3ctors affecting production costs are ~ 'controlled' for. According to this approach,
production is technically efficient if the inputs employed produce the maximum poSSIble output.
The total cost of a service is the sum of the fixed and variable costs. Dividing the total cost by the
total units produced (such as total inpatient maternity cases) results in an estimate of unit costs. On
the basis of figures derived this way, it is poSSIble to extrapolate from one case to total expected
workload. But this type of extrapolation is not entirely correct since average costs may rise or fall
with increasing activity, depending on whether the activity is subject to increasing or decreasing re
twns to scale. Although the method is simple and straightforward, and probably accurate within
narrow ranges of activity, stretched beyond bounds, it may give implauSlble results, especially
where little attention is paid to other detenninants of cost such as how they respond to changes in
overall resource allocation, marginal adjustments in input mix due to relative price changes, and so
on Unit cost estimates may turn out to be lower because of resource reallocation that changes
consumer or producer behaviour, or alters the mix of inputs. 11ws, in general, providing a seIVice
at the lowest cost per unit of output (m a technical sense) does not necessarily guarantee optimal
use of resources.
4.2.1 What should efficiency in htalth care mean?
The ideal procedures for making choices, either between projects in one sector or between
sectors are widely documented.29 A similar procedure for the health care sector resource allocation
may similarly be defined.ll Prior to committing resources to activities that affect the current and fu
ture benefits to society, a thorough analysis of the COWltry's health problems, thejr causes and a
21 Although we can think of public versus private provision of health services as alternatives. 2lI Squire and van der Talc (1979), Misban ( 1972), Irvin ( 1978), Little and Mirrlees (1974). 30 The analysis which follows is developed along lines suggested by Culyer, 1992, and de Ferranti
(1983a, b).
-95-

thorough evaluation of the existing system should be done, taking into account the country's ob
jectives and priorities. Such a sectoral evaluation should include an analysis of the financing
sources, and a detailed analysis of the allocation of expenditures with a view to determining the
unit costs of each activity and how these are likely to behave over time. This requires an estimate
of current and future demand patterns. This type of analysis should be conducted using marginal
rather than average costs. Such analysis provides enough infonnation to enable more focused deci
sions concerning recommendations on objectives for adopting certain procedures, new investments
and feastble means of achieving them, to be made, taking into account the technical effectiveness of
implementing each decision, their administrative requirements and implications, etc. This means es
timates of full costs (both capital and recurrent, pre- and post-implementation, financial and
economic}-using, for economic costs, both efficiency and shadow prices--have to be made.
Then follows an evaluation of the expected effects of each option on the health status, as reflected
in reductions in mortality or morbidity. This analysis will of course take into account the infonna
tion about the target population, the disease patterns and disease agents and the interventions' ef
fectiveness, etc. Fmally, quantifYing the estimates of the value to country of the resulting health
improvelIleDtS. the benefits of each option should be quantified, and reduced to a single (monetary)
wm. Comparing the costs and benefits of each intervention, based on pre-established criteria [such
as the net-present-value (NPV), benefit- cost (B/C) ratio, internal rate ofretum (IRR), etc.], the ac
tivities (or, as usually called, projects) to be funded can be chosen. As a final step, the financing side
of the promising activities are analysed to ensure that they are affordable. It is advisable at this
stage to evaluate the probabilities that those groups, or institutions, required or expected to commit
resources for implementing the projects will be able and willing to do so. The net-resource position
of each project tIrus assessed is determined. Also, at this stage the long-run sustainabiIity of recur
rent costs after project completion and the replicability of the project(s) (elsewhere or later) should
be examined. Of course, the analysis of the planned sources of funds would take into account their
implications for efficiency and equity, as well as implications for the public, quasi-public and private
mix of services or filciIities (if it is a aucial aspect) and other structural considerations (such as the
flexibility of administration, etc.). The important ingredients of such a framework are outlined in
this section
The notion of efficiency is much broader than the cost minimisation interpretation given to it
in previous studies on the Kenyan health care sector (discussed in chapter three). An efficiency
concept that is relevant to a health care system such as Kenya's has four elements which are cunru
IativeIy increaSingly comprehensive-effectiveness or efficacy of health care services (which is the
-96-

sister terminology to the concept of 'technical efficiency' in other economics literature); their
marginal cost-effectiveness; service-mix payoffs in terms of health; and, scale of efficient opera
tionfor different mixes of effective services (see Culyer, 1992). Let us look at each in turn.
Providing only meJIicoIly tffective services
In the health sector, teclmica1 efficiency is closely related to 'effectiveness' but the two are
not synonymous. Suppose society were t3ced with the choice between committing resources to
health or to defence and 'somehow' this choire-problem was resolved in favour of health. It would
soon be realised there are many uses to which those resources can be put in the health sector itself
Ifwe are to maximise the returns from these resources, i.e., use them efficiently, we need to use
them 'effectively' in the particular lines of actions we choose to employ them in (m the health sec
tor). Each of these lines of actions can be summarised by three elements-inputs, their transfonna
tion and output. The input is the resources we have at our disposal-which can be any
combination of persormel, materials, facilities, and so on. The output would nonnally be the result
of an 'input-transfonnation process' -through the health production function, for example, and
eKpresseS the outcome attributable to taking that particular course of action, for example, improve
ment in the health status. If we commit resources in a particular use-in curative care for example
-three POSSIbilities exist. We might record an improvement, a decline or there may be no change
in the health status. Effectiveness applies only to the case where the net change in the desired out
come is attributable to the action in question and is positive (see e.g. Cochrane, 1972; Culyer
1976). Suppose the action is taken at time to. at which point a health state li,o prevails and some
other state Ht! is realised at time tt> then the action is effective if(and only it) Htl~' Ifin the ab
sence of the action the health state would have deteriorated to If u, in cross-sectional ana1ysis the
effectiveness of the action is measured as Et = Wtl - Wtl (see figure 4.2 below).
Over time, effectiveness would be measured by the shaded area in the figure. Thus effective
care is one which improves health status. But effective care is not necessarily efficient care as we
showbdow.
Effectiveness ofhealth care tlms gives the first notion of efficiency in health care-only seN
ices for which there is credtble evidence about their ability to alter for better the patients' course of
iJ)ness should be provided, i.e. provide services that are effective in the sense illustrated above.
Clinical epidemiologists refer to this as efficacy. Culyer, 1992, succinctly puts it this way:
-rn-

Given an objective, such as returning the patient to nonnal functioning as speedily as possible, one should therefore seek those combinations of diagnostic procedures, physicians'time, medicines, surgical procedures, inpatient and outpatient care, health service and family caring, and the patient's own time, that are most effective. To use more of any of these resources than is necessary for an effective impact is wasteful and inconsistent with the objective of maximising the impact ofhea1th resources on the health of the community. For, ifmore than is necessary is used, the excess could have been used at no cost to the patients in question in order to further the health of some other patient. Thus, overall community health .. . is lower than it need be.
~ He
t} Effectiveness
:I: of the 'strategy'
Ht adopted at 0 time~
Hd , tl
tl Time (t)
Figure 4.2: Health improvement between to and tl due to 'effective care'
Technical efficiency is thus a function of effectiveness and the actual inputs. Technical effi
ciency, also termed operational efficiency, is about deciding the best way of doing an activity tlrtt
has been found to be effective----tiJat is, selecting from among the alternative means of achieving
the same outcome, the option that maximises the output for a given amount of resources (cost).
Another way of ensuring the same result is to minimise the cost of producing a given level of out
put. This is the standard neo-classica1 rule of operation for the profit maximising producer. For ex
ampl~o continue the example used above-suppose, as it is, Kenya is interested in reducing the
child mortality and morbidity level due to common childhood diseases. The country can either treat
those who have ill-health as a result of these diseases, or engage in a mass vaccination campaign to
prevent the need for such treatments in the first place. Assume for the time being the end result
achieved by either way is the same-equally reduced mortality and morbidity----tiJat is, effective
ness is the same. The question we want to ask ourselves now is, 'which approach is the more
-98-
(teclmically) efficient one?' Since by assumption the effectiveness is the same in either case,31 as
sessing the costs of each determines which method is technically more efficient. The one which
uses least resources-i.e. inputs (hence least costly}--is the more operationally (or technically) effi
cient method. In SUIIlIIlaIY, technical efficiency is about whether it is poSSIble (by using a different
combination of inputs) to produce the same flow of throughput (number of children vaccinated) or
of output (a reduction of mortality or morbidity to certain levels) by usingfower of one or more of
the complementaIy inputs. If this is poSSIble, then the present process of doing the activity is not
teclmically efficient. Resources could be released from the (ineffective) process without necessarily
adversely affecting the outcomes. For example, in some of the studies reviewed in chapter three, it
was observed that the average prescription cost for similar conditions was generally higher in the
public sector compared to the private sector. Ifit can be established (and this was not done) that
the initial and end health states of the patients was the same in both cases, this would be an instance
of technical inefficiency (or absence of effectiveness in the use of medical care resources) for public
providers.
This approach to defining teclmical efficiency of health care activities raises two issues: one
f3ctua1, the other ethical (CuIyer, ibid.). The &ctual is that the effectiveness of medical practices
should not be taken for granted, instead, reliance should be made of evidence about their relative or
absolute effectiveness. This arises because of two fBctors. The first is that much medical care has
not been subjected to systematic scientific scrutiny and its contnbution to health is therefore hardly
lmown because, as Culyer (ibid.) reasons,
much practice is based on that species of gossip lmown as the case study, that there is often a strong 'medical signature' in explanations of costly variations in clinical practice, [IM] the statistical design of much clinical research in the past has left much to be desired.
The second reason is that health care is only but one of the many determimnts of health,
and often it has only a maIginal impact on it (e.g., see Auster, Leveson and Sarachek, 1969; Gross
man, 1972; Silver, 1972; Hadley, 1982). In developing countries, for example, mortality is more
closely related to levels of poverty, illiteracy, malnutrition, poor housing, poor personal and envi
romnental hygiene, cultural practices, and so on, than to the distnbution of health care services (see
for example, Kalipen, 1993; SIlarlf: Huq and Saleheen, 1993). Such infonnation, usually derived by
estimation of aggregate health production functions, would be useful for Kenya since it would en
lighten health policy decision making, for example, on how health care resources should be allo-
31 This is actually the implicit assumption of operational efficiency-that there exists effective options (e.g. effective health care).
-99-

QIted between geographic areas or among population groups, or whether increasing health care
conswnption is the best policy for achieving our health objectives.
ProvitDg services that are ctJSt..effedive
The second stage of efficiency, cast-e.ffectiveness, assumes teclmical efficiency, but recog
nises that there might exist several technically efficient ways of perfonning a specified health activ
ity. It is therefore becomes necessary to evaluate the cost of combining inputs differently, as
implied by each of the methods. The interest here is to select from among all the available techni
caDy efficient (or medically effective) methods, the one that is least costly. If there exists a less
costly method than the one in current use, the present method is not cost-effective, and, by re
allocation, resources could be released from it and used to improve outcomes elsewhere, or, for
the same activity, more output could be realised for the same level of cost. In the hemth sector,
tht2"e exists several substitution posstbilities-between drugs, between surgery and medicine, re. tween primary and curative care, between use of more qualified and less qualified personnel (e.g.,
doctors versus nurses), and so on, all enabling to achieve a specified objective. Assuming none of
them lepteSelltS inefficient (or ineffective) care, there is need to narrow the definition of efficiency.
The requirement that whatever services are being provided should be provided at least cost pr0-
vides the aiterion for discriminating between the available technically efficient methods. Again, 'to
incur a higher cost than is necessary ... is wasteful and inconsistent with the objective of maximis
ing the impact ofhealth resources on health in the community' (Cu1yer, ibid).
EJIiciencY also demonds concenJrating on health services thot offer the highest pay-offs in tem&f ofhealth
In the health sector, the asswnption of processes having similar effectiveness is far fetched.
Sometimes (poSSlbly most of the times) one method may be the more effective one but also the
more ~e one (Donaldson and Gerard, 1993). In such Q!Ses, the marginal cost-effectiveness
ratio should be used as a guide to decision making: the lower the ratio, the greater the technical ef
ficiency (see also Sugden and Williams, 1978; Curry and Weiss, 1993, chapter 3; Pearce and Nash,
1981, chapter 4). These ratios can be developed through use of various techniques collectively
known as 'economic evaluation'. This involves judging the merit or worth-whileness of some ac
tion (or activities, projects or programs). It aids in decision making concerning the choice between
actions, or even whether, in the case of a single project, it is worth committing resources to. The
programs may be nmtually exclusive (substitutes), complementary, or independent. The economic
-100-

evaluation can be ex-ante or ex-post. In the ex-post case, the pwpose of the evaluation is to decide
whether to contirrue or abandon a program, or modifY its implementation. In the ex-ante case, the
decision at stake is whether to initiate the planned action or not, or, in the case of multiple projects,
which one to initiate where they are substitutes or which combination (where they are independ
ent). Economic evaluation assumes that the non-economic evaluation has already been done-that
is, the effectiveness of the actions has been established. The economic evaluation then quantifies
these (effective) actions in terms of their economic efficiency. The purpose is to ensure that not
only 'worthy' activities are undertaken, but that only those with the biggest pay-offs in tenns of
health are the ones that use the scarce resolU'CeS.
The notions of technical efficiency and cost-effectiveness on their own are thus not discrimi
nating enough to ensure attainment of optimal allocation of resources in the health sector. They do
not take into account the people's valuation of that care as it necessarily implies all individuals
should receive 'standardised' services. Second, in addition to the fonn of care provided, we should
take into account the resources that people, individually or collectively, are willing to make avail
able to pay for it. This it means it is immaterial whether the quality of the care by a particular activ
ity is of the highest best quaIity poSSlble in a technical sense, but whether the level and quality of
that care represents the best use of the economy's resources, given the people's tastes and prefer
ences for it as well as for other fonns of medical care that provide similar outcomes. This means
the 'benefits' derived from the alternative medical options of obtaining a given objective are to be
compared with the costs of producing them---the opportunity cost in terms of foregone benefits.
Higher quality care (m a teclmical sense) is better only if the benefits people derive from increased
quality offset increases in the costs that would be associated with it. Taking these f3ctors into ac
count requires we introduce people's 'needs' for health care into the analysis. 'Often a situation is
regarded as inefficient if people are not getting as IlDJch or as high a quaIity of care as the system
could feastbly (though not costlessly) produce at that time' (pauly, 1971, p. 4). The problem with
this definition of efficiency in health care resource allocation is that it does not take into account the
cost of the 'needed' services-as medical technology changes, so will the demands. It therefore
becomes necessary to evaluate whether, given the people's preferences and tastes for particular
health care services, health resources are being allocated to those sernces (in the sector) that se
cure maxinnun benefits to the conmumity. In the theory of production, this problem is resolved by
the application of cost minimisation techniques for a specified level of output, or what is the same,
maximise the output for a given set of resources (assuming a given desired outcome is the objec
tive). Iffor the moment we assume the output of health care services is 'health' this means with a
-101-

given amount of resources allocated to the health care sector, health should be maximised. In order
to make judgements about efficiency in such cases, it is necessary to have measures of health that
are appropriate for the kind of procedure or service that at least enable comparisons to be made. If
health is 'appropriately' defined, then it would be poSSlble to apply this criterion by allocating
health care resources so as to maximise the excess of , benefits' or health over costs of producing it
(Feldstem, 1963, p. 23). The number of life years gained or saved, as measured by reductions in
mortality or life expectancy at a certain age (e.g. at birth, 25, 45, and so on) are two common such
measures. The Quality of Adjusted Life Years (QAL Y s) is an innovation recently developed aid to
determining the productivity of different health care interventions (see Torrance, 1976), and is <lis
russed in detail in the next chapter. WIth explicit assumptions about the relative values of health or
ill-health, it enables a complete and comprehensive assessment of the effects of alternative proce
dures on outcomes, including the option of doing nothing, to be made (Culyer, 1992).
Together, the above 'principles' of efficiency in the health sector define a framework, which
involves ethical as well as economic judgements, about the rationing ofhealth care resources.
EjJide1U:y also metlIIS providing appropriate scales of the medically- and cost-effective services
Once the low level efficiencies have been established as defined above the next stage is to
detennine overall economic efficiency. In this stage, it is decided which actions are worth allocating
resources fur, taking into account the effects of allocating those resources to those actions, rather
than others outside the health sector. This is why it is also called aIlocative efficiency. Allocative ef
ficiency is useful at the planning stage where decisions are made regarding which activities are
worth doing. At this stage, the scale-i.e. relative sizes--of programs are detennined, and it is as
sumed the question of their technical or operational efficiency has been settled. The aim of alloca
live efficiency is to ensure that society does not lose by having resources allocated to one activity
rather than another. If technical efficiency exists, economic efficiency is synonymous with pareto
ef6ciency. This may be tenned as 'full efficiency'.
These notions of efficiency in the health sector imply that resources or costs are not to be
considered in isolation from what they are believed to enable to be accomplished. Second, effi
ciency in health care is a moral notion that entails the maximisation of the impact of health care.
There is a correspondence here-that inefficiency necessarily implies patients (prospective or ac
tual) are less well-off than they need be. Third, the notion of full efficiency can be applied in princi
ple to organise thinking in making judgements about the appropriate rate of total resource
-102-

deployment to health care as a whole (Culyer, Donaldson and Gerard, 1988). In particular, this
'full efficiency' condition ensures that, in terms of the diagram offigure 4.3 (below), we are at or
somewhere close to the point b.
o
b
, , , Medicine' Medicine with : without : adverse effects 'effect ,on outcomes
Medicine with positive: on '(medicine with but diminishing , outcomes' negative returns) margInal returns' ,
RESOURCES- INPUTS
YJgW'e 4.3: Detennining the optimal size of the health sector
In terms of the efficiency notions used above, effective medicine is implied by the segment of
the total 'productivity' aJIVe where extra real resources to the health sector lead to inaeased out
comes (points such as a). We should stop allocating resources to the health sector at the point b,
although as the above analysis shows, that point would have to be determined by comparing the
benefits and costs-so the outcomes here should be inteq>reted as 'net of costs'. Allocations in
cases such as that depicted by c are inefficient.
The framework for efficiency outlined above can now be related to the Kenyan health policy
framework described in section 4.1 above. Viewed together with the process of resource allocation
as descnbed in chapter three (see section 3.2.1), it is now apparent that, rather than move from top
to bottom in figure 4.1 when allocating resources, as is the present practice, the process should ac
tually be the reverse--moving from the bottom upwards. It is only through such a process that we
can ensure that the resources allocated to the health sector meet all the efficiency criteria set out
above. We saw in chapter two that there is no matching of resources with the 'health needs' of
-103-

various regions in the cowrtry. Such of course would the outcome we would expect to in a situa
tion where the allocation is done, in terms of figure 4.1, from top to bottom, rather than the other
way round, where at each stage, the relevant efficiency notion is taken into account in order to ar
rive at an 'optimal' allocation ofresources to the health sectOf.
4.U Quality of care
The quality of care is often interpreted by patients in tenns of the inputs used, processes
(how the care is provided, i.e. the environment) Of outcomes. Viewed in terms ofinputs Of proc
esses, the above outlined efficiency procedure is sufficient (with qualifications to be outlined in the
rJeId chapter, about how we treat filct:ors that have no direct bearing on outcome enhancements,
sudl as hotel services}--the appropriate quality will be that which is cost-effective in achieving the
ultimate goals of health care activities. Here we define the quality of care in terms of the patient's
well-being in terms of fina.I outcomes, then" perception about the inputs and processes notwith
standing. This is important because in Kenya, there is a tendency (among patients, and even within
the medical fraternity) to associate good quality with non-health affecting filct:ors. Whilst these file..
tors may have some (as yet tmdetennined beneficial) effect on final outcomes, the quality of care
should not be detennined in terms of mctors other than those help advance the cause of medicine
-improvement in health outcomes. This is why we rule out those other f8ctors.
4.2.3 COnsUIDa' choice
The choice of initial point of contact or consultation in the system by the consumer (m the
Kenyan health sector this inadvertedly is closely tied with the choice of the financial intennediary),
and the choice of furt:her medical treatments, diagnostics and so on, and the choice of ancillaIy
services are important, as they differ depending on individual circumstances. The first often relates
to the consumer's ability (or inability) to exercise choice about utilisation The fewer the impedi
ments to such choices (e.g. through the availability of more 'points' of contact with as Jittle inlubi
tive &ctors-such as charges), the greater the consumer's freedom Since, apart from the initial
decision to consult, COIlSUIIlelS generally rely on the advice of doctors as agents, the fewer the im
pediments to them, the higher the choice. The aucial issue now fiIcing the Kenyan health policy is
how to develop the health system without excessive reliance on govermnent revenue. In this con
ted, three main options that are being implemented include:
• cost recovery in the public service through user fee charges
-104-

• increased reliance on insurance to cover the cost of care in the public sector
• increased use of the NGO and private sector, through encouragement of reliance on
privately financed risk-sharing schemes.
These options have different implications for conswner choice and will be crucial in deter
mining the relative balance between the MOH and the private sector, and there is need to examine
the available evidence on their effects on utiIisation. There is need to ensure that only approaciles
that do not deter-or adversely limit the consumers' freedom or distort their choice--conswn~
from making the initial contact are encouraged.
The second choice relates to consumption of services after the initial contact has been made
by the patient. This essentially depends on the agency relationship that exists between the patients
and doctors and to a large extent what happens here is much dependent on the financial intermedi
ary between the patient and the provider. Relationships that distort the incentives of the providers
as agents (for example, by encouraging hasty consultations and off-hand referrals, or rewaJd pro
viders on the basis of pt"()OOdures perfonned or those that encourage the treatment of consumers as
'objects' in a process rather that as the focus of activity) are to be avoided. In this context, there is
need to sift through the literature to detemJine (with a view to encouraging the use of) methods
that cultivate an environment in which providers of all kinds have incentives that enhance the
'agency' role.
The third choice relates to those aspects of the health care system that may have no direct
bearing on medical outcomes and which may therefore be less subject to scrutiny in terms of equity
-things like hotel services, and so on. These, to a certain extent, depend on pe1Dl8l circum
stances and often influence the choice between providers--public, private or NGO.
These choices are to a large extent influenced by the tenns under which health services are
provided under different settings, particularly taking into aa:.ount the financial intennediaIy be
tween the provider and the patient. This affects the range of (clinical) selVices available to consum
ers and there is need to encourage only those that entitle conswners to a comprehensive set of
effective services that are provided efficiently, and equitably (this is taken up in the next chapter).
4~4 The private sector
How do we treat the private sector in our scheme ofhealth services, particularly the proprie
tary providers? The approach adopted here is that these be judged in terms of what they enable to
-105-

be accomplished for patients. That is, we simply view them as instruments to furthering the objec
tive of improved health status of the patients-that in the process of doing so they make profits is
neither here nor there. Ifin pursuit of profits-partirularly in a competitive environment -their ac
tivities can produce outcomes tIKIt are both efficient gaJ equitable, then their activities should be
judged on these coWlts only. The test question is thus: are the private for-profit providers any bet
ter at accomplishing efficient am equitable care? If the answer is an unqualified 'yes', then there is
prima facie case for using the private sector proprietary providers. That is our stand, and its test is
empirical rather than ideological.
4.2.51be question of incentives
This thesis is largely concerned with questions of incentives that will enhance the patient
agent noJationship in an efficient and equitable manner for the system as a whole. The view adopted
is that if one incentive structure accomplishes the objectives of the health sector better than the al
ternatives, there is prima facie case for its use (provided the administrative and management costs
ofimplalJmtmg the scheme do not outweigh the anticipated benefits).
In the next section we present some evidence which is indicative of inefficiency in the Ken
yan public health system, and raise a number of questions about the alternatives available to thwart
s.d1 inefficiencies, most of which are answered in later chapters of the dissertation.
4.3 Potential for Efticiency Improvement in the Kenyan Health Sector
The aim of this section is to provide some prima f3cie evidence to demonstrate there exists
inefficiency or waste in the allocation andIor use of eKisting resources, particularly in the public
health savices, arising mainly from the way resources are allocatedlused amongfm various health
activities: auative services, comnumity and primaIy health services. In terms of the health service
bldgeting and accounting system these allocations are detennined by the allocations ofinputs used
in their production--personneJ, materials, drugs and supplies, maintenance of buildings, equipment
and transport and so on. Fonowing the framework of efficiency discussed above, economic effi
ciency would require that resources be allocated to such health sector activities such that their ef
fect on healih is maximised. But there are diffiailiies in determining whether this is the case for the
health sector as a whole since its output is not easily defined and or measured, even where one's
concem is only for a disease-specific or for a narrowly defined health activity. Hospitals, for exam-
-106-
pie, provide a complex mix of services (to tackle different disease problems) whose impact on vari
ous outcome measures such as morbidity, mortality, disability, and quantity and quality of life vary
considerably. Elsewhere, research has tended to concentrate on limited but measurable aspects of
the health sector activities (Mills, 199Oa), including the analysis of the cost-effectiveness ofparticu
Jar fBcility-based treatment patterns, or looking at the characteristics of patients attending particular
types of filcilities to see whether they are being treated at the 'right' levels--in terms of medical
standards, (e.g. Heller, 1978). In this section, both these approaches, supplemented with interna
tional comparisons (where relevant), are used to examine whether the current patterns of allocation
and resource use in the Kenyan health sector are economically efficient.
0.1 Some evidence of resource mi5-use in the Kenyan public health care system
In chapter two, we showed that the health problems precipitating use of curative services
are dominated by morbidity and mortality from largely preventable causes such as infectious and
parasitic diseases, respiratory system diseases, accidents, injuries and burns. In terms of the frame
work for efficiency sketched above, there is a wastage of resources, both at micro and macro lev
els, because diseases that can be treated at low cost levels in the system continue to be attended to
at higher cost levels in the system. 32 The following example illustrates there is a potential for effi
ciency improvements in the present system. The PADS (1990) study found that in the 1988189 fis
cal year, the Government of Kenya spent Ks. 68.90 and Ks 17.41, respectively per outpatient visit
in the Nakuru Provincial General Hospital (PGH) and the Naivasha District Ho~. On the
other hand, the lowest MOH Health Centre and MOH Dispensary were found to have per outpa
tient unit costs ofKs 16.76 and Ks 11.36, respectively, but patients probably received lower quality
care at the PGH (and the District Hospital) than in other levels of the same type of care. Figure 4.4
shows how.
Unit costs per outpatient visit are plotted along the left vertical axis. On the horizontal axis
are the names of three hospitals (two MOH, one NGO), the least expensive MOH health centre,
and the least expensive MOH dispensary. Along the right vertical axis is plotted the percent of a
sample of outpatient diagnoses cross-checked to verifY the extent to which the symptoms had been
32 Notice that we are talking of the relative or comparative cost of facilities at which these diseases are being attended to. Theoretically, it is possible that the cost per case prevented may exceed the cost per case treated. This is a different angle to the analysis which we suggest must also be considered but is not of immediate import for the present argument
33 It should be noted, however, that the study did not conduct the analysis for a specific disease (which would have given a more impeccable case for the observed cost differentials). Nevertheless, it is instructive.
-107-

correctly identified (were based on a review by an independent physician). The NGO fucility had
the lowest unit cost per outpatient (Ks 7.00), but this might not be a good guide to costs in NGO
fucilities compared to MOH fucilities because it did not include volunteer labour costs. Neverthe
less, there are two ways in which system inefficiency can be shown to exist. First, if patients could
be referred to the private facility and the government meets the cost of treatment there, the NGO
hospital could have treated almost nine more patients for the cost of one at the PGH34, Naivasha
District Hospital and the least cost MOH health centre each could have treated 3 more patients
while the least cost dispensaIy could have treated 5 more patients, probably with more satisfactory
outcomes than the PGH.
110
100
90
80
~70 ';' 60 en
8 50
'a 40 ~30
20
10 o
Nakuru Provincial General Hospital
Naivasha District Hospital
Key:
Mercy Hospital (NGO)
Lowest Lowest Cost MOH Cost MOH Health Dispensary Centre
100 ~ 90 0..
80 ~ '0 o
70!§ 605
'0 50 ';'
':::1
40 ~ 30 8 20 'Cl
1O~ o Qj
tl..
Unit Costs (Ks) Quality: Per cent of correctly identified symptoms
Figure 4.4: Comparison of costs and quality among MOH hospitals, health centre and dispensary and an NGO hospital, 1988/89
The second way of illustrating prima fucie inefficiency is that of examining whether any of
the patients treated at any one of the fucilities in the study could have been treated elsewhere
'probably' with equally good results but at a lower cost (to society and perhaps the patients them-
). Although such a comparison is not perfect as the cost is often also affected by case mix, complexity and other factors. Howev~r, the ge~eral point is that referring patients to the NGO facility and footing the bills rather than treaung them 10 government facilities may result in more patients getting treated at the same cost, provided two conditions obtain: (1) the quality of care does not deteriorate in the NGO facility as a result, and (2) the cost (both to the government and patients) does not defray any potential gains to be had from the exercise.
-108-

seIves-travel, waiting, and so on). The PADS study found that out of an average of 300 outpa
tients treated in the PGH each day, only 20 per cent were referred there. That meant 240 or 80 per
cent of patients were 'self-referred'. Of these self-referred patients, 80 per cent (192) had left a fa
cility nearer thek home to come to the PGH, 15 per cent because of lack of drugs at the fucility
(closer to them), 20 per cent because they considered services there poor. Taking other '1rivia1' ex
cuses for coming to the PGH into account, the study concluded that about one third of the patients
seen at the PGH did not have any genuine reason to be there. A similar analysis done for Naivasha
District Hospital and health centres, estimated that one quarter of outpatients in the district hospital
could have had their 'needs' (see next chapter on more about the meaning of this tenn) satisfied at
a health centre near their home, while between 13 and 17 per cent of patients visiting health centres
could have been attended at a dispensmy. The difference in unit costs between the health centre
and the district hospital is minor in the sample--and might work in favour of the health centre be
cause the district hospital (and the PGH too) are located in wban areas, while the health centres
and dispensaries are rural oriented (and more widespread). By deploying more resources towards
these lower level filcilities, it can be expected more impact on health outcomes would be milised,
for people travel to the higher level f8cilities due to lack of supplies and drugs in health centres and
dispensaries. Thus, if the referral system were streamlined and the resources used to treat such
(marginal) patients at the higher (cost) level f3cilities are reallocated to lower level fucilities, then, as
we have shown above, these resources would be able to cause more persons to be treated in the
system. But WJless the referral system is strengthened, patients will still have incentives to 'short
circuit' the system with adverse cost effects on the system. Analysis along similar lines for inpa
tients was also done with similar conclusions about marginal patients. The Nairobi AIm Study had
similar comments concerning the referral procedures within the City health services. (It is one of
our objectives to propose a refonn that will streamline this referral process).
There is also another 'hidden' potential for efficiency. Reallocating resources in the manner
described, would cause some of the lower level tacilities with high per unit costs due to excess
spare capacity to improve on perfonnance since in these filcilities manpower and other inputs may
presently be under-utilised in many of them, provided other filctors preventing people from using
them (quality, and so on) are overcome. However, the aucial issue here is detennining the desir
able mix of f3cilities that results in an appropriate balance between the higher level filcilities (par
tiaJlarly hospitals) and others in the system (and not whether the higher level fBcilities should be
there) because the higher levels have the important supportive role in terms of supervision and re
ferrals (Mills, 1990a). The application of the efficiency principles discussed in the sense discussed
-109-

here can help to ensure this balance is got and kept right. Given the scenario (about the pattern of
diseaSES) sketched in chapter two and the evidence above, which is illustrative of the public health
5eI'\IiQes, the next question to ask is 'what has been done concerning the resource allocation to alle
viate these problems?'. In the next sub-section we show little has actually been done to realign re
soun:e allocation and the countIy's health problems.
4.3.21be MOH resource aDocation is not geared to the country's bealth problems
Besides the micro issues raised above we can also show that the pattern of resource alloca
tion at overall (public) system level has not been altered in response to the health needs of the
country. We concentrate on the public health sector due the paucity ofprivate sector infonnation,
but also because the allocation pattern within the public hemth sector is of more immediate policy
relevance since the govermnent can influence the health sector directly and indirectly through the
way the health ministIy allocates its resources. The categories used in the analysis concentrate
mostly on recurrent expenditures. Capital expenditures can ~ little else that will not already be
evident from the recurrent allocation The allocations to the eight main functional categories of ex
penditure used by the Ministry of Health (MOH) in Kenya are shown in Table 4.1 for selected
years between 1973n4and 199119235•
Year 1973174 1978179 1983/84 1988189 1989190 199<V91 1991192
QeoaaI Administtalioo and PIaming 5.15 4.57 8.42 4.34 3.l8 296 325
CuraDwHtalth 6834 66.92 67.65 65.68 68.81 68.2 69.75
Pre\aJDYe Medicine and Pro-mcdYe HtaIth 6.6 5.85 5.26 11.7 10.72 9.73 7.41
Ruml Health Services 13.03 9.63 10.97 11.52 12.08 12.82 13.29
Hm1tb TIainiDg 6.64 925 6.63 6.06 5.07 5.77 5.63
NalDIal HtaJth Inswance 0 0 0 0.03 0.59 0 0
Medical SuppXs Co-CldioaringUnit 0.24 1.91 l.06 0.66 0.72 0.53 0.67
MaIical Rtsarch 0 1.87 0 0 0 0 0 T_ 100 100 100 100 100 100 100
Compibl fi'om data on the MOH Rfcurrent Expenditure Estimates, varioos years.
Table 4.1: Functional distribution of RCWTeDt health care expenditures: 197213-1990191 (various yrars--per cent)
" The data used in the analysis are based on 'actual' or realised allocations, rather than planned expenditureS.
-110-

The overall picture can be gleaned from the trends in more recent years. Allocation to pre
ventive and promotive health care programs declined between 1988/89 and 1991192. Although
under the tenns of the Health Care Fmancing Project government was to maintain its funding of
the MOH at least at levels that prevailed in the fiscal year 1988/89, and to increase its funding for
primary and rural health care, and pIVentivelpromotive health services, none of this appears to have
occurred. Although rural primary health services recorded an increase in the share of the budget,
th:d increase appears to Irlve come completely aut of the share devoted to preventive and promo
tive services. On the other hand, expenditure on institutional care, dwing the period actually rose,
although we saw in chapter two that Kenya's health problems are mainly public health oriented.
The filctor contributing to most of this growth was expenditure on public hospitals-mainIy
provincial and district hospitals, which alone accounted for 78 per cent of the total allocation for
aJrative services in 1991/92, a representative figure for the period. Expenditure on psychiatric hos
pitals was only 3 per cent of the curative services budget. The other major component in the cura
tive services bill is the Kenyatta National Hospital, which in 1991192 had a share of 15 per cent.
The latter, when combined with the provincial and district hospitals' share means hospitals alone
took about 94 per cent ofall the curative care budget (see table 4.2 below).
PwpoIe rA~diture: Percent K.eny.ttta National Hospital 15.2
ProviIx:ial General Hospita1s 20.6
Distria Hospitals 57.7
Ps}dlialric SeMces 33
GIants to NGOs 12
Spinal IIYmY lbpital 0.5
BiomxIicaIIHosp Engineering Selvices 02
Dtnal ServK:es 1.2
ToCaI 100
Compiled from MOH datl on Rccurreot ExpeOOiture esimatrs, 1991192
Table 4.2: Dimibution of curative services expenditures, 1991192
The other components of curative services allocations are to non governmental organisa
tions; biomedical engineering very specialised care institutions such as the spinal injwy hospital;
-111-

and, dental services. These had very small allocations in 1991192. Such a distnbution of hospital
eKpeDtiture has impJications for the accessibility of health care services--these as well as the term
'access' itseIfwill be taken up in the next chapter. Another notable observation from the table is the
virtual decline to zero of allocations for medical research. WIthout research into the cowrtry's
health problems and how they can be tackled, resources will continue to be allocated to areas
where thar comibution to society's health are hardly known.
The development budget does not present any consolation either. Although the share
aDocated to curative care between 1973n4 and 19991192 declined from 76 per cent to around 34
per cent, while the share of rural health services increased from 4 per cent to 24 per cent, and that
of preventive services from 5 per cent to 8 per cent, these changes have not been sustained in the
period 1988189 to 1991192 (during which the shares of preventive and promotive services, and ru
ral health services declined, whilst that of curative services remained almost unchanged). On the
other hand, over the period 1973/4-1991192, health training allocations declined from 15 per cent
to a mere one per cent, while general administrative and planning's share rose from almost zero to
abcut 32 per cent-clearly there has been some juggling ofresow-ces in this budget too.
In terms of international standing, Mills, 199Oa, comparing data from various studies of the
health sector in developing countries concluded that:
• hospitals absorb approximately 30-50 per cent ofhea1th sector expenditure
• hospitals absorb approximately 50-60 per cent of current government health sector
eKpellditure
• hospitals absorb approximately 60-80 of government national health facility expenditure
and possibly 70 per cent of district 1eveI health expenditure
• around 60-80 per cent of hospital expenditure can be absorbed by central and general
hospitals, the remainder going to district hospitals.
Lack of data on private sector hospital expenditures makes it difficult for us to conclusively
argue Kenya's position as far as the first count is concerned. As for the other counts, in 1991/92:
• Kenyan hospitals absorbed about 69 per cent of recurrent government health
expenditure, which was on the upper side compared to Mills's findings (taking into
account the caveats about the representativeness ofher data)
• about 84 per cent of government national health filcility expenditure went to hospitals
• central and general hospitals absorbed about 40 per cent of the govenunent budget36.
U This proportion excludes private sector facilities.
-112-

'Thus, according to available infonnation, Kenya's hospital sector takes a more than propor
tionate share of the health sector resources.
1bere are not many studies on cost-effectiveness of various health interventions from the de
veloping countries, but there is crechble evidence that in general preventive care can be a more effi
cient fonn of intervention than curative care. The 1993 World Bank's World Development Report
devoted mainly to health issues asserts:
Spending that reduces the incidence of diseases can produce big savings in treatment costs. For some diseases, the expenditure pays for itself even when all the indirect benefits-5uch as higher labour productivity and reduced pain and suffering-are ignored. Polio is one example. CalruIations for the Americas made prior to the eradication of p0-
lio in the region showed that investing $220 million over fifteen years to eliminate the disease would prevent 220,000 cases and save between $320 million and $1.3 billion (depending on the munber of people treated) in annual treatment costs. The program's net return, after discounting at even as much as 12 per cent a year, was calculated to be between $8 million and $480 million (World Bank, 1993, pp. 19-20).
This report also argues that the decline in communicable diseases-largeI prevent
able-paricularly those of childhood, in the high income countries has led to much of the decline in
mortality in those countries (ibid, p. 23). Indeed, world-wide, the bw"den of diseaese-measur
in tenns of disability adjusted life years (DALYsHargely stems from diseases that are prevent
able, as the following table shows. Of more immediate relevance to the present study, the report,
commenting on childhood diseases concludes
The bw"den of these largely preventable or inexpensively curable diseases of children is far larger in sub-Saharan Afiica (ibid).
In summary, chapter two showed that most of Kenya's health problems are largely prevent
able. This chapter has shown that the health care resource allocation has not paid much attention to
this important fact. The evidence quoted above shows that preventing is likely to be less costly than
treating (at least fur most diseases in the countIy). Given the epidemiological situation and the
characteristics of the Kenyan population (as discussed in chapter two), it is apparent that a substan
tial amount of the health care resources should be devoted to preventive services. Yet, the
allocation of resources to rurative services in Kenya remains high and unchanged, consuming over
two-thirds of the public health sector budget. A juggling of resources between the preventive and
promotive health services, research and training to inaease the funding of rural primary health
services appears to have taken place. This will not be helpful at combating the real health iwes
since rural primaIy services also include ambulatory clinic-type curative services. The result may
weJl have been a mn in real resources devoted to Jl.lfely public health activities.
-113-

Set and ootame (DAL Y) Canmunicable"
Nee DAL Y, disabilily ~ life year. a.lDdudcs maIaDal and perinaJal causes.
259
47
244
74
Source: WorklBank, 1993, Table 1.1, p. 25.
Disease and category
Noooomnumicable
152
146
135
142
Table 4.3: Burden of disease by sex, cause and type ofloss, 1990.
J:qjuries
~
39
33
~
Thus the persistent disease patterns that can be effectively combated through comnnmity
health and preventive programs have not yet led to major changes in the budget, and the current
trends to do not suggest such a change is likely to ocrur W1der the current arrangements. The main
reason for this impasse, we conjecture, is that recurrent spending is much tied with the ecisting dis
tribution of the health capital. Another reason is the contractual arrangements presently in force for
public health service personneJ--most of them are civil servants. Any change in the system that
dots not change this contractual relation, which could largely be blamed for absence of efficiency
incentives. goes only a part of the way. Mechanisms to implement such changes exist and this the
sis will discuss some later. The next sub-section shows some jugg1ing of resow-ces appears to have
oca.ured in favour of persomel costs, the single largest component of the health services budget, in
addition to indicating the partiwlar items on which the jugg1ing of resources occurred, in its mvOUf.
4.3.3 An alternative 'closer' look at the distribution of recUlTeDt curative espenditures
.The functional allocation described above reveals the alloottion of resources in the Kenyan
public health sector is a biased towards hospital institutio~ but that alone cannot tell us what it is
in the system that the resources are used for. To get this, we have re-classified the data by inputs.
Although expenditure breakdown by inputs willoot give us infonnation about the implications of
the present allocation patterns (It does not correlate the ecpenditure on inputs to the actual services
provided or their benefits), it nevertheless can be useful in revealing changes over time in that it
may pinpoint allocation problem areas in the system. The (macro) data on expenditure by input
category used in this section differs slightly from that used in the previous analysis since in recIassi-
-114-

fying the data, we found items recorded under recurrent expenditure which belong to capital ex
penses-such as construction of buildings and pw-chase of vehicles. These are omitted from the
analysis. The result is shown in Table 4.4 below.
The largest input-cost component, as would be expected of a labour intensive industry such
as the health sector, is personnel costs, which increased from K£31 million in 198213 to K£36 mil
lion in real (1982) prices between 1972173 and 1990/91 (although in 1986187 they rose to K£45
million). The main cost component in personnel costs is salaries, wages and personal allowances
which aa:ounted for over 58 per cent (on average) over the peri<.Xf1. On average, the share of per
somel costs in the total MOH recurrent cost bill rose from about 53 per cent in 198213 to 60 per
cent in 199112.
8213 83/4 84/S 8516 86f7 frl/8 8&19 89190 9(),4)1 91192 Avg.'
Personnel <XlSIs 54.5 S9.4 SS.3 62.S 67.4 S9.3 OO.S 54.8 S3.S S7.S 58
Building & equip. main'Enan:e 0.3 0.4 0.7 0.5 0.6 0.7 0.8 0.6 1.1 1 1
Transport operating expenses 4 3.8 3.8 3.7 3.1 27 29 3.3 4.1 3.6 4
~ and medical supplies 19.5 14.6 20.2 14.1 127 13.1 123 14.9 3.8 14.8 IS
Utilities 4.3 3.9 3.9 4 3.3 2 21 3 2 2.9 3
Sut&dy/grams to <Xg8llisations 8.6 8.4 72 6.S S IS.8 IS.3 16.4 17.3 129 11
Otber expenses 8.8 9.6 8.9 8.7 7.8 6.3 6.1 7 8.2 72 8
I Period average
Compiled from the MOH's Reament Expenditure EstimaIfS, varioos years.
Table 4.4: Reament expenditure aDocations by inputs, 198213-91192: (percentages)
The second major cost component was drugs and medical supplies, whose share declined
from 19 per cent in 198213 to just above 12 per cent in 199112. Practically all the other items in the
cost bill experienced a similar fate during the period, with the exception of subsidies and grants to
organisations which increased from less than K£5 m to around K£10 m between 1986 and 1987.38
There are no standard set rules to judge the efficiency of resource allocation by input cate
gory, but de Ferranti (1983a) suggested a general rule ofthumb39:
31 Other cost components in this category include gratuity and pensions contributions, passage and leave allowances.
31 This item is actually not an input, but is included for completeness. It represents the costs to the MOH of handouts to organisations such as the Flying Doctor Services, mission hospitals and international organisations such as the World Health Organisation. etc.
39 This is based on cross-country comparisons of about a dozen countries' experiences. This does not of course make such 'rules of thumb' authoritative, but they can act as useful guides for' general' al-
-115-

"Investigate further whenever • salaries account for less than 4()01o or more than 80 % oftotal recurrent costs, • drugs are less than 10% or more than 35%, or, • transportation is less than 5% or more than 15%, • maintenance and repair of buildings and equipment are less than 1.5% and 15 %, re
spectively, of replacement value. "(de Ferranti, 1983a, p. 50].
Mills (199Ob), reviewing the literature on developing countries' hospital cost structures
came to similar conclusions. According to this comparative approach, Kenya is prima facie not
providing enough resources for building and equipment maintenance and transport. Moreover,
judging by the pattern evident in Table 4.4 (of declining share of these two categories in total allo
cation), the situation worsened over time. Varioos ad hoc studies have pointed out some of these
deficiencies (e.g., MOH, 1990). The problem of insufficient allocations for maintenance and trans
port, and other input categories stems from the large bill incurred in personnel costs, that contirrues
to rise. Because of the limited budget allocation from the central government, some items were
squeezed, including drugs and medical supplies. This, as the review of previous studies on the Ken
yan health sector has shown, has impaired the efficiency of the government funded health service.
The ned: section outlines a simple framework that will be used later as the basis to develop
some structural reform proposals for the system.
4.4 A Framework for Analysing Health Sector Problems in Kenya
This section presents a schematic model of the interaction between various participants in
the Kenyan health system, identifYing the suppliers of finance for provision of health services and
the users of those funds (see figure 4.5 below) with a view to isolating those an"$ where inefficien
cies (with the types of inefficiency and their implications identified) might be expected to arise.
The eKpenditure on health services by the government is only a part of the total funds avail
able for 'health production' in the country. This is because the health sector derives its finances
from sources other than the public sector. For eKaII1ple, households contribute a sizeable amount
through private purchase (mostly in the private sector). Also, some finances to the health sector
come from donors, both residents as well as from ex:temal sources (what we call here the 'rest of
the world').
location patterns.
-116--

Suppliers of Finance
Allocators of finance Spenders of Finance
Ministry of Health (MOH)
National Hospital Insw-ance Fund (NI-llF)
Private Private Sector 2 Insurance Insw-ance
Companies Companies
Households Households
Enterprises
Charityl Non-Govern-Donors mental Sector
l&lCod;
Receivers of finance
Spenders of
Finance! Service Providers
Services Provided
1: EmployerlEmployee Contributions to the National Hospital Insurance Fund 2: Private individual and enterprise purchases of health insurance 3: User-fees paid directly to Ministry of Health (MOH) facilities by patients - - - - - - - - - - ~ Weak linkages in the current system
Beneficiariesl Outcomes
Individual: Health -Mortality. Morbidity. Etc.
Environment. Personal Characteristics. and genetic factors
Figure 4.5: Flow of funds and inter-rdationships among participants in the Kenyan health care system
-117-

Reliable data on the expenditure and financing of health sector expenditures from various
sources is not collected routinely in Kenya«l. The only attempt (known to us) at generating this
type of data is that by a World Bank ad hoc mission on 'Expenditures and financing of the health
sector in Kenya' (MOHIWorld Bank, 1986). According to these estimates, the Ministry of Health
(MOH) is the (single) largest financier of health services, as Table 4.5 below shows. Data given are
for the fiscal year 1983/84 but are representative of all years, including today. The Table shows the
total funds emanating from the various sources in 1983/4.
Soun:.e Finance (K£ m) Per cent of'Total
1 GcMmment:
Minisby ofHea1th 1,206.8 42
CoUege ofHea1th Scieoo:s 25.4 1
Non-fiee AppropriatioDs--aXi of MOH servires 3.7 <I
Municipalities 1526 5
Natimal Hospital Inammce Fund (NHIF) 109 4
1 MiIIbu: Fomgn <DJIributiom 13.1
I.ood amtriluti<m 9.4 }1 Non-fees earnings 6.8
3 Other Noa-GoYemmental Organjsatjons:
ForeJgn contnb~ 11.3 <1
I.ood amtthJtioos 2.1 <1
4 Private compaaiH 53.6 2
S Privaie IDaInoce 35.3 1
6 OuHI-pocket payments 1,175.6 42
7 ImerDatioDaI donon 71 2
TOTAL 1,Jr16 100
Table 4.5 Estimates of financing of recurrent health expenditure by source of finance, 1983/84 (Ks mn)
The two largest sources of finance by tar were central govenunent revt"JlUe through the
Ministly of Health (42 percent) and the out-of-pocket payments (41 percent oftotar1). The Na-
40 That is besides the public sector information . • 1 Although we have doubts on the representativeness of this figure, especially given the attitude of
the mission that estimated it-that patients should pay for the government health services they receive in full through various cost recovery arrangements, as they do in the private sector. The 1982183 urban household budget survey showed that households were spending only 0.8 % of their income on health related expenses. The low income earners spent only 0.6 % of their income on health, while the middle
-118-

tional Hospital Insurance Fund provides only about 4 percent of the recurrent health expenditure,
much of it paid to private and mission f8cilities. Much of the private health insurance is in the form
of company group schemes. International donors also support some recurrent expenditures to the
vohmtaIy sector and to the government, but their contribution is only small at 1 percent of the total
health budget.
Therefore, we can say that in the 'production of health' in Kenya, three groups of 'strategic'
decision makers are involved-households (as individuals or groups of them), the private sector,
and what we loosely term as 'charitable organisations' or simply' others'. However, because in the
end all finances for fimding health services must come form individuals, the above classification is
only adopted for convenience (the diagram of the linkages in the health sector reflects this tact).
These groups vary in thek relative importance in the system. They perform four main fimctions
(some of which are 'delegated' to other third parties) either as suppliers, a/Iocators, spenders, re
ceivers and users of finance, producers of services and beneficiaries, in thek various
capacities/roles as householders, workers Cm enterprises) or benevolents.
As suppliers offinance, these groups deny themselves, or are denied, the use of resources in
other activities in order that these resources are used in the health sector. Here, the chain of trans
actions may be simple or complex, or, put in other words. horizontal or vertical--Smple (horizon
tal) in that suppliers perform the next stage (aOocation-discussed next) directly, or complex
(vertical) in that the second role is transferred to another party. Thus. in the first case, the suppliers
of finance also act as alIocators of resources, in the second case, this decision is passed to other
parties (e.g. the govermnem). An ecample of the first (horizontal) case is where households, enter
prises and benevolents (these last in their individual capacities) have leeway in deciding how to
spend their resources, while in the latter resources are transferred to government (compulsorily as
taxes or fees), to the NHIF (compulsorily as mandated contnbutions of individuals or enterprises),
to private insurance companies (as premiums), or to charitable organisations or other suppliers--a
case of tntra-sectora/-transjers, shown as '1ST' in the diagram (e.g. through 'harambee>42, for
example).
Suppliers of resources (individuals) are the ultimate receivers of the services of the health
sector and their welfilre is one of major concerns of this thesis. Therefore, according to this frame..
woIk, individuals finance all health CNe expenditure by paying insurance premia or by self-insuring
-otherwise termed out-of-pocket expenses, or through the pooling of resources through third
and upper income households spent 0.8% and 1.1% respectively. 42 See footnote 24 above.
-119-

party payers such as the government (though tax-collections that finance the services (both from
individuals as well as corporations», the National Hospital Insurance Fund, and through the place
ofempioyment. WIthin this framework and available statistics, the public sector's contnbution is by
&r the largest source of funding for the health care sector,43 providing over 50 per cent of its total
recurrent and development expenditures. This contribution has been rising nominally at seven per
cent per annum in recent times. Enterprises finance health care by paying insurance premia, in
whole or in part, by self-insured arrangements and/or by providing some clinic services themselves.
It was estimated in 1988 that about 60,000 persons and their fiunilies had some group health insur
ance cover (Vogel, 1990a, b). The benefits and premiums of group covers vary by company. Most
policies operate on a reimbursement basis and include co-payments and are subject to financial ceil
inss for claims under certain headings, e.g., operation charges, etc. These benefits are besides those
obtained under the NHIF. This has often led to too frequent and frivolous use of in-patient serv
ices. Most private health insurance schemes favour the middle and upper income classes in Kenya,
as elsewhere (Vogel, 1990a, b). A few companies dominate the health insurance industry. This is
appaIently perplexing given that private motor insurance is a1ready widespread. But the private in
surance market for hospital care seems to have been pre-empted by the NHIF, established in 1966.
This FWlCi is similar to Social Security and covers about 2.1 million people (roughly 10 per cent of
the total population).
1hJs health sector expenditures, regardless of the financing procedures used, are in the end
bome by people-either as households, individuals (users) or tax-payers, and there is interest in as
sessing how this burden is distnbuted. Data on who bears which types ofhealth expenditures is not
available. Consequently, one cannot easily tell how much is borne by the poor, and so on. Nor is
data available categorising expenditures in wbanlruraI classification. Hence it is hard to comment
on the distribution of the health care expenditure burden--ether between users and non-users, or
between the wbanlrural dimension. The distribution of the burden by income level is usually a
dominant conam Since the data to allow this type of analysis for Kenya is lacking, the burden im
plications of the Ministry of Health expenditure is here ewnined with the aid of data on the com
position of central govermnent revemJe. According to this data, only about 29010 of the health
ecpenditures funded by central government comes from direct taxes. The greatest proportion of
health expenditures funded by the central government comes from indirect taxes-whose average
contribution to the exchequer between 1963/4 and 1990/91 averaged 58%. Only a small propor-
43 Note: Except for the support given to certain mission/charitable organisation facilities, the government doeS not fund privately provided care, nor can 'public patients' be treated in private facilities unless they make private payment arrangements.
-120-

tion of the health expenditures (less than 15%) comes from other sources. Given the large share of
indirect taxes in central goverrunent finance, and that it is poSSIble for some corporate tax burden
to be shifted to households, one may safely conclude that the tax system is on overall regressive.
Therefore the rich may not be contnbuting a large share of the proportion of government reverrue
to finance the MOH expenditures. The pooling of resources involves fiduciaJy relationships in
which an institution spends the money on behalf of the consumers. These arrangements have impli
cations for access to health services (or more fonnally, equity). Chapter five will tIy to give an in
terpretation to the equity conception in Kenyan health policy, and, among others, discuss the
meaning of equity in financing and equity in service provision
Those that receive the funds may be tenned as the a/I0cat0rs. As already evident from the
diagram. aIlocators could be the households, enterprises or some other 'third party' (government,
NHIF, private insurance company, or a benefdctor). We see from the diagram that aIlocators of re
sources are almost synonymous with spenders of resources. They allocate resources to different
receivers of these resources. These are the providers ofhealth care services. In Kenya, as in other
countries, there are three types of providers: the MOH, non-governmental, charitable or non-profit
organisations (NGOs), and for-profit private practitioners, clinics and hospitals. The figure below
shows a matrix of the financing and provision ofhea1th care relationships.
PROVISION
PRNA1E
FINANONG PUBUC FOR PROFIT Nor FORPROFlT
TAX The govanment health se:rvice---Iupi health Nm-existent Support to miEon and a:mesand~ <Xher '~' fdcilities
INSURANCE UmitM PriYcde practitioners and Mission lnpitals JXivate lnpitals
USER-OiARGES Government health As in the 000ve c:eIl Mission lnpitals service
OTHER: -aid Some govemmeot and Nttkrown Mission OOspitals -dJari1y <Xher 'charity' fdcilities
Figure 4.6: A matrix of health care financing and provision in Kenya
Table 4.6 shows the estimated shares of total expenditure handled by various types ofpro
viders for the year 1983184. The issues arising here border on allocative efficiency and these issues
-121-

will be discussed in chapter six. (Our main interest there will be to examine how government
should allocate resources availed to it from the various sources, and implications thereof).
The users offunds (providers ofhealth services) perform the important .function of allocat
ing the resources-by deciding from whom to purchase services. There are three sources -the
MOH facilities, non-governmental (private) organisations, and the for-profit providers. Receivers
also have to decide how to allocate the available resources to various services provided by the
health sector. The decisions made at this level are governed both by 'operational' or technical effi
ciency as well as effectiveness considerations. These are the issues most previous studies on the
sector have been concerned with. The users of funds can be seen to allocate resources to five dif
ferent types of activities--research, training, curative, preventive/promotive, and public (or com
mmity) health services. This is done for the benefit of individuals, who are the final beneficiaries of
the activities of the health sector. These allocations, combined with other factors, such as personal
cbaracteristics, environmental factors and genetic factors determine (or produce) the final output of
the health sector-tbe individual health status (which may be measured by aspects such as mortal
ity andIor morbidity rates, for example).
"-
PnMder EJpenditure (K£ m) Percent "Total
1 Government: MinistJy ofHealth 1,210.4 42
CoUege ofHea1th Sciences 25.4 1
Murridpilifies 160.6 6
Natiooal HospitalIIlsuIaoce Fmd (NHIF) 8.4 <1
1 MiII!Iioa fadlities 68.9 2
3 Other Noo-GovenuoeutaI Organisatioos: 36.8 1
4 Privme (OII.,aaies 11.4 <1
S Private Market:
~ 264.8 9
PIacliDoners 216 8
~ (non-institutional purchases) 6ll) 24
()t:ber out-of-pocket expenditures 93.3 3
'IOTAL 1¥16 100
Source: MOH/WatdBllllt Report 'ExpenditlUWandFil'lt1ltClng cjtIMHfl(JlthSector inKmya.· MinillryofHeaItb, Febn.wy 1986.
Table 4.6: Total gross recun-ent expenditure by type of health care provider, 1983184 (Ks milHons)
-122-

These allocations have economic significance because their financing has different impacts
depending on the source of finance. If reliance is on market forces for example, there will be an in
adequate financing and therefore consumption of public health or conmumity services unless the
government intervenes because it is easy for people to benefit from these services without paying
the full cost. Such services include vector control programmes. In this case, one household 'fi"t».
rides' on another's spending because the benefits cannot be internaJised. An example of this pr0b
lem is the control of mosquitoes (caniers of malaria causing vector). The control of mosquitoes
(e.g. through spraying) by one household without a corresponding effort from other households
soon leads to realisation that 'it is not worth the effort' because mosquitoes----the caniers of the
malaria causing vector-bave no respect for 'property rights'-without organised comnnmity
wide control of the vector, one household's efforts are ineffective. Such services therefore have
spillover effects (externalities) which are hard to intemalise and only comnnmity-wide intervention,
through government taxation and spending, can ensure enough quantities (of them) are provided.
The public intervention solves the 'free rider' problem while reducing the user cost of service and
therefore encourages use (Culyer, 1971). This characteristic, that often distinguishes health care
from other goods and services, prevents the efficient allocation of it in a competitive market from
bemg realised Extemalities occur when a third party receives some benefit or suffers some loss
without choosing to do so (Culyer, 1971; Cullis and West, 1979). In general, there are externalities
when someone's production or utility function is affected by others' acts of production or con
sumption, or, when someone's utility is affected through feelings of altruism or envy by changes in
anotheI"' s well-being, and these effects are not paid or compensated for. These are the interdepend
ence condition and non-price condition, respectively (Dasgupta and Pearce, 1972, p. lIS). Exter
na1ities cause the market value (private or internal cost or benefit) not to coincide with the total
value (social benefit or cost) of these activities or changes. If the social benefits are greater than the
private ones, there are positive externalities (external economies). If the social costs are greater
than the private (mtema1) ones, ectemal diseconomies are said to exist.
There are four poSSIble sources of externalities in health (Culyer, 1975)----altruism, concern
for financial or economic impacts of ill-health, concern for equality (mdividual as well as ge0-
graphic), and egoistic behaviour, all relevant for Kenya. All call for some fonn of collective inter
wntion, though not necessarily public provision of it. These give health services some aspects of
public goods and the competitive market cmnot function efficiently to ensure their efficient and eq
uitable distribution44. We showed above that many health problems in Kenya are of this nature and
.... Note, however that the 'publicness' of a good is not a sufficient condition for government intervention. The pareto efficient allocation may still be attained in this case (see e.g., Cowell, 1986, chapter
-123-

this has to be taken into account by any refoI1Il strategy that encourages reliance on market forces
to determine services offered by service providers. But this does not mean that government should
be involved in the production of such services. Instead, mechanisms can be put in place to ensure
that the efficient level of such care is produced in the market even in the presence of externaIities.
On the other hand, curative services mostly benefit only individuals who consume them. In
this case, there is little diffirulty in inducing individuals to adequately finance them. Government
intervention might be necessary because the poor may not have adequate access to such services
or because a catastrophic illness may impoverish even a middle income-class household. But the
govanment does not have to foot the full cost of the service. Instead, people might be required to
contnbute. according to 'their ability to pay', up to a certain maximum ( per arurum, for example).
Preventive and health promotive services full between the two polar ex:tremes disrussed
above. They have characteristics of both public and curative health care services-people are will
ing to pay for such services but they may not purchase enough of them unless some incentives or
penalties are used to induce them to purchase enough quantities. However, in general, inadequate
financing of public and preventive/promotive health services eventually leads to high expenditures
for auative services. Treatment tends to be more costly in terms offinancial cost, and since inad&
quate prevention/control allows a greater proportion of the population to pass from the less severe
(less costly to treat) phases of illnesses, a greater demand for curative services occurs, which fur
ther aowds out financing for public health. The system gets 'grid-locked' on a treadmill where
more and more is spend on curative services (easily justified because of high demand for services)
but less is invested in public health and prevention activities that might actually reduce the need for
(l.JIMlt levels of spending on curative care. The analysis of the public sector allocations above has
shown that the system is currently 'caught in this trap' which suggests mechanisms are needed to
correct the resource allOOltion patterns.
The MOH currently provides, through the public health service de1ivery system, all five
types ofhealth activities discussed above.'" NGOs provide preventive and curative services, and in
some areas public health services. The private (for-profit) sector providers concentrate on curative
services, but also offer preventive services to those who pay for them. These providers cannot be
ignored as they provide a substantial proportion of health services in the countIy. However, their
objectives are at times at variance with those of the state. For example, the for-profit providers are
8). .. f doct . de th Mi ... i ...... , ., However, the tralmng 0 ors IS un r e UUA...,U,7 of Education. Only nurse and other para_ medical personnel training is charged to the MOH vote.
-124-

geared towards maximising profits, but due to the problems mentioned above, ignore public health.
Furthermore, there is no integration with govenunent services, besides attracting professional per
sonnel from the public sector. The NGO providers (and some private providers too, especially
those in poor areas46) may sometimes provide poor quality services. But both NGO and private
(for-profit) providers are capable of delivering public and preventive health services but do not pro
vide these services due to the problems disci Issed above. Also, at present, these providers also pro
vide limited training ofhealth personnel. Govermnent's decisions about how to finance and deliver
these services affects the development and viability of non-government providers because it can
choose to purchase them from other providers or deliver them. These decisions affect both the
quality and quantity of health services available to the population. Given appropriate incentives,
these providers can play an increased role in the provision of all the four types of services and we
later show what type of incentive structure needs to be implemented to make this poSSlble, follow
ing the criteria discussed in section 4.2 above (see the sections on private sector and incentives).
This is one other objective of this dissertation.
4.5 Summary and Conclusions
This chapter was concerned with the development of the basic principles that should govern
the efficient provision of hemth care in Kenya, providing prima f3cie evidence of some aspects of
inefficiency, particu1arly in the public health services and the development of a framework within
which efficiency issues can be analysed. The basic efficiency principles developed here stipulate that
the system should
• provide only medically effective,
• provide &JCh services cost-effectively,
• concentrate on cost-effective services that offer highest pay-offs in terms ofhealth, and
• provide &JCh services at appropriate scales, i.e., scales that ensure the share of resources
going to health activities secures maximum possible benefits that in any other alternative
use of the same.
Following these criteria, and in conjunction with the epidemiological and demographic pro
file of the Kenyan population, it might turn out to be more rewarding in the long-run to shift re
sources towards preventive services for which there is evidence elsewhere that the payoffs are far
better than those on curative services. The review of the prima f3cie evidence of inefficiency in the
46 These, motivated by profit maximisation, may cut<OSts by providing low quality care. They may rely on unqualified, less costly personnel, or simply ignore standard hygienic conditions.
-125-

system showed that there are various fonns of inefficiency, both at micro and macro levels. The
main miao inefficiencies concern the inappropriate use ofhealth resources particularly by consum
ers, wInle the macro level inefficiencies concern the way resources are allocated to various activi
ties in the system as a whole or, within tacilities, allocations to various health problems.
The health policy decision making framework was used relate the above inefficiency aspects
to various levels at which decisions are made and a model of the health sector was presented in
which various types of problems facing the system were outlined.
The main conclusion anived at in this chapter is that there are aspects of inefficiency in the
Kenyan health care system that need redressing if the system is to maximise the returns from the
currently available resources in tenns of their impact on the health outcomes for the population
However, besides efficiency, equity is the other cardinal objective of the health system. We turn to
this objective in the next chapter.
-126-

- CHAPIERFlVE-
5. THE EQUTIY OBJECTIVE IN KENYAN HEALm POLICY
5.0 Introduction
The question of equity in health and health care in Kenya has until recently been largely ig
nored or only received scant attention of policy makers and legislators. Resource scarcity which we
saw led to concerted efforts to improve efficiency in the system does not appear to have elicited an
equally important question: since there aren't enough resources to provide for all people's health
needs, what can be done to ensure that whatever is available goes round in an equitable manner?
Achieving efficiency gains within ament activity leveIs----or even increasing the level of spending
-is not synonymous with greater equity, as policy makers might (mistakenly) want to believe, un
less the concept of equity is a 'threshold' type (e.g. decent minimum) and the efficiency gains can
enable more people to receive the threshold level. But even though threshold-type policies (of eq
uity) may shift whole distrIbutions upwards-thereby (probably) pushing lots of people above the
threshold level-there would still be inequalities, since it applies only to those at the lower end of
the distribution The recent refollIlS illustrate this problem weI1-they brought into sharp focus the
need for a clear policy on access to health services. This chapter shows that the current policy does
not address the relevant issues and therefore will not lead to significant improvements in the equity
situation unless changes to the orientation ofhealth policy are implemented. The historical perspec
tive of the concern for equity in health services shows most 'equity' procIamations in policy docu
ments reIate to 'increased access to health care services for the greater proportion of the
popu]ation'-wruch need not necessarily translate into 'equitable access'--rather than 'equity in
accessIutilisaton' toIofthem, or even equity in health itself In order to assess the system with re
spect to equity perfonnance, we first review various conceptions of equity, philosophical and non
philosophical specifications (from economics), in order to distil operational conceptual and empiri
cal definitions of equity and contrast them with those implicit in the Kenyan health policy. We fi
nally review some empirical evidence that indicates there is inequity in Kenya. These concepts and
other issues raised in this chapter are used to provide the basis for an interpretation and evaluation
of perfonnance of the Kenyan health care policy.
-127-

5.1 Equity in Kenyan Health Policy and Health Care
5.1.1 The basis for equity concem-health care as an individual's 'right'
Health policy issues-be they pertaining to equity or efficiency-are invariably intertwined
with ethical and other value judgements. To adopt a value-free economic approach would omit
(probably) the most interesting and contentious questions of health policy. The distnbution of
health care resources is one such issue--not amenable to value>-free theoretical economic analysis
(others may include what the health care system should look like and what kind of health care in
terventions deserve priority). But although there is ubiquitous interest in what counts (should
count) as an appropriate distnbution oflelth care resources, it is not obvious why such an interest
exists. Donabedian (1971) distinguished two broad but rival ethical foundations for such a concern
(which correspond to two prototype health care systems-<:alled systems X and Y by Culyer,
Maynard and Williams, 198147). The first values consumer sovereignty and market forces and
treats health care like 'other good things' of life such as food, clothing, shelter and recreation.
Those clJampioning this view argue that what people are generally concerned about is the distribu
tion of well-being, detennined to a large ooent by the way people choose to use their resources on
basic goods, including health care (e.g. Fried, 1978, p. 127). People's investment strategies in basic
goods determine their lelth outcomes-they may not be as healthy as others because of the in
vestment strategy they adopt. Because good health is only one of the determinants of well-being,
basic differences in individual health are therefore not matters of social or moral concems---5ince
people are entitled to spend their share of income in whichever ways they choose.
The second view supposes there is a more fundamental reason why we should be interested
specifically in the distribution of health care resources. According to this view, there is something
unique about health and about inte'lventions to maintain and restore it. Health care (one of the prin
cipal mechanisms of intervening to restore or prevent deterioration in health) is fundamentally dif
ferent from other good things of life such as beer, pens or potatoes---it is not a matter of
.7 These two respectively correspond to libertarian and egalitarian health care system. System X: 'has as its guiding principle consumer sovereignty in a decentralised market, in which access to health care is selective according to willingness and ability to pay. It seeks to achieve this sovereignty by private insurance; it allows insured services to be available partially free at the point of consumption.; it allows private ownership of the means of production and has minimal state control over budgets and resource distribution; and allows the reward of suppliers to be determined by the market'. On the other hand, system Y: 'has as its guiding principle the improvement of health for the population at large; it allows selective access according to the effectiveness of health care in improving health ('need'). It seeks to improve the health of the population at large through a tax-financed system free at the point of service. It allows public.ownc:rship of the means of p~uction subject to central control of budgets; it allows ~me physical direction of reso~; and It allows the use of countervailing monopsony power to mfluence the rewards of suppliers . (Culyer, Maynard and Williams, 1981, p. 134).
-128-

satisfaction of individual desires but something to which individuals have a fundamental claim by
right, like access to the ballot box or to courts of justice. Its distribution therefore "should not de
pend in any way on income and wealth, though it will necessarily have to depend on the income
and wealth of society in general (since resources are limited and health is not the only good thing,
so health care is only ever going to receive a finite share of the total) and entitlement will also
clearly depend on the conditions of 'membership'" (Culyer, 1992). Concerning 'rights', a distinc
tion has to be made between a legal right to health care, and the moral right to it (Veatch, 1982).
Whether there is such a right as a matter of law depends on jurisdiction The Sessional Paper Num
ber 10 of 1965 (Kenya 1965) stated that the govenunent was committed to ~ citizen's 'right' to
'equality' before the law and certain other services, regardless of economic condition, political af
filiation, religion, race, tribe, and so on Amongst o~ the Paper lists the areas to which such
'rights' apply as 'equal opportunities' to education and medical care services, also paraphrased as
'freedom from want, disease and exploitation' (pp. 2, 448). The Paper also states 'The declared aim
of the Government is to provide medical and hospital services, old-age and disability benefits. . .'
(p. 47). Because ofresource constraints, the first step to the realisation of this objective in health
care was the introduction of free services for outpatients and all children in 1965-groups consid
ered previously under-served by the colonial health administration Even during those days, the
idea of cost-effectiveness seems to have existed, political dogmas notwithstanding:
One of our problems is to decide how IIDJch priority we should give to investing in less developed provinces. To make the economy as a whole grow as f3st as poSSIble, [resources] should be invested where [they] would yield the largest ~ in net output. This approach will clearly favour ... areas having abundant ... resources .... A million pounds invested in one area may raise net output by £20,000 while its use in another may yield an increase of £100,000. This is a clear case in which investment in the second area is the wise decision because the country is £80,000 per annum better offby so doing and is therefore in a position to aid the first area by making grants or subsidised loans. The pwpose of development is not to develop an area, but to develop and make better off the people of the area. If an area is deficient in resources, this can best be done by [among others], investing in the health of the people .... (Kenya, 1965, pp. 46-47, italics in original).
A major omission is the fiUlure to recognise that a true marginal analysis as advocated here
requires some marginal valuation in ~ case. That aside, it is noteworthy that the Kenyan consti
tution-which guarantees the protection and preservation of 'fundamental rights' and other basic
freedoms of the individual-does not mention health or health care (e.g. See Kenya, 19691, Chap
ter V, sections 70---86). The rights of individuals to health care services, viewed in light of this pas-
48 A similar statement, but which may have different connotations occurs on page 56: 'Every effon will be made to ensure that equal opponunities are provided for people in less developed pans of the country'.
-129-

sage and the constitution may be interpreted as implying that individuals should have 'equal
opportunities' to health care services in order to be 'free from disease' (see the discussion of access
--the notion implied by the phrase 'equal opportunities' -and equity below).
However, in spite of the existence of such knowledge, these principles were not applied to
health (as the last chapter showed concerning the distnbution of resources among functions), and
we shall1ater show that substantial inequalities in health and access to health care still persist. We
also will proffer possible expJanations for this persistence which need to be the fOOJS of health pol
icy ifinroads are to be made.
Beyond the statutory right to health, there also appears to exist a moral claim to a right to
health care in Kenya, although at first it was not clear to what types of services-for to say there is
a right to health or health care does not necessarily imply a right to equal access for all to whatever
services are available. Nor does it imply that the services have to be free. In most societies, such a
right may beland usually is, expressed in terms of a right to specified set of services, dynamically
defined, but nevertheless not dogmatically equated with the best available (e.g. see Fried, 1983).
That is to say, there is need to specifY what services, if any, may be free, who shall have access to
whiclt (types of) services and on what tenns-how equal should that access be at various levels
given that time and money access costs are dissimilar between individuals? In the first national de
velopment plan (Kenya, 1966), the chapter on health also stated ' ... it is incwnbent on any gov
ernment devoted to the social weIfilre of its citizens to provide adequate health filcilities'--a
political rl1etorical razzmatazz that has proved hard to implement as a policy. More recently, it was
stated that
Effective medical care, particularly when preventive in nature and directed to the rural areas, contributes significantly to national development ... Public spending to maintain and extend costly wban-based hospitals will be curtailed, and the bulk of savings from the slowdown of capital projects in wban areas will be redirected towards small-scale prokects at district and sub-district levels .... Preventive and promotive health progranunes, if adequately supported, can be cost-dective (Kenya, 1984, p. 152-3).
The QJlTer1t development plan (Kenya, 1994a) also states 'Primary Health Care implies pr0-
vision of essential health care UI1iver5r:lIIy accessible to individuals aw:I families in the community
through appropriate means, through their participation, and at a cost that the conummity and coun
tzy can atford' (added italics, p. 231). Before giving an interpretation of this statement, it is impor
tant to point out that provision offree health care is not synonymous with equality of access for all.
Second, universally accessable care is not the same as comprehensive care. Therefore, these state
ments might be interpreted to mean that the (moral) right to health care services applies to 'effec-
-130-

tive preventive care'. Where does this leave individuals in need of curative services? Policy
documents are mostly silent on this, and therefore interpretations have to be inferred from inarticu
late policy statements. The aurent development plan (Kenya, 1994a) puts it this way: '. . . re
sources will continue being redistnbuted from curative to preventive care and from wban to rural
areas. Communities, as a result ofbeing involved comprehensively in formulating and implement
ing health programmes and activities will ensure programme sustenance, and as a result, become
more responsive to their [curative?] health needs' (p. 231). Thus, it seems clear there is no unlim
ited right to all conceivable types of health care that individuals may desire. In short, it therefore ap
pears that in Kenya, the second view ofhealth services--that health is a right of the individual and
access to it should therefore not depend on individual income or wea1th-is the prevailing philoso
phy (although there is a private sector where access to health care seems based on the first view
point), but that right is limited to preventive care services.
There is another reason why the Kenyan government might still acknowledge a right to
health care in a way that is different from rights to other basic goods. For many basic goods the
need of each individual is approximately equal within a certain narrow range, e.g. for clothing, shel
ter or even beer. Variations in individuals' consumption of these latter goods is largely a dependent
on personal preferences. However, for health care (and education too), need is not as evenly dis
tributed. An even distnbution of health care services across individuals might lead to healthy indi
viduals having more care than they really need whereas the less healthy may have considerably less
than they need (UTeSpeCtive of whichever definition of 'needs' is adopted--see section 5.3.2 be
lo~). Therefore, while it is true that the ultimate focus is on individual well-being, a strategy that
allows incomes (and wealth) to determine quantities of goods and services available to individuals
may not work for health care services. Thus, as a matter of social policy there nmst be some judge
ment about how health care services ought to be distnbuted. Taking this and other reasons dis
russed above as the reasons for interest in the distribution of health care in Kenya, the nert
sub-section ex:amines the nature of equity advocated (again, using statements from policy docu
ments). We shall later (m section 5.2) give content to this term as various interpretations can be at
tached to it depending on which theory of justice one starts with.
-131-

5.1.2 The approach adopted by government to realise the equity objective
Having established the basis of the concern for equity, let us now look briefly at the policies
pursued to this end. To put the policies in context, we need to understand some historical perspec
tive ofhealth services in Kenya.
Development of health services lHfore indJ!pendence
The pattern of health care resource allocation that the first full-fledged government of inde
pendent Kenya inherited in 1963 owed its origin to about 70 years of British colonial administra
tion in the country which at the turn of the century penetrated the tenitory for economic
eq>1oitation under the auspices of the Imperial British East Afiican Company (IBEA) in 1888.41
That penetration brought with it western medicine into the territory but, in those days, the main
motive of introducing western medicine was for the treatment of the personnel of the company.
Later, in 1895 when the British Foreign Office assumed respoIlSlbility for Kenya, the mEA medi
cal staff was taken over by the British government and this was the fist first step towards medical
services supported and controlled by the state. But even then, the services were mainly for the ad
ministratOrs although the missionaries had introduced medical services to the indigenous people on
a very Jimited scale-and these were extended to the indigenous people because of the threat of
epidemie&-a public health hazard, as wen as the control of mosquitoes which presented a real
threat to the health of the newcomers. Hence the first (western) medical services provided to the
local people were mainly public health controls. But the coming of the first world war and the mas
sive recruitment of indigenous males as porters opened a Pandora's box on the health situation of
the indigenous people-it led the colonial authorities to reconsider past attitudes and policies and
to improve the quality of medical care in Kenya. After the war, the colonial government con
structed govermnent dispensaries in the native reserves. Beck quotes the case of a medical officer
who justified the increased medical expense by recourse to the humanitarian value of bringing
medicine to the reselVes (ibid., p. 95). By 1922, the medical deparbnent was finnly established as a
government department for the maintenance of health for the entire population and for the im
provement of the Iiving conditions in rural areas. The indigenous people's health was no longer the
responsibility of the missionaries. Indeed, that responsibility then was accorded to the medical de
partment alone, but the essential collaboration of other departments and the missionaries was not
mbrely ignored. As a resuh of that change in policy, medical expenditure increased but, by 1935,
'The ctepartrnent was unable to meet the Afiican demand for the improvement in general welf3re'
49 The account of the history of health services in Kenya for the period before 1950 presented here is based on Beck. 1974.
-132-

(ibid., p. 97). Medical problems took a turn for the worse during the world war two period, but
the post-war period saw a renewed conunitment which spanned not only the provision of services,
but the construction ofhea1th centres and new and larger medical training centres and a hospital in
Nairobi. As a result, (nominal) expenditures increased from an estimated £360,00 in 1945 to
£580,000 in 1948. The onset of the struggle for independence and the state of emergency declared
throughout the territory was a major setback to the development ofhea1th services.
The missionaries, as pointed above, also played an important role in the development of
medical services in Kenya. ParalleIing the colonial administration efforts was the development of
missionary and clrurch supported medical services. But, unlike the colonial administration govern
ment, the missionaries used the health services also as a way of luring the indigenous people to
their fiUth, besides needing them for thek own health-Beck writes that one Or Arthur said in
1912 that the missionary should gain the confidence of the patient through his medical work and in
this way prepare him for acceptance of the Cluistian message (ibid., p. 98). They established hospi
tals and dispensaries among the indigenous peoples well before the colonial government and also
pioneered in the training of AfiiQlIlS as medical aides-rnainly as dressers. Another difference is
that medical missions were quite successful at spreading medical care to the interior. Consequently,
when the colonial administrators changed their attitude towards the health of the indigenous pe0-
ple, the missionaries benefited through increased subsidies in recognition of thek important work,
although later resource problems and doubts about the quality of services offered by missions
strained the relation. This was, however, rectified through increased controls over mission directed
services by the government medical department, even use of some of the more qualified missions
as part of the state system. However, the development of the two systems remained separate and
the situation remained so up to the time Kenya became independent.
Besides western medicine there was also a heterogeneous traditional medicine sector-
which the colonial administration decided not to interfere with except an attempt to purge witch
craft practitioners, sorcerers and others who psychologically 'intimidated' society. As a result,
many traditional practices were not interfered with.
The situation remained that way in spite of govermnent commitment after independence to
reduce and eventually eliminate inequalities both between regions and groups of people.
-133-

Prevailing equity conceptions and changes implemented since independence
Let us now look at the equity conceptions, then and now. In the immediate pre- independ
ence period, as indicated above, there existed a largely fragmented health care system consisting of
traditional medicine as well as science-based medicine. In the fonner, Afiiam traditions governed
access to health care. In that tradition, there was nnrtual social respoIlSlbility Over matters of dis
ease and iJIness---membe co-operated to do their very best for each other with the full knowl
edge and WKierstanding that if society prospers its members will share in that prosperity. The social
tradition ensured that those in need ofhealth care services got them, even when unable to pay. The
traditional medicine-man (the village herbalist) had a duty to treat sick members and to seek com
pensation later. For those unable to pay, memben of their (extended) family had an obligation to
contribute to the cost of treatment-by giving whatever material wealth they had for it. If these
alone were unable, members of the clan to which the family belonged had such an obligation (by
ectension). Generally, it never went beyond the clan, although in times of calamities, all society was
obliged to help. There was tlrus a general fonn of 'social insurance' against illness, where access
was not on account of material or social standing, but according to need. Even today, this tradition
persists, in the spirit of'Harambee' fimd ~.
On the other hand, access to scientific medicine was generally based on economic considera
tions. The scientific medicine system itself was fragmented. There was a network of government
health services where access was at a charge, and missionary and church medical services, 1argely
based on charity. In the fonner, there existed two compulsory schemes: the European Hospital
Fund Authority catering only for Europeans, and the Kenya Hospital Fund Authority which ca
tered for Indians and Arabs and those Afiicans who wished to join volW1tarily. The missionary and
clurch medical services sector provided services to indigent (mainly) rural populations, often on
charity basis. Even these too were fragmented-along denominational lines, e.g., Protestant or
Catholic.
Thus, fur scientific medicine health care was treated like other commodities and access to it
was largely dependent on ability to pay, although there appears to have existed some fonn of a car
ing extemaIity on the part of the missionaries. This led to the development of a rudimentary hemth
aIfe insuranCe system catering for the needs of those who could afford the premiums- mainly
Europeans, some relatively wtJllthy members of the Asian community and a few Afiicans. On the
other hand, access to health care in the traditional medicine sector was socially guaranteed, pro
vided a need for the same was evident, and payment was not a paramOWlt issue.
50 See footnote number 24.
-134-

(i) Equity and the public hemth services after Independence
After independence, the government considered the existing disparities in health services un
acceptable and sought to consolidate the govenunent services under a Ministry of Health, with a
long tenn objective of providing free medical services to all the people, irrespective of their ec0-
nomic or other considerations (as discussed above). Economic constraints led government to intr0-
duce two important refonns in health care--one affecting the consumption of services, the other
their financing. These were (i) the introduction of free outpatient medical services for out-patients
and all children in 1965, and, (0) the establi;mtent of a compulsory national hospital insurance
scheme-the National Hospital Insurance Fund (NHIF), for persons emUng over K£6OO per an
num (or Ks 1,000 per month), later amended in 1972 to allow those willing low income earners to
join on voluntary basis. The scheme operated on the insurance principle of spreading the risks and
consequent costs ofhospitaIisation among all participants--i.e., community rating. Monthly sub
scriptions were set at K£1 (i.e., Ks 20) irrespective of income. Consequently the contnbutory
mechanism adopted was highly regressive.
Beyond these initial changes, between 1966 and 1989 the equity issue seems to have largely
been relegated to the background. Various development plans during this period indicate that the
equity policy pursued was Iargely about increasing the quantity of health services, particularly &cili
ties, in order to bring services to as many people as poSSIble. For example, the building of more
health centres, dispensaries and even hospitals was vigorously pursued. Also the training of more
health personnel in order to lower the popuJation/health persormel ratios. Besides these, other fac
tors external to health care but that have a direct impact on health have also been incorporated in
government policy including income redistnbution through taxation, improved housing, environ
mental sanitation, education and so on
However, during the 1980s, Kenya had a poor economic performance (as discussed in
chapter one) that forced the govermnent to change its outlook on financing of social services such
as health. In what remains the most comprehensive policy document ever produced, the new pol
icy was stated in the following terms:
The Govennnent of Kenya has emphasised the provision of basic needs ever since independence .... In 1985/86, over one third of the total Govenunent outlays will go for water, health and education, while of the recurrent ministry outlays, over 42 per cent is to be spent on these services .... These public expenditures on social services, along with the growth of incomes, have made an important difference in the quality oflife for Kenyans. Since 1960, the recorded overall death rate has been cut in half. . . life eKpeCtancy has risen by more than ten years .... These and other improvements give more Kenyans the potential for productive involvement in the economy. . . . Of course, outlays on basic
-135-

needs cannot be judged entirely as investments in future growth and employment. They have some very immediate benefits ... (Kenya, 1986, p. 11).
and elsewhere, it continues to state that
Govenunent will retain substantial responstbility for basic needs such as education, health and water, although private and 'Harambee' efforts will remain important, and for traditional public services. In exercising this responstbility, a balance must be struck between the desirability of asking beneficiaries to contribute increasingly 10 the cost of social services and the Govenunent s concern that those /eart able to pay still have access 10 such services . ... . . . Government's resources will remain limited .... Yet Government remains connnitted to doing as nruch as posstble to ensure that both social and economic services are widely available to the public ... the only way aut of this dilemma is to involve those who participate in Government services increasingly in financing the recurrent costs of these activities. Government has long charged fees for certain services. The coverage and level of these charges will be reviewed where participation has fallen behind the level of costs and ability to pay; and certain new charges will be considered, . . . proposals will be made to increase the extend of participant's support ... for services ... (Kenya, 1986, p. 24, italics ours).
Guided by this new philosophy, in addition to pressures from increased demand in the filce
of rOO1lced reverrues, government sought to mobilise additional resources and utilise existing ones
more efficiently. In response to the first challenge. ID December 1989, the government introduced
outpatient and inpatient user charges at all public sector fucilities except dispensaries and in July
1990 introduced refonns to the National Hospital Insurance Fund.
In introducing user charges in government health services, it was also realised there was
need for a mechanism to ensure the needy did not miss services due to inability to pay, and two in
stnunents were incorporated---exemptions and waivers. There was a provision for complete ex
emption for those services that nrust be encowaged for social reasons, such as child health, fiunily
planning and AIDS treat:rnenfl. In addition, no extra charges were to be levied for treatment in
specia1iserl (public) hospitals. The exemptions were supposed to be automatic-patients satisfying
the stated aiteria were automatically exempted. The poor also were to be protected through the
use of an explicit waiver based on ability to pay. The granting of the waiver on grounds ofinability
to pay is at the disaetion of designated officers in each health institution. For example, the clinical
officers or comrmmity rrurses in health centres and the designated rrursing, clinical or medical offi
cer in hospitals. After the first consultation, the patient is referred to the area 'chief'S2 with an ex
emption fOlDl for endorsement to certi1Y the person's hardship. Once a person's inability to pay has
been determined, the authorised officer issues an exempt certificate valid for one year. Persons dis-
" The government pays for these services. 'z This tenn is used to designate the administrative officer in charge of a location in Kenya. A loca
tion is a (regional) administrative unit.
-136-

satisfied with the decision taken have the right to appeal. In spite of these measures, attendance at
charging f3cilities initially declined following the introduction of fees. But public concern over lack
of improvement in services and perceptions that the waiver system was not functioning properly
prompted the government to lower maternity charges in August 1990 and to temporarily suspend
all charges till improvements in service delivery and exemption procedures could be ensured. In
1991, it was observed that
Any system of patient fees for government-provided health services requires a process for ensuring that universal access to health service is maintained. There must be a system for exempting hardship cases and patients with limited financial resources. When Facility Improvement Fees [user fees were so baptised!] were introduced in December 1989, a waiver system was carefully developed. The system did not give fixed rules on how to determine whether or not a person is able to pay when he/she seeks care for the first time in a health care filcility. The final decision [was] left to the judgement of the designated officer(s) of each filcility .... (MOH, 1991, p. 8).
This led to a refinement of the system including a specification of which services or people
were exempted from fees--cl1ildren under five years; patients from charitable and destitute homes
and from homes for the mentally handicapped; prisoners and persons in police custody, 'down
ward referrals' from higher health institutions (patients in this category being exempt only for the
first 30 days); civil servants and their dependants and inpatients readmitted for the same diagnosis
within two weeks of discharge. Patients with chronic diseases (diabetes, epilepsy, asthma, tuberw
losis (TB), and so on) and patients infected during an epidemic were not to be automatically ex
empted. The Facility Improvement Fund Operations Manual (MOH, 1992) explains fi.uther
modifications of the exemption and waiver systems. Fees charging resumed in early 1993.
The National Hospital Insurance Fund (NHIF) was also refonned. The NHIF contnbutions
were revised in 1990 from the constant Ks 20 per month per person to a gramlated scale of contri
butions based on income ranging from Ks 30 (for an income ofKs 1,000 per month) to a maxi
nn.un ofKs 320 per month (for those earningKs 15,000 or more), effective from 1 July 1990. The
rates are based on basic monthly income. The Ks 1,000 per month remains the entIy point for con
tributors to qualify. When the Fund became operational in 1967, with monthly contnbutions ofKs
20 per month, only about 40,000 persons qualified for ~. In 1992, the Fund had a mem
bership of 1.3 million people (mostly govennnent and private sector employees, and a few f3rmers,
fishennen and 'jua kali'S) artisans) and a dependent population of8 million [Press Release to 1h!
StarWrd, April 28, 1992]. The benefits have similarly been revised. Initially when the fund was set,
the rates ranged from Ks 35 to Ks 75 per day of hospitalisation, depending on the institution The
'3 A colloquial (Kiswahili) term literally translated meaning working under the blazing sun, otherwise known as the informal sector.
-137-

latter was revised to a maximum ofKs 150 for some approved hospitals. Now they range from Ks
80 and Ks 600 a day, for a maxinrum of 180 days (of hospitalisation) a year. There is no deducti
ble, and the sole 'copayment' consists of payment by contributors of the difference between the
maxinrum amount set for a taciIity that the patient chooses to be hospitalised in, and the institu
tion's p« diem charges, if it is higher than the Fund's limit. This happens only when patients
cl100se the more expensive hospitals. Only inpatient are is covered. But there are plans to widen
the benefit package to include some ambulatory services. Participation by health institutions is by
application which is fonowed by an appraisal for a decision. AD goverrnnent hospitals and health
centres with (paying wings) beds, mission and accredited private hospitals, clinics and nursing
homes are approved for the purpose of claiming benefits from the NIDF. There is a taciIity rate ap
plicable to each category.
Why the waiver system is ineffective
There are reasons to suspect the waiver system may not be effective in realising equity ob
jectives. It is poSSlble that the user fee system as whole, though still not based on fuD-cost recovery,
might be having adverse effects on equity as a whole, and might not be cost effective. The aims of
the system are to raise revenue as weD as to increase efficiency and improve equity. We have al
ready shown the revenue raising aq>acity is fiu" from meeting estimated targets (see chapter three,
Section 3.4, p. 79). There is need to evaluate the over-all cost-effectiveness of this poJicy-its cost
versus the revenues conected. Probably, if the costs of staff specifically recruited for its implemen
tation, together with cost of other mcility staff (time) taken in its administration are evaluated realis
tically, particularly in view of its impact on access to services, it might not turn out to be
cosJ-effective after all. The govenunent mcilities are allowed to retain 75 per cent of the conections
at the conecting f3cility. It is conceivable that this retention clause might discourage facilities from
granting waivers to deserving cases as that lowers the amount available to the mcility. An alterna
tive system of sharing the reverue, for example, a capitated system, might be a better alternative.
Second, the waiver fonn is an accountable dorument, but due to other problems within the system,
some &cilities occasionally have shortages of the waiver fonns. WIthout them, filcilities get excuses
to charge all patients. Third, the system bad asswned 'chiefs' and 'sub-chiefs,54 would play an im
portant role in identifying those in need of such waivers. But these were never infonned about their
expected roles. It was assumed they would know the people who cannot pay. In a country like
Sot A 'chief is a civil servant (public administrator) in charge of an administrative unit called a 'location', while a 'sub-chief' is in charge of a cluster of villages grouped together to form a 'ward' or
'section'.
-138-

Kenya, where wealth is sometimes held in fonns not easily assessed for income detennination, this
is too simplistic an assumption-there is no bases for assessing personal income for most rural sub
sistence fiumers. Moreover, it was assumed the 'chiefs' and 'sub-chiefs' would be impartial. This
might not be the case. Cases of political discrimination along political party lines are not rare in
Kenya and there is no reason to believe such is not the case for health services.
The eKistence of the National Hospital Insurance Fund in its present fonn seems to be an
other source of concern for equity. People who contnbute to this fund have an extra advantage
over the rest in the sense they use the pooled resources to secure better quality care, mostly in the
private sector. The implications are that a two-tier system effectively exists, a fuct reinforced by the
eKistence of a not insignificant private sector.
(UJ Equity in the private sector
Alongside the public health services, the private health services (mcluding the Non
Governmenta1-Organisations' services) sector was left to develop largely without intenerence from
the government except for 'normal' controls to ensure services provided by the sector were ofae
ceptable standards. Access to private services is mainly by out-of-pocket contributions as well as
by private insurance, in addition to whatever the NHIF supports. Consequently, access to these
services is detennined by personal economic standing.
5.1.3 Conclusions
The question of equity in health and health care in Kenya has generally been treated ambiva
lently by Kenyan legislators and policy makers. As in most other developing (and some developed)
countries, Kenyan health policy is rather vague on equity. Though there are policies that suggest
Kenya safeguards and promotes equity in services such as health, we cannot say that each citizen is
'guaranteed access on equal terms', even if that was the intention Government's long tenn inten
tions are to increase availability so that most people have as unimpeded access to services as is
practically possible. After independence, government was offering universal, general and free
health services to target groups. Rectnt policy emphasises the systematic improvement of ec0-
nomic, social, ruItural and working conditions which guarantee andIor promote good health. Gov
enunent still 'guarantees' access for all citizens to preventive, curative and rehabilitative medicine,
independent of their economic status or other similar considerations. There are now more pr0-
nouncements on equitable access to commodities that are health producing (andlor promoting)
-139-

-5UCh as housing, education, clean water and sanitation, better environment and working condi
tions, and so on These statements, taken together with the assurance of access to health services
for an individuals, can be satisfactorily interpreted as adequate grounds for interpreting the value
cIirnate of the Kenyan health policy framework as safeguarding and/or enhancing access to com
modities that promote health, including health services. But viewed in light of recent developments,
that access need not necessarily be equal--it appears perfectly feasible that some citizens will (and
do) eqoy a greater access to particu1ar health promoting goods such as income and education
This conclusion is reinforced by the obseIvation that the government is concerned that there should
not exist situations where some people are deprived of a minimum acceptable access to these
goods, especially health care services.
Moreover, looking at the history of Kenyan health policy since independence, it is evident
that the basic equity objectives has changed. The initial objective was one of unimpeded access at
the point of conswnptiotr-albeit for targeted groups. Zero price did not lead to the reaIisation of
this objective (or so it will be shown below). The new policy still guarantees access at the point of
use subject to diverse fees, taking into account the economic and social status of the citizens. Is
there an apparent inconsistency inherent in the policy objectives or is there a change? Can equal ac
cess be guaranteed in situations where people have 'unequal access' to health promoting goods,
despite the existence of policies geared towards eliminating or (at least) minimising the differentials
in access to goods? It appears the answer must be affinnative. Policy has over time changed from
one of simple equality to one that simply guarantees access to an 'acceptable level of access' to
these goods. The important difference is that although the health policy indeed has equity implica
tions about access to health services, the operational concept now is health itse1f; rather than health
CMe. The actual change in the equity objective can be discerned from eKisting as well as proposed
characteristics: in the past health care was universally available and free (although with token
charges-8g8in, albeit at least to targeted groups--for in-patient services). It was universal in that
it was destined for an Kenyans without disaimination General in that it covered preventive, cura
tive as well as rehabilitative services. Free because it was financed by the state and users were not
making any direct payments for use (or, even if they wrre, those payments were insignifiautt). To
day, the situation is different. Access for those unable to pay is still guaranteed, but only on proof
ofinability to pay. So there is an element of disaimination
In an, we may say that policy statements since independence have been rather vague with re
gard to equity. There have been vague connnitments to the equitable distnbution of resources and
non-discriminaton in treatment, but only few complete pronouncements usable as guiding objec-
-140-

tives. The actual policies indicate a concern for equity---rnostly about regional resource allocation.
But it is not clear what the aims of the present policy are with respect to equity-for it will seek to
guarantee equality of opportunity of access for all citizens to health care services, yet, at the same
time the govermnent will seek to 'make those able to meet part of or all the costs of their health
care' do so. Ifboth statements are correct, then the correct objective would appear to be not just
equality of access to health care, but equality to both private and public health care. This is of
course an ambitious if not amorphous goal. Such equality of access cannot be guaranteed, short of
a massive redistnbution of income. The ambiguity in the statements arises because policy makers
have opted for egalitarian fomrulation when one couched in tenns of guaranteed basic level of
services would seem more appropriate in light of other policy choices. The main problem is that
policy is silent on access to private health care, which, by the very act of the new policy directions,
is being encouraged. Changes in the National Hospital Insurance Fund (NHIF) could enable this
apparent contradiction in government policy to be overcome or eliminated. It seems the original
policy intention sought equity through the strive for a 'threshold' standard of care. Despite the lack
of clarity of successive plans, this cmtinues to be the underlying policy aim.
Two main conclusions may be drawn from the analysis presented in this section: FU'St, that
in Kenya, the main ethical basis of the public health services is that individuals have a 'right' to
'equal' access to health care, although not to all conceivable types of the services. Second, through
inferential analysis of documents, four poSSIble implicit interpretations of equity in the Kenyan
health sector may be stated as:
<D equal access to public health care services for equal need;
~ equal access to health promoting commodities;
<l guaranteed minimum access for all; and,
® WleqU3l opportunity of access to private health care.
These interpretations suggest different objectives with greater or lesser diffirult of attainment
and monitoring, depending on how the tenn 'access' is interpreted and how the objective function
is specified. Accessibility is the absence ofbarrlers (both monetary or non-monetary) that stand in
the way of an individual desiring to use a service and the medical tacilities that provide the care-
i.e. the absence ofbaniecs preventing 'need' from being converted into demand (parkin 1980).
Need and demand are not the same--need is the amount of care believed necessary by medical
authorities while demand is the actual use, i.e. demand is met need (Feldstein, 1966). (Further in
terpretations of , need' are discussed in section 5.3 below). It would therefore be useful if the equity
-141-

objective is stated explicitly, taking into account the different interpretations that may be attached
to 'access'SS, to cover both public and private health care services. Unless this is done, any of the
four poSSIble interpretations might be taken as a correct yardstick for the measurement of collective
decisions in achievement of equity-which, given the fourth interpretation, is questionable and in
consistent. The first and second objectives suggest there exists a specific concern for questions of
distribution in the health domain that is distinct from other explicit or implicit objectives such as
maximising swvival, efficiency of services or guaranteeing consumer choice.
Thus there is need to evaluate whether health equity objectives are being met as well as the
effects of policy choices in light of such goals. Second, the attairunent of equity in health care ap
pears to require equalisation of access between regions although there is an implicit concern for eq
uity between socio-economic groups. Simply guaranteeing that the least well-off (whether areas or
individuals or groups of same) have available a basic level of health care is insufficient. It will not,
for example, guarantee equality of health, which is a more preferred objective (see below). Third,
equity in the delivery of health care should be achieved through the equal access to the general
55 Parkin (1980) distinguishes several notions of economic accessibility to health care as defined by (a) characteristics of the health care delivery system. which subsumes geographical (spatial) at
tributes and socio-organisation (non-spatial) attribute~efined in terms of the volume and distribution of medical resources. The organisation determines the terms of entry to the health care system and the structure use of the system once entered.
(b) characteristics of the population at risk, defined in terms of (i) predisposing factors-age, sex, religion, attitudes to health, and so on; (ii) enabling factors-income and wealth, insurance, and so on; (ill) the illness level, as perceived by the individual or by the delivery system.
(c) outcomes-which depends on utilisation rates and consumer satisfaction. The utilisation rate depends on the type of illness, site of treatment, purpose and time (continued next page).
Several notions of accessibility arise from consideration of these factors. Those barriers relating to the spatial distance between the individual and the provider facilities constitute physical accessibility barriers. These translate into the costs of travelling to make use of health care services using a particular mode of transport to reach the provider and also the cost of travelling to consume health care services -in terms of the opportunity cost of the treatment itself, i.e. the extent to which earnings (or other opportunity costs) foregone in seeking care act as a barrier to the consumption of health care. There are also time costs (foregone earnings). These factors are relevant to the specification of the equality of access to public and private providers alike. Price constraints are another barrier to accessibility. The price paid (either at the point of consumption of health care or via other pre-payment schemes) acts as a barrier to the consumption of health care. Given the differentials in incomes and other enabling factors that exist between individuals as well as regions, it is doubtful equality of access to either private or public services can be achieved. There is also another determinant of accessibility~gibility, which defines the terms of access and to some extent what is being accessed-whether free of charge. Like any other commodity, consumption will tend to be inversely correlated with the price charged. This raises the issue of horizontal and or vertical equity. Besides, informational costs also play a vital role in accessibility. These refer to the extent to which the cost of obtaining information on availability, quality and so on of health care facilities is a barrier to consumption. The cost of obtaining such knowledge is arises from the opportunity to be treated at both types of providers-those unable to afford the charges of private providers will generally not have such information A final accessibility determinant that is similar (in effects) to information constraints is the disutility of treatment-even if perfect information were available, patients might perceive barriers in terms of social stigma (perhaps of pain, embarrassment, and so on). These factors, individually and in combination suggest different policies for ensuring equity to services. In general, the examination of public documents yields ambiguity with regard all the key interpretations of the term • access' .
-142-

range of services. Applying the rule to what are sometimes tenned as 'basic services,' which ex
cludes other available modes of care is not sufficient. Finally, the process of health production and
health care delivery, i.e., availability, and final outcomes (morta1ity, morbidity, service utilisation)
are relevant for evaluating the degree of equity in the system. In the rest of this chapter, we develop
the conceptual framework that will be used as the basis for equity assessments, both in the current
system, as well as for the proposals presented later on in the thesis.
The issues we would address in the rest of the chapter can now be briefly summarised:
<D what is the basis for equity in the Kenyan health care system?
<2> Is it adequate to lead to a consistent policy on equity?
(3) should this basis differ as between the private and public services?
® Is it poSSlble to incorporate efficiency?
We begin the investigation in the next section with a discussion of the bases of equity, both
from the philosophical and health economics literature.
5.2 Pbilosophical and Health Economics Bases of Equity and Their Implications for Kenyan Health Policy
There is widespread agreement amongst writers that equity has something to do with
'equality' (e.g. Culyer, 1991a; Le Grand, 1984~ Veatch, 1982). But although most notions of eq
uity use the concept of equality, equality connotes cases where the shares (~f the entity whose dis
tribution is the point of interest) resulting from a distribution rule are equal wItere$ equity
connotes a situation where they are.fair orjust (Veatch, 1982~ Rawls, 1958). This distinction can
be explained by a simple ecample. n: in a society composed of n individuals producing between
them a certain (fixed) quantity of goods and services (call it Q), a distribution rule was devised that
gave each individual a quantity QhI, i.e. an equal division, then the allocation leads to equality (m
shares). There are two reasons why such a distribution rule may not lead to desirable resuhs. FU'St,
no two individuals in the system would want to consume exactly the same bundle of goods. In
such cases, although individuals may have equal shares, they may not necessarily be happy-which
reduces their welfiIre. Second, to achieve that equal allocation may (and often does) involve trans
ferring resources (wealth) between individuals (from the more productive to the less productive), a
mechanism that often interferes with (actually destroys) incentives to produce. !fin such a society,
a distribution rule (not necessarily the one we have descnbed above) were devised under which
-143-

(for the moment ignoring the production side), the resulting shares were acceptable to all, given
the society s set of (moral) values (that define the marimand or objective of the distribution exer
cise), then the distnbution would be consideredfllir orjust--m other words, the concept offair
ness is a value judgement based on social values. There are several (competing) theories purporting
to explain what is a fair or equitable distnbution of resources. The policy implications for health
care resource distnbution arising from each differ because of differences in focus (some focus on
individual effort, others on personal ability, need, the individual's usefulness to society, yet others
on proportionality-more on these anon-see section 5.3 ). We now review these theories, par
tiru1arly their implications in the health domain, showing (as the analysis unveils), what form of jus
tice is implied by each, and tlrus their implications for health policy in Kenya Our purpose of
reviewing these is not to critique them as such, but to see which one, if any, bears close semblance
to the equity notion in Kenya.
5.2.1 Utilitarianism
In utilitarian welfare economics (e.g. Harsanyi, 1955), justice is inseparable from the goal of
maximising aggregate utility, although in recent times, partly as result of developments in moral
philosophy dealing with the notion of justice as of independent importance, the situation has been
changing (especially due to accounts such as that ofRawls, 1972). Under utilitarianism resources
are al/ocaled so as to maximise aggregate utility-the sum total of individual utilities or to maxi
mise social welfare. Actions are therefore judged on their consequences on aggregate utiJitY6, which requires the equa1ity of the marginal utility of everyone. Utilitarianism is 'impartial' in its
treatment of individuals, an attnbute of'fiUmess' or justice. Ifidentica1 preferences exist, utilitarian
allocations may be equitable in outcome (Culyer, 1980). But this is rare in the health sector and the
application of the utilitarianism principle in the sector may lead to interpersonal inequities, where
health resources are allocated to individuals with different abilities to transform them into out
comes, say health57. In general, resource allocations under utilitarianism rules remit in ejJicient
" Utilitarianism is actually an amalgam of three distinct principles: (1) welfarism-whcre consequences of actions are judged entirely on by the utility information related to a state (of distribution); (2) sum-ranking-where the goodness of a set of utilities of different individuals, taken together, is the sum of these utilities, thereby eliminating the possibility of being concerned with inequalities in the distribution of utilities (between individuals), and the overall goodness or 'social welfare' is simply the aggregate of the individual utilities; (3) consequentialism-where actions, rules and institutions are judged in terms of the goodness of their consequences (See SeD, 1987b).
'1 If policies promoting equity are costly in terms of output, the overall social utility frontier may have sections that are convex to the o~gin. F?r example, suppose there are two individuals, one healthy, the other chronically sick. The chromcally SIck person does not generate as much utility from a given amount of wealth as the ~ealth~ ~n. A utilitarian distribution of wealth starting from a position of equal income would reqwre taking mcome away from the chronically sick person and giving it to the
-144-

distributions but not necessarily equitable distributions. This is because the basis of equality which
realises maxirnisation of aggregate utility is the marginal uti1ity--if aggregate utility is to be maxi
mised, resources have to be allocated to those with higher marginal utility for their use. It is con
ceivable that those with such higher marginal utilities are not necessarily the people the health
policy would rather they get the resources. Utilitarianism is therefore not a theory of justice, but
about efficiency-it is actually devoid of any ethical basis of justice. Given the special consideration
focused on disadvantaged members of society by the Kenyan health policy (as indicated by the rai
son d'e1re of the public health services), utilitarianism cannot form the basis for equity in Kenya (or
indeed, elsewhere).
5.2.2 The dift"erence principle
The maximin theory or 'the difference principle' (Rawls, 1972) rejects welfiuism (utilitarian
ism) and judges distnbutions in tenns of the advantage of the least well-off person or group--i.e.
takes into account the inequalities in the distnbution of utilities (implied by the distnbution of pri
mary goods). Rawls sets two principles of justice that should govern the assignment of rights and
duties to reguIate the distnbution ofsocial and economic advantages: (l) 'each person (or group) is
to have an equal right to the most extensive basic hberty compatlble with similar hberty for others',
and, (0) 'social and economic inequalities are to be arranged so that they are both (a) reasonably
expected to be to everyone's advantage, and (b) attached to positions and offices open to all'. He
argues for the priority of the 'principle ofhberty', which is about 'aspects of the social system that
define and secure equal liberties of citizenship', i.e. the basis for social judgements. The 'second
principle' regulates the distnbution of social and economic advantages and, inter alia incorporates
the 'difference principle', in which priority is given to advancing the position of the worst-offper
sons (pp. 67-75) with reference to indices of 'primary social goods' sa (pp. 62-65)-'things that
every rational man is presumed to want', including 'rights and hberties, powers and opportunities,
income and wealth, and social bases of self-respect'. These are goods for which society should be
healthy person. Hence the distribution of income would become unequal. Here, utilitarianism results in inegalitarian distribution where none existed. This is relevant to health policy where resources are allocated to individuals who possess different abilities to transform them into outcomes, say health. In general, resource allocation under utilitarianism rules results in efficient distributions but will not necessarily be equitable.
,. Rawls's index of primary goods incorporates five types of social goods:
• a set ofbasic liberties, • ftc:cOOm d IroVeUJeDt and cOOice d occ:upttions agaimt a bic:kground d diverse qlp011unities, • powers and pu:rogati\a d office, • iDxJme and wealth, and, • the sx:ial bases d self-respect.
These are the things that every rational man is presumed to want.
-145-

held responsible for guaranteemg the individual a fair share (see also Rawls, 1982). In the 'initial
position', or 'under the veil of ignorance' inequality is justifiable only to the extent that it improves
the shares of primary goods of the least-well off persons, rather than their utility. This (second)
principle therefore supports equity and efficiency claims. The first part of the principle supports ef
ficiency; the second equity.
Interpreted within the context of health (Rawls classified health as natural social primary
good-not directly under the control of the social structure (p. 62», the Rawlsian maximin theory
suggests that inequalities in (access to) health care may be justified only to the extent that they op
erate so as to benefit the least-wel1-off persons (Le Grand, 1987). People or areas with ill health
should receive more medically effective-and tlrus health generating-resources to enable them to
raise their health status to that of the average person (or areas), unless so doing would actually
make them worse off. For Kenya this suggests health policy should be geared towards raising the
health status of those (individuals or areas) with the worst health states, provided they are suscepti
ble to health gains. The Kenyan health policy appears to have elements consistent with this type of
thinking--the Sessional Paper No 10 of 1965 stated that 'The purpose of development is not to
devdop an area, but to develop and make better-off the people of the area' [among others]
through 'investing in the health of the people' (Kenya, 1965, p. 47). There appears to have been a
concern for the level and distnbution of that health, initially the emphasis being on regions. In par
ticular it was then noted that
If these ends are to be achieved, it is necessary to develop a fomrula for grant-in-aid and ech lcaUon and health allocations that take into account the needs and incomes of each province and district. Thus the Government must ensure that all people . . . have mininnun provision of essential welf3re sezvices. A policy of making education, training and health facilities available to all provinces on the same financial terms means that people of the less developed provinces are penalised simply because they are already poor. (Kenya, 1965, p. 47).
The last sentence in the quotation may be interpreted as indicating a concern for what we
may here tenn as the least-advantaged areas (and, by extrapolation, the individuals living in those
areas). It has been shown above that even today, there exists a concern for the worst-offmembers
of society in Kenyan health policy.
In order to translate such a concern into equity policy that is operationally feasible, we need
empirical measures that can be used to quantifY either individual's health states or regional health
status. There are a number of problems however. One is how to define the least advantaged person
-is it in tem1S of their overall consumption of primary goods or in terms ofhealth or health care?
-146-

It may also not be possIble to distinguish between inequalities that benefit the least-well-off from
those that do not. The principle implicitly suggests that inequality is justified only if it is to the ad
vantage of the least well-off. Applied to health, there are problems, e.g. what if the worst-off (in
terms ofreilih) cannot be made better at a1l, or where some individuals have poorer health or in
adequate health care consumption as a result of their own decisions?
5.2.3 Equality of opportunity
The two principles of justice advanced by Rawls apply to individuals who are 'nonnaI, ac
tive and fully co-operating members of a society over the course of a complete life' (Rawls, 1982,
p. 168). If the social institutions in this society guarantee equal basic rights and hberties, and a fair
equality of opportunity, then the long term expectations of the least advantaged persons can be
maximised. WIthout the assumption of'notmal people', Rawls's index of social primary goods is
no longer suitable for assessing how well-off (representative) individuals are, since 'People with
equal indices will not be equally well-off once we allow them to differ in health care needs.' (Dan
ieJs, 1985, p. 43). Therefore Rawls's list ofprimary social goods is too narrow once it is recog
nised that ill health has impact on equality of opportunity. Daniels proposes inclusion ofhealth care
in the list, by incorporating health care institutions and practices among the basic institutions in
volved in providing for fiUr equality of opportunity. The alleviation of impainnent of normal fimc
tioning (used as a crude measure of the relative need for health care services) would thus be the
focus of public (health) policy. The social obligation to meet health care needs derives from the
more general obligation to guarantee 'fair equality of opportunity'-'Health care institutions will
help provide the framework of liberties and opportunities within which individuals can use thek fair
income shares to pursue their own conceptions of good' (ibid., p. 45). The health care institutions;
and practices that are the relevant variables for this purpose are of four levels: preventive health
care institutions; institutions which deliver personal medical and rehabilitative services that 'restore'
the normal functioning (of individuals); institutions involved with more extended medical and social
support services for the (modetately) chronically ill and the frail elderly; and health care and social
services for those who can in no way be brought closer to the idealisation
The fair equality of opportunity appears appealing since it provides a principled method of
characterising the 'importance' of d.ifferent strata of the health system, but it too has some prob
lems, some of which have been appreciated by Daniels himself First, for most connnodities, the
people's pnzences for them can be accommodated by allowing the market for them to respond
-147-

to those preferences. Equity ofaccess (to such goods) is assured if three conditions obtain: (1) the
conmodity is available at close to true social cost; (ii) the consumers are capable of making ra
tional decisions; and, (iii) income distribution is approximately equal. Now, in the medical market,
as Arrow (1963) has shown, the central problems of access are brought about by departures from
the ideals of a competitive market, especially on the supply side, which amounts to the markets not
delivering the services at their true social costs. The market is umesponsive to consumer prefer
ences on the supply side and interventions may be needed to correct the problem, generally
through interventions focused on capital expenditure policy, and on the structure of insurance ar
rangements or other means when the market is umesponsive. It may be assumed that sufficient in
come redistnbution occurs to ensure that no one &Ils below the officially defined poverty line.
These aspects are relevant in Kenya where there is a poor distnbution of income, and there is no
established 'official poverty' 1ine--because the country does not have a welfilre system. It might
therefore be ecpected that even if such an accoWlt was to be used as the basis for health policy,
some important mechanisms have to be established in lieu of income as the basis for determining
access to the basic tier. Second, access to hemth care is more equitable the less the infonnational
and financial baniers, or the supply anomalies that prevent access to health care services. Such file
tors are fonnidable in Kenya
5.2.4 Sen's capabilities approach
The idea that the distribution of prirnaIy goods may be a better reflection of justice or fair
ness inherent in a social set-up has been questioned by Sen (1982, 1985), who argues the utilitarian
and RawIsian approaches focus on goods rather than what those goods can do for people. The
utilitarian approach for example, in explaining what goods do to people (i.e. enable them generate
utility, the ultimate end) uses a subjective measure. Non-subjective factors are however equally im
portant. Hence, to explain what commodities can do to people, and how people use them to pro
duce lwman activities, a much wider range of variables (beyond generating utility) should feature in
the analysis. People relish commodities because they can be transfonned into final outcomes (the
ultimate being weJ.f3re). For example, people demand health care because it helps them generate
(good) health. The ability of people to transfunn commodities into human junctionings, such as
ability to enjoy good health, is the vital link between goods and final outcomes. The commodities
are transfonned into more fundamental intennediate products, called characteristics-such a per
son being able to do certain things, e.g. move about, meet their own nutritional requirements, get
clothed, participate in social life, etc., (Sen, 1982, 1985, er. Lancaster, 1966). In demanding corn-
-148-

modities, people are in f3ct demanding these characteristics. A demand for health care, for exam
ple, is a demand for clinical efficiency, caring by GPs, ability to restore good health, and so on.
Equity objectives should therefore, Sen suggests, be directed at these basic capabilities. The pr0c
ess by which people transfonn these characteristics into 'good' health can be descnbed as.function
ings (Sen, 1982, 1985), and can be represented as in figure 5.1 below.
commodities People ~I----------_I~--------~I ~I __________ ~I--------~
POODS 1-1 ........ ~I CHARACTERISTICS r.t FUNCTIONINGSHUTILITY I Figure 5.1: The chain from goods to utility
In traditional economics, although higher levels of utility are associated with better function
ings, that link depends not only on the subjective aspects, but also on non-subjective elements.
Some people have higher marginal utility per unit increase in income than others and to maximise
utility, utilitarianism would recommend that such people be favoured. In reality, however, and fol
lowing Sen's approach, people may want to incorporate other aspects, such as the intensity of
need and other non-utility considerations. In tenns of equity, Sen argues, the interest is less in
whether a person is functioning in a certain way and more in whether the individual has the capabil
ity to do so. The guiding equity principle thus should be equality of basic capabilities. In health eq
uity concerns, policy objectives may be stated in tellnS of people's access to, rather than utilisation
ofhealth care. The functionings approach requires that people should be able to use medical serv
ices when they choose to do so, rather than able to cootimJously do so. Health status depends on
the capabilities to function which people have available to them. These are in turn determined by
goods (health care, education, food, etc.), or more directly by the characteristics of the goods (such
as clinical efficacy, lmowledge ofhealthy living lifestyles, etc.). The characteristics of goods are re
lated to the environmental factors (availability of medical care, good education, nutritious food,
etc.) while the fimctionings are related to personal characteristics (such as age, socio-economic
class, fiunily size, etc.). Thus, people's ability to achieve good health depends on their access to
health producing goods and their endowment of the health producing personal characteristics.
WIth regard to equity, equality of capabilities (or functionings) implies equal access to health
benefits.
-149-

The implications of Sen' s approach for economic analysis can be visualised in line with a re
lated mode1-the household production framework (Becker, 1965; Lancaster, 1966). This model
emphasises the importance of inputs such as time and environmental constraints in the production
fundamental utiIity yielding commodities. The same is true of Grossman's (1972) model of de
mand for health by households. The fimdamental commodities produced by individualslhouseholds
coincide with Sen's concept ofjunctialings. The fundamental commodities are produced from
market goods, environmental inputs and personal characteristics, which are the source of the capa
bility set. But whereas the lruman capital tradition considers the link between fimctionings and util
ity as non-problematic, Sen emphasises that any two individuals or the same person at different
times, may make identical choices when faced with the same capability set, and yet may experience
quite different utiIity levels. Therefore the focus should be on the capability set. The empirical
analysis involves determining the relationships of the capability set that are relatively universal and
choosing detennining variables and functionings that are relatively observable (Muellbauer, 1987).
5.2.5 Theory of entidements
1he hbertarian theory of justice takes exception to the focus on outcomes. Notable among
them is Nozick's (1974) theory of 'entitlements', which gives 'rights' complete priority and argues
against any manipulation of outcomes to achieve social ends. He stresses that persons are equally
'entitled' to what they have provided it was acquired justly---through hard work, inheritance or
through redistribution by government of wealth of people acquired illegitimately. That two indi
viduals have different incomes is not sufficient to judge the distnbution inequitable: whether it is eq
uitable is entirely procedural. Any outcome anived at through people's exercise of their rights nrust
be acceptable since these have the moral force of rights. These rights include personal hberty, own
ership rights over property (mcluding the freedom to use its fruits, or to use it freely for exchange,
donation or bequethal to others). Attempts to redistnbute resources, other than through voluntary
charity constitute irYusf;ices. If this theory were to fonn the basis for equity in the health domain, it
can be aiticised for the 'extremism' (of mostly undesirable) results that it may lead to---the con
straints imposed by rights can override other important considerations. In the health sector, it is of
ten necessary to compromise rights so as to improve the welfare of the deprived members of
society. There are people with some health conditions that they never cIKJose to have, e.g., geneti
cally acquired health anomalies. It appears Norzick would just consider this 'bad luck' which may
raise sympathy, charity, and so on In general, the theory attaches little weight to the unfortunate.
Moreover, in Kenya, most of the health problems are due to lack (and neglect) of primary health
-150-

care interventions, such as immunisation, personal and environmental hygiene, and so on People
are wilikely to consider benefits other than those accruing directly to them if buying this type of
care in the market if the hbertarian philosophy was in force. Given the current epidemiological and
economic conditions in Kenya, the hbertarian approach to equity would therefore lead to a distri
bution that is biased against the poor and the not so healthy people. Due to these and other similar
considerations, others have suggested some sort of safety net-a standard below which individuals
should not be allowed to fall. This approach is often called the decent minimum.
5.2.6 The decent minimum
The decent mininnun is a standard below which individuals should not be allowed to fall.
This minimwn standard may be defined in terms of final outcomes--health itself or in terms of a
mininnun standard of health care. The concept of a 'decent minimum' level of health care is rele
vant for multi-tier health systems that have a mix of public and private sectors, as in Kenya, where
the public sector delivers health services at costs lower-usually subsidised-than the average
price of the same in the private sector, and serves mainly the poor. But this does not suggest that
public health services are somewhat lower quality compared to private services, only they are usu
ally highly subsidised. So a problem of what a decent minimum is or how it should be detennined
arises. Whether outcomes or standards are used as the foals of a decent minimum specification, a
ID.Jrnber of problems would have to addressed. In the fonner these pertain to health outcomes
comparisons; in the latter, those to do with whether it is costs or quality that is to form the basis
if the latter, there would be problems of comparing health outcomes.
There have been suggestions (which do not address these problems) to explain 'decent mini
nnun' in terms of a set of services considered to provide the minimum quality of care (e.g., Fried,
1983; Enthoven, 1980; Daniels, 1985) in terms of (i) specification ofa general aiterion by refer
ence to which we can tell if the services are within the minimum or above it; (il) description of a
fair procedure for determining the minimum; or, (iii) a simple listing of the types of services to be
included. Fried (1983) suggests that the 'decent mininuun' should reflect some conception ofwhat
constitutes 'tolerable life prospects' in general, emphasise services like maternal and child health
'which set the terms under which individuals will compete and develop'; he cont:imJes ' ... the no
tion of a decent mininuun should include humane and ... worthy surroundings of care for those
whom we know we are not going to be able to treat them'. (p. 494). But he does not explain
howlwho should determine what constitutes tolerable or lrumane pro~. Enthoven (1980)
'9 Although it maybe assumed this is a task for the political process.
-151-

suggested the list of basic health services that Health Maintenance Organisations (HMOs) offer
should consist of-'basic health services' ~ut left open the poSSlbility of expanding or contracting
the list which makes the list indeterminate and therefore of limited use in issues of health equity.
Moreover, his approach is oflimited relevance for Kenya where (private) health insurance is not a
common (or widespread) mode of health care financing, mainly because of economic conditions.
He suggests that such 'structural' baniers may be reduced by severing the link between pian and
employment-through use of vouchers to enhance the purchasing power of rural areas. There are
also doubts about the feastbility of this in Kenya where most established insurance companies oper
ate mainly in wban areas. Moreover, few have diversified their activities beyond the traditional ar
eas of motor vehicle and business related policies. Plus medical services are also biased to the urban
areas. So even if the link between employment and insurance is broken through the use of vouch
ers, this alone would not guarantee enhanced health services to the rural areas. Facilities would
need to be established and adequately staffed to offer relevant services. Finally, the bunmlcratic
and administrative structures, together with the attendant financial commitments required to effect
this approach might be, to put it mildly, out of the scope of Kenya
~.7 The non-envy criterion
Another interpretation of equity is the non-envy criterion (Varian, 1794; Pazner and
Schrneidler, 1978; Baumo~ 1986). Following Varian (1974), an allocation is equitable if no indi
vidual i envies (would rather have) another's,}, share, which may arise if Ut(Q~U,(Q), or
~(Q)~(Q)' for all i and}, [where u(.) is utility]. For example, if there were available a pound each
of fish and beet: and I love beef but cannot stand fish, while you love fish but loathe beet: it is
clearly foolish to insist on equal shares of both fish and beeffor each ofus, but the 'equitable' allo
cation which gives me the beef and you the fish leaves each of us contented (with our respective
shares). This latter allocation is equitable. In more realistic life situations, there are many attributes
in commodities that are hard to share out this way. I may not like so llUlch fish, but still I could do
with some. Or, consider health for example. If I was born with a certain genetic defonnity while
you were born a 'perfect' person, should you be disfigured so that I do not envy your looks (which
otherwise I certainly would)? Or you have an angelic musical voice while mine is as coarse as that
of a scratched record disk. In other words, equity is not a simple construct that can be established
on the basis of individual prefelences or characteristics of commodities alone. Another illustration
with similar conclusions is the act of sharing a cake filirly-whereby for two people, one cuts it and
-152-

the other picks hWher share first (Le Grand, 1984). The resulting allocation should be acceptable
to both, envy-free and fiUr.
This theory divorces the subjective external moral viewpoints of judging a distnbution from
the fiUrness or otherwise of it. Preferences of the individuals are the central players in shaping the
fiWness of distnbutions. But this may be its weakness. People's judgements about what is fiUr to
them may be inaccurate-espe when such decisions concern their own health and use of
health care. The conception is also at variance with everyday understanding of the tenn equity.
There are situations considered equitable where envy persists. For example, in the cake rutting set
ting, suppose there was asymmetric information, say, the cutter knew that a part of the cake was
more nutritious, and adopts a strategy which encourages the other person to choose the less Inltri
tiOllS part, the resulting distribution can hardly be tenned equitable. In other situations there may be
no envy but are nonetheless inequitable (e.g. the hard-done-by person who is a true saint who does
not envy his extremely rich neighbour). It is also doubtful whether the approach can suitably be ap
plied as a guide to equitable health policy. Its application in h~ care resource distribution can of
ten lead to undesirable results-the method consistently disfilvours those with chronic illnesses
(Feldman, 1987). By concentrating exclusively on peoples' prefelences, the method disregards the
role of individual tastes, needs, etc. It has limited applicability (if any) to shaping health care policy
in Kenya. and it can hardly satisfy the envy-free allocation criterion
5.2.8 The health maximisation principle (eDra-welfarism)
Health maximisation is a recent conceptualisation of equity in the health economics litera
ture that has been the focus of equitable health policy in the UK [e.g. see Bell and Mendus (eds.),
1988; Baldwin, Godfrey and Propper (eds.), 1990). It is based on the premise that health semces edst: to promote health and the health of the community should be maximised (see for ~le
Culyer, 1988a). It states that 'a distribution is equitable if and only if it serves to maximise [the
community's] health' (Perejra, 1989).
Two strands of thought have emerged from the health maximisation principle. The first is
the original conception developed to explain equity. It sought to explain why it is desirable for the
public to fund the health care of those unable to do so for themselves. This, termed the 'caring ex
ternality' model ofhealth care, is associated with the pioneering works ofLindsay (1969) and Cu
lyer (1971, 1980). It can be explained briefly as follows. Peoples' utility functions are
interdependent (m the sense developed by Hochman and Rogers, 1969).6> Such interdependence in
-153-

utility functions arises fonn peoples' caring attitude about others in suffering. This is not a concern
for equa1ity (Culyer, 1971). It does not matter whether it is the rich or the poor who are in pain or
suffering. Under-consumption by the 'needy' imposes an external disutility on others.
This approach emphasises the individual's health status (nrespective of their other status
economic, social. etc.) be the focus of concern; that this is absolute (no comparisons of relative
health status); and, that there is need for external support/compensation to enable individuals re
store their nonnal health status. In this regard the approach touches on equity and justice in health
and health care, by an appeal to compassion or the caring attitude of people, which itself suggests a
aiteria for redistribution. But, like other approaches to equity, the fomruIation fiills to be precise on
tenninology used. One cannot tell what kind of equity rule is being advocated by the approach-it
is not clear whether the focus should actually be on health itself or in the equity of utilisation for
equal need. If the focus is on health itsel( the implications for health equity policy are compl~
Since health itself is not a metric that is easily quantifiable, how is one to develop a consistent defi
nition of equity? Since there are difficulties with the concept of health itsel( then the optimisation
of the consumption of the commodities that affect health or the allocation of such resources in a
manner that maximises the health of the cormmmity are feasible alternatives. Either way, the focus
is on rnaximisation rather than distribution.
The second strand of thought in the health maximisation principle, and one that generated a
heated debate in UK. health policy, is the cost-effectiveness analysis (CEA) or cost-utility analysis
(CUA) conunonly referred to as the Quality of Life (QAL Y) approach. It affords primacy to effi
ciency. Distributional questions are important only when they further the cause of efficient use of
resources in health production. This approach especially found filvour with health economists at
the University of York in the UK, although the idea was originally developed by Torrence (1986)
in Canada It has been alleged that CEAlQAL Y approach is the most suitable means of achieving
equity whilst maximising the health of the connmmity (Williams, 1985; Culyer, 1988a, 1990). The
proponents argue weIfarism and utilitarianism as nonnative accowrts for discussing the quality of
life, though profound, paradoxically emphasise the importance of utility theory (Culyer, 19901 but
leave WJreSOlved some ethical issues, similar to those raised above for the 'caring externality'
60 This contrasts with the non<nvy approach in which peoples' utility functions are independent of each others'. But See Culyer (1989a) who has pointed out a possible problem with the caring externality framework:
While it is commonplace to distinguish between utility as 'welfare' and utility 'as an index of choice' in normative and positive analyses respectively, some have difficulty in distinguishing [in a welfarist context] between utility maximizing behaviour that is altruistic and that which is selfish: is not the one who maximizes utility by giving in some sense selfish?
-154-

model.61 The QAL Y approach goes beyond utiIity and incorporates the characteristics of the pe0-
ple (Culyer, 1990). This is why it is also known as the extra-welfarist approach.
The QAL Y approach significantly departs from the traditional Paretian we1fure economics,
and rejects the willingness and ability to pay as appropriate bases for rationing health care. It ~ects
welfarism-the view that social we1fure depends on we1fure (Culyer, 1989a, 1990; Williams,
1988). Culyer has argued that willingness to pay is an irrelevance and may be directly counter to
this objective if it is positively associated with ability to pay, but ability to pay is inversely associated
with 'potential for health improvement', as is often the case. The extra-weIfarist approach
... provides a conceptual framework for handling extremely complex issues in a systematic fashion that exposes each aspect of the argument clearly. It is less important what the cost per QAL Y is, than that individuals with respoIlSlbility for resource allocation in health care have a means of working through the issues so that they can come to their own infonned view about ... different resource allocations. It is in this sense, the method is intended ... as an aid rather than a substitute for thought. (Culyer, 1989a).
The (efficiency) policy objective underlying the QAL Y approach is the maxirnisation of the
community's health. A weighted measure of the individuals' remaining part oflife is calculated (the
weights reflecting the expected quality of life in each year when the characteristics of the individu
als are taken into account:)Q. The individual QALY scores are then swmned up. It is this sum the
health maxirnisation principle seeks maximised by allocating resources efficiently. Wtlliarns (1985)
writes
Procedures should be ranked so that activities that generate more gains to health for every £ of resources take priority over those that generate less; thus the general standard ofhealth in the community would be correspondingly higher.
Now, the contIibution ofQAL Ys in the equity debate seems unclear. Some writers have ar
gued the QAL Y approach does not address the equity issue. Lockwood (1988) argued the QAL Y
approach 'is in principle liable to result in fonns of allocation that are unjust or urifair' (Lockwood,
1988, p. 45, emphasis in original). Other writers have voiced similar concerns [(e.g. Smith, 1987;
Broome, 1985). Smith (1987) is concerned that the QAL Y metric is obtained through the use of
arbitrary assessment of the values of people's lives. Wdliams (1987) responds to this by pointing
that 'far from obscuring the need for value judgements, the procedure highlights the value judge
ments and offers techniques by which they could be more explicit, that the process of quantification
61 Such as whether the quality of life is an absolute or relative idea; whether distributional aspects of the quality of life and the standard of living are best looked at in terms of outcome distribution or by weighting the characteristics of people.
62 Sen's notion of basic capabilities is similar to the • characteristics , approach adopted in most works on QAL Ys--in that both content that utility focuses too much on the subjective responses to commodities and their characteristics, but not enough on what those commodities enable people to do-say move around, learn, enjoy good health, etc.
-155-

is, by virtue of its explicitness, open to criticism at every stage.' Broome (1985) argued the meas
me (QAL Y) ignores population dynarnics-that there will be extra children born as a result of
people having 'extra' time. Since these children would not have come into being had these people
not received extra QAL Y s (say, due to health care), we need to incorporate those effects into QA
LYs-which is impoSSIble, since we have no basis for valuing life.63 But Culyer (1989a) pointed
outthat
... there is nothing to be gained in the context of resource allocation decisions- making from taking an ontological view ofQALYs, or life or lives. One is not concerned with the inherent cherishable worth of people but rather with the value of resources that we might spend in order to gain better health or prevent (or postpone) death or change the prospects of either for the better. If we spend £2,000 per person to protect them from consequences of some risk that is fi1tal for say one in five hundred, it is merely arithmetic that we shall spend, on average, £1 million per life saved: only in this sense is a life 'worth' £1 million
But Wagstaff(I991) and Culyer (1990) point that the critics of the QALY approach have
tended to misinterpret the concept~ften equating it with utilitarianism. Wagstaff (1991) himself
contends that the QAL Y approach is not based on individuals' own valuations of their health, it re
gards a QAL Y as of equal value to everybody and that allows the approach to avoid the many pit
fiills ofutilitarianisrn especially that which implies resources would tend to be allocated away from
people who place a relatively low value on their health. Apart from this (crucial) difference, utili
tarianism and health rnaximisation (through QAL Vs) are sirnilar--'Iike utilitarianism, health maxi
rnisation leads to the conclusion that resources ought to be redeployed away from people ... who
have a low capacity to benefit from treatment' (W~ 1991, P .20). Moreover, the QAL Yap
proach mvours the younger. Also, the principle leads to the conclusion that in a fully employed
economy, resources be redeployed towards people whose output is highly valued and who, as a
result of treatment, are able to return to work soon
Wagstaff (1991) believes the QALY approach embodies to a certain extent, 'a kind of
equality' by the filet that a QAL Y is considered worth the same to everybody.64 Therefore, 'the
outcome of resource allocation via QAL Y is automatically equitable irrespective of the degree of
inequality involved and the type of person who fares badly.' (Wagstaf( 1991, p. 27). This rein
forces Culyer's (1989a) earlier assertion that it may actually be equitable to discriminate against
63 This argument fits with Broome' s (1978) earlier argument that the value of a statistical life is infinite since in the end that statistical life turns out to be someone's (or actual) life. But now we know people are willing to trade small risks for improvement in incomes etc. (Jones-Lee, 1982).
64 This was explicitly stated by Williams (1974) long before the QAL Y approach became a focal issue:
'The acceptance of the fact that an additional year of healthy life is intrinsically worth, say £1,000, no matter to whom it accrues, would lead to a much finer, humanitarian and egalitarian health service than we have at present, . . .'
-156-

those whose capacity to benefit from mediad care is limited-those with worse health (their poor
health cannot allow them to earn sufficient income, etc.). In rationalising the QAL Y then, Culyer
(1989a) has urged the reader
. . . to allow that the sickest in the society are by and large those whom the marginal product of health care in temls of QAL Y s is highest, that these are also the poorest, and that when (ceteris paribus) health service per capita rises, the marginal product in terms ofhealth fiills ... [then] it evidently follows that efforts to equalize geographical distnbution of resources, to charmel more of them to the sick and more of them to the poor, might be seen, not as distnbutional policies to be justified by equity arguments but efficient policies justified by health maximization
Thus in this case, the ema resources are going to the person whose health is worse and also
happens to be poor. TIrus it is posstble to incorporate equity and efficiency objectives within a sin
gle policy procedure, But the validity or otherwise of the argwnent depends on whether or not it is
true that the marginal product of health care in terms of QAL Y s is higher for the poor. Not all
would agree though. Pereira (1989) has pointed out that the opposite could as well be true, where
the rich, due to their enviromnental and personal characteristics, are better able to respond to treat
ment and thus gain more QAL Vs.
The most notable response to these criticisms has been the revision of the notion that a
QALY is worth the same to all. The use of weights (to take account ofQALYs going to difIirent
people) has been considered the most appropriate averrue (Culyer, 1990). Preliminary results from
work in this direction suggests the use of weights to scale down or up some people's QAL Ys is
agreeable, leading some to claim that whatever the prevailing notion of equity, distributional as
pects can easily be integrated into the QAL Y approach simply by maximising a weighted swn of
QALYs rather than the unweighted swn (Culyer, 1989a). But there have been objections to the
approach adopted to determine the weights (Pereira, 1989; Wagstaf( 1991). Pereira (1989) was
concerned that the survey actively encouraged the respondents to opt out for some form of dis
crimination as to which groups of people should receive treatments. That resources are scarce is no
justification that discrimination will e1fective1y operate (p 37). Wagstaff(I991) argues
It is, ... , difficult to distinguish between what people regard as just (or equitable) and what they regard as desirable. The latter will depend not only on what people think. is just, but also on their degree of compassion-or caring ... -and their own selfish interests. (p. 29).
Wagstaff (1991) compares various definitions of equity to determine which among them
gives rise to the notion that society might want to attach different values to QAL Y s going to differ
ent people.65 Only the 'equality of health' definition appears to provide such a basis. But he argues
" The definitions considered are: equal treatment for equal need; equality of access; equality of
-157-

the objective is not senstble since a blind pursuit (of the objective) can lead to absurd conc1usions66•
He proposes an alternative fomulation of the QAL Y approach to overcome these difficulties
when equality of health is used as the guiding equity objective. The fonnulation proposed uses a
Social We1&re FWlCtion (SWF) defined over the health of the population, constructed so as to per
mit some trade-offbetween inequality and efficiency. Such a SWF captures both efficiency and eq
uity considerations, and
... provides a way of examining the extent to which society wants to accept a lower per capita health status in order to achieve greater equity. The SWF approach also provides the non-technical infonnation required in order to determine needs, since it indicates which health improvements are socially desirable. (WagstaH: 1991).
Whereas some conflict is possible between welf3re maximisation and the notion of equal
treatment for equal need (both perspectives of equity), the same is not true if the SWF were de
fined over health 1eve1s.61 Health care maximisation leads to the rule that resources ought to be de
ployed so that the marginal cost per QAL Y is the same across all types ofhealth care. If we are to
take account of inequality at all, resource allocation decisions cannot be made entirely on the basis
of the marginal cost of additional QAL Y s. 'Consideration must also be given to (I) the expected
health of A and B in the absence of treatment and (0) the degree to which the society is averse to
inequality.' The QAL Y approach, ' ... even in its weighted fonn-f3ils to reflect the aversion soci
ety apparently feels towards inequalities in health outcomes.' TIrus Wagstaff concludes the QAL Y
approach does not merit any claim to equity concerns.
Now, Wagstaffs attack on the equity implications of the QAL Y approach is appealing, but
its application, as he himself concedes, will be hindered by the data requirements. Although he sug
gests posstbi1ities of generating the data, there are doubts as to whether it will be poSSIble to gener
ate meaningful data values. For example, how does one go about estimating the values of the
distribution weights? There is no universally agreed method that can be used to solicit responses
from people, that does not, as he puts it hUnseJf: depend on what people think is just, or on the de
gree of compassion and does not reflect people's own selfish interests
On a more general context, the whole idea of health maximisation has data requirements
which are beyond the atpability of Kenya. It requires for example detailed financial and cost infor-
health; and equality and choice (Wagstaff, 1991, pp. 29-34). " He gives an illustration where by a redistribution of resources (from an initially perfectly equita
ble but low health position) improves the health of two individuals, whilst introducing some (small) degree of inequality. The equality of health objective would favour the original position-in spite of the high health for each individual in the new allocation I
67 Welfare maximisation identifies persons in equal need, but assigning those in equal need the same access costs will not necessarily guarantee that they receive the same treatment. .
-158-

mation of particular programmes as well as specific aspect&'operations, if one is to be able to gen
erate meaningful QAL Y or other health concept infonnation Unless specific task forces are
commissioned for this purpose, which means time and resources, it is not poSSIble to get even data
which will approximate anything but the required concept. It is even hard now to know the pro
portion ofhealth resources going to primary preventive or secondaIy (mainly curative) health care,
mainly bocause the paucity of resources forces sharing of the them over these f3cets of health care
delivery. Another problem is the interpretation of the probability m.unbers associated with most in
struments used to generate QAL Y infonnation As Loomes (1988) conceded, this is a problem
with the relatively aged and the semi-literate, and this may be more acute in a developing countIy.
5.2.9 Conclusions
No single principle of justice appears to be the sole basis for health care policy in Kenya,
largely due to unclear statement of policy aims. But it generally appears there is a strand of thought
in all policy proIlOWlcements fuvouring some 'decent minimum'. Moreover, it appears this decent
minimum is largely couched in tenns of access rather utilisation, which might be more appropriate.
Since a comprehensive package of services is obviously not poSSIble, on economic grounds, it is
therefore necessary to ensure the utilisation of a 'minimum package of services' is guaranteed for
diagnostic services that are essential to ascertain the need for medical care services. Access to these
services has to be equal, though not necessarily free. Access to other services----such as curative
and rehabilitative services might not be equal but should be proportional to need with charges vary
ing according to abi1ity to pay. The case for providing free or heavily subsidised preventive services
has similarly not been well artiadated and there is an unclear and uncommitted voice on the part of
the government. These services clearly need to be treated in a fashion similar to that recommended
for diagnostic services. Clearly, there is need for a more systematic approach to equity in Kenya
that if poSSIble leads to unique or general (and consistent) policy prescriptions. The next section is
devoted to the development of such a framework for Kenya, one which also incorporates the prin
ciple of efficiency developed in the previous chapter.
5.3 Equity and Access to Health Care: Towards Optntional Measures
This section is concerned with what Wought to an equitable allocation of health care re
sources in Kenya, where there is a large governmental responsibility both for global resources
made available for health services and for their distribution We attempt to provide a framework
-159-

which may be used to answer several questions at the root of equity concerns: 'what is an equitable
distnbution of the available health care resources in Kenya among Kenyans?', 'Is the present distri
bution ofhealth care resources in Kenya equitable?, and 'How might the distribution be made
and made to remain-more equitable? As it might be now clear from the analysis above, in health
care, although the need for equity is universally acknowledged, there is less agreement about what
that equality is about, i.e., equality of what? Is it equality of outcomes, such as health, or is it equal
ity ofinputs (i.e. health resources)? The philosophical theories reviewed above were of little help in
shedding light on this problem. If a coherent policy for equity in Kenyan health sector is to be
possible, it is necessary to have some broad principles that guide policy fomru1ation
The objective of the Kenyan health care system (discussed in the last chapter) was shown to
be the improvement of the health status of the population Hence health will be taken throughout
the rest of this chapter as the entity whose distnbution we are concerned about. This means the dis
tribution ofhealth resources is only instrumental and not an end in itself But since the health litera
ture has other poSSlble contenders, these too will be discussed, and the merits/demerits of each
pointed out.
5.3.1 What constitutes equity in health and health care?
Above we have defined equity in terms of fuirness (section 5.2). Like health itself: equity
may be defined 'negatively' or 'positively': Most approaches to equity adopt the view that inequal
ity in the way that individuals are treated is judged inequitable if it is arbitrary or it relates to irrele
vant characteristics such as age, race, sec, religion, and so on In a more positive way, equity in
health care requires that patients (actual or potential) who are alike in 'rdevant' respects ought to
be 'treated' in a like filshion, and that patients who are unlike in 'rdevant' respects ought to be
treated in an 'appropriate1y' wilike fashion This is reminiscent of the notions of horizontal and ver
tical equity in public finance economics. Horizontal equity requires similar treatment of like indi
viduals while vertical equity requires the unlike treatment of unlike individuals (Culyer, 1991a,
b, c). Iffor the moment, we take 'need' (we shall shortly define 'need' and other poSSlble candi
dates) as the criterion used for allocating health care resources, the principles imply that like needs
should receive like attention and resources (horizontal equity). Horizontal equity can be expressed
in terms ofhealth care production, inputs, process or output (Cullis and West, 1979~ West, 1981~
Culyer, 1991a, c). On the other hand, those with greater needs should receive greater attention and
resources too (vertical equity). These principles can also be appropriately applied in terms of con-
-160-

tnbutions to the finance for health care. The horizontal equity principle implies that individuals with
'equal ability' to pay make 'equal contributions', whereas the vertical equity principle demands
higher contributions from individuals with higher ability to pay. The principle does not necessarily
relate payments for or receipt of medical care to willingness (and ability) to pay for it. Even if need
was otherwise defined, the implications would not chang~ long as whatever (new) distribu
tional principle in use does not correlate with willingnessIability to pay.
But to apply these concepts in health, the meaning of , need' (or other focus of equity) has to
be clear. This is taken next before we review some of the frequently canvassed candidates for the
respects in which people are to be considered alike or unlike.
5.3.2 'Need' and equity in health care
'Need' (for health care) may defined from several perspectives. One view considers 'need'
as an inherently instrumental concept-an entity is said to be 'needed' only ifit is a necessary c0n
dition for the accomplishment of something else (Culyer, 1976, p. 14; Wdliams, 1974). This lends
nonnative content to the instrumental view of need-depending on what it is that is ultimately
needed (It could be health, for ecample). This may have tar reaching (moral implications) for health
care policy--e.g., needs ought to be met in full if the aim is to save a life; some trade-of£may be al
lowed when one case is deemed 'more deserving' than another, etc. Thomson (1987) objects to
this view, as nonnatively it entails an 'element of practical necessity' -implying inability to function
without whatever it is that is needed, or that the consequences of doing without would be perilous.
An alternative concept of need, the absolute or categorical view, has been advocated by
Wtggins (1991). This view introduces the notion of something bemg needed if a final objective
QUlDOt be achieved without it. the end result ofwhatever is needed as a dichotomous choice:
... a person needs x [absolutely] if and only it: whatever morally and socially it is (economiailly, technologically, politiailly, etc.) possible to envisage occuning within the relevant life-span, he will be banned ifhe goes without x. (pp. 14ft:)
But in health this view fiIils to allow that variations in the degree of illness, etc., connnand
different levels ofinputs (urgency). Granting that health care resources are necessary because they
enhance health, prevent its deterioration, and or prevent death, health is the ultimate entity that is
needed. But even in this case health itself is not a need, but only those elements that are necessary
for its attaimnent-resources, personal characteristics, etc. This returns us to the instrumental per
spective of need but one which now focuses on the penultimate-medical care-which enables
-161-

transitions from poor health states (ill) to some desired end-states (healthy). But at the same time it
implies a notion of need which is binary. This is unduly restrictive for it requires that whatever is
needed must always have a positive productivity in terms ofits contnbution to health. There is con
siderable evidence in the health field to the contrary. Though health care is usually expected to lead
to an improvement in health, it does not (nor is it expected) always to do so. Sometimes care is
given not because any improvement in health is anticipated or hoped for (though nobody would
mind if any occurred) but just to show a caring attitude. In other cases, one may not expect a pay
off in tenns ofbetter health than before, but rather better health than would have otherwise have
been the case-health maintenance rather than full recovery, reduction rather than eIimination of
disability, slowing rather than stopping deterioration (Culyer, 1992, p. 13). In other words, most
results in health are not binary, there is room for better, for worse, etc. But this also raises further
questions concerning 'need' and health care. Is it an attnbute that is inherent in health care or out
side it? Jfoutside, where? In the person who purportedly 'needs' the services? or community? Cu
lyer, Williams and Lavers (1972) p1aced this controversy in perspective when they wrote
... it is difficult to tell when someone says that 'society needs ... ' whether he means that he needs it, society ought to get it in his opinion, whether a majority of the members of the society want it or all of them want it. Nor is it clear whether it is needed regardless of the cost to the society. (p. 14).
Williams (1974) suggested that medical care or treatment is 'needed' if it would lead to
improvement of one's health status. This means we must consider (I) the scope for improving a
person's health through treatment (a technical judgement), and (ii) the eKtend to which the health
improvement is desired (a social valuation judgement)' (WagstaH: 1991). This rules out 'capacity
to benefit' (see below) as a method ofassessing need [because] society, in addition, has to decide
how health gains to individual (say, A) compare with those of another, B. Wagstaff(1991) argues
if the objective of equity is interpreted in terms of the amount of resources required (to treat a per
son in order) to reach some desired improvement in health, then, equal treatment for equal need
does not 'in itself provide a basis for determining an equitable allocation of resoW"CeS--there are
other extraneous 13ctors to be taken into account, especially the social valuation of that care.
CuIyer's (1976) example of the need for water by an individual dying of thirst in a desert illustrates
the difficulties of incorporating these other considerations:
Does the individual dying in the desert need a glass of water? Technically yes, ifhe is to live. Nonnatively yes, if others agree that he ought to have it. If they do not, he may want it as much as it is poSSIble to want anything, but he does not, in our definition, need it (p 16, ~ in original).
-162-

Following this line of argument, society has a duty to decide how the health improvements
of one individual are weighted against those of another (or others). This requires a determination of
the desired level of health for the two individuals. And it means if need is to be interpreted along
these lines (and medical care is just a means to improved health), the criterion of 'equal treatment
for equal health' will not provide an adequate basis for determining an equitable allocation of re
sources(Williams, 1988, p 117; Wasstaft: 1991, p. 31).
An alternative fonnulation of need retains the instnunental notion but links it to resources
and the various end-states they serve, so that the 'need' for medical care is defined relative to some
pre-specified end-state (Culyer and WagstaH: 1991; Culyer, 1992). ThJs 'need' may be defined:
... simply in tenns of improving (or maintaining) health. A need for medical care is then said to exist so long as the individual's capacity to benefit from medical care is positive .. . . We define an individual's level of need as the amount of medical care required to reduce the marginal product of care (or equivalently the individual's 'capacity to benefit') to zero (Culyer and WagstaH: 1991, p. 16).
Thus need is defined as the mininrum amount of health care resources required to exhaust a
person's capacity to benefit. Resource scarcity implies that if 'distnbution is according to need', an requirements for medical care cannot be fulfilled. This raises the question of which needs shall be
met equally. If the objective is equa1ity offinal outcomes, say, equa1ity of changes in health of the
individuals, several poSSlbilities may arise. The policy would be egalitarian if people initially have
similar needs and capacities to benefit from health care resources. In the more realistic cases, where
people 'need' (require) same or equal amounts of health care resources to reduce their marginal
capacity to benefit to zero) but differ in tenns of their capacities to benefit (how much their health
improves, say in QAL Y s), 'distribution according to need' in the manner descnbed by Culyer and
Wagstaff (1991) is inequitable, since persons with greater capacity to benefit from the resources re
ceive larger improvements in health. 'Distribution according to need' in such cases introduces ine
qualities in health where none existed before. Another situation is where people have unequal
needs to begin with (meaning also unequal initial health states). In such cases, the concept ofverti
cal equity has to be invoked, meaning resources have to be divided in proportion to the degree of
inequality existing in the initial situation Although it is poSSIble in this case for 'distnbution accord
ing to need' to result in there being less inequality in health after treatment than before, it need not
always be so. Whether or not the inequality gap is reduced (for example in the two-person case)
wiD depend on whether the person with the greater need also has the greater capacity to benefit. In
other words, 'distribution according to need' in situations where needs differ may result in greater
inequality in health after treatment than was before treatment (CuIyer and WagstaH: 1991, p. 10,
-163-

see also Culyer, 1991). Elimination of inequality in health may require a more unequal distribution
of medical care than that implied ordinarily by vertical equity. In general, 'distribution according to
need' principle will result in inequality of outcome. Therefore the application of the rule in health
care would constitute a departure from the principles of treating persons in equal need equally and
treating persons in unequal need differently than to treat them the same, and to discriminate more
heavily in mvour of those with relatively large needs than warranted by the Aristotelian version of
the equity principle.
5.3.3 Need, equity and efficiency
Defining need as the amount of resources required to exhaust a person's capacity to benefit
immediately links the notion of need to the notion of effectiveness (and hence efficiency) as dis
cussed in chapter two, since
Ifhealth care is not effective, it cannot be said to be needed. If the technology that would improve someone's health for the better does not exist, current services cannot be said to be needed . . . In deciding what needs shaJl be met, it is essential to be able to fonn a judgement about the likely size of the benefit (m terms o( say, enhanced health). So, if needs are to be fairly met (for example, equal treatment for equal need) it becomes important to be able to measure and make informed judgements about the capacity to benefit .... an important element of the capacity to benefit is that it must be seen in terms of changes in health status. An absolutely or relatively high mortality or morbidity rate does not in itseIfindicate a high capacity to benefit: that depends on whether there is a capacity for the rate to be reduced sufficiently by the application of the relevant resources for it to connnand a priority relative to other needs (Culyer, 1992, p. 12).
A number of implications follow from adopting this definition of need. First, need and ill
health are not synonymous. Hence a measure of ill-health, of whatever magnitude, cannot imply
need for health care. The only health care that can be needed is that which has potential gain {pr0-
motes or reduceslpostpones deterioration in health}-ifhealth care would make no difference, then
it is not needed. The second implication is that capacity to benefit is not the same as 'need' since
the fanner is defined in tenns of outputs wherea need is the for resources required to exhaust the
capacity to benefit. It is poSSIble for ecample, for two individuals to have their different capacities
to benefit exhallsted by equal amounts of resources. The third implication of the definition is it em
phasises what can be done for people and done efficiently, rather than what has previously hap
pened or what their current state is. The fourth implication is that it may be equitable and usually
will be desirable for some need to go unmet. Because resources are insufficient to exhaust all ca
pacities to benefit, it may be deemed equitable and desirable to direct resources from some areas
(needs) to others. The fifth implication is that equal access is an incomplete equity principle because
-164-

access implies " ... 'gaining admission' to the system in order/or needs to be assessed . ... " (Cu
lyer, 1991a, p. 35, italics in original). There may however be inequality because of differences in
the impediments that different patients face in trying to avail themselves of that assessment. Access
too is not an end in itseIf-it is instrumental, just as need is. Beyond the assessment stage, utilisa
tion takes over and this will, among other filctors, depend on peoples' capacity to benefit as well as
how equitably the needs are met. Distribution according to need may not necessarily lead to equal
ity of health (or less inequality) and it would rarely do so, except in situations where patients are as.
sessed to be equally sick (equal levels of need for medical care) and have identical capacities to
benefit. 11rus there are poSSIble conflicts between equity in terms of meeting needs and equity in
terms of outcome (distribution of health). Indeed, 'distnbution according to need', 'distnbution ac
cording to capacity to benefit', and 'distribution to minimise or eliminate inequalities in health' are
potentially conflicting distributive principles. Granted the fundamental reason for caring about the
distrIbution ofhealth care is that it helps improve health
it is perverse to select need, capacity to benefit or initial health as the characteristic in pr0-
portion to which health care is allocated, for none of these will necessarily produce more equal distnbution ofhealth that is the true ethical imperative . . . none is as egalitarian as it may initially have seemed. (ibid P 38).
Distribution by initial health is the most likely to lead to the worst inequalities since resources
are diverted from those with least capacity to benefit from them (who most times happen to be the
sickest, requiring substantial health care inputs for even modest improvement to be realised). Dis
tnbution according to capacity to benefit will produce a perverse distnbution when those with bet
ter health have higher capacities to benefit (and it is usually so). An equitable health care policy will
seek to contimJally reduce (with a view to eventually eliminating) the inequality in health. It would
still meet needs, but in proportion to the deviation of all area's health away from the population av
erage. This will mean those further away from the average should receive more and vice-versa. It
will, in short, apply the principles of horizontaI- and vertical-equity. Whilst the overall objective of
equitable health policy remains one of meeting the health needs in such a fashion as to reduce the
dispersion of health in the comnnmity, subject to resource limitations, conflicts will often arise be
tween the ethical desiderata of equity and efficiency.
The principle of meeting needs equitably will thus not be any simple proportionate mecha
nistic approach. It will incorporate many relevant parameters. Judgements about some of the pr0c
ess oriented conceptions of equity-opportunity of access, equity of access, which apparently do
not translate into equality of the respective objects, have to be considered for the contribution,
however minimal, they may make to the ultimate objective of an equitable distrIbution of health.
-165-
This mems, for example, when, considering the equity implications of introducing user-charges or
redistnbuting (relocating) health care facilities to reduce the patients' time and transport costs of
reaching those fucilities, decisions have to be made whether such policies will help reduce inequali
ties in health. Those actions pushing the system in the direction of increased equity will be encour
aged. It is the responstbility of policy makers, on behalf ot: and accountable to the public, to make
such judgements-about needs and the best ways ofmeeting them.
5.3.4 Equality of wbat?-Possible 'candidates' for equitable dimibution
Mooney (1982) suggested that the objective of equity in health may be stated in tenns of
equality of any of the following:
<D expenditure per capita;
(2) inplts per capita;
<3> inputs for equal need;
® access for equal need;
<S) utilisation for equal need-or equal cost for equal need;
CS) ~ met need; andIor
([) health itself.
These notions of equity have clifrerent policy implications for individuals' or territorial eq
uity. Ifin different parts of the country, the cost ofrnanpower and other goods and services that
are inputs into health care differ, then adopting the notion of equity implied by <D and <2> will cer
tainly lead to situations where individuals differ in tenns of their final health status68, i.e. inequality
in final outcomes, because equality of expenditure (or resources) says little, if anything, about the
services received or thek effects on health. Equity defined this way will thus be rather limited. In
such cases, adopting <3> may be a better option In such ases, a policy of equalising health re
SQW'CeS allocated to different areas, unless matched with outcomes and other considerations (as, to
some extent, is the case for the Resource Allocation Working Party [RAWP] fo1ll1Ula used in the
British National Health Service [NHS)-see DHSS, 1976). In this respect, (3) and ® may not dif
fer (m terms of equity policy implications) if to achieve equal access requires differential levels of
inputs (e.g .. , ceteris paribus, if more resources have to be allocated to sparsely populated areas,
etc. so as to guarantee equality of access). However, equal access is a wholly supply side phe
nomenon and means that individuals face the same costs (to themselves) of using a health care
61 That is, if we assume for the moment, more inputs necessarily lead to more 'health· output, which is not necessarily the case for some treatment protocols.
-166-

&cility-e.g. because they live equi-distant from the filcility. Unless ~ is similarly defined, the two
yield different implications. ® refers to actual consumption rather than to access but
consumption is dependent on valuation in use (as reflected in the individual demands for health
care). If individuals inrur different access costs or have different demands, different utilisation rates
may occur as Figure 5.2 below shows (for two individuals, A and B, where utilisation is measured
in tenns of visits to the facility, and benefits may be interpreted as perceived health improvement
after the visit).
Same Demand for A and B ¥"
V(B), V(A)
V(NB)
Visits
(a): Equal demand, differential access
Demand (A)
~ ¥'" Demand (B) ~ Mar inal cost (A)
5 I:Q
V(A) V(B) Visits
(b): Differential demand, differential access
Figure 5.2: Differences in access cost!Idemands aose differences in utilisation
Equalising net met need, <6>, is poSSIble if all regions are ranked in tenns of their health care
needs in the same order and each is rationally based on the principles of cost-benefit analysis
(CBA-see chapter three). The objective of equal health, ~, is complicated by definitional prob
lems, comparison problems and the expenses ina.ured in generating data for this purpose (Mooney
and McGtrlre, 1987), but, a lot of work has been done focusing on this last as the objective of
health policy. Concerning the distnbution ofhealth, the essential pre1iminaIy to any examination of
the distribution of the health or ill-health is to decide on an operationally feasible definition of
heahh. (/} Some economists have attempted to ccplain how these concepts can be applied to equity
in health care . We eclectically review some of the suggestions.
6t In defining health as an objective, one can focus on a number of definitions: for example, mortality or death rates among social classes-though not all illness are fatal, meaning this particular defini-
-167-

Mooney and McGuire (1987) argue for equality of access for equal need for individuals in
temlS of fair shares. Individuals should be able to demand and get health care selVices whenever
they need them and in appropriate quantities (and quality). Their approach is about horizontal eq
uity. Persons in equal health states should get approximately the same treatment, filctors such as
race, income, gender, place of residence, etc., not withstanding. A fiUr allocation of resources un
der this principle suggests that each person should receive according to their need (Broome, 1988;
Loclcwood, 1988).
Equality of access as an equity objective has also received various interpretations. Le Grand
(1982) suggested that access is best interpreted in terms of the time and money costs incurred by
individuals in searching for and using health care f3cilitieslservices, measured in utility terms. Moo
ney (1983) likens equa1ity of access to equality of opportunity (et: Daniels, 1985, i.e., persons
should be able to use health f3ci1ities when in need. The equa1ity of access should apply only to
those in equal need-equal utilisation for those in similar health states. But equality of access
amo~ those in equal need will not necessarily guarantee equa1ity of treatment amongst those in
equal need (WagstatJ; 1991). 'Equal access for equal need' should be interpreted to mean equal
treatment for equal need--but this again has the problem of the meaning and method of establish
ing people's (or regions) needs.
Mooney, HaD, Donaldson and Gerard, 1991, (hereafter MHDG, 1991) also interpret equity
as 'equality of access', rather than the conventional notion of 'equal treatment for equal need'
-conventionally tenned as utilisation, often used as a measure of equity in health care delivery.
(They argue equity goals in policy documents mostly couched in terms of access rather than utilisa
tion). The notion of equity based on equal treatment for equal need when people have different d6-
mand functions is an infringement of consumer sovereignty. In particular, it ignores the individual's
pIefd~JCeS, or, equivalently, applies WJiform or 'standard' medical practices to all. But Culyer,
Doorslaer and WagstatJ; 1991, (hereafter COW, 1991), have pointed that even if people erYoyed
the same access-according to the MHOO's (1991) definition (say, filcing simi1ar costs when
using the health services)-persons in equaI need may end up conswning different amounts (or
types) ofhealth care because of di1ftJ ~1CeS in thejr demand functions. Health policy makers should
be concemed why such differeJlCeS in demand persist before making any judgement. This is neces-
tion will understate the true extent of mortality in the popuIations. Medical records are another source of information on health, but these are often incomplete or difticult to obtain (due to confidentiality), moreover, they are partial in the sense they cover only reported illness. The third source of health information is the sick-off days and illness as reported directly by people in survey interviews-but these are also not very reliable--they may have biases or untruths as well as under-reporting of certain (stigmatising) conditions such as mental illness and venereal diseases.
-168-

sary if they are to know whether such differences are due to differences in the marginal utility of in
come, or due to other more basic differences, or to simply because of differences in people's
prefelences for health care. COW, (1991) point that whereas' ... policy makers talk about access
to health care, policy measures are typically defined in tenns of health care itself' Thus, there is
really no distinction between utilisation and access from this perspective, and this explains why
many works on access have used measures of utilisation. This approach is similar to that adopted
by altruistic models of externalities, which say nothing about equity and distributive justice (Culyer,
1980). They only explain what people regard as desirable (m this case, policy makers), which may
be shaped to a certain extent by what they regard as just but, by and large, it also depends on their
degree of compassion and their economic situation (cf Mooney and McGuire, 1987~ Margolis,
1982). If so, altruistic models are not the right instruments for investigating distnbutive issues, since
The whole point of making a judgement about justice is, after all, to frame it in a way that it is made independently of the interests of the person making it. That is precisely why Rawls (1972) and philosophers since him have been attached to the notion of the 'veil of ignorance' .... (COW, 1991, p. 3).
However, 'equal treatment for equal need' is not necessarily inferior to the notion of
'equality of access', (as MHOO, 1991, put it)-especially in the eyes of policy makersHust be
cause it implies a departure from traditional welfare economics while the latter does not. MHDG,
1991, advocate for a concept that prefened by policy makers. But COW, (1991) contend there
may be a contradiction implied by this belief While 'equal treatment for equal need' is inconsistent
with Paretian value judgements, in reality, health policy makers strive to sever the link between
ability to pay and receipt ofhealth care. Since 'equal treatment for equal need' does just that, it
should be filvoured by policy makers too! Moreover, Gillon (1986) considered the applicability of
the various types of social justice in health care and concluded that, of the various distributive prin
ciples, 'distribution according to need' is most mvoured by physicians and other medical personnel.
His intetpretation of 'need' was 'ill-health'.
COW, 1991, mgue 'equal treatment for equal need' also appears to be consistent with the
rqection of another value judgement of traditional welfare economics: that social welfilre depends
on, and only on, the utility of the various individuals who together make up society'-which is
why policy makers believe that the business of health care is to improve health. This is the extra
welfarisl approach acco~ to which
health care is only a means to an end (viz. improving health) and the ethical justification offilvouring one form ofhealth care distribution rather than another (e.g., distribution according to need) has to be sought in the ethical justification of the associated distribution ofhealth. The same is true of access, which in this view is also a means to an end, . . ..
-169-

Opting for one method of detemlining access ... can . . . therefore be defended only in tenns of ethical justification of the final distnbution of health it gives rise to. (CDW., 1991).
The approach combines the fuimess and efficiency of alternative distnbutional rules in terms
of their implications for the distribution of (say, health) rather than in terms of how they fit with an
inappropriate set of value judgements underlying modem welfare economics. 10
The definition of equity as equality of health is no less popular in the literature (see inter alia
Blade, 1980; DHSS, 1986; Whitehead, 1987). Any reduction in inequality (of health) is good and
vice versa. Health care should therefore be distributed so that the end result is equal (shares of)
health status between individuals or regioruw'groups. The definition provides a clear statement on
what constitutes equitable distribution of health and health care--once the desired distnbution of
health is known, all that is necessaIy is to allocate the health care resources to achieve it. This will
result in equitable allocation, given the people's (different) capacities to benefit from health care
and the costs of the treatments.
5.4 Policy Implications for Kenya
We have seen that in Kenya, although policy statements are often stated in tenninology of
access, the basic objective of the health care system is health. Focusing on the latter leads to a situa
tion where there will be less scope for conflict between efficiency (as discussed in chapter three)
and equity. For the public health services, a munber of practical policy implications follow from the
combined analysis of the last two chapters. These fiIll into four broad categories: underlying (gen
end) policy guidelines; policies to do with 'target groups'; information policy, and research policy.
70 Another formulation of equity taking account of the non-health characteristics of individuals is the equity as choice definition (Le Grand. 1984, 1987). This suggests that inequalities are inequitable if they reflect inequalities in the constraints people face but are not if they reflect di1ferences in tastes. This argument suggests we incorporate weights (say in health maximisation), these weights reflecting differences in peoples preferences. But Le Grand rejects such an approach arguing it would be inequitable for differences in health related behaviour (such as smoking) to have any bearing on the way people are treated by the system. He suggests instead people with such deviant health behaviours should be charged an annual premium to cover the expected costs of treatment arising out of their health damaging activitieslbehaviour, but should continue to receive the same treatment as other individuals. What Le Grand is saying in other words, is that although it might be legitimate and equitable for non-health characteristics to influence their rights to health care sector resources, any discriminations arising as a result should be confined only to the finance of the health care, but not the delivery of that care. In this perspective, there is no equity in the allocation of resources in the health care sector.
-170-

5.4.1 Underlying policy guidelines
Since there may be no single overriding equity principle to guide resource allocation, policy
makers should be prepared to try a multi-pronged approach-for example, combining the caring
externality approach with equality ofhea1th, and when necessary, seek to compensate for inequali
ties in non-health areas in terms of health care (and vice-versa). In distnbuting resources, need
should be used as a necessaIY condition for equitable distnbution of public health care resources.
This means ~ which are adequately serviced by private sector may not receive priority in public
resource allocations, unless there are other overriding considerations-such as easing financial bur
dens of poor people in such areas, in which case other intervention mechanisms (to be discussed
later) may be involked. Equity requires equal and wUversal access for assessment pwposes in the
first instance (partirularly for the primary and emergency services). There should therefore be as
few disincentives (m tenns of money costs or time) to these services. Access to 'approved'
. t:reatments-i.e., further consumption of health care resources (once the initial contact has est:aIr
1ished the existence of need) may be unequal, this dependent on the assessed needs of respective in
dividuals. Fmally, it should, as a rule, be ensured that the treatments that are 'needed' -in the sense
of there being evidence they are effective, are only those that contnbute most to reducing inequali
ties in lalth.
5.4.2 Targeting resources to specific groups
In view of multiple deprivation, mainly in the form of hardships and adverse effects that
some policies, such as user charges in public institutions might inflict on certain vulnerable groups,
there is need for junctialing policy and management structures whose province is the monitoring
of the distribution ofhealth and other relevant factors amongst vulnerable groups (such as the poor
or at risk groups such as pregnant mothers, children, single parents, and so on. Simply because of
their vuJnerabiIity, there is merit in seeking to identifY those members of the comrmmity who are
most at risk from changes in htalth policy and those who are least likely to take advantage of the
available range of effective services. Geographical distribution will also be an important dimension
beawse regions, like individuals, can be multiply deprived and also because health risks vary re
gionaDy, just as they over individuals. It: as is currently the case, policy were to move in the direc
tion of greater decentralisation within budgetaIy allocations to districts, an important determinant
of such allocations ought to be the differential patterns of (lIllProvable) ill-health. Also, the potential
contnbution of different medical specialities to health differs considerably and discovering more
about the significance of each for contnbuting to greater equality in health should be a priority. Fi-
-171-

nally, the rurrent policy of reallocating resources from curative care to preventive and promotive
services, apparently based on the popular fad that 'prevention is better than cure' ought to assess
the relative impact on the distnbution ofhealth that will result from the relative expansions or con
tractions of the respective services. There has to be demonstrable effectiveness of the policy. Such
a shift might be effective in raising the overall health status of the population, but again there is
need to ensure resources are moved to areas where they secure maxinrum returns.
5.4.3 Implications for infonnational requirements
There will be need for infonnation on the current distribution of resources and health in rela
tion to target groups. Appropriate macro-SUIIlIll8IY statistical measures of inequality have to be de
veloped and appropriately employed. These could then be used to make judgements about the
effects of changes in the pattern of resource distribution on the health of individuals and especially
target groups. There will also be need for infonnation on the financial and opportunity costs of
changes in resource patterns, including the overall funding from all sources. Infonnation on time
and monetary costs faced by patients in accessing the system and subsequently using it should play
a major role in assessing the level of co-payments (Le. user fees) to imposed, and this IlU1St take
into account the long travel and waiting costs, and so on, incurred by some patients. This means it
might be necessaIY to allow for area variations in these co-payments, unlike the present system
where they are set at uniform rates throughout the country (If only for the sake of equity).
5.4.4 The need for further research
Further research will be needed in a m.unber of areas, particularly that relates to collection of
data and infonnation on the aspects enumerated above. In this thesis we have, on account of state
ments from various government policy documents, asaibed the 'decent minimum' as the policy as
the policy pursued by planners in the Kenyan ~ policy. The deficiencies (and strengths) of this
pea spective as far as equity in health care policy is concerned have been pointed out. The Ministry
of Health may need to conduct its own research as to what notion of efficiency is to be initially
adopted, but should progressively strive to move towards the adoption of the framework for
efficiency and equity as outlined in the last and present chapters. Further epidemiological and ec0-
nomic work on medical and cost effectiveness, including the development and refinement of out
come measures of health for use both at the micro and macro levels is needed. This will entail
research into the quantification of the health gains potentially to be gained from alternative delivery
-172-

strategies, and changes in programmes defined by targeted groups. The last chapter has indicated
that preventable diseases and deaths continue to dominate our health status statistics. This should
provide the initial set of clues as where it might be potentially rewarding to start research into
'avoidable' deaths. We suggest that the Ministry of Health inunediately sponsor a:i I'KJc research to
make a comprehensive and authoritative review of the existing epidemiological evidence on the
relative effectiveness of medical (mcluding diagnostic) procedures, supplemented, where infonna
tion is available, also by cost-effectiveness. Research into the actual distnbutions of health and sick
ness is also indicated. Preferably, such ~ should be conducted on a 'before' and 'after' basis,
ie. ahead of major policy initiatives so that the results can serve to evaluate the policy. Moreover,
continued routine monitoring also demand research at intervals to monitor distnbutional changes
over time, with a view to identifYing not only their effects but also to assess the sources of changes
as well as their desirability or otherwise. Fmally, the Ministry of Health may also have to develop
appropriate statistical measures of inequality and conduct surveys with empirical measures based
on agreed concepts (ofhealth, equity, access, and so on).
-173-
-CHAYfER SIX-
6. THE AGENCY RELATIONSHIP AND ITS RELEVANCE TO MODELLING A REFORM STRATEGY FOR THE KENYAN HEALTH CARE SYSTEM
6.0 Introduction
From the analysis of the previous chapters it is clear there is need for the Ministry of Health
(MOH) to provide an enabling environment in which providers-both public and private---hzve
the right incentives to be efficient whilst being equitable in their operations, i.e. one which leads
providers to behave in accordance with the national health objectives. This chapter shows how an
efficient and equitable system could be developed for Kenya.
The existing regulatory arrangements are not effective for promoting efficiency in use and
equitable distnbution of resources due to several factors. First, the Ministry of Health is organised
on a hierarclliad or 'pyramidal' structure with a communication network that is not effective for
monitoring the perfonnance of its own provider units (see chapter three), leave alone that of the
private providers. Second, health persorme1, particularly doctors, both in the public as well private
sector, have little, if any incentives to be efficient, partly because such guidelines as exist are not
fully enfurceable, and also because of the scope for discretional decisions that they have on account
of the technologiad knowledge available to them and which allows them to exercise 'professional
judgements' with respect to the utilisation ofinputs as 'scientifically' required. Third, the payment
to public sector doctors (and other health personnel in this sector) of a fixed wage and the cost
based retrospective reimbw"sement of public providers (which constitutes the financial environment
swrounding the providers' decision-making process) cannot provide the incentives necessary for
closing the gap that exists between technical knowledge and the motivation for improving provider
perfonnance. On the other hand, the private providers, driven by the desire to maximise profits, or
due to resource inadequacy, may adopt practices that conflict with the national objectives of the
health sector (see chapter three, section 3.2.2). Fmally, the public budget is not distnbuted accord
ing to any rational basis, while private sector providers have little incentive to locate in 'needy' ar
eas, to train own personnel. conduct research or to provide some types of care (such as preventive)
or to specifically cater for the poor. If 'efficiency' and 'equity' are to fonn the basis for assessing
resource utilisation in the health system, there is need to tackle these sources of problems in the
health &yStem
-174-

We first give a generalised theoretic account which shows why the present environment
cannot motivate efficient behaviour in the operations of provider units. We will then summarise
some filctors that have to be borne in mind when designing refonn proposals to change provider
behaviour in such a setting and then outline the theoretiQ!} framework for refonning the system.
For the public sector, this translates into designing a goal oriented budget policy, i.e. one specify_
ing, within the resulting relationship, a management delegation relationship-through the budget
-a policy able to raise irrentive-compatibility on both sides of the relationship. How this can
then be modified to take account of equity is also discussed. For the private sector, it translates into
designing a policy where the objectives of the MinistIy of Hemth (MOH) coincide with those of
the private sector, i.e. there is no conflict. These re1ationships (between the MOH on the one hand,
and the public and private providers, on the other), can be framed in terms of the principal-agent
relationship. In both cases, we will show that the setting of an optimal reward structure, capable (m
principle) ofproducing incentive compatibitIity--is adequate. For the public sector, (It will be ar
gued) this is best cast in tenns of some fonn of output-sharing, which, along with incentives for ef
ficiency motivation (more of this anon), can raise the work-effort over and above mininrum levels
-by aeating incentive compatIbility and raising work-etfort above some mininrum (i.e. by remov
ing X-inefficiency). Particular attention is paid to issues of perfonnance monitoring and measure
ment to ensure that agents' operations serve to enhance overall system goals. These issues and
their implications for system are discussed at length in this chapter. For the private sector, the
principal-agent relationship is about selJ-regu/ation--in pursuit of selJ-goals -the problem be
comes one of providing an environment within which, whilst pursuing own goals, the private pro
viders also enhance the system's overall objectives.
6.1 Theoretical Approaches to Explaining Variable Efficiency in the Health Sector
6.1.1 Non-aDocative inefficiencies that may sustain X-inefticiency in the health sector
Economists assume that variations in productivity within an industry are due to improper
choice of input and output levels by finns. This may however be corrected by the operation of un
impeded market forces. The competitive market pushes the production units or finns to the pr0-
duction possibility frontier-those that fail to operate on it are simply pushed out of business. In
this model therefore, variations in inter-finn efficiency are short-term phenomena, correctable by
the market forces. Therefore resources tend, over time to be optimally alIocated1uti1ised. This
means, iffinns are operating in an environment of competitiveness in both product and &ctor mar
kets, profit maximisation leads to optimal utilisation of resources. If markets are not tampered with
-175-

~, by govermnent controls, taxes or other devices-or finns do not have objectives other than
profit maximisation, this result would necessarily hold. But in reality this is rare. Often there are
fiIctors-intern to finn decision making process----that are frequently incompatible with profit
maximisation Policies based on the free market framework will not necessarily guarantee unifonn
(and efficient) levels ofperfonnance Wlder such environments, because ofintra-finn inefficiencies
in the fonn of organisational inefficiency or motivational inefficiency-which are non-allocative in
efficiencies----arising out of the existence of these non-profit maximising forms of decision making
behaviour. Such f3ctors may persist, especially in environments such as in the health care market
where, because of the desire to secure fiscal socialjsation of risk, health care is generally not only
not viewed as an object of economic ccchange among consumers and sellers and there is a desire
for equitable rationing of the resources apportioned to it, but there eKists a variety of interest
groups-inside and outside the sector. Their cumulative effect is deviation from official goals
which is not only attnbutable to managerial issues such as poor motivation, fiwlty co-ordination,
bad co-ordination or inadequate resources, but also to the subjectively rational policies of interest
groups attempting to pursue their separate interests. Besides, there is in general a tendency towards
dynamic conservatism in health services-partiruIarly in the practice of mainstream medicine
such that only decisions compatible with the dominant interest groups inside ecisting organisations
are likely to be effective. In such cases, it is often easier to implement innovative plans by setting up
new organisational structures rather than attempting to restructure eKisting ones, because the con
servatism or system frozenness is difficult to overcome. Changes in the external environment
particularly in the market environment-an react forcefully against such conservatism and either
force finns exhibiting such behaviour to change or go out of business.
The X-efficiency theory ofLetbenstein (1966) recognises that finns may exlubit characteris
tics that are inconsistent with profit-maximisation and allows the poSStbi1ity of never reaching the
production possibility frontier in some economic a.ctivities-due to a munber of reasons. FIrst,
non-profit maximising behaviour may mean decisions are not based on a careful calaJlation of their
potential effects. In such cases, the Yerlces-Dodson psychological law-[ which says that at low
pressure levels individuals will not put much effort into carefully calculating their decisions, but as
pressure builds, they move more towards maximising behaviour; but if the pressure builds beyond
a certain level, disorientation occurs and results in a lower level of perfonnance (LeJbenstein,
1987)}-may be opeaative. This is partiruIarly relevant in the health sector where most 'pr0fes
sional decisions' are based not so much on resource considerations as on some aIbeit
inoompIeteluncertain expectations about outcomes. It is not uncommon in most health care sys-
-176-

terns to find fiiction between planners and health professionals due to what the latter consider to be
inadequate levels of funding. A second reason is what Leibenstein caJ1s inertia- where functional
relations are surrounded by inert areas, within which changes in certain values of the independent
variables (e.g. increased financial budget or manpower allocations to a health fiI.cility) do not result
in changes of the dependent variable (say, the munber of cases treated). But theoretically, we
would expect finns experiencing such inertia to disap~ 11111= the capital markets and the prod
uct markets are not competitive. This qualification is true for finns in the health sector. In this sec
tor, particularly in the public sub-sector, most providers do not rely on any organised market for
their capital needs. Also, for well known reasons that have been widely analysed (Arrow, 1963;
Evans, 1984; Culyer, 1989a, b), the health care market is hardly competitive. The existence of in
complete contracts (say, where the payment side is well specified but the effort side is not clearly
defined) is another reason FmaJIy, the discretion that individuals have within certain boundaries
may used to counteract the allocative efficiency of profit maxirnisation behaviour of finns. This is
especially true of activities where agents can manipulate constraints in their interest or perform in
environments characterised by conflict, uncertainty and/or informational asymmetries. This is par
ticularly relevant to causing X-inefficiency where the individuals have discretionary powers to
choose the pace at which an activity is carried out. In such circumstances, the individual's perform
ance amnot be controlled by imposing external guidelines-due to the informational asymmetIy or
the uncertainty. The individuals can choose to invoke these discretionary powers in preference to
ectemally assigned objectives. Hence there is a latent Prisoner's Dilemma-where individuals have
an incentive to move towards the mininnun-tolerated effort level., while the firm has an incentive to
move towards the minimum-tolerated working- condition-wage level. Often the result is an out
come which is intermediate between the Prisoner's Dilermna outcome and the optimal solution,
where there is nrutua1 gain for all participants (Leilienstein, 1987).
6.1.2 Budget rtStraint as tool for dealing with Don-aDocative inefficiencies in the health sector and its deficiencies
In some public activities-such as those of the health sector---the absence of markets en
hances the possibi1ity of edstence of non-allocational inefficiencies as disCllssed above. But a
pseudo-market can simulate the competitive result if allowance is made for the special characteris
tics of the output of health sector and the expenditure funding process involved in its provision
Competitive behaviour amongst health care providers is largely detennined by both ownership
(and the reasons for ownership--e.g., whether as shareholders interested in wealth maximisation
-In-
or with philanthropic inclinations) and how the revenues to fund their activities are generated. If the
latter is perfonnance related (e.g., related to quality and quantity of output), then the basics for effi
cient behavio~ are already in place71• But whexe health providers are funded entirely from a gen
eral fund-through an external budget-based arrangement where revenues come out of a general
tax fund or other sources not linked to the providers' perfonnance-it is difficult to inculcate as
pects of efficient behaviour. A budget am be considered as a means to delegate certain tasks, to
gether with the authority to use a defined set of resources in order to perform those tasks. This
opens the possibility of imposing tight financial restrictions while conferring freedom of resource
allocation within this restriction This is possible in a system where the health sector is largely con
trolled by the government.
Budget restraint has been advocated in public sector studies as the p7ce element towards ef
ficiency motivation in the sector (see Leilienstem, 1966). In the health care sector some studies
have advocated the use of some form of a central budget mechanism so as to rationalise use of
health sector resource (e.g., Rutten and van der WerH: 1982; Beske, 1982). A budget restraint
transfonns the provider's problem into a constrained optimisation problem and so selVes to reflect
resource limitation in the decision making process. The budget constraint gives the feasible sets of
points for constrained optimising behaviour. Instituting a budget restraint policy aimed at reducing
the relative inefficiency of filcilities means that the amount of revenue allocated to a filci1ity j is tied
to some efficiency criterion (such as those discussed in chapter three), defined for all the filcilities
-i = 1, ... , j. ' . '. N. When health care providers are fimded from a central pool through a proc
ess that is not performance related, no direct link appears between the institutional effects of the
revenue and the expenditure sides of thar activity. Besides, this type of funding arrangement has
what NJSkanen (1973) terms illusionary effects on the consumers, also the producers. It encour
ages consumers and producers to want to echaust to zero the marginal benefits derived from de
mand andIor supply of the production WJits. The consumers believe that the tax revenue raised on
thejr incomes 'entitle' them to the conswnption of as much of the public health care as poSSIble
up to the point at which the marginal benefits (to them) are edlausted. Predicting the pattern ofiD
dividual rational behaviour under these circumstances is difficuh since thexe is a 'composite effect
trap' for increasing public expenditure. An increase in output demanded 'necessitates' increased
revenue allocation to producers, which further encourages demand (due to availability), triggering
further demands for increased reveme allocations, and so on, ad i1!finitum. Regulatory mecha
nisms for restraining the expenditure of producing units become necessary. Where no direct link
11 That is so in spite of the problems of the health care industry-the industry is traditionally nonprofit making, where output and quality are bard to measure.
-178-
appears between the reveID.le and expenditure sides of the providers, and supply influences demand
-as is the case in the health care sector (Evans, 1974a, 1974b; Fuchs, 1978; Cromwell and
Mitchell, 198672) the suppliers may manipulate the demand side to attain their (suppliers') own
specific objective&'targets. This can be a source of inefficiency. The funding body lacks the basis for
refusing to grant requests for increased funding, except by resorting to arbitraIy criteria. such as
budget capping. Such arbitrary and indiscriminate budget capping penalises efficient producers and
'rewards' inefficient providers in the system.
The budget restraint introduces a price component on institutions' activities, and can be an
implicit watchdog for efficiency that cause the desired changes in the public institution. But where
this is not so, and the agents' supply factors influence demand conditions and therefore the per
fonnance of institutions, the possibiIity to link budget allocations to predetennined levels of per
fonnance could be a control policy that would provide efficiency motivation rationale against
pressures for sequential expenditure increases. A competitive market ensures efficiency because all
finns produce similar products and fuce the same factor and output prices, and the market forces of
demand and supply cull out inefficient producers. When output is not sold under competitive con
ditions and reverrue is not linked to performance, X-inefficiency may arise and persist.
In the literature on hospital costs, the considerable variation in the performance of compara
ble hospitals indicates that such variations cannot be explained solely by the notion that each hospi
tal is wtique. There has been interest in standardising these indicators so that comparisons can be
made. But there are certain problems that make performance comparisons difficuh or invalid. One
of these is the true definition of hospital output and how this can be related to some notion of pa
tients' health states. Much of the health economics literature points to the minimal contnbution to
health ofhealth care services (Auster, Leveson and Sarachek, 1969~ Grossman, 1972~ Silver, 1972~
Hadley, 1982~ Shari( Huq and Saleheen, 1993; Kalipen, 1993). Also, the output of hospitals
--health--is a nru1tidimensional concept that can be defined in physical, social and functional di
mensions. This makes it extra ordinarily difficult to measure, even in principle, let alone the practi
cal considerations oflack of statistics. The production ofhealth care services is just but one method
of attaining the o~ective of maximising health gains from available resources. Second, the appor
tionment of inputs to those nulltidimensional aspects that are the output of the health care industry
is not easy due to the joint-production nature in the hospital sector. Third, some of the indicators
may be misleading because they fail to reflect real improvements in patients health states,-e.g.,
72 Although what exactly constitutes demand inducement is far from settled, e.g. see Phelps, 1986, among others.
-179-

medical innovations that permit postponement of death rather than cure may be reflected in con
ventional perfonnance indicators as reductions in hospital productivity.
6.1.3. Budget restraint and the 'proximate' behaviour of providen
Whether a budget restraint policy will move the system closer to pareto efficiency is depend
ent on the behaviour of the producers in hospital services industry. To determine and predict the
extent of efficiency or inefficiency in the sector, a knowledge of hospital behaviour (and that of
other filcility levels) is necessary. In modelling hospital behaviour two relevant filctors are consid
ered regarding the unit of analysis:
• whether by focusing on the behaviour of the individual agents working in the hospital
-whose actions ultimately determine the perfonnance of the hospital-it is poSSlble to
em-apolate the behaviour of the whole organisation If that is the case, one also has to
consider the interrelations among the agents within the hospital unit to determine
whether any specific group or sub-group more explains the aggregate behaviour of the
whole organisation; and,
• whether the hospital as an organisation behaves as if it were a single consistent unit with
a clearly defined set of behavioural rules that allow for joint analysis for purposes of
modelling.
There are roughly two types of models of hospital behaviour corresponding to these two
f3ct0rs (Jacobs, 1974):
• (a) models that foals on agents' behaviour~ as physicians, administrators or as
groups of trustees. These models assume the agent has a function to be maximised. The
maximand could be income, profits, output or utility. The maximisation problem is
usually constrained by some function defining the feasible set. The constraint may be
income (Feldstein, 1970), or a function incorporating the marginal valuation of the
individual's own time input that also may depend on income--leading to labour-IeWre
trade-off(Sloan, 1974), or some less well defined notion such as 'professional ethics' in
tenDs of ' best practice' and patient welfare, etc., (Murray, 1974).
• (b) models that treat the hospital as an organism in itself These focus on the behavioural
and organisational aspects of hospitals----eith from the view of hospitals as bureaux
(Mgue and B&nger, 1974), non-profit making institutions (Newhouse, 1970), and
-180-

monopolies (Pauly, 1974; Goldfiub et al., 1980), or from a bargaining type approach
based on property rights (Clarkson, 1972; Harris, 1977).
Regarding the two f3ctors and the corresponding models of the hospital behaviour available,
none exactly represents the situation correctly for Kenyan public sector hospitals. Models in (aJ are
not an adequate representation of the Kenyan hospitals since doctors in public sector hospitals in
Kenya are professional salaried employees-employed on tenns determined by the govermnent,
including working time, as explained in chapter two. Besides, doctors can practice in own/private
clinics outside the government working hours. In such cases, shirking may be a common feature.
Also, doctors have a significant influence over the allocation of health care resources, arising from
the professional training which imparts technological and professional knowledge to them, and em
powers them to make decisions that have major resource implications. Hence they stand out as an
influential group as far as hospital resource use is concerned (see chapter three, section 3.1 ). Yet, in
Kenya, the amount of resources that they can control in any particular hospital is determined out
side that organisation, most times without even consulting their opinion. The second group of
models does not reflect adequately the situation in Kenya since physicians can flex nUlScIes where
resource allocation within the hospital is concemed-indeed, sometimes each physician would
want to have as nruch resources as can be available to go to their particular departmentslspecialities
within the hospital. Therefore we should expect them to shape the hospitals' decision process to a
certain extent. Given this, what is the appropriate characterisation of the behaviour of the Kenyan
public hospitals?
6.1.4 A model of hospital behaviour suited to Kenyan public hospitals
The Kenyan public sector hospitals can be represented as modified bureaux. N1Skanen
(1973) has defined a bureau as a non-profit making organisation (which may be government or pri
vately owned), financed wholly or in part by a periodic appropriation or grant. The behaviour of
bureaux am be portrayed in terms of (I) their characteristiCS; (0) the type or nature of relations be
tween the bureau and their environment; and, (m) the maximand. The characteristics include (a)
the inability of their owners (and, to a limited extent, the employees) to appropriate any part of the
difference between revemJes and costs as part of their income; (b) part or all the recuning revenue
comes from sow-ce(s) other than the sale of output at cost price; (c) they specialise in the provision
of goods and services that people prefer in larger amounts than would be suppJiedlbought if sold at
their per unit cost price; (d) the goods they provide usually have high fixed costs of production, or
cannot be adequately priced due to lack of property rights or due to inadequate marketing technol-
-181-

ogy. Bureaux are manned by appointed bureaucrats-(NISkanen likens them to civil servants)
-full time employees. NISkanen, commenting about the behaviour of the bureaucrat asserts that:
The very problem that leads to the supply by bureaus (the difficult of defining output) creates one of the more important problems of controlling bureaus in any condition for which the objectives of the bureaucrats are not completely consistent with those of the collective organization The difficulty of defining the desired characteristics also makes it diffirult to give appropriate instructions to the bureaucrat. When the objectives of the collective organization and the bureaucrat are consistent, the difficulty of instructing the bureaucrat can lead to a substantial variance of the achieved output around the desired output. When the objectives are not consistent, the difficulty of defining output and the consequent difficulty of instructing the bureaucrat can lead to an output that is systematically different from that desired (N1skanen, 1973, pp. 10-11).
The bureau's environment is defined by three parameter relationships: (a) its relationship
with the funding organisation; (b) its relationship with suppliers oflabour and other factors of pro
duction; and, (c) its relations with the customers of the services it produces. Bureaux have a domi
nant financier-usually a government department (such as the Ministty ofHea1th in Kenya), which
is in twn financed by general taxes. The funding organisation reviews the bureau's proposed activi
ties and budget, approves it, monitors the methods and perfonnance (rarely done in Kenya), and
usually appoints the head of the bureau. The relationship between the activities of the bureau and
those of the funding organisations are important-with the funding organisation relying on the bu
reau to supply the service whereas the bureau lacks other reliable source of funding. The whole re
lationship is in a way an awkward and personal one----characteri by incessant haggling between
the two-sOmetimes with threats, other times with deference, as well as by gaming and appeals to
a common objective by all concerned parties.
Unlike market type production relations, a bureau offers a total output in exchange for a
budget. ratheJ' than units of output at a price. Usually, there is no explicit relation between the bu
reau's budget and the quantity of output. Instead, what is roughly expected of them is the provi
sion of a certain level of service for the stated budget. The demand for the bureau's product is
revegIed throu.Ih the ~ and wiN be related to the general population that the S[JOI'ISOring
organisation serves. As such, the demand for the bureau's output is never directly revealed to it
only through the revealed preferences of the sponsor's demand for services can the bureau deter
mine what level of activity to undertake. In the health sector this relationship is further complicated
by the tact that profit maximisation is not even the appropriate objective, because of difficulties of
quality and outcome measurement that make the efficiency and equity principles depend on mana
gerial COlIUnitment of the provider units (usually committed to 'professional excellence' rather than
overall social gains from scarce resow-ces) and 'understandings' that are not quite legally enforce-
-182-

able contracts, even with public purchasers pursuing non profit maximising objectives. Also, on
moral and ethical grounds, there is often a general feeling that health care services aught not be
governed by market rules.
The sponsoring organisation is usually not a profit seeker, and the officers of the sponsoring
organisation carmot appropriate as personal income part of the difference between the budget they
would be willing to grant and the budget they actually grant the bureau. But there is a possibility
that the bureau's officers can appropriate part of the bureau's expenditures as personal incomes.
Also, there is asynunetric infonnation between the bureau and the sponsor. There is avail
able to the bureau's officers more infonnation-on the relationship between costs and production
processes within the bureau, than to the officers of the sponsoring body. The bureau has a domi
nant position with respect to infonnation for analysing the efficiency of its operations. Therefore,
the sponsor may be passive-it only knows the budget it is prepared to grant for a given quantity
of output but Iacks either the capacity, incentive or the opportunity to obtain infonnation on the
minim.un budget necessmy to supply it.
The bureau hires most of its inputs from the competitive market and usually pays a single
price for all similar labour and materials. But most often, bureaux, being monopoly (or so near)
suppliers of the service, also are monopsony buyers of those specialised labour skills and material
inputs used in the production of the monopolised services. This is partly true of the hospital sector
in Kenyan. The govennnent hospitals are the main employers of medical school graduates and the
Iargest buyer of pharmaceutical mJ medical equipment.
Some bureaux, besides the revenue they get from their sponsor, may raise reverrues from the
sale of output to individuals--usually at less than full cost. Such bureaux efFectively &ce two dis
tinct types of customers-with different demands for the same output-one type being repre
sented by the sponsor, the other the customers who buy the bureau's output directly at a price".
When the bureau is mainly dependent on reveID.lt"S from per unit sale of services, its relations with
its rustomers will be similar to those of the profit seeking organisation. But how tar this relation
approximates that of the profit seeker is also dependent on whether the bureau's sponsor is willing
to compensate for any loss of revenues from such sales. A bureau whose sponsor is willing to
compensate such losses will usually be indifferent to the interests of its customers, even if a large
73 In fact, part of the requirements for registration with most medical professional bodies is proof of service for a specified period with an accredited institution after graduation.
74 An example of the latter case in Kenya is where the hospitals have amenity wards, as in Kenyatta National Hospital or in some provincial hospitals, where the rates in the amenity wards may slightly differ from those charged in • general' wards.
-183-

proportion of its budget comes from sales reverues. Effectively, the bureaux can practice price dis
crimination in such environments.
It is difficult to assign an objective maximand to a finD organised like descnbecl so far. How
ever, NJSkanen (1973) conjectured that the maximising behaviour of the organisation will be
shaped by the behaviour of the agents that compose it. On this basis, he opined that agents will en
gage in 'purposive behaviour' in which some elements of their individual utility-ra1:her than the
general wdfiJre and interests of the sponsoring body-enter the overall organisation's maximand.
As such, the bureaucrat will tend to maximise the bureau's budget, since this will in turn affect
those variables affecting their utility functions, the argument being that the higher the budget, the
higher their associated utility-defined in terms of output, sa1ary15, reputation, power, patronage,
and so on Most of these factors are a positive fimction of the budget. N1Skanen concludes that the
bureauaat will maximise the btJrea!'s budget subject to the constraint that the budget must be
equal to or be larger than the minimum total costs of supplying the output expected by the spon
sor. There is thus X-inefficiency.
The model outlined so far does not 'adequately' depict the behaviour of managers in most
public hospitals in Kenya. A more appealing statement ofwhat will shape the manager's behaviour
is that advocated by Migue and BeJanger (1973) who argue since profit maximisation and compe
tition are not the driving motives in production, the hospital and the decision makers---represent
by physicians and management-are free to give preference to other goals. Following these 'other'
objectives has consequences on production levels and unit costs of hospital services. The hospital
management derives personal satis&ction out of allocating hospital resources to various expenses.
In this respect, the management finds itself in a situation similar to that of consumers having to de
cide how to allocate their budget among various goods and services. In allocating the available
budget, the margin of disaetion eqoyed by the management is equal to the ex:cess of reverrue over
the mininnJIn cost of producing the minimum level of output that can be tolerated (by the sponsor).
This is the actual budget of the management, as opposed to the hospital's budget, which by defini
tion is the cost of producing the actual output (according to the sponsor). The management's
budget is what becomes available to be apportioned to various utility generating ~Ius
the cost of producing the output expected by the sponsor.
75 This may not be very relevant in Kenyan (public sector) hospitals since the salary is usually invariant, irrespective of the budget size, but we may think of personal allowances and so on as having a similar effect.
-184-

The level of output produced and the unit cost of production will depend on the manage
ment's choice between several poSSIble uses in allocating the discretionary budget. The choice be
comes one of either producing a higher level of output and reduce the utility generating expenses
by operating at close to mininrum costs, or to maintain production at a lower level and use the re
sulting budget surplus to cover [strictly] non-essentiaJ experues that bring personal sarisfuction.
Producing the mininrum allowable level of output-or in tenns of the tenninology of section 6.1.1
above, the minimum tolerated work effort--maximises the amount allocated to other desired ex
penses. This has the effect of shifting the unit costs of production upwards, and total reported costs
would then equal total budget at all levels of output. On the other hand, producing the maxinrum
output at minimum cost avoids all unnecessary expenses. The hospital's final choice will obviously
be influenced by the preferences of management and physicians. If the hospitals' primary goal is to
distnbute the services it produces as widely as poSSIble (output maxirnisation) -it will make every
effort to attain productive efficiency by minimising production costs in order to maximise the con
sumption of its services. Now, if this was the case, inefficiency would not be the problem that it is
in hospitals and we must therefore discount the hypothesis that quantity maxirnisation is the driving
force in Kenyan public hospitals~. It does not seem to accord with casual/observed mcts. In
Kenya, this is further complicated by the presence of two lines of authority within the hospitals:
some employees---mainly the non-medical-are under the authority of the administrative secretaIy
(the permanent secretaIy in the MOH), while the medical personnel are under the authority of the
Director of Medical Services (as explained in chapter two). Unless the two are co-ordinated, con
flicts in interest which work against the over-all efficiency ofhospitals can be expected to abound.
If the management is tempted to incur unproductive expenses to satisiY personal prefer
ences, the objective of maxinnun output will not be reached. Here, the hospitals can be perceived
as producing two kinds of goods: goods consumed by the patients and goods eqjoyed by the man
agement as utility generating expenses. The two objectives contlict--hence hospitals cannot attain
minimum costs of production--and we can only conclude that the hospitals will operate at maxi
nuun cost-this means they will spend.all the allocated budget-this conclusion will be shown to
hold (m general) below-section 6.2 below.
An empirically verifiable hypothesis that follows from this analysis is that there is an absence
of a relationship between technical or economic efficiency requirements, the goals pursued by the
hospital and its decision makers, and the enviromnent in which they operate (m which there is no
76 This is despite the fact that the objective of the health policy, as already shown, might be so interpreted.
-185-

drive to maximise profits--there is no competition). This is the main source of inefficiency in public
hospitals in Kenya. The financing arrangements and the semi-monopoly nature of the hospitals
frees them from competitive pressures to be efficient, and this denies the MOH an a1temative
source ofinfonnation by which to gauge the efficiency ofhospitals----thus compounding the moni
toring problem inherent in the nature of hospital output. There is weak external control
6.2 Towards an Alternative Policy Model for the Kenyan Health Sector
6.2.1 The appropriate setting-Some factors to consider
The environment in which actual budgetary interrelationships occur, particularly as regards
the scope of decisions and powers that providers have, is important as it can be moulded in a
manner that intemalises the problem of incentive compatibility. For the public sectors providers,
this could be grounded in the budgeting process (as a form of an efficient reward structure). If
there is to be efficiency (and improvements in the equity situation), there is need effectively to regu
]ate the relationship between the centre (the Ministry ofHea1th) and the periphery (the various pro
videls that make budget requests from the centre). As previously described, the current system is
regulated statutorily within a hierarchical system, with (nearly) unity command and spamted con
trol ofmanagement-implemented through central directives at various levels of the ministry hier
archy. In this type of structure, 'a forus on marlcets alone would ignore most, if not all, of the
processes whereby health care resources are actually assembled and allocated' (Evans, 1983). In
this context. if the MOH is to have some impact on public provider behaviour, it needs to have the
power to enforce its directives on policy targets that it sets for providers to achieve. This has
proved virtually imposstble because of the actual relationship between providers and the MOH,
which is more of a 'principal-agent' nature than a hierarchical type of relationship. The following
factors can be proposed as contnbuting to the fonner type of relationship:
• Fonowing the hospital modd discussed above, the MOH will, in gencn1, always have
less than full information about the perfonnance of providers-there is asymmetric
information concerning the nature of output and technological information which may
often be used by providers as justifications for the actual input utilisation It may prove
too costly ror the centre to generate sufficient information to verifY these re1ationships.
• In addition, problems of behavioural dependence accompanied by informational
dependence further weakens the comnnmication network required for the efficient
operation of hierarchical structures under conditions of no clear observability of
outcomes in relation to inputs employed by providers.
-186-

• As a result providers, operating Wlder less than completely specified contracts, can
dominate the relationship (due to the asynunetric infonnation which the MOH can do
little about) and this makes the MOH virtually ineffectual and merely passive in the
relationship. In such a conWd, only the identity of interests between the MOH and
providers' interests can guarantee the achievement of the system's targets-which is
unlikely whenever rational agents take advantage of the behavioural and infonnational
asynunetries to support the power with which they are vested.
In this type of environment, the C<H>rdination of transactors in the health market towards
conunon objectives, in the presence of conflicting interests, requires a much richer exchange of in
fonnation and incentives than is provided through market exchanges (Hurwicz, 1973).
In general hierarchical structures by nature do not specifically recognise the lack of identity
between individuals and their organisations since economic institutions in these contexts perfonn in
a sort of neo-classical 'black-box' -in which rewards are expected to stimulate the individuals'
productive response. preventing any fonn of economic 'shirlcing'. This view of economic reality
has obvious deficiencies-it fiills to recognise the significance of the &ctors listed above, and in
particular that, within the hierarchy, fixed wages are not related to marginal productivities and
therefore carmot per-se provide incentive motivation to agents (Lazear, 1979). Consequently, an
allocation mechanism, designed to achieve efficiency (and equity) cannot accomplish these goals
unless the mechanism is infonnationally feasible and compatlble with 'natural' incentives of the par
ticipants. Incentive compatibility is the concept introduced by Hmwicz (1972, p. 320) to clwacter
ise those mechanisms for which participants in the process would not find it advantageous to
violate the rules of the process. The idea may be traced back to the 'invistble hand' of Adam Smith
who claimed that in following individual seJf-interest, the interests of society might be served (CU
Iyer, 1985; ten Have, 1988).
Changes in resource allocation procedures, system organisational structures, introduction of
competition, and regulation are among the leading mechanisms tavoured by health care sector re
fonners as possible vehicles for enhancing incentive compatibility (amongst participants) in order to
achieve efficiency and equity in the health sector. These principles suggest mechanisms that would
accomplish the goals if all participants follow the stipulated rules, and, like other problems of incen
tive compatibility in economics, informational feaslbi1ity and incentive compatibility are often major
concerns (Ledyard, 1987). The infonnational concerns arise because asynunetric infonnation pre
vents the attaimnent of the (efficient) competitive outcome (e.g. see Akerlofi; 1970; Rosen, 1985;
-187-

Kreps, Milgrom, Roberts and W1lson, 1982; Atkinson and Stiglitz, 1980). Incentive compatlbility
issues are about enswing that participants in the process would not find it advantageous to violate
the ru1es of the process, otherwise the mechanisms would perform other than as intended, resulting
in inefficient allocation of resources.
In a planned system, such as Kenya's public health services, the problem oflack of incentive
compatlbility can be considered as a sequential one. When management has only imperfect infor
mation about the abilities and willingness of individuals to work, and the outcome of the agent (but
not the agent's woIk-effort) can be observed, the problem of incentive promotion and the efficient
reward structure to achieve it needs to address the question of efficient fimding. The setting pr0-
vides a constant perverse incentive for reducing the agent's work effort instead of moving it to
wards some targeted outcomes. Alchian and Demset:z (1972) have pointed out that in these
cirrumstances individuals may rather freely adjust their work effort with respect to realised reward,
so as to equalise the marginal rate of substitution in consumption. In other words, under less than
complete contracts, each agent will feel compelled to take more leisure, because the effects of re
laxing their rates of substitution between output and leisure will be less than the effect on the true
rate of substitution. 11DJs any contract that pays a pure wage in these circumstances would not
provide incentives to honour the agreement, since the worker could take their wage as given and
select an effort level which tends to zero.
Given the enviromnent presently prevailing in the Kenyan health care sector, the agency re
lationship appears to be the most appropriate setting for analysing the relationship between the
MOH and the public providers. Some changes in the a.urent statutory and financial arrangements
to accompany the regu1ation for the allocation of overall responsibility to the decentralised agencies
will obviously be necessary as it will provide the basis for promotion of efficiency (and equity) im
provements. Two issues need to be dealt with:
• delineating the postulates in this relationship that support a model of incentive
compatibility for the achievement of some common (system-wide) goals, and,
• identifying the appropriate (optimal) reward structure to be effected in the funding
arrangements.
These issues are analysed in the next sub-section, the first within the framework of principal
agatt reJationship, where it is shown it is poSSlble to have incentive compatibility through a modifi
cation of the central funding procedw'es that grants overall respoIlSlbility to the decentralised pro
viders. This is considered in a rather generalised conteKt, although with specific emphasis on
-188-

hospital units within the health care system. The second issue will be resolved in the context of de
velopment of an intra-sectoral financial allocation agreement, verifiable and agreeable to partici
pants in the relationship, after the potential effects of a change in the funding procedures aimed at
ameliorating system efficiency and equity are outlined and analysed. This will be used later as the
basis for proposals to refonn the resource allocation procedures (next chapter).
6.2.2 Funding and performance incentives under the agency relationship
We have stated elsewhere the state ought to ensure health services are available to all the
population In light of the discussion above, the relationship between the Ministry ofHea1th and the
providers of health care can be framed in tenns of the agency relationship under which the latter
(described as the agents), act on behalf of the fonner (the principal) in health care rationing
decision-making process. In this set-up, the principal is the one statutorily granted the responstbility
for enswing health care services are provided to the population Viewed in this light, the principal
may take diverse designations-it would be the MOH if we have in mind the whole country; but it
could also be a provincial or a district health authority that is responstble for health care services
within a particular region in the countIy, or, indeed, any other decentralised level of management
(say, in charge of a particular type of service, group of the population, and so on). The identity of
the particular level of decentralised management does not change the nature of the principal, but it
has consequences for the type of monitoring which can be exercised, given the amount of informa
tion availablelrequired-at each of those organisational levels-for effective control.
The agent, on the other, can be the lower level organisations responstble for health services
in a certain region (vis-a-vis the MOH), or providers-hospitals, health centres and dispensaries
that act on behalf of the principal. The physicians or other health personnel responstble for resource
allocation to individuals may be considered as the ultimate units of analysis, beQwse it is them who
supply the work-effort in terms of medical service provision (m collaboration with other [passive]
inputs) to produce 'output'.
Viewed from the perspective sketched above, the agency relationship becomes the appropri
ate basis for analysing resource allocation and use since it immediately brings to the forefront the
need to Wlderstand the enviromnent which surrounds the relationship. In general, the principal en
joys the outcome of the agent's activity and needs to appropriately 'renrunerate' the agent in order
to motivate and compensate for the disutility suffered by the latter. The reward structure must cope
with both elements of compensation and motivation, taking into account the issue of infonnational
-189-

asymmetIy raised above, which leads to 'adverse selection' and 'moral hazard' problems, in order
to orient their efforts towards some planned targets of perfonnance. These problems are relevant
for both the public and private sector providers. Before we disaJss the basis of system of incentives
that can be adopted to do exactly that in the Kenyan case, let us first outline the essential ingredi
ents of the reward structure within the priIripal-agent relationship.
OptimoJ reward stnu:Jure in a single agency re1otionship
Following the discussion above, the health care providers (both public and private) can be
viewed as 'agents' acting on behalf of the state (the principal) which has the responsibility to ensure
adequate health care services are available to the population The state has several areas of interest
where incerItM>raising is required. First, it wants to induce consumers to consume health care
services without necessarily resorting to fiivolous consumption, which is wasteful. Second, on the
supply side, it has interest in ensuring that providers provide the right amounts ofhealth care serv
ices. The interaction between the 'principal' and 'agents' in this set-up can be likened to that be
tween the employer and an employee.
Following Lazear (1987), the principal-agent relationship may be defined in simple tenns as
follows. The employer seeks, through the clever use of an incentive contract, to get the worker to
operate efficiently, which enables the fum to achieve lower costs and hence become more competi
tive. Competitive firms can offer higher wages to workers and in so doing draw efficient workers
from the less competitive firms that QU1IlOt afford higher wages. The objective function &ced by
such a film may be stated as:
Max. F(Q,E) -C(E) ...................................................................................................... (6.1) F
Where Q is output and is defined as the numeraire and E is worker effort. The fum announces a
compensation schedule F(Q. EJ. C(E) can be thought of as the monetaIy cost associated with sup
plying effort level E. perfect competition in both product and factor markets implies that finns
must maximise the worker net wealth as in (6.1) subject to the zero-profit constraint
Q =F(Q,E) ...................................................................................................................... (6.2)
An incentivtHAlmpatibility problem arises because workers take the compensation scheme F(Q. E)
as given and choose effort levels to maximise expected utility. Once a worker has accepted the job,
hi&'her problem is
-190-
Max. F(Q,E)-C(E) ..................................................................................................... (6.3) E
The worker's effort supply function can then be obtained by solving the first-order condition ass0-
ciated with (6.3) to be:
C/(E) = ~. ~ + ~ ........................................................................................................... (6.4)
i.e. the worker sets the marginal cost of effort equal to its marginal return to himIher. The transfor
mation of effort into output, ~, depends on the production function, e.g.
Q=E+v ............................................................................................................................ (6.5)
so that output is the sum of effort, E, and luck (v). An incentive contract selects F(Q, E) subject to
the zero constraint (6.2), taking into account that the worker behaves according to (6.4). Various
types of incentive contracts are subsumed by F(Q, E)-the polar cases being salary on the one ex
treme, and piece-rate on the other (see Lazear, 1986). A salary is a compensation that depends
only on input so that F(Q. E) takes the form S(E), such as an hourly rate. Irrespective of the
amount produced, the worker receives only a fixed rate that depends only on the &et helshe sup
pJies E of effort. The main deficiency of these types ofincentive contracts is the difficulty of meas
uring E, or the input}. On the other hand, piece-rate compensation depends only on output so that
F(Q. E) takes a form such as R(Q). No matter how nruch or little effort the worker puts, remu
neration depends only on the number of units produced.
A IlUIllber of other intermediate fonns of incentive contracts exist (see Lazear, 1987 for
more detailed t:nmmems) and one form which is particularly relevant to us is the one where pay
ment is by relative output. Two variations eKist in the literature. The first characterises labour mar
kets as 'tournaments' where workers are pitted against each other. The one with the highest
output gets the winning prize (e.g. in the form ofhigh wages) and the other the losing ~ (low
wage). By increasing the spread between winning and losing prices, incentives are provided to
work han!. The optinnun spread induces workers to move to the point where the marginal cost of
effort just equa1s the marginal (social) return to it. This approach has two advantages. FlfSt, it only
requires that relative comparisons be made. It might be easier to observe that one worker produces
more than another than to detennine the actual amount that each produces. Second, it 'evens out'
common noise--attributable to fDctors that have nothing to do with worker effort-so that the
'best' worker is still identified, i.e., relative comparisons are wWfected. This ensures that both risk
averse and risk neutral workers are not penalised for fDctors beyond thek control. The main disad
vantage of this form of incentive contract is that it can only encourage workers to behave effi-
-191-

ciently if they are risk neutral. But workers can increase their probability ofwinning by subverting
other workers' efforts-in other words, it discourag~ co-operation and team spirit.
The second approach suggests that if output levels can be observed, then payments can be
based, at least in part, on team average (see e.g., H()1mstrom, 1982). Using team average allows
finns to better address risk aversion A peer average picks up disturbances that are conunon to all
the fums and allows each to cater for the tastes of risk-averse workers. The problem with this ap
proach, particularly in the health care market, is that output is not only diffiaJlt to measure, but in
addition, there are problems of quality, which may be even harder to measure. Incentive contracts
based on output quantity induce workers to go for speed and in the process, ignore quality. Of
course, if quality can be observed, then the worker can be compensated appropriately for quality
and quantity. The appropriate compensation schedule would essentially be the consumer's demand
for the product as it varies with quantity and quality. These aspects are particularly relevant in the
health sector, as the next section will show.
The next sub-section discusses how a similar approach can be used to raise incentive com
patibility in the health care system, with special modifications which will be pointed out as the
analysis unfolds, and explores the problems that may arise (specific to the health care) under each
approach.
6.2.3 An application to centraDy-funded health care fadines
Following Ledyard, 1987, we may desaibe an economic environment (e) as those features
of the allocation process that might be taken as given, including a description of the agents, the fea
sable allocations they have available and thek preferences for those allocations. The economic envi
ronment describes the agents, thejr feasible allocations, and their preferences for those allocations.
Let i= ),2, .. " n denote each of (m this case, public sector) health care providers, and A be the set
~_'1...' all' (1 2 3 rw n rw l > O' nmical element f A, that of lQmWle ocattons (X = (X , (X , (X , , • " \.AI , \.AI - IS a ~Jt,. 0 so " ~ (XI = A, where A is the available (budget) resources to be allocated among the agents, Each
1-1 agent (here taken as a health care provider) is assumed to have a selfish utility function ul
«(Xi). The
enviromnent is desaibed by e = (I, A, u 1 , u2
, . •. , u"), where I defines the available production
technology. Infonnation is initially dispersed since only i, and only i, lmows ul . The specific knowl-
edge that i has can be identified as i's characteristic e l • The economic environment in this case can
be described in terms of ui, since that infonnation resides only with i, hence we can set ul = el
. Al-
though it is poSSIble to argue where providers submit periodic reports about their activities (as all
-192-

public f8cilities in Kenya are required to do by the Ministry of Health), the 'onmiscient' (central)
plamer, since &he has all the infoImation pertaining to the i's is in a position to evaluate u i , this is
hardly the case (for reasons to be discussed anon).
Following Hurwicz (1960), one poSSIble allocation mechanism requests information from
each of the i agents and proceeds to compute a feasible allocation. It requests information from each agent according to a response function j(rl, r2, ... , rn), where each agent reports
rl = fir, ei), if others have reported r, (here, the r's can be interpreted as budget requests, where r
is standard-common-knowledge or reported-infoImation). Let Jl( e,f) be the set of equilibriwn
response fimctions in the environment e. The feasIble allocations can then be computed using an
outcome function 'I'(r) and the net result in an environment e is the allocation'l'[Jl(e,J)] = aifall i
follow the rules,f(Ledyard, 1987). This can be interpreted as follows: all (public) health care pro
viders send their budget requests that are ec:pressed as functions of prices, computed on the basis
of aggregate demands of hemth care consumption in their respective regions. In equilibrium situa
tions, each provider would then be allocated a budget according to the reported price and demand
intensity. Allocations computed on this basis would be pareto-optimal.
The problem in the above budget setting mechanism is to identifY mechanisms that will be
self-rei1(orcing-i.e. for which no provider is encouraged to cheat (Coles and Malcomson, 1979).
Ifa provider gains nothing (and possibly looses) by cheating (e.g. through use of the WKletectable
characteristic [u l ] that is unobserved externally), then the allocation mechanism is said to be incen-
tive comp:rtib/e. Formally, an allocation mechanism is said to be incentive compatible in all environments (e) whenever there is 00 agent i and no environment Ein e, and 00 characteristic £., such that El eO, I is in e (where El eO, I is the environment derived from £ by replacing El with £., ).
aIXlsuchthat
ul{'I'[Jl(e,f)], el} > UI{'I'[Jl(£1 I e.=e 0' 1,.1)], el }
where ul (a· , El) is in i's utility function in the environment £. That is, no provider can pretend to
have a characteristic different from the true one in order to get an allocation in eKCeSS of the correct
one-aJl providers have an incentive to report correct infonnation. In such a case, the rules are
compatible with thejr (providers) motivations. In other words, incentive compatibility involves
identifying conditions under which, in our case, perfonnance standards can be recreated by an allo
cation mechanism under the hypothesis that individuals will follow their self-interest when they par
ticipate in the implementation process. We propose that in the health sector such incentive
-193-

compatibility mechanism may be achieved through enhancing 'goal compatlbility'-viz, shared ob
jectives by both providers and purchasers ofhealth care services.
By transfonning the problem of health care resource allocation into one of output sharing,
we can view it as a bargaining situation which is amenable to the tools of Game Theory since the
ex:istence of transaction costs, infonnational asynunetries and the characteristics of health care fit
into the framework outlined above. In particular, a solution to the problem requires the search for
some contract agreeable to both parties in the agency-relationship. In the context of the health care
sector, this can be realised through the separation between demand division-that generated by the
mediciIl staff in filcilities, and the supply division of the central administration Under these circum
stances, budget based contracts can be an efficient response to the dichotomy between actual man
agement and the controVownwership of the provider units. Farna, 1980, notes that this type of
solution requires only that
(a) the activity should be capable ofbeing carried out under minimum degree of discipline
among agents (for instance, in competing for a fixed amount of resources), and
(b) some 'market' for the recognition of agents' capacities with regard to their performance
eKists (e.g., the principal is willing to compensate according to perfonnance)
The second requirement means that the agents' compensation consists of two parts----one
defined over the subset of mvourable outcomes, and another defined over unfavourable ones. Fol
lowing the framework of reward structure outlined above, this scheme ensures agents are not ~
nalised when perfonnance is affected (particularly adversely) by fiIctors outside their control.
Consequently, the contract is specified with reference to a standard benchmark. As a resuh, the
outcome is made dependent upon the relationship between actual and pre-stated perfonnance stan
dards, where 'perfonnance' is defined over some observable attnbutes of the outcome, derived
from the agents' activities.
This general setting for incentive enhancement could be optimal for the Kenyan public health
care system since it leads to a prior commitment to share a pre-stated amount of resources (the ta
tal budgeta1y funds availed to the sector) with a possibility of monitoring 'mininwm' levels of effort
resulting. for instance, from average benchmarks. It would have the effect of providing incentives
to the participants for behavioural changes by allowing some fonn of competition between provid
en-arising from the differ ential system of reimbursement that is to be based on some observed
-194-

levels of perfonnance, which is able to motivate a change in the agent's work effort over and
above the minimum.
But how can this framework be implemented to induce desired effects in the previously de
scribed relationship between the MinistIy of Health and the public providers? The public health
care sector in Kenya, as those in other health care systems, serves not only to relieve (mostly poor)
people of the financial risks associated with illness and the cost of health care, but also has two
other equally important functions (et: Evans, 1987). By detaching contnbutions from expected
risks--through their inclusion in the general tax system-it is able to redistnbute wealth from those
with low ex ante expectation of loss to those at high risk. In this way it integrates redistnbutional
policies in a way that the private sector cannot. Second, it serves as a collective purchasing agency
for consumers/patients. It can therefore be used to influence directly both the mix and quantities of
different services provided, as wen as their prices. In the process. the system can affect the distribu
tion of wealth between providers and userslreimbursers ofhea1th care. In addition, it can also serve
to shape the teclmology, the decisions as to how health care will be provided, and the overall out
put of the delivery system. But, and more relevant to our present work, since in addition, the Min
istry ofHealth-under whose portfolio the public health services fiill.--has a duty to ensure citizens
have access to health care services at affordable terms, it should have powerful incentives not only
to control its own providers, but also to respond to (as well as control) private providers' interests
in the system. The political and administrative structure of the reimbursement process is critical in
determining whether incentives to control providers interests would be effective.
6.2.4 Implications for improving incentive compatibility in the health sector
Our analysis so filr indicates that the inct"ntive structure in the Kenyan health care system
-both at maao and micro leve1s---is not geared towards desired outcomes in terms of efficiency
and equity. This lack of synchronisation of the inct"ntive structure and general policy aims in the
system can be divided into four major areas of concern: (I) general incentives in the health care sys
tem as a whole (as provided through the structure put in place by the government; (ii) incentives to
providers--both physicians and hospital managers; (Ui) incentives to consumers; and, (iv) incen
tives to insurers. These roughly correspond to the broad groups of transactors in the health care
sector. In general, the perlbrmance of a social system is a function of both its structure and the re
wards it offers to participants (Dunham, Morone and White, 1982). It is desirable to understand
the complexity of the responses of the transactors to the pattern of rewards, but equally important
-195-

is the need to identifY the participants themselves with the wide variety of institutions (Evans,
1987). But problems of the industrial structure of the health industry raise a fundamental social pol
icy problem-about the design of institutional frameworks so that resource allocation decisions are
assigned to people or groups of people who possess the necessary infonnation to make optimal
decisions and who have appropriate incentives to ensure appropriate correspondence of private
and social objectives (Evans, 1983). In contemplating alternative structures that can be imple
mented in order to improve the allocative and technical efficiency in the health care system, we
need to realise that different methods assign resource allocation authority differently, reflecting the
inherent infonnational asyrmnetries in the health care market and the perverse incentive created
both by this characteristic and by the social responses to it.
The framework discussed above suggests there is need to introduce a spirit of competitive
ness in the allocation of resources to the various end-users in health care. Under idem conditions,
the competition should be driven by the consumer who, when in need, decides where to seek what
services from, and so providers would have to respond according to 'revealed' consumer prefer
ences. But for reasons widely acknowledged the patient-consumer in Kenya, as in most other sys
tems, is not in a position to signifiaurtly influence the providers. Experience elsewhere suggests
that providers and insurers are the most appropriate targets for economic incentives rather than
fiUrly ignorant consumers since in most incentive schemes-case management, clinical budgets
with or without diagnostic related groups (DRGs), competitive medical plans, or prospective rate
setting--the agency role of both providers and financial intermediaries (msurers or health authori
ties) is reinforced by putting them financially at risk and making them accountable for their deci
sions (Normeman and Doorslaer, 1987). Putting the general principle of reinforcing the agency role
into practice in the Kenyan public health care setting would require a redefinition of the role of the
Ministry ofHea1th. At present, the ministry merely acts as a financial intermediaIy between the tax
payers and the public providers. The budgets of the providers are set centrally and there is little
room for competition -either by price or otherwise. Deficits are passed onto the govenunent be
cause most (public) providers are not accountable themselves.
There is therefore need for a different type of incentive structure to ensure there is increased
efficiency. This is where the role of financial competition becomes important. Following the theoty
discussed in the previous section, there are two major ways in which the public providers' role
could be strengthened by putting them financially at risk. In the regulated approach provincial and
district health authorities would get fixed budgets from the MOH budget from which they would
have to cover their beneficiaries for a prescribed set of risks. They should obtain more autonomy in
-196-
negotiating payment contracts with individual providers. They also should be relatively free to ne
gotiate remuneration packages for individual employees. Groot (1987) has demonstrated that ten
sions are created in situations where salaries of specia1ists and other health personnel are omitted
from the budget fomrula and that this may be an obstacle to the emergence of more cost-effective
practice patterns. Some strategic structural innovations are necessary if the framework is to be ap
plied successfully. Since the budget canies with it a sense of authority, it should also reflect a sense
of responsibility among the budget administrators. This demands there be a devolved administra
tive structure in which it is re1ativeJ.y easy to assign responstbility and blame in the event of non
function Besides assigning administrative responstbility, there is also need to assign policy respon
Sibility. By this we mean detennining the appropriate levels of policy formation While the central
govermnent, through the Ministry ofHea1th will be able to intervene at any level of deliveIy, there
is reason to believe the service units at different levels should be allowed some latitude in determin
ing the service mix they would offer the local population This is to be dependent (to a large extent)
on local conditions. However, it will be important to ensure the balance between primary and cura
tive care services does not get distorted as providers operate in a 'business-like' filshion The Min
istry can introduce incentives in the budget process to ensure those aspects it deems critical are not
over-looked by the providers who bid for resources.
The other approach, which would require more profound changes in the system would be to
make public (or even including private) providers compete for clients for a given budget. In this
case, in order to prevent prefemd risk-selection, certain regulation would be necessary to ensure
providers are equitable in dealing with patients. This would require the setting of minimum benefit
packages and improved supply of information
In the rest of this chapter we review the theoretical and empirical evidence of the potential
effects of competition in general, and selective contracting in particular, on some perfonnance
measures in the health sector. In reviewing the empirical evidence, we draw mainly on evidence
from the developed countries-mainly the US system, the British National ~ Service as well
as evidence from the Western Europem1 health QIfe systerns-becaus it is in these countries
where competitive health care reforms have been implemented with varying degrees of success.
However, such limited evidence as may cdst on the implementation of competitive strategies in the
developing countries will also be discussed. The purpose of this review is to make an assessment of
the kind of regulatOI)' enviromnent that is likely to lead the Kenyan health care system towards a
suiUDle enviromnent for pursuing the twin objectives ofincreased efficiency and improved equity.
-197-

6.3 Costs, Outputs and Competition
This section examines the effects of competition and regulation on some selected aspects of
perfonnance such as cost, quality, length of stay and capacity utilisation The section focuses
mainly on hospitals, the biggest user of any health system's resources, including in Kenya.
A profit-maximising hospital in a competitive environment, selling an undiffer'!I1tiated single
service, will always select an output level that is higher and a lower selling price compared to a
profit-maximising monopolist hospital, their relative sizes (in tenns of capital infrastructure) not
Withstanding. In both cases, the unit cost, at whatever output level selected, would be minirrlised.
The monopolist hospital may however earn surplus economic profits compared to the competitive
hospital because its monopoly status enables it to pursue objectives such as those discussed in sec
tion 6.1.1 above, aspects that may translate into X-inefficiency. For example, if monopoly confers a
degree of ' managerial slack', the surplus economic profits realised may be converted into types of
COsts that enhance the utility of managers--fonns of expenditure that represent opportunity cost
but that do not represent the minimum cost per unit of output (minimum marginal cost)-or are
Passed onto capital owners or employees in the fonn of remuneration that is higher than is neces
sary to keep resources in that particular use (CuIyer and Posnett, 1990). Suc~ 'expenditures no
longer correspond to the true opportunity cost of resources.
Thus, in the competitive situation, each hospital acts as a profit maximising 'firm:, respond
ing to the preferences of the fully infonned and knowledgeable consumers. Each hospital is re
garded as being so small, and one among so many, that it cannot exercise control over any aspect
of the market, except in its own (Internal) cost structure. Without collusion, hospitals are forced to
Compete only on the basis of price, since consumers seek only hospitals with the lowest prices.
lIospitals therefore have an incentive to operate at minimum cost in order to attract cw,tom Those
not operating at least cost have this reflected in higher prices, to which consumers respond by
SWitching their custom to elsewhere within the health care industry. The monopolist hospital is free
from such pressures and can afford to operate at higher than minimum costs.
Similar comparative conclusions obtain for output-maximisation subject to a no 1)ss con
straint with respect to costs. Under both competition and monopoly, the output maximisiag l~ospi
tal will set price equal to the average cost and standard results obtain. But predictions of slat.dard ..
economic theoty may be inadequate because hospitals do not adequately fit within this frarruM ork.
-198-

Hospitals are often non-profit making organisations that are different from other organisations in a
number of respects77. First, there are often two lines of authority-medical and managerial. It is
nonnal for both doctors and management to fonnulate hospital policies. The policies so fomruJated
by each group need not coincide. The doctors may not even be employed by the hospital although
they make decisions regarding the admission and treatment of patients. Given the ownership of the
hospital may also be different, there is a management triangle (consisting of physicians, administra
to~ and trustees). Such a management triangle is bound to have some effect on hospital resource
allocation For example, doctors, 'taking on the role of advocacy, and administrators, with a more
global view of hospital activity and costs, may even respond differently to the same method ofhos
pital reimbursement' (Donaldson and Gerard, 1993, p. 118). This raises the question of who in the
hospital reacts to incentives, how they react, and whether different groups of people within the
same hospital react independently or in conjunction-an aspect that depends much on the physical
structure, power and relationships within the hospital and the environment in which health care is
provided (see below).
Quality of services is another aspect distinguishing hospitals from other organisations (e.g.,
see Lee, 1971). The predictions ofstandard theory will differ depending on how much emphasis is
put on 'qUality' as a detenninant of resource allocation. If it is assumed the quality of care is given
and unaffected by output levels, and the hospital receives either wholly or in part, revenues to fi
nance its activity from patient care, expansion in hospital activity does not change the outcomes.
The follo~ Ftgure (6.1) illustrates the point. When the hospital must finance all output
expansion from internal revenues (part a ofFtgUre 6.1), output will be increased up to the point A
On the other hand, if allowance for loss or a subsidy is granted, output will be expanded up to the
point where the new constraint is reached (point P; in part b of Figure 6.1). In both cases, output is
expanded up to the point where marginal cost equals marginal revenue.
11 See Culyer, 1993 for a discussion of other factors differentiating hospitals from ordinary organisations.
-199-

Total cost (TC) .L:-_ Total revenue (TR)
o Output Figure 6.1a: Output-Maximising Hospital with no Subsidy
_ ~~~~~sidy - - ......
, , , , , , , , , ,
r.C .... --TR+Subsidy TR
, , OS is the subsidy or maxi: : mum allowable loss.
Output
Figure 6.1b: Output-maximising Hospital with a Subisdy or Permitted Loss
Figure 6.1: The output-maximising hospital under different conditions
However, ifvariations in the quality of care as a determinant of expenditure is aJlowed, some
problems may arise. Health care may be divided into two categories: necessities and SJpplementary
products (Rice, 1966). Supplementary products are amenities, not strictly necessary for health care
to have desired effects (say, in terms of patient health outcomes). Ifhospitals seek to maximise a
function that contained both quantity and quality as its argwnents (e.g., see Newhouse, 1970), it
may become impoSSIble to distinguish the increases in cost (of inputs) that are gem.Jinely quality in
aeasing from those that may be associated with the supplementary products-and a POSSIbility of
X-inefficiency arises (CuIyer and Posnett, 1990). In such cases, the cost per unit of output may be
higher than technical efficiency requires, for a given level of qua1ity-particularly if quality was
measured in terms of patient health outcomes only.
Another aspect that changes the results of standard theory when applied to hospital behav
iour is the way health care ~ are financed, particularly the use ofhealth care expenditure
insurance (or health insurance in short). If health insurance arrangements are such that there is full
retrospective cost reimbursement for whatever health care services are provided to patients, we
would expect hospitals that are profit-maxirnisers to seek to attract patients not through price com-
-200-

petition, but through naz-price competition, since whatever costs are incurred would be reim
bursed in full (CuIyec, 1993; CuIyer and Posnett, 1990). This frees hospitals from competitive
pressures and allows them to pursue objectives that may strictly not be in accordance with profit
maximising behaviour--.u:h as elevating the 'prestige' of the institution, increased security and
job satisfaction for decision makers, including for the physicians. The pursuit of goals such as crea
tion of a 'prestigious' institution can bring in particularly undesirable aspects of competition be
tween institutions. Prestige is generally related to inputs. The wider the range of services available
and the more expensive and highly specialised the equipment and persotmel in the hospital's serv
ice, the greater the status of the hospital (Lee, 1971, p. 49). But prestige is a relative thing. One
hospital's perception of prestige is a function of the (prestigious inputs) of other hospitals. If one
hospital moves ahead by acquiring new machinery, such as a computerised tomography (er)
scarmer, others may believe they have fBIlen behind. A new enviromnent is created in which their
prestige is no longer at maxinrum. New inputs may then have to be acquired to help them to the
top perch in this new enviromnent, mostly without even evaluating the contribution that the new
equipment will make (e.g., in terms ofactual health outcomes of their clients) to their operations
-it is more of a psychological than economic game. Innovation by hospital 'A' 'creates' a gap for
a competitor hospital 'B', between desired and actual prestige. Besides, other non-price modes
may be employed by hospitals in such an environment including claims of higher quality of care
(advertised to patients in tenns of the additional inputs and procedures--m.ore diagnoses and treat
ments per patient-which may rID most cases] be [wrongly] perceived by patient-conswners as
welfare enhancing but which may not actually affect ultimate outcomes), convenient locations, bet
ter levels of clinical and non-dinical care (e.g., five star hotel type of services), shorter waiting
times, (WlCOnvincingly) courteous staff: and longer in-patient stays ('just to be sure everything is
okay'). All these funns of non-price competition are cost-raising, and, provided revenues come
from priced services and insurance schemes, a rise in the desired status on the part of the hospital
leads to its raising the price in order to raise the ertra revenue required to fund the competition fur
prestige, and so on So long as the costs can be passed to the insurer, there are no incentives to
Jimit them and there is no mechanism fur ensuring that these dimensions of hospital activity are op
timal (Culyer and Posnett, 1990). Matters might even be more muddled if the physicians are paid
on a ~for-service basis, as this will tend to nmforce the adverse effects of the full cost retrospec
tive payment system. The overall implications are that more inputs are used than is strictly neces
sary for the required task; there is idle capacity (meaning higher costs per unit of output); and
fiIctor use that may be insensitive to factor prices. All these f3ctors lead to X-inefficiency. In short,
the effect of competition on costs is uncertain, but it can easily lead to product differentiation and,
-201-

consequemly higher costs. When (non-profit maximising) hospitals maximise quantity and quality
of a savice, unit costs are minimised at each activity level but activity levels will generally exceed
the optimum because consumers and producers alike lack incentives to evaluate the opportunity
costs of the services (sought or provided). Thus there is moral hazard (see Culyer, 1993~ Donald
son and Gerard, 1993, chapter 3).
In the United States, retrospective reimbursement was the most prevalent fonn of hospital
reimbursement before 1982, and available evidence suggests that hospitals behaved in the manner
described above. For example, Robinson and LufI: (1985), using 1972 hospital data found that hos
pitals operating in more competitive environments (as judged by hospital density) reflected higher
costs per day and per case than those operating in less competitive situations after adjustments for
~mix, scale, ownership and so on and there was a tendency for costs to increase monotonically
with the m.unber of neighbouring hospitals. Duplication of clinical services, variations in efficiency
of provision of specific services, higher reserve margins, higher prices and higher quality have also
been found to be phenomena common to competitive environments (Luft, et al., 1986~ Wllson and
Jadlow, 1982; Joskow, 1980, 1983; Woolley, 1989; McPherson, 1989; Wennberg and Gittlesohn,
1982}-13ctors which have been attributed (by Culyer, 1993) to the inadequacy of the underlying
tecfmology that detennines the production and cost fimctions 78.
While these phenomena obviously complicate assessments the efficiency of competition in
the health system, theoretically, it appears that most apparent inefficiencies of provider competition
owe thelr origins by and large to the payment mechanisms on the demand side (ibid.1 particularly
the use ofhealth insurance--ie., to the fonn of competition Comprehensive insurance coverage
removes the incentives for consumers (whether patients or p~cians) to select suppliers on the ba
sis of cost, and generates pressures for suppliers to compete on a non-price basis. The greater the
degree of competition for patients, the greater the extent to which economic rents will be eroded in
cost inatUng ~. Under a letrospect:ive based remiliursement scheme, hospitals have
no incentives to minimise costs in order to protect net revemJes. The combination of third party
payment and retrospective ~ creates a sinJation in which the objective of consumers
to obtain the highest quality aue available is accommodated by suppliers facing an essentially
open-eoded budget constraint. There has therefore been interest to investigate the ways in which
competition between health aue providers can be made to work in such a fashion as to ensure (l)
that the product mix, output rates and quality approximate their policy targets and (ii) that what-
11 See Culyer and Posnett. 1990 and Culyer, 1993, for a review of evidence along this line, from these and other studies.
-202-

ever is produced is produced at least cost. Most policies that have been devised or implemented to
'tame' competition in light of the above two desirable aspects fiIll under the rubric 'managed care'.
6.3.1 Competitive reforms, regulation and managed care Competitive rt/onm and ntIlIIIlged CIl1'e
Most competitive reforms that have appeared in the health sector refonn literature are
closely linked to managed care. But competitive refurms are generally not synonymous with man
aged care (Amould, et al., 1993a, 1993b). Competitive refunns are generally used to descnbe
those policy refunns that strive to improve the perfonnance of the health sector markets by bar
nessing competitive forces--either through direct imposition of competition or by bringing market
forces to bear indirectly through a process of 'yardstick competition' (see Schleifer, 1985). The
purpose of competitive reforms is not to eliminate ~ care regulation such as there may be, but
to restructure the role of the government (or more accurately, payers), to harness competitive in
centives--throu the restructuring of the regulatory framework towards increased reliance on
market mechanisms rather than connnand-and-control devices. Managed care refonns are
rnechairJsms---me competitive and some regu1atory-used to enhance competitive policy re
fonns or purely regulatory refonns or socialised refunns. They can be instituted in both centralised
systems (e.g. the British National Health Service) as well as in the more market oriented (such as
the US and other simiJar) systems.
Managed care systems strive to improve the perfonnance of the health care system by ac
tively 'managing' the patient's choice of provider care (Amould et at., 1993b). Managed care is
designed to intervene in decisions made by health care providers to ensure that only appropriate
and necessary services are provided and that those services are provided efficiently (Langwell and
Menke, 1993). The novelty ofmanaged care systems is that contractual arrangements for provi
sion are made with selected providers to provide a comprehensive set of health care services to a
designated population or group of same, usually at negotiated prices. Fmancial or other incentives
may be used to 'steer' patients towards these providers and the providers have ongoing account
ability for theU" clinical and financial performance through fotmal quality assurance and utilisation
reviews (Hay, Cwtis am Rice, 1991).
The essence of managed care is that providers become accountable to their patients or their
representatives (usually payers-the state or other ~payers) for quality, effectiveness and
the cost ofcare (Lynn, 1991). The interventions used are diverse-they could be in the fonn of in-
-203-

centive contracts or again they could be in the fonn of regulatory or administrative directives such
as utilisation reviews and protocols. The organisational innovations that have facilitated the imple
mentation of managed care strategies have mostly originated in the American health care system.
Some have evolved in response to the needs of the private sector such as the preferred provider or
ganisations (pPOs) and health maintenance organisations (HMOs). Others, such as selective con
tracting, are public sector initiatives--that have occurred where elements of managed care have
been directly canied out by the govemment-as mechanisms for competitive reforms.
The implementation of managed care and competitive refonns has taken diverse fonns in
different countries, the differences being dictated by underlying social system structures. In the
USA, the main ones being the diagnosis and re1ated groups (DRGs) based Medicare Prospective
payment System (PPS) and the introduction of more competition in the health care market
through. selective contracting and other irmovations such as Health Maintenance Organisations
(HM0s) (e.g., see De Lew, Greenberg and Kinchen, 1992; Enthoven, 1987). Other countries are
also ex:perimenting, or considering experimenting with DRGs (Wuey, 1992). The UK and some
European countries have proposed systems of reimbursement that encourage competition (Salt
man and von Otter, 1992; Culyer, Maynard and Posnett, 1990). Others, such as Canada and some
European countries use global budgeting (Evans, et al., 1989; Wolfe and Moran, 1993). Some de
veloping countries have also implemented refunns such as devolved budgeting and competitively
contracting out of some aspects of health services (McPake and Banda, 1994). The theoretical as
pects of these reforms are briefly reviewed below, before evidence on their effects is presented.
Pmspedive payment systems
In the United States, the drive for refunn was as a result of a desire to constrain hospital cost
escalation particularly after the introduction of Medicare and Medicaid. Besides attempts to
sharpen consumer incentives, efforts have concentrated on two broad strategies: changes in the
way hospitals are reimbursed accompanied by price controls on hospital charges, and the introduc
tion of a greater degree of explicit price competition into the market through selective contracting.
In most schemes designed to constrain hospital inflation, hospitals contract with financial intenne
diaries to operate within predefined budgets. Historic hospital costs and utilisation patterns, ad
justed fur inflation and changes in patient workloads are used by the funding agency to fonn the
basis for estimating hospital workloads. The estimated level of workload is then costed in terms of
a fixed price per type of case to determine the hospital's budget in the forthcoming year. These
-204-

budgets can be administered globally for the whole hospital or at departmenta1leveJs with teams of
clinicians (this being tenned as clinical budgeting). In order to encourage hospitals or departments
to remain within budgets, those whose costs eKCeed the fixed rates receive no supplementary fund
ing while those with lower costs are able to retain the surplus, provided such surpluses are spent on
patient care. This approach is an attempt to break the direct link between payment and costs. A
payment system which pays hospitals according to se1f:reported costs provides weak incentives to
be efficient. Setting a fixed price based on the average cost of all suppliers in the industry breaks
that link and generates incentives for producers to minimise costs.
The Prospective Payment System (PPS) is one example of policies that use this approach. It
uses diagnostic and related groups (DRGs) to categorise hospital inpatient activity and to set price
per case. DRGs group patients according to diagnosis and resource use and the reimbursement
rate per case is set prospectively for each DRG (diagnostic related group) category according to
the average cost for that DRG. 1ln1s price per case is constrained by the funding agency and the
hospital is free to decide on the quality and quantity, in terms of length of stay, procedures adminis
tered or the rrurnber of cases admitted.
It may be expected that under this system hospitals will be encouraged to minimise costs in
order to maximise hospital net income. However, how hospitals behave will be detennined to a
large extent by market structure (Culyer and Posnett, 1990, p. 23). Monopoly hospitals may be ex
pected to contiIDJe to minimise costs under a fixed price payment system, provide the minimum
level of amenity consistent with demand and to convert any earned surpluses to profits or other
utility raising expenditures. Competitive hospitals also would strive to minimise costs but in this
case it is poSSlble that non-price competition will continue to exert a significant influence on final
outcomes. For hospitals where the PPS rates are higher than the average cost of treatment, compe
tition for patients may lead to increased expenditures on amenity and quality enhancements until
the difference between the fixed rate and the hospital costs is eroded. Theoretically, such hospitals
could expand their market shares over the long tenn, driving out those competitors unable to
break-even (as their market shares decline}-and so an industry that was once competitive
achieves monopoly status.
On the other hand, were the PPS rates to be lower than average costs, competing hospitals
would be expected to try to reduce their expenditures per case and this process can be expected to
continue until costs per case are equal to the PPS rate. In this case, it might be expected that amen
ity costs and hospital resource use will fiill., which will be reflected in talling cost per admission and
-205-

per case. This decline could be achieved through any one of several poSSlbilities: reduced hospital
stays. substitution of less expensive inputs for costlier ones, reductions in quality of care or any
oombination of these (Donaldson and Gerard, 1993, p. 122). Also, hospitals may select-out those
patients within each DRG who will be less costly to treat (Culyer and Posnett, op cit). Hospitals
may also have an incentive to select-out the less severe DRGs and treat them on an outpatient ba
sis, rather than admit them as inpatients. The effect of this behaviour would be reflected in an in
crease in the average cost per inpatient case since the inpatient mix contains a relatively higher
proportion of the more expensive (and more severe) cases. It is also poSSlble that hospitals will
either deliberately or inadvertedly-;nisclassi cases by 'shifting' some into DRGs which makes
them appear more complicated than they actually are in order to attract a higher prospective pay
ment than would be otherwise.
In summary, in a PPS, prices are not the result of negotiated contracts, nor does the system
attempt to steer patients. It is competitive refo11ll that applies 'yardstick competition' where prices
are not detennined by a competitive process but set prospectively by an oligopolistic buyer. The
notion underlying a PPS is to place providers in direct competition in the absence of direct compe
tition It seeks to aeate incentives for providers to behave as though the nwket were competitive
and 'forces' them to minimise costs. If a fixed-price PPS system is to generate cost savings, it will
do so only for those hospitals for which the fixed rate is lower than current costs. But it is impor
tant to know eKaCtly what factors have contributed to reduced costs before claims of hospital effi
ciency improvements under PPS can be substantiated, since efficiency may be saaificed if the cost
savings are achieved at the expense of quality of care or some patients remain Ulltreated or if
treated, are not treated appropriately. Reducing costs through reduced lengths of stay, earlier pa
tient discharge, or reduced in-hospital resource use enIrrnce efficiency only to the extent that pa
tients are not adversely affected and that additional costs are not imposed on other suppliers such
as primary care physicians or other segments of the comnumity (Culyer and Posnett, 1990, p. 21)
In section 6.3.2 below we shall review some of the empirical evidence that has accumulated assess
ing the effects of PP Ss along these lines.
Co11fH!1itive contracting
Besides changing the basis of hospital rembursement and price controls on hospital charges,
explicit price competition has been introduced into the health care market through competitive
contracting (Amould and De Brock, 1986). The PPS system reviewed above is of course one
-206-

fonn of competitive contracting. Other fonns include selective contracting and competitive bid
ding, which are often linked. These two are irmovations that seek to identifY efficient providers (ei
ther public or private or both) or those willing to bear some or ail the respollSlbility of the financial
risk that goes with service provision Through the process of bidding, sometimes followed with di
rect negotiations between providers and funders, contracts to provide services are awarded to pro
viders who appear promising enough to provide substantial quantities of services at a lower cost.
The bids may specify price only or may include a variable qua1ity component if this has not been
specified initially. These innovations clearly fit within the description of managed care because the
choice of provider is actively managed, but also represent competitive refunns since they also entail
restructuring regu1ations to f3ciIitate market competition
Compared with fixed-price PPS, selective contracting is more flexIble since it allows provid
ers with excess capacity (e.g., empty beds) to make use ofit through selective price discounting,
whilst offering payers the opportunity to control the range and quality of contracted services. Be
sides, in a truly competitive environment, the fixed-payment contract schedule becomes the effec
tive upper-bound to prices rather than the noon. But contracting has the disadvantage that its
effectiveness is dependent on the existence of gerruine competitiorr- 'withOut competition, con
tracting becomes impotent' (Culyer and Posnett, 1990), and also the met that there always is the
fear of a potential disruption of services in case of banlauptcy or insolvency by the winning con
tractor(s) 19. The emphasis on competition may be a critical filctor in Kenya as we have already
shown that besides the uneven distribution the ex:isting service network, it is not adequate. Never
theless, this does not rule out the possibility of selective contracting in Kenya as will become appar
ent when we review some of the evidence on contracting in section 6.3.2 below.
The incentives generated by selective contracting are to a large ex:tent dependent on the
fonn of risk sharing (between providers and payers) arrangements. The uncertainty of health care
cost coverage means the payer is uncertain ofboth the number of people from the covered popula
tion that will require treatment and hence the total cost of treatment during the period. An ideal
contract from the point of view of the payer is the one that specifies in advance the total expendi
ture, sudt as capitation contract under which nmch of the uncertainty is shifted from the payer to
the provider. Under this arrangement, the provider agrees to provide medical care for a specified
population group for a specified period of time, irrespective of the actual number of cases that get
treated or their cost of treatment. In this case, the provider has the incentive to minimise costs of
" For this reason. financial stability and quality assurance are often more crucial than prices in determining the winning bids (see e.g., McCall et al., 1987).
-207-
treatment, but may also have incentives to minimise admissions since additional workloads merely
add to costs without adding to revenues. There is need therefore on the side of the payer to estab
lish quality review procedures in order to discourage ex:cessive cost-cutting and ensure that access
is not denied to patients and the access is to acceptable levels of care. This calls for regular financial
reviews and medical audits.
On the other hand providers would prefer open-ended contracts, stipulating a core of serv
ices or base component where prices are related to specific costs since this protects their total reve
nues and rewards ex:tra workloads. Under competitive situations, open-ended contracts encourage
providers to negotiate (with payers) discounts on nonnal rates and also have the effect of encour
aging them to diversify the range of services they provide and so costs per day or per case may be
reduced. This might be good where, as in Kenya, it is desired to ensure services are available to as
many 'needy' people as poSSIble, since providers will have no incentive to serve any particular type
of clients. But in the absence of strict utilisation review procedures (which may be costly), the im
pact on total costs may be uncertain. This is where the application of the concepts disrussed in
chapter three becomes necessary. Indeed, one of the controversies of the benefits of contracting
out ofhealth services (or other publicly provided social services) is how easily could the cost sav
ings and better value for money (the two aspects much stressed by those in favour of contracting
out) to be gained from the ex:ercise be offiet by reductions in the quality of service, given their
short term nature (Hartley and Huby, 1985). The empirical evidence on the benefits and shortfalls
of competitive contracting is reviewed in section 6.3.2 below.
Global budgeting
Another reform that has been used in health care systems successfully (mainly to contain all
or portions ofhealth care costs) is global budgets, the best example of such a success being Canada
(see e.g., Evans, 1987). There appears to be a strong link between the role of government in pr0-
vider payment and the use of global budgets, which is intuitively appealing since the direct link be
tween funding sources and the provideIS makes global budgets relatively easy to negotiate and
administer (WoJfe and Moran, 1993). Where there are many funders, setting global budgets and
detennining what proportion will be paid by which funding agency would be fiu" more difficult.
Where used, global budgets tend to speeDy infonnation on the following characteristics (ibid.):
• Type of provider covered by the budget-whether physicians or hospitals, or subsets of these.
• Type of expenditure covered by the budget-whether it applies only to operating costs or to capital expenditures as well, or the latter are reviewed and approved separately.
-208-

• Type of service covered by the budget-whether all or only partirular types of services are covered.
• The process by which the budget is set-whether by negotiation between the funding agency (agencies) and the providers or are set by the payer (e.g. insurance company or the government) alone.
• Action taken ifbudget is exceeded--in most cases end of year ovemms are not covered as matter offilct in order to control costs.
• Budget financing source(s). • Geographic boundaries to which the budget applies, if any. The level of geographic
specificity is a function of the degree to which negotiation is a part of the budget-setting process. Regional (rather than national) negotiations often result in better triage between payment levels and local comnnmity health needs.
Besides the notable success of Canada (the second highest per capita spender on health care
in the world after the US) in controlling health care costs through global budgets, the effects of
global budgets have hardly been quantified. But to the extent that global budgets are a fonn of ret
rospective reimbursement, all problems associated with this form of rembursement (as discussed
previously can be expected to abound) whereas if they are set prospectively, they approximate the
PPS system disrussed above. However, in most cowrtries that previously used global budgets, e.g.,
the United Kingdom and some European systems, dissatisfaction with the health systems' perform
ance has led to evolution of different funns of regulatory frameworks because there existed no
pricing mechanism through which the supply of health care resources could be matched to de
mands. For example, in the UK, quasi-markets' or 'internal markets'-artificial markets-bave
been created through rules and regulations with a view to separating the roles of the responsibility
for the finance and provision of health services (Secretaries of State, 1989), and use is made of as.
pects of competitive contracting.
The next section looks at the empirical evidence about the performance of the system irmo
vations reviewed above with a view to drawing conclusions about the lessons learned elsewhere
that may be instructive in designing a system reform proposal for Kenya.
6.3.2 Incentives and system perfonnance under competition: What empirical evidence reveals
Substantial empirical evidence which has emerged since the early 19805 comparing retr0-
spective and prospective reimbursement systems-including selective contracting between payers
and providers-(largely in the USA) tends to lend credence to some of the concerns raised about
the PPS, particularly on how reduced costs (per day, per case) are achieved and the impact on the
quality of care (for reviews of this evidence see for example, Donaldson and Gerard, 1993, chapter
8; Culyer and Posnett, 1990; Culyer, Donaldson and Gerard, 1988; Amould, Rich and White,
-2(1;)-

1993). Here we offer only a selected review of this literature to highlight effects of competition and
regulation on hospital perfonnance and patient health outcomes.
Rosko and Broyles (1987) examine the effects on cost per admission, cost per day, length of
stay, and cases treated using data from a group of 84 hospitals in New Jersey ecperimenting with
two PPS rejmbursement mechanisms relative to a comparison group of 76 hospitals in Eastern
Pennsylvania that were still reimbursed on a cost-based retrospective system. In New Jersey, the
retrospective payment system was initially replaced in 1974 with a PPS that used a fonnula to cal
culate a prospective patient per diem payment for Blue Cross and Medicare patients. This system
was known as SHARE (standard hospital accounting and rate evaluation). After 1978, the per
diem rate was replaced by charges based on DRG categories and the system extended to cover all
patients. Their analysis shows the SHARE programme reduced costs per day by 9.1 per cent, cost
per admission by 9.8 per cent, while the DRG system reduced costs per day by 9.8 per cent and
costs per admission by 14.1 per cent, relative to the cost-based retrospective system. However,
both the SHARE and DRG systems increased admissions-the fonner by 8.8 per cent, the latter
by 11.7 per cent. Hospital average lengths of stay were reduced by 6.5 per cent under the DRG
system but were unaffected under the SHARE programme. Neither payment system was moni
tored for the impact of the shorter length of stay or lower costs per admission and per day on the
quality of care or the health status of patients.
Melnick, Zwanziger and Bradley (1989) and ZW8I12lger and Me1nick (1993) reported simi
lar results on cost per case after the introduction of selective contracting in competitive llW"kets in
California. However, in less competitive marlcets, costs per case tend to rise, albeit at a lower rate
than before (Robinson and Luft, 1988). Most hospitals participating in prospective payment
schemes experienced reductions in the annual rate of hospital cost inflation But there is also some
conflicting evidence. For ecample, Guterman and Dobson (1986) found that admissions had muen (by 3.S per cent) but their study did not control for poSSlble extraneous countervailing fitctors (and
they are aware of this) such as a simultaneous increase in hospital admissions in response to empty
hospital beds. Sloan et al., 1988, in a controlled before-and-after study assessing the effect of
Medicare PPS on the use of medical technologies in hospitals found that the length of stay of
Medicare patients in intensive care units did not change in response to the introduction of PPS but
the use of routine testing declined, while the use of many non-surgical procedures only increased at
a lower rate or actually decreased, relative to the non-Medicare patients control group.
-210-

Whether the changes associated with PPS, particularly the reductions in costs (as measured
by various performance indicators) represent real gains in efficiency has been questioned by some
economists (e.g., see Culyer, 1993; Donaldson and Gerard, op. cit.). Under the DRG PPS, costs
may fiill because hospitals exercise greater selectivity by admitting reJatively lower cost patients in
each categOIy-a form of cream skiImning. For example, Ginsburgh and Cater (1986) found that
the case-mix (an index reflecting the proportion of high cost weighted DRG-, relative to low cost
weighted DRG-patients) was 9.2 per cent higher in 1984 than in 1981, although much of this
change could be attnbuted to changes in documentation and coding under the Medicare PPS pro
grarmne. But the evidence on cream skiImning under DRG PPS, commonly termed as 'DRG
creep' is not conclusive and it is not yet known whether 'DRG creep' is a ont>-time-off effect.
Other alternatives that may lead to reduced costs under the DRG--though not necessarily total
costs-are the earlier of discharge patients, 'perhaps, with less regard to the adequacy of convales
cent fiIcilities at home or other conununity support services' (Culyer, 1993); and shifting of patients
to modes of care not included in the PPS. Whether these practices have any effect on quality of
care or patient health outcomes has also been of interest to economists. In a before- and- after
analysis of the effect of Medicare PPS on patterns of hip fracture, Fitzgera1d et al., (1987) found
that while the mean length of hospitalisation fell (by about 38 per cent) and the munber of therapy
sessions received declined (by about 50 per cent), the rrumber of patients being released to IUll"Sing
homes more than doubled. Moreover, of those released to rrursing homes, 39 per cent were still in
nursing homes six months after discharge from the hospital, compared to 13 per cent before the in
troduction of PPS. Fitzgerald et al., 1987, have conjectured the results suggest deteriorating care,
which leads to overall increased costs to society. Carrol and Erwin, 1987, in a similar study also
found that patients are on average more sick on discharge (under PPS) than previously, although
there is little evidence to suggest their changed overall health care package resulted in worse health
outcomes. Monisey et al., 1988 collaborate the view that the introduction of Medicare PPS in
creased the likelihood of an earlier discharge from a hospital into suh-acute care, with a decline in
discharges to patient's own home, and reduced length of stay. Sagar et al., (1989) examined the
location of death of elderly people after the introduction of Medicare PPS. Their main finding was
that the increase in deaths in nursing homes was greater than expected and was accompanied by a
decline in the percentage of deaths in hospitals.
Therefore, if a PPS is to be implemented in Kenya, it is important that it should have in-bullt
incentive structures and/or regulatory mechanisms to ensure that these undesirable effects are obvi-
-211-

ated. In the next chapter we outline some possible ways of alleviating these (undesirable) effects in
one of the proposals suggested for refonning the resource allocation process.
Some empirical evidence assessing the effects of competitive contracting reforms has also
aca.unulated. In one of the earlier assessments of the process and benefits (m terms of reduced
costs) of contracting out of health services and other local government authorities' services in the
United Kingdom, Hartley and Huby (1985) swveyed finns that were contracted to provide the
some level of service as previously supplied by in-house units by local govermnent authorities and
district health authorities. Their evidence suggested that the yearly savings from competitive ten
dering averaged 26 per cent on a scale ranging from potential savings of 68 per cent to eKtra costs
of 28 per cent. 'Since the average value of contracts in the survey just exceeded £m1, that range
represented considerable sums of money', they concluded. The survey also sought opinions on
'savings expectations' from health authorities and finns that were not involved in contracting. 'Out
of 59 replies, 23 expected savings of 11-20 per cent, and 27 expected savings of 10 per cent or
less. Health authorities were thus consistently underestimating likely cost savings. Finns on the
other hand estimated an average of30 per cent saving on actual contracts, a figure which is some
what higher than the average actually experienced or estimated by local authorities and the NHS'
(ibid.). Their main conclusion was that the findings 'provide ample justification for the introduction
of competition', but also cautioned that if competition is to achieve its full potential, the right con
ditions must be provided, in particular that:
• contracts should be awarded to the lowest bidder, on the basis of more than one specification.
• Gernline efficiency improvements require competitive tendering for different levels of service, so that the public sector buyer can obtain accurate infonnation on the cost of a little more or a little less. This enables the buyer to detennine whether the existing level and quality of service is worthwhile or whether a higher or lower level would be more beneficial.
• This should be a fixed-price contract, with penalty clauses for private finns and their equivalent for in-house units. Wrthout fixed price contracts and budget constraints, private £inns and in-house units have every incentive to 'buy into' a contract by offering optimistic estimates on price, quality and delivery.
• Poor perfonnance must be penalised. That requires a willingness on the part of health and local authorities to enforce penalty clauses for poor quality and late delivery. In principle, in-house units which are successful in competition need to be subject to the same penalties and incentives offered to private contractors.
• There I1UISt be genuine rivahy between those seeking to be awarded contracts. That requires opportunities for new finns to enter the market. WIthout the possibility of new entry, there is a danger that autels and collusive arrangements will emerge resulting in private monopolies replacing public monopolies.
• The results of competition should be publicly available. Details of the winning and rival bids should be published: rate-payers have a right to know how their money is hems
-212-

spent. Moreover, publication reduces the danger of political patronage in the award of contracts, and the information also contIibutes to the competitive process: winners and losers need to know how they compare (ibid.)
Since this study, clinical services increasingly came under scrutiny for their potential to be
contracted out and a modd of 'managed care' in which all clinical services are subjected to this
process has been published by the United Kingdom government (Secretaries of State, 1989).
There, district health authorities (DHAs) have become 'pwcllasers' ofhealth services and have d~
cide whom to contract with to provide services necessary to meet all the service needs of their dis
trict popuJations. They no longer play any direct role in the provision of services. Public hospitals
(which are respoDSlble for higher tiers of the National Health Service (NHS», some major acute
newly independent 'trust' hospitals (i.e., those hospitals with over 250 beds which have volun
teered to opt out of the direct control of the NHS to be governed by boards of directors responsi
ble to management boards that report to the Secretary of State (for health affiUrs», and private
hospitals may compete for 'block funding contracts' for providing services to a specified munber
of cases (on a threc>-year rolling basis), with additional cases funded on cost-per-case basis.
Other European countries have also implemented (albeit in slightly different fonns) models
of managed care systems based on competitive contracting. For example, the 'Dekker' refonns in
the Dutch health care system includes proposals for an 'internal-market' whereby insurers will pur
chase services from suppliers ofhealth and social services on the bases of cost and quality (van de
Ven, 1989). Similar proposal have been implemented in the Swedish health care system (von Otter
and Saltman, 1991; Saltman, 1992). The (expected) effect of these (mtema1-market) systems in
Ew"ope is 1argcly a priori and evidence concerning their impact has yet to emerge, but it should be
expected to affect prices, output, and quality, as similar experiments elsewhere have shown.
In an oft-quoted experiment on selective contracting in California, the state financed Medi
caid programme was empowered in 1982 to solicit bids from suppliers to provide hospital care to
Medicaid beneficiaries. Jotms (1985) estimated that in 1983-84 savings in eccess of 5700 million
had been realised. Paringer and McCall (1991) have also reported that under a bidding system in
the state of Arizona, Medicaid equivalent costs increased by 34.2 per cent from 1983 to 1989,
compared to 60.7 per cent inaease for traditional Medicaid programmes. McComb and Clnistian
son (1987) have also reported on the successful implementation of a bidding process in certain
WISCOnsin counties to set capitation rates for Medicaid eligibles.
Competitive contracting out aspects ofhealth services is also emerging as a poSSIble policy
alternative to public provision and has been applied mainly for non-clinical components of health
-213-

care services in the developing countries, but the evidence is very sc.antyIKl. In Uganda, one hospital
is said to be contracting out meals for statJ: elevator services and management and maintenance of
the steam and boiler houses. In Zimbabwe, 1aundry services are contracted out, while pilot studies
on contracts fur non-clinical services have been carried out in Mexico. The ectreme contracting
model which has occurred in the developed countries has yet to be explored in developing coun
tries, although it is reported by McPake and Banda (1994) that the British dependent tenitories in
the Canbbean are basing their refonn programmes on the British model, while In Zimbabwe and
Pakistan, contracting out clinical services is already occurring. In Zimbabwe, the government is
contracting out clinical services fur non-mine employees to mine hospitals in the mine areas where
a (government) district is not available, while in Pakistan, the contracting out of secondaIy and ter
tiary services is under consideration Similar measures for contracting out for clinical services are
being considered in Mexico and South Afiica. Some of the contractors are fonnally contracted to
provide services on a fee per patient day basis, others receive a subsidy for treating non-private pa
tients, while some receive global (or block) budgets. But un1ike in the above quoted studies, no in
dication of the 00ent of savings or other benefits, if any, have been given concerning·the process of
contracting-out in developing countries, without which it is hard to evaluate the potential effects of
contracting in these countries. India is also said to grant subsidies to non-govenunental organisa
tion (NGO) health filciJ.ities provided they operate an eremption mechanism for patients identified
as poor. In Kenya too, some NGO health filciJ.ities receive subsidies from the government although
there are no funnal agreements that they should serve specific groups of people, but their services
are generally available to most people, partiruIarly the poor in rural areas. This might be interpreted
as an infonnal contract, where the NGO mci1ities 'act in good fiUth', in return for the subsidies re
ceived from the state. Oearly there is potential for contracts with non-govennnental, partiruIarly
with the not-fur-profit health agencies in developing countries, and this is a potential area for eK-
ploitation in Kenya.
6.3.3 Condusions
The analysis in this section (6.3) has been concerned with reviewing the theoretical and em
pirical aspects of the behaviour of hospitals under competition The theoretical analysis shows that
there are evident hazards in transferring the results of the economics of perfect competition to the
health care sector beau lse of the peculiar characteristics of health _care, ~ infonnational
10 The evidence on aspects of contracting out aspects of health services in developing countries presented here (except the reference to Kenya) is derived from McPake and Banda. 1994, who have summarised this information from various sources.
-214-

asymrnetries and the lack of market forces (due to their non-profit maximising nature) that would
compel hospitals to minimise costs. Because of the peculiar characteristics of health care, competi
tion provides incentives that often produce results that may have the opposite effect to what is usu
ally expected-the inefficient use of resoW'Ce5. The main fiIctor making competition impotent is
the form of reimbursement mechanism used to finance hospital activity. Retrospective cost-based
reimbursement in partirular has been shown to be the single most important filctor contributing to
inappropriate resource use in health care. But by modifYing the natw"e of competition, mainly
through reforming of the reimbursement process, it is posstble to harness competitive forces in or
der to promote greater hospital efficiency. Three main reforms of the reimbursement process (the
prospective payment system, global budgets and competitive contracting) implemented particularly
in some developed cowttries have been reviewed for their theoretical innovations, as well as the
empirical evidence about their perfonnance. The empirical evidence indicates that whereas these
do not completely eliminate the undesirable effects of competition (and some like PPS introduce
other Wldesirable effects), competitive contracting appears to have the least (undesirable) effects.
The empirical evidence also shows these approaches have yet to receive widespread acceptance in
developing countries. In contemplating the relevance of these approaches to reforming the health
care sector, our conclusion is that it is poSSlble to introduce competition in the Kenyan health care
system, provided govenunent creates an environment that exploits competitive forces wherever
posstble and builds into that environment features that overcome the undesired effects of competi
tion In the next chapter we will have IIDJCh to say about the character of this environment as well
as outline some necessary safeguards.
6.4 Summary and Conclusions: Implications for Health Policy FonnulatioD in Kenya
This chapter has shown that the present conunand-and-control structure of the Kenyan
health care system that is based on a 'pyramidal' hierarchical organisational set-up is inadequate for
promoting the objectives of efficiency and equity. It was argued that due to the peculiar character
istics ofhealth care, direct control and other similar regulatory mechanisms are ineffective for syn
chronising the incentives of the participants, particularly on the supply side due to informational
asymrnetries that can be used by the providers to undennine and sometimes to counteract the im
posed regu]ation&'controIs. An alternative policy model, based on the 'agency relationship' was
then proposed and it was shown that within that framework, it is poSSIble to synchronise as well as
enhance incentive compatibility through 'goal compatibility', viz., shared objectives by both the
-215-

providers and purchasers ofhealth care. The analysis shows that introducing some fonn of compe
tition between agents (providers) can lead to 'goal compatibility'. The rest of the chapter then re
viewed the theoretical and empirical evidence of the potential effects of competition in general, and
selective contracting in particular, on some perfonnance measures in the health sector, in order to
make an assessment of the kind of competitive enviromnent that will provide a suitable environ
ment for pursuing the twin objectives ofincreased efficiency and improved equity.
The general conclusion that may be drawn from the analysis of the chapter is that there is
need to ensure there is incentive compatibility, structured so as to ensure that goal compatIbility 1»
tween the providers and purchasers ofhealth care services is achieved. While this may not be im
portant in ordinary markets, it is important in health care, mainly because of the difficulties of
measuring andIor monitoring the qua1ity ofhealth care by individuals and other purchasers (due to
infonnational asynunetries). For this reason, there is need for publicly ecpressed demand for meet
ing local population health care needs. The analysis in this chapter shows that one way of achieving
this is via the budget setting mechanism. How this achieves efficiency and equity will be dependent
on the incentives for competition and fur equitable distribution of resources that are incorporated in
the budget. The ntM chapter outlines some proposals incorporating various types of incentives for
encouraging providers to cost their programmes efficiently, to train own personnel, and so on
-216-

-CHAPfER SEVEN-
7. PROPOSALS FORRF.SI'RUCfURlNG THE KENYAN PUBliC HEALm CARE SYSTEM
7.0 Introduction
The exposition given so tar of the current Kenyan health care system has exposed many
weaknesses, particularly in the public services, which are based on public assistance, including:
• inadequate funding for particular services (which has adversely affected the efficiency and
effectiveness of those services), as well as overall under-funding for the system (see
chapter two, section 2.2.2 and chapter 3, section 3.3 .4);
• inequity in the distnbution of health care resources, including health personnel (chapter 2,
2.2.3, and chapter 3, 3.3.4);
• a general lack of incentives for providers and payers to operate efficiently. In the public
sector, the financing process financially 'punishes' economy and efficiency. In the private
sector there is insufficient functioning of market forces (see chapter 3, 3.3.2);
• a general lack of co-ordination between the public and private sub-sectors, which has in
the past led to duplication of services. Besides impeding efficiency and desired care
substitutions, this induces tmdesirable 'revolving door effects' where similar fonns of
care are financed differently, e.g., hospital services being financed by general tax revenues
in the public sector whereas in the private sector, these services are financed either by
insurance or by direct out-<>t:pocket payments (see chapter 3, 3.1.3 and 3.3, chapter 4,
4.4);
• financing that is strongly oriented towards (1) institutions (and even more narrowly,
towards hospitals) rather than services, and (0) inputs rather than outputs (see chapter 3,
3.4 and chapter 4,4.3);
• ineffective control over providers, particularly those in private sector (see chapter 3,
3.2.2).
In addition, other filctors such as advances in medical technology, a rapidly rising popula
tion, and the emergence of new health problems (such as AIDS) contime to make ~ de
mands on available resources. If the system is to be able to cope with these challenges as well as
others as they emerge, it has to be fleKlble and responsive to changes. This chapter presents four
-217-

(alternative) structural changes recommended for the public he:cUth care system to achieve that
flexibility and also proffers some suggestions about the private sector.
The rest of the chapter is organised as follows. Section 7.1 summarises the criteria used to
assess the perfonnance of each proposal. In section 7.2, four proposals for restructuring the public
health services system are outlined and analysed in light of the set criteria Section 7.3 outlines
measures that can be implemented to improve self..regulation in the private sector following the
agency framework discussed in the previous chapter. Section 7.4 summarises and concludes the
cbapter.
7.11be Criteria for Option Evaluation
The following are the simple but elCplicit arteria by which the proposals are to be judged and
trado-offs between them made more elCplicit. Our point of reference is the aurent health care sys
tem, taking into account the pressures and problems fuced by it, the level of resources that are
available to obviate those problems and the realism of the suggested means of obviating them.
7.1.1 Equity
The first aiterion, which we designate as equity, takes into account Kenya's long tenn ob
jective of health for all which aims to decrease the inequalities in health status between regions of
the country and between social strata, through the reduction of the incidence of diseases, the rate
of disability, premature mortality, and extension oflife expectancy at birth. This will be realised un-
der any option that:
• improves the distribution as well as the quantity of f8cilities available to the population,
so helping to reduce the distances that patients cover to access health care mciliti.es,
• has in-built mechanisms sufficient to ensure that the poor and certain categories of at risk
population groups have access to free or subsidised comprehensive care of acceptable
quality, and,
• leads providers to discriminate only on the basis of 'conswnption according to need'.
-218-

7.1.2 Efficiency
The second criterion derives from the recognition that pressures experienced by the econ
omy in the recent past had adverse effects on the govenunent's ability to maintain sufficient fund
ing for health care services and forced the re-appraisal of the efficiency with which resources are to
beJbeing used in the health sector. Effectiveness, quality of services and consumers' choice have
also become important considerations for improved system perfonnance. Therefore OlD" second
criteria, efficiency, will encompass an these aspects-any option that assures efficiently provided
and medically effective services (both in a technical and economic sense, as discussed in chapter
four) that are of high quality with increased choice is to be the preferred option, other things equal.
Efficiency will be interpreted in the sense discussed in chapter four, i.e. secwing maxinrum output
from the available (current) resources. The effectiveness issues are about whether the policies are
helping the system to achieve the intended objective-improved health status. The issue of con
sumer choice, which may be linked to availability, may not be central to reforms of the public serv
ices (for reasons already discussed), but ifin addition to efficiency, a proposal leads to an increase
in the choice set that is made available to patients (and on terms that do not violate the first crite
rion compared to others), that option will be preferred over others.
7.1.3 Ease/difficuIty ofimplementatioD
The third criterion concerns the pragmatic realities of implementing change in the system.
There are several dimensions to be taken into account here. FIrst, the option has to be economi
cally viable-that means affordable and therefore implementable. Second, it has to be 'politically
digestIble', although it need not be 'politically palatable' -that is, it takes into account the policy
aspirations of government policy. Third, the changes implied by the option have to be socially ac
ceptable. The public has to be shown to have reasons to want to use the proposed system of deliv
ery. Such would be the case if the option shows clearly how the needs of specific groups with
special health needs are catered for---e.g. pregnant mothers, disabled people, and children who
may have health needs.that differ from those of the average person in the health system. Fourth, the
negative effects of system change should involve a minimum of disruption Preferably, the disrup
tive aspects of the change should be more than compensated for by the anticipated benefits. Fifth,
the change should be accepted by the health professionals---that is, it should encourage the profes
sionals and other staff to work for its success rather than against it. Fmally, the option has to be
practical in the sense that there exists, or one can be devised with little cost, the managerial and
technological capacity necessary to realise it. These six factors shall constitute our third set of crite
ria for pitting options against each other, and we shall refer to them simply as pragmatic realism.
-219-

7.1.4 Adequacy
Fmally, an all embracing criterion---a:lequacy--is used in a straightforward sense to assess
whether a particular option is sufficient for the achievement of the desired objects as described
above. The option that requires the least 'other necessary changes' to realise those objects shall be
the prefem:d option 81 Therefore, the option that is adopted/prefen ed should address the current
problems of the health care system, achieve the most cost-effective balance in light of the stated cri
teria, and should not produce a new range of problems that are insunnountable, or that have more
disadvantages than benefits.
Besides these, the proposals are also analysed in terms of their acceptability to the work
force, morale of all health workers, effects on employment, and infonnational requirements.
7.2 Proposals for Restructuring the DeJivery of Public Health Care Services in Kenya
The implementation of efficiency and equity in health care is a demanding task whose out
comes are rarely perfect. It is for this reason we opt for an evolutionary refonn where changes are
implemented gradually as the health care system develops institutions and mechanisms necessaIy to
support new structural changes. We start from the recognition that the (present) public system has
incentive structures that are inappropriate or deficient for the promotion of efficiency and equity.
There is need to address the question ofwhat type of incentives (and other structy(al changes that)
would be needed, and to whom (or where) and when they should be directed in order to realise in
aeased effectiveness, decreasing costs, operational efficiency, allocative efficiency, and equity.
In sub-section 7.2.1 we present four proposals each of which can be adopted by the public
health delivery system to realise (with vaIying degrees of comprehensiveness vis-a-vis) the filctors
listed above. The four proposals are (I). the current system with 'modest' internal changes, (b).
adoption of 'global budgets', (m). implementation of prospective rmnbursement, and finally, (iv).
the separation of the purchasing and provision roles through the implementation of provider mar
kets. These proposals have been arranged both in terms of their (I) increasing impact on efficiency,
and, (b) increasing difficulty of implementation The last two are the only refoons likely to increase
11 In the health economics literature, the adequacy criterion is usually addressed at the macro level from the stand-point of whether the level of health care spending is adequate. This often is approached in terms of international comparisons. But as the IHSM, 1988, has argued, this is a moot point as 'it is impossible to assess whether a gi~en country's level ~health ~ is adequate because there will always be unmet need.' (po 19). At the IDlcro-Ievel, adequacy 15 defined ID terms of whether consumers (subjectively) judge the services adequate (ibid.).
-220-

competition in the system. The other two are 'rearrangements' (to varying degrees) ofexisting sys
tem. These proposals are disaJssed next.
7.2.1 Option 1: The current system with internal changes
Under this first proposal, the Ministry of Health information system, following the discus
sion of section 6.2.4 in the previous chapter, will be used to develop local information data bases
that will be useful in generating some indicators of perfonnance to be used to gauge the perfonn
ance of each filci1ity with respect to movement towards predetermined objectives. This requires the
development of perfonnance indicators that can help increase the efficiency of resource use. For
example, indicators of the average cost of providing a certain type of care such as maternity serv
ices may be developed for all hospitals with a maternity ward, and hospitals would then be required
to emulate the lowest cost hospital, provided it is established that the low cost has not been
achieved by trading off quality for cost. This might be diffiaJlt without information about the tech
nical relationship between output and inputs. Such a relationship may be developed by use of'Del
phi panels' or through other methods such as regression analysis, system analysis, and so on
The integration of clinicians in the budget development process is important because they
are among the major allocators of health care resources. Their participation might involve the de
velopment of infonnation on outcomes expected of various medical interventions, quality of care,
and appropriate case-mixes. This would then allow cost-effect:ivtness analyses to be applied in de
termining the best ways of using the limited resources. The usefulness of P=' reviews has also
been recognised by the MOH The application of the results of such reviews may lead to better use
of resources than is the case presently.
The payment ofhealth persormeI could be altered (at present they are paid a fixed salaIy) to
incorporate a 'pe.rfomwlce related component' by which staff receive a combination of capitation
fees, fees for some items of service (this is passable under the present arrangements where it is pos
SIble to admit private patients in amenity wards in some public filciJities), and some allowances that
are based on 'good practice'. This would encourage standard setting and make performance re
view more acceptable to health professionals (rather than view it as an hidden agenda designed to
intrude into thejr professional autonomy).
Another internal reform that is worth attention is contracting out those in-house activities
aurent1y undertaken using ministry ofhealth personnel to the private sector through the use of the
-221-

tender system, following the guidelines on competitive contracting given in sections 6.3.1 and 6.3.2
in the previous chapter. In that chapter we have already shown these are being used elsewhere and
provided the expected benefits exceed the opportunity costs, it should be encouraged. But as this
would be a new ground, this should at first only be restricted to those activities that have no bear
ing on health outcomes of patient care such as catering and IaundJy services. The move towards
this direction could start on experimental basis in selected institutions, provided enough legal
clauses are put in the contracts to ensure there are no loopholes that might lead to some hospital
managers misusing the tendering process for individual gains. When enough experience related in
fommtion has been accuIIDJlated, then contracting out can be introduced into clinical services.
Assessment in tenm of the evabuItion criteria
There is little in this first proposal to suggest there will be improved equity and therefore it
f3lls short of the requirements of the first assessment criterion---tlClUitY. The financial incentives (to
health persormeJ) may lead to some improvements only in terms of throughput, but we cannot tell
a priori whether any disadvantaged groups would gain out of this change or not. However, the
performance related pay may be set in such a manner as to encourage such groups to receive in
aeased attention of the providers (see option two below on how such aspects may be incorpo
rated in setting pay levels for personnel). Increased efficiency may be expected although this will
not be phenomenal. But, although this proposal appears simple and straightforward, it has massive
infonnational requirements-to develop performance indicators, assessment of alternative ways of
providing care in order to detennine the lowest cost option will need to take into account factors
such as variations in case-mix complexities aaoss providers. The creation of the required data base
necessary for development of performance indicators will divert resources from current provision,
the extent of which is hard to judge at this point. This will require personnel trained in statistical
and epidemiological analysis, among others, which makes extra demands on current resources. It
therefore appears the proposal makes more demands on the system than it 'promises' to deliver,
partiallarly on the counts of efficiency and equity. However, given the complementary nature ofit
vis-a-vis other proposals, aspects ofit may become 'suitable inputs' into other proposals, as shown
below.
-222-

7.2.2 Option 2: Introduction of reimbursement using 'global budgets' A. Introduction of reimbursement using a resource allocation formula (a) The setting of institutionoJ recurrent budgetory needs
Under this proposal, in addition to some of the internal changes suggested in proposal one
above, resources would start to be allocated to regions-provinces or district&-<>n the basis of
area 'needs'. There would be need to develop regional health (need) indices. Mortality and mor
bidity are among some of the leading contenders. A combined index: of mortality and morbidity
would be the ideal index but due to scantiness of data, simple proxies of need might have to be
adopt~for example, the use of mortality data that more reflects the health status of each region
Geographic discrepancies in still births, infant, neonatal and post-natal mortality rates would be
suitable candidates here, because the highest proportion of deaths and morbidity in the population
occurs in these early childhood ages. In the absence of such refined data, childhood mortality data
might be used. If overall area mortality rates were to be used, the sensitivity of the index and com
parability between geographic areas might be improved by 'standardising' the mortality rates, as
well as developing a composite (hybrid) index: that reflects the effects of different causes of mortal
ity (mcluding sex composition), which are bound to reflect ecological fBctors that influence death
rates in different regions. The result of such an exercise would be a ranking of regions according to
'need'. Once this has been done, the neKt stage would be to try to link the health resources distri
bution to regional health status. To do this, it would be necessary to relate productivity and ec0-
nomic efficiency in health production in different areas. The assessment of economic efficiency
could be &cilitated by an Wlderstanding of the technological and economic (as well as non
economic) components of 'health production' in the regions. A cross-sectional production func
tion, relating inputs (resoun-.es) to outputs (health status--proxied by measures descnbed above)
in the different regions could then be used to gtnnte 'resource allocation coefficients' that could
be used to evaluate the extent to which differences in regional health status may be related to the
distrIbution of resources. Such a model could provide the basis on which future budgets would be
based as it gives the basis on which resources might be 'justifiably' transferred from one region to
another-it implicitly provides a measure of the relative productivity ofresoW"CeS vis--a-vis the 0b
jectives of efficiency and equity. But it might be necessary to make some adjustments to the out
comes of the above exercise to cater for net-cross boundaIy patient flows, speciality costs and the
costs of some teaching &ci1ities. The general13ctors that the fonnula will take into account are as
follows (most of these might be incorporated directly in the estimation process if regression analy
sis were used):
-223-

• filctors that help account for variations in need for health care across geographical areas:
these include, for example, the population size, its demographic characteristics,
morbidity, and the socio-economic characteristics of the population These filctors, used
in conjunction, may indicate the 'relative deprivation' (of health care services) faced by
the popuIation in a certain area. Demographic characteristics would be used to adjust
(weight) regional populations in re1ation to need for health care. Mortality data may
better reflect need for health services as opposed to data on hospital outpatient (OPD)
attendance, admissions, etc., which vary according to the regional distnbution (supply) of
fi1cilities. Then the regional standardised mortality rate used as a proxy of moIbidity may
be a comprehensive summary of relative need for health care in the area.
• any eKtra workload imposed on an institution due to its status (viz., teaching hospital,
specialised, etc.).
• cross-bO\Uldary patient flows (this would have to be done separately),
• market forces-to incorporate the relative variations in the costs of locally purchased
inputs, e.g., food-stufiS, non-qualifiedlspecialised labour, etc. This adjustment might turn
out to be insignificant, in which case it may be dropped.
• other filctors: e.g., population distnbution, availability of private care f8cilities, etc.
Sparsely distributed popuJations raise service costs, as do populations that can only be
reached through special efforts, e.g., using mobile clinics to serve the areas inhabited by
the nomadic peoples.
For the foregoing to perform as expected, a good infonnation system is necessary. This pro
vides not only the flow ofinfonnation between the diffaent levels of health care delivery but also
for accounting purposes, as well as the basis for decision-making at different levels. This infonna
tion system should collect. analyse and publish, both health and social data, by regions,
economidsocial classes, and so on
The following example illustrates how a simple financing system (with an equity objective of
equal per capita inputs for equal needs~ which results from the consideration of the fiIctors dis
wssed above might have might be implemented. For ~ district, infonnation on (I)
demand/utilisation, (ii) health situation in each region, and (m) existing health coverage would be
collected. This infonnation could then be used to detennine the distnbution ofhealth care expendi
tures as follows (see Figure 7.1 below).
n See chapter 5, section 5.3.
-224-

. Demand! Equitable t • ..
utilisation . distribution
Rate of utilisation by main ..
patterns of health expenditure areas at national
Demographic expenditure
level: structure at •
- preventive services district level
- curative services - estimates for private sector coverage/utilisation. District
health , .~ t i .. situation Standardised fertility Mortality rates at district
rates at district level level: Demographic
(preventive services) - infant mortality structure at - specific mortality 1-4 district level and 5-14 years olds
Proportion of women - standardised mortalkity with secondary ratesfor 15-64 year olds school education Level of coverage -i f
.. by existing health services coverage
Coverage by health Demographic structure (on inverse basis) services indicators: at district level - preventive services - curative serices - private sector activities - others - health related
Figure 7.1: Towards a resource distribution fonnula: A diagrammatic representation
Demand or utilisation rates ofhealth services-based on utilisation by sex: and age groups at
the national level would be applied at district level in order to detennine the demand that would ex
ist if a district had the same use-profile as the rest of the cowrtry. This implicitly assumes that the
utilisation rates of health care services-by sex: and age groups--should be the same all over the
country, which may not necessarily be true. This deficiency could be partially obviated by adopting
two further adjustments. FU'St, by weighting the populationS3 in each district with the health situa
tion indicators-infimt mortality rates, specific mortality rates for ages 1 to 4 years old, and the
standardised morta1ity rates for the age groups 5-14, and 15-64. The rationale of this adjustment is
to introduce differentials in uti1isation by focusing on groups of population which have high de
mands for health care services, partiallarly the young (given the countIy's population structure).
Districts with a worse health situation would receive a bigger allocation of health care resources.
Second, the weighting of district popu1ations by age groups with 'health services coverage' indica
tors on an inverse basis should minimise any remaining biases. The weighting process would in this
13 Preferably. the population base should be a future population-say. five year projected population-that will be catered for.
-225-

case be designed to favour the more disadvantaged districts. For example, the population aged less
than one yeN might be weighted with the percentage of coverage by health centres and the per
centage that has received reconunended infimt vaccination according to the Kenya Expanded Im
rmmisation Programme (KEPI). If the coverage by health services in different age groups is
relatively high in a certain district, that district should end up receiving less resources, the health
situation notwithstanding. (Recall the principles of efficiency discussed in chapter four).
The application of these criteria to the fonnulation of expenditure distribution policy will
VIUY according to the type of expenditure under consideration, i.e. the weights would vary accord
ing to whether it is preventive services, curative services or services by the private sector. The
weights used will have to be compiled from infonnation that is specific to the type of expenditure
under consideration Similarly, appropriate weights would be required for application to capital de
velopment expenditure allocations (see section (b) below), which could be then structured so as to
hasten the pace at which increased services availability proceeds (when private sector services are
also taken into account) in the poorly served areas, so that regional health status converge to the
national average.
(b) Setting copitoJ budgets
The capital allocation process can follow similar principles to those used in the recurrent ex
penditure approach. It will be necessary to set targets for capital fBcilities and compare these with
the existing facilities in order to determine relative regional deprivation To do this, it will be neces
S8IY first to value each region's (province or district) capital stock. Such a valuation should be as
comprehensive as poSStble-encompassing the value of ecisting land, buildings and equipment
an exercise that can make use of stock schedules that already exist (which should be updated
where necessary). Plant and equipment that is relatively old-appropriate accounting procedures
should be used to detennine the age at which plant and equipment should be considered obsolete
-axud be valued at its replacement cost and depreciated accordingly in order not to over-value
the existing stocks where they are likely to become a bottleneck in the IleM future. On the other
hand, plant and equipment which, though still in active use, is considered obsolete in terms the de
preciation rules should be valued at its (current) repJacement cost.
The second stage of the capital allocation process would be to set notional stock: targets for
each region by 'distrb.rting' the value of the total capital stock pro rata to appropriately weighted
regional populations. Preferably projected future populations should be used in the weighting
-226-

stage. The difference between the target (notional) stock and the existing (actual) stocks reveals
the over- or under-target position and shows the degree to a region is above or below its capital re
quirements, given its popuIation Capital allocations can then be set in such a way as raise the
under-target regions to their target levels.
There is one major problem to be confronted though. It should be borne in mind that most
capital in place is relatively rigid. While the distnbution of new capital allocations can be varied at
will, existing infrastructure cannot be similarly changed. Consequently, it would be necessary to de
termine the mininwm levels of capital which should be allocated to each region without regard to
any relative shortf3ll in order to ensure services continuity. The relative increases/decreases in capi
tal allocations to change the regional distnbution should then be determined independent of this
minimum requirement level.
(e) Some dijJicuIties in tM use of afOl7llllla to allocate ~ (i) The difficulty of incorpaating efficiency in the resource allocation formula
The use of a fonnula to allocate resources has the prirnaIy objective of redressing inequity in
the system, by eventually leading to equal opportunity of access to h~ aIre for people at equal
risk84, besides implicitly promoting self-sufficiency. But, as we have already shown in this thesis, the
efficiency of resource commitments in alternative uses has to take account of the efficiency with
which those resources are used. Ifit turns out that the neediest areas (according to the fonnula) are
the least efficient by the criteria of the efficiency of providing services, a real possibility of conflict
arises. If this inefficiency is penalised by denying resources to these (inefficient) regions, this would
have grievous effect on patients as ther access would be further aJrtailed. A possible strategy prof
fered in the UK to resolve a similar problem is to institute a system of inter-district payment for
work performed by districts other than the home one (Paton, 1985). The less efficient districts con
tract with the efficient ones to perfonn for them the tasks they are less efficient at. This allows
money to change hands, yet it is stiD spent on services for people in the district that received it on
QCCOUTd of its relative deprivation, and is spend on services that are efficiently provided. The sys-
84 Although this might not be realised in actuality. Priorities vary from one area to another and services may similarly vary. Even if we assume service variation is not due to differences in efficiency or the effectiveness of the same services in different areas, individuals in different regions might still experience differential opportunities of access to particular types of services despite the fact that they are at equal risk, owing to the orders of ranking diseases in the different areas. The formula has to provide incentives through the manipulation of the resource allocation process or directives to areas concerning services. Granted that all health problems cannot be tackled simultaneously owing to resource constraints, resources can be allocated to regions on the basis of a set of priorities based on a ranking of 'general disease groups' in a way that broadly ensures that there is equal opportunity of access across regions for those at equal risk to treatment in each category rather than for every disease.
-Z27-

tern thus allows reallocations to 'needy' areas to contirrue, despite the shortage there of filcilities,
adequate expertise andIor lack of enough time to provide certain services quickly. The contracting
out need not be with other public providers only, it could include private providers within or out
side the district. The policy thus leads to improved fleKIbility between capital and revenue alloca
tions and allows sound economic decisions to be made-e.g. as between provision at home and
contracting with other providers. TIrus the aim ofusing a fonnula for resomce allocation (equity) is
met without necessarily the eschewing of the efficiency of resomce use.
But the system has certain implicit problems. The districts that contract-out for services
might get locked into a vicious cycle unless some way is found allowing such districts to build the
capacity to provide those services in the long nut There is also the issue of whether the inter
district payments would have to be for marginal or average cost. Besides, the problems associated
with a fee.-for-service mode of payment might also arise, irrespective of the basis chosen. Finally,
the issue of who pays for transport costs has to be resolved. From the point of view of efficiency,
the cost of transpOrting patients for treatment counts. But from the point of view of assessing the
efficiency of resource use by various districts, it makes economic sense to have the districts whose
patients are being treated outside their boWldaries meet these costs (although from a social point of
view it does not matter who meets these costs).
(ii) The problem of cross-bourKJary flows
The other major difficulty to be confronted relates to cross-boundary flows. Although as
stated above, the determination of a district's allocation (of capital or revenues) treats the district as
the natural unit or catchment area and therefore uses its population as the base-Iine for assessing re
source and service needs, seIvice planning and resource allocation must realise that ordinarily pe0-
ple move across district boundaries to receive treatment. In some cases such movements are so
~ they cannot simply be ignored. Even if districts were to strive to be self-sufficient, it
might not be desirable to iron out such flows since on efficiency grounds, some services can only
be meaningfully provided if the substantial economies of scale (and sometimes economies of scope
too) are realised (as opposed to quick access). Where such economies of scale and scope exist, it
means the districts that are better provided or have surplus capacity have lower marginal costs. The
use ofany such district's filcilities by others could provide an efficient short-term respite (although
the continued dependence on such capacity by the latter diminishes the incentives or speed at
which capacity equalisation, or more balance provision between districts proceeds in the long-nm).
-228-

Wrth these caveats in mind, it is recommended that the resource allocation fonnulae for both
capital and revenue should have 'in-built' mechanisms to adjust allocations to take into account
these cross-boundary flows--by adjusting district popu1ations for these flows. This adjustment
cannot be taken care ofunder the method discussed in (1) above since these flows are not activated
by those in charge of health affairs in a particular district-rnther they are dictated naturally by
gravity or decay models relating to particular institutions' catchment areas.
(~ Assessment in terms of the evaluation criteria
The allocation of resources using a fomruIa Iargely caters for equity, as already noted. If em
phasis is put on equity, the option promises large gains. Besides, in tenns of some of other evalua
tion criteria, the option fares well. For ecample, in tenns of pragmatic realism, the option would
find favour with govermnent as it promises to tackle the equity issue sufficiently-it enables re
sources to be redistributed to areas with greatest need-one of the stated government's objective.
Second, it is unlikely to lead to significant service disruption (Ifany) as there is nothing in it to sug
gest it would fitce any opposition from health professionals. Although it would definitely lead to a
reallocation of health personnel, it is unlikely to have grievous effects on the level of employment.
Fmally, it: as suggested above, the approach incorporates most of the internal changes contained in
proposal one, there would be some improvement in the efficiency with which resources are used
and therefore a cost-effective balance in service provision would be realised. But the main problem
would be need for even more irif'ormation, for besides the infonnational needs implied by the
'modest' changes suggested Wlder option one itseJt: other infonnation would be required:
• to assess the economic efficiency through use of (regional) health production functions,
• on cross-boundary flows,
• valuation of capital and its distribution-methodologica1 issues that this valuation raises
notwithstanding
• on population demographic and sociCHlCOnomiC characteristics,
• the distnbrtion of mortality and motbidity by age groups, by sex: and by regions,
• facility utilisation showing utilisation in relation to population characteristics-e.g.,
hospital attendance and admissions by age groups, by sex: and by regions, and so on
These increased infonnation demands diminish its feasibility since even more resources will
be diverted from current service provision to administration of the fixed budgets. Also the option
has irnmense demands for trained managerial resources. But it has to be pointed out that at some
-229-

point in time, these sacrifices have to be made if the system is ever going to have the data base suit
able for assessing perfonnance in terms of economic efficiency and social dimensions (equity).
B An a/temotive metJuxlo1ogy for estimating institutional budgetary requirements (a) Setting recurrent budgets
As an alternative to the method of allocating revenues outlined above, the Ministry of Health
could consider budgeting in a fonnat which shows clearly the allocations for personnel, drugs and
supplies, non-medical supplies, transpOrt operating and maintenance costs, building and equipment
maintenance costs, utilities and so on as separate categories of expenditure for each &cility rather
than the Q.11TeIlt method. Chapter four showed that it is poSSIble to reorganise the budgeting pr0c
ess along these lines (see section 4.3 of that chapter). It would then be relatively easy to track
trends in these categories, and following the rough guidelines outlined in chapter four, it would be
able to see where deficiencies exist and take corrective actionss. The main advantage would be to
ensure that items that are aucial to overall efficiency are not under-funded, whilst it will be poSSlble
to incorporate equity considerations as the following shows.
(i) Setting health per~1 requirements for facilities
According to the analysis of chapter three, health personnel is the most ecpensive resource,
taking an average of about 60 per cent of the recurrent budget in salary and related allowances. It
makes sense to use such an expensive resource efficiently. It might be necessary to re-evaluate the
budgeting process to take into account differences of health personnel requirements for different
types of mcilities in different locations--rather than adopting some arbitrarily set '(nation-wide)
staffing nollllS'. This would ensure that the appropriate mix of doctors, l'DJl'SeS, phannacists and
phannaceutical technologists, radiologists and radiology assistants, laboratory technicians, and so
on, is deployed according to regional needs. This would especially be necessary for 10weJ" level mcilities-especially dispensaries and those health centres without beds where, taking into account
diffi:2ent diseae zones, it might be necessary to staff them taking t3ct0rs such as rwrse time per pa
tient, the amrual number of patients, and the main causes of fiIcility visits for each ecological zone.
Probably, the time taken may vary with types of diseases.
IS The guidelines. based on 'international experience' suggested that: • salaries account for not less than 4()01o or more than 80 % of total recurrent costs, • drugs and medical supplies share to be no less than 10% or more than 3'% of the budget, • transportation operating and maintenance expenses to be between 5% and 15%, and, • maintenance and repair of buildings and equipment to be budgeted to for at between 1.5%
and IS 0/0, respectively, of replacement value.
-230-

For health centres with beds, laboratories and phannaceutica1 teclmologists, estimates of av
erage time taken per patient also have to be taken into account. For instance, to determine the re
quirements for laboratory teclmologists it would be necessary to identify the main types of tests
carried, which could vary with the type of disease, and probably region However, since most types
of analyses have standard procedures that do not vaI}' with region-for example, urine analysis,
blood tests, sputum analysis, and so on----only the rrumber carried of such tests may vary between
areas and this variation should be used to determine the required staff levels accordingly. Such a
procedure could be used to establish the health and other personnel requirements for different
types of filcilities in different locations.
The following methodology, if used to develop staffing needs for different filcilities should
not only lead to better use of staff resources (i.e. efficiency), but also will apparently redress the
maldistnbution of personnel. The method takes into account standard workloads--takes into ac
count utilisation, rather than the staft:population ratios inherent in phase 1 above, that are likely to
ignore the patterns and levels of morbidity (unless corrected for as descnbed).
Each fiIcility would have to identify the most important task or tasks of each category of
health worlcer in terms of hours per 'normal day' taken in various tasks. Partirular attention will be
paid to the distribution of staff time between inpatient and outpatient activities. This might be in
tenDs of time taken processing admission, time taken in inpatient wards, time taken with outpa
tients, and so on This would give the distribution of time in a 'nonnaV day of work, between those
activities, and would have to be adjusted for time-offs, arurual leave entitlements, and non
scl1eduled events such as 'sick-offs' and time taken by staff away from the filcility on administrative
duties, attending seminars, training courses, and so on The workload standard so developed
should be based on average time requirements in these functions that will maintain good profes
sional standards for the job. Such estimates will obviously need professional inputs of the staff con
caned with ecterna1 checks where poSSIble to ensure some staff are not too liberal in allocating
their time use patterns.
Altemativdy, the staff time taken in each alternative task might be used as the basis for ca1-
rulating staff requirements, assuming no task sharing, using a similar approach. This should not be
bard to accomplish as most of the data requirements can be easily determined from records or sim
ple (say one to three months txi me ecercises, although amrual data which shows seasonal varia
tions in workloads might be more infonnative )86. The figure so derived would then be divided into
I6Mwabu (1989) found that utilisation of facilities in rural areas in Kenya varied according to seasoDS.
-231-

the estimated amrual workload (e.g. estimated rrumber of inpatient in the coming year) to calculate
the number of staff in that category required to handle the estimated workload. The figures so de
rived can then be derived will give the required rrumber ofstaffin each category. This figure, multi
pJied by the average pay of the health worker category (for the particular level of health fBcility)
and summed up for all hemth worker categories for each filci1ity yields the total budgetary require
ments for the fiIcility. This approach gives the 'required' staff for each facility, for each category,
which can then be compared with actual staff deployed to the f3cility and appropriate redeploy
ment (between filcilities) can then be implemented. The ratio 'actual' frequired' would then give an
indication of which f3cilities are under greatest work pressure--those will smallest values for the
category of persormel would be the ones with the greatest shortage of staff while staffwould need
to de reduced for f3cilities where the ratio exceeds unity.
The same procedure could also be used to calculate requirements for non-health staff per
sonnel, e.g. clerical staft: orderlies, and so on The aim of the exercise should be structured to en
sure that the quality of care being delivered by staff corresponds to the minimum standard quality
. required for each type of &cility. This means, for example, the workloads calculated for nursing
staff in health centres will preswne that all health centres will operate on the same standards of
ID..JISing care, so all hemth centres will be required to use the same standard workloads to calculate
their nursing staff requirements. If necessary, the practice in the private sector could be examined
to see whether there are variations, provided quality of service is comparable. We suspect for some
categories, the exercise will reveal the MOH needs to employ more staff to meet the national re
quirementS, but the results of the exercise can be used to distribute more equitable the available
staffbefore more can be recruited (assuming funding will be forthcoming from The Treasury to
meet recruitment needs for categories of staff where acute shortage is evident). PoSSIbilities of sub-
stitution should also be examined.
There will also be need to revise the estimates from time to time as professional standards
change, as well as taking into account differences in teclmology in various mcilities. For example,
facilities with microcomputers can be expected to be more efficient in processing patient records,
producing reports, and so on, compared to those using manual methods. It should however be ap
preciated that this method of developing staffing needs will not resolve issues such as where local
demand patterns do not correctly reflect needs due to emaneous mctors such as where mcilities
have low intakes of patients due to poor quality associated with them or inability to pay for serv
ices. This 1atter filctor need not be due to the level of user charges, it might be due to physical costs
of ac.cess to the fi!cilities that result in low utilisation, and so on.
-232-

(ii) Setting pharmaceutical and non-medical supplies budgets
Shortage of pharmaceutical and non-medical supplies has been one factor that has adversely
affected the efficiency of the public health services and there is need to rationalise their budget allo
cations. Kenya is a vast country with diverse disease ecological patterns. This could serve as the
point of departure. Using ecological disease zone patterns, the major causes of ambulatory visits
and OPD health &cility visits and hospitalisation in each ecological zone (these might be refined
and narrowed further if necessary so as to be more precise) would be identified. Then the main
treatment options for each disease at different levels of facilities would be identified r7. This
would require constituting panels of clinicians who devise and deliberate on the options in order to
identifY a 'standard procedure' or several options for treating each condition. This would take into
account factors such as differential inputs necessary to treat the same condition in different loca
tions, and it might also involve comparing various alternatives. For ecample, the treatment of ma
laria might take into account the tact that some malaria strains in Western, Nyanza and Coast
provinces are resistant to routine therapies, and so on. Having decided on the 'effective' proce
dures, it would then be poSSIble to calrulate the actual cost of treating a single case of an episode,
e.g. of malaria It would then be possible to calrulate the cost of each treatment option for each
disease. Then using data on cwrent ficility utilisation, the annual estimated number of cases per
disease, adjusted for population growth, disease trend patterns, sex:-composition, and so on, can be
derived. The process might be simplified by concentrating on the top twenty leading causes of vis
its and hospitalisation, but there is no reason why it should not be as comprehensive as poSSlble.
Moreover, in order not to severely constrain the hands of clinicians, in cases where the cost of
treatments do not show large variations (may be on account of inefficient clinical practices), a com
promise might be reached by taking a weighted average cost of treatment costs. This would re
quire infonnation showing the number of patients treated using any particular treatment regimen.
The setting of the medical and non-medical supplies budgets along these lines will ensure that fBcili
ties do not run out of these items too early in the financial year.
17 These options, which would identified on the basis of their effectiveness and cost, would then constitute the only treatment options clinicians would be expected to use unless there are compelling reasons for other alternatives.
-233-

(zii) Transport operating, buildings and equipment maintenance budgets
These can be set on the same principles as the budgets for personnel requirements, but
would take into account the nature of the institution and the volumes of patients needing transport
to other f3ci1ities in case of transport operating ccpenses. For maintenance purposes, the Ministry
can contract out some of the services such as building maintenance. The Ministry of Public Works,
which is currently responstble for maintenance of public buildings can be among those tendering,
but if it wins, its perfonnance should be subjected to the scrutiny that other winners would have
&ced. The same applies to equipment maintenance, where the Ministry's own maintenance unit
can be allowed to bid on terms that apply equally to all.
(iv) Utilities and other non-medical items lmdgets
For most other items, the setting of the budget would be relatively easy if the main catego
ries above have been budgeted for. For example, in those areas with electricity and telephones, it
should be poSSlble to set realistic budgets for these items since the prices exist and any changes in
them can be easily incorporated, by getting information about anticipated changes in pricing from
the relevant corporations. The exercise is easier in that the providers of these services operate on
the same financial accounting periods as the Ministry ofHealth.
(b) CopitDl budgets
The setting of capital budgets under this alternative might adopt principles similar to those
desaibed under sub-section A (b) above.
(e) Assessment according to tM evaIuotion crit6ia
Compared to the 'formula approach', this alternative is less demanding on the infonnation
that is required for implementation-eccept for capital budgets, most of the infonnation required is
easily available or can be generated by use of relatively short period ad-hoc studies. But while the
efficiency of revenue resources is likely to improve in the short run, it might take a longer time to - ......
improve the equity situation, particularly inter-regional variations in capital stocks (given area
needs) since the revenue budgets would continue for a while to be set on the basis of the existing
capital infi3structure.
-234-

7.2.3 Option 3: Introducing publicly financed competition in the health services through prospective reimbursement budgets
Under this proposal, providers will be reimbursed on the basis ofpre-defined units of work
loads. Units of workloads could be defined in two ways: (i) in tenns of the cost of a particular type
of patient day in hospitals, so that for example, patients in the intensive care unit command a differ
ent rate as compared to those in the maternity ward, and for maternity ward patients, finer distinc
tions can be made between those who have a notmal delivery and those with complications or
those with a ca.eserian-section operation, i.e. the use diagnosis related groups (DRG) type ofinfor
mation; or, (ii) in terms of a population- and utilisation-based index. In both cases there will be
need to develop sufficient data base to enable all case mixes to be costed accurately.
(a) Use of DRG information to set prospective budgets
The DRG type of infotmation will not strictly be used for reimbursement purposes as such,
as has been the case in the US, but for general planning-in the setting of budgets that go to vari
ous providers. The purchasing agency will review the available infonnation on disease etiology,
come up with probable distributions that may be used as the basis for setting budgets. It may be
necessary to deliberate with the providers on the levels of (fixed) fees for each item and providers
are then paid according to that schedule for the 'anticipated' work.
A~ cnst Relative &t.imatai worlc- Budget provided to Diagoosis-ReIamd Grouping (lCD Codes) per day cost per day !aids (cases) caIer fur \\Orldoad
No. DeIailed des:rilXion a b (axb)
1 Jnidive diseases (00 1-136) Cl CIIX W I BI
2 Nutritional metabolic (260-279) c, C,IX w, B,
3 Ao.1I: URI (460-465) cJ CJIX w, B,
4 Pnemmnia (480-486) c4 C4IX w4 B4
S CompIi<'afi<m of pregllluq (631-639) c, C,IX w, B,
6 Skin diseases (680-709) c, C,IX w, B,
- - - - --- - - - --
ToCaI " B
W is the mcility's tDtIl workload while B is the tDtIl budget provided for that worlcklad fur this partiaJJar mcility.
Table 7.1: Setting bospital budgets using DRG infonnation: an illustration
-235-

The payment for each f3ci1ity will be based on the national cost averages of treating different
patient types, generated using morbidity-based cost estimates88• In the case of hospitals, these na
tional cost averages would be based on the use and cost of acute inpatient services for individual
DRGs re1ative to the average cost per episode of hospital stay. For eKaIIlple, if the overall (na
tional) average cost per patient stay in hospitals is x, and the (national) average cost per hospital
stay episode of a patient in DRG group i is C,~ the ratio c/x will be applied to the estimated work
load that a fitcility j anticipates to handle during the period under consideration to determine the to
tal payment to that facility for that category of patients (see Table 7.1 above).
(b) Use of populoJion and uti6sation based sIIInIIards
Prospective budgets can also be set to reflect the perfonnance of facilities gauged by general
'popuJation-based' and 'utilisation-based' standards. The population-based standard will be defined
(at the national level) as the simple product of the rate off3ci1ity utilisation per capita (e.g. the rate
ofhospital admissions per aIpita) and the corresponding utilisation cost per capita (such as hospital
cost per admission). This calculation should then be applied to 'anticipated' ambulatory or inpatient
services workloads for the various f3ci1ities. The utilisation cost per capita rates will of COW'Se be
adjusted by age distnbution of the population as well as by fBcility utilisation rates by ag&-groups
(figure 7.2)
The use of this procedure for calculating hospital activity costs can be illustrated as follows.
Hospitals, depending on the their status, perform roughly four major tasks:
• diagnostic and therapeutic
• administrative and supportive services
• nursing, and • educational (research and teaching).
These services can be used as the basis for calculating actual and expected costs by breaking
them into their respective sub-components as shown in the figure below (the list is for illustrative
JUPC>SeS only and may be incomplete), for both inpatients and outpatients.
The method would lead to a per patient cost that depends on the cost of1abour, material in
puts (such as medical and surgical supplies), prices, and the intensity of service use under each of
the major components of hospital services. Reimbursement rates to various providers would then
• Where neceSS8IY adjusted in order not to incorporate existing inefficiencies in the system.
-236-

be a weighted average number, the exact value of which will be dependent on the type of diagnos
tic category.
Rate of facility utilisation per capita
Utilisation rate by age-groups
Utilisation cost per capita
Figure 7.2: The detennination of facility cost per capita
Utilisation by case-mix
The application of this method for prospectively reimbursing providers may introduce com
petition if the purchaser allows both public and private providers to vie for the purchaser's limited
budget. If the public hospitals are allowed to keep any surplus revemJeS they generate due to the
adoption of cost-saving measures, they will have incentives to improve efficiency, where they sub
stitute less ecpensive inputs for the expensive ones, reducing any unnecessary lengths of stay, and
so on. Moreover, if they do not provide the accepted quality of care, they will be tmable to attract
patients.
To minimise the poSSlbility of deterioration in quality (usually in the fonn 'regression to the
mean') it will be necessary to audit quality in the system so that providers do not adopt cost
minimising methods which lower the quality of services. Another problem associated with pr0-
spective reimbursement is whereby providers shift the burden to other agencies or between
budgets-e.g. the shift of burden from the providers to the f8mily through early discharges, with
possible consequence on full recovery, or by providers concentrating on relatively cheap to treat
cases.
-237-

I. Diagnostic and Therapeutic services laboratory, inpatients, outpatients phannacy: medical and surgical supplies, drugs radiology (diagnostic and therapeutic) } inpatients, treatment (medical) and rehabilitation outpatients
2. Administrative and Support Services general administration medical records laundryllinen general house-keeping routines facility operation and maintenance general supplies
3. Nursing nursingadministration inpatient units (short- and long-stay) onstetrics emergency: inpatients, outpatients supplies surgical and general wards others
4. Education medical education (including research) other (including nursing, laboratory tecnology
training, radiology training, and so on)
Wage rates and Service sensitivity Service intensity prices per capita per task
,. ~ ~ .. -: ......... . I Actual cost per patient cf~ Expected ~st per patient H Value to use for reimbursemenq .... ~
I Length of stay I Case-mix Age-mix I Figure 7:3: Calculation of hospital cost-<omponents to consider
Since the method is by its nature open-ended, it will be necessaI)' to plan fur target levels of
activity in which the numbers and types of admissions are fixed in advance, but enforceable c1auses
should also be incorporated in the contracts to ensure that patients are not turned away on fiimsy
excuses if an institution has over-spend its budget. This will place an element of risk on providers
and therefore encourage them to be more efficient. But such a requirement raises issues of mana
gerial control as the resource use patterns and intensities are the ambit of physicians--admissions,
treatment regimens, and so on, whose interests may not necessarily coincide with those of the hos-
-238-

pital administrators, for example. If physicians are aware of the financial consequences for their in
stitutions, they might feel obliged to adopt methods which maximise surplus income, if they stand
to gain from such surpluses. This method may therefore be hard to implement as it may lead to
conflicts that are hard to resolve.
(c) ~ment in light of the set criteria
In tenns of the set criteria, the introduction of prospective payment by item of service has
certain advantages that have tar reaching implications, partiaJlarly on efficiency. Besides, the
method provides a good opportunity for the government to start to divest itself of the provider
role, if it so wishes. Since providers will be reimbursed on the basis of pre-de6ned units of work
loads. it will not be necessary for the govermnent to provide services. As the funding agency, all it
needs to do is to decide on an appropriate price for a particular service (such as an operation or a
course of t:reament), and then reimburse the provider of that service at the pre-set amount of
money, irrespective of whether that service is provided for less cost. This will encourage providers
to search for and use cost-saving teclmiques. This (and other problems that may have adverse ef
fects on equity as already noted [see chapter 5, section 5.3.1], e.g., adverse selection and cost shift
ing) may however raise problems, necessitating qua1ity of care audits and other regulatory
mechanisms. However if the government decides to divest itself of the 'provider role' changes in
employment patterns may be expected, but this should not necessarily mean service disruptions
since all that will happen is a 'movement' oflabour between the 'newly constituted' providers.
The only disadvantage is that implementation of the option would require detailed costing
infonnation in order to set 'appropriate' payment levels for specific services-in the form of the
development of diagnostic related groups (DRGs) or other form of resource management
teclmiques.
7.2.4 Option 4: Introducing publidy financed competition in the health servim through the separation of the financing and provider roles
Since the 19808 Kenya has implemented hberalisation policies targeted at various sectors of
the economy. Recently, there has been some evidence that these policies are having some positive
results including a full in the rate of inflation, increased foreign exchange availability and a lower
growth in the money supply (Kenya, 1994b). However, besides the introduction of the few 're
fonns' discussed briefly in chapter one (section 1.2) and in chapter five (section 5.1.2), there has
-239-

been no attempt to extent these policies to the health sector-largely because of the concern and
WlCCI1ainty of their impacts on the wInerable groups in the population However, with careful
pJanning, it is possible to 1ibera1ise the health care sector and still ensure all the undesirable effects
of competition (as discussed in the last chapter) are largely avoided. This fourth proposal sedcs to
move the health sector in this direction by recommending the separation of the purchaser and pro
vider roles. Although the government has a principal responsibility in enswing the appropriateness
of quality of care (m terms of financial and geographical accessibility of care; sufficient supply of
care, according to the needs ofloca1 populations; shifting of responsibility back to the consumers,
providers and insurers; etfectiveness and efficiency of care in health care provision), this does not
mean that it has to necessarily be involved directly in the provision of health care. Under conditions
set by the government and stinru1ated by appropriate incentives, market and self-regulation could
help achieve the goals set out for health care. Through selective use of more market and self
regulation incentives, flexibility, efficiency and substitution of care can be increased by use of meas
ures targeted at care providers, insureIs, and to a limited extent, consumers, it is poSSIble to make
the parties involved in the health care sector play a prominent in a restructured system.
Under this proposal, which is the only truly perestroika, 'modified' social rules and arrange
ments that govern the production and consumption of health care under competitive situations
would be invoked. These can operate at one or more offive levels: the individual, provider, pur
chaser, payer or at the system level. Only those refimns that would introduce competition between
the public health sector providers, purchasers and payers are outlined-in the last chapter we saw
that these are the participants in the health sector more suited fur targeting economic incentives at.
The purpose ofintroducing a competitiveness spirit in the public health sector is to make the
public providers behave more like private sector providers by allowing more flecible (and dynamic)
organisational fonns that can adjust easily in response to changing conditions, both inside and out
side the health sector. The (nnportant) difference, however, is that the provider institutions will
continue to be public-owned and operated by the state (albeit indirectly), so that they remain pub
licly accountable--in short, nruch of the red-tape bureaucratic organisational structure will go. 0f
ficers numing these institutions will make decisions instinctively, without having to wait fur
'authority to do something' from the centre. This will remove most of the obstacles that presently
bog the system down This means those running it would behave more like private providers-will
be motivated by the drive to do well in the 'business ofhealth care provision' in a competitive envi
romnent. but only to the ex:tent public health objectives are not compromised. This ensures the &}"S
tem will not lose touch with its social basis. The system will therefore be able to fine-tune, at
-240-
appropriate levels of decision-making the behaviour of the main actors in the sector-particularly
hospitals and professionals, the fonner through the creation of attractive incentives based in the en
viromnent within which they operate, the latter by providing appropriate a1tematives-and also by
providing fleability (e.g. of cost variation) through bargaining at this level where information is (or
could be) most easily obtained. This in turn will ensure a better matching of available resources and
patients' individual needs, since a better rapport between the professional and the patient is created.
The object of this refonn strategy is to change the organisational structure and institutional
reimbursement procedures so that it is posstble to influence the desire of the public providers to at
tract and satisfY patients' needs and operate effectively and efficiently. We first outline the struc
tural changes envisaged, before eKplaining the process that will be used to increase
competitiveness.
(a) Restructuring the system through giving prominence to primary heoJth CIl1'e
The population of Kenya is largely rural based and any refonn--be it in health or other sec
tor-rnust take this f3ct 'as given' and unlikely to change soon Furthermore, the government can
expect itself to continue to be a major financier (and poSSlbly provider) of primmy and comrmmity
health services. Given this, primmy health care should be the corner-stone of any proposed refonn.
Primary hea1th care services in the current system are provided mainly through health centres and
sometimes in the outpatient department (OPD) sections of hospitals and dispensaries. These serv
ice sources are the first points of contact with (most) patients in need of advice or treatment, also
are the 'gate-valves' to specialist hospital services, and access to them should be as unimpeded as
can be made posstble. For these reasons, the objective of refunn should be to make PHC services
more responsive to the needs of the COI1SllIIleI, to raise the standards of care, to promote health
and to prevent illness, to give patients the widest range of choice in obtaining quality primary care
services, give value for money and to enable clearer priorities to be set for PHC service personnel
in relation to the rest of the health sector. To realise these, the following structural refonns in this
important area of the sector are recommended.
Chapter four showed there is a potential for saving if the referral system were effective (see
section 4.3). To reduce the burden ofunnecessary and inappropriate referrals to hospitals, and by
that rut down on the expenditure on the latter, it is essential that health centres and dispensaries be
come the focal points of combating ill-health, also for health promotion Services in these filcilities
should be improved so as to reduce the temptation of patients to go to higher level filcilities. Cur-
-241-

rently, this group offilcilities handles the bulk of the system's workload, both curative and primary
care services, yet, they are 'residual-recipients' in the budgeting process, as already explained (see
chapter three, section 3.2.1). 1bejr budgets should be structured to reflect their importance in the
system, as explained below.
(b) Other necessary clumges in the organisatio1Ull structure of public hospilol services (i) Changes in the stoJus of public hospitalf
In Jine with the proposed changes to primary health care, which redefines the role of health
centres and dispensaries, the role of hospitals will also have to be redefined. Individual public hospi
tals will cease to be dependent administrative units, and adopt a new image--akin to that of public
finns. They will no longer be funded through an automatically allocated budget. Instead, they will
be expected to support themselves partially (and in the long run, entirely) with the revenues they
will genelBte in providing services to clients (the government or the private sector- see below).
Most of the staff presently employed by hospitals are civil servants. It will thus be necessary
to change the employment contracts so that hospitals can hire and fire personnel, set pay scales
(probably with guidance from centre), and decide how to increase productivity and reduce other
transaCtion costs. In this "environment, if the hospital funding arrangements are changed to include
a modified capitation based component, with institutional budgets and persormel salaries deter
mined by actual workloads (and hence indirectly by demand), institutions would get budgets de
pending on their share of the public market. The role of the MinistIy of Health under the new
arrangement will be confined to regulating the operations of hospitals and to making new invest
ment decisions regarding large capital allocations, running the primary care f3cilities- dispensaries
and health centres, and funding of research and medical education.
(D) Clumges in the way the NaIionol HospitalJnsurrurce Fund lJH!I'f1IeS
The National Hospital Insurance Fund (NHIF) presently runs hospital reimbursement
scheme fur all its contIibutors. The contIibutions are in the fonn of compulsory 'earmarked taxes'.
The state presently provides an the manpowc- and financial reso~ to administer the scheme al
though most contributors receive their care mainly in the private sector, as evidenced by the fact
that over 70 per cent of total payments are fur care received in the private sector. In its present
fonn, the NHIF does not merit the Jabel 'national health insurance'. The way the funds are reim
bursed to contributors (who are in need) contracts the principles of a national health insurance pro-
-242-

grannne. In its present form, it just affords the better-off (essentially the wealthy) the opportunity to
get good quality, specialised care that is subsidised at nruch lower prices than the actual cost of
these services in private (mostly for-profit) hospitals. It is perplexing that one of the steps the gov
ernment took in 'reorganising' the health sector in 1989 was to raise the levels of reimbursements
to private (mostly for-profit hospitals)-thereby further reducing the direct costs of hospital care
for those who can afford the co-payments usually associated with the use of private hospitals
where the costs exceed the NHIF reimbursement rates. This move mostly benefits the rich since in
actuality the costs of care by the wealthiest groups in the countIy are partly financed by the low
middle income groups who cannot afford these co-payments and have to resort to the public serv
ices Qike the rest of the non-inured people), yet they nrust contribute to the NHIF, because such
contributions are mandatoI)'. This contradicts the principles of national health insurance, besides
working against the principles of equity as outlined in chapter four. The scheme should be run so
as to pool resources (from each according to their ability to pay) and redistribute resoW'CeS 'filirly'
(i.e., to each according to need).
Taking the foregoing into account, it is proposed that appropriate legal amendments to the
NHIF Act be tabled in parliament to make the NHIF an independent public institution (parastatal)
that will support its operations entirely from contnbutions that it will solicit from 'willing' contnbu
tors in ways that other sickness insurance fimds operate or be disbanded all together. In the same
amendment, changes to allow all the fimds generated from the national health insurance contribu
tions to be directly available to the Ministry ofHea1th (without any pro-rata reductions in the budg
ets allocated to it by The Treasury) to be used to help reduce the gap between the urban and rural
areas, and between aJrative and preventive services. In what we might term as a 'second-best' op
tion, if all the funds cannot be availed to the ministry, then the amendment should seek changes that
at most allow only a (small) part of this reverue to be used as payments for medical services for the
insured while the rest is given to the ministry for reallocation. In this case, the Fund should be re
quired to institute a reimbursement scheme that is inversely related to personal incomes (at least
that part earned from employment). Since the cwrent system has all the infonnation on income
earned from employment, this change should not be hard to implement. Employees use NHIF
cards whenever they or their rdatives are hospitalised and hospitals use the infonnation on the card
to bill the Fund. The Fund should set the rates that an individual is to be reimbursed according to a
scheme which ensures those in lower income brackets get a bigger relief when using the card, and
put those rates on the cards. If such a scheme were implemented, the cwrent situation where the
lower middle income workers subsidise the upper middle and upper income groups would be
-243-

greatly improved, although it will not eIirninate such subsidisation all together. It would be ex
pected that employers would be honest with the details they send to the Fund about personal
iImmes.
If the first option is adopted (reallocating all the funds from NlllF contnbutions to the
MOH) and the Fund transfonned into something akin to a sickness fund, this change will not only
~ the institution to some form of competition, but also bring in more money to the public
health services-about 20 per cent of the ministry's recurrent budget (roughly the amount the min
istry hoped to raise by instituting user-charges, but which we have seen is becoming increasingly
elusive to get). Issues such as the employment status of the workforce cwrently working in this
'department' of the ministry will of course have to tackled. Workers (most of who are civil ser
vants) should be given the opportunity to decide whether to be absorbed in other departments of
the ministry or even other ministries or to remain under the new institution.
Besides tackling the issue of employment, the government should also be concerned about
the directions the private health insurance industIy will now take without the checking influence the
FWld has previously exerted on health insurance in the system. It is likely private insurers will seize
this opportunity to fragment the health insurance further by developing a nrultitude of insurance
plans that are WlCQ-Ordinated, except to the extend market forces are operative, which in itself can
not guarantee fiUmess in the long run, partiaJlarly for some people who might be dissatisfied with
the public services but would be unable to get medical plans they can afford within the private sec
tor. To prevent such an occurrence, the government, through appropriate legislation, can strive to
encourage the establishment of health maintenance organisations that will contract with employers
(and individuals as well) to provide services. In this way, the equity aspirations of the system would
still be promoted, since those with a higher ability to pay (but may have less need for health seJV
ices) will still be contnbuting to the improvement of the public health services (through the ear
marked taxes), yet they would still have opportunities to purchase health insurance packages that
suit thek needs, if dissatisfied with what is on offer from the public services, without necessarily the
eschewing ofthek social obligation to support the unfortunate.
There are several averrues open to implement such a strategy. One option is use the separate
economic divisions existing in the labour market-along the lines presently used to determine
membership/affiliation to trade unions to establish health insurance purchasing groups. Workers in
a particular trade can be advised that if they so desire, they can contnbute a certain proportion of
thelr wages for health insurance coverage, probably depending on their fiunily size and other 'rete-
-244-

vant filctors', probably supplemented by the employer and the trade union Then the relevant trade
union will contract with a health maintenance organisation for providing health care to its mem
bers. Another alternative could use the workman's compensation act. Employers are required by
law to insure their workers (not all employers though-only those with a workforce exceeding 20)
under the workman's compensation regu1ations. Changes might be introduced in this law by
amending it in such a way to enable it to replace the National Health Insurance Fund that exists to
day, by encouraging employers through carefully worked-out tax concessions on employers and
employees. Another possibility is explored the use of the co-operative movement (which is rela
tively widespread, and again mainly organised along divisions in the labour market). The suitability
of these as avenues for purchasing health insurance for workers are areas that need to be studied
closely.
(e) How competition CQJI be injected into the new system
Assuming the changes proposed above in place, the operation of the 'new' system can now
be explained. The purpose of the proposed strategy is to break the link between health care financ
ing and provision as currently exists within the MinistIy of Health into separate entities-i.e. to cre
ate distinct purchaser and provider components. This will have two effects. FlI'St, it will introduce
an aspect of transparency in the operations of the health sector. Second, it willIargely free the la
bour market as some of the labour now engaged by the MinistIy will be free to associate with any
provider to fonn bidding consortia. The MinistIy of Health will largely divest itself of the health
production/provision aspect (except in PHC) and concentrate on the regulatory and purchasing
functions.
(i) Tadding equity tutd t{ficiency in the new system How the overall budget would be split
The MinistIy would, using criteria such as those discussed undeI proposal two above, set
the allocations that will be available to provinces. This means the total resources availed by the
government to the public health services sector (through the MOH budget) would be allocated to
the regions in a two-stage process. In the first stage, using the criteria outlined under option two
above, the total MOH budget would be allocated to the provinces on the basis of their area needs.
In the second stage the provincial budgets would, also using similar criteria, share their budgets be
tween the districts within them, i.e. the districts would get shares of the provincial health budgets
-245-

according to their needs. In reality, therefore, districts become the actual budget holders. This two
stage allocation process will therefore alter for equity issues.
Districts as budget holders: How they'll allocote I'eSOIU'CeS to ensure t1Jidency
The district total budget would be split into two distinct components: (l) a curative services
component that will be allocated primarily to hospitals, and (ii) a primary health care services com
ponent that will be in most cases capitated. It would be upto to each district to detennine the size
of each components, but as pointed out elsewhere in the thesis, since the health problems of most
districts are of the primary health type, this filet should be reflected in the share allocated to PHC
activities.
Allocating the curative services budgeJ resources
The districts will in turn allocate the available curative services resow-ces through a process
that combines capitation and bidding. It is recommended that the central mechanism for both pro
vider institution reimbursement and personnel sa1aries be changed to combine a predetennined
'base level' component and a 'variable' component that will be tied to various perfonnance indica
tors. This 'base plus adjustments' formula will be constructed of different components for institu
tions and statt: and for the capital, primary care or community health service sub-sectors of the
system. The objective in all instances is to mix a degree offinancial certainty (the base) with a de
gree of financial risk (the variable component) in a manner that will stimulate operating efficiency
and responsiveness to patients without endangering the broader effectiveness..linked social objec
tives of the overall system. It would be unwise to make all the finances contingent upon the success
of bidding alone as there are areas where alternatives do not ecist (even when allowance is made
for private not-for-profit providers to bid), but by making it plain that any otheI provider can move
into the area, set up activity and bid for service deliveIY, the government would be sounding a
warning to inefficient bidders, including public sector bidders. This means even in areas where now
there is only one feasible bidder from an area---may be because of economies of scale or scope
the facility presently eqoying natural monopoly would be aware of the threat of entIy by new pr0-
ducers (mcluding private sector competitors).
The use of flexible budgets would transfonn the public provider units from bureaux (as dis
cussed previously in chapter five) to 'public fums'-'free' to design their internal structures and
make judgements concerning scale advantages, employment, contracting services or buying inputs
-246-

from other sow-ces (presumably the cheapest) in the health production chain Rather than use bu
reaucratic control mechanisms, co-ordination of the production activities will now be guided by the
market and providers will increasingly operate as delivery (rather than production) units. If public
hospitals are allowed to act independently, some may decide to reduce their complexity and over
loads by concentrating upon clinical services and purchasing any ancillary and support services
(e.g., mortuary, catering, cleaning and laboratory services, etc.) from other public hospitals or inde
pendent dealers (private sector). Depending on the nature and or type of service, hospitals might
go for 'hard-' or 'soft-contracting.' In the former, each hospital would operate autonomously and
pursue its interests vigorously. Contracts then would have to be complete and exhaustive. In 'soft
contracting,' there will be closer identity of interests between the parties and so formal contracts
need not be as complete. But here there is danger of apportioning costs and revenues. So, except
for those services that scale considerations rule out hard-contracting it is recommended that hospi
tals will be expected to engage in prospective bids for public resow-ces based on plans that they will
provide the MOH, who, presumably will have established a 'plan evaluation and review' unit. That
means there must be a way of assessing or evaluating the performance of each hospital or provider.
A 'flexIble budget' achieves this because appropriate changes are made in the political and
organisational patterns already in place within the system, so that fiscal linkages are forged across
the service sub-sectors within the system----hospital, primary and comnrunity health services, to en
courage treatment at the least intensive, but still appropriate level of care. The institution of com
petitive flextble budgeting does not mean there will be any larger budget over-all, or that it will vary
with the number off8cilities. 'All tacilities' will compete for what will essentially remain a prospec
tively defined resource pool. It will not be a system of open-ended retrospective reimbursement as
in pluralist health care systems. Competition merely translated into zero-sum competition among
the existing &ci1ities for a politically determined pool of aggregate capital and operating resources.
The key to effective functioning of this system is the clarity and appropriateness with which each
existing health sub-sector is divided into specific zero-sum markets. The competitive (and flexIble)
budgets that are finally allocated to various provider units within each service sub-sector should re
fleet the demographic as well as the geographic characteristics.
AIIocoting 1't!SOU1'CI!S for primary core at the district level
We reconunend that these filcilities be given more emphasis in the financial and resource al
location process by giving them capitated budgets (which can be determined in the manner de-
-247-

scribed under proposal 2 above)l1}. Since these providers (health centres and dispensaries) are more
widespread than the hospitals, giving them such capitated budgets and allowing them to purcJme
'required hospital services' from the cheapesF sources (whereIwhen necessary) will serve the
needs of a greater proportion of the population (and therefore the countIy) better.
A programme of expanding the range of services available in these lower level f3ciliti.es is
necessary. This programme nrust consider that it will be necessary to move doctors from hospitals
to work in health centres (and sometimes dispensaries). The health centre might be the appropriate
level to begin at. Upgrading the health centres' and dispensaries' premises and equipment will need
to be undertaken along with introduction of new services such as minor surgery, diagnostic clinics,
and so on. Over the long term, when sufficient expansion (of the physical f3ciliti.es and persormel at
this level) has taken place, people will have the fBcilities (and probably doctors) to choose from,
and the present system whereby people's health history is not kept in one institution (if at all kept)
will cease. At that stage, it will be possible to relate the doctors' salaries (mcomes) to the rrumber
of people under their jurisdiction (e.g., on their lists), with appropriate incentives for doctors prac
tising in sparsely populated areas. This system can weed out bad doctors---those inefficient, uncar
ing, uncommunicative or simply disinterested in their patients andIor provide poor or non-ex:istent
quality of care-and in the long tenn will lead to the emergence of the 'family doctor' concept in
Kenya, where each household will be 'registered' with a doctor who would take care ofits primary
health care needs'problems. Such doctors would effectively act as 'gatekeeper' to hospital services.
It will be necessary to devise a system of incentives that would encourage doctors to move
to the health centres (and to the rural areas) and to remain there. The current employment practice,
under which doctors and other health personnel are employed as civil servants-outside of the
control of the employing insitution--1acks appropriate incentives. We suggest that this be discon
tinued and ~ a different scheme, with appropriate incentives (say, fixed-tenn contracts relat
ing pay to levels of work, quality of care, and so on) be introduced. We propose these fixed
contraets be structured to include in part a capitation component which will be dependent on (I)
the eq>erience of the physician, (ii) the mnnber of patients that a partiaJlar physician manages to
attract to thejr health centre (patient list size), and (iii) per cent of patients on the list that are seen
., Of course, giving these facilities <capitated budgets' would not in itself reduce <unnecessary referrals' unless appropriate incentives are also given to the health personnel-particularly clinicians-not to 'pass on' cases they can competently handle. Besides, 'self-referrals' will not be affected by the use of 'capitated budgets', unless a mechanism to deter people from 'self-refeting' is instituted.
90 It will be necessary to set up a procedure to ensure that the source of hospital services contracted with is indeed the cheapest source in order to minimise andIor eliminate possibilities of misuse of this 'privilege' of choosing a 'preferred' provider.
-248-

dwing the year. Other f3ctors such degree of coverage of PHC activities such as irnnnmisations,
the level of onward referrals, and so on can also be considered. Appropriate weights for each of the
components that are finally settled up on will need to be structured so as to encourage prevention
and health promotion Alternatively let market forces do the job where full privatisation occurs.
There will of course be need for co-ordinated effort between the health and other sectors
(viz.. housing, education, environment, etc.) to ensure the gains achieved in health are not wlder
mined by lack of progress elsewhere. There also will be need for strengthening training and con
timing education for general practitioners, rrurses and other health personnel. These are essential if
the proposed refonns are to have the desired effect. The main advantage of this proposed struc
tural change is that it will strengthen the referral process in a way that has not been poSSIble before.
The prore.ss of splitting the district health budgets between curative and PHC services advo
cated above would change the resource allocation process so that PHC activities are no longer 're
sidual' recipients in the health budget allocation process. In addition, the process introduces a
dimension of interfilce between the private and the public health services sub-sectors that has not
previously eKisted in the system-since it would now be poSSlble to contract private providers and
pay them public resources to provide health care services, depending on the efficiency of their pr0-
posed contracts (see below).
(DJ The process of contracting
The prore.ss of contracting, which will mainly apply for curative services, can be for an initial
specified period, say, one or two years, mbject to review and re<ontracting to ensure the per
fonnance ofincurnbent providers does not tag behind market performance. In so doing, the market
will be used as regulator. In the trial period though, contracts need not be detailed (m tenns of
price, quality, or volume), and should only apply to public providers. The (public) hospitals can en
ter into agreements with the ministIy's representatives (the 'purchasing conunissions'--represerIt
ing the ministIy's interests in various districts) to provide care for a specific period (without
necessarily specifYing the contractual relationships), initially through use of 'block grants'. These
contacts will generally define short- term relationships between the providers and the purchasers.
This would leave open a possibility for purchasers to later revise the contracts, should it become
necessary--on account of non-performance by public providers-to specifY cost, and volume (and
even place). It will leave open the option for 'purchasing commissions' to place contracts with pri
vate sector providers if dissatisfied with the performance of (Public) providers, and even more im-
-249-

portant, to match health care demands with 'needs' and to purchase only effective care, although at
first they won't in general yet know what this is, but the demand for such information will thereby
be created.
Thus, although the current reverrue flows will not be changed initially, anticipation (of
change) will be created among the (public) providers, and by extension, the physicians working in
them too, that they could be changed in the future. This anticipation can be expected to serve as a
further incentive for physicians and other hospital persorme1 to operate co-operatively and effi
ciently in order ensure the success of their institution during the next contracting phase.
Besides the contracts with the ministry's 'purchasing commissions, , (Public) hospitals will be
expected to supplement their revenues by contracting with the primary health care providers, the
NInF (nit would still be there) andIor other private sector ~ and other hospitals. Initially,
public hospitals will be poor at attracting private patients, as they do not have private rooms or
'good' food-amenities that presently attract patients to the private sector providers-although
even at present some private providers send their patients to the public hospitals for conditions they
cannot tackle (e.g. maternity homes which send maternity cases with complicsions to public hos
pitals), it might be expected there will be poSSlbilities for 'trade' along these lines. But ways must
be found to identify patients that have been referred to the public hospitals by privately practising
clinicians. This requires changes in hospital admission regulations. At least, for maternity cases,
regulations may be set requiring patients to have 'booked' admissions at some prior time -this is
not an unexpected 'illness' after all. Otherwise they would have to show where they expected to
go for delivery (m which case negotiations between the original booked institution and the institu
tion carrying out the delivery can be entered into) or the patient pays the full cost of the service.
Ways of dealing with similar cases for other diseases have to be found.
(iiI) Implementing the cJuznge-the time framework
The changes disrussed above aim at strengthening primary health care, through the develop
ment of a network fiunily physicians. Prewntion should be the forus of health activities rather than
treatment of disease, and the family (the sma1lest but probably the most important social unit) the
focus of intervention The proposed structural reform will:
• provide patients with a diversity of providers to choose from---essentially, by allowing
them to choose either private (where these have contracted for provision of services to
public sector patients) or public providers as their preferred provider.
-250-

• introduce incentive driven contracts for filcilities and key persorme1, based on capitation
or other appropriate incentives and real target payments for meeting amrually agreed
health objectives established between the Ministry ofHeaIth, and by the districts and their
hospitals and primary health care seIVices,
• maintain the rurrent nominal co-payments and strengthen the exemption system at the
point of delivery for hospital seIVices,
• enable to put in place a national process of quality and accreditation for health
professionals and health care filcilities that would operate at all levels, but would be
managed locally.
This structural change can be tested by establishing on a trial basis some independent units,
say one per province/district, separated from the national bureaucracy and able to operate much
more flexible local working practices and incentive driven relationships with specialists and other
health persormel. The success of this would then determine the pace at which other tacilities are co
opted into the scheme. Moreover, even for the providers chosen as 'guinea-pigs', the transition
from fixed budgets to fleKlble budgets should be phased gradually. We recommend the 'variable
component' (of the budget) which represents 'uncertain reverrue' be as small as poSSIble at first and
this be increased gradually, perfonnance being evaluated against a pre-set target budget each year.
The aim of the phase-in period is to minimise disruptions to seIVices ..
Such a transition would, whilst controlling charges from the centre, 'allow &cilities the free
dom within certain limits' (guidelines to stipulate these) to vary charges either way depending on
local conditions. The extend to which very hard pressed and under-funded local filcili.ties increase
their contributions to community health seIVices would be rewarded by further centrally provided
financial incentives, using a fonnula that has an in-built inverse relationship. Such incentives would
be related to established amrual health objectives. For this to work, it is essential that the ministry
devises a fuI1IlUla that takes into account the demographic and socio- economic filctors into ac
count when redistributing finances so that economically disadvantaged filcilities do not continue
sinking into oblivion while those in economically better-off areas continue to thrive. But care
should be taken not to discourage those filcilities doing well in tenns of reverue collection.
The critical element is that during a transitional phase, of say, between five and ten years, dif
ferent models of refonn that change patients', and professionals' and policy makers' attitude can be
tested and evaluated together. The change in the health care system should be transitional to build
-251-

into a system that nutS on the strengths of the current service and Kenyan cu1tural nonns, rather
than great leaps into uncharted territories.
(dJ Sonu! issues to be addre.ssed in the.future
The hberalisation of the health sector, particularly along the lines suggested here, has to ap
proached cautiously since, although impressive in intentions, we have no benchmarks, particularly
from other countries in similar stages of development, about the potential outcome of this refonn
process. Even in the developed countries where refonns along these lines are already underway,
there is yet to emerge hard evidence about the extent to which heightened efficiency and continued
preservation of the social values underlying most health care systems----such as equity and compre
hensiveness of services-are compatible. Besides, the capacity of contracting within publicly oper
ated health systems to achieve efficiencies greater than the added transaction costs has yet to be
demonstrated (Saltman and von Otter, 1992). Moreover, the aspect of contracting itself is a rela
tively new phenomenon in Kenya, which has yet to take hold even in private sector business. Con
sequently, the Ministry of Health, which has no experience of writing contracts-even simple
soft-contracts-has no eK8I1lPles to go by. But the recent strike by public hospital doctors, which
forced the ministIy to transfer some patients for treatment in the private sector might have served
as the beginning of a learning process along these lines.
Besides, the ministry has little or no basis for evaluating quality and the performance ofhos
pita1s-beawse these have not been practised in the past and also because of poor infonnation
about the relationship between resource use and outcomes. The ministry should therefore under
take intensive efforts to develop methods to monitor and evaluate service quality and outcomes
(both fur public as weJl as private sector activities).
Another issue that will need to be considered is the linkage between the operating and capi
tal budgets. The ministry should devise mechanisms to ensure that the market allocation of re
sources remforces rather than undermines the broader social objectives of the publicly operated
health care system by taking new investment to areas where it is needed (on equity grounds) but
also ensuring that efficiency is not compromised.
-252-

7.2.5 An assessment of the proposals-a summary
An ex-ante assessment of the proposals presented in sub-sections 7.2.1 to 7.2.4 is necessary
before the adoption of any particular option is endorsed. Section 7.1 presented some of the crucial
consideration to govern the choice that is finally made. The table below presents a self-explanatory
conceptual matrix of option assessment in tenns of efficiency, equity, difficulty of implementation
and adequacy.
Proposal ~ Optim lb 0pti002° 0ptiCIl3d Optioo.4"
Evaluation criterions "" A1tcmative 1 Alternative 2 Alternative 1 Alternative 2
Effect on equi1y JQSIble high high qtrStiooable high rm:Iium
Effi:ct on cfficieocy low-medium high high m:dium high high
DiffiaJlty d Unpememation Jaw medium Imfiwn rm:Iium high m:dium
Adequacy (in term; dom-ing the health st'dOr's Jaw medium Imfiwn m:dium high rm:Iium ~)
Other eOi:ds: -revenue generation. 1imiIed IDJe IDJe JXlSSIble high nBiium - effects on WOJker-mora1e sIigbt medium medium m:dium high high - dIi:d on eqlIoyment - sIigbt Jaw Jaw m:dium high high - iIx:reBld se:rvire wImnes 1ur.bangM high high m:dium high m:dium - dIi:d on quality minimal high high qtrStioo.able QllestitWlhle questioo.able - informational needs high high medium high medium-low medium-low - ~ (UIlknoMl effecIs) possilX?- - - possilX? possiIe? possiIe?
Ncifs: a: All opions are being evaluaIrd relative 10 the aureot &)'Stem b: The CUII'CIJt sySIcm with inIemal cbangcs such as the use cl pedbrmmx:e indicators, in1qpation d clinicians in
the bndgrting ~ changes in the way health peromel are pOd (to include a '~ related ' and a 'variable' ampooent'~ main 1Clcl), and contIacting cm some 'in-house' adivities in the sbort-nm, and clinical se:rvias in the looger-run.
c: The iDttod1.x;tian d reimburscmcnt using a ~ fumwIa. Under 'Altcrnativc 1', both rew:nuc and capital resCJUI'Ct'S are allocated taking into aanmt population and area 'needs', and builds onto all the changes sng'Sb'Xf UIKIer (a) abcM (see main 1Clcl). Under 'Altemativc 2', wbiIst building on changa snggesllld in (a) above, resCJUI'Ct'S are allocaIed to fdcilities aBl13ldng into aanmt population and area needs, bit by mYor cate-gories d c:xpendituIe---~ and <Xher medical supplies, oon-medical supplies, ttansport qlCI'3ting and maintC'Jl8nre oost, ruildin~ and equipment mai.Im:naIK:e alSIs, utilities, and so on.
d: Jntroduction of pOOIic fiJl31lCWl CX)J I qldition throogh use dprospective reimburscmcnt budgas. e: Separation of)mCbaser and provider roIcs throogh the aeation of quasi-intema1 marlceIs (to prOIlw:e oompeti-
tion), and use dblock budgets and bidding 10 allocare resCJUI'Ct'S to pmJic providers, with a po&9biJity of iIror-poraIing private (IKt-for-profit) providers. 'Alternative l' is where all the finxts ooIlcdr.d under the NHIF act are to be used entirely by the MOH to iIIJIXOVC service provision in the rural areas andIor redistribJlion between prcMDtive and aJ1'aIive ~ 'Altemative:' is where only pert of the NHIF funds go to the MOH for rcdis-tributim as UIKIer 'A1temative 1', whilst the <iber part is used to reimburse the contributors who are insured \Dl-
del" the scheme on an '~', given their income. • in terms d eitber nM:DUC saving (which is assumed to be redistrbJt.ed, e.g., a9 UIKIer 'e' above) or increased reve>-
nue availability (to the public sector) IdaDve to the present system. •• in tmns cl disrupUoo (reIaIiYe m existing practices) . ••• indicars possible existena: of some as yet udmown lunanriciptted c:ffccIs .
Table 7.2: Public health sector ref'onn proposals assessment matrix
-253-

In light of the assessment criteria, all proposals will lead to an improvement over the current
system. But proposals two and four come out as the most suitable, but the latter is more difficult to
implement, involves a lot previously wrtried aspects, and may disorient the health labour market,
although it is definitely the better of the two in the long nm. Besides, it would require a lot of polic
ing by the Ministry of Health in order to protect policy principles as well as to have some control
over the direction in which the pattern of provision evolves. Given this, we would recommend the
adoption of option two first (despite its high informational requirements) in order to develop the
necessary infrastructure and the enviromnent suitable environment for Jaunching option four. This
should be left in place until it is evident that the regional discrepancies in availability have con
verged towards the national average-say, for between five to ten years. If this route is taken, op
tion 3 might be used as the intermediate 'test-bed' to see how the system would respond to
exposure to competitive based incentives-a phase which night run for a further five years.
The separation of the purchasing and provider roles (as outlined in option 4) appt"MS to be
the major alternative to the present system in the longer tenn since that will address some of the
current problems such as the poor linkage between funding and workload, efficiency (and varia
tions ofit within the system) and over- and under-utilisation of the capacity of fucilities.
7.3 Some 'Observations' about the Private Sector
This thesis is mainly concerned with the reform of the public health care system, but as we
have seen, the private sector also plays a not insignificant role in the health care system. It would
therefore be erroneous (and tmWise) to concentrate on the public sector alone as this would omit
an important participant in the health system Consequently, this section provides, although in gen
eral kmlS, suggestions concerning the private sector.
The agency-relationship framewoIk sketched in section 6.2.2 in the previous chapter can
also be used to show how the relationship between the state and private sector providers can be
enhanced. We alluded to this aspect in section 6.3.2 of that chapter. Elsewhere (m chapter four) we
showed that the private sector has characteristics and/or objectives that often conflict with those of
the government in the health care sector, in partirular the concern for profits, inadequate attention
to public health, lack of interest in training ptnOnnel (besides causing a high attrition of highly
trained personnel from the public services sector), poor quality ofhealth care services by some of
the private provi~ and the poor integration of the private sector with the public services. A tri-
-254-

age of these problems can be alleviated by an improvement of the relationship between the private
sector and the Ministry of Health (MOH). Generally the Ministry of Health can use the various leg
is1ation at its disposal to stipulate binding rules and regulations, and where necessary directly en
force them over the private sector, or it can enforce them indirectly through 'third parties' such as
professional associations, and so on However, given the inadequacy, and/or mostly lack of infor
rnation about the operations of the private sector, the ministry can instead try to achieve similar ob
jectives without coercion In our considered opinion, this is a preferred approach because of three
reasons. First, although the ministry might have basic regulation concerning various aspects such as
training; registration; mininrum standards for premises, their geographical location and quality of
services to be provided; and incidence of dangerous or unethical practice, it lacks the capacity to
police the private sector to ensure adherence to these regulations. The lack of funding resources
particularly the time, transport and skills--require to effectively police the private sector behav
iour is a major constraint in this ~. Conuption (among the govenunent regulators) may be
another in-htbitive f3ctor-some officers supposed to enforce various aspects of health policy may
instead seek illicit rents in order 'to keep a blind eye on some aspects of non-compliance'. Second,
the use of third parties, such as professional organisations, may fiill to realise the expected result
since third party regulation enforcers may take a passive role, often due to professional self
interest-the medical profession is anyway known for its solidarity, particularly where one of their
members is under criticism, and also due to the ethos of clinical freedom Thus, although the pro
fessional organisations may have re1atively easy access to infonnation about provider behaviour,
and have the professional capacity to evaluate them (as compared to the ministry), their objectives
may be too similar to allow impartial. or independent assessments, wUess it would be to their ad
vantage to do so. Third, policing the private providers through the regulatory framework requires
massive information (besides resources), not only types of information that can be easily acquired
such as the number and identity of providers, their qualifications and locations, but also CUltemal)
information about how activities are canied out in the private sector, including the number and
types of patients seen, employment, the quality of care offered and so on--- infonnation that is not
only difficult to get, but that is also diffirult to assess Cm terms ofits validity).
Taking these f3ctors into accowlt, we suggest that it would be to the advantage of the minis
try, and all other concerned parties, to design incentives structured in a way that it would be to the
advantage of the private sector, including the professional organisations thereo( to conduct them
selves responsibly and in accordance with the aspirations of the national health policy, rather than
as atomistic elements motivated by private gain, within the system More research about the sector
-255-

and the type of incentives that should be provided to achieve this is urgently needed in order to en
sure that the private sector does not ( contime to) undermine the gains achieved by the public sec
tor in terms of the various health sector objectives. This research should focus on the nature
incentives required to make private providers generate and provide accurate infonnation about
thek activities, provide some of the services (mostly public health type of services) they are pres
ently disinterested in, engage in training (rather than 'poach' expensively trained personnel from the
public sector), encourage them to locate and provide services in areas with greatest need, and, gen
erally, to ensure their priorities coincide with those of the state in their activities. This research
should initially focus on those aspects of private sector operations thought to be out of tune with
the aspirations of the national health policy, particularly what is needed to cwb practices that cause
more harm than good, use of unqualified persormel in the provision of sophisticated treatments, re
fusal to grant treatment to emergency and other desperate cases, cwbing of unnecessary medical
interventions, and generally improving quality of care provided in the sector.
7.4 Summary and Conclusions
The current health care system, particularly the public services sub-sector, suffers from in
built inefficiency because there is no direct link between funding and workload. The reimbursement
system is in principle a retrospective full cost reimbursement system with an in-built bias towards a
lack of concern for efficiency and effectiveness. This chapter, primarily concerned with ways of re
structuring the public health care system, has proffered four alternative proposals.
The first, introducing moderate changes within the current system--such as the use of per
fonnance indicators, the integration of (principal) medical personnel in the budget setting process,
changes in the way the medical personnel are remunerated and contracting out some non-medical
activities such as most in-house activities (such as laundry and catering activities in the short run,
and the extension of contracting-out to medical services in the long run-have been found to have
only a marginal impact on the system, although they demand substantial infonnation.
The second, the introduction of a reUnbursement scheme that separates the allocation of
reveme and capital resources and relies on various indicators of 'need' has been found to be one of
the most promising short-nm solutions to some of the current problems, particularly inefficiency
and inequity. However, the option, like the previous one, has a nearly nil capacity to generate eKtra
resources to the public health services sub-sector. It is also demanding on new infonnation.
-256-

The third proposal discussed was the adoption of a prospective payment system This
method combines clinical budgets and DRGs in order to ensure improved economy in the use of
resources. Two approaches have been proposed. The first uses inpatient case mix information to
classify cases into DRGs and hospitals will be paid a unifoIm fixed prospective payment for each
case, adjusted for relevant t3ctors such as teaching status. The second approach suggested uses
hospital activity (such as rrursing, administration, educational, therapeutic and diagnosis) to set the
per-diem rates that hospitals will receive prospectively for anticipated workloads associated with
each activity type. First, each hospital is given a reference group, defined in terms of similarity
taking into account any special characteristics such as teaching status. The per-diem rate will then
be set taking into account these special characteristics of the f8cility, and the costs of a particular
reference group will be used to reimburse activity. This reference cost per-diem would therefore
reflect what a particular f3cility in the reference group would inrur ifits per unit costs were equal to
the average of its reference group for all cost items. It is expected that the adoption of such a pro
cedure, combined with the removal of the existing restrictive noImS on various medical and para
medical staff and the (usually arbitrarily set) ceilings on specific cost items that have in the past
served as effective constraints on the efficient use of resources would give hospital managers more
autonomy for more efficient use of resources. The method rewards producers for reducing costs
per case. It forces hospitals and their medical staffs to co-operate to control expenditure, to relate
clinical and financial information, to consider cost-benefit trade-offs and to control quality. The
proposal allows the POSSlbility of eKtending these prospective payments to private (not-for profit)
providers who meet certain criteria. This (threat of potential entry of other providers) injects some
aspect of anticipation for competition, and, it may be expected, would force physicians and institu
tions to voluntarily impose on themselves quality reviews and other controls they may not ordinar
ily succumb to if the state tried to impose them.
The fourth and last proposal advanced is the separation of the provider and purchasing roles
of the Ministry of Health. Specifically, this proposal suggests that the ministry should divest itself of
participation in hospital services provision and concentrate on provision of primary and preventive
health care services. The ministry should give these services more attention than it does at present
in budget allocations. Another suggested change affects the operations of the National Hospital In
surance Fund and the way the funds contributed to it are allocated. In particular, the proposal fa
vours the idea of turning all the funds collected under the Fund to the ministry for reallocation to
rural areas as well as to prirnaIy and preventive services, reallocations that will serve the greater
needs of the population as compared to present practices, where it appears the Fund's operations
-257-

benefits more the middle upper and upper income groups than the rest of the population, an aspect
that in itseIfis not only a travesty of the principles of equity, but is contrary to the notion of a 'na
tional health insurance' programme.
The chapter ended with suggestions about how the problems of the private sector should be
dealt with. In particular, it was suggested that the agency- relatioriship framework is a suitable ap
proach to resolving problems posed by the sector, although it was pointed out that more research
is needed to detemrine the nature of incentives that would cause the operational aspirations of the
sector providers to coincide with those of the public sector.
-258-

- CHAPI'ER EIGH'f.-
8. CONCLUSIONS
8.0 Summary
This dissertation has been concerned with the design of a framework for refonning the Ken
yan public health care system, which is currently based on a 'Stalinist-type' of model in which (sup
posedly) unttonn services are provided via a centralised system that spans provinces, districts, and
sub-districts. Available statistics indicate the system has perfonned relatively well in terms of broad
crude indicators, given the founding health policy objectives. However, beyond these crude indica
tors, no one had any idea how well it was perfonning. But the poor economic perfonnance and
other f3.ctors (particularly the implementation of structural adjustment and economic stabilisation
policies--demanded by the World Bank and the IMF-in the 1980s) that placed stringent controls
on the government's participation in the economy, resulted in a gradual run-down of state subsi
dies to various social services, notably health and education. The public health care system was
partiruJarly adversely affected by these changes and by the end of the decade the proportion of
government budget allocated to the health sector had declined from about 8 per cent just a decade
earlier to 5 per cent, and by then it was obvious the health system needed refonning, as service
provision fiilled to expand as anticipated. This stirred interest in examining how well the system
was performing with respect to established objectives whilst at the same time imposing the urgency
of seeking alternatives to the public fimds required to sustain the public provision ofhealth services
in order to prevent the deterioration of services. On the basis of evidence from several studies, in
1989 the goverrunent introduced user-fees in all public f8cilities abov~ the dispensaIy level and in
creased most inpatient charges, mostly to supplement the public reverrues, but also to improve the
quality of services. Contnbutions to the National Hospital Insurance Fund were also increased
from the previously regressive Ks. 20 fur all qualifying contributors into a more progressive sched
ule in which contributions now V8I)' with income.
It was argued these changes are inadequate to transfonn the health system into one that can
serve the rising population efficiently and equitably, now and in the future. The thesis that the or
ganisation of the public health services and the existing (more or less guaranteed) retrospective
cost reimbursement institutional budgets and the present health personnel rerm.meration practices
that go with it (which incidentally provide strong disincentives for higher productivity and creativ-
-259-

ity in the efficient use of resources) have combined to create a poa envirorunent for efficient use of
resources, and cannot lead to equity has been sustained by a review of the present system.
An evaluation of the present system leads to the conclusions that
• there is urgent need to explicitly forus on setting strategic direction and objectives that
make the organisation of operating activities the respoDSlbility of professionals;
• in the public sector, production should be decentralised and decisions delegated;
• evaluation and feedback should be a regular feature of all production;
• patients should have the opportunity to choose between alternative types and or
providers of care;
• the respoDSlbility for finance and production in the public sector should be separated,
with more frequent use of external purchases where these promise better service than
public provision;
• there is need to change the engagement contracts of the public health sector employees if
any incmtive related gains are to be extorted out of them.
Beyond these (implicit) structural shifts at the system level, there is need for substantial
changes in the decision making processes inside individual provider organisations. The major impe
tuS to effectiveness should come from improved social dynamics (mcentives and comnrunication).
Command and control relationships should be replaced by interactive incentive- driven relation
ships. Issuing instructions (that are expected to be implemented) should be replaced by dialogutr
by a market style exchange between producers and consumers by participatory discussion among
employees inside organisations, and an emphatic and respectful discourse with patients. In short,
there is need to change the existing structural arrangements within the public health service. Start
ing from this premise, the dissertation proceeded to design a basic institutional framework/system
refunn that can help change the current situation
This framework focused on efficiency and equity. On efficiency, it was noted that although it
is ethically desirable that every Kenyan should achieve the best level of health care the available re
sources can provide, resource scarcity imposes the need for choices between alternatives to which
resources may be committed. This means that whatever resources are allocated for the purpose of
promoting health have to be used in such a filshion as to maximise their impact on the nation s health. That is prescnbed as the objective the system should strive to achieve--the maximisation
of health gains from the resources allocated for the purposes of promoting health. The framework
has four elements which are cumulatively cornpreh.ensive-t system should:
-260-

<D only provide medically effective services--by which is meant providing only those
services for which there is credible evidence about their ability to alter for the better
the patients' course of illness--a notion subsuming both technical efficiency and
medical effectiveness;
(2) provide services that are cost-effective-which requires that whatever services are
being provided should be provided at least cost. This requirement provides the crite
rion for discriminating between alternative technically efficient methods (which inci
dentally, following <D, have also to be medically effective).
(3) concentrate on health services that offer the highest pay-offs in tenns ofhealth gains.
Since medical interventions rarely have equal effectiveness, the concept of marginal
cost effectiveness should be the relevant criterion for choosing between alternative
medically effective interventions-a concept which subsumes all the above.
<ID provide such services as are implied by <D-G> above at appropriate scales. This
stage guarantees overall efficiency since it is at this stage where it is decided which
actions are worth allocating resources to in health care rather than to others outside
the health sector.
The dissertation showed there is potential for efficiency improvement in the Kenyan health
care sector. It also demonstrated that in general the allocation of resources is not consonant to the
existing health problems.
On the issue of equity, it was shown that the current policy (on equity) fiills to address the
'correct' issues and will therefore not lead to any significant improvements in the equity situation
unkss changes in the orientation of the health policy are implemented. It was shown that although
health care-according to pronouncements in various government policy documents on health and
health care-is viewed as an individual's right, an analysis of actual policies hardly underscores
this. Four implicit interpretations of equity in the health sector are poSSIble, given the current
poliCY:
<D equal access to public health care services for equal need;
'" equal access to health promoting conunodities;
<3> guaranteed mininrum access for all to public services; and,
@) opportunity of access to private health care detennined by personal resources.
-261-

Taken together, these interpretations suggest different notions of access to health services,
and therefore different policies for ensuring equity in health care services, some of which contra
dict the notion of a 'right' to health care. Following a review of various philosophical bases of eq
uity it was concluded that the 'decent minimum' is the best interpretation of equity that the Kenyan
health policy should adopt. This interpretation was given further substance by reviewing the mean
ing of equity in health care (mcluding alternative interpretations of such concepts as 'need', 'want'
utilisation and so on,) and their relation to efficiency and it was concluded that the decent minimum
should be interpreted in tenns of , utilisation' rather than 'access'.
A framework to achieve the above was then proposed. In the first part a generalised the0-
retic account discussed some reasons for inefficiency within an industry, and some f3ctors that
even in competitive situations-may cause the economically efficient (competitive) equilibrium not
to be realised. Focusing on the hospital sector for illustrative purposes, two general models ofhos
pital behaviour were examined and found inadequate for explaining the Kenyan (public) hospital
sector. An alternative model of Kenyan hospital behaviour was out1ined which shows that the pre
sent environment cannot motivate efficient behaviour in the operations of providers units. The ec0-
nomic incentives to operate efficiently (or more correctly, inefficiently) within the present system
were then discussed at length. It was argued that due to the peculiar characteristics ofhealth care,
direct control and other similar regulatory mechanisms are inadequate for synchronising the incen
tives of the participants in environments such as exists in the Kenyan hospital sector-particularly
on the supply side-due to informational asymmetries that can be used by the providers to under
mine and sometimes to counteract the imposed regulations/controls. The general conclusion was
that there is need to provide incentives structured so as to ensure that goal compatJ.bility between
the providers and purchasers ofhea1th care services is realised.
An alternative policy model based on the 'agency relationship' was then proposed and it was
shown that within that framewoIk, it is poSSlble to synchronise as well as enhance incentive com
patibility through 'goal compatibility', viz., shared objectives by both the providers and purchasers
of health care. The analysis showed that introducing some form of competition between agents
(providers) can lead to 'goal compatlbility'. The theoretical and empirical evidence of the potential
effects of competition in general, and selective contracting in particular, on some performance
measures in the health sector was then reviewed, in order to assess the kind of competitive envi
romnent that will provide a suitable environment for pursuing the twin objectives of increased effi
cien;y and improved equity.
-262-

Following this, four alternative proposals have been advanced. The first-introducing mod
erate changes within the current system, such as the use of perfonnance indicators, the integration
of (principal) medical in the budget setting process, changes in the way the medical personnel are
remunerated and contracting out some non-medical activities such as most in-house activities
(such as laundry and catering activities in the short run, and the extension of contracting- out to
medical services in the long run}-has been found to have only a marginal impact on efficiency and
equity in the system, though it has enonnous infommtional demands for implementation. Moreo
ver, its implementation involves substantial diversion of resources from current provision
The second-the introduction of a reimbursement scheme that separates the allocation of
reverue and capital resources and relies on various indicators of 'need' ---has been found to be one
of the most promising short-run solutions to some of the current problems, particularly inefficiency
and inequity. However, the option also has an immense infonnational requirement, and has a nearly
nil capacity to generate extra resources to the public health services sub-sector.
The third option proposed was the adoption of a prospective payment system. This method
combines clinical budgets and DRGs in order to ensure improved economy in the use of resources.
Two approaches have been proposed. The first uses inpatient case mix information to classify
cases into DRGs and hospitals will be paid a uniform fixed prospective payment for each case, ad
justed for relevant filctors such as teaching status. The second approach suggested uses hospital
activity (such as nursing, administration, educational. therapeutic and diagnosis) to set the per4em
rates that hospitals will receive prospectively for anticipated workloads associated with each activ
ity type. FIrst, each hospital is given a reference group, defined in terms of similarity--t:a into
account any special characteristics such as teaching status. The per-diem rate will then be set tak
ing into account these special characteristics of the f8cility, and the costs of a particular reference
group will be used to reimburse activity. This reference costper4em would reflect what a particu
lar fiIcility in the reference group would incur if its per unit costs were equal to the average of its
reference group for all cost items. It is expected that the adoption of such a procedure, combined
with the removal of the existing restrictive norms on various medical and para-medical staff and the
(usually arbitrarily set) ceilings on specific cost items that have in the past served as effective con
straints on the efficient use of resources, would give hospital managers more autonomy for more
efficient use of resources. The method rewards producers for reducing costs per case. It forces
hospitals and their medical staffs to co-operate to control expenditure, to relate clinical and finan
cial infonnation, to consider cost-benefit trade-offs and to control quality. The proposal allows the
possibility of extending these prospective payments to private (not-for profit) providers who meet
-263-

certain criteria. This (threat of potential ent.Iy of other providers) injects some aspect of competi
tion, and, it may be expected, would force physicians and institutions to volwltarily impose on
themselves quality reviews and other controls they may not ordinarily succumb to if the state tried
to impose them. This option also has inunense infonnational requirements, and ifimplemented may
require continuous policing to ensure equity objectives are not trampled upon in pW'SUit of
efficiency.
The fowth (and last) proposal advanced is the separation of the provider and purchasing
roles of the Ministry ofHea1th. Specifically, this proposal suggests that the ministry should divest
itself of participation in hospital services provision and concentrate on provision of primary and
preventive health care services. The ministry should give these services more attention than it does
at present in budget allocations. Another suggested change affects the operations of the National
Hospital Insurance Fund and the way the funds contributed to it are allocated. In partiwlar, the
proposal favours the idea of turning all the funds collected under the Fund to the ministry for real
location to rural areas as well as to primary and preventive services, reallocations that will5elVe the
needs of greater proportion of the population as compared to present practices, where it appears
the Fund's operations benefits more the middle upper and upper income groups than the rest of the
population, an aspect that in itseJfis not only a travesty of the principles of equity, but is contraIy to
the notion of a 'national health insurance' programme.
Some suggestions about how the problems posed by the existence of the private sector
should be dealt with are also given. In particular, it was suggested that the agency-re1ationship
frameWork is a suitable approach to resolving problems posed by the sector, although it was
pointed out that more research is needed to detennine the nature of incentives that would cause the
operational aspirations of the sector providen to coincide with those of the public sector.
8.1 Condusions/Recommendation
Following the assessment of all the proposals, it has been found that in the long-run the
separation of purchaser/provider roles is the most promising proposal for restructuring the system.
But since the immediate implementation of that option would introduce 'shocks' of a type previ
ously unknown to the system, we recormnend the adoption of option two at first (despite its high
infonnational requirements) in order to develop the necessary infrastructure and the environment
suitable environment for launching option four. Although it has been shown this option will involve
-264-

diversion of resources from current provision, it is recommended due to its capacity to redress the
inequalities in the system. This is considered a necessary precondition for the introduction of com
petitiveness in the health system. Once implemented, it should be left in place until it is evident that
the regional disparities in availability have converged towards the national average-say, for be
tween five to ten years. If this route is taken, option 3 might be used as the intermediate 'test-bed'
to see how the system would respond to exposure to competitive based incentives-a phase which
might nul for a fiuther five years. The separation of the purchasing and provider roles (as outlined
in option 4) will then be relatively easy to implement as the problems of the linkage between fund
ing and workloads, efficiency (and variations of it within the system) and over- and under
utilisation of the capacity of fucilities would have been smoothened. This proposal would separate
organisationally the fimding and provision of health care (as explained in the main document). The
provision of health care would largely be privatised, but not the demand for it. The advantage of
this separation is that competition and efficiency gains would be created combined with the intrinsic
equity of a 'central allocation' system. Given the difficulty of correcting the capital infrastructure
discrepancies, this time-framework is thought not overtly long, but it will need the conunitment of
successive governments if in the long run it would be poSSlble to implement the purchaser/provider
roles.
8.2 Weaknesses and Strengths of the Thesw: An Overall Assessment
The principal focus of this dissertation was stated as the design of a basic institutional
framework/system refonn for the delivery and financing of personal services as well as preventive
medicine in Kenya encompassing hospital and clinic based services, training institutions for doctors,
tn.lI'SeS and other paramedical professionals, the role of resrMCh in supporting health services, and
the role of various public agencies concerned with preventive programs. A reflection on what has
been achieved or not achieved indicates that two ofthese major objectives (i.e. training and the role
of various public agencies concerned with preventive programmes) have not received as detailed
an analysis as their importance warrants. The only excuse for not doing so is that these objectives
span several mimistries-for eaunple, training is partly funded by the Ministty of Education and
partly by the Ministty of Health. Substantial refonns have already been implemented by the Minis
tIy of Education concerning various aspects of education including cost-sharing. The Ministty of
health should co-ordinate with that Ministty to streamline its training programmes, particularly
those that largely fall W1der its jurisdiction-such as the training of nurses. However, there are
-265-

some training implications arising from the proposals that are directly the respoIlSlbility of the Min
istry of Health. This particularly concerns the need for training managers and clinicians and other
personnel required to develop, interpret, and use the various perfonnance indicators and other in
fonnation on medical- and cost-effectiveness of services.
SirniIarly, most programmes with an element of preventive and promotive care fiill under
different ministries, especially the Ministries of Health, Education, Water, Labour and Man Power
Development, Housing, and Environment and Natural Resources. Any senstble analysis of refonns
should take the role played by each of these various participants into account-an aspect beyond
the scope of the present work.
The other notable deficiency in the present work: has been lack of quantification of most as
pects of the suggested refonns. For example, under the resomce allocation by fomrula proposal, it
would have been more infollIlative if it had been demonstrated what differences it would make to
switch to such a system (compared to the present system). Lack of suitable data to quantifY many
aspects suggested for use was the main reason for this ommission--for example, while it is rela
tively easy to get data on the distnbution of population by region (provinces, districts, and so on),
there is harclly any data on aspects such as utilisation by age group, sex groups, and so on, that can
be meaningfully used to calrulate appropriate weighting f3ct0rs. Consequently, most such issues
are relegated to the next section, as areas that require further research.
Other than the above, I have painstakingly developed a framework for structural health re
fonn of the Kenyan health care system that provides the ingredients required to transform the pub
lic health care system into one that is both efficient and equitable. Even if one were to ignore the
recommendations for reform outlined here, a search for any other alternatives must build on the
discuSSion of efficiency and equity as provided here, if it is to be genuinely problem-solving ori
ented. I want to believe that (and indeed I do!) that-besides the original account of the system
and the problems inherent in it outlined in this dissertation-this is the most significant contribution
of this work: to the Kenyan health care system.
8.3 Research Implications of the Suggated Structural Reform
A number of areas where more research is needed have been identified at various points in
this dissertation These are briefly swnmarised below.
-266-

• In-depth study of the factors influencing the demand for health care, to particularly
identifY the fuctors that have Jargely contnbuted to rising demand.
• Productivity of resources in various uses-their impact on health.
• Cost-effectiveness of alternative treatment regimens.
• Assessment of the relative effects ofoveraIllevel of pay, grading structures and industrial
relations under 'taci1ity level' versus 'national' bargaining-effects of different fonns of
rewards to the public health care staff to identify those that induce the staff to respond to
local health needs.
• The level of detail, in terms of price, quantity, quality and nature of services needed when
specifYing contracts.
• The productivity of different types of health personnel in relation to outputs/outcomes.
• The anticipated distnbutive effects of the structural change.
• The role of the private sector-how its contnbution to the objectives of the health care
system may be improved.
Of course more research issues will become evident as the implementation of the reform un
veils other problem areas.
-267-

-REFERENCES-
Abel-Smith, B., 1967, An International Study of Health Expenditure. Public Health Papers No. 2. Geneva: World Health Organisation.
AkerlotI: G., 1970, The markEtfor lemons: Qualitative uncertainty and the market mechanism. Quarterly Journal of Economics, Vol. 84, pp. 48S-500.
Akin, ] S., N. Birdsall and D. de Femmti, 1987, Financing Health Services in Developing Countries: An Agenda for R4ornt-A World Bank policy study, The Word Bank, Washington, DC.
Alchian, A A, and H Demsetz, 1972, Production, information costs and economic organisation. American Economic Review, Vol. 61, 1972.
Arnou1d. A R, R F Rich and W. D. White, (eds.), 1993, Competitive Approaches to Health Care Monn. Washington OC: The Urban Institute Press.
Arnould, A R, et al., 1993a, Competitive reforms: Context and scope, in Amould, Rich and White, 1993, chapter one.
Amould, A R, et al., 1993b, Competitive reform and the future, in Amould, Rich and White, 1993, chapter five.
Amould, A R and L. M De Brock, 1986, Competition and market failure in the hospital industry: A review of the evidence. Medical Care Review, Vol. 43, No. 2, pp. 253-292.
Arrow, K, 1963, UncertainJy and the welfare economics of medical care. American Economic Review, Vol 53, pp. 941-973.
Atkinson, A B., and 1. E. StigJitz, 1980, Lectures on Public Economics. New York: McGraw-Hill.
Auster, R, 1 Leveson and D. Sarachek, 1969, The production of health: An exploratory study, Journal of Human Resources, N, Fall, pp. 411-436.
Baldwin. S., C Godfrey and C Propper (eds.), 1990, The Quality of Life: Penpectives and Policies, Lordon: Routledge am Kegan Paul.
BaIT, N. and D. Whynes (eds.), 1993, CUJTeIlt Issues in the Economics of Welfare. Current Issues in Economics Series. London: Macmillan.
Baumo~ W. 1., 1986, Super-fairness: Applications and Theory, Cambridge, Massachusetts: The MIT Press.
Beck. A, 1974, History of medicine and health services in Kenya (1900-1950), in Odingo and Onyango, 1974, pp. 91-106.
:seeker, G., 1965, A theory of the allocation of time, Economic Journal, Vol. 75,493-517.
BeD, 1. M, and S. Mendus, 1988, Philosophy and Medical Care, Cambridge: Cambridge University Press.
-268-

Beske, F., 1982, &pe1rJitures and attempts of cost containment in the statutory health insurance .systems of the Federal Republic of Germany. In McLachlan and Maynard, (eds.), 1982, pp.233-264.
Black, D., 1980, Inequalities in Health: Report of the working group chaired by Sir Douglas Black, London: HMSO.
Bonte, J., 1974, Patterns ofmortalityandmorbidity, in Odingo and Onyango, (eds.), 1974.
Broome, J., 1978, Trying to value a life, The Journal of Public Economics, Vol. 9, pp. 91-100.
Broome, J., 1988, Goodness, fairness and QALYs. In Bell and Mendus, 1988, op. cit., pp. 57-73.
Carroll N. v., and W. F. Erwin, 1987, Patient shifting as a response to medicare prospective payment. Medical Care, Vol. 25, pp. 1161-1167.
Clarkson, KW., 1972, Some implications of property rights in hospital management. Joumal of Law and Economics, Vol. 15, pp. 363-384.
Cochrane, A L., 1972, Effectiveness and Efficiency: Random Reflections on HetJlth Services. London: The Nuffield Provincial Hospital Trusts.
Coles, M, and J. M Malcomson, 1979, Contract theory and incentive compaJibility, in Hey, 1979.
Cowell, F. A, 1986, Miaoeconomic Principles. Pbilip Allan Publishers.
Cromwell, J., and J. B. Mitchell, 1986, Physician-i1duced demand for surgery. Journal of Health Economics, Vol. 5, pp.293-313.
Cullis, J. G., and P. A West, 1979, The Economics of Health: An Introduction. London: Martin Robertson.
Culyer, A J., 1971, The nature of the ccmmodity health care and its efficient allocation. ODonI Economic Papers, Vol. 23, 189-211.
Culyer, A J., 1976, Need and The National Health Service: Economics aml sociDl choice. London: Martin Robertson.
Culyer, A 1., 1978, Need, Values and Health Status Measurement. in Economic aspects of health services, London: Martin Robertson.
Culyer, A 1., 1980, The Political Economy of Social Policy, Oxford: Martin Robertson.
Culyer, A 1., 1985, Economics. Oxford: Basil Blackwell.
Culyer, A 1., 1987, Cost containment in Europe. In OECD, 1987, HfJllth Care Systems in Transition. Paris: Social Policy Studies No. 7.
Culyer, A J., 19888, Inequality in health services is, in general, desirable, in D. G. Green (eel.), 1988, Acceptable Inequalities?: Euays in punuit of equality in health care. London: Institute of Economic Afthlrs, Health Unit Paper No 3.
-269-

Culyer, A 1., 1988b, Health Care Expenditures in Canada: Myth and Reality; Past and Future. Canadian Tax Foundation.
Culyer, A 1., 19898, The normative economics of health care financing and provision. ODonl Review of Economic Policy, Vol. 5, pp. 34-58, also reprinted in McGuire, A, P. Fenn and K Mayhew, 1991, Providing Health Care: The Economics of Alternative Systems of Finance and health Care Delivery, Oxford: Oxford University Press, pp. 6>-98.
Culyer, A 1., 1989b, Health, Health Expenditures and Equity, University of York, Centre for Heahh Economics, DisaJssion Paper No. 83, April.
Culyer, A 1., 1990, Commodities, characteristics of commodities, characteristics of people, utilitiesandthequa/ityoflife, inBaldwin, GodfreyandPropper, (eds.), 1990.
Culyer, A J., 19918, Equity in Health Care Policy, University of TorontolUniversity of York, (mimeD).
Culyer, A 1., 1991b, The promise of a reformed NHS: An economist's angle. British Medical Journal, Vol. 302, pp. 1253-1256.
Culyer, A 1., 1992, The morality of efficiency in health care-Some uncomfortable implications. Journal of Health Economics, Vol. 1, no. 7, pp. 7-18.
Culyer, A 1., 1993, Health care insurance cudprovision, inBarr and Whynes, (1993, chapter 8.
Culyer, A J., A Maynard and A Williams, 1981, Alternative systems of health care provision: An ~ on motes cud beams, in Olson, M, (ed.), 1981, A New Approach to the Economics of Health Care. Washington and London: American Institute of Public Policy Research, pp. 131-150.
Culyer, A J., A Wtlliams and R Lavers, 1972, Health indicators. In A Schofields and S. Shaw, (eels.), Social Indicators and Social Policy. London: Hememann, pp. 94-118.
Culyer, A J., and A WagstaH: 1991, Need, Equality and Social Justice, University of York, Centre fOr Health Economics, Discussion Paper No 90, October.
Culyer, A J., and A WagstaH: 1993, Equity cud equality in health and health care. Journal of Health Economics, Vol. 12, pp. 431-457.
Culyer, A J., and J. Posnett, 1990, Ho.spital behaviour and competition, in Culyer, Maynard and Posnett, 1990.
Culyer, A 1., C. Donaldson and K Gerard, 1988, Financial Aspects of Health Services: Drawing on Experience. The Institute ofHea1th Services Management: Working Party on Alternative Delivery and Funding ofHea1th Services, Working paper No. 3.
Culyer, A 1., A Maynard and 1. W. Posnett, (eds.), 1990, Competition in Health Care: &forming the NaJio1U1l Health Services. Macmillan Press.
euny, S., and 1. Weiss, 1993, Project Analysis in Developing Countries. London: Macmillan.
I)ahlgren, G.,1991, Strategies for health financing in Kenya-the difficult birth of Q new policy. Scandinavian Joumal of Social Medicine, Vol. 546, Supplement No. 46, pp. 67--81.
-270-

Daniels, N., 1985, Just Health Care, Studies in Philosophy and Health Policy. Cambridge: Cambridge University Press.
Dasgupta, A K, and D. W. Pearce, 1972, Cost-Benefit Analysis: Theory and Practice. Basingstoke: Macmillan.
de Ferranti, D., 1983b, Some Current Methodological Issues in Health Sector and Project analysis. The World Bank: Population, Health and Nutrition Department, December.
de Ferranti, D., 1983a, Background Information for Analysis of Financing and Resource ADoation Issues in Health Sector and Project Work. The World Bank: Population, Health and Nutrition Department, December.
De Lew, N., G. Greenberg and K Kinchen, 1992, A layman's guide to the US health care system. Health Care Financing Review, Vol. 14, (1), pp. 151-169.
DHSS, (Department of Health and Social Secwity), 1976, Report of the Resource ADoation Working Party, London: HMSO (Her Majesty's Statistical Office).
DHSS, 1986, Review of the Resource Working Party Fonnula. Report by the NHS Management Board. London: HMSO.
Donabedian, A, 1971, Social Responsibility for personal health services: An examination of IxNc values. Inquiry, Vol. 8, pp. 3-19.
Donaldson, C., and K Gerard, 1993, Economics of Health Care Financing: The VISible Hand. Economic Issues in Health Care Series. London: Macmillan, .
Dunharn, A B., 1. A Morone and W. D. White, 1982, Restoring medical markets: Implications fer the poor, Journal of Health Politics and Law, Vol. 7, pp. 488-501.
Eatwell, 1., M Mi1gate and P. Newman (eds.), 1987, The New Palgrave: A DictioIlll1'Y of Economics, London and Basingstoke: Macmi1lan.
Ellis, R, 1. M Kirigia and G. Mwabu, 1990, South Nyanza district study: An empirical exposition of health care users. Nairobi: USAID, (Mimeo).
Enthoven, A C., 1980, Health Plan: The Only Practical Solution to the Soaring Cost of Medical Care. Reading. Massachusetts: Addison Wesley.
Enthoven, A C., 1987, 1he US health care economy: From guild to market in ten years. Health Policy, Vol. 7, pp. 241-251.
Evans, R G., 1974a, Supplier induced demand: Empirical evidence and implications. In M Perlman, (ed.), The Economics of Health and Medical Care. New York: John W~ey and Sons.
Evans, R G., 1974b, Modelling the economic objectives of the physiCian. In RD. Fraser, (ed.), Health Economics Symposium: Proceedings of the fmt Canadian conference, September, 4-6.
Evans, R G., 1983, 1he welfare economics of public health insuranCe: Theory and Canadian practice. In L. SOderstrOm, (eel), Social Economics. Amsterdam: North-Holland.
-271-

Evans, R 0., 1984, Strained Mercy: The economics of Canadian medical care. Toronto: Butterworths.
Evans, R 0., 1987, Public Health Insurance: The collective purchase of individual care, Health Policy, Vol. 7, pp. 115-134.
Evans, R 0., 1990, Tension, compression and shear: Directions, stresses and outcomes of health care cost control. Joumal of Health Politics, Policy and Law, 15: 101-128.
Evans, R 0., 1. Lomas, M L. Barer, R LabeIle, C. Fooks, et al., 1989, Controlling health expenditures-the Camdian reality. New England Journal of Medicine, 320, pp. 571-577.
Fama, E. F., 1980, Agency problems and the theory of the firm. Journal of Politial Economy, VoI. 88, No. 2.
FeJdman. A M, 1987, '~" inEatweJl, Milgate and Newman (eds.), 1987.
Feldstein. M, 1963, Economic analysis as operational research and the National Health Services, <>Dord Economic Papen. March.
Feldstein. M, 1965, The effects of case-mix on hospital costs. Medial Care, Vol. 3, pp. 95-103.
Feldstein. M, 1970, The rising price of physician services. Review of Economics and Statistia, VoL 52, May, 1970.
Feldstein. P. 1., 1966, Research on the demardfor health care services. Mllbank Memorial Fund Quarterly, Vol44, No. 3, Part 2, pp. 128-165.
Fitzgerald, 1. F., L. F. Fagan, W. M Tierney and R S Dittus, 1987, Changing patterns of hip fracture care before and qfter implementation of the prospective payment system. Joumal oftbeAmerican Medical Assodation, Vol. 258, pp. 218-221.
Fried, C., 1978, Right and Wrong, Cambridge, Massachusetts: Harvard University Press.
Fried, C., 1983, An analysis of 'equality' and 'rights' in medical care. In 1. Arras and R Hunt, (eds.), 1983, Ethical Issues in Modem Medicine. Palo Alto, California: Mayfield Publishing Company, pp.490-496.
Fuchs, V. R, (ed.), 1972, bays in the Economics of Health and Medial Care. New York: NBER.
Fuchs. V. R, 1978, The supply of surgeons and the demandfor operations. Journal of Human Resources, Vol 13 (Supplement), pp. 35---56.
Gillon, R, 1986, Pbilosophical Medial Ethics. Chichester: Wdey.
Qinsburgh, P. B., and 0. M Cater, 1986, Medicare case-mix index increase. Health Care Financing Review, Vol. 7, pp. 51-65.
Goldfiu"b, M, M H Hombrook and 1. Rafferty, 1980, Belrzviour of the multi-product firm: A model of the non-profit hospital system. Medical Care, Vol. 18, No. 2.
-272-

Golladay, F., and B. Liese, 1980, Health Problems and Policies in the Developing Countries. World Bank Staff Working Paper No, 412.
Groot, L. M J.,1987, Incentives for cost-effectiveness behaviour: A Dutch experience. Health Policy, Vot. 7, pp. 175--188.
Grossman, M, 1972, The Demand for Health: A theoretical and empirical investigation, New York: NBER.
Gutennan, S., and A Dobson, 1986, Impact of the medicare prospective payment system for hJspitals. Health Care Financing Review, Vol. 7, pp. 97-114.
Hadley, I., 1982, More Medical care, Better Health? An economic analysis of mortality rates. Washington DC: Urban Institute Press.
Harberger, A C., 1978, On the use of distributional weights in social cost-benefit analysis. Journal of Political Economy, Vol. 86, Supplement, pp. 87-120, April.
Hanis, J. E., 1977, The internal organisation of hospitals: Some economic implications. Bell Journal of Economics, Autunm.
Harsanyi, 1. C., 1955, CordinaJ welfare, individualistic ethics, and inter-personaJ comparisons of utility. Journal of Political Economy, Vot. 63, August, pp. 309-21.
Hartley, K and M Huby, 1985, Contracting-out in health and JocaJ autJaities: Prospects, progressandpitfalIs. Public Money, Vol. 5, September, pp. 23-26.
HelIer, P. S., 1978, Issues in the allocation of resources in the medical sector of developing countries: The Tunisian case. Economic Development and Cultural Change, Vol. 27, pp. 121-144, October.
Hey, J. D., (ed.) 1989, Current Issues in Microeconomics. Basingstoke: Macmillan.
Holmstrom, B., 1982, Moral IrIzard in teams. Bell Journal of Economics, Vot. 13, Autumn, pp. 324--40.
Hochman, H H, and 1. D. Rogers, 1969, Pareto optimal distribution. American Economic ~, Vol. 59,~o.3,pp.542-557.
Hoy, E. W., R E. Curds and T. Rice, 1991, Change and growth in managed COTe. Health Main (winter), pp. 18-36.
Hurwicz, L., 1960, Optimality and iTiformatioml efficiency in resource allocation processes. In K Arrow, S. KarIin and P. Suppes (eels.) Mathematical Methods in the Social Sciences. Stanford: Stanford University Press, pp. 27-46.
Hurwicz, L., 1972, On iriformationa/Iy decentralised ~stems. In R Radner and C. B. McGuire, (eds.), DecBion and Organisation. Amsterdam: ~orth-Holland. pp.297-336.
Hurwicz, L., 1973, The design of mechanisms for resource allocation. American Economic ~, Vohune 83, Papers and Proceedings, May, pp. 1-30.
-273-

IHSM (Institute of Health Services Management), 1988, Working Party on Alternative Delivery and Funding of Health Services: Final Report. Institute of Health Services Management
Irvin, G., 1978, Modem Cost-Benefit Methods. An Introduction to FIIUlIICiol, Economic and Sociol Appraisal of Development Projects. London: Macmillan.
Jacobs, P., 1973, A Utility Muimising Approach to the Analysis of Non-Profit Maximising Hospital Behaviour. Unpublished D. Phil. Thesis, Department of Economics and Related Studies, University of York, England.
Jacobs, P., 1974, A swwy of economic mCJti£/s of hospitals. Inquiry, Vol. Xl, June.
Johns, L., 1985, Selective contracting in California. Health Main, Vol. 4, (Fall), pp. 32-48.
Jones-Lee, MW., 1982, The Value of Life and Safety. Amsterdam: North-Hol1and.
Joskow, P. L., 1980, The effects of competition and regulation on hospital bed supply and the reservation quality of the hospital. Bell Journal of Economics, Vol. 11, pp. 421-447.
Joskow, P. L., 1983, Reimbursement policy, cost containment and non-price competition. Journal of Health Economics, Vol. 2, pp. 167-174.
Kalipen, E., 1993, Determinants of irifant mortality in Malawi: A spatial perspective. In Social Science and Medicine, Vol. 37, No. 2, pp. 183-198.
Kenya, Republic ot: 1965, African Socialism and its Application to Planning. Sessional Paper No. 10.
Kenya, Republic ot: 1966, National Development Plan, 1966-1970. Nairobi: Government Printer.
Ken}'a, Republic ot: 1969a, The Constitution of Kenya. Nairobi: Government Printer.
Ken}'a, Republic ot: 1969b, National Development Plan, 1969-1974. Nairobi: Government Printer.
Kenya, Republic ot: 1984, National Development Plan, 1984-1988. Nairobi: Government Printer.
Kenya, Republic ot; 1986, Economic Management for Renewed Growth: Sessio1llll Paper Number 1 t{'1986. Nairobi: GovemmentPrinter.
Kenya, R.epJblic ot: 1989, Demographic and Health Survey, 1989. Kenya Population Council.
Kenya, Republic ot: 1992, Economic Survey, 1992. Central Bureau of Statistics, (CBS), Nairobi.
Kenya, Republic ot: 1994a, National Development Plan, 1994-1997. Nairobi: Government Printer.
Kenya, Republic ot: 1994b, Economic Survey. Central Bureau of Statistics, Ministry of Planning and National Development.
-274-

Kirigia, 1. M, P. Fleuret and D. J. Byme, 1989, Effects of Health Care User Fees: Evidence from Meru District. Nairob~ Kenya: UNICEFIUSAID, (Mimeo).
Kreps, D., P., MiIgrom, P. Roberts and R WllsoIl, 1982, Rational co-operation in the finitely repeated Prisoners' Dilemma. Joumal of Economic Theory, Vol. 27, August, pp. 24~52.
Lancaster, K J., 1966, A new approach to consumer theory, Journal of Political Economy, Vol. 74, 132-157.
LangweIl, K M, and T. Menke, 1993, Controlling costs of the us. health care system: Trends ani prarpects, in Amould, Rich and White, 1993.
Lazear, E. P., 1979, ~ is there mandatory retirement? Joumal of Political Economy, Vol. 87, December, pp. 1261-84.
Lazear, E. P., 1987, Incentive cmtracts, inEatwell, Milgate andNewman, 1987,
Le Grand, J., 1982, The Strategy of Equality: Redistribution and the Sociol Services. London: George Allen & Unwin.
Le Grand, J., 1984, Equity as an economic objective, Journal of Applied Pbilosopby, Vol 1, Part 1, 39-51.
Le Grand, 1., 1987, Equity, health and health care, in Three Essays on Equity, London School of Economics and Political Science: Sun Tory Toyota International Centre for Economics and Related Disciplines (STICERD), WeIfilre State Project, Discussion Paper No. 23.
Ledyard, 1. 0., 1987, Implicit contracts in Eatwell, Milgate and Newman, 1987.
Lee, M L., 1971, A conspiCUOUS production theory of hospital behaviour. Southern Economic Joumal, Vol 38, July.
Labenstein, H, 1966,Al/ocative efficiency vs. 'X-e,fficiency'. Amerian Economic Review, Vol. 56, pp. 392-415, June.
Labenstein,H, 1987, X-4iciency theory, inEatwel1, Milgate andNewman, (eds.), 1987.
Lindsay, C. M, 1969, Medical care and the ecommics of sharing. Emnomica, Vol. 36, pp. 351-362.
Lindsay, C. M, 1976, A theory of government enterprise. Journal of Political Economy, Vol. 84, No. 5.
Little, I, and 1. Miniees, 1974, Project Appraisal and Planning for DevrJopiog Countries. London: Hem.emann Educational Books.
Lockwood, M, 1988, QuaJity of life and resource al/oeation in Bell and Mendus (eds.), 1988.
Loomes, G (1988): Disparities between health state measures: An expIanation and Some Implications, Paper Presented to the UK Health Economics Study Group meeting. Brunnel.
Luft, H, J. Robinson, and D. Gamick., et al., 1986, The role of specialised services in competition among lmpitals. Inquiry, Vol. 23, pp. 83-94.
-275-

Lyrm, T. 1., 1991, The performance ofmanaged care: An insurers perspective. Health Main, Vol. 10, (winter), pp. 625-58.
Margo1is, H, 1982, Selfishness, Altruism and Rationality. Cambridge: Cambridge University Press.
McCall et al., 1987, Evaluation of Arizona health care cost containment system, 1984-85. Health Care Financing Review, Vol. 9, pp. 79-90.
McComb, 1., and 1. Christianson, 1987, Applying competitive bidding to health care. Journal of Health Politics, Policy and Law, Wmter, pp.703-22.
McLachlan, G,. and A Maynard, (eds.), 1982, The PubliclPrivate Mix for Health: The relevance and effects of change. The Nuffield Provincial Hospitals Trust.
McPake, B. and E. E. N. Banda, 1994, ConJracting out health services in developing countries. Health Policy and Planning, Vol. 9, (1), pp. 25-30.
McPherson, K, 1989, International differences in medical care practices. Health Care Financing Review, Annual Supplement, pp. 9-20.
Melnick, G. A, 1. Zwanziger, and T. Bradley 1989, Hospital behaviour under competition ard cost<Onlainment policies in California, 1980-1987. Health Main, Vol. 8, (surmner), pp. 129-39.
Migu6, J. L., and G. Be1anger, 1974a, Toward a general theory ofmanagerial discretion. Pub6c Otoice, Vol. 17, Spring, pp. 27-47.
Migue, 1. L., and G. B&mger, 1974b, The Price of Health. Canada: Macmillan.
Mi11s. A, 199Oa, The economics of hospitals in developing countries. Part I: Expenditure patterns. Health Policy and Planning, Vol. 5, No. 2, pp. 107-117.
Mills, A, 199Ob, The economics of hospitals in developing countries. Part D: Costs and sources of income. Health Policy and Planning, Vol. 5, No. 3, pp. 203-218.
Mishan, E. 1., 1971, Cost-Benefit Analysw. London: AlIen and Unwm.
MOH, 199Oa, Preventive and Primary Health Care Resource Gap Study. Nairobi: Study co-funded by Abt Associates Inc. and TInmder and Associates Inc.
MOH, 1991, Health Care Financing Programme: Position Paper. Nairobi: Health Care Fmancing Programme, MinistIy ofHea1th, July.
MOH, 1992, Facility Improvement Fund: Operations Manual. Nairobi: Health Care Fmancing Secretariat, July.
MOH/GOK, 1993, Strategic Action Plan for Financing Health Care in Kenya. Nairobi: Kenya Health Care Fmancing Project, March.
MOHIWorld Bank, 1986, Report on 'Expenditure ard.finarring of the health sector in Kenya: Nairobi: Ministry of Heath, Febnwy.
-276-

Mooney, G., and A McGuire, 1987, Distributive justice with special reference to geographical inequality in health care. In A Wtlliams, (ed.), Health and Economics, London: Maanillan, pp. 68-71.
Mooney, G., J. Hall, C. Donaldson and K Gerard, 1991, Utilisation as a measure of equity: Weighing heat? Journal of Health Economics, Vol. 10, 475-480.
Mooney, G. H, 1982, Economics, Medicine and Health Care. Harvester Wheatsheaf.
Mooney, G. H, 1983, Equity in health care: Cor!fronting the corrfusion. Effective Health Care, Voll, pp. 179-185.
Monisey, M A, F. A Sloan and J Valvona, 1988, Medicare prospective payment and post-hospital transfers to subacute care. Mediad Care, Vol. 26, pp. 685-698.
MueJ1bauer, J., 1987, Professor Sen on the standard of living, in Sen, 1987a.
Murray, J. A, 1974, 1he belrwiour of physicians: Key to health care sector. Journal of Behavioural Economics, Vol. 3, No. 1, pp. 245-272.
Mwabu, G. M, 1989, Non-monetory factors in household choice of medical facilities. Economic Development and Cultural Change. Vol. 37, No. 2, pp. 383-392.
Mwabu, G. M, J. K Wang'ombe and V. N. Kimani, 1989, Demandfor health services in rural Kenya. Paper presented in the International Health Policy Conference, Manila, Philippines, 31 July-4 August.
Mwabu, G. M, J. K Wang'ombe and V. N. Kimarmi, 1991, Health service pricing reforms and health care demard in Kenya. Nairobi: University of .Nairobi/Ken;yatt University, (Mimeo).
Newhouse, J. P., 1970, Towards a theory ofnon-projit institutions: An economic model of a hospital. AmeritJm Economic Review, Vot. 60, pp. 64-74.
Newhouse, 1. P., Im,MedicoJ care experrJiture: A cross-nationaJ survey. Journal of Human Raourees, Vot. 12, pp. 115---125.
Ng y., 1979, Welfare Economics. London: Maanillan.
NJSkanen, A W., 1973, Bureaucracy: Servant or master? The Institute of Economic AffiUrs.
Nonneman, W., and E. Van Doorslaer, 1987, Ecorrnnic incentives in the health care industry: imp/icationsforhealthpolicymaldng. HalIth Policy, Vol. 7, pp. 109-114.
Nozick, 1974, Anarchy, State and Utopia. New York: Basic Books.
Odingo, S. and Z. Onyango, (eels.), 1974, Health and DBease in Kenya. Nairobi: Heinemann.
OECD, 1987, Fmancing and Delivering Hea1th Care: A comparative analysis ofOECD countries. Paris: OECD.
Paringer, L., and N. McCall, 1991, HmtI competitive is competitive bidding? Health AtTain, Vol. 10, No. 4 (winter), pp. 220-230.
-277-

Parkin, D., 1980, Distance as a User-Cost Affecting Accessibility to Health Services. Unpublished D. Phil. Thesis, Department of economics and Related Studies, University of York, England.
Paton, C., The Policy of Resource ADocation and its Ramifications. Nuffield Provincial Hospitals Trust, Occasional Papers, 2.
pauly, M v., 1971, Medical Care at Public Expense: A S'tIu6' in Applied Welfare Economics. New York: Praeger Publishers.
pauly, M v., 1974, The Behaviour of non-profit hospital monopolies: Alternative models of the 1mpitaI, in Havigtmst, Regulating Health FacDitits Construction. AEI.
Pamer, E., and D. Schmeidler, 1978, Egalitarian equivalent allocations: A new concept of economic equity, Quarterly Journal of Economics, 92, No. 4, pp. 671-687.
pearce, D. W., and C. A Nash, 1981, The Social AppraiW of Projects: A Text in Ct»-IJen4it ~ London: Maanillan.
perejra, 1., 1989, What Does Equity in Health Mean? University of York, Centre for Health Economics, Disalssion Paper No 61, August.
phelps, C., 1986, Induced demand-Can we ever know its extend? Journal of Health Economics, Vol. 5, pp. 355-365.
RawIs. J., 1958, Justice asj:Jirness, in The PbiIosopbical Review, 67, pp. 164-94.
Rawls. 1., 1972, A Theory of Justice, Cambridge, Massachusetts: HaIvard University Press.
Rawls. J (1982): SociaIWlityandprimarygocm, inSenand Williams, (eds.), 1982,159-185.
REACH (Resources for Child Health Project, REACH)IKNH (Kenyatta National Hospital), 1988, Kenyatta National Hospital Board: Plan of Action for Refonn. Comprehensive Report, Nairobi, May.
REACHlMOH, 1988, Nairobi Area Study. Fmal Report: Nairobi: USAID/GOK
REACHlMOH, 1990, Provincial and District Health Services Study: Nakuru Dimict. Main Report. Nairobi, September.
ReeS. R, 1989, Uncertainty. iTiformationandinsurance, in Hey, 1989.
Rice, R G., 1966, An anaJysis Dj hospital as an economic organism. The Modem Hospital. Vo1106, pp. 87-91.
Robinson. J., and H Luft, 1988, Competition, regulation and hospital costs, 1982 to 1986. Joumal of the Amerian Medical Association, Vol. 260, pp. 2676-2681.
Robinson. J. and H Luft, 1985, The impact Dj hospital market structure on patient volume, average length of stay. and the cost of care. Journal of Health Economics, Vol. 4, pp. 333-356.
Rosen. S., 1985, Implicit contracts: A survey. Journal of Economic Literature, Vol. 23, September, pp. 1144-75.
-278-

Rosko, M D., and R W., Broyles, 1987, Short term response of hospitals 10 the DRG praspectivepricingmechanismsinNewJersey. Medical Care, Vol. 25, pp. 8&--94.
RutteD, F., and A van der Wed( 1982, Health policy in the Netherlands: At the C1'aSS-I'oads. In Mclarh1an and Maynard, (eds.), 1982.
Sagar, M A, D. V. Easterling, et al., 1989, Clonges in the location of death after passage of medicare's prospective payment system: A national study. New England Joumal of Medicine, Vol. 320, pp. 433--439.
Saltman, R, 1992, Recent health policy initiatives in the Nordic countries. Health Care Financing Review, Vol. 13, No. 4, pp. 157-167.
Saltman, R B., and C. von Otter, 1992, Planned Markets and Public Competition: Stmtegic Reform in NOJ1hem European HeoJth Systems. London: Open University Press.
Schleifer, A, 1985, A theory of yardstick competition. RAND Journal of Economics, Vol. 16, part 3, pp.21~27.
Scitovsky, T., 1952, Wt"Jf'are and Competition. London: Unwin University books.
Secretaries of State, 1989, Funding Contracts for Health Services, London: HMSO, Working Paper No. 2.
Sen, A K, 1982, Equality ojwhaJ? in Sen, A K, 1982, Choice, Welfare and Measurement. Oxford: BJackwell; Cambridge, Massachusetts; MIT Press.
Sell, A K, 1985, Commodities and Capabilities. Amsterdam: North-Holland.
Sen, A K, 19878, ne Standard of Living. Cambridge: Cambridge University Press.
Sen, A K, 1987b, Justice. InEatwell, Milgate am Newman, 1987.
Sell, A K, and B. WiJJiams, (eds.), 1982, Utilitarianism and Beyond. Cambridge University Press.
Sharit: A M HR, S. M M Huq and M ~Saleheen, 1993, Spatial patterns of mortality in Bang/aJesh. In Social Science and Medicine, Vo136, No. 10, pp. 1325---1330.
Silver, M, 1972, An econometric amIysis of spatial variations in mortality rates by ~ and sex. in Fuchs, (00.), 1972.
Sloan, F. A, 1974, A miaoamJysis of physicians , hours ofwork-decisons. In M Perlman (00.) ne Economics of Medical Care, International Economic Association, London: MaaniDan.
Sloan, F. A, M A Monisey and J VaIvona,. 1988, M.edicare prosJJICIive payment cnJ the use of mediad 1J!Chnologies in hospitals. Medical Care. Vol. 26, pp. 837-851
Smith, C. J., 1987, Equity in the distribution of health and welfare services-Can we rely on the stale 10 reverse the inverse-care law? Social Science and Medicine, Vol. 23, No 10.
Squire, L., and H van der Talc, (1975), Economic Analysis of Projects. Baltimore: The John Hopkins University Press.
-279-

Sudgen, R, and A Williams, 1978, The Principles of Cost-Benefit Analysis, Oxford University Press.
Tait, A A, and P. S. Hefier, 1981, International CompamoDS of Government Finance. International Monetary FlUld, August.
ten Have, H, 1988, Ethics and economics in health care: A medical philosophers view. In Mooney, G., and A McGuire (Eds.) Medical Ethia and Economics in Health Care. Oxford: Oxford Medical Publications.
The Standard, Nairobi: April 28, 1992.
Thomson, G., 1987, Needs London: Routledge and Kegan Paul
Torrance, 1986,G, W, (1986): MeasW'ement for health state utilities for economic apprai8a/, Joumal of Health Economics, Vol. 5, 1-30.
Torrance, G W (1976): Social preferences for health slates, An empirical evaluation of three techniques, Socio-Economic Planning Science, Vol. 10, 129--136.
UNICEF (United Nations Children's Fund), 1993, The State of the World's ChDdren, 1993. Oxford University Press.
United Nations, 1986, World Development Report, Washington DC., 1986.
van de Ven, W. P. M M, 1989, AJuturefor competitive health care in the Netherlands. NHS White Paper Series, Occasional Paper No. 9, Centre for Health Economics, University of YOlk.
Varian, H, 1974, Equity. envyandefficiency, Journal of Economic Theory, Vol. 9,63-91.
Veatch, R M, 1982, Ethical dimensions of the distribution of health care. In J. van der Graag, W. B. Neenan and T. Tsukahara (eds.), 1982, Economics of Health Care. New Yorlc: Praeger Studies in Grants Economics, Praeger Publisha"s pp. 3-24.
VogeI, R, J., 199Oa, Health Insurance in Su~ Africa. The World Bank: Pre-Worldng Paper Series, PopuJation, Health and Nutrition Department, August.
vogeI, R J., 199Ob, An analysis of three national insurance proposals in mb-SaJKIran Africa, International Joumal of Health Planning and Management, Vol. 5, part 4,271-285.
van Otter, C., and R Saltman, 1991, Towards a Swedish health policy for the 1990$: Planned marketsandpub/icjirms. Social science and Medicine, VoL 32, No. 4, pp. 473-481.
wagstaff: A, 1991, QALYs and the efficiency-equity trade-off, Joumal of Health Economics, Vol10,No2,21-41.
Weekly Review, .hme 3, 1994, The medical profession: Doctors issue strike threat. SteJlagraphics, Nairobi, Kenya, pp. 19--20, .
wennberg, J and A Gittlesolm, 1982, Variations in medical care amongst small areas. Scientific American, Vol246, 100--11l.
-280-

west, P., 1981, Theoretical and practical equity in the National Health Service in England. Social Science and Medicine, Vol. 15, pp. 117-122.
Whitehead, M, 1987, The Health Divide: lnequoJities in the 1980's, A Review, London: Health Education Authority, March.
WJggins, D., 1991, Need, Values, Truth. Oxford: Basil Blackwell.
Wlley, M M, 1992, Hospital financing reform and case-mix measurement: An international M'iew. Health Care Finandng Review, Vol. 13, (4), pp. 119-133.
- .
Wtlliams, A, 1973, The cost-benefit approach: Bastard science? andIor insidious poison in the body poIitik? In Wolfe, 1. N., (ed.), 1973, Cost-Benefit and Cost-Effectiveness: Studies andAtullysis. Lomon: Allenand Umwin. pp. 30-60.
Wtlliams, A, 1974, The cost-benefit approach, British Medical Bulletin, 30,252-256.
Williams, A, 1985, The economics of coronary artery by-pass grqfting, The British Medical Journal, 291, 326-29.
Williams, A, 1987, Qualityat:!justedlifeyears, The Lancet, (i), 1327.
Williams, A, 1988, Ethics and eJficiency in the provision of health care in Bell, J M and S Meaius (eels.), 1988.
WJlson, G., and 1. Jadlow, 1982, Competition, profit incentives and technical efficiency in the provision of nuclear medicine services. BeD Journal of Economics, Vol. 13, pp. 472-482.
Wo1fe, P. R, and D. W., Moran, 1993, Global budgeting in the OECD countries. Health Care Financing Review, Vol. 14, (3), pp. 55-76.
WooDey, 1. M, 1989, The competitive effect of horizontal mergers in the hospital industry. Journal of Health Economics, Vol 8, pp. 271-291.
World Bank, 1993, World DeveJopmentReport: Jnvesting in Hea1th, WashingtonDC.
zwanziger, 1., and G. A, MeJnick, 1993, Effects of competition on the hospital industry: Evidence from Ca/ifania. In Amould, Rich and White, 1993.
-281-

6.3 Costs, Outputs and Competition
This section examines the effects of competition and regulation on some selected aspects of
perfonnance such as cost, quality, length of stay and capacity utilisation The section focuses
mainly on hospitals, the biggest user of any health system's resources, including in Kenya.
A profit-maximising hospital in a competitive envirorunent, sel1mg an Wldi1fe.r'!Iltiated single
service, will always select an output level that is higher and a lower selling price ('ompared to a
profit-maximising monopolist hospital, their relative sizes (m terms of capital infrastructure) not
withstanding. In both cases, the unit cost, at whatever output level selected, would be minimised.
The monopolist hospital may however earn surplus economic profits compared to the competitive
hospital because its monopoly status enables it to pursue objectives such as those discussed in sec
tion 6.1.1 above, aspects that may translate into X-inefficiency. For example, ifmonopoly confers a
degree of , managerial slack', the swplus economic profits realised may be converted into types of
costs that enhance the utility of managers-fotms of expenditure that represent opportunity cost
but that do not represent the minimum cost peJ" unit of output (minimum marginal cost}--or are
passed onto capital owners or employees in the £Om of remuneration that is higher than is neces
S8IY to keep resources in that particular use (Culyer and Posnett, 1990). Such ~ no
longer correspond to the true opportunity cost ofre..~.
ThJs, in the competitive situation, ~ hosprtal acts as a profit maximising 'firm: t respond
ing to the preferences of the fully informed and knowledgeable consumers. Each hospital is re
garded as being so small, and one among so many, that it cannot exercise control over any aspect
of the rnarlcet, except in its own (mtemal) cost structure. Wrthout collusion, hospitals are forced to
compete only on the basis of price, since consumers seek only hospitals with the lowest prices.
Hospitals therefore have an incentive to operate at minimum cost in order to attract 0JSt0m. Those
not optnting at least cost have this reflected in higher prices, to which consumers respond by
switching their custom to elsewhere within the health care industry. The monopolist hospital is free
from such pressures and can afford to operate at higher than minimum costs.
Similar comparative conclusions obtain for output-maximisation subject to a no L>ss con
straint with respect to costs. Under both competition and monopoly, the output maximisiHf! l:ospi
tal will set price equal to the average cost and standard results obtain. But predictions of staJ.dard
economic theory may be inadequate because hospitals do not adequately fit within this framt..'Y. ork.
-198-