Ethnicity and Degree of Partisan Attachment in Kenyan Politics
12
Journal of Asian and African Studies 48(1) 114–125 © The Author(s) 2012 Reprints and permission: sagepub.co.uk/journalsPermissions.nav DOI: 10.1177/0021909612440422 jas.sagepub.com J A A S Ethnicity and Degree of Partisan Attachment in Kenyan Politics Federico Battera University of Trieste, Italy Abstract The present analysis disaggregates election results and voter turnout according to the voters’ ethnic background during a time span which covers three electoral processes (1997–2007) in Kenya. The two data combined produced an index which was called the ‘degree of mobilization index’. Given that most of the Kenyan parties proved to be ethnic or made of ethnic alliances, voter turnout was found crucial in differentiating the degree of ethnic mobilization. Ethnicity alone, however, failed to explain these differences. The findings were likely linked to the past record of patronage for the five selected ethnic groups and the ability of such groups to provide a cohesive ethnic leadership. Keywords Elections, ethnic mobilization, Kenya, parties, patronage, voter turnout Introduction Ethnicity has always been considered an indicator for voting and partisan attachment. According to Lipset and Rokkan (1969), characteristics such as ethnicity, race or regional affiliation have a strong effect on voters’ preferences and on the degree of partisan attachment. Sub-Saharan Africa makes no exception. As Norris and Mattes (2003) found, ethnicity influences support to the gov- erning parties. Voter turnout was also considered an indicator of partisan attachment (Wolfinger and Rosenstone, 1980). Voter turnout in Sub-Saharan Africa has been proved to be far above expectations for underdeveloped and rural countries. 1 Political scientists such as Kuenzi and Lambright (2005) decided, therefore, to investigate relationships between turnout and other vari- ables such as gender, age, urban versus rural status, etcetera, in 10 African countries. As is common in vote studies, their analysis was carried out at the individual level, using Afrobarometer data. However, Kuenzi and Lambright failed to include ethnic identity in their analysis. Therefore they were unable to assess the impact of ethnicity on electoral participation. This analysis tries to fill this gap. Since it has been carried out at the constituency level, it con- centrates on one sole country. Kenya has been chosen because it has a well-known record of parti- san attachment. 2 Political violence usually takes an ethnic shape as the country tragically experienced between 1992 and 1994, in 1997 and in 2008, before and/or following electoral Corresponding author: Federico Battera, Department of Political and Social Sciences, University of Trieste, Piazzale Europa, 1 Trieste, 34127, Italy Email: [email protected] 440422JAS 48 1 10.1177/0021909612440422BatteraJournal of Asian and African Studies 12 Article
Transcript of Ethnicity and Degree of Partisan Attachment in Kenyan Politics

Journal of Asian and African Studies48(1) 114 –125
© The Author(s) 2012Reprints and permission:
sagepub.co.uk/journalsPermissions.navDOI: 10.1177/0021909612440422
jas.sagepub.com
J A A S
Ethnicity and Degree of Partisan Attachment in Kenyan Politics
Federico BatteraUniversity of Trieste, Italy
AbstractThe present analysis disaggregates election results and voter turnout according to the voters’ ethnic background during a time span which covers three electoral processes (1997–2007) in Kenya. The two data combined produced an index which was called the ‘degree of mobilization index’. Given that most of the Kenyan parties proved to be ethnic or made of ethnic alliances, voter turnout was found crucial in differentiating the degree of ethnic mobilization. Ethnicity alone, however, failed to explain these differences. The findings were likely linked to the past record of patronage for the five selected ethnic groups and the ability of such groups to provide a cohesive ethnic leadership.
KeywordsElections, ethnic mobilization, Kenya, parties, patronage, voter turnout
Introduction
Ethnicity has always been considered an indicator for voting and partisan attachment. According to Lipset and Rokkan (1969), characteristics such as ethnicity, race or regional affiliation have a strong effect on voters’ preferences and on the degree of partisan attachment. Sub-Saharan Africa makes no exception. As Norris and Mattes (2003) found, ethnicity influences support to the gov-erning parties. Voter turnout was also considered an indicator of partisan attachment (Wolfinger and Rosenstone, 1980). Voter turnout in Sub-Saharan Africa has been proved to be far above expectations for underdeveloped and rural countries.1 Political scientists such as Kuenzi and Lambright (2005) decided, therefore, to investigate relationships between turnout and other vari-ables such as gender, age, urban versus rural status, etcetera, in 10 African countries. As is common in vote studies, their analysis was carried out at the individual level, using Afrobarometer data. However, Kuenzi and Lambright failed to include ethnic identity in their analysis. Therefore they were unable to assess the impact of ethnicity on electoral participation.
This analysis tries to fill this gap. Since it has been carried out at the constituency level, it con-centrates on one sole country. Kenya has been chosen because it has a well-known record of parti-san attachment.2 Political violence usually takes an ethnic shape as the country tragically experienced between 1992 and 1994, in 1997 and in 2008, before and/or following electoral
Corresponding author:Federico Battera, Department of Political and Social Sciences, University of Trieste, Piazzale Europa, 1 Trieste, 34127, Italy Email: [email protected]
440422 JAS48110.1177/0021909612440422BatteraJournal of Asian and African Studies2012
Article

Battera 115
processes. In order to investigate partisan attachment, this analysis disaggregates election results and voter turnout according to the voters’ ethnic background. Since most of the parties have been proven to be ethnic or made of ethnic alliances, voter turnout has proved to be crucial in differen-tiating the degree of partisan attachment.3 Three electoral processes (1997–2007) have been taken into consideration. The analysis covers only five main ethnic groups which account for more than 75% of the entire population. Evidence demonstrates that only for some of them ethnic cohesion is strong. The article is mainly descriptive. However, some possible explanations for those differ-ences are presented in the conclusive part.
The structure of the article is as follows: in the first section the political context of Kenya is described, focusing on the ethnic mobilization before and after one-party rule ended (1991). The second section briefly illustrates the methodology employed. In the third, the results in the degree of partisan attachment for some key ethnic groups – Gikuyu, Luhya, Luo, Kaleenjin and Kamba – are displayed. In the concluding section some possible explanations for the differences discov-ered are offered. The findings, with few adjustments, are compatible with Chandra (2007), who explains partisan attachment and indirectly the resilience of ethnicity through patronage.
A History of Ethnic Mobilization
Ethnic competition leads to ethnic confrontation (Horowitz, 1985). However, since no single Kenyan ethnic group has an absolute majority, ethnic groups have always been forced to ally them-selves to secure a central position in the state. This happened also before the 90s democratization process during the struggle for independence and under the de facto and de jure one-party regime. Governments were always made up by alliances. Furthermore, the political system was strongly presidential. Thus the president had a pivotal role in shaping alliances. Generally the ethnic groups associated with the presidency were able to secure, during the one-party regime, powerful posi-tions in the upper echelons of the government bureaucracy and in the economy. However, each president was always considered enough to not completely exclude other ethnic groups through an ample range of options: from co-optation to divide et impera of ethnic bosses. After the end of Mau Mau struggle (1952–1956) a moderate Gikuyu elite emerged. This combined with a Luo compo-nent – Mboya, Oginga Odinga, etcetera – led to the formation of Kenya African National Union (KANU) and, eventually, to independence. At that time, elites of other major and smaller groups were organized around another party – Kenya African Democratic Union (KADU) – in order to counterbalance KANU hegemony. They asked for majimboism (federalism), which eventually failed after independence. Consequently, KADU diluted itself into KANU leading to a de-facto one-party system.
After the merger between KADU and KANU, KADU leadership was absorbed and started to gain a certain ascendancy in the inner circle of political power. The merger was intended to give prominence to the moderate wing of KANU, led by Kenyatta and the exclusion of the radical wing led by Odinga which eventually founded a new party: Kenya People’s Union (KPU). The radical and moderate wings of KANU were both formed by Gikuyu and Luo leaders (respectively, Kaggia and Odinga vs. Kenyatta and Mboya). However, both the ideological and resource competition took an ethnic stance, given the credit that Odinga received from his province (Nyanza). This resulted in the exclusion of the Luo top leaders under Kenyatta rule (1963–1978). The exclusion of Luo was partially covered by other ethnic groups since Luhya, Kamba and especially Kaleenjin elites were co-opted. Such rise of the Kaleenjin elite became the normal way of rule under Moi (1978–2002) resulting, before the end of the one-party regime (1982–1991), to a decrease in the number of Gikuyu ministers. Kaleenjin presence in the bureaucracy grew at the expense of Gikuyu, while Luo never improved their position and were underrepresented. This also impacted on the

116 Journal of Asian and African Studies 48(1)
delivery of services and development inequalities in the country. The delivery of services and gov-ernment posts assigned to ethnic cliques was the main instrument to keep control on the elite. Elections were, however, held at the constituency level in order to identify local emerging powers. In this way the central power found an instrument to control and co-opt a more loyal elite. Ethnicity and/or tribalism were favoured by the first past the post (FPTP) electoral system which increased the importance of these ‘district leaders’.
With the end of the one-party regime a growing polarization of ethnic groups targeting ethnic groups according to their position towards the ruling party became even more apparent. At that time, and after Mwai Kibaki fell out of favour with President Moi in 1988 and was removed from the vice presidency, disaffection with the KANU regime mounted in Central and Nyanza prov-inces (home to Gikuyu and Luo, respectively). An umbrella of political groups (Forum for the Restoration of Democracy [FORD]) was formed in August 1991. FORD was centred around standing figures such as Oginga Odinga (Luo), Kenneth Matiba (Gikuyu) and Michael Wamalwa (Luhya). However, before the 1992 elections, FORD split into two factions (FORD-A [Asili], led by Matiba and FORD-K [Kenya], led by Odinga) allowing KANU to remain in power. Other par-ties were founded after the death of Odinga (1994) with even stronger ethnic ties as the National Development Party (NDP) in Luoland, Social Democratic Party (SDP) in Ukambani (Kambaland) and Democratic Party (DP), led by Mwai Kibaki, in Gikuyuland. Therefore KANU, in the 90s, was able to maintain a dominant position with a slight majority of votes thanks to the division of the opposition.
In 1992, FORD-K plus FORD-A obtained more votes than KANU, but the results did not pre-vent KANU from winning the presidency, since the same electoral system was applied to the presi-dential election. The same happened during 1997. Table 1 roughly summarizes the geography of regional/ethnic support per party and candidature after the reintroduction of multi-partitism (the two last elections are included).4
As Table 1 illustrates, division in the opposition was overcome only during the 2002 elections when major ethnic bosses apart from Kaleenjin agreed on a new coalition (National Rainbow Coalition [NARC]). As a result KANU was finally driven out from power. During those elec-tions, KANU was able to retain its stronghold only in Rift, obtaining also some of the votes of Gikuyu in the Central province (around 30%). When NARC formed the government, a large cabinet comprised of previously excluded groups such as Gikuyu and Luo was built which lasted a very short time.
However, Table 1 gives us other important information: first, only two ethnic groups – Luo and Kaleenjin – show stability in electoral patterns. In the case of Luo, such stability had been main-tained in 2002 under Kibaki candidacy which was supported by Raila Odinga (son of Oginga Odinga), despite the fact that Luo had a frontrunner of their own (SDP’s James Orengo). Most interesting, in 2007, Kaleenjin massively supported Orange Democratic Movement (ODM) under the Odinga candidacy, contrary to expectations that arose after the endorsement of Moi to the Kibaki candidacy. On the contrary, the other ethnic groups – Gikuyu, Luhya and Kamba – show wavering patterns. While Gikuyu in 1997 and 2007 were massively behind their only candidate, in 1992 and 2002 they split in two.5 Apart from 2002, Luhya always split their vote.6 Kamba show a more stable pattern of vote in 1992, 2002 and 2007; however, they split their vote in 1997. Reasons for these inconsistencies could probably be found in the ethnic ticket of the presidential candidate.
However, if this hypothesis certainly applies for Gikuyu it does not entirely apply for Kamba, Luhya and Luo. In 1997 Kamba had their own candidate (Charity Ngilu) but they split their support between SDP and KANU. The same happened for Luhya who split their support between KANU

Battera 117
and FORD-K notwithstanding the fact that, in 1997, FORD-K presented a Luhya candidate for the presidency (Kijana Wamalwa). In addition, Luo had their own candidate in 2002 but Orengo managed to win only 1.1% of the votes in Nyanza. In order to explain such differences we will try to formulate a hypothesis at the end of the article.
Methodology
To explore differences in ethnic mobilization, it was first decided to concentrate only on electoral constituencies that were almost mono-ethnic. These constituencies were grouped together accord-ing to the five ethnic groups considered. Second, three data were used to analyze the identified constituencies’ groups: the number of constituencies won by the first party (i.e. the party which scored the majority of votes for each ethnic group); the mean percentage of vote scored by the first party, and turnout. The objective was double: (1) finding out if any of the ethnic groups considered had displayed a specific preference for one of the contesting party for the elections; and (2) mea-suring the degree of partisan attachment by combining the percentage of vote scored by the first party with turnout. An index that was called ‘degree of mobilization index’ (DMI) was therefore created. The index was derived by the multiplication of the mean percentage scored by the first party in the won constituencies with the turnout.7
Table 1. Ethnic support and presidential elections in Kenya (since 1992)
1992 1997 2002 2007
Winning Party/coalition
KANU KANU NARC PNU
Candidate(ethnic group)
Moi(Kaleenjin)
Moi(Kaleenjin)
Kibaki(Gikuyu)
Kibaki(Gikuyu)
Main ethnic support Kaleenjin + Kamba + Luhya (part of)
Kaleenjin + Kamba (part of) + Luhya (part of)
Luo + Luhya + Kamba + Gikuyu (part of)
Gikuyu + Luhya (part of)
II Party FORD-A DP KANU ODMCandidate(ethnic group)
Matiba(Gikuyu)
Kibaki(Gikuyu)
Kenyatta(Gikuyu)
R. Odinga(Luo)
Main ethnic support Gikuyu (part of) + Luhya (part of)
Gikuyu Kaleenjin + Gikuyu (part of)
Luo + Kaleenjin + Luhya (part of)
III Party DP NDP FORD-P ODM-KCandidate(ethnic group)
Kibaki(Gikuyu)
O. Odinga(Luo)
Nyachae (ethn. gr. not included)
Musyoka(Kamba)
Main ethnic support Gikuyu (part of) Luo KambaIV Party FORD-K FORD-K SDP Candidate(ethnic group)
O. Odinga(Luo)
Wamalwa(Luhya)
Orengo(Luo)
Main ethnic support Luo Luhya (part of) V Party SDP Candidate(ethnic group)
Ngilu(Kamba)
Main ethnic support Kamba (part of)

118 Journal of Asian and African Studies 48(1)
From 1997 to 2007, Kenya was divided into 210 electoral constituencies; a large number of those was almost mono-ethnic.8 Percentage in votes for a given party and turnout were used as proxies to discover partisan attachment. For example, if in a constituency a given party was able to obtain more than 50% of the votes and similar levels were found in the majority of a single ethnic block, we could infer that that party was considered by the majority of people belonging to that ethnic block as ‘their party’.
Three parliamentary elections were considered: 1997, 2002 and 2007, which means an elec-toral span of 10 years. Five ethnic groups were taken into consideration: Gikuyu, Luhya, Luo, Kaleenjin and Kamba. Their national population share was, respectively: 20.8%, 14.4%, 12.4%, 11.8%, 11.4%, which accounts for more than 75% of the total population. These groups dominated respectively: 30 (most in the central and one in the Rift Valley), 22 (all but one in the Western province, the other in the Rift), 21 (Nyanza province), 24 (Rift Valley), and 17 (Eastern province) constituencies.
The electoral system (FPTP) facilitated the selection of this methodology. The system implies that a single member of parliament (MP) is elected to represent the constituency. Since in the majority of the constituencies almost all the main parties were able to have their own candidate,9 as a result a candidate had to obtain more than 20% of the votes in 1997 (five main parties were counted during that election) or, alternatively, 33.3% in 2002 (three main parties/coalitions) and 16.6% in 2007 (six main parties). Indeed, in most of the constituencies considered the winning party performed well above these thresholds. In the majority of cases the percentage of votes was well over 50%.
Finally, selecting a limited number of constituencies (114 of 210) – the methodology excluded mixed constituencies – gave the advantage of concentrating on constituencies which were pre-dominantly rural (with the exception of some located in Nyanza and Central). In this way, vari-ables such as levels of consumption, education, age, etcetera, which would have potentially influenced the vote, had been controlled. Although some differences in levels of consumption and education are found also in rural areas, these proved to be non-influential on the levels of partici-pation in terms of turnout, in particular during 2007.
Partisan Attachment
The number of seats gained is a misleading indicator of the degree of impact of a party in an ethnic block because the electoral formula (FPTP) multiplies the possibility to win with small differences in votes. For example, in 2007, in Luhya homogeneous constituencies, ODM succeeded to win 16 of 22 constituencies which is apparently a good indicator of ethnic block vote. However, this resulted with a mean percentage vote of 50 when the only three seats gained by the Party of National Unity (PNU) were won with a mean percentage of vote of 58. In the province, Kibaki (PNU) obtained a good 32% of votes which were not translated into a similar percent of seats gained. If the Luhya turnout is compared with that of other ethnic groups the apparent Luhya ethnic block vote falters.
Tables 2a, b and c summarize the elections results in ethnic homogeneous constituencies. The table measures the degree of ethnic mobilization – the degree of mobilization index, devised spe-cifically for the present analysis – and identification to one party from 1997 elections.10
During the 1997 elections the opposition was very fragmented. The opposition parties from the five ethnic groups presented five different presidential candidates. Incumbent Moi, from the Kaleenjin ethnic group and a KANU ticket, won the presidential elections with 40.1% of the national vote, followed by Kibaki from the Gikuyu (31.1%, DP), Raila Odinga, from the Luo

Battera 119
Table 2a. Elections 1997º
Ethnic group No. const. VT (mean) VT-FP First party (FP) (seat; % of vote mean, in won constituencies – V-FP)
DMI
KAMBA 17 70.6 69.7 SDP (9) (55.7) .39GIKUYU 30 77.2 78.6 DP (18) (74.2) .58KALEENJIN 16¹ 81.6 = KANU (16) (84.5) .69LUHYA 22 70.1 68.7 KANU (13) (58.4) .40LUO 21 70.4 71.7 NDP (19) (75.9) .54NATIONAL 65.7
º VT means ‘voter turnout’; VT-FP means ‘voter turnout for the first party in a given ethnic block’; V-FP means ‘votes cast for the first party in a given ethnic block’.¹Kaleenjin constituencies were reduced to 16 because eight MPs ran unopposed.
Table 2b. Elections 2002
Ethnic group No. const. VT (mean) VT-FP FIRST PARTY (FP)(seat; % of vote mean, in won constituencies – V-FP)
DMI
KAMBA 17 57.9 58.5 NARC (13) (62.7) .37GIKUYU 30 66.4 67.6 NARC (22) (68.8) .46KALEENJINº 23 63.5 63.6 KANU (20) (66.2) .42LUHYA 22 57.9 57.7 NARC (21) (67.1) .39LUO 21 54.9 = NARC (21) (79.5) .44NATIONAL 57.0
ºKaleenjin constituencies were reduced to 23 because 1 MP run unopposed
Table 2c. Elections 2007
Ethnic group No. const. VT (mean) VT-FP First party (FP)(seat; % of vote mean, in won constituencies – V-FP)
DMI
KAMBA 17 68.6 69.0 ODM-K (13) (52.2) .36GIKUYU 30 81.2 86.2 PNU (19) (57.2) .49KALEENJIN 24 78.5 80.5 ODM (19) (60.7) .49LUHYA 22 63.0 63.2 ODM (16) (50.0) .32LUO 21 82.3 = ODM (21) (77.5) .64NATIONAL 69.0

120 Journal of Asian and African Studies 48(1)
(10.9%, NDP), Wamalwa from the Luhya (8.3%, FORD-K) and Ngilu from the Kamba (7.7%, SDP). Moi secured the vote of his community and part of the Kamba, Luhya and most of the small ethnic groups which were not included in the present study. Conversely, Odinga and Kibaki obtained votes from their own communities, and Wamalwa and Ngilu failed to obtain the entire vote of their communities. Parliamentary results clearly illustrate the outcome: KANU happened to be the first party in Luhya constituencies and the second in Ukambani (Kambaland). Interestingly, while Kibaki was personally credited with 89% of the votes cast in the Central province, his party – DP – failed to be the ‘take-all’ party in Gikuyu constituencies, where some votes went to Ngilu’s SDP.
In Ukambani SDP emerged as the first party; however, closely followed by KANU. The vote percentages for the two parties were similar. In Luoland the NDP consolidated as a Luo party. Although it reached a lower turnout compared to Gikuyu and Kaleenjin regions, NDP secured the highest mean vote second only to KANU in Kaleenjin areas. In Luhyaland, KANU was the first party. Nevertheless, FORD-K secured a good position since it obtained in the won constituencies a higher mean in votes than KANU.11 In Kaleenjin areas, in eight constituencies, the candidate with KANU ticket ran unopposed, since in most of the Rift Valley opposition was frightened and did not dare defy the powerful KANU; KANU, indeed, secured all Kaleenjin’s constituencies; mobiliza-tion for KANU was so high that in 13 out of 16 constituencies secured by KANU voter turnout did overcome 70% and the candidate obtained more than 50% of the votes.
In Kaleenjin areas KANU obtained the highest mean in percentage of votes recorded for all the parties considered. The degree of mobilization measured by the DMI in Kaleenjin was .69, the highest, followed by a .58 in Gikuyu areas where most of the constituencies secured by DP recorded a combination of both very high score and very high turnout. SDP came second but with a far lower mean percentage of votes in its won constituencies, which means that, where SDP won, it reached very small margins. The degree of mobilization in Luoland was third (.54), while in the other regions considered it was far lower (from .40 in Luhyaland to .39 in Ukambani).
During the following elections (see Table 2b) opposition eventually managed to overcome their differences. Only one credible coalition (NARC) made of former DP, SDP, NDP and FORD-K was set up behind a unique frontrunner – Mwai Kibaki – who was able to win the elections with an overwhelming national majority of 62.2% against Uhuru Kenyatta (31.3%) of KANU, also a Gikuyu. This resulted in a split of Gikuyu vote as expected, although Kibaki secured 69% of the votes in the Central province. In Gikuyu constituencies NARC secured 22 out of 30 constituencies against six for KANU.
In contrast with the following elections (2007), in 2002 turnout in Luoland was the lowest (54.9), though in all the constituencies NARC candidates secured one of the highest percentage of votes in recent Kenyan political history. The most satisfactory conclusion for this result is that dissatisfaction about the candidates turned rather to non-vote because other parties lacked any credibility.12 Probably the opposition to Raila leadership in the province preferred not to vote instead of openly criticize him. The DMI for Luo, Kaleenjin and Gikuyu dropped reaching almost the levels of the other two communities which settled almost at the same levels of 1997.
In the 2007 elections KANU almost completely disappeared from the scene. NARC collapsed as a coalition in 2005 and most of its leadership, excluding DP and FORD-K leaders, set up another party – ODM – in order to defeat the incumbent Kibaki. Behind ODM rallied some of the most important KANU emerging leadership – the so-called ‘young turks’ – though Moi publicly declared in favour of a new Kibaki presidency. In the event of election, Kibaki set up a new coalition – PNU – made mainly of former DP, FORD-K and part of KANU (the Uhuru wing). ODM presented a frontrunner, Raila Odinga, the leader of NDP (now Liberal Democratic Party [LDP]). However,

Battera 121
ODM split before the elections and an ODM-Kenya (ODM-K) appeared behind a frontrunner Kalonzo Musyoka from Ukambani. Contrary to the other main parties, ODM-K lacked in national support and appeared as an ethnic party (Kamba), while the other two – PNU and ODM – tried to secure the swinging vote in two of the ethnic blocks here considered, namely Kaleenjin and Luhya. The results can be seen in Table 2c.
ODM emerged as the party of Luo (21/21), Kaleenjin (18/22) and Luhya (16/22) although with some differences: in Luoland, ODM reached a combination of high score (more than 50% of votes cast in the constituency) and high turnout (more than 70%) in 20 out of 21 constituencies (DMI: .64). Equally, in Kaleenjiland ODM had similar results in 14 out of 18 (DMI: .49) and in Luhyaland two out of 16 constituencies (DMI: .32). Thus in Luhyaland ODM failed to be the powerful machine that happened to be in area inhabited by Luo or Kaleenjin, notwithstanding the fact that a powerful boss like Mudavadi ran as a vice presidential candidate on an ODM ticket. Support for Kibaki was overwhelming in Gikuyuland as it is proved by very high turnout, however fragmented in many parties (PNU secured only 19 out of 30 constituencies).
All the three elections considered show continuity in partisan attachment that goes beyond the name of the parties involved (Table 3).
Interestingly, during each election, in Kaleenjin, Gikuyu and Luo constituencies, the strongest party performed far better than in Luhya and Kamba in terms of DMI. Some possible explanations are sketched in the following section.
Explaining Differences in Ethnic Mobilization
Ethnicity is not only a strong motivation for individual voting behaviour but also a functioning instrument to control votes at the group level. Many theories attempt to explain partisan attachment in ethnic divided countries (Laitin, 1986; Collier, 2001; Reilly, 2001). Two could offer an insight for the cases under examination: the focus on patronage, proposed by Chandra (2007) and the focus on party and ethnic politics suggested by Posner (2005).
Posner, in his work on ethnic politics in Africa, developed a model of ethnic vote which explains how the transition from one-party to a multi-party system affected the ethnic game. The model suggests that, when presidential and parliamentary elections are concurrent, individuals are forced to choose ethnic identities that will maximize their opportunities to get access to resources. Consequently chances for a parliamentary candidate to win in the national election are restricted to those with the pivotal ethnic label and with the ticket of the party which is perceived nationally as associated with that specific ethnic group. Although the hypothesis cannot be discarded – probably none of the Kenyan candidates which were elected in the constituencies here considered were not
Table 3. Degree of ethnic mobilization by ethnic group
Ethnic group 1997Party
1997DMI
2002Party
2002DMI
2007Party
2007DMI
DMImean
KAMBA SDP .39 NARC .37 ODM-K .36 .37GIKUYU DP .58 NARC .46 PNU .49 .51KALEENJIN KANU .69 KANU .42 ODM .49 .53LUHYA KANU .40 NARC .39 ODM .32 .37LUO NDP .54 NARC .44 ODM .64 .54
122 Journal of Asian and African Studies 48(1)
members of a dominant ethnic group – it is probably the easiest and most obvious explanation if other factors are not taken into consideration. For example, Posner’s model cannot explain why some ‘communities’ perform better than others in terms of electoral participation (i.e. turnout). Certainly, to have a presidential candidate of their own could be a stronger motivation to vote. That is why, in 1997 (five presidential candidatures), turnout was comparably higher than in 2002 (three presidential candidatures). However, taken alone, this hypothesis could explain the pattern of ethnic identification and mobilization only for Luo and Gikuyu but it fails regarding the others. Indeed, Kaleenjin neither in the 2002 nor in 2007 elections had a frontrunner and recorded high turnout and high mean of vote for the first party. Furthermore, the model does not explain why in 2007 turnout nationally rose again (three candidatures) unless other hypothesis, as Chandra’s focus on patronage, is taken into consideration.
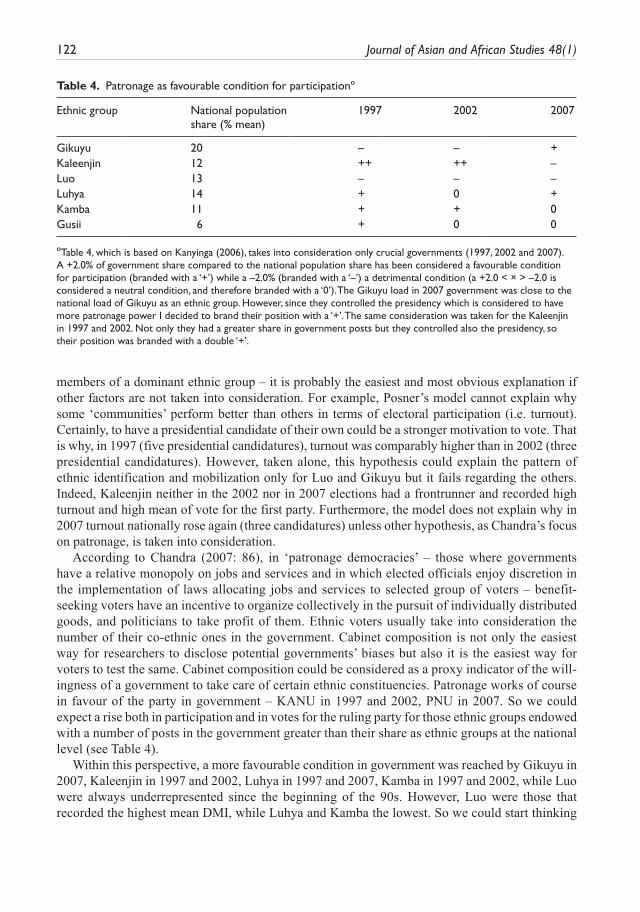
According to Chandra (2007: 86), in ‘patronage democracies’ – those where governments have a relative monopoly on jobs and services and in which elected officials enjoy discretion in the implementation of laws allocating jobs and services to selected group of voters – benefit-seeking voters have an incentive to organize collectively in the pursuit of individually distributed goods, and politicians to take profit of them. Ethnic voters usually take into consideration the number of their co-ethnic ones in the government. Cabinet composition is not only the easiest way for researchers to disclose potential governments’ biases but also it is the easiest way for voters to test the same. Cabinet composition could be considered as a proxy indicator of the will-ingness of a government to take care of certain ethnic constituencies. Patronage works of course in favour of the party in government – KANU in 1997 and 2002, PNU in 2007. So we could expect a rise both in participation and in votes for the ruling party for those ethnic groups endowed with a number of posts in the government greater than their share as ethnic groups at the national level (see Table 4).
Within this perspective, a more favourable condition in government was reached by Gikuyu in 2007, Kaleenjin in 1997 and 2002, Luhya in 1997 and 2007, Kamba in 1997 and 2002, while Luo were always underrepresented since the beginning of the 90s. However, Luo were those that recorded the highest mean DMI, while Luhya and Kamba the lowest. So we could start thinking
Table 4. Patronage as favourable condition for participationº
Ethnic group National population share (% mean)
1997 2002 2007
Gikuyu 20 – – +Kaleenjin 12 ++ ++ –Luo 13 – – –Luhya 14 + 0 +Kamba 11 + + 0Gusii 6 + 0 0
ºTable 4, which is based on Kanyinga (2006), takes into consideration only crucial governments (1997, 2002 and 2007). A +2.0% of government share compared to the national population share has been considered a favourable condition for participation (branded with a ‘+’) while a –2.0% (branded with a ‘–’) a detrimental condition (a +2.0 < × > –2.0 is considered a neutral condition, and therefore branded with a ‘0’). The Gikuyu load in 2007 government was close to the national load of Gikuyu as an ethnic group. However, since they controlled the presidency which is considered to have more patronage power I decided to brand their position with a ‘+’. The same consideration was taken for the Kaleenjin in 1997 and 2002. Not only they had a greater share in government posts but they controlled also the presidency, so their position was branded with a double ‘+’.

Battera 123
that patronage may work also in another way: when an ethnic group has no patronage leaders – that is, those endowed with patronage records – leadership could be built around vocal leaders who complain about exclusion. This is the case with Luo. Luoland has been always neglected in terms of services since Oginga Odinga was thrown out of the Kenyatta government in 1966. And today Nyanza province records the highest poverty level in the country. Furthermore, current Luo leader Raila Odinga is the son of the charismatic Oginga Odinga. His leadership had been there-fore built in Luoland around the largely shared opinion that Luo were punished because they were at the opposition of both Kenyatta and Moi. This relative deprivation (Gurr, 1970) affected much Luo perception to overcome internal differences and motivating people to mobilize around a strong leadership. What happened to Luos failed to work for Luhya or Kamba. A possible expla-nation could be that Luhya failed to forge a unitary and durable leadership.
In 1997 Luhya had a presidential frontrunner: Michael Wamalwa, leader of the FORD-K at that time. In 1997, Wamalwa managed to win around 50% of the vote of the Western province (over-whelmingly Luhya). Nonetheless, he failed to win a majority of seats there. At that time some of the standing Luhya leaders – Mudavadi, Awori, Jirongo – ran with the KANU. And since KANU was in power it was credited with enormous funds for patronage. Therefore patronage worked against Luhya unity. However, patronage did not work again in 2002, because expectations of the Luhya community to have a frontrunner – Musalia Mudavadi – failed. Indeed, Mudavadi ran only as vice-president candidate with a KANU ticket having Moi supported a presidential candidature of Uhuru Kenyatta, something that was judged as a trick by the Luhya community (Katumanga, 2005) because at the same time the share of Luhya members in government dropped. Patronage stopped working as envisaged by KANU leadership, while Mudavadi was accused by his commu-nity of having brought few benefits to Western province during his rise as one of the leading KANU leaders in the 90s.
Again in 2007 the Luhya leadership was split between Mudavadi – running with an ODM ticket and as a vice presidential candidate – and bosses such as Awori or Kombo with the PNU. And again patronage did not work in favour of the PNU candidates and both Awori and Kombo failed to win their parliamentary seats. As we have seen, this resulted in an overwhelming majority of constituencies granted to ODM – however, with a very low turnout and a low mean of votes for the ODM. Results in 2007 in the Western province therefore demonstrate the weaknesses of ethnic leadership here. More specifically, being in the ‘middle’ – only partially co-opted, but in less pow-erful positions – is not a favourable condition to nurture ethnic mobilization as it happened for Luhya (both under Moi and Kibaki) and for Kamba. These two groups show a poor ethnic leader-ship compared to the other three through all post-colonial history of Kenya due to a peripheral position in the geometry of power. Also, when a group reaches a crucial position for the survival of the government, being in the government may not be enough to foster ethnic consciousness – something that takes time. On the contrary, being solidly in power or in an opposite position such as being permanently excluded is likely to lead to more effectual consequences in terms of ethnic capacity to mobilize as a cohesive group.
Acknowledgements
The author would like to thank Giuseppe Ieraci for helpful comments on previous versions of this paper. The author is especially grateful to Tiberius Barasa of IPAR for research assistance and his sound advices. Research in Kenya was helpfully facilitated by IPAR (Institute of Policy Analysis and Research) – Nairobi (Kenya). This article is based on work supported by the Department of Political and Social Sciences (University of Trieste) and benefited from a research project named “The socio-political consequences of democratization” (PRIN 2006) funded by the Italian Ministry of University.

124 Journal of Asian and African Studies 48(1)
Notes
1. Apart from Mali and Senegal, in the top 12 democratized countries, according to Polity IV, rank reached a mean turnout above 60% since 1990, with South Africa on top (82.6%). During the same time, mean turnout for countries like Mexico, India and Poland were under this level.
2. The author carried out field research in 2007 and 2008 before and following the presidential and parlia-mentary elections of December 2007. However, most of the data used for the purpose are freely available on the web from the official site of the Electoral Commission of Kenya (ECK). Ethnic data were based on the 1989 Kenya Population Census (Nairobi, Central Bureau of Census).
3. None of the Kenyan parties are strictly ethnic in their programme or name; however, most of them are commonly identified with certain ethnic groups.
4. ‘Part of’ (in brackets) indicates that a candidate secured more of the 30% of the vote of an ethnic group. 5. If we consider only the Central province vote which accounts for some three-quarters of the Gikuyu vote,
in 1992 62% of Gikuyu vote went to Matiba and 35% to Kibaki and in 2002 69% went to Kibaki and 30% to Uhuru Kenyatta.
6. If we consider only the Western province vote which accounts for some 80% of Luhya vote, in 1992 40% of Luhya vote went to Moi, 39% to Matiba and 18% to Odinga; in 1997 50% went to Wamalwa (luhya) and 45% to Moi; in 2007 66% went to Odinga against 32% to Kibaki.
7. The formula is as follows: DMI = %VT-FP/100 × %V-FP/100. 8. Using the 1989 census which included questions on the ethnic background of the population, only
those constituencies in which the percentage of a single ethnic group was above 75 were considered as mono-ethnic.
9. Exceptions were found only during 1997 elections in some Kaleenjin constituencies in the Rift Valley, where the candidate of the incumbent party – KANU – ran unopposed. For this reason only during that election these constituencies were not counted.
10. The 1992 elections were excluded because no data on the voter turnout were available at the constituency level. Furthermore, 1992 elections were profoundly rigged.
11. The result was that Wamalwa won 50% of personal votes against 40% of Moi.12. See Oloo (2005) on the Luo vote in 2002.
References
Chandra K (2007) Counting heads: A theory of voter and elite behavior in patronage democracies. In: Kitschelt H and Wilkinson SI (eds) Patrons, Clients, and Policies: Patterns of Democratic Accountability and Political Competition. Cambridge: Cambridge University Press, 84–109.
Collier P (2001) Implications of ethnic diversity. Economic Policy 16(32): 127–166.Gurr T (1970) Why Men Rebel. Princeton, NJ: Princeton University Press.Horowitz DL (1985) Ethnic Groups in Conflict. Berkeley, CA: University of California Press.Kanyinga K (2006) Governance institutions and inequality in Kenya. In: Society for International Develop-
ment (ed.) SID Readings on Inequality in Kenya: Sectoral Dynamics and Perspectives. Nairobi: Society for International Development, 345–397.
Katumanga M (2005) Constructing the Abaluhya unity. In Maupeu H, Katumanga W, Mitullah WV (eds) The Moi Succession: The 2002 Elections in Kenya. Nairobi: Transafrica Press, 197–277.
Kuenzi M and Lambright G (2005) Party system and democratic consolidation in Africa’s electoral regimes. Party Politics 11(4): 423–446.
Laitin DD (1986) Hegemony and Culture: Politics and Religious Change among the Yoruba. Chicago, IL: University of Chicago Press.
Lipset SM and Rokkan S (1969) Party Systems and Voter Alignments: Cross-National Perspectives. New York, NY: Free Press.
Norris P and Mattes R (2003) Does ethnicity determine support for the governing party? Afrobarometer Working Paper, No. 26: i–22.

Battera 125
Oloo A (2005) The Raila factor in Luoland. In: Maupeu H , Katumanga W, Mitullah WV (eds) The Moi Succession: The 2002 Elections in Kenya. Nairobi: Transafrica Press, 159–196.
Posner DN (2005) Institutions and Ethnic Politics in Africa. Cambridge: Cambridge University Press.Reilly B (2001) Democracy in Divided Societies: Electoral Engineering for Conflict Management. New York,
NY: Cambridge University Press.Wolfinger RE and Rosenstone SJ (1980) Who Votes? New Haven, CT: Yale University Press.
Federico Battera is Senior Lecturer of Afro-Asian Political Systems at the Department of Political and Social Sciences at the University of Trieste (Italy). He received his PhD in African Studies at the University of Siena (Italy) in 1995. He is author and coauthor of several articles including ‘State- & Democracy-Building in Sub-Saharan Africa: The Case of Somaliland, a Comparative Perspective’ (2004) and ‘The Evolution and Integration of Different Legal Systems in the Horn of Africa: The Case of Somaliland’ (2001). His interests regard democracy, democratization, parties and electoral processes. He has done field research in Tunisia, Kenya, Somalia, Zambia, Yemen, Ethiopia and Afghanistan.