determination of essential and heavy metals in kenyan
9
JAGST Vol. 13(1) 2011 Heavy metals in Kenyan honey Jomo Kenyatta University of Agriculture and Technology 107 DETERMINATION OF ESSENTIAL AND HEAVY METALS IN KENYAN HONEY BY ATOMIC ABSORPTION AND EMISSION SPECTROSCOPY A. Mbiri, A. Onditi, N. Oyaro and E. Murago Department of Chemistry, Jomo Kenyatta University of Agriculture and Technology, Nairobi E-mail: [email protected] Abstract Due to the nutritive and medicinal value of honey for both man and animals, qualitative and quantitative analyses of the minerals is of great importance. Heavy metals and high concentration of essential metals can be toxic both to man and animals. Rapid increase in industrialisation in Kenya has led to environmental pollution, hence increase of these metals in honey. In this project, honey samples collected from different parts of Kenya, namely, Laikipia, Baringo, Nairobi, Ngong, Mbeere, Embu, Kitui, Kibwezi and Lamu were analysed to determine the levels of selected heavy metals (Pb, Cd, Zn, Cu, As) and essential metals (K, Na, Ca, Mg, Fe). The samples were analysed using flame atomic absorption spectroscopy (FAAS) and flame atomic emission spectroscopy (FAES). Hydride generation - atomic absorption spectroscopy (HG - AAS) was used to determine arsenic. Results obtained from this study showed that K, Na, Ca and Mg had mean values ranged from 781.52±0.09 to 172.83±0.02 ppm, 269.1 to 98.04±0.03 ppm, 70.17±3.9 ppm to 19.33±4.07 ppm and 41.88 ±0.92 to 12.64 ±0.43 ppm respectively. Most of the samples had a high level of Zn with mean value 0.19±0.06 ppm followed by Pb with of mean value 0.16±0.10 ppm, then Cu with a mean value of 0.02±0.01 ppm followed by Cd with a mean value of 0.02±0.01ppm and finally As with a mean value of 0.01±0.01 ppm. The concentration of Pb in most samples was found to be above the World Health Organisation (WHO) and Kenya Bureau of Standards (KEBS) limits of 0.1 ppm in food products. Key words: Honey, heavy metals, essential metals, atomic spectroscopy
-
Upload
khangminh22 -
Category
Documents
-
view
0 -
download
0
Transcript of determination of essential and heavy metals in kenyan
JAGST Vol. 13(1) 2011 Heavy metals in Kenyan honey
Jomo Kenyatta University of Agriculture and Technology 107
DETERMINATION OF ESSENTIAL AND HEAVY METALS IN KENYAN HONEY BY ATOMIC ABSORPTION AND EMISSION SPECTROSCOPY
A. Mbiri, A. Onditi, N. Oyaro and E. Murago Department of Chemistry, Jomo Kenyatta University of Agriculture and Technology,NairobiE-mail: [email protected]
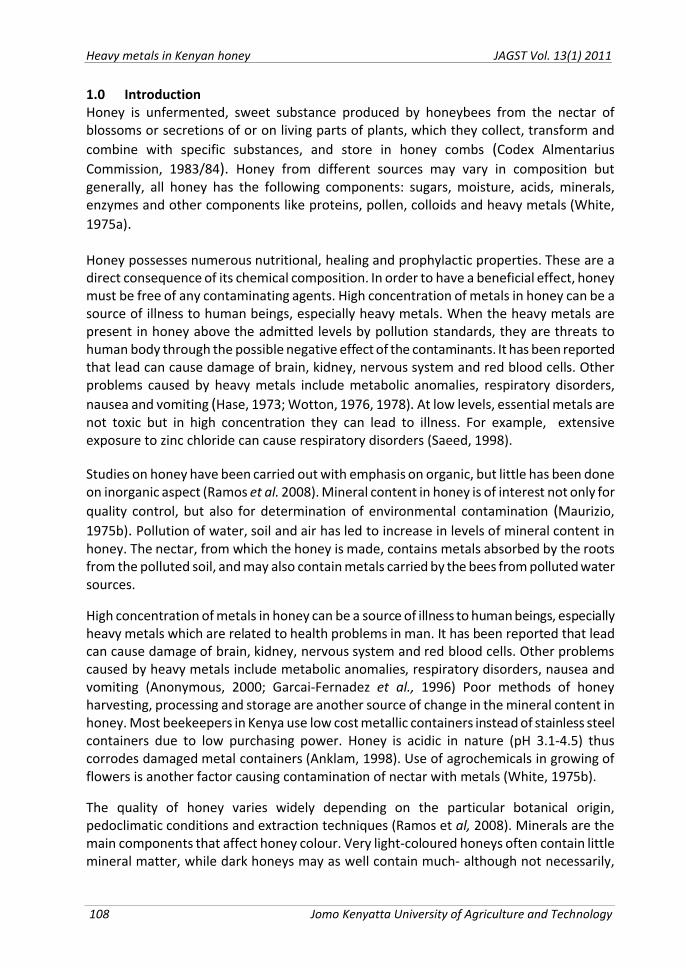
AbstractDue to the nutritive and medicinal value of honey for both man and animals, qualitative and quantitative analyses of the minerals is of great importance. Heavy metals and high concentration of essential metals can be toxic both to man and animals. Rapid increase in industrialisation in Kenya has led to environmental pollution, hence increase of these metals in honey. In this project, honey samples collected from different parts of Kenya, namely, Laikipia, Baringo, Nairobi, Ngong, Mbeere, Embu, Kitui, Kibwezi and Lamu were analysed to determine the levels of selected heavy metals (Pb, Cd, Zn, Cu, As) and essential metals (K, Na, Ca, Mg, Fe). The samples were analysed using flame atomic absorption spectroscopy (FAAS) and flame atomic emission spectroscopy (FAES). Hydride generation -atomic absorption spectroscopy (HG - AAS) was used to determine arsenic. Results obtained from this study showed that K, Na, Ca and Mg had mean values ranged from 781.52±0.09 to 172.83±0.02 ppm, 269.1 to 98.04±0.03 ppm, 70.17±3.9 ppm to 19.33±4.07ppm and 41.88 ±0.92 to 12.64 ±0.43 ppm respectively. Most of the samples had a high level of Zn with mean value 0.19±0.06 ppm followed by Pb with of mean value 0.16±0.10 ppm, then Cu with a mean value of 0.02±0.01 ppm followed by Cd with a mean value of 0.02±0.01ppm and finally As with a mean value of 0.01±0.01 ppm. The concentration of Pb in most samples was found to be above the World Health Organisation (WHO) and Kenya Bureau of Standards (KEBS) limits of 0.1 ppm in food products.
Key words: Honey, heavy metals, essential metals, atomic spectroscopy
Heavy metals in Kenyan honey JAGST Vol. 13(1) 2011
108 Jomo Kenyatta University of Agriculture and Technology
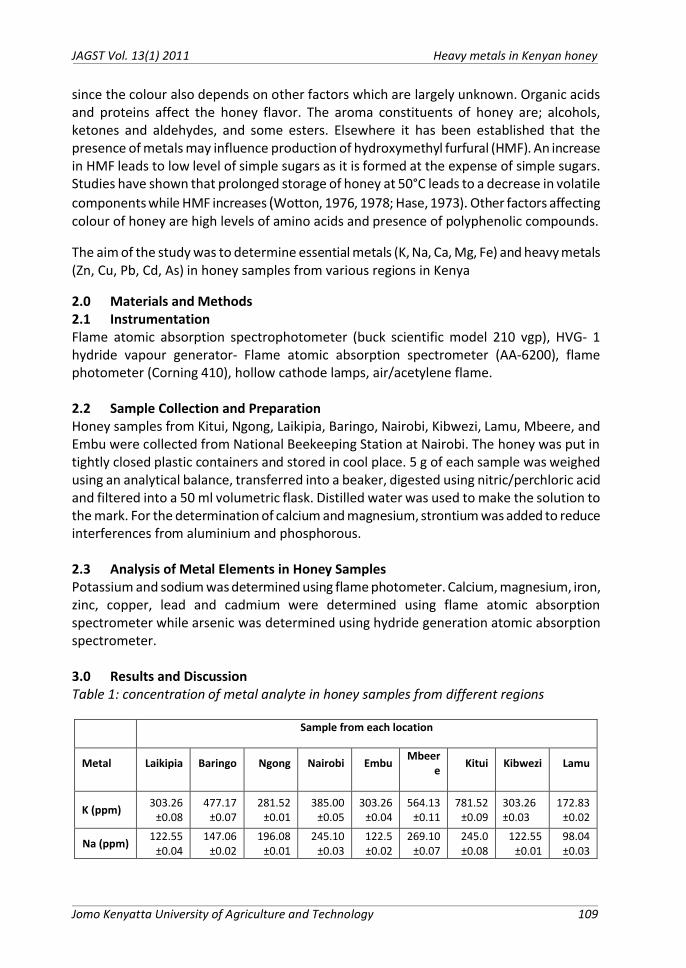
1.0 IntroductionHoney is unfermented, sweet substance produced by honeybees from the nectar of blossoms or secretions of or on living parts of plants, which they collect, transform and combine with specific substances, and store in honey combs (Codex Almentarius Commission, 1983/84). Honey from different sources may vary in composition but generally, all honey has the following components: sugars, moisture, acids, minerals, enzymes and other components like proteins, pollen, colloids and heavy metals (White, 1975a).
Honey possesses numerous nutritional, healing and prophylactic properties. These are a direct consequence of its chemical composition. In order to have a beneficial effect, honey must be free of any contaminating agents. High concentration of metals in honey can be a source of illness to human beings, especially heavy metals. When the heavy metals are present in honey above the admitted levels by pollution standards, they are threats to human body through the possible negative effect of the contaminants. It has been reported that lead can cause damage of brain, kidney, nervous system and red blood cells. Other problems caused by heavy metals include metabolic anomalies, respiratory disorders, nausea and vomiting (Hase, 1973; Wotton, 1976, 1978). At low levels, essential metals are not toxic but in high concentration they can lead to illness. For example, extensive exposure to zinc chloride can cause respiratory disorders (Saeed, 1998).
Studies on honey have been carried out with emphasis on organic, but little has been done on inorganic aspect (Ramos et al. 2008). Mineral content in honey is of interest not only for quality control, but also for determination of environmental contamination (Maurizio, 1975b). Pollution of water, soil and air has led to increase in levels of mineral content in honey. The nectar, from which the honey is made, contains metals absorbed by the roots from the polluted soil, and may also contain metals carried by the bees from polluted water sources.
High concentration of metals in honey can be a source of illness to human beings, especially heavy metals which are related to health problems in man. It has been reported that lead can cause damage of brain, kidney, nervous system and red blood cells. Other problems caused by heavy metals include metabolic anomalies, respiratory disorders, nausea and vomiting (Anonymous, 2000; Garcai-Fernadez et al., 1996) Poor methods of honey harvesting, processing and storage are another source of change in the mineral content in honey. Most beekeepers in Kenya use low cost metallic containers instead of stainless steel containers due to low purchasing power. Honey is acidic in nature (pH 3.1-4.5) thus corrodes damaged metal containers (Anklam, 1998). Use of agrochemicals in growing of flowers is another factor causing contamination of nectar with metals (White, 1975b).
The quality of honey varies widely depending on the particular botanical origin, pedoclimatic conditions and extraction techniques (Ramos et al, 2008). Minerals are the main components that affect honey colour. Very light-coloured honeys often contain little mineral matter, while dark honeys may as well contain much- although not necessarily,
JAGST Vol. 13(1) 2011 Heavy metals in Kenyan honey
Jomo Kenyatta University of Agriculture and Technology 109
since the colour also depends on other factors which are largely unknown. Organic acids and proteins affect the honey flavor. The aroma constituents of honey are; alcohols, ketones and aldehydes, and some esters. Elsewhere it has been established that the presence of metals may influence production of hydroxymethyl furfural (HMF). An increase in HMF leads to low level of simple sugars as it is formed at the expense of simple sugars. Studies have shown that prolonged storage of honey at 50°C leads to a decrease in volatile components while HMF increases (Wotton, 1976, 1978; Hase, 1973). Other factors affecting colour of honey are high levels of amino acids and presence of polyphenolic compounds.
The aim of the study was to determine essential metals (K, Na, Ca, Mg, Fe) and heavy metals (Zn, Cu, Pb, Cd, As) in honey samples from various regions in Kenya
2.0 Materials and Methods2.1 InstrumentationFlame atomic absorption spectrophotometer (buck scientific model 210 vgp), HVG- 1 hydride vapour generator- Flame atomic absorption spectrometer (AA-6200), flame photometer (Corning 410), hollow cathode lamps, air/acetylene flame.
2.2 Sample Collection and PreparationHoney samples from Kitui, Ngong, Laikipia, Baringo, Nairobi, Kibwezi, Lamu, Mbeere, and Embu were collected from National Beekeeping Station at Nairobi. The honey was put in tightly closed plastic containers and stored in cool place. 5 g of each sample was weighed using an analytical balance, transferred into a beaker, digested using nitric/perchloric acid and filtered into a 50 ml volumetric flask. Distilled water was used to make the solution to the mark. For the determination of calcium and magnesium, strontium was added to reduce interferences from aluminium and phosphorous.
2.3 Analysis of Metal Elements in Honey SamplesPotassium and sodium was determined using flame photometer. Calcium, magnesium, iron, zinc, copper, lead and cadmium were determined using flame atomic absorption spectrometer while arsenic was determined using hydride generation atomic absorption spectrometer.
3.0 Results and DiscussionTable 1: concentration of metal analyte in honey samples from different regions
Sample from each location
Metal Laikipia Baringo Ngong Nairobi EmbuMbeer
eKitui Kibwezi Lamu
K (ppm) 303.26 ±0.08
477.17 ±0.07
281.52 ±0.01
385.00 ±0.05
303.26 ±0.04
564.13 ±0.11
781.52 ±0.09
303.26 ±0.03
172.83 ±0.02
Na (ppm)122.55
±0.04147.06
±0.02196.08
±0.01245.10
±0.03122.5 ±0.02
269.10 ±0.07
245.0 ±0.08
122.55 ±0.01
98.04 ±0.03
Heavy metals in Kenyan honey JAGST Vol. 13(1) 2011
110 Jomo Kenyatta University of Agriculture and Technology
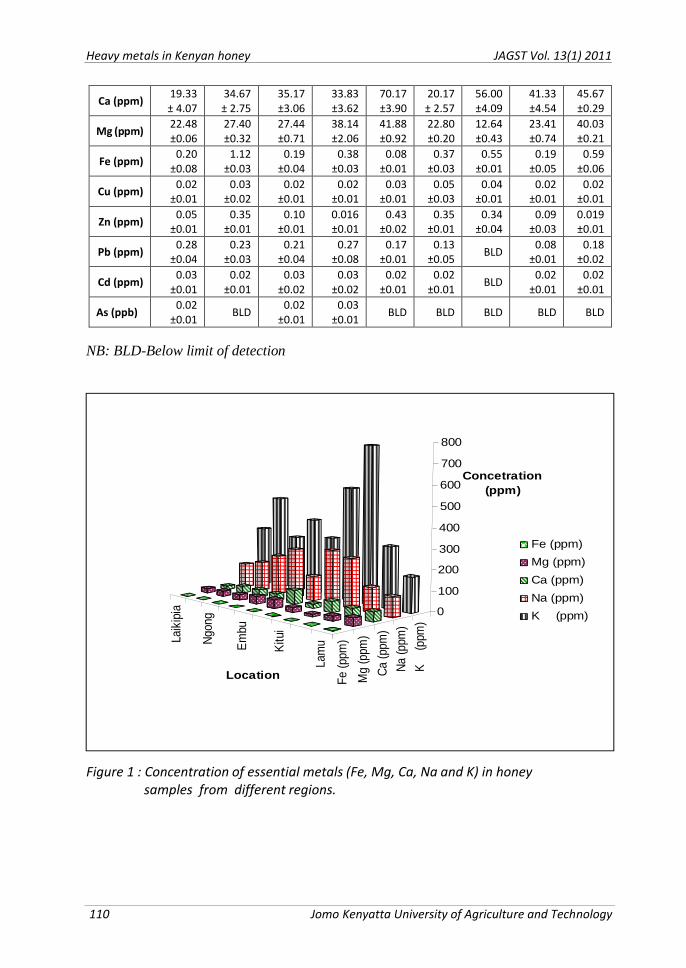
Ca (ppm)19.33 ± 4.07
34.67 ± 2.75
35.17 ±3.06
33.83 ±3.62
70.17 ±3.90
20.17 ± 2.57
56.00 ±4.09
41.33 ±4.54
45.67 ±0.29
Mg (ppm)22.48 ±0.06
27.40 ±0.32
27.44 ±0.71
38.14 ±2.06
41.88 ±0.92
22.80 ±0.20
12.64 ±0.43
23.41 ±0.74
40.03 ±0.21
Fe (ppm)0.20
±0.081.12
±0.030.19
±0.040.38
±0.030.08
±0.010.37
±0.030.55
±0.010.19
±0.050.59
±0.06
Cu (ppm) 0.02 ±0.01
0.03 ±0.02
0.02 ±0.01
0.02 ±0.01
0.03 ±0.01
0.05 ±0.03
0.04 ±0.01
0.02 ±0.01
0.02 ±0.01
Zn (ppm)0.05
±0.010.35
±0.010.10
±0.010.016 ±0.01
0.43 ±0.02
0.35 ±0.01
0.34 ±0.04
0.09 ±0.03
0.019 ±0.01
Pb (ppm)0.28
±0.040.23
±0.030.21
±0.040.27
±0.080.17
±0.010.13
±0.05 BLD0.08
±0.010.18
±0.02
Cd (ppm)0.03
±0.010.02
±0.010.03
±0.020.03
±0.020.02
±0.010.02
±0.01BLD
0.02 ±0.01
0.02 ±0.01
As (ppb)0.02
±0.01BLD
0.02 ±0.01
0.03 ±0.01
BLD BLD BLD BLD BLD
NB: BLD-Below limit of detection
Figure 1 : Concentration of essential metals (Fe, Mg, Ca, Na and K) in honey samples from different regions.
Laik
ipia
Ngo
ng
Em
bu
Kitu
i
Lam
u
Fe (p
pm)
Mg
(ppm
)
Ca
(ppm
)
Na
(ppm
)
K
(ppm
)
0
100
200
300
400
500
600
700
800
Location
Concetration (ppm)
Fe (ppm)
Mg (ppm)
Ca (ppm)
Na (ppm)
K (ppm)
JAGST Vol. 13(1) 2011
Jomo Kenyatta University of Agriculture and Technology
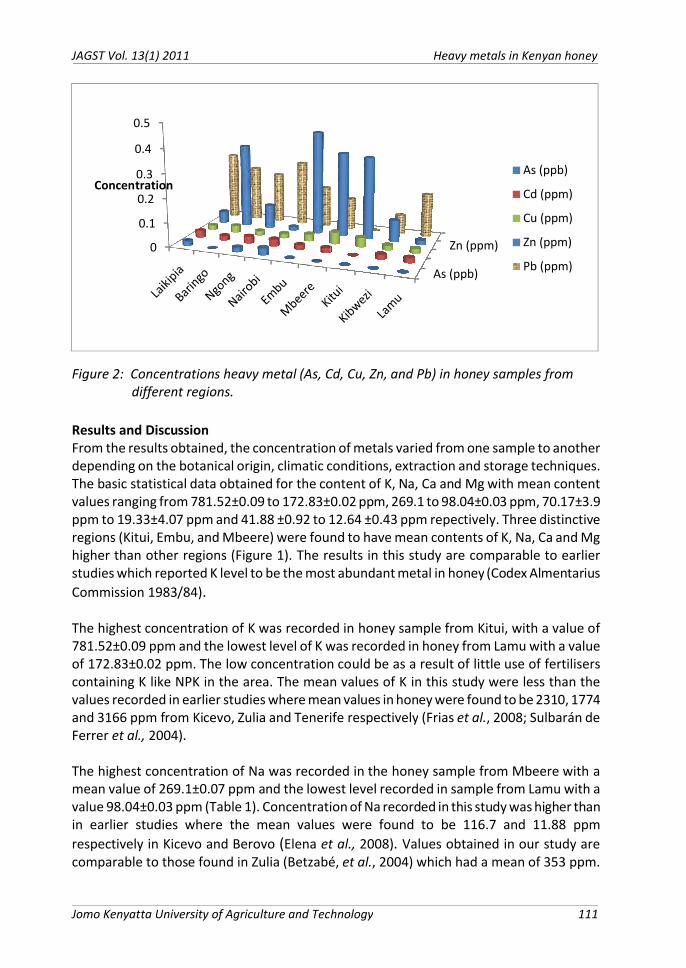
Figure 2: Concentrations heavy metal (As, Cd, Cu, Zn, and Pb) in honey samples from different regions.
Results and DiscussionFrom the results obtained, the concentration of metals varied from one sample to another depending on the botanical origin, climatic conditions, extThe basic statistical data obtained for the content of K, Na, Ca and Mg with mean content values ranging from 781.52±0.09 to 172.83±0.02ppm to 19.33±4.07 ppm and 41.88 ±0.92 to 12.64 ±0.43regions (Kitui, Embu, and Mbeere) were found to have mean contents of K, Na, Ca and higher than other regions (Figure 1). The results in this study are comparable to earlier studies which reported K level to be the most abundant metal in honeyCommission 1983/84).
The highest concentration of K was recorded in honey781.52±0.09 ppm and the lowest level of K was recorded in honey from Lamu with a value of 172.83±0.02 ppm. The low concentration could be as a result of little use of containing K like NPK in the area. The mean values of K in this study were less than the values recorded in earlier studies where mean values in honey were found to be 2310, 1774 and 3166 ppm from Kicevo, Zulia and Tenerife respectivelyFerrer et al., 2004).
The highest concentration of Na was recorded in the honey sample from Mbeere with a mean value of 269.1±0.07 ppm and the lowest level recorded in sample from Lamu with a value 98.04±0.03 ppm (Table 1). Concentration of Na recorded in this study was higher thanin earlier studies where the mean values were found to be 116.7 and 11.88respectively in Kicevo and Berovo (Elena et comparable to those found in Zulia (Betzabé,
0
0.1
0.2
0.3
0.4
0.5
Concentration
Heavy metals in Kenyan honey
of Agriculture and Technology 111
Concentrations heavy metal (As, Cd, Cu, Zn, and Pb) in honey samples from
obtained, the concentration of metals varied from one sample to another rigin, climatic conditions, extraction and storage techniques.
The basic statistical data obtained for the content of K, Na, Ca and Mg with mean content ues ranging from 781.52±0.09 to 172.83±0.02 ppm, 269.1 to 98.04±0.03 ppm, 70.17±3.9
ppm and 41.88 ±0.92 to 12.64 ±0.43 ppm repectively. Three distinctive regions (Kitui, Embu, and Mbeere) were found to have mean contents of K, Na, Ca and Mg
1). The results in this study are comparable to earlier studies which reported K level to be the most abundant metal in honey (Codex Almentarius
The highest concentration of K was recorded in honey sample from Kitui, with a value of ppm and the lowest level of K was recorded in honey from Lamu with a value
ppm. The low concentration could be as a result of little use of fertilisersan values of K in this study were less than the
values recorded in earlier studies where mean values in honey were found to be 2310, 1774 ppm from Kicevo, Zulia and Tenerife respectively (Frias et al., 2008; Sulbarán de
highest concentration of Na was recorded in the honey sample from Mbeere with a ppm and the lowest level recorded in sample from Lamu with a
ppm (Table 1). Concentration of Na recorded in this study was higher thanin earlier studies where the mean values were found to be 116.7 and 11.88 ppm
et al., 2008). Values obtained in our study are Betzabé, et al., 2004) which had a mean of 353 ppm.
As (ppb)
Zn (ppm)
As (ppb)
Cd (ppm)
Cu (ppm)
Zn (ppm)
Pb (ppm)
Heavy metals in Kenyan honey JAGST Vol. 13(1) 2011
112 Jomo Kenyatta University of Agriculture and Technology
The highest concentration of Ca was recorded in honey sample from Embu with a value of 70.17±3.90 ppm while the lowest value was recorded in honey sample from Laikipia with a value of 19.33±4.07 ppm (Table 1). The level of Ca in this study was found to be lower than values of 130 and 287 ppm reported at Macedonia and Zulia (Elena et al., 2008; Betzabé et al., 2004).
The highest level of Mg was found in sample from Embu with a value of 41.88±0.92ppm and the lowest was recorded in honey sample from Kitui with a value of 12.64±0.43ppm (Table1). The levels of Mg in this study are comparable to those reported in Macedonia (Elena, Trajce, Robert , 2008)ranging from 11.78 to 116.7 ppm and those from Zulia (Betzabé et al., 2004).which had a mean of 52 ppm.
The highest level of Fe was recorded in the honey from Baringo with a value of 1.12±0.03ppm and the lowest level was recorded in the honey from Embu with a value of 0.08±0.01ppm (Table1). The values of Fe recorded in honey from our study were lower than those values of 13.5 and 3.37 ppm reported earlier in Zulia and Tenerife (Frias et al., 2008), respectively.
The honey samples from Mbeere recorded the highest concentration of Cu, 0.05 ppm while the lowest concentration of Cu was recorded from honey samples from Ngong, Nairobi and Laikipia which had 0.02 ppm. The concentration of Cu in Kenyan honey were lower, compared to the values recorded in Swiss and Tenerife honey which were 0.88 and 1.28ppm (Stefan, Max, Werner, Gallman, 2007)respectively. There was no great variation in the concentration of Cu in all the honey samples, the values ranged from 0.05±0.03 to 0.02±0.01 ppm (Table 1).The concentration of Cu values in this study were within the maximum permitted level of Cu in food by the Kenya Bureau of standard (KEBS) which is 0.1ppm (Kenya Bureau Standards, 1996)
The highest concentration of Zn was recorded in honey sample from Embu with a value of 0.43±0.02ppm and the lowest was recorded in honey from Lamu with a value of 0.019±0.01ppm (Table1). The values of Zn in this study were found to be lower than those reported at Macedonia ( Elena et al., 2008) and Copsa Mica (Bratu et al., 2005) which were 19.1-2.03 ppm and 0.2-7.5 ppm respectively. The levels of Zn were comparable with those reported at Czech (Lachman et al., 2007) which ranged between 0.40-3.42ppm.
The highest concentration of Pb was recorded in the honey sample from Laikipia with a value of 0.28±0.04 ppm and the lowest level was recorded from samples taken from Kitui which was below the detection limit (Table 1). Levels of Pb in most honey samples except Kitui and Kibwezi were above the maximum permitted level of Pb (0.1 ppm) in food by KEBS (Kenya Bureau Standards, 1996). This could be as a result of poor disposal of printing ink, paints and used dry batteries in these areas. The values of Pb in the honey samples in this study were higher than those determined in Canada and Australia (Sadia et al., 2008), which were found to be 0.04 and 0.02 ppm respectively.
JAGST Vol. 13(1) 2011 Heavy metals in Kenyan honey
Jomo Kenyatta University of Agriculture and Technology 113
The concentrations of Cd in all the honey samples were low with a high of 0.03 ppm and a low of 0.02 pmm recorded. The concentration of Cd in Kitui was below detection limit. All the samples recorded a value below the maximum level of Cd (0.1 ppm) permitted in foods by KEBS(Kenya Bureau Standards, 1996).
Generally all the honey samples recorded very low concentration of As compared to the other heavy metals determined in this study. The highest concentration of As was recorded in the honey sample from Nairobi with a value of 0.03± 0.01 ppb (Table 1). All the values recorded were within the KEBS permitted value of 0.5 ppm in food (Kenya Bureau Standards, 1996).
AcknowledgementsWe wish to acknowledge Jomo Kenyatta University of Agriculture and Technology for allowing us carry out this study in their chemistry laboratory, Nairobi Bee keeping Station for facilitating the collection of honey samples.
Heavy metals in Kenyan honey JAGST Vol. 13(1) 2011
114 Jomo Kenyatta University of Agriculture and Technology
ReferencesCodex Almentarius Commission (1983/84). Proposed Codex Standard for Honey (Rome: FAO/WHO) CX/PFV 84/13.
White J. W. (1975a). Composition of honey. From Honey: a (1975b), Microscopy comprehensive survey ed. E.Crane. pp 157-206
Hase S. (1973). Changes in Quality of Honey Caused by Heating and Storage, pp 248-256, 257-264.
Wotton M. (1976, 1978). Effect of accelerated storage conditions on the chemical composition and properties of Australian honeys, pp 23-28, 167-172.
Saeed H.M. (1998). Hamdard Mexdicus. Vol.XII, Bait-al-Hakimah, PakistanLa Serna Ramos, I., Méndez Pérez, B., & Gómez Ferreras, C. (2008), Aplicación de nuevas tecnologías en mieles canarias para su tipificación y control de calidad. Servicio de Publicaciones de la Caja General de Ahorros de Canarias, Tenerife. Bull Environ Contam Toxicol, 80, pp 30–33.
Maurizio A. (1975b). Microscopy of honey, from Honey: a comprehensive survey ed. E.Crane, 7, pp 240-257
Anonymous (2002). Neb Guide. Cooperative Extention Institute of Agriculture and Natural Resources, University of Nebrasaka, Licoln
Garcai-Fernadez A. J., Gomez-Zapata A. and Luna M. A. (1996). Distribution of Cadmium in blood and tissuses of wild birds. Archives of Environmental Contamination Toxicology, 30, pp 252-258.
Anklam, (1998), A Review of the Analytical Methods to Determine the Geographical and Botanical Origin of Honey. Journal of Food Chemistry, 4, pp 549–562
White J.W. (1975b) Physical Characteristics of Honey, 6, pp 207-239.
La Serna Ramos, I., Méndez Pérez, B., & Gómez Ferreras, C. (2008). Aplicación de nuevas tecnologías en mieles canarias para su tipificación y control de calidad. Servicio de Publicaciones de la Caja General de Ahorros de Canarias, Tenerife. Bull Environ Contam Toxicol, 80, pp 30–33.
Frias, Inmaculada, Gonzalez-Iglesias, Rubio, C., Angel, J., (2008). Metals in fresh honey from Tenerife Island, Spain. Bulletin of Environmental Contamination and toxicology, 80(1), pp 30-33.
Elena S., Trajce S., Robert S., (2008). Monitoring of trace elements in honey in the Republic
JAGST Vol. 13(1) 2011 Heavy metals in Kenyan honey
Jomo Kenyatta University of Agriculture and Technology 115
of Macedonia by atomic absorption spectrometry. Springer e-journals. Environ Monit.,142 , pp 117-126.
Betzabé Sulbarán de Ferrer, Graciela Ojeda de Rodríguez, Jorge Peña, Janeth Martínez y María Morán, (2004), Mineral content of the produced in Zulia state. Edicone PublicadasArio ,54(3).
Stefan Bogdanov, Max Haldlman, Werner Luginbuhi and Peter Gallman, (2007), Mineral in honey: enviromental, geographical and botanical aspects. Journal of Agriculture Research and Bee World ,46 (4), pp 269-275.
Kenya Bureau Standards, 1996, Specifications for honey (Second Edition). KS 0.5-344
Bratu Iuliana, Georgescu Cecilia, (2005), Chemical Contamination of bee honey- Identifying sensor of the environment pollution. Journal of Central of European Agriculture., 1, pp 467-470.
Lachman J., Kolihova D., Miholova D., Kosata J., (2007). Analysis of minority honey componets: Possible use for the evaluation of honey quality. Journal of Food Chemistry. 101(3), pp 973-979.
Sadia bibi, Syed Zahoor Husan and Riffert Naseem malik, (2008). Pollen analysis and heavy metals detection in honey samples from seven selected countries. Bulletin of Environmental Contamination and toxicology, 80, pp 30–33.
Rodriguez Garcia J. C, (2005). Comparison of palladium- magnesium nitrate and ammonium dihydrogenphosphate modifiers for lead contamination in honey by electrothermal atomic absortion spectrometry. Journal of Food Chemistry. Vol. 91 a.