Price, Liquidity, Volatility, and Volume of Cross-listed Stocks
292
• • •
-
Upload
khangminh22 -
Category
Documents
-
view
0 -
download
0
Transcript of Price, Liquidity, Volatility, and Volume of Cross-listed Stocks

Durham E-Theses
Price, Liquidity, Volatility, and Volume of Cross-listed
Stocks
DODD, OLGA
How to cite:
DODD, OLGA (2011) Price, Liquidity, Volatility, and Volume of Cross-listed Stocks, Durham theses,Durham University. Available at Durham E-Theses Online: http://etheses.dur.ac.uk/867/
Use policy
The full-text may be used and/or reproduced, and given to third parties in any format or medium, without prior permission orcharge, for personal research or study, educational, or not-for-pro�t purposes provided that:
• a full bibliographic reference is made to the original source
• a link is made to the metadata record in Durham E-Theses
• the full-text is not changed in any way
The full-text must not be sold in any format or medium without the formal permission of the copyright holders.
Please consult the full Durham E-Theses policy for further details.
Academic Support O�ce, Durham University, University O�ce, Old Elvet, Durham DH1 3HPe-mail: [email protected] Tel: +44 0191 334 6107
http://etheses.dur.ac.uk

Price, Liquidity, Volatility, and Volume
of Cross-listed Stocks
Olga Dodd
Thesis submitted for the degree of
Doctor of Philosophy in Finance
Durham Business School, University of Durham
May 2011
Supervisors: Professor Krishna Paudyal
Dr. Christodoulos Louca
Professor Rob Dixon

ii
Abstract
This thesis examines the possible implications of international cross-listings for the
wealth of shareholders, for stock liquidity and volatility, and for the distribution of trading
volumes across both the domestic and foreign stock markets where the shares are traded. For
the purpose of clarity, these three issues are analysed in three empirical chapters in the thesis.
The first empirical issue examined in this thesis is the effects of international cross-
listings on shareholders’ wealth. This is discussed in chapter 2. The chapter compares the
gains in shareholders’ wealth that result from cross-listing in the American, British, and
European stock exchanges and then evaluates their determinants by applying various theories
on the wealth effects of cross-listing. Moreover, it evaluates how the wealth effect of cross-
listing has changed over time reflecting the implications of the significant developments in
capital markets that have taken place in recent years. In particular, the effects of the
introduction of the Euro in Europe and the adoption of the Sarbanes-Oxley Act in the US are
analysed. The findings suggest that, on average, cross-listing of stocks enhances
shareholders’ wealth but the gains are dependent on the destination market. In addition, the
regulatory and economic changes in the listing environment not only alter the wealth effects
of cross-listings, but also affect the sources of value creation. Overall, this chapter provides
in-depth insights into the motivations for, and the benefits of, cross-listings across different
host markets in changing market conditions.
The second empirical issue examined is the impact of cross-listing and multimarket
trading on stock liquidity and volatility (chapter 3). Cross-listing leads to additional
mandatory disclosure in order to comply with the requirements of the host market. Such
requirements are expected to reduce information asymmetry among various market
participants (corporate managers, stock dealers, and investors). An enhanced information
environment, in turn, should increase stock liquidity and reduce stock return volatility. The
findings of this study suggest that the stock liquidity and volatility improves after cross-
listing on a foreign stock exchange. Moreover, this study distinguishes between cross-listing
and cross-trading. The distinction is important because cross-trading, unlike cross-listing,
does not require the disclosing of additional information. Although such a distinction means
there is a variation in the information environment of cross-listed and cross-traded stocks,
the results do not reveal any significant difference in the liquidity and volatility of the stocks
that are cross-listed and cross-traded. This evidence suggests that the improvement in the
liquidity and volatility of cross-listed/traded stocks comes primarily from the intensified
competition among traders rather than from mandatory disclosure requirements.

iii
The final empirical issue investigated in this thesis (chapter 4) is the identification of
the determinants of the distribution of equity trading volume from both stock exchange and
firm specific perspectives. From a stock exchange perspective, exchange level analysis
focuses on the stock exchange characteristics that determine the ability of a stock exchange
to attract trading of foreign stocks. While from a firm perspective, firm level analysis focuses
on firm specific characteristics that affect the distribution of foreign trading. The results
show that a stock exchange’s ability to attract trading volumes of foreign equity is positively
associated with a stock exchange’s organizational efficiency, market liquidity, and also the
quality of investor protection and insider trading regulations. Analysis also reveals the
superior ability of American stock exchanges to attract trading of European stocks.
Moreover, there is strong evidence suggesting that regulated stock exchanges are more
successful in attracting trading of foreign stocks than non-regulated markets, such as OTC
and alternative markets and trading platforms. From a firm perspective, the proportion of
trading on a foreign exchange is higher for smaller and riskier companies, and for companies
that exhibit lower correlation of returns with market index returns in the host market. Also
this proportion is higher when foreign trading takes place in the same currency as trading in
the firm’s home market and increases with the duration of a listing. Finally, the study
provides separate evidence on the expected levels of trading activity on various stock
exchanges for a stock with particular characteristics.
Overall, the findings of this thesis suggest that international cross-listing is
beneficial for both firms and their shareholders but the findings also suggest that there are
significant variations in the implications of cross-listings for different firms and from listing
in different destination foreign markets. Finally, these implications are not static and respond
to changes and reforms in listing and trading conditions.

iv
Table of Contents
Abstract ii
Acknowledgements vii
Author's declaration 8
Chapter 1
Introduction 9
1.1 Cross-listing trends 12
1.2 Why do companies cross-list? 14
1.3 Economic consequences of international cross-listings 15
1.3.1 Shareholders’ wealth 15
1.3.2 Liquidity and volatility and information environment of cross-listed stocks 20
1.3.3 Implications of the location of trading 23
1.4 Thesis outline 26
Chapter 2
International Cross-Listing of Stocks and Shareholders’ Wealth 28
2.1 Introduction 28
2.2 Literature review 33
2.2.1 Theoretical background on the effects of cross-listings on shareholders’
wealth
33
2.2.2 Empirical evidence on the effects of cross-listings on shareholders’ wealth 39
2.3 Testable hypotheses 43
2.3.1 The effects of cross-listings on shareholders’ wealth 43
2.3.2 Variation in the wealth effects by host and home markets 43
2.3.3 Change in the effects of cross-listings on shareholders’ wealth over time 46
2.3.4 The determinants of the effects of cross-listings on shareholders’ wealth 47
2.3.5 Control variables 51
2.4 Methodology 52
2.4.1. The effects of cross-listings on shareholders’ wealth 52
2.4.2 Univariate analysis of abnormal returns around cross-listing 54
2.4.3 The determinants of the effects of cross-listings on shareholders’ wealth 55
2.4.4 Multivariate regression analysis 57
2.5 The sample 59
2.6 Empirical results 61
2.6.1 The effects of cross-listings on shareholders’ wealth 61
2.6.2 Variation in the wealth effects by host and home markets 61
2.6.3 Change in the effects of cross-listings on shareholders’ wealth over time 63
2.6.4 The determinants of the effects of cross-listings on shareholders’ wealth 66
2.6.5 Change in the explanatory power of the determinants over time 72
2.7 Conclusion 75

v
Chapter 3
Liquidity and Volatility of Stocks Listed and Traded in Multiple Stock Markets 99
3.1 Introduction 99
3.2 Literature review 104
3.2.1 Liquidity 105
3.2.2 Volatility 108
3.3 Hypotheses development 111
3.3.1 Liquidity 111
3.3.2 Volatility 113
3.3.3 Developed vs. emerging home market 114
3.3.4 Main control variables 115
3.4. Methodology 116
3.4.1 Cross-sectional analysis 116
3.4.2 Evolution of stock liquidity and price volatility 118
3.4.3 Time-series framework 119
3.4.4 Variables definition and measurement 120
3.5 The sample 126
3.6 Empirical results 128
3.6.1 Cross-sectional analysis 128
3.6.2 Evolution of stock liquidity and volatility 138
3.6.3 Time-series analysis: the change in stock liquidity and volatility around
cross-listing/ trading
141
3.6.4 Implications of cross-listing and cross-trading for stocks from developed
vs. emerging home markets
146
3.7 Conclusion 148
Chapter 4
The determinants of the foreign trading volume of cross-listed stocks 185
4.1 Introduction 185
4.2 Literature review 191
4.2.1 Theoretical background on multimarket trading 191
4.2.2 Empirical research on multimarket trading 195
4.3 Testable hypotheses 196
4.3.1 Host market characteristics: the pull factors of foreign trading 197
4.3.2 Stock-level factors that affect foreign trading volume 202
4.3.3 Stock-level factors of foreign trading volume by host stock exchange 208
4.4 Methodology 208
4.4.1 Dependent variables 208
4.4.2 Multivariate regression analysis 210
4.4.3 Economic significance 212
4.4.4 Multicollinearity concern 212
4.4.5 Explanatory variable definitions 213
4.5 The sample 214
4.6 Sample summary statistics 215

vi
4.6.1 Foreign equity trading distribution 215
4.6.2 The determinants of the foreign equity trading distribution 218
4.7 Empirical results 225
4.7.1 Pull factors of foreign equity trading: Multivariate regression analysis 225
4.7.2 Stock-level determinants of the foreign trading volume share: Multivariate
regression analysis
229
4.7.3 Stock-level factors by stock exchange: Multivariate regression analysis 236
4.8 Conclusion 239
Chapter 5
Conclusion 270
References 277

vii
Acknowledgements
It is a pleasure to thank those who made this thesis possible.
It is difficult to overstate my gratitude to my primary PhD supervisor, Professor
Krishna Paudyal who inspired me to undertake this PhD. With his endless knowledge of
finance and his inspiration, he has helped to make finance a fascinating subject for me. I am
very grateful for his excellent guidance and invaluable advice and support during my PhD.
I am also very grateful to my second supervisor, Dr. Christodoulos Louca, for his
supervision, mentorship and encouragement. I greatly appreciate the time, ideas and advice
that he provided throughout my thesis-writing period.
I would like to express my gratitude to Durham University for providing me with a
generous scholarship, the Durham University Doctoral Fellowship, throughout the years of
my studies. This has enabled me to focus on my research and also has opened up
opportunities to present my work and receive feedback at doctoral seminars and conferences
around the world.
I would like further to acknowledge with gratitude the fostering research
environment provided in the Department of Finance at Auckland University of Technology.
Special thanks to Professor Alireza Tourani-Rad, the Chair of Finance, for unlimited support
and encouragement during the final stages of this PhD.
Lastly, and most importantly, I would like to thank my family for all their love and
patience. For my loving, supportive, and encouraging husband Patrick and my sweet
daughter Ailish whose faithful support and patience during this PhD is so appreciated. Thank
you.

8
Author’s declaration
This is to certify that:
(i) the thesis comprises only my original work towards the PhD except where indicated,
(ii) due acknowledgement has been made in the text to all other material used,
(iii) the thesis is less than 100,000 words in length, exclusive of table, maps, bibliographies,
appendices and footnotes.
Olga Dodd

9
Chapter 1
Introduction
The liberalization of cross-border capital flows in recent decades has significantly
reduced investment barriers between national capital markets and opened up possibilities for
companies to raise capital in international markets through listing and trading. In the 1980s
and in the first half of the 1990s, the fragmentation of the capital markets was the main
motivation for corporate managers to consider an international cross-listing as a means of
overcoming investment barriers and making a company’s shares accessible to foreign
investors.1 In more recent years, despite the fact that foreign equity markets are now more
integrated and more easily accessible to investors, international listing and trading of a
company’s shares still remains important. This can potentially be attributed to the fact that
significant differences across stock exchanges still exist in the level of investor protection,
equity trading costs and information costs. Nevertheless, the increased integration and
technological sophistication of capital markets, combined with significantly increased costs
of foreign listings in the US during the last decade, have fuelled a debate in the media2 and in
academic literature on the net benefits of international cross-listings (Marosi and Massoud,
2008; Litvak, 2008).
International cross-listings have been intensively covered in the literature.3
However, in light of the important developments that have taken place in capital markets in
the last decade many questions remain unanswered. This is essentially because recent
developments have potentially affected the motivations for and the costs and benefits of
listing a company’s shares abroad. First, the regulatory environment of US-listed companies
has significantly changed as the result of the adoption of the Sarbanes-Oxley Act of 2002
and this has also affected non-US companies cross-listed in the US. While this law was
intended to enhance investor protection and confidence, it has also significantly increased the
1 Cross-listing is a cross-border listing of shares, i.e. a listing of shares on a stock exchange outside of the country of the company’s origin, in addition to the home market listing. 2 For example, ‘Why cross-listing shares doesn’t create value’, McKinsey Quarterly, (November, 2008); ‘Do cross-listings still make sense?’, Business Times Singapore, (July, 15, 2010). 3 Karoly (1998 and 2006) provide a comprehensive review of the literature on cross-listing and its development over time.

10
costs for companies of listing on US stock exchanges. Second, the trading environment in
Europe has been affected by the introduction of the single European currency, the Euro.
While the European Monetary Union facilitates cross-border capital flows in Europe due to
the elimination of foreign currency risk, it also poses questions about the need to cross-list
within increasingly integrated European markets. Third, the global equity trading
environment has changed significantly due to considerable advances in technology that have
meant securities’ trading has moved from the traditional trading floor to electronic trading.
In turn, electronic trading, combined with competition pressure in the stock exchange
industry, has facilitated the introduction of new types of markets and trading platforms that
are generally different from traditional regulated markets in their level of added disclosure
requirements.4 Admission to trade on such markets makes a company’s shares available to a
wider range of investors at no additional direct costs for the company. Despite the fact that a
significant number of stocks are traded on non-regulated markets, current understanding of
the implications is very limited. Potentially, admission to trade on a foreign exchange, or
cross-trading, could be a substitute for the more costly cross-listing.5 However, whether the
benefits from cross-listing and cross-trading are comparable is an empirical question that
needs to be addressed. Moreover, the changes in the global equity trading environment raise
questions for stock exchanges on how to compete successfully in attracting and maintaining
stock listing and trading.
The literature indicates that potential benefits from international cross-listings are
associated with the level of economic and financial development and the regulatory
framework of the host market. Existing empirical evidence on the economic consequences of
international cross-listings, however, is primarily based on the experience of non-US
companies that cross-list on US exchanges. Nevertheless, statistics show that a significant
portion of companies also cross-list on European markets (Table 1.1) where the institutional
4 For example, Open market of Deutsche Börse. 5 Cross-listing is different from cross-trading in the way that it is initiated by the company’s decision to cross-list its shares on a foreign stock exchange and involves a company submitting a listing application and meeting listing and disclosure requirements of the host foreign stock exchange. An admission to trade on a foreign stock exchange, or cross-trading, refers to trading of shares on a stock exchange outside of the country of the company’s origin without meeting the stock exchange’s disclosure and listing requirements, often without the company even being aware that its stock is cross-traded. Both cross-listing and cross-trading are in addition to the home market listing of the stock.

11
characteristics differ significantly from those of the US market.6 Additionally, European
markets have been going through significant changes themselves, prompting the need for
empirical investigation on the net benefits of foreign listing and trading in these markets.7
This thesis aims to address the above gaps in the literature by evaluating the
economic consequences of international cross-listing and multimarket trading of equities on
various international markets by European companies. The European sample provides an
opportunity to evaluate the implications of cross-listing and multimarket trading for stocks
from a wide range of home countries; from Western European countries with developed
markets to Central and Eastern European countries with emerging markets, and from
countries which use common law to those that use civil law. In addition, significant
developments in European markets7 motivate further investigation into how these
developments affect the competitiveness of European financial markets vs. the US financial
markets. Also, European financial markets are appealing for an investigation into the
implications of multimarket trading due to their leadership in technological advances in
equity trading. This leadership can be seen in the number of equity trading platforms that
have been introduced in recent years (e.g. VIRTX of Swiss stock exchange and Open market
of Deutsche Börse). Lastly, the European sample of cross-listed stocks represents a
substantial portion of cross-listed stocks worldwide. For example, in 2007 out of the total
341 foreign companies listed on the London stock exchanges 149 companies, or 43.7% of
the total number of foreign listed companies, were from European countries.
The thesis examines the impact of cross-listings on shareholders’ wealth, on the
stock liquidity and volatility, and on the location of trading of cross-listed stocks.
Shareholders’ wealth maximization is the ultimate goal of corporate financial policies.
Whether a cross-listing could help to achieve this goal is examined in the first empirical
chapter. In turn, the increase in market valuation of cross-listed stocks could by driven by the
improvement in stock liquidity and volatility after cross-listing. The second empirical
6 Discussion of the differences in the institutional characteristics of major equity markets and stock exchanges is presented in chapter 2, section 2.6.2, and in chapter 4, section 4.6.2. 7 European regional integration in the recent decade comprises, in addition to the introduction of the Euro, a significant enlargement of the European Union. Also, Poser (2001) and Galati and Tsatsaronis (2003) suggest that capital market financing as opposed to bank-intermediated credit has become more important in Europe. Finally, significant regulatory changes have been taking place in European financial markets such as the adoption of Financial Services Action Plan including the Markets in Financial Instruments Directive (MiFID). However, the full implementation of the MiFID took place at the end of 2007. Thus, analysis of the impact of this regulation is beyond the scope of this thesis.

12
chapter explicitly examines the impact of cross-listing on stock liquidity and volatility.
Finally, a cross-listing is expected to be beneficial only if the cross-listed stock is actively
traded on the foreign stock exchanges following the cross-listing. The third empirical chapter
addresses the importance of the location of trading of cross-listed stocks and investigates the
determinants of the distribution of foreign trading of cross-listed stocks.
This research has important implications for various groups of market participants.
First, understanding the potential outcomes of cross-listing and multimarket trading is
important for cross-listed companies or companies considering a foreign listing of their
shares. Second, it is relevant for investors that trade foreign equity shares. Third, the findings
of this research help stock exchanges identify the factors that make them competitive in
attracting trading of foreign equities. Finally, the findings of this research should be of
considerable importance to financial market regulators. Because the thesis focuses on cross-
listing and multimarket trading that takes place in different international markets, the
implications of its findings are relevant on an international level.
Cross-listing trends and possible motivations to cross-list are discussed in sections
1.1 and 1.2 respectively. While the individual empirical chapters of this thesis are self
contained and include literature specific to the issue discussed in the chapter, a broad review
of literature on the economic consequences of international cross-listings and multimarket
trading and the contribution this thesis makes to the field are discussed in section 1.3. In
particular, section 1.3 covers the impact of cross-listings on shareholders’ wealth, on the
stock liquidity and volatility and on the location of trading of cross-listed stocks.
1.1 Cross-listing trends
Cross-listing of stocks gained importance in the 1980s facilitated by the
liberalization of cross-border capital flows and by the internationalization of companies’
operations. Since the 1980s, it has been a widespread corporate strategy to access foreign
capital markets, particularly for large companies with an international orientation (Pagano et
al, 2002). Historically, the capital markets of the United States have been considered as the
ultimate destination for a cross-listing, possibly due to a more liquid trading environment, a

13
larger investor base and higher availability of equity capital.8 In recent years, increased
capital market integration and significant technological advances in equity trading, such as
electronic trading, have made equity trading in foreign markets more feasible for investors
and, thus, have potentially reduced the need for companies to cross-list. Despite these
significant changes, the numbers of companies that choose to be cross-listed as well as the
volumes of foreign trading in cross-listed stocks remain considerable. For example,
according to the Bank of New York’s ‘The Depository Receipts9 Markets Review 2007’ in
2007 there were 2,060 foreign companies from 76 countries cross-listed in the United States
providing a total trading volume of nearly $3.3 trillion in 2007.10
Clearly, cross-listing is still an important aspect of international financial markets.
Statistics on the number of foreign companies listed (Table 1.1) show that the US is an
important listing destination for foreign companies. However, it also shows that European
exchanges are important host markets. Thus, foreign companies constitute on average 14%
of the total number of listed companies in the major American exchanges and on average
19% of the total number of listed companies in the British and other major European
exchanges. Moreover, an argument proposed recently suggests that while European markets
have improved their quality and attractiveness to foreign companies, the US is potentially
losing its competitive edge, particularly after the adoption of the Sarbanes-Oxley Act of
2002 (SOX), which has significantly increased the costs of a US listing11 (see, for example,
Zingales, 2007; Yallapragada et al, 2008). Marosi and Massoud (2008) explicitly argue that
foreign companies fled the US market12 due to reduction in net benefits of a US cross-listing
8 A number of the US firms chose to cross-list outside of the US in the 1980s and 1990s. However, empirical evidence suggests that a cross-listing by a US firm outside of the US has no conventional advantages for the cross-listing firm such as improved market valuation (Howe and Kelm, 1987; Lee, 1991; Torabzadeh et al, 1992; Varela and Lee, 1993; Lau et al, 1994). In contrast, two more recent studies report that global equity offerings by US firms outperform domestic equity offerings (Chaplinsky and Ramchand, 2000; Wu and Kwok, 2002). 9 A cross-listing in the US takes place in the form of depository receipt (DR), a negotiable certificate issued by a bank to represent the underlying shares held in trust at a foreign bank, as opposed to direct listing of ordinary shares on a foreign exchange. 10 To put this number into perspective, the total value of the share trading on the NYSE in 2007 was $29.1 trillion. 11 King and Mitto (2007) estimate the annual direct costs of SOX compliance to be $2 to $3 million US dollars. An example from industry: British Airways in their press release related to the delisting of its shares from NYSE announced that rising costs of compliance with the Sarbanes-Oxley Act was a primary reason for delisting; this delisting saves the company £10 million British pounds per year. Source: The Evening Standard (April, 25, 2007). 12 Marosi and Massoud (2008) report that during the period 2002-2006 126 foreign companies voluntary deregistered from US exchanges. Fernandes et al (2010) report that 80 foreign companies

14
after the adoption of SOX.13 Overall, there is recent evidence that a significant number of
companies still choose to have their shares listed on foreign exchanges and also at the same
time, a number of companies choose to delist their shares from foreign exchanges. Such
contradictory cross-listing trends call for further research to explore the costs and benefits of
international cross-listings in the current conditions for different types of companies.
1.2 Why do companies cross-list?
Managerial surveys14 and the literature on the determinants of cross-listing decisions
(Pagano et al, 2002; Sarkissian and Shill, 2004) indicate that an international cross-listing is
often an integrated part of the company’s global business strategy (King and Mittoo, 2007).
Larger, often recently privatized, and more export-oriented companies choose to list their
shares on a foreign exchange to signal to markets, including the consumer market, that the
company has become a global player.15 Furthermore, cross-listing is considered to be a
means of internationalizing the investor base in line with the international profile of the
firm’s operations and thereby accessing the foreign equity capital needed to finance
investment opportunities (Bancel and Mittoo, 2001). As confirmation of the importance of
access to new equity capital, Reese and Weisbach (2002) report a significant increase in both
the number and value of equity offerings following cross-listing in the US. Moreover, a
foreign listing can provide the cross-listed company with an acquisition currency, a foreign
exchange-listed security that is valid in the foreign country to pay for acquisitions in that
announced their intention to deregister from US exchanges in the eight months since the rule 12h-6 took effect in 2007 (this rule has made it significantly easier for foreign firms to deregister with the SEC and thus to delist from US exchanges). Additionally, evidence from business press includes: Goodbye, farewell, auf wiedersehen, adieu…, Wall Street Journal, (February, 9, 2005); Delisting European companies should think twice before delisting from the US stock markets, Financial Times, (April, 25, 2005). 13 Marosi and Massoud (2008) show that SOX has significantly increased the probability of foreign companies delisting from US exchanges. In addition, they show that investor’s reaction to a company’s decision to delist after SOX is significantly less negative than that before SOX, consistent with investors recognizing the compliance costs of SOX. 14 Published survey of foreign managers of companies cross-listed in the US include: Mittoo (1992), Fanto and Karmel (1997), Bancel and Mittoo (2001). 15 Survey of 288 cross-listing announcement statements by European companies obtained from the Factiva news database reveals the following most commonly named reasons to cross-list: foreign operations (named in 50 out of 288 statements); broader investor base (named in 45 out of 288 statements); acquisition plans in the foreign market (named in 42 out of 288 statements); access to capital, enhanced reputation and company profile (named in 29 out of 288 statements); international expansion/growth strategy (named in 20 out of 288 statements); improved company’s visibility (named in 20 out of 288 statements).

15
country.16 Empirically, there is evidence that non-US firms cross-listed in the US are
significantly more active in acquiring US companies (Tolmunen and Torsila, 2005) and
compared to their domestically listed peers, pay less by using US-listed equity rather than
cash (Burns, 2004). In addition, there is evidence that a US cross-listing facilitates greater
access to external financing (Lins et al, 2005), reduces the cost of debt (Ball et al, 2009),
which, in turn, contributes to higher firm growth (Khurana et al, 2008) and improved
operating performance (Charitou and Louca, 2009).
On the flip side of the managerial motivation to cross-list, Charitou et al (2008)
show that a non-US firm is more likely to cross-list in the US if the CEO has substantial
holdings of vested options, which she/he is likely to exercise subsequent to the cross-listing
event associated with abnormal positive stock price performance. Ayyagari and Doidge
(2010) argue that controlling shareholders of non-US firms use a US listing as a means to
decrease the costs of ownership transfer. They provide evidence that controlling shareholders
are more likely than controlling shareholders of matched firms that do not cross-list, to sell
voting rights and control stakes to foreign investors following a listing in the US.
1.3 Economic consequences of international cross-listings
1.3.1 Shareholders’ wealth
Although managers may be motivated by such considerations as the improved
prestige, image and visibility of their company to customers and investors (Bancel and
Mittoo, 2001), the primary financial objective of a foreign listing is a reduction in the
company’s costs of capital and, accordingly, improved corporate valuation (Chouinard and
D’Souza, 2003-2004). Existing empirical evidence on this issue is provided by three groups
of studies that use different methodologies: 1) studies that explicitly examine the changes in
the cost of capital after cross-listing, 2) studies that examine the valuation multiples of cross-
listed firms relative to those of firms that do not cross-list using cross-sectional analysis, and
3) studies that examine changes in stock price around the announcement of cross-listings
and/or around the cross-listing event using the time-series framework.
16 Creation of acquisition currency, as a benefit of a foreign listing, has long been advocated by practitioners. E.g. J.P. Morgan suggests that a cross-listing ‘facilitates merger and acquisition activity by creating a desirable stock-swap acquisition currency’. (Source: www.adr.com).

16
Studies from the first group report that cross-listing in the US by non-US firms is
associated with a significant reduction in the cost of equity capital (Errunza and Losq, 1985;
Jorion and Schwartz, 1986; Errunza and Miller, 2000; Koedijk and van Dijk, 2004). In
addition, Hail and Leuz (2009) show the reduction in the cost of equity is sustained over a
long period of time following the cross-listing event. At the same time, there is no evidence
on the changes in the cost of capital after cross-listing in host markets other than the US.
The second group of studies, the cross-sectional studies, estimate the valuation
premium of cross-listed firms using valuation multiples, most often Tobin’s Q17, and report
that non-US firms that cross-list in the US experience significantly higher valuations
compared to firms that do not cross-list (Lang et al, 2003a; Doidge et al, 2004; Hope et al,
2007; O’Connor, 2009; King and Segal, 2009). However, Gozzi et al (2008) show that
corporate valuation increases significantly before and during the year of cross-listing and
declines afterwards. Such evidence questions the causality of the relationship between cross-
listing and firm valuation. Several studies also compare the valuation premium from cross-
listing in the US and in the UK. However, the findings are conflicting. Thus, Doidge et al
(2009a) find significant valuation premiums for US cross-listings that are persistent over
time, while they find no premiums in valuation for UK cross-listings. The authors interpret
these findings as consistent with the theory that a stock exchange listing in the US ‘has
unique governance benefits for foreign firms’ (Doidge et al, 2009a, p.235). On the other
hand, Bianconi and Tan (2010) find significant valuation premiums for both US and UK
cross-listings.
Finally, the third group of empirical studies, the event studies, focuses on the impact
of cross-listing on shareholders’ wealth and report that, on average, cross-listing in the US
results in significant positive abnormal returns both around the announcement of the decision
to cross-list (Miller, 1999; Doukas and Switzer, 2000; Lee, 2003) and around the cross-
listing event itself (Foerster and Karolyi, 1993 and 1999; Mittoo, 2003; Bris et al, 2007).
However, such evidence primarily concerns cross-listings in the US, while the market
reaction to cross-listing on a foreign market other than the US has received significantly less
attention in the literature. Concerning cross-listing in the UK, prior studies find positive
17 Tobin’s Q is the ratio of the market value of a firm's assets (measured by the market value of its outstanding stock and debt) to the replacement cost of the firm's assets (Tobin, 1959). It provides an indication of the valuation premium that investors assign to the future earnings potential of the firm (King and Mittoo, 2007).

17
abnormal returns (Serra, 1999; Roosenboom and van Dijk, 2009). In addition, Sarkissian and
Schill (2009a) report permanent valuation gains from cross-listing on various host markets
and suggest that cross-listing in the US does not offer unique valuation benefits.
Overall, empirical evidence on the effects of international cross-listings arrive at the
general consensus that cross-listing in the US has a positive impact on shareholders’ wealth.
Evidence on the wealth effects of foreign listings in other markets is limited and
inconclusive. In addition, significant changes in international capital markets discussed
above have potentially altered the net benefits of cross-listings in different markets.
Moreover, there is an ongoing debate in the literature on the sources of value
creation around cross-listings. Conventional wisdom has been that cross-listing is a way to
overcome investment barriers and make shares accessible to foreign investors (Stapleton and
Subrahmanyam, 1977; Errunza and Losq, 1985; Alexander et al, 1987). Accordingly, the
reduction in the cost of capital is the result of the increased shareholder base and wider risk
sharing (Foerster and Karolyi, 1999; Errunza and Miller, 2000). In the late 1990s, however,
despite the increased integration of national capital markets, the number of cross-listings
continued to grow and the valuation benefits from cross-listing continued to be significant.
This challenged the market segmentation argument and prompted new theories on the
valuation impact of cross-listings (Karolyi, 2006). As an alternative explanation, Stulz
(1999) and Coffee (1999) initiated the discussion on the legal bonding of the US cross-listing
and suggested that the impact on the cost of capital of cross-listed companies might come
from the new legal environment that provides better protection to minority shareholders.
In line with the legal bonding explanation of the valuation effects of cross-listing, a
number of empirical studies provide evidence that cross-listing in the US is associated with
an improvement in corporate governance. Doidge et al (2004 and 2009a) explicitly show that
the valuation premium is higher for cross–listings on stock exchanges with stricter disclosure
requirements. Additionally, Doidge (2004) and Doidge et al (2009b) argue that a US cross-
listing constrains the consumption of private benefits by controlling shareholders. More
specifically, Doidge (2004) report that firms that cross-list in the US have significantly lower
voting premiums than firms that do not cross-list, which they interpret as evidence of the
improved protection of minority investors. Doidge et al (2009b) show that firms that have
controlling shareholders with greater ownership of voting are less likely to cross-list in the
18
US because the controlling shareholders would have to give up more private benefits of
control. Charitou et al (2007) and Lel and Miller (2008) also argue that listing on US stock
exchanges improves a company’s corporate governance. Particularly, Charitou et al (2007)
show that cross-listing is associated with more independent boards and audit committees and
more dispersed ownership, while Lel and Miller (2008) show that cross-listing improves the
ability to terminate poorly performing CEOs, especially for companies from countries with
weak investor protection. Finally, Fresard and Salva (2010) suggest that cross-listing in the
US mitigates insiders’ ability to convert the company’s cash holdings into private benefits,
evidenced by the differences in valuation of excess cash of cross-listed companies and their
non-cross-listed peers.
Based on the argument that improved corporate governance and investor protection
are the main sources of benefits from cross-listing, the introduction of the Sarbanes-Oxley
Act18 of 2002 (SOX) in the US was expected to further increase the benefits from cross-
listing in the US. However, in sharp contrast to this expectation, financial markets have
witnessed a wave of de-listings from US exchanges in recent years (as discussed above in
section 1.1). In addition, there is evidence of a negative perception of SOX by investors,
arguably due to the significantly increased compliance costs of a US listing (Zhang, 2007;
Litvak, 2007). Also Litvak (2008) specifically shows that valuation premiums of US cross-
listed companies have declined significantly after the adoption of SOX. Overall, the trend of
de-listing from US exchanges and the empirical evidence regarding investors’ negative
perception of SOX have raised questions about the strength of the legal bonding explanation
for the net benefits of cross-listing.
Although financial research has intensively covered the impact of cross-listings on
shareholders’ wealth, there remain open questions. First, neither of the theories on the
valuation effects of cross-listing has been successful in single-handedly explaining cross-
listing trends and the net benefits of cross-listing. Second, several important capital market
developments, such as the adoption of SOX in the US and the adoption of the single
currency in Europe, have raised new questions on the value of cross-listing.19 Third, since
18 The Sarbanes-Oxley Act of 2002 has toughened corporate governance requirements for publicly traded companies in order to improve investor confidence and reassure the US capital market integrity (Donaldson, 2005). 19 According to the 2005 survey by Mazars, a Paris-based auditing firm, only 43% of European companies think the benefits of US cross-listing after the adoption of SOX outweigh its costs, while

19
the majority of empirical studies provide evidence on the impact of cross-listing in the US,
which is significantly different from other major capital markets in terms of disclosure
requirements and costs of listing, the sources of the benefits of cross-listing in other markets
are still not clear. Chapter 2 of this thesis contributes to the debate on the effects of
international cross-listings on shareholders’ wealth by addressing these gaps in the literature.
In particular, chapter 2 addresses two research questions: 1) Do international cross-listings
on various host markets create shareholders’ wealth? 2) What are the sources of wealth
creation around a cross-listing event? Both the wealth effects of cross-listings and their
determinants are compared across various host markets. The determinants of the wealth
effects are evaluated with a particular focus on the impact of the recent developments in
capital markets on the net benefits of cross-listings and on the sources of these benefits.
The findings of chapter 2 suggest that the impact of cross-listings on shareholders’
wealth depends on the destination market. More specifically, cross-listings in the US result
in the most significant positive cumulative abnormal returns around the cross-listing
announcement, closely followed by cross-listing in the UK, while cross-listings in Europe
have no significant impact on the stock’s market valuation. More importantly, it is
documented that significant developments such as the introduction of Euro in Europe, the
introduction of AIM by the London stock exchange and the adoption of SOX in the US have
significantly affected the impact of international cross-listings on shareholders’ wealth and
also the determinants of this impact.
Chapter 2 contributes to literature on the effects of international cross-listings on
shareholders’ wealth in the following ways. First, it adds to the literature empirical evidence
on the experiences of European stocks cross-listed and traded in American, British and
European markets in addition to the widely reported evidence on the experiences of foreign
stocks cross-listed in the US. Second, it provides evidence on the time variation in the net
benefits of international cross-listing. Specifically, it evaluates how important capital market
developments in the last decade have altered the impact of cross-listings on shareholders’
wealth. Third, it empirically examines potential determinants of the wealth effects of cross-
listings on various host markets.
17% are considering delisting to escape the law. Source: Sarbanes-Oxley Goes Global, Forbes Magazine (July, 13, 2006).

20
1.3.2 Liquidity and volatility and information environment of cross-listed stocks
Along with access to foreign equity markets and a broader shareholders base,
enhanced stock liquidity is an important expected benefit of listing on a foreign market
(Bancel and Mittoo, 2001; Foerster and Karolyi, 1998; Bris et al, 2007). All else being
constant, greater liquidity should translate into a lower cost of equity capital because it
reduces the costs of trading for investors and therefore reduces the required illiquidity
premium (Amihud and Mendelson, 1986; Brennan et al, 1998; Jacoby et al, 2000). However,
empirical evidence on the impact of cross-listing on stock liquidity is mixed. Some studies
report an improvement in stock liquidity after cross-listing in terms of reduced trading costs
(Foerster and Karolyi, 1998; Domowitz et al, 1998), reduced frequency of zero returns (Bris
et al, 2007), and increased trading volumes (Smith and Sofianos, 1997; Foerster and Karolyi,
1998). Other studies, however, report no significant improvement or even deterioration in
stock liquidity after cross-listing (Noronha et al, 1996; Domowitz et al, 1998; Silva and
Chavez, 2008; Berkman and Nguyen, 2010). Overall, existing empirical evidence on the
impact of cross-listing on stock liquidity is not conclusive. In regards to the empirical
evidence on the impact of cross-listing on stock return volatility, there is evidence that the
increase in trading volume after cross-listing is associated with increased stock return
volatility (Barclay et al, 1990; Chan et al, 1996; Werner and Kleidon, 1996; Menkveld,
2008). While this is in line with the literature on the positive relationship between trading
volume and volatility (Karpoff, 1987; Jones et al, 1994; Chan and Fong, 2000), it challenges
theoretical predictions on the positive effects of cross-listings. This contradiction calls for
further investigation of the impact of cross-listings on stock return volatility.
While stock liquidity and volatility are important factors on their own, these stock
trading characteristics have also been used in the literature to proxy the quality of the firm’s
information environment (Leuz and Verrecchia, 2000; Leuz, 2003).20 Information
asymmetry is one of the sources of market segmentation that can be alleviated through cross-
listing (Chouinard and D'Souza, 2003-2004). Since cross-listing is associated with additional
mandatory disclosure requirements, it is expected to reduce information asymmetry between
corporate managers and investors and also among different groups of investors. In turn, an
improved information environment reduces an investor’s information costs and therefore
20 The quality of information environment refers to the costs of acquiring and processing relevant information about the firm and reliability of this information.

21
should lower the cost of equity capital for cross-listed companies (Diamond and Verrechia,
1991). In the case of cross-listing, the theoretical model of Chemmanur and Fulghieri (2006)
predicts a positive stock price reaction to the announcement of cross-listing on a foreign
exchange that has higher disclosure standards than the home exchange, explained by the
reduction in investor’s monitoring costs after cross-listing. Empirically, Doidge et al (2004)
show that cross-listing on a stock exchange with stricter disclosure requirements results in
higher valuation premiums of cross-listed companies. Bris et al (2009) compare the stock
price reaction to cross-listing and admission to trade on the London stock exchange. They
find strong evidence that additional disclosure requirements associated with a stock
exchange listing can explain significantly higher abnormal returns around stock exchange
listing vs. admission to trade. Also, Baker et al (2002) and Lang et al (2003a) show that
increased production of stock-specific information after cross-listing is associated with
higher market valuations.
The quality of the stock’s information environment, however, is not straightforward
to quantify and test empirically. Several studies provide indirect evidence on the
improvement in the stock’s information environment. For example, Baker et al (2002) and
Lang et al (2003a) show that cross-listing is associated with increased media coverage and
improved analyst coverage.21 Baker et al (2002) find that international cross-listings,
including both listings on the New York and London stock exchanges, result in a significant
increase in financial analyst coverage and in media attention.22 Moreover, there is empirical
evidence that, in addition to the increase in the number of analysts following the company
after cross-listing, cross-listing also results in increased analyst forecast accuracy (Lang et al,
2003a) and greater consensus among financial analysts (Das and Saudagaran, 1998).
Fernandes and Ferreira (2008) investigate the change in the quality of the information
environment around cross-listings measured by the stock price informativeness, which is
measured by firm-specific stock return variation. They find cross-listing in the US improves
price informativeness for companies from developed markets but decreases price
informativeness for companies from emerging markets. Overall, existing empirical evidence
on the change in the quality of the stocks’ information environment after cross-listing is
21 In turn, the level of analyst coverage of the company is positively related to the quality of the information environment (Draper and Paudyal, 2008). 22 Baker et al (2002) measure stock visibility by the number of analysts following the stock and the number of newspaper articles written about the company.

22
mainly based on the sample of foreign stocks cross-listed in the US. This fact should prompt
an investigation of this issue that would have implications for other international markets.
Chapter 3 of the thesis links the changes in stock liquidity and volatility after cross-
listing to the changes in the quality of the firm’s information environment. The main
research question addressed is: Does cross-listing improve stock liquidity and volatility? An
improvement in stock liquidity and volatility is expected since cross-listing enhances the
stock’s information environment. Chapter 3 provides a comprehensive analysis of the
different dimensions of stock liquidity and volatility before and after the cross-listing event.
The chapter explicitly addresses the self-selection bias in the cross-sectional analysis of the
consequences of cross-listings, which is potentially present due to the endogenous nature of
cross-listings. This issue is tackled using several alternative techniques. The impact of cross-
listings on liquidity and volatility is evaluated after controlling for the change in stock-
specific characteristics after cross-listing, such as company size, accounting practices,
analyst coverage and trading activity. The sample includes European stocks cross-listed on
various markets. Therefore, the evidence not only complements the existing literature on the
consequences of cross-listing in the US but also offers an analysis of how equity market
specific factors may shape the effects of cross-listing. Last but not least, chapter 3
distinguishes between cross-listing and cross-trading; this is because cross-trading, unlike
cross-listing, does not entail additional disclosure. Thus, the second research question
addressed is: Does cross-listing have a more profound impact on the liquidity and volatility
than cross-trading? If additional mandatory disclosure is the main channel for improvement
in the stock’s information environment then the improvement in the information
environment and, accordingly, the improvement in stock liquidity and volatility after cross-
listing is expected to be more significant than after cross-trading.
The empirical findings of chapter 3 suggest that stock liquidity and volatility
improve after listing on a foreign exchange. Yet, contrary to expectations, the difference in
the impact of cross-listing and cross-trading on stock liquidity and volatility is not
significant. This finding suggests that the improvement in liquidity and volatility of cross-

23
listed and cross-traded stocks is not due to mandatory information disclosure requirements
but rather due to greater information production and intensified competition among traders.23
The major contributions of chapter 3 are as follows: First, it provides up-to-date
evidence on the liquidity and volatility of stocks cross-listed and cross-traded on various
exchanges both relative to stocks that do not cross-list and also relative to the pre-cross-
listing period. Second, it distinguishes between cross-listing and cross-trading and compares
the consequences of these two types of presence on a foreign stock exchange in terms of
stock liquidity and volatility.
1.3.3 Implications of the location of trading
Improvement in transaction costs and stock liquidity after cross-listing can be largely
attributed to the global competition for order flow. This competition forces stock exchanges
to continuously look for ways to improve market quality24 in order to attract and maintain
trading volumes. This task has become particularly relevant in the current environment,
which is characterised by globalization, integration and digitalization of capital markets. In
theory, when a stock is listed on multiple markets, traders make decisions on the location of
trading based largely on transaction costs (Pagano, 1989; Chowdhry and Nanda, 1991).
Accordingly, it is expected that order flow from liquidity traders who seek to attain the
highest possible level of liquidity will eventually gravitate to a single market with the lowest
possible transaction costs.
Another important consideration for traders is the quality of the market’s
information environment. Huddart et al (1999) developed a theoretical model where liquidity
traders choose to trade only on the exchange with the strictest disclosure requirements
because on such exchanges the information advantage of corporate insiders is less. While
theoretical predictions on the location of equity trading are straightforward, it is a difficult
empirical task to validate those predictions while taking into account significant market
23 On occasions the information to be disclosed could also differ. This may not, on its own, mean a higher ‘level’ of disclosure but effectively this brings more information to the market and hence reduces the information asymmetry. It is also possible that the format and regulations pertinent to financial statements may also differ across markets, and hence investors will have information based on two or more accounting practices. This also will lead to lower information asymmetry. 24 Important aspects of market quality include the level of market liquidity and volatility, operational and informational efficiency, transparency and the level of investor protection and insider trading regulations.

24
frictions that potentially distort the equilibrium predicted. Existing empirical evidence on the
location of trading of cross-listed stocks shows the importance of the following stock
exchange characteristics for the ability of a stock exchange to attract foreign equity trading:
time zone differences between the home and host markets, transaction costs, the level of
insider trading regulation, and the level of economic development of the home market
(Pulatkonak and Sofianos, 1999; Halling et al, 2008). Existing literature, however, is solely
focused on the distribution of trading volumes between the US market and the stock’s home
market based on samples of non-US stocks cross-listed in the US. This indicates a
considerable gap in the literature on the relative competitiveness of different international
stock exchanges in attracting trading volumes of foreign stocks. Evidence from non-US
markets would be of significant importance because these markets differ significantly from
the US capital market in their institutional characteristics.
From the point of view of a cross-listed company, the benefits of international cross-
listings are directly associated with the level of trading activity on the foreign exchange.
Thus, there is evidence that more active stock trading on the foreign exchange has several
important outcomes: 1) more significant reduction in the bid-ask spread (Foerster and
Karolyi, 1998), 2) more significant improvement in the stock market valuation (King and
Segal, 2004), and 3) more significant portion of the stock price discovery taking place in the
foreign market (Eun and Sabherwahl, 2003). Existing research shows that the distribution of
the trading volumes of cross-listed stock varies significantly depending on the stock-specific
characteristics (Pulatkonak and Sofianos, 1999; Baruch et al, 2007; Halling et al, 2008).
Once again, the evidence is based on the sample of foreign stocks cross-listed in the US and
ignores trading of cross-listed stocks in other markets. Thus, such evidence is not useful for
companies in understanding potential outcomes from cross-listing in various foreign
markets. This understanding is needed in order to for a company to choose the right host
market for their stock. Hence, this gap in the literature needs to be addressed.
Chapter 4 of the thesis contributes to the empirical literature on the implications of
the location of trading of cross-listed stocks by addressing the following research question:
What determines the distribution of trading of cross-listed stocks? This issue is investigated
both from the point of view of stock exchanges seeking to attract business from abroad and
also from the point of view of corporate managers looking to maximize the liquidity of their

25
company’s stock via listing on a foreign exchange. First, using trading data of cross-listed
stocks that trade on various exchanges, chapter 4 compares the ability of the major
international stock exchanges to attract trading volumes of foreign stocks and evaluates the
stock exchange characteristics that determine this ability. Furthermore, the unique sample
includes data on trading on both regulated stock exchanges and non-regulated markets such
as OTC markets and alternative trading platforms. This allows a comparison of the ability of
these two types of markets, which differ mainly in the level of disclosure required, to attract
foreign equity trading. Second, chapter 4 addresses the importance of stock characteristics in
explaining the distribution of trading volumes of cross-listed stocks. More specifically, it
provides empirical evidence on how firm-specific characteristics affect the level of trading
activity on a foreign exchange and also provides evidence, given its characteristics, on which
particular foreign stock exchange the stock is likely to experience more active trading.
The findings of chapter 4 reveal the superior ability of the US stock exchanges to
attract foreign equity trading of European stocks. The ability of a stock exchange to attract
foreign equity trading is found to be positively determined by its organizational efficiency,
the level of liquidity, the level of investor protection and the enforcement of insider trading
regulation. In line with the predictions of Huddart et al (1999), chapter 4 reports that
regulated stock exchanges have a superior ability to attract trading volumes of foreign equity
compared to non-regulated markets. Finally, it is found that firm-specific factors, such as
currency and duration of trading, company size and stock risk, have significant power in
explaining the distribution of trading volumes in multi-market trading.
The major contributions of chapter 4 are as follows: First, it provides evidence on
the relative ability of the major stock exchanges to attract trading volumes of foreign equity
and factors that affect this ability. Also, it provides evidence on which foreign exchange is
more likely to offer higher trading volumes for a company with specific characteristics. Such
evidence is particularly relevant for companies looking to maximize stock liquidity and
expand their investor base by means of cross-listing.

26
1.4 Thesis outline
The thesis consists of five chapters. Chapter 2 explores the effects of international
cross-listing on shareholders’ wealth. Using cumulative abnormal returns around the cross-
listing announcement as a measure of the wealth effects of cross-listing, chapter 2 compares
the effect of cross-listing on the American, British and European stock exchanges and
evaluates the determinants of these effects. Additionally, it examines the impact of
significant capital market developments, such as the adoption of the Sarbanes-Oxley Act in
the US and the single currency, the Euro, in Europe, on the benefits of cross-listings.
Chapter 3 examines the impact of cross-listing and multimarket trading on stock
liquidity and volatility. Furthermore, the study distinguishes between cross-listing and cross-
trading, because cross-trading, in contrast to cross-listing, does not entail additional
disclosure. Chapter 3 examines and compares the changes in stock liquidity and volatility
after cross-listing and cross-trading.
Chapter 4 examines both the stock exchange level and firm level determinants of the
foreign trading volume of cross-listed and cross-traded stocks. In particular, it evaluates
stock exchange characteristics that affect an exchange's ability to attract and maintain foreign
equity trading and, thus, its competitive position in the industry. Furthermore, the unique
sample of stocks traded on various stock exchanges allows an evaluation of how successful
stock exchanges are in attracting active trading of foreign stocks with particular company
characteristics.
Finally, chapter 5 summarizes the findings and their implications.

27
Table 1.1. Number of listed foreign companies on major American and European exchanges
The table reports the number of listed international companies (absolute number and as percentage of total listed companies) on AMEX, NYSE, NASDAQ, LSE’s Main Market and LSE’s AIM, Deutsche Borse (Frankfurt stock exchange official regulated market only) and Euronext (consolidated statistics for Paris, Amsterdam, Brussels and Lisbon) for the period of time from 1999 to 2007. The sources of data include: World Federation of Exchanges (http://www.world-exchanges.org), LSE (www.londonstockexchange.com), Deutsche Borse (http://www.deutsche-boerse.com), Euronext
(http://www.euronext.com).
2007 2006 2005 2004 2003 2002 2001 2000 1999
AMEX
Number of foreign listed companies 104 100 100 73 55 48 48 51 na
% of total listed companies 17% 17% 17% 13% 10% 8% 8% 8% na
NYSE
Number of foreign listed companies 421 451 452 459 466 472 461 433 406
% of total listed companies 18% 20% 20% 20% 20% 20% 19% 18% 13%
NASDAQ
Number of foreign listed companies 307 321 332 340 343 381 445 488 429
% of total listed companies 10% 10% 10% 11% 10% 10% 11% 10% 9%
London SE Main Market
Number of foreign listed companies 341 330 334 351 381 419 453 501 499
% of total listed companies 22% 21% 20% 19% 20% 20% 20% 21% 20%
London SE AIM
Number of foreign listed companies 347 306 220 116 60 50 42 31 22
% of total listed companies 20% 19% 16% 11% 8% 7% 7% 6% 6%
Number of foreign listed companies 105 104 116 159 182 177 180 187 192
% of total listed companies 12% 14% 15% 19% 21% 26% 27% 29% 30%
Euronext
Number of foreign listed companies 225 256 293 334 346 370
% of total listed companies 19% 21% 23% 25% 25% 25%
Total: major US exchanges
Number of foreign listed companies 832 872 884 872 864 901 954 972
% of total listed companies 14% 15% 15% 14% 14% 14% 13% 13%
Total: major European exchanges
Number of foreign listed companies 1,018 996 963 960 969 1,016
% of total listed companies 19% 19% 19% 19% 20% 20%
Frankfurt SE Official Regulated Market

28
Chapter 2
International Cross-Listing of Stocks
and Shareholders’ Wealth
2.1. Introduction
The globalization and integration of the world financial markets, and in particular,
significant capital market developments such as the introduction of the Euro in the European
Union in 1999, the Sarbanes-Oxley Act of 2002 (SOX) and the introduction of the
Alternative Investments Market (AIM) of the London Stock Exchange in 1996, have
generated considerable debate among academics and practitioners concerning the
motivations for, and the benefits of, cross-listings of European companies on American,
British and European stock exchanges.25 With the introduction of a common currency, the
Euro, the European markets have become more integrated, creating doubt as to whether
cross-listings within Europe actually add wealth to shareholders. Similarly, SOX is likely to
increase the costs of meeting the legal and disclosure requirements of the US Securities and
Exchange Commission, making listing in the US markets less desirable.26 Finally, the
introduction of stock exchanges that are characterised by light disclosure requirements and
easy access to capital (for example the AIM in London) are likely to affect the geographic
trends in cross-listings. The immediate consequence of these developments is that the
motivations and the net benefits of cross-listings are likely to change across different listing
destination markets and over time. This study contributes to this debate by investigating the
effect on the wealth of shareholders in European companies of cross-listing in the American,
British and European stock exchanges.
25 Some anecdotal evidence includes: “Delisting European companies should think twice before delisting from the US stock markets”, Financial Times, (April, 25, 2005); “Why cross-listing shares doesn’t create value”, McKinsey Quarterly, (November, 2008). 26 In this respect, Zhang (2007) and Litvak (2007) find a negative market reaction for companies that are subject to SOX compliance during key announcements that SOX would fully apply to cross-listed foreign issuers.

29
The effects of cross-listings on shareholders’ wealth have been the subject of
intensive theoretical and empirical research (Stapleton and Subrahmanyam, 1977; Alexander
et al, 1987; Foerster and Karolyi, 1999; Miller, 1999). Prior studies, on average, uncover
positive gains in shareholders’ wealth as a result of cross-listings on American stock
exchanges. Conventional wisdom attributes gains in shareholders’ wealth from cross-listing
to market segmentation, liquidity and signalling theories. Market segmentation theory
suggests that cross-listing in a foreign market makes a company’s stocks accessible to
investors who, because of investment barriers, would otherwise find it less advantageous to
hold the stocks. This potentially increases the shareholder base and risk sharing, which in
turn leads to a lower cost of capital and a higher market valuation (Stulz, 1981; Foerster and
Karolyi, 1999; Errunza and Miller, 2000). Liquidity theory postulates that cross-listing in a
more liquid market reduces trading costs for investors and increases the company’s valuation
(Amihud and Mendelson, 1986; Foerster and Karolyi, 1998). Finally, cross-listing may
signal the company’s high quality and future prospects to the market (Fuerst, 1998).
Later research by Stulz (1999) and Karolyi (2006) challenges the adequacy of the
aforementioned theories in explaining the variation of cross-listing valuation effects and the
time series pattern of cross-listings. As a result, other promising theories such as bonding,
market timing and proximity preference theory were developed. Bonding theory proposes
that cross-listing on an exchange with higher legal and disclosure standards ‘bonds’ the
company to better corporate governance practices that limit the ability of managers and
controlling shareholders to expropriate minority shareholders rights (Stulz, 1999; Coffee,
1999 and 2002; Doidge et al, 2004). Market timing theory attributes gains in shareholders’
wealth from cross-listing to managers’ ability to time a cross-listing in relatively ‘hot’ host
markets (Sarkissian and Shill, 2009b). Finally, the wealth effects of cross-listing could be
positively related to the level of investors’ familiarity with the company measured by
geographic, economic, cultural, and industrial proximity between the home and the host
markets (Sarkissian and Schill, 2004, 2009a). Overall, these theories explain the effect of
cross-listing on shareholders’ wealth at a market level. However, the effects on shareholders’
wealth may also vary at a company level. Thus, other researchers have proposed business
strategy theory. Business strategy theory assumes that a cross-listing decision is associated
with a company’s global strategy and predicts that gains in shareholder wealth from cross-

30
listing are a function of company-specific characteristics (Fanto and Karmel, 1997; Bancel
and Mittoo, 2001; Pagano et al, 2002).
Empirical evidence on the aforementioned cross-listing theories is mixed. Miller
(1999) and Errunza and Miller (2000) provide empirical evidence consistent with market
segmentation theory, while Doidge et al (2004) provide empirical evidence consistent with
legal bonding theory. Foerster and Karolyi (1999) interpret their findings as consistent with
liquidity and investor recognition theories. Baker et al (2002) and Lang et al (2003a) also
find evidence consistent with investor recognition theory. Sarkissian and Schill (2009a) and
Sarkissian and Schill (2009b) advocate proximity preference theory and market timing
theory respectively. Finally, business strategy theory is empirically supported by Bancel et al
(2007). Several studies have attempted to test empirically the joint significance of the cross-
listing theories. In this vein, Bris et al (2007) suggest that the explanatory power of market
segmentation theory is more significant than that of legal bonding theory while Bris et al
(2009) find that the explanatory power of the information-based theory of cross-listing is
more significant than that of market segmentation and liquidity theories. Overall, the joint
significance of the cross-listing theories is still not clear. This study contributes to the debate
by providing empirical evidence on the explanatory power of potential determinants of
wealth effects of cross-listings on various markets. Potential determinants are identified
based on the aforementioned cross-listing theories.
In addition, evidence on the impact of developments in capital markets on the
motivations for and net benefits of cross-listings is limited. It is important to consider such
developments in order to improve understanding of the relationship between shareholders’
wealth gains from cross-listing and their determinants. Furthermore, prior studies largely
ignore cross-listings on British and European stock exchanges.27 Since American, British and
European stock exchanges have different characteristics with respect to their level of
economic development in terms of capital market size and liquidity, investor protection and
accounting standards, the motivations for and the net benefits of cross-listings across these
27 At the same time, stock exchange industry statistics show that the number of foreign companies listed on British and European stock exchanges is significant compared to the number of foreign companies listed on American exchanges. Thus, in 2007, 688 foreign companies were listed on the London stock exchange, 225 on the Euronext, and 105 on the Frankfurt stock exchange. Meanwhile, in 2007, all together 832 foreign companies were listed on American exchanges including AMEX, NYSE and Nasdaq (Table 1.1 of Chapter 1, discussed in section 1.1 of Chapter 1).

31
markets are likely to be diverse. In this respect, Roosenboom and van Dijk (2009) compare
the sources of value creation around cross-listings in various markets. For US cross-listings
they report that the effect on shareholders’ wealth is determined by market liquidity,
information disclosure and the level of investor protection. For UK cross-listings, they report
transparency and investor protection as being significant. However, for Europe and Japan the
study finds no significant determinants for the effect of cross-listing on shareholders’ wealth,
which suggests the need for further theoretical and empirical work in these areas.
This study contributes to the cross-listing literature by investigating the effects of
cross-listings on shareholders’ wealth for European companies in American, British and
European markets, the determinants of these effects and their evolution over time. More
specifically, the following research questions are addressed: 1) Do international cross-
listings on various host markets create shareholders’ wealth? 2) What are the sources of
wealth creation around a cross-listing event? To explain the variation in the effects on wealth
of cross-listing across various host markets, this study investigates the role of market
segmentation, liquidity, information disclosure, legal bonding, market timing, proximity
preference, investor recognition, and business strategy theories. Moreover, it considers the
role of capital market developments on the motivations for and benefits of cross-listings.
Using a hand-collected dataset of 254 cross-listing announcements from 21
European markets during the period from 1982 to 2007, the results show an average
statistically significant cumulative abnormal return of 1.8% around the announcement of an
international cross-listing. Mostly, these abnormal returns are contributed by American and
British cross-listings (3.3% and 2.7%, respectively), while European listings do not generate
any significant abnormal returns. The results show that the introduction of the Euro had no
impact on the wealth effects of European cross-listings.
This study provides evidence that the impact of cross-listings on shareholders’
wealth is affected by capital market developments such as the introduction of AIM by the
London stock exchange and the adoption of SOX in the US. With respect to British cross-
listings, the significant abnormal returns can mainly be attributed to the AIM listings, despite
the fact that the AIM offers weaker investor protection than the Main Market of the London
stock exchange. In turn, higher abnormal returns around the AIM listings are driven by the

32
smaller size of the companies listing on AIM. The effects on shareholders’ wealth of British
cross-listings can be explained by proximity preference and business strategy theories.
Finally, regarding American cross-listings, the results are consistent with the
argument that the costs from the adoption of SOX outweigh the benefits. More specifically,
cross-listings that took place in the US before the adoption of SOX resulted in positive and
statistically significant abnormal returns, while cross-listings that took place in the US after
the adoption of SOX have produced insignificant abnormal returns. Positive effects on
shareholders’ wealth before the adoption of SOX are particularly profound for small and
growth companies, while after the adoption of SOX they are positive and significant only for
large companies and for companies from countries with weaker legal environment. Hence,
business strategy can generally explain the effect on shareholders’ wealth of international
cross-listings in the US market, while the investor recognition theory is also valid in the
post-SOX period. The findings on the impact of AIM and SOX on the stock price suggest
that investors evaluate the benefits of a foreign listing in conjunction with the costs involved.
On the whole, this study provides insights into the nature of the motivations for, and
the benefits of, cross-listings across different host markets and over time. The findings are
consistent with the view that the impact of cross-listings on shareholders’ wealth depends on
the destination market and the time it takes place. Changes in the listing environment not
only alter the wealth effects of cross-listings but also affect the sources of value creation
around cross-listings.
The remainder of the chapter is organized as follows: Section 2.2 provides an
overview of the theoretical and empirical literature on the effects of international cross-
listings on shareholders’ wealth, section 2.3 develops testable hypotheses on the direction
and relative magnitude of the effects on shareholders’ wealth of cross-listing and on the
potential determinants, section 2.4 and section 2.5 describe the methodology and the sample
employed respectively, section 2.6 presents the empirical findings and, finally, section 2.7
concludes the chapter.

33
2.2 Literature review
2.2.1 Theoretical background on the effects of cross-listings on shareholders’
wealth
In perfect markets the decision of in which market shares should be listed would be a
source of indifference to companies. In reality, investment barriers such as foreign
investment restrictions, transaction costs, taxes, regulatory frictions, incomplete information,
and variation in liquidity, investor bases, and levels of investor protection between home and
foreign markets might result in differences in a stock’s market valuation. The literature
offers a number of theories which attempt to explain the impact of an international cross-
listing on shareholders’ wealth.
Capital Markets Segmentation theory
A cross-listing makes a company’s stocks accessible to investors who would
otherwise find it less advantageous to hold the stocks because of investment barriers. In turn,
improved stock investability after the cross-listing increases the shareholder base and the risk
sharing and, thus, leads to a lower cost of capital. The seminal work by Stapleton and
Subrahmanyam (1977) offers analysis of the imperfections in international capital markets,
including foreign investments restrictions and taxes, and the implication of these
imperfections for corporate financial decisions. They show that cross-listing is one of the
corporate financial policies that overcome the effects of capital market segmentation and,
accordingly, results in a higher price of cross-listed stock.
Studies by Black (1974), Stulz (1981), Errunza and Losq (1985), Eun and
Janakiramanan (1986), and Alexander et al (1987) offer theoretical models of equilibrium
capital market prices with various investment barriers. Black (1974) and Stulz (1981) show
that taxes on asset holdings by foreign investors might explain the deviation of asset prices
from the expected level and also the bias of investors towards domestic stocks. Errunza and
Losq (1985) examine the impact of regulatory restrictions that result in the inability of some
investors to trade a subset of securities (referred to as ineligible securities) and predict super
risk premium on ineligible securities, which is a function of the differential risk aversion of
restricted and unrestricted investors. Eun and Janakiramanan’s (1986) model that
incorporates legal foreign ownership restrictions also predicts a risk premium over the ‘no-

34
constrains equilibrium price’ for restricted, or domestic, investors and a discount for
unrestricted, or foreign, investors. Extending the work of Stapleton and Subrahmanyam
(1977), Alexander et al (1987) view a listing of a domestic security on a foreign capital
market as the initial stage of capital market integration that produces the so called
‘externality effect’ of indirectly integrating domestic and foreign capital markets. Their
model demonstrates that expected returns are lower when a security is cross-listed under the
condition that stock prices are less positively correlated between different countries than they
are within a single country.
A number of empirical studies (Alexander et al, 1988; Foerster and Karolyi, 1993;
Miller, 1999; Errunza and Miller, 2000) provide empirical evidence consistent with the
market segmentation theory on the effects of cross-listings on shareholders’ wealth.
Legal bonding theory
Stulz (1999) and Coffee (1999) initiated the discussion on whether the impact on the
market valuation of cross-listed companies might come from the new legal environment that
provides better protection to minority shareholders. Thus, a cross-listing on an exchange
with stricter legal and disclosure requirements compared to those of the home market is a
way to ‘bond’ the company to better corporate governance practices, which limit the ability
of managers and controlling shareholders to take excessive private benefits. Doidge et al
(2004) compare the valuation of foreign companies listed in the US to the valuation of those
not listed in the US and report that at the end of 1997, the valuation premium of companies
cross-listed in the US was on average 16.5%, with the premium being higher for companies
cross-listed on major American exchanges, compared to companies with Rule 144a private
placements and OTC listings. Based on their findings, Doidge et al (2004) argue that an
American listing reduces the extent to which controlling shareholders can engage in
expropriation, and this increases the company’s ability to take advantage of growth
opportunities.
Signalling theory
Legal bonding theory is closely related to signalling theory in terms of the effects of
foreign listings on shareholders’ wealth. Fuerst (1998), in an attempt to explain the increase
in the number of listings by foreign companies on American stock exchanges with strict

35
disclosure requirements in the 1990s, developed a theoretical model that rationalises the
choice to cross-list on exchanges with high disclosure levels. Fuerst (1998) argues that
voluntarily bonding to higher levels of disclosure via a cross-listing is a way for managers to
convey information to the market about the firm’s future prospects and quality. Since a
cross-listing on an exchange with strict disclosure requirements signals superior operating
performance in the future, the market reaction to the cross-listing decision is predicted to be
strongly positive.
Liquidity
Amihud and Mendelson (1986) highlight the importance of market microstructure
and, in particular, liquidity in pricing assets and show that expected asset returns is an
increasing and concave function of the bid-ask spread. Thus, financial policies that improve
stock liquidity, such as a cross-listing, are expected to result in increased firm valuation.
Empirically, Kadlec and McConnell (1994) find that Amihud and Mendelson’s (1986)
liquidity factor can partly explain the value effects of listings on the New York Stock
Exchange by over-the-counter (OTC) stocks. They find that abnormal returns around a
NYSE listing are higher for firms that experience a reduction in bid-ask spreads following
the listing. Foerster and Karolyi (1999) provide an indirect test of liquidity theory using the
case of non-US companies cross-listing on American exchanges. They report that abnormal
returns during the listing week, after controlling for the difference in shareholder base, are
positive and significant for NYSE listings and negative for AMEX and NASDAQ listings.
Based on the assumption that NYSE is the most liquid market in this case, the findings are
interpreted as being consistent with the liquidity theory of the effects of cross-listings on
shareholders’ wealth.
Investor Recognition theory
The classic assumption of asset pricing is that markets are efficient, i.e. all
information is costless and immediately available to all investors. However, in reality the
process of the acquisition and dissemination of information in financial markets is
complicated and costly. To address this shortcoming, Merton (1987) developed a model of
capital market equilibrium with incomplete information that relaxes the assumption of equal
information availability and assumes that investors know only about a subset of securities. In
this case, expected returns depend not only on market risk but also on the costs of incomplete

36
information. The Sharpe-Lintner CAPM does not price firm-specific risk since it can be
eliminated via diversification. On the other hand, in Merton’s model investors are not aware
of some stocks, making complete diversification impossible. Thus, returns are expected to be
higher when the firm’s specific risk is higher and the size of the firm’s investor base is
smaller (investor base is referred to as ‘degree of investor recognition’). Accordingly, an
increase in the investor base will result in a higher valuation of the firm and the benefits are
expected to be greater for firms that are less well known by investors. Merton (1987)
suggests that firms should make efforts to expand their investor base in order to improve
their valuation, for example, by increasing a firm’s visibility via advertising and public
relations or by making the stock available to investors who would be unable to invest
otherwise because of regulatory constraints, for example, by an exchange listing. Kadlec and
McConnell (1994) provide empirical support for investor recognition theory in terms of the
effects on shareholders’ wealth. They show that greater abnormal returns around an NYSE
listing announcement by OTC stocks is associated with a greater increase in the number of
shareholders. Extending the application of Merton’s (1987) model to the case of a foreign
listing, Foerster and Karolyi (1999) show that the share price reaction around American
listings by non-US firms can partly be explained by an increase in the investor base. They
suggest that a larger shareholder base after the cross-listing results in wider risk sharing and,
thus, in a reduction in the risk premium.
By listing shares on a foreign exchange, companies increase investor awareness
abroad and make information about the company more easily accessible by foreign investors,
which significantly reduce investors’ monitoring costs. Chemmanur and Fulghieri’s (2006)
theoretical model predicts a positive effect on shareholders’ wealth from a cross-listing
decision, given that following the cross-listing, investors can produce information about the
company at a lower cost. Empirical evidence on the information environment of cross-listed
companies shows that non-US companies cross-listed in the US enjoy an increase in media
attention, analyst coverage and forecast accuracy following the cross-listing and the increase
in visibility is associated with a decrease in the cost of capital after the cross-listing. (Baker
et al, 2002; Lang et al, 2003a; Bailey et al, 2006).

37
Proximity preference theory
Sarkissian and Schill (2004) argue that corporate financing decisions, like portfolio
investments decisions, are biased towards domestic assets, i.e. they exhibit a ‘home bias’.
More specifically, Sarkissian and Schill (2004) show that geographical, economic, cultural,
and industrial proximity measures are important determinants of the corporate decision to
cross-list. Furthermore, Sarkissian and Schill (2009a) provide evidence that wealth benefits
are higher for cross-listings on markets that are already familiar with the company’s home
market’s products (measured by cross-border export) and that are relatively close
geographically (measured by the distance between the capitals).
The expectations of the impact of a cross-listing on shareholders’ wealth based on
proximity preference theory are the opposite of the expectations that arise from investor
recognition theory. While investor recognition theory implies the greatest wealth gains for
shareholders’ occur when the host market is least familiar, due to the need to overcome
higher information barriers, proximity preference theory implies the greatest benefits occur
when the host market is most familiar.
Market timing theory
Corporate managers time the company’s listing on a foreign exchange to take
advantage of high market valuation at the stock-level, i.e. listing following a strong stock
performance on the home market. Also managers time a foreign listing at the market-level,
in other words, listing during a ‘hot’ market period. Ndubizu (2007) presents evidence in
favour of a company-level window-of-opportunities theory that a cross-listing company’s
performance (measured by ROA and cash flows) peaks in the year of the cross-listing and
falls significantly in subsequent years. Also, King and Segal (2009) and Gozzi et al (2008)
report that relative company valuation measured by Tobin’s Q peaks around the cross-listing
and reduces significantly in the following years. Sarkissian and Shill (2009a) provide
evidence of the transitory nature of the effects of cross-listing on shareholders’ wealth, i.e.
they document positive abnormal returns prior to the cross-listing and significantly negative
abnormal returns after the cross-listing.
Henderson et al (2006) evaluate how market-level conditions affect corporate capital
raising decisions and find evidence that companies issue equity in ‘hot’ markets in order to

38
take advantage of soaring market valuations. Sarkissian and Shill (2009b) show that
companies tend to cross-list in ‘hot’ host markets, i.e. when the host market outperforms
other markets economically (in terms of GDP growth) and financially (in terms of growth in
market capitalization-to-GDP ratio).
Business strategy theory
Business strategy theory predicts the impact of cross-listing on shareholders’ wealth
to be a function of company-specific factors, because companies make the decision to cross-
list for reasons related to their global corporate strategy. Pagano et al (2001) report that
companies tend to cross-list on markets where their industry peers are listed, which can be
attributed to cross-listing companies attempting to strengthen their competitive position in
their industry (Pagano et al, 2002). Surveys of corporate finance managers on the benefits of
cross-listings by Fanto and Karmel (1997) and Bancel and Mittoo (2001) reveal that
industry-specific reasons and a company’s global business strategy are among the main
reasons to cross-list. Bancel et al (2007) provide empirical evidence that emphasises the
importance of the business strategy theory in explaining the stock performance of cross-
listed companies.
Overall, predictions of legal bonding, liquidity and investor recognition theories are
similar as they all suggest that a cross-listing in a better quality market than the home market
is beneficial for investors. In each theory, however, market quality is assessed from a
different angle: legal bonding theory addresses the level of investor protection, liquidity
theory the level of market liquidity, and investor recognition theory the quality of the
information environment. Empirically, more developed financial markets offer high levels of
investor protection, liquidity and information availability, and, ultimately lower transaction
costs. This fact makes an empirical test of joint significance of the theories related to the
effects of cross-listings on shareholders’ wealth a challenging task.
Nevertheless, it is interesting to note that market segmentation and proximity
preference theories make opposite predictions. Market segmentation theory suggests that the
benefits of cross-listing would be higher because of the need to overcome more significant
levels of segmentation between the home and the host markets. In contrast, proximity
preference theory expects that the benefits would be higher from cross-listings in host
markets that have a high level of similarities and connections with the home market. Lastly,

39
market timing and business strategy theories predict a significant variation in the effects of
cross-listings on shareholders’ wealth based on both market conditions and company-
specific factors.
2.2.2 Empirical evidence on the effects of cross-listings on shareholders’ wealth
The empirical evidence on the effects of cross-listing on shareholders’ wealth
suggests that in the 1980s and the 1990s non-US companies listing in the US, on average,
experienced significant positive abnormal returns, while the evidence on the effects of cross-
listings on non-US exchanges on stock price is mixed.
Cross-listings in the US
Listing in the US by a foreign company usually takes place in the form of an
American Depository Receipt (ADR). American exchanges offer listing companies a number
of benefits including high liquidity, a large investor base, analyst and media coverage,
greater access to capital and a high level of investor protection. Not surprisingly, the
empirical evidence shows that in the 1980s and 1990s non-US companies listing in the US,
on average, experienced a significant positive abnormal return.
Miller (1999) examines the stock price reaction around the cross-listing
announcement dates for 181 companies from 35 countries that instituted their first
Depository Receipt programme over the period 1985-1995. Miller (1999) finds a positive
abnormal return of 1.15% for a 3-day (-1,+1) event window around the announcement of an
ADR-issuance. Importantly, the stock price reaction is determined by the listing venue
(exchange vs. OTC), home market (emerging vs. developed), and avenues for raising capital
(public or private). Abnormal return is found to be higher for companies from emerging
markets (1.54%) and significantly higher for exchange listings (2.63%) compared to OTC
listings and private placements. Miller (1999) interprets his findings as being consistent with
the argument that higher liquidity and a larger shareholder base increase shareholder wealth.
Later, Coffee (2002) interprets the findings of Miller (1999) as evidence for the legal
bonding theory. Coffee (2002) argues that this difference in price reaction on the
announcement day of different type of listings is important evidence because exchange

40
listings, Rule 144a private placements and OTC listings have critical differences in legal and
reporting requirements.
Lee (2003) reports significant abnormal returns of 1.7% for a 3-day (-1, +1) event
window and 3.3% for a 7-day (-5, +1) event window for a sample of 69 companies from 11
Asian and Latin emerging markets that cross-listed in the US via ADR programs from 1991
to 2001. Lee (2003) shows that the excess returns are unrelated to the degree of integration
between a company’s home stock market and the US stock market and argues that the value
effects are mostly due to an improvement in the company’s ability to take advantage of
growth opportunities.
Foerster and Karolyi (1999) examine stock price behaviour around the first-time US
listings of 153 companies from Canada, Europe and the Asia-Pacific Basin region from 1976
to 1992. Foerster and Karolyi (1999) find a prelisting run-up in prices, defined as the average
daily abnormal returns for the (-49, -10) days event period, are 0.095 % (t=2.28). Around the
day of listing the average daily abnormal returns are as high as 0.35 %. Overall, cross-listing
companies earn CARs of 19% during the year before listing, and an additional 1.20% during
the listing week, however, they incur a loss of 14 percent during the year following the
listing. In general, the findings of Foerster and Karolyi (1999) are consistent with the
liquidity and investor recognition theories on the effects of cross-listings on shareholders’
wealth. A more recent study by Bris et al (2007) uses a relatively small sample of 20 non-US
companies with dual-class shares cross-listed in the US and reports positive and significant
annualized average daily abnormal return of 1.32% for the domestic share class and 0.62%
for the US-listed share class during the 50 day period prior to the cross-listing event. The
findings of Bris et al (2007) mainly support market segmentation theory.
A number of studies examine listings in the US by Canadian companies. Canadian
companies list on the US exchanges directly as opposed to issuing ADRs. Moreover, the
Canadian and the US markets have been geographically, economically and culturally
integrated for some time. Despite this perceptible market integration, the studies of Doukas
and Switzer (2000) and Mittoo (2003) report that Canadian companies experience significant
positive price effects from a cross-listing in the US. Doukas and Switzer (2000) conduct a
joint test of changes in the degree of capital market integration through time and of changes
in risk premium for the sample of 79 Canadian stocks over the period 1985-1996. They find

41
significant positive announcement effects during the (-120;+60) day period around a US
listing announcement. Significant abnormal performance is observed mainly in the listing
announcement period and, particularly, during the 60 trading days prior to the listing
(31.06% on an annualized basis), whereas no significant effects on shareholders’ wealth are
found around the listing dates. Doukas and Switzer (2000) argue that their findings are
consistent with the view that an international listing increases the investor base of the firm
with beneficial effects on its cost of capital.
Mittoo (2003) investigates short- and long- run effects on shareholders’ wealth of
direct listings in the US of 56 Canadian companies over the period of 1976-1990 and of 108
companies over the period of 1991-1999. The short-run performance analysis for the 7-day (-
3,3) day event window around the listing date provides evidence of positive price effects,
with the price effects being smaller in the post-1990 period compared to the pre-1990 period.
The long-run performance analysis shows that cross-listed companies significantly under-
perform Canadian market indices, yielding negative cumulative abnormal returns of -10.53%
during the three years subsequent to a US listing. Mittoo (2003) provides evidence that the
determinants of the effects of a US listing including liquidity and industry factors, vary
cross-sectionally and over time.
Cross-listings outside of the US
Since the US market differs significantly from other international financial markets
by size, liquidity and regulatory environment, the implications from cross-listings in other
markets could differ significantly from cross-listings in the US. Nevertheless, only a few
studies look at cross-listings on exchanges outside of the US.
A number of earlier empirical studies investigated the consequences for
shareholders’ wealth of international cross-listings of US companies (Howe and Kelm, 1987;
Lee, 1991; Torabzadeh, Bertin and Zivney, 1992; Varela and Lee, 1993; Lau, Diltz and
Apilado, 1994). As trading volumes of US cross-listed stocks are generally concentrated in
the US, even after a cross-listing on a foreign exchange (Karolyi, 1998), it would be
unreasonable to anticipate significant effects of a cross-listing for US companies. In fact, the
empirical evidence on the subject shows that the price effects for US companies listing on
major non-US exchanges are negligible.

42
Serra (1999) was one of the first to compare the stock price impact of cross-listings
by non-US companies in the US and in the UK. The study examines the stock returns of 70
companies from 10 emerging markets and a control sample of 65 European companies from
mature markets, around cross-listings in the US (NYSE & NASDAQ) and London (SEAQ-I)
over the period 1991-1995. The study provides evidence that there are significant positive
abnormal returns before listing and a significant decline in returns over the first five weeks
following the listing. Overall, the evidence provided could be supportive of market
segmentation theory. This study reports that, for companies from emerging markets, listing
in the UK has the same effects on shareholders’ wealth as listing in the US. However, for
companies from mature markets, the positive impact on shareholders’ wealth is limited to
NYSE listings.
Bris et al (2009) investigate abnormal returns around cross-listings on the London
stock exchange. Using a sample of 273 stocks including both stocks listed on the LSE and
stocks admitted to trade on SEAQ, this study finds positive significant abnormal returns for
the period (-20, 20) days around the listing/trading date for the stock exchange listings but
not for the admissions to trade. Bris et al (2009) argue that the main source of value creation
around cross-listings is greater information disclosure.
Sarkissian and Schill (2009a) examine monthly stock returns during (-120 months;
+120 months) around foreign listings for more than 1500 listings placed in 25 host countries
based on the listing status as of December 1998. Firstly, they control for the order of the
firm’s foreign listing and report that the first listing is associated with unique effects on
shareholders’ wealth (at least transitory) while multiple listings yield diminishing gains.
Secondly, they report substantial stock price run-up prior to cross-listing and a profound
post-listing decline in returns in the long run, which is consistent with market timing theory.
Nevertheless, they find a permanent change in a firm’s cost of capital of about 2 percent that
can be predominantly explained by cross-product market trade and investor familiarity. In
other words, the long-term gains from a foreign listing are greater for firms listing on foreign
markets that are geographically, economically, and culturally closer to their home market.
The authors suggest that listing on American exchanges does not offer unique benefits to
foreign firms in terms of shareholders’ wealth.

43
Roosenboom and van Dijk (2009) compare the stock price reaction to cross-listing
on eight major stock exchanges controlling for country-specific and firm-level
characteristics. They report that abnormal returns around the day of the announcement of
cross-listing is highest for American listings, followed by British and then by European
listings while it is insignificant for Tokyo listings. This study identifies significant
determinants for the effect on shareholders’ wealth that results from cross-listing in the US
and in the UK but finds no significant determinants for either Europe or Japan.
Overall, there is empirical evidence that, on average, international cross-listings
create wealth for shareholders. However, the evidence on the sources of the net benefits of
cross-listings, particularly on markets outside of the US, is inconclusive.
2.3 Testable hypotheses
2.3.1 The effects of cross-listings on shareholders’ wealth
Based on the theoretical argument that a cross-listing improves stock accessibility to
foreign investors (Merton, 1987; Errunza and Miller, 2000) and stock liquidity (Foerster and
Karolyi, 1999), and in line with empirical evidence of Miller (1999), Serra (1999), and
Roosenboom and Van Dijk (2009), international cross-listings are expected to generate
positive abnormal returns.
H1: An international cross-listing is associated with positive abnormal stock returns.
2.3.2 Variation in the wealth effects by host and home markets
Theoretically, companies from ‘low quality’ markets should experience gains in
shareholders’ wealth upon cross-listing on a ‘higher quality’ market. The quality of the
market is characterised by, among other things, the level of capital market development,
investor base size, liquidity, investor protection, and information environment. The markets
of the US, UK and continental Europe differ from each other in terms of the market qualities
named above and these differences may potentially cause the diverse effects from cross-

44
listings experienced on these markets. The US and the UK are common-law countries that
focus on resolution of information asymmetry and have market-oriented financial systems
(Guenther and Young, 2000). In contrast, the countries of continental Europe are civil-law
countries with bank-oriented financial systems.
Doidge et al (2004) argue that the US market provides a high level of liquidity,
extremely good investor protection, and the highest disclosure standards compared to the rest
of the world. Coffee (2002) specifies that companies cross-listed in the US are committed to
respecting minority investor rights and to increasing disclosure as they subject themselves to
increased enforcement by the Securities and Exchange Commission, to a more demanding
litigation environment and to reconciliation of financial statements in accordance with US
GAAP. At the same time, European laws, according to Coffee (1999), do not even remotely
parallel the US securities laws in terms of their attempt to reduce agency costs and improve
the protection of minority shareholders.28 An important factor influencing cross-border
listings within the European Union is the mutual recognition principle incorporated in
European laws regarding cross-listings (Coffee, 1999), according to which EU companies do
not need to meet any additional legal and disclosure requirements to cross-list within the
European Union.29
Additionally, a cross-listing in the US results in increased attention from financial
analysts. Lang et al (2003a) and Bailey et al (2005) report a significant increase in analyst
coverage following a cross-listing in the US. As to the British market, Baker et al (2002)
report that companies that cross-list in London also experience growth in visibility, but the
increase in the level of analyst and press attention is significantly less compared to that
which occurs after a cross-listing on the NYSE.
Overall, there is evidence that the American, British and European markets differ by
the standards of corporate disclosure, investor protection, and information environment.
Empirically, several studies provide evidence on the effects of cross-listings on shareholders’
28 Investor protection regulation in Europe will be subject to significant change after the Market in Financial Instruments Directive becomes effective in 2004; the ultimate aim of MiFID is investor protection (Moloney, 2007). However, the full implementation of the MiFID is scheduled for November 2007, and the sample of European cross-listing events in this study after November 2007 is insufficient to evaluate impact of the MiFID on the market reaction to cross-listing in Europe. 29 The mutual recognition principle, enforced by EU’s Financial Services Action Plan of 1999, states: “what is sufficient for a company to list in one member country should be sufficient in any other member country” (Wojcik et al, 2005).

45
wealth on various host markets. Mostly, foreign companies that list in the US experience
significant positive abnormal returns (Foerster and Karolyi, 1999; Miller, 1999; Bris et al,
2007). However, evidence on the effect on shareholders’ wealth of foreign listings in British
and European stock markets is still limited. Serra (1999) and Salva (2003) document
significant abnormal returns around the announcement of cross-listings on the London stock
exchange, whereas Roosenboom and van Dijk (2009) find weaker abnormal returns on
several European stock exchanges.
H2.1: Cross-listing in American markets results in the highest positive abnormal
returns, followed by cross-listings in the British and other European markets
respectively.30
In addition to the impact of the host market on the effects of cross-listings on
shareholders’ wealth, the home capital market and country-level characteristics may also
determine the consequences of cross-listings. Two important country factors that might
affect the impact of international cross-listings on shareholders’ wealth are the origin of a
country’s legal system and the level of economic development. According to La Porta et al
(1998, 2002), the origin of a country’s legal system determines the level of investor
protection and, consequently, affects corporate valuation. The level of economic
development can be interpreted as a proxy for the level of capital market segmentation
(Bekaert and Harvey, 1995) and also as a proxy for the level of investor protection (La Porta
et al, 2000). Thus, cross-listing companies from emerging markets overcome more
significant investment barriers and less efficient investors’ protection in their home countries
than cross-listing companies from developed markets. Empirically, Miller (1999) and Serra
(1999) show that emerging market stocks experience higher positive abnormal returns
around cross-listing when compared to stocks from developed markets. Similarly, the
improvement in the level of investor protection after cross-listing would be more significant
for stocks from civil-law countries than for stocks from common-law countries that already
have high levels of investor protection (La Porta et al, 1998). In turn, more significant
improvements after cross-listing should result in higher gains for shareholders.
30 This hypothesis, however, could be challenged by proximity preference theory. According to proximity preference theory, more significant positive impact on shareholders’ wealth is expected from cross-listings in host markets that are closer geographically, i.e. within European markets in the context of this study. Which theory can best explain the patterns in the wealth effects of cross-listings is an empirical question. Forthcoming Hypothesis H4.5 addresses the Proximity preference argument.

46
H2.2: Cross-listings by firms based in emerging markets result in highest positive
abnormal returns, followed by cross-listings by firms based in civil-law and
common-law countries respectively.
2.3.3 Change in the effects of cross-listings on shareholders’ wealth over time
This debate on the net benefits of cross-listing in recent years was fuelled by
developments in financial markets such as the introduction of the Euro in Europe, the
adoption of the Sarbanes-Oxley Act of 2002 in the US and the introduction of AIM in 1996
in the UK.31 Arguably, the introduction of the Euro makes cross-listings on European stock
exchanges unnecessary due to increased integration of financial markets within the Euro
zone. SOX, on the other hand, imposes onerous costs of meeting the legal and disclosure
requirements of the US Securities and Exchange commission, making American listings less
desirable. Finally, the introduction of AIM on the London stock exchange facilitates easier
access to capital for small companies and offers new investment products to a group of
investors that do not place much value on regulation and disclosure (Jenkinson and
Ramadorai, 2007). Consequently, these capital market developments may affect
shareholders’ wealth gains from cross-listings and also firm’s motivations for cross-listing.
The level of global financial market integration and, particularly the level of
integration within European Union, has increased significantly over time, particularly after
the introduction of a single European currency in 1999 (Fratzscher, 2002; Baele et al, 2004b;
Baele, 2005). The introduction of the Euro has eliminated currency risk and encouraged
cross-border equity trading within the Euro zone, which has resulted in more integrated
European markets (Fratzscher, 2002; Galati and Tsatsaronis, 2003; Allen and Song, 2005;
Hardouvelis et al, 2006). On the other hand, the United Kingdom, an EU country that opted
not to join the European Monetary Union, is significantly less integrated with European
financial markets (Fratzscher, 2002; Fraser and Oyefeso, 2005; Hardouvelis et al, 2006).
31 There are other second tier markets in Europe that are similar to the Alternative Investment Market (AIM) of the London stock exchange. For example, Alternext market of Euronext. However, the sample does not include Alternext or any other second-tier market listings due to the unavailability of data. Such data are not available for the sample period because these markets were opened only in recent years. For example, Alternext was opened in May 2005. By the end of 2007 there were only a small number of foreign companies listed on Alternext, for which stock price data were not available in Datastream.

47
H3.1: The introduction of the Euro has reduced the benefits of cross-listing within
the Euro zone markets.
In contrast to the Main Market of the London stock exchange, AIM of the London
Stock Exchange, a successful new market for smaller companies, imposes significantly
reduced disclosure requirements and, thus, offers weaker protection for investors.32
H3.2: Abnormal returns around the announcement of cross-listings on the Main
Market are significantly higher compared to abnormal returns around the
announcement of cross-listing on AIM.
In the US, the level of investor protection increased after the adoption of SOX in
2002 as it imposed even stricter disclosure and listing requirements for US public companies
as well as for non-US companies that have chosen to list on a US exchange.
H3.3: Abnormal returns around a cross-listing on the US stock exchanges have
increased after the adoption of SOX in 2002.
2.3.4 The determinants of the effect of cross-listing on shareholders’ wealth
This section develops testable propositions for the potential determinants of the
effects of international cross-listings on shareholders’ wealth. The focus is on the following
theories: market segmentation, legal bonding, liquidity, investor recognition, proximity
preference, market timing, and business strategy.
Market segmentation: Stulz, (1981), Foerster and Karolyi, (1999) and Errunza and
Miller (2000) argue that improved stock investability after a cross-listing increases the
shareholder base and risk sharing and, thus, leads to lower cost of capital. Improvement in
stock investability due to cross-listing, in turn, is related to the level of market segmentation
between the home and host markets. In this respect, Baele et al (2004a, 2004b) and Baele
(2005) document an increasing level of global and particularly regional integration of
European financial markets over time.
32 While some larger companies choose to list on AIM to avoid the regulatory burden of the Main Market (Jenkinson and Ramadorai, 2007), AIM is still predominantly the market for smaller and younger companies that are not qualified to list on the Main Market.

48
H4.1: The higher the market segmentation between home and host markets the
higher the gains from the announcement of cross-listing.
Legal bonding: Cross-listings on an exchange with stricter legal and disclosure
standards “bond” the companies to respect minority shareholders’ rights (Coffee, 1999;
Stulz, 1999), resulting in lower cost of capital for cross-listing companies.33 Doidge (2004)
provides empirical support for bonding theory by showing that the voting premiums of cross-
listed companies with dual shares are 43% lower than those of non-cross-listed companies.
The level of legal protection and the quality of disclosure standards vary in the international
capital markets. As discussed above, US cross-listings are subject to increased enforcement
by the US Securities and Exchange Commission, a more demanding litigation environment
(Coffee, 2002). British cross-listings must comply with London Stock Exchange rules that
are arguably less strict compared to those of the NYSE (Baker et al, 2002). Finally,
European cross-listings are subject to European legal and disclosure requirements that are
considered the least strict (Coffee, 1999). In this respect, Roosenboom and van Dijk (2009)
find that the level of investor protection is a significant determinant of stock price reaction
for both the US and UK cross-listings but not for European cross-listings.
H4.2: The larger the difference in the level of investor protection between home and
host markets the higher the gains from the announcement of cross-listing.
Liquidity: A listing on a more liquid stock exchange enhances stock liquidity and,
accordingly, improves a stock’s market valuation (Amihud and Mendelson, 1986; Foerster
and Karolyi, 1998). In this vein, King and Segal (2004) link the enduring wealth gains of
shareholders’ in Canadian companies cross-listed in the US, to the changes in stock liquidity
after the cross-listing. In contrast, Roosenboom and van Dijk (2009) find no relationship
between market-level liquidity and market reaction to foreign listings in any of the host
markets examined. Empirical evidence suggests that liquidity in international capital markets
varies widely. Spreads in the US equity market are significantly lower than spreads in the
British equity market (Huang and Stoll, 2001) and other European markets (Venkataraman,
2001). Moreover, liquidity, approximated by transaction costs, is particularly poor in the
emerging markets of Central and Eastern Europe (Domowitz et al, 2001).
33 Legal bonding theory has been a subject to criticism by Siegel (2005) and Burns et al (2007). In particular, Siegel (2005) argues that the Securities and Exchange Commission does not effectively enforce the law against cross-listed foreign companies.

49
H4.3: The larger the difference in market liquidity between the host and home
markets the higher the gains from the announcement of cross-listing.
Investor recognition: According to Merton (1987), a stock’s market valuation is
positively related to the number of investors that are aware of the company. Cross-listing
facilitates easier access to a company’s information and enhances a company’s recognition
abroad, which results in an increased stock price for the cross-listing company (Chemmanur
and Fulghieri, 2006). The level of investor recognition and stock visibility is directly related
to the intensity of analyst coverage since, according to Baker et al (2002), analyst reports are
the main source of firm-specific information for investors. Empirical evidence suggests that
a cross-listing results in the increased attention from financial analysts for the US host
market (Lang et al, 2003a; Bailey et al, 2005) as well as for the UK host market although to a
lesser degree (Baker et al, 2002).
H4.4: The higher the difference in the intensity of analyst coverage between the host
and home markets the higher the gains from the announcement of cross-listing.
Proximity preference: Sarkissian and Schill (2004) show that geographic, economic,
cultural, and industrial proximities are the important determinants of the corporate decision
to cross-list. Furthermore, Sarkissian and Schill (2009a) report that a permanent decrease in
the cost of capital after cross-listing is largely explained by a higher level of investor
familiarity with the home market’s products and also by geographical proximity. Geographic
distance between the host and home markets is a distinctive characteristic of US, British and
European cross-listings by European companies. While continental European markets are
geographically concentrated, with less than 200 km between the capitals of some European
countries, the US market is more than 6,000 km away from the European markets. Thus,
geographic distance is a potential determinant of the effects on wealth around cross-listing
and is particularly relevant for European companies.
H4.5: The smaller the geographical distance between the host and home markets the
higher the gains from the announcement of cross-listing.
Market timing: Market timing theory suggests that corporate finance managers time
the company’s listing on a foreign exchange to take advantage of higher equity valuations in
the host market. Relatively higher equity valuations in the host market may represent

50
differences in the level of economic development between the host and home countries.
Indeed, Rajan and Zingales (2003) provide evidence that all countries exhibit uneven
economic development over time, while Sarkissian and Shill (2009b) establish empirically
the link between the frequency of international cross-listings and the level of economic and
financial outperformance of the host country relative to the home country.
H4.6a: The larger the difference in the level of economic performance between the
home and host markets the higher the gains from the announcement of cross-listing.
Furthermore, it is likely that both host and home markets exhibit high equity
valuations over certain periods of time. Thus, international stock markets were particularly
‘hot’ in the late 1990s, a period known as the dot-com bubble (Ljungqvist and Wilhelm,
2003; Ofek and Richardson, 2003; Derrien, 2005). I examine the incremental impact of
cross-listings on shareholders’ wealth during the dot-com bubble as an additional test of
market timing theory.
H4.6b: Cross-listing events during the bullish stock market period of the dot-com
bubble of the late 1990s are associated with particularly high abnormal returns.
Business strategy: If a cross-listing decision is related to a global corporate strategy
then the impact of cross-listings on shareholders’ wealth should be a function of company-
specific characteristics. One of the primary company characteristics, industrial affiliation, is
named as being among the main motivations to cross-list (Fanto and Karmel, 1997; Bancel
and Mittoo, 2001). Failure to follow cross-listed industry peers may put a company at a
competitive disadvantage (Pagano et al, 2001; Pagano et al, 2002; Mittoo, 2003). In this
vein, the economic press argue that technology companies potentially obtain higher market
valuations by listing on the NASDAQ. A cross-listing, however, may entail more significant
costs for some companies than for others. Indeed, Mittoo (2003) finds significant industry
variation in the effects on wealth of US cross-listings for Canadian companies.
H4.7a: There is industry variation in abnormal returns around the announcement of
cross-listing.
Other company characteristics that are likely to affect the wealth of shareholders
after a cross-listing are growth opportunities and the need for external financing. Doidge et al
(2004) find a significant positive association between companies’ valuation, growth

51
opportunities and their cross-listing status. Growth opportunities should be particularly
pronounced if cross-listing companies raise new equity capital. In this respect, Charitou and
Louca (2009) provide ex post evidence that capital-raising cross-listed companies
outperform both the control sample of non-cross-listed companies and the sample of cross-
listed companies in the pre-cross-listed period.
H4.7b: Abnormal returns around the announcement of cross-listing are positively
related to the cross-listing company’ growth.
H4.7c: Abnormal returns around the announcement of cross-listing are higher for
cross-listings that raise new equity capital.
Table 2.1 summarizes the potential determinants of the effects of cross-listings and
their expected impact of shareholders’ wealth.
2.3.5 Control variables
Company size is positively related to stock liquidity and visibility to investors.34 As
such, a smaller company that makes a commitment to cross-list experiences larger
incremental improvement in the level of liquidity and the quality of the information
environment compared to a larger cross-listing company. Similarly, the first foreign listing
yields more significant incremental change in stock’s accessibility to foreign investors
compared to consequent foreign listings, which is empirically confirmed by Sarkissian and
Shill (2009a). Consequently, company size and listing order are expected to be inversely
related to the impact of cross-listings on shareholders’ wealth. Lastly, often US OTC-
traded35 foreign stocks that are already accessible to US investors choose to upgrade to a US
stock exchange listing in order to improve stock liquidity, visibility to investors, prestige,
and the level of investor protection and, ultimately, the stock’s market valuation. However, a
34 Company size is a distinct feature of cross-listed companies (Pagano et al, 2002). Taking into account the fixed costs associated with listing on a foreign exchange and the minimum issue size requirement by stock exchanges, it is not surprising that mainly large companies choose to list on foreign exchanges. For example, a listing on the main market of LSE costs at least £500,000 in professional fees and requires the minimum ADRs issue size of £700,000 (source:
www.londonstockexchange.com). 35 Level 1 ADRs or over-the-counter (OTC) listing is the easiest and fastest way to gain entry to the US capital market. The main difference between OTC and exchange listings is the level of disclosure: an OTC listing requires neither full SEC registration and disclosure nor US GAAP reporting.

52
US exchange listing involves substantial additional costs compared to an OTC listing.
Accordingly, an upgrade from a US OTC to a US stock exchange listing should result in a
positive change in stock’s market valuation, however, to a lesser degree than a US listing
without prior OTC.
2.4 Methodology
This section first discusses the measurement of two categories of variables: (i) the
effect on shareholders’ wealth from cross-listings, as the dependent variable and (ii) the
determinants of the effects of cross-listing on shareholders’ wealth, as the explanatory
variables. The variable description is followed by an overview of the methods of univariate
analysis and multivariate regression analysis used to evaluate the effect of international
cross-listings on shareholders’ wealth and its determinants.
2.4.1 The effects of cross-listings on shareholders’ wealth
The wealth effects around the announcement of cross-listing
The effects of international cross-listings on shareholders’ wealth are measured by
cumulative abnormal returns over the 21-day (-10, 10) period around the announcement of
the cross-listing.36 As a robustness test, cumulative abnormal returns are additionally
estimated for alternative event windows: (-5, 5) days, (-3, 3) days and (-1, 1) days around the
announcement of cross-listing. Abnormal returns are defined as market-adjusted returns
estimated using a modified market model37: ARi,t = Ri,t – Rm,t (1.1)
36 Under the assumption of market efficiency, stock prices incorporate all information available on the market and stock price adjustment to cross-listing accrues when the news about a company’s intention to cross-list is released to the market. Thus, the wealth effects of cross-listings are expected to be concentrated around the cross-listing announcement. 37 Market-adjusted returns are used in order to avoid loss of observations due to unavailability of pre-cross-listing returns that would be required in order to use conventional methods of estimation of abnormal returns (Brown and Warner, 1985). Brown and Warner (1980), however, show that for short-run analysis, adjustment for the stock’s systematic risk does not significantly affect the estimated excess returns. Also, Draper and Paudyal (2006) show that the abnormal return estimates for event window are not sensitive to the choice of return benchmark.

53
where ARi,t are abnormal returns of company i on day t; Ri,t is return of company i on day t;
Rm,t is market return on day t. Market returns are the corresponding Datastream Total Market
index local currency returns for developed countries and Poland, and the S&P/IFC market
index local currency returns for the rest of the emerging countries in the sample. The
cumulative abnormal returns (CARs) are the sum of abnormal stock returns over the event
window: CARi = ∑t ARi,t, where t={-10, +10}. The even window (-10, 10) days around the
announcement of cross-listing is chosen for analysis to capture potential time lag in the
announcement of cross-listing in the home country and internationally. Analysis of daily
abnormal returns shows that stock price adjustment begins more than one week before the
announcement of cross-listing and continues after the announcement for more than one week
(Figure 2.0).
Robustness test: The wealth effects around the cross-listing event date
While most of the price reaction is expected around the announcement of the event,
previous research suggests that there is stock price- sensitive information both around the
announcement as well as around the cross-listing event itself (Foerster and Karolyi, 1999).
As a robustness test, I additionally evaluate excess returns during a three-month (-2,0) event
window around the cross-listing date.38 To overcome the limitations of the traditional event-
study methodology39, an alternative method of estimating abnormal returns, the Jensen’s
alpha approach (as in Draper and Paudyal, 2006), is used. The advantage of this method is
that it does not require return data availability for a long estimation period prior to the event.
Additionally, this approach allows estimation of excess returns with a multifactor asset
pricing model accounting for size (SMB) and book-to-market (HML) risk factors (Fama and
38 (-2,0) months event window around the cross-listing date is motivated by the fact that the median distance between the announcement date and the cross-listing date in the sample is 33 days. Thus, (-2,0) months event window around the cross-listing, on average, covers the cross-listing announcement date and the listing event date. 39 Market-adjusted abnormal returns for longer event windows such the event window (-2,0) months around cross-listing are not reliable since this approach disregards risk factors. The conventional event-study methodology (Brown and Warner, 1985) with a market model as a benchmark also has a number of limitations. First, the market model fails to control for additional market risk factors such as size and book to market (Fama and French, 1996). Second, this approach requires estimation of model parameters using return data over a rather long (approximately five years based on monthly data frequency for stable and reliable parameter estimates) estimation period, which must be independent of the event. In case of cross-listing, companies often choose to list on a foreign exchange within a few years after listing on a home exchange. Consequently, in many cases home market stock price data is available for a limited time period prior to cross-listing and using a conventional event-study approach would cause the sample to be reduced by more than half.

54
French, 1996). For each event window, Jensen’s alpha αi is estimated with the following
cross-sectional regression: R i - R f = α i+β1 i(Rm - R f)+β 2 iSMB+b3 iHML+ε i (1.2)
where α i is Jensen’s alpha for the event window; (R i - R f) is cumulative risk premium for
company i for the event window; (Rm - R f) is cumulative market risk premium for the event
window; SMB is cumulative difference in value-weighted returns between small market cap
stocks and large market cap stocks for the event window; HML is cumulative difference in
value-weighted returns between value (high book-to-market ratio) stocks and growth (low
book-to-market ratio) stocks for the event window. The risk factors are calculated for all
markets in the sample that contribute at least ten cross-listing events to the sample. SMB is
the difference between monthly value-weighted (based on the market value at the end of
December of the previous year) average returns of two portfolios ranked by size: bottom
50% ‘small’ and top 50% ‘big’. HML is the difference in value-weighted returns between
MSCI Value (high book-to-market ratio stocks) and Growth (low book-to-market ratio
stocks) country indices (in local currency). Jensen’s alpha indicates whether a cross-listing
company experienced statistically significant positive or negative abnormal returns around
the cross-listing event. In order to limit the impact of outliers, estimations of Jensen’s alpha
are done using trimmed (~5% of extreme observations on each end) sample and subsamples.
2.4.2 Univariate analysis of abnormal returns around cross-listing
Abnormal returns around the announcement of cross-listing and around the cross-
listing event are estimated for a number of subsamples motivated by the research questions:
(1) by host markets: the US, UK and Europe, and by home markets classified based on
the home country’s legal origin and the level of development, the UK and Ireland,
continental Europe (excluding CEE) countries and countries of Central and Eastern
Europe (CEE).
(2) over time: (2.1) European cross-listings: before the introduction of the Euro vs.
within the Euro zone40, (2.2) British cross-listings: Main Market vs. AIM, (2.3)
American cross-listings: prior and post Sarbanes-Oxley Act of 2002.
40 The members of the Euro zone are: Austria, Belgium, Finland, France, Germany, Greece, Ireland, Italy, Luxembourg, Netherlands, Portugal, Slovenia, and Spain. The Euro was introduced from 1 Jan

55
(3) by company characteristics: (3.1) company size and (3.2) industry affiliation.
(4) by listing characteristics: (4.1) by listing order, (4.2) capital raising activity, and
(4.3) American cross-listings: upgrade from OTC vs. stock exchange listings without
prior OTC.
Table 2.2 provides the definition and data sources of the variables that proxy
company size, industry affiliation, capital raising activity, order of foreign listing and
presence of OTC trading prior to the US exchange listing. The difference in mean CARs for
different subsamples is evaluated using t-statistics of the two-sample t-test with unequal
variances. The inequality of estimated Jensen alphas for different subsamples is evaluated
using a Wald test.
2.4.3 The determinants of the effects of cross-listings on shareholders’ wealth
Explanatory variables that proxy for each hypothesis include three main groups:
country, company and listing related characteristics. Each of these groups potentially affects
the net benefits of an international cross-listing. Sarkissian and Shill (2004) and Doidge et al
(2004) show the importance of the country-level factors, while Pagano et al (2002) show the
significance of company characteristics for the implications of a cross-listing. Additionally, I
use important capital market developments to capture the time varying cross-listing effects
on shareholders’ wealth. Table 2.2 contains definitions and data sources for all the variables.
Consistent with Sarkissian and Schill (2004) and Roosenboom and van Dijk (2009),
the level of market segmentation between the home and host markets is measured using the
correlation of the host and home market returns. In addition, the increased level of market
integration in Europe after the introduction of the Euro is captured by a dummy variable that
represents cross-listings within the Euro zone.
Evidence of legal bonding can be assessed by the improvement in accounting
standards and the level of investor protection. First, I use country-level accounting standards
index from La Porta et al (1998). Second, I calculate legal index as the product of the anti-
director rights index from Djankov et al (2008) multiplied by the rule-of-law index from
1999 in all Eurozone countries except for Greece, where it was introduced from 1 Jan 2001, and Slovenia, where it was introduced from 1 January 2007.

56
Kaufmann et al (2005). Durnev and Kim (2005) argue that the legal index is a superior
measure of the level of investor protection compared to the anti-director rights index, as it
reflects both de jure, which by itself is not sufficient, and de facto aspects of investor
protection.
Market-level liquidity is measured by the market turnover ratio, i.e. the ratio of the
value of the Datastream Total Market index’s trading volume to the index’s market
capitalization. Investor recognition is measured by the intensity of country-level analyst
coverage, estimated as the average number of analysts per company for each country-year in
the sample. Geographic proximity is quantified by the distance in kilometres between the
capital cities of the host and home markets as in Sarkissian and Shill (2004). Similar to
Sarkissian and Shill (2009b), marking timing is tested by whether the impact of a cross-
listing on shareholders’ wealth is related to the difference in the level of economic
performance between the host and home countries. Economic performance is measured by
the 3-year moving average of the GDP per capita using data obtained from the United
Nations statistics division web-site. Additionally, I evaluate whether a cross-listing during
the dot-com bubble had any valuation premium due to the high level of investor sentiment
(Baker and Wurgler, 2007), as predicted by the market timing theory. In line with Ljungqvist
and Wilhelm (2003) and Ofek and Richardson (2003), a ‘bubble’ dummy variable is used for
cross-listings that took place in 1999 and at the beginning of 2000. To test business strategy
theory, several firm-level variables are obtained. First, a company’s industry is defined based
on FTSE/DJ industry firm-level classification obtained from Datastream. In order to reduce
the number of industry-based sub-groups with a small number of observations, companies
from Basic materials, Consumer goods, or Industrial industry groups are combined into one
group ‘Manufacturers’, and Oil & Gas and Utilities are also combined into one group
‘Natural resources’. Second, company growth is measured by the three-year sales growth
preceding the cross-listing. Lastly, motivated by the findings of Foerster and Karolyi (1999)
and Bancel et al (2007), data on capital raising activity on the foreign market following
cross-listing are obtained from several sources including BNY and Citibank ADRs databases
and Thomson One Banker Equity Deals database. This data are used to evaluate the impact
of the issue of new equity on the foreign market on shareholders’ wealth. Finally, I use three
control variables: 1) company size, which is measured by the company market capitalization,
2) listing order, which is represented by the first foreign listing dummy variable, and 3)

57
presence of an OTC listing prior to a US stock exchange listing, which is represented by
prior-OTC dummy variable.
2.4.4 Multivariate regression analysis
Since the sample includes cross-listing events on various foreign host markets, it is
essential to control for the difference in host market characteristics. European, British and
American capital markets not only differ significantly by the level of liquidity, economic
development, legal and information environment, but also attract for listing different types of
foreign companies (Pagano et al, 2002). In particular, host market-driven variation in the size
of cross-listing companies could be explained by the significant difference in listing
requirements and, accordingly, costs of foreign listing on European, British and American
stock exchanges. Also, geographic distance from home European countries to the US, UK
and continental Europe is profoundly different depending on the destination market. In order
to account for the difference in host market characteristics and for the difference of
characteristics of companies cross-listing in Europe, the US and UK, host-market-adjusted
variables are estimated as the residuals from the following regression:
Varj = Σn=EU,UK,US βn Hostn + εj (1.3)
where Varj are explanatory variables, home market characteristics (market correlation,
accounting standards, investor protection, market liquidity, analyst coverage intensity,
geographic distance, and GDP per capita) and cross-listing company characteristics
(company size and growth); Hostn is host market dummy variable. The error term εj is the
host-market-adjusted variable, i.e. the variation that is not captured by the host market
variable.
The above procedure removes host-market-specific variation among the explanatory
variables and, thus, reduces to some degree correlations among the variables. Nevertheless, it
is important to acknowledge that multicollinearity is still potentially a problem in
multivariate analysis due to significant correlations among country-level variables such as
the level of liquidity, investor protection and economic development (more economically
developed countries are likely to have more liquidity financial markets and better investor

58
protection). The variance inflation factor (VIF) criterion41 is used to verify that the level of
correlations among the variables is sufficiently low for multivariate analysis.
The following regression is estimated to evaluate the explanatory power of the
determinants of the effects of cross-listing on shareholders’ wealth and their variation across
host markets:
CARi = Σn=EU,UK,US βn Hostn + βj,Xi,j + βj,n Hostn Xi,j + εi (1.4)
where Xi,j are the explanatory variables. Explanatory variable is host-market-adjusted, i.e. it
is the residual from regression (1.3), for the following variables: market correlation,
accounting standards, investor protection, market liquidity, analyst coverage, geographic
distance, GDP per capita, company size and sales growth.
Impact of the significant capital market developments
In order to evaluate the impact of the important changes in the listing environment
on the effects of cross-listings on shareholders’ wealth and on the explanatory power of the
determinants of these effects, I estimate regressions that include interaction variables of the
explanatory variables with a time-specific dummy variable, specifically, the Euro for
European cross-listings, and SOX for American cross-listings. Such analysis on the impact
of AIM would be statistically unreliable due to the limited number of AIM cross-listing
events in the sample.
Impact of the introduction of the Euro:
CARi=Σn=EU,UK,US βnHostn+ βj Xi,j +β1j Xi,jDbeforeeuro+β2j Xi,jDeurozone + εi (1.5)
Impact of the adoption of SOX:
CARi=Σn=EU,UK,US βnHostn+ βj Xi,j +β1j Xi,jDbeforesox+β2j Xi,jDsox + εi (1.6)
where Xi,j are the explanatory variables; Dbeforeeuro is dummy variable that equals one if cross-
listing takes place in Europe before the introduction of the Euro; Deuro is dummy variable that
equals one if cross-listing takes place within the Euro zone after the introduction of the Euro;
DbeforeSOX is dummy variable that equals one if cross-listing takes place in the US before the
adoption of SOX; DafterSOX is dummy variable that equals one if cross-listing takes place in
41 VIF quantifies the severity of the multicollinearity in OLS regression analysis and provides an index that measures how much the variance of the parameter estimates is inflated due to multicollinearity. VIF index of 10 or below indicates that multicollinearity does not significantly affect the estimation results (Wooldridge, 2009).

59
the US after the adoption of SOX. Explanatory variable is host-market-adjusted, i.e. it is the
residual from regression (1.3), for the following variables: market correlation, accounting
standards, investor protection, market liquidity, analyst coverage, geographic distance, GDP
per capita, company size and sales growth.
Finally, variance inflation factors (VIF) are estimated for each coefficient estimate in
the regressions (1.4), (1.5) and (1.6) in order to check whether multicollinearity affects the
variables estimates and their significance.41
2.5 The sample
The sample consists of American, British and European cross-listings of European
companies during the period from 1982 to 2007. The initial dataset includes companies from
all European markets available in Datastream that have their stock listed on one or more
stock exchanges outside of their home market. This dataset is cross-checked and
supplemented by cross-listing data from major stock exchange web-sites that attract listings
of European companies: NYSE, NASDAQ, AMEX, LSE (including Main Market and AIM),
Euronext (including Paris, Amsterdam, Brussels, and Lisbon stock exchanges), the Frankfurt
stock exchange, the Irish stock exchange, the Swiss stock exchange, Borsa Italiana, and the
Luxembourg stock exchange. Data on ADRs comes from the Bank of New York and
Citibank ADR databases. The sample is also supplemented with information on foreign
listings from Sarkissian and Shill (2004, 2009b) and the Factiva news database. Based on
this sample, I searched for the cross-listing announcements in the Factiva news database.42
Cross-listing events without cross-listing announcements are used only for a robustness test
of the excess returns around the cross-listing event.43 Preference stock listings are excluded
42 The availability of the announcement date in the earlier years of the 1980s is limited due to data availability in the Factiva news database. For example, one of the main sources of announcement information, the Reuters Financial Services, is available only from 1987. 43 Since I examine excess returns around two events: the cross-listing announcement and the cross-listing event itself (robustness test), effectively there are two samples: (1) the sample of cross-listing announcement events and (2) the sample of cross-listing events. The sample of the cross-listing announcement events is smaller due to the unavailability of announcement dates for some of the cross-listing events.

60
from the analysis. Also, to make the results comparable between US and European listings,
OTC and Portal listings are excluded, i.e. the sample consists of stock exchange listings
only. Finally, I exclude direct IPOs in a foreign country and companies without return data
10 days before and 10 days after the announcement date available in Datastream.
The final sample consists of 254 cross-listing announcements by 210 companies44
that took place on three US exchanges (AMEX, NASDAQ, and NYSE), two markets of the
UK’s LSE (Main Market and AIM) and seventeen other European exchanges. Table 2.3
presents the frequency distribution of the cross-listing announcement events in the sample by
host and home country and by the period of time. The US host market cross-listings
constitute 40.9% of the sample, while the UK host market cross-listings 18.9%. Three largest
home markets presented are the UK (20.1% of the sample observations), Germany (14.6%)
and France (9.8%); the primary cross-listing destination market for these home markets is
the US. The UK host market is the main listing venue for companies from Ireland and
Russia.
44.9% of the cross-listing announcement events in the sample take place in the
1990s (Table 2.3). Additionally, Figure 2.1 presents the number of cross-listing
announcement events in the sample by host country and by the year of cross-listing
announcement. The number of cross-listing events within Europe had an upward trend in the
late 1980s and reached its peak in 1991; in the 1990s it stayed relatively low with the
exception of 1995 and 1999. In recent years the number of new cross-listing events within
Europe still remains significant. British cross-listings are distributed relatively evenly across
the years with the peak in 2005. Overall, there is evidence that the UK as a host market
became more popular in the 2000s, which might be related to the introduction and rapid
growth of AIM. The number of US cross-listing events is high in the second half of the
1990s peaking in 2000 and beginning to decline afterwards. Two possible explanations for
the sharp decline in the number of cross-listing companies in 2003 are 1) the dot-com bubble
burst (year 2000-2001) and 2) the change in regulatory environment (Sarbanes-Oxley Act of
2002).
44 The number of companies is less than the number of events because some companies have more than one foreign listing.

61
2.6 Empirical Results
2.6.1 The effects of cross-listings on shareholders’ wealth
Panel A of Table 2.5 and Table 2.6 report that, on average, European companies
experience a positive market reaction around the announcement of a cross-listing. In
particular, in the event window (-10, 10) days CARs are 1.8% (significant at 1%), with
52.0% of the announcement events resulting in positive CARs. The results for alternative
event windows are similar. In the event window (-5, 5) days CARs are 2.0% (significant at
1%), in the event window (-3, 3) days CARs are 1.5% (significant at 1%), and in the event
window (-1, 1) days CARs are 0.8% (significant at 5%). In similar lines, Panel B of Table
2.6 reports that excess returns during the (-2,0) months around the cross-listing event are
1.2% on average, and statistically significant at the 5% level. Generally, the magnitude of
abnormal returns around the announcement of a cross-listing detected in this study is lower
than reported in earlier studies that used samples of American cross-listing events that took
place before 2000.45 Abnormal returns are concentrated around the announcement and not
around the cross-listing date. This is implied by the lower magnitude and statistical
significance of excess returns during the three months around the cross-listing event
compared to those during the 21-day (-10,10) period around the announcement of the cross-
listing and the insignificant abnormal returns during the 21-day (-10,10) period around the
cross-listing event.46 This finding can be attributed to the efficiency of financial markets.
Overall, the results are in line with existing empirical evidence (Miller, 1999; Foerster and
Karolyi, 1999; Roosenboom and van Dijk, 2009) and are also consistent with the hypothesis
H1 that a cross-listing increases shareholders’ wealth.
2.6.2 Variation in the wealth effects by host and home markets
Host market characteristics. The effects of cross-listings on shareholders’ wealth for
various host markets are expected to vary due to the differences in host market
characteristics. Accordingly, before examining the variation in the effects on shareholders’
45 For example, Foerster and Karolyi (1999) report the average daily abnormal returns of 0.35% around the cross-listing day. Also, Miller (1999) reports a positive abnormal return of 2.63% on the announcement of a US stock exchange listing. 46 Findings on the abnormal returns during (-10,10) days around cross-listing event are not reported in this study but available upon request.

62
wealth around cross-listings by host markets, it is necessary to empirically compare market
characteristics of the host markets in the sample. Table 2.4 reports capital market size,
liquidity, the level of the information environment, disclosure, legal protection and economic
development for the three sets of host markets: Europe (excluding the UK), the UK and the
US. As expected, the US market stands out for its superior level of economic development,
stock market size, liquidity, and analyst coverage intensity. The UK follows the US in terms
of the level of economic development and by stock market size and liquidity. In contrast to
the argument of Doidge et al (2004) and Coffee (2002) that the US has the highest level of
disclosure and investor protection, it is found that, based on the accounting index from La
Porta et al, the anti-director rights index from Djankov et al (2008), and the rule-of-law index
from Kaufmann et al (2005), the UK has a higher level of disclosure and investor protection
compared to the US. European markets (excluding the UK), on average, are significantly
smaller, less liquid, with lower levels of economic development and lower quality of
accounting disclosure compared to both the UK and the US markets. The quality of the
information environment, proxied by analyst coverage intensity, however, is lowest in the
UK, while the high levels of analyst coverage intensity in France, Germany and the
Netherlands contributes to the higher quality of the average information environment in
Europe relative to the UK.
The wealth effects by host market. Table 2.6 reports excess returns around the
announcement of a cross-listing and around the cross-listing event for the subsamples by
host and home markets. Figure 2.0 plots the CARs for a period of 10 days before and after
the announcement of European, British and American cross-listings. Cross-listings within
Europe do not have an impact on stock price either around the announcement or around the
cross-listing event. British cross-listings have a positive impact on the stock price: CARs
during the 21 days around the announcement of cross-listing are 2.7%, significant at 5%.
American cross-listings result in positive and statistically significant excess returns around
the announcement of cross-listing (mean 3.3%) and during the three-month (-2,0) event
window around the cross-listing event (mean 1.8%). These findings are consistent with
hypothesis H2.1 that American cross-listings have the most profound positive impact on
stock price, followed by British cross-listings and then by other European cross-listings.
These results are in line with the findings of Roosenboom and van Dijk (2009). Also the
results on the effects of British cross-listings are consistent with findings of Serra (1999).

63
The wealth effects by home market. Table 2.6 reports that, in line with expectations
(Hypothesis H2.2) and existing empirical evidence of Miller (1999) and Serra (1999), the
magnitude of excess returns around the announcement of a cross-listing and around the
cross-listing event is the highest for stocks from the emerging markets of Central and Eastern
Europe. However, the excess returns of CEE stocks are not statistically significant, which
can be explained by the small sample size and large variation in excess returns within the
subsample. More specifically, cross-listings of companies from two major CEE markets,
Russia and Hungary, that together contribute around 80% of observations from emerging
markets, have different effects on shareholders’ wealth: it is positive for Russian companies
(8.1% around the announcement and 5.9% around the cross-listing event), and negative for
Hungarian companies (-11.0% around the announcement and -10.1% around the cross-listing
event). The difference in the effect of international cross-listings on shareholders’ wealth for
Russian and Hungarian companies can be explained by the difference in the level of
integration of the Russian and Hungarian capital markets with other European capital
markets.47 Furthermore, it is found that stocks from common-law countries, such as the UK
and Ireland experience larger CARs around cross-listings compared to stocks from civil-law
countries, i.e. continental Europe, which is contrary to the theoretical expectation
(Hypothesis H2.2).
2.6.3 Change in the effects of cross-listings on shareholders’ wealth over time
Table 2.7 reports excess returns around the announcement of a cross-listing and
around the cross-listing event for the subsamples by different periods of time.
European cross-listings. Cross-listings within Europe have no positive effects for
shareholders’ wealth either before or after the introduction of the Euro. The results are also
robust to different methods of estimating excess returns (Table 2.7). European cross-listings
within the Euro zone are associated with significant negative returns (median) with only
47 The Russian capital market is the most segmented CEE market with foreign equity ownership restrictions still in place. ADR/GDR program or a direct listing on a foreign exchange is a real opportunity for a Russian company to make its shares accessible to foreign investors. On the other hand, the Hungarian capital market is substantially more integrated with European capital markets, particularly, after Hungary joined European Union in 2004. Thus, the Budapest Stock Exchange is integrated with XETRA, the electronic trading platform of Deutsche Börse, allowing a significant number of Hungarian stocks to be traded on Deutsche Borse’s Open market.

64
45.5% of cross-listing stocks experiencing positive returns during the 21 days around the
announcement of cross-listing. The difference in cumulative abnormal returns around cross-
listings before and after the introduction of the Euro is statistically insignificant.
Figure 2.2 illustrates the changes in shareholders’ wealth that occur as a result of the
announcement of cross-listing by host market and over time. It plots 3-year moving-average
cumulative abnormal returns during a 21-day (-10, 10) period around the announcement of
cross-listing for each host market. Figure 2.2 shows that a cross-listing in Europe yields
positive abnormal returns before 1985 and during the period from 1993 to 1996. After 1995
CARs decline sharply, possibly, in anticipation of the introduction of the single European
currency, the Euro, and remain negative until 2001. In recent years, the effects on
shareholders’ wealth of European cross-listings vary significantly with a positive spike in
2002.
British cross-listings. Contrary to Hypothesis H3.2, CARs around the announcement
of cross-listing on the AIM are 8.4%, significant at 10%, while CARs around the
announcement of a cross-listing on the Main Market are insignificant (Table 2.7). Similarly,
monthly risk-adjusted excess returns around the Main Market listing are insignificant while
excess returns around a listing on the AIM are 10.3%, significant at 10%. Wald statistics
suggest that the difference in estimated excess returns for AIM and the Main Market listings
is significant at 10%. The difference in types of companies that list on the AIM and the Main
Market is striking: the average company value of an AIM company in the sample is £17
million, while the average market value of a Main Market company is £844 million. Thus,
potentially, the difference in excess returns between AIM and Main Market listings is driven
by company size. Furthermore, the direct costs of listing as well as indirect costs of
compliance with the listing requirements are significantly less for AIM listings compared to
Main Market listings. Accordingly, the finding that the AIM listings are associated with
higher positive abnormal returns can be interpreted as the higher-level regulation being
evaluated by investors in conjunction with the costs involved, in line with Jenkinson and
Ramadorai (2007) who document significant positive long-term excess stock returns of
British companies that switch their listing from the Main Market of the LSE to AIM. This is
because investors that are comfortable with lower levels of regulation and disclosure become
the dominant investors of the AIM-listed companies (Jenkinson and Ramadorai, 2007).

65
Figure 2.2 shows that British cross-listings yielded the highest impact on
shareholders’ wealth in the period from 1984 to 1987 when the so-called ‘Big Bang’ took
place in London (change in trading technology and, consequently, trading costs).48 The
periods of 1990-1992 and 1996-1998 are characterized by negative cross-listing
announcement CARs. Starting from 1999, positive abnormal returns are experienced by
companies cross-listing in London, which is possibly related to the introduction and rapid
growth of AIM in the second half of the 1990s.
American cross-listings. Analysis of the CARs before and after the introduction of
SOX reveals that US cross-listings before the adoption of SOX yield positive abnormal
returns of 3.4%, significant at 1% (Table 2.7). For the post-SOX subsample cross-listing
announcement CARs are positive but insignificant, with a negative median of -0.8%,
significant at the 5% level. This finding contradicts theoretical predictions (Hypothesis H3.3)
that SOX increases the benefits from US cross-listings due to enhanced investor protection.
Monthly analysis of excess returns for three months around the cross-listing fails to find a
difference in excess returns for subsamples of the cross-listing events that take place prior to
and post SOX adoption. While SOX improves minority investor protection, it also
significantly increases the costs for listing companies, which explain the negative
contribution of SOX to the impact of American cross-listings on shareholders’ wealth. In this
vein, Zhang (2007) and Litvak (2007) find significant negative abnormal returns around
events leading to the passage of SOX and around announcements indicating that the Act will
apply to cross-listed foreign companies. Also the findings are in line with the argument of
Zingales (2007) that for many foreign companies’ the disclosure and compliance costs after
the adoption of SOX outweigh the benefits from a cross-listing in the US. Due to significant
fixed costs associated with a US cross-listing after the adoption of SOX it is possible that the
negative effect of SOX is more profound for smaller companies. The forthcoming section
2.6.4 addresses the variation in abnormal returns by company size.
Figure 2.2 shows that 3-year average CARs around American cross-listing
announcements are positive for all periods except for the most recent period. Particularly
high CARs are in the period from the late 1980s to early 1990s and in the second half of the
1990s. The obvious observation from Figure 2.2 is the increased variation of CARs starting
48 The number of observations for this period of time is limited.

66
from year 2002 when, as discussed above, significant changes in the US regulatory
environment took place.
Overall, there is strong empirical support for the hypothesis that the effects on
wealth of cross-listings on various host market vary over time. The results highlight the
relevance of changes in the listing environment in explaining the wealth benefits of cross-
listings. The forthcoming section 2.6.5 on the change in the explanatory power of the
determinants of the effects of cross-listings over time continues the discussion on how the
introduction of the Euro in Europe and the adoption of SOX in the US have affected the
sources of wealth creation around cross-listings.
2.6.4 The determinants of the effects of cross-listings on shareholders’ wealth
This section discusses the findings on the potential determinants of the effects of
cross-listings on shareholders’ wealth that are derived from various theoretical explanations.
The expected impact of the determinants is summarised in Table 2.1, while the variables are
defined in Table 2.2. The section begins with the review of the summary statistics of the
variables that proxy for the potential determinants.
The summary statistics
Panel B of Table 2.5 reports summary statistics: number of observations, mean,
median, and percentage of positive observations for the explanatory and control variables.
As expected, the correlation between the host and home market returns, which is the measure
of market segmentation, is the highest for cross-listings within Europe (mean 0.66).
Companies from countries with weaker investor protection, less liquid capital markets and
lower level of economic development, on average, choose to cross-list in the UK while
companies from countries with stronger investor protection, more liquid capital markets,
better information environment and higher level of economic development, on average,
choose to cross-list in the US. Regarding geographic proximity between the host and home
markets, the US host market stands out for the average geographic distance between the
capitals of the host and home markets: 6,286 km vs. 632 km and 707 km are for European
and British cross-listings respectively. 8% of European cross-listings and 12% of American
cross-listings in the sample take place during the dot-com bubble.

67
Regarding business strategy, cross-listing companies, on average, experience
significant growth preceding the cross-listing: mean and median corporate sales growth for
the total sample is 68% and 27% respectively. Also, on average, 22% of cross-listings
involve raising new equity capital. The percentage of capital-raising cross-listings is the
highest for the US subsample (30%). Company size, measured by market capitalization,
varies widely from 3.75 million GBP to 85.4 billion GBP. As expected, larger companies
cross-list in the US (2.45 billion GBP median company size), while smaller companies
choose the UK (0.6 billion GBP median company size). Furthermore, 53% of the cross-
listing events in the sample are the first foreign listings (as opposed to consequent listings).
The percentage of the first foreign listings is the highest for the UK subsample (69%).
Lastly, Table 2.5 indicates that 28% of American listings have had OTC trading in the US
prior to the US stock exchange listing.
The determinants: A univariate analysis
Univariate analysis is performed for company-level and listing-specific variables. In
particular, it covers the following proxies for business strategy theory: company’s industry
affiliation and capital raising activity around cross-listing. Also it covers the following
control variables: company size, listing order and indicator of US OTC trading prior to a
stock exchange listing.
Variation in abnormal returns by industry
Table 2.8 reports CARs around cross-listing for sub-samples by industry
membership classified into six industry groups. The highest positive and statistically
significant excess returns around cross-listing are experienced by natural resources (oil &
gas and utilities) companies. This result is particularly strong for European and American
cross-listings: announcement mean returns of 4.2%, significant at 5%, and 7.8%, significant
at 5%, respectively. This result is in contrast to the existing evidence by Foerster and Karolyi
(1993) and Mittoo (2003) that Canadian resource stocks have a significantly lower price
impact around cross-listing in the US than Canadian non-resource stocks. The positive
impact of the announcement of cross-listing on shareholders’ wealth for manufacturing
companies (1.8%, significant at 5%) is driven mostly by cross-listings in the US (5.6%,
significant at 5%). Overall, it is empirically shown that there is a significant variation in the

68
effects of cross-listing on shareholders’ wealth subject to the company’s industrial affiliation
(Hypothesis H4.7a), which is in line with findings of Bancel et al (2007) and is supportive of
business strategy theory.
Variation in abnormal returns by capital raising activity
Table 2.9 reports that, overall, the effects of a cross-listing are positive and
statistically significant for both capital raising and non-capital raising cross-listings.
However, the effects of capital raising cross-listings on shareholders’ wealth are higher
(CARs 3.9% vs. 1.2%), consistent with Hypothesis 4.7c. However, in contrast to the
hypothesis that CARs are higher for cross-listings that raise new equity capital, it is found
that a US cross-listing yields positive significant CARs when it does not raise new equity
(around 3%, significant at least at 5%).
Variation in abnormal returns by company size
Table 2.10 reports that small companies experience the highest announcement CARs
and monthly risk-adjusted returns: 2.7%, significant at 5%, and 4.3%, significant at 1%,
respectively. As company size increases, excess returns decrease in magnitude and become
insignificant. Overall, consistent with the theoretical predictions, there is empirical evidence
of a negative relationship between the effects of cross-listings on shareholders’ wealth and
company size. This is also consistent with empirical evidence of Roosenboom and van Dijk
(2009) that company size is a negative and significantly determinant of abnormal returns
around international cross-listings. Additionally, Table 2.10 reports cumulative abnormal
returns around the cross-listing by size and by host market. Small companies that cross-list
within Europe gain positive, although, statistically insignificant abnormal returns. CARs
around British cross-listings depend on the destination market: large companies experience
positive and significant abnormal returns around the announcement of the Main Market
cross-listing (4.1%, significant at 5%) while small companies experience positive and
significant abnormal returns around the announcement of the AIM cross-listing (8.4%,
significant at 10%). Before the introduction of SOX in the US it held that smaller companies
had a greater boost in shareholders’ wealth following an American cross-listing. However,
after the introduction of SOX this relationship no longer holds. This finding is in line with
evidence reported by Doidge et al (2009) that company size becomes a significant positive
determinant of the cross-listing valuation premium after the adoption of SOX. This is in line

69
with the argument that SOX significantly reduces the benefits of cross-listing particularly for
smaller companies due to high fixed costs involved (Litvak, 2008).
Variation in abnormal returns by listing order
Table 2.9 reports that the first foreign listing has a stronger impact on shareholders’
wealth than consequent foreign listings: the announcement CARs for a first foreign listing is
2.9%, significant at 5%, while mean CARs for a consequent cross-listing are around zero.
The difference in mean CARs between first and consequent listings is 2.4%, significant at
10%. This result holds for American cross-listings: the announcement of a first foreign
listing in the US yields 5.3%, while consequent American cross-listings have no significant
impact on shareholders’ wealth. This result is consistent with theoretical expectations and
with existing empirical evidence (Sarkissian and Shill, 2009a).
Variation in abnormal returns of American cross-listings: prior OTC trading
The difference in cumulative abnormal returns for American cross-listings with and
without an OTC trading prior to the exchange listing, is statistically significant both for the
announcement CARs and for monthly risk-adjusted excess returns (Table 2.9). Stocks that
did not have an OTC listing prior to the stock exchange listing in the US experience positive
excess returns (4.4% CARs, significant at 1%, around the announcement of cross-listing and
2.6% excess returns during three months around the cross-listing), while stocks that upgrade
from an OTC to an exchange listing do not experience abnormal returns around the upgrade.
Overall, this finding challenges legal bonding theory because it shows that additional listing
and disclosure requirements from a stock exchange listing are not compensated via an
increase in shareholders’ wealth.
The determinants: A multivariate framework
This section discusses the results of the regression analysis of the potential
determinants of the effects of cross-listing on shareholders’ wealth. Table 2.11 reports
coefficient estimates of regressions of CARs for a 21-day (-10, 10) event window around the
announcement of a cross-listing on a number of potential determinants of the effects of
cross-listings on shareholders’ wealth. The choice of the set of determinants in each model
specification is motivated by the need to minimize the impact of multicollinearity on the
estimation results and by the objective of maximizing adjusted R-squared. In order to check

70
whether multicollinearity causes biases in the standard errors estimation, I estimate variance
inflation factors41 on the explanatory variables (Appendices 2.1 – 2.3). The following
variables: market correlation, accounting standards, investor protection, market liquidity,
analyst coverage, geographic distance, GDP per capita, company size and sales growth, are
substituted with the host-market-adjusted variables, i.e. the residuals from the regressions of
the variable on the host market dummy variables (model (1.3), section 2.4.4). Table 2.11
reports estimation results for the base model specification (models 1 and 2) and the extended
specifications, which include interaction variables of the explanatory variables with host
market dummy variables (models 3, 4 and 5). Also Table 2.11 reports R-squared and
adjusted R-squared for each of the regressions. R-squared are within the range from 0.1186
to 0.2073 while adjusted R-squared are within the range from 0.0309 to 0.1239. Such low R-
squared and adjusted R-squared measures are consistent with the literature. For example,
Roosenboom and van Dijk (2009) report R-squared of similar regression specifications of
abnormal returns around cross-listing on the potential determinants that are within the range
from 0.029 to 0.096 (Tables 4, 5 and 6 in Roosenboom and van Dijk, 2009), while this study
does not report adjusted R-squared.
Market segmentation. Table 2.11 reports that the market correlation between the host
and home market returns is negatively related to the effects of cross-listings on shareholders’
wealth. However, this relationship is not statistically significant for the total sample (model
1). For European cross-listings, market correlation is a positive and significant determinant
of CARs (model 3) while for American cross-listings it is negative and statistically
significant (model 5). The result for American cross-listings is consistent with the theoretical
argument related to international portfolio diversification benefits and market segmentation
theory (Hypothesis H4.1), while the result for European cross-listings is in line with
proximity preference theory rather than with market segmentation theory.
Legal bonding. The quality of legal environment of the home country, proxied by
accounting standards, is a positive and statistically significant determinant of CARs only for
American cross-listings (model 5).
Liquidity. According to liquidity theory of the effects of cross-listings on
shareholders’ wealth, improvement in market liquidity should be associated with positive

71
abnormal returns. However, empirical evidence does not support hypothesis H4.3 since the
market liquidity variable has insignificant coefficient (model 1).
Investor recognition. Also the evidence does not support Hypothesis H4.4, since the
analyst coverage variable has insignificant coefficients (models 1 and 2).
Proximity preference. Supportive of Hypothesis H4.5, geographic distance is a
negative and significant determinant of CARs around the announcement of cross-listing.
This relationship is particularly strong for British cross-listings (model 4). For European
cross-listings, however, the interaction variable of geographic distance and host Europe
variables has a positive and significant coefficient estimate that cancels out the positive
coefficient on the geographic distance variable (model 3).
Market timing. The coefficient estimate of GDP per capita variable is statistically
insignificant while the estimate of dot-com bubble is marginally positive for all sub-samples,
except for European cross listings (model 3). This evidence provides weak support for
market timing theory (hypotheses H4.6a and H4.6b).
Business strategy. Consistent with expectations (Hypothesis H4.7a) and the findings
of the univariate analysis (section 2.6.4), Table 2.11 reports that there is a significant
variation in CARs depending on the company’s industry. Companies from the natural
resources sector experience positive and statistically significant CARs around cross-listing in
all model specifications. Sales growth is positive but insignificant determinant of CARs
around the announcement of cross-listing. Table 2.11 also reports that capital raising activity
in the foreign market is only positively and statistically significantly associated with CARs
for British cross-listings (model 4), consistent with Hypothesis H4.7c.
Other determinants. Consistent with expectations and the findings of the univariate
analysis (section 2.6.4), Table 2.11 reports that smaller companies experience larger CARs
around the announcement of cross-listing. Contrary to expectations and the findings of the
univariate analysis, the first foreign listing variable is insignificant in the multivariate
regressions (model 1). Finally, the prior-OTC variable, which indicates that the stock had
been traded on the OTC market in the US prior to the exchange listing, has a negative
coefficient, in line with expectations, but statistically insignificant.
To summarize, analysis of the potential determinants of the effects of cross-listings
on shareholders’ wealth shows that for the total sample company’s affiliation with the

72
natural resources industry is positive and significant determinant, while geographic distance
and company size are negative and significant determinants. Therefore, there is empirical
support for the following theories on the effects of cross-listings: proximity preference and
business strategy.
Even after controlling for the potential determinants, host UK and host US dummy
variables have positive and statistically significant coefficient estimates that can be
interpreted as being in line with the signalling theory of the effects of cross-listings on
shareholders’ wealth (Fuerst, 1998). Multivariate analysis of the determinants by host market
shows that a correlation between the host and home market returns is a positive and
significant determinant of CARs around a European cross-listing. Capital raising activity
(positive) and geographic distance and company size (negative) are significant determinants
of CARs around British cross-listings. Thus, there is empirical support for proximity
preference and business strategy explanations for the effects of British cross-listings on
shareholders’ wealth. Finally, correlation between the host and home market returns is
significant negative determinants of CARs around American cross-listings. In other words,
the effects of American cross-listings on shareholders’ wealth can be explained by market
segmentation theory.
2.6.5 Change in the explanatory power of the determinants over time
Arguably, significant capital market developments, such as the introduction of the
Euro in the EU and the adoption of SOX in the US, have changed the net benefits of cross-
listing and have affected the determinants of the effects of cross-listing on shareholders’
wealth. In addition to the univariate analysis of the variation of excess returns over time
(section 2.6.4), the impact of Euro and SOX is evaluated using multivariate regression
analysis.49 The output is reported in Tables 2.12 and 2.13 accordingly.
49 Multivariate regression analysis on the impact of AIM would be statistically unreliable due to the limited number of AIM listing events in the sample.

73
Impact of the Euro on the determinants of the wealth effects of European cross-
listings
Table 2.12 reports that mostly the determinants of the effects of cross-listings on
shareholders’ wealth do not differ for European cross-listings that took place before and after
the introduction of the Euro. The only significant difference is that the improvement in
information environment, measured by analyst coverage, becomes a significant determinant
of higher CARs around the announcement of cross-listing within the Euro zone after the
introduction of the Euro.
Impact of SOX on the determinants of the wealth effects of American cross-listings
The significant determinants of CARs around the announcement of American cross-
listing before the introduction of SOX were company growth and company size with smaller
high-growth stocks experiencing larger abnormal returns around cross-listing (Table 2.13).
Also the quality of the home country’s accounting standards is a positive and significant
determinant of CARs before the adoption of SOX. The determinants of the effect of an
American cross-listing on shareholders’ wealth after the adoption of SOX are different.
Larger companies from countries with weaker accounting standards are more likely to
experience positive abnormal returns around the announcement of a cross-listing in the US
after the adoption of SOX. This is in line with findings of Litvak (2008) that SOX affects
smaller and riskier companies and companies from countries with strong investor protection
particularly negatively. Also, the improvement in the quality of information environment is a
positive and significant factor contributing to cross-listing CARs after the adoption of SOX.
Finally, a stock exchange listing in the US that takes place after the adoption of SOX
negatively affects stock price for companies that have had their stock traded in the US OTC
market prior to the exchange listing, as suggested by the negative and significant coefficient
estimate on the ‘prior US OTC’ dummy variable.
Overall, the empirical evidence suggests that the effects of international cross-
listings on shareholders’ wealth change over time subject to important capital market
developments that affect the listing and trading environment. More specifically, the effects
of cross-listing on shareholders’ wealth and the explanatory power of its determinants are

74
affected by the introduction of the Euro for European cross-listings, the introduction of
AIM50 for British cross-listings and the adoption of SOX for US cross- listings.
Multivariate analysis of the determinants: Summary of the findings
The empirical results indicate the following. Market segmentation theory gets
support only for American cross-listings. In line with the legal bonding theory, the
improvement in investor protection contributes to the positive abnormal returns around an
American cross-listing after the adoption of SOX. The degree of improvement in market
liquidity cannot explain the effects of a cross-listing on shareholders’ wealth, i.e. there is no
empirical support for liquidity theory for either of the host markets in the sample. In line
with investor recognition theory, an improvement in the information environment determines
the positive effects of cross-listing on shareholders’ wealth for European cross-listings
within the Euro zone and for American cross-listings after the adoption of SOX. Geographic
distance is a significant negative determinant of the effects of cross-listing on shareholders’
wealth, in line with the proximity preference theory, particularly, for British cross-listings.
The findings provide weak empirical support for market timing theory. In line with business
strategy theory, the results show that a significant variation in the abnormal returns around a
cross-listing can be explained by firm-specific factors: companies associated with natural
resources industry and companies that raise new equity capital in the UK experience higher
positive returns around the announcement of cross-listing. Finally, company size is found to
be a significant negative determinant of abnormal returns around cross-listing, particularly
for American cross-listings before the adoption of SOX. Noticeably, company size becomes
a positive determinant of the effects of cross-listing on shareholders’ wealth for American
cross-listings that take place after the adoption of SOX, which can be attributed to the
relatively higher costs of compliance with SOX for smaller companies. In the same way,
higher listing and compliance costs of the US exchange listing after the adoption of SOX can
explain the negative contribution to shareholders’ wealth that occurs as a result of an
upgrade from an OTC listing to an exchange listing in the US.
50 The impact of AIM is evaluated using unvariate analysis only due to an insufficient number of
observations for multivariate analysis. Accordingly, no conclusions on the impact of AIM on the
explanatory power of the determinants of the value effects of cross-listing can be drawn.

75
2.7 Conclusion
This chapter compares the effects on shareholders’ wealth of cross-listings by
European companies in the US, in the UK and within Europe and examines the determinants
of the cross-sectional variation of these effects. First, it is empirically shown that
international cross-listings have a positive and significant impact on shareholders’ wealth of
about 1.8% cumulative abnormal returns during the 21-day period around the announcement
of cross-listing. The positive excess returns around a cross-listing are robust to different
estimation methods. Second, it is shown that the effects of cross-listing on shareholders’
wealth vary significantly among destination markets. A cross-listing in the US market, which
is the most economically and financially developed, liquid and information-rich market in
the sample, results in the largest stock price increase: around 3.3% CARs during the 21 days
around the announcement of cross-listing. This is followed by a cross-listing in the UK,
which results in, on average, 2.7% CARs around the announcement. A cross-listing within
Europe, on the other hand, has an insignificant effect on the stock price.
Third, the study contributes to the literature by evaluating how the effects on
shareholders’ wealth around cross-listings change over time. Time-specific variation in the
effects on shareholders’ wealth is driven by the significant capital market developments in
Europe, the UK and the US. More specifically, the introduction of the Euro in the EU
potentially makes a cross-listing within the Euro zone redundant. The introduction of the
AIM to the London stock exchange in the UK offers new capital market opportunities for
smaller companies and for risk-seeking investors. The adoption of SOX in the US aims to
enhance investor protection but also dramatically increases the costs of cross-listing in the
US. Empirically, no evidence is found that the introduction of the Euro affects the impact on
shareholders’ wealth of a cross-listing within Europe. Contrary to expectations, it is found
that significant positive excess returns around British cross-listings in recent years are driven
by the excess returns around AIM listings, while the excess returns around Main Market
listings are insignificant. Lastly, contrary to the legal bonding argument, it is found that SOX
negatively affects shareholders’ wealth arising from cross-listings in the US.
Finally, this study evaluates potential determinants that arise from various theories
on the effects of international cross-listings on shareholders’ wealth. The results show that
the explanatory power of the determinants varies over time subject to important changes in

76
the cross-listing environment such as the adoption of SOX in the US. Empirical results are
supportive to some extend of the market segmentation, investor recognition and proximity
preference theories. Also strong empirical support is found for business strategy theory.
To conclude, while, on average, the cross-listing of a European company is a wealth-
enhancing corporate event for shareholders, there is large variation in market reaction to an
international cross-listing. A company that is deciding to list on a foreign exchange in order
to improve stock shareholders’ wealth must take into account market conditions, industry-
specific trends and more importantly, carefully weigh the listing costs, both direct and
indirect, against potential benefits.

77
Figure 2.0 Cumulative abnormal returns around European, British and American cross-listings
-0.02
-0.01
0
0.01
0.02
0.03
0.04
0.05
0.06
0.07
-10 -8 -6 -4 -2 0 2 4 6 8 10
CA
Rs
days relative to the announcement of cross-listing
US
Europe
UK 0.015
0.030

78
Figure 2.1 Number of cross-listing announcement events by host market and by year
This figure exhibits the number of cross-listing announcement events in the sample by host market and by year. Out of total 254 cross-listing announcement events in the sample 104 are announcement
of listing in the US, 48 in the UK and 102 in Europe.
Figure 2.2 CARs around the announcement of European, UK and American listings
This figure presents 3-year moving average cumulative abnormal returns 21-day (-10, 10) event window around announcement of cross-listing in the US, UK and Europe by year of cross-listing announcement. 3-year moving-average CARs are calculated as follows: mean CARs for each year are
cumulated for 3-year period (a year before, during and after cross-listing) and then divided by three.

79
Table 2.1 Potential determinants of the effects of cross-listing on shareholders’ wealth
Proxy variable Level of the
variable
Expected impact
on the stock price
Market segmentation
Correlation of the host and home market index returns country-specific -
Legal bonding
Accounting standards (home country) country-specific -
Investor protection (home country) country-specific -
Liquidity
Market liquidity (home country) country-specific -
Investor recognition
Analyst coverage (home country) country-specific -
Proximity preference
Geographic proximity (distance in km) country-specific -
Market timing
GDP per capita (home country) country-specific -
Dot-com bubble time-specific +
Business strategy
Sales growth company-specific +
Industry company-specific variation
Capital raised listing-specific +
Other determinants
Company size company-specific +
First foreign listing listing-specific +
US listings: prior OTC listing listing-specific -

80
Table 2.2 Explanatory and control variables
Proxy variable Variable
level
Definition Data source
Correlation of the
host and home
market index
returns
Country-
specific
Correlation of the home and host market returns is
calculated using monthly return of DS Total Market indices
over 3 years before the cross-listing event
DS Total Market indices return
data are from Datastream
Eurozone listings:
before and after
introduction of Euro
Time-
specific
dummy variable =1 if the listing takes place within Eurozone,
i.e. both host and home markets are within the Eurozone
after Euro introduction; =0 otherwise
Euro introduction dates are
from European Commission (1)
Accounting
standards
Country-
specific
Accounting standards index La Porta et al (1998)
Investor protection Country-
specific
Legal index calculated as the product of the anti-director
rights index and the rule-of-law index
Anti-director-rights index is from
Djankov et al (2007), the Rule-
of-law index is from Kaufmann
et al (2005)
UK listings: Main
Market listings vs.
AIM listings
Time-
specific
dummy variable =1 if the listing takes place in the UK on
AIM of LSE; =0 otherwise
London stock exchange
US listings: before
and after SOX
adoption
Time-
specific
SOX dummy variable =1 if the host market is the US and the
listing that takes place in year 2002 or after; =0 otherwise
dataset
Market liquidity Country-
specific
Market turnover ratio calculated as the value of all trades of
the DS Total Market index over the total market
capitalization of the index for the year preceding the cross-
listing. In regression analysis natural logarithm of market
turnover ratio is used.
Market capitalization and
turnover by value for DS Total
Market indices data are from
Datastream
Analyst coverage Country-
specific
Analyst coverage intensity is calculated as the number of 1-
year EPS analyst estimates per company for each country-
year proceeding cross-listing. In regression analysis
natural logarithm of analyst coverage is used.
Data on 1-year EPS analyst
forecasts are from I/B/E/S
database
Geographic
distance
Country-
specific
The distance in km between the capital cities of host and
home markets. In regression analysis natural logarithm of
distance is used.
Sarkissian and Schill (2004)
GDP per capita Country-
specific
GDP per capita is calculated as 3-year moving average of
GDP per capita in current international dollars for 3 years
proceeding cross-listing. In regression analysis natural
logarithm of GDP per capita is used.
GDP per capita in current
international dollars data are
from UN statistics
Dot-com bubble Time-
specific
Dummy variable that equals one if the listing takes place
during the period of time from Jan 1999 to Mar 2000 and
zero otherwise
dataset
Market segmentation
Legal bonding
Liquidity
Investor recognition
Proximity preference
Market timing

81
Table 2.2 continued
Sales growth Company-
specific
Company total sales (revenue) 3-year growth for the
preceding year
Company total sales data are
from DataStream
Industry Company-
specific
Industry dummy variables based on the FTSE/DJ Industry
Classification; Basic Materials, Consumer Goods, or
Industrials are further combined into industry group
‘Manufacturers’; Oil & Gas and Utilities are further combined
into industry group ‘Natural resources’
Stock level FTSE/DJ Industry
Classification data are from
DataStream
Capital raised Listing-
specific
Dummy variable that equals one if the cross-listing involves
issue of new equity and zero otherwise
Data on capital raising activity is
from BNY and Citibank ADRs
databases and Thomson One
Banker Equity Deals database
Company size Company-
specific
Log of the company’s market capitalization (market value of
common equity) in GB pounds prior to the cross-listing
Market capitalization and
exchange rates to GB pounds
data are from Datastream
First foreign listing Listing-
specific
Dummy variable that equals one if the listing is the first
foreign listing by the company and zero otherwise
dataset
For US listings -
prior OTC listing
Listing-
specific
Dummy variable that equals one if the listing takes place in
the US and the company has had US OTC trading prior to
the cross-listing and zero otherwise
dataset
Business strategy
Other determinants
Control variables
(1) http://ec.europa.eu/economy_finance/euro/index_en.htm

82
Table 2.3 The sample description
This table provides sample distribution by host and home countries and by host country and period of time. Home country is the country of domicile of the cross-listing company. Host country is the cross-
listing destination country. The total sample consists of 254 cross-listing announcement events.
AUSTRIA
BELGIUM
BULGARIA
DENMARK
FINLAND
FRANCE
GERMANY
IRELAND
ITALY
LUXEMBURG
NETHERLANDS
NORWAY
POLAND
PORTUGAL
SPAIN
SWEDEN
SWITZERLAND
UK
US
TOTAL
% of Total
Home country:
AUSTRIA 0 0 0 0 0 0 3 0 0 0 0 0 1 0 0 0 0 1 0 5 2.0
BELGIUM 0 0 0 0 0 2 0 0 0 3 3 0 0 0 0 0 0 1 1 10 3.9
CZECHREP 0 0 0 0 0 0 0 0 0 0 0 0 0 0 0 0 0 1 0 1 0.4
DENMARK 0 0 0 0 1 0 0 0 0 0 0 0 0 0 0 0 0 1 3 5 2.0
FINLAND 0 0 0 0 0 1 1 0 0 0 0 0 0 0 0 0 0 0 3 5 2.0
FRANCE 0 5 0 0 0 1 1 0 1 0 0 0 0 0 1 1 2 2 11 25 9.8
GERMANY 3 0 1 0 0 4 0 0 3 0 1 0 0 0 3 1 0 6 15 37 14.6
GREECE 0 0 0 0 0 0 0 0 0 0 0 0 0 0 0 0 0 0 3 3 1.2
HUNGARY 0 0 0 0 0 0 0 0 0 1 0 0 2 0 0 0 0 1 0 4 1.6
IRELAND 0 0 0 0 0 0 0 0 0 0 0 0 0 0 0 0 0 15 3 18 7.1
ITALY 0 0 0 0 0 1 2 0 0 0 0 0 0 0 0 0 0 0 4 7 2.8
LUXEMBURG 0 0 0 0 0 1 0 0 0 0 0 0 0 0 0 0 0 1 0 2 0.8
NETHERLANDS 0 3 0 0 0 2 4 0 0 0 0 0 0 0 0 0 3 2 7 21 8.3
NORWAY 0 0 0 0 0 0 0 0 0 0 0 0 0 0 0 2 0 2 6 10 3.9
POLAND 0 0 0 0 0 0 0 0 0 0 0 0 0 0 0 0 0 1 0 1 0.4
RUSSIA 1 0 0 0 0 0 1 0 0 0 0 0 0 0 0 0 0 8 2 12 4.7
SPAIN 0 0 0 0 0 0 0 0 1 0 0 0 0 2 0 0 0 1 2 6 2.4
SWEDEN 0 1 0 3 1 1 1 0 0 0 1 1 0 0 0 0 3 1 3 16 6.3
SWITZERLAND 0 0 0 0 0 0 2 0 1 0 0 0 0 0 0 0 0 3 8 14 5.5
TURKEY 0 0 0 0 0 0 0 0 0 0 0 0 0 0 0 0 0 1 0 1 0.4
UK 0 1 0 0 0 6 3 4 0 0 3 0 0 0 0 0 1 0 33 51 20.1
Period of Time:
1982-1989 0 3 0 1 1 7 7 0 0 0 1 1 0 0 0 3 3 7 13 47 18.5
1990-1999 3 7 0 2 1 5 9 2 5 3 6 0 0 0 4 1 4 17 45 114 44.9
2000-2007 1 0 1 0 0 7 2 2 1 1 1 0 3 2 0 0 2 24 46 93 36.6
TOTAL 4 10 1 3 2 19 18 4 6 4 8 1 3 2 4 4 9 48 104 254 100
% of Total 1.6 3.9 0.4 1.2 0.8 7.5 7.1 1.6 2.4 1.6 3.1 0.4 1.2 0.8 1.6 1.6 3.5 18.9 40.9 100
Host country
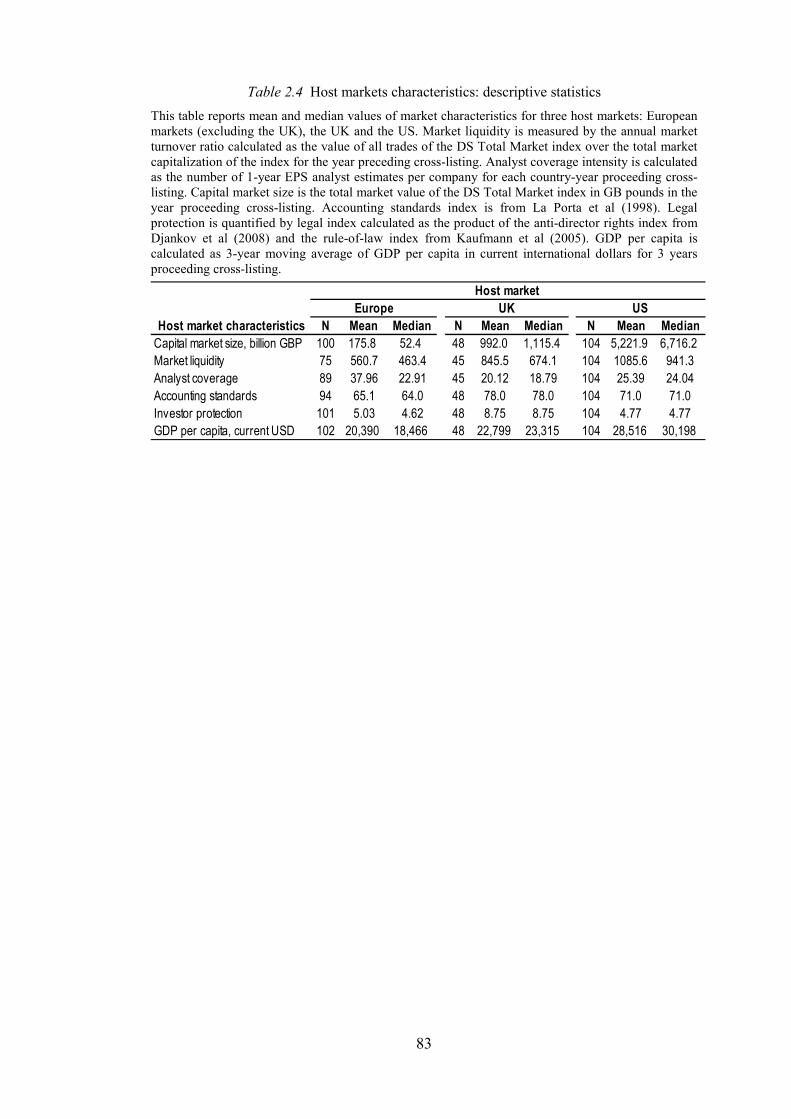
83
Table 2.4 Host markets characteristics: descriptive statistics
This table reports mean and median values of market characteristics for three host markets: European markets (excluding the UK), the UK and the US. Market liquidity is measured by the annual market turnover ratio calculated as the value of all trades of the DS Total Market index over the total market capitalization of the index for the year preceding cross-listing. Analyst coverage intensity is calculated as the number of 1-year EPS analyst estimates per company for each country-year proceeding cross-listing. Capital market size is the total market value of the DS Total Market index in GB pounds in the year proceeding cross-listing. Accounting standards index is from La Porta et al (1998). Legal protection is quantified by legal index calculated as the product of the anti-director rights index from Djankov et al (2008) and the rule-of-law index from Kaufmann et al (2005). GDP per capita is calculated as 3-year moving average of GDP per capita in current international dollars for 3 years proceeding cross-listing.
N Mean Median N Mean Median N Mean Median
Capital market size, billion GBP 100 175.8 52.4 48 992.0 1,115.4 104 5,221.9 6,716.2
Market liquidity 75 560.7 463.4 45 845.5 674.1 104 1085.6 941.3
Analyst coverage 89 37.96 22.91 45 20.12 18.79 104 25.39 24.04
Accounting standards 94 65.1 64.0 48 78.0 78.0 104 71.0 71.0
Investor protection 101 5.03 4.62 48 8.75 8.75 104 4.77 4.77
GDP per capita, current USD 102 20,390 18,466 48 22,799 23,315 104 28,516 30,198
Europe UK US
Host market
Host market characteristics

84
Table 2.5 Dependent and explanatory variables: descriptive statistics
The table reports descriptive statistics: number of observations, mean, median, and percentage of positive observations, of the dependent variable (Panel A) and also of the explanatory and control variables (panel B) for the total sample of 254 cross-listing announcement events and for subsamples by host market. Dependent variable is cumulative abnormal returns (CARs) estimated as a sum of market-adjusted abnormal returns during the event window. All explanatory and control variables are defined in Table 2.2. For
mean CARs ‘***’ indicates significant at 1%, ‘**’ indicates significant at 5% and ‘*’ indicates significant at 10%.
Variable N Mean Median Min Max St Dev >0,% N Mean Median % N Mean Median % N Mean Median %
Panel A. Dependent variable
CARs (-10,+10) days 254 0.018*** 0.008 -0.283 0.794 0.107 52.0 102 -0.002 -0.002 47.1 48 0.027** 0.015 58.3 104 0.033** 0.014 53.8
CARs (-5,+5) days 254 0.020*** 0.009 -0.267 0.451 0.097 53.8 102 0.000 -0.003 45.4 48 0.033*** 0.021 64.6 104 0.032*** 0.016 56.9
CARs (-3,+3) days 254 0.015*** 0.009 -0.245 0.416 0.081 55.5 102 -0.002 0.006 50.5 48 0.034** 0.017 60.4 104 0.022*** 0.012 57.8
CARs (-1,+1) days 254 0.008** 0.004 -0.251 0.256 0.052 52.6 102 0.000 0.002 53.6 48 0.014** 0.008 58.3 104 0.012** 0.000 49.0
Panel B. Explanatory and control variables
Market correlation 243 0.63 0.67 -0.05 0.94 0.18 94 0.66 0.69 48 0.61 0.63 101 0.61 0.65
Investor protection 254 5.7 6.2 -3.9 8.9 3.0 102 5.62 6.13 48 4.74 6.23 104 6.34 6.23
Accounting standards 234 69.7 69.0 51.0 83.0 7.7 96 69.15 68.00 36 68.75 71.50 102 70.48 69.00
Market liquidity 219 626.5 548.8 6.2 2099.5 486.0 90 665.4 548.4 34 352.9 284.2 95 687.7 565.1
Analyst coverage 239 33.7 20.9 1.8 268.1 36.0 96 31.36 20.96 44 32.12 12.30 99 36.61 21.68
Geographic distance, km 240 3,048 1,209 170 8,261 2,829 98 632 433 40 707 463 102 6286 6198
GDP per capita, dollars 254 20,469 20,363 5,891 54,975 7,213 102 19,749 17,698 48 18,597 15,169 104 22,040 23,301
Dot-com bubble 254 0.08 0.0 0.0 1.00 0.27 102 0.08 0.00 48 0.00 0.00 104 0.12 0.00
Sales growth 211 0.68 0.27 -11.90 19.94 2.11 84 0.97 0.27 37 0.15 0.29 90 0.62 0.31
Capital raised 254 0.22 0.00 0.00 1.00 0.41 102 0.12 0.00 48 0.25 0.00 104 0.30 0.00
Company size, million
GBP 254 5,484 1,702 3.75 85,366 10,630 102 3,893 1,515 48 3,079 589 104 8,154 2,448
First foreign listing 254 0.53 1.00 0.00 1.00 0.50 102 0.46 0.00 48 0.69 1.00 104 0.52 1.00
US listings: prior OTC 254 0.11 0.00 0.00 1.00 0.32 102 0.00 0.00 48 0.00 0.00 104 0.28 0.00
All host markets Europe UK US

85
Table 2.6 The wealth effects of cross-listing by host and home markets
Panel A of the table reports mean cumulative abnormal returns around the announcement of cross-listing for total sample of 254 cross-listing announcement events and for subsamples by host and home markets. Abnormal returns are market-adjusted returns with Datastream Total Market index returns in local currency used as a proxy for market returns. Cumulative abnormal returns are calculated as sum of abnormal returns over the 21-day (-10, 10) event window. Panel A also reports the number of observations for each subsample and probability of t-statistics (in parenthesis). Additionally Panel A reports the differences in mean CARs between host markets and its significance; probability of t-statistics for difference in means for paired subsamples is reported in parenthesis. Panel B of the table reports excess returns (alpha) for three-month (-2,0) event window around cross-listing for total sample of 497 cross-listing events, trimmed at 5%, and for subsamples by host and home markets. The excess returns (alpha) are estimated with 3-factor model: R i - R f = α i+β1 i (Rm - R f )+β 2 iSMB+b 3 i HML+ε i . Panel B also reports the number of observations for each subsample, t-statistics on the coefficient estimates (in parenthesis), and probability (Pr) of Wald test. ‘***’ indicates significant at 1%, ‘**’ indicates significant
at 5% and ‘*’ indicates significant at 10%.
mean N mean N mean N mean N
All home markets 0.018*** 254 -0.002 102 0.027** 48 0.033** 104 0.029** 0.035** 0.006
(0.01) (0.78) (0.04) (0.01) (0.05) (0.02) (0.75)
UK & Ireland 0.025* 69 0.014 18 0.022 15 0.033 36 0.008 0.019 0.011
(0.06) (0.54) (0.20) (0.15) (0.77) (0.54) (0.68)
Continental Europe 0.012* 166 -0.004 79 0.041* 21 0.023* 66 0.045** 0.027* -0.018
(ex CEE) (0.07) (0.61) (0.06) (0.07) (0.05) (0.07) (0.46)
CEE 0.036 19 -0.030 5 0.009 12 0.359 2 0.039 0.390 0.351
(0.48) (0.67) (0.77) (0.56) (0.60) (0.53) (0.57)
est. N est. N est. N est. N
All home markets 0.012** 447 0.050 201 0.022 75 0.018** 171 0.81 0.06* 0.01***
(2.39) (0.72) (1.33) (2.20)
UK & Ireland 0.035*** 143 0.037* 41 0.053 26 0.021 78 0.40 0.44 0.42
(3.25) (1.82) (1.42) (1.48)
Continental Europe 0.004 276 0.002 153 0.012 29 0.003 92 0.58 0.86 0.16
(ex CEE) (0.66) (0.22) (0.73) (0.81)
CEE 0.036 28 0.167 7 0.000 20 0.071 3 0.25 0.75 0.58
(0.68) (0.62) (0.0) -
Panel A. CARs around cross-listing announcement
Panel B. Excess returns around cross-listing event
Pr [Wald test statistics]
UK -
Europe
US -
Europe
US -UK
Difference between host
markets
Home market
Home market
All Europe UK US
US -UKUK -
Europe
US -
Europe
Host market
Host market
All Europe UK US

86
Table 2.7 The wealth effects of cross-listing over time
Panel A of the table reports mean cumulative abnormal returns around the announcement of cross-listing for total sample of 254 cross-listing announcement events and for subsamples by different periods of time. Abnormal returns are market-adjusted returns with Datastream Total Market index returns in local currency used as a proxy for market returns. Cumulative abnormal returns are calculated as sum of abnormal returns over the 21-day (-10, 10) event window. Panel A also reports the number of observations for each subsample and t-statistics (in parenthesis). Additionally Panel A reports median, minimum and maxim value, and percentage of positive observations. Panel B of the table reports excess returns (alpha) for three-month (-2,0) event window around cross-listing for total sample of 497 cross-listing events, trimmed at 5%, and for subsamples by different periods of time. The excess returns (alpha) are estimated with 3-factor model: R i - R f = α i +β1 i (Rm - R f)+β2 iSMB+b 3 iHML+ε i . Panel B also reports the number of observations for each subsample, t-statistics on the coefficient estimates (in parenthesis), and probability (Pr) of Wald test. ‘***’ indicates significant at 1%, ‘**’ indicates significant
at 5% and ‘*’ indicates significant at 10%.
Subsample N Mean Median Min Max >0,% estimate N Pr [Wald test]
All host markets 254 0.018** 0.008 -0.28 0.79 52.0 0.012** 447
(2.63) (0.57) (2.39)
Host Europe 102 -0.002 -0.002 -0.28 0.21 47.1 0.050 201
(-0.28) (0.8) (0.72)
before Euro 91 -0.004 -0.001 -0.28 0.21 47.3 0.005 179
(-0.45) (0.72) (0.64)
Eurozone 11 0.011 -0.005 -0.10 0.12 45.5 0.032 22
(0.6) (2.09) (1.27) 0.29
Host UK 48 0.027** 0.015** -0.21 0.32 58.3 0.022 75
(2.11) (6.93) (1.33)
Main Market 39 0.014 0.012** -0.21 0.20 56.4 0.009 63
(1.15) (4.12) (0.53)
AIM 9 0.084* 0.070*** -0.07 0.32 66.7 0.103* 10
(2.08) (28.1) (2.25) 0.09*
Host US 104 0.033** 0.014 -0.20 0.79 53.8 0.018** 171
(2.49) (1.37) (2.20)
before SOX 83 0.034** 0.023** -0.17 0.55 56.6 0.016 139
(2.67) (4.22) (1.64)
after SOX 21 0.029 -0.008** -0.20 0.79 42.9 0.034 32
(0.69) (5.15) (1.54) 0.42
Panel A. CARs around cross-listing announcement
Panel B. Excess returns
around cross-listing event

87
Table 2.8 The wealth effects of cross-listing by industry
Panel A of the table reports mean cumulative abnormal returns around the announcement of cross-listing for total sample of 254 cross-listing announcement events divided into six groups based on industry affiliation as defined in Table 2.2. Abnormal returns are market-adjusted returns with Datastream Total Market index returns in local currency used as a proxy for market returns. Cumulative abnormal returns are calculated as sum of abnormal returns over the 21-day (-10, 10) event window. Panel A also reports the number of observations for each group and t-statistics (in parenthesis). Panel B of the table reports excess returns (alpha) for three-month (-2,0) event window around cross-listing for total sample of 497 cross-listing events, trimmed at 5%, divided into six groups based on industry affiliation. The excess returns (alpha) are estimated with 3-factor model: R i - R f = α i+β 1 i (R m - R f )+β 2 iSMB+b 3 iHML+ε i . Panel B also reports the number of observations for each subsample and t-statistics on the coefficient estimates (in parenthesis). ‘***’ indicates significant at 1%, ‘**’ indicates significant at 5% and ‘*’
indicates significant at 10%.
Panel A. CARs around cross-listing announcement
Industry
mean N mean N mean N mean N
Financials -0.006 50 0.000 25 0.012 8 -0.025 17
(-0.76) (-0.04) (0.66) (-1.39)
Healthcare 0.033 28 0.010 6 0.093 4 0.028 18
(1.26) (0.32) (2.14) (0.72)
Manufacturers 0.02** 102 -0.005 43 0.023 23 0.06** 36
(2.01) (-0.36) (1.33) (2.16)
Nat. resources 0.04** 22 0.04** 8 -0.026 5 0.08** 9
(2.39) (3.27) (-0.58) (2.78)
Services 0.012 22 0.014 7 0.055 7 -0.03** 8
(0.69) (1.05) (1.16) (-2.41)
Technology 0.012 30 -0.039 13 0.030 1 0.053 16
(0.51) (-1.16) - (1.55)
Panel B. Excess returns around cross-listing event
Industry
estimate N estimate N estimate N estimate N
Financials -0.004 85 -0.012 51 0.03 15 -0.012 19
(-0.51) (-1.25) (0.91) (-0.88)
Healthcare 0.055* 41 -0.110 9 -0.004 4 0.087** 26
(1.80) (-1.23) - (2.64)
Manufactors 0.004 179 0.009 85 -0.012 36 0.010 58
(0.50) (0.89) (-0.69) (0.67)
Nat.resources 0.046*** 46 0.071*** 16 0.07 9 0.031 21
(3.31) (3.54) (0.71) (1.38)
Services 0.027 44 0.008 14 0.106 8 -0.021 20
(1.25) (0.25) (1.47) (-0.70)
Technology -0.013 52 0.053 24 0.016 1 -0.037 27
(-0.60) (1.25) - (-1.54)
All Europe UK US
Host market
All Europe UK US
Host market

88
Table 2.9 The wealth effects of cross-listing by listing characteristics
Panel A of the table reports mean cumulative abnormal returns around the announcement of cross-listing for total sample of 254 cross-listing announcement events divided into subsamples by listing characteristics defined in Table 2.2. Abnormal returns are market-adjusted returns with Datastream Total Market index returns in local currency used as a proxy for market returns. Cumulative abnormal returns are calculated as sum of abnormal returns over the 21-day (-10, 10) event window. Panel A also reports the number of observations for each subsample and probability (in parenthesis) of t-statistics. Panel B of the table reports excess returns (alpha) for three-month (-2,0) event window around cross-listing for total sample of 497 cross-listing events, trimmed at 5%, divided into subsamples by listing characteristics. The excess returns (alpha) are estimated with 3-factor model: R i - R f = α i+β1 i (R m - R f )+β 2 iSMB+
+b 3 i HML+ε i . Panel B also reports the number of observations for each subsample and t-statistics on the coefficient estimates (in parenthesis). ‘***’ indicates significant at 1%, ‘**’ indicates significant at 5%
and ‘*’ indicates significant at 10%.
Panel A. CARs around cross-listing announcement
mean N mean N mean N mean N
By listing order
First 0.029*** 134 0.003 47 0.026 33 0.053** 54
(2.66) (0.28) (1.57) (2.34)
Consequent 0.005 120 -0.007 55 0.030 15 0.011 50
(0.71) (-0.61) (1.48) (0.94)
By Capital raising
Capital raising 0.039* 55 0.018 12 0.048 12 0.044 31
(1.90) (0.58) (1.40) (1.36)
Not capital raising 0.012* 199 -0.005 90 0.020 36 0.028** 73
(1.84) (-0.62) (1.56) (2.17)
US listings: with prior OTC vs without prior OTC
no prior OTC 0.044** 75
(2.59)
prior OTC 0.025 29
(0.17)
Panel B. Excess returns around cross-listing event
mean N mean N mean N mean N
By listing order
First 0.019** 243 0.023* 92 -0.003 45 0.023* 106
(2.23) (1.88) (-0.11) (1.89)
Consequent 0.004 204 -0.005 109 0.038 28 0.002 65
(0.69) (-0.55) (1.67) (0.20)
By Capital raising
Capital raising 0.028 65 0.101* 13 0.080 14 -0.019 38
(1.47) (2.16) (1.50) (-0.98)
Not capital raising 0.010* 382 0.000 188 0.011 61 0.031*** 135
(1.87) (0.02) (0.65) (3.28)
For US listings: with
no prior OTC 0.026*** 137
(2.69)
prior OTC 0.034 32
(1.54)
Host market
All US
Host market
All Europe UK US
UKEurope

89
Table 2.10 The wealth effects of cross-listing by company size
Panel A of the table reports mean cumulative abnormal returns around the announcement of cross-listing for total sample of 254 cross-listing announcement events divided into three groups based on company size measured as natural logarithm of market value of company’s common stock prior to cross-listing. Abnormal returns are market-adjusted returns with Datastream Total Market index returns in local currency used as a proxy for market returns. Cumulative abnormal returns are calculated as sum of abnormal returns over the 21-day (-10, 10) event window. Panel A also reports the number of observations for each group and t-statistics (in parenthesis). Panel B of the table reports excess returns (alpha) for three-month (-2,0) event window around cross-listing for total sample of 497 cross-listing events, trimmed at 5%, divided into three groups based on company size. The excess returns (alpha) are estimated with 3-factor model: R i - R f = α i +β1 i (R m - R f )+β 2 iSMB+b 3 i HML+ε i . Panel B also reports the number of observations for each subsample and t-statistics on the coefficient estimates (in parenthesis). Additionally Panels A and B report average company size for each group. ‘***’ indicates significant
at 1%, ‘**’ indicates significant at 5% and ‘*’ indicates significant at 10%.
Panel A. CARs around cross-listing announcement
all before
Euro
Euro
zone
all Main
Market
AIM all before
SOX
after
SOXmean N mean N mean N mean N mean N mean N mean N mean N mean N mean N
Small 170.7 0.027** 84 0.014 35 0.010 32 0.061 3 0.030 23 -0.005 14 0.084* 9 0.042 26 0.081** 15 -0.012 11(2.35) (0.98) (0.64) (1.61) (1.35) (-0.24) (2.08) (1.66) (2.36) (-0.36)
Medium 1,670.6 0.023 85 -0.009 41 -0.010 38 -0.009 3 0.058 12 0.058 12 - 0 0.070** 32 0.050** 29 0.267 3(1.63) (-0.88) (-0.88) (-0.04) (0.28) (0.28) (2.12) (2.01) (1)
Large 14,548.1 0.003 85 -0.013 26 -0.013 21 -0.012 5 0.041** 13 0.041** 13 - 0 0.001 46 0.003 39 -0.008 7(0.36) (-0.81) (-0.70) (-0.41) (2.22) (2.22) (0.12) (0.24) (-0.31)
Panel B. Excess returns around cross-listing event
all before
Euro
Euro
zone
all Main
Market
AIM all before
SOX
after
SOX
est. N est. N est. N est. N est. N est. N est. N est. N est. N est. N
Small 185.3 0.043*** 118 0.030 38 0.033 34 -0.033 4 0.024 34 -0.002 23 0.075 11 0.065** 46 0.062** 34 0.038 12(2.90) (1.12) (1.21) - (0.96) (-0.05) (1.49) (2.39) (2.11) (0.5)
Medium 1,896.4 0.020** 118 0.018 49 0.012 41 0.084* 8 0.043 14 0.043 14 - 0 0.015 55 0.014 48 -0.017 7(2.08) (1.25) (0.69) (2.32) (1.2) (1.2) (0.95) (0.83) (-0.34)
Large 14,303.6 -0.009 118 -0.018 33 -0.170 26 0.051 7 -0.019 17 -0.019 17 - 0 -0.002 68 0.002 53 -0.001 15(-1.13) (-1.07) (-0.86) (1.37) (-0.63) (-0.63) (-0.16) (0.17) (-0.03)
Host market
Host market
Europe
average
company size
(mln GBP)
UK US
average
company size
(mln GBP)
Europe UK USGroup
by
company
size
Group
by
company
size
All
All

90
Table 2.11 The determinants of the effect of cross-listing on shareholders’ wealth: multivariate regression analysis
The table reports the estimation results of regressions of CARs for 21-day (-10, 10) event window around the announcement of cross-listing on a number of potential determinants of shareholders’ wealth effects of cross-listing in the multivariate framework. CARs are calculated as sum of abnormal returns over 21-days event window. Abnormal returns are market-adjusted returns with Datastream Total Market index returns in local currency used as a proxy for market returns. The explanatory variables are defined in Table 2.2. Regression specification is as follows: CARi = Σn=EU,UK,US βn Hostn + βj,Xi,j + βj,n Hostn Xi,j + εi, where Hostn is host market dummy variable and Xi,j are explanatory variables. The following explanatory variables: market correlation, accounting standards, investor protection, market liquidity, analyst coverage, geographic distance, GDP per capita, company size and sales growth, are host-market-adjusted, i.e. εj from the regression Varj = Σn=EU,UK,US βn Hostn + εj. Standard errors, reported in parentheses, are robust to autocorrelation and heteroskedasticity (Newey-West). ‘***’ indicates significant at 1%, ‘**’
indicates significant at 5% and ‘*’ indicates significant at 10%.
Variable
Host
Europe Variable Host UK Variable Host US
Host Europe -0.027 -0.002 -0.007 0.00 -0.01
(-1.15) (-0.28) (-0.86) (0.04) (-1.11)
Host UK 0.026 0.032* 0.038** 0.10** 0.03**
(0.64) (1.97) (2.3) (2.14) (1.99)
Host US 0.011 0.033** 0.018 0.027* 0.032**
(0.51) (2.21) (1.37) (1.87) (2.09)
Market correlations -0.041 -0.104* 0.121* -0.045 -0.029 0.014 -0.213***
(-0.77) (-1.93) (1.68) (-0.96) (-0.23) (0.31) (-2.7)
Accounting standards 0.001 0.00 0.001 -0.002 0.001 0.003 -0.002 0.003*
(1.25) (0.38) (0.41) (-1.00) (0.98) (0.79) (-1.57) (1.68)
Investor protection -0.006 -0.006 -0.029
(-1.13) (-1.16) (-1.53)
Market liquidity 0.005
(0.56)
Analayst coverage 0.018 0.012
(1.22) (0.98)
Geographic distance -0.027* -0.017 -0.086** 0.081** -0.015 -0.111** -0.016 -0.038
(-1.73) (-1.49) (-2.37) (2.13) (-1.1) (-2.59) (-1.34) (-0.23)
GDP per capita -0.044 -0.047 -0.021 0.015
(-0.94) (-1.61) (-0.85) (0.3)
Dot-com bubble 0.053 0.047 0.074 -0.039 0.057 0.034 0.039
(1.52) (1.34) (1.55) (-0.59) (1.57) (0.68) (0.56)
Sales growth 0.004 0.004 0.01 -0.009 0.006 -0.006 0.00 0.022
(0.79) (0.93) (1.32) (-0.96) (1.01) (-0.89) (0.10) (1.64)
Model 1 Model 2
Model 3 Model 4 Model 5
Variable

91
Table 2.11 continued
Variable
Host
Europe Variable Host UK Variable Host US
Industry Financials 0.014
(0.54)
Industry Healthcare 0.019
(0.44)
Industry Manufacturing 0.027
(1.22)
Industry Resources 0.065** 0.046** 0.052** 0.059*** 0.046**
(2.04) (2.41) (2.54) (2.95) (1.98)
Industry Technology 0.031
(0.78)
Capital raised -0.006 0.002 0.003 -0.02 0.184* 0.026 -0.045
(-0.21) (0.08) (0.07) (-0.78) (1.94) (0.59) (-0.95)
Company size -0.009* -0.008* -0.009 0.005 -0.008* 0.002 -0.005 -0.003
(-1.69) (-1.84) (-1.49) (0.65) (-1.68) (0.21) (-1.22) (-0.38)
First foreign listing 0.005
(0.37)
US prior OTC -0.03 -0.027 -0.024
(-1.33) (-1.23) (-1.21)
R2 0.1498 0.1186
Adj-R2 0.0309 0.0632
N 164 187
Model 5
0.1606
0.0777
190
0.1817 0.2073
0.0848 0.1239
190 190
Variable Model 1 Model 2
Model 3 Model 4

92
Table 2.12 Impact of Euro on the determinants of the effects of cross-listing on shareholders’ wealth
The table reports the estimation results of regressions of cumulative CARs for 21-day (-10, 10) event window around the announcement of cross-listing on a number of potential determinants of shareholders’ wealth effects of cross-listing in the multivariate framework. CARs are calculated as sum of abnormal returns over 21-days event window. Abnormal returns are market-adjusted returns with Datastream Total Market index returns in local currency used as a proxy for market returns. The explanatory variables are defined in Table 2.2. Regression specification is as follows: CARi= Σn=EU,UK,US βnHostn+βjXi,j+
+β1jXi,jDbeforeeuro+β2j Xi,jDeurozone+ εi, where Xi,j are explanatory variables; Dbeforeeuro is dummy variable that equals one if cross-listing takes place in Europe before the introduction of Euro; Deuro is dummy variable that equals one if cross-listing takes place within the Euro zone after the introduction of Euro. The following explanatory variables: market correlation, accounting standards, investor protection, market liquidity, analyst coverage, geographic distance, GDP per capita, company size and sales growth, are host-market-adjusted, i.e. εj from the regression Varj = Σn=EU,UK,US βn Hostn + εj. Standard errors, reported in parentheses, are robust to autocorrelation and heteroskedasticity (Newey-West). ‘***’ indicates
significant at 1%, ‘**’ indicates significant at 5% and ‘*’ indicates significant at 10%.
Variable before Euro Euro zone Variable before Euro Euro zone
Host Europe -0.017 -0.012
(-0.77) (-1.24)
Host UK 0.001 0.031*
(0.04) (1.85)
Host US -0.014 0.018
(-0.67) (1.61)
Market Correlations -0.14** 0.168 0.18 -0.099** 0.078 0.146
(-2) (1.57) (1.15) (-2.03) (1.06) (0.91)
Investor protection 0.002 -0.002 -0.007
(1.19) (-1.26) (-1.00)
Analayst coverage 0.026* -0.03 -0.068**
(1.81) (-1.27) (-2.00)
Geographic distance -0.094*** 0.086** 0.096* -0.112*** 0.106*** 0.083*
(-2.75) (2.26) (1.91) (-3.08) (2.72) (1.75)
Dot-com bubble 0.076 -0.034 0.073 -0.03
(1.62) (-0.46) (1.53) (-0.45)
Sales growth 0.01 -0.007 -0.01 0.009 -0.008 -0.007
(1.26) (-0.76) (-0.67) (1.26) (-0.89) (-0.73)
Industry Financials 0.024
(0.95)
Industry Healthcare 0.021
(0.53)
Industry Manufacturing 0.034
(1.61)
Industry Resources 0.084*** 0.056***
(2.82) (2.9)
Host Europe Host Europe
Model 1 Model 2

93
Table 2.12 continued
Variable before Euro Euro zone Variable before Euro Euro zone
Industry Technology 0.035
(0.95)
Capital raised 0.006 -0.032 0.075
(0.17) (-0.56) (1.32)
Company size -0.009 0.00 0.007 -0.008 0.01 -0.003
(-1.41) (0.02) (0.62) (-1.38) (1.09) (-0.24)
First foreign listing 0.008 -0.042 0.011
(0.35) (-1.41) (0.20)
R2
Adj-R2
N
Host Europe Host Europe
0.2036
0.0248
181
0.1642
0.0843
196
Model 1 Model 2

94
Table 2.13 Impact of SOX on the determinants of the effects of cross-listing on shareholders’ wealth
The table reports the estimation results of regressions of cumulative abnormal returns for 21-day (-10, 10) event window around the announcement of cross-listing on a number of potential determinants of shareholders’ wealth effects of cross-listing in the multivariate framework. CARs are calculated as sum of abnormal returns over 21-days event window. Abnormal returns are market-adjusted returns with Datastream Total Market index returns in local currency used as a proxy for market returns. The explanatory variables are defined in Table 2.2. Regression specification is as follows: CARi=Σn=EU,UK,US βnHostn+ βj Xi,j +β1j Xi,jDbeforesox+β2j Xi,jDsox + εi, where Xi,j are explanatory variables; DbeforeSOX is dummy variable that equals one if cross-listing takes place in the US before the adoption of SOX; DafterSOX is dummy variable that equals one if cross-listing takes place in the US after the adoption of SOX. The following explanatory variables: market correlation, accounting standards, investor protection, market liquidity, analyst coverage, geographic distance, GDP per capita, company size and sales growth, are host-market-adjusted, i.e. εj from the regression Varj = Σn=EU,UK,US βn Hostn + εj. Standard errors, reported in parentheses, are robust to autocorrelation and heteroskedasticity (Newey-West). ‘***’ indicates significant at 1%, ‘**’indicates significant at 5% and ‘*’ indicates significant at 10%.
Variable prior SOX post SOX Variable prior SOX post SOX Variable prior SOX post SOX
Host Europe -0.038* -0.008 -0.004
(-1.78) (-0.94) (-0.48)
Host UK -0.018 0.027 0.026*
(-0.55) (1.62) (1.66)
Host US 0.027 0.032*** 0.042***
(1.02) (2.73) (3.2)
Market Correlations 0.04 -0.10 -0.248
(0.58) (-0.82) (-1.14)
Accounting standards -0.001 0.004* -0.006**
(-1.09) (1.81) (-2.16)
Market liquidity -0.012 0.002 0.028
(-1.18) (0.13) (1.11)
Analayst coverage 0.03 -0.019 -0.032 0.004 0.012 -0.072**
(1.65) (-0.67) (-1.06) (0.46) (0.64) (-2.23)
Geographic distance -0.011 -0.19 0.31 -0.022* -0.098 0.492***
(-0.59) (-0.9) (0.6) (-1.84) (-0.62) (2.84)
Model 3
Host USHost US Host US
Model 1 Model 2

95
Table 2.13 continued
Variable prior SOX post SOX Variable prior SOX post SOX Variable prior SOX post SOX
Dot-com bubble 0.012 0.068 0.04 0.04 0.034 0.033
(0.22) (0.88) (0.85) (0.61) (0.67) (0.48)
Sales growth 0.001 0.03 0.004 0.001 0.031* -0.002 0.001 0.028 0.003
(0.20) (1.53) (0.38) (0.27) (1.72) (-0.33) (0.28) (1.47) (0.34)
Industry Financials 0.014
(0.61)
Industry Healthcare 0.008
(0.27)
Industry Manufacturing 0.02
(0.94)
Industry Resources 0.063** 0.044** 0.042*
(2.06) (2.12) (1.83)
Industry Technology 0.047
(1.09)
Capital raised 0.031 -0.052 -0.013
(0.71) (-1.09) (-0.1)
Company size -0.003 -0.019* 0.008 -0.003 -0.020* 0.009 0.019* -0.008* -0.016
(-0.42) (-1.66) (0.67) (-0.56) (-1.93) (0.94) (1.82) (-1.72) (-1.45)
First foreign listing -0.004 0.012 -0.001
(-0.17) (0.35) (-0.02)
prior US OTC -0.005 -0.09* 0.009 -0.069** 0.006 -0.065*
(-0.18) (-1.75) (0.37) (-2.05) (0.25) (-1.78)
R2
Adj-R2
N 189
Model 3
Host US
0.2653
0.1828
0.3013
0.1174
169
0.2271
0.1603
202
Host US Host US
Model 1 Model 2

96
Appendix 2.1 The determinants of the effect of cross-listing on shareholders’ wealth: coefficient estimates and variance inflation factors
The table reports the coefficient estimates and variance inflation factors (VIF) from regressions reported in Table 2.11. CARs are the sum of market-adjusted returns over 21-days event window. The explanatory variables are defined in Table 2.2. Regression specification: CARi = Σn=EU,UK,US βn Hostn + βj,Xi,j + βj,n Hostn Xi,j + εi, where Hostn is host market dummy variable and Xi are explanatory variables. The following explanatory variables: market correlation, accounting standards, investor protection, market liquidity, analyst coverage, geographic distance, GDP per capita, company size and sales growth, are host-market-adjusted, i.e. εj from the regression Varj = Σn=EU,UK,US βn Hostn + εj.
est. VIF est. VIF est. VIF est. VIF est. VIF est. VIF est. VIF est. VIF
Host Europe -0.027 5.99 -0.002 1.10 -0.007 1.40 0.00 1.27 -0.010 1.31
Host UK 0.026 2.69 0.032 1.10 0.038 1.08 0.100 9.11 0.030 1.08
Host US 0.011 7.70 0.033 1.70 0.018 1.56 0.027 1.43 0.032 2.38
Market correlations -0.041 1.58 -0.104 1.85 0.121 1.81 -0.045 1.66 -0.029 2.21 0.014 2.16 -0.213 2.43
Accounting standards 0.001 2.21 0.000 1.38 0.001 2.14 -0.002 2.14 0.001 2.37 0.003 3.02 -0.002 2.08 0.003 2.83
Investor protection -0.006 2.76 -0.006 3.01 -0.029 11.33
Market liquidity -0.005 1.40
Analayst coverage 0.018 2.51 0.012 2.62
Geographic distance -0.027 1.22 -0.017 1.08 -0.086 7.26 0.081 7.32 -0.015 1.27 -0.111 1.57 -0.016 1.11 -0.038 2.29
GDP per capita -0.044 3.35 -0.047 2.43 -0.021 1.93 0.015 2.59
Dot-com bubble 0.053 1.30 0.047 1.24 0.074 2.06 -0.039 2.20 0.057 1.27 0.034 3.28 0.039 3.39
Sales growth 0.004 1.26 0.004 1.06 0.010 3.15 -0.009 3.34 0.006 1.38 -0.006 1.52 0.0005 1.44 0.022 1.41
Industry Financials 0.014 3.92
Industry Healthcare 0.019 2.57
Industry Manufacturing 0.027 5.22
Industry Resources 0.065 1.89 0.046 1.10 0.052 1.14 0.059 1.21 0.046 1.13
Industry Technology 0.031 2.40
Capital raised -0.006 1.62 0.002 1.95 0.003 2.25 -0.020 1.56 0.184 1.63 0.026 4.60 -0.045 4.56
Company size -0.009 1.67 -0.008 1.21 -0.009 1.67 0.005 1.94 -0.008 1.59 0.002 2.28 -0.005 2.44 -0.003 2.38
First foreign listing 0.005 2.72
US prior OTC -0.030 1.81 -0.027 1.58 -0.024 1.75
Adj-R2
N
Variable
Host UK
Model 3 Model 4
190 190
0.0309
164
Model 5
Variable Host USModel 1 Model 2 Variable Host Europe Variable
0.0632
187
0.0777
190
0.0848 0.1239

97
Appendix 2.2 Impact of Euro on the determinants of the effect of cross-listing on shareholders’ wealth: coefficient estimates and variance inflation factors
The table reports the coefficient estimates and variance inflation factors (VIF) from regressions reported in Table 2.12. CARs are the sum of market-adjusted returns over 21-days event window. The explanatory variables are defined in Table 2.2. Regression specification: CARi=Σn=EU,UK,US βnHostn+ βj Xi,j +β1j Xi,jDbeforeeuro+β2j Xi,jDeurozone + εi, where Xi,j are explanatory variables; Dbeforeeuro is dummy variable that equals one if cross-listing takes place in Europe before the introduction of Euro; Deuro is dummy variable that equals one if cross-listing takes place within Euro zone after the introduction of Euro. The following explanatory variables: market correlation, accounting standards, investor protection, market liquidity, analyst coverage, geographic distance, GDP per capita, company size and sales growth, are host-market-adjusted, i.e. εj from the regression Varj = Σn=EU,UK,US βn
Hostn + εj.
est. VIF est. VIF est. VIF est. VIF est. VIF est. VIF
Host Europe -0.017 7.56 -0.01 1.27
Host UK 0.001 2.94 0.031 1.04
Host US -0.014 7.36 0.018 1.21
Market correlations -0.14 2.57 0.168 2.14 0.18 3.18 -0.1 1.72 0.078 1.63 0.146 1.36
Legal protection 0.002 2.88 -0.002 2.47 -0.01 7.83
Analayst coverage 0.026 2.59 -0.03 1.71 -0.068 10.97
Geographic distance -0.094 8.20 0.086 7.37 0.10 2.89 -0.11 5.55 0.106 4.83 0.08 1.90
Dot-com bubble 0.076 2.32 -0.034 2.94 0.073 2.05 -0.03 2.21
Sales growth 0.01 3.42 -0.007 3.53 -0.01 2.17 0.009 2.97 -0.008 3.04 -0.007 1.14
Industry Financials 0.024 4.18
Industry Healthcare 0.021 2.56
Industry Manufacturing 0.034 5.94
Industry Resources 0.084 1.94 0.056 1.14
Industry Technology 0.035 2.28
Capital raised 0.006 2.28 -0.032 2.29 0.08 3.91
Company size -0.009 1.92 0.00 2.63 0.01 3.47 -0.01 1.57 0.010 1.48 -0.003 1.24
First foreign listing 0.008 4.17 -0.042 4.22 0.01 7.90
Adj-R2
N
Variable
Host Europe
Variable before Euro Eurozone
0.0843
196
Model 1
0.0248
181
Model 2
Host Europe
Variable before Euro Eurozone

98
Appendix 2.3 Impact of SOX on the determinants of the effect of cross-listing on shareholders’ wealth: coefficient estimates and variance inflation factors
The table reports the coefficient estimates and variance inflation factors (VIF) from regressions reported in Table 2.13. CARs are the sum of market-adjusted returns over 21-days event window. The explanatory variables are defined in Table 2.2. Regression specification: CARi=Σn=EU,UK,US βnHostn+ βj Xi,j +β1j Xi,jDbeforesox+β2j Xi,jDsox + εi, where Xi,j are explanatory variables; DbeforeSOX is dummy variable that equals one if cross-listing takes place in the US before the adoption of SOX; DafterSOX is dummy variable that equals one if cross-listing takes place in the US after the adoption of SOX. The following explanatory variables: market correlation, accounting standards, investor protection, market liquidity, analyst coverage, geographic distance, GDP per capita, company size and sales growth, are host-market-adjusted, i.e. εj from the regression Varj = Σn=EU,UK,US βn Hostn + εj.
est. VIF est. VIF est. VIF est. VIF est. VIF est. VIF est. VIF est. VIF est. VIF
Host Europe -0.038 6.74 -0.01 1.15 0.00 1.16
Host UK -0.018 2.84 0.03 1.02 0.03 1.04
Host US 0.027 11.64 0.03 1.93 0.04 2.25
Market correlations 0.04 3.03 -0.1 2.87 -0.248 10.28
Accounting standards 0.00 2.3 -0.01 2 0.00 1.89
Market liquidity 0.012 3.07 -0.002 2.26 -0.028 3.84
Analayst coverage 0.03 3.05 -0.019 2.20 -0.032 4.65 0.00 2.02 -0.07 2.01 0.01 1.74
Geographic distance -0.011 1.43 -0.19 1.74 0.31 7.10 -0.02 1.02 -0.10 1.07 0.49 1.15
Dot-com bubble 0.012 3.48 0.068 4.01 0.04 2.91 0.04 3.08 0.03 3.1 0.03 3.26
Sales growth 0.001 1.59 0.03 1.48 0.004 2.12 0.00 1.25 0.03 1.3 0.00 1.34 0.00 1.28 0.00 1.44 0.03 1.35
Industry Financials 0.014 4.33
Industry Healthcare 0.008 2.92
Industry Manufacturing 0.02 6.05
Industry Resources 0.063 2.12 0.04 1.12 0.04 1.12
Industry Technology 0.047 2.92
Capital raised 0.031 4.70 -0.052 4.65 -0.013 1.80
Company size -0.003 3.11 -0.019 2.74 0.008 3.16 0.00 1.82 -0.02 1.98 0.01 1.5 0.02 1.57 -0.02 2.23 -0.01 2.07
First foreign listing -0.004 5.70 0.012 5.09 -0.001 4.33
US prior OTC -0.005 2.26 -0.09 2.07 0.01 1.69 -0.07 1.26 -0.07 1.19 0.01 1.87
Adj-R2
N
0.1828
189
Model 3
Host Europe
Variable prior SOX post SOX
Variable
Model 1 Model 2
Host Europe Host Europe
Variable prior SOX
202
0.1174
169
0.1603
post SOX Variable prior SOX post SOX

99
Chapter 3
Liquidity and Volatility of Stocks Listed and
Traded in Multiple Stock Markets
3.1 Introduction
Companies choose to list on a foreign stock exchange with a view to improving
stock visibility, prestige and liquidity (Bancel and Mittoo, 2001) with the ultimate goal of
enhancing their stock valuation (Chouinard and D'Souza, 2003-2004). Potentially, the
improvement in stock valuation stems from the fact that a cross-listing results in an enhanced
information environment because of the need to meet the mandatory listing and disclosure
requirements. Thus, when stocks are listed in multiple stock exchanges with different
accounting and disclosure requirements investors enjoy additional information. Chemmanur
and Fulghieri (2006) theoretically show that a foreign listing on an exchange with strict
disclosure requirements reduces investors’ monitoring costs and improves stock valuation.
Therefore, an enhanced information environment reduces the adverse selection component of
trading costs and enhances liquidity, resulting in a reduction in the cost of transactions,
especially the bid-ask spread (Kyle (1985) and Glosten and Milgrom (1985) provide an
excellent discussion on how information flow affects the size of the bid-ask spread). This, in
turn, results in a lower cost of capital (Diamond and Verrechia, 1991; Baiman and
Verrecchia, 1996) leading to an increase in the value of the firm.
Existing empirical evidence shows that cross-listing in the US by a foreign company,
on average, results in abnormal positive returns around cross-listing (Miller, 1999; Foerster
and Karolyi, 1999), increased company visibility (Baker et al, 2002), improved analyst
coverage, in terms of quantity as well as accuracy (Lang et al, 2003a), enhanced stock
liquidity (Smith and Sofianos, 1997; Foerster and Karolyi, 1993 and 1998), lower cost of
capital (Errunza and Miller, 2000; Hail and Leuz, 2009) and improved relative valuation
(Doidge et al, 2004 and 2009a). The findings of chapter 2 of this thesis also suggest that
international cross-listing, on average, results in gains in shareholders’ wealth for cross-

100
listing companies. The possible sources of the gains in shareholders wealth after cross-listing
include an improvement in the quality of the stock’s information environment and,
accordingly, an improvement in the stock’s liquidity and volatility. The change in stock
liquidity and volatility after cross-listing is the focus of chapter 3.
The findings on the improvements in stock valuation can be interpreted as indirect
evidence of the reduction in information asymmetry following a cross-listing. Two studies
investigate directly the quality of the information environment of cross-listed stocks. First,
Bailey et al (2006) examine the consequences of the increased disclosure of non-US firms
listed in the US, and report a significant increase in stock return volatility and trading
volume reaction to earnings announcements after cross-listing in the US, which they attribute
to the changes in the company-level disclosure. Second, Fernandes and Ferreira (2008)
investigate the change in the quality of the information environment around cross-listing and
focus on the change in stock price informativeness, i.e. the level of private information
incorporated in the stock price. They find that cross-listing is positively associated with firm-
specific stock return variation, interpreted as the measure of stock price informativeness,
particularly for stocks from developed markets.
The existing evidence on whether cross-listing improves the information
environment is far from conclusive. Moreover, the quality of the information environment is
not easily quantifiable or empirically testable and the results of empirical tests are sensitive
to the choice of proxy. Leuz and Verrecchia (2000) suggest that stock liquidity and volatility
proxy for the quality of the firm’s information environment. More specifically, the
improvement in stock liquidity and the reduction in stock return volatility after cross-listing
can be interpreted as an outcome of the decreased level of information asymmetry between
company managers and investors and between different groups of investors after cross-
listing.
Existing empirical evidence on the change in stock liquidity and volatility after
cross-listing is mixed. Some studies report that after cross-listing there is a significant
decrease in the stock’s trading costs (Foerster and Karolyi, 1998; Domowitz et al, 1998;
Hamet, 2002) and an increase in the stock’s trading volume (Smith and Sofianos, 1997;
Foerster and Karolyi, 1993 and 1998; Hamet, 2002). Other studies report no impact from an

101
international cross-listing on the stock’s trading costs (Noronha et al, 1996; Silva and
Chavez, 2008) and no impact or deterioration of trading activity on the stock’s home market
(Berkman and Nguyen, 2010; Domowitz et al, 1998; Foerster and Karolyi, 1998). Empirical
studies on the impact of cross-listing on volatility report either no significant relationship
(Howe and Madura, 1990; Lau et al, 1994; Martell et al, 1999) or an increase in volatility
after cross-listing, mainly associated with the increase in the stock’s trading activity (Barclay
et al, 1990; Chan et al, 1996; Werner and Kleidon, 1996; Menkveld, 2008). Overall, existing
empirical evidence on the consequences of cross-listing in terms of stock liquidity and
volatility is not conclusive and in some cases is outdated.
There are several potential reasons for corporate finance managers and investors to
be concerned about stock liquidity and volatility. First, improved stock liquidity decreases
trading costs for investors and, accordingly, reduces the required illiquidity premium
resulting in higher stock valuation (Amihud and Mendelson, 1986; Brennan et al, 1998;
Jacoby et al, 2000; Amihud, 2002). Second, lower volatility is associated with a reduction in
the perceived riskiness of the stock (Bushee and Noe, 2000) and, consequently, with a lower
cost of capital (Froot et al, 1992). Finally, a stock with lower volatility provides less costly
and more effective stock-price-based management compensation (Baiman and Verrecchia,
1995 and 1996).
This study contributes to the literature by examining the impact of cross-listing on
the stock’s liquidity and volatility. More specifically, the main research question addressed
is: Does cross-listing improve stock liquidity and volatility? Cross-listed stocks are expected
to have higher liquidity and lower return volatility compared to domestic stocks because
cross-listing improves the stock’s information environment. Several measures are used to
capture various dimensions of stock’s liquidity and volatility, including trading costs and
trading volume-based measures of stock liquidity and stock return variance and intraday
stock price variation. The impact of cross-listing is evaluated in a multivariate framework
after controlling for other factors that potentially affect stock liquidity and volatility. These
include the change in company size, accounting practices, analyst coverage and trading
activity following cross-listing.

102
The second important contribution is a direct comparison between the impact of a
cross-listing and the impact of an admission to trade on a foreign exchange, referred to in
this study as a cross-trading. Cross-listing is initiated by the company’s decision to cross-list
its shares on a foreign stock exchange and involves a company submitting a listing
application and meeting listing and disclosure requirements of the host foreign stock
exchange. Cross-listed stocks are listed in the stock exchange’s official directory of listed
foreign companies available on stock exchange’s web-sites. Cross-trading in this study
includes admissions to trade on foreign over-the-counter (OTC) markets and on foreign new
markets and alternative trading platforms such as Open market of Deutsche Borse and
VIRTX of Swiss stock exchange. OTC trading in the US takes place in the form of a Level I
American Depository Receipt (ADR) and is initiated by the company; OTC trading in the
UK and trading on alternative markets and trading platforms is initiated by market
makers/dealers without the firm’s involvement (a company could be not even aware that its
stocks are cross-traded, for example, on the Open market of Deutsche Borse). The main
difference between cross-listing and cross-trading is that, in contrast to cross-listing, cross-
trading does not involve meeting mandatory listing or additional disclosure requirements.
Cross-trading is similar to cross-listing in the way that it makes a stock accessible to foreign
investors and, thus, facilitates inter-market competition. While cross-trading has become
wide spread in recent decade, the empirical evidence on its implications is limited.51
To
address this gap, this study specifically investigates the extent to which cross-listing and
cross-trading result in different outcomes for stock liquidity and volatility. Thus, the second
research question addressed is: Does cross-listing have a more profound impact on the
liquidity and volatility than cross-trading?
The sample includes 425 stocks from 17 European countries that were listed in
various foreign markets during the period from 1990 to 2007. While prior literature reports
that a US cross-listing is beneficial in terms of liquidity (Foerster and Karolyi, 1993 and
1998) and improvement in the information environment (Lang et al, 2003a; Fernandes and
Ferreira, 2008), the evidence on the implications of foreign listing/trading on other host
markets is limited. Since the US differs significantly from other markets in terms of the size
51
Only a few studies examine the consequences of a foreign trading on stock liquidity (e.g. Hamet,
2002; Ellul, 2006) and stock return volatility (e.g. Bayar and Onder, 2005).

103
of the investor pool, the level of liquidity, and the legal and information environment, it is
reasonable to expect that the findings for the US market are not necessarily applicable to
other markets. Moreover, the inclusion of all foreign listing and trading accounts of the
sample cross-listed stock allows an assessment of the impact of cross-listing and cross-
trading on various host markets and an assessment of the impact of cross-listing on the
stock’s aggregate trading activity.
Using cross-sectional analysis, the liquidity and volatility of cross-listed stocks are
compared against the liquidity and volatility of 3,702 domestic stocks from the same
countries. Several studies find that the impact of a foreign listing in terms of liquidity
(Halling et al, 2008) and corporate valuation (Gozzi et al, 2008) is concentrated around the
cross-listing event and diminishes over time. This study contributes to the debate by
providing evidence on the evolution of stock liquidity and volatility around cross-listing and
cross-trading and their long-run sustainability. Finally, the change in stock liquidity and
volatility is evaluated in a time-series framework against those of the cross-listed stocks over
the pre-cross-listing period of time.
The primary empirical finding is that cross-listing and cross-trading on a foreign
market improve the liquidity and reduce volatility of a stock. In the case of liquidity, this is
also true in comparison to the pre-cross-listing/trading period of time. After controlling for
the effects of factors that are known to affect stock liquidity and for the change in company
characteristics after cross-listing/ cross-trading in the multivariate analysis, it is found that a
presence on a foreign exchange, either through cross-listing or cross-trading, is associated
with a significantly reduced bid-ask spread, increased trading volumes, and also with a
reduction in stock return volatility. Home market stock turnover does not improve after
cross-listing or after cross-trading. At the same time, total turnover, which in contrast to
home market turnover accounts for trading volumes on foreign exchange(s), improves for
cross-listed stocks but not for cross-traded stocks. The documented effects of cross-listing
and cross-trading are found to be sustained over a long period of time following the cross-
listing/ cross-trading event.
Although added mandatory disclosure requirements of cross-listing should cause a
more profound effect on the liquidity and volatility, the results do not show any significant

104
difference in the impact of cross-listing and cross-trading. This finding, arguably, can be
attributed to the fact that the improvement in the information environment after cross-listing
is not substantially different from that after cross-trading. The major improvement in the
information environment of cross-listed and cross-traded stocks arises, possibly, not from
additional mandatory information disclosure but from the intensified competition among
market makers and from the production of stock-specific information. Both enhanced
competition and information production are the outcome of the increase in the number of
market participants with an economic interest in the stock after cross-listing/ cross-trading.
Finally, the results are in line with the expectation that the implications of a foreign
listing and trading vary depending on the level of development of the stock’s home market,
in line with Domowitz et al (1998), Bacidore et al (2005), Halling et al (2008), Fernandes
and Ferreira (2008). More specifically, it is found that the results are driven by the
experience of stocks from developed markets and do not hold for stocks from emerging
markets.
The rest of the chapter is organized as follows: Section 3.2 provides an overview of
the literature on the implications of cross-listing and cross-trading for stock liquidity and
volatility. Section 3.3 develops testable hypotheses on the implications of cross-listing and/or
cross-trading on the stock’s liquidity and volatility and discusses other important factors that
affect stock trading after cross-listing/ cross-trading. Section 3.4 and section 3.5 describe the
methodology and the sample employed, while section 3.6 presents the empirical findings
and, finally, section 3.7 concludes the chapter.
3.2 Literature review
Based on Bancel and Mittoo’s (2001) survey, European managers make a decision to
cross-list with the expectation of improving the company’s visibility, prestige and image and
also to increase the shareholder base and gain improved access to foreign capital markets.
However, companies experience positive net benefits from cross-listing only if there is an
increase in the stock’s trading volume after the cross-listing. Along similar lines, Pagano et

105
al (2002) identify stock liquidity as one of the motives for cross-listing. Reduction in
volatility is generally associated with a reduction in the perceived riskiness of the stock
(Bushee and Noe, 2000). This perception of reduced riskiness can potentially lead to a lower
cost of capital after cross-listing (Froot et al, 1992; Hail and Leuz, 2009). The following two
sub-sections review existing empirical evidence on the impact of multimarket listing on both
stock’s liquidity and volatility.
3.2.1 Liquidity
Cross-listing/cross-trading of a stock on a foreign exchange results in a larger
investor base. A larger investor base in turn should facilitate increased stock turnover and
more intense competition in stock trading among market makers and investors leading to a
reduction in transaction costs. Additionally, cross-listing imposes extra disclosure
requirements and, accordingly, brings more information to the market, which, in turn, is
expected to induce more active stock trading (Kyle, 1985).
Cross-listing and liquidity
A number of studies examine the consequences of international cross-listing on a
stock’s liquidity in general and on trading volumes and trading costs in particular. Noronha
et al (1996) examine the change in liquidity of 126 US stocks following a listing in London
and Tokyo and document a significant increase in trading activity on the home market driven
by an increase in informed trading. However, despite the fact that a listing on a foreign
exchange makes competition among market makers more intense, they do not find any
decrease in spreads. Smith and Sofianos (1997) examine the change in trading activity of 128
non-US stocks listed on the NYSE and report that in total, on the NYSE and the home
market combined, the volume of trading increase by 42% and the home market trading
volume increase by 24%. It should be noted, however, that the increase in the home market
trading activity is driven by the increase in the home market trading volume of stocks from
developed countries. Domowitz et al (1998) show that for stocks from Mexico, a segmented
emerging market, trading activity on the home market reduces after cross-listing in the US,
and they attribute this finding to the migration of foreign investors. However, despite the

106
migration of order flows to the US, Domowitz et al (1998) find evidence that inter-market
competition contributes to narrower spreads. Furthermore, Silva and Chavez (2008) do not
find evidence that internationally cross-listed companies from emerging markets in Latin
America have enhanced liquidity in terms of trading costs in the home market compared to
domestic companies.
Several studies examine liquidity changes after cross-listing in the US by Canadian
companies. Foerster and Karolyi (1993) find an increase of 62% in total trading volume after
cross-listing and an increase in domestic trading volume of 26%. Mitto (1997) reports an
increase in domestic trading volume for stocks listed on the Toronto stock exchange and a
decrease for stocks listed on the Vancouver stock exchange. Foerster and Karolyi (1998)
examine the consequences of the foreign listing of 52 Canadian firms in the US in terms of
liquidity and report that the total trading volume (TSE and US markets combined) increases
by 28% while trading volume on the TSE, the home market, decreases slightly, as some
portion of trading activity migrates to the foreign market. Furthermore, trading costs
measured by the bid-ask spread (posted as well as effective) decrease significantly following
listing in the US, particularly for firms that have a significant portion (over 50%) of total
trading activity taking place in the US. Foerster and Karolyi (1998) interpret the decrease in
the trading costs as the result of intensified competition among market makers due to the
additional presence of US market makers. A recent paper by Kryzanowski and Lazrak
(2009) examines the liquidity of Canadian stocks that cross-list on various US exchanges and
detects no variation in trading costs that might be driven by the choice of the any particular
US exchange as the destination exchange.
A group of studies employ intraday data to investigate the impact of trading on a
foreign exchange on trading activity in the home market. Werner and Kleidon (1996), Howe
and Ragan (2002) and Menkveld (2008) all report that the trading of a cross-listed stock in
the home market is concentrated in the overlapping trading hours. This is in line with the
theoretical prediction of Admati and Pfleiderer (1988) that traders tend to cluster in time.
Furthermore, Bacidore et al (2005) and Moulton and Wei (2009) provide evidence that
liquidity of cross-listed stocks, in terms of spreads and depth, improves during the
overlapping trading hours. However, Bacidore et al (2005) report that the improvement in

107
the home market liquidity is only observed for stocks from developed countries and not for
those from emerging markets.
Halling et al (2008) provide empirical evidence on the home market liquidity of non-
US stocks around cross-listing in the US. They show that trading activity in the home market
is stimulated by a listing on a foreign exchange. More specifically the home market’s stock
turnover ratio peaks in the year of cross-listing and stays above its pre-cross-listed level in
the consequent years. However, these findings hold only for stocks from developed countries
and countries with strong anti-insider trading protection. Stocks from countries with weak
anti-insider trading protection, however, experience a significant decrease in the home
market liquidity after cross-listing.
Finally, Berkman and Nguyen (2010) report evidence that seems to contradict the
prior literature. They show that cross-listing in the US is not associated with improvements
in domestic liquidity, which is proxied by the quoted bid-ask spread, price impact, turnover
and the probability of informed trading. Moreover, they report a weak improvement in stock
liquidity on the home market for stocks from emerging markets and from countries with
weak investor protection and poor accounting information quality.
Overall, existing empirical evidence suggests that after a cross-listing there is
improvement in the home market liquidity for stocks from developed markets but for stocks
from emerging markets there is either no impact or deterioration. These findings are
consistent with the theoretical predictions of Chowdhry and Nanda (1991) that equity trading
tends to be concentrated on the market with lower trading costs.52
They are also in line with
the predictions of Domowitz et al (1998) that domestic market quality of cross-listed stocks
deteriorates if the home market is segmented in terms of information flow. None of the
existing studies, however, examine the aggregate stock turnover after cross-listing that would
account for trading in all markets where the stock is listed/ traded.
Cross-trading and liquidity
Empirical evidence on the impact of over-the-counter (OTC) and off-exchange
trading on the home market liquidity of stocks is limited. Hamet (2002) examined the
52
The level of economic and financial development is highly correlated with trading costs; for
example, Halling et al (2008) use capital market development measure as a proxy for trading costs.

108
trading activity of 52 French stocks that are also traded on SEAQ-I, a trading platform on the
London stock exchange that enables trading of foreign stocks that are not listed on the
London stock exchange. The study reports that off-board trading in London has a positive
impact on the trading volumes and reduces transaction costs on the Paris Bourse. Ellul
(2006) studied the inter-market flow of information and price discovery dynamics of French,
German and Italian stocks that are cross-traded on the LSE’s SEAQ-I and found clear
evidence of order-splitting activity of market makers between the home and the foreign
markets. Large order execution, which is concentrated in London, results in a significant
increase in trading volume and price impact in the home market; and trading volumes on the
home and foreign markets are positively correlated.
3.2.2 Volatility
On the one hand, if cross-listing improves the stock’s information environment due
to increased information production then stock risk, i.e. uncertainty about future cash flows,
should be reduced after cross-listing. On the other hand, higher trading volumes after cross-
listing/ trading should be associated with higher volatility (Jones et al, 1994; Chan and Fong,
2000). Higher trading volumes after cross-listing/ trading are expected due to an increase in
the numbers of investors after a foreign listing and also due to more information released to
the market. More information results in higher trading, potentially due to different
interpretations of public information by investors (Bamber et al, 1999). Therefore,
theoretical predictions on the impact of cross-listing on stock risk are controversial and need
validation by empirical evidence.
Cross-listing and volatility
The literature offers empirical evidence on the consequences of international cross-
listing on stock return variance using both daily and intraday data. The studies that use daily
data include evidence on the experience of US stocks cross-listed outside of the US and of
non-US stocks cross-listed in the US. Barclay et al (1990) show that the increase in stock-
return variance following a listing on a foreign exchange is driven by trading volumes:
NYSE stocks after a secondary listing in Tokyo have an insignificant (less than 1%) portion

109
of total trading volume taking place in Tokyo and their stock-return variance remains
unchanged after cross-listing despite the significant increase in trading hours. At the same
time Japanese stocks listed on the NYSE have more active trading on the foreign exchange
(around 8% of the total trading volume takes place on the NYSE) and experience a
significant increase in the stock-return variance after cross-listing. Similar to Barclay et al
(1990), Howe and Madura (1990) and Lau et al (1994) report no significant changes in stock
risk and return variances after an international cross-listing by a US firm.
Several studies examine the implications on the stock volatility for non-US firms
listing in the US. Jayaraman et al (1993) find a significant permanent increase in return
volatility after cross-listing in the US, on average, by 56% for stocks from developed
European and Asian countries, which they interpret as consistent with the theory that a
foreign listing extends trading hours and creates new profitable opportunities for informed
traders (Freedman, 1989 sited by Jayaraman et al, 1993), whereas the disclosure of more
information via trading results in higher stock volatility (Black, 1986; French and Roll,
1986). For a small sample of Japanese stocks, Ko et al (1997) show that abnormal return
volatility increases after cross-listing in the US. Contrary evidence is reported by Martell et
al (1999): they find no evidence that stock return volatility changes after cross-listing in the
US for a sample of stocks from emerging markets in Latin America and attribute this finding
to the fact that a cross-listing in the US does not extend trading hours for Latin American
stocks. Domowitz et al (1998) argue that the impact of a cross-listing is complex and
depends on the level of transparency of the home market. Empirically, Domowitz et al
(1998) and Coppejans and Domowitz (2000) show that for stocks from Mexico, a market
with poor information linkages, a US listing results in increased volatility in the home
market. This is because the migration of the trading activity to the foreign market results in a
deterioration of the quality of the home market.
Another group of studies focuses on the intraday volatility patterns of cross-listed
stocks. Chan et al (1996) show that foreign stocks cross-listed in the US experience higher
volatility and higher trading volumes than similar US stocks, particularly in the early
mornings. The authors argue that this can be explained by the market reaction to public
information accumulated in the foreign markets overnight. Werner and Kleidon (1996),
Forster and George (1995), and Menkveld (2008) report a significant increase in return

110
volatility of cross-listed stocks in the overlapping trading hours between the home and the
host markets and show that this increase in volatility is related to the level of trading activity
on the home market (Werner and Kleidon, 1996) as well as on the foreign market (Forster
and George, 1995; Menkveld, 2008).
Overall, empirical evidence on the impact of cross-listing on stock return volatility is
mixed. However, there is a common element in most of the empirical evidence: the change
in volatility after cross-listing is positively related to the change in trading volumes after
cross-listing.
Cross-trading and volatility
Empirical evidence on the impact of off-exchange trading on the home market return
volatility is far from comprehensive. Ko et al (1997) report that, for a small sample of
Japanese stocks, abnormal return volatility increases significantly after cross-listing on the
NYSE as well as after listing on the US OTC market. However, the increase in volatility is
less for OTC listings. Bayar and Onder (2005) examine the volatility of French stocks traded
on the Deutsche Borse’s electronic market XETRA and find that volatility increases after
cross-trading on the XETRA for the majority of the stocks in the sample. This finding is
puzzling given the significant level of integration of French and German markets and
because of the additional finding that the home market liquidity deteriorates after cross-
trading on XETRA. The findings of Bayar and Onder (2005) are neither consistent with the
literature that link the increase in volatility to the increase in trading volume nor with the
argument of Domowitz et al (1998) that the increase in volatility is possible if the home and
the host markets are informationally segmented.
To summarize, the empirical evidence on the implications of cross-listing and cross-
trading on stock liquidity and volatility is not conclusive and is based mainly on samples of
US stocks traded outside of the US and of non-US stocks traded in the US. However, a large
population of non-US stocks cross-listed and cross-traded on non-US exchanges is not
covered. At the same time, as Domowitz et al (1998) show, the impact of a cross-listing
depends on the information linkages between the host and home markets. Thus, inclusion in
the sample of various home as well as host markets could shed more light on the economic
consequences of a foreign listing/trading. Furthermore, the evidence on the implications of

111
an admission to trade on a foreign exchange is limited. Moreover, there is no evidence on the
difference between the impacts of cross-listing and cross-trading on stock liquidity and
volatility.
3.3 Hypotheses development
By making the decision to cross-list on a foreign exchange, a company commits to
higher levels of disclosure and scrutiny by a greater number of market participants, which, in
turn, should lower the information asymmetry between company insiders and outside
investors. Consequently, the adverse selection component of trading costs should be lower.
Stock liquidity, measured by bid-ask spread and trading volume, and stock return volatility
are expected to improve if the firm’s information environment improves (Leuz and
Verrecchia, 2000). The improved information disclosure, however, is not the only outcome
of a cross-listing. Intensified inter-market competition, increased stock-specific information
production and enhanced stock visibility after the stock becomes available for trading on a
foreign exchange also potentially have an impact on stock liquidity and volatility. The
following sections 3.3.1 and 3.3.2 discuss specifically how international cross-listing and
cross-trading should affect stock liquidity and volatility.
3.3.1 Liquidity
There are several potential sources of improvement in a stock’s liquidity after a
foreign listing. Firstly, in the case of cross-listing, enhanced disclosure as a result of
compliance with listing requirements reduces information asymmetry (Brown and Hillegeist,
2007), and positively affects stock liquidity (Diamond and Verrecchia, 1991). Since stock
liquidity can be defined as the ability to trade large quantities of the stock at low cost, the
two major dimensions of liquidity are trading quantity and trading cost. Bid-ask spread, a
proxy for the trading cost dimension of liquidity, represents the cost that a trader must incur
in order to execute a trade. Thus, a lower bid-ask spread indicates higher stock liquidity.

112
Kyle (1985) and Glosten and Milgrom (1985) theoretically establish a positive association
between a bid-ask spread and the level of information asymmetry. Extensive empirical
evidence confirms that improved disclosure is associated with improved liquidity in terms of
spreads, trading volumes, depth and adverse selection spread component (Welker, 1995;
Healy et al, 1999; Leuz and Verrecchia, 2000; Heflin et al, 2000; and Krishnamurti et al,
2005).
The other sources of improved liquidity apply both for cross-listing and for cross-
trading. Improvement in the information environment could also be driven by the increase,
after international cross-listing and cross-trading, in the number of market participants that
have economic incentives to generate stock-specific information in order to profit from
informed trading. Kyle (1985) shows that information arrival increases trading volumes.
Noronha et al (1996) empirically confirm the increase in informed trading after cross-listing.
Furthermore, the presence of foreign traders and market makers for cross-listed and cross-
traded stocks boosts inter-market competition. Stoll (1978 and 2001) and Amihud and
Mendelson (1995) theoretically show that increased competition forces market makers to
reduce the spreads. This proposition is supported empirically by Werner and Kleidon (1996).
Finally, a more liquid trading environment after cross-listing could be expected as an
outcome of increased stock visibility and investor recognition (Merton, 1987).
H1.1: Cross-listing or cross-trading on a foreign market improves the liquidity of a
stock.
In case of cross-trading, the stock does not benefit from additional mandatory
disclosure. Although the level of disclosure requirement does not change, the exposure of the
stock to more traders enhances the level of information available in the market as more
trading brings more information to the market (Glosten and Milgrom, 1985). Additionally,
the sources of potential change in stock liquidity in the case of cross-trading include:
increased competition among market makers, improved accessibility to foreign investors,
and change in the composition of the investor base, but not improved disclosure.
Consequently, cross-trading should have a less significant impact on stock liquidity.
H1.2: The improvement in liquidity from cross-listing is significantly higher than the
improvement in liquidity from cross-trading.

113
3.3.2 Volatility
Limited stock-specific information is a source of risk and, accordingly, of higher
volatility due to a higher level of uncertainty about the stock’s future cash flows (Barry and
Brown, 1986; Wang, 1993) and also due to a higher probability of a large one-time stock
price response to new information (Lang and Lundholm, 1993). The other significant
contributor to higher stock volatility in the presence of information asymmetry is noise
trading (Campbell and Kyle, 1993; De Long et al, 1990; Wang, 1993), since more active
noise trading reduces stock price informativeness, meaning it further increases the
uncertainty about stock fundamentals to uninformed traders, and, consequently, increases the
stock’s fundamental risk. Therefore, lower levels of information asymmetry between
corporate managers and shareholders and/or among different groups of investors and traders
are generally associated with lower volatility. Accordingly, since cross-listing is associated
with higher levels of information disclosure due to the presence of additional listing
requirements, it should reduce stock risk (Barry and Brown, 1985 and 1986) and,
specifically, stock return volatility (Wang, 1993; Leuz and Verrecchia, 2000).
H2.1: Stock presence on a foreign exchange (listed and/or traded) reduces stock
return volatility.
Compared to cross-listing, the change in information asymmetry after cross-trading
is less profound as it does not impose additional disclosure requirements. However, cross-
trading does increase the production of stock-specific information as the result of the
increase in the number of market participants that have an interest in the stock as a potential
source of trading profit.
H2.2: Cross-listing is associated with greater reduction in stock return volatility
compared with cross-trading.
Empirical evidence on the relationship between the level of information asymmetry
and volatility, however, contradicts the theoretical prediction: Leuz and Verrecchia (2000)
and Brown and Hillegeist (2007) find that increased disclosure is associated with higher
stock return volatility. Furthermore, a survey of the literature on the implications of an
international cross-listing and cross-trading (discussed in section 3.2.2) reveals that stock
volatility generally increases after cross-listing and cross-trading, particularly when cross-

114
listing and cross-trading is associated with an increase in trading activity. I recognize the
complexity of the relationship between the improved disclosure and stock return volatility
and explicitly control for other important components of the change in volatility after a
foreign listing. Particularly, the change in trading volume after cross-listing is one of the
most important components as its expected impact on volatility is directly opposite to that of
the impact from increased disclosure, as discussed in the forthcoming section 3.3.4 on the
main control variables.
3.3.3 Developed vs. emerging home market
The literature reviewed in section 3.2 provides evidence that the impact of an
international cross-listing on stock liquidity and volatility differs depending on the level of
development of the stock’s home market. Fernandes and Ferreira (2008) show that for stocks
from developed countries stock price informativeness after cross-listing increases, while for
stocks from emerging countries it decreases. Domowitz et al (1998) develop a theoretical
model to show that a cross-listing by a stock from a market with poor information linkages,
which is generally the case for an emerging market, results in a decrease in home market
liquidity and an increase in stock volatility. This is an outcome of the migration of trading
activity to the foreign market and consequent deterioration of the quality of the home market.
Based on the theoretical argument of Domowitz et al (1998) and existing empirical evidence
(Domowitz et al, 1998; Smith and Sofianos, 1997; Bacidore et al, 2005; Halling et al, 2008,
Fernandes and Ferreira, 2008), I put forward an additional hypothesis on the impact of
foreign listing/ trading for stocks from developed and emerging markets.
H3: Compared to stocks from emerging markets, stocks from developed countries
experience a significantly higher improvement in liquidity and a significantly larger
reduction in return volatility after cross-listing and cross-trading.

115
3.3.4 Main control variables
After cross-listing there are several channels through which the information
environment is affected and, accordingly, this affects stock liquidity and stock volatility. I
account for the fact that the changes in stock liquidity and volatility after cross-listing are
potentially driven by the changes in company size, accounting information disclosure
practices, analyst following, and the level of trading activity, and evaluate whether a cross-
listing and/or a cross-trading have an impact on the stock liquidity and volatility after
controlling for changes in these factors.
Firstly, there is evidence that companies that cross-list are larger than those that do
not (Pagano et al, 2002). In turn, larger companies have a better information environment as
predicted by the differential information hypothesis (Freeman, 1987). However, based on the
findings of chapter 2 the implications of cross-listing in terms of the impact on shareholders’
wealth are more profound for smaller companies. Arguably, smaller companies overcome
larger information barriers by means of cross-listing and, consequently, experience greater
incremental reduction in the level of information asymmetry. Thus, the expectation is that
larger companies have a lower level of information asymmetry and, accordingly, better
liquidity and lower volatility; but, the improvement in stock liquidity and volatility after
cross-listing is more significant for smaller companies.
Secondly, a cross-listed company is more likely to have adopted superior accounting
practices (Lang et al, 2003b). Leuz and Verrecchia (2000) show that higher quality
information disclosure as the outcome of adopting internationally recognized accounting
standards and principles is associated with lower levels of information asymmetry, measured
by bid-ask spreads and trading volume. Thus, the expectation is that an improvement in the
quality of accounting information around a cross-listing enhances stock liquidity and reduced
stock volatility.
Thirdly, cross-listing results in increased attention from financial analysts (Baker et
al, 2002; Lang et al, 2003a). The quality of the information environment in turn is positively
related to the level of analyst coverage of the company (Draper and Paudyal, 2008). Thus,
the expectation is that an increase in analyst coverage after cross-listing improves stock
liquidity and reduces stock volatility.

116
In the case of volatility, the evidence53
supports the argument that higher volatility is
associated with higher information flows, in line with Black (1986) and French and Roll
(1986), and with higher trading volumes, in line with Karpoff (1987), Schwert (1989), Jones
et al (1994) and Chan and Fong (2000). Therefore, it is important to control for the change in
the level of trading activity after cross-listing. The expectation is that the increase in trading
activity after foreign listing/ trading significantly increases stock return volatility.
3.4. Methodology
3.4.1 Cross-sectional analysis
In the cross-sectional analysis the liquidity and volatility of cross-listed and cross-
traded stocks are compared against those of pure domestic stocks. However, in order to
evaluate the impact of foreign presence, and cross-listing and cross-trading individually, on
the stock liquidity and volatility, it is necessary to account for the fact that, potentially,
companies that have their shares listed and traded abroad differ in their characteristics from
companies that have their shares listed and traded only in the home market. Thus, a cross-
listing decision is a matter of choice for a company and largely determined by company-
specific factors. Pagano et al (2002) provide evidence that cross-listing companies tend to be
larger, more export-oriented and faster growing compared to peer companies from their
home countries. Similarly, in the case of a cross-trading, larger companies are more likely to
choose to have their shares traded on a foreign exchange (e.g. US OTC) or to be chosen by
market makers to have their shares traded on a foreign exchange (e.g. Open market of
Deutsche Borse). Therefore, there is a potential endogeneity problem in the estimation of the
relationship between cross-listing and/or cross-trading and stock liquidity and volatility. In
other words, improved liquidity and volatility after cross-listing and/or cross-trading is
potentially not an outcome of cross-listing and/or cross-trading as such, but rather the
reflection of the fact that stocks with better liquidity and lower volatility are more likely to
cross-list and cross-trade. Therefore, it is essential to control for the self-selection bias in the
53
Barclay et al (1990), Jayaraman et al (1993), Chan et al (1996), Werner and Kleidon (1996), Forster
and George (1995), Menkveld (2008) - discussed in the literature review in section 3.2.2.

117
regression analysis. I follow Doidge et al (2004) and use Heckman’s (1979) two-stage
estimation method to control for potential endogeneity.54
The first stage of this estimation
procedure evaluates the likelihood of a company cross-listing and/or cross-trading given
company and home country characteristics, using the sample of cross-listed as well as
domestic stocks:
Probability (FPi,t) = f (ωFi,t) (3.1)
where Fi,t is the foreign presence dummy variable that equals one if stock i is cross-listed
and/or cross-traded in month t and equals zero otherwise; Fi,t are the potential determinants
of cross-listing and/or cross-trading status.
Similar to Doidge et al (2004, 2009a), I estimate a probit model that includes
company size and a number of country characteristics, such as economic development,
financial development, legal environment and accounting opacity, as potential determinants
of a cross-listing and/or cross-trading status. Maximum likelihood coefficient estimates from
the probit model are used to calculate the Inverse Mills Ratios, which are the ratios of the
probability density function over the cumulative distribution function of a distribution, for
each observation in the sample:
for FPi,t =1, λi,t = φ(ωFi,t)/ Φ(ωFi,t)
for FPi,t =0, λi,t = -φ(ωFi,t)/[1-Φ(ωFi,t)] (3.2)
where Fi,t is the foreign presence dummy variable that equals one if stock i is cross-listed
and/or cross-traded in month t and equals zero otherwise; λi,t is the Inverse Mills Ratio; φ is
the normal probability distribution function and Φ is the normal cumulative distribution
function. The Inverse Mills Ratio is an estimate of the non-selection hazard that accounts for
the probability of a stock with characteristics Fi,t being listed/ traded on a foreign exchange.
The second stage of the estimation procedure evaluates the relationship between the
measures of liquidity and volatility and the cross-listing and/or cross-trading status and other
stock characteristics using a multivariate framework. Multivariate regression specifications
additionally include the estimated Inverse Mills Ratios in order to account for the self-
selection bias and obtain consistent parameter estimates (Leuz and Verrecchia, 2000; Doidge
et al, 2004). Thus, the main model specification is as follows:
54
This procedure has been used in a number of studies including Doidge et al (2004 and 2009a), Leuz
and Verrecchia (2000), Bailey et al (2006), and Fernandes and Ferreira (2008).

118
Liquidity/Volatility Measurei,t = α + βDi,t + ΣθFi,t + γλi,t +εi,t (3.3)
where Di,t is dummy variable that reflects foreign listed/traded status of the stock i in month
t; Fi,t are control variables; λi,t is the Inverse Mills Ratio.55
In order to control for other important determinants of stock liquidity and volatility
around the change in listing status, additional interaction variables of the main control
variables with a dummy variable representing foreign listed/traded status are included in the
model:
Liquidity/Volatility Measurei,t = α +βDi,t +Σβ1Di,tVi,t + ΣθFi,t + γλi,t +εi,t (3.4)
where Di,t is dummy variable that reflects foreign listed/traded status of the stock i in month
t; Vi,t are stock characteristics, the main control variables; Fi,t are other control variables; λi,t
is the Inverse Mills Ratio.
3.4.2 Evolution of stock liquidity and volatility
As discussed above, the endogeneity concern is that, potentially, more liquid and
less risky stocks have a higher propensity to cross-list and/or cross-trade outside the home
market. One way to test this proposition and, additionally, to evaluate the long-term
sustainability of the changes in liquidity and volatility after the change in the listing status, is
to track the evolution of stock liquidity and volatility of cross-listed stocks before and after
cross-listing/trading.56
In order to reveal the dynamics, the year of the initial foreign
presence/ cross-listing/ cross-trading is assigned as the year 0, and the years around the year
0 are assigned accordingly as the years ≤-4, -3, …, 0, +1, …, +3, ≥+4 relative to the year 0.
Initially, stock liquidity and volatility of cross-listed stocks individually in each of the years
≤-4, -3, …, 0, +1, …, +3, ≥+4 are compared against the stock liquidity and volatility in the
year 0 and against the liquidity and volatility of domestic stocks. Then, the evolution of stock
liquidity and volatility is evaluated using a multivariate regression analysis framework. In
the cross-sectional regression (model specification (3.4), section 3.4.1) variables representing
55
The estimation procedure that does not account for self-selection bias engages similar model
specification without the Inverse Mills Ratio: Liquidity/Volatility Measurei,t = α + γDi,t + ΣθFi,t + εi,t,
where Di,t is the foreign presence dummy variable for stock i in month t and Fi,t are control variables. 56
Similar analysis was performed by Gozzi et al (2008) to track the evolution of Tobin’s Q of cross-
listed stocks around cross-listing event and also by Hail and Leuz (2009) to analyze the sustainability
of the reduction in the cost of capital of cross-listed stocks around cross-listing.

119
foreign presence, cross-listing and cross-trading listing statuses are replaced with a series of
dummy variables representing years around foreign presence/ cross-listing/ cross-trading
from beyond year -4 to beyond year +4. Coefficient estimates on these year dummies relative
to the year of cross-listing/ trading would thus indicate the evolution of stock liquidity and
volatility before, during the year of and after cross-listing and cross-trading, controlling for
other factors.
3.4.3 Time-series framework
The other way to control for the self-selection bias is to examine the changes in the
liquidity and volatility of the cross-listed stocks before and after the cross-listing/trading. In
this analysis, the liquidity and volatility of cross-listed/ traded stocks are compared against
the stock liquidity and volatility of the same stocks over the period of time when the stocks
were not listed or traded abroad, i.e. had domestic listing status. I use a 36 month period57
before the first foreign listing/trading as the base period for calculation of the base or
benchmark variables. I calculate the base, or benchmark, measures of stock liquidity and
volatility for each stock as the averages of these measures over the period of time when the
stock was not listed/ traded abroad. Then, for the purpose of univariate analysis, I calculate
ratios of the liquidity/volatility measures as a ratio of the average liquidity/volatility measure
over the period of time when stock is present abroad (cross-listed and/or cross-traded) to the
base liquidity/volatility measure for each stock. Estimated liquidity and volatility ratios of
more than one indicate an increase in a liquidity/volatility measure after the change in the
listing/trading status. A ratio of less than one represents a decrease.
Additionally, liquidity and volatility ratios are analysed cross-sectionally using
multivariate regression analysis. For the purpose of multivariate analysis, ratios of the
liquidity/volatility measures are calculated for each stock-month by dividing the liquidity/
volatility measure by the base liquidity/volatility measure. The regression specifications
include ratios of the explanatory and control variables, calculated similar to the liquidity and
57
If a full 36 months of data is not available I only use the data if at least 12 full months of complete
data are available.

120
volatility ratios, as ratios of a variable in month t to the base variable, i.e. the average value
of the variable over the period of time when the stock had domestic listing status:
(Liquidity or Volatility Measurei,t / Liquidity or Volatility Measurei,base) =
= α + γDi,t + Σθ(Fi,t /Fi,base) + εi,t, (3.5)
where Liquidity or Volatility Measurei,t is liquidity or volatility measure of stock i in month
t; Liquidity or Volatility Measurei,base is base liquidity or volatility measure of stock i, i.e. the
average over the period of time when the stock was not listed/ traded abroad; Di,t is dummy
variable that reflects foreign listed/traded status of the stock i in month t; Fi,t are stock
characteristics, the explanatory and control variables, of stock i in month t; Fi,base are base
stock characteristics of the stock i, i.e. the average over the period of time when the stock
was not listed/ traded abroad. Such model specifications allow the examination of whether
the change in stock liquidity and volatility is driven by the change the foreign listing/trading
status or by the changes in stock characteristics after cross-listing.
3.4.4 Variables definition and measurement
Dependent variables
The dependent variables reflect stock price behaviour on the stock’s home market.
All liquidity and volatility measures, defined below, are calculated for each month using
daily data. The following widely accepted measures of stock liquidity and volatility are
calculated.
Liquidity
Proportional bid-ask spread is a commonly used liquidity measure (Copeland and
Galai, 1983; Foerster and Karolyi, 1998; Hasbrouck and Seppi, 2001) that reflects the
difference between the ask and bid home market prices relative to the midpoint, i.e. the
average of the ask and bid prices. Monthly average bid-ask spread is the average of the daily
bid-ask spreads: Bid-Ask Spreadi,T=(1/Ni,T)∑( Pask i,t - Pbid i,t)/(( Pask i,t + Pbid i,t)/2), where Bid-
Ask Spreadi,T is the average bid-ask spread of stock i in month T; Ni,T is number of trading
days for stock i in month T; Pask i,t is the ask price of stock i at day t; Pbid i,,t is the bid price of
stock i at day t.

121
Trading volume in the home market, another common trade-based proxy for stock
liquidity (Foerster and Karolyi, 1998; Rubin, 2007; Chordia et al, 2007), is measured by the
average daily number of shares traded on the home market in each month:
VOi,T =(1/Ni,T)∑VOi,t, where VOi,T is average share trading volume of stock i in month T; Ni,T
is number of trading days for stock i in month T; VOi,t is number of shares traded on the
home market of stock i at day t.
Turnover ratio, used by Leuz and Verrecchia (2000) and Leuz (2003) as a proxy for
the level of information asymmetry, is the monthly average of the daily turnover ratios
calculated as a ratio of the trading volume by value, i.e. the product of the number of shares
traded and the stock price, to the stock’s market capitalization58
:
TVtoMVi,T =(1/Ni,T)∑(VOi,t Pi,t /MVi,t), where TVtoMVi,T is average turnover ratio of stock i in
month T; Ni,T is number of trading days for stock i in month T; VOi,t is number of shares
traded on the home market of stock i at day t; Pi,t is closing price of stock i at day t; MVi,t is
market capitalization of stock i at day t.
When a stock is traded in more than one market, as in the case of cross-listed stocks,
analysis of home market liquidity might not provide a complete picture if a significant
portion of the stock trading takes place in foreign market(s). Accordingly, it is beneficial for
an understanding of the stock’s overall liquidity to additionally examine the changes after
cross-listing/ trading in total trading volume and total turnover ratio. Total trading volume
and total turnover ratio take into account trading volumes in all markets where the stock is
listed and traded.
Total trading volume is the average of the total daily trading volume in each month.
Daily trading volume is calculated as the sum of the number of shares traded at day t on all
exchanges in the sample where the stock is being traded:
VOTotali,T =(1/Ni,T)∑∑VOi,m,t, where VOTotali,T is the average share trading volume of stock
i in month T; Ni,T is number of trading days for stock i in month T; VOi,m,t is number of shares
traded on exchange m of stock i at day t. If trading on a foreign exchange takes place in the
58
This turnover measure is numerically equal to the share turnover (Lo and Wang, 2009), calculated
as the ratio of the share trading volume to the number of shares outstanding, which is widely used in
the literature (Datar et al, 1998; Lo and Wang, 2000; Chordia et al, 2001; Chordia et al, 2007;
Statman et al, 2006; Korajczyk and Sadka, 2008).

122
form of depository receipts (DR) then the number of shares traded on a foreign exchange is
adjusted using the DR conversion ratio.
Total turnover ratio is the monthly average of the daily total turnover ratios
calculated as a ratio of the total trading volume in GB pounds (GBP) to the stock’s market
capitalization in GBP. Total trading volume in GBP is the sum of the trading volumes in
GBP on each exchange in the sample where the stock is traded, calculated as the product of
the number of shares traded and the stock price converted to GBP:
TVTotaltoMVi,T=(1/Ni,T)∑((∑VOi,m,tPGBP
i,m,t)/MVGBP
i,t), where TVTotaltoMVi,T is the average
total turnover ratio of stock i in month T; Ni,T is number of trading days for stock i in month
T; VOi,m,t is number of shares traded of stock i on exchange m at day t; PGBP
i,m,t is closing
price of stock i on exchange m at day t converted to GBP; MVGBP
i,t is home market
capitalization of stock i at day t converted to GBP.
Volatility
Higher levels of information asymmetry between companies and shareholders and
among investors are associated with higher variability in stock returns (Barry and Brown,
1985 and 1986; Wang, 1993; Lang and Lundholm, 1993). I use three measures of volatility
to quantify stock risk.59
First, following Lang and Lundholm (1993), and Leuz and
Verrecchia (2000), I use stock return volatility as a proxy for information asymmetry
defined as the monthly standard deviation of the stock’s daily returns including dividend
income.
The second measure of volatility is the firm-to-market volatility ratio, used by
Agrawal et al (2004) and Clayton et al (2005). It additionally accounts for market level
volatility and is calculated as the ratio of monthly standard deviation of the stock’s daily total
returns to the monthly standard deviation of daily total returns of the home market index:
59
The focus of this study is on the total stock risk. A number of studies link the quality of the
information environment to stock’s idiosyncratic risk (e.g. Ferreire and Laux, 2007; Fernandes and
Ferreira, 2008). I acknowledge that stock idiosyncratic risk would be an appropriate measure;
however, I do not use it due to data limitations. In order to obtain reliable estimates of the
idiosyncratic risk using a market model a relatively long time series of daily stock returns are required
(Draper and Paudyal, 1995). In this study I evaluate and compare stock risk over periods of time
when the stock had different listing statuses and in many cases the length of such time periods is not
sufficient to estimate the parameters of a market model.

123
Volatility Ratioi,T = σi,T / σm(i),T, where Volatility Ratioi,T is the firm-to-market volatility ratio
of stock i, or monthly market-adjusted volatility of stock i’s daily returns in month T; σi,T is
monthly standard deviation of stock i’s daily returns in month T; σm(i),T is monthly standard
deviation of stock i’s home market index daily returns in month T.
The third measure of stock volatility focuses on the intra-day volatility of the stock
price. The high-low ratio (Parkinson, 1980; Martens and van Dijk, 2007; Alizadeh et al,
2002) is the average of the daily high-low ratios calculated as the natural logarithm of the
ratio of the highest stock price achieved on the day to the lowest price achieved on the day:
High-low Ratioi,T = (1/Ni,T)∑ln(Phigh i,t /Plow i,t), where High-low Ratioi,T is the average of
daily high-low ratios of stock i in month T; Ni,T is number of trading days for stock i in
month T; Phigh i,t is the highest price achieved of stock i at day t; Plow i,t is the lowest price
achieved of stock i at day t.
Table 3.1 summarizes definition, measurement and data sources for the dependent
variables.
Explanatory and control variables
Explanatory variable: cross-listing/trading status
Definition, measurement and data sources for the explanatory variables are presented
in Table 3.2. The main explanatory variable is the listing status variable that reflects one of
the following listing and/or trading statuses:
� domestic, i.e. not listed or trade outside of the home market
� cross-traded, i.e. traded abroad without stock exchange listing in addition to the
home market listing
� cross-listed, i.e. listed on a foreign exchange in addition to the home market listing
� with a foreign presence, i.e. cross-listed and/or cross-traded inclusive
� cross-listed and cross-traded, i.e. cross-listed and cross-traded simultaneously
Listing/ trading status of a cross-listed company in the sample changes over time:
from domestic to listed and/or traded on one or more foreign exchanges/ trading venues. The
listing/ trading classification is based on the sample data.

124
Main control variables
As outlined in section 3.3.4, a number of firm-specific characteristics could be
responsible for the change in the stock’s information environment and, accordingly, in stock
liquidity and volatility. Company size is measured by stock market capitalization. Daily
stock market capitalization is used to calculate daily measures of stock liquidity and
volatility, whereas stock market capitalization at the end of the month is used in the
regression analysis that uses monthly data. International accounting standards (IAS) is the
dummy variable that proxies for the adoption of IAS or US GAAP accounting practices. The
IAS variable is time varying, i.e. it reflects any changes in the accounting standards used by
a company over time. Analyst coverage is measured by the total number of EPS one-year
estimates on the company in the I/B/E/S database, similar to Leuz and Verrecchia (2000). In
order to overcome the problem of a high correlation between company size and analyst
coverage and to assess the incremental role of analyst coverage in reducing the level of
information asymmetry, I follow Draper and Paudyal (2008) and use residual analyst
coverage variable in the regression analysis, which is the error term εi,t from the regression of
the analyst coverage on the company size: ln(1+ACi) = α + βln(MVi,t) + εi,t, where ACi
is analyst coverage measured by the total number of EPS estimates for stock i in the
preceding year; MVi,t is company size measured by the stock market capitalization of stock
i in month t. The last main control variable of the changes in stock volatility after cross-
listing/trading is the level of trading activity, measured by the stock’s total trading volume,
defined in section 3.4.4 and Table 3.1.
Other control variables
Extensive literature (Roll, 1984; Atkins and Dyl, 1997; Glosten and Harris, 1988;
Stoll, 1989; and Menyah and Paudyal, 2000; Gregoriou et al, 2005) documents that stock
liquidity is determined, in addition to company size, by stock return volatility and, in case of
the bid-ask spread, by the level of trading activity. To control for these two determinants, I
include the stock turnover ratio and return volatility variables (defined in section 3.4.4) in the
regressions of the bid-ask spread and return volatility variable in the regressions of the other
liquidity measures. Further, stock liquidity and volatility are expected to be affected by the
level of the stock’s ownership concentration that restricts the availability of shares for
125
trading to common investors (Leuz and Verrecchia, 2000; Fernandes and Ferreira, 2008).
Ownership concentration is measured as the percentage of shares held by insiders of the total
common shares outstanding at the end of the preceding year. To control for various
dimensions of company risk, I include in the regressions of volatility measures company-
level fundamentals such as sales growth, leverage and intangibles. Sales growth is the
percentage change in sales over the preceding three years. Leverage is the ratio of the total
liabilities to total assets at the end of the preceding year. Intangibles is the ratio of the total
value of intangible assets to the total assets at the end of the preceding year.
Liquidity and volatility of a stock are inevitably affected by the level of the equity
market liquidity and volatility of the stock’s primary market of trading, i.e. the home
country. The level of market liquidity and volatility varies significantly across countries and
is determined by the level of economic and financial development and the level of investor
protection (Domowitz et al, 2001; Chiyachantana et al, 2004; Chiyachantana et al, 2006).
Since the sample includes stocks from seventeen countries that vary significantly by the
above characteristics, it is essential to control for the home country characteristics in the
regression analysis of liquidity and volatility.
As a proxy for the level of economic development of the home country I use the
natural logarithm of the 3-year-average per capita GDP in US dollars. Market size is the
proxy for the level of financial development of the home country and is measured as the
natural logarithm of total market capitalization of the Datastream Total Market index,
converted from local currency to GB pounds. The level of the market liquidity of the home
country complements market size as, despite their size, some small markets are very liquid.
Market-level liquidity is measured by the market turnover ratio calculated as the average of
the daily ratios of the aggregate trading volume by value to the aggregate market
capitalization of the Datastream Total market index, calculated for each month. To control
for the legal environment of the home country, I follow Durnev and Kim (2005) and use the
legal index, defined as the anti-director rights index multiplied by the rule-of-law index,
which assesses the law and order tradition of a country. Durnev and Kim (2005) argue that
the Legal index reflects both de jure and de facto aspects of investor protection, which is
important since some countries with high de jure protection do not have high de facto
investor protection. The anti-director rights index is from Djankov et al (2007) and the rule-

126
of-law index is from Kaufmann et al (2005). Finally, in order to evaluate the change in the
quality of the stock’s information environment due to a change in the listing status, it is
necessary to control for the quality of the information environment of the home country,
which I proxy with the accounting opacity index from Kurtzman et al (2004) that quantifies
inadequate accounting and governance practices on a country level.
3.5 The sample
The main sample consists of European stocks that are cross-listed on a foreign stock
exchange(s). The sample stocks are matched with domestic stocks. Cross-listed stocks are
those that have had their stock cross-listed on at least one foreign exchange in addition to
listing on the exchange in the home market. Cross-listing data includes events up to
December 2007 and comes from the stock exchanges’ web-sites, Factiva news database and
foreign listings dataset of Sarkissian and Schill (2004, 2009a). Data on depository receipts
(DRs) are from the BNY, Citibank, Deutsche Bank, and JP Morgan DRs databases available
on-line. The additional requirement for sample inclusion is the availability of a home market
listing, i.e. direct foreign IPOs are excluded. The analysis is performed on the security level
rather than the company level: all related listings for each cross-listed stock are identified by
ISIN (data source: Datastream). Underlying ISINs and conversion ratios for depository
receipts are from the mentioned above DRs databases. Only common equity and major
securities are included in the sample.
The initial sample included 820 European cross-listed stocks with multiple foreign
listing and trading accounts.60
For each of these stocks I determine their foreign listing/
trading status, as defined in section 3.4.4, for each month from January 1990 to December
2007.61
Stock price and other financial data are obtained from Datastream. After checking
for the availability of daily data required in order to calculate stock liquidity and volatility
measures I am left with the sample of 509 cross-listed/traded stocks from 20 European
60
Those are 820 unique stocks. Each of these stocks contributes to the sample at least one foreign
account. On average, a sample stock is listed and/or traded on more than one foreign exchange. 61
The period of time before year 1990 is excluded from analysis due to poor data availability.

127
countries. The final sample for the regression analysis includes 425 stocks with a foreign
presence from 17 European countries. The sample is reduced from 509 to 425 stocks due to
unavailability of data on some of the explanatory and control variables. Columns (2) and (5)
of Table 3.3 present the distribution of stocks with a foreign presence by home country. The
most represented country is the United Kingdom, followed by France and Germany.
For the purpose of the cross-sectional analysis, the sample of cross-listed stocks is
supplemented by a sample of European domestic stocks, i.e. stocks that have not been listed
or traded on a foreign exchange. The list of listed and traded stocks for each European
country in the sample is obtained from Datastream. For each stock in the list I identify
related listing and trading accounts using the Datastream database. The list of domestic
stocks is obtained by eliminating stocks with at least one foreign listing/ trading account
from the Datastream’s list of European stocks. Initially, I identified 4,844 European domestic
stocks. After checking for the availability of daily data required to calculate stock liquidity
and volatility measures, I am left with the sample of 3,702 domestic stocks from 20
European countries. Out of these 3,702 domestic stocks only 1,755 stocks have data
available for all explanatory and control variables. Columns (3) and (6) of Table 3.3 present
the distribution of domestic stocks by home country. The most represented country is
Germany, followed by the United Kingdom62
and France.
The total cross-sectional sample includes observations from January 1990 to
December 2007 and consists of 4,211 stocks, including 509 stocks with a foreign presence.
The sample used in regression analysis is reduced due to the unavailability of data for some
of the explanatory and control variables; the smallest sample used to estimate some model
specifications contains 2,180 stocks, including 425 stocks with a foreign presence. Columns
(4) and (7) of Table 3.3 present the distribution of the sample by home country.
Finally, for the purpose of the time-series analysis, the sample of 509 cross-listed
stocks from 20 European countries is checked for availability of daily data over the period of
36 months (at least 12 months) prior to the first foreign listing/trading, i.e. over the base
62
The relatively small number of domestic stocks from the UK can be explained by the fact that
majority of the UK stocks are listed or admitted to trade on other European exchanges. Out of the
1,928 UK stocks available in Datasream, only 546 stocks were identified as domestic, while 1,138
stocks were identified as stocks with a foreign presence. The majority of stocks with a foreign
presence are admitted to trade on Berlin exchange, Frankfurt exchange and XETRA.

128
period when a stock had domestic listing status, for the purpose of calculating the base, or
benchmark, measures of liquidity and volatility. Eventually, for the time-series analysis I am
left with a sample of 491 cross-listed stocks.
To avoid drawing spurious inferences from extreme values, the observations of all
liquidity and volatility measures over the whole sample period are trimmed 1% at each end.
Similarly, the observations of company size, sales growth, leverage, and intangibles
variables are also trimmed 1% at each end. The closely held shares variable, proxy for
ownership concentration, is discarded if it is more than 100 percent.
3.6 Empirical results
The empirical results section first discusses the findings from the cross-sectional
analysis of cross-listed stocks as well as domestic stocks. The aim is to evaluate the impact
of the change in the listing status on the stock liquidity and volatility. The cross-sectional
analysis is followed by a discussion of the evolution in the stock liquidity and volatility
before and after cross-listing/trading. Then there will be an examination of the changes in
stock volatility and liquidity performed using the time-series framework. The final sub-
section discusses the implications of multi-market trading for stock from developed vs.
emerging markets.
3.6.1 Cross-sectional analysis
In this section the liquidity and volatility of cross-listed stocks is evaluated against
those of domestic stocks from the respective home countries. First, there is discussion of the
descriptive summary statistics of the liquidity and volatility measures and also of firm
characteristics. Then, the following section estimates the probability of cross-listing and/or
cross-trading. The estimated probability of foreign presence is used in the following
multivariate regression analysis in order to control for the potential self-selection bias. The
final part of the cross-sectional analysis investigates in detail the evolution of stock liquidity

129
and volatility around cross-listing on a year-by-year basis relative to a foreign listing/ trading
event.
Summary statistics
Stock liquidity and volatility measures
Panel A of Table 3.4 reports the mean and median of the liquidity and volatility
measures and the number of stock-month observations (N observations) for the full sample
and for sub-samples by listing/ trading status. Table 3.4 also reports the difference in
variable means and medians between two groups of stocks: 1) stocks with a particular
foreign listing/ trading status (with a foreign presence, and individually for cross-traded only,
cross-listed only and cross-listed and traded simultaneously), and 2) domestic stocks. The
significance of the difference in means is evaluated with the t-test, while the significance of
the difference in medians is evaluated using non-parametric Wilcoxon rank sum test. Based
on the t-test and the Wilcoxon test, I find that mean and median liquidity measures of stocks
with a foreign presence are significantly different from those of domestic stocks. In line with
expectations, compared to those of domestic stocks, stocks with a foreign presence and,
particularly, stocks that are cross-listed and cross-traded at the same time, enjoy a
significantly lower bid-ask spread and significantly higher home market trading volume,
total trading volume, home market turnover ratio and total turnover ratio. However, in
contrast to the expectation that a foreign exchange listing is associated with greater
improvement in stock liquidity compared to an admission to trade, cross-traded stocks have
higher liquidity than cross-listed stocks. Further, Panel A of Table 3.4 reports that, in line
with expectations, mean and median volatility measures of the stocks with a foreign
presence, including cross-listed and cross-traded stocks, are significantly lower than those of
domestic stocks based on the t-test and the Wilcoxon test accordingly.
Firm characteristics
Panel B of Table 3.4 provides descriptive statistics of firm characteristics that are
used as control variables in the multivariate analysis. Based on the t-test and the Wilcoxon
test, companies with a foreign presence and particularly, stocks simultaneously listed and

130
traded abroad, are significantly larger than domestic companies. In fact, a company that has
its stock listed and/or traded on a foreign exchange is, on average, 25 times larger in terms of
market capitalization than an average domestic company in the sample. However, I find no
evidence that companies with a presence on foreign exchange(s) adopt internationally
recognized accounting standards more often than domestic companies. Only stocks that list
and trade abroad at the same time have a higher mean IAS variable than domestic stocks. As
expected, stocks with a foreign presence and, particularly, stocks simultaneously listed and
traded abroad, have significantly higher analyst coverage than domestic stocks (on average,
13.8 analysts follow a stock with a foreign presence as opposed to only 2.9 analysts that
follow a domestic stock) and have significantly lower ownership concentration, measured by
the percentage of closely held shares, than domestic stocks (the difference in ownership
concentration between a stock with a foreign presence and a domestic stock is around 20%).
Furthermore, companies with a foreign presence exhibit significantly lower sales growth, are
significantly more leveraged, and have a significantly higher ratio of intangible assets to total
assets.
Appendix 3.1 reports a correlation matrix of the dependent, explanatory, and control
variables that indicate that the level of correlations between independent variables is within
an acceptable range and, thus, should not cause any bias in the estimation of the determinants
of the stock liquidity and volatility.
Probability of a foreign presence
The first stage of Heckman’s (1979) estimation procedure, which is used to correct
potential self-selection bias in cross-listing and cross-trading status, includes modelling the
probability of a change in the listing status. The probability of a foreign presence is
estimated using the full sample of cross-listed/ traded and domestic stocks as a function of
company and home country-specific characteristics. Table 3.5 reports the output from a
probit regression of the foreign presence dummy variable on company size and a number of
the home country characteristics, including per capita GDP, market size, legal index and
accounting opacity index. The coefficients are estimated using maximum-likelihood
procedures; standard errors are adjusted for clustering at the stock level. Pseudo R-squared

131
statistics indicate that the model has significant explanatory power. All variables have the
predicted sign and are significant. I find that companies are more likely to cross-list and/or
cross-trade outside of the home country if they are larger and fulfil one of the following
country-level factors: higher per capita GDP, smaller capital markets, weaker investor
protection and higher accounting opacity. Additional analysis (not reported) of the individual
probability of cross-listing and cross-trading indicates that the determinants of cross-listing
status and the determinants of cross-trading status are quantitatively similar. The estimates of
the probability of foreign presence from the probit model are utilized to estimate the Inverse
Mills Ratios that are used in the second stage of Heckman’s (1979) correction procedure.
Multivariate analysis
This section discusses the estimation results from the second stage of Heckman’s
(1979) procedure that accounts for the self-selection bias. Alternatively, the output of the
regressions of liquidity and volatility measures without the Inverse Mills Ratio, i.e. of the
regressions that do not account for the self-selection bias, are reported in Appendix 3.2 for
the liquidity measures and Appendix 3.3 for the volatility measures.
A multivariate framework is used to test the main hypothesis that a stock’s
availability for trading on a foreign exchange can improve the stock’s liquidity and volatility.
Also I control for other factors that are likely to affect the cross-section of stock-level
liquidity and volatility. Furthermore, the multivariate analysis is used to test whether the
impact of cross-listing differs from that of cross-trading. All explanatory and control
variables are discussed in section 3.4.4 and summarized in Table 3.2. Panel data regressions
reported in Table 3.6 and Table 3.7 for liquidity measures and in Table 3.8 and Table 3.9 for
volatility measures are estimated using an OLS procedure with heteroskedasticity consistent
(White, 1980) standard errors that are adjusted to account for the possible correlation within
a cluster (Rogers or clustered standard errors).63
Additionally, all model specifications
include industry-fixed effects to account for potential cross-sectional dependence within an
industry and year-fixed effects to account for potential dependence across time. Finally, I
63
This estimation method is chosen based on the findings of Petersen (2009) that it produces unbiased
standard errors when there is a possibility that residuals are correlated cross-sectionally.

132
control for country level differences by including country-level control variables: per capita
GDP, capital market size, legal index and accounting opacity index.
As a robustness test, I use two alternative panel data methods to estimate the
relationship between stock liquidity and volatility and the stock’s foreign presence
controlling for other firm-level and country-level determinants of stock liquidity and
volatility: 1) firm fixed effects that control for all unobserved heterogeneity across stocks
and 2) random effects. The estimation results are presented in Appendix 3.4 for liquidity
measures and Appendix 3.5 for volatility measures.
Liquidity
Table 3.6 and Table 3.7 report results from the regressions of the liquidity measures,
bid-ask spread, trading volume, total trading volume, turnover ratio and total turnover ratio,
on the explanatory and control variables that potentially affect stock liquidity. The dependent
variables are defined in Table 3.1. Regression specifications in Table 3.6 aim to evaluate the
power of the stock’s foreign presence in explaining stock liquidity and additionally include
the Inverse Mills Ratio to account for the probability of a stock having a foreign presence.
Additionally, model specifications (2) of Table 3.6 include interactive variables of
the foreign presence dummy variable with the main control variables: company size,
international accounting standards, and residual analyst coverage. This enables the impact of
the changes in these firm characteristics after cross-listing/ trading to be accounted for. The
interaction variables measure the incremental contribution to the change in stock liquidity
due to the change in the company size, company-level accounting practices and analyst
coverage.
Regression specifications in Table 3.7 focus on the difference in the impact of cross-
listing and cross-trading on stock liquidity and include, instead of a foreign presence
variable, cross-listing and cross-trading variables. Additionally, model specifications (2) of
Table 3.7 include interactive variables of the cross-listing and cross-trading dummy variables
with the main control variables, company size, international accounting standards and
analyst coverage.

133
Bid-ask spread
The hypothesis to test is that cross-listing and, to a lesser degree, cross-trading,
result in a lower bid-ask spread of the stock. In model specifications that do not control for
the change in the following variables: company size, analyst following and accounting
standards (bid-ask spread models (1), Tables 3.6 and 3.7), the coefficient estimates of the
foreign presence variable and the cross-listed variables are positive and significant at the 1%
level. However, after introducing interactive variables to reflect changes in firm
characteristics after the change in listing status, the foreign presence and cross-listed and
cross-traded variables have coefficient estimates that are negative and statistically
significant. The foreign presence variable also has negative and significant coefficient
estimates in the firm fixed effects and random effects models (bid-ask spread models (1) and
(2) in Appendix 3.4).
Theoretically, stocks of larger companies that use higher quality accounting
standards provide lower trading costs to investors due to lower information costs.
Empirically, I find that indeed, company size and international accounting standards are
negative and statistically significant determinants of the bid-ask spread (bid-ask spread
models, Tables 3.6 and 3.7). However, I find that the impact of cross-listing/trading on the
bid-ask spread is asymmetric based on company size and accounting standards used. It is
smaller companies that experience a more considerable incremental reduction in the bid-ask
spread following cross-listing/trading, as suggested by the positive and highly significant
coefficient estimates on the interaction variables of company size with listing status dummy
variables (bid-ask spread models (2), Tables 3.6 and 3.7). Similarly, companies that use
international accounting standards experience an increase in the bid-ask spread after
becoming present on a foreign exchange, suggested by the IAS*Foreign presence variable
coefficient of 0.01, which is significant at 1%. The bid-ask spread model (2) of Table 3.7
reveals that the latter result is driven by cross-traded stocks rather than by cross-listed stocks.
Greater analyst coverage results in lower information costs for investors and,
accordingly, in lower bid-ask spreads. Empirically, the coefficient estimate on the residual
analyst coverage is negative in all bid-ask spread model specifications. However, the
negative impact of the change in intensity of analyst coverage after the change in listing

134
status holds only for cross-trading (bid-ask spread model (2), Table 3.7). Also, the findings
are in line with the theoretical expectations that the bid-ask spread is lower for stocks that are
more actively traded and higher for stocks that exhibit higher return volatility and a higher
concentration in stock ownership (bid-ask spread models, Tables 3.6 and 3.7).
To summarize, the findings provide empirical support for the hypothesis H1.1 that
cross-listed and cross-traded stocks have lower trading costs. This finding is in line with
existing empirical evidence of Foerster and Karolyi (1998), Domowitz et al (1998) and
Hamet (2002). I find that foreign presence overall, and cross-listing and cross-trading
individually, significantly reduces the bid-ask spread, after controlling for stock-specific and
country-level determinants of the bid-ask spread and after controlling for the asymmetric
impact of company size and company accounting practices on the bid-ask spread following
cross-listing/trading. However, the expectation that cross-listing has a more profound impact
than cross-trading due to additional disclosure requirements (hypothesis H1.2) is not
supported empirically. I find that the impact of cross-listing on the bid-ask spread is similar
to that of cross-trading: based on the Wald test the difference in coefficient estimates is
insignificant.
Trading volume
Table 3.6 and Table 3.7 report the output of the regressions of home market trading
volume and total trading volume (the sum of trading volumes on all exchanges and trading
venues) on the determinants of the stock trading activity. It is found that stocks with a
foreign presence exhibit more active home and total trading activity, controlling for other
stock-level and market-level factors (trading volume models (1) and (2), Table 3.6). The
improvement in home market trading is driven equally by cross-listed and cross-traded
stocks (trading volume models (1) and (2), Table 3.7). Furthermore, I investigate whether
trading volume is affected by the change in the listing status itself or rather by the changes in
firm characteristics that emerge after cross-listing/trading, namely: company size, accounting
practices and analyst coverage, and estimate model specifications (2) (Tables 3.6 and 3.7).
As expected, larger companies have higher trading volumes in the home market and
overall. It is, however, smaller companies that experience a more considerable increase in
trading volume after cross-listing/ cross-trading, suggested by the negative and highly

135
significant coefficient estimates on the interaction variables of company size with listing
status dummy variables (trading volume models (2), Tables 3.6 and 3.7). Similarly,
companies that use international accounting standards experience a reduction in trading
volume after becoming present on a foreign exchange, suggested by the negative and
significant coefficient on IAS*Foreign presence variable. Residual analyst coverage is
associated with both significantly higher home market trading volume and total trading
volume. However, the liquidity impact is higher for stocks with a smaller increase in analyst
coverage after cross-listing, as suggested by the negative and significant coefficient estimate
on the Analysts*ForeignPresence and Analysts*Cross-traded variables. In addition, the
trading volume models show that the home market trading volume and the total trading
volume are higher for stocks that exhibit higher return volatility and are lower for stocks
with a higher proportion of closely held shares (Tables 3.6 and 3.7). Based on the Wald test,
the difference between the estimated coefficients of cross-listed and cross-traded variables
(trading volume models (2), Table 3.7) is insignificant.
Overall, the findings support the hypothesis H1.1 that a stock’s presence on a foreign
market increases trading volume of the stock. This is in line with the empirical evidence of
Smith and Sofianos (1997), Foerster and Karolyi (1993, 1998), Hamet (2002). However,
empirical evidence does not support hypothesis H1.2, that is, cross-listing is associated with
a greater increase in the stock’s trading volume than cross-trading.
Turnover ratio
Stocks with a foreign presence do have higher home market and total turnover ratios,
controlling for other stock-level and market-level factors (turnover ratio models (1), Table
3.6). However, based on the output of the regressions that include variables reflecting the
impact of the change in company size, accounting practices and analyst coverage after cross-
listing/trading (turnover ratio models (2), Table 3.6), it is the increase in company size and
the increase in analyst coverage (in the case of the home market turnover) that drive the
improvement in the turnover ratios rather the change in listing status per se. Cross-listing has
a positive and significant impact on stock liquidity, measured by the total turnover ratio,
after controlling for other factors (total turnover ratio models (1) and (2) Table 3.7). The

136
Wald test provides inconclusive evidence on the difference in the impact of cross-listing and
cross-trading on the stock’s turnover ratio.
To sum up, the findings on the change in stock liquidity after cross-listing/ trading
partly support the hypothesis H1.1 that cross-listing and cross-trading improves the liquidity
of a stock. More specifically, it is found that cross-listing, as well as cross-trading,
significantly reduces the stock’s transaction cost measured by the bid-ask spread and
increases the stock’s trading volumes. This is possibly due to facilitated inter-market
competition among market makers rather than the increase in the level of information
disclosure since the evidence suggests that the impact of cross-listing and cross-trading on
the liquidity of a stock is similar.
Volatility
The next step is to examine whether cross-listing and cross-trading contribute to a
change in stock return volatility, controlling for other factors that are likely to affect the
cross-section of stock-level return volatility. I use three measures that reflect different
aspects of stock volatility: stock return volatility, volatility ratio that accounts for market-
level volatility and high-low ratio that captures intra-day stock price variation. The
dependent variables are defined in Table 3.1. Then, Tables 3.8 and 3.9 report output for
regressions of the volatility measures on the explanatory and control variables that are
defined in Table 3.2. Regression specifications in Table 3.8 include the foreign presence
variable and evaluate the impact of the stock’s foreign presence on stock volatility. Table 3.9
reports output of regressions that focus on the difference in the impact of cross-listing and
cross-trading on volatility and include, instead of a foreign presence variable, cross-listing
and cross-trading variables. Additionally, model specifications (2) of Table 3.8 and Table 3.9
include interactive variables of the listing status variable with the explanatory variables,
company size, international accounting standards, residual analyst coverage, and trading
volume, in order to measure the incremental contribution to the change in stock volatility
resulting from the change in these firm characteristics after the change in listing status.
Tables 3.8 and 3.9 report that the coefficient estimates on the foreign presence,
cross-listed and cross-traded variables are negative and statistically significant or

137
insignificant in all model specifications, except for the high-low ratio models (1). After
controlling for the changes in firm characteristics after cross-listing/ cross-trading (models
(2), Tables 3.8 and 3.9), coefficient estimates become more negative and statistically
significant. The exception is the coefficient estimate on the cross-traded variable in the
volatility ratio model (2) (Table 3.9). The high-low ratio, which has positive and significant
coefficient estimate in models (1), becomes negative and significant after controlling for the
change in company size and in stock trading volume (models (2)), implying that intra-day
volatility is also reduced by cross-listing and cross-trading.
As predicted, company size is a highly significant negative determinant of all
measures of stock volatility. However, the impact of foreign presence on stock volatility is
asymmetric based on company size, meaning smaller companies experience larger
reductions in volatility following cross-listing/ cross-trading, as suggested by the positive
coefficient estimates on the interaction variables of company size with foreign presence
(models (2), Table 3.8). This holds for cross-listed but not for cross-listed stocks (models (2),
Table 3.9). In contrast to expectations, the coefficient estimate on the international
accounting standards variable is positive and significant in all model specifications (Tables
3.8 and 3.9). However, for cross-listed/ cross-traded stocks the adoption of international
accounting standards is rewarded with lower return volatility. Furthermore, no consistent
evidence is found that residual analyst coverage has an impact on return volatility. In line
with extensive empirical evidence in the literature (Karpoff, 1987; Schwert, 1989; Jones et
al, 1994; Chan and Fong, 2000), higher trading volume is found to be associated with higher
volatility. The interactive variables of the trading volume and listing status variables capture
the additional increase in volatility due to the increase in trading activity of cross-listed/
traded stocks (return volatility model (2), Tables 3.8 and 3.9). The results also reveal that
stocks with higher growth rates, higher leverage, higher intangibles and more concentrated
stock ownership have significantly higher volatility.
Overall, there is empirical evidence to support hypothesis H2.1 that cross-listing and
cross-trading reduce volatility. In contrast, there is no evidence found to support hypothesis
H2.2 that cross-listing results in greater reduction in return volatility compared to cross-
trading due to additional mandatory information disclosure requirements. The impact of
cross-listing is not different from that of cross-trading as the coefficient estimates are similar

138
in magnitude and statistical significance as suggested by the Wald test (Table 3.9). The fact
that cross-trading reduces volatility as much as cross-listing implies that the improvement in
the stock’s information environment comes not from the imposed cross-listing disclosure
requirements but mostly from the increased production of stock-specific information that
occurs because after cross-listing/ trading, a larger number of investors have access to the
stock.
3.6.2 Evolution of stock liquidity and volatility
Estimates reported in Tables 3.6 - 3.9 provided evidence on whether cross-listing/
trading has a significant impact on stock liquidity and volatility. The next empirical question
is: what are the dynamics of stock liquidity and volatility around cross-listing and cross-
trading? In order to reveal the dynamics, stock liquidity and volatility are examined around
the initial year (year 0) of foreign presence/ cross-listing/ cross-trading.
Panels A.1, A.2, and A.3 of Figure 3.1 plot the results of univariate analysis of the
evolution of stock liquidity and volatility around foreign presence, cross-listing, and cross-
trading respectively. To construct the plotted relative measures of stock liquidity and
volatility, mean liquidity and volatility measures are first calculated for companies with a
foreign presence in year ≤-4, -3, …, 0, +1, …, +3, ≥+4 relative to the year 0 of foreign
presence/ cross-listing/ cross-trading accordingly, then the calculated means are divided by
the mean of the corresponding measure of stock liquidity/ volatility of the companies with
domestic listing status.
Table 3.10 reports the regression estimation output of the evolution of stock liquidity
and volatility controlling for other factors. Regression specifications are the same as model
specifications (2) of Tables 3.6 – 3.9, except that variables representing listing status are
replaced with a series of dummy variables representing years around foreign presence/ cross-
listing/ cross-trading from beyond year -4 to beyond year +4. Only coefficient estimates on
the dummy variables representing years around the year of the change in listing status are
reported in Table 3.10. Panels B.1, B.2, and B.3 of Figure 3.1 plot coefficient estimates on

139
the dummy variables that represent the year relative to the change in listing status reported in
Table 3.10.
Bid-ask spread
A relative bid-ask spread of 0.54 and below (Figure 3.1 Panel A.1) indicates that the
bid-ask spread of companies with a foreign presence is almost half of that of domestic
companies even before foreign listing/ admission to trade, as long as it is four or more years
before cross-listing/ cross-trading. The plot reveals that there is a significant downward trend
in the bid-ask spread following both cross-listing and cross-trading, suggesting that the
reduction in the bid-ask spread after foreign listing/ trading endures over time. After
controlling for other factors that affect the stock’s bid-ask spread, the impact of foreign
presence is profoundly negative (Panel A of Table 3.10; Panel B.1 of Figure 3.1).
Specifically, coefficient estimates on the dummy variable representing years relative to
foreign presence/ cross-listing/ cross-trading are positive for the years before the change in
listing/ trading status and both negative and statistically significant in the year of foreign
listing/ trading and thereafter. Coefficient estimates on the dummy variables for cross-listing
and cross-trading are similar in magnitude and statistical significance; in other words the
impact of cross-listing and that of cross-trading are comparable. Overall, there is evidence
that listing/trading on foreign exchanges is associated with a significant decrease in the bid-
ask spread that is sustainable over time.
Trading volume
Relative trading volume and relative total trading volume measures of 6.33 and
above (Panel A.1 of Figure 3.1) suggest that mean trading volumes of stocks with a foreign
presence is at least 6.33 times higher than those of domestic stocks even before the foreign
listing and continue to increase for the duration of the foreign listing/trading. After
controlling for other factors, foreign listing status is associated with a positive and
statistically significant contribution to the stock’s trading volumes (Panel A of Table 3.10;
Panel B.1 of Figure 3.1). However, the positive impact of the change in listing status is
observed only around cross-listing, whereas the initial year of cross-trading (year 0) is
associated with smaller trading volumes.

140
Turnover ratio
The next proxy of stock liquidity, turnover ratio, accounts for the number of shares
outstanding. Turnover ratio and total turnover ratios of cross-listed stocks three or more
years before the year of the cross-listing/ trading event are no different from those of
domestic stocks. In the year of cross-listing/trading, mean turnover ratios of cross-listing/
cross-trading stocks are above the level of those of domestic stocks, in other words, relative
mean turnover ratio is more than one, and is steadily increasing following the cross-
listing/trading event (Panel A.2 of Figure 3.1). After controlling for other factors, a foreign
exchange listing is associated with a positive contribution to the stock’s turnover ratio and,
particularly, total turnover ratio, while admission to trade is associated with a negative
contribution to the stock’s turnover ratio (Panel A of Table 3.10; Panel B.2 of Figure 3.1).
This finding empirically supports hypothesis H1.2 that cross-listing has a more profound
positive impact on stock liquidity than cross-trading.
Volatility
Panel A.3 of Figure 3.1 shows that stock volatility, measured by stock return
volatility, the volatility ratio, i.e. stock return volatility relative to the stock market volatility,
and the high–low ratio, of cross-listed stocks is less than that of domestic stocks, as relative
volatility measures are below one for any year relative to a cross-listing/ trading event. There
is an increase in the mean stock return volatility and high-low ratio during (-1; +1) years
around the cross-listing/ trading event, followed by a downward trend during and after the
second year relative to the change in listing status. After controlling for other factors that
potentially affect stock volatility in the regression analysis, foreign trading is associated with
a negative and statistically significant contribution to the stock’s return volatility and the
high-low ratio, while a foreign exchange listing is associated with a negative but
insignificant contribution to the stock volatility (Panel B of Table 3.10; Panel B.3 of Figure
3.1). Overall, the decrease in volatility as a result of the change in listing is persistent over
time.
To sum up, the findings of the analysis of the evolution of stock liquidity and
volatility confirm and further extend the results from the cross-sectional analysis (section
3.6.1). Supportive of the hypothesis H1.1, trading on a foreign exchange is found to be

141
associated with reduced transaction costs. Supportive of the hypothesis H1.2 that cross-
listing has greater positive impact on stock liquidity than cross-trading, cross-listing is found
to be associated with a significant increase in trading activity, whereas cross-trading is not.
Furthermore, the findings support hypothesis H2.1 that the stock price of cross-listed/ traded
stocks is less volatile and do not support hypothesis H2.2 that cross-listing is associated with
greater reduction in volatility than cross-trading. More importantly, the improvements in
stock liquidity and volatility due to listing and/or trading on a foreign exchange are found to
be sustainable more than four years after the initial change in listing status.
3.6.3 Time-series analysis: Change in stock liquidity and volatility around
cross-listing/trading
The results from the cross-sectional analysis (section 3.6.1) have revealed a
significant relationship between stock foreign listing/trading status and stock liquidity and
volatility. The next step is to examine the changes in stock liquidity and volatility measures
specifically for cross-listed stocks after the changes in the listing/ trading status. The changes
are related not only to the stock’s listing status but also to firm characteristics. In contrast to
the preceding cross-sectional analysis, the benchmark is liquidity and volatility of cross-
listed stocks prior to the change in listing status and not those of domestic stocks.
Univariate analysis
Initially, liquidity and volatility measures for each stock are calculated for the
periods of time when the stock had a different listing status. The liquidity and volatility
ratios are calculated by dividing the average liquidity/volatility measure over the period of
time when the stock is present abroad, cross-listed and/or cross-traded, to the base
liquidity/volatility measure for each stock, i.e. the average for the period of time when the
stock had just a domestic status. An estimated liquidity/volatility ratio of more than one
indicates an increase in a liquidity/volatility measure after the change in the listing status
from the domestic listing status. Stocks with the same listing status are pooled to estimate the
mean and median effect of the foreign listed/ traded status relative to the domestic status.
Panel A of Table 3.11 reports mean and median liquidity and volatility ratios for the sub-
samples of stocks with various listing statuses: stocks with a foreign presence inclusive of

142
cross-listing and trading, and individually cross-traded (but not cross-listed) stocks, cross-
listed (but not cross-traded) stocks, and stocks cross-listed and cross-traded simultaneously.
Liquidity
Panel A of Table 3.11 reports that the mean and median bid-ask spread ratios of
cross-listed and cross-traded stocks are less than one and are statistically significant based on
the t-test and the Wilcoxon test. This finding implies that a sample stock, on average,
experiences a significant decrease in the bid-ask spread following a foreign listing/
admission to trade. The lowest bid-ask spread ratio, in other words, the most considerable
decrease in bid-ask spread, is for stocks that are listed and traded on a foreign exchange(s)
simultaneously. 71.7% stocks with a foreign presence and as many as 83.1% of stocks that
are cross-listed and traded simultaneously have a bid-ask spread ratio less than one. The
mean and median trading volume, total trading volume, turnover ratio and total turnover
ratio ratios are significantly more than one, suggesting that a sample stock, on average,
experiences significant increases in trading following a foreign listing/ trading. Around 70%
of the stocks with a foreign presence have trading volume and turnover ratios of more than
one, which indicates an increase in trading activity.
Volatility
Panel A of Table 3.11 reports that the mean and median volatility ratios of cross-
listed and cross-traded stocks are more than one or are not statistically different from one
based on the t-test and the Wilcoxon test. This indicates either an increase or no change in
return volatility after the change in listing status. Less than half of the stocks in the sample
(48.9% for return volatility ratio, 47.3% for market-adjusted volatility ratio and 42.4% for
high-low ratio ratio) have volatility measure ratios of less than one, or in other words, less
than half the stocks experience a decrease in volatility after cross-listing/ trading. Thus,
based on a univariate analysis there is no evidence that foreign listing/ trading reduces stock
volatility.
Firm characteristics
Summary statistics of the cross-section of cross-listed/traded and domestic stocks
(Panel B of Table 3.4) show that the firm characteristics of stocks with a foreign presence

143
differ significantly from those of domestic stocks. One possibility is that stocks with
particular characteristics self-select to list on a foreign exchange. The other possibility,
however, is that firm characteristics of a given stock change over time and, particularly, after
a foreign listing. For example, a foreign listing reduces capital constraints for a cross-listed
firm (Lins et al 2005), which in turn would have a positive impact on the company size as a
direct outcome of equity capital and debt raising activity. In order to evaluate the change in
company characteristics around foreign listing/ trading, I calculate ratios of the main control
variables by dividing a variable mean for the period of time when the stock had a particular
foreign listing status, by the average value of the variable over the period of time when the
stock had a domestic listing status. Panel B of Table 3.11 reports the mean and median firm
characteristics ratios. A variable ratio of more than one indicates an increase in the firm-level
variable after foreign listing/ trading. The international accounting standards difference is
calculated as the mean distance between the international accounting standards variable over
the period of time with a particular listing status to the base international accounting
standards variable; a positive international accounting standards difference indicates an
improvement in company accounting practices after cross-listing/ cross-trading.
There is compelling evidence that cross-listed companies experience a significant
increase in company size after a foreign listing/ admission to trade as the mean and median
company size ratios are significantly above one, based both on the t-test and the Wilcoxon
test. The median company size of a stock with a foreign presence is on average 1.47 times
larger than the median company size of the same stocks prior to foreign listing/ trading. The
increase in size is particularly profound for stocks that are simultaneously listed and traded
on foreign exchange(s): 88.8% of these stocks experience an increase in company size after
becoming cross-listed and cross-traded. Company size in this analysis is quantified by the
stock market capitalization, which is the product of the number of common shares
outstanding and the stock price. Additionally, Appendix 3.6 presents analysis of the change
in firm characteristics related to company size. It shows that cross-listed stocks experience a
significant increase in both the number of shares outstanding, which is an indication of
capital raising activity by cross-listed companies, and, to a lesser extent, in stock price,
which is consistent with the literature supporting the existence of the cross-listing valuation
premium (e.g. Miller, 1999; Doidge et al, 2004 and 2009a). Furthermore, Appendix 3.6

144
reports that a significant increase in total assets, which is an alternative proxy for company
size, after cross-listing/trading is comparable to the increase in the market value. The
increase in total assets is driven by the increase in the book value of equity capital and even
more so by the increase in the value of long-term debt. This is consistent with the argument
of Doidge et al (2004) that companies cross-list to take advantage of existing growth
opportunities and also consistent with the argument of Lins et al (2005) that cross-listing
improves access to capital by cross-listed companies.
Simultaneously cross-listed and cross-traded stocks exhibit significantly improved
accounting practices: on average, the use of international accounting standards increases by
19% after foreign listing/ trading (Panel B Table 3.11). Contrary to expectations, the median
analyst coverage ratio shows that presence on a foreign exchange is not associated with an
increase in analyst coverage. In fact, for stocks admitted to trade on a foreign exchange there
is a decrease in analyst coverage relative to the domestic listing status period. The only sub-
group of stocks that experience a statistically significant increase in analyst coverage are
stocks listed on a foreign exchange.
Based on the median ownership concentration ratio, stocks with a foreign presence
and, particularly, simultaneously cross-listed and cross-traded stocks, have more dispersed
ownership after foreign listing/ trading. Company sales growth, however, reduces after
foreign listing/ trading: only around 35% of stocks have a sales growth ratio above one.
There is no evidence that leverage changes significantly around a foreign listed/ trading. The
ratio of intangible to total assets increases significantly: around 70% of stocks with a foreign
presence have the Intangibles ratio above one.
Multivariate time-series analysis
The next step is to regress the liquidity and volatility measure ratios on the dummy
variables representing a foreign listing and/or trading status and the ratios of the control
variables in order to detect the primary determinants of the changes in stock liquidity and
volatility around a foreign listing/ trading. Additionally, I control for market-level liquidity
in regressions of stock-level liquidity measures. Table 3.12 reports the output of the

145
regressions of the liquidity and volatility measure ratios estimated using an OLS procedure
with heteroskedasticity consistent (White, 1980) standard errors adjusted to account for
possible correlation within a cluster.
Liquidity
A stock presence (listed or traded) on a foreign exchange is associated with a
significant decrease in the bid-ask spread and a significant increase in trading activity in
terms of volume and turnover ratio (model (1), Table 3.12). Coefficient estimates on cross-
listed and cross-traded variables are of the same signs and similar magnitudes (model (2),
Table 3.12). Additionally, model (3) controls for changes in firm characteristics and market-
level liquidity. As expected, a significant portion of the improvement in liquidity around
foreign listing / trading can be explained by the increase in company size and by the use of
better accounting standards. Furthermore, a part of the bid-ask spread reduction can be
explained by higher stock turnover after foreign listing/ trading, which, in turn, is positively
associated with increased stock return volatility after cross-listing/ trading. After controlling
for the change in firm characteristics and for market-level liquidity in model (3), coefficient
estimates on the cross-listed and cross-traded variables in the bid-ask spread model remain
negative, however, this is significant only for the cross-traded variable; coefficient estimates
on the cross-listed and cross-traded variables in the trading volume and turnover models
remain positive and significant in all model specifications.
Overall, the empirical results of the time-series analysis of the changes in stock
liquidity after cross-listing/ trading support hypothesis H1.1 that cross-listing or an
admission to trade on a foreign market improves the liquidity of a stock as a result of an
enhanced information environment. However, the results do not support hypothesis H1.2 that
due to greater enforced information disclosure, the impact of cross-listing on stock liquidity
is more profound than the impact of cross-trading. On the contrary, it is found that, based on
the Wald test statistics, the impact of cross-trading is as at least as significant as that of
cross-listing, particularly in the case of the bid-ask spread.

146
Volatility
Based on the regression output of models (1) and (2) (Table 3.12), cross-listing and
cross-trading statuses are not significant determinants of the changes in return volatility and
market-adjusted return volatility and are significant positive determinants of intra-day
volatility, measured by the high-low ratio. Based on model (3) that additionally controls for
changes in firm characteristics, an increase in company size and improvement in accounting
standards, in line with the theoretical expectations, significantly reduces stock volatility,
while the enhanced trading after cross-listing/ trading significantly increases stock volatility.
Coefficient estimates on the cross-listed and cross-traded variables in the volatility models
are not statistically different from zero, with the only exception being the negative and
significant coefficient estimate on the cross-traded variable in the return volatility ratio
model, suggesting that cross-trading reduces stock return volatility.
Overall, the empirical results of the time-series analysis of the changes in stock
volatility after cross-listing/ trading do not support hypotheses H2.1 and H2.2 which relate to
the decrease in stock volatility after cross-listing and/or cross-trading due to the
improvement in the stock’s information environment.
3.6.4 Implications of cross-listing and cross-trading for stocks from developed
vs. emerging home markets
In order to test hypothesis H3 that the impact of cross-listing and cross-trading
differs depending on the stock’s home market, I estimate cross-sectional regressions of
liquidity and volatility measures on the explanatory and control variables separately for two
sub-samples: 1) stocks from developed markets and 2) stocks from emerging markets. Tables
3.13 and 3.14 report the regression output of the liquidity and volatility measures
respectively. The number of observations from stocks from developed markets is
significantly larger than the number of observations from stocks from emerging markets.
This means that the findings from the cross-sectional analysis for the full sample (discussed
in section 3.6.1) may be driven by stocks from developed markets. Indeed, the findings on
the determinants of the trading activity of developed market stocks (Table 3.13 and Table
3.14) are in line with the findings for the full sample (Table 3.7 and Table 3.9).

147
Table 3.13 reports that the impact of cross-listing and cross-trading on stock
liquidity differs for stocks from emerging markets. While cross-listing and cross-trading by
developed market stocks, on average, are associated with an improved stock liquidity in
terms of bid-ask spread, cross-listing and cross-trading by stocks from emerging markets
have no impact on the bid-ask spread. Negative and significant coefficient on the cross-
listing variable for turnover ratio and positive and significant coefficient on the cross-listing
variable for total turnover ratio can be interpreted as evidence for the migration of the stock’s
trading to foreign stock exchanges after cross-listing. This finding is in line with theoretical
argument and empirical evidence of Domowitz et al (1998).
Table 3.14 reports that there is no conclusive evidence that cross-listing reduces
volatility for stocks from emerging markets. On the other hand, cross-trading by stocks from
emerging markets reduces the home market stock return volatility after controlling for the
increase in volatility due to more active trading. In terms of the reduction in stock volatility,
cross-trading seems to be more beneficial than cross-listing for stocks from emerging
markets.
To summarize, the findings support the hypothesis H3 that stocks from developed
markets experience more substantial improvement in liquidity and reduction in volatility
than stocks from emerging markets. These findings are in line with the theoretical argument
of Domowitz et al (1998)64
and the empirical findings of Domowitz et al (1998), Bacidore et
al (2005), Halling et al (2008), Fernandes and Ferreira (2008) on the impact of a foreign
listing for emerging market stocks, which is the opposite to that of the impact of a foreign
listing for developed market stocks.
64
Domowitz et al (1998) show that a cross-listing by a stock from a market with poor information
linkages, which is generally the case for an emerging market, results in a decrease in home market
liquidity due to the migration of trading activity to the foreign market and increase in stock volatility
due to deterioration of the quality of the home market.

148
3.7 Conclusion
A company’s commitment to higher levels of information disclosure and scrutiny by
market participants after a foreign listing should lower the information asymmetry between
managers and investors and also between different groups of investors. The enhanced
information environment of the stock after cross-listing, in turn, should positively affect
stock liquidity and volatility. This study tests this proposition empirically by examining the
changes in a stock’s liquidity and return volatility after the stock becomes available for
trading on a foreign stock exchange. The sample used in the study is a set of European cross-
listed companies that have their shares listed and traded on various foreign exchanges. Since
the presence on a foreign stock exchange enhances the stock’s information environment via
additional information disclosure by the company and also via production of stock-specific
information by an increased number of investors, stocks that can be traded on foreign
exchange(s) are expected to be more liquid and exhibit less return volatility. Furthermore,
this study distinguishes between cross-listing and cross-trading, as they differ in the level of
mandatory information disclosure, and tests the hypothesis that cross-listing improves stock
liquidity and reduces volatility to a greater extent than cross-trading.
Three different methods are used to evaluate the relationship between the foreign
listing status and stock liquidity and volatility. Firstly, the liquidity and volatility of cross-
listed and cross-traded stocks are compared against that of domestic stocks, controlling for
other determinants of stock liquidity and volatility in the cross-sectional analysis. Secondly,
the evolution of stock liquidity and volatility measures is tracked in the years around the year
of cross-listing and/or cross-trading using the sample of cross-listed and/or cross-traded
stocks as well as domestic stocks. Thirdly, stock liquidity and volatility after cross-listing
and cross-trading are evaluated against those of the same stocks for the period of time prior
to cross-listing and cross-trading using time-series analysis. Additionally, the impact of
foreign listing and trading is evaluated individually for stocks from developed markets and
for stocks from emerging markets to test the hypothesis that the implications of cross-listing
and cross-trading depend on the level of economic development of the stock’s home market.
The empirical evidence show that, compared to purely domestic stocks, stocks that
can be traded on an exchange(s) outside of the home country have lower transaction costs,

149
higher trading activity and a less volatile stock return. After controlling for the self-selection
bias and other factors that potentially affect stock liquidity and return volatility, a presence
on a foreign exchange is associated with a significant reduction in transaction costs measured
by the bid-ask spread, increase in trading volumes and a significant reduction in return
volatility. Higher turnover ratios of stocks with foreign presence are mainly explained by the
increase in company size after cross-listing and cross-trading. Cross-listing, however, is
associated with significant improvements in the total trading volume and total turnover ratio
as an outcome of active trading on foreign exchange(s) after cross-listing.
The important finding is that the impact of cross-listing and cross-trading on stock
liquidity and volatility is sustained over time. More specifically, the observed decrease in
bid-ask spread, the increase in total trading volume, and the decrease in volatility are
sustained for four or more years after cross-listing and cross-trading.
Evidence from time-series analysis that investigates the changes in the liquidity and
volatility of cross-listed stocks suggests that cross-listing and cross-trading are associated
with significant improvement in stock’s liquidity. This is true even after controlling for the
change in firm characteristics following the change in listing status.
The next major finding of this study is that the impact of cross-listing is not
significantly different from that of cross-trading. There are two possible explanations for
this. First, there is a possibility that the information environment of cross-listed stocks,
although improved due to additional mandatory disclosure requirements, is not substantially
better than the information environment of cross-traded stocks. The sample contains
European stocks cross-listed on various exchanges, including European exchanges. The level
of additional information disclosed from cross-listing within the European Union is not
expected to be significant due to the presence of the mutual recognition principle with
regards to stock exchange listings. According to this principle, EU-complied companies are
not subject to any additional legal and disclosure requirements when cross-listing within the
European Union. Due to the substantially different legal frameworks they offer, comparing
the impact of cross-listing on different markets, particularly, the US and continental Europe,
on the stock’s information environment, is one of the directions for future research on cross-
listing.

150
Second, the similar impact of cross-listing and cross-trading can be explained by the
fact that along with added mandatory disclosure, there are other important factors that
equally affect the information environment of cross-listed and cross-traded stocks. More
specifically, these factors include improved stock accessibility to foreign investors,
intensified competition among market makers, and increased production of stock-specific
information by a larger number of market participants that have an economic interest in the
stock after cross-listing and cross-trading. The finding that the difference between the
implications of cross-listing and cross-trading is not significant triggers new questions for
future research regarding the motivations and justification for cross-listing vs. cross-trading.
Finally, the impact of increased scrutiny and disclosure after a foreign listing differs
significantly based on the level of economic development of the home country. The findings
discussed above on the impact of cross-listing and cross-trading on stock’s liquidity and
volatility are driven by the observations contributed by stocks from developed markets. For
stocks from emerging markets, cross-listing has no significant impact on the stock’s liquidity
and volatility. Cross-trading, however, is more beneficial for stocks from emerging markets
than cross-listing in terms of reduction in the stock return volatility.
Implications of the findings:
The economic consequences of the findings of this study are relevant to corporate
financial managers as well as equity investors and traders. It has been shown that foreign
listing and trading result in a significant decrease in bid-ask spread, increase in home market
and total trading activity and reduction in stock return volatility. This means that cross-
listing and cross-trading should be viewed by corporate financial managers as a means to
achieve a lower cost of capital. When considering a foreign listing or an admission to trade
as a corporate strategy to improve stock liquidity and risk (and ultimately the value of the
firm) managers should consider the evidence that there is no significant difference in the
impact of cross-listing and cross-trading on transaction costs and return volatility.
Nevertheless, evidence shows that cross-listing results in greater total trading activity as a
result of more active trading on foreign host exchange(s). The additional benefit of cross-
listing in terms of more active trading should, however, be evaluated against the extra costs

151
associated with a cross-listing as opposed to cross-trading. For equity investors and traders it
is relevant to know that cross-listed and cross-traded stocks offer lower costs of trading,
higher stock liquidity and lower return volatility and, accordingly, lower price uncertainty.

152
Figure 3.1 The evolution of stock liquidity and volatility around cross-listing and/or cross-trading
Panel A.1 The evolution of relative stock liquidity. Panel A plots the relative measures of stock liquidity in each year around the year of foreign presence, cross-listing and
cross-trading (year 0). Foreign presence is inclusive of cross-listing and cross-trading. The relative measure of stock liquidity is defined as the mean measure of stock liquidity of
the sub-sample of stocks with a particular listing status over the mean measure of stock liquidity of domestic stocks.
Panel B.1 The evolution of stock liquidity: regression analysis. Panel B plots the coefficient estimates of the year-specific dummy variables relative to the year of foreign
presence, cross-listing and cross-trading (year 0) from regressions reported in Table 3.10. Foreign presence is inclusive of cross-listing and cross-trading.

153
Panel A.2 The evolution of relative stock liquidity. Panel A plots the relative measures of stock liquidity in each year around the year of foreign presence, cross-listing and
cross-trading (year 0). Foreign presence is inclusive of cross-listing and cross-trading. The relative measure of stock liquidity is defined as the mean measure of stock liquidity of
the sub-sample of stocks with a particular listing status over the mean measure of stock liquidity of domestic stocks.
Panel B.2 The evolution of stock liquidity: regression analysis. Panel B plots the coefficient estimates of the year-specific dummy variables relative to the year of foreign
presence, cross-listing and cross-trading (year 0) from regressions reported in Table 3.10. Foreign presence is inclusive of cross-listing and cross-trading.

154
Panel A.3 The evolution of relative stock volatility. Panel A plots the relative measures of stock volatility in each year around the year of foreign presence, cross-listing and
cross-trading (year 0). Foreign presence is inclusive of cross-listing and cross-trading. The relative measure of stock volatility is defined as the mean measure of stock volatility of
the sub-sample of stocks with a particular listing status over the mean measure of stock volatility of domestic stocks.
Panel B.2 The evolution of stock volatility: regression analysis. Panel B plots the coefficient estimates of the year-specific dummy variables relative to the year of foreign
presence, cross-listing and cross-trading (year 0) from regressions reported in Table 3.10. Foreign presence is inclusive of cross-listing and cross-trading.

155
Table 3.1 Stock liquidity and volatility measures
The table presents the list of stock liquidity and volatility measures and provides definition and data
sources for each of the variables.
Variable Definition/ Measurement Data source
Proportional Bid-ask
spread
Monthly average bid-ask spread is the average of the daily bid-ask
spreads. Daily bid-ask spread is the ratio of the difference between ask and
bid home market prices to the average of ask and bid prices
Datastream
Trading volume the average daily number of shares traded on the home market for each
month
Datastream
Turnover ratio the average of the daily turnover ratios. Daily turnover ration is the product
of the number of shares traded and the stock price divided by the stock's
market capitalization
Datastream
Total trading volume the average of the total daily trading volume for each month. Daily trading
volume is the sum of the number of shares traded on all exchanges in the
sample
Datastream
Total turnover ratio the average of the daily total turnover ratios. Daily total turnover ratio is
calculated as the total trading volume in GBP divided by the stock market
capitalization in GBP. Total trading volume in GBP is the sum of the trading
volumes in GBP on each exchange in the sample, calculated as the product
of the number of shares traded and the stock price converted to GBP
Datastream
Return volatility monthly standard deviation of the stock's daily total return (including dividend
income)
Datastream
Volatility ratio the ratio of monthly standard deviation of the stock's daily total return to
monthly standard deviation of the home market index daily total return
Datastream
High-low ratio the average of the daily high-low ratios. Daily high-low ratio is the natural
logarithm of the ratio of the highest stock price to the lowest stock price
achieved on the day
Datastream
Liquidity
Volatility

156
Table 3.2 Explanatory and control variables
The table presents the list of the explanatory and control variables and the abbreviation used in the
forthcoming tables, and provides definition and data sources for each of the variables.
Variable Abbreviation Definition/ Measurement Data source
Foreign presence Foreign presence;
FP
dummy variable =1 if stock is listed and/or
traded on a foreign exchange, =0 otherwise
the sample
Inverse Mills Ratio Inverse Mills Ratio derived from probit model estimation of
probability for a stock to have a foreign
presence
estimated
Cross-listed Cross-listed;
CL
dummy variable =1 if stock is listed on a
foreign exchange, =0 otherwise
the sample
Cross-traded Cross-traded;
CT
dummy variable =1 if stock is admitted to
trading on a foreign exchange, =0
otherwise
the sample
Company size Company size stock market capitalization, daily and
monthly at the end of the month
Datastream
International accounting
standards
Int accounting
standards;
IAS
dummy variable =1 if company used IAS,
IFRS or US GAAP at the end of the
proceeding year, =0 otherwise
Datastream
Analysts coverage Analysts coverage the total number of EPS one-year estimates
on the company
I/B/E/S, Datastream
Analysts coverage
residual
Analysts;
Analysts Residual
the error term from the regression of the
analysts coverage on the company size
estimated
Ownership concentration Own. concentration closely held shares – the percentage of
shares held by insiders of the total common
shares outstanding at the end of the
preceding year
Datastream
Sales growth Sales growth the percentage increase in sales over the
preceding three years
Datastream
Leverage Leverage the ratio of the total liabilities to total assets at
the end of the preceding year
Datastream
Intangibles to Total
assets ratio
Intangibles the ratio of total value of intangible assets to
total assets at the end of the preceding year
Datastream
GDP per capita GDP per capita the natural logarithm of the 3-year average
GDP per capita in USD
UN Statistics Division
Capital market size Market size the natural logarithm of total market
capitalization of the DS Total Market index
converted from local currency to GBP
Datastream
Market liqudity Market turnover the average daily ratio of the aggregate
trading volume by value to the aggregate
market capitalization of the DS Total market
index calculated for each month
Datastream
Legal index Legal index the anti-director rights index multiplied by
the rule-of-law index
Djankov et al (2007),
Kaufmann et al (2005)
Accounting opacity Accounting opacity accounting opacity index Kurtzman et al (2004)
Market-level variables
Stock-level variables

157
Table 3.3 Sample description
The table reports the sample description by the home country. It displays the number of companies with a
foreign presence, i.e. listed and/or traded on a foreign exchange(s), the number of domestic companies,
i.e. listed and traded in the home country exclusively, and the total number of companies, which is the
sum of the two previous categories, for each home country in the sample and for the total sample.
Columns (2) – (4) report description of the sample that includes stocks with data available for all liquidity
and volatility measures defined in Table 3.1. Columns (5) – (7) report description of the sample that
includes stocks with data available for all liquidity and volatility measures defined in Table 3.1 as well as
with data available for all explanatory and control variables defined in Table 3.2. Accordingly, the former
sample is used in univariate analysis, while the latter sample is used in multivariate regression analysis
that incorporates the explanatory and control variables. Stocks from Belgium, Luxemburg and Norway
are excluded from multivariate regression analysis due to unavailability of data on the control variables.
Home Country
Number of
companies with
foreign presence
Number of
domestic
companies
Total
number of
companies
Number of
companies with
foreign presence
Number of
domestic
companies
Total
number of
companies
(1) (2) (3) (4) (5) (6) (7)
Austria 11 6 17 10 2 12
Belgium 13 80 93 0 0 0
Denmark 12 115 127 12 68 80
Finland 9 42 51 8 32 40
France 57 442 499 55 245 300
Germany 55 1559 1614 51 685 736
Hungary 11 13 24 11 2 13
Ireland 42 6 48 33 4 37
Italy 20 64 84 18 38 56
Luxemburg 7 9 16 0 0 0
Netherlands 22 26 48 20 22 42
Norway 12 77 89 0 0 0
Poland 9 199 208 9 50 59
Portugal 2 29 31 2 15 17
Russia 34 122 156 23 26 49
Spain 10 26 36 10 17 27
Sweden 17 110 127 15 27 42
Switzerland 22 74 96 20 63 83
Turkey 12 250 262 11 162 173
United Kingdom 132 453 585 117 297 414
Total 509 3702 4211 425 1755 2180
Sample with data available
for liquidity and volatility measures
Sample with data available
for all variables

158
Table 3.4. Summary statistics
Panel A of the table reports the summary statistics of the stock liquidity and volatility measures by
different listing status. Liquidity and volatility measures are defined in Table 3.1. Panel B of the table
reports the summary statistics of firm characteristics by different listing status. Company-specific
variables are defined in Table 3.2. All stocks are inclusive of domestic stocks and stocks with a foreign
presence, i.e. listed and/or traded on a foreign exchange(s). Stocks with a foreign presence include traded
only stocks, i.e. traded abroad without stock exchange listing in addition to the home market listing,
cross-listed only stocks, i.e. listed on a foreign exchange in addition to the home market listing, and cross-
listed and cross-traded stocks (CL and CT), i.e. cross-listed and cross-traded simultaneously. Number of
observations (N) is the number of stock-months observations of available data. Mean-difference with
domestic is the difference between the mean of the sub-sample with a particular listing status and the
mean of domestic stocks. Median-difference with domestic is the difference between the median of the
sub-sample with a particular listing status and the median of domestic stocks.
Variable
Listing/ trading
status
N
observations Mean
Mean -
difference with
Domestic (1) Median
Median -
difference with
Domestic (2) Min Max St Dev
Panel A: Dependent Variables
Liquidity
Bid-ask spread All 293,978 0.035 0.020 0.000 1.08 0.05
Domestic 253,644 0.039 0.023 0.000 1.08 0.05
Foreign Presence 40,334 0.013 -0.026*** 0.005 -0.017*** 0.000 0.40 0.02
Traded only 21,602 0.015 -0.024*** 0.006 -0.017*** 0.000 0.40 0.03
Cross-listed only 8,142 0.017 -0.022 0.009 -0.013*** 0.000 0.32 0.03
CL and CT 10,590 0.006 -0.033*** 0.003 -0.020*** 0.000 0.40 0.01
Trading volume All 293,978 599.9 12.2 0.000 39,820 2,525
Domestic 253,644 186.8 7.8 0.000 35,876 959
Foreign Presence 40,334 3,198.0 3,011.2*** 767.7 759.8*** 0.000 39,820 5,733
Traded only 21,602 3,003.8 2,817.1*** 655.2 647.3*** 0.000 39,820 5,847
Cross-listed only 8,142 1,631.0 1,444.3** 374.0 366.1*** 0.005 29,555 2,998
CL and CT 10,590 4,798.8 4,612.0*** 1,791.9 1,784.0*** 0.178 39,441 6,633
Total trading All 293,978 678.7 12.7 0.000 43,364 2,852
volume Domestic 253,644 189.6 7.9 0.000 41,116 995
Foreign Presence 40,334 3,754.5 3,564.8*** 1,092.1 1,084.2*** 0.011 43,364 6,490
Traded only 21,602 3,393.7 3,204.1*** 801.5 793.5*** 0.150 43,364 6,578
Cross-listed only 8,142 1,895.6 1,706.0** 517.9 510.0*** 0.011 33,163 3,289
CL and CT 10,590 5,919.5 5,729.9*** 3,005.5 2,997.6*** 0.361 42,605 7,498
Turnover ratio All 293,978 2.40 1.01 0.000 57.29 4.21
Domestic 253,644 2.23 0.86 0.000 57.29 4.34
Foreign Presence 40,334 3.52 1.30*** 2.83 1.98*** 0.000 23.20 3.03
Traded only 21,602 3.73 1.51*** 3.06 2.20*** 0.000 23.20 3.14
Cross-listed only 8,142 2.25 0.02** 1.86 1.00*** 0.001 17.67 2.00
CL and CT 10,590 4.06 1.84*** 3.58 2.73*** 0.001 22.82 3.17
Total turnover All 293,978 2.57 1.08 0.000 57.29 4.35
ratio Domestic 253,644 2.25 0.87 0.000 57.29 4.36
Foreign Presence 40,334 4.56 2.31*** 3.68 2.82*** 0.000 34.13 3.71
Traded only 21,602 4.53 2.29*** 3.65 2.78*** 0.000 30.41 3.76
Cross-listed only 8,142 3.15 0.91*** 2.44 1.57*** 0.006 28.09 2.97
CL and CT 10,590 5.70 3.45*** 4.90 4.03*** 0.009 34.13 3.74

159
Table 3.4 continued
Variable
Listing/ trading
status
N
observations Mean
Mean -
difference with
Domestic (1) Median
Median -
difference with
Domestic (2) Min Max St Dev
Panel A: Dependent Variables
Volatility
Return volatility All 293,978 0.022 0.020 0.000 0.10 0.01
Domestic 253,644 0.022 0.020 0.000 0.10 0.01
Foreign Presence 40,334 0.018 -0.004*** 0.017 -0.004*** 0.000 0.06 0.01
Traded only 21,602 0.018 -0.004*** 0.017 -0.004*** 0.000 0.06 0.01
Cross-listed only 8,142 0.017 -0.005* 0.016 -0.004*** 0.000 0.05 0.01
CL and CT 10,590 0.017 -0.005*** 0.016 -0.004*** 0.001 0.05 0.01
Volatility ratio All 293,978 2.410 2.022 0.000 20.01 1.59
Domestic 253,644 2.482 2.087 0.000 20.01 1.66
Foreign Presence 40,334 1.961 -0.52*** 1.772 -0.314*** 0.000 10.36 0.95
Traded only 21,602 1.960 -0.521*** 1.764 -0.323*** 0.000 10.36 0.98
Cross-listed only 8,142 2.041 -0.441** 1.850 -0.237*** 0.020 9.94 1.01
CL and CT 10,590 1.902 -0.58*** 1.737 -0.350*** 0.091 8.82 0.82
High- low ratio All 293,978 0.033 0.027 0.000 0.19 0.02
Domestic 253,644 0.034 0.028 0.000 0.19 0.02
Foreign Presence 40,334 0.028 -0.006*** 0.024 -0.004*** 0.001 0.13 0.01
Traded only 21,602 0.029 -0.005*** 0.025 -0.003*** 0.001 0.13 0.02
Cross-listed only 8,142 0.026 -0.008*** 0.022 -0.006*** 0.001 0.12 0.01
CL and CT 10,590 0.027 -0.007*** 0.024 -0.004*** 0.001 0.12 0.01
(1) statistical significance reported is based on t-test
(2) statistical significance reported is based on Wilcoxon rank sum test
‘***’ indicates significance at 1% , ‘**’ indicates significance at 5% and ‘*’ indicates significance at 10%
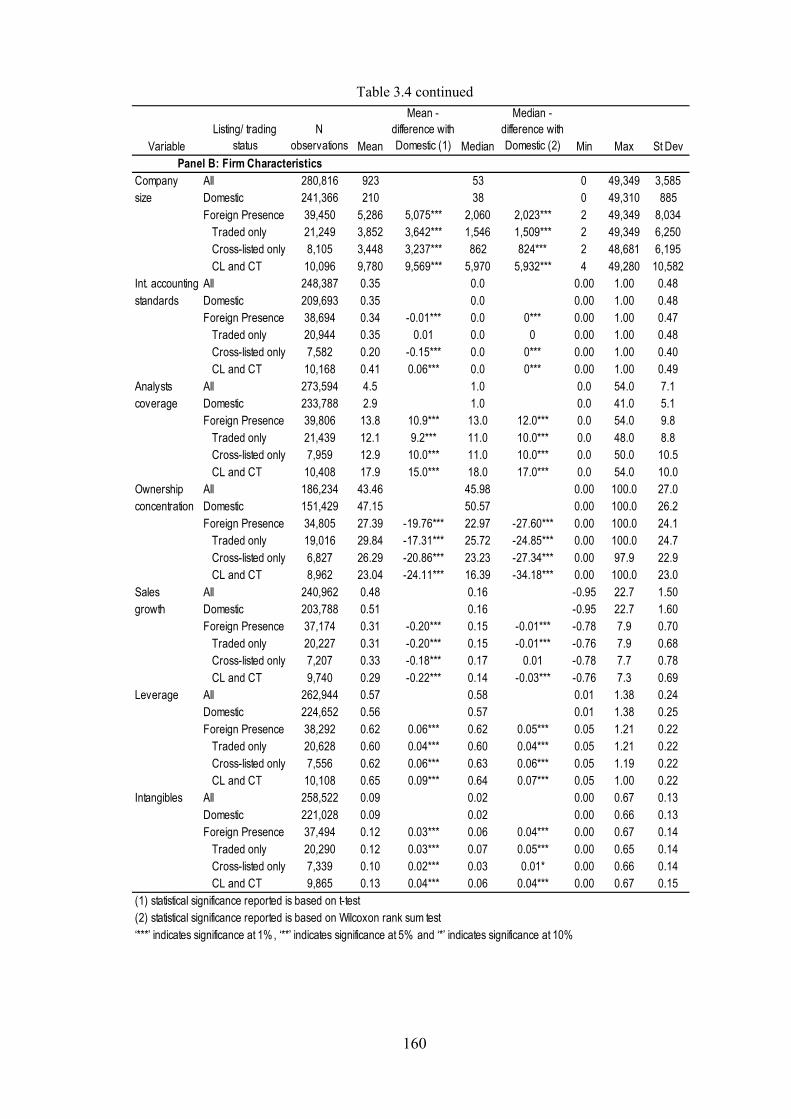
160
Table 3.4 continued
Variable
Listing/ trading
status
N
observations Mean
Mean -
difference with
Domestic (1) Median
Median -
difference with
Domestic (2) Min Max St Dev
Panel B: Firm Characteristics
Company All 280,816 923 53 0 49,349 3,585
size Domestic 241,366 210 38 0 49,310 885
Foreign Presence 39,450 5,286 5,075*** 2,060 2,023*** 2 49,349 8,034
Traded only 21,249 3,852 3,642*** 1,546 1,509*** 2 49,349 6,250
Cross-listed only 8,105 3,448 3,237*** 862 824*** 2 48,681 6,195
CL and CT 10,096 9,780 9,569*** 5,970 5,932*** 4 49,280 10,582
Int. accounting All 248,387 0.35 0.0 0.00 1.00 0.48
standards Domestic 209,693 0.35 0.0 0.00 1.00 0.48
Foreign Presence 38,694 0.34 -0.01*** 0.0 0*** 0.00 1.00 0.47
Traded only 20,944 0.35 0.01 0.0 0 0.00 1.00 0.48
Cross-listed only 7,582 0.20 -0.15*** 0.0 0*** 0.00 1.00 0.40
CL and CT 10,168 0.41 0.06*** 0.0 0*** 0.00 1.00 0.49
Analysts All 273,594 4.5 1.0 0.0 54.0 7.1
coverage Domestic 233,788 2.9 1.0 0.0 41.0 5.1
Foreign Presence 39,806 13.8 10.9*** 13.0 12.0*** 0.0 54.0 9.8
Traded only 21,439 12.1 9.2*** 11.0 10.0*** 0.0 48.0 8.8
Cross-listed only 7,959 12.9 10.0*** 11.0 10.0*** 0.0 50.0 10.5
CL and CT 10,408 17.9 15.0*** 18.0 17.0*** 0.0 54.0 10.0
Ownership All 186,234 43.46 45.98 0.00 100.0 27.0
concentration Domestic 151,429 47.15 50.57 0.00 100.0 26.2
Foreign Presence 34,805 27.39 -19.76*** 22.97 -27.60*** 0.00 100.0 24.1
Traded only 19,016 29.84 -17.31*** 25.72 -24.85*** 0.00 100.0 24.7
Cross-listed only 6,827 26.29 -20.86*** 23.23 -27.34*** 0.00 97.9 22.9
CL and CT 8,962 23.04 -24.11*** 16.39 -34.18*** 0.00 100.0 23.0
Sales All 240,962 0.48 0.16 -0.95 22.7 1.50
growth Domestic 203,788 0.51 0.16 -0.95 22.7 1.60
Foreign Presence 37,174 0.31 -0.20*** 0.15 -0.01*** -0.78 7.9 0.70
Traded only 20,227 0.31 -0.20*** 0.15 -0.01*** -0.76 7.9 0.68
Cross-listed only 7,207 0.33 -0.18*** 0.17 0.01 -0.78 7.7 0.78
CL and CT 9,740 0.29 -0.22*** 0.14 -0.03*** -0.76 7.3 0.69
Leverage All 262,944 0.57 0.58 0.01 1.38 0.24
Domestic 224,652 0.56 0.57 0.01 1.38 0.25
Foreign Presence 38,292 0.62 0.06*** 0.62 0.05*** 0.05 1.21 0.22
Traded only 20,628 0.60 0.04*** 0.60 0.04*** 0.05 1.21 0.22
Cross-listed only 7,556 0.62 0.06*** 0.63 0.06*** 0.05 1.19 0.22
CL and CT 10,108 0.65 0.09*** 0.64 0.07*** 0.05 1.00 0.22
Intangibles All 258,522 0.09 0.02 0.00 0.67 0.13
Domestic 221,028 0.09 0.02 0.00 0.66 0.13
Foreign Presence 37,494 0.12 0.03*** 0.06 0.04*** 0.00 0.67 0.14
Traded only 20,290 0.12 0.03*** 0.07 0.05*** 0.00 0.65 0.14
Cross-listed only 7,339 0.10 0.02*** 0.03 0.01* 0.00 0.66 0.14
CL and CT 9,865 0.13 0.04*** 0.06 0.04*** 0.00 0.67 0.15
(1) statistical significance reported is based on t-test
(2) statistical significance reported is based on Wilcoxon rank sum test
‘***’ indicates significance at 1%, ‘**’ indicates significance at 5% and ‘*’ indicates significance at 10%

161
Table 3.5 Probability of foreign presence
The table reports the output from binary probit model regression of the dependent variable, foreign
presence, on the company size and market-level variables: Probability (FPi,t) = f (ωFi,t), where Fi,t is the
foreign presence dummy variable that equals one if stock i is cross-listed and/or cross-traded in month t
and equals zero otherwise; Fi,t are the potential determinants of cross-listing and/or cross-trading status.
The explanatory variables are defined in Table 3.2. The number (N) of observations is the number of
stock-months observations of available data. The coefficients are estimated using maximum-likelihood
procedures, standard errors are adjusted for clustering on the stock level.
Estimate z-stat Pr > |z|
Intercept -9.60 -9.77 <.0001
Company size 0.59 31.06 <.0001
GDP per capita 0.86 7.56 <.0001
Market size -0.28 -8.15 <.0001
Legal index -0.21 -6.75 <.0001
Accounting opacity 1.88 5.86 <.0001
Pseudo R-Sq 0.513
N observations 266,942
N stocks 3,967
Varible
Foreign presence

162
Table 3.6 Stock liquidity and a foreign presence
The table reports the estimates from the OLS regressions of the dependant variables: bid-ask spread,
trading volume, total trading volume, turnover ratio and total turnover ratio, defined in Table 3.1. Model
(1) specification: Liquidity Measurei,t = α + βDi,t + ΣθFi,t + γλi,t +εi,t, and Model (2) specification:
Liquidity Measurei,t = α +βDi,t +Σβ1Di,tVi,t + ΣθFi,t + γλi,t +εi,t, where Di,t is foreign presence dummy
variable; Vi are main control variables; Fi,t are other control variables; λi,t is the Inverse Mills Ratio. The
explanatory and control variables are defined in Table 3.2. Number (N) of observations is the number of
stock-months observations of available data. Reported in parentheses t-value is heteroskedasticity
consistent (White, 1980) and adjusted for clustering at stock level. ‘***’ indicates significance at 1%,
‘**’ indicates significance at 5% and ‘*’ indicates significance at 10%.
(1) (2) (1) (2) (1) (2) (1) (2) (1) (2)
Foreign presence 0.01*** -0.02*** 0.72*** 2.02*** 1.11*** 1.85*** 0.67*** -1.56*** 1.77*** -1.01*
(4.20) (-3.19) (7.06) (5.18) (11.60) (5.63) (5.03) (-3.83) (9.68) (-1.72)
Company size*FP 0.004*** -0.15*** -0.09* 0.36*** 0.40***
(5.88) (-2.70) (-1.84) (5.73) (5.31)
IAS*FP 0.01*** -0.88*** -0.27** -0.36** 0.62***
(6.58) (-6.91) (-2.18) (-1.98) (3.01)
Analysts*FP -0.002** -0.28*** -0.36*** 0.45*** 0.30
(-2.30) (-2.78) (-3.84) (3.79) (1.54)
Company size -0.01*** -0.01*** 1.21*** 1.47*** 1.13*** 1.27*** 0.90*** 0.28* 0.71*** -0.00
(-28.95) (-27.40) (13.58) (12.13) (13.16) (11.74) (6.73) (1.66) (4.75) (-0.00)
Stock turnover ratio -0.001*** -0.001***
(-14.87) (-15.31)
Return volatility 0.41*** 0.40*** 45.02*** 43.35*** 43.58*** 42.94*** 76.12*** 76.32*** 78.68*** 80.44***
(15.31) (14.89) (22.50) (22.05) (21.96) (21.91) (24.77) (25.16) (24.57) (25.58)
Int accounting stnds -0.01*** -0.01*** -0.04 0.13* 0.06 0.09 -0.37*** -0.24** -0.21** -0.30***
(-7.65) (-9.08) (-0.63) (1.86) (0.90) (1.38) (-3.92) (-2.48) (-2.04) (-3.02)
Own. concentration 0.0001*** 0.0001*** -0.03*** -0.03*** -0.03*** -0.03*** -0.03*** -0.03*** -0.03*** -0.03***
(3.88) (4.14) (-22.49) (-22.49) (-22.54) (-22.52) (-16.71) (-16.74) (-17.07) (-17.19)
Analysts following -0.001** -0.00 0.53*** 0.56*** 0.52*** 0.57*** 0.28*** 0.21*** 0.23*** 0.19***
(-1.98) (-1.22) (11.62) (11.61) (11.52) (11.84) (6.39) (4.58) (4.01) (3.88)
Market turnover 0.003** 0.00 0.07*** 0.08*** 0.06*** 0.06*** 0.21*** 0.20*** 0.20*** 0.18***
(2.31) (1.50) (6.02) (7.06) (5.08) (5.55) (12.65) (12.56) (11.77) (11.01)
GDP per capita 0.00 0.004** -1.33*** -1.05*** -1.62*** -1.48*** -2.81*** -3.49*** -3.45*** -4.23***
(0.45) (2.06) (-8.13) (-5.68) (-10.40) (-8.81) (-7.82) (-8.76) (-9.29) (-10.55)
Market size 0.01*** 0.005*** -0.07 -0.18*** -0.00 -0.05 -0.45*** -0.23** -0.28*** -0.01
(8.68) (8.10) (-1.28) (-2.85) (-0.01) (-0.85) (-5.24) (-2.51) (-3.14) (-0.16)
Legal index -0.002*** -0.003*** -0.69*** -0.76*** -0.64*** -0.67*** -0.66*** -0.50*** -0.56*** -0.37***
(-3.33) (-5.11) (-13.18) (-12.81) (-12.86) (-12.21) (-9.19) (-6.44) (-7.95) (-4.93)
Accounting opacity -0.02** -0.01 5.29*** 5.96*** 4.44*** 4.81*** 2.81*** 1.14 1.45** -0.41
(-2.05) (-0.75) (10.90) (11.15) (9.36) (9.49) (4.61) (1.61) (2.20) (-0.56)
Inverse Mills Ratio 0.004*** 0.002** 1.19*** 1.68*** 0.99*** 1.24*** 1.75*** 0.60* 1.34*** 0.00
(4.13) (2.40) (6.22) (6.82) (5.34) (5.65) (6.16) (1.73) (4.33) (0.01)
Intercept 0.03 0.01 7.82*** 4.04* 10.80*** 8.80*** 24.73*** 34.37*** 31.00*** 41.84***
(1.58) (0.31) (4.42) (1.84) (6.31) (4.47) (6.66) (7.92) (7.90) (9.51)
Industry fixed effects yes yes yes yes yes yes yes yes yes yes
Year fixed effects yes yes yes yes yes yes yes yes yes yes
R-sq 0.3440 0.3513 0.6721 0.6760 0.6884 0.6898 0.3587 0.3625 0.3688 0.3727
N observations 167,542 167,542 166,191 166,191 166,194 166,194 167,542 167,542 167,542 167,542
N stocks 2,347 2,347 2,345 2,345 2,345 2,345 2,347 2,347 2,347 2,347
Bid-ask spread Trading volume Total trading volume Turnover ratio Total turnover ratio

163
Table 3.7 Stock liquidity and cross-listing and cross-trading status
The table reports the estimates from the OLS regressions of the dependant variables: bid-ask spread,
trading volume, total trading volume, turnover ratio and total turnover ratio, defined in Table 3.1. Model
(1) specification: Liquidity Measurei,t = α + βDi,t + ΣθFi,t + γλi,t +εi,t, and Model (2) specification:
Liquidity Measurei,t = α +βDi,t +Σβ1Di,tVi,t + ΣθFi,t + γλi,t +εi,t, where Di,t is dummy variable representing
cross-listing or cross-trading status accordingly; Vi are main control variables; Fi,t are other control
variables; λi,t is the Inverse Mills Ratio. The explanatory and control variables are defined in Table 3.2.
Number (N) of observations is the number of stock-months observations of available data. Reported in
parentheses t-value is heteroskedasticity consistent (White, 1980) and adjusted for clustering at stock
level. ‘***’ indicates significance at 1%, ‘**’ indicates significance at 5% and ‘*’ indicates significance
at 10%.
(1) (2) (1) (2) (1) (2) (1) (2) (1) (2)
Cross-listed 0.01*** -0.01* 0.21* 2.17*** 0.64*** 2.54*** 0.20 0.55 1.21*** 1.09**
(4.35) (-1.76) (1.69) (3.58) (5.75) (5.77) (1.24) (1.15) (6.70) (2.16)
Company size*CL 0.002*** -0.24*** -0.25*** -0.04 -0.02
(2.79) (-3.26) (-4.55) (-0.62) (-0.34)
IAS*CL -0.004** -0.48** 0.03 -0.48* 0.52*
(-1.97) (-2.52) (0.13) (-1.67) (1.80)
Analysts*CL 0.00 -0.08 -0.18 0.30** 0.34
(1.00) (-0.56) (-1.20) (2.06) (1.61)
Cross-traded 0.01*** -0.01** 0.59*** 1.82*** 0.91*** 1.65*** 0.91*** -1.51*** 1.90*** -0.37
(7.07) (-2.16) (5.70) (5.03) (9.31) (4.67) (6.12) (-3.37) (9.32) (-0.48)
Company size*CT 0.003*** -0.13*** -0.09* 0.38*** 0.32***
(3.82) (-2.75) (-1.82) (6.07) (3.63)
IAS*CT 0.01*** -0.71*** -0.24 -0.45** 0.22
(6.48) (-4.88) (-1.61) (-2.20) (0.82)
Analysts*CT -0.003** -0.30** -0.36*** 0.43*** 0.19
(-2.40) (-2.57) (-3.58) (3.25) (0.78)
Company size -0.01*** -0.01*** 1.21*** 1.58*** 1.04*** 1.35*** 0.76*** 0.27 0.34** -0.08
(-29.09) (-28.06) (12.47) (12.61) (11.17) (12.08) (5.35) (1.61) (2.18) (-0.48)
Stock turnover ratio -0.001*** -0.001***
(-15.14) (-15.40)
Return volatility 0.41*** 0.41*** 45.16*** 43.25*** 43.72*** 42.76*** 76.12*** 75.89*** 78.67*** 79.91***
(15.19) (15.22) (22.52) (21.92) (21.97) (21.75) (24.78) (25.02) (24.73) (25.45)
IAS -0.01*** -0.01*** -0.04 0.11 0.06 0.07 -0.38*** -0.19** -0.21** -0.27***
(-7.81) (-8.95) (-0.64) (1.55) (0.90) (1.07) (-3.98) (-2.05) (-2.16) (-2.73)
Own. concentration 0.0001*** 0.0001*** -0.03*** -0.03*** -0.03*** -0.03*** -0.03*** -0.03*** -0.03*** -0.03***
(3.96) (4.13) (-22.64) (-22.63) (-22.64) (-22.67) (-16.69) (-16.73) (-17.06) (-17.18)
Analysts residual -0.001** -0.00 0.53*** 0.56*** 0.52*** 0.57*** 0.28*** 0.20*** 0.22*** 0.19***
(-2.20) (-1.31) (11.75) (11.60) (11.59) (11.87) (6.29) (4.39) (3.97) (3.77)
Market turnover 0.003** 0.00 0.07*** 0.08*** 0.06*** 0.06*** 0.20*** 0.20*** 0.20*** 0.19***
(2.32) (1.32) (5.81) (6.89) (4.86) (5.52) (12.46) (12.59) (11.54) (11.18)
GDP per capita 0.00 0.00 -1.32*** -0.92*** -1.74*** -1.41*** -2.99*** -3.57*** -3.97*** -4.45***
(0.55) (1.16) (-7.48) (-4.78) (-10.59) (-7.98) (-8.03) (-8.96) (-10.59) (-11.10)
Market size 0.01*** 0.005*** -0.08 -0.22*** 0.04 -0.08 -0.39*** -0.21** -0.11 0.05
(8.78) (8.40) (-1.27) (-3.44) (0.66) (-1.27) (-4.35) (-2.28) (-1.23) (0.50)
Legal index -0.01** -0.01* 5.28*** 6.21*** 4.17*** 5.01*** 2.33*** 0.94 0.28 -0.82
(-2.14) (-1.94) (10.44) (11.32) (8.47) (9.60) (3.73) (1.35) (0.42) (-1.16)
Accounting opacity -0.002*** -0.002*** -0.70*** -0.80*** -0.61*** -0.69*** -0.63*** -0.50*** -0.44*** -0.33***
(-3.75) (-4.57) (-12.60) (-13.20) (-11.93) (-12.40) (-8.27) (-6.28) (-6.30) (-4.35)
Bid-ask spread Trading volume Total trading volume Turnover ratio Total turnover ratio

164
Table 3.7 continued
(1) (2) (1) (2) (1) (2) (1) (2) (1) (2)
Inverse Mills Ratio 0.004*** 0.004*** 1.15*** 1.89*** 0.78*** 1.39*** 1.50*** 0.58* 0.64** -0.17
(4.75) (4.74) (5.64) (7.32) (3.96) (6.05) (5.01) (1.67) (2.00) (-0.47)
Intercept 0.03* 0.03 8.00*** 2.37 12.56*** 7.74*** 27.22*** 35.33*** 37.69*** 44.31***
(1.73) (1.60) (4.20) (1.04) (6.92) (3.78) (7.05) (8.19) (9.46) (10.16)
Industry fixed effects yes yes yes yes yes yes yes yes yes yes
Year fixed effects yes yes yes yes yes yes yes yes yes yes
R-sq 0.3462 0.3525 0.6707 0.6730 0.6869 0.6900 0.3604 0.3650 0.3747 0.3773
N observations 167,542 167,542 166,191 166,191 166,194 166,194 167,542 167,542 167,542 167,542
N stocks 2,347 2,347 2,345 2,345 2,345 2,345 2,347 2,347 2,347 2,347
Coefficient Estimates Difference:
Cross-listed - Cross-traded -0.006 0.004 -0.378 0.353 -0.276 0.892 -0.714 2.057 -0.694 1.456
Wald test ( Pr > F stats) 0.002 0.724 0.017 0.589 0.071 0.129 0.000 0.001 0.011 0.156
Bid-ask spread Trading volume Total trading volume Turnover ratio Total turnover ratio

165
Table 3.8 Stock volatility and a foreign presence
The table reports the estimates from the OLS regressions of the dependant variables: return volatility,
volatility ratio, and high-low ratio, defined in Table 3.1. Model (1) specification: Volatility Measurei,t = α
+ βDi,t + ΣθFi,t + γλi,t +εi,t, and Model (2) specification: Volatility Measurei,t = α +βDi,t +Σβ1Di,tVi,t +
ΣθFi,t + γλi,t +εi,t, where Di,t is foreign presence dummy variable; Vi are main control variables; Fi,t are
other control variables; λi,t is the Inverse Mills Ratio. The explanatory and control variables are defined in
Table 3.2. Number (N) of observations is the number of stock-months observations of available data.
Reported in parentheses t-value is heteroskedasticity consistent (White, 1980) and adjusted for clustering
at stock level. ‘***’ indicates significance at 1%, ‘**’ indicates significance at 5% and ‘*’ indicates
significance at 10%.
(1) (2) (1) (2) (1) (2)
Foreign presence 0.00 -0.005*** -0.03 -0.05 0.004*** -0.01***
(1.30) (-5.14) (-0.84) (-0.43) (6.14) (-3.22)
Company size*FP 0.001*** 0.02 0.00***
(4.10) (0.97) (4.39)
IAS *FP -0.003*** -0.35*** -0.01***
(-7.42) (-7.72) (-7.16)
Analysts *FP -0.00 -0.02 -0.00
(-0.64) (-0.52) (-0.64)
Total trading volume*FP 0.0003*** 0.00 0.00
(2.61) (0.31) (1.37)
Company size -0.002*** -0.002*** -0.25*** -0.25*** -0.004*** -0.005***
(-26.63) (-26.65) (-27.45) (-25.85) (-28.57) (-28.86)
Total trading volume 0.001*** 0.001*** 0.15*** 0.14*** 0.002*** 0.002***
(19.92) (18.22) (20.62) (19.53) (22.39) (21.02)
Sales growth 0.001*** 0.001*** 0.02*** 0.02*** 0.001*** 0.001***
(8.69) (8.91) (3.45) (3.39) (7.64) (7.84)
Leverage 0.002*** 0.002*** 0.27*** 0.26*** 0.004*** 0.003***
(3.89) (3.58) (4.65) (4.56) (4.29) (4.03)
Intangibles 0.01*** 0.01*** 0.53*** 0.52*** 0.01*** 0.01***
(7.38) (7.50) (5.18) (5.06) (6.28) (6.40)
Int accounting standards 0.002*** 0.003*** 0.25*** 0.33*** 0.003*** 0.004***
(8.96) (10.95) (8.67) (10.50) (6.76) (9.32)
Ownership concentration 0.00001*** 0.00001*** 0.00*** 0.00*** 0.0001*** 0.0001***
(10.35) (10.98) (7.49) (7.68) (9.94) (10.55)
Analysts following 0.00 0.00 -0.10*** -0.09*** 0.001*** 0.001***
(0.92) (1.11) (-6.00) (-5.66) (3.02) (3.08)
GDP per capita 0.03*** 0.03*** 3.23*** 3.12*** 0.05*** 0.05***
(7.46) (7.84) (6.61) (6.37) (5.92) (6.35)
Market size -0.004*** -0.005*** -0.24*** -0.23*** -0.01*** -0.01***
(-8.10) (-8.69) (-3.88) (-3.75) (-6.98) (-7.63)
Legal index -0.01*** -0.01*** -0.42*** -0.40*** -0.01*** -0.01***
(-6.94) (-7.36) (-3.63) (-3.43) (-6.03) (-6.53)
Accounting opacity 0.10*** 0.10*** 7.68*** 7.30*** 0.16*** 0.17***
(7.27) (7.67) (4.81) (4.59) (6.06) (6.49)
Return volatility Volatility ratio High-low ratio

166
Table 3.8 continued
(1) (2) (1) (2) (1) (2)
Inverse Mills Ratio 0.06*** 0.06*** 4.30*** 4.10*** 0.09*** 0.10***
(8.07) (8.45) (5.21) (4.98) (6.75) (7.17)
Intercept -0.36*** -0.37*** -35.38*** -33.93*** -0.55*** -0.57***
(-7.17) (-7.50) (-6.10) (-5.85) (-5.69) (-6.06)
Industry indicators yes yes yes yes yes yes
Year indicators yes yes yes yes yes yes
R-sq 0.2797 0.2856 0.2523 0.2545 0.3154 0.3222
N observations 149,640 149,640 149,640 149,640 149,640 149,640
N stocks 2,180 2,180 2,180 2,180 2,180 2,180
Return volatility Volatility ratio High-low ratio

167
Table 3.9 Stock volatility and cross-listing and cross-trading status
The table reports the estimates from the OLS regressions of the dependant variables, return volatility,
volatility ratio, and high-low ratio, defined in Table 3.1. Model (1) specification: Volatility Measurei,t = α
+ βDi,t + ΣθFi,t + γλi,t +εi,t, and Model (2) specification: Volatility Measurei,t = α +βDi,t +Σβ1Di,tVi,t +
ΣθFi,t + γλi,t +εi,t, where Di,t is dummy variable representing cross-listing or cross-trading status
accordingly; Vi are main control variables; Fi,t are other control variables; λi,t is the Inverse Mills Ratio.
The explanatory and control variables are defined in Table 3.2. Number (N) of observations is the number
of stock-months observations of available data. Reported in parentheses t-value is heteroskedasticity
consistent (White, 1980) and adjusted for clustering at stock level. ‘***’ indicates significance at 1%,
‘**’ indicates significance at 5% and ‘*’ indicates significance at 10%.
(1) (2) (1) (2) (1) (2)
Cross-listed 0.00 -0.003** -0.02 -0.26 0.001** -0.00
(0.96) (-2.11) (-0.42) (-1.48) (2.15) (-0.87)
Company size*CL 0.00 0.02 0.00
(0.72) (0.89) (1.30)
IAS *CL -0.001** -0.19*** -0.003***
(-2.23) (-2.86) (-2.63)
Analysts *CL -0.00** -0.14** -0.00
(-2.08) (-2.53) (-1.09)
Total trading volume*CL 0.0004* 0.03 0.00
(1.66) (1.15) (0.04)
Cross-traded 0.001** -0.003*** -0.03 0.12 0.004*** -0.004*
(2.44) (-2.94) (-0.85) (0.92) (6.91) (-1.73)
Company size*CT 0.001*** 0.00 0.001***
(2.87) (0.10) (3.23)
IAS*CT -0.002*** -0.26*** -0.005***
(-6.05) (-5.24) (-6.38)
Analysts*CT 0.00 0.03 0.00
(0.90) (0.60) (0.14)
Total trading volume*CT 0.00 -0.01 0.00
(1.48) (-0.81) (0.79)
Company size -0.002*** -0.002*** -0.25*** -0.25*** -0.004*** -0.004***
(-26.91) (-26.78) (-27.10) (-25.95) (-28.83) (-28.94)
Total trading volume 0.00*** 0.00*** 0.15*** 0.15*** 0.00*** 0.00***
(19.75) (18.54) (20.63) (19.88) (22.28) (21.41)
Sales growth 0.001*** 0.001*** 0.02*** 0.02*** 0.001*** 0.001***
(8.76) (8.87) (3.44) (3.40) (7.69) (7.79)
Leverage 0.002*** 0.002*** 0.27*** 0.27*** 0.004*** 0.003***
(3.88) (3.68) (4.64) (4.67) (4.32) (4.16)
Intangibles 0.01*** 0.01*** 0.53*** 0.51*** 0.01*** 0.01***
(7.40) (7.31) (5.18) (4.97) (6.36) (6.28)
Int accounting standards 0.002*** 0.003*** 0.25*** 0.31*** 0.003*** 0.004***
(8.93) (10.90) (8.66) (10.25) (6.71) (9.34)
Ownership concentration 0.00001*** 0.00001*** 0.004*** 0.004*** 0.0001*** 0.0001***
(10.41) (11.02) (7.49) (7.72) (10.01) (10.53)
Analysts following 0.00 0.00 -0.10*** -0.09*** 0.001*** 0.001***
(0.83) (1.03) (-6.00) (-5.54) (2.95) (2.96)
Return volatility Volatility ratio High-low ratio

168
Table 3.9 continued
(1) (2) (1) (2) (1) (2)
GDP per capita 0.03*** 0.03*** 3.23*** 3.13*** 0.05*** 0.05***
(7.49) (7.80) (6.55) (6.37) (6.14) (6.50)
Market size -0.004*** -0.005*** -0.24*** -0.23*** -0.01*** -0.01***
(-8.11) (-8.59) (-3.84) (-3.71) (-7.22) (-7.77)
Legal index -0.01*** -0.01*** -0.42*** -0.40*** -0.01*** -0.01***
(-7.00) (-7.34) (-3.59) (-3.43) (-6.28) (-6.71)
Accounting opacity 0.10*** 0.10*** 7.67*** 7.36*** 0.17*** 0.17***
(7.31) (7.65) (4.77) (4.61) (6.27) (6.63)
Inverse Mills Ratio 0.06*** 0.06*** 4.29*** 4.13*** 0.10*** 0.10***
(8.12) (8.44) (5.17) (5.00) (6.98) (7.34)
Intercept -0.37*** -0.37*** -35.35*** -34.14*** -0.57*** -0.58***
(-7.20) (-7.47) (-6.04) (-5.86) (-5.90) (-6.20)
Industry fixed effects yes yes yes yes yes yes
Year fixed effects yes yes yes yes yes yes
R-sq 0.2800 0.2855 0.2523 0.2547 0.3166 0.3227
N observations 149,640 149,640 149,640 149,640 149,640 149,640
N stocks 2,180 2,180 2,180 2,180 2,180 2,180
Coefficient Estimates Difference:
Cross-listed - Cross-traded 0.000 0.000 0.014 -0.379 -0.003 0.001
Wald test ( Pr > F stats) 0.383 0.996 0.798 0.118 0.004 0.803
Return volatility Volatility ratio High-low ratio

169
Table 3.10 Cross-listing and/or cross-trading and the evolution of stock liquidity and volatility
Panel A of Table 3.10 reports the estimates from the OLS regressions of the dependant variables: bid-ask
spread, trading volume, total trading volume, turnover ratio and total turnover ratio, defined in Table 3.1.
In the regressions, foreign presence, cross-listing, cross-trading variables are replaced by a series of the
year-specific dummy variables relative to the year of foreign presence, cross-listing, cross-trading
accordingly (year 0). Model specification: Liquidity Measurei,t = α + ΣγYn +ΣβDi,tVi,t + ΣθFi,t + εi,t, where
Yn is variable representing a year relative to the year of foreign presence, cross-listing, cross-trading
accordingly (from year -4 and earlier to year +4 and later); Di,t is dummy variable representing foreign
presence, cross-listing, cross-trading accordingly, Vi are main stock-specific control variables; Fi,t are
other control variables. The explanatory and control variables are defined in Table 3.2. Only the
coefficient estimates on the year-specific dummies around foreign presence, cross-listing, cross-trading
are reported in the Table but the regressions include the full set of control variables as in model (2) of
Table 3.6 for foreign presence and model (2) of Table 3.7 for cross-listing and cross-trading. Reported in
parentheses t-value is heteroskedasticity consistent (White, 1980) and adjusted for clustering at stock
level. ‘***’ indicates significance at 1%, ‘**’ indicates significance at 5% and ‘*’ indicates significance
at 10%.
≤-4y -3 -2 -1 0 +1 +2 +3 ≥+4y
Panel A: Liquidity
Bid-ask spread
Foreign presence 0.018 0.009*** 0.012*** 0.015*** -0.017*** -0.015*** -0.016*** -0.016*** -0.016***
(1.42) (4.65) (6.51) (8.59) (-3.21) (-2.93) (-3) (-3.03) (-2.73)
Cross-listed 0 0.004* 0.006** 0.007*** -0.008 -0.005 -0.008 -0.009 -0.011*
(0.12) (1.83) (2.55) (2.94) (-1.64) (-0.85) (-1.44) (-1.58) (-1.91)
Cross-traded 0.011*** 0.012*** 0.013*** 0.016*** -0.01 -0.012* -0.012* -0.011* -0.01
(3.63) (6.14) (8.18) (9.8) (-1.54) (-1.88) (-1.86) (-1.79) (-1.45)
Trading volume
Foreign presence 1.801*** 1.237*** 1.137*** 1.134*** 0.613* 0.685** 0.754** 0.693** 0.765**
(3.83) (7.74) (8.22) (9.03) (1.94) (2.21) (2.36) (2.11) (2.17)
Cross-listed 0.229 0.392** 0.487*** 0.739*** 1.194** 1.365*** 1.281** 1.233** 1.028*
(0.87) (1.97) (2.89) (5.18) (2.26) (2.6) (2.3) (2.2) (1.66)
Cross-traded 0.847*** 1.134*** 1.056*** 0.938*** 0.537 0.486 0.596* 0.529 0.73**
(3.27) (7.38) (7.81) (7.43) (1.63) (1.47) (1.79) (1.54) (2.02)
Total trading volume
Foreign presence 1.89*** 1.244*** 1.185*** 1.194*** 0.808*** 0.838*** 0.888*** 0.841*** 0.863***
(4.43) (7.75) (8.65) (9.53) (2.82) (3.01) (3.13) (2.89) (2.8)
Cross-listed 0.217 0.407** 0.47*** 0.725*** 1.792*** 1.894*** 1.852*** 1.776*** 1.508***
(0.85) (2.27) (2.86) (4.91) (4.48) (4.9) (4.56) (4.46) (3.57)
Cross-traded 0.862*** 1.194*** 1.173*** 1.089*** 0.699** 0.627* 0.672** 0.638* 0.694*
(3.43) (8.15) (9.15) (9.07) (2.1) (1.89) (2.01) (1.84) (1.89)
Turnover ratio
Foreign presence 1.186 0.559*** 0.453*** 0.473*** -2.517*** -2.169*** -1.98*** -1.845*** -1.389***
(1.11) (3.74) (3.16) (3.74) (-7) (-6.08) (-5.52) (-4.98) (-3.55)
Cross-listed -0.133 -0.024 -0.199 -0.046 0.054 0.345 0.317 0.415 0.596
(-0.42) (-0.09) (-0.99) (-0.24) (0.11) (0.75) (0.67) (0.86) (1.18)
Cross-traded 0.218 0.421*** 0.365** 0.426*** -2.295*** -1.999*** -1.733*** -1.49*** -1.19**
(0.72) (2.82) (2.56) (3.2) (-5.44) (-4.66) (-4.09) (-3.43) (-2.55)
Total turnover ratio
Foreign presence 1.468 0.514*** 0.456*** 0.553*** -1.435** -1.166** -1.046* -0.978* -0.293
(1.07) (3.19) (2.99) (3.85) (-2.57) (-2.03) (-1.87) (-1.73) (-0.45)
Cross-listed -0.122 -0.068 -0.273 -0.128 1.07* 1.173** 1.167** 1.152** 1.358**
(-0.31) (-0.27) (-1.21) (-0.58) (1.91) (2.24) (2.3) (2.29) (2.52)
Cross-traded 0.144 0.48*** 0.546*** 0.684*** -0.689 -0.354 -0.267 0.023 0.363
(0.38) (3.02) (3.38) (4.67) (-0.95) (-0.47) (-0.36) (0.03) (0.42)
Years relative to foreign presence/ cross-listing/ cross-trading

170
Table 3.10 continued
Panel B of Table 3.10 reports the estimates from the OLS regressions of the dependant variables: return
volatility, volatility ratio, and high-low ratio, defined in Table 3.1. In the regressions, foreign presence,
cross-listing, cross-trading variables are replaced by a series of the year-specific dummy variables relative
to the year of foreign presence/ cross-listing/ cross-trading accordingly (year 0). Model specification:
Volatility Measurei,t = α + ΣγYn +ΣβDi,tVi,t + ΣθFi,t + εi,t, where Yn is variable representing a year relative
to the year of foreign presence, cross-listing, cross-trading accordingly (from year -4 and earlier to year
+4 and later); Di,t is dummy variable representing foreign presence, cross-listing, cross-trading
accordingly, Vi are main stock-specific control variables; Fi,t are other control variables. The explanatory
and control variables are defined in Table 3.2. Only the coefficient estimates on the year-specific
dummies around foreign presence, cross-listing, cross-trading are reported in the Table, but regressions
include the full set of control variables as in model (2) of Table 3.8 for foreign presence and model (2) of
Table 3.9 for cross-listing and cross-trading. Reported in parentheses t-value is heteroskedasticity
consistent (White, 1980) and adjusted for clustering at stock level. ‘***’ indicates significance at 1%,
‘**’ indicates significance at 5% and ‘*’ indicates significance at 10%.
≤-4y -3 -2 -1 0 +1 +2 +3 ≥+4y
Panel B: Volatility
Return volatility
Foreign presence -0.003** 0 0 0.001 -0.003*** -0.004*** -0.004*** -0.004*** -0.003***
(-2.02) (0.83) (0.36) (1.56) (-3.77) (-4.25) (-4.72) (-4.07) (-3.73)
Cross-listed 0.001* 0 0 0 -0.001 -0.002 -0.002 -0.002 -0.002
(1.68) (0.54) (0.82) (0.07) (-0.87) (-1.21) (-1.3) (-1.4) (-1.07)
Cross-traded -0.001 0 0.001 0.001*** -0.003** -0.003*** -0.003*** -0.003** -0.003***
(-1.12) (-0.14) (1.51) (2.9) (-2.49) (-2.74) (-2.88) (-2.53) (-2.59)
Volatility ratio
Foreign presence -0.174 -0.01 0.028 0.091 0.017 0.049 0.019 -0.02 -0.141
(-1.03) (-0.14) (0.46) (1.6) (0.15) (0.44) (0.16) (-0.18) (-1.23)
Cross-listed 1.680 0.540 0.820 0.070 -0.870 -1.210 -1.300 -1.400 -1.070
(0.01) (-0.61) (0.03) (-0.93) (-0.69) (-0.99) (-0.78) (-0.84) (-1.21)
Cross-traded -1.120 -0.140 1.510 2.900 -2.490 -2.740 -2.880 -2.530 -2.590
(-0.08) (0.13) (1.86) (3.54) (0.95) (1.15) (1.09) (0.47) (-0.46)
High- low ratio
Foreign presence -0.003 0.003*** 0.003*** 0.005*** -0.004** -0.005*** -0.006*** -0.005** -0.004**
(-0.94) (2.6) (3.06) (5.47) (-1.99) (-2.62) (-3.09) (-2.48) (-2.21)
Cross-listed 0.001 0 0.002 0.002 0 0 -0.001 0 0
(0.55) (-0.03) (1.14) (1.53) (-0.06) (-0.09) (-0.2) (0.01) (0.03)
Cross-traded 0 0.003** 0.005*** 0.007*** -0.003 -0.004* -0.004* -0.004* -0.004*
(-0.26) (2.36) (4.57) (6.88) (-1.28) (-1.76) (-1.95) (-1.77) (-1.82)
Years relative to foreign presence/ cross-listing/ cross-trading
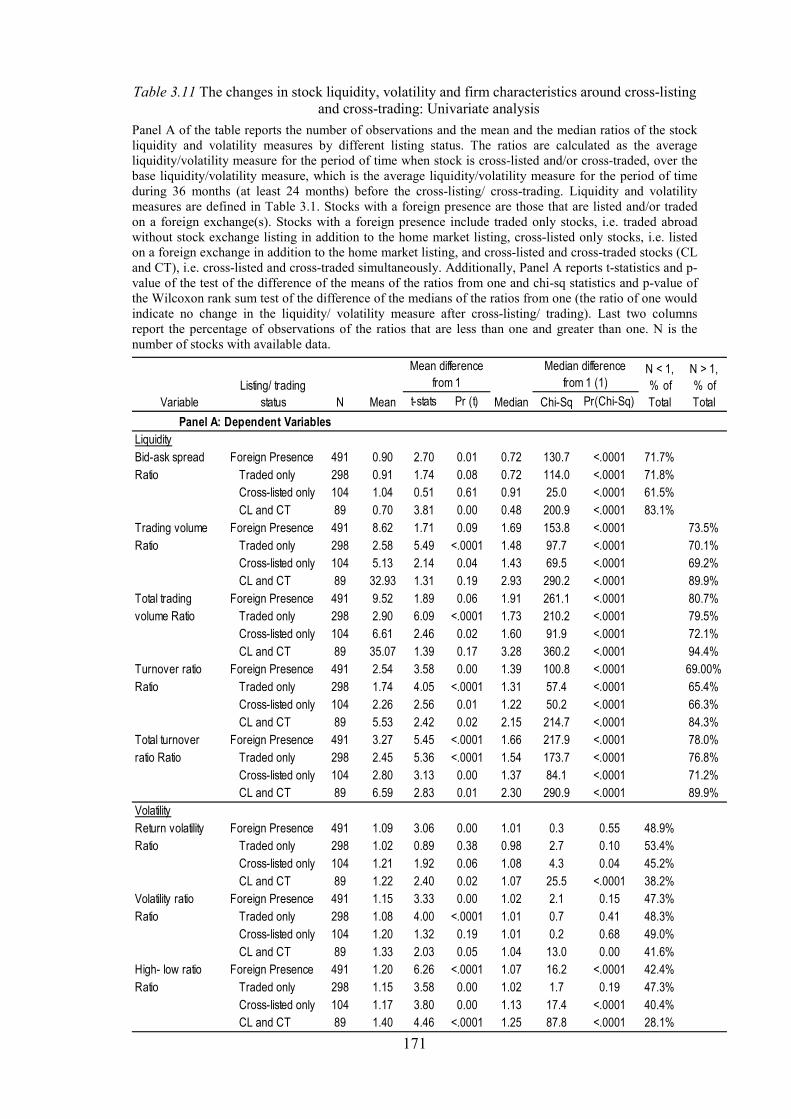
171
Table 3.11 The changes in stock liquidity, volatility and firm characteristics around cross-listing
and cross-trading: Univariate analysis
Panel A of the table reports the number of observations and the mean and the median ratios of the stock
liquidity and volatility measures by different listing status. The ratios are calculated as the average
liquidity/volatility measure for the period of time when stock is cross-listed and/or cross-traded, over the
base liquidity/volatility measure, which is the average liquidity/volatility measure for the period of time
during 36 months (at least 24 months) before the cross-listing/ cross-trading. Liquidity and volatility
measures are defined in Table 3.1. Stocks with a foreign presence are those that are listed and/or traded
on a foreign exchange(s). Stocks with a foreign presence include traded only stocks, i.e. traded abroad
without stock exchange listing in addition to the home market listing, cross-listed only stocks, i.e. listed
on a foreign exchange in addition to the home market listing, and cross-listed and cross-traded stocks (CL
and CT), i.e. cross-listed and cross-traded simultaneously. Additionally, Panel A reports t-statistics and p-
value of the test of the difference of the means of the ratios from one and chi-sq statistics and p-value of
the Wilcoxon rank sum test of the difference of the medians of the ratios from one (the ratio of one would
indicate no change in the liquidity/ volatility measure after cross-listing/ trading). Last two columns
report the percentage of observations of the ratios that are less than one and greater than one. N is the
number of stocks with available data.
t-stats Pr (t) Chi-Sq Pr(Chi-Sq)
Panel A: Dependent Variables
Liquidity
Bid-ask spread Foreign Presence 491 0.90 2.70 0.01 0.72 130.7 <.0001 71.7%
Ratio Traded only 298 0.91 1.74 0.08 0.72 114.0 <.0001 71.8%
Cross-listed only 104 1.04 0.51 0.61 0.91 25.0 <.0001 61.5%
CL and CT 89 0.70 3.81 0.00 0.48 200.9 <.0001 83.1%
Trading volume Foreign Presence 491 8.62 1.71 0.09 1.69 153.8 <.0001 73.5%
Ratio Traded only 298 2.58 5.49 <.0001 1.48 97.7 <.0001 70.1%
Cross-listed only 104 5.13 2.14 0.04 1.43 69.5 <.0001 69.2%
CL and CT 89 32.93 1.31 0.19 2.93 290.2 <.0001 89.9%
Total trading Foreign Presence 491 9.52 1.89 0.06 1.91 261.1 <.0001 80.7%
volume Ratio Traded only 298 2.90 6.09 <.0001 1.73 210.2 <.0001 79.5%
Cross-listed only 104 6.61 2.46 0.02 1.60 91.9 <.0001 72.1%
CL and CT 89 35.07 1.39 0.17 3.28 360.2 <.0001 94.4%
Turnover ratio Foreign Presence 491 2.54 3.58 0.00 1.39 100.8 <.0001 69.00%
Ratio Traded only 298 1.74 4.05 <.0001 1.31 57.4 <.0001 65.4%
Cross-listed only 104 2.26 2.56 0.01 1.22 50.2 <.0001 66.3%
CL and CT 89 5.53 2.42 0.02 2.15 214.7 <.0001 84.3%
Total turnover Foreign Presence 491 3.27 5.45 <.0001 1.66 217.9 <.0001 78.0%
ratio Ratio Traded only 298 2.45 5.36 <.0001 1.54 173.7 <.0001 76.8%
Cross-listed only 104 2.80 3.13 0.00 1.37 84.1 <.0001 71.2%
CL and CT 89 6.59 2.83 0.01 2.30 290.9 <.0001 89.9%
Volatility
Return volatility Foreign Presence 491 1.09 3.06 0.00 1.01 0.3 0.55 48.9%
Ratio Traded only 298 1.02 0.89 0.38 0.98 2.7 0.10 53.4%
Cross-listed only 104 1.21 1.92 0.06 1.08 4.3 0.04 45.2%
CL and CT 89 1.22 2.40 0.02 1.07 25.5 <.0001 38.2%
Volatility ratio Foreign Presence 491 1.15 3.33 0.00 1.02 2.1 0.15 47.3%
Ratio Traded only 298 1.08 4.00 <.0001 1.01 0.7 0.41 48.3%
Cross-listed only 104 1.20 1.32 0.19 1.01 0.2 0.68 49.0%
CL and CT 89 1.33 2.03 0.05 1.04 13.0 0.00 41.6%
High- low ratio Foreign Presence 491 1.20 6.26 <.0001 1.07 16.2 <.0001 42.4%
Ratio Traded only 298 1.15 3.58 0.00 1.02 1.7 0.19 47.3%
Cross-listed only 104 1.17 3.80 0.00 1.13 17.4 <.0001 40.4%
CL and CT 89 1.40 4.46 <.0001 1.25 87.8 <.0001 28.1%
Median difference
from 1 (1)
Mean difference
from 1N < 1,
% of
Total
N > 1,
% of
TotalVariable
Listing/ trading
status N Mean Median

172
Table 3.11 continued
Panel B of the table reports the number of observations and the mean and the median ratios of the firm
characteristics by different listing/ trading status. The ratios are calculated as the firm characteristic for
the period of time when stock is cross-listed and/or cross-traded, over the base firm characteristic, which
is the firm characteristic for the period of time during 36 months (at least 24 months) before the cross-
listing/ cross-trading. Firm characteristics are defined in Table 3.2. Stocks with a foreign presence are
those that are listed and/or traded on a foreign exchange(s). Stocks with a foreign presence include traded
only stocks, i.e. traded abroad without stock exchange listing in addition to the home market listing,
cross-listed only stocks, i.e. listed on a foreign exchange in addition to the home market listing, and cross-
listed and cross-traded stocks (CL and CT), i.e. cross-listed and cross-traded simultaneously.
Additionally, Panel B reports t-statistics and p-value of the test of the difference of the means of the ratios
from one and chi-sq statistics and p-value of the Wilcoxon rank sum test of the difference of the medians
of the ratios from one (the ratio of one would indicate no change in the firm characteristic after cross-
listing/ trading). Last column reports the percentage of observations of the ratios that are greater than one.
N is the number of stocks with available data.
t-stats Pr (t) Chi-Sq Pr(Chi-Sq)
Panel B: Firm Characteristics
Company Foreign Presence 487 2.83 3.61 0.00 1.47 139.6 <.0001 72.5%
size Ratio Traded only 295 2.01 5.39 <.0001 1.42 91.0 <.0001 69.5%
Cross-listed only 103 1.85 4.81 <.0001 1.34 53.9 <.0001 67.0%
CL and CT 89 6.66 2.13 0.04 2.29 273.5 <.0001 88.8%
IAS Difference Foreign Presence 447 0.11 7.78 <.0001 0.00 95.4 <.0001 46.3%
Traded only 270 0.12 7.45 <.0001 0.05 120.1 <.0001 51.9%
Cross-listed only 94 0.00 0.12 0.90 0.00 0.5 0.49 18.1%
CL and CT 83 0.22 4.71 <.0001 0.19 126.3 <.0001 60.2%
Analysts Foreign Presence 435 1.53 5.35 <.0001 0.98 1.4 0.24 47.1%
coverage Traded only 257 1.44 3.38 0.00 0.90 15.9 <.0001 40.9%
Ratio Cross-listed only 92 1.64 3.23 0.00 1.06 14.0 0.00 58.7%
CL and CT 86 1.68 2.91 0.00 1.03 2.7 0.10 53.5%
Ownership Foreign Presence 403 9.31 1.62 0.11 0.96 8.5 0.00 43.4%
concentration Traded only 247 2.62 2.73 0.01 0.99 1.4 0.24 46.6%
Ratio Cross-listed only 83 13.95 1.12 0.26 0.95 12.6 0.00 41.0%
CL and CT 73 26.69 1.03 0.31 0.80 31.1 <.0001 35.6%
Sales Foreign Presence 409 1.15 0.53 0.59 0.64 48.8 <.0001 35.2%
growth Ratio Traded only 247 1.05 0.11 0.91 0.63 48.3 <.0001 34.0%
Cross-listed only 87 0.99 0.06 0.95 0.79 18.9 <.0001 39.1%
CL and CT 75 1.68 0.99 0.33 0.58 36.3 <.0001 34.7%
Leverage Foreign Presence 450 1.04 2.19 0.03 0.99 2.8 0.09 46.4%
Ratio Traded only 272 1.05 1.98 0.05 1.00 0.3 0.60 48.5%
Cross-listed only 95 1.02 0.55 0.58 0.99 1.2 0.28 47.4%
CL and CT 83 1.04 0.88 0.38 0.99 22.0 <.0001 38.6%
Intangibles Foreign Presence 357 8.50 2.94 0.00 1.35 60.2 <.0001 67.0%
Ratio Traded only 224 11.21 2.53 0.01 1.35 81.3 <.0001 71.0%
Cross-listed only 75 2.49 2.77 0.01 1.05 0.6 0.46 52.0%
CL and CT 58 5.82 3.24 0.00 1.88 57.2 <.0001 70.7%
Mean difference
from 1
Median difference
from 1 (1)
N > 1,
% of
TotalVariable
Listing/ trading
status MedianMeanN
(1) based on Wilcoxon rank sum test

173
Table 3.12 The change in stock liquidity and volatility around cross-listing and cross-trading:
Regression analysis
The table reports the estimates from the OLS regressions of the dependant variables, the ratios of the bid-
ask spread, trading volume, total trading volume, turnover ratio, total turnover ratio, return volatility,
volatility ratio, and high-low ratio variables, defined in Table 3.1, to the appropriate base measure, i.e. the
average measure for the period of time when the stock had domestic listing status. Model specification:
(Liquidity or Volatility Measurei,t / Liquidity or Volatility Measurei,base)= α + γDi,t + Σθ(Fi,t /Fi,base) + εi,t,
where Liquidity or Volatility Measurei,base is average liquidity or volatility measure over the period of
time when the stock was not listed/ traded abroad; Di,t is dummy variable representing cross-listing or
cross-trading accordingly; Fi,t are control variables; Fi,base is average control variable over the period of
time when the stock was not listed/ traded abroad. The control variables (except for the market turnover
variable) are calculated as the ratio of the control variables, defined in Table 3.2, to the appropriate base
measure, i.e. the average measure for the period of time when the stock had domestic listing status.
Market turnover variable is defined in Table 3.2. Number (N) of observations is the number of stock-
months observations of available data. Reported in parentheses t-value is heteroskedasticity consistent
(White, 1980) and adjusted for clustering at stock level. ‘***’ indicates significance at 1%, ‘**’ indicates
significance at 5% and ‘*’ indicates significance at 10%.
Bid-ask
spread
Ratio
Trading
volume
Ratio
Total trading
volume
Ratio
Turnover
ratio
Ratio
Total
turnover
ratio Ratio
Return
volatility
Ratio
Volatility
ratio
Ratio
High-low
ratio
Ratio
Model (1)
Foreign Presence -0.46*** 0.81*** 0.95*** 0.47*** 0.76*** -0.03 0.02 0.14***
(-10.36) (10.97) (13.05) (8.62) (12.05) (-1.20) (0.91) (4.46)
Intercept -0.13*** -0.30*** -0.29*** -0.23*** -0.21*** 0.07*** 0.05*** -0.18***
(-13.64) (-13.82) (-12.76) (-13.09) (-9.83) (6.76) (5.39) (-11.33)
Adj. R-sq 0.063 0.086 0.125 0.047 0.095 0.0004 0.0002 0.009
Model (2)
Cross-listed -0.26*** 0.73*** 0.79*** 0.42*** 0.49*** 0.01 -0.016 0.13**
(-2.91) (5.74) (6.36) (4.75) (5.38) (0.34) (-0.53) (2.55)
Cross-traded -0.53*** 0.82*** 0.95*** 0.50*** 0.79*** -0.02 0.03 0.14***
(-11.13) (10.37) (12.95) (8.27) (11.58) (-0.96) (1.13) (3.95)
Intercept -0.08*** -0.39*** -0.37*** -0.30*** -0.26*** 0.06*** 0.05*** -0.19***
(-3.65) (-10.87) (-10.96) (-11.04) (-8.85) (5.07) (4.27) (-10.51)
Adj. R-sq 0.112 0.152 0.204 0.088 0.145 0.0004 0.0007 0.016
Model (3)
Cross-listed -0.02 0.49*** 0.59*** 0.31*** 0.45*** 0.0 -0.016 0.02
(-0.44) (2.98) (3.65) (2.84) (4.28) (-0.01) (-0.48) (0.38)
Cross-traded -0.15*** 0.49*** 0.66*** 0.32*** 0.61*** -0.10*** 0.002 -0.01
(-4.96) (5.45) (7.87) (5.11) (9.16) (-4.52) (0.08) (-0.15)
Company size Ratio -0.37*** 0.27*** 0.32*** 0.11** 0.13** -0.09*** -0.07*** -0.11***
(-13.58) (3.19) (4.00) (2.08) (2.38) (-3.93) (-3.28) (-2.72)
IAS Difference -0.42*** 0.17 0.31*** 0.11 0.35*** -0.14*** -0.06 -0.09**
(-6.84) (1.6) (3.29) (1.43) (4.23) (-4.22) (-1.63) (-2.26)
Analysts coverage 0.0 0.0 0.0 0.0001*** 0.0 0.0001** 0.0 0.0002**
Ratio (0.8) (1.63) (0.62) (3.24) (1.32) (2.28) (-1.17) (2.47)
Own. Concentration 0.0 -0.001*** -0.001*** 0.0 0.0 0.0 0.0 0.0
Ratio (-0.07) (-5.18) (-5.42) (-0.23) (-1.08) (-1.34) (-0.65) (-1.3)
Turnover ratio -0.27*** 0.14*** 0.10*** 0.26***
Ratio (-8.73) (7.2) (5.24) (7.72)
Return volatility 0.63*** 0.35*** 0.40*** 0.31*** 0.41***
Ratio (23.15) (3.66) (7.78) (3.81) (5.85)
Liquidity Volatility

174
Table 3.12 continued
Bid-ask
spread
Ratio
Trading
volume
Ratio
Total trading
volume
Ratio
Turnover
ratio
Ratio
Total
turnover
ratio Ratio
Return
volatility
Ratio
Volatility
ratio
Ratio
High-low
ratio
Ratio
Sales Growth Ratio 0.0 0.0 0.0
(0.51) (-0.53) (-0.31)
Leverage Ratio 0.05 0.07 0.08
(0.83) (1.28) (1.25)
Intangibles Ratio 0.0 0.0 0.0
(1.16) (0.44) (1.07)
Market turnover 0.0 0.15*** 0.05*** 0.14*** 0.03**
(-0.13) (8.52) (3.66) (9.54) (2.41)
Intercept -0.86*** -1.07*** -0.81*** -0.95*** -0.73*** 0.0 -0.03 -0.19***
(-18.06) (-9.72) (-11.06) (-10.21) (-9.03) (0.0) (-0.51) (-2.69)
Adj. R-sq 0.549 0.282 0.315 0.234 0.245 0.087 0.046 0.175
N observations 31,404 31,575 31,575 31,575 31,575 22,621 22,621 22,621
N stocks 309 309 309 309 309 238 238 238
Coefficient Estimates Difference:
CL - CT 0.124 -0.004 -0.067 -0.007 -0.160 0.102 -0.017 0.025
Wald test ( Pr > F) <.0001 0.7829 <.0001 0.5293 <.0001 <.0001 0.0385 0.009
Liquidity Volatility

175
Table 3.13 Stock liquidity: Developed vs. emerging home market
The table reports the estimates from the OLS regressions of the dependant variables: bid-ask spread,
trading volume, total trading volume, turnover ratio and total turnover ratio, defined in Table 3.1. Model
specification: Liquidity Measurei,t = α +βDi,t +Σβ1Di,tVi,t + ΣθFi,t + γλi,t +εi,t, where Di,t is dummy variable
representing cross-listing or cross-trading status accordingly; Vi are main control variables; Fi,t are other
control variables; λi,t is the Inverse Mills Ratio. The explanatory and control variables are defined in Table
3.2. The model is estimated for each liquidity measure for two sub-samples: 1) stocks from developed
markets and 2) stocks from emerging markets. Number (N) of observations is the number of stock-
months observations of available data. Reported in parentheses t-value is heteroskedasticity consistent
(White, 1980) and adjusted for clustering at stock level. ‘***’ indicates significance at 1%, ‘**’ indicates
significance at 5% and ‘*’ indicates significance at 10%.
Developed Emerging Developed Emerging Developed Emerging Developed Emerging Developed Emerging
Cross-listed -0.02** -0.09 2.26*** 3.34** 2.67*** 0.94 0.57 -13.23*** 0.83* 17.42***
(-2.42) (-1.38) (3.62) (2.56) (6.13) (0.58) (1.41) (-3.31) (1.72) (3.37)
Company size*CL 0.003*** 0.01 -0.26*** -0.43*** -0.28*** 0.05 -0.06 1.67*** -0.01 -1.37**
(3.43) (0.93) (-3.38) (-2.79) (-5.09) (0.22) (-1.13) (3.24) (-0.22) (-2.10)
IAS*CL -0.00 0.00 -0.49** 0.00 -0.03 0.00 -0.64*** 0.00 -0.01 0.00
(-1.31) (.) (-2.48) (.) (-0.17) (.) (-2.61) (.) (-0.04) (.)
Analysts*CL 0.00 0.01 -0.09 -0.54 -0.16 0.21 0.29** 1.31 0.36* -2.41
(0.52) (0.48) (-0.61) (-0.87) (-1.15) (0.27) (2.13) (0.86) (1.70) (-0.83)
Cross-traded -0.03*** -0.03 2.12*** 2.33** 2.10*** 1.92* -0.53 0.56 0.84 1.20
(-3.32) (-0.90) (5.63) (2.52) (6.05) (1.94) (-1.26) (0.28) (1.03) (0.58)
Company size*CT 0.004*** 0.00 -0.17*** -0.18 -0.15*** -0.08 0.25*** 0.00 0.16* 0.03
(4.68) (1.03) (-3.51) (-1.22) (-3.21) (-0.54) (4.47) (0.00) (1.81) (0.10)
IAS*CT 0.01*** -0.02* -0.42*** -0.37 0.11 -0.29 -0.15 1.26 0.67*** 1.17
(5.47) (-1.84) (-3.05) (-0.84) (0.90) (-0.63) (-0.82) (1.00) (2.95) (0.79)
Analysts*CT -0.00** -0.00 -0.36*** -0.02 -0.43*** -0.09 0.26** 1.01** -0.03 0.91*
(-2.35) (-0.13) (-2.76) (-0.07) (-4.05) (-0.33) (2.08) (1.97) (-0.13) (1.66)
Company size -0.01*** -0.005*** 1.63*** 1.72*** 1.42*** 1.51*** 0.13 2.21 -0.15 1.80
(-28.80) (-3.31) (12.48) (3.81) (12.65) (3.22) (0.86) (1.58) (-0.94) (1.24)
Stock turnover ratio -0.001*** -0.0003***
(-10.29) (-3.95)
Return volatility 0.45*** 0.17*** 41.67*** 46.62*** 40.96*** 47.34*** 56.83*** 242.94*** 60.62*** 249.15***
(16.24) (2.88) (20.25) (12.28) (20.10) (12.50) (25.34) (13.26) (25.63) (13.64)
IAS -0.01*** -0.00 0.11 0.43** 0.09 0.40** 0.02 -0.41 -0.05 -0.44
(-10.24) (-1.35) (1.60) (2.37) (1.22) (2.20) (0.27) (-0.81) (-0.80) (-0.85)
Own. concentration 0.0001*** 0.00 -0.03*** -0.02*** -0.03*** -0.02*** -0.03*** -0.08*** -0.03*** -0.08***
(5.21) (1.15) (-21.33) (-4.20) (-21.55) (-4.06) (-24.74) (-4.66) (-22.44) (-4.68)
Analysts residual 0.00 -0.00 0.57*** 0.12 0.58*** 0.14 0.20*** -0.56 0.18*** -0.47
(0.52) (-0.34) (11.57) (0.85) (11.76) (0.94) (5.69) (-1.40) (4.44) (-1.16)
Market turnover 0.001*** -0.00 0.12*** 0.03** 0.10*** 0.02** 0.12*** 0.21*** 0.11*** 0.22***
(4.84) (-0.03) (8.70) (2.48) (7.55) (2.24) (10.17) (4.52) (8.27) (4.65)
GDP per capita -0.01** -0.00 -5.49*** -2.70*** -6.31*** -3.19*** 0.18 -2.38 -1.07** -3.31
(-2.01) (-0.33) (-9.04) (-3.30) (-10.48) (-3.76) (0.41) (-0.97) (-2.30) (-1.29)
Market size 0.00*** 0.00 -0.43*** -1.42*** -0.30*** -1.38*** 0.10 -1.76** 0.28*** -1.61**
(5.99) (0.28) (-5.93) (-4.97) (-4.51) (-4.82) (1.25) (-2.32) (3.35) (-2.12)
Legal index -0.004*** 0.03*** -0.99*** -0.88*** -0.91*** -0.70** -0.12* -1.60** -0.03 -1.28
(-7.50) (4.01) (-14.73) (-3.36) (-14.50) (-2.58) (-1.88) (-2.17) (-0.47) (-1.64)
Accounting opacity -0.04*** 1.14*** 5.27*** -19.68*** 4.06*** -17.83** 2.09*** 5.94 0.39 5.38
(-5.98) (3.19) (8.99) (-2.63) (7.41) (-2.41) (3.43) (0.38) (0.63) (0.33)
Bid-ask spread Trading volume Total trading Turnover ratio Total turnover ratio

176
Table 3.13 continued
Developed Emerging Developed Emerging Developed Emerging Developed Emerging Developed Emerging
Inverse Mills Ratio 0.005*** 0.01 1.96*** 2.85*** 1.50*** 2.47** -0.03 7.68*** -0.64** 6.86**
(7.84) (0.81) (7.29) (3.05) (6.48) (2.55) (-0.09) (2.65) (-1.98) (2.29)
Intercept 0.18*** -0.45* 48.89*** 40.77*** 57.49*** 45.10*** -3.48 20.45 9.49* 30.73
(3.25) (-1.72) (7.79) (4.46) (9.25) (4.79) (-0.73) (0.72) (1.93) (1.06)
Industry fixed effects yes yes yes yes yes yes yes yes yes yes
Year fixed effects yes yes yes yes yes yes yes yes yes yes
R-sq 0.3929 0.3385 0.6993 0.4148 0.7154 0.4274 0.3753 0.3850 0.4138 0.3745
N observations 152,755 14,787 151,405 14,786 151,408 14,786 152,755 14,787 152,755 14,787
N stocks 2,020 327 2,018 326 2,018 326 2,019 326 2,020 327
Bid-ask spread Trading volume
Total trading
volume Turnover ratio Total turnover ratio

177
Table 3.14 Stock volatility: Developed vs. emerging home market
The table reports the estimates from the OLS regressions of the dependant variables: return volatility,
volatility ratio, and high-low ratio, defined in Table 3.1. Model specification: Volatility Measurei,t = α
+βDi,t +Σβ1Di,tVi,t + ΣθFi,t + γλi,t +εi,t, where Di,t is dummy variable representing cross-listing or cross-
trading status accordingly; Vi are main control variables; Fi,t are other control variables; λi,t is the Inverse
Mills Ratio. The explanatory and control variables are defined in Table 3.2. The model is estimated for
each liquidity measure for two sub-samples: 1) stocks from developed markets and 2) stocks from
emerging markets. Number (N) of observations is the number of stock-months observations of available
data. Reported in parentheses t-value is heteroskedasticity consistent (White, 1980) and adjusted for
clustering at stock level. ‘***’ indicates significance at 1%, ‘**’ indicates significance at 5% and ‘*’
indicates significance at 10%.
Developed Emerging Developed Emerging Developed Emerging
Cross-listed -0.003** 0.02 -0.17 1.02** -0.00 -0.03*
(-2.12) (1.61) (-0.89) (2.02) (-1.09) (-1.75)
Company size*CL 0.00 -0.00*** 0.02 -0.04 0.00 0.00
(0.71) (-4.26) (0.75) (-1.46) (1.19) (0.73)
IAS *CL -0.001** 0.00 -0.17** 0.00 -0.00*** 0.00
(-2.05) (.) (-2.43) (.) (-2.70) (.)
Analysts *CL -0.001** -0.01** -0.13** -0.02 -0.00* -0.01***
(-2.52) (-2.47) (-2.24) (-0.10) (-1.91) (-2.84)
Total trading volume*CL 0.00* 0.00 0.02 -0.07 0.00 0.00
(1.72) (1.19) (0.81) (-1.47) (0.52) (1.08)
Cross-traded -0.002* -0.01*** 0.12 -0.40*** -0.00 -0.01**
(-1.66) (-3.53) (0.79) (-2.73) (-0.62) (-2.34)
Company size*CT 0.0004** 0.0005** 0.01 0.03 0.00** -0.00
(1.98) (2.00) (0.50) (1.13) (2.56) (-0.00)
IAS*CT -0.002*** 0.00 -0.26*** -0.02 -0.004*** -0.01
(-5.52) (0.13) (-4.80) (-0.25) (-5.90) (-1.61)
Analysts*CT 0.00 0.00 -0.00 0.09** 0.00 -0.00
(0.52) (0.87) (-0.07) (2.31) (0.07) (-0.47)
Total trading volume*CT 0.00 0.0003** -0.02 0.04*** 0.00 0.002***
(1.17) (2.01) (-0.98) (2.82) (0.24) (3.64)
Company size -0.002*** -0.001*** -0.27*** -0.09*** -0.005*** -0.004***
(-25.68) (-8.93) (-26.23) (-7.58) (-26.95) (-12.59)
Total trading volume 0.001*** 0.001*** 0.15*** 0.05*** 0.002*** 0.002***
(17.27) (7.25) (19.03) (6.03) (20.08) (6.83)
Sales growth 0.001*** 0.00 0.03*** -0.01 0.001*** -0.00
(9.07) (0.21) (3.36) (-1.48) (8.02) (-0.84)
Leverage 0.002*** 0.002** 0.27*** 0.13** 0.003*** 0.003**
(3.24) (2.36) (4.33) (2.58) (3.82) (2.18)
Intangibles 0.01*** 0.01*** 0.48*** 0.57*** 0.01*** 0.00
(7.10) (3.36) (4.72) (3.34) (6.26) (0.54)
Int accounting standards 0.003*** 0.00 0.35*** -0.07** 0.005*** 0.00
(10.16) (1.21) (10.34) (-1.99) (9.20) (1.07)
Ownership concentration 0.00001*** 0.00001** 0.004*** 0 0.0001*** 0.00001***
(10.08) (2.08) (7.43) (1.40) (9.86) (2.63)
Analysts following 0.0002* -0.001*** -0.11*** -0.11*** 0.001*** -0.002***
(1.67) (-2.63) (-6.19) (-5.05) (3.75) (-3.17)
Return volatility Volatility ratio High-low ratio

178
Table 3.14 continued
Developed Emerging Developed Emerging Developed Emerging
GDP per capita 0.05*** 0.14** 2.84*** -7.71* 0.08*** 0.39**
(10.90) (2.45) (4.19) (-1.70) (8.95) (2.29)
Market size -0.01*** -0.01* -0.24*** 1.17** -0.01*** -0.05**
(-10.03) (-1.95) (-3.66) (2.17) (-8.78) (-2.25)
Legal index -0.01*** -0.03** -0.44*** 2.14* -0.01*** -0.10**
(-9.05) (-2.50) (-3.55) (1.93) (-7.91) (-2.30)
Accounting opacity 0.14*** 0.21* 8.00*** -25.29** 0.22*** 0.89**
(10.12) (1.75) (4.56) (-2.48) (8.53) (2.33)
Inverse Mills Ratio 0.08*** 0.21** 4.46*** -14.59** 0.12*** 0.62**
(10.71) (2.31) (4.95) (-2.03) (9.06) (2.30)
Intercept -0.56*** -1.49** -31.88*** 93.78* -0.92*** -4.37**
(-10.60) (-2.34) (-4.12) (1.83) (-8.70) (-2.28)
Industry fixed effects yes yes yes yes yes yes
Year fixed effects yes yes yes yes yes yes
R-sq 0.3006 0.1856 0.2527 0.2083 0.3206 0.2717
N observations 138,102 11,538 138,102 11,538 138,102 11,538
N stocks 1,886 294 1,886 293 1,886 294
Return volatility Volatility ratio High-low ratio

179
Appendix 3.1 Correlation matrix
The table reports the correlation matrix of the dependent variable, defined in Table 3.1, and the
explanatory and control variables, defined in Table 3.2. The sample includes monthly observations
contributed by 2,180 stocks including 425 stocks with a foreign presence.
Trading volume
Total trading volume
Turnove
r ratio
Total turnove
r ratio
Return volatility
Volatility
ratio
High-lo
w ratio
Foreign prese
nce
Cross
-listed
Cross
-traded
Company size
Int. acc
ountin
g stnds
Analysts co
verage
Own. co
nce
ntratio
n
Sales growth
Leve
rage
Intangibles
Market turnove
r
GDP per ca
pita
Market size
Legal index
Acc
ountin
g opacity
Bid-ask spread -0.29 -0.30 -0.17 -0.18 0.17 0.11 0.33 -0.22 -0.15 -0.21 -0.50 -0.14 0.01 0.14 0.00 -0.06 -0.05 0.03 0.07 0.11 -0.10 -0.03
(0) (0) (0) (0) (0) (0) (0) (0) (0) (0) (0) (0) (0) (0) (0.74) (0) (0) (0) (0) (0) (0) (0)
Trading volume 1.00 0.99 0.53 0.55 -0.02 -0.03 0.07 0.53 0.35 0.49 0.58 -0.07 0.21 -0.49 0.02 0.08 0.10 0.26 -0.20 0.01 -0.39 0.31
(0) (0) (0) (0) (0) (0) (0) (0) (0) (0) (0) (0) (0) (0) (0) (0) (0) (0) (0) (0) (0)
Total trading 1.00 0.51 0.56 -0.03 -0.03 0.07 0.56 0.38 0.52 0.61 -0.05 0.21 -0.49 0.02 0.09 0.11 0.24 -0.19 0.01 -0.37 0.29
volume (0) (0) (0) (0) (0) (0) (0) (0) (0) (0) (0) (0) (0) (0) (0) (0) (0) (0) (0) (0)
Turnover ratio 1.00 0.95 0.14 0.04 0.22 0.20 0.11 0.22 0.12 -0.06 0.07 -0.23 0.03 0.02 0.04 0.26 -0.34 -0.15 -0.28 0.25
(0) (0) (0) (0) (0) (0) (0) (0) (0) (0) (0) (0) (0) (0) (0) (0) (0) (0) (0)
Total turnover 1.00 0.14 0.04 0.21 0.29 0.19 0.30 0.18 -0.03 0.08 -0.25 0.03 0.04 0.05 0.23 -0.32 -0.14 -0.26 0.23
ratio (0) (0) (0) (0) (0) (0) (0) (0) (0) (0) (0) (0) (0) (0) (0) (0) (0) (0)
Return volatility 1.00 0.58 0.73 -0.11 -0.07 -0.09 -0.24 0.14 0.12 0.11 0.13 -0.03 0.13 -0.13 -0.09 -0.03 0.16 -0.18
(0) (0) (0) (0) (0) (0) (0) (0) (0) (0) (0) (0) (0) (0) (0) (0) (0)
Volatility ratio 1.00 0.36 -0.09 -0.06 -0.09 -0.18 0.17 0.02 0.02 0.00 -0.01 0.13 -0.21 0.17 0.11 0.14 -0.19
(0) (0) (0) (0.0) (0) (0) (0) (0) (0.49) (0) (0) (0) (0) (0) (0) (0)
High-low ratio 1.00 -0.04 -0.04 -0.03 -0.25 0.12 0.13 0.08 0.13 -0.03 0.12 -0.08 -0.16 -0.07 0.07 -0.09
(0) (0) (0) (0) (0) (0) (0) (0) (0) (0) (0) (0) (0) (0) (0)
Foreign presence 1.00 0.63 0.88 0.61 0.00 0.17 -0.31 -0.04 0.12 0.12 0.10 0.05 -0.05 -0.12 0.19
(0) (0) (0) (0.24) (0) (0) (0) (0) (0) (0) (0) (0) (0) (0)
Cross-listed 1.00 0.35 0.43 -0.02 0.13 -0.23 -0.02 0.10 0.07 0.03 0.05 -0.04 -0.10 0.11
(0) (0) (0) (0) (0) (0) (0) (0) (0) (0) (0) (0) (0)
Cross-traded 1.00 0.57 0.03 0.14 -0.26 -0.03 0.10 0.12 0.11 0.06 -0.03 -0.08 0.17
(0) (0) (0) (0) (0) (0) (0) (0) (0) (0) (0) (0)
Company 1.00 0.06 0.00 -0.28 0.00 0.17 0.08 0.05 0.06 0.06 -0.04 0.09
size (0) (0.66) (0) (0.76) (0) (0) (0) (0) (0) (0) (0)
Int. accounting 1.00 -0.02 0.06 0.03 -0.08 0.21 -0.27 0.21 0.07 0.34 -0.33
standards (0) (0) (0) (0) (0) (0) (0) (0) (0) (0)
Analysts 1.00 -0.29 -0.03 0.00 0.12 0.00 0.01 0.05 -0.05 -0.09
coverage (0) (0) (0.84) (0) (0.47) (0) (0) (0) (0)
Ownership 1.00 0.06 -0.05 -0.10 -0.09 -0.14 -0.17 0.25 -0.01
concentration (0) (0) (0) (0) (0) (0) (0) (0)
Sales 1.00 -0.09 0.07 0.00 -0.09 -0.01 0.01 -0.02
growth (0) (0) (0.14) (0) (0) (0) (0)
Leverage 1.00 -0.02 0.02 0.08 0.01 0.05 0.03
(0) (0) (0) (0.02) (0) (0)
Intangibles 1.00 -0.04 0.20 0.16 0.06 -0.13
(0) (0) (0) (0) (0)
Market turnover 1.00 -0.08 0.08 -0.50 0.44
(0) (0) (0) (0)
GDP per capita 1.00 0.57 0.18 -0.37
(0) (0) (0)
Market size 1.00 -0.17 -0.30
(0) (0)
Legal index 1.00 -0.44
(0)

180
Appendix 3.2 Stock liquidity and a foreign presence (without the Inverse Mills Ratio)
The table reports the estimates from the OLS regressions of the dependant variables: bid-ask spread,
trading volume, total trading volume, turnover ratio and total turnover ratio, defined in Table 3.1. Model
(1) specification: Liquidity Measurei,t = α +βDi,t + ΣθFi,t + εi,t, and Model (2) specification:
Liquidity Measurei,t = α + βDi,t + Σβ1Di,tVi,t + ΣθFi,t + εi,t, where Di,t is foreign presence dummy variable;
Vi are main control variables; Fi,t are other control variables. Foreign presence dummy variable equals
one if the stock is listed and/or traded on a foreign exchange and equals zero otherwise. Control variables
are defined in Table 3.2. Number (N) of observations is the number of stock-months observations of
available data. Reported in parentheses t-value is heteroskedasticity consistent (White, 1980) and adjusted
for clustering at stock level. ‘***’ indicates significance at 1%, ‘**’ indicates significance at 5% and ‘*’
indicates significance at 10%.
(1) (2) (1) (2) (1) (2) (1) (2) (1) (2)
Foreign presence 0.02*** -0.02*** 0.88*** 0.81** 1.25*** 0.95*** 0.91*** -1.99*** 1.95*** -1.01*
(12.97) (-2.89) (8.86) (2.49) (13.28) (3.29) (7.15) (-5.7) (11.91) (-1.75)
Company size*FP 0.004*** 0.07* 0.08* 0.44*** 0.40***
(6.06) (1.66) (1.89) (8.82) (5.94)
IAS*FP 0.01*** -0.91*** -0.29** -0.37** 0.62***
(7.76) (-6.9) (-2.42) (-2) (3.01)
Analysts*FP -0.002** -0.34*** -0.41*** 0.42*** 0.30
(-2.12) (-3.3) (-4.3) (3.61) (1.56)
Company size -0.01*** -0.01*** 0.66*** 0.64*** 0.67*** 0.65*** 0.08*** -0.02 0.08*** -0.002
(-28.84) (-27.23) (34.27) (30.6) (35.79) (31.12) (3.36) (-0.54) (3.12) (-0.07)
Stock turnover -0.001*** -0.001***
(-15.16) (-15.63)
Return volatility 0.39*** 0.39*** 47.18*** 45.38*** 45.37*** 44.44*** 79.23*** 77.03*** 81.06*** 80.44***
(14.5) (14.48) (23.22) (22.92) (22.56) (22.57) (25.69) (25.65) (25.42) (25.79)
Int accounting standards -0.01*** -0.01*** -0.05 0.14** 0.06 0.11 -0.38*** -0.23** -0.21** -0.30***
(-7.93) (-9.64) (-0.7) (2.04) (0.82) (1.52) (-3.98) (-2.43) (-2.11) (-3.02)
Ownership concentration 0.0001*** 0.0001*** -0.03*** -0.03*** -0.03*** -0.03*** -0.03*** -0.03*** -0.03*** -0.03***
(3.69) (4.06) (-22.68) (-22.56) (-22.73) (-22.6) (-17) (-16.79) (-17.42) (-17.2)
Analysts residual -0.001** -0.001 0.54*** 0.59*** 0.53*** 0.60*** 0.31*** 0.22*** 0.25*** 0.19***
(-2.18) (-1.38) (11.91) (12.18) (11.81) (12.26) (6.85) (4.81) (4.3) (3.89)
Market turnover 0.0004*** 0.0002** 0.07*** 0.07*** 0.06*** 0.06*** 0.20*** 0.20*** 0.20*** 0.18***
(3.37) (2.02) (5.67) (6.13) (4.78) (4.81) (12.26) (12.23) (11.48) (10.95)
GDP per capita 0.01*** 0.01*** -2.11*** -2.11*** -2.27*** -2.27*** -3.96*** -3.87*** -4.33*** -4.24***
(3.17) (3.51) (-17.4) (-17.68) (-18.9) (-19.09) (-12.16) (-12.13) (-13.31) (-13.14)
Market size 0.005*** 0.004*** 0.19*** 0.18*** 0.22*** 0.21*** -0.06 -0.11** 0.01 -0.01
(7.79) (7.5) (4.55) (4.26) (5.19) (5.15) (-1.21) (-2.14) (0.26) (-0.27)
Legal index -0.003*** -0.003*** -0.50*** -0.50*** -0.48*** -0.48*** -0.37*** -0.41*** -0.34*** -0.37***
(-5.76) (-6.34) (-11.87) (-12.24) (-11.75) (-11.96) (-7.74) (-8.66) (-7.03) (-7.75)
Accounting opacity 0.005 0.01 3.60*** 3.59*** 3.04*** 3.06*** 0.32 0.30 -0.45 -0.42
(0.89) (1.14) (8.95) (9.08) (7.71) (7.88) (0.69) (0.65) (-0.97) (-0.91)
Intercept -0.03* -0.03 17.52*** 17.87*** 18.84*** 19.0*** 38.99*** 39.27*** 41.91*** 41.87***
(-1.72) (-1.62) (17.15) (17.60) (18.53) (18.77) (12.14) (12.35) (12.99) (13.05)
Industry fixed effects yes yes yes yes yes yes yes yes yes yes
Year fixed effects yes yes yes yes yes yes yes yes yes yes
Adj. R-sq 0.342 0.351 0.669 0.673 0.687 0.688 0.355 0.362 0.367 0.373
N observations 167,542 167,542 166,191 166,191 166,194 166,194 167,542 167,542 167,542 167,542
N stocks 2,347 2,347 2,345 2,345 2,345 2,345 2,347 2,347 2,347 2,347
Bid-ask spread Trading volume
Total trading
volume Turnover ratio Total turnover ratio

181
Appendix 3.3 Stock volatility and a foreign presence (without the Inverse Mills Ratio)
The table reports the estimates from the OLS regressions of the dependant variables, return volatility,
volatility ratio, and high-low ratio, defined in Table 3.1. Model (1) specification:
Volatility Measurei,t = α + βDi,t + ΣθFi,t + εi,t, and Model (2) specification:
Volatility Measurei,t = α + βDi,t + Σβ1Di,tVi,t + ΣθFi,t + εi,t, where Di,t is foreign presence dummy variable,
Vi are main control variables; Fi,t are other control variables. Foreign presence dummy variable equals
one if the stock is listed and/or traded on a foreign exchange and equals zero otherwise. Control variables
are defined in Table 3.2. Reported in parentheses t-value is heteroskedasticity consistent (White, 1980)
and adjusted for clustering at stock level. ‘***’ indicates significance at 1%, ‘**’ indicates significance at
5% and ‘*’ indicates significance at 10%.
(1) (2) (1) (2) (1) (2)
Foreign presence 0.0 -0.004*** -0.03 0.02 0.004*** -0.01**
(1.18) (-4.33) (-0.8) (0.18) (5.99) (-2.44)
Company size*FP 0.0004*** 0.004 0.001***
(2.99) (0.23) (3.4)
IAS*FP -0.003*** -0.36*** -0.01***
(-8.1) (-8.23) (-7.73)
Analysts*FP 0.0 -0.03 -0.001
(-1.06) (-0.72) (-1.03)
Total trading volume*FP 0.0004*** 0.01 0.0005**
(3.29) (0.68) (1.97)
Company size -0.002*** -0.002*** -0.25*** -0.25*** -0.004*** -0.01***
(-26.67) (-26.37) (-27.47) (-25.74) (-28.68) (-28.7)
Total trading volume 0.001*** 0.001*** 0.15*** 0.15*** 0.002*** 0.002***
(20.18) (18.46) (20.75) (19.64) (22.71) (21.28)
Sales growth 0.0005*** 0*** 0.03*** 0.03*** 0.001*** 0.001***
(8.82) (9.01) (3.63) (3.53) (7.76) (7.93)
Leverage 0.002*** 0.002*** 0.27*** 0.26*** 0.004*** 0.003***
(3.97) (3.66) (4.71) (4.62) (4.34) (4.07)
Intangibles 0.006*** 0.01*** 0.52*** 0.5*** 0.01*** 0.01***
(7.12) (7.2) (5.07) (4.93) (6.1) (6.18)
Int accounting standards 0.002*** 0.003*** 0.28*** 0.36*** 0.004*** 0.01***
(10.69) (12.59) (9.79) (11.51) (8.26) (10.84)
Ownership concentration 0.00005*** 0.00005*** 0.004*** 0.004*** 0.0001*** 0.0001***
(10.76) (11.39) (7.8) (7.98) (10.33) (10.93)
Analysts residual 0.0 0.0 -0.1*** -0.09*** 0.001*** 0***
(1.03) (1.36) (-5.97) (-5.55) (3.1) (3.3)
GDP per capita -0.003*** -0.003*** 0.66*** 0.66*** -0.01*** -0.01***
(-8.28) (-8.47) (14.77) (14.98) (-8.74) (-8.87)
Market size 0.0 0.0 0.08*** 0.08*** -0.0005** 0***
(-0.32) (-1.26) (5.38) (4.99) (-2) (-2.95)
Legal index 0.001*** 0.001*** 0.18*** 0.17*** 0.001*** 0***
(10.44) (9.76) (11.89) (11.55) (6.42) (5.71)
Accounting opacity -0.01*** -0.01*** -0.77*** -0.76*** -0.02*** -0.02***
(-10) (-10.22) (-5.42) (-5.41) (-9.37) (-9.47)
Intercept 0.05*** 0.05*** -4.88*** -4.81*** 0.11*** 0.11***
(16.61) (18.04) (-13.53) (-13.57) (14.43) (15.24)
Industry indicators yes yes yes yes yes yes
Year indicators yes yes yes yes yes yes
Adj. R-sq 0.275 0.280 0.250 0.253 0.311 0.318
N observations 149,788 149,788 149,788 149,788 149,788 149,788
N stocks 2,180 2,180 2,180 2,180 2,180 2,180
Return volatility Volatility ratio High-low ratio

182
Appendix 3.4 Stock liquidity and a foreign presence: Firm fixed effects and random effects
models
The table reports the estimates from the fixed-firm effects and random effects regressions of the
dependant variables: bid-ask spread, trading volume, total trading volume, turnover ratio and total
turnover ratio, defined in Table 3.1. Model specification: Liquidity Measurei,t = α + βDi,t + Σβ1Di,tVi,t +
ΣθFi,t + εi,t, where Di,t is foreign presence dummy variable; Vi are main control variables; Fi,t are other
control variables. Foreign presence dummy variable equals one if the stock is listed and/or traded on a
foreign exchange and equals zero otherwise. The explanatory and control variables are defined in Table
3.2. Number (N) of observations is the number of stock-months observations of available data. Reported
in parentheses is t-value. ‘***’ indicates significance at 1%, ‘**’ indicates significance at 5% and ‘*’
indicates significance at 10%.
(1) (2) (1) (2) (1) (2) (1) (2) (1) (2)
Fixed
Effects
Random
Effects
Fixed
Effects
Random
Effects
Fixed
Effects
Random
Effects
Fixed
Effects
Random
Effects
Fixed
Effects
Random
Effects
Foreign presence -0.02*** -0.02*** -0.06 -0.07 -0.12*** -0.12*** -1.31*** -1.48*** -1.11*** -1.25***
(-19.21) (-18.13) (-1.40) (-1.59) (-2.92) (-2.88) (-11.96) (-13.68) (-9.54) (-10.90)
Company size*FP 0.004*** 0.004*** 0.05*** 0.05*** 0.07*** 0.07*** 0.27*** 0.30*** 0.30*** 0.32***
(22.25) (22.25) (8.34) (8.52) (12.15) (12.13) (18.68) (20.49) (19.05) (20.78)
IAS*FP 0.003*** 0.004*** 0.02 -0.00 0.16*** 0.15*** 0.66*** 0.66*** 1.00*** 1.00***
(7.83) (8.86) (1.05) (-0.23) (11.10) (9.87) (17.27) (17.20) (24.73) (24.61)
Analysts*FP -0.001*** -0.002*** 0.11*** 0.15*** 0.06*** 0.10*** 0.29*** 0.37*** 0.25*** 0.34***
(-2.67) (-5.52) (10.62) (14.19) (5.41) (9.22) (10.47) (13.66) (8.55) (11.89)
Return volatility 0.38*** 0.41*** 25.64*** 23.45*** 25.68*** 23.25*** 59.24*** 54.46*** 63.67*** 58.21***
(48.87) (54.72) (95.03) (88.02) (96.24) (88.10) (85.80) (80.53) (86.86) (81.09)
Stock turnover ratio -0.001*** -0.001***
(-29.05) (-32.83)
Company size -0.02*** -0.02*** 0.22*** 0.26*** 0.23*** 0.28*** 0.08*** 0.10*** 0.10*** 0.14***
(-146.53) (-157.68) (55.33) (69.53) (59.63) (74.44) (7.86) (11.15) (9.58) (13.69)
Int acc. standards -0.002*** -0.002*** 0.11*** 0.11*** 0.09*** 0.09*** 0.11*** 0.19*** 0.04* 0.18***
(-7.85) (-9.44) (12.23) (13.62) (9.36) (11.74) (4.51) (9.49) (1.76) (8.18)
Analysts following 0.001*** 0.001*** 0.03*** 0.02*** 0.05*** 0.04*** -0.09*** -0.20*** -0.05*** -0.17***
(5.74) (6.34) (6.26) (4.59) (10.70) (8.38) (-6.97) (-15.76) (-3.81) (-12.50)
Own. concentration 0.0001*** 0.0001*** -0.01*** -0.01*** -0.01*** -0.01*** -0.02*** -0.02*** -0.02*** -0.02***
(12.14) (12.74) (-76.61) (-78.34) (-77.37) (-79.01) (-42.34) (-43.20) (-42.96) (-43.88)
Market turnover 0.0001** 0.00 0.05*** 0.05*** 0.03*** 0.03*** 0.12*** 0.12*** 0.11*** 0.11***
(2.03) (0.23) (36.93) (37.37) (24.60) (24.00) (35.27) (35.80) (29.13) (29.58)
GDP per capita -0.01*** -0.01*** -0.18* 1.04*** -0.16* 1.25*** 1.78*** 1.73*** 1.52*** 2.02***
(-3.45) (-6.63) (-1.92) (36.42) (-1.76) (43.96) (7.60) (24.91) (6.10) (27.60)
Market size 0.01*** 0.01*** -0.22*** -0.18*** -0.24*** -0.22*** -0.03 -0.30*** -0.20*** -0.40***
(24.56) (25.93) (-15.34) (-21.93) (-16.56) (-27.75) (-0.82) (-15.06) (-4.97) (-19.12)
Accounting opacity 0.05*** 6.42*** 0.42 6.28*** 7.73*** 7.50***
(5.90) (18.72) (0.00) (18.31) (14.02) (13.35)
Legal index -0.00** -0.57*** -0.58*** -0.61*** -0.63***
(-2.06) (-18.56) (-18.99) (-12.38) (-12.60)
Intercept 0.07*** 0.07*** 5.70*** -7.69*** 5.58 -9.06*** -16.38*** -13.87*** -12.16*** -15.37***
(2.72) (9.06) (6.65) (-27.97) (0.00) (-33.18) (-7.44) (-22.34) (-5.21) (-23.58)
Year fixed effects yes no yes no yes no yes no yes no
R-sq 0.6622 0.2884 0.9246 0.4594 0.9286 0.4573 0.6882 0.1186 0.6827 0.1305
N stocks 2,347 2,347 2,345 2,345 2,345 2,345 2,347 2,347 2,347 2,347
N observations 167,542 167,542 166,191 166,191 166,194 166,194 167,542 167,542 167,542 167,542
Bid-ask spread Trading volume Total trading volume Turnover ratio Total turnover ratio

183
Appendix 3.5 Stock volatility and a foreign presence: Firm fixed effects and random effects
models
The table reports the estimates from the fixed-firm effects and random effects regressions of the
dependant variables: return volatility, volatility ratio, and high-low ratio, defined in Table 3.1. Model
specification: Volatility Measurei,t = α + βDi,t + Σβ1Di,tVi,t + ΣθFi,t + εi,t, where Di,t is foreign presence
dummy variable, Vi are main control variables; Fi,t are other control variables. Foreign presence dummy
variable equals one if the stock is listed and/or traded on a foreign exchange and equals zero otherwise.
The explanatory and control variables are defined in Table 3.2. Number (N) of observations is the number
of stock-months observations of available data. Reported in parentheses is t-value. ‘***’ indicates
significance at 1%, ‘**’ indicates significance at 5% and ‘*’ indicates significance at 10%.
(1) (2) (1) (2) (1) (2)
Fixed
Effects
Random
Effects
Fixed
Effects
Random
Effects
Fixed
Effects
Random
Effects
Foreign presence 0.003*** 0.001*** 0.39*** 0.10* 0.00 0.00
(6.21) (3.18) (6.22) (1.70) (0.31) (0.15)
Company size*FP -0.0004*** -0.0003*** -0.01 0.01 -0.0004*** -0.0005***
(-5.91) (-5.03) (-1.08) (1.46) (-3.77) (-4.33)
IAS*FP -0.001*** -0.001*** -0.20*** -0.24*** -0.003*** -0.003***
(-9.04) (-10.14) (-9.84) (-11.68) (-12.72) (-13.48)
Analysts*FP -0.001*** -0.001*** 0.02 0.15*** -0.001*** -0.003***
(-6.14) (-13.59) (1.43) (9.74) (-7.58) (-15.52)
Total trading volume*FP -0.00 0.00*** -0.08*** -0.08*** 0.001*** 0.001***
(-0.77) (4.72) (-10.52) (-11.70) (7.63) (12.90)
Company size -0.001*** -0.002*** -0.08*** -0.14*** -0.005*** -0.01***
(-34.89) (-61.84) (-13.29) (-28.81) (-66.35) (-90.80)
Total trading volume 0.002*** 0.002*** 0.28*** 0.27*** 0.003*** 0.003***
(88.01) (78.59) (80.60) (83.66) (75.47) (70.79)
Sales growth 0.0002*** 0.001*** -0.02*** -0.04*** 0.001*** 0.001***
(12.12) (27.46) (-5.96) (-13.77) (18.00) (31.41)
Leverage 0.002*** 0.002*** 0.68*** 0.44*** 0.003*** 0.003***
(11.89) (10.60) (23.44) (16.28) (9.16) (8.87)
Intangibles 0.002*** 0.004*** 0.09* 0.12*** 0.01*** 0.01***
(6.75) (13.48) (1.93) (2.75) (10.00) (18.22)
Ownership concentration 0.00001*** 0.00001*** 0.003*** 0.003*** 0.0001*** 0.0001***
(18.33) (21.37) (10.35) (11.01) (19.45) (22.66)
Int accounting standards 0.002*** 0.0002** 0.02 0.02 0.003*** 0.001***
(18.09) (2.18) (1.34) (1.50) (23.31) (10.76)
Analysts following 0.0001** 0.001*** -0.13*** -0.21*** 0.001*** 0.001***
(2.40) (15.40) (-17.91) (-30.36) (9.78) (17.30)
GDP per capita 0.02*** -0.01*** 0.14 1.24*** 0.02*** -0.02***
(21.46) (-38.33) (1.09) (39.51) (11.38) (-37.76)
Market size -0.001*** 0.003*** -0.44*** -0.30*** 0.001*** 0.01***
(-3.78) (41.74) (-21.18) (-32.07) (5.84) (49.17)
Accounting opacity -0.02*** -3.42*** -0.01***
(-14.97) (-24.36) (-3.56)
Legal index 0.00*** 0.15*** 0.004***
(23.93) (11.56) (15.92)
Intercept -0.16*** 0.08*** 4.99*** -6.03*** -0.14*** 0.13***
(-19.24) (38.45) (4.18) (-22.45) (-10.23) (33.77)
Year indicators yes no yes no yes no
R-sq 0.4696 0.1594 0.4080 0.0717 0.5268 0.1907
N observations 149,788 149,788 149,788 149,788 149,788 149,788
N stocks 2,180 2,180 2,180 2,180 2,180 2,180
Return volatility Volatility ratio High-low ratio

184
Appendix 3.6 Change in firm characteristics related to company size around cross-listing/
trading
The appendix reports the number of observations and the mean and the median ratios of firm
characteristics related to company size by different listing/ trading status. The ratios are calculated as the
firm characteristic for the period of time when stock is cross-listed and/or cross-traded, over the base firm
characteristic, which is the firm characteristic for the period of time during 36 months (at least 24 months)
before the cross-listing/ cross-trading. Company size is the stock market capitalization. Number (N) of
shares outstanding is the total number of ordinary shares that represent the capital of the company. Stock
price is the official closing price of the stock. Total assets are the annual Worldscope data on the value of
the firm’s total assets. Book value represents the book value of the equity capital of the company at the
company’s fiscal year end. Long-term debt represents all interest bearing financial obligations, excluding
amounts due within one year. Market capitalization, price, total assets, book value and long-term debt
data are obtained from Datastream. Stocks with a foreign presence are those that are listed and/or traded
on a foreign exchange(s). Stocks with a foreign presence include traded only stocks, i.e. traded abroad
without stock exchange listing in addition to the home market listing, cross-listed only stocks, i.e. listed
on a foreign exchange in addition to the home market listing, and cross-listed and cross-traded stocks (CL
and CT), i.e. cross-listed and cross-traded simultaneously. Last column reports the percentage of
observations of the ratios that are greater than one. N is the number of stocks with available data.
Company size Ratio Foreign Presence 487 2.83 1.47 72.5%
Traded only 295 2.01 1.42 69.5%
Cross-listed only 103 1.85 1.34 67.0%
CL and CT 89 6.66 2.29 88.8%
N of shares Foreign Presence 469 4.77 1.22
outstanding Ratio Traded only 282 2.63 1.18 75.9%
Cross-listed only 102 2.20 1.05 61.8%
CL and CT 85 14.98 1.90 88.2%
Stock price Ratio Foreign Presence 473 2.01 1.26
Traded only 283 1.47 1.20 60.1%
Cross-listed only 102 1.49 1.21 58.8%
CL and CT 88 4.35 1.59 75.0%
Total assets Ratio Foreign Presence 444 2.35 1.40
Traded only 267 1.84 1.35 75.7%
Cross-listed only 96 1.61 1.15 60.4%
CL and CT 81 4.89 2.20 87.7%
Book value Ratio Foreign Presence 363 1.62 1.22
Traded only 223 1.61 1.19 68.6%
Cross-listed only 77 1.32 1.09 59.7%
CL and CT 63 2.05 1.62 84.1%
Long-term debt Foreign Presence 415 7.01 1.58
Ratio Traded only 248 5.13 1.57 72.6%
Cross-listed only 89 4.99 1.23 61.8%
CL and CT 78 15.30 2.57 83.3%
N > 1,
% of TotalVariable
Listing/ trading
status N Mean Median

185
Chapter 4
The determinants of the foreign trading
volume of cross-listed stocks
4.1 Introduction
Globalization has opened up new possibilities for companies to have their shares listed
and traded on foreign markets. In addition, recent technological advances, particularly the
emergence of electronic trading systems, have resulted in significantly intensified competition
within the stock exchange industry. In response, stock exchanges have gone through dramatic
changes over the last decades.65
In the new business environment, a stock exchange’s
competiveness is a function of the exchange’s ability to ‘attract order flow and so provide
liquidity to investors’ (Aggarwal, 2002).66
This chapter contributes to the literature by addressing the following research question:
What determines the distribution of trading of cross-listed stocks? The implications of the
location of trading of cross-listed stocks are investigated both from the point of view of stock
exchanges and also from the point of view of companies. From a stock exchange perspective, it
compares the ability of stock exchanges to attract trading of foreign stocks. This contributes to
the literature that has examined how stock exchanges can attract stocks for listing (Pagano et al,
2001; Fernandes and Giannetti, 2009). From a corporate perspective, this study examines stock-
level determinants of the distribution of foreign trading volume. Because the study analyzes the
case of stocks from multiple countries traded in various foreign stock exchanges, it adds to the
literature that has examined the determinants of foreign trading volume distribution of non-US
65
The changes in the stock exchange industry have included the demutualization of stock exchanges and
stock exchanges becoming for-profit entities. This has been accompanied by stock exchange
consolidations, the development of new market segments and alternative markets and the introduction of
new trading systems and platforms.
Some evidence from the financial press on the intensified competition and the changes in stock
exchange industry include: “In New York: Big Board faces growing threats from its rivals”, The Asian
Wall Street Journal (January, 20, 2000); “Stock market shakeout: A wave of stock market mergers heralds
a new era of competition”, National Post (July, 20, 2000); “Exchanges face up to competition”, Financial
News (February, 22, 2004). 66
Anecdotal evidence on the importance of trading volumes for the stock exchanges survival includes:
“Lack of volume brings end to financial chapter”, The Boston Globe, (October, 3, 2007).

186
stocks that cross-list in the US (Pulatkonak and Sofianos, 1999; Baruch et al, 2007; Halling et
al, 2008). As a further contribution, this study examines the role of stock exchange
characteristics as the determinants of the trading volume distribution of cross-listed stocks. In
addition, this study considers the role of firm specific factors in the ability of a stock exchange
to attract trading volumes of foreign stocks. This is important because some provisions of stock
exchanges may be suitable for some firms but not for others.67
Detailed discussion of the above
contributions of this chapter follows.
The ability of a stock exchange to attract trading volumes is determined by the quality
of the trading environment. Previous research shows that the quality of the equity listing and
trading environment is positively associated with the demutualized status of the exchange
(Hughes and Zargar, 2006; Krishnamurti et al, 2003), the implementation of electronic trading
(Jain, 2005), and the introduction and enforcement of insider trading regulation (Fischer, 1992;
Bhattacharya and Daouk, 2002; Beny, 2005). In the integrated financial markets, however, the
competitive position of a stock exchange can be further strengthened by focusing on attracting
business from abroad and several studies have examined the ability of a stock exchange to
attract foreign listings (Pagano et al, 2001; Fernandes and Giannetti, 2009). There is no
evidence, however, on the determinants of the ability of a stock exchange to attract trading
volumes of foreign stocks. This study contributes to the market microstructure literature by
evaluating the ability of stock exchanges to attract foreign equity trading and by assessing the
stock exchange characteristics that affect the location of trading of foreign stocks.
Knowledge of the determinants of foreign trading volume is also important for cross-
listed companies. Companies choose to cross-list their shares on a foreign exchange in order to
gain access to global capital, internationalize and expand their investor base, and improve stock
visibility to foreign investors. Chapter 2 and chapter 3 of this thesis document that an
international cross-listing is beneficial in terms of the increase in shareholders’ wealth and in
terms of improvement in stock liquidity and volatility. However, in order to achieve the benefits
of cross-listing, it is crucial for cross-listed companies to develop and maintain active stock
trading following the cross-listing. Active trading on a foreign exchange after cross-listing is
associated with lower trading costs measured by the bid-ask spread (Foerster and Karolyi,
67
For example the effect of cost of listing, annual fees, and disclosure requirements could depend on firm
size.

187
1998), improved valuation68
of cross-listed stocks (King and Segal, 2004), and a higher foreign
market share of the stock price discovery (Eun and Sabherwahl, 2003). Additionally, data from
the industry show that insufficient foreign trading volume of cross-listed stocks is a primary
reason for de-listings from foreign exchanges.69
In addition to the evidence on the stock
exchange characteristics that determine foreign trading volumes, this study provides empirical
evidence on the stock-specific factors that affect the distribution of trading volume across
various foreign host markets.
Theoretical models on multi-market trading highlight the importance of market quality
in explaining the location of trading since trading tends to agglomerate on a single market with
the most favourable trading environment.70
However, determining the factors that lead to a
more favourable trading environment is an open empirical question. Existing empirical studies
provide evidence of the increase in liquidity following a cross-listing (Smith and Sofianos,
1997; Foerster and Karolyi, 1993 and 1998; Karolyi, 1998; Jayakumar, 2002; chapter 3 of this
thesis). At the same time, there is evidence of great variability in the foreign market fraction of
trading (Pulatkonak and Sofianos, 1999; Baruch et al, 2007; Halling et al, 2008).
Existing empirical evidence on the distribution of trading volume of cross-listed stocks
is limited to the evidence from foreign stocks that are listed in the US. Focusing on the US as a
single host market has several major limitations. First, such analysis accounts only for the home
market’s share and the US market’s share of trading and ignores trading on other exchanges.
However, companies, particularly European companies, have a long tradition of listing on
multiple exchanges.71
Second, empirical findings on the distribution of equity trading from the
US market might not be applicable to other host markets due to some distinctive US market
characteristics, particularly the time zone difference, which is an important factor in explaining
the distribution of equity trading volume (Pulatkonak and Sofianos, 1999). However, in the case
68
Improved stock liquidity after cross-listing and, accordingly, lower trading costs and reduced illiquidity
premium for investors are expected to lower the cost of capital of cross-listed companies (Amihud and
Mendelson, 1986; Brennan and Subrahmanyam, 1996; Brennan et al, 1998; Jacoby et al, 2000; and
Amihud, 2002). 69
Survey of 119 de-listing announcement statements by European companies obtained from Factiva news
database reveals that the low trading volume on a foreign exchange is by far the main reason for de-listing
(named in 53 out of 119 statements). 70
Theoretical models on multi-market trading have been developed by Kyle (1985), Admati and
Pfleiderer (1988), Pagano (1989) and Chowdhry and Nanda’s (1991). 71
For example, Volkswagen AG simultaneously listed its shares on 13 stock exchanges, Bayer AG listed
on 10 exchanges, Deutsche Bank AG listed on 10 exchanges, Daimler Chrysler AG listed on 7 exchanges
(Abee and Zimmermann, 2006).

188
of equity trading within Europe, the time zone difference is negligible. Thus, the distribution of
trading volume must be driven by other factors that need to be investigated empirically. Finally,
analysis of the US as the single foreign host market does not allow the comparison of various
host markets and does not provide any evidence on relative host market characteristics that
determine the distribution of equity trading. In contrast to the existing research, this study
evaluates trading volume distribution of European cross-listed stocks among multiple foreign
stock exchanges and trading venues.
While the US exchanges attract foreign companies due to a large investor base and a
high level of liquidity, other major non-US stock exchanges are also important as listing and
trading locations of foreign stocks. According to the World Federation of Exchanges’ statistics,
in 2007 listed foreign companies constituted 18% of the total number of listed companies on the
NYSE, 10% on NASDAQ, 22% on LSE, 12% on Deutsche Borse, 19% on Euronext and 25%
on SWX. In addition to the significant number of foreign companies listed, foreign equity
trading contributes significantly to the exchanges’ turnover: in 2007 the fraction of foreign
equity trading in the total equity trading was 9% on the NYSE, 10% on NASDAQ, 41% on
LSE, 8% on Deutsche Borse, 1% on Euronext, and 9% on SWX. The fraction of foreign equity
trading differs among the exchanges and this can potentially be explained by variation in the
stock exchange characteristics, such as market size, aggregate market liquidity, organizational
structure, and market design.
The first part of the analysis of the distribution of foreign equity trading takes place at
the stock exchange level and evaluates the characteristics of the host stock exchange that affect
trading volume of foreign stocks. Exchange characteristics are considered to be the gravitation
forces or the ‘pull’ factors of trading volume. The exchange’s ability to attract foreign equity
trading is quantified by the average foreign trading volume share, which is the average (across
the stocks traded on the exchange) fraction of the trading volume on a particular foreign
exchange out of the total trading volume. Arguably, due to the increasing significance of trading
commissions in stock exchange profitability, a trading-volume-based measure of a stock
exchange’s ability to attract foreign business is a better measure than the ‘number of foreign
stocks listed’ measure used in previous research (Pagano et al, 2001; Fernandes and Giannetti,
2009). Indeed, Aggarwal (2002) states that the main source of a stock exchange’s revenues

189
comes from trading commissions.72
Trading commissions in turn, are a function of trading
volume. Thus, for a stock exchange’s survival, it is crucial to succeed in attracting equity
trading volumes, including trading volumes of foreign equity.
Furthermore, this study contributes to the literature by providing empirical evidence on
the relative attractiveness of regulated markets vs. non-regulated markets (off-exchange venues,
such as OTC markets and trading platforms) that differ mainly in terms of additional disclosure
and listing requirements. Off-exchange equity trading activity is largely ignored by academic
research. Nevertheless, industry statistics show that as much as one third of cash equity trading
of European blue chip stocks takes place over-the-counter.73
Also, Voth (2004) argues that
OTC trading in equities is the main source of competition for exchanges.
In the second part of the empirical investigation, analysis of the distribution of foreign
equity trading takes place at the stock level. This allows the evaluation of the stock-specific
factors that affect the distribution of trading volume across various markets. As discussed
above, existing research on the distribution of foreign trading of cross-listed stocks provides
evidence from foreign stocks cross-listed in the US. Baruch et al (2007) show that the US share
of trading of cross-listed stocks is positively determined by the level of correlation of stock
returns with returns of other assets traded on the host market. Halling et al (2008) report that the
US share of equity trading depends on a number of company characteristics such as size,
volatility and industry and on the level of development of the stock’s home market and the
extent of investor protection. Using a pooled sample of observations from various host
exchanges, this study evaluates stock-level determinants of foreign trading volume distribution.
Stock-level determinants include listing characteristics, company characteristics and home
country characteristics. Several listing characteristics, including currency of listing, form of
listing (depository receipts vs. ordinary listing), and the order of foreign listing (first vs.
consequent), have not been evaluated in the prior literature. These variables have become
72
This is because other sources of revenue have lost their significance: listing fees have been reduced as a
result of intensified competition among exchanges, membership fees have been cancelled as a result of
the demutualization processes, revenues from sales of market data have diminished as a result of
technological advances which dramatically reduced the costs of obtaining such data.
Statistics on the sources of revenue of stock exchanges support the argument on the importance of
trading commissions: according to the World Federation of Exchanges’ ‘Cost & Revenue Survey 2006’
listing fees is only a small fraction - on average less than 10% of total revenues of a stock exchange while
trading commissions is the major revenue source - on average 50% of the total revenues. 73
“Exchanging Over the Counter”. The Banker (2004), p.49.

190
available for investigation due to the novelty of the sample used in this study, which consists of
stocks that are cross-listed on various exchanges.
Finally, this study examines whether the stock-level determinants of foreign trading
volume share differ by host exchange. Pagano et al (2002) show that the US exchanges are more
successful in attracting listings of high-growth companies, technology companies and
companies with a large share of foreign sales, whereas European exchanges mostly attract
listings of companies with a strong record of past profitability.74
The role of stock-specific
factors in explaining the distribution of foreign trading by the host stock exchange is
investigated by estimating the determinants of foreign trading distribution individually for major
exchanges.
The sample consists of the 795 cross-listed stocks from 25 European countries,
including 7 emerging markets. In contrast to the existing empirical studies on the determinants
of the US fraction of trading, this study includes in the sample all foreign listing and trading
accounts of cross-listed stocks (subject to data availability). In total that gives 2,853 foreign
trading accounts on more than 30 foreign stock exchanges (including OTC and trading
platforms) over the period from January 1990 to December 2007.
The empirical findings reveal the superior ability of the US stock exchanges to attract
foreign equity trading of European stocks. Furthermore, this study shows that such stock
exchange characteristics as demutualized status, greater aggregate market liquidity and enforced
insider trading laws are positive determinants, while higher trading costs and higher levels of
accounting opacity are negative determinants of an exchange’s average foreign trading volume
share. There is clear evidence, both from exchange level and stock level analysis, that OTC’s
and trading platforms’ accounts generate significantly less active trading activity than stock
exchanges’ accounts. In addition, the level of investor protection is an important factor in
foreign equity trading: markets that provide better investor protection are more successful in
attracting trading of foreign stocks.
The results also highlight the importance of stock-specific factors, including listing and
company characteristics, in explaining the fraction of trading volume on a foreign exchange.
74
In addition, there is industry evidence to suggest that exchanges specialize in stocks with particular
characteristics. For example, companies traded on the NASDAQ stock exchange differ from those traded
on NYSE, most prominently by company size and industry affiliation.

191
Thus, the fraction of trading on a foreign exchange is higher if it takes place in the same
currency as trading on the stock’s home market and increases with the duration of listing.
Foreign trading volume share is larger for smaller and riskier companies and for stocks that
exhibit lower stock correlation returns with market index returns in the host market. Lastly,
analysis of the determinants by stock exchange reveals that export-oriented foreign companies
have better liquidity in the US. Stocks from emerging markets and from English-speaking
countries have most active foreign trading in London, while larger companies from counties
with stronger investor protection and a better information environment have a higher foreign
trading volume share on VIRTX.
The reminder of the chapter is organized as follows: Section 4.2 provides an overview
of the theoretical and empirical literature on multimarket trading. Section 4.3 develops testable
hypotheses on the potential determinants of the foreign trading volume distribution. Section 4.4
and section 4.5 describe the methodology and the sample respectively. Section 4.6 presents the
empirical findings. Finally, section 4.7 concludes the chapter.
4.2 Literature review
4.2.1 Theoretical background on multimarket trading
The central prediction of theoretical models of multimarket equity trading by Kyle
(1985), Admati and Pfleiderer (1988), Pagano (1989) and Chowdhry and Nanda (1991) is that
all trades of any asset will gravitate to a single market that offers the most favourable trading
conditions.75
The rationale is that all traders will concentrate on a single market in order to
attain the highest possible level of liquidity.
Pagano’s (1989) model assumes the presence of more than one market with different
characteristics where traders can choose to trade. Accordingly, the depth and liquidity of a
market are endogenous and depend on the traders’ choice of trading location. Initially, traders
are assumed to hold different endowments of the stock. Asset price is modelled as a function of
75
O’Hara (1995) provides a comprehensive overview of the earlier theoretical literature on liquidity and
multimarket trading in Chapter 8.

192
the demand, which arises as traders need to rebalance portfolios after receiving a random
endowment shock. Traders maximize their mean-variance utility function and are aware that the
demand affects the market price and, thus, have to base their trading decisions on the
expectations of other traders’ actions. In a one-market world, an increase in the number of
traders in the market has two opposite effects on the expected utility of an investor. On the one
hand, it decreases the variance of the stock price and, consequently, lowers the expected utility.
On the other hand, it positively affects the asset price and, thus, leads to a higher utility from
trading on this market. In cases where a trader can choose between markets, Pagano (1989)
defines a two-market conjectural equilibrium with the condition that each trader’s expectations
about the number of traders on each market and about the endowment variances of traders are
accurate, and shows that all traders will concentrate on a single market. In other words, no two-
market conjectural equilibrium exists unless the two markets are identical in terms of the
number of traders and trading costs, which is possible but highly unlikely. Additionally, the co-
existence of two markets is possible when the difference in the trading costs is compensated for
by the difference in the market volatility (‘speculative value’) or by the difference in the number
of traders (‘liquidity value’).
The limitation of Pagano’s model is that it ignores information asymmetry issues as it
assumes that all risk-averse traders, trading a risky asset in more than one market, have the same
information regarding the asset’s future value. However, strategic behaviour of informed traders
can significantly distort the equilibrium described by Pagano’s model. In fact, Kyle (1985)
shows that the level of trading by informed traders is determined by market liquidity, which, in
turn, depends on trading activity of noise traders. On similar lines, Admati and Pfleiderer (1988)
show that the behaviour of informed traders can affect market liquidity. Informed traders
intensify the concentration of trading at particular times of the day by liquidity traders, who in
turn, cluster their trading in order to avoid the effects of informed trading.
Building upon the framework of Kyle (1985) and Admati and Pfleiderer (1988), which
incorporates the presence of information asymmetries in a simultaneous multimarket trading
environment, Chowdhry and Nanda (1991) consider informed traders as well as large and small
liquidity traders. In contrast to the outcome of Pagano’s (1989) model, the co-existence of more
than one market that simultaneously trades the same assets is always possible due to the
presence of small liquidity traders. Informed and large liquidity traders have the option of

193
trading in multiple markets. Informed traders would trade in multiple markets in order to
maximize profit from private information, and large liquidity traders would trade in order to
minimize costs measured by the price impact of a trade. Small liquidity traders trade only on a
single market. The price in each market is determined by the order flow, traders’ behaviour,
trading rules and the mechanisms of this particular market, and, thus, can differ across markets.
The more segmented the markets are in terms of information flow, the higher informed traders’
expected profits are, due to the presence of small liquidity traders concentrated on a single
market. Chowdhry and Nanda (1991) give small liquidity traders discretion to choose the single
market where they trade and show that they, predictably, choose the market with the lowest
transaction costs and, in equilibrium, will concentrate in the market that has the highest volume
of trading by large liquidity traders. In sequence, the market with the concentration of small
liquidity traders will attract more trading by informed traders as well as by large liquidity
traders. The key implication of Chowdhryand Nanda’s (1991) model is that in equity trading
there always emerges a dominant market with the most favourable trading conditions that
attracts the majority of the trades of the security.
A more recent paper by Domowitz et al (1998) develops a theoretical model of multi-
market trading after international cross-listing that focuses on the importance of informational
linkages between markets. Building upon the framework of Glosten and Milgrom (1985),
Domowitz et al (1998) allow both domestic and foreign investors to trade in the local market as
well as in the foreign market where the stock is cross-listed. Trading costs of local and foreign
markets are different due to the difference in the costs of gathering information about stock
fundamentals. The consequences of the foreign listing in the model depend on the level of
informational segmentation between the foreign and domestic markets. Domowitz et al (1998)
show that in the case of perfect quotation transparency, cross-listing is followed by
improvement in market liquidity, both in terms of trading volume and depth, and by a reduction
in stock price volatility. This is due to intensified competition for order flow from both markets,
improved informativeness of the stock price and the increased number of analysts following the
stock. The model predicts an increase in total trading volume following cross-listing, however,
the distribution of trading volume between the foreign and domestic markets is subject to the
costs of trading in the foreign market. In the opposite case of complete fragmentation, i.e. no
information linkages between the markets, cross-listing is followed by migration of investors to
the foreign market and the reduction of trading volume in the domestic market. Furthermore, the

194
reduction in trading activity leads to higher spreads and higher stock price volatility in the
domestic market after cross-listing. To sum up, the key prediction of Domowitz et al’s (1998)
model is that the consequences of multi-market trading vary significantly depending on the level
of informational transparency between foreign and local markets.
The two most recent theoretical models of the multimarket trading by Baruch et al
(2007) and Baruch and Saar (2009) emphasize the importance of the level of correlation
between stock returns and returns of other securities listed on this market, i.e. the commonality
in return patterns, in explaining the market share of equity trading. Both models employ Kyle’s
(1985) theoretical framework with two markets and three assets: one traded on the first market
only, one traded on the second market and one cross-listed, i.e. traded on both markets.
Competitive risk-neutral market makers make the market for assets listed on their exchange and
can observe the order flow of assets only in their own market. Two groups of investors:
informed traders and discretionary liquidity traders, can choose the market to trade or can trade
on both markets. Market makers obtain information about the asset not only from the asset’s
own order flow, but also from the order flow of other assets traded on the market, which is
feasible due to the correlation of the assets returns traded on the same market. In equilibrium,
the relevance of the order flow of an asset for pricing of another asset in the market is a function
of the level of correlation between these assets, which also negatively affects the sensitivity of
the asset price to its own order flow. Baruch and Saar (2009) further extend the model to
demonstrate how the location of listing affects stock liquidity and show that a stock is more
liquid when it is listed on a market where other assets, that exhibit higher level of correlation
with the stock return, are traded. On the other hand, Baruch et al (2007) extend the model to
analyze the distribution of trading of cross-listed stocks. They show that the level of correlation
of returns of cross-listed stock with other assets traded on the market, determines how
informative the other assets’ order flow for pricing the cross-listed stock is seen to be.
Accordingly, both informed and liquidity traders submit a larger proportion of their orders in the
market that is more informative. In other words, the market on which the cross-listed stock has
higher correlation with the other assets hosts a higher fraction of the trading volume of cross-
listed stock.
To summarize, the theoretical models discussed in this section predict the equilibrium
distribution of trading volumes for stocks that are traded on more than one market. According to

195
Pagano (1989), conditions for the co-existence of two markets are unrealistic. Thus, the likely
scenario is that only one market with the most favourable transaction costs will survive.
Similarly, Chowdhry and Nanda (1991) predict a ‘winner takes most’ equilibrium, meaning that
traders concentrate on the most liquid market. Domowitz et al (1998) show that such an
equilibrium is complicated by the degree of information segmentation between two markets.
Finally, Baruch et al (2007) and Baruch and Saar (2009) highlight the importance of correlation
of stock’s returns with that of the other assets traded on the market in explaining the distribution
of order flow.
4.2.2 Empirical research on multimarket trading
Cross-listed stocks are traded on more than one market. These markets generally differ
significantly in their characteristics and, thus, provide a natural setting for empirical testing of
theoretical models of multimarket trading. Empirical literature on the distribution of trading
volumes of cross-listed stocks indicates a great variability in the foreign market share of global
trading and the explanatory power of its determinants.
The NYSE working paper by Pulatkonak and Sofianos (1999) was the first study to
address the question of what factors determine the location of trading of a cross-listed stock.
This study examines 1996’s global trading data on 254 NYSE-listed non-US stocks and reports
that, on average, 34% of total trading volumes of these stocks are contributed by trading on the
NYSE. However, they also report a great variability in the foreign trading share across different
companies: from 1% for Japanese cross-listed stocks to 95% for Latin American cross-listed
stocks. Further, they examine the determinants of the distribution of trading activity including
time-zone distance, whether the firm comes from developed or emerging economy, home-
market commission rates and several other issue-specific factors. They report that altogether
these factors explain 64 percent of the variation, but it is the time zone factor that is the most
dominant: companies with home markets that trade around the same time-zone as the US are
likely to be more active on the US markets.
Baruch et al (2007) analyse weekly stock returns and volume data on 251 non-US
stocks cross-listed in the US and find strong empirical support for the hypothesis that trading
volume of internationally cross-listed stocks is higher on exchanges on which cross-listed asset

196
returns have a greater correlation with returns of other assets traded on that market. They report
that the US information factor, a proxy for the informativeness of the US market in explaining
returns of the cross-listed stock, is the main determinant of the distribution of trading volumes
between home and US markets.
Halling et al (2008) report that foreign trading volumes peak right after the cross-listing
date and then decrease dramatically in the subsequent six months. However, they point out
considerable cross-sectional variation in the persistence and magnitude of foreign trading.
Halling et al (2008) use a sample of 437 non-US companies that are listed in the US and find
that the portion of the US trade is higher for smaller, export and high-tech oriented companies
and for companies from home markets with higher trading costs and weaker insider trading
protection.
To conclude, empirical evidence on the distribution of trading volumes of cross-listed
stocks is relatively new and still limited. Moreover, the literature offers empirical evidence on
the determinants of foreign trading volume distribution only for non-US stocks that cross-list in
the US. Finally, the role of stock exchange characteristics as the determinants of trading volume
distribution of cross-listed stocks is totally ignored by the prior literature.
4.3 Testable hypotheses
This study examines the factors that determine the distribution of foreign trading
volume of European cross-listed stocks among various exchanges. Arguably, there are two main
forces that affect the location of the trading of foreign equity. On the one hand, there is a set of
characteristics of a host exchange/market where trading of the stock takes place. On the other
hand, there is a set of factors inherent to the traded stock and to the country of its origin. Host
market characteristics determine how favorable a foreign trading environment is and,
consequently, determine the ability of the host exchange to attract or ‘pull’ foreign equity
trading. In turn, stock-specific factors drive trading volumes towards the foreign market
depending on the suitability of a particular host market for the stock. Therefore, the two major
groups of determinants are: 1) host market characteristics (the pull factors) and 2) stock-level
factors. The pull factors include host exchange characteristics and host country characteristics as

197
well as characteristics of the host country relative to those of the home country. The stock-level
factors include: listing characteristics, company characteristics and home market characteristics.
Thus, two general testable hypotheses are as follows:
H1: Host market characteristics determine the ability of the host exchange to attract
foreign equity trading.
H2: The distribution of foreign equity trading volume of a stock is significantly affected
by firm specific factors.
The forthcoming sections 4.3.1 and 4.3.2 develop specific testable hypotheses on the
pull factors and stock-level factors of foreign trading volume distribution. The list of potential
determinants of foreign trading volume, including host market characteristics and stock-level
factors, and the predicted direction of the effect of the determinants on the foreign trading
volume share are presented in Table 4.1.
4.3.1 Host market characteristics: the pull factors of foreign trading
Host market characteristics that potentially affect a stock exchange’s ability to attract
foreign equity trading, include host stock exchange characteristics such as: the level of
disclosure, organizational structure, market design, foreign equity expertise and industry
specialization, market size, market liquidity, and trading costs. Other factors include host
country characteristics, absolute and relative to those of the home country, such as the quality of
legal and information environments.
Level of disclosure: stock exchange vs. trading platform. Cross-listed stocks can be
traded on both regulated markets, which are stock exchanges where the stock is listed subject to
compliance with listing requirements, and on non-regulated markets, i.e. trading venues where
the stock is traded without meeting any disclosure or listings requirements. Specifically, non-
regulated markets in the sample include US OTC market and VIRTX and XETRA trading
platforms. Since the higher level of disclosure of regulated markets reduces traders’ information
costs regulated markets are expected to outperform non-regulated markets in terms of attracting
trading volumes of foreign stocks.

198
H1.1: Regulated markets outperform non-regulated markets in terms of attracting
trading volumes of foreign stocks.
Exchange characteristic: Demutualization of a stock exchange. One of the main
developments in the stock exchange industry since the early 1990s has been the trend to
demutualize exchanges from not-for-profit member-owned organizations into publicly owned
corporations, mainly as a response to technological advances and the increase in global
competition (Aggarwal, 2002). Demutualized exchanges are arguably superior to mutualised
exchanges due to a more flexible governance structure, greater investor participation and greater
access to global markets and capital (Hughes and Zargar, 2006). Empirical evidence suggests
that demutualized stock exchanges provide a better quality market (Krishnamurti et al, 2003)
and demonstrate a higher level of technical efficiency (Serifsoy, 2008).
H1.2: Demutualized exchanges have superior ability to attract foreign equity trading
compared to that of mutualised exchanges.
Exchange characteristic: Market design: Electronic market vs. Floor trading. The other
prominent innovation in the stock exchange industry in the last 20 years has been the dramatic
change in market design due to technological advances, specifically, the introduction of
automated or electronic trading as an addition to and later a replacement for, traditional floor
trading. An electronic market has lower transaction costs due to low development and operating
costs and lower implicit costs of trading (Domowitz, 2002). Empirically Jain (2005) shows that,
based on the evidence from exchanges from 120 countries, electronic trading enhances liquidity
and informativeness of stock markets. In turn, lower transaction costs and higher market
efficiency are expected to enhance the ability of the exchange to attract foreign equity trading.
H1.3: Exchanges that have introduced electronic trading platforms have better ability to
attract foreign equity trading compared to the period of time before the implementation
of electronic trading and also compared to other exchanges that utilize floor trading.
Exchange characteristic: Foreign stock concentration. A stock exchange that has a
significant share of foreign companies in its total number of listed companies might have a
competitive advantage in attracting trading of foreign stocks, possibly due to market expertise in
foreign equity. Pagano et al (2001) show that companies are more likely to cross-list on a
foreign exchange that already has a significant number of cross-listed companies. Additionally,
Serifsoy (2008) argues that the exchange’s share of new foreign listings out of the total number

199
of new foreign listings worldwide is a measure of the general attractiveness of the capital
market.
H1.4: Exchanges with higher share of foreign companies listed have superior ability to
attract foreign equity trading.
Exchange characteristic: Industry specialization. Pagano et al (2002) and Sarkissian
and Schill (2004) argue that a company’s industry is one of the most important factors affecting
a cross-listing decision. Companies are more likely to cross-list on a foreign exchange with a
higher fraction of cross-listed companies in the same industry (Pagano et al, 2001).
Furthermore, Baruch and Saar (2009) argue that ‘stock is more liquid when it is listed on a
market where ‘similar’ securities (i.e., securities with which its value innovations are more
correlated) are traded’ (p. 2240). One of the possible sources of the commonality in returns is
the company’s industry affiliation.
H1.5: Exchanges with a higher fraction of foreign stocks traded from the same industry
attract more active foreign equity trading.
Trade friction: Common language. Sarkissian and Schill (2004) argue that a common
language between countries is a proxy for cultural proximity as it often results from shared
historical background and cultural proximity and is thus an important determinant of a cross-
listing decision. Along similar lines, Grinblatt and Keloharju (2001) find that investors are more
likely to trade stocks of companies that communicate in the investor’s native language. This can
be explained by the fact that the language differential, meaning information barriers between
home and foreign markets, gives home market traders an informational advantage over foreign
market traders under the assumption that most price-sensitive information is generated in the
company’s home market.
H1.6: Host market attracts trading of cross-listed stocks more easily when the host and
home markets share a common language.
Trade friction: Geographic distance. Geographic distance can be interpreted as a
measure of stock’s unfamiliarity to foreign traders.76
Grinblatt and Keloharju (2001) show that
76
Geographic distance between the host and home countries is closely related to the difference in time
zones between the host and home countries. According to Pulatkonak and Sofianos (1999), the time zone
difference is the most significant determinant of foreign trading volume on NYSE. However, in the case
of the European stocks traded within continental Europe, the time zone difference is not relevant as all
continental Western European countries (with the exception of Portugal) are in the same time zone.

200
investors’ equity trading activity is negatively related to the distance between the investor and
the company’s headquarters. Portes and Rey (2005) report that the distance between capital
cities is the main negative determinant of cross-border equity flows. In addition, Sarkissian and
Schill (2004) provide evidence that corporate cross-listing decisions exhibit a ‘proximity bias’
meaning that companies tend to cross-list in geographically-approximate markets. Lastly,
Halling et al (2008) report that the US share of trading is larger for companies based in
countries that are geographically close to the US.
H1.7: Stock’s foreign trading volume share is inversely related to the geographic
distance between host and home countries.
Trade friction: Market size. According to Fernandes and Giannetti (2009), market
capitalization of the host exchange is a positive determinant of the probability of a foreign
company listing on the exchange. The equity market size can be interpreted as a proxy for the
size of the investor base and the level of equity market development. More developed markets
with larger investor bases facilitate market liquidity and, accordingly, are expected to induce
equity trading of foreign stocks.
H1.8: Larger markets have superior ability to attract foreign equity trading.
Trade friction: Aggregate market liquidity. Fernandes and Giannetti (2009) report that
the probability of listing on a foreign exchange is positively related to the level of liquidity of
the foreign exchange and negatively related to the level of liquidity of the home exchange.
Serifsoy (2008) suggests that market liquidity measures the market depth and, thus, is a proxy
for an exchange’s importance and market power.
H1.9: Exchanges that offer a higher level of aggregate market liquidity have a stronger
competitive position in attracting foreign equity trading.
Trade friction: Trading costs. When a stock is traded on several exchanges with
different levels of trading costs it is reasonable to expect that order flow will migrate to the
exchange that offers the lowest costs of execution. Empirically, Pulatkonak and Sofianos (1999)
report that higher home market commissions lead to a higher US share of trading. Halling et al
(2008) report a strong negative relationship between the level of the home market’s financial
development, an indirect proxy for transaction costs in the home market, and the US share of
trading of cross-listed stocks.

201
H1.10: Exchanges that offer lower costs of trading have superior ability to attract
foreign equity trading.
Host country characteristic: Legal environment. The quality of the legal environment
relevant to equity trading is determined by the level of investor protection and enforcement of
insider trading legislation in the country. Weak legal investor protection in the country
empowers corporate managers to seize private benefits of control and, accordingly, increases
the costs of owning and trading stocks for investors and, particularly, for foreign investors who
do not understand how the local system works (Shleifer and Vishny, 1997). In a case when a
stock is traded on more than one market with different levels of investor protection, the rational
expectation is that investors would choose to trade on a market where they are better legally
protected.
H1.11: Host markets that offer better legal protection to investors have superior ability
to attract foreign equity trading.
The other important consideration for traders is legislation regarding insider trading.
The principal aim of insider trading regulation is to prevent insiders with an information
advantage from trading at the expense of other traders (Durnev and Nain, 2007). Numerous
studies on the benefits of prohibiting insiders from trading argue that regulation reduces the
amount of trading based on private information (Durnev and Nain, 2007), decreases adverse
selection costs for market participants (Fischer, 1992), improves investor confidence by
providing incentives for corporate managers to disclose information (Maug, 2002) and enhances
stock price informativeness and market liquidity (Fernandes and Ferreira, 2009; Beny, 2005).
Furthermore, Bhattacharya and Daouk (2002, 2009) suggest that the introduction of the
regulation itself is not sufficient. It is the enforcement of insider trading laws rather than the
existence of such laws that actually results in positive consequences for capital markets.
Empirically, Halling et al (2008) show that the difference in the level of enforcement of insider
trading legislation between the US and the home market is a significant positive determinant of
the US fraction of foreign trading.
H1.12: Host markets that enforce insider trading laws have superior ability to attract
foreign equity trading.

202
Host country characteristic: Information environment. In order to minimize the costs of
obtaining reliable information about the stock, investors would choose to trade on a market with
a better information environment.
H1.13: Host markets with lower levels of accounting opacity have superior ability to
attract foreign equity trading.
4.3.2 Stock-level factors that affect foreign trading volume
Stock-level factors that potentially affect the distribution of equity trading volumes
include three main groups of variables: 1) listing characteristics, 2) company characteristics, and
3) home market characteristics.
Listing characteristics
Although some of the listing characteristics that potentially affect the fraction of trading
on a foreign exchange have been considered in previous studies (Pulatkonak and Sofianos,
1999; Sabherwal, 2007), the majority of listing characteristics examined in this study are unique
and became available for examination due to the novelty of the sample which consists of
European stocks traded on various exchanges.
Level of Disclosure: Listed versus traded. In addition to a stock exchange trading, a
stock can be traded on over-the-counter (OTC) markets. Furthermore, in recent years a number
of alternative markets and trading platforms have emerged that are similar to OTC markets in
their admission rules, for example, the Open market of the Deutsche Borse, including the
Frankfurt and XETRA exchanges, and VIRTX, the trading platform of the Swiss stock
exchange. Often companies are not aware that their stocks are traded on such markets. A stock
exchange listing, in contrast to an OTC and alternative markets trading, imposes additional
disclosure requirements and, accordingly, results in enhanced stock visibility and lower
information costs for investors. Moreover, by meeting stricter listing requirements, companies
signal to the market their quality (Chemmanur and Fulghieri, 2006; Fuerst, 1998). In this study,
if a stock is traded on the exchange where it is listed, it is referred to as listed account. If a stock
is traded on an OTC market or alternative markets where it is admitted to trade rather than
listed, it is referred as a traded account.

203
H2.1: Listed accounts have a higher share of foreign trading volume compared to traded
accounts.
Stock visibility: Listing order. Arguably, the incremental increase in the investor base is
largest for the first foreign listing. Empirically, Sarkissian and Schill (2009a) find that a first
foreign listing has a more profound impact on corporate valuation than subsequent foreign
listings.
H2.2: The first foreign exchange listing generates a higher share of foreign trading
volume compared to consequent foreign listings.
Stock visibility: Duration of listing/ trading. According to Chordia et al (2007), the
duration of listing is a proxy for stock’s visibility to investors and, thus, is expected to have a
positive relationship with the stock’s trading volume on this exchange. Previous research
provides contradictory evidence: Pulatkonak and Sofianos (1999) report a positive but
insignificant impact of the duration of listing on the US share of trading volume, whereas
Halling et al 2008 find that foreign trading volume decreases with the time elapsed since cross-
listing, meaning trading of cross-listed stocks eventually migrates back to the home market.
H2.3: The duration of listing/trading on a foreign exchange positively affects the stock’s
trading volume on this exchange.
Stock visibility: Price level. Pulatkonak and Sofianos (1999) argue that stocks with a
higher US dollar price have a larger US share of trading volume because the minimum tick size
in New York is generally higher than the minimum tick size on the home market, which makes
it difficult for the US market to compete with the home market in attracting order flow. Chordia
et al (2007) report that stocks with higher price level experience higher turnover and interpret
this result as consistent with the findings of Brennan and Hughes (1991), who show that trading
costs are inversely related to price per share.
H2.3: Stock price level is a positive determinant of the stock’s share of foreign trading
volume.
Trade frictions: Currency of listing. When equity trading in the home and host markets
takes place in the same currency, splitting orders between markets is easier for investors as they
bypass currency exchange risk and avoid the extra costs involved in converting local currency
into a foreign currency.

204
H2.4: Foreign trading of stock is more active when it takes place in the same currency
as the home market trading.
Trade frictions: Depository receipts vs. ordinary listings. Foreign listing can take place
in the form of ordinary shares as well as in the form of depository receipts (DRs). Often the DR
conversion ratio, i.e. the number of underlying shares represented by a single depository receipt
is different from one, making the price of a DR differ from the price of the underlying stock.
For US investors ADRs (American DRs) trading could be preferable to trading ordinary shares
in the issuer's home market because ADRs trade, clear and settle according to international
conventions and offer quotes and dividends in US dollars. On the other hand, trading ADRs
could be more expensive than trading ordinary shares as, generally, the Depository77
charges a
per share fee for every share purchased or sold and for dividends accrued. Arguably, the higher
costs of trading outweigh the convenience of trading depository receipts.
H2.5: Depository receipts generate a smaller fraction of foreign trading compared to the
foreign trading volume share of ordinary stocks.
Company characteristics
Company’s visibility: Company size. Larger companies have greater visibility to
investors because they release more public information, experience more intensive media
attention, have larger advertising budgets and a greater analyst following (Bhushan, 1989;
Aggarwal et al, 2005), and, accordingly, have more active trading of their stocks. Even though
Kang and Stulz (1997) and Aggarwal et al (2005) report that larger companies have a greater
fraction of equity owned by foreign institutional investors, it is not clear whether trading activity
in stocks of larger companies would be driven abroad after cross-listing to a higher degree than
trading activity in stocks of smaller companies. Empirically, Halling et al (2008) and Baruch et
al (2007) show that larger companies have a lower share of the US trading volume. A possible
explanation for this is that the trading of stocks of larger companies is anchored in the home
market to a higher degree due to the presence of a more established investor base and a strong
analyst following.
H2.6: Stocks of smaller companies have a higher share of foreign trading.
77
Depository is a bank that issues DRs and acts as a registrar, transfer and corporate action agent.

205
Company’s visibility: Growth opportunities. Another commonly used proxy for stock
visibility is the company’s growth opportunities (Chordia et al, 2007) and this is expected to be
a positive determinant of the stock’s trading activity. In addition, a company’s growth could
signal that the company needs to raise capital. In this case, listing on a foreign exchange might
be motivated by the ‘capital raising for investment’ hypothesis (Pagano et al, 2002). Raising
capital on a foreign exchange increases the probability of having a larger investor base and more
active equity trading on the foreign exchange.
H2.7: Higher-growth stocks have a higher share of foreign trading.
Company’s visibility: Foreign sales. Export-oriented companies are more visible to
foreign investors due to their presence on the product market of the foreign country. Halling et
al (2008) and Baruch et al (2007) argue that the fraction of foreign sales in the company’s total
sales should be positively related to the ratio of foreign to domestic trading volume.
H2.8: Stocks of companies with a higher fraction of foreign sales have a higher share of
foreign trading.
Stock ownership structure: Foreign institutional investors. Baruch et al (2007) and
Halling et al (2008) report that the fraction of the firm’s shares owned by US institutional
investors is a significant positive determinant of the US share of equity trading. Halling et al
(2008) argue that institutional investors are likely to supply liquidity and encourage trading
activity by other market participants in the market where they operate.
H2.9: Stocks with higher foreign institutional ownership have a higher share of foreign
trading.
Stock ownership structure: Ownership concentration. The presence of controlling
shareholders limits the ability of portfolio investors to hold the stock (Dahlquist et al, 2003).
Thus, concentrated stock ownership is inversely related to stock liquidity (Heflin and Shaw,
2000; Rubin, 2007). Additionally, high ownership concentration could signal poor governance
and poor minority investor protection (La Porta et al, 2000).
H2.10: Stocks with higher ownership concentration have a smaller share of foreign
trading.
Stock risk. Riskier stocks, i.e. stocks with higher stock price volatility, have a higher
level of uncertainty about fundamental values. In turn, higher levels of prediction error and

206
rebalancing needs of investors would generate higher trading activity in the stock (Chordia et al,
2007). Halling et al (2008) find that stock return volatility, interpreted as a measure of stock
sensitivity to new information, is positively correlated with the US share of trading volume.
H2.11: Riskier stocks have a higher share of foreign trading.
Transparency level: accounting standards used. Higher levels of transparency at
company level boost investor confidence due to the increased certainty about fundamental
corporate values. Transparency at company level can be measured by the quality of the
accounting standards used by the company. Adopting enhanced accounting disclosure
standards, such as international accounting standards (IAS) or US GAAP, could be a way to
overcome the home country’s institutional deficiencies, particularly for companies from
developing countries (Aggarwal et al, 2005).
H2.12: Stocks of companies that have adopted internationally recognised accounting
standards have a higher share of foreign trading.
Stock return correlation with foreign market index returns. Due to the potential
portfolio diversification benefits, foreign investors should find stocks that exhibit low
correlation of returns with the foreign market index returns appealing. Empirically, Halling et al
(2008) report a negative and significant relationship between the correlation of cross-listed
stock returns with the US market returns and the US share of equity trading.
H2.13: Stocks that exhibit lower levels of correlation of returns with the foreign market
returns have a higher share of foreign trading.
Foreign information factor. Baruch et al (2007) argue that the trading volume of
internationally cross-listed stocks is higher on exchanges in which the cross-listed stock returns
have a higher level of correlation with returns of other assets traded on that market. They show
that the most important determinant of the distribution of trading volumes of stocks cross-listed
in the US, is the US information factor, a measure of the incremental contribution of the US
market in explaining stock’s return.78
H2.14: Stocks with a higher foreign information factor have a higher share of trading on
the relevant foreign market.
78
Calculation of the foreign information factor (Baruch et al, 2007) is explained in Appendix 4.1.

207
Home country characteristics
Home countries in the sample exhibit significant differences in their level of economic
development, the maturity of their legal systems, their accounting practices, the level of
transaction costs, and their cultural and geographic proximity. These differences can potentially
explain the variation in the foreign trading volume share of cross-listed stocks.
Economic development. The sample includes a number of European countries with
developed capital markets as well as countries with emerging capital markets such as Central
and Eastern European countries. Baruch et al (2007) argue that due to the presence of regulatory
constraints and higher overall trading costs in emerging countries, stocks from emerging
countries should have higher foreign trading turnover. Empirically, Baruch et al (2007) and
Halling et al (2008) show that stocks from emerging markets exhibit a higher fraction of foreign
trading.
H2.15: Stocks from emerging markets have a higher share of foreign trading.
Legal environment. As discussed in section 4.3.1, markets with enhanced investor
protection and enforced insider trading regulation have a competitive advantage in attracting
foreign equity trading. Thus, enhanced legal investor protection in the home country should help
to retain trading of cross-listed stocks on the home market.
H2.16: Stocks from home markets with stronger legal protection of investors have a
lower share of foreign trading.
H2.17: Stocks from home markets with enforced insider trading regulation have a lower
share of foreign trading.
Information environment. Corporate transparency is greatly affected by the quality of
accounting standards practised in the company’s country of origin. The accounting opacity of
the home country is an additional risk factor for foreign investors as it increases valuation
uncertainty due to the poor quality and unreliability of accounting information. Thus, it should
be negatively related to the attractiveness of the stock to foreign investors (Aggarwal et al,
2005).
H2.18: Stocks from home markets with higher levels of accounting opacity have a
lower share of foreign trading.

208
Trade friction: Trading costs. As discussed in section 4.3.1, markets that offer lower
costs of trading to investors have a competitive advantage in attracting foreign equity trading.
Thus, higher trading costs in the home market push the trading of cross-listed stocks away from
the home market towards markets with lower costs of trading.
H2.19: Stocks from home markets with higher costs of trading have a higher share of
foreign trading.
4.3.3 Stock-level factors of foreign trading volume by host stock exchange
Finally, I argue that a stock with particular characteristics would have a different level
of trading activity depending on the location of trading. In contrast to existing research on the
distribution of trading volume of foreign stocks listed on US exchanges, this study investigates
the determinants of the distribution of foreign trading among various host exchanges.
Furthermore, the sample structure allows the empirical examination of whether exchanges
specialize in different types of stocks, e.g. in terms of size and risk. Based on evidence from
industry, I expect that the explanatory power of stock-level factors on the distribution of trading
volume varies across host exchanges.
H3: Sensitivity of stock-level factors of foreign trading volume varies by host exchange.
4.4 Methodology
4.4.1 Dependent variables
Analysis is performed initially at the stock exchange level in order to evaluate the
exchange-level factors that affect the exchange’s ability to attract foreign equity trading and
then on the stock-level in order to evaluate the stock-level factors that affect the distribution of
the stock’s trading volume.
Stock–level dependent variable
Foreign trading volume distribution on the stock-level is measured by the foreign share
of equity trading volume, calculated monthly for each stock as the ratio of the number of shares

209
traded on the exchange to the total number of the shares traded in the same month on all
exchanges/ trading venues in the sample79
:
FTVSi,n = NSTi,n /(ΣN
n=1NSTi,n) (4.1)
where FTVSi,n is the stock i’s foreign equity trading volume share on the exchange n in month t;
NSTi,n is the number of shares of stock i traded on the exchange n in month t.
The main innovation of this way of calculating foreign trading volume share is that it
takes into account trading activity on all the venues where a stock is being traded (subject to
data availability). In contrast, the calculation of the US fraction of trading in previous studies
(Baruch et al, 2007; Halling et al, 2008) ignores trading on markets other than the stock’s home
market and the US market. Furthermore, using the number of shares traded for the calculation of
foreign trading volume share rather than the dollar value of equity trading, as in Halling et al
(2008), eliminates potential bias in the findings due to the currency exchange rate fluctuations.
In order to account for the fact that the foreign trading volume share is bounded
between zero and one, the regression analysis uses the logistic transformation of the foreign
trading volume share: logtrFTVSi,n = ln(FTVSi,n / (1- FTVSi,n)) (4.2)
where FTVSi,n is the stock i’s foreign equity trading volume share on the exchange n in month t.
Exchange–level dependent variable
The ability of a stock exchange to attract foreign equity trading is measured by the
exchange’s monthly average foreign trading volume share. The exchange’s average foreign
trading volume share is calculated as the average of the trading volume shares of all foreign
stocks traded on the exchange in each month. A stocks’ trading volume share on a particular
foreign exchange (TVSi,n) is calculated as explained above (formula (4.1)).
AFTVSn = (ΣN
n=1 FTVSi,n )/N (4.3)
79
For example, the Bank of Ireland stock (ISIN: IE0030606259) in 2007 had total trading volume of
18,714 million GBP, including 7,896 million GBP on the home exchange Dublin, and the rest 10,819
million GBP on foreign exchanges, referred to as the foreign trading volume in this study. Foreign trading
volumes were contributed by trading on the London stock exchange (10,368 million GBP), on NYSE
(446 million GBP), on the Frankfurt stock exchange (3 million GBP) and on the US OTC market (2
million GBP). Thus, the Bank of Ireland stock’s foreign trading volume share on the London stock
exchange in this example is 55% (=10,368/18,714), on NYSE 2%, on Frankfurt and US OTC market less
that 1%.

210
where FTVSi,n is the stock i’s foreign equity trading volume share on the exchange n in month t;
NSTi,n is the number of shares of stock i traded on the exchange n in month t; AFTVSn is the
average foreign equity trading volume share of the exchange n in month t.
An exchange’s average foreign equity trading volume share is an innovative measure of
a stock exchange’s competitiveness in attracting foreign business as it is a trading volume-based
measure in contrast to ‘the fraction of foreign stocks listed in the total number of stock listed’
measure of a stock exchange’s attractiveness for foreign stocks used in previous studies (Pagano
et al, 2001; Fernandes and Giannetti, 2009).
In order to account for the fact that the foreign trading volume share is bounded
between zero and one, the regression analysis uses the logistic transformation of the average
foreign trading volume share: logtrAFTVSn = ln(AFTVSn / (1- AFTVSn)) (4.4)
where AFTVSn is the average foreign equity trading volume share of the exchange n in month t.
4.4.2 Multivariate regression analysis
The potential determinants of the foreign trading volumes share are evaluated using
multivariate regression analysis. Based on the findings of Petersen (2009) and following Baruch
et al (2007) the regressions are estimated using OLS procedure with heteroskedasticity
consistent (White, 1980) standard errors adjusted to account for the possible correlation within a
cluster, also called Rogers or clustered standard errors.80
In the exchange-level analysis,
standard errors are adjusted for cluster by exchange, while in the stock-level analysis the cluster
variable is the company’s foreign account on a particular exchange. As a robustness test, in
some model specifications I additionally control for year-fixed effects by introducing year-
specific dummy variables.
Exchange-level multivariate analysis: the pull factors
The first proposition is that host market-specific factors, or the pull factors of the
foreign trading volume, can explain an exchange’s level of equity trading of foreign cross-listed
80
Petersen (2009) compares a number of approaches for estimating standard errors in panel data sets
where the residuals may be correlated cross-sectionally and across time, and concludes that in the
presence of a firm fixed effects (which is the case in this study) only clustered standard errors are
unbiased.

211
stocks. To test this proposition, the monthly average foreign share of equity trading volume, the
measure of a stock exchange’s ability to attract foreign equity trading, is regressed on a set of
exchange-specific and host country-specific variables. In addition, the regression includes a
mean size of foreign companies traded on the exchange as a control variable.
logtrAFTVSn = α0 + Σ θk Zk,n + Cn + εn (4.5)
where logtrAFTVSn is log-transformation of the average foreign equity trading volume share on
the host exchange n in month t; Zk,n is characteristic k of host market n in month t; Cn is average
size of companies traded on host exchange n in month t (control variable). Estimated
coefficients θk and their significance indicate the importance of the stock exchange-level factors
and host country characteristics in explaining the level of the foreign equity trading.
Stock-level multivariate analysis
The second proposition is that stock-level factors, along with the pull factors,
significantly affect the distribution of foreign equity trading volume of cross-listed stocks. The
significance of the stock-level factors and the joint significance of the pull and the stock-level
factors in explaining the foreign share of equity trading volume of European cross-listed stocks
are evaluated at stock level using the following regressions:
logtrFTVSi,n = α0 + Σ γj Xj + εi,n (4.6)
logtrFTVSi,n = α0 + Σ γj Xj + Σ θk Zk,n + εi,n (4.7)
where logtrFTVSi,n is log-transformation of the stock i’s fraction of trading volume on the
exchange n in month t; Xj is vector of stock-level factors; Zk,n is characteristic k of the host
market n or characteristic k of the host market n relative to characteristic k of the stock’s home
market. Where possible, the difference in characteristics between the host and the home markets
is used in the regression instead of the host and home market-specific factors individually.
Multivariate analysis: Stock-specific factors by stock exchange
The third proposition is that the determinants vary depending on the trading venue. To
test this proposition the loadings of the explanatory variables are estimated individually for all
major exchanges in the sample by introducing interaction variables of a stock exchange dummy
variable with the explanatory variables. The dependent variable is the foreign share of equity
trading volume on the stock level. The regression is as follows:

212
logtrFTVSi,n = α0 + Σn,j ωn,j (D_SEn Xj) + εi,n (4.8)
where logtrFTVSi,n is log-transformation the stock i’s share of trading volume on the exchange n
in month t; D_SEn is dummy variable that equals one if trading takes place on exchange n and
zero otherwise; Xj is vector of stock-level factors. Estimated coefficients ωn,j indicate the
loadings of each of the stock-level factors specifically for exchange n.
4.4.3 Economic significance
Since the regression analysis uses the logistic transformation of the dependent variable,
the interpretation of the estimated coefficients is not straight forward. To overcome this issue,
the relative importance of variables is approximated by the economic significance of coefficient
estimates calculated following the methodology of Welch (2004) and Bris et al (2007). The
economic significance indicates the percentage standard deviations of the dependent variable
explained with a one standard deviation change in the explanatory variable. It is calculated as a
ratio of the product of the coefficient estimate and the standard deviation of the variable in the
sample, termed the unit-normalized coefficient, to the standard deviation of the dependent
variable (Bris et al, 2007). Importantly, the economic significance is comparable across
explanatory variables.
4.4.4 Multicollinearity concern
The explanatory variables used in the analysis, particularly country characteristics, may
exhibit high correlations and, thus, may trigger concerns about multicollinearity.
Multicollinearity could inflate the estimates of a parameters variance (Greene, 2008). This in
turn inflates the standard errors of the parameter estimates, reducing the significance of the
coefficient estimates.
To detect whether multicollinearity is an issue, first, I look at the correlation matrix of
the explanatory variables. Second, I estimate variance inflation factors (VIF) for each
coefficient estimate.81
Third, if there is evidence of multicollinearity, I additionally estimate
regression specifications that omit the variable with the highest VIF and evaluate whether there
81
VIF quantifies the severity of the multicollinearity in OLS regression analysis and provides an index
that measures how much the variance of the parameter estimates is inflated due to multicollinearity
(Wooldridge, 2009).

213
are any significant changes in coefficient estimates of other variables that are potentially
correlated with the omitted variable.
4.4.5 Explanatory variable definitions
Explanatory variables, i.e. potential determinants of foreign trading volume distribution,
include two main groups: host market characteristics and stock-level factors. Each of these
groups is expected to affect the distribution of trading volumes of cross-listed stocks. Host
market characteristics, or the pull factors of foreign trading volume, include host stock exchange
characteristics, host country characteristics and host country characteristics relative to home
country characteristics. Stock-level factors include company characteristics, listing
characteristics, and home country characteristics.
Total trading costs are calculated as a sum of price impact costs, implicit costs and
explicit costs, i.e. commissions, from Chiyachantana et al (2004). As a proxy for the level of
investor protection, I use the anti-self-dealing index from Djankov et al (2008) that enumerates
the legal protection of minority shareholders against expropriation by corporate insiders. The
quality of the country’s information environment is measured by the quality of accounting
information prevailing in the country using the accounting opacity index from Kurtzman et al
(2004).82
The company’s growth opportunities are measured by the price-to-book ratio (as in
Chordia et al, 2007). Foreign institutional ownership is measured by the fraction of total shares
in issue held by institutions domiciled in a country other than that of the stock.
Table 4.2 presents detailed definitions and data sources of all the explanatory variables.
Additionally, Appendix 4.1 explains the calculation of the foreign information factor (Baruch et
al, 2007).
82
The most commonly used proxy in the literature for the quality of accounting information on a country
level is the accounting standards index from La Porta et al (1998). However, this index captures the
differences in the quality of accounting information between various countries based on data from 1990
and, thus, is obsolete today. To add to this, there have also been changes in accounting practices in recent
decades, such as the global trend towards the implementation of international accounting standards. In
contrast, this study employs a more recent accounting opacity index from Kurtzman et al (2004) that
quantifies inadequate accounting and governance practices in 48 countries including emerging markets.

214
4.5 The sample
The sample consists of European companies that have had their stock cross-listed on at
least one foreign stock exchange. The sample here is the same as the sample used in chapter 3.83
The final sample consists of 795 companies from 25 different countries with 2,853
foreign accounts, which is about 3.6 accounts per stock. Foreign accounts in the sample include
stock exchange listings and also OTC and admitted to trade accounts. In total there are 39
foreign exchanges in the sample. However, out of 39 exchanges only eleven exchanges attract
more than 90% of the foreign trading volume of European cross-listed stocks in the sample.
Those stock exchanges are: the NYSE, NASDAQ, US OTC, the London stock exchange, Paris,
Amsterdam, Milan, Frankfurt, XETRA, the Swiss stock exchange and VIRTX.84
In this study
Datastream is the main data source for company data such as stock price, number of shares
traded total return index, market capitalization, price-to-book ratio, fraction of foreign sales and
ownership structure.
The final sample includes observations from January 1990 to December 2007. The
period of time prior to 1990 is excluded from analysis due to poor data availability. Market level
data on equity turnover is available from January 1995 from Datastream (DS Total Market
indices).
83
From chapter 3 the Sample section: “Cross-listing data includes events up to December 2007 and
comes from the stock exchanges’ web-sites, Factiva news database and foreign listings dataset of
Sarkissian and Shill (2004, 2009). Data on depository receipts is from the BNY, Citibank, Deutsche Bank
and JP Morgan DRs databases available on-line. The additional requirement for sample inclusion is the
availability of home market listing, i.e. direct foreign IPOs are excluded. The analysis is performed on the
security level rather that the company level: all related listings for each cross-listed stock are identified by
ISIN (data source: Datastream). Underlying ISINs and depository receipts conversion ratios for
depository receipts are from the above mentioned Depository receipts (DRs) databases. Only common
equity and major securities are included in the sample”. 84
Each of these eleven exchanges attracts at least 2% of the total equity trading volume of the sample
stocks with the exception of the Deutsche Borse’s XETRA and the Swiss stock exchange’s VIRTX
trading platforms that are included in the analysis of the major host exchanges for two reasons. First, they
are integral parts of the larger exchanges: the Deutsche Borse and the Swiss stock exchange respectively.
Second, the number of the accounts in the sample on these the exchanges are highly significant. Thus, in
2007, 18.7% of all the account-month observations are contributed by XETRA and 5.8% by VIRTX.

215
4.6 Sample summary statistics
4.6.1 Foreign equity trading distribution
Foreign equity trading distribution is examined on both the exchange-level and the
stock-level.
Foreign equity trading: Exchange-level analysis
The first part of the empirical investigation takes place at stock exchange level. The
variable under investigation is a stock exchange’s monthly average trading volume share,
defined in section 4.4.1. Panel A of Table 4.3 reports the average foreign trading volume share
(AFTVS) for the total sample that consists of the pooled sample of 28 foreign exchanges. Panel
A of Table 4.3 also reports AFTVS individually for eleven major stock exchanges. The AFTVS
is calculated using a monthly panel trading data of 812 European cross-listed stocks from
January 1990 to December 2007. Figure 1 graphically presents the AFTVS and the number of
account-month observations by year, both for the total sample and individually for the eleven
exchanges (based on data reported in Table 4.4). The sample period prior to 1995 is
characterised by a small number of available observations and, thus, should be treated with
caution.
The AFTVS for the total sample is 11.9%. The LSE and NASDAQ have the highest
AFTVSs (36.6% and 29.2% respectively), while VIRTX and XETRA have the lowest AFTVSs
(0.2% and 2.0% respectively) (Panel A of Table 4.3). London’s AFTVS (mean 36.6%), the
highest among the eleven exchanges, reached its maximum of 38.2 % in 1999 (discarding
observations prior to 1995) and its minimum of 10.5% in 2005 (Table 4.4).
NASDAQ’s AFTVS (mean 29.2%), the second highest in the sample, has been
relatively stable across the years with a maximum of 36.7% in 2007 (discarding year 1990
because of the small number of observations) and a minimum of 18.7% in 1994. In the most
recent years of the sample from 2003 to 2007, NASDAQ’s AFTVS is within the 31-37% range,
which is above its historical average. The NYSE’s AFTVS is above the sample’s average:
15.5% with a minimum of 10.4% in 2003. The US OTC’s AFTVS is 9.7% and it has shown a
clear downward trend over the years: it was at its peak of 30.2% in 1990, has been declining
ever since and reached its minimum of 3.6% in 2007.

216
Amsterdam’s AFTVS is 34.9% with a maximum of 24.6% in 1997 (discarding
observations prior to 1995) and a minimum of 8.3% in 2000. In the last two years of the sample
2006-2007, Amsterdam’s AFTVS was around 17%, the highest since 1998. The Paris stock
exchange is also part of Euronext, and has also seen an improvement in the AFTVS in 2005-
2007: it has been steadily improving and reached a maximum of 10.3% in 2007 (with the
historical mean of 2.9%). Milan’s AFTVS is 6.9% with significant fluctuations over time from
16.1% in 2005 to 1.9% in 2007.
The exchanges of Deutsche Borse, Frankfurt and XETRA, both have AFTVSs of
around 2%, significantly below the sample average and this has been steadily low across the
years. Similarly, the Swiss stock exchange and VIRTX have low AFTVSs of 2.9% and 0.2%
respectively. The VIRTX’s share has been low since 2001, when the exchange was introduced.
On the other hand, the Swiss stock exchange seems to have lost the ability to attract trading
volumes of foreign European stocks over time: it had its maximum foreign trading volume share
of 8.8% in 1996 and ever since its share has been declining and went as low as 0.1% in 2007.
In addition to the AFTVS and the number of account-month observations, Table 4.4
reports the foreign trading volume (FTV) in GB pounds (GBP) by year for the total sample and
individually for eleven major exchanges.85
In 2007 the total FTV of the sample European
stocks was 1,044.6 billion GBP. Overall, there is an upward trend in the total FTV over the
years. On average, about 69% of the FTV of the European stocks takes place in the US and 25%
on the major European exchanges, including 18% in the UK and about 7% in continental
Europe. The NYSE is an absolute leader in attracting foreign trading of European cross-listed
stocks in absolute terms: it attracts on average about 43.8% of the total foreign trading volume
of the European stocks, followed by the LSE (19.4%), US OTC market (18.6%) and NASDAQ
(6.5%). The rest of the exchanges attract on average 2% or less of the FETV.
The distribution of foreign trading volume in monetary units (GBP) differs significantly
from the distribution of the number of foreign accounts (Table 4.4). Thus, on average, the US
exchanges attract seven times more of the FTV compared to the major European exchanges
excluding London. At the same time, the US exchanges host only 35% of the foreign accounts
in the sample, while continental European exchanges host 40% of the foreign accounts.
Deutsche Borse’s exchanges Frankfurt and XETRA stand out from the other exchanges by the
85
Trading volumes on various exchanges are converted to GB pounds for comparability.

217
number of the accounts they host, particularly, in the most recent period. In 2007 Frankfurt
contributed 26.8% of all accounts and XETRA contributed 18.7%. The absolute majority of
those accounts is an admission to trade rather than a stock exchange listing. Despite the
significant number of trading accounts, Deutsche Borse and, similarly, the Swiss stock
exchange’ VIRTX struggle to attract and maintain active trading of foreign stocks.
Overall, analysis of the distribution of the foreign trading of the sample European
stocks reveals that the US exchanges are the most successful in attracting trading volumes of
European stocks: the NYSE attracts the highest foreign trading volume in monetary terms
whereas NASDAQ has the highest AFTVS in the sample in 2007. The London stock exchange
follows the NYSE and NASDAQ in ability to attract trading volume of foreign European
stocks: it has both a significant FTV and AFTVS that are above the sample’s average. US OTC
historically hosted a significant portion of the trading volume of European stocks. However,
between 2003 and 2007 it lost the ability to maintain active foreign equity trading. Both the
Euronext stock exchanges in the sample, Amsterdam and Paris, have shown improvements in
recent years in absolute FTV as well as in AFTVS. The Milan stock exchange generates
insignificant FTV compared to the other stock exchanges in the sample. The Frankfurt stock
exchange, XETRA and VIRTX despite having a large number of foreign stocks traded, have not
shown the ability to attract the active trading of foreign stocks. The Swiss stock exchange had
significant business from foreign stocks in the 1990s. However, since then, it has been losing its
share in foreign equity trading of European stocks.
Foreign equity trading volume share: Stock-level analysis
The second part of the empirical investigation takes place at stock level. The variable
under investigation is stock’s foreign trading volume share (FTVS), defined in section 4.4.1.
Panel A of Table 4.5.1 reports the FTVS for the 1990-2007 sample of 519 stocks with 1,714
foreign accounts. For the 2003-2007 sample the table reports the FTVS of 446 stocks with
1,477 foreign accounts and it separately reports the 2003-2007 sub-samples of listed and traded
accounts.86
The AFTVS for the 2003-2007 samples is around 3.0%, which is less than the
86
The number of stocks in the sample in this section is significantly smaller than the number of stocks
used in the analysis of foreign equity trading on the exchange level, 519 (446) stocks vs. 812 stocks,
because the sample in this section includes only stocks with data available for all main stock-level
explanatory variables.

218
FTVS for the 1990-2007 sample of 4.2%.87
The difference in the mean FTVS between listed
and traded accounts is striking: 8.0% for listed vs. 1.0% for traded accounts. Additionally, for
the 2003-2007 sample Table 4.5.2 reports FTVS individually by host stock exchange for eleven
major stock exchanges. NASDAQ has the highest FTVS in the sample (32.1%), followed by
Milan (8.4%), the NYSE (8.4%), Amsterdam (7.8%) and London (6.7%). The Swiss stock
exchange and VIRTX have the lowest FTVSs of around 0.1%, while Frankfurt and XETRA’s
FTVSs are only slightly higher (around 0.5%).
4.6.2 The determinants of the foreign equity trading distribution
As discussed in section 4.3, there are two major groups of factors that potentially affect
the distribution of foreign trading of cross-listed stocks: 1) host market characteristics or the
pull factors and 2) stock-level factors.
Pull factors of foreign equity trading
Pull factors: Exchange-level analysis
Panel B of Table 4.3 reports summary statistics of the pull factors for the total sample
and individually for eleven major stock exchanges, calculated using a monthly panel trading
data of 812 European cross-listed stocks from January 1990 to December 2007. Around 11% of
the observations are traded accounts, i.e. traded on the US and London OTC markets and
VIRTX and XETRA trading platforms. Almost half of all observations in the sample take place
on a demutualised exchange. Indeed, by the end of the sample period all major host exchanges
in the sample had been demutualized. The lowest mean demutualization indicator is for the
NYSE, which was only demutualized in 2006. On average, 80% of the observations take place
on an electronic market as opposed to the traditional floor trading. The lowest electronic market
indicator is for the NYSE which in 2000 was among the last exchanges in the world to introduce
automated trading. After 2002, all exchanges in the sample, both of host and home markets, had
adopted electronic trading making the electronic market indicator an irrelevant variable.
87
The foreign trading volume shares for the total sample and by stock exchange reported in Tables 4.5.1
and 4.5.2 differ from the ones reported in Tables 4.3 and 4.2 for two reasons: 1) the samples vary since
the main sample in current section includes only stocks that have data available for all main explanatory
variables and excludes observations prior 2003, and 2) the weighting methods for the mean calculation
are different.

219
The Amsterdam and Swiss stock exchanges have the highest concentration of foreign
stocks listed (42% and 35% respectively), whereas the Italian stock exchange has the lowest
(2%). The US market stands out through its market size in terms of market capitalization of
listed stocks (5,157.4 billion GBP), which is almost four times larger than the average market
size in the sample (1,299.0 billion GBP) whereas Amsterdam has the smallest market size in the
sample (261.7 billion GBP). The US market has the highest aggregate market liquidity of
100.04 on average (measured by the ratio of the aggregate monthly trading volume to the total
market capitalization), followed by the Frankfurt stock exchange with a 93.06 turnover ratio.
XETRA has the lowest level of liquidity in the sample with a turnover ratio of 36.96. Total
trading costs vary from 0.47 on the Amsterdam stock exchange to 0.94 on the Swiss market
with the sample average being 0.62. The level of investor protection in the host country is
highest in the UK (investor protection index is 0.95) and the lowest in the Netherlands (investor
protection index is 0.20). About 80% of the observations take place in a country where insider
trading laws have been enforced. The lowest enforcement of insider trading laws variable is for
the Frankfurt stock exchange (0.72). Italy has the highest level of accounting opacity (0.63),
followed by the Netherlands (0.38), whereas Germany and the USA have the lowest level of
accounting opacity (0.17 and 0.20 respectively). The average size of a foreign company in terms
of market capitalization is smallest for NASDAQ (3.11 million GBP) and largest for VIRTX
(18.56 million GBP).
Pull factors: Stock-level analysis
Panel B of Table 4.5.1 reports summary statistics of the pull factors calculated at stock
level, specifically, host market characteristics relative to home market characteristics and host
exchange characteristics such as an exchange’s industry specialization and foreign stock
concentration. Additionally, Panel B of Table 4.5.2 reports summary statistics of the pull factors
on stock-level individually for eleven major exchanges. A host market is on average 9.91 times
larger than a home market. The largest difference in market size is 41.39 for NASDAQ
accounts, followed by 28.43 for the NYSE and 26.55 for US OTC. Among non-US exchanges,
London has the largest difference in market size at 9.66. For Amsterdam, Milan and VIRTX the
difference in market size between the host and home markets is less than one, suggesting that
foreign stocks traded on these markets come from home markets that, on average, are larger
than the host market.

220
Aggregate market liquidity of the host market is on average 5.2 times higher than the
market liquidity of the home market. For Swiss and Italian stock exchanges the difference in
market liquidity between the host and home markets is highest (19 times), whereas for Frankfurt
and XETRA it is lowest (0.03), in other words, Frankfurt and XETRA trade foreign stocks that
come from home markets more liquid than the host market. A negative average difference in
trading costs between the host and home markets implies that, on average, costs of trading on
the host market are lower than costs of trading on the home market. London offers the best
improvement in total trading costs (the difference is -0.13), while the Swiss stock exchange and
VIRTX on average have higher trading costs relative to the home market (the positive
difference is 0.39 and 0.41 respectively).
The sample’s average difference in the level of investor protection between the host and
home countries is negative but small in magnitude, i.e. the home market on average has slightly
better investor protection than the host market. London has the highest positive difference, i.e.
improvement, in the level of investor protection at 0.52. The sample average difference in the
enforcement of insider trading laws of 0.09 implies that host countries in the sample have
insider trading laws enforced more often than the home countries. The difference in insider
trading law enforcement is highest for London (0.24) and NASDAQ (0.22), while foreign
listing in Netherlands, Italy, France and Switzerland does not provide any improvement in terms
of insider trading regulation.
The level of accounting opacity in a home country is on average, higher than the level
of accounting opacity in the host country. The highest negative difference between accounting
opacity of the home and host countries is for Frankfurt and XETRA accounts (a difference of -
0.19), while Italy has a significantly higher level of accounting opacity than the level of
accounting opacity in the home country of foreign stocks traded in Milan (a difference of 0.31).
Around 22% of all observations in the sample are for accounts that are traded abroad in
the same language environment as the home country. The highest common language indicator is
for the Swiss stock exchange and NASDAQ’s accounts (0.52 and 0.51 respectively), while
Amsterdam, Milan, and Paris do not host trading of stocks from countries with a common
language. The average geographic distance between home and host markets is around 2,000 km,
driven by the distance of European home markets from the US (average geographic distance to
a US exchange is above 6,000km). Within Europe, the average geographic distance between

221
home and host markets varies insignificantly within a 534–672 km range with the exception of
Milan accounts that have average distance of 1,183 km.
Host stock exchange industry specialization is on average 13% with variation from 28%
for NASDAQ to 10% for Frankfurt. On average, 18% of the companies listed on a host stock
exchange in the sample are foreign companies (foreign stock concentration variable). The
Amsterdam stock exchange has the highest fraction of foreign listed companies (43%), whereas
Italian stock exchange has the lowest (2%).
Pull factors: Correlation analysis
Table 4.6.1 reports the correlation matrix of the AFTVS and the pull factors at stock
exchange level. As predicted, the trading platform indicator is negatively correlated to the
AFTVS. In contrast to expectations, the AFTVS is negatively correlated to demutualized status,
electronic trading, and foreign stock concentration variables. For the rest of the variables, the
signs of the correlation coefficients with the AFTVS variable are in line with theoretical
expectations. Thus, exchanges that have a greater investor base, measured by the total market
capitalization, and offer greater level of aggregate market liquidity have a higher AFTVS. Stock
exchanges located in countries with better investor protection and actively enforced insider
trading laws have more active trading of foreign stocks. Total trading costs and the level of
accounting opacity in the host country are negatively correlated with the AFTVS. A control
variable, average size of traded companies, is negatively correlated with the AFTVS variable.
Pull factors: correlation analysis at stock level
Table 4.6.2 reports the correlation matrix of the FTVS and the pull factors calculated at
stock level. In line with expectations, the differences in market size, in aggregate market
liquidity, in the level of investor protection and in the enforcement of insider trading laws and
the existence of a common language between the host and home countries are all positive
predictors of the FTVS, while the difference in the costs of trading between the host and home
countries is a negative predictor of the FTVS. However, contrary to expectations, the difference
in accounting opacity is positively correlated to the FTVS but the magnitude of the correlation
is low (0.04). Also in contrast to expectations, the geographic distance variable is positively
correlated to the FTVS. However, further analysis reveals that the geographic distance to the US
exchanges variable is a positive and significant predictor of the FTVS, while the geographic

222
distance to non-US exchanges variable is a negative and significant predictor of the FTVS. A
significant correlation coefficient between the FTVS and stock exchange industry specialization
of 0.11 suggests that foreign stocks have a higher fraction of trading on a foreign exchange that
has higher share of foreign stocks traded from the same industry. Foreign stock concentration,
contrary to expectations, is negatively correlated to the FTVS.
Stock-level factors of foreign equity trading
Panel B of Table 4.5.1 reports summary statistics of stock-level factors of foreign
trading volume for the 1990-2007 and the 2003-2007 samples. The reason for using the 2003-
2007 sample rather than the full sample is that data for two important explanatory variables
related to stock ownership structure, foreign institutional ownership and ownership
concentration, are available from Datastream database only from 2003. Both samples in Table
4.5.1 include only observations that have data available for all major explanatory variables.
Panel B of Table 4.5.2 reports summary statistics of the stock-level factors individually for
eleven major exchanges.
Listing characteristics
Average trading indicator has increased from 0.63 for the 1990-2007 sample to 0.71 for
the 1990-2007 sample reflecting the introduction of new trading platforms that in later years,
hosted foreign trading of European cross-listed stocks. Frankfurt, XETRA and London hosted
both listed and traded accounts. London is the most common choice for a first foreign listing by
European companies in the sample: 12% of accounts are a first foreign listing compared to a 2%
sample average, followed by NASDAQ (9%). The average age of an account in the sample is
6.24 years.88
The oldest are the Swiss stock exchange’s accounts (12.72 years), followed by the
NYSE’s accounts (10.61 years), while Milan’s accounts are the youngest (4.35 years). The same
currency indicators for the US exchanges and for the Swiss stock exchange equal zero. On the
other hand, trading on VIRTX takes place in the currency of the stock’s home listing. As a
result of the adoption of the single European currency, the Euro, the same currency indicator for
continental European stock exchanges is relatively high (from 0.55 to 0.98). In the sample, 27%
88
Average duration of London listing/trading in the sample is relatively short (4.64 years). This can be
explained by the changes in trading systems which resulted in the disruption of continuous listing, rather
than a true reflection of the actual duration of listing.

223
of the accounts are in the form of depository receipts. Depository receipts are predominantly
traded in the US. The NYSE, NASDAQ and US OTC have respectively 95%, 89% and 75% of
all accounts in the form of ADRs. Frankfurt, XETRA and to a lesser extent London, accept
depository receipts for trading as a supplement to trading ordinary shares. The average price
level of European cross-listed stocks is 19.9 GBP with the lowest at 10.6 GBP for NASDAQ-
traded and the highest at 33.2 GBP for Swiss stock exchange-traded stocks.
Company characteristics
The average market value of European cross-listed stock is 15.3 billion GBP for the
2003-2007 sample. The smallest in terms of market capitalization (3.8 billion GBP) and the
riskiest foreign stocks in the sample are traded on NASDAQ. The Milan stock exchange has the
highest average market value of traded stocks (30.9 billion GBP). The Swiss stock exchange,
including VIRTX trading platform, attracts large low-risk foreign stocks. The NYSE and
NASDAQ trade stocks that have the highest relative market valuation measured by a price-to-
book ratio, of 4.83 and 3.21 respectively, both above the sample’s average of 3.07. Milan hosts
trading of stocks with price-to-book ratio of 2.0, the lowest in the sample. Noticeably, average
price-to-book ratio for the 1990-2007 sample is higher than the price-to-book ratio for the 2003-
2007 sample (3.64 vs. 3.07), reflecting higher market valuations in the late 1990s, particularly in
the US. On average, the fraction of foreign sales in the company’s total sales is 57% reflecting
the strong export orientation of cross-listed companies. NASDAQ-traded European companies
have the highest foreign sales share in the sample of 68%. Surprisingly, foreign institutional
ownership of European stocks that are traded abroad is only 8% with a slight variation among
exchanges: from 3% for Amsterdam- and Milan- traded stocks to 9% for London- and
NASDAQ- traded stocks. Ownership concentration is 26% for the sample average, varying
from 11% for Milan-traded stocks to 30% for Frankfurt-traded stocks.
The use of international accounting standards have increased significantly over time:
from a 0.52 average for the 1990-2007 sample to a 0.73 average for the 2003-2007 sample. The
Swiss stock exchange and VIRTX only trade stocks of companies that comply with
international accounting standards requirements. The lowest average international accounting
standards variable of 0.68 is for NASDAQ accounts. Average stock return correlation with
foreign market returns and foreign information factor variables have increased over time,
reflecting the increasing integration of the financial markets. The sample’s average stock return

224
correlation with foreign market return is 0.48 with a small variation from 0.35 for NASDAQ-
traded stocks to 0.65 to Milan-traded stocks. The sample’s average foreign information factor is
2.62 with the smallest being for VIRTX-traded stocks (1.47) and the largest for Amsterdam-
traded stocks (3.64).
Home market characteristics
2% of observations in the sample are contributed by stocks that originate in the
emerging markets of Central and Eastern Europe. The Amsterdam, Milan, NASDAQ, Paris,
Swiss stock exchanges and VIRTX trading platform do not host the trading of stocks from
emerging markets. The highest average emerging market indicator in the sample is for
Frankfurt’s and XETRA’s observations (0.04 and 0.032 respectively). The average investor
protection index of the home market is 0.48 varying from 0.33 for Milan- traded accounts to
0.59 for NASDAQ-traded accounts. For 91% of observations, insider trading laws are enforced
in the home country. The average trading costs in home countries are 0.62 with the highest
being 0.69 for London’s accounts and the lowest being 0.53 for VIRTX’s accounts. The
sample’s average accounting opacity index of the home country is 0.34. Stocks from countries
with the lowest level of accounting opacity are traded on the Swiss stock exchange (0.24), while
stocks from countries with the highest level of accounting opacity are traded on the Frankfurt
and XETRA exchanges (0.36).
Listed vs. traded accounts
Additionally, for the 2003-2007 sample Table 4.5.1 reports summary statistics
separately for listed and traded accounts. Listed companies are larger than those admitted to
trade (18.2 billion GBP vs. 14.0 billion GBP), are listed on a foreign exchange for a longer
period of time (8.26 years vs. 5.42 years), are more likely to list in foreign country that shares a
language with the home country (common language indicator 0.34 vs. 0.17), and are more likely
to list in a country that is further away from the home country (geographic distance 2,283 km
vs. 1,974 km).
Stock-level factors: Correlation analysis
Table 4.7 reports a correlation matrix of the FTVS and the stock-level variables for the
2003-2007 sample. All explanatory variables, with the exception of the international accounting

225
standards variable, are significantly correlated with the FTVS variable. Larger companies and
companies with higher growth opportunities have a smaller FTVS. The FTVS is higher for
companies that are more export-oriented, have higher foreign institutional ownership, are riskier
(in terms of stock return variance), and have returns that are less correlated with foreign market
returns. The foreign information factor, contrary to expectations, is negatively correlated to the
FTVS. However, splitting the foreign information factor into two variables the US information
factor and the foreign (non-US) information factor, reveals that these two variables have
opposite effects on the FTVS: the US information factor is positively and significantly
correlated to the FTVS while the foreign (non-US) information factor is negatively and
significantly correlated to the FTVS.
FTVS is higher for companies that are listed (as opposed to admitted to trade), if the
listing is the company’s first foreign listing, if there is a longer duration of listing, and if the
listing takes place in the form of a depository receipt. Stock price level and the same currency
indicator have a rather low negative correlation with the FTVS.
The signs (positive or negative) on the correlation coefficients of all the home country-
level variables are in line with expectations. Companies have a higher FTVS if they come from
an emerging market, from a country with weaker investor protection and insider trading
regulations, with less accounting opacity, and with higher trading cost.
4.7 Empirical results
4.7.1 Pull factors of foreign equity trading: Multivariate regression analysis
The first testable proposition is that host market characteristics determine the ability of
the host exchange to attract foreign equity trading. The ability of the exchange to attract foreign
equity trading is measured by the exchange’s AFTVS defined in section 4.4.1. Equation (4.5)
from section 4.4.2 is used in the regression analysis. Section 4.3.1 identifies the following host
exchange-specific factors as potential determinants of the foreign equity trading distribution: the
level of disclosure, demutualization status, market design, and foreign equity expertise, trading
226
frictions including capital market size, aggregate market liquidity and trading costs, and the
quality of the legal and information environment.
Table 4.8 reports the output of the regressions of the logistic transformation of the stock
exchange’s monthly average foreign share of trading volume (AFTVS) on the host stock
exchange characteristics, the pull factors. Model (1) includes stock exchange-specific factors,
whereas models (2)–(5) additionally include host country characteristics, such as the level of
investor protection, enforcement of insider trading laws and accounting opacity index. Data for
foreign stock concentration are available only for stock exchanges but not for trading platforms
and OTC markets. To avoid the loss of observations, the foreign stock concentration variable is
included only in model (5). As a robustness test, model (3) is estimated with year fixed effects.
Model (4) is estimated with exchange-fixed effects and includes OTC, VIRTX and XETRA
indicators but excludes the demutualization indicator that is not available for OTC observations.
For model (2) of Table 4.8, the primary model specification in the multivariate regression
analysis of the pull factors of the foreign trading volume share, Table 4.8 additionally reports
the economic significance of the coefficient estimates.
In line with the theoretical predictions, trading platforms have, on average, a lower
AFTVS compared to the stock exchange in the sample as coefficient estimates on the trading
platform dummy variable are negative in all model specifications. Model (4) includes, instead of
the trading platform indicator, OTC, VIRTX and XETRA indicators. Coefficient estimates on
the OTC and VIRTX indicators are negative and significant at the 1% level, while coefficient
estimate of the XETRA indicator is insignificant. In line with the theoretical argument that
demutualized exchanges are more efficient, the demutualization dummy variable has positive
and significant coefficient estimate in models (1) and (2). However, after controlling for time
effects in model (3), the demutualization variable is not statistically significantly different from
zero. In contrast to expectations that automated trading provides a competitive advantage to a
stock exchange in attracting trading volumes, the electronic market indicator has a negative and
statistically significant coefficient estimates in model specifications (1) to (4).89
A possible
explanation for the negative sign of the electronic market indicator is that electronic markets in
the sample are overrepresented by trading platforms which have a significantly smaller average
89
In contrast to literature that supports the higher efficiency and lower costs of electronic vs. floor trading
argument (Domowitz, 2002; Jain, 2005), Venkataraman (2001) reports higher trading costs on the
electronic market (Paris) vs. floor trading (NYSE) and suggests that ‘there is a benefit to human
intermediation in the trading process’ (p.1448).

227
share of foreign equity trading. It is possible that the electronic market indicator actually reflects
the lesser ability of trading platforms to attract foreign equity trading
Market size is a positive and significant determinant of the AFTVS in model (1).
However, after controlling for host country characteristics, such as the level of investor
protection, enforcement of insider trading laws and accounting opacity index, it becomes
insignificant. In line with the theoretical predictions, markets with a greater level of aggregate
liquidity are more successful in attracting active trading of foreign stocks, as the coefficient
estimates on the market liquidity variable are positive and highly significant in all model
specifications. Higher transaction costs are expected to be a significant competitive
disadvantage in attracting trading to the exchange. Indeed, the regression analysis reveals that
total trading costs in the host market is a negative and statistically significant determinant of an
exchange’s average fraction of foreign equity trading.
The quality of the legal environment in the host country is expected to have a positive
impact on the stock exchange’s ability to attract foreign equity trading. Analysis reveals that
enforcement of insider trading laws in the host country is positive and significant determinant of
the AFTVS. The level of investor protection is a positive, although statistically insignificant,
factor. As expected, accounting opacity in the host country has a negative impact on the stock
exchange’s ability to actively trade foreign stocks: coefficient estimate on the accounting
opacity index is negative and significant. A control variable, average company size, is a highly
significant (at 1% significance level) and negative determinant of the AFTVS.
Model (5) additionally includes a foreign stock concentration variable that is found to
be an insignificant determinant. Since a foreign stock concentration variable is available for
stock exchanges but not for trading platforms, Model (5) includes stock exchange observations
only and has the highest explanatory power (adjusted R-squared is 77.9%), suggesting that
determinants of the AFTVS differ for stock exchanges and trading platforms. The forthcoming
section 4.7.2 examines the difference in the determinants of foreign trading volume share
between listed and traded foreign accounts.
Multicollinearity issue
There is legitimate concern that the stock exchange level explanatory variables are
correlated. A correlation matrix of the pull factors (Table 4.3) shows that the market size
228
variable is highly correlated with other variables, particularly market liquidity, the level of
investor protection and the enforcement of insider trading laws indicator and the level of
accounting opacity. However, the correlation coefficients are within an acceptable range (0.42-
0.56). Additionally, I estimate variance inflation factors (VIFs) for coefficient estimates for all
model specifications reported in Table 4.8. Estimated coefficients and variance inflation factors
of the pull factors of foreign equity trading are reported in Appendix 4.2. The estimated VIFs
are within the range of 1.08 to 4.18 indicating that multicollinearity should not affect the
findings in any significant way.90
Pull factors: Economic significance
Table 4.8 additionally reports the economic significance of the coefficient estimates for
model (2). Average company size is the most significant determinant of the average fraction of
foreign equity trading (with the economic significance of 42%). This result highlights the
importance of company-specific factors for trading volume distribution and motivates stock-
level analysis that incorporates various stock- specific factors (discussed in forthcoming section
4.7.2). The other significant determinants of the AFTVS are: electronic market trading (negative
impact with the economic significance of 35%), total trading costs (negative impact with the
economic significance of 29%), trading on a demutualized exchange (positive impact with the
economic significance of 25%), and enforcement of insider trading laws in the host country
(positive impact with the economic significance of 24%). In other words, a one-standard
deviation increase in the electronic market indicator, total trading costs, demutualization
indicator, and insider trading enforcement indicator variables would adjust the AFTVS by 0.35,
0.29, 0.25 and 0.24 standard deviations respectively. Further, the aggregate market liquidity’s
economic significance is 21% with positive sign, the accounting opacity index’s economic
significance is 21% with negative sign, and the trading platform indicators’ economic
significance is 14% with a negative sign.
To summarize, the analysis has shown that stock exchange characteristics, or the pull
factors of foreign trading volume, are significant determinants of a stock exchange’ average
foreign trading volume share, which is the measure of a stock exchange’s ability to attract
trading volumes of foreign stocks. The following stock exchange characteristics affect a stock
exchange’s ability to compete for foreign equity trading: costs of trading, the level of
90
Multicollinearity is likely to be an issue if a VIF is above 10 (Wooldridge, 2009; Sabherwal, 2007).

229
accounting opacity, demutualization, market-level liquidity, and the enforcement of insider
trading laws.
4.7.2 Stock-level determinants of the foreign trading volume share: Multivariate
regression analysis
The next step is the investigation of the determinants of the foreign share of trading
volume at the stock level in the multivariate framework. The dependent variable in the
regressions is the logistic transformation of the monthly foreign trading volume share (FTVS)
for each foreign trading account, as defined in section 4.4.1. Equations (4.6) and (4.7), section
4.4.2, are used in the regression analysis of foreign trading volume share at the stock-level. The
output is reported in Table 4.9. Models (1.1) and (2.2) in Table 4.9 include only stock-specific
characteristics such as listing characteristics, company characteristics and home market
characteristics (equation (4.6)). Model specifications (3) - (5) in addition include the pull factors
of the foreign trading volume share calculated at the stock level (equation (4.7)). The pull
factors at the stock level include: the differences between host and home market characteristics
and host exchange characteristics such as host exchange’s industry specialization and foreign
equity expertise.91
Models (1) and (3) do not include stock ownership composition variable or
foreign institutional ownership and ownership concentration variables, which were available
only from January 2003, and, thus, employ the broadest sample of observations from January
1990 to December 2007. Models (2), (4) and (5) contain a full set of the explanatory variables,
including stock ownership composition variables, and, accordingly, employ the sample of
observations from January 2003 to December 2007. Model (5) includes an additional exchange-
specific factor: foreign stock concentration variable, which is available only for stock exchange
observations and not for trading platforms and OTC markets. Accordingly, model (5) is
estimated using the sub-sample that includes only stock exchange accounts.
Stock-level factors: Listing characteristics
Table 4.9 reports that the most significant group of stock-level factors are the listing
characteristics that are all found to be statistically significant determinants of the FTVS. One of
91
None of the model specifications in Table 4.9 include the difference in the demutualization status and
in electronic trading because all stock exchanges in the sample starting from year 2003 have been
demutualized and have adopted automated trading, making these two variables irrelevant for the 2003-
2007 sample.

230
the most significant determinants is whether the stock is listed or traded on a foreign exchange.
There is evidence that traded status, as opposed to listed status, substantially reduces the
fraction of trading on the foreign exchange: the coefficient estimates on the traded indicator in
all model specifications are negative and significant at the 1% level. Thus, a corporate decision
to list on a foreign exchange, as opposed to having a stock admitted to trade, although it entails
additional listing requirements, guarantees more active foreign trading of stock.
Coefficient estimates on the first foreign listing indicator, the duration of the listing and
the same currency indicator variables are also positive and significant mostly at 1% in all model
specifications. Accordingly, the findings suggest that FTVS is significantly higher when a
company is listed abroad for the first time, traded on a foreign exchange in the same currency as
the home listing, and increases with the duration of listing.
The US listings take place primarily in the form of depository receipts, whereas other
exchanges, such as Frankfurt, XETRA and the London stock exchanges, trade ADRs in addition
to trading ordinary shares. After controlling for the US-specific effect92
in models (1.2), (2.2),
(3.2) and (4.2), ADR indicator, as predicted, is a negative and significant determinant of the
FTVS. In line with the expectation that higher priced stocks are more visible to foreign
investors, the coefficient estimate on the price level variable is positive and significant in model
specifications that do not control for the US as host market.
Stock-level factors: Company characteristics
Company size is found to be a negative and significant at 1%, determinant of the FTVS
in all model specifications, suggesting that smaller companies have a significantly larger
FTVSs. Regression analysis reveals that only for the 1990-2007 sample does a company’s
growth significantly affect the FTVS, whereas the coefficient estimate on the price-to-book
variable is statistically insignificant in all model specifications that employ the 2003-2007
sample. The significance of the price-to-book ratio in earlier years could be driven by the
observations from the late 1990s, the period of the dot-com bubble, when growth opportunities,
including those of foreign companies, were valued more highly than ever. Furthermore, there is
evidence that stock risk is a positive and significant at least at a 5% level determinant of the
foreign trading volume share in all model specifications. Company export orientation, measured
92
The US-specific effect is controlled for by including a dummy variable representing the US as the host
market.

231
by the fractions of foreign sales in total sales, is a positive determinant of the FTVS that is
statistically significant in the model specifications that employ the 1990-2007 sample.
A higher fraction of foreign institutional ownership is expected to assure a FTVS,
unless foreign institutional investors prefer to trade on the stock’s home market. After
controlling for home market characteristics (model (2)) and for the differences in host and home
market characteristics (models (4)–(5)) that potentially affect the attractiveness of the home
market relative to the host market as a location of the stock trading, foreign institutional
ownership is a positive and statistically significant determinant of the FTVS. Ownership
concentration, on other hand, have a negative impact on the FTVS, as predicted, however, the
statistical significance of this variable is rather low.
Adopting IAS or US GAAP makes a company more transparent, comparable to other
foreign companies, and, supposedly, more attractive to foreign traders (Aggarwal et al, 2005).
However, I find no empirical support for this proposition: coefficient estimates on the
International accounting standards dummy variable is insignificant in models (2), (4)–(5).
Moreover, in models (1) and (3) that employ the 1990-2007 sample the IAS variable has
negative and significant coefficient estimates, implying that stocks of companies that adopt
international accounting standards are less actively traded in foreign markets.
Due to potential portfolio diversification benefits, stocks that exhibit a low return
correlation with foreign market returns are expected to appeal to foreign investors. Indeed,
empirical evidence strongly supports this proposition: coefficient estimates on the return
correlation with foreign market return variable are negative and significant mainly at 1% in all
models in Table 4.9.
According to Baruch at al. (2007), the foreign information factor that quantifies
marginal contribution of foreign market returns in explaining the stock return pattern, is
expected to be one of the main positive determinants of foreign trading volume share.
Correlation analysis (section 4.6.2) show that the US information factor and the foreign (non-
US) information factor have opposite effects on the FTVS. Thus, these two variables are
included in the regressions individually, in place of the foreign information factor.93
In line
with the findings of Baruch et al (2007), regression analysis reveals that the US information
93
In the model specification that incorporates the collective foreign information factor variable (not
reported), the coefficient estimate on the foreign information factor is not statistically different from zero.

232
factor is a positive and highly significant determinant of foreign trading volume share. At the
same time, the coefficient estimate on the foreign non-US information factor is negative and
significant, which is directly opposite to the theoretical argument of Baruch et al (2007).
Stock-level factors: Country characteristics
Emerging markets are characterised by higher investment barriers for foreign investors.
Thus, it is expected that a foreign listing by a company from an emerging market would
generate more active foreign trading compared to a foreign listing by a company from a
developed market. Empirical findings support this proposition as the coefficient estimate on the
emerging market indicator has a positive sign in all model specifications and is statistically
significant in models (1) and (2). The emerging market indicator becomes insignificant in the
model specifications (3) and (4) that control for the difference in the host and home market
characteristics.
In line with the predictions, FTVS is higher when a stock is traded in a foreign country
that shares a language with the company’s home country as the coefficient estimates on the
common language indicator are positive and significant at the 1% level.
Geographic distance is a proxy for foreign investors’ unfamiliarity and, accordingly, is
expected to have a negative impact on the FTVS. In contrast to this prediction, the coefficient
estimate on the geographic distance variable is positive and highly significant. Furthermore,
summary statistics by stock exchange (Table 4.5.2) show that geographic distance from the US
exchanges is very distinct from geographic distances from other host exchanges. Thus, it is
possible that the geographic distance variable in the regressions captures the US-specific
variation in the FTVS. To disentangle the US premium, models (1.2), (1.2), (2.2), (3.2) and
(4.2) include, instead of the geographic distance variable, a dummy variable representing the US
as the host market and also a residual geographic distance variable. The residual geographic
distance variable is the residual from the OLS regression of the geographic distance variable on
the US host market dummy variable. The coefficient estimate on the residual geographic
distance variable, as expected, has a negative sign. In contrast, the coefficient estimate on the
US host market indicator is positive and significant at the 1% level. This can be interpreted as
the ‘US trading premium’.

233
Weaker investor protection and poor enforcement of insider trading laws in the home
country are expected to drive the equity trading away from the home country to foreign markets
where the stock is listed/ traded. Empirical evidence supports this proposition: the coefficient
estimates on the investor protection and the enforcement of insider trading laws in the home
country dummy variables are negative and significant at 1% in models (1) and (2). Furthermore,
the variables that represent the differences in legal environment between the host and the home
countries, the difference in investor protection and the difference in enforcement of insider
trading laws also have positive and significant coefficient estimates. These findings are
consistent with the theoretical argument that investors prefer to trade in countries that provide
higher standards of investor protection and better enforcement of insider trading laws.
Accounting opacity in the home country affects the perception of the quality of the
company’s accounting information and, thus, should negatively affect the stock’s trading on a
foreign exchange. Indeed, the coefficient estimates on the accounting opacity in the home
country variable are negative and significant in models (1.1) and (2.1). Furthermore, the
coefficient estimate on the difference in accounting opacity index between the host and the
home countries (models (3) – (5)) is positive and significant, at least at the 5% level. This
finding can be interpreted as evidence that foreign investors trade more actively those foreign
stocks that come from countries with a level of accounting opacity lower than that in the foreign
country.
Pull factors at stock level
Higher trading costs in the home country are a significant disadvantage in competing
with foreign exchanges for equity trading volumes. Empirical findings show that the level of
total trading costs in the home country (models (1.2) and (2.2)) is positive and significant at 1%
determinant of the FTVS. However, there is no clear evidence that the difference in costs of
trading between host and home markets is a negative determinant of the foreign trading volume
share.
The difference in the market size variable is positive and significant at least at 1% in
models (3.1), (4.1) and (5) but is insignificant in models (3.2) and (4.2). In contrast to
expectations, the coefficient estimate on the difference in the aggregate market liquidity
between host and home markets is negative and statistically significant in all model

234
specifications, meaning the smaller the difference in market liquidity between the host and
home markets, the higher the foreign fraction of equity trading. This result is difficult to
interpret as the theoretical models of Kyle (1985), Admati and Pfleiderer (1988), Pagano (1989)
and Chowdhry and Nanda (1991) predict concentration of trading in the most liquid market.
Stock exchange industry specialization has insignificant coefficient estimates in all
model specifications. The foreign stock concentration variable (model (5)), also has an
insignificant coefficient estimate. In other words, there is no evidence found that a stock
exchange with a higher share of listed stock from the same industry or a higher share of listed
foreign stocks has an advantage in attracting trading of foreign stocks.
Multicollinearity issue
The correlation matrix of the stock-level factors (Table 4.7) reports that the level of
correlations between the stock-level factors is within an acceptable range (<0.50). Correlations
are higher for the market-level factors, particularly, the difference in market size, the difference
in the level of investor protection, enforcement of insider trading laws, trading costs, and
geographic distance variables (Table 4.6.2) (the highest correlation coefficient is 0.67).
Estimated variance inflation factors (VIF) on the coefficient estimates of the determinants of the
foreign trading volume share are less than 10 (Appendix 4.3), suggesting that multicollinearity
should not cause a bias in the estimation results.90
As a robustness test, models (3.3) and (4.3)
exclude the variable with the highest variance inflation factor, the difference in market size
variable. The output of the models with the omitted variable shows that coefficient estimates on
the other explanatory variables are not affected. Overall, there is sufficient evidence that
multicollinearity does not influence the estimation results in this analysis.
Economic significance of the determinants of foreign trading volume share
Table 4.10 reports the output of the regressions that include all significant determinants
of foreign trading volume share from the multivariate analysis at stock level (Table 4.9).
Additionally, Table 4.10 reports the economic significance of the coefficient estimates. Listing
characteristics are the most significant determinants of foreign trading volume share that jointly
explain the 0.70 standard deviations variation of foreign trading volume share. The traded
indicator variable is individually the most significant factor with economic significance of
24.5%. Thus, change in status from traded to listed would increase the foreign trading volume

235
share by approximately 2.65% (0.242 times 0.11 standard deviation of the independent
variables), keeping all other variables constant. An increase of 2.65% in the foreign trading
volume share is highly significant taking into account that the sample’s average AFTVS is only
about 3%. The other significant listing-specific factors are the duration of listing/trading and the
same currency indicator variables with the economic significance of 19.7% and 14.2%
respectively.
Company size is the most significant company characteristics with an economic
significance of 16.9% (negative contribution).
The difference in the level of investor protection and in the enforcement of insider
trading laws between the host and home countries, jointly explain the 12.5% variation (positive
contribution) in foreign trading volume share. The difference in aggregate market liquidity has
economic significance of 15.3% (negative contribution), whereas the difference in the
accounting opacity index has economic significance of 14.9% (positive contribution).
Geographic distance between the host and home countries has an economic significance of
20.6% with a positive sign. Furthermore, output of Model (2) that includes the US host market
indicator and the residual geographic distance variable reveals that the US host market indicator
is the most significant determinant of foreign trading volume share with economic significance
of 55.0%, while geographic distance is a negative factor with economic significance of 5.0%.
The inclusion of the US host market indicator reverses the economic significance of the DR
indictor from positive 4.8% to negative 6.2%, reduces the economic significance of the US
information factor from 10.7% to 4.2% and of the common language indicator from 15.6% to
8.3%, and increases the economic significant of the difference in the enforcement of insider
trading laws from 1.9% to 9.3%.
Overall, the stock-level analysis has shown that stock-specific factors of foreign trading
volume are significant determinants of foreign trading volume distribution. Significant stock-
specific determinants of foreign trading volume distribution include: 1) listing characteristics
such as listed vs. traded status, the duration and the currency of listing/trading, 2) company
characteristics, particularly, company size and stock risk, and 3) home market characteristics,
such as geographic proximity to the host market and the quality of both the legal and the
information environment. The next section investigates whether the determinants are different
for stocks that are listed as oppose to stocks that are admitted to trade.

236
The determinants of the foreign trading volume share: Listed vs. traded
The nature of a foreign trading varies significantly depending on whether the stock is
listed on a foreign exchange or is admitted to trade. Thus, the determinants of foreign trading
volume share for listed and traded accounts are potentially different. To empirically investigate
this proposition, the following regression is estimated:
logtrFTVSi,n= α0+ β1i Xj +β2i Zk,n+Σγj,Traded(DTradedXj)+Σθk,Traded(DTradedZk,n)+ εi, (4.9)
where logtrFTVSi,n is log-transformation the stock i’s share of trading volume on the exchange n
in month t; DTraded is dummy variable that equals one if the stock is traded without meeting
listing requirements on a stock exchange n in month t and equals zero otherwise; Xj is vector of
stock-level factors; Zk,n is characteristic k of the host market n relative to characteristic k of the
stock’s home market.
Table 4.11 reports the results of this regression. Coefficient estimates on all the
determinants have the same signs, meaning the direction of impact, for both listed and traded
accounts. The only exception is the difference in the enforcement of the insider trading laws
variable, which is positive and significant for listed accounts and negative but insignificant for
traded accounts. The level of statistical significance of the determinants for listed and traded
accounts varies for some variables. Thus, the foreign non-US information factor, the common
language, the difference in the level of investor protection and the difference in market size
variables are significant determinants for traded accounts. The difference in market liquidity is a
significant factor for listed accounts.
4.7.3 Stock-level factors by stock exchange: Multivariate regression analysis
The last stage of the empirical investigation is analysis of stock-level determinants of
the FTVS by stock exchange. Table 4.12 reports the output of the regression of the FTVS on the
stock-level factors for the sample of 1,477 foreign accounts. The independent variables are the
interaction variables of the explanatory variables with the dummy variables that represent
eleven major foreign exchanges, namely: the NYSE, NASDAQ, US OTC, London SE, Swiss
SE, Frankfurt, Paris, Amsterdam, Milan, VIRTX, and XETRA (equation (4.8), section 4.4.2).
The explanatory variables are defined in Table 4.2.

237
The regression output reveals that smaller companies have a notably higher foreign
trading volume share when they are listed/traded in Milan, Amsterdam and US OTC market,
whereas larger companies have a significantly higher FTVS when they are traded on VIRTX
and XETRA. Price-to-book ratio is a positive and significant determinant of the shares of
foreign equity trading for Milan and Amsterdam accounts, and is a negative and significant
determinant for NASDAQ, London, Frankfurt and XETRA accounts. In other words, on the
latter four exchanges value stocks have more active foreign equity trading compared to growth
stocks. In line with the expectations and the findings of the previous section on the stock-level
factors of foreign equity trading, stock risk is a positive determinant of the foreign trading
volume share for the majority of the stock exchanges. Riskier stocks have particularly high
FTVS on the Swiss stock exchange, Frankfurt stock exchange, XETRA, NYSE, and NASDAQ.
The export orientation of a company is a positive predictor of the FTVS only when a stock is
listed/traded on the US exchanges, namely, NYSE, NASDAQ, and US OTC.
Higher foreign institutional ownership assures a higher FTVS only for NYSE listings.
Although higher ownership concentration is expected to lessen stock trading on a foreign
exchange, empirical results show that a stock’s ownership concentration is a negative
determinant of foreign trading volume share only for NYSE listings, while it is a positive
determinant for Milan trading accounts. As expected, companies that have adopted international
accounting standards have higher foreign trading volume share, particularly when their stocks
are traded on VIRTX, the Italian stock exchange, NASDAQ, the NYSE and the Paris stock
exchange. However, the adoption of internationally recognized accounting standards is a
negative determinant of the XETRA’s foreign trading share. Stocks that exhibit lower return
correlations with foreign host market are more actively traded on NASDAQ, NYSE, and
Frankfurt stock exchanges but significantly less actively traded on VIRTX. The foreign
information factor is not a significant determinant of foreign trading volume share except for
London and US OTC accounts (significant only at 10% confidence level).
The interaction variable of the ‘Traded indicator’ variable is calculated only for
exchanges that host listed and also traded accounts. As predicted, traded accounts of the
Frankfurt and XETRA exchanges have significantly smaller FTVS than listed accounts. In
contrast to the expectation that a company’s first foreign listing is expected to generate more
active foreign trading compared to consequent foreign listings, it is found that the first foreign

238
listing indicator is a negative determinant of the FTVS for Paris, NYSE, and Amsterdam
listings. The duration of listing is a significant and a positive determinant of foreign trading
volume share for XETRA, Frankfurt, NYSE, and OTC accounts and a significant and negative
determinant for VIRTX and Paris accounts. Coefficient estimates on the same currency
indicator have positive signs for London, XETRA, and Frankfurt accounts but a negative sign
for Milan accounts. Trading in the form of depository receipts vs. ordinary shares generates
significantly less active trading only on European exchanges (London, XETRA, and Frankfurt),
whereas the difference in foreign trading volume share generated by listings in the form of
ADRs and ordinary listings is insignificant for NYSE and NASDAQ listings and positive and
significant for US OTC market listings. Stocks with a higher price level have higher FTVS
when listed/traded on US OTC market, NYSE and Frankfurt, but a smaller FTVS when listed in
Paris.
Amsterdam, Milan, NASDAQ, the Swiss stock exchange, VIRTX and XETRA do not
host stocks from emerging markets in the sample. Stocks from emerging markets that are traded
in London, Frankfurt and Paris have more active foreign trading compared to stocks from
developed markets. However, stocks from emerging markets have a smaller FTVS compared to
stocks from developed markets on the US OTC market. A common language between the home
and host countries reduces information barriers for foreign investors and, thus, stimulates more
active foreign equity trading, particularly on London, Frankfurt, and Swiss stock exchanges.
Geographic distance between the home and host countries is a measure of the unfamiliarity of
foreign investors with a stock: the greater the distance, the smaller the foreign trading volume
share is for VIRTX, Paris, XETRA, and London accounts. The level of investor protection in
the home country is a positive determinant for Milan, Amsterdam and Swiss stock listings and a
negative determinant for London, Paris and VIRTX listings. Coefficient estimates on the
enforcement of insider trading laws variable are around zero for all exchanges. Stocks from
home markets with higher trading costs have higher FTVS in London and Amsterdam, but,
unexpectedly, smaller FTVS on the Italian and Swiss stock exchanges. Lastly, the accounting
opacity of the home country negatively affects FTVS on Italian stock exchange, VIRTX, Paris
and New York stock exchanges, but positively on the London stock exchange.
To summarize, analysis of stock-specific factors by stock exchange provides a useful
insight for companies that are seeking to improve the liquidity of their stock. More specifically,

239
it provides evidence regarding which foreign market is more likely to provide active trading for
a stock with particular characteristics, including company characteristics and the company’s
home market characteristics. The US exchanges have more active trading in stocks of more
export-oriented companies, the London stock exchange has active trading of stocks from
emerging markets, from English-speaking countries and from countries with poor investor
protection. VIRTX, in contrast, is most successful in generating equity trading of large foreign
companies that comply with international accounting standards and come from countries with
better investor protection and a better information environment.
4.8 Conclusion
This study examines the distribution of foreign trading volume of European cross-listed
stocks and the factors that affect this distribution. The distribution of foreign equity trading is
measured by foreign trading volume share, which is the ratio of the number of shares traded on
a particular exchange to the total number of shares traded on all exchanges in the sample (home
exchange as well as foreign exchanges) for each stock. Arguably, there are two main groups of
determinants for foreign trading volume share: the pull factors of the foreign trading volume, or
exchange-specific factors, and the stock-specific factors. Empirical analysis reveals that both of
these groups are significant determinants of foreign trading volume share.
Analysis of the location of cross-border equity trading of European cross-listed stocks
shows that in terms of total trading volume (the NYSE) as well as in terms of the average
foreign trading volume share (NASDAQ), the US exchanges are important markets where
significant trading of European cross-listed stocks takes place. The London stock exchange
follows the US exchanges for both total foreign equity trading volume and the average trading
volume share of foreign stocks. There is evidence of the diminishing importance of US OTC as
the market place for foreign equity trading. Also, there is evidence of the limited ability of other
off-exchange trading venues, such as trading platforms XETRA and VIRTX, to attract active
trading in foreign stocks despite a large number of foreign stocks being admitted to trade.
The findings on the exchange-specific factors that facilitate a more favourable trading
environment for foreign equity trading are relevant for stock exchanges that compete for trading

240
of foreign stocks. I find evidence that higher trading costs and a higher level of accounting
opacity in the host country have a significant negative impact on the stock exchange’s ability to
attract active foreign equity trading. Furthermore, there is evidence that demutualized stock
exchanges, stock exchanges with higher levels of liquidity and stock exchanges in countries
with enforced insider trading laws have a superior ability to attract equity trading of foreign
stocks.
The second part of the investigation focuses on stock-specific factors as the
determinants of foreign trading volume share. Stock-level analysis provides strong evidence that
stocks admitted to trade on a foreign exchange have a significantly lower share of foreign
trading compared to stocks listed on a foreign exchange. This is in line with the findings on the
exchange-level analysis and in line with the theoretical model of Chemmanur and Fulghieri
(2006) predicting that a foreign listing is beneficial due to the increase in investor awareness of
the stock and the reduction in investors’ monitoring costs. In other words, a stock exchange
listing (as opposed to an admission to trade) on a foreign exchange, despite higher fees and
disclosure requirements, should be regarded as a preferable option for companies that are
looking to improve stock liquidity. Furthermore, the findings suggest that the share of foreign
trading increases over time. While this result is intuitively compelling since duration of listing/
trading is the measure of stock visibility on the exchange, it contradicts the findings of Halling
et al (2008) that trading volumes of large foreign stocks migrate back to the home market after
the first year of cross-listing.
The findings suggest that company characteristics are important determinants of foreign
trading volume share. Specifically, foreign trading volume share is larger for smaller and riskier
companies, for companies with higher foreign institutional ownership and with lower stock
return correlation with host market returns. However, the foreign information factor that Baruch
et al (2007) name as the most significant determinant of trading volume distribution, is a
positive determinant for the US observations but a negative determinant for non-US
observations.
Listing/trading on the US exchanges results in more active foreign trading activity
compared to other host markets. I interpret this as the US trading premium of foreign trading
volume share, similar to the US cross-listing valuation premium of Doidge et al (2004) and
Doidge et al (2009a), which they justify by the fact that the US offers a deep and liquid capital

241
market and a better-quality informational and legal environment. Furthermore, the US trading
premium is robust in controlling for the differences in the level of liquidity, the quality of the
information and the legal environments between the host and home markets.
After disentangling the US-specific variation and the geographic distance between the
host and home markets, the measure of investors’ unfamiliarity with the stock is a negative and
significant determinant of the foreign trading volume share. The finding is in line with the
argument of Sarkissian and Schill (2004, 2009a) regarding the importance of investor
familiarity for cross-listing decisions and is in line with the ‘home bias’ argument (Brennan and
Cao, 1997; Coval and Moskowitz, 1999; Huberman, 2001; Grinblatt, and Keloharju, 2001).
Finally, the findings highlight the importance of the quality of the legal and information
environments for the distribution of foreign equity trading. I find that a market that provides
better investor protection and has enforced insider trading laws has a strong advantage over
other markets in attracting trading volumes of European cross-listed stocks. Furthermore, the
higher the quality of the information environment of the home market and, particularly, of the
home market relatively to the host market, the higher the fraction of trading on the foreign
exchange.
The findings of this study have two important practical applications. First, for stock
exchange executives, it answers the question of which stock exchange characteristics determine
a more favourable trading environment for foreign cross-listed stocks, i.e. what makes stock
exchanges more competitive in attracting foreign equity trading. Second, for corporate
managers seeking to improve their company’s stock liquidity, it answers the question of on
which foreign stock exchange the company stock has the most potential to maximize its
liquidity in terms of trading volume, given specific company characteristics.

242
Figure 4.1 Average stock exchange’s share of foreign equity trading of European cross-listed
stocks and Number of observations
The figures plot the annual average foreign equity trading share and the total annual number of stock-
month observations for the total sample and individually for eleven major exchanges. The average annual
foreign trading share is the mean of the stock-level foreign trading shares of all the stocks in the sample
that are traded on the stock exchange, calculated monthly as the ratio of the number of shares traded on
the exchange to the total number of the shares traded in the same month on all exchanges in the sample.

243
Figure 1 continued
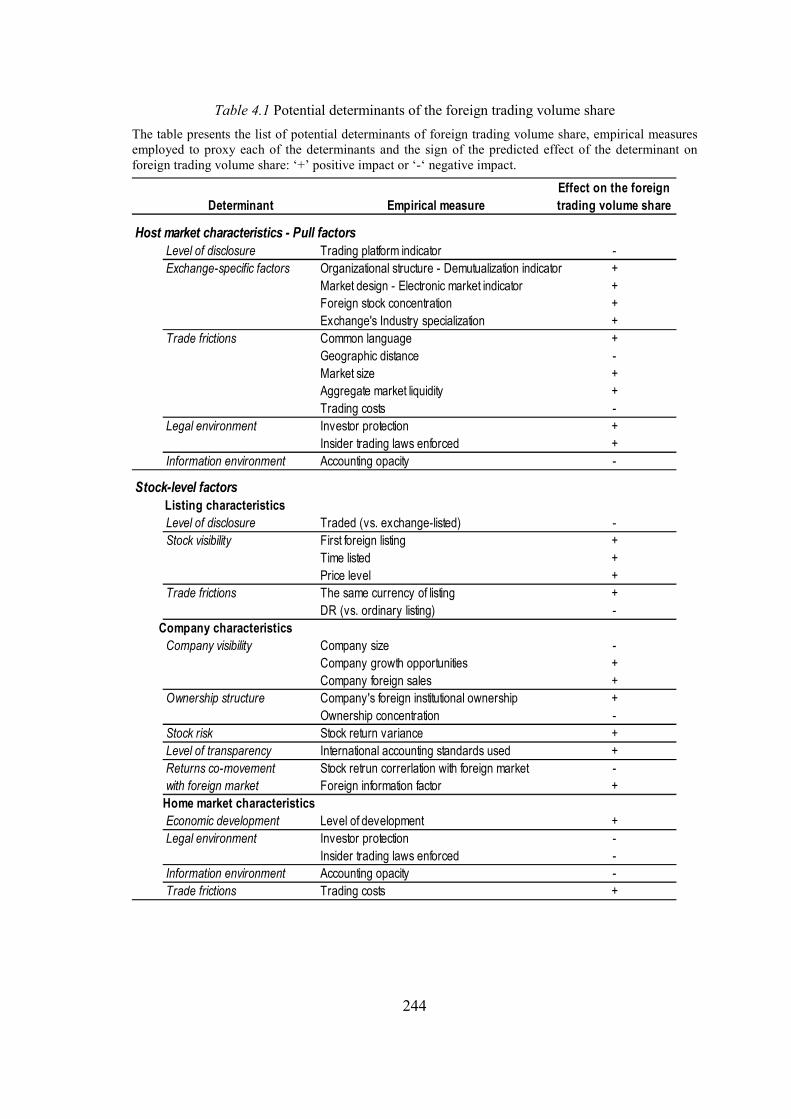
244
Table 4.1 Potential determinants of the foreign trading volume share
The table presents the list of potential determinants of foreign trading volume share, empirical measures
employed to proxy each of the determinants and the sign of the predicted effect of the determinant on
foreign trading volume share: ‘+’ positive impact or ‘-‘ negative impact.
Determinant Empirical measure
Host market characteristics - Pull factors
Level of disclosure Trading platform indicator -
Exchange-specific factors Organizational structure - Demutualization indicator +
Market design - Electronic market indicator +
Foreign stock concentration +
Exchange's Industry specialization +
Trade frictions Common language +
Geographic distance -
Market size +
Aggregate market liquidity +
Trading costs -
Legal environment Investor protection +
Insider trading laws enforced +
Information environment Accounting opacity -
Stock-level factors
Level of disclosure Traded (vs. exchange-listed) -
Stock visibility First foreign listing +
Time listed +
Price level +
Trade frictions The same currency of listing +
DR (vs. ordinary listing) -
Company visibility Company size -
Company growth opportunities +
Company foreign sales +
Ownership structure Company's foreign institutional ownership +
Ownership concentration -
Stock risk Stock return variance +
Level of transparency International accounting standards used +
Returns co-movement Stock retrun correrlation with foreign market -
with foreign market Foreign information factor +
Economic development Level of development +
Legal environment Investor protection -
Insider trading laws enforced -
Information environment Accounting opacity -
Trade frictions Trading costs +
Effect on the foreign
trading volume share
Company characteristics
Listing characteristics
Home market characteristics
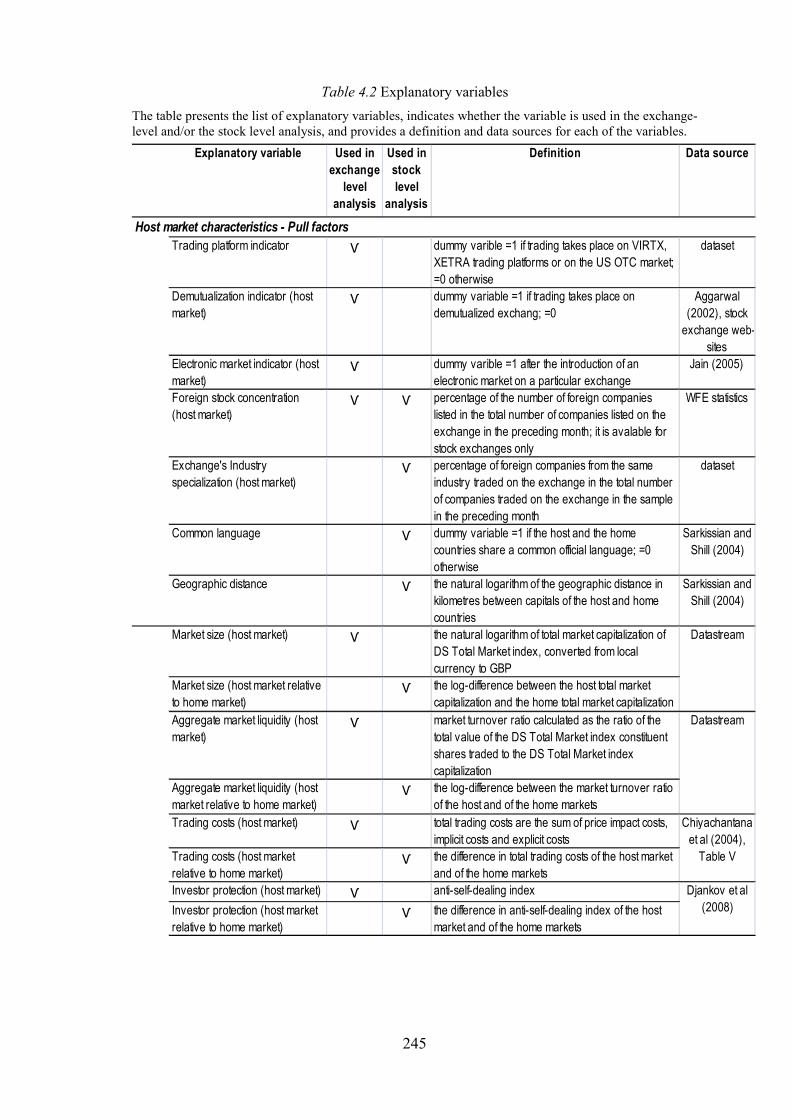
245
Table 4.2 Explanatory variables
The table presents the list of explanatory variables, indicates whether the variable is used in the exchange-
level and/or the stock level analysis, and provides a definition and data sources for each of the variables.
Explanatory variable Used in
exchange
level
analysis
Used in
stock
level
analysis
Definition Data source
Host market characteristics - Pull factors
Trading platform indicator Ѵ dummy varible =1 if trading takes place on VIRTX,
XETRA trading platforms or on the US OTC market;
=0 otherwise
dataset
Demutualization indicator (host
market)Ѵ dummy variable =1 if trading takes place on
demutualized exchang; =0
Aggarwal
(2002), stock
exchange web-
sites
Electronic market indicator (host
market)Ѵ dummy varible =1 after the introduction of an
electronic market on a particular exchange
Jain (2005)
Foreign stock concentration
(host market)Ѵ Ѵ percentage of the number of foreign companies
listed in the total number of companies listed on the
exchange in the preceding month; it is avalable for
stock exchanges only
WFE statistics
Exchange's Industry
specialization (host market)Ѵ percentage of foreign companies from the same
industry traded on the exchange in the total number
of companies traded on the exchange in the sample
in the preceding month
dataset
Common language Ѵ dummy variable =1 if the host and the home
countries share a common official language; =0
otherwise
Sarkissian and
Shill (2004)
Geographic distance Ѵ the natural logarithm of the geographic distance in
kilometres between capitals of the host and home
countries
Sarkissian and
Shill (2004)
Market size (host market) Ѵ the natural logarithm of total market capitalization of
DS Total Market index, converted from local
currency to GBP
Market size (host market relative
to home market)Ѵ the log-difference between the host total market
capitalization and the home total market capitalization
Aggregate market liquidity (host
market)Ѵ market turnover ratio calculated as the ratio of the
total value of the DS Total Market index constituent
shares traded to the DS Total Market index
capitalization
Aggregate market liquidity (host
market relative to home market)Ѵ the log-difference between the market turnover ratio
of the host and of the home markets
Trading costs (host market) Ѵ total trading costs are the sum of price impact costs,
implicit costs and explicit costs
Trading costs (host market
relative to home market)Ѵ the difference in total trading costs of the host market
and of the home markets
Investor protection (host market) Ѵ anti-self-dealing index
Investor protection (host market
relative to home market)Ѵ the difference in anti-self-dealing index of the host
market and of the home markets
Chiyachantana
et al (2004),
Table V
Datastream
Datastream
Djankov et al
(2008)

246
Table 4.2 continued
Explanatory variable Used in
exchange
level
analysis
Used in
stock
level
analysis
Definition Data source
Insider trading laws enforced
(host market)Ѵ dummy variable =0 before enforcement of insider
trading laws and =1 in the year of enforcement of
insider trading regulation and thereafter
Insider trading laws enforced
(host market relative to home
market)
Ѵ non-negative difference between the insider trading
laws enforcement variable of the host and of home
countries (1)
Accounting opacity (host market) Ѵ accounting opacity index
Accounting opacity (host market
relative to home market)Ѵ the difference in the accounting opacity index of the
host country and of the home country
Stock-level factors
Traded (vs. exchange-listed) Ѵ traded indicator=1 if the stock is traded on the US
OTC, London OTC, open market of Deutsche
Bourse, or VIRTX; =0 otherwise
dataset
First foreign listing Ѵ dummy variable = 1 if the foreign account is the fist
and the only foreign listing of the stock; =0 otherwise
dataset
Time listed/ traded Ѵ the number of years a stock has been listed or
traded on a particular exchange
dataset
Price level Ѵ the natural logarithm of the stock price on a particular
exchange denominated in GBP
Datastream
The same currency of listing Ѵ dummy variable =1 if foreign trading takes place in
the same currency as home trading; =0 otherwise
Datastream
DR (vs. ordinary listing) Ѵ dummy variable =1 if the listing is in the form of a
depository receipt; =0 otherwise
dataset
Company size Ѵ market value of the company’s share at the end of
the preceding year
Datastream
Company growth opportunities Ѵ price-to-book value ratio at the end of the preceding
year. If not available from Datastream, it is calculated
as the ratio of the stock price to the company’s book
value
Datastream
Company foreign sales Ѵ the fraction of foreign sales in company’s total net
sales in the preceding year
Datastream
Foreign investors - company's
foreign institutional ownershipѴ the percentage of total shares held by an institution
domiciled in a country other than that of the company
at the end of the preceding year
Datastream
Ownership concentration Ѵ calculated as one minus the percentage of total
shares available to ordinary investors at the end of
the preceding year
Datastream
Stock return variance Ѵ standard deviation of stock weekly returns over the
preceding 12 months, calculated for each month
Datastream
Company characteristics
Listing characteristics
Bhattacharya
and Daouk
(2002)
Kurtzman et al
(2004)

247
Table 4.2 continued
Explanatory variable Used in
exchange
level
analysis
Used in
stock
level
analysis
Definition Data source
International accounting
standards usedѴ dummy variable =1 if the company used
international accounting standards or US GAAP in
the end of the preceding year; =0 otherwise
Datastream
Stock retrun correrlation with
foreign marketѴ correlation coefficient of weekly stock returns and
foreign index returns over preceding 36 (at least
24) months, computed for each month
Datastream
Foreign information factor Ѵ Foreign information factor calculated using
methodology of Baruch et al (2007), explained in
Appendix 4.1
Datastream
Level of development (home
market)Ѵ emerging market indicator =1 if the stock is from
emerging market; =0 otherwise
MSCI list
Investor protection (home
market)Ѵ anti-self-dealing index Djankov et al
(2008)
Insider trading laws enforced
(home market)Ѵ dummy variable =0 before enforcement of insider
trading laws and =1 in the year of enforcement of
insider trading regulation and thereafter
Bhattacharya
and Daouk
(2002)
Accounting opacity (home
market)Ѵ accounting opacity index Kurtzman et al
(2004)
Trading costs (home market) Ѵ total trading costs are the sum of price impact costs,
implicit costs and explicit costs
Chiyachantana
et al (2004),
Table V
Home market characteristics
(1) Host market characteristic relative to home market characteristic: Xrelative = max[(Xhost – Xhome),0]

248
Table 4.3 Average foreign trading volume share and Pull factors: Summary statistics
The table reports summary statistics of the exchange-level average foreign trading volume share and the
host exchange-specific factors, or the pull factors of the foreign equity trading, for the total sample and
individually for eleven major exchanges. The sample of 812 European cross-listed stocks is used to
calculate the exchange-level average foreign trading volume shares, which are the means of the foreign
trading volume shares of the stocks traded on the exchange in each month. Detailed summary statistics of
the average foreign trading volume shares and the number of account-month observations by year and by
stock exchange is presented in Table 4.4. The pull factors are defined in Table 4.2.
Tota
l sam
ple
Am
ste
rdam
Fra
nkfu
rt
London
Mila
n
NY
SE
Nasdaq
OT
C
Paris
Sw
iss S
E
VIR
TX
XE
TR
A
Average foreign trading share 0.119 0.349 0.025 0.366 0.069 0.155 0.292 0.097 0.029 0.029 0.002 0.02
Annual foreign trading volume, bln GBP 10.8 4.1 144.5 12.8 133.4 23.8 324.4 9.4 8.6 0.7 4.4
Foreign trading volume, % of total 2.0% 1.2% 19.4% 1.6% 43.8% 6.5% 18.6% 1.6% 2.1% 0.2% 1.0%
N observations, % of total 1.8% 19.2% 11.4% 0.6% 11.2% 3.4% 12.5% 8.9% 8.7% 8.2% 12.4%
Trading platform indicator 0.11 0 0 0 0 0 0 1 0 0 1 1
Demutualization indicator 0.52 0.62 0.44 0.45 0.70 0.11 0.44 0.48 0.38 0.91 0.86
Electronic market indicator 0.84 0.79 0.94 0.63 0.89 0.44 1.00 0.44 1.00 0.76 1.00 1.00
Foreign stock concentration 0.23 0.42 0.20 0.12 0.02 0.19 0.10 0.15 0.35
Market size, billion GBP 1299 262 463 1113 285 5157 5157 5157 560 337 461 643
Market liquidity 66.1 84.5 93.1 75.5 79.0 100.0 100.0 100.0 60.0 57.7 66.6 37.0
Trading costs 0.62 0.47 0.57 0.56 0.45 0.64 0.64 0.64 0.50 0.94 0.94 0.57
Investor protection 0.46 0.20 0.28 0.95 0.42 0.65 0.65 0.65 0.38 0.27 0.27 0.28
IT laws enforcement 0.80 0.79 0.72 1.00 0.76 1.00 1.00 1.00 1.00 0.82 1.00 1.00
Accounting opacity 0.30 0.38 0.17 0.33 0.63 0.20 0.20 0.20 0.33 0.25 0.25 0.17
Average company size,
million GBP 11.39 13.45 8.99 6.16 15.49 15.54 3.11 5.09 15.97 13.14 18.56 16.07
Panel A. Average foreign trading volume share
Panel B. Pull factors of the foreign equity trading
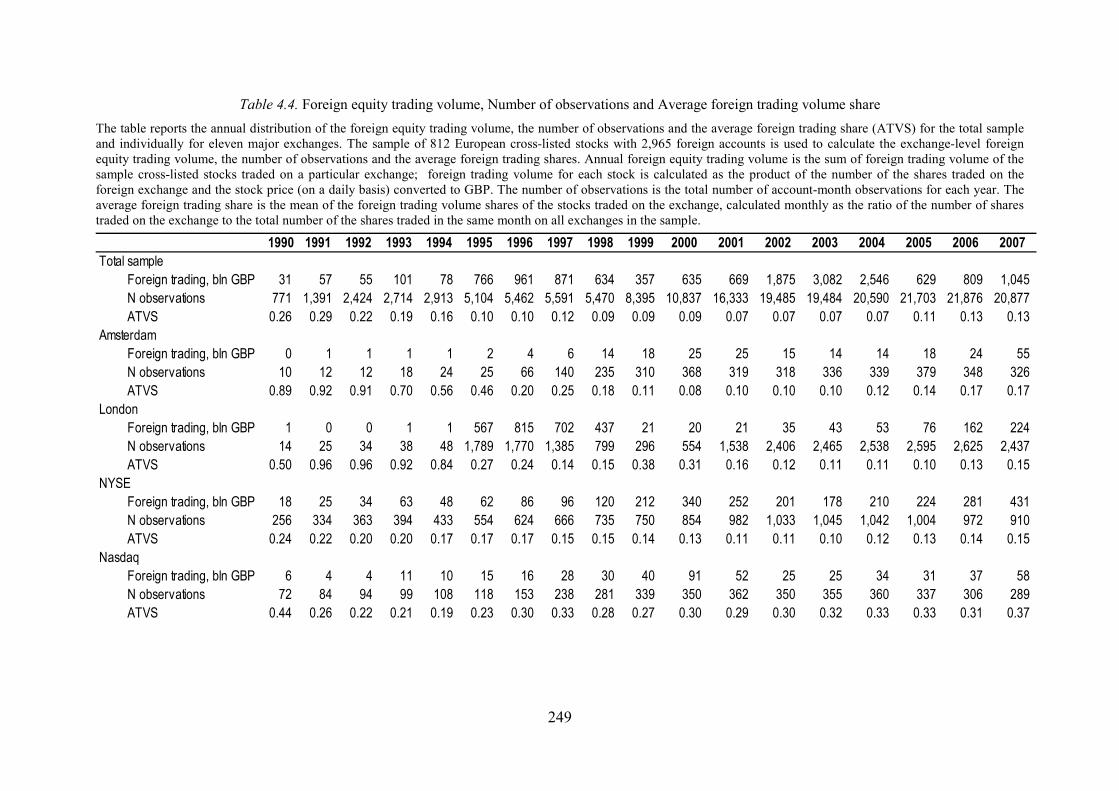
249
Table 4.4. Foreign equity trading volume, Number of observations and Average foreign trading volume share
The table reports the annual distribution of the foreign equity trading volume, the number of observations and the average foreign trading share (ATVS) for the total sample
and individually for eleven major exchanges. The sample of 812 European cross-listed stocks with 2,965 foreign accounts is used to calculate the exchange-level foreign
equity trading volume, the number of observations and the average foreign trading shares. Annual foreign equity trading volume is the sum of foreign trading volume of the
sample cross-listed stocks traded on a particular exchange; foreign trading volume for each stock is calculated as the product of the number of the shares traded on the
foreign exchange and the stock price (on a daily basis) converted to GBP. The number of observations is the total number of account-month observations for each year. The
average foreign trading share is the mean of the foreign trading volume shares of the stocks traded on the exchange, calculated monthly as the ratio of the number of shares
traded on the exchange to the total number of the shares traded in the same month on all exchanges in the sample.
1990 1991 1992 1993 1994 1995 1996 1997 1998 1999 2000 2001 2002 2003 2004 2005 2006 2007
Total sample
Foreign trading, bln GBP 31 57 55 101 78 766 961 871 634 357 635 669 1,875 3,082 2,546 629 809 1,045
N observations 771 1,391 2,424 2,714 2,913 5,104 5,462 5,591 5,470 8,395 10,837 16,333 19,485 19,484 20,590 21,703 21,876 20,877
ATVS 0.26 0.29 0.22 0.19 0.16 0.10 0.10 0.12 0.09 0.09 0.09 0.07 0.07 0.07 0.07 0.11 0.13 0.13
Amsterdam
Foreign trading, bln GBP 0 1 1 1 1 2 4 6 14 18 25 25 15 14 14 18 24 55
N observations 10 12 12 18 24 25 66 140 235 310 368 319 318 336 339 379 348 326
ATVS 0.89 0.92 0.91 0.70 0.56 0.46 0.20 0.25 0.18 0.11 0.08 0.10 0.10 0.10 0.12 0.14 0.17 0.17
London
Foreign trading, bln GBP 1 0 0 1 1 567 815 702 437 21 20 21 35 43 53 76 162 224
N observations 14 25 34 38 48 1,789 1,770 1,385 799 296 554 1,538 2,406 2,465 2,538 2,595 2,625 2,437
ATVS 0.50 0.96 0.96 0.92 0.84 0.27 0.24 0.14 0.15 0.38 0.31 0.16 0.12 0.11 0.11 0.10 0.13 0.15
NYSE
Foreign trading, bln GBP 18 25 34 63 48 62 86 96 120 212 340 252 201 178 210 224 281 431
N observations 256 334 363 394 433 554 624 666 735 750 854 982 1,033 1,045 1,042 1,004 972 910
ATVS 0.24 0.22 0.20 0.20 0.17 0.17 0.17 0.15 0.15 0.14 0.13 0.11 0.11 0.10 0.12 0.13 0.14 0.15
Nasdaq
Foreign trading, bln GBP 6 4 4 11 10 15 16 28 30 40 91 52 25 25 34 31 37 58
N observations 72 84 94 99 108 118 153 238 281 339 350 362 350 355 360 337 306 289
ATVS 0.44 0.26 0.22 0.21 0.19 0.23 0.30 0.33 0.28 0.27 0.30 0.29 0.30 0.32 0.33 0.33 0.31 0.37

250
Table 4.4 continued
1990 1991 1992 1993 1994 1995 1996 1997 1998 1999 2000 2001 2002 2003 2004 2005 2006 2007
OTC
Foreign trading, bln GBP 2 2 2 4 6 8 11 12 12 13 15 232 1,487 2,711 2,134 178 184 119
N observations 156 171 192 229 258 440 500 606 753 891 1,133 2,122 2,674 3,028 3,229 3,415 3,347 3,236
ATVS 0.30 0.16 0.13 0.13 0.12 0.08 0.09 0.12 0.11 0.10 0.09 0.06 0.05 0.04 0.05 0.04 0.04 0.04
Paris
Foreign trading, bln GBP 0 1 1 1 1 1 1 2 3 68 16 28 6 7 8 16 48
N observations 189 558 567 587 590 630 667 613 574 534 522 493 457 385 394 348 342
ATVS 0.02 0.01 0.01 0.00 0.00 0.00 0.01 0.00 0.01 0.02 0.04 0.03 0.02 0.04 0.07 0.09 0.10
Milan
Foreign trading, bln GBP 0 0 0 0 12 0 2 14 24 37 65 46 37 25 19
N observations 9 12 21 24 24 24 31 49 70 72 72 72 72 69 151 371
ATVS 0.00 0.00 0.00 0.00 0.15 0.01 0.02 0.05 0.08 0.10 0.14 0.14 0.16 0.06 0.02
Frankfurt
Foreign trading, bln GBP 1 0 0 1 1 1 2 3 6 17 19 7 5 3 4 5 6 5
N observations 119 135 145 201 248 253 320 440 583 2,983 4,171 5,164 5,415 5,428 5,656 5,787 5,745 5,588
ATVS 0.04 0.03 0.02 0.02 0.03 0.02 0.03 0.02 0.02 0.05 0.03 0.02 0.02 0.02 0.02 0.02 0.02 0.01
XETRA
Foreign trading, bln GBP 0 1 8 10 12 10 12 13 14 16
N observations 3 435 908 1,602 2,398 2,862 3,457 4,042 4,318 3,913
ATVS 0.07 0.01 0.03 0.03 0.02 0.02 0.01 0.01 0.01 0.01
Swiss stock exchange
Foreign trading, bln GBP 2 4 3 108 24 8 9 9 8 4 3 2 2 1 1 1
N observations 475 576 576 579 610 619 625 667 632 619 588 517 482 491 531 558
ATVS 0.05 0.05 0.03 0.07 0.09 0.05 0.04 0.02 0.02 0.03 0.01 0.00 0.00 0.00 0.00 0.00
VIRTX
Foreign trading, bln GBP 4 4 2 2 2 1 1
N observations 1,555 2,496 1,607 1,551 1,491 1,407 1,204
ATVS 0.00 0.00 0.00 0.00 0.00 0.00 0.00

251
Table 4.5 Stock-level variables: Summary statistics
Table 4.5.1 reports summary statistics of the stock-level foreign trading volume share and the stock-level
determinants of the foreign trading volume share for the pooled 1990-2007 sample, the pooled 2003-2007
sample and the 2003-2007 sub-samples of listed and traded foreign accounts.
Table 4.5.2 reports summary statistics of the stock-level foreign trading volume share and the stock-level
determinants of the foreign trading volume share individually for eleven major exchanges for the 2003-
2007 samples.
Stock-level foreign trading volume share is the ratio of the number of shares traded on the exchange to
the total number of the shares traded in the same month on all exchanges in the sample calculated
monthly. The determinants are defined in Table 4.2.
(continued on the next page)

252
Table 4.5.1 Stock-level variables: Summary statistics
Mean N Mean N Min Max Listed Traded
Foreign trading volume share 0.042 81,917 0.030 51,846 0 1 0.080 0.010
Panel B. Stock-level factors
Listing characteristics
Traded indicator 0.63 81,917 0.71 51,846 0 1 0 1
First listing 0.05 81,917 0.02 51,846 0 1 0.07 0
Time listed 5.74 81,917 6.24 51,846 0.17 22 8.26 5.42
Price level 20.0 81,917 19.9 51,846 0.01 5841 18.15 20.66
Same currency 0.4 81,917 0.4 51,846 0 1 0.43 0.39
DR indicator 0.29 81,917 0.27 51,846 0 1 0.29 0.26
Company characteristics
Company size, GBP mln 14,969 81,917 15,254 51,846 1.55 127,867 18,221 14,039
Price-to-book ratio 3.64 81,917 3.07 51,846 0.02 194.68 3.06 3.07
Foreign sales fraction 0.57 81,917 0.57 51,846 0 1 0.59 0.56
Foreign investors 0.08 51,846 0.08 51,846 0 0.94 0.07 0.08
Ownership concentration 0.26 52,504 0.26 51,846 0 0.96 0.23 0.27
Stock risk 0.04 81,917 0.04 51,846 0 0.45 0.04 0.04
Int. accounting standards 0.52 81,917 0.73 51,846 0 1 0.71 0.74
Return correlation 0.44 81,917 0.48 51,846 -0.15 0.94 0.49 0.48
Foreign information factor 2.33 81,917 2.62 51,846 0 27.67 2.75 2.56
Home market characteristics
Emerging market indicator 0.02 81,917 0.02 51,846 0 1 0 0.03
Investor protection 0.49 81,917 0.48 51,846 0.18 0.95 0.48 0.49
IT laws enforced 0.89 81,917 0.91 51,846 0 1 0.86 0.93
Accounting opacity 0.34 81,917 0.34 51,846 0.17 0.63 0.33 0.34
Trading costs 0.61 81,917 0.62 51,846 0.45 2 0.63 0.61
Market size difference 11.0 80,900 9.9 50,955 0.0 348.9 13.2 8.5
Market liquidity difference 4.2 80,254 5.2 50,955 0 109.8 7.86 4.15
Trading costs difference -0.02 81,825 -0.02 51,777 -1.28 0.49 -0.04 -0.02
Investor protection difference -0 81,917 -0.02 51,846 -0.75 0.77 0.04 -0.04
IT law enforced difference 0.1 81,825 0.09 51,777 0 1 0.14 0.07
Accounting opacity difference -0.11 78,924 -0.11 78,924 -0.46 0.46 -0.08 -0.14
Common language 0.23 81,917 0.22 51,846 0 1 0.34 0.17
Geographic distance, km 2197 81917 2064 51846 174 8261 2283 1974
Pull factors - Host exchange
Industry specialization 0.14 67,956 0.13 42,364 0.02 1 0.17 0.12
Foreign stocks concentration 0.19 42,397 0.18 30,658 0.01 0.86 0.2 0.17
N account-months observations 15,056 36,790
N foreign accounts 372 1,117
N stocks (ISINs) 211 410
51,846
1,477
Panel C. Pull factors - Host market characteristics relative to home market characteristics
446
81,917
519
1,714
Sample 2003-2007
Panel A. Foreign trading volume share
Sample 1990-2007

253
Table 4.5.2 Stock-level variables by stock exchange: Summary statistics
Am
ste
rdam
Fra
nkfu
rt
London
Mila
n
NY
SE
Nasdaq
OT
C
Paris
Sw
issS
E
VIR
TX
XE
TR
A
Foreign trading volume share 0.078 0.004 0.067 0.084 0.083 0.321 0.023 0.013 0.001 0.001 0.005
Traded indicator 0 0.88 0.65 1 0 0 1 0 0 1 0.82
First listing 0.02 0 0.12 0 0 0.09 0 0 0 0 0
Time listed 5.92 6.24 4.64 4.35 10.61 10.19 6.26 9.66 12.72 5.86 4.38
Price level 20.7 22.4 19.5 25.0 18.8 10.6 15.5 22.9 33.2 30.7 18.8
Same currency 0.80 0.55 0.27 0.98 0 0 0 0.67 0 1 0.57
DR indicator 0 0.11 0.03 0 0.95 0.89 0.75 0 0 0 0.10
Company size, GBP mln 25,346 12,831 14,275 30,891 23,385 3,851 9,589 23,886 23,435 26,850 18,836
Price-to-book ratio 2.72 3.26 2.78 2.00 4.83 3.21 2.70 2.18 2.66 2.87 3.07
Foreign sales fraction 0.59 0.57 0.56 0.57 0.57 0.68 0.54 0.56 0.65 0.59 0.57
Foreign investors 0.03 0.08 0.09 0.03 0.08 0.09 0.08 0.08 0.05 0.05 0.07
Ownership concentration 0.19 0.30 0.25 0.11 0.25 0.28 0.29 0.24 0.19 0.17 0.24
Stock risk 0.04 0.04 0.04 0.04 0.04 0.06 0.04 0.04 0.03 0.03 0.04
Int. accounting standards 0.78 0.70 0.72 0.90 0.70 0.68 0.70 0.74 1 1 0.75
Return correlation 0.59 0.48 0.49 0.65 0.46 0.35 0.40 0.60 0.52 0.52 0.53
Foreign information factor 3.64 2.89 1.93 1.84 2.65 3.02 1.98 2.69 1.94 1.47 3.23
Emerging market indicator 0 0.04 0.01 0 0.01 0 0.01 0 0 0 0.03
Investor protection 0.42 0.50 0.43 0.33 0.55 0.59 0.54 0.45 0.34 0.40 0.46
IT laws enforced 1 0.91 0.76 1 0.92 0.78 0.92 1 1 1 0.98
Accounting opacity 0 0.36 0.33 0 0.34 0.33 0.32 0 0 0 0.36
Trading costs 1 1 1 1 1 1 1 1 1 1 1
Market size difference 0.6 2.9 9.7 0.8 28.4 41.4 26.6 1.8 1.1 0.9 2.2
Market liquidity difference 15.4 0.03 11.9 19.0 8.6 5.3 9.0 11.1 19.4 11.6 0.03
Trading costs difference -0.08 -0.06 -0.13 -0.10 0.00 -0.03 0.03 -0.07 0.39 0.41 -0.03
Investor protection difference -0.22 -0.21 0.52 0.09 0.11 0.06 0.11 -0.07 -0.08 -0.13 -0.18
IT law enforced difference 0 0.09 0.24 0 0.09 0.22 0.09 0 0 0 0.02
Accounting opacity difference 0.08 -0.19 0 0.31 -0.14 -0.13 -0.12 0.02 0.01 -0.04 -0.19
Common language 0 0.13 0.24 0 0.39 0.51 0.36 0 0.52 0.30 0.11
Geographic distance, km 554 672 638 1183 6261 6030 6258 534 643 582 646
Industry specialization 0.13 0.10 0.13 0.26 0.12 0.28 0.12 0.27 0.15 0.12 0.11
Foreign stocks concentration 0.43 0.18 0.12 0.02 0.20 0.10 0.14 0.27
N account-months observations 1,123 16,187 6,655 483 3,518 1,103 8,512 1,399 612 1,220 8,799
N foreign accounts 31 364 193 26 68 24 213 43 41 100 281
N stocks (ISINs) 31 320 186 26 68 24 187 43 41 100 248
Panel C. Pull factors
Host market characteristics relative to home market characteristics
Host exchange characteristics
Company characteristics
Home market characteristics
Panel A. Foreign trading volume share
Sample 2003-2007
Panel B. Stock-level factors
Listing characteristics

254
Table 4.6.1 Pull factors (exchange-level): Correlation matrix
The table reports the correlation matrix of the exchange-level average foreign trading volume share and
the host exchange-specific factors, or the pull factors of the foreign equity trading. The sample of 812
stocks European cross-listed stocks is used to calculate the exchange-level average foreign trading
volume shares, which are the means of the foreign trading volume shares of the stocks traded on the
exchange in each month. The pull factors are defined in Table 4.2.
Ave
rage
trad
ing
volume sh
are
Trading
platform
indica
tor
Dem
utualization
indica
tor
Electronic marke
t
indica
tor
Foreign
com
panies
conce
ntratio
n
Market s
ize
Market liquidity
Trading
cos
ts
Inve
stor protection
IT la
ws enforced
Accou
ntin
g op
acity
Trading platform indicator -0.05 1
(0)
Demutualization indicator -0.08 0.2 1
(0) (0)
Electronic market indicator -0.31 -0.14 0.43 1
(0) (0) (0)
Foreign companies -0.56 - -0.1 0.04 1
concentration (0) - (0) (0.16)
Market size 0.33 0.34 0.04 -0.12 -0.35 1
(0) (0) (0.04) (0) (0)
Market liquidity 0.39 0 -0.03 -0 -0.62 0.45 1
(0) (0.88) (0.16) (0.98) (0) (0)
Trading costs -0.26 0.14 0.09 0.02 0.11 -0.11 0.05 1
(0) (0) (0) (0.26) (0) (0) (0.01)
Investor protection 0.47 0.03 -0.2 -0.27 -0.35 0.42 0.27 -0.03 1
(0) (0.13) (0) (0) (0) (0) (0) (0.09)
IT laws enforced 0.23 0.19 0.29 0.1 0.02 0.56 0.11 -0.25 0.14 1
(0) (0) (0) (0) (0.49) (0) (0) (0) (0)
Accounting opacity -0.06 -0.32 0.13 0.19 -0.31 -0.43 0.17 -0.27 -0.07 -0.21 1
(0) (0) (0) (0) (0) (0) (0) (0) (0) (0)
Average company size -0.2 0.03 0.35 0.3 0.18 -0.03 -0.01 -0.03 -0.31 0.2 0.13
(0) (0.12) (0) (0) (0) (0.13) (0.52) (0.09) (0) (0) (0)

255
Table 4.6.2 Pull factors (stock-level): Correlation matrix
The table reports the correlation matrix of the pull factors used in the stock-level analysis with the stock-
level foreign trading volume share and other explanatory variables for the 2003-2007 sample. Stock-level
foreign trading volume share is the ratio of the number of shares traded on the exchange to the total
number of the shares traded in the same month on all exchanges in the sample calculated monthly. The
explanatory variables are defined in Table 4.2.
Trading
volume
share
Compa
ny size
Price
-to-boo
k ratio
Foreign sales
Foreign in
vestors
Owne
rship
conce
ntration
Stock risk
Int. accou
nting
stand
ards
Return correlatio
n
US in
form
ation
factor
Foreign (no
n-U
S)
inform
atio
n factor
Trade
d in
dica
tor
First listing
Tim
e listed
Price
leve
l
Same cu
rren
cy
Common 0.32 -0.15 0.04 -0.02 0.07 0.03 0.03 -0.03 -0.24 0.13 -0.08 -0.18 0.23 0.19 0.01 -0.19
language (0.0) (0.0) (0.0) (0.0) (0.0) (0.0) (0.0) (0.0) (0.0) (0.0) (0.0) (0.0) (0.0) (0.0) (0.06) (0.0)
Geographic 0.47 -0.05 0.02 -0.01 0.01 0.04 0.02 -0.04 -0.22 0.64 -0.41 -0.08 -0.05 0.22 -0.01 -0.48
distance US (0.0) (0.0) (0.0) (0.0) (0.0) (0.0) (0.0) (0.0) (0.0) (0.0) (0.0) (0.0) (0.0) (0.0) (0.0) (0.0)
Geographic -0.48 0.05 -0.02 -0.01 -0.01 -0.02 -0.04 0.04 0.20 -0.64 0.40 0.10 0.04 -0.23 -0.02 0.46
distance non-US (0.0) (0.0) (0.0) (0.11) (0.01) (0.0) (0.0) (0.0) (0.0) (0.0) (0.0) (0.0) (0.0) (0.0) (0.0) (0.0)
Market size dif 0.45 -0.24 -0.01 0.01 0.06 0.02 0.07 0.01 -0.31 0.39 -0.28 -0.05 0.13 0.13 -0.09 -0.25
(0.0) (0.0) (0.05) (0.03) (0.0) (0.0) (0.0) (0.20) (0.0) (0.0) (0.0) (0.0) (0.0) (0.0) (0.0) (0.0)
Market liquidity dif 0.31 0.01 -0.04 -0.03 -0.01 -0.06 0.04 0.09 -0.06 0.31 -0.32 -0.30 0.11 0.14 0.12 -0.27
(0.0) (0.03) (0.0) (0.0) (0.0) (0.0) (0.0) (0.0) (0.0) (0.0) (0.0) (0.0) (0.0) (0.0) (0.0) (0.0)
Trading costs dif -0.15 0.24 -0.01 0.06 -0.12 0.00 -0.09 -0.07 0.23 0.09 -0.09 0.04 -0.19 0.06 0.08 0.11
(0.0) (0.0) (0.02) (0.0) (0.0) (0.46) (0.0) (0.0) (0.0) (0.0) (0.0) (0.0) (0.0) (0.0) (0.0) (0.0)
Investor 0.18 -0.02 -0.10 0.00 -0.09 -0.10 0.03 0.15 0.10 0.13 -0.13 -0.10 0.05 -0.01 0.24 0.00
protection dif (0.0) (0.0) (0.0) (0.55) (0.0) (0.0) (0.0) (0.0) (0.0) (0.0) (0.0) (0.0) (0.0) (0.01) (0.0) (0.47)
IT law enforced 0.28 -0.29 0.02 0.00 0.15 0.06 0.10 -0.04 -0.35 -0.04 -0.10 -0.11 0.32 0.06 -0.19 0.11
dif (0.0) (0.0) (0.0) (0.36) (0.0) (0.0) (0.0) (0.0) (0.0) (0.0) (0.0) (0.0) (0.0) (0.0) (0.0) (0.0)
Accounting 0.04 0.10 -0.02 0.15 -0.04 -0.21 0.05 0.13 0.13 0.01 0.01 -0.18 0.07 -0.03 0.21 -0.16
opacity dif (0.0) (0.0) (0.0) (0.0) (0.0) (0.0) (0.0) (0.0) (0.0) (0.09) (0.01) (0.0) (0.0) (0.0) (0.0) (0.0)
Industry 0.11 0.01 -0.10 -0.15 -0.01 -0.06 0.00 0.01 0.11 0.03 -0.07 -0.29 0.11 0.06 0.01 0.09
specialization (0.0) (0.06) (0.0) (0.0) (0.01) (0.0) (0.37) (0.01) (0.0) (0.0) (0.0) (0.0) (0.0) (0.0) (0.22) (0.0)
Foreign stock -0.05 0.05 -0.02 -0.01 -0.05 0.00 0.04 -0.14 0.09 -0.02 0.10 -0.22 -0.08 0.05 0.01 0.16
concentration (0.0) (0.0) (0.0) (0.27) (0.0) (0.59) (0.0) (0.0) (0.0) (0.0) (0.0) (0.0) (0.0) (0.0) (0.14) (0.0)

256
Table 4.6.2 continued
DR in
dica
tor
Emerging
market
Hom
eInve
stor protection
Hom
e
IT la
ws en
forced
Hom
eAccou
nting
opac
ity H
ome
Trading
cos
ts
Hom
e
Com
mon
lang
uage
Geo
grap
hic
distan
ce U
S
Geo
grap
hic
distan
ce non
-US
Marke
t size dif
Marke
t liquidity dif
Trading
cos
ts dif
Inve
stor protection
dif
IT la
ws en
forced
dif
Accou
nting
opac
ity dif
Indu
stry
spec
ialization
Common 0.13 -0.08 0.30 -0.34 -0.14 0.40 1.00
language (0.0) (0.0) (0.0) (0.0) (0.0) (0.0)
Geographic 0.72 -0.05 0.13 -0.01 -0.08 0.00 0.23 1.00
distance US (0.0) (0.0) (0.0) (0.0) (0.0) (0.40) (0.0)
Geographic -0.71 0.07 -0.13 0.00 0.13 0.03 -0.25 -0.99 1.00
distance non-US (0.0) (0.0) (0.0) (0.49) (0.0) (0.0) (0.0) (0.0)
Market size dif 0.48 0.11 -0.16 -0.51 0.07 0.45 0.17 0.63 -0.57 1.00
(0.0) (0.0) (0.0) (0.0) (0.0) (0.0) (0.0) (0.0) (0.0)
Market liquidity dif 0.28 -0.02 -0.16 -0.09 -0.35 0.08 0.17 0.50 -0.50 0.42 1.00
(0.0) (0.0) (0.0) (0.0) (0.0) (0.0) (0.0) (0.0) (0.0) (0.0)
Trading costs dif 0.06 -0.26 0.03 0.50 0.04 -0.92 -0.28 0.12 -0.15 -0.36 0.04 1.00
(0.0) (0.0) (0.0) (0.0) (0.0) (0.0) (0.0) (0.0) (0.0) (0.0) (0.0)
Investor 0.10 0.07 -0.75 -0.01 -0.09 0.09 -0.10 0.19 -0.19 0.48 0.58 -0.08 1.00
protection dif (0.0) (0.0) (0.0) (0.0) (0.0) (0.0) (0.0) (0.0) (0.0) (0.0) (0.0) (0.0)
IT law enforced 0.05 -0.05 0.15 -1.00 0.12 0.54 0.34 0.01 0.00 0.51 0.09 -0.50 0.01 1.00
dif (0.0) (0.0) (0.0) (0.0) (0.0) (0.0) (0.0) (0.0) (0.0) (0.0) (0.0) (0.0) (0.0)
Accounting -0.07 -0.20 -0.09 0.06 -0.83 0.08 0.10 -0.01 -0.02 -0.06 0.60 -0.06 0.29 -0.06 1.00
opacity dif (0.0) (0.0) (0.0) (0.0) (0.0) (0.0) (0.0) (0.0) (0.0) (0.0) (0.0) (0.0) (0.0) (0.0)
Industry -0.05 -0.07 -0.08 0.01 -0.03 -0.05 0.04 0.01 0.00 -0.08 0.24 0.06 0.11 -0.01 0.25 1.00
specialization (0.0) (0.0) (0.0) (0.0) (0.0) (0.0) (0.0) (0.30) (0.36) (0.0) (0.0) (0.0) (0.0) (0.0) (0.0)
Foreign stock -0.02 0.01 -0.04 0.13 -0.02 -0.13 0.01 -0.02 -0.02 -0.31 -0.08 0.12 -0.23 -0.13 -0.11 -0.12
concentration (0.0) (0.03) (0.0) (0.0) (0.0) (0.0) (0.02) (0.0) (0.0) (0.0) (0.0) (0.0) (0.0) (0.0) (0.0) (0.0)

257
Table 4.7 Stock-level factors: Correlation matrix
The table reports the correlation matrix of the stock-level foreign trading volume share and the stock-level factors of the foreign trading volume share for the 2003-2007 sample.
Stock-level foreign trading volume share is the ratio of the number of shares traded on the exchange to the total number of the shares traded in the same month on all exchanges
in the sample calculated monthly. The explanatory variables are defined in Table 4.2. Trading
volum
e
share
Com
pany
size
Pric
e-to-boo
k
ratio
Foreign
sales
Foreign
inve
stors
Owne
rship
conc
entration
Stock risk
Int a
ccou
nting
stan
dards
Return
correlation
US in
form
ation
factor
Foreign
(no
n-
US) inform
ation
Trade
d indica
tor
Firs
t listin
g
indica
tor
Tim
e listed
Pric
e leve
l
Sam
e cu
rren
cy
DR in
dica
tor
Emerging
marke
t
Inve
stor
protec
tion
IT la
w enforce
d
Accou
nting
opac
ity
Company size -0.27 1.00
(0.00)
Price-to-book ratio -0.01 0.04 1.00
(0.06) (0.00)
Foreign sales 0.04 -0.03 -0.03 1.00
(0.00) (0.00) (0.00)
Foreign investors 0.09 -0.18 0.01 0.03 1.00
(0.00) (0.00) (0.00) (0.00)
Ownership 0.03 -0.26 0.03 -0.10 0.44 1.00
concentration (0.00) (0.00) (0.00) (0.00) (0.00)
Stock risk 0.12 -0.37 -0.01 0.13 0.10 0.03 1.00
(0.00) (0.00) (0.019) (0.00) (0.00) (0.00)
Int accounting 0.01 0.10 0.01 0.02 -0.03 -0.15 -0.29 1.00
standards (0.17) (0.00) (0.00) (0.00) (0.00) (0.00) (0.00)
Return correlation -0.27 0.50 -0.10 0.03 -0.18 -0.24 -0.08 -0.03 1.00
(0.00) (0.00) (0.00) (0.00) (0.00) (0.00) (0.00) (0.00)
US Information factor 0.34 -0.01 0.01 0.00 -0.02 0.00 0.00 0.03 -0.05 1.00
(0.00) (0.002) (0.003) (0.33) (0.00) (0.98) (0.32) (0.00) (0.00)
Foreign (non-US) -0.24 0.14 0.03 0.10 -0.06 -0.11 -0.01 0.06 0.24 -0.26 1.00
information factor (0.00) (0.00) (0.00) (0.00) (0.00) (0.00) (0.001) (0.00) (0.00) (0.00)
Traded indicator -0.37 -0.05 0.00 -0.05 0.01 0.09 -0.05 0.03 -0.04 -0.11 0.03 1.00
(0.00) (0.00) (0.85) (0.00) (0.097) (0.00) (0.00) (0.00) (0.00) (0.00) (0.00)

258
Table 4.7 continued
Trading
volum
e
share
Com
pany
size
Pric
e-to-boo
k ratio
Foreign
sales
Foreign
inve
stors
Owne
rship
conc
entration
Stock risk
IAS
Return co
rrelation
US in
form
ation
factor
Foreign
(no
n-US)
inform
ation factor
Trade
d indica
tor
Firs
t listin
g
indica
tor
Tim
e listed
Pric
e leve
l
Sam
e cu
rren
cy
DR in
dica
tor
Emerging
marke
t
Inve
stor protection
IT la
w enforce
d
Accou
nting op
acity
First listing indicator 0.23 -0.29 0.00 -0.04 0.09 0.09 0.05 -0.09 -0.23 -0.04 -0.06 -0.22 1.00
(0.00) (0.00) (0.47) (0.00) (0.00) (0.00) (0.00) (0.00) (0.00) (0.00) (0.00) (0.00)
Time listed 0.34 0.11 0.04 0.06 -0.04 -0.08 -0.12 0.12 -0.02 0.19 -0.09 -0.33 0.04 1.00
(0.00) (0.00) (0.00) (0.00) (0.00) (0.00) (0.00) (0.00) (0.001) (0.00) (0.00) (0.00) (0.00)
Price level -0.04 0.44 0.00 0.08 -0.15 -0.16 -0.28 0.23 0.27 0.00 0.02 -0.02 -0.21 0.08 1.00
(0.00) (0.00) (0.44) (0.00) (0.00) (0.00) (0.00) (0.00) (0.00) (0.44) (0.00) (0.00) (0.00) (0.00)
Same currency -0.09 0.05 -0.06 0.01 -0.08 -0.05 -0.01 0.01 0.22 -0.31 0.19 -0.04 -0.01 -0.05 0.11 1.00
(0.00) (0.00) (0.00) (0.02) (0.00) (0.00) (0.038) (0.002) (0.00) (0.00) (0.00) (0.00) (0.07) (0.00) (0.00)
DR indicator 0.30 0.00 0.03 0.06 0.03 0.00 0.04 -0.03 -0.17 0.47 -0.25 -0.04 -0.06 0.17 0.03 -0.34 1.00
(0.00) (0.26) (0.00) (0.00) (0.00) (0.86) (0.00) (0.00) (0.00) (0.00) (0.00) (0.00) (0.00) (0.00) (0.00) (0.00)
Emerging market 0.06 -0.17 -0.03 -0.15 0.17 0.11 -0.01 0.08 -0.18 -0.04 -0.02 0.08 -0.02 -0.02 -0.02 -0.12 -0.03 1.00
(0.00) (0.00) (0.00) (0.00) (0.00) (0.00) (0.01) (0.00) (0.00) (0.00) (0.00) (0.00) (0.00) (0.00) (0.00) (0.00) (0.00)
Investor protection -0.02 -0.02 0.13 -0.02 0.15 0.13 0.00 -0.23 -0.23 0.08 -0.07 0.01 0.13 0.04 -0.34 -0.34 0.11 -0.15 1.00
(0.00) (0.00) (0.00) (0.00) (0.00) (0.00) (0.94) (0.00) (0.00) (0.00) (0.00) (0.00) (0.00) (0.00) (0.00) (0.00) (0.00) (0.00)
IT law enforced -0.27 0.29 -0.02 0.00 -0.15 -0.07 -0.10 0.04 0.35 0.04 0.10 0.11 -0.32 -0.06 0.19 -0.11 -0.05 0.05 -0.15 1.00
(0.00) (0.00) (0.00) (0.32) (0.00) (0.00) (0.00) (0.00) (0.00) (0.00) (0.00) (0.00) (0.00) (0.00) (0.00) (0.00) (0.00) (0.00) (0.00)
Accounting opacity -0.02 -0.07 -0.01 -0.21 0.04 0.20 -0.06 -0.13 -0.09 -0.07 -0.05 0.04 0.05 0.01 -0.25 0.25 -0.04 0.21 0.03 -0.12 1.00
(0.00) (0.00) (0.15) (0.00) (0.00) (0.00) (0.00) (0.00) (0.00) (0.00) (0.00) (0.00) (0.00) (0.002) (0.00) (0.00) (0.00) (0.00) (0.00) (0.00)
Trading costs 0.23 -0.24 0.02 -0.06 0.12 -0.01 0.07 0.11 -0.31 -0.01 0.01 -0.04 0.21 0.00 -0.05 -0.19 0.03 0.27 -0.02 -0.54 -0.10
(0.00) (0.00) (0.00) (0.00) (0.00) (0.001) (0.00) (0.00) (0.00) (0.15) (0.04) (0.00) (0.00) (0.30) (0.00) (0.00) (0.00) (0.00) (0.00) (0.00) (0.00)

259
Table 4.8 Pull factors of the foreign equity trading
The table reports the estimates from the OLS regressions of the dependant variable, the logistic
transformation of stock exchange’s monthly average foreign share of trading volume. The exchange-level
average foreign trading share is the mean of the foreign trading volume shares of the stocks traded on the
exchange, calculated monthly as the ratio of the number of shares traded on the exchange to the total
number of the shares traded in the same month on all exchanges in the sample. Regression specification is
as follows: logtrAFTVSn = α0 + Σ θk Zk,n + Cn + εn, where Zk,n is characteristic k of host market n in month
t, and Cn is average size of companies traded on host exchange n in month t (control variable). The
explanatory variables are defined in Table 4.2. Additionally, regressions include a control variable,
average company size measured by the natural logarithm of the mean stock market value of stocks traded
on the exchange converted to GBP. Output for model (2) additionally includes economic significance
(econ. sign.) of the variables calculated as the product of the coefficient estimate and the variable’s
standard deviation divided by the standard deviation of the dependent variable. Reported in parenthesis t-
value is heteroskedasticity consistent (White, 1980) and adjusted for clustering at the stock exchange
level. ‘***’ indicates significance at 1%, ‘**’ indicates significance at 5% and ‘*’ indicates significance
at 10%.
Model (3) Model (4) Model (5)
Econ. sign.
Intercept 3.51 6.83* 12.27*** 3.23 8.31**
(1.73) (1.84) (3.35) (0.8) (2.36)
Trading platform -1.13* -1.20* -0.14 -1.08
(-1.87) (-1.79) (-1.69)
Demutualization 1.17** 1.13* 0.25 -0.20 -0.31
(2.39) (1.9) (-0.47) (-0.52)
Electronic market -1.89*** -2.36** -0.35 -2.76*** -1.58** -0.37
(-3.34) (-2.89) (-4.32) (-2.8) (-0.93)
Foreign stocks concentration 0.14
(0.08)
Market size 0.42*** 0.10 -0.09 0.09 -0.12
(3.92) (0.69) (-0.85) (0.47) (-0.79)
Market liquidity 0.29* 0.46*** 0.21 0.52*** 0.50** 0.62***
(2.09) (3.11) (3.66) (2.2) (5.18)
Trading costs -4.14*** -4.35** -0.29 -5.00*** -2.39 -6.87***
(-3.36) (-2.6) (-3.21) (-1.2) (-4.58)
Investor protection 0.31 0.01 0.88 1.42
(0.2) (0.01) (0.52) (0.97)
IT laws enforced 1.44** 0.24 1.65*** 1.55** 0.53
(2.77) (3.51) (2.34) (0.94)
Accounting opacity -3.57* -0.21 -3.62** -1.84 -3.49**
(-1.97) (-2.33) (-1) (-2.34)
Average company size -1.02*** -0.98*** -0.42 -1.32*** -0.83*** -0.76***
(-8.66) (-4.7) (-5.81) (-4.05) (-4.5)
OTC indicator -1.90***
(-4.99)
VIRTX indicator -2.26***
(-4.26)
XETRA indicator 0.35
(0.79)
Year-fixed effects No No Yes No No
Exchange-fixed effects No No No Yes No
Number of exchanges 16 13 13 15 11
Number of observations 2,574 2,237 2,237 2,572 958
Adj. R-sq 0.538 0.616 0.666 0.564 0.779
Model (1)
Model (2)

260
Table 4.9 Determinants of the foreign share trading volume: Stock-level analysis
The table reports the estimates from the OLS regressions of the dependant variable, the logistic
transformation of the foreign share of trading volume. The stock-level foreign trading share is the ratio of
the number of shares traded on the exchange to the total number of the shares traded in the same month
on all exchanges in the sample calculated monthly. Regression specifications are as follows:
logtrFTVSi,n = α0 + Σ γj Xj + εi,n for Models (1)-(2) and logtrFTVSi,n = α0 + Σ γj Xj + Σ θk Zk,n + εi,n for
Models (3)-(5), where Xj is vector of stock-level factors, and Zk,n is characteristic k of the host market n
relative to characteristic k of the stock’s home market. Host US is a dummy variable that equals one if the
US is the host market and zero otherwise. Geographic distance residual variable is the residual from the
OLS regression of the geographic distance variable on the US host market dummy variable. Other
explanatory variables are defined in Table 4.2. All model specification control for year and industry fixed
effects and model (5) additionally controls for exchange fixed effects, i.e. regressions includes dummy
variables that represent year, industry or host stock exchange accordingly. Reported in parenthesis t-value
is heteroskedasticity consistent (White, 1980) and adjusted for clustering at the foreign account level.
‘***’ indicates significance at 1%, ‘**’ indicates significance at 5% and ‘*’ indicates significance at 10%.
Model
(1.1)
Model
(1.2)
Model
(2.1)
Model
(2.2)
Model
(3.1)
Model
(3.2)
Model
(3.3)
Model
(4.1)
Model
(4.2)
Model
(4.3)
Model
(5)
T raded indicator -1.74*** -1.63*** -1.82*** -1.68*** -1.79*** -1.66*** -1.76*** -1.97*** -1.89*** -1.98*** -2.25***
(-10.25) (-9.76) (-9.70) (-9.26) (-9.84) (-9.39) (-9.64) (-9.50) (-9.75) (-9.51) (-8.01)
First listing indicator 0.80** 0.87*** 2.20*** 2.28*** 0.86** 1.02*** 0.86** 2.23*** 2.47*** 2.23*** 0.99**
(2.38) (2.59) (4.99) (5.18) (2.43) (2.88) (2.46) (4.74) (5.06) (4.75) (2.01)
T ime listed/ traded 0.12*** 0.11*** 0.15*** 0.14*** 0.13*** 0.13*** 0.14*** 0.16*** 0.16*** 0.16*** 0.13***
(7.82) (6.83) (8.4) (7.96) (7.33) (7.33) (8.39) (7.78) (7.94) (8.23) (4.57)
Same currency 0.41** 0.70*** 0.88*** 1.15*** 0.70*** 1.14*** 0.74*** 1.14*** 1.49*** 1.12*** 1.12***
(2.21) (3.83) (4.60) (6.13) (3.52) (5.76) (3.80) (5.54) (7.46) (5.46) (4.25)
ADR indicator 0.24 -0.45* 0.14 -0.53** 0.14 -0.73** 0.24 0.01 -0.88*** 0.05 -0.38
(1.00) (-1.69) (0.61) (-2.14) (0.54) (-2.43) (0.95) (0.04) (-3.13) (0.20) (-1.34)
Price Level 0.17** 0.11 0.17** 0.08 0.18** 0.05 0.17** 0.23*** 0.05 0.23*** 0.14
(2.11) (1.46) (2.17) (1.03) (2.35) (0.69) (2.20) (2.59) (0.54) (2.60) (1.32)
Company size -0.30*** -0.28*** -0.32*** -0.27*** -0.29*** -0.24*** -0.30*** -0.33*** -0.25*** -0.35*** -0.39***
(-6.36) (-5.87) (-6.11) (-5.24) (-5.40) (-4.52) (-5.67) (-5.74) (-4.25) (-6.10) (-5.39)
Price-to-book ratio 0.01* 0.01** -0.004 -0.003 0.02** 0.02** 0.02** 0.02 0.02 0.02 0.02
(1.87) (1.97) (-0.74) (-0.56) (2.13) (2.24) (2.10) (0.84) (0.72) (0.83) (0.58)
Stock risk 6.47*** 5.55*** 6.50*** 5.30** 7.38*** 6.48*** 7.57*** 6.44*** 5.40** 6.31*** 7.33**
(3.13) (2.67) (3.08) (2.53) (3.32) (2.93) (3.39) (2.71) (2.30) (2.66) (2.43)
Foreign sales 0.46** 0.47** 0.33 0.41* 0.22 0.20 0.32 0.06 0.03 0.10 0.06
(1.99) (2.05) (1.38) (1.71) (0.86) (0.80) (1.27) (0.22) (0.10) (0.37) (0.19)
Foreign investors 1.38*** 1.12** 1.33** 1.00** 1.43*** 1.39**
(2.94) (2.35) (2.54) (1.98) (2.75) (2.25)
Ownership -0.50* -0.30 -0.50 -0.25 -0.59* -0.55
concentration (-1.72) (-1.07) (-1.48) (-0.78) (-1.74) (-1.38)
Int. accounting -0.63*** -0.55*** -0.06 0.04 -0.45*** -0.38*** -0.48*** 0.04 0.13 0.02 0.20
standards (-5.02) (-4.37) (-0.60) (0.35) (-3.61) (-3.13) (-3.78) (0.35) (1.16) (0.17) (1.24)
Return correlation -1.79*** -1.57*** -1.36*** -1.20*** -1.95*** -1.96*** -2.04*** -1.08** -1.23*** -1.11** -1.59***
(-5.38) (-4.84) (-3.50) (-3.23) (-5.61) (-5.92) (-5.85) (-2.45) (-2.98) (-2.51) (-2.88)
US information factor 0.31*** 0.20*** 0.25*** 0.13*** 0.29*** 0.16*** 0.30*** 0.24*** 0.09** 0.25*** 0.29***
(7.70) (5.02) (5.69) (2.94) (7.14) (4.24) (7.27) (5.33) (2.01) (5.42) (4.11)
Foreign (non-US) -0.08*** -0.05** -0.05** -0.02 -0.07*** -0.04 -0.06** -0.07*** -0.04* -0.06*** -0.09***
information factor (-3.60) (-2.31) (-2.32) (-0.87) (-2.78) (-1.62) (-2.40) (-2.90) (-1.68) (-2.62) (-3.46)
Company characteristics
Listing characteristics

261
Table 4.9 continued
Model
(1.1)
Model
(1.2)
Model
(2.1)
Model
(2.2)
Model
(3.1)
Model
(3.2)
Model
(3.3)
Model
(4.1)
Model
(4.2)
Model
(4.4)
Model
(5)
Home emerging 1.28*** 1.29** 1.60*** 1.62*** 0.61 0.61 1.33 1.30 1.43 1.81 2.41**
market (2.60) (2.40) (3.10) (2.87) (0.55) (0.48) (1.11) (1.00) (0.97) (1.37) (2.03)
Common language 1.04*** 0.59*** 1.09*** 0.59*** 1.14*** 0.72*** 1.11*** 1.31*** 0.81*** 1.27*** 1.74***
(5.20) (2.89) (5.65) (2.94) (5.68) (3.44) (5.62) (6.44) (3.81) (6.41) (5.83)
Geographic distance 0.68*** 0.91*** 0.52*** 0.78*** 1.00*** 1.15*** 1.00***
(6.75) (9.24) (3.41) (6.30) (6.19) (8.88) (4.83)
Host US 3.18*** 3.79*** 3.83*** 5.37***
(9.39) (11.57) (8.28) (11.22)
Geographic distance -0.20 -0.22 -0.39** -0.14
residual (-1.25) (-1.36) (-2.17) (-0.76)
Investor protection -1.61*** -1.30*** -1.12*** -0.90***
Home (-5.70) (-4.66) (-3.75) (-3.12)
Investor protection dif 1.05*** 1.37*** 1.76*** 0.66* 1.23*** 1.06*** -0.62
(3.13) (4.20) (6.59) (1.72) (3.28) (3.39) (-1.24)
IT laws enforced -1.20*** -1.09*** -0.90** -0.77**
Home (-4.30) (-4.03) (-2.50) (-2.17)
IT laws enforced dif 0.20 0.70** 0.81*** 0.40 1.20*** 0.88** -0.07
(0.63) (2.25) (2.75) (0.92) (2.71) (2.03) (-0.13)
Accounting opacity -1.57** -0.60 -1.73** -0.42
Home (-2.11) (-0.83) (-2.36) (-0.58)
Accounting opacity dif 2.56*** 3.03*** 1.88** 3.24*** 4.31*** 3.00*** 3.21**
(3.09) (3.80) (2.19) (3.05) (4.42) (2.82) (2.46)
Trading costs Home 0.23 1.47*** 0.26 1.75***
(0.48) (2.75) (0.51) (3.11)
Trading costs dif 1.05** -0.28 0.34 0.35 -0.87* 0.14 -0.48
(2.20) (-0.60) (0.83) (0.67) (-1.71) (0.28) (-0.72)
Market size dif 0.41*** 0.16 0.22* -0.09 0.32*
(3.10) (1.24) (1.65) (-0.62) (1.75)
Market liquidity dif -0.14*** -0.22*** -0.13** -0.22*** -0.35*** -0.22*** -0.18**
(-2.61) (-4.27) (-2.34) (-3.00) (-5.35) (-3.10) (-2.02)
Industry specialization 0.78 0.85 0.31 -0.09 0.17 -0.33 -0.49
(0.73) (0.8) (0.3) (-0.09) (0.19) (-0.36) (-0.46)
Foreign stock -2.81
concentration (-1.20)
Intercept -6.82*** -4.28*** -9.84*** -6.29*** -8.54*** -5.83*** -10.01*** -12.40*** -6.84*** -13.19*** -10.75***
(-7.08) (-5.97) (-9.19) (-7.21) (-7.22) (-9.27) (-9.04) (-9.72) (-9.47) (-10.94) (-7.20)
Adj. R-sq 0.423 0.441 0.476 0.504 0.462 0.489 0.457 0.497 0.540 0.496 0.619
N observations 81,917 81,917 51,846 51,846 63,602 63,602 63,602 40,889 40,889 40,889 24,061
N foreign accounts 1,714 1,714 1,476 1,476 1,329 1,329 1,329 1,145 1,145 1,145 593
Market characteristics

262
Table 4.10 Economic significance of the determinants of the foreign trading volume share
The table reports standard deviations (st dev) of the variables and the estimates from the OLS regressions
of the dependant variable, the logistic transformation of the foreign trading volume share. The stock-level
foreign trading share is the ratio of the number of shares traded on the exchange to the total number of the
shares traded in the same month on all exchanges in the sample calculated monthly. Host US indicator is
a dummy variable that equals one if the US is the host market and zero otherwise. Geographic distance
residual variable is the residual from the OLS regression of the geographic distance variable on the US
host market dummy variable. Other explanatory variables are defined in Table 4.2. Output additionally
includes the economic significance (econ. sign.) of the variables calculated as the product of the
coefficient estimate and the variable’s standard deviation divided by the standard deviation of the
dependent variable. Reported t-statistics is heteroskedasticity consistent (White, 1980) and adjusted for
clustering at the foreign account level. ‘***’ indicates significance at 1%, ‘**’ indicates significance at
5% and ‘*’ indicates significance at 10%.
estimate t-stats econ. sign. estimate t-stats econ. sign.
Foreign trading volume share 3.53
Listing characteristics
Traded indicator 0.45 -1.94*** -10.56 -0.245 -1.89*** -10.88 -0.239
First listing indicator 0.16 1.52*** 3.59 0.070 1.86*** 4.31 0.086
Years listed (traded) 3.83 0.18*** 10.54 0.197 0.18*** 10.48 0.194
Same currency indicator 0.49 1.02*** 6.01 0.142 1.31*** 7.98 0.181
ADR indicator 0.44 0.38* 1.73 0.048 -0.49** -2.05 -0.062
Company characteristics
Company size 1.93 -0.31*** -6.19 -0.169 -0.28*** -5.77 -0.154
Stock risk 0.03 7.00*** 3.89 0.055 6.29*** 3.55 0.050
Foreign investors 0.12 1.23*** 2.99 0.043 0.90** 2.31 0.031
Return correlation 0.19 -1.54*** -3.8 -0.083 -1.54*** -4.04 -0.083
US information factor 1.50 0.25*** 5.7 0.107 0.10** 2.42 0.042
Foreign (non-US) information factor 2.84 -0.06*** -2.87 -0.051 -0.03 -1.32 -0.022
Market characteristics
Common language 0.41 1.33*** 6.83 0.156 0.71*** 3.49 0.083
Geographic distance 1.16 0.63*** 4.71 0.206
Host US indicator 0.44 4.43*** 10.96 0.550
Geographic distance residual 0.47 -0.37** -2.35 -0.050
Market size difference 1.52 0.27** 2.47 0.118 -0.06 -0.53 -0.025
Market liquidity difference 2.50 -0.22*** -3.62 -0.153 -0.32*** -5.69 -0.227
Trading costs difference 0.21 0.18 0.4 0.010 -1.33*** -3.17 -0.079
Investor protection difference 0.37 1.00*** 3.19 0.106 1.47*** 4.73 0.155
IT laws enforced difference 0.29 0.23 0.66 0.019 1.12*** 3.27 0.093
Accounting opacity difference 0.13 3.93*** 4.56 0.149 4.09*** 5.07 0.155
Intercept -9.55*** -9.48 -6.15*** -11.23
Adj. R-sq 0.487 0.526
N observations 56,682 56,682
N foreign accounts 1,578 1,578
st dev
Model (1) Model (2)

263
Table 4.11 Determinants of the foreign trading volume share: Listed vs. traded
The table reports the estimates from the OLS regression of the dependant variable, the logistic
transformation of the foreign trading volume share on the interaction variables of the explanatory
variables and the dummy variable representing listed or traded status of the foreign account. The stock-
level foreign trading share is the ratio of the number of shares traded on the exchange to the total number
of the shares traded in the same month on all exchanges in the sample calculated monthly. Regression
specification is as follows: logtrFTVSi,n= α0+ β1i Xj +β2i Zk,n+Σγj,Traded(DTradedXj)+Σθk,Traded(DTradedZk,n)+ εi,
where DTraded is dummy variable that equals one if the stock is traded without meeting listing
requirements on a stock exchange n in month t and equals zero otherwise, Xj is vector of stock-level
factors, and Zk,n is characteristic k of the host market n relative to characteristic k of the stock’s home
market. The explanatory variables are defined in Table 4.2. Reported t-statistics is heteroskedasticity
consistent (White, 1980) and adjusted for clustering at the foreign account level. ‘***’ indicates
significance at 1%, ‘**’ indicates significance at 5% and ‘*’ indicates significance at 10%.
estimate t-stats estimate t-stats
First listing indicator 0.04 0.09
Time listed/ traded 0.12*** 4.15 0.25*** 11.06
Same currency 0.83** 2.32 1.20*** 6.23
DR indicator 0.81 0.98 0.18 0.81
Company size -0.46*** -4.71 -0.28*** -5.43
Stock Risk 6.65 1.58 6.78*** 3.34
Foreign investors 1.74** 2.01 0.95** 2.04
Return correlation -2.17*** -2.9 -1.00** -2.2
US information factor 0.19*** 3.58 0.27*** 3.72
Foreign (non-US) information factor -0.06 -1.2 -0.06** -2.44
Common language 0.56 1.29 1.35*** 6.38
Geographic distance 1.13*** 5.39 0.44*** 3.02
Investor protection difference 0.37 0.53 0.78** 2.25
IT laws enforced difference 2.33** 2.46 -0.40 -1.13
Accounting opacity difference 5.20*** 2.71 3.73*** 4.04
Trading costs difference -0.51 -0.67 0.26 0.51
Market size difference 0.15 0.61 0.28** 2.22
Market liquidity difference -0.32*** -2.76 -0.10 -1.58
Intercept -10.74*** -10.65
Adj. R-sq 0.512
N observations 56,682
N foreign accounts 1,578
Variable Var*D_Traded
Listing characteristics
Company characteristics
Market characteristics

264
Table 4.12 Determinants of the foreign trading volume share by stock exchange
The table reports the estimates from the OLS regression of the dependant variable, the logistic
transformation of the foreign trading volume share, on the interaction variables of the explanatory
variables and the dummy variable representing one of the eleven major host stock exchanges:
logtrFTVSi,n = α0 + Σn,j ωn,j (D_SEn Xj) + εi,n, where D_SEn is dummy variable that equals one if trading
takes place on exchange n and zero otherwise; Xj is vector of stock-level factors. The stock-level foreign
trading share is the ratio of the number of shares traded on the exchange to the total number of the shares
traded in the same month on all exchanges in the sample calculated monthly. The explanatory variables
are defined in Table 4.2. Reported in parenthesis t-value is heteroskedasticity consistent (White, 1980)
and adjusted for clustering at the foreign account level. ‘***’ indicates significance at 1%, ‘**’ indicates
significance at 5% and ‘*’ indicates significance at 10%.
Am
ste
rdam
X
i*D
_A
ms
Fra
nkfu
rt
Xi*
D_
Fra
London
Xi*
D_
Lo
n
Mila
n
Xi*
D_
Mil
NY
SE
Xi*
D_
NY
Nasdaq
Xi*
D_
Na
s
OT
C
Xi*
D_
OT
C
Paris
Xi*
D_
Pa
r
Sw
iss S
E
Xi*
D_
Sw
i
VIR
TX
Xi*
D_
Vir
XE
TR
A
Xi*
D_
Xe
t
Listing charactersitics
Traded indicator -1.06*** -0.29 -0.79**
(-3.54) (-0.68) (-2.08)
First listing -1.24* 0.0 -0.62 -2.73*** 0.65 -3.89***
(-1.94) (0.0) (-1.09) (-3.45) (0.73) (-3.52)
Time listed/ traded -0.16 0.13*** 0.13 0.09 0.06** -0.1 0.05* -0.17** 0.01 -1.17*** 0.49***
(-1.64) (4.59) (1.49) (0.63) (2.30) (-1.61) (1.70) (-2.05) (0.23) (-10.39) (9.15)
Same currency 0.44 0.80** 1.91** -15.43** 0.37 1.55***
(0.37) (2.53) (2.30) (-2.21) (0.45) (2.98)
DR indicator -2.25*** -3.63*** 0.01 -1.48 1.98*** -3.01***
(-8.34) (-2.63) (0.02) (-1.41) (5.01) (-8.98)
Price level 0.37 0.25** 0.15 -0.25 0.26* -0.34 0.44*** -0.90*** 0.09 -0.03 -0.11
(1.29) (2.37) (1.05) (-0.56) (1.81) (-0.94) (2.63) (-3.14) (0.42) (-0.14) (-0.68)
Company charactersitics
Company size -1.28*** -0.1 -0.22 -2.12** 0.11 0.11 -0.25** 0.17 -0.07 0.45*** 0.22**
(-4.18) (-1.39) (-1.41) (-2.10) (0.69) (0.37) (-2.48) (0.67) (-0.43) (3.98) (2.03)
Price-to-book ratio 0.17** -0.01*** -0.1** 1.04** 0.0 -0.16* 0.01 0.3 -0.06 0.0 -0.02**
(2.41) (-3.91) (-2.50) (2.03) (0.33) (-1.76) (0.27) (1.43) (-0.5) (0.53) (-2.37)
Stock risk -5.33 16.56*** -1.63 17.93 14.92** 9.89** 2.66 -4.13 42.76*** -7.62 14.97***
(-0.61) (7.67) (-0.43) (1.49) (2.46) (2.10) (0.61) (-0.65) (2.72) (-0.56) (3.39)
Foreign sales 0.0 0.0 0.0 -0.02 0.02*** 0.02** 0.01** 0.01 -0.01 0.0 0.0
(0.26) (-0.21) (0.05) (-1.37) (3.91) (2.33) (2.17) (0.82) (-1.06) (0.33) (0.86)
Foreign investors -0.02 0.0 0.01 0.0 0.03*** 0.01 0.01 0.01 -0.02 0.0 0.0
(-0.80) (0.52) (1.01) (0.03) (3.01) (0.18) (1.09) (1.23) (-1.58) (0.39) (-0.23)
Ownership concentration 2.58 -0.26 0.98 5.60* -1.25** -2.38 -0.94 -0.83 1.5 -0.45 -0.16
(1.57) (-0.80) (1.59) (1.81) (-2.13) (-1.43) (-1.56) (-1.03) (1.55) (-0.76) (-0.28)
International accounting 0.21 0.15 0.28 2.85*** 0.42*** 1.26*** -0.17 0.73** 232.09 10.49** -0.51**
standards (0.40) (1.20) (1.23) (4.06) (2.81) (2.93) (-0.8) (2.08) (1.15) (2.53) (-2.57)
Return correlation 0.51 -1.78*** -1.02 2.98 -2.57*** -3.91* 0.04 -0.83 0.37 1.37* -1.22
(0.29) (-3.98) (-1.16) (1.62) (-3.2) (-1.91) (0.05) (-0.63) (0.23) (1.68) (-1.62)
Foreign information factor 0.0 -0.03 0.10* -0.02 0.0 0.06 0.09* 0.02 0.07 0.04 0.01
(-0.08) (-1.31) (1.90) (-0.22) (-0.15) (1.07) (1.68) (0.40) (1.54) (0.87) (0.18)

265
Table 4.12 continued
Am
ste
rdam
X
i*D
_A
ms
Fra
nkfu
rt
Xi*
D_
Fra
London
Xi*
D_
Lo
n
Mila
n
Xi*
D_
Mil
NY
SE
Xi*
D_
NY
Nasdaq
Xi*
D_
Na
s
OT
C
Xi*
D_
OT
C
Paris
Xi*
D_
Pa
r
Sw
iss S
E
Xi*
D_
Sw
i
VIR
TX
Xi*
D_
Vir
XE
TR
A
Xi*
D_
Xe
t
Home market charactersitics
Home emerging market 3.54*** 6.16*** -1.12 -2.55*** 2.42**
(6.21) (3.00) (-1.54) (-2.78) (2.41)
Common language 1.81*** 8.70*** 1.05 0.27 0.77 6.78* -0.04 1.11
(4.53) (3.01) (0.72) (0.07) (0.47) (1.86) (-0.05) (1.51)
Geographic distance 0.2 0.09 -0.40* 0.84 0.47 0.36 0.25 -1.08** 5.29 -1.01* -0.56**
(0.23) (0.63) (-1.9) (0.31) (1.52) (0.78) (1.27) (-2.29) (1.49) (-1.71) (-2.34)
Investor protection Home 8.85*** -0.56 -8.72* 12.28** -2.82 -0.57 -2.02 -4.21** 2.99*** -3.22*** -1.14
(5.14) (-0.96) (-1.70) (2.41) (-1.21) (-0.11) (-0.78) (-2.52) (3.10) (-5.18) (-1.46)
IT laws enforced Home 0.0 0.0** 0.0 0.03** 0.0 0.0 0.0 0.0** -0.12 0.0 0.0
(-0.13) (2.02) (-0.29) (2.21) (-0.19) (1.00) (-1.12) (2.46) (-1.16) (-1.07) (0.53)
Trading costs Home 12.2* -0.79 5.3*** -42.8*** -0.53 0.98 -0.44 2.69 -42.79** 0.84 0.33
(2.46) (-1.3) (2.66) (-3.46) (-0.50) (0.32) (-0.46) (1.09) (-2.00) (0.35) (0.23)
Accounting opacity Home -4.07 -1.06 4.15** -15.11*** -1.47* 10.81 -0.53 -3.35** 0.0 -7.22* -2.80
(-1.03) (-1.18) (2.08) (-3.08) (-1.71) (1.64) (-0.33) (-2.39) (0.0) (-1.85) (-1.58)
Intercept -8.01***
(-20.49)
Adj. R-sq 0.674
N observations 51,846
N foreign accounts 1,477

266
Appendix 4.1 Foreign information factor calculation
Follow the methodology of Baruch et al (2007), the foreign information factor is calculate as the
difference in R2 (adjusted for degrees of freedom) of a two-index model including foreign market
index and of a single-index model with just the home market index.
Foreign information factor is calculated monthly and each stock in the sample using weekly stock
return and home and host index return data for the preceding 48 (at least 36) months. Home market
returns are calculated using total return data, i.e. inclusive of price change as well as dividend
income, converted into the currency of the foreign market.
Firstly, the following two time-series regressions are estimate for each stock:
(1 - restricted model)
(2 - unrestricted model)
where is the return, calculated in the currency of the foreign market, of stock i in period t,
is the return, calculated in the currency of the foreign market, on the home market index
in period t+k, and is the foreign market index return in period t+k. As in Baruch et al
(2007), the lead and lag terms in the regressions are used to account for non-synchronous trading
across markets in different time zones.
The next step is to calculate the measure that captures the incremental contribution of the foreign
market movement in explaining variation of the stock return in addition to the information about the
stock return contained in movements in the home market index prices. Such measure is computed as
F-statistics for each stock using R2 from the unrestricted, the second, model ( ), and R2 from the
restricted, the first, model ( ):
where n is the number of observations for the stock, 3 in denominator is for the three regressors in
the restricted model and 6 in the denominator is for the six regressors in the unrestricted model.

267
Appendix 4.2 Pull factors of the foreign equity trading: coefficient estimates and variance
inflation factors
The table reports the coefficient estimates and variance inflation factors (VIF) from OLS regressions
reported in Table 4.8. The dependant variable is the logistic transformation of stock exchange’s monthly
average foreign share of trading volume. The exchange-level average foreign trading share is the mean of
the foreign trading volume shares of the stocks traded on the exchange, calculated monthly as the ratio of
the number of shares traded on the exchange to the total number of the shares traded in the same month
on all exchanges in the sample. The explanatory variables are defined in Table 4.2. Additionally,
regressions include a control variable, average company size measured by the natural logarithm of the
mean stock market value of stocks traded on the exchange converted to GBP.
estimate VIF estimate VIF estimate VIF estimate VIF estimate VIF
Intercept 3.51 0 6.83 0 12.27 0 3.23 0 8.31 0
Trading platform -1.13 1.37 -1.20 1.43 -1.08 1.45
Demutualization 1.17 1.37 1.13 1.57 -0.20 4.18 -0.31 1.31
Electronic market -1.89 1.24 -2.36 1.32 -2.76 1.64 -1.58 1.38 -0.37 1.09
Foreign stocks concentration 0.14 2.38
Market size 0.42 1.21 0.10 3.03 -0.09 3.59 0.09 3.81 -0.12 3.91
Market liquidity 0.29 1.41 0.46 1.53 0.52 1.59 0.50 1.84 0.62 2.17
Trading costs -4.14 1.09 -4.35 1.58 -5.00 1.75 -2.39 1.85 -6.87 2.87
Investor protection 0.31 2.07 0.01 2.12 0.88 2.21 1.42 3.78
1.44 1.76 1.65 1.98 1.55 1.93 0.53 2.34
Accounting opacity -3.57 2.03 -3.62 2.12 -1.84 2.11 -3.49 3.36
Average company size -1.02 1.19 -0.98 1.73 -1.32 2.61 -0.83 1.92 -0.76 1.56
OTC indicator -1.90 1.43
VIRTX indicator -2.26 1.25
XETRA indicator 0.35 1.64
Year-fixed effects No No Yes No No
Exchange-fixed effects No No No Yes No
Number of exchanges 16 13 13 15 11
Number of observations 2,574 2,237 2,237 2,572 958
Adj. R-sq 0.538 0.616 0.666 0.564 0.779
Model (2)Model (1) Model (3) Model (4) Model (5)

268
Appendix 4.3 Determinants of the foreign share trading volume (stock-level analysis): coefficient estimates and variance inflation factors
The table reports the coefficient estimates and variance inflation factors (VIF) from OLS regressions reported in Table 4.9. The dependant variable is the logistic transformation
of the foreign share of trading volume. The stock-level foreign trading share is the ratio of the number of shares traded on the exchange to the total number of the shares traded in
the same month on all exchanges in the sample calculated monthly. Host US is a dummy variable that equals one if the US is the host market and zero otherwise. Geographic
distance residual variable is the residual from the OLS regression of the geographic distance variable on the US host market dummy variable. Other explanatory variables are
defined in Table 4.2.
estimate VIF estimate VIF estimate VIF estimate VIF estimate VIF estimate VIF estimate VIF estimate VIF estimate VIF estimate VIF estimate VIF
Listing characteristics
Traded indicator -1.74 1.33 -1.63 1.34 -1.82 1.26 -1.68 1.27 -1.79 1.39 -1.66 1.40 -1.76 1.38 -1.97 1.43 -1.89 1.44 -1.98 1.43 -2.25 2.21
First listing indicator 0.80 1.33 0.87 1.33 2.20 1.31 2.28 1.31 0.86 1.34 1.02 1.34 0.86 1.34 2.23 1.33 2.47 1.33 2.23 1.33 0.99 1.44
Time listed/ traded 0.12 1.24 0.11 1.25 0.15 1.27 0.14 1.27 0.13 1.29 0.13 1.29 0.14 1.26 0.16 1.31 0.16 1.31 0.16 1.29 0.13 1.57
Same currency 0.41 1.88 0.70 1.98 0.88 1.96 1.15 2.02 0.70 1.61 1.14 1.75 0.74 1.61 1.14 1.68 1.49 1.74 1.12 1.68 1.12 1.64
DR indicator 0.24 2.40 -0.45 2.83 0.14 1.92 -0.53 2.19 0.14 2.44 -0.73 2.90 0.24 2.39 0.01 1.95 -0.88 2.25 0.05 1.92 -0.38 2.06
Price Level 0.17 1.74 0.11 1.76 0.17 1.77 0.08 1.80 0.18 1.73 0.05 1.79 0.17 1.73 0.23 1.78 0.05 1.85 0.23 1.78 0.14 1.93
Company characteristics
Company size -0.30 1.93 -0.28 1.94 -0.32 2.07 -0.27 2.09 -0.29 2.05 -0.24 2.07 -0.30 2.05 -0.33 2.28 -0.25 2.33 -0.35 2.25 -0.39 2.62
Price-to-book ratio 0.01 1.03 0.01 1.03 -0.004 1.04 -0.003 1.04 0.02 1.05 0.02 1.05 0.02 1.05 0.02 1.12 0.02 1.12 0.02 1.12 0.02 1.12
Stock risk 6.47 1.28 5.55 1.28 6.50 1.40 5.30 1.40 7.38 1.30 6.48 1.30 7.57 1.30 6.44 1.42 5.40 1.42 6.31 1.41 7.33 1.46
Foreign sales 0.46 1.09 0.47 1.09 0.33 1.15 0.41 1.15 0.22 1.13 0.20 1.13 0.32 1.11 0.06 1.23 0.03 1.23 0.10 1.22 0.06 1.24
Foreign investors 1.38 1.37 1.12 1.37 1.33 1.37 1.00 1.37 1.43 1.36 1.39 1.40
Ownership concenration -0.50 1.46 -0.30 1.47 -0.50 1.56 -0.25 1.56 -0.59 1.53 -0.55 1.61
Int. accounting standards -0.63 1.34 -0.55 1.35 -0.06 1.29 0.04 1.30 -0.45 1.29 -0.38 1.30 -0.48 1.29 0.04 1.26 0.13 1.26 0.02 1.25 0.20 1.29
Return correlation -1.79 1.54 -1.57 1.55 -1.36 1.80 -1.20 1.80 -1.95 1.65 -1.96 1.65 -2.04 1.64 -1.08 1.93 -1.23 1.93 -1.11 1.92 -1.59 1.98
US information factor 0.31 1.63 0.20 1.74 0.25 1.67 0.13 1.78 0.29 1.65 0.16 1.75 0.30 1.64 0.24 1.69 0.09 1.81 0.25 1.68 0.29 1.72
Foreign (non-US) inform. factor -0.08 1.29 -0.05 1.32 -0.05 1.28 -0.02 1.31 -0.07 1.39 -0.04 1.41 -0.06 1.38 -0.07 1.41 -0.04 1.43 -0.06 1.39 -0.09 1.35
Market characteristics
Home emerging market 1.28 1.34 1.29 1.34 1.60 1.46 1.62 1.46 0.61 1.14 0.61 1.14 1.33 1.11 1.30 1.22 1.43 1.22 1.81 1.15 2.41 1.15
Common language 1.04 1.77 0.59 1.92 1.09 1.60 0.59 1.73 1.14 1.55 0.72 1.64 1.11 1.55 1.31 1.50 0.81 1.59 1.27 1.49 1.74 2.08
Model (1.1) Model (1.2) Model (2.1) Model (4.3) Model (5)Model (2.2) Model (3.1) Model (3.2) Model (3.3) Model (4.1) Model (4.2)

269
Appendix 4.3 continued
estimate VIF estimate VIF estimate VIF estimate VIF estimate VIF estimate VIF estimate VIF estimate VIF estimate VIF estimate VIF estimate VIF
Geographic distance 0.68 3.08 0.91 2.77 0.52 5.34 0.78 3.43 1.00 5.70 1.15 3.38 1.00 4.41
Host US 3.18 4.60 3.79 3.74 3.83 8.50 5.37 7.98
Geographic distance residual -0.20 1.31 -0.22 1.35 -0.39 1.28 -0.14 1.41
Investor protection Home -1.61 1.83 -1.30 1.86 -1.12 1.79 -0.90 1.80
Investor protection dif 1.05 3.11 1.37 3.15 1.76 1.78 0.66 3.73 1.23 3.82 1.06 2.13 -0.62 4.59
IT laws enforced Home -1.20 1.81 -1.09 1.82 -0.90 2.12 -0.77 2.13
IT laws enforced dif 0.20 2.51 0.70 2.57 0.81 1.86 0.40 3.60 1.20 3.70 0.88 2.27 -0.07 5.06
Accounting opacity Home -1.57 1.45 -0.60 1.49 -1.73 1.50 -0.42 1.55
Accounting opacity dif 2.56 2.31 3.03 2.32 1.88 2.13 3.24 3.19 4.31 3.23 3.00 3.11 3.21 3.71
Trading costs Home 0.23 2.15 1.47 2.37 0.26 2.28 1.75 2.52
Trading costs dif 1.05 2.32 -0.28 2.52 0.34 1.94 0.35 2.35 -0.87 2.48 0.14 2.20 -0.48 2.57
Market size dif 0.41 7.53 0.16 7.96 0.22 8.43 -0.09 8.86 0.32 8.71
Market liquidity dif -0.14 3.08 -0.22 3.19 -0.13 3.06 -0.22 5.28 -0.35 5.53 -0.22 5.27 -0.18 6.18
Industry specialization 0.78 1.21 0.85 1.21 0.31 1.17 -0.09 1.29 0.17 1.29 -0.33 1.26 -0.49 1.49
Foreign stock concentration -2.81 1.54
Intercept -6.82 0 -4.28 0 -9.84 0 -6.29 0 -8.54 0 -5.83 0 -10.01 0 -12.40 0 -6.84 0 -13.19 0 -10.75 0
Adj. R-sq 0.423 0.441 0.476 0.504 0.462 0.489 0.457 0.497 0.540 0.496 0.619
N observations 81,917 81,917 51,846 51,846 63,602 63,602 63,602 40,889 40,889 40,889 24,061
N foreign accounts 1,714 1,714 1,476 1,476 1,329 1,329 1,329 1,145 1,145 1,145 593
Model (4.2) Model (4.3) Model (5)Model (1.1) Model (1.2) Model (2.1) Model (2.2) Model (3.1) Model (3.2) Model (3.3) Model (4.1)

270
Chapter 5
Conclusion
The thesis examines the effects of cross-listing and cross-trading in international stock
exchanges, on the stock of European companies in terms of the impact on their price, liquidity
and volatility, and the distribution of trading volume in a changing listing and trading
environment.
In particular, the three empirical issues addressed in each empirical chapter of the thesis
are as follows. First, chapter 2 analyses the effect of international cross-listing on shareholders’
wealth and the determinants of these effects across various foreign destination markets and
across time. Second, chapter 3 evaluates the changes in the liquidity and volatility of stocks
after cross-listing and cross-trading. Third, chapter 4 examines the determinants of the
distribution of foreign equity trading volumes both at a stock exchange level and at a firm level.
Overall, the findings of the thesis show that the wealth of shareholders, stock liquidity and
volatility, and the trading volume of European stocks are significantly affected by international
cross-listing and cross-trading. However, the effects are sensitive to host stock exchanges and
regulatory provisions.
The findings of the thesis have several important implications for companies,
international investors, stock exchange authorities, and to the regulators of financial industry.
Furthermore, the findings represent international perspectives as they are based on the
experience of companies from various European countries that are cross-listed in various
international stock markets. The sample is also significant in that it represents a substantial
portion of foreign stocks listed internationally. Finally, the analysis of European stocks allows
an evaluation of the implications for the relative competitiveness of European, British and
American equity markets.
Chapter 2 examines the first empirical issue: the effects of cross-listings on
shareholders’ wealth. The effects on shareholders’ wealth are measured by abnormal returns
around the announcement of a decision to cross-list and also around the cross-listing event.
Abnormal returns are compared across cross-listings on European, British and American host

271
markets and over time. The potential determinants of the effect of cross-listings on
shareholders’ wealth are identified based on various theoretical explanations including market
segmentation, legal bonding, liquidity, investor recognition, proximity preference, market
timing, and business strategy. This study also examines the impact of recent significant
developments in capital markets, such as the introduction of a single currency, the Euro, in
Europe and the adoption of the Sarbanes- Oxley Act (SOX) in the US, which may have affected
the net benefits arising from international cross-listings. Finally, the chapter evaluates the
change in the explanatory power of the determinants before and after the introduction of the
Euro in Europe and before and after the adoption of SOX in the US.
The findings of chapter 2 suggest that, on average, international cross-listings have a
significant positive impact on shareholders’ wealth. However, the impact varies by host
markets. The effect is positive and significant if the stocks are cross-listed in the American and
in the British stock exchanges (3.3% and 2.7% cumulative abnormal returns respectively) while
it remains statistically insignificant if they are cross-listed within European stock markets. In
addition, there is a significant time-specific variation in the wealth effects of cross-listings that
can be partly attributed to the recent developments in international capital markets. The
adoption of SOX in the US is associated with a significant reduction in the gains from listing in
the US markets, especially for smaller companies. In contrast, the shareholder gains from cross-
listing in the UK have increased significantly in recent years. This has been driven by the gains
from AIM listings on the London stock exchange (AIM was established in the late 1990s)
suggesting that the observed gain is primarily driven by the experience of smaller companies.
The introduction of a single currency in Europe, however, has had no significant impact on
shareholders’ gains from cross-listings within the Euro zone. Furthermore, the results reveal the
importance of company characteristics, such as company size, industry, growth opportunities
and previous foreign listing experience, in explaining the effect of cross-listings on
shareholders’ wealth. Empirically, there is support for market segmentation theory applied to
cross-listings in the US, for investor recognition theory applied to cross-listings within the Euro
zone and to cross-listings that take place in the US after the adoption of SOX, and for proximity
preference applied to listings in the UK. Also there is strong empirical support for business
strategy theory. Overall, the findings emphasize the changing nature of the determinants of the
benefits of cross-listings across different host markets and in the face of regulatory changes.

272
The findings of chapter 2 have practical implications for several groups of market
participants. For company managers, increase in shareholders’ wealth is the ultimate goal of a
corporate decision to cross-list. In this respect, the findings indicate that there is a significant
cross-sectional difference in the net benefits of cross-listings across host markets and company
characteristics. From an investor’s point of view, the findings contribute to a better
understanding of the sources of value creation around cross-listings in different international
markets. Finally, the findings on the impact of the Euro, AIM, and SOX on the net benefits of
cross-listings in Europe, the UK and the US accordingly, should be of particular importance for
financial market authorities and regulators.
The gains in shareholders’ wealth around cross-listing documented in chapter 2 could
be driven by the improvement in the stock’s information environment and, accordingly, in stock
liquidity and volatility after cross-listing. Chapter 3 analyses empirically the impact of
international cross-listing and multimarket trading on stock liquidity and volatility. Different
dimensions of stock liquidity are captured by trading costs, trading volumes, and turnover
ratios, while stock return variation and intraday stock price deviation are used to measure
volatility. First, the liquidity and volatility of cross-listed companies are compared against those
of non-cross-listed companies. Given the endogenous nature of a cross-listing decision, I use
Heckman’s (1979) procedure to control for a potential self-selection bias. For a robustness test,
I use time series analysis to evaluate changes in the liquidity and volatility before and after a
foreign listing. In addition, chapter 3 also investigates the differences between the impact of
cross-listing and cross-trading. Unlike cross-listing, cross-trading does not impose additional
disclosure requirements but offers similar trading opportunities for investors.
The results of chapter 3 indicate a significant improvement in trading costs and stock
return volatility. The results hold even after controlling for several potentially responsible
factors such as the change in company size, accounting practices, financial analyst coverage and
stock trading volumes after cross-listing and cross-trading. The reduction in trading costs and
stock return volatility after cross-listing and cross-trading is particularly profound for smaller
companies. Supplementary analysis on the evolution of the liquidity and volatility before and
after cross-listing reveals that the documented improvements are sustained in the long-run after
the change in the listing status. In regards to the difference between the impact of cross-listing
and the impact of cross-trading, cross-listing enhances the stock’s total trading volumes more

273
substantially than cross-trading due to significantly higher trading volumes on the foreign stock
exchange(s) after cross-listing. Nevertheless, cross-trading, similar to cross-listing, improves
stock liquidity and volatility in the company’s home market. Overall, the documented difference
in the impact of cross-listing and cross-trading on the liquidity and volatility of the stock is
considerably smaller than predicted. This finding highlights the importance of alternative
channels of information dissemination in improving the firm’s information environment after
cross-listing and cross-trading. Such channels include greater production of stock-specific
information by more traders after cross-listing and cross-trading and increased competition
among traders. Finally, the findings suggest that the implications of cross-listing and cross-
trading vary depending on the level of development of the company’s home market. While a
cross-listing is beneficial in terms of liquidity and volatility for companies from developed
markets, it has no positive impact for companies from emerging markets.
The findings of chapter 3 should be of considerable importance to companies that are
considering a foreign listing and also to international investors. From a company’s perspective,
stock liquidity and volatility directly affect transaction costs and the perceived riskiness of the
stock, which, in turn, has an effect on the company’s cost of equity capital. The results suggest
that for companies from developed markets cross-listing and cross-trading result in a significant
decrease in the bid-ask spread, an increase in stock trading volumes, and a reduction in stock
return volatility. From the perspective of international investors such findings suggest that
investors could trade the stocks of cross-listed and cross-traded firms at a lower transaction cost
and could have higher price certainty as well.
Chapter 4 investigates the third empirical issue of the thesis: the determinants of the
distribution of trading volumes of stocks that trade on various stock markets. The understanding
of what determines the location of trading of cross-listed stocks is important because the
benefits of cross-listing such as the gains in shareholders’ wealth and the improved stock
liquidity and volatility documented in chapter 2 and chapter 3 are feasible if the cross-listing
results in active trading on the foreign stock exchange. The determinants of the distribution of
trading volume are analysed from both stock exchange and firm specific perspectives. First,
from a stock exchange point of view, the chapter evaluates the ability of the major international
exchanges to attract trading volumes of foreign equity. This ability is measured by a stock
exchange’s average fraction of the total trading volumes of cross-listed stocks. The determinants

274
of a stock exchange’s ability to attract foreign equity trading, or the pull factors of foreign
trading volumes, are examined using cross-sectional regression analysis. In addition, the study
compares the ability of two types of markets – regulated stock exchanges and non-regulated
markets (e.g., over-the-counter markets, alternative markets and trading platforms) to attract
foreign equity trading. Second, from a company’s point of view, the chapter examines stock-
specific determinants of the trading volume distribution. Foreign trading volume distribution on
a stock level is quantified by the stock’s trading volume share on the foreign exchange in the
stock’s total trading volume. Finally, the firm level analysis is extended to further examine the
firm level determinants separately for the major stock exchanges.
The findings discussed in chapter 4 suggest that the ability to attract and maintain
foreign equity trading varies significantly across the major stock exchanges. A cross-sectional
regression analysis of a stock exchange’s fraction of the total trading volumes of cross-listed
stocks reveals that this ability is positively associated with the stock exchange’s organizational
efficiency, the level of market liquidity, the quality of investor protection, and the enforcement
of insider trading regulation. The results also show that regulated stock exchanges are
significantly more successful in attracting trading volumes of foreign stocks than non-regulated
markets. From a company’s perspective, this finding is consistent with the view that a cross-
listing on a regulated exchange is more likely to result in active foreign trading than an
admission to trade in a non-regulated market. Furthermore, the findings highlight the
importance of stock characteristics, particularly company size and stock risk, and of listing
characteristics, such as currency and duration of listing, in explaining the distribution of trading
volumes between the foreign and the home markets. Particularly, smaller companies have
higher fractions of trading taking place on foreign exchange(s). Finally, the chapter provides
separate evidence on firm level determinants of foreign trading volume distribution by stock
exchanges. Such evidence is helpful in understanding the expected levels of trading activity on
various stock exchanges for a stock with particular characteristics.
The findings of chapter 4 have practical implications for four main groups of financial
market participants. First, for stock exchanges the findings contribute to better understanding of
factors that determine a stock exchange’s competitive position within the industry. The evidence
can be used by stock exchanges to focus their marketing efforts on targeting particular types of
foreign companies for listing, especially those which are likely to have higher trading volumes.

275
Second, for cross-listed companies the chapter provides evidence on strategies to maximize the
benefit of cross-listing and cross-trading in terms of active stock trading on foreign market(s).
Active foreign equity trading is crucial for cross-listed companies because it determines the net
benefits of international cross-listings in terms of reduced transaction costs, increased firm
value, and better price discovery in the foreign market(s). Third, for international investors,
knowledge of the location of trading of foreign stocks is essential as it allows investors to
minimize the costs of trading foreign equity. Finally, for financial market regulators to have
empirical evidence that regulated markets with investor protection and enforced insider trading
laws have a superior ability to attract and maintain trading of foreign equity should be of
considerable importance.
On the whole, the findings of this thesis are supportive of the statement that on average
an international cross-listing is beneficial for companies and their shareholders in terms of the
market value of the firm and improved liquidity and reduced price volatility. However, these
benefits vary significantly across firms and destination foreign markets. Chapter 2 provides
evidence that cross-listings on American exchanges, on average, result in a higher increase in
shareholders’ wealth than cross-listing on other host markets. However, the gains from cross-
listing in the US have diminished in recent years. Moreover, evidence in chapter 4 support the
idea that the American exchanges have a superior ability to attract trading of European stocks in
terms of absolute trading volumes and also in terms of the foreign fraction of the total trading
volume. Overall, the US capital market, although arguably losing its competitive edge, is still an
important cross-listing destination for European companies. The British capital market is the
second most important market both in terms of the effects on shareholders’ wealth (chapter 2)
and stock liquidity enhancements, particularly for companies from emerging markets (chapter
4). Finally, European exchanges continue to attract listings of firms based in other European
countries despite significant integration processes within the European Union. However, on
average, firms do not experience any obvious benefit from cross-listing within European
markets (chapter 2).

276
Recommendations for Future Research:
While the thesis has examined the economic consequences of cross-listing and trading
on multiple foreign exchanges, there is still a need for further research to continue on this topic.
• The findings of this thesis, as well as earlier studies, suggest that cross-listing leads to an
increase in shareholders’ wealth. It is possible that such an increase in wealth could be due
to a reduction in the cost of transaction, a reduction in risk or a combination of both.
Therefore, it would be interesting to examine the possible sources of the value
enhancement, i.e. to split the gains into the effects of the reduction in the cost of equity
capital and the transaction costs. So far there is no evidence in the literature on how cross-
listings and admissions to trade on various foreign markets outside of the US affect the
company’s cost of capital.
• Chapter 3 of this thesis investigates the impact of cross-listing and cross-trading on
various markets on the stock liquidity and volatility. However, it would also be useful to
compare this impact across different host markets.
• Finally, further research on the economic consequences of cross-listings in major
international financial markets by companies from non-European markets, especially from
Asian markets, which have recently demonstrated significant economic growth and
increasing integration into the world financial markets, would help to provide a more
complete understanding of the effects of international cross-listings.

277
References
Abee, S. and J. Zimmermann (2006). Do Cross-Listings Drive Regulatory Convergence?
Evidence from Germany. University of Bremen Working paper.
Admati, A. R. and P. Pfleiderer (1988). A Theory of Intraday Patterns: Volume and Price
Variability. Review of Financial Studies, 1 (1): 3-40.
Aggarwal, R. (2002). Demutualization and Corporate Governance of Stock Exchanges. Journal
of Applied Corporate Finance, 15 (1): 105-113.
Aggarwal, R., L. Klapper and P. D. Wysocki (2005). Portfolio Preferences of Foreign
Institutional Investors. Journal of Banking and Finance, 29 (12): 2919-2946.
Agrawal, D., S. T. Bharath and S. Viswanathan (2004). Technological Change and Stock Return
Volatility: Evidence from Commerce Adoptions. SSRN Working paper series.
Alexander, G. J., C. S. Eun and S. Janakiramanan (1987). Asset Pricing and Dual Listing on
Foreign Capital Markets: A Note. The Journal of Finance, 42 (1): 151-158.
Alexander, G. J., C. S. Eun, and Janakirarnarian, S. (1988). International Listings and Stock
Returns: Some Empirical Evidence. Journal of Financial and Quantitative Analysis, 23 (2):
135-151.
Alizadeh, S., M. W. Brandt and F. X. Diebold (2002). Range-Based Estimation of Stochastic
Volatility Models. The Journal of Finance, 57 (3): 1047-1091.
Allen, F. and W.-L. Song (2005). Financial Integration and EMU. European Financial
Management, 11 (1): 7-24.
Amihud, Y. (2002). Illiquidity and Stock Returns: Cross-Section and Time-Series Effects.
Journal of Financial Markets, 5 (1): 31-56.
Amihud, Y. and H. Mendelson (1986). Asset Pricing and the Bid-Ask Spread. Journal of
Financial Economics, 17 (2): 223-249.
Amihud, Y. and H. Mendelson (1995). Multimarket trading: A Self-Regulatory Proposal.
Global Equity Markets: Technological, Competitive, and Regulatory Challenges. R. A.
Schwartz. Chicago, Irwin Professional Publishing: 340-349.
Atkins, A. B. and E. A. Dyl (1997). Transactions Costs and Holding Periods for Common
Stocks. The Journal of Finance, 52 (1): 309-325.
Ayyagari, M. and C. Doidge (2010). Does Cross-Listing Facilitate Changes in Corporate
Ownership and Control? Journal of Banking and Finance, 34 (1): 208-223.
Bacidore, J. M., R. Battalio, N. Galpin and R. Jennings (2005). Sources of Liquidity for NYSE-
Listed Non-US Stocks. Journal of Banking and Finance, 29 (12): 3075-3098.
Baele, L. (2005). Volatility Spillover Effects in European Equity Markets. Journal of Financial
and Quantitative Analysis, 40 (2): 373-401.
Baele, L., A. Ferrando, P. Hördahl, E. Krylova and C. Monnet (2004a). Measuring European
Financial Integration. Oxford Review of Economic Policy, 20 (4): 509-530.

278
Baele, L., A. Ferrando, P. Hördahl, E. Krylova and C. Monnet (2004b). Measuring Financial
Integration in the Euro Area. Ocasional Paper Series ECB #14.
Bailey, W., G. Andrew Karolyi and C. Salva (2006). The Economic Consequences of Increased
Disclosure: Evidence from International Cross-Listings. Journal of Financial Economics,
81 (1): 175-213.
Baiman, S. and R. E. Verrecchia (1995). Earnings and Price-Based Compensation Contracts in
the Presence of Discretionary Trading and Incomplete Contracting. Journal of Accounting
and Economics, 20 (1): 93-121.
Baiman, S. and R. E. Verrecchia (1996). The Relation among Capital Markets, Financial
Disclosure, Production Efficiency, and Insider Trading. Journal of Accounting Research,
34 (1): 1-22.
Baker, H. K., J. R. Nofsinger and D. G. Weaver (2002). International Cross-Listing and
Visibility. Journal of Financial and Quantitative Analysis, 37 (3): 495-521.
Baker, M. P. and J. A. Wurgler (2007). Investor Sentiment in the Stock Market. Journal of
Economic Perspectives, 21 (2): 129-151.
Ball, R. T., Hail, L. and Vasvari, F. P. (2009). Equity Cross-Listings in the U.S. and the Price of
Debt. SSRN Working paper.
Bamber, L. S., O. E. Barron and T. L. Stober (1999). Differential Interpretations and Trading
Volume. Journal of Financial and Quantitative Analysis 34 (3): 369-386.
Bancel, F. and C. R. Mittoo (2001). European Managerial Perceptions of the Net Benefits of
Foreign Stock Listings. European Financial Management, 7 (2): 213-236.
Bancel, F., C. Mittoo and M. Kalimipalli (2007). The Valuation Effects of Capital versus Non-
Capital Raising ADRs: Revisiting European Evidence. Working paper.
Barclay, M., R. Litzenberger and J. Warner (1990). Private Information, Trading Volume, and
Stock-Return Variances. Review of Financial Studies, 3 (2): 233-253.
Barry, C. B. and S. J. Brown (1985). Differential Information and Security Market Equilibrium.
The Journal of Financial and Quantitative Analysis, 20 (4): 407-422.
Barry, C. B. and S. J. Brown (1986). Limited Information as a Source of Risk. The Journal of
Portfolio Management, 12 (2): 66-72.
Baruch, S., Karolyi, G. A. and Lemmon, M. (2007). Multi-Market Trading and Liquidity:
Theory and Evidence. The Journal of Finance, 62 (5): 2169-2200.
Baruch, S. and Saar, G. (2009). Asset Returns and the Listing Choice of Firms. The Review of
Financial Studies, 22 (6):2239-2274.
Bayar, A. and Z. Onder (2005). Liquidity and Price Volatility of Cross-Listed French Stocks.
Applied Financial Economics, 15 (15): 1079-1094.
Bekaert, G. and C. R. Harvey (1995). Time-Varying World Market Integration. The Journal of
Finance, 50 (2): 403-444.
Beny, L. N. (2005). Do Insider Trading Laws Matter? Some Preliminary Comparative
Evidence. American Law and Economics Review, 7 (1): 144-183.

279
Berkman, H. and N. H. Nguyen (2010). Domestic Liquidity and Cross-Listing in the United
States. Journal of Banking and Finance, 34 (6): 1139-1151.
Bhattacharya, U. and H. Daouk (2002). The World Price of Insider Trading. The Journal of
Finance, 57 (1): 75-108.
Bhattacharya, U. and H. Daouk (2009). When No Law is Better than a Good Law. Review of
Finance, 13 (4): 577-627.
Bhushan, R. (1989). Firm Characteristics and Analyst Following. Journal of Accounting and
Economics, 11 (2-3): 255-274.
Bianconi, M. and L. Tan (2010). Cross-Listing Premium in the US and the UK Destination.
International Review of Economics and Finance, 19 (2): 244-259.
Black, F. (1974). International Capital Market Equilibrium with Investment Barriers. Journal of
Financial Economics, 1 (4): 337-352.
Black, F. (1986). Noise. The Journal of Finance, 41 (3): 529-543.
Bris, A., S. Cantale and G. P. Nishiotis (2007). A Breakdown of the Valuation Effects of
International Cross-Listing. European Financial Management, 13 (3): 498-530.
Bris, A., S. Cantale, E. Hrnjic and G. Nishiotis (2009). The Value of Information in Cross-
Listings. Working paper.
Brennan, M. and P. Hughes (1991). Stock Prices and the Supply of Information. The Journal of
Finance, 46 (5): 1665-1691.
Brennan, M. J. and H. Cao (1997). International Portfolio Investment Flows. The Journal of
Finance, 52 (5): 1851-1880.
Brennan, M. J., T. Chordia and A. Subrahmanyam (1998). Alternative Factor Specifications,
Security Characteristics, and the Cross-Section of Expected Stock Returns. Journal of
Financial Economics, 49 (3): 345-373.
Brennan, M. J. and A. Subrahmanyam (1996). Market Microstructure and Asset Pricing: on the
Compensation for Illiquidity in Stock Returns. Journal of Financial Economics, 41 (3):
441-464.
Brown, S. and S. Hillegeist (2007). How Disclosure Quality Affects the Level of Information
Asymmetry. Review of Financial Studies, 12 (2-3): 443-477.
Brown, S. J. and J. B. Warner (1980). Measuring security price performance. Journal of
Financial Economics 8 (3): 205-258.
Brown, S. J. and J. B. Warner (1985). Using daily stock returns: The case of event studies.
Journal of Financial Economics 14 (1): 3-31.
Burns, N. (2004). The Role of Cross-Listed Stock as an Acquisition Currency: Evidence from
Takeovers of U.S. Firms. SSRN Working paper.
Burns, N., B. B. Francis and I. Hasan (2007). Cross-Listing and Legal Bonding: Evidence from
Mergers and Acquisitions. Journal of Banking and Finance, 31 (4): 1003-1031.

280
Bushee, B. J. and C. F. Noe (2000). Corporate Disclosure Practices, Institutional Investors, and
Stock Return Volatility. Journal of Accounting Research, 38 (Supplement issue: Studies on
Accounting Information and the Economics of the Firm): 171-202.
Campbell, J. Y. and A. S. Kyle (1993). Smart Money, Noise Trading and Stock Price
Behaviour. The Review of Economic Studies, 60 (1): 1-34.
Chan, K. and W.-M. Fong (2000). Trade Size, Order Imbalance, and the Volatility-Volume
Relation. Journal of Financial Economics, 57 (2): 247-273.
Chan, K. C., W. Fong, B. Kho and R. M. Stulz (1996). Information, Trading and Stock Returns:
Lessons from Dually-Listed Securities. Journal of Banking and Finance, 20 (7): 1161-
1187.
Chaplinsky, S. and L. Ramchand (2000). The Impact of Global Equity Offerings. The Journal of
Finance, 55 (6): 2767-2789.
Charitou, A., C. Louca and S. Panayides (2007). Cross-Listing, Bonding Hypothesis and
Corporate Governance. Journal of Business Finance and Accounting, 34 (7-8): 1281-1306.
Charitou, A. and C. Louca (2009). Cross-Listing and Operating Performance: Evidence from
Exchange-Listed American Depositary Receipts. Journal of Business Finance and
Accounting, 36 (1-2): 99-129.
Charitou, A., C. Louca and S. Panayides (2008). Why Do Firms Cross-List? The Flip Side of
the Issue. SSRN Working paper.
Chemmanur, T. J. and P. Fulghieri (2006). Competition and Cooperation among Exchanges: A
Theory of Cross-Listing and Endogenous Listing Standards. Journal of Financial
Economics, 82 (2): 455-489.
Chiyachantana, C. N., P. K. Jain, C. X. Jiang and R. A. Wood (2004). International Evidence on
Institutional Trading Behavior and Price Impact. The Journal of Finance, 59 (2): 869-898.
Chiyachantana, C. N., P. K. Jain, C. X. Jiang and R. A. Wood (2006). Volatility Effects of
Institutional Trading in Foreign Stocks. Journal of Banking and Finance, 30 (8): 2199-
2214.
Chordia, T., A. Subrahmanyam and V. R. Anshuman (2001). Trading Activity and Expected
Stock Returns. SSRN Working Paper.
Chordia, T., S. W. Huh, and A. Subrahmanyam (2007). The Cross-Section of Expected Trading
Activity. Review of Financial Studies, 20 (3): 709-740.
Chouinard, E. and C. D'Souza (2003-2004). The Rationale for Cross-Border Listings. Bank of
Canada Review working paper.
Chowdhry, B. and V. Nanda (1991). Multimarket Trading and Market Liquidity. Review of
Financial Studies, 4 (3): 483-511.
Clayton, M. C., J. C. Hartzell and J. Rosenberg (2005). The Impact of CEO Turnover on Equity
Volatility. The Journal of Business, 78 (5): 1779-1808.
Coffee, J. C. Jr. (1999). Future as History: The Prospects for Global Convergence in Corporate
Governance and Its Implications. Northwestern University Law Review, 93 (3): 641-708.

281
Coffee, J. C., Jr. (2002). Racing Towards the Top?: The Impact of Cross-Listings and Stock
Market Competition on International Corporate Governance. Columbia Law Review, 102
(7): 1757-1831.
Copeland, T. E. and D. Galai (1983). Information Effects on the Bid-Ask Spread. The Journal
of Finance, 38 (5): 1457-1469.
Coppejans, M. and I. Domowitz (2000). The Impact of Foreign Equity Ownership on Emerging
Market Share Price Volatility. International Finance, 3 (1): 95-122.
Coval, J. and T. Moskowitz (1999). Home Bias at Home: Local Equity Preferences in Domestic
Portfolios. The Journal of Finance, 54 (6): 2045-2073.
Dahlquist, M., L. Pinkowitz, R. M. Stulz and R. Williamson (2003). Corporate Governance and
the Home Bias. Journal of Financial and Quantitative Analysis, 38 (1): 87-110.
Das, S. and S. M. Saudagaran (1998). Accuracy, Bias, and Dispersion in Analysts' Earnings
Forecasts: The Case of Cross-Listed Foreign Firms. Journal of International Financial
Management and Accounting, 9 (1): 16-33.
Datar, V. T., N. Y. Naik and R. Radcliffe (1998). Liquidity and Stock Returns: An Alternative
Test. Journal of Financial Markets, 1 (2): 203-219.
De Long, J. B., Shleifer, A., Summers, L. H. and Waldmann, R. J. (1990). The Economic
Consequences of Noise Traders. NBER Working paper.
Derrien, F. (2005). IPO Pricing in “Hot” Market Conditions: Who Leaves Money on the Table?
The Journal of Finance, 60 (1): 487-521.
Diamond, D. and R. Verrecchia (1991). Disclosure, Liquidity and the Cost of Capital. The
Journal of Finance, 46 (4): 1325-1359.
Djankov, S., R. La Porta, F. Lopez-de-Silanes and A. Shleifer (2008). The Law and Economics
of Self-Dealing. Journal of Financial Economics, 88 (3): 430-465.
Doidge, C. (2004). U.S. Cross-Listings and the Private Benefits of Control: Evidence from
Dual-Class Firms. Journal of Financial Economics, 72 (3): 519-553.
Doidge, C., G. A. Karolyi and R. M. Stulz (2004). Why Are Foreign Firms Listed in the U.S.
Worth More? Journal of Financial Economics, 71 (2): 205-238.
Doidge, C., G. A. Karolyi and R. M. Stulz (2009a). Has New York Become Less Competitive in
Global Markets? Evaluating Foreign Listing Choice over Time. Journal of Financial
Economics, 91 (3): 253-277.
Doidge, C., G. A. Karolyi, K. V. Lins, D. P. Miller, and R. M. Stulz (2009b). Private Benefits of
Control, Ownership, and the Cross-listing Decision. The Journal of Finance, 64 (1): 425-
466.
Domowitz, I. (2002). Liquidity, Transaction Costs, and Reintermediation in Electronic Markets.
Journal of Financial Services Research, 22 (1-2): 141-157.
Domowitz, I., Glen, J., Madhavan, A. (1998). International Cross-Listing and Order Flow
Migration: Evidence from an Emerging Market. The Journal of Finance, 53 (6): 2001-
2027.

282
Domowitz, I., J. Glen and A. Madhavan (2001). Liquidity, Volatility, and Equity Trading Costs
across Countries and over Time. International Finance, 4 (2): 221-255.
Donaldson, William H. (2005). Testimony Concerning the Impact of the Sarbanes-Oxley Act.
U.S. Securities and Exchange Commission.
Doukas, J. and L. N. Switzer (2000). Common Stock Returns and International Listing
Announcements: Conditional Tests of the Mild Segmentation Hypothesis. Journal of
Banking and Finance, 24 (3): 471-501.
Draper, P. and K. Paudyal (1995). Empirical Irregularities in the Estimation of Beta: The Impact
of Alternative Estimation Assumptions and Procedures. Journal of Business Finance and
Accounting, 22 (1): 157-177.
Draper, P. and K. Paudyal (2006). Acquisitions: Private versus Public. European Financial
Management, 12 (1): 57-80.
Draper, P. and K. Paudyal (2008). Information Asymmetry and Bidders' Gains. Journal of
Business Finance and Accounting, 35 (3-4): 376-405.
Durnev, A. R. T. and E. H. Kim (2005). To Steal or Not to Steal: Firm Attributes, Legal
Environment, and Valuation. The Journal of Finance, 60 (3): 1461-1493.
Durnev, A. A. and A. S. Nain (2007). Does Insider Trading Regulation Deter Private
Information Trading? International Evidence. Pacific-Basin Finance Journal, 15 (5): 409-
433.
Ellul, A. (2006). Ripples through Markets: Inter-Market Impacts Generated by Large Trades.
Journal of Financial Economics, 82 (1): 173-196.
Errunza, V. and E. Losq (1985). International Asset Pricing under Mild Segmentation: Theory
and Test. The Journal of Finance, 40 (1): 105-124.
Errunza, V. R. and D. P. Miller (2000). Market Segmentation and the Cost of Capital in
International Equity Markets. The Journal of Financial and Quantitative Analysis, 35 (4):
577-600.
Eun, C. S. and S. Janakiramanan (1986). A Model of International Asset Pricing with a
Constraint on the Foreign Equity Ownership. The Journal of Finance, 41 (4): 897-914.
Eun, C. S. and S. Sabherwal (2003). Cross-Border Listing and Price Discovery: Evidence from
US-Listed Canadian Stocks. The Journal of Finance, 58 (2): 549-575.
Fama, E. F. and K. R. French (1996). Multifactor Explanations of Asset Pricing Anomalies. The
Journal of Finance, 51 (1): 55-84.
Fanto, J. and Karmel, R. (1997). A Report on the Attitudes of Foreign Companies Regarding a
US Listing. Stanford Journal of Law, Business and Finance, 3 (1): 51-75.
Fernandes, N. and M. A. Ferreira (2008). Does International Cross-Listing Improve the
Information Environment. Journal of Financial Economics, 88 (2): 216-244.
Fernandes, N. and M. A. Ferreira (2009). Insider Trading Laws and Stock Price
Informativeness. Review of Financial Studies, 22 (5): 1845-1887.
Fernandes, N. and M. Giannetti (2009). On the Fortunes of Stock Exchanges and Their
Reversals: Evidence from Foreign Listings. CEPR Discussion Paper DP7308.

283
Fernandes, N., U. Lel, and D. Miller (2010). Escape from New York: The Market Impact of
Loosening Disclosure Requirements. Journal of Financial Economics, 95 (2): 129-147.
Ferreire, M. and P. Laux (2007). Corporate Governance, Idiosyncratic Risk and Information
Flow. The Journal of Finance, 62 (2): 951-989.
Fischer, P. E. (1992). Optimal Contracting and Insider Trading Restrictions. The Journal of
Finance, 47 (2): 673-694.
Foerster, S. R. and G. A. Karolyi (1993). International Listings of Stocks: The Case of Canada
and the US. Journal of International Business Studies, 24 (4): 763-784.
Foerster, S. R. and G. A. Karolyi (1998). Multimarket Trading and Liquidity: A Transaction
Data Analysis of Canada-US Inter-Listings. Journal of International Financial Markets,
Institutions and Money, 8 (3-4): 393-412.
Foerster, S. R. and G. A. Karolyi (1999). The Effects of Market Segmentation and Investor
Recognition on Asset Prices: Evidence from Foreign Stocks Listing in the United States.
The Journal of Finance, 54 (3): 981-1013.
Forster, M. M. and T. J. George (1995). Trading Hours, Information Flow, and International
Cross-Listing. International Review of Financial Analysis, 4 (1): 19-34.
Fraser, P. and O. Oyefeso (2005). US, UK and European Stock Market Integration. Journal of
Business Finance and Accounting, 32 (1): 161-181.
Fratzscher, M. (2002). Financial Market Integration in Europe: on the Effects of EMU on Stock
Markets. International Journal of Finance and Economics, 7 (3): 165-193.
Freedman, R. (1989). A Theory of the Impact of International Cross-Listing. Stanford
University Working paper.
Freeman, R. N. (1987). The Association between Accounting Earnings and Security Returns for
Large and Small Firms. Journal of Accounting and Economics, 9 (2): 195-228.
French, K. R. and R. Roll (1986). Stock Return Variances: The Arrival of Information and the
Reaction of Traders. Journal of Financial Economics, 17 (1): 5-26.
Frésard, L. and C. Salva (2010). The value of excess cash and corporate governance: Evidence
from US cross-listings. Journal of Financial Economics, 98 (2): 359-384.
Froot, K., A. Perold and J. Stein (1992). Shareholder Trading Practices and Corporate
Investment Horizons. Journal of Applied Corporate Finance, 5 (2): 42-58.
Fuerst, O. (1998). A Theoretical Analysis of the Investor Protection Regulations Argument for
Global Listing of Stocks. Yale School of Management Working paper.
Galati, G. and K. Tsatsaronis (2003). The Impact of the Euro on Europe's Financial Markets.
Financial Markets, Institutions and Instruments, 12 (3): 165-221.
Glosten, L. and P. Milgrom (1985). Bid, Ask and Transaction Prices in a Specialist Model with
Heterogeneously Informed Traders. Journal of Financial Economics, 14 (1): 71-100.
Glosten, L. R. and L. E. Harris (1988). Estimating the Components of the Bid/Ask Spread.
Journal of Financial Economics, 21 (1): 123-142.

284
Gozzi, J.C., R. Levine and S.L. Schmukler (2008). Internationalization and the Evolution of
Corporate Valuation. Journal of Financial Economics, 88 (3): 607-632.
Greene, W. H. (2008). Econometric Analysis. 6th edition. Upper Saddle River, NJ: Pearson/
Prentice-Hall.
Gregoriou, A., C. Ioannidis and L. Skerratt (2005). Information Asymmetry and the Bid-Ask
Spread: Evidence from the UK. Journal of Business Finance and Accounting, 32 (9-10):
1801-1826.
Grinblatt, M. and M. Keloharju (2000). The Investment Behavior and Performance of Various
Investor Types: A Study of Finland’s Unique Data Set. Journal of Financial Economics, 55
(1): 43-67.
Grinblatt, M. and M. Keloharju (2001). How Distance, Language, and Culture Influence
Stockholdings and Trades. The Journal of Finance, 57 (3): 1053-1073.
Guenther, D. A. and D. Young (2000). The Association between Financial Accounting
Measures and Real Economic Activity: a Multinational Study. Journal of Accounting and
Economics, 29 (1): 53-72.
Hail, L. and C. Leuz (2009). Cost of Capital Effects and Changes in Growth Expectations
around U.S. Cross-Listings. Journal of Financial Economics, 93 (3): 428-454.
Halling, M., Pagano, M., Randl, O. and Zechner, J. (2008). Where is the Market? Evidence
from Cross-Listings in the US. The Review of Financial Studies, 21 (2): 725-761.
Hamet, J. (2002). Is Off-Board Trading Detrimental to Market Liquidity? The Financial
Review, 37 (3): 385-402.
Hardouvelis, G. A., D. Malliaropulos and R. Priestley (2006). EMU and European Stock Market
Integration. Journal of Business, 79 (1): 365-392.
Hasbrouck, J. and D. J. Seppi (2001). Common Factors in Prices, Order Flows, and Liquidity.
Journal of Financial Economics, 59 (3): 383-411.
Healy, P. M., A. P. Hutton and K. G. Palepu (1999). Stock Performance and Intermediation
Changes Surrounding Sustained Increases in Disclosure. Contemporary Accounting
Research, 16 (3): 485-520.
Heckman, J. (1979). Sample Selection Bias as a Specification Error. Econometrica, 47 (1): 153-
161.
Helflin, F. and K. W. Shaw (2000). Blockholder Ownership and Market Liquidity. Journal of
Financial and Quantitative Analysis, 35 (4): 621-633.
Heflin, F., K. W. Shaw and J. J. Wild (2000). Disclosure Quality and Market Liquidity. SSRN
working paper.
Henderson, B.J., N. Jegadeesh and M.S. Weisbach (2006). World Markets for Raising New
Capital. Journal of Financial Economics, 82 (1): 63-101.
Hope, O.-K., T. Kang, and Y. Zang (2007). Bonding to the Improved Disclosure Environment
in the US: Firms' Listing Choices and their Capital Market Consequences. Journal of
Contemporary Accounting and Economics 3 (1): 1-33.

285
Howe, J. S. and J. Madura (1990). The Impact of International Listing on Risk Implications for
Capital Market Integration. Journal of Banking and Finance, 14 (6): 1133-1142.
Howe, J. S. and K. P. Ragan (2002). Price Discovery and the International Flow of Information.
Journal of International Financial Markets, Institutions and Money, 12 (3): 201-215.
Howe, J. S. and K. Kelm (1987). The Stock Price Impacts of Overseas Listings. Financial
Management, 16 (3): 51-56.
Huang, R. D. and H. R. Stoll (2001). Tick Size, Bid-Ask Spreads, and Market Structure.
Journal of Financial and Quantitative Analysis, 36 (4): 503-522.
Huberman, G. (2001). Familiarity Breeds Investment. Review of Financial Studies, 14 (3): 659-
680.
Huddart, S., J. S. Hughes and M. K. Brunnermeier (1999). Disclosure Requirements and Stock
Exchange Listing Choice in an International Context. Journal of Accounting and
Economics, 26 (1-3): 237-269.
Hughes, P. and E. Zargar (2006). Exchange Demutualization. Blakes, Cassels and Graydon
LLP.
Jacoby, G., D. J. Fowler and A. A. Gottesman (2000). The Capital Asset Pricing Model and the
Liquidity Effect: a Theoretical Approach. Journal of Financial Markets, 3 (1): 69-81.
Jain, P. K. (2005). Financial Market Design and the Equity Premium: Electronic versus Floor
Trading. The Journal of Finance, 60 (6): 2955-2985.
Jayakumar, V. (2002). Impact of International Cross-Listing on Local Exchanges: Evidence
from Chile. International Review of Finance, 3 (3-4): 189-211.
Jayaraman, N., K. Shastri and K. Tandon (1993). The Impact of International Cross Listings on
Risk and Return: The Evidence from American Depository Receipts. Journal of Banking
and Finance, 17 (1): 91-103.
Jenkinson, T. and T. Ramadorai (2007). Do Investors Value High Levels of Regulation?
University of Oxford, Working paper.
Jones, C. M., G. Kaul and M. L. Lipson (1994). Information, Trading, and Volatility. Journal of
Financial Economics, 36 (1): 127-154.
Jorion, P. and E. Schwartz (1986). Integration vs. Segmentation in the Canadian Stock Market.
The Journal of Finance, 41 (3): 603-614.
Kadlec, G. B. and J. J. McConnell (1994). The Effect of Market Segmentation and Illiquidity on
Asset Prices: Evidence from Exchange Listings. The Journal of Finance, 49 (2): 611-636.
Kang, J.-K. and R. M. Stulz (1997). Why is There a Home Bias? An Analysis of Foreign
Portfolio Equity Ownership in Japan. Journal of Financial Economics, 46 (1): 3-28.
Karolyi, G. A. (1998). Why Do Companies List Shares Abroad?: A Survey of the Evidence and
Its Managerial Implications. Financial Markets, Institutions and Instruments, 7 (1): 1-60.
Karolyi, G. A. (2006). The World of Cross-Listings and Cross-Listings of the World:
Challenging Conventional Wisdom. Review of Finance, 10 (1): 99-152.

286
Karpoff, J. M. (1987). The Relation between Price Changes and Trading Volume: A Survey.
The Journal of Financial and Quantitative Analysis, 22 (1): 109-126.
Kaufmann, D., A. Kraay and M. Mastruzzi (2005). Governance Matters IV: Governance
Indicators for 1996-2004. The World Bank Institute.
Khurana, K., Martin X. and Periera R. (2008). Cross-Listing and Firm Growth. Review of
Finance, 12 (2): 293-322.
King, M. R. and D. Segal (2004). International Cross-Listing and the Bonding Hypothesis. Bank
of Canada Working Paper No. 2004-17.
King, M.R. and D. Segal (2009). The Long-Term Effects of Cross-listing, Investor Recognition,
and Ownership Structure on Valuation. Review of Financial Studies, 22 (6): 2393-2421.
King, M. R. and U. R. Mittoo (2007). What Companies Need to Know About International
Cross-Listing. Journal of Applied Corporate Finance, 19 (4): 60-74.
Ko, K., I. Lee and K. Yun (1997). Foreign Listings, Firm Value, and Volatility: The Case of
Japanese Firms' Listings on the US Stock Markets. Japan and the World Economy, 9 (1):
57-69.
Koedijk, K. G. and M. A. Van Dijk (2004). The Cost of Capital of Cross-listed Firms. European
Financial Management, 10 (3): 465-486.
Korajczyk, R. A. and R. Sadka (2008). Pricing the Commonality across Alternative Measures of
Liquidity. Journal of Financial Economics, 87 (1): 45-72.
Krishnamurti, C., J. M. Sequeira and F. Fangjian (2003). Stock Exchange Governance and
Market Quality. Journal of Banking and Finance, 27 (9): 1859-1878.
Krishnamurti, C., A. Sevic and Z. Sevic (2005). Voluntary Disclosure, Transparency, and
Market Quality: Evidence from Emerging Market ADRs. Journal of Multinational
Financial Management, 15 (4-5): 435-454.
Kryzanowski, L. and S. Lazrak (2009). Liquidity Minimization and Cross-Listing Choice:
Evidence Based on Canadian Shares Cross-Listed on the U.S. Venues. Journal of
International Financial Markets, Institutions and Money, 19 (3): 550-564.
Kurtzman, J., G. Yago and T. Phumiwasana (2004). The Opacity Index 2004: The Global Costs
of Opacity. MIT Sloan Management Review.
Kyle, A. S. (1985). Continuous Auctions and Insider Trading. Econometrica, 53 (6): 1315-1335.
Lang, M. and R. Lundholm (1993). Cross-Sectional Determinants of Analyst Ratings of
Corporate Disclosures. Journal of Accounting Research, 31 (2): 246-271.
Lang, M. H., K. V. Lins and D. P. Miller (2003a). ADRs, Analysts, and Accuracy: Does Cross-
Listing in the United States Improve a Firm's Information Environment and Increase
Market Value? Journal of Accounting Research, 41 (2): 317-345.
Lang, M., J. S. Raedy and M. H. Yetman (2003b). How Representative Are Firms That Are
Cross-Listed in the United States? An Analysis of Accounting Quality. Journal of
Accounting Research, 41 (2): 363-386.
La Porta, R., F. Lopez-de-Silanes, A. Shleifer and R. W. Vishny (1998). Law and Finance.
Journal of Political Economy, 106 (6): 1113-1155.

287
La Porta, R., F. Lopez-de-Silanes, A. Shleifer and R. W. Vishny (2000). Investor Protection and
Corporate Governance. Journal of Financial Economics, 58 (1-2): 3-27.
La Porta, R., F. Lopez-de-Silanes, Shleifer, A. and Vishny, R. W. (2002). Investor Protection
and Corporate Valuation. The Journal of Finance, 57 (3): 1147 - 1170.
Lau, S. T., J. D. Diltz and V. P. Apilado (1994). Valuation Effects of International Stock
Exchange Listings. Journal of Banking and Finance, 18 (4): 743-755.
Lee, I. (1991). The Impact of Overseas Listings on Shareholder Wealth: The Case of the
London and Toronto Stock Exchanges. Journal of Business Finance and Accounting, 18
(4): 583-592.
Lee, D. (2003). Why Does Shareholder Wealth Increase When Foreign Firms Announce Their
Listing in the U.S.?, The Ohio State University working paper.
Lel, U. and D. P. Miller (2008). International Cross-Listing, Firm Performance, and Top
Management Turnover: A Test of the Bonding Hypothesis. The Journal of Finance, 63
(4): 1897-1937.
Leuz, C. (2003). IAS versus U.S. GAAP: Information Asymmetry-Based Evidence from
Germany's New Market. Journal of Accounting Research, 41 (3): 445-472.
Leuz, C. and R. E. Verrecchia (2000). The Economic Consequences of Increased Disclosure.
Journal of Accounting Research, 38 (Supplement issue: Studies on Accounting Information
and the Economics of the Firm): 91-124.
Lins K. V., Deon, S. and Zenner, M. (2005). Do Non-U.S. Firms Issue Equity on U.S. Stock
Exchanges to Relax Capital Constraints? Journal of Financial and Quantitative Analysis,
40 (1): 109-133.
Litvak, K. (2007). The Effect of the Sarbanes-Oxley Act on Non-US Companies Cross-Listed in
the US. Journal of Corporate Finance, 13 (2-3): 195-228.
Litvak, K. (2008). The Long-Term Effect of the Sarbanes-Oxley Act on Cross-Listing Premia.
European Financial Management, 14 (5): 875-920.
Ljungqvist, A. and W. J. Wilhelm Jr. (2003). IPO Pricing in the Dot-Com Bubble. The Journal
of Finance, 58 (2): 723-752.
Lo, A. W. and J. Wang (2000). Trading Volume: Definitions, Data Analysis, and Implications
of Portfolio Theory. Review of Financial Studies, 13 (2): 257-300.
Lo, A. W. and J. Wang (2009). Stock Market and Trading Volume. The Handbook of Financial
Econometrics. Y. AIt-Sahalia and L. Hansen. New York, North-Holland. 13: 257-300.
Marosi, A. and N. Massoud (2008). You Can Enter but You Cannot Leave…: U.S. Securities
Markets and Foreign Firms. The Journal of Finance, 63 (5): 2477-2506.
Martell, T. F., Rodriguez, L. Jr. and Webb, G. P. (1999). The Impact of Listing Latin American
ADRs on the Risk and Returns of the Underlying Shares. Global Finance Journal, 10 (2):
147-160.
Martens, M. and D. van Dijk (2007). Measuring Volatility with the Realized Range. Journal of
Econometrics, 138 (1): 181-207.

288
Maug, E. (2002). Insider Trading Legislation and Corporate Governance. European Economic
Review, 46 (9): 1569-1597.
Menkveld, A. J. (2008). Splitting Orders in Overlapping Markets: A Study of Cross-Listed
Stocks. Journal of Financial Intermediation, 17 (2): 145-174.
Menyah, K. and K. Paudyal (2000). The Components of Bid-Ask Spreads on the London Stock
Exchange. Journal of Banking and Finance, 24 (11): 1767-1785.
Merton, R. C. (1987). A Simple Model of Capital Market Equilibrium with Incomplete
Information. The Journal of Finance, 42 (3): 483-510.
Miller, D. P. (1999). The Market Reaction to International Cross-Listings: Evidence from
Depositary Receipts. Journal of Financial Economics, 51 (1): 103-123.
Mittoo, U. R. (1992). Additional Evidence on Integration in the Canadian Stock Market. The
Journal of Finance, 47 (5): 2035-2054.
Mittoo, U. R. (1997). Cross-country listing and trading volume: Evidence from the Toronto and
Vancouver stock exchanges. Journal of International Financial Management and
Accounting, 8 (3): 147-174.
Mittoo, U. R. (2003). Globalization and the Value of US Listing: Revisiting Canadian Evidence.
Journal of Banking and Finance, 27 (9): 1629-1661.
Moloney, N. (2007). Large-Scale Reform of Investor Protection Regulation: The European
Union Experience. Macquarie Journal of Business Law, 8 (4): 147-178.
Moulton, P. C. and L. Wei (2009). A Tale of Two Time Zones: The Impact of Substitutes on
Cross-Listed Stock Liquidity. Journal of Financial Markets, 12 (4): 570-591.
Ndubizu, G. A. (2007). Do Cross-Border Listing Firms Manage Earnings or Seize a Window of
Opportunity? Accounting Review, 82 (4): 1009-1030.
Noronha, G., A. Sann and S. M. Saudagaran (1996). Testing for Micro-Structure Effects of
International Dual Listings Using Intraday Data. Journal of Banking and Finance, 20 (6):
965-983.
O'Connor, T. G. (2009). Does Cross Listing in the USA Really Enhance the Value of Emerging
Market Firms? Review of Accounting and Finance, 8 (3): 308 – 336.
Ofek, E. and M. Richardson (2003). DotCom Mania: The Rise and Fall of Internet Stock Prices.
The Journal of Finance, 58 (3): 1113-1137.
O'Hara, M. (1995). Market Microstructure Theory. Blackwell Publishing.
Pagano, M. (1989). Trading Volume and Asset Liquidity. Quarterly Journal of Economics, 104
(2): 255-274.
Pagano, M., O. Randl, A. A. Röell, and J. Zechner (2001). What Makes Stock Exchanges
Succeed? Evidence from Cross-Listing Decisions. European Economic Review, 45 (4-6):
770-782.
Pagano, M., A. A. Roell, and J. Zechner (2002). The Geography of Equity Listing: Why Do
Companies List Abroad? The Journal of Finance, 57 (6): 2651-2694.

289
Parkinson, M. (1980). The Extreme Value Method for Estimating the Variance of the Rate of
Return. The Journal of Business, 53 (1): 61-65.
Petersen, M. A. (2009). Estimating Standard Errors in Finance Panel Data Sets: Comparing
Approaches. Review of Financial Studies, 22 (1): 435-480.
Portes, R. and H. Rey (2005). The Determinants of Cross-border Equity Flows. Journal of
International Economics, 65 (2): 269-296.
Poser, N. (2001). The Stock Exchanges of the United States and Europe: Automation,
Globalization, and Consolidation. University of Pennsylvania Journal of International
Economic Law 22 (3): 497-540.
Pulatkonak, Melek and Sofianos, George (1999). The Distribution of Global Trading in NYSE-
Listed Non-US Stocks. NYSE Working paper 99-03.
Rajan, R. G. and L. Zingales (2003). The Great Reversals: the Politics of Financial
Development in the Twentieth Century. Journal of Financial Economics, 69 (1): 5-50.
Reese, W. A. and M. S. Weisbach (2002). Protection of Minority Shareholder Interests, Cross-
Listings in the United States, and Subsequent Equity Offerings. Journal of Financial
Economics, 66 (1): 65-104.
Roll, R. (1984). A Simple Implicit Measure of the Effective Bid-Ask Spread in an Efficient
Market. The Journal of Finance, 39 (4): 1127-1139.
Roosenboom, P. and M. A. van Dijk (2009). The Market Reaction to Cross-Listings: Does the
Destination Market Matter? Journal of Banking and Finance, 33 (10): 1898-1908.
Rubin, A. (2007). Ownership Level, Ownership Concentration and Liquidity. Journal of
Financial Markets, 10 (3): 219-248.
Sabherwal, S. (2007). The U.S. Share of Trading Volume in Cross-Listings: Evidence from
Canadian Stocks. The Financial Review, 42 (1): 23-51.
Salva, C. (2003). Foreign Listings, Corporate Governance, and Equity Valuations. Journal of
Economics and Business, 55 (5-6): 463-485.
Sarkissian, S. and M. J. Schill (2004). The Overseas Listing Decision: New Evidence of
Proximity Preference. Review of Financial Studies, 17 (3): 769-809.
Sarkissian, S. and M. J. Schill (2009a). Are There Permanent Valuation Gains to Overseas
Listing? Review of Financial Studies, 22 (1): 371-412.
Sarkissian, S. and M. J. Schill (2009b). Cross-Listing Waves. Working paper.
Schwert, G. W. (1989). Why Does Stock Market Volatility Change Over Time? The Journal of
Finance, 44 (5): 1115-1153.
Serifsoy, B. (2008). Demutualization, Outsider Ownership, and Stock Exchange performance:
Empirical Evidence. Economics of Governance, 9 (4): 305-339.
Serra, A. P. (1999). Dual-Listings on International Exchanges: The Case of Emerging Markets'
Stocks. European Financial Management, 5 (2): 165-202.
Shleifer, A. and R. W. Vishny (1997). A Survey of Corporate Governance. The Journal of
Finance, 52 (2): 737-783.

290
Siegel, J. (2005). Can Foreign Firms Bond themselves Effectively by Renting US Securities
Laws? Journal of Financial Economics, 75 (2): 319-359.
Silva, A. C. and G. A. Chávez (2008). Cross-Listing and Liquidity in Emerging Market Stocks.
Journal of Banking and Finance, 32 (3): 420-433.
Smith, K. and G. Sofianos (1997). The Impact of an NYSE Listing on the Global Trading of
Non-U.S. Stocks. NYSE Working paper 97-02.
Stapleton, R. C. and M. G. Subrahmanyam (1977). Market Imperfections, Capital Market
Equilibrium and Corporate Finance. The Journal of Finance, 32 (2): 307-319.
Statman, M., S. Thorley and K. Vorkink (2006). Investor Overconfidence and Trading Volume.
Review of Financial Studies, 19 (4): 1531-1565.
Stoll, H. (1978). The Supply of Dealer Services in Security Markets. The Journal of Finance, 33
(4): 1133-1151.
Stoll, H. R. (1989). Inferring the Components of the Bid-Ask Spread: Theory and Empirical
Tests. The Journal of Finance, 44 (1): 115-134.
Stoll, H. R. (2001). Market Fragmentation. Financial Analysts Journal, 57 (4): 16-20.
Stulz, R. M. (1981). On the Effects of Barriers to International Investment. The Journal of
Finance, 36 (4): 923-934.
Stulz, R. M. (1999). Globalization, Corporate Finance, and the Cost of Capital. Journal of
Applied Corporate Finance, 12 (3): 8-25.
Tobin, J. (1959). On the Predictive Value of Consumer Intentions and Attitudes. The Review of
Economics and Statistics, 41 (1): 1-11.
Tolmunen, P. and S. Torstila (2005). Cross-Listings and M&A Activity: Transatlantic Evidence.
Financial Management, 34 (1): 123-142.
Torabzadeh, K. M., W. J. Bertin and Zivney, T. L. (1992). Valuation Effects of International
Listings. Global Finance Journal, 3 (2): 159.
Varela, O. and S. H. Lee (1993). International Listings, The Security Market Line and Capital
Market Disintegration: The Case of US Listings on the London Stock Exchange. Journal of
Business Finance and Accounting, 20 (6): 843-863.
Venkataraman, K. (2001). Automated versus Floor Trading: An Analysis of Execution Costs on
the Paris and New York Exchanges. The Journal of Finance, 56 (4): 1445-1485.
Voth, H.J. (2004). Competition from OTC Cash Equity Trading and the Pricing Behaviour of
Stock Exchanges. CEPR paper.
Wang, J. (1993). A Model of Intertemporal Asset Prices under Asymmetric Information. Review
of Economic Studies, 60 (2): 249-282.
Welch, I. (2004). Capital Structure and Stock Returns. Journal of Political Economy, 112 (1):
106-131.
Welker, M. (1995). Disclosure Policy, Information Asymmetry, and Liquidity in Equity
Markets. Contemporary Accounting Research, 11 (2): 801-827.

291
Werner, L. and A. Kleidon (1996). US and UK Trading of British Cross-Listed Stocks: and
Intraday Analysis of Market Integration. Review of Financial Studies, 9 (2): 619-664.
White, H. (1980). A Heteroskedasticity-Consistent Covariance Matrix Estimator and a Direct
Test for Heteroskedasticity. Econometrica, 48 (4): 817-838.
Wojcik, D., G. L. Clark, and R. Bauer (2005). Corporate Governance and Cross-listing:
Evidence from European Countries. Limburg Institute of Financial Economics Working
paper.
Wooldridge, J. M. (2009). Introductory Econometrics: A Modern Approach, South Western,
Cengage Learning.
Wu, C. and C. C. Y. Kwok (2002). Why Do US Firms Choose Global Equity Offerings?
Financial Management, 31 (2): 47-65.
Yallapragada, R. R., A. Toma and Roe C. W. (2008). One of the Prime Beneficiaries Of The
Sarbanes – Oxley Act of 2002: The London Stock Exchange!. International Business and
Economics Research Journal, 7 (10): 67-72.
Zhang, I. X. (2007). Economic Consequences of the Sarbanes-Oxley Act of 2002. Journal of
Accounting and Economics, 44 (1-2): 74-115.
Zingales, L. (2007). Is the U.S. Capital Market Losing its Competitive Edge? ECGI Finance
Working Paper No. 192/2007.