Preparation and characterization of bifunctional, Fe 3O 4/ZnO nanocomposites and their use as...
9
Preparation and characterization of bifunctional Ti–Fe kaolinite composite for Cr(VI) removal Hussain Fida, Sheng Guo, Gaoke Zhang ⇑ School of Resources and Environmental Engineering, Wuhan University of Technology, Wuhan 430070, China article info Article history: Received 2 October 2014 Accepted 11 November 2014 Available online 18 November 2014 Keywords: Adsorption Clay Chromium Ti–Fe kaolinite composite Photocatalytic reduction abstract A novel bifunctional Ti–Fe kaolinite composite with excellent adsorption and photocatalytic properties was synthesized by a simple precipitation method. X-ray diffraction analysis and high-resolution trans- mission electron microscope analysis confirmed the existence of rutile phase TiO 2 and amorphous iron in the composite. The specific surface area of the Ti–Fe kaolinite composite is 5.5 times higher than that of the original kaolinite. The composite was used as an adsorbent as well as photocatalyst for Cr(VI) removal. The results indicate that the low pH is favorable to the Cr(VI) removal by the composite and the removal rate of Cr(VI) reached 87% at pH 3.0. Visible light irradiation obviously increased the removal of Cr(VI) by the composite and greatly shortened reaction equilibrium time, which may be attributed to the photocatalytic reduction of Cr(VI) to Cr(III) by TiO 2 associated with simultaneous redox cycle of Fe(III)/Fe(II). Various common co-existing ions did not show obvious effects on the removal of Cr(VI) by the composite. The composite exhibited very high stability for the Cr(VI) removal. The adsorption models and thermodynamics of Cr(VI) onto the composite were studied. Ó 2014 Elsevier Inc. All rights reserved. 1. Introduction Chromium is widely distributed in the earth’s crust, and is extensively used in many industries including paints, dyes, metal plating, automobile spare parts, stainless steel, leather tanned and petroleum refining. Hexavalent chromium Cr(VI) has been reported to be toxic as well as carcinogenic [1,2]. Chronic exposure to high level of chromium may cause serious health problems, including respiratory tract, stomach, small intestine, male repro- ductive system and developmental disorders in children [3]. Max- imum permissible intake level of chromium in drinking water set by World Health Organization (WHO) is 0.05 mg/L [4]. Due to its high toxicity and a potential carcinogenic activity, removal of Cr(VI) from aqueous media has attracted strong environmental concerns. Many technologies such as chemical precipitation, phy- toextraction, electrodialysis, reverse osmosis, ion exchange, mem- brane filtration and adsorption are widely used for removal of chromium(VI) from water and wastewater [5]. Among these, adsorption seems to be more promising because of its cost effec- tiveness, high efficiency, ease of recovery and reusability [6]. Sev- eral conventional as well as nonconventional materials including red mud [7], coconut coirpith [8], sewage sludge [9], fly ash [10], biomass [11], zeolites and modified zeolites [12], tree fern [13], bone char [14], clay and modified clay [15], have been used as adsorbent for chromium removal. Clays and their modified forms have been employed extensively for removal of chromium because of the low-cost and higher effi- ciency [16]. Natural and Na-purified smectite and kaolinite were employed for Cr(III) removal, adsorption capacity was 117.5 and 61.4 mg/g, respectively for natural and modified clays [17]. Lang- muir adsorption capacities for Cr(III) on montmorillonite modified by poly(hydroxoaluminium) and cetyltrimethylammonium bro- mide were 26.67 and 25.51 mg/g, respectively [18]. Wu et al. [19] reported Ca-montmorillonite modified with humic acid for the adsorption of Cr(III). Turkish montmorillonite showed higher adsorption capacity for Cr(VI) removal at pH 1.0 [20]. Many mod- ified forms of kaolinite including acid-activated, polyoxozirconium, and tetrabutylammonium kaolinite, were also investigated as a potential adsorbents for Cr(VI) in aqueous medium [21]. Modified organo-bentonite was also found to be an efficient adsorbent for the removal of Cr(VI) [22]. However, to the best of our knowledge, there is no report regarding the preparation and application of the Ti–Fe kaolinite composite for Cr(VI) removal to date. In this work, we report the preparation of the novel bifunctional Ti–Fe kaolinite composite by a facile precipitation method. For the first time, this composite was used as adsorbent and photocatalyst for the removal of Cr(VI). The effects of the Fe/Ti ratio in the http://dx.doi.org/10.1016/j.jcis.2014.11.023 0021-9797/Ó 2014 Elsevier Inc. All rights reserved. ⇑ Corresponding author. Fax: +86 27 87887445. E-mail address: [email protected] (G. Zhang). Journal of Colloid and Interface Science 442 (2015) 30–38 Contents lists available at ScienceDirect Journal of Colloid and Interface Science www.elsevier.com/locate/jcis
-
Upload
independent -
Category
Documents
-
view
2 -
download
0
Transcript of Preparation and characterization of bifunctional, Fe 3O 4/ZnO nanocomposites and their use as...
Journal of Colloid and Interface Science 442 (2015) 30–38
Contents lists available at ScienceDirect
Journal of Colloid and Interface Science
www.elsevier .com/locate / jc is
Preparation and characterization of bifunctional Ti–Fe kaolinitecomposite for Cr(VI) removal
http://dx.doi.org/10.1016/j.jcis.2014.11.0230021-9797/� 2014 Elsevier Inc. All rights reserved.
⇑ Corresponding author. Fax: +86 27 87887445.E-mail address: [email protected] (G. Zhang).
Hussain Fida, Sheng Guo, Gaoke Zhang ⇑School of Resources and Environmental Engineering, Wuhan University of Technology, Wuhan 430070, China
a r t i c l e i n f o
Article history:Received 2 October 2014Accepted 11 November 2014Available online 18 November 2014
Keywords:AdsorptionClayChromiumTi–Fe kaolinite compositePhotocatalytic reduction
a b s t r a c t
A novel bifunctional Ti–Fe kaolinite composite with excellent adsorption and photocatalytic propertieswas synthesized by a simple precipitation method. X-ray diffraction analysis and high-resolution trans-mission electron microscope analysis confirmed the existence of rutile phase TiO2 and amorphous iron inthe composite. The specific surface area of the Ti–Fe kaolinite composite is 5.5 times higher than that ofthe original kaolinite. The composite was used as an adsorbent as well as photocatalyst for Cr(VI)removal. The results indicate that the low pH is favorable to the Cr(VI) removal by the composite andthe removal rate of Cr(VI) reached 87% at pH 3.0. Visible light irradiation obviously increased the removalof Cr(VI) by the composite and greatly shortened reaction equilibrium time, which may be attributed tothe photocatalytic reduction of Cr(VI) to Cr(III) by TiO2 associated with simultaneous redox cycle ofFe(III)/Fe(II). Various common co-existing ions did not show obvious effects on the removal of Cr(VI)by the composite. The composite exhibited very high stability for the Cr(VI) removal. The adsorptionmodels and thermodynamics of Cr(VI) onto the composite were studied.
� 2014 Elsevier Inc. All rights reserved.
1. Introduction
Chromium is widely distributed in the earth’s crust, and isextensively used in many industries including paints, dyes, metalplating, automobile spare parts, stainless steel, leather tannedand petroleum refining. Hexavalent chromium Cr(VI) has beenreported to be toxic as well as carcinogenic [1,2]. Chronic exposureto high level of chromium may cause serious health problems,including respiratory tract, stomach, small intestine, male repro-ductive system and developmental disorders in children [3]. Max-imum permissible intake level of chromium in drinking water setby World Health Organization (WHO) is 0.05 mg/L [4]. Due to itshigh toxicity and a potential carcinogenic activity, removal ofCr(VI) from aqueous media has attracted strong environmentalconcerns. Many technologies such as chemical precipitation, phy-toextraction, electrodialysis, reverse osmosis, ion exchange, mem-brane filtration and adsorption are widely used for removal ofchromium(VI) from water and wastewater [5]. Among these,adsorption seems to be more promising because of its cost effec-tiveness, high efficiency, ease of recovery and reusability [6]. Sev-eral conventional as well as nonconventional materials includingred mud [7], coconut coirpith [8], sewage sludge [9], fly ash [10],
biomass [11], zeolites and modified zeolites [12], tree fern [13],bone char [14], clay and modified clay [15], have been used asadsorbent for chromium removal.
Clays and their modified forms have been employed extensivelyfor removal of chromium because of the low-cost and higher effi-ciency [16]. Natural and Na-purified smectite and kaolinite wereemployed for Cr(III) removal, adsorption capacity was 117.5 and61.4 mg/g, respectively for natural and modified clays [17]. Lang-muir adsorption capacities for Cr(III) on montmorillonite modifiedby poly(hydroxoaluminium) and cetyltrimethylammonium bro-mide were 26.67 and 25.51 mg/g, respectively [18]. Wu et al.[19] reported Ca-montmorillonite modified with humic acid forthe adsorption of Cr(III). Turkish montmorillonite showed higheradsorption capacity for Cr(VI) removal at pH 1.0 [20]. Many mod-ified forms of kaolinite including acid-activated, polyoxozirconium,and tetrabutylammonium kaolinite, were also investigated as apotential adsorbents for Cr(VI) in aqueous medium [21]. Modifiedorgano-bentonite was also found to be an efficient adsorbent forthe removal of Cr(VI) [22]. However, to the best of our knowledge,there is no report regarding the preparation and application of theTi–Fe kaolinite composite for Cr(VI) removal to date.
In this work, we report the preparation of the novel bifunctionalTi–Fe kaolinite composite by a facile precipitation method. For thefirst time, this composite was used as adsorbent and photocatalystfor the removal of Cr(VI). The effects of the Fe/Ti ratio in the

H. Fida et al. / Journal of Colloid and Interface Science 442 (2015) 30–38 31
composite, adsorption conditions and visible light irradiation onthe Cr(VI) removal by the composite were studied. A possible pho-tocatalytic mechanism for the reduction of Cr(VI) to Cr(III) sup-ported by XPS results was proposed.
2. Materials and methods
All reagents were analytical grade and used as received withoutany further purification. Deionized water was used throughout theexperiments. The original kaolinite sample used in this study wasobtained from Jiangsu Province (China) and was sieved through a325-mesh prior to its use in the experiments.
2.1. Preparation of the Ti–Fe kaolinite composite
The Ti–Fe kaolinite composite was synthesized in two steps. Inthe first step, 0.5 M NaHCO3 was added into the mixed solution ofTiCl4 and FeCl3 in different Ti4+/Fe3+ molar ratios (0.05:0.1, 0.1:0.1,0.2:0.1, 0.3:0.1, 0.1:0.2, 0.1:0.3 and 0.1:0.4) with constant stirring.Then, the as-obtained mixed solution was aged for 3 h at 55 �C andadded drop wise to the suspension of kaolinite (2 wt%) undervigorous stirring followed by aging for 24 h. The precipitate wascollected by filtration and washed with deionized water for severaltimes, until no chlorides were detected by AgNO3 test. Theas-obtained product was dried in oven at 105 �C for 12 h, andwas ground to a fine powder, which was hereinafter named as theTi–Fe kaolinite composite.
2.2. Characterization of the composite
The structure and crystallinity of the Ti–Fe kaolinite compositewere analyzed by powder X-ray diffraction (XRD) on a D/MAX-RBX-ray powder diffractometer (Rigaku, Japan) with Cu Ka radiation.The morphology of the Ti–Fe kaolinite composite was analyzed byscanning electron microscope (SEM) (JSM5610LV). High-resolutiontransmission electron microscopy (HRTEM) image was recordedwith a HRTEM at an accelerating voltage of 200 kV. The nitrogenadsorption/desorption isotherms were measured on an AUTO-SORB-1 nitrogen adsorption apparatus (Quantachrome, USA).X-ray photoelectron spectroscopy (XPS) analysis was carried outusing an ESCALAB II XPS system with a monochromatic Mg Kasource and a charge neutralizer. All binding energies were referredto the C 1s peak at 284.5 eV of the surface adventitious carbon.Peak deconvolution was performed using Gaussian–Lorentziancomponents after a Linear background subtraction. The FTIR spec-tra were collected by Nexus, Thermo Nicolet. Thermogravimetry(TG) analysis of the samples was carried out on a Netzsch STA449C Jupiter Aeolos (German) coupled to mass spectrometer witha heating rate of 5 �C/min under N2.
2.3. Adsorption studies
A definite amount 2 g/L (0.2 g) of the Ti–Fe kaolinite compositewas added into a flask with 100 mL of 50 mg/L Cr(VI) aqueous solu-tion for adsorption experiments. The same amount was maintainedthroughout the whole study unless otherwise specified. The flaskswere shaken on a shaker at 25 �C with speed of 190 rpm. After fil-tration, the concentration of Cr(VI) was determined using atomicabsorption spectrophotometer (AAS, Analytik Jena ZEEnit 700). Inorder to make a comparison, we took random samples fromadsorption experiment and analyzed Cr(VI) in the samples by1,5-diphenyl carbazide method at a wavelength of 540 nm usingvisible spectrophotometer and AAS method separately. The as-obtained results were comparable within 5% [23]. The pH of theCr(VI) solution was adjusted by adding 0.1 M NaOH or 0.1 M HCl
solution. The effect of common coexisting ions including sodium,potassium, iron, nitrate, chloride, sulfate and bicarbonate on theadsorption of Cr(VI) by the composite was also studied.
2.4. Adsorption isotherms
Adsorption isotherms are expressed in terms of the relationshipbetween the concentration of adsorbate in the solution and theamount adsorbed by the unit mass of the adsorbent at a constanttemperature. The isotherms models such as Langmuir, Freundlich,Tempkin and Dubinin–Radushkevich equations were applied toinvestigate the adsorption mechanism of Cr(VI) over the composite.
Langmuir equationCe
qe¼ 1
bQmþ 1
Qm
� �Ce ð1Þ
Freundlich isotherm log qe ¼ log Kf þ1n
log Ce ð2Þ
Tempkin equation qe ¼ BT ln AT þ BT ln Ce ð3Þ
Dubinin—Radushkevich qe ¼ Q d
� exp BD RT ln 1þ 1Ce
� �� �2 !
ð4Þ
2.5. Photocatalytic experiment
The photocatalytic activity of the as prepared Ti–Fe kaolinitecomposite was evaluated by the Cr(VI) removal from aqueous solu-tion under the visible light irradiation (300 W Dy lamp with a420 nm cutoff filter). In a typical experiment, 200 mg of the compos-ite was dispersed in 100 mL of 50 mg/L Cr(VI). During irradiation,2 mL of sample was taken at different time intervals and centrifugedimmediately to remove the composite particles. The residual con-centration of Cr(VI) in the supernatant was measured by AAS.
2.6. Desorption and regeneration of the adsorbent
For the desorption study, 200 mg of the composite was con-tacted with 100 mL of 50 mg/L Cr(VI) solution. After the adsorptionexperiment, the adsorbent was collected by filtration using0.45 lm millipore filter. Then it was transferred into 50 mL aque-ous solution with deionized water, 0.1 M NaCl, 0.1 M HNO3 and0.1 M HCl, respectively [24]. The mixtures were shaken at roomtemperature overnight, and the filtrates were analyzed to deter-mine the concentration of Cr(VI) after desorption, the same exper-iment was repeated for six times.
3. Results and discussion
3.1. Characterization of the Ti–Fe kaolinite composite
The Fe–Ti kaolinite composites with different Ti4+/Fe3+ molarratios (0.05:0.1, 0.1:0.1, 0.2:0.1, 0.3:0.1, 0.1:0.2, 0.1:0.3 and0.1:0.4) were prepared and their sorption capacity for Cr(VI) wasevaluated. As observed from Fig. 1, the increase of the Ti4+/Fe3+
molar ratio in the composite has no effect on the adsorption capac-ity of the composite. However, the adsorption capacity increasedfrom 21.05 to 24.8 mg/g with increasing the Fe3+ molar ratio inthe composite from 0.1 to 0.4. Meanwhile, the iron leaching ofthe composite showed an increase with increasing the Fe3+ molarratio. The composite with 1:1 molar ratio of Ti4+/Fe3+ was selectedfor further study because of its good adsorption capacity as well as

0.05:0.1 0.1:0.1 0.2:0.1 0.3:0.1 0.1:0.2 0.1:0.3 0.1:0.410
15
20
25
30
Adsorption capacity Leaching of iron
Ti4+/Fe3+ molar ratio in Ti-Fe kaolinite composite
Ads
orpt
ion
capa
city
(mg/
g)
0.1
0.2
0.3
0.4
0.5
Leaching of iron (mg/L)
Fig. 1. The Cr(VI) removal efficiency and iron leaching of the Ti–Fe kaolinitecomposite with different molar ratios of Ti4+/Fe3+ (conditions: adsorbent 2 g/L,Cr(VI) conc. 50 mg/L, pH 3.0, temperature 298 K).
4000 3500 3000 2500 2000 1500 1000 500
800 700 600 500 400
Tra
nsm
ittan
ce
Wavenumber (cm-1)
Kaolinite
Ti-Fe kaolinite
Tra
nsm
ittan
ce
Wave number (cm-1)
Kaolinite
Ti-Fe kaolinite
Fig. 3. FT-IR spectra of the original kaolinite and the Ti–Fe kaolinite composite.
32 H. Fida et al. / Journal of Colloid and Interface Science 442 (2015) 30–38
acceptable iron leaching. The content of Ti and Fe in the Ti–Fekaolinite composite was 13.96 and 8.90 wt%, respectively, asdetermined by ICP-OES.
The adsorption capacity of the Ti–Fe kaolinite composite wascompared with that of the original kaolinite, Ti-kaolinite, Fe-kao-linite and TiO2. The results in Fig. 2 indicate that adsorption rateof Cr(VI) by the Ti–Fe kaolinite composite reached 86.7%, whichis much higher that (all less than 56%) of the original kaolinite,Ti-kaolinite, Fe-kaolinite and TiO2. However, the adsorption effi-ciencies of the Ti–Fe and Ti–Fe kaolinite composite are comparable.The Cr(VI) removal efficiency was increased by 10% when kaolinitewas used as the support for Ti–Fe. Kaolinite is natural, abundant,environment friendly and cost-effective support for the Ti–Fe.Using kaolinite as a support makes Ti–Fe more efficient and eco-nomically feasible.
3.1.1. FT-IR adsorption spectraThe FT-IR spectra of the original kaolinite and the Ti–Fe kaolin-
ite composite are shown in Fig. 3. The spectrum of the originalkaolinite shows major absorption peaks at 3620–3695 cm�1 whichcorresponds to –OH stretching vibrations [25]. The band at1050 cm�1 could be ascribed to Si–O stretching vibrations. Strongabsorption bands at 902 and 540 cm�1 indicate OH and Si–O bend-ing frequencies [26]. The spectrum of the Ti–Fe kaolinite compositeshows similar absorption bands. However, the small peaks rangingfrom 800 to 400 cm�1 in the FTIR spectra of Ti–Fe kaolinite
0
15
30
45
60
75
90
% re
mov
al o
f Cr (
VI)
Ti-Fe Kaolinite
Ti-Fe
Ti-Kaolinite
TiO2
Fe-Kaolinite
Kaolinite
Fig. 2. The Cr(VI) removal efficiency of different materials (conditions: adsorbent2 g/L, Cr(VI) conc. 50 mg/L, pH 3.0, temperature 298 K).
composite disappeared completely as compared to that of the ori-ginal kaolinite. This indicates that the Ti–Fe kaolinite composite isnot a simple mixture of Ti oxide and Fe oxide, but a synergisticinteraction between Fe and Ti occurred during the synthesis [27].
3.1.2. XRD patternsThe XRD pattern of the original kaolinite exhibits the (001) and
(002) peaks of kaolinite at 2h/(planer distance) = 12.5�/7.19 and24.9�/3.58 Å, respectively (PDF No.: 78-1996), as shown in Fig. 4[28]. The decreased intensity of the (001) and (002) peaks of kao-linite in the Ti–Fe kaolinite composite can be attributed to the dis-tortion of the octahedral and tetrahedral structures in the kaolinitein the composite [29]. The new peaks at 2h = 27.5�, 37.0� and 41.3�in the composite corresponding to the planar distances 3.18, 2.83and 2.17 Å can be assigned to (110), (101) and (111) of rutilephase, respectively. The two new peaks at about 35.4�/2.53 and62�/1.49 Å in the XRD pattern of the Ti–Fe kaolinite compositewere observed, which could indicate the presence of poorlyordered 2-line ferrihydrite [30].
3.1.3. SEM and HRTEM imagesThe morphology of the original and Ti–Fe kaolinite composite
was studied by SEM analysis. The original kaolinite (Fig. 5a) exhib-its smooth surface and compose of the agglutinative flakes. Fig. 5b
10 20 30 40 50 60 70
* Ferrihydrite
*
R- Rutile phase of TiO2
Ti-Fe-Kaolinite
Kaolinite
R (111)R (101)R (110)
K (002)K (001)
2 Theta (degree)
*
Fig. 4. XRD patterns of the original kaolinite and the Ti–Fe kaolinite composite.

0.0 0.2 0.4 0.6 0.8 1.00
10
20
30
40
50
60
70
80
90
0 50 100 150 200 250 300 350
0.0000
0.0005
0.0010
0.0015
0.0020
Vol
ume
adso
rbed
(cm
3 g-1)
Relative pressure (p/p0)
Kaolinite Ti-Fe kaolinite composite
dV/d
log
(w) (
cm3 g-1
)
Pore diameter (nm)
Fig. 6. N2 adsorption–desorption isotherms and the pore size distributions plot ofkaolinite and the Ti–Fe kaolinite composite.
H. Fida et al. / Journal of Colloid and Interface Science 442 (2015) 30–38 33
shows that the Ti–Fe kaolinite composite has coarse surface withmany small particles. The phase structure of the Ti–Fe kaolinitecomposite was further demonstrated by HRTEM image, as shownin Fig. 5d. The lattice fringe spacings of 0.24 and 0.32 nm corre-spond to the (101) and (110) crystallographic planes of rutileTiO2 phase, respectively. These results are in well agreement withthat of the XRD analysis.
3.1.4. Nitrogen adsorption–desorptionNitrogen adsorption–desorption isotherms and the pore size
distributions plot of the kaolinite and Ti–Fe kaolinite compositeare displayed in Fig. 6. The BET specific surface area of the originalkaolinite (Table 1) was found to be 19.47 m2/g, which is very closeto that reported in the literature [31,32]. The pore volume and porediameter were 0.0047 cc/g and 11.3 nm, respectively. The BET spe-cific surface area of the Ti–Fe kaolinite composite reached108.2 m2/g, which is in favor of the adsorption of Cr(VI). This resultvery well interprets the Cr(VI) adsorption capacity of the originalkaolinite and the Ti–Fe kaolinite composite in Fig. 2.
3.1.5. Thermal analysisThermal behavior of the original kaolinite and Ti–Fe kaolinite
composite was investigated by TG/DSC analysis, which is given inFig. 7. The thermogram of the original kaolinite showed a minorweight loss below 100 �C and a major weight loss about 12%appeared between 490 and 520 �C. The thermal behavior of theTi–Fe kaolinite composite is analogous, however the weight lossassociated with dehydration is larger (4%) and the dehydroxylationprocess is smaller (6%) than that of the original kaolinite. This maybe assigned to the presence of more water in the interlayer spacesof kaolinite because of the Fe introduction, which is easily removed
Fig. 5. SEM images of (a) the original kaolinite and (b) the Ti–Fe kaolinite composite; (c)composite, the inset is HRTEM image of lattices of TiO2.
in dehydration step. Similarly, the presence of Ti in the compositeresulted in a decrease in the hydroxyl contents and a dehydroxyla-tion with smaller weight loss occurred at relatively lowtemperature.
3.2. Adsorption of Cr(VI) on the Ti–Fe kaolinite composite
3.2.1. Effect of pHThe pH value of the medium is a significant factor in adsorption
process [33]. Fig. 8 reveals that the lower pH favors the adsorption
TEM image of the Ti–Fe kaolinite composite; (d) HRTEM image of the Ti–Fe kaolinite
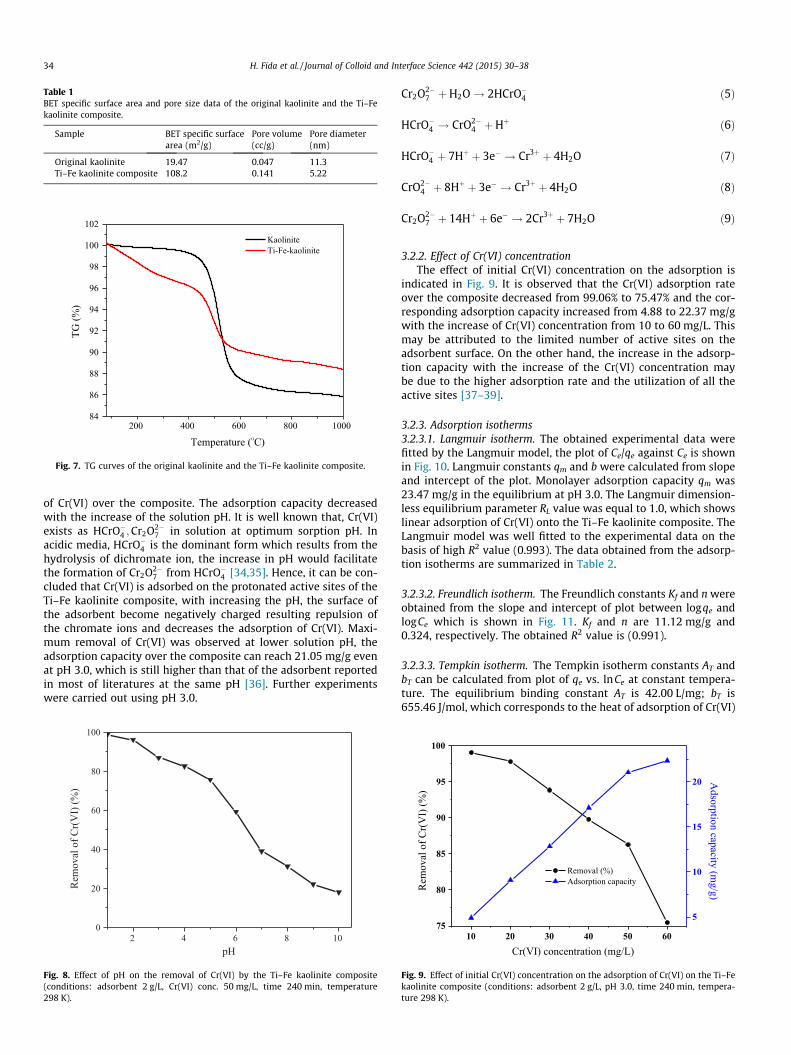
Table 1BET specific surface area and pore size data of the original kaolinite and the Ti–Fekaolinite composite.
Sample BET specific surfacearea (m2/g)
Pore volume(cc/g)
Pore diameter(nm)
Original kaolinite 19.47 0.047 11.3Ti–Fe kaolinite composite 108.2 0.141 5.22
Kaolinite Ti-Fe-kaolinite
200 400 600 800 100084
86
88
90
92
94
96
98
100
102
TG (%
)
Temperature (OC)
Fig. 7. TG curves of the original kaolinite and the Ti–Fe kaolinite composite.
34 H. Fida et al. / Journal of Colloid and Interface Science 442 (2015) 30–38
of Cr(VI) over the composite. The adsorption capacity decreasedwith the increase of the solution pH. It is well known that, Cr(VI)exists as HCrO�4 ;Cr2O2�
7 in solution at optimum sorption pH. Inacidic media, HCrO�4 is the dominant form which results from thehydrolysis of dichromate ion, the increase in pH would facilitatethe formation of Cr2O2�
7 from HCrO�4 [34,35]. Hence, it can be con-cluded that Cr(VI) is adsorbed on the protonated active sites of theTi–Fe kaolinite composite, with increasing the pH, the surface ofthe adsorbent become negatively charged resulting repulsion ofthe chromate ions and decreases the adsorption of Cr(VI). Maxi-mum removal of Cr(VI) was observed at lower solution pH, theadsorption capacity over the composite can reach 21.05 mg/g evenat pH 3.0, which is still higher than that of the adsorbent reportedin most of literatures at the same pH [36]. Further experimentswere carried out using pH 3.0.
2 4 6 8 100
20
40
60
80
100
Rem
oval
of C
r(V
I) (%
)
pH
Fig. 8. Effect of pH on the removal of Cr(VI) by the Ti–Fe kaolinite composite(conditions: adsorbent 2 g/L, Cr(VI) conc. 50 mg/L, time 240 min, temperature298 K).
Cr2O2�7 þH2O! 2HCrO�4 ð5Þ
HCrO�4 ! CrO2�4 þHþ ð6Þ
HCrO�4 þ 7Hþ þ 3e� ! Cr3þ þ 4H2O ð7Þ
CrO2�4 þ 8Hþ þ 3e� ! Cr3þ þ 4H2O ð8Þ
Cr2O2�7 þ 14Hþ þ 6e� ! 2Cr3þ þ 7H2O ð9Þ
3.2.2. Effect of Cr(VI) concentrationThe effect of initial Cr(VI) concentration on the adsorption is
indicated in Fig. 9. It is observed that the Cr(VI) adsorption rateover the composite decreased from 99.06% to 75.47% and the cor-responding adsorption capacity increased from 4.88 to 22.37 mg/gwith the increase of Cr(VI) concentration from 10 to 60 mg/L. Thismay be attributed to the limited number of active sites on theadsorbent surface. On the other hand, the increase in the adsorp-tion capacity with the increase of the Cr(VI) concentration maybe due to the higher adsorption rate and the utilization of all theactive sites [37–39].
3.2.3. Adsorption isotherms3.2.3.1. Langmuir isotherm. The obtained experimental data werefitted by the Langmuir model, the plot of Ce/qe against Ce is shownin Fig. 10. Langmuir constants qm and b were calculated from slopeand intercept of the plot. Monolayer adsorption capacity qm was23.47 mg/g in the equilibrium at pH 3.0. The Langmuir dimension-less equilibrium parameter RL value was equal to 1.0, which showslinear adsorption of Cr(VI) onto the Ti–Fe kaolinite composite. TheLangmuir model was well fitted to the experimental data on thebasis of high R2 value (0.993). The data obtained from the adsorp-tion isotherms are summarized in Table 2.
3.2.3.2. Freundlich isotherm. The Freundlich constants Kf and n wereobtained from the slope and intercept of plot between logqe andlogCe which is shown in Fig. 11. Kf and n are 11.12 mg/g and0.324, respectively. The obtained R2 value is (0.991).
3.2.3.3. Tempkin isotherm. The Tempkin isotherm constants AT andbT can be calculated from plot of qe vs. lnCe at constant tempera-ture. The equilibrium binding constant AT is 42.00 L/mg; bT is655.46 J/mol, which corresponds to the heat of adsorption of Cr(VI)
10 20 30 40 50 6075
80
85
90
95
100
Removal (%) Adsorption capacity
Cr(VI) concentration (mg/L)
Rem
oval
of C
r(V
I) (%
)
5
10
15
20 Adsorption capacity (m
g/g)
Fig. 9. Effect of initial Cr(VI) concentration on the adsorption of Cr(VI) on the Ti–Fekaolinite composite (conditions: adsorbent 2 g/L, pH 3.0, time 240 min, tempera-ture 298 K).

-2 0 2 4 6 8 10 12 14 16
0.0
0.1
0.2
0.3
0.4
0.5
0.6
0.7C
e/qe (g
/L)
Ce (mg/L)
Fig. 10. Langmuir isotherm model for the adsorption of Cr(VI) onto the Ti–Fekaolinite composite.
Table 2The constants and regression data of isotherms for the adsorption of Cr(VI) on the Ti–Fe kaolinite composite (conditions: adsorbent 2 g/L, temperature 298 K, Cr(VI) conc.10–50 mg/L, pH 3.0, time 240 min).
Adsorption isotherm Isotherm parameters R2
Langmuir Qm (mg g�1) 23.47 0.993b (L mg�1) 1.078
Freundlich isotherm Kf (mg1�1/n g�1 L1/n) 11.12 0.991n 0.209
Tempkin equation AT (L mg�1) 42 0.981BT (J mol�1) 3.78bT 588.46
Dubinin–Radushkevich Qm (mg g�1) 17.07 0.874E (kJ mol�1) 3.745
-3 -2 -1 0 1 21.4
1.6
1.8
2.0
2.2
2.4
2.6
2.8
3.0
3.2
ln[q
e(mg/
g)]
ln[Ce(mg/L)]
Fig. 11. Freundlich isotherm model for the adsorption of Cr(VI) onto the Ti–Fekaolinite composite.
1 2 3 4
65
70
75
80
85
90
95
100
Removal (%) Adsorption capacity
Adsorbent amount (g/L)
Rem
oval
of C
r(V
I) (%
)
10
15
20
25
30
35
Adsorption capacity (m
g/g)
Fig. 12. Effect of adsorbent dosage on the adsorption of Cr(VI) onto the Ti–Fekaolinite composite (conditions: Cr(VI) conc. 50 mg/L, pH 3.0, time 240 min,temperature 298 K).
Table 3Thermodynamic data for the adsorption of Cr(VI) on the Ti–Fe kaolinite composite(conditions: adsorbent 2 g/L, Cr(VI) conc. 50 mg/L, pH 3.0, time 240 min).
Temperature (K) DG (kJ mol�1) DH (kJ mol�1) DS (J K�1 mol�1)
H. Fida et al. / Journal of Colloid and Interface Science 442 (2015) 30–38 35
on the composite. The obtained R2 coefficient is 0.981, which islower than that of the Langmuir and Freundlich isotherm.
293 �4.61959 32.424 146.42303 �5.17362313 �5.65172323 �6.57437333 �7.1128
3.2.3.4. Dubinin–Radushkevich (D–R) isotherm. A plot between lnqe
and E2 at constant temperature was used to calculate Qm and k ofD–R isotherm. BD is related to the mean free energy (E), physical
adsorption is supposed to happen for value of E between 1 and16 kJ/mol while chemisorption prevails for E > 16 kJ/mol. Theobtained R2 is 0.845, which displays that the model does not fitwell with the equilibrium experimental data.
E ¼ 1ffiffiffiffiffiffiBDp ð10Þ
3.3. Effect of adsorbent dosage
The removal efficiency of Cr(VI) on the Ti–Fe kaolinite compos-ite was also evaluated as function of the adsorbent dosage (Fig. 12).The removal rate of Cr(VI) on the composite was increased from66.19% to 97.11% while the adsorption capacity of the compositedecreased from 32.1 to 11.78 mg/g with increasing the adsorbentamount from 1 to 4 g/L. The enhanced Cr(VI) removal efficiencycould be ascribed to the vast availability of surface area andadsorption sites [40]. The drop in the adsorption capacity may beattributed to the sites remaining unsaturated during adsorptionprocess [41]. Higher adsorbent dosage may lead to particles aggre-gation, resulting in the decrease of the exposed surface area as wellas the increase of the diffusion path.
3.4. Effect of temperature (thermodynamic studies)
Temperature dependence of Cr(VI) adsorption on the Ti–Fe kao-linite composite was studied in the temperature range from 293 to333 K. Significant increase in Cr(VI) removal has been observedwith the increase of temperature. Higher temperature may facili-tate Cr(VI) ions to overcome the adsorption activation energy bar-rier and easily attach to the adsorbent surface [42,43].Thermodynamic parameters such as DH, DS and DG were calcu-lated from the following equations which are listed in Table 3.
2.2
36 H. Fida et al. / Journal of Colloid and Interface Science 442 (2015) 30–38
Kc ¼Ce
Cið11Þ
1.8
2.0
DG ¼ �RT ln Kc ð12Þ
0.0030 0.0031 0.0032 0.0033 0.00340.6
0.8
1.0
1.2
1.4
1.6
log
Kc
1/T (K)
Fig. 13. Plot of lnKc vs. 1/T for Cr(VI) adsorbed on the Ti–Fe kaolinite composite(conditions: adsorbent 2 g/L, Cr(VI) conc. 50 mg/L, pH 3.0, time 240 min).
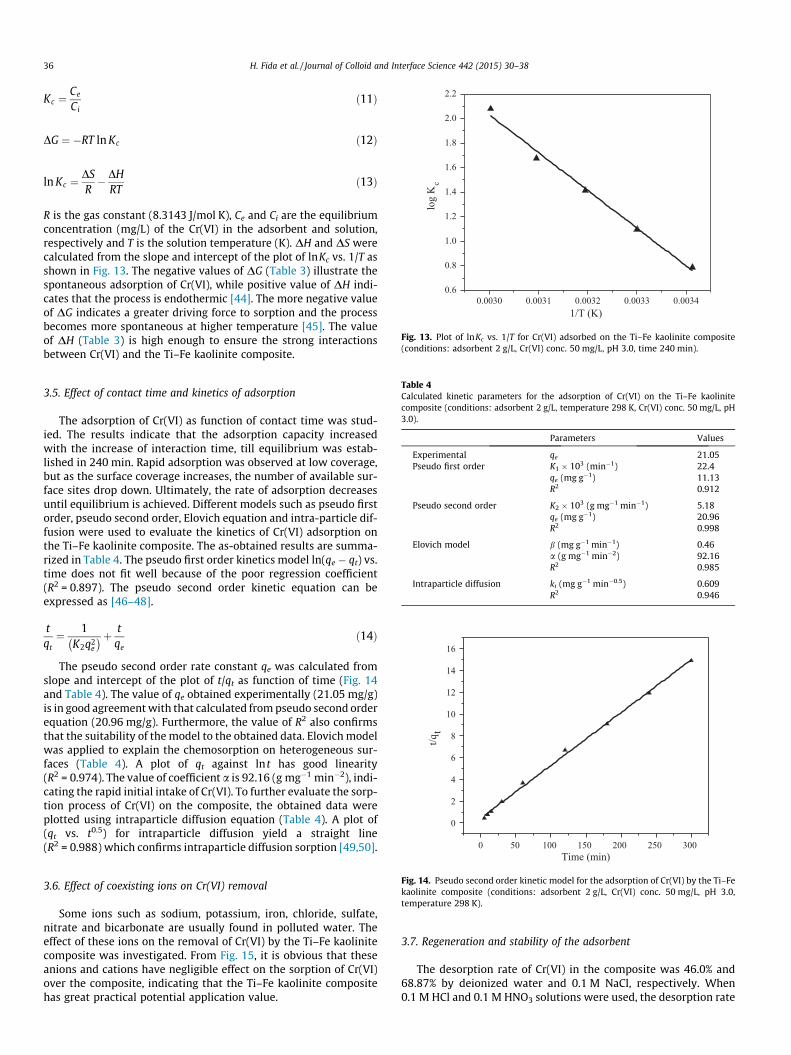
ln Kc ¼DSR� DH
RTð13Þ
R is the gas constant (8.3143 J/mol K), Ce and Ci are the equilibriumconcentration (mg/L) of the Cr(VI) in the adsorbent and solution,respectively and T is the solution temperature (K). DH and DS werecalculated from the slope and intercept of the plot of lnKc vs. 1/T asshown in Fig. 13. The negative values of DG (Table 3) illustrate thespontaneous adsorption of Cr(VI), while positive value of DH indi-cates that the process is endothermic [44]. The more negative valueof DG indicates a greater driving force to sorption and the processbecomes more spontaneous at higher temperature [45]. The valueof DH (Table 3) is high enough to ensure the strong interactionsbetween Cr(VI) and the Ti–Fe kaolinite composite.
Table 4Calculated kinetic parameters for the adsorption of Cr(VI) on the Ti–Fe kaolinitecomposite (conditions: adsorbent 2 g/L, temperature 298 K, Cr(VI) conc. 50 mg/L, pH3.0).
Parameters Values
Experimental qe 21.05Pseudo first order K1 � 103 (min�1) 22.4
qe (mg g�1) 11.13R2 0.912
Pseudo second order K2 � 103 (g mg�1 min�1) 5.18qe (mg g�1) 20.96R2 0.998
Elovich model b (mg g�1 min�1) 0.46a (g mg�1 min�2) 92.16R2 0.985
Intraparticle diffusion ki (mg g�1 min�0.5) 0.609R2 0.946
0 50 100 150 200 250 300
0
2
4
6
8
10
12
14
16
t/qt
3.5. Effect of contact time and kinetics of adsorption
The adsorption of Cr(VI) as function of contact time was stud-ied. The results indicate that the adsorption capacity increasedwith the increase of interaction time, till equilibrium was estab-lished in 240 min. Rapid adsorption was observed at low coverage,but as the surface coverage increases, the number of available sur-face sites drop down. Ultimately, the rate of adsorption decreasesuntil equilibrium is achieved. Different models such as pseudo firstorder, pseudo second order, Elovich equation and intra-particle dif-fusion were used to evaluate the kinetics of Cr(VI) adsorption onthe Ti–Fe kaolinite composite. The as-obtained results are summa-rized in Table 4. The pseudo first order kinetics model ln(qe � qt) vs.time does not fit well because of the poor regression coefficient(R2 = 0.897). The pseudo second order kinetic equation can beexpressed as [46–48].
tqt¼ 1
K2q2e
� �þ tqe
ð14Þ
The pseudo second order rate constant qe was calculated fromslope and intercept of the plot of t/qt as function of time (Fig. 14and Table 4). The value of qe obtained experimentally (21.05 mg/g)is in good agreement with that calculated from pseudo second orderequation (20.96 mg/g). Furthermore, the value of R2 also confirmsthat the suitability of the model to the obtained data. Elovich modelwas applied to explain the chemosorption on heterogeneous sur-faces (Table 4). A plot of qt against ln t has good linearity(R2 = 0.974). The value of coefficient a is 92.16 (g mg�1 min�2), indi-cating the rapid initial intake of Cr(VI). To further evaluate the sorp-tion process of Cr(VI) on the composite, the obtained data wereplotted using intraparticle diffusion equation (Table 4). A plot of(qt vs. t0.5) for intraparticle diffusion yield a straight line(R2 = 0.988) which confirms intraparticle diffusion sorption [49,50].
Time (min)
Fig. 14. Pseudo second order kinetic model for the adsorption of Cr(VI) by the Ti–Fekaolinite composite (conditions: adsorbent 2 g/L, Cr(VI) conc. 50 mg/L, pH 3.0,temperature 298 K).
3.6. Effect of coexisting ions on Cr(VI) removal
Some ions such as sodium, potassium, iron, chloride, sulfate,nitrate and bicarbonate are usually found in polluted water. Theeffect of these ions on the removal of Cr(VI) by the Ti–Fe kaolinitecomposite was investigated. From Fig. 15, it is obvious that theseanions and cations have negligible effect on the sorption of Cr(VI)over the composite, indicating that the Ti–Fe kaolinite compositehas great practical potential application value.
3.7. Regeneration and stability of the adsorbent
The desorption rate of Cr(VI) in the composite was 46.0% and68.87% by deionized water and 0.1 M NaCl, respectively. When0.1 M HCl and 0.1 M HNO3 solutions were used, the desorption rate

Controlled Sodium Potassium Iron Chloride Sulfate Nitrate Bicarbonate
60
80
Rem
oval
of C
r(V
I) (%
)
Fig. 15. Influence of coexisting ions on the adsorption of Cr(VI) onto the Ti–Fekaolinite composite (conditions: adsorbent 2 g/L Cr(VI) conc. 50 mg/L, pH 3.0,temperature 298 K).
0 1 2 3 4 5 60
20
40
60
80
Rem
oval
of C
r(V
I) (%
)
Regeneration times
Fig. 16. Regeneration and reuse of the Ti–Fe kaolinite composite for the removal ofCr(VI).
0 50 100 150 200 250 30010
12
14
16
18
20
22
Cr(
VI)
ads
orpt
ion
capa
city
(mg/
g)
Time (min)
Without visible light irradiation With visible light irradiation
Fig. 17. The removal of Cr(VI) by the Ti–Fe kaolinite composite with and withoutvisible light irradiation.
590 588 586 584 582 580 578 576 574 572
Cr(VI)
Cr(III)
Cr(III)
Cr2p3/2
Cr2p1/2
Inte
nsity
(a.u
)
Binding energy (eV)
Fig. 18. High resolution XPS spectra of the recovered Ti–Fe kaolinite composite.
H. Fida et al. / Journal of Colloid and Interface Science 442 (2015) 30–38 37
of Cr(VI) in the composite reached 78.08% and 95.55%, respectively.The adsorbent regenerated with HNO3 was used for consecutive sixcycles. The adsorption capacity remains more than 80% of the freshadsorbent after fifth recycling (Fig. 16). In order to evaluate the riskof iron leakage to the filtrate, the leached iron in the solution afteradsorption was determined. The iron leaching was only 0.12 mg/L,which shows that most of the iron is firmly attached to the kaolin-ite substrate. This value is not enough to contribute excessive levelof iron in treated water. Hence, the Ti–Fe kaolinite composite pos-sesses promising regeneration ability and high stability.
3.8. Photocatalytic activity
The photocatalytic activity of the Ti–Fe kaolinite composite forCr(VI) removal was evaluated. The results in Fig. 17 confirm that, ascompared to the adsorption without visible light irradiation, theremoval rate of Cr(VI) by the Ti–Fe kaolinite composite increasedfrom 86.68% to 95.26% and the Cr(VI) uptake capacity of the com-posite also increased from 21.05 to 22.12 mg/g under visible lightirradiation. The most important and interesting fact was that theequilibrium time of Cr(VI) adsorption over the composite undervisible light irradiation was only half the time of the adsorptionprocess without visible light irradiation. The enhanced adsorptionefficiency may be due to the fact that the following reactions takeplace when the Ti–Fe kaolinite composite was illuminated withvisible light.
TiO2 !hm hþ þ e� ð15Þ
Cr2O2�7 þ 14Hþ þ 6e� ! 2Cr3þ þ 7H2O ð16Þ
FeðIIIÞ þ e� !TiO2 hmFeðIIÞ ð17Þ
3FeðIIÞ þ CrðVIÞ !TiO2 hm3FeðIIIÞ þ CrðIIIÞ ð18Þ
The photogenerated electron reduces Cr(VI) to Cr(III), the possi-ble mechanism is same (Eq. (16)) as reported in the literatures[51,52]. In the absence of reducing agent, H2O accepts the valenceband holes and the following reaction takes place. The presence ofFe(III) in the Ti–Fe kaolinite composite may also contribute to theenhanced removal capacity [52,53]. XPS high resolution spectra ofthe recovered Ti–Fe kaolinite composite after visible light irradia-tion in Cr(VI) solution have been given in Fig. 18. Significant bandsat binding energy 576 and 585.3 eV for Cr(III) were observed, whichcorrespond to Cr2p3/2 and Cr2p1/2 of Cr(III), respectively [54].Whereas the band with lower intensity at binding energy at
579.8 eV corresponding to Cr(VI) indicates that most of the Cr(VI)has been reduced to Cr(III). The results obtained from XPS analysissuggest the reduction of Cr(VI) to Cr(III).
38 H. Fida et al. / Journal of Colloid and Interface Science 442 (2015) 30–38
4. Conclusions
The as-prepared Ti–Fe kaolinite composite showed interestingbifunctional properties for removing Cr(VI) from aqueous medium.The surface area of the Ti–Fe kaolinite composite is 5.5 timeshigher than that of the original kaolinite. The low pH is favorableto the Cr(VI) removal by the composite. Kinetics study suggeststhat pseudo-second-order adsorption model was suitable todescribe the adsorption behavior of the Ti–Fe kaolinite composite.Langmuir adsorption isotherm perfectly matched the data. Nega-tive values of DG indicate spontaneous tendency while positivevalue of DH describes the endothermic nature of the reaction.The removal efficiency of the Ti–Fe kaolinite composite markedlyincreased from 86.80% to 95.26% and the reaction time was halvedwhen the reaction mixture was exposed to visible light irradiation.The enhanced activity may be attributed to the photocatalyticreduction of Cr(VI)–Cr(III) by TiO2 with simultaneously redox cycleof Fe(III)/Fe(II). The Ti–Fe kaolinite composite possess enhancedCr(VI) removal and detoxification efficiency. The removal effi-ciency of Ti–Fe kaolinite composite is almost higher than most ofadsorbent [6,41]. However, the removal capacity is slightly lowerthan [55,56] but the reaction time for Ti–Fe kaolinite compositeis three times faster. The negligible iron leaching, high desorptionrate, efficient uptake of regenerated adsorbent, minor effect ofcoexisting ions, high efficiency for the removal of Cr(VI) from waterindicate that the Ti–Fe kaolinite composite is a promising optionfor treating waste water containing Cr(VI).
Acknowledgments
This work was supported by National Program on Key BasicResearch Project of China (973 Program) 2013CB632402, Programof Specialized Research Fund for the Doctoral Program of HigherEducation (20110143110015) and National Key Technology R&DProgram of China (2012BAJ25B02-03).
References
[1] R. Aravindhan, K.J. Sreeram, J.R. Rao, B.U. Nair, J. Gen. Appl. Microbiol. 53(2007) 71–79.
[2] M.R. Vanengelen, B.M. Peyton, M.R. Mormile, H.C. Pinkart, Biodegradation 19(2008) 841–850.
[3] V. Chantawong, N.W. Harvey, V.N. Bashkin, Water Air Soil Pollut. 148 (2003)111–125.
[4] W.H. Organization, Guidelines for Drinking Water Quality, World HealthOrganization, Geneva, 2011. pp. 668.
[5] L.N. Shi, X. Zhang, Z.L. Chen, Water Res. 45 (2011) 886–892.[6] T. Burks, M. Avila, F. Akhtar, M. Göthelid, P.C. Lansåker, M.S. Toprak, M.
Muhammed, A. Uheida, J. Colloid Interface Sci. 425 (2014) 36–43.[7] V.K. Gupta, M. Gupta, S. Sharma, Water Res. 35 (2001) 1125–1134.[8] C. Namasivayam, M.V. Sureshkumar, Bioresour. Technol. 99 (2008) 2218–
2225.[9] N.S. Reigosa, S.P. Rodriguez, J.C.N. Munoz, M.A. Estevez, M.J.F. Sanjurjo, E.A.
Rodriguez, A.N. Delgado, Environ. Sci. Pollut. Res. 20 (2013) 2670–2678.[10] S. Rao, H.S. Lade, T.A. Kadam, T.V. Ramana, S.K. Krishnamacharyulu, S.
Deshmukh, G. Gyananath, J. Environ. Sci. Eng. 49 (2007) 255–258.[11] C. Zhao, Q. Yang, W. Chen, B. Teng, Can. J. Microbiol. 58 (2012) 23–28.[12] E.I. Basaldella, P.G. Vazquez, F. Iucolano, D. Caputo, J. Colloid Interface Sci. 313
(2007) 574–578.[13] S.A. Cavaco, S. Fernandes, M.M. Quina, L.M. Ferreira, J. Hazard. Mater. 144
(2007) 634–638.
[14] S. Dahbi, M. Azzi, N. Saib, M. de la Guardia, R. Faure, R. Durand, Anal. Bioanal.Chem. 374 (2002) 540–546.
[15] J. Liu, L.G.K. Zhang, Phys. Chem. Chem. Phys. 16 (2014) 8178–8192.[16] E.C. Leonel, E. Henrique de Faria, R.C. Pimentel, E.J. Nassar, K.J. Ciuffi, M.J. dos
Reis, P.S. Calefi, Quim. Nova 35 (2012) 1407–1411.[17] I.G. Abid, A. Jrad, K. Nahdi, M. Trabelsi-Ayadi, Desalination 246 (2009) 595–
604.[18] B. Hu, H. Luo, H. Chen, T. Dong, Appl. Clay Sci. 51 (2011) 198–201.[19] P. Wu, Q. Zhang, Y. Dai, N. Zhu, Z. Dang, P. Li, J. Wu, X. Wang, Geoderma 164
(2011) 215–219.[20] S.T. Akar, Y. Yetimoglu, T. Gedikbey, Desalination 244 (2009) 97–108.[21] K.G. Bhattacharyya, S.S. Gupta, Ind. Eng. Chem. Res. 45 (2006) 7232–7240.[22] D.L. Guerra, H.C.P. Oliveira, P.C.C. da Costa, R.R. Viana, C. Airoldi, Catena 82
(2010) 35–44.[23] G. Wang, Q. Chang, M. Zhang, X. Han, React. Funct. Polym. 73 (2013) 1439–
1446.[24] W.B. Amorim, A.M. Hayashi, P.F. Pimentel, M.G.C. da Silva, Braz. J. Chem. Eng.
20 (2003) 3–9.[25] S. Guo, G.K. Zhang, J.Q. Wang, J. Colloid Interface Sci. 433 (2014) 1–8.[26] K.G. Bhattacharyya, S.S. Gupta, Ind. J. Chem. Technol. 16 (2009) 457–470.[27] L. Chen, B.Y. He, S. He, T.J. Wang, C.L. Su, Y. Jin, Powder Technol. 227 (2012) 3–
8.[28] Y. Zhang, H. Gan, G. Zhang, Chem. Eng. J. 172 (2011) 936–943.[29] M. Topkafa, H.F. Ayyildiz, F.N. Arslan, S. Kucukkolbasi, F. Durmaz, S. Sen, H.
Kara, Pol. J. Food Nutr. Sci. 63 (2013) 147–154.[30] J. Lu, L. Dongfang, H. Jing, Z. Guowei, L. Bin, Chem. Eng. Res. Des. (2014), http://
dx.doi.org/10.1016/j.cherd.2014.05.001.[31] Ahmet Sari, Omer Idak, Bull. Chem. Soc. Ethiop. 20 (2006) 8.[32] J.C. Miranda-Trevino, C.A. Coles, Appl. Clay Sci. 23 (2003) 133–139.[33] J. Anwar, U. Shafique, Z. Waheed uz, Z. un Nisa, M.A. Munawar, N. Jamil, M.
Salman, A. Dar, R. Rehman, J. Saif, H. Gul, T. Iqbal, Int. J. Phytorem. 13 (2011)410–420.
[34] Y. Li, Z. Jin, T. Li, S. Li, Water Sci. Technol. 63 (2011) 2781–2787.[35] N. Ahalya1, R.D. Karamadi, T.V. Ramachandra, J. Environ. Sci. Res. Int. 1 (2008).[36] K. Pakshirajan, A.N. Worku, M.A. Acheampong, H.J. Lubberding, P.N. Lens, Appl.
Biochem. Biotechnol. 170 (2013) 498–513.[37] S. Gupta, B.V. Babu, Chem. Eng. J. 150 (2009) 352–365.[38] T.S. Anirudhan, P.G. Radhakrishnan, J. Colloid Interface Sci. 316 (2007) 268–
276.[39] X. Lv, X. Xue, G. Jiang, D. Wu, T. Sheng, H. Zhou, X. Xu, J. Colloid Interface Sci.
417 (2014) 51–59.[40] L. Li, L. Fan, M. Sun, H. Qiu, X. Li, H. Duan, C. Luo, Colloids Surf. B. Biointerfaces
107 (2013) 76–83.[41] Y. Zhao, S. Yang, D. Ding, J. Chen, Y. Yang, Z. Lei, C. Feng, Z. Zhang, J. Colloid
Interface Sci. 395 (2013) 198–204.[42] B. Geng, Z. Jin, T. Li, X. Qi, Chemosphere 75 (2009) 825–830.[43] X.S. Wang, Z.Z. Li, S.R. Tao, J. Environ. Manage. 90 (2009) 721–729.[44] A.A. Rouff, J. Colloid Interface Sci. 392 (2013) 343–348.[45] M. Waseem, S. Mustafa, K.H. Shah, A. Naeem, S.S. Shah, K. Mehmood, S.U. Din,
Sep. Purif. Technol. 107 (2013) 238–244.[46] M. Baikousi, A.B. Bourlinos, A. Douvalis, T. Bakas, D.F. Anagnostopoulos, J.
Tucek, K. Safarova, R. Zboril, M.A. Karakassides, Langmuir 28 (2012) 3918–3930.
[47] V.K. Gupta, A. Rastogi, A. Nayak, J. Colloid Interface Sci. 342 (2010) 135–141.[48] Y.J. Jiang, X.Y. Yu, T. Luo, Y. Jia, J.H. Liu, X.J. Huang, J. Chem. Eng. Data 58 (2013)
3142–3149.[49] X. Lv, J. Xu, G. Jiang, J. Tang, X. Xu, J. Colloid Interface Sci. 369 (2012) 460–469.[50] J. Zhu, S. Wei, H. Gu, S.B. Rapole, Q. Wang, Z. Luo, N. Haldolaarachchige, D.P.
Young, Z. Guo, Environ. Sci. Technol. 46 (2012) 977–985.[51] N. Pirrone, M.F. Ghorab, R. Djellabi, R. Messadi, Photo-reduction of hexavalent
chromium in aqueous solution in the presence of TiO2 as semiconductorcatalyst, in: e3s Web of Conferences, vol. 1, 2013, p. 25008.
[52] G.K. Zhang, Y.Y. Gao, Y.L. Zhang, Y.D. Guo, Environ. Sci. Technol. 44 (2010)6384–6389.
[53] X. Wang, S.O. Pehkonen, A.K. Ray, Ind. Eng. Chem. Res. 43 (2004) 1665–1672.[54] J. Matusik, T. Bajda, J. Colloid Interface Sci. 398 (2013) 74–81.[55] X. Lv, X. Xue, G. Jiang, D. Wua, T. Sheng, H. Zhou, X. Xu, J. Colloid Interface Sci.
417 (2014) 51–59.[56] S.C. Xua, S.S. Pana, Y. Xua, Y.Y. Luoa, Y.X. Zhanga, G.H. Lia, J. Hazard. Mater. 283
(2015) 7–13.


![The formation, transport properties and microstructure of 45° [001] grain boundaries induced by epitaxy modification in YBa 2Cu 3O 7− x thin films](https://static.fdokumen.com/doc/165x107/6315b7dbc32ab5e46f0d6fce/the-formation-transport-properties-and-microstructure-of-45-001-grain-boundaries.jpg)