GENERAL AGREEMENT ON sPec(83)3o/Rev.i TARIFFS AND ...
94
RESTRICTED GENERAL AGREEMENT ON s P ec(83)3o/Rev.i TARIFFS AND TRADE 18 November 1983 PROBLEMS OF TRADE IN CERTAIN NATURAL RESOURCE PRODUCTS Background Study on Lead and Lead Products Prepared by the Secretariat Revision Table of Contents # Page Introduction 3 Section I: Production, consumption and prices 6 Mine production 6 Smelting and refining 8 Consumption 11 Prices and stock 15 Section II: Foreign trade 17 Exports: Lead ores and concentrates, lead bullion 17 and refined lead Imports: Lead ores and concentrates, lead bullion 18 and refined lead Direction of trade 25 W Section III: Commercial policy situation 25 The Structure of tariffs 25 Non-tariff and other measures 35 Section IV: Activities in other international organizations 37 The International Lead and Zinc Study Group 37 The International Lead-Zinc Research Organization 37 Summary 38 83-2490 ^ e e D O u n d volume for / y y*J ^ of this series for fmi/JMu to this document.
-
Upload
khangminh22 -
Category
Documents
-
view
2 -
download
0
Transcript of GENERAL AGREEMENT ON sPec(83)3o/Rev.i TARIFFS AND ...

RESTRICTED
GENERAL AGREEMENT ON sPec(83)3o/Rev.i
TARIFFS AND TRADE 18 November 1983
PROBLEMS OF TRADE IN CERTAIN NATURAL RESOURCE PRODUCTS
Background Study on Lead and Lead Products
Prepared by the Secretariat
Revision
Table of Contents
# Page
Introduction 3
Section I: Production, consumption and prices 6
Mine production 6 Smelting and refining 8 Consumption 11 Prices and stock 15
Section II: Foreign trade 17
Exports: Lead ores and concentrates, lead bullion 17 and refined lead
Imports: Lead ores and concentrates, lead bullion 18 and refined lead Direction of trade 25
W Section III: Commercial policy situation 25
The Structure of tariffs 25
Non-tariff and other measures 35
Section IV: Activities in other international organizations 37
The International Lead and Zinc Study Group 37
The International Lead-Zinc Research Organization 37 Summary 38
83-2490 ^ e e D O u n d volume for / y y*J ^ of this series
for fmi/JMu to this document.

Spec(83)30/Rev.l Page 2
Table of Contents (Cont'd.)
List of Tables
Table Table Table Table Table Table Table Table Table Table Table Table Table Table Table
Annex
Annex
1: 2: 3: 4: 5: 6: 7: 8: 9: 10 11 12 13 14 15
I:
II
World lead reserves, 1983 estimates World mine production of lead, 1960-1981 World metal production of lead, 1970-1981 World secondary refined production of lead, 1977-1981 World consumption of refined lead, 1960-1981 Principal uses of lead, 1977-1981 Average cash prices for lead at the LME, 1970-1982
Lead ores and concentrates Lead bullion Refined lead Lead ores and concentrates Lead bullion Refined lead
World exports in 1981 World exports;in 1981 World exports in 1981 World imports in 1981 World imports in 1981 World imports in 1981 Imports by origin, 1981 Summary of tariff situation affecting lead and articles thereof
Trade flows data, 1975-1981, lead ores and concentrates, lead bullion and refined lead
Tariff and Trade Flow Data at the Tariff Line Level
Page
5 7 9 10 12 13 16 19 20 21 22 23 24 26 27
39
44

Spec(83)30/Rev.l Page 3
Introduction
1. This paper provides data on lead and articles thereof (CCCN Nos. ex 26.01, ex 26.03, 28.27, ex 28.30, ex 28.35, 78.01, 78.02, 78.03, 78.04, 78.05 and 78.06). Section I briefly reviews developments with regard to production, consumption and prices. Section II provides data on trade flows. Section III examines commercial policy measures applicable to lead and articles thereof with reference to tariff concessions made in the Tokyo Round, the post-Tokyo Round tariff situation and certain non-tariff measures. Section IV describes activities in some international organizations, notably the International Lead and Zinc Study Group.
2. Lead is one of the oldest metals used by man. Its universal use has been conditioned by its important properties, including its low melting temperature, its excellent castability and malleability, its density and metallic impermeability. Of the common metals, lead is the most corrosion-resistant to acids, chlorine and water. It has a low electrical conductivity and is suitable for use in alloys and compounds with specific properties. According to the classification of industrial materials, lead belongs to heavy metals.
1 Physical properties of lead Symbol: Pb (Plumbum) Density at 20°C g/cm : 11.34 Atomic number: 82 Atomic weight: 207.19 Melting point: 327.4°C Boiling point: 1,751°C Electrical conductivity/••j-fiT cm : 0.048 Frequency ppm: 12.5 2 According to the criterion of use as industrial materials, the
technically most important non-ferrous metals, excluding the.precious metals, may be classified as follows:
(a) heavy metals: lead, copper, zinc and tin; (b) light metals: aluminium, magnesium and titanium; (c) steel improving agents (as alloying metals) or special metals (as
base metals): chromium, cobalt, manganese, molybdenum, nickel, vanadium and tungsten;
(d) other alloying or special metals: antimony, cerium, hafnium, cadmium, lanthanum, lithium, niobium, mercury, rhenium, silicon, tantalum, bismuth, yttrium and zirconium.
Source: Non-ferrous metals, Metallgesellschaft AG.

Spec(83)30/Rev.l Page 4
3. From the geochemical point of view, lead is closely associated with zinc and presently about 63 per cent of lead produced comes from lead-zinc ores. The most important lead ore for recovery of the metal is lead glance or galena (PbS, containing about 86.6 per cent of Pb), which is often associated with sphalerite (ZnS), pyrite (FeS ), chalcopyrite (Cu Fe S ), and other sulfides or sulfosalts, any of whicn can be recovered to yield by-products or co-products. The relatively high value of silver in recent years has given added importance to the recovery of lead from silver-lead ores.
4. Table 1 indicates that in 1983 world lead reserves were estimated at 159 million tons. The most important lead-zinc deposits are situated in the United States, Australia, the Soviet Union and Canada. In Latin America, lead and zinc deposits are found in Mexico, Peru, Brazil and Bolivia and in Asia, in Iran, China, Burma, Thailand and Japan. Africa has lead-zinc deposits in Morocco, Tunisia and Algeria, as well as in South Africa, Zaire and Zambia. Among European countries disposing of extensive deposits of lead and zinc are Spain, Yugoslavia, Germany, F.R., Bulgaria, Romania and Ireland, followed by Sweden, Poland, Portugal and Italy.
5. Almost all lead and lead-zinc ores are extracted by deep mining. Ore dressing and concentration processes of various types separate the metal-containing mineral from the barren rock. Presently, the flotation process is applied to about 60-70 per cent of lead ores. Lead concentrates are then shipped to smelters for further processing which includes the following stages:
(a) The roast-reduction process effects the removal of sulfur by roasting in air, which converts lead sulfide to lead oxide.
(b) The sintered product is smelted along with coke, fluxes and dross to produce lead bullion, slag and fume.
(c) Drossing reduces impurities and removes zinc and copper from the bullion by controlled cooling.
The operation of reduction and smelting is performed in the shaft furnace. The Imperial Smelting (IS) Process developed in the I960's is an improved shaft furnace process and is particularly suitable for the processing of lead-zinc concentrates. In recent years new direct pyrometallurgical processes have been developed to laboratory or pilot plant scales in which roasting of the sulfides, and reduction and smelting of the charge are accomplished simultaneously in the same reactor. These await application in plants of commercial scale.
6. About 70 per cent of lead bullion is refined by pyrometallurgical methods and 30 per cent by electrolysis. Refining removes all impurities which remained in the lead bullion, and at the same time extracts different elements such as zinc, silver, copper, gold, bismuth and antimony. The production of lead is so closely inter-related with that of other elements that both its production rate and market price are influenced to a large degree by the supply and demand situation of these related elements.
7. Refined lead is marketed in the following grades: corroding lead -lead which has been refined to a high degree of purity; chemical lead - a lead of relatively high purity, but undesilverized; acid-copper lead -lead made by adding copper to fully refined lead; and common desilverized

Spec(83)30/Rev.1 Page 5
TABLE 1
World lead Reserves
*
Countries
World
Developing countries
Algeria BraziI Iran Mexico Morocco Peru Spain Yugoslavia Other
Developed countries
Australia Canada Germany, F.R. Ireland Portugal South Africa Sweden United States Other
Centrally-planned economies
Bulgaria China, P.R. Poland USSR Korea, P.D.R. Other
Mi I lion tons
159
36
1 3 2 5 1 4 7 6 7
88
23 22 4 2 2 5 2 25 3
28
3 3 2 17 2 1
% of total I
10O.0
23.7
0.7 2.0 1.3 3.3 0.7 2.6 4.6 3.9 4.6
57.9
15.1 14.5 2.6 1.3 1.3 3.3 1.3 16.5 2.0
ii-i. 2 0 2.0 1.3 11.1 1.3 0,7
Sources - US Bureau of Mines, US Department of the Interior, Minerals Commodity Summaries 1983.
- Estimate of Governmental Organismes and Departments of members States of the EEC and candidates countries.
- Regional distribution of mining production and reserves of mineral commodities in the world - BGR and FIGNR, January 1982.

Spec(83)30/Rev.l Page 6
lead. Lead is readily obtainable in many forms, including ingots, pigs, sheet, foil, powder, wool, shot, coatings, pigments, laminations, extrusions, and castings. Lead is widely used when alloyed with other metals, principally antimony and tin; these forms are classified as antimonial or hard lead, white metals, fusible alloys, and leaded brasses or bronzes.
8. Refining of secondary lead - i.e. lead recovered from scrap, wastes, drosses and residues - also plays an important role in the supply of lead, mainly in developed countries. Because of corrosion resistance, many lead products remain virtually unchanged during their lifetime and the recovery of lead content is not difficult. The main source of scrap is from automobile storage batteries, with additional amounts originating from cable coverings, pipe and sheet.
9. Lead uses may be divided into two categories: metallic, where it is used alone or alloyed with other elements; and chemical, where lead is used in the form of chemical compounds. The largest use of lead is in storage batteries for transportation, communications, and electric utilities. Another significant use of lead is as an anti-knock additive to gasolene (lead tetra-ethyl). Lead is also used in the manufacture of bearings because of its qualities of lubrication and resistance to wear. Although there has been some decline in the use of lead in construction as a result of substitution, consumption of lead in roofing, piping, fittings, electro-galvanizing, etc. is still large. Lead shell and foil are employed for radiation protection purposes in the medical field. Lead continues to be the major metal used for sporting ammunition. Lead is also used in the manufacture of paints, glass porcelain enamel, glass ceramics and packaging.
10. Like most other metal industries, that of lead is relatively highly concentrated. The three largest refining companies - Penarroya (France), ASARCO (United States), and St. Joe Minerals (United States) - account for 18 per cent of the world's mining capacity and 27 per cent of its refining capacity. The twelve largest companies account for 43 per cent of the world's mining capacity and 62 per cent of its refining capacity. Only three of the major companies operate on an international scale, while activities of most of the large companies are oriented to their home markets.
SECTION I: PRODUCTION, CONSUMPTION AND PRICES
Mine production
11. World mine production of lead increased fairly rapidly during the I960's but has tended to stagnate in recent years. Compared to 1980, world mine output in 1981 fell about 3.5 per cent, reaching its lowest level since 1976. Table 2 shows that world lead mine production rose by 46 per cent from 2,376 thousand tons in 1960 to 3,475 thousand tons in 1981. During the same period, the share of developing countries in world mine production fell from 32.5 per cent to 26.2 per cent, while that of developed countries and centrally-planned economies rose from 43.2 per cent to 45.7 per cent and from 24.3 per cent to 28.1 per cent, respectively.
Centrally-planned economies excluded.

TABLZ 2
Spec(83)30/Rev.1 Page 7
World Mine Production of Lead (World to ta la la thouaaada of a e t r i e ton»; lead content, regional and country data
aa a percentage of world production)
World
Developing countries of which:
Argentina
B o l i v i a ^
Brasll
Mexico
Morocco
Peru
Roaaaia
Spain
Tugoalavia
Other
Developed countries of which:
A u s t r a l i a '
Canada
noV Fed. Sep. of Geraany*'
France
I t a l y Ireland Greece
Japan
South Africa ( i a e l . Naaibia)
Salted S t a t e s »
Other
Centrelly-plsnned econoaiee of which:
Bulgaria
China. P.B.*
Korea, O.S.
Poland
USB*
Other
I960
2.375.9
2L1
1.0
0.9 0.1»
8.0
k.0
5.5 0.3
3.1
3.8 5.3
JtLi.
13.2
7.9
5.6
2 .1
0.8
2 .1 0.1 0.5 1.7 2.7
9 .*
2.T
k.O
3.» 2.1
1.6
12.6
0.6
1965
2.752.8
2L2
1.2
0.6
0.9
6.2
2.8
5.6 0.5
2.0
3.9
fc.o
»6.2
1 3 > 9.6
».2 1.8
0.7
1.3 0.1 0 .3 2.0
*.o 9.9
3.1
26.1
3-6
3-6
2.2
1.5
1*.5
0.5
1970
3.U62.7
2<*.9
1.0
0.7
0.6
5.1
2.2
».5
1.2
2 .1
3.7
5.0
51.6
13.2 1 1 . *
5.2 I . *
0.8
1.0 1.8 0.3 1.9 2.0
15.0
2.9
2 .8
3.2 2.0
1.6
13.6
0 .3
*• Op to 1970 exporta, since 1975 production
* Recoverable ae ta l content
* For eocpaxative purposes t o t a l figui •es for the EEC includi
1975
LëMd JL2
0.8
0.5
0.6
5.0
2 .0
».3 1.0
1.6
3.5 3>
1*7.0
9.8
a.8 1.2
0.6
0.8 1.0 o.u 1.» 1.6
15.7
2.3
J2*i
3.0
3.9 3-3 2 .1
16.7
0 .3
t ten nenber
1978
3 . 6 n . S
23.6
0.8
0.5
0.6
*.7
3.0
5.1
0.9
2.0
3.» 2.6
<»7.9
11.1
10.1
5.5 0.9
0.9 0.8
1.6
1.1
lfc.6
3.9
28.3
3.0
* . l
3.0
1.7
16.6
0 .1
States for *X
1979
3,g-»?.s
2».9
0.9
o.u 0.8
».8
3.1
5.1
0.9
2 .1
3.6
3.2
»6.»
11.6
9.»
6.0 0.9
0.8
0.8 2.0 0.6 1.3
1.1
lfc.5
2.5
28.7
3-1
<».3
3-3 1.6
16.3
0.1
1980
3 . ^ . 2
2Jul
0.9
0.5
0.7
* .0
3-2
5.2
0.8
2 .5
3.* 3.3
U7.0
U.O
8.2
5.»
0.9
0.8
0.7 1.6 0.6 1.2
3-7
15-3 2.2
28.5
3.1 k.»
3.5 1.3
16.1
0.1
e whole per iod.
1981
3.'»7'«.9
26.2
1.0
0.5
0.6
*.5 3.3 5.u 0.6
2.fc
3 . *
* .5
U5.7
11.3
9.6
».3 0.8
0.6
0.6 0.» O.T 1.3
3.1
13.1 3.0
28.1
2.6
».« 3-2
1.3 16.»
-
— Excluding.lead content in py r i t e s .
* Est iaates
Source: Metal S t a t i a t l c a 1960-1970 and 1971-1981. Metallgesellschnft AG.

Spec(83)30/Rev.l Page 8
12. In 1981, the Soviet Union, the United States, Australia and Canada were responsible for more than a half of world mine production of lead (16.4 per cent, 13.1 per cent, 11.3 per cent and 9.6 per cent respectively). Other principal mining countries are Peru, People's Republic of China, Mexico, Yugoslavia, Morocco, People's Republic of Korea, South Africa, Bulgaria, Spain, Ireland, and Japan.
Smelting and refining
13. In 1981, world smelter production was about 3.3 million tons and production of refined lead (including secondary lead) accounted for about 5.3 million tons. Compared to 1980 world output in 1981 fell slightly due to weakened demand, mainly in the United States and some European countries as well as in Brazil and Mexico.
14. The smelting and refining of lead is mainly performed in industrial countries. As the lead deposits in several European countries were depleted in the course of industrialization, the industries in most of these countries are based on the import of ores from Australia, Canada, Latin America and other overseas countries. In 1981, developed countries accounted for 51.9 per cent of world smelter production and about 61 per cent of production of refined lead. In the same year, the share of developing countries in world production of lead was 17.2 per cent of smelting and 14.8 per cent of refining. Centrally-planned economies, mainly the USSR, increased their smelting and refining capacities and in 1981 their share in world smelting production was 30.9 per cent, and that of refining 24.3 per cent.
15. Table 3, which indicates the percentage share of producing countries in world smelter production as well as in world production of refined lead, shows that the European Community (mainly Germany, F.R., and the United Kingdom), the United States and the USSR are the major producing countries. Other principal producing countries are Japan, Canada, Australia, France, Mexico and People's Republic of China.
16. As mentioned in paragraph 8 above, secondary lead production has become quite important in world lead supply. Reclaimed lead from scrap is estimated at about 36 per cent of world refined lead production, the bulk of which is lead used in batteries. However, with the introduction of the maintenance-free battery using non-antimonial lead alloys such as lead-calcium, the secondary refining industry may encounter new technical problems over recycling.
17. In 1981, secondary refined production of lead in developed countries accounted for 1,536,000 metric tons and that of developing countries 233,000 tons. In 1980, secondary lead production in centrally-planned economies was estimated at 213,000 tons. Table 4 indicates world secondary refined production of lead from 1977 to 1981.

SpecC83>30/Rev.J Page 9
TABLE 3
World production of lead (World totals in thousands of metric tons; regional and country data as a percentage of world production)
World
Developing countries of which:
Argentina-
Brazil
Mexico
Morocco
Roaania
Spain
Yugoslavia
Other
Developed countries of which:
Canada
United States
EEC*'
Cermany, F.B.
France
I t a ly
3elgi use-Luxembourg
United Kingdom
Greece
Japan
Austral ia
South Africa ( inc . Hamibia)
Other
Centrally-planned economies of which:
Bulgaria*
Poland
USSR»
China, P.R.*
Korea, D.R.*
Other
Lead
19T0
3.266.5
21.8
1.0
0.61
5.1»
0.9
0.9
2.2
2.5
6.2
5Jui
5.T
18.8
lU.8
6.5
3.7
1.7
2 .1
U.3
0.5
5.5
5.5
2 .1
1.7
2» . l
2.8
1.3
15.3
3.1
1.6
smelter
1975
3.182.1
21.7
1.1
1.1
U.8
0.2
1.2
2.3
3.2
5.6
SL1
5.k
18.2
16.8
6.3
3.2
1.0
1.6
3.7
0.5 U.8
5.0
l.fc
0.9
25.8
3.2 1.8
1T.9
0.5 2.U
production from ores and bul l ion-
1978
3.U06.3
ILS
0.6
1.1.
U.7
0.8
1.1
2.U
2.9
1.5
SL1
5.7
16.7
17.0
5.6
3.7
0.9
2.2
3.6
0.6
5.5
6.0
1.2
1.1
22ii
3.1
1.8
18.1
U.l
2.1
1979
3.UU3.5
1L2
0.9
1.6
U.8
1.0
1.1
2.5
2.7
1.8
52.1
5.3
16.8
16.5
5.7
3-7
0.7
1.9
3.6
0.6
5.1
6.3
1.2
0.9
29.0
3.0
1.7
18.0
U.U
1.9
I960
3.3U0.U
i8_a
0.8
1.3
>>.9
1.2
1.1
2.5
2.5
1.3
2L1
».9 16.U
17.3
5-7
3.»
1.3
2.3
3.»
0.6
5.2
6.0
1.2
0.8
2QA
3.1
1.8
19.1
• .3
1.8
1981
3.255.8
1L1
0.6
1.1
U.O
1.5
1.1
2.6
2.3
1.6
2L2
5.2
15-3
17.9
5.8
3.9
1.1
2.3 U.2
0.6
5->»
6.U
1.3
O.U
2°d
3.k
1.7
19 . <•
U.6
1.8
( 1975
U.802.7
1L0
1.0
1.3
3.»
0.2
0.8
2.1
2.6
2.0
60.8
k.5
22.0
22.3
6.6
3.7
1.9
2.1
6.5
0 . 3
. 5.2
U.O
1.2
1.6
i 2L1
2.3
1.6
1».5
2.9
1.7
1.2
'roductio including
1978
5.UT6.1
1LJ
0.5
1.5
U.l
0.5
0.8
2.2
2.1
2.1
SLi
k.5
a.7 22.7
6.8
U.l
2.1
1.9
6.3 O.U
5.3
k.3
1.1
1.7
23. U
2.3
1.6
1U.1
2.9 l.U
1.1
s of refined lead secondary lead i l /
1979
5.6UJ.U
16. U
1.0
1.7
U.O
0.7
0.7
2.2
2.0
2.5
60.9
k.5
21.7
22.5
6.6
3.9
2.2
1.6
6.5 O.U
5.0
U.6
1.1
1.5
22.7
2.1
1.5
13.8
3.0
1.2
1.0
1980
5.U22.Q
ilzl
0.9
1.6
3.1»
0.8
0.8
2.2
1.9
3.1
60^2
k.3
21.3 21.U
6.5
U.O
2.5
2.0
6.0
O.U
6.6
k.3
1.5
1.5
23.6
2.2
1.6
lU.U
3.2
1.2
1.0
1981
5.316.1
;u.a
0.7
1.2
3.1
1.0
0.8
2.2
1.6
1.8
60.?
u.; 20.1
23.C
6.<:
U.3
2.5
l.'i
6.2 O.U
6.C
U.5
1.3
1.Ï
2U.;
2.2
1.2
15.^
3.3
1.2
1.3
- (Figures on lead smelter production for I960 and 1965 are not available. (Figures on production of refined lead including secondary lead available as from 1975.
- For comparative purposes total figures for the EEC include ten member State* for the whole period.
Source: Metal Statistics 1960-1970 and 1971-1981, Metallgesellschaft AG.

Spec(83)30/Rev.1 Page 10
TABtE u
World secondary refined production of lead
(In thousand metric tons, including secondary refined antinonial lead)
estimated a.a. Mot Avsilable
World t o t a l V
.DeveloBinK countries
Algeria.
Argentina
Brazi l
India •
Korea, Sep. of
Mexico
Peru
Spain »
Venezuela
Yugoslavia
Others
Developed countr ies
Aust ra l ia
Austr ia
Tensda
EEC:-
Belgium
Denmark
Prance
Germany, F.R.
I re land
I t a l y
Hetherlands
United Kingdom
Finland
Japan
Hew Zealand
Sweden
South Africa.
Switzerland
USA
Others
Centrally-planned economies
Bulgaria
Czechoslovakia
Germany. D.R.*
Hungary
Poland
USSR»
China, P.R.*
Korea, P.R.»
19TT
1,755,9,
209.7 3.0
T.O
29.0
12.W
-68.5
-29.3
S.O
ia.3 33. T
1.5*6.2
36.5
10.T
55.0
653.6
U2.0
2».2
80.2
190.6
-83.5
20.0
211.»
3.0
117.8
8.0
18.9
2U.0
-617.»
1.3
8.0
19.0
37.0
0.2
22.0
100.0
15.0
5.0
1978
1.737.6
211.1»
3.0
6.0
33.2
10.9
-•9 .3
-38.6
9.0
19.0
W.fc
l i i 2 « . 2 35-1
10.5
50.0
6*9.8
30.0
26.2
82.3
179.1
2.1
85.1
20.6
222.9
5.0
105.0
8.0
18.3
23.6
-620.3
0.6
5.0
19.0
38.0
0.3
25.0
100.0
20.0
5.0
1979
1.898.1
251.8 3.0
6.0
•3 .0
10.8
5.8
58.0
5.0
39.8
10.0
19.0
51.»
1,6*6.J
•2.0
11.9
68.6
697.6
27.0
29.8
90.6
178.5
5.0
101.0
20.0
2»».2
6.0
106.5
9.0
2«.0
23.3
5-0
6*7.5
*.9
k.O
19.0
*0.0
0.1
25.0
100.0
20.0
5.0
1980
1.816.6
256.1 5.0
18.5
U0.«
10.7
10.0
U..0
5-0
37.*
10.0
17.0
58.1
1.560.5
32.6
10.2
69.0
636. U
30.0
2*.5
92.0
159.2
7.0
91.6
19.8
211. »
3.2
129.8
7.0
22.0
35.»
7.0
602.0
5.9
*.0
20.0
ItO.O
0.1
2k.0
100.0
20.0
5.0
1961
1,768.5
233.0
5.0
15.6
31.3
11.1
12.0
38.0
5.0
3*.l
10.0
12.5
58.5
1,535.5 32.3
11.6
69.7
6*1.5
28.0
26.5
99.»
158.8
13.0
97.U
19.7
198.0
*.5
1*1.6
7.0
22.0
26.9
7.0
569.2
3.1
n . a .
n . a .
n-.a.
n . a .
n . a .
n . a .
n . a .
n . a .
V. 2/T
World total does not include production in centrally-planned economies, Romania included with developing countries.
'tor comparative purposes total figures for the EEC include ten member States for the whole period.
Sources: World Metal Statistics, December 1982, Published by World Bureau of Metal Statistics; Miners! Yearbook 1980. US Bureau of Mines - data on centrally-planned economies secondary production.

Spec(83)30/Rev.l Page 11
Consumption
18. Industrialization has brought about changes in the pattern of metal consumption. Consumption of lead, once the most used non-ferrous metal, has fallen in relation to that of other metals. In 1979, the share of lead in total world consumption of the six quantitatively most important non-ferrous metals declined to 14 per cent (1960 « 17.3 per cent), while the share of aluminium consumption rose to 41 per cent (1960 » 27.6 per cent).
19. Compared to the I960's, in the 1970's, the annual rate of growth of consumption of refined lead declined by half, to about 2 per cent. This slow-down in growth may largely be attributed to three factors. Firstly, world economic recession adversely affected the transportation sector (automobile), which is the main consumer of lead (see para. 12). Secondly, consumption of lead was subject to strong substitution pressures by other products such as plastics, other metals and various compounds in its traditional markets such as cable sheathing, sheet and pipe and chemical applications. Finally, environmental regulations have led to a fall-off in the consumption of lead additives, tetraethyl lead and tetramethyl lead in gasoline.
20. In 1981, world refined lead consumption amounted for about 5.2 million tons, the lowest level reached in the last five years. Table 5, indicating world consumption and regional and country percentages of world lead consumption in the period from 1960 to 1981, shows that in 1981 developed countries consumed about 59 per cent of refined lead and centrally-planned economies about 27 per cent. In the same year, the share of world consumption in developing countries, which increased considerably in the I960's remained stagnant at about 14 per cent.
21. The principal refined lead consuming country is the United States, followed by the USSR. In 1981, the shares of these two countries in world consumption were 21.6 per cent and 15.3 per cent respectively. The third place was taken by Japan, which in the period 1960 to 1981 almost doubled its consumption of refined lead. Other important consumers are Member States of the European Economic Community, which together consumed about 23 per cent of all refined lead in 1981. Due to industrialization, consumption of refined lead by some developing countries, mainly Brazil, Mexico, Spain and Yugoslavia, increased substantially.
22. Table 6, indicating principal uses of lead, shows that the battery industry is the dominant user of lead, accounting for 51 per cent of total consumption in 1981. In the same year, the manufacture of pigments and other compounds represented 14 per cent of total consumption, followed by rolled and extruded products and cable sheathing, each accounting for about 8 per cent. The use of lead for gasoline additives declined to 6 per cent of total consumption and that in alloys to about 5 per cent. Shot-ammunition accounted for 2.7 per cent of lead consumption in 1981.
Copper, zinc and tin experienced the same downward trend and in 1979 their shares in metal consumption were as follows: copper 25.5 per cent (1960 - 31.5 per cent), zinc 16.4 per cent (1960 » 20.4 per cent), tin 0.6 per cent (1960 = 1.3 per cent). The share of nickel remained unchanged at 2 per cent.

Sptc( 83)30/ Rev. 1 Pag* 12
TABLE 5
World Consumption of Refined Lead (World total* is thousand* of metric tons; regional and country data as a
percentage of world consumption)
world
Developing countries of which:
Argentina
Brazi l
India
Korea, Rep.of
Mexico
Peru
lee—la
«pais
Yugoslavia Others
Developed countr ies of vaich:
Austra l ia
C—*a)
ixcV Belgiua-Luzeabourg
France
Germany, T.2.
I t a l y
Netherlands
Baited Kingdom
Japan
Baited S ta te s
Others
Centrslly-olanned economies of «men:
Bulger i s
China, ? . l .
Korea, O.S.
Germany, O.S.
Poland
BUI*
Others
I960
2,633.*
2*2
l . i
O.T
0.9
a.*. 1.1
n . a .
0 .5
1.1
0 .9 1.2
70.7
1.9 1.6
31. ?
2 .1
6.1
9.1
5.0
1.9
10.9
3.8 24.6
».9
21.8
a . a .
2 .7
0.2
2 .5
1.9
12.2
2 .3
1965
3.1T8.T
10.6
1.2
0.6
1.2
n . a .
2.2
n .a .
0.5
2 .3
1.3 1.3
66.7
1.8 1.8
29.9
1.6
«••5
8.6
2.9
1 . 7
9.8 k.6
25.7
k.9
22.7
a.a.
3-1
0.5
2.5
1.9
12.1
2.6
19T0
3,805.5
11.»
1.0
0.6
1.1
a . a .
2.5
a . a .
0.9
2.0
1.3 2 .0
63.»
1.6 1.6
ze.o 1.6
5.1
8.1
< • . »
1.3
6.9
5.5 21.7
5.0
2L2
a . a .
».2
0 .5
2.6
1.8
12.7
1 '•'
1975
U.T20.0
13.0
1.1
1.6
0.8
0.2
1.5
0.3
1.0
2.0
1.8
2.7
60.2
1.5
1.9 23.6
1.1
».o 6.0
%.l
0.9
6.52/ 5.5
23.8
3.9
26.8
2.0
3-9
0.5
1.9 2.0
1W.8
«
1978
5.521.5
13.2
0.7
1.5
1.0
0.5
2.0
0 .3
0.8
2 .1
1.5 2 .8
61.8
1.3 1.8
23.5
1.0
3.8 6.1
* .5 1.0
6.i2/ 6.4
25.5
3.3
2L2
1.9 f 5.8
0.5
1.8
1.7
13.8
1.5
1979
5.626.3
1».5
1.0
1.7
1.0
0.6
2.0
O.a
0.8
2.0
1.5 3.5
60.6
I .»
2.2
23.8
1.0
3.8 6.» fc.6
1.0
5.92/ 6.6
23-9
2.7
2».9
1-9
3.7
0.5
1.8
1.5
13.9 1.6
1980
5,737.9
0.9
1.5
1.0
0.6
1.8
0.5
0.9
2.1
1.6
2.9
%£
1.3 2.0
2k.2
1.1 • . 0
6.2
5.2
1.1
5 .6^ 7."»
20.5 It.2
26.6
2.0
a.O
0.5
1.9
1.7
15.0
1.5
1981
5.22k.6
I L Z
0.6
1.3
1.1
0.7
l . S
0.»
0.9
1.9
1.6
3.<>
^ 1
1.3 2.2
23.2
1.1
I..0
6.3
».9
o.a 5.l2/ 7.3
21.6
3.7
27.0
2.3 <<.l
0.5
2.0
1 >
15.3 l . i .
?or comparative purposes total figures for the EEC include ten aember States for the whole period.
^Excluding scrsp and reaelted lead.
'Estimates.
Source: Metal S t a t i a t i c a 1960-1970 and 1971-1931, Metallgesellschaft AG.

SpecC83)30/Rev.1 Page 13
TABLE 6
Principal uses of lead (in percentages of total consumption)
Batteries
Cable Sheathing
Rolled and Extruded Products
Shot-Ammunition
Alloys
Pigments and other Compounds
Gasoline Additives
Mi s c ellaneous
TOTAL*
1977
U8.7
7.1
8.2
3.0
6.2
13.3
8.8
U.7
100.0
1978
1+9.0
7.1
8.3
2.8
6.0
13.7
7.9
5.2
100.0
1979
U8.9
7.6
7.6
2.6
6.U
lU.O
8.1
1+.8
100.0
1980
U8.1
7.9
8.6
2.6
6.0
Ik.6
7.U
U.8
100.0
1981
51.1
7.8
8.3
2.7
5.1
13.9
6.U
U.T
100.0
*Data based on figures from the following countries : Australia, Austria, Belgium, Brazil, Canada, Finland (1978 onwards), France, Germany, F.R., India (1979 onwards), Italy, Japan, Mexico, Netherlands, New Zealand, Scandinavia, Switzerland, United Kingdom, United States.
Source: International Lead and Zinc Study Group; Principal uses of lead and zinc, 1977-1981.

Spec(83)30/Rev.1 Page 14
23. The graph below indicates trends in lead metal production and consumption from 1981 to the beginning of 1983. It shows that in spite of declines, refined lead production still exceeds consumption. These production levels are mainly explained by a lack of producer response to lower demand and prices in the primary sector, although this was partially offset by reductions in secondary sector production as a result of shortages of battery scrap. In 1982 world production of refined lead (both primary and secondary) amounted to 3.9 million tons, about 2 per cent less than in 1981. In the same year, world refined lead consumption further decreased by about 2 per cent to 3.8 million tons (these figures do not include centrally-planned economies).
1981 1982 1983
Moving Annual Totals: Million metric tons
4-2
3-7
Metal product ion:

Spec(83)30/Rev.l Page 15
Prices and stocks
24. Outside the United States, lead purchases are made exclusively on the basis of London Metal Exchange (LME) quotations, for both long-term and spot contracts. In the United States, producer prices are published in metal trade journals, and they are averages of quotes by main producers. In principle, US producer prices closely follow those of the LME but are subject to less fluctuation. Prices of lead are influenced by the production of co-products and by-products as well as by.the production of lower-cost secondary lead recovered from SLI batteries.
25. Table 7 indicates the average price of lead from 1970 through to 1981, at the London Metal Exchange. In nominal terms, prices of lead show a cyclical pattern similar to that of other metals. In the early 1970's there was little investment in lead mining production, as prices were relatively low. In the period 1975 to 1979 increases in consumption relative to production resulted in higher lead prices. The peak in prices in 1979 was the result of large purchases by the Soviet Union and strikes in the United States. After the boom in 1979, the price of lead fell substantially from fc567 per ton to fa311 per ton in 1982 due to the continuing recession and lower consumption levels. During the same period world refined lead stocks increased as follows:
Commercial stocks:
Producers :
Consumers :
Merchants:
LME:
TOTAL
Non-commercial stocks:
3: US stockpile
1978
148
225
7
16
397
545
1979 Thousand
182
252
8
17
459
545
1980 metric
221
224
7
73
525
545
1981 tons
247
214
7
50
518
545
1982
242
180
5
126
560
545
SLI batteries - starting, lighting and ignition. 2 All stocks owned and controlled by producers regardless of location,
including stocks at refineries, in warehouses, in transit, at agents or distributions and at consumers' plants.
3 The current stockpile objective is 997,904 metric tons.
Source: Monthly Bulletin of the International Lead and Zinc Study Group, August 1983.

Spec(83)30/Rev.l Page 16
TABLE 7
Average cash p r i c e s for l e ad a t t he London Metal Exchange,
. 1970-1902 .
600P
900
!
I
400
300
200
100
0 • • • « ' ' » I 1 1 « « 1 » 1970 1971 1972 1973 1974 1975 1976 1977 1978 1979 1980 1981 1982
Yew
Data for Figure (£ per ton)
1970 1971 1972 1973 1974 1975 1976 1977 1978 1979 1980 1981 1982
Average 126.60 103.92 120.62 175.05 252.80 185.88 249.82 353.62 342.55 567.09 390.72 363.03 311
Source: London Metal Exchange.

Spec(83)30/Rev.l Page 17
SECTION II; FOREIGN TRADE •
26. Data below indicate world trade of lead ores and concentrates, lead bullion and refined lead in the period from 1975 to 1981. Detailed information on trade flows in the period from 1975 to 1981 is given in Annex I.
Thousands of metric tons
1975 1978 1979 1980 1981
Ores/concentrates : (lead content)
Exports
Imports
Lead bullion:
Exports
Imports
Refined lead:
Exports
Imports
640.4 (571.2)
620.9 (557.8)
230.5 (199.5)
247.3 (210.8)
868.2 (715.2)
811.0 (672.7)
710.8 (616.4)
667.5 (595.9)
257.2 (216.9)
253.8 (213.1)
978.9 (778.8)
1,037.6 ( 837.0)
645.6 (540.1)
713.3 (623.0)
292.9 238.3)
296.8 (246.1)
987.6 (798.1)
1,105.2 (907.8)
667.9 (583.4)
723.4 (638.9)
248.6 (214.9)
277.3 (237.7)
1,108.4 (889.7)
1,015.7 (807.6)
691.1 (625.9)
711.5 (646.7)
203.4 (176.7)
192.5 (166.0)
899.7 (698.6)
937.8 (749.2)
Note: The totals shown above include published data on exports and imports reported by market economy countries together with estimates of trade between centrally-planned economies and other countries not covered by official trade statistics. Trade among centrally-planned economies is excluded, intra-EEC trade is included. The figures in brackets indicate the world total excluding intra-EEC trade.
Exports
27. In volume terms, world exports of lead ores and concentrates accounted for 626,000 metric tons in 1981 (total trade, without intra-EEC trade). The major exporter was Canada, with 23.3 per cent of total world exports, followed by South Africa with 16.2 per cent, Morocco with 9.4 per cent and
Statistical data on trade flows are based on information supplied by the International Lead and Zinc Study Group.

Spec(83)30/Rev.l Page 18
Peru with 9.0 per cent. Other important exporting countries were Sweden, the United States, Australia, Thailand, Spain, and Bolivia. The figures on world exports of lead ores and concentrates in 1981 are given in Table 8.
28. Exports of lead bullion are mainly undertaken by developed countries which accounted for about 83 per cent of total world exports in 1981. Australia alone was responsible for almost 77.5 per cent of world total exports. Table 9 indicates that other exporting countries were People's Democratic Republic of Korea, Sweden, Spain, France, Mexico and Republic of Korea. Total exports of lead bullion in 1981 were 177.000 of metric tons (total trade, without intra-EEC trade).
29. World exports of refined lead in 1981 accounted for 699.000 metric tons (total trade, without intra-EEC trade). As shown in Table 10, the exports of developed countries represented about 64 per cent of world exports and those of developing countries about 37 per cent. In 1981, principal exporters were Australia, with about 24 per cent of world exports, Canada with a share of 17.0 per cent, the EEC (mainly Germany F.R. and the United Kingdom) with 14.3 per cent, Peru (11.5 per cent), Mexico (9.5 per cent), Morocco (6.3 per cent), South Africa (2.6 per cent) and Yugoslavia (2.0 per cent).
Imports
30. Developed countries accounted for almost 75 per cent of world imports of lead ore and concentrates totalling 647.000 metric tons in 1981 (total trade, without intra-EEC trade). In the same year the share of developing countries was 11.2 per cent and that of centrally-planned economies 13.9 per cent. Table 11 indicates that in 1981 the European Community was the largest importer of lead ores and concentrates (37.4 per cent) followed by Japan (20.8 per cent), the USSR (9.3 per cent) and the United States (9.0 per cent). In 1981, developing countries importing lead ores and concentrates were as follows: Romania, Spain, Tunisia, Mexico, Brazil, India and Yugoslavia.
31. In 1981, almost 94 per cent of world imports of lead bullion were destined to the Member States of the European Economic Community, of which about 66 per cent were imported by the United Kingdom, and 20 per cent by the Federal Republic of Germany. Figures on world imports of lead bullion in 1981 are given in Table 12.
32. As can be seen from Table 13, in volume terms, world imports of refined lead in 1981 were about 750,000 metric tons (total trade, without intra-EEC trade). Among the principal developed country importers, accounting for about 56 per cent of total world trade in 1981, were the European Community (20 per cent, of which Italy 10 per cent and the United Kingdom 6.6 per cent), the United States (13.6 per cent), Japan (6.6 per cent) and Austria (4.8 per cent). Centrally-planned economies accounted for about 18 per cent of world imports, with the USSR and China as the largest importers. In the same year, the share of developing country imports in world imports of refined lead was about 25 per cent. Among others, developing countries importing refined lead were the following: India, Republic of Korea, Egypt, Yugoslavia, Thailand, Malaysia, Turkey and the Philippines.

TABLE 8
World Exports in 1981- : Lead ores and concentrates (Lead content)
Spec(83)3(yRev.1 Page 19
2 / t
Total trade excluding intra-EEC t rade.
Total trade-
Developing countries of which:
Algeria Argentina Bolivia Congo Honduras Iran Korea, Rep. of Mexico Morocco Peru Philippines Spain Thailand Tunisia Yugoslavia
Developed countries of which:
Australia Canada
-1 /
EEC:-
Denmark (Greenland) Germany, F.R. Greece Ireland Italy United Kingdom
Finland Norway Sweden United States South Africa
• 2/ Centrally-planned economies— of which:
Czechoslovakia Other
Thousands of metric tons
625.9
237.1
/2.0-7 10.6r
15.6 /S.07 11.6 /20.07 5.0 -
58.9 56.3 1.1 19.3 /23.07
-
7.7
383.8
22.3 1U6.1
21.0
0.5 0.2 J.k 7.2 5.6 —
1.9 3.U 52.1 33.0 101.5
5.0
u.o 1.0
Percentage of world trade
100.0
37.9
/Ô.37
1.7 2.5 /Î.07 1.9 /1.27 0.8
-9.U 9.0 0.2 3.0 /3\77
-
1.2
61.3
3.6 23.3
3.U
0.1 0.1 1.2 1.2 0.9
—
0.3 0.5 8.3 5.3
16.2
0.8
0.6 0.2
— Exports by centrally-planned economies to other countries ( i . e . excluding trade between them). Figures shown are estimates based on imports reported by receiving countr ies .
/ _7 Estimated.
Source : Based on statistics supplied by the International Lead and Zinc Study Group.

Spec (83) 30/Rev. 1 Page 2 0 *-; \
TABLE 9.
World Exports in 198l : Lead bullion
Total trade-
Developing countries of which:
Korea, Rep. of Mexico Spain Yugoslavia
Developed countries of which:
Australia
EEC:-/
Belgium Denmark France Germany, F.R. Italy Netherlands United Kingdom
Sweden
2/ Centrally-planned economies— of which:
Korea, P.D.R.
Thousands of metric tons
176.7
18.1
0.1 U.7 11.2 2.1
1U6.6
136.9
1.1
0.5
0.2
0.3 0.1
8.6
12.0
12.0
Percentage of world trade
100.0
10.2
0.1 2.7 6.3 1.2
83.0
77.5
0.6
0.3
0.1
0.2-0.1
h.9
6.8
6.8
— Total trade excluding intra-EEC trade. 2/ — Exports by centrally-planned economies to other countries
(i.e. excluding trade among them). Figures shown are estimates based on imports reported by receiving countries.
Source: Based on statistics supplied by the International Lead and Zinc Study Group.

' TABLE 10
World Exports, in 198l - Refined Lead
Spec(83)30/Rev.1 Page 21
1/ - Total trade excluding intra-EEC trade.
deliveries. 2/ - Producers1
Total trade-
Developing countries of which:
Argentina Mexico Morocco Peru Spain Tunisia Yugoslavia Zambia Other
Developed countries
of which:
Australia-Austria Canada
EEC:-/
Belgium Denmark France Germany, F.R. Greece Ireland Italy Netherlands United Kingdom
Finland Japanâ' Sweden South Africa 0/ United States2-7
Switzerland ... . . .-- -4/
Centrally—nlanned economies— of which:
Bulgaria Korea, P.D.R. USSR Other-
Thousands of metric tons
698.6
235.0
0.3 66.3 43.9 80. k 12.2
6.5 14.0 8.3 3.1
446.6
170.5 0.3
119.8
100.2
11.3
5.8 13.6 30. k
Q.JH
0.3 1.6 3.0
33.. U
0.5 2.9
15.7 18.2 XU 17.0
4.0 k.o 7.0 2.0
Percentage of World trade
100.0
33.6
-9.5 6.3
11.5 1.7 0.9 2.0 !•? 0.5 63.9
24.4
— 17.1
14.3
1.6 0.8
•1.9 h.k 0.1 -
0.2 •0.4 4.8 0.1 .0.4
2.2 2.6 2.0 0.7 2 ^
0.6 0.6 1.0 0.3
V -'Includes alloys. 4/ - Exports by centrally-planned economies to other countries;
figures shown are estimates based on imports reported by receiving countries. Source: Based on statistics supplied by the International Lead and Zinc
Study Group.

Spec(83)30/Rev.1 Page 22
TABLE 1 1
World Imports in 1Q81 Lead ores and concentrates (Lead content)
Total trade—
Developing countries of which:
Brazil India Mexico _ . . _ , Romania Spain 2 i Tunisia-' Yugoslavia
Developed countries of which:
Austria/ Canada-'
EEC:"*
Belgium France Germany, F.E. Greece Italy United Kingdom
Japan United States Other .
Centrally-planned economies^ of which: Bulgaria Germany, D.E. USSE —
Thousands of metric tons
6U6,T
72.4
9,8 3.6-9-7 20.0 16.9' 12. k 0.-6
U8U.3
1.0 kô.h
2kX.?
35.7 65.2
102.7. 2.1 12.1 2>.l*
13h,2 58.5 0.3 90.0
28.0 2.0 60.0
Percentage of world trade
100.0
11.2
1.5 0.6 1.5 3.1 2.6 1.9 0.1
7^.9
0.2 7.5
37.4
5.5 10.1 15-9 0.3 1.9 3.7
20.8 9.0
13.9
U.3 0.3 9.3
— Total trade excluding intra-EEC trade. 2/ — Totals shown are based on reported exports to these countries, 3/ — Imports by centrally-planned economies from other countries
(i.e. excluding trade between them). Figures shown are based on reported exports to these countries; plus estimates of tonnages not covered by published data. Source : Based on statistics supplied by the International Lead and
Zinc Study Group.

Spec(83)30/Rev.1 Page 23
TABLE 12
World Imports in 1981 : Lead bullion
Total trade —
Developing countries of which:
Korea, Rep. of Philippines
Developed countries of which:
EEC:-/
Belgium France Germany, F.R. Italy Netherlands United Kingdom
Japan Sweden United States
2/ Centrally-planned economies— of which:
Bulgaria Czechoslovakia USSR
Thousands of metric tons
165.0
1.3
1.2 0.1
16k.7
155.7
8.5 1.1 33.3 2.9
IO9.9
8.3 0.3 0.5
—
-
Percentage of world total
100.0
0.8
0.7 0.1
99-2
93.8
.5.1 0.7 20.0 1.7
66,2 "
5.0 0.2 0.2
-
— Total trade excluding intra-EEC trade. 2/ — Imports of centrally-planned economies from other countries
(i.e. excluding trade among them). Figures shown are reported exports to these countries.
Source: Based on statistics supplied by the International. Lead'sud Zinc Study Group. ..n
T j^ """-"' "*

Spec( 83)30/Rev. 1 Pag* 24
TABLE 13
World Imports in 1981 : Refined lead
Tot*l trade»
Develouinx countries of which:
Algeria Egypt India Indonesia
Israel-7
Korea, Rep. of Malaysia Philippines Romania <• Spain j / Thailand» Turkey2' Yugoslavia Others»
Developed countries ol «bien: Austria Canada
EEC:—
Belgium Denmark France Geraany, F.R. Greece Ireland Italy Netherlands United Kingdom
Finland Japan ,, Hew Zealand*'
Portusai South Africa Sweden Switzerland United States
U/ Centrallvolanned economies -of which:
China Czechoslovakia Germany, O.R. Hungary Poland USSR Others
Thousands of metric tons
7*9.2
168.9
3.6 15.0 31.T 8.T
11.» 1.9 16.T T.9 6.0 10.0 6.8 10.0 2.7 12.1
U..3 «22.2
35.T 9.2
1U9.3
k.T O.T 5.5 8.0 • •7
-73. r 2.9 •9.1
20.9 U9.I 5-2 6.5
17.8-9.3 7.1 10.2 101.9
138..1
30.0 15.0 8.0 2.0 3.1
8O.O
Percentage of world trade
100
25.2
0.5 2.0 a.2 1.2 1.5 0.3 2.2 1.1 0.8 1.3 0.9 1.3 O.k 1.6 5.9
56J;
«.8 1.2
19.9
0.6 0.1 0.7 1.1 0.6 -
9.3
o.u 6.6 2.8 6.6 0.7 0.9 2.U 1.2 0.9 1.» 13.6
lj,U
U.O 2.0 1.1 0.2
o.u 10.7
— Total trade excluding intra-EEC trade.
— Based on reported exports to these countries. * Includes alloys. hi — Imports by centrally-planned economies from other countries
(i.e. excluding trade among them). Figures shown are estimates, except for Poland, based on exports reported by supplying countries, plus estimate of tonnages not covered by reported trade data. £J Estimated.
Source: Based on statistics supplied by the International Lead and Zinc Study Group.

Spec(83)30/Rev. Page 25
Direction of trade
33. Table 14 indicates the sources of supply in lead ores and concentrates, lead bullion and refined lead in 1981 into main markets. In 1981, the main suppliers of lead ores and concentrates to the EEC were Sweden, South Africa, Morocco, Canada, Peru and Australia, covering about 84 per cent of total imports. Imports of lead bullion into the EEC were originated mainly from Australia (77 per cent). Canada, Australia and Morocco accounted for about 66 per cent of EEC's imports of refined lead. About 88 per cent of lead ores and concentrates imported by Japan in 1981 were supplied by Canada, Peru and Morocco and 75 per cent of refined lead by Australia, Peru and Mexico. Leading suppliers of lead ores and concentrates to the United States were Canada, Peru and Honduras, sharing 84 per cent of the total market. About 74 per cent of refined lead imports into the USA originated from Canada, Mexico and Australia. Table 14 also shows the main suppliers of the following countries: Austria, Canada, Sweden, Brazil, India, Mexico, Spain and Yugoslavia.
SECTION III; COMMERCIAL POLICY SITUATION1
2 34. Table 15 shows the pre- and post-Tokyo Round tariff situation in eleven developed markets and some of the main importing developing countries. More detailed information is contained in Annex II, which provides data on both pre- and post-Tokyo Round tariff rates, as well as preferential rates at the tariff line level together with corresponding trade flow data for 1980 (1978 for New Zealand, 1981 for Australia) with respect to lead and products thereof.
The structure of tariffs
Post-MTN tariff situation
35. Table 15 indicates that developed countries made considerable tariff concessions on most lead and lead products in the Tokyo Round. However, m.f.n. duty rates increase with increases in value-added.
This section deals basically with tariff and certain non-tariff measures. A number of other measures affecting the lead and zinc industry (governmental grants and loans, fiscal measures, research assistance, etc.) are referred to in the study on governmental measures published by the International Lead and Zinc Study Group in December 1978.
2 Pre-Tokyo Round rates indicate rates applied in 1973 for Australia
and 1976 for other countries. Post-Tokyo rates indicate final rates in 1987 upon total implementation of concessions. For Australia rates in the post MTN column represent applied rates in 1982. " " indicates MTN rates fully implemented. GSP rates are rates in force in 1983, for Australia GSP rates applied since 1982.

I'nU I» laaartt b» «rial». »»1
(L id C M I M I ; taaauad •( «tr ie t « i )
tni rt Cfacaatntit
Lid hUltt
«aflnad Ju l
laatrtt lain:
M i l »
I t l . l 1.0 UC 1.0
I i l i i 3SJ UC 31.» l a t i t l n l * 2.1 SidtiarlaM 0.5 kVq i r . 0.S Naracca 0.2 G.raiay.O.I. 0.2
CAIAOA
fttlt H.S Saalk Africa 21.1 «SA 15.4 Sait* S.4 l i l l < l i 0.1
l l M J.} 0 » 1.2
Hailca 1.0
iKy
M i l 24I.J Sndaa 41.$ Saatk Africa 41.5 Haracca S . I Canada 11.2 far» 24.» Aaitralla H . I Ikailaad 10.» larkat 4.4 l a l i t i a 4.4 Saala 4.1 Ciackailavakia 1.4 laraaj 1.2 Finland I . I Caaga 1.1 Pa r t i a l 0.5 Aaitrla 0.4 Iinjailavla 0.2 Mkar 1.4
total a j Aaitralla 119.2 ISA 11.4 Saaaaa 1.1 Canada 2.2 faa. i l i» la 2.1 Sattiarl iad l.S Naracca O.S «ualrla 0.1 l a l l t l . 0.1
I f t l l 149.3 Canada 45.1 Aatiralla 31.9 larecca 20.1 Saatk Africa 11.» Hailca 10.2 laa l i la 1.2 Para 4.1 USA 4.2 l . l o . r l i 1.0 Sftia 1.2 Snitiarltnd 1.1 Sxasaa 0.1 Zuaia 0.1 luaaila.ia 0.1 Mkar 4.J
JAPU
M i l Canada
Par»
Haracca
Aaa t ra l l a
l a raa . l ap .a f
l a l l t l a Ikailaad Pklllaplaai ladaaaila Iaraa, f .0 . l .
l a l i l (arai.P.0.8.
1.1.1 Amtr i l ia Para Hailca Saalk Africa Canada
USA
Otkar
134.2
H . I 21.2
14.1
5 .1
1.4
2 . 1
2.4
0 . 1
0 .1
0 . 1
LI 1.1
4M 15.5 12.0
9.1 4.1
1.1 I.I O.t
SttOfl
I . I . I
ac
l a l i l
f a l l ) UC USA flalaad
U 0.1
SJ
Li. S.I 1.0 0.1
urn» sum
M i l *A Canada 23.5 Para 14.1 Mandant 11.1
Ara.nliaa 1.1 Aaitral la 2.2 Ct. l l . 2.1 Hailca 1.0
I.I.I M
M i l !P).{ Canada 50.1 Hailca 11.1 Aaitralla 10.9 UC 1.1
Para 2.9 Artaattaa 0.1 Ck lu , P. I . 0.1 Othir 0.1
« W i t
l . t i l
Saatk Africa «SA
Otkar
M 4.1 4.S 0.*
IIOIA
latal Canada
I a i l l Aaitralla laakla UC
Li 1.1
i U l i . l 0.2
1.1
KIICO
l a l i l U
Pan I.S ISA 1.2
SPAII
l . t . l
Inland Saalk Africa Haracca UC
l . t . l
UC laal i la
I U 1.4 5.2 1.0
2.1
L I 4.4 0.2
1US051AVIA
l . t . l
UC
Itlil Para
Canada
ECC Haracca
L i 0.1
I U 4.4 1.4 0.» 0.2
"f i9«rn far tka EEC «iclada latri-EEC trada.
S .w t i : «arid trida In laad and l ine. 19)4-1981. Intarnattanil la id and l ine Stady O n * .
"

TABLE 15
Summary of tariff situation affecting le»d and articles thereof
Sp*c(33)30/Rev.1 Pag« 27
•
m
CCCN
ex 2601
ex 2603
2827
>
ex 2830
ex 2835
ex 7801
ex 7801
7802
7803
7804
7805
7806
_,. ,__,
Product description
Lead ore and concentrates
Ash and residues of lead
Lead oxides:
red lead and orange lead
Chlorides of Itad
Sulphidts of lead
Unwrought lead
.
Haste and scrap of lead
wrought bars, rods, angles. shaoes and sections of lead;
Wrought plates, sheets. strips, of lead
Lead foil, of a weight per «r not exceeding 1700g:
Lead powder and flakes
Tubes and pipes and blanks therefor, of lead;
Hollow bars, and tube and pipe fittings of Itad
Othtr articlts of Itad
AUSTRALIA*
Pre-HTN
Free
Free
7.5X
7.5X GSP,: Free
7.5X
Free (.100 Unalloy
3SX and SO.064 per kg.
(.900
Free
3SX S0.064/kg.
SSX
)7.5X
)SSX
55X
Post-HTN
Free and 2X— GSP: Free
frtt and 2X— GSP: Free
frtt and 2x1' GSP: Fret
Free and 2x1' GSP: Free
Free and 2ti' GSP: Fret
Frtt and ZlX' td Itad) 2X (undtr by-law) Othtr) GSP:Frtt(both:
Free and ZX— GSP: Free
2X (under by-law) GSP: Free
2X (undtr by-law) GSP: Fret
(Free and 2X )GSP: Fret
» ) > ) ) ) ) ) ) ) ) tfrtt and 2x1' )GSP: frtt ) ) )
21X
AUSTRIA
Pre-HTN
frtt
frtt
16.8X GSP:
Fret
Frtt
5X
8.4X
(Ltad-ti 5X «in. S40/100kgs.
Frtt
10X GSP:
12X GSP:
)18X )GSP:
) > ) ) ) ) ) ) ) ) ) )12X WSP:
) ) )
15X GSP:
17X GSP:
POSt-NTM
Free (B)
frtt (B>
1SX (8) GSP: 7.9X
Free (8)
Fret (8)
4X (8) GSP: 2.2X n alloys) 4X ain. S28/100kgs. GSP: 2.2X •in. S17/ 100kgs. (8)
(Other)
5X
61
9X
6X
7.5X (Lead
8.5X (Ot
Frtt (8)
6X (8) GSP: 4X
7X (8) GSP: 4.7X
)8X (8) )GSP: 6.5X
) ) > ) ) ) ) ) ) ) ) )7X (8) KSP: 4.7X > ) )
8X (8) GSP: 5.7X wool) 8X (8) GSP: 6.2X her)
CANADA**
Pre-MTN Post-«TN
Free (not 4.SX(8)(applied bound) rate Free) GSP: Free GSP: Free
(ex 32900-1)
Free frtt GSP: Free GSP: Free
(ex 68105-1)
15X 12.SX (8) GSP: Free GSP: Free
(92827-1) 12.SX 10.5X (8) GSP: Free GSP: Free
(92827-2)
1SX 12.SX (8) GSP: 10X GSP: 9X
(ex 92830-1)
1SX Free (8) GSP: 10X GSP: SX
(ex 92835-1)
10X 6.8X (8) GSP: Free GSP: Free (ex 34100-1 - Antimonial
lead in blocks) 17.SX 10.2X (8) GSP: 11.SX GSP: Free (ex 33900-1 - Others -
alloyed)
Free Free GSP: Free GSP: Free (ex 33700-1 - Unwrought
unalloyed lead)
frtt frtt GSP: Free GSP: Free
(33700-1)
SX 4X (8) GSP: SX GSP: 2.SX (ex 33800-1 - Unalloyed)
17.SX 10.2X GSP: 11.SX GSP: frtt (tx 33900-1 - Othtrs -
alloyed)
See above: (ex 33800-1-Shetts, strips.. (ex 34100-1-Antim©nial lead (tx 33900-1-Other)
Frtt(unbound) 4.3(8)(applied ratt Frtt)
6SP: Frtt GSP: Frtt (tx 33600-1-Tta Itad)
17.5X 10.2X GSP: GSP: (34405-2 - Co-position foil) SX 4X GSP: Frtt GSP: Frtt
(tx 35101 - Unalloyed) 17.5X 10.2X GSP: 11.SX GSP: Free
(ex 33900-1 - Alloyed)
17.SX 10.2X (8) GSP: 11.SX GSP: Free
(ex 33900-1 - Tubes...) 17.5X 10.2X (8) GSP: 11.5X,10X GSP: Fret
(tx 71100-1-Fittings)
17.5X 10.2X GSP: 10X GSP: Free
(ex 33910-D 17.5X 10.2X GSP: 11.SX GSP: Free
(ex 33900-1)
— Revenue duty.
(8) - Bound rates, Geneva (1979) Protocol to the GATT. "-" - Indicates «TM rates fully implemented. « Applied rates in 1982.
** The figures in parenthesis represent Canadian nomenclature tariff lints, bastd on the concordance with the CCCN indicated by the Canadian authorities.

Spec(83)30/Rev.1 Page 28
CCCN
ex 3601
ex 26C3
2827
ez 2830
ez 2835
ez 7801
ez 7801
7802
7803
780»
7805
7806
Product description
Lead ore and concentrate*
Ash and residues of lead
Lead oxide»;
red lead and orange lead
Chlorides of lead
Sulphides of lead
Unvrought lead
Waste and scrap of lead
Wrought bars, rods, angles, shapes and sections of lead;
lead vire
Wrought plates, sheets, strips, of lead
Lead foil, of a weight per a 2 not exceeding 1700g:
lead powder and flakes
Tubes and pipes and blanks therefor, of lead;
hollow bars, and tube and pipe fittings of lead
Other articles of lead
EEC
Pre-OTII
Free
Free
)12.2* )GSP: Free )
9.6* GSP: Free •»S Oxychloryl
12* GSP: Free
Free (AI For refini
0-02* or i weight of
(bullic 3.5*
(ATT
Free
)10X )GSP: Free ) )
10* GSP: Free
10* GSP: Free
2.5* GSP: Free
)11* )GSP: Free ) ) )
6* GSP: Free ( A Containers
radiation c 8.5*
GSP: Free
(>
Post-MTH
Free
Free
)10.5t (B) )CSP: Free )
6* (B) GSP: Free 3.2* (B)
6.9* (B) GSP: Free
Free ng, eont. ore by silver n lead)) 3.5* Other)
Tn*
)8*(B) )CSP: Free ) )
8KB) GSP: Free
8* (B) GSP: Free
2.2* (B) GSP: Free
)9< (B) )GSP: Free
) ) )
6*: GSP: Free vith anti-overing 8* (3)
GSP: Free
Dther -)
FIHUUrO
Pre-KTJI
Free
TT—
)5* )GSP: Free )
Free
fn*
Free
Free
)11 )GSP: Free ) )
0.5* 1* GSP: Free
Free GSP: Free
2.5* CSP: Free
)1* ICSP: Free 1
1
0.5* GSP: Free
[.010 Lead rop 7.5* GSP: Free
(.090
Post-KTÏI
Free(B)
Free(B)
)3.8Ï (B) )GSP: Tn* )
FreefB)
Free(B)
Free(B)
Free(B)
)Free(B) ) ) )
)Free(B)
).
FreetB)
Free(B)
I Free (B) )GSP: Free
Free(B) GSP: Free e and vool) 5.1* (B) GSP: Free
Jther - )
JAPAJI
Pre-KT»
Free
Free
5* GSP: Free i n CSP: Free
7.5* GSP: Free
5* GSP: Free
Post-<fm
Free
Free
3.TSO) CSP: Free 7t • GSP: Free
».9*(3) CSP: Free
3.7* (B) CSP: Free
7.5* 6* (B) (Unalloyed: used for electrolytic refining) 12* or 1 6.5Î or *8/kg. WIG 1 »5.30/kç.wlC 2A Alloyed - eont. antiaony Ï 7* or | U.7* or »8/kg. WIG 1 ¥S/k«. VIG(' 2B Alloyed - other GSP:Free (all)| C3P:Fr<w 'all
5*
GSP: Tra»
110* IGSP: Free 1 1
20* CSP: Free
)M* )GSP: Free
) ) )
20* CSP: Free
15* CSP: Free
10* GSP: Free
3.2* (3! CSP: Free
)5.8* (3) )CSP: Free ) )
8.2*(Bi GSP: Free
)6.5*(B) )GSP: Free
) ) )
8.2*(B) GSP: Free
7.2* (3) GSP: Free
5.a* (s) GSP: Free
(B) - Bound rates. Genera (1979) Protocol to the GATT.
"-" - Indicates MTU rates fully implemented.

Spec(83)30/Rev.1 Page 29
cccs
ex 2601
ex 2603
2827
ex 2830
ex 2835
ex T801
ex T801
7802
7803
780U
7805
7806
Product description
Lead ore and concentrate*
Ash and residues of lead
Lead oxides:
red lead and orange lead
Chlorides of lead
Sulphides of lead *
Unvrought lead
1
Waste and scrap of lead
Wrought bars, rods angles, shapes and sections of lead; solder
lead vire
Wrought plates, sheets, strips, of lead
Lead foil, of a weight per a not exceeding 1700g:
lead powder and flakes
Tube* and pipes and blanks therefor, of lead;
hollow bars, and tube and fittings of lead
Other articles of lead
HEW ZEALAND
Pre-HTH
Tree
Free
Free
Trmm
Free
15* (001-Solder) Free 1
Post-ton
frs«(B)
Free(B)
FreeCB-except red lead)
Free(B)
Free(B)
15*
GSP: 10* Free
009 Unrefined, refined, exel. lead alloys
Free
15*
32.5*. 15*
50* 5* (001 worked) 5*
(009 other th«
30*. 5*. Free
Free
32.5* 11.38/ 100 kgs.(0.7*)
50*
FreejB)
15* GSP: 10*
5*(B-except solder! GSP: Free
25*(B) GSP: 15*
25* GSP: 15*
n worked)
5* (3- except solder)
Free (B)
5* (partially bound - bends
GSP: Free
50* (applied rate in 1983: 35» GSP: 25*
NORWAY
Pre-HTN
Free
Free
Free
Free
Free
Free
Free
Free )
Free
5*
Free
Free
Free
(00LA nails, l k* GSP: Free
(009
Post-wn»
Free(B)
Free(B)
Free(B)
Free(B)
Free(B)
Free(B)
FreefB)
Free(B))
Free/B)
3.8*(B) ) )
rree(B)
jFree(B)
) ) ) ) Free(B)
•ivet burrs) 3-2«B) GSP: Free Other)
SWEDEN
Pre-MTN
Free
Free
Free
Free
Free
Free
Free
Free )
Free
Free ) ) )
Free
Post-«TTl
Free
Free
Free
Free
Free
Free
Free
Free )
Free
Free )
) )
Free
5* 3.M GSP: Free GSP: Free (001 - Containers) Free Free (002 Lead wool, ropes) •* 1 3.2* GSP: Free | GSP: Free
(009 Other)
(B) - Bound rates, Geneva (1979) Protocol to the GATT.
"-" - Indicates HT» rates fully implemented.

Spec C83)30/Rev.1 Page 30
CCCM Product description
SWITZERLAND
Pre-MTH Po»t->C.1
ex 2601
ex 2603
2827
ex
ex
ex
ex
2830
2835
7801
7801
7802
7803
780*
7805
7806
Lead ore and concentrates
Asb and residues of lead
Lead oxides;
red lead and orange lead
Chlorides of lead
Sulphides of lead
Uovroucht lead i
Waste and scrap of lead
Wrought bars, rods angles, shapes and sections of lead; lead wire
Wrought plates, sheets.
Lead toil, of a weight per • not exceeding 1700g:
lead powder and flakes
Tubes and pipes and blanks therefor, of lead:
hollow bars, and tube and pipe fittings of lead
Other articles of lead
Free
Free
SwF 2.UO/100 kgs.(O.US)
SwF 9/100 kgs. (2.61) CSP: Free
SwP 2.20/100 kgs. (0.1*) CSP: Free
SwP 0.50/100 kgs. (0.12) CSP: Free
SwP 0.20/100 kgs. (O.lS) CSP: Pre*
SwP 0.20/100 kgs. (0.1*) CSP: Free
SwP 9/100 kgs. (0.2*) CSP: Free
SwP 6/100 kgs. (0.32) CSP: Free
SwP 25/100 kgs. (2.1*) CSP: Free
SwF 2/100 kgs. (0.2*) CSP: m9
SwP 8/100 kgs. (l.UI) CSP: Free
SwF 1U/100 kgs. (1.2*) CSP: Free
SwF 12/100 kgs. (0.52) CSP: Free
Free (B)
Free (B)
SwF 2.30/100 kgs.(0.US) (3)
SwF 8/100 kgs. (2.3*) (3! GSP: Free
SwF 2.20/100 kgs. (0.1ÎÏ3! GSP: Free
SwF 0.50/100 kgs. (0.1ÎXB) CSP: Free
SwF 0.20/100 kgs. (0.1SI3) CSP: Free
SwF 0.20/100 kgs. (0.1*13! CSP: Free
SwP 8/100 kgs. (0.2*) (B) CSP: Free
SwF 5/100 kgs. (0.3SXB' CSP: Free
SwF 21/100 kgs. (l.eS)fB' CSP: Free
SwF 2/100 kgs. (0.2*) (3) CSP: Free
SwF 6/100 kgs. (1.1*) (3) CSP: Free
SwF 12/100 kgs. (1.0*)(B) CSP: Free
SwF U/100 kgs. (0.5*)<3) GSP: Free
(Containers- for industrial purpose)
SwF 2U/100 kgs. (0.32) I SwF 23/100 kgs. (0.3*)<3! CSP: Free ' GSP: Free
(Tubes for packing)
SwF 11/100 kgs. (0.2*) | SwF 10/100 kgs. (0.2*)(3) CSP: Free- GSP: Free
(Other articles unworked)
SwF 12/100 kgs. (2.22) GSP: Fm
SwF 10/100 kgs. (1.9*)<3) GSP: Free
(Other articles machined)
SwF 2U/100 kgs. (1.32) 1 SwF 20/100 kgs. (1.1*)(3)
CSP: Free I GSP: Free
(Other articles surface treated)
The figures in parenthesis represent ad valorem incidence based on 1980 import prices.
(B) Bound rates, Geneva (1979) Protocol to the GATT. .
"-" - indicates HTM rates fully implemented.

Spec(83)30/Rev.1 Page 31
m
ceci
3601
*x 2603
2827
Product description
Lead or* tad concentrates
Ash and residue» of lead
ex 2830
2835
7801
ez 7801
7802
Lead ozidei:
red lead and
orange lead
Chlorides of lead
Sulphides of lead
Unvrought lead
Waste and scrap of lead
Wrought bars, rods angles, shapes and sections of lead; lead vire
UHITED STATES
Pre-KI*
0.75*/lb on lead content (1.6*) GSP: Free
Post-MTH
0.75e/lb on lead content (1.6») GSP: Free!/ (B)
(602.10 All lead-bearing ores)
1.065*71b on lead content (2.7») I 0.9e/lb on lead content (2.3») (603.2; Lead dross) ,B)
Free (603.65 Other
ls/lb on copper content •0.75c/lb on lead content •0.67*/lb on tine content (O.k»)
Free (B) Mtal-bearing materials )
O.TeVlb on copper content 0.5*/lb on lead content •0 .5e/ lb on t ine content (0.31)
(603.U9 Other metal-bearing materials) (3)
0.8é/lb on copper content •0.75e/lb on lead content •0.67e/lb on zinc content (1.2»)
(603.50 Other)
le/lb on copper content •0.75*7 lb on lead content •0.67*/lb on zinc content (0.1»)
9.5»
GSP: Free (all)
1.25*71» ( 6» )
15»
1.875*71b (8.6»)
le/lb (2.3»)
0.32*7 lb on copper content •0.3*/lb on lead content •0.3*/lb on zinc content (0.51) (B)
0.6*/lb on copper content •0.U*/lb on lead content «O.Uc/lb on zinc content (0.11)
(603.51» - Other) (B)
I 5» (603.70 - Other) (B)
I GSP: Free ( a l l ^
I 6» (B) (U73.52 Litharge)
I 151(B) (U73.58 Suboxide)
I 8.6»(B) (U73.56 Red lead)
2.3»(B) lead)
GSP: Free (all)
7.5» GSP:
5* GSP:
Free
Free
(k73.5k Orange
(U19.02 Other)
3.7»(B) GSP: Free
(U19.00 Arsenate)
GSP:. Free ( a l l ) 2 /
U.8KB) GSP: Free
1.0625*/lb (5.2»)
1.0625sVlb (5.2*)
GSP: Free
k»(B> (62U.02 Lead bull ion)
U»(B) (62».03 Other)
1.0625*/lb on 99.6» of lead content (5.8»)
(62k.Ok) GSP: Free
1.3125*71» (1.3»)
1.5*71» (11.k»)
11.25»
GSP: Free ( a l l )
GSP: Free
2.3»(B)
GSP: Free
1.2»(3) (62k.30 Wire)
6.3KB) (62k.32 Bars e t c . valued not over
13 1/3*7 lb) I 6.2KB)
(62k.3k Bars e t c . valued over 13 1/3*/lb)
GSP: Free ( a l l )
The figures in parenthesis represent ad valorem incidence based on 1980 import prices.
The figures in parenthesis belov tariff rates indicate TSUS coneordence with the CCCB.
\t) Bound rates, Geaeva(1979) Protocol to the GATT y Honduras is not entitled to the duty-free trcatcent on the TSUS 602.10. 2/ Chile is excluded from the GSP duty-free treatment on the TSUS 603.50. If Mexico is excluded fro» the GSP duty-free treatment on the TSUS k73.52 and U73.56.

ceci
T803
780*
T805
7806
Product description
Wrought pitta*, sheets, •trip*, of 1«*4
•
Lead foil, of • weight per » not exceeding 1700g:
lead powder and flakes
Tube* and pipes and blanks therefor, of lead:
hollow bars, and tub* and pipe fittings of lead
Other articles of lead
UNITED STATES (coatd.)
Pre-KT»
1.3125*71b (3.31)
0.75«71b (3*)
5.5*
12%
0.7*71b (6X)
5.5*
0.75*71b (3*)
GSP: Free (all)
0.75*7lb (7*)
5.5*
5.5*
1.5*71b (11.9J)
11.25* (11.251)
GSP: Free (all)
1.3125*71b (2.6*)
0.75«71b (6*)
5.5*
GSP: Free (all)
8.5*
5*
6*
0.75*71b (0.6*)
5.5*
GSP: Free (all)
(6211.10 Plate
(62U.12 Plate
Post-MTH
2.7* (B) , sheets not clad, unalloyed) 0.75e/lb (3*)(a)
, sheets, not clad, alloyed)
3.9* (B) (62b.lU Plate*, sheets not clad, alloyed
valued over 13 l/3*71b)
(62«.l6 Plate
(62U.18 Strip
(62U.20 Strip
(62U.22 Strip
6.5* (B) , sheets, clad)
».2* (B) , valued not over 13 l/3*/lb
not cut)
3.9* (B) , valued over 13 1/3*7 lb, not cut)
2.5* (B) , cut, valued over 13 1/3*7lb)
GSP: Free (all)
U.7*(3) (6UU.17 Foil not cut to shape valued
not over 13 1/3*/lb)
| 3.9*(1) (61»l».l8 Foil, not cut to shape, valued
over 13 1/3*/lb)
1 2.2* (3) (699.28 Foil cut to shape)
| 11.9* (B) (62k.Ua Lead powder, flakes, valued not
over 13 l/3*/lb)
1 11.25* (B) (62U.U2 Lead powder, flakes, valued over
13 l/3*71b)
(62U.50 Pipes
(62U.52 Pipes
(62U.5U Pipe*
(65» .20 House»
GSP: Free (all)
2S(B) unalloyed)
U.2* (B) alloyed, valued not over 13 l/3*/lb)
3.9* (B) alloyed, over 13 l/3*71b)
GSP: Free (all)
3.1.* (B) told ware)
1 Free(B) (61)0.30 Containers)
1 ZM (B) (6k0.U0 Collapsible "trxbes-r- -
| 0.6* (B) (657.70 Article of lead, valued not over
1 13 l/3*71b)
(657.75 Artxel 1 3.9* (B) es of lead, valued over
13 1/3*/lb) GSP: Free (all)

Spec(83)3(yRev.1 Page 33
CCCH
ex 2c01
ex 2603
2827
ex 2630
ex 2835
ex 7801
ex 7801
7802
7803
7&CI.
7805
7806
1
Product description
Lead ore end concentrates
Ash and residues of lead
Lead oxides; red lead and orange lead
Chlorides of lead
Sulphides of lead
Unvrought lead
Waste and scrap of lead
Wrought bars, rods angles, shapes and sections of lead; lead vire
Wrought plates, sheets, strips, of lead
Lead foil, of a weight per m not exceeding 1700g; lead powders and flakes
Tubes and pipes and blanks therefor, of lead; hollow bars, and tube and pipe fittings of lead
Other articles of lead
BRAZIL 1982
20»
Free
l>5S lead oxide and orange lead) 30* (lead oxide)
30»
30*
1 301
30*
371 (bars and sections) U5* (wire)
37*
1.5*
U5* (tubes, pipes, blanks and hollow bars) 55* (tube and pipe fittings
60* (tubular container) 55* (discs sad joints) 70* (other)
EGYPT 1981/1982
2*
2*
15*
5*
5*
2*
2*
30*
30*
30*
30*
30*
INDIA 1982/1983
60*
b0*
60*
60*
60*
bOl (unalloyed)
60* (other n.e.s.)
60*
6o*
60S
6o*
6o*
60*
KOREA 1982/1983
Free
20*
30*
25*
25*
20*
10*
20*
20*
20*
30*
30*
ROMANIA 1976/1977
Free
5*
101
10*
10*
Free
Free
3*
2*
21
101 (for retail sales) 31 (for other purposes)
31
YUGOSLAVIA 1980/1981
71
51
101
81
101
5!(unrefined) «(alloys) 10*(refined, excluding alloys)
5*
10*
10*
10*
151
9* (unvrought oluabs) 10* (vrought plumbs ; wrappings and other)
Sources: National Tariffs of Brazil, Edition 1982; and of India, Edition 1982/1903.
Publications of the International Custoas Tariffs Bureau, Brussels:
Egypt 1981/1982 Korea 1982/1983 Romania 1976/1977 Yugoslavia 1980/1981

Spec(83)30/Rev.1 Page 34
(a) Raw materials
36. M.f.n. imports of lead as a raw material (CCCN ex 26.01 and ex 26.03) are duty-free in all countries with the exception of Australia, Canada and the United States.
(b) Semi-manufactures
37. Imports of unwrought lead (CCCN ex 78.01) are duty-free in Finland, Norway and Sweden. Post-MTN rates applied by other developed countries range from duty-free (unwrought unalloyed lead) to 10.2 per cent (15 per cent on solder applied by New Zealand). Imports of waste and scrap of lead (CCCN ex 78.01) are duty-free in all countries with the exception of Japan, Switzerland and the United States.
38. Only Finland, Norway (except lead foil) and Sweden grant duty-free treatment to imports of lead semi-manufactures (CCCN 78.02-05) and low rates are applied by Switzerland (1980 ad valorem incidence is between 0.2-1.8 per cent). Imports to Australia are duty-free with 2 per cent revenue duty. Imports of these products are, in general, subject to higher m.f.n. rates in all other developed countries. However, most of the m.f.n. rates were reduced in the Tokyo Round and they range from 1.2 per cent to 25 per cent (wrought plates ... unworked in New Zealand), the majority being between 6 per cent to 10.2 per cent.
39. Most developed countries also apply higher m.f.n. rates to imports of chemical compounds of lead (CCCN 28.27, ex 28.30, ex 28.35). The post-MTN duties on these items range from 2.3 per cent to 15 per cent, the highest rates usually applying to lead oxides. Imports into Finland (except lead oxides), New Zealand, Norway and Sweden are duty-free and specific duties applied by Switzerland are low.
(e) Finished manufactures
40. Lead manufactures (CCCN 78.06) attract positive duties with some exceptions (duty-free on the part of the position applied by Finland, Norway and Sweden) in all developed countries. The majority of post-MTN duty rates range between 3.2 per cent and 8 per cent (50 per.cent in New Zealand). Post-MTN rates applied by Switzerland and the United 'States are low, ranging from 0.2 per cent to 3.4 per cent.
(f) GSP treatment In 1983
41. All developed countries grant either duty-free treatment or preferential rates of duty to imports of lead and lead products from developing countries under their 1983 GSP schemes. Imports of all lead products to Japan, Sweden, Switzerland and the USA are duty-free. Duty-free and reduced GSP rates are applied by Australia (except CCCN 78.06), Canada, the EEC (except CCCN ex 78.01 - unwrought lead), Finland, New Zealand and Norway. Austrian GSP rates are about 20-40 per cent lower than final post-MTN rates.
CCCN ex 26.01 is bound at 4.8 per cent, applied rate is free. 2 GSP duty-free treatment does not apply to imports of TSUS 602.10 from
Honduras, TSUS 603.50 from Chile, TSUS 473.52 and 473.56 from Mexico. 3 GSP treatment is not applicable to Spain, which received a
preferential treatment.

Spec(83)30/Rev.l Page 35
(g) Other preferential treatments
42. Austria, Finland, Norway, Sweden and Switzerland grant preferential duty-free treatment to lead and lead products subject to positive m.f.n. duties when imported from EFTA countries and the EEC. The EEC grants preferential duty-free treatment to lead and all lead products when imported from ACP countries, Mediterranean countries, EFTA countries and associated countries. Preferential rates, between 40 to 60 per cent lower than the post-MTN rates, are applied to imports of lead products from Spain. Yugoslavia attracts duty-free treatment, except CCCN ex 78.01 -unwrought lead. This item is subject to the preferential rate of 0.7 per cent with ceiling limitations. Australia grants duty-free treatment to some imports of lead products from New Zealand and Papua New Guinea. Canada grants duty-free treatment to imports of some lead products from British Commonwealth countries other than the United Kingdom. Imports of lead products from least developed countries into Austria, Canada and Finland are duty-free. Finland also grants duty free access to lead products when imported from the USSR, Bulgaria, Chechoslovakia, German Democratic Republic, Hungary and Poland. Australian imports of lead products into New Zealand are, subject to reduced m.f.n. rates or duty-free.
43. In cases where imports of lead products enter Austria, Finland, the EEC or Norway from European or other sources, and where these products face positive GSP rates or are excluded from GSP schemes, some developing countries face negative preferential tariff rates on the products in question. The same applies to certain developed countries falling outside these preferential trade areas.
44. The present study does not attempt to analyse effective protection in the lead industry due to tariff escalation. As pointed out previously in document TAR/W/29 - COM.TD/W/369, of 8 June 1982, a number of serious difficulties arise in any attempt to measure effective tariff rates. These involve the lack of accurate information on input/output values in specific industries, as well as other factors such as the estimation of the relative importance of trade flows under MFN and GSP rates, the calculation of ad valorem tariff equivalents, the establishment of appropriate tariff weighting patterns, and the accounting for the technological changes in industries. In the case of lead and lead products even the basic data on value added is lacking. Consequently, it has been considered.preferable to Indicate above only the nominal tariff rates and their escalation along the chains of processing.
45. Table 15 also indicates duties on lead and products thereof applied by some major importing developing countries. The protective role of the developing countries' tariff cannot be disassociated from its fiscal function. In some cases, the latter tariffs also include balance-of-payments surcharges.
Non-tariff and other measures
46. Australia does not maintain any control on imports of lead. Under Regulation 9 of the Customs Regulations (Prohibited Exports), exports of lead concentrates and bullion are subject to export control by the Commonwealth Government to ensure that domestic requirements are met and that the price to the Australian producer is reasonable. Imports of lead to Austria are free of non-tariff restrictions. Export restrictions are applied with respect to lead and products thereof, for which individual licences are necessary in order to ensure that domestic requirements are met.

Spec(83)30/Rev.l Page 36
47. In Canada, lead is not subject to any import or export control. However, under the Export and Import Permits Act, the Federal Government can place any commodity on the Export Control List for security reasons, in order to ensure adequate domestic supplies and to implement intergovernmental arrangements or commitments. Moreover, the Government wants to ensure the promotion of further processing of natural resources in Canada and to keep under surveillance exports when market conditions are depressed. Imports and exports of lead in the EEC are free of non-tariff measures. Quantitative restrictions for imports of some lead products from the centrally-planned economies might be applied by some Member States in conformity with the Council Decision regarding import quotas in respect of state-trading countries. Export of waste and scrap for which export quotas might be established by the EEC is not subject to any restrictions in 1983.
48. Under the Trade Agreement with the USSR, Finland applies quotas on imports from this country. Import licences are required for imports from Korea, D.P.R. An import licence is also needed if the country of purchase is a so-called "multilateral country" and the country of origin is a so-called "bilateral country" or "other country" (see Import System of Finland). Export licences are required for the export of lead scrap and residues. Applications are considered on an individual basis.
49. Japan does not maintain any control on trade in lead. Lead is one of the metals covered by National Stockpile Policy. There are no restrictions on trade in lead in Norway; however, in accordance with Acts Nos. 29 and 30 of December 1946 and the Royal Decree of December 1947, the Ministry of Commerce and Shipping is authorized to impose controls and regulations on imports or exports of all kinds of products and commodities.
50. Sweden does not apply any control on imports of lead. Export licences required for exports of scrap, dross, ash and residues, are delivered only where the material cannot be used in Sweden. Imports of lead into Switzerland are free. Waste and scrap of lead (CCCN 78.01-20) are subject to export control in order to ensure adequate domestic supplies. Export duties are applied to exports exceeding quotas established for domestic deliveries. There are no non-tariff measures on imports or exports of lead in the United States. However, lead is one of the strategic and critical materials for which the "National Stockpile Policy" (G.S.A.) applies.
51. The import of lead to India is regulated under the Open General Licence by the state agency the "Minerals and Metals Trading Corporation of India Ltd." Export of lead from India is prohibited. Imports of lead to Spain are subject to quotas for which licences are issued according to prior imports and market requirements. Export licences for lead are granted automatically. Imports of lead ores and concentrates to Republic of Korea are subject to a recommendation from the Korea Mining Association.
In 1983, quantitative restrictions applied, were on imports of lead oxides (ex 28.27) from Bulgaria (400 tons) and discretionary licensing on imports of lead semi-manufactures (CCCN 78.02 to 78.06 - with the exception of Romania and China, P.R.) to Italy.

Spec(83)30/Rev.l Page 37
52. While imports of most lead products into Yugoslavia are free, imports of lead ores and concentrates and refined lead are subject to foreign exchange quotas (RK) established yearly. In addition to customs duties there is a tax of 1 per cent for customs tariff evidencing, a special equalization tax and a special tax of 10 per cent. Exports of lead ash, scrap and waste require export licences while exports of ores and concentrates of lead, refined lead and semi-products of lead are free. In addition, some other developing countries also apply temporary measures such as surcharges and prior import deposits for balance-of-payments purposes.
SECTION IV: ACTIVITIES IN OTHER INTERNATIONAL ORGANIZATIONS
53. The International Lead and Zinc Study Group is an intergovernmental consultative organization which was set up under the auspices of the Economic and Social Council. At present, 32 governments of producing and consuming countries are members. Its main function is, with the co-operation of producers and consumers, to establish transparency in worldwide supply and demand conditions in lead and zinc in order to help countries and companies to define their policies. For this purpose, the Study Group organizes regular inter-governmental consultations on developments in world production and consumption and on international trade in lead and zinc and makes studies of the world current and prospective situation. It publishes special reports dealing with technical and economic subjects of concern to the lead and zinc industry. The Study Group also provides regular statistical data on supply and demand of lead and zinc including forecasts. Although the member governments of the Study Group have never taken any co-ordinated direct economic measure to stabilize the market for lead and zinc, Study Group activities have been helping to solve problems encountered in international trade in lead and zinc and to reduce the instability of markets. The main function of the International Lead-Zinc Research Organization is to promote, sponsor and organize research into the uses of lead and zinc. Besides these two international organizations, some developed countries have their own lead-zinc industry organizations principally involved in developing and promoting the uses of lead (the Lead Development Association in London, the Lead Industries Association in New York, among others).
Member countries of the International Lead and Zinc Study Group are as follows: Algeria, Argentina, Australia, Austria, Belgium, Bulgaria, Canada, Czechoslovakia, Denmark, Finland, France, Federal Republic of Germany, Hungary, India, Ireland, Italy, Japan, Mexico, Morocco, Netherlands, Norway, Peru, Poland, Republic of South Africa, Spain, Sweden, Tunisia, Union of Soviet Socialist Republics, United Kingdom, United States of America, Yugoslavia, Zambia.

Spec(83)30/Rev.l Page 38
Summary
54. World production and consumption of lead have been affected both by economic recession and by changes in demand patterns. Future lead consumption is likely to be influenced by market developments such as increased demand for lighter weight and long-life bactéries, a slower expansion in the motor vehicle population, a possible increase in the use of non-lead batteries and a downward trend in the use of gasoline lead additives and cable coverings. Demand for lead for use in lead chemicals, solders and other alloys and lead sheet for building will depend more on the level of economic activity than on price and technological developments.
55. The short-term prospects for lead are not very encouraging. According to a study by the World Bank world consumption growth is expected to remain low over the next three to four years. This consumption growth is considered more likely to occur in developing rather than in developed countries. Production is forecast to remain at the same level while prices are likely to continué to be low reflecting the depressed state of the lead market and the continuing rise in overall lead stocks.
World Bank: Price Prospects for Major Primary Commodities, July 1982.

Spec(83)30/Rev.1
Pagt 39
TRADE
World Exports 1975-ILead content
Total t r a d e - '
Developing countries Of Witch:
Algeria Argentina Bolivia Congo Hondurts Iran Korea, Rap. of Mexico Morocco Peru Philippines Spain Thailand Yugoslavia
Oeveloped countr ies! ' of which:
Australia Canada EEC:i'
Selgluo
Oenaerk (Greenland)
Franca
Geraany, F.B.
Greece
Ireland
I ta ly
United Kingdoa
Finland Norway South Africa Sweden Switzerland United Sûtes
Centrally-planned economies— of which:
Bulgaria Czechoslovakia Other
AJOfBC I 'LOWS DATA,
1981 : Lead
1975-1981
ores and c ; thousands of aetric
197S 640.4
(S7T7T)
210.1
2.8 •
17.7 2.0»
18.2 34.S 4.4 •
62.9 64.S 2.2 «
0.9 -
418.3 (HO)
39.8 211.9 88.7
(19.4) 0.0
( • ) 2S.6 16.0) S.2
(0.1) 2.0
(0.8) 6.S
(4.2) 36.3 ( - ) 13.1 (8.3)
• ( - )
-2.0 1.9
28.2 0.0
4S.8
12.0
-4.0 8.0
1978
710.8 (ÏTO) 286.7
0.6 •
16.S 2.5»
21.8 29.6 7.4 4.1
81.0 97.4
1.4 0.0 0.5
23.9
420.1 (32577)
72.0 142.7 113.2 (18.8)
0.0 ( - ) 31.4 (2.0) 0.0
(0.0) •
( • ) 26.0 (4.7) 43.3 (7.0) 12.5 (S.I)
• ( - ) 2.0 3.2 -
32.8
• 54.2
4.0
• 4.0
oncentrates tons)
1979
645.6 (W7T)
240.3
2.2 1.6
12.8 5.0»
16.4 15.1 4.3 -
75.6 90.2 3.3 0.0 5.7 8.1
393.3 (2S7.S)
25.1 151.5 144.9 (39.4)
0.6 ( 0.6) 29.7 (9.9) 0.0
(0.0) 1.5
(1.5) 30.1
(16.6) 68.0 (5.6) 12.6 (S.2) 2.4
( - ) 1.5 3.7 0.1
33.6 -
32.9
12.0
6.0 5.0 1.0
1980
667.9 (5oXI)
228.9
2.0* •
15.9 6.0* 9.9
10.0* 2.6 •
69.7 86.3
1.9 5.6
13.0 6.0
423.0 (3TT5")
15.6 147.2 129.8 (45.3)
3.9 ( 2.3) 28.9 .
(11.25 0.0
(0.0) 1.2
(1.2) 19.5 (4.5)
' 60.3 (17.3) 13.9 (6.7) 2.1
(2.1) 0.7 2.4
72.3 32.4
• 27.6
11.0
6.0 4.0 1.0
1981
691.1 (ÏTO)
237.1
2.0* 10.6 15.6 6.0-
11.6 20.0* 5.0 •
58.9 56.3
1.1 19.3 23.0» 7.7
449.0 (18X5)
22.3 146.1 86.2
(21.0) -
( - ) 28.9 (0.5) 0.1
(0.1) 0.2
(0.2) 12.5 (7.4) 29.0 (7.2) 11.3 (S.6) 4.2
( - ) 1.9 3.4
101.5 52.1 2.5
33.0
5.0
-4.0 1.0
• - T o t a l trade including intre-EEC trade, f igure* in brackets Indicate to ta l trade excluding intra-EEC trade.
- 'To ta l EEC-trade, figures in brackets indicate extra-EEC trade.
— Exports by centrally-planned economies to other countries ( i . e . excluding trade between thea). figures shown are estinates based on iaports reported by receiving countries.
• Estimated
Sources: Based on statistics supplied by the International Lead and Zinc Study Group.

Spec(83)3C/Rev.1 Page 40
World Exports 1975-1981 : Lead bullion (thousands of metric tons)
1975 1978 1979 1980 1981
Total trade—
Developing countries of which:
Korea, Rep. of Mexico Spain Yugoslavia
1/ Developed countries— of which:
Australia EECii'
Belgium
Denmark
France
Germany, F.R.
Italy
Netherlands
United Kingdom
Norway Sweden
Centrally-planned economies!/ of which:
Korea, P.D.R.
230.5 (199.5)
5.2
_
5.0 -
0.2
190.3 (159.3) 142.4 32.7 (1.7) 4.2
(N.A.) -
( - ) 2.2
(0.8) 1.7
(0.9) -
( - ) -
( - ) 24.6 ( - )
-15.2
35.0
257.2 (216.9)
9.8
1.3 3.2 5.2 0.1
217.4 (177.1) 147.1 43.9 (3.6) 1.4
(N.A.) 0.4
(N.A.) 10.2 (3.3) 1.1
(0.1) 3.0
( - ) 0.2
(N.A.) 27.6 (0.2)
-26.4
30.0
292.9 (238.3)
26.3
1.9 6.4
17.7 0.3
242.6 (188.0) 161.7 57.5 (2.9) 1.2
(0.4)
( - ) 6.1
(0.0) 2.5
(0.5) 15.3 (1.8) 0.3
(N.A.) 32.1 (0.2) 0.0
23.4
24.0
248.6 (214.9)
11.6
2.6 6.7 2.2 0.1
212.0 (178.3) 153.9 40.0 (6.3) 1.2
(0.9) 0.3
(0.2) 9.2
(4.4) 0.5
( - ) 0.6
(0.4) -
( - ) 28.2 (0.4) 0.0
18.1
25.0
203.4 (176.7)
18.1
0.1 4.7
11.2 2.1
173.3 (146.6) 136.9 27.8 (1.1) 1.5
(0.5) 0.1
(0.0) 0.8
(0.0) 1.3
(0.2) 0.0
( - ) 0.4
(0.3) 23.7 (0.1) 0.0 8.6
12.0
35.0 30.0 24.0 25.0 12.0
^_ — Total trade including intra-EEC t rade, f igures in brackets ind icate t o t a l
trade excluding intra-EEC t rade.
— Total EEC-trade, f igures in brackets indicate extra-EEC t rade.
— Exports by central ly-planned economies to other countries ( i . e . excluding trade between them). Figures shown are estimates based on imports reported by receiving countr ies.
Sources: Based on s t a t i s t i c s supplied by the In ternat iona l Lead and Zinc Study Group.

X~-*£2L-&£S£
Spec(83)30/Rev.1 Page 41
World Exports 1975-1981 : ««fined load I thousands of aetr ic tons J
197$ 1978 1979 1980 1981
Toul t rad* ! 7
Developing countries of which:
Argentina Mexico Morocco Peru Spain Tunisia Yugoslavia Zambia Other
Developed countries— of which:
Australia ' Austria Canada EEC:
Belgiuei
Oennark
France
Germany, F.R.
Greece
Ireland
I ta ly
Netherlands
United Ktngdoa
Finland Japani' Norway South Africa Sweden Switzerland
1/
United Stati . 4 /
3/ Centrally-planned econoiie*-of which:
Bulgaria Korea, P.O.R. Poland USSR Other
868.2 (7T577)
zto.z
. 109.9
4.4 62.7 1.6
20.6 62.4 17.9 0.7
544.0 (391.0)
117.1 0.4
110.9 219.4 (66.4) S5.0 (8.3) 1.2
(1.1) S.6
(3.3) 73.6
(20.7) 1.0
(0.9) 2.0
( - ) 3.2
(3.0) 22.8
(10.2) 5S.0
(18.9) 0.1
39.S 0.2
26.S 11.4 1.8
978.9 (770)
289.2
1.1 111.9 28.1 74.2 S.3
12.2 41.9 10.0 4.5
644.7 (464.6) 148.7
0.7 132.0 314.7
(114.6) 74.8
(23.0) 10.0 (2.6) 24.7
(10.2) 98.9
(34.2) 1.1
(0.6) 3.1
( - ) 4.2
(4.1) 20.3 (4.6) 77.6
(35.3) 0.8 7.8 0.0
27.6 26.4 2.8
987.6 (79S7T)
282.0
0.3 111.0 32.2 69.8
1.9 11.1 35.3 10.0 10.4
671.0 (441.5) 172.2
0.4 118.0 312.0
(122.5) 62.2
(16.9) 5.8
(S.I) 34.5
(22.1) 97.5
(27.9) 0.1
(0.1) •
( - ) 2.7
(2.7) 16.2 (1.4) 93.0
(46.3) 1.0 9.2 0.1
26.0 19.8 4.9
1108.4 (389.7)
248.0
4.6 88.9 32.8 59.3 5.5
11.9 24.7 8.9
11.4 633.4
(617.5) 165.2
0.4 126.5 324.5
(105.8) 70.8
(15.5) 3.9
(3.8) 33.5 (7.3) 97.7
(29.9) 0.6
(0.1) -
( - ) 1.8
(1.7) 16.4 (2.2) 99.8
(45.3) 0.9 6.3 0.0
27.3 21.2 4.1
899.7 (6WJ5)
235.0
0.3 66.3 43.9 80.4 12.2 6.5
14.0 8.3 *.1
647.7 (446.6) 170.5
0.3 119.8 301.3
(100.2) 58.4
(11.3) 5.9
(5.8) 45.1
(13.6) 94.6
(30.4) 1.5
(0.8) 0.9
(0.3) 3.0
(1.6) 11.0 (3.0) 80.9
(33.4) 0.5 2.9 0.0
18.2 15.7 4.8
16.7
44.0
3.2 7.4
34.6
15O.0
15.0 15.0 0.0
11.0 3.0
10.0 6.0 •
8.0 1.0
12.0 6.0 4.6
10.0 2.0
5.0 13.0
• 7.0 2.0
13.7
17.0
4.0 4.0
7.0 2.0
"T7 - Total trade including intra-EEC trade, figures in brackets indicate to ta l trade
excluding 1ntra-£EC trade.
- Total EEC-trade, figures in brackets indicate extra-EEC trade.
- Exports by centrally-planned economies to other countries ( i . e . excluding trade fen t h e a ) . F l a u r * * shawn a r a • « ? - { • * . « « h . . * *4 A . j _ - _ _ » _ — » i i .! J - _ between thea)
countries 4/
figures shown are estiaates based on imports reported by receiving
— Includes alloys
Sources: Based on statistics supplied by the International Lead and Zinc Studv Group.

Spec(83)30/Rev,1 Page 42
World Imports 1975-1981 : Lead ores and concentrates (Lead content; thousands of metric tons)
1975 1978 1979 1980 1981
Total trade-
Developing countries of which:
Brazil India Mexico Romania Spain Tunisia Yugoslavia
1/ Developed countries— of which:
Austria Canada EEC:!'
Belgium
France
Germany, F.R.
Greece
Italy
United Kingdom
Japan United States Other
3/ Central ly-planned economies^.' of which:
Bulgaria Germany, D.R. U.S.S.R Other
620.9 (S37TS)
67.5
14.9 -
13.3 2.0
14.6 12.7 10.0
508.4 (TOO)
7.4 2.5
295.8 (232.7)
43.8 (34.8) 90.9
(60.8) 118.8
(103.5) 3.8
(N.A.) 8.9
(6.4) 29.6
(27.2) 118.5 79.4 4.8
45.0
1.0 5.0
30.0 9.0
667.5 (595.9)
123.8
26.9 -
60.8 4.0
20.0 8.7 3.4
463.7 (392.1)
2.6 4.8
274.1 (202.5)
36.2 (25.4) 87.7
(56.0) 96.4
(87.8) 10.8 ( - ) 12.1 (6.4) 30.9
(26.9) 129.2 53.0
-
80.0
15.0 5.0
40.0 20.0
713.3 (52XÏÏ)
118.3
25.2 -
59.8 18.0 9.1 5.0 1.2
497.0 (406.7)
3.7 1.6
317.7 (227.4)
39.9 (25.0) 87.6
(52.7) 108.4 (95.2) 15.8 (1.4) 29.5
(22.3) 36.5
(30.8) 131.0 40.0 3.0
98.0
25.0 3.0
70.0 -
723.4 (638.9)
105.6
20.9 0.9
34.4 25.0 16.8 6.0 1.6
549.8 (465.3)
2.5 50.9
312.1 (227.6)
36.7 (26.0) 90.7
(55.5) 102.9 (88.8) 18.3 (5.1) 28.8
(21.3) 34.7
(30.9) 137.1 44.1 3.1
68.0
15.0 3.0
50.0 -
711.5 (646.7)
72.4
9.2 3.6 9.7
20.0 16.9 12.4 0.6
549.1 (4Ô4.3')
1.0 48.4
306.7 (241.9)
37.4 (35.7) 92.8
(65.2) 121.7
(102.7) 10.2 (2.1) 15.8
(12.1) 28.8
(24.1) 134.2 58.5 0.3
90.0
28.0 2.0
60.0 -
1/ — Total t rade , inc luding intra-EEC t rade, f igures in brackets indicate t o t a l
trade excluding intra-EEC t rade. — Total EEC t rade , f igures in brackets indicate extra-EEC t rade.
— Imports by cent ra l ly .p lanned economies from other countries ( i . e . excluding trade between them). Figures shown are estimates based on reported exports to these countr ies.
Sources: Based on s t a t i s t i c s supplied by the In ternat iona l Lead and Zinc Study Group.

U.-.
World Imports 1975-1981 : Lead bullion (Thousands of metric tons)
Spec(83)30/Rev.1 Page 43." \
1/ Total trade-
Developing countries of which:
Korea, Rep. of Philippines Spain Yugoslavia
1/ Developed countries— of which:
EEC:!7
Belgium
France
Germany, F.R.
Italy
Netherlands
United Kingdom
Japan Norway Sweden United States
Centrally-planned economies— of which:
Bulgaria Czechoslovakia USSR
1975
247.3 (210.8)
5.4
---
5.4
241.9 (205.4) 241.5 (205.0) 8.9 (6.4) 8.0 (5.0) 84.8 (53.8) 9.8 (9.8) 13.1 (13.1) 116.9 (116.9)
---
0.4
-
--
1978
253.8 (213.1)
1.7
0.7 0.2 0.2 0.6
249.1 (208.4) 242.0 (201.3) 37.9 (25.2) 1.5 (0.0) 62.7 (41.2) 5.9 (0.1) 11.7 (11.6) 123.2 (123.2)
2.5 0.0 0.2 4.4
.3.0
--
3.0
1979
296.8 (246.1)
1.2
0.4 0.4 0.1 0.3
285.2 (234.5) 277.7 (227.0) 37.3 (20.6) 14.3 (9.6) 61.3 (33.1) 2.0 (0.9) 10.3 (10.3) 152.5 (152.5)
5.1 0.5 0.2 1.7
10.4
--
10.4
1980
277.3 (23777)
2.1
1.5 0.1 0.5 -
266.8 (227.2) 256.7 (217.1) 25.7 (14.7) 12.0 (11.3) 69.9 (42.3) 4.5 (4.2) 8.2 (8.2)
136.4 (136.4) 8.9 0.7 0.2 0.3
8.4
3.5 0.9 4.0*
1981
192.5 (166.0)
1.3
1.2 0.1 0.0 -
191.2 (164.7) 182.2 (155.7) 15.2 (8.5) 1.7 (1.1) 46.2 (33.3) 9.0 (2.9) 0.1 ( - )
110.0 (109.9)
8.3 0.0 0.3 0.4
-
--
1 / Total t rade , including intra-EEC t rade , f igures in brackets indicate t o t a l trade excluding intra-EEC t rade.
— Total EEC t rade , f igures in brackets indicate extra-EEC t rade.
— Imports by central ly-planned economies from other countries ( i . e . excluding trade between them). Figures shown are estimates based on exports reported by supplying countr ies.
Sources: Based on s t a t i s t i c s supplied by the In ternat iona l Lead and Zinc Study Group.

Spec(83)30/Rev.1 Page 44
World Imp >rts 1975-1981 : Refined (thousands of metric tons)
Total t rad* ! 7
Developing countries Of which:
Algeria Brazil Egypt India Indonesia
• I r a n i ' . . I s rae l i ' Korea, Rep. of Malaysia Philippines Roaania Spain l
Thailand*.' Turkey!' Yugoslavia OtherV
Developed countries— of which:
Austria Canada
«4/ Belgium
Denmark
France
Germany, F.R.
Greece
Ireland
I ta l y
Netherlands
United Kingdom
Finland Japan . . New Zealand^' Norway!' Portugal South Africa Sweden Switzerland United States
197S
811.0 ( Î7T7)
138.5
7.8 12.5 15.2 14.4 2.6
14.0 0.8 4.5 1.0 6.4 5.0 6.8 6.0 4.7
15.6 21.2
532.8 (39ï7ï">
15.9 2.0
349.8 (211.5)
9.3 (0.4) 6.4
(S.2) 42.8 (2.0) 32.8
(10.6) 7.9
(N.A.) 1.7
(N.A.) 125.4 (94.0) 41.5
(17.4) 82.3
(81.9) 13.0 15.8 7.8 8.2 8.2 3.3 3.2
14.4 91.2
Centrally-planned economies^' 139.7 or which:
China, P.R. Czechoslovakia Germany O.R. Hungary Poland USSR Other
55.0 16.0 3.0 1.0
14.7 48.0 2.0
1978
1037.6 1837.0)
167.8
7.9 0.8
16.0 29.3 6.5
10.6 2.1
20.5 5.2 7.5 4.0 3.5 8.6 3.3 8.8
33.2
728.7 (528.1)
24.5 1.7
369.5 (168.9)
12.7 (0.1) 6.7
(5.3) 32.6 (1.6) 63.4 (5.5) 6.4
(N.A.) 4.2
(0.4) 136.7 (92.5) 38.6 (1.2) 68.2
(62.3) 12.0 48.4 8.6 7.4
14.3 5.7 0.3
15.0 221,3
141.1
40.0 14.0 2.0 4.0 5.1
70.0 6.0
lead
1979
1105.2 (907.3)
178.6
4.2 0.6
15.0* 39.6 S.7 3.6 2.9
19.1 4.7 7.0
17.0 1.0
10.8 2.9 9.6
34.9
688.2 (490.8)
29.5 2.3
356.3 (158.9)
12.9 (0.0) 6.4
(1.2) 31.4 (1.8) 62.5 (6.8) 5.0
(N.A.) 4.0
(0.2) 149.9
(100.0) 37.1 (1.9) 47.1
(47.0) 15.5 50.2 6.6 6.5
13.1 3.4 1.5
11.6 191.7
238.4
50.0 15.0 7.0 2.0 5.4
150.0 9.0
1980
1015.7 1807.S)
167.9
6.4 0.0
14.0» 31.0 7.4 2.0* 1.1
18.2 5.8 4.6
10.0 3.9
11.2 S.S
10.1 36.7
707.9 (499.8)
32.4 2.6
442.8 (234.7)
21.8 (9.9) 3.2
(1.7) 35.4 (6.6) 90.7
(23.7) 7.8
(7.6Î 3.2
( - ) 171.6
(115.2) 46.0 (8.3) 63.1
(61.7) 20.5 69.1 6.8 7.7
16.5 9.2 0.6
18.0 81.7
139.9
35.0 15.0 5.0 2.0 1.9
80.0 1.0
1981
937.8 [7W1)
188.9
3.6 0.2
15.0* 31.7 8.7
11.4 1.9
16.7 7.9 6.0
10.0 6.8
10.0 2.7
12.1 44.2
610.8 (422.2)
35.7 9.2
337.9 (149.3)
19.9 (4.7) 2.2
(0.7) 32.1 (5.5) 69.6 (8.0) 5.8
(4.7) 2.2
( - ) 122.4 (73.7) 34.2 (2.9) 49.5
(49.1) 20.9 49.1 5.2 6.5
17.8 9.3 7.1
10.2 101.9
138.1
30.0 15.0 8.0 2.0 3.1
80.0
— Total trade including intra-EEC trade, figures in brackets indicate total trade excluding intra-EEC trade.
— Total EEC trade, figures in brackets indicate extra-EEC trade.
— Imports by centrally-planned economies from other countries (i.e. excluding trade between them). Figures shown are estimates based on exports reported by supplying countries.
— Based on reported exports to these countries.
•5/Includes alloys • Estimated
Sources; Based on statistics supplied by the International Lead and Zinc Study Grouo.

Spec(83)30/Rev.l Page 45
*
ANNEX II
Tariff and Trade Flow Data at the Tariff Line Level
Explanatory Notes
The Annex II provides information at the tariff line level on different tariff treatment (m.f.n., GSP, LDC etc.) and the corresponding trade flows, as well as imports from individual main suppliers of lead and products thereof.
TARIFFS
Column TYPE OF DUTY
MTN-B: Base rate for the Tokyo Round (pre-Tokyo Round m.f.n. rate)
MFN-F: Final rate (post-Tokyo round m.f.n. rate) MFN 80: M.f.n. rate applicable in 1980 GSP-B: GSP rate in 1981 or 1982 GSP-F: GSP rate related to post-MTN final rate (Austria,
Canada, Japan and Switzerland) FTA: Rate applying to countries signatory to free-trade area
agreement, e.g. EFTA ZONE: Rate applying to countries signatory to inter-zone free
trade agreement (e.g. between EEC and EFTA)
Column RATE
Percentage ad valorem or ad valorem equivalent of specific, mixed or compound rate is indicated with one decimal point. Ad valorem equivalent is based on imports in the year recorded.
Trade flow data
Import figures refer to the year 1980 (1978 for Austria, Canada, Finland and New Zealand).
IMPORTS FROM (i) WORLD (« all sources) and (ii) GSP ORIGIN (- GSP beneficiary countries) are each sub-divided by TOT (= total imports irrespective of tariff treatment), MFN (» imports entitled to m.f.n. treatment), GSP (imports covered by GSP), LDC (imports entitled to LDC preference) and FTA, ZONE, PREF (» imports entitled to free-trade area or other preferential agreements). It may be noted that "imports covered by GSP" do not take into account quantitative and origin rule limitations and non-utilization of GSP and that actual imports under GSP are smaller than imports recorded as GSP.
With respect to imports from world and imports according to different tariff treatment, names of the main suppliers appear in column MAIN SUPPLIERS and imports from four main suppliers are indicated at the bottom. See next page for country name abbreviations.
SHARE for the percentage share of GSP beneficiaries in imports from world
V for value in $1,000 Q for quantity

AFGHANISTAN NETHERLANDS ANTILLES AMERICAN SAMCA DHONNINC MAUD LAKO BURUNOI BAHRAIN EERPUOA PRUNE1 BCISkANA CCCCS (KECL1KGI I S L . IVCRY cum CCPMUNk. AFRICA» NES COLOMBIA CZUHCSLCVAKIA CAYMAN ISLANDS C J 1 B C L I I ALGERIA E C Y M ( U . A . R . I FRENCH AFRICA NES FRENCH ANTILLES GABON GIBRALTAR CSP MEN CRIC1N CSP CTHEF ORIGIN CREEHANC GUYANA
M i l l INDIA IRAC JAMAICA K I R I P A I I KCHEA, REPUEL1C C f L I B E R I A SRI LANKA POHLCCU MEN CQC • • A l l PAURI IAN1A PALAWl NIGER M U E NAURU H.l. 1ERRI IGK IES AuSIRAL IAN TERR.NES C lhER MEN 1REAINENT PAKIS IAN P I I C A I R N ISLAND PAPUA NEW GUINEA PLRILGAL CAIAR RWANDA SENEGAL SIERRA LEONE ST P l t k R E A PIQUELON SkECEN TURKS « CAICCS I S . ICKELAU TRINIUAO A TCBAGC U N I T t O HEP. TANZANIA LRUGGAV S I VINCENT CHENACINE VIET NAM k A L L I S A FUIUNA I S . YUGOSLAVIA
AFG ANT ASM ATN BDI f>»!H bMU UKN BUA CCK C IV COA COL CSK CYM O J I OZA EGY FAF F NT GAB GIB GMO GOO GKL GUY HTI IND IRQ JAM KBT KGK LUR LKA HAH MfO ML I MKI Mrtl NCR N IU NRU NZT OAT OMI PAK PCN PNG PR! GAT KkA SEN SLE SPM SUE ICA TKL 110 Ï Z A UkY VCT VNM k l E YUG
ANGOLA UNITED ARAB EMIRATES B R I T I S H ANIAKC.REU AUSIRAL IA BENIN BAHAMAS B O L I V I A BI IUlAN CCN1RAL AFRICAN R E P . Stoi lZERLANO COMIONk .LAT IN AMER. CLMMONk.OCEANIA,NE S Cf MLKUS CANION A ENDERBURY CYPRUS DOMINICA ECUADOR kESlEHN SAHARA FINLAND FRENCH OCEANIA. NES G M I E O KINGDOM GUINEA GSP MEN IPEATMENT GSP PHLF TREATMENT GUATEMALA HONG KONG HUNGARY B R . I N D I A N CCEAN TERR ICELAND JCROAN KENYA KUWAIT L I B Y A N ARAB JAMAHIR. LESOTHO MADAGASCAR MEN ETA MALI A MUNI SERRAT MALAYSIA N O K K i l K ISLAND NETHERLANDS NEUTRAL ZONE A k C I I C » A M A k C T I C , N E S O l t l t K OCEANIA NES OIHEK CKIG1N PANAMA PANAMA CANAL ZONE P U . AND PARAGUAY REUNION SOUIH A S-E A S I A , N E S SINGAPORE EL SALVADOR SAO IOME A PRINCIPE SWAZILAND CHAD EASI TIMOR I U N I S I A UGANDA U N I I E O SIATES VENEZUELA VIET NAM — SAMuA SOUIH AFRICA
AGO ARE ATB AUS BEN BUS BCL B I N CAP CHE CLA
coc COM CTE CYP DMA ECU ËSH F I N FOC GBR G I N GMT OPT GTM HKG HUN 101 I S L JCR KEN K b ! LUY LSÛ HOC MFE ML I MSR MYS NEK NLO Nil OAA CCE OCR PAN PCZ POL PKY REU SAS SGP SLV S I P SkZ ICO TMP ION UGA USA VEN VNM kSM ZAF
«
ANCCRRA ARABIAN STATES,NES ANTIGUA AND BAKBOCA AUSTRIA BULGARIA O I L I Z E BAkLALOS C M J V t l ISLAND C A f * C A CHINA CLMM0Nk.AN11LLES.NES CCOK ISLANDS CCSIA RICA CERISIHAS ISLAND CIKMANY, E I C l k A L REP O L P I M L A N RLPLlSLlC El I * E T H I L P I A FA1KLAND I S . 4 OEP. EA IM.E ISLANOS CI-ANA GAME 1A E O U A l L k l A l GUINEA GklKACA GUAM IU.NLUKAS INOLNESIA IK AN ITALY JLhNSICN ISLANO S 1 . M I I S - N E V 1 S - A N C L A LEU/NCN PACAC MLXICG MIDWAY ISLANDS MCZAMBICUL PAOkl I I L i N i k LALEDLN1A NK.AkAuUA NEPAL M k ZEALAND L I I F K ASIA N . E . S . C l i l t k PI r. L K I G I N P A C I F I C H O S T TERR. P H I L I P P I N E S KOREA, O L h . REPUBLIC FRENCH POLYNESIA REMANIA SUDAN SLLI.NLN ISLANCS SPANISH AEHICA SOHINAME SYKIAH AkAB REPUBLIC I h A I L A N C 101 AL IGVALU G . S . A N T I L L E S . NES O . S . V IRGIN I S . kAKE ISLAND 0EMLCHA1IC YEMEN ZAIKE
ZAMBIA
ZIMBABWE
ANC ARS A t C AUI LLk
n z Bkb L V I CANP CE.N C M CCK i n CXft I L L L I M El I t l l i I L K l i a CFA G i b C M I l i t COP 1-1.0 ION IRN 11 A J I N M»A EliN PAC PL A P IC P.GJ MLS
• NCL NIC NPL Hlif CAN DPI.
I C I i i a PkK FY F H P SON s i t SPA S l k SYR IMA 101 lev L N I V1R kAK YMC ZAR
1MB Z k t
i -, .
i
r» vt
•< S
z JS
i m M
te O
fc a
S m
< > -4
O z
-0 </> ût X3
n> o
f > oo O» lAl
S • —
•n (0 < —»
, • ' *
3> Z Z X
M *-t
ALBANIA ARGENTINA FRENCH ANTARC. TERR. ALS1RALIA CANCLAOESH EiELGl OM-LOXENBOURG UPAZIL PUPPA CANADA CHILE U N I I L O H E P . CAMEROON CONGO. REPUBLIC CAPE VEROE CUBA GERPAI.V* OEMGCk. REP DENMARK I . E . C . SPAIN F I J I I k A M - E GILBERT « ELL ICE I S . CUACELUUPE GUI M A - B I S S A U GkEECE EMNCH GUI ANA l i t AND A MCOCNALD I S L GPPEK VOLIA I k l L A N O 1 SE Al L JAPAN OEMCCRAIIC KAMPUCHEA LAO PEOPLE 'S OEM REP S A I N I L0C1A LELkAkD A k l N D k A k O MALDIVES MEN OGC MLNCL1IA PAR I I NI CUE N A P . l O I A I S . b . A F R l C A l N IGERIA NORkAY NLk ZEALAND CIHER AFRICA,NES LMAN CIHER PRET 1REA1MENI POklUGUESE ASIA PERU P U L k l O RICO P L M . k E S l AFRICAINES ELUNILN A CCMCRG SAUDI ARAUIA S I 1.ELENA A DEPEND. SOMALIA t . S . S . R . SEYCHELLES ÎCGC IONCA ÏUPPEV UNSPECIFIED O . S . OCEANIA OKI 11SH V I R G I N I S . VANUAIU YEMEN Sc-Ull i AFRICA
ALB AkG A IF ALSP CGO CLX BRA CLk CAN CEL CPk CLG CPV CUB OCR CNK EEC ESP F J I I R A GEL GLP GNB GRC GOF hPD HVO 1RL ISR JPN KliM LAO LLA Lkk PCV MIL M KG M L NAM NGA NCR NZL OAF OMN •EPI PAS PER PRI PkA kNC S AU SIN SLM SLN SYC 1GC I L N IUR UNS USD VGB VCT-* YE ZAFP

TARIFF ASSESSEMtNI M AU3. IMPORTS FROM DEVELOPING COUNTRIES IN 19S1 - T - R i F f ' ' W E I . IMPORTS ItlOOOfc.jFRON . , . . „ .__ „ ' * " f T _ ! >VpE|. IMPORTS ItlOOOIk.jFRON i
TYPE RATE N E B B L P RATE OF ^ WORLD J CSP | REQulttlNG COUNTRY*DGC MAIN O P A S 0 C I C | TARIFA | ORIGIN j ^ S i SUPPLIER
J ^ L - — I _ I _ ™ _ ! ! _ ! ™ i " E U N I T A D ' V 1 T R M T * I VALUE QUANTITY! VALUE QUANTITY! VALUE QUANTITY SHARE RANK|
2601900 METALLIC ORES ^CONCENTRATES &ROASTEO IRON PYRITES, OTHER THAN MANGANESE ORES ^CONCENTRATES QTY:NA
MTN-B FREE U TOT 28329 17725 31417043 16772 21719993 59 BOL HND ZAF CAN USA MTN-F FREE U MFN 80 FREE U MFN 28329 42150655 17725 31417043 16772 21719993 59 BOL HNO 2AF CAN USA
MAIN SUPPLIERS TOT BOL V 7982 Q 3256180 HND V 6528 Q 5000004 ZAF V 4603 Q10681609 CAN V 4212 Q 0 MFN BOL V 7982 Q 3256180 HND V 6528 Q 5000004 ZAF V 4603 Q10681609 CAN V 4212 Q 0
2603000 ASH AND RESIDUES CONTAINING METALS OR METALLIC COMPOUNDS UTY: KG
MTN-B FREE U TOT 869 806780 516 99633 516 99633 59 SGP JPN FJI NZL EEC
MFN 80 FREE U MFN 869 806780 516 99633 516 99633 59 SGP JPN FJI NZL EEC
MAIN SUPPLIERS TOT SGP V 352 Q 51975 JPN V 180 Q 66204 FJI V 151 Q 33638 NZL V 122 U 589289
MFN SGP V 352 Q 51975 JPN V 180 Q 66204 FJI V 151 Q 33638 NZL V 122 Q 589289
2827000 LEAO OXIDES, RED LEAD AND ORANGE LEAD QTY: KG
MTN-B FREE U TOT 212 154799 52 51990 19 19490 8 EEC USA CHN ZAF HEX MTN-F FREE U MFN 80 FREE U MFN 212 154799 52 51990 19 19490 8 EEC USA CHN ZAF HEX
MAIN SUPPLIERS TOT EEC V 75 Q 62830 USA V 50 Q 14099 CHN V 33 Q 32500 ZAF V 29 Q 20800 MFN EEC V 75 Q 62830 USA V SO Q 14099 CHN V 33 Q 32500 ZAF V 29 Q 20800
2830900 CHLORIDES AOXYCHLORIDES OTHER THAN CALCIUM CHLORIDE ZINC CHLORIDE ACOPPER ÛXYCHLCRIDE QTY:NA
MTN-B 25.0 C X TOT 4402 507 1194757 296 360177 6 EEC USA JPN CHN ISR MTN-F 25.0 C X MFN 80 FREE C X MFN 4402 4284846 507 1194757 296 360177 6 EEC USA JPN CHN ISR
MAIN SUPPLIERS TOT EEC V 2104 Q 0 USA V 766 Q 0 JPN V 723 U 2896624 CHN V 211 Q 834580 MFN EEC V 2104 Q 0 USA V 766 Q 0 JPN V 723 Q 2696624 CHN V 211 Q 834580
2830900 BL DITTO - BY-LAM 9*Y: K G
MTN-B 12.5 E C X TOT 17 2738 0 USA MTN-F 12.5 E C X MFN 80 FREE C X MFN 17 2738 0 USA
MAIN SUPPLIERS TOT USA V 17 Q 2738 MFN USA V 17 Q 2738
2835900 SULPHIDES APOLYSULPHIDES OTHER THAN CAOMIUM SULPHIDE QTY: KG
MTN-B FREE U TOT 2135 3062047 483 1605850 1 50 0 USA CHN JPN EEC CAN MTN-F FREE U MFN 80 FREE U MFN 2135 3062047 483 1605850 1 50 0 USA CHN JPN EEC CAN
MAIN SUPPLIERS TOT USA V 998 Q 86557 CHN V 482 Q 1605600 JPN V 374 Q 1057060 EEC V 126 Q 296069 MFN USA V 998 Q 86557 CHN V 482 Q 1605800 JPN V 374 Q 1057060 EEC V 126 Q 296069
73 Q>
<Q <D
•P*
CO •o
n o OO
-vi m
m o

TARIFF ASSESSEMENT * AUS IMPORTS FROM DEVELOPING COUNTRIES I N 1981 TARIFF I TYPEI IMPORTS U 1 0 Q 0 I FROM
TYPE RATE N E B D L P RATE I OF I WORLD | GSP J REQUESTING COUNTRY:OCC J MAIN OF A S 0 C I C i T A R I F I I ORIGIN | X | SUPPLIERS
DUTY T T G V M V VALUE UNIT AO.VlTRMT.J VALUE QUANTITYI VALUE QUANTIIYl VALUE QUANTITY SHARE RANKj
7801100 UNALLOYED LEAD, WASTE ANO SCRAP QTYsNA
MTN-B FREE U TOT 1S8 83 111271 83 111271 52 NIL NCL FJ1 PNC ION MTN-F FREE U MFN 80 FREE U MFN 158 215030 83 111271 83 111271 52 NZL NCL F J I PNG ION
MAIN SUPPLIERS TOT NZL V 75 Q 1037S9 NCL V 39 Q 0 F J I V 34 Q 77197 PNG V 7 U 15362 MFN NZL V 75 Q 1037S9 NCL y 39 Q 0 F J I V 3 * Q 77197 PNG V 7 U 15362
7801900
MTN-B MIN-F MFN 80 GSP1-B FTA ZONE
FREE C FREE C
2 . 0 C FREE FREE FREE
UN!
U U U
UNWROUGHT LEAD CINC ARGENTIFEROUS LEAD) OTHER THAN UNALLOYED LEAD WASTE A SCRAP - 2 6 1 » 0 .048 /KG QTY;
TOT 36 42 0 NZL USA
MFN 6 0 USA
FTA 30 . 42 0 NZL
MAIN SUPPLIERS TOT NZL V 30 Q 42 USA V 6 Q 0 MFN USA V 6 Q 0 FTA NZL V 30 Q 42
7801900 BL OITIO - BY-LAW <jrYi
MTN-B FREfc U TOT 1 0 USA MIN-F FREE U MFN 80 FREE U MFN 1 0 USA
MAIN SUPPLIERS TOT USA V 1 Q 0 MFN USA V 1 Q 0
7802000
MTN-B MTN-F MFN 80 CSP1-B FTA ZUNE
FREE FREE
2 . 0 FREE FREE FREE
WRi
U
U u
WROUGHT BARS, RODS, ETC. OF LEAD, LEAD HIRE QTY: KG
TOT 22 1206 0 CAN EEC USA
MFN 22 1206 0 CAN EEC USA
MAIN SUPPLIERS TOT CAN V 16 Q 590 EEC V 5 Q 547 USA V 1 Q 69 MFN CAN V 16 Q 590 EEC V 5 Q 547 USA V 1 Q 69
7802000 BL DITTO - BY-LAW QfY: KG
MTN-B FREE U TOT 44 40783 0 EEC JPN USA MTN-F FREE U MFN 80 FREE U MFN 44 40783 0 EEC JPN USA
MAIN SUPPLIERS TOT EEC V 42 Q 40239 JPN V 1 Q 26 USA V 1 Q 518 MFN EEC V 42 Q 40239 JPN V 1 Q 26 USA V 1 Q 518
" 0 Q)
(O (D
• t * 00
GO T>
fl> r> 00 I A I
l /J o "*» JO a> <

TYPE OF
OUT Y
7803000
MTN-B MTN-F MFN 80 GSP1-B
7803000
MTN-B MTN-F MFN 60
7804000
MTN-B MTN-F MFN 80
7805000
MTN-B MTN-F MFN 80
7806000
MTN-B MTN-F MFN 80 FTA ZONE
7806000
MTN-B MTN-F MFN 80
RATE N A T
FREE FREE
2 . 0 FREE
MAIN
BL
FREE FREE FREE
MAIN
FREE FREE FREE
MAIN
FREE FREE FREE
MAIN
2 1 . 0 2 1 . 0 2 1 . 0
FREE FREE
MAIN
BL
FREE FREE FREE
MAIN
TARIFF ASSESSEMENT a AU5 IMPORTS TARIFF | TYPEI
E B B L P RATE ] O F j j t t WORLD 1 S 0 C I C J T A R I F ^ | T C V M V VALUE UNIT AO.V |TRMT. | VALUE QUANTITYl
WROUGHT PLATES. SHEETS AN0 STRIP
U U U
SUPPLIERS TOT NZL V MFN NZL V
DITTO BY-LAW
U U U
SUPPLIERS TOT USA V MFN USA V
ror
MFN
12 Q 12 Q
TOT
HFN
17 Q 17 Q
LEAD FOIL WEIGHT NOT EXCEEDING 1 .
U U U
SUPPLIERS TOT USA V MFN USA V
TUBES ANO PIPES* OF LEAD
U U U
SUPPLIERS TOT EEC V MFN EEC V
OTHER GOODS MADE OF LEAD
U U U
SUPPLIERS TOT JPN V MFN JPN V
DITTO - BY-LAN
U
U
SUPPLIERS TOT USA V MFN USA V
TOT
MFN
26 Q 26 Q
TOT
MFN
27 Q 27 Q
TOT
MFN
95 Q 95 Q
TOT
MFN
65 Q 65 Q
, OF LEAD
14
14
2399 2399
22
22
12957 12957
2487
2487
EEC V EEC V
13734
13734
EEC V EEC V
700 GM/M2, LEAD
48
48
12421 12421
48
48
6362 6362
152
152
0 0
68
* 68
0 0
18428
18428
EEC V EEC V
10371
10371
JPN V JPN V
EEC V EEC V
CAN V CAN V
FMI
V
2 2
5 S
JH OEVELOPINC COUNTRIES I N 19ST IMPORTS 1*1000) FROM |
GSP | R E O j i t T I N G COUNTRYïDGC | MAIN ORIGIN J ~ X | SUPPLIERS
&LUE QUANTITYl VALUE QUANTITY SHARE RANK|
0
0
Q Q
0
0
Q Q
POWDERS
22 22
21 21
36 36
3 3
0
0
Q Q
0
0
Q Q
11
11
Q Q
0
0
Q Q
QTY: KG
NZL EEC
NZL EEC
88 86
QTY: KG
USA EEC
USA EEC
777 777
AND FLAKES QTY: KG
USA EEC
USA EEC
6007 6007
QTY: KG
EEC JPN
EEC JPN
4009 4009
QTVINA
JPN EEC PRT USA SWE
JPN EEC PRT USA SWE
0 PRT V 11 Q 0 USA V 9 Q 0 0 PRT V 11 Q 0 USA V 9 Q 0
QTY:NA
USA CAN
USA CAN
u
-o Q>
ID
I
CO T3 n> o
o
TO to <
i 1 :
|
i i I
i P
r
t [ [•'
ji
1"
U
[i
(
) <
'• \
b
•"i

TARIFF ASSESSEMENT : AUT IMPORTS FROM DEVELOPING COUNTRIES IN 1980 TARIFF I TYPEI IMPORTS U 1 0 Q 0 ) FROM |
TYPE OF
DOTY
2601
MTN-B MTN-F MFN 80
2603
MTN-B MTN-F MFN 80
______ 2827
MTN-B MTN-F MFN 80 GSP1-B CSP1-F LDC-B F IA ZONE
2830B
MTN-B MTN-F
RATE N E B B L P RATE A S D C I C T T C V M V VALUE UNIT AD.
1 OF | ITARIF I
.V lTRMT. I
METALLIC ORES AND CONCENTRATES!
FREE FREE FREE
MAIN SUPPLIERS TOT BRA V MFN BRA V
ASH AND RESIDUES CONT.
FREE FREE FREE
MAIN SUPPLIERS TOT EEC V MFN EEC V
TOT
MFN
WORLD I GSP 1 REQUESTING COUNTRYtDGC I ORIGIN I X
I MAIN 1 SUPPLIERS
VALUE UUANTITYl VALUE QUANTITY J VALUE QUANTITY SHARE RANK J
ROASTED IRON PYRITES
153610 22083304 58242 10553040 54993 10530711 35
153610 22083304 58242 10553040 54993 10530711 35
34814 Q 8523968 CAN V 28531 Q S055838 EEC V 15354 Q 45989S USA V 34814 Q 8523968 CAN V 28531 0 5055888 EEC V 15354 Q 459895 USA V
METALS OR
TOT
MFN
4542 Q 4542 Q
LEAD OXIDES. RED AND ORANGE LEAD
16 .8 1S.0 16 .3
8 . 2 7 .5
FREE FREE FREE
MAIN SUPPLIERS TOT EEC V MFN USA V F TA CHE V ZONE EEC V
TOT
MFN
FTA ZONE
359 Q 21 0
1 Q 359 0
METALLIC COMPOUNDS IEXC FKOMIKON A STEEL)
18447 283882 5297 12591 5297 12591 28
18447 283862 5297 12591 5297 12591 28
77074 SGP V 3141 U 6089 ZAF V 2949 Q 34683 JPN V 77074 SGP V 3141 Q 6089 ZAF V 2949 Q 34683 JPN V
1
381 2822 0
21 185 0
1 8 0 359 2629 0
2629 USA V 21 Q 18S CHE V 1 Q 8 185
8 2629
00 OTHER CHLORIDES, BROMIDES - OXYBROMIDES. IODIDES 4 OXYIODIDES
10 .3 0 A C 6 . 0 0 A C
MFN 80 FREE A C X
283SE
MTN-B MTN-F MFN 80
MAIN SUPPLIERS TOT EEC V MFN EEC V
OTHER SULPHIDES THAN OF
FREE FREE FREE
TOT
MFN
2508 Q 2508 a
3933 118053 11 60 S 20 0
3933 118053 11 60 S 20 0
51651 CHE V 650 U 36614 POL V 364 Q 26931 JPN V 51651 CHE V 650 Q 36614 PUL V 364 Q 26931 JPN V
POTASSIUM,SOD!UM.flARIUM.ZINC ANTIMONY
TOT
MFN
74 241 0
74 241 0
QTY:CKG
BRA CAN EEC USA AUS
BRA CAN EEC USA AUS
14701 Q 14341 14701 Q 14341
«IY:CKG
EEC SGP ZAF JPN TMA
EEC SGP ZAF JPN THA
2375 Q 146 2375 Q 146
_________
EEC USA CHE
USA
CHE EEC
QTYsCKG
EEC CHE POL JPN CSK
EEC CHE POL JPN CSK
304 Q 357 304 Q 357
UTYïCKG
EEC CHE USA
EEC CHE USA
-0 . 0»
IQ
o .«
CO
o
00 U4 ^ O
TO
< _»
MAIN SUPPLIERS TOT EEC V 71 Q 238 CHE V 2 Q 3 USA V 1 Q 0 MFN EEC V 71 Q 238 CHE V 2 Q 3 USA V 1 Q 0

TYPÉ OF
DUTY
7801A1
HTN-B MTN-F MFN 80 CSP1-B GSP1-F LDC-B F TA ZONE
RATE
I M I F F A S i t S S E K E B T TARIFF 1 TYPE I
E B B L P RATE I Of | ^ > S 0 C I C I T A R I F I m T C V M V VALUE UNIT AO.VITRMT. I VALUE
A u r I H P O R T S V R Ô Ï Ï O E v e t . Of I NC C O U N T R I E S IE« •• V O U
IMPORTS 1 * 1 0 0 0 » FROM ; WORLD I GSP I REQUES*£NC C0UNTRY:DCC i
| ORIGIN I W X I UUANTITYi VALUE QUANTITY, VALUE QUANTITY SHARE RANK)
S.O 4.0 4.7 2.4 2.0
FREE FREE FREE
LEAD U N ALLOYS, UNWR0UGHT
U TOT
ZONE
936
936
8109
8109
EEC
EEC
MAIN SUPPLIERS
QTY:CKG
MAIN SUPPLIERS TOT EEC V ZONE EEC V
936 0 936 Q
8109 8109
7801A2 OTHER UNWROUGHT LEAD
MTN-B MIN-F MFN 80 GSP1-B GSP1-F LDC-B F TA ZONE
S.O 4 . 0 4 . 7 2 .4 2 . 0
FREE FREE FREE
M H N H M
4000/CKG 0050*TOT 2800/CKG 0040+ 3700/CKG 0047+MFN
GSP
FTA ZONE
29678 290141
383 1919
180 27196
4285 19023
1812 265021
1919 19023
0 1919
0 0
MAIN SUPPLIERS TOT MFN GSP FTA
EEC 00R YUG CHE
ZONE EEC
27196 Q 380 Q 1664 Q 180 Q
27196 Q
265021 YUG V 4250 HUN V 16383 PER V 1812
265021
1664 Q 3 Q
163 Q
19023
1638 3 DOR V 35
1900 BGR V
7801B
MTN-B FREE MTN-F FREE MFN 80 FREE
WASTE ANO SCRAP OF LEAD
MAIN SUPPLIERS TOT CHE V MFN CHE V
TOT
MFN
584 Q 584 Q
766
766
21737
21737
0
0
15081 HUN V 15081 HUN V
158 Q 158 Q
S851 EEC V 5851 EEC V
7802
MTN-B MTN-F MFN 80 GSP1-B CSP1-F L0C-B F IA ZONE
10 .0 6 . 0 9 . 0 4.5 i .O
FREE FREE FREE
WROUGHT BARS, RODS, ANCLES. SHAPES 4 SECTIONS OF LEA0. LEAD WIRE
TOT 963 44 39 0
MAIN SUPPLIERS TOT EEC V FTA CHE V ZONE EEC V
FTA ZONE
950 Q 13 0
950 Q
13 950
114 4325
0 0
4325 CHE V 114
4325
13 Q 114
1827 18283
1827 18283 95
EEC
OOR YUG
CHE EEC
YUG
HUN PER
QTY:CKG
DOR CHE
BGR
PER
380 Q
92 Q
4250 CHE V 180 Q 1812
740
QTY:CKG
CHE HUN EEC
CHE HUN EEC
24 Q 24 Q
80S 805
QTY:CKG
EEC CHE
CHE EEC
"TJ GO Q>
CO (D
TJ n> O
VSI 00 UJ s ^
• .

TYPE OF
DUTY
7803
MTN-B MTN-F MFN 80 GSP1-B GSP1-F LOC-B FTA ZONE
7804
RATE
12.0 7.0 10.7 5.4 3.5
FREE FREE FREE
TARIFF ASSESSEMENT » AUT IMPORTS FROM DEVELOPING COUNTRIES I N 1980 831011 TARIFF I TYPEI IMPORTS (S1000) FROM
E B B L P RATE I OF | WORLD I GSP I REQUESTING COUNTRYiOGC I MAIN S 0 C I C ITARIF I I ORIGIN I * I SUPPLIERS T G V M V VALUE UNIT AD.V |TRMT. | VALUE QUANTITY! VALUE QUANTITYI VALUE QUANTITY SHARE RANKl
WROUGHT SHEETS,PLATES.ETC.OF LEAD
TOT
QTY:CKG
57» 4742
MAIN SUPPLIERS TOT FTA ZONE
EEC SWE EEC
V V V
FTA ZONE
574 4
574
Q 4 Q
5 574
4732 5
4732
SME CHE
10 4732
V V
4 1
Q Q
0 0
5 5
CHE V
EEC SWE CHE
SWE CHE EEC
T co 0) X3
n o
Kn oo
04 o
n> .<
1 Q
MTN-B MTN-F HFN 80 GSP1-B GSP1-F LOC-B FIA ZONE
18 .0 8 . 0
15 .5 7 .8 4 . 0
FREE FREE FREE
LEAD FOIL WEIGHT PER SO. METRE NOT EXCEEOING 1700 GRAMS, LEAD POWDER 4 FLAKES
TOT 145 488 0
QTY:CKG
EEC
MAIN SUPPLIERS TOT EEC V ZONE EEC V
ZONE
145 Q U S Q
145
488 488
488 EEC
7805
MTN-B MTN-F MFN 80 GSP1-B GSP1-F LOC-B FTA ZONE
12.0 7.0 10.7 5.4 3.5
FREE FREE FREE
TUBES AND PIPES AND BLANKS, HOLLOW BARS, ETC. OF LEAD
TOT 26 83 0
QTYsCKG
EEC
MAIN SUPPLIERS TOT EEC V ZONE EEC V
ZONE
26 Q 26 0
26
83 83
83 EEC
7806A
MTN-B MTN-F MFN 80 GSP1-B GSP1-F LOC-B FTA ZONE
LEAD WOOL QTYïCKG
15.0 8.0 13.2 6.6 4.0
FREE FREE FREE
TOT 11 EEC
MAIN SUPPLIERS TOT EEC V ZONE EEC V
ZONE
2 ( -2 (
11 EEC
11 11

TYPE RATE N OF A
DUTY T
7806B
NTN-B MTN-F MFN 80 GSP1-B GSP1-F IDC-B F TA
ZONE FREE
TARIFF » J S £ 5 S E « £ « r > HUT IMPORTS F O a n OE ve i_ OR 1 NO COUNTRIES ÎT5 t 9 & 0 I TYPE I IMPORTS 1*1000) FROM
RATE 1 OF *M HORLO I GSP I R E Q U i ^ I N G COUNTRYJDGC i T A R I F p P | ORIGIN | W
TARIFF E B B L P S 0 C I C I T A R I F 1 V | ORIGIN S W X I T G V M V VALUE UNIT A 0 . V | T R M T . | VALUE QUANTITYI VALUE QUANTITY! VALUE QUANTITY SHARE RANK|
HAIN SUPPLIERS
17.0 8.0 14.7 7.4 4.0
FREE FREE
OTHER ARTICLES OF LEAD NOT ELSEWHERE SPECIFIED
TOT 764 2611
HFN 8 3
MAIN SUPPLIERS TOT EEC V MFN USA V F TA CHE V ZONE EEC V
FTA
ZONE
714 Q
7 Q 24 Q
714 Q
42
714
104
2S04
2504 CHE V 3 JPN V
49 SwE V 2504
0
0
0
0
24 Q 1 Q
18 Q
49 SWE 0 55
18 Q
QTY:CKG
EEC CHE SHE USA JPN
USA JPN
CHE SRE
EEC
55 USA V 7 Q
Spec
Page
i n oo
o
i? -»

TARIFF ASSÊSSEMENT I CAN IMPORTS FROM DEVELOPING COUNTRIES IN 1980 TARIFF I TYPE| IMPORTS ($1000 ) FROM I
TYPE RATE N E B 8 I P RATE I OF | WORLD | CSP I REQUESTING COUNTRY:DGC I MAIN OF A S 0 C I C 1TARIFI I ORIGIN | X I SUPPLIERS
DUTY T T G V M V VALUE UNIT AO.V |TRMT. | VALUE QUANTITYI VALUE QUANTITYl VALUE QUANTITY SHARE RANK|
3290001 00 ORES OF METALS NOP QIYiNA
MTN-B FREE U TOT H 9 1 5 1 69 221 69221 46 USA PER 2AF CHL GAB MTN-F 1.7 A P MFN 80 FREE P MFN 148512 69221 69221 46 USA PER ZAF CHL GAB <iS»,p F R * t
MAIN SUPPLIERS TOT USA V 42651 Q 0 PER V 41751 Q 0 ZAF V 23308 Q 0 CHL V 9651 0 0
MFN USA V 42651 Q 0 PER V 41751 Q 0 ZAF V 23308 Q 0 CHL V 9651 Q 0
3290001 01 ORES OF LEAD
MTN-B FREE U HTN-F 4 . 8 C
3360001 TEA LEAD QTY:
MTN-B FREE U MTN-F 4 . 3 C MFN 80 £REE_ C
3370001 LEAD. OLD, SCRAP, PIG AND BLOCK QTYsNA
MTN-B FREE TOT 19605 21 21 0 USA BRB EEC AUS MTN-F FREE MFN 80 FREE MFN 19605 21 21 0 USA BRB EEC AUS (*S* F FW.EE
MAIN SUPPLIERS TOT USA V 19571 Q 0 BRB V 21 Q 0 EEC V 10 Q 0 AUS V 3 0 0
MFN USA V 19571 Q 0 BRB V 21 Q 0 EEC V 10 Q 0 AUS V 3 Q 0
3380001 LEAD, IN BARS AND IN SHEETS QTY:NA
MTN-B 5 . 0 TOT 98 0 USA MTN-F 4 . 0 MFN 80 4 . 9 MFN 98 0 USA GSP1-B 3 . 0 GSP1-F 2 .5 LOC-B FREE
MAIN SUPPLIERS TOT USA V - 98 Q 0
MFN USA V 98 Q 0
3390001 LEAD, MANUFACTURES OF, NOP QTY:NA
MTN-B 17 .5 TOT 1087 1 1 0 USA EEC SUE JPN THA MTN-F 10.2 MFN 80 16 .6 MFN 1086 0 USA EEC SHE JPN GSP1-B 10 .0 GSP 1 1 1 100 THA GSP1-F 6 . 5 LOC-B FREE
MAIN SUPPLIERS TOT USA V 1058 Q 0 EEC V 26 0 0 SHE V 1 Q 0 JPN V 1 Q 0 MFN USA V 1058 Q 0 EEC V 26 Q 0 SUE V 1 Q 0 JPN V 1 0 0 GSP THA V 1 0 0
tu XJ «a a> m o VJ1 oo
m o ~̂ n <

TYPE OF DUTY
RATE TARIFF I TYPE|
E B 0 L P RATE I 0 ' ^ WORLD 1 S 0 C I C J T A R W I T C V M V VALUE UNIT AO.V |TRMT. | VALUE QUANTITY|
IMPORTS 1*1000) FROM | GSP I KE-a tSTING COUNTRY:OCC I
ORIGIN | W * | VALUE QUANTITY) VALUE QUANTITY SHARE RANK]
NAIN SUPPLIERS
6810S01
MTN-B FREE MTN-F FREE MFN 80 FREE asp-p Fftee
NAIN
SHELTER REFINERY. ROLLING MILL RESI DUE/REVERT INOT SCRAP METAL) IMPORTED FOR RECOVERY OF METAL CONTENT QTY:NA
TOT 36140 38 38 0 USA EEC ZAF AUS ESP
MFN 36U0 38 38 0 USA EEC ZAF AUS ESP
SUPPLIERS TOT USA V MFN USA V
25002 Q 25002 Q
0 EEC V 0 EEC V
S069 Q 5069 Q
0 ZAF V 0 ZAF V
4086 Q 4086 Q
0 AUS V 0 AUS V
1838 Q 1838 Q
7110001
MTN-B MTN-F MFN 80 GSP1-B GSP1-F LOC-D PREF 1
ALL GOODS NOT ENUMERATED ELSEWHERE IN THIS SCHEDULE AND NOT BEING GOOOS PROHIBITED BY LAW
17.5 10.2 16.6 11.0 6.5
FREE 15.0
TOT
MFN GSP
LOC PREF
139748
135761 3698
2 289
3859
0 3698
2 161
6003
2270 3572
2 161
1 96
100 55
QTY:NA
USA EEC CHE JPN OAN
USA EEC CHE JPN OAN HKG MEX KCR PHL CHN
BGO AUS IND JAM NZL SGP
MAIN SUPPLIERS TOT USA V 106360 Q 0 EEC V MFN USA V 106360 Q 0 EEC V GSP HKG V 1681 Q 0 MEX V LDC BGO V 2 Q 0 PREF AUS V 92 Q 0 INO V
9282701
MTN-B MTN-F MFN 80 CSP1-B LOC-B PREF 1
1 5 . 0 12 .5 14 .7
FREE FREE FREE
11248 Q 11248 Q
1252 Q
88 Q
0 CHE V 0 CHE V 0 KOR V
0 JAN V
LEAD OXIDES. OTHER THAN RED LEAD ANO ORANGE LEAD
TOT 680
MFN GSP
6 4 1 39
39
0 39
8297 Q 8297 Q
234 Q
47 Q
39
39
0 JPN V 0 JPN V 0 PHL V
0 NZL V
5
100
3305 Q 3305 Q
223 Q
36 Q
QTYJNA
USA ZAF MEX
USA ZAF MEX
MAIN SUPPLIERS TOT USA V MFN USA V GSP MEX V
597 Q 597 Q
39 Q
9282702
MTN-B MTN-F MFN 80 GSP1-8 FREE LOC-B FREE PREF 1 FREE
REO LEAD ANO ORANGE LEAD
12.5 10.5 12.3
•
MAIN SUPPLIERS TOT MFN
USA V USA V
TOI
MFN
138 Q 138 Q
0 ZAF V 0 ZAF V 0
44 Q 44 Q
0 MEX V 0
208
208
0 ZAF V 0 ZAF V
0
0
65 Q 65 Q
0 ESP V 0 ESP V
39 Q
5 Q 5 Q
0 0
QTYsNA
USA ZAF ESP
USA ZAF ESP
TJ CO Cli T>
ID n a n l/l 00
M O • * *
JO I» <

TARIFF ASSESSEHENT 1 CAN IMPORTS FROM DEVELOPING COUNTRIES I N 19S0 TARIFF I TYPE) IMPORTS I S 1 0 0 0 I FROM I
TYPE RATE N E B 8 L P RATE I OF | WORLD I CSP I REQUESTING COUNTRYsDGC 1 MAIN OF A S 0 C I C I T A R I F I I ORIGIN | X J SUPPLIERS
DUTY T T G V M V VALUE UNIT AD.V |TRMT. | VALUE QUANTITY! VALUE QUANTITY! VALUE QUANTITY SHARE RANK!
9283001 00 CHLORIOES AND OXYCHLORIOES, N . O . P . QTYsNA g ~% CD n
MTN-B 1S.0 C TOT 8199 228 2 0 EEC USA JPN CHN ESP NTN-F 12 .5 MFN 80 14 .7 MFN 7971 0 EEC USA JPN ESP NOR w
TEMP. 13 .8 P GSP1-B FREE GSP 228 228 2 0 CHN HKG - * LOC-B FREE * •
en oo O- l/J
Ui O
PREF 1 FREE < MAIN SUPPLIERS TOT EEC V 3849 Q 0 USA V 3760 Q 0 JPN V 357 Q 0 CHN V 226 Q 0
MFN EEC V 3849 Q 0 USA V 3760 Q 0 JPN V 357 Q 0 ESP V 4 Q 0 GSP CHN V 226 Q 0 HKG V 2 Q 0
9283001 01 FOR MANUFACTURING ARTIF ICIAL RESINS A PLASTIC MATERIALS IN HEADINGS 93901 TO 93905 INCLUSIVE TEMP. FREE C
9283001 02 FOR MANUFACTURING ADDITIVES FOR HEATING, LUBRICATING AND FUEL OILS TEMP. 5 . 0 C
9283001 03 OTHER TEMP. 1 4 . 7
9283501 00 SULPHIDES OTHER THAN SODIUM SULPHIDES
MTN-B 1 5 . 0 C TOT 2712 3 3 0 MTN-F FREE MFN 80 13 .1 MFN 2709 0 GSP1-B FREE GSP 3 3 3 100 LOC-B FREE PREF 1 FREE
MAIN SUPPLIERS TOT USA V 2673 Q 0 EEC V 36 Q 0 PAN V 3 Q 0 MFN USA V 2673 Q 0 EEC V 36 Q 0 GSP PAN V 3 Q 0
USA
USA PAN
EEC
EEC
QTY
PAN
:NA
9283501 01 FOR MANUFACTURING ARTIFICIAL RESINS A PLASTIC MATERIALS IN HEADINGS 93901 TO 93905 INCLUSIVE TEMP. FREE C
9283501 02 FOR MANUFACTURING ADDITIVES FOR HEATING, LUBRICATING AND FUEL OILS TEMP. 5.0 C
9233501 03 OTHER TEMP. 13.1
3

TYPE OF
DUTY
T A R I F F A S S C S S E M E N T > C A N I M P O R T S F R O M D E V E L O P I N G C O U N T R I E S I N 1 9 8 0 TARIFF I TYPE I IMPORTS ($1000) FROM I
RATE N E B 8 L P RATE I OF i f t WORLD I GSP I REQUEJfrNG COUNTRY:0CC I A S 0 C I C | T A K I F | W | ORIGIN | ^ X I T T G V M V VALUE UNIT A 0 . V | T R M T . | VALUE QUANTITY! VALUE QUANTITY] VALUE QUANTITY SHARE RÀNKI
3391001
MTN-B MTN-F NFN 80 GSP1-B GSP1-F LOC-B PREF 1
COLLAPSIBLE TUBES OF LEAD OR TIN OR LEAD COATED WITH T IN
17 .5 10 .2 1 6 . 6 1 0 . 0 6 . 5
FREE 10 .0
TOT
MFN
40
40
0
0
USA
USA
MAIN SUPPLIERS
QTYJNA
3410001
MAIN SUPPLIERS TOT MFN
USA V USA V
40 Q 40 Q
0 0
BABBITT METAL AND TYPE METAL IN BLOCK BAR PLATE A SHEET OTYsNA
MTN-B MTN-F MFN 80 GSPl-B LOC-B PREF 1
10.0 6.8 9.6
FREE FREE FREE
TOT
MFN
34
34
0
0
USA
USA
3440501
MTN-B MTN-F MFN 80
MAIN SUPPLIERS TOT MFN
USA V USA V
34 Q 34 Q
0 0
8.8 S.I
FREE
00 COMPOSITION FOILS OF LEAD ANO TIN
TOT 64
MFN 64
A C X A P P
0
0
QTYïNA
USA
USA
MAIN SUPPLIERS TOT USA V MFN USA V
64 Q 64 Q
0 0
3440501
MTN-B MTN-F
4012102
MTN-B MTN-F MFN 80 GSPl -B CSP1-F LDC-B PREF 1
02
17 .5 10 .2
12 .5 8 . 0
11 .9 7 . 5 5 . 0
FREE 7.5
MAIN
COMPOSITION FOILS OF LEAD. WHETHER OK NOT CONTAINING ANTIMONY
C C
MIRE OF METALS OR ALLOYS (OTHER
TOT
MFN
SUPPLIERS TOT USA V 12742 Q MFN USA V 12742 Q
THAN NICKEL ACOPPER), SINGLE. NOT COATEO OR COVERED,
13071 0
13071 0
0 EEC V 169 Q 0 JPN V 152 Q 0 EEC V 169 Q 0 JPN V 152 Q
N . O . P .
0 CHE V 0 CHE V
USA
USA
QTYlNA
EEC JPN CHE ZAF
EEC JPN CHE ZAF
5 Q 0 5 Q 0
"O co 0) TJ
wi oo
OJ
5 TO S
1 .

IVPE OF
DUTY
RATE
TARIFF ASSESSEMENT s E.C IMPORTS FRCH DEVELOPING C C U M h l E S JN 1960 TARIFF I TYPE I IMPORTS U 1 Û C 0 ) FMCM I
t U B L P RATE I OF | WORLD I CSP 1 HEQuESTING CCLMRYJCGC I MAIN S 0 C I C J T A R I F I I ORIG IN I * I SUPPLIEPS T G V M V VA1UE UNIT A 0 . V | I K M T . | VALUE Q U A N I I T Y l VALUE QUANTITY I VALUE CUAN1I1Y ShARE RANKl
2 6 0 1 9 8 0 0
MTN-B TREE MTN-F FREE MFN 80 FREE
MINERAIS METALLURGIQUES AUTRES QUE MNERA1S OÉ FER OE MANGANESE U« URANIUM OU CE IHLRIUM
TOT 3 2 3 7 5 4 9 1 * 9 6 8 3 1 I 4 5 6 4 Ï Û 44
MFN 3 2 3 6 5 3 5 1 4 9 6 8 3 1 145642Q 44
C I Y : I
USA CAN CHL AUS PER
USA CAN CHL ALS PER
MAIN SUPPLIERS IOT USA V 6 1 1 3 9 1 MFN USA V 6 1 1 3 9 1
CAN V 3 5 4 4 8 8 CAN V 3544 1:8
CHL V 31S3U4 CHL V 319304
AUS V 3 U 2 5 3 ALS V 3 1 * 2 9 3
2603C000
MTN-6 FREE PTN-F FREE MFN 80 FREE
CENDRES. RESIDUS CONT METAL OU COMPUSES METALLIQUES AU1 QUE DECHETS OE I #1) OU HER i ACIER
TOT 9 0 5 2 3 9 1820U3 192817 2 1
MFN 8 3 4 1 0 8 182003 1928<7 23
PAIN SUPPLIERS IOT USA V 3195S5 MFN USA V 3195S5
ESP V ESP V
6 3 2 2 1 6 3 2 2 1
UNS V CHL V
7 1 1 Î 1 4 Î 4 8 C
CHL V IhA V
O I Y : T
OSA ESP UNS C h i 1 1 *
USA ESP CliL I hA ZAF
4 5 4 6 0 4491.4
T) CO 01 TJ
lO (B <1> O
yji oo 00 04
o -v. 30 I» <
28270000
P.TK-B 1 2 . 2 P I N - F 1 0 . 5 MFN 80 1 2 . 0 GSP1-B TREE ZONE FREE
OXVCES DE PLOMB» Y COMPRIS LE MINIUM E l LA MINE ORANGE
PAIN SUPPLIERS TOT UNS V MFN USA V GSP HEX V ZONE AUT V
TOT
MFN GSP ZONE
2 7 2 1 3 9 0 503
77
4 2 7 6 513
932 513 102
MEX V BGR V PER V CHE V
503 313 10 14
0 513 0
513
513
USA V 3 9 0 OOR V 200
SWE V 10
i t i l H C E
'. . 1 J . 2
P I f i - H M H ' U 1(1 GSF1-fc I K ( f Zi . 'M I h l E
PAIN S L F I U L R S
C X U H L t R L K L S CC CU IVRE, CE PLCPB
I C I 279
11.1 RLM V GSP RoH V ILM AUI V
GSP ZONE
191 191
3V
240 39
24U
240 0
PER V PEK V
49 49
AUI V
24C
240
39
i £ i i 4 C 0 f
» " l h - F 1 2 . C P J K - I é . 9 PFK «0 1 1 . 4 GSP1-E f K t l /UNE uni
SLLIUPES AUIRES CUE OE ECTASS1LM HAPYLP LTAIN PERILPE CALCIUP A M I P L I M A FER
PAIN SUPP11LKS 11 I USA V NEN USA V GSP klM V iLUi AUI V
ICI
Ml N GSP ZLNE
631 631
6 259
1596
978 6
3 74
AGI V CSK V
FIN V
259 170
ev
ESP V JI'N V
CUE V
238 14 1
26
11
100
BGR V ZAF V
NGR V
£6
ICO
ClYs T
UNS MEX USA BGR DOR
USA BGR ODR ZAF JPN MEX PER AIT CEE ShE NCR
313 13
1
CIYï I
PCP PER ALI
PCP PEP ALI
0
ICO
CSK V SLN V
C1V: 1
OfA ALI ESP CSK JPN
USA CSK JPN SLN PCI RIP ALI F IN CFE
Ut 29
,?>•

I U E FATE K L» «
CUIV I
<J3554CC
M H 1<:.0 Pf» t l 1 1 . * CSf l -E Hilt IChl fhit
PAIN
IAMFF ASiA-^SEHENT : k.C IPPORIS fHUH DEVLLLPING C C t M ^ J S IK 1910 TAMIF I J * . I IP.FCMS I M O L ^ F H L P J
I b I L P KATE | T f I U K I D | GSP J RECL-FSTIKC CLLKlHVzCbl I S «3 (. I C 11 AH I H I CRlfelN | » | 1 C V .M V VAIUI UNIT A0.V|T»NI.| VALUE UUANTI1YI VALLF GUANTllYl VAILE CLANTI1V ShARE RANK)
830321
« A U SUFPL1EPS
PCI »VJl I UM < AU I K L S UUE I.E I'UIASSIL* CALC1UP BAPYUP 1ER 4 E1AIN
SLPI'I ItRS ici CAN V MIN LAN V /CNE AJI V
TLI
« I
/LNL
123 123 57
236
22/
r.8
LSA V ISA V F IN V
10-1C4
1
AUÏ V 57 ESP V
CIV» 1
O K ISA All ESP F IK
CAN LiA t_
ALT F IK
1
7All I t 100 PLI IO BRUI tIJNI M1N 0 . 0 2 1 O'ARGFM I I OtSI IKE A TIRE AFFINE IPU.PB U'C.IUVREI
P I K - I I I H L P I N - I i H i r P I N SO CHI 1
PAIN
7 M l 10 v o n
P I K - B «.5 P I N - F 1.5 P I K ao 1.5 HIKE I k M
PAIN
7 ( 0 1 3 0 0 0
P.IK-B IHEE P I N - F I K I E PFN 80 FRCt
PA IN
S U P P I I I R S 1(11 AUS V MIN AUS V
PLCPI' HHUI MUINS OE 0
SUPFI IFRS TOT CAN V MEN CAM V /.ONE S W V
OEIMLTS E l PEBRIS DE
SUPI'I IFRS TOI USA V HFN USA V
I U I
HFN
3 9 2 9 5 1 3 9 2 9 5 1
495944
4 5 5 4 6 9
UNS PHK
V V
292
2 9 2
4 04 75 3 1 9 2 9
, 0 2 » O'ARCFNI LU NON U I S I I N E A I I R E
M i l
MIN / U N I
6C396 60396
3 7 3 7
PLCMB
Ï O I
MFN
1 8 9 7 ) 18973
2 I 3 7 B V
190051 6 7 2 8
43374
4 3 3 7 5
USA t S A CHE
CAN CAN
V V V
V V
6 6 5 4 1
324 84 0
4 1 9 0 1 4 1 9 0 1
2 2 9 7
5 5 6 6
5566
7 0 9 0 7090
2*2
292
PPK V 31929 SKE V 2 7047
A F F I N I 1 1 . 3 2 U C / 1 0 0 K G I
6 7 1 2 2
5 2 4 * 4
AUS V 35226 AUS V 35226 F I N V 3 7 0
6084
6 0 ( 4
CHE V 5436 CHE V 54 36
0
0
Ski USA
2a
17
HAR l AT AUI
14
14
H U I HLN
V V
V V V
V V
ACS UK S
ACS I'PK
27114/ 2VC2
( A l l USA
LAN l i A S k i C M
2 1 1 1 6 1E23C
1<4
USA LAK
USA CAK
3056 305»
PP.K S U
SKI USA
<m:
AI S PAH
ALS /AT 1 I I I A L I
C I V :
C M MIN
CHE MIN
USA
VUG
1
/ A I
PI X NCR
1
NLH
NLR
•
.
"D 0) (Û n Wl
CO X) to o
no •O U4
Ul
R TO to <

I A P I I I ASSISMMINI : f . t IPPORIS IRON 01 VI IW'ING C ( UN t ». 11 S IN 1V6H 1 A M I I I I V P r | INPI1KI1 m U L O l IMCH
l ï i ' i R A M N i it ii i i' K A i i I or | kUHio | o s r l R I U U I S U K G u u m w i u (i l A S U t I t i l A R I f l I ORIGIN | t
PU IV I I !i V M y VAIUI UNI I A J J . V l l K H l . l VAl Uf U O A M I I Y l VALIJF QUANI I IV l VALUE CUANI I I t SJ./M r RANKl
780/C000 BAPHti PKtlf ILES CI FILS OE i t t l l C N PLEINE EN PLCPB
PIN-B 10.0 IOÎ 308 3 MIN-F 8 .0 PFN 80 9 .8 MFN 93 0 CSP1-E I R l l CSP 3 3 /UNE fHIE /ONE 89 0
101 Hrn CSP /ONE
ESP USA U I N CHE
V V V V
HFN CSP /ONE
123 89
J 50
1 1 1
M
ESP
USA L I N Cl-E
MAIN SIII 'PI H I ' S
U V : 1
USA CI 1 r I N AUI
JPN
F IN A L I NCR S U
n o
O Ui
KM O
< —i.
MAIN SUPPLIERS 101 ESP V 123 US* V 89 LUE V 30 F IN V 14
JPN V 4
FIN V 14 AUI V 10 NCR V 8
7801(000 IAPLES r r u i t l f S E l BANDES EN PLUMB DC PLUS 0E 1»7 KG AU M< C1VJ I
PIN-B 10.0 TOE 2573 958 958 37 ISP VLC SVf PER USA PIN-F 8.0 PFN 80 9.8 HFN 141 0 USA AIS JPN CAN HUN GSPI-e IRIE GSP 128 128 128 100 PIP /ONE IMl /ONE 407 0 SU II C NLR
MAIN SUPPLIERS TOI ESP V 1067 VUG V 830 SHE V 361 PtR V 128 AUS V 7 JPN V 4 CAN V 1
7C041100
TOI ESP V M IN USA V GSP PER V /CNF SWE V
, HANOI S MINCES
I O I USA V MIN USA V /UHF AUI V
MFN GSP /ONE
1067 128 128 3 6 1
EN Pi
IOT
MFN
/UNE
199 199
99
CHE V 4 3 NOR V
C1Y; I
KIN-B 10.0 IOT 379 0 CSA ALI N/l SU GRC MIN-F 8.0 HFN 80 V.8 MFN 741 0 OSA N/L JPN GSP1-e TRIE /UNE FRrC /UNE 127 0 ALI SU
PAIN SUPPLIERS 10! USA V 199 AUI V 99 N/L V 39 Ski V ib N/l V 39 JPN V 3 SHE V 28
7E0419UC FEUILLES 4 OANOES MINCES EN PLCNB, PUIOS MAX 1.7KG/M2. NON FIXEES SUR SUPPURT CIV»" 7
PIN-e 10.0 I U I 302 0 MIN-F 8.0 *f* 80 9 .8 MFN 288 0 GSP1-B FREE /ONE IKEE /ONE 4 0
PAIN SUPPUFRS TOI USA V 288 ESP V 7 CHE V 4 GRC V MFN USA V 288 /ONE CHE V 4
USA I i p CHE GRC
USA
CI I
3
ÏÏS

- # •
IYPF
or OUIV
HAIE
7804200C
P T * - B M I K - F MFN 80 GSPT-B /UNE
2 . 5
z.z 2 .S
FHEf TkEE
TARIFF ASTTSSLMCNT < E.C IMPORTS FROM DEVELOPING CCUNTRIES IN 1980 1 A K I M | I V P E l IMPORTS I M O C O I IRLP |
N E U B I P RATE j OF | MiRLO | GSP J K I C U I S I I K C CL0N1RY: IXC | A S U t I t j l A H I F | | CKIC1N | % | F I G V H V VALUE UNI I A O . V | I K H I . | VALUE O U A N I I I V l VALUE O U A N T I I Y l VALUE C U A N I M Y SHAKE RANK|
HA IN SUPPLIERS
POUCHES ET P A I L L E ! I ES DE PLOMB
TOT
MFN
ZONE
PAIN SUPPLIERS 101 CHE V 1 » MFN USA V I t ZONE CME V 124
2S3
1 /
124
UNS V 110 SUN V ]
0
0
0
USA V 14
/eouooc MTN-B 1 1 . 0 P Ï N - F 9 . 0 PTN 80 1 0 . 8 CSP1-P FPEE ZONE TRIE
IUCES « TUYAUX, BARRES CREUSES 8 ACCESSOIRES OE TUYAUTERIE EN F l t iMB
PAIN SUPPLIERS HIT VUG V MIN USA V ZONE OIE V
TOI
MFN
ZONE
398 14
1
41S
14
3
398
0
0
398
ESP V
95
USA V 14 OIE V
7 8 0 6 1 0 0 0 EHPAILAGFS MUNIS DE BLINDAGE EN PLCPB P STOCKAGE OU TRANSPIK ! DE MAT R / C I O - ACT IVLS
P I K - e A.O M I K - F 6 . 0 ffH 80 ( . 0 GSP1-E TRIE ZONE FREE
PAIN SUPPLIERS TOT USA V MFN USA V GSP IRQ V ZONE AUF V
TOI 266 21 21
MFN GSP ZONE
203 203
8 8
20 5 11 25
£SP V CAN V ARE V F I N V
0 11 0
13 1 3 8
SYR V JPN V
CME V
11
10 1
6
ICO
AUI V
NOR V
C I Y : 1
L I E UNS USA I S P SUS
USA SIK
t u
4
C I Y : 1
Yib USA cm
L.SA
Ll iF
C I Y : I
USA I SP SYR A L I I IN
USA t # K J f K I k C AKC A L I » If. LML NLK
b
7 ( 0 * 9 0 0 0
M I K - B 8 . 5 M I K - F 8 . 0 PFK 80 8 . 4 GSP1-B FREE ZONE FREE
OUVRAGES EN PLCMB NDA
TOT 2444 29
PAIN SUPPLIERS TOI AUT V MFN JPN V GSP HKG V ZONE AUT V
MFN GSP ZONE
706 532
28 7 0 6
9 7 1 29
1240
JPN V USA V CHN V NOR V
332 4 1 4
1 224
0 29
0
USA V HUN V
SUE V
36
4 28
414 18
166
CIY: 1
ALI JFK USA NLR GRC
0 96
NCR V OAN V
JI 'K USA HKG CM» AUI KLK
224 4
IICK OAK P l i
SKE CHE f IN ID CO ai T3 t a a> ai o
CHE V 99
:
o oo
g -f

TARIFF ASSESSEMENT s F I N IMPORTS FROM DEVELOPING COUNTRIES I N 1980 TARIFF i TYPE I IMPORTS 1*10001 FROM ,
TYPE RATE N E B B L P RATE J OF | WORLD | CSP I REQUESTING COUNTRYsDGC I OF A S D C I C JTARIFI | ORIGIN J « |
DUTY T T G V M V VALUE UNIT AO.V |TRMT. | VALUE QUANTITY! VALUE QUANTITY! VALUE QUANTITY SHARE RANKl
MAIN SUPPLIERS
2601400
MTN-B FREE MTN-F FREE MFN 80 FREE
2603900
HTN-B FREE MTN-F FREE MFN 80 FREE
LEAD ORES AND CONCENTRATES
ASH AND RESIDUES FOR THE RECOVERY OR MANUFACTURE OF OTHER METALS THAN COPPER AND ZINC
TOT
MFN
1523
1523
2883
2883
12
12
12
12
12
12
12
12
QTYJ
QTY: T
0 USA EEC ROM SWE
0 USA EEC ROM SUE
-o Q)
IQ
to
GO • o
m O
O- 00 rv> trf
W
o »s» TO
to <
MAIN SUPPLIERS TOT USA V MFN USA V
1075 Q 1075 Q
2183 EEC V 2183 EEC V
432 Q 432 Q
669 ROM V 669 ROM V
12 Q 12 Q
2827100
MTN-B 5 . 0 MIN-F 3 . 8 MFN 80 4 . 8 GSP1-B FREE LDC-B FREE FTA FREE ZONE FREE PREF 1 FREE
RED LEAD AND ORANGE LEA0
TOT 265 202543
12 SHE V 12 SWE V
MAIN SUPPLIERS TOT DDR V FTA SHE V ZONE EEC V PREF DDR V
FTA ZONE PREF
159 Q 70 Q 36 Q
159 Q
70 36
159
126000 52501 2404 2
126000
52501 24042
126000
SWE V
0 0 0
70 Q 52501 EEC V 36 Q 24042
4 Q 4 Q
19 19
QTY: KG
DDR SWE EEC
SWE EEC DOR
2827900
MTN-B 5 . 0 MTN-F 3 . 8 MFN 80 4 . 8 GSP1-B FREE LDC-B FREE FTA FREE ZONE FREE PREF 1 FREE
LEAO OXIDE AND LEAD DIOXIDE
TOT
ZONE
QTY: KG
66
66
9529
95 29
EEC
EEC
MAIN SUPPLIERS TOT EEC V 66 Q ZONE EEC V 66 Q
9529 9529
28 30900
MTN-B FREE MTN-F FREE MFN 80 FREE
CHLORIDES N . E . S , OXYCHLORIDES 4 HYDROXYCHORIDESl BROMIDES A OXYUROMIOESî IODIDES A OXYIOOIDES
TOT 2977 6206057 192 1216825 5 2850 0
MFN 2977 6206057 192 1216825 5 2850 0
QTY: KG
EEC SWE CHN JPN NOR
EEC SHE CHN JPN NOR
MAIN SUPPLIERS TOT EEC V MFN EEC V
2504 Q 4459996 SWE V 2504 Q 4139996 SwE V
193 Q 454924 CHN V 193 Q 454924 CHN V
187 Q 1213975 JPN V 187 Q 121 Ï975 JPN V
31 Q 31 Q
11200 112ÛÛ

TYPE OF
DUTY
2835900
MIN-U MTN-F MFN 80
7801110
MTN-B MTN-F MFN 80
7801190
MTN-B MTN-F MFN 80
7801200
MTN-B MTN-F MFN 80
7801300
MIN-B MTN-F MFN 80
7802000
MTN-B MIN-F MFN 80
-
• '
KATE N A T
FREE FREE FREE
MAIN
FREE FREE FREE
MAIN
FREE FREE FREE
MAIN
FREE FKEE FREE
HAIN
FKEE FREE FREE
MAIN
1.0 FREE FREE
MAIN
T A R I F F ASSESSEMENT X F I N IMPORTS FROM DEVELOPING l u u n i m t i XT» T W O =- s s - . T A R I F F I TVPEI IMPORTS 1 * 1 0 0 0 ) FROM |
£ B 0 L P RATE 1 OF 1 WORLD | GSP I REQUESTING CQUNTKYsOGC | MAIN S 0 C I C 1 T A R I F » | ORIGIN I WE X | SUPPLIERS T G V M V VALUE UNIT A O . V l T R M T . f ^ VALUE QUANTITYI VALUE QUANTITVl VALÛT QUANTITY SHARE RANK J
SULPHIDES (OTHER THAN SODIUM SULPHIDES)
SUPPLIERS TOT JPN V MFN JPN V
TOT
MFN
366 Q 366 Q
UNREFINED UNWROUGHT LEAD
SUPPLIERS TOT EEC V MFN EEC V
REFINED UNWROUGHT LEAD,
SUPPLIERS TOT SWE V MFN SWE V
REFINED UNWROUGHT LEAD,
SUPPLIERS TOT SWE V MFN SWE V
LEAD WASTE AND SCRAP
SUPPLIERS TOT NOR V MFN NOR V
TOT
NFN
94 Q 94 Q
583
583
12429 12429
116
116
92103 92103
UNALLGYEO
TOT
MFN
19143
19143
106S1 Q101SSS17 106S1 Q101SSS17
ALLOYED
TOT
MFN
6S5 Q 655 Q
TOT
MFN
210 Q 210 Q
1307
1307
830506 830506
352
352
487976 487976
WROUGHT BARS, RODS. ANGLES, SHAPES ANO
C
SUPPLIERS TOT EEC V MFN EEC V
.
TOT
MFN
412 U 412 Q
777
777
228890 228890
, POLYSULPHIDES
27494
27494
EEC V EEC V
122624
122624
SWE V SWE V
18944246
18944246
SUN V SUN V
1418386
1418386
EEC V EEC V
598225
598225
USA V USA V
SECTIONS,
399159
399159
SWE V SWE V
0
0
192 Q 192 Q
0
0
22 Q 22 Q
0
0
6885 Q 7t 6885 Q 7(
0
0
4201 SWE V 4201 SWE V
30521 30521
157665 EEC V )S766S EEC V
646 Q 587343 USA V 646 Q 587343 USA V
0
0
126 Q 126 Q
OF LEAD;
0
0
88572 EEC V 88572 EEC V
LEAD WIRE
350 Q 168562 NOR V 350 Q 168562 NOR V
18 Q 18 Q
1185 Q 1185 Q
6 Q 6 Q
11 Q 11 Q
14 Q 14 Q
9614 AUT 9614 AUT
1288393 USA 1288393 USA
537 537
15 977 SWE 15977 SWE
1600 CHE 1600 CHB
V V
V V
V V
V V
UTY: KG
JPN EEC SWE AUT USA
JPN EEC SWE AUT USA
6 Q 1250 6 Q 1250
QTY: KG
EEC SWE
EEC SWE
QTY: KG
SWE SUN EEC USA
SWE SUN EEC USA
422 Q 442671 422 Q 442671
QTY: KG
SWE EEC USA
SWE EEC USA
QTY: KG
NOR USA EEC SWE
NOR USA EEC SWE
5^Q 5700 S Q 5700
Q I Y i KG
EEC SWE NOR CHE
EEC SWE NOR CHE
1 Q 107 1 Q 107
01
0)
ON U l
X) a o 00 U4
U l
o
I
— 4 4
i |
!
(., I.
i
f:
i
H
!
i !
,1 \i
"
1
,
i

TARIFF ASSESSEMENT * F IN IMPORTS FROM DEVELOPING COUNTRIES I N 1980 TARIFF | TYPE| IMPORTS (S1000) FROM I
TYPE RATE N E B 6 L P RATE ] OF | WORLD I CSP | REQUESTING COUNTRY:OGC 1 OF A S 0 C I C ITARIF I | ORIGIN | X I
DUTY T T G V M V VALUE UNIT AD-VJTRMI- I VALUE QUANTITYl VALUE QUANTITY| VALUE QUANTITY SHARE RANK!
MAIN SUPPLIERS
7803000
MTN-B 0.8 MTN-F FREE MFN 80 FREE
00 WROUGHT PLATESt SHEETS AND STRIP» OF LEAD
A C TOT 500 360620
MFN 500 360620
MAIN SUPPLIERS TOT EEC V MFN EEC V
488 Q 358180 USA V 488 Q 358180 USA V
7 Q 7 U
1705 CHE V 1705 CHE V
7803000
MTN-B MTN-F
780 3000
0 . 5 FREE
MTN-B 1.0 MTN-F FREE
01 WIDTH MORE THAN 2 5 MM
C
02 OTHER
C
7804100
MTN-B 2 .5 MTN-F FREE MFN 80 FREE
LEAD FOIL» WEIGHING (EXCLUDING ANY BACKING) NOT OVER 1»700 G/SQ.METRE
TOT 26 4846 0
MFN 26 4846 0
MAIN SUPPLIERS
7804200
MTN-B FREE MTN-F FREE MF.M 80 FREE
TOT EEC V MFN EEC V
LEAO POWDERS AND FLAKES
MAIN SUPPLIERS TOT EEC V MFN EEC V
24 Q 24 Q
TOT
MFN
47 Q 47 Q
4701 SWE V 4701 SHE V
1 Q 1 Q
71 USA V 71 USA V
47
47
39603 39603
39603
39603
0
0
QTY: KG
EEC USA CHE SHE
EEC USA CHE SWE
4 Q 4 Q
575 SWE V 575 SHE V
1 Q 1 Q
160 160
QTY: KG
EEC SWE USA
EEC SWE USA
1 Q 1 Q
74 74
QIYi KG
EEC
EEC
7805000
MTN-B 1.0 MTN-F FREE MFN 80 0 . 9 GSP1-B FREE LOC-B FREE FTA FREE ZONE FREE PREF 1 FREE
TUBES AND PIPES AND BLANKS THEREFOR» HOLLOW BARS» AND TUBE AND PIPE FITTINGS» OF LEAD QTY: KG
MAIN SUPPLIERS TOT EEC V ZONE EEC V
TOT
ZONE
59 Q 59 Q
59
59
27328
27328
EEC
EEC
27328 27328
T3 to O) TO IQ (D (D r>
o oo
n 5
ff\

TYPE OF
DUTY
RATE
T A R I F F ASSESSEMENT » F I N IMPORTS FROM DEVELOPING COUNTRIES I N 1 9 8 0 PAGE 2 6 S Î 1 0 1 1 TARIFF J TVPEI IMPORTS IS100Û) FROM | ,
N E B B I P RATE I OF | te WORLD I CSP I REQUES^NG COUNTRYIDGC I MAIN A S 0 C I C JTARIFI # | ORIGIN I W I | SUPPLIERS T T G V M V VALUE UNIT AO.V ITRHT. I VALUE QUANT1TY| VALUE QUANTITY! VALUE QUANTITY SHARE RANK| •
7806010
MTN-8 0 . 5 MTN-F FREE NFN 80 FREE
LEAD ROPE AND LEAO WOOL
C TOT
MFN
65
65
41841
41841
0
0
EEC USA
EEC USA
QTY» KG
MAIN SUPPLIERS
7806090
7 .5 5 . 1 7 . 2
MTN-B MTN-F MFN 80 GSP1-B FREE LDC-B FREE FTA ZONE
FREE FREE
PREF 1 FREE
TOT MFN
EEC V EEC V
62 U 62 Q
OTHER ARTICLES OF LEAO» N . E . S .
TOT
MFN
FTA ZONE
41719 USA V 41719 USA V
MAIN SUPPLIERS TOT EEC V MFN JPN V FTA SWE V ZONE EEC V
481
6
33 442
289237
697
7753 280787
442 Q 280787 SWE V 4 Q 593 USA V 14 Q 2866 AUT V
442 Q 280787
3 Q 3 ti
0
0
0 0
14 Q 2 Q 10 Q
122 122
2866 AUT V 104
2915 NOR V
10 Q
9 Q
QTY: KG
EEC SWE AUT NOR JPN
JPN USA
SWE AUT NOR EEC
2915 NOR V
1972
9 Q 1972
TJ c/> at -a to n> n o
o oo
\A o •*»
J O <T> <

RATE TYPE OF OUÏJ
2601813
MTN-B FREE PTN-F FREE HFN 80 FREE
T A R I F F ASSESSEMENT I JPN IMPORTS FROM DEVELOPING COUNTRIES I N 1980 l A K I F F I TYPE I IMPORTS l i l O O O » FRCM
N E B B L P RATE I OF | WORLD I CSP I RECUESTING CLUNTRYJCCC A S 0 C I C I T A R I F I I O R I G I N I X T T C V M V VALUE UNIT A O . V | T R N T . | VALUE ttUANTITVl VALUE OUAMTITVl VALUE CUANTI IV SHARE RANK|
ORES AND CONCENTRATES OF LEAO
IOT
HFN
17852S
170857
59056
59056
5905*
59056
33
34
I I I
NK|
CAN
LAN
'
HER
PER
MAIN SUPPLIERS
CTY: I
ALS 7AF THA
ACS 1HA KCR
TJ CO 01 TJ
IQ fO
/ • S
Oo 00
TO ID
<
MAIN SUPPLIERS IOT CAN V MEN CAN V
101849 101849
PER V PER V
50152 50152
AUS V AUS V
9786 «786
2AF V I HA V
2603 290 AS» A RESIDUES (EXCEPT FROM MFC IRCN/STL) TOR EXTRACTG METALS NOT 2 1 M , COLO GR SILVER
MIN-I» FREE M I N - F FREE MFN 80 FREE
PAIN SUPPLIERS I FIT MFN
P»IL V PHL V
TOT
MFN
72647 72647
151129
151127
75275
75275
75275
75275
AUS V AUS V
64460 64460
USA V USA V
9832 9832
4V
tv
Kt.R V KGR V
7668 4493
ClYi T
I'll ALS USA KIR GAN
PHI AGS USA KGR UAN
1173 1173
282710U LEAO MONOXIDE, REO LEAO AND ORANGE LEAO
MTN-0 14.0 HH-f 7.0 MFN 80 10.2 GSPI-e FREE
MAIN SUPPLIERS TOT MEX V MFN EEC V GSP MEX V
TOT
MFN GSP
1197 135 1197
1762
136 1626
1626
0 1626
CHN V USA V CHN V
235 1
235
BGR V
BGR V
1197
1197
194
194
67
73
EEC V
CIVs KG
MEX CHN BGR EEC USA
EEC USA HEX CHN BGR
135
28272G0
MIN-e 5.0 MTN-F 3.7 MFN 80 3.9 CSF1-6 FREE
LEAO OXIOES OTHER THAN LEAO MONOXIDE
PAIN SUPPLIERS TOT MFN GSP
USA V USA V OAN V
TOT
MFN GSP
256 2S6
1
263
262 1
EEC V EEC V
OAN V
if I KG
MN-l 7.5 Ml-f 4.9 MN 10 Ï.7 GSF1-K IHi
ChLLKICES IfXC AI-IMJMU*. *1NL, UAhlUF, MERCLRY 4 LUhGGM CHLCRIDES» A CXVCFLCRICLS
TLI
I-AIN SGI -U ILRS ) ( I Ml N GSP
CHN EIC CHN
V V V
MFN GSP
1 2 i 2 594
12<!2
2262
984 1278
1278
0 1278
ICC V I S A V MtX V
5 9 4 3 « b
2 9
USA V CHE V INU V
56
56
3fc8 2
17
CTY» KG
0 USA EEC OAN
USA EEC 100 OAN
C i v s KG
2 Ct-N EEC USA MEX 1K0
L I C CSA CFE
4 LFK MIX INC CAN
PEX V 29
CAN V 10 iti^7U
M N - F S . C I- î f. -1 ï.i •FA 80 2.S o S f l - E I h t t
i l l l ' H l C E S I F X C L P I AMIMCNY IRISULPF.IDC i MERCURY S C U ' M U U i P l L Y S U F M G i S
I C I 267 0
L MFN 267 0
C1Y» KG
EEC I S A
L i t USA
l-AIN S l . H l I I - KS Itll MF.N
ECC V EIC V
H 190
tiSA V LSA V
77 77

IV PI ur
IHJIV
M O I I I I
PIN-B PIN-F nrn au
HAM
7 . 5 6 . 0 7 . 1
I A M I f A S S I 4 B . M I N Ï I Jf 'N I H I ' l i n S IRIJN 01V I 11,H ING L L U N T R W IN I V 8 0 l A P I i r | 1VPI | IPPCP1S 1111)1101 IRLP i
N I II U I P RAIE I (.F | WORK) | GSP | k T C U r S I I N C COLNIRV>CGC I A S U t I t I I A R I F I | M U C I N | x I I 0 V H V VALUE UNIT A U . V | 1 R M I . I VAI UC U U A N I I I Y l VALUF. O U A N I I I V j VALUE CUAN1I1V SI.API R A N * |
MAIN S U I T l I I K S
00 U N K K I I U C M I I I A O , UNALLOYED, CUNIC MORE 1HN 9 5 * EUI KOI MORE IHN 9 » . 8 t LEAC, FOR E L E C I R t l V I I t R H 1 H H ,
TUT 6 9 7 9 0 PRK USA
MfN IS 0 USA
USA V IS PAIN SUPPLIERS I d l PRK V K I N USA V
6964 15
C I V !
7801111 0 1 UNV.KUUr.HI LEAD, CONIC 9 5 - 9 9 . 8 1 LEAD ATLR CLECTRLiLVI IC R E F I N I N G , VALUE NCI MURE l l .AN 1 2 2 . 6 4 V t N / K C
P.IN-E P.IN-F
7801111
7 .5 6 . 0
02 UNV.KUUCIII L F A U . CUNIG 9 5 - 9 9 . 8 * L I A O AFGR ELECTROLYTIC R E F I N I N G , HCRE THAN 1 2 2 . 6 4 Y / K G UU1 NCI 1 3 0 W K I ,
P I N - e P I N - F
7801111
7.5 6.0
0 1 UN WROUGHT L f A O , CONTG 9 5 - 9 9 . 8 1 LCAU AfCR E l E C I R O L V I I C R E F I N I N G , CUSTIHS VALUE HOKE IhAN 130YEN/KL
P I N - I P I N - F
7.5 4 .0
7801119
P I N - 0 1 .1 0 E P I N - F 1 .1 G E P IN 80 J . I I I f
00 UNV.ROUCHI LEAO, U N A l l O Y E C , N . E . S .
TOT 7 7 9 0 1
MFN 4 5 0 7 4
2 8 0 1 9
2 8 0 1 9
1 2 5 8 0
275C4
41
61
C I V * 1
PKK P.l» P f l AGS LAP
MIX I ' lR A I S USA 11 AN
780111V
PAIN SUPPLIERS K i t PRK V MFN HEX V
2 7 7 5 1 12829
MEX V PER V
12829 1 2 0 8 0
PER V 12080 AUS V 10415
01 UNV.ROUCIIT L E A D , U N A I L O Y I O . N . E . S . CUSIUMS VALUE NUI PORE IHAN 58 YEN/KG
AUS V 104 15 USA V 4694
P I N - B NA P I N - F M PFK 80 NA
7 8 0 1 1 1 9
P I N - 0 NA P I N - F NA PFN 80 NA
02 UNhPIHJCMI U A U . UNALLUYLU NES. CUSIGMS VALLF NIKE IHAN S8YEN/KC BUI N L I PGRE IEAN 112VEN/KG
8 0 0 / KG 8 0 0 / KG 8 0 0 / KG
TJ CO
| . | to o
/'SI 00
o TO to <
. -
•
: • •

I A R I I F ASSFSSFMFNI ( JPN IMPUR! S FROM 01 VI I ( P IN( . H U M M F S I N IVSU T A P I M I I V P E l IMP0R1S H 1 L U 0 » IRLM |
IVPE PAIT N E U 0 L P HATE I Of | MJKLD I GSP I R I C U I S I I K G C L U N I R H L G l I MAIN I I I A S 0 (. I C ITAK IF | | ORIGIN J X | SUPPLIERS
DUTY T I G V H V VALUE UNI 1 A O . V | I R M I . | VAl (IE U U A M I I V l VALUE C U A N T l l Y l VALUE I U A N T I 1 V SI.AHl PANKl
7801119 03 UNhRUUGHI LEAD, UNALLOYED NES. CUS1CJMS VALUE MOKE THAN 132VCN/KG BUI KCI MORE IHAN 1 4 0 Y I K / K C
P I K - D *A S 8(10/ KG P I K - F KA S 8 0 0 / KG PFk 80 KA S 8 0 0 / KG
7801119 04 UNkKOUGMT LEAU, UNALLOYED NES» CUSTOMS VALUE MURE IHAN H O YEN/KG
PTK-8 ! . 1 S E 8 0 0 / KG P I K - F 3 . 1 S E 8 0 0 / KG PFN 80 3 . 1 S E 8 0 0 / KG
7 8 0 1 1 2 1 UNfcRUUGIIT L E A D , ALLOYEO, CONTAINING AN11MUNY C I V : I
P I K - B 1 2 . 0 M 8 0 0 / KG 0 1 2 0 * 1 0 1 17088 1*921 U 9 2 I 47 MF X KLM OAN PIP K C P I N - F 6 . S M 5 8 0 / KG 0 0 6 5 * PFN 80 8 . 8 M C 6 2 3 / KG 0 0 8 f » H F N 1462 0 GSP1-0 ERIE GSP ' 1 4 9 2 1 U 9 2 1 U 9 2 I
PAIN SUPPLIERS IDT MLX V ( 6 8 4 KOR V 4424 (JAN V 4 0 8 1 MFN EEC V 799 USA V S36 AUS V 126 GSP MIX V 4686 KOR V 4424 UAN V 4 0 8 1
7801129 UNkRUUCHI LEAD, ALLOYED, OTHER THAN C U M A I N I N G « M IMUNY
K T K - e 7 . 0 M 8 0 0 / KG 0 0 7 0 * T O T 314 306 306 P I M - F 4 . 7 M PFK 80 5 . 4 M C 6 4 0 / KC 0054«MFN 8 0 GSP1-B ( M l GSP 3U6 306 306
8 0 0 / KG 00 7 0 * 1 0 1 8 0 0 / KG 0 0 4 7 * 6 4 0 / KC 0054«MFN
T i l l HEX V MTN USA V GSP MIX V
GSP
304 8
304
314
8 3U6
0
PLR N / l PI K
7
0
V V V
L i t USA MIX K I P
9 * 6 1
Ï 6 6
F I X LSA
USA MIX IIKO
ALS N / l (JAN PIP PI I
( . I V : 1
IIKG
PAIN SUPPLILRS T i l l HEX V 304 USA V 8 IIKG V 2
HKG V 2
7 8 0 1 2 0 0 WASH AND SCRAP UF LFAO AND I I S ALLOYS C I » : I
P I N - B 5 . 0 TUT 2655 310 310 10 USA A IS K M N / l PRI P I N - F J . 2 PFN 80 J . 8 C MFN 2545 0 USA A( S N / l PPI ( HI. CSP1-E I R H GSP 310 310 310 100 K M M i l ART I J l i.UM
PAIN SUPPLIERS 101 USA V 1843 AUS V 523 MIN USA V 1843 AUS V 523 (.SP KWI V 124 t i l l V 64
7802COO BARS» ROUS, SECHONS AND MIRES UF 11 AD AND I I S ALLOYS
M I N - n 1 0 . 0 TOI 75 3 3 MIN-F 5 . 8 PFN 80 7 . 5 t MFN 72 0 GSP1-B T R I f GSP . 3 1 3
PAIK SUPIL IERS 10T USA V 58 EEC V 12 OAK V i MFN USA V 58 EEC V 12 LAN V 1 GSP UAN V 3
K M N/L ARE
V V V
124 «6 24
N / l I ' M 1 J l
4
100
CAN AUS
V V V
V V
It t l ?4
USA 1 I t
USA 1 I t I Ah
1 1
t l Y : KG
OAK LAN ALS
CAN ALS
'1

1 Alt I r I ASSISSFMLNI •»
I A R I F I I I V P E I IVPE BAI F N I I) l> I P RAI I I UF |
o r A S O C I C I I A K I F I OUIV I î G V M V VALUL UNI I A O . V l l R M T . I
JI 'N IPPHRIS FROM Of Vt L U I ' I NO I L U N I H I L S IN 1980 IMPCFIS M 10CJ0I F h l M |
WORLD I CSP I RFCUFSI IKG CUGNIRY:LGL J | C R I O I N | 1 |
VAIUE U U A M I I Y ) VALUE I IUANTITYJ VAIUF CUAN1I IY SF-ARL RANKl
MAIN Si l l PI I IKS
7 8 0 1 1 0 0
PIN-B F I K PFN 80
hRI.UGHI P L A I E S , SMI t IS « S I R I P IFF LEAD» UNAILOVEO
2 0 . 0 8 . 2
U . I GSP1-0 TRIE
PAIN SUPPLIERS HIT PER V P.FN USA V GSP PER V
TOT
HFN GSP
112 1
112
111
1 112
USA V
28012C0
P I N - B 2 0 . 0 M IN-F 8 . 2 PFN 80 U . I GSP1-e FREE
PAIN SUPPLIERS 11)1 USA V MFN USA V
MFN
262 2 62
100
CAN V CAN V
7804 100
P I N - B 1 2 . 0 P I N - F 6 . 5 PFN 80 8 . 8 GSP1-B FRIE
LEAO I O IL HEIGHT NUI UVER 1 . 7 0 0 G/H2
101 6 1
C NFN 6 1
112
0 112
WRlliGIIT P L A T E S , SHEETS « STRIP UF LEAD, ALLLYEO
TOT 100
18 18
112
112
V9
1CU
T I R CSA
USA P I N
USA CAN
USA IAN
USA L I C
USA I I C
U l v : KG
L I Y : KG
C I V : Kb
PAIN SUPPLIERS 101 USA V MFN USA V
56 56
EEC V EFC V
7 8 0 * 2 0 0
PFN-e 1 2 . 0 P.IN-F « . 5 MFN 80 8 . 8 GSF1-B I R I t
POknrRS AND FLAKIS UF LEAO AND I I S ALL UVS
101 4
PAIN SUPFLIERS 101 MFN GSP
USA V USA V OUR V
NFN GSP
I J 1
1 1
HUR V
7805 ICO
P I N - B P I N - F PFN 80
l U l i E S , P IPES A MANNS l l iFREFOR, FCLLGh OARS, UF LEAO
20.0 8.2
U . I G S P I - P TRIE
25
1G0
USA [UK
USA til h
U l v : KG
U V :
•-
TJ C/) 0) "O (Q <D n r> O 00 -O CAI
s >» JO n> < -•

IVPE OF
O U I *
M i l
l A R I F f ASSLSSLMINi : JPN I N ' U R I S EROM DFVELUPING ( ( U K I K K S IN I 9 6 0 IARUF
( R 11 l S 0 t I I G V M
R A I E
V A l u r UNI I
| I V P F l I U | I I A K I F |
A U . V l I R H I . I
HURL I) |
I VALUE O U A M I I Y l
I K P I J P I S I t l U O C t FHCM | GSP | H E C U f S r i K G CCiUNlRYM.I.C |
GRIGIN | X | VALUE LU AN I I IV | VAIUE I U A N I I I V SI.AH» PANK|
SU MAIN PI ILRS
78C520O l U I ' f AND PIPE T I M I N G S CE LEAD ( . IV :
M M 15.11 K l f c - r 7 . 2 fTh SU 1 0 . 6 GSP1-B f R I f
780ACCO
H I K - I I P I K - F m , 80
1 0 . 0 5 . 8 7 . 5
GSP1-e I K l t
AH I ICLES 01 LEAD AND I I S ALLOVS, N . E . S .
PAIN SUPPLIERS M i l MIN GSP
USA V USA V OAN V
ior
MEN GSP
500 300
2 /
509
482 27
27
0 27
EEC V EEC V
121 121
SkE ShE
V V
27
27
57 57
5
100
LAN V CAN V
USA LLC.
USA IIC LAN
i7 ï
CIYJ KG
SkF OAN CAN
Ski CAN CUL

IVPfc PATE If
CulV
2ÉC1150
M h - f f i . l t P H - F FREf PFA 80 FREE
2<CllbG
PIN-e FREE PU-F FREE PFK 80 f h t l
FAKIFF ASStSSfcMlNl 3 N^ t I P P U H S FKOK OEVELCPING t C L M M C S IN 1 S 7 t :
TAP.IFF | ÏVPE I 1PFÛRTS I t l C l C I FRLP. t e B L f> RAT I I A ' i hCHLO | GSI' | K E j l à S U K G CLLKTRVlCGL î o c i c i nV iF i I cRibih | M I f. V M V VALUE UNIT AO.VJ IRMI . I
I _ I
I CR lb lh | W | | VALUE UUAMMVJ V*" LE CUANTUVl VALUE CUANTHY ShARE RANKl
LEAL GRES A*0 CONLEKIRAIES
L
83032 1
MAIN SUFPIIEKS
CIVS
ASF ANU RtSIOUfcSIEJtC FMH KFR LF 1F.LN Cf. S IEELI .CCM PETALS CR METALLIC CLPPLLKCS
U ICIT 96 0
MEN 96 0
C I V :
OSA
USA
2827CG1
HTM-B PTN-F HfU 80
2827C02
MIN-B PTh-F MFN 80
2827C09
Vih-F PFN 80
2827019
PTN-P. MIN-F MFN 80
PAIN
FREE FREE FREE
MAIN
FREE FREE FREE
PAIN
FREE FREE FREE
PAIN
FREE FREE FREE
PAIN
2827019B
«(ÎC1CC
P U - C p i h - f PII^ 80
IHIl
IKlt
M I N
ÏUFFlIEKi 1LI M{_N_
LEAD OXIDE
U
SUPPMERS TOT MFN
LEAD DIOXIDE
U
USA V
_ySA_v__
AUS V AUS V
SUPPLIERS TUT EEC V MFN EEC V
CTF.EH LEAO OXIDES THAN
U
SUPPLURS 101 MFN
USA V USA V
96 ,__96
TOT
MFN
U 13
TOT
MFN
4 4
LEAO OXIOE
TOT
MFN
I 3
REC LEAD AM!! CRANGE LEAO
X X X
SUPPLIERS TOT MFN
KEAC LtAD FREE
CFLIRIOES AM)
U
SUPFLURS JCT Mil,
AUS V AUS V
la»
TOT
MFN
113 113
IXVCHLCKICtS
101
MFN
EEC V 404 CLC V 404
18
18
USA V USA V
5
5
USA V USA V
A DIOXIDE
3
3
119
119
USA V USA V
1G86
1086
7AF V lAf V
4 4
1 1
V
4 4
190 190
0
0
0
0
0
0
0
0
158
158
EEC V EEC V
EEC V EEC V
JPfc V JPN V
1 1
2 2
128
128
Iff 129
12
12
AtS V ALS V
CIV» KG
AIS USA ECC
AUS USA EEC
CIV: KG
EEC USA
EEC USA
OTVi KG
USA
USA
«TV: KG
AtS USA EEC
AUS USA EEC
••
01*1
CIV1 KG
EEC 2AF JFK ALS PER
LLC l i t JFN ALS PER
1*5
us
TJ CO 01 "O
10 O
-NJ oo
-y Û o "v. JO <X> <

TAKIFF ASSESSfcMENT J Nil IPPCPIS PPCP CEVELCPIKC U U M P I E S IN 1 Î / 8 « 3 0 3 2 1 I f l H l f | I V P t l IHPCPTS I t t C U ) EPCP |
?VI>£ P A U P J L I L J' HATE I I F I PCPLO I GSP I K E C U I S U P G t C L M R Y : C G C I MAIN U A S t, t I C I T A K I F I 1 CKIC1K | a I SUPPLIED*
OLIV Î I C V H V V A L U UNIT A U . V I T K M I . I VALUE ( J U A M l I Y l VALUE CUANT1IV I VALUE CUANU1Y SHAPE PANPl
P1P-C M M PEP au
I P I E
TREE
H I IK SULPHIDES! IHN S i b U P 11 PLLYSULPHlCt S
I C I 111
MIN 111
/E0 ICC 1
PTP-E M M PEN 80 GSP1-P
15.C IS- l l 15.0 I C C
IK
L U
u
PAIN « L P I U I R S H I USA V MIN USA V
LNVFUUCHI SClCfrK LEAD
«5 45
LLC V LCC V
PAIN SUPPLIERS TCT fcfcC V M»N EEC V
T C I
MEN
72 72
72
IZ
Î Ï 0 U C 9
p i h - e P I P - F PEN 80
EPEE f P E f EREE
LNPPOUChT LEAU t i lHEP IPAP SCLUER
TCT 6 1 9 0
HEN 6 1 9 0
40 40
AUS V AUS V
16 16
CPE V CEiE V
. I V * KG
l ! A E U ALS O f
USA EEC A I S CPE
10 10
EEC
E£C
ALS EEC
ALS EEC
C I V J P C
C I V : KG
TJ GO
t o n n o
-vl oo
TO to <
M I P SUPPLIERS I t i l AUS V P.Fh AUS V
7E012CO
pu-e PTP-F U N 61)
7tU2CC1
piN-e PIP.-F PFP. É0 CSP 1-E
IREE fKEE EREE
EPEE 1Î.0 1Ï.C 10.0
LE/C WASTE <t SC«AI»
U
éC55 é055
EEC V LLC V
1J5 135
hRLLGHI OARS POOS dMRE tF SCLOEP LEAD
U ICT 8 U
U PEP S
^AIN SUPPLIERS ICT EEC V MEN EEC V
AUS V AUS V
EEC ALS
EEC ALS
CIYJ
CIV: PG
-1 ;
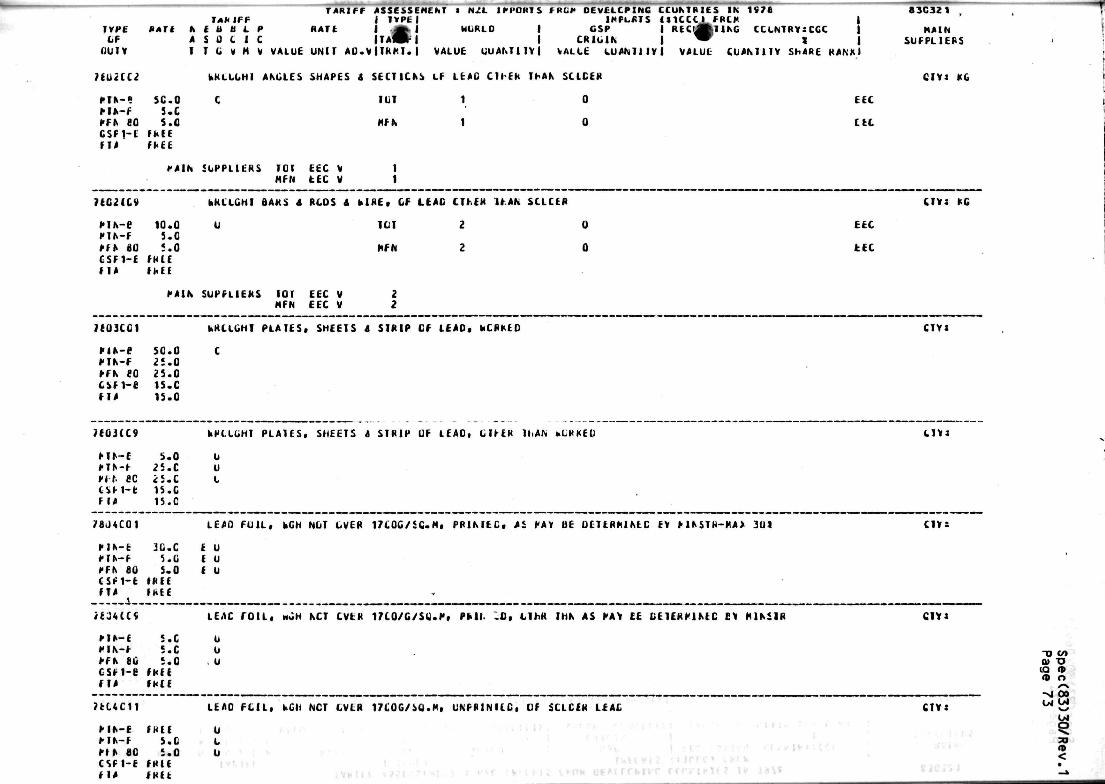
IVPE
or nu iv
7 E U 2 C C 2
m - « M f t - f fFN 80 CSFI - t ( N
RATE
SCO
s.c 5.0
f K f f FREE
TARIFF ASSESSEMEKT • NZL I M ' O K I S fHlif DEVELOPING C C U M B I E S IK 197£ 8 3 C 3 2 1 TARIFF I 1YPL I I P F l f i T S 1S1CCO FRLK |
ft f • t) J. P HATE J j » i WGRLO I CSP I R E C ' J f e l l K G CCUORYsCGC 1 HAIN * S 0 C J C 11 A » I I CRIGIN | W S | SUPPLIERS I T C V M V VALUE U N I ! A U . V | I R P . I . | VALUE GUAM 1 I V I VALCË l U A N I H V j VALUE C U A M M Y SHARE KANXi
k k L L O H l ANGLES SHAPES i SECTIONS LF LEAC C H E R IhAN SCLCER C I V * KG
C I U Ï 1 0 EEC
MEN 1 0 EEC
CAIN SUPPLIERS TOI EEC V 1 MFN tEC V t
7EC2EC» hRLLGHI BARS 4 RCDS A klRE, CF LEAC CIF.ER 1FAN SCLCER CIVS KG
MN-e 10.0 U ICI 2 0 EEC
PU-F 5.0 ttb U0 Ï.0 RFN 2 0 EEC CSF1-Ï FRlt HA H<££
PAIN SUPPLIERS Id EEC V 2 MFN EEC V 2
7E0JCCI kHCLGHT PLAIES» SHEETS i STRIP CF LEAD. kCPKEO CIYS
MK-E SCO C PU-F 25.0 KN 80 25.0 CSF1-E 1S.C FIA 1S.0
7F.OHC9 kPLLGHI PLAIES, SHEETS A STRIP OF LEAO, CIFER THAN kLRKEO CIV:
H k C 5.0 U MK-F 25.C U Ht. 8C 25.C L ISM-b 15. C FIA 15. C
7 8 J 4 C 0 1 LEAO F U 1 L . kGH NUT LVER 1 7 C 0 C / Î C . M , P R I M E C , A i PAY tit DETERR1K.EC EV P H S T R - R A > 3 0 1 C IV :
M f t - É 3 C C E U P I K - F 5 . 0 E U *Ft\ 80 5 . 0 E U C S«= 1 - t IREE FTA thEE
} * 3 * l t <
• I P - I PIN-F ffh 80 GSF1-E FIA
7EUC11
M M M k - f H t 80 CSFI - t FIA
5.C 5.C 5.0
FREE IRIE
FREE 5.0 5.0
nu t F R E E
LE
U
u , u
LE
u G U
LEAC FOIL , HUH KCT CVER 1 7 1 0 / G / S G . P , P H I . 1 0 , LIhK IHK AS PAY EE UETEKPUtC EV P U Î 1 R CIV:
LEAO F L I L , kCli NOT LVLR 17C0G/SQ.M, U N F H 1 N I I C , CF SCLCER LEAC C I V :
•
•
IQ (V to o
->J Oo

IYPE CF
OUIV
7 Ï U U 1 9
M » - E PIN-F PFN £0 CSFF-fi MA
RIN-E
PEN ao
t'Ait h A I
S.C s.c 5-0
FfilE FKEE
FREE FREE FREE
TARIFF ASSESSEMENI i hit IRrGRTS FKOR OEVtLCPINC CCONIRICS IN IV/t TARIFF I 1VPEI IPPCRIS UlCCCi FRCR , I 0 B L P RATE I CF | hCRLD | CSF j hECUSIINC CCCMKVlCCC | i C C I C ITARIFI | CR1C1N j « 1 T C V M V VALUE UNIT AO.VJTRNT.I VALUE UUAM1IYI VALLE CUANIlIVl VALUE CUANTJTV ShARE RANK|
LEAC FCILf hCh NOT CVER 17CQ0/SC. ONPRINTEC OF LEAt CIFER THAN SCLCER
U
LEAC PChDERS 4 FLAKES
U
FAIN SUFFLIERS TCI EEC V MfN EEC V
78Û5C01
PIN-F PFN 80 CSF1-E FIA
so.c 5.C 5.0
FREE FREE
TCI
RFN
2 2
£EC
EEC
«30321
MAIN SUFPLIEPS
CT*»
CIVS KC
TLEE PIPE BINDS i TRAPS* CF LEAO
C
cm
-o CO lO
to
5!
to •o m o <̂ oo
Id o ^) a> <
ÏE05EC9
PIN-F PFN 80 CSH-e fKEt
5.0 S.C
I T * FREE
TUBES PIPES BLANKS. HCLLGWS BARS A TLBE A PIPE F1TIGS IEXC BEENDS A IK/PS) OF LEAD C.70 /Ch l
U TCI 1 0 tEC u U RFN 1 0 *EC
,Ui AG
ÎECéCCI
PIN-E
U N 80 CSPI-E H A
'ilQUH
f U - f PIN-F PfN 80 CSF 1-fc FIA
PAIN
5U.C 50.0 35.0 25 . C i f . C
5C.C 5L.0 35.0 25.C <5.C
CAIN
SUPPLIERS TCT EEC V MFN EEC V
1 1
COLLAPSIBLE TUBULAR COMRS CF
C C C
t i e i k ARTICLES CF LEAO
C C C
SUPPLIERS TCI JPN V MfN JPN V FIA AUS V
NES
TCT
RFN
FIA
13 13 8
LEAD ALLLVS
38
30
8
EEC V EtC V
11 11
0
0
0
AUS V USA V
8 i
USA V
JFN
JFN
ALS
CIVS
CIVJNA
LLC ALS USA
EEC USA
«
SA " >

1 AMI F f A S S F 9 W M I N I : NIIR I M I ' I K I S FROM I H V I L U P I N C C I I I M K i n IN I V b l l I A M I I | I V P r i IMI'CIHIS I t l U C C I IRLP |
IVPE f A I E N r II II L P R A I L | I I I | M J H l u | CSP | M IMJESMf .G L t .UMRV : LXC I IJF A S 0 C I C I I A R I F I j L R I C I N | » |
OUIV I I I. V M V VA IU I UNI I AO. V J I K M I . | VALUE U U A N I H V J V A L U O U A N I I I Y | VALUE l U A N l l l V SI,AM KAfJKl
MAIN SUPI'I I LPS
?<oi<ouo I t AC (IRI C I V !
PI»>-P fP i r MIN-F FREE MFK 80 f H l f
« 0 1 9 0 0 0
H I N - H f M l t P I N - I ERIE MIN 80 I « I E
ASH « RESIDUES FUR IIIE HANUIACIURL OR E X I R A I I I C N Of UÎHER PE1ALS I h A N IUPPER I t I M CR COMI'UUNOS CIV» Hi
I d j $ | 0 H t SU. I IK
HfN 232 0 H I Shi I IN
2(2?1000
PTN-B FREE PTN-F FREE MEN 80 FREE
RED LEAO AND ORANGE LEAO CIV I KG
PAIN SUPPLIERS TOT EEC V HEN EEC V
28279000
PT»-E FREE MTN-F FREE MEN 80 FREE
TOT
HEN
1248 1248
1337
1337
SME V ShE V
EO LEAO * ORANGE LEAOI
10T
MEN
34 34
44
44
EEC V EEC V
89 89
10 10
0
0
0
0
i t J C U U
M I N - ï IKEE C H - f I K t f P fK ÎÙ I h l E
RAIN SUPPLIERS TOT USA V MFN USA V
C l i l f l l U C S A LKVLHLCRIOE! IEXC A M P X M U f l , L A L L I U P t 2 1KC A P A d M S I b R C E L L P l L k S )
EEC ShE
EEC ShE
U l Y : KG
USA EEC
USA EEC
M l h i L P P H E R S I C I USA V H f N USA V
T U !
HFN
VC8 VCd
20SS
2USJ
EEC V EEC V
215
2 IS
6*4 644
CHN V CMN %
17
17
148 148
« t i S S L b C
Plfc-t I M t P U - F im PFK bO i H i f
C 1 M K SULPHIOLS A P C I V S L L P H O E S I t X C SLOILK SUPH1CES
ICI 33 0
MEN 33 0
c 0
ShE V ShE V
ISA EEC
L-SA EEC
133 133
EEC LÎA
EEC LSA
CIV: AG
ChK ShE JPf<
Ch.N ShE JFK
CIV* KG
ShE
ShE
M I K i l F H U ' f c S I C I Mil»
EEC V LLC V
21 LSA V LSA V
ShE V ShE V
no co Q) 73
IQ <V n o ->i oo UI u i
u i o

TYPE Of
DUTY
7A011I0U
KU-I PIR-F KrN so
FREE FREE FREE
TARIFF ASSESSEMENT I NOR IMPORTS FROM DEVELOPING COUNTRIES IN 1960 TARIFF I TYPE I IMPORTS ItlCCOl FRCP I
RATE N E B ft L P RATE I CF I WORLD I CSP I RECUESTIfiG COUNTRYlCGC | A S 0 C I C ITARIFI I ORIGIN I X I T T C V M V VALUE UNIT AD.V»l«MI. I VALUE ilUANTITYi VALUF QUANTITVl VAlj/E CUANT1TV SHARE RANKl
MAIN SUPPLIERS
UNkMJUGHI I f A D , UNREFINED l » E X 100 I N / S i
TOT 994
MFN 994
0
0
c m Kii
USA S k i FCC
USA S k i I K
PAIR SUPPLIERS 101 USA V MfN USA V
9S6 9S6
SHE V SHE V
29 29
7 Î O I won
H f N - P IKEE P I N - F ERIE PEN 80 IKEE
UNHROUGHt LEAD, R E F I N E D , UNALLLY ID l - E X 100 I N 7 S I
ID? 7916
MFN 7916
69
6 9
PAIN SUPPLIFRS 101 EEC V MEN EEC V
4V86 4 9 8 6
SHE V SHE V
IS 78 1S78
EEC EEC
USA USA
V V
V V
9 9
69
«9
877 877
0
0
CAN V LAN V
C I V : HO
l i t S H USA LAK MIX
L i t Sk i USA CAN MIX
4 (.6 4 06
7 Ï 0 1 2 0 U 0
R I R - P FRCE M I N - F FMI f HEN 80 IPEC
UNWPOUGHT L E A D , ALLOYED I ' 2 1 0 • 2 2 0 • 2 9 0 I N 701
TOI SS80
MEN SS80
CIV: or.
IIC SkF
EIC Ski
PAIN SUPPLIERS IUI EEC V MTN ELC V
78015COO H A D HASTE ANO SCRAP
P I H - P IKCE H I N - F ERIE PEN 80 IKEE
PAIN SUPPLIERS I U I EEC V MIN EEC V
1982 3982
IOT
MFN
52 52
SHE V SHE V
1598 1598
0 1 V : KG
56
56
0
0
l i t Ski.
I l l Ski
SHE V SHE V
7E02CUO0
M I N - f l IREE P I K - F FKIE MFN 80 F P U
k H U G M I OAKS. RODS, A K t - l t S , SHAPES A S i l l I I NS I I L E A D . A LEAO HIRE
I U I 511 0
PAIN SUPFI ICRS 1 P I MIN
EEC V EEC V
MFN
426 426
551
C I V : KG
E IC Ski USA
I I I Sk i USA
SHE V SHE V
104 104
USA V USA V
*0 t/) at Xf
to O
-o oo
3 TO to <
n

f I A R I F F ASSFSSEMENI : NOR IMPUNIS FHUM 1)1 V I I l!»'IN(. U . U N I M I S IK 1980
I A P I M | I Y P E ) IMPUNIS I I 1 U 0 0 I FRIP | TYPE RAIE N 11 II II I I» K A I t j UF | WORLD I GSP I K l U U t S I I K l » I C U N I R Y : T I L j MAIN
Of A S 0 t I L 11 AH IF | I ORIG IN I t I SUPPLIERS PUIV T T C V H V VALUE UNI I A U . V | ! R M I . | VALUE U U A N I H Y l VALUE U U A N T I I Y l VALUE L U A M I I Y S I A K t KANK|
7EOH0OU KKIUGI I I P L A I E S , SMEUS «KO S 1 R I P , OF L I A O C I Y : KO
MK—e f R i E l u i m e o u t s u 1
M I N - F TRIE PEK 80 FRFE H r N 17S8 0 L i t S U
M I N SUPPLIERS T i l l E IC V 1688 SHE V 70
HFN EEC V 1688 SWE V 70
7 8 0 * 1 0 0 0 l l A C r O I L U l Y J KG
P I N - P 5 . 0 101 19 0 U?A l i t
P I K - F J . 8 (•FN 80 4 . 8 MFN 12 0 USA CSP1-P. F R I l F I A FREE /UNE FREE /UNE / 0 EEC
MAIN SUPPLIERS 101 USA V NIN USA V /ONE EEC V
101
MFN
/UNE
12 12
7
19
12
7
EEC V 7
0
0
0
7804200C LEAD POWDERS A FLAKES U l Y : Kl .
P I K - B ERIE 1 0 1 37 0 M l M I N - r ERIE HFN 80 ERIE MEN 37 0 l i t
PAIN SUPPLILRS 101 EEC V 37 MEN t t C V 37
7A0SC000 I U R I S . P I P E S A BLANKS IHEREEUR, HOLLOW BARS, TUBE 4 P IPE F I I I I K C S , I f f LEAO C I Y : KO
M N - e FREE 101 14 0 l i t PÏK-F FREE MFN 80 FRFE MFN 14 0 EEC
MAIN SUPPLIERS 101 FFC V 14 MIN EEC V 14
78O60O1U N A I I S , R I V I I BURKS A R I V E I KASIILRS I f f LEAO t l v i
MIN-B IHIE PIN-F ERIE ' PEN 80 FREE
TJ 0)
IQ (D
GO
r> <D O
->J 00 ^ l l / J
I d
o • > v
30 (0 <

I A K I I I - ASSFSSEMtNI I HUH IMPUP1S FROM Of VUliPING CUIMRIFS IN «980 l A M i r I i v i ' E i I M P C H I S i n u o u t F R C * |
IVPl RAIE h C H I- t P RA1I | V.f | WORLD | fcSP | RLCUtSTlNC ( L L M H i l O l | OF A S 0 I 1 t IIAKIF | | ORIGIN | S I
OUIV I I G V N V VAIUF UNI f A O . V l I R H I . j VAIUF UUANI I IV l VAtOF UUANI I IV l VALUE CUAMIIY SI At F RANM
IA IN s o c i a l i es
m«to«o
HIN-B PIN-F Mf N SO GSPI-B FIA taut
4 . 0 S.Z J . 9
FKI t Fkf F FKFE
A M I C U S IJI HAD NFS OIHFR IHAN NAILS, RIVEI BIRRS ê RIVEI HASIiFRS
MAIN SOPPlllRS KIT LFC V MFN JPN V » IA SHE V /ONE EEC V
TU I
MTN
FIA ZONE
5J J
40 53
10 /
« * .
40 JJ
SUE V USA V
40 7
0
0
0 0
JPN V USA V
C I V : KG
I f l SkF JPN USA
JI'N L iA
SU l i t
A . -' 7;

f A R I f f ASStîTWMINI : SUC IMPUKIS IKON DEVELOPING t t U N I k l W t k IfSO 1 AH I I i | IVPEI IMPORTS 1110001 FRCP |
IYPC PAU ft t U H I P R A f I I «if I WORLD I OSP I RFCUCSI1KG ILUNIKV: I U. | MAIN UI A S U I I L |rAH IF | | ORIGIN | X | S U f P l l t k S
IHil Y I T C V H V VAIUE U N I ! A U . V l l H M I . j VALUE UUANlUYl VAIUE UUANIITYI VALU! CUANTHV SI AKf PANkJ
2601 «0011 11 At URL lil>:
Mk-e rpcr MIN-F fRIE Hfk 80 fkCE
26019C90 ASH AKESIOUES CONIC HEIAt FOR EXIRACIN OR PIC PURPS OF OTHR METALS 4LCPPK0S EXC COPPER,/INC « P H I S M CIYl «C
PIK-B F M I I C I 426S 0 I I I NIK ESP USA I IK NIK-F IHIE MIK 80 f R I f MrN 4263 0 f i t K i l l ISP USA f I N
PAIN SUPPLIERS t r i EEC V 1806 NOR V 1541 ESP V 543 USA V 251 MIN EEC V 1806 NOR V 1S41 ESP V S43 USA V 251
2827100C IEAO SALINE OXIDE /RED LEAD OR MINIUM/ CIY: KG
PTK-B FREE TOT 2198 0 EEC DOR PTK-F FREE MFN 80 FREE MFN 2198 0 EEC OOR
RAIN SUPPLIERS TOT EEC V 1977 OOR V 221 MFN EEC V 1977 OOR V 221
28279010 LEAD OXIDE /MASSICOT OR LITHARGE/ OTYs KG
PTK-8 FREE TOT 348 0 EEC USA HTN-F FREE MFN 80 FREE MFN 348 0 EEC USA
PAIN SUPPLIERS TOT EEC V 346 USA V 2 MFN EEC V 346 USA V 2
28279090 LEAC OXIDES IEXC LEAD SALINE OXIOE «LEAD OXIOEItORANGE LEAD CIY» KG
PTK-B FREE TOT 25 0 USA PIft-F FREE MFK 80 FREE MFN 25 0 USA
PAIN SUPPLIERS TOT USA V 25 MFN USA V 25
iéîlliCQ I h U r t l U S AtXYUhlljI iIDE S.tXC UlLLklULS CI AkMNk , CAIC lUk , IIM ,C/K ILM.kAtkfc S ILk d lkLK ClYï KG TJ CO
P l k - f « k i t ÎCÏ H7Û 52 Î2 5 I EC I Î * I SB ESP Ctk <S * K h - f f k l t • n MK 8Û IkkE Mfn 87U 52 52 5 HFC CSA I Sk CSP OCR 3J Jo
UI "A1K ÇU' I l lCKS TCI fctc V tAV USA V 110 ISK V 52 ESP V «4 HfK LLC V 649 USA V 110 I SK V 52 i.SP_V 4* O
i b V . S C î t S L U ' m U t b . l ' t t Y S U t P I I I O t S . t X t SOCILM ÏU IFM0LS «2IKC SULPM0E ClYs KG jj» <
PIA-6 f k t t ICI 149 0 * " LÎA 2A» ALT ^ P l k - f IkEE nh <W f h F * MFN l»9 U t£C USA IH A H
r i . lK S U H I t H S TCI EEC V 144 ISA V 23 2AF V 22 AUI V 10 MFN ELC V 144 LSA V 23 2*F k 22 . ***' V 10

TARIFF ASSESSENENT t SHE IMPORTS FROM DEVELOPING COUNTRIES IN 1980 TARIFF I TYPE I IMPORTS 1*1000) FRCM «
TVPE RATE N E B B L P RATE I OF | MRLO I CSP | RECUESTING COUNTRY»CGC I MAIN OF A S 0 C I C ITAKIFI | ORIGIN | « I SUPPLIERS
n"TY T T C V N V VALUE UNIT AO.V|TKMT.| VALUE QUANTITY| VALUE QUANTITY I VALUE QUANTITY SHARE RANKl ' • — " i'\ .'
r a o m o o U M U I I N E O L I A O I « E X I O O O V S I Q U , K 0
MJN-R j R f f , 0 1 197 0 l i t M R I I I . | |
MFN BO FREE MFN 197 0 l i t NCR U N 00 ° ° © W
PAIN SUPPLIERS I U I E tC V i n NUR V 2 1 F I N V S N I N EFC V U 1 NUR V 2 1 F I N V S
, , _ , , , ^ ^ _ I _ _ I _ _ _ t , _ i " * »
1 ( 0 1 1 9 0 0 R t f l N t O L E A D , UNAILUVEO l - E K 1 9 0 0 * 7 5 1 c i y : " » ô ~ •
M I N - B FHFE 101 4 0 9 0 E l l CÎA r IN NCR "~*
MFN «0 I R Ï I MFN 4 0 9 Q n t US* I IN M R
PAIN S U P F I I I R S 101 EEC V $17 USA V 52 I I N V 17 NLR V 3 MFN f i t V i J 7 LSA V 52 I IN V 17 MIR V 3
7 8 0 1 2 0 1 0 UNkRUUGHt L F A O , A L L C Y E O , P R I M I N G - I V P f MEIAL c l V « KG
I K M R P I N - B I R I t I C I 1 ) 0 8 0 PIN-F IRF I H f N 8U I R I t MFN 1108 0
PAIN SUFPUFRS 11)1 EtC V 1295 NOR V 13 H f N t l C V 1295 NUR V 1J
I K M R
7 8 0 1 2 0 2 0 UNV.RI.UGIII LFAO, ALLOYED. SGlOtR c ' y ! M '
PIK-H FREF 101 IS* ° h l " r e C 0 S A
M I K - F FREE PFN 80 FUfF MFN 1 5 * 0 NCI. I I C USA
MAIN SUPPLIERS 1U1 NOR V 126 t l C V 29 USA V 1 MFN NIIR V 124 EEC V 29 USA V 1
780120VO UNWROUGHI I f A D , A L L O Y E D . 0 1 H E R 1HAN PRIN1G-1YPC CR SCLOER
M I N - B I K f f 101 V 0 1 0 P I K - F F R t l PFN 80 rRCF MFN 9 0 1 0
PAIN SUPPLIERS 1 0 1 EEC V 858 F I N V 15 USA V 9
MIN tFC V 8 5 8 F I N V 55 USA V 9
780 13000 I t A t H A S H AND SCRAP
MIN-D I K t C 101
P I N - F FRFF MFN 80 I R t F MFN
M I N SUPPLIERS 101 CAN V 1417 NUR V 519 USA V 75 MFN CAN V 1417 NOR V 5 1 9 USA V 75
F I N V F I N V
2 0 3 1
2 0 1 1
NUR V NOR V
15 35
519 3 1 9
0
0
NCR V NCR V
t i c
t i c
CAN
CAN
i ir.
( IN
1 1
NCR
M.R
C i v : M ,
LSA NCR
USA NCR
CIY> Kl>
USA
USA
7 Ï02CC00 WROUGHT BARS, RODS, ANCLES. SHAPtS AND S E C H O N S , OF LEAO. LEAD WIRE < - , V : ™
P I N - B I R I t H IT 645 0 H I C5A
P I N - F I R I t , . , „ . . «FN 80 IRCE fi. H f N 645 0 , _ , ' l t u i *
C M N S U I M ' l l l K S t i l l IFC V 644 USA V 1

I A K I i r A S S W S L M I N f » SHE IMI 'URIS fROH DEVELOPING I C U t t i m S IK 1980 l A P I f r | I Y P E I IMPURIS I I 1 0 U 0 I FRCP [
N F U II I P MAM | CF | HOHID J OSP I K I C U F S I I K C ILLN1PY:CGC | MAIN A S U t I C I I A R I F I | O R I G I N | », | SUPPLIERS 1 I C V H V VAIUE UNI I A O . V | I R H f . l VALUE Q U A N I I 1 V ) VALUE C U A N l l l V l VALUE CUANI I1Y ShAM RANK)
WRLIIGIIf P L A I E S S H t l l S ANO S I R I P t F L I AO C I Y : M.
1 0 1 1254 0 H I A L I
MIN 1254 0 « E l A L I
PAIN SUPPLIERS 101 EEC V 1245 AUI V 9
MFN EEC V 1245 AUI V 9
7804100C LEAO F O I L , I T A UF.ICHI {EXCLUDING AKY P A t K I K G I NUI OVER 1 , 7 0 0 CRAHS/SCUAHE MEIRf L 1 V : KG
MIN-H IREE 101 331 0 L ( L ISA P I K - F IREE «FN 80 IREE MrN 531 0 LEt UiA
PAIN SUPFLIEHS IfI Eft V 326 USA V 5 MEN EfC V 326 USA V S
IVPE Of
OU IV
RAM
v.
7 8 0 ) 0 0 0 0
H I K - B P I K - F MFN 80
FREE FREE FREE
780(2000 LEAD POWDERS ANO FLAKES CIY: KG
PIK-F FREE 101 4 0 EM HIN-F FREE HFK 80 IREE MFN 4 0 EEL
PAIN SUPPLIERS 101 LEC V 4 MEN EEC V 4
7805COOO lUeES AND PIPES ANO BLANKS IHEMEFOR OF LEAO. HCLLOW BARS, AKO IUBE AND PIPE F I I 1 1 N L S , L i LEAC ( J I Y : KG
P I K - B I R I E 101 19 0 E f t f IN H I N - F F R f f MFN 80 FREE MFN 19 0 E l l I IN
PAIN SUPPLIERS 101 EEC V 17 F I N V 2 HEN EEC V 17 F I N V 2
78060010 COLIAPSIULE IUBULAR C U N I A I N E R S , OF LEAO C I V : KG
P I K - e 5 . 0 101 1 0 EEL N I N - F 3 . 8 HEN 80 4 . 7 G S P I - B IREE I I A IREE /ONE FREE /ONE 1 0 E l l
PAIN SUPPLIERS 101 EEC V 1 /ONE EEC V I
7806C020 LFAC WOOL AKD LEAO ROPES O I Y : KG
H I K - 0 f H I E I U I 28 0 EEL USA NLK MIN-E IKLE PFK 80 FREE HFN 28 0 ILL USA KIR
PAIN SUPPLIERS 101 EIC V 17 USA V 9 NOR V 2 MFN EEC V 17 USA V 9 NCR V 2

fAMrr ivia H*I i N F n » i P or OU IV
7806C090
P 1 K - ( P1K-F Mrs BO csHi-e H A /ONE
^.o $.2 1.8
( R I E n u t IKF.E
I A R I F F ASSESSEMrNT : SKC I f P U R I S (BUM OF VI11)1' I HO C 1 U M M L S IK 1980 I I V P E I iMPLATS m o u n t FRCP |
RAIF. | OF | MJRLI1 | GSP | RFl iUFSTIKG (U l 'N IRV : !.(.(. | MAIN A S 0 t I I I T A R I F I | L R I G I N | T | SUPI'l IF:*S I I C V M V VAIUF UNI I A U . V l t R H I . I VAIUF O U A N I I I V l VA» UE O U A N I M V l VAI UE C U A N I M V SliAKI KANKl
OIMIR AK1ICLES OF I t A O , IXCEPF COILAPSIULC IUBUIAR c O N I A I M R S . LEAD k C l l ANO IEAC H F I S
IUT « 8 7 0
MFN 89 0
F Î A /ONE
195 205
CIV I Mi- ;
i n i H. .iPK us/i H I
JPK L I A HON
I IK L I . I IK H M L
ai t>
«0 O
oo IM
oo
<
f.y.i<\ S U F F I U - R S n u I E C V MIN JPM V F TA F I N V ZONE EEC V
203 52
185 203
F I N V USA V CHE V
1S3 33
S
JPN V OOR V NOR V
52 4 4
USA V JJ
fi-\

TVRE CE OUTV
RATE
TARIFF ASSESSEMENT « CHE IMPORTS FROM DEVELOPING CCUKTRIES IN 1980 J IMPORTS I41AÇ0I FRCM ! HORLO I GSP | JBuESTIKG CQUNIRY30GC
•AKirr «ssessi
RATE £ CF I TIARIFI
TARIFF m n i f A S 0 C I C TTAR1FI I CHIG1N ) " ^ * J T T G V H V VALUE UNIT AD.VJTRM» I VALUE QUANTITY I VALUE QUANTITY! VALUE CUANTITY SHARE RANKl
MAIN SUPPLIERS
26014000
MIN-P IKft S MIN-F IRtE S MfN 80 IRCE S
LEAC W<t CIV: »«.
PAIN SUPPLIERS 11)1 AUI V MfN AUI V
101
MFN
10 10
10
10
0
0
AL1
A U
260 10 100
FIN-8 TREE S P1N-F IREE S MFN SO TREE S
ASH ANU RESIDUES /OTHER THAN FRUM MANUFACTURE CE IRON OR STEEL. COMAINIKG METALS OR MEIALLIC CCPKUM) CIVi HO
TOT 4693 17 E1L AUI HCR Shl
NFN 4695 1 / LEL AUI HGR ShE
P A I N
2 8 2 7 1 0 0 0
PTN-E 0 . 4 S PTK-F 0 . 4 S PFK 80 0 . 4 S GSP1-E TREE S F T * EREE S JUNE EREE S
PAIN
28272C0C
RTR-B 2 . 6 S RTN-F 2 . 3 S HEN 80 2 . 6 S GSP1-B EREE S F I A EREE S IQUt EREE S
PAIN
itiCUU
M H G . I S M K - I U . I i f f - \ ac 0 . 1 s C i f l - c f H H S I I A f H t t S K M I K K S
PAIN
s u p r i i t R S 1 0 1 EEC V MTN FFC V
4 3 7 / 4 1 7 7
LEAD PR0TOXI0E ( L I T H A R G E ! AND
SUPPLIERS
M I M U H
E E E
SUPPLIERS
240 /CKG 230 /CKC 238/CKG
TOT EEC V GSR e c u y ZONE EEC y
900 /CKG 800 /CKG 887 /CKG
TOT HEX V GSP HEX V
TOI
GSR
ZCNE
59 48 59
TOT
GSR
ZONE
26 26
ZONE EEC V S
L l U K C h C C M C l i 4 L A t C I U H l i . E S
S U H U l t K S
50/CKC SU/CKt 5 0 / L K L
I C I 1-iC V M r LAN V GSP ISK V / U N I EEC V
TCI
Ht h GSP
U,U£
644
^^ 4
644
LEAD
AUI AU I
D IOXIDE
137
78
59
3 1
26
5
N . U . S . -
685
3 / 4
644
BGR HEX
EEC
0 . 5 0
CAN USA
V
V
V V
V
V V
298 298
48 30
5
22 12
78
78
0
26
26
0
4
0 4
0
BGR V BGR V
HEX V
USA V PCI V
17 17
30
30
30
26
26
4
4
12 2
Ski . V SKE V
21
38
83
100
C
1CC
ISK V OCR V
1 1
CTVJ KG
EEC BCK HEX
BGR MtX
EEC
01Y : KG
HEX EEC
HEX
EEC
CTVJ KG
EEC O K USA ISR P l l
CAN LSA PCL OCR ISR
U C
4 1
TJ </> u) "O IQ to to o
VQ
2 •

TARWF ASSESStMENT I CHI: IFPC.R1S FRCH O f c V l l O P I M . C L U U I t S IK I 9 6 0 8 ) 0 3 2 1 Ï A R I I I - I I V P E I JHPLRTS U 1 0 C C J FRCP I
IVPÉ («Al t N I u U L P R A T I 1 CF | kUU-C I CSP I R E L L E S I I K C CCINIHY» CGC | MAIN CF A Î V. I I C I T A K I F I | I M C I N I X I SUFFLIERS
CUIV I I l> V M v V A l l i f UNIT A U . V J I h H I . I VALUE U U A M l ) V | VALLfc C U A U I I I Y I VAILE ( L A M 1 1 Y SFiAkt KANK|
< t j ; < r c c t
M ^ - u KW. - I -K-N sc G j t i - E f k £ £ M/> IhCC ILht f f i t t
G . I S C . 1 S e t s
L ' I U k i U L P H I U l S AND Ht l > i U l P H U E S 1FAN AHPLMOP S U l F h I C E
50/CI .C 5u/CKC 5U/CKO
ICI
MfN
F I A 2LNE
«22
5
5 £12
A L I EEC
TJ t o 0) X3
(Q 0)
00 00 * * I A I
3
<
PAIN SUPPLIERS 1( r fcfct V MlN CSA V t 1A A U ! V / I N C EEC V
/ t u 11000
I M N - e M i N - r MF h s u CSP1-B M A 10KE
0.1 0.1 0.1
IPlt IRtl IRtl
LNWHLUCHI IFAO
PAIN SUPPLIERS
20/LKC 20/CKC 20/LKC
mi tre v MfN LAN V GSP BUN V ZOfl E i C V
«12 5 5
«12
IOT
HFN CSP
IONE
1 2 3 6 * 132S
2*0 U 3 « »
LSA V ALI V
18*54
5 /VO 2 9 6
12168
2 9 6
0 2*6
CAN V LSA V HFX V
3 5 2 ) 2 3 8 *
S6
USA V AUS V
2 f 6
2S6
2 3 8 *
es
1
100
DUR V
780 12000 I l A t MACHINING k A S I l , AM) SCRAP
L l ï l «G
( I L C M USA BLR AUS
LAN USA ALS
BLR MIX
t i e
2*0
LIVS KG
P I N - P P U - F PI N 80
esp i-e F I A 2UNE
0 . 1 0 . 1 0 . 1
I R I I IRFE » R f l
20 /CKC 20/CKC 20 /CKC
101
2GNE
EIC
I t C
PAIK SUPPI IFRS
7 f 0 2 G M O
P I N - B MIN-F PFN 80
1 0 1 K.C V 2CNF ELL V
0 . 2 0 . 2 0 . 2
CSP1-B I R f t
r IA 20NE
IKCC F M F F
hRCUCHT BARS, ROOS, ANGLES. SHAPES A SECI ICNS CF LEAO, I E A O DIRE C I V i KO
PAIN SUPPI IERS
900 /CKG 8 0 0 / L K G 887 /CKC
m i LEC V 2UNE IEC V
IOT
20NE
,211 2 1 1
2 1 1
2 1 1
H t
[ I C
C A

I Y P E
Cf b b l Y
7 8 0 J 0 1 0 0
F / W E
I A K I F F A S ^ J i E M L M IAHEF I 4 t L '
t U K l P RA IL 1 I F | S L L 1 c | I A K I F |
I CHE l M ' b K I S FROM OEVELLPINb C C L K I ^ f S IN 1«bO 1MHLHTS U I G l J ^ F K l P |
kURt.O I CSP | K E t b t S U M i C l l M R Y U G C | I I .R IGIN | 1 J
r I G V M V VAlbfc U M I A O . V I 1 K M I . I VALUC w U A i . U I V l VAlbfc ( . U A M I I V l VA lbE CUANTI1V SHARE BANK I
kRLUGHI P L A I E S . S H t F I S «NO SIR I P . UF LEAD
• 3 0 1 2 1
MAIN SUFPLIERS
I I Y : Kb
O . J O . J O . J
P I N - P MIN-F MEN 80 CSP1-H FRIE r i A m u /ONE I H I E
6 0 0 / C K C 500 /CKG S87/CKG
101
/ONE
1647
1647
E F l
EEC
P A I N SUPI 'MEHS 1 0 1 H C V /UNF tEC V
1647 1647
7 ( 0 4 1000 I E AC F O I l N . OV. 1 .700 CRAMS PER SO. MEIER C I V : Kb
M i m - e M I N - F PFN 80
2 . 1 1.8 2 . 1
CSP1-8 I M I I F I A /ONE
f K I l F R E E
2500/CK.G 7100/CKC 24SO/CKG
101
MfN
55
8
/ONE 47
0
0
CiC
USA
E F C
b i A
CAIN SUPTLICRS IOT t I C V MfN USA V /ONfc E tC V
47 8
47
7 8 0 4 / 0 0 0 PbMJIK ANO FIAKCS I I I I E A 0
USA V
C IYJ KG
P I N - B M I N - F MFN 80
0 . / 0 . 2 0 . /
G S P I - n I R E t F I A
/ONE I K I E IRFE
PAIN SUPPl lEHS
200/CKG 2 0 0 / l K C 200 /CKC
t O f ELC V / O N I L I C V
101
/ONE
56 56
56
56
'805 1000
MIN-P 1.4 PIN-F 1.1 PfM 80 1.4 c s p i - e i R i t I I A IRIF /ONE I R i r
s s s s s s
I U O I S . P IPES A HOI ION BARS OF IEAO
PAIN SUPPLIFRS
8 0 0 / t K C 6 0 0 / l K G 775 /CKG
101 ICC V /ONF. FlC V
101
/ONE
156 156
78052000
PIN-I I 1.2 MIN-I 1.0 PIN 80 1.2 CSP1-P IRfE M A (HIC lUHf IRFE
S S s s s s
IUEE « PIPE F I 1 I I N G S OF LEAD
1400/CKC 1200/CKG 1J75/CKG
156
156
L U
L U
E U
t i c
c m K ( .
b l Y :
TJ C/> Q) XI
<o n> n n
oooo b n o j
g

IVPE RAH ur
nuiv
7806 1CU0
PIK.-B 0.5 MIK-F 0.5 PFh 80 0.5 CSF1-B IKlf F I A I R E E
ZONE fRIf
N A Î
s s s s s s
I A R I F F ASSESSEMINI I C l l t IKPORIS FRCM DEVILOPINC M U M R I E S IK I 9 6 0 I A P I E F I I V P E I IMPURIS U 1 0 C C I FRCP |
E B B L P R A I E | UF | WURLD | CSP I R I O U E S I I K G I t U N I R Y : I.GL I S 0 C I C I I A H I F I I C R I G I N | l | I C V M V VALUE U N I I A 0 . V | 1 R N I . | VALUE O U A N I I I Y l VALUE C U A N I I I Y l VALUE C U A N I I I V Sl'ARL KANK|
MAIN SUPPl IEPS
V A I S , IANKS « IJIHTR C U M A I N E R S FOR I N O U S I P I A l PURPOSES OF LEAO U I V : KO
1200/CKG 1100/CKC I 1 8 / / C K G
101
MFN
ZONE
31
30
I I C LSA
USA
ECL
PAIN SUPPLIERS ICI ECC MIN USA JONC LEO
V V V
30 1
30
7 8 0 6 1 2 0 0
USA V
I U P I S UF I l AU IOR PAC K l KG GOODS C I V :
M I K - P P I N - F MF* 80 CSP1-B F I A JMNÏ
7»0<?0<JO
MIN-P MIN-F PIN 80
0 .3 0 .3 0 .3
ma FREE I K L X
0 . 2 0 . 2 0 . 2
G S P I - B I H I t M A /ONE
ERIE IHEE
t 2400 /CKG E 23U0 /LKG E 2587 /CKG
OIFER A R I I C L E S UF LEAO I t . E . S . UNWQRKEO
1 1 0 0 / L K G 1000/( .KG 1087/CKG
I U I
MFN GSP F I A ZCNE
231
1 1 1
228
0 1 0 0
n
ICO
EU
USA MY S SKI EfC
cl Y: KG
MYS S U USA
PAIN SUPPLIERS IUI EEC V MIN USA V GSP MYS V FIA SUE V ZONE EEC V
228 1 1 1
228
MYS V SWE V USA V
8062200
PIN-B PIK-F PF* 80
GSPi-e 1 IA ZONE
2.2 1.9 2.2
IHEE FREE FREE
S S S S S S
OIFER ARIICLES OF LEAO k.E.S. MACHINED
1200/CKG 1000/LKG M7S/CKG
FOI
MFN
FIA
ZONC
1356
21
54 1281
0
0
0 0
tre
USA
ALI LEC
CIY: KG
ALI USA JPN
jn.
MAIN SUPPLIERS 101 LLC V MIN USA V I IA AUI V ZUNE EEC V
1281 19 54
1281
AUI V JPN V
54 2
USA V 19 JPN V
* A r*\

1 1 A K I I F ASSESSLMIN! I ( l i t IPP0R1S THON DEVELOPING C I U M M C S I N 1980 I AH i n I I V P E I IP.PUFIS I 1 1 U G 0 I FRCP |
IYPF HAIE h ( I l H I I ' HA IE I OF I KURl II | GSP | RECUESIIKG (LUNIRV:CGC I I I I A S U C I C I I A H I F l I ORIGIN I « |
n U I V I I C V H V VAIUE UNIT A U . V | 1 R M I - | VAl Ul U U A N T I I V I VALUE C U A N 1 I I V | V A l U t CUANI I1V SI .AM RAt lKl
MAIN MJI ' I ' l U P S
7 8 0 6 3 1 0 0
P I K - B P I K - F P IN 80 CSP1-B F IA MKF
OlhFR A R I I U E S UF LEAO K . E . S . SURF ACE- IRE A ICO
1.3 S 1.1 S 1.3 S
fRtE S FRFE S IKFE S
PAIN SUPPLIERS
7400/CKt 2000/CKG 23SO/CKG
101
MEN
in r MIN 1 IA /UNE
EEC USA SWE EEC
V V V V
FIA ZONE
62 1 1
62
IK
11
1 62
0
0
0 0
USA V JPN V
JPN V SWE V
CIV: H,
I It USA JPN SkE
USA JIN
SU Elt.

ÏVPE OF
DUTY
60210
HTK-B M1N-F MFN 80 GSP1-B
60320
HTK-B MTN-F PFN 80
60325
HTK-B MIN-F KFK 80 GSPI-e
6036-î
RTN-B RTN-F MFN 80
60370
MTN-B PTN-F PFM 80 GSP1-6
BAT F
TARIFF ASSESStMENT t USA IPPGRIS FROM OEVELCPINC LCUN1RIES IN 1*80 TARIFF I 1VPEI IMPCRIS U10LCI FRCM I
( M I P RATE I OF | WORLD I GSP I HECUESÏING CCLNTRYlCGC I S 0 C i C (TARIF I I CRIGIN I S I T G V M V WAMiP UNIT AO.V lTRMÏ . I VALUE UUANUTYj VALUE CUANIlTYl VALUE CUANUIY SHARE kANK|
1.6 S 1.6 S 1.6 S
FREE
ALL LEAD-BEARING ORES
75/ LB 75/ LB 75/ LB
PAIN SUPPLIERS TOT PER V MFN CAN V GSP PfcH V
TOI
HFN GSP
13293 2873
13293
23928
3413 20515
20515
0 20515
2CS15
20515
HND V AUS V UNO V
3943 322
3943
CAN V ZAF V OIL V
2873 218
1927
85
100
CFL V
HEX V
MAIN SUPPLIERS -a </>
CU TD i (Q to
- — IV O UlYsLEC <-N
00 8 PEk HKO CAN CHL HEX 0 0 ^ CAN ACS 2AF >^ PEC HNC CHL HEX BCL *»
n <
192/ ^ tti • '• "- V-: FLLE OUST OR FUME, CONTAINING OVER 55* CADMIUM, AND NOT OVER 151 LEAO. 2 INC, CR CLPPER U Y !
FREE FREE FREE
2.7 S 2.3 S 2.6 S
FREE
FREE FREE FREE
LEAO ORGSS
1062S/CLB 9000/CLB 10400/CLB
TOT
MFN GSP
761
7S6 5
METAL-BEARING HAIERiALS. NES» RESIDUE, NCI AOVANCEO
TOT 92764 70751
MFN 92764 70751
70751
7C751
ICC
76
76
CAN
CAN G1P
I h A
I F A
ALS
ACS
2AF
ZAF
C I V : L8
G1M
C I Y : M
EEC CAN BRA
EEC CAN BRA
PAIN SUPPLIERS TOT MFN
THA V IHA V
67864 67864
ZAF V ZAF V
8570 85 70
EEC V fEC V
7396 7396
7.5 5.0 7.2
FREE
MATLR1ALS MCTAl-tifcAR ING NES
TOT
MFN GSP
93812
81780 11906
11906
0 11906
11895
110V5
CAN V CAN V
12
99
5265 5265
UY:NA
EtC ALS CAN Of-A JFN
EEC ALS CAN JFK NCR fcKA INO Ptfc MtX MHS
PAIN SUPPLIERS TOT MFN GSP
EEC V EEC V BRA V
61806 61806 7250
AUS V AUS V INO V
9110 9110 1675
CAN V CAN V PER V
E166 8166 1464
«0350
MTN-B MTN-F MFN 80 CSP1-E
MATERIALS NES CONI OV 10* COPPER, EAO.ZINC, IF CU MARKET PRICE 20/LB OH UVER
1.2 S 0 .5 S 1.1 S
FREE C
MAIN SUPPLIERS TUT MFN GSP
CAN V CAN V CHL V
TOT
PFN GSP
580 0 580 C 235 0
1089
8S4 235
235
0 235
0 EEC V 0 EEC V 0
274 Q 274 Q
0 CHL V 0
235
235
235 0
ERA V JPN V MtX V
21
100
725C 2383
67V
CIYSNA
CAN EEC CHL
CAN EEC CHL
60354
NTN-B MTN-F MFN 80
MATERIALS NES,CONIAINING OV J TRQV 02 CF GOLD/ S. TCN.OR OV 100 THOV 02 OF PRECIOUS METALS/ S. ION.IF QTVt
0.1 S 0.1 S 0.1 S

TYPE OF
OUI»
42402
HTN-6 HTK-F HFN 80 GSP 1-8
RATE
5.2 4 .0 3.5
FREE
« TARIFF ASSESSENENT I USA IMPORTS FROM OEVELOPING COUNTRIES IN 1980
I IVPEI IMPORTS IS1000I FROM RATE I OF | hORLO I CSP | REQUESTING CCUNTRVxOGC
*
TARIFF N E I R L P A S 0 C 1 C I I A R I F I I ORIGIN I T T G V M V VALUE UNIT A O . V | I R M I . | VALUE QUANTITVl VALUE QUANTITVl
PAGE S «30623 I I MAIN I SUPPLIERS
VALUE QUANTI IV SHARE RANK I
UNWROUGHT LEAO BULLION
PAIN SUPPLIERS 10T EEC V HFN EEC V CSP HEX V
TO]
HFN GSP
260 260 111
S91
480 111
111
0 111
CAN V CAN V
220 220
«440
MIN-B 11.9 MIN-F 11.9 MEN «0 11.9 CSP1-B FREE
LEAO POUOER ANO FLAKES, NCI OVER 13-1/3 LENTS PER PCUND
MAIN SUPPLIERS TOT HEX V MFN CAN V GSP HEX V
TOT
HFN GSP
20 Q 7 Q 20 C
27
1 20
138773
93773 4S000
20
0 20
HEX V
4S000
111
111 111
18
1L.Û
CIYsM
ETC CAN HEX
tlC CAN r.ix
CTVi Lf
4S000 CAK V 93773 4S000
7 Q
4S000
93773
20
20
4S000 74
4S000 100
HEX CAN
CAN HEX
42442
MIN-B 11.2 MIN-F 11.2 MFN SO 11.2 GSP1-R FREE
LEAC POMOER AM) FLAKE St OVER 13-1 /3 CENTS PER POUND
TOT
PFN GSP
S94 1202111 590 1197637
4 590
44 74 1197637
0 590
MAIN SUPPLIERS 1UI MEX V MFN CAN V GSP MEX V
590 Q 1197637 CAN V 2 C 1274 CHE V
590 C 1197637
2 Q 1 G
1197637
1274 CHE V 2200 EEC V
590
590
1197637 99
1197637 100
1 Q 2200 EEC 1 C 1000
V
QTVi LI
MEX CAN CHE EEC
CAN CHE EEC HEX
1 Q 1000
42450
MIN-B 2.4 NTN-F 2.0 MFN 80 2.5 GSP1-R IRLE
UNALLCVEO LEAD PIPES* TUBES* JBLANKS ANO FITTINGS
TOT 2 2209 0
HFN 2 2209 0
GTVi Lf
CAN
CAN
RAIN SUPPLIERS TOT CAN V MFN CAN V
2 Q 2 Q
2209 2209
•it hi i i •
-o CD (Q
n oo •o
CO TJ n o oo
1/4 O >̂ 30
(D <

TYPE OF
DUIV
62403
K1K-B MTN-F PFN 80
62404
RATE
TARIFE ASSESSEHENI : USA IMPORTS FROM DEVCLCP1NG CCUN1RIES IN I foO ÏARIFF | IVPEI IMPORTS U10CC1 FHLM l
E B B L P RATE | OF | WORLO I GSP 1 RECUtSIING CLLNTRYJCGC I S 0 C 1 C ITAK1F1 | CRIG1N I * I T G V H V VALUE UNIT AII .VITRMT.I VALUE qUAHIlTVI VALUE CUANTlIYl VALUE C l iAMI lV St-AKE RANN|
UNkkUUGHT LEAD. NSPF
MAIN SUPPLIERS
CTY:NA
S.1 4 .0 3.5 C
MAIN SUPPLIERS IOT CAN V MfN CAN V
LEAC WASTE AND SCRAP
IOT
HFN
31649 31649
87630
87606
30991
30991
30491
30991
HEX V HEX V
28009 28009
EEC V EEC V
12176 12176
HIN-e 5 ,8 MTN-F 2-3 MFN 80 3.6 GSP1-B FREE
PAIN SUPPLIERS TOT MFN GSP
CAN V CAN V HEX V
TOT
MFN GSP
1032 1032 405
2143
1674 469
ESP V ESP V DÛM V
469
0 469
636 636
32
469
469
HEX V EEC V GUY V
405 6
13
35
35
ALS ALtS
21
ICO
DLH
PAN
V V
V
V
CAN HEX
CAN HEX
11464 114*4
CAN EÏP
CAN U P MLX LLH
22
0
EEC ACS PtK
EEC ACS PER
C I V l M
MEX liCP GOV
EEC GCY FAN tihS
Spec
Page
vOno O U J
s JO to <
624 10
MTN-B MIN-F MFN 80 CSP1-6
3.3 2.7 3.2
FREE
LEAC PLATES AND SHEETS. NOT ALLOYED, NCI CLAD, NOT CUT, PRESSEC, STAMPED TC NONRECTANGCLAh SI APE
TOT 80 0 CAN JFN
HFN 80 0 CAN JFN
UY: lb
PAIN SUPPLIERS TOT CAN V HFN CAN V
79 79
JPN V JPN V
62412
PTN-B MIN-F MFN 80 GSP1-B
62414
PTN-e MTN-F MFN 80 Gspi-e
3.0 S 3 .0 S 3.0 S
FREE
LEAD ALLOY PLATES AND ShEEIS, NOT OVER 13 1/3 PER L B . , NOl CLAD, NCI CUT, PRESSED CP SIAHPEC IC NINFE CITYJ
E 75/ LB £ 75/ LB E 75/ LB
5.5 3.9 5.3
FREE
LEAD ALLUY PLAIES AND SHEETS, OVER 13 1/3 /LB., NOT CLAD, NOI CUT, PRESSEC, OR SIAMPEO 10 NONKEC1ANCLL
TOT 12 0 EEC CAN
MFN 12 0 EEC CAN
C1Y: IB
MAIN SUPFL1ERS TOT EEC V MFN EEC V
CAN V CAN V

TYPE OF OUfV
<2416
PTN-B HTN-F HFN «Û cspi-e
RATE
TARIFF ASSESSEMENT < USA I HPCftf S FROM OEVLLCP1NC COUNTRIES I N 1*60 TARIFF I IVPCJ IHPURTS ISIDCGI. rRCK |
E B B L P RATE I C | k WURLO I CSP | RECUfWlf.G CLCNTRYiCGC I S 0 t 1 C IIARIH I ORIGIN J w S | T C V H V VALUE UNIT A0.VJ1KMT.J VALUE QUANTITY) VALUE CiUANIlTYl VALUE CUANTI1Y SHARE KANK|
12.0 6 .5
11.3 fHtt
62418
PTN-B HTN-F HFN 80 GSP1-B
6.0 4.2 5.8
FREE
LEAO PLATES AND SHEETS, CLAD, NOT CUT, PRESSED, Oft STAP.PEO TC NCiNRECIANGLLAR ShAPE
LEAC STRIPS» NOT OVER 13 1/3 PER LB, M)T CUT. PRESSED, OR STAPPCO IC NCNkECTANGULAR ShAPE
TOT 4 0 CAN
HFN 4 0 CAN
MAIN SUPPLIERS
Q1VJ
CIV: LB
PAIN SUPPLIERS TOT CAN V HFN CAN V
62420
HIN-B HTN-F HFN 80 GSP1-E
LEAO STRIPS, OVER 13 1/3 PER LB, NOT CUT, PRE5SEO, OR STAHPEO TC NCNRECIAWGULAR SHAPE
5.5 3.9 S.3
TREE
PAIN SUPPLIERS TUT EEC V HFN EEC V CSP OAN V
TOT
HFN CSP
26 26 2
52
50 2
CAN V CAN V
23 23
CAN V JPN V
100
JPN V
CIV: LB
EEC CAN OAN JPN
LLC CAN JPN LAN
62422 LEAO PLATES, SHEETS, AND STRIPS. CUT, PRESSED. OR SIAHPEO TO NCNRECTANCULAR SHAPE NOT CVER 13 1/3 /LE. CTYJ
HIN-B HTN-F HFK 80 GSP1-E
3.0 2.S 2.9
FREE
62424
PTN-B HTN-F HFN 80 0SP1-B
5.5 3.9 5.3
FREE
LEAC PLATES, SHEETS, ANO STRIPS, CUT, PRESSED CR SIAHPEO TC NCNPECTANGtLAR SHAPE CVER 13 1/3 / L b .
TOT 12 0 CAN
HFN 12 0 CAN
QIY2 LB
PAIN SUPPLIERS TOT CAN V HFN CAN V
12 12
62430
PTN-B HTN-F HFN SO 6SP1-e
1.3 1.2 1.2
FREE
GLAZIER'S LEAO ANO LEAO WIRE
TOT
HFN
CIV: 16
619
619
0
0
CAN EEC
CAN EEC
PAIN SUPPLIERS TOT CAN V HFN CAN V
350 354
EEC V EEC V
265 265
Kl • » KflH Sffftn Ï •
• ' '' I V
T) 01
IQ (V
o —>
:
CO TJ <D O
,po Oi
{ft
o >» TO <D
< —A
O
i t •'•• Q
•-.>

TYPE OF
ourv
62432
HTN-8 HIN-F PFN 80 CSP1-B
TARIFF ASSESSEMENT * USA IHPGRTS FKÛM DEVELOPING CLUNTRICS IK 1V8Q TARIFF I TVPEI IHPORTS ($10COI FRCP i
RATE M B 6 1 P RATE I OF I WORLD ) GSP I REOUEST INC COUNTRY:CGC I A S 0 C I C ITAKIFI I ORIGIN 1 * I T T G V M V VALUE UNIT AO.VlTR.-U. | VALUE QUANTITY) VALCE CUANIlIYl VALUE CUANTITV SHARE RANK!
LEAD BARS, ROOS. ANGLES. SHAPE, SECT1CKS AND kIRL, WRCUGHI, M S , NCI CVEfi 13 1/3 /LE
TOT 20 20 20 1C0 HEX
MAIN SUPPLIERS
CIV: Le
11.4 6.3 10.8 EREE
WAIN SUPPLIERS TOT HEX V GSP HEX V
GSP
20 20
20 20 20 ICO HEX
62434
MIN-B MTN-F MEN 80 GSP1-B
62452
PIN-B MIN-F KEN 80 CSPI-B
11.2 6.2 10.6 EREE
LEAD BARS, ROOS, ANGLES, SHAPE, SECTIONS ANO h IRE, kRGUGHT, NES, OVER 13 1/3 /LE
TOT 41 0
HFN 41 0
UTY: 16
CAN EEC
CAN EEC
PAIN SUPPLIERS TUT CAN V HFN CAN V
32 32
EEC V EEC V
LEAC ALLOV PIPtS, TUBES, BLANKS AND FII1INGS, NOT OVER 13-1/3 CTS/LB PER LB. CIV:
6.0 4.2 S.8
TREE
«2454
PIN-B MTN-F HEN 80 CSP1-B
5.S 3.9 5.3
TREE
LEAD ALLOV PIPES, TUBES, BLANKS AND FITTINGS, OVER 13-1/3 CENTS LB
TOT 28 0
HFN 28 0
CIV: LB
CAN
CAN
PAIN SUPPLIERS IOT CAN V HFN CAN V
28 28
64030
PTN-e HIN-F HFN 80 GSP1-B
64040
HIN-B HTN-F HFN 80 CSPI-B
DRUMS, FLASK*, CANS, AND OTHER CONTAINERS, OF BASE PETALS OTHER IHAN STAINLESS STEEL AND ALUP.INUP NCI C1Y:NA
5.0 EREE 4.4
FREE
PAIN SUPPLIERS TOT CAN V HFN CAN V GSP BRA V
TOT
HFN GSP
1S681 15681 4352
44522
32266 7249
2249
0 2 249
722S
5 7223
EEC V EEC V HEX V
12909 12909 729
JPN V JPN V KOR V
5013 5013 7C1
16
0 S9
BRA V LSP V HKG V
LAN EEC JPN BRA LSH
CAN M L JPN ESP ChE BfcA PtX KCR HKG LAN
4352 HC1
6.0 2.4 5.6
TREE
COLLAPSIBLE TUBES OF HETAL
101
HAIN SUPPLIERS TOT EEC V HEN EEC V CSP HEX V
HFN GSP
1232 1232
. 162
2325
2163 162
162
0 162
162
162 100
CAN V CAN V
786 786
HEX V AUT V
162 78
AUT V JPN V
tTY:GPS
fcCC CAN MfcX ACT JPN
EEC CAN ALT JPN MEX
78 e7
-a v* (Q IV IV O
>o 00
8 <

TARIFF TYPE RATE N 6 B 0 L t»
OF A S 0 C I C OUfV • f f G V N V VALUE UNIT AO.WJ
I J W I M J W H S H B m t I B ! f I IVP£|
RATE l j t < F I NORLD
TIM I N I . | VALUE
a m maw pgvtmri«.e CUUI I I I IH m I T M wrcr-IHPURTS l»1C00l FUCK |
I CSP I REVEST IKC COUNTRVSOGC I | ORIGIN I V I I
QUANTITY) VALUE QUANTITY I VALUE QUANT1TV SNARE RANK I
- 1 — m m — MAIN
SUPPLIERS
41900 LEAD ARSENATE OIVl IB
MIN-8 MIN-F MFN SO CSP1-B
S.O 1.7 4 . 8
FREE
TOI
CSP
3S
JS
39483
39483
35
IS
39483
39483
33
35
39483 100
39483 100
PER
PER
NAIN SUPPLIERS TOT PER V OSP PER V
35 Q 35 fi
39483 3948 3
41902
NIN-8 NTN-f MFN 80 GSP1-B
LEAO NITRATE
2.3 1.9 2.2
FREE
TOI
MFN
423
423
948542
948542
0
0
QIV» L8
CHN EEC JPN
CHN EEC JPN
47352
MIN-B MIN-F MfN 80 GSPÎ-B
NAIN SUPPLIERS
4 . 0 2 .4 3.0
FREE
TOT CHN V MFN CHN V
LITHARGE
310 0 310 Q
783098 EEC V 783098 EEC V
101 Q 101 Q
145781 JPN V 145781 JPN V
TOT 9195 20753940
MFN 9195 20753940
«195 20753940
9195 20753940
12 0 12 0
39483 39483
Q1VI LB
9195 20753940 100 HEX
9195 2C7S3940 100 HEX
47354
MAIN SUPPLIERS TOI MEX V NFN MEX V
ORANGE MINERAL
9195 G207SS940 9195 020753940
QIV»
MTN-B NTN-F MFN SO GSP1-B
47354
MTN-B NIN-F MrN 80 GSP1-B
2 .8 2 . 3 2 .7
FREE
8 . 4 3.4 5.4
FREE
REO LEAO
NAIN SUPPLIERS TOT NEX V MFN MEX V
101 1419 2842778
MFN 1419 2842778
1313 0 2487042 EEC V 1313 0 2487042 EEC V
47358
MTN-B MTN-F MFN SO GSP1-B
SUBOXIDE OF LEAO (LEAOV LITHARGE I
15.0 is:o 15.0
FREE
1313 2487042
1313 2487042
101 Q 145734 CAfc V 101 0 145734 CAN V
1313 2487042 92
1513 24S7042 92
S Q S Q
10COO 10000
CIV* LB
MEX EEC CAN
MEX EEC CAN
GIYI
to n n o
o oo
I •
iAoF Y -, ! !
•
• • < M I
: ui; m irk
i ;
•

TYPE OF OUÏ»
«4417
NTK-B MTN-F NFK 80 GSP1-B
£4418
PTN-e PTN-F MFN 80 GSP1-B
«4428
MIN-B PTN-F PFN 80 GSP1-B
RATE
7.0 4.7 4.7
FREE
5.5 3.9 5.3
FREE
5.5 2.2 S.I
FREE
TARIFF ASSESSEMENT l USA IMPORTS FROM DEVELOPING CCUNTMES IN 1980 TARIFF t IVPEI IMPORTS 1S1GC0I FRLM I
N E B 6 t P RATE J OF | HOkLO j GSP I RECUESÏING COUNTRY«CGC I A S 0 C I C ITAKIFI I CRIC1N I X I T T G V N V VALUE UNIT AD.VlTRMT.l VALUE QUANTI TV| VALUE OUANTIIY" VALUE IUAN11TY SHARE RANKl
MAIN SUPPLlEkS
LEAD FOIL. VALUED NOT OVLR 1 3 - 1 / 3 PER POUND. NOT HACKED AND NCT CL1 TO SHAPE. NCI CVEK C.006 INCH IN C IV :
LEAD FOIL . VALUED OVER 13-1 /3 PER PCUND, NOT BACKED ANO NCI CUT TO SHAPE. NCI CVER 0.C06 INCH IN Ih IC QÏYJ
LEAD FOIL, CUI TO SHAPE BUI NO I BACKED. NOI OVER 0 .006 INCI IN THICKNESS
TOI 18 18 18
U ï : 10
MAIN SUPPLIERS TOT HEX V GSP ME.X V.
GSP
18 1Â
18 18 18
ICO
100
KF.X
M X
PIN-B 8.5 MTN-F 3.4 PFN 80 7.9 CSP1-B FREE
HOUSEHOLD AND SAN1TAKV WARES OF BASE METAL. NOT ELSEWHERE SPECIFIED, NCI CCAItC k i l l - PRECICUS PETAL OTY:NA
PAIN SUPPLIERS TOT JPN V MFN JPN V GSP OAN V
TOT
MFN GSP
4087 40E7 3388
15455
5988 9467
9467
0 9467
9459
9459
OAN V EEC V KOK V
3388 1654 2545
KOR V CAN V PR A V
2545 127 1654
61 JJ-N CAN Kl.K BKA EEC
JPN EtC CAN ChN ALT 99 CAN KIK OhA SGI' HXG
Ilk A V 16 54 ChN V 49 SLC V 96 1
65 775
MIN-B M1N-F MFN 80
LEAO ARTICLES, NOI SPECIFICALLY, PRCVIOEO FOR, NCT PRECIOUS METAL PLAIEOi OVER 13-1/3 CENTS PER POUND QTVi LB
5.5 3.9 5.3
GSP1-B FREE
MAIN SUPPLIERS
TOT
MFN GSP
3852 2113347 206S 10517/9 2044 1035867 53
1787 2065
1061568 1051779
0 2065 1051779
TOT OAN V MFN EEC V GSP OAN V
1321 G 650901 EEC V 1170 Q 606728 CAN V 1321 q 650901 MEX V
1170 Q 606728 CAN V 514 0 420808 JPN V 420 U 140456 HKG V
2044 1035867 98
514 Q 420808 MEX V 81 C 20042 ESP V 256 Q 235531 PHL V
OAN EEC CAN MEX HKG
EEC CAN JPN ESP FIN OAN MEX HKG PHL PRI
420 U s a
40 U
140456 3460 7761
at x> lO <D n o
8 30 (D <
r>