TARIFFS AND TRADE
199
GENERAL AGREEMENT ON TARIFFS AND TRADE RESTRICTED MDF/W/52 15 August 1986 Special Distribution PROBLEMS OF INTERNATIONAL TRADE IN FORESTRY PRODUCTS Background Note by the Secretariat Revision1 1Problems of International Trade in Forestry Products was first circulated under the document symbol Spec(84)13. That document was considered by the Working Party on Trade in Certain Natural Resource Products and is herewith re-issued, revised, in follow-up of the Working Party's report (MDF/23), adopted by the CONTRACTING PARTIES on 26 November 1985 (L/5933). 86-1290
-
Upload
khangminh22 -
Category
Documents
-
view
0 -
download
0
Transcript of TARIFFS AND TRADE

GENERAL AGREEMENT ONTARIFFS AND TRADE
RESTRICTED
MDF/W/5215 August 1986
Special Distribution
PROBLEMS OF INTERNATIONAL TRADE IN
FORESTRY PRODUCTS
Background Note by the Secretariat
Revision1
1Problems of International Trade in Forestry Products was firstcirculated under the document symbol Spec(84)13. That document wasconsidered by the Working Party on Trade in Certain Natural ResourceProducts and is herewith re-issued, revised, in follow-up of the WorkingParty's report (MDF/23), adopted by the CONTRACTING PARTIES on 26November 1985 (L/5933).
86-1290

MDF/W/52Page 2
Foreword
(i) The present note is a revised and partly up-dated version ofdocument Spec(84)13 and Add.1, both of March 1984, and of Corr.1 andCorr.1/Suppl.1 thereto. These documents were considered by the WorkingParty on Trade in Certain Natural Resource Products and comments andsuggestions made by the Group, as well as corrections submitted inwriting, are taken up and reflected in the present document. To theextent possible, the note also reflects some recent trade and trade-policy developments of relevance to international trade in forestryproducts.
(ii) For procedural and practical reasons, the product coverage of thesecretariat's note had to be limited, in essence, to the productsclassifiable in CCCN Chapters 44, 45 and 47, e.g. wood and cork andmanufactures thereof (other than furniture) and wood-pulp and cellulose.The limited product coverage notwithstanding, the secretariat did bearin mind the interest manifested by a number of contracting parties instudying also problems of trade for products covered by CCCN Chapter 48,e.g. paper, paperboard and products thereof. One of the countriesinterested in identifying problems of international trade in thatproduct area did present several position papers dealing, in part orwholly (MDF/W/1, MDF/W/3 and Add.1 and NDF/W/49), with forestryproducts' trade-related issues, including also paper and paper products.
(iii) In relation to forestry products trade problems, the WorkingParty, under its Chairman Mr. M. Cartland (Hong Kong), met formally inJune and September 1984 and again in September 1985. In addition, themainly interested delegations met informally, in bilateral orplurilateral consultations, with the Group's Chairman, on a number ofoccasions in the spring and autumn of 1985. Notes on the proceedings ofthe formal meetings are contained in documents MDF/W/2, MDF/W/16 andMDF/W/53. A summary of the Group's main findings, together withsuggestions on possible follow-up, is contained in documents MDF/3 andMDF/23, the Chairman's reports submitted to the GATT Council ofRepresentatives. The report contained in document MDF/23 was forwardedby the Council to the Forty-First Session of the CONTRACTING PARTIES(C/M/194). As noted in document L/5933 and in the Summary RecordSR.41(2, page 15, CONTRACTING PARTIES adopted the report on 26 November1985.
(iv) In the revision of Spec(84)13 - Problems of International Trade inForestry Products - the originally used paragraph numbers have been keptthroughout, if for no better reason than to facilitate reference tocomments made by delegations in relation to specific paragraphs. Somewider ranging comments and certain additional information that has cometo the fore since Spec(84)13 was issued are accommodated in footnotes.
IFor views expressed on dealing with problems of internationaltrade in natural resource products attention is invited to the record ofdiscussions in the Senior Official Group in November 1985, notablydocuments SR.SOG/2 (page 9), SR.SOG/8 (pages 2 and 3) and SR.SOG/11(page 17) and also to PREP.COM(86)SR/3, pages 35-42 and SR/6 - pages 34to 37.

MDF/W/52Page 3
(v) It is realized that a virtually world-wide survey of forestryindustry related activities and of trade and trade problems, as has beenattempted in this note, can never be more than a sketch or overview, andcan never be fully up-to-date. Nevertheless, it is hoped that the dataelaborated and presented in this document will be of some use tocontracting parties, as discussion background material, for theirfurther work. Suggestions by contracting parties for corrections oramendments that may be required would be appreciated.

MDF/W/52Page 4
TABLE OF CONTENTS Page
Foreword 2
INTRODUCTION AND OVERVIEW
Area and product coverage 7Methodology and statistics used 9Recent production and trade developments 10Developments in forestry-industries' technologies 11Forest-policy measures and developments in international
trade of forestry products 13Tariffs and non-tariff measures affecting forestry
products' trade 14Sources and acknowledgement 16
A. FOREST RESOURCES, THEIR USE AND POTENTIAL
General 17Forest resources, by major countries and areas 18Forest land ownership structure and use patterns 20Forest-use policies and objectives 23Protected forest lands, reforestation 24Forest resource appraisals 25Age and species composition of forests, forest management,
forest yields 27Forest die-back problems 29Timber yields as related to tree species and site
conditions 29"Softwood" and "hardwood", definitions 31Climatic factors influencing tree species - composition
of forests 32Major forest tree species of Japan 34Forest-fire data 34Plantation forests and comparative advantage 35Species composition of North-American forests 36Little-known or "secondary" wood species 37
Forest Resources Survey
General 39ECE/FAO/UNEP: Forest Resource Surveys 39Explanatory notes to Table I 40Canada - forestry care and production objectives 41Chile - forestry - industry achievements and targets 42SUMMARY TABLE I (Forest Resources, Wood Production,
Imports, Exports, Trade Balance) 43EC - Forestry policy objectives, wood-industry production
levels and developments 46US forestry products production, trade and requirements 50Japan - forest resources, production, requirements and
trade 51China, Republic of - forest resources and policy measures
and objectives, imports 55Korea, Republic of - afforestation 56Nordic countries - forest resources 56USSR and CMEA countries - forest resources, resource- and
trade developments 57Other countries' and developing countries' forest resource
situation and trade 60

MDF/W/52Page 5
TABLE OF CONTENTS (cont'd) Page
B. PRODUCTION OF MAJOR CATEGORIES OF FOREST PRODUCTS
General 65Explanatory notes to Summary Table II 66Forest products-resource and -industry development,
South Africa Rep. 67New Zealand forest industries' development and targets 67Prerequisites for developing primary forest-products
production, logging and forest-care operations 68Resource accessibility - road infrastructure 70"Floating" 73Wood and cellulose yields in various processing operations 74Disposition of total industrial roundwood production 76Factors contributing to cyclical fluctuation in wood
production and trade 78SUMMARY TABLE II (Per Caput and Total Production of Wood,
Semi-Manufactures and Woodpulp, Net Trade andAvailabilities) 80
ECE and FAO forest products statistics and publications 82Developments in various countries' saw-mill, ply-mill and
pulp production and trade 84
C. INTERNATIONAL TRADE FLOWS IN FORESTRY PRODUCTS
General 88SUMMARY TABLE III-A (Imports and Exports of Wood-, Cork-,
Products thereof and Woodpulp) 89World production and world exports of industrial roundwood 92World production and world exports of sawnwood, plywood,
particle board and woodpulp 93Major importers of roundwood, sawnwood, woodpulp, plywood
and particle board 95SUMMARY TABLE IV-A (Percentage Shares of Different Importers
in Total, in respect of product categoriesreferred to above) 97
IV-B (as above, in respect of exports) 98Major exporters of roundwood, sawnwood, plywood, particle
board, woodpulp 99Technical and marketing characteristics influencing trade-
flows in wood products 100Factors influencing demand for construction grades of wood
in the United States 102Summary data on wood-use in house construction 103House construction, wood-industry activity and -trade in
North America 106House construction and demand for wood products in Europe 107Other factors (including transport, tariff treatment, regional
cooperation, etc.) influencing trade developments forforest-industry products 108

MDF/W/52Page 6
TABLE OF CONTENTS (cont'd) Page
D. TARIFFS AND NON-TARIFF MEASURES AFFECTING TRADE
General 111Private and public ownership patterns 111Pre-Tokyo Round import tariff treatment for various forestry products 112Average duty rates, pre- and post-Tokyo Round, by broad product
categories 114SUMMARY TABLE V-A (Pre- and post-Tokyo Round Tariff Rates, at the
4-digit CCCN position level) 118V-B (Value of Imports from World, at the same level of
detail, and m.f.n. and GSP origin shares in imports) 119Notes on data in the preceding Tables 121Import and/or export duties on forestry products in developing country
areas 122Nominal and effective rates of protection 124Tariff escalation 125Classification criteria 127Distinctions made in tariff schedules for different wood products 128Technical standards, building codes and traditions 131Drawing up technical specifications for little-known woods 133Phyto-sanitary regulations 134Import licensing, controls, restraints, prohibitions 135Other policy measures and action affecting production, prices and trade 135
E. ADDITIONAL NOTES RELATING TO CORK
General 137
ANNEX I-A
SUMMARY TABLE III-B (Imports and Exports of individual GATT membercountries of wood, cork and products thereof, andof woodpulp, by origins and destinations) 139
- abbreviations used in Table III-B 164
ANNEX I-B
Volume of Production, Exports and Imports of GATT member countries in1963, 1973, 1979 and 1981 of: 165
- Industrial roundwood 166- Pulpwood 167- Sawnwood 168- Plywood 169- Particle-board 170- Fibre-board 171- Woodpulp 172
ANNEX II
Trade Matrix for Imports of Wood and Wood Semi-Manufacturesand Woodpulp for Major Import Markets - 1963, 1973, 1981 - 173
- Reproduction of headnote texts for several of the text summarytables 196

MDF/W/52Page 7
Introduction and Overview
1. The present information note is one of several background papersthe secretariat was requested to prepare, in follow-up of the November1982 GATT Ministerial Meeting, with a view to addressing problems ininternational trade in various natural resource products, in theirprimary form and as semi-manufactures and manufactured products.
2. Natural and/or managed forests of differing size and tree-speciescomposition are found around the globe and are absent only from theclimatically most inhospitable regions. An attempt is being made inthis note to provide some relevant data for all GATT contractingparties. Summary data relating to resources, production and trade inforestry products are, to the extent possible, also provided in respectof the Republic of China and the USSR.
3. Forests, both the virgin natural forests and forests planted andmanaged in various ways by man, are a planetary resource of greatimportance in maintaining and equilibrating the atmospheric-,terrestrial- and oceanic-carbon cycle, as a source of atmosphericoxygen, as wildlife habitat, floristic gene-bank, for watershedprotection, for recreational purposes and as a source of construction-and fuel-wood, and of vari2us herbs, medicinal plants, - gums, resinsand of several tree fruits and oils, of fibres and of various dyeing-,tanning materials and certain other products for specific industrialuses. Forests are also of importance, in some cases essential,in operating certain agro-forestry activities and, if propery managed,can provide specialized pasture for game-farming operations.
4. Given the many uses to which forest products can be put, thesubject3is potentially a vast one. For practical and proceduralreasons , the present note concentrates on the subject of internationaltrade issues as they relate to wood and cork, and to manufacturesthereof, and to one of the main wood derivatives - pulp. Morespecifically, the products covered in this note are those classified
1There are a number of other countries in Latin America, Africa,Asia and Oceania which are significant producers and exporters offorestry products (including, in the latter region, Papua and NewGuinea), and there are certain other countries, though not among majorproducers, for which forestry exports are actually or potentially ofimportance, but for which, for lack of space, data could not be providedin the Summary Tabulations. Statistics on forestry-production and-trade for these countries are, however, generally available from therelevant FAO forestry statistics and are, to some extent, also providedin footnotes to text-passages and in Annex II.
2There are 20 four-digit headings in CCCN Chapters 1-24 allocatedexclusively or predominantly to various tree-fruits.
3cf: MDF/23, MDF/3; MDF/W/2, 16, 53; C/W/467 and Add.1, MDF/W/49and Corr.1; C/M/183, 187, 188, 190, 191 and 192.

MDF/W/52Page 8
in the Customs Cooperation Council Nomenclature (CCCN) in Chapter 44(wood and wood products), in Chapter 45 (cork and cork products) and inCCCN Chapter 47 (woodpulp). Details of the product coverage in relationto specific tariff headings and positions in these three CCCN Chaptersare shown in Table V.
5. Slightly more than 30 per cent of the earth's land surface iscovered by forests or woodlands. Man has exploited forests whereverforest resources were easily accessible, and where uses and markets forforest products could be found, and has changed, in the process, thenatural vegetation cover. In the more densely populated areas, forestscompete not only with agriculture but also with land-use for urbansettlements, industrial establishments and road networks. In otherareas of the world forests have been thinned out by use for fuelwood,for pasture, and expanding agriculture, shifting cultivation, in somecases to the point of virtual destruction. In many parts of arid andsemi-arid Africa, Asia, South America and certain insular locations thedestruction of forests is of crisis proportions.
6. Given the great diversity of forests in the different areas of theworld, and the way local populations experience their respective forest,there exists no really adequate way of conveying verbally, in a fewsuccinct paragraphs, a picture of the world's forest-cover and-characteristics. In the circumstances, it was thought that, forpurposes of this note, a tabular presentation of some quantitative datawould, perhaps, best convey the extent of possible forest resources.This approach does have some limitations as regards possibilities forexact inter-country comparisons and attention is therefore invited tothe many caveats in the text preceding Table I in Section A.
7. One of the difficulties in dealing with the subject ofinternational trade in wood and wood semi-manufacturers is the profusionof commercially used names for given species of wood and the largenumber of tree species. In the 'Sixties it was considered (Elseviers)that there existed more than 2,500 botanical tree species, and hencespecies of wood. Recent reference books list even more species. Formany of the main species there may exist several sub-species and alsolocal variants of names and designations. Considerable time and effort
1CCCN Chapter 46 covers plaiting materials and products madethereof. These materials and products are not covered in this note, norare bamboo poles or rattan, both of which are classifiable inChapter 14. To the extent that bamboo or rattan has been processed intoa product covered in Chapter 44, the tariff information provided inSection D might be relevant.
2For a development of the question of forest classification andnomenclature see "Tropical Forests Ecosystem - a state of knowledgereport", prepared by UNESCO/UNEP/FAO, 1978. For a short survey of theworld's major forest regions, in terms of wood resources, with a summarydescription of forest characteristics, see "Wood Resources and Their Useas Raw Material", UNIDO/1S.399, Aug. 83 (based on FAO's comprehensiveforest documentation) and, for a short descriptive commentary, a specialissue of the publication "Co-Evolution", No. 15 (83/84).

MDF/W/52Page 9
has been invested by many individuals, research institutions andcommittees in arriving at a uniform international nomenclature for theidentification of the main species used and traded. Even so, thereremain today at least some five hundred different wood species-varietieswhich are of actual or potential significance in international trade.It is clearly beyond the possibilities of a note like this one to dealin any detail with all the possible variants. The approach adopted wastherefore, to examine, first, the existing import tariff schedules ofGATT member countries and, then, to note the kind of distinctions made,by species or otherwise, and, finally, to examine these distinctions andthe effect they may have on trade. On the basis of this examination, itcan be said that the species-distinctions in the tariff schedules ofGATT member countries are, on the whole, quite limited. Nevertheless,such species-distinctions as do exist in the tariff schedules could, insome cases, be a source of uncertainty as to what tariff treatment isapplicable to a given wood variety, or to the products made thereof.
8. As regards statistical tabulations, two approaches have beenadopted. One, as in Table I - Section A, attempts to provide a"snapshot", as it were, of the situation at a given moment, bringingtogether various elements which, it is hoped, will permit an overallimpression to be gained of forest resources, current forestry productionand use and the Interaction of resources and needs on trade flows.Similarly, in Table II - Section B, it is attempted to providefollow-through data on timber availabilities, the primary manufacturingstages which the available timber undergoes in given countries (takingaccount also of net imports or exports) and, finally, an account of thetype and approximate volume of wood semi-manufactures and of woodpulpavailable for further processing. The juxtaposition of the various datais not without risk and in order to avoid, to the extent possible,misleading conclusions to be drawn from these summary tabulations,relating to one year only, attention is invited to the variousqualifying remarks in the text of this note. The second approach is ofthe more customary nature, setting out statistical data on trends inproduction and trade by means of time-series tabulations; these areshown in Annex I-B and Annex II.
9. Given the vast amount of forestry data which are compiledworldwide and the practical difficulties not only in presenting these,but also in reading tightly packed statistical tables, this note optsfor selectivity, limiting the data presented for forest resources andproduction in the summary tabulations to 1979. For import and exportdata in Table III (which also gives origins of import and exportdestinations) and in Table IV, the data shown were the latest available(up to 1982) when Spec(84)13 was issued. Data in Section D (Table V)are, again, the latest available or, for MTN trade concessions, thefinal MTN tariff rates (i.e. those applied as of 1.1.1986, or1.1.1987). As regards Annex I-B, production and trada data are shownfor 1963, 1973, 1979 and 1981. Data covered in the trade matrix in
1Among these, dealing with a wide range of forestry-researchrelated topics, the International Union of Forestry ResearchOrganizations (IUFRO), founded in 1891-92, might be cited. Today, IUFROhas a membership of about ten thousand scientists, and 500 institutesfrom 85 countries - united in promoting international co-operation inforestry research activities.
2An indication is also provided of import duty reductions to bephased in by Japan over the period 1986 to 1988.

MDF/W/52Page 10
Annex II cover 1963, 1973 and 1981, unless otherwise indicated. Theyear 1963 was chosen as a point of departure, because UN statisticsavailable for that year are more readily comparable with statistics forsubsequent years than the pre-1963 data. 1973 seemed a logicalinterval, was a year of high-level wood industry activity in NorthAmerica, but is also the year in which the post-war housing constructionboom in Europe came to an end; 1979 was chosen because much of theresource/cum/production statistics available from different sourcescould be related to 1979/80 and, finally, 1981 was chosen as the yearfor which data for a considerable number of countries were available atthe time of writing. Several of the developed countries in 1984 and1985, saw a recovery in forestry industry product:Lon and trade, oftenfalling short, however, of the peak levels reached in the mid 1970's, orin 1979. Nevertheless, the data for these earlier years do provide anindication of most countries'forestry related activities and interests.Certain recent trade developments are, to the extent possible,identified separately in later parts of this note.
10. While only a relatively small part of the world's total forestryproducts production moves into international trade (say, around 10 percent, in terms of the volume of industrial roundwood productionequivalent) exports of wood-, cork- and semi-manufactures thereof and of
IThe trade situation, which, for practical purposes, in Spec(84)13had to be frozen in 1981/82, has, of course, further evolved. While theperiod 1981 through the first half of 1983 can, in general, becharacterized as recessionary, for both production and trade in forestryproducts, an improvement in trade opportunities and in the actual volumeof trade flows, particularly those destined to the United States, can benoted as from the second half of 1983, when - in some cases - the highpoints reached in the 1970s were again attained, or even surpassed, withsome exceptions, notably a stagnation or even decline in the volume ofshipments of tropical wood semi-manufactures from Africa to Europe, areflection of the recession in housebuilding and construction activityin Europe (Imports of tropical sawnwood into Europe peaked in 1979).The upturn in demand for forestry products in certain markets over thelast two years notwithstanding, the profitability record of the forestproduct industries was rather mixed, depending not only on past andpresent management results of the enterprises concerned, but dependentalso on the structure of firms, with those firms that could benefit fromthe earlier and more significant upturn in demand for such downstreamproducts as pulp, paper and paper products experiencing generally betterreturns than firms dependent on wood products only. Like prices formany other commodities, export prices for logs and lumber ininternational markets in the mid-Eighties were, on the whole, belowthose of earlier years (but are now expected to firm). Early 1986returns point to a slowdown of export growth for several major forestryproducts exports and possibly a weakening of export prices for woodpulp.It should, however, also be recalled in this context that, since thetrade data for 1979, 1981 and 1982 were recorded, the world's majortrading currencies have undergone repeated - and sometimes major -
adjustments which have, of course, not been without repercussion ontrading opportunities and the direction of trade-flows. Recent changesin petroleum prices will also not be without repercussions on productionand trade-flow possibilities.

MDF/W/52Page 11
woodpulp, from all sources, are important in international trade,amounting to somewhat more than 31 thousand million bS dollars annually,on average, in 1979 and 1980 (not including certain finished woodmanufactures or furniture), or about 1.7 per cent of world exports ofall commodities.
11. It is important to bear in mind that the wood-processing industrieshave undergone major technical and structural changes since internationaltrading opportunities opened up again, in a significant way, in themid-1950s, when the combined effect of the ravages of war and, as aresult thereof, currency restrictions, had started to be overcome inmany countries, and when efforts and institutional arrangements forregional and global co-operation, including those arising from the earlyGATT multilateral trade negotiation rounds, started to take effect.
12. On the technical side there have been remarkable changes in forestcultivation, -harvesting and -logging practices and facilities.Silviculture, as a science, and in actual practice, has made greatprogress. At the level of the wood-processing industries,machine-shaping and -joinery has become increasingly widespread, while,unfortunately, artisanal skills have been on the decline, at leastrelatively so. Increasing reliance on machine processing has favouredthe use of uniform, homogeneous inputs. This, in turn, favouredincreasing use of the technically more homogeneous coniferous woods (interms of processing characteristics), then increased use of blackboard,plywood and fibre- and particle-board, of varying characteristics andspecifications, and of certain varieties of tropical woods.
13. The increasing availability of these items and particularly so the,by now, widespread use of particle-board and fibre-board (at least inthe developed areas), has considerably enlarged the raw material base ofthe industry. "Wood-waste" (both processing-waste and waste-wood, i.e.wood from species previously considered unfit for joinery, panel-boards,and pulpnrs) has become a very relative term, indeed. Newwood-lar.,nating, wood-preservation and wood-colouring techniques havestif "jrther enlarged the resource-base for the industry by opening upuse-possibilities for less durable and less decorative woods (of whichone demand-enhancing variant is a partly transparent overprint processfor otherwise non-decorative veneers). As regards pulpwoodrequirements, the recycling of paper, increased use-possibilities forshort-fibre hardwood pulps and of wood chips, including those fromrubber trees and mangrove tree varieties, have still further enlargedthe raw material base. Moreover, pulping processes which produce largerusable quantities of pulp for a given quantity of wood input, ascompared with conventional, chemical, pulp-manufacturing processes, arecoming more widely into use. Nor are developments at their end. Greatstrides are being made in developing production and markets for greater
IMore than 2.0 per cent if paper were also be included. The1.7 per cent figure also does not cover the not inconsiderable value ofwooden crates and packings, used in exports of non- wood products.

MDF/W/52Page 12
strength "oriented-flakeboard". The increasing availability and use ofmedium-density fibreboard - more recently also in Europe - increasescompetition for natural wood in furniture making. Greater use ofexterior-grade flakeboard for construction will increase competitivepressure on construction-grade plywood. Fighting back, the plywoodindustry has now under development processes and center-less veneerlathes for producing technically acceptable peeled plywood veneer fromsmall-diameter logs. The particle-board industry's response is afurther speed-up in panel-forming and pressing processes. Computercontrol or sorting, sawing and milling operations is starting to spreadfor producing sawn and milled wood products. Milling machines withmicrochip-sensors and precise, motor- or hydraulically-controlled,operations, and even high pressure water-jet cutting and lasercontrolled finishing and cutting techniques are starting to make theirappearance. Certain production processes, such as door manufacture(sometimes wafer-thin veneers over a honeycomb cardboard core) and eventhe fabrication of wall-size panels for pre-fabricated houses (inparticular2European modular prefabs), are starting to be fullyautomated.
14. The whole of the forest products trade has been impacted in a majorway by the rapid development of the export trade in tropical timber,estimated by FAO to have grown, in log equivalents, from about 7 millioncubic metres in the 1950's to approximately 70 million cubic metres in arecent year. While in the early 1950s only a few dozen tropical woodspecies were of some significance in international trade, the number of
'This is primarily a North American development and is only nowstarting to spread to Europe where it is also known as structureboard,or waferboard ("Stirlingboard", in the UK). Outer - and inner - layersof thin woodflakes are put down in different directions, rather than atrandom. This orientation gives more strength (two- or three-foldincrease in bending strength). (Because of their matted appearance suchboards require veneer or plastic overlays, if intended for furnituresurface materials.) As regards medium density fibre (MDF) board it isprobably correct to say that (once it becomes more widely available) itcould have a wider range of uses than any other manufactured boardmaterial. MDF board has high strength, smooth surfaces, excellentmachining characteristics (like good, solid wood) good edge quality andgood finishing properties.
2An interesting summary description of modern manufacturingprocesses in the wood processing industry and the characteristics anduses of many types of wood semi-manufactures was recently published in"A Review of Technology and Technological Development in the Wood andWood Processing Industry and its Implications for Developing Countries",document: UNIDO/IS. 413, of Nov. 1983. For somewhat broader aspects ofwood industry production and trade developments, with particularemphasis on tropical wood varieties, attention is invited to (FAO) UNIDOdocument "Wood Resources and their Use as Raw Material", UNIDO/IS. 339,and "First World-Wide Study of the Wood and Wood-Processing Industries",UNIDO/IS. 398. Another, recent, study to be mentioned is "MechanicalProcessing of Tropical Hardwood in Developing Countries: Issues andProspects for the Plywood Industry's Development in the Asia - PacificRegion" in: Case Studies on Industrial Processing of Primary Products,Commonwealth Secretariat and IBRD.

MDF/W/52Page 13
tropical species traded now is figured in hundreds. Originally, exportsfrom tropical suppliers consisted mainly of logs. Many of thesecountries now restrict or prohibit, or otherwise discourage, logexports, while encouraging exports of sawnwood and plywood, exports ofboth of which have expanded manifold, as have exports of other productsmade of tropical wood varieties.
15. Problems of log restrictions have, in some cases, been overcomethrough joint ventures for forest-resource exploitation, accompanied bythe establishment of transformation industries and internationalmarketing support measures. Many of the forestry enterprises which havesprung up over the last two decades have been geared expressly tosupplying export markets and most of these ventures have been quitesuccessful in this respect. Joint ventures and transnational investmenthave not been limited to developed and developing country co-operation,but are also a feature of developed-cum-developed and developing-cum-developing country co-operation. As joint ventures spread, trade flowswere affected, and so were production developments in various locations.
16. Large-scale increases in exports of semi-finished wood productsto distant markets have been made possible by standardizing grading,performance specifications, shipping documentation, contract conditions,transport and also improved customs clearance facilities, assisted,inter alia, by the work of international standardizing bodies.Container transport is becoming increasingly important for shipments ofwood semi-manufactures and is also widely used for shipping waste paperto be recycled into paper and paperboard manufactures. After the spreadof shipping bundled lots, sometimes palletized, the development ofspecialized ocean transport and of special port terminal-facilities havebeen key elements in the development of that trade. Part of the tradein woodpulp is conducted on the basis of long-term supply contracts;for transport to Japan some 70 special purpose wood-chip bulktransporters ply the Seas. In some cases the interested industries -particularly in respect of pulp and products made thereof - havediversified both their sources of raw material supplies and their marketoutlets through international investment in the form of new foreigninvestment, by acquisitions, or joint ventures, all spurred byincreasing demand for wood, pulp and paper, in the face of expandingconsumer markets and explosive growth in the needs of the print -,publishing and communications-media, for data-processing uses (so farthe paperless office is a myth, but work on many fronts (including byECE) for standardizing intra- and inter-industry and transport-documentation electronic data interchanges (EDI), aiming at anincreasingly paperless office-environment) is accelerating, and in usesfor sanitary purposes and by the packaging industries.
IFor a recent bibliographical listing of ISO standards for wood,wood semi-manufactures, cork and for paper pulp, see ISO document"1 Bibliography", 4th edition, Geneva, March 1984. Among internationalbodies involved in wood-industry products' standardization work, theUN/ECE should be mentioned. For ECE-recommended standards forconstruction sawn-wood, cf. Timber Bulletin, Volume XXXIV, supplement 16,November 1982. Work on shipping policies, standardization of freighttariff rules, multi-modal (door to door) container traffic, etc., hasbeen, and continues to be, undertaken by UNCTAD and OECD.

MDF/W/52Page 14
17. Certain forest resources, hitherto largely inaccessible, are seenas becoming exploitable, for instance additional timber and wood-chipsfrom the USSR could become available for export in the wake of ongoingexploration and development of resources in Siberia and the expansionand improvement of the USSR's transport system. In the Amazon Basin,considerable progress has been made for operating, on a sustained-yieldbasis, several large woodpulp complexes, the output of which is destinedpredominantly for export, and, overall, the accessibility of the Amazonregion's forest resources is improving, as transport infrastructure-development (including rail) proceeds. In other regions of the world(for instance in New Zealand, South Africa, in several EEC countries andin parts of the United States) output from timber and pulpwoodplantations, established in earlier decades, is starting to becomeavailable for harvesting and is already a factor in the market.Pulpwood plantations are also being created in several locations inAfrica, in Asia and in Oceania. Reforestation efforts are beingintensified almost everywhere.
18. While it will be seen from Section A that different regions andcountries are differently endowed with forest resources, either in termsof forest per total land-area, or forest resources per caput, and whileforestry policy objectives are, by necessity, accorded different levelsof importance within different countries' socio-economic policyobjectives, it can be said, generally, that the governments of all ofthe countries covered by this note are keenly aware of the need toprotect forest resources and all of them have on their statute bookspolicies for maintaining forests at desirable levels and, wheneverpossible, to manage this resource so as to obtain sustained yields andto balance short-, medium- and long-term interests. This is trueregardless of whether forest-ownership is public, provincial, communalor private. There exists considerable concern and international supportfor the adoption of appropriate forest management policies and someinternational financial and technical assistance has been directed tofinance efforts for halting desertification and for promotingreforestation, including schemes financed by the EEC, by individualgovernments and by the IBRD and by regional development-banks anddevelopment-associations.
19. As regards trade, it will be noted that, as a result of variousregional-integration schemes and -preferential arrangements, thesuccessive Lom6-Conventions and the GSP, a large part of internationaltrade in wood and wood products has been moving free of import dutiesfor some time, at least as far as imports into many developedmarket-economy countries are concerned. Undoubtedly, the differentregional arrangements are of considerable importance in promotingregional economic development and trade expansion. This is the verypurpose of these arrangements. Yet, for the group of products coveredby this note, an examination of the data in Table III-B, on import-sourcing and export-destinations, shows (North America, perhaps, excepted)that resource- and trade-complementarity is often more important betweendifferent regions than within a given region or preference-area.
20. Trade liberalization and duty-reduction or elimination in variouscontexts notwithstanding, some wood products and wood-derivative productsare considered "sensitive" in several developed countries and continueto be (or are now [temporarily]) subject to positive m.f.n. importduties, which may be relatively high, in some instances. M.f.n. importduties on wood and wood products in many of the developing countries arevery often high, though, perhaps, not higher than import duties for manyother classes of goods.

MDF/W/52Page 15
21. Since virtually all countries have some forests or woodlands and,associated therewith, some wood production and -processing, imports ofwood and wood products are quite often considered as being not amongessential import needs and are thus likely to be among restricted itemswhen balance-of-payments import restrictions, currently widespread inthe developing areas, are imposed.
22. Less favourable tariff treatment for wood and wood products,depending on origin, is a matter of serious concern to a number ofcountries, including some of the major forestry products producers andexporters. In past discussions, these countries have pointed out thatfor many types of forestry products the market is highly competitive andprice sensitive, with the result that even relatively low nominal ratesof duty can have disproportionate effects on export marketingpossibilities, particularly when tariff protectionism on top of suchnatural protection as significant transport costs. Another area ofconcern as regards wood products is the existence of differentiation intariff treatment for given products having the same use, but made fromdifferent woods. Another question that arises is the level of effectivetariff protection, as compared with nominal tariff levels.
23. From such documentation on non-tariff measures as has been examinedfor this note, it is evident that certain non-tariff measure obstaclesto trade in forestry products exist. Some of these measures areintended to deal with temporary problems (mitigating storm damage, ormeasures for protecting the balance-of-payments) or with measuresdesigned to protect the flora, or health (formaldehyde emissions, etc.).Other measures may be designed to serve forest-resource maintenance or-development, or social policy objectives. The picture of the manypossible and varied government support activities, actual or onlyperceived, gets blurred, and sometimes very complicated, by the factthat the State is, ..in many instances, the owner of part, perhaps eventhe major part, of the forest resource. Forest resource disposition- ordevelopment-measures thus become merged with general economic objectivesand policies.
24. Like other sectors of trade, international trade in wood andwood-products is affected by numerous technical standards andregulations. A reading of the relevant documentation suggests that someof the existing technical barriers to trade are, perhaps, due toinsufficient familiarity of importers, exporters and administrationswith the technical characteristics of wood and wood-products availablefrom, and being offered for export by, suppliers in other countries.There is some indication that problems in this area, notwithstanding thefact that standards are sometimes set and enforced by national- orregional professional or industry associations, can often be, and havein the past been, resolved through bilateral consultations betweeninterested countries.
If recently published data on international transportation costfor US imports in 1981 are generally representative, the freight factor(ratio of international transportation cost to the free-alongside valueof the product being shipped) for lumber (and even more so for paper andpaperboard) is particularly high, when compared with freight factors for18 other broad import categories. Ref: H. McFarland "TransportationCost for US Imports from Developed and Developing Countries" in TheJournal of Development Studies, London, Vol. 21, No. 4, July 1985.

MDF/W/52Page 16
25. Special thanks are due to the Geneva-based Timber Section of theECE/FAO Agriculture and Timber Division for the generous access providedto their reference library facilities. Without this facility thepreparation of the overview note (within a relatively short span oftime, when Spec(84)13 was first presented) would not have been possible.The findings arrived at in this note are, of course, the soleresponsibility of the author. Suggestions for any corrections oramendments that might be required will be appreciated.
1Since Spec(84)13 was circulated, 1985 having been designated"International Year of the Forest", much further research by manyindividuals and institutes has gone into the investigation of theworld's varied forest resources, their protection, and their proper usefor social and economic development. Some of the research results,findings and conclusions, for instance those published in connectionwith the IX World Forestry Congress (Mexico, July 1985) and consideredto be relevant for this note, have - to the extent possible - beenreflected in this revision and partial up-date. Last, but not least, itshould be mentionned that ECE/FAO in September/October 1985 published anup-dated and much expanded survey of "The forest resources of the ECEregion (Europe, the USSR, North America)". The wealth of informationprovided by that survey (some 200 pages, including notes on methodology)goes well beyond the summary information, based to some extent onearlier ECE/FAO survey data, attempted in this note. Other material,such as papers prepared for UNIDO's recent "First World-Wide Study ofthe Wood and Wood Processing Industries" did become available in time tobe reflected, as appropriate, in this note and account has also beentaken of some of the major conclusions of the first meeting of ILO's,recently established, Forestry and Wood Industries Committee (cf. ILO,document IC/FWI/1/17 - 1986).
MDF/W/52Page 17
A. FOREST RESOURCES, THEIR USE AND POTENTIAL
26. The main thrust of this overview note is aimed at trade-relatedtopics. However, as primary production and, thereafter, exports of wood(and some of the products derived therefrom) depend on the existence ofan adequate natural resource base, namely forests of various types andspecies-composition, it seems relevant to consider briefly that resourcebase, first globally, then by regions and, in tabular form, bycountries.
27. On a global basis, were it not for the competition in land-use byagriculture, pasture, fuelwood collection, timber offtake, urbansettlement, road networks, and, in some regions, an expanding desert,more than 60 per cent of the world's land surface might be, andpresumably once was, covered by forests, nature's way of providing aprotective cover for the soil. As it is, the original natural forestshave been much thinned out, in some areas to the point of virtualdisappearance. Overall, only slightly mor? than 30 per cent of theearth's land surface, or 4,100 million ha. , is now covered with closedforests or other wooded land, wherein the latter designation,standardizing efforts for common definitions notwithstanding, allows aconsiderable range of interpretations as to the nature and density oftree-stands. It is estimated that about three-fourths of the world'sforest/wo2dland area would qualify for the designation "closedforests".
28. As regards types of natural forests, one finds pine, spruce, birch,aspens, alders and larch in the boreal forests in the North, then,proceeding southward, vast stretches of increasingly more varied standsof conifers, mixed conifer-broadleaved forests in the temperate regions,sparse tree coverage in most of the Mediterranean regions, some scrubsand woodland in the savanna, then, increasingly dense, humid forests andthe wet, evergreen tropical forests of Latin America, Africa and Southand South-East Asia and parts of Oceania. Tree coverage decreases againas one moves still farther south, except where a maritime, humid climatefavours forest growth, such as in parts of southern Chile. In allregions, elevation above sea level makes a considerable difference as tothe type of forests one finds, with, as a rule, coniferous tree-standson the flanks of the great mountain ranges. Australia and such insularlocations as Madagascar are different again as regards flora and forestcharacteristics. More than one half of all tropical shores are fringedwith mangroves and the great river systems on earth have their owncharacteristic forests. Different tree species have, over the ages,found the particular ecological niche most suited to their needs, or oneto which they could adapt. This has led to a bewildering variety oftree species, most of all in the tropical forests.
IOne hectar (ha.)2= 100 x lOOmetres = 10,000 square metres = 2.47acres; 100 ha. = 1 km2 1 million ha. = 10,000 km , cf. alsofootnote 2 on page 13.
2"Closed forest" is a forest which has a closed tree canopy."Other wooded land" designates, in general, areas where treespredominate, but without constituting a full tree canopy. (Closed
.1/.

MDF/W/52Page 18
Footnote (cont'd)
forests - as defined by FAO - are those which, by their different strataand their undergrowth, cover a large part of, or all, the ground andwhich, in general, do not have a continuous herbaceus stratum (except incertain coniferous forests.) Other wooded land - also "open treeformations" - are those in which the canopy is generally less closed.These are essentially mixed broadleaved forest-grassland formations,such as the South-Amercian "cerrado" and "chaco", the African woodlandsand wooded and tree savannas. - FAO Forestry Paper 37). About 1,600million ha. of closed forests are in the temperate zone and about 1,200million ha. in the tropical regions. The volume of standing timber perhectar in the closed forest averages 80 to 100 cubic metres in thetemperate regions and 100 to more than 200 cubic metres (on account ofthe more active bioclimatic conditions) in the tropics. The estimatedtotal volume of growing stock of closed forests is 145,000 million inthe temperate regions and about 185,000 million in the tropical forest.About 75 per cent of the forest area in the temperate and northernregions is covered with coniferous stands. Coniferous forests accountfor 2.5 per cent of total forest area in the tropical regions. The term"other wooded land" applies to about 400 million ha. in the temperatezone and 750 million ha. in the tropical area. Total growing stock inthese "other" woodlands is estimated at 20,000 million cubic metres,two-thirds of which is in the tropical regions (as defined by FAQ, thearea occuring between the Tropics of Cancer and Capricorn). Less thanone-half of the forest area is considered "operable" - the remainder isnot operational for a variety of reasons, such as physical or economicinaccessability, or legal constraints designed to preserve the forestfor its protection potential. The operable volume of growing stock inthe developed areas is estimated at 96,000 million cubic metres (ofwhich 72,500 million coniferous). The figures for total (figures forconiferous in parentheses) volume of operable growing stock, in1000 million cubic metres, are: North America - 36.4 (26.6); Europe -14.1 (8.8); USSR - 40.0 (33.2) - other developed - 5.5 (3.9). Theestimated volume of total growing stock in the developing areas (much ofit not operable, however) is of the order, in 1000 million cubic metres,of close to 80.0 for South, -Central America and Caricom, 38.8 forAfrica and 43 for Asia (including insular). Ref: "Wood Resources andTheir Use as Raw Material"; op.cit.

MDF/W/52Page 19
29. Broadly speaking, the USSR accounts for about 22 per cent of theworld's forest area (about 29 per cent of world closed forest area). Ofthe world's coniferous forests, the share of the USSR, in terms of area,is about 60 per cent. Total growing stock (in 1975) was estimated at74,700 million cubic metres. Growing stock of "operable" forests(i.e. physically accessible and with logging plans) is of the order ofclose to 50,000 million cubic metres (including stands newly accessiblevia the BAM railroad and feeder lines). Coniferous specie representmore than four-fifths of the USSR's operable forest stock. Thecorresponding percentages for other regions, as regards total forestarea (and closed forests respectively), are: about 19 per cent (7 percent) for the African continent; about 19 per cent (22.5 per cent) forSouth- and Central-America; 15.4 per cent (17.6 per cent) for NorthAmerica; about 13 per cent (15 per cent) for Asia; 4.6 per cent (3 percent) for the Oceania Pacific region; 4.1 per cent (5.2 per cent) forthe European region. For the world as a whole, somewhat more than onehalf of the forest and woodland area is located in developing countries.Forest resources in terms of ha. of closed forest/per caput (plus ha. ofopen forest/per caput) in the early 1970s were estimated to be of thefollowing orders of magnitude: North America 2.0 (0.7); CentralAmerica 0.5 (0.02); South America 2.4 (0.7); Africa 0.4 (1.3);Europe 0.3 (0.1); USSR 3.0 (0.4); Asia 0.2 (9.3); Oceania and Pacificregions 3.6 (4.8). World average: 0.7 (0.3).
30. In terms of total area under forests, it can be said that in mostof the developed countries the forest area is either stable, orincreasing slowly. In the developed countries most lumber companies andState forest administrations act on the principle that they are not inthe tree-cutting business but in the tree-growing business; theobjective is not only to preserve the area under forests but also tomake each hectar of forest produce annually more timber than is cut(until final harvest and/or replanting at a given site). In most of thedeveloping countries, despite recent attention and ongoing efforts forreforestation, or afforestation, the total area under forests is stilldecreasing. As population growth in most developing countries is high(absolutely, or in relative terms), average per caput availabilities offorest land in the developing countries have probably declined since theabove estimates were published.
31. Not only is the forest-resource endowment different from region toregion, but there are also great differences in the way this resource isused. In the developed countries the overwhelming part of the forestresource, if harvested, is nowadays, it was not always so, destined forthe market. In order to be profitable, it is marketed largely forindustrial uses. In most of the developing countries, however,conditions are such that most of the wood removals are for firewood, forcooking and heating.
North America's coniferous forests account for more than onefourth of the world total.
2Data based on, and adapted from, "The Global 2000 Report to thePresident" - US Council on Environmental Quality and US Dept. of State,Washington D.C., 1980. Summary data on land suitable as arable/cum/cropland and of forest land potential in different regions of the worldare given in the GAIA Atlas of Planet Management, Pan Books Ltd,London 1985, pages 24-32. Data on total forest and woodland areas ofGATT countries are given in Table I of this note.

MDF/W/52Page 20
32. While in Latin America, except for unexplored and unsettled areas(such as the vast 'terras devolutas' in Brazil, which are owned by theFederal Government), much of the land, including the forest, isprivately owned, in Africa and Asia, and partly in developing Oceania,the forests are administered and exploited on the basis of communal-,rather than individual- or State-ownership, although the State oftenholds ownership-title. The communal rights and uses include thegathering of forest-fruits and -fibres, the collection of wooden polesetc. for construction, and of firewood, as well as certain grazing andhunting rights. This system works well as long as sufficient forest-space in relation to population and its needs is available. Oncepopulation increases significantly, strains on the system develop rapidly,starting normally either from the fuelwood- or the food-shortage end.Once food starts to be in short supply, pressure arises for bringingadditional land under cultivation. As easily cultivable land is normallyalready being exploited, this means recourse to nearby forest land. Theforest is cleared, often by burning, and food crops are then planted.Within two to three years, tree-undergrowth and weeds (which are difficultto eliminate from the imperfectly cleared ex-forest plot) take overagain, making agricultural pursuits toilsome and unproductive. Thisprovides an incentive to repeat the clearing/cum planting operation on anew plot - i.e. shifting cultivation, which leaves behind a degradedforest and is at present-, probably, the main source of overall forestdestruction in the developing areas. In the forests of some of thedeveloped countries, wildlife populations (both small and big game) arerising rapidly, the result both of recent restrictive regulations andreduced forest-care operations. There is some reason to fear long-termdegradation and damage to the rejuvenation of existing natural forests(a matter which is particularly serious in respect of protectivemountain forests), due to excessive forest resource use (including forsports and leisure), or destruction by wildlife or, in some cases, feralanimals.
33. Collection of wood for fuel needs places a heavy toll on theforest. First, deadwood is collected. When deadwood is gone, branchesare chopped off. Finally, the trees go. With fuelwood lacking,agricultural waste materials and dried animal dung are used for fuel.With less natural. fertilizer thus available, soil fertility and foodproduction-capacity declines. This produces pressure for more land tobe brought under cultivation, which manifests itself in increased pressureon remaining forest lands. When combined pressure for fuelwood andcultivable land leads to increased hillside-farming and fuelwoodcollection, soil erosion makes rapid headway, followed by silting ofwater-courses and flooding, creating new and additional problems overwider and wider areas. In the arid and semi-arid zones of the world,wind, rather than' water, is the main agent of erosion. Once theprotective cover of trees and shrubs is removed, most often for firewoodand animal fodder, the destructive force of the wind is unrestrained.The fine fertile soil particles are swept away, leaving the heavier,sandy ones behind. The soil becomes progressively less fertile and lessproductive. Once wind erosion has started, the moving soil particlesadd to the process, in sand-blasting fashion, scouring everything intheir path.
IThe question of forest ownership - very relevant in the context ofassessing resource potential - is a very complex one. Some of thesecomplexities, starting with the very definition of what constitutes a
./.
MDF/W/52Page 21
Footnote (cont'd)
forest (with considerable differences between different countries), arehighlighted in a "unasylva" review article (in Vol. 37, No. 148 (85/2))of "Forêt et environnement en droit compare et international",M. Prieur ed., Presses universitaires de France, 1983.
2J. Westoby, in a book review article, published in "unasylva",Vol. 37, No. 148/85-2, makes the point that it is a misconception toassume that tropical deforestation is necessarily the result ofoverpopulation, recalling that vast areas of tropical forest weredestroyed in centuries past, in places and at times "when there waslittle if any population; indeed, populations - slaves and laterindented labour - had to be brought in to accomplish the deforestation... Brazil's northeast, and most of the Caribbean were deforested in thesixteenth and seventeenth centuries ... in all three tropical regionsdeforestation accelerated in the nineteenth century ... Throughout thetropics it was export-oriented agriculture that pushed the forest back".Even now, the problem is seen as being caused by shifted cultivators(their lands having been absorbed by other users and, perhaps, uses)rather than by shifting cultivation, which, as previously practised, inaccordance with tribal traditions, was ecologically sustainable. Allthis argues for appropriate reforms in many of the areas where tropicalforests are now under assault. More generally it can be said that theterm "shifting cultivation" is variously used by different authors, andthe practice of shifting cultivation may produce widely differingresults. An interesting summary of work conducted by FAO onalternatives to shifting cultivation (in collaboration with researchinstitutes in the UK, Netherlands, France, Tanzania and Ghana) is givenin an article by J.P. Lauly, in "unasylva", Vol. 37,No. 147 (85/1).
3Cf. FAO, WFD/1/1985.

MDF/W/52Page 22
34. In the tropical forests, where fuelwood is not generally in shortsupply, forest clearing for agricultural uses also has its problems; anestimated 11 million ha. of tropical forest and woodland (of which7.5 million ha. in the "closed forest" category) are "cleared", ordegraded each year. Tropical forest soils are generally poor innutrients, so much so that no single tree species can establish itselfas truly predominant. The great species variety Tf the tropical forestis a reflection of the poor soil nutrient levels. The bulk of thenutrients is in the living phytomass, e.g. the trees, shrubs and theunderbrush. Leaves are shed and new leaf growth occurs round the year,and, apart from a shallow layer of surface soil, there is consequentlylittle humus formation, as everything is recycled very rapidly,especially so as most tropical trees - once fallen or felled - are notvery rot-resistant, in the hct and humid environment. When the treesare removed, only few nutrients remain in the so-J. The shallow surfacelayer, even if enriched by ashes - as in slash burning - is quicklydestroyed by weathering and leaching. The forest-to-atmosphere, andback again, water-cycle (forests create their own micro-climate) isinterrupted, the soils dry out, get parched and become unproductive, asnutrient elements needed for plant growth (nitrogen, phosphorus,potassium, calcium, magnesium) are often in short supply - while levelsof aluminium and iron, in a way toxic for plants, are frequently high.Thus, after one or two relatively satisfactory harvests, there is anincentive to shift cultivation to other plots oa virgin forest lands,with all the longer-term problems this entails.
35. These are not imagined scenarios. Even though some of theunderlying statistics on fuelwood-use and -needs, and on the extent ofshifting cultivation, are only estimates, the problems cited are realand widespread. Fortunately, policies and measures for halting thedestruction or degradation of forest resources are being adopted almosteverywhere. Among measures being introduced are the establishment offuelwood-plantations, promotion of better coppice practices, the
IThe fact that most tropical tree varieties (unlike the temperatezone forest-tree varieties, which are mainly fertilized by wind-bornepollens) depend on very specific pollinators (a specific insect varietyor a specific animal) for effective pollination, is another reason.
A concise summary of the status of the world's rain forests, theiruse and protective measures, country-by-country, is contained in "RainForests", National Geographic Magazine, Vol. 163, No. 1, January 1983.
3According to recent FAO estimates, 100 million people indeveloping countries already have insufficient fuelwood for cooking andheating. Another 1,000 million people can only meet these needs bydepleting fuelwood resources. Asia experiences the most acute fuelwoodshortages. Almost all of India and Pakistan are affected by fuelwoodshortages, as are the more heavily populated plains and islands of SouthEast Asia. The Himalayas are particularly badly stricken. In Africathe most severe shortages are in East Africa and Madagascar, but all ofthe arid zones are in danger. In Latin America, the Andean plateau andthe Eastern plains of Brazil are the most critical areas. Ref. FAO,document WFD/1/1985. A detailed map of the fuelwood situation in thedeveloping areas, country-by-country, was published in 1981 by FAO, as a"unasylv" supplement.


MDF/W/52Page 23
introduction of cooking stoves, stricter land-use regulations andimproved agro-silvicullure practices and, to halt desertification, theplanting of windbreaks , hopefully to be complemented by better(holistic!) range-management. With few exceptions, progress in allthese endeavours is slow, however.
36. Reduced, and perhaps declining, as the earth's forest cover..ge maybe, the world's forests continue to be so large as to be defined andappraised only with great difficulty. What is even more difficult is anassessment of the way it can be seen as a resource, since forest-policyobjectives and -uses overlap with many other sectoral and general policyobjectives, to which different importance is attributed in differentsocio-political contexts, depending also on changing environmentalobjectives. In some areas of the world, where forest coverage is nowmuch reduced, because of intensive agricultural uses, the increasedagricultural land-use option was probably mainly prompted by economicconsiderations. For many governments, forest-policy considerationscarry less importance than agricultural policy objectives. Forests thatare being converted to agriculture provide food already in the shortterm, while the forest itself is seen more as a capital asset, often anot very productive one, or productive only in the longer term. It is,of course, realized that forestry activities, including reforestationwork, do provide employment opportunities, an aspect accorded very highimportance in some developing and developed countries. It is alsorecognized that income generated by forestry related employment is fedback into the overall economy. Yet, wherever agricultural land isscarce in relation to food needs, the forests normally lose out toagriculture.
37. While in terms of purely economic returns forestry use objectivesmay now be determined mainly by medium-term considerations, long-termpolicy objectives are not absent. Contrary to a widely-held belief, theimportance of protecting the environment and preserving, orre-establishing, a proper balance between forestry and other land-usesis not something that has been recognized only recently. In fact,governments of most countries, and earlier on some colonialadministrations, have since long attached great importance to properforest management and the maintenance of a balanced ecosystem generally.In some countries forestry legislation goes back well over a hundredyears (in some instances to the late Middle Ages) and in other instances
'Partly under bilateral aid schemes, as in Senegal, where - withCanadian assistance - a 300 km. eucalyptus belt has been built to haltthe acivance of the desert. Other large-scale windbreak plantations,benefiting from international technical and financial assistancemeasures, include a project on the high plateaus of Ethiopia, a projectin Niger, started some time ago with assistance from the US and certainEC sponsored initiatives in some African countries, etc.; Algeria, onits part, has also made great efforts in combating desertification.
2Acceptance of wood-burning stoves, or hearths, which permit10-15 per cent wood-fuel thermal energy content to be recovered (insteadof 2-5 per cent in the typical, three-stone, open-pit fire which is,moreover, through high pollutant emissions, very detrimental to thehealth of users) by local populations is often difficult to achieve.FAO, among others, is doing considerable work for the adoption indeveloping countries of better technologies for the conversion of woodenergy into heat energy and/or mechanical energy. This is only a smallpart of a much wider, integrated, FAO "Tropical Forestry Action Plan",outlined in FAO document M-30 ('85/'86), bearing that title.

MDF/W/52Page 24
at least to the beginning of this century. In some cases (for instance,Switzerland, India) forest-policy objectives and prescriptions arewritten into the Constitution. In many cases forest use and forestryobjectives are regulated by national or federal and provincial laws.While the policy objectives are not always the same, virtually allprovide for maintaining a balance between silvicultural and agriculturaluses, and many of the implementing regulations insist on, and providefor, measures of, at least limited, reforestation. In the case ofprofessionally managed private forest lands reforestation measures areundertaken as a matter of course, even in the absence of Stateregulations. This is so also in the main tropical wood-producing and-exporting countries, notably those of South and South-East Asia and inWest Africa. As a result of these policies and measures, and, ofcourse, also the availability of substitute fuels and industrial rawmaterials other than wood (formerly based on wood, wood ash, etc.), andthe emergence of new sources of wood supplies through trade development,the area under forest in Western Europe and in the United States hasbeer growing, slowly but steadily, with some war-time exceptions,through most of this century. The provisions made for preservingforests for watershed protection purposes, for recreation, and aswildlife and botanical sanctuaries, are also of some significance. Inthe United States, national parks and federal forest lands, the formerfully protected and the latter protected in various ways, wereestablished as from the turn of the century, comprising a very largearea, indeed, and total f rest area in the US is now larger than at thebeginning of the century. Canada, with a total of some 340 million ha.
1The Cote d'Ivoire, for instance, is currently intensifyingreforestation efforts under a programme envisaging outlays equivalent toclose to US$60 million, somewhat more than one-half to be derived fromIBRD financing. More generally, in an IBRD, UNDP and World ResourcesInstitute (the latter a private, Washington-based research institute)study it is proposed to spend US$8 billion over a five-year period(beginning in 1987) to begin reversing the trend of tropicaldeforestation. Many tropical countries are to be covered in thisproposed project, with $1.2 billion earmarked for India and $785 millionfor Brazil. Several countries, including France and FR Germany(FF500 million and DM150 million, respectively, over five years),announced at the February 1986 Silva Conference in Paris large-scalefinancial assistance for protecting and building up again Africa'sforest resources.
2The federal US Government owns about one third (= 290 millionhectares) of all US land; 100 million hectares have been set aside asnational parks, wilderness and primitive areas and other similarreserves. No logging is permitted in these areas, so they are notconsidered commercial forests. Consequently, a large part of trees inthese reserves are over-aged, and thus vulnerable to insect attack anddamage (currently a major problem, also for adjoining private timberlands in Texas and Louisiana). Total commercial forest area, includingprivate and other publicly owned forest land, is of the order of200 million ha., of which about 120 million ha. is owned by privateindividuals, and about 21 million ha. by forest industry companies. Theremaining forests are publicly held in national and state forests, ofwhich 37 million ha. national forests, in which controlled logging ispermitted, but sometimes contested (even violently, nail-spiking,"ecotage") by environmentalists.

MDF/W/52Page 25
of forests, has set aside 9 million ha. as protected parks. In theBrazilian Amazon Basin about 17 million ha. is protected forest andforest reserves in other parts of the country have also been, or arebeing, created. Some of the countries in East Africa have very largeprotected areas of savanna woodland. Protected natural parks are alsoof importance in most of the countries of Western Europe, certain otherdeveloped Countries, and are also found in a number of developingcountries. This has to be taken into account in respect of data on3total forest areas, recorded in Table I for the different countries.
38. Any attempt to appraise the economic value of a given forest areamust evidently take into account such factors as forest composition bytree species, -age, growing stock, growth potential, cost of harvesting,transport, nearness to markets, market demand for the wood and otherforest products concerned, value and importance attached to other thaneconomic considerations, and, last but not least, alternatives andpreferences for either present or future resource use. In other words,the appraisal must take into account, inter alia, both current andfuture revenue and capital appreciation potential. Options available,and exercised, will depend not only on current market conditions forforest products, and on expectations as to future supply/demandrelationships and prices for forestry products, but also on the generaleconomic and fiscal policies prevailing in countries concerned and onthe ownership structure of the forests. That this is not idle
While the latter figure may seem small in relation to the overalllevel of the resource, the park area nevertheless covers an area largerthan the total area under forests in F.R. Germany, the three Beneluxcountries and Denmark combined. The Canadian forest resource proper,namely "stocked, productive, non-reserved forest land" is of the orderof 190 million hectares, of which 36 per cent is mature forest,3 per cent is over-mature, 45 per cent is immature forest and 8 per centconsists of regenerating areas. The degree of private ownership variessomewhat across Canada, but about 80 per cent of total forest lands areowned and administered by provincial governments and about 11 per centby the federal government. Private holdings account for over90 per cent of Prince Edward Islands' (the smallest province) 225,000hectares of forest land and almost 75 per cent of Nova Scotia's4.4 million hectares. Public agencies own about 90 per cent of the120 million hectares located in Ontario and Quebec and over 95 per centof the 116.5 million hectares found in British Columbia, Alberta,Saskatchewan and Manitoba. Source: Government of Canada - ForestryService, "Canada's Forests ... Fibre for the World".
2In Indonesia steps are being taken to require each of thecountry's 27 provinces to convert 10 per cent of the land to forestpreserves. Once these measures are implemented, the country will haveforest preserves totalling about 18 million hectares.
3For details in respect of ECE countries, see "The forest resourcesof the ECE etc.", 1985, op.cit.
4That there may be differences of view as to the true value oftimberland and other forest industry corporate assets has recently beendemonstrated in the context of a number of contested take-overinitiatives of some major forest product companies headquartered inNorth America.

MDF/W/52Page 26
speculation is demonstrated by the considerable difficulties whichwood-processing industries have in some countries, though possessinglarge forest resources, in persuading private owners to offer timber tothe market for industry or for pulping. The disposition to do so, aswell as to engage in forest-care activities, will depend, inter alia, onthe extent to which forest owners are dependent on forest-resourceincome, on the marginal tax rate to which such income may be subject(which under a system of progressive income taxes would be differentfrom case to case and, perhaps, year to year), special forestry- andland-tax provisions, inheritance taxes, etc. State aids to forestmanagement and/or forest harvesting, as in the case of some assistancecurrently provided in the fight against forest die-back, could also makea difference in the way forests are cared for ayd the level of stocksthat are removed and which then come to market.
39. One other important element in regard to forestry resource uses isthe fact that, apart from import duties, and from natural protectionprovided by transport costs (abstracting for the time being fromnon-tariff measures which could affect supplies and hence marketprices), timber prices in many markets are closely related to pricedevelopments in the international market. While, in principle, thisshould be considered desirable, certain problems may arise for properforest management and -use where such integration into the world marketof the forestry resource, and as a consequence fluctuating and often lowprices for timber, coincides with forestry activity being carried outjointly with agricultural activities which, through import protection,are less integrated into the international economy, the forest ownersbeing also farmers. In such cases, agriculture, benefiting perhaps froma variety of support measures, while forestry does not, or much less so,proper forest management may become a problem, with forestry activities
IWith the possible exception of Switzerland (mainly windbreakdamage removals so far) and of some of the countries in Eastern Europe,there was no evidence, at the end of 1985, of significant additionalquantities of industrial roundwood coming to market as a consequence offorest die-back problems in certain areas of Europe. This may, ofcourse, not hold in the future, but an attempt is being made by theindustry to accommodate die-back sanitation fellings (not yet a problemin most areas) through reduced fellings of healthy trees. It shouldalso be pointed out that, apart from some temporary pre-processingstorage problems, wood from die-back trees is normally just as strongand useful as that from the, presumably, healthy trees. In the UnitedStates South and South-East exceptionally large sanitation fellings in1985, to combat insect infections, have, however, led to a largeimbalance in supply and demand of roundwood, with offer prices fallingin some geographic areas to about one-fourth of the national average.(Cf. also footnote 2 on page 24). Developments in European andNorth-American forest die-back sanitation feelings, which may have aneffect on the market, are to be monitored by ECE under a project decidedupon in the autumn of 1985.

MDF/W/52Page 27
being neglected, as compared to agriculture. While, in terms ofregulatory policies and -measures for purposes of environmentalprotection most governments, have, by now, fairly wide authority andintervention possibilities (regardless of the type of forest ownership),possibilities for directing the use of forest resources in the non-Statesector are much more limited. Another important element to consider isthe degree of vertical integration, namely common ownership of theforest resources and of the downstream forest products industries. Inmost of the EEC countries, and certain other European countries, thereexists very little of such integration, while in the United States, andto some extent in Canada, and also in one or two countries in northernEurope and in countries such as Brazil, vertical integration, in termsof privately-controlled forest-resources and forest product-processingindustries, is fairly common. (The integration is not necessarily oneof ownership of the primary resources, but may take the form oflong-term leases or use-contracts in respect of forest land.)Evidently, vertical integration does provide an additional degree offreedom to management, as far as planning of resource-use and-disposition is concerned.
40. In considering forestry resource-potential in relation to areaunder forests, it is relevant to bear in mind that forests havedifferent growth rates, varying with the age of the tree population, byspecies and by site-conditions. Apart from the far North and certaininhospitable mountain climates, where growth is slow, throughout, it canbe said that forests composed of young trees grow quickly. Quick growthnotwithstanding, a certain growth-result has to be attained to makeharvesting worthwhile. During the growth process forests have to becared for, including repeated thinning out, to permit the more promisingportion of the trce-population to develop to the fullest extent thosemarketing- and uss-acharacteristics which are most desired for woodindustry urposes.- Through proper forestry techniques, foresters caninfluence usable trunk length, or diameter growth, or both, to mentionorly some of the intervention possibilities. With good management,various production objectives can be achieved and overall forest growthcan be favourably influenced. This is one of the reasons why productionfrom well-managed forests may often contribute a disproportionally largeshare of a country's overall wood-production volume and -value, and whyforest plantations may well hold the answer to meeting the world'sincreasing requirements for wood and the many products derived therefrom.
IIn Switzerland, for example, the pulp and paper industry is muchinterested in obtaining its pulpwood from domestic sources and,theoretically, much of the pulpwood needs could be obtaineddomestically. Yet, the economics of thinning out forests and forestcare are such (some years excepted, as in 1985) that a part of pulpwoodrequirements is met through imports. It is now hoped that the impetusto proper forest care to be given by increased attention and finance, inthe context of a new programme for the preservation of the forest, willalso lead to greater quantities of pulpwood reaching the market (withoutpreventing, however, a record level of sawn-wood imports in 1985).
2Where certain plantation forests are predominantly destined forpulping, repeated thinning out may be less economical and is hencereduced. In other cases, the pulp mills do count for their supplies onthin - and gnarled wood, removed during forest care operations.Saw-mills are, however, also relying increasingly on smaller diametersaw-logs, made feasible and profitable, in some cases, by the adoptionof laser-traced sawing and innovative (panel-board-construction)lamination techniques. Many complex factors have to be taken intoaccount in "stand-level" and/or "forest-level" management decisions.

MDF/W/52Page 28
41. If left to themselves, as has been the case for forests in remote,inaccessible areas - whether in the high northern latitudes or in thetropics - forests will eventually reach a stage of almost steady-stateequilibrium (though species composition of such forests may change),sometimes referred to as "climax" forests. In steady-state forestsproduction n of new phytomass (or of additional atmospheric oxygen) is, bydefinition, zero. This abstracts from the currently widespreadpreoccupation with negative growth of forests which are reported to be
IForests made up of young and (or still) vigorous trees can beconceived as being not only factories producing wood, but also asproducers of oxygen (of the latter approximately 10 tons per ha. peryear). Atmospheric carbon dioxide is absorbed from the air andconverted by photosynthetic processes into plant sugars and such carbonpolymers as various forms of cellulose and lignin, e.g. the wood, withoxygen being restituted to the atmosphere. The forest land itself, whenprotected against erosion, can also serve as a soil matrix for thedeposition of airborne dust and fine sand particles (several millimetresper year, or 50-60 tons per ha.). Over-mature forests - though perhapsmajestic in appearance - on the other hand, may consume (in decayprocesses) as much oxygen as they produce and, as most of the growth hasalready taken place, there is often little or no net gain in totalwoodfibre production. While the-great bulk of the earth's carbondeposits and reserves are concentrated in the form of sediments on thesea floor and in-the continents and in the form of various minerals andorganic mattep-, with another large part found in the oceans (bound inplankton -r dissolved in the form of bicarbonate) the atmospheric carbondioxide is of particular, even prime, importance in maintaining climaticbalance. Small as the proportion of carbon dioxide is in total
--atmospheric gases, it triggers (together with a few other trace gases)what is known as the greenhouse effect. Large-scale use of fossil-fuelsis adding to naturally released carbon dioxide (of which vast amounts oftermitic origin) and the concentration of carbon dioxide in theatmosphere has increased from about 270/290 parts per million (ppm) acentury ago to about 360 ppm at present. While this, in itself, may notbe cause for alarm (the world has known periods of even higheratmospheric carbon dioxide levels) the ongoing wide-scale destruction(part of it by slash-burning, releasing large amounts of carbon (mon-)oxide') of tropical forests does add a new disturbing element, in thatthe forests - which, next to ocean plankton, are by far the largestliving depositories of carbon - are diminishing to an extent that theirglobal regulatory function is increasingly impaired. Plants which formtheir molecules with three carbon atoms (as is the case for manytemperate zone products and trees (stud'-d so far by USDA)) arestimulated in their growth, and grow to a much larger size, when raisedin a carbon-dioxide rich atmosphere (this factor is not going unnoticedin silvicultural research, practice and planning). Other plants thatbuild their molecules with four carbon atoms (many tropical plantvarieties) are likewise stimulated, and also grow more rapidly but,overall, the final size of these plants is hardly affected. All this,of course, has many implications for balanced growth and good managementof the planet's resources and the environment.

MDF/W/52Page 29
dying from pollution or of - as yet not universally identified - damage,deficiencies or viral disease. (Insect pests are a problem in someareas, adding to, or favouring, the occurence of tree diseases andpollution damage, over-mature trees being particularly vulnerable, butyounger trees are also often affected.) Climax forests are oftencharacterized by large proportions of trees with decaying cores. Thiscan be a major problem, as in certain parts of South-East Asia and inthe Amazon Basin (and perhaps elsewhere), where sometimes close to50 per cent of climax timber stands have been found to be in a state ofpartial decay, making them largely unfit for commercial use. Thequestion of interior decay of trees is also a problem when trying toestablish forest-inventory data on the basis of aerial survey results,unless the aerial survey data can be matched and interpreted inconjunction with status-report data from representative and intensivesurveys on the ground.
42. Just as important as is information on forest age, is informatio-on species-composition of forests for any assessment of the forest-resource potential. Eucalyptus, for instance (though there aresignificant differences in growth rates and characteristics between themore than 500 known eucalyptus sub-species), grows rapidly to a stagewhere harvesting becomes economically worthwhile. For pulping purposesthe rotation period (planting/felling/replanting) may be as short assix to twelve years (depending on sub-species and site conditions). Forpoplars and certain pine varieties, notably Monterrey pine, (also calledradiata pine or pino insignis) the rotation period may be as short astwenty to thirty years. Monterrey pine plantations produce underfavourable climatic and -site conditions more than three times thevolume of wood as produced in the trees' original, natural habitat inthe US, and also about three times as much as pinus sylvestris, the mostcommon conifer species in northwestern Europe. While very few conifershave the growth-rate possibilities of Monterrey pine plantations, (nowwidely planted in various parts of the world, notably in New Zealand andChile, each one of which accounts for about 30 per cent of world radiatapine stands), many conifer varieties have significantly higher growthrates than pinus sylvestris and pinus larix, the latter thriving at the
IThe recent (1985) (re-) discovery of a rod-shaped virus, invarious diseased conifer varieties (and beech and oak) in the F.R. ofGermany, does suggest that the current forest die-back problem may bethe result of virus infection. Such virus infection, first reportedsome 20 years ago in Eastern Europe, reduces the trees'photosynthesizing capacity. The infection is spreading west-south-west,i.e. in a direction opposite to prevailing winds. There are indicationsthat certain forests in past centuries may have suffered from similarafflictions and recovered. The problem is, however, very complex,involving probably, multiple pollutants, stresses and pathogens. (Cf.also "World Resources - 1986", World Resources Institute, WashingtonD.C., and International Institute for Environment and Development,London and Washington.) Undoubtedly, further intensive research inregard to all the hypotheses advanced so far (there are at least sixmajor schools of thought) is required, accompanied by appropriateremedial action.
2Ref.: Manuel de Capacitacion Forestal, Ministerio de Agricultura,Madrid, 1967: - Perhaps as much as 20-30 cubic metres per year perhectar - ref. Chile Economic Report, CORFO, Jan. 1984.

MDF/W/52Page 30
higher elevations. Traditional rotation periods for these twovarieties are assumed to be between 100 to 150 years (shorter rotationperiods are coming into use, however). For oaks, rotation periods - ifthat be the term - are between 80 to 250 years. (The oaks planted underColbert's orders 300 years ago, to serve as construction-timber forFrench navy ships, are now a highly prized product and export-item,mainly for producing oak-veneers.) In other words, wood-offtakepossibilities differ enormously from species to species and Oremodulated further by differences in growing-site conditions. Tropicaltree varieties, although benefiting from year-round growthpossibilities, also have fairly long "rotation periods", for certaincommercially valuable species thirty-five years or more and often wellover sixty years (some of te currently existing giant tropical treesare, of course, much older. However, their giant size often makestheir harvesting virtually impossible, and many of these trees aresimply left standing).
43. For purposes of this note, the point to be borne in mind is that,on average, coniferous forests grow a given volume of wood more rapidlythan temperate-zone broadleaved forests (eucalyptus, poplar and similarexcepted). While all wood produced can have some potential commercial
IPlantations of European larix species in the northern, maritimeinfluenced climates of France, though, at first, seemingly successful,are now perishing under the more humid lowland conditions.
2In respect of certain tree plantations the primary objective isnot necessarily the production of wood. For instance, the large pinuspinaster plantations in south-western France (Landes) were planted forstopping and controlling shifting dunes. That objective has beenachieved. These plantations, based on a slow-growing "pioneer" variety(i.e., a variety which will take root where not much else will grow),also produce about 300 kg. of oleo-resin per ha./year. Nevertheless,these pinus pinaster plantations are now reaching a mature stage, and,with replanting also going on, are making a significant contribution towood production as well (but, as planted outside the Landes region,often constitute a major fire-hazard in the south of France).
3With the exception of teak, there are virtually no plantationforests composed of tropical tree species. Attempts made to establishsuch plantations have, reportedly, not yet given encouraging results.
4Data for two of the EEC countries of traditional, average rotationperiods for different tree species are approximately as follows: forthe Federal Republic of Germany, (for the United Kingdom): spruce, fir,Douglas "fir", 80-100 (60) years; pine- and larch trees 100-120 (60)years; oak trees 140-180 (120) years; beech trees 120-140 (120) years;poplars 40-60 (35) years; other broadleaved trees 80-100 (100) years.Source: EEC/Forestry Statistics. In the United Kingdom (at Hooke Park,Dorset), in a school for row woodland industries, research and practicalexperiments are under way for using hardwood thinnings and relativelyyoung conifers (30 year old spruce) for a variety of structuralconstruction systems; still other uses than for firewood and forpulping are also imaginable.

MDF/W/52Page 31
value it is important to take into account that for certain uses, suchas outdoor construction, certain furniture fabrication etc., the core-or heart-wood from certain species is preferred (though not exclusivelyused). Thus, information on the overall volume of wood produced mayoften be less than what is required for meaningful comparisons ofproduction-levels obtained, or usable, in respect of different species.Differences in the quantity of wood that is usable, and in respect ofits technical qualities, are reflected, to some extent, in differencesin market prices for different wood species and different sawnwoodsections offered. Generally, to be readily marketable, a given woodmust have at least average technical-use and processing characteristics.To command a really good price in the market it must have, in addition,one, or more, outstanding characteristics; a decorative, aestheticaspect may be one of these characteristics. For plywood and otherwood-panels, panel construction and glues or bonding agents used (apartfrom surface finish and wood species used) may be major pricedeterminants in any given market.
44. Before embarking on an examination of national forest resources, itmay be useful to consider briefly the often-made distinction betweenwood from coniferous trees and wood from other trees. Wood from conifertrees is commonly designated "softwood" while that of all other trees -
the broadleaved trees - is designated as "hardwood". It should bestressed from the outset that, though this is a conventional way todistinguish coniferous and other woods, it is an arbitrary distinction.These classification designations, which are also reflected in many ofthe tariff schedules, are based entirely on appartenance to classes oftree- species and not on intrinsic hardness or technical-use propertiesof coniferous and other woods. Some so-called hardwoods are soft, tothe extent of being spongy, and are light, little resistant andnon-durable, while some so-called softwoods are fairly hard, relativelydense and heavy, technically very strong and durable or, as certaincedar woods, quite light, mechanically not very strong, but finegrained, very rot-resistant and often fragrant. It is, however, truethat none of the "softwoods" is as heavy or hard as the hardest ofhardwoods, and there are also some softwoods which are both absolutelyand relatively "soft".
45. What is important to point out for purposes of this note, and inrespect of any attempted assessment of tariff schedules, is that theworld's coniferous forests are concentrated in the cold, orcool-to-temperate climatic zones. In the North they grow all the way
'Hardwood trees, also sometimes referred to as "broadleaved" aretrees classified botanically as "angiospermae (e.g., those producing oneseed in a pod); softwoods trees, sometimes referred to as "coniferous",are trees classified botanically as "gymnospermae" (e.g., characterizedby ("naked") nutlets, or seeds, fertilized by direct contacts withpollens; botanically much older than the angiospermae. Apart fromdifferences in their reproductive systems, the wood of gymnospermae ispeculiar in being composed mainly of disk-bearing tissue without proper"vessels").

MDF/W/52Page 32
up to the southern border of the tundra. Coniferous species indigenousto the Southern-Hemisphere differ botanically from those in theNorthern-Hemisphere, but not very much in wood-usage characteristics, ascompared with those of good, average, Northern-Hemisphere coniferouswood varieties. Parana-pine wood - to mention only one of the species -is, in fact, highly prized for certain uses, and, though this resourceis now becoming relatively scarce, it is still widely used in its areaof origin (Brazil, Paraguay) and also in various import markets in thenorthern hemisphere. Natural coniferous forests in most of thesouthern hemisphere occur generally in small stands, or occur mixed withother species, conifer plantations, however, may, there too, cover vaststretches of land.
46. The geographical distribution of coniferous and of mixed- andbroadleaved-only forests around the world is not without influence onthe pattern and scale of coniferous and broadleaved wood uses indifferent parts of the world. As the main coniferous forests are foundeither in the industrialized consuming countries, or can be procuredfrom other nearby industrialized country sources, coniferous woodsaccount for the bulk of industrial uses of wood and for the bulk ofinternational trade in wood and wood semi-manufactures. For pulpwoodand woodpulp, coniferous varieties are generally preferred, mainly fortheir intrinsic technical characteristics. Nearness of production sitesto markets is not the only determining factor. Both the harvesting andgeneral usage of coniferous woods offer some possibilities for economiesof scale which are not found in nearly the same degree in respect ofhardwood varieties, with the possible exception of wood from teakplantations and from some of the natural Dipterocarp-tree tropicalforests in South-Fast Asia and of certain forests in West
'The main limiting factor to growth of natural conifer forests isnot so much the severe cold of the boreal winters, but the requirementof a minimum average temperature of about 100 Celsius in the monthfollowing the onset of summer, a critical growth period. Where severeclimatic conditions similar to those of the northern areas prevail, suchas in mountainous regions (including the higher elevations of mountainchains and high plateaus in the tropic and sub-tropic zones), conifersare, generally, predominant, or, up to a point, perhaps, in fiercecompetition with scrub oak. While coniferous trees also grow naturallyin warmer climates, as for instance in the circum-Mediterranean regionsand parts of the Caribbean and in southern Brazil, and thrive especiallyin some temperate, maritime-influenced humid climates, as in southernChile, parts of New Zealand, the US Pacific- and Atlantic- coastal areas,parts of the Atlantic and Baltic coasts in Europe, parts of Japan, thesouthwest of France, and parts of the western Iberian Peninsula, theyare competing in these temperate regions with broadleaved treevarieties. There are virtually no large natural conifer forests in thetropics. On the other hand, true tropical trees, most of which areevergreen varieties, do not support freezing temperatures and many sub-tropical and Mediterranean-type tree and shrub varieties are quitetemperature sensitive and often not frost resistant, if and when wintertemperatures fall rapidly and significantly to low sub-zero temperatures,as was the case, for instance, in south-western Europe in the earlymonths of 1985, causing substantial damage, inter alia, to olive groves,eucalyptus plantations and many ornamental trees.

MDF/W/52Page 33
Africa (notably in the Republic of Congo and Gabon), which are alsocharacterized by a fairly uniform species-composition, with similartechnical wood characteristics between sub-species, thus permittingintensive and concentrated harvesting, processing/marketing operationsto be undertaken.
47. The more limited number of tree-species found in the northernregions is traceable to the fact that forests have been repeatedlydecimated, or locally been extinguished, by the southward extension ofArctic-icT and the spreading, inland, of mountain-glaciers during theIce-ages. As the ice cover advanced, the flora and fauna receded. InNorth America, where the main mountain chains run North-South, thisrecession, followed by renewed northward expansion once the ice receded(the last of several ice ages having come to an end only about twelvethousand years ago), permitted many different plant and tree species tosurvive. In Europe, many tree species did not manage to cross, andthen recross, the main mountain barriers, running East to West, and arethus now absent from the natural forests of northern and northwesternEurope. Moreover, tree-resettlement in northern and northwesternEurope, after the end of the last Ice Age, consisted primarily,especially in respect of coniferous forests, of a west-, northwest-boundmove out of northern Asia (the Ural mountain chain running fromsouth-east to north-west) and the Balkans, both of which had largelybeen spared from glaciation, with the result that the natural forests ofnorthern Europe are constituted of only a few tree-species (forinstance: UK - 32 endemic forest-tree species), much more limited thanin Canada and North America. Most of the forests in the centre ofWestern Europe can, however, hardly be considered natural forests, giventhe intensive and widespread silviculture practices employed for almosttwo centuries. One of the results of man's intervention and his desirefor high-yielding forests of pleasant appearance is an even greaterlimitation in tree species than might have occurred under naturalconditions, a situation which may not be without risks for the necessarygenetic variety, for the ecosystem generally, and, perhaps, even forlong-term forestry production, unless forest seed selection policies orcloning practices are implemented with care and discrimination. InChina and Japan, both of which had also been spared by the last Ice Age,
1Recent research results suggest that ice-crystal nucleuscomposition during recent ice-age periods was different from present-dayice-crystal nuclei, resulting in several times greater crystal-latticeplasticity, thus facilitating the ice cover to spread.
2Forest seed prescriptions for public-owned forests in theF.R. Germany are currently the subject of considerable public debate.Forestry policies and practices in a number of European countries, whichhave increasingly shifted the balance between broadleaved and coniferousforests to the advantage of the latter (broadleaved forests predominatedin most of western Europe up until the early 19th century; reflectingalso different use patterns) are currently subject to scrutiny andevaluation, accompanied by a growing interest (particularly evident inthe United Kingdom) in restoring a more balanced distribution betweenbroadleaved and coniferous species.

MDF/W/52Page 34
one finds, likewise, a much larger number of tree species than innorthern Europe. All this is not only of historical interest, but hassome economic consequences as well. The large degree of homogeneity(though tempered somewhat by recurring and large-scale forest fires,which opened possibilities fir tree-varieties other than the originalone to establish themselves) found in the northern forests, and thisincludes, of course, also those in North America, facilitates theadoption of standardized, efficient logging and woodworking methods.Canada has pointed out in this context that the somewhat greater varietyof tree species found in Canada - as compared with Northern Europe - hasonly a marginal impact at the logging stage, given modern technologies,and little, if any, with respect to woodworking. It goes withoutelaborating the point, that properly regenerated forests and plantations
1Japan has a latitudinal span of 15 degrees, resulting in greatregional differences in temperature and precipitation, namely asubtropical, a temperate and a boreal zone. The islands are exceedinglymountainous and relief differences make for further diversity. About1,100 tree and shrub varieties are endemic to the region (some of whichwith close counterparts in China). The temperate zone (most of centralJapan) natural forests are mainly mixed forests, major broadleavedvarieties found include maple, ash, birch, beech, poplar, chestnut andhorse chestnut, Pawlownia; major coniferous varieties are: Japanesecedar, cypress, hemlock, umbrella pine, (jabe) arborvitae, yew, whitepine, black pine, r-ad pine. In the boreal zone (and high elevationselsewhere) coniferous forests predominate, with fir, spruce, larch,hemlock and..Japanese cedar. Among the major broadleaved varieties arebirch, alder, dogwood, oaks, maple, linden, ash, elm, walnut, cherry andmagnolia trees, also some dwarf birch. In the (southern) sub-tropicalregion mixed forests predominate, composed of several oak species, thenthere are fig- and palm trees, camphor trees and certain tropical treeand fruit-tree species and bamboo, to mention only a few. (Forreference to overall forestry data for Japan see also footnotes la andlb on pages 52-54.)
2It is estimated that, worldwide, there are every year more than a100 thousand major forest fires (affecting areas of above 2 ha. each)most of these lit by lightning (in the Western US, on average, 75 percent). When fanned by high wind, or spreading underground at the rootlevel, these fires can be devastating over large areas, as in a recentyear in Indonesia, in Australia, but also in North America andelsewhere. In Canada there are, on average, some 9 thousand forestfires a year, with annual losses ranging from 1.2 - 5.4 million hectaresof merchantable wood stocks. In the United States there occur, onaverage, more than twenty thousand major forest fires a year. To theextent that the areas affected are natural forests, too remote to beexploited and cared for, forest fires are nowadays no longer regarded anatural catastrophe, but part of nature's system of cleaning andregulating natural forests through a very complex ecocycle. (Certain(natural) forest tree varieties (for example lodgepole pine) depend forseed eclosion on the occurence of a fire, others, relatively fireresistant (douglas "fir"), owe their local predominance to repeatedforest fires. Forest fires change acidic soils to alkaline, favouringregrowth of species thriving on such soils. Natural forests composed oftrees of about equal height and age are often an indication of a commonstart-up, as after a major fire.) Where lives or valuable propertiesare at stake, no means are spared, however, to fight wildfires. (Firefighting crews in North America are now assisted (now also in France),and directed, by specialized computer generated "attack" programmes.)For ECE countries' forest fire statistics see TIM/EFC/WP.2/R.73 and Add.l.

MDF/W/52Page 35
of species and age homogeneous forests, as are now found in variousparts of the world, can also offer considerable forest management andtree-harvesting advantages (subject the reservations alreadyexpressed, cf. footnote 2 on page 33). '
48. Apart from the impact of past Ice-ages on the boreal forests, it isalso relevant to point out that the number of species and sub-species inthe general class "conifers" is much smaller than the number of speciesand sub-species in the class "broadleaved trees". Broadleaved forestsin the temperate regions comprise several hundred main species.Predominantly broadleaved forests are often mixed forests, producingwood of quite distinct technical characteristics. In other words, theylack the relative technical homogeneity of the wood produced, generally,from coniferous forests. In the tropics, as has already been indicated,tree species are counted by the thousands. Often several hundreddifferent tree-species are found in an area not larger than just a fewhectares (for the Amazon-Basin as a whole, about 560 different species).The different species, many of which may look alike to the casualobserver, produce woods which generally have technicalcharacteristics very different one from the other. As a consequence,many of the tropical forests have been exploited on a selective basisonly. This may, perhaps, have some advantages from the point of helpingto preserve the tropical forest ecosystem. On the other hand, selectiveexploitation, or "creaming", ma% not necessarily be the most productiveway of using the tropical forest resource and in many cagep selectivefelling also causes much damage to the remaining stands.3'
ISee: "The Comparative Economics of Plantation Forestry - a GlobalAssessment" by R.A. Sedjo, published by: Resources for The Future,Washington D.C, 1983, which makes the point that plantation forestry iscapable of producing very large increases in wood yields (ten to twentytimes the estimated average yield of typical forests in 1978), so thatit would be possible-to satisfy global wood needs by using just a smallfraction of land tow devoted to forests. The study then demonstratesthe feasibility of major expansion of plantation forestry in a number ofareas around the world and thus possibilities of major shifts in theprincipal supply areas on the basis of shifts in comparative advantage.As regard factors relevant in formulating forestry plantation objectivesin temperate regions, attention is invited to a paper submitted tothe Mexico/FAO sponsored Ninth World Forestry Congress (July 1985):"Perspectives on Forestry Plantation Practices in the Temperate Zone".
2For a summary of a recent discussion of "Long-Term Forest ResourcesTrade, Global Timber Supply and Intertemporal Advantage" see theDecember 1983 issue of the American Journal of Agricultural Economics.
3The Illustrated Encyclopedia of Trees, 1980, Salamander Book,Ltd., London, assumes the number of tree-species to be found, on average,per ha. to be of the order of about two in Scandinavia, ten in some ofthe temperate-zone forests and about 100 in the tropical forests.
4In a paper presented by Freezailah B.C. Yeom (Malaysia) to theIX World Forestry Congress it is reported that - because of marketpreferences for wood from "popular species", and consequently a lack ofinterest in marketing lesser known woods, only a small fraction of grosstimber volumes (GTV) are actually being harvested in She tropicalfores5s, namely, in American tropical forests: 38.4 m out of about149 m 3GTV/ha, in Afjica: 13.5 m out of 242 m GTV/ha and in Asia:31.3 m out of 185 m GTV. For an earlier contribution by the sameauthor and another interesting article on the subject of "creaming", byMr. J.S. Bethel, see "unasylva", Vol. 36, No. 145.

MDF/W/52Page 36
49. Translating this general information into practical terms, it maybe noted that, out of about two hundred tree-species growing in Canada,(including also approximately fifty non-native species) about 20 percent are conifers and the rest broadleaved varieties ' . In theUnited States, with its wider spectrum of climatic and soil conditions,the US Department of Agriculture some time ago designated some 580 treespecies as being native to the United States. Out of these, theDepartment had selected some 160 species as being of significantcommercial importance for their wood. Somewhat more than two thirds ofUS tree-species designated as being of commercial importance grow in theEastern States of the Union and, generally, the tree species found 12the Western United States are quite different from those in the EastMore than one half of the commercially important species growing in theUS are also found in Canada. In addition to the more than 580 nativespecies, there grow in the United States (not counting hybrid
l(a)As identified, avoiding double-counting to the extent possible,in "Flore du Canada", published by the Bureau de Traduction, Secretariatd'Etat, Ottawa 1974.
l(b)A useful summary of Canada's rich and varied forest resourcesin the different geographic regions, originally published in 1937 by theCanadian forester W.E.D. Halliday "A Forest Classification for Canada",is reproduced in a recent Canadian Forestry Service Brochure "Canada'sForests - Fibre for the World". The Canadian forest resource isestimated tc contain a total wood volume of about 19.5 billion(thousand million) cubic meters - made up of about 63 per cent softwood,23 per cent wood from mixed forests and the rest hardwood. Spruce,pine, balsam fir, aspen and poplar are. overall, the principal species.That the matter of regional differences in species composition offorests may be of some importance in judging thd value and possibleimpact of species-defined tariff concessions may be seen from Section Dof this note, paragraphs 164 and 165. By geographic regions the mainspecies are as follows: A. Boreal Forest Region: white and blackspruce, and jack pine, also aspen and white birch. B. MontaneForest Region: (blue) Douglas fir, white spruce, ponderosa pine,lodgepole pine, trembling aspen, Engelman spruce, alpine fir, westernwhite birch. C. Coast Forest Region: Western red cedar, Westernhemlock, Sitka spruce, Coast Douglas fir, Amabilis fir, yellow Cypress,mountain hemlock and alpine fir - also some arbutus and Garry oak. D.Columbia Forest Region: Western red cedar, Westerm hemlock, certainDouglas and grand fir, variants of white pine, Larch and Yew. E.Subalpine Forest Region: Engelmann spruce, alpine fir, lodgepole pineand a few other species. F. Great Lakes-St. Lawrence Forest Region:Eastern white and red pine, eastern hemlock, red oak, yellow birch,sugar and red maple, basswood, white elm, eastern white cedar,largetooth aspen. G. Deciduous Forest Region: sugar maple, beech,white elm, black walnut, hickory, basswood, red ash, white oak,butternut, sycamore. H. Acadian Forest Region: Red spruce, balsamfir, yellow birch, sugar maple, white spruce, black spruce, red oak,white elm, black ash, white and grey birch and also Eastern white cedar.

MDF/W/52Page 37
varieties)., about thirty tropical tree species (mainly in Florida), andabout sixty other imported species which haye come acclimatized, andnow grow wild, or are found in plantations. Several of the treespecies producing a significant volume of commercially useful, andindustrially used, wood are virtually unknown outside the United States.Woods of US origin which are shipped overseas in significant quantitiesinclude, in particular, wood of long-leaf yellow pine and of severalother pine varieties, wood of certain cedar varieties (some of which arehighly prized in certain import markets, notably in Japan), wood ofDouglas-"fir", of certain Tsugas, redwood, and, among broadleavedvarieties, oak wood (there are at least twenty-eight oak varieties inthe US, not all of which are in common use in the wood industries),hickory-wood and certain walnut or walnut-like woods and cherry-wood.Virtually all of the woods shipped overseas from North America are woodswhich have special, desirable, technical characteristics or are indemand (including in the US - 2-..aking Ehem relatively rare) on account oftheir particularly decorative aspect.
50. Desirable technical characteristics of a wood notwithstanding,export market opportunities generally open up only when a wood gets tobe known abroad and accepted by potential users. Introduction to, andopening of, export markets often requires heavy promotional efforts andexpenditures and may require considerable time. Thus, some of theAustralian eucalyptus varieties, say Jarrah and Karri (to mention onlytwo out of many), some of which have highly desirable technicalcharacteristics (the wood being similar to, or, in some ways, evenbetter than oak) are not exported in significant quantities, since theyare virtually unknown outside Australia. Viewed from the other side of
laBased on Forest Service Statistics, US Dept. of Agriculture, ascited -n "Materials Handbook", 8th edition, Graw Hill Book Co., NewYork.
lbGrowing stock in exploitable (commercial) closed forests in theUnited States is estimated to be of the order of 20.1 billion (thousandmillion) cubic metres. About 53 per cent of all growing stock in suchforests is found in the Eastern United States. Non-coniferous speciesaccount for 36 per cent of total growing US stock, but for less thanone-tenth of total non-coniferous growing stock is found in the WesternUnited States. As a percentage of total US growing stock, in exploitableclosed forests, the main commercial species are, in the Eastern UnitedStates: (coniferous) southern pines 13.0 per cent, spruce and fir 2.7per cent, white and red pines 1.5 per cent - all other coniferous 2.7per cent; (non-coniferous) oaks 12.2 per cent, hickory 2.1 per cent,hard maple 1.9 per cent, sweet gum 1.7 per cent, yellow birch 0.5 percent, ash, walnut, black cherry 1.9 per cent, all other non-coniferous10.7 per cent - In the Western United States: (coniferous) Douglas fir13.1 per cent, Western hemlock 7.2 per cent, true firs 6.1 per cent,ponderosa pines and sugar pines 5.3 per cent, Western white pine andJeffrey pines 1.0 per cent, redwood 0.6 per cent, all other coniferous:10.6 per cent; (non-coniferous) all types, 3.0 per cent. Source: "Theforest resources of the ECE region" - op.cit.
2For a concise summary of species composition of US forests see"Forestry Handbook", ed. K.E. Wenger (pages 20-27), J. Wiley & Sons,Inc., 1984. For a summary report of major types of woods exported bythe US, attention is invited to two recent brochures published by the USNational Forest Products Association/USDA Foreign Agricultural Service:(i) USA - Wood for the World, Today and Tomorrow and (ii) Trends inTrade: The United States in the World Markets.
MDF/W/52Page 38
the border, some useful and valuable woods are not widely-known inAustralia because they do not occur naturally here, such as chestnuttrees. Unfamiliarity of wood-users with various tropical woods is alsoa problem when trying to introduce these to the market. Some effortsare, however, under way, and have, in some. cases, been crowned withsuccess in introducing formerly virtually unknown tropical woodvarieties (for instance: Framire, Dousjie, Ramin, Wenge) in significantquantities to the international market.
1Other varieties for which an effort is being made to introducethem into the (French) market - originating in Guyane - are Courbaril,"Coeur dehors", Amarante (known since the XVIIIth century but, wrongly,considered rare), Grignum Franc, Gonfolo, Parcouri, Jaboty, Yagamadou,and even the somewhat problematic (cf. "unasylva", Vol. 36, No. 145,pages 51 and 52) Wapa, to name only a few. Among institutions workingon the classification and testing of the so-called secondary tropicaltree species, and promoting their industrial uses, is the French "CentreTechnique Forestier Tropical", which also cooperates closely withsimilar institutes in various countries of Africa and also in SouthAmerica. A recent summary of the Centre's activities is contained in"Marches tropicaux", No. 2068, of 28 June 1985. The promotion of lesserknown tropical woods will also be among the areas of activity of thenewly founded International Tropical Timber Organization (withheadquarters in Yokohama), in co-operation with research, testing andstandardization bodies existing in various ITTO member countries. Lastbut not least, FAO should be mentioned. For a useful overview ofproblems related to marketing lesser-known species of tropical wood(LKS) see unasylva, Vol. 36, No. 145, already referred to in footnote 4on page 35.

MDF/W/52Page 39
Forest Resources Survey
51. Much progress has been made during the last decade and a half incollecting information on the world's forest resources, through fieldinvestigations, aerial photography and radar mapping (some tropicalforests are constantly under cloud-cover), satellite-imaging and-analysis techniques and last, but not least, through an improvedinternational information exchange on all aspects of worldforestry-resources and -uses. As a result, there exists now a largebody of information on world forest resources, both globally and at theregional and national level. For some countries, including the morethan thirty countries which participate in the work of the ECE TimberCommittee, the possibility of periodic reviews and the ongoingstatistical data compilations have, to a large extent, provided adata-base which does permit some meaningful inter-country andinter-temporal comparisons to be made. Countries covered by the ECEforestry and timb r statistics are identified in Column 1 of Table I bythe letters "EC". For many of the developing countries, datacompilations were until quite recently very patchy and little suited forpurposes of inter-country comparisons. It is welcome, therefore, thatFAO, in a joint project with UNEP (within the framework of the GlobalEnvironment Monitoring System (GEMS)), has recently published results ofits ongoing Tropical Forest Resources Assessment Project. In thecontext of that project, different FAQ-directed teams researched andreported under a comprehensive and common-definition and-designation-system on various forest-characteristics of more thanseventy countries. The data so collected are too detailed to bereflected in their entirety in this note. Countries which havebenefited from inclusion in that survey are identified in Table I,Column 1, by the letters TS (Tropical Survey). The data in Table I onland-use for forests reflect, generally, the information provided in therespective country surveys. The data are, nevertheless, subject to somesubjective interpretation, as it was necessary to achieve a degree ofcomparability with data for countries not covered by the survey. Incertain cases, where the detailed notes accompanying the statisticaldata in a given country-survey were still very provisional, and wherethe categories of forest resources were not always clearly identifiableunder more conventional and less detailed category designations, someearlier FAO estimates have been retained. The data on land-use for
1Cf. footnote 1 on page 16.
Three volumes, some 1600 pages - "Forest Resources of TropicalAfrica", "... Tropical America", "...Tropical Asia", FAQ, 1981. - Thedetailed country surveys cover such aspects as: the respective forestresources, for example, mangroves, swamp-, riverine-forests, lowland-,montane-, closed-, dense-, open-forests, productive-, unproductive-,fallow-, degraded-forests; standing stock, growth-; broadleaved-,conifer-, bamboo forests, main tree-species, plantations-, forest-legislation, -ownership, -management, certain forestry product uses, etc.A summary of some of these data by geographic regions, or sub-regions,rather than at the country level of detail, is contained in FAO ForestryPaper 37, "Conservation and development of tropical forest resourcesFAQ 1982. A summary of data covering both ECE and tropical forestresource data is contained in "FAO - Forest Resources - 1980", FAO,Rome, July 1985.

MDF/W/52Page 40
forests in Table 1 are subject to revision in the light of additionalinformation, as and when it becomes available. It must also be stressedthat important information gaps for many of the existing national forestinventories remain. The preparation of a comprehensive forest inventorynormally requires much time, especially so as the manpower resourcesallocated to this task are often very limited. Once completed, theforest inventory may already be partly out of date. The representativenessof forest resource data, often elaborated on the basis of field surveysamples, is not always uncontested. Comparability of data for differentcountries may also suffer from differences in methodology and/or the useof different measurement criteria.
52. An indication of forest resources assessment of a different nature,involving categorizations in terms of producer-, consumer- and tradinginterests for tropical woods, is provided by the consensus reached onthe allocation of voting rights between tropical timber producing- andconsuming-countries under the International Tropical Timber Agreement1983, which, de jure, entered into force on 1 April 1985. Annex A tothat Agreement lists 36 developing countries as producing countries,while Annex B lists 34 countries (including a number of developingcountries) as tropical timber consuming countries. Their inclusion inthe respective lists (as far as the countries are also covered by TableI) is indicated in Column 1 of Table I by the letter "P" for producersand "C" for consumers. It should be pointed out in this connection thatthe Agreement provides for amendments of the respective lists and voteallocations, subject to specified procedures (as first exercised at theITT Council's First Session).
53. From what precedes, it may be deduced that information on the areaof fcrest/Noodland in a given country is not, by itself, sufficient todetermine the adequacy, or otherwise, of forestry potential or of thedegree to whicha possibly existing potential (large growing stock,large increments) could be translated into forestry- products exportpotential. itis for this reason hat an attempt has been made to bringtogether. in cl.'e I, various elements w-hich relate data on a givencountry's overall territory, the area under forest (or classifiable asforest,-woodland , with certain data on sFecies-composit ion of forestareas be; broan' botanicalclasses, or -zyes of forest area. Table Ialso shows overall wood removals and the percentage of the overallremovals usec as Tuelwood; further, the volume of production of"industrial rcund-wood" and the percentage cf industrial roundwoodproduction classifiable as "saw- or veneer-logs" (actual uses might 2differ); and industrial roundwood production per caput in 1979(80).Table I also shows 1979 imports, exports, and trade balance, in millionUS dollars, combined for wood, (including wood chips, now of someimportance in trade), wood semi-manufactures and wood pulp. Also shown
IForests do, of course, also produce "goods" and services otherthan exportable wood, and these may be variously appreciated bydifferent populations and be reflected, for instance, in the level ofremovals, and, indirectly, the size of the growing stock, and so on.For such data as may be available on these qualitative aspects of theforest resource for certain countries see UN/TIM/EFC/WP.2/R.70 andAddenda.
2Population data are either based on national statistics or on"Demographic Indicators of Countries: Estimates and Projections asAssessed in 1980", U.N., New York, 1982).

MDF/W/52Page 41
are data on per caput availability of forest land, wood production perhectar. The data in Table I link up with data in Tables II and III inSections B and C of this note respectively. As regards the compositedata in Table I, it should be borne in mind that whatever limitationsaffect a component datum will, by necessity, affect the validity of thecomposite data. All the data shown are merely intended to serve asbroad indi-cators.
54. As regards data on industrial roundwood production it should beremembered that production may fluctuate significantly from year toyear, reflecting not only movements in the level of economic activity ina given producing country, or the spill-over effects from developmentsin export markets, but also such elements as the need to fell andprocess from time to time significantly varying volumes of wood (with aview to salvaging damaged timbers), for instance after extensive storm-or fire-damage of forests, or in the context of forest clearingsnecessitated by large-scale hydro-electric projects (such as iscurrently the case in Brazil and in some African countries). Cases arealso known where production and exports of wood and wood products weresignificantly affected by drawn-out labour strikes or, seasonally, byclimatic factors, such as particularly severe winters (hindering bothshipments and depressing demand for wood in importing countries'construction industries), prolonged rainy seasons, etc.
55. Also of importance in considering reported production levels andthe level of exports is to bear in mind production potential. In Canada,for instance, it was estimated in the mid-1970s that the annualallowable cut, permitting to maintain productive forests on a sustainedyield basis, was of the order of 276 million cubic metres, while theaverage annual total of wood harvested during the period 1972-76amounted only to about 132 million cuTic metres, or less than one halfof the possible resource utilization. Canadian government policy, asrecently reported, aims at increasing forestry production by theend of this century by about 40 to 50 per cent above current productionlevels.
Reference Canda Year Book1980-81and Canadian ForestryServices,Camaia's Fc -1Forests... Fib o te ,crld90 Ir*. theCanadian. Council of Resource and En-vironent Ministers (CCr-K)established a target wood harvest level of 210 million cubic meters ayear by the end of the century, approximately 40 per cent higher thanthe figure for 1981. It is realized that to reach that objective, on asustainable yield basis, Canada will need to undertake, inter alia, anambitious forest renewal programme, and achieve also a reduction offorest losses due to fire, insects and disease. At the beginning of the1980s, out of total annual harvesting operations, covering about800,000 hectares, only 200,000 hectares were artificially replanted orseeded, with another 200,000-300,000 hectares considered to beregenerating naturally in a satisfactory manner. To close theregeneration gap, the recently adopted "Framework for Forest Renewal",together with the policy objectives set out in the 1981 "Forest SectorStrategy", Canada aims at replantings on 500,000 hectares a year, withan emphasis on the use of genetically superior seedlings, and therehabilitation of at least 100,000 hectares a year of previouslyneglected backlog lands. Silvicultural activities - such as weeding,spacing and fertilizing are to be greatly expanded, so as to cover about400,000 hectares a year.

MDF/W/52Page 42
56. Forestry production, both for domestic purposes and for export, mayalso largely be influenced by, and be a reflection of, overallsocio-economic development planning objectives. For instance in Chile,where industrial roundwood production increased from 2.96 million cubicmetres in 1963 to 14.4 million m in 1980 , the development of the richforestry resources of the country is one of the key elements inscribedin the 1982-1989 Development Plan, both for providing larger quantitiesfor exports and also to meet expected demand for wood under a major, newhousing development programme. The Development Plan, sub-divided intoregional development plans for each of the 13 constituent regions ofChile, provides for significant forestry development in seven out of thethirteen regional plans. In addition, in one of the seven regions, andalso in the Santiago metropolitan area, significant further developmentof the wood-processing industries is among important Plan objectives.
57. Bearing in mind that virtually all countries plan to preserve theirforest resources, striving, at the same time, to increasewood-production, and planning to foster their respective wood-processingindustries, and are also expecting to increase exports of forestryexports, it is hoped that, with the various caveats made, the data inTable I will be largely self-explanatory.
58. Table I is followed (starting with paragraph 59) by comments whichattempt to highlight certain aspects of the forestry-resource situationin a somewhat broader time-framework.
Note: The headnotes to Table I - subject to photo-reduction in thisrevised version of the document - are reproduced, for betterreadability, in larger print size on page 196.
1Up from 8.3 million cubic metres in 1979.
2Unmet housing needs in 1985 further increased (by about 100,000units) due to extensive, earth-quake damage to many of the existingbuildings in March 1985. Making use also of foreign (US) expertise andearth-quake relief assistance, many of the replacement houses (breakingwith local building traditions) are to be built of wood, with emphasison high energy - and good thermic - efficiency characteristics.
3Plan-targets (under a scenario reported in the press in the autumnof 1983, for the following 7-Year Development P an) envisage thatsawn-wood production should reach 4.8 million m by 1996 (= + 120 percent over 1980), pulp production 1.5 million tons (= + 102 per cent over1981) and log-production 5.6 million m (= + 455 per cent over 1980),veneer production 0.17 million tons (+ 58 per cent over 1981). Thevalue of forest products exports (at 1983 prices) is envisaged to reach$1.4 thousand million by 1996. A recent annual report of theInter-American Development Bank (IDB) makes specific mention of Chile'sachievements in the forestry sector and refers to these as an example ofthe kind of forestry policy which should be followed throughout theregion. The report also refers to the relatively high levels ofproductivity in terms of wood growth. Chile (radiata pine plantations =1 million hectares), Brazil and Argentina account for 85 per cent of thetotal area planted for industrial purposes in the region. The greaterpart of these plantations (including, however, fast growing species'pulpwood plantations) are less than ten years old. Ref: Chile EconomicReport, No. 150, CORFO, Jan. 1984.

MDF/W/52Page 43
TABLE1FOREST RESOURCES, MML'en IS! ae4 (t) iec0i: 13150UR OF 4*110O(01 1:1, It TEXT EXPLAWTIONS rOAOIEn01R OAlA4A,as am puato dt batd galUV e. attat...l dats. Oatu Ce. tata acme Il~'la Pr I'M. .1;111aicat area Jt finlad as-r and caarat .A dat da st moPlt
sedactIadla 0 aatyamttcs0t~d 0b ntonl o(EC.ddala to aeepil . ...ntltosi'Itla SurvY, and 'tltact... (2) tndicte tha tseeaty datFaa the cactr a 'uatia lut b-faite" otita, rma the FAC/wIP teeDlcl f,a.-t ..r.t a..c......d by fcrotry-WrMdgdataalld by lb. EC[IFAt2 T~.iaa 0atSIM(ci wraiai II). Ihe ....atseW1 - P eIpuhca sed %. O*f ,t f.rIsas.lam. lcatimo tnla4ll d .n tIa utest eel the 9ll t ....teeatsea Iroolca1 TImb.r A4rsUft(cd. paarsl 52. ts fee Uas c Istleara W.tet. . Al' he data ..enso tc 'k .Aa.0een and -t oleu..a a b. taqutre. 1rad. sed ethe dat art rauedd ad sh.uld
TOTAL AREA, . FUKI~a mmd t100LUD In t1141IPUI~ ~I god 0060lCt 6501010, It79. IteM . WOWSawl.COW119100 And~e hecare, b aIc,~ya.keen be p-saeely T~~~ ~tUior TVIIOTIA0011J ml lt101C316l. MUSAGIMt)Er PUlL? 1.13A~~netsteang ettttitable) .1()t'3 001eU0u2Ot t6,01i010,j1Yor100. I e11sm11.I dsllare
WITa tA., Fe-a Aee) ..,.a (4) h .,. etl1 aaeee i.-j jOPEraellatS11611 000
tO(3) (4) 0 0after. (4) I~/% (1)() i)( (1) (tO)and WI.a
MT)II1 aegt abau 54.1 abed o. SWe.CttI 0401.0 b,l00.O 0.61 abet 001 ahoeet 41.31 0.51 0.32
1140 7 0.67 0.11 . 117.5 119.0 2.0(03) 605 .L4 0. 0.. 15,91: Altbble, 131.13
b.tudo 151.0)5 .%'001 1 0.96 11W029.0ll.(3.2) Ce36017.00 690 (6.03) ~~~~ ~ ~~~~~~~~~1.13700.0 301.0 0.0011.0
(1) 3eeouOCaiO14.4 1.2 a.3%; 2.
as.n.ma. s.~4.9 4.1(0) 10L1 .3 2.0 SIX0 0.0 u 471 9010.02 0.24 1.6 0.3 1.1
(0) DES:' 11. 7. N7.30 1:2.10 3.1 0.7
951.2 S!~~0:.21: :10. 3017 212 01
C: 0.5631 0.10 0.4 320 00 470
67.7 32.3 47.5:(earn) 101 -.60 0.0 .0 110 - 110
(to) 0011101032.3 0.1 0.71; 0.61 0.1 0 0410171 0.00 9.00 0.3 0.3
(12) 0nM90041 47.0 33.0 04.21; : 1:.91 9.3 2.2
((3) CnMAID' 900.3 3. 761(n3( 113.3 117.3 0.36(243~ 61.01 3.4 14 (0.73) 6.02 1.140.0 043.0 6.291.0(14) 3341001. AIVI1IU1 42.3 3.16.ee5 ee 2.9 13 0 * .4 3.WMLICTS-P 75% 0.22 3202 041.
(10) 0140210 123.4 0.5.20.1 s 7. .0 0.4,~941-. 0.10 . 1.0 9.0 -
(16) 0ee:L0 107.1 11.4 20.3 11. 1.2 Ei.ILI' 521- 3.4 0.76 090.0 la 9
5:3.15020 - 601 0,070.12 13.0 23.0 1.0(169 31.31.4.2 22.4 '60.:11 20 .
(1lfcsuon111.4 ~~1.9 116.71: 3.0 .4(t:14.5191 1 1.1 00 1. 90 sa
(0.1) 0: eg. 101-641(0.20) 0.17 23.1 23.6 0.3(21: 1531531451n~nLO 12.9 4. 1.05(n44) 1. 6106
Su66.9 122.311: : 11 1 076 Oa Seel-t 5',3 (1541. 4.9)
.1 0.6 11.31: 5.0.2 41.4.34.0
(20) 104442t'.* 4.3 0.1 111.61 Ita 9.31: 2.0 1- 3.60(0.0.) IC: 63.01 15 4oi 0.36 . 96.0 490.0 90.0
(21..t_4d2, E 24.9 7. 3.91 (o 211J 30.2 cI31
(.):61.010 61 119(04 7,011.0 3,72.0 714.0123)13.0 S. 45.Z1 I., 19.11); 2.3 0.9 .1
(2.0) 321 601 611 100)0.06 . 131.0 199.0 13.0(91) MPOLAt060"0 7.0 0,4 1.11 0.4 07
0:10.01 101 11 2.56 0.00 166,0 132.0 16.0(301 IltLyEC.C 204 .0 22.21 )e 13.31: 9.0 43 ,1
(3.9) C. 21.01 401 541 (1.1) 0.00 ,3. 2,000.0 200.0(31) ti(01LAND5000 3,7 0.3 3.11: 0.9 0 9
C: 111 90 291 2.67 0.00 1,123. 9.0 111.0(32) 010 643INGOO 064 21C361 4.3 j
5:13.00 41011 1.00 0,01 ,407.0 1.493.0 96.0(30) r0tPI, 99.3 0.03 * 1,0 uOt
a~alaaen 911 n. ee~a. (0.01) 136.0 134.0(34) 16.310 (C. 33.1 73.3 69.11 (o 0.61(; :0.2 40 a
(19.4) C. SIX0 tOO 110 1.71 3.43 12,01.0 124.0 2.1450.(35) a1 ~ 20.3 22.0 3011 .3 S I
I: 0,1. 00 90 .0 .06 123,2 0.6 123.3(36) M IA, 1.0 0. 50.00; 0,9
12.4% -99%e 0.02 . ,1 0.00

TABLE1(cont.)(7) 72.9 3.7(4 29.01
(231 100 239.1 1.
13u)50e 21.5 10.1 .114
(31)993|4)law"N.3 1 .C 17,2S
(i9 iULlm00 10.3 0.1 0.91
1921 N2. .1.8 22.91SD1;
(021 ir00tsiLl5: 191.9 117.0 00.91;l: 67.31.: 0.01:
1_0 I0100LC 2.1 0.1 9.01 t. 1.92);191 917C00) 221.2 172.9 911;
(99)Ioah~ll7 01.2 1 2.0 9.9%l
Cr10.3
('.91 39.. 9 .3 9.1 60.31
14_1 01A91 1.1 0.02 11'2)g
1111 lump 301.1 1#. 2.21
!Xa1 s^"rstS 5s, 2,;C;*SueQ
(52) 90 11.1 1.2.9.2 'i.a(54 Mull, 1.2-4.3C: .0
(S4 PLyrsl0511t 22.0 22.6 U.01;19.91; C: . a
(091 wDfES 0.023..
1551 PALE.,C 0.03 ma, m.a.
1S0 93T111 10 15.1l 114.72
1511 llltIT1IUS 0.2 . l.a.
1081 Irv xwIlAJ 20.9 2.0 260.9;C: 10.1
(091 3rIM1u01 2.0 s.9 49.21;C: 7.0
(6) NIM0 120.7 2.2 2.01
(971 wIChRI90IhAS 92.. 21.9 29.71
_ WIMAICC 22.4 3.7 20.31 Ca 20.12)90.91 C: 2.01
_2 ParsTyS 90.9 2.1 2.7S1:k: 16.05 t: R01.
(6l) T0'r 129.5 U9.7 504.1;C: 0.01
1601 PHIclPPIKS"0" 10.0 12.1 42.31:_ 1.31, C: 1.S0
66) mL"C 21.3 3.7 27.31 0.82
671 901Iu1JLOC 9.7 _ . 32.011w 29.39(2.0) C: MA.01; .Ar9
Si6E~~t§S 19 t Esr. 11.0 "ial,2s
1(1) -M010 23.7 0.0 21.1515.31
1091 0v8900 2.0 2.2 11.01;C: sue
(101 SCIEGAL., 19.0 (.9. 11.0 (05.3111,2)SIICXE 0.06 0.03 se1.o1
(71) SIENAl L00900 7.2 2.1 20.3%
1721 0hlGM 0.0 0.03 00.0%
9.1 '.'.
33931 1.33
26.3
0.0 L S 0.I2
9.4 1 Laii .1
3.0 IL soL.o
91 7110- 0.2004.1 PA~
991: 90 0.21
91% 24 0.291
11.7 0.
111 911 0.93
0.03 9 0.02 3 00
111 901 0.10
23.9 Iaa 211 60 12.23)
20.3 LI.t.9
w0% 01 0.92)07.9 L
901 6% O.X9
52S 90% 0.05
o0.7 Id0
29 901 1.60
0.0 nS 0.I
911
21% 21S a.m.
0.,2046 91S 1.20
911. l. 0.00
9.7~ 1. _
0.0 i
. g0 '9 011 0.0
711 70 0.72
.229
01' 0161 65S 0.29.
2. 0.S 5 2S 02
7.0 L
971 20 0.09
MDP/9/52Page 44
0.2 962.0
0.3 1 5.0
2.1I
26.0 65.0
5. -
005.0 21.0
129.0 11U.0
tGA.l 309.1
12.0
3,700.0 1I0.0
2.0 1 14.0
1I212.0 I0.0I
I '..i
1.6. 0.2
0.7
292.0 2.19C.0.
0.23
0.19
0.09
0.31
0.03
0.17
0.03
.070
0.01
0.29
0.070.07
0.09
0.05
2.31
0.02
0.00
2.71
0.33
0.0',
0.01
2.00
0.77
0.09
0.10
0.53
0.89
7.00
0.0I
0.19
C0S
1 140.3
0.2
1 2.1
131.0ML
29.3
22l.0
11.0
201.0
.12.
12.0
- 602.0
.0
17.9
21.7
1649.0
1,702.0
01.0
22.0
0.7
* 0.0
II 1.0
12.0
1- 1100
2.0
1023.0
I..,.
I U.O
1.5.
g.m.
64.0
301.0
11.2
01.I
23.0
17.0
(10.0122.0I
l.a.
291.0
7.4
1.0
7.0
196.0710.0
"I.
207.0

NDF/W/52Page 45
TABLE (cont'd)
(31
6.6 1.
16.3 15.1
45.0 27.5(72.23
4.1 1.1(0.5)
94.5 1.-0
51.4 16.1
5.7 1j
0.5 0.3
16.4 0.5
75.1 9.(6.6)
23.6 6.3
136.3 (195.3
171 7.2
25.6 0.:5
9.1
39.1 17.8
79.1
.5451
3.01 ItJ
12.911 51.6 a14 0.
C:, 66.01; 10% 36 0.29 391.0 529.0 131.0
cork: e.g.
~~~7.6 0.0,5:0.2 97124 0.35 0.A I.3, 0.3
92.6 0.4 20_3*N. 0.01; C: 0.11 71 5 00 .0 20 01 1.
0:585.01 492 (2.73) 6.50 2,467.0 M A. 2,776.0
~~~~~~73%2.90 0.50 373.0 165.0
.;33.5
u~ ~~~.s 1.5
31.5
2.41. C: I.0% I 0.35 0.10 23.0
33.51; 0.7
~~~~70% 171 0.05 0.06 0.2 0.2
60.0%: 0.01 (0.0
el 2.61 %.00 34.0 34.0
3.0% 7.6
961 51 0.02 2.1
25.1% (ar 9.417) 22.7 3J.0.35 I E .
0~~~~~~6% (1.06) 0 1 (15 S.M. 1.2
25.4 1;
~~~~~~1%0.213 0 2.2 0.2
31.l1 (ar39. 420.J '56 3 1.1
C : 47.0 15 59
26.3% 6.3 1 2.~~~~~~3.05 -6
13.4% 2.3
b '1.0 .0 T..
6 ( r 33 3 13.7
5%L0 0 1 1 5. !
2~.56 34 43.0 90 ..0 ~ 5 .0
O15 r 23.l1) 1354.2
iC ;51 j .00 2045.0 "Ol.
II) 1(2)
(75) SPi luNA
(79) TANZANIA75'p
(B0) TMIs0l60'
1(821 T915l0AD A TMWnF
1(01) TURUYLCA
:(6) UPiPED SUTAICs'
590) IURUG0EY
.075 ZIYISAV 1E,

MDF/W/52Page 46
59. In the EEC (not yet including the production figures for Greece,Portugal and Spain), wood production has fluctuated around a level ofclose to 80 million m over most of the last two decades. (Presently itis at a level of about 85 million m per year.) With demand for woodincreasing throughout the period, the additional demand was mainly metthrough increased imports. In terms of raw material (roundwoodequivalent of wood products (including paper and board);, imports rosefrom about 40 million m in 1950 to about 120 million m in themid-1970s - 9f which: roundwood about 10 million m ; sawn-wood, about45 million m ; wood-based sheet materials, (mainly plywood andfibre-board; particle board (needs are largely, though not exclusively,met from Internal production): 37 million m ; other wood products, 3million m ; pup, 33 million m ; (paper and board, 22 million m )EEC Member States have estimated that under existing policies, annualremovals from EEC forests will rise from about 85 million m at presentto slightly over 100 million m by the year 2000. It is thought that,given the adoption of policies which permit this increase to beachieved, and also taking measures for making more efficient use ofexisting resources, (sometimes largely underutilized - as up until nowin France - due in part to the highly fractioned ownership of privateforest lands), and increased recycling, the self-sufficiency ratio,which currently is of tie order of only 40 per cent, could besubstantially improved.
60. As regards the interaction between EEC land-use patterns forfarming and for forests, it has been estimated that there exist, inaddition to some barren land, at present, 5 million ha. of agriculturalland which is, or which has become, sub-marginal for agriculture andwhich would be more suitable for forestry. It is not certain whetherthat agricultural land, additional to any submarginal land, will beconverted, in the medium-term, to forestry activities, althoughproposals to that effect, have, on occasion, been made, and have,indeed, gained force (linked however, to demands for conversion-costsubsidies) in the wake of mounting surpluses in the production ofseveral agricultural commodities. It may also be mentioned that Ireland(which has only a very limited area under forest, and where anyextension of the forest area is dependent upon certification that theland to be so affected is unsuitable for agricultural uses) is shortlyto turn from being a net importer of sawn-wood to becoming anet-exporter, as some of the forest plantations are reaching maturity.In the United Kingdom some of the reforestation work undertaken afterWorld War II is now coming to fruition and starting to have an impact ondomestic supplies of pulpwood, even prompting some (limited) exports,pending the coming on stream of new pulpmills in the United Kingdom (cf.also footnote 1, following page). In France, likewise, additionalforest plantations are reaching maturity, producing both additional
IData cited are based on "Forestry Policy in the EuropeanCommunity"; Bulletin of the European Communities, Supplement 3/1979.Measures announced since that time go in the indicated direction. Onthe Community level the main thrust so far has been the rehabilitationand fire protection of forests and woodlands in the Mediterraneanregion. Data on the EC's forest sector, the industry, and Commissioncomments and proposals for EC forestry policy, are contained in animportant discussion paper: "Memorandum Forets" (issued in "Newsflash",mid-May 1986), published by the EC's Agriculture Information Service,No. 36.

MDF/W/52Page 47
pulpwood and timber and considerable efforts are being made Go makebetter and fuller use of existing timberland resources, partly with aview to reducing import needs. Fast-growing eucalyptus, grown byfarmers under contract to pulp mills, has been introduced, and areascultivated are said to be expanding in south-western France. (Many ofthe eucalyptus plantations were damaged in the 1984/85 winter andefforts are now under way to breed eucalyptus varieties which are frostresistant to minus 30'C, instead of, as at present, only minus 15'C.)Various Mediterranean tree species are threatened by extinction as aresult of the spreading of insect pests and other tree diseases. Hybridvarieties with better disease- and pest-resistance are, however, beingintroduced.
61. The subject of the forestry implications of the accession ofPortugal and Spain to the EEC has been considered at the technical levelof the forest services of these two countries and by the EEC. Broadlyspeaking, it has been calculated that the accession of these two
1Also, as regards individual member States, out of She envisagedadditional removals, the largest part (plus 10 million m logequivalent) is expected to come from French forest resources. A newFrench forest law, providing, inter alia, for mandatory forest-careactivities by private owners, and encouraging regrouping of holdings(now: 1.6 million private owners, controlling 71 per cent of totalforest area (17 per cent of forest area is owned by some 11 thousandcommunal bodies and 12 per cent by the State)) was passed in October1985. In the United Kingdom, some 2.5 million ha. of partly barrenlands (much of it in Scotland) are considered to lend themselves forafforestation, a view which draws protests, however, as regards some ofthe designated areas, from among environmentalists. Industrialroundwood production in the United Kingdom showed an increase by aboutone-half over the period 1979-1985. By the end of this century,domestic su-pl-es of saw-logs in the United Kingdom are expected toincrease by about 80-90 per cent over current levels. It is expectedthat most of the additional domestic availabilities (mainly spruce) willbe used in fencing, shed manufacture, palleting, packaging and miningtimber - as at present. Only about 4 per cent of United Kingdomdomestic timber production is destined for housing construction. Whiledomestically available coniferous woods could be used more extensivelyin construction, demand for the finer grades and qualities of wood forjoinery will continue to be met predominantly through imports. At thesame time it is relevant to note that the United Kingdom sawmills areupgrading the quality of their output (drying, size-specifications,stress grading etc.). In France, over the last two or three years, muchadditional investment has been reported for increasing kiln-dryingcapacity - so much so that it is hoped to meet not only more of thedomestic demand, but to produce also for export. Ireland - whereindustrial roundwood production doubled over the last 5-6 years -
expects to become self-sufficient in the lower grades of coniferouswhitewoods by the end of the century, much of it destined for pulping,with pulpwood production slated to be further developed, partly in jointventures with foreign participation.

MDF/W/52Page 48
countries increases the EEC's forest area by about two thirds and itsproduction of wood by somewhat less than one third. The expectedoverall effect of their accession will be an increase in EEC net importrequirements in the wood sector (Spain, at present, is 2 net importer,and Portugal a net exporter of wood and wood products). Thoughdependent, to some extent, on wood imports, Spain has in recent yearsexperienced significant growth of its wood-processing industry,relatively more so than several other EC countries, and is successfullybidding in export markets both for wood-industry products proper, suchas particle-board, but also for finished articles of wood - the latterbased on the use of traditional, artisanal, skills. Portugal'sforestry-products industry is characterized, on the one hand, byefficient and modern industrial processing complexes, particularly sofor pulp, and, on the other hand, by a large traditional woodworkingsector where small, artisanal units predominate.
362. The United States, the world's largest producer and consumer ofindustrial roundwood and products made3thereof, is also a large netimporter of sawn-wood - 21.7 million m in 1979 (mainly from Canada,equivalent to one half of total Canadian production of sawn-wood in thatyear, or a volume equivalent to more than four fifths of total EEC (10)sawn-wood production in that year), also of plywood, of woodpulp and ofcertain wood manufactures and of paper. In turn, the United Statesexports significant quantities of wood, various wood products andwood-based derivatives. The US overall net trade position for theforestry products covered in this note is only slightly (at least, inrelative terms) in deficit.
1Spain's forest statistics - on which these estimates were partlybased - have recently been revised, with the share of non-exploited,(and, perhaps, economically non-exploitable) forests revised upwardsubstantially. Part of the problem in collecting and then correctlyinterpreting forest statistics for Spain may be one of definitions. TheSpanish term for forest, "monte", in Spain designates "any wooded area,but it may also include areas that could be forested in the future, butwhich are, at present, bushland, as well as national prairie land andeven mountainous agricultural land". (unasylva, Vol. 37, No. 148,pages 57/58.)
2Cf. Section E. - Portugal is the world's largest producer andexporter (1984 = 113 thousand tons) of cork. Both Portugal and Spain(the latter also a large cork producer) are exporting a variety of corkmanufactures. Raw cork is included in Annex II of Article 38 of the EECTreaty as an agricultural product.
3While there is little doubt that the United States is a large,most likely the largest, producer and consumer of wood, volume data forsawnwood, etc., for the United States (also Canadian data), lihenexpressed in terms of cubic metres, may not be fully comparable withthose of most other countries, until such time that all United States(and Canadian) companies report in metric terms. Most of the UnitedStates companies report in terms of board feet equivalents (a unitequivalent to a board one foot by one foot and one inch thick. Onethousand such board feet correspond to 2.36 cubic metres). The problemarises from the fact that the nominal size designations of the mainitems in trade do not correspond exactly to the real size of thedesignated items. For instance, the standard "2 x 4's" (inch) rafters,
.1I.

MDF/W/52Page 49
Footnote (cont'd)
traditionally widely used in timber frame construction, but nowincreasingly substituted for by 2 x 6's (which permit more in-wallinsulation), measure generally only 1.5 by 3.5 inches. (Margins betweennominal and real values differ by different proportions for differentsize specifications.) Overall, it may, however, be assumed that strictconversion of nominal board feet to cubic metres results in anoverstated volume of cubic metres. This overstatement may be quitesignificant and is something that should be borne in mind in comparingUS prices internationally. For total United States production figuresit is, however, also relevant to note that some United States woodindustry observers think that some of the production figures reportedfor the southern United States forest region are, perhaps, significantlyunderstated. This having been said, it should also be mentioned thatdifferences between nominal and real measures are not a problem uniqueto the United States. Even the plywood on sale in Europe, from Europeanproduction, quite often does not correspond to the thicknessspecifications announced (it often is less), as anyone equipped with atape measure or caliper can verify when visiting a lumber yard orbuilding materials' supplier.

MDF/W/52Page 50
63. Unlike in the EEC countries, there exists in the United States veryconsiderable potential for increasing forestry production from domesticresources. Large forest resources exist in the US-Northwest, there arelarge, and moreover rapidly growing, supplies of timber in theUS-Southeast and significant forest resources in the US-Northeast, tomention only the most significant timber stands (cf. also footnote lb onpage 37). The industry is dynamic, well organized and verycost-conscious and efficient, but it is also beset by cyclical swings indemand for wood products, excess capacity in certain product lines andregions, by restructuring needs and often only moderate, or low,profitability, described by industry observers as "profitlessprosperity". The level of forest removals is, on average, relativelylow, when compared with some of the Western European countries, i.e.,the overall production potential is not fully exploited. It has beenestimated that the annual level of wood production reached in themid-1970s could be doubled by the year 2000, thereby meeting projectedincreases in domestic demand for nearly all wood products. A majordemand increase is projected for softwood timber. Demand for hardwoodwill also increase, but both the present and the future domesticsupply/demand relationship is seen to be in better balance for hardwoodthan for softwoods. The US Administration has earmarked wood, pulp,and paper, as being among the industrial sectors which couldsignificantly expand exports. To what extent US forest resources willbe developed to meet both increasing domestic demand and to expandexports will depend, of course, on relative price developments for wood,as compared with those of possible substitute products, bothdomestically and abroad, and-6n international price and exchange ratedevelopments generally, as well as on access facilities in import
Reference: US Forest Service report, "The prospective renewableresource situation in the United States", completed in 1980, assummarized in Unasylva, FAO, Vol. 33, No. 134. A record of a recentdiscussion on "Changing Perceptions of the US Forest Sector:Implications for the RPA [Forest and Rangeland Renewable ResourcesPlanning Act - 1974] Timber Assessment" is contained in theDecember 1983 issue of the American Journal of Agricultural Economics.
2Demand for wood and wood products should be expected to increasemarkedly (competition from, and some substitution by, other productsnotwithstanding) as the necessary general and large-scale infrastructurerehabilitation development programme in the United States gathers steam.Among wood items for which demand will significantly increase are woodenrailroad sleepers (also referred to in North America as ties orcross-ties). About one half of all those now in place will have to bereplaced before the end of this century, an operation necessitated byyears of under-investment, a renewed desire to speed up rail freight,increased axle-loads on new double-stack container cars, and helped alsoby the increasing vigour of the industry, following rail de-regulationand a recent change in accounting conventions and tax treatment rules.
MDF/W/52Page 51
markets, and also on export promotion efforts. 1 US environmental policyconsiderations and desiderata may also have an influence on productiondevelopments. A number of US forestry-products enterprises, or majorforestry-product users, are invested in some Canadian forestryexploitations and complexes (and some Canadian firms have invested in,or participate in, US forestry complexes). Various firms in both ofthese countries are participating in forestry-industry operations inseveral overseas countries. Some European forestry firms, and also NewZealand firms and, to some extent, Japanese firms, have invested in USor Canadian, or in both countries' forestry-product industries. Asignificant number of forestry product enterprises, not only enterprisesoriginally headquartered in North America, could well be characterizedas having almost global dimensions, in some cases with backward andforward linkages, and interlinkages, into other resource-industries, thepaper industry, packaging, consumer products, distribution, publishing,entertainment and media and communications firms and conglomerates.
64. For Japan, the second-largest importer of wood and wood products,after the EEC taken as a group, detailed information on production,consumption, and on projected demand up to the turn of the century, andinformation relating to the extent to which demand might be met fromdomestic resources, is not as readily available in Geneva as for most of
IAccording to the US Office of Technology Assessment (a researchbranch of the US Congress) the US wood-industry is seen as beinginternationally competitive, so that wood exports could be increasedsignificantly. The Forest Products Division, FAS, in the US Dept. ofAgriculture. in close co-operation with the member associations of theUS National Forest Products Association, is currently engaged in aprogrammefor researching and opening up new export markets for US woodand woodproducts. Ref: Foreign Agriculture, Vol. XXII, No. 2, USDernt. Agriculture,Washhington D.C., Feb. 1984. Further, some ofthe State.Goverments and industry associations are active in promotingforest--. p s exports. Sianti za.- and, perhaps, -nc-reasing importpen--aW. lumber unarticulani:--: so for shingles and shakes) waspreceived in United States as a problem. Among proposals made in1985 for overcoming United States industry concerns are joint promotionefforts for North American wood industry products in overseas markets.One summary of the problem, as seen by a US observer, "Stumped by theLumber Issue", appeared in the February 1986 issue of the United StatesConference Board's "Across the Board" magazine. (Not available at thetime this note was written, but presumably relevant, might be a1985 (US) Forest Products Research Society publication "Internationalforest products trade: resources and market opportunities",H.E. Dickerhof, ed.). Apart from very large forest product enterprises,there exist in the US many wood-processing enterprises of medium size,with little traditional export experience. It may be of relevance tonote that the Oct. 1982, Export Trading Act does permit individual firmsto form joint export ventures. (This provision is, of course, notlimited to forest product companies.) However, so far there have notbeen many reports of wood industry producers availing themselves of thisnew facility (nor have potential exporters from other industries, partlythe result of the "high" dollar in the recent past) and, more generally,there exists a lack of awareness of existing, but still untapped, exportopportunities, as noted in the United States Department of CommerceMagazine "Business America", of 9 December 1985.

MDF/W/52Page 52
the other developed countries. la,lb In this connection, it may be notedthat domestic timber removals fell by about one fourth over the period1970 to 1975 and industrial roundwood production has stabilized, more orless, at the level of the mid-1970s. Industrial roundwood-use (based ondomestic production and on imports, including, more recently, largequantities of imported woodchips for pulping) has, however, increasedsignificantly. Only about 30 per cent of total Japanese wood- andwoodchip offtake by industry is currently covered from domestic timberharvests. It might, however, be noted that the area under forests inJapan is significant, both in absolute terms, and relatively, whencompared to total available land area and when seen on a per caput basis(cf. Table I). It is not known to what extent present Japanese forestrypractices are necessitated by watershed protection considerations (mostJapanese forest land is on hillsides (only 15 per cent of the landsurface is level, or of modest enough slope to permit agriculturalsettlement), or are prompted by other environmental considerations.Part of the explanation may be that much of the Japanese forest wasreplanted after World War II, so that, in many instances, the optimaltime for harvesting has not yet come and there may also be some concernin Japan regarding the long-term security of supplies of logs frominternational sources, given an expected overall increase in globalfibre demands and, perhaps, decreasing forest reserves in a number ofproducing areas. According to the Japanese Forestry Agency, there are10 million ha. of plantation forests in Japan, some of which are toreach maturity relatively soon, but the bulk of the plantation forestswill become available as a resource only in the twenty-first century.In Japan, bamboo, some of it cultivated in bamboo plantations, is alsoof some importance, though perhaps less so than in China and in a numberof other Asian countries. Japan participates actively in various forestindustry joint ventures in South-East Asia, and in severalLatin-American countries. As noted in the preceding paragraph, it alsohas some cross-links with forest-industry enterprises in North America.Import demand has traditionally been met from "South Sea" sources,Pacific and Pacific-Rim countries, including also the USSR. Morerecently there have also been imports from certain African, includingWest-African, countries.
l.Particulary the countries participating in the work of the UN ECETimber Committee. From such information that is published by Japan, thefollowing summary data can be derived: total growing stock, in millioncubic metres, in 1981 - coniferous: 1,480; broadleaved: 1,000. Totalforest area 24.7 million ha., of which government owned: 29.9 per cent,other publicly owned: 13.1 per cent; privately owned: 57.0 per cent.Broadleaved natural forests: 47.2 per cent of forest area; coniferousnatural forests: 10.1 per cent; plantation forests: broadleaved 0.6per cent of total area; conifers: 38.8 per cent (bamboo 0.6 per cent).Total forest area designated as protected forest (for headwaterconservation, erosion and soil control, windbreaks and recreation etc.):30.5 per cent. A functional land-use survey (climate, soil,topography), for identifying agricultural or forestry use-suitability,different from purely administrative regional classifications, is givenin a recent OECD document (AGR/TC/WP(86)2).
.1/.

MDF/W/52Page 53
Footnote (cont'd)
Japan
Log Production and Use(million cubic metres)
Production Use
Coniferous Broadleaved Saw logs Pulp Wood chips
1960 37.1 11.4 33.8 8.9 -
1970 26.8 18.6 27.4 6.6 8.31979 21.4 12.1 21.4 1.9 7.91981 20.1 11.2 19.5 1.8 8.4
Domestic Demand, Exports and Imports(million cubic metres)
Demanded Exports Imports
Saw Other (wood),Saw Plywood Plywood Logs except chips Wood chipslogs logs and pulp and pulp
1970 61.0 12.4 0.4 0.6 43.3 4.6 8.51979 60.1 13.6 0.2 0.3 46.9 7.6 21.41981 48.6 10.0 0.1 0.3 35.9 5.9 18.4
Domestically Harvested Logs, by Species(million cubic metres, in 1981)
Total, coniferous: 20.1; Japanese cedar 8.0; Japanese red andblack pine 3.7; Japanese cypress 3.4; Larch, white fir and spruce 3.9.
Total, broadleaved:Remainder: unspecified.
11.2; beech trees 0.7; Japanese oak 0.5.Source: Japan Statistical Yearbook, 1983.
.1/.

MDF/W/52Page 54
Footnotes (cont'd)
bAn estimate of Japan's wood fibre requirements, generally,assumes that requirements over the period 1980-2000 will increase bymore than 60 per cent, part of it to be met through increased imports ofsemi-manufactured and manufactured products (including also paper).Reference: "World Forest Products - demand and supply 1990 and 2000",FAO, Rome, 1982. One rough estimate, based on forest productionestimates and Japanese consumption demand projections, cited byNorth-American wood-industry observers, assumes that importrequirements, in terms of wood-fibre equivalent, will increase by notless than 15 per cent over the next 15 years. This estimate was madebefore the announcement by Japan early in 1986 of various measures forencouraging - among other things - building and construction activities,with - it is assumed - repercussions on wood import requirements andwood-industry activity levels. Fortune magazine, in its issue of 13 May1985, comments on the likely effect of tariff dismantlement on Japan'swood industry in the absence of governmental assistance measures. The1984 spring issue of the Columbia Journal of World Business contains ananalysis of, and comments on, "United States - Japanese SolidwoodProducts Trade', by Roger A. Sedjo. Finally, as regards commonly-used(and preferred, but on account of high cost not always utilized) woodspecies for residential construction the following varieties could bementioned: Hinoki (chamaecyparis obtusa), or, second-choice, Asunaro(also called "asushi" and "hiba") - Thujopsis dolobrata [both, Japanesecypress varieties; fine-grained, pleasant appearance, decay resistant)];Akamatsu (pinus densiflora - or "red pine"; high elasticity, veryresinous, decay resistant); Kuromatsu (pinus Thunbergii or "blackpine"); Tsuga (tsuga sieboldii; a kind of hemlock spruce; thechiefly-used wood material in residential housing construction); Sugi(cryptomeria Japonica - Japanese cedar - good workability, strength andornamental characteristics); Keyaki (abelica serrata - verydecorative); Kiri (pawlownia tomentosa - structurally and aesthetically(light silver-bluish colour) excellent and in vogue - but veryexpensive). Also used are: Momiji or kaede (acer palmatus - maple);Kuwa (morus alba - mulberry); market sizes are based on standardlengths - "ken" (two (different) ken sizes per "tsubo", i.e., 6 or6 1/2 ft. or 1,800-2,000 mm). Reference: H. Engel, op. cited, page132).
A survey of Japan's wood-processing industry, of structuraladjustments, policies and of earlier assistance measures was publishedas "Wood Processing Industry in a 'Timber Deficit' Country, Japan:Structural Change, Adjustment Problems and Policies", byMr. K. Fukasaku; document UNIDO/IS. 403, Aug. 1983.

MDF/W/52Page 55
65. China presently has an area of about 120 million hectares coveredby "forests", growing mainly in the northeast and, to a lesser extent,in the east and central-south. According to the China ForestryMinistry, there are close to 2,500 tree species (2,000 of whichbroadleaved species) plus close to 300 bamboo species. China's forestresources are far from sufficient for meeting the country's needs. Amajor effort has been made in China over the last two decades inafforestation and reforestation, partly by recourse to imaginativemethods, for instance, calling on everyone, aged eleven years or older,to plant every year - since 1979 - on "national tree planting day" (12March), four to six trees on the corners of the homesite, at hedgerowsetc. Since 1980 the principle holds that the tree belongs to the personwho planted it. Even so, once planted, most trees receive insufficientcare, and an estimated one half perish shortly after planting, thuslittle is known about the speed with which China can develop woodproduction, especially so as published statistics and evaluations oftendiffer. (Total forest area in China in 1950 was of the order of 8.6 percent of total land area. It is now reported to be of the order of12.7 per cent. The target for the end of the century is 20 per cent,and the long-term goal is 30 per cent. However, only 30-40 per cent ofthe present tree stands are of timber-industry-quality). Among thespecies harvested for use as timber are Korean and Chinese red pine,China fir araucariaa de Chine), larch, Suren, tocn, catalpa, ash, walnutand camphor trees, as well as several trees of the species abies andpicea. Given the paucity of the forest resource, China is expanding(Unasylva 157, Vol. 38) its particle board industry, so as to make gooduse of available wood waste, also of certain other agricultural wastesand of less valuable wood species. Papers presented by the ChineseDelegation to the IX World Forestry Congress mention good progresshaving been made in the establishment of farmland shelterbelts(including a 7,5500 km. 'Great Green Wall') and in agro-forestdevelore-.; Slhelterbelt planting is continuing. Expansion ofagricultural land at the expense of existing forests is prohibited.Current annual industrial roundwood offttake is reported ts be of theorder of 30 ,million cubic metres (it was only 5 million m in 1950).The aim is tc reach an annual offtake of the order of 100 million cubicmetres a- sustainable yield bass by the end of the century. Totalgrowing stocl at present (including also protected forest areas) isestimates zo te of the order of 9,000 million cubic metres.' Use ofwood for continues to be important. Efforts are, under way toreduce the use of wood, complementing coal, for fuel, by means ofnumerous biogas production facilities. China has emerged in recentyears as a significant import market for industrial roundwood (logsbeing the preferred import) for woodpulp and, still more recently, forplywood (the latter partly under countertrade arrangements with South-EastAsian suppliers) with imports, notably from North America, rising rapidly,running well above the level shown in Tables II and III (in 1984 Chinaimported 7.9 million cubic metres of logs and in 1985 9.7 million m ;imports of woodpulp in 1985 were of the order of 550,000 tons, up fromabout 400,000 tons in 1984). While China is not among major wood
1An assessment and description of the difficulties faced by Chinain its reforestation programme is given in a special forestry relatedissue of the publication "Co-Evolution" No. 15, Hiver 1983/84 - Paris.Certain elements of China's forest resource base, policies and of itswoodworking industry and trade are described in "Potential andRequirement of Increasing the Degree of Wood Processing in DevelopingCountries of Asia and the Pacific", UNIDO document: IS. 395, June 1983.
MDF/W/52Page 56
exporting countries, it is both the world's largest producer and atraditional exporter of such secondary forest products as colophony, tungoil, raw lacquer and camphor. Other "tree" products of importance inexports are white wax, (amur) cork, tannin, Chinese gall, tallow-tree oil,star anisi, shellac, as well as various forest-grown medicinal herbs andstimulants.
66. The Republic of Korea is among the few developing countries whichhave successfully implemented a nation-wide and large-scale reforestationprogramme. The total land area of Korea devoted to forests is important,relatively and absolutely, but most of the forests are not yet mature andin many casTs their main intended function is for hillside erosionprotection. Korea has also built up substantial wood-processing capacityand has become one of the main exporters of plywood. Virtually all of thewood used by the Korean wood-processing industry is imported. Log exportrestrictions applied in some of the growing countries have been a matter ofconcern. Korea participates in a number of forest-industry joint-venturesin several of the countries in South-East Asia. As a major constructioncontractor in several overseas countries, Korea probably also contributedto the rapid development and expansion in recent years of plywood and sawn-wood exports from South-East Asian producers to such destinations as theMiddle East.
67. As regards the forest-resource situation in Europe, it may be notedthat Sweden and Finland, and to a somewhat lesser extent, Norway, possessvery large2forest resources, especially so when set in relation to popula-tion size. Availability of relatively inexpensive energy (of some
1Over the last decade some additional 40 thousand hectares have beenafforested every year, the result of continuous and strong governmentsupport for afforestation and the dedicated efforts of about 20 thousandlocal afforestation groups. Nearly 70 per cent of the Republic of Korea'sland area is now planted with trees, about one half of these are still veryyoung. For a detailed account see "Village Forestry Development in theRepublic of Korea - A Case Study", FAO, Rome, 1982.
2The main commercial coniferous tree-species are pine and spruce.Percentage in total growing stock: pine - Finland 45.1 per cent, Sweden37 per cent; spruce - Finland 37.4 per cent, Sweden 46.0 per cent; (allconiferous: (area) - Norway 80.1 per cent); broadleaved - Finland 17.5per cent, Sweden 15.0 per cent. In Finland pine occurs mostly on drierdepositional soils, spruce on moister bogland soils. In Southern Finland,aspen, maple, elm are found. Particulary widespread are species of thebirch varieties (alders, arctic birch). Among other varieties are oaks andwillows. In Sweden, among major non-coniferous species, one finds variousbetulacea (birch, hornbeam) beech, oaks, elm, ash and maple. In Norway theprincipal forest regions are in the southeast and south. Higher north isthe birch belt. Many conifer forests also have some stands of aspens, ash,elm, lime, oak, black alder, to name only a few. Beech forests are foundnear the Skagerrak. Most of the coastal regions are devoid of forests.
Forest area, by main ownership groups, in percentages of total forest area,is as follows; Publicly owned - Finland 29.2 per cent, Norway 15.4 percent, Sweden 26.7 per cent. - Owned by Forest industries - Finland 7.5 percent, Norway 5.2 per cent, Sweden 24.4 per cent; percentage of farm-forestownership - Finland 60.9 per cent, Norway 64.5 per cent, Sweden 48.9 percent. (Source: national Statistics and ECE (Timber) Statistics.)

MDF/W/52Page 57
importance in certain energy-intensive downstream forest-industryactivities) is on the whole, also favourable, particularly so in Norwayand in Sweden. Forestry-industry complexes may have their own energyproduction resources, or may be affiliated in various ways with, forinstance, (hydro) electric power companies (some of which recently soldoff by their parent companies). Efficient use is being made for processenergy of wood-processing wastes. In order to maintain their currentlevel of pulp and paper production, all three countries are nownet-importers of pulpwood. Yet the level of wood removals in all threecountries is below that of net annual growth in timber stock. There maybe several reasons for this. Part of the trade flows may be prompted bythe relative location of the forest resources and that of thewood-processing mills. Another reason could be insufficient timberreleases, in relation to industry requirements, from privately-ownedforests, in cases where thy forest industries do not own a subtantialpart of the resource base. In the case of Finland a further reasonmight be the need to import goods for settling trade balances, forinstance in trade with the USSR. Last, but perhaps not least, it wouldappear that some of the other western European countries do not find itsufficiently profitable to pulp some of their pulpwood availabilities,preferring instead, to export part of their pulpwood to the Nordiccountries for pulping. While the Nordic countries do not possess suchexceptionally large forest resources as the USSR or Canada, theirresources are both large and growing and that despite annually expandingharvesting operations. Large annual production volumes notwithstanding,annual oftake of wood per ha., in all three countries, is well belowthat of several European countries, notably Austria, Switzerland, theF.R. Germany and certain countries in Eastern Europe. This is, ofcourse, due to the fact that growing conditions, i.e. climate and soil,are less favourable in the Nordic countries than in central Europe. Theremoval percentage (annual removal's share of standing stock) is,however, higher in the Nordic countries than in other parts of Europe.
68. Reference has already been made to the vast forestry resources ofthe USSR agd to the fact that access possibilities to that resource areimproving. As regards forestry products uses, it may be worth noting
`This should bea factor forest farmer ;ro-anticipate higher prices in the futureand act, in consequence, onsupplies. _n practice, prices do not always rise, but may even decrease.
2According to recent reports from Stockholm, it is projected that,as a consequence of newly developed silvicultural methods, and furthertechnical progress generally, yearly fellings in Sweden can be increasesto about 70 million cubic met es in the early 1990s (1984: 66 million mand could reach 100 million m by 2020. (Source: NFA, Cologne andJournal of Commerce, N.Y.)
3An additional, estimated, 12 billion cubic metres of (albeit slowly)growing stock have become more readily accessible as a result of thecoming into operation of the (new) BAM Trans-Siberian railwood line andof related feeder lines. This development notwithstanding, facilitatingaccess to strips of forest lands, say, 100 km deep on either side of thenew track, still leaves much of the Siberian timber resources unexploit-able. At a later stage, infrastructure projects involving the southwardsre-direction of part of the waters of the rivers Sukhona, North Ovina andOnega (decided upon in 1984) - and, at a still later stage, of the West-Siberian rivers Ob and Yenisey, may open up still futher access and, perhaps,transport facilities (the water-deviation canals will have a width ofthe order of 120-200 metres).
MDF/W/52Page 58
that the USSR is in the process of a major modernization/cum/expansionprogramme of its wood-processing and its pulp and paper industry. Thismay influence the future level of annual roundwood production destinedfor export, which, according to available statistics, the USSR has keptrelatively stable over a number of years (reportedly exercisingtemporary "export restraints" vis-a-vis certain import markets which hadrequested restraint). Among USSR development plan objectives, now inthe process of implementation, relying, in part, on imported plant andequipment (but also on reactivated and expanding (but behind plan-schedule) domestic production facilities for logging, wood-working andspecialized materials - handling machinery), is a more rational use ofthe forest raw-material base, the more productive use2of wood-processing-waste materials and, as required, product adaptation. Considerablecut-backs in wood fibre requirements could, and are envisaged to, beachieved, for example, in newsprint production (of which very largetonnages are produced and consumed) by shifting to lighter-weightnewsprint, such as is used in other developed countries. An importantobjective of development policy is the decentralization of processingindustries, including the wood-processing industries. It has beenrecognized by the USSR planning authorities that some internal supplybottlenecks in the past, both for consumer goods and for producer goods(among the latter, railway sleepers), were due, more than to anythingelse, to lack of transport infrastructure and facilities which may, anddoes, result inter alia in large and lengthy accumulation of timber andlumber stocks at points of shipments and major railroad marshallingyards, far removed from centres of processing and/or final consumption.Not only is the transport infrastructure being improved and expanded,
1This should not obscure the fact that the structure of the USSR'sexports of wood, wood semi-manufactures and other wood derived productsis changing. Exports of logs, as a percentage of total wood exports,decreased from 52 per cent in 1973 to 42 per cent in 1983, exports ofsawn-wood increased their share from 48 per cent in 1973 to 58 per centin 1983, exports of plywood, over the same period, more than doubled,particle board exports more than tripled. Exports of pulp and paper areshowing rapid growth and are expected to account shortly for more thantwo fifths of all forestry products exports, in a rising total - thetotal expected to increase very substantially. Main target markets arecountries in the Near and Middle East, India, South-East Asia, Africa,but also China, Japan and Europe. (Source: MOCI, Paris, No. 684,November 1985.)
2For detailed description see: "The USSR Forest and WoodworkingIndustries", UNIDO/IS. 406, July 1983.

MDF/W/52Page 59
but, as a result of the ongoing industrial decentralization, the volumeof goods to be shipped back and forth is also to be significantlyreduced. This has implications for transport facilities that could 1eventually be made available for export movement of forestry products
69. As will be seen from Table II, several of the Eastern Europeancountries - net importers of roundwood, notwithstanding the high levelof their roundwood production (in terms of removals of wood per ha.;rotation are often considerably lower than in Western Europe).Roundwood imports are mainly effected from the USSR. While the highlevel of forest utilization in these countries reflects intensive forestmanagement, pollution and/or tree disease damage to forests in some ofLhess countriss is also very high and this may have an influence on theannual level of present, and then of future, wood removals (cf.footnote L on page 29). Very substantial progress has been made byseveral of these countries in recent years in reforestation (forHungary, see unasylva, No. 145) and in modernizing their wood-processingindustry (temporary setbacks in the pace of that modernization, as inPoland, notwithstanding) and in co-ordinating their wood industries inthe context of CMEA industrial integration, adding thereby considerablyto iher international competitiveness in this sector, with emphasisincreasingly placed on producing, and exporting, higher value-addedtransformation products, for instance furniture (Romania) and chairs,seats, prefabricated housing and, perhaps, woodpulp (CSR).
70. Most of the countries in the circum-Mediterranean areas, andseveral other countries nearby, do not have large forest resources orwood-processing industries. Italy's strength in the sector isconcentrated in the wood-processing industry (a large volume of poplargrowing stock notwithstanding) not really in basic forest resources.Yugoslavia is one of the few exceptions. Although vast stretches ofYugoslavia s territory (Karst and coastal regions) have been denuded oftheir once significant forest cover, by overexploitation in centuriespast, for shipbuilding and construction purposes (not only on sites inYugoslavia) and particularly by overgrazing, the country has, on thePlaisns, bry the Danube and its tributaries, and in certain otherareas asignificant though not entirel- sufficient, domestic forestresources.Yugoslavia has a well developed wood-Drocessing -ndustry andhasalso _- into joint forestrywith several Africancountries Iit is a __-a net importer c- pu_-pwcoc and pulp. RCma :i for
The recent coming into operation of Vostochny, on the PacificCoast, near Vladivostok, which will be the USSR's largest seaport,adding to existing facilities at Nakhodka, adds significantly toforestry-export capacity, through the installation of specializedequipment and facilities for rapidly loading both timber and woodchips.(Exports of woodchips to Japan, much reduced in the early 'Eighties, areto be stepped up significantly in accordance with a multi-year supplycontract and the provision by Japan of inputs in USSR pulpwoodharvesting facilities.) Shipments of various resource products andother merchandise out of existing and new USSR northern seaports, viaArctic Ocean routes, are becoming a practical reality and rail-ferryfacilities from such Baltic ports as Klaipeda, Wyborg, Tallin, todestinations in the GDR and in the West are among transportinfrastructure improvements under way, or planned. ((Cross-Balticrail-ferry capacity between ports in Sweden, Denmark, Finland and F.R.Germany are also being substantially expanded, or have already beenexpanded, benefiting inter alia, the forest products trade.))

MDF/W/52Page 60
which comments in the preceding paragraph are also relevant, hasconsiderable forest resources, an important wood-processing industry,including secondary wood-processing, and is, likewise, engaged in somejoint forestry ventures in Africa. Turkey's forestry resources aresignificant, but are located in remote areas of the country and forestsare largely over-aged, and not very productive. Turkey does have askilled woodworking sector with a long and proud tradition. Industrialroundwood removals have shown significant increases in recent years andwood exports have also expanded, largely in response to the recentlyobserved increasing, but now diminished, import demand in the MiddleEast.
71. In Oceania and the Pacific region there are both a number ofdeveloped and developing countries which, in relation to the size oftheir respective population, are rich in forestry resources. Amongcountries to be mentioned in this category are New Zealand, (Chile - onthe Pacific-Rim of South America), Papua and New Guinea, the SolomonIslands, and, to some extent, Fiji and Australia. With the exception ofNew Zealand and Chile, where forestry-products exports are already ofconsiderable importance, and, to a lesser extent, Australia,forestry-products' export potential in these countries is only startingto be developed, or is still in its nascent stage.
72. As regards the developing countries, the main forestry productsexporters are three of the five ASEAN countries, Malaysia, Indonesia andthe Philippines. (Cf. also Section B.) Singapore is almost entirelydependent for its roundwood supplies on imports, but it has ahigh-technology wood-processing industry and some exports. Thailand,once a major wood exporter, has become a net importer of roundwood andof certain wood semi-manufactures, but continues to be an exporter ofcertain wood manufactures. Burma, has a long tradition as a woodexporter, but the volume of wood exports has not been expanding atanywhere the same rate as that of other countries in the region.Reforestation programmes for teak forests and the establishment of teakplantations are under way, and the wood-processing industry is alsobeing rejuvenated (partly under international assistance projects), but,in the near term, it seems unlikely that export availabilities will showvery substantial increases. Some of the countries in the area, formerlyknown as Indochina, do have very extensive forest resources, but thesecountries are not only not covered by Table I, but data and informationon their Iorestry-production plans and programmes are not readilyavailable . The island of Taiwan, a major producer and exporter ofplywood and other wood semi-manufactures and manufactures, is largelydependent on wood imports for feeding its wood-processing industry.
73. On the African continent, the Republic of South Africa hassignificantly expanded its originally canty forest resource basethrough large-scale forest plantations . The African countries with thelargest forest resources are West-African countries and those borderingon, or comprising, part of the Congo/Zaire Basin area. Nigeria, once a
1As far as Vietnam is concerned, several papers presented to theIX World Forestry Congress reported on the extensive war damage, butalso on major efforts under way to reforest and to regenerate damagedforests. By replanting part of the forests with fast-growing treespecies, major progress is expected to be made over the next fifteen totwenty years.
2Cf. also Para. 81.

MDF/W/52Page 61
major wood-exporting country, while still exporting some wood, currentlyuses most of its industrial roundwood feelings, and products madethereof, domestically and has in recent years even been a net importerof wood semi-manufactures. In Ghana, the once abundant export supplieshave also been much reduced in the wake of increased needs for domesticdevelopment, but exports continue, and some of the wood varietiesavailable for export are, generally, in good demand, subject, of course,like wood and wood semi-manufactures from other suppliers, toIthevicissitudes of demand fluctuations in international markets. TheIvory Coast, the main supplier of tropical woods, and of products madethereof, to Europe, is suffering from severe depletion of its mostvaluable and accessible forest stands. It has started to limit removalsand is fostering reforestation. Precedence is starting to be given tosupplying the domestic wood-processing industry. Nevertheless, theIvory Coast continues to be the main African supplier of tropical woods(main expert markets for roundwood are Italy, France and Spain) and woodproducts. The Congo Republic (log production in recent years expandedon average by 8 per cent/year) and Gabon are both major producers andexporters of tropical wood and their forest resources remain large;internal transport problems for logs to ports and centres of processingare frequently encountered, but improvements in transport facilities areunder way. Mention should also be made of continuing progress beingmade in the Congo in respect of pulpwood plantations for local pulp
IThe restructuration and improvement of the wood industry are highon the list of priority objectives of the Ghanian Government. A TimberExport Development Board (TEDB) was recently established, as was aForest Products Inspection Bureau (FPIB). These two new institutions -which benefit, inter alia, from IBRD and Swedish expert technicalassistance - replaced the former Ghana Timber Marketing Board. TheWorld Bank and the Arab Bank for Economic Development in Africa (BADEA)are contributing $23 million and $9 million respectively to a projectfor the rehabilitation of Ghana's forest products industries (ref. MOCI,November 1985). A first national wood industry products and furniturefair was held ina Accra in April 1985. A furniture fair is scheduled tobe neld ir 187.
LTctal area covered by forests was of the order of 10 million ha.in 1960; 7.2 million ha. in 1970, and is reported to be presently lessthan 3 million ha. Conversion of forest land to agricultural uses,according to SODEFOR (society for the development of plantationforests), has been of the order of 400-500,000 ha. Measures are beingtaken to stop clandestine forest fellings and shifting agriculture.Forty reforestation projects, covering a surface of 1.6 million ha., areshortly to be started. Programme cost is envisaged to be of the orderof $51.6 million - of which 31.3 million financed by the IBRD,10 million by the Commonwealth Development Corporation and the remainderby Ivory Coast public funds. New forest plantations are planned toproduce in 35 years time 6.6 million cubic metres of wood, with anestimated export value of $880 million. Under the project, some 1,760km of forest roads are to be constructed or rehabilitated (MOCI,November 1985). An interesting and up-to-date summary of the IvoryCoast's wood industry and wood industry related policies and problems isgiven in "L'industrie Ivoirienne", Supplement to No. 2094 of "MarchesTropicaux ..." of 27 December 1985. Major improvements in portfacilities, with assistance from Japan, are under way, as are severalinfrastructure development projects, benefiting from EC assistance.

MDF/W/52Page 62
production. The Congo has been developing, for some time, partly injoint venture projects (inter alia with a German firm) a well performingsaw - and veneer mill industry - and also developed exports of woodsemi-manufactures. The forest resources of Cameroon and of the CentralAfrican Republic, in the Congo/Zaire-Basin areas, are also important andboth countries are significant exporters of wood. Zaire has very largeforest resources (the largest of any of the African countries), coveringan area of 120 million ha. Zaire has 47 per cent of Africa's forestarea - or somewhat less than 7 per cent of world timber stands. Fifty-fiveof the tree varieties found in Zaire are considered to be marketable. Mostof the resource is not yet tapped and remains, relatively, inaccessible.Zaire does currently benefit from international assistance measures(including a major grant from Canada) for the rehabilitation of its forestindustries' sector. New wood processing factories are springing up, andtotal roundwood fellings and processing are scheduled to increase five-fold(most of it destined for the domestic market) over the next five years. Anumber of developed countries (including also the United States) areinterested in assisting in the expansion of Zaire's forest productsindustry. Liberia, Guinea, and Guinea Bissau also have significant, largelyuntapped, forest resources and the same holds true for Angola and Mozambique.In Madagascar, much of the original, rich and valuable forest resource hasbeen lost to shifting agriculture (mainly for producing the country's staplefood: rice) and the remaining resource is decreasing (national forest-protection and preservation laws notwithstanding) at an alarming rate, thusseverely limiting wood production- and export-potential, but here too, somerecent policy orientations spell hope that deforestation can be slowed and,perhaps, one day be reversed.
74. In countries in eastern AfricaI (Uganda largely excepted), in Egypt(where some efforts are being made to revive traditional wood-industryskills, and where a (by necessity limited) afforestation programme, withassistance from Sweden, is under way), and the countries in the ArabianPeninsula, countries in Asia-Minor, much of the Himalaya region andPakistan, are only sparsely forested. India, though having some luxuriantforests, with certain tree species of considerable commercial value, isforest-resource-poor when its resources are seen in relation to the size ofthe population. There are some wood products exports, but they are verysmall. India is one of the countries where the maximum volume of woodproduction, and wood production for exports, are stated not to be majorforestry policy objectives. Major objectives are of a social nature,designed to provide employment for a growing number of people, toalleviate poverty, to provide fuelwood and, of course, to protect the landand water-courses against soil erosion, silting and, generally, to protect
1Pulp production in Tanzania is presently being developed. Oncefull production capacity is attained, about 25 thousand tons/per year ofpulp might be available for export. Exports of newsprint to othercountries in the region are also planned.

MDF/W/52Page 63
the environment.I Modern silviculture is, however, practised, asevidenced, inter alia, by India's Sal- and Teak-wood plantations.Efforts are under way in India to modernize and expand pulp- and paper-making capacity, making use not only of pulwood resources, but also ofother fiber materials for pulping. In Sri Lanka, although forests coverabout 25 per cent of the territory, most of the wood removals aye forfuelwood. Sri Lanka does have a small wood-processing industry but,for the time being, it is a net importer of wood and wood products.
75. In Latin America, in terms of total forest resources, no countrycan equal Brazil and the question of forest-resource potential does notpose itself, except on a regional scale, in the semi-arid North-East,where ever, fuelwood is scarce. It is also a country which plans andadministers forest resources in a modern and scientific manner. One ofthe so far few instances of the use of lasers in wood-processing,referred to in the introduction of this note, concerns the Jariwood-working complex in the Amazon region. Research into hardwoodpulping techniques, and actual pulping operations, are among the mostadvanced. Brazil is the home of some of the world's most precious woodvarieties (of which about 80 presently considered exportable). Thecountry owes its very name to a tinctorial wood (Caesalpinia sapan -yielding a purple/red dye, "brazilin"), much prized in early moderntimes, and a trade-monopoly item for Portugal during several centuries.Past and present importance of wood production and tradenotwithstanding, Brazil is also a country of vast dimensions and, whenseen in relation to resource potential, much resource developmentremains ahead. Also it may be noted that, in terms of resource valueper hectar of tropical forest land, the Amazon forests, growing on poor,mineral-stressed soils, are disadvantaged, with tree-cover there beingmore sparse, and individual tree trunks being smaller than in thetropical forests of South-Asia and Africa. Following a set of stricteconomic development objectives, Brazil's contribution to world suppliesof forestry resources, insofar as export marketing of wood is concerned,is now generally limited to exports of processed wood, mainly high-gradepanel products (fibre- and particle-board) and, more recently, also
1According to the latest (1985) report of the New Delhi Centre forScience and Environment, recent satellite data show that the country islosing 1.3 million hectares of forest yearly (or an area about eighttimes larger than indicated by earlier statistics). This poses athreat of an ecological economic and social disaster. There is atremendous demand for firewood, fodder and wood for urban and industrialneeds. Silting rates in dams, as a result of hillside erosion, arereported to be among the world's highest and river-beds are rising,causing serious flooding. If recently proposed plans for promotingreforestation, with the help of international financial assistancemeasures, come into effect, India should be one of the main recipientsof the proposed aid ($1.2 billion out of a global $8.0 billion).
2Part of it built up (plywood manufacture, for tea-chestproduction) under cover of GATT Article XVIII:C measures, invoked in the1950s and early 1960s.

MDF/W/52Page 64
woodpulp, in increasing quantities and also of some wood manufactures.In addition, Brazil is a producer and exporter of some highly-prizedspecialty woods and log exports may, on occasion, be authorized, forinstance when major forest clearings are required in connection withhydroelectric power and irrigation projects (but, for technicalreasons, do not necessarily always materialize).
76. Rich tropical forest resources also exist in the Guyanas and inSuriname, in Venezuela and in some of the coastal areas and the inlandAmazon Basin regions of countries on the Pacific Coast of Latin America.In Venezuela, apart from natural forest vegetation, there exist alsofairly extensive pine plantations. Some of the countries in CentralAmerica, as well as certain parts of Mexico (often particularly variedand rich in phyto-genetic resources, on account of their geographicsituation on a land-bridge between two continents (and the point ofpassage of untold flocks of migrating birds), have significant forestresources, some of it used in agroforestry, sometimes to the detrimentof the forest ("Hamburger" connection). Reforestation for watershedprotection aid for economic uses in Mexico is reported to beprogressing. With the possible exception of Cuba (where a massivereforestation project [1986-1990] is to be implemented), countries inthe Caribbean and the Antilles region, generally, have nowadays onlysparse forest-cover and are often dependent for wood and wood-productson imports.
1Exports of pulp started in the mid-1970s. Exports of wood pulp inthe mid-1970s were of the order of 150 thousand tons per year; theyreached about 900 thousand tons in 1983 and for 1984 and 1985 areestimated to have been of the order of 1 million tons. Exports of paperstarted in 1979, rising to about 600,000 tons, each in 1984 and 1985.Under the most recent development plan, an expenditure of 3-4 billiondollars up to 1990 is foreseen, about doubling pulp production capacityfrom 3.3 million tons at present (to about 6 million) and that of paperfrom 3.7 to 5.0 million tons. As a result of that investment, Brazilmight rise from eight to fifth place among world cellulose producers(JOC).
2Due to its geographical location, Mexico has three large forestecosystems, with temperate climat forest species (mainly pine, oak andoyamel) covering 29 million ha., mountain pine forests (area coveredunspecified, but accounting for four fifths of Mexican lumberproduction) and about 15 million ha. of tropical forests. Government-or State-affiliated agencies control about one fourth of Mexican lumberproduction.
3Forecasts on timber supplies and wood requirements up to the year2000, by broad geographic regions, are contained in a recent FAOForestry Paper: "World Forest Products - demand and supply 1990 and2000", FAO, Rome, 1982.

MDF/W/52Page 65
B. PRODUCTION OF MAJOR CATEGORIES OF FOREST PRODUCTS
77. Even when the term "forest products" is primarily used to designateitems of wood and cork, it covers a vast range of products, ranging fromfuelwood and charcoal, over logs, hewn timbers, sawn-boards,wooden-profiles, veneers, plywood, various wood-particle and -fibre -sheet materials, to assembled joinery (other than furniture of CCCNChapter 94), and assembled structures, to pre-fabricated works-barracks,prefabricated wooden houses, wooden implements and decorative andornamental articles, chop-sticks, tool handles, textile-machinerybobbins, etc. and various other transformed wood products, such aswoodpulv, produced either by mechanical-, thermo-mechanical- or byvarious chemical-processes, and also cork and cork manufactures.Within these various product categories certain products may beby-products of agricultural activities, such as the occasional log cutfrom a hedgerow or from a small timber-stand, offered to the market byforest-owning farmers, or may be the outgrowth of an artisanalwood-shaping and joinery activity, or be the product of one of the manysmall sawmills, slowly disappearing, but which once dotted the rurallandscape, or may even be the result of a pit-hole (and entirely manual)log-sawing operation, still practised in some of the developing areas.The products may also be, and increasingly are, the result of forestry-and wood-processing industrial activities, operated on a large-scale,involving often very capital-intensive processes, with individual plants(such as modern pulp-mill I and particle-board factories), each costingfrom $100 million upward.
78. The listing in the paragraph above, though far from complete, isintended to indicate that it is highly improbable that all of thesevarying activities and sources of "forest-products" are fully andaccurately reflected in the economic and industrial productionstatistics oL ail the countries covered by this note. In fact, they arenot. Artisanal activities involving enterprises with less than five,ten, or sometimes even more, employees (as the case may be, and smallenterprises are very common in certain forestry-cum-agriculturalactivites and in the wocd-working industry) are not covered in theproducing. statistics of manyvcuntries, cr, _: at all presented, areonlyroughly estimated (Reportedlysome research into factory-
products productionactivitiesand problems inthe statistically oftenignored informedsector developed inILO.) As regards trade statistics, when these are based oncustoms-house data, the situation may be somewhat better, since, inprinciple, all frontier-crossing products are recorded. What all thissuggests,. however, is that production- and trade data may not always befully comparable one with the other and also that coverage of recordedproduction data for given product categories may not always be identicalfor the different countries.
IA possible exception to this are some small-sized pulpingfacilities now under development in France, for limited production-runsand decentralized pulping installations.

MDF/W/52Page 66
79. The data inscribed in Table II show, in the first instance,domestic industrial roundwood production of individual contractingparties, to which are added, to arrive at a measure of "unprocessed woodavailability", combined net trade volumes of industrial roundwood and ofpulpwood, to indicate the volume of raw wood available for primaryprocessing in the different countries concerned, whether it be forsawing, for manufacture into wood-sheet materials or for pulpproduction. It will, however, be noted from the data in Table II thatall countries do not necessarily engage in respect of the availableindustrial roundwood in either sawing, sheetmaking or pulpingoperations. Wood can be, and is being used as such, or after havingbeen hewn and squared, for poles (good pole-quality logs fetch goofprices), for fencing, for construction, as sleepers, pitprops etc.
80. Table II also attempts to show data on production of sawn-wood,plywood, particle-board and woodpulp and the level of domesticavailability, taking into account the net trade position forsemi-manufactured wood and woodpulp. (Possible changes in stocks couldnot be reflected in this note). Availability data shown are intended toindicate the materials-base for secondary wood-processing activities,such as for joinery, for house construction, cabinst- and furniture-making and for paper- and paper-board manufacture.
81. Notions as to what is, or should be, covered by the term "forestryproducts production" are likely to differ widely between differentobservers of the forest industry sector. At its most basic level,forestry production may be considered as taking axe, saw or chain-saw,to the forest, with wood production seen as being akin to a simplegathering-activity or, if practised on a larger scale, perhaps to amining operation. Such gathering/mining-type operations do exist, butthey are far from typical of present-day commercial-sc4le forestryactivities. Forestry production may be seen as commencing as a decisionprocess in regard to land-use options, designating part of availableland resources as forest land, another part as agricultural land, as
1In a number of developing countries, and also in Japan, bamboo andrattan (Indonesia produces about 85 per cent of all rattan; very littleof it is exported) are also widely used for the fabrication of variousarticles and implements (including - bamboo - tubewell pipe constructionin India) and for scaffolding (even for high-rise buildings, viz.Hong-Kong) and for construction purposes (including as concretere-enforcing materials). Various vegetable materials other than wood,(bamboo, sisal, coconut fibre, manila, abaca, rice husks, cereal straws,sugar cane bagasse, cotton winters, etc.) may be, and are, to someextent, used for producing woodpulp and for cellulose. Availability ofbamboo and rattan is generally not covered in internationalwood-production or-availability data.
2For fibre-board production and trade data see Annex I-B.3Part of woodpulp production may be (and is, in fact) used in
other, cellulose-using and processing, industries.
4For explanatory notes for various terms used in forestry industrydesignations cf: FAO, Forestry Paper No. 32

MDF/W/52Page 67
land to be set aside for urban settlement, etc.1 In the Republic ofSouth Africa, for example, which originally was not blessed withextensive natural forest-resources, deliberate afforestation policies,pursued both by the government and by the private sector, have by nowresulted in the availability of 1.2-1.4 million ha. of forestplantations, -which supply, on a managed and sustained yield basis,industrial roundwood for an expanding and modern wood-processingindustry, meeting also the not inconsiderable wood-requirements of SouthAfrica's miring industry and of its railroads - 25 per cent of all woodproduction is accounted for by pitprops and by railway sleepers. Frombeing a wood imDort-dependent country in the recent past (it was anexporter early in this century), South Africa has by now built up anexport capacity for wood, and also for woodpulp , and has, in theprocess, generated substantial employment opportunities in this sector.Possibilities exist in South Africa for further expanding the forestdomain, inter alia, by expanding wattle tree plantations, which areamong those that are particularly effective as pioneer-trees inestablishing themselves, ever. in desert-like soils, thus healing SouthAfrica to check the spreading of the desert, while algo increasingproduction potential for wattle bark tanning extracts (and, perhaps, agum-arabic substiture
82. Another example of good forward planning and effective use offorestry resources and potential is supplied by New Zealand. NewZealand does not suffer from the same climatic constraints as largetracts of South Africa, and has large natural forests, and, generally,favour-Tble climatic conditions (very different though as between NorthIslan( and South Island, reflected, inter alia, by differentspecies-composition. in the respective forests) for forest growth. Morethan fifty years ago the New Zealand authorities realized that thevaluable native forests wculd not last indefinitely and acted to ensurea permanent suran> of timber. 'The first bi'g forest C~anting in NewZealand thus began m.ore than fifLty years ago, providing, at the sametime, employ-ment opportunities in an economy affected by the thenworld--we recession. Wood frcm>these plantations, some of which havesince been replamtedmakes amajor contributionto supplying the needsof industry andto
plantations . Zi:. oCs C CrestPla Decnze srea. overan are- stretching morethan 110 kilometres long) New Zealand's forestplantations continue to be expanding, with plantations expected to reach1.3 million ha. by about 1990. Production potential is expected to rise
In at least one developed country, forest land lots carry withthem a quasi-automatic building permit - while lots for agricultural-usedo not. This results in a high market value of land with standingtrees, and it is a brake on forest clearing. Resulting high land taxeson such forest land may adversely affect motivation for forest-careactivities.
2On account of the increased offtake for pulp production,additional annual tree plantings on 38,000 ha. are required(1984 plantings = 7,000 ha.), otherwise domestic pulpwood supplies willbecome insufficient by the end of this century; to meet the needs theforestry-products sector is to be invigorated by further privatization.
3Market demand for wattle tanning extracts (of which there exist
different varieties) is, however, subject to fluctuations, accompaniedby a certain instability in prices obtainable in export markets.
MDF/W/52Page 68
3from about 10 million m of industrial roundwood per year now, to about30-35 million m at the beginning of the next century. The success ofNew Zealand's forest plantations, and forestry industry generally, owesmuch not only to close co-operation between the government and privateinterests, but also to the judicious choice of tree-species for theplantations, the main variety chosen being radiata pine, which, ongrowing sites in New Zealand, reaches maturity in about twenty-three totwenty-five years, and provides a wood with excellent pulp-makingproperties, and good quality lumber as well, subject, however, like manyother types of wood, to being preservative treated for certain uses. In1982, the New Zealand authorities drew up a strategy for forest industrydevelopment in the coming decade and a half. Under that strategy it isplanned to establish, inter alia, a considerable number of new pulpmills, saw-millsS ply-mills and chemical industries, using residue fromthe saw mills. '
83. More generally, actual or potential forest resources consist notonly of forest land, or land on which forests could be grown, but alsoof people who are both willing and trained to undertake forestry work.There exists probably some vague general consciousness that tree-fellingand related logging activities involve hard physical effort. What isgenerally less realized is that this type of work, if it is to becarried out at reasonable costs and without loss of limbs and lives ofthe workforce engaged, requires highly skilled and experienced labour.A demonstration of this fact is sometimes provided when undertakingforest salvage operations after major windfall damage or other naturalcalamities. An initial reaction of the authorities in trying to copewith the additional forest-work thus arising is often to mobilize armyunits to assist the regular forest workforce. However, as trees, eventhose already on the ground, are full of compression- andtension-strains, which may unexpectedly snap - releasing their pent-upenergy potential in violent bursts, and with "widow-maker" branchesquite frequent, logging accidents are, unfortunately, very common,making logging one of the most dangerous occupations of all. Only goodtraining, experience, and good occupational safety practices can containaccident dangers within reasonable limits. In the circumstances, it isnot surprising that storm damaged forests often do not get cleared intime before the windfelled trees become the prey of fungus- orinsect-attacks, and hence lose most, or all, of their commercial value.Where storm damage is to be cleared up quickly, it often requires thetemporary hiring of skilled foreign forest-workers and -crews. InEurope such crews quite frequently come from Finland, or are composed offree-lancing, experienced forest-workers from other countries. Recourseto imported labour is not always appreciated by local forest-workerunions. While special training and experience are necessary for
IRef.: Financial Times, Special Report, 31 August 19832 short follow-up report appeared in the Financial Time edition of
17 June 1985. - Later reports, from other sources, indicate expansionand further quality-upgrading for paper production.
3in Switzerland, where work-place safety practices are highlydeveloped, the accident rate in the woodworking industries is,nevertheless, 60 per cent above, and for logging 200 per cent above, theaccident rate for all industrial occupations. The adoption ofappropriate safety measures and regulations and of training forimproving occupational safety and health of forest and wood industrylabour are among the measures being promoted by ILO; ref. ISBN No.92-2-202765-5, 1981.

MDF/W/52Page 69
logging, and are indispensable for a successful use of forest resources,special skills and aptitudes are also required at the stage of thewood-working and other wood-processing industries, involving goodindustrial product design skills. Among instances which come to mindfor the wood-working sector, and for furniture production, might beDenmark, Finland, Italy, and the ex-"Bauhaus" tradition. Othercountries and design schools are also making a remarkable contributionto the furniture and construction design field, for instance, the UK andFrance, the latter, however, often not for industrial-series production.Also required is a work-force with good traditional woodworking skillsand organizational and marketing talents by management, talents andexpertise without which the rapid expansion of wood-production and-exports from certain newcomer countries to the wood-industry trademight not have been possible.
84. The question of the availability of forest labour is ofrelevance. Until quite recently, possibilities for productivity gainsin tree-felling and logging operations were in no way equal toproductivity developments in industry, or those possible in mechanizedagricultural activities, the main difference arising out of thedifficulties of mechanizing forest-care and -logging activities. Asnational wage levels in most countries rose for all categories oflabour, in line with, or even ahead of, overall, industrial productivitygains, forestry activities, where labour costs rose in an analogousfashion, but not productivity, began to be priced out of the labourmarket, resulting in the decline, or even the abandonment, of forestryexploitation and forest-care in many instances. As this happened, theforest itself tended to become less productive and less remunerative.This spurred, inter alia, imports of wood and wood products from lowercost suppliers and greater use of substitute materials. At the sametime, the forest-industry, particularly so in North America, but also inAustralia, in Scandinavia and in the EEC, was active in designing waysof mechanizing logging and forest-care activities to the maximum extent.The industry, joining its experience in forestry operations with theskills of its transport- and materials-handling machine-builders, hasbuilt up, really taking off in the 1960s, an impressive andever-expanding arsenal of forestry machinery. Among these machines onemight mention the "processors" - which closely approach the tree to befelled, fell it and also clear it from crown and branches, either beforeor - depending on the type of machine - after felling. Then there are"feller-bunchers" which cut a tree close above ground (often by powerfulshearing action) and transport the tree, still held upright, tothe special heavy-duty logging trucks and load it, all in one, rapidlyexecuted, operation. Still other logging machinery is designed toprocess small diameter stems and wood-waste (only about 50 per cent oftree phytomass is in the usable portion of tree-trunks) into wood-chips,blowing these directly - to the extent available - (in the US, in the
1For instance, aluminium- and plastic-frame-windows (share in newconstruction in F.R. Germany above 50 per cent, France 12 per cent),window sills, mouldings, trim- and light construction profiles.Interestingly enough, in some countries, suppliers of aluminium- andplastic-windows, aluminium- and glass- building panels (sometimessupplied with a wooden core) are often former wood-working or woodproducts trading enterprises. Some wood industry observers feel thatimports of wooden joinery products may often be less of a competitionproblem than the competition arising domestically from shifts tosubstitute materials.

MDF/W/52Page 70
early 'Eighties, more than 700 on-site "chipers" were in operation),into transport vans going to the pulp-mills. Other machines evenextract part of the trees' tap roots (increasing wood yield (forchipping, pulping) per tree by as much as 20 per cent above normallogging yields and reducing, af the same time, the cost of preparing thesite for forest regeneration). Unless environmental considerations aretopmost, or harvesting objectives are to obtain from some of the standsvery large diameter trunks, forest fellings are often of theclear-cutting variety, since clear-cutting of tree stands often permitsefficient and particularly successful replanting operations to beundertaken. A prerequisite for successful mechanization of felling andlogging operations is, of course, a certain homogeneity of tree speciesto be harvested and some uniformity of tree-age and -diameters. Themachines used are generally designed to perform with respect to apredetermined range of tree diameters (say between 20-60 cm.), i.e., thehighly-mechanized and standardized logging methods described wouldprobably not be possible, or would not be economically profitable, withpresently existing machinery, in most of the virgin tropical forests.
85. One of the key elements in forestry-products productionpossibilities relates to resource accessibility. It is not widelyrecognized that in many of the tropical forests up to one half of thecommercially realizable cost/price at the point of loading for sea-transport may be accounted for by the initial transport cost to theport (as regards sea-transport, more later). This is not only theresult of the cost of the standing timber being, perhaps, low (it isnever free, as costs are incurred in preliminary surveys, obtention oftimber rights, felling costs, in the form of wages and equipment andmaterials-costs, forest taxes, eventually obligatory reforestationexpenditures etc.),. but also because transport costs are, indeed, high.While in a situation where good forest-roads and a goodroad-infrastructure already exist transport costs may be considerablylower than in the case of a new forest exploitation (be it in adeveloping or in a developed country), transport incurred, or related,costs are in almost all cases quite significant to forest owners, orconcessionaries, considering theexpenses involved in building andmaintaining forest-access roads. ' While in many instances
For an account of different proportions of phytomass assumptionsmade for trunk, crown, branches and roots in different ECE countries'forestry statistics, see: "The forest resources of the ECE region .op.cit.
2aWhere these costs can be kept to a minimum, as a result of theresource base being close to wood-using industries and to markets,competitiveness is much increased. This is, to some extent, the case inthe South-eastern United States; 35 per cent of total US furnitureproduction is now centered in North Carolina, another 25 per cent inVirginia. (Another important section of the furniture industry hasremained in its original, tradional hardwood forests habitat, in theNorth-East and in the Great Lakes' regions.) A demographic shift to the"sun-belt" in recent years has been of significance in helping alongdemand for building materials and for other wood-industry products (alsopulp and paper) in that area. Location of saw-mills, ply-mills,pulp-mills, in relation to timber stands is, however, also ofconsiderable importance, and many of the mills in Canada may beparticularly well situated in this regard.
./.

MDF/W/52Page 71
Footnote (cont'd)
2bDifferences in authorized axle-loads for logging and otherlog-transport trucks, which, in turn, are linked to the load carryingcapacity of logging roads and highways generally, may be one of severalelements affecting competitiveness. Swiss forestry operators havepointed out that the considerably lower maximum axle-loads authorized inSwitzerland, as compared with those authorized in neighbouringcountries, are a significant handicap.

MDF/W/52Page 72
governments may assist concessionaries directly, or by tax relief, inbuilding roads and access ways, in other instances, concessionaries maybe obliged to develop the access roads they built into public highways,an obligation which may, or may not, benefit from tax relief or taxcredit, in one form or another. In other words, what at first sight mayappear to be a straightforward logging-operation may turn out to bethat, but might, in addition, be an activity more akin to that of apublic-works contractor.
86. One point to bear in mind is that, generally, dense populationsettlement and forests do not go together well. Where human settlementsand agricultural and industrial activities expand, forests tend todisappear, except in a limited way, for recreational purposes or fortheir aesthetic landscape effects. In other words, forests are foundaway from settlements, in areas either not needed or not wanted forsettlement purposes. jAmong areas with difficult access conditions arethe mountain regions. However, as easily accessible forests dwindle,attempts will be made to make use of mountain forests for woodproduction. If logging in such areas is carried on without regard toland protection, the consequences can be catastrophic, resulting in soilerosion (the correction and repair, through regrowth of sufficientlywell-rooted plants may take 50 to 100 years), land-slides, river-siltingetc. Since this is realized, and as there are, by now, many regulationsfor the conduct of mountain logging operations - considerable care istaken in logging operations for the protection of the environment.Where forest land is more accessible, heavy earth-moving andmaterials-handling equipment may be used, either alone - as in sometropical forests - or together with the specialized machinery alreadyreferred to. In many of the tropical forests, particularly inriverine- and swamp areas, the use of heavy handling or haulingmachinery is, however, impossible (as in most of Sarawak - one of themain sources of tropical woods), making felling and logging operationsthere as toilsome as ever. In some of the forests in the northernregions, mechanized logging operations are possible only after theground is sufficiently frozen. What all this adds up to is that loggingoperations are often difficult and, consequently, not inexpensive.
1It is estimated that about one fourth of all currently exploitedproductive forests are in mountainous regions with difficult accessconditions, often involving, for the evacuation of logs, the use ofaerial cableways, captive balloons, and, increasingly so, helicopters.A new type of high-lift-capacity airship (pairing some of thecharacteristics of a (helium-filled) dirigible and helicopters), iscurrently under development in North-America, sponsored by both the USGovernment and the Government of British Columbia (a prototype crashedand burned, early in 1986, but development is continuing). Such lighterthan air craft (though difficult to manoeuvre) could be useful, andeconomic, not only in mountainous terrain, but also for loggingoperations in remote areas, by keeping down what otherwise might beexcessive costs for building the access ways.
2Skidding of logs by horses in certain developed areas is stilleconomic, and less destructive of forest soils and forest growth thanmachine or tractor use. The use of trained elephants for such work incertain tropical areas sometimes is both practical and economic.

MDF/W/52Page 73
87. For initial transport, the floating and rafting of logs on inlandwaters and rivers has been of importance in many areas (including inJapan). In the northern areas, such river transport is feasible andpractical, provided the rivers flow southwards, (at least seasonally) tothe ice-free sea, or towards a conveniently-located loading centre.Environmental concerns have started to have a limiting effect onpossibilities of floating or rafting logs down the rivers in certaincountries. Floating, though generally leading to some wood-losses, isnot necessarily harmful (rather the contrary, according to one school ofthought) as regards the end-use qualities of the wood, including forfine joinery and certain instrument construction.
88. The practice of floating has had a major impact on the way theworld has come to know, or rather not to know, tropical wood varieties.Many woods, particularly tropical woods, in their green-state, arevirtually saturated with water. As the woody substance of a tree has aspecific density of 1.5 (or 50 per cent heavier than water), m~ny of thestill "green" logs will either not float or do not float well. Onepossible way to deal with this problem would be to dry the logs beforeattempting to float them (another one would be to raft these togetherwith light-weight trunks, which could be economical if a remunerativemarket outlet for the latter also exists). Unfortunately,large-diameter trunks take a long time to dry, while many woodvarieties, when left simply on the ground, do not take long to bedeteriorated by fungi and insects. As a result, many tropicaltree-varieties - the so-called 'sinkers' - were generally not harvestedin the days before the availability of road-transport facilities andonly 'floaters' were taken. Thus, most of the tropical varieties thepublic in the developed areas came to know are woods which arerelatively light, even in their green state. Teak is among the fewexceptions, as are certain specialty woods, such as these used in portconstruction work (greenheart, kapur, etc.) and ebony.
1Cf. also footnote 3 on page 57.
2A wood with a weight (specific density) of 0.5 - when dry - wouldindicate that one third of the volume of the wood is constituted ofwoody substance, the rest being occupied by cell cavities, intercellularspaces and cell-wall capillaries. The "specific gravity" of the woodysubstance itself is about 1.5, regardless of species, in other words, aheavier wood (in the dry state) has more woody substance. Theproportion of woody substance is, by itself, not a sufficient indicatorof the strength and durability of the wood concerned.
3Teak too, when green, will not float. Teak-trees and -wood are,however, unusually fungus- and insect-resistant, even when thestanding-tree is already "dead". Teak trees destined for transport byfloating were therefore partly debarked while still standing. Thisstopped the return flow of the sap to the roots, which then started todie, while, initially, the leaves continued to evaporate water. Aftertwo to three years the, by then, dry tree (specific density about0.68-0.62), was ready to be floated, ready for shipment and subsequentprocessing and transformation.

MDF/W/52Page 74
89. The main point to be borne in mind is that the bulk of woodnowadays consumed is grown in locations far removed from the points ofend-use and, consequently, transport-facilities available and transportcosts play an important, and often even a decisive, rôle in regard toforest resource-use possibilities and, as far as importers areconcerned, sources of supply.
90. This raises the question of the possibilities of economizingtransport costs by reducing the volume to be shipped, by processing logsnear the sites of production. Other questions which arise are what thevalue-added may be from various processing operations, their employmenteffects and regarding repercussions of alternative use- and production-patterns on foreign exchange receipts or outlays, both absolutely, andin terms of net receipts, bearing in mind that for production to startup, and to continue, imports may be required of machinery and sparesthereof (most of the modern, sophisticated forestry-working and handlingequipment and wood-processing and pulping-equipment are produced in afew developed countries only) and of certain materials (glues, binders,resins, chemicals for wood-preservation, for colouring, bleaching),motor-fuels and lubrication materials. In relation to resourceavailability, and production to be based thereon, and in relation tovolumes to be shipped, the question of normal waste occurring inwood-production and -processing is of some importance.
91. Starting with the tree as it stands in the forest, fellingoperations will, entail the first significant loss in phytomass that canbe extracted. What is recoverable depends on the tree-species, age oftrees, the growing-site conditions (trees in dense forests can developfewer side-branches than those standing singly, or in less denseforests) and the intended use. If the trees are to be transformed intowood-chips (say for pulping) most of the tree-phytomass would, inprinciple, be usable, if reduced to chips right at the production site.Some of the trees are, however, difficult or uneconomic to chip andchip-production at the felling site is, for the time being, theexception, rather than the rule. Chips made from different tree speciesoften do not lend themselves to one and the same use. This is thus aproblem for tropical forests. Chips, once they are produced, should notbe kept stored for too long, or use-quality will deteriorate. As wooddoes not only grow straight, and as there are side-branches and crownbranches, these will have to be removed and it will generally be foundimpractical to transport all of this material to the pulp mill. Wheretrees are intended to be used as saw- or veneer logs, the removal willgenerally be limited to part of the tree trunk, accounting, in general,for much less than 50 per cent of the overall tree-phytomass.
92. There occurs, hence, a first volume-reduction already at thelogging stage. In terms of volume reduction in subsequent processingand transformation, the greatest volume contraction occurs intransforming wood into chemical cellulose pulp. Indications available
ISince the cellulose fibre component represents about 50 per centof the wood substance (cf. also footnote 1 on page 73) yields of 48 to56 per cent are achieved in making chemical cellulose pulp:4.2 - 4.5 m solid volume per ton are required (production figures forpulp are normally reported in tons rather than cubic meters) forunbleached sulphate pulp, or 4.5 - 5.0 m per ton for bleached grades.The other main component of the wood substance, lignin, is dissolved in
./.

MDF/W/52Page 75
Footnote (cont'd)
the cooking liquor and used as fuel, enabling modern sulphate pulpplants to obtain self-sufficiency with regard to steam needed forcooking and drying the pulp, and allowing also back-pressure power to begenerated by the drop in the steam pressure; in integrated mills thesteam will cover, instead, part of the needs for heat in the paper mill.The chemistry of lignin is still far from utlerstood. The lacunae inour understanding are, however, not preventing other uses from beingfound for lignin, namely lignin derived alcohols, feeds and glue, and,potentially, further processing into (particularly tough), resin baseproducts. When producing mechanical pulps, thepulp yield attains94 - 98 per cent of the wood input (about 2.5 m per ton) but, on theother hand, there is no spent liquor to burn and the power inputnormally exceeds 1,200 kwh/ton and may reach 2,000 kwh/tons, or more,for thermo-mechanical pulps (TMP). [As this note is being written,notices in the press are suggesting that among several other pulpingprocesses that are being tried, a new "ester-pulping" process, underdevelopment in the US, holds promise of increasing productivity (higheryields - 60 to 70 per cent, instead of 48 to 50 per cent, shorterprocess time, lower peak heat requirement) and of virtually eliminatingpollution problems (no sulphur inputs required). Time will tell if, andwhen, "ester pulping" will supplement in a significant way, or willdisplace, the currently-used pulping processes and installations.]

MDF/W/52Page 76
from various sources suggest that solid-wood losses in saw-millingoperations may vary between one-fourth to two-thirds of the initiallog-volume, depending very much on the initial diameter of the log, thelog species, the number of boards or beams, rafters, etc. to be producedfrom a given log volume, the type of sawing etc., the equipment used,operator skills etc., so that one might assume that volume losses insawing might, on average, be close to 40 per cent. Much of theoriginal tree trunk is not directly suited to be transformed into veneerand, if losses in preparation for veneer making are taken into account,the wood yield in making plywood is rather low, 30 - 50 per cent. Inactual veneer production, solid-wood losses are probably less important,given the fact that good-quality veneer-logs bought, and internationallytraded and prepared as such, are expensive, and hence likely to behandled with care and circumspection, that sawing of veneer-logs (inwhich volume loss is quite high) is relatively rare nowadays, and thatlosses in knife-slicing and by peeling are relatively limited, the mainloss-determinant, for the latter process, being the initial roundness ofthe log and the remaining core-diameter which is not suited for peeling.As regards wood-chips for the production of particle-board these areoften derived from wood left-overs. However, in the production processabout 8 - 10 per cent of bonding agents are also required. Hard-fibre-boards are made by compression of wood-fibres, with (3 per cent), orwithout, additional, bonding agents. For other types of panel productsbetween 3 - 9 per cent of binders are required and for plywood between4 - 8 per cent. As fibre-board may be compressed, or be fluffed (as foracoustic tiles etc.), overall volume losses and/2r gains are difficultto determine in the abstract, in aggregate terms .
I1n this context it must be pointed out that the volume loss insaw-milling (35 - 40 per cent) is not, strictly speaking, a loss whenthe residues are chipped and sold to pulp mills or chip and waferboardfactories. In all major softwood producing countries saw-mill chipsrepresent a large proportion of the total wood supply to the pulp mills.
2In most wood-processing facilities in developed countries there isa high degree of utilization of raw materials. Residues such as scraps,bark and sawdust are used either as raw materials for producingfibreboard, particle board, or other products, or are burned to produceenergy (including also kiln-drying of sawnwood). Wood residues not usedat the location where they are produced are sometimes sold to otherfirms. Overall, for the developed countries, about 50 per cent of thewood delivered to the mill is recovered in primary products and of theremaining residues about 75 per cent is used in some form either forenergy production or as raw material. For a thorough discussion ofconversion factors in processing wood into sawnwood, railway sleepers,panel products and paper pulp, differentiated also by reportingcountries, see "Conversion Factors for Forest Products", ECE/FAO,Supplement 12 to Volume XXXIV of the "Timber Bulletin for Europe",March 1982, and document TIM/EFC/WP.2/R 74, June 1985. In developingcountries the situation is somewhat different, however, as regards theuse made of process waste. Mill utilization of wood-processing residuesis much lower, one of the reasons being that the developing countries sofar produce very little kiln-dried sawnwood,or reconstituted board orpaper. Reference: UJNIDO/IS 437 - "The Use of Residues for EnergyProduction in the Mechanical Wood Processing Industry", February 1984.

MDF/W/52Page 77
93. Reduction in shipping volume is, of course, not an end in itselfand the availability of wood is not the only, or main, determinant, ofthe type of production to be envisaged. Availability of relativelyinexpensive energy for mechanical pulp mills, and possibilities forevacuating processing wastes, are, for instance, very important inregard to pulp production. Nearness to downstream industries, and theexistence, or lack, of market alternatives for different types of woodproducts and their derivatives are of major importance. As regardstransport, shipping companies are, evidently, aware of the benefits tobe obtained from shipping more elaborated, higher-value products, andshipping rates (this may also apply to some land-freight rates) maycorrespondingly be set at higher levels for more highly processed items.Thus it is not a priori certain where, and to what extent, gains fromlowering the volume of goods to be transported will accrue. Some of theLatin American producers and exporters of wood and woodpulp, forexample, are convinced that they could step up exports if it were notfor the lack of adequate (frequency of sailings, schedule reliability,direct connections) and truly competitive ocean transport facilities onSouth-North routes. In this context, it is relevant to note that someof the large forestry-products companies do own specialized portfacilities and/or sea and 'Land transport facilities (some of the forest-products companies have come to forestry from initial transportoperations (railroads, ocean tranport)), which - in today'svery competitive situation in trans-Pacific and trans-Atlantic oceantransport, and under deregulated rail- and road transport in NorthAmerica - may, or, more likely, may not, confer a competitive advantage.
94. Having touched upon the subject of approximate processing losses,it may be useful to return briefly to the question of the use made ofworld wood production. Total world wood removals in 1979 were of theorder of 3,020 million cubic metres. Out of this, an estimated 52.8 percent was presumably used for fuelwood, leaving 1,445 million cubicmetres (47.8 per cent of total wood removals) in the category"industrial roundwood". The reported sawn-wood output in that year wasof the order of 450.7 million cubic metres. Using the, assumed,processing-waste factor of about 40 per cent, this would have required asaw-log input of the order of about 750 million cubic metres, or about52 per cent of total industrial roundwood availabilities (not takinginto account possible variations in stocks). Production of pulpwood andof wood-particles in that year was reported to have been of the order of356 million cubic metres - or 24.6 per cent of total industrialroundwood production. The next most important use category was "otherindustrial roundwood" (used either as such, in the form of poles, posts,piling, or for such special purposes as preparation of tanningmaterials, for gazogenes, distillation, etc.), absorbing an estimated171.3 million cubic metres, or 11.8 per cent of industrial roundwoodmaterials. Use of industrial roundwood for pitprops (not included inthe preceding subtotal) required 33.8 million cubic metres, or 2.3 percent of the total. Production of veneer and plywood took close to58 million cubic metres, or about 4 per cent of total industrialroundwood. Production of particle board amounted to 41.2 million cubicmetres and of fibre-board to 18.1 million cubic metres. Whileproduction of these materials also involves some wood-losses, othermaterials, including recycled wastes from other production-processesare, or may have been, added; production may be assumed to have

NDF/W/52Page 78
required wood inputs of at least 60 million cubic metres, or some 4 percent of 1979 industrial roundwood production. While these figurescannot be very precise, they might help to form an overall idea of thelikely order of magnitudes involved in industrial roundwood disposition.In short, somewhat more than one-half is processed into sawnwood(railway sleepers account for a very small share of that), about onefourth is pulped and veneers and wood-based panels account for close toone eighth of total industrial roundwood use.
95. Table II, which follows, based on production and trade datarecorded by FAO, should be read bearing in mind that the data relate toone year only, 1979, and that production levels may be subject toimportant year-to-year fluctuations. Further, the very low levels ofproduction and availability of sawn-wood and plywood in many developingcountries, while indicating low consumption levels in these countriesfor these wood semi-manufactures, should not be seen in isolation.Industrial roundwood as such can be put to good use in many applicationsand is being used as such, sometimes supplemented by bamboo and rattan.As regards woodpulp, which is shown as not being available insignificant quantities in many countries, it may be noted thatmeaningful and efficient further-processing of woodpulp requiresinstallations of plant and equipment of a certain minimum productioncapacity. Where such plants do not exist, requirements of products madefrom pulp are generally met more economically through imports.
96. Seasonal, year-to-year, and wide cyclical fluctuations in woodremovals and forestry-industry activity and trade are subjects whichhave attracted much attention, and the remarks that follow can do nomore than to point to some of the underly ag factors, the interaction ofwhich is very complex, making production forecasts and forward planningfor optimizing short- and medium-term forest-industry policies hazardousand difficult. One of the key factors involved is the nature of forestgrowth and its effect on production decisions. Unlike otheragricultural crops, which have a planting to harvest cycle reckoned interms of a season, a year, or a biennial cycle, forest production is along-term proposition, with rotation periods reckoned in multiples ofdecades. While, theoretically, wood removals can be modulated in
1In further processing to paper and paperboard, recycled paper is
by now of considerable importance. For instance, for the EEC, as awhole, recycled paper and paperboard accounts for about 40 per cent ofpaperboard of combined fibre pulp/cellulose inputs for overall paper andpaperboard production. The waste paper percentage inputs do, however,differ significantly as between industries of EC member countries,depending, inter alia, on types of paper and paperboard produced, typeof technical installations and also on market preferences. (Frenchmagazine publishers are reported to prefer truly white papers which,(de-inking notwithstanding), limits significantly waste paper inputpossibilities for producing that type of printing paper.)
2The subject of the economics of pulp and paper production indeveloping countries is dealt with in a number of papers published in"unasylva", Vol. 36, No. 144, FAO, Rome '84/2.
3Reference was made to the problem of cyclical downturns in demandfor forestry products in the Report to the Council of the Working Partyon Structural Adjustment and Trade Policy - GATT document L/5568, of 20Oct. 1983.

MDF/W/52Page 79
response to changes in demand, wood-processors' interests are opposed toany large-scale fluctuations in demand. Unfortunately, widefluctuations in demand for wood products, particularly wood forconstruction purposes (responsible in most cases for one half or more ofall industrial roundwood uses), is one of the problems besetting theforestry-products industries, since demand is not only related tocurrent consumption, but to investment demand and to expenditure forhousing and plant construction, and, not unrelated thereto, also tomarket developments for such consumer durables as furniture. Likewise,when it comes to wood employed for packing uses, (paletting andwood-crating are particularly important for shipments of machineryand construction materials, which, in turn, are highly affected bycyclical investment variations), demand fluctuations for wood aregenerally more pronounced than cyclical changes in demand for consumergoods generally.
Note: The column heading descriptions - subject to photo-reduction inthis revised version of the document - are reproduced, for betterreadability, in larger print size on page 196.

a3/W/52TABLE II
PER CAPUT AND TOTAL PRODUCTION OF WOOD, - SEMI-MANUFACTURESAND WOODPULP, NET TRADE AND AVAILABILITIES
1979( Units. at Shown: aSkilogras; mIllion a3*11110n Ton. )
_*~:,Ila 1.03 0.96 '0.26 0.33 64tC
-* iJ 1.97 1.73 '2.23 0.43 1571
: ro.zedes 0.02 0.01 0.01 0.002 (1110
i-Ddoa n.e. n.e. . 0.24
Znz 0.60 0.24 0.24 0.19
_____________ 1.06 0.01 0.01 0.003
*lI ~ t1.90 0.44 0.41 0.12 031
. ________0.73 0.03 0.03 0.01
r 04 0.16 0.01 0.01
roon 1.13 0.26 10I4 0.03S
*1.* 6_ 3b.Et6.5276.03 16.41 0.77 5311
;.w1.23 0.22 t0.16 0.02
________ 1.70 0.10 0.10 0.002
'̂ It _ t1.06 0.76 00.68 0.12
Ct)o~a t.60 0.13 £*.12 0.04 611
1 33 0.40 O.33 0.01
;________ 0.33 0.04 0.04 0.00 4Ypj39~t 0.17 0.12 0.12 0.23
C 1.11 03.24. .77 0.31 61K
3.e- In. 0.33 10.01 0.01) 0.02 _
0 .3 0.26
6'.OlwI 0.26 0.23 10.72 0.30 60Y
Cenmatr4 0.39 0.36 11.17 0.59 22Y
. 'ence 0.72 0.52 0. S0 0.23 631
r Cer uny 0.49 0.44 O0.46 0.37 631c
0.234 Ob 1II tenO 0.12 0.10 '3.O3 0.20 1311
0 .14 0.0 10.21 0.13 4411
!!dS 0.06 0.06 00.09 0.34 0911
l_____ 0 0S 0.07 0O.0S 0.24 0051
0 04 (0.01) 00.03 0.02 _
O~rane |9.62 0.67 El."6 0.70 |,10t
___. 4.26 2.06 n.e. 0.06
2I-S0.02 0.02 n.e.
0. | 0.23 | L.20 O.f4 |
________ 70.23 0.19 00.1S 0.00 _
1.00 0.04 00.29 0.004
0.S6 |0.38 | 0.33 0.22 3241
| | _ | l0.04 0.40| __C
rIl' 0 .31 0.0 0.03 0.01 I11.03 0.17| 1033 0.02 1le0 .0 0.03 3*.40 0.10 131
|*-rr Coast |1.4 3 0.70 03329 0.0 |
111cc^ OI00 0.012 0.01 0.4
je7t 20 0.29 -O1.05 0479,
13.70 04.94
12.34 13.s2
0I71 L0.04 _
0.20 -
s2.- 1 0.04
2.56 'O.O9
0.04
2.1S 00.34
157.31 |S.33
0.49 |0.13
0.44 _7
I 3.43 IOV
3.33 00.17
0.67 10.17
.33}
0.07
b6." |3.10
0.01
69.49
2.32 12.4i
|1.3U 00.00
23.11 '16
26.92 1 .32
0.750 0.39
0.34 |E.07
4.62 1 .91
0.79 010.44.01 I0.310O03 10.00
40.78 12.37
.Ot I _170.01
2.52 113.200.06 'O0.030.24 10.01
3.001 'O.5- 10.oo
19.06 0O.01
24.10 |9.52
0.11 10.21
0.47 113.20
0.02 00.1°°
7l33.27 1102
04.96
l. _
03.30
03.03
02.61
.1.20
. 0a05
11.4700.04
12.45
-Is'0.30
00.407
Z¶4.49
-InILudes aLo Pu.Lpood
2/.r data on vorLd prodctt1on nd trade Iea th. Statletce.L Tabtht tn hone 1, MI.lk 5"o dat -n II Iad and lntra-trade. beta o.-n orI. dvtdual EEC cowtr . ncLude
- . gn'",1d Wa than on. half the mInl. aowt thoen 1n the Vetee In oeven Co.Ln.
1p-ou1nt:n. dt - secrmtarlat wltt1.e.
I
Y
3.33
16.70
0.20
52.12
0.04
1.34
7.37
3.13
0.07
11.73
0.01
26.75
28.19
1.14
1.27
1.29
4.32
0.13
40.70
2.33
0.13
0.25
3.70
0.01
19.00
4.14
1.79
2.27
010.20
I
Y'0Isel_I.9
'II,I iga_.
Z
1HwJlII t| E:-
.3sx
..~
.3.g
.I
...J3)
450.68 41.23 | .32 r
0.19 10.63 _ .25 T 0.0 1001 1.30
3.17 3.90 0.S3 - 0.90 | 3.37 4.76
6.59 03.9 ¶116 'O.63 0. O O.Ot 5 24
0.13 ,0.oo1 0.0 - 0.20
-_ 10.04 - 10.02 0.06
0.02 C0.01 _ _ 0.06
O;0O _ _ _ _ 0.01
14.07 00.52 0.S0 - 0.76 10.11 04.75
0.42 11.1o _ _ 0.12 - 0."
0.42 00.14 _ _ 0.01 0.01 0.23
44.30 029.93 1.23 0.00 2.51 10.34 11.33
0.07 10.0 - - - - 0.05
2.t7 t1.03 0.00 | 0.02 _ 1.36
0.93 10.03 0.03 _ 0.0S 1.03
0.05 00.03 - X. 0.02
0.10 10.40 _ . 0.02 0.52
0.07 1b07 -_ 001 . 10.02 1.17
4.76 13.94 0.56 l0.07 0.30 00.02 4.73
._ 00.06 - O031 - 0.I 0.10
0.67 11.62 | t.7 El.,11 O OS it 5.04
o.wa I¶-47 3.4 0 10.15 10.14 2.09
9.66 13.37 2.19 X0.04 0.54 101.5 04.95
10.42 '4.65 6.37 10.13 0.44 I0.48 22.54
0.39 1o.04 0.29 0.001 0.03 = .3 1.23
0.12 3 0.00 1o.o6 - 10.05 0.36
2.34 1.58 t.S00 103S 0.41 10.03 10.13
0.25 _336 0.°0 0047 0.04- 00.4 4-.7
1.77 13.23 0.60 '¶.49 0.02 '1.16 13.32
_ 10.67 0.04 10.01 0.01 X0.06 0.79
9.71 E6.61 0.30 'O.32 0.64 03.53 3.69
____0.041_ _3 0.03
0.33 0. 0.01 _ 0.04 - 0.30
0.06 0O00 - OS.0
0.01 10.01 _ . . 0.02
1.13 G0.93 0.25 0.02 0.00 10.02 2.31
- 10.06 - 10.02 _ 10.01 0.09
10.01 10.02 0.02 . 0.1 00.01 10.22E t~~~~~~l8: l 52) cal :O.S03.41 11.29 . . 0.62 .2 2.55
10.23 0.06 _ 0.07 10.02 0.39
0.67 0O330 _ 0.06 00.02 0.41
0.03 10.04 _ _ _ 0021 0.03
39.63 1.06 1 .26 XO.OS 3.03 S 0.00 54.46
05
}s
-It
.03
1.97192.50
0.03
.34
01.0
0.12
0. 3
0.01
0(1t.34M
0.37
0.03
0.10
l10.40
OAS4
I1:0.07)
9.25
.1 1
1 9 20
10.12 0.1
00.23 0.03
T 0309 1.13| .02 O.C1
T - -1
06931O.09
11343 0.27
00.06 0.16
10.03 0.93
10.2 0.62
1004 0.11l1. 3.33
132¶3 4.1
10.o7 0.10
00.0 .0
1
7 .17 1.32
I 10.o0 1 0.1t1010.100
0.20
-1
i. _"
_
Z
I
1,C-1. v

MDF/W/52Page 81
TABLE 11 (cont'd)
1 2 3 4 56ct, _ _O 5s _
K aIAVscar 0.7? 0.09 0.07 0.02 U1
01 3.25 2.-t1.17 0 5
KoreI Et. C. S9 0.06 0.0. 0.01 _
00)
lu..aI1 -,s;4 0.02 IC." 0.03 _
S11
N." Z.4l4.J 2.90 2.71 12.6 O." laic
Ill:9Juqs 8.10 0.33 J0.09 0.10 10
'S~lel 1.71 0.05 0.08 0.03 _?2'13 2.00 12.14 1.16 S1
P.IlI 0.23 0.08 0.01 0.002
0 -V 0.809 ODO 0.09 !t
Phil 0448 0.32 0.09 10.17 0.01 5*!,.s.s osg C.S3 90.46 0.24 2"
07)
jturI9lug 0.04 0.02 80.04 0.03 *b1 A D0.19 0.33 10."4 0.21 S
49)
.Ws8 0-.07 0.01 0.04 n.e. _
S..eri, 1.23 0.0 0.05 0.003
02)
Strnsvo _ 0.0* 0.1 1
SU,, ^eflca O.39 0.S O 31 0.0A Ift
5wIy 30.51 0.2.0 la. 0.16 3216
5Pa)Lha 0.51 0.04 0.04 0.002 _
64)
SPo71.96 1.00 0.3 045 024
47)
&.,.k . .43 6.00 I*.15 C." OU5
Svftulwa 0.0' 0.50 'o.s9 0.16 __79)
T7a.la 0.5 0.40 . 0.2136U
70)
0,et lad.0 0.493 0. p0.09 0.005 -
all
Toea 0.23 0.03 0.05 0.00S_
72)
TI.gTeo a 0.9 0.02 0.60 0.00
731
0ol0.4 AV.'lca 0.01 0.13 0.16 0.04 171
3.8 Lanka 0.01 0.11 0.10 0.002 1
j"I 1.°1 0.90 0054 0.S1 211-87)_I,.De.t .olt 4 . 0.46O73O
B30)_
Ua:zgwy 1.59 0.10 0.15 0.04 10-
99f 0.62 O.S0 3G.S3 0.20 Sim
1i'aO land 0.3 0.03 0.01 0.002 _
018
1blo 0.25 0.06 0.06 0.004
02)-92=
'Cr~n86,m~ _0.09 0.00 0.00_ 0.17_ __ 2_
1USSD 0.01 0.16 10..1 0.05 7t
iuseia 0.2 001 01 0.00 ___
10.30l32.61
0.01ILnl1.7"0.21
6.11
5a.10.07
0.64
9.33
5.73
14.37
0.04
0. 1
9.76
00.49
0.60
0.3349.31
322
6.22
0.10
0.06
0.12
6.961.39
306.25
10.301
10.40
2.28
105S4.18
016'.1
*
I0.01
80.2910.04
10.958*0.7 I00.09
10.04
0.061
I 0.03
1 0.02
.
10.041
I00
I10.01
:7I s°
-I - I19
-.Z-10.25
0040
-L41.
J0.90
6.70
0.21
0.61
1.64L2.97Us*IS
1-- .41
- 0o.321
- 0.60
- 0.03S
- 6.96
- 1.39l
0.30
I05'o1102I- 2.16
S .°
rH I 12
, 1 _ _ .0p112I I. Is.1
,15 10.,3 0.2 0
.Ub.92 O.OS 3eones 2I.u I." S."
I I.~IL
0.231 - - 0 . 0.23
3.04 p0.2 0_ _0 _ 03.04
e0 M:0.4S 1.9
0. 10- 0 _ _ . 0.03
0.01 10.02 _ _ - _ 0.04
0.l3 0.31 0.-2 0.05 0.0 510.O 1.95
040 10 03 - 0.02 10.01 0.03_~o _0 - _ ; - 0.0
2.00 0.0 - 0.09 80.07 2.21
2.36 va.a o.U 1.003 2.01 10.07 4.74
0.04 10.00 .4 0.10
0.55 0.01 _ _ 0.04 t0.0 0.57
1.26 0.92 _ . 0.U 0.4z 0."4
7.64 p057 1.01 0.20 0.23 bal-nca 5.33
2.24 10.U1 0.32 00.11 0.02 - 1.59
4.. '0.94 ue3 'o.30 0.S0 p0.13 4.70
ao.o b.o.oo - 0.00 o.os- 10.02 _ _- 0.02
0.39 10.27 . 0.01 0.4 to0.34 0.27
1.06 J7.03 0.20 '0.01 0.01 p0.01 1.7
2.4 18.21 0.35 10.17 0.13 03.04 .30
10.03 _ 0.03
0.09 t0.02 0.01 _ 0.02 '0.01 0.09
11.22 16" 1.24 10.49 0.09 10007 0.47
1.60 40.3s 0.6 10 22 0.02 10.06 2.55
0.07 _ - * - - 0.77
1.06 10.20 0.01 0.09 2.46
_ 10.01 - 0.1L0.03 '0.0 _ , - 0.03 0.09
_ 10.20 0.02 0001 0.01 0.29
3.09 8.01 0.43 - 0.05 . 3.45
0.02 _ - - - - |0.02
57.5 821.70 7.20 '0.27 17.13 11.51 030.49
- 10.02 _- 0.02
0.00 00.00 0.01 Mr0.0 0.17
4.27 to.30 0.73 balsat 0.19 1O.3 4.3
0.09 '0.03 - . 0.00 0.07
0.04 .001 o.oI30.10 1ot1 0.02 - 0.02 0.85
317.05 ______ 34.92 35M.11
20.19 baaCve 0.0 80.02 | 1.S4 I 20.70
99.70 I7.39 1.90 '0.27 9.46
C0t.0 * 1 0.02
it0.* O."6 0.5890.2i~ i3b
0o.02 7 - I o0.02
0.06~~~044 ~0.60
0.01 7 0.01
1-.0 10.2s 0.1 1
1.53 0021 0.32
1- 80.00 0.0
0.04-a | O.0b 0.00|
1.., "I . $1 l ..2
1.-u 1o0o. 0.9o1
0.72o 0.07 0.79
0..0 I or10.02 0.4|
1.0 0.73 0.327
0-.0 10.02 0.02
:~~~~~~~~CT
10.727 03 00
- 8003 0.13
11.00 1 100 1 0.01 I
0.29 1 0.03 0.32
I I10.02!00 0.031
0°.68 I 0.10 I 0.S05
01 72 0. 1 °t
213 8oo 2.37o
50.7 I 00.4 I 3.121
icr capers .46 ld r: totals see oArm In."ll I40 - Vernl PreFCt slatisticsJ UN. - PFo ataIlon t05it80ca

MDF/W/52Page 82
97. While certain types of specialty woods are not readilysubstitutable by other wood varieties, or by other non-wood materials,many of the common construction woods are interchangeable one againstanother, within certain limits, in such uses as residentialconstruction. The result is that the cost of wood construction-materialsbecomes of some importance, in terms of profitability optimization,particularly so where the proportion of wood in the total house price issignificant, bearing in mind also that the construction industry(operating with competitive bidding - or as promoters' developmentprojects) is generally extremely cost-conscious as regards factor costsand hence is ready to achieve savings by employing, if necessary,substitute materials. Some forest-resource rich countries, which canoffer wood at very competitive prices, thus have become major suppliersto certain import markets, where they may account for a significantshare of overall consumption of dimension lumber, shingles and shakesetc. This has its advantages and its disadvantages, in that producersin the exporting countries come to depend not only on developments inthe construction business cycle in their own country, but are alsobenefiting from housing-booms, or suffering from housing-constructionindustry woes, in other countries. In other words, they are confrontedby conditions which are to a large extent beyond the control not only ofthe industry itself, but also to a large extent beyond the control oftheir respective national authorities.
98. Within the limits of the present note it is not possible to enterinto even a cursory examination of all of the elements which doinfluence forestry- and wood-industry activities, or even to list allthe relevant indicators. In respect of developments andforestry-industry trend-report data for most of the main developedcountry forestry-products producers, -exporters and -importers,attention is invited to the FAO publications issued under the aegis ofthe ECE Timber Committee and the FAO Forestry Commission. Thesecomprise:
- statistics of production, trade and prices;
- analysis of recent trends on forest products markets;
- short-term forecasts by the ECE Timber Committee for productionand trade;
- long-term outlook studies;
- forest inventory data;
- periodic medium-term surveys of particular sectors.
Shifts to substitute materials are, of course, a possibility forcountering important price rises - say of construction wood. However,given existing building codes, local ordnances and clients preferences,such shifts are normally not easily operable in the short term. Shiftswhich are, however, often possible, at relatively short notice, arethose between different suppliers of the same or similar products, ifthere are significant differences in the offer prices for the product inquestion.

MDF/W/52Page 83
The data are mostly Annual and cover the ECE countries in Europe, NorthAmerica and the USSR . The data collection and dissemination system ofFAO/ECE is integrated with that of the FAO Forest Department, whichpublishes among other things, the FAO Yearbook of Forest Products(production and trade of forest products, worldwide). The latest issueof the Yearbook, published in 1986, covers data for the period1973-1984. FAO also publishes series of forest products prices (annualdata). A recent FAO publication on forest-product prices is FAQForestry Paper No. 46, with series for 1963-1982. FAO also publishes amonthly bulletin on "Tropical Forest Products in World Timber Trade".It is also engaged in a series of long-term outlook studies of which thefirst, on the pulp and paper sector, is scheduled to be published in1986 or 1987. It should also be noted that once the InternationalTropical Timber Organization becomes fully operational, the Organizationwill collect, process and disseminate data on production, trade,marketing and related issues for tropical timber. Data relating totrade and tariff treatment of tropical timber in major markets are alsodealt with in certain documents of the GATT COM/TD/W series. Shortsummaries of major developments in world trade in wood and in woodpulpare given in GATT's annual "International Trade" (1985/86).
1Since January 1985 most of this information is published in theFAO/ECE Timber Bulletin, which is available on subscription. Except forone of the annual issues (No. 3 - special issue, and which will dealeach year with a different subject)** each issue number has the samecoverage from year to year. The ten issues of the Bulletin (in 1985)were:
1. - ECE Timber Committee Yearbook (1984);2. - Monthly Prices for Forest Products;
3** - Survey of the Saw-milling Industries;
4. - Monthly Prices for Forest Products;
5. - Forest Product Statistics (up to Dec. 1984);
6. - Annual Forest Products Market Review;7. - Forest Products Trade Flow Data 1983 and
1984;
8. - Monthly Prices for Forest Products;9. - Forest Products Markets in 1985 and Prospects
for 1986;10. - Forest Products Statistics (up to June 1985).
(As noted before, in the autumn of 1985, ECE published "The forestresources of the ECE region", with data on forest area, growing stock,increment and removals, ownership and management, biomass growing stockand major uses of the forest.) In (autumn) 1986, "European TimberTrends and Prospects to the Year 2,000 and Beyond", covering the outlookfor the whole forest and forest-products sector, will be published.Finally, profiles are published periodically of the forest and forestproducts sector of individual countries. FAO publishes periodicallybibliographies of its forestry-related documentation. The 1984bibliography covers documentation for the period 1979-1983.
** The 1984 Special Issue (Supplement No.2) contained a Survey of theECE Wood-based Panels Industries.

MDF/W/52Page 84
99. Saw-milling is a traditional industry for most of the countries inEurope, dating back to the development and use of power-transforming, or-generating equipment. The industry developed on an artisanal scale andwas transplanted in that form to other parts of the world. In manycountries vestiges of this earlier, small-scale, industry are stillsurviving. Many countries in the developing world, to this day, do notpossess a major saw-milling sector. Other countries have started todevelop a saw-milling industry and some of the countries in Asia,South-East Asia, Latin America and, in a few cases, in Africa, havebuilt up modern, efficient and relatively large-scale saw-millingindustries to process their wood resources, both for domesticconsumption and, in some cases, for export. This development of thesaw-milling industry, and also of plywood-production, was in some casesspurred by governmental policies which tied logging concessions onpublic-owned land to the progressive establishment of saw- and plywoodmills, progressively limiting log exports by means of tie-in regulations;for example, for each cubic metre of logs exported, one or more cubicmetres have to be processed domestically into sawn-wood or plywood.Some governments have also set export duties on exports of logs (say20-25 per cent), on sawn-wood (say 5 to 10 per cent), while grantingexport duty exemption for exports of plywood.
100. The emergence of new producers, entering the international market,new wood-processing methods, a changed economic environment generally,and a different mix in products in demand in the market, all combine insetting into motion the current, and far from completed, restructuringof the wood-processing industry. Similarly, the pulp and paper industryis undergoing a major restructuring process, for streamlining operationsand increasing specialization, in an ever more competitive environment.With respect to the saw-mill sector this may be illustrated by thesituation in the French (broadly) Rhone-Alp s administrative region.Production in this group of ten Departments accounts for about 15 per
IThese policy measures were adopted both with a view to raisingrevenue and to foster development and industrialization, based on theuse of domestic raw material sources. The measures taken have, in fact,spurred increased production, both for the domestic market and forexport. Indonesia, for instance, where total plywood productioncapacity in 1973 was less than 30 thousand cubic metres per year, had aninstalled plywood production capacity of 3.7 million cubic metres in1982. (This is equivalent to more than twice the installed capacity inthe EEC.) Up to 1977, Indonesian plywood exports were of the order ofseveral thousand cubic metres per year. In 1984, 2.7 million cubicmetres were exported. Early in 1984, seventy plywood factories were inoperation, forty-nine more were under construction and thirty more wereplanned. Exports of wood and wood semi-manufactures are now the secondmost important source of Indonesia's foreign exchange earnings, afterpetroleum. Plywood production is targeted to reach 7 million cubicmetres (ref. Journal of Commerce, N.Y., 15 August 1985). The mainexport markets for plywood in recent years were the United States (in1985 China), Canada, Middle East, Australia, Hong Kong* and Singapore.*
*(Part of it for re-export, including also destinations in China.)It is, however, relevant to note that much of the recent plywoodproduction capacity expansion is destined for domestic consumption,which is expanding rapidly.
2Comprising the Departments Ain, Ardeche, Drome, Isere, Loire,Haute-Loire, Rhône, Saone-et-Loire, Savoie and Haute-Savoie.

MDF/W/52Page 85
cent of French (or about 6 per cent of EEC (10)) production ofsawn-wood. Out of some 940 saw-mills in this administrative grouping,an undetermined, but in any event very small, number of saw-millsprocess tropical hardwood logs. About 540 of the saw-mills have anaverage output of sawn-wood of approximately 2 cubic metres perwork-day, some 310 saw-mills produce an average of 10-11 cubic metres ofsawn-wood per work-day, and the remaining 90 saw-mills produce, onaverage, close to 40 cubic metres per work-day. A limited number ofsaw-mills account for the bulk of the output in each of the tenDepartments concerned. There are two types of saw-milling enterprisesin the region. The majority are small, family-run and -ownedenterprises, processing locally offered logs, as and when these areoffered, for local users. Generally, plant and equipment is obsolete,by modern standards, but in working condition and amortized. Theseenterprises are, generally, neither profitable nor strapped foroperating funds. Most go out of business for want of a successorwilling to take over when the owner-operator leaves the business.Alongside these traditional, rural, saw-mills one finds somemedium-sized enterprises which have invested in modern, productivity-enhancing equipment and machinery and which are, technologically, quiteup to date. To finance modernization (generally accompanied by anexpansion of saw-milling capacity) most of these enterprises have had torely on bank-financing. The combined sawn-wood processing capacity 1exceeds wood production possibilities from the local forest resources.Most of the saw-mills operate at, perhaps, one half of installedcapacity; the financing charges do not. Most of the enterprises, forlack of finance, could not take their modernization efforts all the way;most lack kiln-drying facilities. The local (mountain) tree-croparrives at the saw-mills with a very high moisture content (of the orderof 40 per cent). Finance for carrying sawn-wood stocks long enough forair-drying is often not available, or considered to be too expensive.Market outlets outside the region are not readily conquered. Thesawn-wood assortment on offer is limited and often does not correspondto what main industrial users want. In any event, the saw-lot 3assortments available are not sufficiently large for major users. Atpresent, the industry is still in a state of recession. The industry isconcerned and alarmed about what are seen to be low prices for importsfrom the USSR (as and when these occur, including - in the past- undercounter-trade deals), reported to be landed in Marseilles at pricesbelow those economically quotable ex-saw-mill in the area. Frenchprices for domestically produced assortments are generally alsoconsiderably higher than prices for similar assortments offered by theUS, Canadian and Scandinavian suppliers (which, in particular as regardssupplies from the latter, often have benefited from in-factory-appliedwood preservative treatment).
IHowever, for the whole of France, installed saw-milling capacityis considered, by the authorities, as insufficient, and government-sponsored efforts are under way to expand saw-milling capacity, so as tocorrespond more closely to the envisaged increased utilization ofdomestic forest resources.
2Since this was first written (83/84), major efforts are underwayin France to build additional kiln-drying facilities with a view tomatching production more closely to domestic market demand and fordeveloping export sales.
Reference: "L'Agriculteur du Sud-Est", Lyon, No. 137, Oct. 1982.

MDF/W/52Page 86
101. While the narrative above relates to one specified region inFrance, a similar story,1with variations, could be told for certainother countries as well. Austria, for instance, a major exporter ofconiferous sawn-wood, is also a country with numerous, small saw-mills,which are struggling for survival; exports are accounted for by arelatively limited number of large, efficient saw-mills, deriving theirlogs partly from imports from the USSR and from countries in EasternEurope. In Japan too the saw-milling industry, in terms of the numberof operating enterprises, has undergone a large contraction over thelast decade and a half. Recent developments in structural adjustmentsof the Western-European wood-processing industry were aggravated by oneof the worst business slumps at the start of the 1980s. Production ofsawn softwood, in 1982, in a number of countries was at the lowest(seasonal) level on record for many years (and even now it is still inrecession, including in the Nordic regions). In North America, the1981/82 cyclical downturn was particularly severe. US-sawnwood outputin 1981/82 reached a low point not experienced for several decades.For particle-board, the earlier euphoria in Europe for the installationof new capacity came to an end even earlier. At present, it seems, nonew particle-board capacity is being installed, but investments forincreasing productivity (press times are being reduced significantly),are continuing in some cases, and capacity for new types of panel boardsis also being developed. In other cases, plants are closing and thoseremaining are sometimes merging (as recently in France and F.R. Germany)to carry on with improved efficiency (for instance, through productspecialization, streamlined marketing, etc.; with these efforts,however, not always crowned with success), thereby reducing somewhatpressure from the overhang of capacity on the market. In any event,ever since the mid-1970s, particle-board, fibre-board and plywoodfactories in most of the developed countries have been operating, onaverage, at between3three fourths to a high of about four fifths ofinstalled capacity.
102. In woodpulp production too, the recent business downturn showed upthe existence of considerable excess-installed-capacity (in a downturn).While little in the way of additional pulping capacity, as is officiallyreported, being installed, except, it seems, in the USSR [also the CSR,Brazil, Portugal and the Republic of South Africa], modernization andrestructuring (involving limited new capacity being installed, replacingout-of-date small-scale plants, being shut down elsewhere) is going on.Some industry observers are already speculating on a shortage of pulpingcapacity, (for instance, in Japan) in a few years, while in otherquarters fears are expressed about further excess capacity beinggenerated, for instance in Western Europe. This is just one example ofthe many and constant changes, not always very transparent, even for the
1For detailed stastistical tables of the saw-milling industry inECE countries see the ECE/FAO "timber Bulletins Vol. XXXVIII, No. 3,(special issue, May 1985).
2For details see the "Annual Forest Products Market Review", in theECE/FAO "Timber Bulletin for Europe".
3For details see "Medium-Term Survey of the Wood-based PanelsSector", ECE/FAO, Supplement 10 to Vol. XXXII of the "Timber Bulletinfor Europe", and relevant subsequent issues.

MDF/W/52Page 87
industry itself. To mention one specific example, just a few yearsago, Brazil's major venture into pulp-making was considered to be aneconomic failure; and so it might have been, at the then prevailingpulp prices of US$300 a ton. When prices rose to $450 a ton - goingstill higher and rising, then, for other pulp-types' suppliers - theBrazilian venture into pulp production and exports turned into asuccess. (The current prices for market pulp are somewhat lower; withoutput being cut back by major producers, price levels may stabilizesomewhat.) To end this Section on a positive note, it may also bementioned that one of the pulp-tree varieties imported by Brazil to beplanted in its pulpwood plantations (gmelina arborea - originating inMalaysia/India, where it permits harvesting for pulping purposes withina six to ten year cycle) did not, at first, particularly thrive in itsnew Brazilian habitat, on account of unsuitable soil conditions, but nowturns out to be particularly suitable for the production of certainhigh-value specialty papers and, fortunately, for the success of thisparticular venture, the gmelina plantations were also complemented withfast growing2Caribbean pine [and eucalyptus, on the decrease again]plantations.
103. The point of all this is that the data shown in Table II can be nomore than a possible point of departure for exploring the complexsubject of production developments and of structural adjustments in theworld's forest- and wood-processing industries.
1... if estimates were to be based only on published, official
industry statistics and aggregate production and capacity forecasts;... according to press reports, capacity for both pulp and paper andpaperboard production is, apparently, being expanded by variousenterprises, with a continuing preference for building up integrated(pulp-cum-paper) production units. Useful summary data on industrydevelopments may, for instance, be found in such trade publications as"Pulp and Paper International", San Francisco, (particularly the annualreview issues).
2Unlike pine, eucalyptus is a short-fibre wood. In the sulphidechemical process, pulp manufacture fibres are generally broken downfurther so that eucalyptus pulp could normally be used only as a fillerin producing long-fibre based papers. In the sulphate process thefibres are left intact. While the sulphate process is far from new, itis said that it was Brazilian researchers/producers who proved that goodpaper can be made from 100 per cent eucalyptus pulp - and such pulp isnow increasingly used, on grounds not only of cost-saving, but also onaccount of yielding a high-quality pulp (Ref. Financial Times 19.XI.85).Incidentally, this is a technological development which is not fullyreflected in some of the tariff treatment provisions in the CCCN and hasbeen, or is, the subject of discussion among some of the interestedparties.

MDF/W/52Page 88
C. INTERNATIONAL TRADE FLOWS IN FORESTRY PRODUCTS
104. International trade in wood, wood semi-manufactures andmanufactures, in woodpulp and in cork and cork manufactures is ofconsiderable importance, accounting for close to 2 per cent of the valueof world exports. From the data assembled for the purposes of thepresent note it will be seen that trade in forestry products is not onlyimportant generally, but is a matter of particular interest to a numberof contracting parties yhich are heavily dependent on export earningsfrom forestry products. (Sections A and B of this note have shown thediffering levels of forest resources of different countries and also thedifferences in their respective wood-industries' processing capacity.)
105. While, in value terms, world exports of wood and wood products,have continued to grow through most of the 1970s, in volume termsexports of logs, pulpwood, sawn-wood, plywood and particle-board (inother words the major trade items covered by CCCN Chapter 44) havestagnated since 1973, after a period of significant, and even rapid,growth in the 1960s and early 1970s. In 1981 total exports of theseitems were at a level even below that reached in 1979 and in themid-1970s and, though recovering somewhat thereafter, still have notreached the earlier peak year levels. The volume of woodpulp exports,which in the 1960s had grown relatively less than exports of wood andwood semi-manufactures, continued to show modest growth also in the1970s - but virtually stagnated, worldwide, during the period 1979-1981.Unlike timber products, trade in woodpulp did expand significantly in1983 and 1984, and stayed at a high plateau through most of 1985, in thewake of considerable expansion in demand for paper and paper products.A slow-down in growth is feared, however, for 1986. Data on importdevelopments, by countries and major product categories, spanning theperiod 1963-1981 are shown in Annex II.
106. As noted in Table I - in Section A - somewhat more than one half ofall wood "harvested" in the world is used in the form of fuelwood orcharcoal, for cooking and heating purposes, and very little fuelwood orcharcoal is traded internationally, except among some of the countriesin South-East Asia and, to a more limited extent, in East Africa. Thereis also soie limited trade in charcoal between some of the developedcountries. More recently, some richly forest resource endoweddeveloped countries have hinted at possibilities for supplying fuelwoodpellets (based on wood processing wastes) to fuelwood starved regions inthe developing world and some trial shipments, financed by charitableorganizations, to destinations in East Africa, have been reported.
1A recent Canadian Forest Service Brochure makes the point that thedollar value of Canada's forest product sales (in the broader sense) inworld markets (Can$ 13 billion in 1983), exceeded that of Canadianexports of all metals and minerals combined by about 10 per cent, offarm products by over 20 per cent and of energy and energy-materials by25 per cent.
2If a new French wood-waste transformation process (thermo-condensation of wood, at about 250'C) were to be developed industrially,significant trading opportunities for "roastwood", for use in industry,might arise. "Roastwood" can be produced with only 10 per cent energyloss in conversion from wood; it has high caloric value, 5,500 cal/kg;is not as brittle as charcoal; and is hydrophobic, with ash residues ofonly 1 per cent.

MDP/W/52Page 89
TABLE III-A
TABLE 1I1I.AIlORTS end EXPORTS OF MOO. CORK. PRODUCTS TEREOF AM0 I MIILPI
_u1.. US dollaIs - in years srws details. Includirq sourcs of lapiR M Mprt asinetisg 1. labia 111. in Au I . A-
WOOend OO PRCOUCTS ORK a CORK._IW.,-I_.ORTS EXPORTS IORTS EXPORTSIS
24 2471242) 241(243) (631) 635(632) 24 247042) 21243) 6631) 135(32) 251 251 254 633 24. 1433WOO, WOO, WOO, VIEW, O W, VEN, M WU LP. O m COK. MACOLUW, RCOUGN SHO, PLYW, NAC. LW, ROm, SAm, PLmO mAI vAT HASTE AWU. BA , VtOI SWM WORKED ETC. 7111ES COOK SUARED WORKED ETC. 7DRES PAME PAER - STITASTE T.1 IES
ac~ La i& no.a 11; n-. n& n i - . .
106.3
0.4
0.2
3.9
0.2
61.1
1.3
8.1
8.5
960.0
26.6
7.6
245.0
211.5
38.0
8.1
368.8
23.0
31.4
215.9
115.2
0.1
7.0
12.9
252.5
0.8
0.2
0.3
14.2
20.0
7.6
4,552.0
235.9
55.6
46.5
0.1
2.7
0.1
11.1
0.1
0.7
130.5
0.3
0.4
8.2
7.9
14.5
5.4
1,422.3
67.4
178.1 82.0
537.1 1 134.7
867.758.7
99.5
978.8
472.1
1,124.1
377.4
0.7
22.1
128.6
117.5
541.9
33.2
67.8
0.7
0.5
0.1
5.2
112.1
0.3
0.6
1.1
4.4
1.1
658.8
134.3
21.4
65.3
197.4
4.6
8.4
52.4
131.6
239.1
711.4
0.7
1.0
141.6
114.2
2,716.2
33.2
81.0
2.1
18.0
0.1
296.1
383.9
7.4
29.6
86.9
188.7
'1.04.0
21.9
7.7
36.7
1.2
80.3
0.7
.0.9
1.3
110.8
54.6
77.4
29.0
14.2
14.0
64.3
20.5
624.0
0.9
139.9
33.3
2,554.0
5.8
52.0
2.0
3.7
155.7
7.1
128.8
0.2
108.3
i..
21.5
185.4
2.9
1.1
12.1
12.6
185.7 1 489.2
3.6 2.7 181.2
2.6
10.1
43.6
1.3
0.8
2.3
15.3
47.0
92.7
1.0
19.6
4.6
2.8
48.6
41.1
96.9
8.9
86.9
5.2
20.
2.2
109.4
0.7
24.5
339.4
11.8
8.3
8.4
34.9
613.5
10.1
115.6
118.5
149.8
1.0
1.1
118.8
14.6
54.0
123.7
139.6
4.6
0.4
10.4
58.3
1.8
36.5
0.6
53.7
0.5
4,313.9
202.6
55.9
834.6
1,260.4
45.3
17.6
767.2
263.8
868.5
2.6
120.2
297.7
0.1
3,213.8
128.2
11.5
105.4
10.3
8.2
41.3
35.2
0.1
0.8
1.7
7.8
0.3
0.2
3.0
1.8
0.2
1.5
23.6
0.5
0.3
6.4
5.3
0.3
7.1
1.1
2.6
11.1
6.5
0.3
0.1
6.8
0.5
0.4
0.3
115.2
3.8
2.6
60.1
36.0
2.2
0.5
14.8
3.2
16.0
0.2
1.5
0.2
0.8
0.5
0.9
0.5
0.1
0.6
23.9
. 0.1
SITC:
IIa
World (notshtwn)AFGIh1 10- ISO
AUSTRALIA'Ic'
AUSTIIA
,4IBBANGLADESH
g79BELZE:_ '7e
BENIN174
BRAZIL
. '7'BURL'Sl
'751 CAERCON
I
CENT1RALAFRICAN REP
M~LD
I) CHILEk
11
3) CEsm REP.
i) CuW
I) CkITUS1'7
I] CZECt SLO-
VAX IA
. ',9
2) DCPIMICANIREPUEL IC
. '81
- 'SI
EC - Extrs -
EEC (1l)
3/24) BELGIUPJLUXEMOURG
5) DENMARK
'816) FRANCE
. '617) F.R.GEPIk'18
B8) XECEE- '81
9) IRELAND'l1
I) ITALY. TMla) IETHNRLA1!
'leI2) UNITED
KIMNOI
216.3
274.3
0.4
7.2
19.8
0.2
0.1
337.0
0.8
2.0
0.5
15.5
29.6
16.2
5,739.5
264.7
187.6
857.3
1,128.3
91.1
105.5
1,433.8
502.6
1,162.6

MDF/W/52
Page 90
TABLE III-A (cont'd)
M VA VWMYONUCT
24 247124 2
mm. IWA 3oMu
141.4
2.0
2.4
135.6
19.2
7.8
0.1
82.8
0.5
6.2
5,221.0
0.1
684.3
52.6
1.3
15.1
10.0
0.4
2.4
13.5
0.4
4.8
183.2
16.4
4.9
0.7
38.5
113.3
27.2
.23.8
3.3
3.5
25.7
0.3
2.2
3,610.4
647.7
0.3
0.4
0.3
1.9
3.8
11.9
3.8
0.7
0.3
5.2
87.0
INFMS
M. W
309.3
11.2
2.0
2.3
15.8
2.5
57.0
0.1
4.0
784.9
27.9
50.5
1.3
11.5
9.9
0.4
2.1
11.5
0.3
0.2
112.6
12.1
4.2
0.3
.9.4
34ciLiTI
51.9
12.6
0.1
0.2
0.3
. 5
9.28
0.2
15.4
402
18.4
52.7
0.8
2.1
8.9
5.4
0.2
2.1
5.4
0.2
0.4
28.5
68.7
2.7
2.8
0.4
44.4
1.7
MM~.Thus
7.0
25.6
1.5
0.2
0.2
13.4
0.6
2.2
13.8
1.3
1.2
119.2
3.4
22.7
0.3
0.2
4.6
1.0
0.5
0.8
7.6
70.3
0.2
0.1
0.3
2.0
1.4
UNIT24 247(242) -248(243)1 5340fl IS6321
me09 me -e I ER mmuWEED, moUG am~l, PLvO, mwx-T~Mu SOW mmoE [ETC. jTIES
1,095.7
112.5
61.4
5.5
0.1
53.1
9.0
556.0
0.4
379.8
34.8
1.8
49.2
15.3
1,569.9
97.0
1.0
e3.4
4.1
208.2
138.2
142.1
114.3
111.4
39.4
2.6
0.1
8.4
377.9
317.9
6.9
0.4
0.3
0.2
1,072.1
32.1
0.5
11.6
76.1
3.7
4.6
915.3
1.1
22.1
0.6221.41
0.4
61.7
27.4
1.4
48.9
14.1
489.5
63.9
0.5
42.9
4.0
125.8
88.7
83.4
352.2
7.4
3.1
29.0
11.2
316.1
12.6
17.7
76.4
0.9
395.2
4.6
175.0
42.4
2.2
10.7
7.5
156.4
25.3
22.6
0.2
115.2
0.2
7.3
0.9
3.2
40.8
3.1
45.8
63.8
23.8
1.2
13.4
0.2
30.3
0.1
39.9
7.4
13.7
2m ator
21.0 -6.
210 32.
73.4 7.3
30.7
83.1
38.0 -
- 0.4
0.3 0.1
879.9 51.3
0.2 0.3
348.5 0.1
* 0.4
3.7
4.0
0.1
3.7 141.5
7.2 -
98.2 241.7
7.2 -
28.5
37.0 10.7
64.7 0.1
181 202.2
cAm, DIcm.
** 0.2
Of.
1.3
5.9
0.5
0.4
0.1
0.1
0.5
16.5
0;.31.6
0.3
0.6
0.7
0.1
0.36.6
0.2
0.4
0.6
0.2
3.0
0.3
3.6
0.6
0.4
0.3
0.5
0.5 40.9
SITC:
COUNTRY3) EGYPT
- '81
5) GHAi
'783) GUYANA
- '791) HAITI
77/781) HUNGARY
- '81:)ICELAIH
* '79I) INDONESIA
,) ISRE
~)IVORYCOS* '79
*)JAMAICA- '53
'JUPAN* '81
I) ITIKYA- '53
I) KOREA IXP.- '81
i) KUWKAIT. '53
KID4GASCAR
KALAW I* Igo
i) MALAYSIA
) ALO IVES
i) ZALT- 'E
i) FAURITANIA* '72
)KAURITIUS
1) NECAU
)NIGE
79
WIRWAY'81
i) PAAKISTANI* '81PERU
)PHILIPPINE- '81
)FOLAXID* '8PORTUGAL- !81
0.3
0.2
0.1
1.2
0.1
190.0

MDF/W/52Page 91
TABLE III-A (cont'd)
M90 s VO MYOwCS
25'A 7(_I.WM 12fl(2'.3 11163) 162(302)I -
"e [a. I SDuson no'w3 I M0., M
- 1wa aIC, 1
42.0 1
76.3
0.1
21.7
31.5
15.5
0.9
1.5
0.2
139.2
0.9
47.0150.5
66.0
0.5
46.1
47.6
2,013.01.9
10.2
71.5
1.5
(5,9b4.8)| (9,163.1)
4.2
0.6
113.6
11.0
3.3
.. I90.7
97.410.5
1.9
0.5
11.4
8.82.3
0.3
7B9.0D.7
1.2
31.90.21.1
t(3,119.5)
0.9
1650.6
53.0115.5
1.5
1.5
0.2
9.5
(2.0)
0.3
529.61.3
".9
2.111.0
0..
E
(1,976.;)
EXPORTS
24 247(2452) b12(3)1 G1l) &51wO, M, VEwNM, M
UWN, OUGN, SKI)D, l l, MWICCas swum WREe C. Ws
1.1
1.0
201.1
6M.2
3.5
1,092.1
77.1
1.0
6.6
1.1
7.9
2,312.5
7.0
(12,.10.0)
0.11
5.30.1
19.9
61.1
0.?3.5
4.3
1,125.9
42.3
2.7
of which: J(3,126.0)
1.1
0.1
21.9
0.2
*.0"1,031.8
14.60.80.3
3.6
932.9
241.3
4.3
I(9,20.98
221.0
77.7
99.2
53.7
13.9
717.6
0.5
7.7
72..
2.4
196.325.70.3
48.9
1.9
11.1.
252.41
0.4
119.7
2.1(0.02)
j(3.437.9) (2,249.9)
IMPORTS lMPORTS EXPORTS
PULP PULP. coa, com cox_cma_U5.t IL U M -
PS ts . s s 1xSME
2.2
137.7
2.5
56.0
159.00.2
85.5
0.5
9.2
25.7
1.919.,
4.
137.2
i(9,977.2)
6.1
82.7
1,3.5.1
25.5
6.91.2
2,015.0
56.1I
_
(8,763.6)
0.1
0.5
0.3
1.1
0.1
0.,
7.6
0.3
1.1
of wicih:'lb*{R5)
1.2
5.2
11.,
33.3
s.I5.9
(236.7)
0.3
23.5
1.1
0.7
0.6
36.1
6.,
0.3
of vhIkh: (270.2)
Y!Data given are the latest available In UN Statistical Papers, series D; ecept for a fev cases, Identified in ftetnotes to tho dots In the more detellcidtble 111-9 In Annex lb.
1kJSub-totsl covers EEC Plu 37 coavlries for which daht in the table above relate to 1981 or 1982. Dita for China and the USSR ore not available in series 0 statistics. Given th
disparity in the period covered, and the lac of coeproheniveness, sub-totals are provided for convenience only.For details of product coverage of the difforeit SIC groups and of 51C Divislon 24 (vhich also coven pulpvood, fuelvood, charcoal and rwv, eta.) s" the notes to tablo I.1
Symbols uscd: I'-' s* anIcbs 0,W0a.. * not available
' * Estimate
I M.MM Lue410,MIC
9) RDKUIi
c..9) cICA
RE..
0) z JJ
is) SRI LAW- '92,
- "S'2) SI"G&Ru
- 'El
'3) Sill. A.QICAREP.
'5) SPiSL- '51
15) 33! LAiKA_ '52
16) SU21i1l18
79) SAtsN A
7D) !WRLAIC'21
79) TANiSA.68
80) P1K!LA
_ lb]
8I) oZR,'51
:92) T21Nl0Gf/
(9k) us5~- al
(95) UGUKA
VOLT't- 'El
(BS) U5RUIAY* '5716
(89 YDMSL&YVI- 'el
(90) ZA1;E
179(91)2L)91A'79(92) Z$A0EX
Sub-Total for4! countries
Lb/1
..
5.6
0.3
183.7
296.9
1.0
402.9
20;.7
9.7
0.4
47.0
57.8
0.9
0.1
Z,223.0
1.8
11.0
199.4
0.1
2.6
[17,245.1)
. .
I , , I_ .
I I - . - -l- . I I . .
I
3 lye:
0.8
I

MDF/W/52Page 92
107. Worldproduction and world exports of "industrial roundwood" i.e.,wood other than that used for fuel or for charcoal, in million cubicmetres, amounted to:
1963 1973 1979 1981(Million cubic metres)
Production 1053.0 1360.0 1445.0 1384.0
Exports ofindustrial roydwoodplus pulpwood- : 54.7 134.5 146.2 134.4
Percentage oftotal industrialroundwoodproduction exported 5.,.% 9.9% 10.1% 9.7Z
(Share of pulpwood ofexports in totalindustrial roundwoodproduction) (1.3%) (1.9%) (2.3%) (1.9%)
Proportion of pulpwoodexports in roundwoodexports : 25% 19.4% 22.8% 21.5%
l/Not including intra-trade among the (then) 10 EEC member-States
-/For purposes of production statistics, pulpwood is included inthe category "industrial roundwood"; in trade statistics it isexcluded, as are all products processed from "industrial roundwood", thelatter thus becoming a residual category. As the distinction betweenthe residual "industrial roundwood" category and pulpwood is becomingless relevant, in some uses they are interchangeable, pulpwood exportshave been added to those of "industrial roundwood".

MDF/W/52Page 93
1108. World production and world exports of the main woodsemi-manufactures were as follows (in million cubic metres):
SAWNWOOD 1963
Production
Exports
% of Exportsin Production
361
46
12.7%
1973
445
71
15.9%
1979
45182
18.2%
PLYWOOD
Production
Exports
% of Exportsin Production :
PARTICLE-BOARD-/
Production
Exports
% of Exports
in Production :
20.2
1.8
9%
6.0
0.2
3.3%
42.2
6.2
14.7%
32.0
2.34
7.3%
42.3
6.4
15.1%
41.23.2
7.8%
109. Production and world
tons)
WOODPULP
exports / of woodpulp
1963 1973
- (in million metric
1979 1981
Production
Exports
% of Exportsin Production :
70.0
11.2
16%
114.3
17.9
15.7%
123.0
19.9
16.2%
125.3
20.2
16.1%
l/Not including intra-trade among the (10) EEC member-States; forwoodpulp, intra-EEC trade is small, both absolutely and relatively.
2/Intra-EEC trade, which is here excluded, is the most important,the EEC being also the largest producer and consumer of particle-board.Production of particle- and waferboards in North America is, however,rapidly expanding.
1981
41971
16.9%
37.96.55
17.3%
39.72.35
5.9%

MDF/W/52Page 94
110. In examining international trade flows, in value terms, it will beseen from Table III-A, and from the statistical data in Annex II, that,as far as products in CCCN Chapter 44 (ex-SITC Division 24) areconcerned, the category "wood, simply worked" (SITC 248) accounts forthe largest share. Trade in saw- and veneer logs (SITC 247) isimportant, but the total trade value is somewhat lower. Trade inwoodpulp (ex-SITC 251) is almost as large as trade in categorySITC 248.
111. The great importance of woodpulp in international trade flows may,at first sight, seem astounding, since it is widely believed that pulpis produced in joint, continuous processes, together with paper andpaper-board, in which case, pulp, as such, would not show up in tradestatistics. Such joint manufacturing processes are, indeed, andincreasingly so, a feature of many of the large modern pulp-paper mills.There are, however, many exceptions to this and the reason is that theforest-base resource/cum/ energy resources for pulping are notnecessarily found in the same locations as the existing paper mills,which are often situated closer to end-use markets for paper. Whilemany of the paper mills so situated own pulping facilities situated inother locations, or have assured access to pulp supplies by inter-firmarrangements, other paper manufacturers, fibre-board manufacturers etc.depend for their pulp supplies on the market. The fact that the marketis supplied with pulp by producers most of whom are also producers andexporters of paper has led to concern being voiced in some instancesabout pricing policies for pulp and paper respectively, and pricingpolicies have been, and still are, the subject of official investigationand/or Court review. The increasing (EEC about 40%, Switzerland 44%,Sweden - 11%), and repeated, use of recycled waste paper in papermanufacturing, replacing pulp made from virgin fibres (i.e. less freshwood (trees) needed) may eventually also require an additional input ofvirgin fibre pulp to give the end-product sufficient strength. Wastepaper being, to some extent, a substitute for pulp, the question of theeffects of exports of waste paper on the availability of domestic
1Exports of waste paper are, in some cases, important. The UnitedStates, both in 1984 and in 1985, exported as much as 3.3 million tonsand, in terms of volume, waste paper, both for being recycled in the USand for export, is among the main cargoes transiting through the Port ofNew York-Newark. Most of the US-produced paper and paperboard isproduced from virgin fibre pulp and is, consequently, much sought after.Exports, most of which go to destinations in Asia, are partly renderedeconomic by the large imbalance in the volume of the east- and westboundtrans-Pacific container cargoes. Shipments of baled waste paper(20-25 tons per container) help to avoid too many containers beingreturned empty to the "Far East". Italy is also a significant importerof US (container-packed) waste paper.
2SITC 251 distinguishes between eight types, or qualities, ofwoodpulp. As in the main developed import markets covered by this paperall types of woodpulp are, generally, duty free, no separate analysisfor different types of woodpulp has been attempted for purposes of thisnote. Among the different types of market pulp - sulphate pulp is ofparticular importance in international trade flows. Waste paper is anitem covered by Chapter 47 of the CCCN, but, as it generally enters dutyfree, it is not dealt with separately in the Summary Tariff Table.

MDF/W/52Page 95
paper-making materials has, on occasion, been a matter of concern to theindustry; at other times, high levels of waste paper collection,spurred by high waste paper prices, have led to waste paper gluts andthen much lowered prices, in a recurring cycle. The point to be bornein mind is that only part of woodpulp production and, perhaps, trade is"captive", while another part, different from country to country and byindustrial sectors and sub-sectors, operates through the market.
112. So as not to lose sight of the wood for the trees in thisexamination of international trade flows, attention is invited toTable IV-A, which shows the percentage shares of major importers inworld trade in both 1973 and in 1981 in the product categories"industrial roundwood", "sawnwood", "plywood", "particle-board" and"woodpulp", and to Table IV-B, which shows country shares in exports forthe same product categories and years. Attention is also invited toTable V-B, showing imports into major markets, compiled on the basis ofcustoms statistics.
113. With respect to imports of industrial roundwood (mainly saw- andveneer-logs) it will be seen that both in 1973 and in 1981, Japan, byitself, accounted for more than one half of the total value of imports,the EEC for 17 per cent and 13 per cent, in 1973 and 1981 respectively,and the three leading importers - Korea being in third position -accounted for more than 80 per cent of industrial roundwood imports in1973 and for more than 70 per cent in 1981.
114. For sawnwood imports (not including the important intra-EECexchanges) the EEC was, both in 1973 and in 1981, the world's majorimport market, taking 48.1 and 48.3 per cent respectively, followed bythe United States with 24.4 and 16.8 per cent, and Japan with 6.6 and7.1 per cent. Here too, these three markets together account for aboutfour fifths of 1973 imports and for more than two thirds of imports in1981 (a recession year when both domestic production and demand weredepressed, particularly so in the United States).
115. For woodpulp the situation is not much different, with the EEC infirst position, accounting for about 46 per cent of total imports, bothin 1973 and in 1981. The US in both years accounted for about 19 percent, and Japan for 6.9 and 9.1 per cent respectively. In other words,these three markets taken together account for close to three fourths ofall wood pulp imports.
116. For plywood, the same three countries - EEC, US, Japan, in first,second and third position respectively - accounted for 76.6 per cent oftotal imports in 1973 and for 56.9 per cent in 1981, the decrease by1981 being attributable to a drastic fall in Japan's share in importsand to a large decrease in the United States share. The exactcombination of circumstances leading to this decrease is not known. Itmay however be noted that, apart from pronounced recessionary tendenciesin the US market, other factors may also have been of importance,including the fact that two major US producers of plywood, activeIinoverseas joint-venture forestry/cum/plywood-production operations ,
1lIncluding the largest US plywood producer, accounting for about19 per cent of US plywood production and for about 30 per cent of USplywood distribution. Another factor may be that in the constructionsector, particularly for siding, under-roofing, etc., flakeboard is, inthe United States, increasingly being substituted for plywood.

MDF/W/52Page 96
reduced their level of participation in certain joint ventures (geareduntil recently mainly for export to the United States), prior to finaltransfer of ownership to host-State-agencies or companies. Thesereductions notwithstanding, the EEC and the United States, combined,still accounted for close to 57 per cent of all plywood imports in 1981(down from 64.4 per cent in 1973).
117. For particle-board the situation is somewhat different. The EEC isnot only the world's leading producer, but also the region with the mostactive trade performance, if intra-trade is included. Excludingintra-trade, the EEC remains the main Importer (the main suppliers beingAustria, Finland, Sweden, Norway and Switzerland and some of thecountries of the CMEA region). Altogether, the EEC, in this rapidlyexpanding sector of trade (temporarily slowed by recessionary forces inEurope), accounted for 52 per cent of total imports in 1973 and for some45 per cent in 1981. Production and use of particle-board (which underUS production conditions are estimated to cost about 30 per cent less t?produce than use-equivalent plywood for building construction purposes)is only now starting to develop in a significant way in areas outsidethose cited in this paragraph. The cost advantage in the use ofparticle-board (which include those with veneer- and plastic overlays)is even more important .i furniture manufacturing than in buildingconstruction activities. While the particle-board manufacturingindustry in Europe is presently suffering from overcapacity, and whilelong-distance trade of particle-board panels is handicapped by arelatively low value- to weight- and volume-ratio, international tradeopportunities for more elaborated products based thereon may not bewithout interest in the long term and it may also be mentioned thatthere exist certain specialty products (such as panels only 2mm thick,or with true wood-veneer, melamine or aluminium sheet overlay) whichcould find a wider market internationally for use in specialtyapplications, for example, panelling and for outer-shells and furniturein camper trailers, vans etc.
1For some building purposes in some States in the United States,particle-board is not yet authorized under the existing building codes.
2See, for instance, the furniture items on offer in departmentstores and furniture-outlets in Europe, which are frequently little morethan particle-board panels, joined by different types of industrial-fasteners.
3The fact that the F.R. Germany, together with Italy, are normallyin first or second position, respectively, in regard to world furnitureexports, may owe something to the high levels of panel-productiontechnology and sophisticated panel-use possibilities developed in bothof these countries. Panel use technologies are, however, spreadingrapidly to many other countries.

,KLILA_.0'd)
anI"a
5.1
1.1
11lW
LI
W1.631LI
LSI
.1
I-1I
Li
LI
31.
13.
H1.
Mn
'11?
LI1.3
ST
LI
LILILi
Ij
alILI
LI
Li
3.1ILI.1..
1.1
L
II
LS
IP2LI
U3i
.LI
L
Un331s
Izililis|
m*1111
II
IL
II
LIL
LILI
L2ILI
.LI_i
.LII3L
I.III.3.,3a
31131113'-
3111
LI,
LI1.3
1.11.1
IIL---
I11'
1''1
1.113.1
LS
II -,
11LH
Ii I
II.a1.|"11.3111
11.}
1LI
LI1.
.1
LI§
LILI
LI
L.
II
II.
I.6
1.3
3.3
iLI
-ILI
LI1
I1
ILI
I1.1
.IA*
M1.S6I3
ll~~~~~~sa 1
)~~~
~ 1111.l13
13.U"I
11*
44.~~~~~~tin
II.13331I3I
11.S111
13.)133133
51.SkiII..
11.7)31~~~~~~~~~~~1.
II.I.A111
UID
IL
i
Ii.U
t
Ii.t1.31
IL.stub1310
II_
so.3
U).331331
.6I
1.
II.I313
__.
si_I1.
11.1.1111*1
.1
A
31.~
_§
3.
6
II.33133
'I.33531LI
-.
I1.35333V
I1.
I1.311
UI
1.1_I
I3I
3.g 1311I
I)3133
II
usO5N
01
LI
1.0
LI
LIeLILIILI
Li,3.,
1.6.
3.13.
ILI
8.13.
LI1.
LL
21.
LI
-LI
Bz_
ax
flm
11113
t
LiLi1
1.1
LI
II
13.1.
1
L.ILIZI
IA3.1
i!-I
I_
1.11
.1
3.13.1
1.11.1
II
1,11I
II
LI
r...I
-I..1
.i
i--1i
II
I0.4
-
on
Is
I--I
11U
LILI1.
II
1.1
ILI
LI
ICS
II
-I
Ei<!
No,"
LtI11
1.1LI
LIUI
1.1LI
1.16.
I-
LIU
LI1Li
6.LLI
I1Ii
LI__
WA
IA
r.j
II
I
FIZlI-I
UNbo
_co
:MApD4
Irr%
_:,
1I-:H
I.SON
2.YU
L3_%1
IM~ll.
ILsl
ILta
MI.UN14S131.
Ii. cm1
U.Oakwa
2kcmg
"al
S1.11
3L£311
it.Mu33
fl..31. 13
Wr.1311
r.. 13
U.-U.
IL35311
IVa
J.113WsV
ILIIn)III
.I
I'..
3
iI.5131Y
£7.*1
'1.2316
Cl.0*113111U.m
Y."S~~~~~~~~~~~~~~~
-

11135335)16IWTUS1111Bang
VWC
IMmilewln
ismjnpq5t-
-l
xo.SO
fall).131113
33113&SIIi)
IoI 5
1.11
(I)33)5
U31.1
(1)a1)
(I)11)313aim
(1)11UU3 1.0
11)-mz
.a
1.I
I(3)
I.'i
in)mut
AS
Imu.
LILI
(11
WIa3
01.1
In)cm
(333)51.?
1.0A
Di)ai|||
MlUM'
InJ51i
i
Da)mul
MNI s
Li
M13331&rzlII.
II
III)KEAa
(3)33£m
(II)K.
PI)wi=ll
Mull
nn
Ni)allI
U70.1
LiLi
3.3.3
K
Li
ILi
1.-Li
I1
1.3
1
LI1.I
LiLi
LSLILI
I1-tMasIi
.Ial
LiL
LI
Li
IL'n
ILz
I
Li
a.LI
II
,I
IX,
*~
LI1
Uii
LiL
Si
2.S..
1.i
n1.Li
1113I-
Ial
IFInto
1.1
Li
II
Li
IDSO
S.1
1.7
LiE
.1II.%
P.>131111
.331.
tInlno.,
3,1119.11
3.16,9
IT
.I
31.1A
.1
1L
1.1
Li
L_
1i)m131
rzlMD^
IN)INIIM
(1111111
51)Moll
Il)1Mul
1U)-M
III)3*3t3
RI)3119
IW)wRI)
Fism
in
s" YXZ
f
In)33)33
wnswi
In)two1
1u
(M)Ya4
1I)III
(11)MI15.
IM51111181111
III)MMIIID
in)11211
to)IUm
(53)13615
(I)7w,
fit)wIIll
3ns
P4 eu"us
IN)amm.fl(11)
"Mlyll
irr
__________r---------.-----------4;----
.I
IPI.
MIA
,i1
).1
1¢7
LILII.'9.1
1.1
Ll
II)
I13
.1
L
I.,
I
1.11
S.)
2.,
LI
11.1
:'.
_-,11-JI
Ii
LI
I., LI.
II.
11.1
It.
kV'
rto
-!LI
EZ.1
|BE
1.1
135
tin1.11.1
I,'
'LIL
U
IA
1.II
S.?Li
*.
ILIII
I.
I.1.1
z,1u
1
Ii
IZIZZ11 IS..1
.1?1.
111I
L13LI'I
1.1
LILI
11.11
1311I
I.1
lI
Ii1.11
I)1.1
11.1 LI
13,
r.4
III
1.1
Li I
nJ1
IN)
1..1.1
I.1
Ui
z.lz1zf
LII
013I
kVII
M31
II--
1Wm
Ill-us,1
ILI1
all",*A
|v|
I.wI.,
I31
at
C%)
:(3
JI
--
:'IT
I.1I
-1I
J|
g*,
'lq
ll
'J!.-
Iw ._eI
1.-
1
1I
I
6.3L
all
1.1
I

MDF/W/52Page 99
118. As regards exports of logs and simple wood semi-manufactures, thedata presented in Sections A and B show that a number of countries havevirtually no potential for sustainable and economically viable exports,while a number of other countries do have large potential, but with theemphasis on potential, rather than on current production and currentexports, the latter being determined not only by the degree ofinfrastructure development, but also by the size of actual or potentialmarket outlets and the transport economics of supplying these markets.
119. For industrial roundwood exports, Table IV-B shows that fourcountries: the United States, Indonesia, Malaysia and the USSR,accounted in 1973 for about 63 per cent of total2exports. In 1981 thesame four countries accounted for 64.4 per cent.
120. For sawnwood, Canada, Sweden, the United States, Finland and theUSSR combined, accounted in 1973 for 82.6 per cent of total exports andin 1981 for 74.2 per cent. Canada and Sweden were the countriessuffering the largest decrease in their respective percentage shares.
121. In 1973, for world exports of plywood, the Republic of Korea wasthe leading supplier, followed by the island of Taiwan and Finland. Thethree countries together accounted for more than one half of totalexports. With the addition of six more countries, the United States,Singapore, Japan, Malaysia and Canada and the Philippines (ranked inorder of their export shares), the combined share of these ninecountries rises to 82.3 per cent. (This compares with an EEC share of1.7 per cent in 1973.) In 1981, the share of the first three listedcountries amounted to 43 per cent. In 1981, compared with 1973, Japan,Korea, China and Canada lost percentage-share points, while Singapore,the US, Malaysia and the Philippines registered increases. By 1981
1Part of Canada's position as a supplier of US lumber and woodpulpneeds is explained by the nearness of main US centres of consumption inrelation to Canadian forest resources. If high international transportcosts would have to be added, competitiveness could be affectedseverely. The ongoing, but recently slowed, demographic shift andindustry relocation from the north-eastern and northern-central regionsof the US to the so-called sun-belt is a development in favour ofsouthern US forest-producing areas where, moreover, some of thefastest-growing US forest resources are. On the other hand, there isalso growing interest in developing or reviving forest-product exportsto be shipped across the Great Lakes region to centres of distributionin central USA and there is also growing evidence of returning vigour,urban renewal, and increasing housing construction in the United StatesNorth-East.
2To round out the picture, it may be mentioned that largequantities of woodchips are exported by Canada, with Japan being themain market.

MDF/W/52Page 100
there were also some newcomers to the league of major plywood exporters,notably Indonesia, Romania and Brazil. The EEC increased its share inexports to 3.3 per cent in 1981, but remained below the level of anysingle country out of the four ASEAN countries cited above.
122. The total value of particle-board exports approximately tripledbetween 1973 and 1981. Austria, Sweden, Finland, the EEC, Spain, theUnited States, Switzerland and the USSR were the main exporters,accounting for a combined total of 78.2 per cent of exports in 1981.Spain was the country registering, by far, the largest increase inexports.
123. For woodpulp, four countries (in that order): Canada, Sweden, theUnited States and Finland, are the leading exporters - accounting in1973 for 82.1 per cent of all exports and for 84.5 per cent in 1981. Ofthe four countries listed, three are large net exporters - the US is anet importer. The EEC, for comparison (also the world's largest netimporter), had a share of 1 per cent of total exports in 1973 and ashare of 0.6 per cent in 1981. Norway is also a large exporter and, asnoted in the text, Brazil has emerged as a major exporter. A number ofdeveloping countries, also South Africa, and, among the CMEA countries,the USSR, though producing mainly for meeting their domesticrequirements, are starting to export woodpulp.
124. Given the preponderance of certain markets in world imports ofwood, wood semi-manufactures and woodpulp, accounting for between two-thirds to approximately four-fifths of total imports for the respectiveproduct categories, much can be deduced regarding the likely, and, infact, actual, directions of major world trade flows.
125. Before taking up the subject of export destinations and sources ofimports of wood and wood semi-manufactures, it may be appropriate torecall that wood is not a homogeneous commodity and that the same can besaid for the wood-derivative products. Different woods have differenttechnical characteristics, which destine them for specific uses. Ebonyis not only used for sculpture, but is the wood used for half-tone keysof pianos and, since the XVIII century, for fine inlays and veneers(French 6beniste), there exist not only black, but also brown, red,yellow and green varieties; melanoxylons (other blackwood varieties inthe ebony family) constitute the preferred material for making high-grade wood wind-instruments. A Brazilian wood species is the wood forviolin bow-strings; only a few cedar-, and juniper-trees, and Katsura
IOne point worth noting is that "plywood" is not a homogeneousproduct. Plywood made of coniferous species - virtually a NorthAmerican specialty (more than 90 per cent of "softwood plywood" isproduced there) (in Japan the first (three) softwood plywood mills wenton stream in 1985), is destined predominantly for building, generalconstruction, crates and for packing. The same is true for most of theSouth-East Asian "hardwood plywoods". Other plywoods are used infurniture, decorative panelling, boatbuilding etc. Lamin-board andbeams (often included in statistics with plywood) serve buildingpurposes again. The species of wood used in the core layers and thoseon the faces make a difference in use-possibilities (and prices askedfor), as do the ply-numbers, glues used and also sheet-size. As thereis some specialization in production, there exists considerable scopefor trade complementarity.

MDF/W/52Page 101
(from Japan), are widely used for pencil-making; Tilias, strobus-pineand balsa are the woods for delicate sculpture and model-making; If -for archery bows (and now also for pharmaceuticals production); hickoryand white-ash are preferred for tough and resilient tool handles,'colonial' furniture imitations and "northern ash" for baseball bats;briar for smoking pipes; Santal wood for use in funeral rites;guaiacum (also known as lignum vitae and as such identified (duty-free)in several tariff schedules) - for pharmacy, but also as bearing-packingmaterial for marine propeller shafts; true mahogany for delicatecabinet-joinery; angelique, greenheart, kapur, for sluice-gates, portjetties; teak, walnut, oak, cherry and satin wood - are there to meetconsumers' wishes with regard to the decorative aspects of wood panelsand furniture, etc. etc. These special quality woods, to mention only afew, are further differentiated by growing sites. Palisander fromBrazil looks different from palisander from Honduras or that fromMadagascar or from India. The trade and part of the public know thisand they may be prepared to pay for certain special wood characteristics.Generally, trade in these woods and certain products made thereof may bemore affected by low levels of supplies in relation to demand, ratherthan by problems of rapid demand fluctuations, or by the level of importduties, if any. Even in pulp manufacture and use, preferences fordifferent wood qualities exist, which is reflected in the price of thepulp made from the respective wood, prices often further differentiatedby geographical location of growing sites of the pulpwood used; buthere too the situation may not be immutable.
126. International trade in specialty woods, such as mentioned above, isof significance but, in terms of volumes involved, this trade is,obviously, limited. The matter already looks different when it comes tosubstitutes for certain cabinet-making and joinery- or marine-use woods.A good part of the wood import trade nowadays is based on providingwoods which may be used as substitutes for wood varieties high inconsumer esteem, but rare and dear. True mahogany, once growing inCuba, with resources long since depleted for shipbuilding, from"Armada"-days onwards (cherished, among other things, for beingunusually splinter-free upon projectile impact) and for finefurniture-making purposes, is being substituted by several CentralAmerican wood varieties with characteristics close to Cuban mahogany,but more generally so by certain (lighter and less dense) West Africanvarieties. Walnut wood, by now almost a rarity in Western Europe(except in France for small- to medium-diameter trunks), is beingsubstituted by American walnut (not quite the same grain and colour),but also by woods which only have a superficial similarity with truewalnut. Again, the list could be continued and would be long, indeed.
127. While demand for specialty woods is not immutable, since consumertastes change, and as possible replacement materials are developed (forinstance, various types of plastics), the change in demand is generallygradual. On the other hand, the more common woods are subject to widevariations in demand brought about by the fluctuations of the businesscycle. This problem of a general nature is dwarfed by the problemsencountered by producers and exporters of wood products destined fordirect use in house construction. This is not a new problem, but it hadtaken on a new proportion in the last few years on account of the(hopefully it was only temporary) escalation of money interest ratesand, as a result thereof, of mortgage rates, these rates often rising tovery high levels, with consequently high monthly payments, so as todisqualify, on reasons of lending institutes' affordability criteria,many aspiring houses buyers.

MDF/W/52Page 102
While this is a problem for producers of building materials and forbuilders, generally, in any high money-interest area, the effect on theforestry sector is, evidently, particularly marked in those areas wherea relatively large proportion of house construction cost is accountedfor by the cost of lumber and where most houses are largely built ofwood. This set of conditions is found (among other locations, such asin Scandinavia) in North America, where the residential building sector,in any one year, accounts for about one half, or more, of all lumberused.
128. According to data published earlier, the United States woodproducts industry did not experience a good housing construction yearduring the first half of the 1980's. In 1978, new housing starts wereof the order of 2.1 million. Declining from that peak year, new housingstarts had plunged to just over 1 million in 1982. This was the lowestannual level since the 1930's. When mortgage interest rates (which hadreached a high of 18-19 per cent) started to fall in the spring of 1983,housing starts advanced by 70 per cent over that of the correspondingperiod in 1982, to an annualized rate of 1.9 million in August 1983. Asinterest rates rose again, the annualized rate sank to 1.6 millionhousing starts by November, or to an annualized rate of 1.7 million forthe whole of the year. In 1984, when mortgage interest rates were ofthe order of 15-13 per cent, housing starts remained at the 1.7 millionlevel. During most of 1985, mortgage interest rates were below 13 percent. The expected increase in housing starts, to be kindled by thelowered interest rate and pent-up demand, did not happen. New housingstarts for 1985 totalled 1.725 million. Towards the end of 1985,mortgage interest rates further declined, edging towards 10 per cent.Interested buyers, but by lenders' standards of affordability perhapsnot sufficiently solvent, or who had themselves hesitated in 1985,hoping for a further tumble in interest rates - as it proved, correctlyso, started to come into the market. While at the time of writing it istoo early to say what the level of housing starts for the whole of 1986is likely to be - it is certain already that new sales of single familyhomes in the first half of 1986 (although somewhat slowed towardsemester's end) are at record levels. Housing starts should follow, andsome industry observers expect that 1986 will become as good aresidential house construction year as 1978. There are also indicationsthat new contracts for heavy construction (such as public works andutilities) are rebounding from relative stagnation, part of itreflecting earlier uncertainty, arising from the debate over tax reform(for instance, the tax status of municipal bonds, used to finance manypublic works projects). There exist thus good prospects for a furtherup-turn in demand for construction-related lumber, panelboards, etc. Inthe same vein it may be mentioned that an earlier trend of downsizing ofnew houses (i.e., less wood needed per house), to increaseaffordability, (less of a problem in Canada, where the average squarefootage house-unit on demand is 20-35% larger than in the US;[downsizing is still a preoccupying problem in the UK]), had gone intoreverse, even before the recent fall in mortgage rates. There is, ofcourse, a lesson in this, namely that macro-economic happenings (real or
By mid-April 1986, United States nationwide mortgage rates wereaveraging 9 1/2-10 per cent for a thirty-year, fixed-rate loan,9 1/4 per cent for a fifteen-year loan, or 8 1/4 per cent on thirty-yearadjustable rate mortgages (ARMs).

MDF/W/52Page 103
imagined, if account is also taken of inflation/deflation, taxdeductibility, etc.) can make the fortune, or create havoc for theconstruction, forest- or, for that matter, any other industry - withoutindustry-specific causes being at the root. That public expectationsabout inflation, finance, fiscal, and monetary matters, more thanbuilding material prices as such, are a major determinant ofdevelopments in the construction sector might also be deduced from therelatively limited proportion of the cost of primary building materialsin the final selling price of most houses - even in conditions whereland prices for developed home construction lots are reasonably low.
1The average United States single-family hose in 1983 had5.1 rooms, had 1,500-1,700 square feet (125-142m ) living space and wassituated (not an average figure, but fairly typical of "middle-inco e"aspirations) on a lot of about one quarter of an acre (about 1,OOOm ),or slightly more, depending on area and degree of area urbanization.Early in 1986 the median selling price of the new "average" house was$88,300, with an average of $110,400 (existing older houses in goodcondition - lot included - often sold for 15-20 per cent less). Landcosts in the United States often would be of the order of one sixth toone quarter of the house selling price. In Japan, land costs (inflated,in part, by policies designed to preserve agricultural land) mightaccount for, perhaps, 80 per cent of the price of a single family-unit"home", for a house priced, upward, from Yen 25 million (i.e.,US$125,000 in mid-1985, at a rate of, then, US$1.00 = Yen 200) the housebeing normally about a third smaller than the United States average, andsituated on a lot one-third to one-sixth the size of the "typical"United States lot. Obviously, this leaves little room for cost-savingsby economizing on building materials. On the other hand, it is alsotrue that house-buyers' spatial expectations and building practices forthe traditional home (= house and garden), are much reduced in Japan, ascompared with the "West". -his is, however, less true for modern-life-style houses, requiring much more space to accommodate conveniences,appliances and storage. But back to the typical United States house:apart from various bulk materials for foundation, drainage, insulation,roofing, floor-covering, specific prefabricated items such as doors,windows, bathroom-, kitchen-, heating/air-conditioning-equipment andfittings, the construction or this average house - if constructed in the"stick-by-stick" timber-frame (also called "wood-frame" or "platform-frame") method, will require, on average (including about 5 per centwastage), 8,500-10,000 board feet (one board foot equals (nominally) apiece of lumber 12 x 12 inches and 1. inch thick) of lumber, (mainly2 x 4's, 2 x 6's, 2 x 8's, 2 x 10's of Douglas "fir", spruce and(Georgia) pine). Cost per 1,000 board feet of such lumber, early in1986, at United States East-Coast ports, was of the order of US$220-230,up significantly from mid-1985, but well below 1979/1980 levels. Inmetric equivalents, the lumber required comes to 20-23 cubic metres - avolume, corresponding to the cubic capacity of a well-stacked, fair-sizedmoving van. Also required would be a significant (depending also onfloor plans) volume of "wallboard" (a good part of which (for interiorwalls) might be gypsum/plaster boards). To put the timber-frame housetogether, in the traditional method, 120-150 kgs of nails would be used,and, finishing it, perhaps 300 kgs of paint - all together (not countinglabour incorporated in equipment and sub-assemblies), requiring about3,500 man hours of work. Work time needed to put up (i.e. erect andsheathe) the timber-frame shell would only be a fraction of total worktime. One widely-used estimate is that a "framing crew" of threecarpenters, using just the basic tools of the trade, can frame andsheathe, working on the building site, a house in two weeks or less.

MDF/W/52Page 104
In certain areas of the world, including parts of Europe, good masteryof wood-construction techniques, other than of the most conventionaltypes, is relatively scarce (but now said to be coming back in Europe,increasingly being taught in building-training institutions) andarchitects, paid on a percentage of construction cost basis, are oftendisinclined to recommend wooden constructions since the wood materials,being relatively inexpensive, tend to lower construction costs - hencelower fees - while, at the same time, requiring, perhaps, more of thearchitects' planning and design time than would reliance on conventionalbrick and beton building methods. Partly to spread wood-buildingknow-how, and partly to diversify market outlets for lumber, both theUnited States and Canada are actively engaged in promotinginternationally the well-proven (energy efficient, fast, relativelyinexpensive, good fire-retarding characteristics, good seismic shockresistance) timber-frame construction method (in Japan, apparently, withsome success; with the number of houses built with "two-by-fours" inthe period April 1985 through March 1986, up by 24% over the previousyear, part of the rapid increase attributable, however, to the low basepercentage).
1In Canada 95 per cent of new single family houses are builtprimarily of wooden construction materials, in the United States 90 percent, in Sweden 96.5 per cent, in Norway 93 per cent, in Finland 77 percent, in Japan about 45 per cent (up to the late 19th century allresidential construction in Japan was in the form of "wooden houses";with, however, at least one, bamboo-reinforced, but no-load-bearing,clay wall in each house), in France 7 per cent and in the United Kingdompresently between 5 and 10 per cent (after some undeserved adversepublicity for "timber-frame" construction in the media. Prior to that,about 20 per cent of post-war single-family houses in the UK weretimber-frame houses. This is not directly visible, as virtually all ofthese "wooden houses" in the UK are brick-clad). Not all of the woodenhouses are built by the timber-frame method (a centuries'-old method,often designed for being dissembled - moving to another site -re-assembly, and built in a way having many features in common with whatwould now be called 'post and beam' construction). The moderntimber-frame construction (benefiting from Adam Smith's recommendedspecialization for making nails ("pins") on a large scale) is,basically, a nailed, "stick-by-stick", construction, using to bestadvantage (i.e. avoiding, as far as possible, the need for resawing, orresizing) certain standard sizes of lumber and board materials (UnitedStates timber frame house- sizes will change slightly if and whenmetrication really gets under way; stud spacing and length will bedifferent, partly because of changes in the size of sheathing panelsetc.). Trade and building expert teams from the United States andCanada have toured a number of countries to demonstrate, partly withpilot projects, some of the advantages of building by the timber-framemethod. Indeed, for promoting expansion in international trade instandard-sized lumber, timber-frame construction is ideal, since therequired lumber (involving only a few standard sizes - unlike the morethan 100 different "standard" lumber sizes used in traditional Japaneseconstruction) can be bundled and shipped in compact form, while theshipping of pre-assembled housing almost invariably (particularly so forroof-trusses) implies transporting a "lot of air-space". (The problem
* /

MDF/W/52Page 105
Footnote (cont'd)
can partly be overcome by good modular construction design - as severalEuropean prefabricated house builders have demonstrated.) As a result,under United States conditions, shipments of prefabricated home sections(wall panels, floor- and roof-trusses) tend to become uneconomicbeyond a radius of about 150 miles, or about 250 km. Promotion ofstick-by-stick timber-frame assemblies notwithstanding, there can belittle doubt that, given wage developments in industrialized countries,and the development of ever more efficient and automated woodworking andassembly machinery, a growing portion of house construction elementswill, in future, be fabricated on the factory floor (less wastage,better quality control and, of course, less labour) rather than on site,cutting assembly time on the site by perhaps 80 per cent. In the UnitedStates, prefabricated assemblies in single house construction (includingprefabricated doors, windows, roof-trusses, for otherwise traditionally-built houses) now account for about a third of total wood constructionmaterials used. Among instances for promoting the use of wood in houseconstruction one could cite: UNIDO's publication "The Popular Manualfor Wooden House Construction" - UNIDO-ID/330 - 1985 (in cartoon style,for international distribution - originally prepared in Brazil); a"conclusion" emanating from the first session (September 1985) of theILO's Forestry Wood Industries Committee - recommending, inter alia, theproclamation of a special "Wooden Housing Day", at either the nationalor international level, or both (ILO IC/FWI/1/13); an ongoing UnitedStates Government study, with mainly wooden, modular-built, houses fromseveral producers and countries, installed at a test-site in the UnitedStates for determining insulation and thermal efficiency of thesehouses. Also to be mentioned are efforts sponsored by the Frenchauthorities, in collaboration with the industries concerned, forpromoting use and consumption of (domestically-produced) wood, throughprize contests for the design of wooden houses, including multipledwelling units, the actual construction of model villages composed ofwooden houses, etc.

MDF/W/52Page 106
129. Perhaps the extensive reference to developments in the US housingmarket will be clearer when it is recalled that the United States is theworld's largest consumer of sawnwood (accounting in 1979 for close toone fourth of world consumption of combined soft- and hardwoodsawnwood), the world's second largest sawnwood producer, the largestsingle-country importer, and the destination (1981 figures, cf. TableIII-B) of close to two-thirds of Canadian sawnwood exports. As Canadain recent years exported 70 per cent of its sawnwood production, it caneasily be appreciated that a large-scale contraction in US demand forsawnwood, or important fluctuations in demand, would be a matter ofmajor interest to Canada, especially so as the forestry sector is themain industrial activity of the Province of British Columbia and a majorindustry in several other Provinces.
130. Reference to Canada should, of course, not becloud the fact that animportant contraction in demand for house and related building materialsis also a major calamity for the US forestry products industry. Largeparts of the US North-West, and of other US forestry-products producingregions, have suffered important setbacks in recent years and haveexperienced heavy unemployment. In both Canada and the United States,there have been numerous mill closures, and profit margins from timberprocessing since 1980, have been, and still are, relatively low, onaverage. Cyclical fluctuation in demand for housing, and hence, forwood products is, however, not the only factor for reduced or decliningemployment (not only in North America) in the industry in recent years.Technological advances in wood processing have resulted in often largeproductivity increases, and, consequently, a reduction in labour inputsrequired for a given volume of output. The strength of the US dollarvis-a-vis the Canadian dollar has also been cited by US wood industrysources as a Rroblem in maintaining (not quite achieved) its domesticmarket share. Sawnwood is not the only forest products sub-sector tosuffer in housing construction- and business-downturns. Lauan andMeranti plywood - among tropical plywood varieties - are, or at leastwere, extensively used in the United States for the construction ofresidential housing, mobile housing, non-residential building and inremodelling. These and other plywoods and, more recently, also
IThe biggest producer of sawn-softwood is the USSR, also thebiggest consumer, despite an export varying between 8 and 10 million mannually. T1e production in the US of sawnwood in 1981 was 370 million m` and large quantities were imported, some 25 million m ,while at the same time the export volumes from the US West Coast arerunning high. In certain import markets, high-quality US southern pinesawnwood is increasingly in demand.
2Canada produced 39 million m3 of sawnwood, exporting about 70 percent thereof, and is by far the largest single-country exporter on theworld market.
3Employment in the US lumber and wood industries over the period1973-1982 experienced an annual decline of the order of 0.8 per cent;it increased significantly in 1983 and again in 1984, stagnating at, orslightly decreasing, in 1985, to a level of about 0.7 million. Ref:GATT International Trade, annual reports and US national statistics.
4The US dollar in relation to the Canadian dollar moved from belowpar in 1976 to about Can$ 1.40 for most of 1985. In the spring of 1986the spread fluctuated between one US dollar per 1.3/1.44 Canadiandollars. During the period of the US dollar's great strength, theCanadian dollar was, nevertheless, also relatively strong vis-a-viscertain other major currencies, which affected Canada's competitivenessin the markets concerned.

MDF/W/52Page 107
particle- and flake-boards are widely used for exterior siding and assub-floor and sub-roofing material. An examination of the trade data inTable III-B will show that many countries, not only Canada, but producersof all these items (notably producers of sawnwood and wood-based panelsin Asia, South-East Asia and in Latin America), have a major interest inthe US market.
131. The EEC member-States, as a group, are even more important as animport market for forestry products than is the United States. This islargely a reflection of the fact that, good forestry management practicesnotwithstanding, the EEC countries are relatively poor in forest resources.As the different member-States do not all operate simultaneously the samemonetary and interest-rate policies, EEC-wide swings in economic activityand housing construction are, in general, not as much in step, and hencesomewhat less pronounced, than demand fluctuations in the US. Further, theuse of wood materials in housing construction is more limited (much is used,however, for concrete-casing) than in North America. While some of the fac-tors cited above may help to limit the absolute size of swings in demand forconstruction wood in the EEC, fluctuations as such can generally not beavoided, and high mortgage rates in several European countries (some evenhigher than in the US in recent years) and reduced, or even negative, popu-lation growth are reflected in most oC the EEC's regions in reduced levels ofconstruction activity. As in the United States, the negative effects of adownturn in demand, particularly so in the context of the long spread-outrecession, are not limited to EEC producers of lumber and wood products, butare also shared by foreign suppliers. Not only is the volume of wood demandsubject to periodic cyclical fluctuations, but prices for wood and woodproducts are also depressed whenever demand slackens.
1EEC-wide, construction-industry analysts are expecting a (moderate)upturn in construction activity starting in 1986 and continuing into 1987.In the United Kingdom, private housebuilding in 1983, '84 and '85 wasalready at a relatively high level, as high as previously seen in 1973.It is relevant to note that much of the post-war housing construction inEurope, particularly so many of the buildings erected in the 1950's andearly '60's, are by now in need of repair - or, as far as wooden windowframes and chassis and doors are concerned, often requiring outrightreplacement, since the materials and construction methods used, (unliketurn-of-the-century and early 20th century high-quality woodwork) makerepairs uneconomic. There exists thus a potentially vast replacementdemand in several EC countries, including in the UK, France and F.R.Germany. If visual appearance can provide a clue, replacement demand inthe US should also be high. One, perhaps, interesting feature of theJapanese market situation is a popularly subscribed-to concept thatindividual family housing is due for renewal/reconstruction, orexpansion (normally in the same style as before - cf. para. 168), afterthe relatively short time-span of about 25 years.
2World export price indices (calculated in US dollars) - 1980 = 100
1981 1982 1983 1984 1985 1986Q1
(i) timber 86 74 81 75 66 83(ii) wood pulp 100 92 81 93 78 84(iii) all agricultural
raw materials 93 82 85 88 76 76
Source: GATT, International Trade 1985/86

MDF/W/52Page 108
This is a painful experience for all producers and, on a national scale,is particularly upsetting in all those cases where wood exports accountfor an important part of a given country's export earnings, as is thecase, for instance, for some of the West African countries and forseveral other countries which are among the main suppliers of EEC woodand wood products imports.
132. What has been elaborated above in respect of the United States andthe EEC, because of their great weight and importance in world imports,applies, mutatis mutandis, also to other import markets.
133. As will be seen from the export destination data in Table III-B,and also from the data in Annex II, many of the major forestry productexporters, during the period covered by these tabulations, were shippingan important part of their wood semi-manufactures to countries in theMiddle East and in North Africa, regions which are not endowed withforest resources sufficient to meet their needs in respect of wood forconstruction and for joinery. The increased demand for wood in thesecountries in the recent past arose mainly in connection with theimplementation of large-scale economic development programmes, buteffective demand has slackened considerably in the wake of thesignificant decline in export earnings from petroleum.
134. Large-scale fluctuations in demand for wood and wood products dueto contraction, expansion, followed by another contraction, in housingconstruction and in overall levels of business activity in main importmarkets are not the only problems faced by forestry products producersand exporters. Fluctuations in foreign-exchange rates have alsocontributed to significant shifts and/or fluctuations in theinternational competitiveness of different producing areas. Many exportcontracts are denominated in dollars. Even where this is not the case,a given national currency may be pegged in various ways to the dollar -or to a basket of major trading currencies. In other areas, nationalcurrencies and export contracts may be denominated in other currencies -say, in CFA-francs, related to the French franc, as is, for instance,the case for some important exporters of wood in West Africa in the"Franc-Zone". Part of given countries' export and import trade may beeffected under the terms of compensation agreements. Wood and, morerecently plywood, are among items offered on a compensation trade basisby some important exporters and are, apparently, among the moreacceptable trade items for some of their respective countertradepartners. Such countertrade arrangements introduce new marketing andproduct-disposal methods and incentives into the international woodtrade. Directions of trade are also influenced by freight transportconventions or shipping conferences. Certain shipments of wood fromWest Africa to Western Europe, effected under agreed Conference terms,are, fr instance, subject to freight charges which are as high orhigher than those for shipments of like goods and quantities over themuch longer distance from South-East Asia to Europe. Outgoing
1Interestingly enough, some shipments in recent years of lumberfrom West Africa to destinations in the Asia-Pacific region (arelatively new, but apparently not yet a significant, steady-trade-flowdevelopment) are reported to have benefited (despite the much largerdistances involved) from shipping rates that are significantly lowerthan the unit rates for shipments to Europe.

MDF/W/52Page 109
trans-Pacific freight from North America is, apparently, subject to muchhigher freight rates than east-bound trans-Pacific freight destined forNorth-American ports. Trans-Atlantic freight from different loadingareas on the North-American East-coast are also subject to differentdegrees of competition, in terms of facilities offered by differentshipping lines concerned. Some increases in trans-Pacific andtrans-Atlantic freight rates announced in 1984 and early 1985 werecommented upon by North-American forest industry representatives asjeopardizing years of efforts for developing overseas markets for theirproducts. Shipping company representatives have countered by claimingthat, for several years past, freight rates charged were insufficient tomeet operating costs and even threatened the survival of manycompanies. Some of the larger forestry products companies, not only inNorth America, but also in Europe, have their own ships, shipping linesor transport affiliates (but, in the present competitive pricingsituation, may not derive much comfort or cost-benefit from this). SomeJapanese log importers rely on ships which do load logs directly fromthe Sea, close to producing sites, without relying on ports, as is thecase for most other shippers. Some exporting areas, and even someforest products companies, possess specialized wood handling portterminals, and they may also own ships especially built for transportingwood or wood chips (specialized lumber transport ships have a longhistory and tradition, encompassing even some of the famous "clipper"ships). Even inter-coastal and inland transport may be subject tospecial cabotage rules and prescriptions, affecting conditions ofcompetition. Where rail networks are State-owned, special, temporaryfreight privileges may be granted to deal with special problems, such aswood removal needs occasioned by wind- and snow damage; volumes soaffected may be quite important. Several major firms, primarily, andinitially, in the transport sector, operate, inter alia, forest industryenterprises. The listing above is not intended to be exhaustive, but toserve as an indication that the subject 2f the elements influencingtrade directions could be a complex one.
135. One of the questions naturally raised in the GATT context is theinfluence of tariff barriers on actual or potential trade flows. Whilethe subject of the tariff itself is among those to be taken up in thefollowing section, the question of their effect on trade flows alreadyarises in the context of an examination of actual trade flows. Theinformation set out in Table III-B does suggest that the tariff is notthe only element which influences trade flows. The United States, apartfrom its Generalized System of Preference scheme and the operation of
1Over the period 1970 to 1984, the world merchant fleet (in termsof deadweight tons) more than doubled. World sea-borne trade (byvolume) (index 1970 = 100) stood at 150 in 1979 and at 134 in 1984,i.e., a case of too many ships for the amount of cargo available. Whilemuch of the excess capacity is in tanker capacity, dry-cargo capacitytonnage is also in excess by about one-third. Container-ship capacityis also (and still) expanding. As a result, some of the announced rateincreases could not be made to stick and some observers of the shippingindustry feel that, in real terms, ocean freight rates may presently beat exceptionally low levels (expecting, however, a "change of tide", asreflected in increased ($) rates by mid-1986).
2A catalogue of some of the problems, difficulties and challengesin international sea transport and policies, as seen by some of themajor shipping nations, is contained in the OECD publication MaritimeTransport [1983].

MDF/W/52Page 110
the special facilities offered under the Caribbean Basin Initiativefor developing countries, does not grant trade preferences on productsclassifiable under CCCN Chapters 44 or 47. Yet, the Scandinaviancountries, though very competitive internationally, are not among majorm.f.n. suppliers of sawnwood to the United States. In wood-based panelsand wood-manufactures their share in US imports is also relatively low.Trade in wood among EFTA countries, though duty free, is also relativelylow, except in a few product lines. This is, perhaps, not surprising,in view of the similarity in forest resource endowments among the majorNordic forestry-products producers. In the EEC, intra-trade, thoughimportant generally, is not necessarily large for all product lines andfor all member-States. For wood products, some of the EEC countr'astrade largely with non-Common Market countries, though the other tradepartners involved may be those which take part in the wider Europeanfree-trade arrangements. Finland has arrangements containing tariffpreferences with several eastern European countries. Other EFTAcountries generally do not grant preferential duties for imports fromthe Eastern Trading Area (according to data compiled in the GATT TariffStudy Files), nor do the EEC countries. Yet, some countries importsignificant quantities of wood and wood products, which remain subjectto positive m.f.n. rates, from countries in eastern Europe. Sometimesimports from m.f.n.-dutiable origins account for a large, or major,share of imports under a given tariff position, while in other casesm.f.n.-dutiable imports - originating (apart from CMEA origins) in theUnited States, Canada, Australia, New Zealand and South Africa, to nameonly some of the more important actual or potential suppliers - have tocompete with imports benefiting from various preferences.
136. Japan, the other major import market, has a tariff structure whichis fairly complex and though the Japanese tariff schedule does notprovide for developed or developing country preferences, other than theGSP for the latter group (subject to exclusions or limitations forcertain items), tariff positions are sometimes defined in relation totree- and wood-species, which, in effect, may create differentiatedconditions of access for goods from different sources. Such speciesdifferentiation is also found in certain other tariff schedules. Thisdifferentiation is often not at all discernible from broad, aggregatetrade statistics. The differentiation is, however, detectable from theGATT's detailed Tariff File listings. 'Detailed' is, however, thecorrect description for these listings - not only for Japan - but forall of the countries for which they exist, so that it would be highlyimpractical to attempt to reproduce these listings in full. Someattempt will be made in the following Section to illustrate the topic oftariff differentiation with reference to a few selected instances.
137. In closing this Section it may be appropriate to point out, onceagain, that data relating to one given year may not be truly indicativeof trade flows in another year. What is intended to be conveyed in thestatistical tabulations of Tables III and IV are orders of magnitude,not more than that.
1Since Spec(84)13 was issued, there has also come into force theUS-Israel Free Trade Area (FTA). US import duties on forest productsfor imports from Israel will be reduced and eliminated according to aprogramme schedule. Likewise, Israel will reduce and eliminate importduties on US imports. US imports from Israel of lumber and woodproducts (not including wooden furniture) in 1982 amounted toUS$836,000. Israel's imports from the US, of the same products, in1982, came to US$3.45 million.
MDF/W/52Page 111
D. TARIFFS AND NON-TARIFF MEASURES AFFECTING TRADE
138. It may be recalled at the outset, that much of the world's forestland is public property . Consequently, forest-usage, -disposition and-development are subject to State- or other public-body decision-makingof a general nature, in which action, as it relates to forest-managementand -uses (and indirectly or directly to international trade in forestryproducts), may well be subordinated to objectives, conceived in thecontext of broader social and economic policies. While in a few casesState agencies may be directly responsible for forest- management andresource-development and -exploitation, actual forest resourceexploitation, even of State-owned and administered forest land, is mostfrequently in the hands of commercial companies, which operate inaccordance with guidelines or directives set out in long-, medium- orshort-term lease-contracts or logging concessions. In recent yearsmany of the logging concessions granted by developing countries containedmandatory clauses for the progressive establishment of forest-productprocessing capacity (saw-mills, ply-mills, etc.). Sometimes these alsocover trade prescriptions, such as the ratio of processed wood exportsto be achieved in relation to log exports (if any), indigenizationclauses (concerning originally foreign or joint-venture operations),reforestation obligations and forest-road infrastructure development andmaintainance obligations. Obligations of a similar nature may also beapplied to private, domestically-owned, forest-operations, by means oflaws, fiscal incentives or disincentives. Conversely, many governmentshave, on their part, taken various measures for facilitating thedevelopment of national-, or regional-, forest resources throughprovision, or participation in construction, of road infrastructure,transport- and port-facilities, through the granting of tax relief,special import facilities, special import permits and duty relief forforest-industry equipment imports, financing facilities on favourableterms, etc. These facilities are often granted in a way similar to
IEven in the EEC (of 10), where private ownership predominates,more than one fifth of all forest land is State-owned and another fifthis owned by other public bodies. (In France, where 80 per cent of theforest area is privately owned, the ONF (Office National des Forzts)manages the State-owned forest lands and those of about 11,000 localadministrations and is responsible for about 35 per cent of all domestictimber sales. The Office, whose origins can be traced back to Colbert,is currently being reorganized with a view to taking a still more activerole in forest management and forest industry development. In Spain,forests on public lands account for one-third of the total, but centralGovernment State-owned forests account for only 4 per cenz of totalforests.) In Canada, Provincial Governments control the bulk of forestlands. In developing countries - with the exception of certaincountries in Latin America (notably Brazil) - most of the forestresource is owned by Central- or State governments, or is subject tocommunal exploitation-rights and administration. In the United States,close to one third of all forests are on federal lands and a significantproportion of remaining forests is either owned, or administered, byother public bodies. Private forest holdings of one of the largeNorth-American forest-industry companies exceed 2.5 million hectaresForest lands owned by several other forest product companies are alsolarge and may exceed 1 million ha. each. (For the respective ownershippatterns in the US and Canada, see also footnote 2 on page 24 andfootnote 1 on page 25).

MDF/W/52Page 112
those extended by many countries to the agricultural sector.Considerable efforts are being made in many countries in fosteringforestry-research and -training operations, advanced silyiculturalpractices and for afforestation and forest rejuvenation.
139. Forest-industry activities and exports of forestry products are ofgreat importance for a number of national-, or provincial-governments,(depending upon the constitutional clauses, or administrativearrangements) as sources of tax revenue, for financing State- anddevelopment-budget expenditures.
140. Given the important interrelation of forestry-industry activitieswith general economic and policy objectives in many of the countriescovered by this note, no short summary of governmental policies can givean adequate description of the range, and the possible impact oninternational trade, of all of the measures in existence, or notified atone time Ad another, as influencing actual trade flows in forestryproducts. It is with this caveat in mind that the followingparagraphs, dealing with tariffs and with non-tariff measures should beread.
141. As regards the tariff scene, and bearing in mind what has beenindicated in the preceding Section on the preponderance of certaincountries in world trade in wood and wood semi-manufactures, it may bewell to start with a brief review of earlier tariff treatment in somemajor markets, before arriving at a bird's eye view of the post-TokyoRound tariff scene in major import markets, presented in Table V.
142. As forest industry products are important, in both exports andimports of many countries, they have been the subject of attention insuccessive rounds of GATT tariff- and trade-negotiations. Import dutieson different forest product items have benefited on different occasions(in different degrees, depending upon product and import market) fromnegotiated or unilateral tariff-cutting action. A Study prepared by theUnited States Tariff Commission, at the request of and for the UnitedStates Senate Finance Committee, and presented in April 1974 , traces,inter alia, for the wood, cork and pulp sector, the import duty
laThe Nordic countries and Canada supplied the following, jointlyagreed, comment on Paragraph 138: "The subjects covered by thisparagraph are very important among factors which have a direct bearingon the competitiveness of a saw-milling industry. Government aid toregional development, to improve transport facilities, to assist inreforestation and investment programmes, tax exemptions, import dutyrelief etc. is often of substantial importance to the individualcompany, but at the same time they are so generalized, and oftendisguised, that the effects are difficult to assess. Any attempt toanalyse the trade in sawn-wood and pulp could not forgo to try toevaluate the effects of public aid, open or hidden. Of some importancethough are the ownership conditions with regard to the wood supply. Incountries where public ownership of forests is significant, timber-cutting rights are made available to forest industries in return forobligations which are related in varying degrees to world marketconditions.
lbCf. also C/M/198, pages 32 and 33.
2..."Trade Barriers" - Report to the Committee on Finance of the USSenate and its Sub-Committee on International Trade; Tariff CommissionPublication 665, Volumes 1 - 11, Washington D.C., April 1974.

MDF/W/52Page 113
treatment accorded in major markets, notably the EEC, Japan, UK, Canada,from pre-GATT days, to the Kennedy Round tariff concessionsimplementation stage. The study compares import treatment in thesemarkets with that in the United States. The study also contains adescription of the methodology used and an indication of the inherentdifficulties in making inter-temporal and inter-country comparisons oftariff treatment by reference to duty averages.
143. The Study found that (1970) trade weighted average import dutieson wood and cork products in the US, the NEC, Japan and Canada comparedas follows, between "pre-trade agreement" duty rates and statutory dutyrates (or their ad valorem equivalents) in force on 1 January 19724(thedate when the Kennedy Round duty rates had been fully implemented)
1It may in this connection be noted that in the United States (andprobably in other countries) import duties paid on imported materialsused by industry in the manufacture of other goods are deductible frombusiness income tax, thereby, in most cases, further lowering the real(duty) incidence. This aspect of one of the interrelationships betweenthe tariff and the tax system has been demonstrated in the (1985/1986)United States tax reform debate.
2For reasons explained in the Study, the trade weighting used in
arriving at the figures, reflected in paragraphs 143 and 144 of thisnote, involves the weighting with each country's own imports. Thisaverage is assumed to have the strongest bias downward because itminimizes the importance of high rates, which deter trade, andemphasizes the importance of large trade items, which are likely to beproducts with lower rates of duty.
3For the US - 1934, for the EEC and Canada, basically, the ratesbefore GATT tariff negotiating rounds and for Japan its 1954 pre-GATTaccession rate.
4The study also identifies the pre-Kennedy Round rates; these areomitted here, for brevity.

MDF/W/52Page 114
Import duty average (or range) in % ad valorem for the productsin the listed product category
US EEC Japan Canada /
Pre- Post-V Pre- Post- Pre- Post- Pre- Post-trade agreement rates
Category:
Cork andmanufacturesthereof : 14.4 4.4 1.6 1.2 0.5 0.5 17.5 8.2
Wood and Cork,in the rough : 0.2 0.1 0.5 0.2 0.0 0.0 10.3 4.8
Wood and Cork, 5.5- 0.5- 0.4- 0.2- 1.1- 0.8- .. 2.2-semi-manufactures: .. 5.1 10.9.. C.) .. 11.8
Softwood lumber: 0.74- 10.0 5.0 free- free- 5.0 free4.68 free 10.0 10.0
Wood shingles,shakes : free free 14.0 7.0 18.4 11.3 free free
Wood-basedpanels : 34.1 15.1 14.7 12.9 20.0 15.9 31.7 13.8
Plywood : 40.0- 7.5- 15.0 13.0 20.0 15.0- 35.0 15.0=50.0 20.0 20.0
Paper pulpand waste : 0.0 0.0 2.2 1.1 4.7 4.7 8.3 0.0
= not available
l/Arithmetic average of duty rates.2/Post = 1.1.19723/Temporary rate then (1972):10%
144. A comparison, in the above tabulation of average duty rates, ofsome of the sub-categories with the overall category "wood and cork andmanufactures thereof" provides an example of the difficulty of assessingthe degree of protection afforded by import duties on the basis ofaverage import duty data, when related to a broad product category,particularly where the trade-weighted average covers both duty-free as

HDF/W/52Page 115
well as dutiable imports. Taking the average for dutiable imports only,the data calculated for the US Tariff Commission Study, in regard of1.1.1972, average, trade-weighted duty rates (% ad valorem or ad valoremequivalents) are as follows:
Post-Kennedy Round
Category: US EEC Japan Canada
Wood and Corkandmanufactures 1/thereof : 12.1 9.6 15.4- 13.4
Wood and Corkin the rough : 6.4 3.4 5.0 3.7
Wood and Corksemi-manufactures: 4.0 6.8 10.3 9.4
Paper pulp andwaste paper : 0.0 3.0 (5.0) 0.0
For softwood lumber, wood-shingles and shakes, wood-based panels andplywood, the average, weighted duty rates on 1 January 1972 would be thesame as those shown for these sub-categories in paragraph 143, under theheading "Post-" trade agreement rates.
145. Bearing in mind also the experience gained in the preparation ofthe Basic Documentation for the GATT Tariff Study (Summary by IndustrialProduct Categories, Geneva, published in March 1974), estimates by thesecretariat of trade-weighted pre- and post3Tokyo Round tariff averagesfor the wood and cork sector are as follows-:
1Certain unilateral reductions were put into effect on 1 April1972.
2Weighted average of all duty rates, using most favoured nationimports (in 1977, in some cases 1976) of the country concerned, at thenational tariff line level, as the weighting pattern.

MDF/W/52Page 116
Average duty rates in percent ad valorem
Category:
(1) US (2) EEC (3) Japan (4) Canada Total,9
TariffsPre- Post- Pre- Post- Pre- Post- Pre- Post- (1) through (4)
1/ plus: Austria,Tokyo Round- Finland, Norway,
Sweden andSwitzerlandPre- Post
Wood andcork inthe rough: 0.1 0.0 0.1 0.0 0.0 0.0 0.3 0.1 0.1 0.0
Wood-based 3 2 3/panels 14.2 7.11- 10.6 8.2 19.9 17.8 14.9-' 7.5_ 13.8 7.0
Othersemi-manufac-tured woodand cork 2products : 0.3 0.0 0.7 0.6 0.5 0.5 2.1- 0.8 0.7 0.4
Manufac-turedArticlesof wood 2/or cork : 4.5 2.8 7.2 5.1 9.0 4,5 12._- 8.1 7.0 4.5
l/For woodpulp, which covers only oneall within CCCN heading 47.01, see Table V-
tariff line, or a few tariff lines,
-/Average duty rates for Japan (following reductions made in 1986, orannounced for 1.1.1987 and 1 April 1987, and 1 April 1988 respectively) willeventually be lower. Revised, trade-weighted duty rate averages are not yetavailable.
3/-'Certain concessions for plywood were granted on a conditional basis,partly with a delayed target date (1.1.1990), and are not so far in effect, Thepost-Tokyo Round duty rate thus is higher than the target rate averages shown.Difficulties encountered in moving towards duty reductions in the mutual UnitedStates/Canadian plywood trade are set out, as reported by the United States, inthe United States 1985 Annual Report on National Trade Estimates, pages 43 and44 (e.g. the report required by Section 303 of the United States Trade andTariff Act of 1984). Further, in the United States, it was announced (22 May1986) that cedar shingles and shakes, previously duty-free, would be subject toa - temporary - tariff of 35 per cent, declining - through successivereductions over a five-year period - to 8 per cent.

MDF/W/52Page 117
146. Useful as data on average duty levels by product category may be forpurposes of aggregate economic analysis , such data provide littleinsight regarding the degree of protection the import tariff affordsdomestic production of a given product and of the possible impact of thetariff on trade. Experience shows that, for an in-depth examination ofthe protective effect of a tariff, virtually an item-by-item approach isrequired. As this is not possible in the context of an overview paper,some broad indications of progress made in dismantling tariff barriersin the Tokyo Round on wood, cork and products thereof and on wood pulpmay be gleaned from the information set out in Table V-A, which providesdata on pre- and post-Tokyo Round ad valorem duties (or ad valoremequivalents, as calculated for the GATT Tariff Study files) at the CCCNfour-digit level for some of the major import markets. The Table alsoprovides an indication of the areas in which tariff protection is stillof some significance in the listed countries. Generally, it can bestated that tariff protection remains to be of some significance inregard to fibre-board (CCCN position 44.11), plywood (44.15), to someextent also for particle-board (44.18), and for sawn-wood (44.05,44.13), in certain markets. As sawn-wood (including also planed woodetc.) and plywood are among the most important items in internationaltrade in wood, import tariffs are perceived by some countries as beingamong the remaining problems and the list of actual, or potential,tariff-treatment problems may, of course, be much longer, dependingupon products and import markets involved.
Note: The headnote to Tables V-A and V-B, subject to photo-reduction inthis revised version of the document, are reproduced, for betterreadability, in larger print size on page 198.
Page 118: Japan: one or more sub-positions under each of thefollowing CCCN numbers have benefited (or will benefit, with effect fromspecified dates in 1987 or 1988) from tariff reductions announced inJanuary 1986: 44.05; 44.11; 44.13; 44.14; 44.15; 44.18 and 44.19.
Canada: * = agglomerated, more than 10% (by weight)binder = 10.2%;
** = coniferous, untreated = free; coniferous,treated = 6.8%;
= [final rate to become effective 1.1.1990].
1See in this context a study by the UNCTAD Secretariat forUNIDO - "Tariff and Non-Tariff Measures in the World Trade of Wood andWood Products", prepared in the context of UNIDO's first world-widesectoral study of the wood and wood processing industry, documentUNIDO/IS.396 (1983).
2Not all of the GATT countries which made tariff concessions in theTokyo Round on wood, cork and products thereof, or on pulp, could becovered in the Summary Table. Apart from the countries covered in TableV-A, Iceland and Spain made m.f.n. duty concessions on a wide range ofwood products. Argentina, I-dia, and the Rep. of South Africa madeconcessions on a few items. Australia made concessions on a few itemsand reduced duties unilaterally on several other tariff positions. Anumber of other countries also effected duty reductions without,however, binding the reduced rates. In a few cases, duties were boundat ceiling levels. Some of the countries not covered by the Table mayhave granted tariff concessions in earlier GATT negotiating rounds.

Lseres all0 1srOflltift owPs
pot. AND POST. 10O0KYO RONII-NPR DUTIES110 Or SEE01(ITI~OLIM lwl1'N11.s thusAn fornt5 siPslt.lih&.sBeee Roet Ire flu) Films II... seoplloble assi1 1.I.0101. mill osrils shIn gsuslplees) - 034s4 or thus nlai ites I 5W0of.GATTtm rt ... ....lPtsre MutrilhVJ'l1 U.e islat~.zlwe*M c~lk altsol5 a urso~jt.si ujallalara leiols II. viesa jouts. PfIre.l bwWue misalfttelEIsi'eektihe In. osear Is CNNNIs7.IupryMer "ethls u' eel.6 eAe. *he, su-I pefalseO~lgers mi0lt I"Isoels ntis I., dillsrea ..6,.u1.stlu .stils a Wasp111t 45501m. Rales sham Os, theUS med twas. in elisoalad Is CCCI knulng s e I Motllslhel. ill rule shai Ren I. fraies~,Os6Hm1.to ce r dtleltI.,ritos Ut. 0071 Uwes PRIM6es.
3W FDA00111
44.01 FUEL 0VA On.s On. On On. On. C., One0 Ofs In. On 000 IOlOr O. n/3Wi400 On. On. On One In. 0.4.7 On:'. On. In. On.42.00 1000 On.OM4AXM (15 W W W 017 FM IM 6.0 5.0.(me .1.1.00.OI 1044.03W 1.1~~~I' 130IO. IOIOn . n n n .0 .10,0 12.0 Wr0411L On I20 On.s On. I
In 0.7 Onfn n 3. 10 O. Oe
44.03 3OD nW JMm 3.0 On. 3.0 On. On. On. Ost On.; j 1j,4tr Sp1/ Wn; 0.7. On n.; 10.0, 10.0 Ins On./11 M, I'M f- f- I al i, (IIII'tOn. 0.4/On. On. 30.0/Ores.. 10.0 Ore.s32.13.0 11-4 .7, 10.444.04 rusthly On. On. 7.0 On In. In.M eI n; 04(e'2 0.1 OnIn. 1.01. 10.05.30. Ire.nIM W.2.0
ii .71 1_17 17,~~~~~ On.I'10.4 10.0 On. In.
44.12
44.110
sused Se.
hilss.. Spei
NP3W Is'his.)
- JLMW1
-710161 0.1.JOINlIMeli
10 L0 4.IIEIEM dSeee
11=1111I
.10020). owe
Msed
it.0
3.01
3.0.2.?
3.0, 4.0,
0.2. 4.4
10.0
3.0
4.0
1.10/Isex1LO
1104Oree400 t;
U
3.1
4.0
3.0
12.0
10.0
in ad. VIM MULMO - orC 1.1.
4.21
4.726
44.27
44,21
wow PI0111
0100.1 Tim,
UTENSIL o
OW.
WIte
LAM I sItlegs
L~ .Ol_ q,
ld.ttstl Il 111lCs
;or~mm
7.13.1
14.0/1.1,I,0. 7.1
3.1,
4.0
1.1, 7.0
4.0,7.1
7,1
3,0
1.0,
4.1
100
7.0. 14.
1.0.7.0.
On. 3.0 O'e FMre nts triple Ores,1.4FMi, One fmi fre . 2.2/Irs.3.0 Ofe 0.61.7Iii. 3.0 On. fre fre A.6.lIn., fre tre fre lopureislei)3.0 1. .
re,1.0SA uie .2. FM fmseen 0.1 . 0.16free FMe tre fre 0.1 ..'4.0
11.,210 Ouee 1.0 U. em One;10.1.11.0 On 4.4 0.W.6/ 3.03.01 so n' 7.1
1.0 LI On I. .4.0 2.7 On. On. .2
0.0. 0,0 On. 51.0 emI. On.W. 3.0 3.1.7.71.0 On. 3.0 em On. 2.7.1.0 3.1 se On. 7. 6,2
2.10.:.. 1.1,7.0 es On.; 1.1 1.0- 3.0
11450481, WAA1. 7.1 1.4 1. 1..1.1.0.0 10.0 1.1,7.3,3.1 es In.; 3.0.- 4.5 11.0. 14.40.0 4.51/.4 7.2 LI.5 1.4-10.0 1.7,3.1 .1. e . 7.0
ZOn .1 .1.1.711.0 4, .1. 1. 4. 1 1.1. 1.07.0 3.1 0.4. 3.1 3.1.
1. 1 1.1fue 2.7 On In. 1.11.0.140. 7.1 3.3..L1.7 2 10.1. 21.013.0 7.7 1.1. 2.2 4.1(40.1)' 1. 10.2.7.2, 0.0 3.0 4.0. 7. 4.0 1.0.-10.314.013.S, 3.0 3.2. 1.1 3.2 7.0 . 1.1.0, 7.0
rates
L986
On.; Ls. 10.0
1.0; .0
71.1
7.1.21.1
13.1
1 0.0
12.0f .
0.0 n.
I11.0; 17.0
20.1
10.0
!0.0 I
11.07.0
10.0
12.0
11.07.7
___I__ -%H, . of mae 117
V-01fntO 0; -r' at retail
11.01.1
2.51,7.17.0, 4.2
2.1, S.07.511.1,:3.2, 4.7
7.1
4.0
10.0I1,0
S.0, 7.13.2,4.2
7.1, 10.0
4,0
10,0.- 40.0
Oise; 10.0.-11.0/ [n.;
I 7,S
...fn..1.0. 1.0.
10.0/O.
15.0
11.0. .
01.0
1.0.,34.01ls 1.0.
On.0
In.0
113.0,pi.)1.0
fees
22.1, 30.0/
340.
On.5
11.0
I1.0
11.0
015.0/On
0.,1 .10.
10.0,
11 .02
11.0,
27.1/On..
f7 .1,02.1
11,0.
21,0/ Ores15,0,21,0
11,0, 20,0,201. .40,0/Ores,11.0.40,0
10.0/On..
10.0
On.;. -0.1.0
20.0
27..1
4.0,20.0
One0, 10,0
10.0
10.0
On.,10.0
40,0.18,020.0.-10,0
40.0
30.0(40,0)
On.; 17,140,.4A2.1/
Oise; 1.0;20.0
40,0M.110.20.0
40,0
gi . ,)/.
On I.!20. 0/ ., 70.01.7.All, , .
.0/,
3.0;10.0
a.13.0.17.011.0.
7.71I
1.0,10.0
1.71
2.712.21
4.13.3
10.0,12.01.71,
10.0
4.15
3.1
0.04.21
00.05.71
10.01.7
011
11.0,11.4
1.0
11.0, 34.07.7
10.4
#60.010.4
11.07.7
3.0,
34.0, 41.010.4,11.0
34.010.4
On.; 10.0
1.2
10.0
10.0
10.0
10.0.sa10.0
10.0
10.0
34.O.Sa
2.0
2.0
10.0
0.0
10.0
I.0
10.0
10.0
10.0
10.0
150.30.0 T'. 0.B'SO.0 . I
15.0,34,0,50.0/7.7,10,4, 17.1
50.0)8.110.4, 17,1
10.0,
.7. 10.0
117.11I3.1, 10.0 200 10,0, 340'2.75. P
.0 I0.0,1.7 4,
'
1 1 .1 1 40.0
11,0 11,0, 40.0 I10.0, 40,0'I.2 7.7, 10.0
1 11,4 2
S.71 11.4 10.0
20.0
821.0/ .1
1.1. s. On.; 1,.& 10 ,0,18,0',.0
,0
3.1 12.14.
1.0/On" Or..
In.
3,04,0
7.41.1
On-.,, 02
15.0,
1.0, 0.0
3.7, 4.0
10,0,70.0)
80., P.10(10.0)4.0
1.0
(0.0)51.14.0
fn. 1.10.1/On.
.1, 4.1
1,01.0 I
On., 11.7
I.s, 0.0I1.1
11,1; 20,0;
46.0, 1.3.
1.0
,1.I
1
On.
/I
3.1
7.1, 10.r/I'n.
I0.0. 9.2.
* 4.0/
4.0
70.0/6.0
01.0/
.11,0
Otis; (ep
(Is 0.2
n. (7.1,1.0,
12.1, 11.0
.0
9.21
j17.01/9.2
19.21
0,.0 .0 4.0 . 7.1 4.0 10.1.0 -30 3.7. 3.7 .1.
10.0 On., 1.0 .~O.f m ON. 1,0.- 1.11.0 On., 7.1. 4.2, 0.0.-4.2
3.0 se On . us us;f3.1 3.2
emOn; On.. 1.0 mm On.; 3.0 0.4. 31.013.0 On. 7.1 LS 0.4 34.0
?.0 1.10.0; 10.0; On .C.1 .0 .1-3.0 . On. 4.0 .13.11.0.10.0; 7.1 Is. On.
13.0 2.1.3.210.0 7. 1 1. .0 1.7
1.0 1.1 1.1 3.0 4.37.0
17.0 S.0C .. 10.0 fmOn; 1.7 .4.07.0 3.0 1.. 2 1.0, 1.4 .
1.2 5 Oes; 4...3.0
On; .; 2.1 On. 2.1 1.0.00./ 2.7 n 2.2 0.1
1.1 34.0
12.0 7.1 7.1 1.0 4.4 .13.17.0 1.1 1.1 .0 3.3.
1.33.0.5.0.1.0 Ofss,7.5 .e, Ois; 1.0 0.7.- 7.011.0/3.0, Oise 7.1. 3.0 0.2 . 4.1
1.0. 7.0 __ I.

MDF/W/52Page 119
INS aW mu ..Isw11113.
VW. la e
* *~ge j bt is 33.35 ..' .. gus"" , eZ l, " .......................
111 53 3313.,--_ .,swism ,,_,, -
hI"}{}|Wobum is n mg} mg§ 113*.5.v~ SsW-it * -*-li IILI
M Up. f1$.Si..s ts s _s. t a . . 3 1
3 in¢nss55~t3 5 3 13 1-33-15Mi =:,W-A -> - I l 1s - II I
maul.. 533153 53)13~~~~~I 13 13 3 5UaIEwv 1M1.1 3u * I3.utuE33. 3I. 1- I 33.3.35 53 I 3iIs
311115 153 * - 1 - 1 171 153 .
W d. *13 | 31| 3 "L. |I | | 51.1 33.3 ' I I* I3.I I A1- 1 I gulM..i 141 1*3 3 * -53 * *15* 331.
NU. 3 1 I I 1 pa1 113 |5 LIflU m s313.1 1. 31 13.1 31.1
is.I 3 a1 3. I31.1-. 3
%.1-15-5-11-33-z1 3 1 315p 1- 3u aI 1 a 1113 ILI pi %I5 U 5 1 3 I I L)
WI I4ti1--SU1-- 4I9lwIf "LiN os11I11110'.N3. 11.5 33.) 31 31NI.13III 3i.? .313I . 3I IIIW3l e t II n I1 'k'1 1's 1 IY~g 1"19d is 1I3W I
I11.355121ll 53I353~UI sI g I13 I 3 33. 53sII t 1
-MUD sk. I I9I'0' 1-''I ,1-*1-I10..,l 31I .11 311.3u. 1 3).3a|'131 "'3. 321 111.51.^'1 ..3-1 1'1
11-11 g..I~d~a 11 35 1I aOu 1 11 it" 3i 153 ILI
S.IA wd4, . xi8|t|INg| , W la is W
te.1 i3 t I sis 1 1.1 15 to1- - | |-- IsI IIt8LI Im J I . I .1 3 I 3 1 1 | 41 |I
0.1s -Kom.. .I14119-6 11 3. 3. 1 sI . I5L33.Id1 1.1 1 .II.155.11
, ILI I II l. IJ I 113 .35 ILI
1(mallim I5 1"3 ILI 130 111. PLI 1 | 1| ILI
l cWI w1tt 2g1 1 u isI1atud II1l 1
110 1 33.1 33.1 53 1131)I11311 321.A31531.1 L.1 ..3.5I.13 I -u11u 1 I ' a 1 3 -'-. 1 *1- 3 11 I
I a&.)... 53l l~ l~ l r13 153l.Ll .113 _5 1i3
53351 3~~~~1. 31. IU3. 333 3.1 US 31. 111
5.11332> SUIL I* 11.3 %I Il U11 11 1 1 121.
1-3)1135"L- 13 I13I ILI 1 M13 1- SW3g3bt.I 311 Ia 3.3. 13a 11. 1.
'1.t"M1 513 1%3 ILI3 $LI5 PA 53, 15
!3 U|11|aW | | | U| U |1.3 33. 3|.5 33.5| | - |3|U z ! | I W B13.551.1) s15535531agtnsli~lfl5 llsit* VS 5ti.
Kong13) 3AN. 31 131.1321. 313 3. 311 xi. 331 . .3.
WS m mu MT.1A5LI. v13 li I.* ,t 1 I55 D4U1Cmy.Iiv. , 11 13 V1 5I9 13to 113 53
hu3- sk.11 11 5 5 13- 1 1 3 is
of35 55.3 335 335MO. 1. 5. 311. 355 31 .3355.153153313 .513 13. 1531 153 1no3 113.1 5113,1 T 113Ji1035 153153 53 53 153 35~ 53 35
51.JmIubor W . 139 xi 5 a13 3 5 1 5W armtil a513 1 Is33 11 35 5
sl.5ice A111 I 1 141, IL*II III W5 Oxx I'5sflm1d3audL 53 71 3 5 33113M1II IA OL
uw~eiu,...,3)5.5 311.1 31.3 1. 31s. 3)1. 31s 53.315s51l.,.h. 13 5 3 1 13 5 3 1 5
du3anU41 II* 53la 53u"shbWve13 153 -2-W.. 15353"e"ianso"o s-eoSm

j1I11 I M i wmua ITITUJ
1'w, I'1r'I 1'If I 5.14. Ife. I few I --w I tfwI
EU * v 4.l145. 5ffrm ifew .1.1
W ~ I"LlljslwUUL LIMA Il 0.14A
1U. U L Itw" 113.1.1.313. LI U1
uUIA. L A
rfI I:31 I IeW fe e .144few f, fWl 5-
I 'I
'U
LTi1.LE
E~~1 L I1NM Ma
fmU lo fro1 11 1.1
few, few 511. 5.3 few
fin, #,U few Sow f
UJI 1.11feIU few fw U, 5.3 tJ,UX
l~plus! few U-fw11A U.X_~~~~~~~~~~~~~~~~~~o. U. ILI.
few'.11.3 W - 1'U~~~
fewl~l~U,I1Iew¶14. i.1 US I . seI|13.. 55.Sfew 5.1.l ' l U
If f e few U..A .j
I w-ISQ
fe w"f. I I.ew
.1 ~Imb
1,3.3) 1 11
E"II1
WII-IDWWU3 I. 1 1- 1 -
low.
#IUK 3a *Li11 1 I tI , 1 1 r61 1
UL"QKsSw I AI'M IL; I I' * IM* I * I IL.IW m. U it V s IK
SA l 31.1 .* s1 It i.s, IL, . . . 1-; .
W~a dflo I I I&I Im'l list.? 'MA I 11
6 t7 .tz I I .113. 1301.1 3-Il45.555. t I i 1- 13 -~ IP s I i.11 *s I
AALnta I I151. I I . IM.11"'UdoU 311.1 35.1 3.1 I.5 1 11.SI IOLS PLwfI1 5~15 1.3 .4 1 1 13
* 01 1 31 I I .l 1 31.1 I SI 1S5agte *$ 13I t ~ @ | w , s
.. . ..5.1
' u "I
a I nl ss .1 a. aIi s1,1
tt Se adl wlia l.| 4' '1 sf.la "5l .1 -| E
15131 IJ I I i|13i i 113I " 1 W 'I I o 1 - I - 31 n
I s I s I I I
i115. 351 ..t I I * 11u2.3s~l~u
MDF/W/52Page 120
LeI]
U
W
to
U
InufeU
I= Non-1M.*^t "1 ^
ho.
- Now11i
" X"910
1..1I
tIiM .a"Mr-'Uw
mbm ue1.
-l _ _

MDF/W/52Page 121
147. As regards international trade in logs, import tariffs are,perhaps, no longer a problem. On the other hand, export controls and/orthe prohibition of log exports from some of the producing areas, exportduties and various types of non-tariff measures, such as tacit importcontrols, or quotas, as well as stringent phyto-sanitary controls incertain import markets for logs have, in various contexts, been cited asmeasures hindering trade-expansion and -development and are seen in somecountries (including by Korea Rep.) as a problem in maintainingwood-industry production levels. Tariff-free quotas for certain woodsemi-manufactures negotiated, or unilaterally granted, up to pre-setceiling levels, are seen both as a welcome trade liberalization measure,and also as a measure introducing a degree of uncertainty for exportersin respect of the extent, and the lapse of time in a given quota period,in which they may benefit from more liberal access possibilities. Thisis a problem not only for exporters but also for the import trade, aproblem which has led to complaints about licence -allocations and-utilization procedures, for instance within the EEC.
148. One of the shortcomings for inter-country comparisions of summarydata on average tariff protection calculated for m.f.n. duties and (on amore substantive basis) actual tariff treatment, a problem perceived bysome of the major exporters of wood and wood products, is theincreasingly more limited geographical area-coverage of m.f.n. dutyconcessions. The US Tariff Commission Study, previously cited, notesthat in 1955 almost 90 per cent of all imports (not just the wood, cork,pulp sector) paid m.f.n. rates of duty, but that by 1970 that figure haddeclined to 75 per cent. As is generally known, the internationaltrading scene has much changed since the early 1970s, with the resultthat today a large part of international trade is subject topreferential conditions of access, either under the GSP or under variousfree-trade agreements or arrangements. Where.m.f.n. duties havesubsequently been reduced, or eliminated, which was the case in a numberof countries (for instance, in the Nordic countries, as can be seen fromTable V-A) the effect of tariff preferences on a country's own importshas, of course, been attenuated or eliminated. While this is not asubject for the present note, it is relevant to point out that, as shownin Table V-B, imports originating from m.f.n. sources often account foronly a limited percentage of all imports. The same is, however, oftentrue for imports from GSP sources, although such imports, in principle,benefit in most of the countries covered in Table V-B from import dutyexemption, or, in a few cases, from duty reduction.1 At the same time,it will be noted that, remaining m.f.n. duties notwithstanding, manycountries (for the EEC see also Table III-B) do import from outside therespective common market free-trade area, or the GSP beneficiary areas.
149. The question of preferential trade flows is not one limited onlyto the GSP, or to the European free-trade area agreements, but isrelevant also for trade between Australia and New Zealand and theSPARTECA countries, and, for trade flows among countries in South- andCentral America, for trade among developing countries in West Africa, in
IFor details of GSP treatment of tropical wood products cf.COM.TD/W/345 and Addenda. GSP facilities, and recent changes in Japan'sGSP are described in L/4531/Add.1O (page 6).

MDF/W/52Page 122
the ASEAN region and under such other arrangements as the GATT ProtocolRelating to Trade Negotiations Among Developing Countries and also forremaining Commonwealth Preferences, special area preferences and,perhaps, for trade among the CMEA countries and within the Arab CommonMarket region. While some of the participants in these regionalpreferential arrangements are among those with rich forest resources,actual trade flows in wood, wood products and pulp among these countriesare often quite limited, as indicated by Table III-B. Often this may bedue to the similarity, rather than complementarity, in resourceendowments. In other cases, other trade restraints may operate, ortariff preferences may be of a theoretical nature, rather than ofpractical significance since, sometimes, preferential tariff concessionsexchanged involve bindings at a ceiling level, set above the actuallyapplied, or applicable, duty rate. In other cases, preferentialarrangements may involve more than merely preferential duty ratereductions, entailing, for instance, inter-industry consultation andco-operation provisions between the different trading partners, orelaborate and sophisticated techniques (as within sectoral agreementsnegotiated earlier on in the LAFTA context) for determining at whichpreference level preferential trade flows will actually be generated.These provisions and facilities notwithstanding, trade development andpreferential trade expansion results are not always at a level expected,or desired, by the participants, partly so because industry interestsmay not always match with development planning-exercises and -projects.
150. While m.f.n. duties on trade in wood, wood products, cork andwoodpulp countries have been substantially reduced since the 1950s, oreven eliminated for some sub-categories of these products in thedeveloped areas, m.f.n. duties on the same categories of products inmany of the developing countries remain on the high side. Import dutieson wood in the rough, in some thirty selected African, Asian and SouthAmerican countries range from 5 per cent and 11 per cent to more than 40per cent respectively in Africa and South America and up to more than100 per cent in Asia; for wood semi-manufactures the range is from 5per cent and 14 per cent to more than 40 per cent and 80 per centrespectively in Africa and South America and from some 50 per cent tomore than 60 per cent in Asia. For wood manufactures (not includingfurniture) the range is from 5 per cent to more than 60 per cent inAfrica, from close to 30 per cent to more than 80 per cent in South
1A limited number of wood items are covered in the tariffconcession schedules of some of the participating countries.
2Most of the countries in the Arab Common Market region, which inrecent years had been a major importing region for wood products, aretraditionally among the low-duty countries, and few of these countriesare forestry products exporters, so that there is only limited practicalscope for tariff preferences. Other forms of trade controls in thesecountries may, however, be important.
3This is, for example, the case for some ASEAN concessions on woodproducts. However, under a recent ASEAN decision, joint-ventureprojects, involving participants from other ASEAN members, stand tobenefit from preferential treatment in each other's markets for woodproducts manufactured by these joint ventures, some of which are inexistence and are already among major wood-products producers, notablysome of the ASEAN joint ventures operating in Indonesia.

MDF/W/52Page 123
America and from some 50 per cent up to 125 per cent in Asia. Some ofthe lower import duties found in a number of African developingcountries must be supplemented, for purposes of practical comparison,with additional fiscal duties which may be equal to, or a multiple of,the import duty itself.
151. While import duties in many of the developing countries on wood andwood products are high, when compared with prevailing duty rates indeveloped countries, the rates applicable in developing countries onwood and wood products are generally not very different from thoseapplicable in the countries concerned in regard of most other products -except imports of certain necessary food items and of goods for specificdevelopment purposes. Where wood and wood products are required forspecific development projects they are often imported on governmentaccount, or benefit from specific duty exemptions. Import dutytreatment of wood and wood products in most of the developing countriesshould also be seen in the context of their revenue needs anddevelopment policy objectives. All this does not imply thatpossibilities for reducing and, where possible, eliminating tariffbarriers should not be actively explored, especially so as many of thehigh duty rates are probably "redundant", and not conducive to thedevelopment of viable, efficient wood-processing industries in thedifferent developing regions.
152. Several of the major wood producers and exporters among thedeveloping countries are levying export duties or taxes on exports oflogs. Some of the export duties and taxes have a long history, in thesense that they do go back to pre-independence days. The primaryobjective of these duties or taxes was the collection of revenue. Bothimport and export taxes in developing countries can, and often do, makean important contribution to overall State revenue receipts, given therelatively undeveloped nature of other forms of revenue collection,while in most developed country contexts varied fiscal- instrumentsand -mechanisms are available to serve that purpose.
153. A more recent development is the use of export duties and taxes forwood industry development purposes. Under these schemes, operated insome South-East Asian countries, but also in West Africa, export dutiesand taxes are differentiated according to stages of processing, withduties on exports of logs being highest, with those on sawn-wood andsimilar products set at a lower rate, with the lowest - or a zero - rateapplying to plywood, or other more highly manufactured wood items. Thisactive encouragement of manufactured wood exports is frequentlysupplemented by special incentives and regulations which favour domesticwood processing activities. Among measures in use in developing
1lInformation on duty rates applicable to imports of unmanufacturedwood, and cork, wood and cork semi-manufactures, manufactured articlesof wood and cork and of woodpulp, by duty-rate categories, wascirculated to interested contracting parties in the GATT LDC/TS documentseries for a large number of individual developing countries. For arecent summary of tariff information on wood and wood products for anumber of developing countries, cf. also UNIDO/IS.396 - op. cit.
2The provision of such incentives is, however, not necessarilylimited to developing countries only.

MDF/W/52Page 124
countries are regulations which limit the granting of logging concessionsto enterprises which guarantee to set up saw- or ply-mills, to process aprogressively increasing share of the log harvest into sawn-wood andplywood. To the extent that the firms are also exporters, log exportsmay be subject to a form of mixing regulation, linking the volume ofpermitted log exports to the volume of sawn-wood or plywood exports.
154. The question of the "optimum mix" of these different policymeasures, depending on the exact nature of the objectives pursued, hasprompted much expert advice to governments, including advice frominternational agencies and consultants' services, which explore, interalia, questions relating to tax- and export-strategies. While thesemeasures and policies have, undoubtedly, played a role in the rapiddevelopment in recent years of exports of sawn-wood and of plywood frompart of the developing regions, and while these policies have someinfluence on the level of employment opportunities in both exporting andimporting countries, the exact foreign exchange earnings impact may beless certain to assess. This is partly so because in the past fewyears, when the wood industry almost everywhere has suffered fromrecessionary forces, export prices of logs have, on the whole, held upbetter than, say, export prices of tropical sawn-wood. (Lowered pricesfor plywood imports have, however, exerted downward pressures on logexport prices and - in Japan - prices have also been affected byincreased import competition between softwood and hardwood logs.)
155. With respect to remaining import duties on the products covered bythis note, countries having major export interests have repeatedly madethe point that, much as they appreciated the progress made in past GATTnegotiations in reducing many m.f.n. import duties, to what may appearto be, at first sight, relatively low duty rates, such duties couldnevertheless still be serious barriers to trade expansion. Given thestructure of the market for forestry- and wood-products, pricedifferences of only a few percentage points, occasioned by the continuedexistence of import duties, say on sawn-wood, could make all thedifference between success or failure in entering a given import market,or in expanding market shares in competition with preferentialsuppliers. Relatively low nominal duties, even if applied at a uniformrate (say, logs and sawn-wood, both dutiable at 6 per cent ad valorem),could give rise to high levels of effective protection for thesaw-milling operations, close to 20 percentage points, if the 6 per centduty rate for the intermediate product is applied to the value-addedprice element (say, about 27-30 per cent value-added for saw-milling).Moreover, duty rates on raw materials are often zero, while m.f.n.duties on intermediate products are, more often than not, positive,frequently rising to higher and higher levels for each successiveprocessing stage ?utput, the maximum duty level being applicable to thefinished product. Successive duty-rate cutting, as a result of oftenselective reductions of duty rates, effected in multilateral tariffnegotiations, has somewhat reduced the problem of tariff escalation.For the wood sector it will, for instance, be seen from Table V-A that,in some of the major import markets, tariff escalation does not carrythrough consistently from the lowest to the highest stages of
1The 6 per cent duty on both logs and sawn-wood is hypothetical.A more likely, real world, combination is a zero duty on logs withpositive m.f.n. duty rates for sawn-wood of the order of close to 4 percent, 6 per cent or 10 per cent, i.e., giving, at the higher nominalrates, ceteris paribus, still higher effective protection to sew-millingoperations.

MDF/W/52Page 125
processing. Some potentially labour-intensive wood products, forexample, wooden foundry mouldings, wooden household utensils, spools-,bobbins- for textile machinery, even wooden joinery etc., may be subjectto lower m.f.n. duties than certain in*.. mediate wood products (say,fibre-board, plywood - in some cases, also wooden beadings, mouldings -the latter when compared with sawn-, planed-wood etc.).
156. Tariff escalation, as contained in the original tariff schedules,has also lost some of its practical significance as a.result of tariffexemption for imports from designated sources, in the context of thetariff preferences granted virtually across the board under the GSP andunder certain regional common market and free-trade area arrangements.With import duties eliminated for all, or for a wide range of, products,the question of effective protection provided through import tariffs hasdisappeared for preference beneficiary countries in those markets wherethey receive across-the-board preferences. The problem may subsist,however, in respect of other markets in which positive m.f.n. dutiesremain in force. Evidently, the question is of greatest importance inrespect of m.f.n. duty-protected import markets which are presentlylarge importers, or could potentially be large import markets. Thus,though diminished in importance for some countries, the question oftariff escalation and potentially high effective protection levels isstill oneIo5 the issues confronting the international tradingcommunity ' and, of course, individual producers and exporters. Suchtariff escalation, in practice, as notified for instance by Canada, is,apparently, discouraging many of the smaller Canadian wood-processingfirms from trying to enter foreign markets. The same effect has beennoticed in other producing areas.
157. In all cases where import duties are applicable, the question ofactual or potential differentiation in import treatment as betweendifferent woods, and the products made thereof, may assume considerableimportance. The same is true for differentiation in import treatmentas regards non-tariff measures, applied differently as between wood andwood products derived from different species of trees. In the case ofnon-tariff measures, such differentiation does, for instance, occur (andmay be justified) in relation to the application of certainphyto-sanitary measures, and in relation to product classification andacceptance3under prescribed product-characteristic, or performance-standards.
Tariff escalation is a virtually built-in feature of all CCCN-based tariff schedules, since the CCCN-structure can be traced back tothe 1931/1937 League of Nations Draft Customs Nomenclature (DCN). Oneof the four guiding principles for the establishment of the DCN was thatit should "take into account the quantity of work embodied in the goods,starting with raw materials, for arriving at semi-manufactures andfinished products" with the purpose, as evidenced by the DCN draftinghistory, of permitting governments to determine the degree of protectionnecessary for each stage of processing activity. (Cf. also GATTdocument TAR/W/18.) The question of tariff escalation on wood and wood
.1/.

MDF/W/52Page 126
Footnote (cont'd)
products is one of the subjects dealt with in an UNCTAD study preparedfor UNIDO - document UNIDO/IS/396, op.cit. A GATT secretariat noterelating to a possibly related subject (import elasticities and tariffescalation) was circulated in document MDF/W/5. In the context of theWorking Party's deliberations, a submission by Canada (cf. MDF/W/3, page12) suggests that ascending tariff position numbers, which in the CCCNsystem would indicate successively higher stages of processing, maysometimes be misleading, in that positions which are several positionnumbers apart, and dutiable at significantly different rates (cf. TableV A), may actually be fairly similar (such as "rough" lumber, under CCCNposition 44.05, and "dressed or worked" lumber, which falls underposition 44.13), with little extra value added, and consequentlysignificant tariff escalation, leading to significantly different tradeflow patterns for 44.05 and 44.13 items in several key markets.
2The effective protection concept, first raised in the mid-1950s,attracted much attention in the 1960s and early 1970s (cf. for instance,"Effective Tariff Protection", Geneva 1971, containing papers presentedto, and a record of the proceedings of, the first internationalconference on that subject, held in December 1970, co-sponsored by theGATT and the (Geneva) Graduate Institute of International Studies).Partly for the reasons cited in the paragraphs above, and partly becauseof formidable practical difficulties in achieving internationalconsensus on the relative importance and treatment of various real-lifeproblems which should be incorporated in a valid general equilibriummodel (with forward and backward linkages, which might offset theprotective effect of positive duties, to the extent of, perhaps, givingnegative effective protection results even with positive import duties),effective protection theory, although of a fairly high level ofrefinement, has not found widespread use, or general acceptance, foragreed negotiating objectives. A recent contribution to the discussionof the effective protection concept, and a refinement thereof, with datarelating, inter alia, to wood products, paper and furniture, can befound in "The Structure of Tariff Protection: Effects of ForeignTariffs and Existing NTBs", by V. Deardorf and R.M. Stern, in The Reviewof Economics and Statistics, Vol.LXVII, No.4, November 1985. As far asthe question of effective protection on wood and wood products isconcerned, reference may also be made to GATT document MTN/SEC/W/2/Add.1,of March 1976. Various aspects of the use of export taxes and importduties, and the effective protection they are providing in certainspecific instances involving wood and wood semi-manufactures, are thesubject of examination in a (broad-based) FAO-sponsored consultancyproject.
3As an example one might cite the testing, shortly to beundertaken, or to be completed, by Japan, for acceptance of lodgepoleand ponderosa pine as materials to be used for structural laminatedlumber under the JAS Standard. (Ref. L/5858 of 3 Sept. 1985.)

MDF/W/52Page 127
158. Given the great variety of trees growing in the world (severalthousand species, at least; cf. Introduction and Section A), thereexists, theoretically, considerable scope for the reflection of thisspecies-diversity in the tariff schedules of the different producing-,exporting- and importing-countries. In practice, distinction bytree-species and wood products thereof in the tariff schedules of mostof the countries covered by this note is fairly limited. Suchdifferentiation as does exist may, however, have important effects,depending on how differentiation in classification carries through tothe tariff treatment stage, and has been, and still is, the subject ofdiscussion and/or negotiations between interested countries.
159. The original Brussel Tariff Nomenclature on which the CustomsCooperation Council Nomenclature currently in force is based (150countries use the CCCN, only fourteen do not), does not specificallydistinguish, for customs purposes, between different wood varieties. (Adistinction is, however, sometimes carried, for statistical purposes,for linking up with the Standard International Trade Classification/SITC- categories between coniferous wood and non-coniferous wood.) All ofthe distinctions made in the original BTN/CCCN classification arerelated to sequential processing stages of wood and/or related todifferent uses of wood. As it is a fact that certain species of woodare used predominantly, or even exclusively, in certain applications anduses, the CCCN - even without mentioning specific wood species and theproducts thereof - thus does contain a degree of implicit speciesdistinction. The new Harmonized System, which has recently beenelaborated by the Customs Cooperation Council for adoption by membercountries for tariff schedule- and statistical purposes, does, however,contain certain species distinctions by singling out various woodspecies under a number of re-defined CCCN positions, namely: new 44.03(previously 44.03-04), 44.07 and 44.08 (formerly ex 44.05, ex-13, ex-28)and 44.12 (ex 44.15). Singled out are a number of tropical woods(including certain grouped wood varieties) and, among non-tropicalwoods: oak, beech, other non-coniferous and coniferous woods.
160. In the GATT itself, in follow-up of the 1963 MinisterialDeclaration and the Action Programme, then adopted, and, thereafter, inthe context of the Kennedy Round, various tropical wood varieties werenotified by interested tropical wood exporting countries for priorityaction in any duty reduction programmes. Requests for this type ofaction, as it related to tropical woods, were generally sympatheticallyreceived by developed countries and - where such action wasadministratively feasible - did lead to import duty dismantlement formany of the woods for which action was requested. However, as, at thetime, few developing countries had built up significant export capacityof processed wood items, the liberalization measures, as requested,
IDetails of the specifically designated tropical woods arecontained in GATT document COM/TD/W/345/Add.1, of 22 September 1983.Given the ongoing preoccupation with trade-development possibilities fortropical wood and wood products in the GATT, FAO, UNCTAD, ITC, ITTO andother bodies - many of which are concerned with the opening up of newmarket outlets for secondary species of tropical woods - the question ofthe advisability, or otherwise, of a differentiation between differentwoods in tariff schedules is, potentially, a vast subject.

MDF/W/52Page 128
affected, by necessity, primarily unprocessed wood, increasing thereby,inadvertently, and, as it turned out, temporarily, the "effectiveprotection" for certain wood products. To the extent that virtually allwoods (with some important exceptions in some markets) were subsequentlycovered by the broader-based GSP schemes, the earlier distinctionbetween designated tropical woods and other woods from GSP originsdiminished and virtually disappeared. Consequently, in the tariffschedules of most of the developed countries, and in the accompanyingadministrative regulations, distinctions between different tropicalwoods (with exceptions as noted) are now of little importance, ifmaintained at all. Distinctions between (mainly) non-tropical woodvarieties and the duty rates applicable to products made thereof, can,however, be found in the tariff schedules of Australia, Canada, Hungary,Japan (recently attenuated), New Zealand, Poland, Republic of SouthAfrica, Switzerland and, to a pertain extent (for instance, on plywoodvarieties), the United States.
161. The situation for developing countries' tariff schedules is thatmost countries do not make a distinction that is significant in terms ofimport duty rates applicable to different woods, and wood productsderived therefrom. Developing countries which do make detaileddistinctions in their tariff schedules according to tree species andsub-species often reflect details of their export tariff structure intheir import tariff. As different tree species are not all benefitingfrom equally high levels of export demand, export taxes are set atdifferent rates for different log- and wood-species. On the import sidethey are, however, generally subject to a common, standard duty rate,which, given the production and demand structure is, moreover, unlikelyto have an effect on import patterns and demand.
162. Preferential treatment, or its opposite, is not necessarilycircumscribed by preferential treaty provisions. Since it is a factthat certain tree varieties grow only in certain regions of the world,the out-specification in the tariff (or in non-tariff measure
As Switzerland uses exclusively specific duty rates for all woodsand wood products, differentiation by wood species would be required ifall woods were to be subject to the same ad valorem incidence rate(since different woods have different densities, or weight). Inpractice, rate differentiation by species exists, as indicated byexisting duty rate ranges in given tariff headings in Table V-A. Someof the duty rate distinctions by species in the Canadian, Australian,New Zealand and, to a certain extent, South African tariff schedulesare, presumably, intended to give effect to preferences under remainingCommonwealth Preferences, or NAFTA, or SPARTECA, as the case may be.
2Developing countries covered by this note, which do makedistinctions by species, and which are also duty-rate significant, are:Argentina, Brazil, Haiti, Israel, Korea Republic, Pakistan, Spain, SriLanka, Uruguay and, to some extent, Yugoslavia.

MDF/W/52Page 129
regulations) of a given wood, known to grow only in a given area, orareas, amounts, in practice, to an area-preference - at least for theprimary wood items - every if the applicable (high or low) duty rate iscouched in m.f.n. terms.
163. While distinctions in import duty treatment for logs are rare indeveloped countries, since logs (particularly saw and veneer logs) areimport-duty free in most developed countries (while export duties onlogs, differentiated by species, are not uncommon in developingcountries, perhaps for the reasons already cited), differentiation inimport treatment of such items as sawn-wood may be of real significance,the maintenance of such restrictions reflecting probably true concern ofthe importing countries as to the effect which further reduction and/orremoval of import duties might have on domestic producers, or onsuppliers benefiting from trade preferences - unless, of course, failureto reduce duty levels observed at the end of a negotiating round shouldhave been due to a real, or perceived, lack of reciprocity in tariffconcessions received by the country from which tariff concessions onwood and wood products were requested.
164. Tariff schedules may also have their technical intricacies. Forinstance, the reference in both the US and Canadian tariff schedules toSpanish cedar relates neither to the true cedar variety nor to Spain,but to a mahogany-like wood (species cedrella), growing south of the USborder, which is appreciated, inter alia, for the fabrication of cigarboxes. Thuya, juniper and cypress are also commonly referred to in theUnited States as cedar. Trees of the real oak species grow virtuallynowhere in the tropics; reference to tropical oak in one of theEuropean tariff schedules examined for this note is, therefore,ambiguous. Trade designations such as African walnut may have no linkwhatsoever to the walnut (juglans) species. For Japan, someoneconsulting the tariff schedule may still be bewildered by the truemeaning of tariff provisions, or the scope of tariff concessions made.For example, to understand the significance of tariff concessions madeby Japan on coniferous lumber, a knowledge is required both of theconiferous varieties included in the botanical species pinus, abies,
In this connection, geo-tectonic movements, eons ago, resulting inthe similarity of certain forest-vegetation in China, Japan and adjacentareas and the Americas (with some of the species found in these regionsgrowing nowhere else naturally), may still be of some relevance. Forexample, the one and only exception in Japan's tariff schedule of a logstill bearing m.f.n. import duty concerns a tree variety - Kiri - nativeto Japan, but also growing naturally in China, Canada and the US. Thisfast-growing tree, a member of the Pawlownia family, is planted in Japanmainly for its ornamental value (its leaves, flowers and stem form oneof the two imperial crests of Japan (the other one is based on thechrysanthemum), but may also be grown for wood, as in Brazil, where Kiriplantations were established by Japanese settlers. GSP benefitsnotwithstanding, the main suppliers to Japan (m.f.n. duty on Kiri logsis 2.5 per cent) are Canada and the United States. Import duties onwood products made from Kiri have also proved resistant to change, but,compared with some other wood products, are relatively low.

MDF/W/52Page 130
picea and larix - and, by implication, also of the species that are notincluded in the species sequoia, podocarpus, araucaria (the latter twoof importance in southern-Hemisphere forests) taxodium, juniperus,cupressus and pseudotsuga. Once such an understanding is achieved, therationale has to be sought for treating imports of given woodsdifferently, depending on size specifications - which, in the mind ofthe reader, could then be crosslinked to whether or not the wood inquestion has been kiln-dried. Certain technical reasons may well exist,in the sense that small section lumber, properly kiln-dried, generallydoes keep all its technical strength characteristics, while kiln-driedlarger section lumber may not (with the emphasis on may, depending onthe way drying is done) retain all its initial strength characteristics.If this were only a matter of tariff classification, it would not beimportant, but, as the differences in tariff classification do entaildifferences in tariff treatment, this is a matter of concern to forestresource owners who possess timber resources which are more dependent onkiln-drying before shipment anq use than producers possessing stands ofcertain other timber varieties . One possible assumption might be thatthese are merely technical matters, occurring in tariff schedules and inthe non-tariff measure regulations coincidentally, or an account of apossible lack of technical information at the time the tariff orregulation was elaborated. In some cases this might well be so. Inother cases such technical distinctions are there for a purpose and mayprove to be true stumbling blocks for tariff dismantlement and tradeliberalization.
165. Progress in tariff dismantlement notwithstanding, it may, forexample, be no comfort for North American producers of spruce, pine andfir to know that dressed, green hemlock and douglas-"fir" (sometimesalso, likewise incorrectly, referred to as Douglas spruce, -pine,-hemlock; botanically it is a pseudotsuga) are free of import duty inJapan, while their lumber varieties (dressed and kiln-dried) remainsubject to an import duty of 10 per cent, thus putting spruce, pine andfir, which are used in the same end-market (mainly construction), at acompetitive disadvantage not only vis-a-vis the equivalent Japaneseproduct, but also vis-a-vis exporters (including those from NorthAmerica) of hemlock and douglas-fir. At this point it will be generallyrealized that the subject is an extremely complex one, and that thethreshold to the world of non-tariff measures or barriers may have beencrossed.
1Different tree species have different moisture contents whenprocessed, (influenced also by site conditions and, inter alia, theseason of felling and logging operations) and may hence requiredifferent lengths of time for air-drying, so that the latter option maynot always be practical. Apart from technical reasons, there may besome underlying economic rationale for differentiation, namely the factthat kiln-drying is very energy-intensive. In saw-mills that kiln-dry,normally 60 - 85 per cent of total thermal energy used is accounted forby kiln-drying. It is, however, also relevant to note that saw-millresidues could be used for generating the heat and/or energy forkiln-drying. Part of the question may thus hinge not only on therelative cost of equipment and energy inputs (which may vary widely overtime and/or mill location), but also on the possible alternative uses ofsaw-mill residues at the given location.

MDF/W/52Page 131
166. While several of the references made above relate to Japan and,mainly, to North American export interests, the subject of technical standardsand problems caused thereby, or, conversely, the trade opportunities they mayopen for other suppliers, is a subject of universal relevance. French saw-millers complain, for instance, that current French building standardsvirtually preclude the use of boards containing knots in the type of roof-truss construction (also known as "American") that has been common since the1960s. French saw-millers point out that many of the French mountain forestsproduce trees that cannot be free of knots and that such wood was successfullyused in ages past for (admittedly heavier-timbered post and beam) roofconstruction. Construction industry and wood processing Industry users inFrance point out that much of the wood available from domestic sources doesnot correspond to their requirements under the current changed construction-and wood-industry-use conditions , thus obliging them to rely on imports.
167. Not only new regulations and new building techniques may be seen as acause of problems - or of opportunities - for trade, depending on theinterests involved. In Japan, for instance, the use of "two-by-fours"'(inches; nominally 5.08 x 10.16 cm. cross-section) lumber, was approved forresidential construction only a decade ago. This most common lumber-size forresidential construction in North America, in a recent year was used in nodmore than 2 per cent of single family house construction projects in Japanand only 12 per cent of Japan's housing can be classified as "prefabricated,modular or manufactured". The favourite construction method in Japancontinues to be the traditional post-and-beam method. Under this system acentral pillar, instead of exterior walls, supports the weight of thestructure with overhead beams. This permits (in addition to at least one,traditional "clay wall") lightweight, airy partition walls, which give, amongother things, an admirable flexibility to Japanese residences, but which mayalso heighten vulnerability to the spread of fire, thus prompting, perhaps,another wood-use restrictive regulation. Possibly, though not necessarily,linked both to traditional construction design and as an anti-fire measure,are various building codes which limit the market for wooden buildings torelatively low density units, i.e., precluding the construction of three- orfour-storey apartment buildings from wood. (At about the time of the May 1986Tokyo Summit meeting - a jointly-sponsored (by United States and Japaneseindustries and authorities) three-storey wooden demonstration house,especially anti-fire and anti-seism reinforced, "Summit House '86" wasinaugurated in Tokyo.)
'Association: "France - Promobois - Construction", Figaro,16 Sept. 1983 and "L'Agriculteur du Sud-Est", op. cit.
2Other typical lumber sizes are 2 x 10 for floor joists and also2 x 6 (also 2 x 8) for outer walls in (the increasing number of) caseswhere thicker wall insulation material is to be installed.
2'Close to one million dwellings are constructed per year in Japan,
slightly less than one-half are wooden constructions, and 4-5 per centof constructions out of the latter figure (according to some observers)are timber-frame (cf. also end of footnote 1 starting on page 103).
Ref: Wall Street Journal, 16 Feb. 1983 - ("Prefabricated" in the"Western" sense. In fact, a large - probably the major - part of lumber goinginto traditional, residential construction in Japan is "pre-shaped" byprocessors and in carpenters' workshops.)

MDF/W/52Page 132
168. The Japanese post-and-beam construction method has a tradition of manycenturies, is scientifically proven to have good anti-tremor ductility (goodtremor-energy dissipation and good overall stability and recovery - part ofit due to the fact that most traditional houses rest loosely on foundationstones; there are, on average, three to four noticeable seismic tremors aday), but it is also costly. As many as, or even more than, 100 sizes oflumber may be needed to build a house by this method. (Lumber sizes used intraditional residential construction have been - for more than 300 years -standardized to an unusual, and almost nation-wide degree, involving, interalia, very elaborate, ingenious, but not necessarily maximum-strength, grooveand 'pin' joinery. For a real eye-opener on this subject, essential in theauthor's view for developing wood marketing in Japan, see "The JapaneseHouse" by H. Engel - published by Ch.E. Tuttle Co., Rutland Vt. and Tokyo;11th printing 1983.) As a consequence, Japanese wood-users (almost all ofthem professionals; wood-working "do-it-yourselvers" are rare in Japan) areunusually concerned with obtaining lumber cut to exact sizes and havingparticularly well defined processing characteristics (Japanese craftsmen havedeveloped their very special methods and tools over the ages for fine,precision wood-working techniques and tools, which -ire .Lot without admirersin other countries). This makes Japanese buyers of wood and wot4 productsexacting clients, paying attention also to the wood's overall aestheticaspects (as for many other products), not only for eventually to oe exposed,varnished surfaces (with, reportedly, a preference for "white woods") andinsistence on particularly close size tolerances, specific year-ringcharacteristics, the latter perhaps specified by reference to height abovesea level at which given tree species grew, etc. Such specifications, in theeyes of certain producer/exporters, may seem to be still further complicated,by the insistence of buyers on metric specifications, obligatory in Japan,[but difficult to follow, even for Japanese builders, accustomed to measuringand lay-out in terms of "ken" grids and tatami (straw mat) multiples; theTokyo Standard (but now often deviated from), tatami is about 0.90 x 1.80metres], which many North American producers, geared primarily to supplyingthe vast domestic market (particularly United States producers, wheremetrication is progressing only slowly) may not always be in a position tosupply immediately. Japanese market requirements as regards size andthickness specifications for plywood sheets have, in the past, also causedsome difficulties for plywood exports from some of the developing areas, 1whose export production was geared to United States market specifications.Suppliers of wood products which are new to the Japanese market may,likewise, run up against buyers' traditional views and concepts, until it isrealized that, for instance, rapid tree growth - as for radiata pine -does not mean that the wood from species with rapid growth may not have goodtechnical qualities. For certain woods (including oak) rapid early growthis, in fact, a prerequisite for high mechanical strength and resistance.(But then, sub-species and site conditions may make great differences;unlike most foreign oak wood, Japanese oak wood does not have a reputation ofgreat durability.) For certain uses, easy processing characteristics may besought, as might be associated with wood from certain slow growing treevarieties. The buyer's judgement of the technical characteristics of agiven foreign wood is often fashioned by experience with using seeminglysimilar domestic woods. In Japan some of the domestic softwoods have verygood technical characteristics, but perhaps as much as half of the domestic
1R.A. Sedjo, in "United States-Japan Solidwood Trade", op. cit. -notes that "In a real sense the Japanese have a comparative advantage inwood processing as the result of their unique standards andrequirements". - Many of the exporters have by now establishedply-mills capable of producing sheet-sizes in demand in Japan - andplywood imports into Japan increased significantly in the recent past.

MDF/W/52Page 133
coniferous tree species produce wood with relatively low technical strengthcharacteristics. In the circumstances, it is perhaps not surprising, givenalso the easy availability of high-grade "South-Sea" hardwoods for plywoodproduction, that coniferous-species plywood found approval and acceptance asa building material in Japan only some years ago, by which time it wasrealized, however, that certain coniferous plywoods are not only excellentconstruction materials generally, but are probably unsurpassed in some uses,for instance as concrete-casing.
169. The meeting of different technical standards, evolved in differentnational contexts, on the international market and in the negotiating arena,is not without problems. A given tropcial wood which may have excellentstrength and performance characteristics in humid tropical climates oftendoes not perform well in temperate-zone conditions and, conversely, somewidely-used temperate-zone woods would fare badly, performance-wise, werethey to be employed in tropical climates, or in such constantly humidclimates as are found in large parts of Japan. (Another factor to be takeninto account for Japan is that parts of many houses remain unheated inwinter. Inside-to-outside thermal stresses on wooden construction may thusbe reduced.) Countries relying largely on traditional mortise and tenon woodjoinery methods have wood requirements that are different from thosecountries where wood to be used for "joinery" work is based largely on theuse of various forms of metallic industrial fasteners, dowels and glue.Moreover, one thing leads to another. Large-scale recourse to nailedtimber-frame construction also implies, using current construction methods,large needs for wood-based panels for joining studs, joists, rafters, etc.into a shell of sufficient rigidity. A wood species, or a wood product,evaluated by laboratory tests, and found adequate in one set of circumstances,may be found wanting in the context of other circumstances, in anothercountry. The problem becomes particularly acute when introducing new woodvarieties or products to the international market.
170. Increasing reliance on exporting woods of secondary species andproducts made thereof is a virtual necessity for most of the tropicalwood- producing countries, for the reason that most tropical forests arecomposed of a large variety of wood species and that some of thevarieties better known in the international market are nearingexhaustion. As new woods arrive on the market, tropical wood producers- the problem is, however, not entirely limited to tropical woodproducts - may try to assure potential clients of the qualities of theirrespective products, by categorizing them according to specifiedtechnical performance characteristics, or standards. However, as woodis essentially a composite product of various carbon polymers withdifferent and complex molecular interlinking ("elongated cells wrappedin helical bands of cellulose and encased in lignin sheaths"), differentfrom species to species, each wood has its own combination of useful andof less desirable characteristics. The question thus arises whichcombination of characteristics should be specified for a given woodproduct. This, evidently, depends on the intended end-use and thepossible end-use depends very much on the market characteristics and the
Some woods with high silica contents quickly dull saw blades, chippers,knives. Saw- and sanding-dust of certain woods causes skin rashes, or isoutright toxic. Some woods are, perhaps strong, but not durable and do notreadily absorb wood preserving materials. Some are difficult to glue, tonail, to polish or to paint, some have poor dimensional stability, etc.,other woods may have exactly opposite characteristics, singly, or in variouscombinations; cf. also footnote 2 to paragraph 88.

MDF/W/52Page 134
domestic technical standards, or codes, for the use of wood products in agiven market. This poses a real dilemma. As technical standards differsubstantially from import market to import market, and even within a givenregional or national market (with standards often set by regionalprofessional associations or under prefectural- or even local building codes)a given product specification, valid for one market, may make the productrelatively unattractive in another market. The establishment of, and gradingto, relatively low performance requirements, that may have been drawn up bythe importing country, is not a solution either. Countries which have atradition of producing and exporting high performance products may feel (thisis not a hypothetical example) that a lower standard may induce competitorsto undercut their position in a given market by supplying a lower-standard,lower-cost product.. This set of problems has beer. recognized and muchinternational effort is going into trying to resolve these, through workbeing undertaken on the part of professional- and wood-industry associations,government departments concerned, the FAO, UN regional Commissions (notablyESCAP, as far as the developing regions are concerned), and. other inter-national bodies. Mutually beneficial agreements are possible, as -presumably - the agreed North American technical standard for plywood forexports to Europe. Much work remains to be done, however, to overcome someof the real problems encountered with respect to technical standards.
171. In the context of GATT tariff negotiations, problems in thetechnical standards area concerning wood and products surfaced in theform of several notifications submitted for the Inventory on Non-TariffMeasures, and also, inter alia, in regard to the respective US andCanadian technical standards for softwood-plywood (with some of thetariff concessions on plywood exchanged between these two countries inthe Tokyo Round being conditional, and the issues not yet resolved:cf. footnote to paragraph 145). In this connection it may, however, bepointed out that intended modifications of technical standards, or theintroduction of new technical standards, are to be notified by thethirty-seven signatory countries, and the2EEC, of the MTN (Tokyo Round)Agreement on Technical Barriers to Trade. Consultation facilities withrespect to envisaged changes in technical standards exist, both at the GATTand at notified national consultation points. It is, however, not only newstandards which may create problems for interested exporters and importers,but also existing standards and the way in which these are administered,providing in some instances for time-consuming and costly re-inspection, forinstance on softwood3plywood, lumber etc. and, as a related issue, difficultcustoms formalities.
172. Closely linked to the question of technical standards is that of phyto-sanitary standards and regulations on imports and exports of logs, wood, woodproducts and wooden packing materials. Together with technical standard
IFor a summary description of construction regulations, codes ofpractice etc., attention is invited to a United Nations publication (SalesNo. E.85.11.E.14) "Building Regulations in ECE Countries", New York, 1985.At the national level in Europe there is now a growing tendency to simplifyand to weed out unnecessarily complex codes which act as a brake onconstruction and, hence, economic activity generally.
2Notifications are being kept on file in the secretariat and can be madeavailable to signatories of the Agreement, on request. A reference listingof the standards notifications received so far (only a few notificationsrelate specifically to forest products) is contained in GATT documentTBT/W/68 and revisions.
As regards the latter measure, cf. also GATT NTM Inventory,No. II,0.21

MDF/W/52Page 135
notifications (many of which related to various building-coderegulations), notifications concerning phytosanitary measures were thosemost often cited as obstacles to trade in the submissions for the GATTWon-Tariff Measure Inventory. Many of these earlier notifications havebeen resolved in bilateral consultations, since many of the specificproblems notified involved country-specific issues and were thusamenable to bilateral discussion, negotiation and solution. Some of theissues - Presumably settled - may, and sometimes do, after a while, comeback to life. The question of the nature and extent of phytosanitaryregulations required for protecting flora, fauna and health (covered byGATT Article XX(b)), in a way which does not unduly affect trade flows,is a real one. Within the present century the major North Americanchestnut variety was wiped out by an insect pest, European elm standsare being preserved with difficulty by the introduction of a number ofdisease-resistant hybrid species, Pinus strobus (Weymouth Pine),re-transplanted from North America to Europe, has proved to beparticularly vulnerable to disease in certain areas (notably in theUnited Kingdom). Several of the circum-Mediterranean coniferousvarieties are not only threatened by recurring forest fires but also byplant diseases; some of the eucalyptus plantations in the IberianPeninsula are also vulnerable to plant disease etc. etc. In thecircumstances, it is not surprising that fairly severe phytosanitaryregulations are being applied in many countries, limiting notably theimportation of wood that is not debarked, and limiting also the numberof ports or points of entry for wood and products, so as to ensureproper inspection, fumigation if necessary (certain wood-destroyinginsect larvae have very long latency periods from incubation to eclosion,while others have a very rapid development cycle). Given the need forhaving appropriate phytosanitary regulations, there is little else thatcan be said in this note, except echoing the hope, voiced in variousGATT contexts, that regulations will be applied inIsuch a manner as notto affect trade more than is absolutely necessary.
173. Import controls, import licensing and quantitative restrictions areamong the other major non-tariff measures often cited as affecting tradein wood and wood products. Most of these import controls and restric-tions are not specific to the wood sector but, generally, affect a widerange of products - perhaps most products - for example, those which arepart of import control measures applied for protecting the balance-of-payments, as is the case in many developing countries. In other cases,import controls, even import prohibitions, particularly in non-GATTcountries, are applicable to all imports, while each actual import istreated as an administrative exception. Some sources report, forinstance, that imports of wood into certain countries in the Middle Eastare prohibited. Yet, export statistics of their trade partners show thatthese countries are among major importers of wood products. In certaincases, a large part of all imports of wood and wood-products is accountedfor by government purchases; this is true particularly in a number ofdeveloping countries, when implementing development plan projects. Thereare some cases where large-scale transactions involving lumber, and morerecently also plywood, are effected under counter-trade compensationarrangements. Imports of wood and wood products originating in some ofthe CMEA countries into some of the Western European countries may besubject to import quota. Exports from some of the CMEA countries, toWestern European destinations, of logs and wood products and fibre-board
1In this connection attention is invited to a summary ofdiscussions relating to this subject, contained in document AG/W/13.

MDF/W/52Page 136
may be subject to voluntary export restraints and/or price undertakings.Some other suppliers of fibre-board to developed country destinationshave also undertaken minimum export price commitments, sometimes inreturn for cessation of anti-dumping procedures. Certain CCCNChapter 47 products - among others - have been, and perhaps are, thesubject of surveillance measures and regulatory prescriptions. Certainlog export controls in North America, agreed upon some time in the past,seem to have had as their purpose not only the ensuring of adequate andreasonably priced domestic supplies of logs and building materials madetherefrom, but also the protection of certain foreign forest-producerinterests. Other controls instituted at the State or Provincial-levelmay have been prompted primarily with a view to fostering localvalue-added industries.
174. Periodic consultations regarding production-levels, exports andexport prices are held between various producer-, industry- and tradeassociations in producing-, exporting- and importing countries. Thequestion of trade development and trade development planning forforestry products may also be the subject of consultation betyjeenindustry associations, perhaps with government participation. Wheretariff quota facilities exist, such as in the EEC, for certain woodproducts, additional customs formalities are an inevitable by-productfor implementing the tariff quota. In this connection, it has beenpointed out that the opening of annual quotas tends to bunch importsinto the first part of the year, forcing importers to keep largeinventories and exporters to skew their production operations.Moreover, the quotas may be the subject of consultations between theadministrations concerned and interested industries. Items subject toGSP quota ceilings also imply additional administrative controls forimports under quota. Quantitative import restrictions are imposedsometimes to limit imports so as to ensure domestic offtake ofabnormally high domestic production volumes, such as might occur in thewake of large-scale damage to forests by high winds or excessive snowloads. Action along the same lines is apparently envisaged in one ormore markets in response to "acid-rain-kill" damage. Measures forpromoting increased offtake of domestically produced timber, perhapstogether with measures aimed at improving the competitive position ofwood as an industrial raw material and in consumer products, have beenreported, or are planned to be introduced, for several countries.
1For instance, between the South-East Asian Lumber Producers'Association (SEALPA) and the Japan Lumber Importers Association, orbetween members of the Federation of Plywood Manufacturers of Korea,Malaysia and Singapore (KOMASI).
2Such as the Australian-New Zealand Joint Consultative Council onForest Industries - ref. unasylva, FAO, Vol. 32, No. 130, 1980.

MDF/W/52Page 137
E. ADDITIONAL NOTES RELATING TO CORK
175. Summary tariff data on pre- and post-Tokyo Round tariff treatmentin major import markets of unmanufactured cork and of cork manufactures(CCCN positions 45.01-45.09) are contained in Table V-A. Import andexport statistics relating to cork and cork manufactures for practicallyall of the countries covered by the present note are given inTables III-A and III-B. Table V-B contains statistics based on customsdata for imports of cork into some cork importing countries.
176. International data compilations for cork production and trade aremuch less abundant than those for wood and wood products. Worldproduction of raw cork in recent years has ranged between350-390 thousand tons per year. Production of cork (from cork oaks;certain other trees also have cork-like bark) has been tried in variousgeographic regions (including the USSR and California), but commercialsuccess in the new growing areas has, on the whole, been rather limited.Most of the cork grown for commercial purposes is produced in just a fewcountries. Portugal traditionally accounts for close to one half ofworld cork production, but production in Portugal has been trending downover the last two decades. Average annual production for the period1964-1972 was about 218 thousand tons and the average for 1973-81 was178 thousand tons. Production in 1982 is estimated at 167 thousand tonsand for 1983 at 140 thousand tons. About 22 per cent of total forestland in Portugal is under cork oaks. Spain normally contributessomewhat more than one fourth of world cork production. The other mainproducers are Italy (peninsular Italy, Sardinia and Sicily; together,about 6 per cent), Algeria and Morocco (5 percent each), France(including production in Corsica, 3 per cent) and Tunisia 2 per cent.In the Mediterganean regions, there is also some limited cork productionin Yugoslavia.
Banco de Fomente Nacional; according to the same source,production estimates are (thousand tons): for 1984 - 125- for 1985 -116; for 1986 - 178; 1987 - 162; 1988 - 124; 1989 - 130; 1990 -168.
2Data compiled for the "Estadistica Forestal de Espana" show corkproduction in the eary 1970s to have been of the order of between62-125 thousand tons annually and in the second half of the 1970s annualproduction was between 81-89 thousand tons. Data available fromofficial statistics for 1980 give widely divergent production figures,76 and 111 thousand tons, respectively. Wide year-to-year fluctuationsare, however, not uncommon, given the eight- to ten-year periodicity inharvesting of individual cork plantations.
3Efforts by private forest owners (with the approval and support ofthe government) are under way in France for rehabilitating part ofFrench cork-oak resources. The overall acreage of cork oak standsinvolved is, however, quite limited.
4As regards the cork "industry's" possible role in the EEC'sforestry policies, attention is invited to "Memorandum Forets",published by the EC Agricultural Information Service, Notes Rapides de1'Europe Verte, (Newsflash), No. 36, Brussels, 1986.

MDF/W/52Page 138
177. Known and used from the days of antiquity, demand for cork startedto rise rapidly, alongside with the increasing availability of glassbottles, as from the end of the 17th century. As natural cork oakstands could not satisfy the rising demand, cork plantations wereestablished, as from the middle of the 18th century, first in Spain and,in the century that followed, in France, Portugal, Italy and in NorthAfrica. Some of the cork oaks still in production today (underconditions of normal exploitation, cork oaks can attain an age of atleast 150 years) go back to the period of the first plantations. Corkoaks reach the productive stage in about fifteen years after plantingand are then partly peeled every eight to ten years. The best yield,and the commercially most valued cork, is obtained from, and following,the third harvest.
178. Cork harvesting and the subsequent processing is a skilled andrelatively labour-intensive operation. In Portugal most of the cork-producing units are small-scale. Some modern processing plants alsoexist, particularly in the Lisbon area, and there are plans by thegovernment for modernizing the cork sector, which, in recent years, hasbeen beset by various structural problems, leading to the closure ofmany of the smaller cork producing/processing units.
179. In the production of high-quality bottle-corks, considerable wastematerial is produced. Since about 1910, cork waste has been processed(much of it in the US) with natural, and in later years also withsynthetic, resins into agglomerated cork and cork products. Whilenatural cork is mainly used for high-quality stoppers, and, to someextent, as flotation material, and in certain sports goods, fishing polehandles etc., agglomerated cork is used in a wide range of products,ranging from cork disks in crown-corks for bottles, thermic- andacoustic insulating sheets, and in various technical articles, includingmotor joints and gaskets (this kind of use is responsible for some ofthe higher import duties found in some tariff schedules for certainagglomerated cork products). Ground- cork and cork granules may also beused in conjunction with latex in floor coverings and as an essentialconstituent-part of linoleum. In its raw state, cork is inodorous andimpermeable. While it loses its non-odorous quality once carbonized, toclose any open pores, cork is highly heat resistant and it isrot-resistant. Cork was used already in the Middle Ages as aninsulating material, a use which is increasingly being rediscovered, butwhich is not yet appreciated sufficiently to assure the cork industrythe brilliant future it deserves.
180. The value of world exports of cork and cork manufactures in recentyears was of the order of US$350-400 million. Exports of Portugalaccount for more than one half of the total, followed by Spain, the EEC,Sweden (cork manufactures only) and the United States. Main importersfor raw cork are the EEC, Portugal (domestic production in recent yearswas not sufficient to meet domestic and export demand for raw andmanufactured cork), the United States, Argentina, Japan, Brazil andYugoslavia. The main importers of manufactured cork products are theEEC, the United States, Switzerland, Australia, Canada, Japan,Yugoslavia, the USSR, Romania, Czechoslovakia and Sweden.

Abbreviations: Country-naas abbreviations used_re- ISO-Codes. An explanatory listing is givenat. the end of the Table.I..' not available- less than $53,PD0
DVG - developIng - as used in UN Statistics;designation used here without prejudiceas to the status of any country or territory.
AMNFX - A * D't' ;,
TARLE 111 - 1r 139
IMIPORTS and EXPORTS of WOOD, CORK ned PRODUCTS THEREOFand of WOOO-PULP
Data in million US dollars forthe years shown against the
respective countriesSource: Data derived from - UN Statistical Papers,
Series 0, various volumes. Data shown are toelatest available in print/or on cicro-film, unlessotherwise indicated.
SITC/Rev,2 - No, Codes and data covered are:
DIVISION - 24 . CORK and WOOD, (all, i.o. also covers fuelwood and oulpuood)- group - .4* CORK, natural, raw and waste, - also 244 in SITC/Rev.1, or CCCN headings 45.01, .02.- group - 247 OTHER WOOD in the rougA or roughly squared - corresponds to 242 in SITC/Rev.l and to CCCN headings - 44.03 B,-C,-D and 44.04 A and 3 - or :a6- ard
veneer-loqs, pitprops, polts, pillie9 and othor wood, in the rough, n.e.- group - W48* WOOD S!VFLf WORKED and RAILWAY SLEEPERS of wood - corresponds to 243 in SITC/Rev.l and to CCCN headings 44.05 - A and 2, 44.07, 44.13 A and n - or,
sleeper!, wood sawn, planed, tongued, grooved, stc., sliced or peeled if thickness exceeds 5 mm., blocks, strips, pieces for carquet or wood blockflooring, not further manufactured.
DIVISION - 25- grouw - 251 . PULP and WASTE PAPER - also 251 in SITC/Rev.1, or CCCN headings 47.01, -02.
DIVISION - 63- grouD - 633 * CORK HANUFACTURES - also 633 in SITC/Rev.l, or CCCN headings 45.03, -04.- group - . VENEERS, PLYWOD (including blockboard, lanin-board, etc., cellular wooa panels), OTHER RECONSTITUTED WOOD, wooden shells, it;ol handles simplyy worked
only - for details see relevant SITC explanatory notes) and OTHER WOOD n.e.s. - corresponds to 631 in SITC/Rev.l, or CCCN hsadings 44.09C;, 44.12, 14,.15 A, 8, C, 44.16, -17, -18, and 44.19.
- group - 635 WOOD MANUFACTURES, n.e.s. - corresponds to 632 in SITC/Rev.l and to CCCN headings en 44.11, 44.20, .71, -22, .23, -24, -25, -26, _27, .2, - ~r: wondenpacking cases, druos, casks, barrels, vats, othor coopers' pro ucts, riven staves of wood - builders' carpenter and joinery (including prefibricatrdand sectional buildings (Note: of sone importance in trade in the form of uorks'.barracks, exported to major construction sites, for instance those inthe Middle-East, North Africa, etc.) and assembled parquet flooring panels, manufactures of wood for domestic or decorative use, boxes, trays, cases,articles of furniture (other than those falling within CCCN heading 94.01, 02 or SITC Division 82), tool handles, spools, cops, bobbins, wood springblocks, match splints, etc. - and articles of wood, n.e.s.
WOOD and WOO PRODUCTS
IHPORTS24 247(242) 248(243) 634(631) 635(632)
WOOD, WOOD, WOOD, VEJIEER, WOODLUMBER, ROUGH, SHAPED, PLYWOOD, HAHIUFAC-CORK SQUARED WORKED ETC. TURES
World153.9
DVG1 37.0
LAFTA1 34.1
ClL51.8
PRY35.0
PRA33.0
EOL14.1
US6.5
CAN3.4
PRT3.0
ESP3.0
Worl d4.7
DGV3.3
LAFTA0.6
COG2.1
US1.0
CHL0.6
EEC0.4
CIV0.2
Worl d143.1
DVG133.7
LAFTA1 33.5
CHL51.2
PRY35.0
BRA33.0
eoL14.1
US5.5
CAN3.4
SHE0.4
HND0.2
World15.9
DVG11.8
LAFTA11.4
BRA8.3
PRY2.6
FIN0.4
ITA0.7
IDEU0.5
lus0.5
1BOL0.4
ZAF0.4
,orl d15.5
DVG5.6
LAFTA4 .9
FIN8.1
BRA1.7
PRY1 .4
URY0.8
0.6US
0.5CHL
0.3ITA
0.2
EXPORTS
24 T 247(242) 248(243) 634(631)1 635(632)WOOD, MOOD, WOOD, VENEER, IMOoLUMBER, ROUGH, SHAPED, PLYWOOD, MANUFAC-CORK SQUARED WORKED ETC. TURES
Worl d0.6
DVG0.3
LAFTA0.3
.IPN0.3
URY0.3
Worl d0.4
DVG0.1
LAFTA0.1
JPN0.3
URY0.1
Worl d0.1
DVG0.1
LAFTA0.1
URY0.1
Worl d World d0.1
- - - I - =-i - - IWorl d
216.3D\G
77.1CAN
59.9M'YS
45.rNZL
38.5US
37.5PAL
16.0SIJP
5.6PUG
3.78UR
1.3
Worl d World215.9
DVG77.1
CAN59.9
GYS45.8
NZL38.5
US
37.5P!L
16.0GP
i3.7PUR
1.3
World55.6
DVG4.0.7
NZL9.1
bO1YS6.5
PNG4.5
PAL
3.8SGP
3.2EEC
1;.9Us
1.0
THA1.2
World d33.?
DVJ15.4
DAN9.9
Z71S.9
EEC4.7
'.5US
1 .4
PPL1.3
CAN.1
THA0.4
Worl d239 .1
7.GJP-N
212.3EEC"9)
14.0
N7.L2.9
1..9r;Ll
0.3
NCR
0.5
Worl d1 .2
O'J50.3
?1ZL0.7
PHL0.3
EEC(9)
0.2
World
20.5
Dv(1 .7
EEC(9)13.8
NZL2.2
0..JPli
0.5
US
0.5
ION
?.5
0.5
WHorld7.1
DVG3.8
SP1.9
JPN0.9
DAN7n.8
FKG
C.3EEC
r.2PNH
11.1
Worl d
DOVG1.5
PNGu0.4
11.I0.2
EEC0.1
SAU0.1
WOOD,
I HPOR75
251
PULP,WASTEPAFER
Worl d6q.9
DOV52.7
LAFTA52.7
CHL3?.6
BRA19.1
US8.2
CAN7.6
PAT0.4
FIN0.4
SWEO0.?
7AF0.1
Worl d1213.7
ODJ1.3
NZL
CAN
F IN
5.3PRT
1.68RA
JP'I
JAP0.1
-PULP
EXPORTS251
PULP,WASTEPAPER
World
iorl7.6
DVU0.4
NZL1.'
JPN0.3
NO0.2
TVA2.1
CORK and CORK HANUFACTURESIMPORTS l EXPORTS
24 1 633 1 1 244 1 633I-1-- 1 1- I I~~~~~--
CORK, CORK CORK, CORKRAW, KANUFNC- | RAW, MANUFAC.. WASTE TURES - WASTE TURES
Worl d6.1
PRT
ESP3.0
3.0
Worl d0.?
PRT0.I
Wcorl dC, .4
PRTC.2
World11.1
PRT8.1
ESP1.5
1 .1US
C.?JPM
I .1I
Worl d
World
Worl d
| loridl.SC'.O; ..s1.4
7L
INumberina corresponds to number assigned for ournosps of Tablos and 11.
COUNTRYI'YEAR
It) ARGENTINA/ I ?
(3) AUSTRAL/'80
IA
_ ..
1 1. 1 1l
._*._ _ _

MDF/W/52Page 140
IS:
COUNTRY/YEAR
AUSTRIrp1I
OOD PRDWUCTS
W:rlr'r4.7,
24.6
LI.62.1
1:7.'
SAE14.r
'55011.0
1. .
'vV5I:
II . t
rld
DYG2.9
EVFT
31.2
CSF
Ucsr
11.2
6.1
3.1us
1.?I .7
__ __ __w__ _
M=.D WO, M, VEIMQ, MDOLUMBlER. 11=11. SHAKO. FLYWO IW"A=K SWAM NOW M. TRSS
world11t.?
D'Jul21.7
EFY421.e
EEC22.7
cSR34.6
14.9sw
10.3
*Si.?
F
4.2
L.5
2.0t
World
46.5DVG
0.?EFTA
10.'.
EEC
CE.EDCV
25.1
CHEI E.7
3.1
I 2.7ITI
0.3
y,j-VI-
e.
"rld67.?
D062.3
EFTAEIM11.2
EEC,,.,
DEV2!.4
ITO
11.1
6.2
Y'
'.C
FIN2.'
%l!1.2
EXPORTS24 247(242) 24.s(2') %(631) ws(m
W, MO. Wo., VENEER, MUDER, RHO, SNA, Pym . j riC.CONK SQUARED WO EIC. 1URES
ilol dWorld'11I.4
DVS42.6
En'
39.4
IEC514.4
YtU343.5
LBY13.3
IRRe.,
Ret:E.1
syp.7
SA2
5222.!
Wf.rld
DV;4.9
0.9EEC
73.5Yu0
3.51QN
SRC.5
0.4
.lId2?4.C
DVG37.7
EFTA39.0
EEC497.2
YUu4.0
13.3
7.7
7.3VR!2.3
SAU4.'
YE11 .
World125.2
ek'32.6
Er"20.0
EEC96.1
H'J4.1
W3.3
1.3ESt
C.9tROt
SAt0.3
RO:
0.3_
World109.4
1t.2EFTA
36.2
EEC59.E
LBYIV'.1120
3.1SAU
1.'
0.9
0.9
C.6IRR11
'U
!! h'L E Si wa-l c .trl c .,rl c' aPI d .rl _ iOrld World IWrld World World
:., r<C. C.1 .'.1 t, 0.7 C.7 . _:'; ';.: 2';5 DN;VL WVi
.4 0.4.t*3 tl;S S;R SiP -
C.4 0.4
-aSCS 00-' d i^ aow-l r orl C iorldc io1d *orl d Wor' d :orl d Worldl-: s ; . ^ 2.' r. . . .
~.,,,.p .,.1 D; Y'
C' "7 txgl. 0.3|
,D 19H110D 'S EEC,1 ' :aLX2It C?25 .:
CA CAL C %
'1 1.2 C. I
IL -'1 ..,l e -1 drl du...0'¶~~~~~~~~~~~
'-r-t~t |' | . --14 W:1,,world| |trl.| 'w r W:rlcd World 'iorld
I rI.' 11' 1.
NOWIL.0JMI ;swe I ILPIVSTE IIVAS I
?AR IPAE RI
iorl d139.6
6.0
34.0
EEC22.!
|orld4.6
usc
IA ...
1.1SiE
rl.4
's
c.4
Vorl C
|orl d1I0.21
DVGI1.7
EFTA6.5
VEE
74.2YL'2
37.5
PUll
PL1 2.'
I nZAI.
1.2IESF
0.4
World
|Wiorld
=DK VW C= KAJTtS111M~s:3,- .-EXPORTSYA &U 1 VA It
I I 633
COK, CORK CORK, COMAUV. WIr1. RAU. 1 NACASm LuNES 1- VAS1E ITES,
We
EVIL
0.1EEC
0.1HUT
vorld
4.3
EE: I1.1
4.1.SpI1.'
World d0.2
I.E10.1
IPr.1
t.5I l
World WCO'd vijjW::rl
t
.?ld ..,:_
.or _ol . .
~~~~~~~~4
--_ . , , ,, , _ _

MDF/W/52Page 141
WOOD and WOOD PRODUCTSlMPORTS
2647(242 1240243) Wa(631) 86352)Ml M~o.M1m.S wUi. MWOOLWIDE.MUSjwe, nrymo, 1Mujr
cm-Sam noMiAET. umIESoldorid World World IWorld World
24 247(242) 28(2.3) 634(63111 MU2)MoO. WOOD, WOm, VEINER. ; W=WED, IOIG SWM.I PLYWj0 PANJVFC-mg SMOAD MU IM.-E-- I'TC.
World wr World Ivrl WorldO| 0.7
CIV0.1
u0.2
EEC0.2
2US0.2
______: -, _------ -- -1-
(9) BRAZIL World World World World World World Wrld World world WorldI'82 19.8 3.9 12.9 11.1 0.5 141.6 1.3 139.9 1U1.3 24.5
OY6 0;DM DOV DVG D1 OVG 01|G Dov ov13.4 0.4 12.8 0.9 27.4 27.3 28.7 7.1
LlPTA LAFTA LAFT4 LAFTA LAFTA LlFTA LAF| A LAFTI
13.3 0.3 12.8 10.2 22.2 22.2 9.2 5.6PRY US PRY EEC EEC EEC [UI1 EEC EEC IEEC
13.1 3.5 12.8 0.8 0.2 64.3 1.1 64.2 * 40.0 12.2U5 PRY US US PIPT US US US
3.5 0.3 0.2 27.5 0.2 27.5u
32.4 4.0ET ARG6 1G IG I URY
1.8 10.0 10.0 3.8 2.8PRT YEN VEI VEN VEN
1.1 8.2 8.2 4.7 1.6ZIFJ EFTA IS PRY
7.2 5.1 2.2 0.6EFTA PIT | LU | Alt
5.6 4.3 2.2 0.5PRT URI on8 SAU
4.5 3.6 1.8 0.3IRY l ESP TTO ESP
3.6 2.6 1.6 0.2
3.1 2.1 1.5E ALT
2.6 1.8 1.3
(10) BURIA World World World World World World World World World world/177 0.2 0.2
OVO 0V6
0.1 0.1IllO IWII
0.1 0.1
(ll) BURUIJDI World World World World World World World World World World1'75 _ _ | 0.1 0.1 '
(12) CAJEROOl World World World World World World World World World Worldlwsa 0.1 I * 1 0.7 5.2 144.2 110.9 33.3 21.5 1
OWG MY MI DG OWG0.3 2.2 0.9 1.3 1.8
EEC EEC EEC(9) CM9) EEC(9) 1EEC(9).7 4.9 90.9 64.3 31.5 19.3
I~~~~II ! ElNSI I0.3 23.1 18.5 4.6 0.6
M E GYi5.1 5.0 0.4 0.1
4.9 4.9
3.3 3.2
IRT IRT3.3 3.2
1.2 0.4
0 0.4
I OO.PULP
aIMATS IEXPORIS
2
PULP, PULP.ASE WASTE
PAP I PAERR
twiod I dorld
1- 11'
World10.4
5.5
World278.7
Dyi35.5
CHL EEC
5.0 117.0us 1I
4.0 63.1
0.7 43.2AMR £16a
0.2 18.1g1 NOR
0.2 10.8CAN VEN
0.2 6.9COL
4.4
3.5|!ncludss ulpD forhleachingunder contract,Mvew xocired.
World od
World
World
World
worldI 0.1
EEC0.1
CVORTS II C ;PORKS244 633 24 1
CORK. CORK CORK. CORKRAW, 1WAC- RA, MAF 1ASTEIUNES WASTEI
World World torld torif.
World World World World3.0 G.3 _ 0.1
ES EEC US1.8 0.2 0.1
PIT1.1
World Wrld World World_ 0.1
Worl d World World World
World World World World
EXPORTS

MDF/W/52Page 142
ImiITS EXPORTS
251pip, PULP,VASTE MOSEPAPER PAPER
World World58.3 3,213.8
IDV6146.0
us lus58.3 1,6?6.9
EECI 1870.4
K48.9
ESP27.1
I 1 26.0NEX
15.9
13.9SUE
10.6THA
9.3
World World
1
ilorld
CORK .rd CORK NAXTIURESINOTS rEXPORS
21A | 63 § bX 633CMR, ICORK I W. I CORK
- |ASTE TURESI -WASTE TUREL
World World6.9
PRT2.9
us2.6
EEC0.9
ESP0.5
World WorldI .
World
World
|World
1.
'o'ld
World World World I world
'=.
- ---II
-Ie0NI24 247(242) 249243 16(m) _(632)
WOO, W.OO, _ EIl, WLWlER, tOUCHl SAPED, PLKYWO, MIWIAC.CORKI SOUAD WO EltC. TIES
World337.0
OVG16.1
US317.4
ORA9.5
IYS1.9
FIN1.9
PIPE1.6
5fiP1.0
EEC0 .7
IN0.0.5
World
World61.1
US60.6
FIN0.5
world
World252.5
D1116.1
US233.6
BA9.5
HIS1.8
PI.1.6
FIN1.3
S061.0
EEC0.6
IN0.5
World
World138.5
D1G41.1
US13.4
0AN18.4
ODR13.2
PIL3.6
A3.0
5692.0
EEC1.6
FIN1.6
World
World112.4
DIG20.3
US82.9
7.0HIS
5.2EEC
4.9
2.9PIL
2.6"n
2.0
0.6
World
EXPORTS
2A 247(242) 241243) 634(31) 635(632)WOO, WOOD, W , VNEER, NOLuIm, llOUGH, SmP, KiYWO, NAuIJIACORK SO110ED WOK1ED EC. TMS
World2,716.2DVG
140.7US1,762.2A377.7
EEC 1346.I
ADS61.5
D2A33.3
SAD30.1
LRY26.5
KWT8.1
YU66.2
CUB5.5
C4.4.2
World33.2
DV61.3
EEC21.9
EFTA1.1
rM4.5
ESP3.0
RDK0.7
Clv0.7|SDN0.
TMO0.3
World54.6
OVD1.5
A30.1
US20.8
EEC1.3
World27.4
DVG0.7
EEC19.6
EF7A0.4
YUS3.6
ESP2.0
CIV0.7
RON
0.6WA
0.3
World2,554.0DY6
139.1us1,684.3EEC
340.7in3l9.8
AUS61.5
DZA33.3
LOY26.5
EGY19.6
KU9.1
World5.8
DVy0.7
EEC2.2
EF1A0.7
ESP1.0
YuG0.9
SON0.4
TCO0.3
RON0.1
World185.4
DYG4.7
EEC'5.8
US77.2
'I3.8
an2.9
AUT0.9
FIN0.B
S40.9
CL0.5
World339.4OVa
7.7US30.6
EEC19.9
AUS2.0
ISA1.5
CIL1.0
SAD0.9
TTO0.7
REX0.6
Norld
(15) CHAD World World World WorldC orld World World World World World/'75 0.8 - 0.9 0.3 . . ._
DVG DW DVG0.9 0.8 0.3
0.8 0.9 0.2GAB
0.1
WO dW PRODUCTS
COUNTRY
(13) CANADA/'91
(14) CEU4ALAFR IC.EP.
/'80
. I I __ ___
_

WOODANDWOOD PRODUCTSIMPORTS
24 1247(242) 243(243) MM(61 635(632wNo M, km, K~w* rOUUM. MIC MED. FLYO, NAC.CK S__AMD "a EC. mu
iorld
DVS:.2
0..?ESP
1.6KEX
5..'S
2.3
.1I
'gorl d
W :-1 :
U'0.1
ticol d:..
D7S:.3
i:rl !
:.:SAR51
I.!
COR ..III.
W vr dE.'
DVr6.3
LAFTA5.,
E'Jl".7
PER1.4
a.3
I.?
ivrld0.5
DusU.'.
EXITS24 2477421. 2U(243J1 6*61) 0432)
in, WOM. WO, VEEKI, M. aOnlH, MAMD, PLY. WIWC-
CORK SIAED WA11D ETC. TURES
4 rld541.'*,
77.3:-. ..
V.R
EEC1'.213.7
YEN6.9
SWU6.6
6.3
4.5
1.4
Worl d2.1
GVG2.0
LAFTA2.0
YEN
-rl c
LAFTA17.KOR
'6.
B.,EEC
2.7YEN
2.4LKA
0.8CAN
0.5ARG
0.2PER
3.1
World
4orl d52.0
32.5LAFA
EEC14.5
13.5SIU
6.5
4.5YEN
'.4EGY
1.4LRE
1.4JPY
1.3
World-..
DVG1.9
LAFTA1.9
VEN1.9
World?.9
DVG2.0
LARTA1.4
VEN1.4
EEC0.8
KOR0.6
iorld1.4
DVG0.7
LAFTA0.S
VEN0.6
us0.6
gorld11.8
DVG11.8
LARA11.6
VEN11.6
PAN0.1
World9.3
OVG4.E
LAFTA4.3
YEX4.1
Us3.2
TTO0.3
ECU0.1
ECv.
CAN0.1
4-1 *Wol
1 Z; C!GC iorld qorld dorld gori dorld World WorldR EP _ . . _ _ 18.0 14.2 3.7 12.1
175 ~~~ ~ ~~~ ~ ~~~~~~~~~~~DVGDVGOVO OVO1.3 0.6 0.7 1.3
EEC(9) EEC(9) EEC(9) EEC(9)8.5 6.7 1.9 9.5
FRT PRT ESP 111W2.3 2.3 o.g 1.3
ESP ESP REU us2.1 1.3 0.7 0.3
USM ZAF1.0 1.0 0.2
0.8 0.8.11 JPN
0.7 0.7ZAl ZAF
0.5 C.3POL MRG
0.3 0.2
(19° CUBA/ urlo orl a 4rltd 0orld World World aorld -:nrld World Wiold
E~ITXPDRT5
;s1 _ sWP. PULP.VASE WATEPAPER PAPER
40orld dor'd1.8 1?8.2
OvG 0VGC.2 92'.
LAFTA LAFTA0.2 76.1
US., G1.5 3'.6
EEC24.4
BRA17.2
KtR13.9
VEI8.;
CUL7.9
JPN7.
..7
lWorld _ orld
DVG23.9
LAFTA23.8
GHL19.5
FIX2.1
woldd
MDF/W/52Page 143
'917)UUMIA'18
I I I - L i m i -F
Oorl d

MDF/W/52Page 144
VW si WO MODUCTS
IMPORTS
24 I 247(242) 243(243) M M)1 15(noO, IDOO, WoO, vemIR, inWOLUMBER, ADUGH, SHAP, PLYWG,CORK SOAPED RI M. lURES
io'-I aIrl s15.5Dl'^u
1.E
5.6USSR
059
1.6GHA
0.9SGPC0.6EEC
C..4YUG
.4RPN
r,
iorld1.3
1.1ESP
C.2
World14.2
DOG1.
USSR5.0
SWE3.3
C051.6
FIN0.9
6UN0.8
SGP0.6
YUGC.4
RMO..3
Worldd1.9
0%2.6
EEC3.5
SGP1.5
Dan5'.8
BUL0.4
RW.0.3
CP.0.3
ESPC.2
mYsC.2
world1.4
0.4UK
0.4EEC
0.4ROM
0.2PRT
0.1
EXPORTS II- - - ,--
24 247(2421 MM)1 '24(631) 65(32)WO. VOOD. MO, MM~E, VOOUNlEl, mmRUD, SAo, YW, NACCORK SUARE[ WC ME. IUES
world eorl d Worl e world0.1 I . . I
WorldI.'4
DVZ8.3
IRD5.6
'Y1.5
LBN0.6
SAU0.3
SYR0.2
SEN0.1
z?!)CZ:x- A:rid World world iorl t Worl d worl d world d WorldWtorld WorldSLCVMIiA ?'-.6 9. 2 .0 14.9 4.4 296.1 14.0 15'.7 12.6 34.9
'?? DV7 DVS DVG DYS DvS DIG DYG*.* e~~~~~~~~~~~~~~~~.s1.C7.9 G.4 4,.9
uss; ULS-S USS- YUG 6DR EO-. AUT EEC EEC EEC
Lg: 12r r7.9 4.3 136.5 6H.7 BB.5 11.3 7.8
:v COVl RONI FIN EFTR9 EEC ALIT SUE YUG'.1 ..1 4.5 C.? 117.5 4.0 45.8 0.9 7.8
CH. CPE ALIT YUG YUE T UG KEN RUN1.? 1.C ?.6 24.6 I6.6 e.o C. 6.4
FPT GAS A NUN CDE IRN 60Rt.' ;. ;.3 6.6 3.- 5.3 3.3
E3P FIN. IRV IrK HUUN PCLC.5 6.3 3.? 3.6 2.1
Gkt ~~~ ~~~~~~~~~CypIRNJ Sd58 CreJ1.2? 1.0 5ilE 1.7 2.0
; ?) DYNI AN World worlc i:-lI World World world World Wo ld World WorlcREJBLIC I. e9.5 7.5 5.. 1.1 _ .
El1 DV" DVS OY? MR 01GL.Y 01.9 v. 3.2 C.?'; Ui OS' O'; U'us? us
t.E lt ,
CR1. LCLA!'?.1 1.1 V.0 1.9
CH7 C. C.&'. C. " .;r[6 C.?
! C.' 1R;.'~~~~~~~... S | 0-- _ _V -I
COUNTRYI,YA
(7.1) ,YFmus,'q.,
MOD-PULPIWORTS EXPORTS
35P 1 _ *2S1tPUL
mmST VASTPAPER PAPER
World World
0.6OVG
C.2SCE
IC.2LIN
C.2
Wiorld53.7
USSR2Z.2
FIRI17.?
S;E13.2
AU!2.1
WorldI.;.
USC.,;
ALIT'.7
GlS2.6
YUO2.5
DEL0.9
r.L_
iiorld
L
I I

MDF/5/9 2Page 14V
COUNTRY`YEAR
EEC/l0i
of which3LX
FRADEUGRCIREITAhL1
UK
WOOD and WOOD PRODUCTS
IMHORTS24 247(242) 248(243) 634(631) 635(632)
WOOD, WOOD, WOOD, VENEER, WOOLUMBER, ROUGH, SHAPED, PLYWOOD, MANUFAC.CORK SQUARED WORKED ETC. TURES
Extra-EEC
264.7
187.6857.3
1,128.3
97.1
105.51,433.e
5022.61,162.6
Extra-EEC
26.6
7.6
245.0
211.5
38.0
8
36 8.8
;3.031.4
Extra-EEC
235.9
1 78.1
537.1
867.7
58.7
99.5
978.8
472.1
1,124.1
Extra-EEC
1.4?2.
67.4
837.1134.7327.4
22.1128.6
117.5
541.9
Extra-EEC
134.321.465.3197.4
4.68.'152.443.4131.6
EXPORTS
24 247(242) 248(243)1 634(631) 635(632)WOOD WOOD, WOOD, VENEER,f W0OOLUMBER, ROUGH, SHAPED, PLYWOOD, HANUFAC.CORK [SOUARED WORKEO _ ETC. TURES
Extra-EEC
7.4
?9.6
96.9
188.7
1.04.0
7i.97.7
36.7
Extra.EEC64.3
3.6
2.6
1U.143.6
1.30.8
7.3
Extra-EEC195.7
?.715.3
47.092.7
1.0
19.64.6
6.8
Etxra-EEC489.0
181.2
48.6
41.136.98.9
86.9
5.2?0.
Extra-EEC613.5
10.1115.6119.5149.8
1.0
1.114S.814.654.0
T.) Total ofrecordedintra-gEEexchanles int'p followingtables forEEC-countries (660.1) (224.5) (330.8) (821.3) (633.8) (693.5) (169.9) (364.7) (805.7) (666.2)
(23)/BELGIUM. World1 World World World World World World World World World
(?4) LUXEM- 445.3 73.2 319.0 130.8 147.6 123.0 50.5 68.3 240.5 59.3
SBURG/ DVG DVG OVG DVG 0VG 0VG OVG OVG OVG DVG
',1 73.7 21.4 52.0 27.0 5.5 3.5 2.3 1.3 6.5 6.7
includess EFTA EFTA EFTA EFTA EFTA EFTA EFTA EFTA EFTA EFTA
int-3 EEC 65.6 0.2 64.9 9.4 4.9 1.6 0.7 0.9 2.5 2.1
trade, (EEC (EEC (EEC (EEC (EEC (EEC (EEC (EEC (EEC (EEC
181.1) 46.6) 83.9) 63.4) 133.0) 118.8) 46.9) 65.6) 228.1) 49.2)
US CHR US US OAN OZA DZA ESP US SAU
48.8 9.0 43.5 18.1 3.0 1.8 1.7 0.4 1.1 2.6
CAN CIV CAN KLR US ESP EGY TUN TUN OZA
29.3 5.5 29.0 5.3 1.2 0.6 0.3 0.3 1.1 2.6
USSR US USSR SGP ESP EGY ESP DZA SYR US
27.6 4.9 27.5 4.4 0.9 0.5 0.2 0.2 1.0 0.8
MYS COG MYS PHL SGP TUN TUN EGY OZA MAR
24.9 1.7 24.9 3.9 0.5 0.4 0.1 0.2 0.7 0.2
CHR ZAR SGP CIV BRA ISR EGY CIV16.3 1.7 9.9 3.7 0.4 0.4 0.5 0.2
SGP LBR CHR USSR GDR L8N CYP IR09.9 1.2 7.2 3.4 0.4 0.4 0.5 0.2
CIV 8UR AUS CAN CAN SAU SON
6.9 1.2 5.9 3.3 0.3 0.5 0.2
(75) OENHAaK/ WorldI
World World World World World World World World World
'8l' 192.6 8.5 181.5 110.9 26.5 55.0 6.0 36.3 48.6 238.4
OVG OVG OVG DVG OVG 0VG 0VG DVG 0VG OVG
16.4 3.5 12.7 19.3 1.3 3.1 0.1 3.0 3.1 77.4
EFTA EFTA EFTA EFTA EFTA EFTA EFTA EFTA EFTA EFTA
155.8 3.9 151.0 32.2 17.7 25.9 2.5 11.7 14.4 30.0
(EEC (EEC (EEC (EEC (EEC (EEC (EEC (EEC
5.0) 0.9) 3.4) 28.9) 5.1) 25.4) 3.4) 122.8)USSR CQG USSR US CSR GRL GRL L OZA
6.7 1.0 6.7 25.0 0.5 2.6 2.5 2.3 65.9
8UR CIV 8UR SGP HUN AUS AdsS AT GRL6.6 0.6 5.8 3.6 0.3 0.4 0.4 0.4 4.6
JPN CHR JPN BRA US ZAF ZAF HUN US
3.3 0.6 3.2 3.3 0.1 0.2 0.2 0.? 3.7
US SUR US THA GOR NO IND CAN ESP
2.6 0.8 2.4 3.1 0.1 0.2 C.7 0.1 1.6
HYS S MYS YEM YEN SAU
1.8 1.8 3.0 0.2 0.2 1.4
PHI PL KR CAN
1.6 1.6 2.4 1.3
P01 OL1 P01 _181.4 1.3 1.8 1.2
WOOD"PLP
251 25PULP,WASTEPAPER
Extra-EEC
7(17.6
55.9
824.6
45.3
17.E767.?
763.8
968.5
('259.?)
World
2'8.6OVG
13.3
EFTA
0O.?(EEC
76.0)CAN
51.1
US
49.3)BRA
17.5
ESP
5.8
USSR
2.3
MAR0.3
Cal0.3
World
57.4
OVGl.c
EFTA
48.1(EEC
1.5)SWE
29.3FIN
11.1
NCR7.6
ESP
7.3BRA
1.0USSR
0.7CSR
0.2
PULP.WASTE
PAPER
Extra.EEC
al~1 05.'.
B."41.335.20.1
81.7
7.8
(326.1)
World
90.2OVG
0.2EFTA
9.6
(EEC
79.9)
ESP0.3
MAR
0.2
ZAF0.1
World
26.9
DVG1.1
EFTA
7.1
(EEC
18.7)MAR
0.5
SON0.5
ICf.(23)2Data for 1982 also available
CORK and CORK MANUFACTURES
IMPORTS EXPORTS
244 1 633 1 244 633CORK, CORK CORK, CORKRAW. IANUFAC- RAW, MIANUAFC.;
WASTE lURES I.WASTE 1URESI
ivtr3.EEC E tr3.EEC Extra-'CL Extra-EEC'3.; 14.5.7 1, 4:
.0~~~~~~~.6.4 66.1 .5.3 36. 0.,.3 2? -
0.5 -7.1 1L.8 0.e1.1 3.7
.
2.6 16.0 5 11.5
(0.9) (13.3) 1 (9.3j
World World World orldC.5 5.9 _ 5.5
DVI nvG 2VG
EFTA EFTA EFTA0.3 3.2 0.1
(EEC (EEC (EEC.) ?2.1) 0,4)
PRT PRT
World W~orld World iiorl0.3 4.7C2)
DVG .1 ova,
.1 0.2
EFTA EFTA EFTAO.' ?.3 O.:
(EE;9 ) EEcr
0.1202
G.2 PRT
0.3 4.7 . C
KOR. SWE0.1 0.20.2 1.

MDF/W/52Page 146
WOD and 11OD PRODUCTSINPORTS
24 247(242) 1248(243) WM(61 635(632)
M.00 MO. M.OO VENEER. 100LOW.ER ADUROUH SHAPED, PL.Y10, MAWAG-COUAJ SW5RED WERXEG ETC. lURES
World I
90i.2Ova
EFTA716.4
(EEC46.9)
95.0AAB
95.3CANR
90.6Ls
73.5U558
63.1PRL
571.1MYS
22.5PCL
19.2LBR
18.5
1,279.6
295.6
(EEC151.
14'.5rys
9! .2
69.7
71.1CAN
43.7Civ
4c .1PCIL
23.7IBA
22.6010
2C.7W6
IM.
""'C257.4
0VIG23L.5
EFTA3.6
(EEC12.'.)
GAB92.9
CIV
17.0PnL
13.4cmG
8.5
15.CWF
1.5ESP
1.351£
1.2
Wo,-ld264.9
CDrT121 .9
ERTA
(EEC53.')
us51.5
CIV34.5
LBACR19.9I04810 4
worle593.0
131.2
(EEC26.8)
CAN83.6
us66.3
USSR47.1
PAL39.
MIS36.2
POL19.1
CIV18.7
SGP14.8
0187.5
ION7.5
171.8ERTA412.9
(EEC71.5)
94.6us
CAN'2.9
SGP15.5
PL16.59R%
13.7NRm
11.7CAL
7.5PAL
5.3
740..5
58.2EFTA
31.0(EEC
105.8)GAP
25.0)ESP
7.6
4.6018
3.9US5R
3.5MON
3.4
World
58.2ERTA
31 r.(EECI105.8)GASi25.0ESP!17.0
1CAN7.6
4.6clip
3.9USSR
3.5KOF
3.4
World190.7
DvG18.5
ERTA17.8
(EEC125 4)
ESP12.5
OAN12.4
LS3.7
RC#2.5
CNNl2.1
IND1.3
BRA1.2
Wtld101
EFT $17.9
SEEC125.4)
ESP12.5
OAN12.4
is3.7
10K2.5
CNN2.1
1.3BRL1.
I I I 1 1 I I-- --
EXPORTS
24 247(242) 248(243) 634(631) 635(632)WOO. WOOD, WO, VEIWER, MOtOulR, ROUGH, SHAPE, PLYI)OOC MANlUFAC-WIRK SODARED WORKED EIC. YURES
World world World Would We-Id35*.& 113.2 171.3 229.8 191.5
0115 roA U15 015 Dru21.7 10-.0 11.6 15.7 95.8
ERTA EFTA ERTA EFTA EFTA41.0 12.8 17.3 11.1 10.4
(EEC (EEC (FC EC EC275.2) 103.1) 124.3) 188.7) 73.0)
ESP ESP ESP TOG DZA23.6 5.7 17.8 5.1 41.3
MAR MAR0 OZA lEN SAU5.1 41.& 2.5 3.9 17.7
EGY EGY EGY us us3.7 1.9 1.7 2.6 7.3
OZA NGA 110 OZA 1102.7 0.9 0.7 2.3 6.7
TON SONl SAil 10 NGA1.7 0.3 0.5 1.7 6.3
VGA SEt NGA UP MAR1.3 0.3 0.3 1.7 3.9
M1 RON us 1558 ESP0.7 0.2 0.1 0.9 1.9
10-.0EFTA
12.8(EEC131ES0'
5.7MAR
11.4
IA1.90.9
0.3SEN
0.3RNO
0.2
World171.3
DAT11.5
ERTA17.3
(EEC124.3)
ESP17.8
OZA2.5
EGY1.7
1100.
SAUl0.5
NWAC.3
LIS0.1
World229.8
DvI.16.2
ERTA11.1
(EECI188.7)YUGl
5.1VEN
3.9us
2.60Z*
Z.3110
1.7ESP
1.7USSR
C.9
World191.5
OAT95.8
EFTA10.4
i(EEC73.0)OZA
41.3SAUlus17.7
7.316.7
NGA6.3
MAR3.9
ESP1.9
World359.&
OMT21.7
ERA
(EEC
ES272.5)23.6
MAR5.1
EGY3.7
OZA2.7
TUIJ1.7
WA41.3
1100.7
OD0-PULP CORK and CORK HANUFAC11JRESIMPORTS EXPORTS IMP1ORTS EXPORTS
21 251 21A -633 L244 633
WULP PULP. CORK. CORK CORK. CORY.WASTE WASTE RAW, MWArJA- RAW, KAWFAr-PAPER PAPER -WA." T'JRES .WASTE TURESWorld ho'1,4 World World World World
913.4 124.7 5.4 67.2 C.4 7.1DAT Oro MA 015 D4G
61.7 3. 0.? M. C.9ERTA ERTA ERTA ERt
376.6 3.7 4.2 48.1 .(EEC EEC EEC EEC EEC
78.6) c3.4) 1.1) 1.4) 4.5)CAN ESP PRT PAT us
192.6 31.3 4.2 47.3 I.C'is KOR ESP ESP SAL,
148.4 1.8 2.c. 12.1 0.2USS8 MAR US
33.7 0.3 C-BRA OZA ISA
25.1 0.2 0.1COL SEN
23.8 0.1
P9A 0.1
World1,349.'
OAT
ERIA562?
CA%280.3
253.6BRA
59.CUSSR
29.2ESP
23.8CAL
19.2YI5
2.?MAR
2.0~COP
1.2
124.7
3.8ERTA
3.7(EEC8..ESP
31.3KGRMAR
C.3OZA
0.2.SEN
I..IP010.1
orldov6.'G.2
ErIA4.?
PRI4.0,ESP
2.c
World£7.25.6
tEECPRY47.3.ESP
12.1
Word Wrr',
(E:EC 0cC*.41 I'.5)
SAu.1-2
USSR
ISI.
(26) FROACEI'18
(27) F.A.6ERNINY
/'8el
1cf. (23)
I . --.- .

MDF/W/ 52
Page 147
WM0 and M10 PMOUTS
INM2TS
W . RUGH.
inW Cal' jSM5JM 081H1
77 EFTI
(EEC (E C
CIV; CcI'9.6 927
ts OAQ1 .5
ROK P4L CoN5.4 1.4 C.B
CV S BUR3.7 1.2 C.8
ZAF3.5 0.5 0.4
GLYI0U, I AWACETC. lURE
v.&)
(ECH
0.1
0.1
0.1
..IlL.1
(EEC2.4)
2.2
OAR
0.5
'15G
1D0.4
0.3
CHI0.2
- -EXPORIS1247(2A2)~ U4311 A34(63l)L6_3(632)
MwIM.0C.IRO YERA. moLUim, notG, SHAPED, PLYIDU IIANUFAC.CRK, SCUAKED WrC0 ETC. I IWRS
- i- --
it'v d
1.0
1.0
SAL]
0.5
LBO0.2
0.1
0.1
dorld Uorid1.0
1.0
SAU0.5
LEN0.2
0.1
CIP
0 1
ioric12.2
03V
(EEC
3.3)IAN
2.8
SAO]1.3
COw1.1
lILT
0.5
YUG0.5
0.4
0.4
3VG
(EEC
0.4
0.2
CP0.2
Wer'ld11.4
0.9
EFTA0.8
(EEC
10.3)
LOY0.9
AM50.1
2R8.8
DVII
98.3
(EEC28140.0)
OZA
47.6
LOY29.6
15.
13.0
5.1
1W
2.6
CAN
1.0
S - I - A --.--4-4 1-4 4 -
(35.) ITzy.1'51
ICf. (23)
111.3
3 96
E0.453.9
(EC
6.3)
17.5
Civ
93.us
3.21USSR
1.3
1.6
1.573
302.2
ERTA709.3
(EC
140.1
clv
YUG121.9
L6sR
102.1
90.9
ID77.3CAN
38.2
32.?
PUN
16.6
14.7
8.1
0.8
CAN
GilA
Civ
RA
I .1
Vferl455.9
0Ow173.3
ERTA145.9
i(EEC
Civ
177.2
22.7
cMG14.5
10.6
10.4
CmA10.2
9.9
dorld103.5
27.6
EFTA
(EEC
4.0)CAN
16.7
civ
13.7
BRA .
Ius3.1
1.7
G.APHL
1.5
Orl127.4
EFTA545.0
1(EEC
89.2
us
80.5
ION.
75.6
USSR67.4,
20.1
Civ
10.8
PIS10.4
465
l1s.
6.2
(EEC
2.7
CAN
DN2.12.0
SGP
1.8
us
1.7
'(CR
0.7
low.
World
170.9
20.7ERTA
(EEC
51.3')YLG
14.0
us12.8
12.5
CAN f16.8
CAN6.7
ESP .
World
27.0
2.2
EFTA2.7
(EEC
18.6)us
1.5
CAN
1.2
CIAN1.2
SGPa.3
ION
C.3
BR&0.2
USSR
P-2
85.3
DVII
15.8
ERTA17.8
(EEC
32.9)YUG
7.8
OAN6.0
Civ
2.3
SGP1.6
lie1.4
OaA1.4
CAN
1.4
Wold World
13.7 1.9
1.9)
1.9
2.0
Ow.
1.0
ERTA0.2
,EEC0.7)
LBY .
EFTA'.0
(EEC9.7)
UK
9.0
World
26.5
8.7
EFTA8.6
&.u)
5.5
TUG
3 1:
1.4.
0.6IZA
0.4
0.3
JOR0.1
World
7.1
(EEC
7.1)
U%6.9
2:3,.47.7
EFTA
(EEC761.6)
4.7
TUG
3.0
0.4
0.3
1.9
(EEC1.9)
UK
.1.9
World
150.9
DVII
28.7
ERTA12.3
EC
83.6)TUG
14.9
us3.5
ESP
3.5
EGY
2.!
'5AD2.3
SAL]
1.7
SGP1.5
IQOCAILP W" -VRE
IIVORTS EXPORTS EX
36
HASTVIrE 1aI. UX1FA:.. RAW. 'W JFAt-PAME PI EQWASTE RE
9 ;j
CAN
1.3
ESP
0."
0.5
TUG
G.4
Vop"1 1d Varld I Word I World I or~ld8.0
ERTA10.8
(EEC0.4)
us
3.*.CAN
3.4
World851.1
21.4
ERiA334 7
(EEC83.9)
CAN
199.6
LIS163.2
ESP
15.0
USSR
14.1
BRA13.5
TUG
9.5
(EEC
UK1.1
r0.3
We-Id8.3
C.4ERTA
0.1
(EEC
7.5)
0.1
(EEC (EEC
C .51
PRT0.4
Worli 'darid Wol Uorid7.1 16.7 O.? 4..
0.5 0.4 .EFTA EtTA tria E
3.6 1. . .
PAt ESP CI( YLE3.6 2.0 .6 '.
ESP SicCL2.7 0.8 0
0.2
. I
I I
I I L- I -I- i I __-]
i
1.0

MDF/W/ 52Page 148
COUNTRYI'YEAR.-
(31) NETPER.LANDS
/1p81
(,32) UNITEDK1 5DDM/'I8e
(33) EGYFT/gel
iCf . (2?)
WM 11 IBMWOROOJCTSINIHES
24 247(2421 J1 248(243) 163(631) 635(632)WO. ILOOWOOD.MD VVEIER, MMWLUMBER, ROWUGH. SHAPED, PLYWOGD, KWAUA-CORK SWAIRO WURKED ETC. TURES
Void14575.7
OV?1749.6
[FTA219.5
(EEC77.1)
PYS92.2
us38.1I
25.;SFp
21.5ION
18.6CANi
15.5
14.?
orld
214.4[FTA
485.3(EEC.
49.CAL
216.61SFP
BRI75.6
PP411.4.5
V.2033.8
US301.9
MY?28.2
sP.17.6
ION15.7
CIV.14.7
World340.5
6.1USSR
79.7PIN
76.6SWEE151 .9
'Ls-I1
K'k
World40.5
DHS?1.7
0.2(EEC
8.0CIV
3.9GAB
3.6SUN
2.4LOA
1.6LS
0.7006
C.'
world37.5
DV?15.1
EFTA9.8
(EEC6.1)
MI6.2
MSR'..1'
LB,4 .0
K,15
0.8GAS
0.5caw
Wenld27.2
PIN26.7
SWE0.3
World522.3
OHS155.5
[FTA217.8
tEEC50.2)
MYS92.1
us35.7
USSR24.4
SUP21.5
IN18.5CAN
15.0CSA
10.4
lo:.166.5198.3
[FTA471.5
(EEC42.4
CAN216.1
IS110.OBRA
75.5PHI.44.5
P"33.0
Ml128.2
CSA17.6ION15.7
world309.3OHS
5.7U5SP79.0',01.EFIll
31.1-29.;
1&.1
World287.6
DV?45.
25.3(EEC
170.1)us
19.1NOR
15.0CAK
11.9DAli
6.?
5.9ESP
5.7PHlL
5.0
World692.1
DV?206.4
[PTA159.L
(EEC151,.2)
CR52.2
SUP46.7
15471.1
NT5S35.2
FOR30.9
PHI.24.5
CAN17.0
BRA14.8
MSS14.3
World51.9oHS18.1
S.1EEC
7.9
RVI
5.-1ZSP
4i'S.f'
WI113.2OHS
18.5
14.?)
'EC69.8)iDAN
~m
9.4
~SP2.8ESP
1.6RUNl
1.5lIlA1.5
py?1.4
World180.7
56.2EFTA
27.5(EEC.
49.1)CAN
CAN13.9
Ls13.4
7.5500
6.MY
3.8NAA
3.7
wrld7.9OHS
EEC3.8
[VIAOK#
.1
I.- - -~~XPRTI -I24 247(242) 248(243)1 634(631) 635(6321
WOO MO. WOO. VENEER, 1OOjLUWBER, MROG, SHAPED, jPLYWOOD, MANUFAC-CORK SQUARED WAORO jETC. lURES
World95.8
OV6
5.0(EEC
es.ESP
0.CAN
0.5
0.4AUG
0.4ARE
0.1us
0C.1
0.1
World54.9OV? 4..1
EVIA31,1
(EEC18.2)
SAD0.7
ESP0.5
!GA0.
C"PV.3
AREC.?
1W40.3
2KB0.2
World9.8
Oro0.4
[VIA0.4.
(EEC8.0)
EBY0 3
world8.2
OHS1.0[ViA6.3
(EEC5.9)
ESP0.4
IIND2KB
C.?
[1.2
AMG0.1
73.3LIV?
rP,6
2.5(EEC
68.7)ESP
0.6CAN
C1.5£15
V.4ARE
0.1
World14.2
MV2.3
(EEC11.41)
SAU0.7
I&A ti.3SLE
0.2KWlT0.2
CYP0.1
:"417d.82.2
(EEC42.6)
us0.1
MIZ0.6
[6Y0.5
WSY0.4
ARE0.2
~A80.1
RON0.1
44.7DV?
11.7EFTA .(EEC
44.3)us
2.8WGA
2.7SAU
1.2I1D
1.0ARE
1.0CAll
V.AE6Y
0.5
90.7
9.2EVTl
:1.6[EEC
8;.1)SAD
3.7 IISGA
2.8ESP
0.5[6Y
0.602A
0.1WO
0.4AKE
0.4
World98.1'
DVG44.43.8
(EEC1'4.0)
SAD12.4
16A6.6
02W3.2
DO A2.5
SON1.5
1.41
AE1.4
World World World World
EEC0.1
WOOPULP
2.1 251
PULP, PULP.VASTE WASTEPAPER PAIPER
ibond Werld32C.2 42.1
V?h[VIA [rik
122.5 l.Z!(EEC (EEC
56.4) 40.4)
63.5 0.5cA YIX7
53.5 0.1BRA
1c.9
7.5[SP
3.1CHR
1.0CUB
0.6
World World880.2 28.0
39.1. 1.2[VIA [FTA
4345.1 4.8(EEC (EEC
11.7) ?O.?)
CAN [SP155.5 0.4
7~A 0.3MAN PCI.
USSR7.3
ESP
CHI.
21.8
11.6.USSR3.3
3.0SWECAN
0.8
L.6!TA
C.?!
CORK and CORK VAJACIOURES
LCDAY. CORKI .ICOR K70RAW. IKANAV£- jRAN. IIJ.ANUAC-II.WA~iEVUMESI I.WASTE jIDIESkorld ;IWorld1. 4.
EFI AI1.0
(EECC.7)
PRY1.0
World I2.6
2.?
PRl[SP
'.3
0.2
world0.2
[VT A2.9
(EECiPY1.6)
2.8
v.2
world16.7
MV
EVILA14.?
([[11C .7)
P0714.C[3:
1 .(I
IWorld0.3
PIT0.2
i.I -
(EEcC .?)
0.i
.2 1 1.2
EFIA'
I1.0)
e.orld11.;
?3.6
EFnI'¶01
I BY0
0.7
0.1.
I 0.34214
0.?
w,--le WorldEl
I
- I I -L i i i 4I i i i. i i i I I
I I .i . i i---- i i IL-- I I I i 4 v i I
i : i i I
I
III
. II

MDF/W/52Page 149
Aw M PeOUCTS
I ImPORTS
i J -i24t (243) 1W0M 1635(6i3231 tooC, mm. ;
CMINI
jLuw. m1 OWED,* u.001 IScEU ;aRMP
FINLAW worlj drls dorld/'81 141 23.8 11.2
3.1 @ 3.1EFTA EFTA EFA
3.0 0.3 1.5EEC EEC
4.8 2.5USSR USSR CM
114.2 23.0 1.5Us US
9.8 1.1POL CM
3.5 1.0CAN CIV
1.5 1.0CHR I A
1.0 0.5CIV am1
1.0 0.5JPN POL
0.5 0.5
World2.0
DVG1.0
EEC1.0
1.0
World World2.0
OVE1.0
EEC1.0
ZAR1.0
79EEM. MOPLIWMD, afZ-MT. TM
World
12.6DY6
2.3EnA
3.0
EEC5.3
2.9aEU
3.0US
1.1SEP
0.5
CN
0.7
THIs0.3
World25.6
DYG0.3
EFTA14.3
EEC4.3
USSR2.4
1.2TUE
0.6GM9
0.3CAN
0.2KYS
0.2
KAO0.2
World IMe-ld. 1.5
EEC1.5
(36) GARBIA JWorld World World World World/J77 I. . . 0.1 0.2
Cf. t37?below
W WW_~~~~~~~~~~~~~~~~~ _
'-7; 1,, World World World Woerld ilerld
_9
EXMORTS
24 247(242) 2W(243)_ 6JS(Q2)
woo. i NO I,MIO. VEt,. 'OOLWR, tOC N, SIAD, PLYIOD, PAMJFAC.CORk SQUAED WHOD ETC. YUlES
World World World World Worldl ,;'-.' 114.3 915.3 352.2 115.2E OVE DOG OV6E 1G213.0 61.3 151.7 62.5 34.3
ariA ETA EFTA EFTA EFTA14.1 24.6 49.3 62.2 27.3
EEC EEC EEC EEC EECo96.2 22.0 673.9 197.9 22.2
EGT MEY BYT Su1 USSR55.5 18.4 37.1 18.4 25.5
0ZA I01 02Y lR0 1R033.7 10.9 31.0 15.0 11.5
190 SAU Il USSR ARG28.7 5.9 27.6 10.5 10.2
LIY LIT ISR US LIT23.6 8.3 19.5 9.6 7.0
In SYR TUN IRI SA322.0 7.4 16.2 5.6 1.4
ISO IUN LTY EGY DZA20.4 5.1 15.3 6.2 1.3
SIU LOU ESP MR US17.5 1.2 14.9 5.7 1.0
World dWorld World World World112.5 111.4 1.1 7.4 _
DO6 0V6 DYE DV69.5 9.3 0.2 0.1
EEC(9) EEC(9) EEC(9) EEC66.2 65.3 0.9 7.2
GRC GIC LON12.e 12.5 0.2
ISR IS110.2 10.1
ESP ESP7.9 7.9
"AR NAP4.7 4.7
LII LBI3.5 3.3
PN A2.1 2.1
ERA EFA2.0 2.0
World World World orld World
World World World world lorld61.4 39.4 22.1 3.1
DVE DVY DY6 V62.7 1.2 1.5 0.6
EEC EEC EEC EC49.9 32.3 17.6 2.4
USSR USSR ES? i2.6 2.6 1.3 0.5
2.2 1.5 1.0uG ESP CP
1.9 0.9 0.4usi EGY G68
1.3 0.9 0.4
0.9 0.3 0.31ZL US SA
0.4 0.2 0.3P 60
0.4 0.1
WOOOJfULP ;' vad CORK MANUFCTURES
IWMTS WORTSEII EpOS251 251 244 4i
UL, IIPULP. Z" ;,;K;S I|K, '"'RK IWASTE WASTE oI .CA . FACI.IV, DCu;P5PIA PAPER '-.RSAE
derld World bor!5 World World world21.0 526.6|VM8V * 1 16| *
0.6
ERTA ER A EFTA7.1 k0.3 1.2
EEC. USSR EEC0.6 117.2 0.1
CMN PAT
7.2 15.0 0.6
ZAF CNM SWE4.3 13.5 0.6
IRA Ion ESP0.6 13.1 0.2
RON ESP0.4 10.6
WA
5.4
Id r5.1
IWorld I World World W9orld I d r'd lWor1d
World
World
World
World
I .
World World World World
World world World World
I
I, I I _
II
..
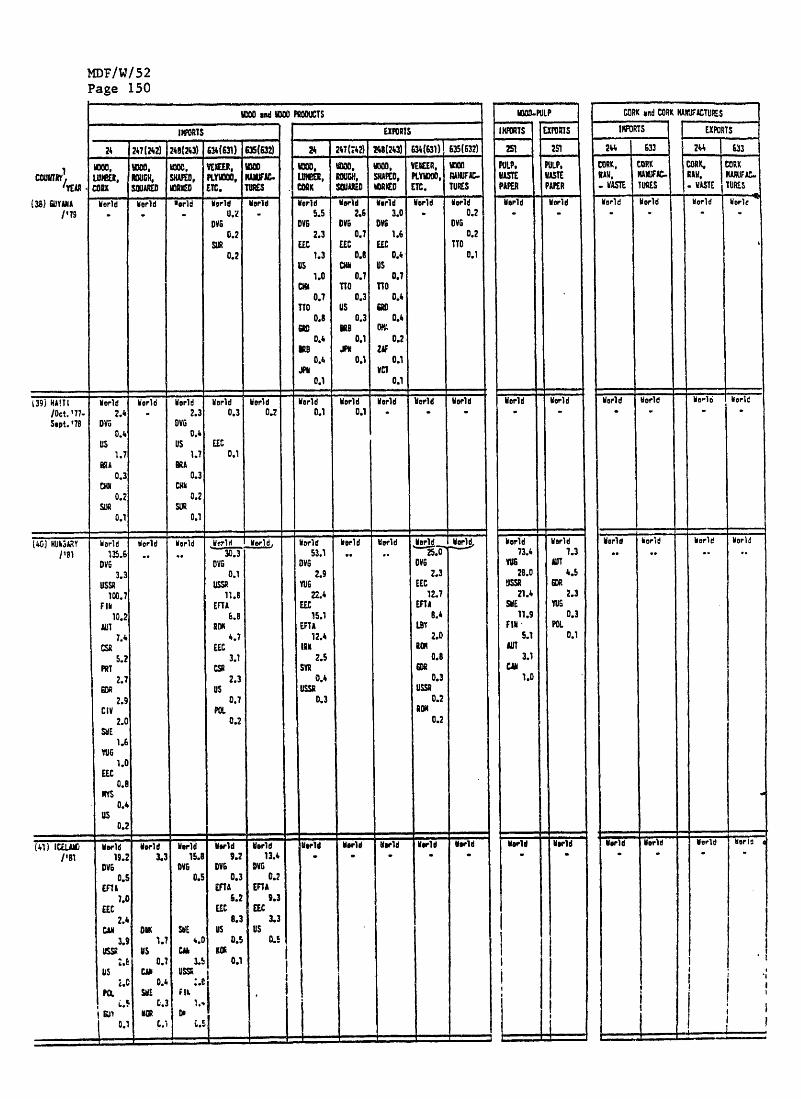
WOOD and WOOD PRODUCTS
24 247(242) 248(243)634(631)635(632)WOOD, WOOD, WOOD VENEER,WOODLOMBER, ROUGH, SHAPED, PLYWOODKANUFAC,CORX, SOUAREDWORKEDETC, TURESWorld World *arld World
DV60.2
SUR0.2
World
EXPORTS.24 247(242) 246(243) 634(631) 635(632)WOOD WOOD, WOOD, VUEER, WOODLUMBER, ROUGH, SHAPED, PLYWOOD, PAUTUFACCORKSOUARED ETC,TOURES ETC. lURESWorld
5.5DV6
2.3EEC
1.3US
1.0cm
0.7TTO
0.80.4
MRB0.4
JPN0.1
World2,6
DVG0.7
EEC0.8
cm0.7
TTO0.3
US0.3
BRB0.1
0.1
World3.0DGG1.6
EEC0.4
us0.7
TTO0.4
OMK0.2
0.1ZAF
DO
World World0.2
DVG0.2
TTO0.1
(39) HAITI World World World World World World World World World World/Oct. '77. 2.4 - 2.3 0.3 0.2 0.1 0.1Sept. '78 DVG DVG
0.4 0.4US US EEC1.7 1.7 0.1
0.3 0.3CNN CNN
0.2 0.2SUR SUR
0.1 0.1
(40) HUNGARY World World World World World World World World/I'81 135.6 .. .. 30.3 53.1 .. .. 25.
DV6 DVG DVG DVG3.3 0.1 2.9 2.3
USSR USSR YUG EEC100.7 11.8 22.4 12.7
FIN EFTA EEC EFTA10.2 6.8 15.1 6.4
AUT ROM EFTA LBY7.4 4.7 12.4 2.0
CSR EEC IRK ROM5.2 3.1 2.5 0.8
PRT CSR SYR GOR2.7 2.3 0.4 0.3
GOR US USSR USSR2.9 0.7 0.3 0.2
CIV P0L ROM2.0 0.2 0.2
SWE1.6
YUG1.0
EEC0.8
0.4
0.2
(41) ICELAND World World World World World World World World World World/1'1 19.2 3.3 15.8 9.2 13.4 . -
DVG DVG DVG DWG0.5 0.5 0.3 C.2
EFTA EfA EFlA7.0 6.2 9.3
EEC EEC EMC2.4 8.3 3.3
CAN DMK SWE US US3.9 1.7 4.0 0.5 0.5
USSR US CAA GOG2.5 0.7 3.5 0.1
2.0 0.4 USSRPOL SWE FIN
0.5 0.30.31.0
0.1 0.10.5
WOOD-PULPIMORTS EXPORTS
251 251PULP. PULP,WASTE WASTEPAM PAPERWorld World
World
World73.4
YUG28.0
USSR21.4
SME111.9FIN
5.1AUT3.1
CAN1.0
World
World
World7.3
4.5GDR
2.3YUS
0.3POL
0.1
World
CORK aind CORK MANUFACTURESIMORTS EXPORTS
244 633 224 633CORK, CORK CORK, CORKRAW, MUFAC- RAW, MANUFAC-
WASTE TURES WASTE TURESWorld World World lone
World World World world
World World World World
.. .. .. ..
World World World World
MDF/W/52Page 150
COUNTRYI
(38) GUYANA/*79

MDF/W/52Page 151
WOOD and WOOD PRODUCTS
INMORTS24 247(242)248(243)604(63)635(632)
in WOOD,WOOD, VEMEER,WOODLUMBER,ACUGN, SMAPED, PLYWOOD, MANUFAC.,CORK SOUARED VOUREDETC. TURES
World7.11
DVG6.2
NPlL6.2
PRT1.3
EEC1.2
World0.1
World
82.8
DV10.2FIN
23.5
FRA13.5
GAB9.0
RON
8.1
YUG
5.8
SWE3.7
US
3.6
PRT
3.5
World3.5
3.5NPL.
3.5
World
25.7
DVG
9.3
FRA12.7
GAB
8.9
UK1.0
FIN
0.9
0.6
CIV
0.4
SNE
0.4
World2.6
DVG2.4
NPL2.4
EEC0.1
World
World57.0
DVG0.9
FIN24.4
RON8.0
YUG5.8
US3.6
PRT3.5
AUF1.5
CAN1.4
FRA0.8
World0.2
EEC0.2
World0.8
DVG0.3
EEC
SGP
0.1
World
15.4DVG
1.8
YUG6.6
RON
2.4
UK1.8
DVG1.0
SGP
0.8
NKG0.5
2AF0.4
CAN0.3
W0rld0.6
EEC0.6
World2.2
DVG0.4
AUS1.0
US0.3
SGP0.1
KOR0.1
EEC0.1
World13.8
DVG1.5
YUG6.5
DEU1.1
RON1.0
SWE0.8
BRA0.8
ITA0.8
FIN0.6
US0.4
EXPORTS
24 247(242) 248(243) 634(631) 635(632)WOOD, WOOD, WOOD, VENEER, WOODLUMBERROUGH, SHAPED, PLAYWOOD MANUFAC-CORK SOUARED WORKED ETC, TOURES
World9.0
DVG4.7
JPN3.8
PAK1.3
SGP0.6
SOM0.6
SAB0.4
HKG0.4
ARE0.3
OMN0.3
World
556.0DYG
189.5JPN
278.3EEC
79.6CAN
68.0SGP
45.8
21.7
19.8NYS
16.1SMU
2.7
World
0.4
DVG0.3
World
3.6PAK
1.0SGP
0.6
0.6SAU
0.4WKG
0.4OMM
0.3IRO
0.2
DVG87.3
JPN239.6OAM49.3
16.7
12.3HKG
2.0EEC
0.9LKA
0.7
2.7
World
World0.6
DVG
World221.4
DVG98.1
EEC78.8
JPN37.3
SGP32.4
THA15.9
OAM15.0
HKG7.9
KOR3.1
SAI
World
0.4
0.4
World11.2
5.5
1.8EEC
1.6IRO
1.4WKG
0.9USSR0.8OPM
0.7SYE
0.5US
0.4
World316.1
DVG203.9
SEP61.6
US55.5
SAU37.5
EEC
JPN19.4
KWT8.5
BUL3.3
OMN2.0
World
12.6
DVG
0.9
BLD7.5
UK
3.0
BLX0.5
CYP0.5
ITA0.2
NGA0.2
World7.3
OVG5.0
KWT1.8
EEC1.1
ARE0.8
JPN0.7
IRO0.5
US0.5
SAU0.4
OAT0.3
World6.7
1.2EEC
3.0JPN
1.4US
0.9SGP
0.6HKG
0.4
World
0.9
EEC
0.4
US 0.3
CHE 0.1
WOOD-PULPIMPORTS EXPORTS
251 251
PULP, PULP.WASTE WASTEPAPER PAPER
World World30.7
US9.8
CAN9.8
SVE
FRA1.0
NOR0.9
FIN
CHE0.2
SLF0.2
World World83.1
DVG25.4
US28.4
DAN17.1
FIN3.2
SWE5.7
BRA4.6
NZL3.2
CHL2.4
1.3
World World38.0
SME13.5
FIN10.0
US5.4
PRT5.3
CAN3.5
244 533 244633
RAW MANUFAC0- RAWWASTE TURES -WASTE TURES
World worldworld world
PRT1.3
World
EEC0.2
World0.6
PRT0.2
AUS0.1
World World
EEC
0.4
PRT0.2
World
World
World
World
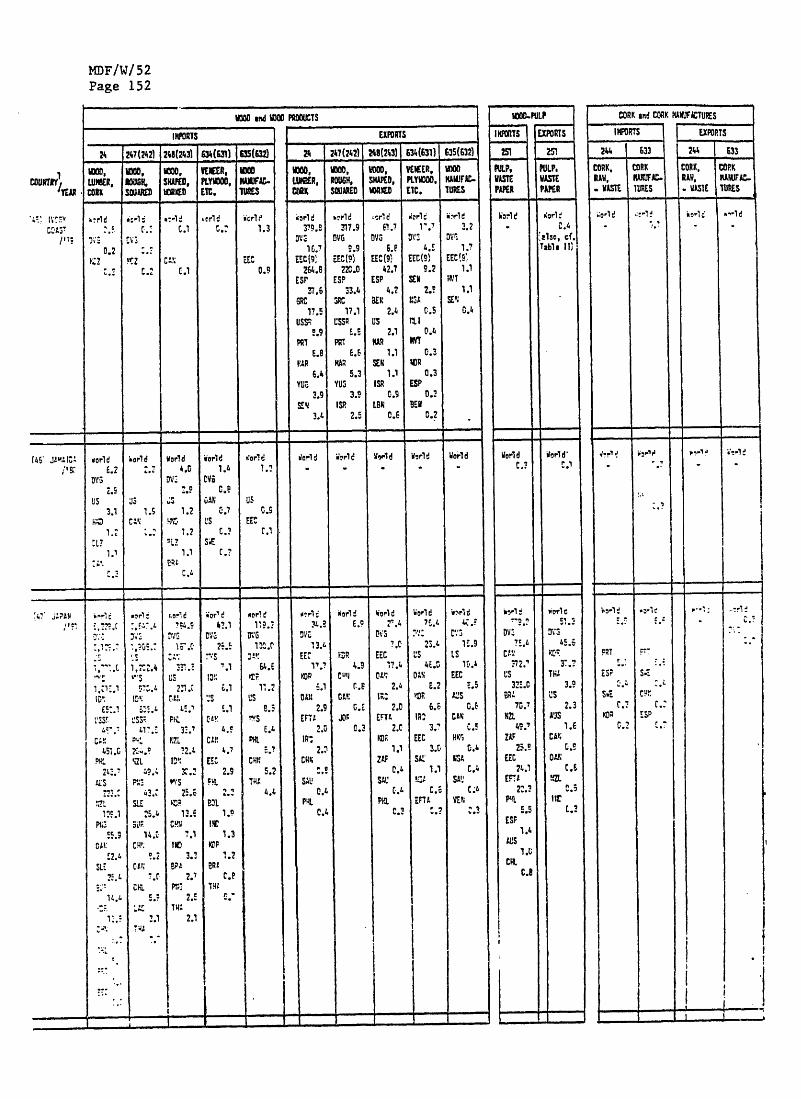
MDF/W/ 52Page 152
WOOD end WOODPRODUCTS
IMPORTS
24 247(2421 248(243) 634(631) 635(632)WOOD, WOOD, WOOD, VENEER, WOODLUMBER, ROUGH, SHPAED, PLAYWOOD MANUFAC-CORK SOURED WORKEDETC TURES
world
0.2YRZ
0.2
0.20.3
0.2 0.1EES
0.8
EXPORTS
24 247(42) 248(243) 634(631) 635(632)WOOD, WOOD, WOOD, VENEER, WOOD
LUMBER ROUGH, SHAPED, PLAYWOOD,MANUFAC-CORKSHPAED WORKED ETC. TOURES
DVG16.7
EEC (9)264.8
ESP37.6
GRC17.5
USSRR.9
E.8MAR
6.4
E.8
3.9
SEU3.9
317.9DYG
9.9EEC(9)
222.0
ESP33.4
SAC
17.1USSR
PRT8.5
KAR5.3
YUG3.9
ISP
2.5
World61.76.8
EEC(9)42.7
ESP4.2
BEN2.4
US
2.1MAR
1.1SEN
1.1ISR
0.9
0.6
1.7DVG
4.5EEC(9)
9.2
2.NGA
0.5
0.4MVT
0.3NOR
0.3ESP
0.3BEN
0.2
World3.2
EEC(9)1.1
HVT1.1
SEN0.4
(45' JM4104 World world World World World World World World World World/'8: E.2 2.2 4.0 1.41.2
2.9 2.9 0.8
US US US GAN US3.1 1.S 1.2 0.7 0.5
HMD CAN MNG US EEC
1.2 1.2 0.2 0.1
1.0 1.1 0.7
DVG DVG DVG DVG DVGDVG DVG DVG
US. 1,202.4 331.8 64.6 11.7 4.9 17.4 48.0 10.4
US US IONKOR CHJ 049, DAN EEC
1,018.1 970.4 0.1 6.1 0.8 2.4 E.2 E.5US US DAN CAN IRO VDE AUS
652.1 635.4 45.1 6.1 8.5 2.9 G.E 2.0 6.6 0.8
USSR USSRPHL DAN VVS JOGEETA IRO CAN457.3 417.5 33.7 4.8E.4 2.0 0.3 2.0 3.7 0.5
CANPHLCANPHLIRQ HKG451.0 224.8 4.7 2.0 3.0 0.4 0.4
PHL NZL IDN EEC CHN CHK ZAF SAR NBA30.2 2.9 5.2 0.6 1.1 0.400
ALS PWS VVS PHL THA SAV SAU NBA SAU223.5 25.6 2.3 4.4 0.4 0.5 0.4
NZL SLE KOR BOL PHL PPL EETA VER
109.1 25.4 13.6 1.9 0.4 0.3 2.2 .3
55.3 14.0 1.1 1.3OAN CHR IND KDP
26.4CAN BPA CAP26.4 7.6 2.7 0.8
WOOD-PLUP
INMORTS EXPORTS
251 251PLUP, PULP,WASTE WASTEPAPER PAPER
world World0.4
also. cf.Table II)
World
0.7
World.DVG
75.475.4
US326.0
US
25.9820.
ZAF
25.9
EEC24.1
5.5
ESF1.4
1.0CHL
0.8
1.1
51.8
3.9US
2.3AUS
1.6
0.8
DAN 0.60.5
HE
0.8
CORK and CORK MANFACTURESIMPORTS EXPORTS
244 633 244 633
CORK. CORK CORK, CORK
RAW, MANUFAC- RAW, MANUFAC-
-WASTE -WASTE TURESWorld world
KOR ESP
I
worldworld world0.1 0.1 1 .3

WOOD and WOOD PRODUCTS
IMPORTS
24 247(242) 248(243)634(631)635(632)WOOD, WOOD WOOD, VEMEER, WOOD
LUMBER, ROUGH, SHAPED, PLAYWODMANUFAC-CORK SOURED WORKED ETC TURES
EXPORTS
24 247(242), 248(24)634(631) 635(632)WOOD,WOOD,VENEER,LUBER, ROUGH, SHAPED, PLYWOOD, MANUFAC-CORK SOUARED WORKED EYC, TURES
World World World1.8 1.4
YEN0.4
EEC
C.3
0.2
C.9
IV,
0.5.
0.2
USA
0.1
DVG1
SAU
0.7EEC
0.2
.2)DREA RED World World World World World World World World World
DVG DVG DVG DV G DVG DVG DVG DVG DVG DVG551.2 542.0 16.2 6.9 1.1 30.3 0.3 30.4 174.2 16.9
VVS VVS US JPN JPN SAU SYR SAU US JPN
. JPN JPN SAU SAUS US THA SGP SYR LBV EEC US
EETA BAT ARE BATUSEBT DAN LBY
52.5 .3.2 2.4 2.3 0.3~~~~ 0.352.7 23.7 15.3 !0.2 14.1DANDAN
5.2 3.9 2.3 0.3 0.2FIN DAN
2.0 0.2
US VCR VER
YUG GEU
1Includes $1.3 fuelwood and charcoal
W00D-PULP
IMPORTS EXPORTS
PULP. PULP,
WASTE WASTE,
PAPER PAPER
World .
3.2
42.2
JPN
CHL
YZL
ZAF.10.5
SYE'
CAN
0.8
DVG
0.2
YUJ0.1
0.1
World
MDF/W/52Page 153
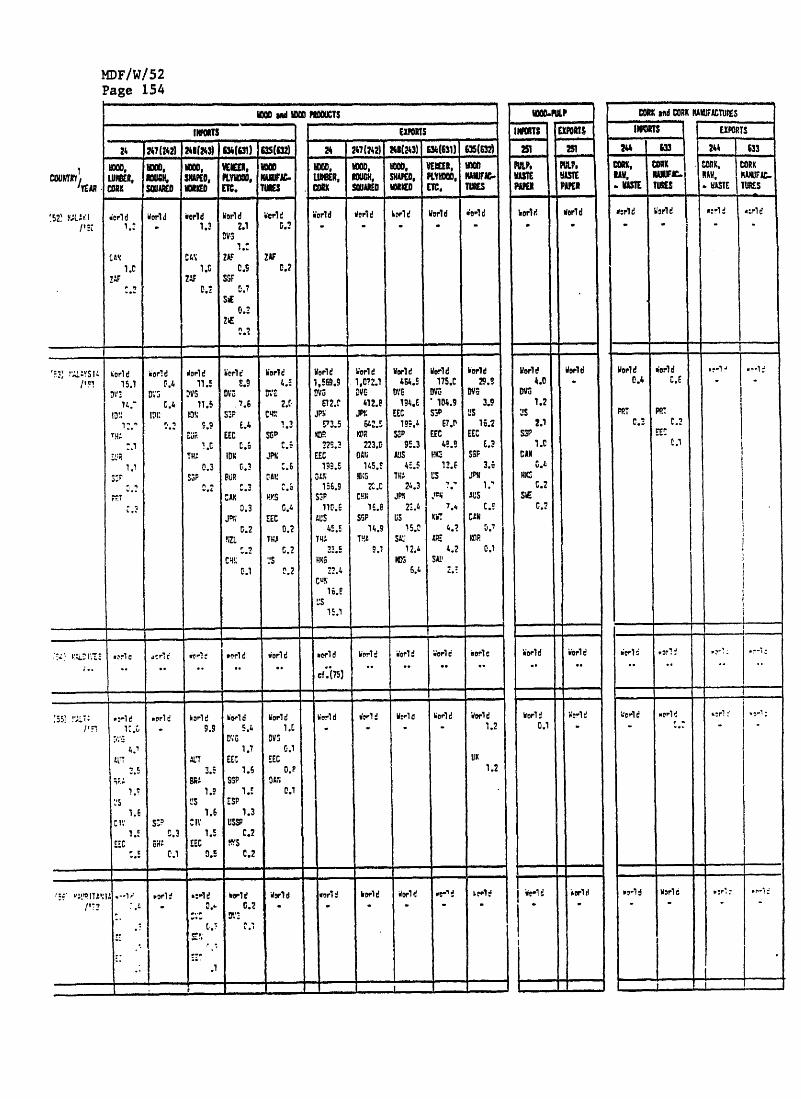
MDF/W/52Page 154
WOOD AND WOODPRODUCTSIMPORTS
24 247(422) 248(243) 634631) 635(632)WOOD WOOD WOOD, VEMEER, WOODLUMBER ROUGH, SNAPED, PLAYWOOD MANUFAC-CORK SOUARED ETC. TURES
World1.0
1.0
0.2
World World1.3
CAN1.0
0.2
World2.1
DVGi
ZAP0.9
SGF0.7
SAE0.2
0.2
World0.2
ZAF0.2
EXPORTS24 247(242) 248(243) 634(631) 635(632)WOOD,WOOD,WOOOD, VEEMEER WOOD
LUMBER, ROUGH, SHAPED PLAYWOODMENUFAC-CORK SOUARED WORKED EYC. TURES
World World World World World World
World15.1
DVG.14.7
IDN:12.0
THA.0.1
EUR1.1
0.2PRT
0.3
Worl d0.4
0.4IDN 9.2
world11.5
DVG11.5
9.9DUR1.0
0.3SGP
World6.9
7.6SEP
6.4EEC
0.6IDN
0.3
AP0.3
JPN0.2
NZL
0.1
World
2.51.3
SGP
0.60.60.6
HKS
EEC0.2
THA0.2
0.2
World1,569.9DVG
E12.0JPN
573.5
EEC199.5
156.9SSP110.6
AUS
THA45.533.5
HKG22.4
CUP16.5
US
15.1
World1,072.1DVG
412.8JPNJPN
642.5223.8145.8
20.0CHN
16.8SSP
14.9THA
9.1
World
194.4EEC
SGP95.3
AUS
24.3JPN
23.4US
15.0SAU
12.4
6.4
Worl175.C
DVG104.9
SSP67.0
EEC42.8
HKS12.6
US7.77.4
4.2ARE4.2
SAU
world29.5
DVG3.9
US16.2
EEC0.8
SGF3.6
JPN1,7AUS0.8
CAN0.7
0.1
WorldWorld World World World World World World World
WorldWorldWorld World World World WorldWorld World World/*51 10.0 - 9.9 5.4 1.0 1.2
DVG DVG1.7 C0.1
AT ALT EE50 EEC UK
3.5 3.5 1.6 0.8 1.2
1.0 1.5 0.1
1.6 1.6 1.3
1.5 0.3 1.5 0.2EEC GHA EEC VYS
0.5 0.1 0.5 0.2
world World World world world world world world world
COUNTRY
CAN
WOOD-PULPIMPORTS EXPORTS
251
PULP, PULP,
WASTE WASTEPAPER PAPER
World world
World World
4.0/'57 DVG1.2
2.1
1.0CAN
0.4.HKS
0.2SWE
0.2
world
world0.1

MDF/W/ 52Page 155
WOOD and WOO PROUCTS
INPORTS
24 247(242) 241(243) 634(631)635(632)WOOD WOOD, WOOD, VEMMER, WOODLUMBER,ROUGH SHAPED, PLAYWOOD MANUFAC-CORK SQAURED WORKEDEYC, TOURES
DVG
ZAF
0.2
IND0.1
EXPORTS
247(242) 248(243) 634(631) 635(632)WOOD, WOOD, WOOD, VEMEER, WOODLUMBER, ROUGH SHPAED, PLYWOOD, MANUFAC-CORK SQUARED WORKED ETC. TUNES
World World World World Worl World World World World World1.9 11.5 5.4 3.2 32.1 32.1 63.9 42.4 13.4
5.21.3 0.3 6.9 0.4 4.6 9.9AUS AUS AUS JPN JPN JPN AUS AUS .
CAR CAN EEC US AUS CHN JPN AGS
1.7 0.50.4 1.6 0.3 1.7 4.9 1.1US SSP DAN NCL EEC
GHAEECEEC1.0 0.4 0.8 0.7
0.8 0.6 0.7PVG ZAF SSP EEC PVGworld World World World World World World World world World
.7 1.0 0.5 0.5 2.: .
0.2 1.4 , . 01CRI CRI EEC JPN SLV GTM
EEC SLV ESP PAN CRI0.2 0.2 0.1 0.2 0.6
PAN EEC EEC SLV0.2 0.1 0.1 0.5
ESP RND0.2 0.4
-WorldWorld world World World World World World WorldWorld
DVG DVG DVG... 0.30.3. 0.3
CIV CIV CIV EEC0.2 0.7 .
EEC ESP
WOOD-PULPIMPORTS EXPORTS
251 251
PULP. PULP.WASTE WASTEPAPER PAPER
World3.
1.4
CAN
FAN
0.4
World
14 .5
31.5
58.0
KC
EEC
World
World
CORK and CORK MANUFACTURESIMPORTS EXPORTS
244 633 244 633CORK, CORK CORK, CORKRAW. MANUFAC- RAW, MANUFAC--WASTE TURES WASTE TURES
World
1 4
YS
SUR
2.1
NYS.
0.2
1.8
1.2CAN
0.3
0.2ZAF
0.2
0.1

24 247(242) 248(243) 634(63) 635(632)WOOD, WOOD, WOOD, VENNER, WOODLUMBER, ROUGH SHAPED,PLAYWOOD, MANUFAC-CORK, SOUARED WORKED, ETC. TURES
24 247 (242) 248(243)634(631) 635(632)
LUMBER ROUGH,SHAPED PLAYWOODMANUFAC-CORK SOUARED, WORKED ETC.TURES
.
WorldWorld WorldWorld
PRT PPT
ESP
MDF/W/52Page 156
IMPORTS EXPORTS
PULP, PULP,
World World7.2
DVG0.2
SWE5.0
EEC0.7
US0.2
ARG0.7
CAN0.2
JPN0.1
CORK and CORKMANUFACTURESIMPORTS EXPORTS
244- 633 244 633CORK, CORK CORK, CORKRAW, MANUFAC- RAW, MANUFAC-
WASTE TURES WASTE TURESYEAR-
world4.6
0.7EEC
1.0
DAK0.5
0.2
World
DVG0.5EEC
1.5
1.0FIN'
0.9CAN
0.5
World0.2
EEC0.2
29.5DVG
EEC
5.1SVE
3.4POL
1.9
1.51.3
CIV0.9
CA0.9
World7.8
DVG0.7
E'EG4.8
US1.1
SAE1.0
FIN0.3
AUT
0.2BRA 0.7
World World World World World World World
UK0.7
World98.2DVG
34.4
241.7DVG
EETA15.4
USSR
POL11.2
GER7.6
ESP
1.2
0.7
World
6.7EETA
ESP
BRA
.
2.2
1.2
IDH
118.6
EEC6.6
UG4.0
1.6
1.11.8CAS.
ADS.0.3
13.640.3
KPR
NYS0.8
USSR
World70.2
2.1EETA
EEC12.5
1.70.4
SGP.
0.8t.?
NYS
80.4
0.1EETA
41.7EEC
35.0
0.6
World
EETA
EEC
EETA
EEC
World
0.1EETA
4.7EEC
6.3
36.3
EETA
EECDYA
0.7ESY
0.3US
GMB0.1
World World0.1
World
0.1
EETA11.5
World0.2PS
NYS4.7
?.I.
1.4
SSP
World
4.6
sur1.
World
DVG
1.1
0.7EEC
CAF0.7
World World World World World
WOOD and WOOD PRODUCTS

IMPORTS
24 247(242) 248(243) 634(631) 635(632)WOOD, WOOD, WOOD, VEEMER WOODLUMBER, ROUGH SHPAEDPLYWOOD, MANUFAC-CORK SQUARED WORKED ETC. TUNES
World
DVG
LAFTA0.9
LAFTA
4.0US 4.0CHL
0.4
World39.5
EFTA1 .1
0.3.0.1
US
World0.3
AUS
World4.0
DVG
LAFTA0.8
US3.4
CHL0.5
0.4.
World0.3
US0.3
FIN1.9
SWE0.4
US
EEC0.1
World0.4
EEC
WORLD1.7
LAFTA1.7
LAFTA
0.3
BRA
0.1CHL
0.1
World0.3
DVG0.1
EXPORTS
24 247(242) 248(243) 634(631) 635(632)WOOD WOOD WOOD, VENNER, WOODLUMBER ROUGH, SHAPED, PLAYWOOD MANUFAC-CORK SQUARED WORKED ETC. TOURES
1.4US
1.3EEC
0.6ESP
0.4CHE
0.2
World208.2
DVG
88.5EEC
68.3US
15.5CAN
12.6AUS
11.7
5.0SGP
1.5HKG
1.2
World
world76.1
GVG15.4
J?N55.0
OAN10.6
EEC5.7
4.9
World5.0
OVG
USSR3.7
EEC0.5
0.3
USSR27.8
US0.1
World44.4
DVG0.1
USSR39.0
RCM3.5
BUL1.3
EFTA0.3
EEC0.1
0.1
world
1.2EEC
0.3USSR
0.2CSR
0.1VHM
0.1
World138.2
DVG16.1
EEC75.3
EFTA40.3
SYR6.1
RCM4.4
DZA1.2
YUG1.0
World3.7
EEC2.0
MAR0.9
TUN0.8
World4.0
DVG1.5
LAFTA1.5
VEN1.4
US1.3
EEC0.6
ESP0.4
CHE0.2
World125.8
6.8EEC
JPN29.3
US15.2
AUS11.7
YUG3.2
ESP2.8
DAN
SEP1.5
World88.7
DVG
EEC66.7
DZA3.1
EFTA6.1
SYR6.1
USSR0.6
IRQ0.2
World7.52.3
LAFTA2.3
4.8VEN
1.3COL
0.8ESP
0.3CHL
0.1ECU
0.1
World156.4
DVG29.4
US82.5.
EEC34.6
HKG27.5
JPN3.33.1
CAN2.7
ISR0.8
CHE0.3
World25.3
DVG4.7
EEC17.3
MGA2.6
EFTA2.0
EGY1.1
IRN0.9
US0.8
SDR0.4
World39.9
US15.7
EEC
JPN5.6
AUS 4.3CAN
ESP0.3
HKS0.3
SGP0.3
World7.4
DVG0.6
EEC3.1
EFTA1.0
US0.9
CSR0.7
HUN0.6
DZA0.3
CUB0.3
WOOD-PULP
PULP.WASTEPAPER
World28.5
OVG14.8
LAFTA14.8
CHL13.5
ZAFUS
3.9CAN
3.6
1.3
World37.0
DVG7.1
US
NZL
CAN4.6
HKG1.0
ZAF
AUS0.7
JPN
:
World64.7
USSR28.5
EFTA26.1
ESP0.1
WOODand WOODPRODUCTS
MDF/W/52Page 157
-PULPEXPORTS
251
PAPERWASTEPAPER
World
World10.7
DVG1.9
JPN
EEC3.3KOR,
CAN0.4
IDN0.2
IND0.2
World0.2
AUT0.1
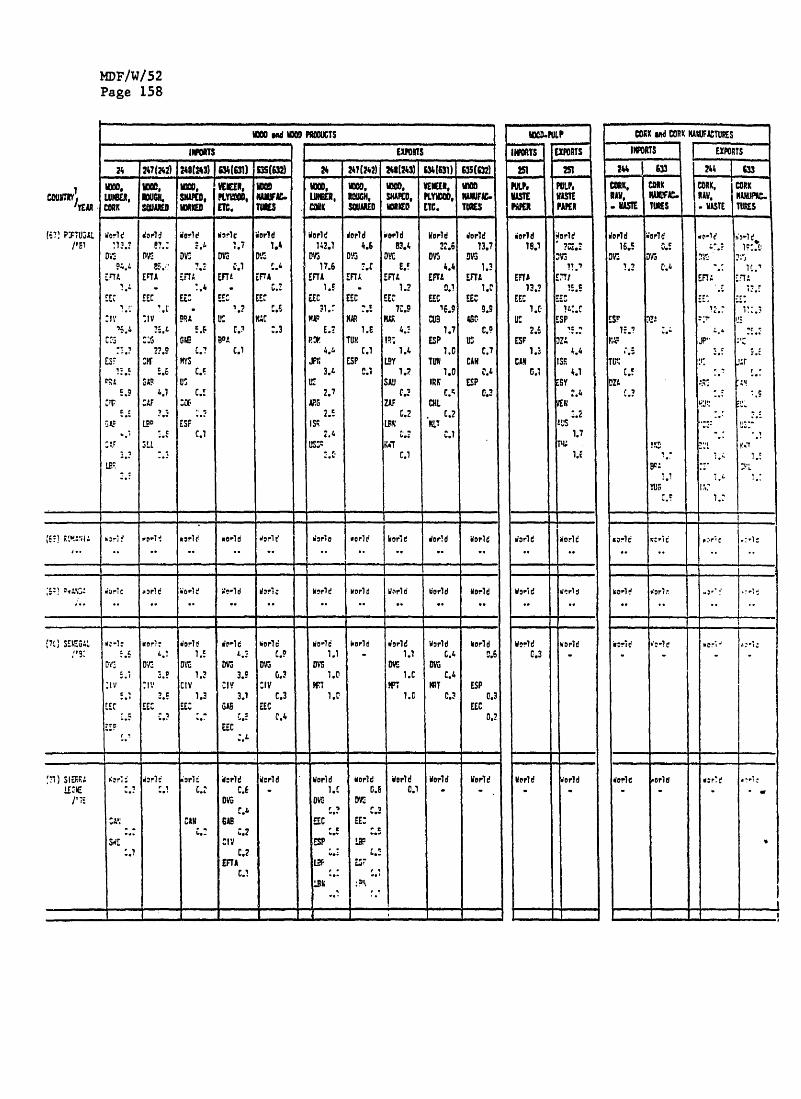
MDF/W/52Page 158
nODNW M FISWeS
INFOIITS-24 247(242) 243(243) 31 __(_2)
000, W , VIVO. VLUIlD, IMUCII SiwAED, PML , INMKFAC.CORK DE0D 00 MET. .T. S
Wo~rldr
r;D'4.I~..Ut
E1.:
,..
ES-;
t.'..
'1F
LB:.
World
1?v5e.;:
.I.EI
?'.L':lv
':
?.P.::s "7
..6
GA!'
4.1ATJ
*.'0C
?.-.LPD .eIi!LL
:i
told^..7.:--.4
EE
PR;!.6
MYS
C..
ESF0.1
WOrlC1.7
;.1En'
EE'
U:e.1
C.1
ii'rld1.4
0..
tCEEE.
r....MctA%3
EXPOTS
24 247(242) 24 413) W13(1) 635( )v00im, .VW IID, VE .ER, mu111r, tUCH, SHAPEO, PLY100, NAWFW.CORK SOUAKED _1_110 ETC. lURES
_olWorldrWarJ
17.6EFTA
EEC;I.'
")DE.2?
7 .y4.4
,X71;3.L
2.7ASG
2.'
7.4US..
.I.:
dorld4.6
EFTh
1..
TUN1.1
ESP0.1
sorld83.4
DVOE.!.
1.?
MAEE.;
4. '.
1.1
1.?SAU
C.2ZAIF
C.2
~..TL9K1
0.1
World20.6
4.4
0.1
EMC16.9
ma1.7
ESP
1.0
TUN1.0
IRKC.?
CHL, t.2
ITYC. I
World13.7
Dru1.3
EFTA1..
EEV9.9
US0.7
CANC.&
ESSP1C.3
,;' ! ICW:oiio-I dR-Ie oo_oleoooi dorld world
z~~~~~~~,c- 1 N -0 _ -r .- 1 ._
;.:' a:,, .,.r, cC .rcd Ior c .1d Woi: ,i21 c' world W.rlac world World
(7') SEllOGl4t ~:-1:sIxo-- so d i-ic worhd _ -la World mont' World World,"9: C.. .' 1, L o 1.1 _ 1.1 C.4 0.6
aEDlr DMt Dr) DtY DMG DWE DYVG.:.;. 1.? 30 1.3. 1.0 1.C C.4
:IV -1.1 CIV OIv :IV W7 WI VRT ESPE * ?.F 1.3 3.1 C.3 .t 1.C. C.? 0.3
?Cr EEC EE; GAS EEC EEC. - i.? :." .. r.4 D.?
EEC
_S__ir, __-W-_r_._'.71 ) SIE~F.: Woril W:-lr ..ol Orld Wcrld World worl d World World gorldLE ;.? :.10 C." r. 1.t G.8 D.1 -
DV1 OO Dr.;
CAN CAB EEC EE.:.- C.2 .7 .- C.'
S~~~~r I v~~~~~~~~ESP' L8.1 0C.? .:
EFTA _1P ES'0.M. -
I&M0.FULP
INFORS EXPORTS
weLP PULP,VASTE WASTE
iorld qorle18.1 ,?1.
EIA - IECC E
C- IL: I
ESF *2Z1
CAN I M3. 1 l~uu4.1
EGY
'.I4YU
1.6
World
..
C.3
erld
o-1-world
world
X mad CORK KANUFACTURESIWORTS | EXPORTS
7 63J 244 6CtiCORK.._ ..K I Ic Roon, NM.VI lR AN. MI .
m.ASTE ES _..USE TUNES
iorld16.!
or;
:Sr19.'.
..r,r
DZA...
!!.,i...
1 ..
i I
.eu-,
,. I
E7C:
1'.
:: !
..'.,
1.:
Il.'I.,.
I lr.{1
IC.'
1'5:
...
1.i.
9rbI. .,
I ...
.. _ *- I*-
Wo!?'b 'bo'1 ?'-.'i
.ohbl . .,-
do.1c onid _
COUJTlYI
(.'! PTF.U3AL"F,
-. . . _ I . I II I I t

WOOD and WOOD PRODUCTS
24 247(242) 248(243) 634(631)635(632)WOOD, WOOD,WOOD, VEMEER, WOOD
LUMBER, ROUGH,SHPAED, PLAYWOOD, MANUFAC-CORK SQUARED WORKEDETC. TURES
BUR BUR
Other Africa THA
NZL US
US
USSE PNG
C..T
4ZL
THA
JPN
0.1
NYS
3.8
2.15CAN
1.4
JPN
FIN
0.8
0.4
8.7
4.9HKG!
CAN
1.1
IND0.9
0.6
THA0.5
EEC
EXPORTS
24 247(242) 243(243) 634(631)635(632)WOOD, WOOD,WOOD, VENEER WOODLUMBERROUGH SHAPED, PLAYWOOD MANUFC-SQUARED WORKED ETC. TORES`
r Africa
SAU
ARE
11.4
8.8
AUS
6.5
THA6.1
8.1 96.33.6 66.4
Other Africa26.4
KUR
1.3 18.0
ARE
8.8
6.5
9.4
6.1
DVG
130.9
EEC
.2
KJT20.4
SAU
20.3
HKG
18.3
ARE
16.1
MYS8.8
US
6.2
6.0
World27.7
DVE70.6
JPN1.5
US
1.4
NYS
.0
CHN0.6
SAU0.5
('1) REP F World world World world World World World Workd world World
(74)
DVG DVC DVG DVG DVG DVG DVG DVG49.7 4.0 22.7 3.4 14.0 8.2 8.0
EFTA EEC EEC EEC DZA MAR EEC EEC
EFTA EFTA. EEC EEC EFTA EFTA
US USSR CAN PRT TUN OZA CUB LBY17.8 1.4 2.2 13.7 1.4 3.3 1.3 1.9
CRG USSR FIN US MAR ESY TUN IRN US13.2 0.4 1.4 9.2 0.2 0.7 1.0 1.9
UBR HMD CIV IND OZA CIV EGY DZA MAR
CMR THA ARG CYP EFTA TUN SAU3.8 0.1 1.2
USSR CAF PHL BRA HSD BRA JOR CHL DZA2.4 6.8 0.1 0.1 1.3 . 0.7 1.2
PRT US BRA THA USSR TUN YER EGY USSR7.9 4.9 0.1 0.1 1.1 0.1. 0.2 0.8
CIV PRT
PHL ION6.5
CAF CAN5.6 3.4
(71.) SRI LANKA.World World World World World World World World World World/'92 1.0 0.1 0.8 3.3 0.5 3.5 0.1 0.2 2.4
0.8 1.9 0.3 0.2 0.5
KYS SGP SGP EECEEC EEE EEC
MDV MDV USSR EEC JPN
0.2 YUG EFTA
--- - - - -
1lFuelvaod, charcoal $3.2 billion
WOOD-PULP
IMPORTS EXPORTS
PULP. PULP,WASTE WASTE
PAPER PAPER
world World
HKG KOR
CAN MYS0.3 1.3
0
FIN CAN0.1 0.4
SON
YEN
World
DVG
EFTA
64.0EEC
34.2
34.1
CAN
CHL
BGL
0.4
0.2
SWE
CHE
2.0
0.5:
world
DVS
1.1
69.7
EFTA
3.6
JPNIDN
0.9
MAR
0.3
HUNC3.3
World
MDF/W/ 52Page 159
World

24 247(242) 245(243) 1653(631) 635(632)WOOD, WOOD, WOOD, VENEER WOODLUMBER,ROUGH SHAPED, PLYWOODMANUFACTCORK SOURED WORKED ETC.TURES
7.Z FT;
EEC'1 71
L1
it;..se
E2I4.1EEC
I.
51.1.1
ZC.4
L7. r
20.5EEC
F-.9F
P.-
1.1
1.1-IV
EFT.441.1
16.'4E.5
2.'
1.0'
r.?
DvS.r'IC
EMEECroi.
2. C
1.1
1.1
yr!:
EXPORTS24 247(242) -241(243) 634(631)635(632)
WOOD,WOOD,WOOD, VENEER,WOODLUMBER, ROUGHSHAPED, PLYWOOD, MANUFACTCORK SQUAREDWORKED ETC. TURES
173.EMI
E:C
EGY47.7
347V
W7.ed01.3
3;.7
IC.,1E'EC
C.
150.4EFTA11.4
EEC699.71
EGY47.7
M1
rn d
00u. 9.0v
EFTA
EEC54.4
5.1
C.D
ES' I TP ~ I IRS I LSY41.7
LSYIs.C9R.5
6.3
2.7
C.?
0.3Is;
10.0LaY
15.6160
9.4P'AZ
30.iJCF.
Z.7MY
M9
0.A
0.4
C.,
W-.I 'I
EFTi.77.0
EEC
IN:L3Y
L.S
1.9
1.7
1.-%EDO
1.
I-- J 4-I- i - i. -
1.t
7.t
L40
L.'
Cl~
1.1
..
10
E'1.
J.4
4.7
E
Cr.
.5
LSL
C...F
,.CEFTA
4:.?
EEC.
4.L
C:
t.4
CCL
C..
-.1
DVY
,70
?C.
EC.
Crk
C..
Yu...
W-'.Id
DV77.109
0.1
EMI
EEC
7':-
.0.
kenld61.1
EVIL
EEC
wr?-i e14.E
:.ILErEC
I:.,.ES"
I..
52.7
1.4
0'.EEC
0.7
vss
C.,
I~..
0.1
0.1
DV30l.7
EEC
14.6.
IR.CI 1.7
0.5
C.'
,R.2
E.:
C. 1.0 .7C I.C~~~~~~~~~~-MPIS 9vI
IWORTS EXPORTS
21 251
WAST WA9tPAPER PAPER
*d 60rid
EFTi EFTA
Eic EEC
CLM ESPS.C 77.4
SR: :~7.' 10.4
1.2-602
1.3
15!.0C
I P?.:EEC
II7.'u.S
.SF!.1
92.:.
hevrldV0.:
'ssq-
14.LPI'M
11.017-.7
Cs)
Yt.
IC.?!EC
L.J!
W~I
MDF/W/ 52Page 160
MO Bad V)OO PRO(YS
CoumTRY'YEAR .
-~7: S40BE.'01
SAI.'TZZJ'..

MDF/W/52Page161andWOODPRODUCTS
247(242 260(243) 634(631) 635(632)
WOOD, WOOD, WOOD, WOOD,CORK LUMBER, ROUCH, SHAPED, PLYWOOD, MANUFAC-24 ', 1S WMJ WasM . M. MD, VEEl ILW1' IIW% MM,' FL.M KX
0__ M. .TI__
- I-~ ~
31 ! T;. ., . , . .",1~rl d e er' rl~d j~rl o 'Drl e ior', i:t*or0
.9: ;*R~~~~AEEC ;. .
wl' vzX:n., .-.: .a,, C tor7 4ol orld ilorled eod 1e.11 4-rnd&, 31, '.' ;, 11.; a.: , _ , , '.,
';: U3 uS LIS EEC !L
:..I &EL HMO M OrBn
:.N - t!SLIP 1 Q
U. ,,lY EFTA wS
N2L ZZL CAN r,;G.U__Y
T~3URISI WI d m.^Fr orl~ iorld wer1d iorl d iorl d go-Id iorls Jor7ed
WnG D#G 311G l;, rJG4.
EFTA P:L EFTA P:R £EEt EFTAs-,.7 1 ; 7CX. ~ .5
EE1. EE: FINl! PQT rW, t£C
FIN1 EfTYtUG :G6 EFTA 9UL
:.'LIP USSR° ESP MR~n
7; vCI CHL PNL
CL ESP
AN P-1 L_ __ __ ___MD)F/W/52Page 161
W. KMLP
PO PAEI
4.AN
IAj
ierl-d w1.I _ .-
SmSW
!*075
.,.
1- :
".'.'3
,
..!N..
C.!: ..
:14..I
..
.; ...4
..3
C..
301
'U;
;.1
Jorl d
I.:
C.7JP!I4
;.:
US.
..I
1.-'..
.M. C1..r.5W.t
1.5rpA
C.,*ER'
I'*
..i.
r -
L4.p: . .
Ply.%11
:npr
"C
J -;"d0.3
1'.'
u.sI.:
tSp
1.S5'
'. 3
1ESP. .,I
"I4...EE^
13.1
ME6.'.
KnT
vI,.
;.£
...3.'
'Yi
..v
..-N
d:rlt
'IS%4.
.9: dIw.
4.3uS
!.SI.AN
1.4EE:.
O.?
orld
I.!cEFTA
1.';.'.
E;P. .
I

MDF/W/52page162WOODandWOODPRODUCTSINPUTS
24 24?(242) 248(243) 634 1635(63X2WOOD, WOOD, WOOD, VERNEER, WOOD
LUMBER, ROUGH, SHAPED, PLYWOOD, MANUFAC-CORK SQUARED WORKED ETC. TURES
WorldII2.3
od
EXPORTS24 247(242) 248(243) 634(631) 635(632)
WOOD, WOOD, WOOD, VERNEER, WOODLUMBER, ROUGH, SHAPED, PLYWOOD, MANUFAC-CORK SQUARED WORKED ETC. TURES
World
7.9DYE
6.9PRO
3.7L8Y
1.3EEC
1.1SYR
0.9LAN
0.3SAU
0.2JOR.0,2
4.3
DYV4.1
PRO3.1SIR0.7
EEC0.2
LON0.1
World3.6
DVY2.7
LOY1.3
EEC0.91RO0.6
SYR0.2
LRV0.2
world3.0
IDYE7.3
RNN7.3LAY0.4
EEC0.2
World11.4
DYG10.9
8.6LB1
0.9SMR
0.51RX0.4
J£20.3
SAl0.1
(85) UGANDA World World World World World World World World IWorld World/176 0.1 . .
0.3 0.3 . , . .DYV DVG DVY
0.1 0.2 0.3KEN KEN KEN
0.1 0.2 0.hUSSR
0.1
(86) UNITED Worl d World World World World World World borld World WorldSTATES 2,223.0 35.4 2,013.0 789.0 529.6 2,372.5 1,125.9 932.9 343.6 252.4
/lei DVY DVG DVG DVG DVG Dro DYE DYEDG DEVG158.5 1.4 152.9 540.8 272.5 290.3 87.2 199.6 57.8 126.0
CAN CAN CN WAN CAN PN .1PI EEC EEC SWUZO C.0 33.9 1,943.1 172.9 194.0 1,257.0 832.2 23c.5 183.6 65.6BRA CIV BRA cAo ha EEC CNN CAN Coll CAN
61.2 0.5 61.2 160.0 138.5 297.9 89.2 215.8 75.3 64.9PHl GUY PHL KOR HEX CAN EEC YPk HEX EEC
27.7 0.3 25.4 140.7 44.4 2e5.8 56.3 13E.7 18.2 31.7IyS
Tm HYS PL EEC Cur CAo HEX EFTA JP16.1 0.2 16.6 1M8.0 31.6 89.2 54.4 55.5 12.6 15.7
EU ECU J'll IS NEX KOR AUS SAU HEX8.2 8.2 52.B 19.8 60.6 49.5 48.7 11.6 15.4
PRT BOU HEX PN16 KOR SAW SAW JPIN6.S 6.3 28.9 13.2 56.5 7,1 22.3 7.8 6.5
BOL SGP BRA TIA SWE MIX EGY CAR 9US6.3 5.5 21.3 12.4 49.6 4.1 16.2 3.5 4.2
SGP HW) EEC UKE ADS DAN ESP AIS AUS5.6 4.9 14.7, 11.2 48.9 4.1 13.6 2.3 3.1
BUR BUR EFTA P1. SAW BRA TIC 31S ESP4.9 4.8 14.5 10.8 29.8 4.0 12.0 2.2 2.9
WK6 WE IYS MO EGY DON TTO DON3.5 3.5 13.0 7.6 16.7 10.1 1.5 2.5
Oan DAN PER KOR ESP VEl TUR2.8t 2.8 5.8 6.1 15.6 7.3 1.7
PER USSR EFl To JA"1.7 4.1 5.9 12.3 7.0
EEC CRI CNN DON 9111.7 3.1 5.5 11.3 5.9
BRA YEN4.4 9.3
(87)UPPER world world world world World Worlo lC sorle ld IrldVCLY. 1.8 . 1.8 C.7 1.3 -/c', yE DVG DEu DVY
1.8 1.0 0.7 C.9F.:~~~~~N6HI 10~ CIV
0.9 .9 C.4 .S
0.9 V.9 t;. t.3
_______ - - - - - -.
IIvhichr: CICE 19.3, Ar. 9.'
WOO-PULP
IiiORTS EXPORTS
251 251
POLP. PULP.
WAST WASTE
P IPER PAPER
World World
25.7 1.2
us9.9
SWE8.2
CaN3.9
FIN1.2
SAIU1.2
EEC0.3
Worldd
World1,189.6DvY
61.1CAN1,692.1BRA
59.3EFTA
19.3EEC
3.2TUa
1.6IX
1.4
I RO I
1.2
Worldd
2,015.0
DVG56.1
EEC395.2
315.6REX
139.0KDE
129.3CHAN
68.6
DAN
62.2
VEN61.4
ZlA
EFTl35.7
ES27.3
TRA19.c
ION
17.2
15.7
_
borl W orld
I L
CORK sad CORK HAMVACTRES
24 16X EJ:MTCORK, CORK COAKRAW. jIAC. ARIfAC
WASTE TIUNES .W TUNES
World0.4
pRI0.3
World World Borld
World World world girld
World world world world7.6 33.3 C.7 4.3
DYG DYG DvG0.5 0.' 2.3
PRI PET CAN HEX6.5 24.3 C.1 1.2
IU ESP SAU CAN0.5 4.4 0.1 0.9
ESP EEC LAF1L SAU0.4 1.6 0.1 0.3
CAN EEC0.6 G.3
YUG ZLF0.3 0.2
G.1 0.1KOR G,1~~~~EGY0.1
World World World be.C!
HDF/W/52Page 162
YoR.1
(34) TU5EY World Worldp'l I 0.9 G 0.4
world
USSR0.4
USSR
0.4PRT 0.3
us
EEC2.1
0.2
R-§W I

MDF/W/52Page 163
WOODANDWOOD PRODUCTSINPUTS
24 2472*2) 248(243) 01)431) 63S(632)WOOD, WOOD, WOOD,WOOD,LUMBER,ROUGH, SHAPED, PLYWOOD,MANUFAC-CORK SQUAREDWORKEDETC. TURES
iorld11.0
046lC.C
LAFTA9.8
BRA5.7
CIL2.1
PRY1.3
US0.7
world0.4
DVG0.2
L1FTA0.2
us0.2
ARG0.1
Worl d10.:
DV69.6
LAFTA9.6
BRA5.7
CHL2.!
PRY1.7
US0.6
Worl d1.:
cv61.1
LAFTA1.1
BRA1.0
world4.9
0VG4.7
LAFTI4.6
BRA4.1
ARG0.4
EXPORTS
24 27(2421 M(243) 634(63111 635(632)1VOW, WO, V1W, VEICER. 100lUEtR, ! am.,SAMPD,PLym. MAIFC-CI) |-SGUARED WORIIED ETC.lC, IES*--Worla world I world World World
0.4OHS
0.40.'
4-4. ......4. 4 +-4-1-4-4.1-
Worl d199.4
OVSi5.2
USSR78.4
CSR35.7
HUN15.4
CAN14.0
UOT11.0
GAS1.5
CIV9.4
LBR5.0
CJR
4.0CAF
2.7
World125.5
DOS32.3
USSR35.8
CSR22.9
HUN14.6
CAN14.0
GAB10.8
CIV9.4
CIR4.0
LBR4.0
L9R3.4
LUT2.9
World71.5O0G2.6
USSR42.5
CSR12.8
AUT8.3
EEC2.5
GOR1.6
LBR1.1
POL9
0.5
,World31.9
OVa0.5
EEC27.5
us1.5
EFTA1.3
r,;0.4
BUL0.4
HUN0.3
ROD0.3
World2.4 I
CSR1.2
9UL0.4
EEC0.3
6OR0.1
ALB0.1
World292.8
0V659.6
EEC179.9
USSR28.'.
E6Y24.0
EFTA14.9
TUNI8.8
SYR5.5
SAU5.4
MAR4.6KAT3.G
ESP2.1
World42.30460.2
EEC38.0SOT4.1IRE0.1
World241.3
59.3EEC
147.7USSR
28.5EGY
24.0TUN
8.8ISR
5.8MAR
4.6KWT
3.0ESP
2.1
World77.6
7.9EEC
35.2USSR
16.6CSR
7.7CHE
5.4AUT
2.0IRO
1.9ISR
1.8SYR
1.7
World118.7
D0642.4
EEC53.6
IRC32.1
ISR10.0
LOY9.1
lUT4.4
US
1.0CSR
0.56O0
0.5
(90) ZAIRE World iorl d world orl d World World We.ld Worl d World World/178 0.1 0.2 l.a 7.0 2.7 4.3 0.5 2.1
OVS0.1
EEC EEC EEC EEC(9) EEC(9) EEC EEC0.1 1.0 6.9 2.4 4.0 0.4 1.4
1PN JPN US NGA0.2 0.2 0.1 0.4
ESP ESP0.1 0.1
(91) ZAKO IA Worl d World World World World Worl d Worl d World Worl d World/'79 2.6 1.2 1.4 1.1 0.2 _ . .
OVG DIIG0.5 0.3
EEC UF NOR EEC ZAF1.2 0.6 0.6 0.4 0.1
ZAP SWE ZSF WAF0.9 0.5 0.3 0.3
NOR TOW OWN0.6 0.3 0.2
SWE KEN CANI0.5 0.1 0.10.3
KEN0.1
(92)JIMAWE World World World world World World World World World Worl d...C.H.I..N.A. . .
CU" . . .. . _ _ .. - ., _~~~~~~A
1H mTS I EXPORTSIni- -1
71LP 1 W.2IWASVE W.| I<, MS|PAPE | |pAmEaorid World
4.6Ova
3.7CILi2.1
BRA1.5
0.9
I I
137.2DVG
0.6USSR
43.3EFTA
60.4AUT
41.4CAN
11.6us
9.5EEC
7.5CSR
2.9ITUNI
0.6
| orld
cid
World
borld
World56.1
HUN2Z5.717.9
&UT6.7
GOR5.7
World
World
World
:RK 1"aiK0R1z:FtESIWmIS'I EXRTS
VA j2 3 13 20 33MOAX, CORK I CR ORalRAW I AET- I AWAVi, iANVAFIC..15MM TUIES I i..ASTE V 5S-s
World dorld f or1 d qorl0.3 S _
ESP0.2
PRY0.1
World World World World1.1 5.9 - 0.3
PRT PAT USSR0.7 4.7 0.3
ESP ESP0.2 m.7
GOR EEC0.1 0.4
World World World world
world World world World
World World World world
(89) YUGO.SLAV IA
/181
_ _ _l
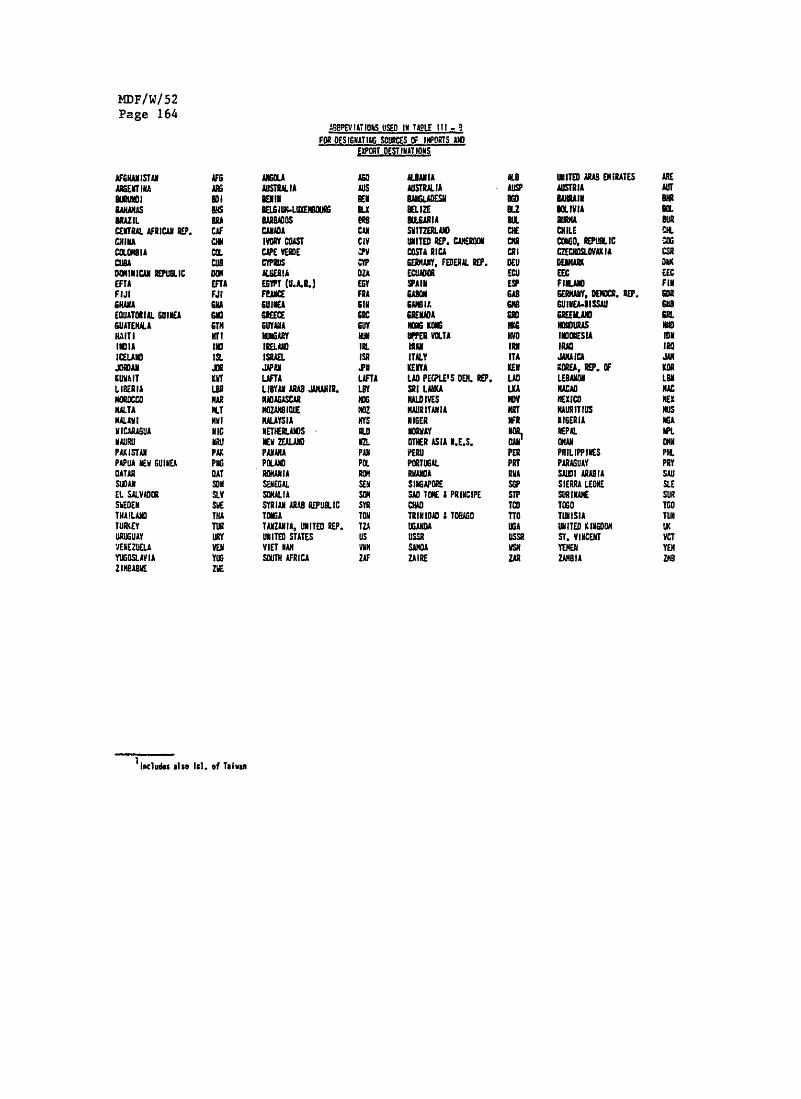
MDF/W/ 52Page 164
ABBRERVIATIONS USED IN TABLE III - 9FOR DESIGNATING SOURCES OF IMPORTS AND
EXPORT DESTINATIONS
AFGANISTANARGENTINA
RUSIABRAZIL
CENTRAL AFRICAN REP.
COLOBIACUUADOMINICAN REPUBLICEFTAFIJIGRUAEQUATORIAL GUINEAGUATEMALAHAITI
ICELAND
KUWAITLIBERIANRC=MALTAMALANI
NICARAUA
NAURIPAKISTANPAPUA NEW GUINEAOATARSWANEL SALVADORSWEDENTHAILANDTUEYURiNIUAYVENEZUELAYUGOSLAVIAZIMBABWE
AIGAM
WIR01Ns
cocilEWBRCOI
omDONEFTAFJI6U
6THHTX
RIN1S.1SJORKWTLBRMAR
PMWPVic
PAKOATSONSLVSUETHATugUQYYENY2
AUSTRALIA
BELGIUK-LUXEMOURGBARBADOSCANADAIVORY COAS
CAE KIEE
ALGERIA
EMPT (LA.R.)FWCEGUINEAGREECE
GUYANA
HUINGARYIRELAJNiISRELSJAPAN
LAFTALIBYAN ARAB JAMAIIR.
MADAGASCA
MOZAMBIQUEMALAYSIA
NETHERLADSNW ZEALANDPANAMA
POLAND
RUMANIA,
SENEGAL
SOMALIA
SYRIAN ARAB REPUBLIC
TANZAN1A UNITED REP.
UNITED STATES
VIET NAN
SOUTH AFRICA
AGO
AUSBENeLXeRCANCIV
1PV1YPOZAEGYFRA
GIN
GCGUY6urnIRL151ISR
JItLAPTA
LOY
IV)!
BYE
ROGNO.MPSPAN
PO.RON
SENSONSYRTONTZA
US
VkMZjF
ALBANIAAUSTRALIABANGAESH1BELIZE
SWITZERLANDUNITED REP. CAMEROONCOSTA RICAGERMANY, FEDERAL REP.ECUVAIN
GRENADA
WPER VOLTA
ITALYKENYALAO PEEPLE'S DEN. RPO.21I LANKAMALD IVESMAURITANIANIGERNORWAYOTHER ASIA N.E.S.PERUPORTUGAL.SINGAPORESAD TORE I PRINCIPE
TRINIDADS TOBUGANDAUSSRWAOA
ZAIRE
AUSPBmBLL
OULCNE
CR1eRIDEUECUESPGABSMQlfG
IRSITAKENLAOLKANVNRNAN
PERPITRWASEPSLPTO)TTOLKAUSSRWERTAR
UNITED AIA EMIRATESAUSTRIABAHAINNOLIVIA
CHILECONGO, REPUiLICCZECHOSLOVAIADENMARKEECFIULANDGERMANY., DEDMCI. REP.GUINEAISSAUGR1EEILANODURAS
INODNESIAIRIOJAlAUIUOEA, RP. O
LEBAMNMACADNEXICOMAURITIUSNIGERIANEPALmaPHILIPPINESPARAGUAYSAlDI ARABIASIERRA LEWNESURINAIETOGOTUNISIAUNITED KINGDOMsr. VINCENTYEMENZAMBIA
1 1Icluds also Isl. of Taivan
AREAUr
ILWRC5L
CSR
EECFIN601618ULGluINDIROJANKORLONMACNEX
NGADM1PHLPRYSAUSLESURTGOTUNUKVCTYEN219

MDF/W/ 52Page 165
Annex I - B Page
Volume of production, exports and imports in 1963,1973, 1979 and 1981 of:
- Industrial roundwood 166- Pulpwood 167- Sawnwood 168- Plywood 169- Particle board 170- Fibre board 171- Wood pulp 172

MDF/W/ 52 Production and trade:industrial productionPage 166 (1Ii.C.blcv h1
1963 1973Prod. Exp. II_,. I__*JI d. I1 .
I_
(1) World i . , ,43.x z.6 ' .48 l3.I,3.3 _
'79V~50
En.11s.4l 1
1939
Ig. Prod. IzP. I op.
l.55 1.393.97(2) ovelmttm 1.19 0.02 0.13 3.27 * 0.07 4.70 0.01 4.07 * 0.02(3) Asejimllm 10.57 0.02 0.15 11.31 1.1 0.18 13.70 4.06 0.02 16.90 4.97(4) £mejrts 3.00 0.35 0.33 11.01 0.53 2.01 12.07 0.90 3*.47 12.14 0.07 3.36(5) Waeladesh 0.79 1.09 C."0 . 0.90 -(4) Barbados- 0.01 . * - .- - -
(I) 11.liz ;0.08 0.05 . - 0.4 . * 00
(3) Seml. 0.12 * - 0.14 0.20 .07(9) 11MU Il1 16.07 0.04 0.01 23.83 0.43 0.00 52.00 .9 00 5.423, 0.01 0.02(10) Ilrom 2.16 0.14 * 2.49 0.17 * .56 0.09 21 0.01(19) Urvaill 0.02 - * 0.03 * - 0.04 . - 00(12) courses 0.37 0.21 - 1.33 0.70 - 2.13 0.4;22 .67(13) Congda 33.74 3.44 1.40 140.3 3.04 157.31 3.33 131.22 3.74(14) Comtrul Iffit.. Iseablic 3.35 3.01 * 0.75 0.16 * 0.49 0.13 - 0.55 0.14 -
(15)Ctbad 3.37 C.3" . 0.44 * - 0.46(16) Chbll 2.116 MI.3 L034 0.97 12.19 0.Y.(17) Colombla 2.32 3.09 * 3.65 0.04 - 3.30 * 2.i5(10) Cmu.9. *Meb~lI of 0.62 0.43 * 0.06 0.31 * 0.67 0.17 8.75 0.71(13) Cahd 3.44 * - 0.39 * 0.01 0.39 . 039(20) Cyporv 0.04 - 0.06 - 0.07
C007(79) C~chlodsemwbt 19.05 0.74 0.10 13.57 3.90 0.0" 96.04 3.33 0.03 17.17 3.10 0.09(22) Soel1cee04 11,l 0.31 * * 0.33 0.01 -~ 0.31 * 0.05
EtC. (hVtr*4IC) (10) 55.73 0.35 90.41 75.59 1US 13.39 40.43 1.7 11.5 70.59 4.72 9.52(73124) klliametLVbserg 2.23 0.43 0.19 2.31 0.49 3.24 2.32 0.73 3.14 2.24 0.34 3.23(75) Comwar 1.35 0.03 0.13 7.03 0.39 0.34 1.0 0.53 0.00 1.05 0.53 0.09(24) Frames 21.40 1.70 2.11 29.72 3.07 2.91 MI.1 7.0 7.00 29.13 3.37 2.34(27) 6erumy. Fed. RVe. of 20.63 0.39 3.1 79.61 2.07 3.31 26.02 L3Z 3.42 27.34, 3.13 3.34
(73) fiftee 0.37 - 0.01 0.65 - 0.36 0.75 0.39 0.73 * 0.76
(79) IruleaW 0.33 0.31 0.03 3.42 . 0.06 0.34 0.13 0.04 0.59 0.34 0.04
(30) Italy 5.05 * 3.57 4.09 0.01 5.56 4.62 0.01 5.57, 4.63 0.01 5.07
(31) smletielsdv 0.65 0.1V. 0.91 0.946 0.43 1.0 0.79 0.51 0.97 0.73 0.AD 0.73
(37) Vlmted Kingdom 2.63 0.07 1.49 3.23 0.03 0.70 4.01 0.05 0.34 4.24 0.67 0.A
(33) (itypt 0.06 - 0.04 0.07 - 0.06 0.03 0.05 0.09 * 0.12
(34) FImslaw 33.13 2.25 0.05 3.01 3.60 5.17 40.73 1.19 3.67 30.71 2.67 4.03
(35) 6.14., 1.53 1.14 * .36 1.75 * 1.11 1.17 - 1.76 1.10(16) IambI. 0.01*-0.01- - 0.01 . . 0.01 * -~~~~~~~~~~~~~~~~~~~~~~~~~~~~~~~~~~~~~~~~~~~~~~~~~~~~~~~~~~~~~~~~~~~~~~~~~~~~~~~~~~~~~~~~~~~~~~~~~~~00100(37) show 1.5 0.67 A.4 00 2.52 32 .2 00
(33) WIvN 0.17 0.03 0.01 0.25 0.05 0.01 0.16 0.03 * 0.19 00
(39)3bill 0.74 0.01 - 0.24 .0.74 - 0.01 0.24
(40) limsper 7.01 0.17 1.17 7.92 0.73 1.93 3.51 0.02 1.36 3.71 0.7" 1.43
(471) Icelmad - * 0.01 * 0.01 . 0.01 - 0.03
(42) India 7.43 0.02 0.01 1I.9 0.04 0.01 13A.3 0.03 0.02 .10.3 0.03 0.07(43)ladamam~~~~~~s 5~.60 0.15 273.1 13.57 - 24.11 19.52 . 16.39 7.644(44) Imr~~~~~~~vl ~~0.04 - 0.17 0.06 - 0.15s 0.11 * 0.21 0.11 * 0.10
(45) Iwrm'y at21 1.45 - .5 3.0 5.47 3.20 * 5.1 .34(46) .lautu . - ~~~~~~ ~~~~~~~~~~~0.05..01 0.02 . 0.01 0.07
(07) Joam. 4400 002 13.03 41.53 0.01 57.10 33.77 0.04 60.33 37.56 0.03. 2.0
)41) o1mii 0.49 0.01 * 0.73 - 1.14 .1.19 -
(43) goneRapeb1I icof6)AD 0.42 1.71 - 5.43 2.44 9.03 7.07 - 55
(SI) osdepuca, 3.57 - .5 - - 0.311- .3(52) PaluvI 0.16 - * 0.79 - .19 - O.3A(53) hbloyula 3.61 3.9 0.11 24.70 13.42 0.7 32.41 16.7 0.04 32.44 16.1, 0.04
(54) Neldills(56hmltmlse 0.03 - .04 0.04 . * 00
(57) kberIth, 3.03 . . 0.02 - - 0.03 - 001(53) 3m. zamhad 5.16 0.27 3.01 10.44 2.19 0.09 3U514S1.6 1.5 00
(50) Illeselve 0.77 0.01 - 0.75 0.01 ON.0 0.01 0.001 0.01 0.01
(40) hoger 0.93 - . 0.17 - .1 . - 07(41) Ilouris 2.50 0.47 3.53 0.33 :I6.19 0.01 - 7.316 00(62) Wai,7.46 0.03 1.72 7.001 0.20 2.06 3.15s 1.01 1.10 0.13 0.3 1.59
(63) Pakistan 0.47 * 0.03 0.43 - 0.01 0.57 . 0.0k 0.59 - 0.03(441 Pv~~~~~~~~~v ~0.62 . . 1.277 0.02 1.44 . 70DI
(45) Philippines 90.71 6.57 * 17.50 7.76 1.33 1.75 3.103 1.44 0.01(44) P~7mmd 15.12 0.45 0.16 10.3? 0.33 0.05 18.M 1.9' 01 1.3 1.0 01
(67) Pertagyl 3.20 0.16 0.01 4.00 0.13 0.43 3.73 0.35 0.17 7.11 0.3? 0.40
(40) 16011a 13.37 1.033 16.16 0.49I 0.02 14.37 0.20 0.49 14.51 0.10 0.73
(49) levdw 3.05 - - 0.06 D'%034 - 0.06 - -4(9 M3upi 0.31 - 0.02 0.41 * 003 0.47 - 004 0.43 - 00
(71) SMen Loom 0.13 * . 013 - * 0.11 -0 .0.16 -0 -.1
(72) Slepeoaat * -: 0.01 1.33 0.4 .4 0.02 0.31(73) Smallh frica 5.90 0.01 * 3.o3 0.09 0.05 3.76 0.11 0.05 10 .1 00
(74 Soel. 4.90 0.73 3.31 0.03 1.53 10.43 0.34 1.43 13.11 0.13 0.43
(75) SH Lamba 0.AD 0.43 0.60 0.65 -
(76)Sw"m 0.73 3.02 0.01 0.14 0.07 0.01 0.35 0.02 - 0.20 0.03(77) Samdba 39.70 1.40 0.60 54.37 3.50 0.01 40.51 1.14 3.79 45.37 1.41 6.31(73) Su1olbelad 2.53 .0.11 0.44 3.1 0.7`6 0.41 3.22 0.10 0.73 3.79 0.70 0.97
(73) Ovojama 0.3 10.01 0.31 0.30 0.01 0.0 0.01(005) Thailand 3.45 0.02 - 5.31 0.09 0.0? 6.22 ;.73 4.31 - 0.15(31) top 0.09 j-0.17 0.1is 0.1is(07) frioldod SWd Imelp 0.39 * 0.10 - .06 * - 0.08 -
(33) Ima1mle 0.05 * 0.02 0.07 * 0.02 0.17 * .4 0.12 * 00
(04) o2i. .70 3.07 0.04 6.47 0.03 0.00 4.041 - 73 0.4(05) VP."a 0.51 . .3 - * 1.39 - 1.47 *(0)blted Steles 241.39 4.54 4.I0 337.71 11.37 2.3 167 40 .0 1.7 1.5 29
(07)mpe.0.909 ~~~~~0.37 * - 0.45 . - 0.9 *.3 -
(00) Uoay0.21 * .3 0.21 * .1 043 * .1 024(09) Ywpaslala 9.07 0.47 9.00 0.50 1.13 VA. 0.70 1.37 MA.4 0.45 1.43(90) maire 1.50 0.09 0.0 2.20 0.04 . 2.71 0.05 * 2.3? 0.04(91) 2.SbI* 0.31 . - 0.32 - 0.46 0.03 0.43(92) holdle's 0.40 * 001 0.3x 1.1is 1.34 -
fetal1(2) throeh (97) shows 717.73 34.03 33.9 963.77 02.42 103.17 1*054.11 99.22 V1000 007.45 13.39 00.01
Ma~n 33.42 0.05 0.97 45.04 0.07 4.47 44.94 0.07 7.20 48.06 3.06 5.77low ~~~~~~247.19 7.05 314.5 13.97 0.23 775.90 16.33 0.21 277.20 15.39 0.32
Kit: lb* commditis KIAddSreONII OfrWPI 111111100PS, b11e'd, Otk Wr ltrll raakmd,&d is tk"game of trade, Cbjts or 08rtlel man Adl rM"..od. dab for Inividal EC obr States IKtldO 1ro-UC trod.
t 0:. Yearbook of host Ard&ts. aelytical loby Satforelp Trde .1U.At dlt, lind* SItvMt1c.
I

Productionand Trade: plywood MDF/W/52
t1Ioa1Cobcw tNotrio) Page 167
1963 1973 1919 1951
_r4 END. IV-PrId. Cas. I... P|d. Esp 1I lop. " rc..|If.(1) Vend 712.25 12.11 11.5 326.17 25.21 25.10 355.31 36.41 38.14 [ 32.55 41.52J 9.15
(7) £rg~~~~~nII~~ia ~0.47 MA.6 2.43 - . 1.54 -(3) LAstrallI 1.74 . 1.96 1.13 . 5.31 4.'6 6.50 6.164) Austria 1.54 0.63 2.37 0.13 1.11 3.73 0.24 1.58 3.73 0.77 1.33
(5) 0a,.v1adh 0.02 0.01 . . 0.06 . 6.06(6) larbadns . . . . . . . .Slo1 . . . . . . .
i '
(9)E azsl 1.63 . . 4.00 .- 17.30 . 20.90O .-(10) 6urua . . . . . . . . .-(11) h d .. . . . .(12) Car.om . . . . . . . . .
(13) Canada 37.06 2.96 0.35 42.38 2.60 0.34 41.03 2.37 1.07 41.03 2.67 0.69(14) Cantral Africa Owobb Ic . . . . .
(15) Chad . . . . . . . .(16) Cile 0.92 . 1.40 . 3.20 . 3.06(17) Colehd 0.09 . 0.30 . . 0.47 . . 0.39 . .(10) Centa
. . . . . . . . .
(19) Cubas(25) Cyoras . . . . . . 0.01 - . 0.37 . .(21) C,,Chaalalvkla 2.43 0.36 3.57 1.45 .73 2.03 4.71 1.97(722 Dag0 elca. apaubllc . . .
.ltC. (CtE.ta4tC (10) 3.79 0.03 3.45 17.19 0.53 3.31 25036 1.39 3.09 27.79 3.74 3.44(231/4) llgI.A/Laxeazurg 0.38 0.01 0.38 0.66 0.06 1.91 0.5 0.16 2.7t 0.54 0.21 2.97(25) CDnoark 0.05 . . 0.00 0.16 - 0.79 0.51 0.03 0.29 0.49 0.03(2z3 Trae 3.17 0.53 1.01 3.21 1.91 0.57 0.61 7.07 0.07T 9.19 2.31 0.70(77) Ga6raw.red. Rep. .8 3.41 0.02 1.05 6.36 0.57 1,72 3.83 1.46 1.41 9.63 2.10 1.66(25) Greece
. . . 0.14 . . 014 . . 0.14 .(29) Irnlad 0.14 . . 0.00 . . 0.09 0.06 . O.CS9 0.77 -(30) Italy 1.07 1.01 0.02 1.44 0.93 1.47 0.91 1.26(31) Motherlands 0.13 0.01 0.31 0.41 0.25 0.25 0.37 0.36 0.40 0.33 0.46 0.33(3:J UnitedItiegda 0.45 . 0.74 0.90 . 0.06 1.00 0.01 G.01 1.17 0.59 0.01
(33) Ctyst(34) Folead 17.45 1.31 0.49 17.16 0.32 4.36 10.40 0.62 3.07 20.72 1.59 3.50(35) Gabe.(lb.) wganl(37) 4mne o w(38) Gaa - . . . . . . . . .(38) Sah l(40) Iaars 0.7Z 0.10 0.12 0.95 0.71 0.38 0.70 0.67 0.37 1.23 0.77 0.26(41 ) Iceland .
.(47 ) IndIa 0. 0 - 21 1.21(43) IedonaeI* . . . 0.04 0.02 0.02 0.45 0 02 0.47(10) Il.rael 0.01 * . 0.03 . 0.05 . O.OS
(45) IN " CaaCoast . . .(46) Jnaca ..(7) Jao 9.15 0.45 12.50 10.74 0.79 16.69 11.25 13.60(49 )
,i, . 0. 17 0.17(41) KOVu. too. 0.04 0.01 0..1 . 0.01 0.23 0.29(S1)atauic.ar . . . .. . . . .(52) 1 alad . . . . . . . .(53) Ma.laa - 0.73 0.73 0.61 0.21 0.61 0.30(54) Sadlve. . .
. .(55) Ojita .. . . . . .(56) emnrt lant -
.- . . . . . -(5?) Muwritsue . . . .
(50) Na 1ea1a8d 1.16 3.42 0. 7 3.02 0.4 3.77 0.52(59) i cer.ua - . . . .
(60) Niger - ---(61) NI gerl -(67) 11r-ay 3.12 0.03 1.11 3.67 0.12 1. 6 3.01 0.71 1.10 3.03 0.75 1.29(63) Pa1istan(64) Poer. 0.04 0.02 0.04(65) Phil 100" 0.12 - 0.73 0.52 0.66(66) Pelau d 2.25 0.45 0.15 3.41 0.73 0.01 4.56 1.03 0.06 4.74 1.19 0.11(67) PontN18a 0.65 0.11 2.25 0.12 3.03 0.90 . 3.28 0.25(61) lOanrl 1.99 0.72 3.2 0.33 33.62 0.19 0.47 4.05 0.15 0.26(69) kvad. - .(70)
....0 1 - - . . .
(71) Sl
ierr a Lo w -. .
(77) Slaga**re - - - - - .(73) South Africa 1.57'
. . 3.49 . - 3.7 . 3.18 .(14) SOate 0.4 0.16 3.93 0.02 0.74 6.06 0.03 0.76 7.01 0.13 0.16(75) SIt Lanke - 0.O 3(76) oat . . . .(17) Soon 21.97 1.11 0.47 78.23 3.06 0,49 26.30 O.57 7.72 23.93 1.14 .37(70) Stuorliad 0 .5 9 0.01 0.12 0.78 0.26 0.36 0.10 0.07 0.57 0.85 0.03 0.7479) l i...laI)lt
oiled . . . . .. .. .1) l * - - .97rid dad a d obe o
01) lT a Iala 0.03Ph ) lwihv 3 0.03 113 0.03 1.03 0.69
b)U eda . . . . ...
91) lItted51S1 .t 7S. 05 0.20 2.9 10.91 5.24 1.52 116.7 5 7.09 1.43 124.32 .91 1.66
59) poorVelta1 e) Ur noqa y 0.03 . 0.10 0. 150 9) V1a1, 1a 1.71 0.40 . 1. 23 0.14 1.02 1.45 0.33 1.13 1.68 0.25 1.5190) e ...91)tfla.n. .. . . . . . . . .
'1 lobat.. . . . . 0.09 . .10
lala17 (2)t hr.ah (97 ) aboeu: 130.3 t 0.33 1.07 727.7 3 2.1 1 27 .938 75.0 27.93 37.93 321.26 33.22 38.38
China 1.40 .93 5.09 0.05 5.31 15lisp 19.1t 3.54 5.70 7.72 37O 7.96 . 37.60 7.90
U1E 1.wdoel§ mftet omdlw szlacl.4'r-r~nr e-Ifemim-4 P,4.,.ftrguo, In frib OCthe"gM-aAleocvi,1.smdll..extraaf pecles VAVOroaldaus .It@ de data for Individual (IC nobrSthin Includelir-E.U'FJo.S.i_-:01m, Tearhb l,.f fvns tIrr. .4 , £alnlsl, i i%.i, .rrus e A,* .II9,rooll, Tad, Sta!istlcs.

MDF/W/52Page 168 Production end Trade: SunWood
(Millon Cubic Metres)
Prod.
O31 Verld 360.67
1963
46.72 I
-I-op. Prod.
W5 43 445.32
1973
72.35 7Iop.
09
rePd.
450.68
919Lap. Iop. Prid.83.38 81.73 1119 16
1981
CW. lop.
72-76 70.1 1(2) Argentina 0.73 - 0.119 0.39 - .16 0.91 0.63 o.88 - 0. 61(3) Australia 3.37 009 0.66 3.419 0.08 32.09 3.17 0.07 0.97 3*55 0.06 1.05(11) Austria I*.38 290 0.03 5.77 3.441 0.18 6.9 1.7 017 .1 .8 01((5) Bangladesh 0.1411 - 0.21 . - 0.18 0.01 0.15 -8 010(61 Barbados - - .03 - - 0.0*O 0.011 - 0.06
1DeliZo 0.01 0.02 - 0.03 0.01 0.02 0.01 - 0.011 -Be1n in - 0.01 0.01 - 0.01 0.01
() Brazil 5.69 0.811 7.11 1.06 0.03 111.07 0.83 0.31 111.88 0.711 0.311(30) Burma 0.52 0.12 - 0.63 0.11 - 0.112 0.10 - 0. 112 0.12(321 Durundi- -- - - -(122) Cameroon 0.08 0.02 - 0.37 0.08 - 0.142 0.211 0.117 0.13(33) Canada 23.29 15.31 0.56 36.22 23.611 1.17 111.81 31.66 1.68 38.96 27.63 2.18(111) Central African Republic 0.011 - 0.10 0.07 - 0.07 0.02 - 0.07 0.02 -(125) Chad - - 01 - 0.01 - 0.01 00(161 Chile 0.0 0.5 ..0 0.0 -3 1.8 21741 08(17 Colombia 0.99 0.05 - .2 .1 09 20.0 .1 00(15) Coungo. Mepublic of 0.03 0.01 - .0o5 0.03 0.05 0.03 . 0.07 0.03 0.01(19) Cuba 0.23 0.16 0.11 - 0.111 0.10 - 0.110 0.11 - 0 511(20) Cyprus 0.02 0.03 0.02 - 0.07 0.07 - 0.07 0.05 o.06(23) Czechoslovakia 3.87 0.79 0.17 11.22 0.77 0.15 11.76 1.07 0.13 11.95 1.15 0 13(2)Dominican Itepublie 0.1 - - - 0.28 - 0.06 -0.08(22 E11 - (Extra EEC) (10) 215 0.5 217 27.75 0.72 29.841 26.112 0.69 29.187 25.1 .1 2.
(23/241) Belsium/Luzembour 0.741 0.12 1.02 0. 4~ 0.15 1.56 0.67 0.20 3.82 0.69 0.211 1.28(25) Denmark 0.59 0.08 0.89 0.83 0.10 1.811 0.80 0.31 1.58 0.83 0.19 0.93(26) Fs-ance 8.38 0.98 1.111 30.93 1.11 2.68 9.66 0.83 3.20 9.06 0: ~ 2 60
(27) erman. Pad ~ep 8.112 0.22 3.95 10.111 0.66 11.76 10.412 0.82 -5.417 9.511 0 111(28 Groee 0.21 - 0.32 0.35 . 0.118 0.39 0.01 0.55 0.38 0.05 -
(29) Ireland ~~~~~~~~0.050.01 0.30 0.05 - 0.4*0 0.12 0.02 0.55 0.22 0.011 0.117(30) Italy 2.02 0.01 3.57 2.70 0.05 5.05 2.311 0.111 5.72 2.60 0.08 5.01(31) Netherlands 0.28 0.03 2.39 0.28 0.09 3.62 0.25 0.22 3.58 0.30 0.23 2.1*6
United Xingdo. 0.88 . 8.811 1.110 0.05 10.97 1.77 0.06 8.341 157 0.05 5 81(311) OsIntand 0.37 . 0.31 - 0.67 2 .53
(341 Finland ~~6.66 1.9 0.2 8.17 5.26 0.02 9.71 6.6" 0.03 8.32 5.111 0.02(35) Gabon 0.041 0.01 2. 0.07 0.01 0.11 0.01 0.1 -(36 amabia . -- - . . - . -I"7 G1Isnar, 0.111 0.241 0.37 0.31 0.38 0.08 0.38 0.05 -(36) Ouyana 0.07 0.02 - 0.07 0. 01 o.06 0.01 - 0.07 0.01(39) Haiti 00.02 - .1 - 000.01 0.01 0 01 0.01(1*0) Hungary o.85 0.011 0.78 1.05 0.341 i0i 3.18 0.11 0:948 1.11 0.011 0.76(1*1 Zealand 0.060 6 0.06(112) India 2.17 - 0.01 5.63 . 0.01 . 0.02 10.98 . 0.02(113) Indonesia 3.80 0.01 . 3.11 0.33 - 3.111 1.28 - 3.112 1.12 -(41* Israel - - 0.29 . - 0.29 - . 0.28 - - 0.20(115) Ivory Cosat 0.1 0.06 - 0.50 0.241 0.67 0.30 M.66 0.27(116) Tamaices. 0.06 0.03 . 0.12 0.03 . 0.011 0.03 . 0.07(147) 3apon 30.111 0.32 0.95 44*166 0.06 3.68 39.63 0.06 5.32 36.96 0.5 3 90('81) Kenya 0.06 0.01 0.10 0.01 0.03 0.19 0.01 . 0.19 0.01(119) Korea. Republic of 0.69 - 0 03 1.57 0.25 0.0*8 3.111 0.52 - 2.98 0.211(50) Kuvait --- 0.01 0.07 0.7 0.26 . 0.07 0.26(52) Madagascar 0.05 - 0.32 . - 02 0.23(52) Malawi 0.01 0.03 . 0.01 0.03 - 0.01 0.011 -
(53) Malaysia 1.911 0.71 0O011 11.11 2.211 0.08 5.26 3.511 0.22 5.28 2.98 0 21(51*) Maldivas- - - . . .(55) Maita . 001 - . 0.02 . - 0.02 . . .03(56) Mauritania - . - . - - .(57) Mauritius 0.03 0.01 0.01 . 0.01 0.01 - 0.02 - . 0 01(58) New Zealand 1.59 0.08 0.08 2.06 0.25 0.011 1.83 0.51 0.03 2.20 0.55 0 03(59) Nicaragua 0.13 0.03 - 0.35 0.141 - 0.110 0.03 . 0.410 0.01(60) Niger . . - - -- . - . -
(61) Nigeria 0.32 0.08 . 0.78 0.011 . 2.01 2.70 -(62) Norway 1.52 0.11 0.21 2.36 0.-117 0.26 2.36 0.117 0.39 2.116 0.25 0.1(63) Pakistanz 0.10 . 0.09 . 0.011 0.06 - 0.05 0.06 0.08i(641 Peru 0.16 0.03 0'.09 0.39 0.01 0.01* 0.55 0.02 0.01 0.611 0.01 0.02(65) Philippines 1.311 0.12 - 1.06 0.113 - 1.26 0.92 - 1.22(66) Poland 6.68 0.80 0.09 7.85 0.80 0.22 7.66 6 oi 6.83 0359(67) Portugal 1.31 0.33 0.02 2.21 0.65 0.03 2.211 0: 9 0:01 1.87 0.79 0 03(68 1 omenia 11.78 1.95 . 5.37 1.741 41.741 0.911 11.50 1.15 0.09(69) Iwanda - . . . -
(70) Senegal 0.0el 0 02 . - 0.01 0.01 . 0.01 C.01 . 0 01(71' Sierra Leone p.:01 - 0 03 0.02 . 0C2 - - 0.112 -!72) 3ingapore, 0.01 0.01 . 0.83 1.311 0.82 0.39 1.117 1.20 0.112 0.96 1.20(73) South Africa 0.76 0.01 0.50 1.57 0.02 0.119 1.56 0.10 0.13 1.88 0.10 0.13(711) Spain 2.12 0.02 0.57 2.58 0.07 1.115 2.511 0.13 2.341 2.39 0.21 0.96(75) Sri Lanka 0.13 . 0.02 . 0.02 - . 0.03 0.01(76 Surinase 0.0114 0.06 0.01 - 0.09 0.02 . 0.06 0.01(77) Sveden 8.116 11.88 0.23 13.714 9.111I 0.20 11.22 7.00 0.311 10.50 5.611 0.20(78) Switzerland 1.38 0.01 0.149 1.66 0.13 0.112 1.60 0.13 0.118 1.79 0.09 0.57(79) ?anzania 0.11 0.01 0.01 0.10 0.01 - 0.07 0.6 -(80) Thailand 1.12 0.10 . 1.941 0.09 0.22 1.56 0.01 0.8). 1.10 0.3(81) Togo - 0.01 - - 0.01 . 0.01 -(82) Trinidad and Tobago 0.0114 0.01; 0.01140 10.04 . 0.3 0.03 . .8(83) Tunisia 0.01 o.06 - . 0.13 . - 0.25 . .2
0.25(811) Turkey 1.1 . 2.118 0.05 0.1 3.19 0.01 3.18 02(85) Uganda 0.011 0.01 0.01 0.01 0.02 . 0.02 -
(86) United States 81.51 2.05 11.53 91.23 11.8 12 36 87.68 5.03 26.73 70.33 5.62 22 06(87) Upper Voltas 0.01 - - 0.02 . . 0.02
(88) Uruguay 0.07 o .06 0.07 . 0 03 0.10 . 0.05 0.10 . 0.011s(89) Yugoslavia 2.83 0.91 3.114 1.311 0.20 11.27 1.12 0.32 11.241 0.81 0 32(90) Zaire 0.15 0.0114 0.16 0.03 - 0.09 0.03 . 0.09 0.02(91) Zambia 0.05 . . 0.02 - 0.03 0.011 0.01 0.011 . .02(92) Ziebabwe 0.06 0.011 0.09 0.08 . . 0.15 0.02 0.03 0.20 0.02 0 02
Tntal. (2) through (9.2) 2.1182 1.7 293 22 81 1.5 710 581 2916 616 3qabove 2.:3.8 4.7 291 22 81 1-5 7.5 7-4 294 46 39
China 11.18 O.a - 16.30 0.20 0.0? 20.19 0.69 0.09 38.211 0.07 0 3*8USSR 110.86 6.71* 0 36 116.23 8.111 0.28 99.70 7.73 0.311 98.31 7.011 0 yc
.=t:ThO aggregat- 1nrludoa emvodinrrfus cr not-nrnniferouamndsleepers. Trade data ror tni4vtdual XIC seeber States includeintra.E=T'a de.
- ~~~~~~~~~~~~.___. . . Au,s... v e .. -. *.1
0

Production and trade:Plywood
(01111w4 Web Retres)(Mission CubicMetres)(7) krpetee(3) Oujetraia(6)1 6il01ldesh(6) larhdes(11 sells.
(12) Unit)1(103 lCrmas0II) Clureel ArcmR~ l(17) cawea
(16) Chile(17) Celembia(15) Conw. Rep.(10) Cuha(70) Coprui(71) Clecheelenekia(27) Oeetetcae Reoublic
EEC . (CEtriEECC) (10)
(26) Oenannk(2b Franco(77) Germany, Fed. Rep.(20) Groeec(719) Ireland(30) Italy(31) Netherlands(37) Wnitled Mtodes
(33) Egypt(31.) rIsioed(36) Gie.n(36) GaaMla(37) Ghana(30) Guyana(39) Haiti(1.0) Kuenery(41l) Ieeland(i?) ledin(1.3) Indonesila(1.1) larani(1.61 tonr Cnast(1.6) .laatca(1.7) japna(ii) Kenya(1.91 Repn. .(60) Knalit(61) hdadgaswn(67) Roal an(53) Nalaysla(61.) 11aldivee(56) Kialts(56) panrltanla(61) 11Sartttne(50) Ien Zealand(59) vicarious(GO) Niger(62) Mnruay(63) Pakistan(61.) Fern(65) Phtliopteec(66) Pnland(GJ) Pertagal(60) 10samta(GO) Enende(10) Sanegn1(11) Sierra Leow(77) Steoanere(73) Snuth hfrlca(11.) Spain(16) Sri LAanh(11) Sartesae(11) Snadm,(70) SelteerlWAd(19) lanueela(go) Thallnad(01) Togo(02) TIriMa and leheon(03) leelela(SI.) lerhey(05) goinda(06) WM~n States(01) Wpoyr Voilta(00) Uruguay(09) Oieet(90) ar( l) lahla
Intel. (7) threegh (97) ahenn:
ChInaUSSIT
MDF/W/52
Page 169
1091
II
1063
Fred. U. f
0.03 -0.10
0.03 0.01
0.0PA -0
1.36 .1
0.010.01.
0.10 0.0?
0.0? 0.03
0.01 .0
0.0.4 000.67 0.0?
0.0? -.3
0.1.0 0.0?
0.0?7 .00.01.
0.03 0.0?0.02 00
.0 7 0.342
0.201 D0
0. 010.0 0.0?
0.7
0.01
0.010.12 Om0.07 0.07
0.0
.01I 0.060.01 0.01
* 0.01
0.01.
0.1.7 0.35
* 0.0?0. 0.03
0.07 0.07NO 0.I10.20 01
0.02 0:01* 0.01.
0.10 0.00.03 0.11.0.0? 1.1.0* 0.06
0.60 -0.01.
;0.0
- 0.010.0? 0.0110.01 -
0.29 1.1.6
0.36 0.01
0.01
0.010.01
0.12
0.1.4 0.130.01 0.030.0?* 0.01
0.03 LZ
* 0.0
0.31 77
0.960.37 0.01.
Ill.
0.CT
0.120.01
0.01
0.65a0.0
0.017.13
0.07
0.0?
0.132.310.100.0?
0.51.
0.09
00.6
0.00.030.010.71
0.07
0.130.010.020.030.600.01
0.0?
0.0?0.0?08.03
0.0?
01.70
0.720.03b
a 0I
0.0?
0.010.010.1110.030.030.0?0.7010.03
a0I0.010.0?
0.02
0.01
0.01
0.01
0.01
0.01.
Im.0
0.0l0.010.0?0.07
0.I6
0.070.0?0.070.0!
01.220.170.3?
0.62
0.0?
0.00
0.020.01
0.0?0.01
0.01
0.01
0.lo0.07
0.01
6.11.
0.0
0.00.09
2.61
0.0210.0
1.620.0?
0.01.
0.01
0.01.
0.3.026
0.07
0.0
0.630.9
0.01.0.07
0.30
0.13
0.070.000.0?
0.0I0.0?
0.07
38.11
1.011199
0.05
~0.1
a0.0.090
0.21
0.520.350.0?
0.6
0.01
0.01.
0.01.
0.01
0.10
1.SD
0.07
0.07
7.10
0.01
0.190.07
0.11
0.0?
0.07
14.00
0.01
0.01
33.04
1.312.DO
III
0.1
C020
0.1.1
0.02
0.11.
;0.10.07
0.16
0.540.01
0.09
0.47
0.0?
0.07
10.0
0.61.
0.01.
0.01
0.01
0.01
0.113
0.01
0.01
0.010.1.9
0.01.
0.030.17a0.00.03
0.01
0.01
0.0?0.07
0.16
1.300.01
0.1.7
0.01
0.01
0.010.01.
0.01
0.01
0.3?
to.
6.1.7
0.01
0.00
003
0.01)0.01
0.72
0.76
0.06
0.46
0.00
a0.0
0.01.
0.06
0.0
;0.0
0.01
0.04
ti : ripeed, fly. We Ply Men IKec ledi neener, blecklennd. eardl W 4etteeheard. Other powju ed tech es celleler heart WAd cem lecite y1 eed.
trade datjoer fadiideal soeehr Statues eclede ltetrEC0 tralda.
So urc e,: F V e arhae ef F- - I F . cal table, Ferm1o Innate. UNlCeannillIn i St etlle ic
I1

MDF/W/52Page 170 Production and Trade: ParticleBoard
(Million Cubic Metres)
1963 1973 1979 1981
Prod. LEx. I mp. Prod. UP. I ap. Prod. UP. lap. Prod. w. I|[p.(1) World _ 6.014 0.60 0.54 1 51.95 4 14 14.22 41.23 5.62 T5.86 39.67 5.15 ] 5 55
3 - -I - . ,
(2) Argentina 0.0o3 - - 0.17 - . 0.25 - - 0.27- -(3) Australila 0 03 - - 0.34 0.1 001j-' 0.53 - - 0.614 0.01-(14)) Austria 0 13 0.01 0.88e 0.141 0.02 1.16 0.66 0.03 3.16 0.58 0.03(5 Bangladesh . - - - - 001 - - 0.01 -() Barbados - - - - -- - -
(9) Brazil, 0.1 - 01 - 055 - 066 0.01 -(10) Du",* -- - -(11) Burundi - - - - - - -- -(12) Cameroon -- - - - - - -- -(13) Canada 0.9- 0.56 - 0720 1.28 0.01 0.06 0.72 0.01 0.08(14) Central African Republic --- - - ----
(15 Chad- - - - - - - - -- -(16) Chile 0.012 0.03 - 0.05 - 0.07-(ii) Colombia 0.01 . - 0.01 - - 003 - - 0014-
CongoC Rep. of - - - - - - --(19) Cuba- - - - - - - - - -(20) CYPrs - 0 0.01 0.01(21) C,,ohoal,akia 0.10 - 0.0 0.140 0.03 0.'014 0.6 0.07 0.62-0.05(22) Dominloan Republic - - - - - - 003 -- -
EEC -(Eztre-EEC) (10) 2.71 0.03 0.17 12.06 0.114 1.13 13.21 0.15 1.84 13.609 0.146 1.65231214) "~g~,Lxabourg 0.27 0g 3 .8 g:1 0 lj 2 7 2.2 .2 1. 2.20
(26) France 0.51 0.03 0.02 1.96 0.27 0.214 2.19 0 39 0.143 2.29 0.37 0.45(27) Germany. ?ed. Rep, of 1.22 0.07 0.18s 5.57 0.36 0.46 6.37 0.72 0 90 5.714 0.65 0 87(28) Greeoe - - 001 0127 G- - 0 29 0.01 - 0.30 oo-2(291 Ireland 0.22 002- 013 0.04 0 01 0.05 0 01 0.07 0.014 - 0.09(30) Italy 0.25 0.01 1.70 0.05 0 126 1.50 0.03 0.141 2.20 0 014 0 141(31) Netherlands 0.0 0.01 0.10 0.07 0.05 0.56 0 10 0.08 0.55 0.77 0.05 0.149(32) United Kingdom 0 114 - 0.07 0.30 0.01 1.28 0.60 0.05 1.514 0.514 0.07 1.32(33) Egypt 00 . - 0.03 - - 0.014 - 0.01 .0.04 - 0 01(314) Pinland 0.12 G0.04 - 0.89 0.148 . 0.80 0.32 - 0.71 0.314-(35) Gabon . . - - - - -- - -(36) Cambis(N) Ghana 0.01 - - 0.01 -
(39) Haiti - --- - -- - --
(140) )iurgary O0.04 0.02 0 19 0.Q3 0 02 0.25 0.01 0.03 0.214- 0.09(141) losland - - - 0.01 0.02 - 0.01.(142) India 0 01 - - 0.01 - .2 - - 0.02 - -(143) Indonesia - - - -- - -- -
(414) Israel 0.01 o.06 0.01 - 0.06 - - 0.06- -(14) Ivory Coast - - - 0.0 - - - -(146) Jamaica - - 0.01 -- - - -- -(147) Japan 0.16 - - 0.65 - 0.05 1.26 O0.0 1114 - 0.01(04) Kenya - - - -- -- - -- -(149) Korea. Rep. of 0.01 0.12 0.09 - 0.05 0.05 0.07 0.02(50) Kuwait - - - - - -- -(51) Madagagoar- - - - - -- - -- -(52) Malawi- - - - - -- - --(153) Malaysia - - - - -- - -- -(514) Maldives,(55) Maltas(5) Mauritania- - - - -- - -- -(57) Mauritius- - - -- - -- -M5) New Zealand- - 0.12 - - 0 12 0 05 o.16 0.05(59) Nicaragua - - -- -- - -- -(60) Niger - - - - --
(61) Nigeria - - - - - 0.014 - - 0.05 -(62) Norway 0.09 - 0 01 0.39 0.16 0.05 0.35 0.05 0.08 0.39 0.05 0.09(63) Pakistan - 0.03 - - 0.014 - 0 014-(614) Peru - - - 0.01(65) Philippines - - -. .01 0.01 -(e6) Poland 0.13 0.02 - 148 G0.3 0.18 1.01 0.01 0.21 1.014 - 0.114(~)Portugal 0.02 0 01 - .6 0.A - 0.32 0.11 - 0.38 0.07 -
(C8) Romania 0.15 0.03 - 0 55 0.16 - 1.03 0.30 - 0.90 0.16(69) Rwanda(70) Senegal - - - - - -- - -- -(71) Sie9rra Leone(72) Singapore -- - - - -. 0.01 0.01 0.03(73) South Africa 0.02 0.01 0.21 - 0.20 0.01 - 0 20 0.01 -714) Spain 0.06 - 0 91 0.02 0 03 1.38 0.17 - 1.30 0.33 -75) Sri Lanka- - - --- -- -76) Sulrinam. 0.02 0.02 - 0.01 0.01 - 0.01 -- 0077) Sweden 0.13 0.03 0.01 0.814 0.33 0 08 2.214 0.55 0.06 1.09 0.35 0.0378) Switzerland 0.14 - 0.01 0.141 0.01 0.22 0.65 0.29 0.07 0.60 0.20 0.09
0O Thailand 0.1 - 0.1G-M0.01 - - 001 -
02) Trilnidad and Tobago -- - - - - - .0183) Tunisia - - 0.01 - - 0.02 - 0.01 0.02 - 0.01814) Turkey o.114 o.143 - - 0.33--65) Uganda- - - . - - - - - - -
di) United States 0.86 - - 6.35 0 16 0.04 7.20 0.18 0 145 6.10 0.25 0.5287) Upper Volts - -- --- - -a) Uruguay - - 0.01 - .0O- 01
1!9) Yugtoslaylia 0 09 . - 0.32 0.01 0.11 0.73 0.05 0.05 0.79 0.07 0.0290) Zaire-- - --- - -91) Zambie- - - --
92) Zimbabwe - .02 - - 0.02 -
TOTAL (2) through (92)above: 5.20 0.57 0.50 27.70 3.95 14.00 314 12 5.35 5.141 3; 03 14. F.0 5.11
Ch, na 0.02 O.014 - 0 014 - 0.02 0.014 V'.01 0.014USSR 0.14! 0.02 ) .0~s 0 17 - 4.70 0.27 - 5.00 0.36 -
IQi=. A sheet material m~anufactured from small pieces or wood or other ligno-cellulosic mate.rials (e.R chipJfl4aesisplinters., shardsea,shreds, eta.) sg amersted by use or an orcanic binder~together with one or sore -V the. following sgan s heat pressure. hur-ldl.Yeaitalyst. etc. Trade data for individual EEC member States Include inLro-EECtr'ade
3ouxrees: 71A.. Yearbook of forest products. 1Eurostat. Analytical tables of foreign trade. UN. Commodity. Trade Statistics.
I

MDF/W/52Page 171
Production and Trade: Fibroboard(Million Cubic Meters)
1963 ~~~~~1973 1919 1991
Prod. tip. lop. fProd. Esp. lop. Prod. UaP. lop. Prod. Eap. Ilap.
(1) World 11.29 1.62 1.143 17.52 2.57 2.57 18.05 2.34 2 06 254 2. 2 014
(2i Argentina 0 02 - o.06 0.02 * 0o6 0.01 0 01 0.07 0.02 0.03(3) Australia 0 14 0.02 0.01 0.17 0.0o6 -. 0.12 0.01 -0.110.01(4) Aust ria 0.12 0.05 - 0.15 0.08s 0.01 0 12 0.08 0.01 0.11 0.06 0.01
) Bongled h - - - - - - - - -
(10)Beiz
(9) Smazll01 - 0.35 0.09 - 072 060814 0.21(11) burund I(12) Cameroon- - - - - - - - -
(13) Canada 0 78 0 07 0 4 1.13 0.15 0.11 0.87 0.7 00 074008 01(14) Central African Resp. ----- - - - - - -(15) CMa(16) Chile 0.01 - * 0.02 O.0Oil 0.02 - 0.04 0.02
(1)Co3able- 0.01 0.02 - - 0.02 -(1) Congo..Sep.L of~
(19) Cuba 0.06 0.- -1(20) Cyprus -
(21) Caeohoslovakla 0.09 0 02 001 0.114 0.01 0.6 0 22 0.03 0.02 0.22 0.'02 0 02(22) Dominican Ilepublic - 003 ..,. ~.&u- O-o 0o .0 0 8
EEC - (Extra-EEC) (10) 1.04 ~ '3 08 ' 9 cl. 1." 0.9 0.0'.' r.5 08.408(23/214) Belgium/Luxembourg 0.08 0.04 0.05 0 13 0.07 0.09 0.02 0.02 0.07 0.03 0 05 0l.06122) Denmark 0.01 - 0.08 - - 0.13 - 0.01 0.07 - - 0.062Pranee, 0.28 0.06 0.08 0.37 0.16 0.05 0.29 0.15 0.0 0.27 0.114 0 114
2 Germany. Yea Rep of 0.3 00 0.17 0.37 0.04 0.30 0 31 0.07 0.28 0.24 0.05 0.24
(29) Irelan 00e 0101 0.02 0.02 0 0- 0.02 0.01 0.04 0.01
(31) Netherlands 0.05 0.03 0.23 0 06 0.05 0 21 0.04 0 03 0.11 0.03 0 01 0.12(32) United Kingdnm 0.15 - 0.36 0 06 0.02 0.56 0.05 0.02 0.43 0.05 0.02 0.30(133) Egypt ---- - - - - - - -(34) Finland 0 45 0.29 - 040 0.2 - 027 0.10 * 02 0.12-
(3j) Osbon(36) GaltiI
(140) Hungary 0.04 - - 0.05 - 0.03 0.09 - 002 0.10 0.102 0.04(41) Iceland- - - - - - - -(42) India 0.702 - 0.03 0 01 - 0.03 - - 00(43) Indonesal - -- -- - - -- -(4.4) Israel 0).03 - 0 02 O.0 - - 0,01-C 45) Ivory.Coast - -- - . - - - - -
41 0.40 075 0.01 0.01 0.65 0 02 - 0.55 0.03(49) Korea. IsOp.of- 0.02 0.01 - 0.02 0.01 -00(50) Kuvait - - - - - - - - -
(521) Madagascoar- - - - - - - - - --(52) Na1:4- - - - -
(53) M~alaysia - .3 - - 0 02 - 002 - - 00(54) Maldives- - -- - -(55) Malta- -- - - - - - - - -(56 Mauritania - - - - - - - - - -
(5)Now Zeai:nd 006 - 0.09 0 01 - 014 0.02 - 0.13 0.03(59) Nicaragua- -- - - - - - - -(60) Niger -- - - - - - - - - -(61) Nigeria - -- - 0.01 - - 0.06 - - 006(62) Norway 0 25 0 14 - 031 0.115 0.01 0.22 0.07 0.01 0.21 0.07 0.01(63) Paldata&n - .01 - - 0.01 - - 001 - 001(64) Peru" - - - - -
(65) Philippines 0.02 - 0.08 - - .7 - - 0.07 --(66), Poland 0.24 0.0 0614 0.23 0.3 .6 021 .6 0.54 0.1 017()Portugl 0.02 0.01 o.04 0.03 - 0.07 0.02 - 0.07 0.02 -
01 Roania 0.09 0.01 0.29 0.09 - . 0.30 0.05 - 031 0.06 -(69) ituanda(70) Senegal- - - * - - - -
(71) Sierra Leone- - -- - - - - --
(72) Sin3gapor - -- 0.0 0.3 - .0 002 - 0.2 .273) South A rica 0.11 0.07 - 0.16 0.11 - 0.07 0.02 - 0.07 0.02-(74) 3PSpaI n 0.04 - 0.0 0.1 0.35 0.07 - 0.41, 0.13 -75) Sri Lanka76) Surinauc- - - - - -
7)Swee 0.92 0.56 - 0.98 0.52 0.01 o.69 0.36 0.01 0.49 0.214 0.0278wtzraland 0.05 - 0.01 0 07 0.01 0.01 0.05 0.02 0.02 0.069 0.02 0.014
10) Thailand - - 003 - - 0.03 0.01 0.01 0.03 0.01 0.0181) Togo - - - - - -
82) Trinidad and Tobago -- - -83) Tunisaa814)) Turkey 0.03 -004 - 0.07 - 007--655 Uganda - - - - - . -
06) United States 5.05 0.06 0.21 7.53 0.16 0.54 7 19 0.17 0.33 14.90 0 34 0.27J)Upper Voltas - -
00 Uruguay- - -- . - - - - -
~~9)Tugoalavia ~~~~0.07 0.03 - 0.10 O.04 - .0 00 .1 0.0-90) Zaire -- - - - - -11) Zambia - - -- - - 001 - - 00
C2) timbabowe - .o1 - - - - . --
TOTAL? (21 through (92) abovt 10 27 1.59 3.34 15 25 2.39 2.44 14.20 1.96 1.90 11.44 2.07 1.89
elIna 0 12 - 0.21 . - 0.32 - - 0.49 -
USSR 0.~~~~~~~~0 0.02- 1.88 0.18 - 3.01 0 31 3.00 0.32 -
Nm The aprrorato includes cayprenued andi non-eeaprweseel rihr~hnard. Fibreloard (rftbreolbaldina board): a panel manufactured from fibres ofwood om lim
*g ihalno-celulcale as~eviml&a wiLls Lio psJd-ary bouaid dorivlmqt from the fellig oftime f~breo asd theirdata
rent.Sad~rvllydivproperties . Donding eaterlals and/or additives may be added. It Is usually flat Preea1d but way *e
a dadO . -Trade datalnSC member States 111olude Intre-BEC trade

MDF/W/52Page 172
Production trade: wood Ply
(Million Tons)
LI) Vword
2) ALrostisa13) Aasaralta(i) Astriats) lanolsde'ISb) tarbades(7) blueLu) 5..!.o(VI h15a.l)l urull110) burua
(1?) Cuva"1131 Canada114) Ceptral Afric SRepublc
(14) Chile~17j coleubi113) Can9., Uap. of10) Cale
(201 Clem(21) lo~cis"elakaiaJ22) Oimlcso ImpAblic
ECC. (Emar.1.1C LII)173124) Ulie/lmto/aabsor;125) bmlv4L24) Frn127) C any. lid. Rlp.(21) Irauw129) Ireland130) Italyt31) kthtlwhda132) United Kiagd"
(3.1) Lgypt(34) Finlaud(35) Gab..(341) Calab(31) Gha(38) Guyanaa(39) Hatti(40) "wyI) lolvead
(42) lad!.143) W.daatat44) lsrge!liSJ Ivoery Cent(is1 l4aul a147) Jwaat4l) Loay(49) hWIN. Up. of150) Uaa!t!(51) Nadepmaar(53) Ralusl,Eb3) Nalaysta(54) 1aldtwa15b) Walt.(54) Uavwalmi(S7)1 Nwitaust53) go zealamdS9J) licara.&a(40) lipst141) Nigeria142) hkrav(31 raklietan144) Peru115) Philippines144) Palaid(47) Periolal(45) Sway!.IL) mAds(50) Somovalll) Sivrra Low(7?) Stagaeaea173) South Africa174) ISa!.iM) Sri lanka
(74) Swila(57) Said..Pa) e 5ttaarlaod(70) Tansla100) Iia1laa151) loet102) rtrnidad TobagW1) l1oala,154) Ta.aayI1) IOlwa1h) hnilte Slate137) her Volta(55) 10r4wa109) Teqaulavia190) lairs(91) tub,&
IV12) llaabbiee1*ta1, %?J thm~1921 &bra'
iC~ii.0551S
1043
Pred. tv.
10.01 11.30
0.070.35 .0.45 0.140.03
0.42
11.I? 3.03
0.1 0.020.02 -
0.43 0.03
3.02 0.030.11 .0.02 0.01.27 0.051.44 0.0.03 0.0
0142
0.02 0.01
4.57
.030.400.11 0.070.21 0.04
0.44 0.130.24 0.01
1.5 3.7102 0.02
0.07
27.33 1.20
0.33 0'.04
44.31 11.02
O.K
0.02
31 0.2
0.100.210.040.01
0.0s
0.07
0.01O.OS0.04
;.290.230.110.040.900.070.040.040.432.U0.05
0.05
0.12
0.4700;
0.0
0.010.010.050.04
0.20.05
0.01
0.020.15
0.010.11
0.01
0.010.04
10.140.010.09
Od.3 [
0.510.000.03
1 15
15.54
0.35
0.07
0.05
5.100.410.101.94
0.04
0.92
0.130.34
iS
0.27
Q:4
10.100.05
0.750.4
0.50
0.7s0.540.50
0.3
103.75
1.307.13
973
let.
0.09
0.15
5.91
0.10
0.02
0.040.140.00
0.13
0.01
0 A@
0.01
0.05
0.14
0.01
0.440.05
I.'9
0.30
4.770.02
0.0e
0.020.52
1w Pa-r
13.02 1
0.150.310.150.02
0.12
0.05 1
0.01
0.0 1
0.o3
e C)
0.W01.010.140.09
;1.90.11
1.500.12
02.5
0.040.01
0.15
0.05
0.01
0.17
0.0
0.350.010.05
0.05
3.17
0.0
0.11
0.240.0.
1919
Id. lv. lop. Pred.LI5 20.41 20.0 12b.7
0.301.21
0.03
1.09
3.52
0.700.12
;O.J
0.9!5.S10.0370.0
0:101.04
1.53
0.190.32
7047
0.10
0.45
:-2
0.25
0.020.14
0.01
0.72
1.001.10
0.23:
0.55
0.43I:
;.D0.09
0.12
0.030.01
0.03
0.011.11
0.47
0.57
0.350:03
0.410.12
3.570.01
2.2
D 70.0
10.410.04
0.230.14
0.04
olalla
2: I
0.09
1.40
2.20.:I
0.070.04
1.730.4
0.02
0.090.05
0.1D
0.01
0:.30.010 040.07
0.250.05
O.10
130:.20.010.033.e50.01
0.1
0.23
0.11
0.310.701.270.03
13.3
0.04
10.:0.740.13
0.55
0.340.071.127.020.02
10.700.20I0.1717.33
I :
1:0.09
0.43
0.277.100.020.210.01
1.
1.41
.10.70
I1.01.2
441:10.02
0.45
0.0
.1:5.00
1051
to. IW.20.55 19.40
0.120.200.2 O.20
4.25 0.10
0001
0.07
.0.0
0.01 0.1
0.1 I1 .340.14 0.420.04 0.110.75 1.910.11 2.42
0.030.01 1.54
. 0.07
C' I0.04 1.04
. .1
-l 0.12
-.51 0.04
0. 1 .02* 0.12
0.11 0.01
0.14 0.20a* 0.01
0.0
0.02 0.1
0.13 0.27
-24 0.01
2.5s 0.03
0.03 0.23
0~l.1!0.0!0.03
3.32 3.49
0.1
0.10 0.21
0.5 0.127
k w.: the C m ditie VIa laCl dode S ae raom els: voiaatcal. wel.eIei- C a, eh Ieal mod la Pulp. flo r*a 11.o la might
(sir.dIy*. laW setaOZ stvm). rdae dats taloadaldbal lIC uamar Stlate laden. talraUI; tran.
sooms! rUn. To . so fet Prowlrts. ltrasta. £aalyia.1 1.41.. f rlert Iran.. SW. Iammadia Orad s5ai.atile.
._ . l6-

MDF/W/ 52Page 173
Annex II Page
Import origins by countries and areas, of woodand wood semi-manufaciures and wood pulp, for selectedimport markets- 1963 , 1973, 1981 nameLy:
- EEC (10) 175- United States 176- Japan 177- Canada 178- EFTA (7) 179- Austria 180- Finland 181- Sweden 182- Switzerland 183- Australia 184- New Zealand 185- Korea Rep. 186- Singapore 187- Spain 188- Egypt 189- Tunisia 190- Yugoslavia 191- Saudi Arabia 192- Total developing countries 193- Total developed countries 194- Total 195
1New Zealand = 1964

MDF/W/52Page 174
ANNEX II
IMPORT ORIGINS, BY COUNTRIES AND AREAS, OF WOOD,WOOD SEMI-MANUFACTURES AND W 0ODPULPI
Area abbreviations used:
EC (10)
EFTA (7)
ANZSA
OT.WE
DVP
DVG or LDC
CAR. LAM
E.nASIA
MIDEAS
ETA
: (excluding intra-trade) Belgium/Luxembourg, Denmark, France,Federal RepubLic of Germany, Greece, Ireland, Italy,Netherlands, United Kingdom
: Austria, Iceland, Norway, Portugal, Sweden, Switzerlandand the associate member Finland)
: Australia, New Zealand, South Africa
: Other Western Europe (Spain, Malta, Turkey,Yugos lavi a)
: Developed countries
: Developing countries
: South America and Central America
: South and East Asia
: West Asia
: Eastern Trading Area
1Data derived from: United Nations trade data tapes

VI3UA 33g3 U.S. P36146C
I33U3MP IAL 3930 wnnO3943 142.11 34.42 34.9,37 93.74, 11.90 1.3N1393 1017.34 I3 .13.41
SW46r611 *&Nn 9Lpems1961 31342.03 64*93 193393973 qn',.7 1-0.1 391.63s3993 153.-t? 393.13 l,6O.41
*tVIr.0Of393 3117.21 0.9" 133401971 SnJ6.93 40.31 V.tlS19s3 3.63. 123.43 93.91
'SUI1CI? 30131143943 4.40 0.09. 0.0D3l9s13 1.13 0.01 3.101913 295.34 0.S 3.13
193 433.43 0.04 11.123913 Mo.0t 0.01 3.031931 113.41 0.lbs .09
WOOD PULP19e1 1T4.62 92.34I 3.19t3V3 3133.33 l.-OT 2ZV9.331933 4243. O163.90 93Y.04
YE11 C2.1, AN HOMDUR SUAZIL361USYRIAL 30*" wo00
3913 3.9T 0.37 2.1219y1 3.39 0.43 4.2419is 7.44 0.72 0.11
S30NWOO 36D SLF~p1QS1393 30.13 4.51 23.231913 33.02 10.92 44.433933 137.1T 4.21 134.S1
PLYWOOD1394 0.19 0.00 0.49191`3 T.3 0.11 7.'.?1923 21.01 0.00 2S3.2
PaYT ICLE s01St'1363 0.13 0.00 0.003913 0.14 0.00 C.141l93 0.13 0.00 0.01
PULPWOOD1913 0.00 0.00 0.001913 0.01 0.00 0.001193 0.31 0.00 0.00
WO0OD PULP1393 0.0b 0.00 0.001973 0.14 0.00 0.131931 391.T7 0.00 144.9s
toM'i00311YVI Artiri CS-Fan ct11.1
INDUSTRIAL 30110 6OO01943b 137.34 30.19 0.013973 391.09 15.1- 3.93393l S13.90 41.41 2.3
S8WN6O0D *61 SLtEI RS1391 31.29 3.-3 0.04194731 364.93 1.11 3.630to33 135.39 317.3 O.S3
PLYOO3949 32.4v 0.00 0.003T73 33.S9 2.43 0.00t9l3 23.7T 3.43 0.01
PARTIttF fo&%"1*13 0.00 0.00 0.001373 0.31 0.00 0.001931 0.13 0.00 0.00
19s3 0.24 0.00 0.001973 0.1 0.11 0.00lst3 O.ST 0.00 0.00
WOO PULP.11s3 1.1S 0.00 0.001919 M3.U 0 00 0.003933 3.4 T.13 0.00
tCMlOOTTYT&* VT& toss CtwC14-
IkDUSWI AL Vftn vnOD1173 $?.?S 47.94 24.1Slilt 176.71 Sm.09 S2.47
1113 II.43 133.43 161.6IOTI SIN.24 152.40 *S.19Sle361036133 IL .Wfl13 3300.0
1'43 91o.4 1..S2 30.23973 37.01 42.94 24.33oval %4.0s 7.S0, R.Tv
PAPT~ctr Ong*,
3933 321.73 930.03 92.12
6190063 10 SLIPS O.2b o.o
1931 2.30 34.37 4."PULPWOO')
to&,% 7404 1T.0% 1.443913 3.4 2.31 13.393931 39.1.363 39 34.91
woff", VUL1063 39.435 3S.3 3.9T1971 13.01 24.37 3.103933 94.21 29.32 3.19
IMPORTS eV AIfAS Awn tD"4001TV cams At 1-1-0?Lf1w NILLION DOLLARS U53
J£P16 P11303 Ioff IaUSTin V1LAN swurt olt. Wa
0.39 0 OO .1.53.09 0.00 49.31 20.092.20 0.30 132. VS 13.13
9.10 0.00 493.3 303.3911.30 0.30 130S.04 275.3113.23 0.00 21 529.10
3S.S 0.00 434.1 0.9036.34 0.00 121.ST 1.133.91 0.00 114.37 2.93
0.00 0.30 3.M3 0.190.01 0.-0 110.40 23.490.01 0.00 229-S. 91.10
0.00 0.00 13.94 0.11D00 0.00 2.35 1.03
0.00 0.00 9.41 4.31
0.00 0-00 513.99 35.t90.04 0.00 1Ot5.09 14.430.03 0.00 1913.29 13.44
CHI3E fttUOO P811AW .1SI3
0.00 0.01 0.00 32.640.00 0.03 0.00 134.770.43 0.02 0.05 IS."
0.13 0.53 0.00 33.950.54 4.33 0-.0 321.04
I3.31 2.43 0.33 102.34
0.00 0.00 0.00 0.120.00 0.01 0.00 130.310.00 0.00 0.00 302.34
0.00 0.00 0.00 0.000.00 0.00 0.00 0.040.00 0.00 0.00 0.24
0.00 0.00 0.00 0.000.00 0.00 0.00 0.030.00 0.00 0.00 0.01
0.00 0.00 0.00 0.240.00 0.00 0.00 0.28
47.10 0.00 0.30 4.05
0O6CO C43061 691N6 IVORY
3S.19 40.43 26.00 44.0428.90 111.43 44.14 217.0113.17 330.19 9.14 241.31
0.39 0.45 15389 9.201.16 0.41 S3.41 34.015.31 1340 16.04 &4.40
0.03 S.190 2.4 0.010.13 13.33 9.30 2.190.12 20.9S 0.08 0.43
0.00 0.00 0.00 r.000.00 0.00 0.00 C.030.02 0.00 0.00 0.01
0.00 0.04 0.00 0.040.no0 0.00 0.14 0.520.00 0.00 0.00 0.01
0.00 0.00 0.00 0.000.00 0.00 0.00 0.000.00 0.03 0.00 0.00
PO0A31 30RA3IA L1GAPV` CHIME
13.9 4.41 1.31 0.0230.43 2.41 3.40 0.0430.39 3.29 1.53 0.24
ISM2 44.11 2.49 0.0013.50 13.33 20.31 0.0430.12 24.01 6.13 0.34
0.33 13.3 0.00 0.142.13 5.93 1.31 1.439.34 .9S 0.02 0.26
0.30 0.23 0.03 0.003.42 3.43 0.09 0.000.31 3.92 0.03 0.02
3.43 3.44 0.62 0.004.04 0.49 1.39 0.004.1T7 .s9 0.71 0.00
0.02 31.0 0.02 0.043.41 0.04 0.33 0.000.03 31.3 0.02 0.S
30.s1 1.49 4.2212.31 33.40 39.9123.33 3.49 34.43
33.I 39.933.w-s24
73.12 111.10 304.13
39.4 0.41 2.14130.27 9.3S 21.53133.14 4.32 21.31
1.43 a1.3 0. 034.9V 24.01 .4134.24 40.29 31.35
12.24 1.24 2.32001 0.4s 1.030.01 0.08 3.3
1143. 34 10.40 4.10211.49 "4.S30 14.52S44.S3 IO31.S94 9.s3
3URN& I3OO61 MALAYS PHILIP
IS." 0.1T 0.00 5.3214.ST 90.14 1I0.3 33.S44.49 4.T 1.29 19.32
9.12 0.S3 0.00 0.271.24 21.21 224.24 .31T9.Ts 124.16 233.49 99.19
0.30C0.00.00
0.000.000.00
0.000.000.00
0.000.00
0.200.49
0.010.24T.51
0.00
0.04
27.00
0.01
0.000.000.000.00
0.000.00
0.00
0.00 0.000.09 43.15
39.13 4304
0.00 0.000.00 0.010.00 0.00
0.00 0.000.00 0.000.00 0.03
0.00 0.000.00 0.000.00 O.OC
N030CC OCEANIA
0.00 0.010.00 1.03O.S4 1.34
0.00 0.000.05 0.130.01 3.03
0.01 0.001.10 0.010.03 0.01
0.00 0.000.00 0.000.00 0.00
0.00 0.000.00 0.000.53 0.00
3.32 0.003.30 0.60
14.17 0.00
MDF/W/52Page 175
0.013 63.531.24 123.I2.13 311.94
0.73 443.0430.41 1914.12.09 3090.32
0.34 43.370.34 22.5332.23 422.t0
0.29 :1.93.2" 121410.00 234.91
0.08 23.410.01 4.422.31 334
33.33 143.4135.01 1402.3S3l6.9 3501.44
Sl6&1 16AIL3 K0R1A. MINEIS
0.S30.441.20
3.3331.9214.l9
0.94
0.00
5.174.331.14
0.00 0.09 O.014.53 52.03 0.0433.Ts 38.96 0.33
0.00 0.00 0.000.00 0.01 0.000.00 0.1 0.00
0.00 0.00 0.000.00 0.00 0.000.00 0.00 0.00
0.00 0.00 0.0060.13 000 0.003.21 0.00 0.03
PAPUA U SOLOMON ALL LOC
2.01 0.00 227.17C."! ^.00 121.033.27 0.40 422.44
0.00 0.00 99.S30.31 0.00 319.210.35 60. 371.04
0.00 0.00 13.490.01 0.00 181.3360.0 0.00 34.4
0.00 0.00 0.230.00 0.00 0.230.00 0.00o 3.33
0.00 0.00 0.240.00 0.00 0.800.00 s0.0 0.94
0.00 0.00 4.170.00 0.00 14.s80.00 0.00 235.45
0.00 0.410.00 0.110.25 0640
0.00 0.010.00 0.030.33 0.54
0.03
42.49
0.000.020.00
0.00
0.00
0.000.000.000
4.19
0.320.02
0.000.00
0.04f0.000.03

MDF/W/52Page 176
pill., -I I IMPORT7& NV' LIFAS A"f CFrV343IYV rt.3'US U.L.£.9tIN MILLIfIN DOLLANS Ul~
vpsu% w.ng ti. . cAooooD JAPAN FCIIS110 ET atSlUS F IWL A suFOvw 07. Wd! .o:SS VI, OVP
Iq3 0o 33on 20.19 0.0"3 00 .3 .0 0 0.00.00 0.0 0.00 20.01307'20.09 0.00 ~~~~~14.02 0.330 0.11 0.02 0.0 0.00 D0.1 0.0 0.0 1.
3993 00.07 0.0300')4.50 0.00 0.0 0.00 0.00 0.00 0.60 0.00 0.00 00.03
33 &;lo.11 0.00 21T.01 7.57 0.19 0.00 0.00 0.00 0.00 0.00 0.15 315.53p97 1' Ss5 33.3o 3,91.73 3.20 2.10 0.60 0.00 0.00 0.07 0.01 0.00 1190.3193933'I ?*I32.97 0.no10 3903.33 0.315 1.60 0.1If 0.00 0.00 0.13 0.03 0.12 1909.50
1901 109.00o 0.00 7.004 55.00 1.00 1.39 0.00 7.32 0.00 0.27 0.00 71.3)3913 303.92 0.00 32.13 55.70 1.20 33.~~~~~ ~ ~ ~~090.13.500 .0 0.0 P31.22
1973 3.12 0.00 ~~~~~0':.1.0 0.s 0.3012i 10.00 D0.00 0.0 0".000.002 0.00 1S.03191 0.0 .0 00 0.00 0.0: 0.01 0.00 0.00 0.:00 0.300 10
3932.5I.0 33 0.0 0.00 0.0 0.0 0.00 0.00 .000 3
1973 6.03 ~~~~~~0.0 It.5s 0.0 0.00 0.00 0.00 0.0000 0 0.00 0.0 3.7393 1.0 0.00 10.03 0.00 0.30 0.00 0.00 0.00 0.08 0.00 0.00 10.00
WdOOD Put:14#f1 3IT.15; 0.00 30.136 0.0011 0.22 20.3:'2 0.0 T.0A, 0I.04 0.00 0.10 327.0?393 05.71" 0.010 0120.05 0.01 0.33 19.52 0.00 0.17 10.99 1.05 .11.71 050.00,19311333519 0.00 130I .51 11 .0 1.0 00 9.01 3.3 0.00 02.52 1740.15
VYEA CA6.LA39 4'IONDU RMAYIL CHILE ECUAOO PARAGU t.053* BURMA OSEDOIEE WBAYS PHILIP S30GAP IHAILA 3031A. HIDFASINDUSTRIA3L 303133 WO00D
1901 0.3T 0.030 0.03 0.00 0.00 0.00 0.07 0.02 0.00 0.00 0.50 0.33 0.00 0.00 0.0039473 0.37 0.02 0.0 0.00 0.00 0.00 1.00 0.02 0.25 0.15 0.24 0.01 0.01 0.00 0.001933 0.53 0.01 000 0.0 0.00 0.00 0.23 0.02 0.05 0.09 0.00 0.Cf 0.00 0.00 0.00
SAWWnM~dft AM" SLVYPE91903 1 30,2 3.33 1.22 0.01 1.10 0.00 7.31 0.22 0.00 0.00 1.33 0.10 0.30 0.00 0.00I1973 55.10 71.52 20.32 0.30 3.93 0.50 37T.71 0.10 0.12 11.09q 3.05 3.504 5.70 0.03 0.0219I 917.51 0.39 01.13 0.10 1.20 1.01 01t.00 0.60 1.95 15.97 25.00 5.32 0.53 0.09 0.07
PL WO003903 2. a000 0.02 0.00 0.00 0.330 32.25 0.02 0.00 0.00 35.02 0.00 0.00 5.59 0.231971 3.51' 0.00 2.31I 0.00 0.00 0.00 293.30, 0.00 0.00 5.20 00.51 2.90 0.02 165.97r 0.111931 1.0 0.00 10.0? 0.00 0.00 0.00 019.03 0.00 29.30 2.26 30.09 1.11 0.05 300.50 0.00
PARTICLE "DAN"33"71 0.29 0.00 0.02 0.00 0.00 0.00 0.01 0.00 0.00 0.00 0.00 0.00 0.00 0.00 0.003.91 0.30 0.00 0.00 0.00 0.00 0.00 0.00 0.00 0.00 0.00 0.00 0.00 0.00 0.00 0.02
19"3 I.20 0J.00o 0.00 0.00 0.00 0.00 0.00 0.00 D."~ 0.00 0.00 0.00 0.00 0.00 0.001971 0.27 0.02 0.0 0.00 0.0 0.00 0.00 0.00 0f.00 0.00 0.00 0.00 0.00 0.00 0.001931 0.000 00 000 0 .00 000 0.00 0.00 000 0.00 0.00 0.00 0.00 0.00 0.00 0.00
WO000 P311.6393 0.0 0.00 0.0000a.0000 0 .0 000 .000 00 0.000 00D O0.03 0.0 0.0
1'l,73 0.05 0.00 0.00o 0.0 .000 0000 00000 0a 0.0 .00 0.00 0.0 000 001933 59.39 0.00 59.30, 0.00 0.00 0.00 0.01 0.;; 0.00 0.00 0.01 0.00 0.00 0.0 0..070yrAV AFRICA CA MC-fO C3131.A CONGO 000034 GHANA 3V037 L.10133 9030CC OCEANIA PAPUA* Wt SOLOMON ALL. LOC
343133 L 30I13DW`43133190 1.52 0.03. 0.00 0.00 0.00 0."0 0.00 0.00 0.00 0.01 0.00 0.00 3.593473 0.6 0.0 000 .0 0.0 4,a0010 0.00 0.00 0.00 0.00 0.70399 0.3 0.2 0.0 0.0 030 000 051 00 0.30 0.00o 0.00 0.00, 1.39
SAWNdWOfl 3330 51.11.6'19034 2.05 0.00 0.00 0.00 0.00 1.25 0.00 0.00 0.00 0.01 0.00 0.00 20.801971l 0.62 0.11 0.00 0.03 0.02 1.0 2.37 0.00 0.00 0.11 0.01 0.09 93.17I931 0.15 0.30 0.00 0.02 0.00 0.52 5.60 0.07 0.00 0.11 0.01 0.00 352.91
PLYwOOW19031 0.09 0.00 0.00 0.00 0.00 0.00 0.00 0.00 0.00 0.00 0.00 0.00 35.50197 13.332 0.00 0.00 0.00 0.30 0.01 0.01 0.00 0.00 0.00 0.00 0.00 302.50303 0.0 0.00 0.00 0.00 0.00 0.00 0.00 0.00 0.00 0.00 0.00 0.00 032.00
PIWYICLE 93306019731 0.00 0.00 0.00 0.00 0.00 0.00 0.00 0.00 0.00 0.00 0.00 0.00 0.291933~: 33.00 '3.00 000 000 0.00 0.00 0.00 0.00 0.00 *.00 0.00 0.00 0.13
,6390 00 0.00 0 0.00 .00 .00 0600 0-.00. 10.0 0.00 011.00 0.00 0.00 3:.03973 33.090.00 0.00 0.00 0.00 0.00 0~~~~~~~~~~~.00.00 00 0.0 0.00 0.00 .273933 33.03 0.033f 0.:00 0.00 0.00 0.0 0.00 0.00 0.00 0.00 0.00 0.00 0.00
340033 PULP
399I .-,7 0.00D 0.30 0.00 0.00 0.00 0.00 0.00 0.00 0.00 0.00 0.0 01.04C0930330ITVVFA0 6_*a tot5 CZICH. POL*k3. 603U3I* HUNiGARY CHIME
39,., 0.00 0.00 0.00 0.00 0.00 0.00 0.00193 000 0:.00 00 0:.100 0.0:,to 10.00O 0".0333933 33.00 ~~~~~0.3333 0.00 0.00 0.130 01.00 0.003903 'S Is 0.30''O 0.330" 0.0 0.00 3.00' 0.001933 33.3' 0.00 0.03~ ~~~~~~0.00 0.91) 0.00 0.50
317' '" :'
1.:3 23 '.0 0001 0.00' 0.00 0.0030N3 0.307.00 0.330 0.00 0.30 0.00 0.0!
3I'll 33(3 I..,33 33.00 0.30 33.00 0.00o 0.031903 3333 0.033 0.30 0.00 0.03 0.00 0.00
Pul P Wn-w1903 0.00 ~~~~~0.330 D30 0.033 0.0 On3 .33973 0.33 0.3333 0.0D 0.00 .0 3.0 0.3
3901 3.033 0.0O 0.00 0.00 0.0 O.0. 0.00
31311 0.00o 0.03 0.330 0.00 0.00 0.00 0.00tool 0.00f 0.00 0.00 0.80 0.00 0.00 0.nft

MDF/W/52Page 177
IMPORTS BY AREAS AND COMMODITY GROUPS JAPANIN MILLION DOLLARS US$
y1rAt's ~m 1 .S. cawar's JaAPA EC I Ift FF1A AUSTRI FI OIL4AN 1013E 01. WEf LAISI 71 OVP
393 345.39 33.19 10.23 0.00 0.21: 0.00 0.00 0.00 0.00 0.00 5.e2 304.24193 2943 9993 35 S 0.00 0.59 0.0es 0.00 0.02 0.03D 0.00 3.2M 3077.94I 6199 344.1 70.5 5. 0.00 1.546 0.00 0.00 0.00 0.00 0.00 4%.73 3304.32
sa9unn Ait urI.13 I0.9WI ..70 0.00 0.44, 0.00 0.00 0.00 0.00 0.00 0.04 35.401931 7U4.39 ~~233.04 337? 0.00 192 0.24 0.5 00 .3 0.00 32.43 599.40
Pt V30f'03943 O0.03 0.00 0.10 0.00 0.02 0.00 0.00 0.00 0.00 0.00 0.00 0.0219T73 17:#0.4 221 0.45 0.00 0.04 0.07 0.00 0.04 0.01 0.10 0.01 2.39I"O1 13.1? 2.33 4.10 0.00 0.09 0.14 0.00 0.03 0.10 0.00 0.02 7.23
Pall Id! 31n1301943 0.0s 0.00 0.00 0.00 0.02 0.01 0.00 0.00 0.00 0.00 0.00 0.031973 4.5 0.1s 0.01 0.0 0.0 0.002 0.00 0.00 0.02 0.00 0.00 0.221931 2.9 0.13 0.00 000 0.5 0.00 0.00 0.00 10.00 0.00 1.37 2.44
PULPIWOOD1943 4.4~~~~~ 0.03 D0.0 0.00 0.0 .00 0.00n 0.00 0.00 0.00 0.03 0.051973 34.90 0.25 0.00 0~~~~~~~~D.00 00 0.00, .00 0.00 0.03 0.00 0.52 0.33
191I 33 01S00 06.00 0.00 0.00 0.00 0.00 0.00 0.00 0.00 0.13
3W300 PuL:1973 244.04 33.9'S'7 11.9 0.0 5 1.4 0.0 33"31O23 .2253
1951 342.45 312.335 372.13 0.00 0.34 22.30 0.00 3.09 14.21 1.39 75.74 714.22C033n037v
YE AR C33.tAM #OnOfUm R3823L CHILI ICUADO 153*013 F.A53A 30RN) 130031 MALMY PHILIP S13059 IHAILA K0REA. P1j0E85INDOUSTIAIL 301.IN0 WO00
1943 0.43D0.00 0.0 0.00 0.01 0.00 224.43 0.54 0.92 0.00 153.54 0.22 0.41 0.00 0.04
173 2.31 0.00 0.64 0.00 0.00 0.23 14632.03 15.40 414.70 0.00 3SI.A3 0.03 3.42 0.12 0.001991 9.13 0.31 1.75 5.317 0.00 0.43 1314.95 14.04 411.43 971.12 204.62 0.45 2.47 0.00 0.00
93 0.09 0.00O 0.00 0.00 0.0O .0 44s.4 .0 00 .9 0.0 04 .0 001973 1.99 ~~~~~0.00 0.34 0.02 0.4 0.001 10".44 0.57, 0.71D 0.00" !.40 D3.3 3.7 D! 0.00
193 7.0 Z."4 2.73 0.29 0.59 0.27 154.43 0.39 30.21 25.7? 32.73 3.27 2.11 13.41 0.00
PLYWOOD194 0.00 0.00 0.00 0.00 0.00 0.00 0.00 0.00 0.00 0.00 0.00 0.00 0.00 0.00 0.003973 .0 00 .0 00 0.00 0.00 144.22 0.00 0.00 0.00 3.31 4.55 0.04 37.92 0.00193 0.0 0.0 0.00 0.0 0.3 000 54 0.00 1.35 1.17 0.15 0.00 0.09 1.04 0.00
PARTICLE "nan3o1943, 0.00 0.00 0.00 0.00 0.00 0.00 0.00 0.00 0.00 0.00 0.00 0.00 0.00 0.00 0.00
197 0.00 0.00 0.00 0.0 0.0 .0 413 0.0 .00 0.00 0.00 0.00 0.04 4.09 0.00191 0.00 600 0.00 0.00 0.00 0.00 0.13 0.00 0.00 0.00 0.00 0.05 0.00 0.01 0.00
PULPW30111943 00 0.0 0.00 0.00 0.30 0.00 0.03 0.00 0.00 0.00 0.03 0.00 0.00 0.00 0.001973 0O:.04 0.0 004 0.00 0.00 0.00 4.17 0.00 3.33 0.00 0.74 0.00 0.00 0.00 0.00
el3 0.00 00 0.00 0.00 0.00 0.00 3.7? 0.00 13.05 03.45 0.04 0.00 0.00 0.00 0.00
31100 PULP100 .0 00 .0 .S 00 .0 00 .0 .0 00 .D 001943 0.0? 0.00 0.00 0.00 0.00 0.00 0.05 0.00 0.00 0.00 0.00 0.00 0.00 0.00 0.00
1931 71.59 0.00 70.47 0.30 0.00 0.00 4.04 0.00 0.00 0.00 5.53 0.00 0.04 0.19 0.00
YEAAt31130 013130D 013.4 CONGO GA30N 011334 IVORY 415131 W030CC 0OCEAN1A PAPUA N SOLOM4ON ALL L0tINOUSTRI At 30UN0 b11000
1943 0.34 0.02 0.00 0.00 0.13 0.04 0.05 0.00 0.00 1.34 1.27 0.00 224.341973 71.1 D.4 000 32 0.3 4.74 5. 0.39 0.00 23.21 19.31 3.91 1434.54163 1.21 3.41 0.0 3. S145 00 0.95 0.1 0.00 43.42 42.93 25.37 1911.73
533311000 AND S111,135193 0.0 0.00 0.00 0.00 0.00 0.00 0.00 0.00 0.00 0.00 0.00 0.00 4.49193 .1 0.00 0.00 0.00 0.00 0.01 0.02 0.00 0.00 0.35 0.21 0.00 104.50
1931 0.0 0.00 0.00 0.00 0.00 0.00 0.00, 0.00 0.00 2.44 2.-44 0.00 166.99PLYIIOOD
1943 0.0 0.00 0 00000 0a.00.00 0. .0 00 0.00 0.00, 0.00,.003973 D0.00 0.0 00.0 a0 0.00 0.0 0.00 0.0 0.00 0.00 0.00 0.00 144.22
a3 0.00 0.00 000 0.00 .00 0.0 00 0.0 00.00 0.00 0.00RO 0.00, 0.00 5.74
1343 0.0 .0 00 .0 000.00 .00 0.0 0.0 0.00 0.0 0.00 0.0I9:,",0.00 0.00Do 0.00. 0.00n00 0.00 0 .0 .000 0 :0.0 0.00 0.00 43193 n.00 .0 0.0 .0 0 0. D .0.0 0.00 0.00 01.001 0.0 0. 00D 0.00 0.13
e94 0.0 D00 00 0.00 0 00 0.000 0 D.0 0.00 0.00 .0 000 .0
1973 0.0 0.0o.0.0 0000 0 0 .0 0.0 00 '02D .5 .0 441931 0.00 0.00 0.00 0.00 0.00 0.10,0 0.00 0.00 0.00 0.03 0.00 0.00 3.50
W000 PULP1943 0.4 00 .0 0.00 0'.00 :0.00 0.00 0.00 0:.00 0.00 01.00 0.00 .0.23193 0.32 01.0 0.0 .0 : 0.00 0.0 0.00 0.00 0.00 0.00 0.0 I000l .419P3 0.'3 0.02 0.00 0.00 0M0 0.00 0.00 0.00 0.00 0.00 0.00 0.00 75.24
C0q30033,v,1AR 113' U155 011d. POLAND ROMANIA4 HUNGARY CHIME
1943 I402339 0.00 0.00 0.00 0.00 001973 4:4.02 413.02 0.00 0.00 0.00 0.00 4.2len3 434.1I 447.31 0.00 0.00 0.00 0.00 3.20
1I43 0.09 0.00 0.00 0.00 0.04 0.00 0.051973 3.094 31.71 0.001 0.00 0.00 0.00 0.101933 16.30 11.14 0.00 0.00 0.230 0.00 1.03
1943 0.0, 0.00 0.00 0.011 0.0 0.00 0.00197 1.49: 0.07 0.' 0.00 0.3 0.00 1.42393 .4 0.00 0.0 0.00 0.0 0.0 01
11943 3.0 0.00 0.0 0.0 0.0 0.00 0.00
3I7 0.01 0.09. 0.00 0.00 0.00 0.00 0.011931. D.0 00 .0 00 0.00 0.0 0.00I1943 4.12,I O "04.12 .0 0.:0 0.00: 0.00 0.00
197329.43 29.44 0~~~1.00 0.00 0.00 0.00 0.03191 'S9
I P9.931 0.010 0.00 0.2 0.001 0.00
A3I000 014 .0
WeoPK194 0.43 0.31 0.30ie 0.00 0.10 0.00 0.30I;"% S.,? %.G1 0.00 0.00 0.00 0.00 0.02191 0t.14 0.05S 0.00 0.00 0.10 0.00 0.02

MDF/W/52Page 178
IMPORTS BY AREAS AND COMMODITYGROUPCANADA woJmmDY nmr-Los rawDsSIl HILLIOM DOLLARS US)
vr&R Wn"L fl U.S. CANADA JAPAN Eciol10 EFT asuswa, PI WLago SWEDEN 0T. WE atS$ ~T. OVP
INDU%?'ISL I "U'VnMW"'I'l" Ial6O 37.41 0.00 0.00 0.00 0.0@ 0.00 0.00 0.00 0.00 0.00 Iv.631973 4.2 '91 .0 .0 000 00D.0O.0 0.0 00 0.00 *V.12lePI 5.0% 74.5 0.00 0.00 0.04 09 000 0.9 0.0 0.00 0.01 75.01
S&WknnOO AN?, SLVP',rS3940 ?-.71 34.44 1.00 1.27 0.09 0.00 0.00 0.00 0.00 0.00 0.01 23.04
197 I9.9 9.3 0.0 D0 .2 01.00 .D 0.00. 0.DS 0.01 97.2135 152.%4 203.50 0.00 01.0 O041 1.3 O.D 1.25 0.00 0.00 0.10 215.902
Pt Ywt001940 7.9 0.47 0.00 3.34 0.40 0.19 0.00 0.19 0.00 6.01 0.00 4.44
103 6001I4 0.00, 1.9 07 I.17 0.00 1.34 0.00 0.01 0.04 10.941931 79.0~~~~~ 01.So 0.00 2.54 0.14 1.49 0.00 1.57 0.31 0.00 0.00 43.350
PAP? ICLE 1059'?173 110.4 13.40 0.00 0.00 0.10 0.00 0.00 0.00 0.00 0.00 0.00 11.50
1951 14.53 14.75 0.00 0.00 0.10 0.00 0.00 0.00 0.00 0.00 0.00 14.351
PULPW"0OO3915 2.14 2.24 0.00 0.00 0.00 0.00 0.00 0.00 0.00 0.00 0.00 2.24
1973 3.5% 1.55 0.00 o"0.00 0.00'.o 0.00" '0.00 0.00 0.00 0.0 .00 1.35'1193 1301is 3I91 0.0 00 0.0 0.0 000 0.0 0.00 0.00 00 13.91
WOOD PULP193 10.25 5.74, 0.00 0.00 0.02 0.00 0.00 0.00 0.00 0.00 1.45 10.251973 27.27 11.73 0.00 0.00 0.75 3.29 0.00 0.10 1.10 0.00 06 721953 49.64 43.03 0.00 0.7 0.00 0.00 0.00 0.00 0.00 0.00 0.0 41.Is
YEAR CAQ.IAM HONOUR SIAZIL CHILE ECUADO PARAC*J E.ASSA suRMA UNDONE NALAVS PHILIP SINGAP 7MAR18 KROEA. PIDEASINDUSTRIAL R10110 WOOD
1943 01.001 01.00 0.00.01 1:001 0.00 0.0000 601 0.00 0.00 0.0 0.00 0.00 0.00 0.00 0.0019730 001 0.0 0.0 0.0 0.00 00 0.0.0000 0 000 0.00 0.00 0.00 0.00 0.003951 0.00 0.00 0.00 0.00 0.60 .6 0.00 0Z.00. 0.00 0.00 0.00 0.00 0.00 0.00 0.00
SAWNWOOD AND SLEEPERS19463 0.50 0.02 0.10 0.00 0.03 0.00 0.71 0.05 0.00 0.00 0.14 0.00 0.14 0.00 0.00193I.'s.0 31 0.00 0.17 0.24 5.59 0.00 0.00 0.95 0.45 1.50 1.41 0.1? 0.00Iva1 10 .1 0.05 9.51 0.00 0.02 0.03 5.45 0.01 0.52 1.75 1.55 3.04 0.07 0.00 0.00
PLYwVODa93000.0,.0 0.0 0.00 0.00 2.25 0.00 0.00 0.00 0,180 0.00 0.00 0.00 0.201973 0.0W ~~~~0.00.3O.0 0.00 0.0 34.0 0.00 0.00 0.0 0.5 :.II 0.00 5.4 0019,1l 0.30.101 .010 1.01.0 0.00, '0.:00 000 '34.43 0.00 0.35 0.15 1.55 0.0a 0.01 131.7 0.00
PARTICLf SOAR'?1973 0.00 0.00 0.00 0.00 0.00 0.00 0.00 0.00 0.00 0.00 0.00 0.00 0.00 0.00 0.001951 0.00 0.00 0.00 0.00 0.00 0.00 0.00 0.00 0.00 0.00 0.00 0.00 0.00 0.00 0.00
PULPWOOD.0 .0 0.0 00 00 .0 .0 000 00 .0 .0 0.0 001943 0.00 0.00 0.00 0.00 0.00 0.00 0.00 0.00 0.00 0.00 0.00 0.00 0.00 0.00 0.001971 0.00 0.00 0.00 0.00 0.00 0.00 0.00 0.00 0.00 0.00 0.00 0.00 0.00 0.00 0.00O
WOOD PULP"I'll 0.0 0.00 00 0.0 .000 00 0.00 0.0 0 .00 t 0.0 0.00 0.00 0.00 0.00 0.001973 0.00 0.00' 0:o.00 0.00 :'0.00 D0.00 '0.:00 0.00 0.00 0.00 0.00 0.00 0.00 0.00 0.001951 0.03 0.00 0.03 0.00 0.00 0.00 0.00 0.00 0.00 0.00 0.00 0.00 0.00 0.00 0.00
TV a SPARICA CaN4RO CENT.& CONGO G450N GN4NA IVORY LISER? K010CC OCEANIA PAPUJA N SOLOMON ALL LOC
IWOUSTPIAL ROUND WnOO1043 0.0 0.00 0.00 0.00 0.00 0.00 0.00 0.00 0.00 0.00 0.00 0.00 0.10019473 0.00o 0.00 0.00 0.00 0.00 0.00 0.00 0.00 0.00 0.00 0.00 0.00 0.011951 0.00 0.00 0.00 0.00 0.30 0.00 0.00 0.00 0.00 0.00 0.00 0.00 0.00
SAuWNWOOD AND SLEEPERS3943 5.47 0.02 0.00 0.00 0.00 0.14 0.03 0.00 0.00 0.00 0.00 0.00 1.473970 O.W 00 0.000 00 .0 0.29 0.07 0.01 0.000 0.00 0.00 0.00 10.721951 0.41 0.03~D 0.00 00.00 '0.00" 0.00 0.37 0.0 0000 0 0 00. 0.0 1407
PLYWOnD1943 0.7 0.00 0.00 0.00 0.72' 0.00 0.00 0.00 0.00 0.00 0.60 0.00 3.21lo'3 0.02 0.00 0.0 000 0.00 0.02 0.00 0.00 0.00 0.00 0.00 0.00 14.1219511 0.00 0.00 0.00 0.00 0.00 0.00 0.00 0.00 0.00 0.00 0.00 0.00 34.42
PARTICLE BOARDI971 0.00 0.00 0.00 0.00 0.00 0.00 0.00 0.00 0.00 0.00 0.00 0.00 0.003931 0.00 0.00 0.00 0.00 0.00 0.00 0.00 0.00 0.00 0.00 0.00 0.00 0.00
PULPWOOD1943 03.00 0.00 0.00 0.00 0.00 0.00 0.00 0.00 0.00 0.00 0.00 0.00 0.001973 0.0 .0 00 .0 00 .0 00 .0 00 .0 00 .0 0019511 O0.00 0.00" 0.01,0 0.00"1 0.00Io 00.00 000 0.00oO* .0.010 0.6100 0.:000 0.00 0.:00a
1000 PULP
I97 0.0 0.00 00.0 0.0 0.00 0.09 0.00 0.00 0.00 0.00 0.00 0.00 0.003931 0.0 0.00 0.00 0.00 0.00 0.00 6.00 0.00 0.00 0.00 0.00 .0 0.50 0.01
YIEAsit A URpSS CEEFCH. POLAND NOMNffIA MIUNOAN? CHIME
193 0.00 0.00 0.00 0.0 0.00 0.00 007190 a.0 0000 0
0 .000 0 0.00 0.003*94 0.00 0.00 0:.901 0.0 0.00 '06.00~ 0.00
1970 0.00O 0.00 0.00 0.00 0.00 0.00 0.001951 O 0.5 0.0 0.0 000 0.00 0.00 0.52540, 0.0 0.050 0.0:00 0.:00 0.00 0.00 0.01
I191VI 1.106 11,O 1:0.00 0.00 0.0 0.50 10.03911 3.31 ~~~~~~~11110.0 0.0 0.0 000 50
1'?PI I.512 .2 0 0.00 0.00 0.00 0.00
1931 0.00., 0.0 0.0 000 000 0.0
Put Obin"39040 9.00 0.00 00 .0 00 .0 603973 O.00 0.0 O.' 0.0D ODO$: 0 0.0 0.09 0.00"O1pi .00 0.060 0.00 0.00 0.00 0.00 0..03
WieII PutN1940 0.05 0.00D '0.0 .0 .0 0.0 00393 .0 80.0 00 0.0 05 000 .01953 0.80 0.00 0.50 0.00 0.00 0.00 6.00
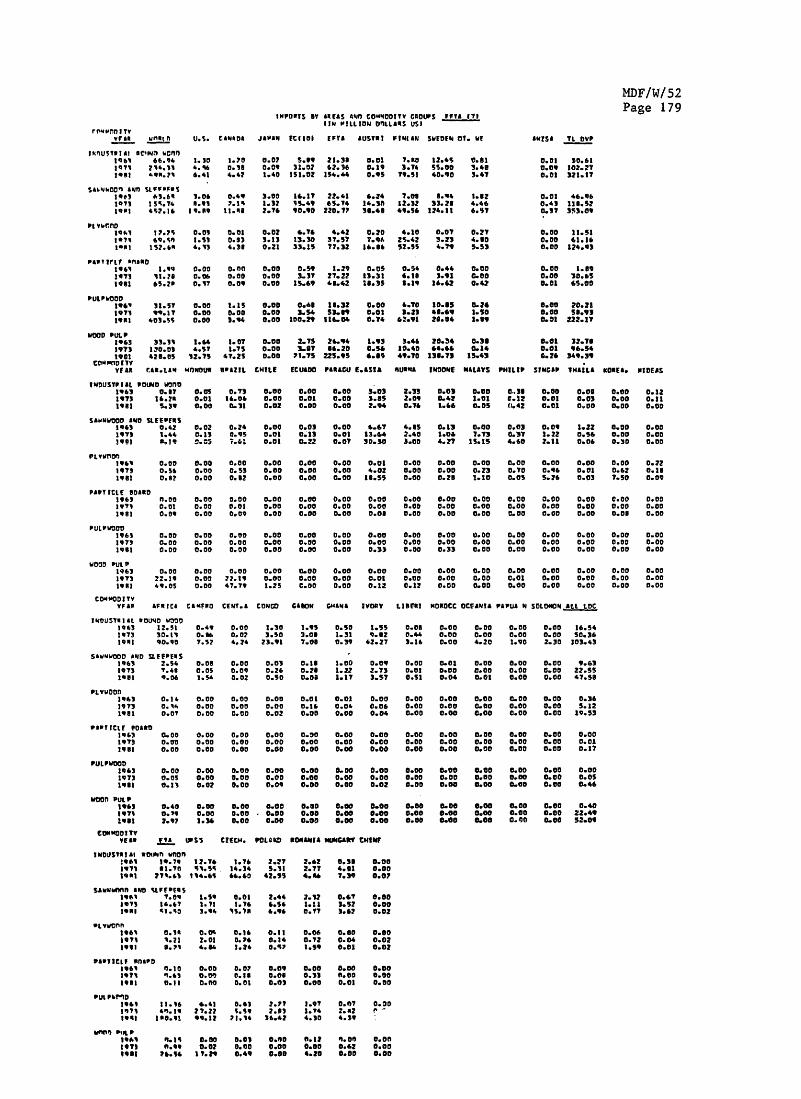
MDF/W/52 Page179 IMPORTSBYAREAS AND COMMODITY GROUPS 2133 171(INMILLION DOLLARS US)
rrPnhvn I TVVFAm wuflnt U.S. .*A04 J833 KIMol EFTA &UST! vIfail am SWEEN 01. WV
tabI 44.94 1.30 1.70 0.07 S.39 23.33 0.01 1.30 12.4s 0.813311 214.11 4.- 0.198 0.09 31.02 62.36 0.19 3.14 55.00 3.433933~l '93.71 4.41 4.42 1.40 151.02 IS4.4 0.95 19.53 40-.0 3.41
S*41003n *N1 St"FWSaS3oel 63..n 1.0o 0.49 3.00 14.1? 22.41 4.24 1.0e 3.94 3.321013 55.1'. 3.91 7.I5 1.32 15.49 45.14 14.30 12.32 33.23 4.441[pt 4%$27.1 33.p 11.13 2.14 90.90 220.17 36.43 49.54 124.11 4.51
Pt VwrnoD1961 137.75 0.0 0.01 0.02 4.14 4.42 0.20 4.10 0.01 0.211361 49. 1 3.S1 0.33 3.13 13.30 31.51 7.90 2S.42 3.23 4.g0363l 152.43 4.13 4.33 0.21 33.15 11.32 14.38 52-.5 4.19 3.53
wP T Irtf unaft1941 1.33 0.00 0.O0 0.00 0.5 1.29 0.05 0.54 0.44 0.0091*1 131.23 0.0 0.00 0.00 3.31 21.22 13.31 41.3 3.91 0.00
l393 45.2p 0.11 0.09 0.00 15.49 41.42 1.395 3.19 14.42 0.42
PULPWOOD194 3I.ST 0.00 1.15 0.00 0.43 13.32 0.00 4.10 10.-5 0.241911 9*.1T 0.00 0.00 0.00 3.S54 53.3 0.01 3.23 43.49 1.501933 403.55 0.00 3.94 0.00 100.29 31.04 0.74 42.91 23-.3 1.39
MDF/W/52Page 179
&Nrs1 L OVP
0.03 30.610.09 302.210.01 321.31
0.01 44.Qf60.43 113.520.31 353.09
0.00 33.530.00 61.130.00 124.93
0.00 1.390.00 30.450.01 4S.00
0.00 20.210.00 51.930.01 222.11T
WOOD PULP1393 33.11 I." 1.01 0.00 2.75 24.94 1.93 3.44 20.34 0-.3 0.01 32.133913 120.03 4.5, 1-.5 0.00 3.3' 54.20 0.56 30.40 44.44 0.14 0.03 94.541931 423.05 112.5 4T.25 0.00 73.1S 225.95 4.35 49.10 133.T1 15.43 0.24 349.39
COMzn1DI*YYEAR rit4.t*3 HONOUR 334Zl3 CHILE EC1UDO P*R3W E.3SI3 RURM3 I3DO0E MALAYS PHILIP SIN3C05 IHAILL 303E. It0DE1S
INnUSTP3*L 0OU3D WOMO1943 0.31 O.0S 0.13 0.00 0.00 0.00 3.03 2.33 0.03 0.000o39 0.00 0.03 0.00 0.123913 14.23 0.01 34.04 0.00 0.01 0.00 3.35 2.09 0.42 1.01 c.12 0.03 0.03 0.00 0.313931 5.39 0.00 0.31 0.02 0.00 0.00 2.94 0.14 1.44 0.05 (1.42 0.01 0.00 0.00 0.00
S&wuuO0D ANO SLEEPERISI193 0.42 0.02 0.24 0.00 0.03 0.00 4.41 4.35 0.13 0.00 0.03 0.09 1.22 0.00 0.001913 1.44 0.13 0.95 0.01 0.13 0.01 13.44 2.40 1.06 1.13 0.31 3.22 0.34 0.00 0.003933 St.3 0.; 7.T; 0.01 0.22 0.01 30.30 3.00 4.21 15.15 4.40 2.11 0.04 0.30 0.00
1941 0.00 0.00 0.00 0.00 0.00 0.00 0.01 0.00 0.00 0.00 0.00 0.00 0.00 0.00 0.223913 0.5 0.00 0.53 0.00 0.00 0.00 4.02 0.00 0.00 0.23 0.10 0.q9 0.01 0.42 0.131933 0.32 0.00 0.32 0.00 0.00 0.00 13.55 0.00 0.28 1.10 0.05 5.24 0.03 7.50 0.09
PAPT lCLlE BOA01943 0.00 0.00 0.00 0.00 0.00 0.00 0.00 0.00 0.00 0.00 0.00 0.00 0.00 0.00 0.003911 0.01 0.00 0.01 0.00 0.00 0.00 0.00 0.00 0.00 0.00 0.00 0.00 0.00 0.00 0.001931 0.09 0.00 0.09 0.00 0.00 0.00 0.03 0.00 0.00 0.00 0.00 0.00 0.00 0.03 0.00
PULPWOOD1963197)1961
0.00 0.00 0.00 0.00 0.00 0.00 0. 0.00 0.00 0.00 0.00 0.00 0.00 0.00 0.000.00 0.00 0.00 0.00 0.00 0.000.00 0.00 0.00 0.00 0.00 0.00 0.00 0.00 0.000.0o 0.00 0.00 0.00 0.00 0.00 0.33 0.00 0.33 000 0.00 0.00 0.00 0 000
WOD PULP1943 0.00 0.00 0.00 0.00 0.00 0.00 0.00 0.00 0.00 0.00 0.00 0.00 0.00 0.00 0.0091T3 22.19 0.00 22.39 0.00 0.00 0.00 0.01 0.00 0.00 0.00 0.01 0.00 0.00 0.00 0.001933 49.05 0.00 41.19 1.25 0.00 0.00 0.12 0.12 0.00 0.00 0.00 0.00 0.00 0.00 0.00
CO 3OD3ITYVFIW FvwIC* ral.4ro C13T.& CONGD GABO G&4ANA IVOSY LIN33I 40ROCC OCAN1A PAPUA N SOLOWN&ILL 3.0DC
INOUST9133.I01ND0 WOOD1943 12.51 0.49 0.00 3.30 1.93 0.50 1.531973 30.11 0.36 0.02 3.50 3.03 3.31 9.321933 90.30 1.52 4.24 23.91 1.08 0.39 42.21
S*14WOO *AND 33.1P31S941 2.5S4 0.03 0.00 0.03 0.13 I.0 0.093913 s1:43 0.05 .O9 0.24 0.23 1.22 2.733933 9.06 1.54 0.02 0.50 0.03 1.31 3.S
3943 0.14 0.00 0.00 0.00 0.03 0.03 0.001913 0. 0.00 0.000 0 00 0.14 0.04 0.03931 0.01 0.00 0.00 0.02 0.00 0.00 0.04
1363 0.00 0.00 0.00 0.00 0.30 0.00 0.001913 0.00 0.00 0.00 0.00 0.00 0.00 0.001931 0.00 0.00 0.00 0.00 0.00 0.00 0.00
PULPWOOD1393 0.00 0.00 0.00 0.00 0.00 0.00 0.003913 0.35 0.00 0.00 0.00 0.00 0.00 0.001931 0.1s 0.02 0.00 0.09 0.00 0.00 0.02
1O100 PULP3943 0.40 0.00 0.00 0.00 0.00 0.00 0.00I117 0.19 0.00 0.00 0.00 0.00 0.00 0.001933 2.97 1.34 0.00 0.00 0.00 0.00 0.00
3E34 VIA UPS$ CZEIC. POL20D ROMANIA UNG CR er1N0IJS133*I vot3inon130
131I 9.7I 12.1 314 2.213118 31.10 51.55 34.34 5.133I3 71.41% 314.45 44.40 42.5S
393. 1.09 1.59 0.01 2.443913 34.4 3.13 13.1 4.5S19w33 53.,0 3O., 5.13 494
3961 0.13 0.0 0.34 0.11
3199 B.71 2.31. 3.24 0.57
wa~~~~~ltlF ~ ~ 00 10n 0:0t933 0.3o 0.00 0.03 0.03
PUt PbmD3941 33.14 -4.4 0.43 2.7131|1| 40.33 21.22 5.19 2.@3393I3 10.91 99.12 I3.14 36.42
wnn0) P'iL339. 0.3 0.00 0.01 0.03913 fl.99 0.02 0.00 0.003933 14.54 11.29 0.49 0.00
0.03 0.00 0.00 0.00 0.00 13.540.4 0.00 0.00 0.00 0.00 0So.363.34 0.00 4.20 1.90 2.30 303.43
0.00 0.03 0.00 0.00 0.00 9.630.03 0.00 0.00 0.00 0.00 22.530.51 0.04 0.01 0.00 0.00 41.53
0.00 0.00 0.00 0.00 0.00 0.340.00 0.00 0.00 0.00 0.00 5.120.00 0.00 0.00 0.00 0.00 19.53
0.00 0.00 0.00 0.00 0.00 0.000.00 0.00 0.00 0.00 0.00 0.010.00 0.00 0.00 0.00 0.00 0.31
0.00 0.00 0.00 0.00 0.00 0.000.00 0.00 0.00 0.00 0.00 0.050.00 0.00 0.00 0.00 0.00 0.44
0.00 0.00 0.00 0.00 0.00 0.400.00 0.00 0.00 0.00 0.00 22.490.00 0.00 0.000.o 0 0.00 52.09
2.42 0.33 0.002.7? 4.31| 0.004.4 1.39 0.07
2.12 0.4, 0.001.11 3.52 0.000.T1 3.42 0.02
0.06 0.00 0.000.12 0.04 0.023.59 0.01 0.02
0.00 0.00 0.000.33 0.O00 0:.000.00 0.03 0.00D
3.91 0.1:1 0.001314, 2.62 r4.30 4.39
01.111 01.001 0.000.00 0.42 0.004.10 0.00 0.00

MDF/W/52Page 180
PJ0P IMPORTS BY AREASANDCOMMODITYGROUPS AUSTRIA(IN MILLION DOLLARS US)
COMMODITYWORLD U.S.CANADA JAPAN ECTIONETTAAUSTRIA FINLAND SWEDEN DT.WE UN754 TL DVP
INDUSTRIAL ROUNDWORLDI99 I 1I.27 0.59 0.04 0.00 0.32 0.01 0.00 0.00 0.00 0.70 0.00 1.6k1 0f1 1.0 0" .14 0.00 1.9. 1:.09 "O., 0.01 0.22 1.27 0.0? 21.40IOPJ J11.6 .54 0.7 o 110 o0' 0.00 0.0 0.01 1.12 0.00 19.21
SANDWOOD AND SLEEPERS1969 7.20 0. SO 0.01 0.00 0.19 0.l3 0.00 0.00 0.05 0.16 0.0 .50197 7.746 1.7 0.91 0.05 19.103 1.04 0.00 0.0'. 2.. 1.40 0.02 I.301 191 .5 .1 00 23.70 2345 0.00 4.72 14.01 2.1'.0.1 544
PLYWOOD1969 11.14 000) 0.09 0.130 0.10 0.02 0.00 0.02 0.00 0.02 0.00 0.141IT 0.0 0.16 0.01 1.10 1.61 0.00 1.07 0.15 0.15 0.00 31.111170 11%.I 0.1'. 0.01, 0.00 5.54 6.02 0.00 2.95 0.613 0.15 0.00 11.04
PARTICAT BOARD1971 1.91 0.00 11.00 0.00 1.34 0.155 0.00 0.01 0.00 0.00 0.00 1.951,90I 0.71 0.00 0.00 0.00 6.76 1.06 0.00 0.00 0.00 0.01 0.00 0."'
PULPWOOD19619 5.99 0.00 0.00 0.00 0.00 0.00 0.00 0.00 0.00 0.26 0600 0.26171 157 .0 00 .0 12 .0 00 .0 0.0 1.5 0.00 27
1993 15.17 000 0.00 0.0 I. 7 0.01 0.0 001 0.0 I.5T 0.0 1.16
WOOD PULY1t'1 0.1'. 0.00 C.A0 0.00 0.12 0.12 0.00 0.0'. 0.05 00 .0 021971 1.47 0.04 0.00 .00 0.01 0.11 0.00 0.00 0.00 0.11 0.00 02
I1901 106.7 1951 19.2? 0.00 5.00 10.21 0.00 5.96 131.131 7.03 0.00 75.05
COMMODITYYEl BRdL ON1*SAZIL CHILE. ECUADO PARLGU! E.ASIA uRSU0 INDOOII MALAYS PHILIP SINGAP THA111A 10RE, PI016
INDUSTRIAL ROUNDWOOD1961 0.01 0.00 0.01 0.00 0.00 0.00 0.40 0.09 0.00 0.00 0.10 0.00 0.01 0.00 0.0717 0.005 0.01 0.01 0.00 0.01 0.00 0.36 0.24 0.06 0.04 0.02 0.00 0.00 0.00 0.10191 0.02 0.00 0.01 0.02 0.00 0.00 0.14 0.09 0.00 0.00 0.05 0.00 0.00 0.00 0.00
SAWWNWOOO AND SLEEPE'S11961 0.02 0.00 0.02 0.00 0.01 0.00 0.01 0.01 0.00 0.00 0.00 0.00 0.00 0.0 .0I973 0.17 0.0 0.a00 0.0 0.01 1.02 0.00 0.14 1.40 0.01 0.25 0.01 0.0 0.01901 0.20 0:.02 0.0 s.0 0.09 0.00 10.72? 0.05 2.07 10.20 6.01 1.51 0.00 0.00 0.00
PLVVOOD1941 0.00 0.0 0.00 0.00 0.C0 0.00 0.00 0.00 0.00 0.00 0.00 0.00 0.00 0.00 0.001I71 0.00 0:.00 0.00 0.00 0.00 0.00 0.01 0.00 0.00 0.00 0.00 0.00 0.00 0.00 0.001901 0.20 0.00, 0.20o 0.00 0.00 0.00 0.14 0.00 0.00 0.00 0.00 0.00 0.00 0.03 0.00
1971 0.0 0.01110 0:.00 :.0.0 .00 C01.0 0.00I 0.U 0.00 0.00 0.00 D0.0 0:.00 0.00 0.0190 000 0.0 0.0O0 0.00 0.00 0.00 0.00 0.00 0.00 0.00 0.00 0.00 00 0 0.00 0.0
PULYWOOD19631 0.00 0.00 0.00 0.00 0.00 0.00 0.00 0.00 0.00 0.00 0.00 0.00 0.00 0.00 0.001971 0.00 0.00 0.00 0.00 0.00 0.00 0.00 0.00 0.00 0.00 0.00 0.00 0.00 0.00 0.00Joel 0.00 0.00 0.00 0.00 0.00 0.00 0.00 0.00 0.00 0.00 0.00 0.00 0.00 0.00 0.00
11000 PULP1961 0.0 000 0.00 0.0 0.30 0.00 0.00 0.00 0.00 0.00 0.00 0.00 0.00 0.00 0.00197 .00 0.00 0.00 O0.00 0.0 0.00 0.01a 0.00 0.00 0.00 0.01 0.00 0.00 0.00 0.001901 420 0.00o 1.03 1.25 0.00 0.00 0.0o 0.00 0.00 0.00 0.00 0.00 0.00 0.00 0.00
16IV LESICA CA-PEO C6347.6 CONGO GAOOM GHANA IVOPY LINFE! N030CC OCEANIA PAPUA 34 SOLOMON ALL tOCTWOUSTRIM ROUND wonnf
194 .44 0.0 00 0a.'. 07'. 0.11 0.29 0.00 0.00 0.00 0.00 0.00 1.991971 64.41 0.15 0.01i 0.'32 0.91 0.27 2.4 0.02 0.00 0.00 0.00 0.00 4.911901 2.71 0.1is 0.01 0.01 0.73 0.2.0 1.20 0.19 0.00 0.01 0.01 0.00 2.09
S&WWWOOD £349 SLE;PPEO191 0.07 0.00 0.00 0.00 0.00 0.00 0.01 0.00 0.00 0.00 0.00 0.00 0.1119712.99 0.02 0.01 0.010.03 0.U 19 00 0.0 0.00 0.00 0.00 6.50
1901 2.75 0.0 00 00 .1 0.7a123 .0 0.0 0.00 0.00 0.00 21.67
PLYWOOD1963 0.00 0.00 0.00 0.00 0.00 0.00 0.00 0.00 0.00 0.00 0.00 0.00 0.001979% q1.0 0.00 0.00 0.00 0.00 0.00 0.00 0.00 0.00 0.00 0.00 0.00 0.011901 0.00 0.00 0.00 0.00 0.00 0.00 0.00 0.00 0.00 0.00 0.00 0.00 0.35
PARTICLE B0ARD197 0.00 0.00 0.00 0.00 0.00 0.00 0.00 0.00 0.00 0.00 0.00 0.00 0.00
19.1 0.00 0.00 0.00 0.00 0.00 0.00 0.00 0.00 0.00 0.00 0.00 0.00 0.00
1069P0.00 0.00 0.00 0.0 0.0 0."0 0.00 0.00 0.00 0.00 0.00 0.00 0.0039731 0:t.00 0.00l '0.00) 0.00. 0.30 0.00 0.0 0.00 0.00 0.00 a 0.0 .0 001901 0C 0.00 0.110 0.00 0.00 0.00 0.00 0.000 0.0D 0.00t 0.0 000 0 .00
WO000 PULYI%,, 0.00 0.00 0.00 0.00 0.00 0.00 0.00 0.00 0.00 MO00 0.00 0.00 0.001971 .2 001 00 . 00.0a 0.00 0.00 0.00 0.00 0.00 0.60 0.00 0.211901 1.271 0.14 0.0 00 .30 0.00 0.00 0.00 0.00 0.00 0.00 0.00 6"00
COIIMOOITYyeAs PTA URSS MC2F. POLAND MOMANIA WMIPIAXY CHINE
NOWOISvPIIL oflIPo unn113961 7.9 4 .0 227 2.62 .110 0.003971 96.40 0.5 910 4.5 2.77-1 4.00 0.001903 9.40 '3.6 6.9.4 7.70 4.04 7.10 0.02
SAWNWOODAND SPEEWANS096 0.46 0.00 0.00 0.21 0.315 0.00 0.00I971 3.9 00 19 0.53 0.0. 1.79 0.00IV* '919T 0.11 14.7 2.62 0.01 1.'5 0.00
1910I 0.00 0.00 0.00 0.01 0.00 0.00391791 0.0' 0.00 00 0.0 01 003 .0to I 0..91 0.02 022 0:'I12, 00 %.6 000.00 .0
37 00.00 .00n 0.9 0.00 0.30 0.00 0.00
IOIAl .7 07 0.63D 2.27 1.9 .7 00
P01194 PULPC:T P 0
3949UP., 8.97 0.00 0.00 0.00 0.12 NO.0 0.0017 0.0.0 .0 0.00 0.00 0.00 0.6P 0.00
1901 P4.91 31.29 0.49 0.00 1%.01 0.00 0.00

MDF/W/ 52Page 181
*43S IMPORTS BY AREAS AND COMMODITY GROUPS FINLAND(IN MILLION DOLLARS US)
YEAR WORLD U.S. CANADA JAPAN ESSOCT EFTA AUSTRIA FINLAND SWEDEN DT.WE DNSSA YL DVP
in61 9.2 .0 R013 0.00 0.10 0.3*. 0.00 0.00 0.36& 0.00 0.00 0.49197' 6'1.? 10.:00, 0.11 0:.00 0.00 210.14, 0.00 0.00 20.1V4 0.00 0.00 20.941931 33.1, 0.00o 0.00D 0.00 1.15 1.47 0.00 0.00 0.1as 0.03 0.01 3.67
394 .3 0.2 000 02 0.134 0.312 0.00 93.00 0.12 0.01 0.00 0.173973 4:.E1 0.27 0.0, 0.124 1.13 0.312 0.01 0.00 0.29 0.41 0.0as 2.5039-t 33112 3.17 1.*5 0.11 2.03 1.47 0.49 0.00 0.15 0.01 0.00 7.35
PL Y113r33f191.0 0.09.0.00 0.00 0.00 0.01 0.00 0.03O, 0.0 0.00 0.00O 0.0 .0
1971 0.11 0.35 0.00 0.13 0.1 0. 000 0.0 0.0 0.00.0 .01933 7.. .04 0.01 0.00 0.40 0.11 0.00 0.00 0.12 0.00 0.00o 0.11
PAPIICLFr 133039 .09 0.00 0.00 0.00 0.02 0.07 0.01 0.00 0.04 0.00 0.00 0.09193 90.5 0.02 0.00 0.00 0.27T 0.041 0.0 .0 0.43 0.01 0.00 0.30
PULWOO
1.5 0.00 0.00 0.00 0.02 0.22 0.00 0.00 0.22 0.00 0.00 0.241977 6-'.90 0.00 0.00 0.00 0.00 19.12 0.00 0.00 19.12Z 0.00 0.00 19.3219311 92:.51 0. n0 0.00 0.00 2.14 0.71 0.00 0.00 0.07 0.01 0.01 2.37
WOOD PULY3614 0.51 0.03 0.10 0.00 0.22 0.23 0.00 0.00 0.23 0.00 0.00 0.531973 1.15 0.05 0.00 0.00 0.01 1.07 0.00 0.00 0.7T6 .0 0.00 11393 2.0 0.09 7.2S 0.00 0.03 4.64 2.07 0.00 3.33 0.00, 4.3 1.0
9215 CAR.t&AMHONIIUR RISATIL CHILE FCUADo PARAGU 2.4511 IURWA INCOME MALAYS PHILIP 5311051 THAIA K10111. PI01AS
INDUSTRIAL ROUND WOOD1963 0.02 .0 0.00 0.00 0.00 0.00 0.13 0.12 0.00 0.00 0.00 0.00 0.01 0.00 0.00193 .0 0.00 0.00 0.00 0.00 0.00 0.00 0.00 0 .00 .0 00 .0 00 .0 00
131B 0.00 0.00 0.0 0.00 0.00a 0.00 0.00 0.0 0.00 0.00, CC0.00 0.0 0.00 0.00 0.00
SAWNWOOD AND SLFPFPES1963 0.01 0'.00 0.00 0.00 0.00 0.00 0.15 0.10 0.00 0.00 0.00 0.00 0.04 0.00 0.001973 0.01.6 0.00 0.0 0.00 0.02 0.00 0.44 0.17 0.02 0.13 0.00 0.00 0.04. 0.00 0.001961 012 0.00 0.0' 0.00 0.03 0.00 0.35 0.51 0.01 0.03 0.02 0.02 0.01 0.02 0.00
PLUWOOD1961 0.0 0.0 00".0O.0 00 .0 .0 00 00 .0 00 0.0 0.00 0.0193 0.0 0.0 000 00 .0 .0 0.2 00 00 0 0.01 0.00 0.01, 0.00 0.0 0.li
390 0.01 0.00 0.01 0.00 0.00 0.00 1.60 0.0 0.00 0.00 0.00 0.30 0.02 0.67 0.0
PARTICLE BOARD197 0.00 0.03 0.00 0.00 0.00 0.00 0.00 0.00 0.00 0.00 0.00 0.00 0.00 0.00 0.003931 0.00 0.00 0.00 0.00 0.00 0.00 0.03 0.00 0.00 0.00 0.00 0.00 0.00 0.03 0.00
PULPWOOD3943 0.00 0.00 0.00 0.00 0.00 0.00 0.00 0.00 0.00 0.00 0.00 0.00 0.00 0.00 0.001971 0.00, 0.00 0.0 0.D00 0.00 0.00 0.00 0.00 0.00 0.00 0.00 0.00 0.00 0.00 0.00I393I 0.00 0.00 0.00t,.00 0.00 0.00 0.00 0.00 0.00 0.00 0.00 0.00 0.00 0.00 0.00
WOOD PULP19613 0.00 0.00 0.00 0.00 0.00 0.00 0.00 0.00 0.00 0.00 0.00 0.00 0.00 0.00 0.00197l 0.00 10.00 0.00 0.00 0.00 0.00 0.00 0.00 0.00 0.00 0.00 0.00 0.00 0.00 0.001933 0.51 0.00 0.53 0.00 0.00 0.00 0.00 0.00 0.00 0.00 0.00 0.00 0.00 0.00 0.00
YEAR ADFRICA CAMPARD CANYA CONGO GABON GHANA IVORY LIBARY HNORDCC DCENANIA PAPUA N SOLDNDNALL LOC
1901 0.24 0.00) 0.00 0.00 0.00 0.12 0.11 0.00 0.00 0.00 0.00 0.00 0.19I3973 0.21 0.:00 0.0011 0.010 0.00 01.00 0.20 0.00 0.00 0.00 0.00 0.00 0.213933 0.0 0.00D 0.00 0.00 0.00 0.00 0.00 0.00 0.00 0.00 0.00 0.00 0.00
SAWNWOOD AND SLEEPERSDe1.0 0.00 0.00 0.00 0.00 0.05 0.03 .0 000.00 0.00 0.00 0.24
397 0.10 0.0 .2 .0 0.0 0.22 0.22 0.00 0.00 0.00 0.00 0.00 1.001931 2.31 0.99 00.00 .0.11t C0.to02 0.00 0.91 0.00 0.00 0.00 0.00 0.00 1.09
PLYWOOD1961% 0.03 0.00 0.00 0.00 0.00 0.00 0.00 0.00 0.00 0.00 0.00 0.00 0.023q73 0.0 0000 0 0 .000 000 0 .0 0.0 0.00o 0.00 0.00 0.00 0.01193 .0 00 0.000 00 0.001 0.00 .000'.: 0a 0.0 00 0.00 0.00 1.42
PARTICLE WOOD371 0.00 0.00 0.00 0.00 000 0.00 0.00 0.000 0.00 0.00 00 .0 00
193t 0.00 0.00 0.00 0.00 0.00 0.00 0.00 0.00 0.00 0.0 0.00 0.00 00
PULPWOOD39463 0.00 0.0 0.00 0.00,00 00:0 0.00 0.00.0 00," 00:.00 0.00 0.00 0.0 0.00397 0.0 01.0 0.0 00 .0 00 .0 0.C00o00 .0 .0 00,933 0.00 0.00 0.00 0.00 0.30 0.00 0.00 0.00 0.00 0.00o 0.00 O.00N 0.0,0
3961 0.00 0.00 0.00 0.00 00 0.0 00 000 .0 000 .0 000 0.0039713 0.0 0.00 0.0 000 0.00:C 0.00 0.00, 0.00 0.0 0.00 0.0 0.00 0.00193 0.0 0.00 0.00 0.00 0.00 0.00 0.00 0.00 0.00 0.00 0.00 0.00 0.4
9233A F71 LRSS CZECH. POL.AW ROMNAIA HUNGARY CHINEFINDUSTRIAL ROUND WOOD
3963 9.4 9.04 0.00 0.00 0.00 0.00 0.003973 9.13, 19.73 0.00 0.00 .."0 0.00 0.001913 33.69 30972 0.00 2.97 0.00 0.00 0.00
SAWNWOOD AND SLEEPRS'9.I .% 0.7 00 . 00.13 0.00 0.00973 I3.33, .' 0.02 .0.010 ''0.2 10.56 0.06 0.00
3993 0.99 0.007 0.00 0.13 0.33 0.30 0.02
PLYWOOD396, 0.0011 0.001 0:.010 0.010 0.20,1 10.00 0.00l19710.39 0.39 0.00 0.0 0.0 0.00 0.0RI 0.0 0o0n 0.00 0.00 0.00 0.00 0.00
PARTICLE BOARD3971 00" 0.00 0.130 0.00 0.00 0.00 0.003993I 0.10 0.00 0.100 0.00 0.00 0.00 0.00
3960 .'S' 0.14 .0 0.00"'O 0.0 0.0: 0.00
IT0 2.9 2.5 .0 00 0.00 0.00 .01933 994.66 96.69 0.00o 2.97' 0.00 0.00 0.00
WOOD PLUP3961 0.00) 0.00 0.00 0.00 0.00 0.093 0.001970 ":.0, 0.02' .0.00 0.00 0.00 0.9300 0.00
393 0.1 0.00 0.0000s0o9 0.00 .0

MDF/W/52Page. 182
P U 1014 IMPORTSBYAREASAND COMMODITY GROUPS SWEDEN(IN MILLION DOLLARS US)
YEAD WORLD U.S. CANADA JAPAN ECCORT EFTA AUSTRIA FINLAND SWEDEN DT. WEANISATL DVP
3931 9.34 0.314 0.00 0.02 0.10 S.2?7 0.00 4.33 0.00 0.00 0.00 5.531"i) 199 .so:o00.3 5.30, 0).0 6 D 0.00 o1:oo 0.01 .3.41933 p50.qz 0.0 3.19 0. 14.0 30. 000 I99 0.00 0.13 0.00 139.3
I I3 I5.I 0.50 0.03 1.1 1.4" 5.05s 0.0? 4.951 0.00 0.92 0.00 9.543973 m'349 3.43 0.31 0.57 44? 10.33 0.01 15.33 0.00 0.94 0.0ON 37.401933 4.96.9 5.33 .13.3.34 7.19 20.50o *.oi 31.12 0.00 0.30 0.03 34.19
PR Vwtcf)39461 441 .1 030 .3 09 ID2 0.9 33 .00 0.00 0.00 4.1703571 t.13 0.3 0.35 3.14 0.33 34.33 0.5 3.2 .0 03 0.00 17.4193149.17 2.22 2D.00 03 1.0 23.43 010 27.93 0.00 0.2? 0.0 3.
s3373CLP. q03.01961 0.74 0.00 0.00 0.00 0.22 0.43 0.00 0.23 0.00 0.00 0.00 0.103973 7.40 0.0011 0.00 0.0 0.21 4.74 0.00) 4.34 0.00 0.00 0.00 7.0333 0.71 0.37 00 0.0 2.3 4.35 0.24 4.23 0.00 0.23 0.03 10.33
PULPWOOD13A.14.34 00 .0 00 0.00 4.3 0.00 3.4,I 0.00 0.00D 0.00 4.13
.1911 5.S 00 .0 0.0 .2 5.19 0.00 3.23 0.00 0.000.0 543933 127.22, 0.00 3.3? 0.00 15.39 35.29 0.00 42.1? 0.00 0.31 0:.00 1.44.141
WOOD PULPI945 3.03 0.34 0.44 0.00 0.03 0.44 0.00 0.42 0.00 0.00 0.00 3.033913 9.30 2.24 3.43 0.00 0.22 5.43 0.00 0.06 0.00 0.03 0.00 9.303933 13.51 1.?? 3.92 0.00 0.79 37.33 0.00 3.99 0.00 0.44 0.313 29.95
CCOMMODITY13*3 CA9.LAK HONIIUN BRAZIL CHILE FUCIADO PARAGU E.AS3A 33UR3A 3IN0036 MALAYS PHILIP PGAOP THAILA f(0P14. MIDEIS
3941 0.14 0.03 0.05 0.00 0.00 0.00 3.a& 3.79 0.00 0.00 0.00 0.00 0.01 0.00 o.oo19V73 0.02 0.00 0.00 0.00 0.00 0.00 3.09 1.03 0.00 0.00 0.02 0.00 0.00 0.00 0.00393l 0.00 0.00 0.00 0.00 0.00 0.00 0.35 0.33 0.00 0.00 0.00 0.00 0.00 0.00 0.00
393 .23 03 0.09 0.00 0.03 0.00 4.37 3.0? 0.03 0.00 0.02 0.00 0.35 0.00 0.0039 0.1 0.0 02 .0 00 .0 27 .3 03 .39 0.34 0.09 0.0 0.0 0.03 "3I.4 0.0 09 0.0:01 0.05 000 2.32 I.24 0.44 0.4 0.09D 0.23 0.4 000 000
PLYWOOD3943 0.0 0.0 00 .0 00 .0 00 .0 00 .0000.000.. 0.0 0.D00 0.34
39710.020.00 0.02 0.00 0.00 0.00: 3:.40 0.0:00 0.:00, 0,.04 0.2? 0.20 0.00 0.37 0.37393 0.15 0.00 0. 0.0 0.00 0.0 4.03 0.00 0.00 0.23 0.03 2.30 0.03 0.93 0.04
PARTICLE BOARD39 .00 0.00 0.00 0.00 0.00 0.00 0.00 0.00 0.00 0.00 0.00 0.00 0.00 0.00 0.00
397;3 0.00 0.00 0.00 0.00 0.00 0.00 0.00 0.00 0.00 0.00 0.00 0.00 0.00 0.00 0.00l93t 0.00 0.00 0.00 0.00 0.00 0.00 0.00 0.00 0.00 0.00 0.00 0.00 0.00 0.00 0.00
PULPWOOD3945 0.00" 0.00 0:.00 0.00 0 .00 0.00 0.0 0.00 00 0 0.00 0.00 0.00'00 0 0: 0.00 00DO1.0 0.O 0.0 00 .0 0.00 0.00 0.0 0.00l0.0 0.00 0.0 0.0 000 00
3933 0.00 0.00 0.00 0.00 0.00 0.00 0.00 0.00 0.00 0.00 0.00 0.00 0.00 0.00 0.003941 0.00 0.00 0.00 0.00 0.00 0.00 0.00 0.00 0.00 0.00 0.00 0.00 0.00 0.00 0.003o7l 0.00 0.00 0.00 0.00 0.00 0.00 0.00 0.00 0.00 0.00 0.00 0.00 0.00 0.00 0.00
COMMODITYvrA' £39314 CAWaFmO C131.4 CONG0 GA30ON GHANA IVORY LIBE33 M030CC OCEANIA PAPUA4 N SOLOMON ALL-LDC
INDUSTRIAL PLYTWOOD3943 1.41 0.20 0.00 0.04 0.34 0.03 0.44 0.00 0.00 0.00 0.00 0.00 3.443973 91.0 0.30.D:00" 0.00 0.79 0.33 3.03 0.:02 0:.00D 0.0:0 0. 00 0.00" "4I.3393 774 0.13 0.00 0.00 3.12 0.0 04 0.04 0.0 0.0 0.0 000o 3
SAWNWOOD AND SLEPERS3941'3.93 0.0? 0.00 01 0.13 0.21 0.03 0.00 0.03 0.00 0.00 0.00 4.93
3 N3.9 0.1 O.0' .0:03 0.20 0.30 0.00 0.00 0.00 0.00 0.00 3.753933 3.1? 0.09 0.00 0.04 0.02 0.12 0.73 0.00 0.00 0.00 0.00 0.00 4.77
FLYWOOOD3941, a.04 0.0 0.0 00 .3 0.00 0.00 0.00 0.00 0.00 0.00 0.00 0.203971 0.04 0.00 0.000.100 0.050s 0.03 0.00 0.00 0.00 0.00 0.00 0.00 3.3933 0.01 0.00 0.0 0.02 0.00 0.00 0.00 0.00 0.00 0.00 0.00 0.00 4.27
PARTICLE BOARD"945 0.00 0.00 0.010 0.00 0.910 0.00 0.00 0.00 0.00 0.00 0.00 0.00 0.003973 0.00 0.00 0.00 0.00 0.00 0.00 0.00 0.00 0.00 0.00 0.00 0.00 0.003933 0.00 0.00 0.00 0.00 0.00 0.00 0.00 0.00 0.00 0.00 0.00 0.00 0.00
PULPWOOD1e1000 .0 .0 00 00 .0 0.0 00 .0 .0 003943l '3.00 0.00 0.00 0.00 0.00 0.00 0.00 0.00 0.00 0.00 0.00 0.00 0.003973 0.00 0.00 0.00 0.00 0.00 0.00 0.00 0.00 0.00 0.00 0.00 0.00 0.00
3933 0.00 0.00 0.00 0.00 0.00 0.00 0.00 0.00 0.00 0.00 0.00 0.00 0.003941 0.00 0.00 0.00 0.00 0.00 0.00 0.00 0.00 0.00 0.00 3.00 0.00 0.00
l93l 0.00 0.00 0.00 0.00 0.00 0.00 0.00 0.00 0.00 0.00 0.00 0.00 7.11?
YEAR ETA URSS CIFCN. POLABND ROMINIA HUNGARY CHINE
INDUSTRIAL WOULD WOOD391 0.00 0.00 0.00 0.00 0.00 0.00 0.001915 4.51, 4.29 0.00 0.02 0.00 0.03 0.001933 59*94. 31.03 0.22 30.74 0.90 0.00 0.00
39 I .0 .0.00 0.00 3.33 0.33 0.33 0.0037 4.3'4 0.00 0.13 3.02 0.34 0.30 0.00
3933 5.3 0.44 3.39 2.03 0.04 2.03 0.00
PLYWOOD
3945" 0.01 0.00 0.00 0.001 0.03 0.00 0.00
3935 0.09? 0.00 0.00 0.09 0.00 0.00 .0
393 .05 0.00 0.330 0.03 0.00 0.03 0.00
393 0.00n 0.00 0.00 0 .00, 10.00 0.00' 0.03 R3."~f I33.719 0.12 50.74 0.10 0.-,0 0.90
399.5 0.00 33.00 0.00 0.00 0.00t 0.00 0.00t3971 rjOf0.0 0 0.0 0 0.003.0 .00 0.60 0.003933 I.2 0.C00 0.00 0.00 0.30 0.00 0.09

MDF/W/ 52IMPORTS BY AREAS AND COMMODITY GROUPSSWITZERLAND Page 183
(INMILLIONDOLLARS US)YEAR WORLDU.S. CANADA JAPAN ECCEDI EFTA AUSTRIA FINLAND SWEDENDT.WE ANISA TL DVP
INDUSTRIAL ROUND WOOD1969 251.06, 0. ST 0.96 0.00 5.02 0.66 0.01 0.605 0.00 0.0Os 0.01 1.132579 r19.46 1.335 0.11 0.01 7.15 0.120 0.19 0.00 0.01 0.12 0.02 9.591932 47.59 2.9It 0.01 1.40 31.39 1.11. 0.95 0.03 0.09 o.oo 0.00 36.gi
1969 2 9.9 0.70 0.S00 19 .5 . 1? 0.6 .7 0.93 0.00 225I97 1.49 2.91 1.40 0.2 5.1 592 14.22 3.4 79 2.0.1 4632391 241.SI .34 3.1 0.24 S1.06 14.460 31.13 1.65 16.04' .3.23 0.01 135S.22
ll 5.34 0.00 0.00 0.00 5.94 0.22 0.10 0.07 0.02 0.24 0.00 5.30297 3.0 0.20 0.47 0.03 10.57 13.41 7.69 3.73 1.72 4.23 0.00 23.912991 %0.91. 0.32 0.00 0.01 22.23 22.12 26.75 4.90 0.10 5.06 0.00 50.22
PARTICLE BOARD
2979 24.66 0.06lo0fT.010, 0.00' 2.3 134 3.22 0.05 0.02 0.00 0.00, .14.442991 79q.10 0.00 0.05 0.00 4.57 33.47 15.0 0.03 0.22 0.01 0.00 23.10
PULPWOOD1963 1.2 0.00 0.33 0.00 0.36 0.63 0.00 0.63 0.00 0.00 0.00 1.32I973 19 0.00 0 .00 0.00 1.94 0.01 0.01 0.00 10.00 110.0 00 1199 224 0.000 00 0.0 15.50 0.7 0.7 0.00 0.00 0.00 0.00 16.24
WOOD PULP,19691 19.412 1.46 0.531 01.0 2.24. 35.17 1.93 2.34 10.67 0.00 0.00 19.411973 53 193 0.32 D.00 3.57 49.39 0.56 3.15 36.63 0.00 0.00 55.251961, 149.70 3.74 17.67 0.00 12.27 102.23 4.76 21.44 66.10 5.15 0.02 144.03
YEADR CAR.LAN WOUDUP BRAZIL CHILE ECUAORD PARAGU EURSIA RBURMA MAMALA PHILIP SINGAP THALA KOREA MIDEAS
19,63 011.2 0.0011 0.11 011.00 0:.00 0:.00 0.4 0.212 0.03 0.00 0.0,1 0.00 0.06 .0 0.06I97 01.3 0.0 .000011 0.0 0.0 I.49 0.7 03 0.1 0.00.0 .0 0 .D a00 0.00 0.002931 0.09 0.00 0.01 0.00 0.00 0.00 1.23 0.,54 0.27 0.04 0.37 0.01 0.00 0.00 0.00,
SAWNWOOD AND SELLPERS2963 0.01 0.00 0.00 0.00 0.00 0.00 0.14 0.01 0.00 0.00 0.00 0.03 0.04 0.00 .01973 0.1 0.12 0.0 0.00 0.00 0.00 2.74, 0.01 0.12 1.97 0.1 0.1 0.00 0.0 .0291 026 0.00 0.I621 0.00 0.00 0.00 2.93 0.03 0.1 13 0.25 0.13 0.00 0.00 D~o
2963 0.000.00 0.00 0.00 0.00 0.00 00 "0.00 0.0 0.00D 0.00D 0.00 0.00 0.00 0.0029730.00 0.00 0.00 0.00 0.00 0.0 0.0.0 00 0.00 0.00 .00 0.03 0.00 0.00 0.00
1931 0.01 00001 1 .0 .000 0 0.00 .0 .00 0.02 0.00 0.07 0.00 0.49 0.00
PARTICLE BOARD1963 0.0 0.00 0.00 0.00 0.00 0.00 0.00 0.00 0.00 0.00 0.00 0.00 0.00 0.00 0.001973 0.00 0.00 0.00 0.00 0.30 0.00 0.00 0.00 0.00 0.00 0.00 0.00 0.00 0.00 0.001931 0.00 0.00 0.00 0.00 0.00 0.00 0.00 0.00 0.00 0.00 0.00 0.00 0.00 0.00 0.00
PULPWOOD2963 0.00 0.00 0.00 0.00 0.00 0.00 0.00 0.00 0.00 0.00 0.00o 0.00 0.00 0.00 0.002973 0.00 0.00 0.00 0.00 0.00 0.00 0.00 0.00 0.00 0.00 0.00 0.00 0.00 0.00 0.00D2932 0.00 0.00 0.00 0.00 0.00 0.00 0.00 0.00 0.00 0.00 0.00 0.00 0.00 0.00 0.00
WO0D PULP2969 0.00 0.00 0.00 0.00 0.00 0.00 0.00 0.00 0.00 0.00 0.00 0.00 o.oo 0.00 0.001973 0.00 0.00 0.00 0.00 0.00 0.00 0.00 0.00 0.00 0.00 0.00 0.00 0.00 0.00 0.002932 2.54 0.00 2.54 0.00 0.00 0.00 0.00 0.00 0.00 0.00 0.00 0.00 0.00 0.00 0.00
YEAR ADRICA CAMERO CANT.A CONGO CANONC GHANA INVORY LIBERI MORDCC DCEANIA PAPUA N SOLD MON ALL LDC
INDUSTRIAL ROUND WOOD1I163 6.45 0.19 0.00 1.09 .0.34 0.14 0.63 0.05 0.00 0.00 0.00 0.00 7.072973 21.73s 0.53 0.01 2.37 1.31 0.92 5.03 0.40 0.00 0.00 0.00 0.00 13.361932 V.07? 1.36 0.04 0.32 1.10 0.11 3.67 0.07 0.00 0.00 0.00 0.00 10.34
SAWNWOOD AND SLEEPERS963 0.90 0.0? 0.00 0:.0? 0.3 0.01 0.014 00 0.00 D0.00 0.00. 0.00 0.45
1973 0.73R 0.02 0.02 0.02 004 0.0 0.3 0.0 0.00 0.00 0.00 0.00 3.67r1992 2.44 0.05s 0.00 0.00 0.04 0.25 0.290 0.46 0.00 0.00 0.00 0.00 4.63
1963 0.0,0 0.0000 0 O0.0 0.00 0.00 0.00 0.00 0.00 0.00 0.00 0.00 0.001973 0.0 0.1100 0.0 0.0 0.00 0.00 0.00 0.00D 0.00 0.00 0.00 0.00 0.071I3 0.00 .00 0.0 0.0 0.00 0.00 0.00 0.0 0.00 0.00 0.00 0.00 0.69
19431 0.00 0.00 0.00 0.00 0.00 0.00 0.00 0.00 0.00 0.00 0.00 0.00 0.001973 0.00 0.00 0.00 0.00 0.00 0.00 0.00 0.00 0.00 0.00 0.00 0.00 0.001931 0.00 0.00 0.00 0.00 0.00 0.00 0.00 0.00 0.00 0.00 0.00 0.00 0.00
PULPWOOD
I2963 0.00 0D00 0.00 00 0.0 0.0 000 00 0 .0 000 0.0 000 00
1973 0.00 0.00 0.00 0.00 0.00 0.00 0.00 0.00 0.00 0.00 0.00 0.00 0.00
1931 0.00 0.00 0.00 0.00 0.00 0.00 0.00 0.00 0.00 0.00 0.00 0.00 0.00
1973 0.07 0.00 0.00 0.00 0.00 0.00 0.00 0.00 0.00 0.00 0.00 0.00 0.071931 0.1t4 0.00 0.00 0.00 0.06 0.00 0.00 0.00 0.00 0.00 0.00 0.00 2.67
YEAR ETA URSS CYFCN POLAND ROMANIA HUNGARYCHINE
INDUSTRIAL ROUND WOOD291.3 0.3 0.00 0.306 0.00 0.00 0.00 0.0029796 03 0.0 0.63 0.00 0.00 0.00 0.00193g 0.39 0.0 0.43 MD11 0.00 0.00 00
2969 2.39 9 0.01 0.43 2.73 0.49 0.002979 2.490.11 0.00 0.10 0.91 0.91I 0.01932fl.60.12 0.02 0.20 040 0.05 0.00
29169 2.0 0.00 0.04 0.00. 0.00 0.00 0.00
12173 0., 0.0 0 ."0 0.01 0.02 0.00 0.00t1991 0.014, 0.00 0.00 0.04 0.00 0.00) 0.00
PARTICLE BOARD19. .00,1.00 0.01 0.00 0.00 0.00) 0.01119:13 0.I00 0.00 0.00 0.00 0.00 0.00 0.00
1391 0.00 0.00 0.00 0.00 0.10 0.00 0.00
29 0.00 "0.0n 0.00 0.00 00D 00 0.0 0a.001979 0.00 0.00 0.00 0.000 0.00 0.000 0.00
1992 0.00 0.00 0.00 0.00 0.00 0.00 0.00)2969 0.0 00 . 00.O00.0 0.000.11931 0.0 0.00 0.00:: :0.00 0.00 0.00 0.00

MDF/W/ 52Page 184
3I0 IMPORTSBY AREAS ANDCOMMODITY GROUPS AUSTRALIA(IN MILLION DOLLSARS US)
YEAR WORLD U.S.CANADA JAPAN FCILOD EFTA AUSTRIAFINLAND SWEEDEN DT. WE ANSATN DYPINDUSTRIAL ROUND WOOD
tomv.. 9.49 9.9I 0.00 0.10 0.00 .
00.005 D 0.0 0.8011 0.21 O'17 1,
teal oti 0~.01I 0.00e 0.00 0.00 0.0! 0.00 0.00 0.0! 0.00.00 0.04
A~3--11%b0.0WS10491 17P ".6Aa 0.04 0.09 0.15 0.17 0.00 0.42 0.206 0.00 1.ft 3.441171 111.17 13.41 7.71 0.12 0.1? 0.59 0.00 0.52 0.07 0.01 9.72 17.00l"It 1.44 47*, 5306S 0.11 1.05 2.312 0.00 1.15 0.1? 0.00 '0.ma 150.42
Pt V.C"101909 71 0.02 0.101 0.41 0.02 0.00 0.00 0.00 0.00 0.00 0.01 0.54
191 14. I 0.01 0.1 0.74 0.04 0.01 0.00 0.0! 0.00 0.00 0.50 1.41I..i 17.90 0.22 0.02 0.0 0.14, 0.02 0.00 0.02 0.00 0.00 3.09 3.53
PACTICLE BOARD"l9'1 0.01 0.00 0.00 0.00 0.01 0.03 0.00 0.00 0.0ON 0.00 0.00 0.041971 0.97 0.00 0.00 0.00 0.00 0.02 0.00 0.02 0.00 0.000.1 .0lilt 0.06 0.00. 0.00 0.00 0.02 0.00 0.00 0.00 C0.00 .0002 .0
WOOD PULP1901 1916:1 I? 4.15 0.1 0.04 1.2? 0:.00 3.04 3:.51 0.00 4.04 19.1stil '575 .51 14. 0.8 0.1 `4.22 0.0 417 99 0.00 14.49 57.29
19111 113.04 11.%.41.2 3.49 0.10 is.04 00 4.3 4.15 0.00 57.52 110.09
COMMODITYVP&* C&N.1 AN HnrN0UR RRAMt CHILl !CUAnO PARAGU [.ASIA SUVN" INCOME MAnLAYS PHILIP SINCOP 7.'AILA KOREA. MESS*
INDUSTIAL ROULDN WOODI941# 00 0.00 0.00 0.00 0.00 0.00 Z."4 0.00 0.04 0.00 0.15 0.00 0.02 0.00 0.00I173 0.000 0.00 0.00 0.00 0.00 0.00 4.03 0.00 1.52 2.34 0.00 0.13 0.01 0.00 0.00lilt3 0.00 0.00 0.00 0.00 0.00 0.00 0.00 0.00 0.00 0.00 0.00 0.00 0.00 0.00 0.00
SAWN WOOD ANS SLEEPERS1913 0.1 00 8.4 .0 0.04 0.00 .39 0.09 0.00e 0.00 0.12 0.05 0.17 0.00 0.00
197 a., 0007.7 0.0 0.09 0.00 39.31 0.21 1.74 24.99 4.41 1.75 3.21 0.00 0.001813 0.90 0.00 0.79 0.00 0.11 0.00 44.14 0.24 2.61 43.42 13.30o 5.70 0.00 0.00 0.00
PHYWOOD194.3 0.03 0.00 0.03 0.00 0.00 0.00 0.01 0.00 0.00 0.00 0.00 0.00 0.00 0.00 0.003971 0.00 0.00 0.0 0.00 0.00 0.00 1.461 0.00 0.03 0.24 0.11 0.77 0.01 0.39 0.00
,IC.I 0.00 C.00 0.00 0.00 0.00 0.00 24.90 0.00 0.75 0.51 0.05 2.17 0.00 0.55 0.00
394ICL0S!a.0g.0a.0n.0 00 00 0.00 0.00 0.00 0.00 0.00 0.00 0.00 0.001Q71, 0.0 0.00,.00 :t,10.00 0.00 0.00 0.44 0.00 0.00 0.00 0.00 0.00 0.01 0.45 0.00aI3 0.00 0.0 0.0 0.00 0.00 0.00 0.04 0.00 0.00 0.00 0.02 0.01 0.00 0.00 0.00
WOOD PULP1941 0.00 0.00 0.00 0.00 0.00 0.00 0.00 0.00 0.00 0.00 0.00 0.00 0.00 0.00 0.00197 0.0 000 00s.0 .0 0.0 0000 0 .0 0.00 0.00 0.00) 0.00 0.00 0.00t9il 09 0.00 0.9 0.0 00 0.0.000.00 000 0.00 0.00 0.t0 0.00 0.00 0.00
COMMODITYYEAR AFRICA COMERO CANT. A CONGO GABON GHANS AIVORY LIBERY MPRPCP PCENAOA AAU N SC;PNMPNM A;LL DOCALL
INDUSTIRALROUND WOOD1949 0.0? 0.00 0.00 0.00 0.00 0.02 0.05 0.00 0.00 0.19 0.0, 0.00 2.9317 0.0 0.00 0.0 0.000 0 0.011C 0.00 C0.00 0.00 0.5 0.9 004 41
it1 0.0 0.0 0.1 .0 0.00 0.0e.000 00 0.0 0.10 0.03 0.04 0.11
SAWNDWOOD AND SLEEPRS1941 0.04 0.00 0.00 0.00 0.00 0.03 0.00 0.00 0.00 0.55 0.54 0.00 3.59
19730.07 0.00 0.00 0 0.00 a0.0 0.0 0.0 .0 .0 .9 0.00 44.24till 0.10 D0.00 0.0 0.00 0.00 0.01 0.0 0.00 0.00 4.1 1 .344 0.55 72.22
PLYWOOD191 0.0! 0.00 0.00 0.00 0.01 0.00 0.00 0.00 0.00 1.72 1.72 0.00 1.17
tIll 0.00 0.00 0.00 0.00 0.00 0.00 0.00 0.00 0.00 4.5G 4.54 0.00 12.94lilt 0.00 0.00 0.00 0.00 0.00 0.00 0.00 0.00 0.00 4.54 4.47 0.00 29.44
PAPTICLE BOARD1943 0.00 0.00 0.00 0.00 0.00 0.00 0.00w 0.00 0.00 0.00 0.00 0.00 0.011Q71 0.00D 0.00 0.00 0.00 0.00 0.00 0.00 0.00 0.00 0.00 0.00 0.00 0.44,
tol1 0.00 0.00 0.00 0.00 0.00 0.00 0.00 0.00 0.00 0.00 0.00 0.00 0.04
WOOD PULP190 0.00 0.00 0.00 0.00 0.00 0.00 0.00 0.00 0.00 0.00 0.00 0.00 0.001973 024 0.0 0.00 0.00 0.00 0b.00 0.00 0.00 0.00 0.00 0.00 0.00 0.24liP! 0.00 000 0.00 0.00 0.00 0.00 0.00 0.00 0.00 0.00 0.00 0.00 0.94
COMMIDY YEAR ETA URSS CLEAN POLAND ROMANIA HUNGEARY CHINE
IN'lUSTRIAt *00N31 11009"I", 0.0 0.00 0.00 0.00 0.00 0.00 0.00li7A 0.001 0.0011 0.00 0.0 0.0 0.0000lapI 00 000 00 0 o.0 0.0 0.00 0.00
SA11N1q0311Awf1 SLPIPOSS194S 0.0, 0.02 0.00 0. 0 0.00 0.00 0.00197 0.0 0.00 0.0 .0 01 .0 00
96 0.0 000.0 0.90 0.00 0.00 0.00
MI7 .0 0.00 0.00: 0.00:D 0.00 0.00 0.04till 0.009 0.00 0.00 0.00 0.00 0.031 0.00
11941 0.07l 0.00 0.00 0.00 0.70 0.00 0.00tin?' 0.0' 0.00~C:" 0.00' 0.00C 0.0: 0.00I" 0.0:0tII a10 0.0 0.00 000 0.0O .0 0 .0
WO0110 P'ILPIMN 0.0 000 0.00 00 0.00.00 0.30h) 0.0 00 00 00 0.90 0.00 .0lt 0.00 00.00 .00 0.00 O."0 0.on .0

MDF/W/52Page 185
iMPORTSBY AREAS AND COMMODITY GROUPS n.pt.(IN MILLIONDOLLARS US)
COMMODITY YEARWORLDU.S.CANADAJAPANECATOPIEFTAAUSTRIAFINLAND SWEDEN DT. LOC
INDUSTIRAL WPAWOI WOOD134 3.F% 0.0o 0.00 0.00 0.)0 0.00 0.00 0.00 0.00 0.00 1.1 1.911I9V 0.93 0.00 0.00 0.00 0.00 0.04 0.00 0.00 0.00 0.00 0.;4 0.44tel 1.q 0.oon 0.00 0.00 0.10 0.00 0.00 0.00 o.o0 O.-O 1.75 1.74
Ie1 I0.0 2.lU 1.49 0.21 0.02 0.00 0.00 0.00 0.00 0.00 3.32 3.011971 11.00 9S.7 1.94 0.03 0.02 0.00 0.00 0.00 0.00 0.00 1.21 7.70t131 11.4? 1.14 1.4 D0.o 0o02 o.-n o-.o O.oo o.oo O.Oo 7.74 5.50
el Virnra186. . 0n0. 0.o 0 0.02 0.04 0.00 0.00 o.o0 0.00 0.00 0.07 0.IS71q3 '.* I.Ot 0.01 0.00 0.01 0.30 0.00 0.00 0.00 0.00 1.10 2.39
1911 1.13 O.0o 0.00 0.00 0.00 0.01 0.00 0.01 0.00 0.00 1.o57S7
Parmir %iosD1*
V
0.V. 0.07 0.00 0.00 0.00 0.00 0.00 0.00 0.00 0.00 0.54 0.411-11 0.21 0.00 0.00 0.00 0.00 0.00 0.00 0.00 0.00 0.00 0.00 0.00
1001 '.-3 0.04 0.21 0.00 0.00 2.5e 0.00 2.10 0.49 0.00 0.01 2.341973 314Y Z.9 0.00 0.00 0.00 0.54 0.00 0.52 0.02 0.00 0.00 3.47191l 3.43 1.41 0.31 0.31 0.00 C.43 0.00 0.43 0.00 0.30 0.94 3.43
cr~owooi *YYPso f4s.LA14 Hnr4fUQ SUAYIL CHILE ECUAJD PARAGU E.ASI WU3X INDO3 MALAYS PWIL1P SINCAP10 IL7 3n0E1. PIOE0S
InDUSRIltL 31U1n wD001943 0.00 0.00 0.00 0.00 0.00 0.00 0.33 0.00 0.05 0.21 o.CO 0.00 0.00 0.00 0.00197V 0.00 0.00 0.00 0.00 0.00 0.00 0.14 0.00 0.13 0.00 0.00 0.00 0.00 0.00 0.00193l 0.00 0.00 0.00 0.00 0.00 0.00 0.00 0.00 0.00 0.00 0.00 0.00 0.00 0.00 0.00
53303400 3140 1513135t1963 0.03 0.01 0.00 0.00 0.00 0.00 0.47 0.01 0.00 041 0.01 0.00 0.04 0.00 0.001973 0.23 0.00 0.00 0.231 0.00 0.00 1.33 0.00 0.00 C.44 0.33 o.1n 0.21 0.00 0.001931 0.09 o.on 0.03 0.00 0.00 0.00 1.25 0.23 0.05 0.22 0.52 0.19 0.00 0.00 0.00
P1IYWOOD1634 0.00 0.00 0.00 0.00 0.00 0.00 0.00 0.00 0.00 0.00 0.00 0.00 0.00 0.00 0.001973 0.00 0.0n 0.00 0.00 0.00 0.00 0.22 0.00 0.00 s0.0 0.00 0.1S 0.00 0.00 0.001901 0.00 0.00 0.00 0.00 0.00 0.00 0.12 0.00 0.00 0.01 0.00 0.01 0.00 0.00 0.00
PAT ICLE Roa0D1979 0.00 0.00 0.00 0.00 0.00 0.00 0.09 0.00 0.00 0.00 0.00 0.00 0.00 0.09 0.001931 0.00 0.00 0.00 0.00 0.00 0.00 0.23 0.00 0.00 0.00 0.00 0.00 0.00 0.00 0.00
WOOD PULP1043 0.00 0.00 0.00 0.00 0.00 0.00 0.00 0.00 0.00 0.00 0.00 0.00 0.00 0.00 0.001973 0.00 0.00 0.00 0.00 0.00 0.00 0.00 0.00 0.00 0.00 0.00 0.00 0.00 0.00 0.001931 0.n0 0.00 0.00 0.00 0.00 0.00 0.00 0.00 0.00 0.00 0.00 0.00 0.00 0.00 0.00
CO iDwoI TVVEsl &VaICS CAw5o 0E34.1 CONGO GABON GHANA IVORY LIFFRI 40O0CC OCEANIA PAPUA W SOLOMON ALL LOC
INDUSTRIA*L wOUnD won01943 0.00 0.00 0.00 0.00 0.00 0.00 0.00 0.00 0.00 0.00 0.00 0.00 0.341973 0.13 0.00 0.00 0.00 0.00 0.13 0.00 0.00 0.00 0.24 0.00 0.15 0.551931 0.11 0.13 0.00 0.00 0.00 0.00 0.00 0.00 0.00 0.00 0.00 0.00 0.19
S54hOOrl AN0 SLEFPERS1943 1.1? 0-.00 0.00 0.04 0.00 0.99 0.0 0.00 0.00 0.14 0.00 0.00 1.991973 0.79 0.00 0.14 0.03 0.00 0.42 0.00 0.00 0.00 0.35 0.00 00o0 3.2119"1 1.1' 0.09 0.04 0.04 0.00 1.00 0.00 0.00 0.00 3.03 0.44 0.07 S.59
PLVIIr'0'1943w 0.0! 0.00 0o.0 0.00 0.00 0.00 0.00 0.00 0.00 0.00 0.00 0.00 0.011973 0.01 0.00 0.00 0.00 0.00 0.01 0.00 0.00 0.00 0.03 0.03 0.00 0.211931 0.00 0.0o 0.00 0.00 0.00 0.10 0.00 0.00 0.00 0.59 0.40 0.00 0.71
PARTICLE 9004D1973 0.00 o.nn 0.00 0.00 0.00 0.00 0.00 0.00 0.00 0.00 0.00 0.00 0.0911R1 0.00 0.00 0.n0 0.00 0.00 0.00 0.00 0.00 0.00 0.00 0.00 0.00 0.23
w0nD PULP1393 0.00 0.o0 0.00 0.00 0.00 0.00 0.00 0.00 0.00 0.00 0.00 00co 0.001973 0.00 0.00 0.00 0.00 0.00 0.00 0.00 0.00 0.00 O 00 0.00 0.00 0.00191l 0.00 0.00 0.00 0.00 0.00 0.00 0.00 0.00 0.00 0.00 0.00 0.00 0.00
YEIR 911 1USS 079Cm. POLALD RO1MANIA HUN1101 C0uE
Iun USTYI IA0ROUN W0on0194' 0.0o 0.00 0.00 0.00 0.00 0.00 0.001973 0.0' 0.00 0.00 0.00 0.00 0.00 0.0019a1 0.0? 0.00 0.00 0.00 0.00 0.00 0.00
313434300! IWO sLEEPrs'1943 0.0- 0.00 0.00 0.00 0.00 0.00 o.o01979I 0.00) 0.00 0.00 0.00 0.00 0.00 0.001991 0.00 0.0o 0.no 0.00 0.00 0.00 0.00
104&3 0.00n 0.00 0.00 0.00 0.00 0.00 0.001973 0.01 0.00 0.00 0.90 0.o0 0.00 0.011911 0.10 P.00 0.10 0.00 0.10 0.00 0.00
PmttLr .paSe.I-RV 0.00 0.0n 0.00 0.10 0.00 0.00 0.00t9e3 0.00 0.00 0.00 0.00 0.00 0.00 0.00
34141 PwtR1943 0.0 0.00 0.00 0.00 0.00 0.00 o.on197s O.O0 0.00n 0.0 0.00 0.10 0.00 0.001911 q.o13 0.00 0.00 o.n0 0.00 0.00 0.00

MDF/W/52Page 186
iMPORTS AREAS AND COMMODIUTGRUOPSKORAPREP.COMMODITYYEAR WORLDU.S. CANADA JAP[AN ECILOD EFTA AUSTRIA FINLAND SWEDEN DR. WE ANIS A TL DVP
INDIUSTRIAL ROUBDWOOD164301.70 3.3! 51.54, 0.64 0.70 0.n0 a.00 0.00 0.00 0.00 0.3eV .23S63364 03 .11 37 .0 00 0.00 0.00 0.00 0.00 3.714 37.37163!443.36 67.310 0.10 34. 0.0 0.0 0.00 0.00 0.00 0.00 1.S 106.01
1643 I. 13 0.09 0.00 0.'4 0.00 0.00 0.00 0.00 0.00 0.00 0a00 1.201673 7.011 a.6 00 .9 00 0.0 0.00 0.00 0.00 0.000.? .0lilt 07.62 6.13 0.4 .5 .0 02 0.00 0.23 0.00 0.00 0.02, 1.1.7.0
P1 NUOOO1.3 0.0 0.00a ''0.00 0.00, 0.001 0.00 0.00 0".00 0.00,, 0.00 0.0 0.00167 0.! 000 0.0 0.6 001 0.0 0.0 00000 0 0.006 0.0 0.21Q61 6.74 0.3411 0.00 0.61 0.55 0.9 0.0 M. 0.0.0 .00 0.0 341
1653 00 .0 .0 00 00 .0 0 0.0.40.0.00 000 0.00 .0
1673 0.44 0.00: 0.00 0:.44 0.0 .0.00 0.00" 0.100 '0.006 0 .00 0. O 00 .0 .441661 l.1 0.00 0.60 0.00 0.00 0.00 0.00 0.00 0.00 0.00 0.13 0.13
PULPM'0001:643 03 0.0 .00 0.01 0.00 0.00 0.00 0.00 0.00 00 .0 021673 6.5! 0.00J" 0.0 0.00 0.0 0.00 0.00 0.00 1:0.00 0.00 0.51 0.9
163! 0.46 0.0 0.0 00 .0 00 .0 00 0.00 .00 .00 .0
w000 PULPI43 6.03 0.63$ 0.22 0.10 06 0.3 0.00 0.20 0.12 0.00 0.00 3.04167% 44.63 11.43 20.19 6.46 3.613 12.02 0.00 0.00 6.06 0.00 4.04 40.74163! 247.50 35.%6 40.9 44.51 0.07 13.25 0.00 2.031 *.23 0.21 1.3206.23
COMMODITYYEAR CAR.LNA HONUAUY BRAZIL CHILE FINLAND PARAGU E.AIS BURMA INCOME MALAYA PHILIP SINGOP THAILA KOREA MKIDEAS
INDUSTRIAL ROUND WOOD1'63 0.0 00O.0 .0 00 0.00 13.5s 0.00 0.00 0.00 11.29 0.00 0.00 0.00 0.001673 00 0.0 0.0 0.00 0.0 0.0 271.3, 0:.0 144.273 103.17 210.43 0.30 1.04 0.00 0016os3t 0 0.0 0.0 300 .0 000 461.0 4.40 110.07 342.07 13.03 0.00 0.00 0.00 0.00
SAWNWOODANDSLEEPERSAwwld~oO AND0 SLWPPPIS16031 0.00 0.00t 0.60 0.00 0.00 0.00 0.04 0.00t 0.00 0.00 0.00 0.00 0.00 0.00 0.00I63 00 0.00 0.00 0.00 0.0 00a.2 08 .0 000 00 .0 00 .0 001631 0.'n00 000 0.00 0.0 0.00 0.0 1. 0.07 5.4 302 0.00 2.2 00 0 0.0 0.00
PLVYnf)'1 613 0.00 0.00 0.00 0.00 0.00 0.00 0.00 0.00 0.00 0.00 0.00 0.00 0.00 0.00 0.001677 0.00 0.00 0.00 0.00 0.00 0.00 0.00 0.00 0.00 0.00 0.00 0.00 0.00 0.00 0.001631 0.00 0.00 0.00 0.00 0.00 0.00 1.33 0.00 0.02 0.00 0.00 0.23 0.00 0.00 0.00
PARIClLl 60*31:60 0.00 0.00 0.00 0.00 0.00 0.00 0.00 0.00 0.00 0.00 0.00 0.00 0.00 0.00 0.001671 0.0 .000000 0.000 0 0.00 0.00 0.0 0.00 0.00 0.00 0.00 0.00 0.00196 0.0 000 00 0.0 0.00 0.0 000 0.0 0.00 0.00 0.00 0.00 0.00 0.00 0.00
PULP OOD19643 0.0 0.00 0.00 0.00 0.00 0.00 0.11 0.00 0.00 0.00 0.11 0.00 0.00 0.00 0.00173 0.0 0.0 .0 .0 0.0 00 0C .0 0.00O 0.00 0.00 0.00 0.00 0.00 0.00 0.00
1661 0.0 .00 0.00 0.0 0.00 0.00 0.44 0.00 0.37 0.00 0.00 0.00 0.00 0.00 0.00
W100 PULP164 0.00 0.00 0.00 0.00 0.00 0.00 0.57 0.00 0.00 0.00 0.00 0.00 0.00 0.00 0.00,;73 0.00 0.00 0.00 0.00 0.00 0.00 4.13 0.00 0.00 0.00 1.40 0.00 0.03 0.00 0.00
1661 16.32 0.00 21.40 10.41 0.00 0.00 14.96 0.00 0.00 0.00 1.13 0.00 0.412 0.00 0.00CD--DOTT
CANT. a CINBGO CGAPON GHANA INVORY LIBERI CMORODCC DECANIA PAPUA SCLONDNA ALL DOCFlV.A PAPUA N SOLOM4ON
INDUST IAt aOUND wmD163 000 0.00 0.00 0.00 0.00 0.00 0.00 0.00 0.00 0.00 0.00 0.00 13.99
1731 0.01 0.00 00 0.0 .00 0.00 0.00I) 0.0011 1110.00 01.0 0.0 0.001 271.63116 0.6 0.005 0o.0 0f.0 0.0 00 .2 00 .0 20.35 16.92 0.33 16,.42
SAWNWOOD AN0 SLFfItPF16431 n.00 0.00 0.00 0.00 0.00 0.00 0.00 0.00 0.00 0.00 0.00 0.00 0.041A73 0.0:0 0, .001 0.00 0.00" 0.00 0.00 0.00 0.00 0.00 0.00 0.00 0.00 0.121661 C.0 0.0 0.0 0 .0 0 0.00 0.00 0.00 0.00 0.00 0.00 0.00 0.00 10.10
PLYWOOD1643 0.0 0000 0 0 .0 0.00 0.00 0.00 0.00 0.00 0.00 0.00 0.00 0.0013 0.0 0.00 0.00 0.0 0.0 0.0 00a .0 00 .0 00 .0 00Ts6 0.0 00O.0 00 .0 00 0.00 0.00 0.00 0.00 0.00 0.00 1.33
1647 0.0on 0.00 0.00 0.00 0.030 0.00 0.00 0.00 0.00 0.00 0.00 0.00 0.001673 0.0 0.0 0.00 0.00 0.00 0.00 0.00 0.00 0.00 0.00 0.00 0.00 0.0016! .0 0.00 0.00 0.00 0.00 0.00 0.00 0.00 0.00 0.00 0.00 0.00 0.00
PULPIIOOO1,607 0.00 0.00 0.00 0.00 0.00 0.00 0.00 0.00 0.00 0.00 0.00 0.00 0.111A7T 0.0 000 00 0.0 0.00 0.00 0.00 0.00 0.00 0.00 0.00 0.00 0.0016P1 0.0 0. 0 .:00 0.00 a0.00 0.00 0.00 0.00 0.00 0.00 0.00 0.00 0.00 0.40
6000t PULP1647 0.00 0.00 0.00 0.00 0.00 0.00 0.00 0.00 0.00 0.00 0.00 0.00 0.57!67) 0.06 0.00 0.00 0.00 0.00 0.00 0.00 0.00 0.00 0.00 0.00 0.00 4.13I'l1 0.00 0.0n 0.00 0.00 0.00 0.00 0.00 0.00 0.00 0.00 06.00 0.00 33.33
C866'IO IPOLAND ROMANIA HUNGARY CHINE. PnlLO!) 6011ANI1 HUN
INDUS7'ItL 95'LPD 1101643I 0.00 0.030 0.00 0.00 0.00 0.00 0.001673 "0.00 C0.0 0.00 .0 011 0.0:0 000 :0.00,61 0.08 0.0 0.0 000 000 0.no .0
16O., 0.0, 0.60 0.00 0.00 0.00 0.00 0.001673 a.00 0.o00n00 .0 .0 0016 .00 0.0 0:.00 0.00 0.0 0:.0 0.00
1077 .0 O.1 0.00I 0.0 0.00 0.0 000
ISP! 0.00 000:m 0.00 0.00 0.0O C.0 0.00
16 .014 0.00) 0.60 0.00 0.0 0.00 0.0
16. .0 .00 0.00 0.00 0.08 0.00 0.001%16% .0 00 6.0 0.00 0.O0 0.00, 0..7I661 0.0O8O 0.0 0.00 0.0 0:0 0.00 0.0006
716 606 0.0 00 0 0.0 0.00 0.00 001613 6.0o.0n.60.00 0.00 0.0 0 0 .30le
&6!.0 0.00 0.00 0.00 0.00 0.0091 0.00
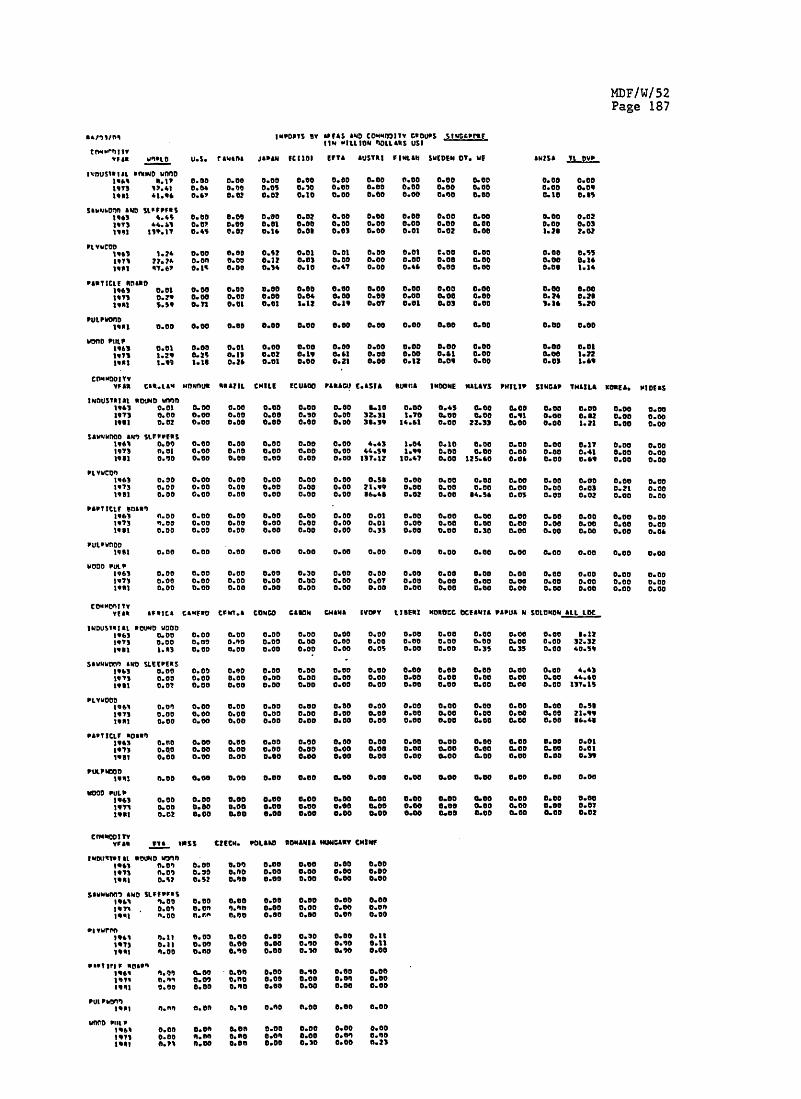
MDF/W/52Page 187
m1909 IMPORTSBY AREAS ANDCOMMODITY GROUPS SINGAPORE
YEAR WORLDU.S. CANADA JAPAN ECITO EFTA AUSTRIA FINLAND SWEDEN DT .WED ANAA TL .DVP
INDUSTIRAL ROUND WOOOD316931.1 , 0.00 0.00 0.00 0.00 0.00 0.00 01.00 0.00 0.00 0.00 0.0019731 1:1.45 0.04 0.00 0.05 0.510 0.00 0.00 0.00 0.00 0.00 05.00 0.09l931 43.96 0.61 0.02 0.01 0.10 0.00 0.00 0.00 0.00 0.00 0.10 0.RS
SANDWOOD AND SPEEPERSl965 4.619 0.00 0.00 0.00 0.02 0.00 0.00 0.00 0.00 0.00 0.00 0.0219731 4.411 0.013 0.00 0.05 0.00 0.00 0.00 0.00 0.00 0.00 0.00 0.031393 159.3? 0.41 0.01 0.36 0.03 0.03 0.00 0.01 0.02 0.00 3.23 2.02
PHYWOODD3136 1.2' 0.00 8.010 M.P 0.05 0.01 0.00 0.01 D.00 0.00 0.00 0.S51973 21.711 0.001 0.00 0.22 0.03 0.00 0.00 0.00 0.00 0.00 0.00 0.16lips 97.41 0.31t 0.00 0.34 0.30 0.47 0.00 0.46 0.00 0.00 0.03 1.14
PARTICLE ROUND1963s 0.01 0.00 0.00 0.00 0.00 0.010 0.00 0.00 0.00 0.00 0.00 0.001973 0.219 0.00 0.00 0.00 0.04 0.00 0.00 0.00 0.00 0.00 o.24 0.231931 5.59 0.75 0.01 0.01 11.12 0.19 0.0? 0.01 0.03 0.00 3.3s S.20
PULPWOOD1935 0.00 0.00 0.00 0.00 0.00 0.00 0.00 0.00 0.00 0.00 0.00 0.00
WOOD PULP1963 0.05 0.0.0 0.05 0.00 0.00 0.00 0.00 0.00 0.00 0.00 0.00 0.011971 3.29 0.2% 0.33 0.02 0.19 0.61 0.00 0.00 0.61 0.00 0.00 1.22list 1.911 1.13 0.26 0.01 0.00 0.21 0.00 0.32 0.09 0.00 0.03 1.6,
COMMODITYYEAR CARLAN HONOYUR BRAZIL CHILE ECUAROD APKAGIA E.ASTA BURMAPHILIP SINGAP THAILA KOREA MIDEAS
INDUSTRIAL ROUND WOOODM96 0.01 0.00 0.00 0.00 0.00 0.00 LI10 0.00 0.45 0.00 0.00 0.00 0.00 0.00 0.005973 0.00 0.00 0.00 0.00 0.00 0.00 32.31 1.70 0.00 0.00 0.91 0.00 0.32z 0.00 0.001933 0.02 0.00 0.00 0.00 0.00 0.00 33.39 14.65 0.00 22.33 0.00 0.00 1.25 0.00 0.00
SAWNWOOD AND SLEEPERS19631 0.00) 0.00 0.00 0.00 0.00 0.00 4.43 1.04 0.10 0.00 0.00 0.00 0.17 0.00 0.001973 0.03 0.00 0.00 0.00 0.00 0.00 44.59 5.99 0.00 0.00 0.00 0.00 0.41 0.00 0.001931 o0oo 0.00 0.00 0.00 0.00 0.00 137.12 10.47 0.00 152.60 0.06 0.00 0.69 0.00 0.00
PLYWOOD196 0.00 0.00 0.00 0.00 0.00 0.00 0.53 0.00 0.00 0.010 0.00 0.00 0.00 0.00 0.003973 0.00 0.00 0.00 0.00 0.00 0.00 21.99 0.00 0.00 0.00 0.00 0.00 0.03 0.21 0.001933 0.00 0.00 0.00 0.00 0.00 0.00 36.43 0.02 0.00 34.56 0.05 0.00 0.02 0.00 0.00
PARTICLE BOARD3963 0.00 0.00 0.00 0.00 0.00 0.00 0.05 0.00 0.00 0.00 0.00 0.00 0.00 0.00 0.001973 0).00 0.00 0.00 0.00 0.00 0.00 0.03 0.00 0.00 0.00 0.00 0.00 0.00 0.00 0.001931 0.00 0.00 0.00 0.00 0.00 0.00 0.33 0.00 0.00 0.30 0.00 0.00 0.00 0.00 0.06
PULPWODD1933 0.00 0.00 0.00 0.00 0.00 0.00 0.00 0.00 0.00 0.00 0.00 0.00 0.00 0.00 0.60
WOOD PULP1963 0.00 0.00 0.00 0.00 0.50 0.00 0.00 0.00 0.00 0.00 0.00 0.00 0.00 0.00 0.0039739 0.00 0.00 0.00 0.00 0.00 0.00 0.0? 0.00 0.00 0.00 0.00 0.00 0.00 0.00 0.001931 0.00 0.00 0.00 0.00 0.00 0.00 0.00 0.00 0.00 0.00 0.00 0.00 0.00 0.00 0.00
CoIW"On???YEAR 5P9IC& caNERO CPNY.A CONGO GA1110 GHANA MVONT LIRERS HNODCC, OCIANIA PAPUA N SOLOKON ALL LOt
INDUSTNIAL POUND WOOD3963 0.00 0.00 0.00 0.00 0.00 0.00 0.00 0.00 0.00 0.00 0.00 0.00 3.123973 0.00 0.003 0.00 0.00 0.00 0.00 0.00 0.00 0.00 0.00 0.00 0.00 32.321935 1.35 0.00 0.00 0.00 0.00 0.00 0.05 0.00 0.00 0.35 0.35 0.00 40.59
SAWNWMIIO AND SLEEPERS1963 0.00 0.003 0.00 0.00 0.00 0.00 0.00 0.00 0.00 0.00 0.00 0.00 4.435973 0.00 0.00 0.00 0.00 0.00 0.00 0.00 0.00 0.00 0.00 0.00 0.00 44.401933 0.07 0.00 0.00 0.00 03.00 0.00 0.00 0.00 0.00 0.00 0.010 0.00 537.15
PLYWOOD3063 0.00l 0.00 0.00 0.00 0.00 0.00 0.00 0.00 0.00 0.00 0.00 0.00 0.51973 0.00 0.00 0.00 0.00 0.00 0.00 0.00 0.00 0.00 0.00 0.00 0.00 21.993933 0.00 0.00 0.00 0.00 0.00 0.00 0.00 0.00 0.00 0.00 0.00 0.00 36.43
PAVT ICLF 30330)1963 0.00 0.00 0.00 0.00 0.00 0.00 0.00 0.00 0.00 0.00 0.00 0.00 0.013973 0.00 0.00 0.00 0.00 0.00 0.00 0.00 0.00 0.00 0.600 0.00 0.00 0.011o3l 0.00 0.00 0.00 0.00 0.00 0.00 0.00 0.00 0.00 0.00 0.00 0.00 0.39
PULPWOO0D19951 0.00 0.00 0.00 0.00 0.00 0.00 0.00 0.00 0.00 0.00 0.00 0.00 0.00
WOOD PULP1943 0.00 0.00 0.00 0.00 0.00 0.00 0.00 0.00 0.00 0.00 0.00 0.00 0.0039731 0.00 0.00 0.00 0.00 0.00 6.00 01.00 0.00 0.00 0.00 0.00 0.00 0.0719ol 0.02 0.00 0.00 0.00 0.00 0.00 0.00 0.00 0.00 0.00 0.00 0.00 0.02
CEPINOOS WYYPA9 MI loss CIECH. POLAND ROMIANIA HUNGARY CHINP
IWtXIRYISL 31340 WO11S1960 0.001 0.00 0.00) 0.00 0.00 0.00 0.003973 0.05) 0.030 0.00 0.00 0.00 0.00 0.001933 0.%2 0.52 0.010, 0.00 0.00 0.00 0.00
SRwWWWf7OO AND SLPFPPPSS3963% 0.00 0.00 0.00 0.08 0.00 0.00 0.0039'm " 0.001 0.00f 0.001 0.00 0.00 0.00 0.00t19911 ".00 013nf 0.00 0.00 0.00 0.00 0.00
Pt YwrOO39491 0.15 0.003 0.00 0.00 0.50 0.00 0.311973 0.33 0.00 0.00 0.00 0.030 0.90 0.111933 0.00 0.010 0.010 0.00 0.510 0.90 0.00
3949 0.0) 0.00 0.00 0.00 8.010 0.00 0.003979 O. m9 0.09) 0.010 0.00 0.00 0.0of 0.003991 0.00 0.00 0.00 0.00 0.00 0.00 0.00
Put Pb1000JONI n.00 0.00 0.060 0.00 0.00 8.00 0.00
WnOD Plot39(91 0.00 0.0" 0.00 0.00 0.00 0.00 0.0019731 0.00 01.004 0.30 0.00f 0.00 0.00 0.003933 0.1191 0.00 0.00l 0.00 0.30 0.00 0.23

M.DF/W/ 52Page 188
8InI" IMPORPTSBYAREAS AND COMMODITY GROPS SPAIN(IN MIOLLIONDOLLEARSUS)
YEAR WORLD U.S. CANADA JAPANECCILDS EVCTA AUSTRE FINLANDSWEDEN DT.WEANISA TL DVP
INDUSTIRAL ROUNDWOOD"3"I .1 0.01s 0.'3 0.00 0.33 1.55 0.00 0.03 0.046 0.03 0.00 2.0813071 3.3 3.3 141 0.00 4.33 2.32 0.00 0.01 0.00 0.33 0.00 32.33loot 310.04 .1.00 0.11 0.08 0.31 4.01 0.00 0.00 0.05 0.00 0.00 3,1.06
33 4.3 9.3 31 .1 10 02 .1 39 40 .30.00 23.73131 33.0 50 1.1 .0 373 533 .36.3 19 33 .1 34.915
1333 I0.1 T7. 3 3.37, 0.03 4.55 3.7 0.01: 1"3.'9750.43" '1.331 0. 00 3.2
I30 3.0 00 0.0 00 0.3 00 0000.03 0.02 0.010.0 .01373 3.0 0. 33 0.00 0 .00 0.33 0.24 000.00 0.01 0.00 0.00 079133 1.30 0.05 3.00 0.00 0.54 0.20 0.00 0.20 0.00 0.01 0.00 1.09
3301 '1.10 0.00 0.00 0.00 0.04 0.00 0.00 0.01 0.03 0.00 0.0 0.213735 2.73 0.03 0.00 0.00 0.35 0634 0.00 0.0" 0.03 0.00 0.0 11331 0.3? 0.00 0.00 0.00 0.41 0.05 0.00 01.00 0.01 0.03 0.00 0.4
313 P&aMO331 2.04 0.00 0.S3 0.00 0.03 1.34 0.00 0.00 0.00 0.00 0.00 3.35
I37 3.1 0.0I.4 0.00 L? 19 0.0 00 005 .30.0 .71333 4.73 0.0 00 10 00 0.02 4.37T 0.00 0.00 0.00 0.00 0.00 4.33
Wre0n PULP1303s 2M.3 2.43 0.%0 0.00 0.32 13.31 0.00 4.91 11I.04 0.05 0.21 22.1213731 73.54 V."4 33.33 0.00 30.51 43.00 0.00 10.50 254,3 0.00 0.00 73.431333 145s.22 10.70 32.37 0.00 14.43 03.34 0.4? 11.331 33.40 0.00 0.01 13.701
COMiMODITY33*8 133.1,61 MON0U3 13"211, CHItf KcUMs PAXACU F.011* SUIJON 3N00ME MALAYS PHILIP 5314059 THAIL& 00318. VI0135
INDUSTRIAL 30UM0 WO00D1303 0.04 0.00 0.02 0.00 0.00 0.00 0.03 0.00 0.00 0.00 0.00 0.00 0.00 0.00 0.003I73 0.33 0.02 5.14 0.00 0.01 0.00 9.3is 0.00 2.23 0.92 1.91 0.00 0.00 0.00 0.003333 0.035 0.03 0.01 0.00 0.00 0.00 0.35 0.13 0.22 0.00 0600 0.00 0.00 0.00 0.00
58uNO3100 AND SLI'P3Fe31341 0.31 0.03 0.07 0.01 0.00 0.00 0.01 0.00 0.00 0.00 0.00 0.00 0.01 0.00 0.003373 IT.7 5.20 0.51 0.00 0.03 0.07 3.30 0.00 0.22 2.50 0.00 1.01 0.02 0.00 0.00331 15.3 3.29' 4.30 0.00 0.19 0.33 14.11 0.00 4.41 2.57 0.34 0.23 0.00 0.00 0.00
OLY73100333 0.00 0.00 0.00 0.0 0.01 0.00 0.00 0.00 0.00 0.00 0.00 0.00 0.00 0.00 0.00331 0.00 0.000 0.0 000 0.00 0.00 0.03 0.00 0.00 0.00 0.00 0.00 0.00 0.00 0.00
1o31 0.00 0.00 0.00 0.00 0.00 0.00 0.10 0.00 0.00 0.00 01.00 0.00 0.00 0.05 0.00
PAUYICLE 30O3RD33030.00 0.00 0.0 0.00 0.00 0.0 0.00 0.00 0.00 0.00 0.00 0.00 0.00 0.00 0.001371 0.01 0.00to 0.02 0.0 0:.0 0.0 000 0.00 0.00 0.00 0.00 0.00 0.00 0.00 0.00
lo33 0.01I 0.00 0.01 0.00 0.00 0.00 0.00 0.00 0.00 0.00 0.00 0.00 0.00 0.00 0.00
1341 0.0 .0 0.0 0.00 0.0 0.00 0.00 0.00 000.0 0.00 0.00 0.00 0.00 0.00373 0.0 0.0 0.0 00 0.10 0.0 0000 0 0 0.00 00. 0.0 0.00 0.00 0.00 0.001333 0.00 0.00D 0.110 0.00 0.00 0.00 0.00 0.00 0.00 0.00 0.00 0.00 0.00 0.00 0.00
WO00D PULP3301 0.00 0.00 0.00 0.00 0.00 0.00 0.00 0.00 0.00 0.00 0.00 0.00 0.00 0.00 0.003373 0.02 C0.00 0.0 0.0 'D.00 0.0:02 0.00o 0.010 .0 .000,-.000 00.00. 0.:00 0.00 0.00 0.00
333 C.0000 0.00 527 00 0.0 .0 000 .000 0. 00 0.0 0.00 0.00 0.00
Yvan AT*Its1 180330 1907.0 t0010 CA30N 014104 IVOSY 113533 MDK0CC OlVSNIA PAPUA H1 SOLOMNOI ALL Lac318m~vt131 L 303900 310fl0
3303 3.41 0.23 0.00 0.00 0.00 0.12 0.50 0.00 0.01 0.00 0.00 0.00 1.493373 133.07 0.0 3.7 0.00 0.00 7.33 40.33 4.31 0.00 0.00 0.00 10.00 104.3433311 07.15 it.1n 2.44 5.33l 30.00 0.00 31.50 3.05 0.00 0.00 0.00 0.00 07.5911#30 0.50 0.00 0.00 0.00 0.00 0.44 0.01 0.00 0.00 0.00 0.00 0.00 0.713373, 1.43 0.00 0.33 0.00 0.00 1.20 2.39 0.14 0.00 0.00 0.00 0.00 11.071331 33.00 3.03 1.13 2.15 0.05 0.02, 4.35 1.20 0.00 0.00 0.00 0.00 43131
33030.010.00 0.00 0.00 .00 0.00 0.00O 0.00 0.00 0.00 0.00 0.01I'l,7 0.3 0.00 0.00 .0 00'. 0.00 0.0 0.27 0.00 0.00 0.00 r.00 0.00 0.311331 0.20 0.000 0.0 0.00 0.0 0.0 .0 00 .0 0.0 00 .0 0433031 0.00 0.00 0.00 0.00 0.00 0.00 0.00 0.00 0.00 0.00 0.00 0.00 0.00
0.0000011
000 00 0.00v 0.03303 .00 000 000 0.0 0.0 0.0 0.0 0.00 0.00 0.0 0.00 0.00 0.00
3373 0.0 0.00 000 0.0 0.0 0.00 0.00 0.00 0.0 0.00 0.00 0.00o 0.0I33 I 0 00 0 .00 000 0.00 0.00 0.00 0.00 60.0 0.00 0.00 0.00 0.00
1301 0.300 0.:00 0.00 0.00 0.00 0.00 0.00 0.00 0.00 0600 0.00 0.00 01
131 0.03 0.00 3.00 0.00 0.00 0.00 0.00 0.00 0.03 0.00 0.00 0.00 0.103333 0.24 0.00 0.00 0.00 0.00 0.00 0600 0.00 0.00 0600 0.00 0.00 5.93
YES' JL73 LOSS C2FCH. P01010 *OMAI&o H3J0GA3V CHINE
13OUS57 ftI OUN30100 0033063 0.03o 0.03 0.00 0.00 0.00 0.00 0.001371 0.331 0.43 0.00 0.406 06.0 0.0 0.00V333 .0 00. 0.00 0.0 0.00 0.00 0.00
SA3103flfl £011 9PIRS3330 033 0.14. 0.00 0.00 0.39 0.00 0.0013373 30.33 ?.33 0.80 0.031 3.23 0.00 0.0
t333 30.11 33.24 0."8 0.140 1.30 0.00 0.00
330 0.00 0.0 0.001 0.00 0.41. 0.00D 0.001371 0.08 .13 0.0 0.0 0.8 000 003331 3.13 1.3 0.00 0.80 0.60 0.0 0.00
P1?16"3:1130 00001 IS0
3301 0.03 0. 0.0 0.0 0.0 8.0o .0
tool 0.01 0.03 8.03 0.00 0.70 0.00 0.00
Put P300)33038.83 8.03 3.508o0.00 0.40 0.08f 0.0331371 0.33 0.:4"3 0.00 0.40 0.00 0.Go 0.00
3333 0.08I 0.00 0.00 0.00 0.00 0.00 0.00
3O1043 P-IL:331 .43 0.41 3.33 3.30 0.00 0.00 0.00333 0.03 0.010 3.60 3.00 0.60 0.00 0.00
loot 3.53 3.5 3.06 8.00 0.30 0.00 0.00

MDF/W/52Page 189
nSJ lMPORTS BY AREASAND COMMODITY GROUYPS EGYPT(IN MILLIONDOLLDARS US)
YEAR WORLD U.S. CANADA JAPAN ECCIOR EFTA AUSTRIA FINDLAND SWEDENDE.WE ANIS AVLDYP
INDUSTRIAL ROUND WOOD1931 2.36 0.0on -).no 0.00 0.16 3.63 0.00 1.62 0.00 0.0191q3 S.ff 0.00 0.00 0.00 0.19 2.16 0.00 1-.0 0.46 0.00391 '1.1s M.non 0.80 0.010 1.90 27.90 0.010 21.60 0.31 0.13
SAWNWOOOD AND SLEEPERS1941 13.19 0.19 0.00 0.01 0.23 0.11 0.01 0.01 o.o0 s.64I*?, 90.38 0.12 0.00 0.00 0.00 0.24 0.00 0.24 0.00 1.0319S1 3%0.75 31.13 20.71 0.00 S.29 102.21 3.69 43.91 s1.5S 30.11
PLYWOOD3911 3.4S o.On 0.00 0.00 0.03 0.21 0.00 0.21 0.00 0.001lo st 42. Z3.03 0.110 0.14 2.42 5.03 0.30 4.23 0.00 3.32
POARTICL;EWORAD19r1 MA0 0.00 0.n0 0.00 0.00 0.01 0.00 0.00 0.01 0.001til 2.1 0.01 0.00 0.00 0.33 1.21 0.29 0.34 0.03 0.65
31071 1.23 0.8W 0.00 0.00 0.*4 I.6S 0.00 1.19 0.46 0.001331 4.01 0.00 0.00 0.00 1.90 0.94 0.00 0.94 0.00 0.13
WO00 PULP1911 90.198 1.1fi 0.03 0.00 0.00 5.47 0.00 3.74 3.33 0.00
*NY5S it OvP
0.00 1.800.00 2.640.00 23.94
0.01 16.32y0.03 1.130.13 195.62
0.00 0.290.00 1.44
0.00 0.010.00 2.25
0.00 2.340.00 2.97
0.00 4.31
V1A3 TAN.L3" MnmoUt 6%*211 CHILIF EtCU0 O PA3AGU 1.6SIA 3UNN9 INDOE MALAYS PHILIP SIMCAP THRIL& V=31. PSOFASIN"STRI t NO40WD noD
196 O0.2 0.00 0.00 0.00 0.00 0.00 0.01 0.00 0.00 0.01 0.00 0.01 0.00 o.00 o.0o1971 0.00 0.00 0.00 0.00 0.00 0.00 0.00 0.00 0.00 0.00°° oo 0.00 0.00 0.00 0.001931 0.00 0.00 0.00 0.00 0.00 0.00 0.00 0.00 0.00 0.00 0.00 0.00 0.00 0.00 O.OD
2961 0.12 0.00 0.01 0.00 0.00 0.00 0.13 0.00 0.00 0.04 0.00 0.04 0.00 O1.00 0.421971 0.00 0.00 0.e0 0.00 0.00 0.00 0.00 0.00 0.00 0.00 0.00 0.00 0.00 0.00 0.021981 3.4s 0.00 0.00 3'.s 0.00 0.00 1.9? 0.00 O0.t 0.00 0.0D 1.2 0.00 .54 0.00
PLYWOOD1013 0.00 0.00 0.00 0.00 0.00 0.00 0.3s 0.00 0.00 0.00 0.00 0.00 0.00 0.00 0.011933 0.33 0.00 0.39 0.00 0.00 0.00 17r1. 0.00 2.03 0.00 0.00 2.36 0.00 3.14 o.-e
PANICL3. "MA301971 0.00 0.00 0.00 0.00 0600 0.00 0.00 0.00 0.00 0.00 0.00 0.00 0.00 0.00 0.001931 0.00 0.00 0.00 0.00 0.00 0.00 0.00 0.00 0.00 0.00 0.00 0.00 0.00 0.00 0.00
PULPWOOO1973 0.011 0.00 0.00 0.00 0.00 0.00 0.00 0.00 0.00 0.00 0.00 0.00 0.00 0.00 0.00lo3t 0.00 0.00 0.00 0.00 0.00 0.00 0.00 0.00 0.00 0.00 0.00 0.00 0.00 0.00 0.00
W000 PULP1913 1e.00 0.00 0.00 0.00 0.00 0.00 0.00 0.00 0.00 0.00 0.00 0.00 0.00 o.oO 0.00
C0ON0DI~l7113 AFRICA CAME90 t,597.* CDOCO 6A130 GHANA IVORY LIERT1 901.CC C0A011 PAPUA u SOLOMON ALL t0C
IDuUSItIAL WuOUD WOOD1963 0.01 0.0o 0.00 0.00 0.00 0.01 0.00 0.00 O.CO 0.00 0.00 0.00 0.151973 0.39 0.00 0.00 0.00 0.00 O0.3 0.00 0.00 0.00 0.00 0.00 0.00 0.3919e1 0.311 0.00 0.00 0.00 0.00 0.24 0.04 0.00 0.00 0.00 0.00 0.00 0.30
Sawkw0on *90 StfFvfPS1963 0.06 0.01 0.00 0.00 0.00 0.00 0.00 0.00 0.01 0.00 0.00 0.00 0.73191I 0.00 0.00 0.00 0.00 0.00 o.ob 0.00 0.00 o.o0 0.00 0.00 0.00 0.021133 0.11 0.00 0.00 0.00 0.00 0.00 0.00 0.00 0.00 0.00 0.00 0.00 5.53
PLYWOOD3971 0.00 0.00 0.00 0.00 0.00 0.00 0.00 0.00 0.00 0.o0 0.00 0.00 0.34sent 0.00 0.00 0.00 0.00 0.00 0.00 0.00 0.00 0.00 0.00 0.00 0.00 13.13
PAP? 303.5 3083019714 0.00 0.00 0.00 0.00 0.00 0.00 0.00 0.00 0.00 0.00 0.00 0.00 0.001931 0.00 0.00 0.00 0.00 0.00 0.00 0.00 0.00 0.00 0.00 0.00 0.00 0.00
1973 n.-V 0.00 0.00 0.00 0.30 0.39 0.00 0.00 0.00 0.00 0.00 0.00 0.3nlis9 0. 0 0.00 0.00 0.00 0.00 0.24 0.04 0.00 0.00 0.00 0.00 0.00 0.30
W00D PULP1913 0.21 0.00 0.00 0.00 0.00 0.00 0.00 0.00 0-.1 0.00 0.00 0.00 0.21
COQMOOIIV7rw Trr totSS C7FCH. POLAND 10NVAI& HUNGARY CRIME
INDUS"7I AL 3MU4DW09OD1961 0.19 0.00 0.04 0.00 0.14 0.00 0.001391 0.26 0.26 0.00 0.00 0.00 0.00 0.001391 0.74 0.14 0.00 0.00 0.00 0.00 0.00
Sa911900n 391 SfvrorUS39614 31.99 3.36 0.71 0.04 2.49 0.01 0.02I'l 19.1 0 l.3 0.44 0.00 4.44 0.00 0.00
T'1 102.91 19.01 8.17 0.12 23.23 0.00 0.00
11 9.19 2.36 0.00 0.00 0.16 0.00 0.0019' 11.64 4.b6 0.16 1.25 5.91 0.00 0.20
19?% 0.00 0.00 0.00 0.00 0.00 0.00 0.00flat 0.1 0.00 0.0n6.0 0.00 0.110 0.00 0.00
1911 8.23 0.2l. 0.00 0.10 0.00 0.00 0.00393-1 0.94 0.14 0.110 0.110 0.00 0.00 0.00
WM"n *UL *1971 '-I3 2.33 o."rI 0.00 0.00 0.00 0.10

IMPORTS BY AREASANDCOMMODITYGROUPSTUSINANAYEAR WORLD U.S CANADA JAPAN ECCIODIEVYAAUSTRIAFINLANDSWEEDNEDT.YEI04.4
193! 4.19194) 3.14
1,7: 11.1619e1 4r.59
VIvn I TV
lWU 1lb OnU lowfl194) 0.4919701 0.04
1.51 ".04
PUwTILr 5
Jol "s . o
61f. 0.00I1973 '1.0f4
IS'!1 1.52
WOOD0 PULP
1931 0.22
114' CS.LA-Nt
INI1nusI'I L SOLPJO 40001941S ' 5.0n1973 0.001951 0.00
544314000 awl) Stf FtCSS1949 0-01
'tYwool)1943S 0.00
194)b 0.00
1931 0.00
0.00 0-.000.00 0.140.0') 0.00
0.03 0.60
0.01 1.010.05 1.14.
0.00 0.00
0.01 0.00
0.00 0.00
0.00 0.000.00 0.000.00 0.00
1.53 1.14
0.00 0.00
0.00 0.000.00 0.00
0.00 0.00
0.0Of 0.00
0.00 0.00
0.00 0.000.00 0.000.00 0.00
0.00S 0.000.00 0.00'
0.0')7 0.00
3n3015 SlV ANw C0'I'40011t cInUPS TUNISIA1I ILLION DOLL ARS USI
JAPAN M ID0IF3 auSvRI VINLAN 531o0w CT. IE
0.00 0.12 0.00 0.00 0.00 0.00 0.010.00 0.4S 0.10 0.00 0.o0 0.00 0.210.00 0.53 0.40 0.01 0.20 0.00 0.4
0.00 0.54 1.20 0.34 0.12 O.74 0.9'0.00 0.12 1.3! 0.74 0.97 0.17 4.5i0.00 1.47 22.15 0.41 13.14 3.IS 10.31
0.00 0.45 0.01 0.00 0.01 0.00 0.00.00 0.04 0.01 0.00 0.01 0.00 0.040.00 0.05 0.01 0.00 0.01 0.00 0.04
0.00 0.05 0.00 0.00 0.O0 0.00 0.01
0.00 0.04 0.00 0.00 0.00 0.00 0.01
0.00 0.30 0.91 0.00 0.04 0.00 0.0O
0.00 0.91 4.31 0.00 0.00 4.31 0.01
NILE 0UMOO PARAU F.ASIA 3UM111 INOONE MALAYI
0.00 0.00 0.00 0.00 0.00 0.00 0.0O0.00 0.00 0.00 0.00 0.00 0.00 0.04
0.00 0.00 0.00 0.00 0.00 0.00 0.04
0.00 0.00 0.00 0.04 0.04 0.00 0.04
0.00 0.00 0.00 0.00 0.00 0.00 0.013.70 0.00 0.00 0.00 0.00 0.00 0.0?
0.00 0.00 0.00 0.00 0.00 0.00 0.010.00 0.00 0.00 0.00 0.00 0.00 0.010.00 0.00 0.00 0.00 0.00 0.00 0.04
0.00 0.00 0.00 0.00 0.00 0.00 0.0?0.00 0.00 0.00 0.00 0.00 0.00 0.010.00 0.00 0.00 0.00 0.00 0.00 0.01
0.00 0.10 0.00 0.00 0.00 0.00 0.04
£1A14 IL OVP
0o 0.00 0.12P5 0.00 1.1a* 0.00 1.87
wsO.CO 2. To*E 0.00 3.191I 0.00 35.13
0.00 0.673 0.00 0.04
>O0.00 0.05
fO 0.00 0.050.X00 0.04
f2 0.00 1.13
0.00 3.2Z
1 P1ILIP SICAP THAILA £0DR3. vIOFAS
.OCO 0.00 0.00 0.00 0.DI 0.00 0.00 0.00 0.00 0.00D 0.00 0.00 0.00 0.00 0.00
7 0.00 0.00 0.00 0.00 0.00l 0.00 0.00 0.00 0.00 0.00
O.o0-0 O.- 0.00 0.00 0.00
0 0.00 0.00 0.00 0.00 0.00D 0.00 0.00 0.00 0.00 0.00D 0.00 0.00 0.00 0.00 0.00
D 0.00 0.00 0.00 0 .001 0.00 0.00 0.00 0.00 0.00D 0.00 0.00 0.00 0.00 0.00
o 0.o0 0.00 0.00 0.00 O.OD
coNUnot TyYEA' APUtir CA85E1O CENT.& COSIO CGwild GHANA IVORY LJSFRI MOROCC OCEANIA PAPUA N SCLONON ALL tOC
14f'1JS7tIAL0*4)4WOOD194) D.0" a0.00191 0.nO. 0.00Joe1 0.5S 0.00
SAWwMIMnn AND SMPFUSI6 0.01 0.00MT n.0on 0.001asi 0.1I 0.02
PLYWC4n01r4 0.0 0.001J7) 0.01 0.00193a1 0.00 0.00
PA3TICLP Fl43v194 0.00 0.0017 0.00 0.001l31 0.29 0.00
tWO111 PULl1951 0.00 0.00
C0'N?.r-ITT1183 PTA 1135S
1NOVSTWIAI30n14 I 00194.) 0.22 0.11Jo,1 0.001931 1.47 0O0n1
S43WNW1I0AN)"MLIPPrERS19) 0.37T O.%
1Jel 7.49 4.9"
1943 0.01 0.00173 0.110 0.0019l1 1100 0.00
197)1 p.00 0.001TO1 0.00 0.00
Wf11l1 w11t1931 0.00 0.0o
0.00 0.00 0 0.00 0.00 0.00 0.000.00 000 0.00 0.00 0.00 0.00 0.000.00 0.00 0.40 0.00 0.45 0.00 0.00
0.0o 0.o00 0.00 0. 0.01 0.00 0.0o0.00 0.000.o 0 0.00 0.0I 0.00 0.000.o0 0.02 0.O O.0O 0.27 0.00 0.00
0.00 0.00 0.01 0.00 0.00 0.00 0.000.00 0.00 0.00 ..qO 0.o0 0.00 0.0100.00 .00 0.0 0.00 0.00 0:.00 0.:1000.00 o0.0 o0.00 0o.0 0. 0.00 0.000.00 0.00 0.00 0.00 0.00 0.00 0.000.00 0.00 o.oo 0.00 o.o0 0.00 0.29
0.00 0.00 0.00o.00 0.00n.00 0.0O
C79ECH. POLIW1 PIMA"NI
0. 0S 0.00 0.000.00 0.00 0.000.00 1.-4 0.00
0.04 0.00 0.000.04 0.00 0.000.00 0.12 0.00
0.00 0.01 0.000.00 0.00 0.000.00 0.00 0.00
5.00 0.00 0.000.0n0 0.00 0.00n.100 0.00 0.00
0.00 0.00 0.00
HUNGARY
0.00
0.00
0.00
0.00
0.000.60
0.00
0.00
0.00
0.000.00
0.00
0.00
CHINE
0.00
0.00
0.00
0.00
0.0n0.03
0.00
0.00
0.00
0.00
0.00
0.00
0.00
MD1F/W/52Page 190
0.00o 0.000.o0 0.00C.00 0.00
0.00 0.000.00 0.000.00 0.00
0.00 000.00 0.00
0.00 0.000 .00 000.00 0.00
0.00 0.00
0.00 0.000.00 0.000.00 0.35
0.00 0.030.00 0.000.00 4.12
0.00 0.010.00 0.010.00 0.00
0.00 0.000.00 0.000.00 0.29
0.00 0.00

IMPORTS BY AREAS AND COMMODITYRGROUPSYUGOSLAVIA(IN MILLION DOLLARS US)
YEAR WORLD U.S. CANADA JAPAN ECCIZIO EFTA AUSTRAIFINLAND SWEDEN DY.WEANESS TL DYP
INDUSTRIAL ROUNDWOOOD31.6 0.4|1 0.00 0.00 0.00913T In.*1 0.3 0.00 0.00
19pt1 116.15 0.00 34.04 0.00
391 0.0 0.0D 0.03 0.003915 17.71 0.S0 0.00 0.00191P 71.47 0.06 0.00 0.00
PLYWOOD3.3 0.00 0.on 0.00 0.00917 9.. o0.00 0.00 0.00
I13P f.41 0.00 0.0o 0.00
PARTICLE BOARD19051 .00 0.00 0.00 0.001911 R.R0 0.00 0.00 0.001531 2.24 0.00 0.00 0.00
9173 1". 7 0.00 0.00 0.0019l3 Ri.1s 0.00 14.04 0.00
WrIOD PULP191 a.50 O.Y9 0.42 0.0017T3 24.42 3.55 5.1 0.00151.1 13.S0 3.20 1I.64 0.00
co-woonllYEAR C&R.LAM HONOUR BRAZIL CHRLE
INDUSTNIAL 30.1n WOOD151 0-01 0.00 0.00 0.00I971 0.02 O0.o O0O0 0.0019l3 o.0o 0.00 0.00 0.00
SAW"NWOOn ASD SLFEPRS
1973 0.00 0.00 0.00 0.00ISRI 0.00 0.00 O.00 0.00
191 a0.00 0.00 0.00 0.00311 0.00 0.00 0.00 0.00
ISP! 0.00 0.00 0.00 0.00
PARTICLE POAR'191t 0.00 0.00 0.00 0.001513 0.00 0.00 0.00 0.003931 0.00 0.00 0.00 0.00
PULPWOOD03971 0.00 0.00 0.00 0.003931 0.00 0.00 0.00 0.00
WOOD PULPF1963 0.00 0.00 0.00 0.00
9137 0.00 0.00 0.00 0.001931 0.00 0.00 0.00 0.00
COOODIPYYEAR APICA CAMPRO CE fl-A CONGO
INOUSThILRCOUND ODOn1563 0.10 0.00 0.00 0.001573 3.1.3 0.0. 0.45 0.351931 372Rt 4.04 2.41 0.72
SAWNUDOY A4D SLIEPERS
1I.e3 0.00 0.00 0.00 0.00
190 3 0.sn 0.0o 0.00 0.0011.31 1.42 0.00 0.29 0.00
WI" IOOD'93 0.00 0.00 0.00 0.001373 0.00 0.00 0.00 0.00193t 0.00 0.00 0.00 0.00
PARTICLE 30*2 0.0
1063 0.00 0000 0.001973 0.00 0.00 0.00 0.00
li31 '1.410 0.00 0.00 0.00
PULPWOOD
1163 0.00 0.00 0.00 0.001931 0.00 0.00 0.00 0.00
WOOD PUPC1963 0.00 0.00 0.00 0.001.73 0.00 0.00 0.00 0.003931 0.4 0.00 0.00 0.00
POLPODIYY'll 313 3.5I "cH,. POLI:oWODPU5L1PL POO WIn
1961 31.00 0.00 0.00 0.00
1515 3.19 3.00 4.55 0.00tSP 15.1.1.5**5.33E 22.37 0.34
10I1 0.00 0.00 0.00 0.001913 31.33 33O0 0.00 0.00PACL S.E S.30*. 0 O'l 0
395 31.97 0.00 0.00 0.0031.31 0.1.1 0.00 0.00 0.00
tops.7 %1611 3.3Ss. I.1.3 0.00
11.33 10.16 55.455 33.30 0.36
lPtn n.oll n.0010 0.-0 .1.00
11.011 0.033 0.033 0.330 0.0031.731 1.10T 3.4? 0.00 0.11
1.T1 9.40 O.O5 0.00 0.00too 139-6t '11 16 * TS-°°.0
0.11 0.02 0.0006 1.11 3.11
0.33 2.31 2.3B
0.00 0.00 0.002.44 3.o2 $.3T2.S2 S.30 3.30
0.00 0.00 0.002.53 0.09 0.004.40 0.01 0.00
0.00 0.00 0.003.07 5.1 5.S10.73 0.SG 0.50
0.01 2.30 2.300.33 2.02 2.02
0.50 3.52 1.212.30 10.12 4.224.43 53.64 16.04
ECUADO PARAGU E.ASIA
0.00 0.00 0.010.00 0.00 0.000.00 0.00 0.00
0.00 0.00 0.000.00 0.00 0.100.00 0.00 1.15
0.00 0.00 0.000.00 0.00 0.000.00 0.00 0.00
0.00 0.00 0.000.J0 0.00 0.000.00 0.00 0.00
0.00 0.00 0.000.00 0.00 0.00
0.00 0.00 0.000.00 0.00 0.000.00 0.00 0.00
CABON GHANA IVORY
0.02 0.13 0.00OSO 0.b9 6.73
10.79 0.90 9.41
0.00 0.00 0.00O.O 0.40 0.000.00 0.00 0.03
0.00 0.00 0.000.00 0.00 0.000.00 0.00 0.00
0.00 0.00 0.000.00 0.00 0.000.00 0.00 0.00
0.00 0.00 0.000.00 0.00 0.00
0.00 0.00 0.000.00 0.00 0.000.00 0.00 0.00
1031AN3A HUNGARY C033E
0.00 0.00 0.002.24 1.00 0.001.05 14.42 0.00
0.00 0.00 0.00OT7 0.10 0.000.00 0.25 0.00
0.00 0.00 0.000.00 0.00 0.000.00 0.00 0.00
O.Oo 0.3o0 0.0o0.15 0.34 0.000.16 O.2S 0.00
2.2' 0.17 0.003.05 34.10 0.00
0.00 0.00 0.030.00 0.11 0.000.00 0.00 0.00
0.00 0.00 0.030.00 0.00 0.000.00 0.00 0.00
0.00 0.00 0.000.00 0.04 0.00o.on 0.00 0.00
0.00 0.00 0.000.09 0.00 0.000.01 0.00 0.00
0.00 0.00 .O000.00 0.00 0.000.00 0.00 0.00
0.00 0.00 0.000.00 0.00 0.00
0.14 1.33 0.001.11 3.70 0.004.23 12.59 0.15
1UR3A 13300S MALAYS PHILIP
0.00 0.00 0.00 0.000.00 0.00 0.00 0.000.00 0.00 0.00 0.00
0.00 0.00 0.00 0.000.10 0.00 0.00 0.000.14 0.36 0.15 0.00
0.00 0.00 0.00 0.000.00 0.00 0.00 0.000.00 0.00 0.00 0.00
0.00 0.00 0.oo 0.000.00 0.00 0.00 0.000.00 0.00 D.00 0.00
0.00 0.00 0.00 0.000.00 0.00 0.00 0.00
0.00 0.00 0.00 0.000.00 0.00 0.00 0.000.00 0.00 0.00 0.00
LISERI 503.0CC OCESNIA PAPUR N
0.00 0.00 0.00 0.000.15 0.00 0.00 0.00.9.5 0.00 0.00 0.00
0.00 0.00 0.00 0.000.00 0.00 0.00 0.001.03 0.00 0.00 0.00
0.00 0.00 0.00 0.000.00 0.00 0.00 0.000.00 0.00 0.00 0.00
0.00 0.00 0.00 0.000.00 0.00 0.00 0.00.00 0.00 o.00 0.00
0.00 0.00 0.00 0.000.00 0.00 0.00 0.00
0.00 0.00 0.00 0.000.00 0.00 0.00 0.000.00 0.00 0.00 0.00
NISA Ut DVP
0.01 0.210.00 3.530.00 17.24
0.00 0.030.00 31.140.00 10.33
0.00 0.000.00 1.6?0.00 *.41
0.00 0.000.00 P.230.00 1.32
0.00 2.340.00 1.139
0.00 5.030.00 21.630.00 T3.30
SINGAP THALA KOREA. PIDEAS
0.00 0.09 0.00 0.000.00 0.00 0.00 0.000.0o 0.00 0.00 O.OD
0.00 0.00 0.00 0.000.00 0.00 0.00 0.000.00 0.00 0.00 0.00
0.00 0.00 0.00 0.000.00 0.00 0.00 0.000.00 0.00 0.00 0.00
0.00 0.00 t.00 0.000.00 0.00 0.00 0.000.00 0.00 0.00 0.00
0.00 0.00 0.00 0.000.00 0.00 0.00 0.00
0.00 0.00 0.00 0.000.00 0.00 0.00 0.000.00 0.00 0.00 0.00
SOLOMON ALL LOC
0.00 0.2?0.00 9.000.00 32.23
0.00 0.000.00 0.400.00 2.4
0.00 0.000.00 0.000.00 0.00
0.00 0.000.00 0.000.00 0.00
0.00 0.000.00 0.00
0.00 0.000.00 0.000.00 0.43
MDF/W/52Page 191

MDF/W/52Page 192
93109 IMPORTS By AREAS AND COMMODITYGROUPSSAUDIAREAVIA(IN MILLION DOLLARS US)
YEAR WORLD U.S. CANADA JAPAN ECCIOIEFTA AUSTRAI FINLAND SWEDENDT. WE DIANS TL DYP
INDUSTIRAL ROUND WOOODit' 0. D0.04 0.o0 0.00 0.15 0.02 0.00 0.00 0.01 0.0o 0.54 0.3to79" .3 1. '.0 0.55 0"I5 0.04 0.05 0.01 0.01 0.02 0.KS 2.3'I5I 7.90 7.91 9.41 0.2 1.71 2v.1 3.95 11.01 11.75 21.3 0.43 52.43
SANWNWOOD ANDSLIPEPRS5949 '.40 0.'3 0.01 0.02 0.4 O 0.05 0.00 0.45 0.15 0.O2 1.041971 51.4' 0.43 0.03 0.09 0.25 1.S 0.J39 0.01 1.25 1.04 0.00 3.43?9p5 7PT.41 91.3. 22.59 0.OS 41 45.02 53.22 9.54 3T1. 4. 1 0.24 127.20
PLYWOODlos1 29%.97 13.11 1.54 1.47 4.09 25.20 15.4 19.05 4.1T 1.12 0.21 43.37
PARTICLE BOARD1." 2.50 0.01 0.00 0.05 0.54 0.5t 0.10 0.34 0.00 0.04 0.00 1.11
PULPWOOD19s3t 57 0.01 0.01 0.00 0.03 0.02 0.00 0.01 0.00 0.03 0.00 0.01
YEAR CARLAN HONOUR BRAZIL CHILE ECUADO PARAGU EASIA BURMA IDOMEHALLAYSPHILIP SINGAP THAILA MOREA WIDEAA
INDISTRIAL ROUND WOOD1e41 .0o 0.00o 0.0 0.00 0.00 0.03 0.00 0.00 0 0.00 0.00 0.00 0.00 0,0
I507 0.42 0.00 0.00 0.00 0.01 0.00 0.33 0.00 0.00 0.00 0.00 0.01 0.01 0.00 0.401se1 3.40 0.00 0.45 1.35 0.00 0.00 13.23 0.43 0.00 7.15 0.04 5.73 0.14 3.31 0.34
s*,.N100I *140 SLrP'E3S594 . 0.00 0.050oo.0o0 o0.00 0.00n 0.1 0.01 0. 000I, 0.0 0.00 0. O.0 0.00 1.545973 0.3 0.00 0.00 0.00 0.05 0.00 3.1 0.00 0 0 0.03 0.1 3.24 0.01 0.01 3X415935 5.74 0.00 5.40 0.23 0.00 0.00 33.75 0.12 1.44 11.21 0.515.31 0.11 91 0.92
PL. 5400'593l OT3 0.00 0.09 0.21 0.01 0.00 131.S2 0.07 20.94 4.39 0.31 29.55 0.13 S5.03 0.90
1931 0.00 0.00 0.00 0.00 0.00 0.00 0.49 0.00 0.13 0.00 0.00 0.00 0.00 0,TI 0.13
1931 0.0. 0.00 0.00 0.01 0.00 0.00 0.44 0.00 0.00 0.33 0.00 0.24 0.00 0.04k 0.00
Vras *73IC& CA-ran CFNI.* CONuO GAON CHANA IVORY LIBEKI NOROCC OPEIfNI PAPUA N SOLOMON 4LL LOC
IMOUSTII AL 5OUNbDI!nf)5914 0.0o 0.00 0.00000 00 .00 0.0 0.00 0.00 0.00 0.00 00 0.00 0.20VS73 0.D" 0.00 0.00 0.00 0.0 0 0.00 0.0 0 0.0 0 0.00 1.53ll3 1.71 0.00 0.00 0.00 0.00 1.33 0.10 0.00 0.00 0.00 0.00 0.00 13.97
SAWNWnoD AN0 SLEEPEIS543 0.4 0.00 0.00 0.00 0.00 0.00 0.00 0.00 0.00 0.00 0.00 0.00 2.145973 5.24 0.00 0.00 0.00 0.00 0.00 0.00 0.00 0.00 0.00 0.00 0.00 3.145931 5.14 0.04 0-09 0.00 0.00 1.14 1.73 0.03 0.00 0.00 0.00 0.00 *49.0
PLI OO93191 0.0 0.00 0.00 0.00 0.00 0.00 0.02 0.00 0.00 0.00 0.00 0.00 353.23
Paftr ctfF0151955 0.00 0.00 0.00 0.00 0.00 0.00 0.00 0.00 0.00 0.00 0.00 0.00 0.71
PULP 5won05933 0.00 0.00 0.00 0.00 0.00 0.00 0.00 0.00 0.00 0.00 0.00 0.00 0.45
C0PnO0 rVVIIa T*l LN&S UCetd. VOLIN'S ROMANIA HUNGARY CHINE
INUSnISEL rnUNo won"1593 0.0 0.00 0.00 0.00 0.00 0.00 0.005973 1.47 0.03 0.o2 0.05 1.11 0.00 0.05931 1.09 4*.95 O.1 0.00 13.55 0.00 0.20
SaWNNOOO AND0 51F3E1St0o 0.00*5 0.00 0.00 0.0 0.00 0.005973 '.49 5.1*. 0.01 0.02 I.09 0.00 00193I 45.53 9.45 0.02 0.00 41.33 0.00 0.20
PLYVOnD001531 3.4:5 1.20 0.00 0.00 7.02 0.00 1.30
PAPIYCLF 30*305931 0.55 0.04 0.00 0.00 0.09 0.00 0.00
PULpbOO'S5935 0.00 0.00 0.00 0.00 0.00 0.00 0.00

MDF/W/ 52Page 193
IMPORTSBYAREAS AND COMMODITY GROUPS THOTAL DVG(IMMILIONDOLLARS US)
YEAR WORLD U.S. CANADA JAPAN ECI201 ETAAUSTIRA FINLAND SWEDEN DT.YE ANISA TL DYP
on", 41.01i b 4*9 016 0.99q 5.02 2.43 0.00 1.76 0.23 0.0'. 1.22 36.61197' 4I1:.6 19.0'" 0.2 1.51, 12.10 4..31 0.01 1.39 0.944 0."7 6.90 66.513113P 3004.1 32 1.7 11.10 1.1 19.93 66..6 5.46 4"..4 13.41 4.59 3.7 245.I33
1". *..%. S.."Ao o..' o-su 1.96l O.S6 0.611 1.51 2.o4 9.62 0.0 It.513971~ t2%1. 1 5.EI 3.7is 0.35 6.So 15.64' 4.33 32.63 1.64 36.16 0.0so 0.O0391 3199913.47 300G.'11 2.16 r3.43 S00.74 24.29 160.31 105.41 10.619 4.19 634.62
et 7110023911 .6.?0 3.361 0.22 0.99 4.0 0.64 0.01 0.6 01i.6s.0 66
190 n~.42.94.6 1.56 10.01 13.71 31.72 2.49 24.54 4.40 1.06 2.47 65.12
399 tl.04 o.6BP 0.00 0.00 0.30 0.01 0.00 0.00 0.00 0.00 0.00 0.93395 .046 0.43 0.00 0.44 1.42 0.03s 0.00 0.02 0.01 0.03 0.25s 2.16191 3.49 6.35S 0.31 0.02 3.43 1.09 0.4" 1.44 0.0? 0.4?7 4.41 11.76
194Pnrn3 0.'19 0.16 0.100 0.01 0.,10 0.00 0.00 0.00 0.00 0.00 0.00 0.2791.3 4.12 0.00 0.06 0.00 0.46 1.41 0.00 1.19 0.46 0.00 0.51 2.9139I3 3.4S 0.11 0.01 0.00 1.94 0.95 0.00 0.95 0.00 0.13 0.00 3.13
111113 PULP363 9.0 24.11t 6.51 0.10 0.60 21.14 0.00 6.47 32.44 0.03 0.16 53.463913 102.16, 94.0 50.63 10.1,3 5.20 66&.90 0.04 10.73 64.41 0.61 10.39 259.04
"PI . V97.9II .7 10 0.3 72 114.7 1.0 31.13 63.066 1.21 31.612 530.64
716&K .L' HnOIJOI 96A23ZL CNILV ECUADO PAEACU [.ASIA SUPH4A MOR0E1 IIALAVS PHILIP 33IN061 IHAILA K0REA. 610183A
196 9.44S 0.26 0.390 0.03 0.09 4.55 30.6 0.75 0.'6 0.01 11.32 0.C? 0.41 0.00 0.163971 3.0 0.01 0.36 0.00 0.:02 1.22 323.55 1394 146.42 103.171 21.63 0.13 S.19 0.01 0.401963' 53.2" 3.30 0a2 4..631 0.14 0.52 434'.23 39.79 11696 430.23 13.14 1.61 2.94 3.34 0.34,
SAwNwIInO AND %LEFP1613963 21.2 2376 .0 00 .1 96 4.21 0.12 0.04 0.01. 0.65 0.40 0.00 1.-16197) 62.37 6.00~2:3 132 S.2 00 3.5 5.9 54 0.19 0.64 .46:3.19 102 0.01 3.46
.91 34.4 1.69 29.4346:ID-: "R6.09D 0.65 36.76o 266.51 22.95 266 9.2 2.15 112136 340O 9.65 0.93
PLY WnO')3961 0.16 0.00. 0.0 0.0 000 0.00 1.75 0.00 0.00 0.00 0.01 0.00 0.00 0.00 0.069137 3.63 0.06 0 .26 0.00:Do 0.04 0.9 41.27 0.00 0.00 0.01 1.36 3.16 0.03 0.22 0.021963 26.91 0.15 .4, 0.27 13.14 0.90 373.41 0.09 50.13 105.65 22.34 42.92 0.33 56.55 1.06
3961 0.00 0.00 0.00 0.00 0.00 0.00 0.01 0.00 0.00 0.00 0.00 0.00 0.00 0.00 0.001975 a.00 0.00 0.00 0.00 0.00 0.00 0.03 0.00 0.00 0.00 0.00 0.00 0.00 0.00 0.00I993 9.314 0.00 0.62 0.00 7.66 0.02 0.97 0.00 0.36 0.30 0.00 0.00 0.06 0.27 0.3'
PUL 0110001961 0.00 0.00 0.00 0.00 0.30 0.00 0.11 0.00 0.00 0.00 0.36 0.00 0.00 0.00 0.00I975 0.00 3.00 0.00 0.00 0.00 0.00 0.00 0.00 0.00 0.00 0.00 0.00 0.00 0.00 0.00911 0.0, 0.00 0.00 0.02 0.00 0.00 1.10 0.00 0.37 0.31 0.00 0.24 0.00 0.06 0.00
3OO61U 3.60 0.00 0.11 1.29 0.00 0.0.0 0.17 0.00 0.00 0.00 0.00 0.00 0.00 0.00 0.001913 10.93 0.00 1.74 15.3 0.00 0.00 5.99 0.00 0.00 0.00 1.40 0.00 0.06 0.00 0.173991l 1339.62 0.00 29.52 306.17 0.00 0.00 16.65 0.00 0.00 0.00 3.16 0.00 0.42 0.00 0.00
Y1'V 04161CC 046151 01111.4 CONGO 0*901 GHANA IV0RY L3RFM1 "060CC OCFAHIA PAPLIA Pd SOLOON ALL LODCINOUSYPIIL ra3J110 wnr300
1961 4.12 0.01 0.00 0.04 4.13 0.77 0.17 0.00 0.00 11.01 0.01 0.00 42.601971 35.01 0.04. 0.00 0.02 4.66 3.13 6.50 0.00 0.00 0.00 0.00 0.00 342.023911 '7.10 0.27 0.7 3.21UZ 119.04 1.62 38.35 0.053 0.00 20.75 19.92 0.63 733.73
3963 0.59 0. 0.070 0.00 0.70 0.02 0.01 0.00 0.01 0.00 0.00 0.00 40.26391. 1.020.0z0 0.0 0.01 0.13 0.09 0.49 0.00 0.00 0.00 0.00 0.00 325.34
19611 7.0 0.9 0.09 0.02 0.43 3.116 4.09 0.03 0.00 0.00 0.00 .0 309
PLYWOOD39611 0.40 0.0 0.00 0.00 0.01 0.14 0.00 0.00 0.00 0.00 0.00 0.00 2.47315 0.1 0.0 0.vD n 00 0.001, 0.03 0.0121 0.00 0.00 0.31 0.00 0.00 0.00 43.31193 191 000 000 0.00 0.00 0.16 0.90 0.40 0.0 .00 0.00 0.00 405.16
PSRTICLF pn36601963 0.", 0.00 0.00 0.00 0.130 0.00 0.00 0.00 0.00 I0.00 0.00 0.100 0.011911t 0.01 0.00 0.00 0.00 0.00 0.00 0.00 0.00 0.00 0.00 0.00 0.00 0.043913 0.29 0.00 0.00 0.110 0.00 0.00 0.00 0.00 0.29 0.00 0.00 0.00 10.75
PULP 340003063 0.001 0.00 0.00 0.00 0.00 0.00 0.00 o.00 0.00 0.00 0.00 0.00 0.31195 .9 0.00 0:.00 0.00. 0.040 0.9: 0.00 0.00 110.00 0.0:0 0.00 0.00 0.9
3963 0.1'" 0.00 0.00 0.00 0.0 02 .600 0s 00. 0.000 0600 0 .3
WOOD PULP1961 0.02 0.00 0.00 0.00 0.10 0.00 6.00 0.00 0.00 0.00 0.60 0.00 2.393975 1.16 0.033 0.00O0.0000.00.000 0.00 0.00 0.1:D 00.00 0.0 .0 03
191 02 .0 .0 000 0. 0.000 0. 0.00o 00. 0.600 0.0 0.00 357.66
7V1Vt 76 WmSS C19CH. POLAIlM ROMANIA MAJGARY CUINI
1961 3.00I 0.60 0.01 0.00 0.14 0.00 0.111911 :.43 I.00 0.02 0.03 1.17 0.00 0.103993 '9.3' 6.3, 0.36 .6 13.31 0.00 0.37
303247.09 3~46.16 2.9P 32.36 IT.62 13.00 2.12
39461 ~ 3 0.00 0.00 0.02 0.00 0.00 0.??393, S 16.IL 2.4 0.00 0.00 1.16 0.00 2.41093 59.19 9.76 0.36 3.24. 12.95 0.00 6.04
D90 ."0 0.00 ).00 0.00 0.00 0.00 0.00
093 11) 0.06 0.00 0.00 3.61 0.030 0.04
pill 6br1i"%304.1 0.0 0.0 000 00 .1 0.0 0.01075 0*26 0.0 0.0 0.00 0.0 0.0 0.10
190 r.74 0.74 0.00 0.130 0.00 0.70 0.00
W19'0 PIlL'3941 01 .0 00 0.00 0.01 0.00 0.00
39111.11 2.36 0.110 0.04 01.10 0.00t 0.03I00£06 4.99 11 1111 0.00 0.00 0.00 0.27

MDF/W/ 52Page 194
41'3113. IMPORTS BYAREAS AND COMMODITY GROPS TOTLA DYP(IN MILLION DOLLARS US)
COMMODITYYEARWORLD U.S. CANDATS JAPNA PCIIIDA EFTA AUSTRIA FINLAND SWEDEN DT.WE ANISATLDYP
INDIUSTIRAL ROUNDWOOOD"6". 14"'331320 47.43 0.22 4.10 72.45 1.3 33.7S5 1I.55 5.14j1 4e5.7I O.:1 Z 1.81 33.14 131.Ts 23.51 1G.0T 70-.4 25.T7315 5451.43 3759.40 111.43 3.40 355.4 355.15 17.23 103.13 4-.40 33.IS
sauwutrn assi SL"r5S3.147 3555.25 51.75 4i3.44 11.31 lS-IS 531.3S 111.42 151.72 220.22 33.F43577 t1A .s 454.54IS. .9sS is.s* 313 3833. 2539.45 413.03 322.24 30.15353 05452.22 04.55 21531.4, 21.43 143.25 2452.30 514.53 310.10 521.90 115.2
PLYWOOD3543 275.53 1.52S 4.04 64.55 .S2 S3.44 1.10 53.0T 0.72 2.703513 T24.23 T
0.12 3.143 a1.Ts 13.32 137.40 5.10 ISS.S 12.30 2T.1415!1 1444.55 145.35 123.54 S554 41.62 260.25 £5.y 230.14 11.14 24.53
PAPTICLE1364 3.10 0.16 0.013197 1154.55 35.12 5.S111533 445.11 35.SS *4.22
PULPWOODI 6*T4 2.35
1 513 2711.03 53.34 5.35
1851 G7.'pm 14.45 3T.T1
WOOD PULP
1363 12S5.T3 431.34 131.2415T3 2951.75 *74.50 1053.213561 1615.25 1220.15 5112.05
YEAR Cl3*.L*t HONOUR 5*3Z3It
INOUSIRI*1at OUD wnO57.1 4 0.45 3.55
1575 53.Ty 0.14 24.3S1581 22.64 1.04 2.45
SIWNWnOD *:D SLEEPERS1513 46.31 S.5o 24.41
.1530 359.53 23.1" 54.611535 247.35 21.11 20M.2
PLVWnOO1543 2.55 0.00 0.53en17 12.04 0.17 10.401351 55.64 0.44 '1.42
PAR6 ICLE01.1 0.00
15774 0.41T 0.00 0.11I1531 n3.3 0.00 0.34
PULPW"OD35463 3.20 0.00 0.00
1573 4.5I 0.07 0.04
1581 0.34 0.00 0.00
WOOD PULP
1353 0.03 0.00 0.00
1373 27.IS 0.00 22.34511.75 0.00 52 5.T11
tVnVIODI 1YYEAR AFRICA CAME0 CENT.&
1WIUSINIAL *OUNO WOOD205.57 11.53 0.01
573 745v.Os 43.35 55.11
fo151 176.253 3.50 11.51
SAMNWOO" 41n SLIPFrS3563 40.41 1.51 0.04
1973 124.55 7.44 3.45
TONI 111.32 31.54 4.05
3543 14.134 0.00 0.00
1573 2.4 0.001553 5.47 0.01
PAPT ICIT BOARD1*61 o0.0o 0.00 0.00
1573 0.01 0.00 0.001TO1 1.3 0.00 0.00
1545 0.24 0.00 0.001573 '1.53 0.04 0.001551 0.11 0.02 0.00
3W33310 PULP1547 S.3 0.00 0.001573 14.43 0.00 0.001TO1 413.2 3.71 0.00
YC16 rT& 3M55 CZECH.
IunUST-lat ow"i meD1364 1%.T7 15.14 12.35
5.1 3.01 4 1415T3 52.11 4167.14 1435-
SAWMWMo A" SLFFttw..1354 2 52.0 143.0 24.53
1 317 Q4*.S9 75'.54 47.25
1366 15.3-1 452.40 133.S1
PLVWrC'tC13.517 14.4 7.14
to .1 7S0.37 3.
36n1 *1.41 41310 10.04
&113(1tFon36n351 I.-5 0.31 0.0531 331.514 0.73 1.141531 7.331 O-ln
Put1 313nnI*5 41.$7 70.7 2.4T310 3 135 .51 *5.43 19.50lo53 5'4.30 .14 44.1
TIMM PULP1 10.
31 31.27 21.03 M.4Y31 13S.21 1345.42 .3
00-0 0.104TO 1 0-25 2.13 1.92 0.10 0.2 4.03
0.01 7.40 143.47 46.4 41.2S 30.03 1." 1..0 1TT.340.01 17.14 213.S3 109.53 44." 74.52 51.33 1.34 4132.1
0.00 0.51 33.45 0.11 10. 12.050 3603 0.01 71.25
0.00 4.12 40.57 3.35 3.24 45.13 2.71 o0S3 31.550.00 300.44 132.05 1.13 42.51 23.52 30.7T 2.32 257.5T
0.11 4.13 459.43 13.5S 180.10 345.46 7.03 24.20 1232.470.31 24.23n 231.33 15.55 243.23 4.-45 13.02 71.74 2T10.144.14 42.61 23T7.73 11.T20 454.33 1233.22 107.55 201.54 T707.04
CHILE ECUADO 383'A13 1.AS14 MI 13 101NOW IIALAYS PHILIP 53403& 31331LA 3OREA. 3IOFAS
0.00 0.030.01 0.054.13 0.02
0.50 1.981.03 5.25
11.57 1 1.13
0.00 0.100.00 0.010.00 0.03
0.00 0.000.00 0.000.00 0.110
0.00 0.00
0.00 0.00
0.00 0.00
0.00 0.000.00 0.00
S4.42 0.10
CONGO C^B
11.05 42.53
16.03 115.457.ST 140.31
0.45 0.334.50 1.023.57 1.53
0.03 5.530.43 12.040.15 20.95
0.00 0.000.00 0.00
0.02 0.00
0.00 0.040.00 0.000.05 0.00
0.00 0.000.00 0.000.00 0.03
POLAIM V9MANIA
5.0
33.34 .*45S5.0 5.21
11 44.41
0.47 3.51
2.42 G.."
0.55 0.33
0.315 4.22
.4 46
0.02 13.221.13 0.04
0.03 .40
0.00 244.240.23 1545.200.52 1553.55
0.00 4a.420.95 532.532.44 535.
0.00 35S.230.00 442.10
*.0.0 0.00
0.00 4.13,0 0
o. 0.0
0.00 4.20
0.00 4.11
-.00 0.35
0.00 2.250.30 10.25
GHANA I3VDRY
21.45 43.2531.20 34 4.34
10.45 145.45
5.40
40.3 44.*-2220. 30
2.47 0.01
* 40 2.53
0.03 0.13
0.00 0.00
0.00 0.00
0.00 0-01
0.00 0.040.14 0.520.0 o0.0e
0.000.000.00
HUNG4Y1I
1.455.41
21.55
3.3124.1412.52
0.001.410.07
0.000.7
0.-
0.- 95. 1115.43
0.02I."0.02
0.000.00
CH4INE
0.034.313.46
0.33
3.22
0.44
0.:00O..20.03
0.02
0.000.04
0.00
0.040.01
0.5S
13.54 1.52 0.21 140.33 0.83 1.57 0.0034.33 471.51 14.75 S2.33 0.15 5.32 0.1321.44 411.53 512.55 224.55 3.74 2.47 0.25
14.40 0.71 0.41 5.05 1.54 3.04 0.0010.5 25.13 27.40 34.49 44.34 13.41 34.10
13.43 145.5s 395.73 334.70 53.01 3-50 14.12
0.120.000.00
0.000.000.00
0.00
0 00
0.00
0.12
LI
0.5133.3
0.01
O."10.44
0.00
to."r
0.04
0.000.000.00
0.000.0o0.00
0.00 0.00 15.42
0.10 51.00 50.14
11.53 53.24 122.21
0.00 0.00 0.00
0.00 0.01 0.00
0.00 0.00 0.02
0.00 0.00 0.033.35 0.00 0.745.33 0.44 0.04
O.O0 0.00 0.00
0 0 o00 1.570.00 0.00 3.74
14ROCC OCEhNI* PAPUA N
O.bI 1.55 1.15
0.00 25.45 15.410.54 14.55 44.13
0.01 073 0.55
0o.5 4.54 5.720.10 10.30 G.5
0.04 1.72 1.721.10 4.55 4.5
0.03 3.14 4.In
0.00 0.00 0.00
0.00 0.00
.00 000 01.00
0.00 0.00 0.00o.Oo o.oo o oo0.00 0.25 0.25
0.03O 0 .00
0.o0 3.32 0.00 0.00
0.00 0.13 0.00 0.00.00 24.13 0.00 0.00
0.05 0.031 5.0
3.2 0 .13
0.00 0.00 0.000.01 0.05
0.23 0.00 0.03
0.00 0.00 0.000.00 0.00 0.00
0.00 0.00 0.00
0. 0.
0. 0.1
SOLOONDIALL. Loc
0.00 434.145.10 2333.54
23.30 2735.21
0.00 153.41005 524.3S1.30 1350.14
0.00 55.44
0.00 102.33
0.00 389.20
0.00 0.25
0.00 5.240.00
0.00 3.133
0.00 1l-1.0.00 5.21
0.00 5.430 .00
0.00 434.15
0.51
0.40
0.03~o0.10
5.44
12.04
0.03
0.41
0.000.00
0.04
0.00
0.10
361IS2 IL DVP
1.25 23S.4510.45 1350.115S3.9 2051.23
4.35 1145.3029.61 4072.36100.0 4533.21
0.44 1ST.42.25 413.0411.4S 700.72

MDF/W/52
314P IMPORTS BYAREASAND COMMODITY GROUPS TOTALPage 195
(IN MILLION DOLLATS US)
COMMODITY EYAR WORLD U.S. CANADA JAPAN ECCIDOIEFTAAUSTRIAFINLAND SWEEDNE DT.WE DNISA TL DYP
INDUSTRILA ROUNDWOOOD" 4I "3I .0 33.14 43.43 1.21 11.73 *4 T79 134 40.50 20.20 5.3 7.3- 9300.941397 431`.93 0 S0.94 1.1- 4 2 1 7.94 71.30 2 n4.19. 145 3.49
39s9 4740.7 13474.77 133.31 9.09 134.44 420.74 92.72 152.42 42-.1 44.74 54.77 2331.33
1369 3443.9U -" 41.4.9 13.24 24.49 540.09 112-25 197.29 222.24 43.44 3.12 1121.343731 S2.4 a4*9 12.2-12 19.91 70.32 154GQC 302.97 430.74 323.10 123.01 3041 4343.35
13931 3so0n 11 2912.74 3.39 145.34 2153.03 400.32 9T0.41 1024.T5 134.55 305.04 7144.13
PLYWOOD
244.35 3.72 2.314 64.44 9.33 53.S5 1.10 51.15 0.77 2.71 0.33 140.33"3S7 3234.41 72.9 3.45 32.72 22.S3 330.05 9.31 154.0 12.95 27.99 2.2 431.4
2132.44 34 .45% 124.91 49.40 53.30 2o.Vs 22.24 254.70 15.49 31. 14.12 730.33
PART ICLE1394 9.64 0.39 .00.03 0.1 0.80 4.92 0.25 2.1" 1.91 0.10 0.29 1.013973 399.04 34 .4 9.51 0.45 9 02 143.104t .94 4S.27 30.05 3." 2.15 330.431931 47906 19.45 44.33 0.03 21.35 231.53 130.45 45.39 1.99 52.35 4.7 4446.01
PULPWOOD113.95 2.62 31.49 0.01 0.51 33-.3 0.11 13.94 12.09 3.03 0-03 11.54
193M 233.11 3.34 9.24 0.00 S.40 42.22 3.39 4.43 49.44 2.71 1.04 34.44
1931 472.73 14.53 37.71 0.00 102.57 133.00 7.13 43.36 23.92 10.91 2.32 301.10
14 1311.74 171.94 3*7.57 0.41 4.12 47.0-3 1.-95 194.55 377.41 7.11 24.45 1233.073153.50 41q.70 33O3.39 10.31 29.43 1374.12 19.43 25.9" 850.91 33.43 81.93 3039.19
39st 4243.0? 1414-.3 1939-. 56.99 43.22 2473.23 113.90 634.48 1287.05 103.74 254.47 T529.24
coMNITY
VEml C63..L4% 4OI4IUM NNA2L CHILE 1ECUADO PA63GW E.651A SURNA INDONE MALAYS PHILIP SINGAP 0031*. P30135
INOUST7I3L POU0D W41D943 141.391 o.3 4.33 0.011973 41.32 0.15 27.21 0.011931 7T.-9 4.15 2.91 51.14
£61WNWDOO AND ILIEPEtS194i3il 76.20 1.12 43.27 2.001973 227.15 31.73 130.11 .*45lis3 3w9.09 2S.00 226.71 58.04
PLYWOOD394 3.13 0.00 0.53 0.00 0.001973 113.b 0.22 10.45 0.00 0.051931 43.34 0.9." 4.14 0.27 13.22
3637 ICLE 3o063194s n.1? 0.00 0.00 0.00 0.001973 ".47 0.00 0.21 0.00 0.00131| 9.53 0.00 O.73 0.00 T.33
PULPWOOD1933 3.20 0.00 0.00 0.00 0.001973 4.33 0.02 0.04 0.00 0.0019l3 0.33 0.00 0.00 0.02 0.00
WOOD PULP1394 1.431 0.00 0.31 1.29 0.0019i3 S54.0 0.00 78.30 2S.15 0.001931 S50.09 0.00 354.19 149.95, 0.00
co'mmVrOI1TV*9 APUICA CaUERM CENT.& CONG GCABN
ISDUSTVAI&1 3OW3D W1o1394 710.74 11.41 0.01 17.13 47.041971 744.07 49.93 35.1? 34.04 120.511931 334.25 90.17 11.71 30.73 179.33
SIWNWOOD *AN0 SLEEPERS1943 4*.04 1.35 0.04 0.43 0.331973 175.41 *.-4 1.49 4.51 1.141931 177.72 13.23 4.14 3.59 1.94
PLYWOOD1963 14.44 0.00 0.00 0.03 5.943973 34.4S 2.43 0.00 0.43 12.051931 74.09 3.43 0.01 0.15 20.95
P3TIICLF 1s1wn1943 0.00 0.00 0.00 0.00 0.001e73 0.02 0.00 0.00 0.00 0.001931 0.434 0.00 0.00 0.02 0.00
PULPWDO01943 0.34 0.00 0.00 0.00 0.043973 1.74 0.04 0.00 0.10 0.0419s3 1.01 0.02 0.00 0.09 0.00
WnD PULP1943 S.33 0.00 0.00 0.00 0.001973 17.14 0.00 0.00 0.00 0.00193 41.3 3.1 0.30 0.00 0.03
rn09w300v7f74 PTA tSS CZECH. POLAND POSI043
IN0US57IPL 3o04n wnnf3943 101.77 79.44 12.7 3.94 9.2119T7 437.32 139.00 45.74 133.'s 3.531933 9419.70 432.41 142.0S 54.43 22.34
1943 794.70 174.34 25.5S ST.44 49.441973 59.29 S46.PT' 43.50 00.74 103.241910 1909.74 43n.74 134.91 00.23 103.43
'Lv74n311393 71.17 134.4 2.14 0.43 1.911973 *4.53 32.99 3.43 2.42 7.90393l Inw.24 *4.34 10.40 131.7 22.49
193 1..99 0.3T 0.09, 0. 39 0.31973 11.79 0.39 1.7? 13.7 7.03l9o1 39.10 3.37 0.10 0.13 7.90
PULP b0oon1393 43.5S 30.33 2.67 3.90 '.43979 110.1% 97.74 39.30 9.34 4.4?los3 30-4.M 234.0 464.12 41.45 7.93
WM?$ Put P1343 20.35 41.44 3.01 0.02 1.231397 33.9o 93.21 P.4T 3.92 0.04931 310.03 3I54.3T 2.34 0.01 5.40
0.11 4.55 "4.310.0? 1.so 1333".70.10 0.97 2464.23
1.33 0.31 72.??9.313 11.0 571.4712.57 40.65 3225.45
0no0 37.03o.96 433.330.33 1115.71
0.00 0.010.00 4.740.00 1.75
0.00 0.150.00 4.200.00 5..!1
0.00 0.940.00 3.270.30 23.90
GHANA IVORY
28.22 49.0232.33 352.4412.06 347.74
13.99 5.3440.9b 44.7021.95 77.25
2.41 0.019.42 2.530.08 0.74
0.00 0.000.00 0.000.00 0.01
0.00 0.041.05 0.520.24 0.13
19.31 2.15 0.01 171.70 0.943b.29 319.93 117.9 314.66 1.3241.23 734.94 1402.74 237.49 3.55
13.41 0.32 0.04 5.04 2.6114.14 25.42 277.4* 35.14 67.9541.53 193.59 591.32 134.34 114.20
0.12 0.00 0.00 15.43 0.090.00 0.10 51.01 55.72 44.430.09 122.25 159.09 144.61 130.11
0.000.000.00
0.000.000.00
0.000.000.32
0.5733.:354.74
D."10.47
0.000.040.04
0.000.000.00
0.000.00D0.00
0.00
0.00 0.00 0.000.00 0.00 0.00
HUNGARY
1.499.43
23.59
3.2224.25
32.52
0.001.41
0.039
0.000.390.23s
0.39
S. 1739.43
0.02
1.29o0.02
0.00 0.00
0.00 0.01
0.0 .O00
3.75 o1.0
0.004 0.00
0.00 0.000.00 0.00
...0C OCdAN
0.011O400.00 2.450.54 95.30o
0.02 0.510.05 4.540.10 10.31
0.04 1.72
0.03 5.14
0.00 0.000.00 0.000.29 0.00
0.00, 0.251.53 0.03
3.32 0.009.34 0.00
24.17 0.00
0.00
0.02
0.74
9.93
PAPUA N
1. 4519.41
0.X5S.72'.95
I3.124.594.33
0.0"6.000.00
0.00
0.25
0.000.00K ea
0.00
0.00
D el 0wOs0.23 0.04
0.00 0.000.00 0 000.24 0.00
0.00 0.030.00 0.03
SOLOMON ALL tOC
0.00 524.4?29.10 2325.9629.13 3463.43
0.00 191.43O0.09 339.491.30 to1631430.00 41.390.00 74.:190.00 l124.04
0.00 0.310.00, 5.23,O.00 12.110.00 12.520.00 4.43
0.00 1.33
0.00 30.250.00 191
0.00 57bat6CHINE
0.334.41
0.19oO.7T10.33
1.25
5.93
0.000.010.0%
0.000.040.00
0.040.030.32
1.93 0.0015.11 0.135.41 3.40
3.42 0.0019.43 34.315.30 23.71
0.01 5.410.14 266.SS0.44 283.93
0.731.220.74
1.973.54I1S4
5.529.9013.02
0.120.030.95
0.000.000.00
0.040.170.10
00o0
0.3S
0.000.000.04
0.000.030.19

MDF/W/52Page 196
I. Text of headnotes to Summary Table I (reference page 42)
TABLE 1
FOREST RESOURCES, WOOD PRODUCTION - Total, per ha., per caput -IMPORTS, EXPORTS - TRADE BALANCE (1979)'
Note: COMPOSITE FIGURES - COLUMNS (8) and (9) INDICATE ORDERS OFMAGNITUDE ONLY, SEE TEXT EXPLANATIONS FOR OTHER DATA
1Area and population data based on UN and national data. Data fortotal area include in some cases significant areas of inland waters andwaterways. Area data do not imply a judgement by the secretariat as tothe legal status of territories. As regards the year chosen, please seeparagraph 9. Data on forest areas, forestry production, disposition,and trade are derived from FA0 forestry statistics, supplemented bynational, or EEC-data, as appropriate. The annotations "TS" - TropicalSurvey, and "EC" in column (2) respectively indicate that forestry datafor the country in question have benefited either from the FAO/UNEPtropical forest surveys or are covered by forestry review data compiledby the ECE/FAO - Timber Section (cf. paragraph 51). The annotation "P"- Producer - and "C" - Consumer refer to a classification established inthe context of the 1983 International Tropical Timber Agreement(cf. paragraph 52). Data for many countries are provisional. All thedata are subject to amendment and correction, as may be required. Tradeand other data are rounded and should be considered indicators ofmagnitude only.
II. Text of column headings for Table II (reference page 79)
(Units, as shown: m3, kilogrammes; million m3, million tons)
Country
Total Wood Removals - Per Caput, m3Total Industrial Roundwood, Production - Per Caput, m3
Total Industrial Rouidwood, Availability (Production, NetTrade), Per Caput, m
E - net exports I - net imports
Total Sawnwood - Particle-Board - Plywood, Domesti5Availability (Production - Net Trade) per Caput, m
Column 1 :
Column 2 :
Column 3 :
Column 4 :
Column 5 :

MDF/W/52Page 197
II. Text of column headings for Table II (cont'd) (reference page 79)
(Units, as shown: m3, kilogrammes; million m3, million tons)
Column 6 :
Column
Column
7
8
Column 9 :
Column 10:
Column
Column
11:
12:
Column 13:
Column 14:
Column 15:
Column 16:
Column 17:
Column 18:
Column 19:
Column 20:
Total Domestic Woodpulp, Availability (Production, NetTrade), Kilogrammes, Per Caput
Total Industrial Roundwood, Production - Million m33Net Trade Industrial Roundwood - Million ni -
E - net exports I - net imports
Net Trade Pulpwood - Million m3 -E - net exports I - net imports
Total Indistrial Wood (including Pulpwood) AvailabilityMillion m
Total Sawnwood Production Million m3
Net Trade, Sawnwood - Million m3 -E - net exports I - net imports
Total Particle-Board Production - Million m3
Net Trade - Particle-Board - Million m3nE - net exports I - net imports
Total Plywood Production - Million m3
Net Trade - Plywood - Million m3E - net exports I - net imports
Total Domestic Availability of Sawnwood, Particle-Board,Plywood - Million m
Total Production - Woodpulp - Million tons
Net Trade - Woodpulp, Million metric tonsE - net exports I - net imports
Total Domestic Availability of Woodpulp - in millionmetric tons

MDF/W/52Page 198
III. Title and headnote to Tables V-A and V-B (reference page 117)
TABLE V-A
PRE- AND POST- TOKYO ROUND MFN IMPORT DUTIES OF SELECTED IMPORT MARKETS
Duties shown in per cent ad valorem
'Source: GATT Tariff Study Files:
Post-Tokyo-Round rates are final rates (i.e. applicablePre- as of 1.1.1987 [or applied as of 1.1.1986] - with certain
minor exceptions). Most of the final rates shown arePost- GATT bound rates, except for Australia and, to some
extent, New Zealand, which effected a series ofunilateral reductions in recent years. Pre-Tokyo-Roundbase rates differ somewhat from country to country.Temporary duty reductions are not shown. Where severalpercentage figures apply, this indicates rates fordifferent sub-positions within a four-digit heading.Rates shown for the US and Canada are allocated to CCCNheadings on a provisional basis. All rates shown are forinformation only. For contractual rates refer to the1979 Geneva Protocol.
TABLE V-B
IMPORTS FROM WORLD IN MILLION US DOLLARS BY CCCN HEADING(1980 or 1981 - as shown) AND PERCENTAGE SHAlE IN
TOTAL OF IMPORTS FROM MFN AND GSP ORIGINS
Symbols: .. not available- = less than $50 thousand