Eliminating Excessive Tariffs on Exports of Least Developed Countries
52
Eliminating Excessive Tariffs on Exports of Least Developed Countries ∗ Bernard Hoekman Francis Ng Marcelo Olarreaga Abstract Although average tariffs in Quad markets are very low, tariff peaks and tariff escalation have a disproportional effect on exports by least developed countries (LDCs). Tariff peak products tend to be heavily concentrated in agriculture and food products and in labor intensive sectors such as apparel and footwear. Full duty and quota free access for LDCs in the Quad for tariff peak products would result in a 11 percent increase in their total exportson the order of $2.5 billion. Exports to Quad countries of tariff peak products would expand by 30 to 60 percent. Given that LDC exports of tariff peak items account for only a small share of total developing country exports, granting LDCs duty free access has a negligible impact on other developing countries. For the same reason, Quad imports increase only marginally, suggesting that this should not be a factor constraining implementation of duty free access for the poorest countries. JEL: F13, F14, O19 Keywords: Market access, least developed countries, trade preferences ∗ The views expressed in this paper are those of the authors and should not be attributed to the World Bank. We are grateful to Ataman Aksoy, Uri Dadush, Elena Ianchovichina, William Martin, Aaditya Mattoo, and participants in a trade seminar at the World Bank for helpful discussions and suggestions; to Gerard Durand, Alice Enders, Daniel Morales, and Javier Suarez for valuable advice and data on tariffs; and to Lili Tabada for excellent assistance. Development Research Group, World Bank, 1818 H Street, NW, Washington, DC, USA. Centre for Economic Policy Research, London, UK.
Transcript of Eliminating Excessive Tariffs on Exports of Least Developed Countries

Eliminating Excessive Tariffs on Exports of Least Developed Countries∗∗∗∗
Bernard Hoekman��
Francis Ng� Marcelo Olarreaga��
Abstract Although average tariffs in Quad markets are very low, tariff peaks and tariff escalation have a disproportional effect on exports by least developed countries (LDCs). Tariff peak products tend to be heavily concentrated in agriculture and food products and in labor intensive sectors such as apparel and footwear. Full duty and quota free access for LDCs in the Quad for tariff peak products would result in a 11 percent increase in their total exports�on the order of $2.5 billion. Exports to Quad countries of tariff peak products would expand by 30 to 60 percent. Given that LDC exports of tariff peak items account for only a small share of total developing country exports, granting LDCs duty free access has a negligible impact on other developing countries. For the same reason, Quad imports increase only marginally, suggesting that this should not be a factor constraining implementation of duty free access for the poorest countries. JEL: F13, F14, O19 Keywords: Market access, least developed countries, trade preferences ∗ The views expressed in this paper are those of the authors and should not be attributed to the World Bank. We are grateful to Ataman Aksoy, Uri Dadush, Elena Ianchovichina, William Martin, Aaditya Mattoo, and participants in a trade seminar at the World Bank for helpful discussions and suggestions; to Gerard Durand, Alice Enders, Daniel Morales, and Javier Suarez for valuable advice and data on tariffs; and to Lili Tabada for excellent assistance. � Development Research Group, World Bank, 1818 H Street, NW, Washington, DC, USA.
� Centre for Economic Policy Research, London, UK.

1
Introduction Average most-favored-nation (MFN) tariffs in the Quad (Canada, the EU, Japan and the
US) have fallen to about 5 percent. Given that the Quad grant developing countries
preferential access to their markets through the General System of Preferences (GSP) and
related schemes, as well as reciprocal trade agreements such as NAFTA or the Euro-
Mediterranean Partnership Agreements, the majority of goods imported from developing
countries enters into Quad markets on a duty-free basis.1 Despite the low average MFN
and preferential tariff rates that apply in developed countries, tariffs for some
commodities are over 100 percent. Such tariff peaks are often concentrated in products
that are of export interest to developing countries. They include major agricultural staple
food products, such as sugar, cereals and fish; tobacco and certain alcoholic beverages;
fruits and vegetables; food industry products with a high sugar content, clothing and
footwear. The Uruguay Round of multilateral trade negotiations actually increased tariff
dispersion, as tariffication of non-tariff barriers (NTBs) in agriculture led to the
imposition of high duties on agricultural products that had previously been quota
constrained (Hoekman and Kostecki, 2001). As a result, tariffs that are more than three
times higher than the average MFN duty are not uncommon in the Quad.
In many cases where there are tariff peaks, preferences tend to be limited, in that
�sensitive� products are excluded from the schemes or some type of quantitative
limitation is imposed, either in terms of the amount that can be imported under the
preferential rates (a tariff rate quota) or in terms of the countries that are eligible
(Michalopoulos, 1999, Hallaert, 2000). Moreover, the tariff structure of developed
countries shows significant tariff escalation, so that market access for more processed
products (embodying greater value added) is more restricted. For example, fully-
processed manufacturing food products face tariffs twice as large as products in the first-
stage of processing in the EU and Japan, with final goods confronting an average MFN
tariff of 24 and 65 percent, respectively. In Canada the ratio is even higher: tariffs on
fully-processed food products are 12 times higher than for 1st stage processed products
1 Both GSP and North-South FTAs give rise to trade diversion. This will benefit some developing countries, but hurt others.

2
(the MFN tariff on fully processed is 42 percent).2 The existence of duty-drawback
systems for Quad-based exporters and the fact that GSP preferences in the Quad are more
likely to be granted for products with low MFN tariffs (see below), reinforces the degree
of escalation, as some imports of semi-processed products or raw materials are exempted
from duties when used as inputs in export production.
This paper assesses the potential effects on the value and the pattern of trade from
implementing initiatives to grant least developed countries (LDCs) duty free access for
tariff peak items in Quad markets.3 The paper is motivated by recent proposals of the
Commission of the European Communities to provide LDCs with free access to the EU
for all products except arms. We investigate what implementation of this proposal by all
Quad countries would mean for LDCs. The paper focuses on tariff peaks only�tariffs
below 15 percent are ignored. We do this for a number of reasons. First, peaks affect
commodities that are of relatively greater importance for LDCs than other developing
countries�they account for a larger share of total LDC exports. Second, from a political
economy point of view this is where the �action� is�these are the products with the
highest protection in the Quad. Third, moving beyond tariff peaks to consider elimination
of all tariffs on all imports from LDCs requires the use of a computable general
equilibrium model of the world economy. Although such tools are readily available, they
do not allow a detailed and disaggregated analysis of the effect of liberalization at the
product and country level. As we are interested in determining the likely impact of duty-
free access on the pattern and composition of trade, we use a partial equilibrium
approach. By limiting our focus to tariff peaks�which account for only a small share of
total trade of most countries�such an approach is unlikely to lead to misleading
conclusions.4
We do not quantify the effect of remaining NTBs�the focus is solely on tariffs
and tariff preferences. NTBs are relatively unimportant in the Quad�only 1.2 percent of
tariff lines are subject to NTBs in Canada, 4.2 percent in Europe, 2.6 in Japan and 2.9 in
the US (OECD, 1997a). However, they do apply to a sector that is of great interest to
2 Figures are from WTO Trade Policy Reviews of Quad countries. 3 We use the United Nations definition of LDCs. This comprises the 48 countries listed in Table 7 below. 4 See Ianchovichina, Mattoo and Olarreaga (2000) for a CGE-based estimate of the gains for Sub-Saharan Africa of unrestricted market access for all goods in the Quad.

3
developing countries�clothing�which is still constrained by quotas. By ignoring these
quotas and the associated rents, our analysis underestimates the potential export response
by LDCs following duty-free access for tariff peak products. However, given that the
WTO Agreement on Textiles and Clothing requires that remaining quotas are to be
removed no later than 2005, in the medium term what matters are the tariff preferences.
As any duty free access initiative will in all likelihood take some time to be implemented,
ignoring textiles and clothing quotas should not have major implications for our results.
In the case of agriculture, the Uruguay Round led to tariffication of all NTBs in the Quad
(with the exception of rice in Japan). Although tariff rate quotas are often used, these
involve two-tier tariff systems, with out of quota imports subject to higher tariffs. In this
paper we use out of quota tariffs as the appropriate measure of protection, which may
lead to an overestimate of the effects of duty-free access. Specific tariffs�frequently
used for agricultural products in the Quad�have been converted into ad valorem
equivalents using OECD data (OECD, 1997a; 2000).
The paper is structured as follows. We start with a description of the extent and
importance of existing tariff peaks in the Quad (Section 1); the preferential treatment
granted to developing countries for these tariff peaks products (Section 2) and the
prevailing pattern of developing country exports (Section 3).5 We then assess the possible
impact of granting duty free access for tariff peak items to the Quad for LDCs, using
partial equilibrium simulation methods (Section 4). Section 5 concludes.
1 Tariff peaks and imports in Quad Between 6 and 14 percent of Quad tariff lines at the 6-digit of the Harmonized System
(HS) are above 15 percent (Table 1).6 There are 200 to 300 such lines in the US, the EU
and Japan, whereas Canada has more than 700 tariff peaks. The average tariff in the Quad
over all tariff peak products is 28 percent, or 4.5 times the unweighted total average tariff
of 6.2 percent. The highest average tariff for peak products is found in the EU with an
average of 40.3 percent (compared to an average of 7.4 percent for all products). In the
5 Under preferential treatment we include both unilateral schemes such as GSP, Lomé or LDC preferences, and those granted under bilateral agreements, such as NAFTA, Canada-Chile and the Euro-Med agreements. 6 The WTO and UNCTAD define tariff peaks as all tariff line above 15 percent (at the 6 digit of the HS).
4
US and Canada, most of the tariff peaks are in industrial products (over 85 percent),
whereas in the EU and Japan most peaks affect agricultural products (91 and 77 percent).
The maximum tariff rate at the 6-digit level of aggregation in Canada, the EU, Japan and
the US, respectively, applies to butter (340 percent), edible bovine offal (250 percent),
raw cane sugar (170 percent) and ground nuts in shell (120 percent).
Total imports of products subject to tariff peaks in the Quad in 1999 was $92.8
billion. More than 60 percent of Quad imports of these products originate in developing
countries (55.2/92.8�see Table 1) and potentially face an average tariff of 28 percent.7
This represents around 5 percent of total developing countries exports to the Quad. LDC
exports are disproportionately affected by tariff peaks in the Quad�products subject to
tariff peaks represent 15 to 30 percent of total exports to the US, EU and Canada. Up to
$22 billion of tariff revenue may be collected on these tariff peak items by Quad
countries, half of which is contributed by developing country exporters (including those
with preferential treatment); LDC exporters may pay up to $200 million in tariff revenue,
in spite of their preferences.
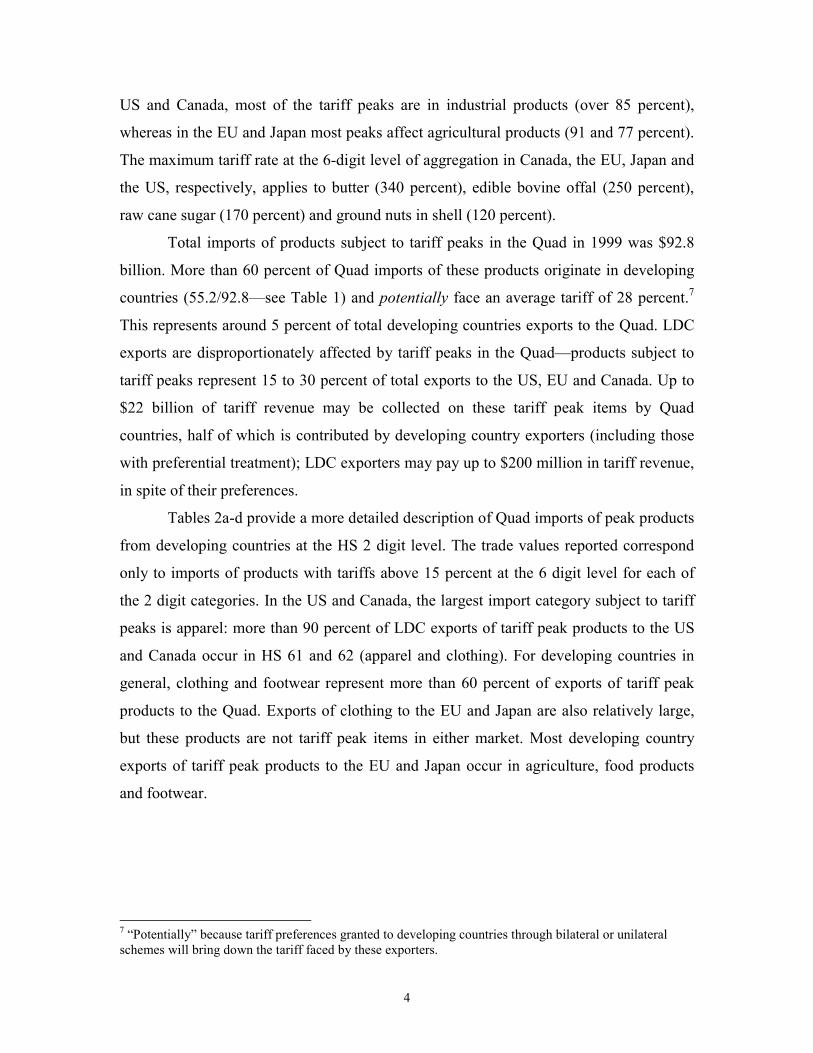
Tables 2a-d provide a more detailed description of Quad imports of peak products
from developing countries at the HS 2 digit level. The trade values reported correspond
only to imports of products with tariffs above 15 percent at the 6 digit level for each of
the 2 digit categories. In the US and Canada, the largest import category subject to tariff
peaks is apparel: more than 90 percent of LDC exports of tariff peak products to the US
and Canada occur in HS 61 and 62 (apparel and clothing). For developing countries in
general, clothing and footwear represent more than 60 percent of exports of tariff peak
products to the Quad. Exports of clothing to the EU and Japan are also relatively large,
but these products are not tariff peak items in either market. Most developing country
exports of tariff peak products to the EU and Japan occur in agriculture, food products
and footwear.
7 �Potentially� because tariff preferences granted to developing countries through bilateral or unilateral schemes will bring down the tariff faced by these exporters.

5
Table 1: Tariff peaks and imports by Quad, 1999
Tariff Peak Product (at HS 6-digit Level) USA EU15 /a Japan Canada All Quad
No. of Tariff Peak Products (mfn>=15%) /b 307 317 233 732 1077 /e of which: Agriculture Products /b 48 290 178 85 364 /e Industrial Products /b 263 27 55 647 713 /e
Tariff Peak Products as % of All Tariff Lines 6.1 6.2 4.6 14.3 7.8 /f
Average MFN Tariff Rates (unweighted in %): Tariff Peak Products 20.8 40.3 27.8 30.5 28.0 All Products 5.0 7.4 4.3 8.3 6.2 Maximum Rate 121.0 251.9 170.5 342.7 221.5
Total imports of Tariff Peak Products 41.2 27.1 15.8 8.7 92.8 (US$ billion) of which: All Preferential & GSP Countries 26.3 16.5 4.8 7.6 55.2 Least Developed Countries /c 0.9 0.3 0.03 0.09 1.3 ACP Developing Countries /d 2.7 2.7
Share of Tariff Peak products in total imports (%) 4.6 3.4 4.9 4.6 4.2 of which: All Preferential & GSP Countries (%) 6.6 4.9 2.8 4.8 5.2 Least Developed Countries /c 15.0 2.8 2.6 30.2 11.4 ACP Developing Countries /d 15.0
Import Revenue Collection in Tariff Peak 5.4 8.9 6.3 1.6 22.2 Products from the World (in Billion of US$) of which: All Preferential & GSP Dev. Countries 4.6 4.3 1.4 0.7 11.0 Least Developed Countries /c 0.2 0.03 0.001 0.02 0.2 ACP Developing Countries /d 0.57 0.6
Notes: /a Excludes all EU intra trade in world totals /b No overlapping items in the Quad aggregates
/c Based on the United Nations classification of 48 countries /d Based on fourth Lomé Convention for 59 Africa, Caribbean and Pacific (ACP) low income
countries. Includes a large number of LDCs. /e Number of non-overlapping categories. /f This is the simple (unweighted) average across Quad countries. Note that of the 5032 tariff lines
at the 6 digit level of the Harmonized System, 21 percent (1077/5032) includes a tariff peak item in at least one Quad member. Sources: OECD for MFN tariff, WTO tariff files for preferences and UN Comtrade Statistics for trade.

6
Table 2a: Canadian Tariff Peak Imports by HS 2-digit (1996-98 average) DC (non-LDC) LDCs World
Tariff Peak at HS 2-digit Product $ '000 All Peaks $ '000 All Peaks $ '000 All Peaks 01 Live animals. 134 0.0 0 0.0 25118 0.3 02 Meat and edible meat offal 12 0.0 0 0.0 116718 1.3 04 Dairy prod; birds' eggs; honey 9653 0.3 12 0.0 227028 2.6 06 Live tree & other plant; bulb, cut flowers 38432 1.1 3 0.0 50659 0.6 08 Edible fruit and nuts; melons 0 0.0 0 0.0 20 0.0 10 Cereals. 2937 0.1 0 0.0 16482 0.2 11 Prod mill indust; malt; starches 649 0.0 0 0.0 16511 0.2 12 Oil seed, oleagi fruits; misc grain 0 0.0 0 0.0 0 0.0 13 Lac; gums, resins & other veg 0 0.0 0 0.0 3 0.0 15 Animal/veg fats & oils & prod 14003 0.4 5 0.0 67360 0.8 16 Prep of meat, fish or mollusks 16 0.0 0 0.0 111379 1.3 17 Sugars and sugar confectionery 0 0.0 0 0.0 76 0.0 18 Cocoa and cocoa preparations 11530 0.3 12 0.0 225982 2.6 19 Prep of cereal, flour, starch/milk prod 2583 0.1 1 0.0 109161 1.3 20 Prep of vegetable, fruit, nuts prod 8454 0.2 4 0.0 11073 0.1 21 Miscellaneous edible preparations 21007 0.6 17 0.0 333050 3.8 22 Beverages, spirits and vinegar 5573 0.2 1 0.0 116947 1.3 23 Residues & waste from food indust 8333 0.2 148 0.2 141109 1.6 24 Tobacco and manufactured 313 0.0 0 0.0 10187 0.1 33 Essential oils & resinoids, perf. 197 0.0 1 0.0 81149 0.9 35 Albuminoidal subs; modified starches 110 0.0 0 0.0 5602 0.1 39 Plastics and articles thereof. 36479 1.0 151 0.2 396692 4.6 40 Rubber and articles thereof. 35795 1.0 85 0.1 100675 1.2 42 Articles of leather; saddlery, travel pr 108267 3.0 45 0.1 118978 1.4 43 Furskins and artificial fur thereof. 9796 0.3 7 0.0 17308 0.2 51 Wool, fine/coarse animal hair nes 32530 0.9 9 0.0 87919 1.0 52 Cotton. 51587 1.4 26 0.0 241263 2.8 53 Other vegetable textile fibres & yarns 2193 0.1 0 0.0 4220 0.0 54 Man-made filaments. 79183 2.2 1 0.0 249164 2.9 55 Man-made staple fibres. 98053 2.7 60 0.1 272819 3.1 56 Wadding, felt & nonwoven, yarns etc. 9119 0.3 15 0.0 240986 2.8 57 Carpets and other textile floor coverings 7148 0.2 176 0.2 66718 0.8 58 Special woven fab; tufted tex fab etc 22818 0.6 11 0.0 106245 1.2 59 Impregnated, coated, cover/laminated 13128 0.4 1 0.0 164554 1.9 60 Knitted or crocheted fabrics 78072 2.2 2 0.0 247784 2.9 61 Art of apparel & clothing access 756272 20.9 34576 38.9 1134671 13.1 62 Art of apparel & clothing access 1068566 29.6 50355 56.6 1502785 17.3 63 Other made up textile articles 141153 3.9 1410 1.6 414617 4.8 64 Footwear, gaiters and articles 606225 16.8 141 0.2 859968 9.9 65 Headgear and parts thereof. 40650 1.1 1559 1.8 56996 0.7 67 Prepr feathers & down; art flower nes 2629 0.1 89 0.1 3727 0.0 68 Art of stone, plaster, cement, asbestos 0 0.0 0 0.0 177 0.0 70 Glass and glassware. 1150 0.0 0 0.0 44277 0.5 85 Electrical mech equip parts, sound pr 171068 4.7 2 0.0 392525 4.5 86 Railw/tramw locom, rolling stock etc. 7 0.0 0 0.0 22473 0.3 89 Ships, boats and floating structures 53317 1.5 0 0.0 73031 0.8 91 Clocks and watches and parts nes 8740 0.2 9 0.0 13005 0.1 94 Furniture; bedding, mattress, cushion 16789 0.5 1 0.0 54570 0.6 95 Toys, games & sports requisites, nes 26841 0.7 0 0.0 54440 0.6 96 Miscellaneous manufactured articles 10824 0.3 4 0.0 75004 0.9
All above Peak Products (50) 3612335 100.0 88940 100.0 8683203 100.0 All Peaks as % of All Goods 12.1 30.2 4.6
All goods 29735968 294206 189663049 Source: Computations based on UN COMTRADE Statistics.

7
Table 2b: European Union Tariff Peak Imports by HS 2-digit (1996-1998 average)
DCs (non-LDCs) LDCs & ACP World (excl intra EU) Imports As % of LDCs ACP Total as % Imports As % of
Tariff Peak at HS 2-digit Products $ '000 All Peaks $ '000 $ '000 of All Peaks
$ '000 All Peaks
01 Live animals. 196738 1.2 3 0 0.0 198627 0.4 02 Meat and edible meat offal 1484861 9.0 2501 32284 1.2 2479580 4.7 03 Fish & crustacean, mollusk nes 414792 2.5 18352 58281 2.6 640485 1.2 04 Dairy prod; birds' eggs; honey 408724 2.5 532 1120 0.1 1158305 2.2 06 Live tree & other plant; bulb, cut flowers 403997 2.5 24351 172061 6.6 616188 1.2 07 Edible vegetables and roots & tubers 748841 4.5 1893 6239 0.3 786957 1.5 08 Edible fruit and nuts; melons 3215127 19.5 11357 523714 18.0 3854199 7.2 09 Coffee, tea, mat and spices 5718 0.0 18 136 0.0 7712 0.0 10 Cereals. 655581 4.0 5992 43400 1.7 1812641 3.4 11 Prod mill indust; malt; starches 30152 0.2 72 930 0.0 64027 0.1 12 Oil seed, oleagi fruits; misc grain 76 0.0 0 0 0.0 76 0.0 13 Lac; gums, resins & other veg 4783 0.0 29 44 0.0 12102 0.0 15 Animal/veg fats & oils & prod 283301 1.7 35 105 0.0 293660 0.6 16 Prep of meat, fish or mollusks 1504943 9.1 73048 475351 18.4 2599617 4.9 17 Sugars and sugar confectionery 290881 1.8 50961 872813 31.0 1305696 2.4 18 Cocoa and cocoa preparations 1040 0.0 0 2 0.0 2284 0.0 19 Prep of cereal, flour, starch/milk prod 109982 0.7 275 1880 0.1 337617 0.6 20 Prep of vegetable, fruit, nuts prod 2788622 16.9 3115 128265 4.4 3360717 6.3 21 Miscellaneous edible preparations 235059 1.4 1308 54198 1.9 745369 1.4 22 Beverages, spirits and vinegar 413058 2.5 2170 262588 8.9 903738 1.7 23 Residues & waste from food indust 158264 1.0 179 1073 0.0 1278138 2.4 24 Tobacco and manufactured 415206 2.5 34135 67035 3.4 658981 1.2 29 Organic chemicals. 1452 0.0 0 0 0.0 6456 0.0 35 Albuminoidal subs; modified starches 17148 0.1 1 0 0.0 58026 0.1 38 Miscellaneous chemical products 207 0.0 0 0 0.0 1630 0.0 56 Wadding, felt & nonwoven, yarns etc. 4143 0.0 5084 79 0.2 10053 0.0 64 Footwear, gaiters and articles 2117353 12.9 27649 10328 1.3 3032077 5.7 87 Vehicles o/t railw/tramw roll stock, pts 550465 3.3 4888 139 0.2 873057 1.6
All above Peak Products (28) 16460512 100.0 267948 2712065 100.0 53322977 100.0 All Peaks as % of All Goods 4.9 2.8 15.0 6.7
All Goods 336372956 9486662 18046842 793651939
Memo: Non-Peak Items 61 Art of apparel & clothing accessories 12628395 76.7 1045824 531205 52.9 30819954 57.8 62 Art of apparel & clothing accessories 20492103 124.5 1205487 258471 49.1 40252929 75.5
Source: Computations based on UN COMTRADE Statistics.
8
Table 2c: Japan's Tariff Peak Imports by HS 2-digit Product (1996-98 average)
DCs (non-LDCs) LDCs World Value As % of Value As % of Value As % of
Tariff Peak at HS 2-digit products $ '000 All Peaks $ '000 All Peaks $ '000 All Peaks
02 Meat and edible meat offal 2890 0.1 1832 6.2 2806021 17.7 03 Fish & crustacean, mollusk nes 0 0.0 0 0.0 38 0.0 04 Dairy prod; birds' eggs; honey 119343 2.5 71 0.2 827820 5.2 07 Edible vegetables and roots & tubers 846 0.0 0 0.0 847 0.0 08 Edible fruit and nuts; melons 632238 13.1 5 0.0 842950 5.3 09 Coffee, tea, mat and spices 26052 0.5 163 0.6 74160 0.5 10 Cereals. 182470 3.8 223 0.8 2529817 16.0 11 Prod mill indust; malt; starches 10262 0.2 0 0.0 392065 2.5 12 Oil seed, oleagi fruits; misc grain 14104 0.3 278 0.9 16654 0.1 15 Animal/veg fats & oils & prod 520 0.0 0 0.0 3254 0.0 16 Prep of meat, fish or mollusks 24717 0.5 0 0.0 164710 1.0 17 Sugars and sugar confectionery 352085 7.3 3 0.0 583853 3.7 18 Cocoa and cocoa preparations 85582 1.8 0 0.0 266135 1.7 19 Prep of cereal, flour, starch/milk prod 288889 6.0 1 0.0 674369 4.3 20 Prep of vegetable, fruit, nuts prod 871435 18.1 5 0.0 1264282 8.0 21 Miscellaneous edible preparations 266046 5.5 51 0.2 747216 4.7 22 Beverages, spirits and vinegar 358005 7.4 32 0.1 2030025 12.8 24 Tobacco and manufactured 1755 0.0 0 0.0 5178 0.0 29 Organic chemicals. 31194 0.6 0 0.0 47472 0.3 35 Albuminoidal subs; modified starches 93962 2.0 0 0.0 180893 1.1 38 Miscellaneous chemical products 1636 0.0 0 0.0 1638 0.0 41 Raw hides and skins (other than fur) 34476 0.7 12069 41.0 116134 0.7 42 Articles of leather; saddlery, travel pr 336185 7.0 67 0.2 592537 3.7 43 Furskins and artificial fur thereof. 85942 1.8 1 0.0 120450 0.8 53 Other vegetable textile fibres & yarns 1580 0.0 7 0.0 17462 0.1 58 Special woven fab; tufted tex fab etc 24482 0.5 2 0.0 36376 0.2 60 Knitted or crocheted fabrics 6300 0.1 0 0.0 7275 0.0 64 Footwear, gaiters and articles 956262 19.9 14621 49.7 1491240 9.4
All above Peak Products (28) 4809258 100.0 29430 100.0 15840872 100.0 All Peaks as % of All Goods 2.8 2.6 4.9
All goods 172280687 1139299 321584044
Memo: Non-Peak Items 61 Art of apparel & clothing accessories 5798652 120.6 8433 28.7 7014898 44.3 62 Art of apparel & clothing accessories 7631923 158.7 16294 55.4 9220499 58.2
Source: Computations based on UN COMTRADE Statistics.

9
Table 2d: United States Tariff Peak Imports by HS 2-digit (1996-98 average)
Developing countries (non LDC) LDCs World Non-Mex Mexico Total As % Imports As % of Imports As % of
Tariff Peak at HS 2-digit Product $ '000 $ '000 of All Peaks
$ '000 All Peaks $ '000 All Peaks
02 Meat and edible meat offal 63 0 0.0 0 0.0 18312 0.0 04 Dairy prod; birds' eggs; honey 147 32 0.0 0 0.0 704 0.0 07 Edible vegetables and roots nes 21946 163044 1.0 17 0.0 220214 0.5 08 Edible fruit and nuts; melons 145263 166620 1.7 6 0.0 317574 0.8 11 Prod mill indust; malt; starches 23 6 0.0 0 0.0 33 0.0 12 Oil seed, oleagi fruits; misc etc. 41151 3871 0.2 92 0.0 45380 0.1 15 Animal/veg fats & oils & prod 2959 5862 0.0 1 0.0 18770 0.0 19 Prep of cereal, flour, milk prod 2831 318 0.0 0 0.0 8504 0.0 20 Prep of vegetable, fruit, nuts 309031 66832 2.0 15 0.0 441239 1.1 21 Miscellaneous edible prep 132 469 0.0 0 0.0 5230 0.0 24 Tobacco and manufactured 828882 31038 4.7 63707 6.9 1132888 2.8 28 Inorgn chem; compds of prec 27 218 0.0 0 0.0 435 0.0 29 Organic chemicals. 230 0 0.0 0 0.0 9034 0.0 30 Pharmaceutical products. 9140 99 0.0 0 0.0 118917 0.3 42 Articles of leather; saddlery 132 35 0.0 1 0.0 10084 0.0 51 Wool, fine/coarse animal hair 46265 12525 0.3 18 0.0 185022 0.4 52 Cotton. 1797 77 0.0 3 0.0 15085 0.0 54 Man-made filaments. 128835 17204 0.8 4 0.0 714444 1.7 55 Man-made staple fibres. 177819 7248 1.0 246 0.0 479378 1.2 56 Wadding, felt & nonwoven, yarn 707 13 0.0 0 0.0 8213 0.0 58 Special woven fab; tufted fabrics 4642 12311 0.1 9 0.0 137878 0.3 60 Knitted or crocheted fabrics 1292 1817 0.0 7 0.0 238127 0.6 61 Art of apparel & clothing access 4957240 1716956 36.1 376335 41.0 11050780 26.8 62 Art of apparel & clothing access 4245221 582678 26.1 476601 51.9 9293099 22.6 64 Footwear, gaiters and parts etc. 950635 132102 5.9 730 0.1 4904978 11.9 69 Ceramic products. 111009 127765 1.3 20 0.0 855098 2.1 70 Glass and glassware. 67670 32752 0.5 1181 0.1 327747 0.8 82 Tool, implement, cutlery, spoon 5184 770 0.0 0 0.0 75849 0.2 86 Railw/tramw locom, rolling stock 48 19692 0.1 0 0.0 416215 1.0 87 Vehicles o/t railw/tramw roll stock 281 3289379 17.8 0 0.0 10063170 24.4 96 Miscellaneous manufactures 3513 26215 0.2 15 0.0 56282 0.1 All Above Peak Products (31) 12064119 6417948 100.0 919009 100.0 41172410 100.0 All Peaks as % of All Goods 8.4 7.5 15.0 4.6 All Goods 143519745 85767530 6114833 886667625
Source: Computations based on UN COMTRADE Statistics.
10
2 Tariff peaks and developing country preferences Most developing countries enjoy preferential access to Quad markets, either through
unilateral schemes such as the GSP, or through free trade agreements such as NAFTA or
EU Association Agreements. In the case of Canada, Japan and the EU, around 170
developing countries benefit from GSP (or better) preferences.8 In the case of the US, 29
developing countries are excluded from GSP, so that only 140 developing countries
benefit from some sort of preferential access.
Preferences granted by the Quad are of a cascading nature�countries with FTAs
generally get the best treatment, followed by LDCs and other developing countries. The
US grants preferences to the members of the Andean Pact (ATP) and the Caribbean
(CAR), and to Mexico under NAFTA.9 For the EU, we report both Lomé preferences
(ACP), and the FTA preferences granted to Eastern Europe and Mediterranean countries.
Note that in the case of the EU three different groups of countries are constructed: LDCs
that are not ACP members; ACP countries (broken down into LDC and non-LDC
countries); and non-ACP, non-LDC developing countries that benefit from GSP
treatment. Finally, in the case of Canada, developing countries are grouped into those
benefiting from LDC, GSP, or Caribbean preferences, and Mexico and Chile, that benefit
from FTAs.
On average these preferential schemes are quite generous. In the EU, the average
tariff faced by LDCs or ACP members is below 1 percent, compared to the 7.4 percent
average MFN tariff. GSP preferences in the EU are less generous, but still imply more
than a 50 percent margin. Japan and the US follow with a 50 percent preference margin
under their GSP regime, and an average 60 percent preference for LDCs. Canada gives a
25 percent preference to GSP countries and 45 percent to LDCs. The US data suggest that
preference margins granted to developing countries are relatively small in products with
tariff peaks. GSP countries only benefit on average from a 20 percent margin. LDCs have
a 41 percent margin; Andean Trade Pact and Caribbean countries benefit on average from
a 45 percent preference margin.
8 The EU was the first customs territory to grant GSP preferences to developing countries in 1971. See Kenan and Stevens (1997) or Hallaert (2000) for a detailed description of the European GSP. 9 In the simulations discussed in section 4 we also include preferences for developed countries that benefit from preferences in other Quad markets (see footnotes in Table 3 for a description).

11
Table 3: Tariff Peaks and Preferential Duty Rates in the Quad, 1999
Number of Average Pref. Rate (unweighted in %) Preferential Trade Agreements/GSP Countries Tariff Peak
Products All Goods at HS-6
United States: Canada 1 0.6 0.1 Mexico 1 1.6 0.3 Israel 1 0.6 0.1 ANDEAN /a 4 14 1.7 Caribbean Community /b 22 13.5 1.6 GSP-only beneficiaries /c 80 16 2.4 Least developed Countries /d 38 14.4 1.8 Other Countries (MFN Rate) (20.8) (5.0)
European Union: 15 Eastern Europe and Middle East /e 30 20.1 1.8 GSP-only beneficiaries /f 42 19.8 3.6 Least Developed ACP Countries /g 37 11.9 0.8 Other ACP Countries /h 32 12.4 0.9 Other Least Developed Countries /i 11 12.6 0.9 Other Countries (MFN Rate) /j (40.3) (7.4)
Japan: GSP-only beneficiaries /k 127 22.7 2.3 Least Developed Countries /l 42 19.0 1.7 Other Countries (MFN Rate) (27.8) (4.3)
Canada: United States 1 7.1 1.6 Australia 1 28.2 7.8 New Zealand 1 28.2 7.8 Mexico 1 15.9 3.1 Chile 1 12.2 2.4 Israel 1 11.8 2.5 Caribbean Countries /m 18 23.3 4.3 GSP-only beneficiaries /n 108 28.2 6.2 Least Developed Countries /o 47 22.8 4.4 Other Countries (MFN Rate) (30.5) (8.3)
Notes: /a Included Bolivia, Colombia, Ecuador and Peru under Andean Trade Preference Act. /b Based on 20 Caribbean countries under Caribbean Basin Economic Recovery Act and Bahamas, Nicaragua. /c Included 80 developing countries or territories under GSP scheme but excluding 29 other developing economies. /d Based on UN 48 least developed countries but excluding 10 countries. /e Including countries with reciprocal and non reciprocal trade agreements with the EU. /f Most developing countries in Latin America and Asia; excludes Hong Kong, Korea and Singapore (non-GSP nations). /g Included 37 ACP and least developed countries under Lome Convention. /h Included ACP 32 countries under Lome Convention but not under the group of least developed countries. /i Included 11 least developed countries but not under ACP countries. /j Included all industrial countries, Hong Kong, Korea, Singapore and 14 transition countries. /k 127 countries; excludes Albania, Bosnia, Estonia, Latvia, Lebanon, Lithuania, Macedonia, Moldova, Vietnam, Yugoslavia. /l Excludes 3 LDCs: Comoros, Djibouti and Tuvalu. 3 others (Congo DR, Kiribati and Zambia) are included in the GSP group. /m Included 18 Caribbean countries or territories under Commonwealth Caribbean Countries Tariff. /n Excluded 8 developing countries: Albania, Aruba, Bosnia & Herz, Macedonia, Mongolia, Oman, Saudi Arabia, Yugoslavia /o Excluded Myanmar.
Source: WTO files.

12
Preferences are much less generous for tariff peak products. Indeed, except for the
EU, the preference margins are significantly below the average across all products.
Preference margins for GSP beneficiaries in Canada, Japan and the US on tariff peak
items are only 8, 18 and 23 percent, respectively. For LDCs the margins fall to 25 percent
in Canada and 30 percent in the US and Japan. More detail on the structure of preferences
for different tariff brackets in the Quad is provided in Table 4. For example, for tariffs
between 50 and 100 percent, the preference margin granted to LDCs is only 17 percent in
the US and 22 percent in Japan. Thus, although existing preferential schemes grant
significant preferences to developing countries, preferences are concentrated in products
which already enjoy low tariffs (between 0 and 10 percent) rather than on tariff peaks. In
other words, preferential schemes offer little protection against tariff peaks in the Quad,
except for the European Union. Data on the average MFN import duties on tariff peak
products at the HS 2 digit level, and preference margins granted by the Quad to different
groups of developing countries are provided in Appendix A. A value of 1 in the
preference columns means that the products enter the Quad member duty-free�there is a
100 percent margin.
3 Tariff peaks and LDC exports In order to simulate the possible effect of duty free access to the Quad, data are required
on the total value of LDC exports to the world of products that are subject to tariff peaks
in the Quad. Tariff peaks in the Quad affect LDC exports to the world because Quad
tariffs lower world prices (see Appendix C). Data on global exports of LDCs of products
subject to peaks in the Quad are reported in Tables 5a-d at the HS 2 digit level, where
values again correspond only to those 6-digit products within each 2 digit category that
face tariff peaks in the Quad (i.e., they do not correspond to exports of all products within
the 2 digit category). Total exports of LDCs to each Quad member and to the world at the
2 digit level are reported in Appendix B. They amount to $22.7 billion, of which $17
billion is exported to the Quad.10
10 More than 26 percent are mineral fuels exports (HS 27) for which there are no tariff peaks in the Quad. Non-oil exports of LDC amount to $17 billion.

13
Table 4: Structure of MFN and LDC Duty Rates by Quad Countries, 1999
United States European Union Tariff Rate No. of As % of MFN LDCs No. of As % of MFN LDCs at HS-6 digit Tar Lines All Lines Rate Rate Tar Lines All Lines Rate Rate
MFN >= 100 3 0.1 115.4 42.8 22 0.4 132.5 46.2 MFN >= 50 5 0.1 86.0 70.9 49 1.0 73.8 26.0 MFN >= 40 1 0.0 44.0 38.9 25 0.5 43.6 12.1 MFN >= 30 9 0.2 33.3 20.5 46 0.9 34.5 13.3 MFN >= 25 20 0.4 26.4 16.8 26 0.5 27.0 9.4 MFN >= 20 47 0.9 22.0 13.0 60 1.2 22.2 5.0 MFN >= 15 226 4.4 16.8 12.5 89 1.7 17.2 1.7 MFN >= 10 374 7.3 12.0 6.8 715 14.0 11.9 0.2 MFN >= 5 1096 21.4 6.9 1.9 1478 28.9 6.8 0.0 MFN > 0 2355 46.1 2.9 0.1 2125 41.6 3.0 0.0 MFN = 0 977 19.1 0.0 0.0 478 9.3 0.0 0.0
All Products 5113 100.0 5.0 1.8 5113 100.0 7.4 0.8 Tariff Peak Prod 311 6.1 20.8 14.4 317 6.2 40.3 12.3 (MFN >= 15)
Tariff Rate Japan Canada
MFN >= 100 3 0.1 139.2 118.0 38 0.7 184.9 141.1 MFN >= 50 11 0.2 67.0 52.3 22 0.4 79.4 42.6 MFN >= 40 17 0.3 45.4 25.6 2 0.0 46.0 24.5 MFN >= 30 26 0.5 33.8 19.4 1 0.0 35.3 35.3 MFN >= 25 36 0.7 27.2 19.9 6 0.1 25.0 1.8 MFN >= 20 55 1.1 22.4 17.5 305 6.0 22.8 20.6 MFN >= 15 85 1.7 17.1 11.2 358 7.0 17.7 11.2 MFN >= 10 341 6.7 12.6 2.8 572 11.2 11.4 3.1 MFN >= 5 832 16.3 7.2 1.7 1376 26.9 7.6 2.1 MFN > 0 1465 28.7 3.5 0.4 1087 21.3 3.0 1.0 MFN = 0 2241 43.8 0.0 0.0 1346 26.3 0.0 0.0
All Products 5112 100.0 4.3 1.5 5113 100.0 8.3 4.4 Tariff Peak Prod 233 4.6 27.8 19.3 732 14.3 30.5 22.8 (MFN >= 15)
Source: WTO files
More than $5.5 billion of LDC exports to the world, or 25 percent of their total
exports, are potentially affected by tariff peaks in Canada (Table 5a�column 3). Most of
these affected exports are in apparel and clothing (HS 62 and 62). More interestingly,
more than 99 percent of LDC exports of apparel to the world are affected by a tariff peak
in Canada (total exports are reported in Appendix B). There is almost no preferential
access for LDCs in these items (the preference margin is only 8 percent�see Table A1).
This implies that full duty free access to Canada is likely to have a significant effect on

14
LDC exports. Exports of other developing countries potentially affected by a Canadian
tariff peaks are also concentrated in apparel�and preference margins are even smaller
(around 3 percent). However, Mexico and Chile benefit from a 66 percent preference
margin in these items under their respective bilateral trade agreements with Canada
which brings the tariff they face to around 10 percent.
Similarly, more than $3 billion of LDC exports to the world, or 14 percent, are
potentially affected by tariff peaks in the US (Table 5d). Most LDC exports to the world
facing a tariff peak in the US are again concentrated in apparel ($2.6 billion dollars), and
do not benefit from preferential access. Tobacco is another tariff peak item that is an
important export for both LDCs and GSP beneficiaries. In the case of LDCs, more than
95 percent of their total exports of tobacco to the world potentially face a tariff peak in
the US of 63 percent (the MFN rate on these products averages 73 percent, with a 14
percent preference margin for LDCs�see Appendix Table B4).
The numbers are smaller in the case of Japan and the EU (Tables 5b and 5c), with
tariff peaks in each market affecting some $500 and $800 million of LDC exports to the
world, respectively. Although these numbers are small in absolute terms, the effect of
peaks in these markets on specific LDCs may be quite large. For example, currently
Djibouti, Kiribati, Somalia and Tuvalu together export less than $50 million to the world.
LDC exports affected by EU tariff peaks are concentrated in meat and fish products (HS
16), fish and crustaceans (HS 03), sugar (HS 17), tobacco (HS 24) and footwear (HS 64)
(Table 5b). However, as indicated in Table A2, with the exception of meat, fish or
mollusk products (HS 16) and sugar (HS 17), all of these exports benefit from full duty
free access into the EU. In the case of preparations of meat, the 68 percent preference
margin brings the tariff faced by LDC exporters around 10 percent. In the case of sugar,
however, the preference margin granted to LDCs is quite small; their exports face an
average tariff of 29 percent.
LDC exports that are affected by Japanese tariff peaks include sugar (HS 17), raw
hides and skins (HS 41) and footwear (HS 64) (Table 5c). Of these, sugar is the only one
where no preference is granted to LDCs. Full duty free access is granted for footwear,
while in the case of hides and skins, an 80 preference margin is granted to LDCs�see
Appendix Table A3.

15
Table 5a
Canada: Tariff Peaks and developing country exports to the world (US$ million) Tariff Peak at HS 2-digit Product MFN tariff Exp of LDC Exp of GSP Exp of Mex Exp of Chl Exp of CAR Exp of Wld
01 Live animals. 198.8 0.0 195.9 0.0 3.4 0.0 746.6 02 Meat and edible meat offal 109.9 0.1 1705.9 2.4 17.0 0.5 6463.9 04 Dairy prod; birds' eggs; honey 197.5 1.4 1389.0 10.0 23.7 4.8 23700.0 06 Live tree & other plant; bulb, cut flowers 15.2 29.5 1163.3 19.5 2.8 0.9 4020.2 08 Edible fruit and nuts; melons 16.6 0.0 1.3 0.0 0.0 0.0 10.9 10 Cereals. 70.2 0.3 1671.3 35.4 0.2 0.1 14100.0 11 Prod mill indust; malt; starches 85.3 4.6 411.5 1.1 9.0 0.3 2745.5 12 Oil seed, oleagi fruits; misc grain 18.3 0.0 3.8 0.0 0.0 0.0 23.8 13 Lac; gums, resins & other veg 74.0 0.0 41.9 0.0 0.0 0.0 54.5 15 Animal/veg fats & oils & prod 28.0 1.8 3524.5 2.1 1.8 0.4 6514.0 16 Prep of meat, fish or mollusks 68.7 0.2 610.1 3.3 8.0 0.3 2402.3 17 Sugars and sugar confectionery 16.6 0.0 16.4 0.0 0.0 0.0 74.8 18 Cocoa and cocoa preparations 85.5 0.2 303.6 18.0 6.0 0.3 3893.8 19 Prep of cereal, flour, starch/milk prod 54.5 0.2 395.6 7.2 2.1 1.6 2486.0 20 Prep of vegetable, fruit, nuts prod 19.4 0.0 502.7 9.4 7.1 0.0 918.3 21 Miscellaneous edible preparations 48.9 2.2 880.6 42.4 66.2 10.6 9137.3 22 Beverages, spirits and vinegar 26.7 2.0 398.1 74.8 2.2 7.0 2498.6 23 Residues & waste from food indust 30.3 4.4 347.7 2.5 6.4 0.0 3996.9 24 Tobacco and manufactured 17.6 7.8 917.1 6.6 0.5 0.8 9859.3 33 Essential oils & resinoids, perf. 18.0 0.7 118.2 4.6 1.7 1.6 2285.8 35 Albuminoidal subs; modified starches 18.0 0.0 240.4 0.8 0.0 0.1 977.3 39 Plastics and articles thereof. 16.7 1.3 1693.8 39.7 4.0 0.3 8907.0 40 Rubber and articles thereof. 16.8 0.4 1897.0 45.7 0.9 0.0 3412.1 42 Articles of leather; saddlery, travel pr 16.6 3.2 4278.2 18.8 0.6 0.0 4999.2 43 Furskins and artificial fur thereof. 19.2 0.1 420.7 0.1 1.5 0.0 777.7 51 Wool, fine/coarse animal hair nes 16.5 0.1 309.5 14.8 4.6 0.1 2659.2 52 Cotton. 17.3 11.3 4035.9 172.2 25.4 0.6 9109.7 53 Other vegetable textile fibres & yarns 16.0 0.0 208.6 0.2 0.7 0.0 411.4 54 Man-made filaments. 19.0 2.1 7224.0 33.1 3.9 0.3 13400.0 55 Man-made staple fibres. 19.0 3.3 5002.1 21.7 10.4 0.9 10600.0 56 Wadding, felt & nonwoven, yarns etc. 16.9 15.4 1062.2 82.8 2.8 1.4 5643.1 57 Carpets and other textile floor coverings 18.9 4.4 501.7 12.7 0.4 0.1 2258.4 58 Special woven fab; tufted tex fab etc 17.9 1.3 1838.0 60.3 4.9 1.2 4782.5 59 Impregnated, coated, cover/laminated 17.8 0.7 2147.3 15.7 1.3 0.0 5756.6 60 Knitted or crocheted fabrics 18.0 1.8 4663.7 36.7 0.7 0.3 8004.4 61 Art of apparel & clothing access 23.3 1776.5 45500.0 2233.2 13.9 452.2 72000.0 62 Art of apparel & clothing access 22.4 2678.1 63200.0 3185.4 30.4 144.6 94900.0 63 Other made up textile articles 22.1 99.9 7835.3 466.0 3.2 3.9 13400.0 64 Footwear, gaiters and articles 20.8 74.9 30700.0 391.6 12.5 5.4 45800.0 65 Headgear and parts thereof. 18.7 136.1 1487.6 38.5 0.1 1.2 2071.0 67 Prepr feathers & down; art flower nes 21.3 1.7 391.0 0.1 0.0 0.0 433.9 68 Art of stone, plaster, cement, asbestos 21.3 0.0 0.6 0.0 0.0 0.0 3.7 70 Glass and glassware. 16.6 0.1 361.1 54.1 0.0 0.1 2224.0 85 Electrical mech equip parts, sound pr 16.7 0.3 5098.9 505.9 0.6 0.5 12800.0 86 Railw/tramw locom, rolling stock etc. 15.0 1.3 178.9 19.7 0.4 0.0 996.1 89 Ships, boats and floating structures 22.5 621.7 4623.6 1.0 0.5 301.0 10500.0 91 Clocks and watches and parts nes 18.6 0.0 689.2 0.2 0.1 2.4 835.2 94 Furniture; bedding, mattress, cushion 21.0 1.1 1073.0 59.5 3.6 0.0 1818.8 95 Toys, games & sports requisites, nes 16.4 0.0 713.8 5.7 0.0 0.0 1099.3 96 Miscellaneous manufactured articles 17.5 0.1 496.7 54.4 0.1 1.3 1995.5
All above Peak Products (50) 30.5 5,492.8 212,471.1 7,809.9 285.8 947.0 438,508.4 All Peaks as % of All Goods 0.25
All goods 8.3 22,263 102,498 5,560
Source: Computations based on UN COMTRADE Statistics.

16
Table 5b: EU Tariff Peaks and developing countries exports to the world US$ million)
Tariff Peak at HS 2-digit Products MFN
Tariff Exports of
LDC (Non-ACP)
Exports of GSP
Exp of ACP
(non LDC)
Exports of ACP+LDC
Exports of FTAs
World trade
01 Live animals. 38.2 0.7 747.1 0.7 1.0 247.2 6455.3 02 Meat and edible meat offal 71.0 0.4 4053.2 35.7 9.7 876.6 35436.3 03 Fish & crustacean, mollusk nes 18.7 28.3 1980.6 235.1 86.5 175.4 3401.9 04 Dairy prod; birds' eggs; honey 59.1 1.1 942.5 7.5 0.6 542.9 28565.7 06 Live tree & other plant; bulb, cut flowers 16.9 0.1 959.5 190.2 29.6 235.9 3552.6 07 Edible vegetables and roots & tubers 25.4 0.2 1490.6 16.9 2.0 227.3 2991.5 08 Edible fruit and nuts; melons 20.2 0.4 6446.6 549.0 12.1 945.5 8832.7 09 Coffee, tea, mat and spices 16.0 0.0 7.2 0.3 0.0 4.3 64.6 10 Cereals. 75.6 9.8 4708.6 52.5 11.4 687.1 35831.3 11 Prod mill indust; malt; starches 38.2 5.2 530.4 10.4 0.6 148.3 5779.8 12 Oil seed, oleagi fruits; misc grain 74.4 0.0 0.1 0.0 0.0 3.3 8.4 13 Lac; gums, resins & other veg 17.8 0.0 23.1 0.0 0.1 2.5 112.8 15 Animal/veg fats & oils & prod 56.0 0.8 134.1 2.2 0.1 369.4 4623.0 16 Prep of meat, fish or mollusks 23.5 24.9 5214.1 490.3 56.8 578.3 11229.7 17 Sugars and sugar confectionery 37.6 1.4 3540.0 1155.3 83.1 514.9 11643.8 18 Cocoa and cocoa preparations 24.0 0.0 8.2 0.8 0.0 3.8 140.1 19 Prep of cereal, flour, starch/milk prod 34.1 1.6 938.8 10.0 0.3 143.1 9413.7 20 Prep of vegetable, fruit, nuts prod 26.1 1.4 5222.8 170.3 3.7 1516.9 16249.0 21 Miscellaneous edible preparations 19.2 2.1 1373.4 83.4 2.0 245.7 11612.6 22 Beverages, spirits and vinegar 35.7 2.3 1747.4 365.8 3.4 392.6 11729.6 23 Residues & waste from food indust 71.4 5.2 652.4 14.9 4.8 153.4 8403.0 24 Tobacco and manufactured 56.2 3.6 1292.4 384.4 47.1 731.5 18118.1 29 Organic chemicals. 33.9 0.0 54.0 0.0 0.0 3.6 182.8 35 Albuminoidal subs; modified starches 24.9 0.0 191.5 0.3 0.0 5.7 1140.6 38 Miscellaneous chemical products 45.9 0.0 13.2 0.0 0.0 1.9 103.9 56 Wadding, felt & nonwoven, yarns etc. 21.1 0.4 75.6 0.3 10.2 1.6 114.8 64 Footwear, gaiters and articles 18.2 31.4 11400.0 50.7 1.5 293.0 9117.8 87 Vehicles o/t railw/tramw roll stock, pts 16.3 5.0 2533.0 3.5 0.5 170.8 25041.1
All above Peak Products (28) 40.3 126.5 56280.5 3830.5 366.9 9222.2 269896.6 All Peaks as % of All Goods
All Goods Source: Computations based on UN COMTRADE Statistics.

17
Table 5c:
Japan's Tariff Peaks and world exports of developing countries (millions US$)
Tariff Peak at HS 2-digit products MFN Tariff
Exp. Of LDC
Exp. of GSP
Word trade
02 Meat and edible meat offal 39.31 12.7 1755.5 12991.7 03 Fish & crustacean, mollusk nes 15.00 0.8 101.2 975.8 04 Dairy prod; birds' eggs; honey 28.99 3.2 1514.4 23006.5 07 Edible vegetables and roots & tubers 15.80 0.0 15.9 31.0 08 Edible fruit and nuts; melons 19.81 27.2 9279.3 16292.5 09 Coffee, tea, mat and spices 17.81 6.5 556.5 1998.6 10 Cereals. 63.38 16.9 1592.2 8527.1 11 Prod mill indust; malt; starches 23.24 11.2 543.6 3530.4 12 Oil seed, oleagi fruits; misc grain 19.10 23.8 66.6 111.1 15 Animal/veg fats & oils & prod 26.99 0.1 114.3 1268.5 16 Prep of meat, fish or mollusks 20.69 0.2 686.1 1662.8 17 Sugars and sugar confectionery 71.25 175.4 5636.1 10761.1 18 Cocoa and cocoa preparations 22.77 0.7 557.0 5570.7 19 Prep of cereal, flour, starch/milk prod 21.91 6.4 1775.9 12640.9 20 Prep of vegetable, fruit, nuts prod 22.69 4.7 6327.4 12775.8 21 Miscellaneous edible preparations 22.35 7.8 1860.0 11362.8 22 Beverages, spirits and vinegar 38.65 9.5 3314.3 23943.4 24 Tobacco and manufactured 18.63 0.2 533.3 1578.4 29 Organic chemicals. 20.00 0.0 196.0 746.5 35 Albuminoidal subs; modified starches 23.31 0.1 206.8 1483.1 38 Miscellaneous chemical products 80.83 0.0 9.6 74.4 41 Raw hides and skins (other than fur) 26.08 370.9 5158.7 11496.8 42 Articles of leather; saddlery, travel pr 15.52 12.2 5085.9 6690.7 43 Furskins and artificial fur thereof. 16.25 0.7 827.3 2226.4 53 Other vegetable textile fibres & yarns 16.00 0.2 482.2 946.1 58 Special woven fab; tufted tex fab etc 17.90 1.3 310.5 635.0 60 Knitted or crocheted fabrics 15.70 1.7 245.9 483.6 64 Footwear, gaiters and articles 36.24 95.6 18062.0 31305.7 All above Peak Products (50) 27.8 790.2 66814.5 205117.5 All Peaks as % of All Goods
All goods 4.3 22263 Source: Computations based on UN COMTRADE Statistics.

18
Table 5d:
US tariff peaks and global exports of developing countries (US$ million)
Product Description MFN Export LDC
ExportGSP
Export NGSP
ExportMEX
Export ATP
ExportCAR
Export WLD
02 Meat and edible meat offal 19.2 0 538 1 0 0 0 1170
04 Dairy prod; birds' eggs; honey 20.9 0 298 2 0 2 0 694
07 Edible vegetables and roots nes 20.6 14 1288 316 211 3 4 2808
08 Edible fruit and nuts; melons 16.7 2 1139 62 218 13 1 2254
11 Prod mill indust; malt; starches 16.3 0 10 0 0 0 0 12
12 Oil seed, oleagi fruits; misc etc. 78.0 17 695 220 4 1 0 993
15 Animal/veg fats & oils & prod 19.9 1 1569 30 6 34 0 2088
19 Prep of cereal, flour, milk prod 16.8 0 253 7 15 9 0 776
20 Prep of vegetable, fruit, nuts 28.7 0 3070 295 86 111 26 4981
21 Miscellaneous edible prep 19.8 0 623 5 1 4 0 1079
24 Tobacco and manufactured 73.5 400 9862 750 61 43 1 17143
28 Inorgn chem; compds of prec 15.1 0 1 0 0 0 0 4
29 Organic chemicals. 16.8 0 65 15 0 0 0 156
30 Pharmaceutical products. 30.0 0 950 42 9 1 0 2169
42 Articles of leather; saddlery 20.0 0 39 76 0 0 0 137
51 Wool, fine/coarse animal hair 20.5 0 1660 139 26 17 0 2804
52 Cotton. 18.3 0 122 51 0 1 0 230
54 Man-made filaments. 16.4 2 3370 5356 24 11 0 11570
55 Man-made staple fibres. 16.3 3 3992 2978 17 17 0 9283
56 Wadding, felt & nonwoven 15.2 0 53 47 0 4 0 146
58 Special woven, tufted fabrics 18.5 0 850 753 39 12 0 2087
60 Knitted or crocheted fabrics 18.6 0 377 663 2 4 0 1294
61 Art of apparel & clothing 19.5 1326 17607 13490 1765 293 335 40452
62 Art of apparel & clothing 18.9 1342 18087 13211 614 117 75 38129
64 Footwear, gaiters and parts etc. 27.8 40 6432 10514 143 16 1 18271
69 Ceramic products. 17.6 0 3774 122 138 39 0 5832
70 Glass and glassware. 16.2 1 1266 266 47 7 0 2098
82 Tool, implement, cutlery 15.2 0 74 152 1 0 0 313
86 Railw/tramw locom, 17.2 1 390 8 20 0 0 987
87 Vehicles o/t railw/tramw 25.0 0 11192 408 3595 94 0 33540
96 Miscellaneous manufactures 20.7 0 76 34 29 1 0 195 Total (tariff peak products) 20.8 3151 89724 50016 7073 853 447 203696 Peaks as a % of Total 0.14 0.04 0.07 0.07 0.02 0.08 0.04 Total (All goods) 5/0 22263 2108310 732781 102498 41605 5560 4787750
4. Effects of Reducing tariff peaks in the Quad The small size of LDC exports relative to total developing country exports that are
potentially affected by Quad tariff peaks implies that the gains for developing countries
from a reduction in tariff peaks could be much larger than the tariff revenue collected in

19
the Quad on their exports. Indeed, preferential access may allow for re-directing an
important share of their exports to the market that grants further preferential access. This
section provides estimates of the change in LDC exports if each Quad member was to
grant duty free access to all LDC exports of tariff peak items. For comparison purposes,
we also calculate the impact of duty free access for peak items for all developing
countries (current GSP beneficiaries), and the effect of a nondiscriminatory (MFN)
reduction of all tariff peaks to a level of 5 percent (the Quad average). For each Quad
member, we group developing countries according to the type of preference that they
receive, distinguishing between LDCs, GSP beneficiaries and FTA partners (results for
the latter are not reported for space reasons).11 In all simulations we also have groups of
developed countries corresponding to the different tariff regimes in Quad members. In
the case of the EU and Japan, all developed countries enter into the MFN regime
category, whereas for Canada we separate Australia, New Zealand, the US and Israel. We
do not report results of changes in exports for developed countries.12 To further simplify
the presentation, we report results at the 2-digit level of the HS. However, simulations
pertain only to affected 6-digit tariff peak items within each 2-digit category.
The simulations use a simple partial equilibrium model of the world market for
each �product��defined as a 6-digit tariff line item. We assume that each 6-digit item
represents only a small share of the economy, so that the effects on other markets of a
change in tariffs can be ignored. Import demand and export supply are iso-elastic and are
calibrated for each country/group using trade value, unit prices, tariffs and preference
margins at the 6-digit tariff line level. World markets are assumed to be perfectly
competitive and integrated, in the sense that there is no further scope for arbitrage across
countries. Products are perfectly homogenous. The world price is determined by equating
total world import demand (the sum across countries/groups) to total world export supply
(the sum across countries/groups). We employ a conservative supply elasticity of 0.5 to
reflect the difficulty many LDCs will have in generating a supply response to the changed
incentives following duty free access for tariff peak items. Demand elasticities were
11 Stevens and Kennan (2000) have identified more than 30 tariff regimes in the EU. We follow them in working with only the major aggregate categories/groups. 12 These are available from the authors upon request.

20
derived using the estimates reported in Shiells, Stern and Deardorff (1986) and Stern et
al. (1976).
Appendix C provides a more detailed description of the methodology and data
sources. As shown there, granting duty free access to a group of developing countries
unambiguously reduces the world price (at the existing world price there is excess
supply), which will in turn reduce other developing countries� exports. The country/group
benefiting from duty free access obviously benefits (in spite of the world price decline).
We report results for each Quad member in turn.
Canada
Table 6a reports changes in the value of exports of LDCs and GSP beneficiaries, both in
terms of dollar value of percentage change of tariff peak exports to Canada, following
the elimination of tariff peaks in Canada. The first simulation grants duty free access to
LDCs only, whereas the second simulation grants full duty free access to all developing
countries for peak items�including not only LDCs, but also GSP beneficiaries. Both
scenarios have implications for developing country groups. Thus, duty free access for
LDCs will result in some trade diversion away from GSP beneficiaries and FTA
members. Extending duty free access to all developing countries will be to the detriment
of countries that currently obtain the greatest preference margins, generally countries that
are members of FTAs.
LDC exports expand by $1.6 billion if duty free access is granted exclusively to
these countries. Under this scenario the loss in export revenue (associated with trade
diversion) for other developing countries is small�total exports fall by $555 million
relative to the base line. This is equivalent to 0.3 percent of their total exports of peak
products to the world. Note that the predicted changes in export revenue for LDCs are
larger than the tariff revenue data in Table 1. The reason is that all exports to the world of
products facing tariff peaks in Canada will be affected by Canada�s tariff reforms.
The greatest increases for LDC exports under the preferential duty free access
scenario occur in products that are both highly protected and where LDCs have en
existing supply capacity (as reflected in existing exports to the world of the products

21
concerned). As can be seen from Table 6a, virtually all of the increase occurs in
categories 61-62 of the HS: apparel.13 Coming a far second is footwear and headgear.
Which LDCs are the major gainers? Table 7 reports the total predicted increase in
exports for each LDC. In absolute terms, Bangladesh is by far the largest gainer, with a
more than $1 billion increase in exports following the grant of duty free access to LDCs
(equal to some 60 percent of the total increase in LDC exports). Liberia follows with a
$180 million increase. However, in relative terms, the increase in exports of Bangladesh
and Liberia is similar to those of Haiti, Lao and Cambodia�who all see their exports
increase by 20 percent. Table 8 shows the top 5 products at the 2 digit level of the
Harmonized System would experience the largest increase in export revenue in dollar
terms and the top 5 countries that benefit from these increases. Bangladesh is the top
exporter in all 5 products.
The largest gains for developing countries obviously occur when duty free access
is granted to all developing countries (simulation II). Exports to Canada of peak items by
non-LDCs increase by 22 percent, while those of LDCs increase by 16 percent. In
absolute terms, the increase in GSP countries exports dominates, reflecting their much
larger share of the total market. Total exports of tariff peak products increase by some
$47 billion, of which $46.1 billion accrues to GSP beneficiaries (2.1 percent of their total
exports to the world) and $892 million to LDCs (4 percent of total LDC exports to the
world). Most of the overall increase in exports again occurs in textiles and apparel.
However, a few other sectors are also significant, including dairy and cereals.
An MFN reduction in tariff peaks to 5 percent, moving the structure of protection
closer to uniformity, would generate an increase in total export revenue of slightly more
than 0.1 percent for non-LDC developing countries ($1.5 billion). LDCs would see their
exports decline slightly (0.5 percent of current exports to the world), as existing
preferential access is eroded. The largest losses are for Mexico ($925 million�not
reported), reflecting preference erosion in the Canadian market. However, this represents
less than 1 percent of total Mexican exports to the world.
13 Most of these gains are heavily concentrated in around 10 tariff lines at the 6 digit level of the Harmonized System.

22
The European Union
Table 6b reports changes in the value of exports of LDCs and GSP beneficiaries, both in
terms of dollar value and percentage change of tariff peak exports to the EU, following
elimination of tariff peaks by the EU. The effect of duty free access for LDCs are smaller
than in the case of Canada, reflecting the fact the EU already provides significant
preferential access to all developing countries. However, exports of LDCs could increase
by some $185 million, representing a 37 percent increase in exports of peak items to the
EU. In contrast to the Canadian case, most of the increase in exports occurs in
agricultural commodities, especially sugar products (accounting for 64 percent of the
increase), followed by cereals, meat, and fruit. Exports of textiles and clothing are of
course also important in the EU, but these are not tariff peak items.
Full duty free access for all developing countries would increase exports of tariff
peak items to the EU by some 18 percent ($11 billion), while not detrimentally affecting
LDC exports. Sugar accounts for about 15 percent of the total increase. The largest
expansion occurs in meat (almost 30 percent). Cereals and footwear are other important
growth areas, each accounting for about 15 percent of the total increase. A MFN
reduction in peaks to 5 percent would increase non-LDC developing country exports of
tariff peak items by only 1.3 percent, and reduce LDC exports of such products by some
9 percent. LDC exports of sugar would expand slightly, but most categories decline.
Table 7 reports export increases by LDC. The largest absolute increase under duty
free access for LDCs only occurs in Madagascar with an expansion in exports of $26
million, equivalent to about 4 percent of Madagascar�s total exports. In relative terms, the
LDC that gains the most from duty free access to the EU is the Maldives, with a 19
percent increase in exports ($13.5 million); followed by Kiribati with a 17 percent
increase ($1 million) and Somalia with a 15 percent increase ($4.4 million). Table 8b
reports the top 5 products in terms of export value growth at the 2 digit level of the
Harmonized System and the top 5 exporters in these categories. Countries that gain
include Malawi, Myanmar, Sudan and Nepal.
Granting duty free access to LDCs generates an export revenue loss for those
ACP countries that are not LDCs (however, ACP members as a whole experience a net
gain of $135 million, as the majority are LDCs). Our estimates suggest that the $23

23
million loss in export revenue for these non-LDC ACP countries associated with granting
duty free access to LDCs represents less than 0.1 percent of their total exports to the
world. Finally, if tariff peaks are reduced on a MFN basis to 5 percent, then the loss for
ACP countries that do not benefit from LDC preferences would be ten times larger
(around 1 percent). LDCs would also see their export revenue fall by 0.2 percent as their
preference margins erode.
Japan
In the case of Japan, elimination of tariff peaks for LDCs has a significant effect on their
exports of sugar and certain cereals. Increases in exports of these commodities account
for almost all of the 62 percent increase in LDC exports of tariff peak items to Japan
(Table 6c). Other developing countries lose market share in Japan as a result of granting
duty free access to LDCs, but the decline in exports is only 0.4 percent of their total
exports to the world.
One would expect to see large increases in exports of products such as rice and
groundnuts, as these are highly protected, with ad valorem equivalents of the specific
tariffs that apply to out of quota quantities often exceeding 100 percent�WTO (1997).
Rice is currently the only quota constrained product in Japan�the domestic/world price
ratio is over 5. In the simulations, LDCs do not experience a large increase in exports of
these items because they are not significant exporters of these commodities.14 Those
LDCs that produce rice largely consume it domestically. Total exports to the world of
cereals�including rice�by LDCs was only $20 million in the late 1990s (Appendix B).
Thus, no matter how high the preference margin in Japan, the methodology used in the
simulations cannot generate a large increase in exports. In the longer run, rice producers
might change policies so as to export domestic production to Japan, importing their
requirements from the rest of the world. There is clearly a large incentive to do this, and
doing so would greatly increase the gains of preferential access to the Japanese market.
14 Using the out of quota ad-valorem equivalents provided in the WTO�s 1997 Trade Policy Review of Japan for groundnuts and dairy products and setting an ad-valorem equivalent for rice at 150 percent provides slightly larger gains for LDCs and other developing countries. Full duty free access to LDC generates an extra $15 million to the existing $497 million increase in exports; whereas when GSP beneficiaries also benefit from duty free access, this generates an extra $2 billion to the existing $14 billion increase in GSP exports.
24
If full duty free access is extended to all developing countries, their total exports
would expand by $13.6 billion, or 20 percent of total exports to Japan. LDC exports
would also increase slightly. The composition of the increased trade would be different.
In addition to sugar, which would account for about 25 percent of the total increase,
major growth categories include footwear (another 25 percent), alcoholic beverages,
cereals, and meat.
The LDC that benefits the most from duty free access to Japan in absolute terms
is Bangladesh, with a simulated export increase of $229 million (47 percent of the total
increase in LDC exports). However, this represents only around 5 percent of Bangladesh
exports. In relative terms, the main beneficiaries are Somalia (a 43 percent increase in
exports�or 12.8 million) and Cape Verde (a 23 percent increase�$4.4 million). Sudan
and Togo follow with more than 10 percent. Looking at the major growth items, countries
that gain significantly include Madagascar, Myanmar and Nepal (Table 8a).
United States
Granting duty free access to LDCs for the 307 tariff peaks in the US while keeping tariffs
on other sources of supply unchanged (first column of Table 6d) generates an extra $1.1
billion dollar of export revenue for LDCs (a 35 percent increase, or 5 percent of their
total exports to the world). Other developing countries see their export revenue contract,
but the aggregate reduction is less than $0.4 billion. Total diversion losses are negligible
given the small size of LDC exports. Mexico, the Andean Pact and Caribbean countries
are not affected (their overall export revenue contracts by just $18 million, compared to
total exports of $150 billion). Most of the action in the US market revolves around
apparel, which accounts for two-thirds of the LDC export increase. Tobacco accounts for
most of the remaining increase.
If duty free access is extended to all the developing countries that now have
preferential treatment, total exports of tariff peak items to the US of both the LDC and
non-LDC group would expand by about 20 percent. Total exports of LDCs to the world
increases by 2.9 percent. In the case of GSP countries, the $18 billion increase is equal to
1 percent of their exports to the world. Many more product categories would see

25
significant increases, but the same categories dominate. One noteworthy difference is the
predicted increase in imports of automotive products (mostly parts).
The smallest gain for LDCs is obtained when tariff peaks in the US are reduced to
5 percent on a MFN basis. This generates an increase of only 4 percent in total LDC
exports of tariff peak items to the US. GSP developing countries increase their export
revenue by a total of almost $3 billion, some of which occurs to the detriment of Mexico.
The LDC that benefits the most from duty free access to the US is Bangladesh,
with an increase in exports of $737 million (67 percent of the total increase in exports of
LDCs). This represents a 16 percent increase in Bangladesh�s exports to the world. In
relative terms, the main beneficiary is Malawi with a 25 percent increase. If we focus on
the major growth items, countries that expand their exports include Cambodia and
Myanmar (textiles) and Malawi, Gambia and Sudan.
Summary of the simulation results
The results suggest that the greatest impact for LDCs associated with a reduction in tariff
peaks is to be expected if full duty free access is granted to them exclusively. In order to
calculate the total impact on LDC exports, the gains calculated above for each LDC in
each Quad market cannot simply be added. This is because in some cases tariff peaks on
a 6-digit item are found in more than one Quad market. It is therefore necessary to correct
for double counting. Once this is done, we arrive at an estimate of the total increase in
LDC exports following duty-free access for peak products in the Quad of $2.5 billion.
This is equivalent to an 11 percent increase in their total exports of all goods to the world.
Total imports into the Quad associated with duty free access for peak products
will expand by only a modest $132 million (most of it concentrated in the US�not
reported). The reason for this small effect on the import side is that the increase in LDC
export revenues essentially involves diversion of trade from other sources (both
developed and developing countries). The small import effect suggests there is not a
compelling reason to be concerned with possible adjustment costs for domestic import-
competing industries located in the Quad. The diversion does imply losses for other
developing countries. However, these losses are very small in relative terms, given the
very small magnitude of LDC exports. Overall, the decline in exports of other developing

26
countries and OECD nations will be less than 0.1 percent of their total exports to the
world.
If duty free access is also granted to other developing countries, the increase in
export revenue for LDCs would be halved to 6 percent of their current exports to the
world, as they now need to compete with other developing countries in Quad markets. An
MFN reduction of tariff peak items to 5 percent would have little effect on LDC exports
as they would not only need to compete with other developing and industrialized
countries in Quad markets, but also would see the value of their current preferential
access under GSP or LDC preferential schemes erode. Thus, although an MFN reduction
of tariff peak items is desirable from a world welfare point of view, it provides relatively
little in terms of export revenue gains for LDCs. The same is true under duty free access
for all developing countries as a group. While this benefits non-LDCs significantly,
LDCs do not experience major gains�indeed, they may lose. Both a unilateral MFN
elimination of all tariff peaks in the Quad and duty free access for all developing
countries is likely to be difficult to realize in political terms, as it will lead to substantially
greater import penetration in the Quad. Attaining such outcomes is likely to require a
broader negotiating context that allows for reciprocal concessions to be offered by
developing countries. Such negotiations are likely to be launched in the coming years,
and as a result one can expect that tariff barriers will be reduced further. As far as LDCs
are concerned, the results of the simulations suggest that an immediate offer of duty free
access is a low cost option for the Quad to offer, while not imposing a very large cost on
other, less advanced, developing countries.

27
Table 6a: Estimates of Export Changes in LDCs and GSP Groups by HS-2 Product After Canadian Tariff Peak Reform
Simulation I: LDC=0 Simulation II: LDC=GSP=0 Simulation III: MFN=5%
LDC-Exp LDC-Exp
GSP-Exp GSP-Exp
LDC-Exp
LDC-Exp
GSP-Exp GSP-Exp
LDC-Exp LDC-Exp
GSP-Exp GSP-Exp
HS-2 Product ($ '000) % change
($ '000) % change
($ '000) % change
($ '000) % change
($ '000) % change
($ '000) % change
01 Live animals. 26 0.0 -16 0.0 4 0.0 16643 0.0 0 0.0 681 0.0 02 Meat and edible meat offal 10 0.0 0 0.0 -37 0.0 954329 0.4 -77 0.0 -175297 -0.1 04 Dairy prod; birds' eggs; honey 5578 0.1 -209 0.0 4273 0.1 4131186 1.9 -400 0.0 61779 0.0 06 Live tree & other plant; bulb, cut flowers 3384 0.1 -1021 0.0 2265 0.0 89336 0.0 -1142 0.0 -45044 0.0 08 Edible fruit and nuts; melons 0 0.0 0 0.0 0 0.0 268 0.0 0 0.0 0 0.0 10 Cereals. 310 0.0 -44 0.0 226 0.0 1400094 0.7 149 0.0 1099119 0.5 11 Prod mill indust; malt; starches 7313 0.1 -1527 0.0 4375 0.1 446131 0.2 154 0.0 19446 0.0 12 Oil seed, oleagi fruits; misc grain 0 0.0 0 0.0 0 0.0 735 0.0 0 0.0 47 0.0 13 Lac; gums, resins & other veg 0 0.0 0 0.0 0 0.0 1397 0.0 0 0.0 0 0.0 15 Animal/veg fats & oils & prod 468 0.0 -79 0.0 277 0.0 149039 0.1 -270 0.0 -70307 0.0 16 Prep of meat, fish or molluscs 119 0.0 -17 0.0 76 0.0 400045 0.2 -45 0.0 1267 0.0 17 Sugars and sugar confectionery 0 0.0 0 0.0 0 0.0 3241 0.0 0 0.0 0 0.0 18 Cocoa and cocoa preparations 0 0.0 0 0.0 -17 0.0 292203 0.1 -125 0.0 -36028 0.0 19 Prep of cereal, flour, starch/milk prod 12 0.0 -2 0.0 -7 0.0 188940 0.1 -65 0.0 -45104 0.0 20 Prep of vegetable, fruit, nuts prod 8 0.0 -5 0.0 2 0.0 58906 0.0 0 0.0 2206 0.0 21 Miscellaneous edible preparations 165 0.0 -16 0.0 45 0.0 413859 0.2 -696 0.0 -82297 0.0 22 Beverages, spirits and vinegar 0 0.0 0 0.0 -135 0.0 87470 0.0 -590 0.0 -25270 0.0 23 Residues & waste from food indust 648 0.0 -71 0.0 434 0.0 119692 0.1 -329 0.0 30167 0.0 24 Tobacco and manufactured 2142 0.0 -181 0.0 1916 0.0 225674 0.1 415 0.0 48911 0.0 33 Essential oils & resinoids, perf. 0 0.0 0 0.0 -2 0.0 7039 0.0 -103 0.0 -12235 0.0 35 Albuminoidal subs; modified starches 11 0.0 -2 0.0 8 0.0 55368 0.0 0 0.0 253 0.0 39 Plastics and articles thereof. 0 0.0 0 0.0 -68 0.0 177653 0.1 -150 0.0 -40018 0.0 40 Rubber and articles thereof. 0 0.0 0 0.0 -51 0.0 214335 0.1 -63 0.0 7351 0.0 42 Articles of leather; saddlery, travel pr 0 0.0 0 0.0 -239 0.0 309936 0.1 -371 0.0 -129272 -0.1 43 Furskins and artificial fur thereof. 0 0.0 0 0.0 -7 0.0 35266 0.0 -14 0.0 -5899 0.0 51 Wool, fine/coarse animal hair nes 1 0.0 0 0.0 -2 0.0 30822 0.0 -13 0.0 -19401 0.0 52 Cotton. 2777 0.1 -716 0.0 1944 0.0 545558 0.3 56 0.0 53466 0.0 53 Other vegetable textile fibres & yarns 0 0.0 0 0.0 -4 0.0 20101 0.0 -5 0.0 -1750 0.0 54 Man-made filaments. 511 0.0 -218 0.0 239 0.0 1032003 0.5 -28 0.0 42605 0.0 55 Man-made staple fibres. 980 0.0 -426 0.0 502 0.0 778653 0.4 29 0.0 34216 0.0 56 Wadding, felt & nonwoven, yarns etc. 2283 0.0 -1343 0.0 821 0.0 147773 0.1 71 0.0 -162 0.0 57 Carpets and other textile floor coverings 0 0.0 0 0.0 -278 0.0 48726 0.0 -562 0.0 -24355 0.0 58 Special woven fab; tufted tex fab etc 304 0.0 -118 0.0 152 0.0 260649 0.1 -12 0.0 16947 0.0 59 Impregnated, coated, cover/laminated 2 0.0 0 0.0 -59 0.0 245129 0.1 -94 0.0 -21938 0.0 60 Knitted or crocheted fabrics 387 0.0 -205 0.0 141 0.0 542854 0.3 -25 0.0 32582 0.0 61 Art of apparel & clothing access 626521 11.4 -203022 -0.1 380824 6.9 9971146 4.7 8146 0.1 326556 0.2 62 Art of apparel & clothing access 879046 16.0 -320456 -0.2 510282 9.3 12819728 6.0 12552 0.2 371658 0.2 63 Other made up textile articles 29345 0.5 -12099 0.0 15682 0.3 1353439 0.6 -883 0.0 27389 0.0 64 Footwear, gaiters and articles 19937 0.4 -6886 0.0 11096 0.2 5783008 2.7 -1989 0.0 13252 0.0 65 Headgear and parts thereof. 19362 0.4 -8899 0.0 3585 0.1 197310 0.1 -9119 -0.2 3091 0.0 67 Prepr feathers & down; art flower nes 0 0.0 0 0.0 0 0.0 0 0.0 -109 0.0 -23518 0.0 68 Art of stone, plaster, cement, asbestos 2 0.0 0 0.0 2 0.0 181 0.0 0 0.0 35 0.0 70 Glass and glassware. 8 0.0 -1 0.0 7 0.0 60935 0.0 -3 0.0 -5970 0.0 85 Electrical mech equip parts, sound pr 82 0.0 -17 0.0 60 0.0 969865 0.5 1 0.0 21973 0.0 86 Railw/tramw locom, rolling stock etc. 0 0.0 0 0.0 -26 0.0 14495 0.0 -114 0.0 -5437 0.0 89 Ships, boats and floating structures 0 0.0 0 0.0 -46304 -0.8 1141569 0.5 -120460 -2.2 69328 0.0 91 Clocks and watches and parts nes 0 0.0 0 0.0 -4 0.0 46011 0.0 -6 0.0 -22401 0.0 94 Furniture; bedding, mattress, cushion 347 0.0 -155 0.0 167 0.0 159223 0.1 18 0.0 16766 0.0 95 Toys, games & sports requisites, nes 7 0.0 -3 0.0 3 0.0 79335 0.0 0 0.0 7812 0.0 96 Miscellaneous manufactured articles 10 0.0 -2 0.0 5 0.0 67535 0.0 -5 0.0 -5392 0.0
Net gains fm all peaks 1,602,106 29.2 -557,757 -0.3 892,175 16.2 46,094,833 21.7 -116,274 -2.1 1511,809 0.7 Note: Total LDC exports to the world of peak items in base year: $5.5 billion; total GSP exports of peak items to world in base year was $212 billion. The first column in each group of countries and in each simulation gives the dollar value of the export change. The second column provides the percentage change relative to current exports of tariff peak items to Canaada. Source: Authors calculations

28
Table 6b: Estimates of Export Changes in LDCs and GSP Groups by HS-2 Product After EU Tariff Peak Reform
Simulation I: LDC=0 Simulation II: LDC=GSP=0 Simulation II:MFN=5%
LDC-Exp
LDC-Exp
GSP-Exp GSP-Exp
LDC-Exp
LDC-Exp
GSP-Exp GSP-Exp
LDC-Exp
LDC-Exp
GSP-Exp
GSP-Exp
HS-2 Product ($ '000) (%) ($ '000) (%) ($ '000) (%) ($ '000) (%) ($ '000) (%) ($ '000) (%)
01 Live animals. 1731 0.4 -396 0.0 467 0.1 157654 0.3 -157 0.0 13581 0.0 02 Meat and edible meat offal 18392 3.7 -3267 0.0 9104 1.8 3241296 5.4 -641 -0.1 333896 0.6 03 Fish & crustacean, mollusc nes 0 0.0 0 0.0 -13897 -2.8 216244 0.4 -17466 -3.5 7826 0.0 04 Dairy prod; birds' eggs; honey 2206 0.4 -56 0.0 1784 0.4 603378 1.0 123 0.0 213247 0.4 06 Live tree & plant; bulb, flowers 0 0.0 0 0.0 -3481 -0.7 39764 0.1 -2758 -0.6 12247 0.0 07 Edible vegetables, roots & tubers 752 0.2 -919 0.0 -489 -0.1 -125392 -0.2 -392 -0.1 -82339 -0.1 08 Edible fruit and nuts; melons 2672 0.5 -3356 0.0 -1275 -0.3 -346249 -0.6 -647 -0.1 -113213 -0.2 09 Coffee, tea, mat and spics 0 0.0 0 0.0 -1 0.0 168 0.0 -2 0.0 -127 0.0 10 Cereals. 24376 4.9 -17676 0.0 -172 0.0 1365455 2.3 -4331 -0.9 18514 0.0 11 Prod mill indust; malt; starches 4341 0.9 -523 0.0 3189 0.6 245100 0.4 1374 0.3 98045 0.2 12 Oil seed, oleagi fruits; misc grain 0 0.0 0 0.0 0 0.0 17 0.0 0 0.0 12 0.0 13 Lac; gums, resins & other veg 0 0.0 0 0.0 -6 0.0 2594 0.0 -4 0.0 1762 0.0 15 Animal/veg fats & oils & prod 39 0.0 -1 0.0 -13 0.0 44006 0.1 -75 0.0 18176 0.0 16 Prep of meat, fish or molluscs 669 0.1 -332 0.0 -12701 -2.6 422568 0.7 -11899 -2.4 -6408 0.0 17 Sugars and sugar confectionery 119020 24.1 -67516 -0.1 29576 6.0 1593922 2.6 7053 1.4 391943 0.7 18 Cocoa and cocoa preparations 2 0.0 0 0.0 1 0.0 2252 0.0 0 0.0 228 0.0 19 Prep of cereal, flour, starch/milk 822 0.2 -150 0.0 521 0.1 337005 0.6 122 0.0 81865 0.1 20 Prep of vegetable, fruit, nuts prod 131 0.0 -41 0.0 -571 -0.1 592750 1.0 -752 -0.2 102750 0.2 21 Miscellaneous edible prep. 233 0.0 -26 0.0 80 0.0 193192 0.3 -261 -0.1 17860 0.0 22 Beverages, spirits and vinegar 395 0.1 -117 0.0 -339 -0.1 238450 0.4 -874 -0.2 -45232 -0.1 23 Residues & waste from food 9070 1.8 -5469 0.0 1794 0.4 350258 0.6 -93 0.0 12389 0.0 24 Tobacco and manufactured 0 0.0 0 0.0 -4993 -1.0 382245 0.6 -9381 -1.9 -120977 -0.2 29 Organic chemicals. 0 0.0 0 0.0 0 0.0 19613 0.0 0 0.0 4104 0.0 35 Albuminoidal subs; starches 0 0.0 0 0.0 0 0.0 0 0.0 -5 0.0 -24025 0.0 38 Miscellaneous chemical products 0 0.0 0 0.0 -1 0.0 6628 0.0 -3 0.0 1919 0.0 56 Wadding, felt & nonwoven, yarns 0 0.0 0 0.0 -1674 -0.3 5241 0.0 -1462 -0.3 2241 0.0 64 Footwear, gaiters and articles 0 0.0 0 0.0 -1991 -0.4 1271984 2.1 -3885 -0.8 -114896 -0.2 87 Vehicles o/t railw/tramw roll 0 0.0 0 0.0 -301 -0.1 254541 0.4 -534 -0.1 -28553 0.0
Net gains from all peaks 184,848 37.5 -99,844 -0.2 4612 0.9 11,114,668 18.5 -46,949 -9.5 796,838 1.3 Note: Total LDC exports to the world of peak items in base year: $493 million; total GSP country exports of peak items to world in base year was $60 billion. The first column in each group of countries and in each simulation gives the dollar value of the export change. The second column provides the percentage change relative to current exports of tariff peak items to the EU. Source: Authors calculations

29
Table 6c: Estimates of Export Changes in LDCs and GSP Groups by HS-2 Product After Japanese Tariff Peak Reform
Simulation I: LDC=0 Simulation II: LDC=GSP=0 Simulation III:MFN=5% LDC-
Exp LDC-Exp
GSP-Exp GSP-Exp
LDC-Exp
LDC-Exp
GSP-Exp GSP-Exp
LDC-Exp
LDC-Exp
GSP-Exp GSP-Exp
HS-2 Product ($ '000) (%) ($ '000) (%) ($ '000) (%) ($ '000) (%) ($ '000) (%) ($ '000) (%)
02 Meat and edible meat offal 6971 0.9 -842 0.0 5780 0.7 734494 1.1 -1039 -0.1 -119565 -0.2 03 Fish & crustacean, mollusc nes 78 0.0 -1 0.0 77 0.0 3808 0.0 0 0.0 0 0.0 04 Dairy prod; birds' eggs; honey 1560 0.2 -234 0.0 1291 0.2 399000 0.6 -56 0.0 -28976 0.0 07 Edible vegetables and roots & tubers 9 0.0 -6 0.0 3 0.0 1094 0.0 0 0.0 -5 0.0 08 Edible fruit and nuts; melons 1306 0.2 -1055 0.0 -4161 -0.5 323370 0.5 -3010 -0.4 46387 0.1 09 Coffee, tea, mat and spics 513 0.1 -306 0.0 -87 0.0 60437 0.1 -701 -0.1 -5701 0.0 10 Cereals. 18250 2.3 -5459 0.0 9285 1.2 875825 1.3 -1718 -0.2 -162089 -0.2 11 Prod mill indust; malt; starches 3270 0.4 -625 0.0 2507 0.3 128772 0.2 94 0.0 -34714 -0.1 12 Oil seed, oleagi fruits; misc grain 4230 0.5 -6249 0.0 -1909 -0.2 5347 0.0 -330 0.0 -924 0.0 15 Animal/veg fats & oils & prod 40 0.0 -4 0.0 34 0.0 45917 0.1 0 0.0 86 0.0 16 Prep of meat, fish or molluscs 61 0.0 -21 0.0 37 0.0 90851 0.1 -2 0.0 -12927 0.0 17 Sugars and sugar confectionery 450913 57.1 -277419 -0.4 85637 10.8 3066181 4.6 1240 0.2 62666 0.1 18 Cocoa and cocoa preparations 154 0.0 -11 0.0 131 0.0 143325 0.2 -53 0.0 -14835 0.0 19 Prep of cereal, flour, starch/milk prod 1561 0.2 -226 0.0 1224 0.2 467175 0.7 -413 -0.1 -21184 0.0 20 Prep of vegetable, fruit, nuts prod 1186 0.2 -438 0.0 574 0.1 989634 1.5 -190 0.0 -11574 0.0 21 Miscellaneous edible preparations 1376 0.2 -198 0.0 1025 0.1 377751 0.6 -527 -0.1 -55139 -0.1 22 Beverages, spirits and vinegar 2323 0.3 -714 0.0 1506 0.2 1247766 1.9 -409 -0.1 -147708 -0.2 24 Tobacco and manufactured 64 0.0 -10 0.0 52 0.0 89218 0.1 0 0.0 63 0.0 29 Organic chemicals. 0 0.0 0 0.0 0 0.0 0 0.0 -4 0.0 -29511 0.0 35 Albuminoidal subs; modified starches 0 0.0 0 0.0 0 0.0 0 0.0 -13 0.0 -38260 -0.1 38 Miscellaneous chemical products 0 0.0 0 0.0 0 0.0 0 0.0 -19 0.0 -5075 0.0 41 Raw hides and skins (other than fur) 0 0.0 0 0.0 -31499 -4.0 358526 0.5 -57933 -7.3 -293718 -0.4 42 Articles of leather; saddlery, travel pr 2517 0.3 -996 0.0 1375 0.2 579281 0.9 -121 0.0 -11439 0.0 43 Furskins and artificial fur thereof. 83 0.0 -21 0.0 60 0.0 45508 0.1 -38 0.0 -56026 -0.1 53 Other vegetable textile fibres & yarns 0 0.0 0 0.0 0 0.0 0 0.0 -13 0.0 -37357 -0.1 58 Special woven fab; tufted tex fab etc 0 0.0 0 0.0 -60 0.0 23576 0.0 -160 0.0 -14361 0.0 60 Knitted or crocheted fabrics 0 0.0 0 0.0 -81 0.0 15822 0.0 -179 0.0 -10533 0.0 64 Footwear, gaiters and articles 29 0.0 -5 0.0 -6463 -0.8 3509678 5.3 -27858 -3.5 -2776550 -4.2
Net gains from all peaks 496,495 62.8 -294,840 -0.4 66337 8.4 13,582,356 20.3 -93,454 -11.8 -3,778,969 -5.7
Note: Total LDC exports to the world of peak items in base year: $790 million; total GSP exports of peak items to world in base year was $66.8 billion. The first column in each group of countries and in each simulation gives the dollar value of the export change. The second column provides the percentage change relative to current exports of tariff peak items to Japan.
Source: Authors calculations

30
Table 6d: Estimates of Export Changes in LDCs and GSP Groups by HS-2 Product After United States Tariff Peak Reform
Simulation I: LDC=0 Simulation II: LDC=GSP=0 Simulation III:MFN=5%
LDC-Exp LDC-Exp
GSP-Exp GSP-Exp
LDC-Exp
LDC-Exp
GSP-Exp GSP-Exp
LDC-Exp
LDC-Exp
GSP-Exp GSP-Exp
HS-2 Product ($ '000) (% change)
($ '000) (% change)
($ '000) (% change)
($ '000) (% change)
($ '000) (% change)
($ '000) (% change)
02 Meat and edible meat offal 1 0.0 -1 0.0 0 0.0 79681 0.1 0 0.0 3668 0.0 04 Dairy prod; birds' eggs; 0 0.0 0 0.0 0 0.0 50447 0.1 -1 0.0 1749 0.0 07 Edible vegetables, roots 764 0.0 -426 0.0 -289 0.0 113713 0.1 -525 0.0 40389 0.0 08 Edible fruit and nuts; 26 0.0 -15 0.0 -110 0.0 59455 0.1 -126 0.0 22148 0.0 11 Prod mill indust; malt; 0 0.0 0 0.0 -21 0.0 775 0.0 -17 0.0 306 0.0 12 Oil seed, oleagi fruits; 26997 0.9 -28536 0.0 -3273 -0.1 128751 0.1 2427 0.1 104374 0.1 15 Animal/veg fats & oils 0 0.0 0 0.0 -1 0.0 154186 0.2 -53 0.0 50412 0.1 19 Prep of cereal, flour, starch 16 0.0 -3 0.0 3 0.0 28926 0.0 -19 0.0 -2335 0.0 20 Prep.vegetable, fruit, nuts 79 0.0 -24 0.0 38 0.0 462751 0.5 1 0.0 74933 0.1 21 Misce. edible prep. 0 0.0 0 0.0 0 0.0 84203 0.1 0 0.0 9436 0.0 24 Tobacco 329056 10.4 -198019 -0.2 89662 2.8 1830789 2.0 39858 1.3 371948 0.4 28 Inorgn chem; 0 0.0 0 0.0 0 0.0 0 0.0 0 0.0 -82 0.0 29 Organic chemicals. 0 0.0 0 0.0 0 0.0 0 0.0 0 0.0 -6117 0.0 30 Pharmaceutical products. 170 0.0 -47 0.0 110 0.0 296017 0.3 9 0.0 24090 0.0 42 Articles of leather 13 0.0 -2 0.0 11 0.0 10440 0.0 2 0.0 1602 0.0 51 Wool, fine/coarse 63 0.0 -31 0.0 27 0.0 239031 0.3 2 0.0 13167 0.0 52 Cotton. 20 0.0 -9 0.0 10 0.0 18488 0.0 1 0.0 2343 0.0 54 Man-made filaments. 420 0.0 -84 0.0 321 0.0 625595 0.7 13 0.0 33369 0.0 55 Man-made staple fibres. 810 0.0 -270 0.0 502 0.0 617246 0.7 25 0.0 26676 0.0 56 Wadding, felt, yarns 46 0.0 -16 0.0 26 0.0 7021 0.0 0 0.0 107 0.0 58 Special woven fab; tufted 67 0.0 -19 0.0 43 0.0 147539 0.2 3 0.0 11402 0.0 60 Knitted or crocheted fab. 10 0.0 -2 0.0 7 0.0 80568 0.1 1 0.0 8307 0.0 61 Art of apparel & clothing 395761 12.6 -83168 -0.1 293339 9.3 3859192 4.3 48514 1.5 650588 0.7 62 Art of apparel & clothing 336286 10.7 -73015 -0.1 251660 8.0 3495104 3.9 37013 1.2 439221 0.5 64 Footwear, gaiters 16630 0.5 -2927 0.0 12851 0.4 1932681 2.2 1562 0.0 243656 0.3 69 Ceramic products. 33 0.0 -11 0.0 20 0.0 586311 0.7 1 0.0 38940 0.0 70 Glass and glassware. 0 0.0 0 0.0 -78 0.0 194680 0.2 -168 0.0 14443 0.0 82 Tool, implement, cutlery 0 0.0 0 0.0 0 0.0 4713 0.0 0 0.0 -4612 0.0 86 Railw/tramw, rolling . 0 0.0 0 0.0 0 0.0 0 0.0 -92 0.0 -26391 0.0 87 Vehicles o/t railw/tramw 0 0.0 1 0.0 -29 0.0 3476051 3.9 -92 0.0 803051 0.9 96 Miscellaneous manuf. 60 0.0 -22 0.0 11 0.0 7060 0.0 -33 0.0 -1696 0.0
Net gains from all peaks 1,107,327 35.1 -386,646 -0.4 644,841 20.5 18,591,414 20.4 128305 4.1 2,949,094 3.3
Note: Total LDC exports to the world of peak items in base year: $3.2 billion; total GSP exports of peak items to world in base year was $89.8 billion. The first column in each group of countries and in each simulation gives the dollar value of the export change. The second column provides the percentage change relative to current exports of tariff peak items to the US.
Source: Authors calculations

31
Tab
le 7
: Est
imat
es o
f LD
C E
xpor
t Cha
nges
by
Mar
ket A
fter
Qua
d T
ariff
Pea
k R
efor
m
(bas
ed o
n 19
96-9
8 ex
port
ave
rage
s in
$ m
illio
n)
A
ll G
oods
C
anad
ian
Tari
ff P
eak
Ref
orm
E
U T
ariff
Pea
k R
efor
m
Japa
nese
Tar
iff P
eak
Ref
orm
U
nite
d St
ates
Tar
iff P
eak
Ref
orm
E
xpor
t to
L
DC
=0
ldc=
gsp=
0 m
fn=5
%
Exp
sh
are
LD
C=0
ld
c=gs
p=0
mfn
=5%
E
xp
shar
e L
DC
=0
ldc=
gsp=
0 m
fn=5
%
Exp
sh
are
LD
C=0
ld
c=gs
p=0
mfn
=5%
E
xp
shar
e C
ount
ry
Wor
ld
Exp
Chg
E
xp C
hg
Exp
C
hg
in %
E
xp C
hg
Exp
Chg
E
xp
Chg
in
%
Exp
Chg
E
xp C
hg
Exp
C
hg
in %
E
xp C
hg
Exp
Chg
E
xp
Chg
in
%
Afg
hani
stan
10
2.9
0.7
0.4
-0.1
0.
04
0.1
0.0
0.0
0.08
0.
9 0.
1 -0
.2
0.17
0.
1 0.
1 0.
0 0.
01
Ang
ola
4272
.5
0.1
0.0
0.0
0.00
0.
0 0.
0 0.
0 0.
02
0.2
0.0
0.0
0.03
0.
0 0.
0 0.
0 0.
00
Ban
glad
esh
4496
.1
1030
.2
573.
7 -7
4.8
64.3
0 12
.2
0.3
-3.1
6.
63
229.
1 30
.6
-43.
1 46
.14
736.
7 42
9.0
85.4
66
.53
Ben
in
193.
6 0.
5 0.
3 0.
0 0.
03
1.0
0.0
-0.2
0.
53
0.4
0.1
-0.1
0.
08
0.5
0.3
0.1
0.05
B
huta
n 22
.5
0.4
0.2
0.0
0.02
0.
2 0.
0 0.
0 0.
10
0.5
0.1
-0.1
0.
10
0.2
0.1
0.0
0.02
B
urki
na F
aso
148.
9 0.
3 0.
2 0.
0 0.
02
3.7
0.1
-0.9
1.
99
11.4
1.
5 -2
.1
2.29
0.
2 0.
1 0.
0 0.
01
Bur
undi
82
.4
0.0
0.0
0.0
0.00
0.
1 0.
0 0.
0 0.
06
0.3
0.0
-0.1
0.
06
0.2
0.1
0.0
0.02
C
ambo
dia
471.
7 99
.4
55.4
-7
.2
6.20
3.
8 0.
1 -1
.0
2.07
9.
2 1.
2 -1
.7
1.84
58
.5
34.1
6.
8 5.
28
Cap
e V
erde
18
.9
2.8
1.6
-0.2
0.
18
0.6
0.0
-0.2
0.
34
4.4
0.6
-0.8
0.
89
1.9
1.1
0.2
0.17
C
entra
l Afri
can
Rep
. 18
3.9
0.1
0.1
0.0
0.01
0.
6 0.
0 -0
.2
0.35
0.
4 0.
1 -0
.1
0.08
0.
5 0.
3 0.
1 0.
05
Cha
d 11
5.0
0.0
0.0
0.0
0.00
0.
0 0.
0 0.
0 0.
01
0.1
0.0
0.0
0.02
0.
0 0.
0 0.
0 0.
00
Com
oros
15
.5
0.1
0.0
0.0
0.00
0.
7 0.
0 -0
.2
0.36
0.
1 0.
0 0.
0 0.
02
0.0
0.0
0.0
0.00
C
ongo
, Dem
. Rep
. 12
84.0
0.
2 0.
1 0.
0 0.
01
1.4
0.0
-0.4
0.
75
1.3
0.2
-0.3
0.
27
1.0
0.6
0.1
0.09
D
jibou
ti 16
.0
0.1
0.1
0.0
0.01
0.
1 0.
0 0.
0 0.
08
0.6
0.1
-0.1
0.
11
0.1
0.1
0.0
0.01
Eq
uato
rial G
uine
a 31
6.6
0.0
0.0
0.0
0.00
6.
3 0.
2 -1
.6
3.40
0.
1 0.
0 0.
0 0.
01
0.0
0.0
0.0
0.00
Er
itrea
33
.5
0.2
0.1
0.0
0.01
0.
1 0.
0 0.
0 0.
04
0.7
0.1
-0.1
0.
14
0.3
0.2
0.0
0.03
Et
hiop
ia
482.
3 0.
6 0.
3 0.
0 0.
04
0.4
0.0
-0.1
0.
21
13.1
1.
7 -2
.5
2.63
0.
3 0.
2 0.
0 0.
03
Gam
bia,
The
15
8.0
0.1
0.1
0.0
0.01
0.
5 0.
0 -0
.1
0.25
1.
0 0.
1 -0
.2
0.19
3.
2 1.
8 0.
4 0.
29
Gui
nea
708.
5 0.
1 0.
1 0.
0 0.
01
2.5
0.1
-0.6
1.
34
0.3
0.0
-0.1
0.
06
0.2
0.1
0.0
0.02
G
uine
a-B
issa
u 62
.4
0.0
0.0
0.0
0.00
0.
4 0.
0 -0
.1
0.19
0.
0 0.
0 0.
0 0.
00
0.0
0.0
0.0
0.00
H
aiti
253.
1 49
.3
27.4
-3
.6
3.08
2.
4 0.
1 -0
.6
1.28
9.
1 1.
2 -1
.7
1.84
38
.1
22.2
4.
4 3.
44
Kiri
bati
6.0
0.0
0.0
0.0
0.00
1.
0 0.
0 -0
.3
0.54
0.
0 0.
0 0.
0 0.
00
0.0
0.0
0.0
0.00
La
o PD
R
172.
2 31
.1
17.3
-2
.3
1.94
1.
0 0.
0 -0
.2
0.53
4.
2 0.
6 -0
.8
0.85
22
.9
13.3
2.
6 2.
07
Leso
tho
na
0.0
0.0
0.0
0.00
0.
0 0.
0 0.
0 0.
00
0.0
0.0
0.0
0.00
0.
0 0.
0 0.
0 0.
00
Libe
ria
1098
.6
180.
6 10
0.6
-13.
1 11
.27
2.2
0.1
-0.6
1.
17
0.3
0.0
-0.1
0.
06
2.0
1.2
0.2
0.18
M
adag
asca
r 69
4.3
55.3
30
.8
-4.0
3.
45
25.5
0.
6 -6
.5
13.7
7 21
.8
2.9
-4.1
4.
39
15.3
8.
9 1.
8 1.
38
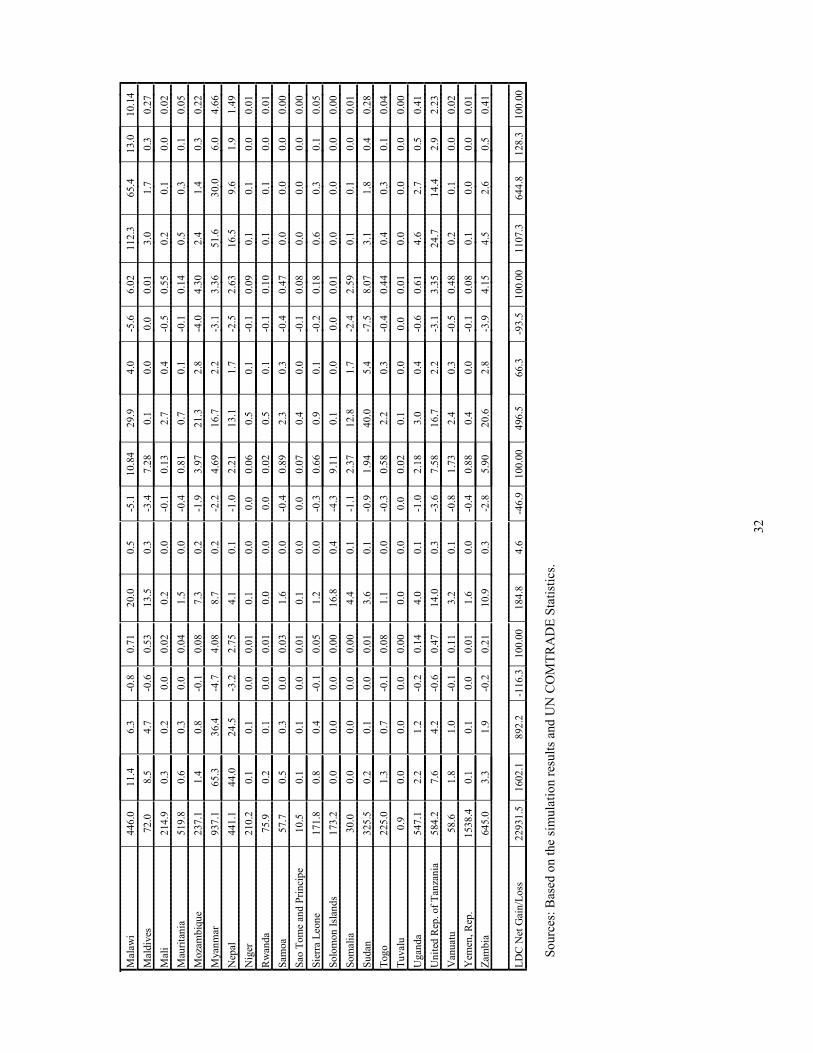
32
Mal
awi
446.
0 11
.4
6.3
-0.8
0.
71
20.0
0.
5 -5
.1
10.8
4 29
.9
4.0
-5.6
6.
02
112.
3 65
.4
13.0
10
.14
Mal
dive
s 72
.0
8.5
4.7
-0.6
0.
53
13.5
0.
3 -3
.4
7.28
0.
1 0.
0 0.
0 0.
01
3.0
1.7
0.3
0.27
M
ali
214.
9 0.
3 0.
2 0.
0 0.
02
0.2
0.0
-0.1
0.
13
2.7
0.4
-0.5
0.
55
0.2
0.1
0.0
0.02
M
aurit
ania
51
9.8
0.6
0.3
0.0
0.04
1.
5 0.
0 -0
.4
0.81
0.
7 0.
1 -0
.1
0.14
0.
5 0.
3 0.
1 0.
05
Moz
ambi
que
237.
1 1.
4 0.
8 -0
.1
0.08
7.
3 0.
2 -1
.9
3.97
21
.3
2.8
-4.0
4.
30
2.4
1.4
0.3
0.22
M
yanm
ar
937.
1 65
.3
36.4
-4
.7
4.08
8.
7 0.
2 -2
.2
4.69
16
.7
2.2
-3.1
3.
36
51.6
30
.0
6.0
4.66
N
epal
44
1.1
44.0
24
.5
-3.2
2.
75
4.1
0.1
-1.0
2.
21
13.1
1.
7 -2
.5
2.63
16
.5
9.6
1.9
1.49
N
iger
21
0.2
0.1
0.1
0.0
0.01
0.
1 0.
0 0.
0 0.
06
0.5
0.1
-0.1
0.
09
0.1
0.1
0.0
0.01
R
wan
da
75.9
0.
2 0.
1 0.
0 0.
01
0.0
0.0
0.0
0.02
0.
5 0.
1 -0
.1
0.10
0.
1 0.
1 0.
0 0.
01
Sam
oa
57.7
0.
5 0.
3 0.
0 0.
03
1.6
0.0
-0.4
0.
89
2.3
0.3
-0.4
0.
47
0.0
0.0
0.0
0.00
Sa
o To
me
and
Prin
cipe
10
.5
0.1
0.1
0.0
0.01
0.
1 0.
0 0.
0 0.
07
0.4
0.0
-0.1
0.
08
0.0
0.0
0.0
0.00
Si
erra
Leo
ne
171.
8 0.
8 0.
4 -0
.1
0.05
1.
2 0.
0 -0
.3
0.66
0.
9 0.
1 -0
.2
0.18
0.
6 0.
3 0.
1 0.
05
Solo
mon
Isla
nds
173.
2 0.
0 0.
0 0.
0 0.
00
16.8
0.
4 -4
.3
9.11
0.
1 0.
0 0.
0 0.
01
0.0
0.0
0.0
0.00
So
mal
ia
30.0
0.
0 0.
0 0.
0 0.
00
4.4
0.1
-1.1
2.
37
12.8
1.
7 -2
.4
2.59
0.
1 0.
1 0.
0 0.
01
Suda
n 32
5.5
0.2
0.1
0.0
0.01
3.
6 0.
1 -0
.9
1.94
40
.0
5.4
-7.5
8.
07
3.1
1.8
0.4
0.28
To
go
225.
0 1.
3 0.
7 -0
.1
0.08
1.
1 0.
0 -0
.3
0.58
2.
2 0.
3 -0
.4
0.44
0.
4 0.
3 0.
1 0.
04
Tuva
lu
0.9
0.0
0.0
0.0
0.00
0.
0 0.
0 0.
0 0.
02
0.1
0.0
0.0
0.01
0.
0 0.
0 0.
0 0.
00
Uga
nda
547.
1 2.
2 1.
2 -0
.2
0.14
4.
0 0.
1 -1
.0
2.18
3.
0 0.
4 -0
.6
0.61
4.
6 2.
7 0.
5 0.
41
Uni
ted
Rep
. of T
anza
nia
584.
2 7.
6 4.
2 -0
.6
0.47
14
.0
0.3
-3.6
7.
58
16.7
2.
2 -3
.1
3.35
24
.7
14.4
2.
9 2.
23
Van
uatu
58
.6
1.8
1.0
-0.1
0.
11
3.2
0.1
-0.8
1.
73
2.4
0.3
-0.5
0.
48
0.2
0.1
0.0
0.02
Y
emen
, Rep
. 15
38.4
0.
1 0.
1 0.
0 0.
01
1.6
0.0
-0.4
0.
88
0.4
0.0
-0.1
0.
08
0.1
0.0
0.0
0.01
Za
mbi
a 64
5.0
3.3
1.9
-0.2
0.
21
10.9
0.
3 -2
.8
5.90
20
.6
2.8
-3.9
4.
15
4.5
2.6
0.5
0.41
LDC
Net
Gai
n/Lo
ss
2293
1.5
1602
.1
892.
2 -1
16.3
10
0.00
18
4.8
4.6
-46.
9 10
0.00
49
6.5
66.3
-9
3.5
100.
00
1107
.3
644.
8 12
8.3
100.
00
Sour
ces:
Bas
ed o
n th
e si
mul
atio
n re
sults
and
UN
CO
MTR
AD
E St
atis
tics.

33
Table 8a: Export Changes in LDCs by Major Product After Duty Free Access in EU and Japan (Based on 1996-98 export average in $ Million)
EU Tariff Peak Reform Japanese Tariff Peak Reform HS-2 Product Beneficial
LDCs Peak Exp to
World
Export Increase
Exp Sh in %
Beneficial LDCs
Peak Exp to World
Export Increase
Exp Sh in %
02 Meats & edible meat SDN 5.2 9.5 51.8 MDG 2.1 2.3 33.2 MDG 2.2 4.1 22.1 SDN 2.0 2.2 31.1 VUT 1.8 3.3 18.1 VUT 1.8 2.0 28.4 MYR 0.2 0.3 1.6 MYR 0.1 0.2 2.3 UGA 0.1 0.2 1.0 UGA 0.1 0.1 1.6 All LDCs 10.1 18.4 100.0 All LDCs 6.4 7.0 100.0
10 Cereals MYR 8.9 9.6 39.3 MYR 3.3 6.8 37.3 MDG 3.1 3.3 13.7 MOZ 2.2 4.6 25.2 SDN 2.9 3.2 13.0 MDG 2.1 4.4 23.9 MOZ 2.2 2.4 9.8 UGA 0.5 1.1 6.0 TZA 1.6 1.7 7.0 GMB 0.2 0.5 2.6 All LDCs 22.6 24.4 100.0 All LDCs 8.7 18.3 100.0
11 Flour, malt & starch NPL 3.6 2.6 60.5 NPL 3.5 1.9 59.5 BGD 0.8 0.6 13.6 BGD 0.8 0.4 13.7 MYR 0.6 0.4 9.4 ETH 0.5 0.3 8.0 ETH 0.3 0.2 5.1 MYR 0.4 0.2 7.3 BTN 0.2 0.2 3.6 BTN 0.2 0.1 3.6 All LDCs 5.9 4.3 100.0 All LDCs 5.9 3.3 100.0
12 Oil seed & misc grain SDN 11.0 3.9 92.3 MYR 0.3 0.1 2.3 AFG 0.2 0.1 1.6 NER 0.2 0.1 1.3 CAM 0.1 0.0 1.0 All LDCs 11.9 4.2 100.0
17 Sugars & confectionery MWI 23.1 32.0 26.9 MWI 23.2 99.6 22.1 ZMB 16.6 23.0 19.3 ZMB 16.6 71.3 15.8 MOZ 13.0 18.0 15.2 MOZ 15.3 65.8 14.6 MDG 11.4 15.8 13.3 SDN 14.8 63.7 14.1 TZA 9.9 13.7 11.5 MDG 11.4 48.9 10.9 All LDCs 85.9 119.0 100.0 All LDCs 104.9 450.9 100.0
23 Residue & waste food MYR 3.5 3.2 34.8
ZAR 1.7 1.6 17.2 NPL 1.6 1.4 15.8 MOZ 0.7 0.6 6.9 TGO 0.7 0.6 6.8 All LDCs 10.1 9.1 100.0

34
Table 8b: Export Changes in LDCs by Major Product After Duty Free Access in Canada and US (Based on 1996-98 export average in $ Million)
Canadian Tariff Peak Reform USA Tariff Peak Reform HS-2 Product Beneficial
LDCs Peak Exp to World
Export Increase
Exp Sh in %
Beneficial LDCs
Peak Exp to World
Export Increase
Exp Sh in %
12 Oil seed & misc grain GMB 8.4 13.5 50.1 SDN 6.4 10.3 38.2 MWI 0.5 0.9 3.2 MDG 0.4 0.7 2.4 NER 0.2 0.4 1.3 All LDCs 16.8 27.0 100.0
24 Tobacco MWI 310.1 250.3 76.1 TZA 54.0 43.6 13.2 UGA 11.0 8.9 2.7 ZMB 10.1 8.1 2.5 LBR 5.6 4.6 1.4 All LDCs 407.6 329.1 100.0
61 Clothing, knitted BGD 1145.6 404.0 64.5 BGD 936.3 279.3 70.6 CAM 192.3 67.8 10.8 CAM 121.8 36.3 9.2 HTI 119.7 42.2 6.7 HTI 91.9 27.4 6.9 MYR 109.6 38.6 6.2 MYR 78.4 23.4 5.9 MDG 93.5 33.0 5.3 LAO 28.9 8.6 2.2 All LDCs 1776.6 626.5 100.0 All LDCs 1326.8 395.8 100.0
62 Clothing, not knitted BGD 2109.1 692.2 78.7 BGD 1133.3 283.9 84.4 CAM 133.4 31.2 5.0 MYR 65.2 16.3 4.9 MYR 99.9 23.4 3.7 CAM 36.7 9.2 2.7
NPL 95.6 22.4 3.6 LAO 34.8 8.7 2.6 MDG 90.2 21.1 3.4 NPL 27.0 6.8 2.0 All LDCs 2678.5 879.0 100.0 All LDCs 1342.4 336.3 100.0
63 Other made up textiles BGD 80.4 23.5 80.1 MWI 6.9 2.0 6.8
NPL 6.0 1.7 6.0 CAM 2.0 0.6 2.0 MDG 1.7 0.5 1.7
All LDCs 100.3 29.3 100.0 64 Footwear BGD 41.5 11.0 55.3 BGD 22.1 9.2 55.2
CAM 11.2 3.0 14.9 CAM 7.9 3.3 19.6 CPV 7.0 1.9 9.3 CPV 3.5 1.5 8.8 MYR 6.7 1.8 9.0 MYR 2.4 1.0 5.9 LAO 3.6 1.0 4.8 LAO 1.5 0.6 3.8 All LDCs 75.1 19.9 100.0 All LDCs 40.1 16.6 100.0
65 Headgear & parts BGD 130.8 18.6 96.1 NPL 3.0 0.4 2.2 MDG 0.8 0.1 0.6 CAM 0.6 0.1 0.4 HTI 0.5 0.1 0.4 All LDCs 136.1 19.4 100.0
Sources: Based on simulation results and UN COMTRADE Statistics.

35
Caveats
The estimated gains from preferential access may be too high even though we have
deliberately assumed a limited supply response.15 Although expanding exports to a
particular market by re-directing exports from other regions does not require an increase
in total exports (and therefore in supply), it does requires the establishment of strong
business relationships and a good reputation as a supplier in the new market, which may
limit the gains from these preferential initiatives. However, one can also argue that the
static nature of the simulations underestimates the potential export gains for LDCs. If
allowance is made investment, the supply response in LDCs to large tariff preference
margins in the Quad may be much higher than the one assumed in the simulations.
An important qualification to consider is that the estimates are premised on the
assumption that access is truly free. In practice any type of preferences will be
accompanied by rules of origin and may remain subject to the threat of contingent
protection�antidumping, countervailing duties and safeguard actions. Both types of
policy instruments can be used to make duty free access irrelevant in practice. Examples
abound of protectionist lobbying in Quad members to tighten GSP rules of origin to
restrict the ability of beneficiaries to significantly expand exports. Usually such lobbying
is facilitated by the use of value added tests or local content requirements�e.g., at least
40 percent of the value added in production must originate in the country of export. The
problem with such criteria is that they can be changed unilaterally and allow significant
discretion for administering authorities to determine if the rule has been met.
An example from the US illustrates how rules of origin may be used to nullify the
benefits of preferences. In 1983, the US adopted the Caribbean Basin Initiative, which
granted Caribbean countries duty-free access to the US for many products. To determine
whether a product was eligible for preferential treatment, at least 35 percent of the value
of the good imported into the US must have been generated in the Caribbean. The
preference scheme induced foreign investment in the Caribbean, including firms that
established operations in Costa Rica and Jamaica to convert surplus European wine into
ethanol, which was then exported to the US. This production process met the 35 percent
15 One can also argue that the static nature of the simulations underestimates the potential export gains for LDCs. Once we allow for investment (FDI), the supply response in LDCs to large tariff preference margins in the Quad may be much higher than the one assumed in the simulations.

36
value added test. Two years later, with production and exports doing well, the exporters
were hit with a rule change: a US Congressman introduced an amendment to a tax bill
raising the value added requirement for ethanol to 70 percent�an impossible
requirement to meet for the Caribbean producers. The US industry that had lobbied for
this rule change was never threatened by the imports�which never exceeded three
percent of US consumption (Bovard, 1991: 22). Rules of origin are also high cost to
administer�the tariff equivalent of the associated red tape can be significant. Herin
(1986) estimated the ad-valorem cost of fulfilling rules of origin in EFTA was high
enough for some 25% of all trade to pay the MFN tariff rather than document origin.
The WTO includes an Agreement on Rules of Origin that aims to foster the
harmonization of the rules used by members. The agreement calls for a work program to
be undertaken by a Technical Committee, in conjunction with the WCO, to develop a
classification system regarding the changes in tariff subheadings based on the
Harmonized System that constitute a substantial transformation. In principle, such rules
are to be based on the change in tariff heading methodology, not value added criteria. The
former involves rules that specify that a good originates if in the production process, the
good that is produced is classified in a HS category that differs from that applying to the
major inputs used. The WCO harmonization program, expected to be completed by the
end of 2001, provides a potential solution to the rules of origin problem, as it creates the
possibility of the Quad adopting the WCO rules. The WCO rules of origin are intended to
be applied for non-preferential commercial policy instruments�tariffs, import licensing,
antidumping and so forth�but there is no reason why they could not be applied to
preferential trade as well. Doing so would help to greatly reduce transactions costs and
uncertainty.
The threat of antidumping and similar instruments of contingent protection can
also make duty free access redundant if there is a probability that once exports have
expanded they will be targeted by such mechanisms. It is therefore important that duty
free access schemes exempt LDCs exempt from the application of antidumping and
safeguard actions. While this may be politically difficult to achieve, the small trade flows
concerned should make such a promise relatively painless in practice. A problem,
however, is that antidumping is an �automatic� type of instrument, whose application

37
cannot be blocked by the political authorities unless the relevant laws and regulations are
amended. More generally, being unilateral, it must be recognized that duty free access
offers by the Quad are not enforceable. This implies a need for good faith efforts to
deliver on promises to open markets fully and to prevent attempts to re-impose protection
through the backdoor. Monitoring of the implementation of duty free access by civil
society (development-oriented NGOs) could help ensure compliance. This is an area
where it is not possible to rely on WTO dispute settlement, given that preferences are
unilateral.
Finally, it should be noted that the above analysis completely ignores the fact that
trade barriers faced by developing countries include policies imposed by other
developing countries. Almost 40 percent of developing countries exports were imported
by other developing countries in 1998 (Hertel and Martin, 1999). Moreover, tariffs are
higher in developing countries for products. Own liberalization is likely to be a major
precondition for benefiting fully from duty free access in the Quad.
5 Concluding remarks Although average tariffs confronting LDCs in Quad markets are very low, tariff peaks
and tariff escalation have a disproportional effect on LDC exports. Goods that are subject
to MFN tariffs of 15 percent or higher account for 11 percent of LDC exports to the
Quad, although these types of products represent only 4 percent of total Quad imports
($93 billion). Of this small amount, LDCs account for less than 4 percent of total Quad
imports of tariff peak items�they are very small players.
Products that are subject to tariff peaks, especially in Canada and the US, tend to
benefit from only limited preferential access. The impact of tariff peaks is therefore
disproportionately great for LDCs. Tariff peak products tend to be heavily concentrated
in agriculture products (sugar, cereals, meat) and in labor intensive sectors such as
apparel and footwear. LDC exports of tariff peak items to the Quad tend to be highly
concentrated. In Japan, LDCs are virtually not present in the market; in the US and
Canada exports are heavily concentrated in apparel. Only in the EU do LDCs have a
relatively diversified presence in that they export non-negligible quantities of a number
products.

38
Elimination of tariff peaks for LDCs in Quad markets will have a significant
effect on LDC exports to these markets, ranging from 30 to 60 percent. The extra $2.5
billion of exports by LDCs represents an 11 percent increase in their total exports to the
world. This would constitute a major improvement in terms of export performance. The
impact of duty free access on domestic producers and domestic consumption in the Quad
would be very small, in part LDCs will displace trade from other sources. While such
displacement�trade diversion�is inherently a problem associated with granting
preferential access to only a subset of countries, the amounts involved are very small
relative to total developing (non-LDC) country exports of tariff peak products. Moreover,
LDC exports expand more than other developing countries trade contracts. In terms of
other developing country total exports to the world, the decline associated with providing
LDCs with free access to the Quad is quite small�less than 0.1 percent of their global
exports.
The overall increase in exports of $2.5 billion can be compared to the magnitude
of the official development assistance (ODA) given by the Quad to LDCs. Total ODA to
LDCs stood at $6.7 billion in 1998, more than two-thirds of which was provided by the
EU and its member states. If we divide the projected increase in LDC exports of tariff
peak items following granting of duty free access in Canada, the EU, Japan and the US
by the ODA provided by each of these Quad members to all LDCs, we can conclude that
duty free access would generate an increase in exports that is equivalent to more than 5
times ODA granted by Canada; more than double that provided by the US, about half that
granted by Japan ODA, and only 4 percent of EU ODA.16
The distribution of export increases across products and countries reflects
differences in both the export bundle of LDCs and the tariff peak items in Quad
countries. In terms of specific product categories and countries, the impact of duty free
access for LDCs is relatively concentrated. In the US and Canada, most of the action is in
apparel. In the EU and Japan, the action is primarily in sugar and related products, and
cereals. In terms of which LDCs benefit most, Bangladesh would be a big beneficiary, as
the largest LDC exporter of apparel, footwear and fish to the EU, US, and Canada. Other
LDCs will also benefit significantly in relative terms. Cambodia, Cape Verde, Haiti, Lao,
16 Data on ODA based on OECD DAC figures.

39
Liberia, Malawi, the Maldives and Somalia would all see their exports increase by 20
percent or more. Given that tariff peaks across Quad countries occur in different products
and that LDC export bundles are quite varied, it is important that all Quad members grant
preferential access to ensure that all LDCs benefit.
It is well known that protectionist trade regimes in industrialized countries are not
the most important factor constraining LDC export growth�importance as well are
domestic distortions and institutional weaknesses that create high transactions costs, bias
investment incentives and raise risk premia�see, e.g., Ng and Yeats (1996), World Bank
(2001). Duty free access will not solve the problem of the marginalization of LDCs in
global trade. However, it is something that can be offered to these countries by the Quad,
and that can help offset to some extent the major domestic challenges and transactions
costs that confront domestic entrepreneurs in these countries. In the process it may help
alter the domestic political economy forces that constrain the adoption and
implementation of better policies by mobilizing groups that will benefit from improved
access to the Quad.

40
References
Finger, J. Michael and Sam Laird (1987), �Protection in Developed and Developing Countries-An overview�, Journal of World Trade Law, 21(6).
Finger, J. Michael and Ludger Schuknecht (1999), �Market Access Advances and Retreats: the Uruguay Round and beyond�, Policy Research Working Paper, The World Bank.
Grether, Jean-Marie and Marcelo Olarreaga (1999), �Preferential and non-preferential trade flows in world trade� in: M. Rodriguez-Mendoza, P. Low and B. Kotschwar, eds. Trade rules in the making: challenges in regional and multilateral negotiations, Brooking Institution Press, DC.
Hallaert, Jean-Jacques (2000), �Un bilan a mi-parcours du SPG Europeen: impact du volet industriel sur les pays en developpement d�Asie�, mimeo, Science Po (GEM), Paris.
Herin, Jan (1986), �Rules of origin and differences between tariff levels in EFTA and in the EC�, AELE Occasional paper #13, Geneva.
Hertel, Thomas and Will Martin (1999), �Would developing countries gain from inclusion of manufactures in the WTO 2000 negotiations?� (available at www.worldbank.org/trade.
Hoekman, Bernard and Michel Kostecki (2001) The Political Economy of the World Trading System. (Oxford: Oxford University Press).
Ianchovichina, Elena, Aaditya Mattoo and Marcelo Olarreaga (2000), �Unrestricted Market Access for Sub-Saharan Africa: How much is it worth and who will pay?�, mimeo, The World Bank, Washington, DC.
Kennan, Jane and Christopher Stevens (1997), �From Lomé to the GSP: Implications for the ACP of Losing Lomé Trade preferences�, Institute of Development Studies, University of Sussex.
Mattoo, Aaditya and Marcelo Olarreaga (2000), �Reciprocity across modes of supply in the WTO: a negotiating formula�, Policy Research Working Paper , The World Bank.
Michalopoulos, Constantine (1999), �Trade Policy and Market Access Issues for Developing Countries: implications for the Millennium Round�, Policy Research Working Paper #2214, The World Bank.
Ng, Francis and Sandy Yeats (1996), �Open Economies Work Better! Did Africa�s Protectionist Policies Cause its Marginalization in World Trade?, Policy Research Working Paper #1636, The World Bank.
OECD (1997a), Indicators of Tariff and Non-Tariff Barrier, Paris. OECD (1997b), Market Access for Least-Developed countries, (WTO document
WT/LDC/HL:19). Stevens, Christopher and Jane Kennan (2000), �Analysis of EU Trade Arrangements�
with Developing and Transition Economies�, IDS, University of Sussex. WTO (several years), Trade Policy Review (Quad Countries), Geneva.

41
APPENDIX A:
Tariff Peaks at 2-digit HS in Quad
Table A1: Peaks and preferential access into the Canadian market
Tariff Peak at HS 2-digit Product # 6 �digit lines MFN tariff LDC pref. GSP pref Mex Pref Chl Pref CAR Pref
01 Live animals. 4 198.8 0.00 0.00 0.00 0.25 0.25 02 Meat and edible meat offal 10 109.9 0.60 0.17 0.17 0.60 0.60 04 Dairy prod; birds' eggs; honey 26 197.5 0.31 0.03 0.05 0.50 0.54 06 Live tree & other plant; bulb, cut flowers 1 15.2 0.47 0.47 0.51 0.60 1.00 08 Edible fruit and nuts; melons 1 16.6 0.00 0.00 0.00 0.00 0.00 10 Cereals. 3 70.2 0.00 0.00 1.00 0.69 0.53 11 Prod mill indust; malt; starches 7 85.3 0.14 0.02 0.14 0.07 0.14 12 Oil seed, oleagi fruits; misc grain 1 18.3 0.00 0.00 0.00 0.00 0.00 13 Lac; gums, resins & other veg 1 74.0 0.00 0.00 0.00 0.00 0.00 15 Animal/veg fats & oils & prod 8 28.0 0.80 0.57 1.00 1.00 1.00 16 Prep of meat, fish or mollusks 5 68.7 0.59 0.14 0.22 0.50 0.66 17 Sugars and sugar confectionery 1 16.6 0.00 0.00 0.00 0.00 0.00 18 Cocoa and cocoa preparations 2 85.5 1.00 0.18 1.00 0.73 1.00 19 Prep of cereal, flour, starch/milk prod 3 54.5 0.96 0.26 0.87 0.96 1.00 20 Prep of vegetable, fruit, nuts prod 2 19.4 0.00 0.00 0.77 0.48 1.00 21 Miscellaneous edible preparations 4 48.9 0.97 0.37 0.77 0.83 1.00 22 Beverages, spirits and vinegar 3 26.7 0.67 0.27 1.00 1.00 1.00 23 Residues & waste from food indust 2 30.3 0.29 0.00 0.40 0.50 0.50 24 Tobacco and manufactured 1 17.6 0.00 0.00 1.00 1.00 1.00 33 Essential oils & resinoids, perf. 1 18.0 1.00 0.74 1.00 0.57 1.00 35 Albuminoidal subs; modified starches 2 18.0 0.00 0.00 0.00 0.50 0.50 39 Plastics and articles thereof. 5 16.7 1.00 0.36 0.70 0.72 1.00 40 Rubber and articles thereof. 7 16.8 1.00 0.37 0.85 1.00 1.00 42 Articles of leather; saddlery, travel pr 3 16.6 1.00 0.42 0.72 1.00 1.00 43 Furskins and artificial fur thereof. 2 19.2 1.00 0.34 0.61 1.00 1.00 51 Wool, fine/coarse animal hair nes 7 16.5 0.87 0.41 1.00 1.00 0.00 52 Cotton. 66 17.3 0.15 0.06 0.62 0.62 0.00 53 Other vegetable textile fibres & yarns 2 16.0 1.00 0.13 1.00 1.00 0.00 54 Man-made filaments. 34 19.0 0.01 0.00 1.00 1.00 0.00 55 Man-made staple fibres. 68 19.0 0.10 0.03 1.00 1.00 0.00 56 Wadding, felt & nonwoven, yarns etc. 22 16.9 0.39 0.16 0.77 0.77 0.00 57 Carpets and other textile floor coverings 14 18.9 1.00 0.47 0.77 0.77 0.00 58 Special woven fab; tufted tex fab etc 31 17.9 0.34 0.11 0.65 0.65 0.00 59 Impregnated, coated, cover/laminated 13 17.8 0.90 0.33 0.73 0.73 0.00 60 Knitted or crocheted fabrics 16 18.0 0.38 0.12 0.65 0.65 0.00 61 Art of apparel & clothing access 114 23.3 0.07 0.02 0.62 0.62 0.00 62 Art of apparel & clothing access 116 22.4 0.09 0.04 0.66 0.66 0.00 63 Other made up textile articles 52 22.1 0.14 0.06 0.68 0.68 0.03 64 Footwear, gaiters and articles 23 20.8 0.12 0.07 0.70 0.67 0.00 65 Headgear and parts thereof. 4 18.7 0.61 0.12 1.00 1.00 0.00 67 Prepr feathers & down; art flower nes 4 21.3 1.00 1.00 1.00 1.00 1.00 68 Art of stone, plaster, cement, asbestos 1 21.3 0.00 0.00 1.00 1.00 1.00 70 Glass and glassware. 7 16.6 0.46 0.22 0.73 1.00 1.00 85 Electrical mech equip parts, sound pr 3 16.7 0.00 0.00 0.00 0.00 0.00 86 Railw/tramw locom, rolling stock etc. 7 15.0 1.00 0.55 0.92 1.00 1.00 89 Ships, boats and floating structures 10 22.5 1.00 0.04 0.74 1.00 1.00 91 Clocks and watches and parts nes 6 18.6 1.00 0.50 1.00 1.00 1.00 94 Furniture; bedding, mattress, cushion 2 21.0 0.00 0.00 0.77 1.00 1.00 95 Toys, games & sports requisites, nes 1 16.4 0.13 0.06 0.84 1.00 1.00 96 Miscellaneous manufactured articles 4 17.5 0.68 0.34 0.76 1.00 1.00 Source: OECD and WTO tariff files.

42
Table A2: Preferential access into the EU market in tariff peaks
Tariff Peak at HS 2-digit Products # of 6-digit tariff lines
MFN Tariff
LDC Pref.
GSP Pref.
ACP Pref.
ACP +LDC Pref.
FTA Pref.
01 Live animals. 7 38.2 0.06 0.00 0.30 0.35 0.00 02 Meat and edible meat offal 41 71.0 0.08 0.00 0.10 0.10 0.00 03 Fish & crustacean, mollusk nes 17 18.7 1.00 0.10 1.00 1.00 0.00 04 Dairy prod; birds' eggs; honey 25 59.1 0.12 0.01 0.06 0.12 0.02 06 Live tree & other plant; bulb, cut flowers 2 16.9 1.00 0.18 1.00 1.00 0.33 07 Edible vegetables and roots & tubers 12 25.4 0.79 0.15 0.66 0.79 0.00 08 Edible fruit and nuts; melons 8 20.2 0.66 0.12 0.64 0.66 0.06 09 Coffee, tea, mat and spices 2 16.0 0.50 0.69 1.00 1.00 0.00 10 Cereals. 14 75.6 0.06 0.00 0.06 0.07 0.00 11 Prod mill indust; malt; starches 31 38.2 0.17 0.02 0.20 0.21 0.00 12 Oil seed, oleagi fruits; misc grain 1 74.4 0.15 0.00 0.16 0.16 0.00 13 Lac; gums, resins & other veg 1 17.8 1.00 0.30 1.00 1.00 0.00 15 Animal/veg fats & oils & prod 8 56.0 0.60 0.19 0.51 0.60 0.03 16 Prep of meat, fish or mollusks 22 23.5 0.68 0.20 0.67 0.68 0.01 17 Sugars and sugar confectionery 9 37.6 0.14 0.03 0.21 0.25 0.05 18 Cocoa and cocoa preparations 1 24.0 0.25 0.10 0.25 0.25 0.25 19 Prep of cereal, flour, starch/milk prod 13 34.1 0.37 0.11 0.39 0.42 0.30 20 Prep of vegetable, fruit, nuts prod 42 26.1 0.88 0.15 0.88 0.90 0.02 21 Miscellaneous edible preparations 8 19.2 0.95 0.28 0.78 0.95 0.28 22 Beverages, spirits and vinegar 12 35.7 0.71 0.33 0.77 0.78 0.06 23 Residues & waste from food indust 6 71.4 0.06 0.03 0.11 0.13 0.00 24 Tobacco and manufactured 8 56.2 1.00 0.39 1.00 1.00 0.00 29 Organic chemicals. 3 33.9 1.00 0.33 0.53 1.00 0.53 35 Albuminoidal subs; modified starches 2 24.9 1.00 1.00 1.00 1.00 1.00 38 Miscellaneous chemical products 2 45.9 0.50 0.00 0.33 0.50 0.33 56 Wadding, felt & nonwoven, yarns etc. 2 21.1 1.00 0.15 1.00 1.00 1.00 64 Footwear, gaiters and articles 13 18.2 1.00 0.30 1.00 1.00 1.00 87 Vehicles o/t railw/tramw roll stock, pts 5 16.3 1.00 0.44 1.00 1.00 1.00 Source: OECD and WTO tariff files.

43
Table A3: Preferential access into the Japanese market in tariff peaks
Tariff Peak at HS 2-digit products # of 6-digit lines
MFN Tariff
LDC preferences
GSP preferences
02 Meat and edible meat offal 9 39.31 0.13 0.13 03 Fish & crustacean, mollusk nes 4 15.00 0.00 0.00 04 Dairy prod; birds' eggs; honey 25 28.99 0.05 0.05 07 Edible vegetables and roots & tubers 1 15.80 0.00 0.00 08 Edible fruit and nuts; melons 11 19.81 0.15 0.09 09 Coffee, tea, mat and spices 5 17.81 0.49 0.11 10 Cereals. 1 63.38 0.00 0.00 11 Prod mill indust; malt; starches 28 23.24 0.11 0.06 12 Oil seed, oleagi fruits; misc grain 1 19.10 0.00 0.00 15 Animal/veg fats & oils & prod 2 26.99 0.00 0.00 16 Prep of meat, fish or mollusks 4 20.69 0.05 0.05 17 Sugars and sugar confectionery 11 71.25 0.05 0.05 18 Cocoa and cocoa preparations 6 22.77 0.49 0.18 19 Prep of cereal, flour, starch/milk prod 13 21.91 0.15 0.04 20 Prep of vegetable, fruit, nuts prod 32 22.69 0.23 0.06 21 Miscellaneous edible preparations 7 22.35 0.19 0.11 22 Beverages, spirits and vinegar 16 38.65 0.39 0.16 24 Tobacco and manufactured 2 18.63 0.00 0.00 29 Organic chemicals. 2 20.00 1.00 1.00 35 Albuminoidal subs; modified starches 2 23.31 1.00 1.00 38 Miscellaneous chemical products 1 80.83 1.00 1.00 41 Raw hides and skins (other than fur) 10 26.08 1.00 0.57 42 Articles of leather; saddlery, travel pr 5 15.52 0.20 0.10 43 Furskins and artificial fur thereof. 8 16.25 0.47 0.47 53 Other vegetable textile fibres & yarns 4 16.00 1.00 1.00 58 Special woven fab; tufted tex fab etc 4 17.90 1.00 0.50 60 Knitted or crocheted fabrics 3 15.70 1.00 0.50 64 Footwear, gaiters and articles 16 36.24 0.81 0.40 Source: Computations based on UN COMTRADE Statistics.

44
Table A4: Preferential Access into the US market in tariff peaks
Product Description # lines MFN LDC GSP Mexico ATP Caribbean
02 Meat and edible meat offal 2 19.20 0.00 0.00 1.00 0.00 0.00 04 Dairy prod; birds' eggs; honey 2 20.90 0.38 0.00 0.25 0.38 0.38 07 Edible vegetables and roots nes 10 20.56 0.88 0.18 0.90 1.00 1.00 08 Edible fruit and nuts; melons 5 16.66 0.80 0.18 0.74 0.80 0.80 11 Prod mill indust; malt; starches 1 16.30 1.00 0.00 1.00 1.00 1.00 12 Oil seed, oleagi fruits; misc etc. 3 77.95 0.00 0.33 0.67 0.00 0.00 15 Animal/veg fats & oils & prod 4 19.92 0.50 0.25 0.50 0.50 0.50 19 Prep of cereal, flour, milk prod 2 16.79 0.84 0.50 0.63 0.84 0.84 20 Prep of vegetable, fruit, nuts 11 28.67 0.55 0.11 0.56 0.55 0.55 21 Miscellaneous edible prep 1 19.80 0.74 0.00 0.43 0.74 0.74 24 Tobacco and manufactured 7 73.48 0.14 0.09 0.96 0.14 0.14 28 Inorgn chem; compds of prec 1 15.10 1.00 1.00 1.00 1.00 1.00 29 Organic chemicals. 4 16.75 1.00 1.00 1.00 1.00 1.00 30 Pharmaceutical products. 1 30.00 0.00 0.00 0.00 0.00 0.00 42 Articles of leather; saddlery 1 20.00 0.00 0.00 0.60 0.13 0.13 51 Wool, fine/coarse animal hair 4 20.45 0.00 0.00 1.00 0.00 0.00 52 Cotton. 10 18.34 0.00 0.00 1.00 0.00 0.00 54 Man-made filaments. 27 16.37 0.00 0.00 1.00 0.00 0.00 55 Man-made staple fibres. 56 16.27 0.00 0.00 0.97 0.00 0.00 56 Wadding, felt & nonwoven, yarn 1 15.20 0.00 0.00 1.00 0.00 0.00 58 Special woven fab; tufted fabrics 15 18.47 0.00 0.00 1.00 0.07 0.20 60 Knitted or crocheted fabrics 5 18.58 0.00 0.00 1.00 0.00 0.00 61 Art of apparel & clothing access 58 19.50 0.00 0.00 0.85 0.02 0.05 62 Art of apparel & clothing access 41 18.85 0.00 0.00 0.83 0.02 0.14 64 Footwear, gaiters and parts etc. 12 27.77 0.01 0.01 0.57 0.01 0.01 69 Ceramic products. 4 17.63 0.09 0.09 0.27 1.00 1.00 70 Glass and glassware. 4 16.16 1.00 0.08 0.42 1.00 1.00 82 Tool, implement, cutlery, spoon 1 15.23 1.00 0.65 0.65 1.00 1.00 86 Railw/tramw locom, rolling stock 7 17.20 1.00 1.00 1.00 1.00 1.00 87 Vehicles o/t railw/tramw roll stock 5 25.00 1.00 0.00 1.00 1.00 1.00 96 Miscellaneous manufactures 2 20.66 0.78 0.57 1.00 0.78 0.78 Source: OECD and WTO tariff files.

45
Appendix B: Total Exports of LDC by HS-2 digit (1996-98 average, peaks and other products)
Export Values of LDCs ($ '000) Export Shares of All Goods (%)
HS-2 Product Canada EU Japan USA World Canada EU Japan USA World
01 Live animals. 70 4384 670 3523 12306 0.02 0.05 0.05 0.06 0.05 02 Meat and edible meat offal 0 2649 1905 21 11298 0.00 0.03 0.14 0.00 0.05 03 Fish & crustacean, mollusc nes 10983 569991 400391 136963 1307056 3.74 6.06 29.94 2.25 5.74 04 Dairy prod; birds' eggs; honey 12 535 71 102 1873 0.00 0.01 0.01 0.00 0.01 05 Products of animal origin 17 4372 3248 943 11468 0.01 0.05 0.24 0.02 0.05 06 Live tree & other plant; bulb, cut flowers 141 0 56 1550 34618 0.05 0.00 0.00 0.03 0.15 07 Edible vegetables and roots & tubers 247 61539 8139 613 250776 0.08 0.65 0.61 0.01 1.10 08 Edible fruit and nuts; melons 1510 68239 17 24000 257010 0.51 0.73 0.00 0.39 1.13 09 Coffee, tea, mat and spics 18586 928734 106749 125653 1407068 6.32 9.87 7.98 2.06 6.18 10 Cereals. 41 5995 484 128 19373 0.01 0.06 0.04 0.00 0.09 11 Prod mill indust; malt; starches 10 119 0 165 5460 0.00 0.00 0.00 0.00 0.02 12 Oil seed, oleagi fruits; misc grain 822 120725 57273 23180 282589 0.28 1.28 4.28 0.38 1.24 13 Lac; gums, resins & other veg 12 44216 3305 15826 70480 0.00 0.47 0.25 0.26 0.31 14 Vegetable plaiting materials, nes 110 6088 113 1402 14957 0.04 0.06 0.01 0.02 0.07 15 Animal/veg fats & oils & prod 22 54930 1626 1508 89950 0.01 0.58 0.12 0.02 0.40 16 Prep of meat, fish or molluscs 530 73066 7935 438 83974 0.18 0.78 0.59 0.01 0.37 17 Sugars and sugar confectionery 69 62605 3 22332 103055 0.02 0.67 0.00 0.37 0.45 18 Cocoa and cocoa preparations 268 51913 0 2840 68535 0.09 0.55 0.00 0.05 0.30 19 Prep of cereal, flour, starch/milk prod 19 310 2 177 3158 0.01 0.00 0.00 0.00 0.01 20 Prep of vegetable, fruit, nuts prod 239 3209 15 372 5304 0.08 0.03 0.00 0.01 0.02 21 Miscellaneous edible preparations 66 1327 51 48 4208 0.02 0.01 0.00 0.00 0.02 22 Beverages, spirits and vinegar 131 2271 52 689 6122 0.04 0.02 0.00 0.01 0.03 23 Residues & waste from food indust 155 30380 89 6771 48190 0.05 0.32 0.01 0.11 0.21 24 Tobacco and manufactured 939 208971 39075 63707 405337 0.32 2.22 2.92 1.05 1.78 25 Salt; sulphur; earth & ston, lime 39564 33851 873 4457 119327 13.46 0.36 0.07 0.07 0.52 26 Ores, slag and ash. 34792 565475 6385 124427 757596 11.84 6.01 0.48 2.04 3.33 27 Mineral fuels, oils & prod 55357 664502 253674 2972303 5957934 18.84 7.06 18.97 48.83 26.16 28 Inorgn chem; compds of prec met 7940 67907 21 4701 149466 2.70 0.72 0.00 0.08 0.66 29 Organic chemicals. 137 1647 205 172 7777 0.05 0.02 0.02 0.00 0.03 30 Pharmaceutical products. 12 1494 0 12309 22587 0.00 0.02 0.00 0.20 0.10 31 Fertilisers. 11 1028 4 908 32335 0.00 0.01 0.00 0.01 0.14 32 Tanning/dyeing extract; tannins etc 30 4229 22 735 8154 0.01 0.04 0.00 0.01 0.04 33 Essential oils & resinoids, perf. 209 16215 244 2133 31690 0.07 0.17 0.02 0.04 0.14 34 Soap, organic surface-active agents 14 350 3 80 9957 0.00 0.00 0.00 0.00 0.04 35 Albuminoidal subs; modified starches 53 1790 0 618 2755 0.02 0.02 0.00 0.01 0.01 36 Explosives; pyrotechnic prod 0 10 0 110 141 0.00 0.00 0.00 0.00 0.00 37 Photographic or cinematographic pr 1 585 43 23 790 0.00 0.01 0.00 0.00 0.00 38 Miscellaneous chemical products 97 374 78 141 2496 0.03 0.00 0.01 0.00 0.01 39 Plastics and articles thereof. 221 3954 348 1051 13733 0.08 0.04 0.03 0.02 0.06 40 Rubber and articles thereof. 653 17095 71 10700 106054 0.22 0.18 0.01 0.18 0.47 41 Raw hides and skins (other than fur) 191 171564 14278 10193 321639 0.06 1.82 1.07 0.17 1.41 42 Articles of leather; saddlery, travel gds 226 8063 1173 17929 28818 0.08 0.09 0.09 0.29 0.13 43 Furskins and artificial fur thereof. 46 7997 3 385 8774 0.02 0.08 0.00 0.01 0.04 44 Wood and articles of wood. 647 166790 108025 10358 621952 0.22 1.77 8.08 0.17 2.73 45 Cork and articles of cork 0 1 0 0 46 0.00 0.00 0.00 0.00 0.00 46 Manufactures of straw, plaiting mat etc 65 4782 205 1780 7382 0.02 0.05 0.02 0.03 0.03 47 Pulp of wood/of other fibrous cellulosic 3 90 1181 280 2347 0.00 0.00 0.09 0.00 0.01 48 Paper & paperboard; art & paper pulp 81 7455 92 682 11724 0.03 0.08 0.01 0.01 0.05 49 Printed books, newspaper prod. 59 5149 190 460 9137 0.02 0.05 0.01 0.01 0.04

46
50 Silk. 11 144 15 34 517 0.00 0.00 0.00 0.00 0.00 51 Wool, fine/coarse animal hair nes 22 14747 49 1126 17828 0.01 0.16 0.00 0.02 0.08 52 Cotton. 7372 387578 9307 2923 893293 2.51 4.12 0.70 0.05 3.92 53 Other vegetable textile fibres & yarns 1899 89221 8461 10282 225674 0.65 0.95 0.63 0.17 0.99 54 Man-made filaments. 27 747 1 31 7510 0.01 0.01 0.00 0.00 0.03 55 Man-made staple fibres. 60 2534 0 313 12684 0.02 0.03 0.00 0.01 0.06 56 Wadding, felt & nonwoven, yarns etc. 235 5815 5115 6713 24786 0.08 0.06 0.38 0.11 0.11 57 Carpets and other textile floor coverings 744 143206 479 18998 176810 0.25 1.52 0.04 0.31 0.78 58 Special woven fab; tufted tex fab etc 23 731 16 935 2275 0.01 0.01 0.00 0.02 0.01 59 Impregnated, coated, cover/laminated 1 72 0 22 822 0.00 0.00 0.00 0.00 0.00 60 Knitted or crocheted fabrics 2 230 58 8 2022 0.00 0.00 0.00 0.00 0.01 61 Art of apparel & clothing access 34576 1045824 8436 617568 1776361 11.77 11.12 0.63 10.15 7.80 62 Art of apparel & clothing access 50358 1205487 16294 1338093 2701549 17.14 12.81 1.22 21.98 11.86 63 Other made up textile articles 1499 42296 4059 62874 134869 0.51 0.45 0.30 1.03 0.59 64 Footwear, gaiters and articles 154 49246 14774 1024 77791 0.05 0.52 1.10 0.02 0.34 65 Headgear and parts thereof. 1584 5354 873 127707 137169 0.54 0.06 0.07 2.10 0.60 66 Umbrellas, walking-stick, whips etc. 1 166 0 11 317 0.00 0.00 0.00 0.00 0.00 67 Prepr feathers & down; art flower nes 108 1731 27 414 2348 0.04 0.02 0.00 0.01 0.01 68 Art of stone, plaster, cement, asbestos 19 550 38 213 1489 0.01 0.01 0.00 0.00 0.01 69 Ceramic products. 263 9749 213 3935 16127 0.09 0.10 0.02 0.06 0.07 70 Glass and glassware. 486 810 47 1206 3249 0.17 0.01 0.00 0.02 0.01 71 Natural/cultured pearls, prec stones 599 1844328 5837 144089 2093964 0.20 19.60 0.44 2.37 9.20 72 Iron and steel. 39 7356 228 1474 25024 0.01 0.08 0.02 0.02 0.11 73 Articles of iron or steel. 92 3023 1285 2503 10879 0.03 0.03 0.10 0.04 0.05 74 Copper and articles thereof. 417 113822 94756 472 386526 0.14 1.21 7.09 0.01 1.70 75 Nickel and articles thereof. 0 708 67 12 2478 0.00 0.01 0.01 0.00 0.01 76 Aluminium and articles thereof. 55 1242 1247 209 7256 0.02 0.01 0.09 0.00 0.03 78 Lead and articles thereof. 1 92 0 0 937 0.00 0.00 0.00 0.00 0.00 79 Zinc and articles thereof. 0 1313 0 0 3057 0.00 0.01 0.00 0.00 0.01 80 Tin and articles thereof. 2 229 19 255 1104 0.00 0.00 0.00 0.00 0.00 81 Other base metals; cermets thereof. 10492 60878 108250 76728 277691 3.57 0.65 8.09 1.26 1.22 82 Tool, implement, cutlery, spoon, fork 111 2838 2 110 4580 0.04 0.03 0.00 0.00 0.02 83 Miscellaneous articles of base metal 48 1207 69 944 2951 0.02 0.01 0.01 0.02 0.01 84 Nuclear reactors, boiler, mech appl. 2510 56041 612 4168 86754 0.85 0.60 0.05 0.07 0.38 85 Electrical mech equip parts, sound pr 2184 27327 6008 6573 102545 0.74 0.29 0.45 0.11 0.45 86 Railw/tramw locom, rolling stock etc. 16 333 0 5 1009 0.01 0.00 0.00 0.00 0.00 87 Vehicles o/t railw/tramw roll stock, pts 183 9563 42 247 17823 0.06 0.10 0.00 0.00 0.08 88 Aircraft, spacecraft, and parts nes 194 27205 5 27 30066 0.07 0.29 0.00 0.00 0.13 89 Ships, boats and floating structures 6 138674 16682 459 631624 0.00 1.47 1.25 0.01 2.77 90 Optical, photo, cine, meas, presision 364 26611 6491 1664 44687 0.12 0.28 0.49 0.03 0.20 91 Clocks and watches and parts nes 23 2074 6 45 2487 0.01 0.02 0.00 0.00 0.01 92 Musical instruments; parts & access 24 581 35 188 975 0.01 0.01 0.00 0.00 0.00 93 Arms and ammunition; parts & access 0 129 0 280 438 0.00 0.00 0.00 0.00 0.00 94 Furniture; bedding, mattress, cushion 173 6468 669 2486 15374 0.06 0.07 0.05 0.04 0.07 95 Toys, games & sports requisites, nes 1258 7033 4756 28926 44491 0.43 0.07 0.36 0.48 0.20 96 Miscellaneous manufactured articles 37 1947 716 917 6021 0.01 0.02 0.05 0.02 0.03 97 Works of art, collectors pieces nes 167 2423 2829 9900 17085 0.06 0.03 0.21 0.16 0.08
All Goods 293848 9408647 1337262 6086994 22772093 100.00 100.00 100.00 100.00 100.00 As % of All Exports to the World 1.3 41.3 5.9 26.7 100.0 Source: Based on partner�s data from UN Comtrade statistics

47
Appendix C: The empirical model World markets are perfectly competitive and integrated, in the sense that there is no
further scope for arbitrage across countries. Products traded in world markets under the
same 6-digit classification of the Harmonized system (HS) are considered as perfectly
homogenous. Each product of the 6-digit HS classification is a sufficiently small share of
the economy, so that the effects on other product�s markets of changes in a particular 6-
digit product market can be considered as negligible.
Because we are interested on the consequences of reductions of tariff peaks in country i,
let us model import demand for each HS-6-digit product of country i=US, EU, CAN, JPN
as given by:
( )[ ] 1 Ε
iW
ii TP
AM
+= (1)
where Ε is the import demand elasticity (common to all countries in our simulations),17
WP is the world price; iT is the MFN tariff in country i and iA is a demand parameter in
country i. Throughout the paper we will assume that tariffs are kept constant in the rest of
the world. Therefore rest-of-the-world import demand is given by:
[ ]ΕW
ROWROW P
AM = (3)
Export supply of country j to country i is given by:
( )[ ]ΘΠ jiiWjij TPBX →→ += 1 (2)
Θ is the export supply elasticity (common to all countries); ji→Π is the level of tariff
preference granted by country i to exports from j. Thus, if 0=→ jiΠ imports of i from j

48
have to pay country i�s MFN tariff. Similarly if 1=→ jiΠ exports from j receive the
domestic price in i. jB is a supply parameter.
The equilibrium world price is obtained by solving for the world price the world market
clearing condition, i.e.,
( )[ ]
)(
jjiij
ROWii
ji
kk
P
EW TB
ATAXMp
W
ΘΕ
Θ
Ε
Π
+
→
+++
=
=−=
∑∑∑
1
11
0argsol (3)
All demand and supply parameters are calibrated using UN�s trade data (value and
quantities) at the 6-digit of the Harmonized system and MFN and preferential margins of
country i: 18
[ ] [ ] ( )[ ]ΕΕΘΠ iWiiWROWROW
jii
jj TPMAPMA
T
XB +==
+=
→
1 ; ; 1
(4)
Using the calibrated parameters in (4) and replacing them into the right-hand-side of (3)
we simulate in the empirical section the effect on world prices (and developing countries�
export revenue) of changes in country i�s tariff peaks. Before jumping into the simulation
exercise, let us determine analytically what would be the predictions from the setup
described above. Effect on world prices of a reduction in tariff peaks
To sign the effect of a reduction in tariff peaks on world prices, differentiate (3) with
respect to it . It yields:
17 The 6-digit HS import demand elasticities have been derived from Stern et al. (1976). 18 Given that goods are perfectly substitutable exports of j to the rest-of-the-world need to receive the same
price as exports to country i.

49
( )( )
( )( )
( ) ( )
( )0
1
11
11
111
21
1
11
<
+
++
+
−
++
−
+++
+=
∂∂
∑∑
∑∑
→
→−
→
→
−
−+
→
jjiij
iiROW
jjijiij
jjiij
ii
)(
jjiij
iiROW
i
EW
TB
TAATB
TBTA
TBTAA
tp
Θ
ΕΘ
Θ
Ε
ΕΘ
Θ
Ε
Π
ΠΠΘ
ΠΕ
ΠΘΕ
(5)
Thus a reduction of country i�s tariff peaks will necessarily lead to an increase in world
prices. Does this necessarily lead to an increase of country j�s export revenue? No, given
that some countries benefit from preferential access and therefore their export price is
partly determined by the tariff.
Effect on export revenue of a reduction in tariff peaks
The export revenue of country j is given by:
( ) ( )( ) 111 +→→ +=+= ΘΠΠ jiiWjjjiiWj TPBXTPER (6)
The change in export revenue following a change in country�s i tariff is obtained by
differentiating the right-hand-side of (6) with respect to iT :
( ) ( )( )
+
∂∂
++=∂
∂→→ jiW
i
WjiiWj
i
j PTP
TPBT
ERΠΠΘ Θ11 (7)
Thus, if country j has no preferential access to country i�s market (i.e., 0=→ jiΠ ), then a
tariff cut will necessarily bring an increase in export revenue of country j.19 Similarly, if
19 To see this note that the term in square brackets on the right-hand-side of (7) will then have the same sign as the change in world prices (which is negative).

50
country j has full preferential access into country i�s market (i.e., 1=→ jiΠ ), then a tariff
cut will necessarily bring a decline in export revenue of country i.20
More generally, the export revenue of country j will increase following a tariff reduction
in country i if:
jiiW
i
i
W TPT
TP
→<∂∂
Π (8)
That is, if the elasticity of the world price with respect to the tariff is smaller than the
tariff faced by the exporter j in country i.
This suggests that a crucial element of the analysis of the effects of tariff reductions in the
Quad on the export revenue of developing countries is the degree of preferential access
that developing countries enjoy in Quad markets.
Effect on world price of an increase in preferential access
The derivative of the world price given in equilibrium by equation (3) with respect to the
degree of preference ( ji→Π ) is clearly negative, suggesting that any increase in the tariff
preferences that country i grants to country j will reduce world prices.
Annex: Data sources
All trade data is from UN Comtrade Database (value and unit prices). MFN tariff
schedules for Quad members are from the OECD compendium of tariff, 2000. Tariff
preferences have been calculated using Quad member tariff schedules reported in the
WTO IDB database and preference data provided by the WTO�s Trade Policy Review
division (when data was available at the 8 or 10 digit level, simple averages were taken). 20 To see this note that the term in square brackets on the right-hand-side of (7) will then be necessarily larger than zero as the elasticity of world price with respect to the tariff change in country i is necessarily

51
In instances where specific tariffs are applied, we use ad valorem equivalents calculated
by the OECD and the TPR division. Elasticities of import demand are assumed to be
equal across countries and are constructed using data reported in: C. Shiells, R. Stern and
A. Deardorff (1986), �Estimates of the elasticities of substitutions between imports and
home goods for the United States�, Weltwirtschaftliches Archiv 122, 497-519 and R.
Stern, J. Francis and B. Schumacher (1976), Price elasticities in international trade: an
annotated bibliography, London (An excel file is available from the authors). Export
supply elasticities are also assumed constant across countries and due to the lack of
information at this level of disaggregation we set its value to 0.5 (alternatively, we
provide estimates with the elasticity of export supply set equal to 0).
smaller than the initial tariff in absolute value (unless we are in the presence of the Metzler paradox in which an fall in tariff leads to an increase in domestic prices).