
“Preliminary Review of Digital Scenario Tools Suitable for ...
43
“Preliminary Review of Digital Scenario Tools Suitable for Long-Term Big-City Concepts” Research Report 2 Project Steering Group Halvard Dalheim, NSW Planning and Environment (Chairperson) Professor Keith Hampson, CEO SBEnrc Professor Peter Newman, Curtin University Professor Peter Newton, Swinburne University Dr Charlie Hargroves, Curtin University Paul Fourie, Main Roads Western Australia Antony Johnstone, Aurecon Rebecca Monckton, NSW RMS University Research Team Project Leader: Professor Peter Newman, Curtin University Project Manager: Charlie Hargroves, Curtin University Researchers: Giles Thomson, Curtin University Heather Shearer, Griffith University Hussein Dia and Stephen Glackin, Swinburne University Christopher Pettit and Scott Lieske, UNSW Version 1 (30 November 2016)
-
Upload
khangminh22 -
Category
Documents
-
view
1 -
download
0
Transcript of “Preliminary Review of Digital Scenario Tools Suitable for ...

“Preliminary Review of Digital Scenario Tools Suitable for Long-Term Big-City Concepts”
Research Report 2
Project Steering Group
Halvard Dalheim, NSW Planning and Environment (Chairperson)
Professor Keith Hampson, CEO SBEnrc
Professor Peter Newman, Curtin University
Professor Peter Newton, Swinburne University
Dr Charlie Hargroves, Curtin University
Paul Fourie, Main Roads Western Australia
Antony Johnstone, Aurecon
Rebecca Monckton, NSW RMS
University Research Team
Project Leader: Professor Peter Newman, Curtin University
Project Manager: Charlie Hargroves, Curtin University
Researchers: Giles Thomson, Curtin University
Heather Shearer, Griffith University
Hussein Dia and Stephen Glackin, Swinburne University
Christopher Pettit and Scott Lieske, UNSW
Version 1 (30 November 2016)

Table of Contents
Preliminary Review of ‘CommunityViz’ .................................................................................................. 4
1. What platform is the system running on and how is it accessed? ..................................................... 4
2. Has the tool be applied at subdivision, precinct, and city level? ....................................................... 4
3. Does the tool allow for consideration of both land use and transport related data? ...................... 5
4. Does the tool allow for real time streaming of data? ......................................................................... 5
5. What data preparation is required to use the tool, is this data freely available? What are the inputs and outputs of the tool, what is it reporting on? ................................................................................ 5
6. Can data be uploaded and downloaded from the tool, or does it just provide reports? ................. 5
References .................................................................................................................................................. 5
Preliminary Review of ‘AURIN’ ............................................................................................................... 7
1. Has the tool be applied at subdivision, precinct, and city level? ....................................................... 8
2. Does the tool allow for consideration of both land use and transport related data? .................... 10
3. Does the tool allow for real time streaming of data? ....................................................................... 11
4. What data preparation is required to use the tool, is this data freely available? ........................... 11
5. What platform is the system running on and how is it accessed? ................................................... 12
6. What are the inputs and outputs of the tool, what is it reporting on? ........................................... 12
7. Can data be uploaded and downloaded from the tool, or does it just provide reports? ............... 12
References ................................................................................................................................................ 13
Preliminary Review of ‘What if’ ........................................................................................................... 14
1. What platform is the system running on and how is it accessed? ................................................... 14
2. Has the tool be applied at subdivision, precinct, and city level? ..................................................... 15
3. Does the tool allow for consideration of both land use and transport related data? .................... 18
4. Does the tool allow for real time streaming of data? ....................................................................... 19
5. What data preparation is required to use the tool, is this data freely available? What are the inputs and outputs of the tool, what is it reporting on? .............................................................................. 19
6. Can data be uploaded and downloaded from the tool, or does it just provide reports? ............... 20
References ................................................................................................................................................ 20
Preliminary Review of ‘ENVISION’ ....................................................................................................... 21
1. Has the tool be applied at subdivision, precinct, and city level? ..................................................... 21
2. Does the tool allow for consideration of both land use and transport related data? .................... 21
3. Does the tool allow for real time streaming of data? ....................................................................... 21
4. What data preparation is required to use the tool, is this data freely available? ........................... 21
Page | 2

5. What platform is the system running on and how is it accessed? ................................................... 21
6. What are the inputs and outputs of the tool, what is it reporting on? ........................................... 21
7. Can data be uploaded and downloaded from the tool, or does it just provide reports? ............... 24
Preliminary Review of ‘Envision Scenario Planner (ESP)’...................................................................... 25
1. Has the tool be applied at subdivision, precinct, and city level? ..................................................... 25
2. Does the tool allow for consideration of both land use and transport related data? .................... 25
3. Does the tool allow for real time streaming of data? ....................................................................... 25
4. What data preparation is required to use the tool, is this data freely available? ........................... 25
5. What platform is the system running on and how is it accessed? ................................................... 25
6. What are the inputs and outputs of the tool, what is it reporting on? ........................................... 25
7. Can data be uploaded and downloaded from the tool, or does it just provide reports? ............... 26
Preliminary Review of ‘UrbanSim’ ....................................................................................................... 27
1. Has the tool be applied at subdivision, precinct, and city level? ..................................................... 28
2. Does the tool allow for consideration of both land-use and transport related data? .................... 29
3. Does the tool allow for real time streaming of data? ....................................................................... 30
4. What data preparation is required to use the tool, is this data freely available? ........................... 30
5. What platform is the system running on and how is it accessed? ................................................... 31
6. What are the inputs and outputs of the tool, what is it reporting on? ........................................... 31
7. Can data be uploaded and downloaded from the tool, or does it just provide reports? ............... 32
References ................................................................................................................................................ 32
Preliminary Review of Transport Models ............................................................................................. 33
Introduction to Transport Models .......................................................................................................... 33
1. Has the tool be applied at subdivision, precinct, and city level? ..................................................... 39
2. Does the tool allow for consideration of both land use and transport related data? .................... 40
3. Does the tool allow for real time streaming of data? ....................................................................... 40
4. What data preparation is required to use the tool, is this data freely available? ........................... 40
5. What platform is the system running on and how is it accessed? ................................................... 42
6. What are the inputs and outputs of the tool, what is it reporting on? ........................................... 43
7. Can data be uploaded and downloaded from the tool, or does it just provide reports? ............... 43
References ................................................................................................................................................ 43
Page | 3

Preliminary Review of ‘CommunityViz’1
1. What platform is the system running on and how is it accessed?
The CommunityViz® planning support system was developed by the Orton Family Foundation (Rutland, Vermont, USA). CommunityViz is a set of two integrated extensions to ArcGIS: Scenario 360 and Scenario 3D. The Scenario 360 extension extends the quantitative capabilities of ArcGIS by allowing formula-based spreadsheet-like calculations to be performed on geographic data. These formula-based data attributes enable on-the-fly adjustment of geographic and numeric inputs as well as automatic recalculation of maps and quantitative output in a process referred to as “dynamic analysis” (Walker and Daniels 2011, pp. 32-35). Scenario 3D allows for three-dimensional display of the built environment and landscape with real-time movement and object manipulation in a semi photo-realistic setting (Lieske and Hamerlinck 2015). While originally designed for small town and rural planning, the powerful analytical capabilities of the Scenario 360 extension of CommunityViz as well as the built in scenario analysis capabilities make it a promising tool for urban and transport scenario planning.
2. Has the tool be applied at subdivision, precinct, and city level?
The tool has been applied at the subdivision, precinct and city level. For example, at the precinct level, the New Jersey Transportation Planning Authority used CommunityViz as a software foundation for developing a small area land use impact tool (SALUIT). The tool provides a scenario-based analysis of the transportation, economic, environmental and infrastructure impacts of land-use changes (NJTPA 2016). The tool is intended to help NJTPA staff work with county planners on projects such as transit-oriented development, corridor redevelopment and neighbourhood revitalisation. The tool is easy to use, after users define a study area it downloads all data relevant to the area and automatically calibrates models. Results are presented as a series of maps and linked charts. Users are able to use CommunityViz to do further analysis and scenario comparison (Placeways 2016a).
An example of the use of CommunityViz at the city scale is provided by the Community Planning Association of Southwest Idaho (COMPASS). Metropolitan Planning Organization. The COMPASS MPO is responsible for Ada and Canyon Counties, the greater Boise area, Idaho, USA. CommunityViz was used in a geodesign-like interactive scenario planning process that had the goal of creating a preferred growth scenario for Boise and the surrounding region (Placeways 2016b). An extensive public engagement process resulted in the development of four scenarios: Active corridors, Hometowns, Outdoor Playground and Town and Country. CommunityViz was also used to analyse the land use and building capacity implications of the 16 local government comprehensive plans in the scenario planning study area. A draft preferred scenario was created by moving jobs and/or population to locations congruent with the local comprehensive plans. This draft preferred scenario was presented in a workshop with local planning agencies and other organizations in order to refine the scenario and informally allow exceptions to local comprehensive planning guidelines where required. The final, preferred scenario is being used to guide transportation decisions as part of the regional transportation plan (Placeways 2016b).
1 This review was written by Dr Scott Lieske at UNSW. Page | 4

Several Australian examples of the use of CommunityViz at the subdivision level are presented in Lieske et al. (2008). Examples include a scenario-based impact analysis of a proposed structure plan in Brisbane’s West End, a scenario-based evaluation of infrastructure costs in Gosford, NSW and a scenario-based alternatives analysis of a greenfield development in Maleny, Queensland. All three examples present multiple alternative land-use scenarios that are presented as both 2d maps as well as interactive or screen captured 3d scenes. In each case scenario impacts are presented quantitatively with charts that allow direct comparison of impacts across scenarios.
3. Does the tool allow for consideration of both land use and transport related data?
The NJTPA SALUIT tool provides an excellent demonstration of consideration of land use and transport data using CommunityViz. Land use data are based on a modified Anderson et al. (1976) land use and land cover classification system. Examples of the transportation data included in the model include proximity to bus stop, proximity to regional bus, express bus or ferry, proximity to train, light rail, or Port Authority of New York and New Jersey stations. Proximity is measured for both households and employment locations. The system measures roadway system impacts of land use change in terms of vehicle trips per day, vehicle miles travelled, average trip length as well as truck trips per day for residential and non-residential uses. The system estimates transport mode share, parking impacts, a sixty minute travel time commuter shed and a New Jersey transit score, a measure of transit readiness.
4. Does the tool allow for real time streaming of data?
CommunityViz does not currently allow for real-time streaming of data. However, the dynamic analysis capabilities of CommunityViz allow rapid single click re-calculation of formula-based data attributes and scenario impacts when data sets are updated or otherwise changed.
5. What data preparation is required to use the tool, is this data freely available? What are the inputs and outputs of the tool, what is it reporting on?
CommunityViz comes out of the box as a clean slate. Data, formulas and models are populated by the user. The user must acquire the data that is incorporated in a CommunityViz analysis. Common data preparation steps include clipping data to a study area and aligning data to a common projection. All inputs, outputs and what an analysis reports are all fully customizable. The flexibility of CommunityViz as well as examples of data inputs and resultant outputs are available on the Placeways, LLC website in the form of numerous short case study write-ups: http://placeways.com/communityviz/casestudies.html
6. Can data be uploaded and downloaded from the tool, or does it just provide reports?
As CommunityViz is GIS-based data can be easily uploaded and downloaded from the tool. In addition to automated scenario-based html format reporting CommunityViz allows scenario sharing through a free Scenario 360 Analysis Viewer (http://placeways.com/communityviz/publisher.html) as well as online publication through a web viewer (http://apps.communityviz.com/viewer/?appid=81e0cb48dc5e4ed9a4cf28a0169c6111).
References
Page | 5

Anderson, James Richard. 1976. A land use and land cover classification system for use with remote sensor data. Vol. 964. US Government Printing Office.
Lieske, S.N., Hamerlinck, J.D., 2015. Integrating Planning Support Systems and Multicriteria Evaluation for Energy Facility Site Suitability Evaluation. Journal of the Urban and Regional Information Systems Association 26, 13–24.
Lieske, S., Lyons, K., Wall, K., Wall, R., 2008. Planning Decision Support-Australian Examples, in: Proceedings of the Queensland Spatial Conference. Presented at the Queensland Spatial Conference, Queensland Spatial Conference, Surfer’s Paradise, Queensland., Australia.
New Jersey Transportation Authority 2016. Small Area Land Use Impact. http://njtpa.org/data-maps/modeling/land-use-impact-model.aspx Accessed 25 October 2016.
Placeways 2016a. Small Area Land Use Impact Tool. CommunityViz® Case Study. http://placeways.com/PDFs/planning/NJTPA_SALUIT.pdf
Placeways 2016b. Communities in Motion 2040: Scenario Planning for the first year of the LRTP update. CommunityViz® Case Study. http://placeways.com/PDFs/planning/COMPASS.pdf
Walker, D., Daniels, T.L., 2011. The planners guide to CommunityViz: the essential tool for a new generation of planning. Planners Press, American Planning Association, Chicago.
Page | 6

Preliminary Review of ‘AURIN’2
The Australian Urban Infrastructure Network (AURIN) is a powerful online GIS tool that can assist in building an evidence base around existing localities at various scales. AURIN’s mandate is to provide “an evidence base for policy” and it “encourages more research to support urban resource management and policy decisions by making information easier to access”. It can help greatly in understanding many aspects of existing settlements but it is not a design tool. It’s strength is the ability to analyse various localities (spatially and demographically), and to better understand the relationship between various datasets to aid researchers and policy makers to reveal urban patterns using underlying datasets, for example, demonstrating the correlation between low population density and obesity. AURIN also includes extended workbench tools like Envision/ESP, What-if, and so on, which have not been considered in this summary, rather these tools are the subject of separate analysis in this project.
The $1.1 billion Super Science Initiative was announced in the May 2009 Budget. Over the period 2009–2013 the targeted investments will address three priority areas informed by the 2008 Strategic Roadmap for Australian Research Infrastructure. As part of the EIF Super Science initiative, the Australian Urban Research Infrastructure Network (AURIN) received $20 million funding for the ‘establishment of facilities to enhance the understanding of urban resource use and management’. The University of Melbourne was named the lead agent responsible for the implementation of the AURIN project. AURIN research infrastructure will incorporate an operational e-research facility enabling researchers to access that data and information on-line, with a capability for interrogating those data using statistical and spatial analysis and modelling tools that are interfaced with geographic information system (GIS) tools to visualise both data inputs and the outputs of such analysis and modelling.
The AURIN research infrastructure will provide the mechanisms, protocols and tools by which data across the various facets of the urban realm can be accessed, interrogated, modelled and/or simulated, and visualised. The on-line data sets and the e-research facility will provide an enhanced capability for urban researchers to better understand the processes and patterns of urban development across Australia’s urban system and the interactions between the natural, built, economic, social and cultural elements of those urban environments.
AURIN’s Objectives are to:
- Enhance their understanding of the processes and outcomes of dynamic processes shaping the past, current and potential future state of Australia’s urban system
- Enhance their capability to analyse, model and understand the complexities of the interactions between the natural, built, economic, social and cultural environments of urban places.
- Produce an improved evidence base to inform policy and practice for urban resource use, planning and management.
2 This review was written by Giles Thomson, Curtin University. Page | 7

- Provide the capability to simulate urban growth and development scenarios and test them against for sustainable achieving sustainable futures.
The employment of information systems to process data into a form that assists knowledge sharing and communication between experts and non-experts, informing a community of users (decision-makers) focussed on solving a common problem. (Barton and Pettit – RatLoc14). Funding for AURIN has been provided by the Australian Government under the National Collaborative Research Infrastructure Strategy (NCRIS) and associated programmes. The Government involvement that has enable the tool for free use also creates a number of restrictions relating to privacy and commercial use (see question 5).
AURIN provides a powerful, relatively accessible online tool for the analysis of existing urban areas. It has some limitations in that accessibility is not available to industry, but rather the focus is upon researchers within academia and to a lesser extent government. The tool comes with tutorials but for newcomers requires some investment of time to learn the basics an get acquainted with the available datasets, that said, the AURIN team are relatively accessible to offer support and they provide regular training across Australia. Regarding big city planning, AURIN’s greatest contribution would be in the provision of strong evidence based inquiries to inform future plans. It is not a tool for creating future city plans, rather it can help with the analysis of current urban performance. The AURIN portal’s strength is that the researcher can combine many different datasets thus offering researchers great scope and creativity to seek out interesting patterns that future strategic plans may wish to retain, strengthen or rectify.
1. Has the tool be applied at subdivision, precinct, and city level?
The AURIN tool covers all of Australia, however some datasets are limited in there geographic coverage, for example, the many dataset layers available for Melbourne may not be available for smaller settlements. Many of the 1600 datasets are not national but may be state based or limited to Local Government Areas. However, if other datasets are available they may be “ingested” for use within the portal. The process for accessing geolocated data involves a visual interface whereby a user may:
- Select and area of inquiry – i.e., which datasets to extract, analyse and visualise from the 1,600 linked datasets
- Select a level of geography - by drawing an area selection bounding box around the inquiry area. Data is collected using standard Australian statistical divisions therefore aggregated data may be measured from the smallest statistical geographic division, down to SA1 – around 200-800 persons (see Figure 1) or even smaller if data is customised and uploaded into the portal. Analysis may be conducted on the gathered from the smallest meshblock to neightbourhood, city, state or even national regions.
Page | 8
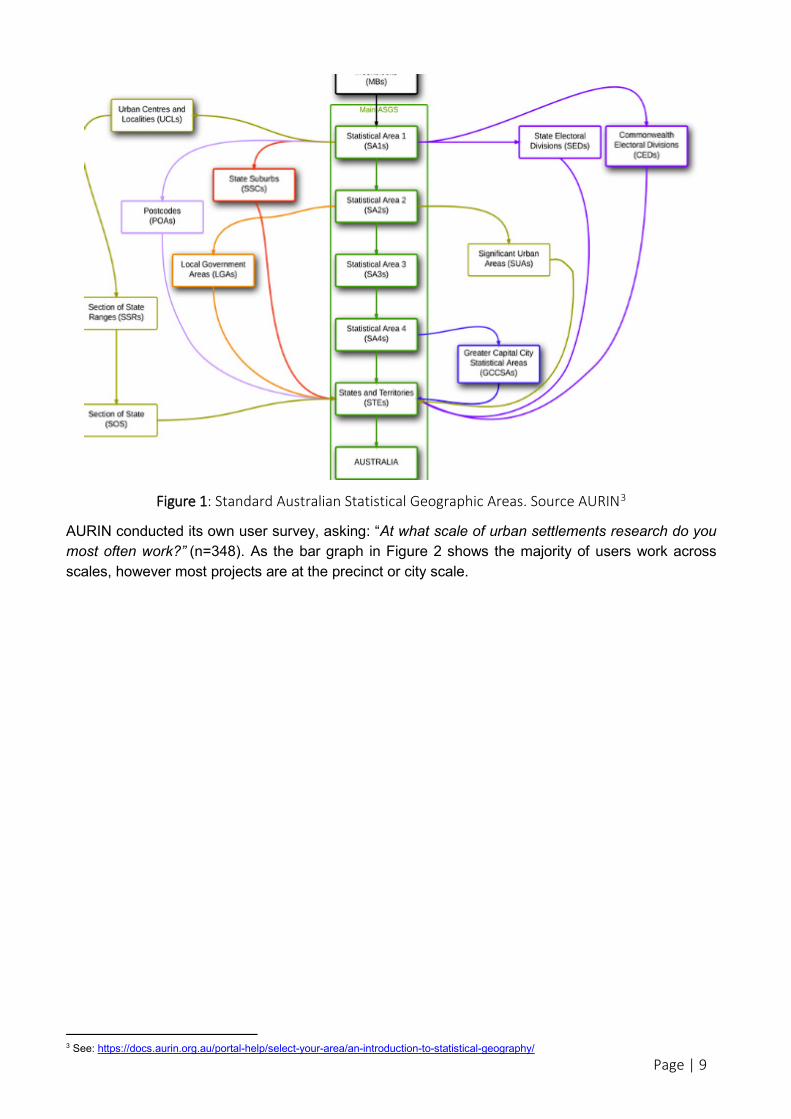
Figure 1: Standard Australian Statistical Geographic Areas. Source AURIN3
AURIN conducted its own user survey, asking: “At what scale of urban settlements research do you most often work?” (n=348). As the bar graph in Figure 2 shows the majority of users work across scales, however most projects are at the precinct or city scale.
3 See: https://docs.aurin.org.au/portal-help/select-your-area/an-introduction-to-statistical-geography/ Page | 9
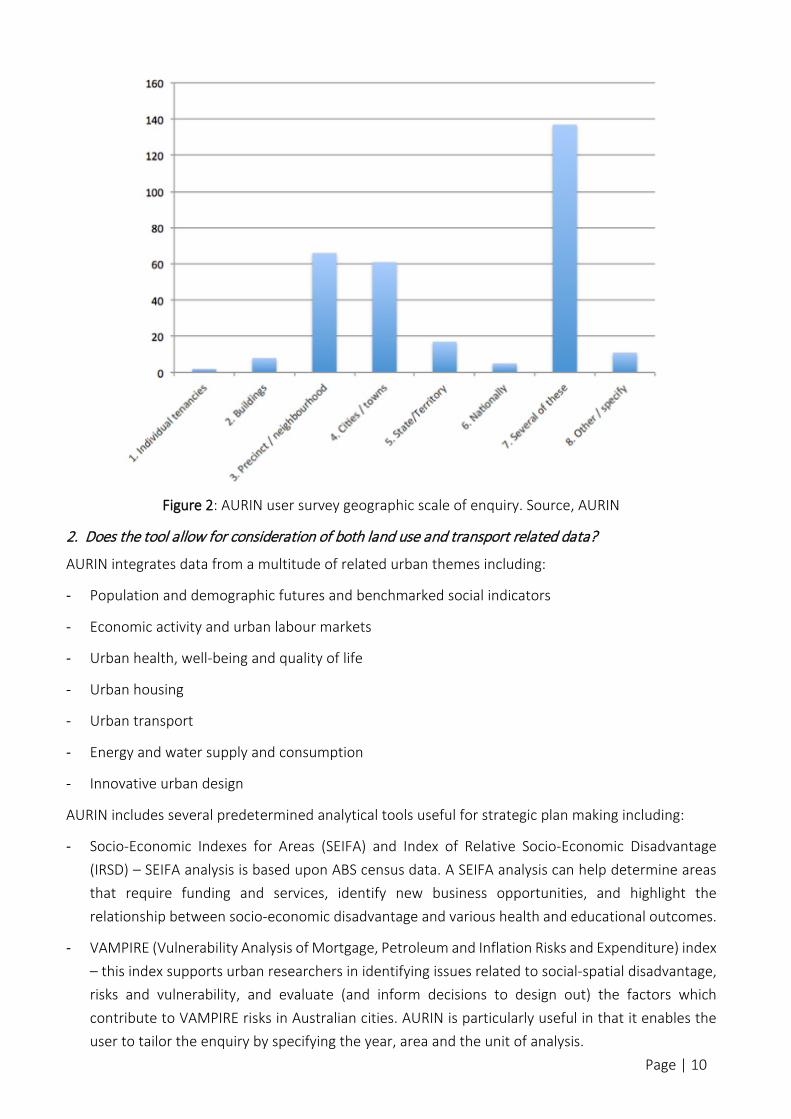
Figure 2: AURIN user survey geographic scale of enquiry. Source, AURIN
2. Does the tool allow for consideration of both land use and transport related data?
AURIN integrates data from a multitude of related urban themes including:
- Population and demographic futures and benchmarked social indicators
- Economic activity and urban labour markets
- Urban health, well-being and quality of life
- Urban housing
- Urban transport
- Energy and water supply and consumption
- Innovative urban design
AURIN includes several predetermined analytical tools useful for strategic plan making including:
- Socio-Economic Indexes for Areas (SEIFA) and Index of Relative Socio-Economic Disadvantage (IRSD) – SEIFA analysis is based upon ABS census data. A SEIFA analysis can help determine areas that require funding and services, identify new business opportunities, and highlight the relationship between socio-economic disadvantage and various health and educational outcomes.
- VAMPIRE (Vulnerability Analysis of Mortgage, Petroleum and Inflation Risks and Expenditure) index – this index supports urban researchers in identifying issues related to social-spatial disadvantage, risks and vulnerability, and evaluate (and inform decisions to design out) the factors which contribute to VAMPIRE risks in Australian cities. AURIN is particularly useful in that it enables the user to tailor the enquiry by specifying the year, area and the unit of analysis.
Page | 10

- Walkability Analysis, this tool incorporates connectivity, land use mix and population density to create a walkability index with gross density. Similarly a “Neighbourhood Generator” tool, can be used to determine PedSheds around a given point e.g., public transport stops.
- MeteroARIA (Metropolitan Accessibility / Remoteness Index of Australia) a very useful tool that visualises remoteness from services including: public transport, shopping, education, financial/postal services, see: https://aurin.org.au/projects/data-hubs/metro-aria/ https://www.adelaide.edu.au/apmrc/research/projects/category/about_aria.html.
3. Does the tool allow for real time streaming of data?
The AURIN architecture facilitates connection to many data types. Direct connections to federated datasets are prioritised, whereby upon retrieval the data is as current as the custodian maintains. For example, although the Census is structured around 5-yearly epochs, it has had a direct connection into the ABS server via .stat and SDMX – so AURIN users access the latest ABS data as it is updated or fixed. The most regularly updated datasets include:
- Australian Business Register is updated monthly
- National Health Services Directory is annual
- Geoscience Australia, Landgate, Vicgov are realtime connections
Realtime connections are preferred and as they become available are integrated into the AURIN portal. AURIN has the technical capacity to integrate with streaming data, and longitudinal warehousing upon application. As a rule, data provided through AURIN is the latest snapshot, historic records are generally not “warehoused”. Some of the datasets have longitudinal records, like the energy and water data, or ABS that can be shopped easily in the portal. For other projects AURIN’s developers are currently in the negotiating terms and conditions for sharing phase of longitudinal repositories.
4. What data preparation is required to use the tool, is this data freely available?
Federated data sources are connected to via infrastructure and are ingested as-is. AURIN adds a layer of metadata, licencing, and access permissions to make the terms and conditions of the data explicit to the user. Metadata is published openly to data.aurin.org.au this webpage opens to allow a word search for the relevant datasets. Several tutorials are available online including a “quickstart guide” that offers first time users a quick orientation to the opportunities the tool offers (see: https://docs.aurin.org.au/aurin-portal-quick-start-guide/).
Freely available creative commons attribution license (CC-BY see: http://creativecommons.org.au/learn/licences/) data is available via the AURIN OpenAPI and the portal. The AURIN portal is a securitised system that facilitates access to both open data and data with access restrictions as defined by the custodian. Because the federated datasets are linked via the portal form the data custodian, some datasets require the logged-in user to agree to license data before they are able to download the dataset, but the approval process is instant upon agreeing to the license agreement. The portal makes available many datasets that would otherwise require considerable time investment and negotiation with the data custodian to access. For this reason alone it is a valuable contribution to big city planning analysis.
Page | 11

See https://aurin.org.au/resources/becoming-an-aurin-data-provider/ for more information
5. What platform is the system running on and how is it accessed?
The AURIN Portal is fully cloud-based and accessed via any modern browser. AURIN is funded by the federal government and data agreements with custodians allow AURIN to make data available to government and academia, it is not a public interface. There are limitations on who can access data along the following lines:
- “.edu” have automatic access,
- “.gov” will need to request access and this will usually be provided,
- “.org” may be able to negotiate access but this can not be guaranteed, and
- “.com” can not have access.
All the data has terms and conditions and an explicit licence any user can view. Generally, CC-BY is the most permissive licence. CC-BY-NC only permits non-commercial usage. Other datasets might have specific data agreements - e.g. http://data.aurin.org.au/dataset/healthdirect-nhsd-nhsd-point-na. This would generally mean SBEnrc partners who are not government or academia would need to negotiate separate agreements for access. AURIN has considerable the infrastructure in place to host geo-located datasets (of various spatial unit granularities e.g. postcode or SD, SA, CD etc). The AURIN Portal has been engineered from open-source components including the R statistical package. While open-source the ‘BY’ in the creative commons licence (CC-BY) requires acknowledgement of the AURIN tool, the suggested citation is in the metadata.
6. What are the inputs and outputs of the tool, what is it reporting on?
The AURIN portal provides a fully integrated spatial decision support system, connecting to 1,600 curated and federated datasets with over 100 analytical tools and advanced mapping and charting capabilities. This framework facilitates our diverse user group (over 5,100 users nationally) to gather inputs and process outputs specific to their field of inquiry.
In terms of the evidence-base which the tool enables, research into strategic planning processes within 5 Australian cities found that industry cultures, and the lines of discussion they produce in various locations, are seemingly influenced by person-to-person interaction as much as actual planning documentation or empirical evidence (Hale & Eagleson 2015). Findings emphasise the idea that planning and infrastructure policy formulation and research should emerge beyond the current tendency for ad hoc and incoherent sources of influence. It should increasingly come from a stronger empirical base – in order to improve the implementation of advanced land use/transport infrastructure concepts in cities facing a globalised world of policy challenges.
Accessible tools such as AURIN are therefore critical to provide the empirical evidence required to improve the quality of strategic planning in Australian cities.
7. Can data be uploaded and downloaded from the tool, or does it just provide reports?
Users can upload csv/shp data into their secure cloud based account and download data as csv/geojson/shp with metadata and licence documents bundled.
Page | 12

The AURIN portal is particularly useful for the creation of GIS maps at a number of scales and where data exists longitudinal analysis is possible. The data rich map making ability of AURIN makes it a powerful evidence-based complement to traditional strategic planning mapping. The AURIN portal functions as a repository for raw data and can enable creative enquiry by the user, however several decision support products have been developed using AURIN as a foundation to enable better evidence-based policy decisions making these tools include:
- WhatIf? – A tool for understanding land use supply, demand and likely future land use change scenarios. Use extensively by the Department of Planning in WA to test growth scenarios in the Perth and Peel region.
- Envision – A multi-criteria evaluation tool for assessing redevelopment potential of precincts within established suburbs.
- ESP – Envision Scenario Planner, a 3D visualisation and planning tool for testing urban regeneration options (sustainability and economic) using a project library of typical or custom typologies.
- EIAT - Economic Impact (Input – Output) Analysis tool for regional infrastructure investment project. The tool uses Census employment data and industry multipliers to estimate economic impacts of regional infrastructure investment projects.
- Housemod – this tool uses ABS census data to project current and future regional housing markets. Housemod generates small areas estimates for housing stress, poverty, first home buyer shares and a range of other housing related variables by using a spatial microsimulation technique for deriving small area estimates. The methodology brings together ABS survey data and benchmarks this survey data for each region of Australia using small area ABS Census data.
References
Hale, C. & Eagleson, S., 2015. Metropolitan infrastructure, planning & institutions – a comparative world view. Australian Planner, 52(4), pp.277–296. Available at: http://dx.doi.org/10.1080/07293682.2015.1076013.
Page | 13

Preliminary Review of ‘What if’4
1. What platform is the system running on and how is it accessed?
There is clearly a need for generic tools to support strategic planning of urban growth occurring in the major cities and regional centres across Australia. Such generic tools are often referred to as planning support systems (PSS), and can be used to inform strategic planners on the impact of population growth and other socio-economic factors on the future of Australian cities. ‘What If?’ is an on-line GIS-based Planning Support System (PSS) designed to support the land planning process. It does so by conducting land suitability analysis, projecting future land use demand, and allocating the projected demand to suitable locations. Developed initially as a desktop application in the 1990s by Klosterman (1998) What If? has been updated and re-engineered as an online application (Pettit et al, 2013, 2015). The original desktop What If? 2.0 planning support system that has been used by over 150 users in 22 countries.
Figure 1: Online What If? Scenario Planning Tools comprising land suitability mapping and land demand reporting
The first application of the Online What If? PSS has been developed and tested in the context of the Perth to Peel Region in Western Australia (Pettit et al, 2015). The AURIN team at the University of
4 This review was written by Professor Chris Pettit at UNSW. Page | 14

Melbourne worked with the Department of Planning in Western Australia in data preparation and in the formulation of a series of planning scenarios which align with the Perth to Peel Region – Directions 2031 Metropolitan Plan. The Online What If? PSS tool has been designed to assist other cities and regions across Australia in understanding land use supply, demand and likely future land use change scenarios including in Melbourne (Pettit et al, 2008) and Hervey Bay (Pettit, 2005).
The Online WhatIf? code has been released as an open-source project, accessible through these links:
- https://github.com/AURIN/online-whatif
- https://github.com/AURIN/online-whatif-ui
- https://github.com/AURIN/workbenchauth.
Full user documentation can be found at http://docs.aurin.org.au/what-if/.
2. Has the tool be applied at subdivision, precinct, and city level?
The What if? Tool is most applicable at the municipal and city levels, not at the subdivision and precinct level. An example at the municipal level is for Hervey Bay where the tool was applied in looking at future urban growth scenarios from 2001 to 2021. These were comprehensive scenarios for a number of land use including commercial, light industry, general industry, social infrastructure, park residential, low density residential, medium density residential, medium density residential, rural residential, local shopping and open space. Road, water and sewer infrastructure plans were considered in the land use allocation module. Future land use scenarios were generated as illustrated in Figure 2 for the entire Hervey Bay mainland shire (excluding Fraser Island). In the context of Perth, the online What if? Tool was initially used to generate scenarios for Metro North West region with a focus on two scenarios – an employment generator scenario and an environmental conservation scenario (See Pettit et al, 2015) see Figure 3 for example of employment generation scenario.
Page | 15

Figure 2: Visual comparison of three alternative land-use planning scenarios for Hervey Bay, 2021: (a) iteration 1, (b) iteration 2, (c) no land-use control plan (`build out'). (Pettit, 2005)
The online What if? Tool has further been applied to create land use change scenarios across the entire Perth to Peel Metropolitan region see Figure 4. These metro wide scenarios have initially be run to evaluate land availability as driven by expected land demand for additional housing. 5 scenarios were develop in consultation with the Western Australian Department of Planning (i) per-urban growth scenario, (ii) all infill compact city scenario, (iii) likely city scenario, (iv) transit city scenario, (v) activity centre city scenario. Under the Likely City Scenario it was observed that land currently zoned to support residential use would run out in 2036. Thus What if? provided useful metrics for planners to test various land use supply and demand scenarios.
Page | 16

Figure 3: Residential suitability maps for the employment generation scenario) (Pettit et al, 2015)
Page | 17

Figure 4: Formulation of What If? Housing allocation relating to Activity centre scenario across Perth to Peel Metropolitan Region 2011- 2051 (unpublished results)
3. Does the tool allow for consideration of both land use and transport related data?
One of the strengths of What if? is that it is land use driven and can accommodate a number of land use categories. There exists flexibility in the What if? Set up module to custom set and label land use categories to align with existing planning classes. What if? can also incorporate transport related data in the form of transport infrastructure plans which are used in the land use allocation module. However, as discussed in Biermann et al (2015) one of the limitations to What if? Is that is not a land use transport integrated (LUTI) model. Also the What if? model is rule based and currently does not include spatial interactions to dynamically influence future land use allocations. Also the tool does not
Page | 18

accommodate the complexity in land use and transport dynamics unlike agent based modelling tools such as UrbanSim (Biermann et al, 2015).
4. Does the tool allow for real time streaming of data?
What if? does not currently allow for real-time streaming of data. It relies on spatial data layers to create opportunity and constraint layers in the suitability module. Demographic, housing and employment project information is entered into the land use demand module. Existing zoning, transport and other infrastructure plans are entered as digital layers in the land use allocation module
5. What data preparation is required to use the tool, is this data freely available? What are the inputs and outputs of the tool, what is it reporting on?
Like other GIS Planning Support Systems, What if? comes out of the box as a framework package. Data collection, geoprocessing and cleaning has to be done in a GIS package then the resultant Uniformed Area Zone (UAZ) file which is stored as a Shapefile is loaded into the What if? Tool. The tool can be used with the best available data but ideally fine grain land parcel level data would be used to populate the land use suitability, growth and allocation modules as illustrated in Figure 5.
Page | 19

Figure 5: What if? Data inputs and outputs (Pettit, 2005)
6. Can data be uploaded and downloaded from the tool, or does it just provide reports?
As What if? is a GIS-based planning support system, data can be easily uploaded and downloaded from the tool. In-fact the tool requires GIS data to run and standard GIS packages such as ArcGIS or QGIS are required to undertake pre-processing to input the opportunity and constraint layers that go into the land suitability module and also the land use allocation patterns and infrastructure control plans that go into the land use allocation module. The resultant GIS data and report CSV can be downloaded from What if? and then viewed in other packages such as a standard GIS package or converted to KML and made viable via a Virtual Globe packages such as Google earth as illustrated in Figure 4.
References
Biermann, S, Pettit, C.J. Brits, A. (2015) Modelling Behavioural Responsiveness in City Structuring, State of Australian Cities Conference 2015, the Gold Coast, Queensland 9-11th December.,
Pettit, CJ, Klosterman, RE, Delaney, P, Whitehead, AL, Kujala, H, Bromage, A, Nino-Ruiz, M 2015 The Online WhatIf? Planning Support System: A Land Suitability Application in Western Australia, Applied Spatial Analysis and Policy. Vol 8, Issue 2, pp 93-112
Klosterman, RE 1999, ‘The WhatIf? Collaborative Planning Support System’, Environment and Planning, B: Planning and Design, no. 26, pp. 393-408
Pettit, CJ 2005, ‘Use of a collaborative GIS-based planning support system to assist in formulating a sustainable-development scenario for Hervey Bay, Australia’, Environment and Planning, B: Planning and Design, vol. 32, no. 4, pp. 523-546
Pettit, CJ, Klosterman, RE, Nino-Ruiz, M, Widjaja, I, Tomko, M, Sinnott, R, Stimson, R 2013, ‘The Online WhatIf? Planning Support System’, in Planning Support Systems for Sustainable Urban Development, eds S Geertman & J Stillwell, Springer, Berlin, pp 349-362.
Pettit, C.J., Keysers, J., Bishop, I.D. and Klosterman, R. (2008) Applying the What if? Planning Support System for Better Planning at the Urban Fringe, in Landscape Analysis and Visualisation: Spatial Models for Natural Resource Management and Planning, (Eds. Pettit, C., Cartwright, W., Bishop, I., Lowell, K., Pullar, D. and Duncan, D.), Springer, Berlin, pp 435-454.
Pettit, C. (2005) Use of a Collaborative GIS-based Planning Support System to assist in Formulating a Sustainable Development Scenario for Hervey Bay, Australia, Environment and Planning B: Planning and Design, 32(4): 523-545.
Page | 20

Preliminary Review of ‘ENVISION’5
1. Has the tool be applied at subdivision, precinct, and city level?
ENVISION can and has been applied at the subdivision and precinct level. It has citywide data but would gain no benefit from operating at this scale
2. Does the tool allow for consideration of both land use and transport related data?
ENVISION currently has road and limited transport data used to locate landuse. It also has the capacity to add new transport and landuse layers, but the outputs would be limited to finding precincts close to specific forms of transport or in high (low) transport areas. The potential for further data provisions is endless (if they exist), but this would also only be locating properties and precincts.
3. Does the tool allow for real time streaming of data?
ENVISION does not currently take streamed data. Its outputs have the capacity to be streamed, but only in the form of maps and/or reports.
4. What data preparation is required to use the tool, is this data freely available?
Data for ENVISION needs to be rigorously prepared for new cities and for annual data updates. Data currently exists for Perth, Melbourne, Christ Church (NZ) and Sydney will be incorporated into the system in early 2017. Metro wide data takes roughly one month to prepare. Adding new data points is a trivial coding procedure. Data ownerships changes by state. Most of the data is freely available (the rough ABS and state data channels) but the more pertinent market data is not.
5. What platform is the system running on and how is it accessed?
ENVISION is an online tools. The can both be accessed through www.greyfieldplanning.com.au but users need CRCSI approval to do so
6. What are the inputs and outputs of the tool, what is it reporting on?
ENVISION uses the following variables which can be queried to provide a map of the resultant dwellings that adhere to the rules
The first set of data is stored at the parcel level
• Redevelopment Potential Index >=: The RPI is the percentage of value that is in the land. It is calculated by dividing the land value by the capital improved value of the property. 0.8 indicates that 80%. By selecting this variable, it cuts out dwellings where the RPI is less than the user entered cut off value.
• Dwelling Age >=: Selects land parcels with dwellings older than the selected value.
• Dwelling Age = variable to capture dwellings in specific age brackets.
• Area >= Selects land parcels with area greater than the selected value.
• Area <=: Selects land parcels with area less than the selected value.
5 This review was written by Dr Stephen Glackin at Swinburne University. Page | 21

• Nearby Demolitions >= Selects land parcels with the selected number of demolitions, over an eight year period, within 200m of a land parcel.
• Nearby Housing Increase >= Selects land parcels with the selected number of additional dwellings, over an eight year period, within 200m of a land parcel.
• Frontage >= Selects land parcels with street frontage greater than the provided value.
• Elevation Change <= Selects land parcels where the difference between the minimum and maximum elevation is less than the value provided.
• Distance to Major Shops <=: Selects land parcels that are within the provided distance to medium scale supermarket.
• Distance to Local Shops <=: Selects land parcels that are within the provided distance to small, suburban, shops and strip malls.
• Distance to Strategic Centre <=: Selects land parcels with the supplied distance to Major strategic centers.
• Distance to Main Road <=: Selects land parcels within the supplied distance of main roads (Australian road category 0-2).
• Distance to Medical <=: Selects land parcels with the supplied distance to significant medical centers ; sites with significant plant and area, not simple doctors suites.
• Distance to Park <=: Selects land parcels within the supplied distance to public open space.
• Distance to Primary School <=: Selects land parcels within the supplied distance to primary schools.
• Distance to Secondary School <=: Selects land parcels within the supplied distance to secondary schools.
• Distance to Tertiary School <=: Selects land parcels within the supplied distance to a university, college or TAFE.
• Extra Land >=: Selects land parcels with at least the amount of extra land (in addition to building footprint) available on a land parcel.
• Distance to Train Station <=: Selects land parcels within the supplied distance to a train station.
• Exclude Strata Title: Removes any land that is strata titled (due to its difficulty to redevelop).
• Include Vacant Land: due to its increased potential for redevelopment.
• Exclude Env. Sensitive: Remove any land that has been categorized as environmentally sensitive. This is a category constructed from numerous interstate zones and overlays relating to ecology or cultural sensitivity.
• Exclude Heritage: removes any land parcels that have been marked as heritage sites.
Only Residential Land Use: Shows only residential land; as opposed to all of the land including industrial and commercial, which may not be considered for residential development.
Page | 22

The below variables are stored at the aggregated SA1 level.
• Public transport access: Locally derived access to transport incorporating distance and frequency of services.
• SEIFA High: Socio Economic Indicator for Areas (advantage and disadvantage) indicative of areas with high levels of income and education.
• SEIFA Low: (Socio Economic Indicator for Areas (advantage and disadvantage) indicative of areas with low levels of income and education.
• Aged 75+: % of population aged > 75 years (downsizing / retirement home)
• Aged 55-74: % of population aged 55-74 years (Aging ‘empty nesters’ with home ownership)
• Aged 30-54: % of population aged 30-54 years (first time home buyers/new families)
• Aged 20-29: % of population aged 20-29 years (first time home buyers/renters)
• Aged 0-19: % of population aged 0-19 years (children)
• Quality education high: indicates a high % of individuals with university education
• Quality education low: indicates a high % of individuals without university education
• Country of Origin High: indicates a high % of Australian born individuals
• Country of Origin low – indicates a high % of individuals born overseas.
• Many additional ABS categories can be easily added.
The variables below are used in the viability tool and provide an estimate of cost versus the sales value and number of sales of each typology in the area
• Scenario: the type of redevelopment scenario.
• Typical: owners sell land to developers.
• Joint venture: owners work cooperatively.
• Non for profit: gifted land for social housing.
• Residential land: the square metres of residential land available.
• Demolitions & material: the square metres of demolitions and the material to be demolished.
• Typologies: the set of dwellings that can be built in the precinct.
• Quality: the quality of the build and fit out.
• Floor space: the amount of floor space the dwelling contains.
• Material: the primary building material of the dwelling.
• Stories: how many stories the building has.
• Car park/gardens: the square meters of additional land required by each dwelling.
• Quantity: the number of units being developed.
Page | 23

• Variable costs: all additional costs associated with the development.
• Selling cost: the cost of selling the dwellings, as a percentage of sales value.
• Professional costs: the costs of hiring engineers, lawyers and other professionals, as a percentage of construction costs.
• Development charges: the levy placed on development of more than one unit on a lot by municipal authorities.
• Holding costs: the costs of holding the land prior to and during development.
• Acquisition costs: stamp duty.
• Finance: the range of costs associated with financing the development.
• Equity: the amount of equity held by the development group.
• Interest rate: the rate for development loans.
• Finance charges fixed: the base amount of establishing a large line of credit.
• Finance charges variable: the percentage of the loan amount taken by financial organizations to establish the account on top of fixed fees.
• Timing: how long the project will take and the stages of income.
• Project duration: length of weeks to complete the project.
• Stages: the number of sales/income stages occurring within the project.
• Costs: a summary of all costs associated with the development, including the final cost of each dwelling typology.
• Sales: the identified suburb the development is occurring in and the annual sales and volumes of each typology
7. Can data be uploaded and downloaded from the tool, or does it just provide reports?
ENVISION does not currently allow data to be uploaded (by users) shape files of identified precincts can be downloaded with each lot’s building footprint.
Page | 24
Preliminary Review of ‘Envision Scenario Planner (ESP)’ 6
1. Has the tool be applied at subdivision, precinct, and city level?
ESP works at the subdivision and precinct scale
2. Does the tool allow for consideration of both land use and transport related data?
ESP is based on land use typologies and has the capacity to alter roads and paths, but only at a precinct scale. Other than precinct additional VKT and car parks created it does not have transport data. Neither is there a capacity to join precincts to link transport data (which would be ideal).
3. Does the tool allow for real time streaming of data?
ESP does not receive or send streaming data.
4. What data preparation is required to use the tool, is this data freely available?
ESP runs on various ‘typologies’ which are placed into a precinct. Each typology takes significant time to prepare and assess. New climate areas (NSW, QLD, SA) would need to have each typology assessed to accommodate the climate factors for that area. Housing typologies are owned by CRCSI, however any new typologies are owned by the individual responsible for creating them.
5. What platform is the system running on and how is it accessed?
ESP is an online tools. The can both be accessed through www.greyfieldplanning.com.au but users need CRCSI approval to do so
6. What are the inputs and outputs of the tool, what is it reporting on?
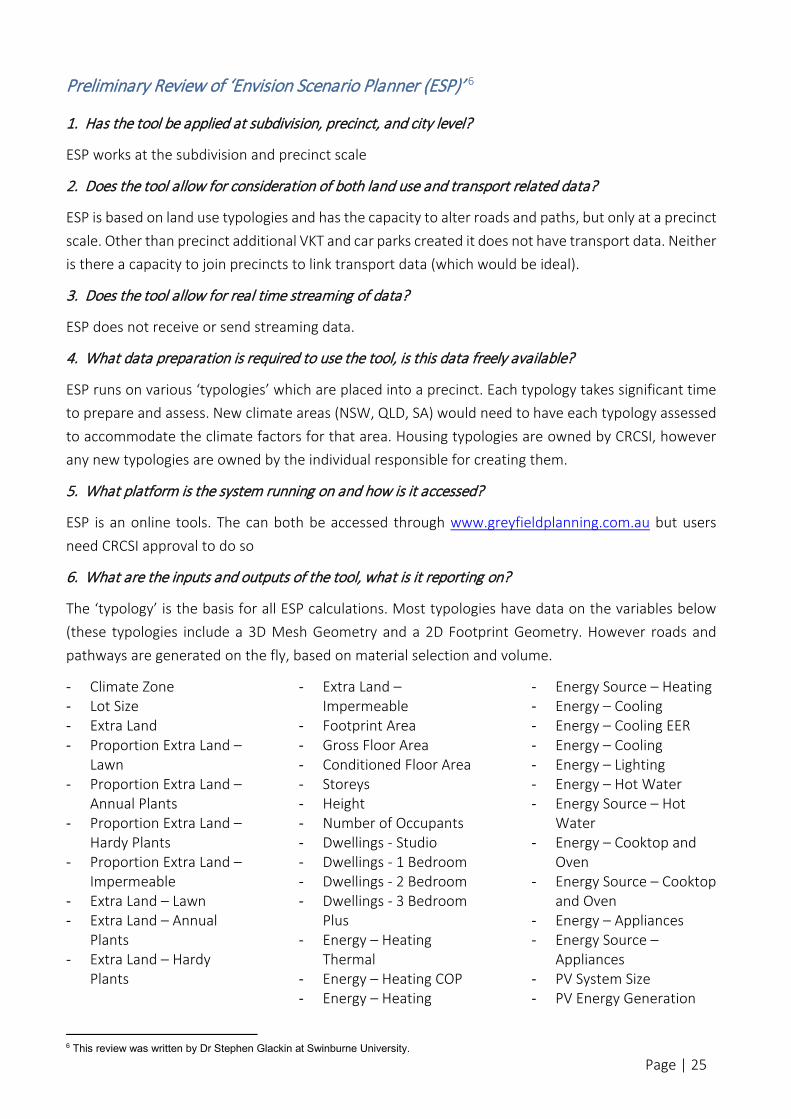
The ‘typology’ is the basis for all ESP calculations. Most typologies have data on the variables below (these typologies include a 3D Mesh Geometry and a 2D Footprint Geometry. However roads and pathways are generated on the fly, based on material selection and volume.
- Climate Zone - Lot Size - Extra Land - Proportion Extra Land –
Lawn - Proportion Extra Land –
Annual Plants - Proportion Extra Land –
Hardy Plants - Proportion Extra Land –
Impermeable - Extra Land – Lawn - Extra Land – Annual
Plants - Extra Land – Hardy
Plants
6 This review was written by Dr Stephen Glackin at Swinburne University.
- Extra Land – Impermeable
- Footprint Area - Gross Floor Area - Conditioned Floor Area - Storeys - Height - Number of Occupants - Dwellings - Studio - Dwellings - 1 Bedroom - Dwellings - 2 Bedroom - Dwellings - 3 Bedroom
Plus - Energy – Heating
Thermal - Energy – Heating COP - Energy – Heating
- Energy Source – Heating - Energy – Cooling - Energy – Cooling EER - Energy – Cooling - Energy – Lighting - Energy – Hot Water - Energy Source – Hot
Water - Energy – Cooktop and
Oven - Energy Source – Cooktop
and Oven - Energy – Appliances - Energy Source –
Appliances - PV System Size - PV Energy Generation
Page | 25
- Energy – Total Operating - CO2 – Greenspace - CO2 – Impervious - CO2 – Total External
Embodied - CO2 – Internal
Embodied Intensity - CO2 – Internal
Embodied - CO2 – Total Embodied - CO2 – Heating - CO2 – Cooling - CO2 – Lighting - CO2 – Hot Water - CO2 – Cooktop and
Oven - CO2 – Appliances - CO2 – Total Operating - Internal Water Use
Intensity - Internal Water Use –
Total - Rainwater System - Rainwater System
Supply - Share of Rainwater Used
Internally
- Internal Water Use – Rainwater
- Internal Water Use – Potable
- Greywater System - Share of Internal Water
Use to Greywater - External Water Use -
Greywater - External Water Use -
Rainwater - External Share of
Balance - Bore vs Potable
- External Water Use - Bore
- External Water Use - Potable
- External Water Demand – Lawn
- External Water Demand – Annual Plants
- External Water Demand – Hardy Plants
- External Water Demand – Total
- Water Use – Total Potable
- Water Demand – Total - Stormwater - Cost – Land Parcel - Cost – Lawn - Cost – Annual Plants - Cost – Hardy Plants - Cost – Impermeable - Cost – Total Landscaping - Cost – Building
Construction - Cost – Property - Cost – Electricity Usage - Cost – Gas Usage - Cost – Water Usage - Cost – Total Operating - Azimuth - Azimuth Heating Energy
Array - Azimuth Cooling Energy
Array - Parking Spaces – Garage - Parking Spaces – Street
Level - Parking Spaces –
Underground
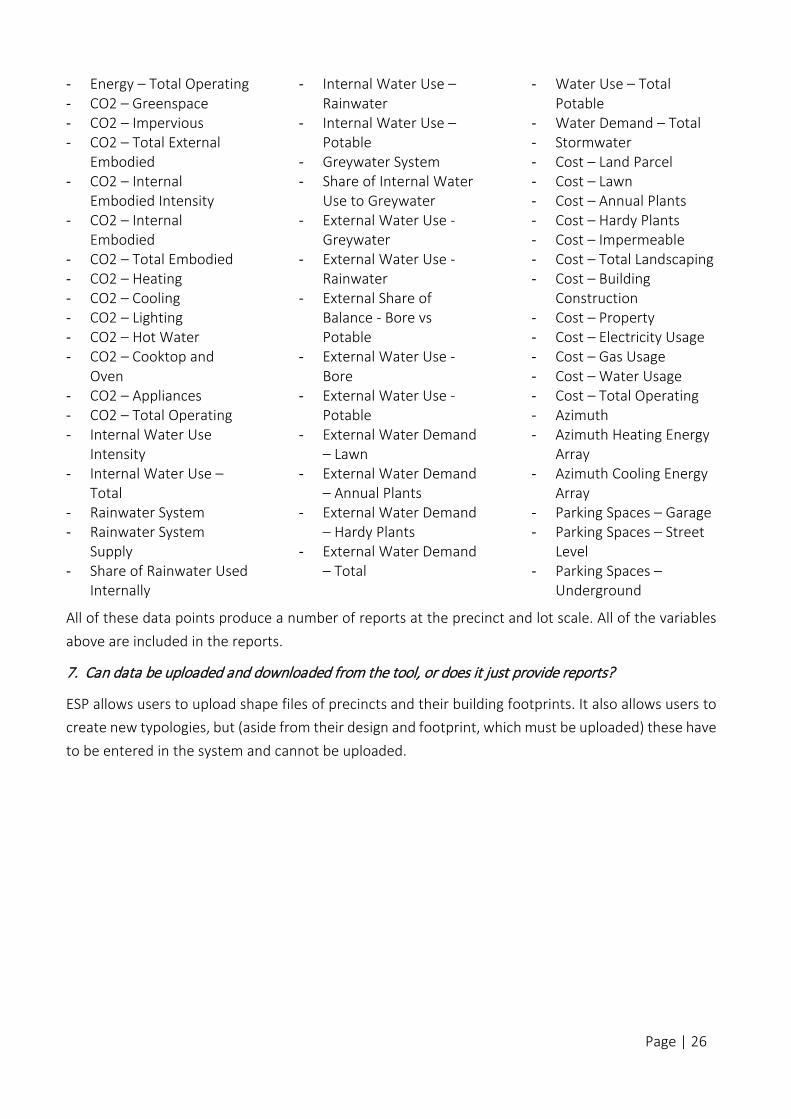
All of these data points produce a number of reports at the precinct and lot scale. All of the variables above are included in the reports.
7. Can data be uploaded and downloaded from the tool, or does it just provide reports?
ESP allows users to upload shape files of precincts and their building footprints. It also allows users to create new typologies, but (aside from their design and footprint, which must be uploaded) these have to be entered in the system and cannot be uploaded.
Page | 26
Preliminary Review of ‘UrbanSim’7
UrbanSim is an open source simulation platform for supporting planning and analysis of urban development, incorporating the interactions between land-use, transportation, the economy, and the environment. (UrbanSim website, 20168)
UrbanSim is a tool for use by urban planners, policymakers, and other community stakeholders to help formulate and evaluate combinations of land-use, transportation and environmental policies. It is intended to support deliberation and debate on such issues as building new transit systems or freeways, or adopting alternative growth management regulations and incentives, as well as on broader issues such as sustainable, livable cities, economic vitality, social equity, and environmental preservation. (Waddell & Borning, 2004).
UrbanSim is primarily designed to be used to support urban land-use, environmental and transportation planning, including modelling future scenarios9. It aims, by using a simulation framework, to model how the market works and changes over time (Waddell, 2014). “Although UrbanSim is designed to model real estate markets, the raison d’etre of UrbanSim is as a scenario planning tool. Regional or city planners want to understand how their cities will develop in the presence or absence of different policies or in the context of different assumptions that they have little or no control over, like economic growth or migration of households.”10
Unlike other software, UrbanSim is open source, which means that it is free for anyone to use (and to edit/modify) 11. This is both advantageous and disadvantageous; and this will be further discussed in the following report. UrbanSim has been available since approximately 1998; it was developed in 1996 by Paul Waddell, University of California, Berkeley and has undergone a number of iterations and improvements, including a brief period when it was sold to Autodesk, which owns a number of architectural and building management type software, and is best known for AutoCAD12, and subsequently has been taken over once again by the original developers.
As stated in Brits (2016), the underlying basis of UrbanSim is an agent-based modelling framework that uses random utility theory (discrete choice) and urban economics of location behaviour to predict real estate price movements (also see, Waddell, 2002). It is not a single model, rather it is a software architecture comprising a number (family) of models based on relational database architecture, incorporating geographical, demographic, and economic information. Sub models are used to describe actors or processes (Brits, 2016; Waddell, 2002). Other factors such as transport modelling (travel demand models) or macro-economic models are available, but are exogenous to UrbanSim.
UrbanSim has a number of advantages that would make it suitable for use in scenario planning, as it is extremely powerful, specifically designed for such use, and can incorporate transport modelling. It is
7 This review was written by Dr Heather Shearer at Griffith University. 8 http://www.urbansim.com/urbansim/ 9 https://en.wikipedia.org/wiki/UrbanSim 10 http://udst.github.io/urbansim/gettingstarted.html 11 Of note, much of the information in this article is based on the (unpublished) PhD thesis, Brits, Andre, (2016), and personal communication with Andre Brits. 12 http://www.autodesk.com.au/
Page | 27
also open source software and (currently) free to use. On the other hand, it has a number of disadvantages, including the highly specialised knowledge required to make the most effective use of its powerful modelling ability, and the time necessary to prepare the datasets for even a simple model. These advantages and disadvantages are further detailed below.
Advantages
- Open source coding in Python, therefore free to use and modify
- Ability to reflect market behaviour
- Large international community of users
- Flexible and adaptable modelling platform
- Ability to model at highly disaggregated spatial scales (lot level)
- Dynamic perspective of time
Disadvantages
- Requires extremely high level IT skills and planning knowledge
- Very steep learning curve
- Lengthy time to prepare datasets
- Poor GUI, requiring export and editing in other (paid) software
- Transport model could be improved
- Inability to model real-time data
In conclusion, it is the personal opinion of this writer (based on the literature review, analysis of the software and existing IT knowledge13) that the current iteration of UrbanSim is too complex to be used for scenario planning for the vast majority of planners and is best used in a specialised IT/modelling or academic environment. This complexity is further exacerbated by the poor GUI. Although it has some capacities beyond ArcGIS, it would be best used to support modelling in ArcGIS (or another GIS based system).
1. Has the tool be applied at subdivision, precinct, and city level?
UrbanSim can be applied at any level, from the household to the city (it can be used at grid cell, zone or parcel level). It is optimally used at the household/parcel level (cadastre) to model the future trajectory of a city. The more detailed the level of UrbanSim and the larger the geographical area, the more computing power that is required. To model a spatial area such as the greater Brisbane City area, would require a mainframe computer. Smaller spatial areas can be modelled on high power lap or desktops (i.e. i7 processors). Parcel-based analyses also require significant time to prepare the required datasets.
13 Of note, the author of this review, H. Shearer, has relatively high level IT skills, including spatial analysis, and found that installing, implementing and using UrbanSim was extremely complex and time consuming, so much so that the review is based not on actual use of the tool, but on a literature review and personal communication with more specialised users (Andre Brits).
Page | 28

UrbanSim has been used in some 70 plus centres worldwide, but the majority of implementations of the tool have been for research purposes, and in the USA (where it was developed). In the USA, it has been used in planning practice in Washington, San Francisco, Seattle, Austin, Salt Lake City and a number of other cities; and overseas it has been used in Zurich (Switzerland), Paris (France), Amsterdam (the Netherlands) and Tel Aviv (Israel). UrbanSim is not commonly used in Australia, and there is very little research on its use in the Australian context. Generally speaking, using the tool in the Australian context means building on a US template, with the concomitant issues, such as modifying the Imperial system of measurement and different scales of urban governance (all requiring data manipulation).
2. Does the tool allow for consideration of both land-use and transport related data?
Yes it does. The tool is mainly related to land-use data and real estate market projections, but it can use transport data plugins (sub models). UrbanSim requires network travel times (to nearest CBD, airports, arterials and freeways), the latter two calculated by Euclidean distance (straight line) and the former two by network type analysis (similar to service area analysis that uses the road network to calculate distance) (Brits, 2016, p9). A sub model of the tool is the Travel Demand Model, which is used to predict traffic congestion and travel modes between interchanges. Currently, the travel data is not dynamic and must be calculated externally. Furthermore, transport data and zone tables are integral and fundamental to UrbanSim, and incorporating real-time transit data would significantly improve this aspect of the tool (Brits, 2016).
The underlying assumption behind UrbanSim is that …”future land-use patterns depend on household and employment location choices (demand), which in turn depend on the supply, quality and price of residential and non-residential built space, access to jobs, access to community services (e.g. schools, health services, sport and recreation, etc.) and other aesthetic and environmental considerations” (Brits, 2016, p.11). Because of this, the models (and sub-models) comprising UrbanSim are based on Random Utility Maximisation Theory (individual choice). In other words, the models explicitly represent the result of multiple choices (including travel behaviour choices) made by multiple actors, and forecast over time. The outputs of the model are thus dynamic and path dependent.
Acquiring the actual data required for the tool is relatively simple; particularly in Queensland, which has excellent State and Local Government sources of free data, such as Cadastre, transport infrastructure and land-use planning. Federal Government datasets such as Census demographic data are also freely available, and often in time series downloads. Private sector data is available but is often too costly to acquire and not necessarily superior to free government data (except perhaps certain high level imagery data, which is not relevant in this case). Land-use data is often researcher-derived from a combination of data sources, such as Planning Schemes, citizen data such as Open Street Map and interpretation of aerial photographs.
Page | 29
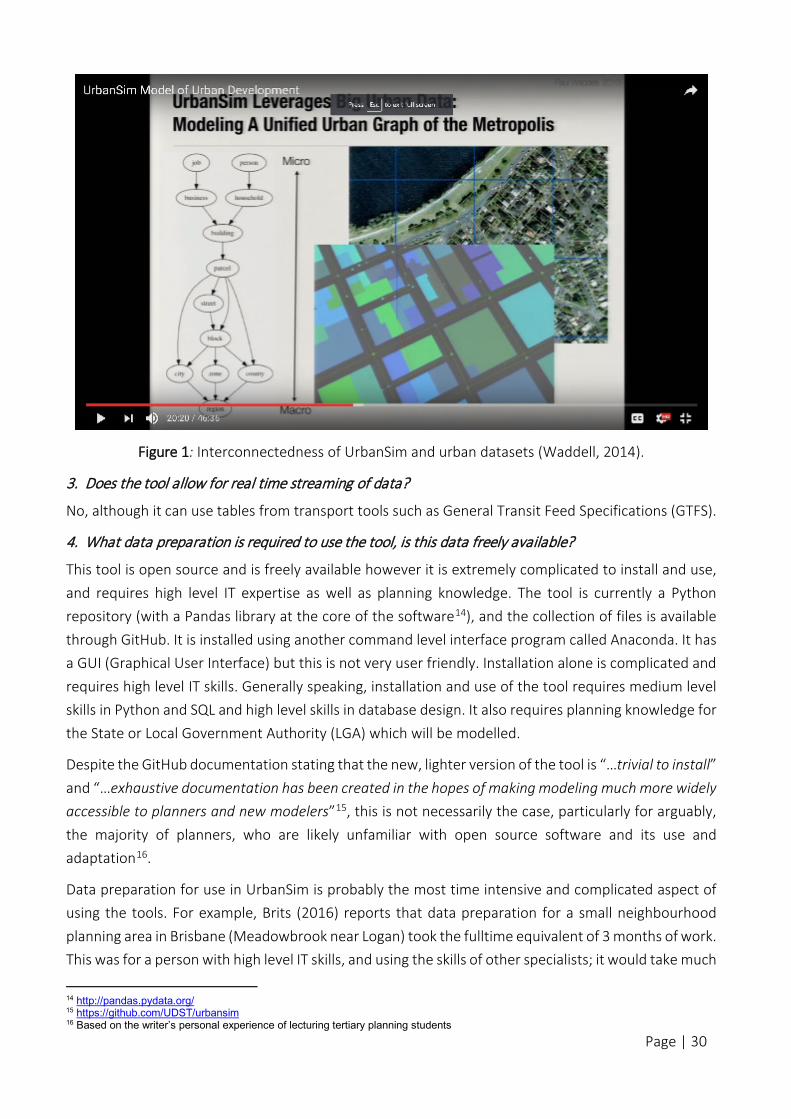
Figure 1: Interconnectedness of UrbanSim and urban datasets (Waddell, 2014).
3. Does the tool allow for real time streaming of data?
No, although it can use tables from transport tools such as General Transit Feed Specifications (GTFS).
4. What data preparation is required to use the tool, is this data freely available?
This tool is open source and is freely available however it is extremely complicated to install and use, and requires high level IT expertise as well as planning knowledge. The tool is currently a Python repository (with a Pandas library at the core of the software14), and the collection of files is available through GitHub. It is installed using another command level interface program called Anaconda. It has a GUI (Graphical User Interface) but this is not very user friendly. Installation alone is complicated and requires high level IT skills. Generally speaking, installation and use of the tool requires medium level skills in Python and SQL and high level skills in database design. It also requires planning knowledge for the State or Local Government Authority (LGA) which will be modelled.
Despite the GitHub documentation stating that the new, lighter version of the tool is “…trivial to install”
and “…exhaustive documentation has been created in the hopes of making modeling much more widely accessible to planners and new modelers”15, this is not necessarily the case, particularly for arguably, the majority of planners, who are likely unfamiliar with open source software and its use and adaptation16.
Data preparation for use in UrbanSim is probably the most time intensive and complicated aspect of using the tools. For example, Brits (2016) reports that data preparation for a small neighbourhood planning area in Brisbane (Meadowbrook near Logan) took the fulltime equivalent of 3 months of work. This was for a person with high level IT skills, and using the skills of other specialists; it would take much
14 http://pandas.pydata.org/ 15 https://github.com/UDST/urbansim 16 Based on the writer’s personal experience of lecturing tertiary planning students
Page | 30

longer to do this for a non-specialist. This is a relatively short time period for data processing, as previously it took 2 – 3 years to process the data, although the developers are working on automating some of this (Waddell 2014). Nor is there much methodological guidance on how to set up and use the software. These issues are probably the biggest negative to this software, which in other aspects, seems highly suited to urban scenario planning.
Waddell (2016, personal communication) states that an improved Graphical User Interface (GUI) to be known as Urban Canvas, is currently in the development phase, and should be released towards the end of 2016. This product was released previously as part of the (brief) ownership of UrbanSim by Autodesk, but is now being revised,17 and a beta version will be freely available to researchers, but it is envisaged that Urban Canvas will be a paid product (Waddell, P, Personal Communication, 2016).
5. What platform is the system running on and how is it accessed?
UrbanSim was originally designed in Java, but in the last decade, was re-engineered in Python and created as an “Open Platform for Urban Simulation’’ (GitHub, 2016). UrbanSim is in its present iteration, a Python code repository that requires various Python plugins (as well as the ability to link to a SQL relational database). It is possible to install UrbanSim as an executable, but it can also be installed via GitHub18 and another piece of open source software called Anaconda/Conda.19 These can be installed and run on most PCs or laptops, and it runs on later iterations of Windows, as well as OS and Linux. Of note however, if the later versions of Python (i.e. 3.5.n) are installed on the system, it is necessary to roll-back to Python versions 2.7.n (relatively simple to do through the Conda command-line interface).
6. What are the inputs and outputs of the tool, what is it reporting on?
UrbanSim itself is a microsimulation dynamic discrete choice model; in other words, it uses large scale datasets of disaggregated data (households, buildings, businesses, etc.) to predict the future result of discrete choices (i.e. where to buy a property, to establish a business, etc.). Thus it requires inputs of often very large datasets, such as households and their characteristics, businesses, buildings, jobs, development proposals in the pipeline, and economic and demographic information (Waddell, 2014).
To use UrbanSim, it is first necessary to set up the Base Year Model (the base year relational database), and this is the most time consuming and complex aspect of using UrbanSim. This is essentially, “…a snapshot of the base information defining the initial state before a simulation” (Brits, 2016, p7). For the Brits study (2016), 44 data tables were created (or adapted) solely for the base year database and included:
• Datasets; i.e. parcel data (cadastre), buildings, households, travel data and jobs; • Model Estimation Tables; i.e. Household location choice, Real estate price, Home based
employment location choice; and • Definition Tables; Planning assumptions, Classifications and Templates.
17 http://inthefold.autodesk.com/in_the_fold/2015/04/autodesk-previews-urban-canvas-at-american-planning-association-conference.html 18 https://github.com/UDST/urbansim 19 http://udst.github.io/urbansim/gettingstarted.html#installation
Page | 31

Notwithstanding the 44 datasets used in the example, 7 base tables are required to run UrbanSim; these are cadastre, buildings, household, persons, jobs, travel and development project proposals. The other tables are usually derived from the 7 base tables.
Generally speaking, creating a new model requires adapting a pre-existing template, and then specifying and developing them interactively. Implementation of an active choice model involves selecting options for each step and setting configurations. UrbanSim leverages big urban data and from that, models a unified and interconnected graph of the metropolis.
7. Can data be uploaded and downloaded from the tool, or does it just provide reports?
Data can be both uploaded and downloaded from the tool; and because of its (currently) limited graphical abilities, it is possible to export data to be visualised in other software, such as ArcMap. Data can be imported or exported as shapefiles, dbf, SQL or csv. GIS software is useful to integrate, organise, review and manage these data (prior to and post analysis in UrbanSim) (Waddell, 2014).
References
Brits, A., 2013, November. Embedding Urban Growth Modelling in Planning Practice. In State of Australian Cities Conference, Sydney (pp. 26-29).
Brits, A., 2016, Unpublished PhD Thesis (name), Griffith University, Queensland
Brits, A., 2016, Personal Communication
UrbanSim (2016) https://github.com/UDST/urbansim
Waddell, P, 2016. Personal Communication
Waddell, P. 2014. UrbanSim Model of Urban Development. YouTube recording of presentation to Citris Research Exchange Seminar 20
Waddell, P., 2010. Integrated Land-use and Transportation Planning and Modelling: Addressing the Challenges in Research and Practice. Transport Reviews, 31(2): 209–229.
Waddell, P. and Borning, A., 2004. A case study in digital government developing and applying urbansim, a system for simulating urban land-use, transportation, and environmental impacts. Social Science Computer Review, 22(1), pp.37-51.
Waddell, P., 2002. UrbanSim: Modeling urban development for land-use, transportation, and environmental planning. Journal of the American Planning Association, 68(3), pp.297-314.
20 https://www.youtube.com/watch?v=CWfiqFXAvRI Page | 32

Preliminary Review of Transport Models21
Introduction to Transport Models
Hierarchy of Transport Models
Transport professionals have access to a variety of modelling tools which can be applied at a number of levels depending on the application and modelling need. At the highest level are macro-simulation (or macroscopic simulation) tools which model traffic on a network as a time-varying flow on each link, and assume that traffic streams generally follow behaviours similar to fluid streams. These tools are useful for building strategic, regional or city-wide models without attention to individual traveller behaviour. At the next level are dynamic simulation tools which include mesoscopic, microscopic and hybrid models. These dynamic models allow greater levels of detail than a strategic model. In the Mesoscopic approach, the vehicles are modelled as individual entities with simplified behavioural models (car following and lane changing) with a slight loss of realism resulting in an event-oriented simulation approach. Microscopic simulation offers the highest level of detail and allows for distinguishing between the different types of vehicles and drivers. It also enables a wide range of network geometries (e.g. freeways, arterials, streets etc.) and traffic control (e.g. traffic signals, give-way intersections and ramp metering) modelling.
The behaviour of each vehicle is continuously modelled using detailed car following, lane changing, and gap acceptance models. In the Hybrid approach, the simulation concurrently applies the microscopic models in certain selected areas and the mesoscopic models in the rest. This approach can be used in large-scale networks where there is a need in specific areas to have a level of microscopic detail but with a global network evaluation. In recent times, agent-based or nanoscopic modelling approaches have also been introduced. These offer a number of features which allow for modelling network performance using end-to-end trips made by travellers over multiple modes of transport, rather than single-mode trips made in a vehicle or walking. These tools also allow for modelling individual traveller behaviour including dynamic decision processing incorporating a dynamic mode-choice function of individual travellers. This provides capabilities to allow a traveller in the model to make instantaneous choices between available modes as well as choices between available routes.
The different levels of hierarchy are illustrated in Figure 1
21 This review was written by Dr Hussein Dia at Swinburne University. Page | 33

Figure 1: Transport Modelling Hierarchy
Land Use Transport Interaction Models
The need for land use and transport integration has been identified in a large number of previous studies (e.g. PATREC, 2014). The purpose of Land Use Transport Interaction (LUTI) models is to help decision makers evaluate how cities develop, and manage and operate sustainable transport systems through the interaction of three key factors: population, land use and transport services.
LUTI models can therefore be thought of as tools to identify the optimal distribution of services and facilities in order to maximise access to jobs, activities, services and economic opportunities while minimising the adverse environmental impacts associated with mobility. The main appeal of these models is their ability to evaluate the interplay and feedback of information from the land use system to the transport system, and vice versa. This way, the influence of land use patterns are reflected on the development of transport infrastructure and mobility patterns. Similarly, the models can also be used to evaluate how transport interventions impact urban form and how people engage in various land use activities. For example, the models can be used to estimate the impacts resulting from a change in transport infrastructure (e.g. building a new railway line) or new residential, commercial or industrial developments. The models produce evaluations that include economic impacts (local, city-wide or regional) often disaggregated by sector, and predictions of impacts on households, population, jobs etc. for each of the modelled areas. The most fundamental benefit of these models is the ability
Page | 34

to predict the effects on land valuation, employment patterns and transport mode choices. These models therefore act as an important bridge between theory and experiment by predicting the impacts of proposed interventions measures before they are implemented in real-wold situations.
While the need for LUTI models has long been established, the practice today generally separates the land-use plans from the transport modelling. On the one hand, transport planners utilise transport modelling tools to evaluate the impacts of transport infrastructure interventions with minimal input about land development and social impacts. On the other hand, land use planners tend to apply qualitative analyses in development of forecasts without a thorough investigation of the transport impacts. There have been numerous attempts over the past two decades to develop land-use modelling tools that can be integrated into transport models. These include ITLUP (also known as DRAM/EMPAL), MEPLAN, TRANUS and DELTA (Oryani et al, 1996). However, these tools have met with limited success either due to rigid data structures and requirements; time-consuming calibration and validation methodologies; lack of GIS capabilities; difficulty of integration with established transport modelling tools; or lack of commercial support.
In recent times, two LUTI tools that have attracted considerable attention include the suite of commercial software tools from Citilabs (particularly Cube Avenue which includes Cube Voyager and Cube Land), and UrbanSim which is a free open source simulation platform that supports the planning and analysis of urban developments and models the interaction between land use, transport, the economy and environment. UrbanSim is included in this project but is being reviewed and covered separately in another document. This document focuses on the commercial software tools from Citilabs. A number of government agencies in Australia and New Zealand (e.g. in South Australia, Tasmania, Victoria, Western Australia and the City of Christchurch in New Zealand) use a range of products from this commercial provider. These agencies also currently have a number of existing transport models based on the “Cube Voyager” software, which can potentially be integrated or interfaced with “Cube Land” which is the land use model from the same vendor.
Cube Suite of Transport and Land Use Software Tools
The Cube suite of transport and land-use software includes the following modules:
System Interface - Cube Base: This is the interface that allows for data input, editing, mapping, reporting, model
development and scenario creation and management. It is also the interface used to initiate the different modelling tools within Cube.
Demand Modelling - Cube Voyager: Urban and regional demand forecasting and assignment. This tool allows the user
to build macroscopic regional models to understand large scale personal travel demands
- Cube Land: Land use model for combined transport-land use modelling. This tool allows the users to predict the land-use changes given modifications to the transport system
Page | 35
- Cube Cargo: This tool is used to model freight movements throughout a city or region to understand the impacts of commodity flows
Simulation - Cube Avenue: This is a city mesoscopic simulation tool to model the dynamics of congestion
throughout a day. It uses mesoscopic traffic simulation methodologies and dynamic traffic assignment
- Cube Dynasim: This is a multimodal microscopic traffic simulation tool which models all aspects of traffic operations
Specialised - Cube Analyst: This is a matrix estimation tool for use with roadway and public transport data. It
uses data assimilation techniques for trip origin-destination (OD) matrix estimations. It directly estimates trip matrices from roadway and public transport counts and other survey data
- Cube Cloud: Secure sharing of models, data and results with customised access to different users
- Cube Cluster: Reduces run-times by allocating calculations over multiple processors and machines
The focus of this report will be on the “Cube Voyager” and “Cube Land” modules of the software which are the two main tools necessary for modelling land-use transport interaction at the macro level. Transport demand and supply depend on the location of activities and land use within the study area. The transport system also influences the activity patterns and the land use. This creates a cycle loop between land-use and transport costs (Figure 2).
The “Cube Voyager” tool allows users to build macroscopic regional models to understand large scale personal travel demands. “Cube Land”, on the other hand, is used to predict land-use changes given modifications to the transport system. The Cube suite of software tools therefore provide an efficient integration of the land-use and the traffic models that are developed using these tools. The transport model essentially provides the congestion and accessibility values to the land-use model. The land-use model then determines where households and firms will locate based on accessibility and other conditions of the zone. The location of households and firms also influences traffic demand and therefore congestion levels.
Page | 36

Figure 2: Integrated LUTI Modelling in Cube Suite of Software
Cube Voyager
Cube Voyager is used to understand large scale personal travel demand. It provides capabilities to create detailed representations of roadway and public transport networks and can be used to create a comprehensive infrastructure database for use in estimating point-to-point paths and associated travel times, costs, and distances. It also provides functionality for studying the effectiveness and efficiency of public transport systems. The software has automated processes for creating walk, cycle and transfer links between multi-modal services. The software also provides methods to represent highly complex fare structures and for modelling public transport capacity constraints. The tool can be used to address a range of questions such as those presented in Figure 3. The outputs generated include matrices of times, costs, and distances by mode and component.
Figure 3: Models of large scale personal travel demand
Cube Voyager Cube Land
Page | 37
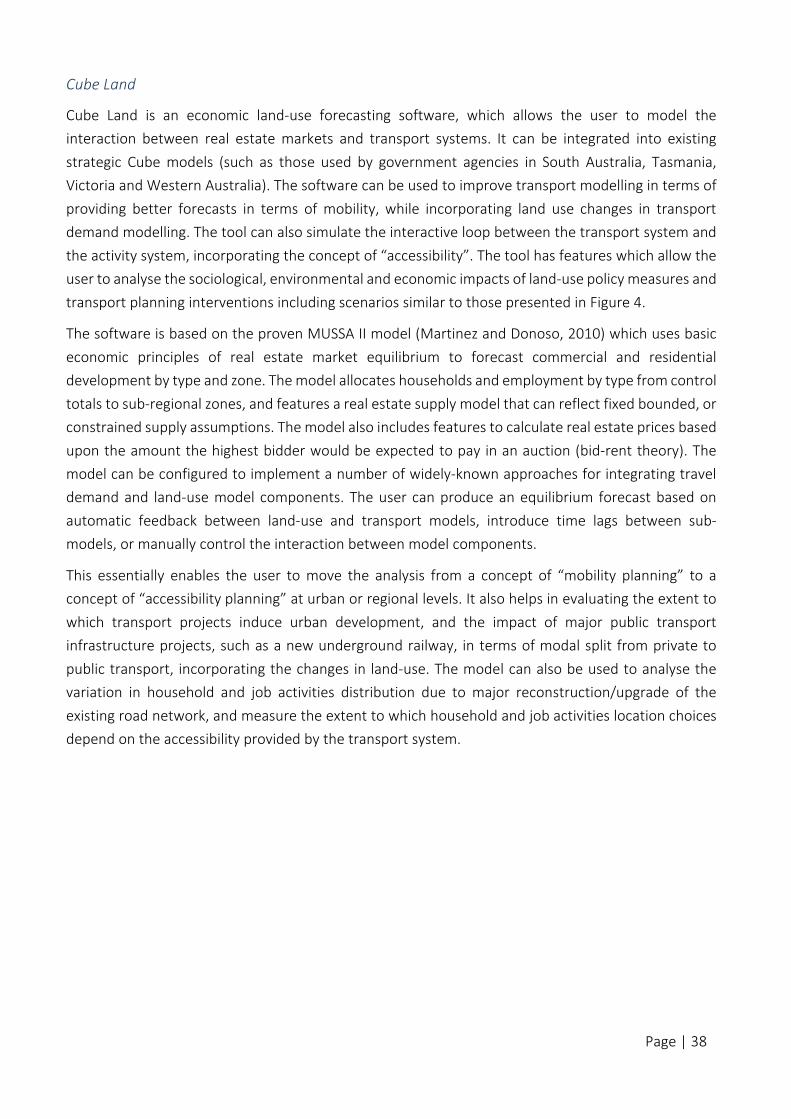
Cube Land
Cube Land is an economic land-use forecasting software, which allows the user to model the interaction between real estate markets and transport systems. It can be integrated into existing strategic Cube models (such as those used by government agencies in South Australia, Tasmania, Victoria and Western Australia). The software can be used to improve transport modelling in terms of providing better forecasts in terms of mobility, while incorporating land use changes in transport demand modelling. The tool can also simulate the interactive loop between the transport system and the activity system, incorporating the concept of “accessibility”. The tool has features which allow the user to analyse the sociological, environmental and economic impacts of land-use policy measures and transport planning interventions including scenarios similar to those presented in Figure 4.
The software is based on the proven MUSSA II model (Martinez and Donoso, 2010) which uses basic economic principles of real estate market equilibrium to forecast commercial and residential development by type and zone. The model allocates households and employment by type from control totals to sub-regional zones, and features a real estate supply model that can reflect fixed bounded, or constrained supply assumptions. The model also includes features to calculate real estate prices based upon the amount the highest bidder would be expected to pay in an auction (bid-rent theory). The model can be configured to implement a number of widely-known approaches for integrating travel demand and land-use model components. The user can produce an equilibrium forecast based on automatic feedback between land-use and transport models, introduce time lags between sub-models, or manually control the interaction between model components.
This essentially enables the user to move the analysis from a concept of “mobility planning” to a concept of “accessibility planning” at urban or regional levels. It also helps in evaluating the extent to which transport projects induce urban development, and the impact of major public transport infrastructure projects, such as a new underground railway, in terms of modal split from private to public transport, incorporating the changes in land-use. The model can also be used to analyse the variation in household and job activities distribution due to major reconstruction/upgrade of the existing road network, and measure the extent to which household and job activities location choices depend on the accessibility provided by the transport system.
Page | 38

Figure 4: Land-use Modelling in the Cube Suite of Software
The two LUTI tools that have attracted the attention of researchers and practitioners in recent times include UrbanSim and Cube Land. This document focused on the potential of Cube Land to be integrated within the existing strategic transport models used by government agencies in Australia. A number of these agencies in Victoria, South Australia, Tasmania and Western Australia, have existing Cube strategic transport models which are used in their jurisdictions. These agencies have invested heavily in licenses, training of personnel and development of regional models. From a practical point of view, the Cube Land model can be readily integrated within these existing models thereby reducing development time and costs. It is unknown, however, if any of these agencies have trialled the Cube Land tool yet.
1. Has the tool be applied at subdivision, precinct, and city level?
Cube Voyager (macroscopic strategic transport modelling tool) is used to develop models at the city or regional level to understand large scale personal travel demands. Cube Land is generally integrated in the model at this level in the hierarchy although it can also be integrated with Cube Avenue (mesoscopic simulation to model the dynamics of congestion throughout a day). This allows the user to either investigate the city-wide or regional impacts. Cube Land cannot be used with the micro-simulation tool Dynasim.
Cube Voyager models are used extensively around the world. In Australia, the tools are used by the government agencies of Western Australia, South Australia, Victoria and Tasmania. These agencies have have full Cube Voyager multi-modal transport models. The government agencies in NSW are using Cube Voyager for public transport modelling only. Cube Land can be used on its own as a land-use modelling tool, or it can be used in conjunction with Cube Voyager (macroscopic) or Cube Avenue
Page | 39

(mesoscopic) modules. These models are all launched from “Cube Base” which is an interface that houses a scenario manager and ArcGIS engine. Generally, “Cube Land” is sold as a package with Voyager to allow users to build LUTI models.
2. Does the tool allow for consideration of both land use and transport related data?
Yes. See Section 2-3 of this document. Through integration of the “Cube Voyager” or “Cube Avenue” transport modelling tools and the “Cube Land” land-use models, the tools allow for consideration of the interactions between land-use and transport modelling.
3. Does the tool allow for real time streaming of data?
The mesoscopic and microscopic tools can potentially be interfaced to real-time sources of traffic data through scripting and application programming interfaces. The strategic models, however, do not require the real time data and rely mainly on static network and demand profile data. The tools, however, include sophisticated GIS importing tools and other features that allow for ease of data integration from different sources.
4. What data preparation is required to use the tool, is this data freely available?
Land-use Modelling
The data required for the development of the land-use models includes the zone specifications, real-estate categories, household and firm categories as detailed below and illustrated in Figure 5.
Figure 5: Cube Land Methodology, Inputs and Outputs
Inputs: When designing a land-use model, the user specifies the model in terms of its fundamental dimensions. These dimensions determine the level of detail in the model through three types of information:
Page | 40

(1) Zones: The study area must be divided into into zones.
(2) Real estate categories: Classification of the different types of real estate.
(3) Household and firm categories: Classification of households by socioeconomic characteristics and firms by economic activity.
For each category, the user creates attributes that represent the households, firms, real estate, and zones. Based on the defined categories, the user provides the software with the input that defines each future modelling scenario:
- Regional control totals of households and firms by category, including changes to the population distribution. Using predictions of demographic changes, the user can determine the number of households per category, and by using macroeconomic studies, the user can also define the economic variables needed to compute the number of firms. With these inputs, Cube Land can study, for example, how an increase in the population’s income or an increase in employment will cause changes in the region’s structure.
- Changes in regulations, subsidies or taxes on land use and real estate development in each zone.
- Changes in transport. Based on a transport model, the user can provide information on transport quality of service measures (accessibility and attractiveness) for activities in each zone.
- Partial projections of the real estate supply, based on anticipated future projects. For example, this can allow the user to study the impacts of a proposed real estate development.
Outputs
Using the above inputs, Cube Land solves for equilibrium between demand (households and firms) and supply (real estate market: zones and properties) and provides the following results:
- Real estate supply in each zone, classified by real estate type
- Rents (prices) for use or lease, by real estate type in each zone
- Disaggregated urban location, indicating the number of households and firms in each category, located in each type of real estate in each zone
Finally, based on these results, the user can analyse the impact of changes on a specific scenario. For example, the user can investigate a range of issues including:
- Benefits obtained by each demand agent (households and firms) and each real estate supplier, either due to a real estate project, a new regulation, a change in demand or changes in the transportation system.
- The impacts of transport projects or real-estate regulation changes could have on the location of agents or on the real estate supply
- Natural growth trends within the framework of planned transport system development and land use projects
- Identification of locations where is it most efficient to develop land in order to achieve pre-defined community outcomes and objectives
Page | 41
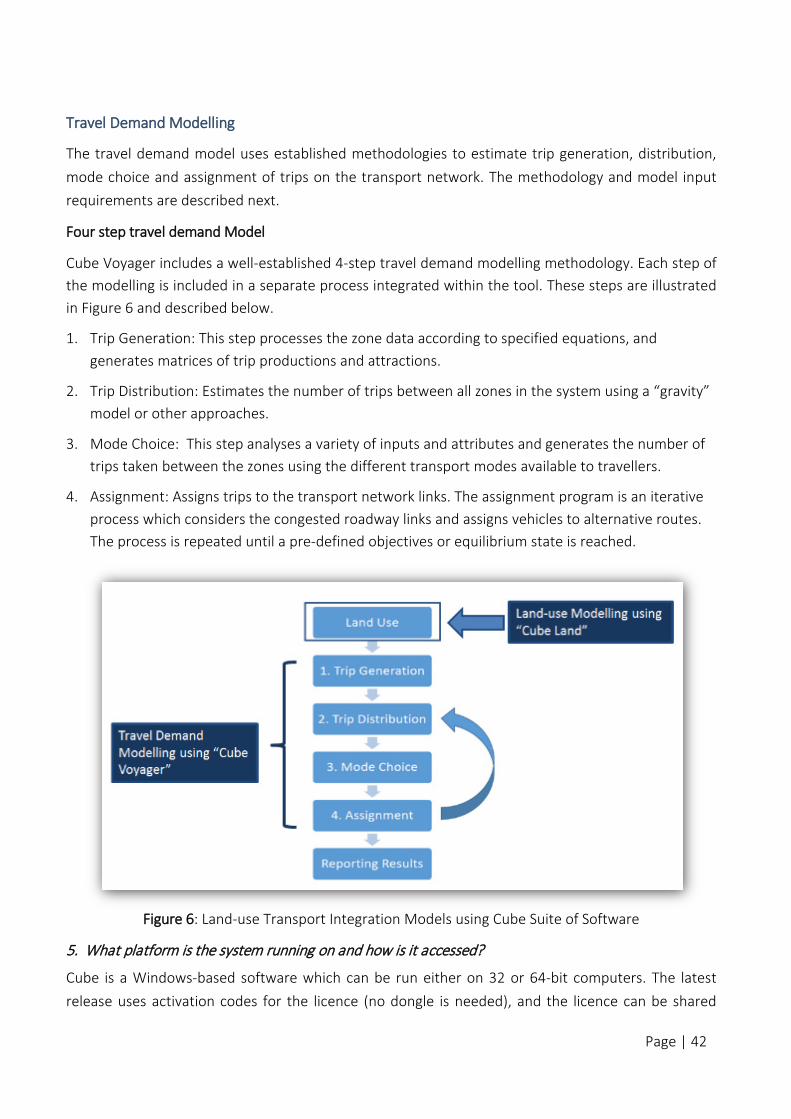
Travel Demand Modelling
The travel demand model uses established methodologies to estimate trip generation, distribution, mode choice and assignment of trips on the transport network. The methodology and model input requirements are described next.
Four step travel demand Model
Cube Voyager includes a well-established 4-step travel demand modelling methodology. Each step of the modelling is included in a separate process integrated within the tool. These steps are illustrated in Figure 6 and described below.
1. Trip Generation: This step processes the zone data according to specified equations, and generates matrices of trip productions and attractions.
2. Trip Distribution: Estimates the number of trips between all zones in the system using a “gravity” model or other approaches.
3. Mode Choice: This step analyses a variety of inputs and attributes and generates the number of trips taken between the zones using the different transport modes available to travellers.
4. Assignment: Assigns trips to the transport network links. The assignment program is an iterative process which considers the congested roadway links and assigns vehicles to alternative routes. The process is repeated until a pre-defined objectives or equilibrium state is reached.
Figure 6: Land-use Transport Integration Models using Cube Suite of Software
5. What platform is the system running on and how is it accessed?
Cube is a Windows-based software which can be run either on 32 or 64-bit computers. The latest release uses activation codes for the licence (no dongle is needed), and the licence can be shared
Page | 42

across a network if required. Cube can be installed in any number of ways either on the desktop or on servers and can also be run on the cloud for additional computation power. The cloud option is enabled through “Amazon Web Services” and “Cube Cloud” which provide users with modelling speed enhancements and scalability benefits. The Amazon Web Services enables the user to choose their IT infrastructure and minimise costs spent on IT equipment. Cube Cloud also allows users to choose the processing power they require, and implement models online for safe sharing with a community of users.
6. What are the inputs and outputs of the tool, what is it reporting on?
These are reported in Section 4.4.
Most of the inputs to the Cube Land model include zonal attributes (area by land-use category, average household income etc.); zonal accessibility and attractiveness; real estate unit characteristics by zone (average lot size, average floor space, etc.); market-segmented households and jobs (households stratified by size and income, jobs stratified by industry type); base real estate supply stock; and zoning policies or other restrictions.
Typical outputs from a Cube Land model include number of real estate properties (e.g. housing units) by type in each zone, built area by land use type; households and jobs by zonal location and real estate property type, average household income by zone, variations in number of households/population and jobs for each zone due to changes in the transport network or testing policies; rents by real estate type and zone (simulated relative property values) and bids of each consumer type
7. Can data be uploaded and downloaded from the tool, or does it just provide reports?
The transport network input data can be uploaded from GIS layers and databases. Cube Base comes with a transport GIS designed on ESRI’s ArcGIS technology. All data is stored in ESRI’s geodatabase format. The outputs include a wide range of reports and charts. The data can also be exported to Microsoft Office for further manipulation or for use in other models.
References
Martinez, F.J. and Donoso, P. (2010). The MUSSA II Land Use Auction Equilibrium Model. In: Residential Location Choice, Models and Applications. Editors: J Preston, D. Simmonds and F. Pagliara, Chapter 4, Advanced in Spatial Science, Springer, 99-113.
Oryani, K., Greiner, U and Harris, B. (1996). Review of Land Use Models: Theory and Application. Available at: http://ntl.bts.gov/lib/7000/7500/7505/789761.pdf
PATREC (2014). Transport modelling review: independent review. Final report, Planning and Transport Research Centre, The University of Western Australia, Perth, Australia.
Page | 43