PRELIMINARY BUDGET - Des Moines Public Schools
163
PRELIMINARY BUDGET FINANCIAL STATEMENTS 2016-2017 AND Think. Learn. Grow.
-
Upload
khangminh22 -
Category
Documents
-
view
3 -
download
0
Transcript of PRELIMINARY BUDGET - Des Moines Public Schools
PRELIMINARY BUDGET
FINANCIAL STATEMENTS
2016-2017
AND
Think. Learn. Grow.
FISCAL YEAR 2017 PRELIMINARY BUDGET & FINANCIAL STATEMENTS
March 8, 2016
BOARD OF DIRECTORS Rob X. Barron, Chair
Teree Caldwell-Johnson, Vice Chair Heather Anderson
Connie Boesen Cindy Elsbernd
Dionna Langford Natasha Newcomb
Thomas Ahart, Superintendent
Report issued by the Office of Business and Finance Thomas Harper, Chief Financial Officer
(515) 242-7745
2323 Grand Avenue
Des Moines, Iowa 50312
TABLE OF CONTENTS
Executive Summary Superintendent’s Message ............................................................................................................................... 5 Des Moines: A Vibrant & Diverse City ........................................................................................................ 7 Des Moines Public Schools: A Leader in Urban Education .................................................................... 9 Fiscal Profile .....................................................................................................................................................36 Allocation of Human Resources ..................................................................................................................52 District Leadership .........................................................................................................................................61 Financial Structure, Policy, and Process Fund Structures & Descriptions ..................................................................................................................67 Financial Policies ..............................................................................................................................................75 Budget Process ................................................................................................................................................81 Financial Summaries Summary All Funds .........................................................................................................................................87 Fund Balances ..................................................................................................................................................94 Revenues ........................................................................................................................................................ 125 Long-Range Financial Plans ........................................................................................................................ 143 Appendix Proposed Filing for the FY 2017 Certified Budget ............................................................................... 152 Glossary ......................................................................................................................................................... 153 Acronyms ...................................................................................................................................................... 159
2016-2017 Preliminary Budget 3
EXECUTIVE SUMMARYP R E L I M I N A RY B U D G E T 2 0 1 6 - 1 7
SUPERINTENDENT’S MESSAGE
March 8, 2016
Members of the Board Rob X. Barron, Chair Teree Caldwell-Johnson, Vice Chair Heather Anderson Connie Boesen Cindy Elsbernd Dionna Langford Natasha Newcomb
It is my pleasure to present the preliminary 2016-17 budget for Des Moines Public Schools.
The preliminary budget is based on significant assumptions, as we are facing substantial unknowns at this time. The district’s General Fund accounts for approximately 80% of all revenues received in a given year. Nearly all of those funds come from two sources: State Aid and Local Funds, including property taxes. The amount of State Aid and Local Funds is driven by the level of Supplemental State Aid (e.g., Allowable Growth) the state allocates to Iowa schools.
School districts in Iowa are required by law to certify budgets by April 15 of each calendar year; yet, for several years, the Legislature did not established Supplemental State Aid (Allowable Growth) and State Foundation Aid in a timely manner. In the 2013 legislative session, the Legislature set Supplemental State Aid (Allowable Growth) for schools for FY 2014 and FY 2015, which enabled the district to make more accurate assumptions for FY 2015.
Unfortunately, FY 2016 was a return to form for the state. After weeks of deadlock on school aid between the Senate and House, both chambers of the Legislature reached a compromise in early June (well after districts were required to certify their budgets). The compromise provided K-12 schools with a base 1.25% increase to Supplemental State Aid, plus an additional $55.7 million for one-time spending, resulting in an overall increase of approximately 2.62% for FY 2016. Over the Fourth of July weekend (July 2, 2015), the Governor vetoed the one-time spending funds.
As of the beginning of March 2016, Supplemental State Aid (Allowable Growth) has not been set for FY 2017, and there is no indication that the Legislature will set FY 2017 or FY 2018 Supplemental State Aid before the April 15 deadline for school districts to certify their budgets. Consequently, the district has undertaken multiple-scenario budget forecasting to identify various contingency plans.
2016 - 2017 Preliminary Budget 5

In addition, the district is facing some significant financial issues that must be addressed to maintain the long-term financial health of the district, while continuing to take steps to improve student outcomes. One of the priorities of the school district is to maintain a vital, fiscally sound organization so that students continue receive education in a robust, supportive environment that is conducive to teaching and learning.
The state controls the maximum amount each district can spend each year through the Spending Authority function. One of the few ways a district’s Spending Authority can grow is through an increase in Supplemental State Aid. In situations where Spending Authority is not growing, if no adjustments are made to expenses, the district’s “reserves” are tapped into to cover expenses for the year. The significant predicament this creates is the resulting decrease in the district’s Maximum Authorized Budget; it is illegal for a school district to exceed its Maximum Authorized Budget, even if it has the cash on hand.
Given the political climate in the state, the real fear is that 0-2% Supplemental State Aid is the “new normal” for school districts, and the years of regular 4% increases to Supplemental State Aid are a thing of the past. School districts have also experienced an increase in categorical funding from the state that can only be spent on certain programs, not for general education purposes. Supplemental State Aid (Allowable Growth) is vital as costs paid for with General Fund dollars — such as health care, other compensation components, fuel costs, and cost of goods and services — continue to rise.
The preliminary budget takes these conditions into consideration and presents a plan that will maintain the long-term financial health of the district, while continuing to support efforts to improve the education students in Des Moines receive and the opportunities available to them.
It is vital that we continue to advocate for an increase in Supplemental State Aid that supports the important work of schools across this state. This preliminary budget is based on a worst-case-scenario of 1.00% growth in Supplemental State Aid. After the Legislature sets school funding, the budget may be amended, if needed. We also need to continue to monitor the action at the statehouse on Statewide Penny funding, which is the primary source of the renovation and construction funds in the district. Statewide Penny funding is set to sunset in 2029; the district bonded ahead for construction projects in 2010, 2012, 2013, and 2014. The district plans to bond against the Statewide Penny funds one additional time, which will obligate all remaining funds prior to the 2029 sunset.
Sincerely,
Thomas M. Ahart, Ed.D. Superintendent
2016 - 2017 Preliminary Budget 6
DES MOINES: A VIBRANT & DIVERSE CITY
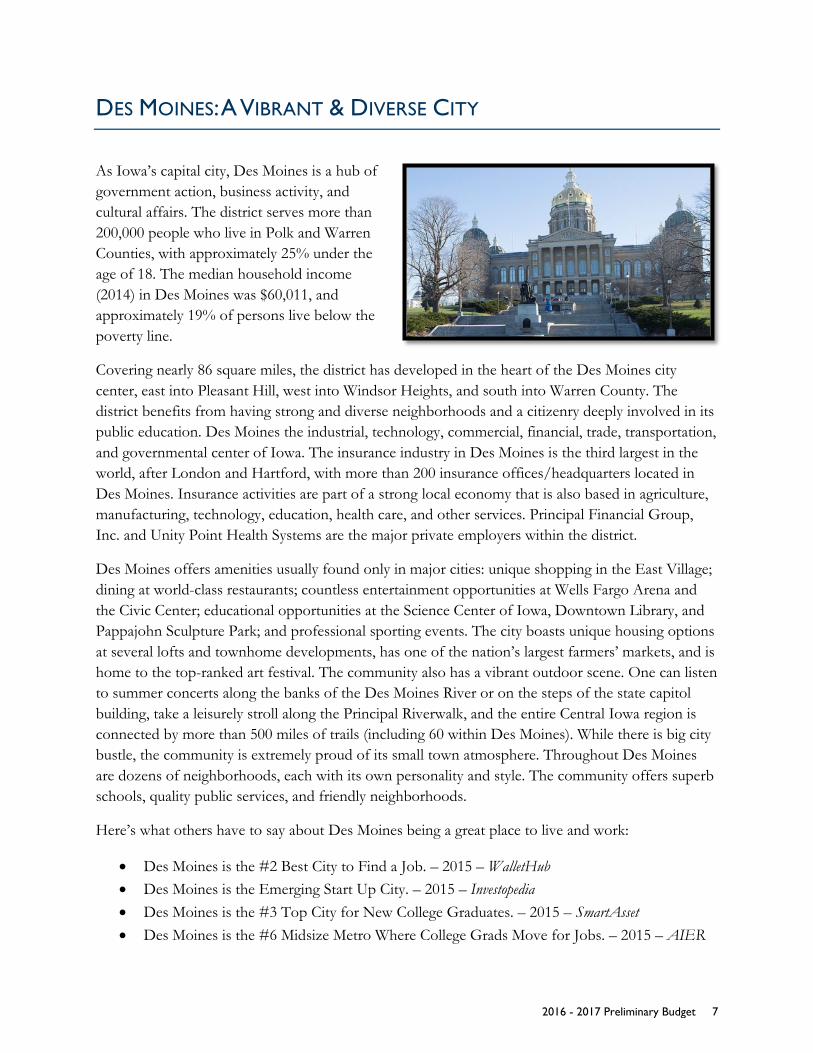
As Iowa’s capital city, Des Moines is a hub of government action, business activity, and cultural affairs. The district serves more than 200,000 people who live in Polk and Warren Counties, with approximately 25% under the age of 18. The median household income (2014) in Des Moines was $60,011, and approximately 19% of persons live below the poverty line.
Covering nearly 86 square miles, the district has developed in the heart of the Des Moines city center, east into Pleasant Hill, west into Windsor Heights, and south into Warren County. The district benefits from having strong and diverse neighborhoods and a citizenry deeply involved in its public education. Des Moines the industrial, technology, commercial, financial, trade, transportation, and governmental center of Iowa. The insurance industry in Des Moines is the third largest in the world, after London and Hartford, with more than 200 insurance offices/headquarters located in Des Moines. Insurance activities are part of a strong local economy that is also based in agriculture, manufacturing, technology, education, health care, and other services. Principal Financial Group, Inc. and Unity Point Health Systems are the major private employers within the district.
Des Moines offers amenities usually found only in major cities: unique shopping in the East Village; dining at world-class restaurants; countless entertainment opportunities at Wells Fargo Arena and the Civic Center; educational opportunities at the Science Center of Iowa, Downtown Library, and Pappajohn Sculpture Park; and professional sporting events. The city boasts unique housing options at several lofts and townhome developments, has one of the nation’s largest farmers’ markets, and is home to the top-ranked art festival. The community also has a vibrant outdoor scene. One can listen to summer concerts along the banks of the Des Moines River or on the steps of the state capitol building, take a leisurely stroll along the Principal Riverwalk, and the entire Central Iowa region is connected by more than 500 miles of trails (including 60 within Des Moines). While there is big city bustle, the community is extremely proud of its small town atmosphere. Throughout Des Moines are dozens of neighborhoods, each with its own personality and style. The community offers superb schools, quality public services, and friendly neighborhoods.
Here’s what others have to say about Des Moines being a great place to live and work:
• Des Moines is the #2 Best City to Find a Job. – 2015 – WalletHub • Des Moines is the Emerging Start Up City. – 2015 – Investopedia • Des Moines is the #3 Top City for New College Graduates. – 2015 – SmartAsset • Des Moines is the #6 Midsize Metro Where College Grads Move for Jobs. – 2015 – AIER
2016 - 2017 Preliminary Budget 7
• Des Moines is the #4 Best City for Technology Workers to Start their Career. – 2015 – Computer Training Schools
• Des Moines is the Best Places for Business and Careers. – 2015 – Forbes • Des Moines is the #1 Best City for Young Professionals. – 2014 – Forbes • Des Moines is the #3 Best City with the most job opportunities per Capita. – Beyond.com • Des Moines is the #2 Best City for Business and Careers. – 2014 – Forbes • Des Moines is the #1 Wealthiest City in America. – 2014 – Today show • Des Moines is the #1 City with an Up and Coming Downtown. – 2014 – Forbes • Des Moines is the #6 City for raising a family. – 2014 – Forbes • Des Moines is the #1 Place for Business and Careers in 2013. – Forbes • Des Moines ranks #1 “Best Cities for Families.” – Kiplinger • Des Moines Named No. 5 in Top 100 Best Cities for Families. – Parenting Magazine • Greater Des Moines Ranks #1 Best City for Young Professionals. – Forbes • Des Moines ranks #2 Best Place for Business. – Forbes • Des Moines is the #1 richest metro in the nation. – US News & World Report • Des Moines is the #1 city in the US for home renters. – Time Magazine • Iowa ranks #9 for best state for business. – CNBC • Des Moines is the #4 city in the nation for doing business. – MarketWatch • Des Moines ranks in the top 10 “Best Cities for the Next Decade.” – Kiplinger • Des Moines ranks #1 as the “Best Place for Business and Careers.” – Forbes 2010 • Des Moines is one of the 20 strongest-performing metro areas. – Brookings • Des Moines living costs are 10 percent below the national average. – The Council for
Community and Economic Research • Des Moines is the #6 healthiest places to live. – Parenting Magazine
2016-2017 Preliminary Budget 8
DES MOINES PUBLIC SCHOOLS: A LEADER IN URBAN EDUCATION
DISTRICT GOALS
Together, the Mission, Vision, Student Expectations, and Board Beliefs serve as the overarching goals for the district.
DMPS developed its Student Expectations and Board Beliefs with public input through a series of community conversations. Student Expectations are deliverables that address educational goals and specific desired outcomes for students. Board Beliefs emphasize the governance of school operations and focus of the district’s work on behalf of Des Moines students.
Mission The Des Moines Public Schools exists so that graduates possess the knowledge, skills, and abilities to be successful at the next stage of their lives.
Vision To be the model for urban education in the United States.
Student Expectations 1. Students demonstrate proficiency and understanding of a rigorous core curriculum:
A. They demonstrate proficiency in reading, writing, speaking, and listening. B. They demonstrate proficiency in mathematics, including algebra and geometry. C. They demonstrate financial and economic literacy. D. They demonstrate an understanding of the value of fine and performing arts in society. E. They demonstrate proficiency in technological and information literacy. F. They demonstrate proficiency in science, including life, earth, and physical science.
2. Students possess the knowledge and skills to be self-directed and autonomous: A. They demonstrate critical thinking and problem solving skills. B. They exercise sound reasoning in making complex choices. C. They exhibit creative, innovative, and entrepreneurial thinking. D. They understand the attributes of physical and mental well-being.
3. Students have world awareness: A. They learn from and work with individuals representing diverse cultures and religions in a
spirit of mutual respect in school, work, and community. B. They understand the rights and obligations of citizenship at local, state, national, and global
levels. C. They are actively engaged in community life. D. They will be exposed to languages and cultures of the world.
2016 - 2017 Preliminary Budget 9
Board Beliefs 1. We believe in every child and, no matter their circumstance, will support them in achieving at their highest level.
• DMPS will work to ensure our students are career and post-secondary education ready.
2. We believe all students will have the best staff working to provide and support their education. • DMPS will be a best place to work, committed to recruiting, developing, retaining, and
recognizing high quality staff in a climate and culture where people are able to do their best work.
3. We believe in the full engagement of our parents and community in the support of our students’ education. • DMPS will commit to the support, training, and tools needed to maximize engagement
opportunities with our parents and the entire community.
4. We believe, as a community, in providing the resources necessary to offer PK-12 education of the highest quality. • DMPS will work, proactively and creatively, with the community to assure the proper
investment in our commitment to our children.
5. We believe first-rate facilities are essential to quality education. • DMPS is committed to facilities, as centers of our community and neighborhoods, which
offer safe, healthy, well-run, and creative learning environments.
6. We believe in a school district that operates with transparency, accountability, and efficiency at every level. • DMPS is committed to operating in an atmosphere of full-disclosure to ensure transparency,
accountability, and efficiency.
EXCEPTIONAL EDUCATIONAL OPPORTUNITIES
With more than 33,000 students, Des Moines Public Schools is by far the largest public school district in Iowa. While the district may be the largest provider of public education in Iowa, DMPS takes anything but a one-size-fits-all approach to educating students. In fact, families in Des Moines can find more educational options than anyplace in the state, including:
• Advanced Placement. Central Academy, attended by students from 39 central Iowa middle and high schools, is Iowa’s top AP program, dedicated to providing a challenging curriculum. The Belin-Blank Center for Gifted Education and Talent Development placed Central Academy “in a class by itself” as a college preparatory school. In addition, DMPS is in the midst of a significant expansion of AP course offerings throughout all five comprehensive high schools.
• International Baccalaureate. DMPS provides opportunities for students to participate in a comprehensive IB program at four elementary schools (Hubbell, Park Avenue, Stowe, and Walnut Street), four middle schools (Brody, Goodrell, Meredith, and Merrill), and one high school (Hoover). In addition, Central Academy offers the International Baccalaureate diploma program.
2016 - 2017 Preliminary Budget 10

• Career & Technical Institute. Located at Central Campus, CTI offers students learning opportunities in several high-skill areas, including graphic design, broadcasting & film, culinary arts, fashion, and automotive technology. In addition, DMPS is home to one of only three high school aviation programs certified by the FAA and has the largest marine biology program of any non-coastal high school.
• Higher Education Partnerships. Des Moines Public Schools’ proximity to Drake University,Iowa State University, Des Moines Area Community College, and other Institutes of HigherEducation have created numerous partnerships and collaborative efforts that supportstudents, teachers, and administrators.
• Alternative Programs. Scavo Alternative High School, Future Pathways, Orchard Place, DesMoines Alternative, and Middle School Alternative provide programming for students whomay be struggling with attendance requirements at a comprehensive school or have otherpersonal issues and need alternative programming.
• Ruby Van Meter and Smouse schools. Ruby Van Meter School (serving secondary-age children)and Smouse Opportunity School (serving elementary-age children) provide high-quality,specialized instruction to physically and mentally disabled students.
• Downtown School. The Downtown School, located in Central Campus, is a national modelwhere students learn in multiage classes. The school has been nationally recognized for itsinnovative education program and as a great option for working parents.
• Montessori. Cowles Montessori School is the only public Montessori program in Iowa, servingstudents in grades K-8. Students learn in multi-age classrooms, and children’s naturalcuriosities are exploited to the fullest as they advance at their own pace.
OUTSTANDING WORKFORCE
Des Moines Public Schools is proud to be home to thousands of educators and other professionals who work hard each and every day to help the students of our community succeed. The good work performed by our teachers and staff has earned awards, honors and recognition at the state and national level. Highlights of some recent honors include:
2015 Iowa Teacher of the Year – Clemencia Spizzirri, Merrill Middle School Iowa Department of Education
Eleven National Award Winners Presidential Award for Excellence in Mathematics and Science Teaching
Three-time Distinguished Budget Presentation Award Recipient Eight-time Certificate of Achievement Recipient Government Finance Officers Association
2016 - 2017 Preliminary Budget 11
Meritorious Budget Award Recipient Nine-time Certificate of Excellence Award Recipient Association of School Business Officials International
Four-time ENERGY STAR Partner of the Year U.S. Environmental Protection Agency
2014 Elementary School Counselor of the Year Iowa School Counselor Association 2014 School Social Worker of the Year Iowa School Social Workers Association 2013 Elementary and Middle School Art Educators of the Year Art Educators of Iowa Nation’s Top College-Prep High Schools – Roosevelt Washington Post
Five High Schools on the Iowa AP Top 50 Index Belin-Blank Center for Gifted Education
2012 Green Ribbon School – Central Campus 2013 Green Ribbon District – DMPS U.S. Department of Education Green Ribbon Schools 2015, 2014, 2013, 2012 Award of Excellence National School Public Relations Association
Other honors earned by Des Moines Public Schools and its employees include:
• 2016 AP Teacher of the Year — College Board• 2015, 2012, 2010, 2009, 2006, 1995, 1997, 1997, 1995, 1995, 1983 Presidential Award for
Excellence in Mathematics and Science Teaching recipients• 2015, 2014, 2013, 2012, 2010 state finalists for Presidential Award for Excellence in
Mathematics and Science Teaching• 2015 Iowa Teacher of the Year — Iowa Department of Education• 2015 Educator of the Year — Iowa Association of Alternative Education• 2015 Magna Award — National School Boards Association• 2015, 2014, 2013, 2012 honors — National School Public Relations Association• 2015, 2014, 2013, 2012 ENERGY STAR Partner of the Year — Environmental Protection
Agency• 2015, 2014 ENERGY STAR Partner of the Year for Climate Communications —
Environmental Protection Agency• 2014 Prostart Educator of Excellence Award — Iowa Restaurant Association• 2014 Iowa School Social Worker of the Year — Iowa School Social Workers Association• 2014 Four Rotary Educators of the Year
2016 - 2017 Preliminary Budget 12
• 2014 Rising Star — Journalism Education Association• 2014, 2013, 2012 finalists for Iowa Teacher of the Year• 2015, 2014, 2013, 2012, 2011, 2010, 2009, 2008, 2007 Certificate of Excellence in Financial
Reporting and 2015 Meritorious Budget Award — Association of School Business Officials Association for the school district’s comprehensive annual financial report and annual budget, respectively
• 2014, 2013, 2012, 2011, 2010, 2009, 2008, 2007 Certificate of Achievement and 2015, 2014, 2013 Distinguished Budget Presentation Award — Government Finance Officers Association for the school district’s comprehensive annual financial report and annual budget, respectively
• 2013 Trailblazing Teacher — The Center for Green Schools• 2013 Steve France Honor Award — Iowa Association for Health, Physical Education,
Recreation, and Dance• 2013 Rod Vahl Teacher of the Year award — Iowa High School Press Association• 2013 Outstanding Middle School Art Educator — Art Educators of Iowa• 2013 Outstanding Elementary Art Educator — Art Educators of Iowa• 2013 Green Ribbon School Award for Des Moines Public Schools — U.S. Department of
Education• 2013 Excellence in Education Award — Iowa State Education Association• 2013 Dr. Robert E. and Phyllis M. Yager Exemplary Teaching Recognition Award — University of
Northern Iowa• 2013, 2012 Governor’s Iowa Environmental Excellence Award• 2012 Phyllis Yager Memorial Commitment to Diversity Award — University of Iowa• 2012 honoree as a Champion of Change in education — White House• 2012 Green Ribbon School Award for Central Campus — U.S. Department of Education• 2012 Gary Hendrichs Memorial Award — Iowa School Counselor Association• 2012 finalist for America History Teacher of the Year — Iowa Preserve• 2012 Education Support Personnel of the Year for the State of Iowa• 2011 Outstanding Secondary Art Educator — Art Educators of Iowa• 2011 Outstanding Iowa Biology Teacher of the Year — National Association of Biology Teachers• 2011 Educator of the Year — Printing Industry of the Midwest• 2011 and 2009 James Madison Fellowships for the state of Iowa• 2010 James Bryant Conant Award in High School Teaching• 2010 Iowa School Social Worker of the Year — Iowa School Social Workers Association• 2010 Iowa Financial Literacy Educator of the Year• 2010 honoree for the Teacher Program — Toyota International• 2010 Edyth May Sliffe Award for Distinguished High School Mathematics Teaching — Mathematical
Association of America
2016 - 2017 Preliminary Budget 13
For the third year in a row, the Government Finance Officers Association (GFOA) of the United States and Canada presented a Distinguished Budget Presentation Award to the district for its annual budget for the fiscal year beginning July 1, 2015. In order to receive this award, a district must publish a budget document that meets program criteria as a policy document, as on operations guide, as a financial plan, and as a communications device.
2016 - 2017 Preliminary Budget 14
The Association of School Business Officials (ASBO) International awarded the district its Meritorious Budget Award for excellence in budget presentation for the 2015-16 budget year. It is the first time DMPS has been presented with the honor. The Meritorious Budget Awards program promotes and recognizes excellence in school budget presentation and enhances school business officials’ skills in developing, analyzing, and presenting a school system budget. After a rigorous review by professional auditors, the award is conferred only on school districts that have met or exceeded the program’s stringent criteria.
2016 - 2017 Preliminary Budget 15
For the eighth year in a row, the Government Finance Officers Association (GFOA) of the United States and Canada awarded a Certificate of Achievement for Excellence in Financial Reporting to the district for its comprehensive annual financial report (CAFR) for the fiscal year ended June 30, 2014. In order to be awarded a Certificate of Achievement, a district must publish an easily readable and efficiently organized CAFR. This report must satisfy both generally accepted accounting principles and applicable legal requirements. We believe our current CAFR continues to meet the GFOA’s Certificate of Achievement requirements and have submitting it to the GFOA to determine eligibility for another certificate.
2016 - 2017 Preliminary Budget 16

The district was recently informed that Association of School Business Officials (ASBO) International has, for the ninth time, awarded a Certificate of Excellence in Financial Reporting to the district for the fiscal year ending June 30, 2015. This award represents the highest recognition for school district operations offered by ASBO International.
2016 - 2017 Preliminary Budget 17
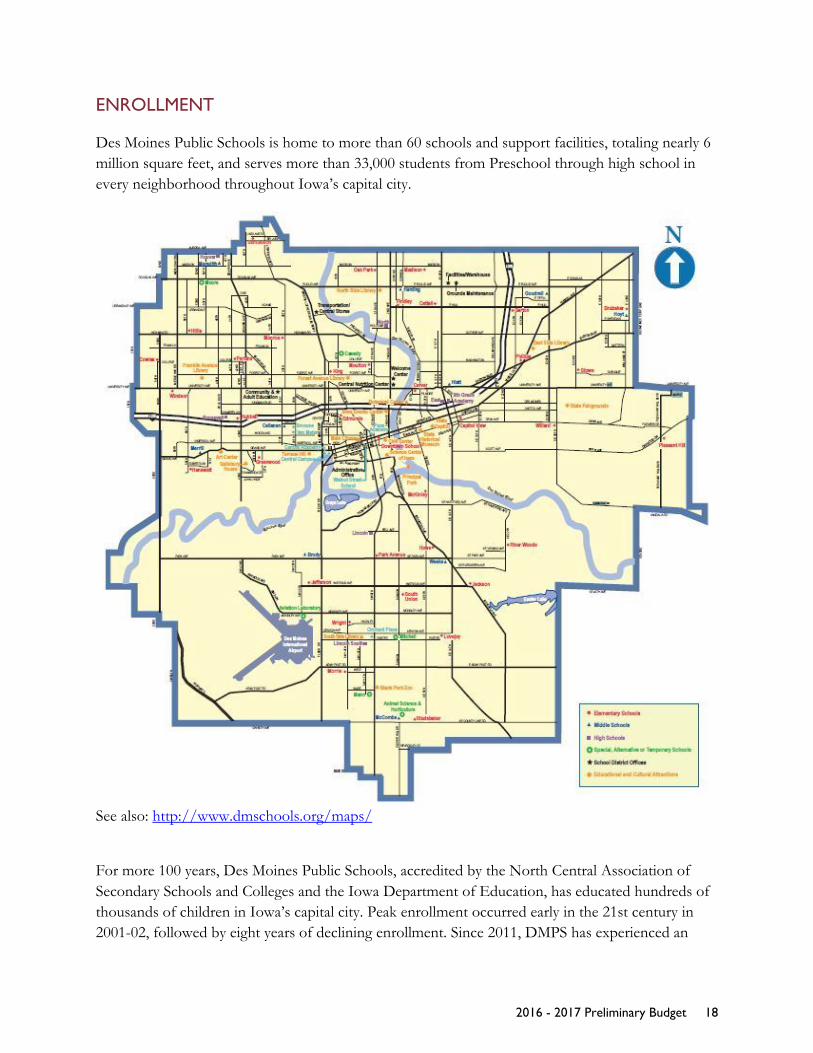
ENROLLMENT
Des Moines Public Schools is home to more than 60 schools and support facilities, totaling nearly 6 million square feet, and serves more than 33,000 students from Preschool through high school in every neighborhood throughout Iowa’s capital city.
See also: http://www.dmschools.org/maps/
For more 100 years, Des Moines Public Schools, accredited by the North Central Association of Secondary Schools and Colleges and the Iowa Department of Education, has educated hundreds of thousands of children in Iowa’s capital city. Peak enrollment occurred early in the 21st century in 2001-02, followed by eight years of declining enrollment. Since 2011, DMPS has experienced an
2016 - 2017 Preliminary Budget 18
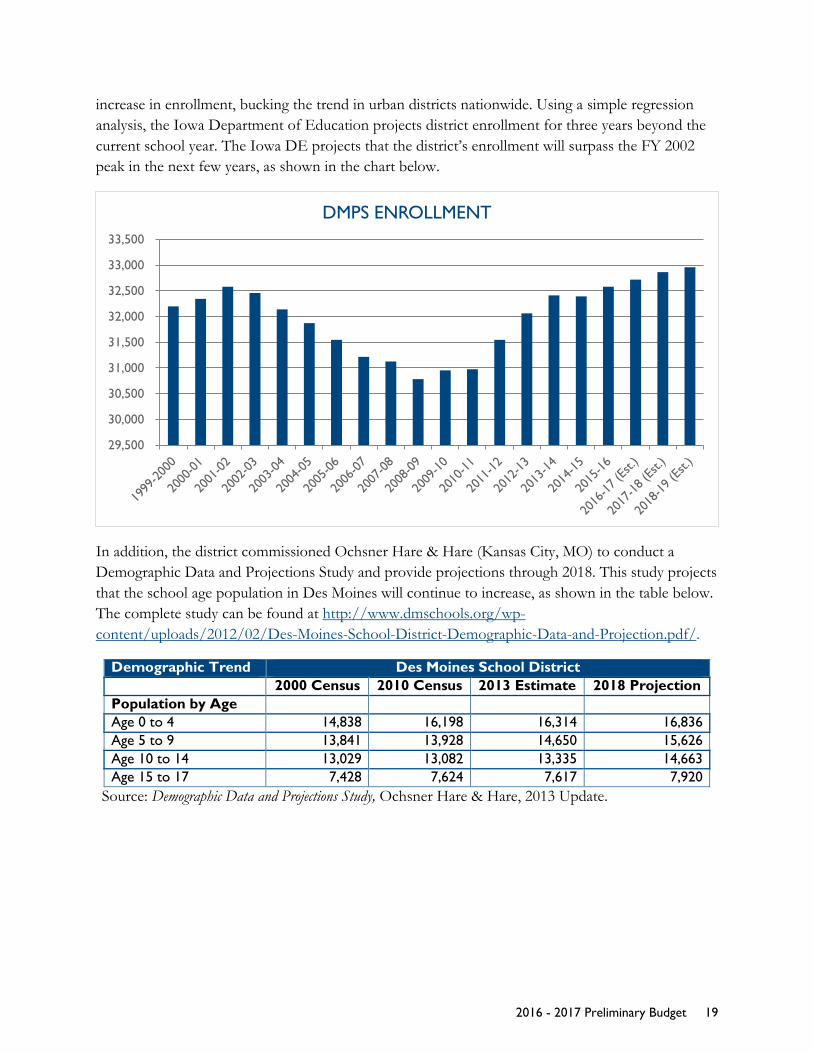
increase in enrollment, bucking the trend in urban districts nationwide. Using a simple regression analysis, the Iowa Department of Education projects district enrollment for three years beyond the current school year. The Iowa DE projects that the district’s enrollment will surpass the FY 2002 peak in the next few years, as shown in the chart below.
In addition, the district commissioned Ochsner Hare & Hare (Kansas City, MO) to conduct a Demographic Data and Projections Study and provide projections through 2018. This study projects that the school age population in Des Moines will continue to increase, as shown in the table below. The complete study can be found at http://www.dmschools.org/wp-content/uploads/2012/02/Des-Moines-School-District-Demographic-Data-and-Projection.pdf/.
Demographic Trend Des Moines School District 2000 Census 2010 Census 2013 Estimate 2018 Projection
Population by Age Age 0 to 4 14,838 16,198 16,314 16,836 Age 5 to 9 13,841 13,928 14,650 15,626 Age 10 to 14 13,029 13,082 13,335 14,663 Age 15 to 17 7,428 7,624 7,617 7,920
Source: Demographic Data and Projections Study, Ochsner Hare & Hare, 2013 Update.
29,500
30,000
30,500
31,000
31,500
32,000
32,500
33,000
33,500
DMPS ENROLLMENT
2016 - 2017 Preliminary Budget 19
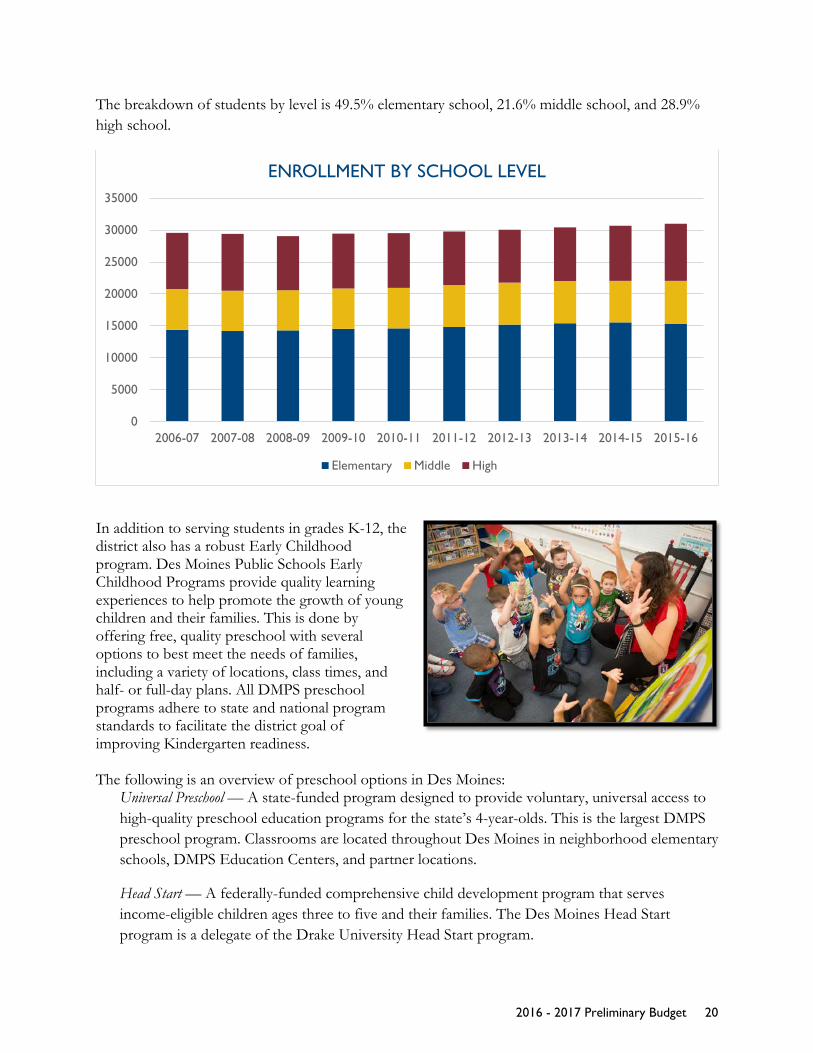
The breakdown of students by level is 49.5% elementary school, 21.6% middle school, and 28.9% high school.
In addition to serving students in grades K-12, the district also has a robust Early Childhood program. Des Moines Public Schools Early Childhood Programs provide quality learning experiences to help promote the growth of young children and their families. This is done by offering free, quality preschool with several options to best meet the needs of families, including a variety of locations, class times, and half- or full-day plans. All DMPS preschool programs adhere to state and national program standards to facilitate the district goal of improving Kindergarten readiness.
The following is an overview of preschool options in Des Moines: Universal Preschool — A state-funded program designed to provide voluntary, universal access to high-quality preschool education programs for the state’s 4-year-olds. This is the largest DMPS preschool program. Classrooms are located throughout Des Moines in neighborhood elementary schools, DMPS Education Centers, and partner locations.
Head Start — A federally-funded comprehensive child development program that serves income-eligible children ages three to five and their families. The Des Moines Head Start program is a delegate of the Drake University Head Start program.
0
5000
10000
15000
20000
25000
30000
35000
2006-07 2007-08 2008-09 2009-10 2010-11 2011-12 2012-13 2013-14 2014-15 2015-16
ENROLLMENT BY SCHOOL LEVEL
Elementary Middle High
2016 - 2017 Preliminary Budget 20

Shared Visions — The district is the recipient of three grants from the Iowa Department of Education to implement the Shared Visions program at three preschool programs in Des Moines located in McKinley, Capitol View, and Moulton elementary schools. The Shared Visions Preschool Program provides comprehensive quality preschool program experiences for at-risk children who are ages three to five years.
Early Childhood Special Education (ECSE) — Services are available for eligible children three to five years of age. ECSE staff assist in the identification, assessment, and development of an Individualized Educational Plan for eligible children. A continuum of services are available, tailored to meet the individual needs of each student, including integrated classroom settings with Head Start, Universal Preschool, and self-contained programming. ECSE classrooms are located throughout Des Moines in neighborhood elementary schools and in DMPS Education Centers.
As the chart below indicates, more than 2,100 students were enrolled in preschool programs through a variety of funding sources in 2015-16. Students received preschooling in district buildings or in partnering religious, child care, and other organizations.
Universal Preschool,
1544
Head Start, 454
Shared Visions, 48
Early Childhood Iowa, 130
PRESCHOOL ENROLLMENT BY FUNDING SOURCE
2015-16
2016 - 2017 Preliminary Budget 21
District Demographics
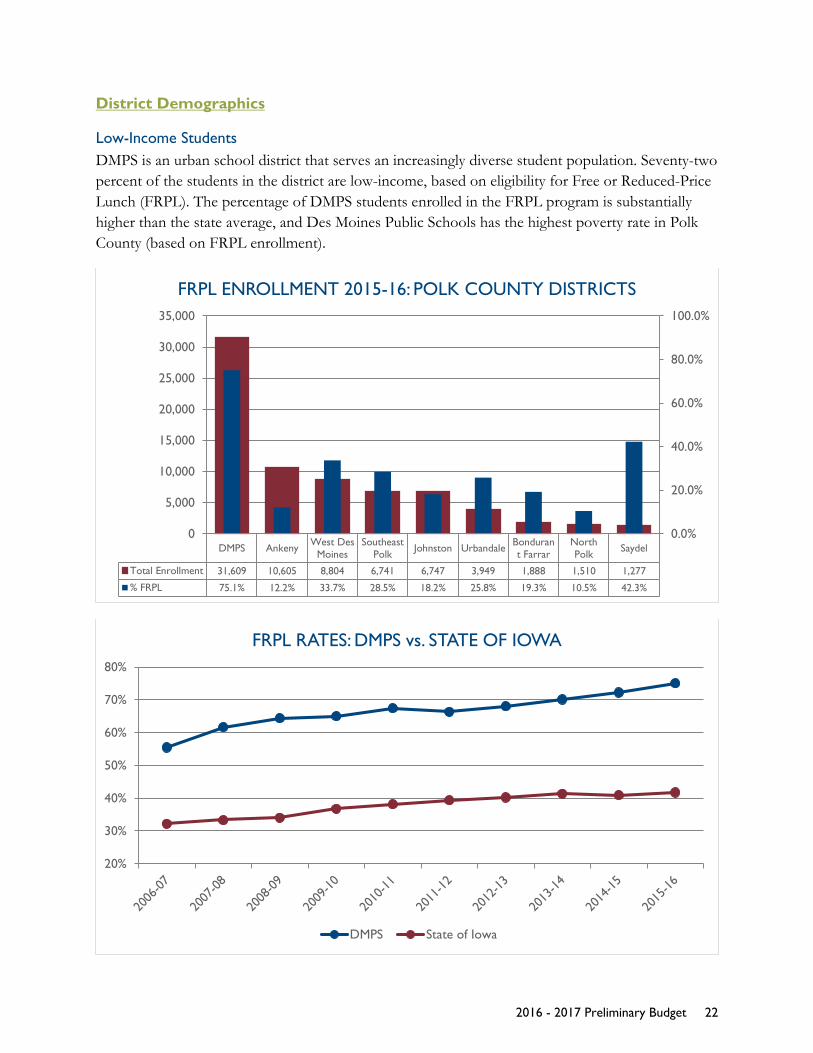
Low-Income Students DMPS is an urban school district that serves an increasingly diverse student population. Seventy-two percent of the students in the district are low-income, based on eligibility for Free or Reduced-Price Lunch (FRPL). The percentage of DMPS students enrolled in the FRPL program is substantially higher than the state average, and Des Moines Public Schools has the highest poverty rate in Polk County (based on FRPL enrollment).
DMPS Ankeny West DesMoines
SoutheastPolk Johnston Urbandale Bonduran
t FarrarNorthPolk Saydel
Total Enrollment 31,609 10,605 8,804 6,741 6,747 3,949 1,888 1,510 1,277
% FRPL 75.1% 12.2% 33.7% 28.5% 18.2% 25.8% 19.3% 10.5% 42.3%
0.0%
20.0%
40.0%
60.0%
80.0%
100.0%
0
5,000
10,000
15,000
20,000
25,000
30,000
35,000
FRPL ENROLLMENT 2015-16: POLK COUNTY DISTRICTS
20%
30%
40%
50%
60%
70%
80%
FRPL RATES: DMPS vs. STATE OF IOWA
DMPS State of Iowa
2016 - 2017 Preliminary Budget 22
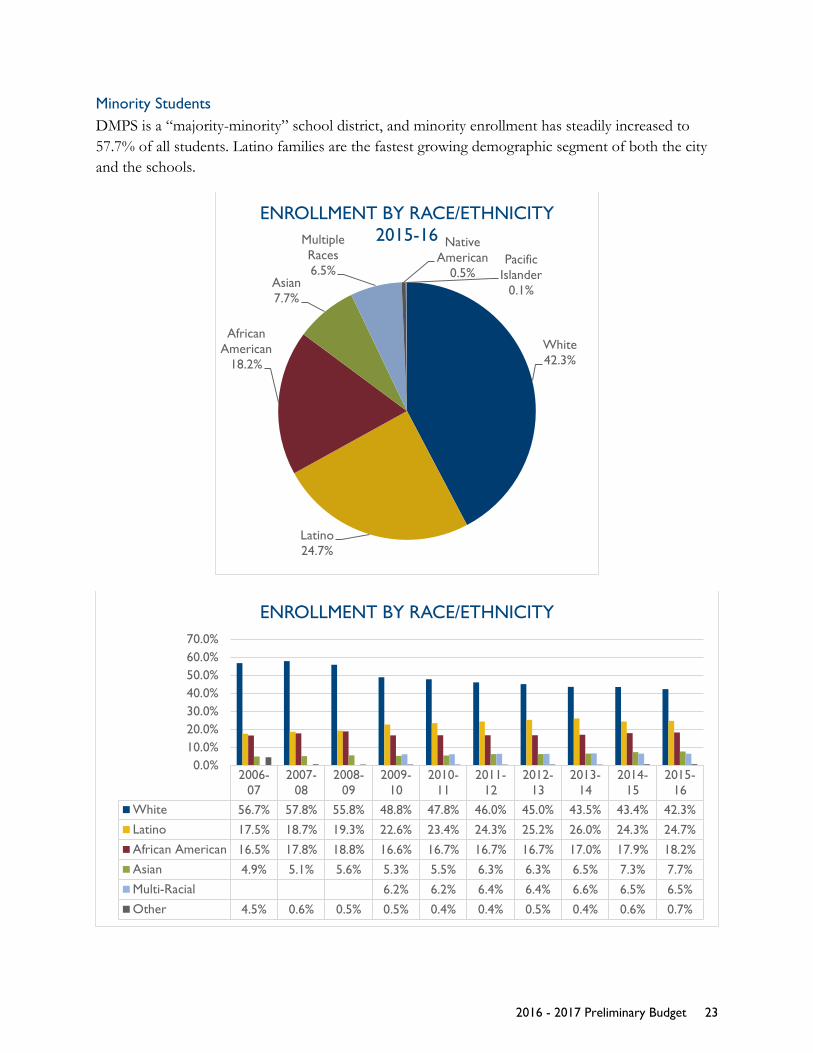
Minority Students DMPS is a “majority-minority” school district, and minority enrollment has steadily increased to 57.7% of all students. Latino families are the fastest growing demographic segment of both the city and the schools.
White42.3%
Latino24.7%
African American
18.2%
Asian7.7%
Multiple Races6.5%
NativeAmerican
0.5%Pacific
Islander0.1%
ENROLLMENT BY RACE/ETHNICITY 2015-16
2006-07
2007-08
2008-09
2009-10
2010-11
2011-12
2012-13
2013-14
2014-15
2015-16
White 56.7% 57.8% 55.8% 48.8% 47.8% 46.0% 45.0% 43.5% 43.4% 42.3%Latino 17.5% 18.7% 19.3% 22.6% 23.4% 24.3% 25.2% 26.0% 24.3% 24.7%African American 16.5% 17.8% 18.8% 16.6% 16.7% 16.7% 16.7% 17.0% 17.9% 18.2%Asian 4.9% 5.1% 5.6% 5.3% 5.5% 6.3% 6.3% 6.5% 7.3% 7.7%Multi-Racial 6.2% 6.2% 6.4% 6.4% 6.6% 6.5% 6.5%Other 4.5% 0.6% 0.5% 0.5% 0.4% 0.4% 0.5% 0.4% 0.6% 0.7%
0.0%10.0%20.0%30.0%40.0%50.0%60.0%70.0%
ENROLLMENT BY RACE/ETHNICITY
2016 - 2017 Preliminary Budget 23

English Language Learners In the last decade, DMPS has experienced a 74% increase in the number of students enrolled in English Language Learner (ELL) classes and a 294% increase in 20 years. DMPS students speak more than 100 different native languages and dialects, and currently 20% of the entire student body is ELL.
To successfully support ELL students, DMPS employs 105.5 FTE ELL teachers, 43.0 FTE bilingual community outreach (BCO) workers who speak 15 languages and dialects, 1.0 FTE ELL Enrollment Facilitator, 1.0 FTE BCO Support staff, 3.0 FTE ELL Network Support staff, 2.0 FTE ELL Curriculum Coordinator, and 1.0 FTE ELL Program Coordinator. ELL sites are located in five high schools, ten middle schools, thirty-five elementary schools, four Intensive English Language Centers (East, Hoover, Meredith, and Edmunds), and special programs are at Smouse, Ruby Van Meter, and Scavo. Funding for the ELL program is provided by the State through supplemental weighted funding, and the district supports legislation to extend the weighted funding.
-
1,000
2,000
3,000
4,000
5,000
6,000
7,000
ENGLISH LANGUAGE LEARNERS
2016 - 2017 Preliminary Budget 24
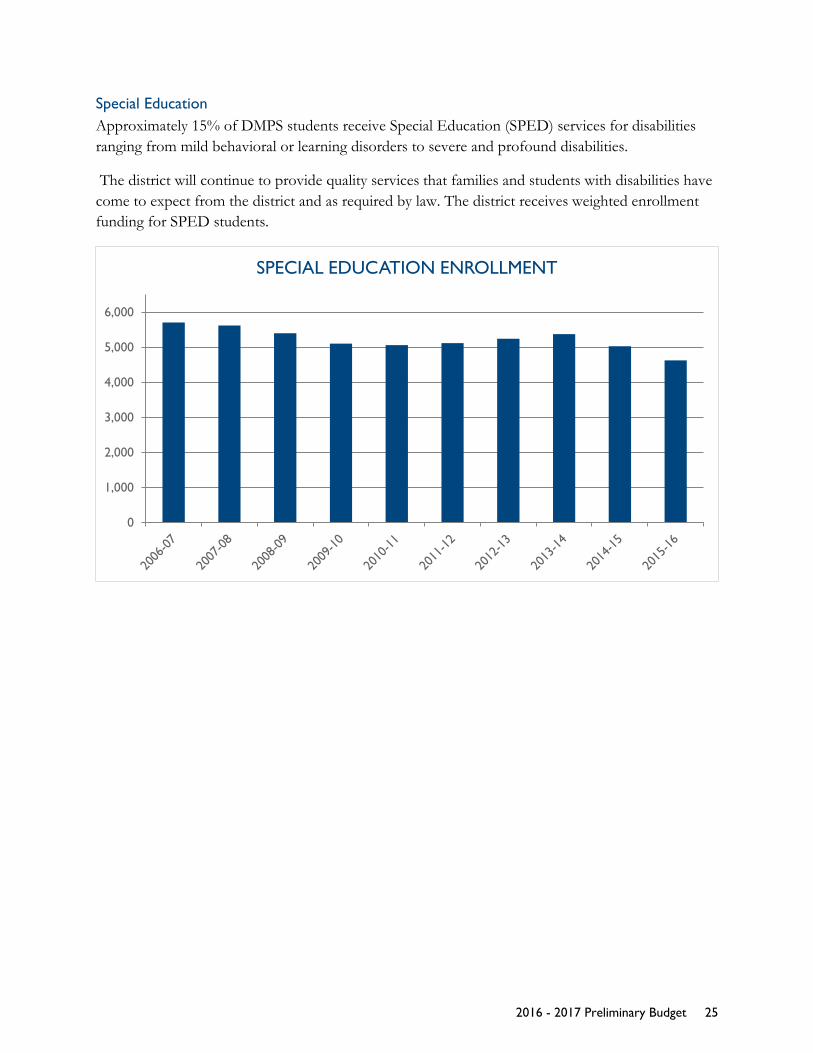
Special Education Approximately 15% of DMPS students receive Special Education (SPED) services for disabilities ranging from mild behavioral or learning disorders to severe and profound disabilities.
The district will continue to provide quality services that families and students with disabilities have come to expect from the district and as required by law. The district receives weighted enrollment funding for SPED students.
0
1,000
2,000
3,000
4,000
5,000
6,000
SPECIAL EDUCATION ENROLLMENT
2016 - 2017 Preliminary Budget 25

A FOCUS ON PROGRESS
School Improvement Strategies being implemented by the district are showing success in improving student achievement. Each year, the district takes an opportunity to highlight some of the key projects and initiatives that are being undertaken to improve outcomes for students. With this budget, the district will continue to support these efforts.
Strengthening Core Instruction The district will continue to maintain important initiatives that have contributed to increasing student success, such as improving the core instruction in the district through the implementation of an Instructional Framework and Leadership Framework, a Multi-Tiered System of Support, and Standards Referenced Grading, with Cultural Competency built into all areas of education, as described below. The complementary work of these four essential elements of teaching and learning is Des Moines will be accelerated through the implementation of the Schools for Rigor treatment, with the desired outcome of creating student-centered classrooms with rigor.
Instructional Framework and Leadership Framework Implementation of an instructional framework, in conjunction with frameworks for leadership and coaching, provides for a coherent, aligned district system and strengthens the collective capacity for improvement. An instructional framework creates a common language defining what effective teaching looks like and provides guidance for designing and implementing quality instruction. The framework includes levels of performance (scales), which provide enhanced opportunities for teacher feedback and growth. Additionally, it elevates the work of the Common Core State Standards and academic priorities of rigor, engagement, and intervention.
The common language provided in the instruction and leadership frameworks is the foundation of continuous improvement embedded in learning cycles; individual professional development plans; and is differentiated PD at the district, school, and individual levels. It is the foundation of the district’s system of supports for the growth and development of DMPS students and staff. The instructional framework is not an evaluative tool; rather, it is used to provide meaningful support, professional development, and actionable feedback to teachers on their practice.
Multi-Tiered System of Support In order to achieve the mission of the Des Moines Public Schools, a comprehensive system of supports must be in place to ensure that all students are learning and achieving at high levels. This imperative reflects the reality that regardless of how effectively the district develops and implements high-quality curricula aligned with standards, some students will need additional support and interventions or extensions in order to be successful. Implementing the structures of a Multi-Tiered System of Support (MTSS) helps ensure that all students have an evidence-based system of instruction to support them in achieving success. The district’s MTSS is designed to enable schools to provide the appropriate level of instruction and intervention for students. Using performance data and monitoring learning rates through MTSS, educators can make important instructional
2016 - 2017 Preliminary Budget 26
decisions to meet the needs of students of different backgrounds, learning styles, and levels of attainment.
Standards Referenced Grading One of the most prominent topics of discourse in education on the national stage is also one of the most controversial: effective grading practices. Des Moines Public Schools is committed to providing fair, accurate, specific, and timely information regarding student progress towards agreed-upon common standards, as well as feedback for next steps and growth areas. Grades in Des Moines communicate what students know and can do. The guiding practices for Standards Referenced Grading in Des Moines Public Schools are:
1. A consistent 4-point grading scale will be used.2. Letter grades, derived from the 4-point scale, will be based solely on achievement of
course/grade level standards. Student participation, work completion, and ability to workwith others will be reported separately using the “DMPS Citizenship and EmployabilitySkills Rubric.”
3. Scores will be based on a body of evidence.4. Achievement will be organized and reported by learning topic, which will be converted to a
grade at semester’s end.5. Students will have multiple opportunities to demonstrate proficiency.6. Accommodations and modifications will be provided for exceptional learners.
Cultural Proficiency A challenge for Des Moines Public Schools is that certain student populations are lagging behind the intended outcome of all students graduating and possessing the knowledge, skills, and abilities for success at the next stage of their lives. Research shows that student outcomes can be improved through a systemic approach where students are engaged through their own environmental lenses. The use of a cultural proficiency framework will assist in fostering the right learning environment for students, and by developing the capacity of school leaders and teachers to engage with, create meaning for, and set high expectations for students of all cultural experiences, students will experience success.
Cultural proficiency focuses on learning about oneself and recognizing how one’s culture and identity may affect others, while relieving those identified as outsiders from the responsibility of doing all of the adapting. Cultural proficiency is the way a person or organization effectively engages with and plans for issues that arise in diverse environments. It is a paradigm shift from viewing cultural differences as problematic to learning how to interact effectively with other cultures.
Schools of Rigor To accelerate the work of these four key elements of teaching and learning in Des Moines Public Schools and reduce the variance between different levels and schools, over the next three years, the district will implement the Schools of Rigor plan. Critical components of the Schools or Rigor model are results coaching and intensive support cycles with professional development. The
2016 - 2017 Preliminary Budget 27
goal of results coaching is to help teachers continue to develop by providing the right structure and support. Intensive support cycles have been developed for the district leadership team; school leadership teams; the entire school; and coaches, teacher mentors, and professional learning community facilitators.
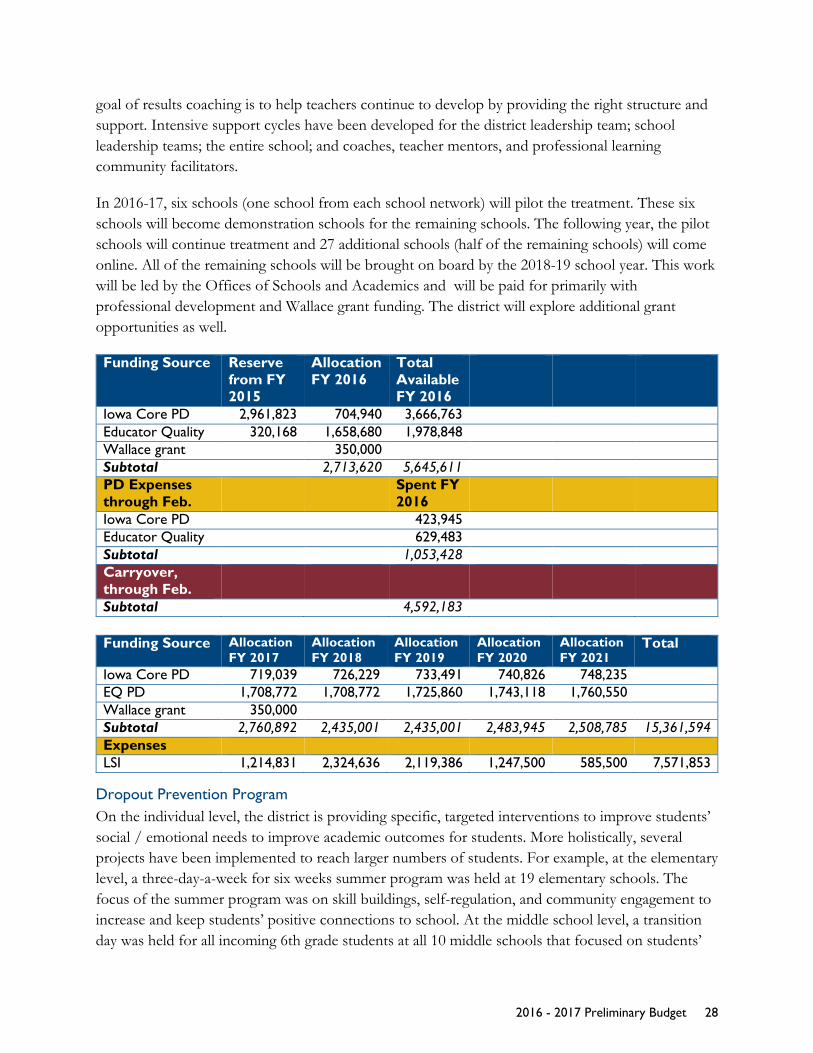
In 2016-17, six schools (one school from each school network) will pilot the treatment. These six schools will become demonstration schools for the remaining schools. The following year, the pilot schools will continue treatment and 27 additional schools (half of the remaining schools) will come online. All of the remaining schools will be brought on board by the 2018-19 school year. This work will be led by the Offices of Schools and Academics and will be paid for primarily with professional development and Wallace grant funding. The district will explore additional grant opportunities as well.
Funding Source Reserve from FY 2015
Allocation FY 2016
Total Available FY 2016
Iowa Core PD 2,961,823 704,940 3,666,763 Educator Quality 320,168 1,658,680 1,978,848 Wallace grant 350,000 Subtotal 2,713,620 5,645,611 PD Expenses through Feb.
Spent FY 2016
Iowa Core PD 423,945 Educator Quality 629,483 Subtotal 1,053,428 Carryover, through Feb. Subtotal 4,592,183
Funding Source Allocation FY 2017
Allocation FY 2018
Allocation FY 2019
Allocation FY 2020
Allocation FY 2021
Total
Iowa Core PD 719,039 726,229 733,491 740,826 748,235 EQ PD 1,708,772 1,708,772 1,725,860 1,743,118 1,760,550 Wallace grant 350,000 Subtotal 2,760,892 2,435,001 2,435,001 2,483,945 2,508,785 15,361,594 Expenses LSI 1,214,831 2,324,636 2,119,386 1,247,500 585,500 7,571,853
Dropout Prevention Program On the individual level, the district is providing specific, targeted interventions to improve students’ social / emotional needs to improve academic outcomes for students. More holistically, several projects have been implemented to reach larger numbers of students. For example, at the elementary level, a three-day-a-week for six weeks summer program was held at 19 elementary schools. The focus of the summer program was on skill buildings, self-regulation, and community engagement to increase and keep students’ positive connections to school. At the middle school level, a transition day was held for all incoming 6th grade students at all 10 middle schools that focused on students’
2016 - 2017 Preliminary Budget 28

social / emotional needs as they matriculated from elementary to middle school. At the high school level there is an intentional focus on providing immediate, weekly (if necessary) connections to students who are potential dropouts until they return to school. Once the student reengages with school, the student is immediately connected with school personnel who provide ongoing support.
English Language Leaner Program Over the last decade the DMPS ELL program has become a truly district-wide program. Ten years ago, the ELL program was in fewer than 20 schools, and English Language Learners resided in pockets of the city. Today, ELL families live in every corner of the city, and the community has benefited from the increased diversity. In fact, 20% of the entire student body is ELL. Today, there is an ELL program in all but three DMPS elementary schools (Downtown, Walnut Street, and Cowles); in all middle and high schools; and there are special programs at Smouse, Ruby Van Meter, and Scavo. In addition, the district has four Intensive English Language Centers (located at East, Hoover, Meredith, and Edmunds) for newly-arrived students.
The program has increased support to schools by providing a dedicated ELL support person for every ELL network. The district currently employs 105.5 FTE ELL teachers, 43.0 FTE bilingual community outreach (BCO) workers who speak 15 languages and dialects, 1.0 FTE ELL Enrollment Facilitator, 1.0 FTE BCO Support staff, 3.0 FTE ELL Network Support staff, 2.0 FTE ELL Curriculum Coordinator, and 1.0 FTE ELL Program Coordinator.
The district has engaged in several efforts to improve outcomes for ELL students and families. For example, the district participates in the ELL Literacy Grant program with the Iowa Department of Education to study effective K-12 ELL models and practices. In addition, the district is piloting and proving training on the newly adopted English Language Proficiency standards from the state of Iowa to all ELL teaching staff and classroom teachers. The district is also increasing targeted outreach and increasing efforts to engage ELL parents at the school and in the community by reaching out to various groups. The ELL is developing consistent messaging, with expectation that bilingual community outreach staff will lead engagement activities.
The district also offers a summer enrichment opportunity to the large and growing population of English Language Learners. Collectively, the summer ELL sites at Hoover/Meredith, Callanan, Windsor, Lovejoy, and Stowe served more than 300 students in 2015, most of whom were at Level 1 or 2 of the 5-point Limited English Proficiency scale (5 is the highest level prior to classroom mainstreaming). The summer program provides opportunities for ELL students to develop language skills in reading, writing, speaking, and listening. It also helps students assimilate to Iowa and American culture through fieldtrips and activities. The program in 2015 was themed around the Iowa State Fair.
2016 - 2017 Preliminary Budget 29
Talent Development The district is committed to recruiting and developing talent within the community to find the future teachers and administrators of Des Moines Public Schools as part of a “Grow Our Own” philosophy. Some examples of the innovative strategies employed in Des Moines include the Dream to Teach program, the 3D Coalition, and the development of a Leadership Pipeline. One of the goals of the district’s equity plan is to increase the overall number of underrepresented employees, teachers, and administrators in the district, which these programs also help address.
Dream to Teach Dream to Teach is a program that works with minority students in middle and high school who are interested in becoming teachers. The overarching goal of the program is to increase the number of minority students interested in pursuing a career in the teaching profession and provide a pipeline of support from middle school through college and into their first years as teachers for DMPS.
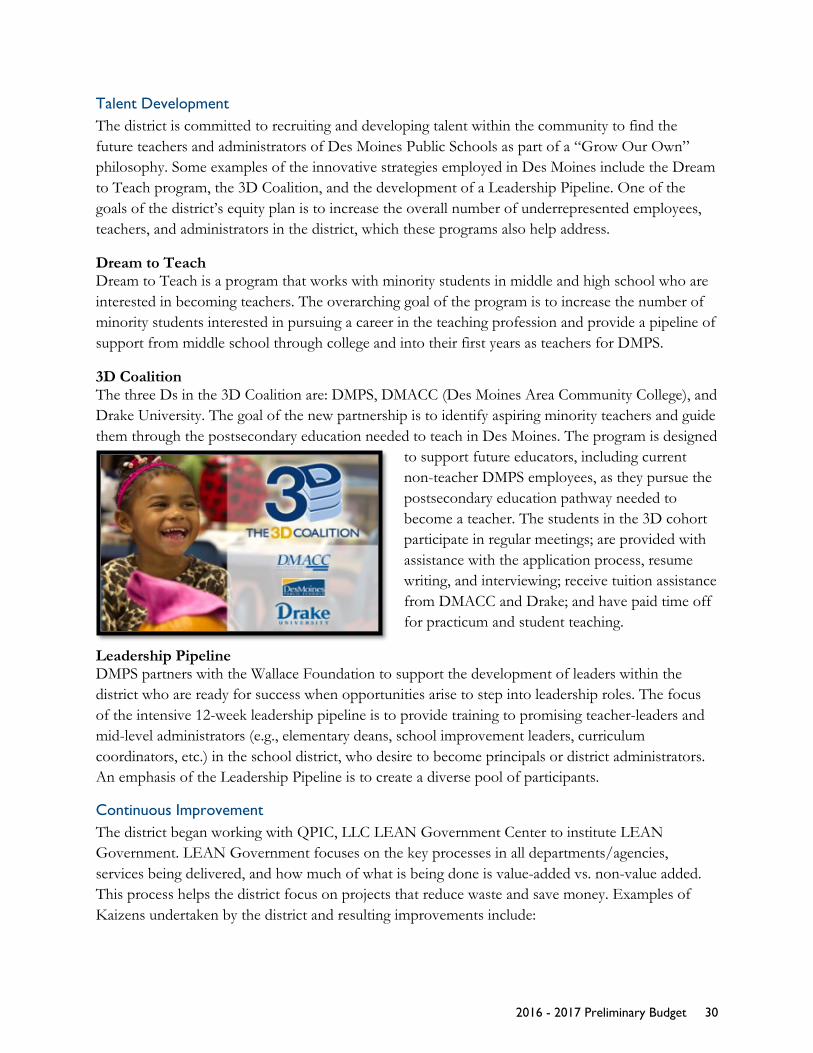
3D Coalition The three Ds in the 3D Coalition are: DMPS, DMACC (Des Moines Area Community College), and Drake University. The goal of the new partnership is to identify aspiring minority teachers and guide them through the postsecondary education needed to teach in Des Moines. The program is designed
to support future educators, including current non-teacher DMPS employees, as they pursue the postsecondary education pathway needed to become a teacher. The students in the 3D cohort participate in regular meetings; are provided with assistance with the application process, resume writing, and interviewing; receive tuition assistance from DMACC and Drake; and have paid time off for practicum and student teaching.
Leadership Pipeline DMPS partners with the Wallace Foundation to support the development of leaders within the district who are ready for success when opportunities arise to step into leadership roles. The focus of the intensive 12-week leadership pipeline is to provide training to promising teacher-leaders and mid-level administrators (e.g., elementary deans, school improvement leaders, curriculum coordinators, etc.) in the school district, who desire to become principals or district administrators. An emphasis of the Leadership Pipeline is to create a diverse pool of participants.
Continuous Improvement The district began working with QPIC, LLC LEAN Government Center to institute LEAN Government. LEAN Government focuses on the key processes in all departments/agencies, services being delivered, and how much of what is being done is value-added vs. non-value added. This process helps the district focus on projects that reduce waste and save money. Examples of Kaizens undertaken by the district and resulting improvements include:
2016 - 2017 Preliminary Budget 30

In July 2015, the district brought together a group of end users, support staff, educators, and administrators to determine the best process for how to purchase items in the district. The objectives were simple: 1) Move to a true procurement model where items are purchased with volume based discounts in a predetermined plan, and 2) Reduce the amount of time administrators spend on purchasing items significantly, enabling principals to focus on the core mission of educating students. A few of the outcomes from this work to date include:
• At three pilot sites (Weeks, Samuelson, and Roosevelt), schools will no longer order officesupplies; the supplies will be refilled automatically without involvement from the buildingstaff.
• A centralized site was further promoted showcasing the current contracts that already existto save the building administrator time when trying to purchase an item.
• The employee reimbursement will be combined with the payout so it is onetransaction/deposit instead of separate.
In August 2015, an AP Disbursement Kaizen was convened as a complement to the purchasing work. The work has focused on improving efficiency and moving toward paperless payments. Highlights of the outcomes for this work to date include:
• End-user use has been improved by condensing reporting.• Threshold policies/procedures have been modified to enable checks to be issued
weekly, improving efficiency and timeliness.• To prepare for Vendor Online, the district reached out to its top 50 vendors and
implemented sets to facilitate automation, eliminating the need for DMPS staff to manuallyconduct vendor look-ups and facilitate electronic payments.
Student Activities The district has placed an emphasis on providing students with opportunities to be involved with school outside of the classroom. Activities offered for students include athletics, music, summer camps, school clubs, middle school intramurals, and debate. The research is clear: Students are more likely to succeed when they feel connected to school; for example, connected students have better school attendance, grades, and test scores and stay in school longer. By the end of the fall semester in the 2015-16 school year, 86% (5,801) of middle school students participated in one or more school activity. In all of the 2014-15 school year, a total of 80% (5,167) participated. By the end of the fall semester, 42% (3,813) of high school total high school students participated in one or more activity. In all of the 2014-15 school year, a total of 49% (4,229) participated. This summer, more than 60 sports camps will be offered for elementary and secondary students.
Over the last four years, the district has made a concerted effort to increase the enrollment of students into arts programs. The 2016 DMPS Student Art Exhibit featured the works of 734 students, up from 272 in 2012, or an increase of 270%.
2016 - 2017 Preliminary Budget 31

Music participation is also off the charts for DMPS students. The district has increased resources for purchasing and repairing instruments, hiring staff, and specializing teachers. Enrollments in vocal music programs have more than doubled in three years, from 5,716 in 2012-13 to 12,766 this year.
Participation among two demographic subgroups in particular exploded. The number of African American students went from 363 to 1,418. Among Hispanic/Latino students, the growth was even more dramatic, from 211 to 1,565, a more than seven-fold increase. Enrollment in instrumental music has also increased dramatically, from 3,893 students to 5,653 over the same period. In 2012-13, 25% of instrumental student-musicians were Black or Latino. This year they comprise 35% of the total. Another contributing factor to the increase in arts participation is the Turnaround Arts cohort of schools in the Northside feeder pattern, where arts integration throughout the curriculum is not only boosting overall academic achievement but also boosting turnout for arts-based extracurricular programs.
Graduation and Dropout Rates School improvement efforts across the district are having a real impact in Des Moines Public Schools. Beginning with the graduating class of 2009, graduation rates in Iowa have been calculated with a new formula established by the U.S. Department of Education. Unique student identification numbers are assigned to ninth-grade students, allowing school districts to carefully account for students as they move through high school. At the state level, the method helps determine when a student graduates, even if the student has moved to a different district in Iowa during high school.
The 4-year graduation rate for Des Moines has increased nine percentages points since Iowa began using its current graduation rate formula in 2009. The Class of 2014 at Des Moines Public Schools had a graduation rate of 81.68%, an increase of 2.52% over the previous year and the highest since Iowa began using its current graduation rate formula in 2009. (Official graduation information lags; official data is released in April of each year for the last graduating class.) The four-year graduation rate at the district’s five comprehensive high schools alone was 86.58%, up from 82.79% the previous year. The 5-year graduation rate (Class of 2013) is also the highest since 2009. Des Moines Public Schools saw a slight increase in the dropout rate, which was 4.33% for the 2013-14 school year
2016 - 2017 Preliminary Budget 32

compared to 4.16% in 2012-13. However, the dropout rate is at its second-lowest level in the past six years.
DMPS Dropout Rate 2008-09 2009-10 2010-11 2011-12 2012-13 2013-14
Grade 7-12 Rate 5.10% 4.80% 4.80% 4.73% 4.16% 4.33%
DMPS has been able to impact the graduation rate in Des Moines because of the hard work of students and staff. Several initiatives in recent years that have contributed to raising the graduation rate, including:
DMPS implemented an Early Indicator System (EIS) to help identify students who may be at risk of dropping out of school. The EIS tracks attendance, class performance, and discipline/behavior issues at the elementary and secondary levels. In addition, each high school now has an Academic Support Lab to help serve students who are identified through the EIS as at-risk for dropping out of school.
Over the past few years DMPS has greatly expanded access to Advanced Placement courses, with new AP courses at Central Academy and a more complete AP curriculum offered at all five high schools. During that time, AP enrollment has quadrupled and participation in AP exams has doubled, raising expectations for academic success throughout all high schools.
72.68% 78.48% 75.68% 79.15% 79.36% 81.68%76.97% 82.88% 81.00% 82.89% 84.04%
0%
20%
40%
60%
80%
100%
Class of 2009 Class of 2010 Class of 2011 Class of 2012 Class of 2013 Class of 2014
FOUR AND FIVE YEAR GRADUATION RATES
Four-Year Rate Five-Year Rate Linear (Four-Year Rate)
2016 - 2017 Preliminary Budget 33
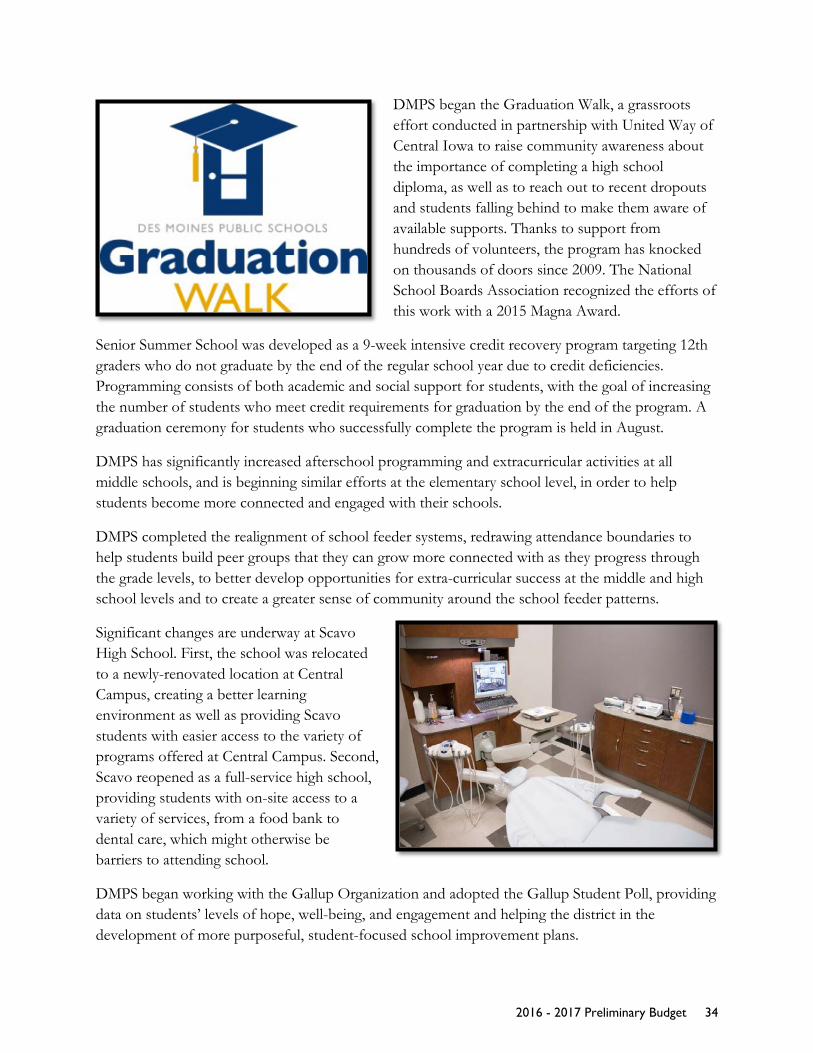
DMPS began the Graduation Walk, a grassroots effort conducted in partnership with United Way of Central Iowa to raise community awareness about the importance of completing a high school diploma, as well as to reach out to recent dropouts and students falling behind to make them aware of available supports. Thanks to support from hundreds of volunteers, the program has knocked on thousands of doors since 2009. The National School Boards Association recognized the efforts of this work with a 2015 Magna Award.
Senior Summer School was developed as a 9-week intensive credit recovery program targeting 12th graders who do not graduate by the end of the regular school year due to credit deficiencies. Programming consists of both academic and social support for students, with the goal of increasing the number of students who meet credit requirements for graduation by the end of the program. A graduation ceremony for students who successfully complete the program is held in August.
DMPS has significantly increased afterschool programming and extracurricular activities at all middle schools, and is beginning similar efforts at the elementary school level, in order to help students become more connected and engaged with their schools.
DMPS completed the realignment of school feeder systems, redrawing attendance boundaries to help students build peer groups that they can grow more connected with as they progress through the grade levels, to better develop opportunities for extra-curricular success at the middle and high school levels and to create a greater sense of community around the school feeder patterns.
Significant changes are underway at Scavo High School. First, the school was relocated to a newly-renovated location at Central Campus, creating a better learning environment as well as providing Scavo students with easier access to the variety of programs offered at Central Campus. Second, Scavo reopened as a full-service high school, providing students with on-site access to a variety of services, from a food bank to dental care, which might otherwise be barriers to attending school.
DMPS began working with the Gallup Organization and adopted the Gallup Student Poll, providing data on students’ levels of hope, well-being, and engagement and helping the district in the development of more purposeful, student-focused school improvement plans.
2016 - 2017 Preliminary Budget 34
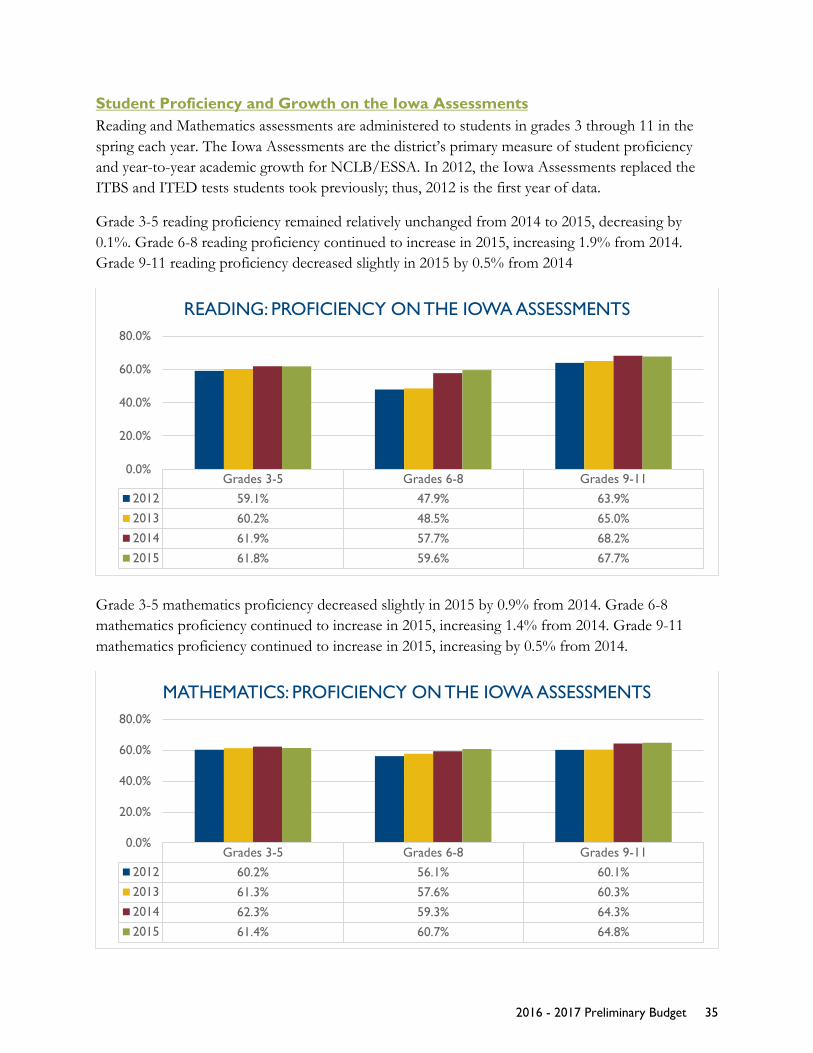
Student Proficiency and Growth on the Iowa Assessments Reading and Mathematics assessments are administered to students in grades 3 through 11 in the spring each year. The Iowa Assessments are the district’s primary measure of student proficiency and year-to-year academic growth for NCLB/ESSA. In 2012, the Iowa Assessments replaced the ITBS and ITED tests students took previously; thus, 2012 is the first year of data.
Grade 3-5 reading proficiency remained relatively unchanged from 2014 to 2015, decreasing by 0.1%. Grade 6-8 reading proficiency continued to increase in 2015, increasing 1.9% from 2014. Grade 9-11 reading proficiency decreased slightly in 2015 by 0.5% from 2014
Grade 3-5 mathematics proficiency decreased slightly in 2015 by 0.9% from 2014. Grade 6-8 mathematics proficiency continued to increase in 2015, increasing 1.4% from 2014. Grade 9-11 mathematics proficiency continued to increase in 2015, increasing by 0.5% from 2014.
Grades 3-5 Grades 6-8 Grades 9-112012 59.1% 47.9% 63.9%2013 60.2% 48.5% 65.0%2014 61.9% 57.7% 68.2%2015 61.8% 59.6% 67.7%
0.0%
20.0%
40.0%
60.0%
80.0%
READING: PROFICIENCY ON THE IOWA ASSESSMENTS
Grades 3-5 Grades 6-8 Grades 9-112012 60.2% 56.1% 60.1%2013 61.3% 57.6% 60.3%2014 62.3% 59.3% 64.3%2015 61.4% 60.7% 64.8%
0.0%
20.0%
40.0%
60.0%
80.0%
MATHEMATICS: PROFICIENCY ON THE IOWA ASSESSMENTS
2016 - 2017 Preliminary Budget 35
FISCAL PROFILE
BUDGET OVERVIEW
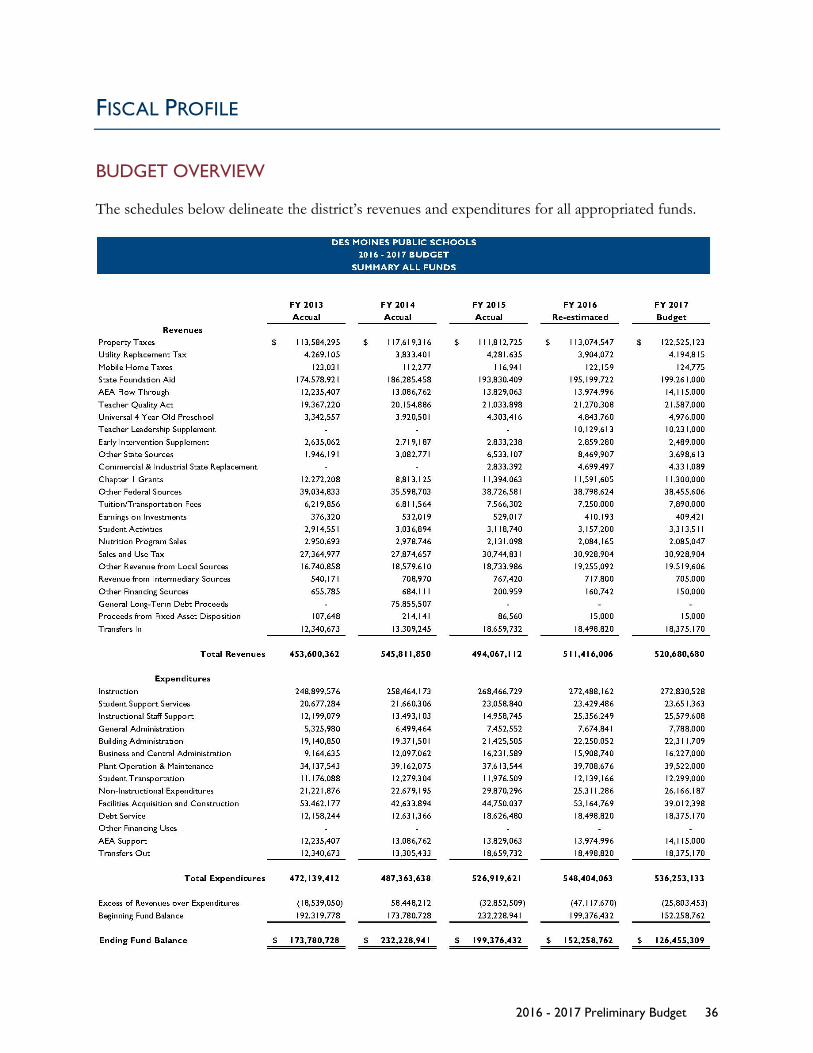
The schedules below delineate the district’s revenues and expenditures for all appropriated funds.
2016 - 2017 Preliminary Budget 36

LOCAL STATEWIDE DEBT FOOD & CHILD GENERAL MANAGEMENT PPEL PERL ACTIVITY TRUST OPTION PENNY SERVICE NUTRITION CARE PRESCHOOL OTHER TOTAL
RevenuesProperty Taxes 106,485,000$ 8,186,820$ 6,969,126$ 884,177$ -$ -$ -$ -$ -$ -$ -$ -$ -$ 122,525,123Utility Replacement Tax 3,661,000 284,550 218,534 30,731 - - - - - - - - - 4,194,815State Foundation Aid 199,261,000 - - - - - - - - - - - - 199,261,000AEA Flow Through 14,115,000 - - - - - - - - - - - - 14,115,000Teacher Quality Act 21,587,000 - - - - - - - - - - - - 21,587,000Universal 4 Year Old Preschool 4,976,000 - - - - - - - - - - - - 4,976,000Teacher Leadership Supplement 10,231,000 - - - - - - - - - - - - 10,231,000Early Intervention Supplement 2,489,000 - - - - - - - - - - - - 2,489,000Other State Sources 3,186,173 333,000 2,000 - - - - - - 177,440 - - - 3,698,613Mobile Home Taxes 104,000 11,000 8,824 951 - - - - - - - - - 124,775Commercial & Industrial State Replacement 3,736,827 280,784 283,153 30,325 - - - - - - - - - 4,331,089Chapter 1 Grants 11,300,000 - - - - - - - - - - - - 11,300,000Other Federal Sources 19,878,000 - - - - - - - - 18,577,606 - - - 38,455,606Tuition/Transportation Fees 7,890,000 - - - - - - - - - - - - 7,890,000Earnings on Investments 275,000 - 4,000 - - 71,221 - 59,200 - - - - - 409,421Student Activities 20,000 - - - 3,282,511 11,000 - - - - - - - 3,313,511Nutrition Program Sales - - - - - - - - - 2,085,047 - - - 2,085,047Sales and Use Tax - - - - - - - 30,928,904 - - - - - 30,928,904Other Revenue from Local Sources 13,855,000 - 400,000 522,254 - 90,000 - 200,000 - - 4,417,352 - 35,000 19,519,606Revenue from Intermediary Sources 705,000 - - - - - - - - - - - - 705,000Other Financing Sources - - - - - 150,000 - - - - - - - 150,000General Long-Term Debt Proceeds - - - - - - - - - - - - - - Proceeds from Fixed Asset Disposition 15,000 - - - - - - - - - - - - 15,000Transfers In - - - - - - - - 18,375,170 - - - - 18,375,170
Total Revenues 423,770,000 9,096,154 7,885,637 1,468,438 3,282,511 322,221 - 31,188,104 18,375,170 20,840,093 4,417,352 - 35,000 520,680,680
ExpendituresInstruction 264,228,570 4,865,000 100,000 322,958 3,225,000 89,000 - - - - - - - 272,830,528Student Support Services 23,018,363 633,000 - - - - - - - - - - - 23,651,363Instructional Staff Support 25,579,608 - - - - - - - - - - - - 25,579,608General Administration 6,934,000 854,000 - - - - - - - - - - - 7,788,000Building Administration 22,004,709 307,000 - - - - - - - - - - - 22,311,709Business and Central Administration 16,227,000 - - - - - - - - - - - - 16,227,000Plant Operation & Maintenance 34,873,000 2,279,000 2,370,000 - - - - - - - - - - 39,522,000Student Transportation 9,894,000 1,605,000 800,000 - - - - - - - - - - 12,299,000Non-Instructional Expenditures 847,000 498,000 1,000 973,606 - - - - - 20,203,499 3,610,082 - 33,000 26,166,187Facilities Acquisition and Construction - - 5,389,000 118,398 - - 33,505,000 - - - - - 39,012,398Debt Service - - - - - - - - 18,375,170 - - - - 18,375,170Other Financing Uses - - - - - - - - - - - - - - AEA Support 14,115,000 - - - - - - - - - - - - 14,115,000Transfers Out - - - - - - - 18,375,170 - - - - - 18,375,170
Total Expenditures 417,721,250 11,041,000 8,660,000 1,414,962 3,225,000 89,000 - 51,880,170 18,375,170 20,203,499 3,610,082 - 33,000 536,253,133
Excess of Revenues over Expenditures 6,048,750 (1,944,846) (774,363) 53,476 57,511 233,221 - (20,692,066) - 636,594 807,270 - 2,000 (15,572,453)Beginning Fund Balance 74,827,310 4,286,679 5,671,554 196,243 1,656,721 3,333,626 - 71,802,672 - 1,422,764 (984,330) - 175,136 162,388,376
Ending Fund Balance 80,876,060$ 2,341,833$ 4,897,191$ 249,719$ 1,714,232$ 3,566,847$ -$ 51,110,606$ -$ 2,059,358$ (177,060)$ -$ 177,136$ 146,815,923$
DES MOINES PUBLIC SCHOOLS2016 - 2017 BUDGET
SUMMARY ALL FUNDS
FISCAL YEAR 2017 BUDGET
SPECIAL REVENUE CAPITAL PROJECTS ENTERPRISE
2016 - 2017 Preliminary Budget 37
GUIDING PRINCIPLES
Policy Governance: Management Limitations Using guidance from the GFOA, ASBO, Iowa Association of School Boards, and Iowa School Finance Information Services, among others, each year the Board sets targets for financial indicators, including the district’s solvency ratio and unspent spending ratio. The targets set for both the solvency ratio and unspent spending ratio place the district into the “healthy range” identified for each of these financial indicators.
The following Management Limitations (ML) are used in budget development.
Management Limitation 2.5: Financial Planning/Budgeting Financial planning for any fiscal year or the remaining part of any fiscal year may not deviate materially from the Board’s Student Expectations Policy or risk financial jeopardy.
Accordingly, the Superintendent shall not present a budget that:
1. Falls below a 15% solvency ratio for the General Fund.2. Falls below a 15% unspent spending ratio for the General Fund.3. Creates a situation or condition described as unacceptable in the “Financial Conditions and
Activities.”4. Omits credible projections of revenues and expenses and disclosure of planning
assumptions.5. Plans the expenditure of more funds than are projected to be received in any fiscal year.
The Board revisits and revises the limitations annually and were last revised December 8, 2015.
Budget Parameters Each year, the School Board adopts budget parameters that guide the work of the district in developing the annual budget and the direction of the district for future. The School Board set the following parameters for FY 2017 budgetary planning:
• Meet and stay within Board Management Limitations.• Maintain financial health; provide a balanced budget.• Keep DMPS Student Expectations and Board Beliefs at the forefront.• Review status of all levies; make strategic adjustments as needed.• Seek input from the Citizens’ Budget Advisory Committee (CBAC) on budget issues.• Seek input from the Employees’ Budget Advisory Committee (EBAC) on budget issues.• Continue to seek operational efficiencies and improve operational effectiveness.• Continue to focus on drop-out prevention and graduation rate improvement strategies.• Focus on strategies to close the achievement gap.• Improve English Language Learners (ELL) programming.• Continue to assess needs and evaluate programming to:
2016 - 2017 Preliminary Budget 38
o Create innovative programs to meet unmet needs;o Maintain or grow programs that are demonstrating success;o Strategically abandon programs that do not demonstrate value;o Assess and address curriculum needs and program delivery as needed to stay ahead of
advances in technology and digital content.• Improve parent and student engagement.
Board Policies Board Policy 700 The primary responsibility of the board is to provide the citizens of Des Moines an education program consistent with the mission of the district and the Student Expectations. Business and operational functions relative to this mission shall be managed and implemented in an efficient, effective and equitable manner.
Board Policy 702 Planning of the budget is a continuous process involving study and deliberation by the Board, the administrative staff, the faculty, other staff members, and the citizens of the community.
The Superintendent of Schools shall submit an annual budget for consideration, deliberation, and approval by the Board of Directors. After adoption of the budget by the official action of the board, the superintendent and/or designated representatives will be authorized to administer specific expenditures.
The budget document shall include revenue sources and expenditures for all areas of operation to implement the Student Expectations and Budget Parameters set by the board of directors.
2016 - 2017 Preliminary Budget 39
ASSUMPTIONS SIGNIFICANT AND FINANCIAL & BUDGETARY ISSUES
Assumptions for a Balanced Budget This budget document, similar to prior years, incorporates financial assumptions. These assumptions are used to ensure that revenues and expenditure projections are credible. The assumptions, as required by Board adopted Management Limitation 2.5(4), were used to develop the Certified Budget.
This budget document presents analysis that continues to follow sound budgeting principles including:
• presentation of a balanced budget, • limited use of one-time funding to cover one-time costs as authorized by the board, • use of ongoing funding to cover ongoing costs, • determination of revenues and expenditures, • alignment of expenditures incurred and related revenues earned in the same fiscal year, • incorporation of Board Management Limitations and Board budgetary parameters, and • integration of reasonable financial assumptions.
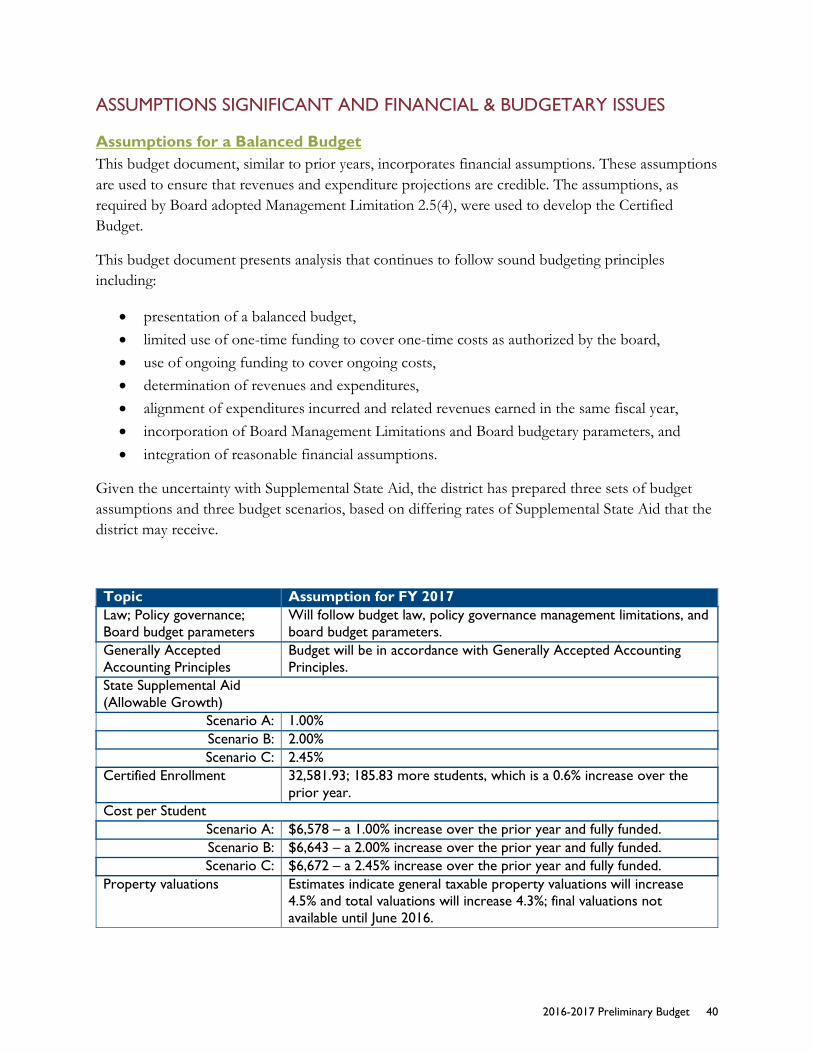
Given the uncertainty with Supplemental State Aid, the district has prepared three sets of budget assumptions and three budget scenarios, based on differing rates of Supplemental State Aid that the district may receive.
Topic Assumption for FY 2017 Law; Policy governance; Board budget parameters
Will follow budget law, policy governance management limitations, and board budget parameters.
Generally Accepted Accounting Principles
Budget will be in accordance with Generally Accepted Accounting Principles.
State Supplemental Aid (Allowable Growth)
Scenario A: 1.00% Scenario B: 2.00% Scenario C: 2.45%
Certified Enrollment 32,581.93; 185.83 more students, which is a 0.6% increase over the prior year.
Cost per Student Scenario A: $6,578 – a 1.00% increase over the prior year and fully funded. Scenario B: $6,643 – a 2.00% increase over the prior year and fully funded. Scenario C: $6,672 – a 2.45% increase over the prior year and fully funded.
Property valuations Estimates indicate general taxable property valuations will increase 4.5% and total valuations will increase 4.3%; final valuations not available until June 2016.
2016-2017 Preliminary Budget 40

State property tax relief Will continue to receive increased state aid to replace property taxes and thereby reduce property taxes applicable to the district, per state law.
Cash Reserve Levy Recommend increasing the levy to the prior period amounts. Statewide Penny Will parallel modeling and Department of Revenue projections. The
district is monitoring closely proposed changes to the law. Short-term investment rates Forecasted to be less than 1% in FY17. State Aid - Certified Budget
Scenario A: Based on receipt of full funding of each student at a district cost per student of $6,578, a 1.00% increase.
Scenario B: Based on receipt of full funding of each student at a district cost per student of $6,643, a 2.00% increase.
Scenario C: Based on receipt of full funding of each student at a district cost per student of $6,672, a 2.45% increase.
Weighted funding Funding is based on weighting factors as defined by law for Home School, ELL, SPED, At Risk programming, and Regional programming. It does not include Preschool.
Certain State grants Funding for state grants is same as the current year. Compensation Includes a conservative estimate of the possible results of collective
bargaining. Health insurance premiums will increase 4% (Alliance Select) and 2.68% (Blue Access). Compensation—salaries and benefits—in the General Fund represents 82.5% of overall expenditures. Impact of transitional fees associated with the Affordable Health Care cost.
Utilities costs Energy conservation efforts will continue to offset increased utility costs; however, cannot allow for unknown weather factors.
Early retirements 100 early retirement slots were opened, 99 filled for FY 2014 and an additional 100 slots were opened for FY 2015. Initially, a cap of $1M in expenditure was implemented in FY2016. Recently, the district settled with DMEA and revisited the cap; as a result of the settlement a total of 71 retirees were eligible for the early retirement program for FY 2016. The Board will continue to evaluate the early retirement plan going forward.
Balanced budget Resources will cover expenditures, as required by law.
2016-2017 Preliminary Budget 41
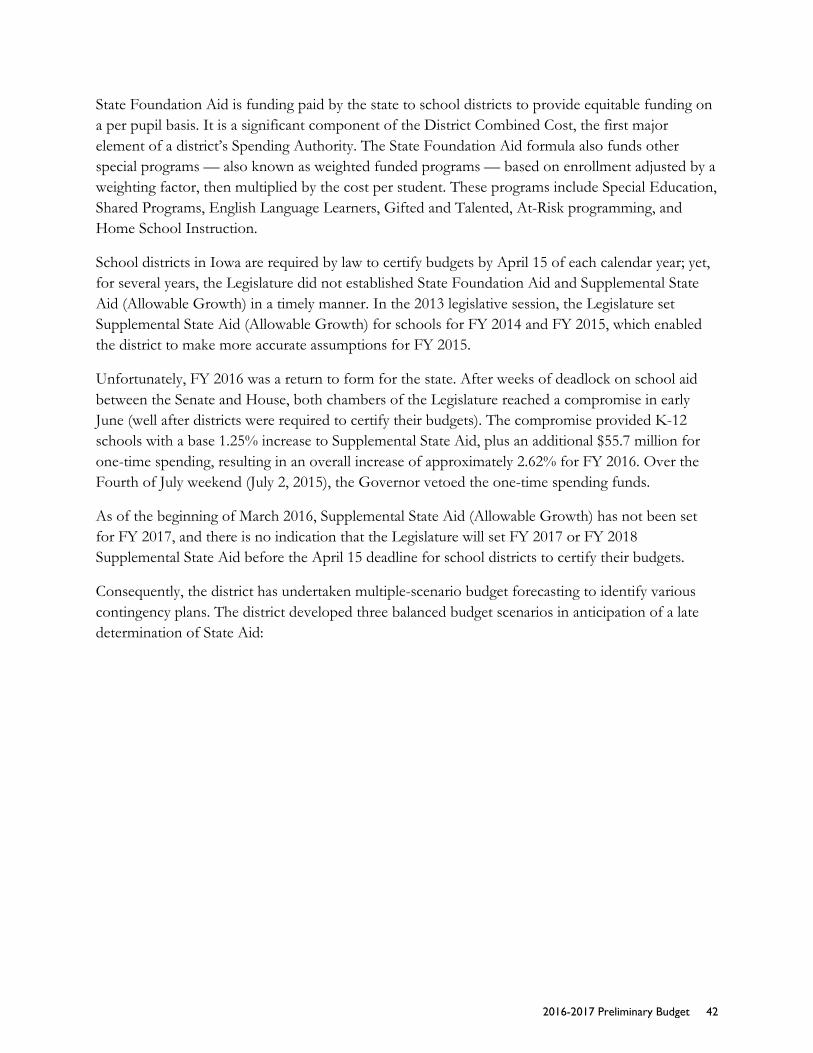
State Foundation Aid is funding paid by the state to school districts to provide equitable funding on a per pupil basis. It is a significant component of the District Combined Cost, the first major element of a district’s Spending Authority. The State Foundation Aid formula also funds other special programs — also known as weighted funded programs — based on enrollment adjusted by a weighting factor, then multiplied by the cost per student. These programs include Special Education, Shared Programs, English Language Learners, Gifted and Talented, At-Risk programming, and Home School Instruction.
School districts in Iowa are required by law to certify budgets by April 15 of each calendar year; yet, for several years, the Legislature did not established State Foundation Aid and Supplemental State Aid (Allowable Growth) in a timely manner. In the 2013 legislative session, the Legislature set Supplemental State Aid (Allowable Growth) for schools for FY 2014 and FY 2015, which enabled the district to make more accurate assumptions for FY 2015.
Unfortunately, FY 2016 was a return to form for the state. After weeks of deadlock on school aid between the Senate and House, both chambers of the Legislature reached a compromise in early June (well after districts were required to certify their budgets). The compromise provided K-12 schools with a base 1.25% increase to Supplemental State Aid, plus an additional $55.7 million for one-time spending, resulting in an overall increase of approximately 2.62% for FY 2016. Over the Fourth of July weekend (July 2, 2015), the Governor vetoed the one-time spending funds.
As of the beginning of March 2016, Supplemental State Aid (Allowable Growth) has not been set for FY 2017, and there is no indication that the Legislature will set FY 2017 or FY 2018 Supplemental State Aid before the April 15 deadline for school districts to certify their budgets.
Consequently, the district has undertaken multiple-scenario budget forecasting to identify various contingency plans. The district developed three balanced budget scenarios in anticipation of a late determination of State Aid:
2016-2017 Preliminary Budget 42
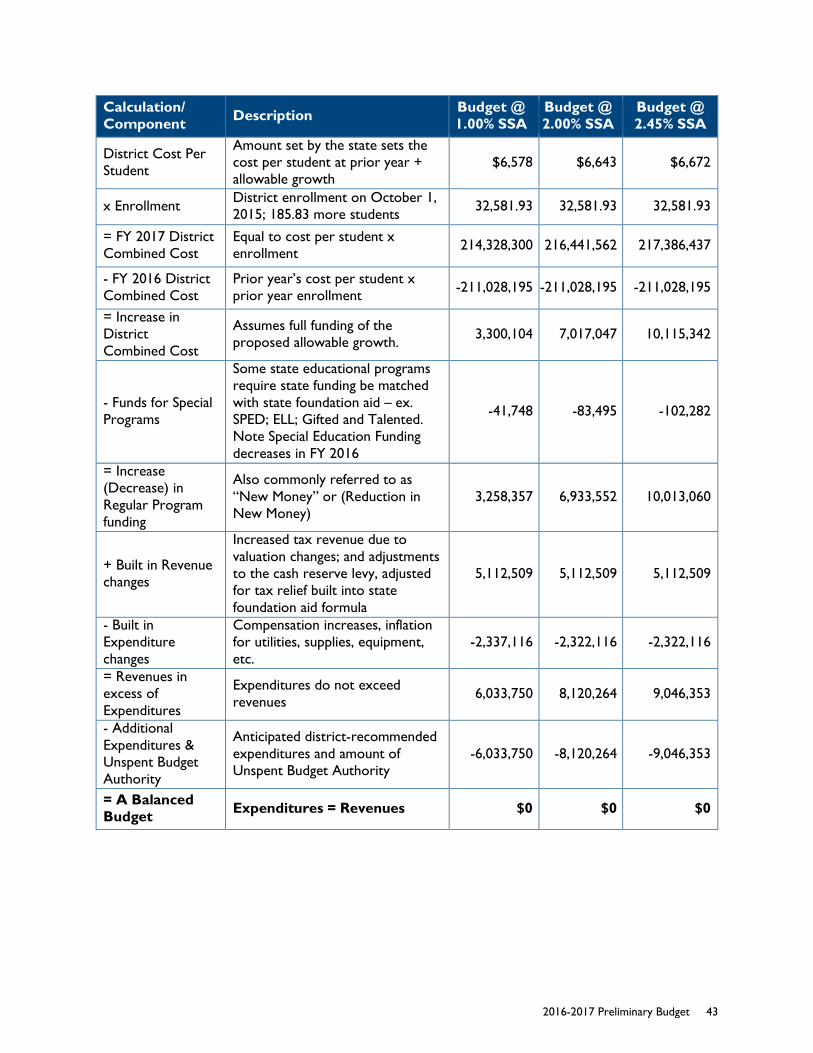
Calculation/ Component Description Budget @
1.00% SSA Budget @ 2.00% SSA
Budget @ 2.45% SSA
District Cost Per Student
Amount set by the state sets the cost per student at prior year + allowable growth
$6,578 $6,643 $6,672
x Enrollment District enrollment on October 1, 2015; 185.83 more students 32,581.93 32,581.93 32,581.93
= FY 2017 District Combined Cost
Equal to cost per student x enrollment 214,328,300 216,441,562 217,386,437
- FY 2016 DistrictCombined Cost
Prior year’s cost per student x prior year enrollment -211,028,195 -211,028,195 -211,028,195
= Increase in District Combined Cost
Assumes full funding of the proposed allowable growth. 3,300,104 7,017,047 10,115,342
- Funds for SpecialPrograms
Some state educational programs require state funding be matched with state foundation aid – ex. SPED; ELL; Gifted and Talented. Note Special Education Funding decreases in FY 2016
-41,748 -83,495 -102,282
= Increase (Decrease) in Regular Program funding
Also commonly referred to as “New Money” or (Reduction in New Money)
3,258,357 6,933,552 10,013,060
+ Built in Revenuechanges
Increased tax revenue due to valuation changes; and adjustments to the cash reserve levy, adjusted for tax relief built into state foundation aid formula
5,112,509 5,112,509 5,112,509
- Built inExpenditurechanges
Compensation increases, inflation for utilities, supplies, equipment, etc.
-2,337,116 -2,322,116 -2,322,116
= Revenues in excess of Expenditures
Expenditures do not exceed revenues 6,033,750 8,120,264 9,046,353
- AdditionalExpenditures &Unspent BudgetAuthority
Anticipated district-recommended expenditures and amount of Unspent Budget Authority
-6,033,750 -8,120,264 -9,046,353
= A Balanced Budget Expenditures = Revenues $0 $0 $0
2016-2017 Preliminary Budget 43
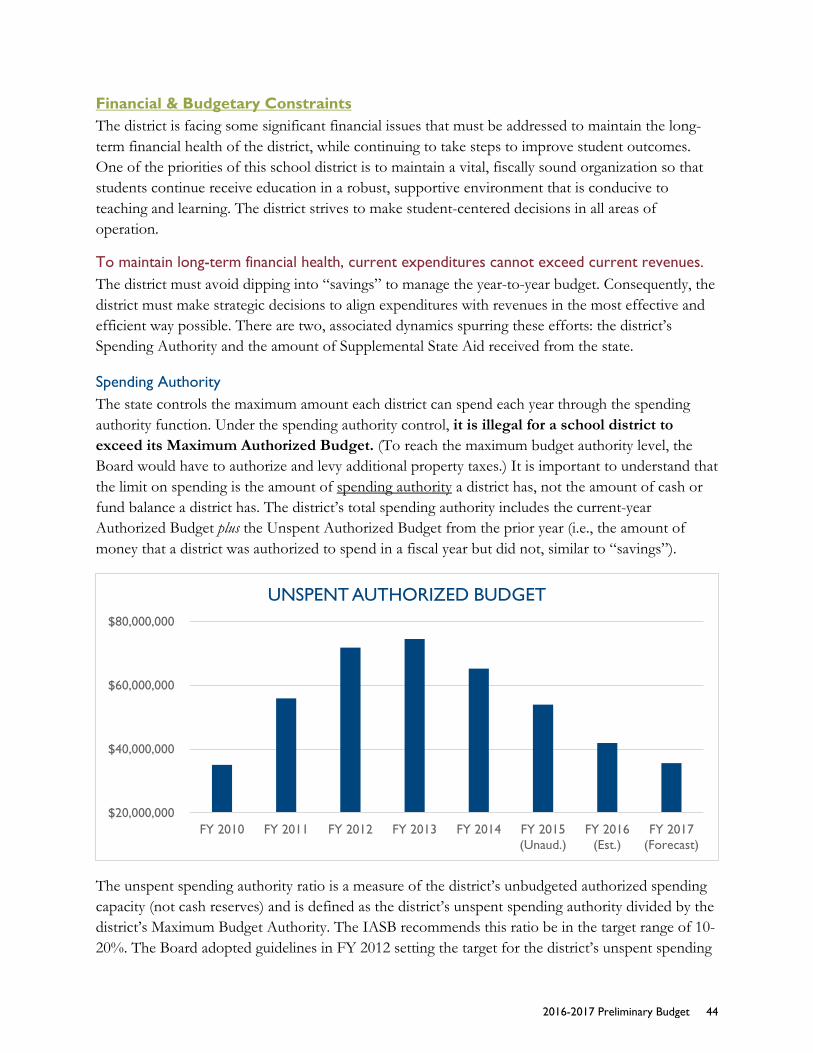
Financial & Budgetary Constraints The district is facing some significant financial issues that must be addressed to maintain the long-term financial health of the district, while continuing to take steps to improve student outcomes. One of the priorities of this school district is to maintain a vital, fiscally sound organization so that students continue receive education in a robust, supportive environment that is conducive to teaching and learning. The district strives to make student-centered decisions in all areas of operation.
To maintain long-term financial health, current expenditures cannot exceed current revenues. The district must avoid dipping into “savings” to manage the year-to-year budget. Consequently, the district must make strategic decisions to align expenditures with revenues in the most effective and efficient way possible. There are two, associated dynamics spurring these efforts: the district’s Spending Authority and the amount of Supplemental State Aid received from the state.
Spending Authority The state controls the maximum amount each district can spend each year through the spending authority function. Under the spending authority control, it is illegal for a school district to exceed its Maximum Authorized Budget. (To reach the maximum budget authority level, the Board would have to authorize and levy additional property taxes.) It is important to understand that the limit on spending is the amount of spending authority a district has, not the amount of cash or fund balance a district has. The district’s total spending authority includes the current-year Authorized Budget plus the Unspent Authorized Budget from the prior year (i.e., the amount of money that a district was authorized to spend in a fiscal year but did not, similar to “savings”).
The unspent spending authority ratio is a measure of the district’s unbudgeted authorized spending capacity (not cash reserves) and is defined as the district’s unspent spending authority divided by the district’s Maximum Budget Authority. The IASB recommends this ratio be in the target range of 10-20%. The Board adopted guidelines in FY 2012 setting the target for the district’s unspent spending
$20,000,000
$40,000,000
$60,000,000
$80,000,000
FY 2010 FY 2011 FY 2012 FY 2013 FY 2014 FY 2015(Unaud.)
FY 2016(Est.)
FY 2017(Forecast)
UNSPENT AUTHORIZED BUDGET
2016-2017 Preliminary Budget 44
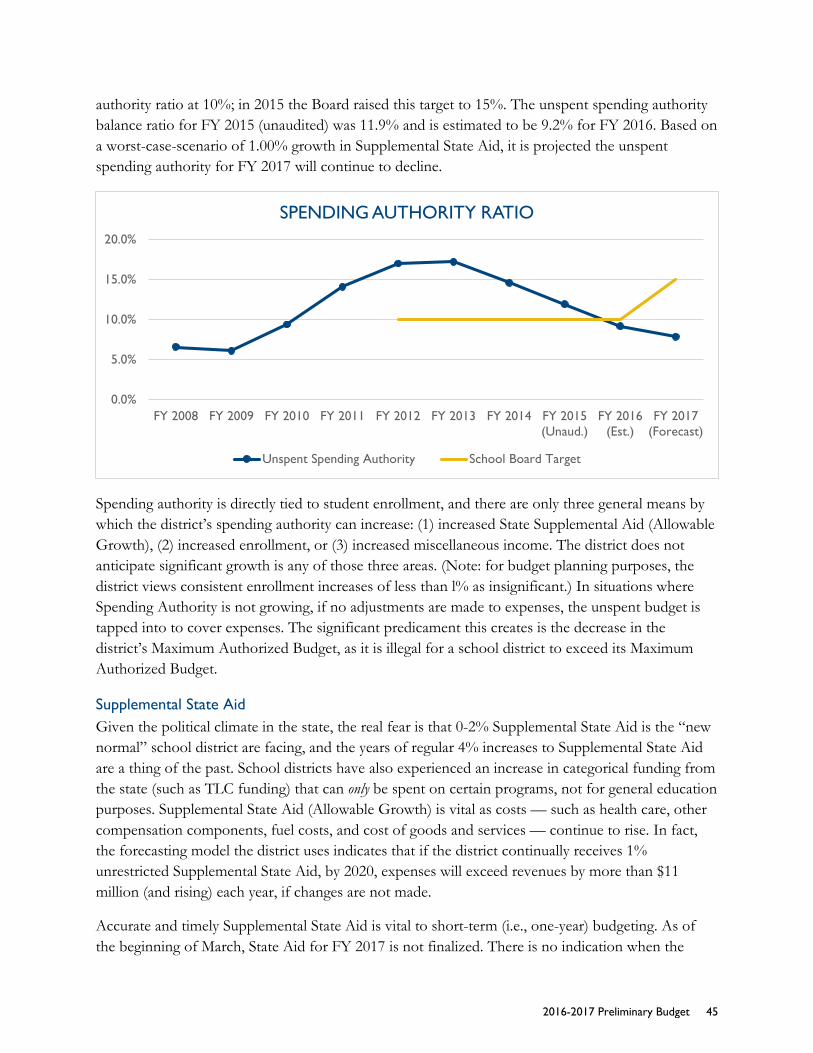
authority ratio at 10%; in 2015 the Board raised this target to 15%. The unspent spending authority balance ratio for FY 2015 (unaudited) was 11.9% and is estimated to be 9.2% for FY 2016. Based on a worst-case-scenario of 1.00% growth in Supplemental State Aid, it is projected the unspent spending authority for FY 2017 will continue to decline.
Spending authority is directly tied to student enrollment, and there are only three general means by which the district’s spending authority can increase: (1) increased State Supplemental Aid (Allowable Growth), (2) increased enrollment, or (3) increased miscellaneous income. The district does not anticipate significant growth is any of those three areas. (Note: for budget planning purposes, the district views consistent enrollment increases of less than l% as insignificant.) In situations where Spending Authority is not growing, if no adjustments are made to expenses, the unspent budget is tapped into to cover expenses. The significant predicament this creates is the decrease in the district’s Maximum Authorized Budget, as it is illegal for a school district to exceed its Maximum Authorized Budget.
Supplemental State Aid Given the political climate in the state, the real fear is that 0-2% Supplemental State Aid is the “new normal” school district are facing, and the years of regular 4% increases to Supplemental State Aid are a thing of the past. School districts have also experienced an increase in categorical funding from the state (such as TLC funding) that can only be spent on certain programs, not for general education purposes. Supplemental State Aid (Allowable Growth) is vital as costs — such as health care, other compensation components, fuel costs, and cost of goods and services — continue to rise. In fact, the forecasting model the district uses indicates that if the district continually receives 1% unrestricted Supplemental State Aid, by 2020, expenses will exceed revenues by more than $11 million (and rising) each year, if changes are not made.
Accurate and timely Supplemental State Aid is vital to short-term (i.e., one-year) budgeting. As of the beginning of March, State Aid for FY 2017 is not finalized. There is no indication when the
0.0%
5.0%
10.0%
15.0%
20.0%
FY 2008 FY 2009 FY 2010 FY 2011 FY 2012 FY 2013 FY 2014 FY 2015(Unaud.)
FY 2016(Est.)
FY 2017(Forecast)
SPENDING AUTHORITY RATIO
Unspent Spending Authority School Board Target
2016-2017 Preliminary Budget 45
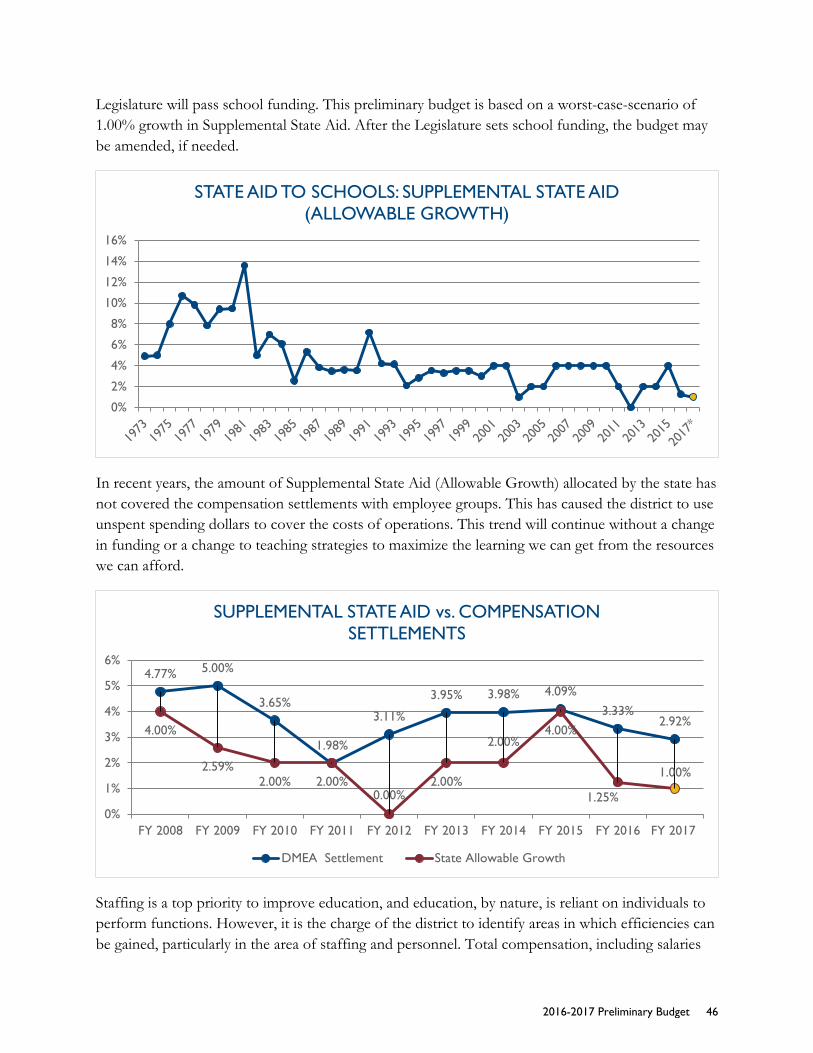
Legislature will pass school funding. This preliminary budget is based on a worst-case-scenario of 1.00% growth in Supplemental State Aid. After the Legislature sets school funding, the budget may be amended, if needed.
In recent years, the amount of Supplemental State Aid (Allowable Growth) allocated by the state has not covered the compensation settlements with employee groups. This has caused the district to use unspent spending dollars to cover the costs of operations. This trend will continue without a change in funding or a change to teaching strategies to maximize the learning we can get from the resources we can afford.
Staffing is a top priority to improve education, and education, by nature, is reliant on individuals to perform functions. However, it is the charge of the district to identify areas in which efficiencies can be gained, particularly in the area of staffing and personnel. Total compensation, including salaries
0%
2%
4%
6%
8%
10%
12%
14%
16%
STATE AID TO SCHOOLS: SUPPLEMENTAL STATE AID (ALLOWABLE GROWTH)
4.77% 5.00%
3.65%
1.98%
3.11%
3.95% 3.98% 4.09%3.33%
2.92%4.00%
2.59%2.00% 2.00%
0.00%2.00%
2.00%4.00%
1.25%
1.00%
0%
1%
2%
3%
4%
5%
6%
FY 2008 FY 2009 FY 2010 FY 2011 FY 2012 FY 2013 FY 2014 FY 2015 FY 2016 FY 2017
SUPPLEMENTAL STATE AID vs. COMPENSATION SETTLEMENTS
DMEA Settlement State Allowable Growth
2016-2017 Preliminary Budget 46
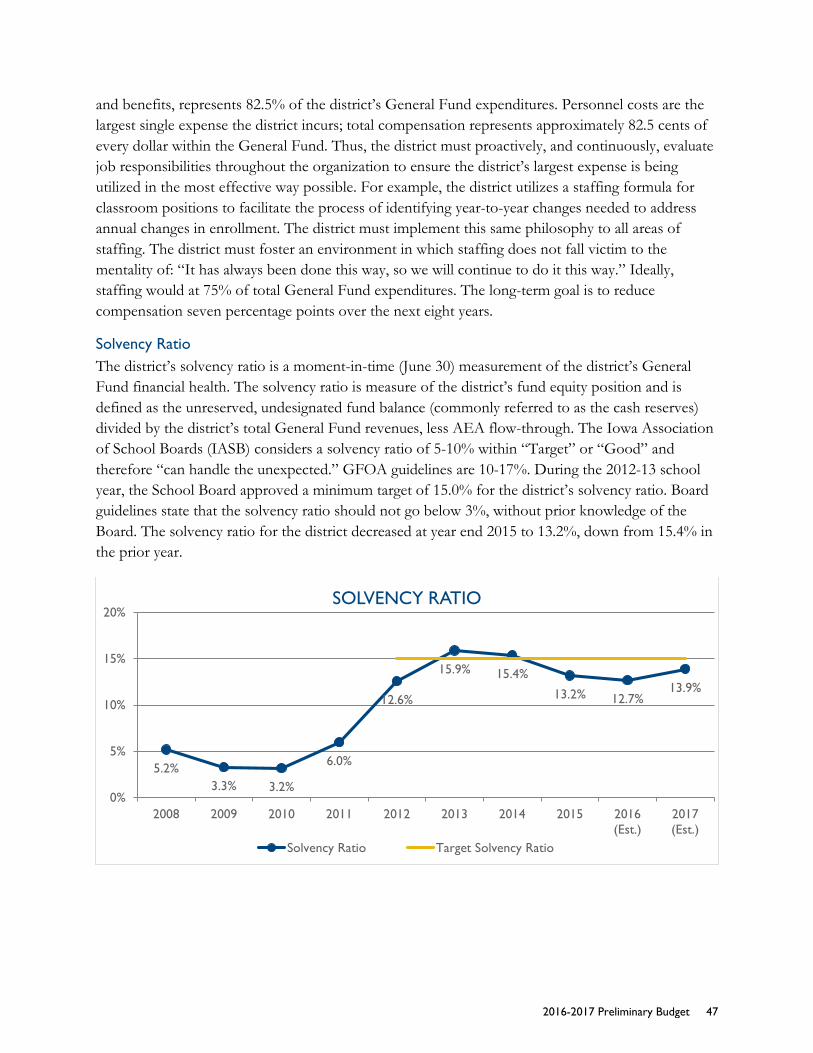
and benefits, represents 82.5% of the district’s General Fund expenditures. Personnel costs are the largest single expense the district incurs; total compensation represents approximately 82.5 cents of every dollar within the General Fund. Thus, the district must proactively, and continuously, evaluate job responsibilities throughout the organization to ensure the district’s largest expense is being utilized in the most effective way possible. For example, the district utilizes a staffing formula for classroom positions to facilitate the process of identifying year-to-year changes needed to address annual changes in enrollment. The district must implement this same philosophy to all areas of staffing. The district must foster an environment in which staffing does not fall victim to the mentality of: “It has always been done this way, so we will continue to do it this way.” Ideally, staffing would at 75% of total General Fund expenditures. The long-term goal is to reduce compensation seven percentage points over the next eight years.
Solvency Ratio The district’s solvency ratio is a moment-in-time (June 30) measurement of the district’s General Fund financial health. The solvency ratio is measure of the district’s fund equity position and is defined as the unreserved, undesignated fund balance (commonly referred to as the cash reserves) divided by the district’s total General Fund revenues, less AEA flow-through. The Iowa Association of School Boards (IASB) considers a solvency ratio of 5-10% within “Target” or “Good” and therefore “can handle the unexpected.” GFOA guidelines are 10-17%. During the 2012-13 school year, the School Board approved a minimum target of 15.0% for the district’s solvency ratio. Board guidelines state that the solvency ratio should not go below 3%, without prior knowledge of the Board. The solvency ratio for the district decreased at year end 2015 to 13.2%, down from 15.4% in the prior year.
5.2%3.3% 3.2%
6.0%
12.6%
15.9% 15.4%
13.2% 12.7%13.9%
0%
5%
10%
15%
20%
2008 2009 2010 2011 2012 2013 2014 2015 2016(Est.)
2017(Est.)
SOLVENCY RATIO
Solvency Ratio Target Solvency Ratio
2016-2017 Preliminary Budget 47
Financial Forecast Multi-year financial planning can potentially avoid the budgetary cycle of simply putting out the next fire by providing a longer term perspective on what problems are coming and thus preventing or minimizing them. Maintaining the financial health of the district is accomplished through a variety of factors including: (1) Maintaining a spending authority ratio within the recommended guidelines of 10-20%, (2) Maintaining a solvency ratio within the recommended guidelines of 5-15%, (3) Following GFOA recommendations of 60 days of cash reserves on hand, (4) Managing the district’s investment portfolio and debt, and (5) Conducting trend/forecast analysis including the various impacts tax rates can have on the district. Long-term forecasting helps the district budget for areas of operation to implement achieve Student Expectations, while staying within the annual Budget Parameters set by the Board of Directors. The Business & Finance department reviews financial data on daily, monthly, quarterly, and annual basis. If an analysis determines that an initiative is not effective, corrective steps are taken. The Business & Finance department also completes and presents quarterly monitoring reports to the Board to demonstrate the district’s fiscal condition.
The forecast used to develop the preliminary budget makes the following assumptions for revenues:
(1) Enrollment increases by approximately 100 students per year (2) The percent of growth for Supplemental State Aid (also known as “Allowable Growth”) is
1.00% for FY 2017, 2.50% for 2018, 3.00% for 2019, 2.50% for 2020 and 3.00% for 2021 (3) Standard federal programs will remain the same.
The district also completed forecasts with Supplemental State Aid for FY 2017 at 2.00% and 2.45%.
The forecast makes the following assumptions for expenditures:
(A) Historical increases for compensation (state average) will continue: 3.00% salary & 4.00% health insurance
(B) Staffing based on November 2015 levels, with 100 FTE positions eliminated in FY 2017 and 75 FTE positions eliminated in FY 2018
(C) Modest price increases for goods and services (inflation) (D) Self-Insurance funding for health insurance ends after FY 2019 (E) Spending for technology, textbook adoptions, etc. will approximate FY 2015 levels (F) Includes estimate for funding of Drake MA program (G) Includes estimate for 3rd grade summer school (H) Includes technology replacement schedule
2016-2017 Preliminary Budget 48
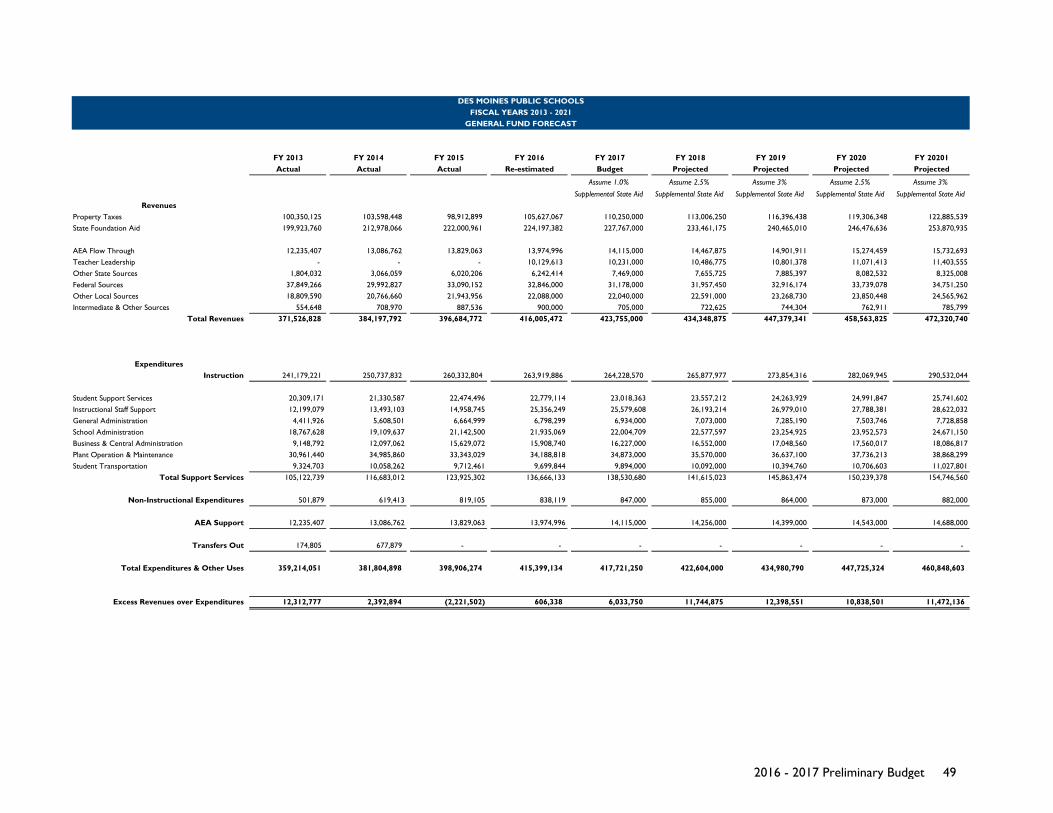
FY 2013 FY 2014 FY 2015 FY 2016 FY 2017 FY 2018 FY 2019 FY 2020 FY 20201Actual Actual Actual Re-estimated Budget Projected Projected Projected Projected
Assume 1.0%
Supplemental State Aid
Assume 2.5%
Supplemental State Aid
Assume 3%
Supplemental State Aid
Assume 2.5%
Supplemental State Aid
Assume 3%
Supplemental State AidRevenues
Property Taxes 100,350,125 103,598,448 98,912,899 105,627,067 110,250,000 113,006,250 116,396,438 119,306,348 122,885,539State Foundation Aid 199,923,760 212,978,066 222,000,961 224,197,382 227,767,000 233,461,175 240,465,010 246,476,636 253,870,935
AEA Flow Through 12,235,407 13,086,762 13,829,063 13,974,996 14,115,000 14,467,875 14,901,911 15,274,459 15,732,693Teacher Leadership - - - 10,129,613 10,231,000 10,486,775 10,801,378 11,071,413 11,403,555Other State Sources 1,804,032 3,066,059 6,020,206 6,242,414 7,469,000 7,655,725 7,885,397 8,082,532 8,325,008Federal Sources 37,849,266 29,992,827 33,090,152 32,846,000 31,178,000 31,957,450 32,916,174 33,739,078 34,751,250Other Local Sources 18,809,590 20,766,660 21,943,956 22,088,000 22,040,000 22,591,000 23,268,730 23,850,448 24,565,962Intermediate & Other Sources 554,648 708,970 887,536 900,000 705,000 722,625 744,304 762,911 785,799
Total Revenues 371,526,828 384,197,792 396,684,772 416,005,472 423,755,000 434,348,875 447,379,341 458,563,825 472,320,740
ExpendituresInstruction 241,179,221 250,737,832 260,332,804 263,919,886 264,228,570 265,877,977 273,854,316 282,069,945 290,532,044
Student Support Services 20,309,171 21,330,587 22,474,496 22,779,114 23,018,363 23,557,212 24,263,929 24,991,847 25,741,602Instructional Staff Support 12,199,079 13,493,103 14,958,745 25,356,249 25,579,608 26,193,214 26,979,010 27,788,381 28,622,032General Administration 4,411,926 5,608,501 6,664,999 6,798,299 6,934,000 7,073,000 7,285,190 7,503,746 7,728,858School Administration 18,767,628 19,109,637 21,142,500 21,935,069 22,004,709 22,577,597 23,254,925 23,952,573 24,671,150Business & Central Administration 9,148,792 12,097,062 15,629,072 15,908,740 16,227,000 16,552,000 17,048,560 17,560,017 18,086,817Plant Operation & Maintenance 30,961,440 34,985,860 33,343,029 34,188,818 34,873,000 35,570,000 36,637,100 37,736,213 38,868,299Student Transportation 9,324,703 10,058,262 9,712,461 9,699,844 9,894,000 10,092,000 10,394,760 10,706,603 11,027,801
Total Support Services 105,122,739 116,683,012 123,925,302 136,666,133 138,530,680 141,615,023 145,863,474 150,239,378 154,746,560
Non-Instructional Expenditures 501,879 619,413 819,105 838,119 847,000 855,000 864,000 873,000 882,000
AEA Support 12,235,407 13,086,762 13,829,063 13,974,996 14,115,000 14,256,000 14,399,000 14,543,000 14,688,000
Transfers Out 174,805 677,879 - - - - - - -
Total Expenditures & Other Uses 359,214,051 381,804,898 398,906,274 415,399,134 417,721,250 422,604,000 434,980,790 447,725,324 460,848,603
Excess Revenues over Expenditures 12,312,777 2,392,894 (2,221,502) 606,338 6,033,750 11,744,875 12,398,551 10,838,501 11,472,136
DES MOINES PUBLIC SCHOOLSFISCAL YEARS 2013 - 2021
GENERAL FUND FORECAST
2016 - 2017 Preliminary Budget 49
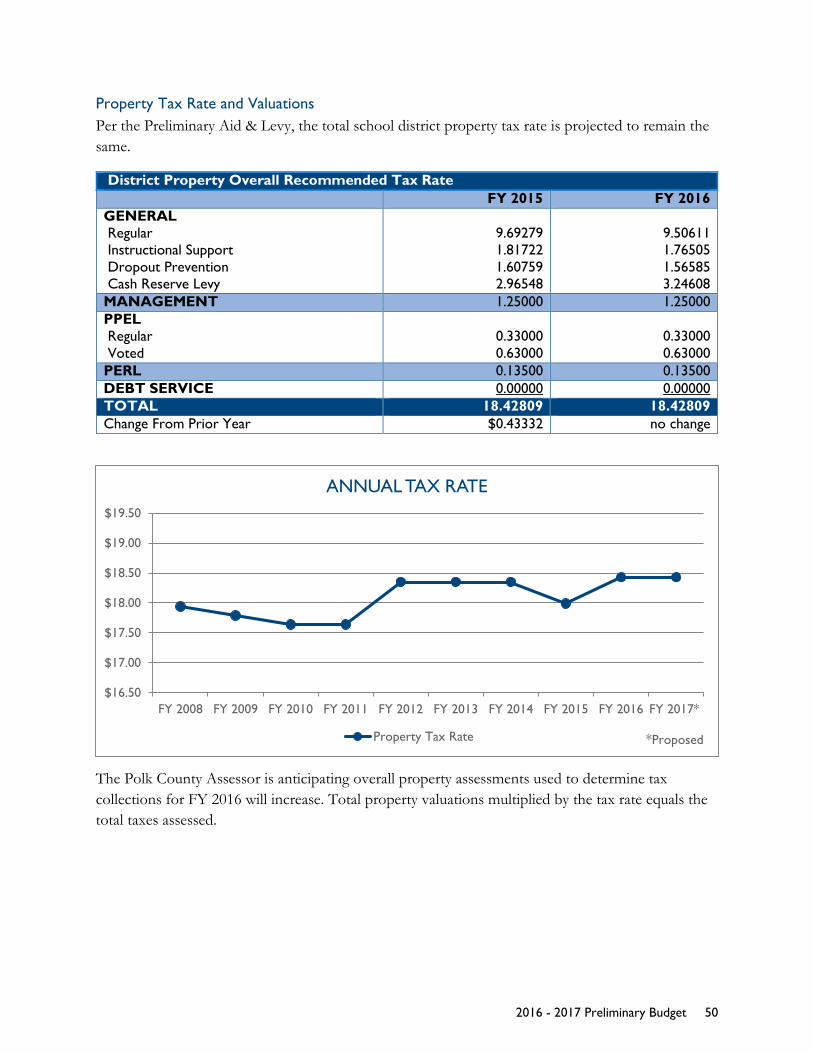
Property Tax Rate and Valuations Per the Preliminary Aid & Levy, the total school district property tax rate is projected to remain the same.
District Property Overall Recommended Tax Rate FY 2015 FY 2016 GENERAL Regular Instructional Support Dropout Prevention Cash Reserve Levy
9.69279 1.81722 1.60759 2.96548
9.50611 1.76505 1.56585 3.24608
MANAGEMENT 1.25000 1.25000 PPEL Regular Voted
0.33000 0.63000
0.33000 0.63000
PERL 0.13500 0.13500 DEBT SERVICE 0.00000 0.00000 TOTAL 18.42809 18.42809 Change From Prior Year $0.43332 no change
The Polk County Assessor is anticipating overall property assessments used to determine tax collections for FY 2016 will increase. Total property valuations multiplied by the tax rate equals the total taxes assessed.
$16.50
$17.00
$17.50
$18.00
$18.50
$19.00
$19.50
FY 2008 FY 2009 FY 2010 FY 2011 FY 2012 FY 2013 FY 2014 FY 2015 FY 2016 FY 2017*
ANNUAL TAX RATE
Property Tax Rate *Proposed
2016 - 2017 Preliminary Budget 50

Polk County Warren County Total Polk Warren Total Polk County Warren County Total Polk Warren Total
Residential 3,938,822,740$ 56,733,883$ 3,995,556,623$ 1.2% 1.3% 1.2% 4,436,735,776$ 56,751,574$ 4,493,487,350$ 12.6% 0.0% 12.5%Commercial 2,063,029,059 2,345,850 2,065,374,909 -4.5% 4.3% -4.5% 1,863,337,544 2,383,830 1,865,721,374 -9.7% 1.6% -9.7%Industrial 152,059,768 0 152,059,768 -5.9% NA -5.9% 155,925,564 0 155,925,564 2.5% NA 2.5%Agricultural 2,033,484 1,251,393 3,284,877 -14.6% -6.3% -11.6% 1,987,161 1,279,006 3,266,167 -2.3% 2.2% -0.6%Utilities (WO Gas & Electric) 30,224,180 847,857 31,072,037 -10.7% 2.6% -10.4% 26,592,896 906,327 27,499,223 -12.0% 6.9% -11.5%Railroads 15,301,417 - 15,301,417 -7.9% NA -7.9% 16,924,718 - 16,924,718 10.6% NA 10.6%
Total Valuation 6,201,470,648 61,178,983 6,262,649,631 -1.2% 1.3% -1.2% 6,501,503,659 61,320,737 6,562,824,396 4.8% 0.2% 4.8%Less: Military 13,912,678 303,728 14,216,406 -3.0% -8.4% -3.0% 13,159,612 294,468 13,454,080 -5.4% -3.0% -5.4%Plus: Gas & Electric 230,558,467 3,882,594 234,441,061 1.1% 0.2% 1.1% 223,852,758 3,787,685 227,640,443 -2.9% -2.4% -2.9%
Total General Taxable Valuation 6,418,116,437 64,757,849 6,482,874,286 -1.1% 1.2% -1.1% 6,712,282,803 64,813,954 6,777,010,759 4.6% 0.1% 4.5%TIF Value 692,605,126 0 692,605,126 -7.6% NA -7.6% 710,049,900 0 710,049,900 2.5% NA 2.5%
Total Debt & PPEL Taxable Valuation 7,110,721,563$ 64,757,849$ 7,175,479,412$ -1.8% 1.2% 1.8% 7,422,332,703$ 64,813,954$ 7,487,146,657$ 4.4% 0.1% 4.3%
1/1/2015FY 2015 - 2016 One Year Change
DES MOINES PUBLIC SCHOOLS2016 - 2017 BUDGET
LOCAL FUNDS: PROPERTY VALUATIONS
FY 2014 - 20151/1/2014
One Year Change
2016 - 2017 Preliminary Budget 51
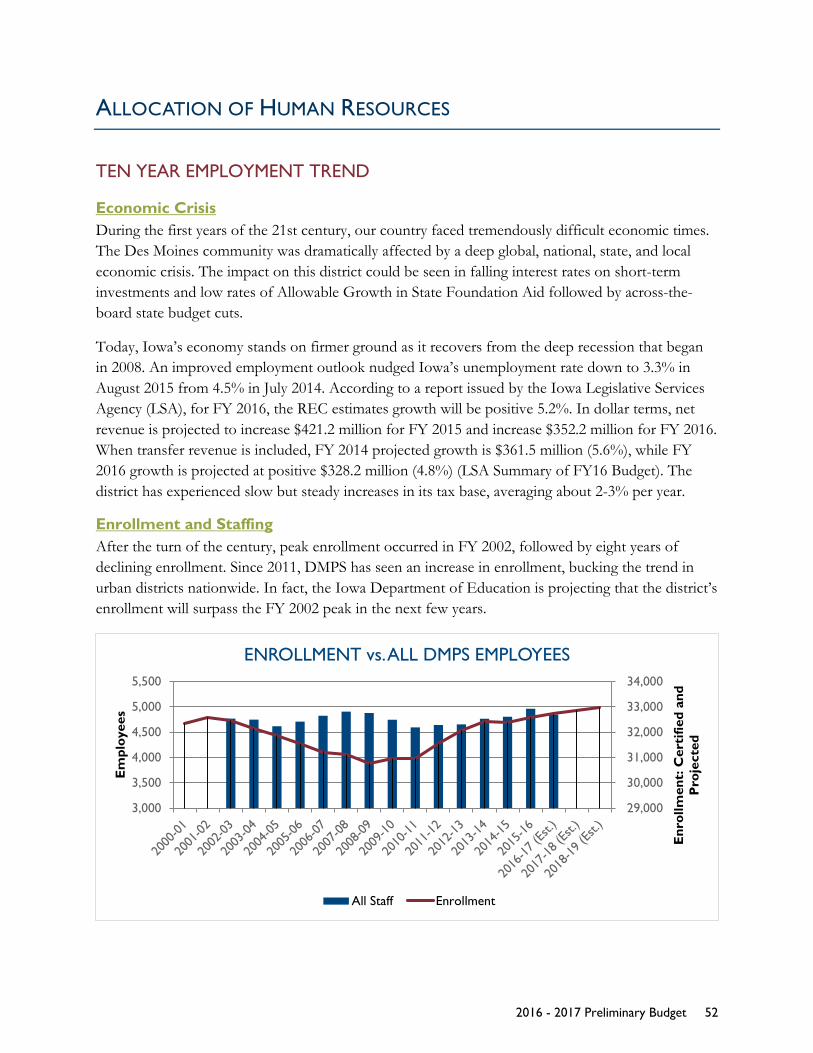
ALLOCATION OF HUMAN RESOURCES
TEN YEAR EMPLOYMENT TREND
Economic Crisis During the first years of the 21st century, our country faced tremendously difficult economic times. The Des Moines community was dramatically affected by a deep global, national, state, and local economic crisis. The impact on this district could be seen in falling interest rates on short-term investments and low rates of Allowable Growth in State Foundation Aid followed by across-the-board state budget cuts.
Today, Iowa’s economy stands on firmer ground as it recovers from the deep recession that began in 2008. An improved employment outlook nudged Iowa’s unemployment rate down to 3.3% in August 2015 from 4.5% in July 2014. According to a report issued by the Iowa Legislative Services Agency (LSA), for FY 2016, the REC estimates growth will be positive 5.2%. In dollar terms, net revenue is projected to increase $421.2 million for FY 2015 and increase $352.2 million for FY 2016. When transfer revenue is included, FY 2014 projected growth is $361.5 million (5.6%), while FY 2016 growth is projected at positive $328.2 million (4.8%) (LSA Summary of FY16 Budget). The district has experienced slow but steady increases in its tax base, averaging about 2-3% per year.
Enrollment and Staffing After the turn of the century, peak enrollment occurred in FY 2002, followed by eight years of declining enrollment. Since 2011, DMPS has seen an increase in enrollment, bucking the trend in urban districts nationwide. In fact, the Iowa Department of Education is projecting that the district’s enrollment will surpass the FY 2002 peak in the next few years.
29,000
30,000
31,000
32,000
33,000
34,000
3,000
3,500
4,000
4,500
5,000
5,500E
nrol
lmen
t: C
erti
fied
and
Pro
ject
ed
Em
ploy
ees
ENROLLMENT vs. ALL DMPS EMPLOYEES
All Staff Enrollment
2016 - 2017 Preliminary Budget 52
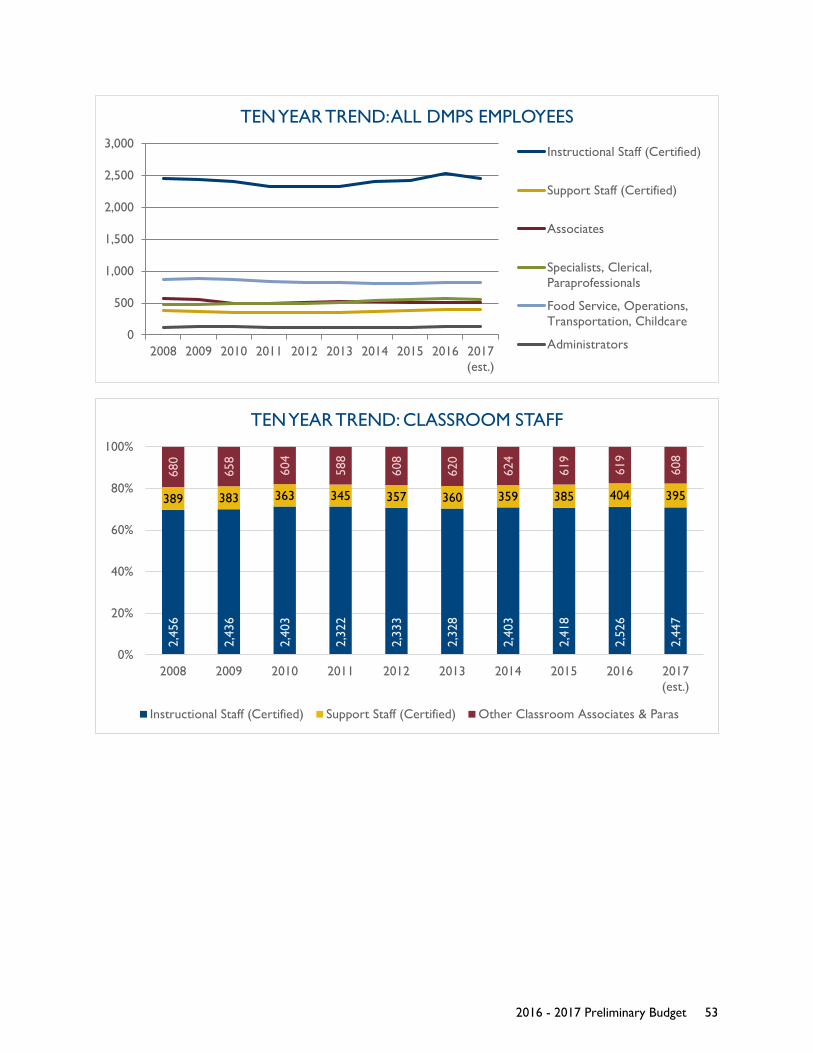
0
500
1,000
1,500
2,000
2,500
3,000
2008 2009 2010 2011 2012 2013 2014 2015 2016 2017(est.)
TEN YEAR TREND: ALL DMPS EMPLOYEES
Instructional Staff (Certified)
Support Staff (Certified)
Associates
Specialists, Clerical,Paraprofessionals
Food Service, Operations,Transportation, Childcare
Administrators
2,45
6
2,43
6
2,40
3
2,32
2
2,33
3
2,32
8
2,40
3
2,41
8
2,52
6
2,44
7
389 383 363 345 357 360 359 385 404 395
680
658
604
588
608
620
624
619
619
608
0%
20%
40%
60%
80%
100%
2008 2009 2010 2011 2012 2013 2014 2015 2016 2017(est.)
TEN YEAR TREND: CLASSROOM STAFF
Instructional Staff (Certified) Support Staff (Certified) Other Classroom Associates & Paras
2016 - 2017 Preliminary Budget 53
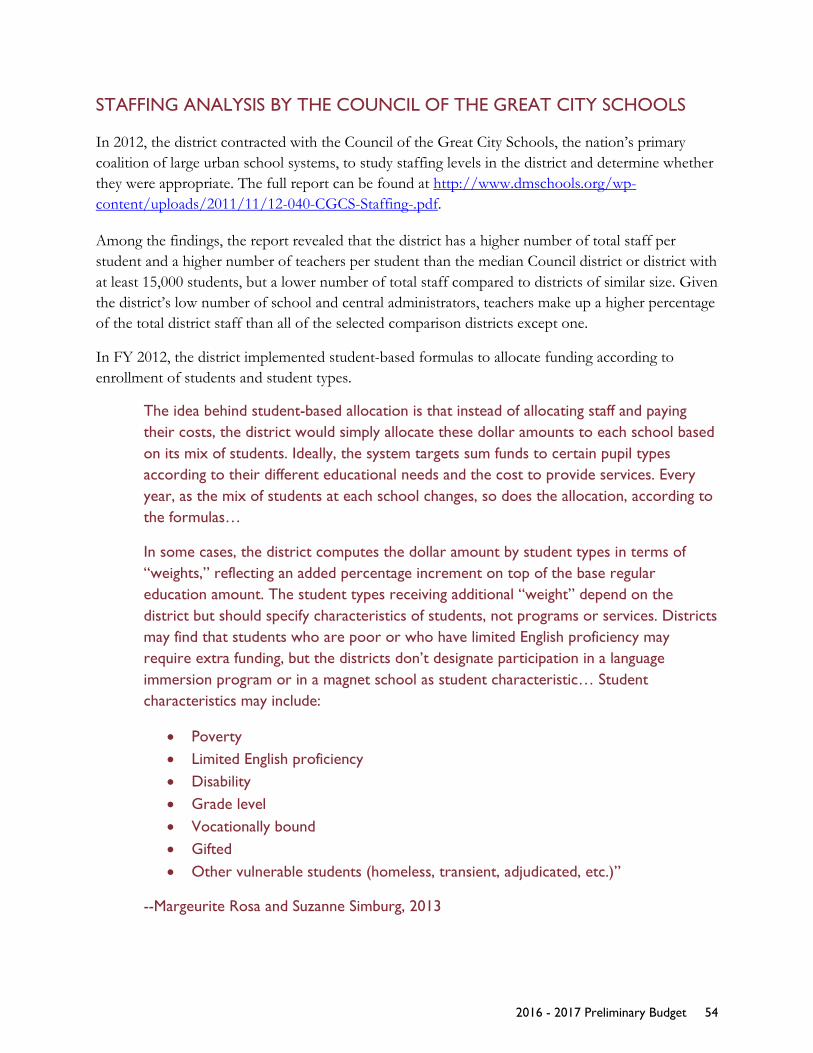
STAFFING ANALYSIS BY THE COUNCIL OF THE GREAT CITY SCHOOLS
In 2012, the district contracted with the Council of the Great City Schools, the nation’s primary coalition of large urban school systems, to study staffing levels in the district and determine whether they were appropriate. The full report can be found at http://www.dmschools.org/wp-content/uploads/2011/11/12-040-CGCS-Staffing-.pdf.
Among the findings, the report revealed that the district has a higher number of total staff per student and a higher number of teachers per student than the median Council district or district with at least 15,000 students, but a lower number of total staff compared to districts of similar size. Given the district’s low number of school and central administrators, teachers make up a higher percentage of the total district staff than all of the selected comparison districts except one.
In FY 2012, the district implemented student-based formulas to allocate funding according to enrollment of students and student types.
The idea behind student-based allocation is that instead of allocating staff and paying their costs, the district would simply allocate these dollar amounts to each school based on its mix of students. Ideally, the system targets sum funds to certain pupil types according to their different educational needs and the cost to provide services. Every year, as the mix of students at each school changes, so does the allocation, according to the formulas…
In some cases, the district computes the dollar amount by student types in terms of “weights,” reflecting an added percentage increment on top of the base regular education amount. The student types receiving additional “weight” depend on the district but should specify characteristics of students, not programs or services. Districts may find that students who are poor or who have limited English proficiency may require extra funding, but the districts don’t designate participation in a language immersion program or in a magnet school as student characteristic… Student characteristics may include:
• Poverty • Limited English proficiency • Disability • Grade level • Vocationally bound • Gifted • Other vulnerable students (homeless, transient, adjudicated, etc.)”
--Margeurite Rosa and Suzanne Simburg, 2013
2016 - 2017 Preliminary Budget 54
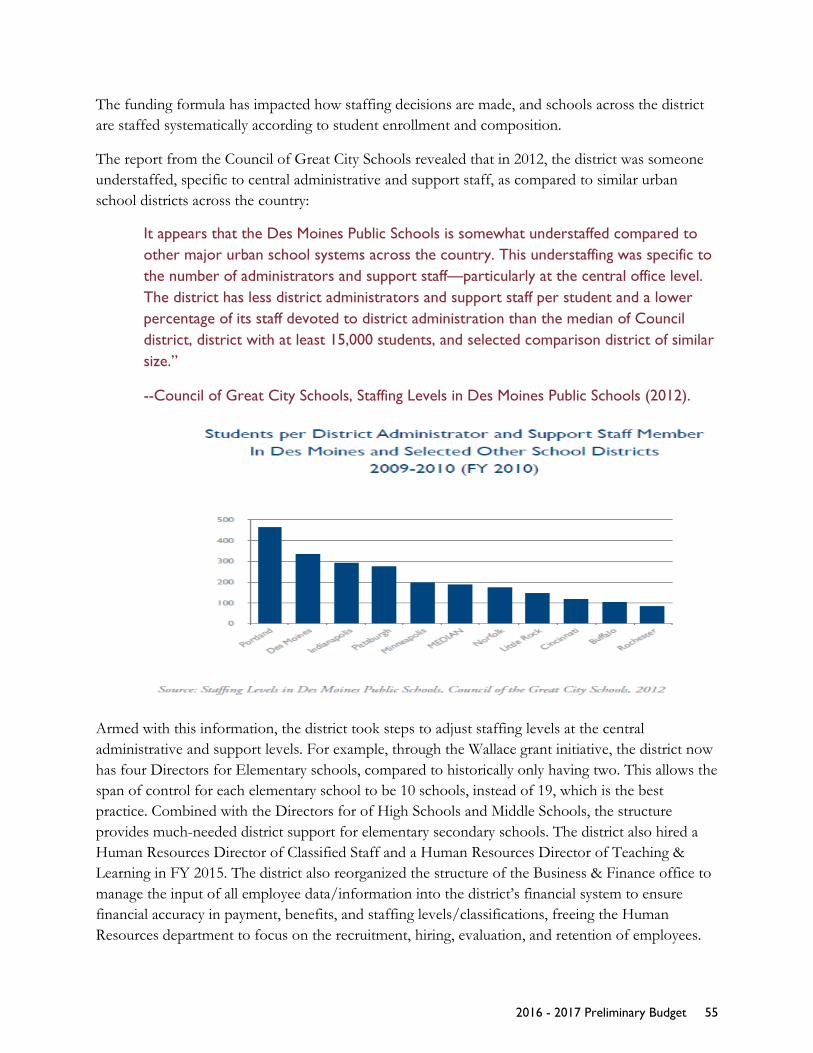
The funding formula has impacted how staffing decisions are made, and schools across the district are staffed systematically according to student enrollment and composition.
The report from the Council of Great City Schools revealed that in 2012, the district was someone understaffed, specific to central administrative and support staff, as compared to similar urban school districts across the country:
It appears that the Des Moines Public Schools is somewhat understaffed compared to other major urban school systems across the country. This understaffing was specific to the number of administrators and support staff—particularly at the central office level. The district has less district administrators and support staff per student and a lower percentage of its staff devoted to district administration than the median of Council district, district with at least 15,000 students, and selected comparison district of similar size.”
--Council of Great City Schools, Staffing Levels in Des Moines Public Schools (2012).
Armed with this information, the district took steps to adjust staffing levels at the central administrative and support levels. For example, through the Wallace grant initiative, the district now has four Directors for Elementary schools, compared to historically only having two. This allows the span of control for each elementary school to be 10 schools, instead of 19, which is the best practice. Combined with the Directors for of High Schools and Middle Schools, the structure provides much-needed district support for elementary secondary schools. The district also hired a Human Resources Director of Classified Staff and a Human Resources Director of Teaching & Learning in FY 2015. The district also reorganized the structure of the Business & Finance office to manage the input of all employee data/information into the district’s financial system to ensure financial accuracy in payment, benefits, and staffing levels/classifications, freeing the Human Resources department to focus on the recruitment, hiring, evaluation, and retention of employees.
2016 - 2017 Preliminary Budget 55

PERSONNEL: PAST YEAR, CURRENT YEAR, AND BUDGET YEAR
DMPS Employee Schedule 2015 2016 2017 (Est.) Administrators Central Office 37.0 39.0 39.0 Elementary Schools 37.0 38.0 38.0 Middle Schools 20.0 20.0 20.0 High Schools 20.0 24.0 24.0 Special Schools 9.0 5.0 5.0 Administrators 123.0 126.0 126.0 Instructional Staff (Certified) Classroom teachers 1,563.7 1,578.3 1,552.7 ELL 91.0 106.5 110.5 Head Start 14.0 14.0 14.0 Home Instruction 6.0 5.0 5.0 Preschool 34.0 34.0 34.0 Special Ed teachers 499.4 494.0 486.0 Title I, Rdg, Math, Instruct Coaches 208.9 287.9 242.1 Float 1.0 6.0 3.0 Instructional Staff (Certified) 2,418.0 2,525.7 2,447.3 Continued on next page
Administrators
InstructionalStaff
(Certified)
Support Staff(Certified) Associates
Specialists,Clerical,
Paraprofessionals
Food Service,Operations,
Transportation, Childcare
Total
2015 123.0 2,418.0 384.6 517.7 552.0 811.0 4,806.3
2016 126.0 2,525.7 403.7 515.4 563.8 827.5 4,962.1
2017 (est.) 126.0 2,447.3 395.1 504.2 549.1 827.5 4,849.2
0
1,000
2,000
3,000
4,000
5,000
6,000
ALL DMPS PERSONNEL: PAST YEAR, CURRENT YEAR & BUDGET YEAR
2016 - 2017 Preliminary Budget 56
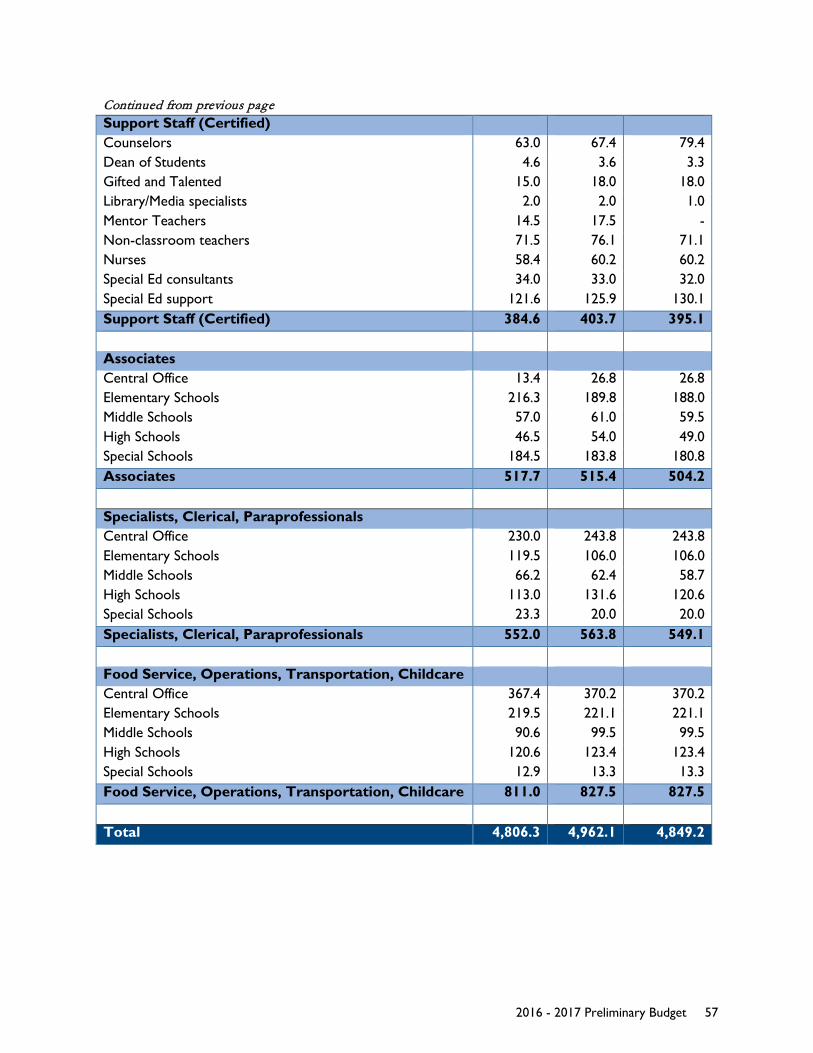
Continued from previous page Support Staff (Certified) Counselors 63.0 67.4 79.4 Dean of Students 4.6 3.6 3.3 Gifted and Talented 15.0 18.0 18.0 Library/Media specialists 2.0 2.0 1.0 Mentor Teachers 14.5 17.5 - Non-classroom teachers 71.5 76.1 71.1 Nurses 58.4 60.2 60.2 Special Ed consultants 34.0 33.0 32.0 Special Ed support 121.6 125.9 130.1 Support Staff (Certified) 384.6 403.7 395.1 Associates Central Office 13.4 26.8 26.8 Elementary Schools 216.3 189.8 188.0 Middle Schools 57.0 61.0 59.5 High Schools 46.5 54.0 49.0 Special Schools 184.5 183.8 180.8 Associates 517.7 515.4 504.2 Specialists, Clerical, Paraprofessionals Central Office 230.0 243.8 243.8 Elementary Schools 119.5 106.0 106.0 Middle Schools 66.2 62.4 58.7 High Schools 113.0 131.6 120.6 Special Schools 23.3 20.0 20.0 Specialists, Clerical, Paraprofessionals 552.0 563.8 549.1 Food Service, Operations, Transportation, Childcare Central Office 367.4 370.2 370.2 Elementary Schools 219.5 221.1 221.1 Middle Schools 90.6 99.5 99.5 High Schools 120.6 123.4 123.4 Special Schools 12.9 13.3 13.3 Food Service, Operations, Transportation, Childcare 811.0 827.5 827.5 Total 4,806.3 4,962.1 4,849.2
2016 - 2017 Preliminary Budget 57
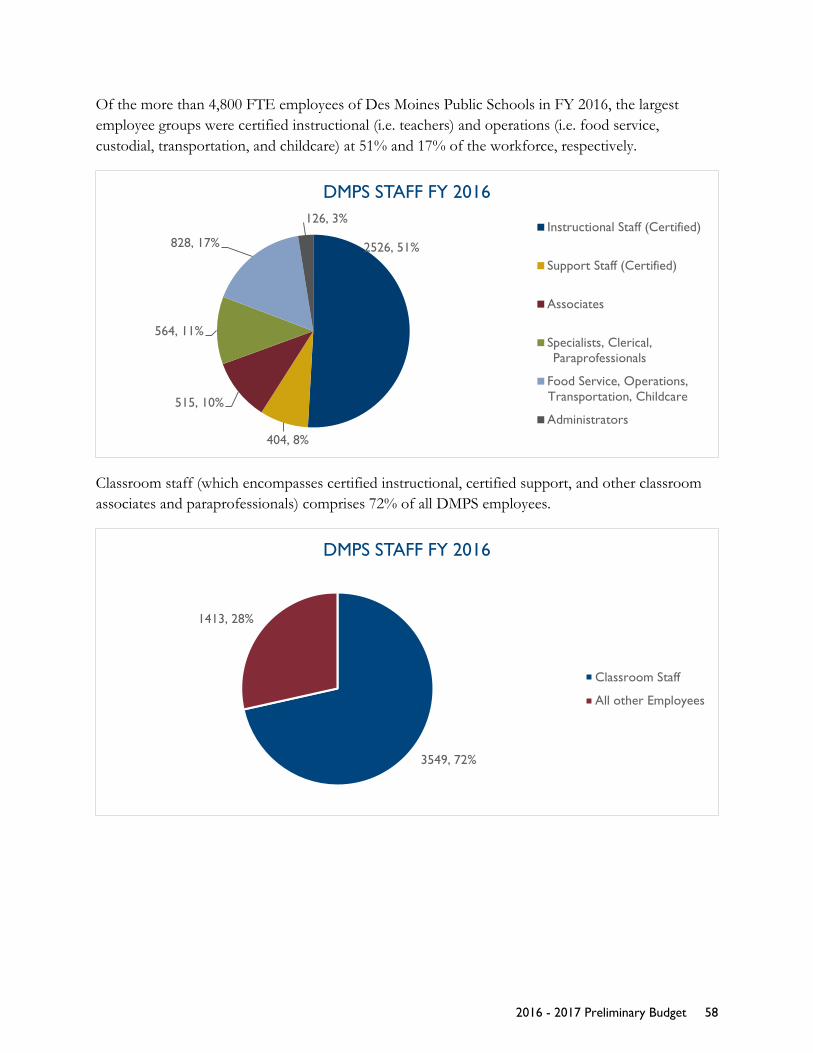
Of the more than 4,800 FTE employees of Des Moines Public Schools in FY 2016, the largest employee groups were certified instructional (i.e. teachers) and operations (i.e. food service, custodial, transportation, and childcare) at 51% and 17% of the workforce, respectively.
Classroom staff (which encompasses certified instructional, certified support, and other classroom associates and paraprofessionals) comprises 72% of all DMPS employees.
2526, 51%
404, 8%
515, 10%
564, 11%
828, 17%
126, 3%
DMPS STAFF FY 2016
Instructional Staff (Certified)
Support Staff (Certified)
Associates
Specialists, Clerical,Paraprofessionals
Food Service, Operations,Transportation, Childcare
Administrators
3549, 72%
1413, 28%
DMPS STAFF FY 2016
Classroom Staff
All other Employees
2016 - 2017 Preliminary Budget 58
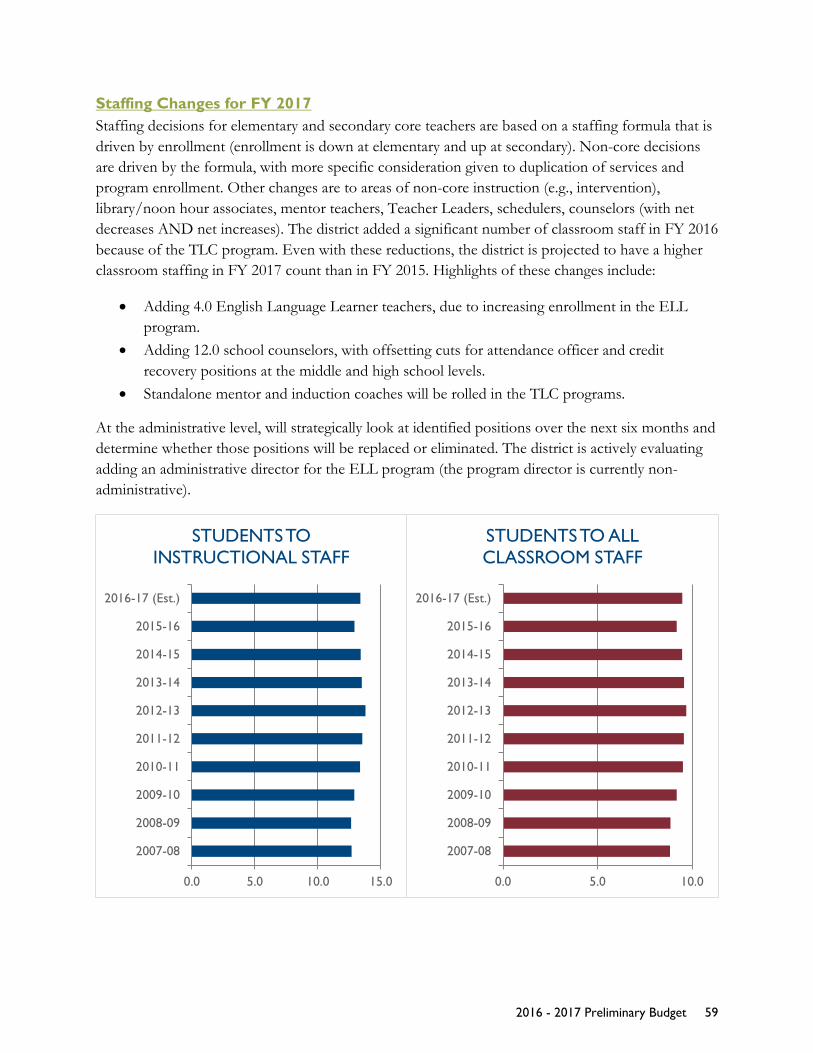
Staffing Changes for FY 2017 Staffing decisions for elementary and secondary core teachers are based on a staffing formula that is driven by enrollment (enrollment is down at elementary and up at secondary). Non-core decisions are driven by the formula, with more specific consideration given to duplication of services and program enrollment. Other changes are to areas of non-core instruction (e.g., intervention), library/noon hour associates, mentor teachers, Teacher Leaders, schedulers, counselors (with net decreases AND net increases). The district added a significant number of classroom staff in FY 2016 because of the TLC program. Even with these reductions, the district is projected to have a higher classroom staffing in FY 2017 count than in FY 2015. Highlights of these changes include:
• Adding 4.0 English Language Learner teachers, due to increasing enrollment in the ELL program.
• Adding 12.0 school counselors, with offsetting cuts for attendance officer and credit recovery positions at the middle and high school levels.
• Standalone mentor and induction coaches will be rolled in the TLC programs.
At the administrative level, will strategically look at identified positions over the next six months and determine whether those positions will be replaced or eliminated. The district is actively evaluating adding an administrative director for the ELL program (the program director is currently non-administrative).
0.0 5.0 10.0 15.0
2007-08
2008-09
2009-10
2010-11
2011-12
2012-13
2013-14
2014-15
2015-16
2016-17 (Est.)
STUDENTS TO INSTRUCTIONAL STAFF
0.0 5.0 10.0
2007-08
2008-09
2009-10
2010-11
2011-12
2012-13
2013-14
2014-15
2015-16
2016-17 (Est.)
STUDENTS TO ALL CLASSROOM STAFF
2016 - 2017 Preliminary Budget 59
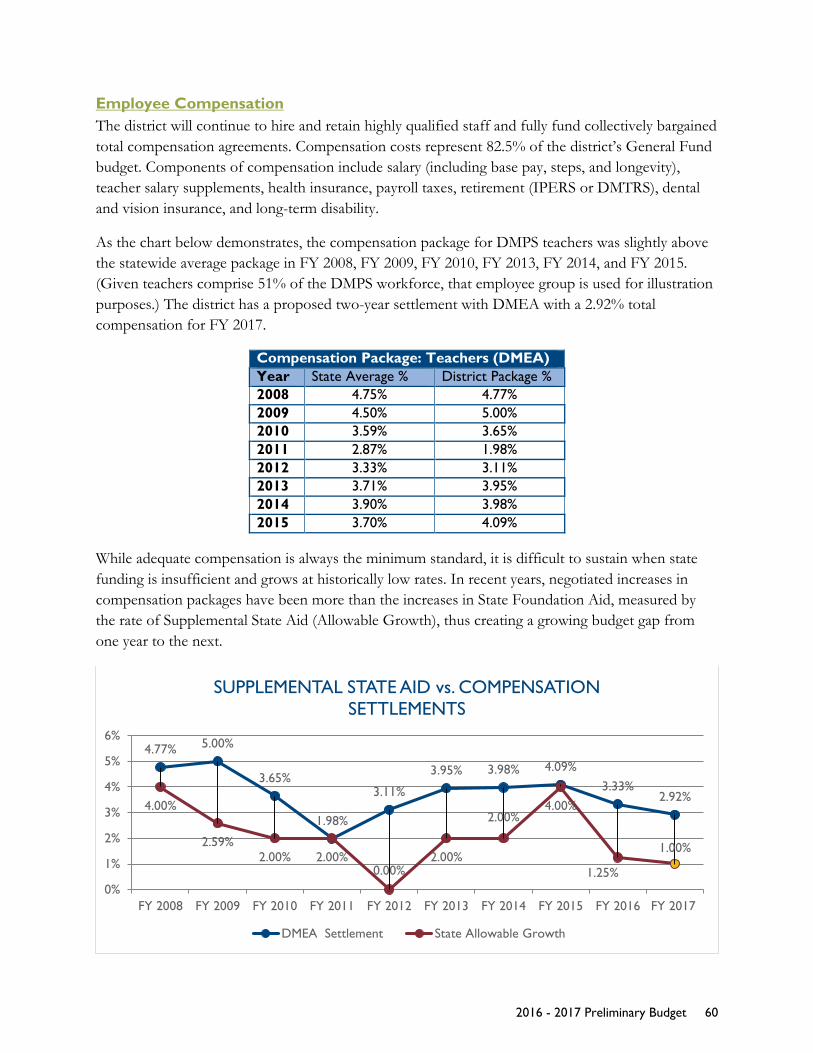
Employee Compensation The district will continue to hire and retain highly qualified staff and fully fund collectively bargained total compensation agreements. Compensation costs represent 82.5% of the district’s General Fund budget. Components of compensation include salary (including base pay, steps, and longevity), teacher salary supplements, health insurance, payroll taxes, retirement (IPERS or DMTRS), dental and vision insurance, and long-term disability.
As the chart below demonstrates, the compensation package for DMPS teachers was slightly above the statewide average package in FY 2008, FY 2009, FY 2010, FY 2013, FY 2014, and FY 2015. (Given teachers comprise 51% of the DMPS workforce, that employee group is used for illustration purposes.) The district has a proposed two-year settlement with DMEA with a 2.92% total compensation for FY 2017.
Compensation Package: Teachers (DMEA) Year State Average % District Package % 2008 4.75% 4.77% 2009 4.50% 5.00% 2010 3.59% 3.65% 2011 2.87% 1.98% 2012 3.33% 3.11% 2013 3.71% 3.95% 2014 3.90% 3.98% 2015 3.70% 4.09%
While adequate compensation is always the minimum standard, it is difficult to sustain when state funding is insufficient and grows at historically low rates. In recent years, negotiated increases in compensation packages have been more than the increases in State Foundation Aid, measured by the rate of Supplemental State Aid (Allowable Growth), thus creating a growing budget gap from one year to the next.
4.77% 5.00%
3.65%
1.98%
3.11%
3.95% 3.98% 4.09%3.33%
2.92%4.00%
2.59%2.00% 2.00%
0.00%2.00%
2.00%4.00%
1.25%
1.00%
0%
1%
2%
3%
4%
5%
6%
FY 2008 FY 2009 FY 2010 FY 2011 FY 2012 FY 2013 FY 2014 FY 2015 FY 2016 FY 2017
SUPPLEMENTAL STATE AID vs. COMPENSATION SETTLEMENTS
DMEA Settlement State Allowable Growth
2016 - 2017 Preliminary Budget 60
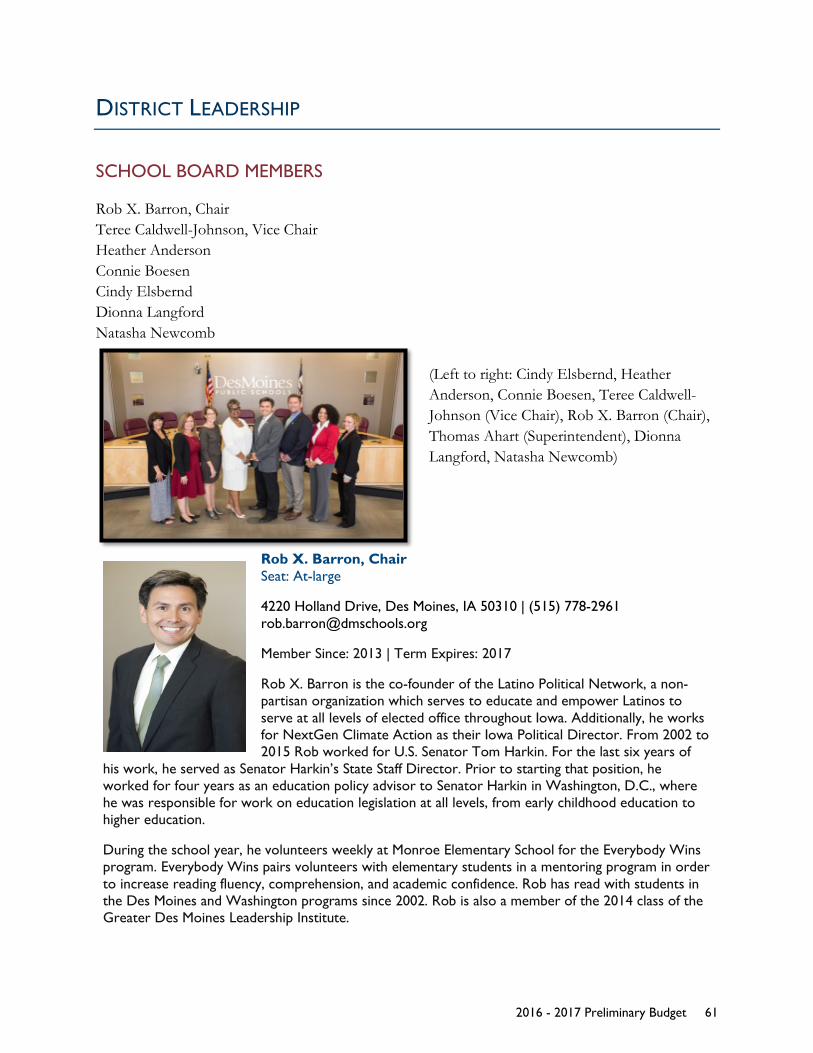
DISTRICT LEADERSHIP
SCHOOL BOARD MEMBERS
Rob X. Barron, Chair Teree Caldwell-Johnson, Vice Chair Heather Anderson Connie Boesen Cindy Elsbernd Dionna Langford Natasha Newcomb
(Left to right: Cindy Elsbernd, Heather Anderson, Connie Boesen, Teree Caldwell-Johnson (Vice Chair), Rob X. Barron (Chair), Thomas Ahart (Superintendent), Dionna Langford, Natasha Newcomb)
Rob X. Barron, Chair Seat: At-large
4220 Holland Drive, Des Moines, IA 50310 | (515) 778-2961 [email protected]
Member Since: 2013 | Term Expires: 2017
Rob X. Barron is the co-founder of the Latino Political Network, a non-partisan organization which serves to educate and empower Latinos to serve at all levels of elected office throughout Iowa. Additionally, he works for NextGen Climate Action as their Iowa Political Director. From 2002 to 2015 Rob worked for U.S. Senator Tom Harkin. For the last six years of
his work, he served as Senator Harkin’s State Staff Director. Prior to starting that position, he worked for four years as an education policy advisor to Senator Harkin in Washington, D.C., where he was responsible for work on education legislation at all levels, from early childhood education to higher education.
During the school year, he volunteers weekly at Monroe Elementary School for the Everybody Wins program. Everybody Wins pairs volunteers with elementary students in a mentoring program in order to increase reading fluency, comprehension, and academic confidence. Rob has read with students in the Des Moines and Washington programs since 2002. Rob is also a member of the 2014 class of the Greater Des Moines Leadership Institute.
2016 - 2017 Preliminary Budget 61

Rob is a Des Moines native. He and his wife Angela, an elementary art educator in Ankeny live in the Beaverdale neighborhood with their son, Javy. Rob is a graduate of Des Moines Roosevelt High School and Grinnell College. He also attended Hanawalt Elementary School, Merrill Middle School, Central Academy, and Lincoln High School. Rob received his B.A. in Political Science from Grinnell College.
Teree Caldwell-Johnson, Vice Chair Seat: District Four
3907 SW 29th Street, Des Moines, IA 50321 | (515) 287-3123 [email protected]
Member Since: 2006 | Term Expires: 2017
Teree Caldwell-Johnson serves as the CEO of Oakridge Neighborhood and Oakridge Neighborhood Services a housing and humans services non-profit agency located in Des Moines, IA. Prior to assuming her position at Oakridge, Teree held progressively responsible positions in local government across the country most recently serving as Polk County
Manager from 1996-2003. Active in the community, Teree serves on several non-profit boards including, University of Kansas College of Liberal Arts and Sciences Advisory Board, Mid-Iowa Health Foundation, Greater Des Moines Community Foundation and I’ll Make Me A World in Iowa. In addition, Teree is a member of Alpha Kappa Alpha Sorority Incorporated, Jack and Jill of America and The Links, Incorporated where she serves on the National Executive Council and the National Foundation Board in her capacity as Director of Philanthropy.
Teree holds a B.A. in English from Spelman College in Atlanta, GA and an MPA from the University of Kansas in Lawrence, KS. She has also completed post-graduate studies at Bucknell University in Lewisburg, PA. Teree and her husband Vernon, a retired non-profit executive, are the parents of two children, Baley and Baxtyr.
Heather Anderson Seat: District One
4114 Lincoln Place Drive, Des Moines, IA 50312 | (515) 783-8983 [email protected]
Member Since: 2015 | Term Expires: 2019
Heather Anderson teaches 2nd grade at Walnut Hills Elementary School, which is part of the Waukee Community School District. Previously she taught at Cowles Montessori School in Windsor Heights, a Des Moines Public School. At Cowles, she was instrumental in developing an extensive after school program. Programming at Cowles truly followed the child and
throughout the years students were exposed to an array of opportunities such as a running club, science clubs, foreign languages (French, Spanish, Arabic), yoga, drama, cribbage, chess, mock trial, student council, and computer programming to name a few. She worked with the teachers, parents, and community members to offer students opportunities to learn both inside and outside of the classroom. Heather collaborated with the city of Windsor Heights, the school district, community members, teachers, parents, students, organizations, and local businesses to offer the first ever 5K Run/walk in the district. She also established a school-wide science fair and environmental day. She
2016 - 2017 Preliminary Budget 62

wrote and received over 20 grants for the school that provided funding to renovate the greenhouse by adding solar energy, resources/materials for teachers and students, professional development for teachers and staff, and most importantly increased hands-on, real-life learning opportunities for students. Heather formed a partnership with a very dedicated parent at Cowles, together they wrote grants to implement school gardens and offer many “Healthy” events and activities for the families of Cowles. Due to these efforts in 2010, Cowles became a Farm to School Chapter through the Iowa Department of Agriculture. She worked with local organizations to donate any extra produce from the gardens and established partnerships with local universities.
In 2013, Heather Anderson was one of five finalists for the Iowa Teacher of the Year. That same year she also was the recipient of the Izaak Walton League of Iowa Teacher of the Year. The following year, Heather was honored to receive the 2014 ISEA Excellence in Education Award. She also received “Outstanding Volunteer Award” from the Iowa Urban Tree Council along with one of her fellow teachers at Cowles in honor of their environmental projects involving the whole Cowles community. 2015 brought Heather another honor she was the recipient of the NEA Foundation Awards for Teaching Excellence. During the summer of 2015 as a NEAF Global Learning Fellow, she traveled to Peru representing all of the teachers of Iowa. She was able to tour an IB school and rural schools in Peru. Meet with the teachers, students, and families of Peru. Heather is a currently sits on the boards of the Iowa Conservation Education Coalition (ICEC), Cherry Glen Learning Farms and is a member of the Greater Des Moines Botanical Garden’s Students & Teachers Advisory Committee. She is a founding member of the Iowa Department of Education’s Iowa Outstanding Educators Advisory Council and last year was a presenter at the first annual Emerging Educators Academy a daylong conference offered to pre-service teachers as well as to 1st and 2nd year teachers. Heather is a life-long resident of Des Moines and a product of DMPS herself, her husband teaches at Hoover high school, and she currently has five children enrolled at Roosevelt High School.
She earned a BA in Elementary Education from Upper Iowa University, a MA from Viterbo University, and holds credentials from the American Montessori Society and the Iowa Montessori Center.
Connie Boesen Seat: At-large
3011 Don Lee Court, Des Moines, IA 50317 | (515) 266-7063 [email protected]
Member Since: 2003 | Term Expires: 2017
Connie Boesen works for Polk County and also is the owner of Applishus, Inc., a concession business. Her extensive involvement with Des Moines Public Schools includes serving as president/chair of the School Board for three years, past-president of the Council of Des Moines PTAs, past- president of the East High School PTA, Co-Chair and treasurer of the
Schools First Local Option Sales Tax campaign. She has served on the boards of Des Moines Public Library, Blank Park Zoo, United Way of Central Iowa and Early Childhood Iowa. Connie is currently on the United Way of Central Iowa Education Committee.
Connie graduated from East High School and attended DMACC and Grand View College. She is married to Ted Boesen, Jr. and has two daughters who graduated from East High as well as four stepchildren.
2016 - 2017 Preliminary Budget 63

Cindy Elsbernd Seat: At-large
659 46th Street, Des Moines, IA 50312 | (515) 771-1140 [email protected]
Member Since: 2011 | Term Expires: 2019
Cindy Elsbernd was born in Decorah, Iowa and is a graduate of the University of Northern Iowa. She has lived in Des Moines since 1993.
Cindy and her husband, Ryan, have two sons: Sam and Lars
Cindy is the director a non-profit organization in Des Moines called Iowa Kidstrong, Inc., which she founded in February, 2005 with a mission to promote healthy, active lifestyles to youth. Over the last several years, 22 Des Moin. es Public elementary schools as well as other schools in surrounding areas have participated in Iowa Kidstrong’s KidStriders program. Elsbernd has also launched several other programs through the organization to encourage students to get and stay active, including a marathon training program for high school youth called See-Us Run Des Moines. In September 2010, Cindy was awarded the 2010 Healthy Iowa Visionary Award presented by the Academy for a Healthy Iowa – a collaboration between the Iowa Department of Public Health, Governor’s Council on Physical Fitness and Nutrition, and Wellness Council of Iowa.
Dionna Langford Seat: District Two
743 19th Street, #9, Des Moines, IA 50314 | (515) 339-0456 [email protected]
Member Since: 2015 | Term Expires: 2017
Dionna Langford is a native of Des Moines and a graduate of East High School. She went on to the University of Iowa and received a Bachelor’s degree in Social Work, with a certificate in Critical Cultural Competence. In the past, she has served as a Project Organizer with AMOS (A-Mid Iowa Organizing Strategy) and as a Business and Employer Relations
Coordinator at the Evelyn K. Davis Center for Working Families. In her role at the center, Dionna worked to establish critical partnerships with our business community in order to connect job seekers with companies in need of skilled workers. Currently, she works for the Work Readiness Program at Children and Families of Iowa. In her role, she serves as an advocate helping young adults 16-24 create action plans to achieve their educational and vocational goals.
2016 - 2017 Preliminary Budget 64
Natasha Newcomb Seat: District Three
4024 Hubbell Ave., #234, Des Moines, IA 50317 | (515) 661-4032 [email protected]
Member Since: 2015 | Term Expires: 2019
Natasha, along with her son, moved to Des Moines in January of 2007. Her background includes more than eight years of experience working for state, local and national candidates, issue campaigns and unions. In addition to her career in public service and politics, Natasha obtained her Juris
Doctor from Drake Law School with certificates in legislative practice and public service and holds a Bachelor of Arts degree in political science with a concentration in political processes and a minor in sociology. Currently, Natasha serves on two boards for the City of Des Moines, the Neighborhood Revitalization Board and the Housing Services Board. She has been a Neighborhood Revitalization board member since 2012. In 2013, the Mayor appointed Natasha to the Housing Services Board. She is currently serving as the chair pro tem. In March of 2015, she was elected to serve on the board of directors of the Multicultural Educational Programs, Inc. (MEP). MEP is committed to empowering underrepresented groups by providing educational opportunities. In her free time, Natasha volunteers for Care for Camps, an organization that delivers food, clothing and other necessities to the homeless communities around Des Moines. Additionally, from 2008 to 2011, Natasha sat on the board of directors for The Homestead, a nonprofit dedicated to assisting adults and children with autism.
FIRST-LEVEL ADMINISTRATIVE PERSONNEL
Dr. Thomas Ahart, Superintendent Brenda Edmundson Colby, Chief Academic Officer (interim) Bill Good, Chief Operations Officer Thomas Harper, Chief Financial Officer Matt Smith, Chief Schools Officer Dr. Anne Sullivan, Chief Human Resources Officer
2016 - 2017 Preliminary Budget 65
FINANCIAL STRUCTURE, POLICY, AND PROCESS
P R E L I M I N A RY B U D G E T 2 0 1 6 - 1 7
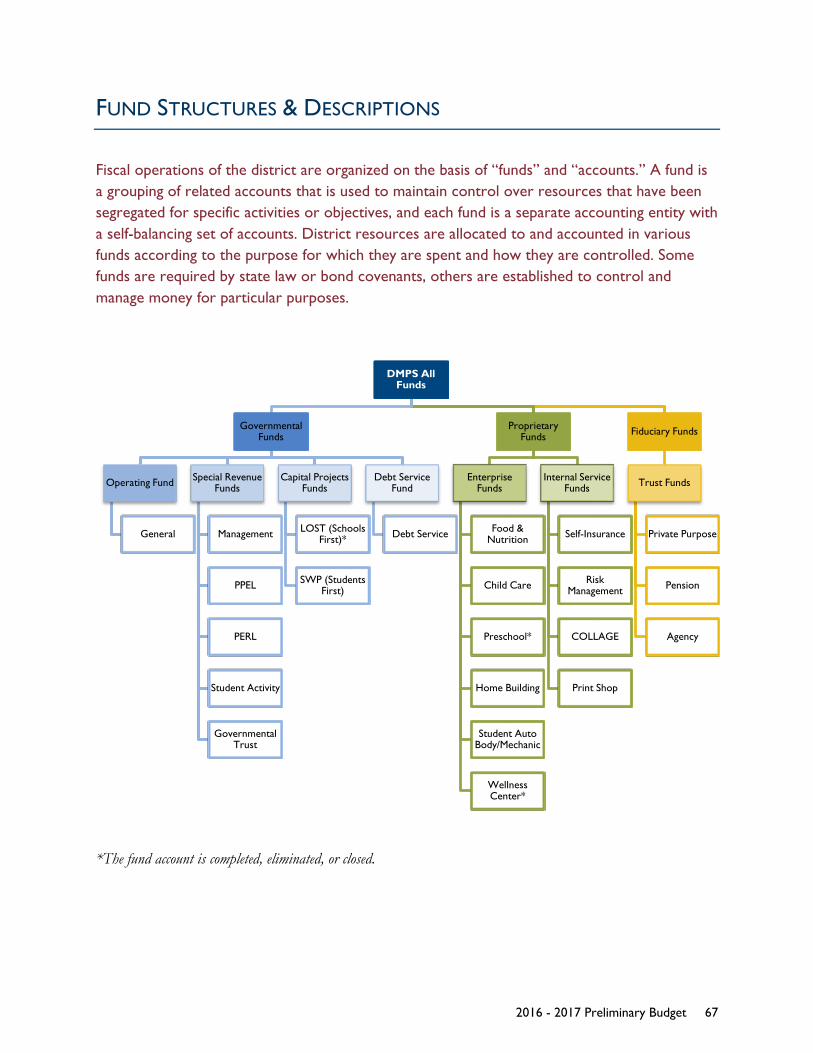
FUND STRUCTURES & DESCRIPTIONS
Fiscal operations of the district are organized on the basis of “funds” and “accounts.” A fund is a grouping of related accounts that is used to maintain control over resources that have been segregated for specific activities or objectives, and each fund is a separate accounting entity with a self-balancing set of accounts. District resources are allocated to and accounted in various funds according to the purpose for which they are spent and how they are controlled. Some funds are required by state law or bond covenants, others are established to control and manage money for particular purposes.
*The fund account is completed, eliminated, or closed.
DMPS All Funds
Governmental Funds
Operating Fund
General
Special Revenue Funds
Management
PPEL
PERL
Student Activity
Governmental Trust
Capital Projects Funds
LOST (Schools First)*
SWP (Students First)
Debt Service Fund
Debt Service
Proprietary Funds
Enterprise Funds
Food & Nutrition
Child Care
Preschool*
Home Building
Student Auto Body/Mechanic
Wellness Center*
Internal Service Funds
Self-Insurance
Risk Management
COLLAGE
Print Shop
Fiduciary Funds
Trust Funds
Private Purpose
Pension
Agency
2016 - 2017 Preliminary Budget 67
All of the district’s funds are divided into one of three categories: I) Governmental, II) Proprietary, and III) Fiduciary.
I) GOVERNMENTAL FUNDS Governmental Funds account for activities typically associated with government operations. Property taxes and intergovernmental revenues, such as State Aid and federal funding, primarily support Governmental Funds. Expenditures are classified by function such as instruction, support services, operation and maintenance of plant, student transportation, operation of non-instructional services, and capital construction. The four fund types in the Governmental Fund category are:
A) The Operating Fund (i.e., General Fund) accounts for day-to-day operations of schools and is the general operating fund of the district. It is funded primarily by state funds, federal funds, and local revenues, including property taxes.
B) Special Revenue Funds account for and report the proceeds of specific revenue sources (other than Capital Projects or Debt Service) that are legally restricted or committed to expenditures for specified purposes.
C) Capital Projects Funds account for all revenues and expenditures generated through the collection of local option sales taxes and expenditures attributed to the Schools First or Students First renovation programs.
D) The Debt Service Fund accounts for all aspects of the incurrence and repayment of general long-term debt.
II) PROPRIETARY FUNDS Proprietary Funds account for activities similar to those found in the private sector where the intent of the governing body is to finance the full cost of providing services primarily through user charges. As described below, there are two fund types in the Proprietary Fund category:
A) Enterprise Funds account for operations that are financed and operated in a manner similar to private business enterprises or where the intent of the district is to finance or recover, primarily through user fees, the costs of goods or services on a continuing basis or where the district has determined that the revenue earned, cost incurred, and/or net income is necessary for management accountability.
B) Internal Service Funds account for business-like activities where related goods or services are provided by one district department to other district departments on a cost reimbursement basis.
III) FIDUCIARY FUNDS Fiduciary Funds account for assets held by the district in a trustee capacity or as an agent for individuals, private organizations, other governments, or other funds. They provide information about the financial relationships in which the district acts solely as a trustee or agent for the benefit of others.
2016 - 2017 Preliminary Budget 68
A) Trust or Agent Funds held by the district (e.g. Private-Purpose Trust, Pension Trust, and Agency Funds), while included in the budget book, are appropriated and, therefore, are not part of the total budget.
Within the three fund categories and the various fund types, the district maintains the following fund accounts:
I) GOVERNMENTAL FUNDS A) Operating Fund:
1. General Fund – The General Fund is the largest fund in the district. It is used to account for and report all financial resources not accounted for and reported in another fund.
B) Special Revenue Funds: 1. Management Fund – The Management Fund is authorized by Iowa Code Section 298.4. The Management Fund receives monies from a tax levy approved by the Board for the purpose of covering the costs of property and liability insurance, equipment breakdown insurance, unemployment, early retirement incentives, workers’ compensation claims, and judgments. Given the district’s re-evaluation of the early retirement program, the district intends to lower the tax rate in the Management fund to reflect this cost reduction.
2. Physical, Plant, and Equipment Levy Fund (PPEL) – PPEL is authorized by Iowa Code 298.2. Revenue is primarily generated from voter- and Board-approved property tax levies. PPEL will continue at the same rate as in past years. The voter portion of the PPEL levy was renewed by voters in September of 2010 for ten years. The PPEL Fund accounts for transactions related to the improvement of facilities and grounds, construction of schools, certain equipment expenditures, and other expenditures authorized in Iowa Code 298.3. PPEL is used for purposes such as energy improvements, payment of energy and QZAB notes, building repairs and improvements, musical instruments, ADA compliance, security upgrades, property acquisition, buses, abatement of hazardous materials, emergency repairs, telecommunications equipment, technology, and purchases of vehicles and other large equipment.
3. Public Education and Recreation Levy Fund (PERL) – PERL is authorized by Iowa Code 300.2. Revenue is primarily generated through a voter-approved property tax levy and community education fees. The PERL levy will continue at the same rate as in past years. The PERL Fund accounts for transactions related to school playgrounds and recreational activities within the district, including Community Education programming. These funds also pay for a portion of district activity directors’ compensation, certain middle school intramural athletic programs, and City of Des Moines summer recreation programs.
4. Student Activity Fund – The Student Activity Fund accounts for transactions that occur due to school-sponsored, student-related co-curricular and extra-curricular activities. For example, money received from admission fees for events such as athletic events, drama
2016 - 2017 Preliminary Budget 69
productions, yearbook purchases, student fundraising, and other student-related activities are accounted for in this fund. Expenditures from this fund must directly benefit students.
5. Governmental Trust Funds – Governmental Trust Funds can be used for general district purposes, unless otherwise stipulated by the trust. Within these funds, Expendable Trust Funds account for transactions that are received in trust in which both the principal and interest earned can be used to support the district, while Permanent Trust Funds account for transactions that are received in trust in which only the interest earned, and not the principal itself, can be used to support the district.
C) Capital Projects Funds: 1. Local Option Sales Tax: LOST (Schools First) – LOST accounted for monies received from a local option sales tax for school infrastructure. In 1999, the voters of Polk County approved a one cent local option sales tax to fund infrastructure needs of schools. In 2007, the district issued revenue bonds to get ahead of escalating construction costs, which allowed the district to maintain optimum timing of projects and to bridge the gap between the more aggressive construction schedule and receipt of taxes. When interest rates came down, the district paid off the revenue bonds early, thus avoiding future interest costs on the debt. The final LOST-funded projects were completed and paid out in FY 2013, and the fund has had no activity since July 1, 2013.
2. Statewide Penny: SWP (Students First) – SWP accounts for monies received from a statewide sales tax for school infrastructure. In 2009, voters approved a Revenue Purpose Statement to enable the district to use its portion of a statewide one cent sales tax for school renovation. As outlined in the Revenue Purpose Statement, Students First projects focus on:
• Safety and security • Replacement of obsolete, inefficient, or worn-out equipment or systems • Money saving strategies • Improvements to buildings which were not targeted with Schools First revenues • Technology infrastructure upgrades • Air conditioning classrooms • Improvements to enhance research-based student achievement • Changing program needs
The district began receiving revenue from the statewide penny for school renovation in FY 2011 and has been completing projects outlined in the first five-year plan. In July 2014, the Superintendent’s Facility Advisory Committee recommended, and the School Board adopted, a new five-year plan with a ten-year vision for facilities improvements.
To minimize inflationary increases, the Board approved the sale of $70 million in Revenue Bonds in 2010; the sale of a second round of bonds for $71.9 million in March 2012; and the sale of a third round of bonds for $70 million in FY 2014. In December 2013, the district
2016 - 2017 Preliminary Budget 70
sold $8.78 million in bank-qualified bonds; an additional round of non-bank qualified bonds were sold in May 2014 for $61.9 million. Bond proceeds will be used on the priorities outlined above at schools throughout the district.
D) Debt Service Fund: 1. Debt Service Fund – The Debt Service Fund accounts for and reports financial resources that are restricted, committed, or assigned to the expenditure of principal and interest. On March 1, 2010, the district received proceeds from the sale of the first round of $70 million in Revenue Bonds. Beginning in December 2010 and continuing through June 2029, principal and interest payments will be made on these Revenue Bonds. The district received $71.9 million in proceeds from the sale of a second round of Revenue Bonds on May 8, 2012. Principal and interest payments will be made on the second round of Revenue Bonds beginning in December 2012 and will continue through June 2029. The district received $8.78 million in proceeds from the sale of the third round (part a) of Revenue Bonds on December 30, 2013. Principal and interest payments will be made on the third round of Revenue Bonds beginning in June 2014 and will continue through June 2029. The District received $61.9 million in proceeds from the sale of the third round (part b) of Revenue Bonds on May 1, 2014. Principal and interest payments began in December 2014 and continue through June 2029. As required by law, funds will be transferred from the PPEL and the Statewide Penny funds to the Debt Service Fund to make principal and interest payments on the district’s notes and bonds as they come due.
II) PROPRIETARY FUNDS A) Enterprise Funds:
1. Food and Nutrition Fund – The Food and Nutrition Fund accounts for transactions related to the school lunch, breakfast, and summer food programs authorized by Iowa Code 283A. Funding for these programs is provided by student sales and state and federal reimbursement through the operation of the National School Lunch Program. These funds are used to pay for personnel, food, supplies, and equipment purchase and repair.
2. Child Care Fund – The Child Care Fund accounts for transactions for before-school, after-school, and summer child care programs authorized by Iowa Code 298A.12 and 279.49. The district provides before-school, after-school, and summer child care at various sites throughout the district through the Metro Kids program. Revenue is generated from fees, and the funds are primarily used to pay for staff.
2.b. Preschool Fund – The Preschool Fund accounted for transactions for preschool programs with an instructional component for children who had not yet met the age requirement for school-aged education prior to FY 2008. Since FY 2008, the state has provided free preschool to four year olds through the Universal Preschool program. As required by the state, Universal Preschool is accounted for in the General Fund. Previously, both the before- and after-school child care program and the preschool program were accounted for in the district’s Child Care Fund. In FY 2014, the district
2016 - 2017 Preliminary Budget 71
eliminated the Preschool Fund through a permanent General Fund transfer with the approval of the district School Board and the state School Budget Review Committee.
3. Home Building Fund – The Home Building Fund accounts for transactions for home building activities performed by students as part of an instructional Career and Technical Education (CTE) program. Students in the Home Building program receive hands-on training in the construction of residential homes. This fund also accounts for the sale of homes constructed in the program. Proceeds from the sale of completed houses finance the program. The students are currently working on completing another home. Once it is complete, it will be made available for sale to the general public. The expectation is the home will be completed and sold in FY16.
4. Student Auto Body/Mechanic Fund – The Student Auto Body/Mechanic Fund accounts for transactions related to the service and repair of automobiles performed by students as part of an instructional Career and Technical Education (CTE) program. Students in the Auto Body/Mechanic program receive hands-on training in the repair and maintenance of automobiles. District employees and other community members allow students to work on damaged vehicles and perform regular service work on cars and trucks for a fee. These fees support and sustain the program.
5. Wellness Center Fund – The Wellness Center Fund accounted for fees charged to members and costs associated with managing the Wellness Center. The Wellness Center exercise facility at Central Campus closed on October 1, 2012, and the pool closed on June 30, 2013. The final Wellness Center projects were concluded and the District is determining the proper way to utilize these funds going forward. The fund has had no activity since July 1, 2013.
B) Internal Service Funds: 1. Self-Insurance Fund – The Self-Insurance Fund accounts for the district’s self-insured medical plans including regular health, vision, and dental. This fund is supported by premiums charged to other funds based on employee payroll assignments. Medical, vision, and dental claims are paid in full from this fund.
2. Risk Management Fund – The Risk Management Fund accounts for the district’s premium-based insurance plans including life and long-term disability insurance. The fund is supported by premiums charged to other funds based on employee payroll assignments. Premiums are then paid from the fund to the life and long-term disability insurance carriers.
3. Print Shop Fund – The Print Shop Fund accounts for activities related to centralized printing operations of the district. Schools and departments use the Print Shop for large and complex print jobs and are charged a competitive rate for printing services. Fees are charged based on the services performed. Expenses include staffing, equipment, and costs of inventory items.
2016 - 2017 Preliminary Budget 72
4. COLLAGE Fund – The COLLAGE Fund accounts for transactions related to materials and services provided by COLLAGE. COLLAGE offers services such as lamination and artistic edging and supplies such as construction paper and poster boards. Teachers are the main consumers of these services and products, although COLLAGE is open to other staff and the public. Fees are charged based on the services performed or products purchased. Expenses include staffing, equipment, and costs of inventory items.
III) FIDUCIARY FUNDS A) Trust or Agent Funds:
1. Private-Purpose Trust Funds – Private-Purpose Trust Funds account for transactions that are received in trust and are expended based on the donors’ wishes and designations. Most of the funds are designated for student scholarships based on criteria established by the donor.
2. Pension Trust Fund – The Pension Trust Fund (i.e. Des Moines Teachers Retirement System, DMTRS) accounts for the district’s defined contribution retirement plan for teachers. The fund provides pension benefits to eligible district teachers and administrators. While this fund is accounted for in the district’s Comprehensive Annual Financial Report, it is not a budget fund and, therefore, not included in the Budget Book.
3. Agency Funds – Agency Funds account for assets held in a custodial capacity by the district for individuals, private organizations, or other governments. PTAs and PTOs are generally accounted for in these funds. While this fund is accounted for in the district’s Comprehensive Annual Financial Report, it is not a budget fund and, therefore, not included in the Budget Book.
2016 - 2017 Preliminary Budget 73
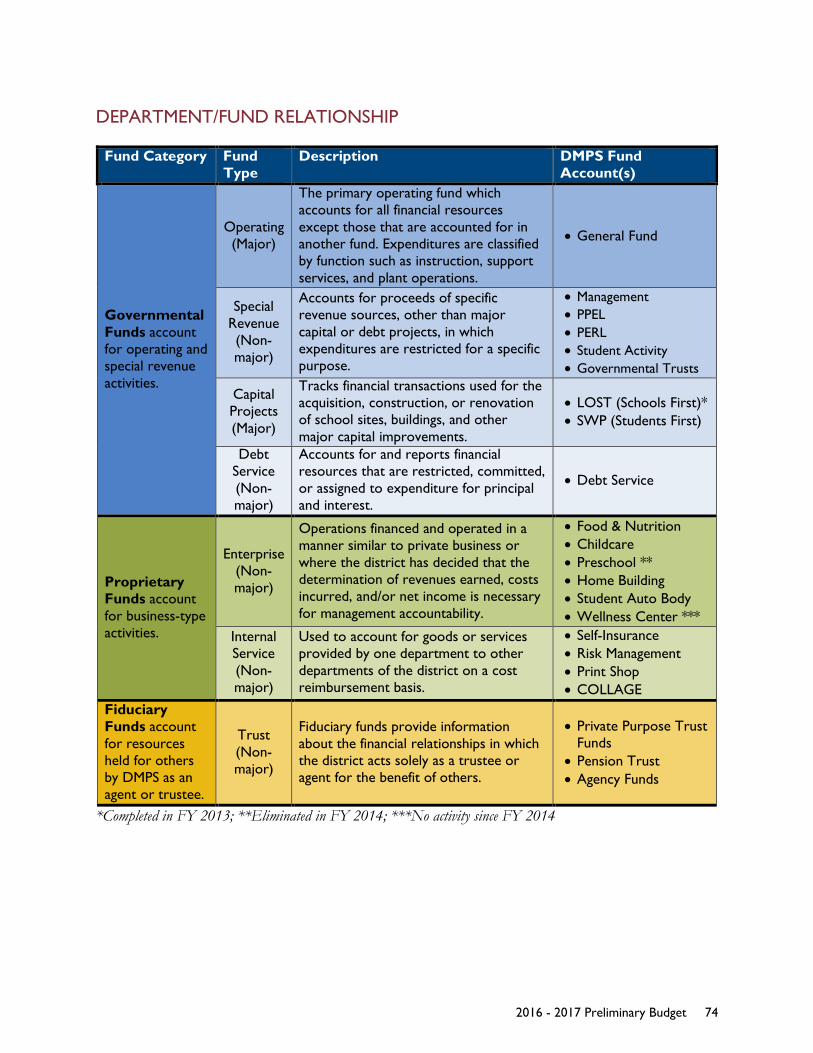
DEPARTMENT/FUND RELATIONSHIP
Fund Category Fund Type
Description DMPS Fund Account(s)
Governmental Funds account for operating and special revenue activities.
Operating (Major)
The primary operating fund which accounts for all financial resources except those that are accounted for in another fund. Expenditures are classified by function such as instruction, support services, and plant operations.
• General Fund
Special Revenue (Non-major)
Accounts for proceeds of specific revenue sources, other than major capital or debt projects, in which expenditures are restricted for a specific purpose.
• Management • PPEL • PERL • Student Activity • Governmental Trusts
Capital Projects (Major)
Tracks financial transactions used for the acquisition, construction, or renovation of school sites, buildings, and other major capital improvements.
• LOST (Schools First)* • SWP (Students First)
Debt Service (Non-major)
Accounts for and reports financial resources that are restricted, committed, or assigned to expenditure for principal and interest.
• Debt Service
Proprietary Funds account for business-type activities.
Enterprise (Non-major)
Operations financed and operated in a manner similar to private business or where the district has decided that the determination of revenues earned, costs incurred, and/or net income is necessary for management accountability.
• Food & Nutrition • Childcare • Preschool ** • Home Building • Student Auto Body • Wellness Center ***
Internal Service (Non-major)
Used to account for goods or services provided by one department to other departments of the district on a cost reimbursement basis.
• Self-Insurance • Risk Management • Print Shop • COLLAGE
Fiduciary Funds account for resources held for others by DMPS as an agent or trustee.
Trust (Non-major)
Fiduciary funds provide information about the financial relationships in which the district acts solely as a trustee or agent for the benefit of others.
• Private Purpose Trust Funds
• Pension Trust • Agency Funds
*Completed in FY 2013; **Eliminated in FY 2014; ***No activity since FY 2014
2016 - 2017 Preliminary Budget 74

FINANCIAL POLICIES
BUDGETING PRINCIPALS
This budget document presents analysis that continues to follow sound budgeting principles including presentation of a balanced budget, limited use of one-time funding to cover one-time costs as authorized by the board, use of ongoing funding to cover ongoing costs, determination of revenues and expenditures, alignment of expenditures incurred and related revenues earned in the same fiscal year, incorporation of Board Management Limitations and Board budgetary parameters, and the integration of reasonable financial assumptions.
School districts in Iowa must operate within their means. There are eight ways a budget can be balanced:
The district’s General Fund is balanced using method #2 (Revenues + Fund Balances ≥ Expenditures). The district’s combined budget is balanced using method #8 (Revenues + Fund Balances + Transfers + Loans ≥ Expenditures).
ENTITY-WIDE FINANCIAL POLICIES
Annual Directives: Board Budget Parameters The School Board adopted the FY 2017 Budget Parameters at the December 8, 2015 Board meeting. The FY 2017 Budget Parameters are:
• Meet and stay within Board Management Limitations. • Maintain financial health; provide a balanced budget. • Keep DMPS Student Expectations and Board Beliefs at the forefront. • Review status of all levies; make strategic adjustments as needed. • Seek input from the Citizens’ Budget Advisory Committee (CBAC) on budget issues. • Seek input from the Employees’ Budget Advisory Committee (EBAC) on budget issues.
1. Revenues ≥ Expenditures 2. Revenues + Fund Balances ≥ Expenditures 3. Revenues + Transfers ≥ Expenditures 4. Revenues + Loans ≥ Expenditures 5. Revenues + Fund Balances + Transfers ≥ Expenditures 6. Revenues + Fund Balances + Loans ≥ Expenditures 7. Revenues + Transfers + Loans ≥ Expenditures 8. Revenues + Fund Balances + Transfers + Loans ≥ Expenditures
2016 - 2017 Preliminary Budget 75

• Continue to seek operational efficiencies and improve operational effectiveness. • Continue to focus on drop-out prevention and graduation rate improvement strategies. • Focus on strategies to close the achievement gap. • Improve English Language Learners (ELL) programming. • Continue to assess needs and evaluate programming to:
o Create innovative programs to meet unmet needs; o Maintain or grow programs that are demonstrating success; o Strategically abandon programs that do not demonstrate value; o Assess and address curriculum needs and program delivery as needed to stay ahead of
advances in technology and digital content. • Improve Parent and Student Engagement.
Board Governance Policy: Management Limitations In addition to the Budget Parameters, the district utilizes the Policy Governance and Management Limitations to develop the budget. Using guidance from the GFOA, ASBO, Iowa Association of School Boards, and Iowa School Finance Information Services, among others, each year the board sets targets for financial indicators, including the district’s solvency ratio and unspent spending ratio. The targets set for both the solvency ratio and unspent spending ratio place the district into the “healthy range” identified for each of these financial indicators.
The following Management Limitations (ML) are used in budget development.
ML 2.5: Financial Planning/Budgeting Financial planning for any fiscal year or the remaining part of any fiscal year may not deviate materially from the Board’s Beliefs nor risk financial jeopardy.
Accordingly, the Superintendent shall not present a budget that:
1. Falls below a 15% Solvency Ratio for the General Fund. 2. Falls below a 15% Unspent Spending Ratio for the General Fund. 3. Creates a situation or condition described as unacceptable per Board Management
Limitation 2.3 Financial Conditions and Activities. 4. Omits credible projections of revenues and expenses and disclosure of planning
assumptions. 5. Plans the expenditure of more funds than are projected to be received in any fiscal year.
ML 2.3: Financial Conditions & Activities With respect to actual ongoing conditions of the district’s financial resources, the Superintendent shall not cause or allow the development of fiscal jeopardy or a material deviation of actual expenditures from the Board’s Beliefs.
Accordingly, the Superintendent shall not:
1. Fail to provide quarterly summaries of the financial condition of the district.
2016 - 2017 Preliminary Budget 76
2. Fail to settle district payroll obligations and payables in a timely manner. 3. Fail to implement prudent competitive quoting procedures for all facility improvement
projects in an amount that meets or exceeds the competitive quote threshold as established by Iowa law.
4. Fail to implement prudent competitive bidding procedures for all facility improvement projects in the amount of $100,000 or more.
5. Fail to implement prudent competitive procedures, including but not limited to RFPs, for purchasing and securing contractual and professional services.
6. Obligate the district to contracts or expenditures greater than $100,000. 7. Acquire, lease, or dispose of real property. 8. Invest funds in securities contrary to state law. 9. Allow tax payments to other governmental ordered payments or filing to be overdue or
inaccurately filed.
Business & Operations Policies Guiding Principles (Series 700; Code 700) The primary responsibility of the board is to provide the citizens of Des Moines an education program consistent with the mission of the district and the Student Expectations. Business and operational functions relative to this mission shall be managed and implemented in an efficient, effective, and equitable manner.
Budget Planning (Series 700; Code 702) Planning of the budget is a continuous process involving study and deliberation by the Board, the administrative staff, the faculty, other staff members and the citizens of the community.
The Superintendent of Schools shall submit an annual budget for consideration, deliberation and approval by the Board of Directors. After adoption of the budget by the official action of the board, the superintendent and/or designated representatives will be authorized to administer specific expenditures.
The budget document shall include revenue sources and expenditures for all areas of operation to implement the Student Expectations and Budget Parameters set by the board of directors.
Preparation of Budget Document (Series 700; Code 703) The Superintendent shall be responsible for preparing and submitting to the board, not later than the first meeting in April, a tentative detailed budget for the ensuing fiscal year. A formalized budget for the same year will be submitted to the board as soon as is practical.
Budget Publication, Review and Certification (Series 700; Code 704) A public hearing shall be held prior to the required budget certification each year to receive public comment on the budget document. The school district shall, at least ten (10) days but no later than twenty (20) days prior to the public hearing, publish the estimated budget and public hearing date, time, and place in accordance with the Code of Iowa. At least one board meeting providing an opportunity for board discussion of the budget, including the opportunity for public input, will be
2016 - 2017 Preliminary Budget 77
held at a meeting prior to the date of the public hearing and certification of the budget. Upon receiving the required certification by the board, the budget will be filed with the county auditor no later than April 15.
Cash Flow and Investments (Series 700; Code 770) District funds in excess of current needs shall be invested in compliance with this policy. The goals of the district’s investment portfolio in order of priority are:
• To provide safety of the principal • To maintain the necessary liquidity to match expected liabilities • To obtain a reasonable rate of return
In making investments, the district shall exercise the care, skill, prudence, and diligence under the circumstances then prevailing that a prudent person acting in a like capacity and familiar with such matters would use to meet the goals of the investment program.
District funds are monies of the district, including operating funds. Operating funds of the district are funds, which are reasonably expected to be used during a current budget year or within fifteen months of receipt. When investing operating funds, the investments must mature within three hundred and ninety-seven days or less. When investing funds other than operating funds, the investments must mature according to the need for the funds.
The board authorizes the Chief Financial Officer (CFO) to invest funds in excess of current needs in the following investments:
• Interest bearing savings, money market, and checking accounts at the district’s authorized depositories.
• Obligations of the United States government, its agencies, and instrumentalities. • Certificates of deposit and other evidences of deposit at federally insured Iowa depository
institutions. • Repurchase agreements in which underlying collateral consists of investments in government
securities. The district must take delivery of the collateral either directly or through an authorized custodian. Repurchase agreements do not include reverse repurchase agreements.
• Prime banker acceptances that mature within two hundred seventy days and are eligible for purchase by a federal reserve bank. At the time of purchase, no more than ten percent of the investment portfolio can be in these investments and no more than five percent of the investment portfolio can be invested in the securities of a single issuer.
• Commercial paper or other short-term corporate debt that matures within two hundred seventy days and is rated within the two highest classifications, as established by at least one of the standard rating services, with no more than five percent at the time of purchase placed in the second highest classification. At the time of purchase no more than ten percent of the investment portfolio can be in these investments and no more than five percent of the investment portfolio can be invested in the securities of a single issuer.
2016 - 2017 Preliminary Budget 78
• An open-end management investment company registered with the federal Securities and Exchange Commission and commonly referred to as a money market mutual fund. The money market mutual fund shall use only the investments individually authorized by law for school districts.
It shall be the responsibility of the CFO to oversee the investment portfolio in compliance with this policy and the law.
The CFO shall have the discretion to contract with an outside person to invest school district funds, to advise on investments, to direct investments, to act in a fiduciary capacity, or to perform other services to the Board for review and approval consistent with Management Limitations 2.3. The CFO shall also provide the Board with information about and verification of the outside person’s fiduciary bond. Contracts with outside persons shall include a clause requiring them to notify the district within thirty days of any material weakness in internal structure or regulatory orders or sanctions against information necessary to ensure that the investments and the outside person doing business with the district meet the requirements outlined in this policy. It shall be the responsibility of the CFO to deliver a copy of this policy to the district’s depositories, auditor, and outside persons doing business with the district.
It shall also be the responsibility of the Superintendent, in conjunction with the CFO, to develop a system of investment practices and internal controls over the investment practices. The investment practices shall be designed to prevent losses, document the officers and employees responsibility for elements of the investment process, and ensure the capability of management.
Business & Operations Procedures Budget Planning (Series 700; Code 702) The CFO shall implement a meeting schedule pertaining to the development and certification of the following year’s budget. Meetings are open to all interested parties:
• December through first week of January: o Budget hearings for those individuals who are responsible for preparation of budget
documents. • Last week in January:
o Budget review meetings for adjustment and balancing of budget documents. • At one of February board meetings:
o Budget work session’ authorization to publish budget and set public hearing date. • First board meeting in March or April:
o Hold public hearing and certify budget. • On or before April 15:
o File approved certified budget.
2016 - 2017 Preliminary Budget 79
Cash Flow and Investment Procedure (Series 700; Code 770) Maximum positive cash flow is achieved by following these four procedural concepts: 1) daily deposits of all incoming receipts, 2) enhancing the receipt of funds by using timely collection and billing methods, 3) scheduling businesslike expenditure payment procedures, and 4) preparation of a balanced budget with a realistic forecast of revenues and expenditures.
Investments are made based on Iowa Code guidelines for the purpose of earning interest income. The investment procedure includes: 1) obtaining daily bank balance position information from the bank, 2) projecting daily cash flow position allowing for in-transit cash items, 3) determining market investment opportunities available, 4) implementing the actual investment purchase, and 5) accounting for the principal and the interest of the investment.
OTHER FINANCIAL INFORMATION
Internal Control District management is responsible for establishing and maintaining an internal control system designed to ensure that district assets are protected from loss, theft, or misuse and to ensure that adequate accounting data are compiled to allow for the preparation of the basic financial statements in accordance with accounting principles generally accepted in the United States of America. Internal control is designed to provide reasonable, but not absolute, assurances that these objectives are met. The concept of reasonable assurance recognizes that the cost of a control should not exceed the benefits likely to be derived and the valuation of costs and benefits requires estimates and judgments by management.
Single Audit As a recipient of federal, state, and county financial assistance, the district is also responsible for ensuring that an adequate internal control is in place to ensure compliance with applicable laws and regulations related to those programs. This internal control is subject to periodic evaluation by management and external auditors. As a part of the district’s single audit, tests are made to determine the adequacy of the internal control over financial reporting and its compliance with applicable laws and regulations, including those related to major federal award programs. The results of the district's single audit for the fiscal year ended June 30, 2015 revealed no instances of material weakness in the internal control or violations of applicable laws.
Budgetary Controls In addition, the district maintains strong budgetary controls. The objective of these budgetary controls is to ensure compliance with legal provisions embodied in the annual appropriated budget approved by the Board of Directors. Activities of the General Fund, Special Revenue Funds, Capital Projects Funds, Debt Service Fund, Enterprise Funds, and Private Purpose Trust Funds are included in the annual appropriated budget by program. Project-length financial plans are adopted for the Capital Projects Funds and budgeted accordingly on an annual basis.
2016 - 2017 Preliminary Budget 80
BUDGET PROCESS
BUDGET PLANNING
Budget planning is a continuous process involving study and deliberation by the Board, administrative staff, faculty, other staff members, and citizens of the community. On November 18, 2014 the School Board adopted the FY 2016 Budget Parameters that were used by the district to develop the FY 2016 budget. The district also utilizes the Employees’ Budget Advisory Committee and the Citizens’ Budget Advisory Committee extensively in the development of the proposed budget for certification. It is important to note there are two distinctive budget types with uniquely different purposes:
Certified Budget The Superintendent submits an annual budget for consideration, deliberation, and approval by the Board of Directors no later than the first meeting in April. Iowa law requires the proposed budget (i.e., the certified budget) to be filed with the Polk County Auditor by April 15 of each year. The “proposed/certified budget” provides data that is the basis of the school property tax levy to begin on July 1 and run through June 30 of the following calendar year. In addition, the certified budget establishes the legal expenditure limit in each of the district’s various expenditure categories. The Superintendent and/or designated representative is authorized to administer specific expenditures only after the official adoption of the certified budget by the Board. The proposed budget for certification is included in the Appendix.
Legal Requirements for Budget Publication, Review, and Certification A public hearing is held prior to the required budget certification each year to receive public comment on the budget document. On or before April 15 of each year, Iowa Code Sections 24.9 and 24.17 require the district to accomplish the following:
1. The school district must publish a notice with the location, date, and time for the public hearing at least ten (10) days but no later than twenty (20) days prior to the public hearing.
2. The school district must hold a public hearing. 3. Upon receiving the required certification by the board, the certified budget must be
filed with the county auditor no later than April 15.
In meeting the filing requirement of April 15, it is necessary to re-estimate miscellaneous incomes and expenditures for the current fiscal year as well as initially estimate miscellaneous incomes and expenditures for the next fiscal year. Because the process requires making estimates as many as fifteen months in advance, it may be necessary to amend the budget to change the legal expenditures limit in some of the various categories. In the event the budget is amended, the legal expenditures limit can only be increased to use un-anticipated miscellaneous incomes or prior year unused funds. The current fiscal year school property tax levy is final and cannot be
2016 - 2017 Preliminary Budget 81
changed. As the state has not yet set Supplemental State Aid for FY 2017, the district is proposing the maximum tax levy. This levy can be amended to be lower amount after state funding has been set, but it cannot be increased.
Formal Budget Presentation In addition to the certified budget, a formalized budget presentation is developed for the same year and is released as soon as is practical. The formal budget presentation is the culmination of a multi-month budget development process (described below) and is completed in May or June of each year, prior to the July 1st beginning of the fiscal year. The budget book is designed to serve as a management tool. It is a detailed analysis of all revenue sources and expenditures for all areas of operation to implement the Student Expectations/Board Beliefs and Budget Parameters set by the Board of Directors. The information contained in the main body of this document is reflective of the budgeted plan to fund the district’s instructional programs and services and is more complete than the certified budget.
The purpose of the certified budget and the formal budget presentation is to provide timely information with which to make strategic decisions that ultimately affect the quality of education provided to students.
BUDGET DEVELOPMENT
District Budget Development The district-wide budget development process is a collaborative process involving many stakeholders including school personnel, Employees’ Budget Advisory Committee, Citizens’ Budget Advisory Committee, Business & Finance, the CFO, the Superintendent, and the Board.
The budget reflects the labor, materials, and resources required to fulfill the goals and objectives outlined by the Board. The budget serves as an operational plan, stated in financial terms, for carrying out the goals of the school system.
The budget preparation process begins each year in the fall, continues through April 15 with the adoption of the certified budget by the Board, and culminates with revisions based on actual enrollment in October.
During this time period, Business & Finance works with the Employees’ Budget Advisory Committee, Citizens’ Budget Advisory Committee, and school and program administrators to determine enrollment projections and anticipated programmatic changes.
School Budget Development The development of a school budget is a critical component of the district-wide process. A school’s budget is often driven by allocation formula, contractual obligations, district-wide policies and procedures, and school-based initiatives.
2016 - 2017 Preliminary Budget 82
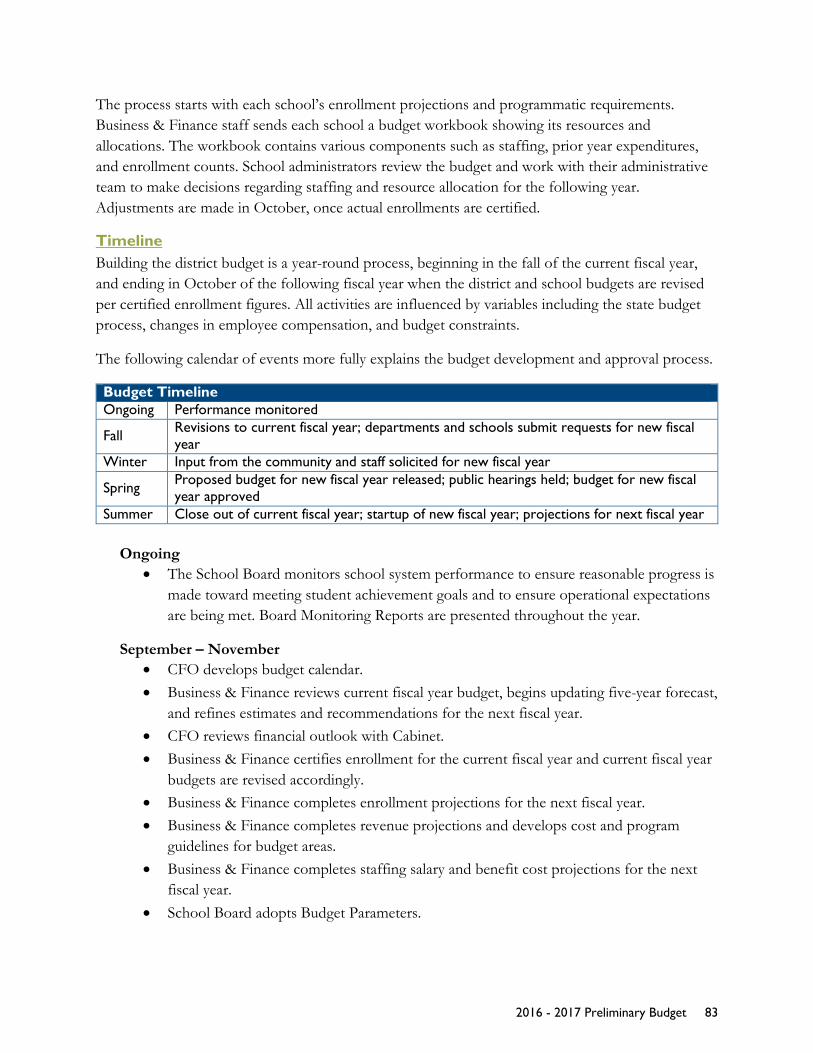
The process starts with each school’s enrollment projections and programmatic requirements. Business & Finance staff sends each school a budget workbook showing its resources and allocations. The workbook contains various components such as staffing, prior year expenditures, and enrollment counts. School administrators review the budget and work with their administrative team to make decisions regarding staffing and resource allocation for the following year. Adjustments are made in October, once actual enrollments are certified.
Timeline Building the district budget is a year-round process, beginning in the fall of the current fiscal year, and ending in October of the following fiscal year when the district and school budgets are revised per certified enrollment figures. All activities are influenced by variables including the state budget process, changes in employee compensation, and budget constraints.
The following calendar of events more fully explains the budget development and approval process.
Budget Timeline Ongoing Performance monitored
Fall Revisions to current fiscal year; departments and schools submit requests for new fiscal year
Winter Input from the community and staff solicited for new fiscal year
Spring Proposed budget for new fiscal year released; public hearings held; budget for new fiscal year approved
Summer Close out of current fiscal year; startup of new fiscal year; projections for next fiscal year
Ongoing • The School Board monitors school system performance to ensure reasonable progress is
made toward meeting student achievement goals and to ensure operational expectations are being met. Board Monitoring Reports are presented throughout the year.
September – November • CFO develops budget calendar. • Business & Finance reviews current fiscal year budget, begins updating five-year forecast,
and refines estimates and recommendations for the next fiscal year. • CFO reviews financial outlook with Cabinet. • Business & Finance certifies enrollment for the current fiscal year and current fiscal year
budgets are revised accordingly. • Business & Finance completes enrollment projections for the next fiscal year. • Business & Finance completes revenue projections and develops cost and program
guidelines for budget areas. • Business & Finance completes staffing salary and benefit cost projections for the next
fiscal year. • School Board adopts Budget Parameters.
2016 - 2017 Preliminary Budget 83

December – February • Superintendent and CFO solicit input on budget priorities from community groups and
employees. • Citizens’ Budget Advisory Committee (CBAC) and Employees’ Budget Advisory
Committee (EBAC) develop suggestions for cost-savings and priorities and budget recommendations for submission to the Board.
• Cabinet prioritizes recommended initiatives and changes to programs and services. • Superintendent and CFO (with Cabinet) make preliminary program and staffing
additions/reductions decisions. • Business & Finance prepares proposed budget for certification.
March – April • Proposed budget is released for public review and presented to the Board. • CFO meets with community and employee groups to discuss the proposed budget. • Board holds work sessions. • Superintendent, CFO, CBAC, EBAC, and the Board hold public hearings. • Board adopts and certifies the budget. • Business & Finance files budget with the Polk County Auditor.
May – August • Business & Finance updates revenue estimates as new information becomes available
from the tax assessor, state legislature, State Department of Education, and federal government agencies.
• Business & Finance finalizes budget based on the most current information and the formal budget book is developed.
• Business & Finance closes out accounts for current fiscal year, enters appropriations for the new fiscal year into books of accounts, and opens new accounts for the next fiscal year.
• Business & Finance completes startup for new fiscal year through the distribution of approved line item budget amounts for building principals and department heads.
• Business & Finance develops a financial forecast for the following fiscal year, framing the underlying assumptions on expected costs, revenue, position turnover, inflations, and other issues that drive budget development.
2016 - 2017 Preliminary Budget 84
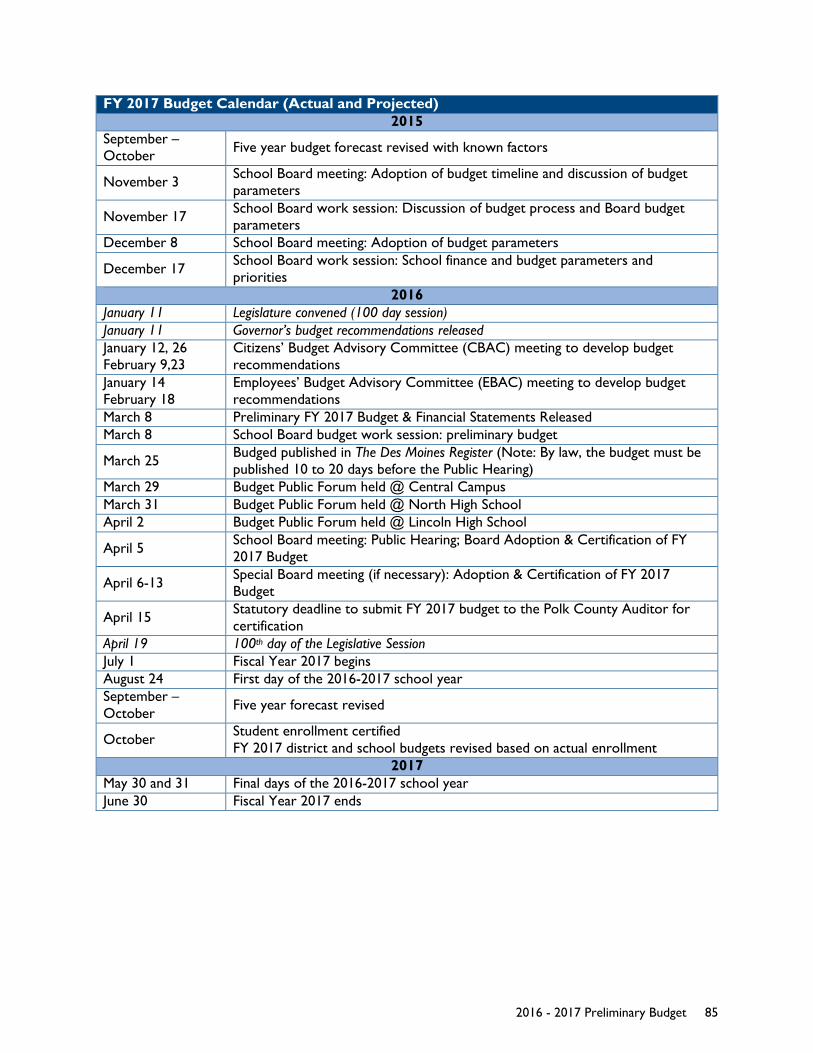
FY 2017 Budget Calendar (Actual and Projected) 2015
September – October Five year budget forecast revised with known factors
November 3 School Board meeting: Adoption of budget timeline and discussion of budget parameters
November 17 School Board work session: Discussion of budget process and Board budget parameters
December 8 School Board meeting: Adoption of budget parameters
December 17 School Board work session: School finance and budget parameters and priorities
2016 January 11 Legislature convened (100 day session) January 11 Governor’s budget recommendations released January 12, 26 February 9,23
Citizens’ Budget Advisory Committee (CBAC) meeting to develop budget recommendations
January 14 February 18
Employees’ Budget Advisory Committee (EBAC) meeting to develop budget recommendations
March 8 Preliminary FY 2017 Budget & Financial Statements Released March 8 School Board budget work session: preliminary budget
March 25 Budged published in The Des Moines Register (Note: By law, the budget must be published 10 to 20 days before the Public Hearing)
March 29 Budget Public Forum held @ Central Campus March 31 Budget Public Forum held @ North High School April 2 Budget Public Forum held @ Lincoln High School
April 5 School Board meeting: Public Hearing; Board Adoption & Certification of FY 2017 Budget
April 6-13 Special Board meeting (if necessary): Adoption & Certification of FY 2017 Budget
April 15 Statutory deadline to submit FY 2017 budget to the Polk County Auditor for certification
April 19 100th day of the Legislative Session July 1 Fiscal Year 2017 begins August 24 First day of the 2016-2017 school year September – October Five year forecast revised
October Student enrollment certified FY 2017 district and school budgets revised based on actual enrollment
2017 May 30 and 31 Final days of the 2016-2017 school year June 30 Fiscal Year 2017 ends
2016 - 2017 Preliminary Budget 85
FINANCIAL SUMMARIESP R E L I M I N A RY B U D G E T 2 0 1 6 - 1 7

SUMMARY ALL FUNDS
FY 2013 FY 2014 FY 2015 FY 2016 FY 2017Actual Actual Actual Re-estimated Budget
RevenuesProperty Taxes 113,584,295$ 117,619,316$ 111,812,725$ 113,074,547$ 122,525,123$ Utility Replacement Tax 4,269,105 3,833,401 4,281,635 3,904,072 4,194,815Mobile Home Taxes 123,031 112,277 116,941 122,159 124,775State Foundation Aid 174,578,921 186,285,458 193,830,409 195,199,722 199,261,000AEA Flow Through 12,235,407 13,086,762 13,829,063 13,974,996 14,115,000Teacher Quality Act 19,367,220 20,154,886 21,033,898 21,270,308 21,587,000Universal 4 Year Old Preschool 3,342,557 3,920,501 4,303,416 4,843,760 4,976,000Teacher Leadership Supplement - - - 10,129,613 10,231,000Early Intervention Supplement 2,635,062 2,719,187 2,833,238 2,859,280 2,489,000Other State Sources 1,946,191 3,082,771 6,533,107 8,469,907 3,698,613Commercial & Industrial State Replacement - - 2,833,392 4,699,497 4,331,089Chapter 1 Grants 12,272,208 8,813,125 11,394,063 11,591,605 11,300,000Other Federal Sources 39,034,833 35,598,703 38,726,581 38,798,624 38,455,606Tuition/Transportation Fees 6,219,856 6,811,564 7,566,302 7,250,000 7,890,000Earnings on Investments 376,320 532,019 529,017 410,193 409,421Student Activities 2,914,551 3,036,894 3,118,740 3,157,200 3,313,511Nutrition Program Sales 2,950,693 2,978,746 2,131,098 2,084,165 2,085,047Sales and Use Tax 27,364,977 27,874,657 30,744,831 30,928,904 30,928,904Other Revenue from Local Sources 16,740,858 18,579,610 18,733,986 19,255,092 19,519,606Revenue from Intermediary Sources 540,171 708,970 767,420 717,800 705,000Other Financing Sources 655,785 684,111 200,959 160,742 150,000General Long-Term Debt Proceeds - 75,855,507 - - - Proceeds from Fixed Asset Disposition 107,648 214,141 86,560 15,000 15,000Transfers In 12,340,673 13,309,245 18,659,732 18,498,820 18,375,170
Total Revenues 453,600,362 545,811,850 494,067,112 511,416,006 520,680,680
ExpendituresInstruction 248,899,576 258,464,173 268,466,729 272,488,162 272,830,528Student Support Services 20,677,284 21,660,306 23,058,840 23,429,486 23,651,363Instructional Staff Support 12,199,079 13,493,103 14,958,745 25,356,249 25,579,608General Administration 5,325,980 6,499,464 7,452,552 7,674,841 7,788,000Building Administration 19,140,850 19,371,501 21,425,505 22,250,052 22,311,709Business and Central Administration 9,164,635 12,097,062 16,231,589 15,908,740 16,227,000Plant Operation & Maintenance 34,137,543 39,162,075 37,613,544 39,708,676 39,522,000Student Transportation 11,176,088 12,279,304 11,976,509 12,139,166 12,299,000Non-Instructional Expenditures 21,221,876 22,679,195 29,870,296 25,311,286 26,166,187Facilities Acquisition and Construction 53,462,177 42,633,894 44,750,037 53,164,769 39,012,398Debt Service 12,158,244 12,631,366 18,626,480 18,498,820 18,375,170Other Financing Uses - - - - - AEA Support 12,235,407 13,086,762 13,829,063 13,974,996 14,115,000Transfers Out 12,340,673 13,305,433 18,659,732 18,498,820 18,375,170
Total Expenditures 472,139,412 487,363,638 526,919,621 548,404,063 536,253,133
Excess of Revenues over Expenditures (18,539,050) 58,448,212 (32,852,509) (47,117,670) (25,803,453)Beginning Fund Balance 192,319,778 173,780,728 232,228,941 199,376,432 152,258,762
Ending Fund Balance 173,780,728$ 232,228,941$ 199,376,432$ 152,258,762$ 126,455,309$
DES MOINES PUBLIC SCHOOLS2016 - 2017 BUDGET
SUMMARY ALL FUNDS
2016 - 2017 Preliminary Budget 87
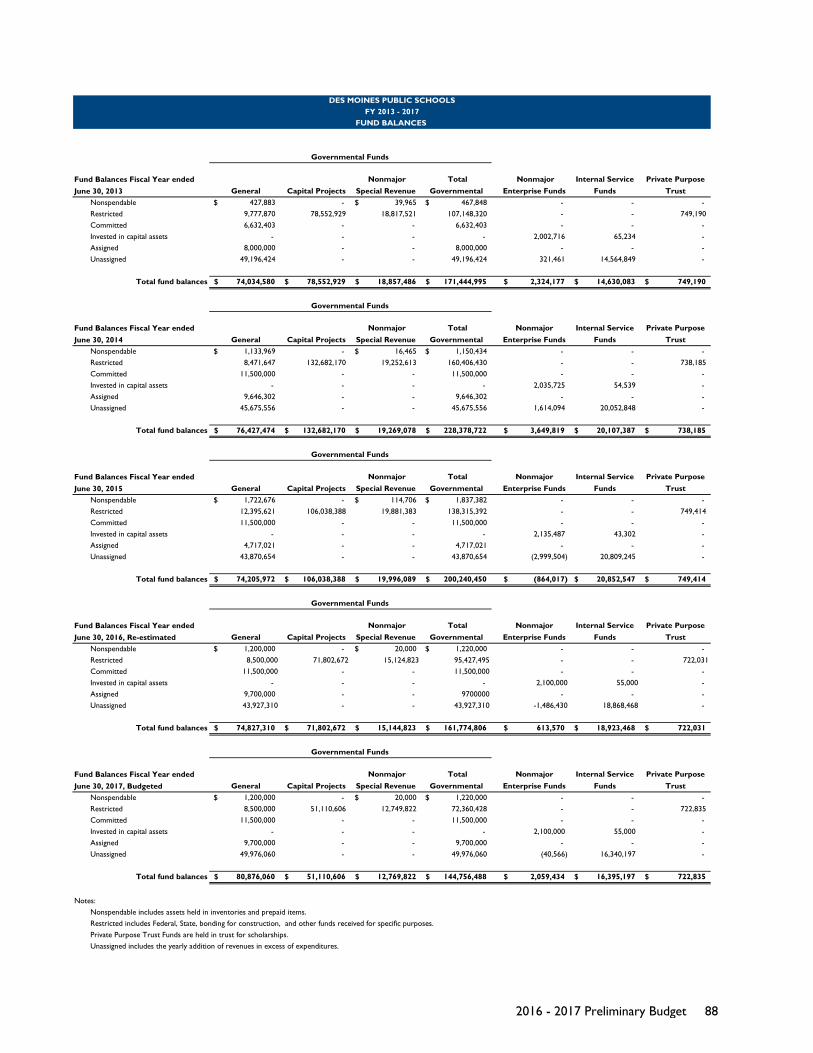
General Capital Projects Nonmajor
Special Revenue Total
Governmental Nonmajor
Enterprise Funds Internal Service
Funds Private Purpose
Trust Nonspendable 427,883$ - 39,965$ 467,848$ - - - Restricted 9,777,870 78,552,929 18,817,521 107,148,320 - - 749,190Committed 6,632,403 - - 6,632,403 - - - Invested in capital assets - - - - 2,002,716 65,234 - Assigned 8,000,000 - - 8,000,000 - - - Unassigned 49,196,424 - - 49,196,424 321,461 14,564,849 -
Total fund balances 74,034,580$ 78,552,929$ 18,857,486$ 171,444,995$ 2,324,177$ 14,630,083$ 749,190$
General Capital Projects Nonmajor
Special Revenue Total
Governmental Nonmajor
Enterprise Funds Internal Service
Funds Private Purpose
Trust Nonspendable 1,133,969$ - 16,465$ 1,150,434$ - - - Restricted 8,471,647 132,682,170 19,252,613 160,406,430 - - 738,185Committed 11,500,000 - - 11,500,000 - - - Invested in capital assets - - - - 2,035,725 54,539 - Assigned 9,646,302 - - 9,646,302 - - - Unassigned 45,675,556 - - 45,675,556 1,614,094 20,052,848 -
Total fund balances 76,427,474$ 132,682,170$ 19,269,078$ 228,378,722$ 3,649,819$ 20,107,387$ 738,185$
General Capital Projects Nonmajor
Special Revenue Total
Governmental Nonmajor
Enterprise Funds Internal Service
Funds Private Purpose
Trust Nonspendable 1,722,676$ - 114,706$ 1,837,382$ - - - Restricted 12,395,621 106,038,388 19,881,383 138,315,392 - - 749,414Committed 11,500,000 - - 11,500,000 - - - Invested in capital assets - - - - 2,135,487 43,302 - Assigned 4,717,021 - - 4,717,021 - - - Unassigned 43,870,654 - - 43,870,654 (2,999,504) 20,809,245 -
Total fund balances 74,205,972$ 106,038,388$ 19,996,089$ 200,240,450$ (864,017)$ 20,852,547$ 749,414$
General Capital Projects Nonmajor
Special Revenue Total
Governmental Nonmajor
Enterprise Funds Internal Service
Funds Private Purpose
Trust Nonspendable 1,200,000$ - 20,000$ 1,220,000$ - - - Restricted 8,500,000 71,802,672 15,124,823 95,427,495 - - 722,031Committed 11,500,000 - - 11,500,000 - - - Invested in capital assets - - - - 2,100,000 55,000 - Assigned 9,700,000 - - 9700000 - - - Unassigned 43,927,310 - - 43,927,310 -1,486,430 18,868,468 -
Total fund balances 74,827,310$ 71,802,672$ 15,144,823$ 161,774,806$ 613,570$ 18,923,468$ 722,031$
General Capital Projects Nonmajor
Special Revenue Total
Governmental Nonmajor
Enterprise Funds Internal Service
Funds Private Purpose
Trust Nonspendable 1,200,000$ - 20,000$ 1,220,000$ - - - Restricted 8,500,000 51,110,606 12,749,822 72,360,428 - - 722,835Committed 11,500,000 - - 11,500,000 - - - Invested in capital assets - - - - 2,100,000 55,000 - Assigned 9,700,000 - - 9,700,000 - - - Unassigned 49,976,060 - - 49,976,060 (40,566) 16,340,197 -
Total fund balances 80,876,060$ 51,110,606$ 12,769,822$ 144,756,488$ 2,059,434$ 16,395,197$ 722,835$
Notes:Nonspendable includes assets held in inventories and prepaid items.Restricted includes Federal, State, bonding for construction, and other funds received for specific purposes.Private Purpose Trust Funds are held in trust for scholarships.Unassigned includes the yearly addition of revenues in excess of expenditures.
Fund Balances Fiscal Year ended June 30, 2016, Re-estimated
Governmental Funds
Fund Balances Fiscal Year ended June 30, 2017, Budgeted
FY 2013 - 2017DES MOINES PUBLIC SCHOOLS
FUND BALANCES
Fund Balances Fiscal Year ended June 30, 2015
Governmental Funds
Governmental Funds
Governmental Funds
Fund Balances Fiscal Year ended June 30, 2013
Fund Balances Fiscal Year ended June 30, 2014
Governmental Funds
2016 - 2017 Preliminary Budget 88
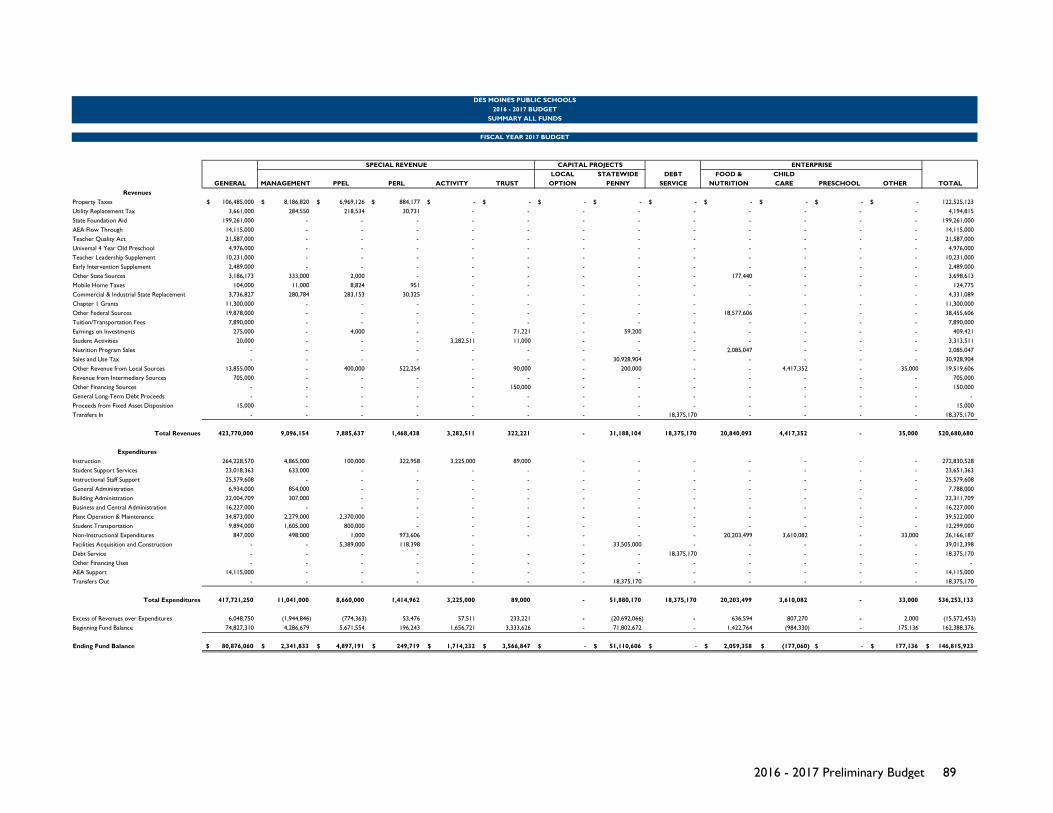
LOCAL STATEWIDE DEBT FOOD & CHILD GENERAL MANAGEMENT PPEL PERL ACTIVITY TRUST OPTION PENNY SERVICE NUTRITION CARE PRESCHOOL OTHER TOTAL
RevenuesProperty Taxes 106,485,000$ 8,186,820$ 6,969,126$ 884,177$ -$ -$ -$ -$ -$ -$ -$ -$ -$ 122,525,123Utility Replacement Tax 3,661,000 284,550 218,534 30,731 - - - - - - - - - 4,194,815State Foundation Aid 199,261,000 - - - - - - - - - - - - 199,261,000AEA Flow Through 14,115,000 - - - - - - - - - - - - 14,115,000Teacher Quality Act 21,587,000 - - - - - - - - - - - - 21,587,000Universal 4 Year Old Preschool 4,976,000 - - - - - - - - - - - - 4,976,000Teacher Leadership Supplement 10,231,000 - - - - - - - - - - - - 10,231,000Early Intervention Supplement 2,489,000 - - - - - - - - - - - - 2,489,000Other State Sources 3,186,173 333,000 2,000 - - - - - - 177,440 - - - 3,698,613Mobile Home Taxes 104,000 11,000 8,824 951 - - - - - - - - - 124,775Commercial & Industrial State Replacement 3,736,827 280,784 283,153 30,325 - - - - - - - - - 4,331,089Chapter 1 Grants 11,300,000 - - - - - - - - - - - - 11,300,000Other Federal Sources 19,878,000 - - - - - - - - 18,577,606 - - - 38,455,606Tuition/Transportation Fees 7,890,000 - - - - - - - - - - - - 7,890,000Earnings on Investments 275,000 - 4,000 - - 71,221 - 59,200 - - - - - 409,421Student Activities 20,000 - - - 3,282,511 11,000 - - - - - - - 3,313,511Nutrition Program Sales - - - - - - - - - 2,085,047 - - - 2,085,047Sales and Use Tax - - - - - - - 30,928,904 - - - - - 30,928,904Other Revenue from Local Sources 13,855,000 - 400,000 522,254 - 90,000 - 200,000 - - 4,417,352 - 35,000 19,519,606Revenue from Intermediary Sources 705,000 - - - - - - - - - - - - 705,000Other Financing Sources - - - - - 150,000 - - - - - - - 150,000General Long-Term Debt Proceeds - - - - - - - - - - - - - - Proceeds from Fixed Asset Disposition 15,000 - - - - - - - - - - - - 15,000Transfers In - - - - - - - - 18,375,170 - - - - 18,375,170
Total Revenues 423,770,000 9,096,154 7,885,637 1,468,438 3,282,511 322,221 - 31,188,104 18,375,170 20,840,093 4,417,352 - 35,000 520,680,680
ExpendituresInstruction 264,228,570 4,865,000 100,000 322,958 3,225,000 89,000 - - - - - - - 272,830,528Student Support Services 23,018,363 633,000 - - - - - - - - - - - 23,651,363Instructional Staff Support 25,579,608 - - - - - - - - - - - - 25,579,608General Administration 6,934,000 854,000 - - - - - - - - - - - 7,788,000Building Administration 22,004,709 307,000 - - - - - - - - - - - 22,311,709Business and Central Administration 16,227,000 - - - - - - - - - - - - 16,227,000Plant Operation & Maintenance 34,873,000 2,279,000 2,370,000 - - - - - - - - - - 39,522,000Student Transportation 9,894,000 1,605,000 800,000 - - - - - - - - - - 12,299,000Non-Instructional Expenditures 847,000 498,000 1,000 973,606 - - - - - 20,203,499 3,610,082 - 33,000 26,166,187Facilities Acquisition and Construction - - 5,389,000 118,398 - - 33,505,000 - - - - - 39,012,398Debt Service - - - - - - - - 18,375,170 - - - - 18,375,170Other Financing Uses - - - - - - - - - - - - - - AEA Support 14,115,000 - - - - - - - - - - - - 14,115,000Transfers Out - - - - - - - 18,375,170 - - - - - 18,375,170
Total Expenditures 417,721,250 11,041,000 8,660,000 1,414,962 3,225,000 89,000 - 51,880,170 18,375,170 20,203,499 3,610,082 - 33,000 536,253,133
Excess of Revenues over Expenditures 6,048,750 (1,944,846) (774,363) 53,476 57,511 233,221 - (20,692,066) - 636,594 807,270 - 2,000 (15,572,453)Beginning Fund Balance 74,827,310 4,286,679 5,671,554 196,243 1,656,721 3,333,626 - 71,802,672 - 1,422,764 (984,330) - 175,136 162,388,376
Ending Fund Balance 80,876,060$ 2,341,833$ 4,897,191$ 249,719$ 1,714,232$ 3,566,847$ -$ 51,110,606$ -$ 2,059,358$ (177,060)$ -$ 177,136$ 146,815,923$
DES MOINES PUBLIC SCHOOLS2016 - 2017 BUDGET
SUMMARY ALL FUNDS
FISCAL YEAR 2017 BUDGET
SPECIAL REVENUE CAPITAL PROJECTS ENTERPRISE
2016 - 2017 Preliminary Budget 89
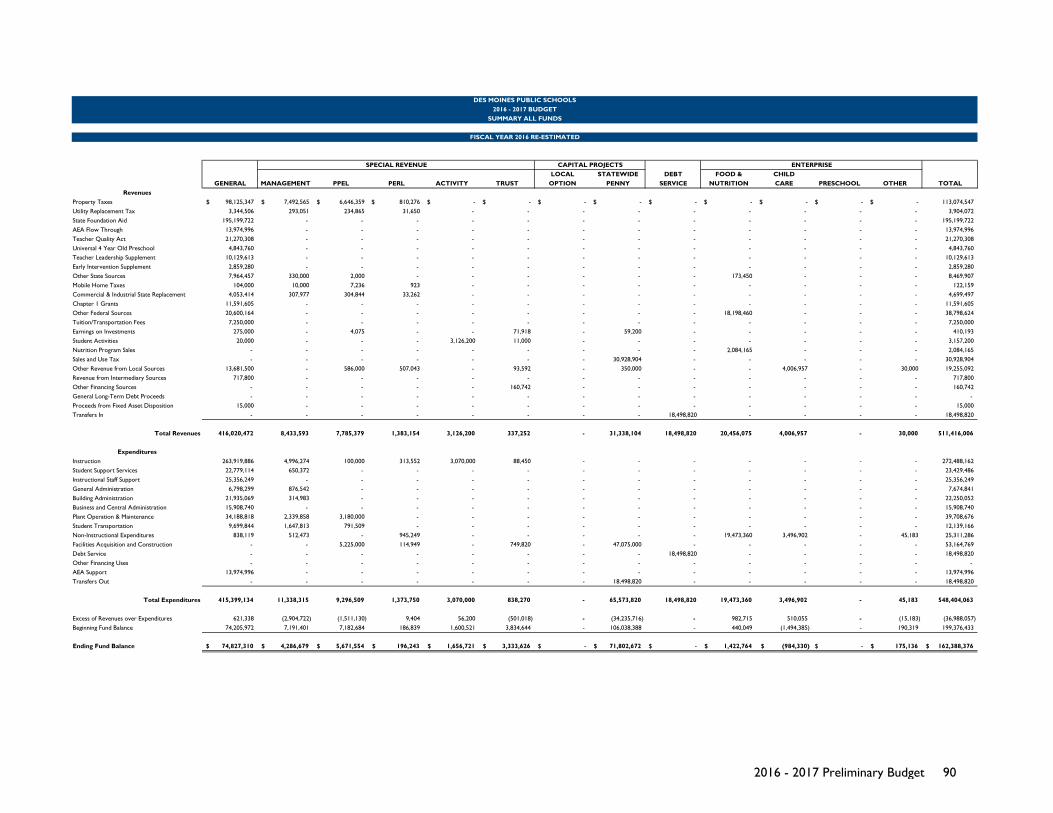
LOCAL STATEWIDE DEBT FOOD & CHILD GENERAL MANAGEMENT PPEL PERL ACTIVITY TRUST OPTION PENNY SERVICE NUTRITION CARE PRESCHOOL OTHER TOTAL
RevenuesProperty Taxes 98,125,347$ 7,492,565$ 6,646,359$ 810,276$ -$ -$ -$ -$ -$ -$ -$ -$ -$ 113,074,547Utility Replacement Tax 3,344,506 293,051 234,865 31,650 - - - - - - - - - 3,904,072State Foundation Aid 195,199,722 - - - - - - - - - - - - 195,199,722AEA Flow Through 13,974,996 - - - - - - - - - - - - 13,974,996Teacher Quality Act 21,270,308 - - - - - - - - - - - - 21,270,308Universal 4 Year Old Preschool 4,843,760 - - - - - - - - - - - - 4,843,760Teacher Leadership Supplement 10,129,613 - - - - - - - - - - - - 10,129,613Early Intervention Supplement 2,859,280 - - - - - - - - - - - - 2,859,280Other State Sources 7,964,457 330,000 2,000 - - - - - - 173,450 - - - 8,469,907Mobile Home Taxes 104,000 10,000 7,236 923 - - - - - - - - - 122,159Commercial & Industrial State Replacement 4,053,414 307,977 304,844 33,262 - - - - - - - - - 4,699,497Chapter 1 Grants 11,591,605 - - - - - - - - - - - - 11,591,605Other Federal Sources 20,600,164 - - - - - - - - 18,198,460 - - - 38,798,624Tuition/Transportation Fees 7,250,000 - - - - - - - - - - - - 7,250,000Earnings on Investments 275,000 - 4,075 - - 71,918 - 59,200 - - - - - 410,193Student Activities 20,000 - - - 3,126,200 11,000 - - - - - - - 3,157,200Nutrition Program Sales - - - - - - - - - 2,084,165 - - - 2,084,165Sales and Use Tax - - - - - - - 30,928,904 - - - - - 30,928,904Other Revenue from Local Sources 13,681,500 - 586,000 507,043 - 93,592 - 350,000 - - 4,006,957 - 30,000 19,255,092Revenue from Intermediary Sources 717,800 - - - - - - - - - - - - 717,800Other Financing Sources - - - - - 160,742 - - - - - - - 160,742General Long-Term Debt Proceeds - - - - - - - - - - - - - - Proceeds from Fixed Asset Disposition 15,000 - - - - - - - - - - - - 15,000Transfers In - - - - - - - - 18,498,820 - - - - 18,498,820
Total Revenues 416,020,472 8,433,593 7,785,379 1,383,154 3,126,200 337,252 - 31,338,104 18,498,820 20,456,075 4,006,957 - 30,000 511,416,006
ExpendituresInstruction 263,919,886 4,996,274 100,000 313,552 3,070,000 88,450 - - - - - - - 272,488,162Student Support Services 22,779,114 650,372 - - - - - - - - - - - 23,429,486Instructional Staff Support 25,356,249 - - - - - - - - - - - - 25,356,249General Administration 6,798,299 876,542 - - - - - - - - - - - 7,674,841Building Administration 21,935,069 314,983 - - - - - - - - - - - 22,250,052Business and Central Administration 15,908,740 - - - - - - - - - - - - 15,908,740Plant Operation & Maintenance 34,188,818 2,339,858 3,180,000 - - - - - - - - - - 39,708,676Student Transportation 9,699,844 1,647,813 791,509 - - - - - - - - - - 12,139,166Non-Instructional Expenditures 838,119 512,473 - 945,249 - - - - - 19,473,360 3,496,902 - 45,183 25,311,286Facilities Acquisition and Construction - - 5,225,000 114,949 - 749,820 - 47,075,000 - - - - - 53,164,769Debt Service - - - - - - - - 18,498,820 - - - - 18,498,820Other Financing Uses - - - - - - - - - - - - - - AEA Support 13,974,996 - - - - - - - - - - - - 13,974,996Transfers Out - - - - - - - 18,498,820 - - - - - 18,498,820
Total Expenditures 415,399,134 11,338,315 9,296,509 1,373,750 3,070,000 838,270 - 65,573,820 18,498,820 19,473,360 3,496,902 - 45,183 548,404,063
Excess of Revenues over Expenditures 621,338 (2,904,722) (1,511,130) 9,404 56,200 (501,018) - (34,235,716) - 982,715 510,055 - (15,183) (36,988,057)Beginning Fund Balance 74,205,972 7,191,401 7,182,684 186,839 1,600,521 3,834,644 - 106,038,388 - 440,049 (1,494,385) - 190,319 199,376,433
Ending Fund Balance 74,827,310$ 4,286,679$ 5,671,554$ 196,243$ 1,656,721$ 3,333,626$ -$ 71,802,672$ -$ 1,422,764$ (984,330)$ -$ 175,136$ 162,388,376$
DES MOINES PUBLIC SCHOOLS2016 - 2017 BUDGET
SUMMARY ALL FUNDS
FISCAL YEAR 2016 RE-ESTIMATED
SPECIAL REVENUE CAPITAL PROJECTS ENTERPRISE
2016 - 2017 Preliminary Budget 90

LOCAL STATEWIDE DEBT FOOD & CHILD GENERAL MANAGEMENT PPEL PERL ACTIVITY TRUST OPTION PENNY SERVICE NUTRITION CARE PRESCHOOL OTHER TOTAL
RevenuesProperty Taxes 92,954,619$ 11,540,553$ 6,507,056$ 810,497$ -$ -$ -$ -$ -$ -$ -$ -$ -$ 111,812,725Utility Replacement Tax 3,497,543 498,314 250,545 35,233 - - - - - - - - - 4,281,635State Foundation Aid 193,830,409 - - - - - - - - - - - - 193,830,409AEA Flow Through 13,829,063 - - - - - - - - - - - - 13,829,063Teacher Quality Act 21,033,898 - - - - - - - - - - - - 21,033,898Universal 4 Year Old Preschool 4,303,416 - - - - - - - - - - - - 4,303,416Early Intervention Supplement 2,833,238 - - - - - - - - - - - - 2,833,238Other State Sources 6,020,205 354,478 2,986 - - - - - - 155,438 - - - 6,533,107Mobile Home Taxes 96,460 12,772 6,704 1,005 - - - - - - - - - 116,941Commercial & Industrial State Replacement 2,364,276 298,137 149,899 21,080 - - - - - - - - - 2,833,392Chapter 1 Grants 11,394,063 - - - - - - - - - - - - 11,394,063Other Federal Sources 21,696,088 - 58,428 - - - - - - 16,972,065 - - - 38,726,581Tuition/Transportation Fees 7,566,302 - - - - - - - - - - - - 7,566,302Earnings on Investments 368,895 - 5,341 - - 65,622 - 89,159 - - - - - 529,017Student Activities 73,588 - - - 3,033,599 11,553 - - - - - - - 3,118,740Nutrition Program Sales - - - - - - - - - 2,131,098 - - - 2,131,098Sales and Use Tax - - - - - - - 30,744,831 - - - - - 30,744,831Other Revenue from Local Sources 13,935,170 - 8,400 442,716 - 108,824 - 304,726 - - 3,904,107 - 30,043 18,733,986Revenue from Intermediary Sources 767,420 - - - - - - - - - - - - 767,420Other Financing Sources - - - - - 200,959 - - - - - - - 200,959General Long-Term Debt Proceeds - - - - - - - - - - - - - 0Proceeds from Fixed Asset Disposition 86,867 - - - - - - - - (307) - - - 86,560Transfers In 33,252 - - - - - - - 18,626,480 - - - - 18,659,732
Total Revenues 396,684,772 12,704,254 6,989,359 1,310,531 3,033,599 386,958 - 31,138,716 18,626,480 19,258,294 3,904,107 - 30,043 494,067,112
ExpendituresInstruction 260,332,804 4,489,037 100,000 304,419 3,137,395 103,074 - - - - - - - 268,466,729Student Support Services 22,474,496 584,344 - - - - - - - - - - - 23,058,840Instructional Staff Support 14,958,745 - - - - - - - - - - - - 14,958,745General Administration 6,664,999 787,553 - - - - - - - - - - - 7,452,552Building Administration 21,142,500 283,005 - - - - - - - - - - - 21,425,505Business and Central Administration 15,629,072 - 602,517 - - - - - - - - - - 16,231,589Plant Operation & Maintenance 33,343,029 2,102,308 2,168,207 - - - - - - - - - - 37,613,544Student Transportation 9,712,461 1,480,522 783,526 - - - - - - - - - - 11,976,509Non-Instructional Expenditures 819,105 460,445 - 917,717 - - - - - 22,513,600 5,129,472 - 29,957 29,870,296Facilities Acquisition and Construction - - 4,695,055 111,601 - 787,362 - 39,156,019 - - - - - 44,750,037Debt Service - - - - - - - - 18,626,480 - - - - 18,626,480Other Financing Uses - - - - - - - - - - - - - - AEA Support 13,829,063 - - - - - - - - - - - - 13,829,063Transfers Out - - - - - - - 18,626,480 - - - - 33,252 18,659,732
Total Expenditures 398,906,274 10,187,214 8,349,305 1,333,738 3,137,395 890,436 - 57,782,499 18,626,480 22,513,600 5,129,472 - 63,209 526,919,621
Excess of Revenues over Expenditures (2,221,502) 2,517,040 (1,359,946) (23,207) (103,796) (503,478) - (26,643,783) - (3,255,306) (1,225,365) - (33,166) (32,852,509)Beginning Fund Balance 76,427,474 4,674,361 8,542,630 210,046 1,704,317 4,338,122 - 132,682,171 - 3,695,355 (269,020) - 223,485 232,228,940
Ending Fund Balance 74,205,972$ 7,191,401$ 7,182,684$ 186,839$ 1,600,521$ 3,834,644$ -$ 106,038,388$ -$ 440,049$ (1,494,385)$ -$ 190,319$ 199,376,432$
DES MOINES PUBLIC SCHOOLS2016 - 2017 BUDGET
SUMMARY ALL FUNDS
FISCAL YEAR 2015 ACTUAL
SPECIAL REVENUE CAPITAL PROJECTS ENTERPRISE
2016 - 2017 Preliminary Budget 91
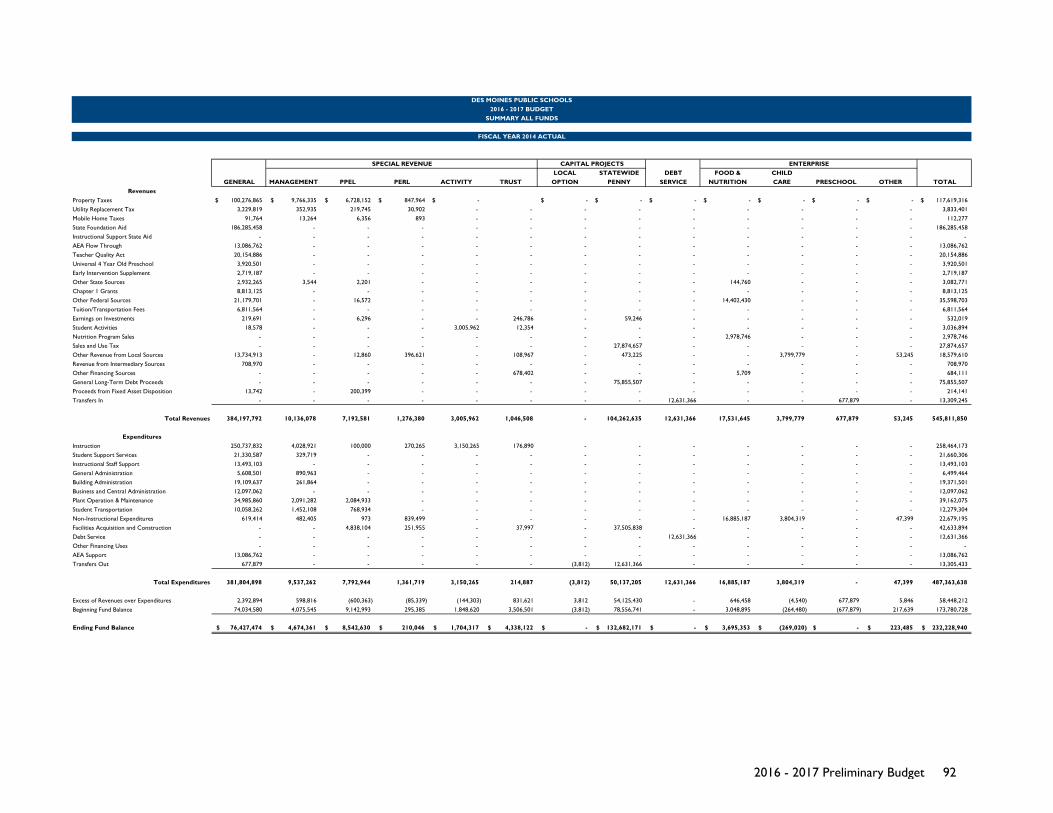
LOCAL STATEWIDE DEBT FOOD & CHILD GENERAL MANAGEMENT PPEL PERL ACTIVITY TRUST OPTION PENNY SERVICE NUTRITION CARE PRESCHOOL OTHER TOTAL
RevenuesProperty Taxes 100,276,865$ 9,766,335$ 6,728,152$ 847,964$ -$ -$ -$ -$ -$ -$ -$ -$ 117,619,316$ Utility Replacement Tax 3,229,819 352,935 219,745 30,902 - - - - - - - - - 3,833,401Mobile Home Taxes 91,764 13,264 6,356 893 - - - - - - - - - 112,277State Foundation Aid 186,285,458 - - - - - - - - - - - - 186,285,458Instructional Support State Aid - - - - - - - - - - - - - - AEA Flow Through 13,086,762 - - - - - - - - - - - - 13,086,762Teacher Quality Act 20,154,886 - - - - - - - - - - - - 20,154,886Universal 4 Year Old Preschool 3,920,501 - - - - - - - - - - - - 3,920,501Early Intervention Supplement 2,719,187 - - - - - - - - - - - - 2,719,187Other State Sources 2,932,265 3,544 2,201 - - - - - - 144,760 - - - 3,082,771Chapter 1 Grants 8,813,125 - - - - - - - - - - - - 8,813,125Other Federal Sources 21,179,701 - 16,572 - - - - - - 14,402,430 - - - 35,598,703Tuition/Transportation Fees 6,811,564 - - - - - - - - - - - - 6,811,564Earnings on Investments 219,691 - 6,296 - - 246,786 - 59,246 - - - - - 532,019Student Activities 18,578 - - - 3,005,962 12,354 - - - - - - - 3,036,894Nutrition Program Sales - - - - - - - - - 2,978,746 - - - 2,978,746Sales and Use Tax - - - - - - - 27,874,657 - - - - - 27,874,657Other Revenue from Local Sources 13,734,913 - 12,860 396,621 - 108,967 - 473,225 - - 3,799,779 - 53,245 18,579,610Revenue from Intermediary Sources 708,970 - - - - - - - - - - - - 708,970Other Financing Sources - - - - - 678,402 - - - 5,709 - - - 684,111General Long-Term Debt Proceeds - - - - - - - 75,855,507 - - - - - 75,855,507Proceeds from Fixed Asset Disposition 13,742 - 200,399 - - - - - - - - - - 214,141Transfers In - - - - - - - - 12,631,366 - - 677,879 - 13,309,245
Total Revenues 384,197,792 10,136,078 7,192,581 1,276,380 3,005,962 1,046,508 - 104,262,635 12,631,366 17,531,645 3,799,779 677,879 53,245 545,811,850
ExpendituresInstruction 250,737,832 4,028,921 100,000 270,265 3,150,265 176,890 - - - - - - - 258,464,173Student Support Services 21,330,587 329,719 - - - - - - - - - - - 21,660,306Instructional Staff Support 13,493,103 - - - - - - - - - - - - 13,493,103General Administration 5,608,501 890,963 - - - - - - - - - - - 6,499,464Building Administration 19,109,637 261,864 - - - - - - - - - - - 19,371,501Business and Central Administration 12,097,062 - - - - - - - - - - - - 12,097,062Plant Operation & Maintenance 34,985,860 2,091,282 2,084,933 - - - - - - - - - - 39,162,075Student Transportation 10,058,262 1,452,108 768,934 - - - - - - - - - - 12,279,304Non-Instructional Expenditures 619,414 482,405 973 839,499 - - - - - 16,885,187 3,804,319 - 47,399 22,679,195Facilities Acquisition and Construction - - 4,838,104 251,955 - 37,997 - 37,505,838 - - - - - 42,633,894Debt Service - - - - - - - - 12,631,366 - - - - 12,631,366Other Financing Uses - - - - - - - - - - - - - - AEA Support 13,086,762 - - - - - - - - - - - - 13,086,762Transfers Out 677,879 - - - - - (3,812) 12,631,366 - - - - - 13,305,433
Total Expenditures 381,804,898 9,537,262 7,792,944 1,361,719 3,150,265 214,887 (3,812) 50,137,205 12,631,366 16,885,187 3,804,319 - 47,399 487,363,638
Excess of Revenues over Expenditures 2,392,894 598,816 (600,363) (85,339) (144,303) 831,621 3,812 54,125,430 - 646,458 (4,540) 677,879 5,846 58,448,212Beginning Fund Balance 74,034,580 4,075,545 9,142,993 295,385 1,848,620 3,506,501 (3,812) 78,556,741 - 3,048,895 (264,480) (677,879) 217,639 173,780,728
Ending Fund Balance 76,427,474$ 4,674,361$ 8,542,630$ 210,046$ 1,704,317$ 4,338,122$ -$ 132,682,171$ -$ 3,695,353$ (269,020)$ -$ 223,485$ 232,228,940$
DES MOINES PUBLIC SCHOOLS2016 - 2017 BUDGET
SUMMARY ALL FUNDS
FISCAL YEAR 2014 ACTUAL
SPECIAL REVENUE CAPITAL PROJECTS ENTERPRISE
2016 - 2017 Preliminary Budget 92
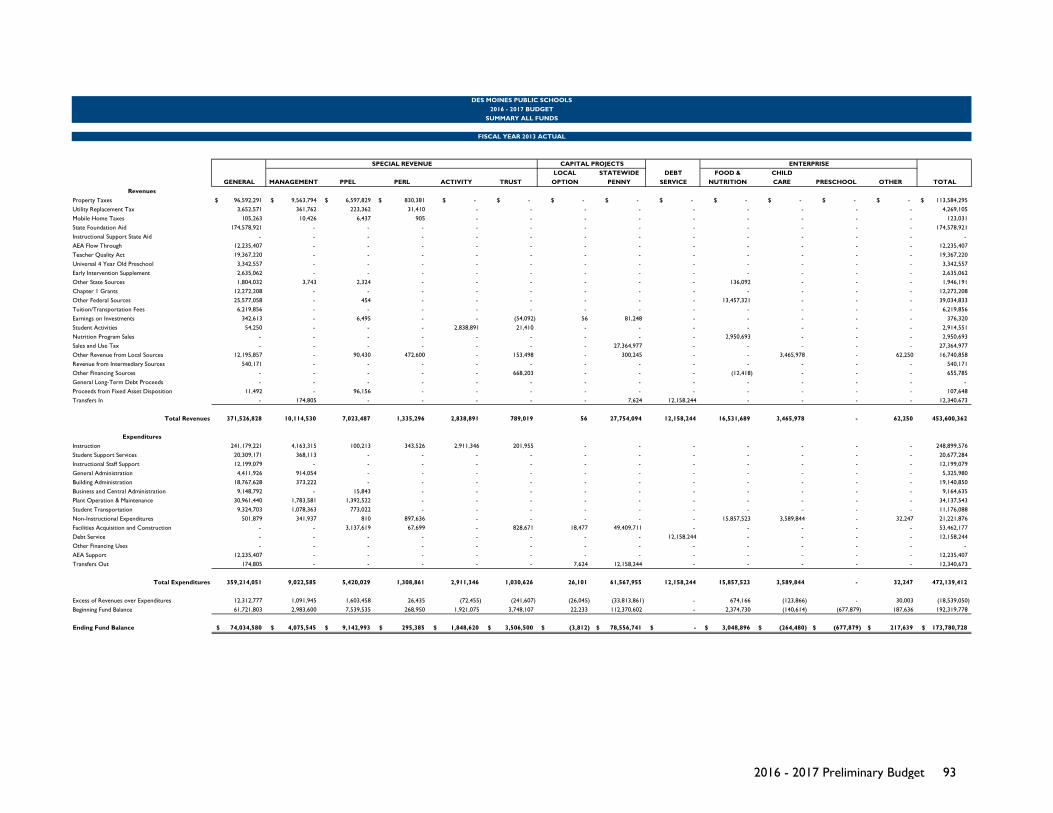
LOCAL STATEWIDE DEBT FOOD & CHILD GENERAL MANAGEMENT PPEL PERL ACTIVITY TRUST OPTION PENNY SERVICE NUTRITION CARE PRESCHOOL OTHER TOTAL
RevenuesProperty Taxes 96,592,291$ 9,563,794$ 6,597,829$ 830,381$ $ - $ - $ - $ - $ - $ - $ - $ - $ - 113,584,295$ Utility Replacement Tax 3,652,571 361,762 223,362 31,410 - - - - - - - - - 4,269,105Mobile Home Taxes 105,263 10,426 6,437 905 - - - - - - - - - 123,031State Foundation Aid 174,578,921 - - - - - - - - - - - - 174,578,921Instructional Support State Aid - - - - - - - - - - - - - - AEA Flow Through 12,235,407 - - - - - - - - - - - - 12,235,407Teacher Quality Act 19,367,220 - - - - - - - - - - - - 19,367,220Universal 4 Year Old Preschool 3,342,557 - - - - - - - - - - - - 3,342,557Early Intervention Supplement 2,635,062 - - - - - - - - - - - - 2,635,062Other State Sources 1,804,032 3,743 2,324 - - - - - - 136,092 - - - 1,946,191Chapter 1 Grants 12,272,208 - - - - - - - - - - - - 12,272,208Other Federal Sources 25,577,058 - 454 - - - - - - 13,457,321 - - - 39,034,833Tuition/Transportation Fees 6,219,856 - - - - - - - - - - - - 6,219,856Earnings on Investments 342,613 - 6,495 - - (54,092) 56 81,248 - - - - - 376,320Student Activities 54,250 - - - 2,838,891 21,410 - - - - - - - 2,914,551Nutrition Program Sales - - - - - - - - - 2,950,693 - - - 2,950,693Sales and Use Tax - - - - - - - 27,364,977 - - - - - 27,364,977Other Revenue from Local Sources 12,195,857 - 90,430 472,600 - 153,498 - 300,245 - - 3,465,978 - 62,250 16,740,858Revenue from Intermediary Sources 540,171 - - - - - - - - - - - - 540,171Other Financing Sources - - - - - 668,203 - - - (12,418) - - - 655,785General Long-Term Debt Proceeds - - - - - - - - - - - - - - Proceeds from Fixed Asset Disposition 11,492 - 96,156 - - - - - - - - - - 107,648Transfers In - 174,805 - - - - - 7,624 12,158,244 - - - - 12,340,673
Total Revenues 371,526,828 10,114,530 7,023,487 1,335,296 2,838,891 789,019 56 27,754,094 12,158,244 16,531,689 3,465,978 - 62,250 453,600,362
ExpendituresInstruction 241,179,221 4,163,315 100,213 343,526 2,911,346 201,955 - - - - - - - 248,899,576Student Support Services 20,309,171 368,113 - - - - - - - - - - - 20,677,284Instructional Staff Support 12,199,079 - - - - - - - - - - - - 12,199,079General Administration 4,411,926 914,054 - - - - - - - - - - - 5,325,980Building Administration 18,767,628 373,222 - - - - - - - - - - - 19,140,850Business and Central Administration 9,148,792 - 15,843 - - - - - - - - - - 9,164,635Plant Operation & Maintenance 30,961,440 1,783,581 1,392,522 - - - - - - - - - - 34,137,543Student Transportation 9,324,703 1,078,363 773,022 - - - - - - - - - - 11,176,088Non-Instructional Expenditures 501,879 341,937 810 897,636 - - - - - 15,857,523 3,589,844 - 32,247 21,221,876Facilities Acquisition and Construction - - 3,137,619 67,699 - 828,671 18,477 49,409,711 - - - - - 53,462,177Debt Service - - - - - - - - 12,158,244 - - - - 12,158,244Other Financing Uses - - - - - - - - - - - - - - AEA Support 12,235,407 - - - - - - - - - - - - 12,235,407Transfers Out 174,805 - - - - - 7,624 12,158,244 - - - - - 12,340,673
Total Expenditures 359,214,051 9,022,585 5,420,029 1,308,861 2,911,346 1,030,626 26,101 61,567,955 12,158,244 15,857,523 3,589,844 - 32,247 472,139,412
Excess of Revenues over Expenditures 12,312,777 1,091,945 1,603,458 26,435 (72,455) (241,607) (26,045) (33,813,861) - 674,166 (123,866) - 30,003 (18,539,050)Beginning Fund Balance 61,721,803 2,983,600 7,539,535 268,950 1,921,075 3,748,107 22,233 112,370,602 - 2,374,730 (140,614) (677,879) 187,636 192,319,778
Ending Fund Balance 74,034,580$ 4,075,545$ 9,142,993$ 295,385$ 1,848,620$ 3,506,500$ (3,812)$ 78,556,741$ -$ 3,048,896$ (264,480)$ (677,879)$ 217,639$ 173,780,728$
DES MOINES PUBLIC SCHOOLS2016 - 2017 BUDGET
SUMMARY ALL FUNDS
FISCAL YEAR 2013 ACTUAL
SPECIAL REVENUE CAPITAL PROJECTS ENTERPRISE
2016 - 2017 Preliminary Budget 93
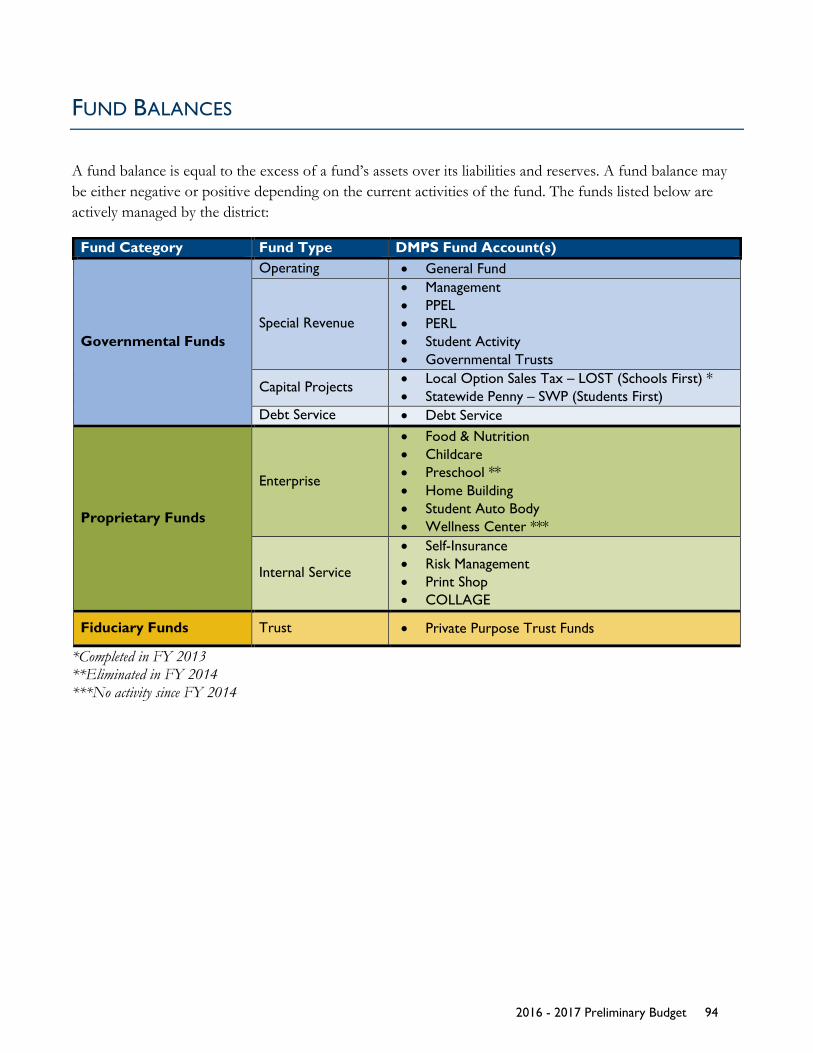
FUND BALANCES
A fund balance is equal to the excess of a fund’s assets over its liabilities and reserves. A fund balance may be either negative or positive depending on the current activities of the fund. The funds listed below are actively managed by the district:
Fund Category Fund Type DMPS Fund Account(s)
Governmental Funds
Operating • General Fund
Special Revenue
• Management • PPEL • PERL • Student Activity • Governmental Trusts
Capital Projects • Local Option Sales Tax – LOST (Schools First) * • Statewide Penny – SWP (Students First)
Debt Service • Debt Service
Proprietary Funds
Enterprise
• Food & Nutrition • Childcare • Preschool ** • Home Building • Student Auto Body • Wellness Center ***
Internal Service
• Self-Insurance • Risk Management • Print Shop • COLLAGE
Fiduciary Funds Trust • Private Purpose Trust Funds
*Completed in FY 2013 **Eliminated in FY 2014 ***No activity since FY 2014
2016 - 2017 Preliminary Budget 94
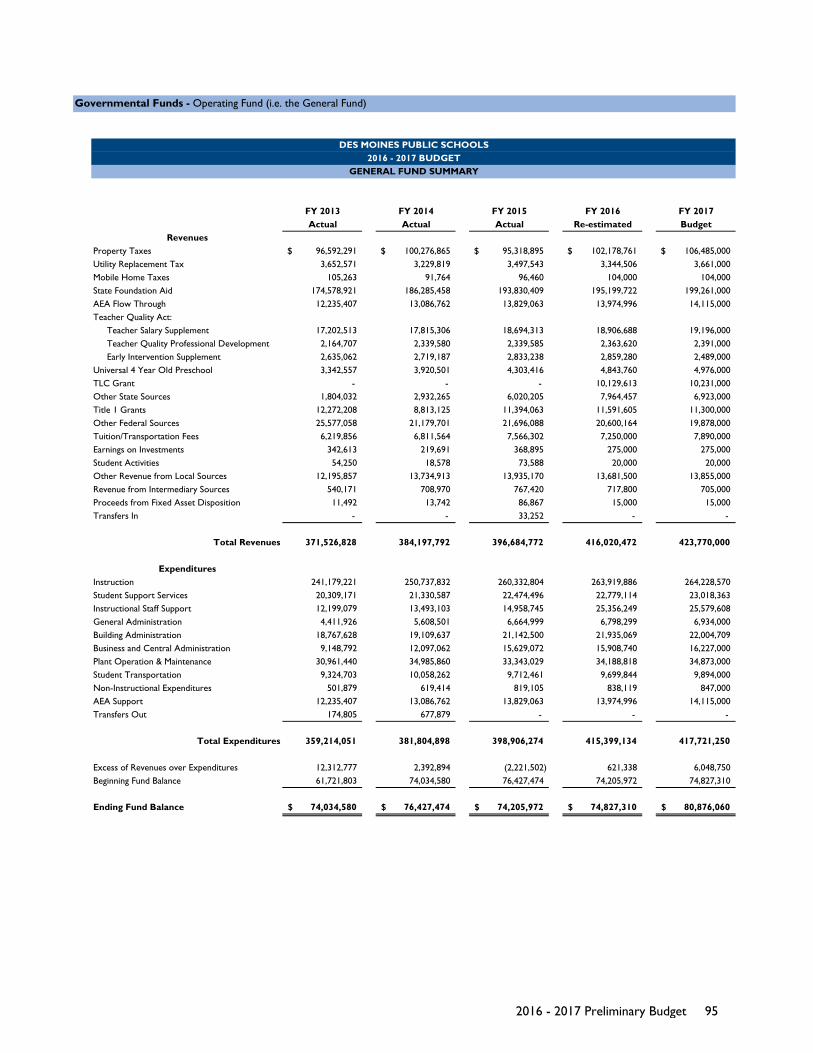
FY 2013 FY 2014 FY 2015 FY 2016 FY 2017Actual Actual Actual Re-estimated Budget
Property Taxes 96,592,291$ 100,276,865$ 95,318,895$ 102,178,761$ 106,485,000$ Utility Replacement Tax 3,652,571 3,229,819 3,497,543 3,344,506 3,661,000 Mobile Home Taxes 105,263 91,764 96,460 104,000 104,000 State Foundation Aid 174,578,921 186,285,458 193,830,409 195,199,722 199,261,000 AEA Flow Through 12,235,407 13,086,762 13,829,063 13,974,996 14,115,000 Teacher Quality Act:
Teacher Salary Supplement 17,202,513 17,815,306 18,694,313 18,906,688 19,196,000 Teacher Quality Professional Development 2,164,707 2,339,580 2,339,585 2,363,620 2,391,000 Early Intervention Supplement 2,635,062 2,719,187 2,833,238 2,859,280 2,489,000
Universal 4 Year Old Preschool 3,342,557 3,920,501 4,303,416 4,843,760 4,976,000 TLC Grant - - - 10,129,613 10,231,000 Other State Sources 1,804,032 2,932,265 6,020,205 7,964,457 6,923,000 Title 1 Grants 12,272,208 8,813,125 11,394,063 11,591,605 11,300,000 Other Federal Sources 25,577,058 21,179,701 21,696,088 20,600,164 19,878,000 Tuition/Transportation Fees 6,219,856 6,811,564 7,566,302 7,250,000 7,890,000 Earnings on Investments 342,613 219,691 368,895 275,000 275,000 Student Activities 54,250 18,578 73,588 20,000 20,000 Other Revenue from Local Sources 12,195,857 13,734,913 13,935,170 13,681,500 13,855,000 Revenue from Intermediary Sources 540,171 708,970 767,420 717,800 705,000 Proceeds from Fixed Asset Disposition 11,492 13,742 86,867 15,000 15,000 Transfers In - - 33,252 - -
Total Revenues 371,526,828 384,197,792 396,684,772 416,020,472 423,770,000
Instruction 241,179,221 250,737,832 260,332,804 263,919,886 264,228,570 Student Support Services 20,309,171 21,330,587 22,474,496 22,779,114 23,018,363 Instructional Staff Support 12,199,079 13,493,103 14,958,745 25,356,249 25,579,608 General Administration 4,411,926 5,608,501 6,664,999 6,798,299 6,934,000 Building Administration 18,767,628 19,109,637 21,142,500 21,935,069 22,004,709 Business and Central Administration 9,148,792 12,097,062 15,629,072 15,908,740 16,227,000 Plant Operation & Maintenance 30,961,440 34,985,860 33,343,029 34,188,818 34,873,000 Student Transportation 9,324,703 10,058,262 9,712,461 9,699,844 9,894,000 Non-Instructional Expenditures 501,879 619,414 819,105 838,119 847,000 AEA Support 12,235,407 13,086,762 13,829,063 13,974,996 14,115,000 Transfers Out 174,805 677,879 - - -
Total Expenditures 359,214,051 381,804,898 398,906,274 415,399,134 417,721,250
Excess of Revenues over Expenditures 12,312,777 2,392,894 (2,221,502) 621,338 6,048,750 Beginning Fund Balance 61,721,803 74,034,580 76,427,474 74,205,972 74,827,310
Ending Fund Balance 74,034,580$ 76,427,474$ 74,205,972$ 74,827,310$ 80,876,060$
Revenues
Expenditures
Governmental Funds - Operating Fund (i.e. the General Fund)
DES MOINES PUBLIC SCHOOLS2016 - 2017 BUDGET
GENERAL FUND SUMMARY
2016 - 2017 Preliminary Budget 95
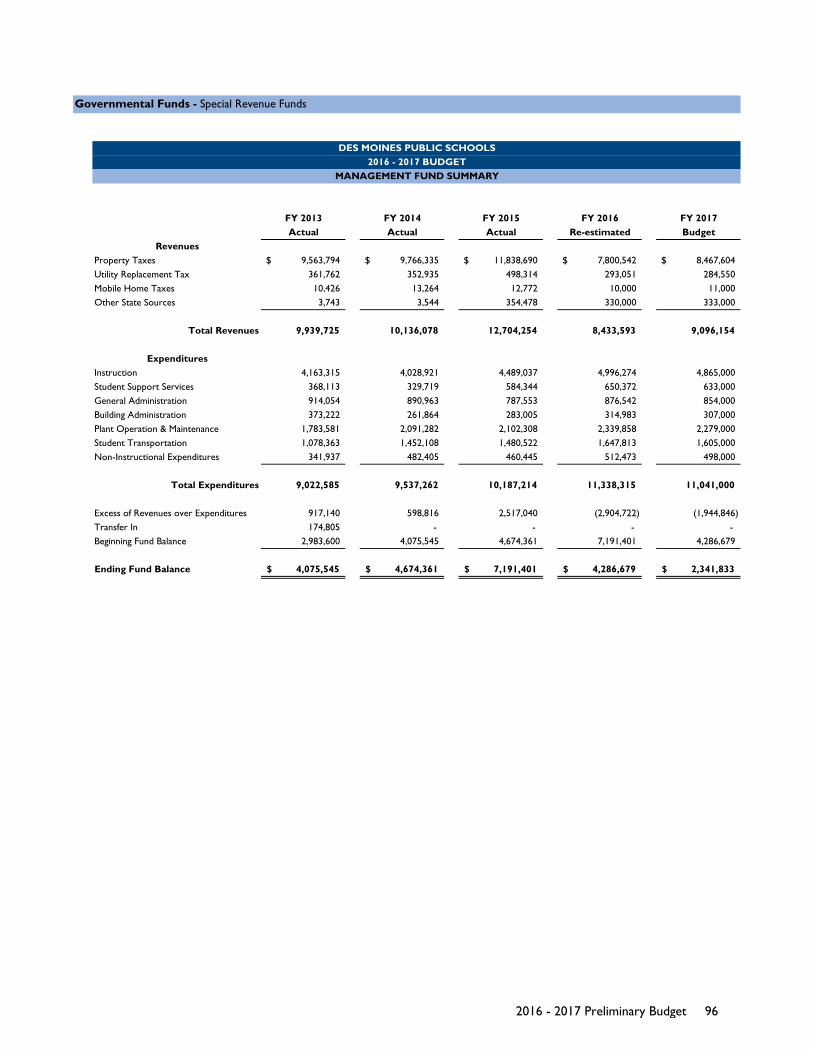
FY 2013 FY 2014 FY 2015 FY 2016 FY 2017Actual Actual Actual Re-estimated Budget
RevenuesProperty Taxes 9,563,794$ 9,766,335$ 11,838,690$ 7,800,542$ 8,467,604$ Utility Replacement Tax 361,762 352,935 498,314 293,051 284,550Mobile Home Taxes 10,426 13,264 12,772 10,000 11,000Other State Sources 3,743 3,544 354,478 330,000 333,000
Total Revenues 9,939,725 10,136,078 12,704,254 8,433,593 9,096,154
ExpendituresInstruction 4,163,315 4,028,921 4,489,037 4,996,274 4,865,000Student Support Services 368,113 329,719 584,344 650,372 633,000General Administration 914,054 890,963 787,553 876,542 854,000Building Administration 373,222 261,864 283,005 314,983 307,000Plant Operation & Maintenance 1,783,581 2,091,282 2,102,308 2,339,858 2,279,000Student Transportation 1,078,363 1,452,108 1,480,522 1,647,813 1,605,000Non-Instructional Expenditures 341,937 482,405 460,445 512,473 498,000
Total Expenditures 9,022,585 9,537,262 10,187,214 11,338,315 11,041,000
Excess of Revenues over Expenditures 917,140 598,816 2,517,040 (2,904,722) (1,944,846)Transfer In 174,805 - - - - Beginning Fund Balance 2,983,600 4,075,545 4,674,361 7,191,401 4,286,679
Ending Fund Balance 4,075,545$ 4,674,361$ 7,191,401$ 4,286,679$ 2,341,833$
Governmental Funds - Special Revenue Funds
DES MOINES PUBLIC SCHOOLS2016 - 2017 BUDGET
MANAGEMENT FUND SUMMARY
2016 - 2017 Preliminary Budget 96
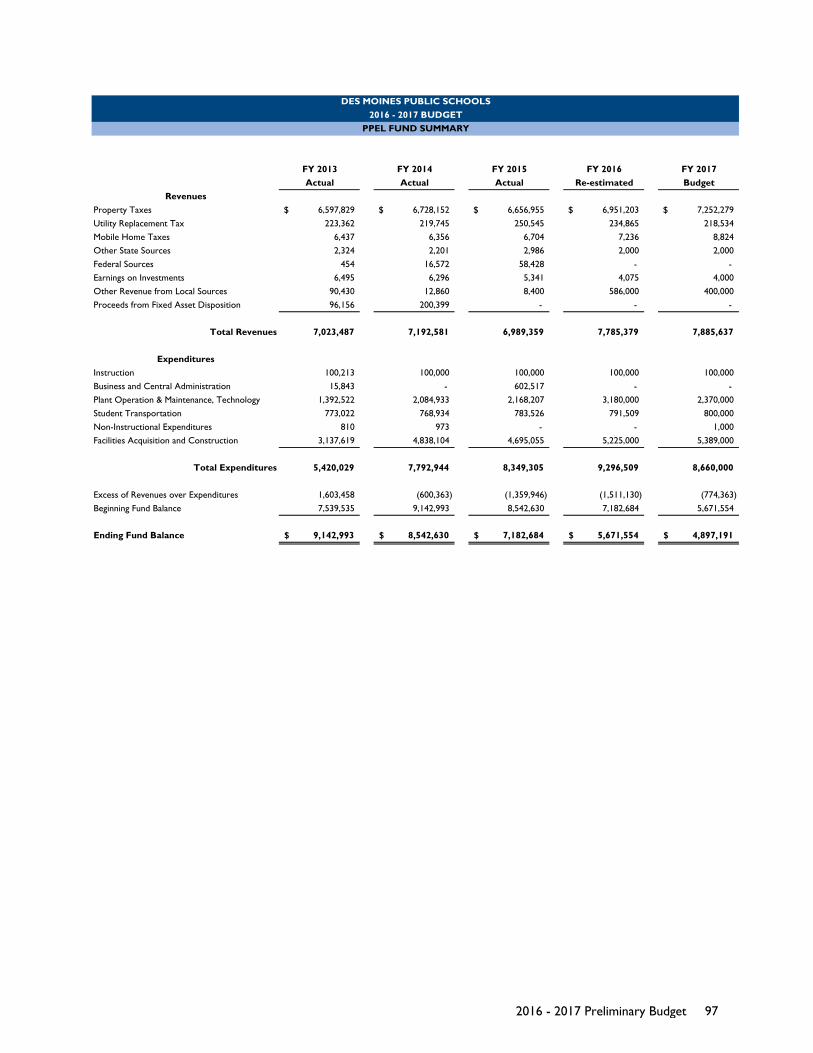
FY 2013 FY 2014 FY 2015 FY 2016 FY 2017Actual Actual Actual Re-estimated Budget
RevenuesProperty Taxes 6,597,829$ 6,728,152$ 6,656,955$ 6,951,203$ 7,252,279$ Utility Replacement Tax 223,362 219,745 250,545 234,865 218,534Mobile Home Taxes 6,437 6,356 6,704 7,236 8,824Other State Sources 2,324 2,201 2,986 2,000 2,000Federal Sources 454 16,572 58,428 - - Earnings on Investments 6,495 6,296 5,341 4,075 4,000Other Revenue from Local Sources 90,430 12,860 8,400 586,000 400,000Proceeds from Fixed Asset Disposition 96,156 200,399 - - -
Total Revenues 7,023,487 7,192,581 6,989,359 7,785,379 7,885,637
ExpendituresInstruction 100,213 100,000 100,000 100,000 100,000Business and Central Administration 15,843 - 602,517 - - Plant Operation & Maintenance, Technology 1,392,522 2,084,933 2,168,207 3,180,000 2,370,000Student Transportation 773,022 768,934 783,526 791,509 800,000Non-Instructional Expenditures 810 973 - - 1,000Facilities Acquisition and Construction 3,137,619 4,838,104 4,695,055 5,225,000 5,389,000
Total Expenditures 5,420,029 7,792,944 8,349,305 9,296,509 8,660,000
Excess of Revenues over Expenditures 1,603,458 (600,363) (1,359,946) (1,511,130) (774,363)Beginning Fund Balance 7,539,535 9,142,993 8,542,630 7,182,684 5,671,554
Ending Fund Balance 9,142,993$ 8,542,630$ 7,182,684$ 5,671,554$ 4,897,191$
DES MOINES PUBLIC SCHOOLS2016 - 2017 BUDGET
PPEL FUND SUMMARY
2016 - 2017 Preliminary Budget 97
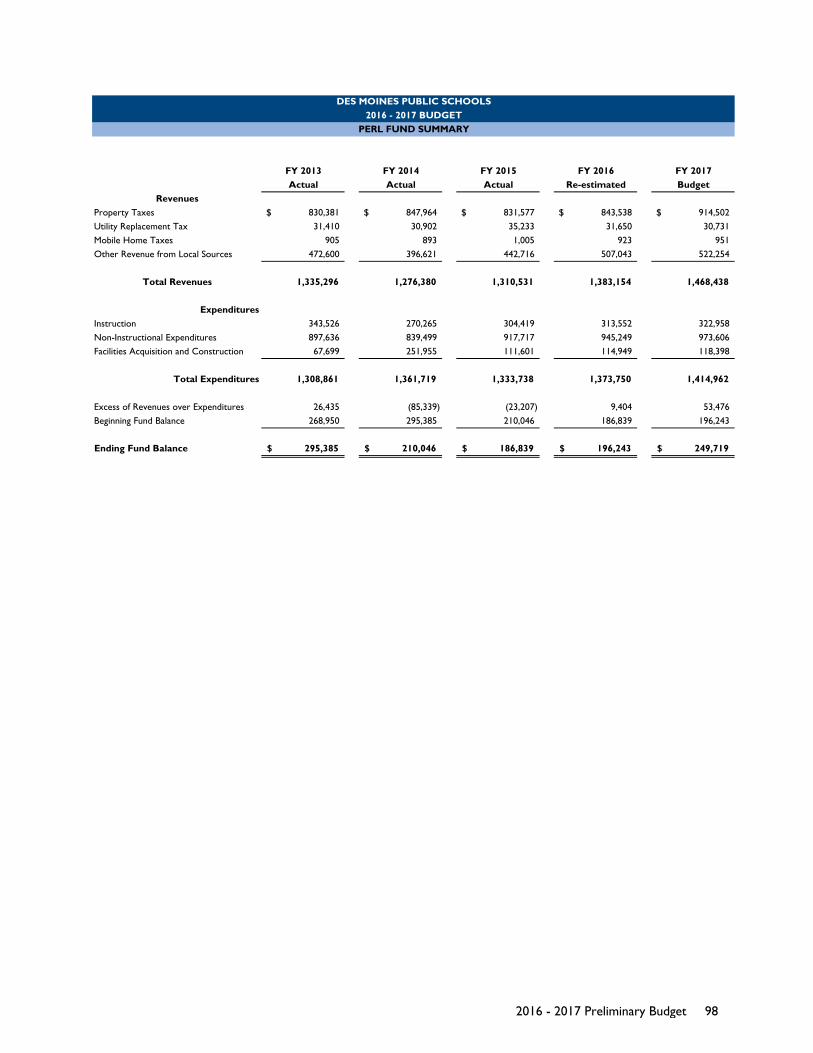
FY 2013 FY 2014 FY 2015 FY 2016 FY 2017Actual Actual Actual Re-estimated Budget
RevenuesProperty Taxes 830,381$ 847,964$ 831,577$ 843,538$ 914,502$ Utility Replacement Tax 31,410 30,902 35,233 31,650 30,731Mobile Home Taxes 905 893 1,005 923 951Other Revenue from Local Sources 472,600 396,621 442,716 507,043 522,254
Total Revenues 1,335,296 1,276,380 1,310,531 1,383,154 1,468,438
ExpendituresInstruction 343,526 270,265 304,419 313,552 322,958Non-Instructional Expenditures 897,636 839,499 917,717 945,249 973,606Facilities Acquisition and Construction 67,699 251,955 111,601 114,949 118,398
Total Expenditures 1,308,861 1,361,719 1,333,738 1,373,750 1,414,962
Excess of Revenues over Expenditures 26,435 (85,339) (23,207) 9,404 53,476Beginning Fund Balance 268,950 295,385 210,046 186,839 196,243
Ending Fund Balance 295,385$ 210,046$ 186,839$ 196,243$ 249,719$
DES MOINES PUBLIC SCHOOLS2016 - 2017 BUDGET
PERL FUND SUMMARY
2016 - 2017 Preliminary Budget 98
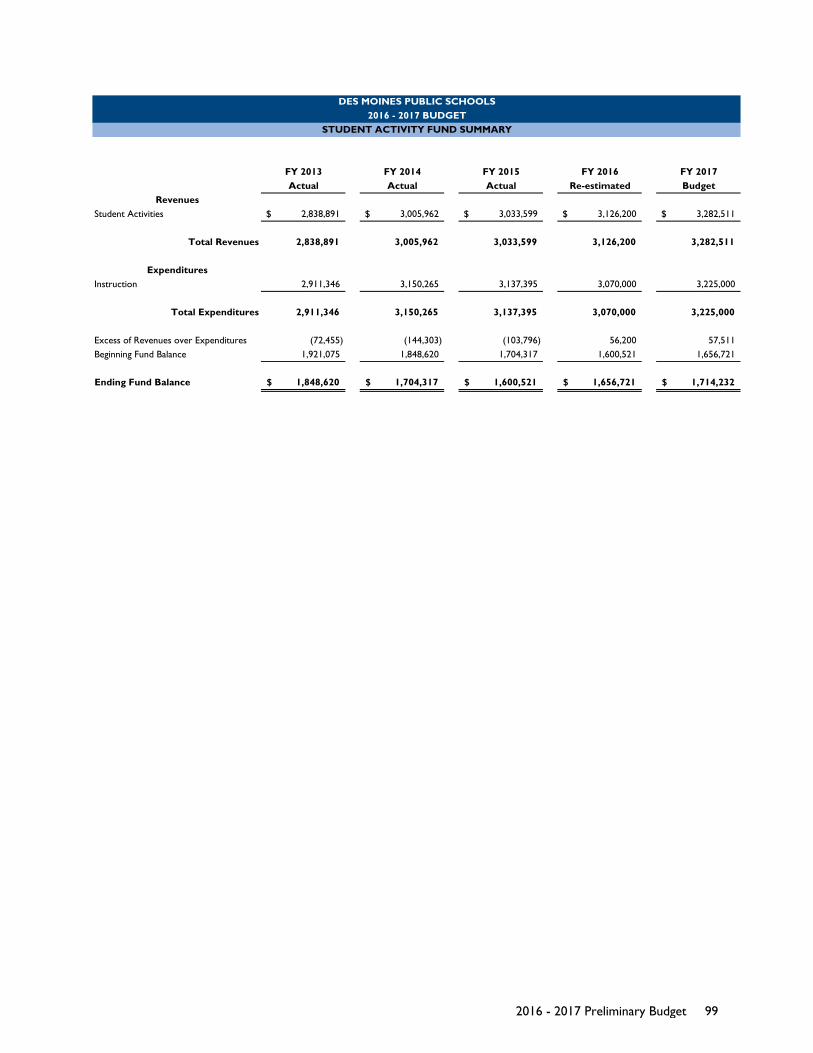
FY 2013 FY 2014 FY 2015 FY 2016 FY 2017Actual Actual Actual Re-estimated Budget
RevenuesStudent Activities 2,838,891$ 3,005,962$ 3,033,599$ 3,126,200$ 3,282,511$
Total Revenues 2,838,891 3,005,962 3,033,599 3,126,200 3,282,511
ExpendituresInstruction 2,911,346 3,150,265 3,137,395 3,070,000 3,225,000
Total Expenditures 2,911,346 3,150,265 3,137,395 3,070,000 3,225,000
Excess of Revenues over Expenditures (72,455) (144,303) (103,796) 56,200 57,511Beginning Fund Balance 1,921,075 1,848,620 1,704,317 1,600,521 1,656,721
Ending Fund Balance 1,848,620$ 1,704,317$ 1,600,521$ 1,656,721$ 1,714,232$
DES MOINES PUBLIC SCHOOLS2016 - 2017 BUDGET
STUDENT ACTIVITY FUND SUMMARY
2016 - 2017 Preliminary Budget 99

FY 2013 FY 2014 FY 2015 FY 2016 FY 2017Actual Actual Actual Re-estimated Budget
Earnings on InvestmentsInterest 1,301$ 1,402$ 2,030$ 1,221$ 1,221$ Dividends 77,499 59,619 63,592 70,697 70,000Change in Fair Market Value (132,892) 185,765 (233,985) - -
Student Activities 21,410 12,354 11,553 11,000 11,000Other Financing Sources 668,203 678,402 434,944 160,742 150,000Donations 153,498 108,967 108,824 93,592 90,000
Total Revenues 789,020 1,046,508 386,958 337,252 322,221
Instruction 201,955 176,890 103,074 88,450 89,000Facilities Acquisition and Construction 828,671 37,997 0 787,362 749,820 -
Total Expenditures 1,030,626 214,887 890,436 838,270 89,000
Excess of Revenues over Expenditures (241,606) 831,621 (503,478) (501,018) 233,221Beginning Fund Balance 3,748,107 3,506,501 4,338,122 3,834,644 3,333,626
Ending Fund Balance 3,506,501$ 4,338,122$ 3,834,644$ 3,333,626$ 3,566,847$
Revenues
Expenditures
DES MOINES PUBLIC SCHOOLS2016 - 2017 BUDGET
COMBINED GOVERNMENTAL TRUST FUNDS SUMMARY
2016 - 2017 Preliminary Budget 100
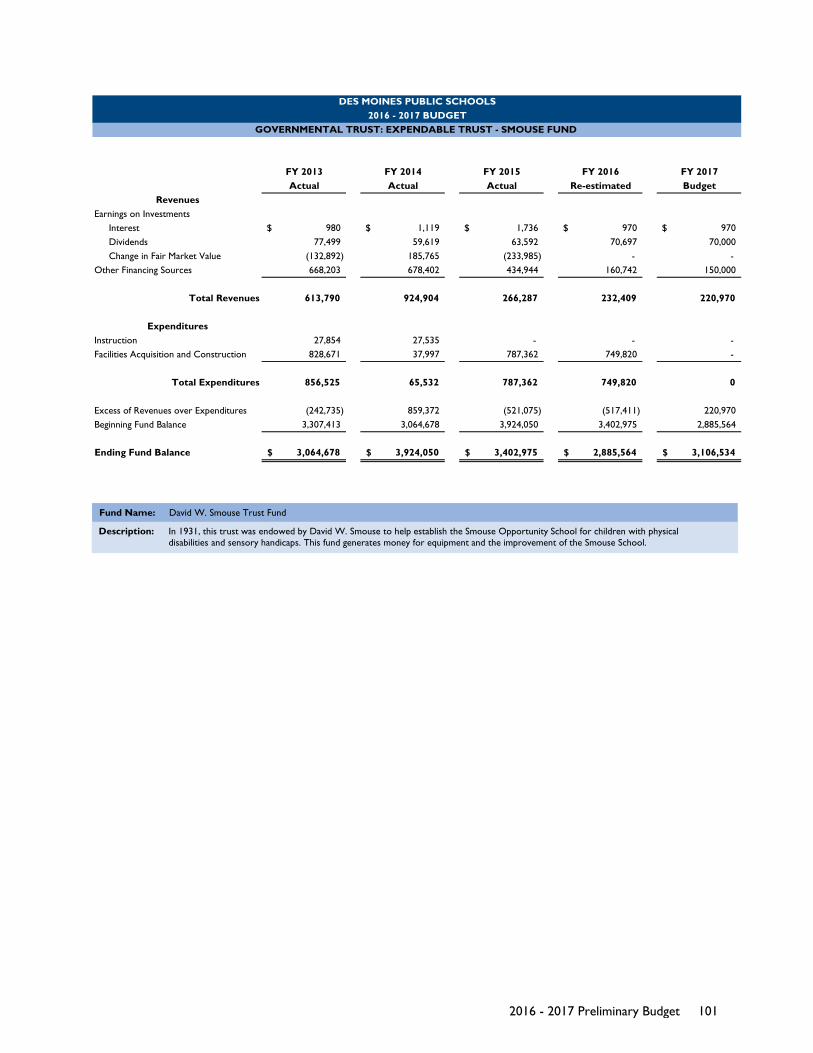
FY 2013 FY 2014 FY 2015 FY 2016 FY 2017Actual Actual Actual Re-estimated Budget
Earnings on InvestmentsInterest 980$ 1,119$ 1,736$ 970$ 970$ Dividends 77,499 59,619 63,592 70,697 70,000Change in Fair Market Value (132,892) 185,765 (233,985) - -
Other Financing Sources 668,203 678,402 434,944 160,742 150,000
Total Revenues 613,790 924,904 266,287 232,409 220,970
Instruction 27,854 27,535 - - - Facilities Acquisition and Construction 828,671 37,997 787,362 749,820 -
Total Expenditures 856,525 65,532 787,362 749,820 0
Excess of Revenues over Expenditures (242,735) 859,372 (521,075) (517,411) 220,970Beginning Fund Balance 3,307,413 3,064,678 3,924,050 3,402,975 2,885,564
Ending Fund Balance 3,064,678$ 3,924,050$ 3,402,975$ 2,885,564$ 3,106,534$
Revenues
Expenditures
DES MOINES PUBLIC SCHOOLS2016 - 2017 BUDGET
GOVERNMENTAL TRUST: EXPENDABLE TRUST - SMOUSE FUND
Fund Name: David W. Smouse Trust Fund
Description: In 1931, this trust was endowed by David W. Smouse to help establish the Smouse Opportunity School for children with physical disabilities and sensory handicaps. This fund generates money for equipment and the improvement of the Smouse School.
2016 - 2017 Preliminary Budget 101
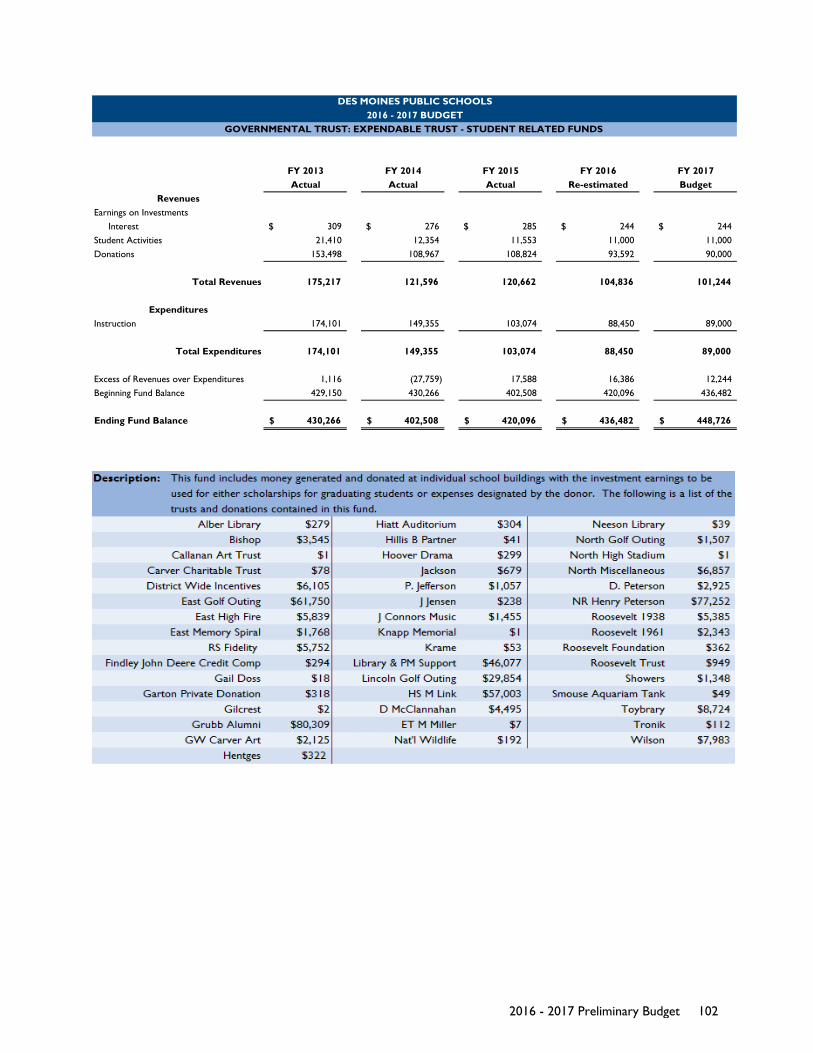
FY 2013 FY 2014 FY 2015 FY 2016 FY 2017Actual Actual Actual Re-estimated Budget
Earnings on InvestmentsInterest 309$ 276$ 285$ 244$ 244$
Student Activities 21,410 12,354 11,553 11,000 11,000Donations 153,498 108,967 108,824 93,592 90,000
Total Revenues 175,217 121,596 120,662 104,836 101,244
Instruction 174,101 149,355 103,074 88,450 89,000
Total Expenditures 174,101 149,355 103,074 88,450 89,000
Excess of Revenues over Expenditures 1,116 (27,759) 17,588 16,386 12,244Beginning Fund Balance 429,150 430,266 402,508 420,096 436,482
Ending Fund Balance 430,266$ 402,508$ 420,096$ 436,482$ 448,726$
Revenues
Expenditures
DES MOINES PUBLIC SCHOOLS2016 - 2017 BUDGET
GOVERNMENTAL TRUST: EXPENDABLE TRUST - STUDENT RELATED FUNDS
2016 - 2017 Preliminary Budget 102
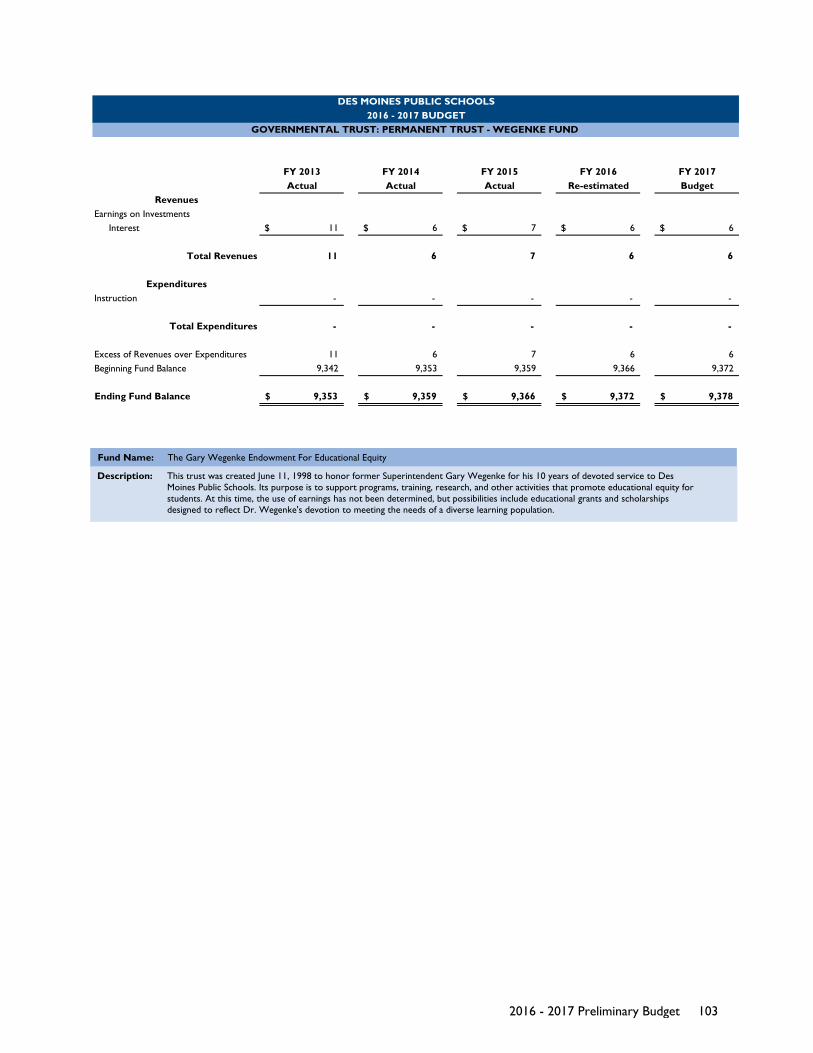
FY 2013 FY 2014 FY 2015 FY 2016 FY 2017Actual Actual Actual Re-estimated Budget
Earnings on InvestmentsInterest 11$ 6$ 7$ 6$ 6$
Total Revenues 11 6 7 6 6
Instruction - - - - -
Total Expenditures - - - - -
Excess of Revenues over Expenditures 11 6 7 6 6Beginning Fund Balance 9,342 9,353 9,359 9,366 9,372
Ending Fund Balance 9,353$ 9,359$ 9,366$ 9,372$ 9,378$
Revenues
Expenditures
DES MOINES PUBLIC SCHOOLS2016 - 2017 BUDGET
GOVERNMENTAL TRUST: PERMANENT TRUST - WEGENKE FUND
Fund Name: The Gary Wegenke Endowment For Educational Equity
Description: This trust was created June 11, 1998 to honor former Superintendent Gary Wegenke for his 10 years of devoted service to Des Moines Public Schools. Its purpose is to support programs, training, research, and other activities that promote educational equity for students. At this time, the use of earnings has not been determined, but possibilities include educational grants and scholarships designed to reflect Dr. Wegenke's devotion to meeting the needs of a diverse learning population.
2016 - 2017 Preliminary Budget 103
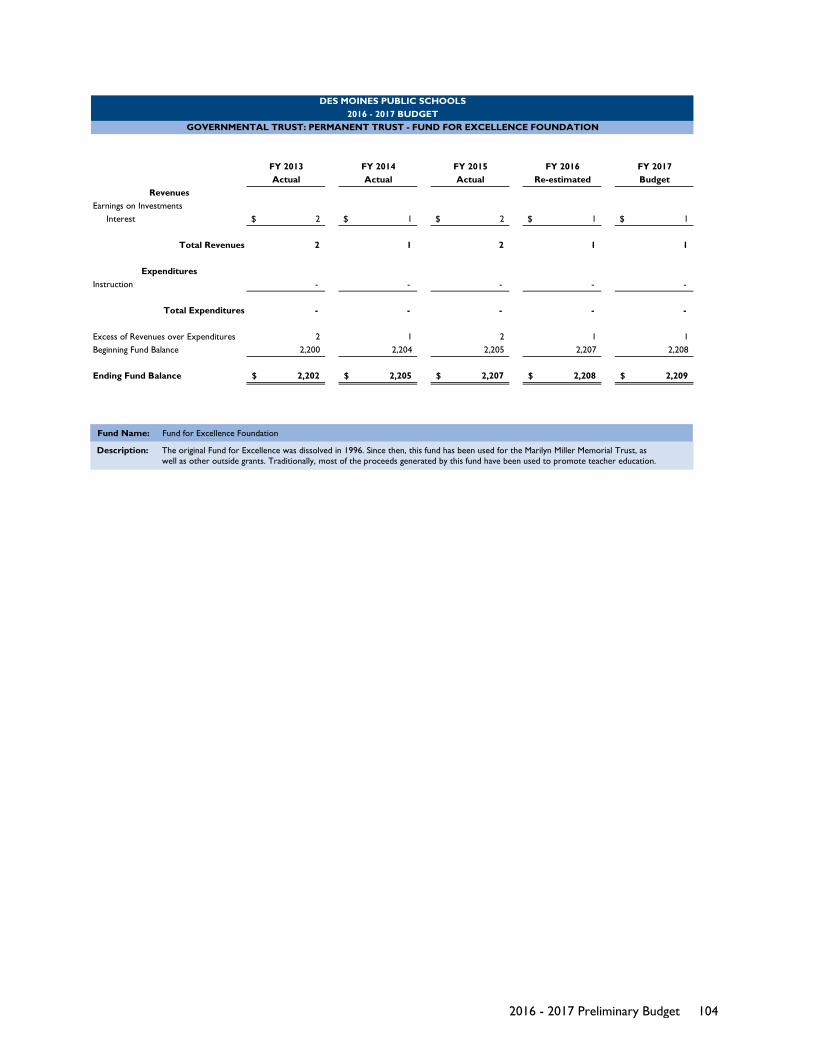
FY 2013 FY 2014 FY 2015 FY 2016 FY 2017Actual Actual Actual Re-estimated Budget
Earnings on InvestmentsInterest 2$ 1$ 2$ 1$ 1$
Total Revenues 2 1 2 1 1
Instruction - - - - -
Total Expenditures - - - - -
Excess of Revenues over Expenditures 2 1 2 1 1Beginning Fund Balance 2,200 2,204 2,205 2,207 2,208
Ending Fund Balance 2,202$ 2,205$ 2,207$ 2,208$ 2,209$
Revenues
Expenditures
DES MOINES PUBLIC SCHOOLS2016 - 2017 BUDGET
GOVERNMENTAL TRUST: PERMANENT TRUST - FUND FOR EXCELLENCE FOUNDATION
Fund Name: Fund for Excellence Foundation
Description: The original Fund for Excellence was dissolved in 1996. Since then, this fund has been used for the Marilyn Miller Memorial Trust, as well as other outside grants. Traditionally, most of the proceeds generated by this fund have been used to promote teacher education.
2016 - 2017 Preliminary Budget 104

FY 2013 FY 2014 FY 2015 FY 2016 FY 2017Actual Actual Actual Re-estimated Budget
RevenuesEarnings on Investments 56$ $ - $ - $ - $ - Sales and Use Tax - - - - - Other Revenue From Local Sources - - - - - Transfers in - - - - -
Total Revenues 56 - - - -
ExpendituresFacilities Acquisitions and Construction 18,477 - - - - Transfers Out 7,624 (3,812) - - -
Total Expenditures 26,101 (3,812) - - -
Excess of Revenues over Expenditures (26,045) 3,812 - - - Beginning Fund Balance 22,233 (3,812) - - -
Ending Fund Balance (3,812)$ - - - -
The Local Option Sales Tax funding was replaced by the Statewide Penny funding. Fund completed in FY 2013.
Governmental Funds - Capital Projects Funds
DES MOINES PUBLIC SCHOOLS2016 - 2017 BUDGET
LOCAL OPTION SALES TAX (LOST) FUND SUMMARY
2016 - 2017 Preliminary Budget 105

FY 2013 FY 2014 FY 2015 FY 2016 FY 2017Actual Actual Actual Re-estimated Budget
RevenuesEarnings on Investments 81,248$ 59,246$ 89,159$ 59,200$ 59,200$ Sales and Use Tax 27,364,977 27,874,657 30,744,831 30,928,904 30,928,904Other Revenue from Local Sources 300,245 473,225 304,726 350,000 200,000General Long-Term Debt Proceeds - 75,855,507 - - - Transfers In 7,624 - - - -
Total Revenues 27,754,094 104,262,635 31,138,716 31,338,104 31,188,104
ExpendituresFacilities Acquisition and Construction 49,409,711 37,505,838 39,156,019 47,075,000 33,505,000Transfers Out 12,158,244 12,631,366 18,626,480 18,498,820 18,375,170
Total Expenditures 61,567,955 50,137,205 57,782,499 65,573,820 51,880,170
Excess of Revenues over Expenditures (33,813,861) 54,125,430 (26,643,783) (34,235,716) (20,692,066)Beginning Fund Balance 112,370,602 78,556,741 132,682,171 106,038,388 71,802,672
Ending Fund Balance 78,556,741$ 132,682,171$ 106,038,388$ 71,802,672$ 51,110,606$
DES MOINES PUBLIC SCHOOLS2016 - 2017 BUDGET
STATEWIDE PENNY (SWP) FUND SUMMARY
2016 - 2017 Preliminary Budget 106
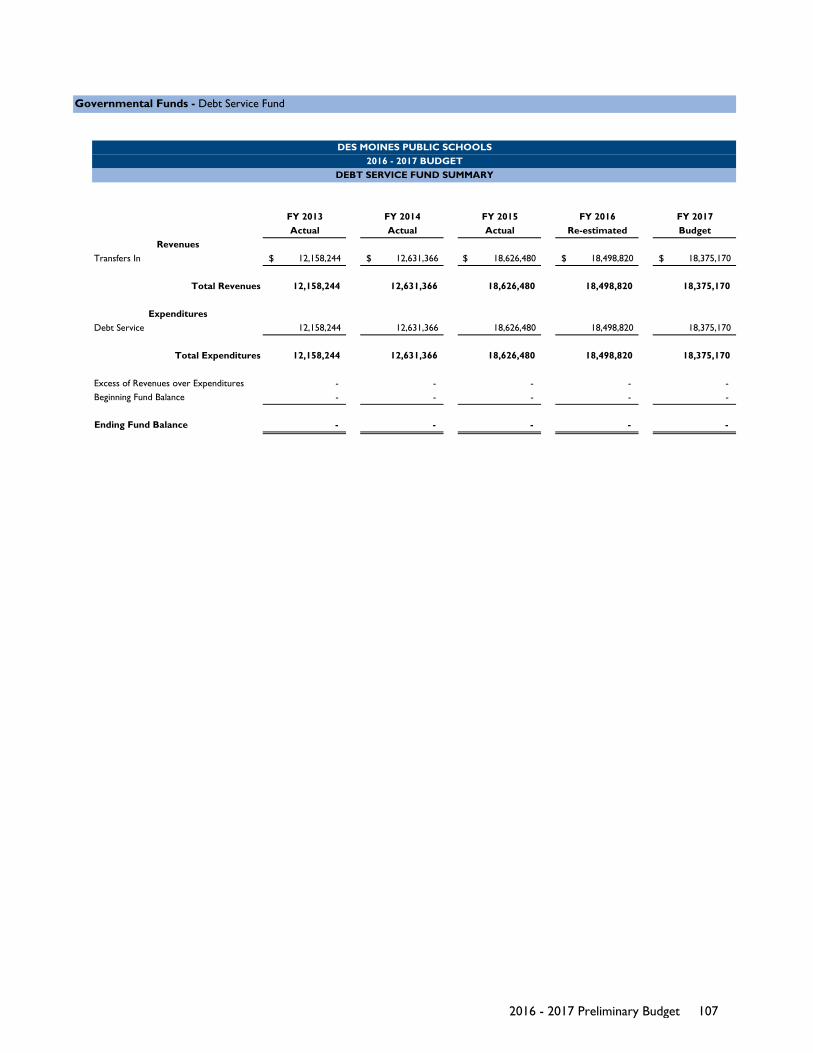
FY 2013 FY 2014 FY 2015 FY 2016 FY 2017Actual Actual Actual Re-estimated Budget
RevenuesTransfers In 12,158,244$ 12,631,366$ 18,626,480$ 18,498,820$ 18,375,170$
Total Revenues 12,158,244 12,631,366 18,626,480 18,498,820 18,375,170
ExpendituresDebt Service 12,158,244 12,631,366 18,626,480 18,498,820 18,375,170
Total Expenditures 12,158,244 12,631,366 18,626,480 18,498,820 18,375,170
Excess of Revenues over Expenditures - - - - - Beginning Fund Balance - - - - -
Ending Fund Balance - - - - -
Governmental Funds - Debt Service Fund
DES MOINES PUBLIC SCHOOLS2016 - 2017 BUDGET
DEBT SERVICE FUND SUMMARY
2016 - 2017 Preliminary Budget 107
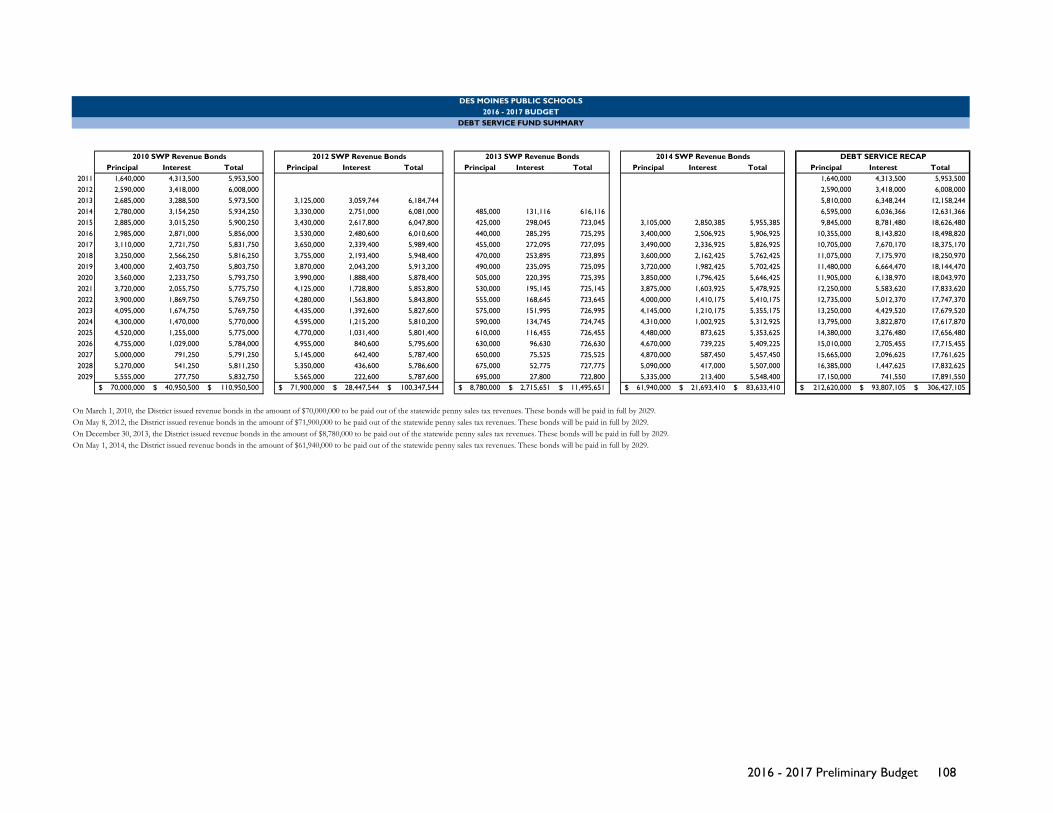
Principal Interest Total Principal Interest Total Principal Interest Total Principal Interest Total Principal Interest Total2011 1,640,000 4,313,500 5,953,500 1,640,000 4,313,500 5,953,5002012 2,590,000 3,418,000 6,008,000 2,590,000 3,418,000 6,008,0002013 2,685,000 3,288,500 5,973,500 3,125,000 3,059,744 6,184,744 5,810,000 6,348,244 12,158,2442014 2,780,000 3,154,250 5,934,250 3,330,000 2,751,000 6,081,000 485,000 131,116 616,116 6,595,000 6,036,366 12,631,3662015 2,885,000 3,015,250 5,900,250 3,430,000 2,617,800 6,047,800 425,000 298,045 723,045 3,105,000 2,850,385 5,955,385 9,845,000 8,781,480 18,626,4802016 2,985,000 2,871,000 5,856,000 3,530,000 2,480,600 6,010,600 440,000 285,295 725,295 3,400,000 2,506,925 5,906,925 10,355,000 8,143,820 18,498,8202017 3,110,000 2,721,750 5,831,750 3,650,000 2,339,400 5,989,400 455,000 272,095 727,095 3,490,000 2,336,925 5,826,925 10,705,000 7,670,170 18,375,1702018 3,250,000 2,566,250 5,816,250 3,755,000 2,193,400 5,948,400 470,000 253,895 723,895 3,600,000 2,162,425 5,762,425 11,075,000 7,175,970 18,250,9702019 3,400,000 2,403,750 5,803,750 3,870,000 2,043,200 5,913,200 490,000 235,095 725,095 3,720,000 1,982,425 5,702,425 11,480,000 6,664,470 18,144,4702020 3,560,000 2,233,750 5,793,750 3,990,000 1,888,400 5,878,400 505,000 220,395 725,395 3,850,000 1,796,425 5,646,425 11,905,000 6,138,970 18,043,9702021 3,720,000 2,055,750 5,775,750 4,125,000 1,728,800 5,853,800 530,000 195,145 725,145 3,875,000 1,603,925 5,478,925 12,250,000 5,583,620 17,833,6202022 3,900,000 1,869,750 5,769,750 4,280,000 1,563,800 5,843,800 555,000 168,645 723,645 4,000,000 1,410,175 5,410,175 12,735,000 5,012,370 17,747,3702023 4,095,000 1,674,750 5,769,750 4,435,000 1,392,600 5,827,600 575,000 151,995 726,995 4,145,000 1,210,175 5,355,175 13,250,000 4,429,520 17,679,5202024 4,300,000 1,470,000 5,770,000 4,595,000 1,215,200 5,810,200 590,000 134,745 724,745 4,310,000 1,002,925 5,312,925 13,795,000 3,822,870 17,617,8702025 4,520,000 1,255,000 5,775,000 4,770,000 1,031,400 5,801,400 610,000 116,455 726,455 4,480,000 873,625 5,353,625 14,380,000 3,276,480 17,656,4802026 4,755,000 1,029,000 5,784,000 4,955,000 840,600 5,795,600 630,000 96,630 726,630 4,670,000 739,225 5,409,225 15,010,000 2,705,455 17,715,4552027 5,000,000 791,250 5,791,250 5,145,000 642,400 5,787,400 650,000 75,525 725,525 4,870,000 587,450 5,457,450 15,665,000 2,096,625 17,761,6252028 5,270,000 541,250 5,811,250 5,350,000 436,600 5,786,600 675,000 52,775 727,775 5,090,000 417,000 5,507,000 16,385,000 1,447,625 17,832,6252029 5,555,000 277,750 5,832,750 5,565,000 222,600 5,787,600 695,000 27,800 722,800 5,335,000 213,400 5,548,400 17,150,000 741,550 17,891,550
70,000,000$ 40,950,500$ 110,950,500$ 71,900,000$ 28,447,544$ 100,347,544$ 8,780,000$ 2,715,651$ 11,495,651$ 61,940,000$ 21,693,410$ 83,633,410$ 212,620,000$ 93,807,105$ 306,427,105$
On March 1, 2010, the District issued revenue bonds in the amount of $70,000,000 to be paid out of the statewide penny sales tax revenues. These bonds will be paid in full by 2029.On May 8, 2012, the District issued revenue bonds in the amount of $71,900,000 to be paid out of the statewide penny sales tax revenues. These bonds will be paid in full by 2029.On December 30, 2013, the District issued revenue bonds in the amount of $8,780,000 to be paid out of the statewide penny sales tax revenues. These bonds will be paid in full by 2029.On May 1, 2014, the District issued revenue bonds in the amount of $61,940,000 to be paid out of the statewide penny sales tax revenues. These bonds will be paid in full by 2029.
DES MOINES PUBLIC SCHOOLS2016 - 2017 BUDGET
DEBT SERVICE FUND SUMMARY
2010 SWP Revenue Bonds 2012 SWP Revenue Bonds 2013 SWP Revenue Bonds 2014 SWP Revenue Bonds DEBT SERVICE RECAP
2016 - 2017 Preliminary Budget 108
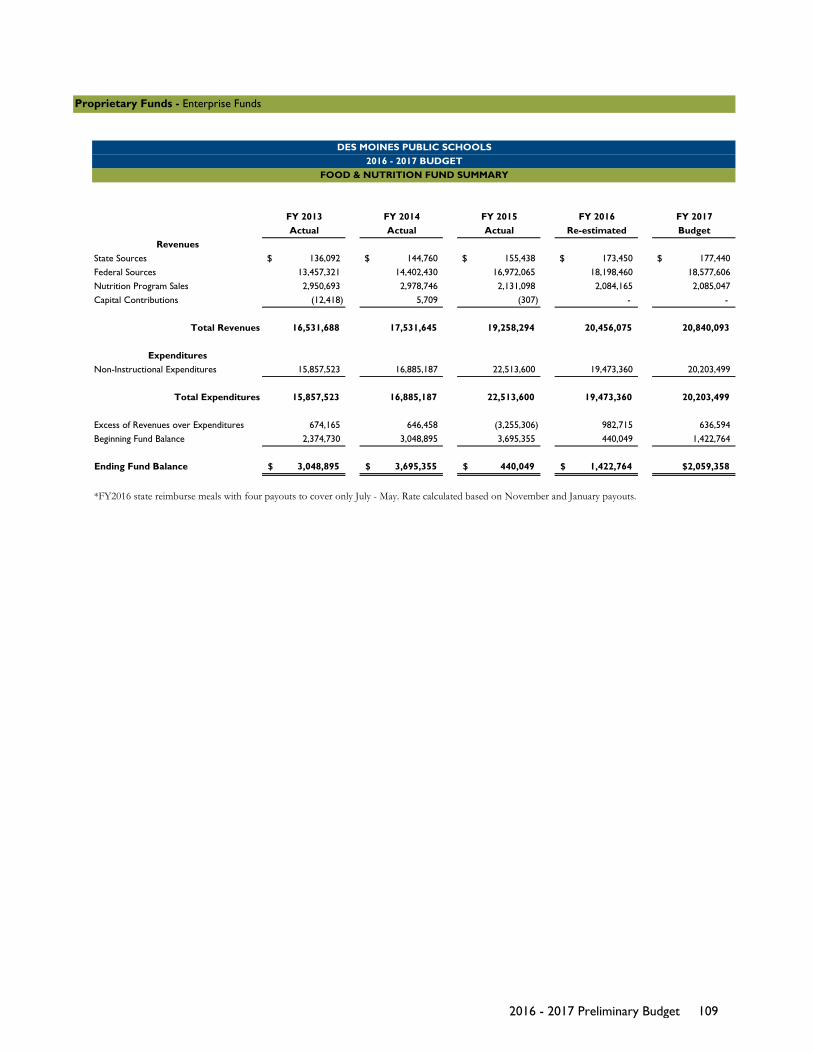
FY 2013 FY 2014 FY 2015 FY 2016 FY 2017Actual Actual Actual Re-estimated Budget
RevenuesState Sources 136,092$ 144,760$ 155,438$ 173,450$ 177,440$ Federal Sources 13,457,321 14,402,430 16,972,065 18,198,460 18,577,606Nutrition Program Sales 2,950,693 2,978,746 2,131,098 2,084,165 2,085,047Capital Contributions (12,418) 5,709 (307) - -
Total Revenues 16,531,688 17,531,645 19,258,294 20,456,075 20,840,093
ExpendituresNon-Instructional Expenditures 15,857,523 16,885,187 22,513,600 19,473,360 20,203,499
Total Expenditures 15,857,523 16,885,187 22,513,600 19,473,360 20,203,499
Excess of Revenues over Expenditures 674,165 646,458 (3,255,306) 982,715 636,594Beginning Fund Balance 2,374,730 3,048,895 3,695,355 440,049 1,422,764
Ending Fund Balance 3,048,895$ 3,695,355$ 440,049$ 1,422,764$ $2,059,358
*FY2016 state reimburse meals with four payouts to cover only July - May. Rate calculated based on November and January payouts.
Proprietary Funds - Enterprise Funds
DES MOINES PUBLIC SCHOOLS2016 - 2017 BUDGET
FOOD & NUTRITION FUND SUMMARY
2016 - 2017 Preliminary Budget 109
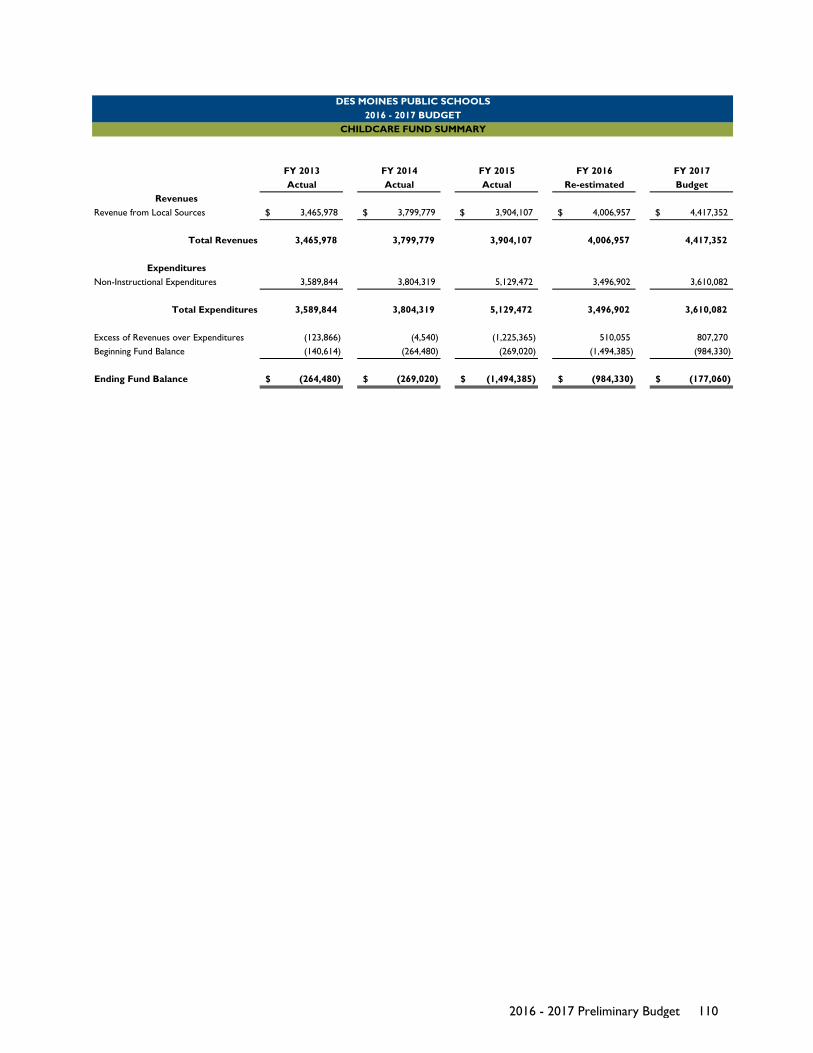
FY 2013 FY 2014 FY 2015 FY 2016 FY 2017Actual Actual Actual Re-estimated Budget
RevenuesRevenue from Local Sources 3,465,978$ 3,799,779$ 3,904,107$ 4,006,957$ 4,417,352$
Total Revenues 3,465,978 3,799,779 3,904,107 4,006,957 4,417,352
ExpendituresNon-Instructional Expenditures 3,589,844 3,804,319 5,129,472 3,496,902 3,610,082
Total Expenditures 3,589,844 3,804,319 5,129,472 3,496,902 3,610,082
Excess of Revenues over Expenditures (123,866) (4,540) (1,225,365) 510,055 807,270Beginning Fund Balance (140,614) (264,480) (269,020) (1,494,385) (984,330)
Ending Fund Balance (264,480)$ (269,020)$ (1,494,385)$ (984,330)$ (177,060)$
DES MOINES PUBLIC SCHOOLS2016 - 2017 BUDGET
CHILDCARE FUND SUMMARY
2016 - 2017 Preliminary Budget 110

FY 2013 FY 2014 FY 2015 FY 2016 FY 2017Actual Actual Actual Re-estimated Budget
RevenuesRevenue from Local Sources $ - $ - $ - $ - $ - Transfers In - 677,879 - - -
Total Revenues - 677,879 - - -
ExpendituresNon-Instructional Expenditures - - - - -
Total Expenditures - - - - -
Excess of Revenues over Expenditures - 677,879 - - - Beginning Fund Balance (677,879) (677,879) - - -
Ending Fund Balance (677,879)$ - - - -
The district eliminated the Preschool Fund through a permanent General Fund transfer with the approval of the district School Board and thestate School Budget Review Committee.FY2014 transfer from General Fund to clear out Fund BalanceFund eliminated in FY 2014.
DES MOINES PUBLIC SCHOOLS2016 - 2017 BUDGET
PRESCHOOL FUND SUMMARY
2016 - 2017 Preliminary Budget 111
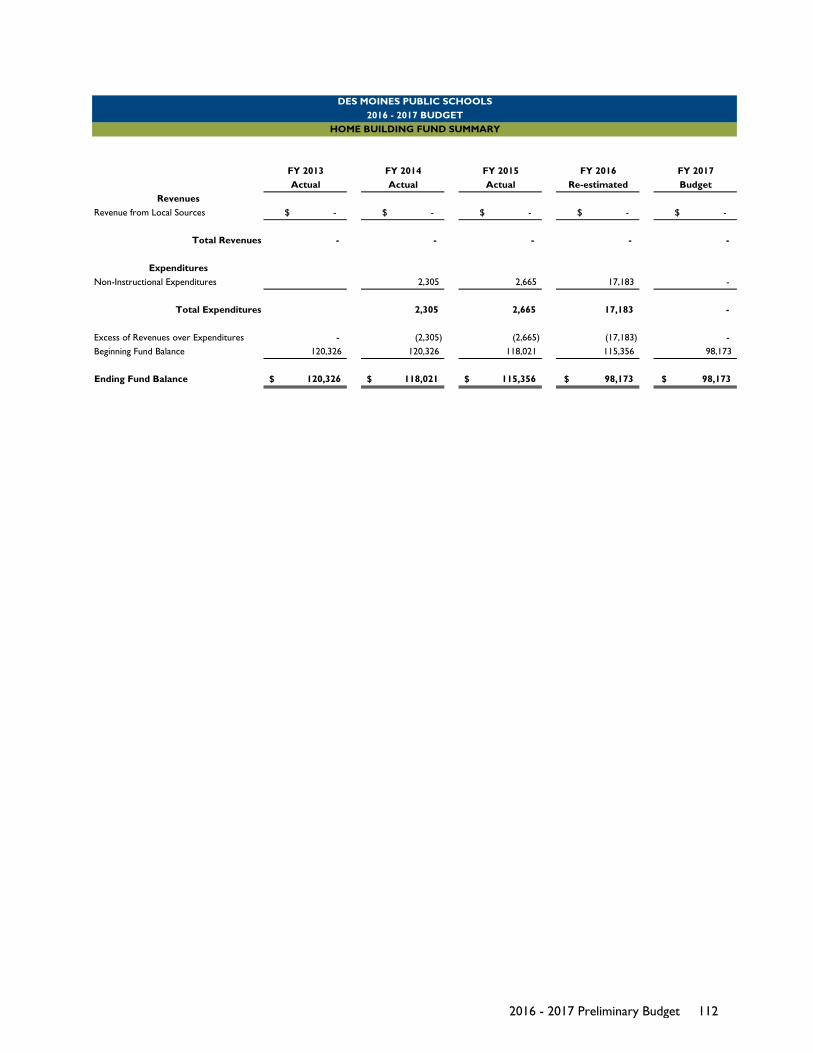
FY 2013 FY 2014 FY 2015 FY 2016 FY 2017Actual Actual Actual Re-estimated Budget
RevenuesRevenue from Local Sources $ - $ - $ - $ - $ -
Total Revenues - - - - -
ExpendituresNon-Instructional Expenditures 2,305 2,665 17,183 -
Total Expenditures 2,305 2,665 17,183 -
Excess of Revenues over Expenditures - (2,305) (2,665) (17,183) - Beginning Fund Balance 120,326 120,326 118,021 115,356 98,173
Ending Fund Balance 120,326$ 118,021$ 115,356$ 98,173$ 98,173$
DES MOINES PUBLIC SCHOOLS2016 - 2017 BUDGET
HOME BUILDING FUND SUMMARY
2016 - 2017 Preliminary Budget 112
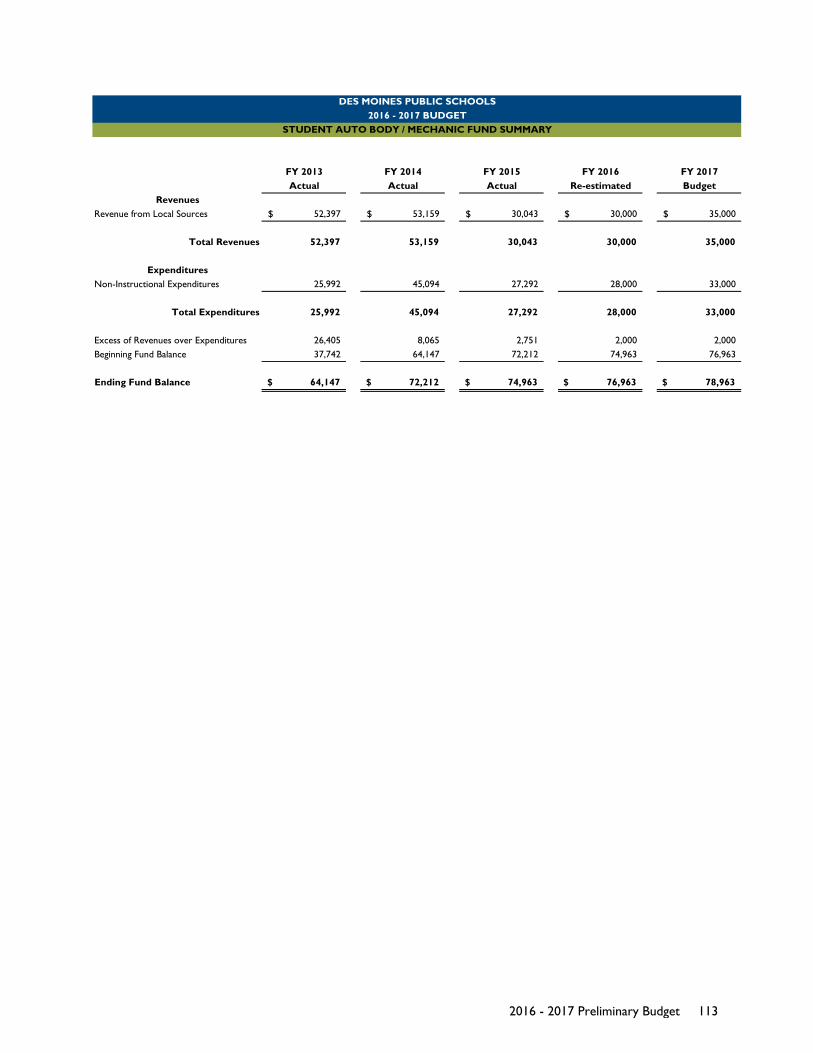
FY 2013 FY 2014 FY 2015 FY 2016 FY 2017Actual Actual Actual Re-estimated Budget
RevenuesRevenue from Local Sources 52,397$ 53,159$ 30,043$ 30,000$ 35,000$
Total Revenues 52,397 53,159 30,043 30,000 35,000
ExpendituresNon-Instructional Expenditures 25,992 45,094 27,292 28,000 33,000
Total Expenditures 25,992 45,094 27,292 28,000 33,000
Excess of Revenues over Expenditures 26,405 8,065 2,751 2,000 2,000Beginning Fund Balance 37,742 64,147 72,212 74,963 76,963
Ending Fund Balance 64,147$ 72,212$ 74,963$ 76,963$ 78,963$
DES MOINES PUBLIC SCHOOLS2016 - 2017 BUDGET
STUDENT AUTO BODY / MECHANIC FUND SUMMARY
2016 - 2017 Preliminary Budget 113
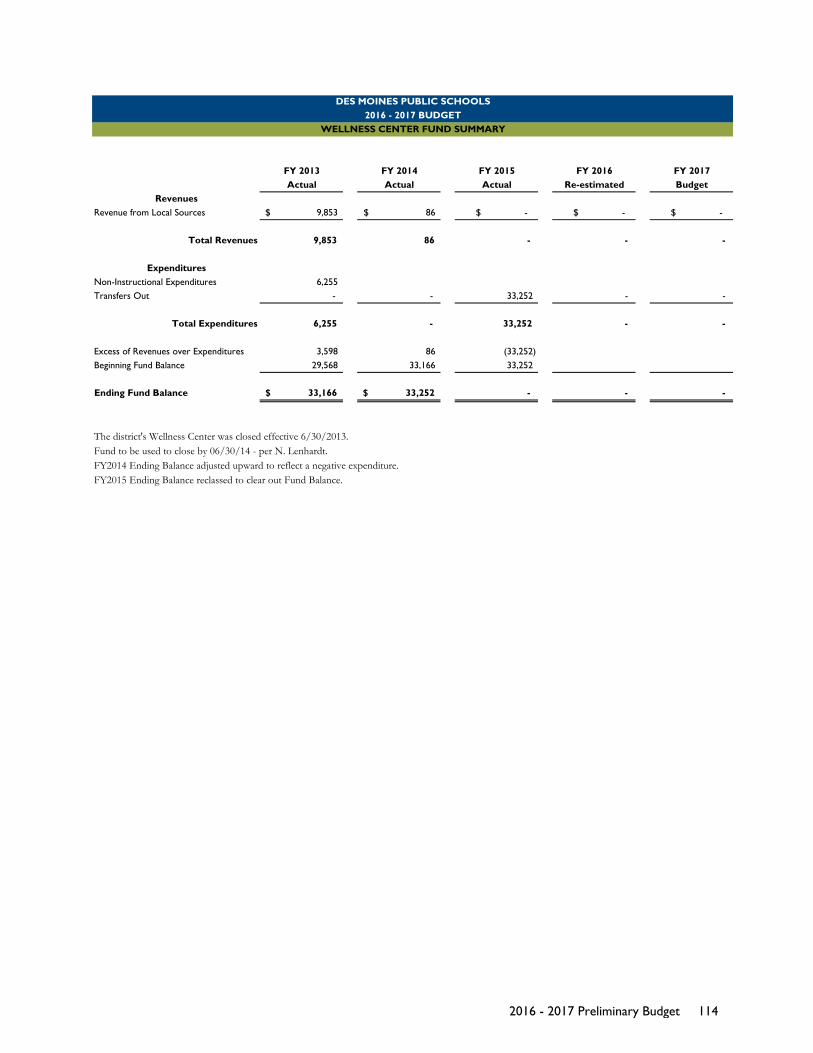
FY 2013 FY 2014 FY 2015 FY 2016 FY 2017Actual Actual Actual Re-estimated Budget
RevenuesRevenue from Local Sources 9,853$ 86$ $ - $ - $ -
Total Revenues 9,853 86 - - -
ExpendituresNon-Instructional Expenditures 6,255Transfers Out - - 33,252 - -
Total Expenditures 6,255 - 33,252 - -
Excess of Revenues over Expenditures 3,598 86 (33,252)Beginning Fund Balance 29,568 33,166 33,252
Ending Fund Balance 33,166$ 33,252$ - - -
The district's Wellness Center was closed effective 6/30/2013. Fund to be used to close by 06/30/14 - per N. Lenhardt.FY2014 Ending Balance adjusted upward to reflect a negative expenditure.FY2015 Ending Balance reclassed to clear out Fund Balance.
DES MOINES PUBLIC SCHOOLS2016 - 2017 BUDGET
WELLNESS CENTER FUND SUMMARY
2016 - 2017 Preliminary Budget 114
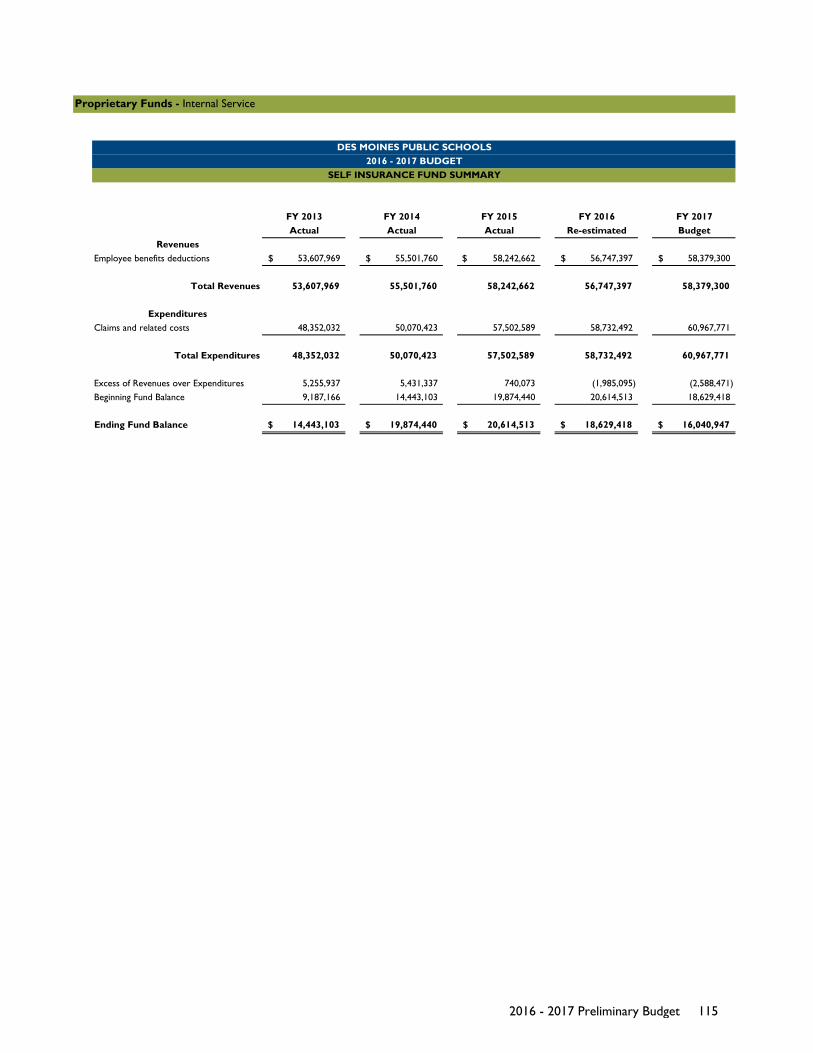
FY 2013 FY 2014 FY 2015 FY 2016 FY 2017Actual Actual Actual Re-estimated Budget
RevenuesEmployee benefits deductions 53,607,969$ 55,501,760$ 58,242,662$ 56,747,397$ 58,379,300$
Total Revenues 53,607,969 55,501,760 58,242,662 56,747,397 58,379,300
ExpendituresClaims and related costs 48,352,032 50,070,423 57,502,589 58,732,492 60,967,771
Total Expenditures 48,352,032 50,070,423 57,502,589 58,732,492 60,967,771
Excess of Revenues over Expenditures 5,255,937 5,431,337 740,073 (1,985,095) (2,588,471)Beginning Fund Balance 9,187,166 14,443,103 19,874,440 20,614,513 18,629,418
Ending Fund Balance 14,443,103$ 19,874,440$ 20,614,513$ 18,629,418$ 16,040,947$
Proprietary Funds - Internal Service
DES MOINES PUBLIC SCHOOLS2016 - 2017 BUDGET
SELF INSURANCE FUND SUMMARY
2016 - 2017 Preliminary Budget 115
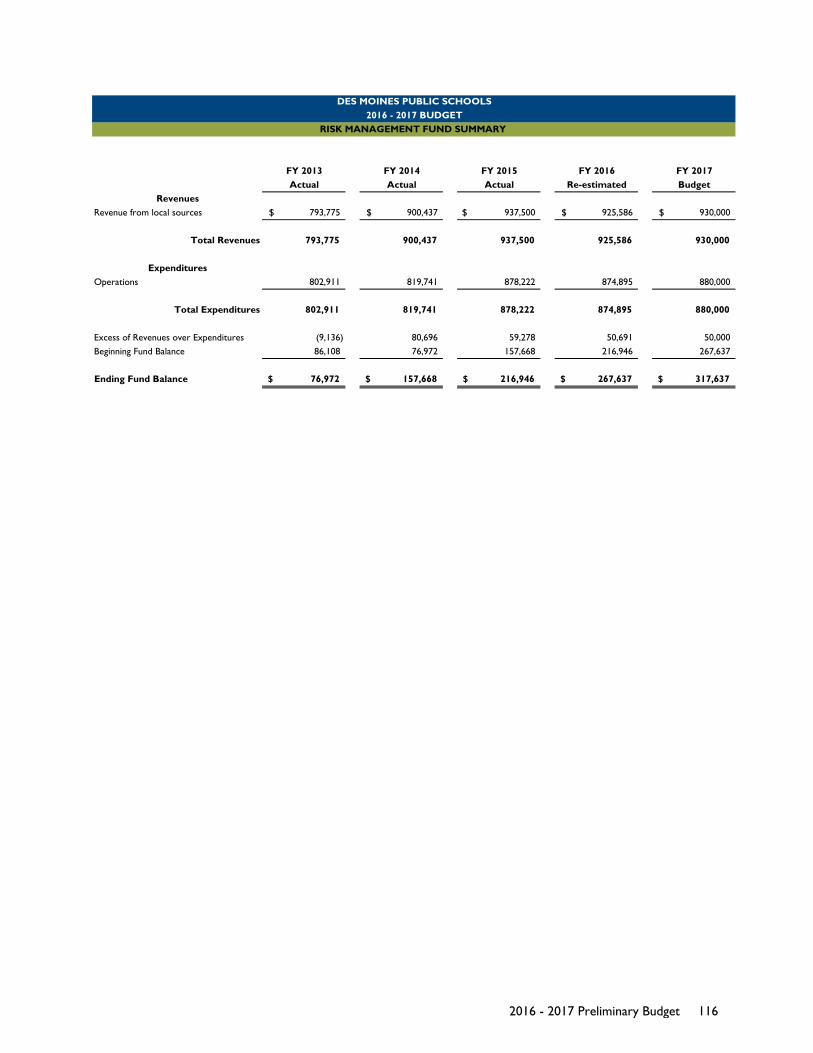
FY 2013 FY 2014 FY 2015 FY 2016 FY 2017Actual Actual Actual Re-estimated Budget
RevenuesRevenue from local sources 793,775$ 900,437$ 937,500$ 925,586$ 930,000$
Total Revenues 793,775 900,437 937,500 925,586 930,000
ExpendituresOperations 802,911 819,741 878,222 874,895 880,000
Total Expenditures 802,911 819,741 878,222 874,895 880,000
Excess of Revenues over Expenditures (9,136) 80,696 59,278 50,691 50,000Beginning Fund Balance 86,108 76,972 157,668 216,946 267,637
Ending Fund Balance 76,972$ 157,668$ 216,946$ 267,637$ 317,637$
DES MOINES PUBLIC SCHOOLS2016 - 2017 BUDGET
RISK MANAGEMENT FUND SUMMARY
2016 - 2017 Preliminary Budget 116
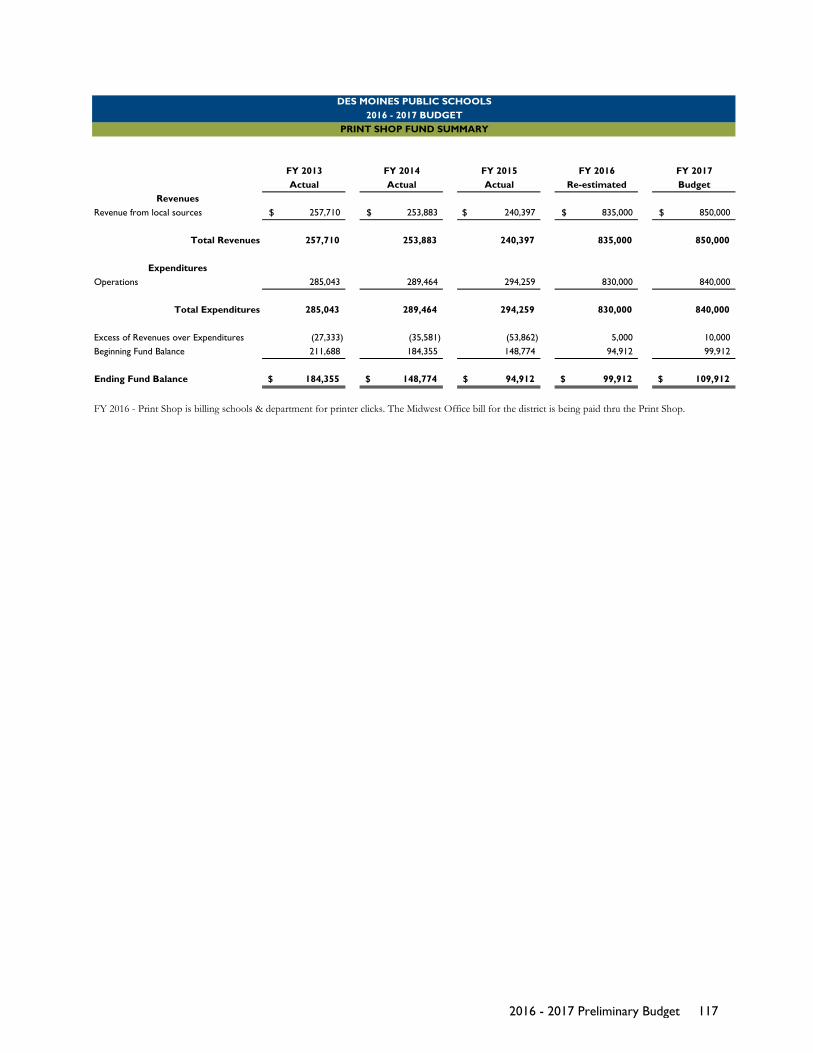
FY 2013 FY 2014 FY 2015 FY 2016 FY 2017Actual Actual Actual Re-estimated Budget
RevenuesRevenue from local sources 257,710$ 253,883$ 240,397$ 835,000$ 850,000$
Total Revenues 257,710 253,883 240,397 835,000 850,000
ExpendituresOperations 285,043 289,464 294,259 830,000 840,000
Total Expenditures 285,043 289,464 294,259 830,000 840,000
Excess of Revenues over Expenditures (27,333) (35,581) (53,862) 5,000 10,000Beginning Fund Balance 211,688 184,355 148,774 94,912 99,912
Ending Fund Balance 184,355$ 148,774$ 94,912$ 99,912$ 109,912$
FY 2016 - Print Shop is billing schools & department for printer clicks. The Midwest Office bill for the district is being paid thru the Print Shop.
DES MOINES PUBLIC SCHOOLS2016 - 2017 BUDGET
PRINT SHOP FUND SUMMARY
2016 - 2017 Preliminary Budget 117
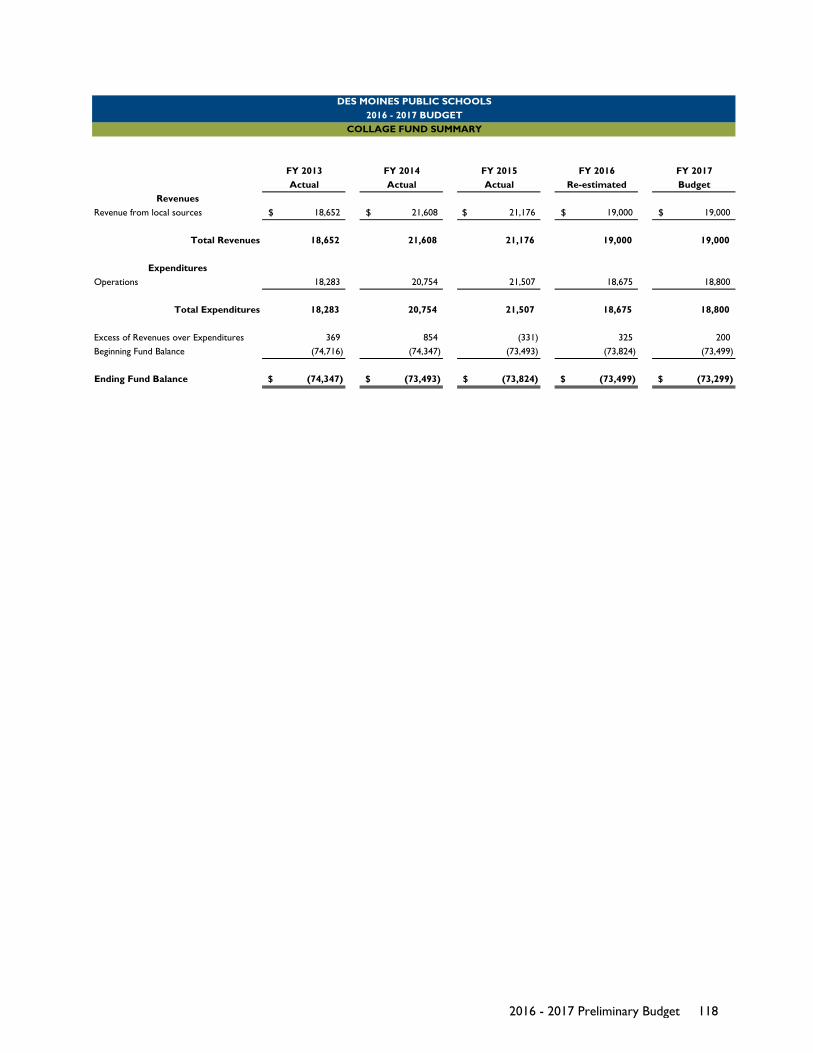
FY 2013 FY 2014 FY 2015 FY 2016 FY 2017Actual Actual Actual Re-estimated Budget
RevenuesRevenue from local sources 18,652$ 21,608$ 21,176$ 19,000$ 19,000$
Total Revenues 18,652 21,608 21,176 19,000 19,000
ExpendituresOperations 18,283 20,754 21,507 18,675 18,800
Total Expenditures 18,283 20,754 21,507 18,675 18,800
Excess of Revenues over Expenditures 369 854 (331) 325 200Beginning Fund Balance (74,716) (74,347) (73,493) (73,824) (73,499)
Ending Fund Balance (74,347)$ (73,493)$ (73,824)$ (73,499)$ (73,299)$
DES MOINES PUBLIC SCHOOLS2016 - 2017 BUDGET
COLLAGE FUND SUMMARY
2016 - 2017 Preliminary Budget 118

FY 2013 FY 2014 FY 2015 FY 2016 FY 2017Actual Actual Actual Re-estimated Budget
Donations 55,505$ 6,845$ 20,254$ 5,000$ 5,000$ Investment Income:
Interest and Dividends 779 621 660 569 576Increase (Decrease) in value of investments 611 (123) (135) 0 0
Total Revenues 56,895 7,344 20,779 5,569 5,576
Scholarships 7,350 18,350 9,550 32,952 10,500
Total Expenditures 7,350 18,350 9,550 32,952 10,500
Excess of Revenues over Expenditures 49,545 (11,006) 11,229 (27,383) (4,924)Beginning Fund Balance 699,646 749,191 738,185 749,414 722,031
Ending Fund Balance 749,191$ 738,185$ 749,414$ 722,031$ 722,835$
Expenditures
COMBINED TRUST FUNDS SUMMARY
Revenues
Fiduciary Funds - Trust Funds
DES MOINES PUBLIC SCHOOLS2016 - 2017 BUDGET
2016 - 2017 Preliminary Budget 119
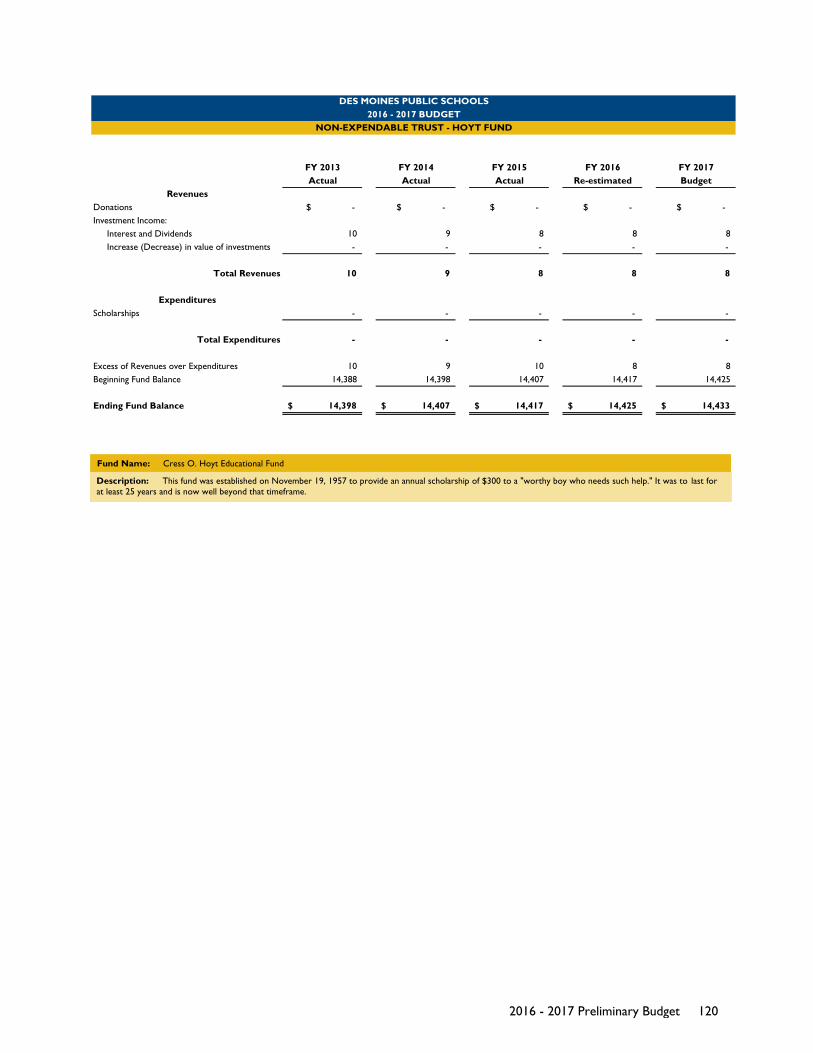
FY 2013 FY 2014 FY 2015 FY 2016 FY 2017Actual Actual Actual Re-estimated Budget
Donations $ - $ - $ - $ - $ - Investment Income:
Interest and Dividends 10 9 8 8 8Increase (Decrease) in value of investments - - - - -
Total Revenues 10 9 8 8 8
Scholarships - - - - -
Total Expenditures - - - - -
Excess of Revenues over Expenditures 10 9 10 8 8Beginning Fund Balance 14,388 14,398 14,407 14,417 14,425
Ending Fund Balance 14,398$ 14,407$ 14,417$ 14,425$ 14,433$
DES MOINES PUBLIC SCHOOLS2016 - 2017 BUDGET
NON-EXPENDABLE TRUST - HOYT FUND
Revenues
Expenditures
Fund Name: Cress O. Hoyt Educational Fund
Description: This fund was established on November 19, 1957 to provide an annual scholarship of $300 to a "worthy boy who needs such help." It was to last for at least 25 years and is now well beyond that timeframe.
2016 - 2017 Preliminary Budget 120
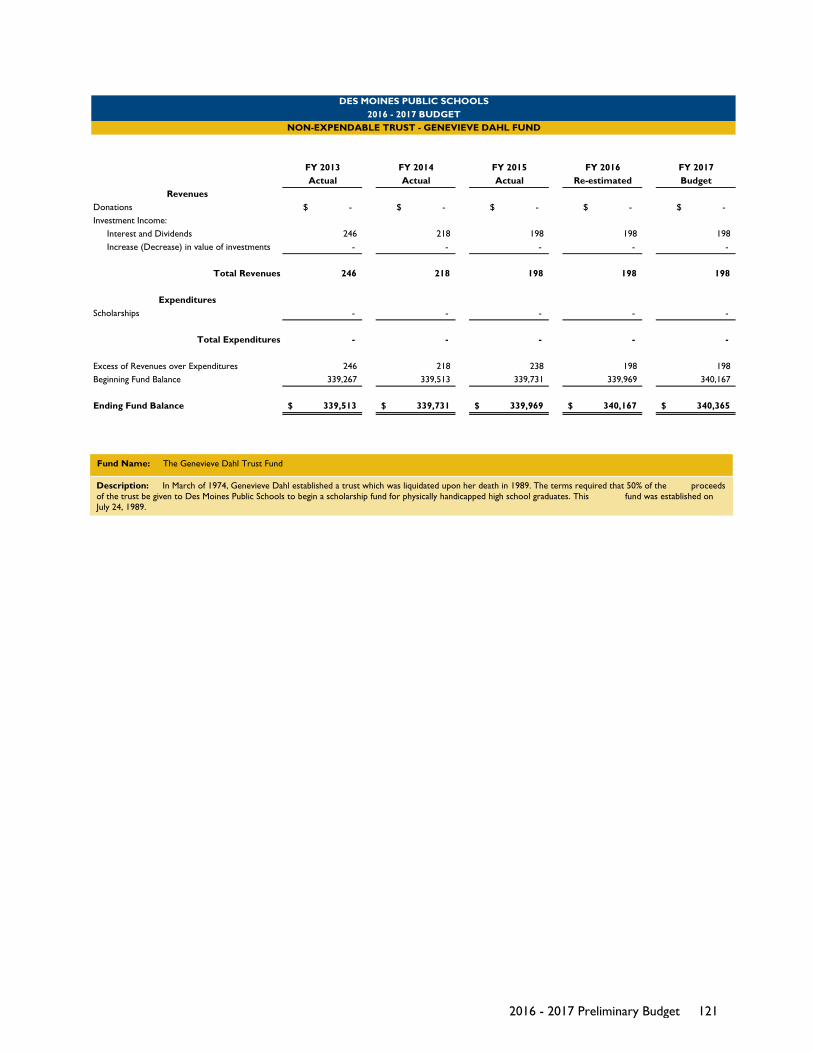
FY 2013 FY 2014 FY 2015 FY 2016 FY 2017Actual Actual Actual Re-estimated Budget
Donations $ - $ - $ - $ - $ - Investment Income:
Interest and Dividends 246 218 198 198 198Increase (Decrease) in value of investments - - - - -
Total Revenues 246 218 198 198 198
Scholarships - - - - -
Total Expenditures - - - - -
Excess of Revenues over Expenditures 246 218 238 198 198Beginning Fund Balance 339,267 339,513 339,731 339,969 340,167
Ending Fund Balance 339,513$ 339,731$ 339,969$ 340,167$ 340,365$
DES MOINES PUBLIC SCHOOLS2016 - 2017 BUDGET
NON-EXPENDABLE TRUST - GENEVIEVE DAHL FUND
Revenues
Expenditures
Fund Name: The Genevieve Dahl Trust Fund
Description: In March of 1974, Genevieve Dahl established a trust which was liquidated upon her death in 1989. The terms required that 50% of the proceeds of the trust be given to Des Moines Public Schools to begin a scholarship fund for physically handicapped high school graduates. This fund was established on July 24, 1989.
2016 - 2017 Preliminary Budget 121
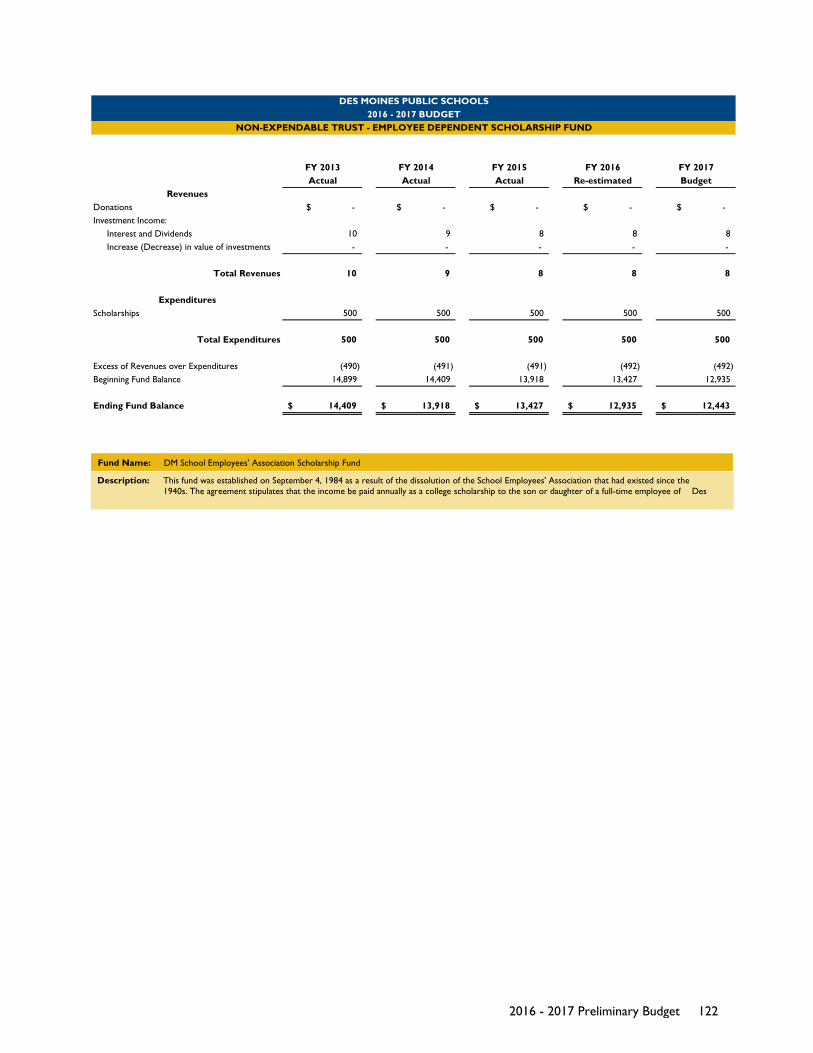
FY 2013 FY 2014 FY 2015 FY 2016 FY 2017Actual Actual Actual Re-estimated Budget
Donations $ - $ - $ - $ - $ - Investment Income:
Interest and Dividends 10 9 8 8 8Increase (Decrease) in value of investments - - - - -
Total Revenues 10 9 8 8 8
Scholarships 500 500 500 500 500
Total Expenditures 500 500 500 500 500
Excess of Revenues over Expenditures (490) (491) (491) (492) (492)Beginning Fund Balance 14,899 14,409 13,918 13,427 12,935
Ending Fund Balance 14,409$ 13,918$ 13,427$ 12,935$ 12,443$
DES MOINES PUBLIC SCHOOLS2016 - 2017 BUDGET
NON-EXPENDABLE TRUST - EMPLOYEE DEPENDENT SCHOLARSHIP FUND
Revenues
Expenditures
Fund Name: DM School Employees' Association Scholarship Fund
Description: This fund was established on September 4, 1984 as a result of the dissolution of the School Employees' Association that had existed since the 1940s. The agreement stipulates that the income be paid annually as a college scholarship to the son or daughter of a full-time employee of Des
2016 - 2017 Preliminary Budget 122
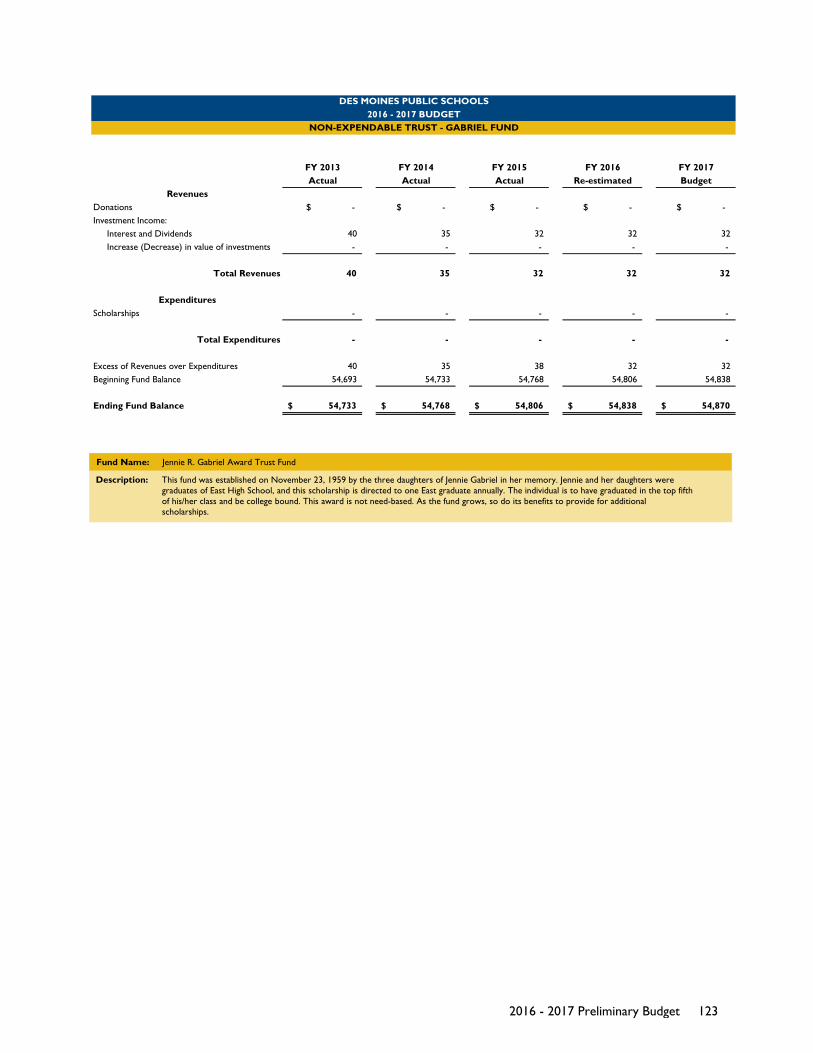
FY 2013 FY 2014 FY 2015 FY 2016 FY 2017Actual Actual Actual Re-estimated Budget
Donations $ - $ - $ - $ - $ - Investment Income:
Interest and Dividends 40 35 32 32 32Increase (Decrease) in value of investments - - - - -
Total Revenues 40 35 32 32 32
Scholarships - - - - -
Total Expenditures - - - - -
Excess of Revenues over Expenditures 40 35 38 32 32Beginning Fund Balance 54,693 54,733 54,768 54,806 54,838
Ending Fund Balance 54,733$ 54,768$ 54,806$ 54,838$ 54,870$
DES MOINES PUBLIC SCHOOLS2016 - 2017 BUDGET
NON-EXPENDABLE TRUST - GABRIEL FUND
Revenues
Expenditures
Fund Name: Jennie R. Gabriel Award Trust Fund
Description: This fund was established on November 23, 1959 by the three daughters of Jennie Gabriel in her memory. Jennie and her daughters were graduates of East High School, and this scholarship is directed to one East graduate annually. The individual is to have graduated in the top fifth of his/her class and be college bound. This award is not need-based. As the fund grows, so do its benefits to provide for additional scholarships.
2016 - 2017 Preliminary Budget 123
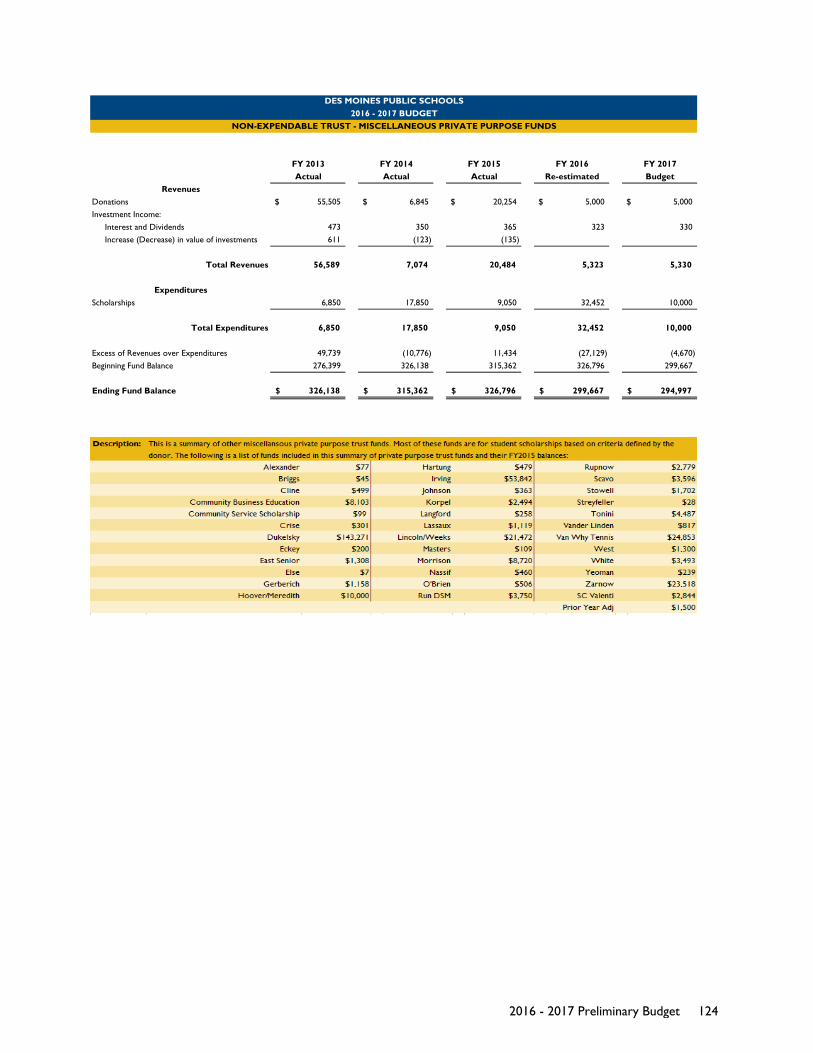
FY 2013 FY 2014 FY 2015 FY 2016 FY 2017Actual Actual Actual Re-estimated Budget
Donations 55,505$ 6,845$ 20,254$ 5,000$ 5,000$ Investment Income:
Interest and Dividends 473 350 365 323 330Increase (Decrease) in value of investments 611 (123) (135)
Total Revenues 56,589 7,074 20,484 5,323 5,330
Scholarships 6,850 17,850 9,050 32,452 10,000
Total Expenditures 6,850 17,850 9,050 32,452 10,000
Excess of Revenues over Expenditures 49,739 (10,776) 11,434 (27,129) (4,670)Beginning Fund Balance 276,399 326,138 315,362 326,796 299,667
Ending Fund Balance 326,138$ 315,362$ 326,796$ 299,667$ 294,997$
DES MOINES PUBLIC SCHOOLS2016 - 2017 BUDGET
NON-EXPENDABLE TRUST - MISCELLANEOUS PRIVATE PURPOSE FUNDS
Revenues
Expenditures
2016 - 2017 Preliminary Budget 124
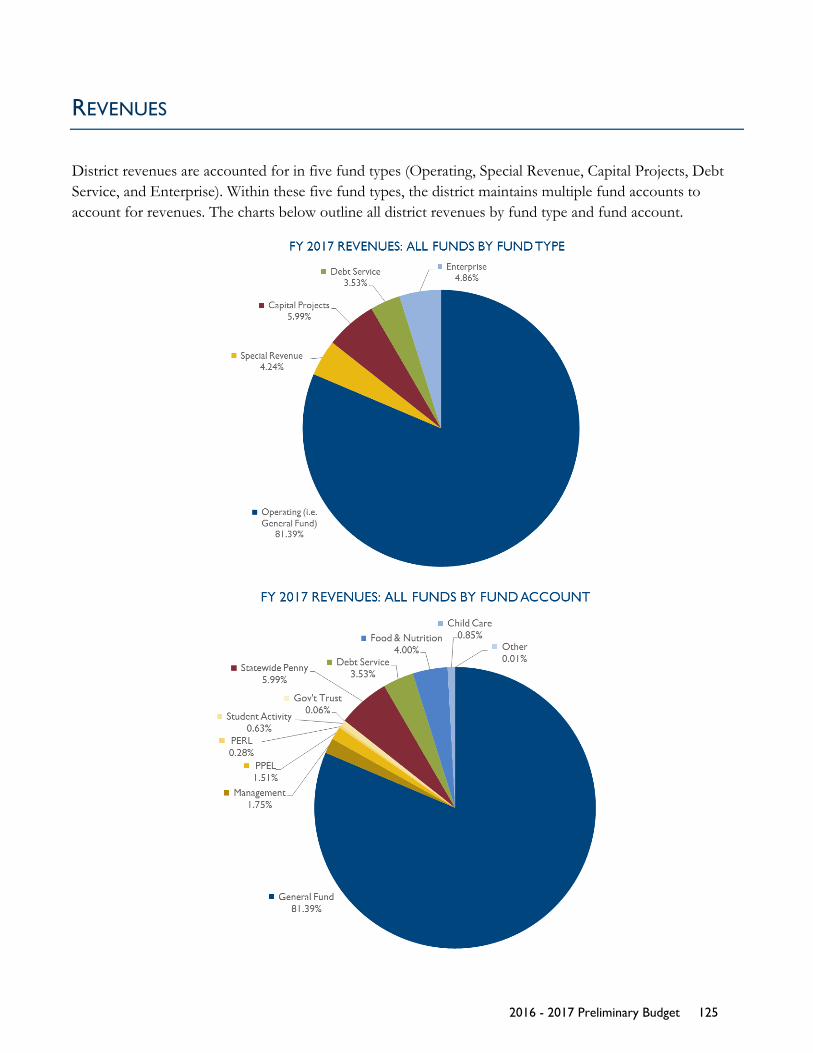
REVENUES
District revenues are accounted for in five fund types (Operating, Special Revenue, Capital Projects, Debt Service, and Enterprise). Within these five fund types, the district maintains multiple fund accounts to account for revenues. The charts below outline all district revenues by fund type and fund account.
2016 - 2017 Preliminary Budget 125
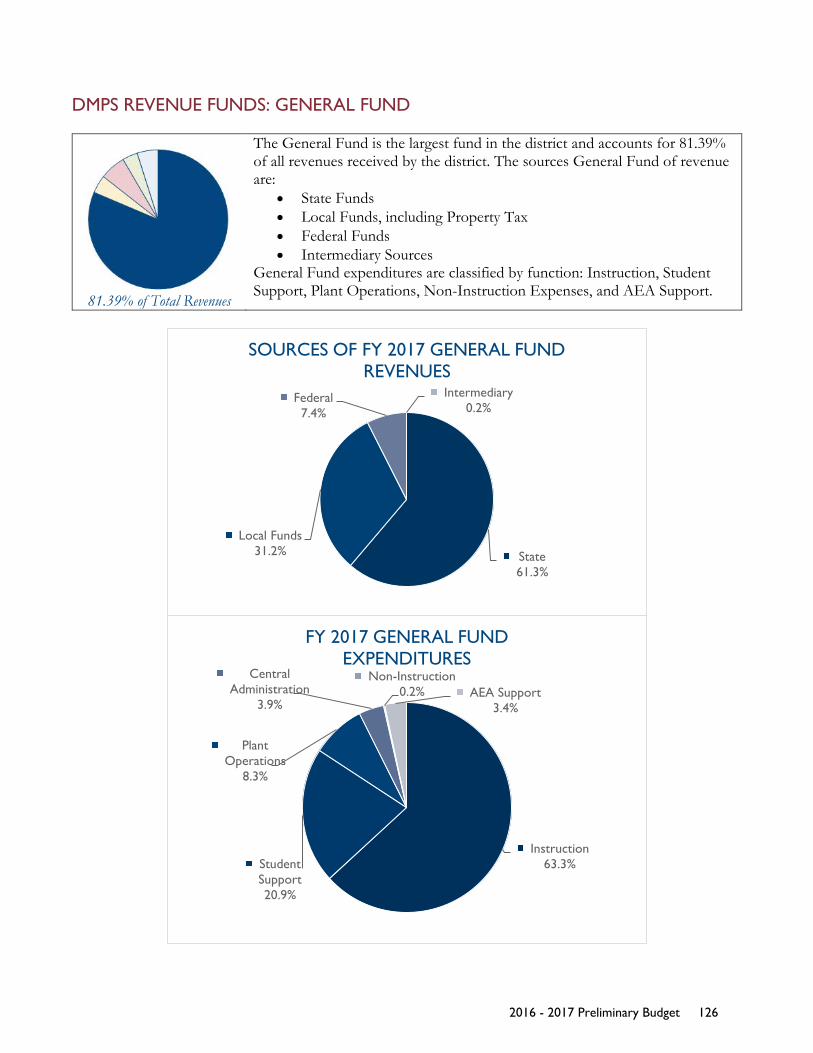
DMPS REVENUE FUNDS: GENERAL FUND
81.39% of Total Revenues
The General Fund is the largest fund in the district and accounts for 81.39% of all revenues received by the district. The sources General Fund of revenue are:
• State Funds • Local Funds, including Property Tax • Federal Funds • Intermediary Sources
General Fund expenditures are classified by function: Instruction, Student Support, Plant Operations, Non-Instruction Expenses, and AEA Support.
State61.3%
Local Funds31.2%
Federal7.4%
Intermediary0.2%
SOURCES OF FY 2017 GENERAL FUND REVENUES
Instruction63.3%Student
Support20.9%
Plant Operations
8.3%
Central Administration
3.9%
Non-Instruction0.2% AEA Support
3.4%
FY 2017 GENERAL FUND EXPENDITURES
2016 - 2017 Preliminary Budget 126
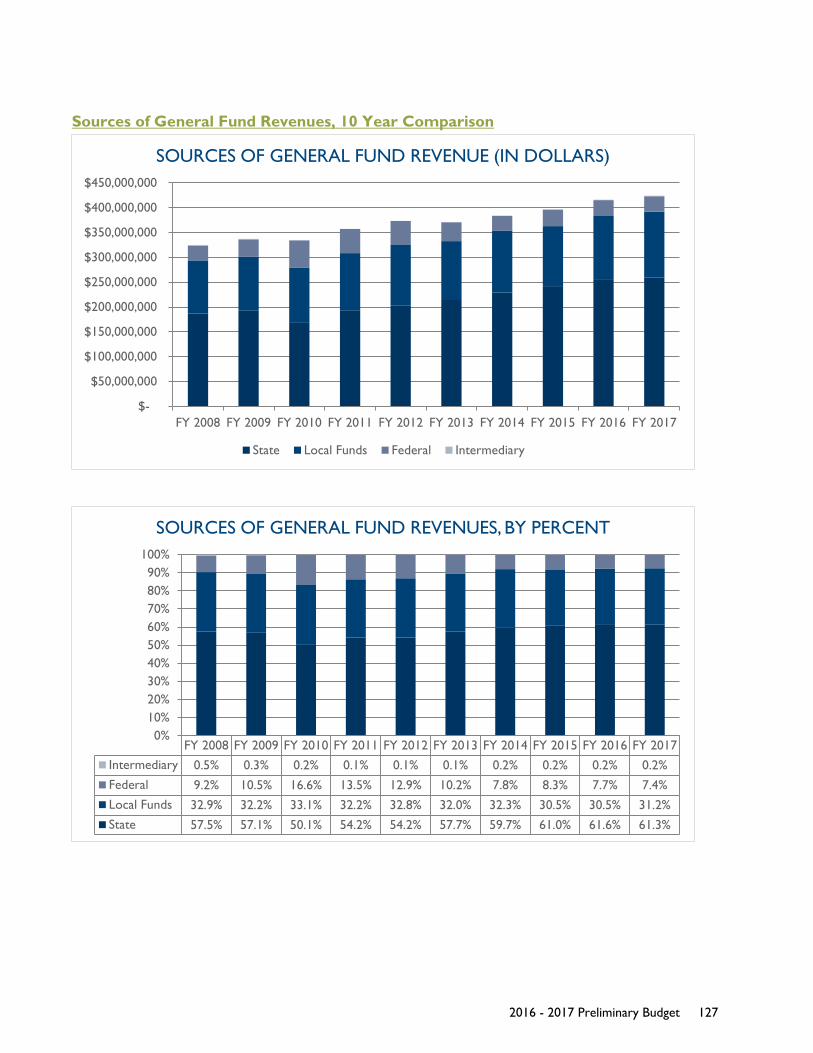
Sources of General Fund Revenues, 10 Year Comparison
$-
$50,000,000
$100,000,000
$150,000,000
$200,000,000
$250,000,000
$300,000,000
$350,000,000
$400,000,000
$450,000,000
FY 2008 FY 2009 FY 2010 FY 2011 FY 2012 FY 2013 FY 2014 FY 2015 FY 2016 FY 2017
SOURCES OF GENERAL FUND REVENUE (IN DOLLARS)
State Local Funds Federal Intermediary
FY 2008 FY 2009 FY 2010 FY 2011 FY 2012 FY 2013 FY 2014 FY 2015 FY 2016 FY 2017Intermediary 0.5% 0.3% 0.2% 0.1% 0.1% 0.1% 0.2% 0.2% 0.2% 0.2%Federal 9.2% 10.5% 16.6% 13.5% 12.9% 10.2% 7.8% 8.3% 7.7% 7.4%Local Funds 32.9% 32.2% 33.1% 32.2% 32.8% 32.0% 32.3% 30.5% 30.5% 31.2%State 57.5% 57.1% 50.1% 54.2% 54.2% 57.7% 59.7% 61.0% 61.6% 61.3%
0%10%20%30%40%50%60%70%80%90%
100%
SOURCES OF GENERAL FUND REVENUES, BY PERCENT
2016 - 2017 Preliminary Budget 127

General Fund Source of Revenue: State Funds
State funds account for 61.3% of General Fund revenues. State revenues include State Foundation Aid, Teacher Salary Supplement, and Universal Preschool.
State Aid is the single largest source of revenue for the General Fund. State Foundation Aid budgets are based on the initial “Aid & Levy” documents released by the Iowa Department of Education each year in early February. The Aid & Levy projects Foundation Aid based on a per student funding formula which has been in place for years and is administered by the Iowa Department of Education. Property tax rates and subsequent revenues are part of the Aid & Levy and can be adjusted with School Board approval, within limits defined by the State.
The initial Aid & Levy used to develop the 2017 budget utilizes an allowable growth of 1.00%. Final State Foundation Aid will not be determined until the Iowa Department of Education releases the final Aid & Levy in June, coupled with the determination by the Iowa Legislature, which is ongoing as of the beginning of March.
State grants are usually determined in advance, and projections are based on grant documents.
State
GENERAL FUND REVENUES
2016 - 2017 Preliminary Budget 128
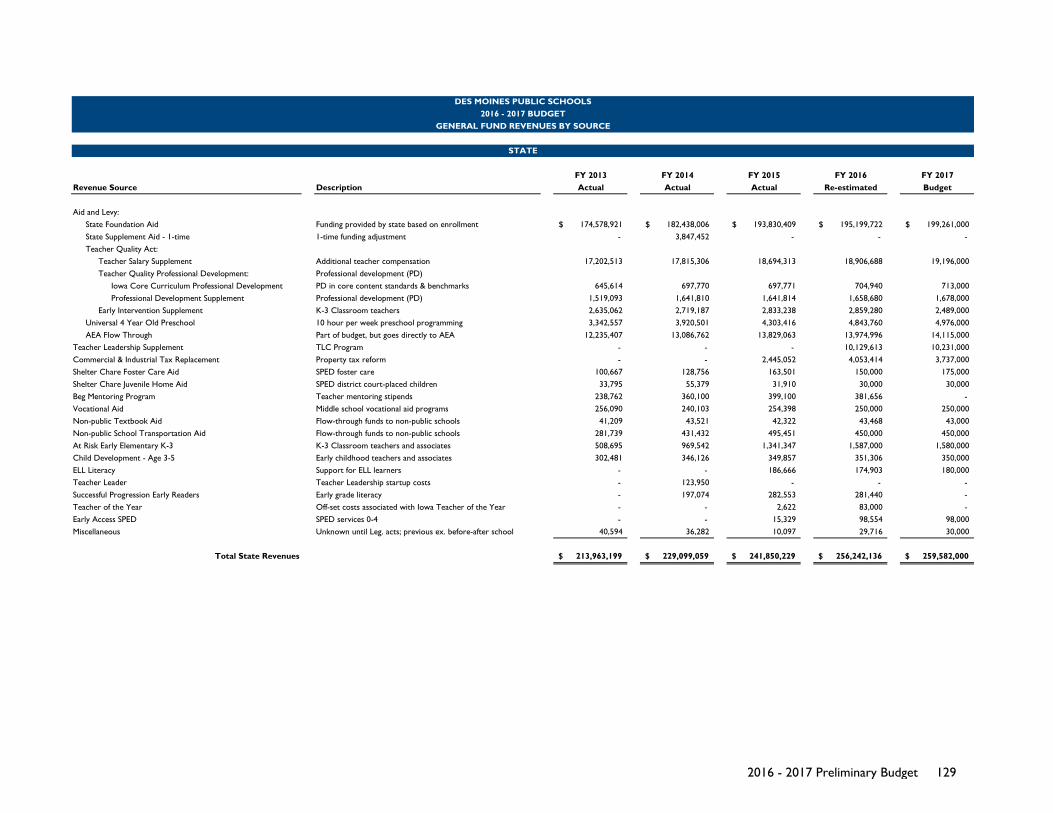
FY 2013 FY 2014 FY 2015 FY 2016 FY 2017Revenue Source Description Actual Actual Actual Re-estimated Budget
Aid and Levy:State Foundation Aid Funding provided by state based on enrollment 174,578,921$ 182,438,006$ 193,830,409$ 195,199,722$ 199,261,000$ State Supplement Aid - 1-time 1-time funding adjustment - 3,847,452 - - - Teacher Quality Act:
Teacher Salary Supplement Additional teacher compensation 17,202,513 17,815,306 18,694,313 18,906,688 19,196,000Teacher Quality Professional Development: Professional development (PD)
Iowa Core Curriculum Professional Development PD in core content standards & benchmarks 645,614 697,770 697,771 704,940 713,000Professional Development Supplement Professional development (PD) 1,519,093 1,641,810 1,641,814 1,658,680 1,678,000
Early Intervention Supplement K-3 Classroom teachers 2,635,062 2,719,187 2,833,238 2,859,280 2,489,000Universal 4 Year Old Preschool 10 hour per week preschool programming 3,342,557 3,920,501 4,303,416 4,843,760 4,976,000AEA Flow Through Part of budget, but goes directly to AEA 12,235,407 13,086,762 13,829,063 13,974,996 14,115,000
Teacher Leadership Supplement TLC Program - - - 10,129,613 10,231,000Commercial & Industrial Tax Replacement Property tax reform - - 2,445,052 4,053,414 3,737,000Shelter Chare Foster Care Aid SPED foster care 100,667 128,756 163,501 150,000 175,000Shelter Chare Juvenile Home Aid SPED district court-placed children 33,795 55,379 31,910 30,000 30,000Beg Mentoring Program Teacher mentoring stipends 238,762 360,100 399,100 381,656 - Vocational Aid Middle school vocational aid programs 256,090 240,103 254,398 250,000 250,000Non-public Textbook Aid Flow-through funds to non-public schools 41,209 43,521 42,322 43,468 43,000Non-public School Transportation Aid Flow-through funds to non-public schools 281,739 431,432 495,451 450,000 450,000At Risk Early Elementary K-3 K-3 Classroom teachers and associates 508,695 969,542 1,341,347 1,587,000 1,580,000Child Development - Age 3-5 Early childhood teachers and associates 302,481 346,126 349,857 351,306 350,000ELL Literacy Support for ELL learners - - 186,666 174,903 180,000Teacher Leader Teacher Leadership startup costs - 123,950 - - - Successful Progression Early Readers Early grade literacy - 197,074 282,553 281,440 - Teacher of the Year Off-set costs associated with Iowa Teacher of the Year - - 2,622 83,000 - Early Access SPED SPED services 0-4 - - 15,329 98,554 98,000Miscellaneous Unknown until Leg. acts; previous ex. before-after school 40,594 36,282 10,097 29,716 30,000
Total State Revenues 213,963,199$ 229,099,059$ 241,850,229$ 256,242,136$ 259,582,000$
DES MOINES PUBLIC SCHOOLS2016 - 2017 BUDGET
GENERAL FUND REVENUES BY SOURCE
STATE
2016 - 2017 Preliminary Budget 129
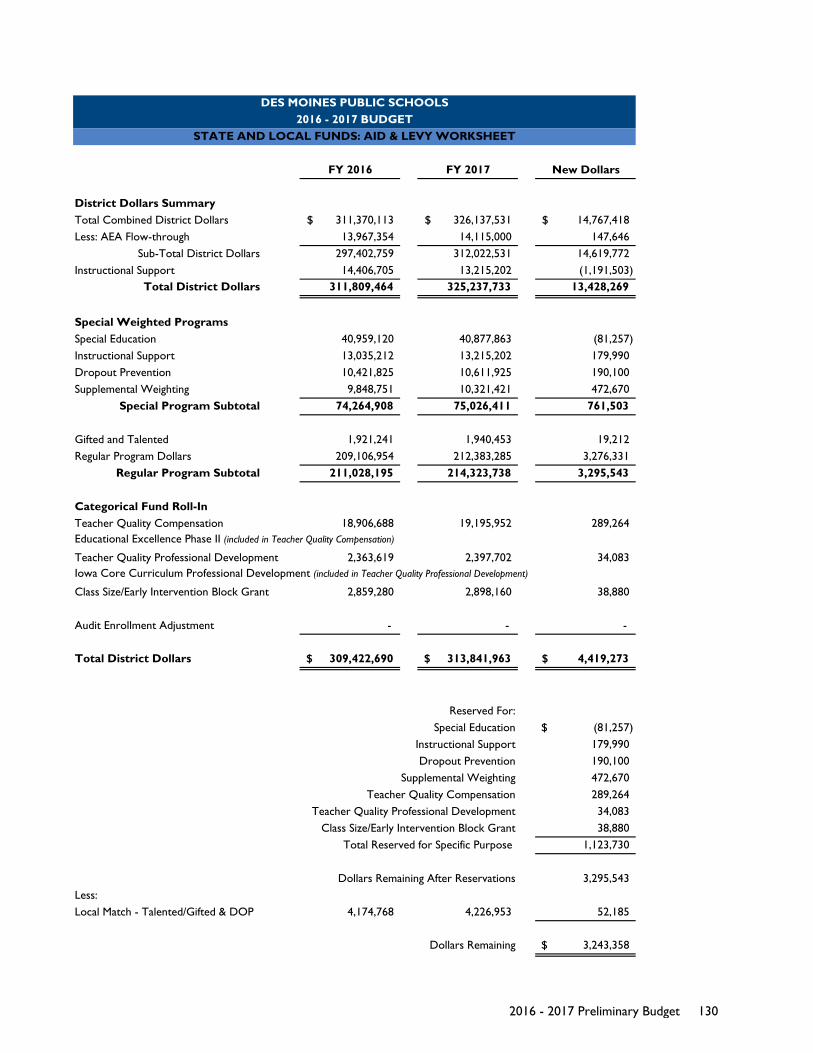
FY 2016 FY 2017 New Dollars
District Dollars SummaryTotal Combined District Dollars 311,370,113$ 326,137,531$ 14,767,418$ Less: AEA Flow-through 13,967,354 14,115,000 147,646
Sub-Total District Dollars 297,402,759 312,022,531 14,619,772Instructional Support 14,406,705 13,215,202 (1,191,503)
Total District Dollars 311,809,464 325,237,733 13,428,269
Special Weighted ProgramsSpecial Education 40,959,120 40,877,863 (81,257)Instructional Support 13,035,212 13,215,202 179,990Dropout Prevention 10,421,825 10,611,925 190,100Supplemental Weighting 9,848,751 10,321,421 472,670
Special Program Subtotal 74,264,908 75,026,411 761,503
Gifted and Talented 1,921,241 1,940,453 19,212Regular Program Dollars 209,106,954 212,383,285 3,276,331
Regular Program Subtotal 211,028,195 214,323,738 3,295,543
Categorical Fund Roll-InTeacher Quality Compensation 18,906,688 19,195,952 289,264Educational Excellence Phase II (included in Teacher Quality Compensation)
Teacher Quality Professional Development 2,363,619 2,397,702 34,083Iowa Core Curriculum Professional Development (included in Teacher Quality Professional Development)
Class Size/Early Intervention Block Grant 2,859,280 2,898,160 38,880
Audit Enrollment Adjustment - - -
Total District Dollars 309,422,690$ 313,841,963$ 4,419,273$
Reserved For:Special Education (81,257)$
Instructional Support 179,990Dropout Prevention 190,100
Supplemental Weighting 472,670Teacher Quality Compensation 289,264
Teacher Quality Professional Development 34,083Class Size/Early Intervention Block Grant 38,880
Total Reserved for Specific Purpose 1,123,730
Dollars Remaining After Reservations 3,295,543Less:Local Match - Talented/Gifted & DOP 4,174,768 4,226,953 52,185
Dollars Remaining 3,243,358$
DES MOINES PUBLIC SCHOOLS2016 - 2017 BUDGET
STATE AND LOCAL FUNDS: AID & LEVY WORKSHEET
2016 - 2017 Preliminary Budget 130
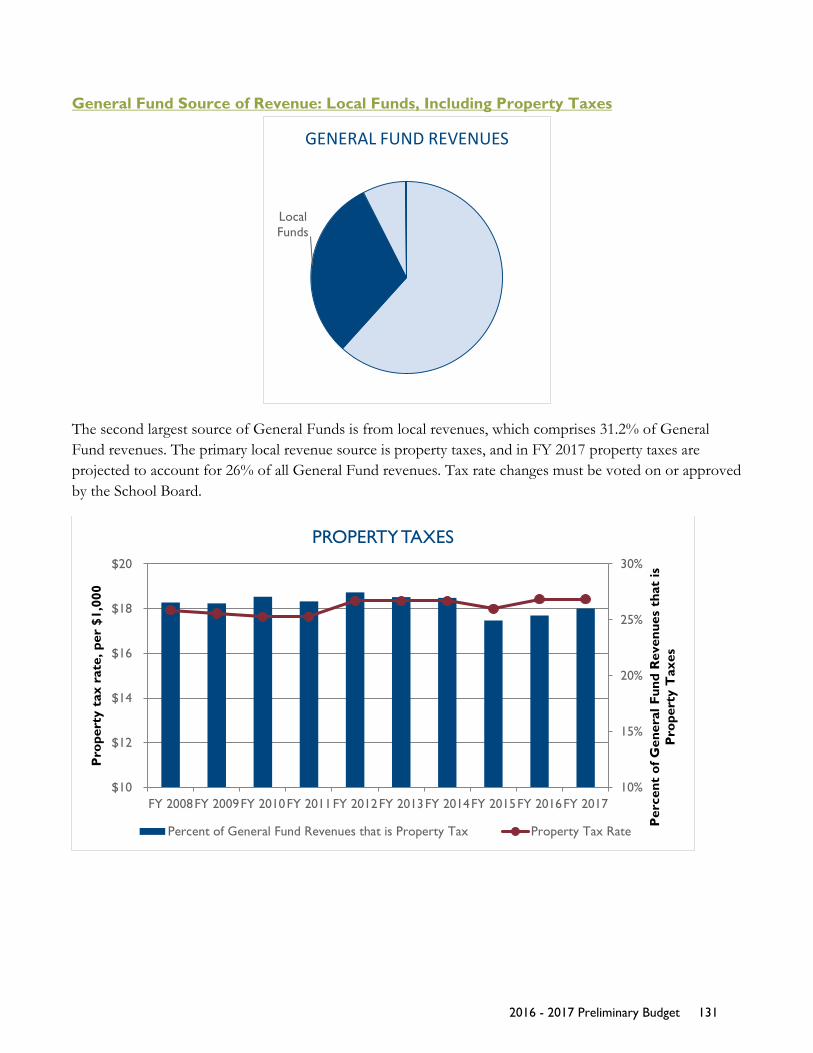
General Fund Source of Revenue: Local Funds, Including Property Taxes
The second largest source of General Funds is from local revenues, which comprises 31.2% of General Fund revenues. The primary local revenue source is property taxes, and in FY 2017 property taxes are projected to account for 26% of all General Fund revenues. Tax rate changes must be voted on or approved by the School Board.
Local Funds
GENERAL FUND REVENUES
10%
15%
20%
25%
30%
$10
$12
$14
$16
$18
$20
FY 2008FY 2009FY 2010FY 2011FY 2012FY 2013FY 2014FY 2015FY 2016FY 2017
Per
cent
of G
ener
al F
und
Rev
enue
s th
at is
P
rope
rty
Tax
es
Pro
pert
y ta
x ra
te, p
er $
1,00
0
PROPERTY TAXES
Percent of General Fund Revenues that is Property Tax Property Tax Rate
2016 - 2017 Preliminary Budget 131
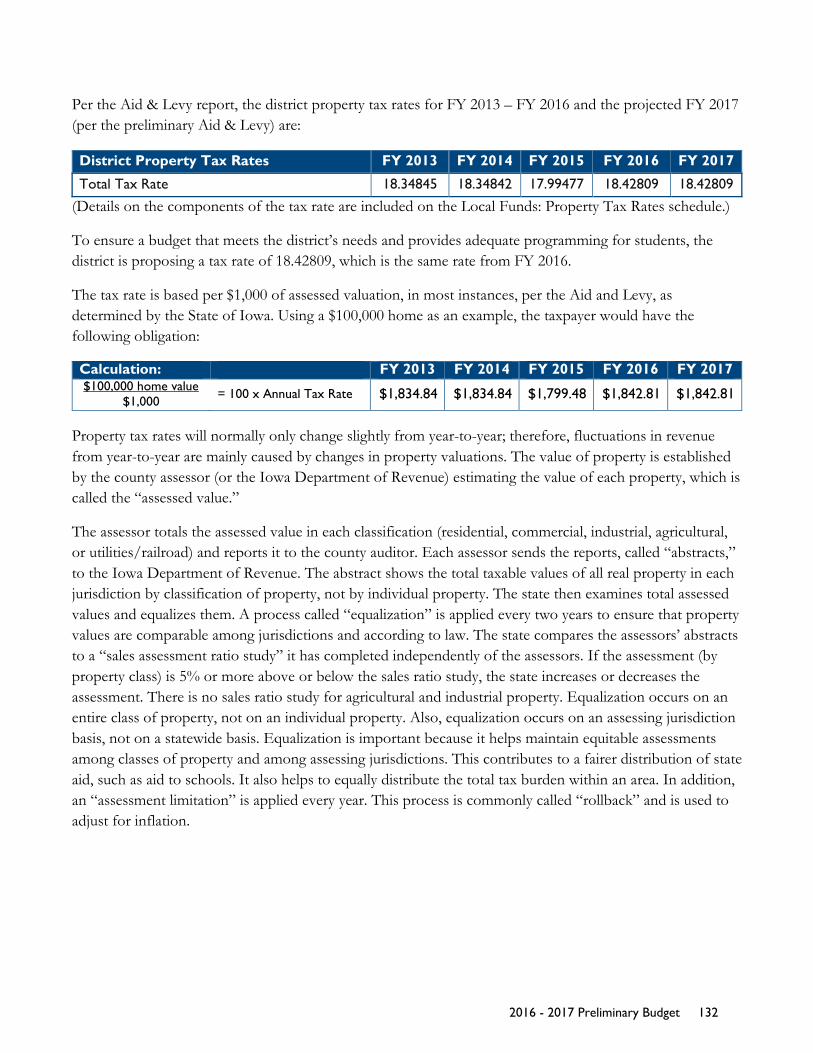
Per the Aid & Levy report, the district property tax rates for FY 2013 – FY 2016 and the projected FY 2017 (per the preliminary Aid & Levy) are:
District Property Tax Rates FY 2013 FY 2014 FY 2015 FY 2016 FY 2017
Total Tax Rate 18.34845 18.34842 17.99477 18.42809 18.42809
(Details on the components of the tax rate are included on the Local Funds: Property Tax Rates schedule.)
To ensure a budget that meets the district’s needs and provides adequate programming for students, the district is proposing a tax rate of 18.42809, which is the same rate from FY 2016.
The tax rate is based per $1,000 of assessed valuation, in most instances, per the Aid and Levy, as determined by the State of Iowa. Using a $100,000 home as an example, the taxpayer would have the following obligation:
Calculation: FY 2013 FY 2014 FY 2015 FY 2016 FY 2017 UU$100,000 home value
$1,000 = 100 x Annual Tax Rate $1,834.84 $1,834.84 $1,799.48 $1,842.81 $1,842.81
Property tax rates will normally only change slightly from year-to-year; therefore, fluctuations in revenue from year-to-year are mainly caused by changes in property valuations. The value of property is established by the county assessor (or the Iowa Department of Revenue) estimating the value of each property, which is called the “assessed value.”
The assessor totals the assessed value in each classification (residential, commercial, industrial, agricultural, or utilities/railroad) and reports it to the county auditor. Each assessor sends the reports, called “abstracts,” to the Iowa Department of Revenue. The abstract shows the total taxable values of all real property in each jurisdiction by classification of property, not by individual property. The state then examines total assessed values and equalizes them. A process called “equalization” is applied every two years to ensure that property values are comparable among jurisdictions and according to law. The state compares the assessors’ abstracts to a “sales assessment ratio study” it has completed independently of the assessors. If the assessment (by property class) is 5% or more above or below the sales ratio study, the state increases or decreases the assessment. There is no sales ratio study for agricultural and industrial property. Equalization occurs on an entire class of property, not on an individual property. Also, equalization occurs on an assessing jurisdiction basis, not on a statewide basis. Equalization is important because it helps maintain equitable assessments among classes of property and among assessing jurisdictions. This contributes to a fairer distribution of state aid, such as aid to schools. It also helps to equally distribute the total tax burden within an area. In addition, an “assessment limitation” is applied every year. This process is commonly called “rollback” and is used to adjust for inflation.
2016 - 2017 Preliminary Budget 132
Residential, commercial, and industrial real estate is assessed at 100% of market value, and the assessor must determine the fair market value of the property. To do this, the assessor generally uses three approaches:
• Market Approach: Analyze sales of similar properties that were recently sold, and determine the most probable sales price of the property being appraised.
• Cost Approach: Estimate how much money at current labor and material prices it would take to replace the property with one similar to it. This is useful when no sales of comparable properties exist.
• Income Approach: If the property produces income, such as an apartment or office building, estimate its ability to produce income.
Agricultural real estate is assessed at 100% of productivity and net earning capacity value. The assessor considers the productivity and net earning capacity of the property. Agricultural income as reflected by production, prices, expenses, and various local conditions is taken into account.
The utilities/railroad class of property is assessed at the state level.
Details on the components of the property valuations are included on the Local Funds: Property Valuations schedule.
2016 - 2017 Preliminary Budget 133
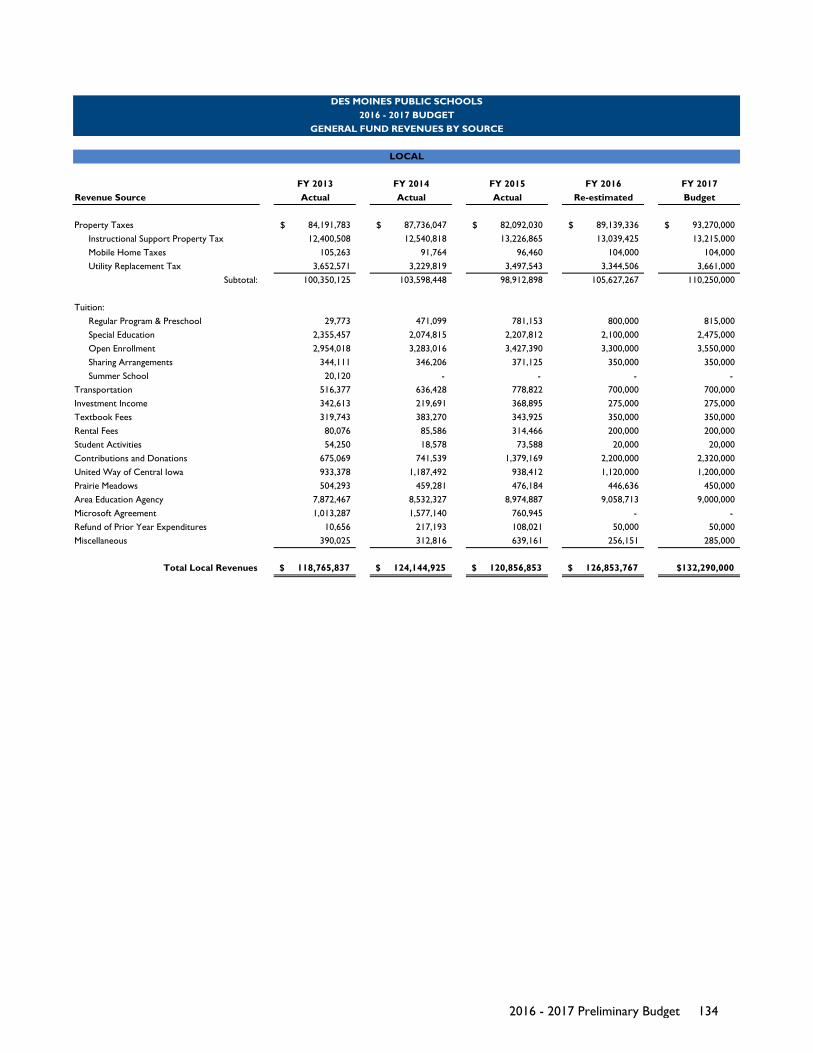
FY 2013 FY 2014 FY 2015 FY 2016 FY 2017Revenue Source Actual Actual Actual Re-estimated Budget
Property Taxes 84,191,783$ 87,736,047$ 82,092,030$ 89,139,336$ 93,270,000$ Instructional Support Property Tax 12,400,508 12,540,818 13,226,865 13,039,425 13,215,000 Mobile Home Taxes 105,263 91,764 96,460 104,000 104,000 Utility Replacement Tax 3,652,571 3,229,819 3,497,543 3,344,506 3,661,000
Subtotal: 100,350,125 103,598,448 98,912,898 105,627,267 110,250,000
Tuition:Regular Program & Preschool 29,773 471,099 781,153 800,000 815,000Special Education 2,355,457 2,074,815 2,207,812 2,100,000 2,475,000Open Enrollment 2,954,018 3,283,016 3,427,390 3,300,000 3,550,000Sharing Arrangements 344,111 346,206 371,125 350,000 350,000Summer School 20,120 - - - -
Transportation 516,377 636,428 778,822 700,000 700,000Investment Income 342,613 219,691 368,895 275,000 275,000Textbook Fees 319,743 383,270 343,925 350,000 350,000Rental Fees 80,076 85,586 314,466 200,000 200,000Student Activities 54,250 18,578 73,588 20,000 20,000Contributions and Donations 675,069 741,539 1,379,169 2,200,000 2,320,000United Way of Central Iowa 933,378 1,187,492 938,412 1,120,000 1,200,000Prairie Meadows 504,293 459,281 476,184 446,636 450,000Area Education Agency 7,872,467 8,532,327 8,974,887 9,058,713 9,000,000Microsoft Agreement 1,013,287 1,577,140 760,945 - - Refund of Prior Year Expenditures 10,656 217,193 108,021 50,000 50,000Miscellaneous 390,025 312,816 639,161 256,151 285,000
Total Local Revenues 118,765,837$ 124,144,925$ 120,856,853$ 126,853,767$ $132,290,000
DES MOINES PUBLIC SCHOOLS2016 - 2017 BUDGET
GENERAL FUND REVENUES BY SOURCE
LOCAL
2016 - 2017 Preliminary Budget 134
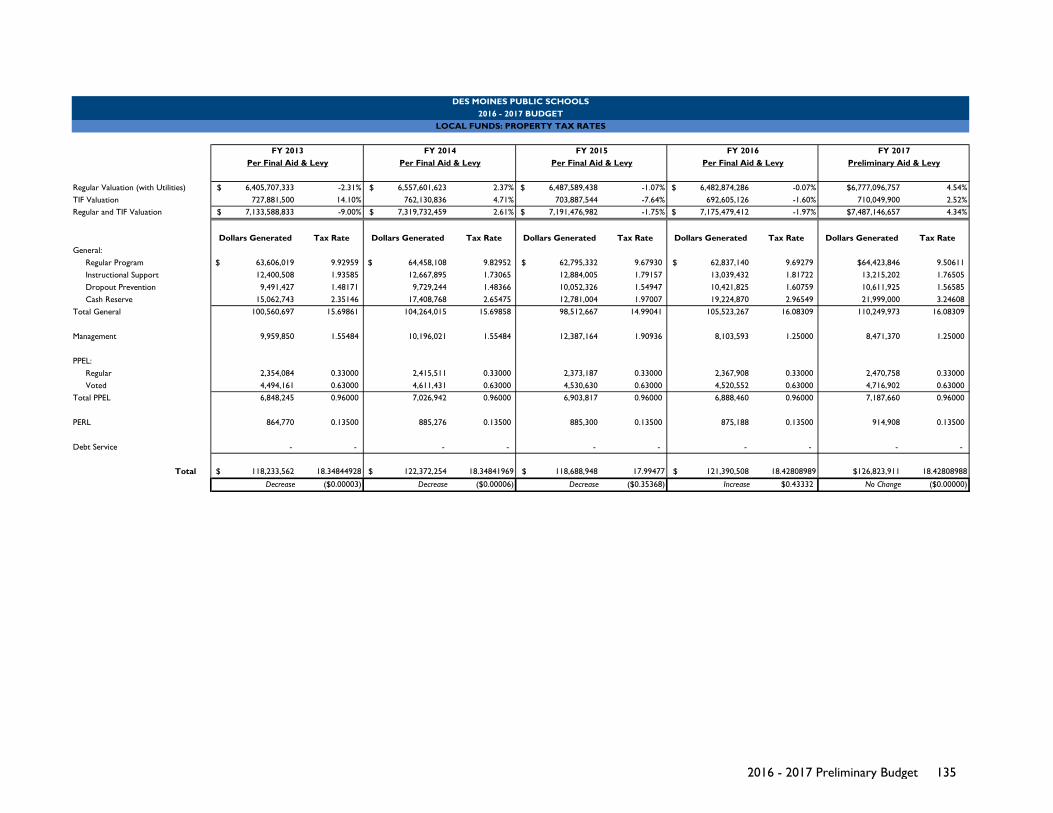
Regular Valuation (with Utilities) 6,405,707,333$ -2.31% 6,557,601,623$ 2.37% 6,487,589,438$ -1.07% 6,482,874,286$ -0.07% $6,777,096,757 4.54%TIF Valuation 727,881,500 14.10% 762,130,836 4.71% 703,887,544 -7.64% 692,605,126 -1.60% 710,049,900 2.52%Regular and TIF Valuation 7,133,588,833$ -9.00% 7,319,732,459$ 2.61% 7,191,476,982$ -1.75% 7,175,479,412$ -1.97% $7,487,146,657 4.34%
Dollars Generated Tax Rate Dollars Generated Tax Rate Dollars Generated Tax Rate Dollars Generated Tax Rate Dollars Generated Tax Rate General:
Regular Program 63,606,019$ 9.92959 64,458,108$ 9.82952 62,795,332$ 9.67930 62,837,140$ 9.69279 $64,423,846 9.50611Instructional Support 12,400,508 1.93585 12,667,895 1.73065 12,884,005 1.79157 13,039,432 1.81722 13,215,202 1.76505Dropout Prevention 9,491,427 1.48171 9,729,244 1.48366 10,052,326 1.54947 10,421,825 1.60759 10,611,925 1.56585Cash Reserve 15,062,743 2.35146 17,408,768 2.65475 12,781,004 1.97007 19,224,870 2.96549 21,999,000 3.24608
Total General 100,560,697 15.69861 104,264,015 15.69858 98,512,667 14.99041 105,523,267 16.08309 110,249,973 16.08309
Management 9,959,850 1.55484 10,196,021 1.55484 12,387,164 1.90936 8,103,593 1.25000 8,471,370 1.25000
PPEL:Regular 2,354,084 0.33000 2,415,511 0.33000 2,373,187 0.33000 2,367,908 0.33000 2,470,758 0.33000Voted 4,494,161 0.63000 4,611,431 0.63000 4,530,630 0.63000 4,520,552 0.63000 4,716,902 0.63000
Total PPEL 6,848,245 0.96000 7,026,942 0.96000 6,903,817 0.96000 6,888,460 0.96000 7,187,660 0.96000
PERL 864,770 0.13500 885,276 0.13500 885,300 0.13500 875,188 0.13500 914,908 0.13500
Debt Service - - - - - - - - - -
Total 118,233,562$ 18.34844928 122,372,254$ 18.34841969 118,688,948$ 17.99477 121,390,508$ 18.42808989 $126,823,911 18.42808988
Decrease ($0.00003) Decrease ($0.00006) Decrease ($0.35368) Increase $0.43332 No Change ($0.00000)
FY 2017Preliminary Aid & Levy
DES MOINES PUBLIC SCHOOLS2016 - 2017 BUDGET
LOCAL FUNDS: PROPERTY TAX RATES
Per Final Aid & LevyFY 2015
Per Final Aid & LevyFY 2016
Per Final Aid & LevyFY 2014FY 2013
Per Final Aid & Levy
2016 - 2017 Preliminary Budget 135
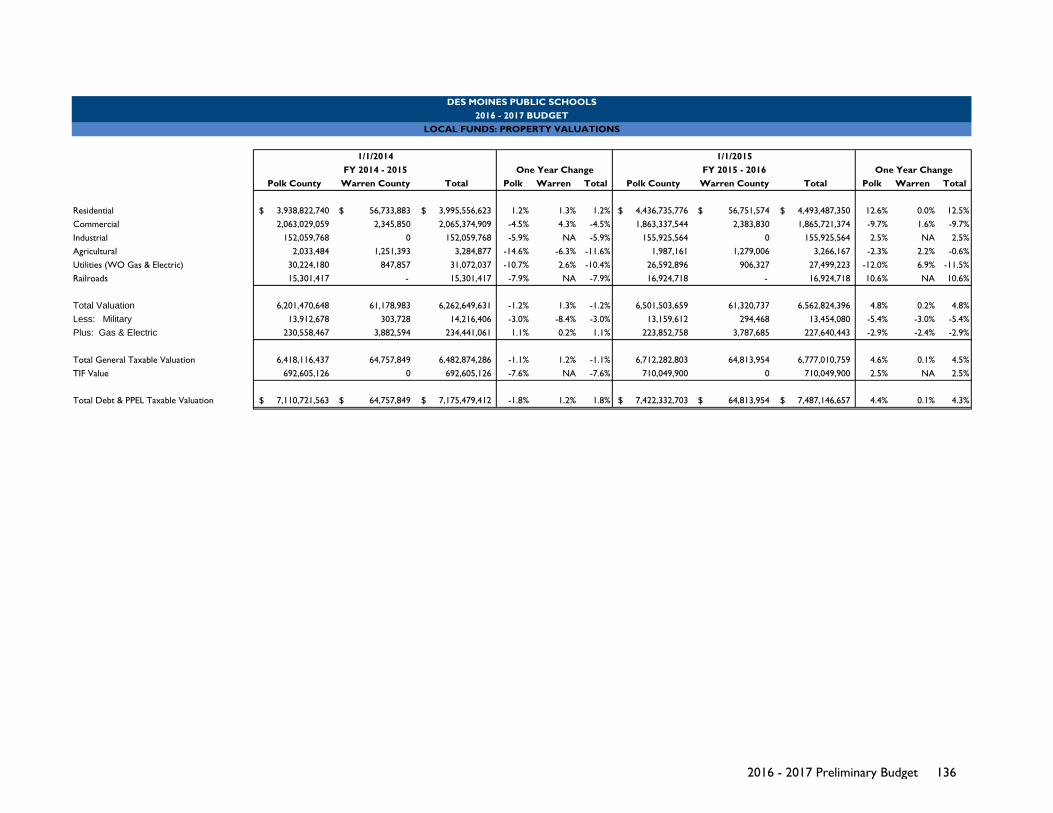
Polk County Warren County Total Polk Warren Total Polk County Warren County Total Polk Warren Total
Residential 3,938,822,740$ 56,733,883$ 3,995,556,623$ 1.2% 1.3% 1.2% 4,436,735,776$ 56,751,574$ 4,493,487,350$ 12.6% 0.0% 12.5%Commercial 2,063,029,059 2,345,850 2,065,374,909 -4.5% 4.3% -4.5% 1,863,337,544 2,383,830 1,865,721,374 -9.7% 1.6% -9.7%Industrial 152,059,768 0 152,059,768 -5.9% NA -5.9% 155,925,564 0 155,925,564 2.5% NA 2.5%Agricultural 2,033,484 1,251,393 3,284,877 -14.6% -6.3% -11.6% 1,987,161 1,279,006 3,266,167 -2.3% 2.2% -0.6%Utilities (WO Gas & Electric) 30,224,180 847,857 31,072,037 -10.7% 2.6% -10.4% 26,592,896 906,327 27,499,223 -12.0% 6.9% -11.5%Railroads 15,301,417 - 15,301,417 -7.9% NA -7.9% 16,924,718 - 16,924,718 10.6% NA 10.6%
Total Valuation 6,201,470,648 61,178,983 6,262,649,631 -1.2% 1.3% -1.2% 6,501,503,659 61,320,737 6,562,824,396 4.8% 0.2% 4.8%Less: Military 13,912,678 303,728 14,216,406 -3.0% -8.4% -3.0% 13,159,612 294,468 13,454,080 -5.4% -3.0% -5.4%Plus: Gas & Electric 230,558,467 3,882,594 234,441,061 1.1% 0.2% 1.1% 223,852,758 3,787,685 227,640,443 -2.9% -2.4% -2.9%
Total General Taxable Valuation 6,418,116,437 64,757,849 6,482,874,286 -1.1% 1.2% -1.1% 6,712,282,803 64,813,954 6,777,010,759 4.6% 0.1% 4.5%TIF Value 692,605,126 0 692,605,126 -7.6% NA -7.6% 710,049,900 0 710,049,900 2.5% NA 2.5%
Total Debt & PPEL Taxable Valuation 7,110,721,563$ 64,757,849$ 7,175,479,412$ -1.8% 1.2% 1.8% 7,422,332,703$ 64,813,954$ 7,487,146,657$ 4.4% 0.1% 4.3%
1/1/2015FY 2015 - 2016 One Year Change
DES MOINES PUBLIC SCHOOLS2016 - 2017 BUDGET
LOCAL FUNDS: PROPERTY VALUATIONS
FY 2014 - 20151/1/2014
One Year Change
2016 - 2017 Preliminary Budget 136
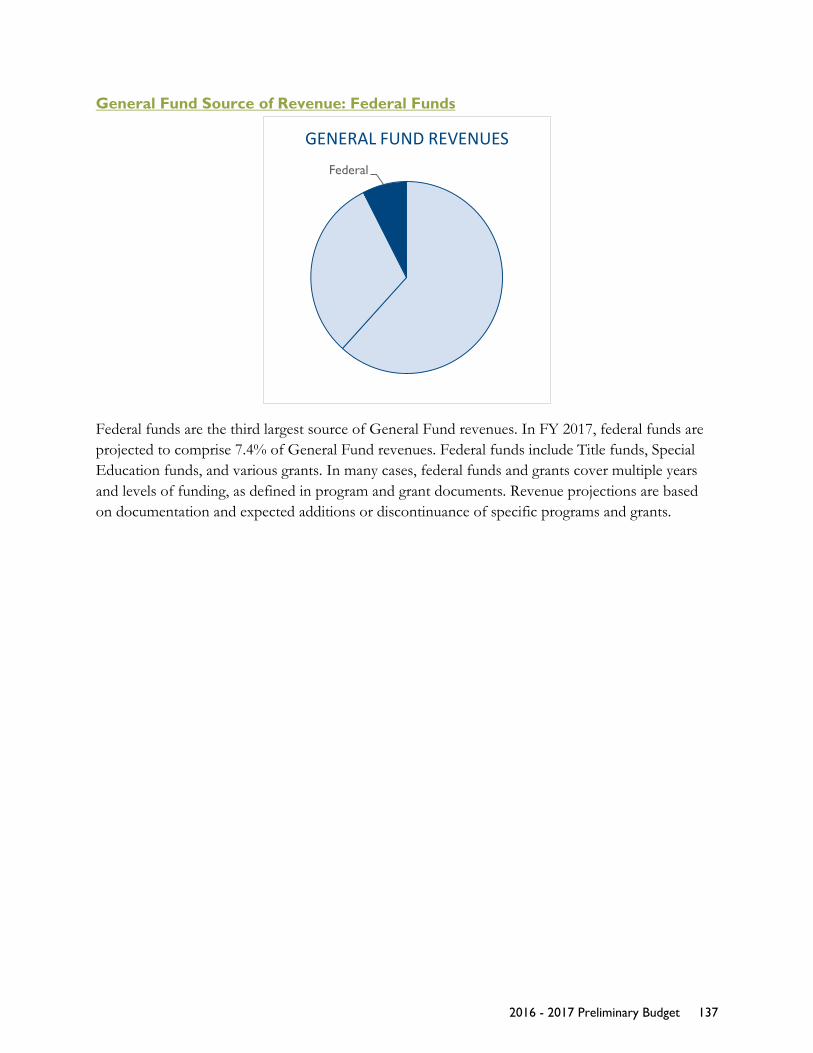
General Fund Source of Revenue: Federal Funds
Federal funds are the third largest source of General Fund revenues. In FY 2017, federal funds are projected to comprise 7.4% of General Fund revenues. Federal funds include Title funds, Special Education funds, and various grants. In many cases, federal funds and grants cover multiple years and levels of funding, as defined in program and grant documents. Revenue projections are based on documentation and expected additions or discontinuance of specific programs and grants.
Federal
GENERAL FUND REVENUES
2016 - 2017 Preliminary Budget 137
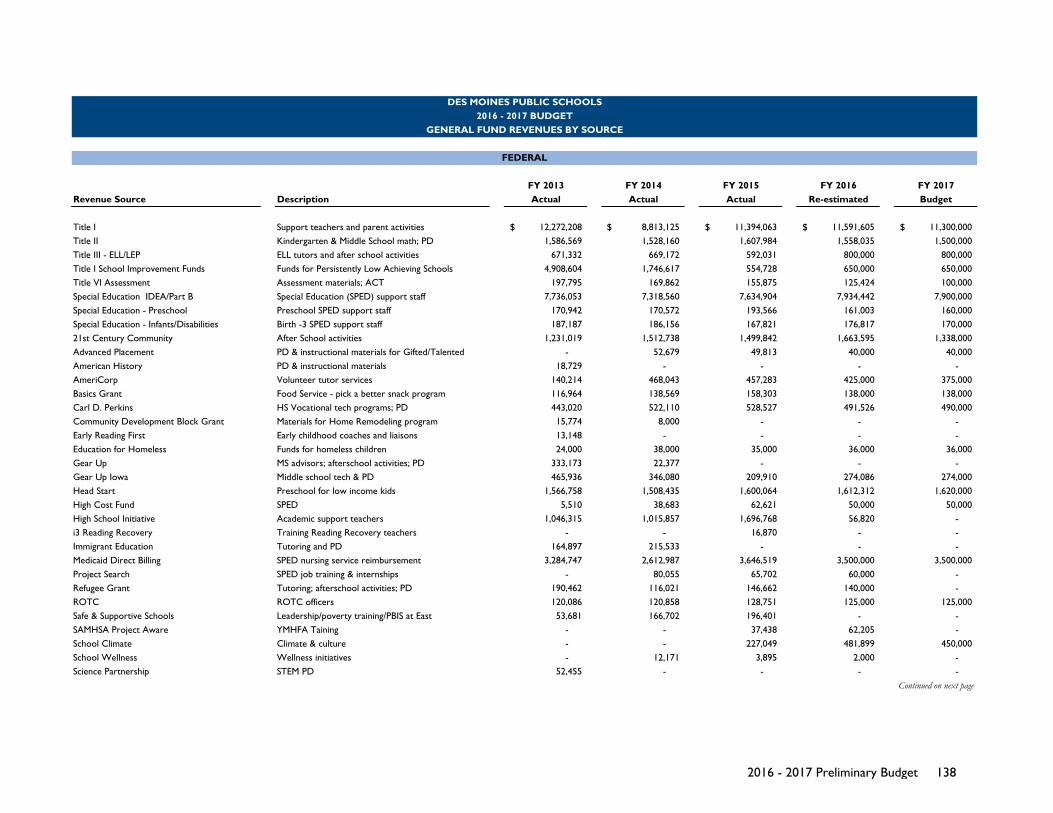
FY 2013 FY 2014 FY 2015 FY 2016 FY 2017Revenue Source Description Actual Actual Actual Re-estimated Budget
Title I Support teachers and parent activities 12,272,208$ 8,813,125$ 11,394,063$ 11,591,605$ 11,300,000$ Title II Kindergarten & Middle School math; PD 1,586,569 1,528,160 1,607,984 1,558,035 1,500,000Title III - ELL/LEP ELL tutors and after school activities 671,332 669,172 592,031 800,000 800,000Title I School Improvement Funds Funds for Persistently Low Achieving Schools 4,908,604 1,746,617 554,728 650,000 650,000Title VI Assessment Assessment materials; ACT 197,795 169,862 155,875 125,424 100,000Special Education IDEA/Part B Special Education (SPED) support staff 7,736,053 7,318,560 7,634,904 7,934,442 7,900,000Special Education - Preschool Preschool SPED support staff 170,942 170,572 193,566 161,003 160,000Special Education - Infants/Disabilities Birth -3 SPED support staff 187,187 186,156 167,821 176,817 170,00021st Century Community After School activities 1,231,019 1,512,738 1,499,842 1,663,595 1,338,000Advanced Placement PD & instructional materials for Gifted/Talented - 52,679 49,813 40,000 40,000American History PD & instructional materials 18,729 - - - - AmeriCorp Volunteer tutor services 140,214 468,043 457,283 425,000 375,000Basics Grant Food Service - pick a better snack program 116,964 138,569 158,303 138,000 138,000Carl D. Perkins HS Vocational tech programs; PD 443,020 522,110 528,527 491,526 490,000Community Development Block Grant Materials for Home Remodeling program 15,774 8,000 - - - Early Reading First Early childhood coaches and liaisons 13,148 - - - - Education for Homeless Funds for homeless children 24,000 38,000 35,000 36,000 36,000Gear Up MS advisors; afterschool activities; PD 333,173 22,377 - - - Gear Up Iowa Middle school tech & PD 465,936 346,080 209,910 274,086 274,000Head Start Preschool for low income kids 1,566,758 1,508,435 1,600,064 1,612,312 1,620,000High Cost Fund SPED 5,510 38,683 62,621 50,000 50,000High School Initiative Academic support teachers 1,046,315 1,015,857 1,696,768 56,820 - i3 Reading Recovery Training Reading Recovery teachers - - 16,870 - - Immigrant Education Tutoring and PD 164,897 215,533 - - - Medicaid Direct Billing SPED nursing service reimbursement 3,284,747 2,612,987 3,646,519 3,500,000 3,500,000Project Search SPED job training & internships - 80,055 65,702 60,000 - Refugee Grant Tutoring; afterschool activities; PD 190,462 116,021 146,662 140,000 - ROTC ROTC officers 120,086 120,858 128,751 125,000 125,000Safe & Supportive Schools Leadership/poverty training/PBIS at East 53,681 166,702 196,401 - - SAMHSA Project Aware YMHFA Taining - - 37,438 62,205 - School Climate Climate & culture - - 227,049 481,899 450,000School Wellness Wellness initiatives - 12,171 3,895 2,000 - Science Partnership STEM PD 52,455 - - - -
Continued on next page
DES MOINES PUBLIC SCHOOLS2016 - 2017 BUDGET
GENERAL FUND REVENUES BY SOURCE
FEDERAL
2016 - 2017 Preliminary Budget 138
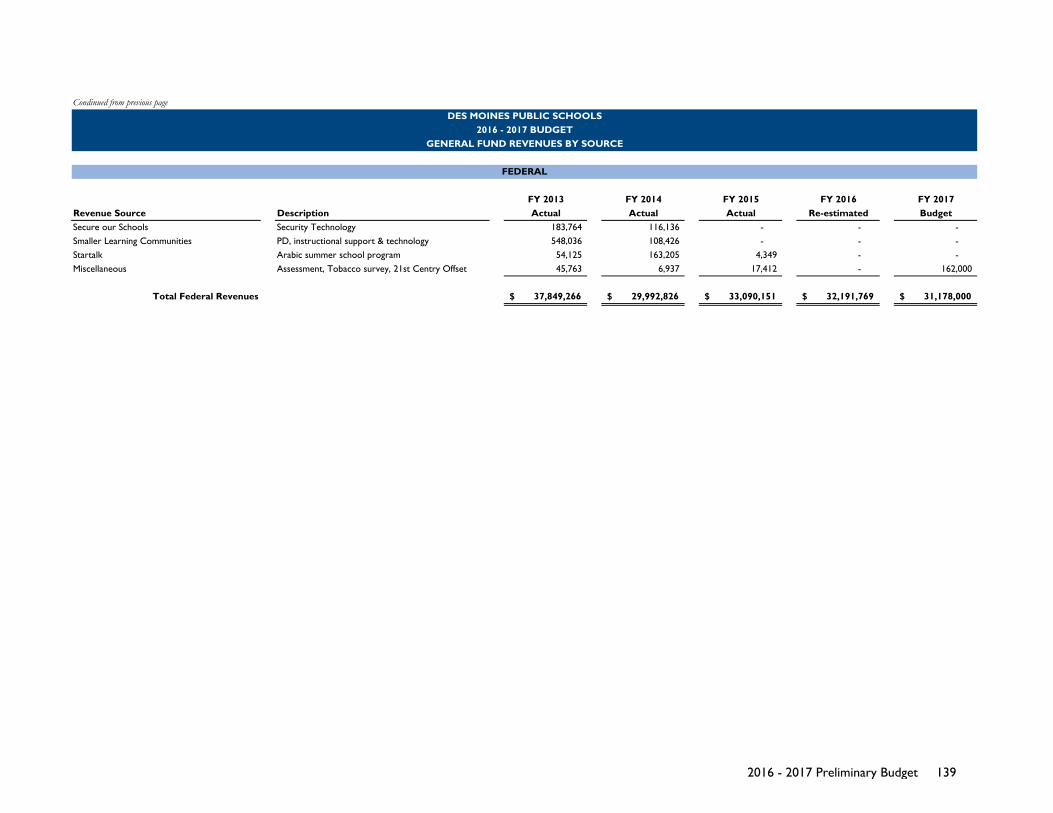
Condinued from previous page
FY 2013 FY 2014 FY 2015 FY 2016 FY 2017Revenue Source Description Actual Actual Actual Re-estimated BudgetSecure our Schools Security Technology 183,764 116,136 - - - Smaller Learning Communities PD, instructional support & technology 548,036 108,426 - - - Startalk Arabic summer school program 54,125 163,205 4,349 - - Miscellaneous Assessment, Tobacco survey, 21st Centry Offset 45,763 6,937 17,412 - 162,000
Total Federal Revenues 37,849,266$ 29,992,826$ 33,090,151$ 32,191,769$ 31,178,000$
2016 - 2017 BUDGETGENERAL FUND REVENUES BY SOURCE
FEDERAL
DES MOINES PUBLIC SCHOOLS
2016 - 2017 Preliminary Budget 139
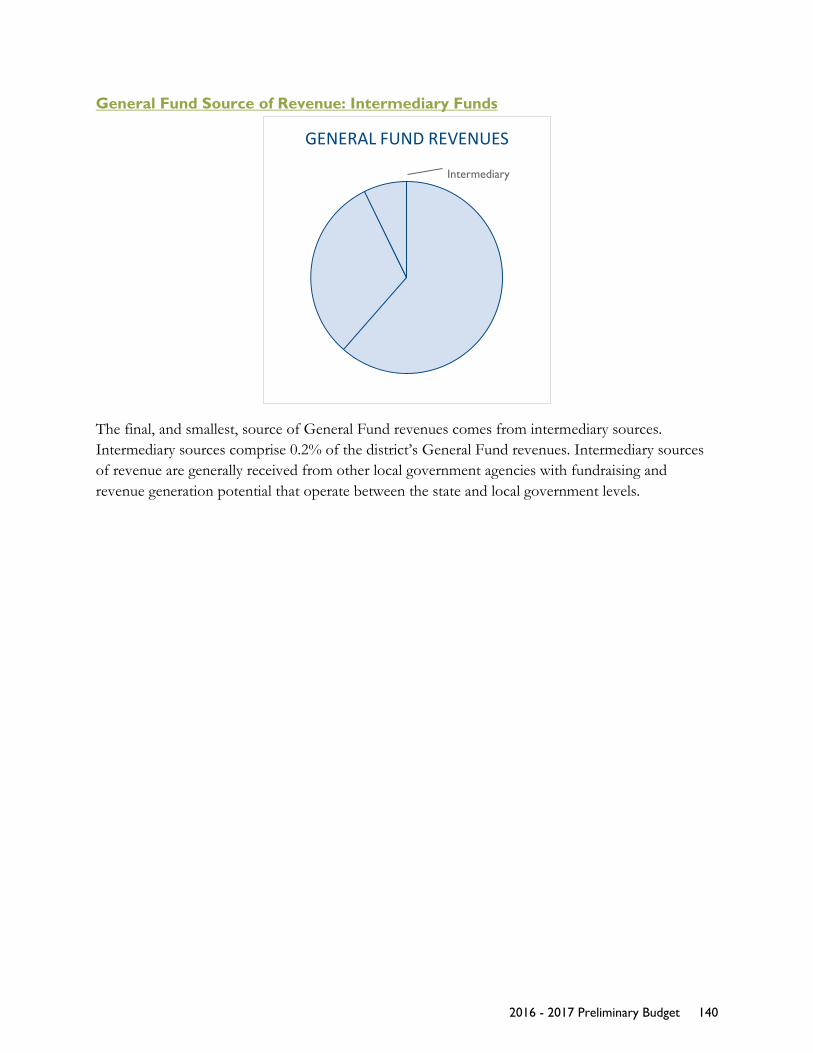
General Fund Source of Revenue: Intermediary Funds
The final, and smallest, source of General Fund revenues comes from intermediary sources. Intermediary sources comprise 0.2% of the district’s General Fund revenues. Intermediary sources of revenue are generally received from other local government agencies with fundraising and revenue generation potential that operate between the state and local government levels.
Intermediary
GENERAL FUND REVENUES
2016 - 2017 Preliminary Budget 140

FY 2013 FY 2014 FY 2015 FY 2016 FY 2017Revenue Source Description Actual Actual Actual Re-estimated Budget
Community Betterment Summer school programs 9,400$ 17,043$ 2,400$ 12,000$ 5,000$ Grants Through Area Education Agency Special Education 530,771 691,927 765,017 705,800 700,000
Total Intermediary Revenues 540,171$ 708,970$ 767,417$ 717,800$ 705,000$
DES MOINES PUBLIC SCHOOLS2016 - 2017 BUDGET
GENERAL FUND REVENUES BY SOURCE
INTERMEDIARY
2016 - 2017 Preliminary Budget 141
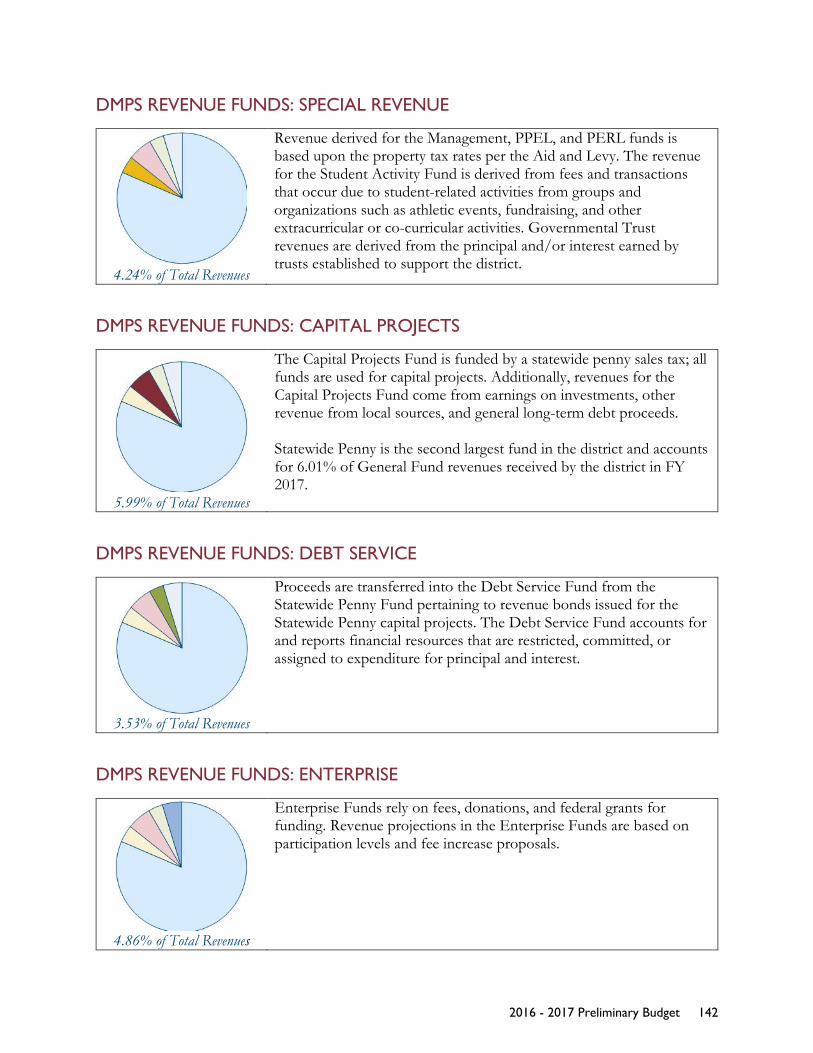
DMPS REVENUE FUNDS: SPECIAL REVENUE
4.24% of Total Revenues
Revenue derived for the Management, PPEL, and PERL funds is based upon the property tax rates per the Aid and Levy. The revenue for the Student Activity Fund is derived from fees and transactions that occur due to student-related activities from groups and organizations such as athletic events, fundraising, and other extracurricular or co-curricular activities. Governmental Trust revenues are derived from the principal and/or interest earned by trusts established to support the district.
DMPS REVENUE FUNDS: CAPITAL PROJECTS
5.99% of Total Revenues
The Capital Projects Fund is funded by a statewide penny sales tax; all funds are used for capital projects. Additionally, revenues for the Capital Projects Fund come from earnings on investments, other revenue from local sources, and general long-term debt proceeds. Statewide Penny is the second largest fund in the district and accounts for 6.01% of General Fund revenues received by the district in FY 2017.
DMPS REVENUE FUNDS: DEBT SERVICE
3.53% of Total Revenues
Proceeds are transferred into the Debt Service Fund from the Statewide Penny Fund pertaining to revenue bonds issued for the Statewide Penny capital projects. The Debt Service Fund accounts for and reports financial resources that are restricted, committed, or assigned to expenditure for principal and interest.
DMPS REVENUE FUNDS: ENTERPRISE
4.86% of Total Revenues
Enterprise Funds rely on fees, donations, and federal grants for funding. Revenue projections in the Enterprise Funds are based on participation levels and fee increase proposals.
2016 - 2017 Preliminary Budget 142
LONG-RANGE FINANCIAL PLANS
Purpose There is a two-part purpose for long-range financial planning. First, it provides a forward looking view of the General Fund operating budget, which is the fund that accounts for 81% of all revenues received by the district and has the least expenditure restrictions. It is from this account that the majority of salaries are funded. With a forward-thinking view, the Board and the district is able to evaluate the long-term sustainability of the annual operating budget. Second, long-range planning provides a reference point for future budgetary decisions budget by weighting potential spending needs and projected revenue.
The long-range forecast, which projects General Fund revenues and expenses for the budget year plus an additional five years based on a series of assumptions, is a key tool used for financial planning. Multi-year financial planning can potentially avoid the budgetary cycle of simply putting out the next fire by providing a longer term perspective on what problems are coming and thus preventing or minimizing them. Multi-year budgeting can also end the “us vs. them” dynamic that can plague the budget process. Multi-year planning helps build understanding and consensus for change in the district.
Long-term forecasting helps the district budget for areas of operation to implement achieve Student Expectations, while staying within the annual Budget Parameters set by the Board of Directors. The Business & Finance department reviews financial data on daily, monthly, quarterly, and annual basis. If an analysis determines that an initiative is not effective, corrective steps are taken. The Business & Finance department also completes and presents quarterly monitoring reports to the Board to demonstrate the district’s fiscal condition.
Key Issues Compensation Compensation—salaries and benefits—represents 82.5% of overall expenditures in the General Fund. The issue of compensation has several key components including cost of living for employees, rising health care costs, sustainability of the workforce, and maintaining effective programing. To address this key issue, the district has a multi-faceted approach. For example, the district conducts comprehensive negotiations with employees, conducts extensive training for staff, and is implementing a district-wide wellness program.
Cost of Goods and Services The district is focused on finding ways to do more with less and directing funds toward costs that impact students. The district has pursued multiple ways to address rising costs of goods and services including paper reduction strategies, system integration, data analysis, and energy savings.
2016 - 2017 Preliminary Budget 143
Spending Authority Iowa uses a school finance formula which sets the maximum amount a district is authorized to spend and certify on a budget for a fiscal year. A district’s spending authority is the sum of the district’s combined cost and miscellaneous income for the budget year plus unspent balance from the previous year. It is illegal for a district to exceed its maximum authorized budget.
Supplemental State Aid For the last several years, the legislature has not established the percent of growth for Supplemental State Aid (also known as “Allowable Growth”) in a timely manner. Consequently, the district has undertaken multiple scenario budget forecasting to identify various contingency plans.
Approach to Financial Planning The following guidelines from the GFOA steered the development of the district’s long-range financial plans:
1. Baseline Assessment • What is the current fiscal/financial condition, and, after careful analysis of revenue and
expenditure trends and related budget drivers, what is the fiscal/financial condition likely to be in the future if no policy changes or corrective actions are made? o The baselines assessment helps to: Communicate a clear picture of the district’s financial strengths, weaknesses, and
potential future with no corrective action. Quantify the impact of key budget drivers. Identify hidden and emerging problems. Provide a framework for addressing intermediate and longer-range
considerations in budget discussions.
2. Initiatives Development • Given this baseline assessment, what initiatives (on both the expenditure and revenue
side of the budget) should be pursued, and what are the fiscal implications of those initiatives? o The multi-year planning process includes development of a menu of options,
generally quantified, that represent the best available approach to achieving and maintaining balance. Approaches would typically involve some (or all) of the following: Workforce strategy Management and productivity initiatives (e.g., transportation, facilities,
technology) Program prioritization State legislative agenda Tax rates and cost recovery Debt management
2016 - 2017 Preliminary Budget 144
3. Implementation • What institutional/organizational measures will ensure that initiatives are put in place? • What performance measures are appropriate to monitor the success of these initiatives,
and are the necessary data collections/systems in place? • Revisit and revise based on results.
o Once a plan has been adopted and implementation of initiatives has begun, it is important to find practical ways to do the following: Measure: “That which gets measured gets done.” What are the performance
measures that track the progress made toward implementing an initiative? How do you measure whether the initiative had the desired impact(s)?
Monitor: What are the most effective way to communicate with staff in charge of implementing changes to discuss challenges, successes and failures? How will those lessons and the progress achieved be communicated?
Manage: It is okay to change strategies mid-course as the nature of the problem, available resource levels, etc. change. Measurement and monitoring will indicate when those changes are appropriate.
Alliance for Excellence in School Budgeting Des Moines Public Schools is one of 35 school district members of the Government Finance Officers Association (GFOA) Alliance for Excellence in School Budgeting. The Alliance, composed of school districts from 21 states across the United States serving anywhere from a thousand students up to several hundred thousand students, is working with the GFOA to implement the Best Practices in School Budgeting. The Best Practices outline a budget process that centers on aligning resources with areas of greatest impact on student achievement.
As a member of the Alliance, the district is working to implement the Best Practices with support from GFOA in the form of collaborative meetings, newly developed eLearnings, networking with peer organizations, and other supports. The district’s ultimate goal for this endeavor is to improve the budget process and focus on aligning, evaluating, and prioritizing initiatives to maximize student achievement.
Maintaining the Financial Health of the District The district is facing some significant financial issues that must be addressed to maintain the long-term financial health of the district, while continuing to take steps to improve student outcomes. One of the priorities of this school district is to maintain a vital, fiscally sound organization so that students continue receive education in a robust, supportive environment that is conducive to teaching and learning. The district strives to make student-centered decisions in all areas of operation.
Maintaining the financial health of the district is accomplished through a variety of factors including: (1) Maintaining a spending authority ratio within the recommended guidelines of 10-20%, (2) Maintaining a solvency ratio within the recommended guidelines of 5-17%, (3) Following GFOA
2016 - 2017 Preliminary Budget 145
recommendations of 60 days of cash reserves on hand, (4) Managing the district’s investment portfolio and debt, and (5) Conducting trend/forecast analysis including the various impacts tax rates can have on the district.
To maintain long-term financial health, current expenditures cannot exceed current revenues. The district must avoid dipping into “savings” to manage the year-to-year budget. Consequently, the district must make strategic decisions to align expenditures with revenues in the most effective and efficient way possible. There are two, associated dynamics spurring these efforts: the district’s Spending Authority and the amount of Supplemental State Aid received from the state.
Spending Authority The state controls the maximum amount each district can spend each year through the Spending Authority function. Under the Spending Authority control, it is illegal for a school district to exceed its Maximum Authorized Budget. (To reach the maximum budget authority level, the Board would have to authorize and levy additional property taxes.) It is important to understand that the limit on spending is the amount of Spending Authority a district has, not the amount of cash or fund balance a district has. The district’s total Spending Authority includes the current-year Authorized Budget (which consists of the district’s combined cost and miscellaneous income) plus the Unspent Authorized Budget from the prior year (i.e., the amount of money that a district was authorized to spend in a fiscal year but did not, similar to “savings”).
The Unspent Spending Authority ratio is a measure of the district’s unbudgeted authorized spending capacity (not cash reserves) and is defined as the district’s Unspent Spending Authority divided by the District’s Maximum Budget Authority. The IASB recommends this ratio be in the target range of 10-20%. The Board adopted guidelines in FY 2012 setting the target for the district’s Unspent Spending Authority Ratio at 10%; in 2015 the Board raised this target to 15%. The unspent spending authority balance ratio for FY 2015 (unaudited) was 11.9%. Based on a worst-case-scenario of 1.00% growth in Supplemental State Aid, it is estimated the unspent spending authority for FY 2016 and FY 2017 will also decline.
Spending Authority is directly tied to student enrollment, and there are only three general means by which the district’s Spending Authority can increase: (1) increased State Supplemental Aid (i.e., Allowable Growth), (2) increased Enrollment, or (3) increased Miscellaneous Income. The district does not anticipate growth is any of those three areas. (Note: for budget planning purposes, the district views consistent enrollment increases of less than l% as insignificant.) In situations where Spending Authority is not growing, if no adjustments are made to expenses, the Unspent Budget is tapped into to cover expenses. The significant predicament this creates is the decrease in the district’s Maximum Authorized Budget, and it is illegal for a school district to exceed its Maximum Authorized Budget.
Supplemental State Aid Supplemental State Aid has been abysmal over the past decade. Given the political climate in the state, the real fear is that 0-2% Supplemental State Aid is the “new normal” and that the years of
2016 - 2017 Preliminary Budget 146

regular 4% increases to Supplemental State Aid is a thing of the past. School district have also experienced an increase in categorical funding from the state (such as TLC funding) that can only be spent on certain programs, not for general education purposes. Supplemental State Aid (Allowable Growth) is vital as costs—such as health care, other compensation components, fuel costs, and cost of goods and services—continue to rise. In fact, the forecasting model the district uses indicates that is the district continually receives 1% unrestricted Supplemental State Aid, by 2020, expenses will exceed revenues by more than $11 million (and rising) each year, if changes are not made.
In recent years, the amount of Supplemental State Aid (i.e., Allowable Growth) allocated by the state has not covered the compensation settlements with employee groups. This has caused the district to use some of the unspent spending dollars to cover the costs of operations. This trend will continue without a change in funding or a change to teaching strategies to maximize the learning we can get from the resources we can afford. Staffing is a top priority to improve education, and education, by nature, is reliant on individuals to perform functions. However, it is the charge of the district to identify areas in which efficiencies can be gained, particularly in the area of staffing and personnel.
Accurate and timely Supplemental State Aid is vital to short-term (i.e., one-year) budgeting. As of the beginning of March, State Aid for FY 2017 is not finalized. There is no indication when the Legislature will pass school funding. This preliminary budget for FY 2017 is based on a worst-case-scenario of 1.00% growth in Supplemental State Aid. After the Legislature sets school funding, the budget may be amended, if needed.
Solvency Ratio The district’s solvency ratio is a moment-in-time (June 30) measurement of the district’s General Fund financial health. The solvency ratio is measure of the district’s fund equity position and is defined as the unreserved, undesignated fund balance (commonly referred to as the cash reserves) divided by the district’s total General Fund revenues, less AEA flow-through. The Iowa Association of School Boards (IASB) considers a solvency ratio of 5-10% within “Target” or “Good” and therefore “can handle the unexpected.” GFOA guidelines are 10-17%. During the 2012-13 school year, the School Board approved a minimum target of 15.0% for the district’s solvency ratio. Board guidelines state that the solvency ratio should not go below 3%, without prior knowledge of the Board. The solvency ratio for the district decreased at year end 2015 to 13.2%, down from 15.4% in the prior year.
General Fund Fiscal Outlook through FY 2021 The forecast makes the following assumptions for revenues:
(1) Enrollment increases by approximately 100 students per year (2) The percent of growth for Supplemental State Aid (also known as “Allowable Growth”) is
1.00% for FY 2017, 2.50% for 2018, 3.00% for 2019, 2.50% for 2020 and 3.00% for 2021 (3) Standard federal programs will remain the same.
The forecast also makes the following assumptions for expenditures:
2016 - 2017 Preliminary Budget 147
(A) Historical increases for compensation (state average) will continue: 3.00% salary & 4.00% health insurance
(B) Staffing based on November 2015 levels, with 100 FTE positions eliminated in FY 2017 and 75 FTE positions eliminated in FY 2018
(C) Modest price increases for goods and services (inflation) (D) Self-Insurance funding for health insurance ends after FY 2019 (E) Spending for technology, textbook adoptions, etc. will approximate FY 2015 levels (F) Includes estimate for funding of Drake MA program (G) Includes estimate for 3rd grade summer school (H) Includes technology replacement schedule
The forecasting model indicates that if the district continually receives 1% unrestricted Supplemental State Aid, by 2020, expenses will exceed revenues by more than $11 million (and rising) each year, if changes are not made.
One method the district is undertaking to address these concerns is to evaluate job responsibilities to ensure we are purposeful in staffing decisions. Education, by nature, is reliant on individuals to perform functions. However, it is the charge of the district to identify areas in which efficiencies can be gained, particularly in the area of staffing and personnel. Personnel costs are the largest single expense the district incurs; total compensation represents approximately 82.5 cents of every dollar within the General Fund. Thus, the district must proactively, and continuously, evaluate job responsibilities throughout the organization to ensure the district’s largest expense is being utilized in the most effective way possible. For example, the district utilizes a staffing formula for classroom positions to facilitate the process of identifying year-to-year changes needed to address annual changes in enrollment. The district must implement this same philosophy to all areas of staffing. The district must foster an environment in which staffing does not fall victim to the mentality of: “It has always been done this way, so we will continue to do it this way.” Ideally, staffing would at 75% of total General Fund expenditures. The goal is to reduce compensation seven percentage points over the next eight years.
2016 - 2017 Preliminary Budget 148
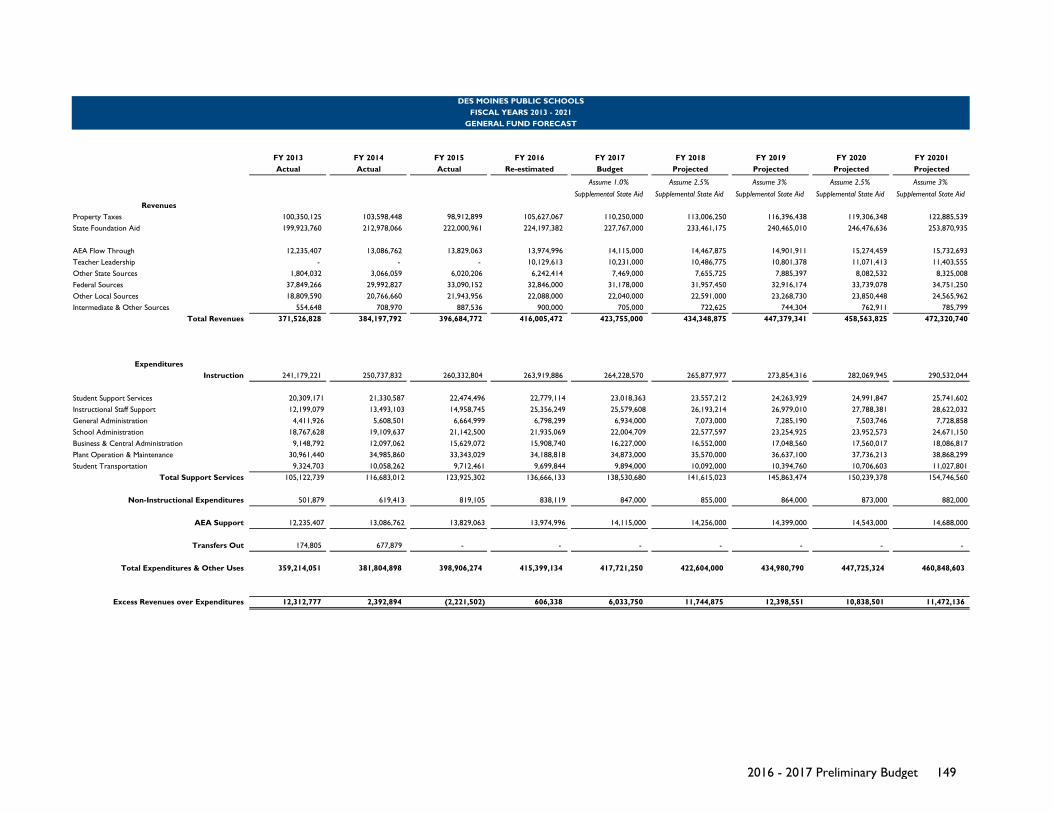
FY 2013 FY 2014 FY 2015 FY 2016 FY 2017 FY 2018 FY 2019 FY 2020 FY 20201Actual Actual Actual Re-estimated Budget Projected Projected Projected Projected
Assume 1.0%
Supplemental State Aid
Assume 2.5%
Supplemental State Aid
Assume 3%
Supplemental State Aid
Assume 2.5%
Supplemental State Aid
Assume 3%
Supplemental State AidRevenues
Property Taxes 100,350,125 103,598,448 98,912,899 105,627,067 110,250,000 113,006,250 116,396,438 119,306,348 122,885,539State Foundation Aid 199,923,760 212,978,066 222,000,961 224,197,382 227,767,000 233,461,175 240,465,010 246,476,636 253,870,935
AEA Flow Through 12,235,407 13,086,762 13,829,063 13,974,996 14,115,000 14,467,875 14,901,911 15,274,459 15,732,693Teacher Leadership - - - 10,129,613 10,231,000 10,486,775 10,801,378 11,071,413 11,403,555Other State Sources 1,804,032 3,066,059 6,020,206 6,242,414 7,469,000 7,655,725 7,885,397 8,082,532 8,325,008Federal Sources 37,849,266 29,992,827 33,090,152 32,846,000 31,178,000 31,957,450 32,916,174 33,739,078 34,751,250Other Local Sources 18,809,590 20,766,660 21,943,956 22,088,000 22,040,000 22,591,000 23,268,730 23,850,448 24,565,962Intermediate & Other Sources 554,648 708,970 887,536 900,000 705,000 722,625 744,304 762,911 785,799
Total Revenues 371,526,828 384,197,792 396,684,772 416,005,472 423,755,000 434,348,875 447,379,341 458,563,825 472,320,740
ExpendituresInstruction 241,179,221 250,737,832 260,332,804 263,919,886 264,228,570 265,877,977 273,854,316 282,069,945 290,532,044
Student Support Services 20,309,171 21,330,587 22,474,496 22,779,114 23,018,363 23,557,212 24,263,929 24,991,847 25,741,602Instructional Staff Support 12,199,079 13,493,103 14,958,745 25,356,249 25,579,608 26,193,214 26,979,010 27,788,381 28,622,032General Administration 4,411,926 5,608,501 6,664,999 6,798,299 6,934,000 7,073,000 7,285,190 7,503,746 7,728,858School Administration 18,767,628 19,109,637 21,142,500 21,935,069 22,004,709 22,577,597 23,254,925 23,952,573 24,671,150Business & Central Administration 9,148,792 12,097,062 15,629,072 15,908,740 16,227,000 16,552,000 17,048,560 17,560,017 18,086,817Plant Operation & Maintenance 30,961,440 34,985,860 33,343,029 34,188,818 34,873,000 35,570,000 36,637,100 37,736,213 38,868,299Student Transportation 9,324,703 10,058,262 9,712,461 9,699,844 9,894,000 10,092,000 10,394,760 10,706,603 11,027,801
Total Support Services 105,122,739 116,683,012 123,925,302 136,666,133 138,530,680 141,615,023 145,863,474 150,239,378 154,746,560
Non-Instructional Expenditures 501,879 619,413 819,105 838,119 847,000 855,000 864,000 873,000 882,000
AEA Support 12,235,407 13,086,762 13,829,063 13,974,996 14,115,000 14,256,000 14,399,000 14,543,000 14,688,000
Transfers Out 174,805 677,879 - - - - - - -
Total Expenditures & Other Uses 359,214,051 381,804,898 398,906,274 415,399,134 417,721,250 422,604,000 434,980,790 447,725,324 460,848,603
Excess Revenues over Expenditures 12,312,777 2,392,894 (2,221,502) 606,338 6,033,750 11,744,875 12,398,551 10,838,501 11,472,136
DES MOINES PUBLIC SCHOOLSFISCAL YEARS 2013 - 2021
GENERAL FUND FORECAST
2016 - 2017 Preliminary Budget 149
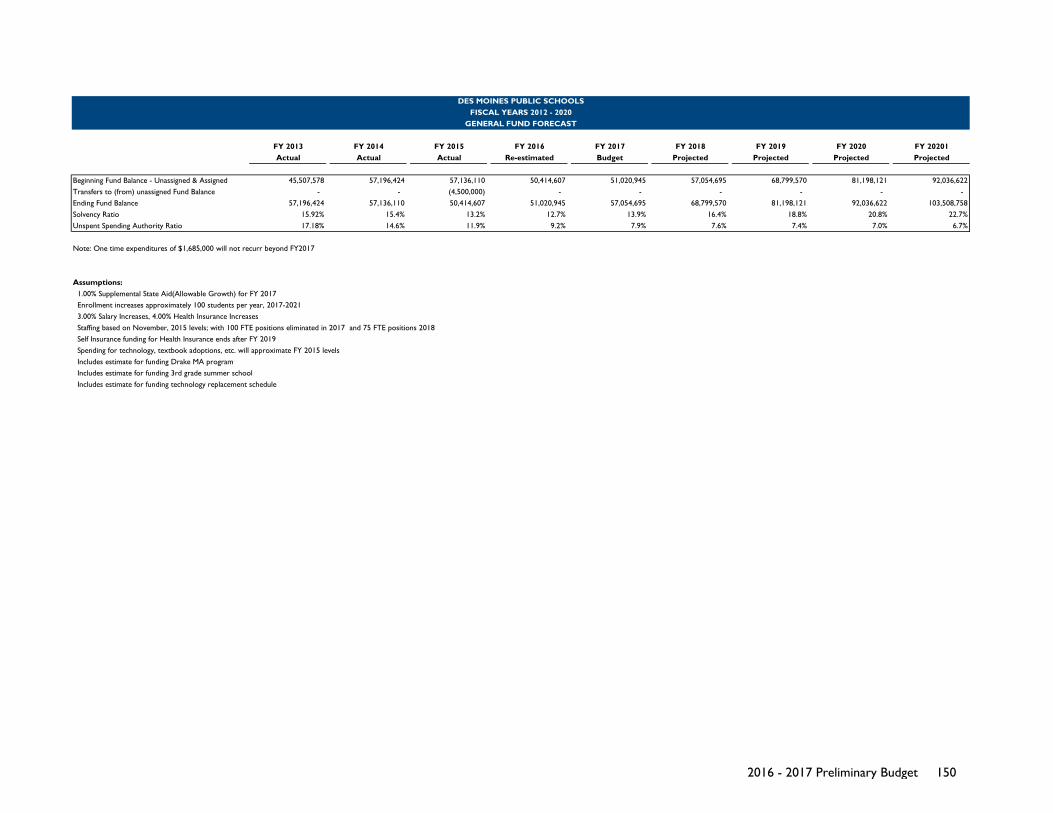
FY 2013 FY 2014 FY 2015 FY 2016 FY 2017 FY 2018 FY 2019 FY 2020 FY 20201Actual Actual Actual Re-estimated Budget Projected Projected Projected Projected
Beginning Fund Balance - Unassigned & Assigned 45,507,578 57,196,424 57,136,110 50,414,607 51,020,945 57,054,695 68,799,570 81,198,121 92,036,622Transfers to (from) unassigned Fund Balance - - (4,500,000) - - - - - - Ending Fund Balance 57,196,424 57,136,110 50,414,607 51,020,945 57,054,695 68,799,570 81,198,121 92,036,622 103,508,758Solvency Ratio 15.92% 15.4% 13.2% 12.7% 13.9% 16.4% 18.8% 20.8% 22.7%Unspent Spending Authority Ratio 17.18% 14.6% 11.9% 9.2% 7.9% 7.6% 7.4% 7.0% 6.7%
Note: One time expenditures of $1,685,000 will not recurr beyond FY2017
Assumptions: 1.00% Supplemental State Aid(Allowable Growth) for FY 2017 Enrollment increases approximately 100 students per year, 2017-2021 3.00% Salary Increases, 4.00% Health Insurance Increases Staffing based on November, 2015 levels; with 100 FTE positions eliminated in 2017 and 75 FTE positions 2018 Self Insurance funding for Health Insurance ends after FY 2019 Spending for technology, textbook adoptions, etc. will approximate FY 2015 levels Includes estimate for funding Drake MA program Includes estimate for funding 3rd grade summer school Includes estimate for funding technology replacement schedule
FISCAL YEARS 2012 - 2020GENERAL FUND FORECAST
DES MOINES PUBLIC SCHOOLS
2016 - 2017 Preliminary Budget 150

APPENDIXP R E L I M I N A RY B U D G E T 2 0 1 6 - 1 7
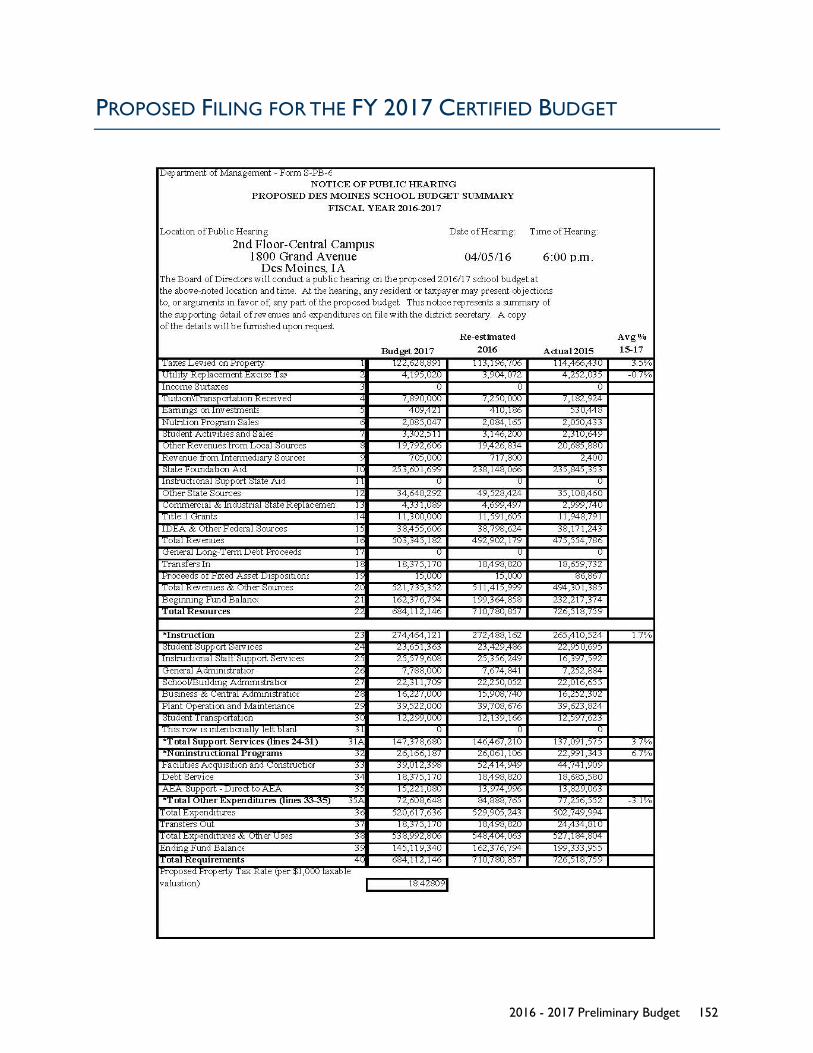
PROPOSED FILING FOR THE FY 2017 CERTIFIED BUDGET
2016 - 2017 Preliminary Budget 152

GLOSSARY
ACADEMIC SUPPORT LAB (ASL) – A non-traditional classroom environment designed to support students who need alternative programming for credit recovery and/or academic intervention. ASL teachers collaborate with student support staff to determine if additional support services are necessary for students to be successful.
ALLOWABLE GROWTH – The amount by which state cost per pupil and district cost per pupil will increase from one budget year to the next, as of FY 2015 also known as Supplemental State Aid.
AREA EDUCATION AGENCY (AEA) – A service bureau that provides a variety of programs, services, and other resources including special education to local education agencies located in a certain geographical area.
AREA EDUCATION AGENCY (AEA) SUPPORT – State funding for AEAs that passes through local a school district’s budget.
AT-RISK FUNDING – Funding generated by the supplementary weighting plan for at-risk students used to develop or maintain at-risk programs.
AT-RISK STUDENT – Any identified student who needs additional support and who is not meeting or not expected to meet the established goals of the educational program (academic, personal/social, career/vocational). At-risk students include but are not limited to students in the following groups: homeless children and youth, dropouts, returning dropouts, and potential dropouts.
BOARD BELIEFS – Board-defined goals regarding the governance of school operations that focus the district’s work on behalf of the education of students in Des Moines. Together, Board Beliefs and Student Expectations serve as the overarching goals for the district. The Board Beliefs and Student Expectations were developed in part as the result of public input at a series of Community Conversations.
BOARD OF DIRECTORS (BOARD, SCHOOL BOARD) – The elected or appointed body that has been created according to state law and is vested with responsibilities for the educational mission of the district.
BOND – A written promise to pay a specific sum of money — called the face value — at a fixed time in the future — called the maturity date — and carrying interest at a fixed rate, usually payable periodically.
BUDGET – A plan of financial operation embodying an estimate of proposed expenditures for a given period or purpose and the proposed means of financing them.
2016 - 2017 Preliminary Budget 153
BUDGET GUARANTEE – The minimum amount of budget authority given to the district by the State, regardless of enrollment declines and changes to the State-calculated cost per pupil. The guarantee is a calculation based on the previous year’s budget wherein the new budget cannot be less than 101% of the previous year’s budget authority.
BUILDING ADMINISTRATION – Activities concerned with overall administrative responsibility for a school.
BUSINESS AND CENTRAL ADMINISTRATION – Activities concerned with paying, transporting, exchanging, and maintaining goods and services for the district. Included are fiscal, human resources, and internal services necessary for operating the district. Also included are activities, other than general administration, which support each of the other instructional and supporting services programs. These activities include planning, research, development, evaluation, information, staff, and data processing services.
CABINET – Superintendent and senior district administrators.
CITIZEN’S BUDGET ADVISORY COMMITTEE (CBAC) – A group of community citizens tasked to provide recommendations to the Superintendent and Board for revenue enhancements and expenditure reductions in balancing the budget. Committee members are not to be former or current district employees or Board members.
COMMUNITY EDUCATION – Activities that develop knowledge and skills that meet the immediate and long-range educational objectives of adults who, having completed or interrupted formal schooling, have accepted adult roles and responsibilities. Programs include activities to foster the development of fundamental tools of learning, prepare students for a post-secondary career, prepare students for post-secondary education programs, upgrade occupational competence, prepare students for a new or different career, develop skills and appreciation for special interests, or to enrich the aesthetic qualities of life.
DEBT – An obligation resulting from the borrowing of money or from the purchase of goods and services. Debts of local education agencies include bonds, warrants, and notes.
DEBT SERVICE FUND – A fund established to account for the accumulation of resources used to pay long-term debt, including principal and interest.
DISTRICT COST PER PUPIL – A calculated amount of dollars set by the State Foundation Aid Formula that represents the maximum amount of expenditures per student available to the district.
DROPOUT PREVENTION – Dropout Prevention interventions are school- and community-based initiatives that aim to keep students in school and encourage them to complete their high school education. Interventions and services, such as counseling, monitoring, school restructuring, curriculum redesign, financial incentives, and community services are provided to eliminate barriers so students may be successful academically, personally and in a career or vocation. Resources are
2016 - 2017 Preliminary Budget 154
focused on outcomes in the following three domains: 1) Staying in school, 2) Progressing in school, and 3) completing school.
EARLY INDICATOR SYSTEM (EIS) – A system used to identify students who may be at risk of dropping out of school or who may need social or emotional interventions to improve academic performance.
EMPLOYEE’S BUDGET ADVISORY COMMITTEE (EBAC) – A group comprised of delegates from the district’s various employee groups and collective bargaining stakeholders tasked to provide recommendations to the Superintendent and Board for revenue enhancements and expenditure reductions in balancing the budget.
ENGLISH LANGUAGE LEARNERS (ELL) – Educational programming to assist students whose language background is in a language other than English in transitioning to the English language.
EXPENDITURES – Obligations incurred for services rendered and/or goods received that result in decreases in net financial resources.
FIDUCIARY FUNDS – Funds held in a custodial capacity such as Trust Funds.
FISCAL YEAR – An accounting period equal to twelve months. For the district, the fiscal year begins July 1 and ends June 30.
FULL-TIME EQUIVALENT POSITION (FTE) – A measuring unit equal to one full-time position; not necessarily one person (e.g. two 0.5 FTE positions equal 1.0 FTE).
FUND – A self-balancing set of accounts. The accounts of a fund constitute a complete entity, and all of the financial transactions for the particular fund are recorded in them.
FUND BALANCE – A balance that is equal to the excess of a fund’s assets over its liabilities and reserves. A fund balance may be either negative or positive depending on the current activities of the fund.
GENERAL ADMINISTRATION – Activities concerned with establishing and administering policy for operating the district.
GENERAL FUND – The chief operating fund of the district, which accounts for all financial resources of the district except for those required to be accounted for in a different fund.
INSTRUCTION – Teaching activities dealing with direct interaction between teachers and students provided for in or outside of the classroom or any other approved medium, such as a computer.
INSTRUCTIONAL STAFF SUPPORT – Activities associated with assisting instructional staff with the content and process of providing learning experiences for students and staff.
2016 - 2017 Preliminary Budget 155
INSTRUCTIONAL SUPPORT LEVY – A levy placed on property values that provides additional funding for district instructional programs including elementary counseling; class-size reduction; and reading, writing, and math recovery.
INTERNAL SERVICE FUNDS – Funds that account for the financing of goods or services provided by one department to other departments on a cost reimbursement basis.
INVESTMENT INCOME – Revenue earned on the investment of idle school district funds. Investments are statutorily limited to money markets and government backed securities.
LEVY – (Verb) To impose taxes or special assessments. (Noun) The total of taxes or special assessments imposed by a governmental unit.
MISSION STATEMENT – The Des Moines Public Schools Exist So That Graduates Possess the Knowledge, Skills and Abilities to Be Successful at the Next Stage of Their Lives.
NON-INSTRUCTIONAL EXPENDITURES – Activities concerned with providing non- instructional services — such as food services — to students, staff, or the community.
OPERATIONS – Activities concerned with keeping the physical plant clean and ready for daily use. Activities include operating heating, cooling, lighting, and ventilating systems; repairing and replacing facilities and equipment; and the costs of building rental and property insurance.
OTHER FINANCING SOURCES – Other financing sources encompassing all other revenues received from the local level such as refund of prior year expenditures, transfers, etc.
PERSISTENLY LOW ACHIEVING SCHOOL (PLAS) – The lowest achieving 5% of schools in the state, based on low overall student achievement.
PLANT OPERATION AND MAINTENANCE – Activities concerned with keeping the physical plant open, comfortable, and safe for use; keeping the grounds, buildings, and equipment in effective working condition and state of repair; and maintaining safety in buildings, on the grounds, and in the vicinity of schools.
PROPERTY RICH/POOR – A term used to describe the property tax base of a school district based on taxable valuation per student in that district. The higher the valuation per student the more “property rich” the district is, as it can generate more tax dollars than a “property poor” district given the same tax rate.
PROPERTY TAXES – The second largest source of revenue for the district. Property taxes are based on the taxable valuation of all taxable property within the school district. They are certified (independently) by the district, levied by the County Board of Supervisors, and collected and remitted by the County Treasurer.
QUALIFIED ZONE ACADEMY BONDS (QZAB) – A U.S. government debt instrument that allows qualified schools to borrow at nominal interest rates (as low as zero percent) for costs
2016 - 2017 Preliminary Budget 156
incurred in connection with the establishment of special programs in partnership with the private sector.
REGULAR PROGRAM BUDGET– The district cost per pupil times the certified enrollment.
SOLVENCY RATIO – Calculated ratio equal to the Unreserved/Undesignated fund balance divided by total revenues.
SPECIAL EDUCATION – Education primarily for students with special needs. The programs include pre-kindergarten, kindergarten, elementary, and secondary services for the mentally challenged, physically challenged, emotionally disturbed, and students with learning disabilities.
SPECIAL PROGRAMS – Activities primarily for students with special needs. Special Programs include pre-kindergarten, kindergarten, elementary, and secondary services for talented and gifted, the mentally and physically handicapped, emotionally disturbed, at-risk, students with learning disabilities, limited English speaking students, and special programs for other types of students.
SPENDING AUTHORITY – The maximum amount of spending allowed under law based on the combination of district cost per pupil, miscellaneous income, and unspent authority from the previous fiscal year.
STATE (FOUNDATION) AID – Funding provided by the State as part of the state foundation aid formula.
STUDENT EXPECTATIONS – Board-defined deliverables that address educational goals and specific desired outcomes for students. Together, Student Expectations and Board Beliefs serve as the overarching goals for the district. The Student Expectations and Board Beliefs were developed in part as the result of public input at a series of Community Conversations.
STUDENT SUPPORT SERVICES – Activities designed to assess and improve the well- being of students and to supplement the teaching process.
STUDENT TRANSPORTATION – Activities concerned with conveying students to and from school, as provided by State and Federal law. This includes trips between home and school and trips to school activities.
SUPPLEMENTAL STATE AID – Formerly known as Allowable Growth, Supplemental State Aid is the amount by which state cost per pupil and district cost per pupil will increase from one budget year to the next.
SUPPLEMENTAL WEIGHTING – This additional weighting is designed to encourage a particular type of activity by school districts. Supplemental weighting is currently available for shared classes, at-risk students, and for non-English speaking students.
TAXES – Compulsory charges levied by a governmental unit for the purpose of financing services performed for the common benefit, such as schools.
2016 - 2017 Preliminary Budget 157

TITLE PROGRAMS – Provides federal funding to schools that have high poverty levels. The funding is meant to help students who are at risk of falling behind academically. The funding provides supplemental instruction for students who economically disadvantaged or at risk for failing to meet state standards
UNSPENT SPENDING AUTHORITY – The remaining amount of spending authority at the end of a fiscal year that is carried over into the following fiscal year to determine that year’s maximum amount of spending authority.
2016 - 2017 Preliminary Budget 158
ACRONYMS
The following is a list of the commonly used acronyms used in Des Moines Public Schools.
~A~ ACT American College Testing ADA Americans with Disabilities Act ADA Average Daily Attendance ADM Average Daily Membership AEA Area Education Agency AP Advanced Placement ARRA American Recovery and Reinvestment Act ASBO Association of School Business Officials AVID Advanced Via Individual Determination AYP Adequate Yearly Progress ~B~ BCOW Bilingual Community Outreach Worker BEDS Basic Educational Data Survey BF Business & Finance BRI Basic Reading Inventory ~C~ CAO Chief Academic Officer CARF Comprehensive Annual Financial Report CBAC Citizens’ Budget Advisory Committee CFA Common Formative Assessment CFO Chief Financial Officer CGI Cognitively Guided Instruction CHRO Chief Human Resources Officer CIA Curriculum, Instruction & Assessment COO Chief Operating Officer CSIP Comprehensive School Improvement Plan CSO Chief Schools Officer CTE Career & Technology Education ~D~ DE Department of Education DHS Department of Human Services DINA District in Need of Assistance DM Des Moines DMACC Des Moines Area Community College DMICSD Des Moines Independent Community School District DMPS Des Moines Public Schools DMTRS Des Moines Teacher Retirement System DSM Des Moines
2016 - 2017 Preliminary Budget 159
~E~ EBAC Employees’ Budget Advisory Committee EC Education Center ECE Early Childhood Education ECSE Early Childhood Special Education ED Executive Director EEO Equal Employment Opportunity ELA English Language Arts ELDA English Language Development Assessment ELL English Language Learner ES Elementary School ESEA Elementary & Secondary Education Act ~F~ FAA Federal Aviation Administration FAY Full Academic Year FERPA Family Educational Rights and Privacy Act FMLA Family & Medical Leave Act FRPL Free & Reduced Price Lunch FTE Full-Time Equivalency FY Fiscal Year ~G~ GAAP Generally Accepted Accounting Principals GFOA Governmental Finance Officers Association GPA Grade Point Average GT Gifted & Talented ~H~ HBAC Health Benefits Advisory Committee HF House File HR Human Resources HS High School HVAC Heating, Ventilation & Air Conditioning ~I~ IASBO Iowa Association of School Business Officials IB International Baccalaureate IC Infinite Campus IDE Iowa Department of Education IDEA Individuals with Disabilities Education Act IDHS Iowa Department of Human Services IDPH Iowa Department of Public Health IELC Intensive English Language Center IEP Individualized Education Plan IEP Individualized Education Program IHE Institute of Higher Education
2016 - 2017 Preliminary Budget 160

IPDM Iowa Professional Development Model IPERS Iowa Public Employees Retirement System ISD Independent Community School District ISEA Iowa Science Teachers Association ISU Iowa State University ~K~ K Kindergarten ~L~ LEA Local Education Agency LEP Limited English Proficiency LOST Local Option Sales Tax LRE Least Restrictive Environment ~M~ ML Management Limitation ~N~ NCES National Center for Education Statistics NCLB No Child Left Behind NPR National Percentile Rank NSS National Standard Score ~P~ PBIS Positive Behavior Intervention & Support PD Professional Development PERL Public Education & Recreation Levy PK Pre-Kindergarten, Preschool PLAS Persistently Low Achieving School PLC Professional Learning Community PLTW Project Lead the Way PMIC Psychiatric Medical Institute for Children PPEL Physical, Plant & Equipment Levy PTA Parent Teacher Association PTO Parent Teacher Organization ~Q~ QZAB Qualified Zone Academy Bond ~R~ RFP Request for Proposal RTI Response to Intervention ~S~ SAT Scholastic Aptitude Test SE Special Education SEA State Education Association
2016 - 2017 Preliminary Budget 161
SINA School in Need of Assistance SIP School Improvement Plan SIS Student Information System SLC Smaller Learning Communities SPED Special Education SRI Scholastic Reading Inventory SRG Standards Referenced Grading SSA Supplemental State Aid STEM Science, Technology, Engineering & Mathematics SWP Statewide Penny ~T~ TLC Teacher Leadership & Compensation ~U~ UEN Urban Education Network USDA U.S. Department of Agriculture ~Y~ YTD Year to Date
2016 - 2017 Preliminary Budget 162

Think. Learn. Grow.
www.dmschools.org | facebook.com/dmschools | twitter.com/dmschools